annual national government budget implementation review ...€¦ · annual national government...
TRANSCRIPT

OFFICE OF THE CONTROLLER OF BUDGET
ANNUAL NATIONAL GOVERNMENT BUDGET IMPLEMENTATION REVIEW REPORT
FY 2016/17
AUGUST, 2017
THE REPUBLIC OF KENYA

THE REPUBLIC OF KENYA
OFFICE OF THE CONTROLLER OF BUDGET
ANNUAL NATIONAL GOVERNMENT
BUDGET IMPLEMENTATION REVIEW REPORT
FY 2016/17
AUGUST, 2017

iiANNUAL NATIONAL GOVERNMENT BUDGET IMPLEMENTATION REVIEW REPORT FY 2016/17 AUGUST, 2017
OFFICE OF THE CONTROLLER OF BUDGET
FOREWORD
It is my great pleasure to present the Annual National Government Budget Implementation Review Report (BIRR) for the Financial Year 2016/17. This report presents the aggregate performance of budget implementation by Ministries, Departments and Agencies (MDAs) of the National Government for the twelve months ending in 30th June, 2017 and marks the end of the first five years since implementation of the devolved system of governance in Kenya.
The report is prepared in line with Article 228 (6) of the Constitution of Kenya, 2010 and Section 9 of the Controller of Budget Act, 2016 which require the Controller of Budget (COB) to submit to each House of Parliament a report on the implementation of the budgets of National and County government every four months.
The Government through the FY 2016/17 Budget Policy Statement (BPS) had anticipated sustained economic growth. The key features of the National Government Budget for FY 2016/17 were to improve the business environment by improving security, maintaining macro-economic stability and reducing the cost of doing business so as to encourage investment opportunities in the Country. The Government had committed to continue spending on infrastructure to unlock constraints to growth and continue spending on all sectors to create employment. In addition, the Government had planned to sustain investment in social services for the welfare of Kenyans by investing in quality and accessible health care services and education and strengthening the social safety nets. Similarly, the Government committed to enhance service delivery through devolution by consolidating the gains already made in the devolved units in order to provide better service delivery to the citizenry. The foregoing shaped the budget programmes and projects, and formed the basis for the MDAs budget implementation review by the Office of the Controller of Budget.
The report provides information on the implementation status of budgets of the National Government Ministries, Departments and Agencies (MDAs) for FY 2016/17. It provides the overall budget performance in both revenue and expenditure and identifies key challenges that hampered implementation to achieve budget objectives. This report is largely based on analysis of expenditure returns and financial reports submitted by the respective MDAs and supported by expenditure data generated from the Integrated Financial Management Information System (IFMIS). The information is also informed by continuous monitoring of receipts into the Consolidated Fund and exchequer issues to the MDAs approved by the Controller of Budget and corroborated with data provided by the National Treasury (NT).
The information published in the Budget Implementation Review Report is disseminated to the wider public in line with Section 39 (8) of the PFM Act, 2012, which requires the Controller of Budget to ensure that the public has access to information on budget implementation.
Public participation in budget monitoring is a key principle in Public Finance. This report is therefore, intended to create awareness and share information on budget implementation among stakeholders including but not limited to; Legislators, Policy makers, and the Public. The Office calls upon readers of the report to take keen interest on the information provided on implementation of the budget in order to interrogate the use of public resources in line with underlying budget policy guidelines and priorities by the Government. This will provide the necessary impetus for optimal utilization of public resources for the benefit of all Kenyans.
Mrs. Agnes Odhiambo, CBSCONTROLLER OF BUDGET

iiiANNUAL NATIONAL GOVERNMENT
BUDGET IMPLEMENTATION REVIEW REPORT FY 2016/17 AUGUST, 2017
OFFICE OF THE CONTROLLER OF BUDGET
TABLE OF CONTENTS
FOREWORD ......................................................................................................................................................... II
LIST OF ABBREVIATIONS AND ACRONYMS ....................................................................................... VII
EXECUTIVE SUMMARY ................................................................................................................................. IX
KEY HIGHLIGHTS ..............................................................................................................................................X
1 INTRODUCTION .........................................................................................................................................1
2 ANALYSIS OF RECEIPTS AND EXCHEQUER ISSUES ...................................................................22.1 Introduction ............................................................................................................................................................ 2
2.2 Analysis of Revenue Estimates and Receipts into the Consolidated Fund ........................................................... 2
2.2.1 FY 2016/17 Revenue Estimates ................................................................................................................. 2
2.2.2 Receipts into the Consolidated Fund ......................................................................................................... 2
2.3 FY 2016/17 Overall Budget .................................................................................................................................... 3
2.4 Exchequer Issues to the MDAs and County Governments in FY 2016/17............................................................ 3
2.4.1 Recurrent Exchequer Issues by Sector ...................................................................................................... 5
2.4.2 Exchequer Issues to Consolidated Fund Services (CFS) in FY 2016/17 .................................................... 6
2.4.3 Development Exchequer Issues by Sector .................................................................................................. 7
3 NATIONAL GOVERNMENT OVERALL EXPENDITURE ANALYSIS ........................................83.1 Introduction ............................................................................................................................................................ 8
3.2 Overall Government Budget Performance ............................................................................................................ 8
3.3 Consolidated Fund Services (CFS) ...................................................................................................................... 10
3.3.1 Public Debt ............................................................................................................................................... 10
3.3.2 Guaranteed Debt to State Parastatals ....................................................................................................... 10
3.3.3 Salaries and Allowances for Constitutional Office Holders ..................................................................... 10
3.3.4 Pensions and Gratuities ............................................................................................................................ 11
3.4 MDAs Expenditure Analysis ............................................................................................................................... 11
3.4.1 MDAs Recurrent Expenditure Analysis .................................................................................................. 11
4 DEVELOPMENT AND RECURRENT EXPENDITURE ANALYSIS BY SECTOR IN FY 2016/17 ............................................................................................................................................................244.1 Introduction .......................................................................................................................................................... 24
4.2 Agriculture, Rural and Urban Development (ARUD) Sector ............................................................................. 24
4.3 Education Sector .................................................................................................................................................. 27
4.4 Energy, Infrastructure and Information Communications Technology (EI & ICT) Sector ............................... 30
4.5 Environmental Protection, Water and Natural Resource Sector ......................................................................... 32
4.6 General Economic and Commercial Affairs (GECA) Sector .............................................................................. 35
4.7 Governance, Justice, Law and Order Sector (GJLOS) ........................................................................................ 38

ivANNUAL NATIONAL GOVERNMENT BUDGET IMPLEMENTATION REVIEW REPORT FY 2016/17 AUGUST, 2017
OFFICE OF THE CONTROLLER OF BUDGET
4.8 Health Sector ........................................................................................................................................................ 41
4.9 National Security Sector ...................................................................................................................................... 44
4.10 Public Administration and International Relations (PAIR) Sector ..................................................................... 45
4.11 Social Protection, Culture and Recreation Sector .............................................................................................. 48
5 BUDGET PERFORMANCE BY PROGRAMMES FOR FY 2016/17 ...............................................515.1 Introduction .......................................................................................................................................................... 51
5.2 Agriculture, Rural and Urban Development (AR & UD) Sector ........................................................................ 51
5.3 Education Sector .................................................................................................................................................. 52
5.4 Energy, Infrastructure and Information Communications Technology (EI & ICT) Sector ............................... 53
5.5 Environment Protection, Water and Natural Resources Sector .......................................................................... 54
5.6 General Economic and Commercial Affairs (GECA) Sector .............................................................................. 55
5.7 Governance, Justice, Law and Order (GJLOS) Sector ........................................................................................ 56
5.8 Health Sector ........................................................................................................................................................ 58
5.9 National Security Sector ...................................................................................................................................... 59
5.10 Public Administration and International Relations (PAIR) Sector ..................................................................... 59
5.11 Social Protection, Culture and Recreation Sector ............................................................................................... 61
6 KEY ISSUES AND RECOMMENDATIONS ........................................................................................636.1 Introduction .......................................................................................................................................................... 63
6.2 Key Issues and Recommendation ........................................................................................................................ 63
6.2.1 Delay in Submission of Quarterly Reports on Financial and Non-Financial Performance .................... 63
7 CONCLUSION .............................................................................................................................................64
ANNEX I: MDAS DEVELOPMENT EXPENDITURE FOR FY 2016/17 (KSHS.) .................................65
ANNEX II: MDAS RECURRENT EXPENDITURE FOR FY 2016/17 (KSHS) .......................................69
ANNEX III: SECTORAL DEVELOPMENT EXPENDITURE FOR FY 2016/17 (KSHS) .....................75
ANNEX IV: SECTORAL RECURRENT EXPENDITURE FOR FY 2016/17 (KSHS) ...........................76

vANNUAL NATIONAL GOVERNMENT
BUDGET IMPLEMENTATION REVIEW REPORT FY 2016/17 AUGUST, 2017
OFFICE OF THE CONTROLLER OF BUDGET
LIST OF TABLES
Table 2.1 Statement of Receipts into the Consolidated Fund in FY 2016/17 (Kshs. Billions) ........................................2
Table 2.2: Summary of Exchequer Issues for FY 2016/17 compared to FY 2015/16 (Kshs. billions) ..............................3
Table 2.3 Annual Estimates and Exchequer Issues by Sector for FY 2016/17 compared to FY 2015/16 (Kshs. Billions) .................................................................................................................................................4
Table 2.4: Sectoral Recurrent Estimates and Exchequer issues for FY 2016/17 and FY 2015/16 (Kshs. Billions) ..........5
Table 2.5: CFS Budgetary Allocation and Exchequer Issues for FY 2016/17 compared to FY 2015/16 (Kshs. Millions) ................................................................................................................................................6
Table 2.6: Sectoral Development Annual Estimates and Exchequer Issues for FY 2016/17 and FY 2015/16 (Kshs. Billions). ...................................................................................................................................7
Table 3.1: Overall Government Budget Performance for FY 2016/17 Compared to FY 2015/16 (Kshs Billion) ............8
Table 3.2: Annual Budget and Cumulative Expenditure for CFS in the FY 2016/17 (Kshs. Millions).......................... 10
Table 3.3 Breakdown of Recurrent Expenditure by MDAs for FY 2016/17 (Kshs. Millions) ...................................... 12
Table 3.4: Breakdown of Development Expenditure by MDAs for FY 2016/17 (Kshs. Millions) ................................ 19
Table 4.1: AR & UD Sector-Analysis of Exchequer Issues and Expenditure for FY 2016/17 (Kshs. Billions) .............25
Table 4.2: Education Sector-Analysis of Exchequer Issues and Expenditure for FY 2016/17. (Kshs. Billions) ............28
Table 4.3: EI & ICT-Analysis of Exchequer Issues and Expenditure for FY2016/17 (Kshs. Billions) ........................... 31
Table 4.4: Environmental Protection, Water and Natural Resources Sector-Analysis of Exchequer Issues and Expenditure for the period FY 2016/17 (Kshs. Billions) ..............................................................34
Table 4.5: GECA Sector-Analysis of Exchequer Issues and Expenditure for FY 2016/17 (Kshs. Billions) ................... 36
Table 4.6 GJLOS Sector-Analysis of Exchequer Issues and Expenditure for FY2016/17 (Kshs. Billions) ..................40
Table 4.7: Health Sector-Analysis of Exchequer Issues and Expenditure for the period July 2016 to July, 2017. (Kshs. Billions) ...................................................................................................................................... 43
Table 4.8: National Security Sector-Analysis of Exchequer Issues and Expenditure for FY2016/17 (Kshs Billions) ................................................................................................................................................44
Table 4.9: PAIR Sector-Analysis of Exchequer Issues and Expenditure for FY2016/17 (Kshs. Billions) .....................46
Table 4.10: Social Protection, Culture Recreation Sector-Analysis of Exchequer Issues and Expenditure, FY 2016/17 (Kshs. Billions) ............................................................................................................................49
Table 5.1: AR &UD Sector’s Programme Performance for FY 2016/17 (Kshs. Billions) .............................................. 51
Table 5.2: Education Sector’s Programme Performance for FY 2016/17 (Kshs. Billions) ............................................. 52
Table 5.3: EI & ICT Sector’s Programme Performance for FY 2016/17 (Kshs. Billions) .............................................. 53
Table 5.4: Environment Protection, Water and Natural Resources Sector’s Programme for FY 2016/17 (Kshs. Billions) ............................................................................................................................................... 55
Table 5.5: GECA Sector’s Programme Performance for FY 2016/17 (Kshs. Billions) .................................................. 56
Table 5.6: GJLOS Sector’s Programme Performance for FY 2016/17 (Kshs. Billions .................................................. 57
Table 5.7: Health Sector’s Programme Performance for FY 2016/17 (Kshs. Billions) ................................................... 58
Table 5.8: National Security Sector’s Programme Performance for FY 2016/17 (Kshs. Billions) ................................. 59
Table 5.9: PAIR Sector’s Programme Performance for FY 2016/17 (Kshs. Billions) .................................................... 59
Table 5.10: Social Protection, Culture and Recreation Sector’s Programme Performance for FY 2016/17 ....................... (Kshs. Billions) ............................................................................................................................................... 61

viANNUAL NATIONAL GOVERNMENT BUDGET IMPLEMENTATION REVIEW REPORT FY 2016/17 AUGUST, 2017
OFFICE OF THE CONTROLLER OF BUDGET
LIST OF FIGURES
Figure 3.1: Comparison of Annual Budget and Expenditure by Sector in FY 2016/17 .....................................................9
Figure 3.2: Annual Budget and Expenditure by Sector in FY 2016/17 ..............................................................................9
Figure 3.3: Summary Analysis of MDAs’ Recurrent Expenditure in FY 2016/17 (Kshs. Millions ................................ 18
Figure 3.4: Summary Analysis of MDAs’ Development Expenditure in FY 2016/17 (Kshs. Million) ...........................23
Figure 4.1: Budgetary Allocation Trend for AR & UD Sector from FY 2012/13 to FY 2016/17 (Kshs. billion) ............25
Figure 4.2: Exchequer Issues to AR & UD Sector for FY 2016/17 (Kshs. Billions) ........................................................26
Figure 4.3: Budgetary Allocation Trend for the Education Sector from FY 2012/13 to FY 2016/17 (Kshs. Billion) ......28
Figure 4.4: Exchequer Issues to the Education Sector for FY 2016/17 (Kshs. Billions) ..................................................29
Figure 4.5: Budgetary Allocation Trend for the EI & ICT Sector from FY 2012/13 to FY 2016/17 (Kshs. Billion) .......30
Figure 4.6: Exchequer Issues to the EI & ICT Sector for FY 2016/17 (Kshs. Billions) ................................................... 32
Figure 4.7: Budgetary Allocation Trend for the Environmental Protection, Water and Natural Resources Sector from FY 2012/13 to FY 2016/17 (Kshs. Billions) ........................................................................................... 33
Figure 4.8: Exchequer Issues to Environmental Protection, Water and Natural Resources Sector for FY 2016/17 (Kshs. Billions) .............................................................................................................................................. 35
Figure 4.9: Budgetary Allocation Trend for the GECA Sector from FY 2012/13 to FY (2016/17 (Kshs. Billion) .......... 36
Figure 4.10: Exchequer Issues to the GECA Sector for the FY 2016/17 (Kshs. Billions) .................................................. 37
Figure 4.11: Budgetary Allocation Trend for the GJLOS Sector from FY 2012/13 to FY 2016/17 (Kshs. Billion) .......... 39
Figure 4.12: Exchequer Issues to the GJLOS Sector for FY 2016/17 (Kshs. Billions) ....................................................... 41
Figure 4.13: Budgetary Allocation Trend for the Health Sector from FY 2012/13 to FY 2016/17 (Kshs. Billion) ........... 42
Figure 4.14: Exchequer Issues to the Health Sector for the FY 2016/17 (Kshs. Billions) .................................................. 43
Figure 4.15: Budgetary Allocation Trend for the National Security Sector from FY 2012/13 to FY 2016/17 (Kshs. Billion) ................................................................................................................................................44
Figure 4.16: Budgetary Allocation Trend for the PAIR Sector from FY 2012/13 to FY 2016/17 (Kshs. Billion) ............. 45
Figure 4.17: Exchequer Issues to the PAIR Sector for FY 2016/17 (Kshs. Billions) .......................................................... 47
Figure 4.18: Budgetary Allocation Trend for the Social Protection, Culture Recreation Sector from FY 2012/13 to FY 2016/17 (Kshs. Billion) .....................................................................................................48
Figure 4.19: Exchequer Issues to the Social Protection, Culture Recreation Sector in FY 2016/17 (Kshs. Billions) ....... 50
viiANNUAL NATIONAL GOVERNMENT
BUDGET IMPLEMENTATION REVIEW REPORT FY 2016/17 AUGUST, 2017
OFFICE OF THE CONTROLLER OF BUDGET
LIST OF ABBREVIATIONS AND ACRONYMS
A-I-A Appropriations-in-AidAIDS Acquired Immune Deficiency SyndromeAMISOM Africa Union Mission in SomaliAR & UD Agricultural Rural and Urban DevelopmentASDSP Agricultural Sector Development Support ProgrammeASAL Arid and Semi-arid LandBn BillionBIRR Budget Implementation Review ReportCFS Consolidated Fund ServicesCOB Controller of BudgetCRA Commission on Revenue AllocationDANIDA Danish International Development AgencyEACC Ethics and Anti-Corruption CommissionEI & ICT Energy Infrastructure and Information Communication TechnologyEWNR Environment Protection, Water and Natural ResourcesFY Financial YearGDP Gross Domestic ProductGECA General Economic and Commercial AffairsGJLOS Governance, Justice, Law and Order SectorIEBC Independent Electoral and Boundaries CommissionIFMIS Integrated Financial Management Information SystemICPD International Conference on Population and DevelopmentIPOA Independent Policing Oversight AuthorityJSC Judicial Service CommissionKCEP Kenya Cereal Enhancement ProgrammeKEMRI Kenya Medical Research InstituteKEMSA Kenya Medical Supplies AgencyKMTC Kenya Medical Training CollegeKNCHR Kenya National Commission on Human RightsKNH Kenyatta National HospitalKRB Kenya Roads BoardKshs Kenya ShillingsLMIS Labour Market Information SystemMDA(s) Ministries Departments and AgenciesMoLPP Ministry of Lands and Physical PlanningMTEF Medium Term Expenditure FrameworkNACC National Aids Control CouncilNCAPD National Coordinating Agency for Population and DevelopmentNGEC National Gender and Equality Commission

viiiANNUAL NATIONAL GOVERNMENT BUDGET IMPLEMENTATION REVIEW REPORT FY 2016/17 AUGUST, 2017
OFFICE OF THE CONTROLLER OF BUDGET
NHIF National Hospital Insurance FundNIS National Intelligence ServiceNLC National Land CommissionNPSC National Police Service CommissionNT National TreasuryOCOB Office of the Controller of BudgetO&M Operations and MaintenancePAIR Public Administration and International RelationsPE Personnel EmolumentsPFM Act Public Finance Management ActPLWDs Persons Living with DisabilitySAGAs Semi-Autonomous Government AgenciesTSC Teachers Service CommissionWPA Witness Protection Agency

ixANNUAL NATIONAL GOVERNMENT
BUDGET IMPLEMENTATION REVIEW REPORT FY 2016/17 AUGUST, 2017
OFFICE OF THE CONTROLLER OF BUDGET
EXECUTIVE SUMMARY
This is the Annual National Government Budget Implementation Review Report for FY 2016/17 and covers the period July 2016 to June 2017. The report is prepared in accordance with Article 228(6) of the Constitution of Kenya, 2010 and Section 9 of the Controller of Budget Act, 2016, which require the Controller of Budget to submit to Parliament quarterly reports on budget implementation by the National and County Governments every four months. The report presents the performance of revenue and expenditure and highlights the key challenges encountered by National Government entities during budget execution.
Budget implementation in the FY 2016/17 recorded commendable improvement with an overall budget of Kshs.2.6 trillion from Kshs.2.3 trillion recorded in FY 2015/16, representing 15 per cent increase. This resulted to an increase in allocation for recurrent expenditure (Kshs.1.5 trillion), development expenditure (Kshs.861.2 billion) and county governments (Kshs.300.1 billion), the highest budgetary allocations in the last five financial years (FY 2012/13 to FY 2016/17).
In FY 2016/17, exchequer revenue1 raised by the Government through the National Treasury was Kshs.2.03 trillion representing 96.9 per cent of the revised annual target of Kshs.2.1 trillion. This was 9.4 per cent improvement compared to Kshs.1.9 trillion received into the exchequer account in FY 2015/16. The Tax Income, Domestic Borrowing and Commercial Loans categories contributed Kshs.1.25 trillion, Kshs.415 billion and Kshs.186.3 billion respectively. Grants from International Organization and AMISOM contributed Kshs.13.4 billion.
The total exchequer issues to MDAs, Consolidated Fund Services (CFS) and County Governments for the period under review amounted to Kshs.2 trillion, representing 95.4 per cent of the revised annual net estimates. This was an increase from Kshs.1.79 trillion issued in FY 2015/16. The exchequer issues for recurrent activities were Kshs.819.9 billion, Kshs.394.2 billion for development activities, while Kshs.498.1 billion was released for CFS. County Governments received Kshs.284.7 billion.
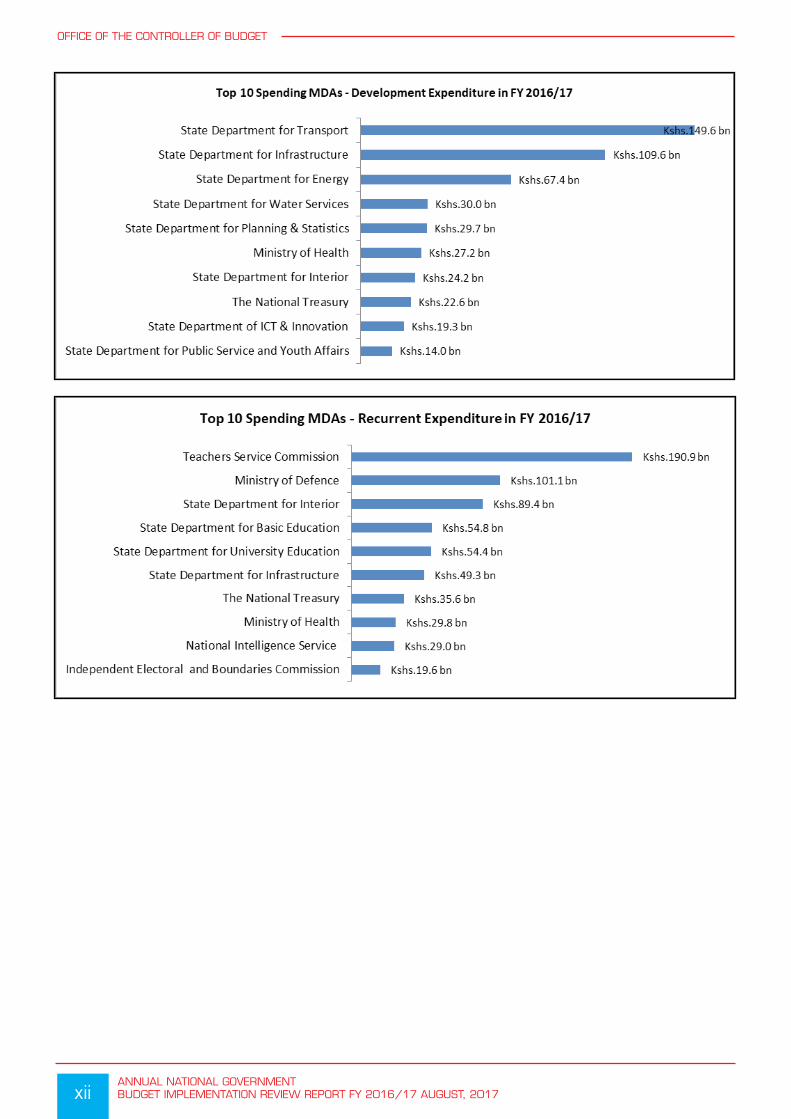
The total expenditure by the National Government was Kshs.1.96 trillion, representing 84.7 per cent of the revised gross estimates. This comprised of recurrent expenditure at Kshs.1.36 trillion and Kshs.602.3 billion for development expenditure representing 93.4 per cent and 69.9 per cent of the revised gross estimates respectively. Recurrent expenditure comprised of Kshs.858.3 billion towards MDAs recurrent activities and Kshs.499 billion for CFS. This represents 14.8 per cent growth from Ksh.1.18 trillion (90.5 per cent) recorded in FY 2015/16. Analysis of the MDAs recurrent expenditure shows that, a total of Kshs.341.4 billion was current transfers to Semi-Autonomous Government Agencies (SAGAs) which represented 39.8 per cent of the total recurrent expenditure. The second highest expenditure category was Personnel Emoluments at Kshs.329.8 billion representing 38.4 per cent of the total recurrent expenditure by MDAs. Further analysis of the Personnel Emoluments (PE) shows that the Teachers Service Commission (TSC) recorded the highest expenditure at Kshs.189. 6 billion, which translated to 57.5 per cent of the total PE expenditure by all MDAs. This is attributed to teachers’ salaries which constitutes the bulk of the recurrent expenditure under TSC. Domestic and Foreign Travel was the third highest recurrent spending category at Kshs.15.6 billion recording Kshs.9.5 billion and Kshs.6.1 billion for the two categories respectively.
The gross development expenditure amounted to Kshs.602.3 billion, representing an absorption rate of 69.9 per cent, a marginal increase from 66.3 per cent recorded in the previous financial year. Capital Transfers to SAGAs was the highest spending economic category at Kshs.297.7 billion, while Refurbishment of Buildings and Infrastructure recorded Kshs.114.2 billion, representing 49.4 per cent and 19 per cent of the revised gross development expenditure respectively.
During FY 2016/17, budget implementation faced a number of challenges. These included; delay in submission of quarterly financial performance reports by MDAs to the Office of the Controller of Budget, and budget rationalisation through the supplementary budget leading to inadequate resources to MDAs to implement planned activities. The OCOB recommends timely submission of financial reports to enhance budget monitoring and reporting. Whenever, there are budget revisions, the National Treasury should discuss with the respective MDAs to allow for prioritization of activities for effective implementation of the budget.
1 Exchequer Revenue includes: Tax Income, Net Domestic Borrowing, Commercial Loans, Opening balances from Previous year, Non-Tax Income, Loans-Foreign Governments & International Organizations, Unspent balances recovered from MDAs, Grants-Foreign Governments & International Organizations, Grants from AMISOM, Program Loan-Budget Support, Domestic Lending and On-Lending etc.

xANNUAL NATIONAL GOVERNMENT BUDGET IMPLEMENTATION REVIEW REPORT FY 2016/17 AUGUST, 2017
OFFICE OF THE CONTROLLER OF BUDGET
KEY HIGHLIGHTS

xiANNUAL NATIONAL GOVERNMENT
BUDGET IMPLEMENTATION REVIEW REPORT FY 2016/17 AUGUST, 2017
OFFICE OF THE CONTROLLER OF BUDGET
xiiANNUAL NATIONAL GOVERNMENT BUDGET IMPLEMENTATION REVIEW REPORT FY 2016/17 AUGUST, 2017
OFFICE OF THE CONTROLLER OF BUDGET

xiiiANNUAL NATIONAL GOVERNMENT
BUDGET IMPLEMENTATION REVIEW REPORT FY 2016/17 AUGUST, 2017
OFFICE OF THE CONTROLLER OF BUDGET


1ANNUAL NATIONAL GOVERNMENT
BUDGET IMPLEMENTATION REVIEW REPORT FY 2016/17 AUGUST, 2017
1 INTRODUCTION
The Annual National Government Budget Implementation Review Report (BIRR) for the FY 2016/17 has been prepared pursuant to Article 228 (6) of the Constitution of Kenya, 2010 and Section 9 of the Controller of Budget Act, 2016 which requires the Controller of Budget to submit to each House of Parliament a report on the implementation of the budgets of the national and county governments every four months.
The FY 2016/17 Budget was premised on high expectations for the realization of economic growth. Its key features were to improve the business environment by improving security, maintaining macro-economic stability and reducing the cost of doing business so as to encourage investment opportunities in the country. The government had committed to continue spending on infrastructure to unlock constraints to growth while maintaining sectoral spending for employment creation. The government planned to sustain investment in social services for the welfare of Kenyans by investing in quality and accessible health care services and relevant education and strengthening the social safety nets. Similarly, the Government undertook to enhance service delivery through devolution by consolidating the gains already made in the devolved units in order to provide better service delivery to the citizenry. This informed the formulation of the budget programmes and projects, and formed the basis for the review of budget implementation by MDAs.
The current Budget Implementation Review Report for the FY 2016/17 covers the period July 2016 to June 2017 and provides information on implementation status of budgets of the National Government Ministries, Departments and Agencies (MDAs) for FY 2016/17 and compares the performance with previous Financial Year. Information on budget implementation includes budget estimates, receipts into the Consolidated Fund, exchequer issues, expenditure by MDAs and identifies key challenges that hampered budget implementation to achieve the set objectives. The report is organized into seven chapters including the introduction section.
Chapter two of the report presents information on financing of the budget for the FY 2016/17. This includes analysis of receipts into the Consolidated Fund and compares the performance with 2015/16 financial year. It also presents funds withdrawn from the Consolidated Fund as approved by the Controller of Budget in line with Article 228(4) of the Constitution of Kenya, 2010 for both recurrent and development expenditure, and also exchequer releases to the County Governments. Chapter three presents the actual expenditure on recurrent and development by MDAs and the CFS, which constitutes payment of public debt, pension and gratuities, salaries and allowances to Constitutional Office holders and subscriptions to International Organisations. Further, recurrent and development expenditure are disaggregated by economic categories. Recurrent expenditure includes Personnel Emoluments (PE) and Operations and Maintenance (O&M). The main categories under Operations and Maintenance include Domestic and Foreign Travel, Hospitality, Training, Current Transfers to Semi-Autonomous Government Agencies (SAGAs) among others. The major economic categories under development expenditure include Capital Transfer to SAGAs, Refurbishment of buildings/Infrastructure, Construction and civil works, Purchase of specialized plant, equipment and machinery among other development expenditure.
Chapter four presents analysis of budget performance by Sector for both development and recurrent expenditure. The absorption of the budget by the MDAs is expressed as a percentage of total expenditure against the revised gross estimates while exchequer issues are presented as a percentage of the revised net estimates. Chapter five presents information on how MDAs achieved their objectives as outlined in their Programmed Based Budgets (PBB).
Chapter six of the report highlights key issues which affected smooth implementation of budgets by the respective government entities and provides appropriate recommendations on how to address them in future while chapter seven provides the conclusion of the report.

2ANNUAL NATIONAL GOVERNMENT BUDGET IMPLEMENTATION REVIEW REPORT FY 2016/17 AUGUST, 2017
2 ANALYSIS OF RECEIPTS AND EXCHEQUER ISSUES
2.1 IntroductionThis chapter provides summary on receipts into the Consolidated Fund in FY 2016/17. It also provides a breakdown on how funds received into the Consolidated Fund were released to the MDAs for both development and recurrent expenditure. This is in line with Article 228 (4) of the Constitution which stipulates that, the Controller of Budget shall oversee the implementation of the budgets of the national and county governments by authorizing withdrawals from public funds as provided for under Articles 204, 206 and 207 of the Constitution of Kenya, 2010.
2.2 Analysis of Revenue Estimates and Receipts into the Consolidated FundThis section presents an overview of the revised revenue estimates and actual receipts into the Consolidated Fund in FY 2016/17.
2.2.1 FY 2016/17 Revenue Estimates
The revised revenue estimates for FY 2016/17 was Kshs.2.1 trillion. The National Treasury estimated to finance the revised budget, from the following sources; Tax income (Kshs.1.3 trillion), Non-tax income (Kshs.54.1 billion), Net Domestic borrowing (Kshs.517.8 billion), Commercial Loan (Kshs.186.3 billion), Loans from Foreign Governments and International Organisations (Kshs.42.3 billion) and Grants from Foreign Governments and International Organisations (Kshs.18.7 billion).
Other sources of exchequer revenue for the period under review include; Grants from the African Mission in Somalia (AMISOM, Kshs.6.4 billion) Domestic lending and on-lending (Kshs.2.1 billion) and Kshs.8.3 billion which comprise of Kshs.7.4 billion,Kshs.0.4 billion and Kshs.0.5 billion from Programme loan-budget support, Grants-DANIDA Support to County Health and Grants-Debt Swap respectively.
2.2.2 Receipts into the Consolidated Fund
In the FY 2016/17 total receipts into the Consolidated Fund was Kshs.2 trillion and comprised of balance brought forward from the previous financial year (FY 2015/16), tax and non-tax income, net domestic borrowing, loans and grants from foreign governments and international organisations, programme loan for budget support, domestic lending and on-lending, grants from AMISOM, commercial loans and unspent balances recovered from MDAs from the previous financial year, FY 2015/16.
Table 2.1 presents a statement of receipts into the Consolidated Fund in FY 2016/17 compared to FY 2015/16 performance.
Table 2.1 Statement of Receipts into the Consolidated Fund in FY 2016/17 (Kshs. Billions)
Receipts Category
Revised Esti-mates FY 2016/17
Actual Receipts
Perfor-mance Against An-nual Target (%)
Contri-bution by Category (%)
Actual Receipts June 2016
Increase/ Decrease in re-ceipts over June 2016
per-centage change (%)
Opening Balance 01.07.2016 - 59.8 - 2.9 0.2 59.6 >100
Total Tax Income 1,257.2 1,253.4 99.7 61.9 1,108.2 145.3 13.1
Total Non-Tax Income 54.1 52.8 97.6 2.6 44.7 8.2 18.2
Net Domestic Borrowing 517.8 415.0 80.1 20.6 506.2 (91.2) (18.0)

3ANNUAL NATIONAL GOVERNMENT
BUDGET IMPLEMENTATION REVIEW REPORT FY 2016/17 AUGUST, 2017
OFFICE OF THE CONTROLLER OF BUDGET
Loans-Foreign Governments and International Organisa-tions
42.3 31.4 74.1 1.5 33.7 (2.3) (6.9)
Programme Loan- Budget Support 7.4 6.8 91.9 0.3 8.6 (1.8) (21.3)
Domestic Lending and On-Lending 2.1 1.8 82.8 0.1 2.4 (0.7) (27.1)
Grant-Foreign Governments and International Organisa-tions
18.7 6.6 35.2 0.3 9.0 (2.4) (26.7)
Grants-DANIDA support to County Health Facilities 0.4 0.4 96.7 0.01 0.7 (0.3) (41.4)
Grants-Debt Swap 0.5 0.03 5.6 0.001 0.3 (0.3) (90.7)
Grants from AMISOM 6.4 6.8 105.4 0.3 4.3 2.5 57.9
Commercial Loans 186.3 186.3 100 9.2 134.9 51.4 38.1
Unspent Balances - 6.8 - 0.3 0.4 6.4 >100
Total Receipts 2,093.4 2,027.9 96.9 100 1,853.6 174.3 9.4
Source: National Treasury
2.3 FY 2016/17 Overall BudgetThe FY 2016/17 Revised Budget amounted to Kshs.2.6 trillion; representing 15 per cent increase compared to Kshs.2.3 trillion in FY 2015/16. The Budget comprised of Kshs.861.2 billion allocated for development expenditure, Kshs.1.5 trillion for recurrent expenditure and Kshs.300.1 billion for the County Governments.
2.4 Exchequer Issues to the MDAs and County Governments in FY 2016/17In the FY 2016/17, total exchequer issues to the MDAs and County governments amounted to Kshs.2.0 trillion representing 95.4 per cent of revised net estimates, a marginal decrease compared to 96.3 per cent issued in FY 2015/16. Table 2.2 presents a summary of the exchequer issues for FY 2016/17 against the revised net estimates compared to FY 2015/16 performance.
Table 2.2: Summary of Exchequer Issues for FY 2016/17 compared to FY 2015/16 (Kshs. billions)
Vote
FY 2016/17 FY 2015/16
Revised Gross Esti-mates
Revised Net Es-timates
Ex-cheq-uer Issues
% of Exch. Issues to re-vised Net Esti-mates
% of Ex-chequer issues to total Issues
Revised Gross Esti-mates
Re-vised Net Esti-mates
Ex-chequer Issues
% of Exch. Issues to re-vised Net Esti-mates
% of Ex-chequer issues to total Issues
Recurrent 1,453.70 1,366.80 1,318.0 96.4 66.0 1,306.3 1,229.2 1,196.5 97.3 66.7
:MDAs 927.5 840.6 819.9 97.5 41.1 811.6 734.5 720.3 98.1 40.2
: CFS 526.2 526.2 498.1 94.7 24.9 494.7 494.7 476.3 96.3 26.6

4ANNUAL NATIONAL GOVERNMENT BUDGET IMPLEMENTATION REVIEW REPORT FY 2016/17 AUGUST, 2017
OFFICE OF THE CONTROLLER OF BUDGET
Devel-opment (MDAs)
861.2 441.8 394.2 89.2 19.7 681.9 369.7 333.2 90.1 18.6
County Govern-ments
300.1 284.7 284.7 100.0 14.3 287.0 264.2 264.0 99.9 14.7
Total 2,615.0 2,093.3 1,996.9 95.4 100 2,275.2 1,863.1 1,793.7 96.3 100
Source: National Treasury & OCOB
From the analysis, County Governments received the highest proportion of exchequer issues to the revised net estimates at 100 per cent while development expenditure received the lowest proportion at 89.2 per cent. A total of Kshs.284.7 billion was released from Consolidated Fund to the respective County Governments’ County Revenue Funds (CRF) which was earmarked for transfer in the financial year.
Table 2.3 shows a breakdown of the annual estimates and exchequer issues by sectors in FY 2016/17 compared to FY 2015/16.
Table 2.3 Annual Estimates and Exchequer Issues by Sector for FY 2016/17 compared to FY 2015/16 (Kshs. Billions)
Name of the Sector
FY 2016/17 FY 2015/16
Revised Gross Esti-mates
Revised Net Esti-mates
Excheq-uer Is-sues
% of Exch. To Net Esti-mates
Revised Gross Esti-mates
Revised Net Esti-mates
Excheq-uer Is-sues
% of Ex-chequer To Rev.Net Esti-mates
Agriculture, Rural & Urban Develop-ment
51.7 41.6 38.4 92.3 70.8 57.7 51.5 89.3
Education 345.6 322.7 319.9 99.1 323.9 302.9 295.8 97.7
Energy, Infrastruc-ture and Information Communications Technology (EI & ICT)
584.7 202.3 182.3 90.1 406.6 119.5 113.6 95.1
Environmental Pro-tection, Water and Natural Resources
95.7 48.6 44.9 92.4 59.1 31.0 26.9 86.8
General Economic & Commercial Affairs (GECA)
22.2 19.8 19.0 96.0 17.3 16.8 15.9 94.4
Governance, Justice, Law and Order (GJLOS)
210.9 209.0 199.5 95.5 160.7 159.5 153.6 96.3

5ANNUAL NATIONAL GOVERNMENT
BUDGET IMPLEMENTATION REVIEW REPORT FY 2016/17 AUGUST, 2017
OFFICE OF THE CONTROLLER OF BUDGET
Health 77.4 63.0 56.5 89.7 61.7 46.7 42.2 90.4
Public Administration and International Relations
216.8 194.5 174.1 89.5 248.5 225.2 213.8 94.9
Social Protection, Culture and Recreation
53.3 50.7 49.3 97.2 31.2 30.9 26.3 85.1
National Security 130.2 130.2 130.2 100 113.8 113.8 113.7 99.9
Sub -Total for MDAs 1,788.50 1,282.4 1,214.10 94.7 1,493.30 1,104.20 1,053.5 95.4
Consolidated Fund Services (CFS) 526.2 526.2 498.1 94.7 494.7 494.7 476.2 96.3
County Governments 300.1 284.7 284.7 100 287.0 264.2 264.0 99.9
Grand Total 2,614.80 2,093.30 1,996.90 95.4 2,275.20 1,863.10 1,793.70 96.3Source: National Treasury & OCOB
In FY 2016/17, exchequer issued to MDAs amounted to Kshs.1.2 trillion representing 94.7 per cent of the revised annual net estimates. This presents 15.4 per cent growth in absolute figures from Kshs.1.1 trillion released in FY 2015/16. National Security Sector received the highest proportion of exchequer issues to the revised annual net estimates at 100 per cent, while the Public Administration and International Relations Sector (PAIR) received the lowest proportion at 89.5 per cent.
2.4.1 Recurrent Exchequer Issues by Sector
In FY 2016/17, the revised net recurrent estimate to MDAs totalled Kshs.840.6 billion which was 14.5 per cent growth compared to Kshs.734.5 billion allocated in FY 2015/16. The total exchequer issues to MDAs for recurrent expenditure amounted to Kshs.819.9 billion, representing 97.5 per cent of the revised net recurrent estimates, a slight decrease compared to 98.1 per cent achieved in FY 2015/16.
Table 2.4 shows sectoral recurrent estimates and exchequer issues for FY 2016/17 and FY 2015/16.
Table 2.4: Sectoral Recurrent Estimates and Exchequer issues for FY 2016/17 and FY 2015/16 (Kshs. Billions)
Name of the Sector
FY 2016/17 FY 2015/16
Revised Gross Es-timates
Revised Net Es-timates
Excheq-uer Is-sues
% of Exch. To Net Esti-mates
Revised Gross Esti-mates
Revised Net Esti-mates
Excheq-uer Is-sues
% of Ex-chequer To Net Estimates
Agriculture, Rural & Urban Development (ARUD)
30.2 23.0 22.1 96.1 15.1 14.6 14.4 98.1
Education 315.4 296.7 295.5 99.6 303.6 286.6 283.7 99.0
Energy, Infrastruc-ture and Information Communications Technology (EI & ICT)
64.9 12.0 11.0 91.7 52.5 7.6 7.2 94.8

6ANNUAL NATIONAL GOVERNMENT BUDGET IMPLEMENTATION REVIEW REPORT FY 2016/17 AUGUST, 2017
OFFICE OF THE CONTROLLER OF BUDGET
Environmental Pro-tection, Water and Natural Resources
22.5 12.9 12.8 99.2 17.4 9.0 8.9 98.8
General Economic and Commercial Af-fairs (GECA)
12.5 12.4 12.2 98.4 7.4 7.3 7.2 98.6
Governance, Jus-tice, Law and Order (GJLOS)
177.2 176.5 170 96.3 140.9 140.1 136.7 97.5
Health 35.7 31.8 30.2 95.0 29.2 25.2 25.1 99.7
Public Administra-tion and Internation-al Relations (PAIR)
121.0 120.2 111.1 92.4 118.1 116.7 110.4 94.6
Social Protection, Culture and Recre-ation
25.1 25.1 24.8 98.8 13.6 13.5 13.0 96.7
National Security 130.2 130.2 130.2 100 113.8 113.8 113.7 99.9
Total 934.7 840.6 819.9 97.5 811.6 734.5 720.3 98.1
Source: National Treasury & OCOB
A review of recurrent exchequer issued shows that National Security received the highest proportion of exchequer issues to the revised net estimates at 100 per cent while Energy, Infrastructure and Information Communications Technology (EI & ICT) sector recorded the lowest proportion at 91.7 per cent, a decline compared to 94.8 per cent recorded in FY 2015/16.
2.4.2 Exchequer Issues to Consolidated Fund Services (CFS) in FY 2016/17
The revised allocation to CFS in FY 2016/17 amounted to Kshs.526.2 billion, an increase by 6.4 per cent from Kshs.494.7 billion allocated in FY 2015/16. Table 2.5 shows the annual allocation and exchequer issues to CFS in FY 2016/17 and FY 2015/16 respectively.
Table 2.5: CFS Budgetary Allocation and Exchequer Issues for FY 2016/17 compared to FY 2015/16 (Kshs. Millions)
Consolidated Fund Services (CFS)
FY 2016/17 FY 2015/16
Revised Net Estimates
Exchequer Issues
% to Rev.Net Estimates
Revised Net Estimates
Exchequer Issues
% to Rev. Net Esti-
mates
Public Debt 459,903.7 435,717 94.7 437,459.4 421,849.9 96.4
Pensions and Gratu-ities 60,691.1 58,487.6 96.4 51,691.1 50,860.0 98.4
Salaries, Allowances & Miscellaneous 5,615.8 3,905.7 69.5 5,523.7 3,536.4 64.0
Subscriptions to Inter-national Organizations 0.5 - - 2.2 1.8 81.8
Total 526,211.2 498,110.3 94.7 494,676.4 476,248.1 96.3
Source: National Treasury and OCOB

7ANNUAL NATIONAL GOVERNMENT
BUDGET IMPLEMENTATION REVIEW REPORT FY 2016/17 AUGUST, 2017
OFFICE OF THE CONTROLLER OF BUDGET
In FY 2016/17, the total exchequer issues to CFS amounted to Kshs.498.1 billion, representing 94.7 per cent of the revised net estimates. Pensions and Gratuities received the highest proportion of exchequer issues to the revised net estimates at 96.4 per cent while Salaries, Allowances and Miscellaneous had the lowest at 69.5 per cent. Subscriptions to International Organizations did not receive exchequer issues in the period under review compared to 81.8 per cent received to 2015/16 financial year.
2.4.3 Development Exchequer Issues by Sector
In FY 2016/17, the revised net allocation to development expenditure was Kshs.441.8 billion, 19.5 per cent increase compared to Kshs.369.7 billion allocated in FY 2015/16. The total exchequer issues released to MDAs for development activities in the period under review amounted to Kshs.394.2 billion, representing 89.2 per cent of the revised net estimates, a slight decline compared to 90.1 per cent (Kshs.333.2 billion) recorded in FY 2015/16. Table 2.6 shows Sectoral development annual estimates and exchequer issues for FY 2016/17.
Table 2.6: Sectoral Development Annual Estimates and Exchequer Issues for FY 2016/17 and FY 2015/16 (Kshs. Billions).
Name of the Sector
FY 2016/17 FY 2015/16
Revised Gross Esti-
mates
Revised Net Esti-
mates
Exch. Issues
% of Exch. to Net Esti-
mates
Revised Gross
Estimates
Revised Net Es-timates
Exch. Issues
% of Exch.
to Rev. Net Esti-mates
Agriculture, Rural & Ur-ban Development 28.7 18.7 16.4 87.7 55.7 43.0 37.2 86.4
Education 30.3 26.0 24.4 93.8 20.3 16.3 12.1 74.2
Energy, Infrastructure and Information Communica-tions Technology (EI & ICT)
519.9 190.3 171.3 90.0 354.1 111.9 106.4 95.1
Environmental Protection, Water and Natural Re-sources
73.2 35.7 32.1 89.9 41.7 22.0 18.2 81.6
General Economic and Commercial Affairs (GECA)
9.7 7.3 6.8 93.2 9.9 9.5 8.7 91.2
The Governance, Justice, Law and Order (GJLOS) 33.7 32.6 29.5 90.5 19.8 19.4 16.9 87.3
Health 41.7 31.3 26.2 83.7 32.5 21.5 17.0 79.1
Public Administration and International Relations (PAIR)
95.8 74.4 63.0 84.7 130.3 108.5 103.4 95.3
Social Protection, Culture and Recreation 28.3 25.6 24.5 95.7 17.5 17.4 13.3 76.3
Total 861.3 441.8 394.2 89.2 681.9 369.7 333.2 90.1
Source: National Treasury & OCOB
Analysis of exchequer issues to MDAs development expenditure per sector in FY 2016/17 shows that, Social Protection, Culture and Recreation Sector received the highest proportion of development exchequer issues to revised net estimates at 95.7 per cent while Health Sector received the lowest exchequer issues to revised net estimates at 83.7 per cent.

8ANNUAL NATIONAL GOVERNMENT BUDGET IMPLEMENTATION REVIEW REPORT FY 2016/17 AUGUST, 2017
3 NATIONAL GOVERNMENT OVERALL EXPENDITURE ANALYSIS
3.1 IntroductionThis chapter presents expenditure analysis for FY 2016/17 for both development and recurrent expenditure by the national government Ministries, Departments and Agencies (MDAs). The Consolidated Fund Services (CFS) is discussed under recurrent expenditure and provides information on Public debt; Pensions and gratuity; and Salaries and allowances to Constitutional Office holders and Miscellaneous services. The chapter also presents expenditure by economic classifications by the government entities, for development and recurrent votes respectively.
3.2 Overall Government Budget PerformanceIn FY 2016/17, the revised aggregate budget for the government was Kshs.2.6 trillion, as presented in table 3.1. This includes the budget estimates for the national government entities and the allocation to county governments and compared to the previous financial year, FY 2015/16.
Table 3.1: Overall Government Budget Performance for FY 2016/17 Compared to FY 2015/16 (Kshs. Billion)
VOTE
FY 2016/17 FY 2015/16
Revised Gross Esti-mates
Revised Net Esti-mates
Cumula-tive Ex-chequer Issues
Cumula-tive Ex-penditure
% of Ex-cheq-uer to revised Net Es-timates
Ab-sorp-tion Rate (%)
Gross Esti-mates
Net Esti-mates
Ex-chequer Issues
Expend-iture
% Ex-cheq-uer to Net Esti-mates
Absorp-tion rate (%)
Recur-rent 1,453.7 1,366.8 1,318 1,357.3 96.4 93.4 1306.2 1,229.2 1,196.5 1,182.0 97.3 90.5
MDAs 927.5 840.6 819.9 858.3 97.5 92.5 811.6 734.5 720.3 706.5 98.1 87.1
CFS 526.2 526.2 498.1 499.0 94.7 94.8 494.7 494.7 476.3 475.5 96.3 96.1
Develop-ment 861.2 441.8 394.2 602.3 89.2 69.9 681.9 369.7 333.2 451.8 90.1 66.3
County Govern-ments
300.1 284.7 284.7* 319.1** 100 79.9 287.0 264.2 264.0* 295.3** 99.9 80.4
Total 2,615.0 2,093.3 1,996.9 2,278.7 95.4 87.1 2,275.1 1,863.1 1,793.7 1,929.1 96.3 84.8
Source: NT, OCOB, MDAs & County Treasuries
*Refers to shareable revenue exchequer issues.** The difference between the Exchequer Issues of Kshs.284.7 billion and expenditure of Kshs.319,1 billion was financed by revenue from local sources and opening cash balance brought forward from FY 2015/16.The total funding by the National Government through exchequer issues in FY 2016/17 amounted to Kshs.1,996.9 billion, representing 95.4 per cent of the revised net estimates, (a slight decline from 96.3 per cent in FY 2015/16). The exchequer issues comprised of Kshs.1.3 trillion for recurrent expenditure, Kshs.394.2 billion for development expenditure, and Kshs.284.7 billion for the County governments. Overall expenditure for both the National and County Governments was Kshs.2.3 trillion (Kshs.1,357.3 billion on recurrent, Kshs.602.3 billion on development, and Kshs.319.1 billion by County Governments), representing an overall absorption rate of 87.1 per cent, an increase compared to 84.8 per cent recorded in FY 2015/16.

9ANNUAL NATIONAL GOVERNMENT
BUDGET IMPLEMENTATION REVIEW REPORT FY 2016/17 AUGUST, 2017
OFFICE OF THE CONTROLLER OF BUDGET
Figure 3.1 and 3.2 shows comparison of sectors annual budget allocation and total expenditure in FY 2016/17.
Figure 3.1: Comparison of Annual Budget and Expenditure by Sector in FY 2016/17
Source: MDAs & National Treasury
Figure 3.2: Annual Budget and Expenditure by Sector in FY 2016/17
Source: MDAs & National Treasury

10ANNUAL NATIONAL GOVERNMENT BUDGET IMPLEMENTATION REVIEW REPORT FY 2016/17 AUGUST, 2017
OFFICE OF THE CONTROLLER OF BUDGET
3.3 Consolidated Fund Services (CFS)The Consolidated Fund Services (CFS) comprises of funds allocated towards: (i) Repayment of public debt (domestic and foreign debt, and government guaranteed loans to parastatals), (ii) Pensions and gratuities, (iii) Salaries and allowances to Constitutional Office holders and miscellaneous services, and (iv) Subscriptions to International Organizations.
Table 3.2 presents a summary on CFS exchequer issues and expenditure performance in the FY 2016/17.
Table 3.2: Annual Budget and Cumulative Expenditure for CFS in the FY 2016/17 (Kshs. Millions)
Consolidated Fund Services (CFS) Printed Esti-mates
RevisedEstimates
Exchequer Releases
Cumulative Expenditure
Expenditure as a % of Revised Esti-
matesPublic Debt 466,514.0 459,903.7 435,717.0 436,266.7 94.9Pensions and Gratuities 55,691.1 60,691.1 58,487.6 58,487.6 96.4
Salaries & Allowances 3,956.0 4,271.4 2,355.0 2,807.2 65.7Subscriptions to International Orga-nizations 0.5 0.5 - - -
Miscellaneous Services 128.0 128.0 - - -
Guaranteed Debt 1,017.2 1,216.4 1,550.74 1,443.3 118.7
Total 527,306.8 526,211.3 498,110.3 499,004.8 94.8
Source: National Treasury & OCOB
The revised allocation for CFS in the FY 2016/17 was Kshs.526.2 billion a 6.4 per cent increase from Kshs.494.7 billion allocated in FY 2015/16. The total exchequer release to CFS amounted to Kshs.498.1 billion, representing 94.7 per cent of the revised net estimates, a 4.5 per cent increase compared to Kshs.476.2 billion released in FY 2015/16. The overall CFS expenditure amounted to Kshs.499 billion, representing 94.8 per cent of the revised net estimates and an increase by 5 per cent from Kshs.475.5 billion spent in FY 2015/16.
3.3.1 Public Debt
The revised allocation towards payment of public debt in FY 2016/17 amounted to Kshs.459.9 billion, a 5.4 per cent increase from Kshs.436.5 billion allocated in FY 2015/16. The total exchequer issues for the period under review amounted to Kshs.435.7 billion representing 94.7 per cent of the revised annual estimates, a 3.3 per cent increase from Kshs.421.8 billion released in FY 2015/16. Total expenditure during the same period was Kshs.436.3 billion, representing 94.9 per cent of the revised annual estimates which is a 3.6 per cent increase from Kshs.421.1 billion spent the FY 2015/16.
3.3.2 Guaranteed Debt to State Parastatals
In FY 2016/17, the revised allocation towards the repayment of guaranteed loans to State Parastatals was Kshs.1.2 billion a slight increase from Kshs.0.9 billion allocated in the FY 2015/16. A total of Kshs.1.6 billion was released for settlement of the guaranteed debts to State Parastatals with a total expenditure of Kshs.1.4 billion, representing 118.7 per cent of the revised annual estimates, 37.5 per cent growth compared to. Kshs.1.1 billion spent in the FY 2015/16.
3.3.3 Salaries and Allowances for Constitutional Office Holders
In FY 2016/17, Kshs.4.3 billion was allocated for payment of salaries and allowances for Constitutional Office holders, a decline by 22.7 per cent compared to Kshs.5.5 billion allocated in FY 2015/16. The total exchequer issues released amounted to Kshs.2.4 billion representing 55.3 per cent of the revised annual estimates. Actual expenditure in the period under review was Kshs.2.8 billion representing 65.7 per cent of the revised annual estimates.

11ANNUAL NATIONAL GOVERNMENT
BUDGET IMPLEMENTATION REVIEW REPORT FY 2016/17 AUGUST, 2017
OFFICE OF THE CONTROLLER OF BUDGET
3.3.4 Pensions and Gratuities
The revised annual estimates for pensions and gratuities in FY 2016/17 was Kshs.60.7 billion, which was a 17.4 per cent increase from Kshs.51.7 billion allocated in FY 2015/16. The exchequer issues for the period under review amounted to Kshs.58.5 billion, representing 96.4 per cent of the revised annual estimates, while expenditure was Kshs.58.5 billion representing 96.4 per cent of the revised annual estimates. This represent 15 per cent increase compared to Kshs.50.9 billion spent in FY 2015/16.
3.4 MDAs Expenditure AnalysisThis section presents the analysis of MDAs expenditure for both development and recurrent activities and the Appropriations-In-Aid (A~I~A) received in FY 2016/17. Recurrent expenditure is analyzed based on major economic classifications namely; Personnel Emoluments (PE) and Operation and Maintenance (O&M). The O&M includes; Domestic and foreign travel, Printing and advertising, Rentals and rates for non-residential, Training, Hospitality, Maintenance expenses for motor vehicles and other assets, Current transfers to SAGAs and other expenses.
Development expenditure is analyzed by the main economic items, which include; Maintenance of motor vehicles and other assets for programmes/projects, Capital transfers to SAGAs, Civil works and construction of residential buildings, Refurbishment of buildings and infrastructure, Purchase of specialized plant, equipment and machinery, Pre-feasibility studies and other development expenditure.
3.4.1 MDAs Recurrent Expenditure Analysis
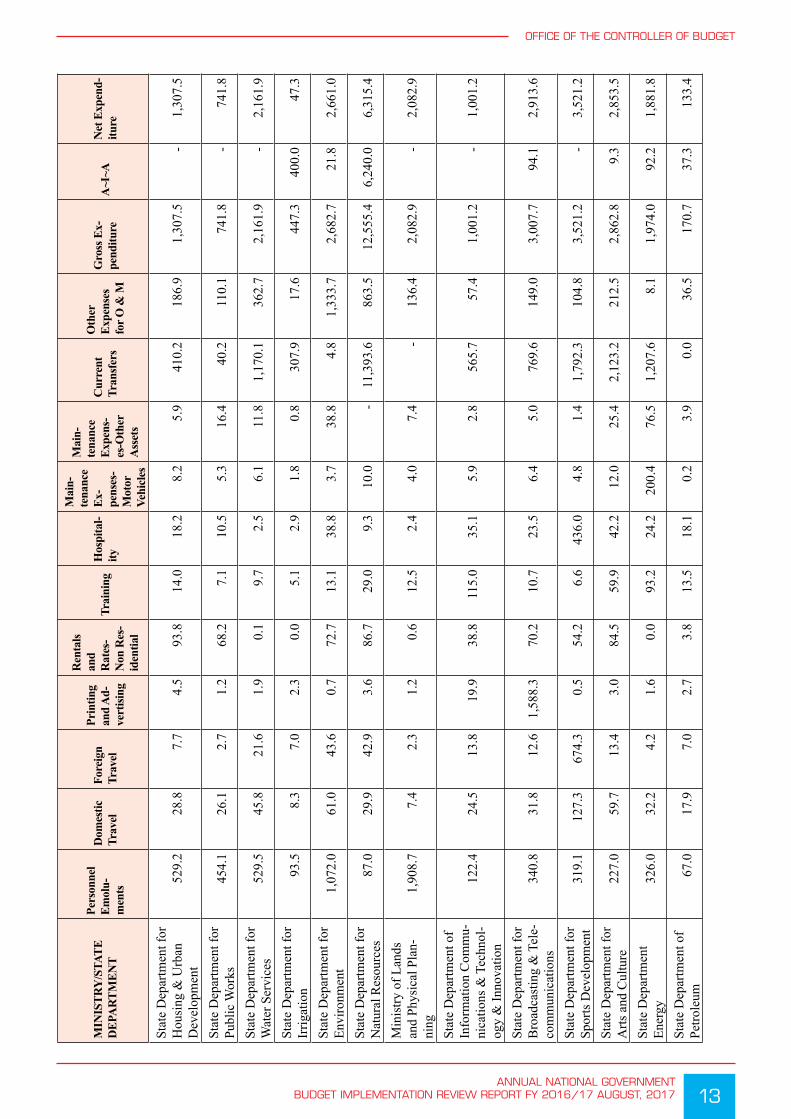
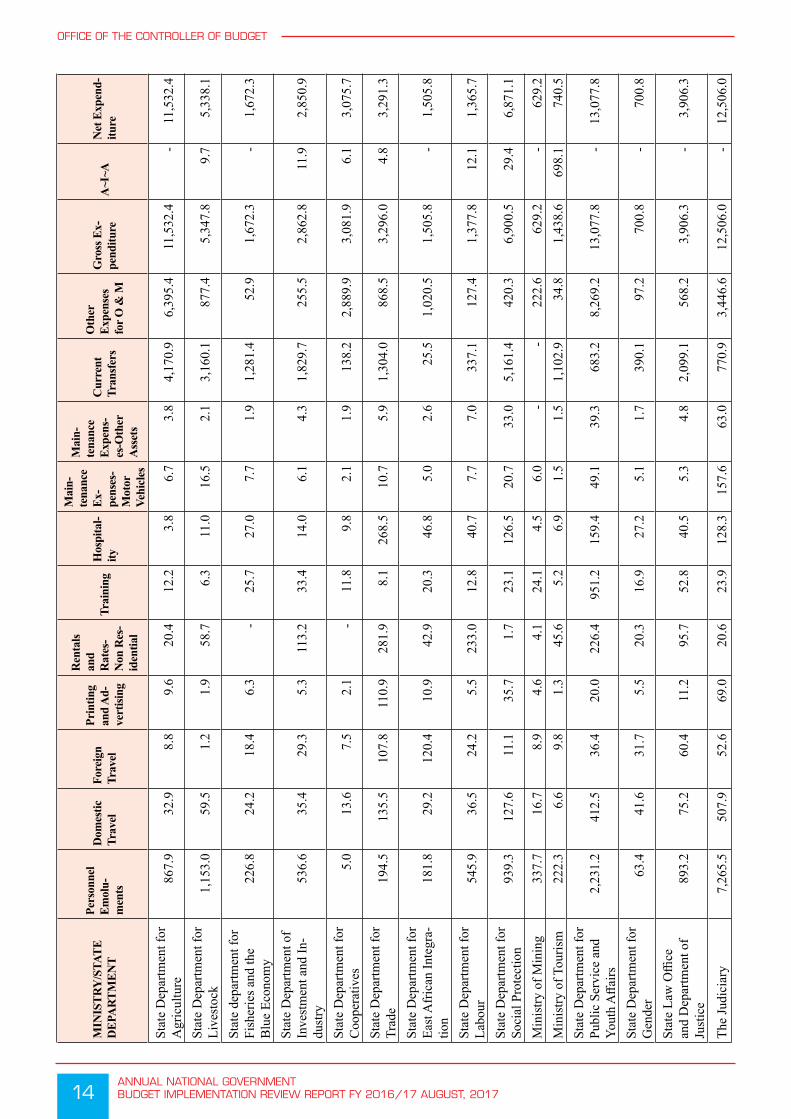
In the FY 2016/17, the revised allocation for MDAs recurrent expenditure amounted to Kshs.927.5 billion. Gross expenditure on recurrent activities by the MDAs for FY 2016/17 amounted to Kshs.858.3 billion representing 92.5 per cent of the revised annual recurrent estimates. The breakdown of the MDAs’ total recurrent expenditure for FY 2016/17 is presented in table 3.3.

12ANNUAL NATIONAL GOVERNMENT BUDGET IMPLEMENTATION REVIEW REPORT FY 2016/17 AUGUST, 2017
OFFICE OF THE CONTROLLER OF BUDGET
Tabl
e 3.
3
Bre
akdo
wn
of R
ecur
rent
Exp
endi
ture
by
MD
As f
or F
Y 2
016/
17 (K
shs.
Mill
ions
)
MIN
ISTR
Y/S
TATE
D
EPA
RTM
ENT
Pers
onne
l Em
olu-
men
ts
Dom
estic
Tr
avel
Fore
ign
Trav
el
Prin
ting
and
Ad-
vert
ising
Ren
tals
and
Rat
es-
Non
Res
-id
entia
l
Trai
ning
Hos
pita
l-ity
Mai
n-te
nanc
e Ex
-pe
nses
- M
otor
Ve
hicl
es
Mai
n-te
nanc
e Ex
pens
-es
-Oth
er
Ass
ets
Cur
rent
Tr
ansf
ers
Oth
erEx
pens
es
for O
& M
Gro
ss E
x-pe
nditu
reA
~I~A
Net
Exp
end-
iture
The
Pres
iden
cy1,
699.
970
5.2
322.
752
.613
4.7
63.6
1,73
3.5
252.
510
5.2
754.
03,
429.
69,
253.
7-
9,25
3.7
Stat
e D
epar
tmen
t for
In
terio
r63
,175
.01,
020.
149
.47.
074
6.7
825.
011
6.1
400.
329
7.3
722.
322
,089
.489
,448
.4-
89,4
48.4
Stat
e D
epar
tmen
t for
C
orre
ctio
nal S
ervi
ces
9,65
2.2
111.
314
.87.
278
.050
.545
.477
.73.
83.
16,
757.
716
,801
.9-
16,8
01.9
Stat
e D
epar
tmen
t for
D
evol
utio
n16
9.1
18.1
2.7
1.7
72.5
7.3
25.1
4.5
1.9
407.
866
.977
7.5
-77
7.5
Stat
e D
epar
tmen
t for
Sp
ecia
l Pro
gram
mes
140.
024
.06.
42.
077
.012
.817
.65.
33.
087
2.5
7,13
9.1
8,29
9.8
-8,
299.
8
Stat
e D
epar
tmen
t for
Pl
anni
ng &
Sta
tistic
s33
4.6
56.9
28.0
19.8
39.4
61.4
72.9
17.9
5.8
4,18
6.7
112.
84,
936.
2-
4,93
6.2
Min
istry
of D
efen
ce77
9.7
37.2
22.0
1.9
0.0
25.4
8.0
6.3
3.8
100,
143.
212
0.9
101,
148.
6-
101,
148.
6M
inis
try o
f For
eign
A
ffairs
and
Inte
rna-
tiona
l Tra
de4,
516.
816
8.6
1,61
5.6
23.0
1,40
3.6
37.6
496.
859
1.2
55.0
560.
11,
244.
910
,713
.13.
110
,710
.0
Stat
e D
epar
tmen
t for
B
asic
Edu
catio
n3,
272.
382
.121
.314
.425
.836
.243
.519
.326
.917
,891
.333
,393
.754
,826
.71,
327.
053
,499
.7
Stat
e D
epar
tmen
t for
Vo
catio
nal a
nd T
ech-
nica
l Tra
inin
g0.
019
.99.
71.
355
.69.
810
.42.
91.
02,
130.
320
5.6
2,44
6.4
-2,
446.
4
Stat
e D
epar
tmen
t for
U
nive
rsity
Edu
catio
n44
6.7
25.6
10.4
3.6
45.8
19.2
11.3
8.5
9.7
47,0
69.3
6,73
5.9
54,3
85.9
7,72
4.2
46,6
61.7
The
Nat
iona
l Tre
as-
ury
2,14
5.9
83.5
82.0
1.8
40.3
64.1
370.
635
.940
.518
,154
.214
,541
.235
,560
.0-
35,5
60.0
Min
istry
of H
ealth
4,28
6.5
42.7
3.9
85.9
-21
2.9
26.4
22.7
56.8
23,3
49.5
1,75
8.1
29,8
45.5
1.2
29,8
44.4
Stat
e D
epar
tmen
t for
In
fras
truct
ure
1,01
0.3
26.5
4.8
2.6
-8.
518
.29.
621
.048
,001
.719
2.2
49,2
95.5
48,0
04.4
1,29
1.1
Stat
e D
epar
tmen
t for
Tr
ansp
ort
180.
58.
51.
60.
24.
85.
14.
14.
264
.25,
439.
870
.95,
783.
74,
375.
51,
408.
2
Stat
e D
epar
tmen
t for
M
ariti
me A
ffairs
29.8
13.8
5.3
1.2
7.7
3.8
8.0
1.8
5.8
40.0
107.
622
4.8
-22
4.8
13ANNUAL NATIONAL GOVERNMENT
BUDGET IMPLEMENTATION REVIEW REPORT FY 2016/17 AUGUST, 2017
OFFICE OF THE CONTROLLER OF BUDGET
MIN
ISTR
Y/S
TATE
D
EPA
RTM
ENT
Pers
onne
l Em
olu-
men
ts
Dom
estic
Tr
avel
Fore
ign
Trav
el
Prin
ting
and
Ad-
vert
ising
Ren
tals
and
Rat
es-
Non
Res
-id
entia
l
Trai
ning
Hos
pita
l-ity
Mai
n-te
nanc
e Ex
-pe
nses
- M
otor
Ve
hicl
es
Mai
n-te
nanc
e Ex
pens
-es
-Oth
er
Ass
ets
Cur
rent
Tr
ansf
ers
Oth
erEx
pens
es
for O
& M
Gro
ss E
x-pe
nditu
reA
~I~A
Net
Exp
end-
iture
Stat
e D
epar
tmen
t for
H
ousi
ng &
Urb
an
Dev
elop
men
t52
9.2
28.8
7.7
4.5
93.8
14.0
18.2
8.2
5.9
410.
218
6.9
1,30
7.5
-1,
307.
5
Stat
e D
epar
tmen
t for
Pu
blic
Wor
ks45
4.1
26.1
2.7
1.2
68.2
7.1
10.5
5.3
16.4
40.2
110.
174
1.8
-74
1.8
Stat
e D
epar
tmen
t for
W
ater
Ser
vice
s52
9.5
45.8
21.6
1.9
0.1
9.7
2.5
6.1
11.8
1,17
0.1
362.
72,
161.
9-
2,16
1.9
Stat
e D
epar
tmen
t for
Ir
rigat
ion
93.5
8.3
7.0
2.3
0.0
5.1
2.9
1.8
0.8
307.
917
.644
7.3
400.
047
.3
Stat
e D
epar
tmen
t for
En
viro
nmen
t1,
072.
061
.043
.60.
772
.713
.138
.83.
738
.84.
81,
333.
72,
682.
721
.82,
661.
0
Stat
e D
epar
tmen
t for
N
atur
al R
esou
rces
87.0
29.9
42.9
3.6
86.7
29.0
9.3
10.0
-11
,393
.686
3.5
12,5
55.4
6,24
0.0
6,31
5.4
Min
istry
of L
ands
an
d Ph
ysic
al P
lan-
ning
1,90
8.7
7.4
2.3
1.2
0.6
12.5
2.4
4.0
7.4
-13
6.4
2,08
2.9
-2,
082.
9
Stat
e D
epar
tmen
t of
Info
rmat
ion
Com
mu-
nica
tions
& T
echn
ol-
ogy
& In
nova
tion
122.
424
.513
.819
.938
.811
5.0
35.1
5.9
2.8
565.
757
.41,
001.
2-
1,00
1.2
Stat
e D
epar
tmen
t for
B
road
cast
ing
& T
ele-
com
mun
icat
ions
340.
831
.812
.61,
588.
370
.210
.723
.56.
45.
076
9.6
149.
03,
007.
794
.12,
913.
6
Stat
e D
epar
tmen
t for
Sp
orts
Dev
elop
men
t31
9.1
127.
367
4.3
0.5
54.2
6.6
436.
04.
81.
41,
792.
310
4.8
3,52
1.2
-3,
521.
2
Stat
e D
epar
tmen
t for
A
rts a
nd C
ultu
re22
7.0
59.7
13.4
3.0
84.5
59.9
42.2
12.0
25.4
2,12
3.2
212.
52,
862.
89.
32,
853.
5
Stat
e D
epar
tmen
t En
ergy
326.
032
.24.
21.
60.
093
.224
.220
0.4
76.5
1,20
7.6
8.1
1,97
4.0
92.2
1,88
1.8
Stat
e D
epar
tmen
t of
Petro
leum
67.0
17.9
7.0
2.7
3.8
13.5
18.1
0.2
3.9
0.0
36.5
170.
737
.313
3.4
14ANNUAL NATIONAL GOVERNMENT BUDGET IMPLEMENTATION REVIEW REPORT FY 2016/17 AUGUST, 2017
OFFICE OF THE CONTROLLER OF BUDGET
MIN
ISTR
Y/S
TATE
D
EPA
RTM
ENT
Pers
onne
l Em
olu-
men
ts
Dom
estic
Tr
avel
Fore
ign
Trav
el
Prin
ting
and
Ad-
vert
ising
Ren
tals
and
Rat
es-
Non
Res
-id
entia
l
Trai
ning
Hos
pita
l-ity
Mai
n-te
nanc
e Ex
-pe
nses
- M
otor
Ve
hicl
es
Mai
n-te
nanc
e Ex
pens
-es
-Oth
er
Ass
ets
Cur
rent
Tr
ansf
ers
Oth
erEx
pens
es
for O
& M
Gro
ss E
x-pe
nditu
reA
~I~A
Net
Exp
end-
iture
Stat
e D
epar
tmen
t for
A
gric
ultu
re86
7.9
32.9
8.8
9.6
20.4
12.2
3.8
6.7
3.8
4,17
0.9
6,39
5.4
11,5
32.4
-11
,532
.4
Stat
e D
epar
tmen
t for
Li
vest
ock
1,15
3.0
59.5
1.2
1.9
58.7
6.3
11.0
16.5
2.1
3,16
0.1
877.
45,
347.
89.
75,
338.
1
Stat
e de
partm
ent f
or
Fish
erie
s and
the
Blu
e Ec
onom
y22
6.8
24.2
18.4
6.3
-25
.727
.07.
71.
91,
281.
452
.91,
672.
3-
1,67
2.3
Stat
e D
epar
tmen
t of
Inve
stm
ent a
nd In
-du
stry
536.
635
.429
.35.
311
3.2
33.4
14.0
6.1
4.3
1,82
9.7
255.
52,
862.
811
.92,
850.
9
Stat
e D
epar
tmen
t for
C
oope
rativ
es5.
013
.67.
52.
1-
11.8
9.8
2.1
1.9
138.
22,
889.
93,
081.
96.
13,
075.
7
Stat
e D
epar
tmen
t for
Tr
ade
194.
513
5.5
107.
811
0.9
281.
98.
126
8.5
10.7
5.9
1,30
4.0
868.
53,
296.
04.
83,
291.
3
Stat
e D
epar
tmen
t for
Ea
st A
fric
an In
tegr
a-tio
n18
1.8
29.2
120.
410
.942
.920
.346
.85.
02.
625
.51,
020.
51,
505.
8-
1,50
5.8
Stat
e D
epar
tmen
t for
La
bour
545.
936
.524
.25.
523
3.0
12.8
40.7
7.7
7.0
337.
112
7.4
1,37
7.8
12.1
1,36
5.7
Stat
e D
epar
tmen
t for
So
cial
Pro
tect
ion
939.
312
7.6
11.1
35.7
1.7
23.1
126.
520
.733
.05,
161.
442
0.3
6,90
0.5
29.4
6,87
1.1
Min
istry
of M
inin
g33
7.7
16.7
8.9
4.6
4.1
24.1
4.5
6.0
--
222.
662
9.2
-62
9.2
Min
istry
of T
ouris
m22
2.3
6.6
9.8
1.3
45.6
5.2
6.9
1.5
1.5
1,10
2.9
34.8
1,43
8.6
698.
174
0.5
Stat
e D
epar
tmen
t for
Pu
blic
Ser
vice
and
Yo
uth
Affa
irs2,
231.
241
2.5
36.4
20.0
226.
495
1.2
159.
449
.139
.368
3.2
8,26
9.2
13,0
77.8
-13
,077
.8
Stat
e D
epar
tmen
t for
G
ende
r63
.441
.631
.75.
520
.316
.927
.25.
11.
739
0.1
97.2
700.
8-
700.
8
Stat
e La
w O
ffice
an
d D
epar
tmen
t of
Just
ice
893.
275
.260
.411
.295
.752
.840
.55.
34.
82,
099.
156
8.2
3,90
6.3
-3,
906.
3
The
Judi
ciar
y7,
265.
550
7.9
52.6
69.0
20.6
23.9
128.
315
7.6
63.0
770.
93,
446.
612
,506
.0-
12,5
06.0

15ANNUAL NATIONAL GOVERNMENT
BUDGET IMPLEMENTATION REVIEW REPORT FY 2016/17 AUGUST, 2017
OFFICE OF THE CONTROLLER OF BUDGET
MIN
ISTR
Y/S
TATE
D
EPA
RTM
ENT
Pers
onne
l Em
olu-
men
ts
Dom
estic
Tr
avel
Fore
ign
Trav
el
Prin
ting
and
Ad-
vert
ising
Ren
tals
and
Rat
es-
Non
Res
-id
entia
l
Trai
ning
Hos
pita
l-ity
Mai
n-te
nanc
e Ex
-pe
nses
- M
otor
Ve
hicl
es
Mai
n-te
nanc
e Ex
pens
-es
-Oth
er
Ass
ets
Cur
rent
Tr
ansf
ers
Oth
erEx
pens
es
for O
& M
Gro
ss E
x-pe
nditu
reA
~I~A
Net
Exp
end-
iture
Ethi
cs &
Ant
i-Cor
-ru
ptio
n C
omm
issi
on1,
584.
6-
--
--
--
--
1,60
9.4
3,19
4.0
-3,
194.
0
Nat
iona
l Int
ellig
ence
Se
rvic
e-
--
--
--
--
29,0
44.1
-29
,044
.1-
29,0
44.1
Offi
ce o
f the
Dire
ctor
of
Pub
lic P
rose
cu-
tions
1,16
8.8
107.
49.
37.
712
8.3
73.3
57.9
13.0
6.7
0.0
243.
41,
815.
8-
1,81
5.8
Offi
ce o
f the
Reg
-is
trar o
f Pol
itica
l Pa
rties
121.
416
.31.
34.
317
.131
.717
.11.
5-
370.
551
.463
2.7
-63
2.7
Witn
ess P
rote
ctio
n A
genc
y17
1.0
6.9
1.2
1.6
13.2
7.2
12.5
6.1
1.2
-16
0.4
381.
3-
381.
3
Ken
ya N
atio
nal
Com
mis
sion
on
Hu-
man
Rig
hts
210.
822
.416
.810
.046
.97.
98.
36.
00.
937
.252
.241
9.5
-41
9.5
Nat
iona
l Lan
ds C
om-
mis
sion
707.
965
.821
.336
.325
.919
.419
4.8
7.6
--
167.
31,
246.
3-
1,24
6.3
Inde
pend
ent E
lec-
tora
l and
Bou
ndar
ies
Com
mis
sion
4,54
4.2
--
--
--
--
-15
,048
.319
,592
.5-
19,5
92.5
Parli
amen
tary
Ser
-vi
ce C
omm
issi
on4,
198.
698
3.2
824.
310
7.0
271.
021
1.0
217.
541
.180
.65.
01,
625.
98,
565.
2-
8,56
5.2
Nat
iona
l Ass
embl
y9,
388.
93,
009.
61,
486.
543
.6-
135.
826
4.8
31.9
16.7
5.0
1,41
4.4
15,7
97.2
-15
,797
.2Ju
dici
al S
ervi
ce
Com
mis
sion
2.3
46.3
48.4
14.4
10.0
145.
810
0.7
0.6
0.5
-54
.742
3.8
-42
3.8
Com
mis
sion
on
Rev
-en
ue A
lloca
tion
155.
810
.62.
84.
645
.08.
814
.64.
72.
3-
60.6
309.
8-
309.
8
Publ
ic S
ervi
ce C
om-
mis
sion
568.
264
.516
.230
.16.
932
.155
.24.
77.
00.
343
3.3
1,21
8.6
0.7
1,21
7.9
Sala
ries &
Rem
uner
-at
ion
Com
mis
sion
258.
623
.74.
53.
928
.75.
291
.82.
24.
1-
107.
352
9.9
0.1
529.
8

16ANNUAL NATIONAL GOVERNMENT BUDGET IMPLEMENTATION REVIEW REPORT FY 2016/17 AUGUST, 2017
OFFICE OF THE CONTROLLER OF BUDGET
MIN
ISTR
Y/S
TATE
D
EPA
RTM
ENT
Pers
onne
l Em
olu-
men
ts
Dom
estic
Tr
avel
Fore
ign
Trav
el
Prin
ting
and
Ad-
vert
ising
Ren
tals
and
Rat
es-
Non
Res
-id
entia
l
Trai
ning
Hos
pita
l-ity
Mai
n-te
nanc
e Ex
-pe
nses
- M
otor
Ve
hicl
es
Mai
n-te
nanc
e Ex
pens
-es
-Oth
er
Ass
ets
Cur
rent
Tr
ansf
ers
Oth
erEx
pens
es
for O
& M
Gro
ss E
x-pe
nditu
reA
~I~A
Net
Exp
end-
iture
Teac
hers
Ser
vice
C
omm
issi
on18
9,55
5.9
142.
414
.49.
619
.795
.727
.331
.643
.8-
983.
219
0,92
3.6
521.
619
0,40
2.0
Nat
iona
l Pol
ice
Ser-
vice
Com
mis
sion
199.
738
.9-
2.9
56.2
4.8
26.8
13.8
1.9
425.
380
.442
5.3
-42
5.3
Aud
itor G
ener
al2,
522.
735
4.9
44.6
12.7
168.
396
.023
.523
.811
.8-
742.
14,
000.
420
4.0
3,79
6.4
Con
trolle
r of B
udge
t24
0.3
14.9
3.7
62.1
1.9
15.9
12.8
4.6
1.6
-13
6.3
494.
0-
494.
0Th
e C
omm
issi
on
on A
dmin
istra
tive
Just
ice
212.
710
.34.
45.
945
.412
.95.
03.
92.
7-
116.
141
9.1
-41
9.1
Nat
iona
l Gen
der &
Eq
ualit
y C
omm
issi
on14
4.4
30.3
8.0
5.3
41.5
29.1
7.6
5.4
1.0
-10
8.5
381.
2-
381.
2
Inde
pend
ent P
olic
e O
vers
ight
Aut
horit
y22
2.8
33.6
1.5
3.6
38.1
3.9
28.9
2.8
2.4
-95
.943
3.4
-43
3.4
Tota
l32
9,75
9.1
9,48
1.7
6,09
1.4
2,52
3.1
5,43
3.9
3,99
6.6
5,75
3.5
2,24
2.6
1,25
5.7
341,
427.
715
0,38
3.3
858,
348.
669
,828
.578
8,52
10.1
Sou
rce:
MD
As a
nd N
ation
al Tr
easu
ry IF
MIS
Dire
ctora
te
Not
e: B
ased
on ex
pend
iture
repor
ts fro
m IF
MIS
and
fina
ncial
repo
rts fr
om th
e MD
As,
some
MD
As g
enera
ted a
nd u
tilise
d A
ppro
priat
ions-i
n-A
id (A
-I-A
). E
xpen
ditur
e on
PE d
oes n
ot in
clude
fig
ures
for th
e Nat
ional
Intel
ligen
ce Se
rvice
and
par
tially
for t
he M
inist
ry of
Defe
nce a
nd E
thics
and
Ant
i-Cor
rupt
ion C
ommi
ssion
.

17ANNUAL NATIONAL GOVERNMENT
BUDGET IMPLEMENTATION REVIEW REPORT FY 2016/17 AUGUST, 2017
OFFICE OF THE CONTROLLER OF BUDGET
Analysis of recurrent expenditure breakdown by MDAs in the FY 2016/17 shows that, the highest spending category was current transfers to SAGAs which amounted to Kshs.341.4 billion representing 39.8 per cent of total recurrent expenditure, followed by Personnel Emoluments at Kshs.329.8 billion representing 38.4 per cent of the total recurrent expenditure. Expenditure on domestic travels amounted to Kshs.9.5 billion, while that on foreign travel was Kshs.6.1 billion. Other expenditures includes hospitality at Kshs.5.8 billion, Rentals and Rates at Kshs.5.4 billion, Training (Kshs.4 billion), Printing and Advertising (Kshs.2.5 billion) among others.
The highest expenditure on personnel emoluments was incurred by TSC at Kshs.189.6 billion, which was 57.5 per cent of the total PE expenditure by MDAs while current transfers to SAGAs was highest in the Ministry of Defence at Kshs.100.1 billion.
From the analysis, other categories with high expenditures include; Kshs.3 billion on Domestic travel by the National Assembly, Kshs.1.6 billion on foreign travel by the Ministry of Foreign Affairs and International Trade, Kshs.1.6 billion on Printing and Advertising by State Department for Broadcasting & Telecommunications, Kshs.1.4 billion on rentals and rates for non-residential buildings by the Ministry of Foreign Affairs and International Trade, Kshs.951.2 million on training by the State Department for Public Service and Youth Affairs, Kshs.1.7 billion on hospitality by the Presidency, Kshs.591.2 million on maintenance of motor vehicles by the Ministry of Foreign Affairs and International Trade, and Kshs.297.3 million on maintenance of other assets by the State Department for Interior. The category on ‘Other O&M expenditure’ was highest in State Department for the Interior recording Kshs.22.1 billion. Figure 3.3 shows the composition of MDAs recurrent expenditure for FY 2016/17.
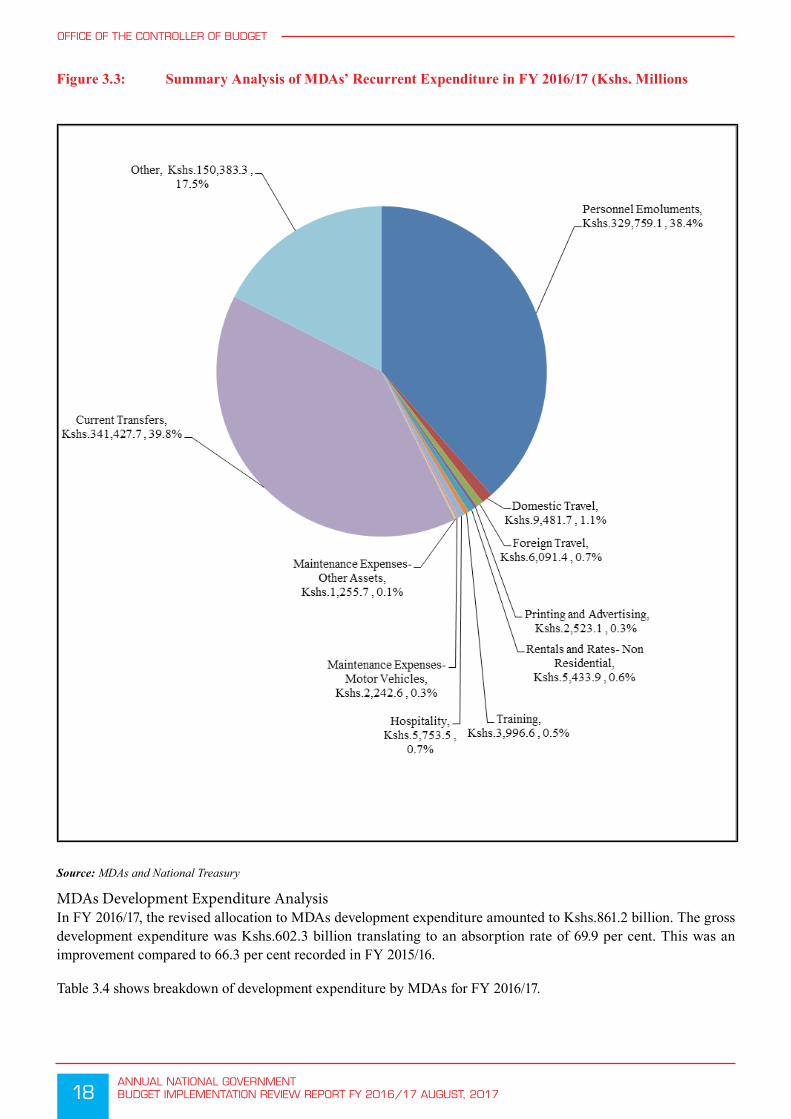
18ANNUAL NATIONAL GOVERNMENT BUDGET IMPLEMENTATION REVIEW REPORT FY 2016/17 AUGUST, 2017
OFFICE OF THE CONTROLLER OF BUDGET
Figure 3.3: Summary Analysis of MDAs’ Recurrent Expenditure in FY 2016/17 (Kshs. Millions
Source: MDAs and National Treasury
MDAs Development Expenditure AnalysisIn FY 2016/17, the revised allocation to MDAs development expenditure amounted to Kshs.861.2 billion. The gross development expenditure was Kshs.602.3 billion translating to an absorption rate of 69.9 per cent. This was an improvement compared to 66.3 per cent recorded in FY 2015/16.
Table 3.4 shows breakdown of development expenditure by MDAs for FY 2016/17.

19ANNUAL NATIONAL GOVERNMENT
BUDGET IMPLEMENTATION REVIEW REPORT FY 2016/17 AUGUST, 2017
OFFICE OF THE CONTROLLER OF BUDGET
Tabl
e 3.
4:
Bre
akdo
wn
of D
evel
opm
ent E
xpen
ditu
re b
y M
DA
s for
FY
201
6/17
(Ksh
s. M
illio
ns)
Min
istry
/Sta
te D
epar
tmen
t
Mai
nte-
nanc
e of
Mot
or V
e-hi
cles
(Pro
-je
cts/P
ro-
gram
mes
)
Mai
nte-
nanc
e of
othe
r As-
sets
Cap
ital
Tran
sfer
s
Con
-st
ruct
ion
of B
uild
-in
g
Ref
urbi
sh-
men
t of
Build
ings
/ In
fras
truc
-tu
re
Res
iden
-tia
l (In
-cl
udin
g H
oste
ls.)
Con
-st
ruct
ion
and
Civ
il W
orks
Purc
hase
of
Spec
ializ
ed
Plan
t, Eq
uip-
men
t and
M
achi
nery
Pre-
Feas
i-bi
lity
and
App
raisa
l St
udie
s
Oth
er E
x-pe
nses
Gro
ss E
x-pe
nditu
re(A
-I-A
)N
et E
x-pe
nditu
re
The
Pres
iden
cy -
- 2
80.0
121
.9 4
3.0
- -
- -
10.
7 4
55.6
- 4
55.6
Stat
e D
epar
tmen
t for
In-
terio
r 0
.3 2
8.1
1,9
78.0
607
.2 5
6.5
- 2
2.6
20,
240.
9 -
1,2
86.7
24,
220.
3 -
24,
220.
3
Stat
e D
epar
tmen
t for
Cor
-re
ctio
nal S
ervi
ces
- -
- -
- -
- -
- 2
42.0
242
.0 -
242
.0
Stat
e D
epar
tmen
t for
D
evol
utio
n -
- 1
37.0
- -
- -
- -
247
.6 3
84.6
19.
9 3
64.7
Stat
e D
epar
tmen
t for
Spe
-ci
al P
rogr
amm
es -
- -
- -
- 3
2.2
- -
7,2
57.1
7,2
89.3
2,6
46.2
4,6
43.0
Stat
e D
epar
tmen
t for
Pla
n-ni
ng &
Sta
tistic
s -
- 2
9,11
4.3
23.
8 -
- 2
13.3
- 2
95.1
8.1
29,
654.
7 -
29,
654.
7
Min
istry
of D
efen
ce -
- -
- -
- -
- -
25.
0 2
5.0
25.
0 -
Min
istry
of F
orei
gn A
ffairs
- -
69.
4 -
- -
- -
- 8
9.7
159
.1 -
159
.1
Stat
e D
epar
tmen
t for
Bas
ic
Educ
atio
n -
- 8
,111
.4 -
- -
- -
- 2
2.4
8,1
33.8
- 8
,133
.8
Stat
e D
epar
tmen
t for
Vo
catio
nal a
nd T
echn
ical
Tr
aini
ng -
- 2
,326
.0 1
01.1
- -
- -
- 2
,317
.5 4
,744
.6 -
4,7
44.6
Stat
e D
epar
tmen
t for
Uni
-ve
rsity
Edu
catio
n 4
.7 -
7,8
75.7
1,0
01.5
- -
- -
- 4
99.6
9,3
81.5
1,4
51.1
7,9
30.4
The
Nat
iona
l Tre
asur
y 0
.1 -
11,
009.
8 7
9.0
158
.7 -
- 2
47.4
682
.3 1
0,43
0.6
22,
607.
8 4
,301
.5 1
8,30
6.3
Min
istry
of H
ealth
- -
16,
328.
8 3
50.4
- -
- 6
5.5
- 1
0,41
4.2
27,
159.
0 -
27,
159.
0St
ate
Dep
artm
ent f
or In
-fr
astru
ctur
e -
-
107,
999.
2 1
61.5
78.
1 -
280
.1 -
141
.3 9
07.3
109
,567
.5 3
3,84
5.3
75,
722.
3
Stat
e D
epar
tmen
t for
Tr
ansp
ort
- -
- -
10
1,12
4.1
- 3
8,50
0.0
- -
9,9
83.0
149
,607
.2 -
14
9,60
7.2
Stat
e D
epar
tmen
t Hou
sing
an
d U
rban
Dev
elop
men
t -
- 5
0.0
236
.1 1
45.0
- 1
2,04
9.3
30.
0 4
05.0
1,1
06.0
14,
021.
3 -
14,
021.
3

20ANNUAL NATIONAL GOVERNMENT BUDGET IMPLEMENTATION REVIEW REPORT FY 2016/17 AUGUST, 2017
OFFICE OF THE CONTROLLER OF BUDGET
Min
istry
/Sta
te D
epar
tmen
t
Mai
nte-
nanc
e of
Mot
or V
e-hi
cles
(Pro
-je
cts/P
ro-
gram
mes
)
Mai
nte-
nanc
e of
othe
r As-
sets
Cap
ital
Tran
sfer
s
Con
-st
ruct
ion
of B
uild
-in
g
Ref
urbi
sh-
men
t of
Build
ings
/ In
fras
truc
-tu
re
Res
iden
-tia
l (In
-cl
udin
g H
oste
ls.)
Con
-st
ruct
ion
and
Civ
il W
orks
Purc
hase
of
Spec
ializ
ed
Plan
t, Eq
uip-
men
t and
M
achi
nery
Pre-
Feas
i-bi
lity
and
App
raisa
l St
udie
s
Oth
er E
x-pe
nses
Gro
ss E
x-pe
nditu
re(A
-I-A
)N
et E
x-pe
nditu
re
Stat
e D
epar
tmen
t of P
ublic
W
orks
- -
- 8
63.8
63.
9 -
- -
41.
6 -
969
.3 -
969
.3
Stat
e D
epar
tmen
t for
Wa-
ter S
ervi
ces
10.
0 -
22,
199.
6 -
7,0
48.0
- -
60.
6 -
681
.8 2
9,99
9.9
110
.6 2
9,88
9.3
Stat
e D
epar
tmen
t for
Irri-
gatio
n -
- 6
,938
.0 -
- -
357
.8 -
- 6
85.6
7,9
81.5
1,6
08.9
6,3
72.6
Stat
e D
epar
tmen
t for
Env
i-ro
nmen
t -
- 6
74.0
- 9
8.0
- -
- -
891
.1 1
,663
.2 -
1,6
63.2
Stat
e D
epar
tmen
t for
Nat
-ur
al R
esou
rces
- -
- -
12.
5 -
- -
- 1
,533
.6 1
,546
.1 -
1,5
46.1
Min
istry
of L
ands
and
Ph
ysic
al P
lann
ing
- 1
2.3
3.4
87.
4 3
9.8
- -
- 5
70.0
2,2
31.2
2,9
44.2
- 2
,944
.2
Stat
e D
epar
tmen
t of I
nfor
-m
atio
n C
omm
unic
atio
ns &
Te
chno
logy
& In
nova
tion
- -
19,
314.
4 -
- -
- -
- -
19,
314.
4 -
19,
314.
4
Stat
e D
epar
tmen
t of
Bro
adca
stin
g an
d Te
le-
com
mun
icat
ions
- -
319
.0 -
- -
- -
- 1
0.0
329
.0 -
329
.0
Stat
e D
epar
tmen
t for
Sp
orts
Dev
elop
men
t -
- 1
,998
.0 -
- -
- -
- -
1,9
98.0
- 1
,998
.0
Stat
e D
epar
tmen
t for
Arts
an
d C
ultu
re -
- 3
99.7
12.
0 -
- -
- -
77.
6 4
89.3
- 4
89.3
Stat
e D
epar
tmen
t for
En-
ergy
- -
31,
236.
2 -
- -
28,
801.
8 1
6.7
528
.2 6
,825
.7 6
7,40
8.6
- 6
7,40
8.6
Stat
e D
epar
tmen
t of P
e-tro
leum
- -
300
.5 3
0.8
14.
5 -
- -
595
.4 5
06.0
1,4
47.1
- 1
,447
.1
Stat
e D
epar
tmen
t for
Ag-
ricul
ture
- -
3,3
04.8
56.
1 -
- 1
41.7
- 6
3.4
5,8
76.0
9,4
42.1
- 9
,442
.1
Stat
e D
epar
tmen
t for
Liv
e-st
ock
1.9
- 1
,449
.1 2
0.0
52.
5 -
- -
- 2
85.5
1,8
08.9
- 1
,808
.9
Stat
e de
partm
ent f
or F
ish-
erie
s and
Blu
e Ec
onom
y -
- 1
,026
.2 0
.5 -
- 5
89.6
- -
487
.1 2
,103
.4 5
32.7
1,5
70.7

21ANNUAL NATIONAL GOVERNMENT
BUDGET IMPLEMENTATION REVIEW REPORT FY 2016/17 AUGUST, 2017
OFFICE OF THE CONTROLLER OF BUDGET
Min
istry
/Sta
te D
epar
tmen
t
Mai
nte-
nanc
e of
Mot
or V
e-hi
cles
(Pro
-je
cts/P
ro-
gram
mes
)
Mai
nte-
nanc
e of
othe
r As-
sets
Cap
ital
Tran
sfer
s
Con
-st
ruct
ion
of B
uild
-in
g
Ref
urbi
sh-
men
t of
Build
ings
/ In
fras
truc
-tu
re
Res
iden
-tia
l (In
-cl
udin
g H
oste
ls.)
Con
-st
ruct
ion
and
Civ
il W
orks
Purc
hase
of
Spec
ializ
ed
Plan
t, Eq
uip-
men
t and
M
achi
nery
Pre-
Feas
i-bi
lity
and
App
raisa
l St
udie
s
Oth
er E
x-pe
nses
Gro
ss E
x-pe
nditu
re(A
-I-A
)N
et E
x-pe
nditu
re
Stat
e D
epar
tmen
t for
In-
vest
men
t and
Indu
stry
- -
2,7
38.0
- 3
.0 -
8.3
- 1
2.7
379
.3 3
,141
.3 9
7.1
3,0
44.3
Stat
e D
epar
tmen
t for
Co-
oper
ativ
es -
- -
- -
- -
- -
530
.0 5
30.0
- 5
30.0
Stat
e D
epar
tmen
t for
Tra
de -
- 5
0.0
- -
- -
- 2
7.0
12.
7 8
9.7
- 8
9.7
Stat
e D
epar
tmen
t for
Eas
t A
fric
an In
tegr
atio
n -
- -
- -
- -
- 1
.9 1
4.2
16.
1 -
16.
1
Stat
e D
epar
tmen
t for
La-
bour
- -
15.
7 1
55.4
3.7
- -
- 6
7.9
161
.8 4
04.5
- 4
04.5
Stat
e D
epar
tmen
t for
So-
cial
Pro
tect
ion
- -
12,
514.
8 2
9.1
20.
6 -
- -
- 1
,094
.8 1
3,65
9.3
- 1
3,65
9.3
Min
istry
of M
inin
g -
18.
4 2
2.3
6.0
85.
8 -
- -
- 1
,177
.6 1
,310
.1 -
1,3
10.1
Min
istry
of T
ouris
m -
- 2
,171
.0 -
- -
- -
1,0
04.5
200
.0 3
,375
.5 -
3,3
75.5
Stat
e D
epar
tmen
t for
Pu
blic
Ser
vice
and
You
th
Affa
irs 1
00.0
- 3
2.0
460
.4 4
,586
.3 5
18.4
- -
675
.0 7
,657
.8 1
4,02
9.9
- 1
4,02
9.9
Stat
e D
epar
tmen
t for
Gen
-de
r -
- 3
,430
.0 -
- -
- -
- -
3,4
30.0
- 3
,430
.0
Stat
e La
w O
ffice
and
De-
partm
ent o
f Jus
tice
- -
- -
6.7
- -
- -
19.
0 2
5.7
- 2
5.7
The
Judi
ciar
y -
- 2
,259
.8 2
95.2
125
.8 -
- -
- 1
04.1
2,7
84.9
- 2
,784
.9Et
hics
& A
nti-C
orru
ptio
n C
omm
issi
on -
- -
- -
- -
- -
250
.0 2
50.0
- 2
50.0
Offi
ce o
f the
Dire
ctor
ate
of
Publ
ic P
rose
cutio
n -
- -
- -
- -
- -
2.6
2.6
- 2
.6
Nat
iona
l Lan
d C
omm
is-
sion
- -
- -
- -
- -
82.
0 2
1.3
103
.3 -
103
.3
Parli
amen
tary
Ser
vice
C
omm
issi
on -
- -
1,4
60.5
419
.3 -
- -
- -
1,8
79.7
- 1
,879
.7
Publ
ic S
ervi
ce C
omm
is-
sion
- -
- 2
9.8
8.5
- -
- -
- 3
8.3
- 3
8.3

22ANNUAL NATIONAL GOVERNMENT BUDGET IMPLEMENTATION REVIEW REPORT FY 2016/17 AUGUST, 2017
OFFICE OF THE CONTROLLER OF BUDGET
Min
istry
/Sta
te D
epar
tmen
t
Mai
nte-
nanc
e of
Mot
or V
e-hi
cles
(Pro
-je
cts/P
ro-
gram
mes
)
Mai
nte-
nanc
e of
othe
r As-
sets
Cap
ital
Tran
sfer
s
Con
-st
ruct
ion
of B
uild
-in
g
Ref
urbi
sh-
men
t of
Build
ings
/ In
fras
truc
-tu
re
Res
iden
-tia
l (In
-cl
udin
g H
oste
ls.)
Con
-st
ruct
ion
and
Civ
il W
orks
Purc
hase
of
Spec
ializ
ed
Plan
t, Eq
uip-
men
t and
M
achi
nery
Pre-
Feas
i-bi
lity
and
App
raisa
l St
udie
s
Oth
er E
x-pe
nses
Gro
ss E
x-pe
nditu
re(A
-I-A
)N
et E
x-pe
nditu
re
Teac
hers
Ser
vice
Com
mis
-si
on 3
1.6
- -
12.
7 3
0.0
- -
- -
- 61.
6 1
2.7
521
.6- 5
08.9
Aud
itor G
ener
al -
- -
144
.0 -
- -
- -
- 1
44.0
- 1
44.0
Tota
l 1
48.5
58.
9
297,
676.
1 6
,346
.2
114,
224.
4 5
18.4
80,
996.
7 2
0,66
1.1
5,1
93.3
76,
502.
2 6
02,3
25.9
45,
159.
9
557,
166.
0
Sou
rce:
MD
As a
nd N
ation
al Tr
easu
ry IF
MIS
Dire
ctora
te

23ANNUAL NATIONAL GOVERNMENT
BUDGET IMPLEMENTATION REVIEW REPORT FY 2016/17 AUGUST, 2017
OFFICE OF THE CONTROLLER OF BUDGET
Analysis of MDAs development expenditure by economic items in FY 2016/17 shows that, the highest expenditure by category recorded by the MDAs was on capital transfers to SAGAs at Kshs.297.7 billion which represents 49.4 per cent of the revised gross development expenditure by the MDAs. The second highest expenditure category was refurbishment of buildings/infrastructure at Kshs.114.2 billion which accounted for 19 per cent of the revised gross development expenditure. Other categories with high expenditures include; Construction and civil works at Kshs.81 billion, purchase of specialized plant, equipment and machinery at Kshs.20.6 billion, construction of buildings (non-residential) at Kshs.6.3 billion and pre-feasibility and appraisal studies at Kshs.5.2 billion.
The highest spending on capital transfers to SAGAs was Kshs.108 billion by the State Department for Infrastructure accounting for 36.3 per cent of the category expenditure followed by Kshs.31.2 billion by the State Department for Energy which accounted for 10.5 per cent of the category gross expenditure.
The highest expenditure on refurbishment of buildings was Kshs.101.1 billion by the State Department for Transport translating to 88.5 per cent of the total MDA expenditure under this category. The State Department for Transport also spent the highest amount on construction and civil works at Kshs.38.5 billion which accounts for 47.5 per cent of the total expenditure under this category. The highest expenditure under the category of the Purchase of Specialized Plant, Equipment and Machinery was Kshs.20.2 billion by the State Department for Interior representing 98.0 per cent of the total expenditure under the category. The State Department for University Education spent the highest amount on Construction of buildings at Kshs.1 billion translating to 15.8 per cent of the total expenditure in that economic item.
Figure 3.4 shows the composition of MDAs development expenditure for FY 2016/17.
Figure 3.4: Summary Analysis of MDAs’ Development Expenditure in FY 2016/17 (Kshs. Million)
Source; MDAs and National Treasury

24ANNUAL NATIONAL GOVERNMENT BUDGET IMPLEMENTATION REVIEW REPORT FY 2016/17 AUGUST, 2017
4 DEVELOPMENT AND RECURRENT EXPENDITURE ANALYSIS BY SECTOR IN FY 2016/17
4.1 IntroductionThis chapter presents analysis of performance by Sector for both development and recurrent expenditure in FY 2016/17. The Sectors are discussed in alphabetical order as follows; Agriculture, Rural and Urban Development (ARUD); Education; Energy, Infrastructure and Information Communications Technology (EI & ICT); Environmental Protection, Water and Natural Resources (EWNR); Governance, Justice, Law and Order (GJLOS); Health, Public Administration and International Relations (PAIR); National Security; and Social Protection, Culture and Recreation Sector.
4.2 Agriculture, Rural and Urban Development (ARUD) SectorThe Agriculture Rural and Urban Development (ARUD) Sector consists of five MDAs namely: the Ministry of Lands and Physical Planning (MoLPP); State Department for Agriculture; State Department for Livestock; State Department for Fisheries and the Blue Economy and the National Land Commission (NLC). The Sector has twenty six Semi-Autonomous Government Agencies (SAGAs) and nine training institutions.
The Sector contributes significantly to the economy through the provision of raw materials for agro-based industries, agricultural exports as well as availing food to the Kenyan population. The goal of this Sector is to attain national food security and sustainable management of land, and the blue economy. Some of the objectives of the Sector include: improve market access and trade; strengthen institutional capacity for improved service delivery; enhance the role of youth and women in the Sector; enhance accessibility, equity and sustainable management of the land resource; and improve storage, access and retrieval of land resource data and information.
The revised annual budgetary allocation to the Sector in FY 2016/17 was Kshs.51.7 billion representing 2.1 per cent of the revised gross national budget, a significant decrease from Kshs.70.8 billion of revised allocation in FY 2015/16. This decline is attributed to the reorganization of the national government that led to moving of the State Department for Housing & Urban Development from AR & UD Sector to Energy, Infrastructure and Information Communication Technology Sector.
The revised allocation comprised of Kshs.28.7 billion (55.5 per cent) for development activities and Kshs.23 billion (44.5 per cent) for recurrent expenditure. State Department for Agriculture received the highest budgetary allocation of Kshs.23.1 billion (44.7 per cent of the Sector’s allocation), while National Land Commission (NLC) had the lowest budgetary allocation of Kshs.1.4 billion (2.7 per cent of the Sector’s allocation).

25ANNUAL NATIONAL GOVERNMENT
BUDGET IMPLEMENTATION REVIEW REPORT FY 2016/17 AUGUST, 2017
OFFICE OF THE CONTROLLER OF BUDGET
Figure 4.1 shows the budgetary allocation trend for the AR & UD sector for the period FY 2012/13 to FY 2016/17
Figure 4.1: Budgetary Allocation Trend for AR & UD Sector from FY 2012/13 to FY 2016/17 (Kshs. billion)
Source: National Treasury
In FY 2016/17, the total exchequer issues to the sector amounted Kshs.38.4 billion, representing 92.3 per cent of the sector’s revised net estimates. This comprised of Kshs.16.4 billion for development expenditure, representing 87.5 per cent of the revised development net estimates and Kshs.22.1 billion for recurrent expenditure, representing 96.2 per cent of the revised annual recurrent net estimates.
Table 4.1 shows AR & UD Sector analysis of exchequer issues and expenditure in FY 2016/17.
Table 4.1: AR & UD Sector-Analysis of Exchequer Issues and Expenditure for FY 2016/17 (Kshs. Billions)
VOTE
Development Recurrent
Revised Gross Est.
Revised Net Est.
Exch. Issues Exp.
% of Exch. to Net Est.
% of Exp.
to Rev.
Gross Est.
RevisedGross Est.
RevisedNet Est.
Exch. Issues Exp.
% of Exch.
to Rev. Net Est.
% of Exp.
to Rev.
Gross Est.
Ministry of Lands and Physical Planning
3.4 3.4 2.7 2.9 80.3 87.2 2.3 2.3 2.2 2.1 96.1 92.2
State Department for Agriculture 11.5 9.7 8.9 9.4 91.4 82.4 11.6 11.6 11.6 11.5 99.8 99.3
State Department for Livestock 11.1 3.4 2.6 1.8 75.6 16.3 6.0 6.0 5.3 5.3 87.6 88.6
State department for Fisheries and Blue Economy
2.7 2.2 2.1 2.1 99.1 79.0 1.8 1.8 1.8 1.7 99.1 91.2
National Land Commission 0.1 0.1 0.1 0.1 100 100 1.3 1.3 1.3 1.2 99.7 98.3

26ANNUAL NATIONAL GOVERNMENT BUDGET IMPLEMENTATION REVIEW REPORT FY 2016/17 AUGUST, 2017
OFFICE OF THE CONTROLLER OF BUDGET
VOTE
Development Recurrent
Revised Gross Est.
Revised Net Est.
Exch. Issues Exp.
% of Exch. to Net Est.
% of Exp.
to Rev.
Gross Est.
RevisedGross Est.
RevisedNet Est.
Exch. Issues Exp.
% of Exch.
to Rev. Net Est.
% of Exp.
to Rev.
Gross Est.
Total 28.7 18.7 16.4 16.4 87.5 57.1 23.0 23.0 22.1 21.9 96.2 95.1
Total for the Sector Revised
Gross Est.
Revised Net Est.
Exch. Issues Exp.
% of Exch.
to Revised Net Est.
% of Exp.
to Rev.
Gross Est.
Development 28.7 18.7 16.4 16.4 87.5 57.1Recurrent 23.0 23.0 22.1 21.9 96.2 95.1Total 51.7 41.6 38.4 38.3 92.3 74.0
Source: MDAs and National Treasury
In the period under review, The National Land Commission received the highest proportion of development exchequer issues to revised development net estimates at 100 per cent while the State Department for Livestock received the lowest at 75.6 per cent. State Department for Agriculture received the highest proportion of recurrent exchequer issues to the revised recurrent net estimates at 99.8 per cent while State Department for Livestock received the lowest at 87.6 per cent.
Figure 4.2 shows the exchequer issues to ARUD Sector in FY 2016/17.
Figure 4.2: Exchequer Issues to AR & UD Sector for FY 2016/17 (Kshs. Billions)
Rec,Kshs.11.6 Bn (56.6%)
Kshs.5.3Bn (67.1%)
Kshs.2.2 Bn (44.9%)
Kshs.1.8 Bn (46.2%)
Kshs.1.3 Bn (92.6%)
Kshs.8.9 Bn (43.4%)
Kshs.2.6 Bn (32.9%)
Kshs.2.7 Bn (55.1%)
Kshs.2.1 Bn (53.8%)
Kshs.0.1Bn (7.4%)
State Department for Agriculture
State Department for Livestock
Ministry of Lands and Physical Planning
State department for Fisheries and the BlueEconomy
National Lands Commission
Dev Rec
Source: National Treasury
The total expenditure for the sector during FY 2016/17 amounted to Kshs.38.3 billion, representing 74 per cent of the revised gross estimates, an increase compared to 69 per cent recorded in FY 2015/16. The expenditure comprised of Kshs.16.4 billion as development expenditure, representing an absorption rate of 57.1 per cent,(a decline from 63.9 per cent recorded in FY 2015/16) and Kshs.21.9 billion as recurrent expenditure, representing 95.1 per cent of the revised recurrent estimates, an increase from 87.9 per cent (Kshs.13.3 billion) recorded in FY 2016/17.

27ANNUAL NATIONAL GOVERNMENT
BUDGET IMPLEMENTATION REVIEW REPORT FY 2016/17 AUGUST, 2017
OFFICE OF THE CONTROLLER OF BUDGET
National Land Commission recorded the highest absorption on development budget at 100 per cent while the State Department for Livestock had the lowest absorption on development budget at 16.3 per cent. State Department for Agriculture recorded the highest percentage of recurrent expenditure to revised annual recurrent estimates at 99.3 per cent while State Department Livestock had the lowest at 88.6 per cent.
Some of the major projects implemented by the ARUD sector in the period under review includes; Regional Pastoral Livelihood Resilience Programme and Small Holder Diary Commercialisation Programme at Kshs.1.6 billion and Kshs.198.3 million respectively, Agricultural Sector Development Support Programme (ASDSP) and Kenya Cereal Enhancement Programme (KCEP) at Kshs.790 million and Kshs.554 million respectively, Processing and Registration of Titles and Digitization of Land Registry at Kshs.1.3 billion and Kshs.834 million respectively while the Public Land Information Management System accounted for Kshs.82 million.
4.3 Education SectorThe Education Sector consists of four MDAs namely: State Department for Basic Education, State Department for University Education, State Department for Vocational and Technical Training and The Teachers Service Commission (TSC) together with their affiliated agencies and institutions.
The sector envisions a globally competitive education, training, research and innovation for sustainable development. In order to realize this, the sector undertakes to provide, promote and coordinate quality education for sustainable development. The sector’s overall goal is to increase access to education and training; improve quality and relevance of education; reduce inequality as well as leverage on knowledge and skills in science, technology, and innovation for global competitiveness.
The sector’s goals and objectives have been aligned to the Constitution of Kenya 2010 and Vision 2030 as well as to international commitments and policies; legal and regulatory reforms aimed at achieving the objects of the Constitution with regard to education and training. These objectives are; quality education, expanded access and inclusivity in education. The Sector also aims at ensuring that the education system is relevant and promotes innovativeness.
The revised annual budgetary allocation to the sector in FY 2016/17 was Kshs.345.7 billion representing 13.8 per cent of gross national budget, an increase from Kshs.323.9 billion allocated in FY 2015/16. The allocation comprised of Kshs.30.3 billion (8.8 per cent) for development expenditure and Kshs.315.4 billion (91.2 per cent) for recurrent expenditure. The Teachers Service Commission received the highest budgetary allocation of Kshs.191.2 billion (55.3 per cent of the sector’s allocation), while State Department for Vocational and Technical Training had the lowest budgetary allocation of Kshs.7.4 billion (2.1 per cent of the sector’s allocation). Figure 4.3 shows budgetary allocation trend of the Education Sector for the period FY 2012/13 to FY 2016/17

28ANNUAL NATIONAL GOVERNMENT BUDGET IMPLEMENTATION REVIEW REPORT FY 2016/17 AUGUST, 2017
OFFICE OF THE CONTROLLER OF BUDGET
Figure 4.3: Budgetary Allocation Trend for the Education Sector from FY 2012/13 to FY 2016/17 (Kshs. Billion)
Source: National Treasury
In FY 2016/17, the sector received exchequer issues amounting to Kshs.319.9 billion representing 99.1 per cent of the sectors’ revised net estimates. This comprised of Kshs.24.4 billion for development expenditure representing 93.7 per cent of the revised development net estimates and Kshs.295.5 billion to recurrent expenditure representing 99.6 per cent of the revised recurrent net estimates.
Table 4.2 shows Education sector analysis of exchequer issues and expenditure in FY 2016/17.
Table 4.2: Education Sector-Analysis of Exchequer Issues and Expenditure for FY 2016/17. (Kshs. Billions)
VOTE
Development Recurrent
Re-vised Gross Est.
Re-vised
Net Est.
Exch. Issues Exp.
% of Exch. to Net Est.
% of Exp.
to Rev.
Gross Est.
Re-visedGross Est.
Re-visedNet Est.
Exch. Is-
suesExp.
% of Exch.
to Rev. Net Est.
% of Exp.
to Rev.
Gross Est.
State De-partment for Basic Edu-cation
15.3 12.8 11.5 8.1 89.7 53.2 58.1 56.7 56.2 54.8 99.2 94.3
State De-partment for Vocational and Techni-cal Training
4.9 4.9 4.7 4.7 96.8 97.0 2.5 2.5 2.5 2.4 98.9 96.7

29ANNUAL NATIONAL GOVERNMENT
BUDGET IMPLEMENTATION REVIEW REPORT FY 2016/17 AUGUST, 2017
OFFICE OF THE CONTROLLER OF BUDGET
State De-partment for University Education
10 8.2 8.1 9.4 99.1 94.1 63.6 46.9 46.2 54.4 98.5 85.5
Teachers Service Com-mission
0.1 0.1 - 0.01 - 12.7 191.1 190.5 190.5 190.9 100 99.9
Total 30.3 26.0 24.4 22.3 93.7 73.6 315.4 296.7 295.5 302.6 99.6 95.9
Total for the Sector
Re-vised Gross Est.
Re-vised Net Est.
Exch. Is-
suesExp.
% of Exch. to Re-vised Net Est.
% of Exp.
to Rev.
Gross Est.
Development 30.3 26.0 24.4 22.3 93.7 73.6
Recurrent 315.4 296.7 295.5 302.6 99.6 95.9
Total 345.6 322.7 319.9 324.9 99.1 94.0
Source: MDAs and National Treasury
In the period under review, State Department for University Education received the highest proportion of development exchequer issues to the revised development net estimates at 99.1 per cent while State Department for Basic Education had the lowest at 89.7 per cent. Teachers Service Commission received the highest proportion of recurrent exchequer issues to the revised recurrent net estimates at 100 per cent while State Department for University Education received the lowest at 98.5 per cent.
Figure 4.4 shows the exchequer issues to the Education Sector in FY 2016/17.
Figure 4.4: Exchequer Issues to the Education Sector for FY 2016/17 (Kshs. Billions)
Source: National Treasury
The total expenditure for the sector during FY 2016/17 amounted to Kshs.324.9 billion, representing 94 per cent of the revised annual estimates, an increase compared to 90.7 per cent (Kshs.293.8 billion) recorded in FY 2015/16. The expenditure comprised of Kshs.22.3 billion for development activities, representing an absorption rate of 73.6 per cent, and Kshs.302.6 billion, representing 95.9 per cent of the revised recurrent estimates.

30ANNUAL NATIONAL GOVERNMENT BUDGET IMPLEMENTATION REVIEW REPORT FY 2016/17 AUGUST, 2017
OFFICE OF THE CONTROLLER OF BUDGET
The State Department for Vocational and Technical Training recorded the highest absorption of development budget at 97 per cent (Kshs.4.7 billion) while Teachers Service Commission had the lowest absorption of development budget at 12.7 per cent. Teachers Service Commission recorded the highest percentage of recurrent expenditure to revised annual recurrent estimates at 99.9 per cent while State Department for University Education had the lowest at 85.5 per cent.
Some of the major projects implemented by the sector in the period under review includes; Kenya Primary Education Project – GPE Programme at Kshs.1.8 billion, Construction of Kenyatta University Children Hospital at Kshs.869.1 million, Construction of Tuition Block at Turkana University College at Kshs.862 million, Secondary Infrastructure Improvement at Kshs.643 million, ICT Integration in Secondary Education Project at Kshs.312.5 million and Upgrading of National Schools at Kshs.285 million.
4.4 Energy, Infrastructure and Information Communications Technology (EI & ICT) SectorThis sector comprises of 9 MDAs namely: State Department for Infrastructure, Transport, Maritime and Shipping Affairs, Housing and Urban Development, Public Works, Information Communications Technology and Innovation, Broadcasting and Telecommunication, Petroleum and Energy.
The sector is identified as one of the key areas upon which the three pillars of the Kenya Vision 2030 are anchored and an enabler of sustainable economic growth, development and poverty reduction. The sector aims at sustaining and expanding physical infrastructure to support a rapidly-growing economy in line with the priorities in the Constitution of Kenya and Kenya Vision 2030.
The revised annual budgetary allocation to the sector in the FY 2016/17 was Kshs.584.7 billion representing 22.4 per cent of revised gross national budget, a significant increase from Kshs.406.6 billion (43.8 per cent increase) allocated in FY 2015/16. This increase is attributed to the government reorganization and additional state departments which increased from four (4) to nine (9) for the sector. The allocation comprised of Kshs.519.9 billion (88.9 per cent) for development expenditure and Kshs.64.9 billion (11.1 per cent) for recurrent expenditure. State Department for Infrastructure received the highest budgetary allocation of Kshs.210.8 billion (36.1 per cent of the sector’s allocation) while State Department for Maritime and Shipping Affairs had the lowest budgetary allocation of Kshs.0.3 billion of the sectors’ allocation.
Figure 4.5 shows the budgetary allocation trend for the EI & ICT Sector for the period FY 2012/13 to FY 2016/17.
Figure 4.5: Budgetary Allocation Trend for the EI & ICT Sector from FY 2012/13 to FY 2016/17 (Kshs. Billion)
Source: National Treasury

31ANNUAL NATIONAL GOVERNMENT
BUDGET IMPLEMENTATION REVIEW REPORT FY 2016/17 AUGUST, 2017
OFFICE OF THE CONTROLLER OF BUDGET
In FY 2016/17, the sector received exchequer issues of Kshs.182.3 billion representing 90.1 per cent of the sectors’ revised net estimates. This comprised of Kshs.171.3 billion for development expenditure representing 90 per cent of the revised development net estimates and Kshs.11 billion representing 91.6 per cent of the revised annual recurrent net estimates.
Table 4.3 shows EI&ICT sector analysis of exchequer issues and expenditure in FY 2016/17.
Table 4.3: EI & ICT-Analysis of Exchequer Issues and Expenditure for FY2016/17 (Kshs. Billions)
VOTE
Development Recurrent
Revised Gross Est.
Revised Net Est.
Exch. Issues
Exp. % of Exch. to Net Est.
% of Exp. to Rev. Gross Est.
Re-vised Gross Est.
Revised Net Est.
Exch. Issues
Exp. % of Exch. to Rev. Net Est.
% of Exp. to Rev. Gross Est.
State Department for Infrastructure 160.9 95.0 88.8 109.6 93.4 68.1 49.9 1.9 1.9 49.3 98.7 98.7
State Department for Transport 163.3 15.9 11.4 149.6 71.7 91.6 5.8 1.4 1.4 5.8 99.2 99.3
State Department for Maritime & Shipping Affairs
- - - - - - 0.3 0.3 0.2 0.2 94.4 88.5
State Department for Housing & Ur-ban Development
17.5 11.6 9.6 14.0 82.4 80.0 1.3 1.3 1.3 1.3 98.3 99.2
State Department for Public Works 1.2 1.2 1.0 1.0 86.4 83.1 0.8 0.8 0.7 0.7 97.1 95.6
State Department of ICT & Innova-tion
21.1 21.1 19.3 19.3 91.3 91.3 1.1 1.1 1.0 1.0 84.2 87.4
State Department for Broadcasting & Telecommuni-cations
0.3 0.3 0.3 0.3 97.0 100 3.3 3.1 2.4 3.0 76.7 91.0
State Department Energy 152.7 43.7 40.4 67.4 92.5 44.2 2.1 1.9 1.9 2.0 99.7 94.8
State Department of Petroleum 2.9 1.5 0.6 1.5 39.2 50.4 0.2 0.2 0.1 0.2 92.9 84.1
Total 519.9 190.3 171.3 362.7 90.0 69.8 64.9 12.0 11.0 63.5 91.6 97.9
Total for the Sector
Revised Gross Es-
timates
Revised Net Esti-
mates
Exch. Issues Exp.
% of Exch. to Revised Net Est.
% of Exp.
to Rev. Gross Est.
Development 519.9 190.3 171.3 362.7 90.0 69.8
Recurrent 64.9 12.0 11.0 63.5 91.6 97.9
Total 584.7 202.3 182.3 426.2 90.1 72.9

32ANNUAL NATIONAL GOVERNMENT BUDGET IMPLEMENTATION REVIEW REPORT FY 2016/17 AUGUST, 2017
OFFICE OF THE CONTROLLER OF BUDGET
Source: MDAs and National Treasury
In the period under review, State Department for Broadcasting and Telecommunication received the highest proportion of development exchequer issues to the revised development net estimates at 97 per cent while State Department for Petroleum had the lowest at 39.2 per cent. State Department for Energy received the highest proportion of recurrent exchequer issues to revised recurrent net estimates at 99.7 per cent while the State Department for Broadcasting and Telecommunication had the lowest proportion of recurrent exchequer issues at 76.7 per cent.
Figure 4.6 shows the exchequer issues to the EI & ICT Sector in FY 2016/17.
Figure 4.6: Exchequer Issues to the EI & ICT Sector for FY 2016/17 (Kshs. Billions)
Source: National Treasury
The total expenditure for the sector during the FY 2016/17 amounted to Kshs.426.2 billion, representing 72.9 per cent of the revised gross estimates, an increase compared to 59.8 per cent (Kshs.243.1 billion) recorded in 2015/16 financial year. This comprised of Kshs.362.7 billion as development expenditure, representing an absorption rate of 69.8 per cent, an increase from 64.3 per cent recorded in FY 2015/16 and Kshs.63.5 billion in recurrent expenditure, representing 97.9 per cent of the revised recurrent estimates, a significant increase compared to 29.6 per cent recorded in FY 2016/17.
State Department for Broadcasting and Telecommunication recorded the highest absorption of development expenditure at 100 per cent while the State Department for Energy recorded the lowest absorption of development expenditure at 44.2 per cent. State Department for Transport recorded the highest percentage of recurrent expenditure to revised recurrent gross estimates at 99.3 per cent while State Department of Petroleum had the lowest at 84.1 per cent.
Some of the key projects implemented by sector in the period under review include; Construction of Mombasa to Nairobi and Nairobi to Naivasha Standard Gauge Railway at a cost of Kshs.98.9 billion and Kshs.38.5 billion respectively, Relocation Units at Kibera and Mukuru slums at Kshs.2.2 billion and Acquisition of two ferries for Likoni Channel at Kshs.650 million, Construction of 1,850 housing units for National Police and Kenya Prison Service at Kshs.1.5 billion and the Kenya Informal Settlement Improvement Project at Kshs.2.7 billion.
4.5 Environmental Protection, Water and Natural Resource SectorThe Environmental Protection, Water and Natural Resources Sector consist of five MDAs namely: The State Department for; Environment, Natural Resources, Water Services, Irrigation and Ministry of Mining with a total of 26 Semi-Autonomous Government Agencies.
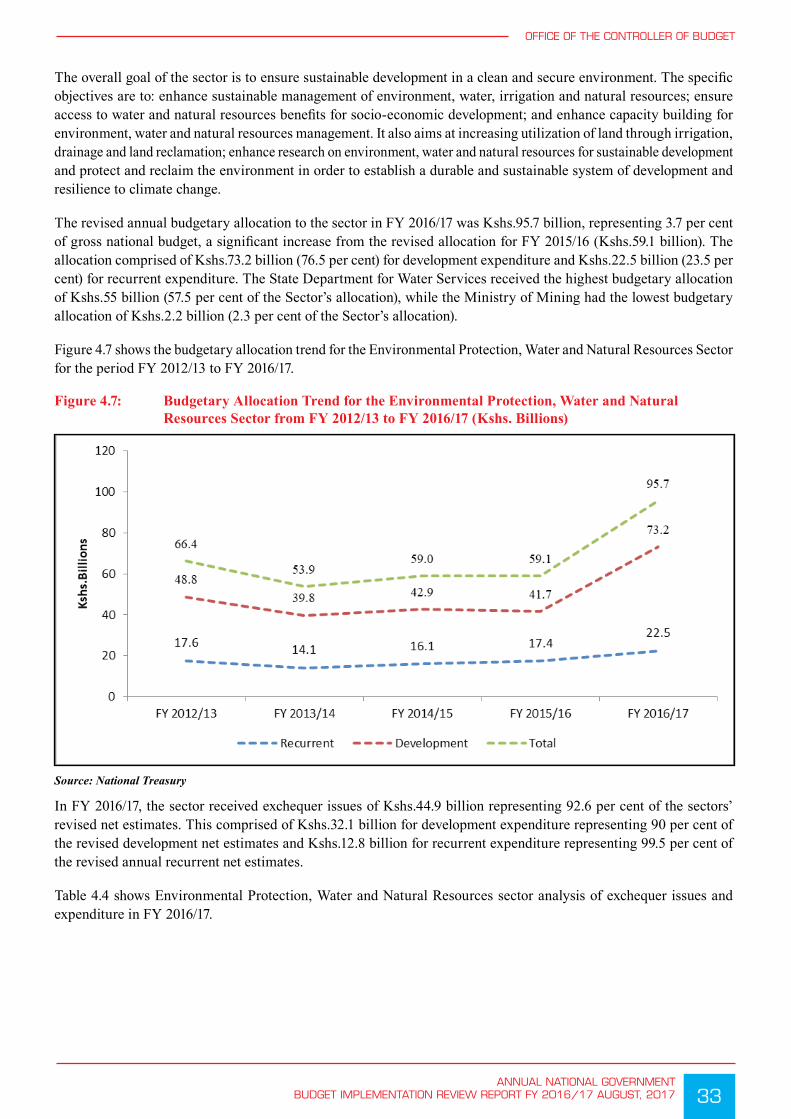
33ANNUAL NATIONAL GOVERNMENT
BUDGET IMPLEMENTATION REVIEW REPORT FY 2016/17 AUGUST, 2017
OFFICE OF THE CONTROLLER OF BUDGET
The overall goal of the sector is to ensure sustainable development in a clean and secure environment. The specific objectives are to: enhance sustainable management of environment, water, irrigation and natural resources; ensure access to water and natural resources benefits for socio-economic development; and enhance capacity building for environment, water and natural resources management. It also aims at increasing utilization of land through irrigation, drainage and land reclamation; enhance research on environment, water and natural resources for sustainable development and protect and reclaim the environment in order to establish a durable and sustainable system of development and resilience to climate change.
The revised annual budgetary allocation to the sector in FY 2016/17 was Kshs.95.7 billion, representing 3.7 per cent of gross national budget, a significant increase from the revised allocation for FY 2015/16 (Kshs.59.1 billion). The allocation comprised of Kshs.73.2 billion (76.5 per cent) for development expenditure and Kshs.22.5 billion (23.5 per cent) for recurrent expenditure. The State Department for Water Services received the highest budgetary allocation of Kshs.55 billion (57.5 per cent of the Sector’s allocation), while the Ministry of Mining had the lowest budgetary allocation of Kshs.2.2 billion (2.3 per cent of the Sector’s allocation).
Figure 4.7 shows the budgetary allocation trend for the Environmental Protection, Water and Natural Resources Sector for the period FY 2012/13 to FY 2016/17.
Figure 4.7: Budgetary Allocation Trend for the Environmental Protection, Water and Natural Resources Sector from FY 2012/13 to FY 2016/17 (Kshs. Billions)
Source: National Treasury
In FY 2016/17, the sector received exchequer issues of Kshs.44.9 billion representing 92.6 per cent of the sectors’ revised net estimates. This comprised of Kshs.32.1 billion for development expenditure representing 90 per cent of the revised development net estimates and Kshs.12.8 billion for recurrent expenditure representing 99.5 per cent of the revised annual recurrent net estimates.
Table 4.4 shows Environmental Protection, Water and Natural Resources sector analysis of exchequer issues and expenditure in FY 2016/17.

34ANNUAL NATIONAL GOVERNMENT BUDGET IMPLEMENTATION REVIEW REPORT FY 2016/17 AUGUST, 2017
OFFICE OF THE CONTROLLER OF BUDGET
Table 4.4: Environmental Protection, Water and Natural Resources Sector-Analysis of Exchequer Issues and Expenditure for the period FY 2016/17 (Kshs. Billions)
VOTE
Development Recurrent
Revised Gross Est.
Revised Net Esti-
mates
Exch. Is-
suesExp.
% of Exch. to Net Est.
% of Exp.
to Rev. Gross Est.
Re-visedGross Est.
Re-visedNet Est.
Exch. Issues Exp.
% of Exch.
to Rev. Net Est.
% of Exp.
to Rev.
Gross Est.
State Department for Water Services
50.5 22.0 20.5 30.0 93.0 59.4 4.5 2.4 2.4 2.2 99.6 48.0
State Department for Irrigation
16.6 8.3 7.0 8.0 84.4 48.2 0.9 0.5 0.5 0.4 99.9 51.5
State Department for Environment
2.8 2.5 1.9 1.7 77.2 58.5 3.7 2.9 2.9 2.7 100 73.1
State Department for Natural Resources
2.0 1.5 1.5 1.5 100 79.0 12.6 6.3 6.3 12.6 99.2 99.9
Ministry of Mining 1.3 1.3 1.2 1.3 89.2 99.2 0.9 0.9 0.9 0.6 99.6 69.9
Total 73.2 35.7 32.1 42.5 90.0 58.1 22.5 12.9 12.8 18.5 99.5 82.1
Total for the Sector Revised
Gross Es-timates
Re-vised Net Est.
Exch. Issues Exp.
% of Exch. to Revised Net Est.
% of Exp. to Rev.
Gross Est.
Development 73.2 35.7 32.1 42.5 90.0 58.1
Recurrent 22.5 12.9 12.8 18.5 99.5 82.1
Total 95.7 48.6 44.9 61.0 92.6 63.7
Source: MDAs and National Treasury
In FY 2016/17, State Department for Natural Resources received the highest proportion of development exchequer issues to the revised annual development net estimates at 100 per cent while State Department for Environment received the lowest at 77.2 per cent. State Department for Environment received the highest proportion of recurrent exchequer issues to the revised net estimates at 100 per cent while State Department for Natural Resources received the lowest at 99.2 per cent.
Figure 4.8 shows the exchequer issues to the Environmental Protection, Water and Natural Resources sector in FY 2016/17.

35ANNUAL NATIONAL GOVERNMENT
BUDGET IMPLEMENTATION REVIEW REPORT FY 2016/17 AUGUST, 2017
OFFICE OF THE CONTROLLER OF BUDGET
Figure 4.8: Exchequer Issues to Environmental Protection, Water and Natural Resources Sector for FY 2016/17 (Kshs. Billions)
Kshs.2.4 Bn (10.5%)
Kshs.0.5 Bn (6.7%)
Kshs.2.9 Bn (60.4%)
Kshs.6.3 Bn (80.8%)
Kshs.0.9 Bn (42.9 %)
Kshs.20.5 Bn (89.5%)
Kshs.7.0 Bn (93.3%)
Kshs.1.9 Bn ( 39.6 %)
Kshs.1.5 Bn (19.2%)
Kshs.1.2 Bn (57.1%)
State Department for Water Services
State Department for Irrigation
State Department for Environment
State Department for Natural Resources
Ministry of Mining
Source: National Treasury
The total expenditure for the sector during FY 2016/17 amounted to Kshs.61 billion, representing 63.7 per cent of the revised annual estimates, an increase compared to 45.1 per cent (Kshs.26.7 billion) recorded in FY 2015/16. The expenditure comprised of Kshs.42.5 billion in development expenditure, representing an absorption rate of 58.1 per cent, an improvement compared to 46.1 per cent (Kshs.19.2 billion) recorded in FY 2015/16 and Kshs.18.5 billion in the recurrent expenditure, representing 82.1 per cent of the revised recurrent estimates, an increase compared to 42.9 per cent (Kshs.7.5 billion) reported in FY 2015/16.
Ministry of Mining recorded the highest absorption of development expenditure at 99.2 per cent while State Department for Irrigation recorded the lowest at 48.2 per cent. State Department for Natural Resources recorded the highest percentage of expenditure on its recurrent budget at 99.9 per cent while the State Department for Water Services recorded the lowest expenditure at 48 per cent.
Some of the major projects implemented by the sector in the period under review includes: Itare Dam Water Project and Karimenu Dam Water Supply Project at Kshs.4.2 billion and Kshs.3.7 billion respectively, National Expanded Irrigation Programme and the Galana Kulalu Irrigation Development Project at Kshs.2.3 billion and Kshs. 1.8 billion respectively, Lake Victoria Environment Management Programme at Ksh.508.9 million, and The Green Schools Programme and the Construction of Wildlife Security Fence in Laikipia at Kshs.544.5 million and Kshs.200 million respectively.
4.6 General Economic and Commercial Affairs (GECA) SectorThe General Economic and Commercial Affairs (GECA) Sector consists of five MDAs namely; State Departments for Investment and Industry, Cooperatives, Trade, East African Integration, and Ministry of Tourism. The Sector aims at promoting investments, increased manufacturing share to the GDP and exports, improvement of the business environment, savings mobilization and good governance in cooperative development, trade development and fair trade practices, promotion of regional integration and sustaining tourism recovery.
The revised annual budgetary allocation to the sector in FY 2016/17 was Kshs.22.2 billion, representing 1 per cent of the gross national budget, an increase from Kshs.17.3 billion allocated in FY 2015/16. The allocation comprised of Kshs.9.7 billion (43.6 per cent) for development expenditure and Kshs.12.5 billion (56.4 per cent) for recurrent expenditure. State Department for Investment and Industry received the highest budgetary allocation of Kshs.8.3 billion (37.3 per cent of the sector’s allocation), while State Department for East African Integration had the lowest allocation at Kshs.1.6 billion (7.2 per cent of the sector’s allocation).
Figure 4.9 shows the budgetary allocation trend for the GECA Sector from FY 2012/13 to FY 2016/17.

36ANNUAL NATIONAL GOVERNMENT BUDGET IMPLEMENTATION REVIEW REPORT FY 2016/17 AUGUST, 2017
OFFICE OF THE CONTROLLER OF BUDGET
Figure 4.9: Budgetary Allocation Trend for the GECA Sector from FY 2012/13 to FY (2016/17 (Kshs. Billion)
Source: National Treasury
In the FY 2016/17, the Sector received exchequer issues amounting to Kshs.19 billion, representing 96.3 per cent of the sector’s revised net estimates. The exchequer issues comprised of Kshs.6.8 billion towards development expenditure, representing 93.1 per cent of the revised development net estimates, and Kshs.12.2 billion for recurrent expenditure, representing 98.2 per cent of the revised recurrent net estimates.
Table 4.5 presents analysis of exchequer issues to GECA Sector and expenditure in FY 2016/17.
Table 4.5: GECA Sector-Analysis of Exchequer Issues and Expenditure for FY 2016/17 (Kshs. Billions)
VOTE
Development Recurrent
Re-vised Gross Est.
Re-vised Net Est.
Exch. Issues Exp.
% of Exch. to Net Est.
% of Exp.
to Rev.
Gross Est.
RevisedGross Est.
RevisedNet Est.
Exch. Issues Exp.
% of Exch. to Rev. Net
Est.
% of Exp. to Rev. Gross
Est.
State Depart-ment for In-vestment and Industry
5.4 3.1 3.0 3.1 97.1 58.4 2.9 2.8 2.8 2.9 100 98.2
State Depart-ment for Co-operatives
0.5 0.5 0.5 0.5 98.3 100 3.2 3.2 3.1 3.1 98.2 97.6
State De-partment for Trade
0.1 0.1 0.1 0.1 81.9 73.2 3.5 3.5 3.3 3.3 96.3 94.2
State Depart-ment for East African Inte-gration
0.1 - - 0.02 - 24.8 1.5 1.5 1.5 1.5 98.4 99.5
Ministry of Tourism 3.6 3.6 3.2 3.4 89.2 94.0 1.5 1.5 1.4 1.4 99.2 98.6
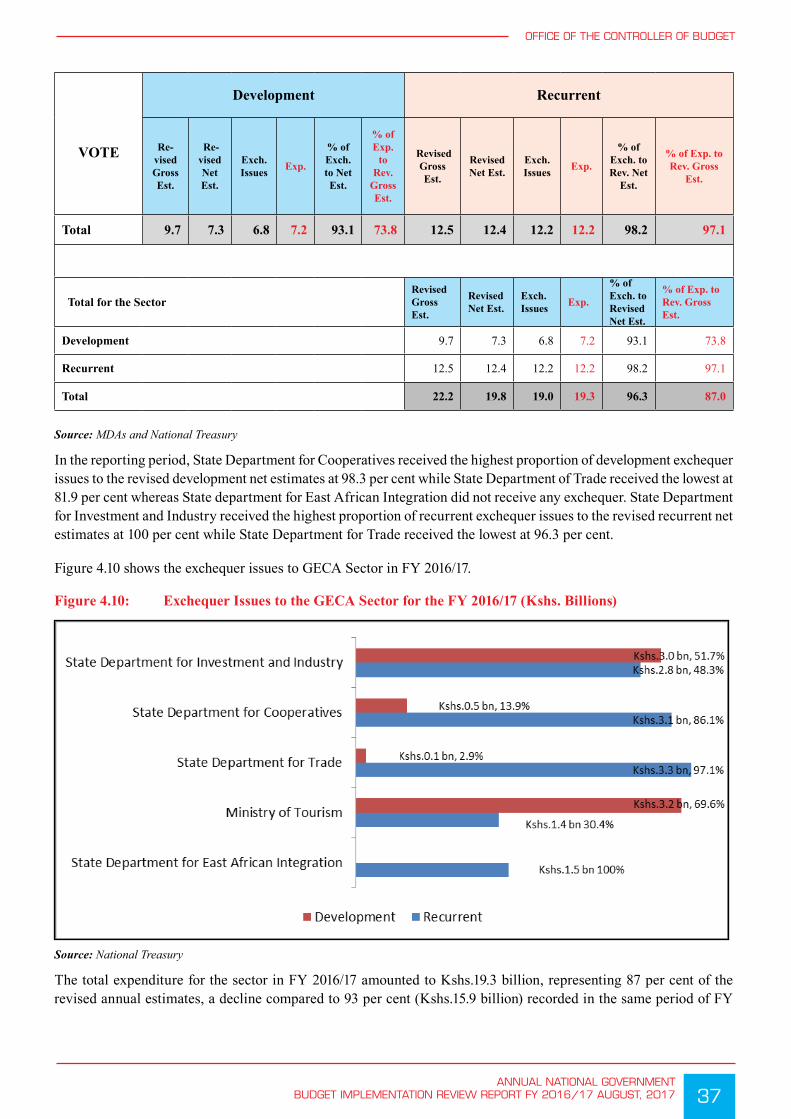
37ANNUAL NATIONAL GOVERNMENT
BUDGET IMPLEMENTATION REVIEW REPORT FY 2016/17 AUGUST, 2017
OFFICE OF THE CONTROLLER OF BUDGET
VOTE
Development Recurrent
Re-vised Gross Est.
Re-vised Net Est.
Exch. Issues Exp.
% of Exch. to Net Est.
% of Exp.
to Rev.
Gross Est.
RevisedGross Est.
RevisedNet Est.
Exch. Issues Exp.
% of Exch. to Rev. Net
Est.
% of Exp. to Rev. Gross
Est.
Total 9.7 7.3 6.8 7.2 93.1 73.8 12.5 12.4 12.2 12.2 98.2 97.1
Total for the SectorRevised Gross Est.
Revised Net Est.
Exch. Issues Exp.
% of Exch. to Revised Net Est.
% of Exp. to Rev. Gross Est.
Development 9.7 7.3 6.8 7.2 93.1 73.8
Recurrent 12.5 12.4 12.2 12.2 98.2 97.1
Total 22.2 19.8 19.0 19.3 96.3 87.0
Source: MDAs and National Treasury
In the reporting period, State Department for Cooperatives received the highest proportion of development exchequer issues to the revised development net estimates at 98.3 per cent while State Department of Trade received the lowest at 81.9 per cent whereas State department for East African Integration did not receive any exchequer. State Department for Investment and Industry received the highest proportion of recurrent exchequer issues to the revised recurrent net estimates at 100 per cent while State Department for Trade received the lowest at 96.3 per cent.
Figure 4.10 shows the exchequer issues to GECA Sector in FY 2016/17.
Figure 4.10: Exchequer Issues to the GECA Sector for the FY 2016/17 (Kshs. Billions)
Source: National Treasury
The total expenditure for the sector in FY 2016/17 amounted to Kshs.19.3 billion, representing 87 per cent of the revised annual estimates, a decline compared to 93 per cent (Kshs.15.9 billion) recorded in the same period of FY

38ANNUAL NATIONAL GOVERNMENT BUDGET IMPLEMENTATION REVIEW REPORT FY 2016/17 AUGUST, 2017
OFFICE OF THE CONTROLLER OF BUDGET
2015/16. The expenditure consisted of Kshs.7.2 billion for development expenditure, representing an absorption rate of 73.8 per cent, a decline from 91.3 per cent recorded in the same period FY 2015/16 and Kshs.12.2 billion for recurrent expenditure, representing 97.9 per cent of the revised recurrent estimates, an improvement compared to 95.3 per cent (Kshs.7 billion) reported in FY 2015/16.
The State Department for Cooperatives recorded the highest absorption of development budget at 100 per cent (Kshs.0.5 billion) while The State Department for Investment and Industry recorded the lowest at 58.4 per cent whereas, State Department for East African Integration did not spend on development activities. State Department for East African Integration recorded the highest percentage of recurrent expenditure to the revised annual recurrent estimates at 99.5 per cent while State Department for Trade had the lowest at 94.2 per cent.
Some of the major projects implemented by the sector in the period under review includes: Tourism Recovery Project Programme and Sustaining of New Markets and Siting Booths in Tourism Target Programme – Kenya Tourism Board at Kshs.1.1 billion and Kshs.860 million respectively, Acquisition of equipment and machinery for the New KCC at Kshs.470 million and Establishment of Commodities Exchange Platform at Kshs.27 million.
4.7 Governance, Justice, Law and Order Sector (GJLOS)The GJLOS Sector consists of fourteen (14) MDAs, twenty (20) Semi-Autonomous Government Agencies (SAGAs) and fifteen (15) Tribunals with specific mandates. The 14 MDAs are: State Department for Interior, State Department for Correctional Services, State Law Office and Department of Justice, The Judiciary, Ethics and Anti-Corruption Commission (EACC), Office of the Director of Public Prosecutions, Office of the Registrar of Political Parties, Witness Protection Agency (WPA), Kenya National Commission on Human Rights (KNCHR), Independent Electoral and Boundaries Commission (IEBC), Judicial Service Commission (JSC), National Police Service Commission (NPSC), National Gender and Equality Commission (NGEC), and the Independent Policing Oversight Authority (IPOA).
The role of the sector includes; provision of security, correctional services, legal advisory services to government agencies, and administration of justice. It also plays a major role in promoting integrity and the fight against corruption, provision of prosecution services, regulating political parties, protecting witnesses, and protecting human rights. Further, the Sector plays an instrumental role in the delimitation of electoral boundaries and management of electoral process, promotion of gender equality and inclusion of marginalized groups and communities, and civilian policing oversight.
In addition, the sector plays a role in border management, peace building and conflict management, registration services, regulation of the gaming industry, provision of population management services, eradication of drugs and substance abuse, crime research and government printing services. The sector also plays a key role in ensuring achievement of national values, and promoting national cohesion.
The revised annual budgetary allocation to the sector in FY 2016/17 was Kshs.210.9 billion representing 8.1 per cent of gross national budget, an increase compared to Kshs.160.7 billion allocated in FY 2015/16. The allocation comprised of Kshs.33.7 billion (16 per cent) for development expenditure and Kshs.177.2 billion (84 per cent) for recurrent expenditure. State Department for Interior received the highest budgetary allocation of Kshs.135.1 billion (64.1 per cent of the sector’s allocation), while Witness Protection Agency had the lowest at Kshs.0.4 billion (0.2 per cent of the sector’s allocation). Figure 4.11 shows the budgetary allocation trend for the GJLOS for the period FY 2012/13 to FY 2016/17.

39ANNUAL NATIONAL GOVERNMENT
BUDGET IMPLEMENTATION REVIEW REPORT FY 2016/17 AUGUST, 2017
OFFICE OF THE CONTROLLER OF BUDGET
Figure 4.11: Budgetary Allocation Trend for the GJLOS Sector from FY 2012/13 to FY 2016/17 (Kshs. Billion)
Source: National Treasury
In FY 2016/17, the total exchequer issues for the sector was Kshs.199.5 billion, representing 95.4 per cent of the Sectors’ revised net estimates. This amount comprised of Ksh.29.5 billion for development expenditure representing 90.6 per cent of the revised development net estimates. The recurrent exchequer issues amounted to Ksh.170 billion, representing 96.3 per cent of the revised recurrent net estimates. Table 4.6 shows the GJLO Sector’s analysis of exchequer issues and expenditure in FY 2016/17.

40ANNUAL NATIONAL GOVERNMENT BUDGET IMPLEMENTATION REVIEW REPORT FY 2016/17 AUGUST, 2017
OFFICE OF THE CONTROLLER OF BUDGET
Table 4.6 GJLOS Sector-Analysis of Exchequer Issues and Expenditure for FY2016/17 (Kshs. Billions)
VOTE
Development Recurrent
Revised Gross Est.
Revised Net Est.
Exch. Issues Exp.
% of Exch. to Net Est.
% of Exp.
to Rev.
Gross Est.
RevisedGross Est.
RevisedNet Est.
Exch. Issues Exp.
% of Exch. to Rev. Net
Est.
% of Exp.
to Rev. Gross Est.
State Department for Interior 27.5 27.4 26.4 24.2 96.5 88.0 107.6 107.2 105.2 89.4 98.1 83.1
State Department for Correctional Services
0.5 0.5 0.5 0.2 99.8 46.1 20.2 20.2 20.2 16.8 100 83.1
State Law Office and Department of Justice
0.4 0.1 0.1 0.02 99.3 6.8 4.6 4.3 3.9 3.9 91.3 84.1
The Judiciary 4.2 4.2 2.2 2.8 53.3 67.1 13.0 13.0 12.7 12.5 97.7 96.5
Ethics & Anti-Corruption Commission
0.3 0.3 0.3 0.3 100 100 3.2 3.2 3.2 3.2 99.8 98.9
Office of the Director of Public Prosecutions
0.1 0.1 - 0.003 - 2.6 2.1 2.1 1.8 1.8 85.7 85.9
Office of the Registrar of Political Parties
- - - - - - 0.8 0.8 0.7 0.6 80.7 76.6
Witness Protection Agency - - - - - - 0.4 0.4 0.4 0.4 100.0 98.2
Kenya National Commission on Human Rights
- - - - - - 0.4 0.4 0.4 0.40 98.9 95.3
Independent Electoral and Boundaries Commission
0.8 0.1 - - - - 23.1 23.1 19.8 19.6 86.0 84.9
Judicial Service Commission - - - - - - 0.5 0.5 0.4 0.4 96.7 94.2
National Police Service Commission
- - - - - - 0.4 0.4 0.4 0.4 98.6 97.8
National Gender & Equality Commission
- - - - - - 0.4 0.4 0.4 0.4 98.5 98.5
Independent Policing Oversight Authority
- - - - - - 0.5 0.5 0.4 0.4 89.4 89.4
Total 33.7 32.6 29.5 27.5 90.6 81.7 177.2 176.5 170.0 150.4 96.3 84.8
Total for the Sector Revised
Gross Est.
Revised Net Est.
Exch. Issues Exp.
% of Exch. to Revised Net Est.
% of Exp.
to Rev. Gross Est.
Development 33.7 32.6 29.5 27.5 90.6 81.7
Recurrent 177.2 176.5 170.0 150.4 96.3 84.8Total 210.9 209.0 199.5 177.9 95.4 84.3Source: MDAs and National Treasury

41ANNUAL NATIONAL GOVERNMENT
BUDGET IMPLEMENTATION REVIEW REPORT FY 2016/17 AUGUST, 2017
OFFICE OF THE CONTROLLER OF BUDGET
From the sector analysis on the exchequer issued in the FY2016/17, the Ethics and Anti-Corruption Commission (EACC) received the highest proportion of development exchequer issues to revised development net estimates at 100 per cent, while the Judiciary recorded the lowest at 53.3 per cent. The Witness Protection Agency and the State Department for Correctional Services received the highest proportion of recurrent exchequer issues to revised recurrent net estimates at 100 per cent, while the Office of the Registrar of Political Parties received the lowest at 80.7 per cent.
Figure 4.12 shows the exchequer issues to the GJLOS Sector in FY 2016/17.
Figure 4.12: Exchequer Issues to the GJLOS Sector for FY 2016/17 (Kshs. Billions)
44
Figure 4.12: Exchequer Issues to the GJLOS Sector for FY 2016/17 (Kshs. Billions)
Kshs.105.2 Bn (79.9%)
Kshs.20.2Bn (97.6%)
Kshs.3.9 Bn (97.5%)
Kshs.12.7 Bn (85.2%)
Kshs.3.2Bn (91.4%)
Kshs.1.8 Bn (100%)
Kshs.0.7 Bn (100%)
Kshs.0.4 Bn (100%)
Kshs.0.4 Bn (100%)
Kshs.19.8 Bn (100%)
Kshs.0.4 Bn (100%)
Kshs.0.4 Bn (100%)
Kshs.0.4 Bn (100%)
Kshs.0.4 Bn (100%)
Ksh.26.4 Bn (20.1%)
Ksh.0.5 Bn (2.4%)
Kshs.0.1 Bn (2.5%)
Ksh.2.2 Bn …
Kshs.0.3 Bn (8.6%)
State Department for Interior
State Department for Correctional Services
State Law Office and Department of Justice
The Judiciary
Ethics & Anti-Corruption Commission
Office of the Director of Public Prosecutions
Office of the Registrar of Political Parties
Witness Protection Agency
Kenya National Commission on Human Rights
Independent Electoral and Boundaries…
Judicial Service Commission
National Police Service Commission
National Gender & Equality Commission
Independent Police Oversight Authority
Development Recurrent
Source: National Treasury
The total expenditure for the sector in FY 2016/17 amounted to Kshs.177.9 billion, representing 84.3 per cent of the
revised annual estimates. The development expenditure was Kshs.27.5 billion, translating to an absorption rate of
81.7 per cent while total recurrent expenditure was Kshs.150.4 billion, representing 84.8 per cent of the revised
recurrent annual estimates. EACC recorded the highest absorption rate of development expenditure at 100 per cent
while the Office of the Director of Public Prosecutions recorded the lowest at 2.6 per cent. Equally, EACC recorded
the highest proportion of recurrent expenditure to the revised annual estimates at 98.9 per cent while the Office of
the Registrar of Political Parties recorded the lowest at 76.5 per cent.
In the period under review GJLOS Sector undertook the following projects; The Judiciary Performance
Improvement Project at Kshs.2.3 billion, Construction of Embu High Court at Kshs.65.6 million and the
Construction of Prefabricated Courts in Tawa, Garsen and Runyenjes by the Judiciary at Kshs.50.1 million.
4.8 Health SectorThe Health Sector consists of Ministry of Health and seven Semi-Autonomous Government Agencies (SAGAs)
namely; Kenyatta National Hospital (KNH), Moi Teaching and Referral Hospital (MTRH), Kenya Medical
Research Institute (KEMRI), Kenya Medical Supplies Authority (KEMSA), Kenya Medical Training College
(KMTC), National AIDS Control Council (NACC), and the National Health Insurance Fund (NHIF).
Source: National Treasury
The total expenditure for the sector in FY 2016/17 amounted to Kshs.177.9 billion, representing 84.3 per cent of the revised annual estimates. The development expenditure was Kshs.27.5 billion, translating to an absorption rate of 81.7 per cent while total recurrent expenditure was Kshs.150.4 billion, representing 84.8 per cent of the revised recurrent annual estimates. EACC recorded the highest absorption rate of development expenditure at 100 per cent while the Office of the Director of Public Prosecutions recorded the lowest at 2.6 per cent. Equally, EACC recorded the highest proportion of recurrent expenditure to the revised annual estimates at 98.9 per cent while the Office of the Registrar of Political Parties recorded the lowest at 76.5 per cent.
In the period under review GJLOS Sector undertook the following projects; The Judiciary Performance Improvement Project at Kshs.2.3 billion, Construction of Embu High Court at Kshs.65.6 million and the Construction of Prefabricated Courts in Tawa, Garsen and Runyenjes by the Judiciary at Kshs.50.1 million.
4.8 Health SectorThe Health Sector consists of Ministry of Health and seven Semi-Autonomous Government Agencies (SAGAs) namely; Kenyatta National Hospital (KNH), Moi Teaching and Referral Hospital (MTRH), Kenya Medical Research Institute (KEMRI), Kenya Medical Supplies Authority (KEMSA), Kenya Medical Training College (KMTC), National AIDS Control Council (NACC), and the National Health Insurance Fund (NHIF).
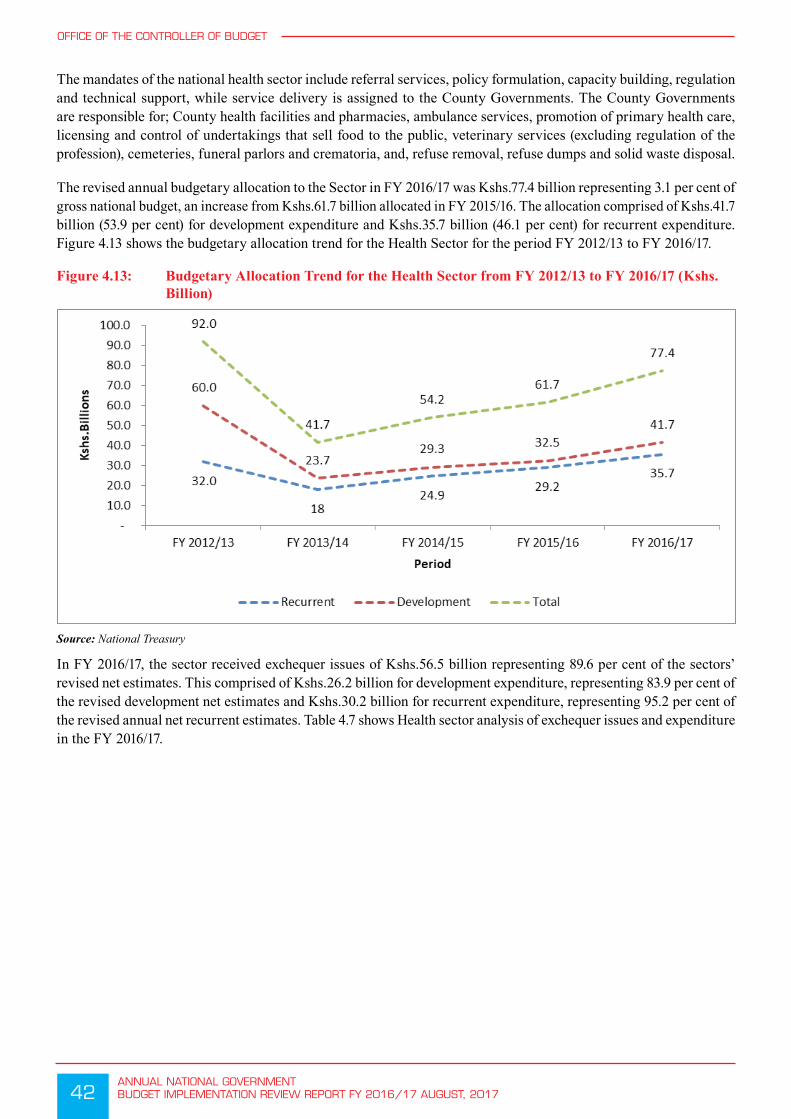
42ANNUAL NATIONAL GOVERNMENT BUDGET IMPLEMENTATION REVIEW REPORT FY 2016/17 AUGUST, 2017
OFFICE OF THE CONTROLLER OF BUDGET
The mandates of the national health sector include referral services, policy formulation, capacity building, regulation and technical support, while service delivery is assigned to the County Governments. The County Governments are responsible for; County health facilities and pharmacies, ambulance services, promotion of primary health care, licensing and control of undertakings that sell food to the public, veterinary services (excluding regulation of the profession), cemeteries, funeral parlors and crematoria, and, refuse removal, refuse dumps and solid waste disposal.
The revised annual budgetary allocation to the Sector in FY 2016/17 was Kshs.77.4 billion representing 3.1 per cent of gross national budget, an increase from Kshs.61.7 billion allocated in FY 2015/16. The allocation comprised of Kshs.41.7 billion (53.9 per cent) for development expenditure and Kshs.35.7 billion (46.1 per cent) for recurrent expenditure. Figure 4.13 shows the budgetary allocation trend for the Health Sector for the period FY 2012/13 to FY 2016/17.
Figure 4.13: Budgetary Allocation Trend for the Health Sector from FY 2012/13 to FY 2016/17 (Kshs. Billion)
Source: National Treasury
In FY 2016/17, the sector received exchequer issues of Kshs.56.5 billion representing 89.6 per cent of the sectors’ revised net estimates. This comprised of Kshs.26.2 billion for development expenditure, representing 83.9 per cent of the revised development net estimates and Kshs.30.2 billion for recurrent expenditure, representing 95.2 per cent of the revised annual net recurrent estimates. Table 4.7 shows Health sector analysis of exchequer issues and expenditure in the FY 2016/17.

43ANNUAL NATIONAL GOVERNMENT
BUDGET IMPLEMENTATION REVIEW REPORT FY 2016/17 AUGUST, 2017
OFFICE OF THE CONTROLLER OF BUDGET
Table 4.7: Health Sector-Analysis of Exchequer Issues and Expenditure for the period July 2016 to July, 2017. (Kshs. Billions)
VOTE
Development Recurrent
Revised Gross Est.
Revised Net Est.
Exch. Issues Exp.
% of Exch. to Net Est.
% of Exp.
to Rev. Gross Est.
RevisedGross Est.
RevisedNet Est.
Exch. Issues Exp.
% of Exch. to Rev. Net
Est.
% of Exp.
to Rev. Gross Est.
Ministry of Health 41.7 31.3 26.2 27.2 83.9 65.1 35.7 31.8 30.2 29.8 95.2 83.5
Total 41.7 31.3 26.2 27.2 83.9 65.1 35.7 31.8 30.2 29.8 95.2 83.5
Total for the Sector Revised
Gross Est.
Revised Net Est.
Exch. Issues Exp.
% of Exch. to Revised Net Est.
% of Exp.
to Rev. Gross Est.
Development 41.7 31.3 26.2 27.2 83.9 65.1
Recurrent 35.7 31.8 30.2 29.8 95.2 83.5
Total 77.4 63.1 56.5 57.0 89.6 73.6
Source: MDAs and National Treasury
Figure 4.14 shows the exchequer issues to Health Sector in the FY 2016/17.
Figure 4.14: Exchequer Issues to the Health Sector for the FY 2016/17 (Kshs. Billions)
Source: National Treasury
The total expenditure for the sector in FY 2016/17 amounted to Kshs.57 billion, representing 73.6 per cent of the revised annual estimates, an increase compared to 68.5 per cent recorded in FY 2015/16. The expenditure consists of Kshs.27.2 billion for development activities, representing an absorption rate of 65.1 per cent, an increase compared to 52.5 per cent (17.1 billion) recorded in FY 2015/16 and Kshs.29.8 billion for recurrent expenditure, representing 83.5 per cent of the revised gross recurrent estimates, a decline from 86.3 per cent (Kshs.25.2 billion) recorded in FY 2015/16.
In the period under review, Ministry of Health undertook the following projects; Hire of medical equipment for 98 hospitals at Kshs.9.6 billion, Free Maternity Programme at Kshs.5.2 billion, Kenya Health Sector Support Project (KHSSP) at Kshs.3.5 billion, Tuberculosis Round 6 Programme at Kshs.865.5 million and Malaria Round 10 under– Special Global Fund Programme at Kshs.539.3 million.

44ANNUAL NATIONAL GOVERNMENT BUDGET IMPLEMENTATION REVIEW REPORT FY 2016/17 AUGUST, 2017
OFFICE OF THE CONTROLLER OF BUDGET
4.9 National Security SectorThe Sector consists of the Ministry of Defence and the National Intelligence Service (NIS). The mandate of the sector is to ensure security of the country against any threats emanating from within or outside the Kenyan borders, defend the country, and provide support to civil power in maintaining peace and order.
The revised annual budgetary allocation to the sector in FY 2016/17 was Kshs.130.2 billion translating to 5.2 per cent of gross national budget, an increase from Kshs.113.8 billion allocated in FY 2015/16. The allocation comprised of Kshs.45 million for development expenditure and Kshs.130.2 billion for recurrent expenditure. Ministry of Defence received the highest budgetary allocation of Kshs.101.2 billion (77.7 per cent of the sector’s allocation), while National Intelligence Service received Kshs.29.0 billion (22.3 per cent of the sector’s allocation).
Figure 4.15 below shows the budgetary allocation trend for the National Security Sector for the period FY 2012/13 to FY 2016/17.
Figure 4.15: Budgetary Allocation Trend for the National Security Sector from FY 2012/13 to FY 2016/17 (Kshs. Billion)
Source: National Treasury
In FY 2016/17, the sector received Kshs.130.2 billion as exchequer issues, representing 100 per cent of the sector’s revised net estimates. Ministry of Defence received Kshs.101.1 billion and National Intelligence Services (NIS) Kshs.29 billion, representing 100 per cent of revised net estimates respectively. Table 4.8 shows the National Security sector analysis of exchequer issues and expenditure in the FY 2016/17.
Table 4.8: National Security Sector-Analysis of Exchequer Issues and Expenditure for FY2016/17. (Kshs Billions)
VOTE
Development Recurrent
Revised Gross Est.
Revised Net Est.
Exch. Issues Exp.
% of Exch. to Net Est.
% of Exp.
to Rev. Gross Est.
RevisedGross Est.
RevisedNet Est.
Exch. Issues Exp.
% of Exch. to Rev. Net
Est.
% of Exp.
to Rev. Gross Est.
Ministry of De-fence 0.05 - - 0.03 - 55.6 101.1 101.1 101.1 101.1 100 100
National Intelli-gence Service - - - - - - 29.0 29.0 29.0 29.0 100 100
Total 0.05 0.03 55.6 130.2 130.2 130.2 130.2 100 100
Total for the Sector Revised
Gross Est.
Revised Net Est.
Exch. Issues Exp.
% of Exch. to Revised Net Est.
% of Exp.
to Rev. Gross Est.
Development 0.05 - - 0.03 - 55.6

45ANNUAL NATIONAL GOVERNMENT
BUDGET IMPLEMENTATION REVIEW REPORT FY 2016/17 AUGUST, 2017
OFFICE OF THE CONTROLLER OF BUDGET
Recurrent 130.2 130.2 130.2 130.2 100 100
Total 130.2 130.2 130.2 130.2 100.0 100
Source: MDAs and National Treasury
The total expenditure for the sector in FY 2016/17 amounted to Kshs.130.2 billion, representing 100 per cent of the revised annual estimates, and an increase from 99.9 per cent recorded in FY 2015/16. Expenditure for the Ministry of Defence amounted to Kshs.101.1 billion, representing 100 per cent of the recurrent estimates, recording an increase compared to 99.9 per cent (Kshs.92.2 billion) for FY 2015/16. NIS expenditure amounted to Kshs.29 billion, representing 100 per cent of its revised annual recurrent estimates, an increase compared to Kshs.21.5 billion spent in FY 2015/16.
4.10 Public Administration and International Relations (PAIR) SectorThe Public Administration and International Relations Sector (PAIR) consists of 14 MDAs namely; The Presidency, State Department for Planning and Statistics, State Department for Devolution, Ministry of Foreign Affairs, National Treasury, State Department for Public Service and Youth Affairs, Parliamentary Service Commission, National Assembly, Commission on Revenue Allocation, Public Service Commission, Salaries and Remuneration Commission, Office of Auditor General, Controller of Budget, and Commission on Administrative Justice.
The sector provides overall policy and leadership direction to the country, oversees national legislation as well as the human resource function in the public service. It further coordinates national policy formulation, implementation, and, monitoring and evaluation. Other key mandates undertaken by the sector include resource mobilization and management, implementation of foreign policy, and provision of oversight on the use of public resources, and delivery of other services.
The revised annual budgetary allocation to the sector in FY 2016/17 was Kshs.216.8 billion representing 8.3 per cent of gross national budget, a decrease compared to Kshs.284.5 billion allocated in FY 2015/16. The allocation comprised of Kshs.95.8 billion (44.2 per cent) for development expenditure and Kshs.121 billion (55.8 per cent) for recurrent expenditure. The National Treasury received the highest budgetary allocation of Kshs.77.9 billion (35.9 per cent of the sector’s allocation), while Commission on Revenue Allocation (CRA) had the lowest at Kshs.0.4 billion (0.2 per cent of the sector’s allocation).
Figure 4.16 shows the budgetary allocation trend for the PAIR Sector for the period FY 2012/13 to FY 2016/17
Figure 4.16: Budgetary Allocation Trend for the PAIR Sector from FY 2012/13 to FY 2016/17 (Kshs. Billion)
Source: National Treasury
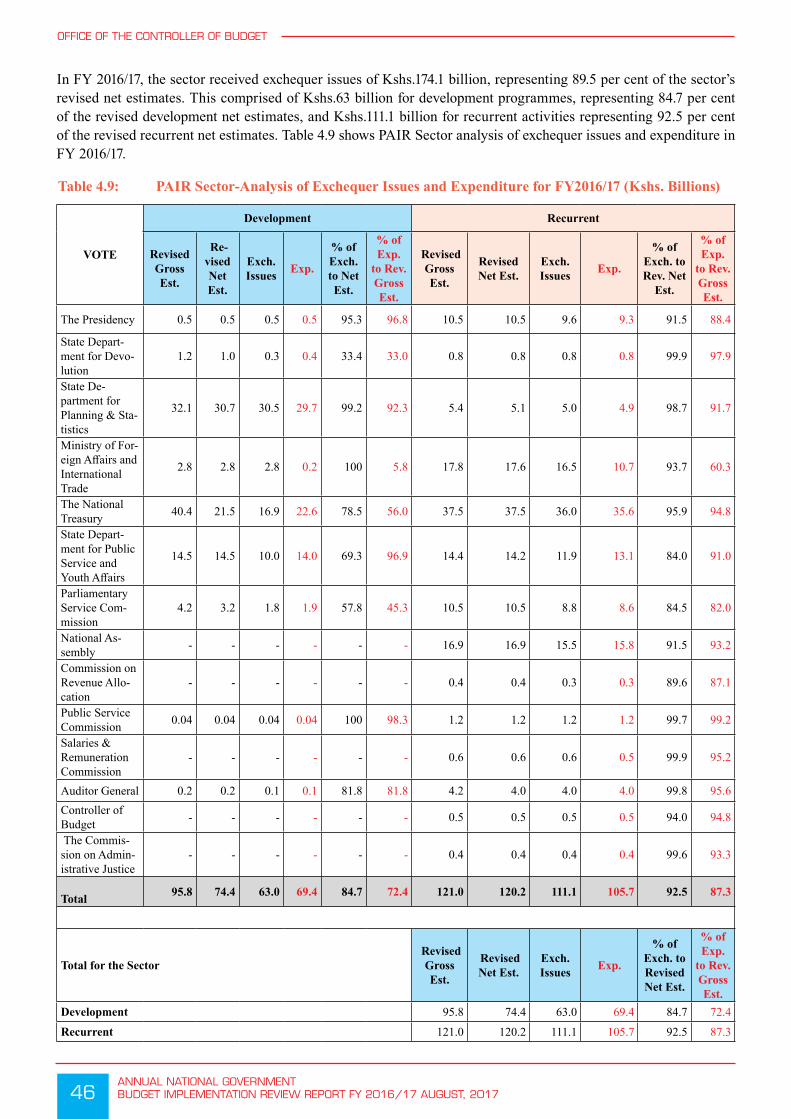
46ANNUAL NATIONAL GOVERNMENT BUDGET IMPLEMENTATION REVIEW REPORT FY 2016/17 AUGUST, 2017
OFFICE OF THE CONTROLLER OF BUDGET
In FY 2016/17, the sector received exchequer issues of Kshs.174.1 billion, representing 89.5 per cent of the sector’s revised net estimates. This comprised of Kshs.63 billion for development programmes, representing 84.7 per cent of the revised development net estimates, and Kshs.111.1 billion for recurrent activities representing 92.5 per cent of the revised recurrent net estimates. Table 4.9 shows PAIR Sector analysis of exchequer issues and expenditure in FY 2016/17.
Table 4.9: PAIR Sector-Analysis of Exchequer Issues and Expenditure for FY2016/17 (Kshs. Billions)
VOTE
Development Recurrent
Revised Gross Est.
Re-vised Net Est.
Exch. Issues Exp.
% of Exch. to Net Est.
% of Exp.
to Rev. Gross Est.
RevisedGross Est.
RevisedNet Est.
Exch. Issues Exp.
% of Exch. to Rev. Net
Est.
% of Exp.
to Rev. Gross Est.
The Presidency 0.5 0.5 0.5 0.5 95.3 96.8 10.5 10.5 9.6 9.3 91.5 88.4
State Depart-ment for Devo-lution
1.2 1.0 0.3 0.4 33.4 33.0 0.8 0.8 0.8 0.8 99.9 97.9
State De-partment for Planning & Sta-tistics
32.1 30.7 30.5 29.7 99.2 92.3 5.4 5.1 5.0 4.9 98.7 91.7
Ministry of For-eign Affairs and International Trade
2.8 2.8 2.8 0.2 100 5.8 17.8 17.6 16.5 10.7 93.7 60.3
The National Treasury 40.4 21.5 16.9 22.6 78.5 56.0 37.5 37.5 36.0 35.6 95.9 94.8
State Depart-ment for Public Service and Youth Affairs
14.5 14.5 10.0 14.0 69.3 96.9 14.4 14.2 11.9 13.1 84.0 91.0
Parliamentary Service Com-mission
4.2 3.2 1.8 1.9 57.8 45.3 10.5 10.5 8.8 8.6 84.5 82.0
National As-sembly - - - - - - 16.9 16.9 15.5 15.8 91.5 93.2
Commission on Revenue Allo-cation
- - - - - - 0.4 0.4 0.3 0.3 89.6 87.1
Public Service Commission 0.04 0.04 0.04 0.04 100 98.3 1.2 1.2 1.2 1.2 99.7 99.2
Salaries & Remuneration Commission
- - - - - - 0.6 0.6 0.6 0.5 99.9 95.2
Auditor General 0.2 0.2 0.1 0.1 81.8 81.8 4.2 4.0 4.0 4.0 99.8 95.6Controller of Budget - - - - - - 0.5 0.5 0.5 0.5 94.0 94.8
The Commis-sion on Admin-istrative Justice
- - - - - - 0.4 0.4 0.4 0.4 99.6 93.3
Total 95.8 74.4 63.0 69.4 84.7 72.4 121.0 120.2 111.1 105.7 92.5 87.3
Total for the Sector Revised
Gross Est.
Revised Net Est.
Exch. Issues Exp.
% of Exch. to Revised Net Est.
% of Exp.
to Rev. Gross Est.
Development 95.8 74.4 63.0 69.4 84.7 72.4
Recurrent 121.0 120.2 111.1 105.7 92.5 87.3

47ANNUAL NATIONAL GOVERNMENT
BUDGET IMPLEMENTATION REVIEW REPORT FY 2016/17 AUGUST, 2017
OFFICE OF THE CONTROLLER OF BUDGET
VOTE
Development Recurrent
Revised Gross Est.
Re-vised Net Est.
Exch. Issues Exp.
% of Exch. to Net Est.
% of Exp.
to Rev. Gross Est.
RevisedGross Est.
RevisedNet Est.
Exch. Issues Exp.
% of Exch. to Rev. Net
Est.
% of Exp.
to Rev. Gross Est.
Total 216.8 194.5 174.1 175.0 89.5 80.7
Source: MDAs and National Treasury
The Ministry for Foreign Affairs and the Public Service Commission received the highest proportion of development exchequer issues to the revised development net estimates at 100 per cent each while State Department for Devolution received the lowest at 33.4 per cent. The Salaries and Remuneration Commission and State Department for Devolution received the highest proportion of recurrent exchequer issues to the revised recurrent net estimates at 99.9 per cent each while the State Department for Public Service and Youth Affairs received the lowest at 84 per cent.
Figure 4.17 shows the exchequer issues to the PAIR Sector in FY 2016/17.
Figure 4.17: Exchequer Issues to the PAIR Sector for FY 2016/17 (Kshs. billions)
Ksh.9.6 bn (95%)
Kshs.0.8 bn (72.7%)
5.0 bn (14.1%)
Kshs.16.5 bn (85.5%)
Kshs.36.0 bn (68.1%)
Kshs.11.9 bn (54.3%)
Kshs.8.8 bn (83.0%)
Kshs15.5 bn (100%)
Kshs.0.3 bn (100%)
Kshs.1.2bn (100%)
Kshs.0.6 bn (100%)
Kshs.4.0 bn (98.3%)
,Kshs.0.5bn (100%)
,Kshs.0.4 bn (100%)
Kshs.0.5 bn (5%)
Kshs.0.3 bn (27.3%)
30.5 bn ( 85.9%)
Kshs.2.8 bn (14.5%)
Kshs.16.9 bn (31.9%)
Kshs.10.0 Bn (45.7%)
Kshs.1.8 bn (17.0%)
,Kshs. 0.1bn (1.7%)
The Presidency
State Department for Devolution
State Department for Planning & Statistics
Ministry of Foreign Affairs
The National Treasury
State Department for Public Service and Youth Affairs
Parliamentary Service Commission
National Assembly
The Commission on Revenue Allocation
Public Service Commission
Salaries & Remuneration Commission
Auditor General
Controller of Budget
The Commission on Administrative Justice
Dev Rec
Source: National Treasury
The total expenditure for the sector in FY 2016/17 totalled Kshs.175 billion, representing 80.7 per cent of the revised annual gross estimates, a decrease compared to 81.4 per cent (Kshs.202.2 billion) recorded in FY 2015/16. Expenditure comprised of Kshs.69.4 billion in development expenditure, representing an absorption rate of 72.4 per cent, a decrease from 78.3 cent recorded in the same period of FY 2015/16 and Kshs.105.7 billion for recurrent expenditure, representing an absorption rate of 87.3 per cent and an increase compared to 84.8 per cent (Kshs.100.2 billion) reported in the same period of FY 2016/17.

48ANNUAL NATIONAL GOVERNMENT BUDGET IMPLEMENTATION REVIEW REPORT FY 2016/17 AUGUST, 2017
OFFICE OF THE CONTROLLER OF BUDGET
Public Service Commission recorded the highest absorption for both development budget and recurrent budget at 98.3 per cent (Kshs.38.3 million) and 99.2 per cent (Kshs.1.2 billion) respectively. The Ministry of Foreign Affairs had the absorption for both development and recurrent expenditure at 5.8 per cent (0.2 billion) and 60.3 per cent (10.7 billion) respectively.
Some of the major projects implemented by the PAIR sector in the period under review includes; The Kenya Hunger and Safety Net Programme and the Ending Drought Emergencies, and Support Drought Risk Management at Kshs.2.5 billion and Kshs.500 million respectively, Kenya Statistics Programme for Results Programme and Integration and Coordination with International Conference on Population and Development (ICPD) and National Coordinating Agency for Population and Development(NCAPD) Programme at Kshs.1.4 billion and Kshs.164 million respectively, Devolution Support Programme for Results at Kshs.287.7 million and the Completion of perimeter fence at Nairobi State House at Kshs.99.6 million.
4.11 Social Protection, Culture and Recreation SectorThe Social Protection, Culture and Recreation Sector comprise of five MDAs namely; State Departments for Sports Development, Arts and Culture, Labour, Social Protection, Special Programmes, and Gender Affairs. The sector plays a major role in the country’s transformation by promoting and exploiting Kenya’s diverse cultures and arts; enhancing a reading culture; regulation, development and promotion of sports, the film and music industry; and preservation of the country’s heritage. It also promotes harmonious industrial relations, safety and health at workplaces, employment promotion, industrial training, regulation of trade unions, productivity improvement, manpower planning and development, social security, social assistance, children care and protection and vocational training for Persons Living with Disability (PLWDs) and development of community groups.
The revised annual budgetary allocation to the sector in FY 2016/17 was Kshs.53.4 billion, representing 2.1 per cent of gross national budget, an increase from Kshs.31.2 billion allocated in FY 2015/16. The allocation comprised of Kshs.28.3 billion (53 per cent) for development expenditure and Kshs.25.1 billion (47 per cent) for recurrent expenditure. State Department for Social Protection received the highest budgetary allocation of Kshs.22.5 billion (42.2 per cent of the Sector’s allocation), while State Department for Labour had the lowest budgetary allocation of Kshs.1.9 billion (3.6 per cent of the Sector’s allocation).
Figure 4.18 shows the budgetary allocation trend for the Social Protection, Culture Recreation Sector for the period FY 2012/13 to FY 2016/17.
Figure 4.18: Budgetary Allocation Trend for the Social Protection, Culture Recreation Sector from FY 2012/13 to FY 2016/17 (Kshs. Billion)
Source: National Treasury

49ANNUAL NATIONAL GOVERNMENT
BUDGET IMPLEMENTATION REVIEW REPORT FY 2016/17 AUGUST, 2017
OFFICE OF THE CONTROLLER OF BUDGET
In FY 2016/17, the sector received exchequer issues amounting to Kshs.49.3 billion, representing 97.3 per cent of the sector’s revised net estimates. The exchequer issues comprised of Kshs.24.5 billion for development expenditure, representing 95.8 per cent of the revised annual development net estimates, and Kshs.24.8 billion for recurrent expenditure, representing 98.9 per cent of the revised recurrent annual net estimates.
Table 4.10 shows an analysis of exchequer issues and expenditure incurred by the Social Protection, Culture Recreation Sector in FY 2016/17.
Table 4.10: Social Protection, Culture Recreation Sector-Analysis of Exchequer Issues and Expenditure, FY 2016/17 (Kshs. Billions)
VOTE
Development Recurrent
Re-vised Gross Est.
Re-vised Net Est.
Exch. Issues Exp.
% of Exch. to Net Est.
% of Exp.
to Rev.
Gross Est.
RevisedGross Est.
Re-visedNet Est.
Exch. Issues Exp.
% of Exch.
to Rev. Net Est.
% of Exp.
to Rev. Gross Est.
State Depart-ment for Special Programmes
7.5 4.8 4.8 7.3 100 97.7 8.3 8.3 8.3 8.3 100 99.6
State Depart-ment for Sports Development
2.0 2.0 2.0 2.0 99.9 99.4 3.5 3.5 3.5 3.5 99.0 100
State Depart-ment for Arts and Culture
0.5 0.5 0.5 0.5 97.5 98.7 3.0 3.0 2.9 2.9 98.9 96.8
State Depart-ment for Labour 0.4 0.4 0.4 0.4 87.5 96.6 1.5 1.5 1.4 1.4 93.1 90.7
State Depart-ment for Social Protection
14.5 14.5 13.5 13.7 93.1 94.5 8.0 8.0 8.0 6.9 99.9 86.6
State Depart-ment for Gender 3.4 3.4 3.4 3.4 100 100.0 0.8 0.8 0.7 0.7 86.4 90.2
Total 28.3 25.6 24.5 27.3 95.8 96.5 25.1 25.1 24.8 23.7 98.9 94.4
Total for the Sector Revised
Gross Est.
Re-vised Net Est.
Exch. Issues Exp.
% of Exch. to Re-vised Net Est.
% of Exp.
to Rev. Gross Est.
Development 28.3 25.6 24.5 27.3 95.8 96.5
Recurrent 25.1 25.1 24.8 23.7 98.9 94.4
Total 53.4 50.7 49.3 50.9 97.3 95.5
Source: MDAs and National Treasury
The State Departments for Gender and Special Programmes received the highest proportion of development exchequer issues to revised development net estimates at 100 per cent each while State Department for Labour received the lowest at 87.5 per cent. State Department for Special Programmes received the highest proportion of recurrent exchequer issues to revised net estimates at 100 per cent while State Department for Gender received the lowest at 86.4 per cent.
Figure 4.19 shows the exchequer issues to the Social Protection, Culture Recreation Sector in FY 2016/17.

50ANNUAL NATIONAL GOVERNMENT BUDGET IMPLEMENTATION REVIEW REPORT FY 2016/17 AUGUST, 2017
OFFICE OF THE CONTROLLER OF BUDGET
Figure 4.19: Exchequer Issues to the Social Protection, Culture Recreation Sector in FY 2016/17 (Kshs. Billions)
Kshs. 8.3 Bn(63.4%)
Kshs. 3.5 Bn (63.6%)
Rec, Kshs.8.0 Bn (37.2%)
Kshs.4.8 Bn (36.6%)
Kshs.2.9 Bn (85.3%)
Kshs. 2.0 Bn (36.4%)
Kshs.0.4 Bn (22.2%) Kshs.1.4 (77.8%)
Kshs.0.5 Bn (14.7%)
Kshs.13.5 Bn (62.8%)
Kshs.3.4 Bn (82.9%)Kshs. 0.7 Bn (17.1%)
State Department for Special Programmes
State Department for Sports Development
State Department for Arts and Culture
State Department for Labour
State Department for Social Protection
State Department for Gender
Source: National Treasury
The total expenditure for the sector in FY 2016/17 amounted to Kshs.50.9 billion, representing 95.5 per cent of the revised gross estimates, an increase compared to 86.7 per cent recorded in FY 2015/16.
The State Department for Gender recorded the highest absorption rate of its revised development budget which was at 100 per cent while State Department for Social Protection recorded the lowest rate at 94.5 per cent. On recurrent expenditure, State Department for Sports Development recorded the highest proportion expenditure to its revised gross recurrent budget at 100 per cent while the State Department for Social Protection recorded the least at a rate of 86.6 per cent.
Some of the major projects implemented by the sector in the period under review includes: National Social Safety Net Programme at Kshs.12.9 billion, Women Enterprise Fund and Uwezo Fund Programmes at Kshs.800 million and Kshs.500 million respectively, Restoration of Monuments at Fort Jesus at Kshs.150 million and the Establishment of national Labour Market Information System (LMIS) at Kshs.82.7 million.

51ANNUAL NATIONAL GOVERNMENT
BUDGET IMPLEMENTATION REVIEW REPORT FY 2016/17 AUGUST, 2017
5 BUDGET PERFORMANCE BY PROGRAMMES FOR FY 2016/17
5.1 IntroductionThis chapter presents analysis of MDAs budget performance based on programmes implemented in FY 2016/17. The chapter also provides detailed information on how funds were allocated to the various programmes within the ministries/departments for both development and recurrent expenditure and the implementation status of each programme. The Sectors are presented in an alphabetical order.
5.2 Agriculture, Rural and Urban Development (AR & UD) SectorIn FY 2016/17, the sector revised budgetary allocation for AR & UD sector was Kshs.51.7 billion comprising of Kshs.28.7 billion (55.5 per cent) for development activities and Kshs.23 billion (44.5 per cent) for recurrent expenditure to fund 10 programmes. The analysis of Sector programmes for the period under review is presented in table 5.1.
Table 5.1: AR &UD Sector’s Programme Performance for FY 2016/17 (Kshs. Billions)
VOTE ProgrammeRev Dev. Est.
Rev Rec. Est.
Rev Gross Est.
Dev. Exp.
Rec. Exp.
Total Exp.
Pro-gramme
Implemen-tation Rate
(%)
Ministry of Lands and Physical Planning Land Policy and Planning 3.4 2.3 5.6 2.9 2.1 5.0 89.2
State Department for Agriculture
General Administration Planning and Support Ser-vices
0.7 2.5 3.2 0.4 2.5 3.0 92.8
Crop Development and Management 10.6 8.9 19.5 9.0 8.8 17.9 91.8
Agribusiness and Informa-tion Management 0.2 0.2 0.4 0.1 0.2 0.3 68.6
State Department for Livestock
Livestock Resources Man-agement and Development
11.1 6.0 17.2 1.6 5.3 6.9 40.5
State Department for Fisheries and the Blue Economy
Fisheries Development and Management 2.7 1.8 4.5 2.1 1.7 3.8 84.0
National Land Com-mission
Land Administration and Management - 0.1 0.1 - 0.06 0.1 95.4
General Administration Planning and Support Services
0.02 1.1 1.1 0.02 1.1 1.1 98.4
Land Disputes and Conflict Resolutions - 0.1 0.1 - 0.1 0.1 99.4
National Land Information Management Systems 0.1 0.01 0.1 0.1 0.01 0.1 99.6
Total 28.7 23.0 51.7 16.3 21.9 38.3 74.0
Source: MDAs and National Treasury
The Crop Development and Management programme under State Department for Agriculture received the highest budgetary allocation at Kshs.19.4 billion, which accounted for 37.6 per cent of the total budgetary allocation to the sector while the Land Administration and Management under the NLC received the lowest allocation at Kshs.62.2 million which was less than 1 per cent of the sector total budgetary allocation.

52ANNUAL NATIONAL GOVERNMENT BUDGET IMPLEMENTATION REVIEW REPORT FY 2016/17 AUGUST, 2017
OFFICE OF THE CONTROLLER OF BUDGET
The total expenditure for the programmes in the period under review amounted to Kshs.38.3 billion representing 74 per cent of the revised gross estimates. It comprised of development expenditure at Kshs.16.4 billion, representing an absorption rate of 57.1 per cent and Kshs.21.9 billion as recurrent expenditure representing 95.1 per cent of the revised annual estimates for recurrent programmes.
Analysis of programme performance shows that National Land Information Management Systems programme under NLC recorded the highest proportion of programme expenditure to its revised annual estimates at 99.6 per cent while the Livestock Resources Management and Development programme under State Department for Livestock recorded the lowest proportion of its programme expenditure to the revised annual estimates at 40.5 per cent.
5.3 Education SectorThe Education sector revised budgetary allocation in FY 2016/17 was Kshs.345.6 billion comprising of Kshs.30.3 billion (8.8 per cent) for development programmes and Kshs.315.4 billion (91.2 per cent) for recurrent programmes to fund 13 programmes. The analysis of Sector programmes for FY 2016/17 is presented in table 5.2.
Table 5.2: Education Sector’s Programme Performance for FY 2016/17 (Kshs. Billions)
VOTE ProgrammeRev Dev. Est.
Rev Rec. Est.
Rev Gross Est.
Dev. Exp.
Rec. Exp.
Total Exp.
ProgrammeImplementation
Rate (%)
State Department for Education
Primary Education 4.3 16.9 21.2 2.4 16.2 18.6 87.6
Secondary Education 8.6 32.3 40.9 5.4 32.0 37.4 91.6
Quality Assurance and Standards 0.3 4.1 4.4 0.3 2.1 2.4 55.7
General Administration, Planning and Support Services
0.1 4.8 5.0 0.0 3.9 3.9 78.3
State Department for Vocational Training and Technical Training
Technical Vocational Education and Training 6.8 2.3 9.1 4.7 2.3 7.0 76.3
Youth Training and Development 0.1 - 0.1 0.1 - 0.1 53.4
General Administration, Planning and Support Services
- 0.2 0.2 - 0.17 0.17 92.9
State Department for University Education
University Education 9.9 61.6 71.5 9.1 53.3 62.5 87.3
Research, Science, Technology and Innovation 0.03 1.1 1.1 0.03 1.0 1.1 94.2
General Administration, Planning and Support Services
- 0.9 0.9 - 0.6 0.6 66.0
Teachers Service Commission
Teacher Resource Management - 185.3 185.3 - 185.2 185.2 99.9
Governance and Standards - 0.1 0.1 - 0.0 0.0 91.8
General Administration, Planning and Support Services
0.1 5.8 5.9 0.05 5.7 5.7 96.9
Total 30.3 315.4 345.6 22.3 302.6 324.9 94.0
Source: MDAs and National Treasury
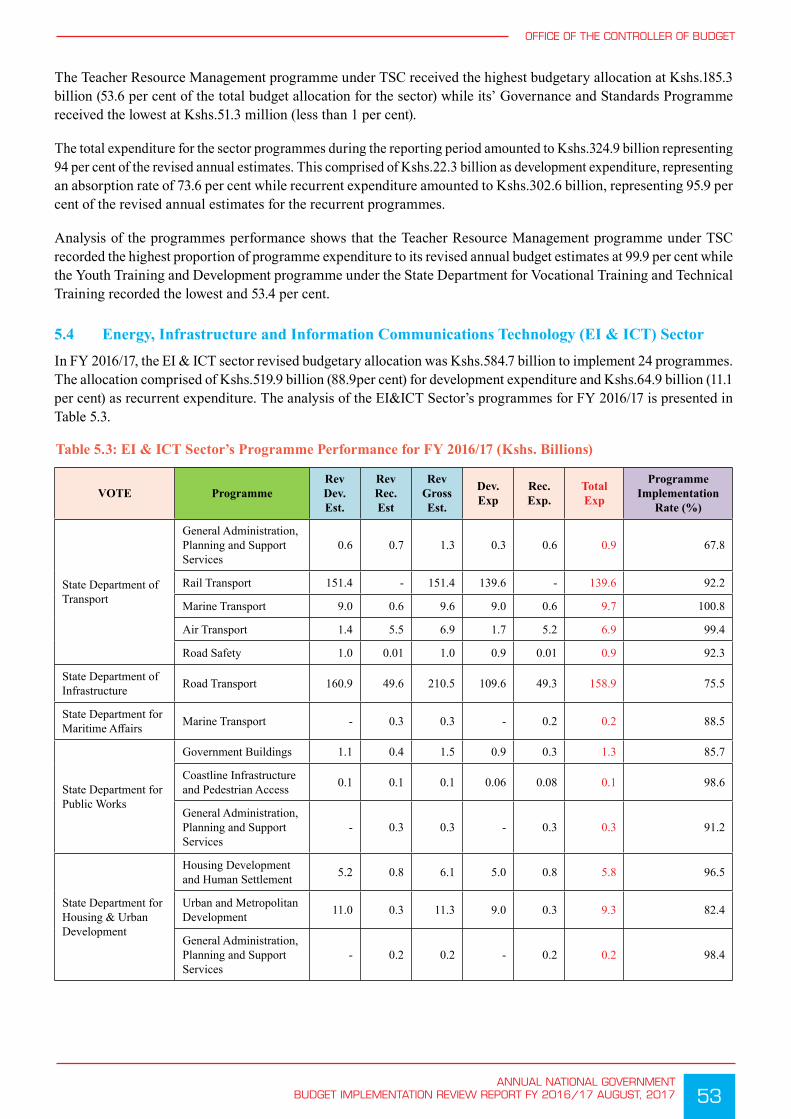
53ANNUAL NATIONAL GOVERNMENT
BUDGET IMPLEMENTATION REVIEW REPORT FY 2016/17 AUGUST, 2017
OFFICE OF THE CONTROLLER OF BUDGET
The Teacher Resource Management programme under TSC received the highest budgetary allocation at Kshs.185.3 billion (53.6 per cent of the total budget allocation for the sector) while its’ Governance and Standards Programme received the lowest at Kshs.51.3 million (less than 1 per cent).
The total expenditure for the sector programmes during the reporting period amounted to Kshs.324.9 billion representing 94 per cent of the revised annual estimates. This comprised of Kshs.22.3 billion as development expenditure, representing an absorption rate of 73.6 per cent while recurrent expenditure amounted to Kshs.302.6 billion, representing 95.9 per cent of the revised annual estimates for the recurrent programmes.
Analysis of the programmes performance shows that the Teacher Resource Management programme under TSC recorded the highest proportion of programme expenditure to its revised annual budget estimates at 99.9 per cent while the Youth Training and Development programme under the State Department for Vocational Training and Technical Training recorded the lowest and 53.4 per cent.
5.4 Energy, Infrastructure and Information Communications Technology (EI & ICT) SectorIn FY 2016/17, the EI & ICT sector revised budgetary allocation was Kshs.584.7 billion to implement 24 programmes. The allocation comprised of Kshs.519.9 billion (88.9per cent) for development expenditure and Kshs.64.9 billion (11.1 per cent) as recurrent expenditure. The analysis of the EI&ICT Sector’s programmes for FY 2016/17 is presented in Table 5.3.
Table 5.3: EI & ICT Sector’s Programme Performance for FY 2016/17 (Kshs. Billions)
VOTE ProgrammeRev Dev. Est.
Rev Rec. Est
Rev Gross Est.
Dev. Exp
Rec. Exp.
Total Exp
ProgrammeImplementation
Rate (%)
State Department of Transport
General Administration, Planning and Support Services
0.6 0.7 1.3 0.3 0.6 0.9 67.8
Rail Transport 151.4 - 151.4 139.6 - 139.6 92.2
Marine Transport 9.0 0.6 9.6 9.0 0.6 9.7 100.8
Air Transport 1.4 5.5 6.9 1.7 5.2 6.9 99.4
Road Safety 1.0 0.01 1.0 0.9 0.01 0.9 92.3
State Department of Infrastructure Road Transport 160.9 49.6 210.5 109.6 49.3 158.9 75.5
State Department for Maritime Affairs Marine Transport - 0.3 0.3 - 0.2 0.2 88.5
State Department for Public Works
Government Buildings 1.1 0.4 1.5 0.9 0.3 1.3 85.7
Coastline Infrastructure and Pedestrian Access 0.1 0.1 0.1 0.06 0.08 0.1 98.6
General Administration, Planning and Support Services
- 0.3 0.3 - 0.3 0.3 91.2
State Department for Housing & Urban Development
Housing Development and Human Settlement 5.2 0.8 6.1 5.0 0.8 5.8 96.5
Urban and Metropolitan Development 11.0 0.3 11.3 9.0 0.3 9.3 82.4
General Administration, Planning and Support Services
- 0.2 0.2 - 0.2 0.2 98.4

54ANNUAL NATIONAL GOVERNMENT BUDGET IMPLEMENTATION REVIEW REPORT FY 2016/17 AUGUST, 2017
OFFICE OF THE CONTROLLER OF BUDGET
VOTE ProgrammeRev Dev. Est.
Rev Rec. Est
Rev Gross Est.
Dev. Exp
Rec. Exp.
Total Exp
ProgrammeImplementation
Rate (%)
State Department for Information Communications & Technology
General Administration Planning and Support Services
- 0.2 0.2 - 0.2 0.2 79.4
ICT Infrastructure Development 21.1 0.3 21.5 19.3 0.3 19.6 91.2
E-Government Services - 0.6 0.6 - 0.5 0.5 92.3
State Department for Broadcasting & Telecommunication
General Administration Planning and Support Services
- 0.4 0.4 - 0.3 0.3 88.8
Information and Communication Services
0.2 2.4 2.7 0.2 2.4 2.6 97.6
Mass Media Skills Development 0.1 0.2 0.3 0.1 0.2 0.3 100.0
State Department for Energy
General Administration Planning and Support Services
0.4 0.3 0.7 0.2 0.3 0.5 69.0
Power Generation 31.6 0.8 32.4 15.4 0.8 16.2 49.9
Power Transmission and Distribution 118.8 0.4 119.2 47.9 0.3 48.2 40.4
Alternative Energy Technologies 2.9 0.2 3.1 1.9 0.1 2.0 67.2
State Department for Petroleum
Exploration and Distribution of Oil and Gas
2.9 0.2 3.1 1.4 0.2 1.6 52.6
Total 519.9 64.9 584.7 362.7 63.5 426.2 72.9
Source: MDAs and National Treasury
From the analysis, Road Transport programme under State Department for Infrastructure received the highest allocation of Kshs.210.5 billion (36 per cent of the total budget allocation for the sector) while the Coastline Infrastructure and Pedestrian Access programme under State Department for Public Works had the lowest allocation of Kshs.141.3 million (less than 1 per cent of the total budget allocation for the sector).
The total expenditure for the sector programmes in the period under review amounted to Kshs.426.2 billion representing 72.9 per cent of the revised annual estimates. This comprised of Kshs.362.7 billion for development expenditure, representing an absorption rate of 69.8 per cent and Kshs.63.5 billion for recurrent expenditure representing 97.9 per cent of the revised recurrent annual estimates.
Analysis of the programme performance shows that Marine Transport Programme under State Department for Transport recorded the highest absorption of programme expenditure to its’ annual revised estimates at 100.8 per cent while Power Transmission and Distribution programme under State Department for Energy had the lowest programme expenditure rate of 40.4 per cent.
5.5 Environment Protection, Water and Natural Resources Sector
In FY 2016/17, the revised budgetary allocation to the sector was Kshs.95.7 billion for implementing 11 programmes. This comprised of Kshs.73.2 billion (76.5 per cent) for development programmes and Kshs.22.5 billion (23.5 per cent) for recurrent expenditure. The analysis of Environment Protection, Water and Natural Resources sector programmes for FY 2016/17 is presented in Table 5.4.

55ANNUAL NATIONAL GOVERNMENT
BUDGET IMPLEMENTATION REVIEW REPORT FY 2016/17 AUGUST, 2017
OFFICE OF THE CONTROLLER OF BUDGET
Table 5.4: Environment Protection, Water and Natural Resources Sector’s Programme for FY 2016/17 (Kshs. Billions)
VOTE ProgrammeRev Dev. Est.
Rev Rec. Est.
Rev Gross Est.
Dev. Exp.
Rec. Exp
Total Exp
ProgrammeImplemen-tation Rate
(%)
State Department for Water Services
General Administration, Planning and Support Services 0.3 0.6 0.9 0.63 0.4 1.0 111.7
Water Resources Management 43.9 4.1 48.0 28.5 1.9 30.4 63.3
State Department for Irrigation
Irrigation and Land Reclamation 8.3 0.9 9.1 6.1 0.8 7.0 76.1
Water Storage and Flood Control 3.6 - 3.6 1.9 - 1.9 51.5
State Department for Environment
Meteorological Services 0.5 1.3 1.8 0.5 1.2 1.8 98.4
Environment Management and Pro-tection 1.7 1.8 3.5 0.98 0.9 1.9 54.1
General Administration, Planning and Support Services 0.4 0.6 1.0 0.2 0.5 0.7 69.7
State Department for Natural Re-sources
Natural Resource Management 2.0 12.6 14.5 1.5 12.6 14.1 97.1
Ministry of Min-ing
General Administration Planning and Support Services - 0.4 0.4 - 0.4 0.4 87.4
Resources Surveys and Remote Sensing 0.4 0.1 0.5 0.4 0.1 0.5 89.6
Mineral Resources Management 0.9 0.3 1.2 0.93 0.1 1.1 87.3
Total 73.2 22.5 95.7 42.5 18.5 60.9 63.7
Source: MDAs and National Treasury
From the analysis Water Resources Management programme under State Department for Water Services received the highest budgetary allocation at Kshs.48 billion (56.7 per cent of the total budget allocation for the sector) while General Administration, Planning and Support Services programme under Ministry of Mining received the lowest budgetary allocation at Kshs.0.4 billion (less than 1 per cent of the total budget allocation for the sector).
The total expenditure for the sectors’ programmes in the period under review amounted to Kshs.60.9 billion representing an absorption rate of 63.7 per cent. This expenditure comprised of Kshs.42.5 billion for development expenditure, representing an absorption rate of 58.1 per cent and Kshs.18.5 billion for recurrent expenditure, representing 82.1 per cent of the revised annual estimates for recurrent programmes.
The General Administration, Planning and Support Services programme under State Department for Water Services recorded the highest proportion of programme expenditure to its’ revised annual estimates at 111.7 per cent while Water Storage and Flood Control programme under State Department for Irrigation recorded the lowest proportion of programme expenditure to its’ revised annual estimates at 51.5 per cent.
5.6 General Economic and Commercial Affairs (GECA) SectorIn FY 2016/17, the sector’s revised budgetary allocation was Kshs.22.2 billion for implementing 7 programmes. This comprise of Kshs.9.7 billion (43.5 per cent) for development programmes and Kshs.12.5 billion (56.5 per cent) for recurrent programmes. Analysis of GECA sector programmes for the period under review is presented in Table 5.5.

56ANNUAL NATIONAL GOVERNMENT BUDGET IMPLEMENTATION REVIEW REPORT FY 2016/17 AUGUST, 2017
OFFICE OF THE CONTROLLER OF BUDGET
Table 5.5: GECA Sector’s Programme Performance for FY 2016/17 (Kshs. Billions)
VOTE Programme Rev Dev. Est.
Rev Rec. Est
Rev Gross Est.
Dev. Exp.
Rec. Exp.
Total Exp
ProgrammeImplemen-tation Rate
(%)
State Department for In-vestment and Industry
General Administration Planning and Support Services
0.2 0.7 0.9 0.04 0.6 0.7 75.5
Industrial Development and Investments 3.3 1.2 4.5 2.2 1.1 3.3 71.6
Standards and Business Incubation 1.9 1.0 2.9 10 1.0 1.9 66.0
State Department for Co-operatives
Cooperative Develop-ment and Management 0.5 3.2 3.7 0.5 3.1 3.6 97.9
State Department for Trade
Trade Development and Promotion 0.1 3.5 3.6 0.1 3.3 3.4 93.5
State Department for East African Integration
East African Affairs and Regional Integration
0.07 1.5 1.6 0.02 1.5 1.5 96.4
Ministry of Tourism Tourism Development and Promotion 3.6 1.5 5.1 3.4 1.4 4.8 95.3
Total 9.7 12.5 22.2 7.2 12.2 19.3 87.0
Source: MDAs and National Treasury
The Tourism Development and Promotion programme under Ministry of Tourism received the highest allocation at Kshs.5.1billion (22.7 per cent of the total budget allocation for the sector) while General Administration, Planning and Support programme under State Department for Industry and Investment received the lowest allocation at Kshs.0.9 billion (3.9 per cent of the total budget allocation for the sector).
The total expenditure for the sector programmes in FY 2016/17 amounted to Kshs.19.3 billion representing an absorption rate of 87 per cent. This comprised of Kshs.7.2 billion for development activities, representing an absorption rate of 73.8 per cent of the revised annual estimates and Kshs.12.2 billion incurred on recurrent expenditure representing 97.1 per cent of the revised recurrent estimates.
The Cooperative Development and Management programme under State Department for Cooperatives recorded the highest proportion of programme expenditure to its revised annual estimates at 97.9 per cent while Standards and Business Incubation programme under State Department for Industry and Investment recorded the lowest at 66 per cent.
5.7 Governance, Justice, Law and Order (GJLOS) SectorThe GJLOS sector revised budgetary allocation in FY 2016/17 was Kshs.210.9 billion to implement 21 programmes. The allocation comprised of Kshs.33.7 billion (16 per cent) for development expenditure and Kshs.177.2 billion (84 per cent) for recurrent expenditure. Analysis of the GJLOS sector programmes for period under the review is presented in Table 5.6.

57ANNUAL NATIONAL GOVERNMENT
BUDGET IMPLEMENTATION REVIEW REPORT FY 2016/17 AUGUST, 2017
OFFICE OF THE CONTROLLER OF BUDGET
Table 5.6: GJLOS Sector’s Programme Performance for FY 2016/17 (Kshs. Billions
VOTE ProgrammeRev Dev. Est.
Rev Rec. Est
Rev Gross Est.
Dev. Exp
Rec. Exp.
Total Exp
Pro-grammeImple-men-tation Rate (%)
State Department for Interior
Policing services 11.9 83.9 95.8 10.3 72.2 82.6 86.2
Planning, policy Coordina-tion and Support Services 13.8 16.3 30.0 12.3 12.6 25.0 83.1
Government Printing Ser-vices 0.2 0.8 1.0 0.05 0.6 0.6 64.4
Population Management Services 1.8 5.6 7.3 1.5 4.0 5.5 74.7
Betting Control, Licensing and regulation Services - 0.1 0.1 - 0.01 0.01 9.3
State Department for Correc-tional Services
Correctional services 0.5 19.9 20.4 0.2 16.3 16.5 80.9
General Administration, Planning and Support Ser-vices
0.01 1.3 1.3 0.04 0.5 0.5 41.1
State Law Office and Depart-ment of Justice
Legal Services 0.01 1.9 1.9 - 1.5 1.5 78.8
Governance, Legal Training And Constitutional Affairs 0.3 1.7 2.0 - 1.5 1.5 74.0
General Administration, Planning and Support Ser-vices
0.1 1.1 1.1 0.03 0.9 1.0 84.9
The Judiciary Dispensation of Justice 4.2 13.0 17.1 2.8 12.5 15.3 89.4
Ethics and Anti-Corruption Commission Ethics and Anti-Corruption 0.3 3.2 3.5 0.3 3.2 3.4 99.0
Office of Director of Public Prosecutions Public Prosecution Services 0.1 2.1 2.2 0.003 1.8 1.8 82.2
Office of the Registrar of Political Parties
Registration, Regulation and Funding of Political Parties - 0.8 0.8 - 0.6 0.6 76.5
Witness Protection Authority Witness Protection - 0.4 0.4 - 0.4 0.4 98.2
Kenya National Commission on Human Rights (KNCHR)
Protection and Promotion of Human Rights - 0.4 0.4 - 0.4 0.4 99.7
Independent Electoral and Boundaries Commission
Management of Electoral Processes 0.8 23.1 23.8 - 19.6 19.6 82.2
Judicial Service Commission Dispensation of Justice - 0.5 0.5 - 0.4 0.4 94.2
National Police Service Commission
National Police Service Hu-man Resource Management - 0.4 0.4 - 0.4 0.4 97.8
National Gender and Equali-ty Commission
Promotion of Gender Equal-ity and Freedom from Dis-crimination
- 0.4 0.4 - 0.4 0.4 98.5
Independent Police Over-sight Authority Policing Oversight Services - 0.5 0.5 - 0.4 0.4 89.4
Total 33.7 177.2 211.0 27.5 150.4 177.9 84.3
Source: MDAs and National Treasury
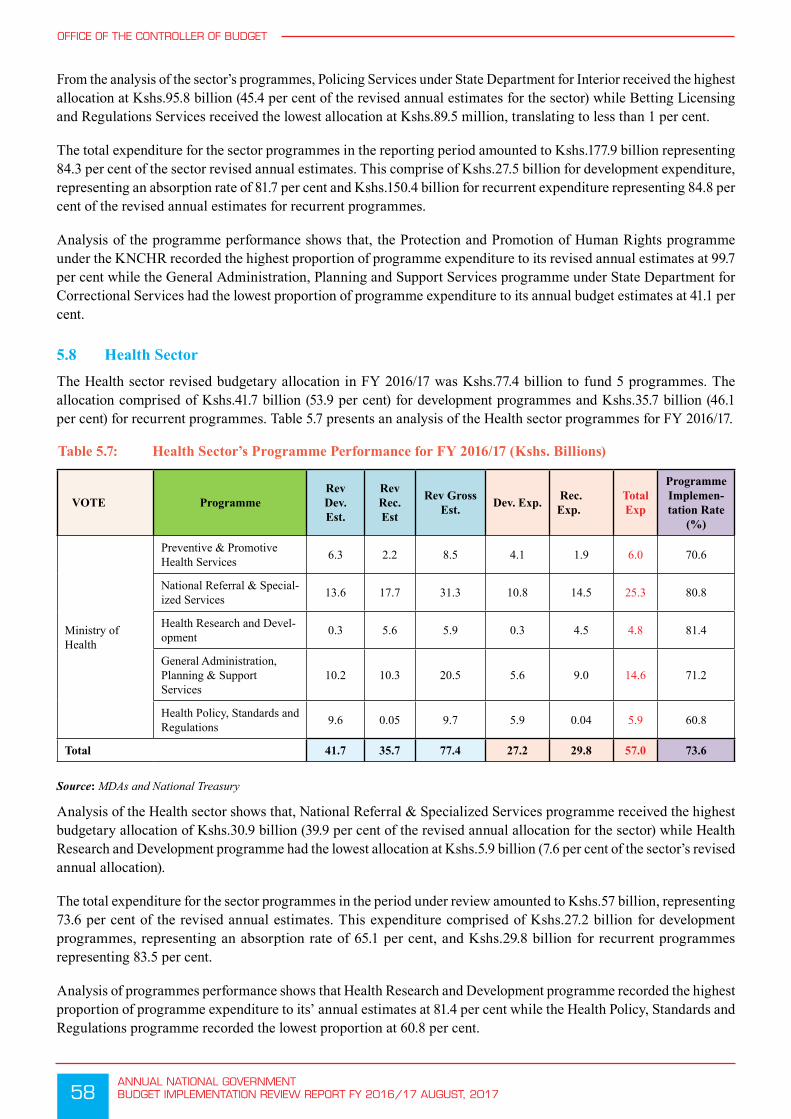
58ANNUAL NATIONAL GOVERNMENT BUDGET IMPLEMENTATION REVIEW REPORT FY 2016/17 AUGUST, 2017
OFFICE OF THE CONTROLLER OF BUDGET
From the analysis of the sector’s programmes, Policing Services under State Department for Interior received the highest allocation at Kshs.95.8 billion (45.4 per cent of the revised annual estimates for the sector) while Betting Licensing and Regulations Services received the lowest allocation at Kshs.89.5 million, translating to less than 1 per cent.
The total expenditure for the sector programmes in the reporting period amounted to Kshs.177.9 billion representing 84.3 per cent of the sector revised annual estimates. This comprise of Kshs.27.5 billion for development expenditure, representing an absorption rate of 81.7 per cent and Kshs.150.4 billion for recurrent expenditure representing 84.8 per cent of the revised annual estimates for recurrent programmes.
Analysis of the programme performance shows that, the Protection and Promotion of Human Rights programme under the KNCHR recorded the highest proportion of programme expenditure to its revised annual estimates at 99.7 per cent while the General Administration, Planning and Support Services programme under State Department for Correctional Services had the lowest proportion of programme expenditure to its annual budget estimates at 41.1 per cent.
5.8 Health SectorThe Health sector revised budgetary allocation in FY 2016/17 was Kshs.77.4 billion to fund 5 programmes. The allocation comprised of Kshs.41.7 billion (53.9 per cent) for development programmes and Kshs.35.7 billion (46.1 per cent) for recurrent programmes. Table 5.7 presents an analysis of the Health sector programmes for FY 2016/17.
Table 5.7: Health Sector’s Programme Performance for FY 2016/17 (Kshs. Billions)
VOTE ProgrammeRev Dev. Est.
Rev Rec. Est
Rev Gross Est. Dev. Exp. Rec.
Exp.Total Exp
ProgrammeImplemen-tation Rate
(%)
Ministry of Health
Preventive & Promotive Health Services 6.3 2.2 8.5 4.1 1.9 6.0 70.6
National Referral & Special-ized Services 13.6 17.7 31.3 10.8 14.5 25.3 80.8
Health Research and Devel-opment 0.3 5.6 5.9 0.3 4.5 4.8 81.4
General Administration, Planning & Support Services
10.2 10.3 20.5 5.6 9.0 14.6 71.2
Health Policy, Standards and Regulations 9.6 0.05 9.7 5.9 0.04 5.9 60.8
Total 41.7 35.7 77.4 27.2 29.8 57.0 73.6
Source: MDAs and National Treasury
Analysis of the Health sector shows that, National Referral & Specialized Services programme received the highest budgetary allocation of Kshs.30.9 billion (39.9 per cent of the revised annual allocation for the sector) while Health Research and Development programme had the lowest allocation at Kshs.5.9 billion (7.6 per cent of the sector’s revised annual allocation).
The total expenditure for the sector programmes in the period under review amounted to Kshs.57 billion, representing 73.6 per cent of the revised annual estimates. This expenditure comprised of Kshs.27.2 billion for development programmes, representing an absorption rate of 65.1 per cent, and Kshs.29.8 billion for recurrent programmes representing 83.5 per cent.
Analysis of programmes performance shows that Health Research and Development programme recorded the highest proportion of programme expenditure to its’ annual estimates at 81.4 per cent while the Health Policy, Standards and Regulations programme recorded the lowest proportion at 60.8 per cent.
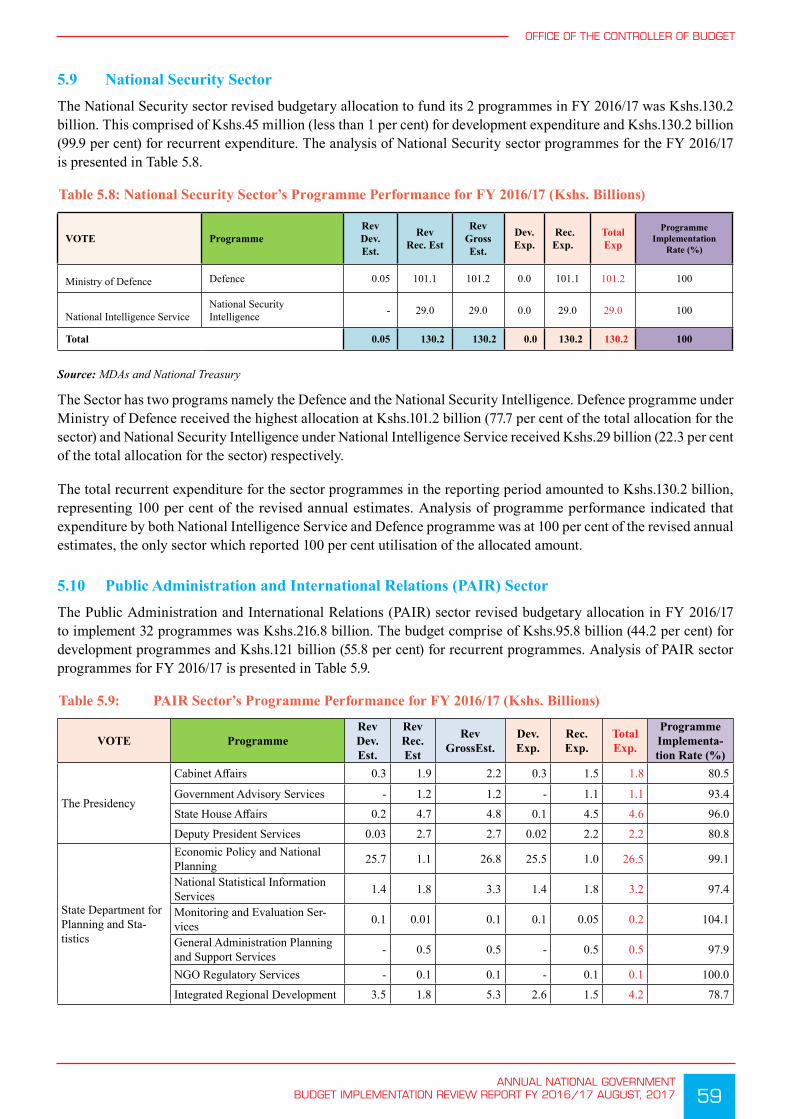
59ANNUAL NATIONAL GOVERNMENT
BUDGET IMPLEMENTATION REVIEW REPORT FY 2016/17 AUGUST, 2017
OFFICE OF THE CONTROLLER OF BUDGET
5.9 National Security SectorThe National Security sector revised budgetary allocation to fund its 2 programmes in FY 2016/17 was Kshs.130.2 billion. This comprised of Kshs.45 million (less than 1 per cent) for development expenditure and Kshs.130.2 billion (99.9 per cent) for recurrent expenditure. The analysis of National Security sector programmes for the FY 2016/17 is presented in Table 5.8.
Table 5.8: National Security Sector’s Programme Performance for FY 2016/17 (Kshs. Billions)
VOTE ProgrammeRev Dev. Est.
Rev Rec. Est
Rev Gross Est.
Dev. Exp.
Rec. Exp.
Total Exp
ProgrammeImplementation
Rate (%)
Ministry of Defence Defence 0.05 101.1 101.2 0.0 101.1 101.2 100
National Intelligence ServiceNational Security Intelligence - 29.0 29.0 0.0 29.0 29.0 100
Total 0.05 130.2 130.2 0.0 130.2 130.2 100
Source: MDAs and National Treasury
The Sector has two programs namely the Defence and the National Security Intelligence. Defence programme under Ministry of Defence received the highest allocation at Kshs.101.2 billion (77.7 per cent of the total allocation for the sector) and National Security Intelligence under National Intelligence Service received Kshs.29 billion (22.3 per cent of the total allocation for the sector) respectively.
The total recurrent expenditure for the sector programmes in the reporting period amounted to Kshs.130.2 billion, representing 100 per cent of the revised annual estimates. Analysis of programme performance indicated that expenditure by both National Intelligence Service and Defence programme was at 100 per cent of the revised annual estimates, the only sector which reported 100 per cent utilisation of the allocated amount.
5.10 Public Administration and International Relations (PAIR) SectorThe Public Administration and International Relations (PAIR) sector revised budgetary allocation in FY 2016/17 to implement 32 programmes was Kshs.216.8 billion. The budget comprise of Kshs.95.8 billion (44.2 per cent) for development programmes and Kshs.121 billion (55.8 per cent) for recurrent programmes. Analysis of PAIR sector programmes for FY 2016/17 is presented in Table 5.9.
Table 5.9: PAIR Sector’s Programme Performance for FY 2016/17 (Kshs. Billions)
VOTE ProgrammeRev Dev. Est.
Rev Rec. Est
Rev GrossEst.
Dev. Exp.
Rec. Exp.
Total Exp.
ProgrammeImplementa-tion Rate (%)
The Presidency
Cabinet Affairs 0.3 1.9 2.2 0.3 1.5 1.8 80.5
Government Advisory Services - 1.2 1.2 - 1.1 1.1 93.4
State House Affairs 0.2 4.7 4.8 0.1 4.5 4.6 96.0
Deputy President Services 0.03 2.7 2.7 0.02 2.2 2.2 80.8
State Department for Planning and Sta-tistics
Economic Policy and National Planning 25.7 1.1 26.8 25.5 1.0 26.5 99.1
National Statistical Information Services 1.4 1.8 3.3 1.4 1.8 3.2 97.4
Monitoring and Evaluation Ser-vices 0.1 0.01 0.1 0.1 0.05 0.2 104.1
General Administration Planning and Support Services - 0.5 0.5 - 0.5 0.5 97.9
NGO Regulatory Services - 0.1 0.1 - 0.1 0.1 100.0
Integrated Regional Development 3.5 1.8 5.3 2.6 1.5 4.2 78.7

60ANNUAL NATIONAL GOVERNMENT BUDGET IMPLEMENTATION REVIEW REPORT FY 2016/17 AUGUST, 2017
OFFICE OF THE CONTROLLER OF BUDGET
VOTE ProgrammeRev Dev. Est.
Rev Rec. Est
Rev GrossEst.
Dev. Exp.
Rec. Exp.
Total Exp.
ProgrammeImplementa-tion Rate (%)
State Department for Devolution
Devolution Services 1.0 0.6 1.6 0.4 0.5 0.9 57.8General Administration and Man-agement 0.0 0.2 0.3 0.0 0.2 0.2 95.8
Ministry of Foreign Affairs
General Administration Planning and Support Services 0.1 5.6 5.7 0.1 3.0 3.1 54.4
Foreign Relation and Diplomacy 2.6 12.1 14.7 0.1 7.7 7.8 52.8
The National Trea-sury
General Administration, Planning and Support Services 7.2 31.5 38.7 3.0 30.0 33.0 85.3
Public Financial Management 34.3 4.6 39.0 18.6 4.2 22.8 58.5Economic and Financial Policy Formulation and Management
1.4 1.1 2.5 1.0 0.9 1.9 77.3
Market Competition - 0.5 0.5 - 0.4 0.4 69.8
Government Clearing Services - 0.05 0.05 - 0.03 0.0 61.8
State Department for Public Service and Youth Affairs
Public Service Transformation 1.8 5.5 7.3 1.8 4.7 6.5 88.6
Youth Empowerment 12.7 8.7 21.4 12.3 8.4 20.6 96.5
Parliamentary Ser-vice Commission
Senate Affairs - 4.0 4.0 - 3.1 3.1 77.4General Administration, Planning and Support Services 3.2 6.4 9.6 1.9 5.4 7.3 76.5
National Assembly National Legislation, Representa-tion and Oversight - 16.9 16.9 - 15.8 15.8 93.2
Commission on Rev-enue Allocation
Inter-Governmental Revenue and Financial Matters
- 0.4 0.4 - 0.3 0.3 87.1
Public Service Com-mission
General Administration, Planning and Support Services 0.04 0.9 1.0 0.01 0.9 1.0 99.1
Human Resource management and Development - 0.2 0.2 - 0.2 0.2 99.7
Governance and National Values - 0.1 0.1 - 0.1 0.1 99.9
Salaries and Remu-neration Commission
Salaries and Remuneration Man-agement - 0.6 0.6 - 0.5 0.5 95.2
Auditor General Audit Services 0.2 4.2 4.4 0.1 4.0 4.1 95.1
Controller of Budget Control and Management of Pub-lic finances - 0.5 0.5 - 0.5 0.5 94.8
Commission on Ad-ministrative Justice
Promotion of Administrative Justice - 0.4 0.4 - 0.4 0.4 93.3
Total 95.8 121.0 216.8 69.4 105.7 175.0 80.7
Source: MDAs and National Treasury
Analysis of programme budgetary allocation shows that Public Financial Management programme received the highest budgetary allocation at Kshs.39 billion which was 18 per cent of the sector’s revised annual allocation while the Government Clearing Services received the lowest allocation at Kshs.48.5 million, translating to less than 1 per cent, all under the National Treasury.
The total expenditure for the Sector in the period under review amounted to Kshs.175 billion, representing 80.7 of the revised annual estimates. This comprises of Kshs.69.4 billion as development expenditure, representing an absorption rate of 72.4 per cent and Kshs.105.7 billion as recurrent expenditure, which represented 87.3 per cent for recurrent programmes.

61ANNUAL NATIONAL GOVERNMENT
BUDGET IMPLEMENTATION REVIEW REPORT FY 2016/17 AUGUST, 2017
OFFICE OF THE CONTROLLER OF BUDGET
Analysis of the programme performance indicated that Monitoring and Evaluation Services programme under State Department for Planning and Statistics recorded the highest proportion of programme expenditure to its revised annual estimates at 104.1 per cent while the Foreign Relation and Diplomacy programme under the Ministry of Foreign Affairs had the lowest at 52.8 per cent.
5.11 Social Protection, Culture and Recreation SectorThe Social Protection, Culture and Recreation sector revised budgetary allocation to fund 16 programmes in FY 2016/17 was Kshs.53.3 billion. The allocation comprise of Kshs.28.3 billion (53 per cent) for development programmes and Kshs.25.1 billion (47 per cent) for recurrent programmes.
Table 5.10 presents an analysis of the Social Protection, Culture and Recreation sector’s programme for FY 2016/17.
Table 5.10: Social Protection, Culture and Recreation Sector’s Programme Performance for FY 2016/17 (Kshs. Billions)
VOTE ProgrammeRev Dev. Est.
Rev Rec. Est
Rev Gross Est.
Dev. Exp.
Rec. Exp.
Total Exp
ProgrammeImplementation
Rate (%)
State Department for Special Programmes
Special Initiatives 7.5 0.9 8.4 7.3 0.9 8.2 98.0
Accelerated ASAL Development 0.03 7.3 7.3 0.03 7.3 7.3 100
State Department for Sports Development
Sports 2.0 3.1 5.1 2.0 2.9 4.9 96.0
General Administration, Planning and Support Services - 0.6 0.6 - 0.6 0.6 98.9
State Department for Arts and Culture
Culture 0.2 1.4 1.6 0.2 1.3 1.6 98.1
The Arts 0.1 0.7 0.8 0.1 0.7 0.8 99.1
Library Services 0.1 0.6 0.8 0.1 0.6 0.8 99.6
General Administration, Planning and Support Services - 0.3 0.3 - 0.3 0.3 98.5
State Department for Labour
Promotion of the Best Labour Practice - 0.6 0.6 - 0.5 0.5 82.6
Manpower Development, Employment and Productivity Management
0.4 0.4 0.8 0.4 0.3 0.7 94.7
General Administration, Planning and Support Services - 0.6 0.6 - 0.5 0.5 95.8
State Department for Social Protection
Social Development and Children Services 0.8 3.0 3.8 0.7 2.3 3.0 77.4
National Social Safety Net 13.6 4.8 18.4 12.9 4.6 17.6 95.2
General Administration, Planning and Support Services 0.0 0.1 0.1 0.0 0.1 0.12 94.2
State Department for Gender
Community Development 2.1 - 2.1 2.1 - 2.1 100
Gender Empowerment 1.3 0.8 2.1 1.3 0.7 2.0 96.3
Total 28.3 25.1 53.3 27.3 23.7 50.9 95.5
Source: MDAs and National Treasury
The National Social Safety Net programme under the State Department for Social Protection received the highest budgetary allocation at Kshs.18.4 billion (34.5 per cent of allocation to the sector) while the General Administration, Planning and Support Services programme under State Department for Social Protection received the lowest allocation at Kshs.132.3 million (less than 1 per cent of allocation to the sector).

62ANNUAL NATIONAL GOVERNMENT BUDGET IMPLEMENTATION REVIEW REPORT FY 2016/17 AUGUST, 2017
OFFICE OF THE CONTROLLER OF BUDGET
The total expenditure for the sector programmes in the reporting period amounted to Kshs.50.9 billion representing 95.5 per cent of the revised annual estimates. This comprised of Kshs.27.3 billion for development expenditure representing an absorption rate of 96.5 per cent while Kshs.23.7 billion was spent as recurrent expenditure which accounted for 94.4 per cent.
Analysis of the programme performance shows that Accelerated ASAL Development programme under the State Department for Special Programmes and Community Development programme under State Department for Gender recorded the highest proportion of programme expenditure to its total annual budget estimates at 100 per cent. Social Development and Children Services programme under the State Department for Social Protection recorded the lowest absorption at 77.4 per cent.

63ANNUAL NATIONAL GOVERNMENT
BUDGET IMPLEMENTATION REVIEW REPORT FY 2016/17 AUGUST, 2017
6 KEY ISSUES AND RECOMMENDATIONS
6.1 IntroductionAccording to the FY 2016/17 BPS, budget implementation was based on the high expectations for economic growth in the Country. This was to be achieved through improved business environment coupled with high investment in infrastructure and other sectors that would stimulate growth and employment creation. This objective was to be supported by key social welfare initiatives such as the investment in accessible health care, education as well as the strengthening of safety nets through cash transfers to the vulnerable groups in the society.
This objective was to be delivered through the annual budgetary allocation to spending entities mainly the MDAs and was meticulously anchored in the FY 2016/17 Budget Policy Statement and the MTEF. Chapter six highlights the key cross-cutting issues and challenges that affected the budget performance by the MDAs in the FY 2016/17 and makes recommendations aimed at mitigating such challenges for seamless budget execution.
6.2 Key Issues and RecommendationBudget implementation in the FY 2016/17 witnessed mixed results compared to the previous financial year. Despite the increased level of performance, a number of factors impacted negatively on the budget execution during the financial year. These factors included:-
6.2.1 Delay in Submission of Quarterly Reports on Financial and Non-Financial Performance
A number of MDAs delayed to submit their quarterly financial reports to the Office of the Controller of Budget. Article 228 (6) of the Constitution of Kenya, 2010 requires the Controller of Budget to submit to each House of Parliament a report on the implementation of budgets of the national and county governments every four months. Further, Section 83(1) & (4) of the Public Finance Management Act, 2012 requires an accounting officer for national government entity to prepare a report on financial and non-financial performance of the entity for each quarter and submit to the Cabinet Secretary in charge of the National Treasury and a copy to be forwarded to the Controller of Budget not later than fifteen days after the end of each quarter.
The delay in submission of quarterly financial reports to the Controller of Budget affects the preparation of the Budget Implementation Review Report (BIRR).
In order to meet the constitutional and legal requirements, MDAs should ensure timely preparation and submission of the quarterly expenditure reports to the Controller of Budget in line with Section 83(4) of the PFM Act, 2012 to allow timely preparation and publication of the Budget Implementation Review Reports.
64ANNUAL NATIONAL GOVERNMENT BUDGET IMPLEMENTATION REVIEW REPORT FY 2016/17 AUGUST, 2017
7 CONCLUSION
This National Government Budget Implementation Review Report gives a synopsis of the performance of the budget for FY 2016/17 covering the period July 2016 to June 2017. The report has been prepared in line with Article 228 (6) of the Constitution of Kenya and Section 9 of COB Act, 2016 which require the Controller of Budget to submit to each House of Parliament a report on the implementation of budgets of the national and county governments every four months,
Analysis of the FY 2016/17 Budget Implementation Review Report shows a commendable improvement in the overall budget execution. The total expenditure by the National Government increased by 14.8 per cent from Kshs.1.18 trillion recorded in FY 2015/16 to Kshs.1.96 trillion in FY 2016/17. Development expenditure amounted to Kshs.602.3 billion, representing an absorption rate of 69.9 per cent , an increase from 66.3 per cent recorded in the previous financial year.
Budget implementation in the FY 2016/17 recorded overall improvement compared to the previous financial year. Revenue received into the Consolidated Fund was Kshs.2 trillion representing 96.9 per cent of the revised annual estimates, an increase compared to Kshs.1.8 trillion received in the FY 2015/16 (99.5 per cent of the annual target). Funds released towards recurrent and development expenditure as well as the County governments increased compared to FY 2015/16, with total exchequer releases amounting to Kshs.2 trillion representing 95.4 per cent of the net revised estimates. This is an increase compared to Kshs.1.8 trillion (96.3 per cent of the revised net estimates) released in the FY 2015/16. Total expenditure by National Government entities amounted to Kshs.1.96 trillion (84.7 per cent of the revised gross estimates), an improvement compared to Kshs.1.6 trillion (82.2 per cent) recorded in FY 2015/16. Total MDAs development expenditure was Kshs.602.3 billion, recording an absorption rate of 69.9 per cent and 33.3 per cent growth compared to Kshs.451.8 billion (an absorption rate of 66.3 per cent) recorded in FY 2015/16. Recurrent expenditure, inclusive of CFS expenditure, totalled Kshs.1.4 trillion (93.4 per cent of the revised gross estimates), which was a 13 per cent increase compared to Kshs.1.2 trillion (90.5) recorded in FY 2015/16.
The Office appreciates the continuously efforts by the National Government entities in implementing the budget in order to achieve the Country’s economic growth projections. To achieve these economic growth projections, more resources should be allocated towards development activities in order for the spending entities to deliver services to the public in an efficient manner while observing the principles of public finance. There is therefore need for timely reporting on financial and non-financial performance for informed decision making. In this regard, the Office calls upon all stakeholders to continue engaging the Government on budget implementation to ensure prudent use of public resources and ensure budgeted activities are implemented for the benefit of the citizenry.
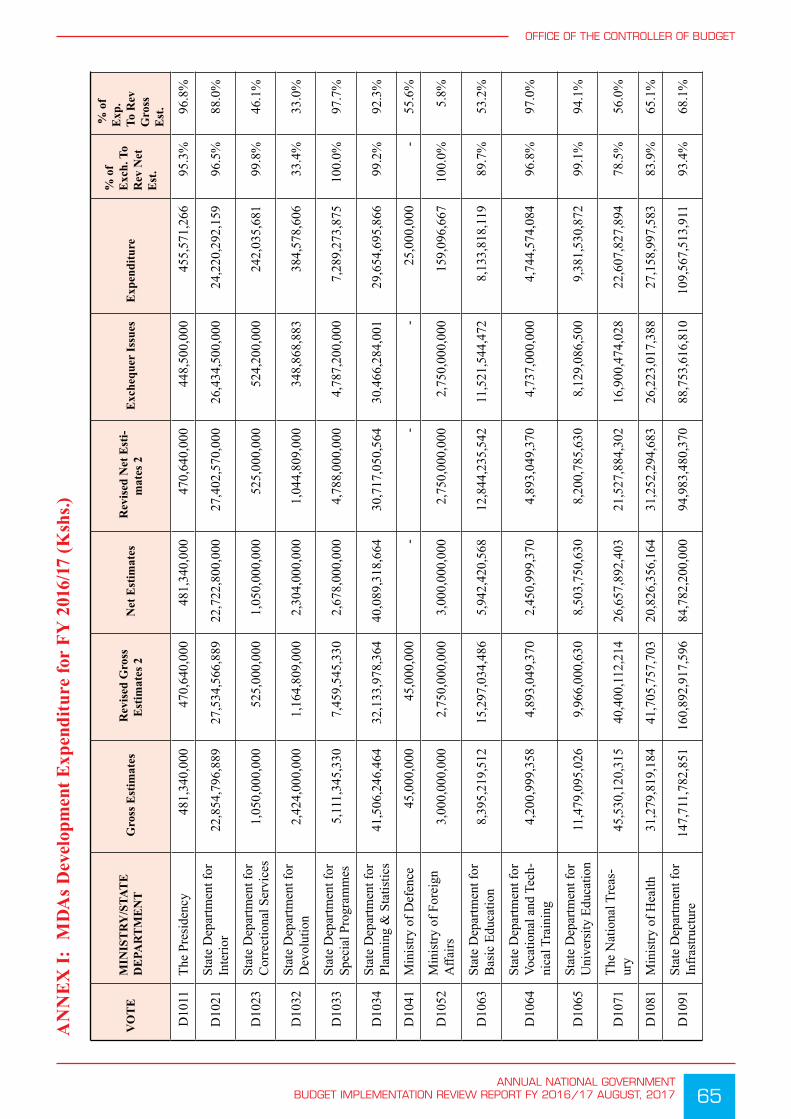
65ANNUAL NATIONAL GOVERNMENT
BUDGET IMPLEMENTATION REVIEW REPORT FY 2016/17 AUGUST, 2017
OFFICE OF THE CONTROLLER OF BUDGET
AN
NE
X I:
MDA
s Dev
elop
men
t Exp
endi
ture
for
FY 2
016/
17 (K
shs.)
VO
TE
MIN
IST
RY
/STA
TE
D
EPA
RT
ME
NT
Gro
ss E
stim
ates
Rev
ised
Gro
ss
Est
imat
es 2
Net
Est
imat
es R
evis
ed N
et E
sti-
mat
es 2
Exc
hequ
er Is
sues
Exp
endi
ture
% o
f E
xch.
To
Rev
Net
E
st.
% o
f E
xp.
To R
ev
Gro
ss
Est
.
D10
11Th
e Pr
esid
ency
481
,340
,000
470
,640
,000
481
,340
,000
470
,640
,000
448
,500
,000
455
,571
,266
95.3
%96
.8%
D10
21St
ate
Dep
artm
ent f
or
Inte
rior
22,
854,
796,
889
27,
534,
566,
889
22,
722,
800,
000
27,
402,
570,
000
26,
434,
500,
000
24,
220,
292,
159
96.5
%88
.0%
D10
23St
ate
Dep
artm
ent f
or
Cor
rect
iona
l Ser
vice
s 1
,050
,000
,000
525
,000
,000
1,0
50,0
00,0
00 5
25,0
00,0
00 5
24,2
00,0
00 2
42,0
35,6
8199
.8%
46.1
%
D10
32St
ate
Dep
artm
ent f
or
Dev
olut
ion
2,4
24,0
00,0
00 1
,164
,809
,000
2,3
04,0
00,0
00 1
,044
,809
,000
348
,868
,883
384
,578
,606
33.4
%33
.0%
D10
33St
ate
Dep
artm
ent f
or
Spec
ial P
rogr
amm
es 5
,111
,345
,330
7,4
59,5
45,3
30 2
,678
,000
,000
4,7
88,0
00,0
00 4
,787
,200
,000
7,2
89,2
73,8
7510
0.0%
97.7
%
D10
34St
ate
Dep
artm
ent f
or
Plan
ning
& S
tatis
tics
41,
506,
246,
464
32,
133,
978,
364
40,
089,
318,
664
30,
717,
050,
564
30,
466,
284,
001
29,
654,
695,
866
99.2
%92
.3%
D10
41M
inis
try o
f Def
ence
45,
000,
000
45,
000,
000
- -
- 2
5,00
0,00
0-
55.6
%
D10
52M
inis
try o
f For
eign
A
ffairs
3,0
00,0
00,0
00 2
,750
,000
,000
3,0
00,0
00,0
00 2
,750
,000
,000
2,7
50,0
00,0
00 1
59,0
96,6
6710
0.0%
5.8%
D10
63St
ate
Dep
artm
ent f
or
Bas
ic E
duca
tion
8,3
95,2
19,5
12 1
5,29
7,03
4,48
6 5
,942
,420
,568
12,
844,
235,
542
11,
521,
544,
472
8,1
33,8
18,1
1989
.7%
53.2
%
D10
64St
ate
Dep
artm
ent f
or
Voca
tiona
l and
Tec
h-ni
cal T
rain
ing
4,2
00,9
99,3
58 4
,893
,049
,370
2,4
50,9
99,3
70 4
,893
,049
,370
4,7
37,0
00,0
00 4
,744
,574
,084
96.8
%97
.0%
D10
65St
ate
Dep
artm
ent f
or
Uni
vers
ity E
duca
tion
11,
479,
095,
026
9,9
66,0
00,6
30 8
,503
,750
,630
8,2
00,7
85,6
30 8
,129
,086
,500
9,3
81,5
30,8
7299
.1%
94.1
%
D10
71Th
e N
atio
nal T
reas
-ur
y 4
5,53
0,12
0,31
5 4
0,40
0,11
2,21
4 2
6,65
7,89
2,40
3 2
1,52
7,88
4,30
2 1
6,90
0,47
4,02
8 2
2,60
7,82
7,89
478
.5%
56.0
%
D10
81M
inis
try o
f Hea
lth 3
1,27
9,81
9,18
4 4
1,70
5,75
7,70
3 2
0,82
6,35
6,16
4 3
1,25
2,29
4,68
3 2
6,22
3,01
7,38
8 2
7,15
8,99
7,58
383
.9%
65.1
%
D10
91St
ate
Dep
artm
ent f
or
Infr
astru
ctur
e 1
47,7
11,7
82,8
51 1
60,8
92,9
17,5
96 8
4,78
2,20
0,00
0 9
4,98
3,48
0,37
0 8
8,75
3,61
6,81
0 1
09,5
67,5
13,9
1193
.4%
68.1
%

66ANNUAL NATIONAL GOVERNMENT BUDGET IMPLEMENTATION REVIEW REPORT FY 2016/17 AUGUST, 2017
OFFICE OF THE CONTROLLER OF BUDGET
VO
TE
MIN
IST
RY
/STA
TE
D
EPA
RT
ME
NT
Gro
ss E
stim
ates
Rev
ised
Gro
ss
Est
imat
es 2
Net
Est
imat
es R
evis
ed N
et E
sti-
mat
es 2
Exc
hequ
er Is
sues
Exp
endi
ture
% o
f E
xch.
To
Rev
Net
E
st.
% o
f E
xp.
To R
ev
Gro
ss
Est
.
D10
92St
ate
Dep
artm
ent f
or
Tran
spor
t 1
75,8
06,5
96,0
00 1
63,3
05,3
96,0
00 1
5,34
5,00
0,00
0 1
5,85
4,80
0,00
0 1
1,36
7,77
6,34
3 1
49,6
07,1
89,6
3871
.7%
91.6
%
D10
94St
ate
Dep
artm
ent
Hou
sing
and
Urb
an
Dev
elop
men
t 1
9,28
9,02
0,00
0 1
7,52
1,83
5,00
0 1
3,36
4,02
0,00
0 1
1,59
6,83
5,00
0 9
,560
,020
,511
14,
021,
321,
026
82.4
%80
.0%
D10
95St
ate
Dep
artm
ent o
f Pu
blic
Wor
ks 2
,047
,000
,000
1,1
68,5
00,0
00 2
,047
,000
,000
1,1
68,5
00,0
00 1
,009
,600
,000
969
,258
,267
86.4
%82
.9%
D11
03St
ate
Dep
artm
ent f
or
Wat
er S
ervi
ces
39,
606,
072,
000
50,
472,
606,
131
11,
139,
000,
000
22,
005,
534,
131
20,
460,
757,
602
29,
999,
947,
098
93.0
%59
.4%
D11
04St
ate
Dep
artm
ent f
or
Irrig
atio
n 1
8,10
7,92
9,75
0 1
6,56
8,42
9,75
0 9
,840
,000
,000
8,3
00,5
00,0
00 7
,008
,794
,345
7,9
81,4
84,3
7484
.4%
48.2
%
D11
05St
ate
Dep
artm
ent f
or
Envi
ronm
ent
4,2
46,6
19,7
31 2
,843
,881
,500
3,9
00,5
44,7
31 2
,497
,806
,500
1,9
27,2
41,4
90 1
,663
,152
,944
77.2
%58
.5%
D11
06St
ate
Dep
artm
ent f
or
Nat
ural
Res
ourc
es 3
,592
,000
,000
1,9
57,0
00,0
00 2
,146
,000
,000
1,5
45,5
00,0
00 1
,545
,500
,000
1,5
46,0
54,4
7210
0.0%
79.0
%
D11
12M
inis
try o
f Lan
ds
and
Phys
ical
Pla
n-ni
ng 3
,841
,480
,000
3,3
75,4
80,0
00 3
,832
,080
,000
3,3
66,0
80,0
00 2
,703
,400
,000
2,9
44,1
58,8
9380
.3%
87.2
%
D11
22
Stat
e D
epar
tmen
t of
Info
rmat
ion
Com
mu-
nica
tions
& T
echn
ol-
ogy
& In
nova
tion
22,
313,
000,
000
21,
147,
895,
788
19,
501,
000,
000
21,
147,
895,
788
19,
305,
556,
336
19,
314,
401,
846
91.3
%91
.3%
D11
23St
ate
Dep
artm
ent o
f B
road
cast
ing
and
Tele
com
mun
icat
ions
658
,000
,000
329
,000
,000
658
,000
,000
329
,000
,000
319
,000
,000
328
,967
,700
97.0
%10
0.0%
D11
32St
ate
Dep
artm
ent f
or
Spor
ts D
evel
opm
ent
1,5
55,0
00,0
00 2
,010
,500
,000
1,5
55,0
00,0
00 2
,010
,500
,000
2,0
08,0
00,0
00 1
,997
,999
,999
99.9
%99
.4%
D11
33St
ate
Dep
artm
ent f
or
Arts
and
Cul
ture
986
,000
,000
495
,820
,660
986
,000
,000
495
,820
,660
483
,500
,000
489
,257
,174
97.5
%98
.7%

67ANNUAL NATIONAL GOVERNMENT
BUDGET IMPLEMENTATION REVIEW REPORT FY 2016/17 AUGUST, 2017
OFFICE OF THE CONTROLLER OF BUDGET
VO
TE
MIN
IST
RY
/STA
TE
D
EPA
RT
ME
NT
Gro
ss E
stim
ates
Rev
ised
Gro
ss
Est
imat
es 2
Net
Est
imat
es R
evis
ed N
et E
sti-
mat
es 2
Exc
hequ
er Is
sues
Exp
endi
ture
% o
f E
xch.
To
Rev
Net
E
st.
% o
f E
xp.
To R
ev
Gro
ss
Est
.
D11
52St
ate
Dep
artm
ent f
or
Ener
gy 1
15,1
83,3
31,7
15 1
52,6
53,3
83,1
20 3
6,53
0,93
6,98
6 4
3,67
8,97
4,92
5 4
0,39
9,45
2,65
4 6
7,40
8,61
2,74
692
.5%
44.2
%
D11
53St
ate
Dep
artm
ent o
f Pe
trole
um 4
,208
,400
,000
2,8
70,2
50,0
00 2
,870
,900
,000
1,5
32,7
50,0
00 6
00,6
92,6
40 1
,447
,138
,066
39.2
%50
.4%
D11
61St
ate
Dep
artm
ent f
or
Agr
icul
ture
12,
678,
265,
821
11,
457,
809,
152
9,9
18,1
36,7
83 9
,682
,486
,047
8,8
54,3
95,9
70 9
,442
,105
,337
91.4
%82
.4%
D11
62St
ate
Dep
artm
ent f
or
Live
stoc
k 1
1,74
2,13
5,48
0 1
1,12
1,63
5,48
0 4
,003
,031
,164
3,3
82,5
31,1
64 2
,555
,676
,956
1,8
08,9
37,7
2075
.6%
16.3
%
D11
64St
ate
Dep
artm
ent f
or
Fish
erie
s and
Blu
e Ec
onom
y 2
,530
,000
,000
2,6
61,3
45,6
54 2
,030
,000
,000
2,1
61,3
45,6
54 2
,142
,534
,238
2,1
03,4
24,8
3399
.1%
79.0
%
D11
72St
ate
Dep
artm
ent
for I
nves
tmen
t and
In
dust
ry 5
,379
,787
,000
5,3
79,7
87,0
00 5
,053
,600
,000
3,1
00,0
00,0
00 3
,009
,178
,329
3,1
41,3
25,4
7097
.1%
58.4
%
D11
73St
ate
Dep
artm
ent f
or
Coo
pera
tives
530
,000
,000
530
,000
,000
530
,000
,000
530
,000
,000
520
,900
,000
530
,000
,000
98.3
%10
0.0%
D11
74St
ate
Dep
artm
ent f
or
Trad
e 2
45,0
00,0
00 1
22,5
00,0
00 2
45,0
00,0
00 1
22,5
00,0
00 1
00,3
00,0
00 8
9,67
6,23
881
.9%
73.2
%
D11
83St
ate
Dep
artm
ent f
or
East
Afr
ican
Inte
gra-
tion
65,
000,
000
65,
000,
000
- -
- 1
6,14
2,74
8-
24.8
%
D11
84St
ate
Dep
artm
ent f
or
Labo
ur 4
77,2
00,0
00 4
18,6
10,0
00 4
77,2
00,0
00 4
18,6
10,0
00 3
66,3
22,8
24 4
04,5
22,4
5187
.5%
96.6
%
D11
85St
ate
Dep
artm
ent f
or
Soci
al P
rote
ctio
n 1
4,82
1,80
0,00
0 1
4,45
7,89
8,00
0 1
4,82
0,40
0,00
0 1
4,45
7,89
8,00
0 1
3,45
9,33
8,52
0 1
3,65
9,27
0,60
293
.1%
94.5
%
D11
91M
inis
try o
f Min
ing
3,8
90,3
21,4
29 1
,321
,134
,978
3,8
68,0
00,0
00 1
,321
,134
,978
1,1
78,7
00,0
00 1
,310
,134
,978
89.2
%99
.2%
D12
01M
inis
try o
f Tou
rism
4,8
42,0
00,0
00 3
,592
,000
,000
4,8
42,0
00,0
00 3
,592
,000
,000
3,2
05,1
00,0
00 3
,375
,452
,013
89.2
%94
.0%
D12
11St
ate
Dep
artm
ent f
or
Publ
ic S
ervi
ce a
nd
Yout
h A
ffairs
12,
648,
065,
996
14,
483,
065,
996
12,
648,
065,
996
14,
483,
065,
996
10,
041,
963,
550
14,
029,
925,
156
69.3
%96
.9%

68ANNUAL NATIONAL GOVERNMENT BUDGET IMPLEMENTATION REVIEW REPORT FY 2016/17 AUGUST, 2017
OFFICE OF THE CONTROLLER OF BUDGET
VO
TE
MIN
IST
RY
/STA
TE
D
EPA
RT
ME
NT
Gro
ss E
stim
ates
Rev
ised
Gro
ss
Est
imat
es 2
Net
Est
imat
es R
evis
ed N
et E
sti-
mat
es 2
Exc
hequ
er Is
sues
Exp
endi
ture
% o
f E
xch.
To
Rev
Net
E
st.
% o
f E
xp.
To R
ev
Gro
ss
Est
.
D12
12St
ate
Dep
artm
ent f
or
Gen
der
3,4
96,9
00,0
00 3
,430
,000
,000
3,4
72,4
00,0
00 3
,430
,000
,000
3,4
30,0
00,0
00 3
,430
,000
,000
100.
0%10
0.0%
D12
52St
ate
Law
Offi
ce
and
Dep
artm
ent o
f Ju
stic
e 3
79,0
00,0
00 3
79,0
00,0
00 7
0,00
0,00
0 7
0,00
0,00
0 6
9,50
0,00
0 2
5,70
3,85
199
.3%
6.8%
D12
61Th
e Ju
dici
ary
4,4
49,0
00,0
00 4
,153
,000
,000
4,4
49,0
00,0
00 4
,153
,000
,000
2,2
14,0
46,2
47 2
,784
,879
,718
53.3
%67
.1%
D12
71Et
hics
& A
nti-C
or-
rupt
ion
Com
mis
sion
100
,000
,000
250
,000
,000
100
,000
,000
250
,000
,000
250
,000
,000
250
,000
,000
100.
0%10
0.0%
D12
91O
ffice
of t
he D
irect
o-ra
te o
f Pub
lic P
rose
-cu
tion
98,
550,
000
98,
550,
000
98,
550,
000
98,
550,
000
- 2
,550
,000
0.0%
2.6%
Nat
iona
l Lan
d C
om-
mis
sion
- 1
03,3
26,1
35 1
03,3
26,1
35 1
03,3
00,0
00 1
03,3
26,1
3510
0.0%
100.
0%
D20
31In
depe
nden
t Ele
c-to
ral a
nd B
ound
arie
s C
omm
issi
on 7
65,2
09,7
00 7
65,2
09,7
00 5
3,00
0,00
0 5
3,00
0,00
0 -
--
-
D20
41Pa
rliam
enta
ry S
er-
vice
Com
mis
sion
4,1
50,0
00,0
00 4
,150
,000
,000
4,1
50,0
00,0
00 3
,150
,000
,000
1,8
21,6
00,0
00 1
,879
,743
,202
57.8
%45
.3%
D20
71Pu
blic
Ser
vice
Com
-m
issi
on 3
9,00
0,00
0 3
9,00
0,00
0 3
9,00
0,00
0 3
9,00
0,00
0 3
9,00
0,00
0 3
8,33
9,39
910
0.0%
98.3
%
D20
91Te
ache
rs S
ervi
ce
Com
mis
sion
100
,000
,000
100
,000
,000
100
,000
,000
100
,000
,000
- 1
2,67
7,53
10.
0%12
.7%
D21
11A
udito
r Gen
eral
224
,000
,000
176
,000
,000
224
,000
,000
176
,000
,000
144
,000
,000
144
,012
,529
81.8
%81
.8%
TOTA
L 8
20,1
61,4
49,5
51 8
61,2
13,2
61,6
26 4
16,3
95,9
43,4
59 4
41,8
04,7
44,4
39 3
94,2
29,4
40,6
37 6
02,3
25,9
00,7
3789
.2%
69.9
%

69ANNUAL NATIONAL GOVERNMENT
BUDGET IMPLEMENTATION REVIEW REPORT FY 2016/17 AUGUST, 2017
OFFICE OF THE CONTROLLER OF BUDGET
AN
NE
X II
: M
DAs R
ecur
rent
Exp
endi
ture
for
FY 2
016/
17 (K
shs)
VO
TE
MIN
IST
RY
/STA
TE
D
EPA
RT
ME
NT
Gro
ss E
stim
ates
Rev
ised
Gro
ss
Est
imat
es 2
Net
Est
imat
es R
evis
ed N
et E
sti-
mat
es 2
Exc
hequ
er Is
sues
Exp
endi
ture
% o
f Exc
h.
To R
ev N
et
Est
.
% o
f Exp
. To
Rev
G
ross
Est
.
R10
11Th
e Pr
esid
ency
7,9
43,3
24,6
69 1
0,47
1,75
5,46
2 7
,934
,692
,595
10,
463,
123,
388
9,5
72,9
63,0
00 9
,253
,652
,988
91.5
%88
.4%
R10
21St
ate
Dep
artm
ent
for I
nter
ior
102
,907
,039
,319
10
7,60
2,86
2,44
5
102,
533,
302,
319
107
,229
,125
,445
105
,219
,650
,000
89,
448,
416,
390
98.1
%83
.1%
R10
23St
ate
Dep
artm
ent
for C
orre
ctio
nal
Serv
ices
19,
209,
032,
569
20,
226,
920,
720
19,
209,
032,
569
20,
226,
920,
720
20,
220,
600,
000
16,
801,
886,
446
100.
0%83
.1%
R10
32St
ate
Dep
artm
ent
for D
evol
utio
n 6
49,4
51,4
92 7
94,4
65,7
66 6
49,4
51,4
92 7
94,4
65,7
66 7
93,9
50,0
00 7
77,5
05,9
3299
.9%
97.9
%
R10
33St
ate
Dep
artm
ent
for S
peci
al P
ro-
gram
mes
1,4
05,8
11,2
47 8
,331
,211
,404
1,4
05,8
11,2
47 8
,331
,211
,404
8,3
30,7
00,0
00 8
,299
,754
,832
100.
0%99
.6%
R10
34St
ate
Dep
artm
ent
for P
lann
ing
& S
ta-
tistic
s 4
,717
,330
,425
5,3
84,8
29,8
91 4
,391
,330
,425
5,0
58,8
29,8
91 4
,994
,300
,000
4,9
36,1
99,7
2498
.7%
91.7
%
R10
41M
inis
try o
f De-
fenc
e 9
8,65
4,16
1,51
9
101,
149,
926,
564
98,
654,
161,
519
101
,149
,926
,564
101
,148
,200
,000
101
,148
,580
,576
100.
0%10
0.0%
R10
52M
inis
try o
f For
eign
A
ffairs
17,
206,
235,
947
17,
759,
129,
758
17,
036,
640,
947
17,
589,
534,
758
16,
481,
100,
000
10,
713,
126,
002
93.7
%60
.3%
R10
63St
ate
Dep
artm
ent
for B
asic
Edu
catio
n 5
8,77
9,80
3,08
8 5
8,13
5,51
1,96
0 5
7,34
7,20
3,08
8 5
6,70
2,91
1,96
0 5
6,23
7,86
0,00
0 5
4,82
6,68
5,22
099
.2%
94.3
%
R10
64St
ate
Dep
artm
ent
for V
ocat
iona
l and
Te
chni
cal T
rain
ing
2,3
24,5
29,8
52 2
,529
,461
,570
2,3
24,5
29,8
52 2
,529
,461
,570
2,5
02,8
00,0
00 2
,446
,394
,178
98.9
%96
.7%
R10
65St
ate
Dep
artm
ent
for U
nive
rsity
Edu
-ca
tion
60,
652,
433,
681
63,
594,
179,
787
43,
969,
833,
681
46,
911,
579,
787
46,
217,
688,
000
54,
385,
908,
425
98.5
%85
.5%
R10
71Th
e N
atio
nal T
reas
-ur
y 3
6,74
0,85
7,28
5 3
7,52
7,56
4,69
0 3
6,74
0,85
7,28
5 3
7,52
7,56
4,69
0 3
5,99
6,00
0,00
0 3
5,56
0,01
3,04
895
.9%
94.8
%
R10
81M
inis
try o
f Hea
lth 2
8,99
0,11
0,83
8 3
5,73
7,00
9,33
9 2
5,01
2,23
4,36
1 3
1,75
9,13
2,86
2 3
0,22
9,30
0,00
0 2
9,84
5,52
0,06
195
.2%
83.5
%

70ANNUAL NATIONAL GOVERNMENT BUDGET IMPLEMENTATION REVIEW REPORT FY 2016/17 AUGUST, 2017
OFFICE OF THE CONTROLLER OF BUDGET
VO
TE
MIN
IST
RY
/STA
TE
D
EPA
RT
ME
NT
Gro
ss E
stim
ates
Rev
ised
Gro
ss
Est
imat
es 2
Net
Est
imat
es R
evis
ed N
et E
sti-
mat
es 2
Exc
hequ
er Is
sues
Exp
endi
ture
% o
f Exc
h.
To R
ev N
et
Est
.
% o
f Exp
. To
Rev
G
ross
Est
.
R10
91St
ate
Dep
artm
ent
for I
nfra
stru
ctur
e 2
9,03
9,08
5,19
0 4
9,94
5,69
0,90
1 1
,839
,085
,190
1,9
41,3
18,9
01 1
,916
,650
,000
49,
295,
501,
103
98.7
%98
.7%
R10
92St
ate
Dep
artm
ent
for T
rans
port
5,7
80,7
40,4
12 5
,825
,225
,133
1,4
03,7
40,4
12 1
,448
,225
,133
1,4
37,2
08,0
00 5
,783
,722
,173
99.2
%99
.3%
R10
93St
ate
Dep
artm
ent
for M
ariti
me A
ffairs
237
,159
,288
254
,159
,288
237
,159
,288
254
,159
,288
239
,900
,000
224
,842
,746
94.4
%88
.5%
R10
94St
ate
Dep
artm
ent
for H
ousi
ng &
Ur-
ban
Dev
elop
men
t 8
62,2
99,4
44 1
,317
,662
,844
862
,299
,444
1,3
17,6
62,8
44 1
,295
,000
,000
1,3
07,5
37,1
2498
.3%
99.2
%
R10
95St
ate
Dep
artm
ent
for P
ublic
Wor
ks 8
97,1
87,5
46 7
75,8
67,2
68 8
93,1
87,5
46 7
71,8
67,2
68 7
49,4
00,0
00 7
41,7
68,4
8897
.1%
95.6
%
R11
03St
ate
Dep
artm
ent
for W
ater
Ser
vice
s 3
,624
,591
,649
4,5
02,3
67,3
70 1
,486
,833
,410
2,3
64,6
09,1
31 2
,355
,300
,000
2,1
61,8
58,2
3999
.6%
48.0
%
R11
04St
ate
Dep
artm
ent
for I
rrig
atio
n 9
33,0
08,3
51 8
69,0
90,2
76 5
33,0
08,3
51 4
69,0
90,2
76 4
68,5
00,0
00 4
47,2
87,5
1899
.9%
51.5
%
R11
05St
ate
Dep
artm
ent
for E
nviro
nmen
t 2
,979
,114
,030
3,6
69,3
67,9
51 2
,160
,214
,030
2,8
50,4
67,9
51 2
,850
,430
,000
2,6
82,7
11,7
4510
0.0%
73.1
%
R11
06St
ate
Dep
artm
ent
for N
atur
al R
e-so
urce
s 1
1,32
2,34
3,04
6 1
2,56
3,06
9,74
6 5
,082
,322
,046
6,3
23,0
48,7
46 6
,269
,800
,000
12,
555,
387,
759
99.2
%99
.9%
R11
12M
inis
try o
f Lan
ds
and
Phys
ical
Pla
n-ni
ng 2
,188
,601
,179
2,2
59,6
36,0
94 2
,179
,186
,429
2,2
50,2
21,3
44 2
,162
,501
,000
2,0
82,9
23,6
9296
.1%
92.2
%
R11
22
Stat
e D
epar
tmen
t of
Info
rmat
ion
Com
mun
icat
ions
&
Tec
hnol
ogy
&
Inno
vatio
n
909
,425
,207
1,1
45,9
23,0
22 9
09,4
25,2
07 1
,145
,923
,022
964
,923
,000
1,0
01,2
10,5
0584
.2%
87.4
%
R11
23
Stat
e D
epar
tmen
t fo
r Bro
adca
stin
g &
Te
leco
mm
unic
a-tio
ns
2,0
50,1
26,8
30 3
,305
,431
,277
1,8
70,1
26,8
30 3
,085
,431
,277
2,3
65,3
00,0
00 3
,007
,749
,959
76.7
%91
.0%

71ANNUAL NATIONAL GOVERNMENT
BUDGET IMPLEMENTATION REVIEW REPORT FY 2016/17 AUGUST, 2017
OFFICE OF THE CONTROLLER OF BUDGET
VO
TE
MIN
IST
RY
/STA
TE
D
EPA
RT
ME
NT
Gro
ss E
stim
ates
Rev
ised
Gro
ss
Est
imat
es 2
Net
Est
imat
es R
evis
ed N
et E
sti-
mat
es 2
Exc
hequ
er Is
sues
Exp
endi
ture
% o
f Exc
h.
To R
ev N
et
Est
.
% o
f Exp
. To
Rev
G
ross
Est
.
R11
32St
ate
Dep
artm
ent
for S
ports
Dev
elop
-m
ent
3,6
06,9
50,5
51 3
,517
,631
,688
3,6
06,5
50,5
51 3
,517
,231
,688
3,4
81,3
64,0
00 3
,521
,248
,437
99.0
%10
0.1%
R11
33St
ate
Dep
artm
ent
for A
rts a
nd C
ultu
re 2
,651
,046
,449
2,9
57,3
52,3
59 2
,640
,446
,449
2,9
57,3
52,3
59 2
,923
,500
,000
2,8
62,8
22,0
6598
.9%
96.8
%
R11
52St
ate
Dep
artm
ent
Ener
gy 2
,078
,552
,046
2,0
83,0
52,0
46 1
,871
,436
,740
1,8
75,9
36,7
40 1
,870
,585
,000
1,9
73,9
99,2
2299
.7%
94.8
%
R11
53St
ate
Dep
artm
ent o
f Pe
trole
um 9
1,15
1,59
8 2
02,8
51,5
98 4
3,78
6,90
4 1
55,4
86,9
04 1
44,4
00,0
00 1
70,6
61,6
0192
.9%
84.1
%
R11
61St
ate
Dep
artm
ent
for A
gric
ultu
re 8
,586
,076
,695
11,
618,
155,
989
8,5
57,0
76,6
95 1
1,58
9,15
5,98
9 1
1,56
8,56
0,00
0 1
1,53
2,38
8,43
199
.8%
99.3
%
R11
62St
ate
Dep
artm
ent
for L
ives
tock
1,8
89,9
38,3
20 6
,034
,845
,571
1,8
65,9
38,3
20 6
,010
,845
,571
5,2
65,2
00,0
00 5
,347
,802
,664
87.6
%88
.6%
R11
63St
ate
Dep
artm
ent
for F
ishe
ries a
nd
the
Blu
e Ec
onom
y 1
,653
,196
,791
1,8
34,5
75,7
36 1
,653
,196
,791
1,8
34,5
75,7
36 1
,817
,400
,000
1,6
72,3
39,3
0699
.1%
91.2
%
R11
72St
ate
Dep
artm
ent
of In
vest
men
t and
In
dust
ry 2
,668
,815
,153
2,9
14,5
69,0
24 2
,646
,315
,153
2,8
35,4
44,8
07 2
,835
,400
,000
2,8
62,8
22,0
6510
0.0%
98.2
%
R11
73St
ate
Dep
artm
ent
for C
oope
rativ
es 3
,120
,950
,523
3,1
59,2
41,6
35 3
,114
,450
,523
3,1
52,7
41,6
35 3
,095
,800
,000
3,0
81,8
72,4
0998
.2%
97.6
%
R11
74St
ate
Dep
artm
ent
for T
rade
2,9
19,2
82,1
36 3
,499
,339
,747
2,8
99,5
22,1
36 3
,471
,579
,747
3,3
42,1
60,0
00 3
,296
,046
,273
96.3
%94
.2%
R11
83St
ate
Dep
artm
ent
for E
ast A
fric
an
Inte
grat
ion
1,5
41,1
65,0
24 1
,513
,815
,010
1,5
39,1
65,0
24 1
,511
,815
,010
1,4
87,0
60,0
00 1
,505
,754
,784
98.4
%99
.5%
R11
84St
ate
Dep
artm
ent
for L
abou
r 1
,301
,843
,257
1,5
19,6
94,2
30 1
,292
,843
,257
1,5
19,6
94,2
30 1
,414
,800
,000
1,3
77,8
00,3
1793
.1%
90.7
%
R11
85St
ate
Dep
artm
ent
for S
ocia
l Pro
tec-
tion
8,1
08,1
36,0
32 7
,964
,957
,811
8,0
64,3
71,0
32 7
,964
,957
,811
7,9
57,8
20,0
00 6
,900
,506
,115
99.9
%86
.6%
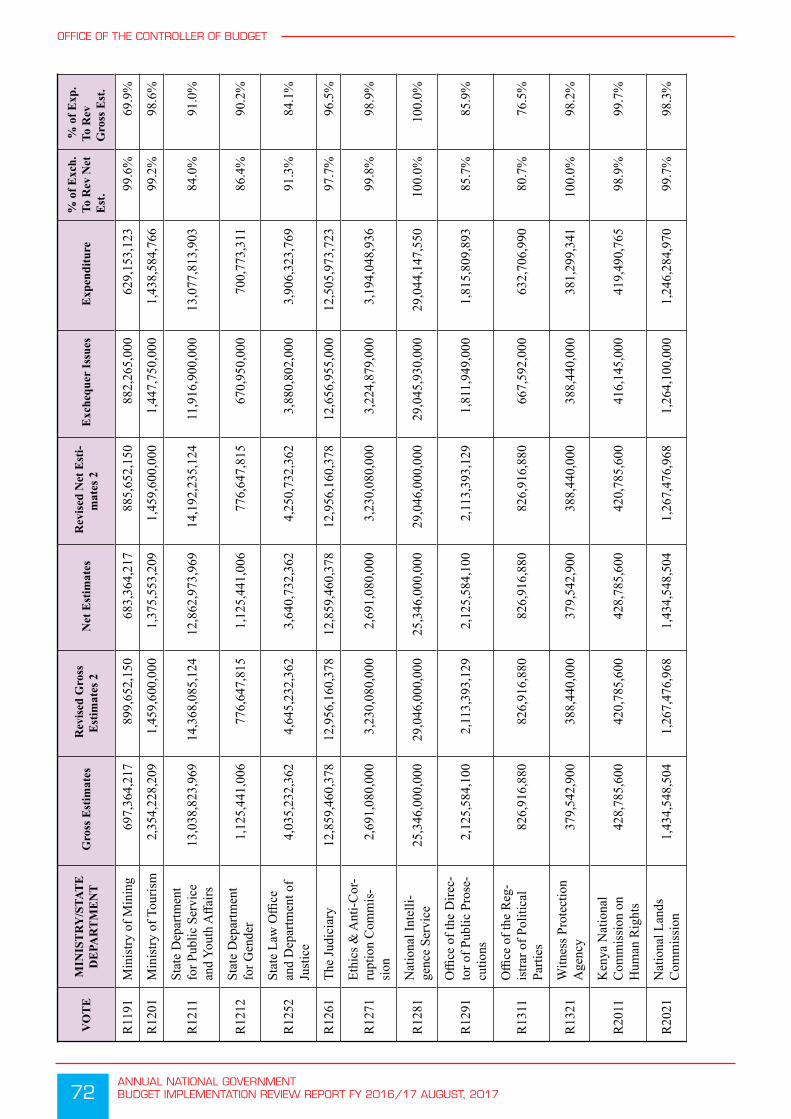
72ANNUAL NATIONAL GOVERNMENT BUDGET IMPLEMENTATION REVIEW REPORT FY 2016/17 AUGUST, 2017
OFFICE OF THE CONTROLLER OF BUDGET
VO
TE
MIN
IST
RY
/STA
TE
D
EPA
RT
ME
NT
Gro
ss E
stim
ates
Rev
ised
Gro
ss
Est
imat
es 2
Net
Est
imat
es R
evis
ed N
et E
sti-
mat
es 2
Exc
hequ
er Is
sues
Exp
endi
ture
% o
f Exc
h.
To R
ev N
et
Est
.
% o
f Exp
. To
Rev
G
ross
Est
.
R11
91M
inis
try o
f Min
ing
697
,364
,217
899
,652
,150
683
,364
,217
885
,652
,150
882
,265
,000
629
,153
,123
99.6
%69
.9%
R12
01M
inis
try o
f Tou
rism
2,3
54,2
28,2
09 1
,459
,600
,000
1,3
75,5
53,2
09 1
,459
,600
,000
1,4
47,7
50,0
00 1
,438
,584
,766
99.2
%98
.6%
R12
11St
ate
Dep
artm
ent
for P
ublic
Ser
vice
an
d Yo
uth
Affa
irs 1
3,03
8,82
3,96
9 1
4,36
8,08
5,12
4 1
2,86
2,97
3,96
9 1
4,19
2,23
5,12
4 1
1,91
6,90
0,00
0 1
3,07
7,81
3,90
384
.0%
91.0
%
R12
12St
ate
Dep
artm
ent
for G
ende
r 1
,125
,441
,006
776
,647
,815
1,1
25,4
41,0
06 7
76,6
47,8
15 6
70,9
50,0
00 7
00,7
73,3
1186
.4%
90.2
%
R12
52St
ate
Law
Offi
ce
and
Dep
artm
ent o
f Ju
stic
e 4
,035
,232
,362
4,6
45,2
32,3
62 3
,640
,732
,362
4,2
50,7
32,3
62 3
,880
,802
,000
3,9
06,3
23,7
6991
.3%
84.1
%
R12
61Th
e Ju
dici
ary
12,
859,
460,
378
12,
956,
160,
378
12,
859,
460,
378
12,
956,
160,
378
12,
656,
955,
000
12,
505,
973,
723
97.7
%96
.5%
R12
71Et
hics
& A
nti-C
or-
rupt
ion
Com
mis
-si
on 2
,691
,080
,000
3,2
30,0
80,0
00 2
,691
,080
,000
3,2
30,0
80,0
00 3
,224
,879
,000
3,1
94,0
48,9
3699
.8%
98.9
%
R12
81N
atio
nal I
ntel
li-ge
nce
Serv
ice
25,
346,
000,
000
29,
046,
000,
000
25,
346,
000,
000
29,
046,
000,
000
29,
045,
930,
000
29,
044,
147,
550
100.
0%10
0.0%
R12
91O
ffice
of t
he D
irec-
tor o
f Pub
lic P
rose
-cu
tions
2,1
25,5
84,1
00 2
,113
,393
,129
2,1
25,5
84,1
00 2
,113
,393
,129
1,8
11,9
49,0
00 1
,815
,809
,893
85.7
%85
.9%
R13
11O
ffice
of t
he R
eg-
istra
r of P
oliti
cal
Parti
es 8
26,9
16,8
80 8
26,9
16,8
80 8
26,9
16,8
80 8
26,9
16,8
80 6
67,5
92,0
00 6
32,7
06,9
9080
.7%
76.5
%
R13
21W
itnes
s Pro
tect
ion
Age
ncy
379
,542
,900
388
,440
,000
379
,542
,900
388
,440
,000
388
,440
,000
381
,299
,341
100.
0%98
.2%
R20
11K
enya
Nat
iona
l C
omm
issi
on o
n H
uman
Rig
hts
428
,785
,600
420
,785
,600
428
,785
,600
420
,785
,600
416
,145
,000
419
,490
,765
98.9
%99
.7%
R20
21N
atio
nal L
ands
C
omm
issi
on 1
,434
,548
,504
1,2
67,4
76,9
68 1
,434
,548
,504
1,2
67,4
76,9
68 1
,264
,100
,000
1,2
46,2
84,9
7099
.7%
98.3
%

73ANNUAL NATIONAL GOVERNMENT
BUDGET IMPLEMENTATION REVIEW REPORT FY 2016/17 AUGUST, 2017
OFFICE OF THE CONTROLLER OF BUDGET
VO
TE
MIN
IST
RY
/STA
TE
D
EPA
RT
ME
NT
Gro
ss E
stim
ates
Rev
ised
Gro
ss
Est
imat
es 2
Net
Est
imat
es R
evis
ed N
et E
sti-
mat
es 2
Exc
hequ
er Is
sues
Exp
endi
ture
% o
f Exc
h.
To R
ev N
et
Est
.
% o
f Exp
. To
Rev
G
ross
Est
.
R20
31In
depe
nden
t Ele
c-to
ral a
nd B
ound
a-rie
s Com
mis
sion
18,
565,
800,
000
23,
065,
800,
000
18,
560,
800,
000
23,
060,
800,
000
19,
823,
900,
000
19,
592,
528,
611
86.0
%84
.9%
R20
41Pa
rliam
enta
ry S
er-
vice
Com
mis
sion
10,
382,
000,
000
10,
451,
736,
000
10,
382,
000,
000
10,
451,
736,
000
8,8
27,3
00,0
00 8
,565
,245
,425
84.5
%82
.0%
R20
42N
atio
nal A
ssem
bly
16,
948,
000,
000
16,
948,
000,
000
16,
948,
000,
000
16,
948,
000,
000
15,
504,
200,
000
15,
797,
171,
069
91.5
%93
.2%
R20
51Ju
dici
al S
ervi
ce
Com
mis
sion
450
,000
,000
450
,000
,000
450
,000
,000
450
,000
,000
435
,200
,000
423
,784
,393
96.7
%94
.2%
R20
61Th
e C
omm
issi
on
on R
even
ue A
llo-
catio
n 3
55,7
81,7
74 3
55,7
81,7
74 3
55,7
81,7
74 3
55,7
81,7
74 3
18,9
57,0
00 3
09,7
91,8
0489
.6%
87.1
%
R20
71Pu
blic
Ser
vice
C
omm
issi
on 1
,179
,370
,000
1,2
28,3
01,5
97 1
,178
,870
,000
1,2
27,8
01,5
97 1
,224
,100
,000
1,2
18,5
85,4
3399
.7%
99.2
%
R20
81Sa
larie
s & R
emu-
nera
tion
Com
mis
-si
on 5
33,0
40,0
00 5
56,4
40,0
00 5
32,9
40,0
00 5
56,3
40,0
00 5
55,6
50,0
00 5
29,9
11,0
1099
.9%
95.2
%
R20
91Te
ache
rs S
ervi
ce
Com
mis
sion
193
,992
,348
,650
19
1,12
0,01
0,34
2
193,
772,
348,
650
190
,545
,010
,342
190
,544
,600
,000
190
,923
,602
,538
100.
0%99
.9%
R21
01N
atio
nal P
olic
e Se
rvic
e C
omm
is-
sion
435
,340
,000
434
,998
,700
435
,340
,000
434
,998
,700
429
,100
,000
425
,257
,377
98.6
%97
.8%
R21
11A
udito
r Gen
eral
4,1
82,8
80,0
00 4
,182
,880
,000
4,0
32,8
80,0
00 4
,032
,880
,000
4,0
26,6
00,0
00 4
,000
,418
,612
99.8
%95
.6%
R21
21C
ontro
ller o
f B
udge
t 5
61,2
69,8
50 5
21,1
74,7
91 5
61,2
69,8
50 5
21,1
74,7
91 4
90,0
00,0
00 4
93,9
76,2
0694
.0%
94.8
%
R21
31Th
e C
omm
issi
on
on A
dmin
istra
tive
Just
ice
468
,632
,000
448
,989
,051
468
,632
,000
448
,989
,051
447
,300
,000
419
,091
,369
99.6
%93
.3%
R21
41N
atio
nal G
ende
r &
Equa
lity
Com
mis
-si
on 4
16,2
70,8
78 3
86,9
70,4
35 4
16,2
70,8
78 3
86,9
70,4
35 3
81,2
00,0
00 3
81,1
60,8
4198
.5%
98.5
%

74ANNUAL NATIONAL GOVERNMENT BUDGET IMPLEMENTATION REVIEW REPORT FY 2016/17 AUGUST, 2017
OFFICE OF THE CONTROLLER OF BUDGET
VO
TE
MIN
IST
RY
/STA
TE
D
EPA
RT
ME
NT
Gro
ss E
stim
ates
Rev
ised
Gro
ss
Est
imat
es 2
Net
Est
imat
es R
evis
ed N
et E
sti-
mat
es 2
Exc
hequ
er Is
sues
Exp
endi
ture
% o
f Exc
h.
To R
ev N
et
Est
.
% o
f Exp
. To
Rev
G
ross
Est
.
R21
51In
depe
nden
t Pol
ice
Ove
rsig
ht A
utho
rity
491
,338
,899
484
,935
,269
491
,338
,899
484
,935
,269
433
,610
,000
433
,439
,275
89.4
%89
.4%
TOTA
L 8
57,5
25,9
88,8
54
927,
532,
891,
335
79
0,82
7,22
4,31
4 8
40,6
12,1
70,5
78 8
19,9
40,4
46,0
00 8
58,3
48,5
83,5
6597
.5%
92.5
%

75ANNUAL NATIONAL GOVERNMENT
BUDGET IMPLEMENTATION REVIEW REPORT FY 2016/17 AUGUST, 2017
OFFICE OF THE CONTROLLER OF BUDGET
AN
NE
X II
I:
Sect
oral
Dev
elop
men
t Exp
endi
ture
for
FY 2
016/
17 (K
shs)
Sect
orR
evis
ed G
ross
Est
imat
esR
evis
ed N
et E
stim
ates
Exc
hequ
er Is
sues
Exp
endi
ture
% o
f E
xch.
To
Rev
Net
E
st.
% o
f E
xp.
To R
ev
Gro
ss
Est
.
Agr
icul
ture
, Rur
al a
nd U
rban
Dev
elop
men
t 2
8,71
9,59
6,42
1 1
8,69
5,76
9,00
0 1
6,35
9,30
7,16
4 1
6,40
1,95
2,91
887
.5%
57.1
%
Ener
gy, I
nfra
stru
ctur
e an
d IC
T 5
19,8
89,1
77,5
04 1
90,2
92,2
36,0
83 1
71,3
15,7
15,2
94 3
62,6
64,4
03,2
0090
.0%
69.8
%
Gen
eral
Eco
nom
ics a
nd C
omm
erci
al A
ffairs
(G
ECA
) 9
,689
,287
,000
7,3
44,5
00,0
00 6
,835
,478
,329
7,1
52,5
96,4
6993
.1%
73.8
%
Hea
lth 4
1,70
5,75
7,70
3 3
1,25
2,29
4,68
3 2
6,22
3,01
7,38
8 2
7,15
8,99
7,58
383
.9%
65.1
%
Educ
atio
n 3
0,25
6,08
4,48
6 2
6,03
8,07
0,54
2 2
4,38
7,63
0,97
2 2
2,27
2,60
0,60
693
.7%
73.6
%
Gov
erna
nce,
Just
ice,
Law
and
Ord
er (G
JLO
S) 3
3,70
5,32
6,58
9 3
2,55
2,12
0,00
0 2
9,49
2,24
6,24
7 2
7,52
5,46
1,40
990
.6%
81.7
%
Publ
ic A
dmin
istra
tion
and
Inte
rnat
iona
l Rel
atio
ns 9
5,76
7,60
5,57
4 7
4,35
8,44
9,86
2 6
2,96
0,69
0,46
2 6
9,35
3,79
0,58
584
.7%
72.4
%
Nat
iona
l Sec
urity
45,
000,
000
- -
25,
000,
000
-55
.6%
Soci
al P
rote
ctio
n ,C
ultu
re a
nd R
ecre
atio
n 2
8,27
2,37
3,99
0 2
5,60
0,82
8,66
0 2
4,53
4,36
1,34
4 2
7,27
0,32
4,10
195
.8%
96.5
%
Envi
ronm
ent P
rote
ctio
n, W
ater
and
Nat
ural
R
esou
rces
73,
163,
052,
359
35,
670,
475,
609
32,
120,
993,
437
42,
500,
773,
866
90.0
%58
.1%
Tota
l 8
61,2
13,2
61,6
26 4
41,8
04,7
44,4
39 3
94,2
29,4
40,6
37 6
02,3
25,9
00,7
3789
.2%
69.9
%

76ANNUAL NATIONAL GOVERNMENT BUDGET IMPLEMENTATION REVIEW REPORT FY 2016/17 AUGUST, 2017
OFFICE OF THE CONTROLLER OF BUDGET
AN
NE
X IV
: Se
ctor
al R
ecur
rent
Exp
endi
ture
for
FY 2
016/
17 (K
shs)
Sect
orR
evis
ed G
ross
Est
imat
esR
evis
ed N
et E
sti-
mat
esE
xche
quer
Issu
esE
xpen
ditu
re%
of E
xch.
To
Rev
Net
Est
. %
of E
xp. T
o R
ev G
ross
Est
.
Agr
icul
ture
, Rur
al a
nd U
rban
Dev
elop
men
t23
,014
,690
,358
22,9
52,2
75,6
0822
,077
,761
,000
21,8
81,7
39,0
6396
.2%
95.1
%
Ener
gy, I
nfra
stru
ctur
e an
d IC
T64
,855
,863
,377
11,9
96,0
11,3
7710
,983
,366
,000
63,5
06,9
92,9
2191
.6%
97.9
%
Gen
eral
Eco
nom
ics a
nd C
omm
erci
al A
ffairs
(G
ECA
)12
,546
,565
,416
12,4
31,1
81,1
9912
,208
,170
,000
12,1
85,0
80,2
9798
.2%
97.1
%
Hea
lth35
,737
,009
,339
31,7
59,1
32,8
6230
,229
,300
,000
29,8
45,5
20,0
6195
.2%
83.5
%
Educ
atio
n31
5,37
9,16
3,65
929
6,68
8,96
3,65
929
5,50
2,94
8,00
030
2,58
2,59
0,36
199
.6%
95.9
%
Gov
erna
nce,
Just
ice,
Law
and
Ord
er
(GJL
OS)
177,
233,
495,
918
176,
460,
258,
918
169,
990,
022,
000
150,
362,
126,
750
96.3
%84
.8%
Publ
ic A
dmin
istra
tion
and
Inte
rnat
iona
l Re-
latio
ns12
0,99
9,13
3,90
412
0,16
8,45
6,83
011
1,14
9,32
0,00
010
5,65
2,50
2,52
592
.5%
87.3
%
Nat
iona
l Sec
urity
130,
195,
926,
564
130,
195,
926,
564
130,
194,
130,
000
130,
192,
728,
126
100.
0%10
0.0%
Soci
al P
rote
ctio
n, C
ultu
re a
nd R
ecre
atio
n25
,067
,495
,307
25,0
67,0
95,3
0724
,779
,134
,000
23,6
62,9
05,0
7798
.9%
94.4
%
Envi
ronm
ent P
rote
ctio
n, W
ater
and
Nat
ural
R
esou
rces
22,5
03,5
47,4
9312
,892
,868
,254
12,8
26,2
95,0
0018
,476
,398
,384
99.5
%82
.1%
Tota
l92
7,53
2,89
1,33
584
0,61
2,17
0,57
881
9,94
0,44
6,00
085
8,34
8,58
3,56
597
.5%
92.5
%
