annual performance statistics report - tga.gov.au · access to unapproved therapeutic goods the...
TRANSCRIPT
Annual Performance Statistics Report July 2016 to June 2017

Therapeutic Goods Administration
Annual Performance Statistics Report | July 2016 to June 2017 Page 2 of 62
Copyright
© Commonwealth of Australia 2017 This work is copyright. You may reproduce the whole or part of this work in unaltered form for your own personal use or, if you are part of an organisation, for internal use within your organisation, but only if you or your organisation do not use the reproduction for any commercial purpose and retain this copyright notice and all disclaimer notices as part of that reproduction. Apart from rights to use as permitted by the Copyright Act 1968 or allowed by this copyright notice, all other rights are reserved and you are not allowed to reproduce the whole or any part of this work in any way (electronic or otherwise) without first being given specific written permission from the Commonwealth to do so. Requests and inquiries concerning reproduction and rights are to be sent to the TGA Copyright Officer, Therapeutic Goods Administration, PO Box 100, Woden ACT 2606 or emailed to <[email protected]>.

Therapeutic Goods Administration
Annual Performance Statistics Report | July 2016 to June 2017 Page 3 of 62
Contents About the Therapeutic Goods Administration __________________ 4
Executive summary ______________________________________________ 5
Performance highlights: July 2016 to June 2017 _______________ 5
1. Prescription medicines _____________________________________ 8
2. Over-the-Counter medicines ______________________________ 14
3. Complementary Medicines ________________________________ 20
4. Biologicals _________________________________________________ 29
5. Medicine and vaccine adverse event reports _____________ 31
6. Medical Devices ___________________________________________ 32
7. Exports _____________________________________________________ 42
8. Access to unapproved therapeutic goods ________________ 45
9. Medicines and biologicals manufacturing ________________ 50
10. Recalls _____________________________________________________ 53
11. Laboratory testing _________________________________________ 55
12. Regulatory compliance ____________________________________ 59
Therapeutic Goods Administration
Annual Performance Statistics Report | July 2016 to June 2017 Page 4 of 62
About the Therapeutic Goods Administration The Therapeutic Goods Administration (TGA) is part of the Department of Health and is responsible for assessing whether therapeutic goods available for supply in Australia are safe and fit for their intended purpose.
Products for which therapeutic claims are made are assessed by the TGA and entered on the Australian Register of Therapeutic Goods (ARTG). At 30 June 2017 there were 87,258 therapeutic goods on the ARTG. These therapeutic goods can be lawfully manufactured and supplied in Australia and include prescription medicines, over-the-counter medicines, complementary medicines, biologicals, and medical devices.
The TGA regulates the supply of:
· medicines prescribed by a doctor or dentist
· medicines available from behind the pharmacy counter
· medicines available in the general pharmacy
· medicines available from retail outlets
· complementary medicines, such as vitamins, herbal and traditional medicines
· medical devices, from simple devices like bandages to complex technologies like heart pacemakers
· products used to test for various diseases or conditions (in vitro diagnostic devices (IVDs)), such as blood tests
· vaccines, blood products, and other biologics.
We also play a regulatory role in overseeing the manufacturing process and advertising of therapeutic goods.
More information about how therapeutic goods are regulated in Australia can be found on our website (www.tga.gov.au).

Therapeutic Goods Administration
Annual Performance Statistics Report | July 2016 to June 2017 Page 5 of 62
Executive summary Each year the TGA provides information on our regulatory performance through the Annual Performance Statistics Report and the Half Yearly Performance Snapshot. We also report annually on our performance under the Regulator Performance Framework through the TGA Self-Assessment (Key Performance Indicators) Report.
The following statistics cover the period 1 July 2016 to 30 June 2017 and contribute to our suite of performance reports.
highlights: July 2016 to June 2017 PerformanceKey observations for 2016-17 are summarised below, including trends and notable changes from previous reporting periods.
Prescription medicines Since the 2015-16 report, the number of submissions received across some Category 1 application types varied significantly. While the number of New Chemical Entity submissions remained constant, the number of Extension of Indication submissions increased noticeably and the number of generic medicine submissions greatly decreased. All Category 1 submissions processed in 2016-17 were within the legislated 255 working day timeframe and, on average, were decided in 220 working days or less.
Over-the-Counter medicines The total number of new medicine applications received in 2016-17 was slightly higher than in 2015-16 with an increase in the number of low risk (N1) and medium risk (N3) applications. In the higher risk (N4 and N5) categories, applications received in 2016-17 were roughly half that received in 2015-16. The total number of applications received to vary existing medicines decreased substantially compared with 2015-16, mostly due to a decrease in the number of low risk (C1) applications. The number of higher risk variation (C2, C3 and C4) applications was consistent with previous periods.
While median approval times for new medicine applications in 2016-17 were longer by approximately 2 weeks compared with 2015-16, the percentage of applications processed within target time continued to be at, or very close to 100%. The longer median approval times can be attributed to the increase in the number of lower risk and medium risk applications as well as varying level of complexity of higher risk applications.
Complementary medicines The number of new ingredients approved for use in listed medicines significantly increased to 79 in 2016-17 compared with 18 in 2015-16, primarily due to a number of excipient ingredients with limited availability being added to the Therapeutic Goods (Permissible Ingredients) Determination under section 26BB of the Therapeutic Goods Act 1989.
The number of post market compliance reviews completed has remained similar with 10% more reviews completed in 2016-17 than in 2015-16. Investigations, which arise from complaints from the public, industry referrals and adverse event reporting, increased in 2016-17 compared with 2015-16. Investigations are assessed using a risk prioritisation system and where required, will result in a compliance review being initiated.

Therapeutic Goods Administration
Annual Performance Statistics Report | July 2016 to June 2017 Page 6 of 62
The rate of verified compliance breaches has remained similar; 79% in 2016-17 compared with 80% in 2015-16. This suggests that the significant increase in the number of compliance reviews in recent years has not driven any improvement in compliance rates. The proportion of medicines found to be non-compliant for which breaches included ‘insufficient evidence being held by the sponsor to support the medicine indication’ was similar; 54% in 2016-17 compared with 64% in 2015-16.
Labelling, advertising and evidence continued to be major compliance breaches for listed medicines. In 2016-17, 22 products were found to have safety related issues, compared with 13 products in 2015-16. This increase was largely a result of continued targeted work undertaken on reviewing the safety of ingredients.
The number of approved new registered complementary medicines increased to 10 in 2016-17 compared with 3 in 2015-16. The total number of variations completed in 2016-17 decreased to 24 compared with 30 in 2015-16.
Biologicals The number of new and variation applications stabilised following the transition of most biologicals into the new biologicals regulatory framework during 2014-15. The number of Technical Master File variations increased due to work by the public cord blood banks.
Medicine and vaccine adverse event reports Overall, adverse event reporting increased from 17,633 medicine and vaccine adverse event notifications in 2015-16 to 19,736 in 2016-17. In particular, the increased number of vaccine Adverse Event Reports may reflect recent additions to the National Immunisation Program in 2016. Adverse event reporting from members of the public also increased which is likely to be the result of activity to promote consumer adverse event reporting.
Medical device incident reports An increase in incident reports in 2016-17 resulted from media attention, sponsor training workshops in 2016 to increase awareness, and expansion of the Insite program.
Medical devices There was a significant increase in the number of Level 2 compulsory audits of applications for inclusion of Class III and Active Implantable Medical Devices on the ARTG, which include the assessment of clinical evidence, completed in 2016-17 (471) compared with 2015-16 (205). We refined our processes for clinical evidence assessment in relation to audits and built the capability of our assessment teams to improve assessment timeframes for new medical devices. Concurrent assessments by staff with differing expertise, triage of applications and better application of the risk based approach to assessment of evidence for different categories of devices resulted in reduced waiting times for commencement of the audits of applications seeking pre-market authorisation from 8-9 months to about one month. By the end of the reporting period this significantly increased the completion rate of assessments and improved patients’ access to new medical devices.

Therapeutic Goods Administration
Annual Performance Statistics Report | July 2016 to June 2017 Page 7 of 62
Exports The number of new export medicine listing applications and variations remained constant over the last two years. The number of export certificates for medicines dropped in 2016-17 by 25%, however there was an increase in the number of device certificates issued. All medicine certificates were issued within the target timeframe of 15 days. Over 80% of device certificates and new listings and variations were also completed within the target timeframe.
All human blood and tissue permits were released within the 24 hour target timeframe to ensure that emergency demands overseas were met.
Access to unapproved therapeutic goods The number of notifications and applications for most Special Access Scheme (SAS) categories increased since 2015-16, especially Category A for both medicines and devices. An exception is SAS Category B for biologicals as higher volume products previously accessed through SAS are now on the ARTG.
Medicines and biologicals manufacturing Demand for Good Manufacturing Practice (GMP) clearances continued to increase with 6,506 applications received during 2016-17 compared with 5,657 in 2015-16. Major contributing factors included sponsors sourcing more products from new and multiple manufacturers, globalisation and company mergers, and overseas regulatory agencies undertaking more inspections in other countries, creating more evidence to be used in support of Australian GMP clearance applications.
Recalls There was a significant decrease in the number of medicine recalls from 57 in 2015-16 to 32 in 2016-17, and a slight decrease from 611 in 2015-16 to 598 in 2016-17 in the number of medical device recalls.
Laboratory testing Over the past four years there has been a continued increase in the failure rate of products tested by the TGA Laboratories on a contract basis for external agencies such as the World Health Organization (WHO) and other governments within the region. This increase was again observed in 2016-17. These results highlight the important role we play in supporting other governments to identify sub-standard, degraded or adulterated medicines supplied for use in other countries, and helping to ensure continued health security for the region, including Australia.
Regulatory compliance Investigations increased by 64% in 2016-17, with 2,887 completed compared with 1,760 in 2015-16. The largest contributor to investigations continues to be referrals from Australian Border Force in relation to the importation of unapproved prescription medicines.

Therapeutic Goods Administration
Annual Performance Statistics Report | July 2016 to June 2017 Page 8 of 62
1. Prescription medicines Applications to register new or vary existing prescription medicines are accompanied by supportive scientific data and evaluated, with timeframes underpinned by legislation and/or associated business rules.
The framework for prescription medicines includes the following categories which are subject to legislated timeframes:
· Category 1 application: An application to register a new prescription medicine (other than an additional trade name) or to make a variation to an existing medicine that involves the evaluation of clinical, pre-clinical or bio-equivalence data. For example, new chemical entities, extensions of indication and new routes of administration.
The legislated timeframes for the two stages of a Category 1 application are: 40 working days for notification of acceptance or rejection of the application and 255 working days for the completion of the evaluation and notification of the decision.
· Category 2 application: An application accompanied by two independent evaluation reports from comparable overseas regulators in whose jurisdiction the product is approved for the same indication.
The legislated timeframes for the two stages of a Category 2 application are: 20 working days for notification of acceptance or rejection of an application and 175 working days to notify the applicant of the decision.
· Category 3 application: An application to register or to vary the registration of a prescription medicine where the application does not require the support of clinical, pre-clinical or bio-equivalence data. For example, a change in the site of manufacture, a change to the synthetic route, a change in the product specifications, a change in the steps of manufacture or a change in trade name.
The legislated timeframe for a Category 3 application is 45 working days for notification of acceptance or rejection of an application, completion of evaluation and notification of the decision.

Therapeutic Goods Administration
Annual Performance Statistics Report | July 2016 to June 2017 Page 9 of 62
1.1. Approval times Once an application has been accepted by the TGA, the approval time is defined as the number of TGA working days until a decision is made. As detailed above, this timeframe is underpinned by legislation and excludes public holidays, weekends, the time allocated to the applicant to provide responses to requests for information and ‘mutual clock stop’ periods agreed with the applicant.
In accordance with the Therapeutic Goods Regulations 1990, a ‘submission’ may include a number of applications submitted at the one time. The data presented below relates to submissions as this best reflects the evaluation and decision-making processes.
Table 1 Prescription medicine application approval time for July 2016 to June 2017
Approval time (TGA working days)
Application type
Submissions approved
Legislated timeframe
Mean Median Range
A: New chemical entity Category 1 38 255 220 208 161-238
B: New fixed-dose combination Category 1 4 255 201 203 179-218 C: Extension of indication Category 1 45 255 198 202 106-238
D: New generic medicine Category 1 111 255 182 172 109-254 E: Additional trade name (ATN) Category 1 2 255 140 140 44-237 ATN 47 45 34 36 10-62 F: Major variation Category 1 46 255 185 185 134-226 G: Minor variation Category 1 0 255 N/A N/A N/A Category 3 104 45 27 26 8-43 H: Minor variation Category 1 4 255 142 143 111-172 Category 3 1,253 45 24 23 1-51 J: Changes to Product Information requiring the evaluation of data Category 1 63 255 142 140 46-228

Therapeutic Goods Administration
Annual Performance Statistics Report | July 2016 to June 2017 Page 10 of 62
Table 2 Prescription medicine median approval time comparisons
Median approval time (TGA working days)
Application type Legislated timeframe 2015-16 2016-17
A: New chemical entity Category 1 255 199 208 B: New fixed-dose combination Category 1 255 167 203 C: Extension of indication Category 1 255 195 202
D: New generic medicine Category 1 255 158 172 E: Additional trade name (ATN)a Category 1 255 219 140 ATN 45 35 36 F: Major variation Category 1 255 183 185 G: Minor variationb Category 1 255 163 0 b Category 3 45 19 26 H: Minor variationc Category 1 255 146 143 Category 3 45 20 23 J: Changes to Product Information requiring the evaluation of data Category 1 255 134 140 a In July 2015, a legislated 45 working day process for ATN submissions commenced. These applications were
under both the Category 1 framework with a legislated timeframe of 255 working days and the new ATN submission framework with a legislated timeframe of 45 working days.
b The type G minor variations differ from type H minor variations in that they result in a new ARTG entry. No type G Category 1 applications were approved in 2016-17.
c The minor variations (type H) refer to applications to change the formulation, composition or design specification or the container for the goods or any other attribute that results in the goods being separate and distinct. These applications are typically ‘Category 3’ changes, unless the supporting scientific package contains non-clinical or clinical data in which case the application is a ‘Category 1’ application.

Therapeutic Goods Administration
Annual Performance Statistics Report | July 2016 to June 2017 Page 11 of 62
Figure 1 Submissions received 2015-16 to 2016-17
43 43 46 56
142
100
0
20
40
60
80
100
120
140
160
Jul 15 - Jun 16 Jul 16 - Jun 17
Num
ber o
f Sub
mis
sion
s R
ecei
ved
A – New Chemical Entity C – Extension of Indication D– New Generic Medicine
Figure 2 Mean approval times 2015-16 to 2016-17
193
220
186 198
170 182
0
50
100
150
200
250
Jul 15 - Jun 16 Jul 16 - Jun 17
Mea
n ap
prov
al ti
me
A – New Chemical Entity C – Extension of Indication D– New Generic Medicine

Therapeutic Goods Administration
Annual Performance Statistics Report | July 2016 to June 2017 Page 12 of 62
Figure 3 Median approval times 2015-16 to 2016-17
199 208 195 202
158 172
0
50
100
150
200
250
Jul 15 - Jun 16 Jul 16 - Jun 17
Med
ian
appr
oval
tim
e
A – New Chemical Entity C – Extension of Indication D– New Generic Medicine
1.2. Submission outcomes
Table 3 Number of completed prescription medicine submissions by type and outcome for July 2016 to June 2017
Submission Type Approved Withdrawn Rejected Total
A: New chemical entity 38 4 0 42 B: New fixed-dose combination 4 2 0 6 C: Extension of indication 45 2 2 49 D: New generic medicine 111 2 2 115 E: Additional trade name (ATN) (Category 1) 2 0 0 2 E: ATN 47 1 0 48 F: Major variation 46 2 1 49 G: Minor variation 104 2 0 106 H: Minor variation (Category 1) 4 0 0 4 H: Minor variation (Category 3) 1,253 16 0 1,269 J: Changes to Product Information 63 3 0 66 Total 1,717 34 5 1,756

Therapeutic Goods Administration
Annual Performance Statistics Report | July 2016 to June 2017 Page 13 of 62
1.3. Other applications In addition to the application types discussed above, we also process numerous other application types. These applications are assessed in accordance with a risk-based approach, for example, some requests are categorised as ‘self-assessable’ and do not usually involve the evaluation of scientific data. Some applications are received because the sponsors are obliged to inform the TGA of new information related to the safety of their products. Other applications involve editorial corrections to the register entry or the associated product information document. The number of these applications is presented below.
In accordance with the legislation, registered medicines must comply with numerous standards at the time they are registered and throughout their lifecycle. Following an appropriate application and review of the scientific data and safety considerations, we may grant an ‘exemption’ from a particular standard for a product. The number of applications approved and rejected is also presented below.
Table 4 Number of other prescription medicine applications
2015-16 2016-17 July to June
Prescription medicine applications
Safety related request 781 738 Self-assessable request 1,404 1,244 Minor editorial change to product information 481 459 Correction of error 123 124 Total 2,789 2,565 Exemptions to comply with a standard
Approved 88 89 Rejected 0 1 Total 88 90
1.4. Orphan drug designations ‘Orphan drugs’ are often developed to treat small and very specific patient populations who suffer from rare diseases and conditions. The application and evaluation fees for orphan drugs can be waived to help reduce their development costs and facilitate their access to the Australian marketplace. A medicine needs to be designated by the TGA as an orphan drug before an application can be accepted to register it on the ARTG. The designation process involves a review of whether the drug meets the established criteria which are underpinned by legislation.
The quality, efficacy and safety of orphan drugs are assessed at the same standard as for other registered prescription medicines.
Table 5 Number of orphan drug designations
2015-16 2016-17 July to June
Number of designations 22 29

Therapeutic Goods Administration
Annual Performance Statistics Report | July 2016 to June 2017 Page 14 of 62
2. Over-the-Counter medicines Over-the-Counter (OTC) medicine applications are categorised as new medicine (N) or change (C) applications and are further categorised by risk (N1 and C1 are low risk, N5 and C4 are highest risk). The OTC application categorisation framework outlined below defines the different OTC medicine application levels and the key application criteria.
Table 6 Categorisation of OTC medicine applications
Application category
Definition
N1 An application submitted as a ‘Clone’. N2 An application which complies with an OTC medicine monograph. N3 New application for a ‘generic’ medicine other than those ‘generic’ applications in
levels N1, N2 or N4. N4 An application for a ‘generic’ medicine where the medicine:
requires supporting safety and/or efficacy (clinical/toxicological) data or a justification for not providing such data; and/or requires a higher level of assessment due to the umbrella branding segment of the product name; and/or has not been previously registered as an OTC medicine following down-scheduling.
N5 An application for a new product that is an extension to a ‘generic category’ product or an application for a product containing a new chemical entity as an active ingredient.
C1 Quality and non-quality changes classified as ‘negligible risk’. C2 Quality and non-quality changes classified as ‘low risk’ – no safety and/or efficacy
data required; quality data may be required. C3 Quality and non-quality changes classified as ‘low risk’ – safety and/or efficacy data
required unless justified; quality data may be required. Umbrella branding segment of new name requires a higher level of assessment.
C4 Non-quality changes classified as ‘moderate risk’ – safety and/or efficacy data required unless justified.
B1 Request for advice in relation to a registered OTC medicine for the purpose of listing the medicine as a pharmaceutical benefit that does not contain clinical data.
B3 Request for advice in relation to a registered OTC medicine for the purpose of listing the medicine as a pharmaceutical benefit that contains clinical data or a justification as to why such data is not needed.
Requests for consent under section 14/14A of the Act
Request for consent by the Secretary under sections 14 and 14A of the Act to the import, export or supply of therapeutic goods that do not comply with an applicable standard.

Therapeutic Goods Administration
Annual Performance Statistics Report | July 2016 to June 2017 Page 15 of 62
2.1. Approval times Approval time is defined as the number of working days from the acceptance of the application until formal notification of decision. Approval time excludes time where we were unable to progress the application until the sponsor provided additional information unless otherwise specified.
We aim to have 80% of applications completed within target timeframes. Target timeframes for processing of applications are a result of new OTC pre-market business processes and are subject to ongoing review.
Table 7 Median approval time for OTC medicine applications
2015-16 2016-17 July to June
New medicine applications (days) N1 14 27 N2 26 43 N3 90 94 N4 89 106 N5 151 192 Change applications (days) C1 5 7 C2 8 14 C3 31 14 C4 110 86
Table 8 OTC medicine approval time against target time by application category for July 2016 to June 2017
Application type
Number completed Range Mean Median
Target time
(days)
% within target
New medicines
N1 93 0-41 25 27 45 100 N2 7 37-47 42 43 55 100 N3 29 16-143 88 94 150 100 N4 29 4-162 101 106 170 100 N5 8 45-196 167 192 210 100 Change applications
C1 396 0-75 8 7 20 97 C2 226 0-78 21 14 64 99.6 C3 7 10-107 30 14 120 100 C4 1 86 86 86 170 100
Therapeutic Goods Administration
Annual Performance Statistics Report | July 2016 to June 2017 Page 16 of 62
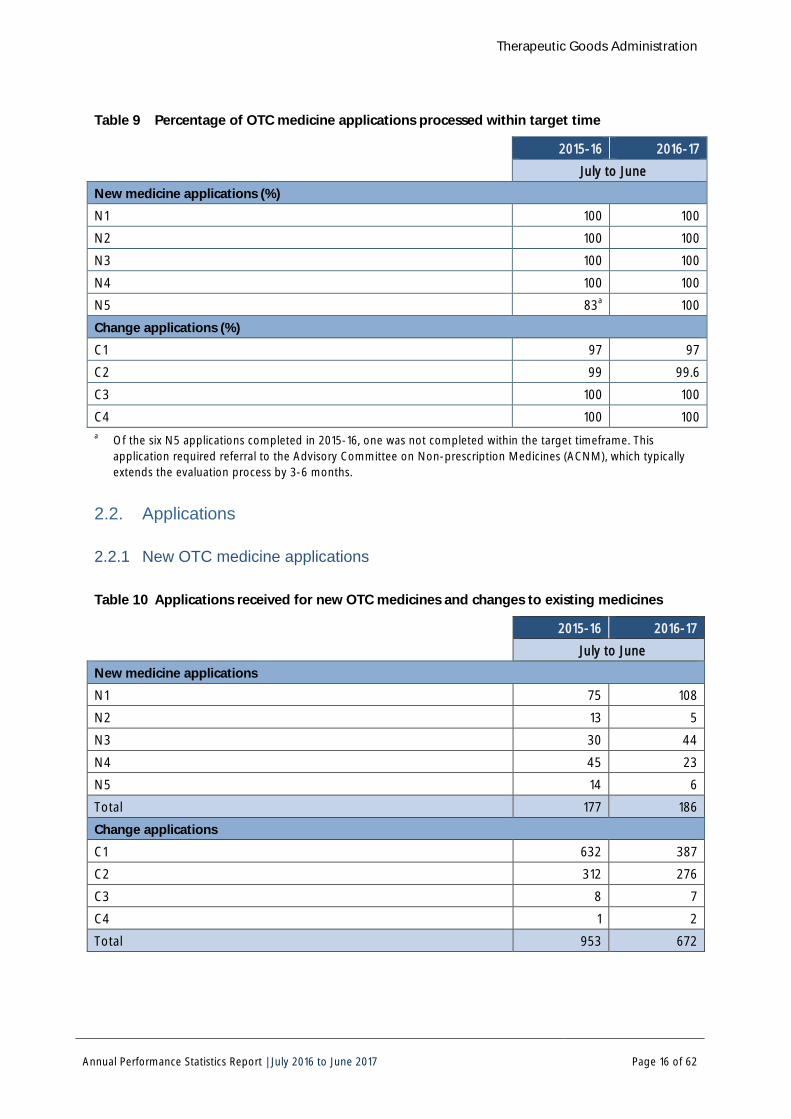
Table 9 Percentage of OTC medicine applications processed within target time
2015-16 2016-17 July to June
New medicine applications (%)
N1 100 100 N2 100 100 N3 100 100 N4 100 100 N5 83a 100 Change applications (%)
C1 97 97 C2 99 99.6 C3 100 100 C4 100 100 a Of the six N5 applications completed in 2015-16, one was not completed within the target timeframe. This
application required referral to the Advisory Committee on Non-prescription Medicines (ACNM), which typically extends the evaluation process by 3-6 months.
2.2. Applications
2.2.1 New OTC medicine applications
Table 10 Applications received for new OTC medicines and changes to existing medicines
2015-16 2016-17 July to June
New medicine applications
N1 75 108 N2 13 5 N3 30 44 N4 45 23 N5 14 6 Total 177 186 Change applications
C1 632 387 C2 312 276 C3 8 7 C4 1 2 Total 953 672

Therapeutic Goods Administration
Annual Performance Statistics Report | July 2016 to June 2017 Page 17 of 62
2.2.2 Completed applications
Table 11 New OTC medicine applications completed and outcomes
2015-16 2016-17 July to June
N1
Approved 79 93 Rejected 0 0 Withdrawn by sponsor 0 1 Returned/failed screening 1 0 Total 80 94 N2
Approved 3 7 Rejected 0 0 Withdrawn by sponsor 0 1 Returned/failed screening 5 0 Total 8 8 N3
Approved 25 29 Rejected 0 0 Withdrawn by sponsor 7 2 Returned/failed screening 7 3 Total 39 34 N4
Approved 50 29 Rejected 0 0 Withdrawn by sponsor 0 0 Returned/failed screening 5 6 Total 55 35 N5
Approved 6 8 Rejected 0 0 Withdrawn by sponsor 1 0 Returned/failed screening 5 0 Total 12 8
Therapeutic Goods Administration
Annual Performance Statistics Report | July 2016 to June 2017 Page 18 of 62
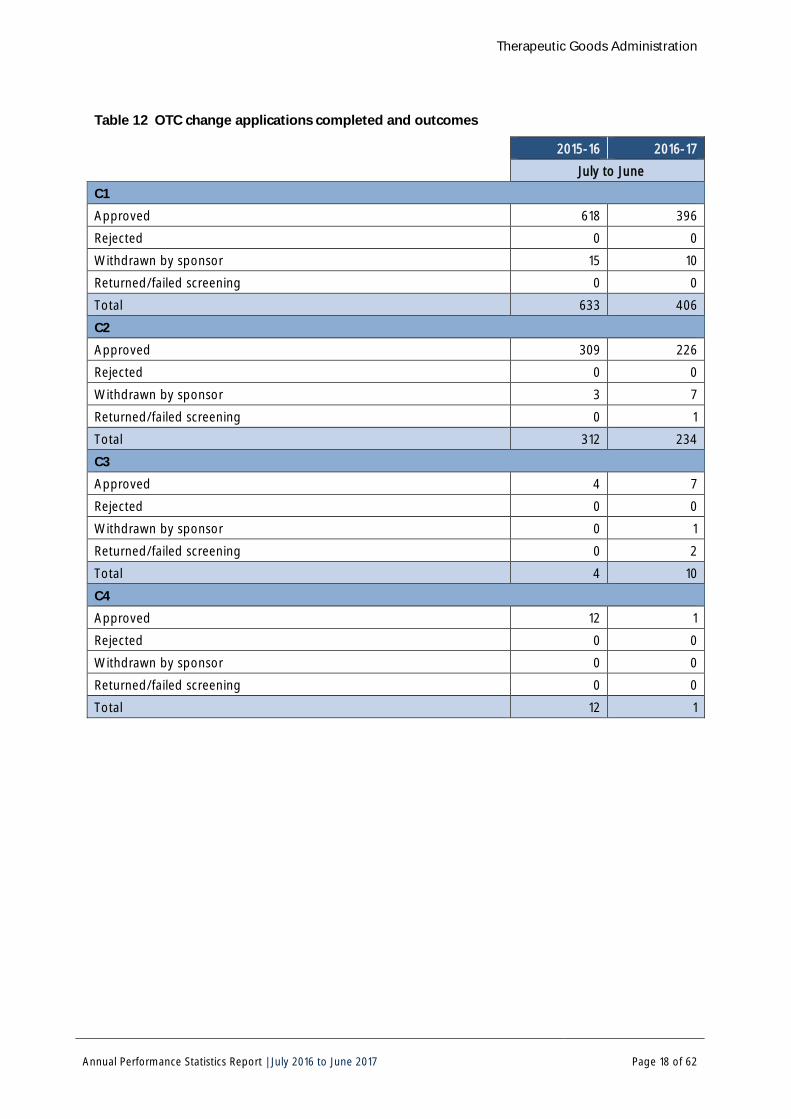
Table 12 OTC change applications completed and outcomes
2015-16 2016-17 July to June
C1
Approved 618 396 Rejected 0 0 Withdrawn by sponsor 15 10 Returned/failed screening 0 0 Total 633 406 C2
Approved 309 226 Rejected 0 0 Withdrawn by sponsor 3 7 Returned/failed screening 0 1 Total 312 234 C3
Approved 4 7 Rejected 0 0 Withdrawn by sponsor 0 1 Returned/failed screening 0 2 Total 4 10 C4
Approved 12 1 Rejected 0 0 Withdrawn by sponsor 0 0 Returned/failed screening 0 0 Total 12 1

Therapeutic Goods Administration
Annual Performance Statistics Report | July 2016 to June 2017 Page 19 of 62
2.2.3 Other applications In addition to the application types discussed above, we also process other application types. This includes requests for advice for the purpose of listing a medicine as a pharmaceutical benefit. The number of requests is presented below.
In accordance with the legislation, registered goods must comply with numerous standards at the time they are registered and throughout their lifecycle. Following an appropriate application and review of the scientific data and safety considerations, we may grant an ‘exemption from a particular standard for a product. The number of applications approved and rejected is also presented below.
Table 13 Number of other OTC medicine applications
2015-16 2016-17 July to June
Requests for advice for the purpose of listing a medicine as a pharmaceutical benefita
B1 N/A 1 B3 N/A 1 Total N/A 2 Requests for consent under section 14/14A of the Act to import, export or supply therapeutic goods not complying with an applicable standardb
Approved N/A 25 Rejected N/A 1 Total N/A 26 a B1 and B3 requests have recently been implemented. This is the first year for reporting on these application types.
Both B1 and B3 applications were approved. b Reporting of requests under section 14/14A of the Act has been introduced in this reporting period.

Therapeutic Goods Administration
Annual Performance Statistics Report | July 2016 to June 2017 Page 20 of 62
3. Complementary Medicines
3.1. Registered complementary medicines Registered complementary medicines are considered to be of relatively higher risk than listed medicines based on their ingredients or the indications for the medicine. These medicines are fully evaluated by us for quality, safety and efficacy prior to being accepted on the ARTG.
Table 14 Registered complementary medicine applications by outcome
2015-16 2016-17 July to June
New medicines
Approved 2 6 Rejected 0 1 Withdrawn 1 3 Returned/failed screening 0 0 Total new applications completed 3 10 Variations
Approved 27 20 Rejected 0 1 Withdrawn 3 3 Returned/failed screening 0 0 Total variations completed 30 24 Application for consent to import, supply or export goods under section 14/14A of the Acta
Approved 1 1 Rejected 0 0 Total applications completed 1 1 a Applications can be made for consent to import, supply or export goods under section 14/14A of the Therapeutic
Goods Act 1989.
Therapeutic Goods Administration
Annual Performance Statistics Report | July 2016 to June 2017 Page 21 of 62
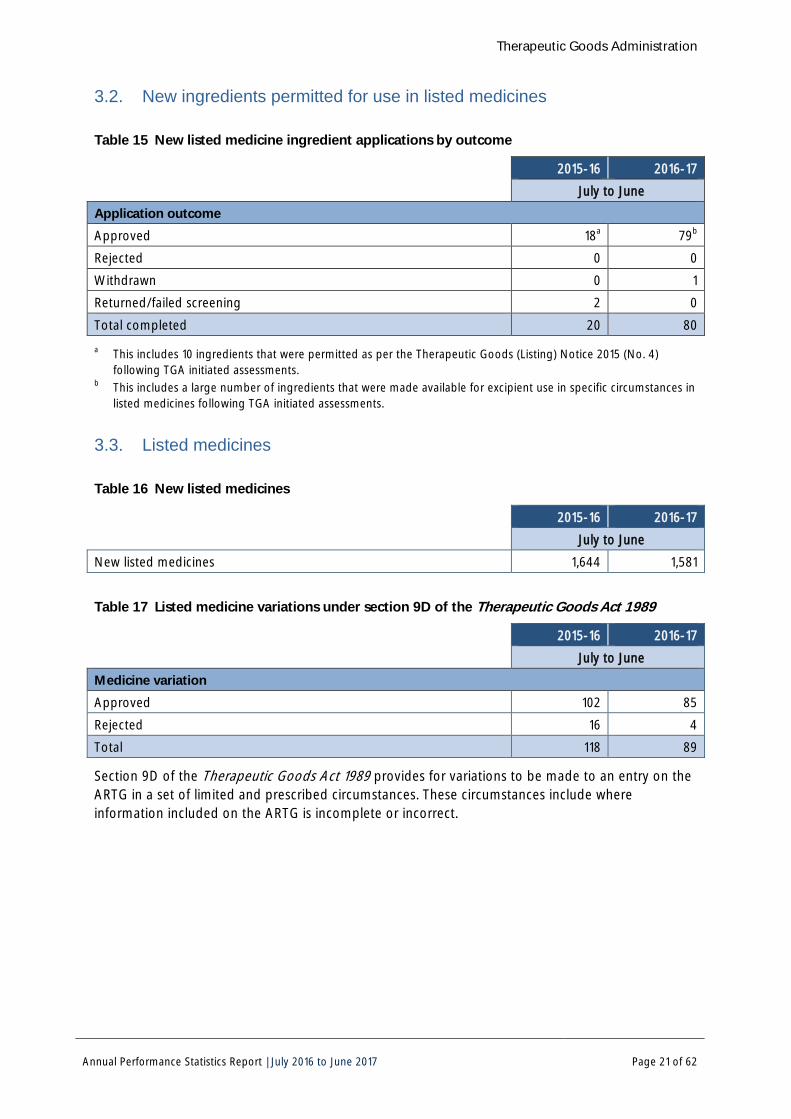
3.2. New ingredients permitted for use in listed medicines
Table 15 New listed medicine ingredient applications by outcome
2015-16 2016-17 July to June
Application outcome
Approved 18a 79b Rejected 0 0 Withdrawn 0 1 Returned/failed screening 2 0 Total completed 20 80 a This includes 10 ingredients that were permitted as per the Therapeutic Goods (Listing) Notice 2015 (No. 4)
following TGA initiated assessments. b This includes a large number of ingredients that were made available for excipient use in specific circumstances in
listed medicines following TGA initiated assessments.
3.3. Listed medicines
Table 16 New listed medicines
2015-16 2016-17 July to June
New listed medicines 1,644 1,581
Table 17 Listed medicine variations under section 9D of the Therapeutic Goods Act 1989
2015-16 2016-17 July to June
Medicine variation
Approved 102 85 Rejected 16 4 Total 118 89
Section 9D of the Therapeutic Goods Act 1989 provides for variations to be made to an entry on the ARTG in a set of limited and prescribed circumstances. These circumstances include where information included on the ARTG is incomplete or incorrect.

Therapeutic Goods Administration
Annual Performance Statistics Report | July 2016 to June 2017 Page 22 of 62
Table 18 Listed medicine applications under section 14/14A of the Therapeutic Goods Act 1989
2015-16 2016-17 July to June
Application
Exemptiona granted 7 7 Rejected 4 2 Total 11 9 a Sponsors can apply for certain exemptions under Section 14 of the Therapeutic Goods Act 1989. Applications seek
consent to import, export or supply a complementary medicine that does not comply with the applicable standards.Listed medicine reviews
3.3.1 Investigations Investigations include complaints and referrals from internal and external stakeholders and screening of recently listed medicines on the ARTG, but can also include products not listed on the ARTG. All investigations are assessed and triaged based on a risk management approach to provide the greatest overall benefit for the Australian public. Investigations may be completed through a number of mechanisms, such as initiating a targeted review or referral to another area of the TGA.
Table 19 Listed medicine investigations undertaken and outcomes
2015-16 2016-17 July to June
Initiated investigations 114 201 Completed investigations
Medicines prioritised for targeted review 69 134 Referred to another TGA area or government organisation 14 18 No further action takena 32 54 Total completed investigations 115 206 a The outcome ‘no further action taken’ includes examples where the investigation was resolved by other means
such as the product has been or is currently under review; the complaint was not justified and did not warrant further action; or advice was provided to the complainant.
Therapeutic Goods Administration
Annual Performance Statistics Report | July 2016 to June 2017 Page 23 of 62
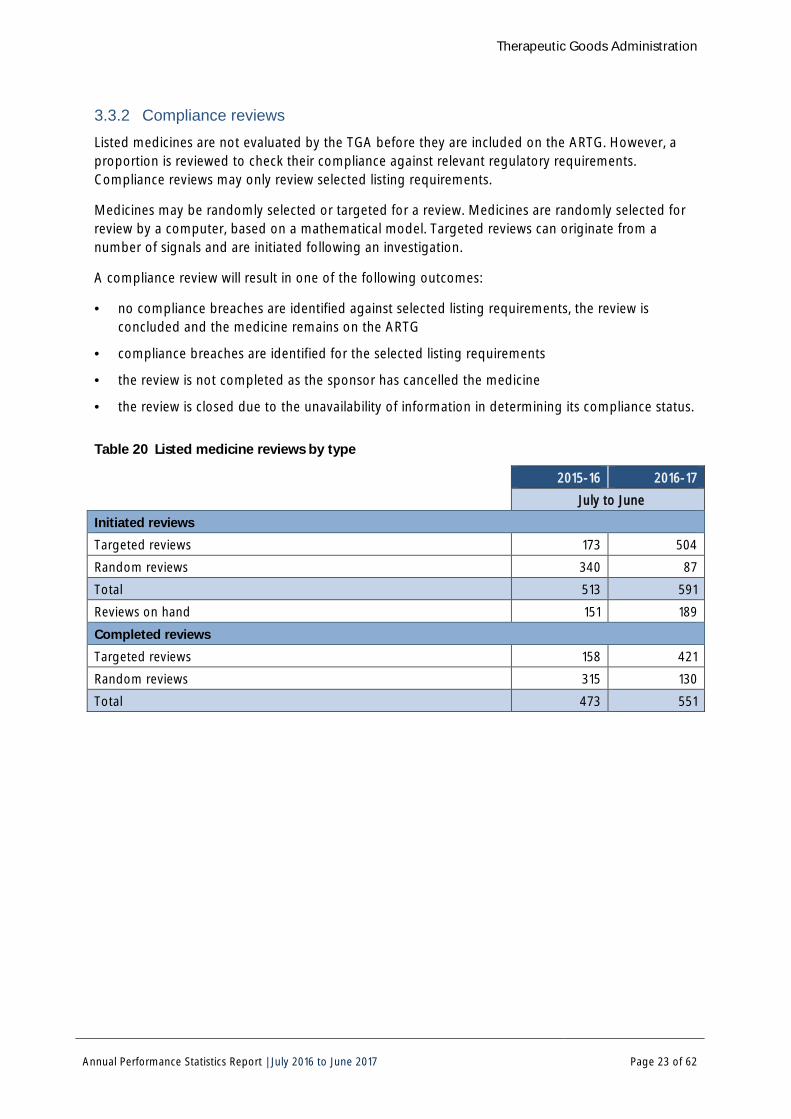
3.3.2 Compliance reviews Listed medicines are not evaluated by the TGA before they are included on the ARTG. However, a proportion is reviewed to check their compliance against relevant regulatory requirements. Compliance reviews may only review selected listing requirements.
Medicines may be randomly selected or targeted for a review. Medicines are randomly selected for review by a computer, based on a mathematical model. Targeted reviews can originate from a number of signals and are initiated following an investigation.
A compliance review will result in one of the following outcomes:
· no compliance breaches are identified against selected listing requirements, the review is concluded and the medicine remains on the ARTG
· compliance breaches are identified for the selected listing requirements
· the review is not completed as the sponsor has cancelled the medicine
· the review is closed due to the unavailability of information in determining its compliance status.
Table 20 Listed medicine reviews by type
2015-16 2016-17 July to June
Initiated reviews
Targeted reviews 173 504 Random reviews 340 87 Total 513 591 Reviews on hand 151 189 Completed reviews
Targeted reviews 158 421 Random reviews 315 130 Total 473 551

Therapeutic Goods Administration
Annual Performance Statistics Report | July 2016 to June 2017 Page 24 of 62
Table 21 Completed listed medicine reviews by outcome
2015-16 2016-17 July to June
Compliance status determined Medicines with no compliance breaches 81 87 Medicines with verified compliance breaches 327 330 Sub-total 408 417 Compliance status unable to be determined Medicines cancelled by sponsors after request for information 43 74 Medicines not yet manufactured 19 58 Other 1 1 Sub-total 63 133 Product not a therapeutic good 2 1 Total completed 473 551

Therapeutic Goods Administration
Annual Performance Statistics Report | July 2016 to June 2017 Page 25 of 62
Figure 4 Outcomes of compliance reviews by reason for initiation
Compliance status determined
76%
Compliance status unable to be determined
24%
No compliance breaches
21%
Verified compliance breaches
79%
Cancelled by sponsor after request for information
56%
Not manufactured 44%
Other 0%
Random 31%
Targeted 69%
Random 26%
Targeted 74%
Random 14%
Targeted 86%
Random 10%
Targeted 90%
Targeted 100%
In this period, we have performed a higher proportion of targeted reviews than in 2015-16. We initiated a number of targeted compliance projects based on the compliance data obtained from the previous reporting period. These projects have covered oral probiotics indicated for vaginal conditions and listed medicines with blood glucose and cholesterol indications. Of the reviews where we were able to determine a compliance status, 79% had verified compliance breaches, which is consistent with the non-compliance rate from the previous period, despite the different proportion of random to targeted reviews.

Therapeutic Goods Administration
Annual Performance Statistics Report | July 2016 to June 2017 Page 26 of 62
Table 22 Types of listed medicine compliance issues identified
Of the completed compliance reviews, the following are the types of issues identified in those medicines where a compliance breach was verified. Individual medicines may have multiple issues.
2015-16 2016-17 July to June
Type of compliance issue Information provided in ARTG entry 53 119 Manufacturing, quality and/or formulation 63 62 Labellinga 110 94 Advertisinga 71 86 Unacceptable presentationa 119 140 Evidenceb 210 180 Safetyc 13 22 Non-response to a request for informationd 6 8 Otherd 2 4 a In previous reports ‘Labelling’, ‘Advertising’ and ‘Unacceptable presentation’ were reported collectively as
‘Labelling and/or advertising’. The 2015-16 data has been updated to incorporate the additional breakdown of categories. ‘Unacceptable presentation’ includes the presentation (labelling, packaging and any advertising material) being misleading to consumers and text and graphics being unacceptable.
b ‘Evidence’ means the evidence held by the sponsor does not support the claims relating to the medicine. c ‘Safety’ means that the medicine is not safe for the purposes for which it is to be used. d In previous reports ‘other’ included non-response to a request for information. However this is now being
reported separately.
Therapeutic Goods Administration
Annual Performance Statistics Report | July 2016 to June 2017 Page 27 of 62
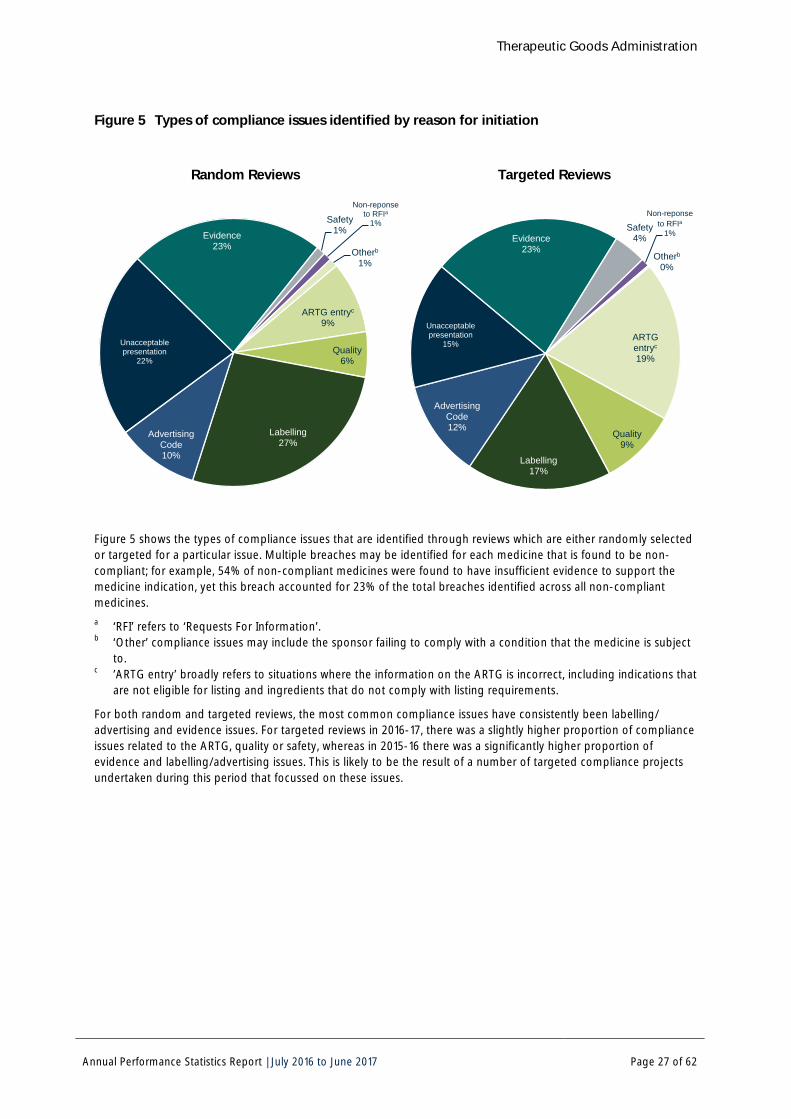
Figure 5 Types of compliance issues identified by reason for initiation
Random Reviews
Targeted Reviews
ARTG entryc 9%
Quality 6%
Labelling 27%
Advertising Code 10%
Unacceptable presentation
22%
Evidence 23%
Safety 1%
Figure 5 shows the types of compliance issues that are identified through reviews which are either randomly selected or targeted for a particular issue. Multiple breaches may be identified for each medicine that is found to be non-compliant; for example, 54% of non-compliant medicines were found to have insufficient evidence to support the medicine indication, yet this breach accounted for 23% of the total breaches identified across all non-compliant medicines. a ‘RFI’ refers to ‘Requests For Information’. b ‘Other’ compliance issues may include the sponsor failing to comply with a condition that the medicine is subject
to. c ’ARTG entry’ broadly refers to situations where the information on the ARTG is incorrect, including indications that
are not eligible for listing and ingredients that do not comply with listing requirements.
For both random and targeted reviews, the most common compliance issues have consistently been labelling/ advertising and evidence issues. For targeted reviews in 2016-17, there was a slightly higher proportion of compliance issues related to the ARTG, quality or safety, whereas in 2015-16 there was a significantly higher proportion of evidence and labelling/advertising issues. This is likely to be the result of a number of targeted compliance projects undertaken during this period that focussed on these issues.
Non-reponse to RFIa
1%
Otherb 1%
ARTG entryc 19%
Quality 9%
Labelling 17%
Advertising Code 12%
Unacceptable presentation
15%
Evidence 23%
Safety 4%
Non-reponse to RFIa
1%
Otherb 0%
Therapeutic Goods Administration
Annual Performance Statistics Report | July 2016 to June 2017 Page 28 of 62
Table 23 Actions taken following listed medicine reviews
2015-16 2016-17
July to June
Actions following a Request for Information
Medicines found to be compliant and review concluded 81 87 Medicines cancelled by the TGA without a proposal to cancel notice 0 0
Proposal to cancel notice or warninga sent by the TGA 327 330
Total 408 417
Actions following Proposal to Cancel noticeb
Medicines cancelled by the TGA 44 17
Medicines cancelled by sponsors after being notified of compliance breaches 76 84
Reviews concluded after compliance breaches were addressed 207 229 a In some targeted review projects, sponsors are sent a ‘warning’ letter instead of a ‘proposal to cancel’ letter. A
proposal to cancel or warning letter are considered the same for reporting purposes. b The figures provided under ‘Actions following a Proposal to Cancel notice’ are a breakdown of the figures
provided under ‘Actions following a Request for Information’.
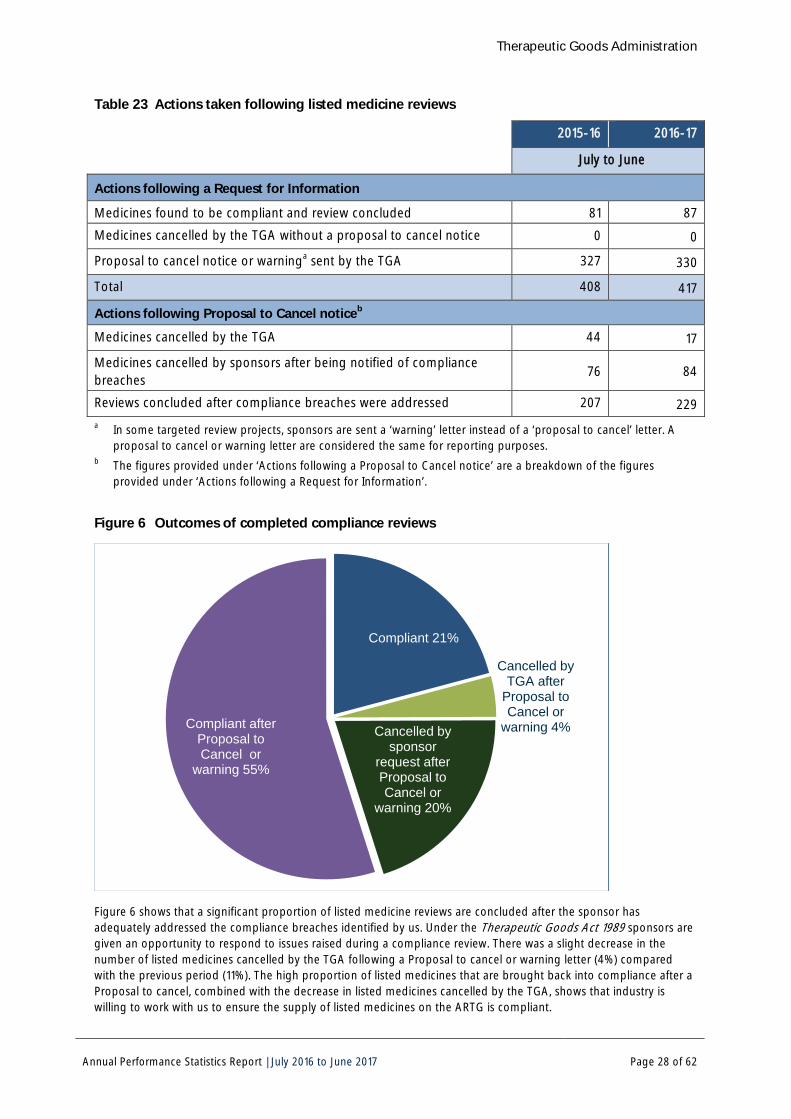
Figure 6 Outcomes of completed compliance reviews
Figure 6 shows that a significant proportion of listed medicine reviews are concluded after the sponsor has adequately addressed the compliance breaches identified by us. Under the Therapeutic Goods Act 1989 sponsors are given an opportunity to respond to issues raised during a compliance review. There was a slight decrease in the number of listed medicines cancelled by the TGA following a Proposal to cancel or warning letter (4%) compared with the previous period (11%). The high proportion of listed medicines that are brought back into compliance after a Proposal to cancel, combined with the decrease in listed medicines cancelled by the TGA, shows that industry is willing to work with us to ensure the supply of listed medicines on the ARTG is compliant.
Compliant 21%
Cancelled by TGA after
Proposal to Cancel or
warning 4% Cancelled by sponsor
request after Proposal to Cancel or
warning 20%
Compliant after Proposal to Cancel or
warning 55%

Therapeutic Goods Administration
Annual Performance Statistics Report | July 2016 to June 2017 Page 29 of 62
4. Biologicals The Australian Regulatory Guidelines for Biologicals define the different biological classes.
4.1. Inclusion of biologicals
Table 24 Applications for biologicals received and on hand
2015-16 2016-17 July to June
Applications received
Technical Master File (TMF)a new 2 0 TMF annual updates 6 5 TMF variations 9 20 TMF notifications 7 27 Plasma Master Fileb annual updates 15 11 Biological Class 2 – new applications 2 4 Biological Class 3 – new applications 2 0 Biological Class 2 – variations 26 14 Biological Class 3 – variations 2 1 Total received 71 82 Applications on hand
TMF new 2 1 TMF annual updates 4 4 TMF variations 2 7 TMF notifications 0 0 Plasma Master File annual updates 3 4 Biological Class 2 – new applications 3 6 Biological Class 3 – new applications 4 3 Biological Class 2 – variations 7 2 Biological Class 3 – variations 1 0 Total on hand 26 27 a Technical Master Files (TMF) contain information from manufacturers that demonstrate how product safety and
quality standards have been met for Blood, Blood Components and Haematopoietic Progenitor Cells. b Plasma Master Files contain control strategies that ensure the quality and safety of plasma, from collection
through to plasma pooling prior to fractionation and including donor selection criteria and testing, which are part of medicinal products or medical devices.
Therapeutic Goods Administration
Annual Performance Statistics Report | July 2016 to June 2017 Page 30 of 62
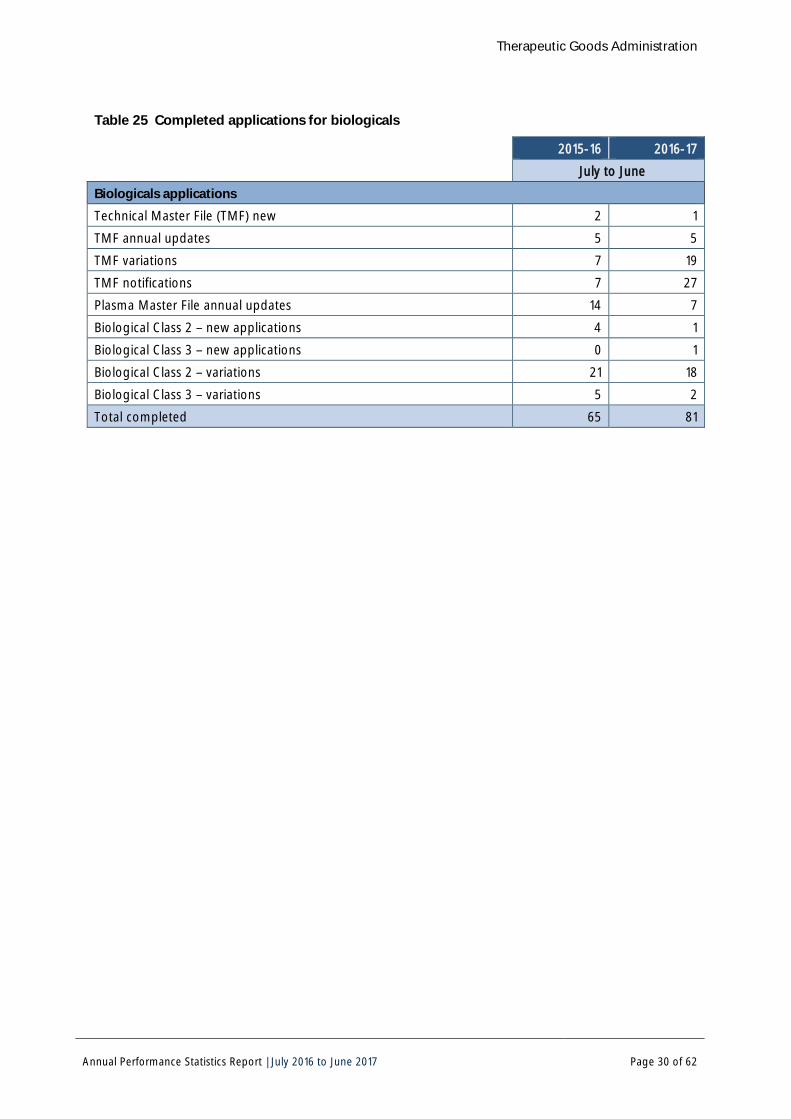
Table 25 Completed applications for biologicals
2015-16 2016-17 July to June
Biologicals applications
Technical Master File (TMF) new 2 1 TMF annual updates 5 5 TMF variations 7 19 TMF notifications 7 27 Plasma Master File annual updates 14 7 Biological Class 2 – new applications 4 1 Biological Class 3 – new applications 0 1 Biological Class 2 – variations 21 18 Biological Class 3 – variations 5 2 Total completed 65 81

Therapeutic Goods Administration
Annual Performance Statistics Report | July 2016 to June 2017 Page 31 of 62
5. Medicine and vaccine adverse event reports
5.1. Adverse medicine and vaccine reaction notifications
Table 26 Source of notifications of medicine and vaccine adverse reactions
2015-16 2016-17
July to June
Reports with clear causality by reporter
Hospitals 2,194 1,850 Companies 8,776 9,194 General practitioners 644 573 Specialists 221 245 Pharmacists 883 1,063
Members of the public 813 1,104 Nurses, dentists, complementary healthcare practitioners 214 157 State/Territory Health departments 2,619 3,274 Reports withdrawn, or rejected, or without clear causality
1,269 2,276 Total received 17,633 19,736 Mean number of reports received weekly 339 380 Vaccine reports included in this table 3,361 4,020
Therapeutic Goods Administration
Annual Performance Statistics Report | July 2016 to June 2017 Page 32 of 62
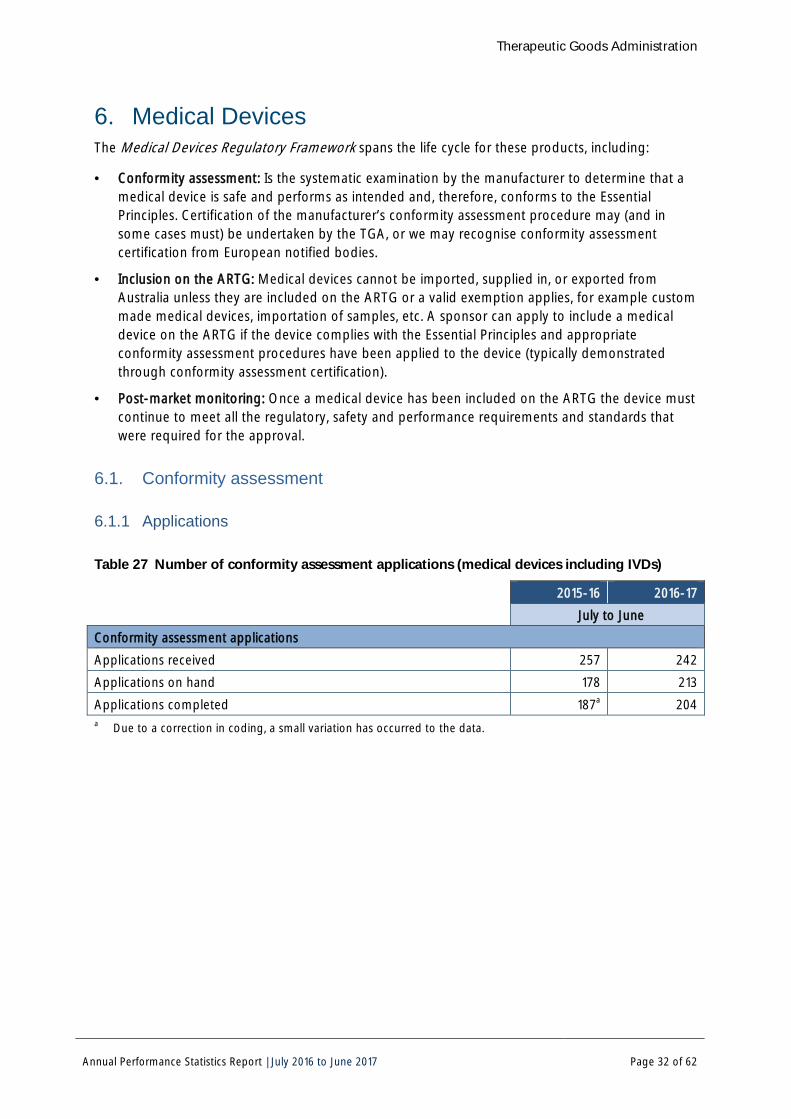
6. Medical Devices The Medical Devices Regulatory Framework spans the life cycle for these products, including:
· Conformity assessment: Is the systematic examination by the manufacturer to determine that a medical device is safe and performs as intended and, therefore, conforms to the Essential Principles. Certification of the manufacturer’s conformity assessment procedure may (and in some cases must) be undertaken by the TGA, or we may recognise conformity assessment certification from European notified bodies.
· Inclusion on the ARTG: Medical devices cannot be imported, supplied in, or exported from Australia unless they are included on the ARTG or a valid exemption applies, for example custom made medical devices, importation of samples, etc. A sponsor can apply to include a medical device on the ARTG if the device complies with the Essential Principles and appropriate conformity assessment procedures have been applied to the device (typically demonstrated through conformity assessment certification).
· Post-market monitoring: Once a medical device has been included on the ARTG the device must continue to meet all the regulatory, safety and performance requirements and standards that were required for the approval.
6.1. Conformity assessment
6.1.1 Applications
Table 27 Number of conformity assessment applications (medical devices including IVDs)
2015-16 2016-17 July to June
Conformity assessment applications Applications received 257 242 Applications on hand 178 213 Applications completed 187a 204 a Due to a correction in coding, a small variation has occurred to the data.

Therapeutic Goods Administration
Annual Performance Statistics Report | July 2016 to June 2017 Page 33 of 62
6.1.2 Outcomes Table 28 Outcomes of conformity assessment applications
2015-16 2016-17 July to June New
Approved 49 37 Rejected 3 1 Withdrawn / Lapsed 23 20 Variation (changes and re-certifications)
Approved 91 124 Rejected 3 2 Withdrawn / Lapsed 18 20 Total 187 204 Table 30 has been broken down into ‘New’ and ‘Variation’ assessment application to provide additional transparency and understanding. In reviewing the changes in reporting the final total was increased by one, as per updates to operational data.
6.1.3 Processing times We are required to complete conformity assessment applications within 255 working days.
Processing time is defined as the number of working days from the acceptance of the application until formal notification of decision. Under the Therapeutic Goods Regulations 1990, working days exclude public holidays and weekends. Processing time excludes time where we were unable to progress the application until the sponsor provided additional information unless otherwise specified.
Table 29 TGA processing times for new devices and variations
2015-16 2016-17 July to June
New devices
Mean TGA processing time (days) 133 129 Median TGA processing time (days) 178 167 Variations (changes and recertifications)
Mean TGA processing time (days) 93 114 Median TGA processing time (days) 71 101 During 2016-17, 100% of conformity assessment applications were completed within 200 working days.
Therapeutic Goods Administration
Annual Performance Statistics Report | July 2016 to June 2017 Page 34 of 62
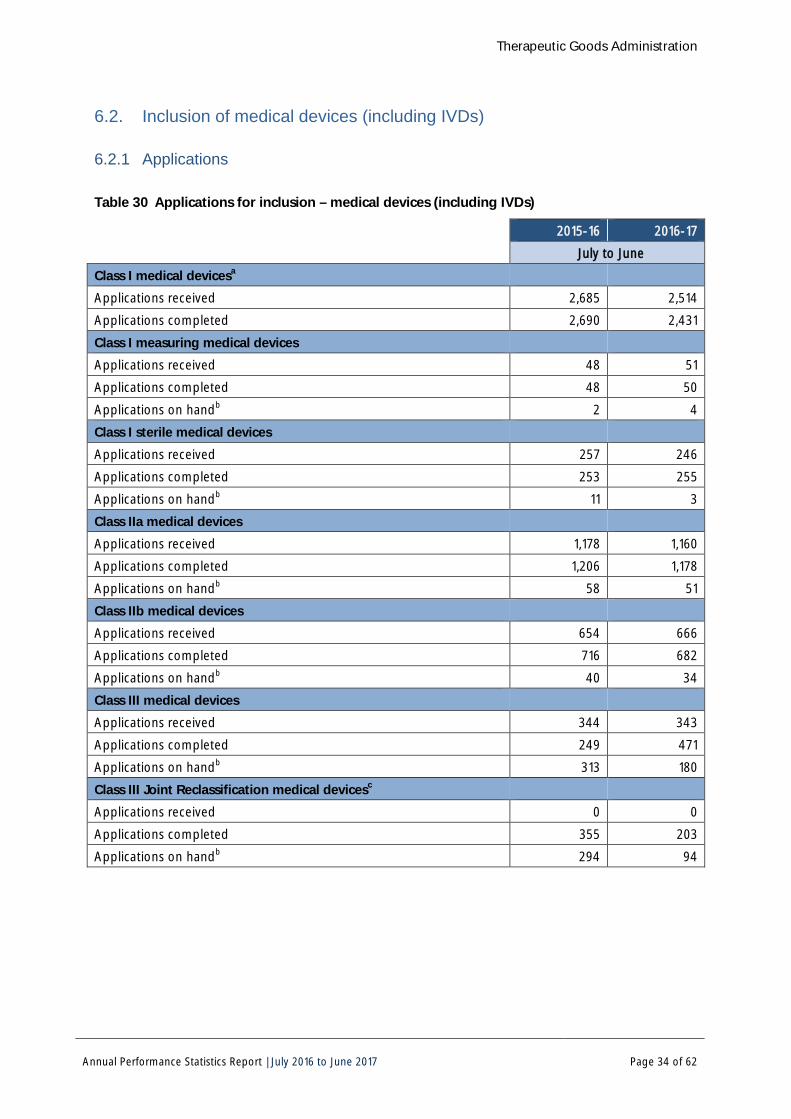
6.2. Inclusion of medical devices (including IVDs)
6.2.1 Applications
Table 30 Applications for inclusion – medical devices (including IVDs)
2015-16 2016-17 July to June
Class I medical devicesa Applications received 2,685 2,514 Applications completed 2,690 2,431 Class I measuring medical devices Applications received 48 51 Applications completed 48 50 Applications on handb 2 4 Class I sterile medical devices Applications received 257 246 Applications completed 253 255 Applications on handb 11 3 Class IIa medical devices Applications received 1,178 1,160 Applications completed 1,206 1,178 Applications on handb 58 51 Class IIb medical devices Applications received 654 666 Applications completed 716 682 Applications on handb 40 34 Class III medical devices Applications received 344 343 Applications completed 249 471 Applications on handb 313 180 Class III Joint Reclassification medical devicesc Applications received 0 0 Applications completed 355 203 Applications on handb 294 94

Therapeutic Goods Administration
Annual Performance Statistics Report: July 2016 to June 2017 Page 35 of 62
2015-16 2016-17 July to June
Active Implantable Medical Devices (AIMD)
Applications received 49 48 Applications completed 19 87 Applications on handb 62 23 Class 1 IVDsd Applications received 92 94 Applications completed 112 91 Applications on handb 1 4 Class 2 IVDs Applications received 104 96 Applications completed 148 94 Applications on handb 10 12 Class 3 IVDs Applications received 65 49 Applications completed 131 45 Applications on handb 11 15 Class 4 IVDs Applications received 25 15 Applications completed 29 15 Applications on handb 0 0 a Class I medical devices are automatically included (i.e. these applications are completed within 24 hours). There
are no applications for this classification of device ‘on hand’. Differences in the number received and finalised relate to those applications received on the last day of the reporting period and/or technological errors occurring in the system.
b Applications on hand – figures shown are correct as of the date when the data was extracted. There may also be delays between the date of the decision and the time when the system is updated due to administrative and/or technological processes.
c The transition period for joint reclassification finished on 30 June 2015. A large number of applications were received at the end of this transition period, late in the January to June 2015 reporting period. As the transition period has now finished Class III joint reclassification applications will be rolled into the general Class III applications in future reports.
d The number of applications for Class 1 IVD includes auto-included devices and applications completed with or without audit.

Therapeutic Goods Administration
Annual Performance Statistics Report: July 2016 to June 2017 Page 36 of 62
6.2.2 Outcomes Class I automatically included medical devices are not counted in the outcomes for inclusion applications as these applications cannot be rejected.
Table 31 Outcomes of medical device applications by classification
Number of applications 2015-16 2016-17
Device Classification
Approved/ Accepted
Rejected/ Lapsed
Withdrawn Approved/ Accepted
Rejected/ Lapsed
Withdrawn
Class I 2,690 0 0 2,431 0 0 Class I Measurement 47 0 1 44 2 4 Class I Sterile 234 0 19 248 0 7 Class IIa 1,132 2 72 1,128 6 44 Class IIb 679 1 36 659 3 20 Class III 207 12 30 398 18 55 Class III Reclassification 278 7 70 152 3 48 AIMD 17 0 2 87 0 0 Class 1 IVDa 112 0 0 84 0 7 Class 2 IVDa 136 3 9 71 2 21 Class 3 IVDa 123 1 7 37 0 8 Class 4 IVDa 28 0 1 14 0 1 a The IVD transition period ended on 30 June 2015, with a number of applications received late in the transition
period. The higher number of applications completed in 2015-16 reflected the end of this transition period.

Therapeutic Goods Administration
Annual Performance Statistics Report: July 2016 to June 2017 Page 37 of 62
6.2.3 Processing times The agreed target time for Level 1 application audits is 30 TGA work days and for Level 2 application audits is 60 TGA work days (reflected in ‘TGA days’). This does not include the period we are waiting for information or payment of fees (reflected in ‘sponsor days’).
Table 32 Processing times for medical device application audits (including IVDs)
2015-16 2016-17 Number of
applications Sponsor days
TGA daysa
Number of applications
Sponsor days
TGA daysa
Mean Processing Time Medical devices
Applications completed without audit 2,112b 2,105 Non-compulsory auditc 497 30 43 310 42 55 Level 1 compulsory audit 32 27 26 40 25 18 Level 2 compulsory audit 205 55 161 471 74 159 IVDs
Applications completed without audit 148b
77
IVD non-compulsory audit 17 41 65 10 35 46 IVD compulsory audit 159 26 45 82 29 39 Median Processing Time Medical devices
Applications completed without audit 2,112b
2,105
Non-compulsory auditc 497 21 21 310 27 24 Level 1 compulsory audit 32 23 9 40 23 13 Level 2 compulsory audit 205 49 158 471 60 155 IVDs
Applications completed without audit 148b
77
IVD non-compulsory audit 17 33 58 10 22 36 IVD compulsory audit 159 21 41 82 18 29 a TGA time starts when the application is selected for audit, and does not include public holidays and weekends,
and the time when we wait for information or payment from the sponsor. b Auto-included applications for Class I and Class 1 IVD are complete within 24 hours, and not included in the
figures above. c Non-compulsory audit – estimate for the audit processing time does not include applications for reclassification
of joint replacement medical devices received during transitional period (Class III Joint Reclassification medical devices), and applications supported by European Community (EC) certificates issued by certain notified bodies.

Therapeutic Goods Administration
Annual Performance Statistics Report: July 2016 to June 2017 Page 38 of 62
6.3. Post-market monitoring
6.3.1 Compliance reviews As Class I medical devices are automatically included on the ARTG, we undertake post-market compliance reviews for these devices. This includes restricted word reviews, where applications for Class I devices are identified by the use of specific words indicative of risk, or listing issues relating to the inclusion of the device.
We also conduct targeted compliance reviews that are initiated on a case by case basis. These may be conducted in relation to devices of any Class.
Table 33 Restricted word Class 1 medical device and targeted compliance reviews
2015-16 2016-17 July to June
Restricted word reviews
Reviews completed 0 54 Reviews commenced 1 55 Reviews on hand 1 1 Targeted compliance reviewsa
Reviews completed 104 35 Reviews commenced 83 45 Reviews on hand 164 175 a The number of targeted reviews includes the number of compliance reviews undertaken in relation to all classes
of medical devices.
6.3.2 Post-market reviews We also undertake a range of post market reviews.
Table 34 Medical device targeted reviews
2015-16 2016-17 July to June
Post market reviews
Reviews commenced – number of ARTG entries 80 396 Reviews completed – number of ARTG entries 83 239 Reviews on hand – number of ARTG entries 163 263

Therapeutic Goods Administration
Annual Performance Statistics Report: July 2016 to June 2017 Page 39 of 62
6.3.3 Medical device incident reports Processing time is defined as the number of working days from the receipt of the notification until the incident has been investigated and resolved. Under the Therapeutic Goods Regulations 1990, working days exclude public holidays and weekends.
The target timeframe for processing of medical device incident reports is 90 working days.
Table 35 Number of medical device incident reports and processing times
2015-16 2016-17 July to June
Device incident reports
Reports received 3,841 4,896 Reports completed 3,608 4,918 Reports still in progress 207 380 Processing time
Mean TGA processing time (days) 1 1 Median TGA processing time (days) 14 10 Percentage processed within target timeframe 100% 95%

Therapeutic Goods Administration
Annual Performance Statistics Report: July 2016 to June 2017 Page 40 of 62
Table 36 Medical device incident report outcomesa
2015-16 2016-17 July to June
Incident report outcome
Reviewed and used for trend analysis purposes 2,988 4,125 Reviewed, no further action required 330 279 Product recall 40 70 Recall for product correction 19 4 Hazard alert 25 22 Product notification 1 0 Safety alert 9 20 Product enhancement/improvement notice 0 1 Instructions for use amended 3 5 Referral for post-market review 23 82 Refer to another TGA Branch 51 39 Company warned 0 13 Product suspended from ARTG 0 0 Product cancelled from ARTG 4 1 Manufacturing process improvements 10 12 Quality system process improvements 1 0 Maintenance carried out by the hospital 0 0 Change to design 13 3 Not device related 9 16 Other 39 81 a Outcomes are not mutually exclusive.

Therapeutic Goods Administration
Annual Performance Statistics Report: July 2016 to June 2017 Page 41 of 62
6.3.4 Devices manufacturing
Table 37 Outcomes of Quality Management System (QMS) audits of Australian manufacturers
2015-16 2016-17 July to June
QMS audits (Australia)
Number of audits conducted 38 38 Satisfactory compliance (of completed audits) 79% 71% Marginal compliance (of completed audits) 21% 24% Unacceptable (of completed audits) 0% 0% Close-out in Progress 0% 5% Processing time
Initial audits conducted within 3 months of applicationa 17% 57% Re-audits conducted within 6 months of due date 41% 16%
a The improvement in processing times for initial audits was the outcome of process improvement resulting in more timely internal notification of required audits, and more up to date status of manufacturers due to the Medical Devices Single Audit Program (MDSAP).
Table 38 Outcomes of QMS audits of overseas manufacturers
2015-16 2016-17 July to June
QMS audits (overseas)
Number of audits conducted 20 26 Satisfactory compliance (of completed audits) 75% 92% Marginal compliance (of completed audits) 15% 0% Unacceptable (of completed audits) 10% 0% Close-out in Progress 0% 8% Processing time
Initial certification audits conducted within 6 months of applicationa 50% 80% Certification re-audits conducted within 6 months of due date 17% 9% a The improvement in processing times for initial audits was the outcome of process improvement resulting in
more timely internal notification of required audits, and more up to date status of manufacturers due to the MDSAP.

Therapeutic Goods Administration
Annual Performance Statistics Report: July 2016 to June 2017 Page 42 of 62
7. Exports Processing time is defined as the number of working days from the acceptance of the application, including payment, until formal notification of decision. Under the Therapeutic Goods Regulations 1990, working days exclude public holidays and weekends. Processing time excludes time where we were unable to progress the application until the sponsor provided additional information unless otherwise specified.
7.1. Export only medicines The target timeframe for processing of export only medicine applications and variations is 31 working days.
Table 39 Approval times for export only medicines
2015-16 2016-17 July to June
New applications
Mean TGA processing time (days) 21 25 Median TGA processing time (days) 20 26 Percentage processed within target processing time 98% 75% Variations
Mean TGA processing time (days) 18 22 Median TGA processing time (days) 16 22 Percentage processed within target processing time 100% 89%
Table 40 Applications for new and variations to export only medicines
2015-16 2016-17 July to June
Export only applications
Applications received 241 242 Applications awaiting response from sponsor 20 9 Applications completed
Approved 221 207 Withdrawn 10 17 Total completed 231 224

Therapeutic Goods Administration
Annual Performance Statistics Report: July 2016 to June 2017 Page 43 of 62
7.2. Export certifications for medicines The target processing time for applications for an export certificate for a medicine is 15 working days.
Table 41 Export certification applications and processing times
2015-16 2016-17 July to June
Applications received 2,124 1,582 Applications completed
Approved 2,127 1,413 Withdrawn 18 3 Total completed 2,145 1,416 Processing times
Mean TGA processing time (days) 12 12 Median TGA processing time (days) 12 13 Percentage processed within target timea 98% 99% a We aim to have 100% of applications processed within the target timeframe.
7.3. Export certification assessment for medical devices The target processing time for applications for an export certificate for a medical device is 5 working days.
Table 42 Medical device applications and processing times for export certification assessments
2015-16 2016-17 July to June
Applications received 496 553 Applications completed Export certificates issued 483 504 Applications withdrawn 3 10 Total completed 486 514 Processing time
Mean TGA processing time (days) 4 4.5 Median TGA processing time (days) 5 4 Percentage processed within target timea 96% 83% a We aim to have at least 90% of applications processed within the target timeframe.
Therapeutic Goods Administration
Annual Performance Statistics Report: July 2016 to June 2017 Page 44 of 62
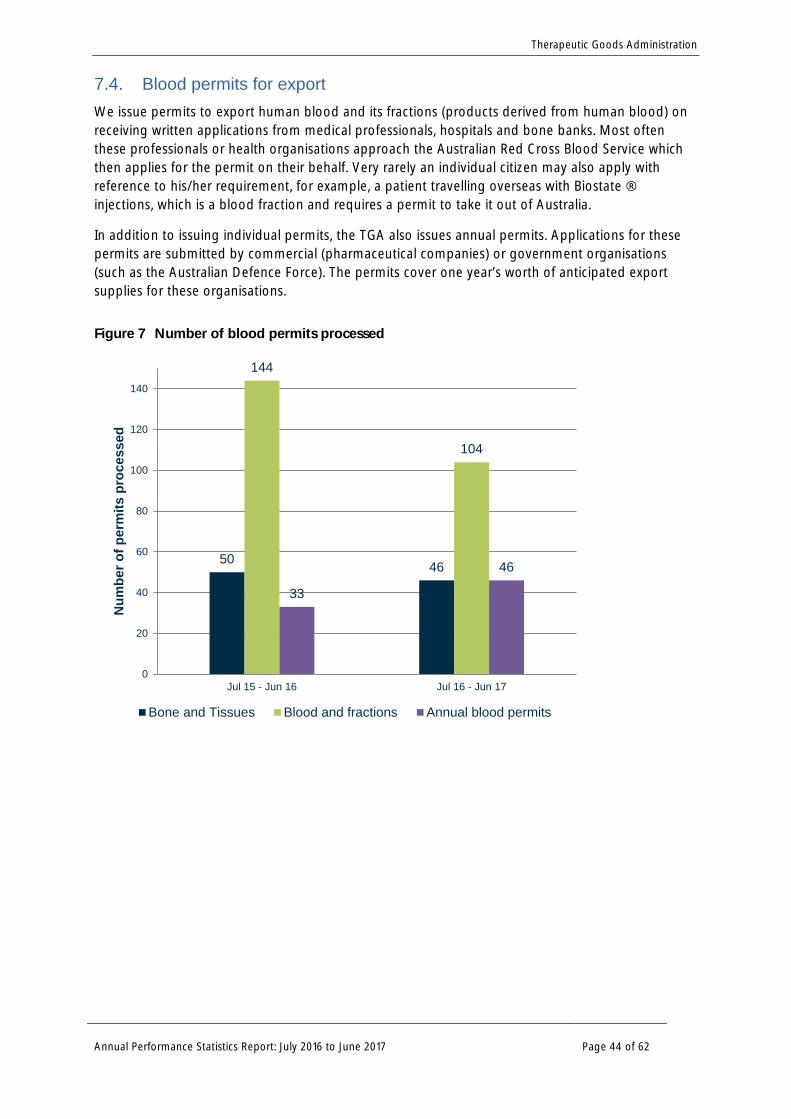
7.4. Blood permits for export We issue permits to export human blood and its fractions (products derived from human blood) on receiving written applications from medical professionals, hospitals and bone banks. Most often these professionals or health organisations approach the Australian Red Cross Blood Service which then applies for the permit on their behalf. Very rarely an individual citizen may also apply with reference to his/her requirement, for example, a patient travelling overseas with Biostate ® injections, which is a blood fraction and requires a permit to take it out of Australia.
In addition to issuing individual permits, the TGA also issues annual permits. Applications for these permits are submitted by commercial (pharmaceutical companies) or government organisations (such as the Australian Defence Force). The permits cover one year’s worth of anticipated export supplies for these organisations.
Figure 7 Number of blood permits processed
50 46
144
104
33
46
0
20
40
60
80
100
120
140
Jul 15 - Jun 16 Jul 16 - Jun 17
Num
ber o
f per
mits
pro
cess
ed
Bone and Tissues Blood and fractions Annual blood permits

Therapeutic Goods Administration
Annual Performance Statistics Report: July 2016 to June 2017 Page 45 of 62
8. Access to unapproved therapeutic goods
8.1. Special Access Scheme The SAS refers to arrangements which provide for the import and/or supply of an unapproved therapeutic good for a single patient, on a case by case basis. For this reporting period, two pathways existed under the scheme and they are categorised as follows:
· Category A is a notification pathway which can only be accessed by medical practitioners for patients who are seriously ill with a condition from which death is reasonably likely to occur within a matter of months, or from which premature death is reasonably likely to occur in the absence of early treatment.
· Category B is an application pathway which can be accessed by health practitioners for patients that do not fit the Category A definition. An approval letter from TGA is required before the goods may be accessed.
Any unapproved therapeutic good can potentially be supplied via the SAS except for drugs of abuse in Schedule 9 of the Poisons Standard (where the manufacture, possession, sale or use is prohibited by State or Territory law) which cannot be accessed through the SAS Category A process.
Table 43 SAS medicine notifications and applications
2015-16 2016-17
July to June Category A notifications
Total Category A notifications 38,806 46,678 Category B applications
Approved 19,307 21,609 Cancelled 312 355 Rejected 51 21 Pending at end of reporting period 443 418 Total Category B applications 20,113 22,403

Therapeutic Goods Administration
Annual Performance Statistics Report: July 2016 to June 2017 Page 46 of 62
Table 44 SAS device notifications and applications
2015-16 2016-17
July to June Category A notifications
Total 3,922 4,914 Category B applications
Approved 2,081 2,113 Cancelled 116 96 Rejected 20 1 Pending at end of reporting period 16 135 Total 2,233 2,345
Table 45 SAS biological notifications and applications
2015-16 2016-17
July to June Category A notifications
Total 44 47 Category B applications
Approved 3,171 2,024 Cancelled 25 89 Rejected 0 0 Pending at end of reporting period 35 44 Total 3,231 2,157
Therapeutic Goods Administration
Annual Performance Statistics Report: July 2016 to June 2017 Page 47 of 62
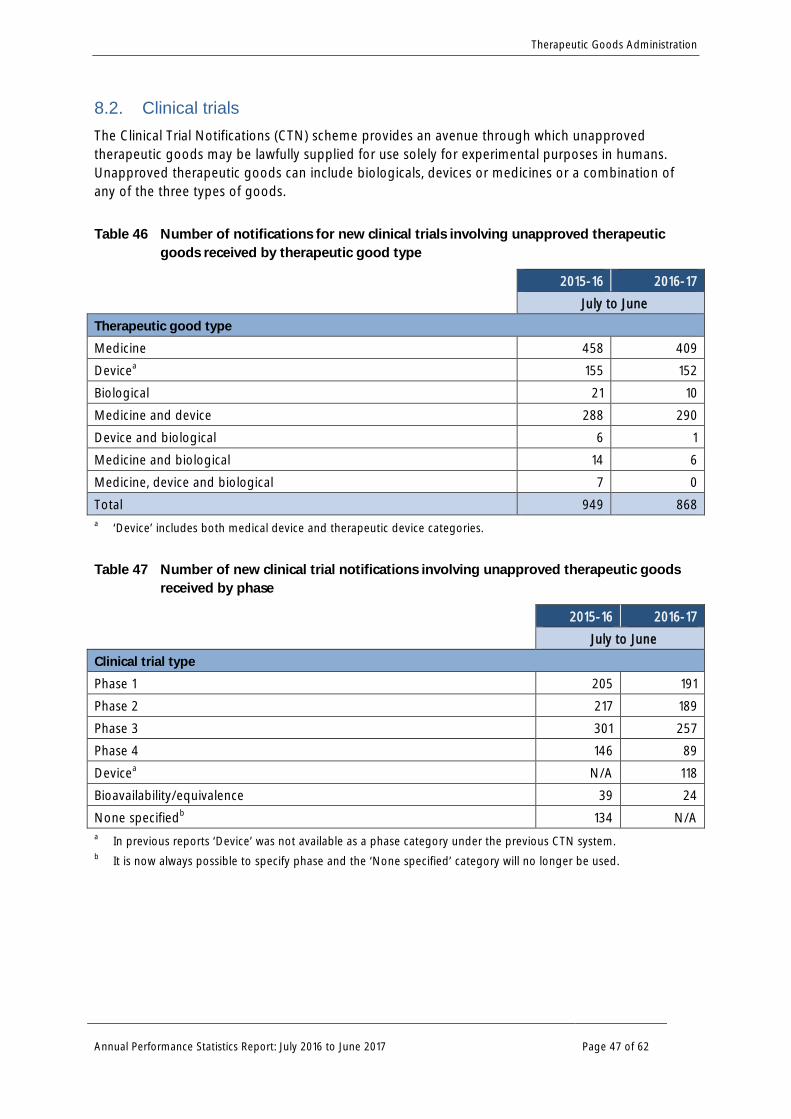
8.2. Clinical trials The Clinical Trial Notifications (CTN) scheme provides an avenue through which unapproved therapeutic goods may be lawfully supplied for use solely for experimental purposes in humans. Unapproved therapeutic goods can include biologicals, devices or medicines or a combination of any of the three types of goods.
Table 46 Number of notifications for new clinical trials involving unapproved therapeutic goods received by therapeutic good type
2015-16 2016-17
July to June
Therapeutic good type
Medicine 458 409 Devicea 155 152 Biological 21 10 Medicine and device 288 290 Device and biological 6 1 Medicine and biological 14 6 Medicine, device and biological 7 0 Total 949 868 a ‘Device’ includes both medical device and therapeutic device categories.
Table 47 Number of new clinical trial notifications involving unapproved therapeutic goods received by phase
2015-16 2016-17
July to June
Clinical trial type
Phase 1 205 191 Phase 2 217 189 Phase 3 301 257 Phase 4 146 89 Devicea N/A 118 Bioavailability/equivalence 39 24 None specifiedb 134 N/A a In previous reports ‘Device’ was not available as a phase category under the previous CTN system. b It is now always possible to specify phase and the ‘None specified’ category will no longer be used.

Therapeutic Goods Administration
Annual Performance Statistics Report: July 2016 to June 2017 Page 48 of 62
Table 48 Number of notifications for new clinical trials and variations to previously notified clinical trials, including non-fee attracting variations, involving unapproved therapeutic goods received by therapeutic good type
2015-16 2016-17
July to June
Therapeutic good type
Medicine 1,090 1,230 Devicea 249 266 Biological 31 12 Medicine and device 1,072 1,417 Device and biological 20 2 Medicine and biological 37 10 Medicine, device and biological 27 1 Total 2,526 2,938 a Device includes both medical device and therapeutic device categories. The online system captures the actual number of notifications received for new clinical trials and requests to change significant details to clinical trials already notified. A variation to a previously notified clinical trial may include an addition of a site(s), change to a therapeutic good, or change in principal investigator etc
Table 49 Number of new clinical trials and variationsa to previously notified clinical trials involving unapproved therapeutic goods received by phase
2015-16 2016-17
July to June
Phases
Phase 1 415 459 Phase 2 598 648 Phase 3 1,177 1,358 Phase 4 274 246 Deviceb N/A 194 Bioavailability/equivalence 46 33 None specifiedc 217 N/A a A variation may include any change to a previously notified clinical trial such as an additional site, change to a
therapeutic good, or change in principal investigator. b In previous reports ‘Device’ was not available as a phase category under the previous CTN system. c It is now always possible to specify phase and the ‘None specified’ category will no longer be used.

Therapeutic Goods Administration
Annual Performance Statistics Report: July 2016 to June 2017 Page 49 of 62
8.3. Authorised Prescribers The Authorised Prescriber Scheme allows approved medical practitioners authority to prescribe a specified unapproved therapeutic good(s) to patients who are identified by their medical condition. If a medical practitioner becomes an Authorised Prescriber they may prescribe the product to patients in their immediate care, within the indication specified, without seeking further approval from the TGA.
Table 50 Authorised Prescriber approvals for medicines, medical devices and biologicals
2015-16 2016-17 July to June
Approvals by therapeutic good type
Number of approvals for medicines 661 764 Number of approvals for medical devices 238 304 Number of approvals for biologicals 0 1
Therapeutic Goods Administration
Annual Performance Statistics Report: July 2016 to June 2017 Page 50 of 62
9. Medicines and biologicals manufacturing
9.1. Manufacturing licences issued to Australian manufacturers
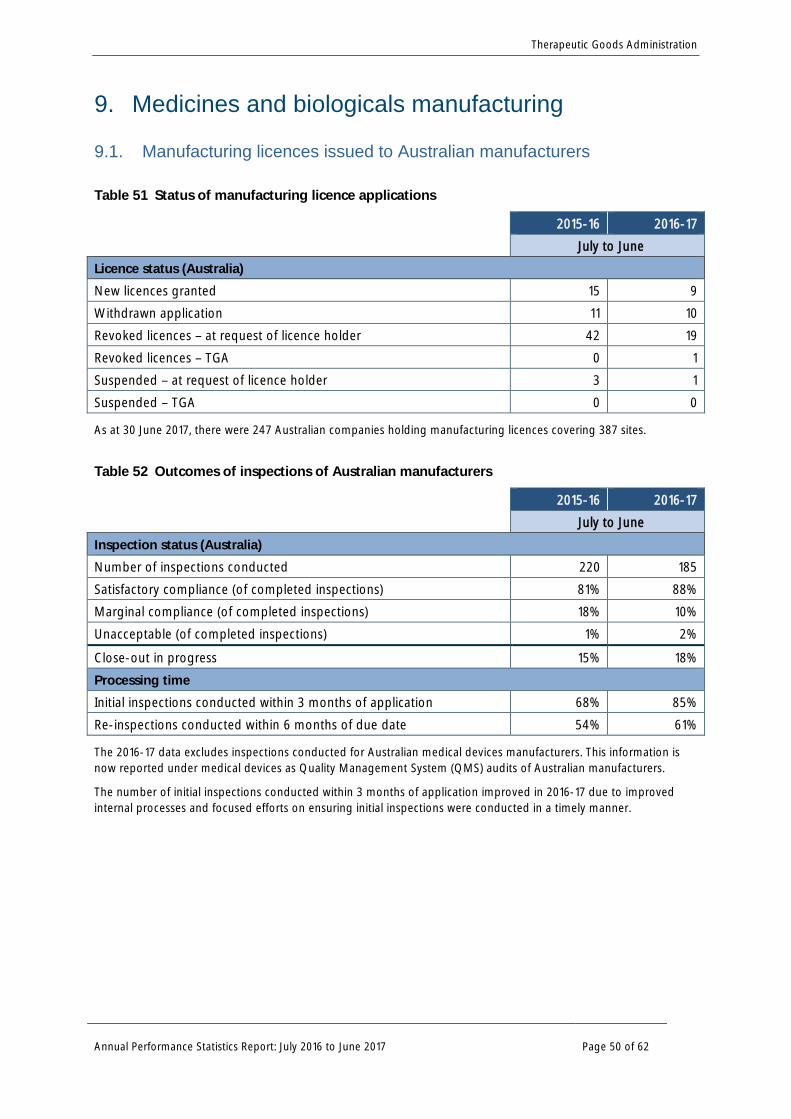
Table 51 Status of manufacturing licence applications
2015-16 2016-17 July to June
Licence status (Australia)
New licences granted 15 9 Withdrawn application 11 10 Revoked licences – at request of licence holder 42 19 Revoked licences – TGA 0 1 Suspended – at request of licence holder 3 1 Suspended – TGA 0 0
As at 30 June 2017, there were 247 Australian companies holding manufacturing licences covering 387 sites.
Table 52 Outcomes of inspections of Australian manufacturers
2015-16 2016-17 July to June
Inspection status (Australia)
Number of inspections conducted 220 185
Satisfactory compliance (of completed inspections) 81% 88% Marginal compliance (of completed inspections) 18% 10% Unacceptable (of completed inspections) 1% 2%
Close-out in progress 15% 18% Processing time
Initial inspections conducted within 3 months of application 68% 85% Re-inspections conducted within 6 months of due date 54% 61%
The 2016-17 data excludes inspections conducted for Australian medical devices manufacturers. This information is now reported under medical devices as Quality Management System (QMS) audits of Australian manufacturers.
The number of initial inspections conducted within 3 months of application improved in 2016-17 due to improved internal processes and focused efforts on ensuring initial inspections were conducted in a timely manner.

Therapeutic Goods Administration
Annual Performance Statistics Report: July 2016 to June 2017 Page 51 of 62
9.2. Approval (certification) of overseas manufacturers
Table 53 Manufacturing certification application by status (overseas)
2015-16 2016-17 July to June
Applications (overseas)
New applications received 38 46 Re-inspection applications 52 38 Applications completed
Certified 44 33 Rejected 28 59 Total completed 72 92
As at 30 June 2017, there were 206 overseas manufacturers covering 207 manufacturing sites that were subject to TGA inspection and approximately 2,700 overseas manufacturing sites that relied on evidence from recognised regulators.
Table 54 Outcomes of inspections of overseas manufacturers
2015-16 2016-17 July to June
Inspection status (overseas)
Number of inspections conducted 76 58 Satisfactory compliance (of completed inspections) 95% 94% Marginal compliance (of completed inspections) 4% 6% Unacceptable (of completed inspections) 1% 0%
Close-out in progress 18% 10% Processing time Initial certification inspections conducted within 6 months of application 40% 64% Certification re-inspections conducted within 6 months of due date 75% 66% The 2016-17 data excludes inspections conducted for overseas medical devices manufacturers. This information is now reported under medical devices as QMS audits of overseas manufacturers. The number of initial overseas inspections conducted within six months of application improved in 2016-17 due to improved internal processes and focused efforts on ensuring initial inspections were conducted in a timely manner.

Therapeutic Goods Administration
Annual Performance Statistics Report: July 2016 to June 2017 Page 52 of 62
9.3. Good Manufacturing Practice clearances GMP clearance is required for all medicines (unless exempt) supplied in Australia. This includes products supplied to sponsors by overseas manufacturers.
Table 55 GMP clearance application status
2015-16 2016-17 July to June
Applications received 5,657 6,506 Applications completed
Approved 5,132 5,067 Rejected 263 642 Total completed 5,395 5,709
Therapeutic Goods Administration
Annual Performance Statistics Report: July 2016 to June 2017 Page 53 of 62
10. Recalls
10.1. Medicine recalls
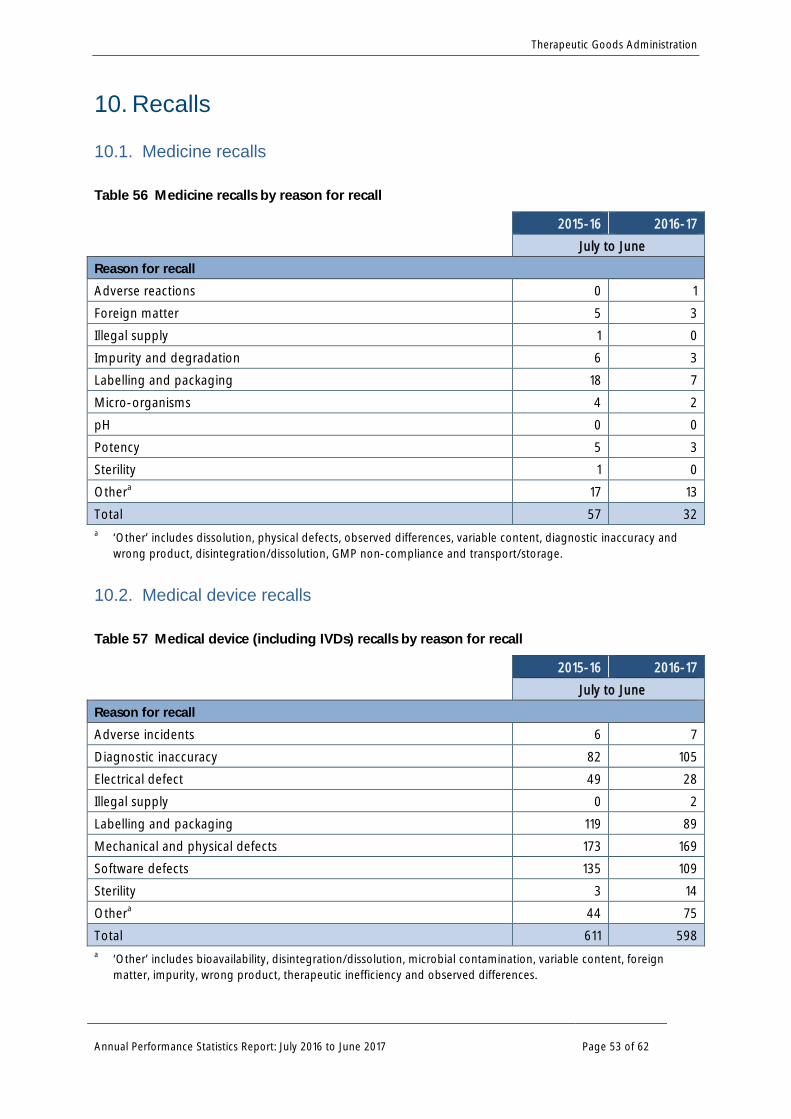
Table 56 Medicine recalls by reason for recall
2015-16 2016-17 July to June
Reason for recall
Adverse reactions 0 1 Foreign matter 5 3 Illegal supply 1 0 Impurity and degradation 6 3 Labelling and packaging 18 7 Micro-organisms 4 2 pH 0 0 Potency 5 3 Sterility 1 0 Othera 17 13 Total 57 32 a ‘Other’ includes dissolution, physical defects, observed differences, variable content, diagnostic inaccuracy and
wrong product, disintegration/dissolution, GMP non-compliance and transport/storage.
10.2. Medical device recalls
Table 57 Medical device (including IVDs) recalls by reason for recall
2015-16 2016-17 July to June
Reason for recall
Adverse incidents 6 7 Diagnostic inaccuracy 82 105 Electrical defect 49 28 Illegal supply 0 2 Labelling and packaging 119 89 Mechanical and physical defects 173 169 Software defects 135 109 Sterility 3 14 Othera 44 75 Total 611 598 a ‘Other’ includes bioavailability, disintegration/dissolution, microbial contamination, variable content, foreign
matter, impurity, wrong product, therapeutic inefficiency and observed differences.

Therapeutic Goods Administration
Annual Performance Statistics Report: July 2016 to June 2017 Page 54 of 62
10.3. Biological recalls
Table 58 Biological recalls
2015-16 2016-17 July to June
Recalls to hospital level 0 2
Therapeutic Goods Administration
Annual Performance Statistics Report: July 2016 to June 2017 Page 55 of 62
11. Laboratory testing The Laboratories Branch conducts post-market monitoring and compliance testing, investigations and reviews, as well as market authorisation assessment of therapeutic goods.
The Laboratories Branch identifies and prioritises therapeutic goods for testing to fulfil the regulatory compliance and monitoring requirements of the TGA, and the transparency and accountability requirements of government. The testing program also provides flexibility and capacity to provide testing for investigations into problem reports, complaints and urgent public health concerns.
A risk management approach is used, which is consistent with ISO 31000: Risk Management principals and guidelines, to identify products with a higher risk of not complying with the required quality standards. This risk based, targeted approach to testing is reflected in the failure rates reported in the table below.
The Database of TGA Laboratory Testing Results1 was launched in the first half of 2017 to provide information to the public about the 2000-plus samples we test each year, and to increase understanding of how our testing program contributes to the regulation of therapeutic goods. Consumers and health professionals can now clearly see which products have been tested by the TGA, whether they passed or failed, and for those that did fail what regulatory action was taken. Providing this information has been an important enhancement to the transparency of the Government’s regulatory processes and the vital role of the TGA in ensuring the quality, safety and efficacy of medicines and medical devices for Australian consumers.
1 https://www.tga.gov.au/ws-labs-index

Therapeutic Goods Administration
Annual Performance Statistics Report: July 2016 to June 2017 Page 56 of 62
Table 59 Samples and products tested by type of therapeutic good and percentage which failed
2015-16 2016-17 July to June
Therapeutic good type
Prescription medicines Total 941 1,168 % fail 0.5 0.9
OTC medicines Total 47 51 % fail 19.1 13.7
Complementary medicines Total 108 87 % fail 20.4 13.8
Medical devices Total 114 168 % fail 29.8 31
Contracta Total 19 32 % fail 36.8 62.5
Unregisteredb Total 467 220 % fail 76.2 63.6
Total samples (excluding AHQ samples) 1,696 1,726 Total samplesc 2,202 2,328 Percentage fail 25.5% 14% Total number of products testedd 761 590 a Performed on request for overseas regulators or aid agencies and encompasses medicines and medical devices. b Unregistered refers to products that meet the definition of therapeutic goods but are not included on the ARTG
or otherwise specifically exempted from this requirement in the legislation. This often includes adulterated complementary medicines or counterfeit products.
c Includes accreditation, harmonisation and quality control (AHQ) samples. d The TGA may test a number of samples of each product per reporting period.
Table 60 Samples that failed laboratory testing by reason for July 2016 to June 2017
Med
ical d
evice
s
OTC
med
icine
s
Pres
crip
tion
med
icine
s
Unre
gist
ered
pr
oduc
ts
Com
plem
enta
ry
med
icine
s
Tota
l
Reasons
Contamination 4 4 2 0 2 12 Formulation 0 0 4 136 6 146 Label and packaging deficiencies 8 2 0 0 0 10 Performance 23 1 4 0 3 31 Physical or mechanical properties 17 0 0 3 0 20 Unregistered 0 0 0 1 1 2 Total 52 7 10 140 12 221

Therapeutic Goods Administration
Annual Performance Statistics Report: July 2016 to June 2017 Page 57 of 62
Table 61 Batch release and export certification
2015-16 2016-17
July to June
Batch releases and certifications
Batch releasea 401 453 Export certificationb 59 75 a Evaluation of batch release documentation for vaccines, biotechnology and blood products. b Certification of biological products being exported from Australian manufacturers to overseas markets.
The Laboratories Branch provides WHO-approved certificates for batches of biological products to be exported by Australian manufacturers to overseas markets. The number of certificates provided by the Laboratories Branch therefore depends on the number of requests received.
Table 62 Target timeframes in working days for laboratory testing by priority and testing type
Priority of testing Biochemical/
chemical testing Microbiological testing Medical device testing
Urgent 20 (95% of target times to be met)
40 (95% of target times to be met)
20 (95% of target times to be met)
Priority 40 (80% of target times to be met)
50 (80% of target times to be met)
40 (80% of target times to be met)
Routine 50 50 50 Testing on products linked to potential public safety concerns are assigned to the ‘Urgent’ testing category. Urgent testing may impact on the timeframes for priority and routing testing. Priority is given to testing of products with the highest risk of a quality deficiency. Compliance against these timeframes is outlined in the table below.

Therapeutic Goods Administration
Annual Performance Statistics Report: July 2016 to June 2017 Page 58 of 62
Table 63 Compliance with testing timeframes for July 2016 to June 2017
Priority Total Percentage
Therapeutic good type
Medical devices Routine 128 90% Priority 33 94% Urgent 7 43%
OTC medicines Routine 34 56% Priority 8 100% Urgent 9 100%
Prescription medicines Routine 141 63% Priority 9 78% Urgent 6 83%
Complementary medicines Routine 56 66% Priority 31 68% Urgent 0 N/A
Unregistered products Routine 3 100% Priority 213 95% Urgent 4 100%
Low numbers of samples within categories may affect compliance percentages. Samples involving complex biological assays are excluded from the target turnaround timeframes.

Therapeutic Goods Administration
Annual Performance Statistics Report: July 2016 to June 2017 Page 59 of 62
12. Regulatory compliance The TGA Regulatory Investigations and Enforcement Unit conducts compliance and enforcement activities against a risk based compliance framework. Using principles of responsive regulation, a range of tools are utilised including encouragement and guidance to comply, restrictions or warnings, suspensions or sanctions and cancellations. At the apex, activities including investigations into illegal import or manufacture of unapproved and counterfeit therapeutic goods can result in criminal or civil court action. All compliance activities have the intended purpose of protecting public health.
Table 64 Regulatory compliance investigations by final action taken
2015-16 2016-17 July to June
Investigation in progress 361 1,136 Completed investigations Warned (including destruction) 946 1,973 No offence detected 185 110 Goods released under Personal Import Scheme 519 691 Referred to another agency or department outside Health 28 21 Referred to another branch within the TGA 10 13 Filed for intelligence purposes 55 45 Finalised in a linked file 11 25 Import treated as abandoned goods by Customs 3 8 Recall of goods 2 1 Matters referred to the Commonwealth Director of Public Prosecutions 1 0 Total completed 1,760 2,887 Goods (units) seized and destroyed at the point of importationa N/A 884,081 a Due to a change in reporting function, the number of units can now be captured. Units refers to single dosage
unit e.g. 1 tablet, 1 capsule, 1 tub of powder or single device.

Therapeutic Goods Administration
Annual Performance Statistics Report: July 2016 to June 2017 Page 60 of 62
Table 65 Types of products investigateda
2015-16 2016-17 July to June
Therapeutic good type
Complementary medicines 463 599 Prescription medicines 1,802 4,367 Medical devices 98 166 Homoeopathic medicines 4 36 OTC medicines 45 54 Biological products 48 28 Other 66 119 Total 2,526 5,369 a Regulatory compliance investigations may include more than one type of product.
Table 66 Regulatory compliance investigations by special interest categories
2015-16 2016-17 July to June
Compliance investigation category
Unapproved product 2,110 4,855 Counterfeit product 320 326 Parallel import/export 9 28 Manufacture without licence 1 8 Advertising offence 17 19 Traditional Chinese medicines 7 15 Othera 7 33 Total 2,471 5,284 a Products that fall outside the remit of the Therapeutic Goods Act 1989, for example food products.
Table 67 Investigations by complainant type and state/territory for July 2016 to June 2017
Origin ACT NSW NT QLD SA VIC WA TAS Othera Total Complaints resolution 0 9 0 2 0 4 2 0 2 19
Customs 4 2,373 37 136 12 412 190 0 5 3,169 External agency 5 7 0 5 2 6 1 0 4 30 General public 4 13 0 5 0 17 3 0 136 178 Patient/ practitioner 0 1 0 1 1 2 0 0 2 7
Sponsor/client 2 9 0 2 1 6 2 0 16 38 TGA internal 51 1 0 0 0 0 0 0 0 52 Total 66 2413 37 151 16 447 198 0 165 3,493 a Other includes investigations of anonymous (unknown) origin.

Therapeutic Goods Administration
Annual Performance Statistics Report: July 2016 to June 2017 Page 61 of 62
Version history
Version Description of change Author Effective date
V1.0 Original publication Reporting and Collaboration Services
12/09/2017

Therapeutic Goods Administration PO Box 100 Woden ACT 2606 Australia
Email: [email protected] Phone: 1800 020 653 Fax: 02 6203 1605 https://www.tga.gov.au
Reference/Publication D17-714108