annual report 2002 - amazon web services · efb's core values are dedication to clients,...
TRANSCRIPT

Annual Report 2002

Board of Directors
Ali K. Al-Husry
Fayiz M. Soheimat
Shaker Bin ZeidGeneral Manager / New Work Company
Bassem K. SalemGeneral Manager / Packaging Inductries Company
Mohammed M. El-SeifChairman / El-Seif Development Company
Said S. DarwazahChairman / Hikma Investment
Investment & Integrated Industries Company represented byChairman / Elia C. Nuqul
Social Security Corporation reperesented byMem. of the Board of Directors / Yehya Abu Ersheid
Arab Potash Company represented byJordan Investment Corporation representative / Nabih Salameh (Until 9/4/2002)
Abdel Raouf W. Al-Bitar (From 9/4/2002)
Jordan Phosphate Mines Company represented byDeputy Managing Director for Finance / Marwan Rishaydat
Jordan Loan Guarantee Corporation represented byGeneral Manager / Mohammed Said Hamami
Bayader Trade & Investment Company Ltd. represented byChairman / Amer M. Fariz
Jaloul Trade & Investment Company represented byGeneral Manager / Mohamed Saleh Hourani
Chairman
Vice Chairman
Members

EXPORT & FINANCE BANK (EFB) aims to be:
The first class provider of comprehensive commercial and investment
banking services.
The Bank with the innovative edge in Jordan.
The preferred choice for exporters, corporate clients and talented
employees.
A major contributor to the growth and development of Jordan's capital
market.
EFB’s Mission Statement
EFB's core values are dedication to clients, maximization of employees'potential and provision of superior services.

EFB’S Performance in 2002

Chairman & Chief Executive’s Statement
In all my years as Chairman of the Export & Finance Bank, I have not felt as much pride in
presenting to the General Assembly our Annual Report and financial statements as I do today
- our Seventh Annual Meeting. It is often said that the strength of one's character can only be
truly revealed in times of stress and times of difficulty. Character is best measured not when
things are good for you, but rather when one is tested; when you take some knocks, endure
some frustrations, and encounter some setbacks. The year 2002 was a trying year for the
Export & Finance Bank, but we proved once again that our integrity is uncompromising, our
steadfastness is unbending, and our commitments are deep. The Export & Finance Bank
ended the year stronger than ever, because our character is stronger than ever.
Despite the increasingly difficult circumstances in which we operated, we managed to produce
a remarkable set of results. Net profits for the year were up by 10% to JD 5.568 million.
Lending increased to JD 127 million, a 5% increase for the year, while customer deposits
grew by 46% to a total of JD 133 million. Total Assets now stand at JD 273 million, and our
Shareholder's Equity has grown to over JD 37.6 million.
We were able to achieve these results because of our flexibility and responsiveness to changes
in our environment. Aside from expanding our business in almost every area of operation,
the Bank adopted a more comprehensive approach to addressing risk and identifying events
of change in credit and capital market conditions that could adversely affect the bank. We put
in place measures to control these risks particularly in the area of credit. We reviewed the
entire credit portfolio to make sure that outstanding credit risk is addressed. We closed 2002
with a high performing and well-diversified credit portfolio.

Our numbers are solid, but this is not a time to become complacent. The next phase of
growth is ahead of us. We should make our greatest leaps precisely at times like these when
the markets are weak and yet we are relatively strong. Although we still have the capacity to
grow organically, we must look beyond the near future if we are to continue to offer
exceptional returns to our shareholders. Today, the spirit of change is an integral element in
the mindset of everyone at EFB, and we must continue to pursue change if we are to remain at
the forefront of this vibrant industry. The opportunities are unlimited. However, in seeking
out these opportunities, our focus will continue to be on synergies rather than size, and
efficiency rather than volume. I am certain that such a strategy will lead to more
improvements in the quality of service for clients along with steady long-term gains in value
for shareholders.
On behalf of the Export and Finance Bank, I would first like to take this opportunity to express
our deep appreciation to all our shareholders and clients who put their trust in us during this
challenging year. We were able to produce these exceptional results because of your
unyielding faith in our integrity and strength. I also wish to thank the Central Bank of Jordan
for their leadership and guidance during this turbulent year for the banking sector. Finally, my
full appreciation goes to my fellow board members for their full support, and to the
management and staff of the bank for their dedication, commitment, and loyalty throughout
the year. Collectively you have been the impetus behind our drive to increase earnings and
enhance shareholder value.
Ali K. Al-Husry
Chairman & CEO
Board of Directors’ Report
The Board of Directors has the pleasure in welcoming the general assembly in its seventh
ordinary annual meeting and to present to you the financial statements of the Export and
Finance Bank for the year ended on December 31, 2002.
We are proud to report that the Bank has been able to deliver yet another record financial
performance in 2002 with bottom line results, after provisions and tax, amounting to JD 5.6
million representing a 10% increase over the previous year and 16% return on average equity.
In line with our long-term business objective, our fee-based income has continued to
increase, contributing 55% to our total operating revenues as compared to 50% for the
previous year.
On the other hand, there has been no change in net interest income, despite a 5% growth in
the bank's lending business. This is partly reflective of the significant cuts in our lending
interest rates in line with the market trend and a substantial expansion of 46% in customer
deposit base, reflecting the confidence customers have in the Bank’s solid financial position.
Thus the Bank's liquidity ratio has jumped from 35% to 45% over the year, which is well above
international and local regulatory requirements. The same also applies to the Bank's capital
adequacy ratio currently at 23.85% as compared to the Central Bank of Jordan and Basle
Committee minimum rates of 12% and 8% respectively.
Total operating expenses (TOE), which include provisions for bad and doubtful debts, have
increased by 11% only compared to 13% increase in total operating revenues (TOR), thereby
resulting in a further improvement in the management efficiency ratio (TOR/TOE) from 2.15:1
in 2001 to 2.17:1 in 2002. The increase in TOE is mainly attributable to the fact that the Bank,
in order to confront the challenges of future expansion and increase of business, had to take
some highly necessary measures to enhance operational efficiency and internal control
procedures, including increased investment in technology, training as well as the hiring of
new staff.
Furthermore, while net income before tax increased by 13% for the year, income tax provision
was up by 21% contributing to a lower than anticipated net profit result. This disproportionate
increase is due to changes made in the income tax law including the treatment of capital
gains and interest income on bonds.
Despite the Bank’s high capital adequacy ratio, our primary objective remains further
consolidation of our capital base in anticipation of future regulatory capital increase
requirements, and in order to maintain both local and international confidence in our policies
and future plans and strategies. Based on the Bank's continued strong operating
fundamentals and financial performance, we take this opportunity to recommend distribution
of a stock dividend of 15%, thus increasing the Bank's paid-up capital by a further amount of
JD 4.5 million, and maintaining total shareholder equity at about JD 37.6 million which
represents an increase of 17% over the previous year. We strongly believe that this ongoing
policy of capital consolidation in order to be stronger as we go forward, is in the best
long-term interest of the Bank's shareholders and will remain our primary core objective.

SECTOR
ManufacturingGeneral TradeTransport ServicesGeneral ServicesOther
Total
JD MILLION
61.623.621.814.95.30
127.2
PERCENT
48.418.517.211.74.20
100
Non-performing loans (NPL) amounted to JD 16.8 million of which 55% is covered by provisions and
interest in suspense. The ratio of NPL to our total lending portfolio is 13.2%, which is consistent with
the banking sector’s average and we remain comfortable with the credit quality of our portfolio.
However, the prevention of this ratio from growing further will be a major objective and challenge as
we go forward.
CREDIT FACILITIES AND OPERATIONS
Total direct facilities grew by 5% over the past year to reach JD 127 million, while net direct facilities
(after deduction of provisions for bad and doubtful advances) stood at around JD 116 million at the
end of 2002 representing approximately 42% of total assets as compared to 47% at the end of
2001; this slight drop being partly attributable to the acceleration in our deposit growth towards the
end of 2002. On the other hand, indirect credit facilities extended throughout 2002 reached JD 436
million, representing a growth of 4% from the previous year, as a result of which our commission
revenues generated by indirect facilities increased by 4%. This was relatively disappointing due
primarily to the fact that the volume of the re-export business has been substantially less than the
growth anticipated at the beginning of the year because of the difficult circumstances affecting the
region. In response, we had to shift to new business opportunities that were identified by us.
On the other hand, there was an increase in revenues generated by other operations, with the end
result of our total fee-based income actually showing a 26% increase over the year, but in fact lower
than the growth projected at the beginning of the year; forecasts that were predicated by a more
optimistic outlook for the regional economic and political environment prevailing a year ago.
Our growth in other areas has remained on course. We have particularly pressed upon our
advantage in the Qualifying Industrial Zones (QIZ) sector, where manufacturing companies are
engaged in duty-free and unrestricted exports to the USA market, capitalizing on the long
experience that we have gained through our diversified commercial dealings with this fastest
growing export sector over the past three years. In this regard, we have been assisted by the
presence of our offices in three QIZ areas, enabling us to serve our client base in a more efficient
way and to be in an advantageous position in exploring new business opportunities.
We will pursue an expansionary policy in this area, which we firmly believe to have strong growth
prospects. To emphasize our commitment to service the export sector and to continue building a
market leadership position in export financing, we intend to press ahead this year with our plan to
establish a branch in the Aqaba Special Economic Zone (ASEZ), which is showing signs of
developing into an attractive business centre for foreign investors.
The table shown below illustrates the sectoral breakdown of our lending portfolio:

16
TREASURY AND MONEY MARKET OPERATIONS
Treasury once again proved to be effective and efficient in managing the Bank's dealing in foreign
exchange and money market activities. Additionally, treasury provided our clients with financial
instruments to hedge against interest rate and currency risk related to their normal trading
transactions. Revenues from our foreign currency dealings increased by 23% for the year and our net
interest earnings on our surplus funds have been maximized by making optimum use of the
available money market instruments.
We have also started trading in the international bond markets both for our own portfolio and for our
customers, and we have continued in asserting ourselves as market makers in the local bond
market.
INVESTMENT BANKING & CAPITAL MARKETS
Corporate Finance and M&A
The Export & Finance Bank continued to play a pioneering role in providing investment-banking
services to our clients. This was particularly noticeable in the structured products and fixed-income
market.
In 2002, we successfully arranged and managed a JD 22 million long-term syndicated facility to
finance the leveraged buyout of Aramex International Ltd by the Dubai-based private equity firm
Rasmala Partners Ltd. The facility, the first of its kind to be extended in the region, was regarded as a
watershed for acquisition finance and we are delighted to have been able to contribute our expertise
to such an innovative acquisition and capital restructuring.
The Bank also acted as the lead manager, underwriter, and primary dealer for the issue of two large
commercial paper programs. The Bank issued commercial paper for the Jordan Phosphate Mines
Company Ltd, and arranged and underwrote a commercial paper program for Jordan Mobile
Telephone Services Company (Fastlink), The commercial paper program for both companies was
issued in series, and placed with banks, insurance companies, pension funds and other large
institutional investors.
On the mergers & acquisition front, the Export & Finance Bank acted as the buy-side financial
advisor to the acquisition of Public Mining Ltd. The Government of Jordan, acting through the
Jordan Investment Corporation, sold 510,000 shares of Public Mining Ltd, representing 51% stake in
the company. The Bank advised, arranged and executed the transaction on behalf of a consortium of
strategic investors, and remained the trustee of the company until all legal formalities were satisfied.

Asset Management
The returns from our managed portfolios were positive. Our capital guaranteed portfolios earned
annualized rate of returns in excess of 7% in 2002 despite a strong downturn in the local market. In
addition, our proprietary portfolio invested in the Amman Stock Exchange earned an annualized rate
of return in excess of 13% in 2002 despite a year-on-year loss of 1.56% for Amman Stock Exchange
Index.
Going forward, we plan to focus on Asset Management and make it a major activity and revenue
source for the Bank. We believe that our portfolio management services can provide our clients with
attractive opportunities to achieve returns within a relatively short to medium time span through
investing in equity, equity-related securities, fixed-income instruments and other money market
instruments issued both in Jordan and internationally.
Research
Our research team continued to produce publications and studies on individual public shareholding
companies, macroeconomic conditions, financial markets and various sector analyses. This year we
covered 14 major economic sectors and expanded extensive stock coverage to 21 listed companies.
In addition, we issued our annual Jordan Economic Report, and initiated sovereign rating reviews on
selected Arab countries. Our strong and credible research remains an integral part of our advisory
functions to several local, regional and international funds on Jordanian equity and macroeconomic
developments.
Capital markets
Facing competition from over 28 firms seated on the Amman Stock Exchange, our brokerage office
consistently maintained one of the highest market shares on the ASE. With volume of JD 102.5
million (out of a total JD 1.9 billion for 2002) we executed over 5.03% of all transactions on the
Amman Stock Exchange, and closed the year ranking fifth among the licensed brokerage houses. We
also remained active in bond trading activities where we executed 40% of all bonds traded on the
Amman Stock Exchange, and closed the year ranking in the number one spot.
The growth of the activities and services rendered by our capital markets division has been
maintained with revenues generated from these activities exceeding JD3.2 million, representing a
59% growth over the previous year. Other revenues, including brokerage commissions and
custodian services reached JD708 thousand for the year 2002, representing a 23% growth over the
previous year.
We continued to offer investment and trading in the US markets through a specialized unit available
to service, advise and process our clients' orders, In addition, we were able to offer our clients
margin trading by passing their positions directly over to our US-based brokers while preserving
overall management over their accounts.
35 - Issan Ajlouni Street, ShmeisaniTel: 962-6-569 4250Fax: 962-6-569 2062
P.O.Box: 941283 Amman 11194Jordan
E-mail: [email protected]://www.efbank.com.jo
OUTLOOK
Diversified banking services are what have allowed us to grow shareholder value over the past six
years and we believe that such a business model will carry us forcefully into the new millennium. We
are continuously seeking to be a first class provider of comprehensive commercial and investment
banking services and the preferred choice for exporters, corporate clients and talented employees.
In 2003 we will open a representative office in the Aqaba Special Economic Zone, which we believe
has the potential to develop into an attractive business centre for foreign investors. Aside from the
provision of corporate banking services, we are working towards providing a wider range of services
and consumer products to our clients in the coming year, as well as exploring other potential
opportunities that may rise in and outside of the country.
Continuing to improve the Bank's performance in its various activities will remain our core objective
in 2003. We have put in place an aggressive plan to continue investing in technology and are
dedicating substantial resources toward employee development and training. All this should
translate into a growth in net profits and a considerable increase in overall shareholder value.
We believe that in order to maintain both local and international confidence in our policies and future
strategies, we have to maintain our policy of capital consolidation in order to be stronger as we go
forward. This in turn will be in the best long-term interest of the bank's shareholders and will remain
a primary core objective.

The Financial Statementsas of December 31, 2002
& Auditors’ Report


17,201,183
46,898,793
500,000
28,050,807
112,189,589
17,750,805
11,842,738
704,268
2,424,938
237,563,121
41,835,047
90,858,759
38,376,502
24,933,424
254,337
7,663,388
1,535,000
205,456,457
25,300,000
1,822,353
1,706,000
131,013
3,147,298
32,106,664
237,563,121
15,178,075
55,914,415
500,000
33,263,530
116,126,352
24,897,004
23,315,406
1,068,460
3,154,899
273,418,141
31,027,875
132,860,875
38,265,827
26,400,293
473,654
4,929,244
1,870,000
235,827,768
30,000,000
2,601,091
1,558,055
147,229
3,283,998
37,590,373
273,418,141
AS OF DECEMBER 31, 2002 BALANCE SHEET
ASSETS
Cash on hand and balances at the Central Bank of Jordan
Balances at banks and financial institutions
Deposits at banks and financial institutions
Trading investments
Credit Facilities, net
Available for sale investments
Held to maturity investments, net
Fixed assets, net
Other Assets
Total Assets
LIABILITIES AND SHAREHOLDERS' EQUITY
Liabilities
Banks and financial institutions' deposits
Customers' deposits
Margin accounts
Loans and advances
Sundry Provisions
Other liabilities
Income tax provision
Total Liabilities
Shareholders' Equity
Paid in capital
Statutory reserve
Voluntary reserve
Fair value reserve
Retained earnings
Total Shareholders' Equity
Total liabilities and Shareholders' Equity
(In Jordanian Dinars)
20012002
3
4
5
6
7
8
9
10
11
12
13
14
15
16
17
18
19
20
21
22
The Accompanying notes from 1 - 42 are an integral part of these financial statements
22
Notes

14,600,283
8,063,830
6,536,453
3,013,631
9,550,084
3,219,182
1,713,127
4,932,309
14,482,393
1,618,183
1,385,625
279,732
3,129,157
219,317
6,695,014
7,787,379
1,950,000
77,874
77,874
48,379
65,000
5,568,252
0.186
16,309,503
9,824,419
6,485,084
2,967,848
9,452,932
2,024,984
1,395,326
3,420,310
12,873,242
1,466,948
1,003,170
197,042
3,077,369
254,337
5,998,866
6,874,376
1,615,000
68,743
68,743
-
65,000
5,056,890
0.169
Interest income
Interest expense
Net interest income
Net commission
Net Interest and Commission Income
Other income -
Gain from financial assets and instruments
Other operating income
Total other income
Net operating income
Expenses -
Employees costs
Other operating expenses
Depreciation and amortization
Provision for possible loan losses
Sundry Provisions
Total operating expenses
Net Income Before income tax and appropriations
Less: Income tax
Provision for Jordanian Universities fees
Provision for scientific research and vocational training
Vocational and technical training and education support fees
Board of Directors' remuneration
Net Income
Earnings per share
STATEMENT OF INCOMEFOR THE YEAR ENDED DECEMBER 31, 2002 (In Jordanian Dinars)
24
25
26
27
28
29
30
7
17
31
23
20012002Notes
The Accompanying notes from 1 - 42 are an integral part of these financial statements
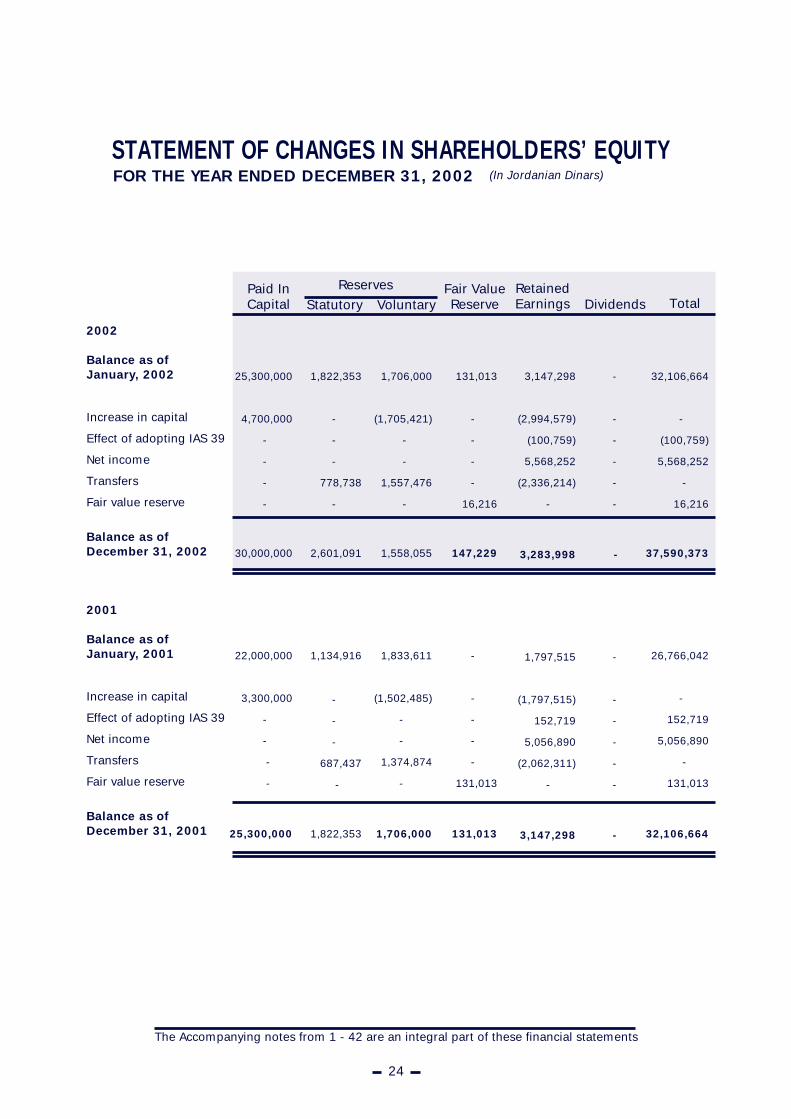
2002
Balance as ofJanuary, 2002
Increase in capital
Effect of adopting IAS 39
Net income
Transfers
Fair value reserve
Balance as ofDecember 31, 2002
2001
Balance as ofJanuary, 2001
Increase in capital
Effect of adopting IAS 39
Net income
Transfers
Fair value reserve
Balance as ofDecember 31, 2001
STATEMENT OF CHANGES IN SHAREHOLDERS’ EQUITYFOR THE YEAR ENDED DECEMBER 31, 2002 (In Jordanian Dinars)
25,300,000
4,700,000
-
-
-
-
30,000,000
22,000,000
3,300,000
-
-
-
-
25,300,000
Paid InCapital Statutory Voluntary
RetainedEarnings Total
24
Dividends
1,706,000
(1,705,421)
-
-
1,557,476
-
1,558,055
1,833,611
(1,502,485)
-
-
1,374,874
-
1,706,000
1,822,353
-
-
-
778,738
-
2,601,091
1,134,916
-
-
-
687,437
-
1,822,353
3,147,298
(2,994,579)
(100,759)
5,568,252
(2,336,214)
-
3,283,998
1,797,515
(1,797,515)
152,719
5,056,890
(2,062,311)
-
3,147,298
32,106,664
-
(100,759)
5,568,252
-
16,216
37,590,373
26,766,042
-
152,719
5,056,890
-
131,013
32,106,664
Reserves
131,013
-
-
-
-
16,216
147,229
-
-
-
-
-
131,013
131,013
Fair ValueReserve
-
-
-
-
-
-
-
-
-
-
-
-
-
-
The Accompanying notes from 1 - 42 are an integral part of these financial statements

20012002
STATEMENT OF CASH FLOWSFOR THE YEAR ENDED DECEMBER 31, 2002 (In Jordanian Dinars)
CASH FLOWS FROM OPERATING ACTIVITIES
Net income before income tax
Adjustments for -DepreciationProvision for possible loan lossesFair value reserve for available for sale investmentLosses on sale of fixed assetsDifferences in exchange rates Sundry Provisions
Changes in assets and liabilities -
Increase in deposits at banks and financial institutionsIncrease in credit facilitiesDecrease (increase) in trading investments(Increase) decrease in other assets(Decrease) increase in banks and financial institutions deposits
that mature within three monthsIncrease in customers' deposits(Decrease) increase in margin accounts(Decrease) increase in other liabilities
Net cash from operating activities before income tax
Income tax paid
Net cash from operating activities
CASH FLOWS FROM INVESTING ACTIVITIES
Purchase of available for sale investments(Purchase) sale of held to maturity investmentsPurchase of fixed assetsSale of fixed assets
Net cash used in investing activities
CASH FLOWS FROM FINANCING ACTIVITIES
Increase in loans Dividends paid
Net cash from financing activities
Difference in exchange rates
Net increase in cash and cash equivalents
Cash and cash equivalents, beginning of the year
Cash and cash equivalents, end of the year
25
6,671,890
197,042
3,077,369(524,481)
1,003(535,339)
254,337
9,141,821
( 500,000)22,774,020
(10,105,080)9,616
3,560,0004,668,220
21,128,1532,436,299
7,565,009
(1,010,000)
6,555,009
( 7,102,147)4,800,759(371,319)
-
( 2,672,707)
5,184,708 -
5,184,708
535,339
9,602,349
31,412,580
41,014,929
7,518,252
279,732
3,192,157(164,822)
- (693,558)
219,317
10,351,078
- 7,128,920
(5,047,901)(729,961)
(10,658,735)42,002,116
(110,675)(2,734,144)
25,942,858
(1,615,000)
24,327,858
( 7,230,742)(11,472,668)
( 662,924)19,000
(19,347,334)
1,466,869-
1,466,869
693,558
7,140,951
41,014,929
48,155,88032
Notes
The Accompanying notes from 1 - 42 are an integral part of these financial statements
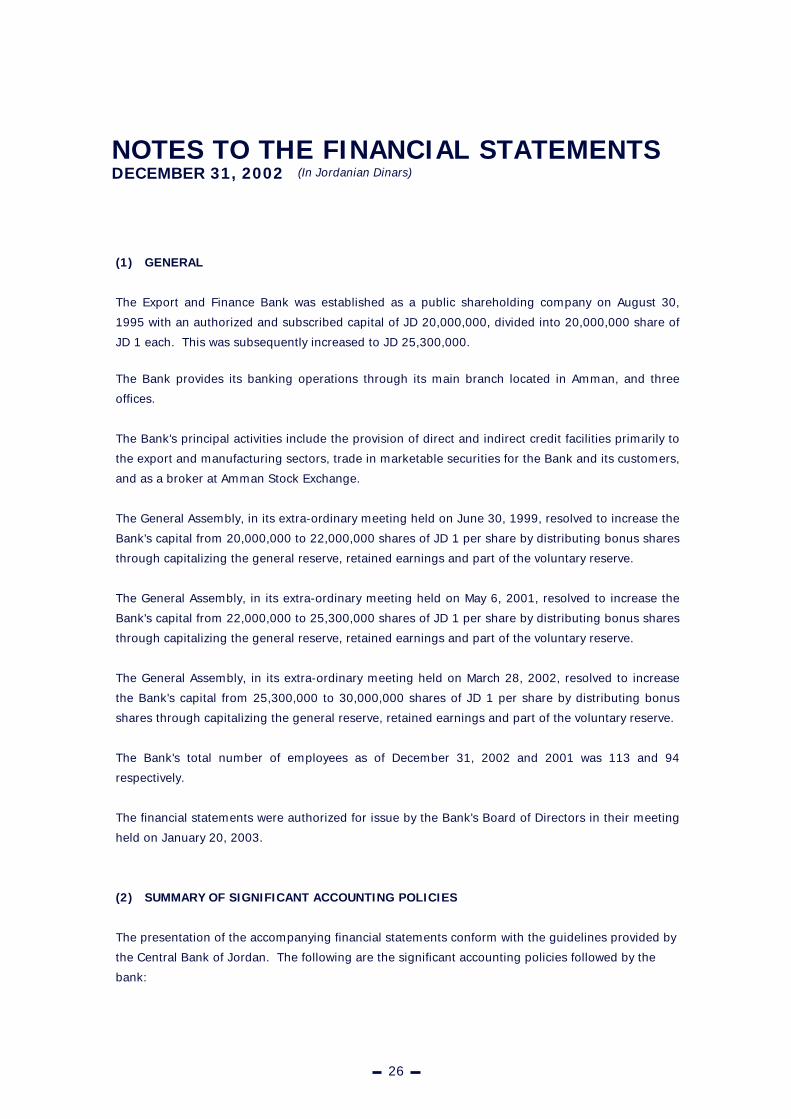
NOTES TO THE FINANCIAL STATEMENTSDECEMBER 31, 2002 (In Jordanian Dinars)
(1) GENERAL
The Export and Finance Bank was established as a public shareholding company on August 30,
1995 with an authorized and subscribed capital of JD 20,000,000, divided into 20,000,000 share of
JD 1 each. This was subsequently increased to JD 25,300,000.
The Bank provides its banking operations through its main branch located in Amman, and three
offices.
The Bank's principal activities include the provision of direct and indirect credit facilities primarily to
the export and manufacturing sectors, trade in marketable securities for the Bank and its customers,
and as a broker at Amman Stock Exchange.
The General Assembly, in its extra-ordinary meeting held on June 30, 1999, resolved to increase the
Bank's capital from 20,000,000 to 22,000,000 shares of JD 1 per share by distributing bonus shares
through capitalizing the general reserve, retained earnings and part of the voluntary reserve.
The General Assembly, in its extra-ordinary meeting held on May 6, 2001, resolved to increase the
Bank's capital from 22,000,000 to 25,300,000 shares of JD 1 per share by distributing bonus shares
through capitalizing the general reserve, retained earnings and part of the voluntary reserve.
The General Assembly, in its extra-ordinary meeting held on March 28, 2002, resolved to increase
the Bank's capital from 25,300,000 to 30,000,000 shares of JD 1 per share by distributing bonus
shares through capitalizing the general reserve, retained earnings and part of the voluntary reserve.
The Bank's total number of employees as of December 31, 2002 and 2001 was 113 and 94
respectively.
The financial statements were authorized for issue by the Bank's Board of Directors in their meeting
held on January 20, 2003.
(2) SUMMARY OF SIGNIFICANT ACCOUNTING POLICIES
The presentation of the accompanying financial statements conform with the guidelines provided by
the Central Bank of Jordan. The following are the significant accounting policies followed by the
bank:
26

Basis of preparation
The accompanying financial statements are prepared in accordance with International Financial
Reporting Standards, as published by the International Accounting Standards Board and Central
Bank of Jordan laws and regulations under the historical cost convention except for the trading
investments, available for sale investments and financial derivatives which are stated at fair value.
Also the hedged financial assets and liabilities were stated at fair value.
Change in accounting principles
The Bank has adopted IAS 39 (Financial Instruments: Measurement and recognition) starting January
1, 2001, as a result the opening balances of retained earnings as of January 1,2001 has been
adjusted. Prior year comparative figures have not been restated in accordance with the
requirements of IAS 39.
Financial transaction's recognition date
Sales and purchases of financial assets are recognized as of the commitment date.
Trading Investments
Trading investments are initially measured at cost and subsequently carried at fair value with gains
or losses recognized in the income statement.
Credit facilities
Credit facilities are carried at amortized cost after allowance for possible loan losses, interest and
commission in suspense.
Allowance for non-performing facilities is recognized to provide for the possible loan losses
according to IAS 39 or Central Bank of Jordan regulations whichever is higher. Allowance for
possible loan losses in accordance with IAS 39 represents the difference between the book value and
the recoverable value which is the present value of expected future cash flows including collections
from collaterals discounted at its original interest rate . The provision is recorded in the statement
of income.
Interest and commission of non-performing facilities are suspended based on Central Bank of
Jordan regulations.
General provision for direct and indirect credit facilities is established to provide for the unidentified
possible loan losses based on Central Bank of Jordan regulations.
27

Loans provided for are written off from the allowance of possible loan losses when the collection
procedures become ineffective. The excess in the allowance of possible loan losses - if any - is
transferred to the statement of income, and cash recoveries of loans that were previously written off
are credited to the income statement.
Available for sale investments
Available for sale investments are initially measured at cost and subsequently carried at fair value.
Gains or losses on measurement to fair value of available-for-sale investments are recognised
directly in the fair value reserve in shareholders equity, until the investment is sold or otherwise
disposed of, or until it is determined to be impaired, at which time the cumulative gain or loss
previously recognised in equity is included in net profit or loss for the period.
Held to maturity investments, net
Held to maturity investments are carried at amortized cost and the discount or premium is
amortized using the effective interest rate method.
Fair value
The fair value of traded financial assets is based on quoted market prices, where no quoted market
prices are available, a reasonable estimate of fair value is used based on one of the following
methods:
- Comparison with the current market value of a similar financial instrument.
- Forecasted discounted cash flow.
- Options pricing models.
In case the fair value of an investment can not be reliably measured, it is stated at cost or amortized
cost with any impairment in value recorded in the statement of income.
Revenue and expense recognition
Income and expenses are recognized on the accrual basis except for interest and commission
income of non-performing facilities which are recorded as interest and commission in suspense in
accordance with the central Bank of Jordan regulations.
Income from shares (dividends income) are recorded as an income only when earned.Commission
income is recognized when it is earned.
Commission income is recognized when it is earned.
28

Fixed assets
Fixed assets are stated at cost and are depreciated over their estimated useful lives using the
straight line method at annual rates ranging from 10% to 20%, except for land.
Whenever the recoverable amount of an asset is impaired, the carrying value is reduced to the
recoverable amount, and the impairment loss is recorded in the statement of income.
Income Tax
The Bank provides for income tax in accordance with the Income Tax Law no. (57) of 1985 and its
subsequent amendments, the last of which being law no. (14) of 1995 effective on January 1, 1996,
and in accordance with IAS 12. The Bank makes provisions for possible loan losses in accordance
with the regulations of the Central Bank of Jordan. As these provisions had not been allowable as
deductible expenses for income tax purposes before January 1, 2000, and until such time it is
accepted by the Income Tax Department, this gives rise to a potential deferred tax asset as of
December 31, 2001. Because of the uncertainty over the recognition of this deferred tax asset, the
Bank believes it would not be appropriate to recognize it as an asset in the financial statements.
Properties held for resale
Properties held for resale are recorded at fair value upon the transfer of title to the Bank. Such
properties are acquired by the Bank in connection with bad loans, and the Bank is required to
dispose of such properties within two years according to Central Bank of Jordan regulation. The
properties are appraised on an individual basis annually and declines in market value are recorded
in the income statement.
Investment accounts managed on behalf of the customers
Represents investments managed by the bank on behalf of customers and it is not part of the bank's
assets, therefore it is not included in the financial statements.
Financial derivatives
a- Financial derivatives held for trading
Derivative financial instruments such as, foreign currencies forward deals, interest rate future deals,
swaps, foreign currencies options and others, are recorded at cost in the balance sheet as other
assets / liabilities, and subsequently carried at fair value.
29

The fair value is determined according to the market price, if such prices are not available
discounted cash flow models, standard forms, or internal pricing forms are used whichever is more
suitable as of the financial statement date. Changes in the fair value are recognised in the statement
of income.
b- Financial derivatives for hedging purposes
1- Fair value hedge:
Derivatives that qualify as fair value hedges are carried at fair value with the corresponding change in
fair value recognised in the income statement.
2- Cash flow hedge:
Changes in the fair value of a hedging instrument that qualifies as a highly effective cash-flow hedge
are recognised directly in the hedging reserve in shareholders' equity. The ineffective portion is
immediately recognized in net profit or loss.
3- Hedge of net investments in a foreign entity:
Changes in the fair value of a hedging instrument that qualifies as a highly effective hedge of net
investments in a foreign enmity are recognized directly in the hedging reserve in share holders'
equity. The ineffective portion is immediately recognized in net profit or loss.
Foreign currencies
Assets and liabilities denominated in foreign currencies are translated to Jordanian Dinars using the
Central Bank of Jordan's middle exchange rates at year end. Foreign currency transactions during
the year are recorded using exchange rates that were in effect at the dates of transactions. Gains or
losses arising from foreign currency translations are reflected in the statement of income.
Foreign currencies' forward deals are re-evaluated using the Central Bank of Jordan's middle
exchange rates at year end, gains and losses from the re-evaluation are reflected in the statement of
income.
Cash and cash equivalents
Represents cash on hand and cash balance that mature within 3 months, it includes cash on hand,
balances at banks and financial institutions, less banks' and financial institutions deposits' that
mature within three months.
30

Repurchase and resell agreements
Assets sold with a simultaneous repurchase agreement at a future date will continue to be
recognized in the bank's financial statements due to the Bank's continuing control over these assets
using the same accounting policies with the proceeds of the sale recorded as a liability. The
difference between the selling price and the repurchase price is recognized as an interest expense
over the agreement term.
Purchased assets with a simultaneous resell agreement at a future date are not recognized in the
bank's financial statements as assets since the Bank is not able to control these assets. The related
payments are recognized as part of deposits at banks and financial institutions or customers' loans
as applicable, and the difference between purchase price and reselling price is recognized in the
statement of income.
Risk management
The Bank's management tries to mitigate the credit and market risks through setting investment
ceilings and applying set percentages that correspond with the Central Bank of Jordan and board of
directors regulations and through diversification of investments and a conservative credit granting
policy to mitigate credit risk. The Bank has a risk evaluation system to assess the financial standing
of its clients.
*
End of service indemnity
In accordance with labor law no. (8/96) companies subject to Social Security law are not entitled to
pay end of service indemnity.
31

(3) CASH ON HAND AND BALANCES AT THE CENTRAL BANKS OF JORDAN
Cash on hand
Balances at the Central Bank of Jordan
Current accounts
Time and notice deposits
Statutory cash reserve
Certificates of deposit
Except for the statutory cash reserve held at the Central Bank of Jordan as of December 31, 2002
and 2001 there are no restricted cash balances.
(4) BALANCES AT BANKS AND FINANCIAL INSTITUTIONS
Local Banks and financial institutions
Current accounts
Deposits maturing within 3 months
Certificates of deposit
Foreign Banks and financial institutions
Current accounts
Deposits maturing within 3 months
Non interest bearing balances at banks and financial institutions amounted to JD 1,496,785 and JD
1,272,581 as of December 31, 2002 and 2001 respectively.
Restricted balances amounted to JD 5,562,771 and JD 14,401,230 as of December 31, 2002 and
2001 respectively.
581,012
5,652,380
-
5,967,791
5,000,000
17,201,183
20012002
1,195,620
2,707,802
2,500,000
7,774,653
1,000,000
15,178,075
143,983
2,127,958
500,000
10,136,834
33,990,018
46,898,793
20012002
32
169,240
1,444,959
-
8,245,286
46,054,930
55,914,415

(5) DEPOSITS AT BANKS AND FINANCIAL INSTITUTIONS
Local Banks and financial institutions
Certificates of deposit
No restricted deposits as of December 31, 2002 and 2001.
(6) TRADING INVESTMENTS
Shares not listed in financial markets *
Shares listed in financial markets **
Bonds listed in financial markets
* Fair value for these share is computed based on last sale transaction.
** Investment in shares listed in financial markets includes stocks held under resale agreement,
amounting JD 23,682,714 and JD 12,716,869 as of December 31, 2002 and 2001 respectively.
(7) CREDIT FACILITIES, NET
Bills and notes discounted
Overdraft facilities
Loans and advances
Credit cards
Less: Interest in suspense
Allowance for possible loan losses
Credit facilities, net
20012002
140,000
29,122,975
4,000,555
33,263,530
2001
500,000
500,000
2002
500,000
500,000
33
144,200
21,215,186
6,691,421
28,050,807
44,196,261
14,230,990
68,814,135
72
127,241,458
1,774,922
9,340,184
11,115,106
116,126,352
20012002
50,300,264
13,601,059
56,977,409
63,878
120,942,610
1,236,760
7,516,261
8,753,021
112,189,589

Credit facilities granted by sector are set forth below:
Agriculture
Manufacturing and mining
Constructions
General trade
Transportation services
Tourism, hotels and restaurants
Services and public facilities
Financial services
Investment in shares
Vehicles
Real estate purchase
Consumable goods
Others
The non-performing credit facilities as defined by the Central Bank of Jordan's regulations amounted
to JD 16,781,585 representing 13.19% of total facilities and JD 11,462,479 representing 9.48% of
total facilities as of December 31, 2002 and 2001 respectively.
There are no credit facilities granted or guaranteed by the government as of December 31, 2002
and 2001 respectively.
The specific allowance for possible loan losses according to CBJ regulations and IAS 39 amounted
to JD 7,348,409 and JD 6,818,523 as of December 31, 2002.
The specific allowance for possible loan losses according to CBJ regulations and IAS 39 amounted
to JD 5,647,137 and JD 4,767,847 as of December 31, 2001.
The gross fair value of collaterals held against credit facilities amounted to JD 119,277,263 and JD
91,223,694 as of December 31, 2002 and 2001 respectively.
34
1,045,696
61,571,943
3,106,022
23,565,178
14,189,726
1,388,369
8,380,915
1,392,922
1,890,074
7,661,579
703,200
454,983
1,890,851
127,241,458
20012002
1,546,033
58,630,460
2,777,977
28,010,964
8,591,842
1,459,453
9,172,742
526,067
155,599
5,965,000
326,852
104,615
3,675,006
120,942,610

Allowance for possible loan losses:
Opening balance at January 1,
Transferred to provision
during the year
Provision written back
Ending balance at December 31,
Allowances that were settled, collected or transferred against other non-performing credit facilities
amounted to JD 946,367 and JD 843,485 as of December 31, 2002 and 2001 respectively.
Interest in suspense:
Opening balance at January 1,
Suspended interest during the year
Less: Suspended interest on settled loans
Interest suspended written off
Ending balance at December 31,
20012002
2001
1,236,760
894,746
202,816
153,768
1,774,922
2002
617,329
664,535
45,104
-
1,236,760
35
Specific General Total Specific General Total
2,738,871
2,908,266
-
5,647,137
1,700,021
169,103
-
1,869,124
4,438,892
3,077,369
-
7,516,261
5,647,137
3,069,506
(1,368,234)
7,348,409
7,516,261
3,192,157
(1,368,234)
9,340,184
1,869,124
122,651
-
1,991,775

(8) AVAILABLE FOR SALE INVESTMENTS
Shares *
Bonds
* Investment in shares includes an amount equal to JD 100,000 represents shares of Jordan Loan
Guarantee Company which are listed but not traded at Amman stock exchange which was stated at
cost since the fair value could not be measured reliably. The management believes that there is no
impairment in the value of these shares as of year end.
(9) HELD TO MATURITY INVESTMENTS, NET
Treasury bills
Bonds and debentures
20012002
20012002
22,815,384
500,022
23,315,406
11,842,738
-
11,842,738
36
Traded Total Traded Total
100,000
17,650,805
17,750,805
100,000
17,650,805
17,750,805
1,102,119
23,794,885
24,897,004
1,102,119
23,794,885
24,897,004

(10) FIXED ASSETS, NET
December 31, 2002
Beginning balance
Additions
Retirements
Accumulated depreciation
Net Book Value at year end
December 31, 2001
Beginning balance
Additions
Retirements
Accumulated depreciation
Net Book Value at year end
(11) OTHER ASSETS
Accrued interest and commission income
Prepaid expenses
Brokerage office receivables
Tax paid in advance
Interest paid in advance / CBJ bills
Others
2000
37
365,713
361,567
-
(231,090)
496,190
247,044
118,669
-
(136,863)
228,850
Furnitureand Fixture Computers InstallationsVehicles Total
24,600
95,993
(21,000)
(12,944)
86,649
3,600
21,000
-
(2,430)
22,170
630,838
106,485
-
(543,686)
193,637
620,003
38,278
(27,443)
(416,955)
213,883
349,003
98,879
-
(155,898)
291,984
155,631
193,372
-
(109,638)
239,365
1,370,154
662,924
(21,000)
(943,618)
1,068,460
1,026,278
371,319
(27,443)
(665,886)
704,268
806,820
674,753
719,368
-
12,189
211,808
2,424,938
20012002
1,157,004
737,864
769,146
203,991
18,739
268,155
3,154,899
806,820
674,753
719,368
50,226
12,189
161,582
2,424,938
(10) FIXED ASSETS, NET
December 31, 2002
Beginning balance
Additions
Retirements
Accumulated depreciation
Net Book Value at year end
December 31, 2001
Beginning balance
Additions
Retirements
Accumulated depreciation
Net Book Value at year end
(11) OTHER ASSETS
Accrued interest and commission income
Prepaid expenses
Brokerage office receivables
Tax paid in advance
Interest paid in advance / CBJ bills
Others

(12) BANKS AND FINANCIAL INSTITUTIONS' DEPOSITS
Current accounts and
demand deposit
Deposits maturing
within 3 months
Deposits maturing
within 3 - 12 months
Deposits with maturities
exceeding one year
Certificates of deposit
(13) CUSTOMERS' DEPOSITS
Current accounts and demand deposits
Saving deposits
Time and notice deposits
Certificates of deposit
- Governmental institutions' deposits amounted to JD 38,546,795 representing 29.01% of total
customers' deposits and JD 33,181,999 representing 36.52% of customers' deposits as of December
31, 2002 and 2001 respectively.
- Non-interest bearing deposits amounted to JD 10,315,848 representing 7.76% of total deposits
and JD 4,906,994 representing 5.40% of total deposits as of December 31, 2002 and 2001
respectively.
- Dormant accounts amounted to JD 90,232 and JD 26,726 as of December 31, 2002 and 2001
respectively.
- Restricted deposits amounted to JD 12,115,566 representing 9.11% of total deposits and JD
6,293,156 representing 6.93% of total deposits as of December 31, 2002 and 2001 respectively.
20012002INSIDE
JORDAN
38
OUTSIDE
JORDANTOTAL
INSIDE
JORDAN
OUTSIDE
JORDANTOTAL
10,214,773
7,198,777
8,250,00
-
10,500,000
36,163,550
3,823,291
1,848,206
-
-
-
5,671,497
16,992,045
5,944,565
2,091,265
-
6,000,000
31,027,875
14,038,064
9,046,983
8,250,000
-
10,500,000
41,835,047
15,545,626
5,189,649
2,091,265
-
6,000,000
28,826,540
1,446,419
754,916
-
-
-
2,201,335
10,063,855
12,641
68,058,191
12,724,072
90,858,759
15,495,481
61,033
107,678,795
9,625,566
132,860,875
20012002

(14) MARGIN ACCOUNTS
Direct credit facilities
Indirect credit facilities
Deposits against cash margin dealings' facilities
(15) LOANS AND ADVANCES
Amounts borrowed from Central Bank of Jordan
Amounts borrowed from foreign banks
Others
Central Bank of Jordan borrowings are due during the period from 2003 till 2007, with an annual
interest rate that ranges between 2.5% to 6.75%. Installments are paid according to monthly.
quartely, or semi annually schedules.
Borrowings from foreign banks are due during 2003 and 2007, with an annual interest rate that
ranges between 3.645% to 4.457%. Installments are paid semi-annually.
Borrowings from Arab Investment Company / Bahrain amounting JD 4,963,000 are due on
December 2003 renewed automatically, with an annual interest rate that ranges between 2.169% to
2.172%.
Borrowings from Arab Trade Finance amounting JD 1,772,500 are due on February 2003 renewed
automatically, with an annual interest rate of 1.736%.
Borrowing from Real estate Mortgage Finance Co. amounting JD 436,804 are due on June 2005,
with an annual interest rate of 6.25%.
An amount of USD 2,625,000 was deposited as a guarantee against the loan from the Arab
Investment Company / Bahrain with an annual interest rate of 1.32%.
There are no guarantees against loans and advances from other parties.
39
19,734,826
16,320,968
2,320,708
38,376,502
25,710,325
10,600,550
1,954,952
38,265,827
20012002
12,186,257
7,784,167
4,963,000
24,933,424
13,256,789
5,971,200
7,172,304
26,400,293
20012002

(16) Sundry Provisions
2002
Sundry Provisions
2001
Sundry Provisions
2000
254,337
254,337
-
-
Opening Balanceat January 1st
Addition
(17) OTHER LIABILITIES
Accrued interest expenses
Interest and commissions received in advance
Deferred income
Accrued expenses
Certified cheques
Cheques payable
University fees provision
Scientific research provision
Vocational and technical training and education support fees
Board of directors remuneration
Outgoing transfers
Incoming transfers
Other
(18) INCOME TAX PROVISION
The movement on the income tax provision was as follows:
Beginning balance
Income tax paid
Provision for income tax for the year
Ending balance
20012002
930,000
1,010,000
1,615,000
1,535,000
1,535,000
1,615,000
1,950,000
1,870,000
20012002
40
1,667,000
1,717,390
599,790
529,710
609,565
194,286
68,743
68,743
-
65,000
1,224,040
774,220
144901
7,663,388
848,949
1,277,495
970,709
408,663
333,366
619,597
77,874
77,874
48,379
65,000
-
92,161
109,177
4,929,244
Ending Balanceat December 31st
219,317
219,317
254,337
254,337
473,654
473,654
254,337
254,337

Income tax appearing in the statement of income represents the following:
Provision for income tax for the year
The Income Tax Department reviewed the Bank's records for the year ended 1999 and assessed an
additional income tax amounting to JD 100,000. However the Bank has contested the decision. As
of the date of these financial statements the Bank did not reach a final settlement with the Income
Tax Department.
The Income Tax Department reviewed the Bank's records for the year ended 2000 and assessed an
additional income tax amounting to JD 180,000. However the Bank has contested the decision. As
of the date of these financial statements a final settlement was not reached with the Income Tax
Department.
(19) PAID IN CAPITAL
During 2002 the Bank distributed 4,700,000 bonus shares representing 18.577% of the authorized
and subscribed capital by which the paid in capital increased to JD 30,000,000 divided into
30,000,000 share of JD 1 each, through capitalising part of the voluntary reserve and the retained
earnings.
(20) VOLUNTARY RESERVE
Voluntary reserve amounted to JD 1,558,055 at the end of current year and JD 1,706,000 at the end
of prior year.
(21) FAIR VALUE RESERVE
Beginning balance
Unrealised gain
Realised gain transferred to statement of income
Net movement during the year
Current balance
2001
1,950,000
2002
1,615,000
41
2001
131,013
160,346
144,130
16,216
147,229
2002
-
131,013
-
131,013
131,013
Bond

(22) RETAINED EARNINGS
Beginning balance
Amount capitalized in bonus issue
Effect of adopting IAS (39) for the first time *
Transferred to statement of income due to sale of available for sale investments
Net income
Transferred to statutory and voluntary reserves
Ending balance
(23) PROPOSED CAPITAL INCREASE
The Board of Directors have proposed to the General Assembly, in its extra-ordinary meeting held
during 2002, to increase the Bank's capital by JD 4,700,000 through capitalising part of the
voluntary reserve and retained earnings.
(24) INTEREST INCOME
Direct credit facilities
Bills and notes discounted
Overdrafts
Loans and advances
Credit cards
Other
Balances at the Central Bank of Jordan
Balances and deposits at Banks and Financial institutions
Trading investments
Available for sale investments
Held to maturity investments
20012002
42
20012002
1,797,515
(1,797,515)
156,820
(4,101)
5,056,890
(2,062,311)
3,147,298
3,147,298
(2,994,579)
-
(100,759)
5,568,252
(2,336,214)
3,283,998
4,157,588
1,713,139
5,310,671
4,265
921,709
1,802,216
650,780
1,045,144
703,991
16,309,503
4,090,838
1,610,689
5,549,406
4,336
214,148
863,727
383,131
1,155,834
728,174
14,600,283
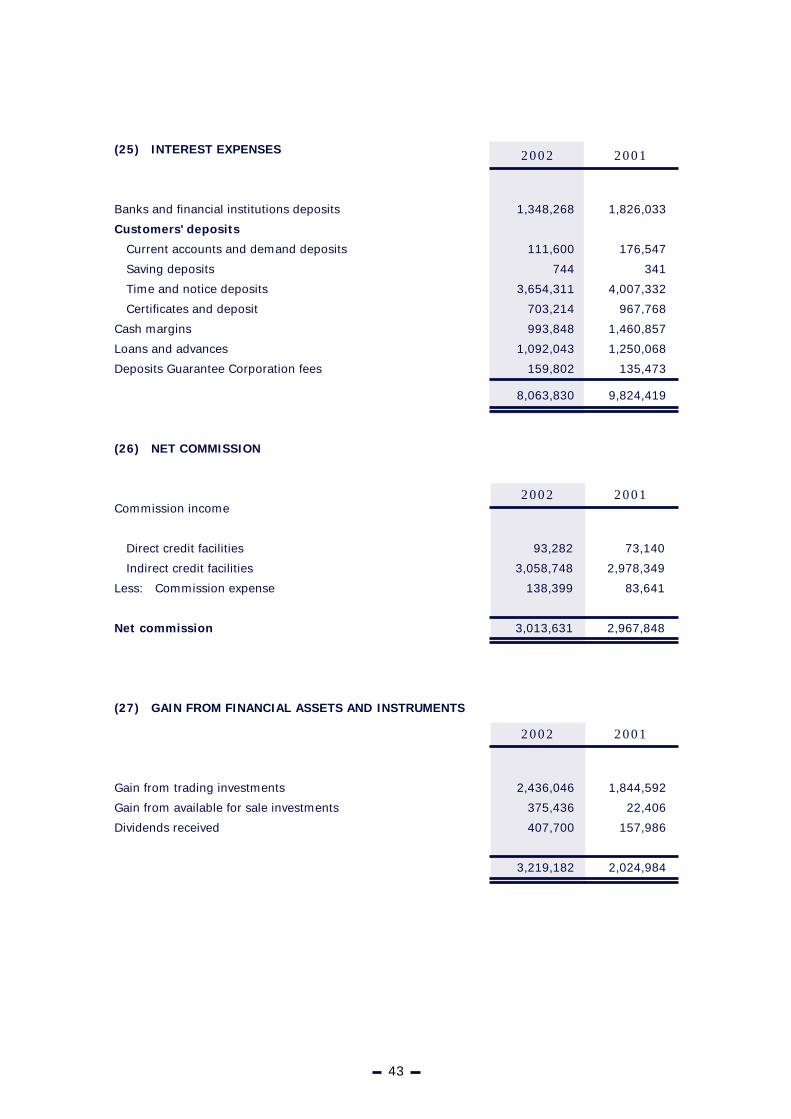
(25) INTEREST EXPENSES
Banks and financial institutions deposits
Customers' deposits
Current accounts and demand deposits
Saving deposits
Time and notice deposits
Certificates and deposit
Cash margins
Loans and advances
Deposits Guarantee Corporation fees
(26) NET COMMISSION
Commission income
Direct credit facilities
Indirect credit facilities
Less: Commission expense
Net commission
(27) GAIN FROM FINANCIAL ASSETS AND INSTRUMENTS
Gain from trading investments
Gain from available for sale investments
Dividends received
2001
73,140
2,978,349
83,641
2,967,848
2002
93,282
3,058,748
138,399
3,013,631
20012002
43
1,826,033
176,547
341
4,007,332
967,768
1,460,857
1,250,068
135,473
9,824,419
1,348,268
111,600
744
3,654,311
703,214
993,848
1,092,043
159,802
8,063,830
2001
1,844,592
22,406
157,986
2,024,984
2002
2,436,046
375,436
407,700
3,219,182

(28) OTHER OPERATING INCOME
Revaluation gain
Foreign currency trading
Commission on customers' funds management
Other income
(29) EMPLOYEES EXPENSES
Salaries and benefits
Employee Bonus
Social security
Medical expenses
Paid vacations
Bank's contribution in social activities fund
(30) OTHER OPERATING EXPENSES
Rent
Consulting and professional fees
Stationary and printings
Board of directors' transportation
Reuters' subscription expense
Donations
Advertisement
Subscriptions, fees and licenses
Hospitality
Travel and transportation
Computer expenses
Post, telephone, telex and swift
Brinks
Internet
Maintenance
Insurance
Training and research
Subscriptions
Others
44
20012002
535,339
283,048
576,886
53
1,395,326
693,558
309,856
707,828
1,885
1,713,127
20012002
825,242
530,000
57,957
41,237
9,146
3,366
1,466,948
1,056,183
400,000
91,589
60,808
2,618
6,985
1,618,183
20012002
159,381
51,877
70,468
30,779
69,211
35,956
114,938
147,104
18,251
40,615
40,101
91,104
6,996
6,991
14,831
19,810
21,105
28,332
35,320
1,003,170
195,309
135,287
89,829
29,943
76,209
56,755
175,366
202,949
26,633
30,277
53,932
127,615
11,133
7,951
19,031
51,546
25,215
42,306
28,339
1,385,625
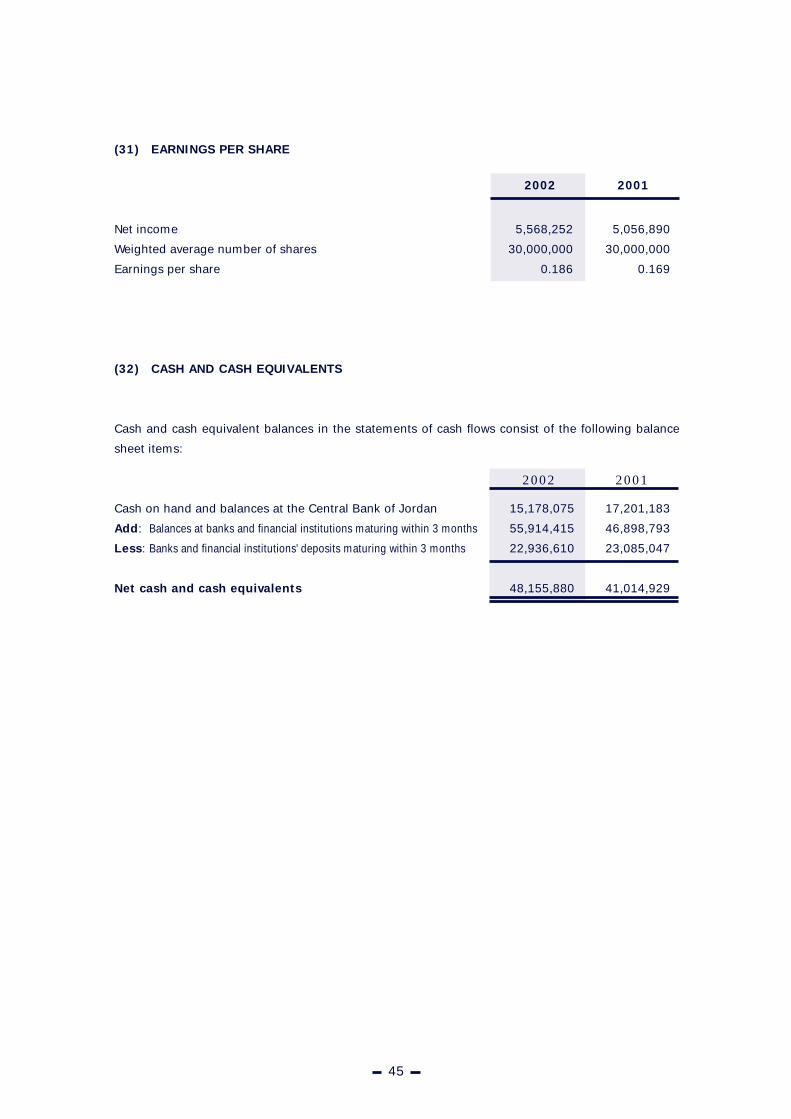
(31) EARNINGS PER SHARE
Net income
Weighted average number of shares
Earnings per share
(32) CASH AND CASH EQUIVALENTS
Cash and cash equivalent balances in the statements of cash flows consist of the following balance
sheet items:
Cash on hand and balances at the Central Bank of Jordan
Add: Balances at banks and financial institutions maturing within 3 months
Less: Banks and financial institutions' deposits maturing within 3 months
Net cash and cash equivalents
2001
5,056,890
30,000,000
0.169
5,568,252
30,000,000
0.186
2002
45
20012002
17,201,183
46,898,793
23,085,047
41,014,929
15,178,075
55,914,415
22,936,610
48,155,880

(33) DERIVATIVES
The following schedule shows the negative and positive fair values of the financial instruments'
derivatives at year end, along with the distribution of the fair value according to the maturity:
December 2002
Derivatives held for trading
Fair value hedging derivatives
Cash flow hedging derivatives
Hedges of net investments
in foreign entities derivatives
December 2001
Derivatives held for trading
Fair value hedging derivatives
Cash flow hedging derivatives
Hedges of net investments
in foreign entities derivatives
(34) FAIR VALUE OF FINANCIAL INSTRUMENTS
Following are financial assets and financial liabilities that were not stated at fair value:
Held to maturity investments
Direct facilities
Banks and financial
Institutions' deposits
Customers' deposit
Margin accounts
Loans and advances
Net difference between
Book value and fair-value
As for credit facilities and due to the fact that there is not a secondary market to trade these facilities, in addition to
the cost and time constraints, the fair value for these facilities can not be computed accurately. However the Bank's
management believes that the fair value of direct facilities is not less than the book value.
46
Positive Fair Value
98,735
-
-
-
98,735
82,865
-
-
82,865
82,865
-
-
-
-
-
-
-
-
-
-
18,918,844
-
-
-
18,918,844
14,981,744
-
-
-
14,981,744
Negative Fair Value
TotalPar Value
Within3 Months
3 - 12Months
1 -3 Years
Over3 Years
-
-
-
-
-
-
-
-
-
-
-
-
-
-
-
-
-
-
-
-
-
-
-
-
-
-
-
-
-
Par Value Maturity
Book Value DifferenceFair Value2002 2001
Book Value DifferenceFair Value
11,842,738
112,189,589
41,835,047
90,858,759
38,376,502
24,933,424
-
11,842,738
*
41,835,047
90,858,759
38,376,502
24,933,424
-
-
-
-
-
-
-
-
23,315,406
116,126,352
31,027,875
132,860,875
38,265,827
26,400,293
-
23,315,406
*
31,027,875
132,860,875
38,265,827
26,400,293
-
-
-
-
-
-
-
-
18,918,844
-
-
-
18,918,844
14,981,744
-
-
-
14,981,744

(35) INTEREST RATE RISKSensitivity of interest rates as of December 31, 2002
ASSETSCash on hand and balances at the
Central Bank of Jordan
Balances at Banks and financial institutions
Deposits at Banks and financial institutions
Trading investments
Credit facilities, net
Available for sale investments
Held to maturity investments, net
Fixed assets, net
Other assets
Total Assets
LIABILITIES AND SHAREHOLDERS' EQUITYLiabilities
Banks and financial institutions' deposits
Customers’ deposits
Margin accounts
Loans and advances
Sundry Provisions
Other liabilities
Income tax provision
Total LiabilitiesShareholders' Equity
Total Liabilities and Shareholders' Equity
Interest rate sensitivity
Off balance sheet items sensitivity
Cumulative interest rate sensitivity gap
Sensitivity of interest rates as of December 31, 2001
ASSETSCash on hand and balances at the
Central Bank of Jordan
Balances at Banks and financial institutions
Deposits at Banks and financial institutions
Trading investments
Credit facilities, net
Available for sale investments
Held to maturity investments, net
Fixed assets, net
Other assets
Total Assets
LIABILITIES AND SHAREHOLDERS' EQUITYLiabilitiesBanks and financial institutions' deposits
Customers' deposits
Margin accounts
Loans and advances
Sundry Provisions
Other liabilities
Income tax provision
Total LiabilitiesShareholders' Equity
Total Liabilities and Shareholders' Equity
Interest rate sensitivity
Off balance sheet items sensitivity
Cumulative interest rate sensitivity gap
3.85
2.00
6.38
7.48
8.49
6.69
3.92
-
-
2.00
5.48
3.15
3.82
-
-
1 - 3Months
3 - 6Months
1 - 3Years
6 Monthsto 1 Year
Over 3Years
Zero-InterestElements Total
AverageInterest
Rate%
-
-
-
-
37,395,883
-
11,357,891
-
-
48,753,774
8,091,265
9,302,362
-
2,413,772
-
-
-
19,807,399
-
19,807,399
28,946,375
-
(27,922,759)
-
-
500,000
-
12,846,414
8,957,576
-
-
-
22,303,990
-
4,836,150
-
2,804,759
-
-
-
7,640,909
-
7,640,909
14,663,081
-
(13,259,678)
-
-
-
-
26,193,944
6,141,009
-
-
-
32,334,953
-
-
-
6,964,061
-
-
-
6,964,061
-
6,964,061
25,370,892
-
12,111,214
-
-
-
-
3,385,348
6,144,300
-
-
-
9,529,648
-
-
-
2,811,572
-
-
-
2,811,572
-
2,811,572
6,718,076
-
18,829,290
11,398,982
1,496,785
-
29,262,975
-
1,102,119
-
1,068,460
3,154,899
47,484,220
533,841
10,315,848
10,600,550
-
473,654
4,929,244
1,870,000
28,723,137
37,590,373
66,313,510
(18,829,290)
105,263,985
-
15,178,075
55,914,415
500,000
33,263,530
116,126,352
24,897,004
23,315,406
1,068,460
3,154,899
273,418,141
31,027,875
132,860,875
38,265,827
26,400,293
473,654
4,929,244
1,870,000
235,827,768
37,590,373
273,418,141
-
105,263,985
-
3,779,093
54,417,630
-
4,000,555
36,304,763
2,552,000
11,957,515
-
-
113,011,556
22,402,769
108,406,515
27,665,277
11,406,129
-
-
-
169,880,690
-
169,880,690
(56,869,134)
-
-
2,000,000
45,126,212
-
6,691,421
50,837,887
46,840
1,992,099
-
-
106,694,459
23,085,047
65,259,210
22,055,534
9,414,091
-
-
-
119,813,882
-
119,813,882
(13,119,423)
-
-
3,000,000
500,000
-
-
23,272,136
21,338
9,850,639
-
-
36,644,113
18,750,000
11,166,500
-
1,343,890
-
-
-
31,260,390
-
31,260,390
5,383,723
-
(7,735,700)
-
-
-
-
9,789,407
-
-
-
-
9,789,407
-
9,526,055
-
2,080,238
-
-
-
11,606,293
-
11,606,293
(1,816,886)
-
(9,552,586)
-
-
500,000
-
20,267,827
12,390,856
-
-
-
33,158,683
-
-
-
5,894,896
-
-
-
5,894,896
-
5,894,896
27,263,787
-
17,711,201
-
-
-
-
8,022,332
5,191,771
-
-
-
13,214,103
-
-
-
6,200,309
-
-
-
6,200,309
-
6,200,309
7,013,794
-
24,724,995
12,201,183
1,272,581
-
21,359,386
-
100,000
-
704,268
2,424,938
38,062,356
-
4,906,994
16,320,968
-
254,337
7,663,388
1,535,000
30,680,687
32,106,664
62,787,351
(24,724,495)
104,463,802
-
17,201,183
46,898,793
500,000
28,050,807
112,189,589
17,750,805
11,842,738
704,268
2,424,938
237,563,121
41,835,047
90,858,759
38,376,502
24,933,424
254,337
7,663,388
1,535,000
205,456,457
32,106,664
237,563,121
-
104,463,802
-
3.33
4.07
6.25
5.98
9.83
8.52
5.94
-
-
5.98
5.47
3.66
6
-
-
47

(36) LIQUIDITY RISK
December 31, 2002
Cash on hand and balances at the
Central Bank of Jordan
Balances at Banks and financial institutions
Deposits at banks and financial institutions
Trading investments
Credit facilities, net
Available for sale investments
Held to maturity investments, net
Fixed assets, net
Other assets
Total Assets
LIABILITIES AND SHAREHOLDERS' EQUITYLiabilities Banks and financial institutions' deposits
Customers’ Deposits
Margin accounts
Loans and advances
Sundry Provisions
Other liabilities
Income tax provision
Total Liabilities
Shareholders' Equity
Total Liabilities and Shareholders' Equity
Liquidity risk
Cumulative liquidity risk sensitivity gap
December 31, 2001
Cash on hand and balances at the
Central Bank of Jordan
Balances at Banks and financial institutions
Deposits at banks and financial institutions
Trading investments
Credit facilities, net
Available for sale investments
Held to maturity investments, net
Fixed assets, net
Other assets
Total Assets
LIABILITIES AND SHAREHOLDERS' EQUITYLiabilitiesBanks and financial institutions' deposits
Customers' deposits
Margin accounts
Loans and advances
Sundry Provisions
Other liabilities
Income tax provision
Total LiabilitiesShareholders' EquityTotal Liabilities and Shareholders' Equity
Liquidity risk
Cumulative liquidity risk sensitivity gap
10,274,653
47,499,889
-
4,000,555
22,810,158
-
-
-
-
84,585,255
6,228,626
82,519,819
10,600,550
8,920,647
-
-
1,870,000
110,139,642
-
110,139,642
(25,554,387)
-
48
Within1 Month
1 - 3Months
6 Monthsto 1 Year
3 - 6Months
1 - 3Years
No SpecificMaturity TotalOver
3 Years
1,000,000
-
-
-
13,494,605
2,552,000
11,957,515
-
-
29,004,120
-
20,707,063
27,665,277
2,485,482
-
-
-
50,857,822
-
50,857,822
(21,853,702)
(24,199,029)
-
-
-
23,682,714
37,395,883
-
11,357,891
-
-
72,436,488
8,091,265
9,302,362
-
2,413,772
-
-
-
19,807,399
-
19,807,399
25,629,089
4,747,346
15,178,075
55,914,415
500,000
33,263,530
116,126,352
24,897,004
23,315,406
1,068,460
3,154,899
273,418,141
31,027,875
132,860,875
38,265,827
26,400,293
473,654
4,929,244
1,870,000
235,827,768
37,590,373
273,418,141
-
-
-
-
500,000
-
12,846,414
8,957,576
-
-
-
22,303,990
-
4,836,150
-
2,804,759
-
-
-
7,640,909
-
7,640,909
14,663,081
19,410,427
-
-
-
-
26,193,944
6,141,009
-
-
-
32,334,953
-
-
-
6,964,061
-
-
-
6,964,061
-
6,964,061
25,370,892
44,781,319
-
-
-
-
3,385,348
6,144,300
-
-
-
9,529,648
-
-
-
2,811,572
-
-
-
2,811,572
-
2,811,572
6,718,076
51,499,395
3,903,422
8,414,526
-
5,580,261
-
1,102,119
-
1,068,460
3,154,899
23,223,687
16,707,984
15,495,481
-
-
473,654
4,929,244
-
37,606,363
37,590,373
75,196,736
(51,973,049)
-
7,967,791
36,117,976
-
6,691,421
28,506,589
-
1,992,099
-
-
81,275,876
6,356,478
51,167,174
16,320,968
909,964
-
-
1,535,000
76,289,584
-
76,289,584
4,986,292
-
-
-
-
-
22,331,298
46,840
-
-
-
22,378,138
2,692,299
8,922,534
22,055,534
8,504,127
-
-
-
42,174,494
-
42,174,494
(19,796,356)
(14,810,064)
3,000,000
500,000
-
-
23,272,136
21,338
9,850,639
-
-
36,644,113
15,750,000
11,166,500
-
1,343,890
-
-
-
28,260,390
-
28,260,390
8,383,723
6,290,528
17,201,183
46,898,793
500,000
28,050,807
112,184,589
17,750,805
11,842,738
704,268
2,424,938
237,563,121
41,835,047
90,858,759
38,376,502
24,933,424
254,337
7,663,388
1,535,000
205,456,457
32,106,664
237,563,121
-
-
-
-
-
-
9,789,407
-
-
-
-
9,789,407
3,000,000
9,526,055
-
2,080,238
-
-
-
14,606,293
-
14,606,293
( 4,816,886)
1,473,642
-
-
500,000
-
20,267,827
12,390,856
-
-
-
33,158,683
-
-
-
5,894,238
-
-
-
5,894,896
-
5,894,896
27,263,787
28,737,429
-
-
-
-
8,022,332
5,191,771
-
-
-
13,214,103
-
-
-
6,200,309
-
-
-
6,200,309
-
6,200,309
7,013,794
35,751,223
6,233,392
10,280,817
-
8,642,517
-
100,000
-
704,268
2,424,938
28,385,932
14,036,270
10,076,496
-
-
254,337
7,663,388
-
32,030,491
32,106,664
64,137,155
(35,757,223)
-

(37) FOREIGN CURRENCIES RISKS
US Dollar
Sterling Pound
Euro
Swiss Franc
Japanese Yen
Others
(38) GEOGRAPHICAL AND SEGMENTAL DISTRIBUTION OF
ASSETS AND LIABILITIES AND OFF BALANCE SHEET ITEMS
Assets and liabilities and off balance sheet items were distributed in current period and in prior
period as follows:
According to Geographical area:
Inside Jordan
Other Arab countries
Asia *
Europe
Africa *
America
Others
Total
According to segment:
Individuals accounts
Corporate accounts
Others
Total
20012002
(215,747)
26,862
101,851
14,183
2,122,457
-
6,790,617
8,842
(2,086,080)
13,900
39,769
99,617
(152,965)
30,521
75,607
7,236
12,690
42,700
ForeignCurrency
Equivalentin JD
ForeignCurrency
Equivalentin JD
9,577,739
8,600
(3,324,616)
32,814
7,362,127
-
AssetsOff BalanceSheet Items
Liabilities
2002 2001
192,431,746
9,086,034
448,053
25,424,111
-
10,173,177
-
237,563,121
219,144,458
10,591,430
-
43,067
-
7,784,166
-
237,563,121
AssetsOff BalanceSheet Items
Liabilities
30,603,525
5,696,137
12,918,957
52,747,005
-
2,225,178
-
104,463,802
216,945,325
8,402,583
-
41,370,117
-
6,700,116
-
273,418,141
258,510,107
8,118,933
90,840
328,891
-
6,369,370
-
273,418,141
51,296,880
7,002,029
17,580,902
28,639,848
-
480,212
264,114
105,263,985
Assets Liabilities
2002 2001
15,191,943
109,460,178
112,911,000
237,563,121
20,103,519
109,131,742
108,327,860
237,563,121
Assets Liabilities
6,687,524
48,184,590
49,591,688
104,463,802
25,955,622
90,170,730
157,291,789
273,418,141
59,234,209
111,892,493
102,291,439
273,418,141
17,129,020
68,484,131
19,650,834
105,263,985
Off BalanceSheet Items
Off BalanceSheet Items
* Excluding Arab Countries
49

(39) RELATED PARTY TRANSACTIONS
Balance sheet items
Direct credit facilities
Deposits at banks
Margin accounts
Off balance sheet items
Indirect credit facilities
Income statement items
Interest and commission income
Interest and commission expense
(40) OFF BALANCE SHEET ITEMS
The bank has the following off balance sheet items as of the financial statements date:
Letters of credit
Acceptances
Letters of guarantee -
Payments
Performance
Other
Forward deals in foreign currencies
Non utilized ceilings
20012002
4,045,121
31,552,290
112,712
242,591
437,728
1,875,159
20012002
31,019,551
6,412,347
11,051,253
16,569,158
15,222,023
14,981,744
9,207,726
104,463,802
27,340,706
11,242,688
10,004,020
8,522,544
18,492,025
18,918,844
10,743,158
105,263,985
2,548,653
32,643,659
91,496
-
155,130
1,293,395
50

(41) LITIGATION
The Bank appears as a defendant in one lawsuit filed against it in the normal course of business for
JD 1,428,676 as of December 31, 2002.
According to lawyer's opinion the outcome of the lawsuit will be favourable and the Bank's
management believes that there is no need to provide for this lawsuit.
(42) RECLASSIFICATIONS
Some of 2001 balances were reclassified to correspond with 2002 classifications.
51

OtherDisclosures

AUDITORS
The Financial Statements of 2002 have been audited by the Allied Accountants (A member firm ofErnst & Young International) and their fee for the year was JD9,000.
DIRECTORS’ INTEREST
The Directors of the Bank had the following intersts in the Bank’s capital at the end of 2002:
Social Security Corporation
Mohammed M. El-Seif
Abdel Raouf W. Al-Bitar
Ali K. Al-Husry
Bassem K. Salem
Investments & Integrated Industries Company
Jordan Phosphate Mines Company
Said S. Darwazah
Bayader Trade & Investment Co. Ltd.
Jordan Loan Guarantee Corporation
Fayiz M. Soheimat
Shaker Bin Zeid Bin Shaker
Jaloul Trade & Investment Company
3,000,000
2,919,485
2,548,786
2,030,602
1,915,584
1,624,950
1,500,000
1,080,170
267,878
201,180
153,780
71,249
37,500
Name No. Of Shares2002
SUBSTANTIAL INTEREST IN CAPITAL
Social Security Corporation
Mohammed M. El-Seif
Abdel Raouf W. Al-Bitar
Ali K. Al-Husry
Bassem K. Al-Salem
Abeer Bint Turky Bin Abdel Aziz
Investments & Integrated Industries Company
Jordan Phosphate Mines Company
Said S. Darwazah
Jordan Industrial Cities Corporation
10.000
9.732
8.496
6.769
6.385
5.849
5.417
5.000
3.601
2.500
Name (%) Interest
3,000,000
2,919,485
2,548,786
2,030,602
1,915,584
1,754,575
1,624,950
1,500,000
1,080,170
750,000
No. Of Shares2002
53

DIRECTORS’ EMOLUMENTS
The emoluments of the Bank’s Directors for the year 2002 were as follows:
Ali K. Al-Husry
Said S. Darwazah
Elia C. Nuqul
Bassem K. Salem
Amer M. Fariz
Mohammed S. Hourani
Shaker Bin Zeid
Fayiz M. Soheimat
Marwan S. Rishaydat
Arab Potash Company
Abdel Raouf Al-Bitar
Yehya Abu Ersheid
Mohammed S. Hamami
Mohammed M. El-Seif
269,000
269,000
NameSalaries &
OtherRemuneration
5,000
5,000
5,000
5,000
5,000
5,000
5,000
5,000
5,000
5,000
5,000
5,000
5,000
65,000
Remuneration
11,634
11,634
2,400
2,400
2,400
2,400
2,400
2,400
2,400
2,400
2,400
600
1,800
2,400
2,400
1,143
29,943
OtherBenefits
Transportation
DONATIONS
During the year 2002, the bank made charitable contributions totaling JD 56,755 , as per the
following:
Instituion
Al-Hussein Fund for Creativity & Excellence
Jordanian Charity Commission
Hussein Cancer Center
Young Women Muslim Association
The Jordanian Hashemite Fund (Al-Bir Wal-Ihsan Campaign)
Other (Charitable & Social Foundations)
Total
Amount
9,375
10,000
15,000
3,500
3,000
15,880
56,755
54

PERSONNEL
Total number of staff and their qualifications at end of 2002 was as follows:
Senior Management
Middle Management
Management Support
Total
6
4
3
13
Category
11
16
49
76
UniversityDegree
-
5
11
16
-
-
8
8
DiplomaSecondary
SchoolNo. of Staff
Qualifications
17
25
71
112
MastersDegree
TRAINING
Details of training provided to employees during 2001 is as follows:
No. of Training Courses
No.of staff
22
24
125
97
InsideJordan
Training Courses
OutsideJordan
55
STATEMENT OF DIRECTORS’ RESPONSIBILITIES
The Board of Directors confirms that the financial statements have been prepared on a going
concern basis and there are no material transactions that might affect the bank’s ability to
continue in business for the foreseeable time.
The Board of Directors is responsible for the preparation and the fair presentation of the financial
information contained in this annual report. The Board of Directors is also responsible for
establishing and maintaining an effective internal control structure and procedures for financial
reporting and safeguarding of assets.

Boar
d O
f D
irect
ors
Ch
airm
an /
CE
OA
ud
it C
om
mit
tee
Exe
cuti
ve C
om
mit
tee
Act
ing G
en
era
l M
anag
er
Inte
rnal
Au
dit
Legal
Con
sult
ant
Inve
stm
en
tD
ep
artm
en
tP
ers
on
nel
Dep
artm
en
tM
ain
Bra
nch
Cre
dit
Dep
artm
en
tFin
anci
alD
ep
artm
en
tC
om
pu
ter
Dep
artm
en
tTre
asu
ryD
ep
artm
en
t
Org
aniz
atio
nal
Ch
art
Sp
eci
alP
roje
cts
Dep
artm
en
t