annual report 2002 - bourse€¦ · ibm, infineon, intel, lucent, micron, motorola, nseb, on...
TRANSCRIPT

A l w a y s A h e a d
A l w a y s A h e a d
A n n u a l R e p o r t 2 0 0 2
Be
si
An
nu
al R
ep
ort 2
00
2
Besi is a leading manufacturer of semiconductor
packaging, plating and die handling equipment.
Our offering covers both lead frame and array
connect applications. We design and manufacture
technologically advanced, high-performance
equipment and integrated systems for assembly
process operations in the semiconductor industry.
Besi equipment is mainly used to produce
semiconductor packages providing the electronic
interface and physical connection between chips
and other electronic components and also
protects the chip from the external environment.
For users, our innovative systems mean high pro-
ductivity and improved yields of defect-free devi-
ces – all at a low total cost of ownership.

A l w a y s A h e a d
A n n u a l R e p o r t 2 0 0 2
During the past financial year several integral
components of the Company did not always
fully project “group membership” to the out-
side world. As from now we aim to change
this awareness-situation and all Besi companies
worldwide will be instantly recognizable at
a glance. One Company, one “look”, one team.
Worldwide.
Our considered judgement is that this will impact
positively both outside and inside the Company.
The quality of the Besi offering will now reflect
right across the Company. Meanwhile, it should
further enhance the team approach.
Technology and teamwork.
A sustainable, quality combination.

A n n u a l R e p o r t 2 0 0 22

Company Profile 51
Selected Consolidated Financial Data 62
Corporate Information 918
Letter to Shareholders 93
Report of the Supervisory Board 144
Industry Background 175
Management’s Discussion and Analysis of Financial Condition and Results of Operations 306
Consolidated Financial Statements 2002 49
Independent Auditors’ Report 50
Consolidated Balance Sheets 51
Consolidated Statements of Operations 52
Consolidated Statements of Cash Flows 53
Consolidated Statements of Shareholders’ Equity 55
Consolidated Statements of Comprehensive Income (Loss) 56
Notes to the Consolidated Financial Statements 57
7
A n n u a l R e p o r t 2 0 0 2 3
Contents

A n n u a l R e p o r t 2 0 0 24
for almost 40 years, a similar combination of new ideas combined with solid expertise has characterized Besi

Besi is een vooraanstaand producent van machines voor
de verschillende stappen in het assemblageproces van half-
geleiders. Verschillende stappen waarvoor Besi machines
levert zijn het verpakken oftewel ‘packaging’, het selecteren
ofwel ‘die sort’, het monteren van halfgeleiders op een
contactvlak oftewel flip-chip ‘die attach’ en ook het middels
een elektrolytisch proces aanbrengen van een contactlaag
oftewel ‘platen’. Onze machines bieden een hoge producti-
viteit bij maximale ‘yield’. Besi opereert vanuit vier pro-
duktgroepen met elk een specifieke product focus. De Besi
Molding groep produceert Fico automatische molding
machines en de Besi Trim and Form groep produceert Fico
snij- en buigmachines. Onze Besi plating groep produceert
Meco electro plating machines, alsmede geautomatiseerde
precisie zaagmachines. De Besi die handling groep, waarin
RD Automation en Laurier zijn samengevoegd, produceert
RDA flip-chip ‘die attach’ precisie machines en Laurier
chip sorteer machines.
Besi heeft een geavanceerde assemblagemachine ont-
wikkeld op basis van ‘geclusterde’ processen, genaamd
ABC (Advanced Back-end Cluster). De ABC integreert
zowel producten van Besi-dochterondernemingen als pro-
ducten van anderen, met als doel het leveren van een
compleet assemblageproces.
Besi’s klanten zijn de toonaangevende fabrikanten van
halfgeleiders en assemblagediensten in de Verenigde Staten,
Europa en Azië. Onze apparatuur wordt specifiek gebruikt
voor halfgeleidermontage en vormt bij veel klanten een aan-
zienlijk percentage van hun totaal geïnstalleerde machine-
park. Besi profiteert van langdurige, nauwe relaties met de
meeste van haar klanten en is ervan overtuigd dat dit heeft
bijgedragen tot de huidige toonaangevende positie in vele
van haar productlijnen.
Besi is in mei 1995 ontstaan uit het samenvoegen van
Fico en Meco en is sinds december 1995 beursgenoteerd.
Besi’s aandelen staan genoteerd aan de beurs in de
Verenigde Staten, Nasdaq, en aan de beurs van Amsterdam,
Euronext.
A n n u a l R e p o r t 2 0 0 2 5
Company Profile
Bedrijfsprofiel
Besi is a leading manufacturer of semiconductor
packaging, plating and die handling equipment for both
leadframe and array connect applications. We design and
manufacture technologically-advanced, high-performance
equipment and integrated systems for the semiconductor
industry’s assembly process operations. Our equipment is
used principally to produce semiconductor packages,
which provide the electronic interface and physical con-
nection between the chip and other electronic components
and protect the chip from the external environment. Our
innovative systems offer customers high productivity and
improved yields of defect-free devices at a low total cost
of ownership. We operate primarily through four wholly
owned divisions. Our Besi molding division provides Fico
automated molding systems and our Besi trim and form
division provides Fico trim and form systems. Our Besi
plating division provides Meco plating systems and singu-
lation systems. Our Besi die handling division, combining
our former RD Automation and Laurier subsidiary, provides
RDA flip chip die attach systems and Laurier automated
die sorting systems. Recently, we began marketing and
selling our Advanced Back-end Cluster equipment, or ABC,
which is an integrated solution of assembly process equip-
ment, incorporating products from our subsidiaries as
well as from other manufacturers.
Our customers are leading US, European and Asian
semiconductor manufacturers and packaging subcontrac-
tors and include Agere, Amkor, ASE, AVX, Conexant,
IBM, Infineon, Intel, Lucent, Micron, Motorola, NSEB,
ON Semiconductor, Philips and STMicroelectronics. Our
equipment performs critical functions in our customers‘
semiconductor assembly operations and in many cases
represents a significant percentage of their installed base
of packaging and plating equipment. Our business has
benefited from close, long-term relationships with our
customers, many of whom have been purchasing our
equipment and services for over 30 years. We believe that
these customer relationships have contributed to our
attaining a leading position in each of our principal
product lines. We were incorporated in May 1995 and are
publicly listed since December 1995. Our shares are listed
on Nasdaq and Euronext.

A n n u a l R e p o r t 2 0 0 26
Selected Consolidated Financial Data
(1) The financial data for the year ended December 31, 1998 have been restated from NLG into euro using the exchange rate as of January 1, 1999
(Euro 1 = NLG 2.20371).
1998 1999 2000 2001 2002
EURO (1) EURO EURO EURO EURO
STATEMENTS OF OPERATIONSNet sales 150,914 105,645 197,972 150,030 83,228Cost of sales 103,000 71,041 121,171 96,253 55,849Gross profit 47,914 34,604 76,801 53,777 27,379
Selling, general and administrative expenses 34,078 26,490 33,841 30,563 26,235Research and development expenses 10,761 7,612 11,440 15,446 12,470Write-off of acquired in-process research and development - - 11,461 - -
Restructuring charges (release) 4,356 (1,067) - 8,306 786Goodwill impairment - - - - 3,302Amortization of intangible assets 2,744 2,744 3,126 3,848 2,591Total operating expenses 51,939 35,779 59,868 58,163 45,384
Operating income (loss) (4,025) (1,175) 16,933 (4,386) (18,005)Interest income (expense), net (647) (563) 2,814 4,240 3,395Other income, net 227 1,180 - - -Income (loss) before taxes and equity in earnings (loss) of affiliated companies and minority interest (4,445) (558) 19,747 (146) (14,610)
Income taxes (benefit) (669) (1,098) 6,311 518 2,404Income (loss) before equity in earnings (loss) of affiliated companies and minority interest (3,776) 540 13,436 (664) (17,014)
Equity in earnings (loss) of affiliated companies and loss on sale of affiliated companies 1,732 1,891 5,031 (16,314) -
Minority interest - - - - 3
Net income (loss) (2,044) 2,431 18,467 (16,978) (17,011)
EARNINGS (LOSS) PER SHAREBasic (0.08) 0.09 0.61 (0.53) (0.54)Diluted (0.08) 0.09 0.61 (0.53) (0.54)
WEIGHTED AVERAGE NUMBER OF SHARES USEDTO COMPUTE EARNINGS (LOSS) PER SHAREBasic 26,394,425 26,394,425 30,242,151 31,794,675 31,462,482Diluted 26,394,425 26,415,048 30,351,462 31,794,675 31,462,482
OTHER OPERATING DATA:Net sales per employee 153 130 254 183 124Capital expenditures 4,564 1,213 6,311 3,393 4,903Depreciation of property, plant and equipment 5,318 4,985 4,465 4,495 4,135Net cash provided by (used in) operating activities 6,202 4,878 12,066 14,942 (4,224)

A n n u a l R e p o r t 2 0 0 2 7
Semiconductor Market(Annual growth rate)
1984 1985 1986 1987 1988 1989 1990 1991 1992 1993 1994 1995 1996 1997 1998 1999 2000 2001 2002 2003 2004 2005 2006 2007
15% trend
Semiconductor sales (in $ bln)
% change
Source: VLSI Research January 2003
50%
40%
30%
20%
10%
0%
-10%
-20%
-30%
300
225
150
75
0
bln$
Semiconductor Equipment, Assembly and Packaging(In US$ billion)
1984 1985 1986 1987 1988 1989 1990 1991 1992 1993 1994 1995 1996 1997 1998 1999 2000 2001 2002 2003 2004 2005 2006 2007
Semiconductor Equipment
Assembly
Packaging
Source: VLSI Research January 2003
2002-2007:
CAGR Semiconductor Equipment: 11.0%
CAGR Assembly: 13.1%
CAGR Packaging Equipment: 14.7%
60
50
40
30
20
10
0
A n n u a l R e p o r t 2 0 0 28
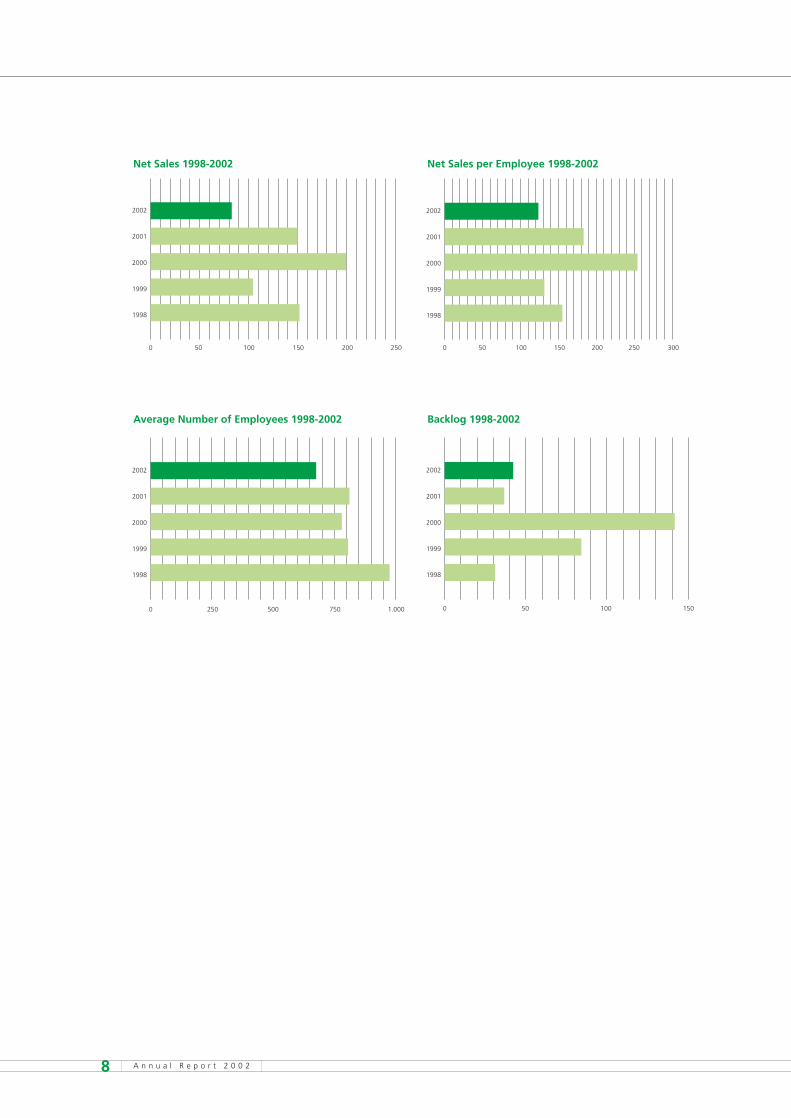
0 50 100 150 200 250
1998
1999
2000
2001
2002
Net Sales 1998-2002
0 50 100 150 200 250 300
1998
1999
2000
2001
2002
Net Sales per Employee 1998-2002
0 250 500 750 1.000
1998
1999
2000
2001
2002
Average Number of Employees 1998-2002
0 50 100 150
1998
1999
2000
2001
2002
Backlog 1998-2002

L e t t e r t o S h a r e h o l d e r s
A n n u a l R e p o r t 2 0 0 2 9
for almost 40 years, a similar combination of new ideas combined with solid expertise has characterized Besi

Dear Shareholders,
Besi’s business in 2002 continued to be adversely
affected by one of the most difficult semiconductor
industry environments in recent memory. Industry
analysts estimate that global semiconductor equip-
ment sales declined between 20% - 30% in 2002 as
compared to 2001 after a decline between 30% - 35%
in 2001 as compared to 2000. Assembly equipment
was even more adversely affected by the downturn.
After a decline of 56% in 2001 as compared to 2000,
industry analysts estimate a decline of 21% in 2002
as compared to 2001. Similarly, our net sales declined
by approximately 44% in 2002 as compared to 2001
and by 24% in 2001 as compared to 2000. From the
peak of the cycle in 2000 to the trough in 2002, our
net sales declined by 58%, whereas industry analysts
estimate a 65% decrease for the total assembly
equipment market.
In spite of a € 66.8 million decline in shipments
this year versus last year, we managed to limit our los-
ses in 2002 and the utilization of our cash resources
due to the extensive restructuring of our operations
over the past 18 months to significantly reduce our
break-even levels. We continue to evaluate opportu-
nities to further reduce our break-even levels in light
of uncertain forecasts for semiconductor equipment
demand in 2003, as evidenced by the consolidation
of our Laurier, Inc. and RD Automation subsidiaries
in the second half of 2002. Due to such efforts we
were able to break-even on an adjusted net earnings
basis in the fourth quarter of 2002 excluding one-time
year-end adjustments for the impairment of certain
tax and intangible assets. The second half of the
year also witnessed a significant improvement in our
net sales, bookings and backlog from lower levels in
the first six months of 2002.
A n n u a l R e p o r t 2 0 0 21 0
Letter to Shareholders
Ook in 2002 werden de resultaten van Besi negatief
beïnvloed door één van de sterkste dalingen in de vraag
naar halfgeleiders in de historie van de industrie, waardoor
ook de vraag naar halfgeleiderproductieapparatuur verder
is gedaald. Besi heeft haar bedrijven verder aangepast
aan de huidige marktomstandigheden en, met name door
de samenvoeging en reorganisatie van RD Automation en
Laurier, de kostenstructuur verlaagd om te kunnen blij-
ven investeren in ontwikkeling van nieuwe machines.
Gezien de onzekere verwachtingen voor 2003 is Besi
voornemens om mogelijkheden die het break-even niveau
verder kunnen verlagen te onderzoeken en waar mogelijk
te benutten.
De belangrijkste punten van 2002 zijn:
• Een 99% toename van de nieuwe opdrachten in 2002 ten
opzichte van 2001; een toename van de “book-to-bill’’
ratio van 0.30 in 2001 naar 1.07 in 2002.
• Een omzetstijging van bijna 90% in het vierde kwartaal
2002 ten opzichte van het eerste kwartaal van 2002.
Ondanks de moeilijke marktomstandigheden was het
netto resultaat exclusief de bijzondere lasten in het vier-
de kwartaal positief.
• De acquisitie van Laurier, gevestigd in de Verenigde
Staten, voor een bedrag van US$ 8.9 miljoen waarmee
Besi haar produktenpakket en klantenbasis verder heeft
uitgebreid.
• Een verdere kostenreductie in de Verenigde Staten van
€ 2.5 miljoen door samenvoeging en herstructurering van
RDA en Laurier in Londonderry, New Hampshire, USA.
• De oprichting van Fico Tooling in China, een 87%
deelneming waarmee we in de toekomst een verdere
kostprijsverlaging willen bereiken.
• De commerciële introductie en marketing van geïnte-
greerde assemblagelijnen onder de naam ABC (Advan-
ced Back-end Cluster). Het uiteindelijke doel van de
ABC systemen is de integratie van alle processtappen in
de back-end assemblage.
Bericht aan de Aandeelhouders

Our most important achievements this year were:
•A 99% increase in bookings in 2002 as compared to
2001, an increase in the book-to-bill ratio from 0.30
in 2001 to 1.07 in 2002 and a 16% increase in our
year-end backlog.
• Increased net sales from the first quarter of 2002
to the fourth quarter of 2002 of almost 90% and
positive adjusted net earnings excluding one-time
charges in the fourth quarter of 2002 in spite of
an extremely challenging business environment.
•The acquisition of Laurier for US$ 8.9 million in cash
added intelligent die sorting capabilities, particularly
for advanced chip scale packaging applications,
to our range of assembly solutions and expanded our
customer base, development and US manufacturing
capabilities.
•A further reduction of our overhead levels by an
estimated € 2.5 million, primarily as a result of
the consolidation of our Laurier and RDA facilities
in Londonderry, New Hampshire, USA, and staff
reductions related thereto in response to continued
adverse market conditions.
•The establishment of Fico Tooling China, a tooling
manufacturing facility, in which we own 87% equity
interest, from which we expect to further lower our
costs of production for tooling.
•The commercial introduction and marketing of
integrated lines of assembly equipment under the
ABC product name (Advanced Back-end Cluster),
combining products from our subsidiaries as well
as from other manufacturers. The ultimate objective
of the ABC system is to integrate all process steps
of either conventional leadframe or array connect
back-end assembly operations into a single system.
R e s u l t s o f O p e r a t i o n s
Net sales for 2002 were € 83.2 million, a 44.5%
decrease as compared to net sales in 2001 of € 150.0
million. Our net loss for 2002 was € 17.0 million, or
€ 0.54 per share as compared to a net loss of € 17.0
million or € 0.53 per share in 2001. Our adjusted
operating earnings (loss) before restructuring and asset
impairment charges decreased from earnings of € 3.9
million in 2001 to a loss of € 13.9 million in 2002. The
decline in adjusted operating loss in 2002 as compared
to 2001 was mainly due to the substantial decrease in
net sales and decreased gross margins resulting from
the underabsorption of production overhead and price
competition. Such decline was partially offset by opera-
ting expense savings due to our restructuring efforts.
The Consolidated Financial Statements presented
in this Annual Report are prepared in conformity with
accounting principles generally accepted in the United
States of America. In accordance with these principles,
we adopted SFAS No. 142, “Goodwill and Other
Intangible Assets” as of January 1, 2002 and of that
date, goodwill amortization ceased. In accordance with
accounting principles generally accepted in the Nether-
lands, goodwill continued to be amortized. Results in
accordance with accounting principles in the Nether-
lands therefore differ from the results presented in this
Annual Report.
B o o k i n g s / B a c k l o g
Our backlog at December 31, 2002 increased
by 16.4% to € 42.5 million from € 36.5 million
at December 31, 2001, primarily due to increased
bookings for molding systems, trim and form inte-
gration systems and plating systems. New orders in
2002 were € 89.1 million, including € 1.8 million
of die sorting systems’ backlog that was acquired
as part of our purchase of Laurier, an increase of
98.9% as compared to € 44.8 million in 2001.
The book-to-bill ratio for 2002 was 1.07 compared
to 0.30 for 2001.
A n n u a l R e p o r t 2 0 0 2 1 1

P r o d u c t D e v e l o p m e n t
Through the downturn we have maintained our
commitment to research and development. Research
and development expenses were € 12.5 million in
2002 as compared to € 15.4 million in 2001.
The development program of the ABC system is on
schedule. We showed a prototype version demonstra-
ting its capabilities at Semicon Singapore and Semicon
West in San Jose, USA, in 2002. The response by both
customers and die and wire bonding partners has been
very positive. We expect to ship the first system to one
of our major customers in the first half of 2003.
Other product development highlights during the
year included the introduction of our 300 mm chip
sorter, a next generation molding system and a new
manual flip chip M9a die attach system with accuracy
of ± 1 micron. Our next generation singulation system
is currently being tested at two potential customers.
Furthermore, we expect that the consolidation of our
US flip chip die attach operations and die sorting activi-
ties will allow us to enhance and strengthen our deve-
lopment capabilities in die handling applications.
F i n a n c i a l C o n d i t i o n
We continue to maintain significant cash balances
and a strong liquidity position. At December 31, 2002,
we had € 119.9 million in cash and shareholders’
equity was € 200.5 million and we maintained a sol-
vency ratio of 81.8%. Our cash position decreased by
€ 21.6 million as of December 31, 2002 as compared
to December 31, 2001 primarily as a result of the acqui-
sition of Laurier (€10.6 million in cash purchase price),
the expenditure of € 4.9 million on repurchases of our
ordinary shares, the financing of a cash flow deficit
from operations of € 4.2 million and the retirement of
debt and capital leases of € 2.9 million partially offset
by € 6.5 million of proceeds received from the sale and
lease back of one of our buildings. Capital expenditures
during 2002 were € 4.9 million as compared to
€ 3.4 million in 2001. The expenditures in 2002 were
incurred primarily for the purchase of machinery and
equipment and computer equipment, as well as the
first installments for (i) the construction of a new
80,000 square foot facility in Duiven, the Netherlands
for molding systems and tooling manufacturing and
(ii) the establishment of our first manufacturing facility
in mainland China for the production of tools.
We expect capital spending in 2003 to increase to
approximately € 13.0 million, principally as a result of
the expenditures required to complete these new
buildings in 2003.
O t h e r
Resignation of Executive Member
of the Management Board.
Effective October 23, 2002, Mr. Jörg Rischke re-
signed from his position as executive member of the
Management Board and Chief Operating Officer of the
Company in anticipation of his planned retirement in
October 2003. Mr. Rischke will remain a member of
Besi’s Management Board and Managing Director of
Meco Equipment Engineers B.V. until his retirement
date. Mr. Rischke has served as Managing Director of
Meco Equipment Engineers since 1988. He joined Besi’s
Management Board in 1995 and became executive
member of its Management Board on April 29, 1998.
The Supervisory Board and the Management Board of
Besi are very grateful to Mr. Rischke for his past contri-
butions to the success of the Company.
Termination of Frankfurt Stock Exchange Listing.
We decided that in light of the small trading volume
of shares on the Frankfurt Stock Exchange as compared
to the Euronext and the Nasdaq National Market
and the cost of maintaining a listing on the Frankfurt
Stock Exchange, it would be in the best interest of
the Company and our shareholders to terminate the
Company’s listing on the Frankfurt Stock Exchange.
Our application to delist the shares was approved by
A n n u a l R e p o r t 2 0 0 21 2

the Frankfurt Stock Exchange and trading of our shares
on the Frankfurt Stock Exchange ended on October
24, 2002.
Stock Repurchase Program.
On June 17, 2002, we announced that we intended
to repurchase up to 1,000,000 of our ordinary shares
to limit the dilutive effect of options issuance, under
which we spent € 4.9 million to repurchase 896,447
ordinary shares in 2002, or approximately 3% of our
outstanding ordinary shares.
O u t l o o k
The semiconductor- and semiconductor equipment
markets are currently in the midst of a severe and
protracted downturn and visibility of a recovery in the
industry is still low. Additionally, current economic
uncertainties make forecasting results for future periods
extremely difficult, but we believe that our latest product
generations and efforts to reduce operating costs leave
us well positioned for any industry recovery.
We believe that based on order trends in 2002, our
new order intake reached bottom in the third quarter
of 2001 and subsequently we have seen modest impro-
vement in new order rates from September 2001 until
the present time resulting in a 16% higher backlog
at the end of 2002 as compared to the end of 2001.
In spite of such improvement, we expect that industry
conditions will remain difficult for at least the first half
of 2003. Although we project that our net sales for
the first half of 2003 will increase as compared to the
first half of 2002, we expect that net sales will decrease
from those experienced in the second half of 2002.
In light of depressed industry conditions, there is
much work to be done to position the company for
future success. We would like to highlight a number of
key objectives that we have outlined for achievement
in 2003. They include (i) obtaining initial orders and
delivering first shipments of our ABC product line,
(ii) completing new generations and enhancements to
our packaging and plating product lines in preparation
for the next industry upturn, (iii) increasing our manufac-
turing infrastructure in Asia including our establishment
of a facility in mainland China for the production of
tools, (iv) completing the modernization of our Dutch
manufacturing facilities through the construction of the
Duiven molding, trim and form integration and tooling
facility which should become operational in the second
half of 2003 and (v) making additional product line
acquisitions, if available at reasonable valuations, to
further enhance our assembly integration strategy.
We realize that these ambitious targets can only
be met with the continued support of our customers,
shareholders, workforce, partners and suppliers around
the world for which we are grateful.
We look forward to sharing our progress with you
in the year to come.
Board of Management
Richard W. Blickman
President and CEO
February 11, 2003
A n n u a l R e p o r t 2 0 0 2 1 3
A n n u a l R e p o r t 2 0 0 21 4
Report of the Supervisory Board
F i n a n c i a l S t a t e m e n t s
At its meeting on February 10, 2003, the Super-
visory Board adopted the financial statements and
the notes thereto of BE Semiconductor Industries N.V.
(“the Company”) for the financial year ended
December 31, 2002 provided in this Annual Report
(the “2002 US Financial Statements”), as prepared
by the Board of Management. The 2002 US
Financial Statements presented in this Annual Report
have been prepared in conformity with accounting
principles generally accepted in the United States of
America. KPMG Accountants, independent public
auditors, duly examined the 2002 US Financial
Statements. The report of KPMG is included in this
Annual Report.
At its meeting on February 10, 2003, the Super-
visory Board also adopted financial statements and
notes thereto of the Company for the fiscal year
ended December 31, 2002 as required by applicable
rules and regulations in the Netherlands (the “2002
Statutory Financial Statements”). Under applicable
rules and regulations in the Netherlands, the
Statutory Financial Statements must be prepared
in accordance with accounting principles generally
accepted in the Netherlands. KPMG Accountants,
independent public auditors, duly examined the 2002
Statutory Financial Statements. The 2002 Statutory
Financial Statements are not included in the Annual
Report, but will be made available in connection
with the Company’s Annual General Shareholders
Meeting for approval.
The 2002 US Financial Statements reflect the
adoption of SFAS No. 142, “Goodwill and Other
Intangible Assets” as of January 1, 2002, as required
by generally accepted accounting principles in the
United States of America , which require that goodwill
amortization ceases as of January 1, 2002. In contrast,
the 2002 Statutory Financial Statements reflect the
continued amortization of goodwill, as required
by accounting principles generally accepted in the
Netherlands. Accordingly, the reported results in
the 2002 Statutory Financial Statements differ from
the results presented in the 2002 US Financial
Statements as contained in this Annual Report.
H e t J a a r v e r s l a gDe Raad van Commissarissen van BE Semiconductor
Industries N.V. (de “Vennootschap”) heeft in zijn ver-
gadering van 10 februari 2003 de jaarrekening van de
Vennootschap over het boekjaar 2002 (met toelichting) (de
‘2002 US Financials’) zoals die door de Raad van Bestuur
van de Vennootschap was opgesteld, vastgesteld. Deze
‘2002 US Financials’, die zijn opgenomen in dit jaarver-
slag, zijn opgesteld met inachtneming van ‘US GAAP’.
Tevens heeft de Raad van Commissarissen op 10
februari 2003 de jaarrekening van de Vennootschap over
het boekjaar 2002 (met toelichting), vastgesteld die is
opgesteld op grond van de in Nederland geldende regels
die van toepassing zijn op het opstellen van jaarrekenin-
gen (de ‘2002 Statutory Financial Statements’).
Deze ‘2002 Statutory Financial Statements’ zullen door
de accountant van de Vennootschap, KPMG, van een
goedkeurende verklaring worden voorzien. Deze ‘2002
Statutory Financial Statements’ zijn niet in dit jaarver-
slag opgenomen, maar zullen tijdig, voorafgaand aan
de Algemene Vergadering van Aandeelhouders van de
Vennootschap, beschikbaar zijn.
De ‘2002 US Financials’ zijn opgesteld met inachtne-
ming van ‘SFAS No. 142’, “Goodwill and Other
Intangible Assets”. Op grond van deze nieuwe regels, die
onderdeel uitmaken van ‘US GAAP’, mag goodwill niet
langer worden afgeschreven. Volgens Nederlandse regels
moet goodwill echter wel worden afgeschreven, hetgeen
ook in de ‘2002 Statutory Financial Statements’ is ver-
werkt. Dit heeft tot gevolg dat de resultaten die blijken uit
V e r s l a g v a n d e R a a d v a n C o m m i s s a r i s s e n

A n n u a l R e p o r t 2 0 0 2 1 5
The Supervisory Board recommends that the share-
holders approve the 2002 Statutory Financial State-
ments as submitted by the Board of Management and
adopted by the Supervisory Board.
The Board of Management has also included a
proposal that a no dividend will be declared for the
year ended December 31, 2002.
S u p e r v i s i o n
The Supervisory Board met seven times during
2002. Topics of the meetings included, among other
items, the Company’s general strategy, its financial
performance, the internal division of tasks of the
Board of Management, potential strategic alliances
and acquisitions and the general risks associated with
the operation of the Company. Frequent contact
took place between the chairman of the Supervisory
Board and management of the company. Special
attention was paid to developments related to cor-
porate governance, especially changes stemming
from the passage and enactment of the Sarbanes-
Oxley Act of 2002.
During the fiscal year ended December 31, 2002,
the Supervisory Board approved, among other things,
the following actions:
•The acquisition of Laurier Inc., which has been
finalized on January 4, 2002;
•The incorporation of Fico Tooling Leshan Company
Ltd., a joint venture in China with Leshan Radio
Company, Ltd. which was established on June 25,
2002;
•The sale and lease back transaction of the building in
Drunen for € 6.5 million; and
•The approval of a plan to repurchase up to 1,000,000
of the Company’s ordinary shares.
A u d i t C o m m i t t e e
In 2002, the Audit Committee met four times to
discuss the scope and results of audits and review the
Company’s internal accounting control policies and
procedures. The Company’s external auditor, KPMG,
attended each of these meetings. Furthermore, the
Audit Committee separately met with the auditor.
Frequent contact took place between the chairman of
the Audit Committee and management of the company.
de ‘2002 Statutory Financial Statements’ afwijken van
de resultaten in de in dit jaarverslag opgenomen ‘2002
US Financials’.
De Raad van Commissarissen beveelt de aandeelhou-
ders aan de ‘2002 Statutory Financial Statements’ goed te
keuren in overeenstemming met het voorstel daartoe van
de Raad van Bestuur, met tevens daarbij de aanbeveling
geen dividend over 2002 uit te keren.
To e z i c h tDe Raad van Commissarissen vergaderde gedurende
het jaar 2002 zeven keer. Onderwerpen waren o.a. de stra-
tegie, de financiële prestaties, de interne taakverdeling
binnen de Raad van Bestuur, mogelijke strategische
samenwerkingen en potentiële acquisities en de risico’s
verbonden aan de bedrijfsvoering. Ook los van de vergade-
ringen is er regelmatig contact tussen de Raad van Bestuur
en de voorzitter van de Raad van Commissarissen geweest.
Speciale aandacht werd besteed aan de ontwikkelingen op
het gebied van corporate governance, in het bijzonder de
‘Sarbanes Oxley Act’, die in 2002 in de Verenigde Staten
van kracht werd.
De volgende besluiten zijn door de Raad van Commis-
sarissen gedurende het boekjaar 2002 goedgekeurd:
• De acquisitie van Laurier Inc., die is afgerond op
4 januari 2002;
• De oprichting van Fico Tooling Leshan Company Ltd.,
een joint venture in China met Leshan Radio Company,
Ltd., op 25 juni 2002;
• De ‘sale and lease back’ transactie van het gebouw in
Drunen voor € 6.5 miljoen; en
• De inkoop door de Vennootschap van maximaal één
miljoen eigen aandelen.

During 2002 the Audit Committee focused on identify-
ing the Company’s critical accounting policies.
The Audit Committee closely followed the introduc-
tion of the Sarbanes-Oxley Act of 2002 and the deve-
lopment of the rules promulgated by the United States
Securities and Exchange Commission, which implement
the provisions of the Sarbanes Oxley Act.
In anticipation of the passage of the Act and the
implementation of the new rules, the Audit Committee
invited a number of audit firms to attend the tender on
the Company’s audit services for the period 2003 - 2005.
This procedure has been completed, and the Super-
visory Board has proposed that KPMG be appointed
as the Company’s auditors for the fiscal year ending
December 31, 2003. This proposal will be presented to
the shareholders for approval at the Annual General
Shareholders Meeting to be held on March 27, 2003.
R e m u n e r a t i o n C o m m i t t e e
The Remuneration Committee met once and re-
viewed and approved the remuneration of the Board
of Management.
The Supervisory Board likes to express its thanks
and appreciation to all involved for their hard work and
dedication to the Company.
February 11, 2003
The Supervisory Board.
A n n u a l R e p o r t 2 0 0 21 6
Report of the Supervisory Board Cont.
Het ‘Audit Committee’ vergaderde gedurende het
boekjaar 2002 vier keer in aanwezigheid van de externe
accountant. Tijdens de ‘Audit Committee’ vergaderingen
werden de inhoud en de bevindingen van accountantscon-
troles besproken alsmede de accountingprocedures en
interne controle. Daarnaast was er regelmatig contact tus-
sen de Raad van Bestuur en de voorzitter van het ‘Audit
Committee’. Gedurende het boekjaar 2002 is binnen het
‘Audit Committee’ de nadruk gelegd op de meest relevante
accountingprocedures.
Het ‘Audit Committee’ heeft de invoering van de
‘Sarbanes Oxley Act’ en de in aansluiting daarop, door de
Amerikaanse SEC uitgevaardigde regelgeving, nauwlet-
tend gevolgd. Vooruitlopend op de invoering van verdere
regelgeving heeft het ‘Audit Committee’ een aantal accoun-
tantskantoren een aanbieding laten maken voor de accoun-
tantscontrole van 2003 – 2005. Deze procedure is afgerond
en de Raad van Commissarissen zal de benoeming van
KPMG als accountant van de Vennootschap voor het
boekjaar 2003 voorstellen tijdens de aankomende Alge-
mene Vergadering van Aandeelhouders waarin ook de
‘2002 Statutory Financial Statements’ ter goedkeuring
zal worden voorgelegd.
R e m u n e r a t i e C o m m i t t e eHet ‘Remuneration Committee’ is gedurende het boek-
jaar 2002 eenmaal bijeen gekomen en heeft de voorge-
stelde bezoldiging van de leden van de Raad van Bestuur
goedgekeurd.
De Raad van Commissarissen bedankt alle mede-
werkers voor hun inzet en toewijding.
11 februari 2003
De Raad van Commissarissen
A u d i t C o m m i t t e e

A n n u a l R e p o r t 2 0 0 2 1 7
I n d u s t r y B a c k g r o u n d
for almost 40 years, a similar combination of new ideas combined with solid expertise has characterized Besi

A n n u a l R e p o r t 2 0 0 21 8
Semiconductors are the basic building blocks used
to create an increasing variety of electronic products
and systems. Most consumers picture semiconductors
as small black boxes. The small black boxes are actually
the packaging that surrounds the silicon chip itself and
both protects the chip from the external environment
and provides the interface between the chip and other
electronic components.
Historically, semiconductors were mass produced as
standard parts. Their electronic functionality was
determined by configuring many standard parts on a
printed circuit board that was custom designed for
each application. Continuous improvements in semi-
conductor process and design technologies have led to
smaller, more complex and more reliable devices at a
lower cost per function. Over time, system users and
designers have continued to demand more functionali-
ty, higher levels of performance, greater reliability and
shorter design cycle times, all at a lower cost. The semi-
conductor industry has responded by combining the
functions of multiple chips onto one chip. In addition,
by increasing the number of chips per wafer and wafer
diameter, manufacturers have reduced costs and increa-
sed device yields.
The rapid development of advanced semiconductor
applications requires semiconductor manufacturers to
continually improve their core technology and manu-
facturing capabilities to remain competitive. Due to
increased requirements for complexity, miniaturization
and customization, semiconductor manufacturers
demand highly sophisticated, cost-effective equipment
from semiconductor assembly packaging and plating
equipment suppliers.
The semiconductor manufacturing process involves
two distinct phases, wafer processing, commonly refer-
red to as the front-end, and assembly/test operations,
including die attach wire bonding, packaging, plating
and testing functions, which are commonly referred to
as the back-end. Wafer processing involves thousands
of complex steps applied to a silicon wafer to form mil-
lions of circuits on the wafer comprising a large number
of chips. As the cost of equipment and the production
cost per wafer for the front-end is very high, it is critical
for manufacturers to protect their investment during
the back-end process by minimizing losses from defecti-
ve processing, increasing throughput and shortening
manufacturing lead times for semiconductor products.
The semiconductor assembly process first involves
the separation from the wafer of the individual chips or
"die" and the attachment of each die to a plated metal
leadframe or a multilayer substrate. The connection of
the chip is then made either by bonding extremely fine
gold or aluminum wire to the leadframe or by creating
direct connections (the so-called flip chip die attach) to
the substrate. Next the chips are molded by encapsula-
tion in an epoxy plastic. In leadframe applications, the
leads are then deflashed and tin-plated, the chips are
separated into individual devices, and the leads are
trimmed and formed. In array connect applications,
connections between the substrate and the chip are
attached by ball placement and reflow processes and
the devices are cut, or singulated, into individual units.
Functional test is carried out in various testing opera-
tions. At present, test is separate from assembly opera-
tions. However, advanced integration capabilities alrea-
dy permit the integration of test functions with leadfra-
me trim and form operations.
Industry Background

A n n u a l R e p o r t 2 0 0 2 1 9
P r o d u c t s a n d S e r v i c e s
The Company develops and produces semiconduc-
tor packaging, plating, die attach and die sorting equip-
ment for both leadframe and array connect applications.
Our packaging equipment consists of:
•automated molding systems that encapsulate semi-
conductor devices in epoxy resin;
•automated trim and form systems used to cut and
then form metallic leads of encapsulated semiconduc-
tor devices;
•automated singulation systems used to cut packaged
array connect substrates;
Our plating equipment consists of a comprehensive
line of fully automated tin-lead plating systems.
Our die handling equipment consists of:
• manual and automated high precision systems which
place the contact points of the chip in direct contact
with the packaged substrate;
•automated die sorting equipment which is used to
inspect, select and sort dies, flip chips, wafer level chip
scale packages and opto-electronic devices for further
processing in assembly operations.
In 2001, we began marketing and selling integrated
lines of assembly equipment under the ABC product
name which principally combine products from our
subsidiaries and other manufacturers.
Halfgeleiders zijn de bouwstenen voor elektronische
producten en systemen. Halfgeleiders werden in het ver-
leden hoofdzakelijk als standaardcomponenten in grote
volumes geproduceerd. Steeds meer toepassingen kun-
nen op één chip ontwikkeld worden. De snelle ont-
wikkeling van geavanceerde halfgeleidertoepassingen
dwingt fabrikanten hun kerntechnologie, waartoe pack-
aging behoort, en productieprocessen voortdurend te
verbeteren om concurrerend te kunnen blijven.
P r o d u c t e n e n D i e n s t e nBesi ontwikkelt en produceert halfgeleider packaging-,
plating-, chip montage- en chip sorteer machines.
Onze packaging machines bestaan uit:
• geautomatiseerde molding machines, die de gemonteer-
de chips met kunsthars omhullen;
• geautomatiseerde snij- en buigmachines, die de metalen
contactpootjes van de verpakte chip snijden en buigen;
• geautomatiseerde precisie zaagmachines, die de verpak-
te chip - als deze op substraatmateriaal gemonteerd is -
in enkelvoudige producten zaagt.
Onze plating machines brengen zeer dunne, eventueel
verschillende laagjes metaal aan en bestaan uit volauto-
matische processtraten met een lengte variërend van 20
tot 60 meter.
Onze die handling machines bestaan uit:
• Flip-chip ‘die attach’ systemen, die chips monteren op
substraten, zowel handmatig als geautomatiseerd zijn te
bedienen, plaatsen de contactpunten van de chip direct
op de contactpunten van een substraat.
• Geautomatiseerde chip sorteer machines, toegepast
voor het inspecteren, selecteren en sorteren van chips,
flip-chip componenten en direct op een wafer
verpakte chips.
In 2001 heeft Besi een nieuw assemblagelijn-concept,
ABC, geïntroduceerd, welke processtappen op proces-
niveau integreert met zowel producten van Besi origine
als die van andere fabrikanten.
D e H a l f g e l e i d e r I n d u s t r i e
A n n u a l R e p o r t 2 0 0 22 0
A u t o m a t e d M o l d i n g S y s t e m s
Once chips have been bonded, either using wire bond
technology or flip chip die attach technology, they must
be encapsulated in a stable, electronically neutral base. We
produce a range of automated molding systems for lead-
frame and array connect markets that encapsulate semi-
conductor devices in epoxy resins. We believe that package
proliferation, from 400 package types five years ago to pac-
kage types today to what we believe will be over a thou-
sand package types in the coming years, both for lead-
frame and new array connect devices, will further increase
the necessity of sophisticated automated molding proces-
ses. In addition, automated molding processes are needed
to enable manufacturers to increase their yield and volume
of defect-free devices through better process control.
Further, the rapid transition to smaller, thinner surface-
mount devices and the advent of array connect packages
requires more precise handling and processing techniques
that require an automated environment. As a result, manu-
facturers have demanded automated molding equipment
with features that are sophisticated enough to support the
introduction of new packages and at the same time suffi-
ciently flexible to permit both the high-volume production of
devices and smaller production runs of specialized chips. Our
automated molding systems feature an electromechanical
drive and modular design range to accommodate from one
to 16 strips. In 2000, we introduced a molding system plat-
form for the high density array connect market.
A u t o m a t e d Tr i m a n d F o r m
I n t e g r a t i o n S y s t e m s
Automated trim and form integration systems are used
to cut and then form metallic leads of encapsulated semi-
conductordevices in preparation for placement on a printed
circuit board or in other applications. Our trim and form
integration systems have the ability to integrate laser mar-
king, vision inspection and functional testing. Trim and
form integration, including test, is the final step in the
manufacture of a semiconductor using conventional lead-
frame technology. The procedure requires a high degree
of precision, particularly with the increasing adoption of
smaller devices with thinner and more numerous leads
that can easily be misformed or broken during the trim
and form process.
Automated S ingu la t ion Sys tems
Singulation is the final step in the assembly of semi-
conductors using the newly developed array connect
technology in which the molded substrates are cut into
individually packaged units. Our technology is based on
the technology we used to develop our trim and form
integration systems.
G e a u t o m a t i s e e r d eV e r p a k k i n g s - i . e . M o l d i n g M a c h i n e sAls chips eenmaal zijn gemonteerd op een contact-
drager dienen ze in een stabiele, neutrale behuizing te
worden verpakt. Wij produceren een serie geautoma-
tiseerde molding machines voor toepassing bij zowel
conventionele verpakkingstechnologie als verpakkingen
gebaseerd op substraattechnologie, waarbij chips in
kunsthars worden verpakt. Een verdere toename van het
aantal verpakkingssoorten zal leiden tot een toename van
ontwikkelingen voor geavanceerde geautomatiseerde
moldingprocessen.
G e a u t o m a t i s e e r d e S n i j - e n B u i g m a c h i n e sMet deze machines worden de metalen pootjes van ver-
pakte chips gesneden en gebogen ter voorbereiding van het
monteren op printplaten of in een andere toepassing.
Snijden en buigen is de laatste processtap van de fabricage
van halfgeleiders en vereist een hoge mate van precisie.
G e a u t o m a t i s e e r d e P r e c i s i e Z a a g m a c h i n e sZagen is de laatste processtap van de fabricage van
halfgeleiders op substraatbasis, waarbij een reeks verpakte
chips in enkele producten gezaagd wordt.
P a c k a g i n g M a c h i n e s
Packaging Equipment

A n n u a l R e p o r t 2 0 0 2 2 1
P a c k a g i n gE q u i p m e n t
for almost 40 years, a similar combination of new ideas combined with solid expertise has characterized Besi

A n n u a l R e p o r t 2 0 0 22 2
A u t o m a t e d P l a t i n g S y s t e m s
As part of the back-end manufacturing process, the
leadframes which carry semiconductor chips must first be
plated with electro-conductive materials, such as silver or
gold. Once encapsulated, the chips must again be plated
with tin-lead to facilitate soldering with other components.
As semiconductor devices become increasingly complex,
semiconductor manufacturers require plating systems that
provide both higher accuracy of plating position and uni-
form distribution of plating metals. In addition, systems
must operate on a fully automated basis to achieve higher
throughput levels with a minimum number of defects.
We currently supply plating equipment to manufac-
turers of stamped and etched leadframes. Although the
plating equipment market for stamped leadframes is
characterized by a large installed base of equipment built
in-house, we believe that to the extent this market conti-
nues to grow, more suppliers of leadframes will outsource
their needs for plating equipment. The equipment
market for etched leadframes is supplied by independent
manufacturers.
A u t o m a t e d B a l l
P l a c e m e n t S y s t e m s
To capitalize on the growth of the array connect
market, we are developing a proprietary line of ball
placement systems which places the soldered ball onto
the substrate molded strip in order to provide the device
with full electrical conductivity. We believe that such
systems are required for semiconductor manufacturers
seeking to establish a fully automated array connect
manufacturing line.
G e a u t o m a t i s e e r d eP l a t i n g M a c h i n e sEen essentiële processtap voor chip back-end assembly
vormt het aanbrengen van een geleidend laagje, bestaande
uit zilver of goud voordat de chip gemonteerd kan worden.
Eenmaal verpakt worden de pootjes vertind, tevens middels
een platingproces, om de chip te kunnen verbinden met
andere onderdelen.
Wij leveren plating machines aan vrijwel alle fabri-
kanten van halfgeleiders en fabrikanten van chip mon-
tagemateriaal.
G e a u t o m a t i s e e r d e B a l lP l a c e m e n t M a c h i n e sOm van de verwachte verdere groei van de op
substraattechnologie gebaseerde chip montage te kunnen
profiteren, ontwikkelen wij een nieuwe ball placement
machine.
P l a t i n g M a c h i n e s
Plating Equipment

A n n u a l R e p o r t 2 0 0 2 2 3
P l a t i n gE q u i p m e n t
for almost 40 years, a similar combination of new ideas combined with solid expertise has characterized Besi

A n n u a l R e p o r t 2 0 0 22 4
F l i p C h i p D i e A t t a c h
E q u i p m e n t
Flip chip technology eliminates the need for con-
ventional wire bonding by placing the contact points of
the chip in direct contact with the packaged substrate.
The use of flip chip bonding technology is critical for
the needs of chip manufacturers to further shrink devi-
ce sizes while increasing functionality for applications
such as wireless telephony, personal digital assistants,
consumer electronics and Internet infrastructure.
In the opto-electronics field, precision flip chip die
attach systems are critical in the assembly of filters such
as waveguides which optimize the flow of data in fiber
optic networks.
Our die attach equipment offers a variety of solu-
tions for process development and volume production
environments, including models that can accommodate
bonding accuracy up to one micrometer. In addition,
we offer semi-automatic systems capable of bonding
from 10 g to 125 kg of force, with average placement
accuracies of approximately two micrometers.
D i e S o r t i n g E q u i p m e n t
Automated die sorting equipment is used to
inspect, select and sort bare die, flip chips, wafer level
chip scale packages and opto-electronic devices as
small as 0.2 millimeters square from a wafer for further
processing in back-end semiconductor assembly opera-
tions. Pick-and-place equipment is also capable of
handling 300 millimeter diameter wafers, the next
major step in the evolution of mass produced semicon-
ductor devices.
F l i p - c h i p D i e A t t a c hM o n t a g e M a c h i n e sFlip-chip montagetechnologie kan de huidige fijne
draad montagetechnologie deels vervangen, door de con-
tactpunten op de chip direct op de contactpunten op het
substraat te plaatsen. De flip-chip montagetechnologie
maakt een verdere miniaturisatie mogelijk.
C h i p S o r t e e r M a c h i n e sDe chip sorteermachines worden toegepast om chips te
sorteren na inspectie vanuit “wafers”, noodzakelijk voor
het assembleren van halfgeleiders. Onze machines worden
gebruikt om chips en flip-chips te sorteren vanuit wafers,
zowel voor als na assemblage, met een wafer diameter tot
maximaal 300 mm. Tevens voor het sorteren van opto-elec-
tronische componenten met een afmeting van 0,2 x 0,2
millimeter. 300 Millimeter wafers vormen de basis naar
de volgende evolutiestap voor de massaproduktie van
halfgeleiders.
D i e H a n d l i n g M a c h i n e s
Die Handling Equipment

A n n u a l R e p o r t 2 0 0 2 2 5
D i e H a n d l i n gE q u i p m e n t
for almost 40 years, a similar combination of new ideas combined with solid expertise has characterized Besi

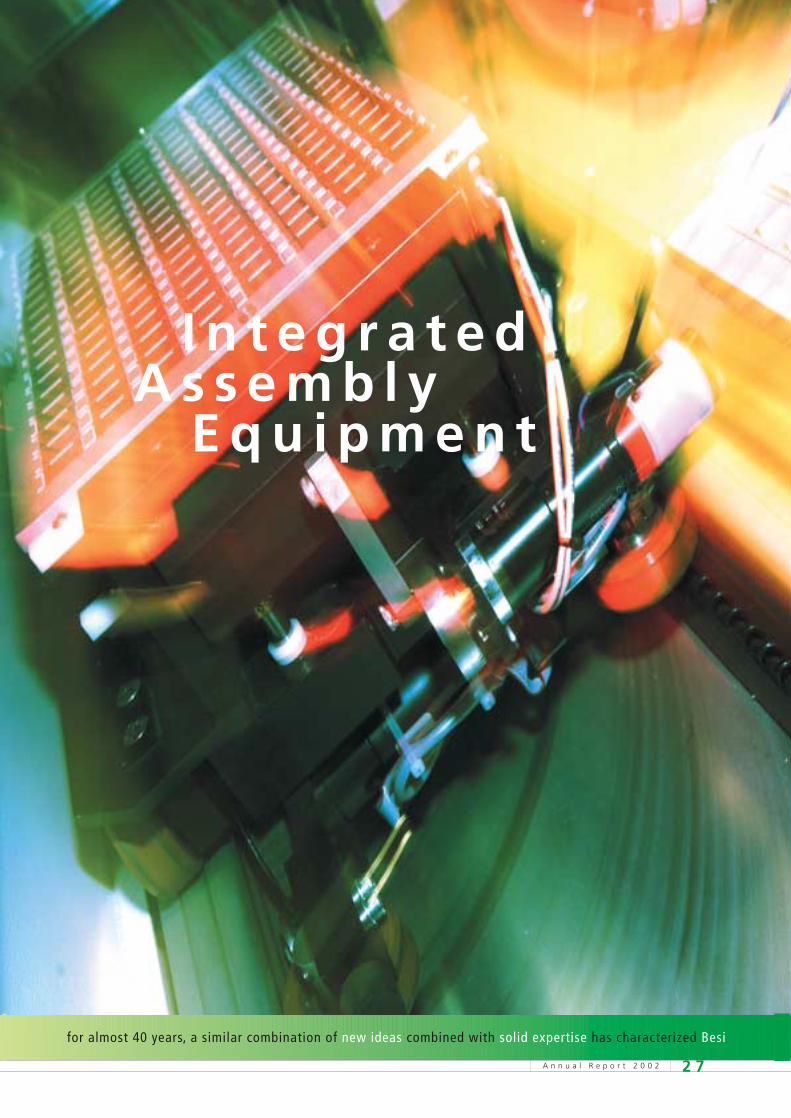
I n t e g r a t e d A s s e m b l y
E q u i p m e n t
In 2001, we began marketing and selling integrated
lines of assembly equipment under the ABC product
name, principally by combining products from our sub-
sidiaries as well as from other assembly manufacturers.
Our long-term goal for the ABC system is to integrate
all process steps of either conventional leadframe
or array connect back-end assembly operations in a
single system.
A n n u a l R e p o r t 2 0 0 22 6
ProcessedWafer
Diesort
Leadframe
Dicing
ArrayConnect
TestHandling
Die/WireBonding
Plating, Trimand Form
Molding
Flip chipDie Bonding
Ball Placement,Reflow, Singulation
Molding
Besi Products
B a c k - e n d A s s e m b l y
From Processed Wafer to Completed Chip
Integrated Assembly Equipment
Molding
Trim & Form Die Handling
Plating
Singulation
€ 83.2 million
2002
€ 150.0 million
2001
€ 198.0 million
42%
19%
26%
4%9%
44%
22%
30%
3% 1%
43%
28%
29%
40%
28%
24%
3% 5%
2000
€ 105.6 million
1999
A n n u a l S a l e s
G e ï n t e g r e e r d eA s s e m b l a g e M a c h i n e s
Besi heeft in 2001 een nieuw assemblageconcept ge-
introduceerd onder de productnaam ABC, welke het moge-
lijk maakt processtappen - vervaardigd door dochteronder-
nemingen en vervaardigd door anderen – te clusteren i.e.
te combineren. Het ABC-systeem beoogt op termijn alle
assemblageprocesstappen te integreren, van zowel de hui-
dige montagetechnologie als de toekomstige montage-
technologieën.
A n n u a l R e p o r t 2 0 0 2 2 7
I n t e g r a t e dA s s e m b l y
E q u i p m e n t
for almost 40 years, a similar combination of new ideas combined with solid expertise has characterized Besi

A n n u a l R e p o r t 2 0 0 22 8
S t r a t e g y
Our objective is to become the world's leading
supplier of advanced, back-end assembly equipment
incorporating both leadframe and array connect
process technologies. The principal elements of our
strategy to achieve this goal are set forth below.
L e v e r a g e o u r
Te c h n o l o g y L e a d e r s h i p
t o E x p l o i t N e w P a c k a g i n g
Te c h n o l o g i e s
Our customers’ success depends on our timely
development of manufacturing processes and equip-
ment to address changing requirements for new
semiconductor packaging. In the array connect
market, we have introduced advanced molding
systems and singulation systems designed to address
our customers’ requirements for miniaturization and
higher chip density at lower overall cost. We have
been involved in the development and production of
chip scale ball grid array technology since the early
1990s and are one of the leading suppliers of equip-
ment used in chip scale ball grid array molding.
A c t i v e l y P u r s u e
B a c k - e n d S y s t e m
I n t e g r a t i o n
We believe that customer demands for higher
throughput, quality and flexibility in the assembly pro-
cess offer significant opportunities for those equip-
ment manufacturers able to automate and integrate
that process. We intend to expand the range of auto-
mated systems for various leadframe and array
connect assembly processes and ultimately to offer
a complete, integrated solution for our customers.
Our current generation of systems has introduced
the integration of molding with wire bonding and
post cure, as well as the integration of marking, vision
inspection and testing with trim and form and singu-
lation processes. We intend to continue this process
by introducing other products to support an
automated and integrated assembly process, inclu-
ding advanced test handling systems and tracking
systems, as part of our goal of offering customers a
one-stop, integrated solution for the entire assembly
manufacturing process.
F o c u s o n S t r a t e g i c ,
L o n g - Te r m C u s t o m e r
R e l a t i o n s h i p s
Our close relationships with our customers, many
of which exceed thirty years, provide us with valuable
knowledge about the semiconductor packaging and
plating requirements as well as opportunities to deve-
lop back-end systems in conjunction with our custo-
mers. We believe that these relationships, combined
with our position as a leading supplier of integrated
assembly systems, provide an opportunity to broaden
the range of products sold to these customers and to
enhance our reputation as a supplier of a broad and
flexible range of assembly systems.
E x p a n d G l o b a l S a l e s
a n d S e r v i c e O p e r a t i o n s
We maintain regional sales and service operations
in Europe, the Asia Pacific region and the United
States and have customers in each region. As part of
our strategy, we intend to expand our customer base
in critical global markets, particularly in China and
Japan. Given the globalization of the semiconductor
industry, we believe that a significant presence in sales
and after-market service in each geographic region is
critical to sustain close relationships with customers
and generate new product sales.
S e l e c t i v e l y
P u r s u e A c q u i s i t i o n s
We believe that in order to implement our goals
of providing customers with highly automated,
integrated solutions with optimal packaging flexibility,
it is critically important to identify and incorporate
new technologies and processes on a timely basis.

A n n u a l R e p o r t 2 0 0 2 2 9
Onze doelstelling is ‘s werelds sterkste leverancier te
worden van geavanceerde chip assemblageapparatuur,
zowel voor de huidige montagetechnologie als voor de toe-
komstige substraattechnologie. De belangrijkste stappen
van deze strategie zijn:
L e i d e r s c h a p i n Te c h n o l o g i e V e r g r o t e n d o o r h e t I n t r o d u c e r e n v a n C h i p a s s e m b l a g eM a c h i n e s v o o r N i e u w eM o n t a g e t e c h n o l o g i e ë nHet succes van Besi’s klanten is mede afhankelijk van
een tijdige ontwikkeling van productieprocessen en machi-
nes voor nieuwe eisen gesteld aan de volgende generatie
chipverpakkingen. Om telkens een verdere verkleining van
chip packages en hogere packaging dichtheid tegen lagere
algemene kosten te kunnen realiseren, ontwikkelt Besi
steeds meer geavanceerde packaging systemen, waaronder
precisie zaagmachines.
A c t i e f B e z i g h o u d e n m e t e e n V e r d e r e B a c k - e n d P r o c e s i n t e g r a t i eWij beogen het scala van geautomatiseerde machines
voor diverse montagestappen voor de conventionele monta-
geprocessen en tevens de nieuwe montageprocessen op
substraatbasis te reduceren door procesintegratie om uitein-
delijk één complete, geïntegreerde procesoplossing aan te
kunnen bieden.
R i c h t e n o p S t r a t e g i s c h e K l a n t e n r e l a t i e sv o o r d e L a n g e Te r m i j nDoor langdurige relaties met klanten te onderhouden
verkrijgen wij continu essentiële kennis over de nieuwe
eisen voor halfgeleider montageprocessen, om deze eisen
te kunnen vertalen in nieuwe machines.
W e r e l d w i j d e V e r k o o p - e n S e r v i c e O r g a n i s a t i eWij willen onze regionale verkoop- en servicewerk-
zaamheden in het Verre Oosten, Europa en de Verenigde
Staten versterken en ons klantenbestand op kritieke wereld-
markten, in het bijzonder China en Japan, verder uitbrei-
den. Aanwezigheid met verkoop en service in elke geogra-
fische regio is essentieel voor het behoud van nauwe rela-
ties met klanten om de nieuwe ontwikkelingen in de vol-
gende generatie machines te kunnen implementeren.
A c q u i s i t i e s S e l e c t i e f N a s t r e v e nVoor het bereiken van onze doelstellingen, namelijk
om onze klanten geautomatiseerde, geïntegreerde proces-
oplossingen met optimale flexibiliteit te bieden, is het van
wezenlijk belang om nieuwe technologieën en processen
tijdig te identificeren en te ontwikkelen in nieuwe machi-
nes. Daarom streven wij ernaar, naast eigen ontwikkeling,
die bedrijven te kopen, die ons zowel in staat stellen uitein-
delijk geïntegreerde, geautomatiseerde montageprocessen
te kunnen leveren als Besi’s positie in de wereld verder
te versterken.
Towards that end, we intend to actively identify and
evaluate acquisition candidates that could assist us in
attaining our overall goals of achieving integrated,
automated assembly, maintaining product leadership,
addressing evolving new packaging technologies and
expanding our geographic scope. In September 2000
we acquired our RDA subsidiary in order to expand
our array connect product portfolio and in January
2002 we acquired our Laurier subsidiary allowing us
to incorporate intelligent die sorting capabilities in our
integration strategy. We expect to implement our
acquisition strategy by leveraging our reputation in
the industry, extensive product range and significant
cash resources. In addition, we will also, where appro-
priate, evaluate implementing our goals through joint
ventures, alliances and other strategic relationships.
S t r a t e g i e

A n n u a l R e p o r t 2 0 0 23 0
M a n a g e m e n t ’sD i s c u s s i o n a n d
A n a l y s i s o f F i n a n c i a lC o n d i t i o n a n d
R e s u l t s o f O p e r a t i o n s
for almost 40 years, a similar combination of new ideas combined with solid expertise has characterized Besi

A n n u a l R e p o r t 2 0 0 2 3 1
for almost 40 years, a similar combination of new ideas combined with solid expertise has characterized Besi

A n n u a l R e p o r t 2 0 0 23 2
O v e r v i e w
Our net sales and results of operations depend in
significant part on the level of capital expenditures by
semiconductor manufacturers, which in turn depends
on the current and anticipated market demand for
semiconductors and for products utilizing semiconduc-
tors. Demand for semiconductor devices and expendi-
tures for the equipment required to assemble semicon-
ductors is cyclical, depending in large part on levels of
demand worldwide for computing and peripheral
equipment, telecommunications devices and automoti-
ve and industrial components as well as the production
capacity of global semiconductor manufacturers.
Historically, as demand for these devices has increased,
semiconductor manufacturers have sought to increase
their capacity by increasing the number of wafer fabri-
cation facilities and equipment production lines, and
installing equipment that incorporates new technology
to increase the number of devices and the amount of
computing power per device. As demand has increa-
sed, semiconductor prices have also typically risen.
Conversely, if the additional capacity outstrips the
demand for semiconductor devices, manufacturers
historically have cancelled or deferred additional equip-
ment purchases until demand again begins to outstrip
aggregate capacity. Under such circumstances, semi-
conductor prices typically fall.
Due to the lead times associated with the producti-
on of our semiconductor manufacturing equipment,
our sales orders historically have lagged any downturn
or recovery in the semiconductor market by approxima-
tely nine to twelve months. Our results of operations
historically have fluctuated significantly both on an
annual and quarterly basis depending on overall levels
of semiconductor demand globally and the specific pro-
duction requirements of our principal customers.
During 2001 we saw a significant deterioration in
industry conditions. Although we experienced increa-
sed order levels in 2002, the slowdown in the semicon-
ductor and semiconductor equipment industry continu-
ed throughout 2002 and we expect this slowdown to
continue through at least the first half of 2003.
Our sales are generated primarily by shipments to
the Asian manufacturing operations of leading US and
European semiconductor manufacturers and, to a lesser
extent, Korean and other Asian manufacturers and
subcontractors. Most of our principal competitors on a
worldwide basis are Japanese, which historically have
dominated the Japanese market, because Japanese
semiconductor manufacturers typically purchase equip-
ment from domestic suppliers. To date, our sales to
Japanese customers have been limited.
This Annual Report contains certain forward-
looking statements as that term is defined in the
Private Litigation Securities Reform Act of 1995.
For this purpose any statements herein that are
not statements of historical fact may be deemed to
be forward-looking statements. Without limiting the
foregoing, any estimates of future business or finan-
cial results constituting forward looking statements
and any statements including the words “believes,”
“anticipates”, “plans”, “expects”, “intends” and
similar expressions are intended to identify other
forward-looking statements. These forward-looking
statements represent the expectations of manage-
ment as of the date of the filing of this report.
Actual results could differ materially from those anti-
cipated by the forward-looking statements due to a
number of important factors, including the risks
and uncertainties faced by us described elsewhere in
this Annual Report and in other documents we have
filed with the Securities and Exchange Commission.
You should consider carefully each of these risks and
uncertainties in evaluating our financial condition
and results of operations.
Management’s Discussion and Analysis ofFinancial Condition and Results of Operations

A n n u a l R e p o r t 2 0 0 2 3 3
Our sales to specific customers tend to vary signifi-
cantly from year to year depending on customers’
capital expenditure budgets, new product introductions,
production capacity and packaging requirements.
In addition, we derive a substantial portion of our net
sales from products that have an average selling price
in excess of € 300,000 and that have significant lead
times between the initial order and delivery of the
product. The timing and recognition of net sales from
customer orders can cause significant fluctuations in
operating results from quarter to quarter.
On November 15, 2001, we sold our 30% equity
interest in Possehl Besi Electronics N.V. (“PBE”) to an-
other shareholder L. Possehl & Co., mbH (“Possehl”) for
€ 18.1 million cash. We determined that our ongoing
involvement in PBE was not strategic to our long-term
ambition to be the leading provider of integrated
assembly solutions to the semiconductor industry.
In addition, we determined that our interests would be
better served by redeploying the cash from the trans-
action to help fund attractive opportunities in what we
believe are higher growth markets in our core equip-
ment business, such as chip scale ball grid array and
other assembly technologies, either through internal
means or through acquisition. In connection with the
transaction, we recorded a loss of € 4.8 million in the
fourth quarter of 2001, which is included in “equity
in earnings (loss) of affiliated companies and loss on
sale of affiliated companies” in our Consolidated
Statements of Operations. The loss on disposal of PBE
included the reversal of the portion of our cumulative
translation adjustment component of shareholders’
equity relating to our investment in PBE, which reduced
the loss on sale by € 5.3 million.
On January 4, 2002, we acquired Laurier, Inc.
(“Laurier”), a privately held company located in
Londonderry, New Hampshire, USA, for US$ 8.9 million
in cash. Laurier manufactures die sorting equipment
used to inspect, select and sort bare die, flip chips,
wafer level chip scale packages and opto-electronic
devices from a wafer for further processing in assembly
operations. Laurier’s results of operations are included
in our consolidated results of operations from the date
of acquisition.
E v a l u a t i o n o f C r i t i c a l
A c c o u n t i n g P o l i c i e s
Our discussion and analysis of our financial condi-
tion and results of operations are based upon our con-
densed consolidated financial statements, which have
been prepared in accordance with accounting principles
generally accepted in the United States. The prepara-
tion of these financial statements requires management
to make estimates and assumptions that affect the
reported amounts of assets and liabilities as of the date
of the financial statements and the reported amounts
of revenues and expenses during the reporting periods.
Areas where significant judgements are made include,
but are not limited to, revenue recognition, inventories,
long-lived assets and goodwill and intangible assets.
Actual results could differ materially from these estimates.
R e v e n u e R e c o g n i t i o n
Our revenue recognition policy conforms to the
Securities and Exchange Commission Staff Accounting
Bulletin No. 101. Advance payments received from
customers are recorded as a liability until the products
have been shipped. Shipment of products occurs after
a customer accepts the product at our premises.
We recognize revenues from sales of products upon
shipment. The risk of loss and rewards of ownership
with respect to products transfer to customers at that
time. The sale of the product to the customer is thereby
considered complete and no significant obligations
remain after the sale is completed. A customer's sole
recourse against us is to enforce our obligations relating
to installation, which is considered inconsequential, and
warranty. Operating expenses and other income and
expense items are recognized in the income statement
as incurred or earned.

I n v e n t o r i e s
We periodically evaluate whether or not the carry-
ing value of our inventories is in excess of market value
or whether we have excess or obsolete items in our
inventory. Our evaluation includes judgements regar-
ding future market developments that might have an
adverse effect on the valuation of our inventories.
Inventories are stated at the lower of cost (first-in,
first-out method) or market value. Cost includes net
prices paid for materials purchased, charges for freight
and custom duties, production labor costs and factory
overhead. Precious metals are valued at the market
price at the balance sheet date. Variances in market
price from balance sheet date to balance sheet date
are recorded in gross profit as gains or losses.
L o n g - l i v e d A s s e t s
Long-lived assets, such as property, plant and
equipment, and purchased intangibles subject to amor-
tization, are reviewed for impairment whenever events
or changes in circumstances indicate that the carrying
amount of an asset may not be recoverable.
Recoverability of assets to be held and used is measured
by a comparison of the carrying amount of an asset to
estimated undiscounted future cash flows, an impair-
ment charge is recognized by the amount by which the
carrying value of the asset exceeds the fair value of
the asset. Assets to be disposed of are reported at the
lower of the carrying amount of fair value less costs
to sell, and depreciation ceases.
Goodwill and intangible assets not subject to amor-
tization are tested annually for impairment. An impair-
ment loss is recognized to the extent that the carrying
amount exceeds the asset’s fair value.
G o o d w i l l a n d
I n t a n g i b l e A s s e t s
Goodwill represents the excess of the costs of pur-
chased businesses over the fair value of their net assets
at date of acquisition and through December 31, 2001
was being amortized by the straight-line method.
The amortization of the goodwill from the Meco acqui-
sition (13 years) and the RDA acquisition (13 years),
was based on the weighted average remaining lives of
Meco’s and RDA’s patents as determined by an in-
dependent valuation. Goodwill was assessed for recover-
ability by determining whether the amortization of the
goodwill balance over its remaining life could be recover-
ed through undiscounted future operating cash flows
of the acquired operation. As of January 1, 2002, good-
will is no longer amortized, but is required to be evalua-
ted for impairment at least annually in accordance with
SFAS No. 142. The amortization of patents and other
identifiable intangible assets is based on the weighted
average remaining lives of 13 years for Meco, RDA
and Laurier and 16 years for Fico as determined by an
independent valuation at the date of acquisition.
The Company adopted the provisions of SFAS No.
141, “Business combinations” as of July 1, 2001 and
SFAS No. 142 as of January 1, 2002. Goodwill and any
intangible asset determined to have an indefinite useful
life acquired in a purchase business combination com-
pleted after June 30, 2001 and determined to have an
indefinite useful life are not amortized, but will continue
to be evaluated for impairment annually in accordance
with SFAS No. 142.
In connection with the transitional goodwill impair-
ment evaluation, Statement No. 142 required the
Company to perform an assessment of whether there
was an indication that goodwill, and equity-method
goodwill, is impaired as of the date of adoption.
To accomplish this, the Company was required to iden-
tify its reporting units and determine the carrying value
of each reporting unit by assigning the assets and liabili-
ties, including the existing goodwill and intangible
assets, to those reporting units as of January 1, 2002.
The Company was required to determine the fair value
of each reporting unit and compare it to the reporting
unit's carrying amount within six months of January 1,
A n n u a l R e p o r t 2 0 0 23 4

A n n u a l R e p o r t 2 0 0 2 3 5
2002. To the extent a reporting unit's carrying amount
exceeds its fair value, an indication exists that the repor-
ting unit's goodwill may be impaired and the second
step of the transitional impairment test must be perfor-
med. In the second step, the implied fair value of the
reporting unit's goodwill, determined by allocating the
reporting unit's fair value to all of its assets (recognized
and unrecognized) and liabilities in a manner similar
to a purchase price allocation in accordance with
Statement No. 141, must be compared to its carrying
amount, both of which would be measured as of the
date of adoption. This second step is required to be
completed as soon as possible, but no later than the
end of the year of adoption. The Company was not
required to perform the second step for any of its iden-
tified reporting units during its January 1, 2002 good-
will transitional impairment test.
C o n t r a c t u a l O b l i g a t i o n s a n d
C o m m e r c i a l C o m m i t m e n t s
We are not involved in any speculative trading activities.
Our only related party transactions were with our for-
mer PBE joint venture, of which we sold our 30% share
on November 15, 2001. Such related party transactions
consisted of sales and purchases as specified in the
following table.
(Euro in thousands)
January 1, to November 15, 2001Sales 3,486Purchases 270
(Euro in thousands) Payments due by period
Less than 1 year 1-3 years 4-5 years After 5 years Total
Long term debt 955 635 - - 1,590Capital lease obligationsincluding imputed interest 600 1,200 1,200 6,997 9,997
Operating lease 1,826 1,949 1,387 4,959 10,121Unconditional purchase obligations 9,466 - - - 9,466Total contractual obligations and commercial commitments 12,847 3,784 2,587 11,956 31,174
Unconditional purchase obligations relate to buildings, equipment and specific external technical staff.
Management believes that these transactions were
conducted at arms length basis on terms and condi-
tions equivalent to those that could have been obtained
from third parties.
The following table discloses our contractual obliga-
tions and commercial commitments.

Q u a n t i t a t i v e a n d
Q u a l i t a t i v e D i s c l o s u r e s
a b o u t M a r k e t R i s k
We are exposed to market risks from changes in
foreign currency exchange rates and interest rates,
which may adversely affect our results of operations and
financial condition. We seek to minimize the risks asso-
ciated with interest rate and foreign currency exchange
rate fluctuations through our regular operating and
financing activities and, when deemed appropriate,
through the use of derivative financial instruments. We
do not use financial instruments for trading or other
speculative purposes.
F o r e i g n C u r r e n c y
E x c h a n g e R a t e R i s k
As a consequence of the global nature of our bus-
inesses, our operations and reported financial results
and cash flows are exposed to the risks associated with
fluctuations in exchange rates between the euro and
other major world currencies. Currency exchange rate
movements typically also affect economic growth, infla-
tion, interest rates, government actions and other fac-
tors. These changes can cause us to adjust our finan-
cing and operating strategies. The discussion below of
changes in currency exchange rates does not incorpora-
te these other economic factors. For example, the sensi-
tivity analysis presented in the foreign exchange rate
risk discussion below does not take into account the
possibility that rates can move in opposite directions
and that gains from one category may or may not be
offset by losses from another category. Operations out-
side the Netherlands and other countries that have
adopted the euro as their currency for 2002 constitute
approximately 19% of our net sales. As currency
exchange rates change, translation of the Statements
of Operations of our international business into euro
affects year-over-year comparability. We historically
have not hedged translation risks because cash flows
from international operations have generally been rein-
vested locally. We estimate that a 10% change in
foreign exchange rates would affect our reported
operating income (loss) by less than € 1.0 million.
Our currency risk exposure primarily occurs because
we generate a portion of our net sales in currencies
other than the euro while the major share of the corres-
ponding cost of sales is incurred in euro. The percentage
of our consolidated net sales which is denominated in
euro amounted to approximately 63% of total net sales
in the year ended December 31, 2002, whereas net
sales represented by US dollars or dollar-linked currencies
amounted to approximately 37%. Approximately 77%
of our costs and expenses were denominated in the
euro and the remaining 23% in various currencies, prin-
cipally the dollar and dollar linked currencies. In order to
mitigate the impact of currency exchange rate fluctua-
tions, we continually assess our remaining exposure to
currency risks and hedge such risks through the use of
derivative financial instruments. The principal derivative
financial instruments currently used by us to cover
foreign currency exposures are forward foreign currency
exchange contracts that qualify for hedge accounting.
I n t e r e s t R a t e R i s k
Our long-term debt, excluding capital leases, bears
interest at fixed rates. Our long-term capital lease obli-
gations, bank debt and lines of credit currently bear a
variable rate of interest. An immediate 10% change in
interest rates would not have a material effect on our
results of operations over the next fiscal year.
A n n u a l R e p o r t 2 0 0 23 6

R e s u l t s o f O p e r a t i o n s
A n n u a l R e p o r t 2 0 0 2 3 7
for almost 40 years, a similar combination of new ideas combined with solid expertise has characterized Besi

A n n u a l R e p o r t 2 0 0 23 8
(Amounts in thousands except share and per share data) Year ended December 31,
2000 2001 2002 2002EURO EURO EURO USD(1)
Net sales 197,972 150,030 83,228 87,265Cost of sales 121,171 96,253 55,849 58,558Gross profit 76,801 53,777 27,379 28,707
Selling, general and administrative expenses 33,841 30,563 26,235 27,507Research and development expenses 11,440 15,446 12,470 13,075Write-off of acquired in-process research and development 11,461 - - -
Restructuring charges - 8,306 786 824Goodwill impairment - - 3,302 3,462Amortization of intangible assets 3,126 3,848 2,591 2,717Total operating expenses 59,868 58,163 45,384 47,585
Operating income (loss) 16,933 (4,386) (18,005) (18,878)Interest income, net 2,814 4,240 3,395 3,559
Income (loss) before taxes and equity in earnings (loss) of affiliated companies and minority interest 19,747 (146) (14,610) (15,319)
Income taxes 6,311 518 2,404 2,520
Income (loss) before equity in earnings (loss) of affiliated companies and minority interest 13,436 (664) (17,014) (17,839)
Equity in earnings (loss) of affiliated companies and loss on sale of affiliated companies 5,031 (16,314) - -
Minority interest - - 3 3
Net income (loss) 18,467 (16,978) (17,011) (17,836)
EARNINGS (LOSS) PER SHARE:Basic 0.61 (0.53) (0.54) (0.57)Diluted 0.61 (0.53) (0.54) (0.57)
WEIGHTED AVERAGE NUMBER OF SHARES USED TO COMPUTE NET EARNINGS (LOSS) PER SHARE:Basic 30,242,151 31,794,675 31,462,482 31,462,482Diluted 30,351,462 31,794,675 31,462,482 31,462,482
OTHER OPERATING DATA:Capital expenditures 6,311 3,393 4,903 5,141Depreciation and amortization 7,591 8,343 6,726 7,052Net cash provided by (used in) operating activities 12,066 14,942 (4,224) (4,429)
(1) Translated solely for convenience of the reader at the noon buying rate on December 31, 2002 (€ 1.00 = US$ 1.0485)
S u m m a r y F i n a n c i a l a n d O t h e r O p e r a t i n g D a t a
Results of Operations

A n n u a l R e p o r t 2 0 0 2 3 9
N e t S a l e s
Our net sales consist of sales of automated molding
systems, automated trim and form integration systems,
singulation systems, automated plating systems and
die handling systems.
Our net sales decreased from € 150.0 million in
2001 to € 83.2 million in 2002, a decrease of
44.5%. The decrease in net sales in 2002 as compared
to 2001 was due to a significant deterioration in
industry conditions, extensions of product delivery dates
and order cancellations by customers, resulting in a
significantly lower volume of shipments. Net sales in the
fourth quarter of 2002 increased by 21.4% compared
to net sales in the third quarter of 2002 due to increased
order activity in the first half of 2002, resulting in
increased shipments in the fourth quarter of 2002.
B a c k l o g
Our backlog at December 31, 2002 increased
by 16.4% to € 42.5 million from € 36.5 million at
December 31, 2001, primarily due to increased book-
ings for molding systems, trim and form integration
systems and plating systems. New orders in 2002 were
€ 89.1 million, including € 1.8 million of die sort
systems’ backlog that was acquired as part of our pur-
chase of Laurier, an increase of 98.9% compared to
€ 44.8 million in 2001. The book-to-bill ratio for 2002
was 1.07 compared to 0.30 for 2001.
We include in backlog only those orders for which
we have received a completed purchase order. Such
orders are subject to cancellation by the customer with
payment of a negotiated charge. Because of the
possibility of customer changes in delivery schedules,
cancellation of orders and potential delays in product
shipments, our backlog as of any particular date
may not be representative of actual sales for any
succeeding period.
G r o s s P r o f i t
Cost of sales includes materials, purchased compo-
nents and subassemblies from subcontractors, direct
labor and manufacturing overhead. It also includes costs
relating to the pre-production and customization of
new equipment once a product has advanced beyond
the prototype stage. Changes in our cost of sales typi-
cally lag changes in net sales due to our manufacturing
lead times.
Gross profit decreased by 49.1% from € 53.8 million
in 2001 to € 27.4 million in 2002. As a percentage of
net sales, gross profit decreased from 35.8% in 2001 to
32.9% in 2002, due to the significant decrease in net
sales in 2002 which was only partially offset by reduced
production and overhead costs.
S e l l i n g , G e n e r a l a n d
A d m i n i s t r a t i v e E x p e n s e s
Selling, general and administrative expenses consist
of expenses related to sales of products and services,
Our net sales per product line for the periods indicated were as follows:
2001 Compared to 2002
(Euro in million)
2001 2002 % changeAutomated molding systems 60.9 35.2 (42.2)Automated trim and form integration systems 41.5 15.8 (61.9)Singulation systems 4.6 2.9 (37.0)Plating systems 36.1 21.7 (39.9)Die handling systems 6.9 7.6 10.1Total net sales 150.0 83.2 (44.5)

A n n u a l R e p o r t 2 0 0 24 0
administrative and other corporate level expenses not
related to the production of products and all expenses
associated with ongoing customer support.
Our selling, general and administrative expenses in
2001 totaled € 30.6 million and represented 20.4% of
net sales compared to € 26.2 million or 31.5% of net
sales in 2002. The decrease in selling, general and ad-
ministrative expenses was mainly due to a decrease in
net sales and our restructuring efforts. The increase
in selling, general and administrative expenses as a
percentage of net sales resulted primarily from the signi-
ficant decrease in net sales.
R e s e a r c h a n d
D e v e l o p m e n t E x p e n s e s
Research and development spending relating to
packaging and die handling equipment varies from year
to year depending on our new product development
cycle. As research and development expenses do not
include pre-production and customization costs, our
research and development expenses decrease as products
move from prototype development to production and
final customer acceptance.
Research and development expenses relating to
plating equipment include costs related solely to new
product development efforts and exclude new product
pre-production and customization expenses and design
and engineering expenses incurred in sustaining and
enhancing existing product lines.
Our research and development expenses decreased
from € 15.4 million in 2001 to € 12.5 million in 2002.
As a percentage of net sales, research and develop-
ment expenses were 10.3% and 15.0%, respectively.
Research and development spending in 2002 was
mainly related to integrated assembly line functionality
and chip scale ball grid array packaging applications.
The increase in research and development spending as
a percentage of net sales in 2002 reflects our conti-
nued investment in research and development despite
the current market downturn.
R e s t r u c t u r i n g C h a r g e s
On June 15, 2001, we adopted an initial restructuring
plan that included a reduction of our global workforce
(including temporary workers) of approximately 13%.
These actions were necessitated by the semiconductor
industry downturn that resulted in a significant reduction
in new orders. We undertook this restructuring: (i) to
better align our cost structure with anticipated revenues
and (ii) to improve manufacturing efficiency and produc-
tivity. We recorded pre-tax restructuring charges of € 3.6
million in connection with the reduction of our work-
force in the second quarter of 2001. As a result of conti-
nued adverse market conditions in the semiconductor
equipment industry, we took additional restructuring
measures in each of the third and fourth quarters of 2001,
which resulted in a cumulative workforce reduction of
approximately 26%. In connection with those additional
restructuring measures, we incurred additional restruc-
turing charges for employee severance and benefits of
€ 1.7 million and € 3.0 million in the third and fourth
quarter of 2001, respectively.
In the third quarter of 2002, we relocated our flip
chip die attach operations from New Jersey to New
Hampshire in the United States and consolidated these
activities with our die sorting business to form a single
Die Handling Systems business unit. In the fourth quarter
of 2002 we restructured the combined business by redu-
cing its workforce by approximately 28%. We recorded
a restructuring charge relating to these actions of
€ 0.8 million in 2002.
The 2001 provision for the reduction in workforce in-
cluded severance and other benefits for approximately
180 employees in the Netherlands and Asia. The releases
mainly relate to social security expenses and disabled per-
sonnel included for which we were not obliged to pay.
The additions to the restructuring reserve in the second
quarter of 2002 related to higher than expected severance
cost and later than expected final employment termina-
tions. The additions in the third quarter of 2002 mainly

relate to severance payments for the reduction in work-
force in the United States and relocation cost. The addi-
tions in the fourth quarter of 2002 relate to severance
payment for the further reduction in workforce in the
United States. Total remaining cash outlays for restruc-
turing activities are expected to be € 1.3 million, which
primarily will be expended during 2003.
O p e r a t i n g I n c o m e ( L o s s )
Operating loss increased from € 4.4 million in 2001
to € 18.0 million in 2002. Operating loss for 2002 inclu-
ded non-cash goodwill impairment of € 3.3 million.
Furthermore, operating loss for 2001 and 2002 included
restructuring charges of € 8.3 and € 0.8 million, respec-
tively. Operating loss also increased due to lower net
sales, lower gross margins, partially offset by a decrease
in selling, general and administrative expenses and rese-
arch and development spending.
We incurred annual patent and other identifiable
assets amortization charges of € 2.6 million in 2002,
which related to the acquisitions of our Fico, Meco, RDA
and Laurier subsidiaries in October 1993, May 1995,
September 2000 and January 2002, respectively.
As of January 1, 2002, we adopted SFAS No. 142
and SFAS No. 144. SFAS No. 142 eliminates the amorti-
zation of goodwill and indefinite-lived intangible assets,
addresses the amortization of intangible assets with finite
lives and addresses impairment testing and recognition
for goodwill and intangible assets with indefinite lives.
SFAS No. 144 establishes a single model for the impair-
ment of long-lived assets and broadens the presentation
of discontinued operations to include disposal of an
individual business. As a result of the adoption of SFAS
No. 142, goodwill amortization ceased.
We reviewed our business and determined that there
are four reporting units to be reviewed for impairment in
accordance with the standard – the reporting units were:
packaging equipment, plating and singulation equipment,
flip chip die attach equipment and die sorting equipment.
Upon adoption of SFAS No. 142 in the first quarter of
2002, we completed the required transitional impairment
testing of goodwill, and based upon those analyses, did
not identify any impairment charges as a result of adop-
tion of this standard effective January 1, 2002.
We have determined that our annual test for impair-
ment of goodwill will take place at the end of the fourth
quarter of each year, which coincides with the comple-
tion of our annual forecasting process. In the third quar-
ter of 2002, we consolidated our die attach equipment
business unit and die sort equipment business into a sin-
gle die handling equipment business unit. Due to the
severity and the length of the current industry downturn
and uncertainty of the timing of improvement in industry
conditions we have revised our earnings forecasts for each
of our business units that were tested for impairment.
As a result, in the fourth quarter of fiscal year 2002, we
recognized a goodwill impairment loss of € 3,302 in the
die handling equipment reporting unit. The fair value of
each reporting unit was estimated using the expected
present value of future cash flows.
We do not have any identifiable assets with indefinite lives.
I n t e r e s t I n c o m e , N e t
Our interest income, net decreased from € 4.2 mil-
lion in 2001 to € 3.4 million in 2002, due to lower
interest rates and lower cash balances.
A n n u a l R e p o r t 2 0 0 2 4 1
(Euro in thousands)
Restructuring reserve as of January 1, 2002 5,487Second quarter 2002 releases (1,201)Second quarter 2002 additions 1,205Third quarter 2002 additions 400Fourth quarter 2002 additions 386Amortization assets (107)Cash payments in 2002 (4,889)Restructuring reserve as of December 31, 2002 1,281
Changes in the total restructuring reserve were:
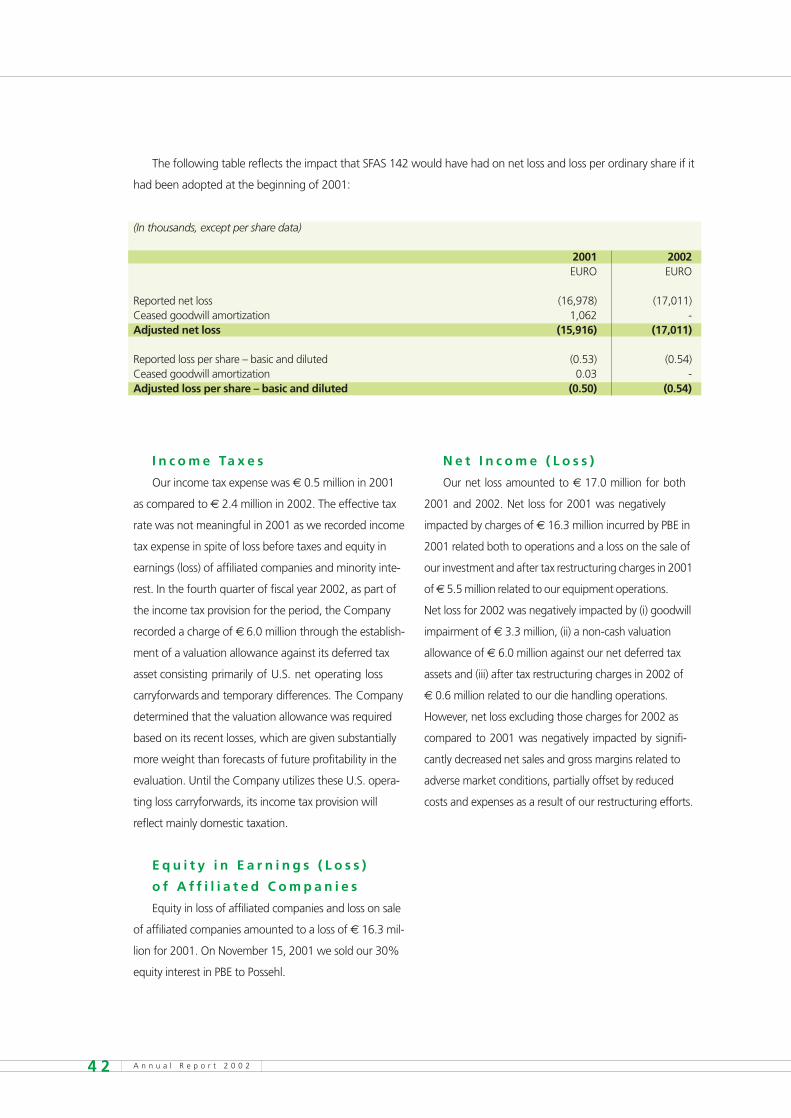
A n n u a l R e p o r t 2 0 0 24 2
The following table reflects the impact that SFAS 142 would have had on net loss and loss per ordinary share if it
had been adopted at the beginning of 2001:
I n c o m e Ta x e s
Our income tax expense was € 0.5 million in 2001
as compared to € 2.4 million in 2002. The effective tax
rate was not meaningful in 2001 as we recorded income
tax expense in spite of loss before taxes and equity in
earnings (loss) of affiliated companies and minority inte-
rest. In the fourth quarter of fiscal year 2002, as part of
the income tax provision for the period, the Company
recorded a charge of € 6.0 million through the establish-
ment of a valuation allowance against its deferred tax
asset consisting primarily of U.S. net operating loss
carryforwards and temporary differences. The Company
determined that the valuation allowance was required
based on its recent losses, which are given substantially
more weight than forecasts of future profitability in the
evaluation. Until the Company utilizes these U.S. opera-
ting loss carryforwards, its income tax provision will
reflect mainly domestic taxation.
E q u i t y i n E a r n i n g s ( L o s s )
o f A f f i l i a t e d C o m p a n i e s
Equity in loss of affiliated companies and loss on sale
of affiliated companies amounted to a loss of € 16.3 mil-
lion for 2001. On November 15, 2001 we sold our 30%
equity interest in PBE to Possehl.
N e t I n c o m e ( L o s s )
Our net loss amounted to € 17.0 million for both
2001 and 2002. Net loss for 2001 was negatively
impacted by charges of € 16.3 million incurred by PBE in
2001 related both to operations and a loss on the sale of
our investment and after tax restructuring charges in 2001
of € 5.5 million related to our equipment operations.
Net loss for 2002 was negatively impacted by (i) goodwill
impairment of € 3.3 million, (ii) a non-cash valuation
allowance of € 6.0 million against our net deferred tax
assets and (iii) after tax restructuring charges in 2002 of
€ 0.6 million related to our die handling operations.
However, net loss excluding those charges for 2002 as
compared to 2001 was negatively impacted by signifi-
cantly decreased net sales and gross margins related to
adverse market conditions, partially offset by reduced
costs and expenses as a result of our restructuring efforts.
(In thousands, except per share data)
2001 2002EURO EURO
Reported net loss (16,978) (17,011)Ceased goodwill amortization 1,062 -Adjusted net loss (15,916) (17,011)
Reported loss per share – basic and diluted (0.53) (0.54)Ceased goodwill amortization 0.03 -Adjusted loss per share – basic and diluted (0.50) (0.54)

N e t S a l e s
Our net sales decreased from € 198.0 million in
2000 to € 150.0 million in 2001, a decrease of 24.2%.
The decrease in net sales in 2001 as compared to 2000
was due to a significant deterioration in industry condi-
tions, extensions of product delivery dates and order
cancellations by customers, resulting in a significantly
lower volume of shipments.
A n n u a l R e p o r t 2 0 0 2 4 3
2000 Compared to 2001
Our net sales per product line for the periods indicated were as follows:
B a c k l o g
Our backlog of € 141.7 million at December 31,
2000, decreased by 74.2% to € 36.5 million at
December 31, 2001. The substantial decrease was due
to deteriorating market conditions that adversely affected
new order rates, and influenced extensions of product
delivery dates and order cancellations by customers. New
orders in 2001 were € 44.8 million, a decrease of 82.2%
compared to € 251.1 million in 2000. New orders for
2001 were negatively affected by order cancellations of
€ 10.8 million. The book-to-bill ratio for 2001 was 0.30
as compared to 1.27 for 2000.
G r o s s P r o f i t
Gross profit decreased by 30.0% from € 76.8 mil-
lion in 2000 to € 53.8 million in 2001. As a percentage
of net sales, gross profit decreased from 38.8% in 2000
to 35.8% in 2001. The gross profit and gross margin
decrease in 2001 compared to 2000 was due to sub-
stantially lower net sales and increased provisions for
obsolete stock and inventory amounting to € 4.3 mil-
lion related to customer order cancellations, which
were only partially offset by reduced production and
overhead costs.
S e l l i n g , G e n e r a l a n d
A d m i n i s t r a t i v e E x p e n s e s
Our selling, general and administrative expenses in
2000 totaled € 33.8 million, or17.1% of net sales com-
pared to € 30.6 million, or 20.4% of net sales, in 2001.
The decrease in selling, general and administrative
expenses was mainly due to a decrease in net sales and
our restructuring efforts, partially offset by increased
provisions for doubtful accounts of approximately € 1.7
million. The increase in selling, general and administra-
tive expenses as a percentage of net sales resulted
primarily from the significant decrease in net sales.
R e s e a r c h a n d
D e v e l o p m e n t E x p e n s e s
Our research and development expenses increased
by 35.1% from € 11.4 million in 2000 to € 15.4 million
in 2001. As a percentage of net sales, research and
development expenses were 5.8% and 10.3% in 2000
and 2001, respectively. The increase in research and
development spending in 2001 mainly related to inte-
grated assembly line functionality and chip scale ball
grid array packaging applications. We developed and
officially introduced a new Advanced Back-end Cluster
(“ABC”) assembly line in the third quarter of 2001, an
advanced assembly line for the integration of key pac-
(Euro in million)
2000 2001 % changeAutomated molding systems 87.1 60.9 (30.0)Automated trim and form integration systems 44.4 41.5 (6.5)Singulation systems 5.1 4.6 (9.8)Plating systems 59.3 36.1 (39.1)Die handling systems 2.1 6.9 228.6Total net sales 198.0 150.0 (24.2)

A n n u a l R e p o r t 2 0 0 24 4
kaging processes (molding, cure, post-cure, trim and
form, singulation, test and sorting).
R e s t r u c t u r i n g C h a r g e s
On June 15, 2001 we adopted an initial restructu-
ring plan that included a reduction of our global work-
force (including temporary workers) of approximately
13%. These actions were necessitated by the current
semiconductor industry downturn that has resulted in a
significant reduction in our new orders. We undertook
this restructuring: (i) to better align our cost structure
with anticipated revenues and (ii) to improve manufac-
turing efficiency and productivity. We recorded pre-tax
restructuring charges of € 3.6 million in connection with
the reduction of our workforce in the second quarter of
2001. As a result of continued adverse market condi-
tions in the semiconductor equipment industry, we took
additional restructuring measures in the third and fourth
quarters of 2001, which will result in a cumulative work-
force reduction of approximately 26%. In connection
with those additional restructuring measures, we incur-
red additional restructuring charges for employee sever-
ance and benefits of € 4.7 million.
Changes in the restructuring reserve were as follows:
The provisions in 2001 for the workforce reduction
include severance and other benefits for approximately
180 employees, representing primarily most major depart-
ments at our Fico subsidiaries in the Netherlands and Asia.
O p e r a t i n g I n c o m e ( L o s s )
Operating income (loss) decreased from income of
€ 16.9 million in 2000 to a loss of € 4.4 million in 2001.
Operating margins were 8.6% and negative 2.9% in
these years, respectively. The operating loss for 2001
included restructuring charges of € 8.3 million.
Our operating income in 2000 included a one-time
write-off of acquired IPRD of € 11.5 million relating
to the acquisition of RDA in September 2000.
Excluding restructuring charges and the write-off
of acquired IPRD, operating income decreased from
€ 28.4 million in 2000 to € 3.9 million in 2001.
This decrease was mainly due to lower net sales, lower
gross margins, increased research and development
spending and increased goodwill amortization resulting
from the acquisition of RDA, partially offset by a
decrease in selling, general and administrative expenses.
We incurred annual patent and goodwill amortiza-
tion charges of approximately € 3.8 million in 2001,
which related to the acquisition of our Fico, Meco and
RDA subsidiaries in October 1993, May 1995, and
September 2000, respectively. Effective January 1, 2002
SFAS No. 142 we ceased amortizing goodwill and intan-
gible assets with indefinite useful lives in accordance
with SFAS No. 142.
I n t e r e s t I n c o m e , N e t
Our interest income, net increased from € 2.8 mil-
lion in 2000 to € 4.2 million in 2001, due to higher ave-
rage cash balances outstanding as a result of the
investment of the € 94.0 million proceeds from the
April 2000 public offering of our ordinary shares and the
investment of cash flow generated from operations.
I n c o m e Ta x e s ( B e n e f i t )
Our income tax expense was € 6.3 million in 2000
as compared to € 0.5 million in 2001. The effective tax
rate was 32.0% in 2000 and was not meaningful in
2001 as we recorded income tax expense in spite of loss
before taxes and equity in earnings (loss) of affiliated
companies. The effective tax rate for 2000 before the
IPRD charge was 34.2%. The change in effective tax
rate and the provision for income taxes in 2001, in spite
of the pre-tax loss incurred, was due to the impact of
non-deductible expenses, and losses in certain foreign
subsidiaries, in which we were not able to recognize
a tax benefit. The sale of PBE was a non-taxable event
(Euro in thousands)
Restructuring reserve 8,306Cash payments in 2001 (2,819)Restructuring reserve as of December 31, 2001 5,487

A n n u a l R e p o r t 2 0 0 2 4 5
and as a result no tax benefit relating to the loss we
incurred on the sale has been recorded.
E q u i t y i n E a r n i n g s ( L o s s )
o f A f f i l i a t e d C o m p a n i e s
Equity in earnings (loss) of affiliated companies
amounted to income of € 5.0 million for 2000 as com-
pared to a loss of € 16.3 million for 2001, including our
proportionate share of restructuring charges aggregating
€ 5.8 million. The equity in earnings of affiliated com-
panies for 2000 and 2001 includes total goodwill amor-
tization of € 1.3 million and € 1.1 million, respectively.
On November 15, 2001 we sold our 30% equity
interest in PBE to Possehl for € 18.1 million cash.
In connection with this transaction, we recorded a loss
of € 4.8 million. This loss is included in equity in ear-
nings (loss) of affiliated companies and loss on sale of
affiliated companies. The loss on disposal of PBE in-
cluded the reversal of the portion of our cumulative
translation adjustment component of shareholders’
equity relating to our investment in PBE, which reduced
the loss on sale by € 5.3 million.
PBE announced a restructuring plan in 2001 in
order to significantly lower its overhead structure and
reach break-even profitability levels. In connection
therewith, PBE recorded restructuring charges until
November 15, 2001 of € 19.3 million to cover the esti-
mated costs of severance for a workforce reduction of
approximately 30% as well as for the consolidation
and/or closing of three European facilities and the re-
location of Hong Kong leadframe manufacturing ope-
rations to mainland China. We recorded our propor-
tionate 30% share of this charge, which amounted to
€ 5.8 million in 2001.
PBE’s net sales for 2000 were € 253.1 million as
compared to € 155.9 million for the period January 1,
2001 to November 15, 2001. Operating income (loss)
for 2000 amounted to income of € 29.4 million as
compared to a loss of € 31.0 million in the 2001 period,
including restructuring charges of € 19.3 million. The
decrease in operating income was due to the decrease
in net sales, as well as a decline in gross margins from
26.1% in 2000 to 10.9% in the period January 1 to
November 15, 2001, due to adverse market condi-
tions, significantly lower net sales, the adverse impact
of competitive pricing pressure and an under-absorp-
tion of costs due to lower sales levels. As a percentage of
net sales, selling, general and administrative expenses
were 14.2% in 2000 and 17.0% in the period January
1 to November 15, 2001. The increase in the 2001
period was due to the substantial decline in net sales.
In December 2001, subsequent to the sale of our
30% interest in PBE on November 15, 2001, the Board
of Directors of PBE announced a change in accounting
principle. This change, relating to the depreciation
method of certain fixed assets, resulted in a one-time
charge of € 5.8 million in the results of PBE in 2001.
Subsequent to the sale of the 30% interest in PBE, we
no longer had any representation on the Board of
Directors of PBE nor any other rights or responsibilities
regarding PBE. As a result, PBE’s December 2001 change
in accounting principle is treated as a post-disposal
subsequent event and our proportionate share of this
change has not been included in the Consolidated
Statements of Operations (see Note 8 of the Notes to
the Consolidated Financial Statements).
N e t I n c o m e ( L o s s )
Net income for 2000 was € 18.5 million as com-
pared to a net loss of € 17.0 million in 2001. The
decrease in net income was due principally to charges
of € 16.3 million incurred by PBE related both to
operations and a loss on the sale of our investment
and net after tax restructuring charges in 2001 of
€ 5.5 million related to our equipment operations.
In addition, significantly decreased net sales and gross
margins related to adverse market conditions and
increased research and development expenses in sup-
port of new product offerings for the next market
upturn contributed to the net income decline as com-
pared to 2000, partially offset by reduced costs and
expenses as a result of our restructuring efforts.
Liquidity and Capital Resources
A n n u a l R e p o r t 2 0 0 24 6
We had € 141.5 million and € 119.9 million in cash at
December 31, 2001 and December 31, 2002, respectively.
We finance Meco and, to an extent, Fico, on a stand-
alone basis. Meco utilizes funds generated from its results
of operations and available bank lines of credit to finance
its working capital and capital expenditure requirements.
Meco and Fico maintain lines of credit with various local
commercial banks. The credit lines of Meco and Fico are
unsecured. The principal restrictive covenant in each line is
related to solvency ratios, which generally are based on a
ratio of each subsidiary’s equity to its assets. Currently, our
Die Handling Systems subsidiary and, to an extent, Fico
are financed through intercompany loans.
The working capital requirements of our subsidiaries
are affected by the receipt of periodic payments on orders
from their customers. Although Fico and Besi Die Handling
generally receive partial payments for automated molding
systems, automated trim and form integration systems
and die handling systems prior to final installation, initial
payments generally do not cover a significant portion of
the costs incurred in the manufacturing of such systems.
Meco generally receives a higher initial payment upon
receipt of orders than Fico and Besi Die Handling.
Net cash provided by (used in) operating activities
were € 14.9 million and (€ 4.2) million in 2001 and 2002,
respectively. The primary use of cash from operations in
2002 were a net loss of € 17.0 million that included non-
cash charges of € 10.0 million for depreciation, amortiza-
tion and goodwill impairment and € 4.5 million other
non-cash losses, combined with increased working capital
requirements of € 1.7 million. At December 31, 2002, our
cash totaled € 119.9 million and our total debt and capi-
tal lease obligations totaled € 9.0 million which included a
subordinated loan of € 0.3 million outstanding from De
Nationale Investeringsbank N.V., 90% of which is guaran-
teed by the government of the Netherlands. At December
31, 2002, shareholders’ equity stood at € 200.5 million.
Our capital expenditures increased from € 3.4 million
in 2001 to € 4.9 million in 2002. The expenditures in 2002
were incurred primarily for the purchase of machinery and
equipment and computer equipment, as well as the first
installments for (i) the construction of a new 80,000 squ-
are foot facility in Duiven, the Netherlands for molding
systems and tooling manufacturing and (ii) the establish-
ment of our first manufacturing facility in mainland
China for the production of tools. We expect capital
spending in 2003 to increase to approximately € 13 mil-
lion, principally as a result of the expenditures required to
complete these new buildings in 2003.
At June 28, 2002, we sold the land and buildings of
one of our subsidiaries in a sale and lease back trans-
action for € 6.5 million in cash. At the date of this trans-
action, the cost of the land and buildings totaled € 6.9
million and the net book value of the real estate sold by
us amounted to € 5.4 million. Our gain on this trans-
action of € 1.1 million is being amortized and netted
against rental expenses over the twelve and a half year
term of the lease. Gross rental expenses total € 0.6 mil-
lion per annum.
On June 17, 2002, we announced that we had adop-
ted a plan to repurchase up to 1,000,000 of our ordinary
shares from time to time. As of December 31, 2002, we
had repurchased 896,447 ordinary shares at an average
price of € 5.45 per share under this repurchase program.
At December 31, 2002,we had available lines of credit
amounting to € 24.3 million, under which no borrowings
were outstanding. At December 31, 2002, € 323 was
reserved for guarantees and € 1,001 was reserved for
foreign exchange contracts under such lines. Interest is
charged at the bank’s base lending rates plus increments
ranging from 1.0% to 1.5%. The credit facility agree-
ments include covenants requiring to maintain certain
financial ratios. We were in compliance with, or had
received waivers for, all loan covenants at December 31,
2001 and 2002.
We believe that our cash position, internally generated
funds and available lines of credit will be adequate to meet
our levels of capital spending, research and development
and working capital requirements for at least the next
twelve months.

Recently Issued Accounting Pronouncements
A n n u a l R e p o r t 2 0 0 2 4 74 7
In June 2001, the FASB issued SFAS No. 143,
“Accounting for asset retirement obligations”. SFAS
No. 143 addresses financial accounting and reporting for
obligations associated with the retirement of tangible
long-lived assets and the associated retirement costs.
It requires that we recognize the fair value of a liability
for an asset retirement obligation in the period in
which it is incurred if a reasonable estimate of fair value
can be made. The Company adopted SFAS No. 143
on January 1, 2003 and the adoption did not have
a material impact on the Company’s consolidated
financial statements.
In August 2001, the FASB issued SFAS No. 144,
“Accounting for the impairment or disposal of long-
lived assets". SFAS No. 144 establishes a single accoun-
ting model for the impairment of long-lived assets and
broadens the presentation of discontinued operations
to include more disposal transactions. The Company
adopted SFAS No. 144 effective January 1, 2002 and
the adoption did not have a material impact on the
Company’s consolidated financial statements.
In April 2002, the FASB issued SFAS No. 145,
Recission of FASB Statements No. 4, 44, and 64,
Amendment of FASB Statement No. 13, and Technical
Corrections. In rescinding FASB Statement No. 4 and
FASB No. 64, FASB No. 145 eliminates the requirement
that gains and losses from the extinguishment of debt
be aggregated and, if material, classified as an extra-
ordinary item, net of the related income tax effect,
however, an entity would not be prohibited from classi-
fying such gains and losses as extraordinary items so
long as they meet the criteria of paragraph 20 of APB
30, Reporting the results of operations – Reporting
the Effects of Disposal of a Segment of a Business, and
Extraordinary, Unusual and Infrequently Occurring
Events and Transactions. Further, the Statement amends
SFAS No. 13 to eliminate an inconsistency between the
accounting for sale and leaseback transactions and
certain lease modifications that have economic effects
that are similar to sale-leaseback transactions. The stan-
dard is effective for transactions occurring after May 15,
2002. The adoption of SFAS No. 145 did not have a
material impact on the Company’s consolidated finan-
cial statements.
In June 2002, the FASB issued SFAS 146, Accounting
for Exit or Disposal Activities which addresses significant
issues regarding the recognition, measurement, and
reporting of costs that are associated with exit and
disposal activities, including restructuring activities that
are currently accounted for pursuant to the guidance
that the Emerging Issues Task Force (“EITF”) has set
forth in EITF 94-3 Liability Recognition for Certain
Employee Termination Benefits and Other Costs to Exit
an Activity (including Certain Costs Incurred in a
Restructuring). The standard will be effective for exit or
disposal activities that are initiated after December 31,
2002.The Company adopted SFAS No. 146 on January
1, 2003 and the adoption did not have a material impact
on the Company’s consolidated financial statements.
In November 2002, the FASB issued Interpretation
No. 45, “Guarantor’s Accounting and Disclosure
Requirements for Guarantees, Including Indirect
Guarantees of Indebtedness of Others (hereinafter “the
Interpretation”), which addresses, among other things,
the disclosures to be made by a guarantor in its interim
and annual financial statements about its obligations
under guarantees. The Interpretation also requires the
recognition of a liability by a guarantor at the inception
of certain guarantees. The Interpretation requires the
guarantor to recognize a liability for the non-contingent
component of the guarantee, this is the obligation to
stand ready to perform in the event that specified trig-
gering events or conditions occur. The initial measure-
ment of this liability is the fair value of the guarantee at
inception. The recognition of the liability is required
even if it is not probable that payments will be required
under the guarantee or if the guarantee was issued
with a premium payment or as part of a transaction

with multiple elements. The Company has adopted
the disclosure requirements of the Interpretation as at
December 31, 2002 and will apply the recognition
and measurement provisions for all guarantees entered
into or modified after December 31, 2002.
In November 2002, the Emerging Task-Force issued
its consensus on EITF 00-21, “Revenue Arrangements
with Multiple Deliverables” (“EITF 00-21”) on an ap-
proach to determine whether an entity should divide an
arrangement with multiple deliverables into separate
units of accounting. According to the EITF in an arrange-
ment with multiple deliverables, the delivered item(s)
should be considered a separate unit of accounting if
all of the following criteria are met: (i) the delivered
item(s) has value to the customer on a standalone basis,
(ii) there is objective and reliable evidence of the fair
value of the undelivered item(s), (iii) if the arrangement
includes a general right of return, delivery or perfor-
mance of the undelivered item(s) is considered probable
and substantially in the control of the vendor. If all the
conditions above are met and there is objective and re-
liable evidence of fair value for all units of accounting in
an arrangement, the arrangement consideration should
be allocated to the separate units of accounting based
on their relative fair values. However, there may be cases
in which there is objective and reliable evidence of the
fair value(s) of the undelivered item(s) in an arrange-
ment but no such evidence for one or more of the deli-
vered items. In those cases, the residual method should
be used to allocate the arrangement consideration.
The guidance in this Issue is effective for revenue arrange-
ments entered into in fiscal beginning after June 15,
2003. Alternatively, entities may elect to report the change
in accounting as a cumulative effect adjustment in
accordance with Accounting Principles Board Opinion
20, "Accounting Changes". If so elected, disclosure
should be made in periods subsequent to the date of
initial application of this consensus of the amount of
recognized revenue that was previously included in the
cumulative effect adjustment. The Company believes
that the adoption of EITF 00-21 will not have a material
impact on the Company's consolidated financial state-
ments.
In December 2002, the FASB issued SFAS No. 148,
“Accounting for Stock Based Compensation - Transition
and Disclosure - an amendment of FASB Statement
No. 123.” SFAS No. 148 permits two additional transi-
tion methods for entities that adopt the fair value based
method of accounting for stock-based employee com-
pensation. The Statement also requires new disclosures
about the ramp-up effect of stock-based employee
compensation on reported results. The Statement also
requires that those effects be disclosed more prominent-
ly by specifying the form, content, and location of those
disclosures. The transition guidance and annual dis-
closure provisions of SFAS No. 148 are effective for fiscal
years ending after December 15, 2002, with earlier
application permitted in certain circumstances.
The interim disclosure provisions are effective for finan-
cial reports, containing financial statements for interim
periods beginning after December 15, 2002.
The Company has adopted the annual disclosure requi-
rements of SFAS No.148 in the consolidated financial
statements.
A n n u a l R e p o r t 2 0 0 24 84 8

A n n u a l R e p o r t 2 0 0 2 4 9
C o n s o l i d a t e dF i n a n c i a l S t a t e m e n t s
2 0 0 2Independent Auditors’ Report
Consolidated Balance Sheets
Consolidated Statements of Operations
Consolidated Statements of Cash Flows
Consolidated Statements of Shareholders’ Equity
Consolidated Statements of Comprehensive Income (Loss)
Notes to the Consolidated Financial Statements
for almost 40 years, a similar combination of new ideas combined with solid expertise has characterized Besi

To the Superv i sory Board and
the Board of Management of
BE Semiconductor Indust r ies N .V.
We have audited the accompanying consolidated
balance sheets of BE Semiconductor Industries N.V. and
subsidiaries as of December 31, 2001 and 2002 and
the related consolidated statements of operations, cash
flows, shareholders' equity and accumulated other
comprehensive income (loss), for each of the years in
the three-year period ended December 31, 2002. These
consolidated financial statements are the responsibility
of the management of BE Semiconductor Industries
N.V. Our responsibility is to express an opinion on these
financial statements based on our audits. We did not
audit the financial statements of Possehl Besi Electronics
N.V., a 30% owned investee company which was sold
on November 15, 2001. BE Semiconductor Industries
N.V.’s investment in Possehl Besi Electronics N.V. at
December 31, 2001 and 2002 was nil, and its equity
in earnings was income of € 6,330,000 for the year
ended December 31, 2000 and loss of € 10,372,000
for the period January 1, 2001 to November 15, 2001.
The financial statements of Possehl Besi Electronics N.V.
were audited by other auditors whose report has been
furnished to us, and our opinion, insofar as it relates to
the amounts included for Possehl Besi Electronics N.V.
for each of the years in the two-year period ended
December 31, 2001, is based solely on the report of the
other auditors.
We conducted our audits in accordance with audi-
ting standards generally accepted in the United States
of America. Those standards require that we plan
and perform the audit to obtain reasonable assurance
about whether the financial statements are free of
material misstatement. An audit includes examining,
on a test basis, evidence supporting the amounts and
disclosures in the financial statements. An audit also
includes assessing the accounting principles used and
significant estimates made by management, as well as
evaluating the overall financial statement presentation.
We believe that our audits and the report of the other
auditors provide a reasonable basis for our opinion.
In our opinion, based on our audits and the report
of the other auditors, the consolidated financial state-
ments referred to above present fairly, in all material
respects, the financial position of BE Semiconductor
Industries N.V. and subsidiaries at December 31, 2001
and 2002 and the results of their operations and their
cash flows for each of the years in the three-year period
ended December 31, 2002, in conformity with accoun-
ting principles generally accepted in the United States
of America.
We refer to Note 2 to the Consolidated Financial
Statements that BE Semiconductor Industries N.V.
issued also statutory financial statements in accordance
with accounting principles in the Netherlands which
are available at the Company and will be filed at
the Chamber of Commerce of Oost-Brabant
(‘s-Hertogenbosch). Based upon section 2:395 sub-
section 2 of the Netherlands Civil Code we state that
we expressed an unqualified opinion on these statutory
financial statements.
As discussed in Note 1 to the consolidated financial
statements, on January 1, 2002 the Company adopted
Statement of Financial Accounting Standards (“SFAS”)
No. 142, “Goodwill and Other Intangible Assets”.
As required by SFAS No. 142, goodwill and intangible
assets with indefinite lives are no longer amortized, but
instead tested for impairment at least annually.
KPMG Accountants N.V.
‘s-Hertogenbosch, the Netherlands
February 11, 2003
A n n u a l R e p o r t 2 0 0 25 0
Independent Auditors’ Report
5 0

Consolidated Balance Sheets
A n n u a l R e p o r t 2 0 0 2 5 1
(Amounts in thousands) December 31,
2001 2002 2002EURO EURO USD
ASSETS
Cash and cash equivalents 141,506 119,866 125,680Accounts receivable 31,078 28,238 29,607Inventories 29,310 33,424 35,045Other current assets 5,087 7,687 8,060
Total current assets 206,981 189,215 198,392
Property, plant and equipment 28,466 23,103 24,224Goodwill 13,025 14,690 15,402Patents and trademarks 18,705 17,036 17,862Other non-current assets 4,709 954 1,000
Total assets 271,886 244,998 256,880
LIABILITIES AND SHAREHOLDERS’ EQUITY
Current portion of long-term debt andcapital leases 1,648 1,228 1,288
Accounts payable 5,520 13,103 13,738Accrued liabilities 22,692 17,272 18,110
Total current liabilities 29,860 31,603 33,136
Long-term debt and capital leases 9,040 7,812 8,191Deferred gain on sale and lease back - 1,012 1,061Deferred tax liabilities 4,684 4,039 4,235
Total non-current liabilities 13,724 12,863 13,487
Minority interest - 44 46
Ordinary shares 28,933 28,117 29,480Preference shares - - -Capital in excess of par value 181,799 177,730 186,350Retained earnings (deficit) 15,267 (1,744) (1,829)Accumulated other comprehensive income (loss) 2,303 (3,615) (3,790)
Total shareholders’ equity 228,302 200,488 210,211
Total liabilities and shareholders’ equity 271,886 244,998 256,880
The accompanying notes are an integral part of these consolidated financial statements.
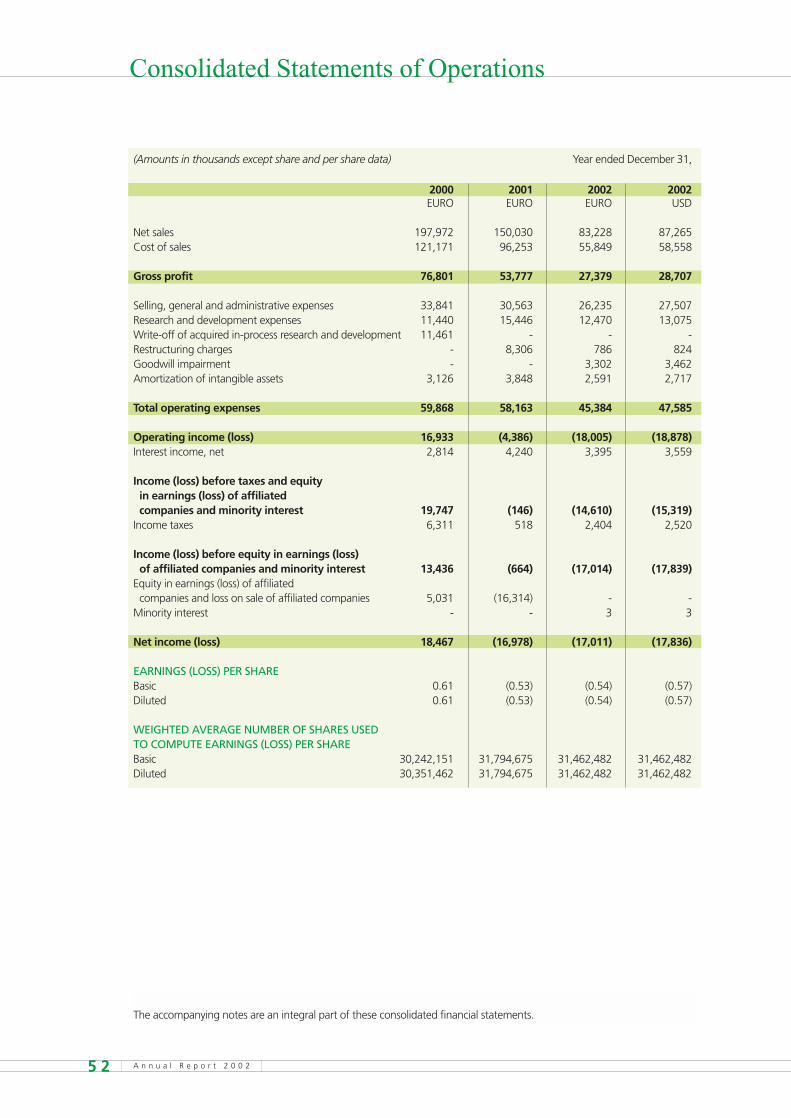
Consolidated Statements of Operations
A n n u a l R e p o r t 2 0 0 25 2
(Amounts in thousands except share and per share data) Year ended December 31,
2000 2001 2002 2002EURO EURO EURO USD
Net sales 197,972 150,030 83,228 87,265Cost of sales 121,171 96,253 55,849 58,558
Gross profit 76,801 53,777 27,379 28,707
Selling, general and administrative expenses 33,841 30,563 26,235 27,507Research and development expenses 11,440 15,446 12,470 13,075Write-off of acquired in-process research and development 11,461 - - -Restructuring charges - 8,306 786 824Goodwill impairment - - 3,302 3,462Amortization of intangible assets 3,126 3,848 2,591 2,717
Total operating expenses 59,868 58,163 45,384 47,585
Operating income (loss) 16,933 (4,386) (18,005) (18,878)Interest income, net 2,814 4,240 3,395 3,559
Income (loss) before taxes and equity in earnings (loss) of affiliatedcompanies and minority interest 19,747 (146) (14,610) (15,319)
Income taxes 6,311 518 2,404 2,520
Income (loss) before equity in earnings (loss) of affiliated companies and minority interest 13,436 (664) (17,014) (17,839)
Equity in earnings (loss) of affiliatedcompanies and loss on sale of affiliated companies 5,031 (16,314) - -
Minority interest - - 3 3
Net income (loss) 18,467 (16,978) (17,011) (17,836)
EARNINGS (LOSS) PER SHAREBasic 0.61 (0.53) (0.54) (0.57)Diluted 0.61 (0.53) (0.54) (0.57)
WEIGHTED AVERAGE NUMBER OF SHARES USED TO COMPUTE EARNINGS (LOSS) PER SHAREBasic 30,242,151 31,794,675 31,462,482 31,462,482Diluted 30,351,462 31,794,675 31,462,482 31,462,482
The accompanying notes are an integral part of these consolidated financial statements.

Consolidated Statements of Cash Flows
A n n u a l R e p o r t 2 0 0 2 5 3
(Amounts in thousands) Year ended December 31,
2000 2001 2002 2002EURO EURO EURO USD
CASH FLOWS FROM OPERATING ACTIVITIES:Net income (loss) 18,467 (16,978) (17,011) (17,836)
Adjustments to reconcile net income (loss) to net cash provided by (used in) operating activities:
Depreciation of property, plant and equipment 4,465 4,495 4,135 4,335Write-off of acquired in-process research and development 11,461 - - -Amortization of intangible assets 3,126 3,848 2,591 2,717Goodwill impairment - - 3,302 3,462Deferred income taxes (benefits) (5,179) (1,541) 2,403 2,520Loss (gain) on disposal of equipment (131) (5) 13 14Loss on disposal of subsidiaries and affiliated companies - 4,805 - -Translation of debt in foreign currency (20) 176 2,109 2,211Minority interest - - (3) (3)Equity in (earnings) loss of affiliated companies (5,031) 11,509 - -
Effects of changes in assets and liabilities:Decrease (increase) in accounts receivable (14,151) 17,484 3,575 3,748Decrease (increase) in inventories (11,856) 10,847 (2,405) (2,522)Decrease (increase) in other current assets (1,607) 3,224 (2,857) (2,996)Increase (decrease) in accrued liabilities 6,478 (1,335) (7,393) (7,751)Increase (decrease) in accounts payable 6,044 (21,587) 7,317 7,672
Net cash provided by (used in) operating activities 12,066 14,942 (4,224) (4,429)
CASH FLOWS FROM INVESTING ACTIVITIES:Capital expenditures (6,311) (3,393) (4,903) (5,141)Proceeds from sale of equipment 214 28 6,789 7,118Proceeds from sale of subsidiaries and affiliated companies 955 18,091 - -
Acquisition of subsidiaries, net of cash acquired (25,235) (170) (10,605) (11,119)Decrease in advances to affiliated companies 169 173 - -
Net cash provided by (used in) investing activities (30,208) 14,729 (8,719) (9,142)

Consolidated Statements of Cash Flows Cont.
A n n u a l R e p o r t 2 0 0 25 4
(Amounts in thousands) Year ended December 31,
2000 2001 2002 2002EURO EURO EURO USD
CASH FLOWS FROM FINANCING ACTIVITIES:Payments on long-term debt and capital leases (1,915) (1,704) (1,646) (1,726)Payments on other long-term liabilities (901) - - -Net proceeds from (payments of) advancesfrom customers 4,282 (9,688) 1,015 1,064
Payments of bank lines of credit (6,807) - (1,324) (1,388)Purchase of own shares - - (4,885) (5,121)Proceeds of secondary offering (net of expense of € 3,172) 94,028 - - -
Proceeds from minority shareholder - - 48 50
Net cash provided by (used in) financing activities 88,687 (11,392) (6,792) (7,121)
Net increase (decrease) in cash and cash equivalents 70,545 18,279 (19,735) (20,692)
Effect of changes in exchange rates on cash and cash equivalents 214 378 (1,905) (1,997)
Cash and cash equivalents at beginning of the year 52,090 122,849 141,506 148,369
Cash and cash equivalents at end of the year 122,849 141,506 119,866 125,680
SUPPLEMENTAL DISCLOSURE:Cash paid for interest 1,040 833 710 744Cash paid for income taxes 7,525 2,822 653 685
The accompanying notes are an integral part of these consolidated financial statements.

Consolidated Statements of Shareholders’ Equity
A n n u a l R e p o r t 2 0 0 2 5 5
(Amounts in thousands except share data)
Number of Share Capital Retained Accumulated Total
ordinary capital in excess earnings other com- share-
shares at par of par (deficit) prehensive holders’
outstanding value value income (loss) equity
EURO EURO EURO EURO EURO EURO
Balance at December 31, 1999 26,394,425 23,955 92,749 13,778 3,154 133,636
Net income - - - 18,467 - 18,467Exchange rate changes for the year - - - - 1,612 1,612Conversion of priority shares toordinary shares 250 - - - - -
Conversion of par value from NLG into euro - 64 (64) - - -
Issuance of shares (net ofexpense of € 3,172) 5,400,000 4,914 89,114 - - 94,028
Balance at December 31, 2000 31,794,675 28,933 181,799 32,245 4,766 247,743
Net loss - - - (16,978) - (16,978)Exchange rate changes for the year - - - - 1,139 1,139Reclassification – adjustment for exchange rate changes on sale of affiliated companies realized in net loss - - - - (3,602) (3,602)
Balance at December 31, 2001 31,794,675 28,933 181,799 15,267 2,303 228,302
Net loss - - - (17,011) - (17,011)Exchange rate changes for the year - - - - (5,918) (5,918)Purchases of own shares (896,447) (816) (4,069) - - (4,885)
Balance at December 31, 2002 30,898,228 28,117 177,730 (1,744) (3,615) 200,488
The accompanying notes are an integral part of these consolidated financial statements.

A n n u a l R e p o r t 2 0 0 25 6
Consolidated Statements of Comprehensive Income (Loss)
(Amounts in thousands) Year ended December 31,
2000 2001 2002 2002EURO EURO EURO USD
Net income (loss) 18,467 (16,978) (17,011) (17,836)
OTHER COMPREHENSIVE INCOME (LOSS):Foreign currency translation adjustment 1,612 1,139 (5,918) (6,205)Adjustment for exchange rate changes on sale of affiliated companies realized in net loss - (3,602) - -
Comprehensive income (loss) 20,079 (19,441) (22,929) (24,041)
The accompanying notes are an integral part of these consolidated financial statements.
Accumulated other comprehensive income (loss) consists of:
Year ended December 31,
2000 2001 2002 2002EURO EURO EURO USD
Foreign currency translation adjustment 4,766 2,303 (3,615) (3,790)
Accumulated other comprehensive income (loss) 4,766 2,303 (3,615) (3,790)

A n n u a l R e p o r t 2 0 0 2 5 7
N o t e s t o t h e C o n s o l i d a t e d
F i n a n c i a l S t a t e m e n t s
for almost 40 years, a similar combination of new ideas combined with solid expertise has characterized Besi

1 Basis of Presentation
BE Semiconductor Industries N.V. (“Besi”) was
incorporated in the Netherlands in May 1995 as a
wholly owned subsidiary of AdCapital AG, former
Berliner Elektro Holding AG (together with its consoli-
dated subsidiaries, “Berliner Elektro”) to serve as the
holding company for a worldwide business engaged
in the development, production, marketing and sales of
back-end equipment for the semiconductor industry.
Besi’s principal operations are in the Netherlands,
Asia, and the United States. Besi operates its business
through its subsidiaries Fico B.V. (“Fico”), Meco
International B.V. (“Meco”) and their respective subsi-
diaries, Lilogix Inc. d/b/a RD Automation (“RDA”) and
Laurier Inc. (“Laurier”).
On October 1,1993, Berliner Elektro acquired all the
outstanding shares of Fico from a third party for consi-
deration of € 27.2 million (NLG 60 million). This acqui-
sition was accounted for using the purchase method
of accounting. At that time, certain tangible and in-
tangible assets were revalued to reflect their fair value.
The resulting negative goodwill was allocated propor-
tionally to the acquired non-current assets.
Effective May 1, 1995, Besi acquired all the out-
standing shares of Meco from a third party for conside-
ration of € 52.2 million (NLG 115 million). This acqui-
sition was financed through the issuance of € 25 million
(NLG 55 million) of share capital (excluding issue expen-
ses) and € 27.2 million (NLG 60 million) short-term
intercompany debt (denominated in German marks).
This acquisition was accounted for using the purchase
method of accounting. At that time, certain tangible
and intangible assets were revalued to reflect their
fair value.
In April 2000, 18.4 million ordinary shares of Besi
were sold to investors through the Euronext (former
Amsterdam Stock Exchange), Frankfurt Stock Exchange
and Nasdaq Stock Market at a price of € 18.00 (US$
17.30). Besi sold a total of 5.4 million shares, including
the exercise of the underwriters’ over-allotment option
of 2.4 million shares. Berliner Elektro sold 13 million sha-
res, thereby reducing its ownership of Besi’s ordinary
shares from approximately 55% to less than 5%.
The gross and net proceeds of the offering to Besi were
€ 97.2 million and € 94.0 million, respectively.
On September 1, 2000, Besi acquired, through one
of its subsidiaries, RDA for cash consideration of US$
21.75 million (€ 24.5 million). Acquisition cost amoun-
ted to US$ 1.4 million. RDA designs, develops, markets
and services flip chip die attach systems for the semi-
conductor industry’s assembly operations. This acquisi-
tion was accounted for using the purchase method of
accounting. In connection with this transaction, an
allocation of the purchase price was made resulting in
certain purchase accounting adjustments.
The purchase price, including acquisition costs, was
allocated as follows:
The identifiable intangible assets include patents
and trademarks. The patents and trademarks are
amortized over their estimated useful life of 13 years.
Effective January 1, 2002, Besi ceased amortizing
goodwill, which previously was being amortized over
its estimated useful life of 13 years, and instead eva-
luates for impairment annually in accordance with the
Financial Accounting Standards Boards (“FASB”)
Statement of Financial Accounting Standards (“SFAS”)
No. 142, “Goodwill and other intangible assets”.
The acquired in-process research and development
(“IPRD”) was not considered to have reached techno-
logical feasibility and in accordance with generally
accepted accounting principles the value of such, cal-
culated based on discounted probable future cash
A n n u a l R e p o r t 2 0 0 25 8
(In thousands) USD
Net tangible assets 268Identifiable intangible assets 3,583In-process research and development 9,983Goodwill 9,267
23,101

A n n u a l R e p o r t 2 0 0 2 5 9
flows, was expensed in the third quarter of 2001 to an
amount of US$ 10 million (€ 11.5 million; after tax
€ 7.1 million). The risk-adjusted discount rate applied
was 35%. The pro forma impact of this acquisition
on prior year financial information is not significant.
On November 15, 2001, Besi sold its 30% equity
interest in Possehl Besi Electronics N.V. (“PBE”) to
L. Possehl & Co., mbH (‘’Possehl”) for € 18.1 million
cash. In connection with this transaction, Besi recor-
ded a loss on disposal of € 4.8 million. This loss is
included in equity in earnings (loss) of affiliated com-
panies and loss on sale of affiliated companies in the
Consolidated Statements of Operations.
On January 4, 2002, Besi acquired Laurier for
cash consideration of US$ 8.9 million. Acquisition
cost amounted to US$ 0.5 million. This acquisition
was accounted for using the purchase method of
accounting. In connection with this transaction, an
allocation of the purchase price was made resulting in
certain purchase accounting adjustments.
The purchase price, including acquisition costs, was
allocated as follows:
The patents are amortized over their estimated
useful life of 13 years. The goodwill resulting from the
transaction will not be amortized, but will instead be
evaluated for impairment in accordance with SFAS No.
142. The pro forma impact of this acquisition on pri-
or year financial information is not significant.
P r e s e n t a t i o n
The accompanyingconsolidated financial statements
include the accounts of BE Semiconductor Industries N.V.
and its consolidated subsidiaries (collectively, “the
Company”). The Company follows accounting principles
generally accepted in the United States of America
(“US GAAP”).
The Consolidated Financial Statements presented
in this Annual Report are prepared in conformity with
accounting principles generally accepted in the United
States of America. In accordance with these principles,
the Company adopted SFAS No. 142, “Goodwill and
Other Intangible Assets” as of January 1, 2002 and of
that date, goodwill amortization ceased. In accordance
with accounting principles generally accepted in the
Netherlands, goodwill continued to be amortized. Results
in accordance with accounting principles in the Nether-
lands therefore differ from the results presented in this
Annual Report.
The accompanying consolidated financial statements
are, solely for the convenience of the reader, also trans-
lated into US dollars (“USD” or “US$”) using the noon
buying rate in New York City for cable transfers in foreign
currencies as certified for customs purposes by the Federal
Reserve Bank of New York in effect on December 31,
2002 (€ 1.00 = US$ 1.0485). Such translations should not
be construed as representations that the euro amounts
could be converted into US dollars at that or any other
date. All euro and US dollars are expressed in thousands,
unless otherwise stated.
2 Summary of Significant Accounting Principles
(In thousands) USD
Net tangible assets 1,161Patents 1,508Goodwill 6,695
9,364

A n n u a l R e p o r t 2 0 0 26 0
P r i n c i p l e s o f C o n s o l i d a t i o n
As of December 31, 2002, the following subsidiaries are included in the accompanying Consolidated
Financial Statements:
The balance sheets of the Company’s foreign subsi-
diaries are translated at the year-end exchange rate and
the income statements of the foreign subsidiaries are
translated at the average rate of exchange prevailing
during the period. Translation differences arising from
the consolidation of the financial statements of foreign
subsidiaries are recorded directly to accumulated other
comprehensive income (loss).
All significant intercompany profit, transactions and
balances have been eliminated in consolidation.
D e r i v a t i v e F i n a n c i a l
I n s t r u m e n t s
In accordance with SFAS No. 133 “Accounting for
Derivative Instruments and Hedging Activities" and
SFAS No. 138, “Accounting for Derivative Instruments
and Hedging Activities, an Amendment of SFAS 133”,
which the Company adopted on January 1, 2001, all
derivative financial instruments are carried in the
Consolidated Balance Sheets at fair value.
Using qualifying criteria defined in SFAS No. 133
and 138, derivative instruments are designated and
accounted for as either a hedge of exposure to the
change in fair value of a recognized asset or liability or
unrecognized firm commitment (fair value hedge), or a
hedge of the exposure to variability in the cash flows of
a recognized asset or liability, or forecasted transaction
(cash flow hedge). For a fair value hedge, the gain or loss
(both the effective and ineffective portions) relating to
the change in fair value of the derivative instrument is
recognized in earnings in the period of change, together
with the gain or loss on the hedged item attributable to
the hedged risk. For a cash flow hedge, gains and losses
relating to changes in the fair value of the derivative
instrument that are highly effective are initially recorded
in accumulated other comprehensive income or loss and
Name Location Percentage of ownership
BE Semiconductor Industries USA, Inc. Wilmington, Delaware, USA 100%Fico B.V. Duiven, the Netherlands 100%Fico Molding Systems B.V. Herwen, the Netherlands 100%Fico Trim & Form Integration Systems B.V. Duiven, the Netherlands 100%Fico Tooling B.V. Duiven, the Netherlands 100%Fico Tooling Leshan Company Ltd. Leshan, China 87%Fico Asia SDN. BHD. Shah Alam, Malaysia 100%Fico America Inc. Chandler, Arizona, USA 100%ASM Fico (F.E.) SDN. BHD. Kuala Lumpur, Malaysia 99.9%1)
Fico Korea Ltd. Seoul, Korea 100%Fico Hong Kong Ltd. Hong Kong, China 100%Nihon Fico Ltd. Tokyo, Japan 100%Fico Sales & Service Pte. Ltd. Singapore 100%Meco International B.V. Drunen, the Netherlands 100%Meco Equipment Engineers B.V. Drunen, the Netherlands 100%Meco Japan Co. Ltd. Tokyo, Japan 100%Meco Equipment Engineers Inc. Rock Hill, South Carolina, USA 100%Meco Equipment Engineers (Far East) Pte Ltd. Singapore 100%Lilogix Inc. (d/b/a RD Automation) Londonderry, New Hampshire, USA 100%Laurier Inc. Londonderry, New Hampshire, USA 100%
1) The Company has a 100% beneficial ownership.

subsequently reclassified into earnings when the
underlying hedged item affects earnings. The ineffective
portion of cash flow hedges is recognized in earnings
immediately. During 2002, the derivative instruments
used by the Company all qualify as fair value hedges.
The Company does not use derivative financial
instruments for trading or speculative purposes.
The Company uses forward foreign currency exchan-
ge contracts to hedge certain firm commitments denom-
inated in foreign currencies. The terms of the currency
instruments used are consistent with the timing of the
firmly committed transactions being hedged. The purpo-
se of the Company’s foreign currency management acti-
vity is to protect the Company from changes in fair value
of foreign currency denominated transactions that may
be adversely affected by changes in exchange rates.
F o r e i g n C u r r e n c y
Foreign currency transactions are recorded at the
exchange rate at the date of origin or at a forward
contract rate if hedged through a related forward foreign
currency exchange contract. Assets and liabilities deno-
minated in foreign currencies are translated at year-end
exchange rates, taking into account applicable hedge
accounting requirements. Realized exchange rate diffe-
rences are recorded in the Consolidated Statements of
Operations in selling, general and administrative expenses.
C a s h a n d C a s h E q u i v a l e n t s
Cash and cash equivalents consist of highly liquid
investments with an original maturity date at the date of
acquisition of three months or less.
A c c o u n t s R e c e i v a b l e
Accounts receivable are recorded at the invoiced
amount and do not bear interest. The allowance for
doubtful accounts is the Company’s best estimate of the
amount of probable credit losses in the Company’s
existing accounts receivable. The Company determines
the allowance based on historical write-off experience
by industry and national economic data. The Company
reviews its allowance for doubtful accounts monthly.
Balances which are over 90 days past due and exceed a
specific amount are reviewed individually for collectibility.
Account balances are charged off against the allowance
after all means of collection have been exhausted and the
potential for recovery is considered remote.The Company
does not have any off-balance sheet credit exposure
related to its customers.
I n v e n t o r i e s
Inventories are stated at the lower of cost (first-in,
first-out method) or market value. Cost includes net pri-
ces paid for materials purchased, charges for freight and
custom duties, production labor costs and factory over-
head. Precious metals are valued at the market price at
the balance sheet date. Variances in market price from
balance sheet date to balance sheet date are recorded in
cost of sales as gains or losses.
P r o p e r t y, P l a n t
a n d E q u i p m e n t
Property, plant and equipment are stated at cost less
accumulated depreciation. Depreciation is calculated
using the straight-line method, based on the following
estimated useful lives:
L e a s e s
Assets acquired under capital leases are included in
the balance sheet at the present value of the minimum
future lease payments and are depreciated over the
shorter of the lease term or their estimated economic
lives. A corresponding liability is recorded at the inception
of the capital lease and the interest element of capital
leases is charged to interest expense.
A n n u a l R e p o r t 2 0 0 2 6 1
Category Estimated useful lifeBuildings 15 - 30 yearsLeasehold improvements 1) 5 - 10 yearsMachinery and equipment 2 - 10 yearsOffice furniture and equipment 3 - 10 years
1) Leasehold improvements are amortized over the shorterof the lease term or economic life of the asset.

A n n u a l R e p o r t 2 0 0 26 2
L o n g - l i v e d A s s e t s
Long-lived assets, such as property, plant and
equipment, and purchased intangibles subject to
amortization, are reviewed for impairment whenever
events or changes in circumstances indicate that the
carrying amount of an asset may not be recoverable.
Recoverability of assets to be held and used is measu-
red by a comparison of the carrying amount of an
asset to estimated undiscounted future cash flows.
An impairment charge is recognized by the amount by
which the carrying value of the asset exceeds the fair
value of the asset. Assets to be disposed of are repor-
ted at the lower of the carrying amount of fair value
less costs to sell and depreciation ceases.
Goodwill and intangible assets not subject to amor-
tization are tested annually for impairment. An impair-
ment loss is recognized to the extent that the carrying
amount exceeds the asset’s fair value.
G o o d w i l l a n d I n t a n g i b l e
A s s e t s
Goodwill represents the excess of the costs of
purchased businesses over the fair value of their net
assets at date of acquisition and through December 31,
2001 was being amortized by the straight-line method.
The amortization of the goodwill from the Meco
acquisition (13 years) and the RDA acquisition (13 years),
was based on the weighted average remaining lives
of Meco’s and RDA’s patents as determined by an in-
dependent valuation. Goodwill was assessed for re-
coverability by determining whether the amortization
of the goodwill balance over its remaining life could
be recovered through undiscounted future operating
cash flows of the acquired operation. As of January 1,
2002, goodwill is no longer amortized, but is required
to be evaluated for impairment at least annually in
accordance with SFAS No. 142. The amortization of
patents and other identifiable intangible assets is based
on the weighted average remaining lives of 13 years
for Meco, RDA and Laurier and 16 years for Fico as
determined by an independent valuation at the date
of acquisition.
The Company adopted the provisions of SFAS No.
141, “Business combinations” as of July 1, 2001 and
SFAS No. 142 as of January 1, 2002. Goodwill and any
intangible asset determined to have an indefinite useful
life acquired in a purchase business combination
completed after June 30, 2001 and determined to have
an indefinite useful life are not amortized, but will
continue to be evaluated for impairment annually in
accordance with SFAS No. 142.
In connection with the transitional goodwill impair-
ment evaluation, Statement No. 142 required the
Company to perform an assessment of whether there
was an indication that goodwill, and equity-method
goodwill, is impaired as of the date of adoption.
To accomplish this, the Company was required to iden-
tify its reporting units and determine the carrying value
of each reporting unit by assigning the assets and liabi-
lities, including the existing goodwill and intangible
assets, to those reporting units as of January 1, 2002.
The Company was required to determine the fair
value of each reporting unit and compare it to the
reporting unit's carrying amount within six months of
January 1, 2002. To the extent a reporting unit's carry-
ing amount exceeds its fair value, an indication exists
that the reporting unit's goodwill may be impaired and
the second step of the transitional impairment test had
to be performed. In the second step, the implied fair
value of the reporting unit's goodwill, determined by
allocating the reporting unit's fair value to all of its
assets (recognized and unrecognized) and liabilities in a
manner similar to a purchase price allocation in accor-
dance with Statement No. 141, must be compared to
its carrying amount, both of which would be measured
as of the date of adoption. This second step is required
to be completed as soon as possible, but no later than
the end of the year of adoption. See further discussion
of the goodwill transitional impairment tests and
annual impairment tests in Note 7.

A n n u a l R e p o r t 2 0 0 2 6 3
I n v e s t m e n t i n
A f f i l i a t e d C o m p a n i e s
Investment in unconsolidated affiliated companies,
where the Company exercises significant influence (gene-
rally a voting share of 20%-50%), are accounted for
under the equity method. Investment in affiliated compa-
nies also includes goodwill relating to the investment.
I n c o m e Ta x e s
The Company applies SFAS No. 109 “Accounting
for Income Taxes”, which requires the asset and liability
method of accounting for taxes. Under the asset and lia-
bility method, deferred tax assets and liabilities are
recognized for the future tax consequences attributable
to differences between the financial statement carrying
amounts of existing assets and liabilities and their res-
pective tax bases and operating loss and tax credit carry
forwards. Deferred tax assets and liabilities are measured
using enacted tax rates expected to apply to taxable
income in the years which these temporary differences
are expected to be recovered or settled. The effect on
deferred tax assets and liabilities of a change in tax rates
is recognized in income in the period that includes the
enactment date. Deferred tax assets are reduced by a
valuation allowance to the amount that is more likely
than not to be realized.
R e v e n u e R e c o g n i t i o n
Shipment of products occurs after a customer
accepts the product at the Company's premises.
Advance payments received from customers are
recorded as a liability until the products have been shipped.
The Company recognizes revenues from sales of
products upon shipment. The risk of loss and rewards of
ownership with respect to products have been trans-
ferred to customers at that time.The sale of the product
to the customer is thereby considered complete and no
significant obligations remain after the sale is completed.
A customer's sole recourse against the Company is to en-
force the Company's obligations relating to installation,
which is considered inconsequential, and warranty.
Operating expenses and other income and expense
items are recognized in the Consolidated Statements of
Operations as incurred or earned.
W a r r a n t y E x p e n s e
The Company records a liability for estimated
warranty expense when corresponding sales revenue is
recognized, that is, at the time of shipment. The amount
recorded is based on a history of actual costs incurred
and on estimated probable costs related to such current
sales.
R e s e a r c h a n d D e v e l o p m e n t
Research and development costs are charged to
expense when incurred. Subsidies and other governmen-
tal credits to cover research and development costs rela-
ting to approved projects are recorded as research and
development credits in the period when the research
and development cost to which such subsidy or credit
relates, occurs. Technical development credits (Technische
Ontwikkelingskredieten or "TOKs") received from the
Netherlands government to offset the costs of certain
research and development projects are contingently
repayable to the extent sales of equipment developed
in such projects occur. Such repayments are calculated
as a percentage of sales revenue and are charged to
research and development expenses. No repayment is
required if such sales do not occur (see Note 19).
P e n s i o n C o s t s
Pension plans are funded with insurance companies
based on a defined contribution plan. The Company has
no other liability regarding pensions other than
payment of annual premiums, which are charged
against earnings.
S t o c k O p t i o n s
The Company applies Accounting Principles Board
Opinion (“APB”) No. 25 “Accounting for Stock Issued to
Employees”, and related interpretations in accounting
for its plans. SFAS No. 123 “Accounting for Stock-

A n n u a l R e p o r t 2 0 0 26 4
Based Compensation” allows companies to elect
to either account for stock options using fair value
based method, or continue to account for stock
option plans under APB No. 25, and disclose pro
forma disclosure of net income and earnings per
share as if SFAS No. 123 were applied. The stock-
based employee compensation plans are described
more fully in Note 15. The Company accounts for
those plans under the recognition and measurement
principles of APB No. 25 and related Interpretations.
No stock-based employee compensation cost is
reflected in net income (loss), as all options granted
under those plans had an exercise price equal to the
market value of the underlying ordinary shares on
the date of grant. The Company has elected to conti-
nue to account for its stock options under the provi-
sions of APB No. 25 and disclose the pro forma effect
of SFAS No. 123. The following table illustrates the
effect on net income (loss) and earnings (loss) per
share if the Company had applied the fair value
recognition provisions of SFAS No.123 to stock-based
employee compensation.
C o n c e n t r a t i o n o f C r e d i t R i s k
A relatively small number of customers account for
a significant percentage of the Company’s net sales.
The loss of a major customer or any reduction in orders
by such customers, including reductions due to market
or competitive conditions, would have a material adver-
se effect on the Company’s business, financial condition
and results of operations. The Company’s future success
will depend in part upon its ability to obtain orders from
new customers, as well as the financial condition and
success of its customers and the worldwide economy
in general.
The Company’s customers consist of semiconductor
manufacturers located throughout the world. The Com-
pany performs ongoing credit evaluations of its cus-
tomers’ financial condition and generally requires no
collateral to secure accounts receivable. The Company
maintains an allowance for doubtful accounts based
on an assessment of the collectibility of such accounts.
E a r n i n g s p e r S h a r e
Basic earnings per share have been computed using
the weighted average number of ordinary shares out-
standing during the period. Diluted earnings per share
2000 2001 2002EURO EURO EURO
Net income (loss) as reported 18,467 (16,978) (17,011)Deduct: Stock-based employee compensation expense determined under fair value based method for all awards, net of related tax effects (729) (1,040) (1,407)
Add: Stock-based compensation expense included in net income (loss), net of related tax effect - - -
Pro forma net income (loss) 17,738 (18,018) (18,418)
BASIC EARNINGS (LOSS) PER SHARE:As reported 0.61 (0.53) (0.54)Pro forma 0.59 (0.57) (0.59)
DILUTED EARNINGS (LOSS) PER SHARE:As reported 0.61 (0.53) (0.54)Pro forma 0.58 (0.57) (0.59)

A n n u a l R e p o r t 2 0 0 2 6 5
have been computed using the weighted average number
of ordinary shares and equivalents (representing the dilu-
tive effect of stock options) outstanding during the period.
U s e o f E s t i m a t e s
The preparation of the Company's consolidated
financial statements in conformity with generally accep-
ted accounting principles requires management to make
estimates and assumptions that affect the reported
amounts of assets and liabilities and disclosure of contin-
gent assets and liabilities at the balance sheet dates and
the reported amounts of revenue and expense during
the reported periods. Actual results could differ from
those estimates.
I m p a c t o f R e c e n t l y I s s u e d
A c c o u n t i n g S t a n d a r d s
In June 2001, the FASB issued SFAS No. 143,
“Accounting for asset retirement obligations”. SFAS No.
143 addresses financial accounting and reporting for
obligations associated with the retirement of tangible
long-lived assets and the associated retirement costs.
It requires that the Company recognizes the fair value of
a liability for an asset retirement obligation in the period
in which it is incurred if a reasonable estimate of fair value
can be made. The Company adopted SFAS No. 143 on
January 1, 2003 and the adoption did not have a material
impact on theCompany’sconsolidatedfinancial statements.
In August 2001, the FASB issued SFAS No. 144,
“Accounting for the impairment or disposal of long-lived
assets". SFAS No. 144 establishes a single accounting
model for the impairment of long-lived assets and broa-
dens the presentation of discontinued operations to
include more disposal transactions. The Company adop-
ted SFAS No. 144 effective January 1, 2002 and the
adoption did not have a material impact on the
Company’s consolidated financial statements.
In April 2002, the FASB issued SFAS No. 145, “Recission
of FASB Statements No. 4, 44, and 64, Amendment of
FASB Statement No. 13, and Technical Corrections.”
In rescinding FASB Statement No. 4 and FASB No. 64,
FASB No. 145 eliminates the requirement that gains and
losses from the extinguishment of debt be aggregated
and, if material, classified as an extraordinary item, net of
the related income tax effect, however, an entity would
not be prohibited from classifying such gains and losses
as extraordinary items so long as they meet the criteria
of paragraph 20 of APB 30, Reporting the results of ope-
rations – Reporting the Effects of Disposal of a Segment
of a Business, and Extraordinary, Unusual and Infrequently
Occurring Events and Transactions. Further, the State-
ment amends SFAS No. 13 to eliminate an inconsistency
between the accounting for sale and leaseback transacti-
ons and certain lease modifications that have economic
effects that are similar to sale-leaseback transactions.
The standard is effective for transactions occurring after
May 15, 2002. The adoption of SFAS No. 145 did not
have a material impact on the Company’s consolidated
financial statements.
In June 2002, the FASB issued SFAS 146, “Accounting
for Exit or Disposal Activities” which addresses significant
issues regarding the recognition, measurement, and
reporting of costs that are associated with exit and dis-
posal activities, including restructuring activities that are
currently accounted for pursuant to the guidance that
the Emerging Issues Task Force (“EITF”) has set forth in
EITF 94-3 “Liability Recognition for Certain Employee
Termination Benefits and Other Costs to Exit an Activity
(including Certain Costs Incurred in a Restructuring)”.
The standard will be effective for exit or disposal activities
that are initiated after December 31, 2002. The Company
adopted SFAS No.146 on January1, 2003 and the adop-
tion did not have a material impact on the Company’s
consolidated financial statements.
In November 2002, the FASB issued Interpretation No.
45, “Guarantor’s Accounting and Disclosure Require-
ments for Guarantees, Including Indirect Guarantees of
Indebtedness of Others (hereinafter “the Interpretation”),

A n n u a l R e p o r t 2 0 0 26 6
which addresses, among other things, the disclosures
to be made by a guarantor in its interim and annual
financial statements about its obligations under gua-
rantees. The Interpretation also requires the recogni-
tion of a liability by a guarantor at the inception of
certain guarantees. The Interpretation requires the
guarantor to recognize a liability for the non-contin-
gent component of the guarantee, this is the obliga-
tion to be ready to perform in the event that specified
triggering events or conditions occur. The initial mea-
surement of this liability is the fair value of the guaran-
tee at inception. The recognition of the liability is
required even if it is not probable that payments will
be required under the guarantee or if the guarantee
was issued with a premium payment or as part of
a transaction with multiple elements. The Company
has adopted the disclosure requirements of the
Interpretation as at December 31, 2002 and will apply
the recognition and measurement provisions for
all guarantees entered into or modified after
December 31, 2002.
In November 2002, the EITF issued its consensus
on EITF 00-21, “Revenue Arrangements with Multiple
Deliverables” on an approach to determine whether
an entity should divide an arrangement with multiple
deliverables into separate units of accounting.
According to the EITF in an arrangement with multiple
deliverables, the delivered item(s) should be conside-
red a separate unit of accounting if all of the follo-
wing criteria are met: (i) the delivered item(s) has value
to the customer on a standalone basis, (ii) there is
objective and reliable evidence of the fair value of the
undelivered item(s), (iii) if the arrangement includes a
general right of return, delivery or performance of the
undelivered item(s) is considered probable and sub-
stantially in the control of the vendor. If all the condi-
tions above are met and there is objective and reliable
evidence of fair value for all units of accounting in an
arrangement, the arrangement consideration should
be allocated to the separate units of accounting based
on their relative fair values. However, there may be
cases in which there is objective and reliable evidence
of the fair value(s) of the undelivered item(s) in an
arrangement but no such evidence for one or more
of the delivered items. In those cases, the residual
method should be used to allocate the arrangement
consideration. The guidance in this Issue is effective
for revenue arrangements entered into in fiscal years
beginning after June 15, 2003. Alternatively, entities
may elect to report the change in accounting as a
cumulative effect adjustment in accordance with APB
Opinion 20, "Accounting Changes". If so elected, dis-
closure should be made in periods subsequent to the
date of initial application of this consensus of the amount
of recognized revenue that was previously included
in the cumulative effect adjustment. The Company
believes that the adoption of EITF 00-21 will not have
a material impact on the Company's consolidated
financial statements.
In December 2002, the FASB issued SFAS No. 148,
”Accounting for Stock Based Compensation -
Transition and Disclosure“ - an amendment of FASB
statement No. 123. SFAS No. 148 permits two addi-
tional transition methods for entities that adopt the
fair value based method of accounting for stock-
based employee compensation. The statement also
requires new disclosures about the ramp-up effect of
stock-based employee compensation on reported
results. The statement also requires that those effects
be disclosed more prominently by specifying the form,
content, and location of those disclosures. The transi-
tion guidance and annual disclosure provisions of
SFAS No. 148 are effective for fiscal years ending after
December 15, 2002, with earlier application permit-
ted in certain circumstances. The interim disclosure
provisions are effective for financial reports, containing
financial statements for interim periods beginning
after December 15, 2002. The Company has adopted
the annual disclosure requirements of SFAS No.148
in the Consolidated Financial Statements.

A n n u a l R e p o r t 2 0 0 2 6 7
3 Accounts Receivable
Accounts receivable, net consist of the following:
December 31,
2001 2002EURO EURO
Accounts receivable 35,580 31,150Allowance for doubtful accounts (4,502) (2,912)Total accounts receivable, net 31,078 28,238
A summary of activity in the allowance for doubtful accounts is as follows:
2001 2002EURO EURO
Balance at January 1, 2,524 4,502Provision (release) for allowance for doubtful accounts 2,014 (1,364)Addition due to acquisition of subsidiary - 52Accounts receivable written off (36) (173)Foreign currency translation - (105)Balance at December 31, 4,502 2,912
Inventories, net consist of the following:
4 Inventories
December 31,
2001 2002EURO EURO
Precious metals 14 20Raw materials 9,146 12,106Work in progress 18,111 18,142Finished goods 2,039 3,156Total inventories, net 29,310 33,424
A summary of activity in the allowance for obsolescence is as follows:
2001 2002EURO EURO
Balance at January 1, 3,713 5,950Provision for loss on obsolete inventory 2,541 707Addition due to acquisition of subsidiary - 215Inventory written off (315) (1,437)Foreign currency translation 11 (237)Balance at December 31, 5,950 5,198

A n n u a l R e p o r t 2 0 0 26 8
5 Other Current Assets
Other current assets consist of the following:
December 31,
2001 2002EURO EURO
VAT receivables 917 2,233Income taxes 238 2,242Subsidies and development credits receivable 190 158Interest to receive 145 875Deposits 234 197Prepaid expenses 917 1,028Deferred tax assets 1,371 389Other 1,075 565Total other current assets 5,087 7,687
Land, buildings Machinery Office Assets Total
and leasehold and furniture and under
improvements equipment equipment construction
EURO EURO EURO EURO EURO
BALANCE AT JANUARY 1, 2002:Cost 21,872 23,586 16,548 492 62,498Accumulated depreciation (5,838) (15,296) (12,898) - (34,032)Property, plant and equipment, net 16,034 8,290 3,650 492 28,466
CHANGES IN BOOK VALUE IN 2002:Investments 39 1,500 1,251 2,113 4,903Disposals (5,497) (99) (177) - (5,773)Depreciation (637) (1,849) (1,649) - (4,135)Acquisition of subsidiary - 45 214 - 259Foreign currency translation (253) (200) (125) (39) (617)
(6,348) (603) (486) 2,074 (5,363)
BALANCE AT DECEMBER 31, 2002:Cost 14,759 24,687 16,748 2,566 58,760Accumulated depreciation (5,073) (17,000) (13,584) - (35,657)Property, plant and equipment, net 9,686 7,687 3,164 2,566 23,103
Property, plant and equipment, net consist of the following:
6 Property, Plant and Equipment

A n n u a l R e p o r t 2 0 0 2 6 9
The Company has obligations under various capital
and operating leases, primarily for land and buildings,
manufacturing and office facilities and equipment.
Assets under capital leases included in property, plant
and equipment consist of the following:
December 31,
2001 2002EURO EURO
Land and buildings 9,453 9,453Machinery, equipment and office furniture 241 215Accumulated depreciation (1,323) (1,588)Total 8,371 8,080
The legal ownership of the assets under capital
leases lies at a third party, however, the Company main-
tains economic ownership.
As of December 31, 2002, the Company had contractual
purchase obligations amounting to € 7.5 million,
primarily for the construction of manufacturing facilities
and purchase of machinery, tools, equipment and
office facilities.
As of January 1, 2002, the Company adopted SFAS
No. 142 and SFAS No. 144. SFAS No. 142 eliminates
the amortization of goodwill and indefinite-lived in-
tangible assets, addresses the amortization of intangible
assets with finite lives and addresses impairment
testing and recognition for goodwill and intangible
assets with indefinite lives. SFAS No. 144 establishes a
single model for the impairment of long-lived assets
and broadens the presentation of discontinued opera-
tions to include disposal of an individual business.
As a result of the adoption of SFAS No.142, goodwill
amortization ceased as of January 1, 2002.
The Company reviewed its business and determined
that there are four reporting units to be reviewed
for impairment in accordance with the standard – the
reporting units were: packaging equipment, plating
and singulation equipment, flip chip die attach equip-
ment and die sorting equipment. Upon adoption of
SFAS No. 142 in the first quarter of 2002, the Company
completed the required transitional impairment testing
of goodwill, and based upon those analyses, did not
identify any impairment charges as a result of adoption
of this standard effective January 1, 2002.
The Company has determined that its annual test
for impairment of goodwill will take place at the end of
the fourth quarter of each year, which coincides with
the completion of its annual forecasting process. In the
third quarter of 2002, the Company consolidated its
flip chip die attach equipment business and die sorting
equipment business into a single reporting unit, die
handling equipment. Due to the severity and the length
of the current industry downturn and uncertainty of
the timing of improvement in industry conditions, the
Company has revised its earnings forecasts for each
of its business units that were tested for impairment in
the fourth quarter of fiscal year 2002. As a result, the
Company recognized a goodwill impairment loss of
€ 3,302 in the die handling equipment reporting unit.
The fair value of each reporting unit was estimated
using the expected present value of future cash flows.
The Company does not have any identifiable assets
with indefinite lives.
7 Goodwill, Patents and Trademarks

7 Goodwill, Patents and Trademarks Cont.
A n n u a l R e p o r t 2 0 0 27 0
Goodwill Patents Trademarks Total
EURO EURO EURO EURO
BALANCE AT JANUARY 1, 2002:Cost 17,890 34,223 838 52,951Accumulated amortization (4,865) (16,270) (86) (21,221)Goodwill, Patents and Trademarks 13,025 17,953 752 31,730
CHANGES IN BOOK VALUE IN 2002:Acquisition of subsidiary 8,161 1,685 - 9,846Amortization - (2,531) (60) (2,591)Goodwill impairment (3,302) - - (3,302)Foreign currency translation (3,194) (652) (111) (3,957)
1,665 (1,498) (171) (4)
BALANCE AT DECEMBER 31, 2002:Cost 22,690 35,172 708 58,570Accumulated amortization (8,000) (18,717) (127) (26,844)Goodwill, Patents and Trademarks 14,690 16,455 581 31,726
The following table outlines the components of goodwill, patents and trademarks at December 31, 2002 after
adoption of the standard and recognition of the goodwill impairment:
Aggregate amortization expense for the year ended December 31, 2002 was € 2.6 million. Estimated amortization
expense for each of the next five years is € 2.6 million per year.
The following table reflects the impact that SFAS No. 142 would have had on net loss and loss per ordinary share if it had
been adopted at the beginning of 2001:
Year ended December 31,
2001 2002EURO EURO
Reported net loss (16,978) (17,011)Ceased goodwill amortization 1,062 -
Adjusted net loss (15,916) (17,011)
Reported loss per share – basic and diluted (0.53) (0.54)Ceased goodwill amortization 0.03 -
Adjusted loss per share – basic and diluted (0.50) (0.54)

8 Investment in Affiliated Companies
A n n u a l R e p o r t 2 0 0 2 7 1
The Company sold its 30% equity interest in PBE
on November 15, 2001, for € 18.1 million cash. As a
result, the investment in affiliated companies as of
December 31, 2001 and 2002 is nil.
The Company’s equity in earnings (loss) of affiliated
companies and loss on sale of affiliated companies con-
sists of the 30% interest of the company in the results
of PBE:
Year ended January 1 December 31, to November 15,
2000 2001EURO EURO
Equity in earnings (loss) of affiliated companies 6,330 (10,372)Amortization of goodwill (1,299) (1,137)Loss on sale of affiliated companies - (4,805)Equity in earnings (loss) of affiliated companies and loss on sale of affiliated companies, net 5,031 (16,314)
Year ended January 1 December 31, to November 15,
2000 2001EURO EURO
Net sales 253,112 155,916Gross profit 66,075 16,944Operating income (loss) 29,350 (31,013)Net income (loss) before minority interest 22,957 (34,216)Net income (loss) 21,100 (34,572)
The loss on sale of affiliated companies of PBE
included the reversal of the portion of the cumulative
translation adjustment component of shareholders’
equity relating to the investment in PBE, which reduced
the loss by € 5.3 million.
In December 2001, subsequent to the sale of the
Company’s 30% interest in PBE on November 15, 2001,
the Board of Directors of PBE announced a change in
accounting principle. This change, relating to the depre-
ciation method of certain fixed assets, resulted in a
one-time charge of € 5.8 million in the results of PBE in
2001. PBE has, in compliance with US GAAP, disclosed
the impact of this accounting change as a cumulative
effect of a change in accounting principle computed as
of January 1, 2001. Also, as required by US GAAP, the
results of operations of PBE for its fiscal year ended
December 31, 2001, were prepared on the basis of the
newly adopted accounting principle.
Subsequent to the sale of its 30% interest in PBE,
the Company no longer had any representation on the
Board of Directors of PBE nor any other rights or res-
ponsibilities regarding PBE. As a result, PBE’s December
2001 change in accounting principle is treated as a
post-disposal subsequent event and the Company’s
proportionate share of this change has not been
included in the Consolidated Statements of Operations.
The following table presents condensed financial information of results of operations of PBE.

8 Investment in Affiliated Companies Cont.
A n n u a l R e p o r t 2 0 0 27 2
The Company’s proportionate share in the results of PBE
in the accompanying financial statements is presented on
the basis of PBE’s former accounting principle. The inclu-
sion of the impact of this change in accounting principle
in the consolidated financial statements of the Company
would not affect the net income (loss) of the Company
for the year 2001, as the Company sold its 30% interest
in PBE on November 15, 2001, and accordingly, the
impact of the change in accounting principle would have
resulted in an equal and offsetting adjustment in the loss
on the sale of PBE recorded by the Company.
Although the Company was not required to retroac-
tively adjust its 30% share of the net loss of PBE for 2001
and the amount of the loss on the sale of its investment
in PBE since the decision to change the accounting prin-
ciple was made by PBE subsequent to the disposal date,
the following schedule discloses the impact that the
change would have otherwise had on the previously
issued quarterly results of the Company.
As described above, the sum of the Company’s 30%
share of PBE’s cumulative effect of change in accounting
principle and the 2001 impact of the newly adopted
accounting principle of € 1.7 million would have resulted
in an equal and offsetting adjustment in the loss on the
sale of PBE at November 15, 2001.
The following table summarizes related party trans-
actions with PBE:
First quarter Second Quarter Third Quarter Fourth Quarter Total
2001 2001 2001 2001 2001EURO EURO EURO EURO EURO
The Company’s 30% sharein loss of PBE as reported (265) (5,645) (2,317) (2,145) (10,372)
30% Share of the cumulative effect of change in accounting principle (1,226) - - - (1,226)
30% Share of the impact of newly adopted accounting principle (145) (145) (145) (73) (508)
The Company’s 30% share in loss of PBE including effect of change in accounting principle (1,636) (5,790) (2,462) (2,218) (12,106)
UNAUDITED
Year ended January 1December 31, to November 15,
2000 2001EURO EURO
Sales 9,199 3,486Purchases 1,378 270

A n n u a l R e p o r t 2 0 0 2 7 3
9 Deferred Income Taxes
The items giving rise to the deferred tax assets (liabilities), net were as follows:
The deferred tax assets for operating loss carry
forwards are related to the US and Japanese operations
of the Company. Under applicable US tax law, the carry
forwards related to the Company's US operating losses
of € 9.6 million expire during the periods of 2010
through 2022. The carry forwards related to the
Company’s Japanese operating losses amounting to
€ 1.6 million expire during the periods of 2003
through 2007.
The net change in the total valuation allowance for
the year ended December 31, 2000 was a decrease of
€ 54, principally due to the release of the provision for
Meco’s Japanese subsidiary. This release was due to
the evaluation of the subsidiary’s anticipated profitability
over the period of years that taxable income is expected
to be generated to realize the benefit of these tax
assets. The net change in the total valuation allowance
for the year ended December 31, 2001 and 2002 was
an increase of € 516 and € 7,182, respectively, princi-
pally due to uncertainty regarding the realization of the
deferred tax assets of the Company’s US and Japanese
subsidiaries through future taxable income.
In assessing the realizability of deferred tax assets,
management considers whether it is more likely than
not that some portion or all of the deferred tax assets
will not be realized. The ultimate realization of deferred
tax assets is dependent upon the generation of future
taxable income during the periods in which those
December 31,
2001 2002EURO EURO
DEFERRED TAX ASSETS- Operating loss carry forwards 1,643 3,398- Intercompany interest - 1,672- Intangible assets 4,871 3,206- Inventories 192 724- Provisions 123 672- Other items 303 133Total deferred tax assets, gross 7,132 9,805- Valuation allowance (1,677) (8,859)Total deferred tax assets, net 5,455 946
DEFERRED TAX LIABILITIES- Intangible assets (5,109) (4,811)- Other items (317) (3)Total deferred tax liabilities (5,426) (4,814)Total deferred tax assets (liabilities) 29 (3,868)
DEFERRED TAX ASSETS- Current 1,371 389- Non-current 4,084 557
5,455 946
DEFERRED TAX LIABILITIES- Current (742) (775)- Non-current (4,684) (4,039)
(5,426) (4,814)Total deferred tax assets (liabilities) 29 (3,868)

A n n u a l R e p o r t 2 0 0 27 4
9 Deferred Income Taxes Cont.
temporary differences become deductible. Management
considers the scheduled reversal of deferred tax liabili-
ties, projected future taxable income, and tax planning
strategies in making this assessment. In the fourth
quarter of fiscal year 2002, as part of the income tax
provision for the period, the Company recorded a charge
of € 6.0 million to establish a valuation allowance
against its deferred tax asset consisting primarily of
US net operating loss carryforwards and temporary dif-
ferences. The Company determined that the valuation
allowance was required based on recent US tax losses,
which were given substantially more weight than fore-
casts of future profitability in the Company’s evalua-
tion of whether it is more likely than not that the US
net operating loss carryforwards will be realized. Until
the Company utilizes these US operating loss carry-
forwards, its income tax provision will reflect mainly
domestic taxation.
The deferred tax liabilities for intangible assets relate
to temporary differences of intangible assets of Fico,
Meco and Laurier.
Short-term debt consists of the following:
At December 31, 2002, Fico had credit facilities of
€ 7,487 with ING Bank and € 6,353 with ABN AMRO
Bank to meet working capital needs. At December 31,
2001 and 2002, no borrowings were outstanding
under the revolving credit facilities, however, the
amount that was available to be drawn under the lines
was reduced by nil and € 161 respectively, in outstan-
ding bank guarantees. The credit facility agreements
include covenants requiring Fico to maintain certain
financial ratios.
At December 31, 2002, Meco had credit facilities
of € 5,899 with SNS Bank Nederland N.V. and € 4,538
with F. van Lanschot Bankiers N.V. to meet working
capital needs. At December 31, 2001 and 2002, no
borrowings were outstanding under the revolving
credit facilities, however, the amount that was available
to be drawn under the lines was reduced by € 90 and
€ 162, respectively, in outstanding bank guarantees
and € 579 and € 1,001, respectively, for foreign
exchange contracts and check payments facilities.
The credit facility agreements include covenants requi-
ring Meco to maintain certain financial ratios.
The Company was in compliance with, or had
received waivers for, all credit line covenants at
December 31, 2001 and 2002.
December 31,
2001 2002EURO EURO
Current portion of long-term debt and capital leases 1,648 1,228Total short-term debt 1,648 1,228
10 Short-term Debt
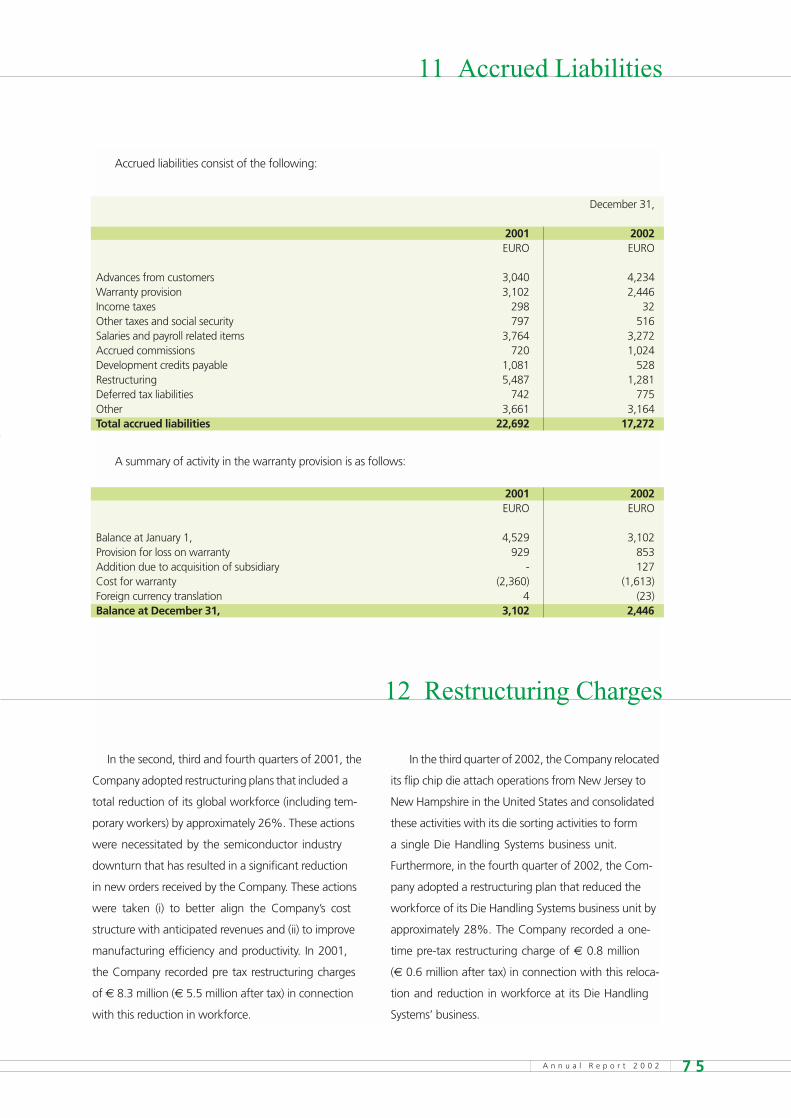
A n n u a l R e p o r t 2 0 0 2 7 5
11 Accrued Liabilities
Accrued liabilities consist of the following:
A summary of activity in the warranty provision is as follows:
December 31,
2001 2002EURO EURO
Advances from customers 3,040 4,234Warranty provision 3,102 2,446Income taxes 298 32Other taxes and social security 797 516Salaries and payroll related items 3,764 3,272Accrued commissions 720 1,024Development credits payable 1,081 528Restructuring 5,487 1,281Deferred tax liabilities 742 775Other 3,661 3,164Total accrued liabilities 22,692 17,272
2001 2002EURO EURO
Balance at January 1, 4,529 3,102Provision for loss on warranty 929 853Addition due to acquisition of subsidiary - 127Cost for warranty (2,360) (1,613)Foreign currency translation 4 (23)Balance at December 31, 3,102 2,446
In the second, third and fourth quarters of 2001, the
Company adopted restructuring plans that included a
total reduction of its global workforce (including tem-
porary workers) by approximately 26%. These actions
were necessitated by the semiconductor industry
downturn that has resulted in a significant reduction
in new orders received by the Company. These actions
were taken (i) to better align the Company’s cost
structure with anticipated revenues and (ii) to improve
manufacturing efficiency and productivity. In 2001,
the Company recorded pre tax restructuring charges
of € 8.3 million (€ 5.5 million after tax) in connection
with this reduction in workforce.
In the third quarter of 2002, the Company relocated
its flip chip die attach operations from New Jersey to
New Hampshire in the United States and consolidated
these activities with its die sorting activities to form
a single Die Handling Systems business unit.
Furthermore, in the fourth quarter of 2002, the Com-
pany adopted a restructuring plan that reduced the
workforce of its Die Handling Systems business unit by
approximately 28%. The Company recorded a one-
time pre-tax restructuring charge of € 0.8 million
(€ 0.6 million after tax) in connection with this reloca-
tion and reduction in workforce at its Die Handling
Systems’ business.
12 Restructuring Charges

A n n u a l R e p o r t 2 0 0 27 6
Changes in the restructuring reserve were:
The 2001 provision for the reduction in workforce
included severance and other benefits for approxi-
mately 180 employees in the Netherlands and Asia.
The releases mainly relate to social security expenses
and disabled personnel included for which we were
not obliged to pay. The additions to the restructuring
reserve in the second quarter of 2002 related to
higher than expected severance cost and later than
expected final employment terminations.
The additions in the third quarter of 2002 mainly
relate to severance payments for the reduction in
workforce in the United States and relocation cost.
The additions in the fourth quarter of 2002 relate
to severance payments for the further reduction in
workforce in the United States. Total remaining cash
outlays for restructuring activities are expected to be
€ 1.3 million, which primarily will be expended
during 2003.
EURORestructuring reserve as of January 1, 2002 5,487Second quarter 2002 releases (1,201)Second quarter 2002 additions 1,205Third quarter 2002 additions 400Fourth quarter 2002 additions 386
Impairment assets (107)Cash payments in 2002 (4,889)Restructuring reserve as of December 31, 2002 1,281
On June 28, 2002, the Company sold the land and
buildings of one of its subsidiaries in a sale and lease
back transaction for € 6.5 million in cash. At the date
of this transaction, the cost of the land and buildings
totaled € 6.9 million and the net book value of this real
estate amounted to € 5.4 million. The Company’s gain
on this transaction of € 1.1 million will be amortized
and netted against rental expenses over the twelve and
a half-year term of the operating lease. Gross rental
expenses total € 0.6 million per annum.
The total deferred gain on the sale and lease back as
of December 31, 2002 amounts to € 1,012.
12 Restructuring Charges Cont.
13 Deferred Gain on Sale and Lease Back
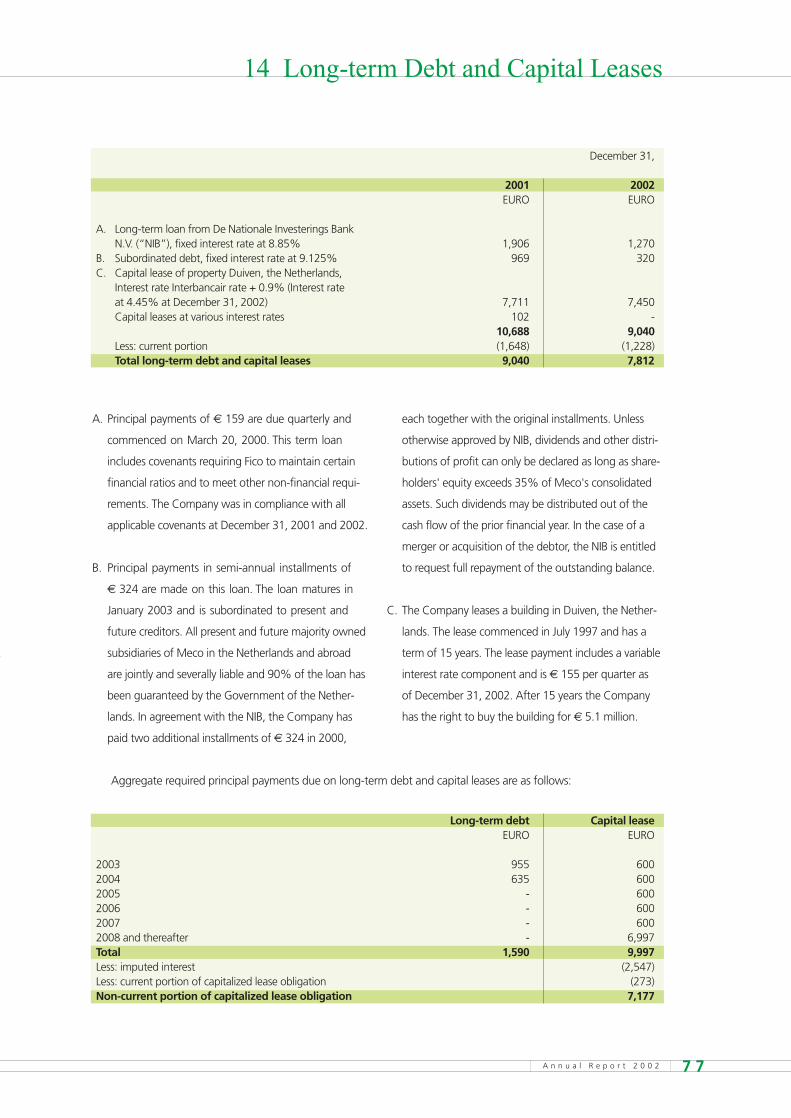
A n n u a l R e p o r t 2 0 0 2 7 7
14 Long-term Debt and Capital Leases
A. Principal payments of € 159 are due quarterly and
commenced on March 20, 2000. This term loan
includes covenants requiring Fico to maintain certain
financial ratios and to meet other non-financial requi-
rements. The Company was in compliance with all
applicable covenants at December 31, 2001 and 2002.
B. Principal payments in semi-annual installments of
€ 324 are made on this loan. The loan matures in
January 2003 and is subordinated to present and
future creditors. All present and future majority owned
subsidiaries of Meco in the Netherlands and abroad
are jointly and severally liable and 90% of the loan has
been guaranteed by the Government of the Nether-
lands. In agreement with the NIB, the Company has
paid two additional installments of € 324 in 2000,
each together with the original installments. Unless
otherwise approved by NIB, dividends and other distri-
butions of profit can only be declared as long as share-
holders' equity exceeds 35% of Meco's consolidated
assets. Such dividends may be distributed out of the
cash flow of the prior financial year. In the case of a
merger or acquisition of the debtor, the NIB is entitled
to request full repayment of the outstanding balance.
C. The Company leases a building in Duiven, the Nether-
lands. The lease commenced in July 1997 and has a
term of 15 years. The lease payment includes a variable
interest rate component and is € 155 per quarter as
of December 31, 2002. After 15 years the Company
has the right to buy the building for € 5.1 million.
December 31,
2001 2002EURO EURO
A. Long-term loan from De Nationale Investerings BankN.V. (“NIB”), fixed interest rate at 8.85% 1,906 1,270
B. Subordinated debt, fixed interest rate at 9.125% 969 320C. Capital lease of property Duiven, the Netherlands,
Interest rate Interbancair rate + 0.9% (Interest rateat 4.45% at December 31, 2002) 7,711 7,450Capital leases at various interest rates 102 -
10,688 9,040Less: current portion (1,648) (1,228)Total long-term debt and capital leases 9,040 7,812
Aggregate required principal payments due on long-term debt and capital leases are as follows:
Long-term debt Capital leaseEURO EURO
2003 955 6002004 635 6002005 - 6002006 - 6002007 - 6002008 and thereafter - 6,997Total 1,590 9,997Less: imputed interest (2,547)Less: current portion of capitalized lease obligation (273)Non-current portion of capitalized lease obligation 7,177

A n n u a l R e p o r t 2 0 0 27 8
15 Employee Benefits
P e n s i o n P l a n s
BE Semiconductor Industries N.V. and its Dutch subsi-
diaries have defined contribution plans, which provide
retirement benefits that cover substantially all employees.
The Company has no continuing obligations other than
the annual contributions. Aggregate pension plan contri-
butions were € 3,615 in 2000, € 3,855 in 2001 and
€ 3,425 in 2002.
The Company‘s US, Malaysian, Korean and Japanese
subsidiaries have retirement plans that are integrated
with and supplement the governmental benefits provided
in the laws of the United States of America, Malaysia,
Korea and Japan, respectively.
E m p l o y e e S t o c k O p t i o n P l a n s
In 1995, the Company established the BE Semiconduc-
tor Industries Incentive Plan 1995 (the “Incentive Plan
1995”). The Company may issue 1,250,000 ordinary sha-
res (“1995 Plan Shares”) under the Incentive Plan 1995,
subject to adjustments for share splits, share dividends,
recapitalizations and similar events. 1995 Plan Shares can
consist, in whole or in part, of unauthorized and unissued
shares or treasury shares. During the years from 1995 to
2001, the Company made awards under the Incentive
Plan 1995 to executive officers and senior employees of
the Company. Options granted between 1995 and 1998
to Dutch employees and officers vested in full on the date
of grant. Options granted between 1999 and 2001 vest
after three years. The Incentive Plan 1995 expired in 2001.
Stock options granted under the Incentive Plan 1995
have exercise prices, which were equal to the market pri-
ce of the Company’s ordinary shares on the date of grant.
In 2001, the Company established the BE Semiconduc-
tor Industries Incentive plan 2001 – 2005 (the “Incentive
Plan 2001”). The total of ordinary shares (‘’2001 Plan
Shares”) that may be issued under the Incentive Plan
2001, shall not exceed 1.5% per year of the total ordi-
nary shares outstanding, subject to adjustments for share
splits, share dividends, recapitalizations and similar events.
2001 Plan Shares may consist, in whole or in part, of
unauthorized and unissued shares or treasury shares.
The Company anticipates that it will, on an annual basis,
make awards under the Incentive Plan 2001 to executive
officers and senior employees of the Company.
Options granted in 2002 vest after three years. Stock
options granted under the Incentive Plan 2001 will have
exercise prices equal to the market price ordinary shares
on the date of grant.
In the years 2000, 2001 and 2002, the Company
granted stock options to all of its employees. The options
granted vest after three years and have exercise prices
equal to the market price of the Company’s ordinary sha-
res on the date of grant. For all options granted in 2001
and 2002, except options granted under the Incentive
Plan 2001, upon employee exercise, the Company is
required to sell the employee’s exercised shares at market
value on the exercise date and pay the cash proceeds to
the related employee, less the total employee cost to
exercise the related options. These options are reported
as variable stock options. All other options granted by the
Company are reported as fixed stock options.
The Company accounts for stock-based compensation
using the intrinsic value method. Accordingly, no compen-
sation has been recorded for the fixed stock options gran-
ted. Additionally, no compensation cost was recognized
for the variable stock options granted in 2001 and 2002
due to the Company’s ordinary share market value.
F i n a n c i n g o f S t o c k O p t i o n P l a n s
Option plans that were issued in 1999 and 2000 were
constructed with a virtual financing arrangement whereby
Besi financed the fiscal value of the options granted to
employees subject to the Dutch tax-regime. The loans
issued under this arrangement are repayable to Besi on the
exercised date of the respective option, provided that the
option was actually exercised. If the options expire unexer-
cised, the respective loans are forgiven. Besi accrues a liabi-
lity for the respective fiscal implication of this arrangement.

A n n u a l R e p o r t 2 0 0 2 7 9
15 Employee Benefits Cont.
Following is a summary of changes in Besi options:
2000 2001 2002
Number of Weighted Number of Weighted Number of Weighted
options average options average options average
exercise exercise exercise
price price price
EURO EURO EURO
FIXED OPTION PLANSOutstanding, beginning of year 310,019 9.40 597,186 13.18 821,896 11.90Options granted 436,147 14.52 253,066 9.51 223,337 9.32Options expired (131,980) 9.50 - - (51,692) 11.28Options forfeited (17,000) 7.03 (28,356) 11.90 (64,446) 10.90Outstanding, end of year 597,186 13.18 821,896 12.10 929,095 11.56
Exercisable, end of year 155,172 11.54 181,284 12.12 190,798 11.74
VARIABLE OPTION PLANSOutstanding, beginning of year - - - - 67,983 9.55Options granted - - 73,786 9.55 67,627 8.94Options forfeited - - (5,803) 9.55 (12,900) 9.44Outstanding, end of year - - 67,983 9.55 122,710 9.23
Exercisable, end of year - - - -
Options outstanding Options exercisable
RANGE OF EXERCISE PRICE Number of Weighted Weighted Number of Weighted
options average average options average
remaining exercise exercise
contractual price in price in
life (years) EURO EURO
FIXED OPTION PLANS€ 6.35 37,200 2.33 6.35 37,200 6.35€ 7.70 - € 9.80 505,250 4.22 9.42 - -€ 10.05 - € 11.28 110,598 2.22 10.18 53,598 10.05€ 14.65 - € 17.90 276,047 3.43 16.72 100,000 14.65
VARIABLE OPTION PLANS€ 7.70 - € 9.80 122,710 4.33 9.23 - -
Stock options outstanding and exercisable at December 31, 2002:
The fair value of the Company’s option awards to employees was estimated using the Black-Scholes option-pricing
model assuming no dividends, vesting after three years and the following weighted average assumptions:
The per share weighted average fair value of options granted during 2000, 2001 and 2002 was € 8.10, € 5.40
and € 5.30, respectively.
2000 2001 2002Expected life (years) 5.6 5.8 5.7Expected stock price volatility 52.8% 54.1% 55.2%Risk-free rate 5.2% 5.0% 4.9%

A n n u a l R e p o r t 2 0 0 28 0
16 Share Capital
As of December 31, 2001 and December 31,
2002, the Company’s authorized capital consisted of
55,000,000 ordinary shares, nominal value of € 0.91
per share, and 55,000,000 preference shares, nominal
value € 0.91 per share. At December 31, 2001 and
December 31, 2002, 31,794,675 and 30,898,228 ordi-
nary shares, respectively were outstanding. No prefe-
rence shares were outstanding at December 31, 2001
and December 31, 2002.
On September 17, 2002, the Company announced
that it had adopted a plan to repurchase up to
1,000,000 of its ordinary shares from time to time to
partially fund its stock-based employee benefit and
incentive plans. As of December 31, 2002, the
Company had repurchased 896,447 ordinary shares
at an average price of € 5.45 per share under this
repurchase program.
F o r e i g n E x c h a n g e
Due to the international scope of the
Company’s operations, the Company is exposed to
the risk of adverse movements in foreign currency
exchange rates. The Company is primarily exposed to
fluctuations in the value of the euro against the US
dollar and dollar-linked currencies, since approxima-
tely 37% of the Company’s sales are denominated
in US dollar and dollar-linked currencies.
The Company seeks to protect itself from adverse
movements in foreign currency exchange rates by
hedging firmly committed sales contracts, which
are denominated in US dollars or Japanese yen
through the use of forward foreign currency
exchange contracts. In addition, the Company also
uses forward foreign currency exchange contracts
to hedge accounts receivable that are denominated
in a foreign currency. During 2001 and 2002, the
Company did not have any derivative financial
instruments that were held for trading or speculative
purposes or that qualify as cash flow hedges.
Forward exchange contracts used to hedge the
foreign currency exposure resulting from assets and
liabilities denominated in currencies other than
the functional currency are accounted for as fair
value hedges.
The Company has exposure to credit risk to the
extent that the counterparty to the transaction fails
to perform according to the term of the contract.
The amount of such credit risk, measured as the
fair value of all forward foreign currency exchange
contracts that have a positive fair value position, was
€ 79 and € 658 at December 31, 2001 and 2002,
respectively. The Company believes that the risk of
significant loss from credit risk is remote because it
deals with credit-worthy financial institutions.
The Company does not, in the normal course of
business, demand collateral from the counterparties.
17 Financial Instruments

A n n u a l R e p o r t 2 0 0 2 8 1
17 Financial Instruments Cont.
December 31,
2001 2002EURO EURO
To sell US dollars for euro 6,884 8,898To buy euro for Japanese yen 336 -
At December 31, 2001 and 2002, unrealized gains
on forward foreign currency exchange contracts that
were designated as a hedge of firmly committed trans-
actions amounted to € 10 and € 685, respectively.
F a i r V a l u e o f
F i n a n c i a l I n s t r u m e n t s
The book value of the Company’s on-balance-sheet
financial instruments, which consist of cash and cash
equivalents, accounts receivable, accounts payable and
long-term debt, approximate their fair value due to the
short maturity of those instruments and to the fact
that interest rates are floating or approximate the rates
currently available to the Company.
The fair value of the Company’s forward foreign
currency exchange contracts, which are estimated using
pricing models based on the discounted cash flow
method, had a negative value of € 4 at December 31,
2001 and a positive value of € 658 at December 31,
2002, respectively.
Foreign currency losses amounted to € 94, € 69
and € 294 for the years ended December 31, 2000,
2001 and 2002, respectively, and are reported as part
of selling, general and administrative expenses.
The following is a summary of the Company’s forward foreign currency exchange contracts:
The Company leases certain facilities and equip-
ment under operating leases. As of December 31,
2002, the required minimum lease commitments were
as follows:
Committed rental expense was € 1.8 million,
€ 1.6 million and € 9.1 million as of December 31,
2000, 2001 and 2002, respectively. In addition, the
Company has an unconditional obligation related to
the purchase of equipment and hiring of specific
external technical staff totaling € 1.9 million as of
December 31, 2002. Furthermore, the Company
had contractual purchase obligations relating to
the construction of manufacturing facilities and pur-
chase of machinery and tools of € 7.5 million at
December 31, 2002.
Lease and rental expenses amounted to
€ 1.1 million, € 1.7 million and € 1.8 million for the
years ended December 31, 2000, 2001 and 2002.
EURO
2003 1,8262004 1,1882005 7612006 7112007 6762008 and thereafter 4,959Total 10,121
18 Commitments and Contingencies

A n n u a l R e p o r t 2 0 0 28 2
The Company designs, develops, manufactures,
markets and services (i) molding systems, trim and form
and integration systems (“packaging equipment”)
through its Fico subsidiary, (ii) selective plating and tin-
lead plating systems and singulation systems (“plating
and singulation equipment”) through its Meco subsidiary,
(iii) flip chip die attach and die sorting systems through its
subsidiaries RDA and Laurier (“die handling equipment”)
for the semiconductor industry’s "back-end" assembly
operations. On January 4, 2002, the Company acquired
Laurier Inc., a die sort equipment business. In the third
quarter of 2002, the Company consolidated its Die Attach
Equipment business and Die Sort Equipment business into
a single Die Handling Systems business and has reclassi-
fied financial data for the Die Attach Equipment business
and Die Sort Equipment business for prior periods.
The Company provided leadframes and connector plating
services to customers through PBE, a joint venture in
which it owned a 30% equity interest. It sold its equity
interest on November 15, 2001. The accounting principles
that are used for reporting the results of operations of
the segments are the same accounting principles as used
for the Company’s Consolidated Financial Statements.
The measure of profit or loss used by the Company’s chief
operating decision maker to evaluate the performance
for each operating segment is income (loss) before taxes
and equity in earnings (loss) of affiliated companies and
minority interest.
20 Segment, Geographic and Customers’ Information
The Company receives subsidies and credits for research
and development from various governmental sources.
In 1994, the Company entered into research and deve-
lopment credit agreements with the Government of the
Netherlands, Ministry of Economic Affairs, to fund research
and development projects for a new generation of automa-
ted molding systems. If the Company generates sales of the
products that were created using the amounts received
under the grant, the Company is required to repay such
amounts. The amount of repayment as a percentage of the
realized sales of the related products was 6% in 1999 and
8.5% in 2000 and thereafter. Actual and contingent
amounts repayable accrue interest. The interest rate was
6.15% between 1994 and 2002. The remaining amount
(including interest) contingently repayable was € 4,632 and
€ 4,547 at December 31, 2001 and 2002, respectively. The
amounts reflected in accrued liabilities at December 31,
2001 and 2002, with respect to sales of automated mol-
ding systems, were € 868 and € 425 respectively.
In 1996, the Company entered into research and deve-
lopment credit agreements with the Government of the
Netherlands, Ministry of Economic Affairs, to fund research
and development projects for a new generation of trim and
form systems. If the Company generates sales of the pro-
ducts that were created using the amounts received under
the grant, the Company is required to repay such amounts.
The amount of repayment as a percentage of the realized
sales of the related products was 6% in 1999 and 8.5% in
2000 and thereafter. Furthermore, 40% of sales of the pro-
totype and related assets, to which the aid was related, are
contingently repayable. Actual and contingent amounts re-
payable accrue interest. The interest rate was 6.3% between
1997 and 2002. The remaining amount (including interest)
contingently repayable was € 1,309 and € 1,295 at
December 31, 2001 and 2002, respectively. The amounts
reflected in accrued liabilities at December 31, 2001 and
2002, with respect to sales of automated trim and form
systems were € 213 and € 103, respectively.
The amounts of research and development subsidies
and credits offset against research and development expen-
ses amounted to € 485 in 2000, € 290 in 2001 and
€ 409 in 2002.
19 Research and Development Credits

A n n u a l R e p o r t 2 0 0 2 8 3
Packaging Plating and Die handling Lead Corporate/ Total
equipment singulation equipment frames elimination
equipment
EURO EURO EURO EURO EURO EURO
Year ended December 31, 2000:Net sales 131,428 64,417 2,127 - - 197,972Depreciation and amortization 4,391 2,800 389 - 11 7,591Interest income (expense), net (1,974) 542 5 - 4,241 2,814Income (loss) before taxes 14,225 14,551 (11,676) - 2,647 19,747Earnings of affiliated companies - - - 5,031 - 5,031Capital expenditures 5,302 987 6 - 16 6,311Long-lived assets 29,693 21,039 13,596 38,540 27 102,895Long-term liabilities, non-group 9,721 978 - - - 10,699Total assets 102,418 68,167 20,777 38,540 95,845 325,747
Year ended December 31, 2001:Net sales 102,435 40,653 6,942 - - 150,030Depreciation and amortization 4,390 2,800 1,141 - 12 8,343Restructuring charges 8,252 54 - - - 8,306Interest income (expense), net (1,798) 468 13 - 5,557 4,240Income (loss) before taxes (4,817) 1,143 (1,176) - 4,704 (146)Loss of affiliated companies - - - (16,314) - (16,314)Capital expenditures 2,655 682 56 - - 3,393Long-lived assets 28,129 18,912 13,139 - 16 60,196Long-term liabilities, non-group 8,720 320 - - - 9,040Total assets 110,777 55,170 20,153 - 85,786 271,886
Year ended December 31, 2002:Net sales 50,981 24,665 7,582 - - 83,228Depreciation and amortization 4,066 2,110 539 - 11 6,726Restructuring charges - - 786 - - 786Goodwill impairment - - 3,302 - - 3,302Interest income (expense), net (1,977) 495 (725) - 5,602 3,395Income (loss) before taxes (5,511) (2,228) (9,715) - 2,844 (14,610)Minority interest 3 - - - - 3Capital expenditures 4,224 539 115 - 25 4,903Long-lived assets 27,402 11,891 15,505 - 31 54,829Long-term liabilities, non-group 7,812 - - - - 7,812Total assets 104,317 59,791 18,910 - 61,980 244,998
Income (loss) before taxes of the Company’s die attach equipment segment includes a write-off of acquired IPRD
for the year ended December 31, 2000 of € 11.5 million.
The following table summarizes selected financial data of the Company’s packaging equipment, plating and sin-
gulation equipment, die handling equipment and the leadframes businesses:

A n n u a l R e p o r t 2 0 0 28 4
20 Segment, Geographic and Customers’ Information Cont.
The following table summarizes net sales, net
income (loss), long-lived assets and total assets
of the Company's operations in the Netherlands,
the United States of America and Asia Pacific, the
significant geographic areas in which the Company
operates. Intra-area sales are based on the sales
price to unaffiliated customers.
The Netherlands United Asia Intangible Elimination Total
States Pacific assets
EURO EURO EURO EURO EURO EURO
Year ended December 31, 2000:Net sales 176,381 5,695 24,640 - (8,744) 197,972Net income (loss) 23,344 (6,301) 4,973 (3,519) (30) 18,467Long-lived assets 64,006 119 3,819 34,951 - 102,895Total assets 448,315 39,846 27,544 34,951 (224,909) 325,747
Year ended December 31, 2001Net sales 133,211 9,334 14,246 - (6,761) 150,030Net income (loss) (12,144) (691) (243) (3,803) (97) (16,978)Long-lived assets 24,787 139 3,540 31,730 - 60,196Total assets 420,726 42,011 30,615 31,730 (253,196) 271,886
Year ended December 31, 2002Net sales 79,620 9,203 8,435 - (14,030) 83,228Net income (loss) 332 (11,698) (136) (4,922) (587) (17,011)Long-lived assets 19,846 302 2,955 31,726 - 54,829Total assets 422,139 41,404 14,048 31,726 (264,319) 244,998
Year ended December 31,
2000 2001 2002EURO EURO EURO
Europe and Rest of World 64,384 47,766 28,307United States 22,905 33,323 10,107Malaysia 43,694 27,319 16,638Philippines 13,634 6,574 4,013Taiwan 13,548 3,923 7,392Other Asia Pacific 39,807 31,125 16,771
Total net sales 197,972 150,030 83,228
Net income (loss) of the Company’s United States segment includes a write-off of acquired IPRD for the
year ended December 31, 2000 of € 7.6 million.
The following table represents the geographical distribution of the Company’s net sales to unaffiliated
companies.

A n n u a l R e p o r t 2 0 0 2 8 5
The following table represents export sales by the Company's Netherlands operations to unaffiliated customers
that exceeded 10% of total net sales in each year:
The Company’s net sales are generated primarily
by shipments to Asian manufacturing operations of lea-
ding US and European semiconductor manufacturers
and, to a lesser extent, Taiwanese and other Asian
manufacturers and subcontractors. The following table
presents sales to specific customers that exceeded 10%
of total net sales in each year.
Other United Malaysia Philippines Rest of the Total
Europe States World
EURO EURO EURO EURO EURO EURO
YEAR ENDED:December 31, 2000 60,457 - 32,636 - 60,514 153,607December 31, 2001 45,344 20,431 23,100 - 34,910 123,785December 31, 2002 25,863 - 14,390 - 27,477 67,730
Year ended December 31,
2000 2001 2002EURO EURO EURO
Customer:A 23,911 25,890 19,627B 36,911 16,102 12,161
Aggregate cash compensation paid or accrued by
the Company for its management including members
of the Board of Management of the Company was
€ 2,120 in 2000, € 1,977 in 2001 and € 1,719 in 2002.
Amounts accrued to provide pension, retirement or
similar benefits to these individuals, as a group, were
€ 215 in 2000, € 187 in 2001 and € 220 in 2002.
The remuneration of the individual executive mem-
bers of the Management Board for the year ended
December 31, 2002 was as follows:
(1) Executive member of the Management Board untilOctober 23, 2002; remuneration relates to the perioduntil October 23, 2002
(2) Bonus is included in the year to which it relates.
(In euros)Salaries Bonus (2) Pension
R.W. Blickman 294,961 - 54,326J. W. Rischke (1) 137,948 - 32,367
21 Remuneration Management Board and Supervisory Board

A n n u a l R e p o r t 2 0 0 28 6
21 Remuneration Management Board and Supervisory Board Cont.
The remuneration of the individual members of the
Supervisory Board members for the year ended
December 31, 2002 was as follows:
Details of options held by the Board of Management in the ordinary shares of BE Semiconductor Industries N.V.
were as follows:
As of January 1, 2002, J.W. Rischke held 76,942
options in the ordinary shares of BE Semiconductor
Industries N.V., 23,000 options were granted during
2002 with an exercise price of € 8.94, 10,221
options expired during 2002 and no options were
exercised during 2002. J.W. Rischke resigned as
executive member of the Management Board as of
October 23, 2002.
Loans outstanding relating to the stock options
to the executive member of the Management Board
amounted to € 286,795 as of December 31, 2002
(details financing see Note 15 Employee Benefits).
Details of options held by the Supervisory Board in the ordinary shares of BE Semiconductor Industries N.V.
were as follows:
Jan.1, Granted Exercised Expired Dec. 31, Exercise Expiration
2002 in 2002 in 2002 in 2002 2002 price date
R.W. Blickman 20,042 - - 20,042 - - -20,042 - - - 20,042 10.05 29-4-20038,500 - - - 8,500 6.35 29-4-2005
20,000 - - - 20,000 17.90 17-4-2006142,000 - - - 142,000 9.80 5-12-200640,000 - - - 40,000 9.55 2-5-2007
- 36,000 - 36,000 8.94 30-4-2008
Jan.1, Granted Exercised Expired Dec. 31, Exercise Expiration
2002 in 2002 in 2002 in 2002 2002 price date
E. B. Polak - 1,322 - - 1,322 8.94 30-4-2008D. Sinninghe Damsté - 1,322 - - 1,322 8.94 30-4-2008T. de Waard - 1,322 - - 1,322 8.94 30-4-2008
(In euros)
RemunerationW. D. Maris 15,882E. B. Polak 11,042D. Sinninghe Damsté 11,042T. de Waard 11,042
In 2002, part of the remuneration to the Super-
visory Board members has been replaced by the
acceptance of granting of options by three Supervisory
Board members. The fair value of the option awards
to the Supervisory Board members was estimated
using the Black-Scholes option-pricing model.
Total remuneration did not change compared to the
remuneration approved by the General Meeting of
Shareholders.

A n n u a l R e p o r t 2 0 0 2 8 7
The total number of personnel employed per sector were:
December 31,
2000 2001 2002
Sales and Marketing 159 133 120Manufacturing and Assembly 522 475 371Research and Development 70 66 78General and Administrative 83 72 73Total number of personnel 834 746 642
Year ended December 31,
2000 2001 2002EURO EURO EURO
Interest income 4,412 5,053 4,166Interest expense (1,598) (813) (771)Interest income, net 2,814 4,240 3,395
As of December 31, 2000, 2001 and 2002 a total of 590, 545 and 460 persons respectively, were employed in the Netherlands.
The components of interest income, net are as follows:
Year ended December 31,
2000 2001 2002EURO EURO EURO
Wages and salaries 32,060 31,456 27,824Social security expenses 4,342 3,226 3,407Pension and retirement expenses 2,257 2,739 2,352Total personnel expenses 38,659 37,421 33,583
The average number of employees during 2000, 2001 and 2002 was 778, 819 and 673, respectively.
Personnel expenses for all employees were as follows:
23 Interest Income
22 Selected Operating Expenses and Additional Information

A n n u a l R e p o r t 2 0 0 28 8
24 Income Taxes
The components of income (loss) before income taxes and equity in earnings (loss) of affiliated companies and
minority interest are as follows:
The Netherlands domestic statutory tax rate is
35% for the years ended December 31, 2000 and
2001 and 34.5% for the year ended December 31,
2002. The reconciliation between the actual income
taxes (benefit) shown in the Consolidated Statements
of Operations and the expense (benefit) that would
be expected based on the application of the domestic
tax rate to income (loss) before taxes and equity in
earnings of affiliated companies and minority interest,
is as follows:
The sale of the Company’s 30% interest in PBE
on November 15, 2001, was a non-taxable event and
as a result no tax benefit relating to the loss incurred
on the sale has been recorded. In the fourth quarter
of fiscal year 2002, as part of the income tax provi-
sion for the period, the Company recorded a charge
of € 6.0 million through the establishment of a valua-
tion allowance against its deferred tax asset consisting
primarily of US net operating loss carryforwards and
temporary differences. The Company determined
that the valuation allowance was required based on
its recent losses, which are given substantially more
weight than forecasts of future profitability in the
evaluation. Until the Company utilizes these US
operating loss carryforwards, its income tax provision
will reflect mainly domestic taxation. The increase in
valuation allowance at December 31, 2002 as com-
pared to December 31, 2001 represents an adjust-
ment of the beginning of the year valuation allowance
to an amount of € 4.2 million due to a change in
circumstances that caused a change in the judgement
about the realizability of the related deferred tax asset
in future years.
Year ended December 31,
2000 2001 2002EURO EURO EURO
Domestic 23,360 1,796 (2,867)Foreign (3,613) (1,942) (11,743)Total 19,747 (146) (14,610)
Year ended December 31,
2000 2001 2002EURO EURO EURO
“Expected” income taxes (benefit) based on domestic rate 6,911 (51) (5,040)
Non deductible expenses 442 214 126Goodwill impairment - - 1,255Foreign tax rate differential (720) (127) (249)Tax exempt income (172) (17) (904)Increase (decrease) in valuation allowance (113) 492 7,214Other (37) 7 2Income taxes shown in Statements of Operations 6,311 518 2,404

A n n u a l R e p o r t 2 0 0 2 8 9
Year ended December 31,
2000 2001 2002EURO EURO EURO
Shares outstanding at beginning of the year 26,394,425 31,794,675 31,794,675Weighted average shares issued during the year 3,847,541 - -Weighted average shares converted from priorityshares to ordinary shares 185 - -
Weighted average repurchased shares - - (332,193)Average shares outstanding – basic 30,242,151 31,794,675 31,462,482
Dilutive shares contingently issuable upon the exercise of stock options 330,708 - -
Shares assumed to have been repurchased for treasury with assumed proceeds from the exercise of stock options (221,397) - -
Average shares outstanding – assuming dilution 30,351,462 31,794,675 31,462,482
The following table reconciles shares outstanding at the beginning of the year to average shares outstanding
used to compute income (loss) per share:
For purposes of computing diluted earnings per
share, weighted average ordinary share equivalents
do not include stock options with an exercise price
that exceeds the average fair market value of the
Company’s ordinary shares for the period, because
the impact on earnings (loss) would be anti-dilutive.
For the year ended December 31, 2000, 137,586
options to purchase ordinary shares with an average
price of € 16.54 were excluded from the calculation
of dilutive earnings per share. For the years ended
December 31, 2001 and 2002, all options to purcha-
se ordinary shares were excluded from the calculation
of diluted loss per share as the effect would be anti-
dilutive due to the Company’s loss for those years.
The Company’s provision for income taxes (benefit) consisted of the following:
Year ended December 31,
2000 2001 2002EURO EURO EURO
CURRENT:- domestic 9,290 1,599 (151)- foreign 2,200 460 152DEFERRED:- domestic (756) (756) (1,181)- foreign (4,423) (785) 3,584
6,311 518 2,404
25 Earnings per Share
24 Income Taxes Cont.

A n n u a l R e p o r t 2 0 0 29 0
On September 1, 2000, the Company acquired
RDA. The following is a summary of the net cash paid
for acquisition:
On January 4, 2002, the Company acquired Laurier.
The following is a summary of the net cash paid for
acquisition:
USD
Fair value of assets 25,139Liabilities (2,038)Deferred purchase price and acquisition cost (646)
Cash paid 22,455Less: cash acquired (158)Net cash paid for acquisition 22,297
USD
Fair value of assets 12,632Liabilities (3,268)Deferred purchase price and acquisition cost (452)
Cash paid 8,912Less: cash acquired (1)Net cash paid for acquisition 8,911
26 Supplemental Cash Flow Information

A n n u a l R e p o r t 2 0 0 2 9 1
C o r p o r a t eI n f o r m a t i o n
for almost 40 years, a similar combination of new ideas combined with solid expertise has characterized Besi

A n n u a l R e p o r t 2 0 0 29 2
S U P E R V I S O R Y B O A R D B O A R D O F
M A N A G E M E N T
Willem D. Maris (1939) T H E S U P E R V I S O R Y B O A R D Richard W. Blickman (1954)
Chairman H A S F O R M E D T H E President and Chief
Dutch nationality F O L L O W I N G C O M M I T T E E S Executive Officer, Chairman
Appointed 2000 – 2004
Additional functions: Audit Committee Jörg W. Rischke (1943)
Member Supervisory Board Members: Dick Sinninghe COO and Executive Member
Vanderlande Transport Damsté, Willem Maris, until October 23, 2002
Mechanismen B.V., Evert Polak, Tom de Waard Managing Director Meco
Member Board of Directors of
Photronics Inc. and Remuneration Committee Teun Wartenbergh (1957)
FSI International Inc. Members : Willem Maris, COO
Tom de Waard
Evert B. Polak (1944) Hugo Menschaar (1946)
Dutch nationality The remuneration of the Director Corporate
Appointed 2000 – 2004 members of the Supervisory Technology
Additional function: Board does not depend on the
Chairman Supervisory Board results of the Company. Cor te Hennepe (1958)
of PSV Stadium B.V. None of the members of the Director of Finance
Supervisory Board personally as of March 1, 2002
Dick Sinninghe Damsté (1939) maintains a business
Dutch nationality relationship with the Company
Appointed 2000 – 2004 other than as member of
Additional functions: the Supervisory Board.
Chairman Supervisory Board Three of the members of the
of H.I.T.T. N.V., Member Supervisory Board own 1,322
Supervisory Board of options each on shares of
Vedior N.V. and NKI/AvL the Company.
Tom de Waard (1946)
Managing Partner Clifford
Chance Amsterdam
Dutch nationality
Appointed 2000 - 2004
Additional function:
Member Supervisory Board
of STMicroelectronics N.V.
Corporate Information

A n n u a l R e p o r t 2 0 0 2 9 3
O T H E R M E M B E R S
O F M A N A G E M E N T O T H E R I N F O R M AT I O N
Jaap H.M. Beijersbergen (1963) CORPORATE OFFICE STATUTORY FINANCIAL
Director Sales of Besi Marconilaan 4 STATEMENTS
5151 DR Drunen The statutory financial
Willy M. Enzing (1959) The Netherlands statements of BE
Managing Director of Tel. 31 416 384 345 Semiconductor Industries N.V.,
Fico Trim and Form Fax 31 416 384 344 Fico B.V. and Meco
Integration Systems www.besi.com International B.V. are prepared
e-mail: [email protected] in accordance with legal
Robert J. Foppen (1947) [email protected] requirements in the
Worldwide Sales and Marketing Netherlands. Copies of these
Manager of Meco TRANSFER AGENT AND financial statements are
REGISTRAR available to shareholders upon
Paul A. Govaert (1956) The Bank of New York written request to the
Managing Director New York, U.S.A. Company.
of Fico Tooling
INDEPENDENT AUDITORS
Frans J.M. Jonckheere (1959) KPMG Accountants N.V. A N N U A L M E E T I N G
Director of Operations ‘s-Hertogenbosch,
of Meco the Netherlands The Annual General Meeting of
Shareholders will be held at
David S. Morgan (1961) LEGAL COUNSEL 2 p.m., on March 27, 2003
General Manager Stibbe at the NH Barbizon Palace
of Besi Die Handling Systems Amsterdam, the Netherlands Hotel, Prins Hendrikkade
as of January 3, 2003 59-72, 1012 AD Amsterdam,
LEGAL COUNSEL IN U.S.A. the Netherlands.
Philip M.G. Nijenhuis (1945) Hale and Dorr LLP,
Managing Director of Counselors at Law, Boston,
Fico Molding Systems Massachusetts, U.S.A.
TRADE REGISTER
Chamber of Commerce
‘s-Hertogenbosch,
the Netherlands
Number 09092395
FORM 20-F
A copy of Besi’s
Form 20-F as filed with the US
Securities and Exchange
Commission is available
without charge by writing
to the Company.

A n n u a l R e p o r t 2 0 0 29 4
People invent and work with machines.
Somewhere along the industrial (r)evo-
lution, we became connected, we became
interdependent. Machinery in its widest
definition is the embodiment of our
prosperity and our welfare. Perhaps in
the Western world, even our well-being.
Machines become intelligent and do
part of our thinking when we build cars.
Other machines are dressed up as pets
to teach us how to take care – the
human touch. But eventually we will
become one.
m a c h i n e r yv e r s u s
h u m a n b e i n g s

A n n u a l R e p o r t 2 0 0 2 9 5
for almost 40 years, a similar combination of new ideas combined with solid expertise has characterized Besi

A n n u a l R e p o r t 2 0 0 29 6
Addresses
E U R O P E
BE Semiconductor
Industries N.V.
Marconilaan 4
5151 DR Drunen
The Netherlands
Tel. (31) 416 384345
Fax (31) 416 384344
Fico B.V.
Fico Tooling B.V.
Fico Trim & Form
Integration Systems B.V.
Ratio 6
6921 RW Duiven
The Netherlands
Tel. (31) 26 3193600
Fax (31) 26 3113831
Fico Molding Systems B.V.
Nijverheidstraat 14-16
6914 AD Herwen
The Netherlands
Tel. (31) 316 243600
Fax (31) 316 243700
Fico Tooling B.V.
Boschstraat 10
6442 PB Brunssum
The Netherlands
Tel. (31) 45 5253597
Fax (31) 45 5252588
Meco International B.V.
Meco Equipment
Engineers B.V.
Marconilaan 2
5151 DR Drunen
The Netherlands
Tel. (31) 416 384384
Fax (31) 416 384300
Fico Malta Service
Location
c/o STMicroelectronics
Industry Road
Kirkop ZRQ 10 - Malta
Tel. (356) 216 42214
Fax (356) 216 41175 -
216 42578
Rydon Technology Ltd.
(sales representative)
66 Upper Headland Park
Road, Preston, Paignton
Devon TQ3 1JF
United Kingdom
Tel. (44) 1803 526939
Fax (44) 1803 522952
U S A
BE Semiconductor
Industries USA, Inc.
Fico America, Inc.
224 E. Chilton Drive
Suite # 9,
Chandler, AZ 85225
USA
Tel. (1) 480 4978190
Fax (1) 480 4979104
RD Automation
Laurier Inc.
10 Tinker Avenue
Londonderry, NH 03053
USA
Tel. (1) 603 6264700
Fax (1) 603 6264242
Fico America, Inc.
15720 Winchester Blvd.
Suite # 4,
Los Gatos,CA 95030-3337
USA
Tel. (1) 408 3994580
Fax (1) 408 3994582
Fico America, Inc.
3630 North Josey Lane
Suite # 100,
Carrollton,TX 75007-3143
USA
Tel. (1) 972 3952106
Fax (1) 972 3952116
Fico America, Inc.
905 Fair Oaks Drive
Garland, TX 75040
USA
Tel. (1) 972 5301373
Fax (1) 972 5305649
Meco Equipment
Engineers Inc.
445 Bryant Blvd.
Rock Hill, SC 29732
USA
Tel. (1) 803 3661780
Fax (1) 803 3297382
A S I A
Fico Asia Sdn. Bhd.
3 Jalan 26/7
Section 26
40000 Shah Alam
Selangor Darul Ehsan
Malaysia
Tel. (1) 60 3 51911799
Fax (1) 60 3 51914009
Fico Tooling Leshan Co. Ltd.
Electronic Park,
High Tech Zone
Leshan, Sichuan
614000 China
Tel. (86) 833 2596385
Fax (86) 833 2596368
Meco Equipment
Engineers (F.E.) Pte. Ltd.
40, Jalan Pemimpin #04-06A
Tat Ann Building
Singapore 577185
Tel. (65) 6255 2722
Fax (65) 6255 6766
Fico Sales & Service Pte.
Ltd.
73, Merryn Road
Singapore 298518
Tel. (65) 6100 2700 - (65)
9387 0451
Fax (65) 6399 2700
Fico Asia (Melaka)
19, Jalan BP 11,
Tamam Bertam Perdana,
75200 Melaka
Malaysia
Tel. (60) 6336 2093
Fax (60) 6334 3583
Fico Asia (Penang)
765-B, Jalan Sultan Azian
Shah
Sungai Nibong
11900 Penang
Malaysia
Tel. (60) 4643 6015
Fax (60) 4643 2893
Fico Asia (Thailand)
19/106.M-23 801 Pradau 4
Put-ta-mol-thon Road 1
Bangramad, Thalingchan
Bangkok 10170
Thailand
Tel. (66) 2887 7659
Fax (66) 669 500 2686
Ampoc Far-East Co. Ltd.
(sales representative)
17F,No.171,Sung-TehRoad
Taipei
Taiwan, R.O.C.
Tel. (886) 2 2726 2220
Fax (886) 2 2726 2227
Fico Shanghai
Room 701, Building 8,
No. 81, Lane 442
Huai Hai Xi Road
Shanghai
200052 China
Tel. (86) 21 62832063
Fax (86) 21 62834663
Ampoc Trading
(Shanghai) Ltd.
(sales representative)
4F, No. 2, Zhongshan Rd
Kun Shan, Jiang Su, China
Tel. (86) 512 57592051
Fax (86) 512 57592053
Silicon International Ltd.
(sales representative)
Unit 4B, Jin Ming Building
8 Zun Yi South Road
Shanghai
200336 China
Tel. (86) 21 6270 1651
Fax (86) 21 6219 1185
Meco Manila Eng. R.O.
Unit 802 Cityland Pasong
Tamo Towers
Pasong Tamo Street
Makati City
Philippines
Tel. (63) 2894 2652
Fax (63) 2892 5210
Fico Asia (Philippines)
3rd Floor EM Arcade
Km. 30 National Highway
San Pedro, Laguna
Philippines, Zip 4023
Tel. (63) 2869 2143
Fax (63) 2869 1665
Fico Hong Kong Ltd.
2/F Possehl Building
14-18 Ma Kok Street
Tsuen Wan, N.T.
Hong Kong
Tel. (852) 2512 1723
Fax (852) 2512 1732
Meco Japan Co. Ltd.
Nakamura Building, 6F
31-7,Shinbashi 4-chome
Minato-ku
Tokyo 105, Japan
Tel. (81) 3343 41251
Fax (81) 3343 41252
Nihon Fico Ltd.
Nakamura Building, 7F
31-7,Shinbashi 4-chome
Minato-ku
Tokyo 105-0004, Japan
Tel. (81) 3343 37951
Fax (81) 3343 37971
Fico Korea Ltd.
2F, Sinkwang-Building
114-2, Bangi-Dong
Songpa-Ku, Seoul
Korea
Tel. (82) 2449 5725
Fax (82) 2415 9820
Yubong Corporation
(sales representative)
Woongzin Bldg., 5th Floor
Deungchon-3-dong
Seoul 157-030, Korea
Tel. (82) 2 3663 1801
Fax (82) 2 3663 7277

A l w a y s A h e a d
A l w a y s A h e a d
A n n u a l R e p o r t 2 0 0 2
Be
si
An
nu
al R
ep
ort 2
00
2
Besi is a leading manufacturer of semiconductor
packaging, plating and die handling equipment.
Our offering covers both lead frame and array
connect applications. We design and manufacture
technologically advanced, high-performance
equipment and integrated systems for assembly
process operations in the semiconductor industry.
Besi equipment is mainly used to produce
semiconductor packages providing the electronic
interface and physical connection between chips
and other electronic components and also
protects the chip from the external environment.
For users, our innovative systems mean high pro-
ductivity and improved yields of defect-free devi-
ces – all at a low total cost of ownership.