annual report 2004 - outokumpu
TRANSCRIPT

Annual Report 2004
OU
TO
KU
MP
U A
NN
UA
L RE
PO
RT
2004

outokumpu 2004 2 Vision and strategic direction
4 Outokumpu business operations and market position
6 Statement by CEO Rantanen
8 Interview with Juusela and Virrankoski
10 Management discussion on the fi nancial results and strategy
16 Risk management
19 Market review
business operations 24 Outokumpu Stainless
30 Outokumpu Copper
34 Outokumpu Technology
37 Other operations
38 Human resources
41 Environment, health and safety
fi nancial statements 44 Contents of the fi nancial statements
45 Review by the Board of Directors
54 Auditor’s report
55 Consolidated fi nancial statements, IFRS
96 Key fi nancial fi gures
102 Parent company fi nancial statements, FAS
investor information 108 Outokumpu Oyj’s shares and shareholders
115 Outokumpu’s corporate governance
122 Board of Directors
124 Group Executive Committee
127 Annual General Meeting and Investor Relations
Contents
Consolidated fi nancial statements presented in this annual report have been prepared in accordance with
International Financial Reporting Standards (IFRS). Outokumpu started to apply IFRS in its third-quarter
interim report, which was published on October 26, 2004. Prior to IFRS, Outokumpu’s fi nancial reporting was
based on Finnish Accounting Standards (FAS). Outokumpu’s date of transition to IFRS was January 1, 2003.
Accounting principles applied in the IFRS fi nancial statements are presented on pages 60–64. In graphs and
tables, data for the years 2003–2004 are presented according to IFRS and for prior years according to FAS.
All fi gures in the annual report have been rounded and consequently the sum of individual fi gures can deviate
from the presented sum fi gure.

2
We are aiming to be the undisputed number one in stainless steel.
Vision and strategic direction
Vision and strategic objectives
Outokumpu is an international stainless steel and technology company. Outo-kumpu’s vision is to be the undisputed number one in stainless steel, with suc-cess based on operational excellence. To this end, Outokumpu has defi ned two key strategic objectives:
• Value creation through building superior production and distribution capa-bilities in all major markets around the world
• Value realization through commercial and production excellence
Outokumpu has started work to map out the path toward realizing this vision. Today, our priority is to deliver on the promises we made during the previous strategic phase of growth and transformation in 2000–2004. At the same time, we are setting ambitious new targets for the coming fi ve-year period to make sure we emerge as the number one stainless steel producer in Europe.
Outokumpu’s future success will be achieved by building and reinforcing operational excellence, both in the commercial and production arena. This op-erational excellence will be leveraged outside Europe to achieve global leader-ship: becoming the undisputed number one in stainless steel over the next ten years. In the light of Outokumpu's target of continuing to grow faster than the market, the operational excellence efforts will be supported by further develop-ment of the Group's current asset base, value chain and product offering.

3Outokumpu 2004
Outokumpu’s key strengths
Being the undisputed number one in stainless means:• Most profi table
• Best in customer relationship management
• Most effi cient production operations
• Most attractive employer
Produces stainless steel, the fastest-growing
segment of the metals market
A major investment program for future earnings
growth almost completed
Added value through knowledge in metals
technology and innovations
Financial objectives
Outokumpu’s overall fi nancial objective is to gener-ate maximum sustainable economic value added. The specifi c group-level fi nancial objectives in line with the vision of becoming the number one in stainless steel in terms of growth, profi tability and fi nancial strength are:
• To continue growing faster than the market• A return on capital employed of over 13% and always the best among peers• Gearing below 75%
Dividend policy
The Board of Directors has established a dividend policy according to which the dividend payout ratio over a business cycle should be at least one-third of the company’s net profi t for the period. In its an-nual dividend proposal, the Board will, in addition to fi nancial results, take into consideration the Group’s investment and development needs.

4
Stainless
Main products and customers
Main products are cold and hot rolled stainless steel coil, sheet and plate. Other products include precision strip, hot rolled plate, long products as well as tubes and fi ttings. These products are mainly used in process industries, such as pulp, paper and chemicals and the offshore oil industry, catering and house-holds, vehicle manufacture and the building and construction industry.
Market position
• World market size 24 million tonnes or some EUR 42 bil- lion. During the last ten years, consumption has grown by almost 7% per annum • One of the world’s largest and most cost-effi cient producers • Slab capacity will increase to 2.75 million tonnes and the capacity for cold rolled material and white hot strip to 1.9 million tonnes when the major investment at Tornio comes fully on stream• 25% share of the stainless steel coil market in Europe and 8% worldwide• Main markets are Europe (70% of sales), Asia (17%) as well as North and South America (11%)
Production facilities
Main production facilities are located in Finland, Sweden, Brit-ain and the US.
Source: CRU. Includes cold and hot rolled products in Western world.
Major producers
Estimated slab capacity Slabs SlabsMillion tonnes 2004 2006
Arcelor, Luxemburg 3.15 2.82
ThyssenKrupp, Germany 2.88 2.88
Outokumpu, Finland 2.60 2.75
Acerinox, Spain 2.33 2.43
POSCO, South Korea 2.00 2.00
Source: CRU and Outokumpu.
Outokumpu business operations and market position
Others 5%
Raw materials and energy
Stainless steel and carbon steel scrap, ferrochrome and nickel are the main raw materials. Outokumpu operates its own chrome mine at Kemi and a ferrochrome smelter at Tornio, both in Fin-land. Stainless steel and carbon steel scrap, part of ferrochrome and nickel are purchased on the open market.
Electric energy accounts for some 4% of total costs. The Group’s single largest consumer of electric energy is the Tornio ferrochrome smelter.
Outokumpu is an international stainless steel and technology compa-ny. Customers in a wide range of industries use our metal products, technologies and services worldwide. We are dedicated to helping our customers gain competitive advantage. We call this promise the
Outokumpu factor. Outokumpu operates in some 40 countries and employs 19 500 people. In 2004,
the Group’s sales amounted to EUR 7.1 billion, of which 95% was generated out-side Finland.
In 2004, Outokumpu’s operations were organized into three strategic entities: Stainless, Copper and Technology.
In August 2004, Outokumpu announced that its future strategic direction is based on leadership in stainless steel, and that various options to exit the fabricated copper products business will be explored. The divestment process of Outokumpu Copper is underway.
Process industry 29%
Catering and households 25%
Transportation 16%
Welded tubes 15%
Building and construction 10%
End-uses

5Outokumpu 2004
Technology
Main products and customers
Outokumpu Technology designs and delivers plants, processes and equipment tailored for each customer’s needs, and provides engineering, project and support services globally. Customers are producers of metals and industrial minerals as well as companies in chemical and other process industries.
Market position
• Solid experience in the whole production chain of metals as a strength• Market leader in many technologies• Extensive R&D resources• Competitors are either engineering companies or equipment manufacturers• Main markets are Asia (36% of sales), North and South America (20%), Europe (18%) as well as Australia and Oceania (17%)
Copper
Main products and customers
Main products include ACR tubes, heat transfer coils and com-ponents used in air-conditioning applications, radiator strips used in the automotive industry, sanitary tubes and roofi ng and architectural products used in the building and construction in-dustry, copper tubes, strips and connectors used in the electron-ics and communication industry, alloy wire and superconducting wire used in the electrical industry as well as welding electrodes. In addition, brass rod products are manufactured.
Market position
• World market size 20 million tonnes, of which the market served by Outokumpu 6 million tonnes or EUR 20 billion. Demand growth 2–3% per annum; for special products 5–10%• The only global manufacturer of higher value-added pro- ducts with production in the US, Europe and Asia• Delivery capacity 600 000 tonnes, over 10% share of the selected markets• Main markets are Europe (44% of sales), North and South America (38%) as well as Asia (17%)
Production facilities
Production facilities are located in the Netherlands, Belgium, Britain, Spain, Italy, Austria, China, Malaysia, Mexico, France, Sweden, Finland, Thailand, the Czech Republic and the US.
Outokumpu customer groups
Heat transfer 43%
Building and construction 21%
Electrical 13%
Electronics and communication 11%
Industrial machinery and equipment 8%
Others 4%
Major producers
Estimated delivery capacity
1 000 tonnes
SMI (KME), Italy 800
Outokumpu, Finland 600
Wieland-Werke, Germany 500
Poongsan, South Korea 450
Olin, the US 370
Mueller Industries, the US 320
Source: Outokumpu.
Raw materials and energy
Cathode copper, copper scrap and alloy elements, such as zinc and tin are used as raw materials. Raw materials are purchased on the open market.
Electric energy accounts for some 2% of total costs.
Operations
Competence centers in Finland, Germany, Sweden, North and South America, Australia as well as Russia. Sales and service centers in altogether 16 countries.

6
Statement by CEO Rantanen
For Outokumpu, the year 2004 was signifi cant in several ways. In late August the Board decided on the new strategy for the Group with the ambition of becoming the global leader in stainless steel. To
this end, we also started to study alternatives to exit the fabri-cated copper products business. The decision to focus on stainless is based on good global growth prospects for the busi-ness and our already strong competitive position. We have also decided to continue developing the technology business as part of Outokumpu. The market for our technology offering is clearly improving, and our target is to benefi t from our strong position.
We have made progress in ramping up the new Tornio ca-pacity and the share of fi nished products in total deliveries is increasing. Together with favorable market conditions and bet-ter product mix, this resulted in a signifi cant improvement in profi tability in 2004. Actually Outokumpu recorded the high-est ever profi t in the company’s history. Some of our key targets were not yet reached, however. For example, gearing is still higher than the target of 75%. But I have every reason to be-lieve that with continued good profi ts, tight working capital management and the divestiture of Outokumpu Copper we will reach our goal.
I was very pleased to start as the new CEO at the beginning of January, 2005. My fi rst months at the helm of the company have confi rmed my belief that Outokumpu is very well posi-tioned to succeed also in the future.
Our vision – to be the undisputed number one in stainless with success based on operational excellence – is bold, ambi-tious and inspiring. Number one does not necessarily mean be-
ing the largest in volume but rather being the best in the indus-try in terms of fi nancial performance, managing customer rela-tionships and as an employer.
Our future success in stainless will be based on operational excellence. On the commercial side, operational excellence is about achieving the best customer satisfaction in the industry. We will focus on improving our skills and capabilities in the commercial teams as well as improving our service offering and product development to meet customer needs. As regards pro-duction, operational excellence will improve safety, effi ciency and productivity, thus reducing variances in our performance and lowering costs. This will be achieved by applying a com-mon methodology across our sites.
We will be launching the commercial and operational excel-lence programs in early April this year. These programs, aimed at improving our performance and ways of working, will in-volve personnel throughout the organization and will require learning new skills and competences. It is a massive training exercise and thus results cannot be expected soon. However, over the longer term I am convinced that the programs will form a sound platform for our global expansion and also yield great fi nancial benefi ts.
Our fi nancial targets have been modifi ed to refl ect the new vision. The new profi tability target of reaching over 13% re-turn on capital employed every year and to be consistently the best among peers follows the vision – the undisputed number one. I regard the new fi nancial targets as demanding but achiev-able, especially once the Tornio expansion is up and running and the operational excellence efforts start delivering the ex-pected fi nancial returns .

7Outokumpu 2004
Juha RantanenCEO
The new organizational structure also supports the new vi-sion. The Executive Committee focuses on running the stain-less business directly, and we have strengthened the functional leadership in the top team. The leaders of our commercial and production operations will have a key role in driving the opera-tional excellence efforts together with the business units.
The business outlook for the fi rst half of 2005 remains healthy. Although the base price of stainless steel has softened somewhat, global capacity utilization rates are expected to stay high in 2005, providing a supportive background for prices and margins. This year we will complete the ramp-up of the Tornio expansion and our profi tability should continue to im-prove through higher volumes, better product mix and lower unit conversion costs. For the fi rst half of this year, we estimate that the Group’s operating profi t, excluding non-recurring items, will be at least at the level of the corresponding period in 2004.
I see for myself an exciting journey ahead in leading Outo-kumpu toward the new vision. I also want to thank Jyrki Juu-sela for leading the company very successfully and leaving the company well positioned for me to continue.
Our vision is ambitious and inspiring. We have an exciting journey ahead.

8
Interview with Juusela and Virrankoski
CEO Jyrki Juusela, who retired at the end of 2004, and his colleague, Deputy CEO Risto Virrankoski , who retired in February 2005, agree that a lot has happened to Outokumpu during its transforma-
tion from being a mining company to become a Group with a focus on stainless steel and technology. There’s been no let-up in the pace, and some pitfalls have been encountered here and there.
What was the initial situation like when Juusela
took over as CEO in 1992?
Juusela: When I took over as CEO, the company was in a seri-ous and diffi cult situation. The balance sheet was in bad shape, especially after a string of acquisitions. Virrankoski: What’s more, just like other businesses, we were in the grips of a deep recession. We suffered record losses and our shareholders’ equity was nearly eaten up. That’s how bad it was at the outset. But we managed to ride out the slump, put the balance sheet in better shape and get the company turning a profi t. Once we had achieved this, a wide-ranging study was then launched in 1996 to determine the direction the Group would take to achieve future growth. Juusela: We arrived at a decision toward the end of 1997. We concentrated our efforts on metals and technology, with a clear focus on stainless steel. It was easy to set our bearings on this course, because history and especially the future market outlook spoke in favor of stainless steel.
Was it hard to get out of mining?
Juusela: Making the decision wasn’t diffi cult at all. It’s clear to me that a medium-sized mining company, like Outokumpu was, can’t succeed. In the mining business you have to be either small and fl exible, or else have the necessary size.
Virrankoski: A big factor that slowed down acting on the deci-sion, however, was that Outokumpu has its roots in the mining business. Without mining, there wouldn’t be any Outokumpu. This “mindset debt” held us back for too long, but ultimately we made the decision. Taking our time didn’t result in big fi -nancial losses, and we were able to exit the mining business on reasonable terms. Juusela: For me, selling the nickel and zinc businesses were dif-fi cult decisions, because a lot of top management’s know-how was bound up with them. But once those decisions had been taken, it was management’s job to concentrate on new things. Virrankoski: The divestiture of all of Outokumpu’s traditional businesses was mentally taxing, even though we knew that the funds that were freed up would be put to good use. We weren’t just selling ore, machinery and buildings, but Outokumpu peo-ple. We always tried to make sure that the divested businesses ended up with an owner to whom they were even more impor-tant than to Outokumpu. It’s always good to be a core busi-ness.
Was there anything that should have been
done differently?
Juusela: I don’t want to speculate. Even with the benefi t of hind-sight, I wouldn’t do anything differently now, only a bit faster. Virrankoski: On balance, I don’t regret anything. There’s always a time and place factor for everything.
What do you look back upon with the most
pleasure?
Virrankoski: I recall at least two things, one big and one small. The big matter was the settlement that was reached in 1988 in Outokumpu Oy’s pensions dispute. I was listening to the news in my car one evening when the announcer said: “It appears

9Outokumpu 2004
The new managementfaces the challenge of turning good into even better.
that an amicable settlement will be reached in Outokumpu’s three-year long pensions dispute.” That brought tears to my eyes. The other thing happened a few years ago when, quite surprisingly, we were able after all to continue the Hitura min-ing operations that had already been put on the block. There was a good feeling for a number of days when I was able to tell the employees about this surprising turn of events. More than a hundred people were able to keep their jobs. These people have lived up to the requirements of that decision and have made profi ts. Juusela: For my part, I’ve always appreciated the way Outo-kumpu people are eager to tackle something new. They have belief in the future and in their abilities.
What was Outokumpu like as a place to work?
Juusela: Outokumpu was very good as a workplace. There weren’t any cliques. Rather, fairness and equality were the norm. There was often a lot of discussion when arriving at a decision, but once the decision had been made, there was no more arguing, but instead, everybody set to work. Virrankoski: Outokumpu has been a very tolerant company that also made room for dissidents. This is probably due to the fact that the company places a high value on innovation. Big ideas are permitted.
International investors got interested in Outokumpu
in the mid-1990s. What is your experience of this?
Juusela: What I’ve seen of investor circles, I like. Managing our investor relations has been a dialogue in which manage-ment has also been able to put questions to investors. I’ve learned a lot from these discussions. Virrankoski: My experiences are maybe a bit spottier. There are different kinds of investors, and their expectations can be con-fl icting. It’s of the utmost importance that the company’s man-agement ultimately acts as it sees fi t in the company’s best in-terests. If this isn’t enough, the shareholders can change the management.
What kind of message would you like to send?
Virrankoski: Outokumpu is a leading company in its own sec-tor. It’s been in business as an independent company for nearly a century now under its own name. Outokumpu’s business is nevertheless subject to risk factors, but the company has dem-onstrated its ability to remake itself and to keep risks in check. The new management’s starting point is, at least substantively, far better than when Jyrki took over. This poses the challenge of turning good into even better.Juusela: I remember saying just that back in 1992 – Outo-kumpu is a great company.
Risto Virrankoski Jyrki Juusela

10
World economic growth accelerated in 2004, and metal prices rose strongly. Demand for Outokumpu’s products was healthy, led by the revival in industrial investments, but
growth nevertheless slowed down toward the end of the year. The conversion margins for stainless steel and copper products, which have an impact on Outokumpu’s earnings, developed much more moderately than raw material prices did. The con-version margins for stainless steel rose by 5% while the conver-sion margins for copper products declined.
The Group’s sales were up 20% on the previous year, to EUR 7 136 million. The growth was attributable to the rise in selling prices, an increase in total deliveries of copper products and an improved product mix for stainless steel.
The Group’s operating profi t more than doubled to EUR 468 million thanks to increased delivery volumes, an improved product mix and higher conversion margins. Outokumpu Stainless generated 94% of the Group’s operating profi t. Net profi t for the fi nancial year rose to EUR 390 million and earn-ings per share to EUR 2.13. The return on operating capital was 10.3% and the return on equity 17.0%.
Although the base price of stainless steel has weakened slightly, global capacity utilization rates are expected to remain high in 2005, providing a supportive background for prices and margins. Completion of the ramp-up of the new cold roll-ing mill in Tornio (RAP5) will improve profi tability further thanks to larger production volumes, lower unit conversion
Management discussion on the fi nancial results and strategy
costs and a better product mix. The total delivery volume of Outokumpu’s fi nished stainless steel products is estimated to increase by well over 20% in 2005, depending on the market situation. Given the higher volumes and lower unit conversion costs, but also slightly softening base price of stainless steel, the Group’s operating profi t, excluding non-recurring items, in January–June 2005 is estimated to be at least at the level of the same period in 2004.
Growth in working capital weakened
capital structure
Although cash fl ow from operating activities headed into posi-tive territory in the fourth quarter, net cash generated from op-erating activities was EUR 128 million negative on a full-year basis. The sharp rise in raw material prices and the higher busi-ness volume increased the Group’s working capital by EUR 710 million. Internal measures to control the increase in work-ing capital did not suffi ce to offset the effect of the very strong rise in raw material prices. The Group’s liquidity nevertheless remained satisfactory throughout the year. Interest-bearing net debt at the end of the year was EUR 2 435 million. Despite clearly improved earnings, the Group’s gearing ratio remained at the level seen at the end of 2003. The debt-to-equity ratio was 97.2% and the equity-to-assets ratio 35.8%. Capital ex-penditure amounted to EUR 473 million.
Personnel
19 465
Stainless 47%Copper 41%
Technology 9%Others 3%
Operating capital
5 151 € million
Stainless 80 %
Copper 18%
Technology 0.8%
Others 1.5%
Sales
7 136 € million
Stainless 64%Copper 28%
Technology 6%
Others 2%

11Outokumpu 2004
In December, Outokumpu sold 47 million Boliden AB shares for EUR 130 million. As a result, Outokumpu’s holding in Boliden fell from 49% to 26.5%. Following the Boliden transaction in 2003, Outokumpu had an EUR 166 million subordinated note from Boliden on its balance sheet. Boliden repaid the entire subordinated note to Outokumpu in the fourth quarter of 2004. In March 2005, Outokumpu sold fur-ther its Boliden shares for EUR 115 million and the ownership fell to 16.1%.
The key factors for bringing gearing down to the 75% target level are good profi tability, freeing up of working capital through operational excellence and the divestiture of the fabri-cated copper products business.
Sales
€ million
Operating profi t
Comparable
Offi cial
€ million
Group key fi gures
2004 2003
Sales € million 7 136 5 922- change from previous year % 20.5 6.6Operating profi t € million 468 214- in relation to sales % 6.6 3.6Profi t before taxes € million 477 108Net profi t for the fi nancial year € million 390 112
Capital employed on Dec. 31 € million 4 941 4 108Return on capital employed % 10.3 5.0Operating capital on Dec. 31 € million 5 151 4 287
Net cash generated from operating activities € million (128) 194Net interest-bearing debt on Dec. 31 € million 2 435 2 025- in relation to sales % 34.1 34.2Equity-to-assets ratio % 35.8 33.0Debt-to-equity ratio % 97.2 97.2
Earnings per share € 2.13 0.65Equity per share € 13.65 11.54Dividend per share € 0.50 1) 0.20Share price on Dec. 31 € 13.15 10.77Market capitalization on Dec. 31 € million 2 383 1 923
Capital expenditure € million 473 622Personnel on Dec. 31 19 465 19 359
1) Board’s proposal to the Annual General Meeting.
Earnings per share
€

12
The table below presents the sales and comparable operating profi t (i.e. operating profi t excluding non-recurring items and Outo-kumpu Copper’s LIFO-FIFO inventory adjustment) by the Group’s businesses.
Management discussion on the fi nancial results and strategy
Equity-to-assets ratio
%
Debt-to-equity ratio
%
The Group’s comparable operating profi t
improved signifi cantly
The Group’s comparable operating profi t rose to EUR 417 mil-lion and the comparable return on capital employed to 9.2%. Capital employed was higher due to large investments and the growth in business volume. The steep rise in nickel and copper prices increased working capital signifi cantly. At the end of the year, an estimated EUR 400 million excess working capital was tied up because of raw material prices that were higher than the long-term averages.
Outokumpu Stainless’ sales were up 34% to EUR 4 637 million, and comparable operating profi t quadrupled to EUR 425 million. Total deliveries of stainless steel were on a par with 2003, but delivery volume of cold rolled and white hot strip
products increased by 12%, thus improving the product mix. The growth in operating profi t was attributable mainly to the increased proportion of better-margin fi nished products, thereby improving the average conversion margin. The 2% higher Eu-ropean cold rolled base price improved profi tability. Since Ou-tokumpu has its own ferrochrome production it gained from the rise in ferrochrome prices, too. In the early 2004, Outo-kumpu benefi ted from the rapid rise in raw material prices due to the timing difference between the inventory turnover rate and the invoiced alloy surcharge. The rise in the cold rolled base price in Europe evened out toward the end of the year, and the price level has declined slightly at the beginning of 2005. In addition to the trend in the base price, the factors contributing on Outokumpu’s profi tability in 2005 are the growth in deliv-
Financial development excluding items affecting comparability
Sales Operating profi t
€ million 2004 2003 2004 2003
Outokumpu Stainless
Coil Products 3 503 2 749 320 98 Special Products 1 650 1 297 69 (1) North America 367 252 22 5 Others (883) (848) 14 4
Outokumpu Stainless total 4 637 3 450 425 106
Outokumpu Copper
Regional businesses 1 226 721 12 (1) Global businesses 879 707 16 27 Others (56) 200 (6) 1
Outokumpu Copper total 2 050 1 628 23 27
Outokumpu Technology 423 405 8 5
Zinc – 396 – 20
Other operations 163 263 (39) (72)
Intra-group items (136) (220) 0 3
The Group total, excluding
items affecting comparability 7 136 5 922 417 89
LIFO-FIFO inventory adjustment of Outokumpu Copper 22 (2)Release of the Finnish TEL disability pension liability 36 –Gain on the sale of the fi lter business 16 –Stelco Hardy closure provision (3) –Waalwijk closure costs (7) –Loss on the sale of the Boliden shares (19) –Gain on the Boliden transaction (1) 120Excess of Outokumpu’s interest in thenet fair value of acquired net assets over cost – 23Gain on the sale of Arctic Platinum Partnership – 26Gain on the sale of the Inmet shares – 10Gain on the sale of the precious metals assets – 9Panteg closure 7 (7)Provisions for the copper tube cartel fi nes – (54)
The Group total, offi cial operating profi t 7 136 5 922 468 214

13Outokumpu 2004
ery volumes of stainless steel, an improved product mix and lower unit conversion costs. Total deliveries of fi nished prod-ucts are estimated to grow by well over 20% in 2005, depend-ing on the market situation. Comparable operating profi t of Outokumpu Stainless in January–June 2005 is estimated to be at least at the level of the same period a year earlier.
Outokumpu Copper’s sales were up 26%. The growth was due principally to the fabrication business that was acquired from Boliden at the end of 2003 and to the rise in the price of copper. Comparable operating profi t was EUR 23 million, and profi tability was still unsatisfactory. The average conversion margin of Outokumpu’s copper products fell by 10%. Demand for copper products is expected to hold up moderately well in the fi rst part of 2005. Across the whole copper products indus-try, any improvement in volumes or conversion margins during 2005 is likely to be rather modest. Based on the current market prospects and order backlog, Outokumpu Copper’s compara-ble operating profi t for the fi rst six months of 2005 is expected to improve on the same period of last year.
The recovery in industrial investments in 2003 was refl ected in a slight growth in Technology’s sales. Comparable operating profi t was nonetheless still unsatisfactory, though it improved markedly from the previous year. The order backlog fi rmed up signifi cantly, rising to a record level of EUR 458 million at the end of the year. In 2005, Technology’s comparable operating profi t is forecast to improve slightly.
Profi tability analysis by business
Operating profi t margins showed an improvement on the pre-vious year, especially for the stainless steel units. Because of the sharp rise in raw material prices, a greater amount of cash was tied up in working capital in step with the growth in business volume. In addition, the uncompleted investment program at Tornio weakened the relative capital turnover ratio in the Coil Products division. The return on operating capital of all of Ou-tokumpu Stainless’ divisions, Outokumpu Copper’s Americas and Europe divisions and Technology exceeded the Group’s av-erage cost of capital before taxes.
Operating capital and return on operating capital in 2004
Op
erat
ing
pro
fi t
mar
gin
, %
Capital turnover ratio
The return on operating capital (ROOC) shown in the above chart comprises two components: the operating profi t margin and the capital turnover ratio. There are two
curves for ROOC. Each point on the upper curve gives a 13% target return on operating capital and, similarly, the lower curve indicates the Group’s 8% weighted average
cost of capital before taxes. If a business unit does not cover the weighted average cost of capital, it will generate negative economic value added. The higher the capital
turnover ratio, the less the change in the operating profi t margin will impact ROOC. The size of the circle refl ects the amount of operating capital tied up into a business
unit. Not shown in the chart are Outokumpu Stainless’ North America (capital turnover ratio of 13.9 and operating profi t margin of 6.0%) and Outokumpu Technology
(capital turnover ratio of 10.9 and operating profi t margin of 3.0%).
%
Return on capital employed
Comparable
Offi cial
14
A favorable trend in shareholder value
At the end of 2004, Outokumpu Oyj had a market capitaliza-tion of EUR 2 383 million, an increase of EUR 460 million during the year. Outokumpu paid dividends of EUR 36 mil-lion in 2004.
According to the dividend policy established by the Board of Directors the dividend payout ratio over a business cycle should be at least one-third of the company’s net profi t for the period. In its dividend proposal, the Board takes into account not only the fi nancial results but also the Group’s investment and development needs. The proposed dividend for 2004 is EUR 0.50 per share, corresponding to 23.6% of the Group’s profi t for the fi nancial year attributable to equity holders of the company. The effective dividend yield is thus 3.8%. Outo-kumpu’s average dividend payout ratio over the past fi ve years has been 35.4%.
Outokumpu’s overall fi nancial objective is to generate maxi-mum sustainable economic value added on the capital invested by shareholders. Outokumpu makes use of the weighted aver-age cost of capital (WACC) in defi ning the capital charge for economic value added, and it applies this for purposes such as estimating the profi tability of investment projects and defi ning the economic and commercial value of its business operations.
In 2004, Outokumpu’s weighted average cost of capital after taxes was about 6%. The fi gure was obtained using a target capital structure in which the weight of the equity cost was 60% and the weight of debt 40%. The cost of equity was 7.5% and the after-tax cost of debt was 3.7%.
In 2004, Outokumpu generated EUR 136 million of eco-nomic value added with a 6% WACC.
Clear strategic focus: to be the number one in
stainless steel
Since 2000, Outokumpu has forged ahead with its strategy of growth and transformation. The target has been to double the size and profi ts of the businesses and to carry through the trans-formation by focusing on more downstream and higher-mar-gin businesses by 2004–2005. Outokumpu has more than doubled its sales, to over EUR 7 billion. Its position in the fast-growing stainless steel sector has strengthened substantially, and the company has exited the mining business as well as pro-duction of zinc and copper metal. The earnings targets have nevertheless not been reached in all areas. For example, the re-turn on capital employed has fallen below the 15% target, and the debt-to-equity ratio at the end of 2004 was 97.2%, exceed-ing the 75% target level.
In August 2004, Outokumpu’s Board of Directors outlined the Group’s future strategic focus: to achieve the leading posi-tion in stainless steel. Concurrently, a study was launched of the alternatives for exiting the fabricated copper products busi-ness. A focus on stainless steel is a logical continuation of the development of Outokumpu’s business portfolio. Over the next few years, Outokumpu will devote resources to the effi cient uti-lization and marketing of the new capacity from Tornio, and to stepping up business processes.
Management discussion on the fi nancial results and strategy
At the beginning of 2005, the new vision of targeting the leading position in stainless was outlined, fi nancial targets were updated and a decision was made on the new management sys-tem and organization that will come into effect at the begin-ning of April. At the same time, it was decided to continue developing the technology business as part of the Outokumpu Group. The role of the technology business will henceforth be more independent and, from the Group’s perspective, the busi-ness will be steered by Outokumpu Technology’s board of di-rectors. Outokumpu Copper, too, will be managed on a sepa-rate basis until the business has been divested.
Outokumpu’s future success will be based on building and strengthening operational excellence in both commercial ac-tivities and in production. In addition, Outokumpu is study-ing possibilities to increase capacity to gain economies of scale, develop its distribution and service center network, and expand its product range to bright annealed and ferritic grades. The objective is to secure the number one position in Europe with-in stainless steel over the next fi ve years and the leading posi-tion globally ten years out. To reach the leading position world-wide, Outokumpu intends to obtain production capacity also outside Europe, either through greenfi eld investments or by way of suitable acquisitions or alliances.
Outokumpu continually monitors the development of its business portfolio in order to ensure that the businesses fi t in with the Group’s strategy and reach the profi tability and per-formance targets that have been set. This furthermore involves an assessment of potential acquisition and divestiture candidates that would improve the value of the Group’s business portfolio.
Financial targets in line with the new vision
Outokumpu’s overall fi nancial objective is to generate maxi-mum sustainable economic value added on the capital that shareholders have invested in the company.
At the group-level the fi nancial targets for growth, profi ta-bility and the balance sheet structure – targets that tie in with the objective of achieving the number one position in stainless steel – are the following:
• To continue growing faster than the market• A return on capital employed of over 13% and always the best among peers • Gearing below 75%
Factors affecting Outokumpu’s profi tability
Outokumpu’s business is cyclical. Profi tability depends not on-ly on Outokumpu’s own actions but also, in particular, on in-dustrial investments. Furthermore, changes in the operating environment, the overall economic situation as well as the busi-ness cycle affect Outokumpu’s fi nancial results. Metal prices no longer have a major impact on Outokumpu’s fi nancial per-formance. Instead, the main factors driving profi ts are the con-version margins for stainless steel and copper products. The prices of metal raw materials nonetheless feed through into the amount of capital tied up in operations.

15Outokumpu 2004
Within stainless steel business, operating profi t is affected not only by conversion margins but also, chiefl y, by unit costs, delivery volumes and product mix. The conversion margin for stainless steel is calculated by deducting the raw material costs from the transaction price. The transaction price is the selling price of stainless steel and is equal to the base price of stainless steel plus the alloy surcharge. The alloy surcharge that is applied in Europe and in North America includes the cost of the alloy-ing elements in stainless steel: principally nickel, chrome, mo-lybdenum and scrap iron. Typically, the base price charged to the customer is fi xed, and the risk relating to changes in the cost of the alloys is passed on to the customer through the alloy sur-charge. Because the alloy surcharge mechanism is in use only in Europe and in North America, the nickel portion of the price in the fi xed-price sales contracts that are customary in Asia, for ex-ample, is hedged through derivative contracts. Because changes in market conditions affect the base price, movements in the base price show which way the market is headed. Changes in the base price are directly refl ected in the conversion margin and in the company’s profi tability. The overall price and the conversion margin for stainless steel are linked to the economic cycle, and especially to the level of industrial investments in the main cus-tomer segments. Changes in the conversion margin are also part-ly attributable to strong fl uctuations in demand, which is often refl ected in the de-stocking and re-stocking cycle.
In the fabrication of copper products, operating profi t is de-termined mainly on the basis of the level of conversion mar-gins, unit costs, delivery volumes and the product mix. The conversion margin for the copper products fabrication business is the difference between the unit price of the raw material – copper metal – and the unit price of the product sold to the customer. Conversion margins for fabricated copper products are mainly dependent on the demand in customer industries and competition. Changes in the conversion margins for cop-per products have generally not been as strong as they are for stainless steel.
The pricing currencies for stainless steel and fabricated cop-per products are as a rule determined by the market area: euros in Europe and US dollars in the US and Asia. Price levels be-tween Europe, the US and Asia may vary. Outokumpu’s pro-duction costs, in turn, are for the most part in euros, Swedish kronor and British pounds. Prices of raw materials are deter-mined primarily in US dollars.
In the production of stainless steel and the fabrication of copper products, the capacity utilization rate also has a major impact on operating profi t. Production volumes depend on de-mand, and products are manufactured mainly to fulfi ll orders. Apart from delivery volumes, the product mix also has an effect on profi tability, because the conversion margins for products vary with the value-added component.
The table below shows the sensitivity of Outokumpu’s oper-ating profi t and working capital in 2005 to changes in conver-sion margins, raw material prices and the foreign exchange rates between the main currencies and the euro.
Key exchange rates
EUR/USD EUR/GBP EUR/SEK
10% sustained increase, effect on operating profi t
€ million Stainless Copper Group
Conversion margin 235 75 310
Ferrochrome price 15 – 15
USD/EUR 45 10 55
SEK/EUR (60) (5) (65)
GBP/EUR (30) 0 (30)
The fi gures are estimates and the effect of hedging has not been taken into
account. They are calculated on the basis of the average prices and exchange
rates in 2004 and planned production during 2005.
10% sustained increase, effect on working capital
€ million Stainless Copper Group
Nickel price 70 – 70
Chrome price 15 – 15
Copper price – 30 30
The fi gures are calculated based on the year-end 2004 situation and average
prices in 2004.

16
Risk management
Outokumpu operates in accordance with the Board-approved risk management policy defi n-ing the objectives, approaches and areas of re-sponsibility of risk management. Risk manage-
ment supports the Group strategy and business targets. It fur-thermore defi nes a balanced risk profi le from the perspective of shareholders as well as other stakeholders, such as customers, suppliers, personnel and lenders.
Outokumpu has defi ned a risk to be anything that might have an impact on the activities the company has undertaken to achieve its objectives. Risks can thus be threats, factors of uncertainty or lost opportunities relating to present or future operations.
Outokumpu’s risk tolerance tells the range in which the Group’s capital structure, earnings and cash fl ow can vary. The Group Executive Committee confi rms each year the Group’s risk tolerance as part of strategic planning. The risk management process is part of the Group’s management system, and in practice it is divided into four stages: identifi cation of risks; assessment and measurement; control and mitigation; and reporting.
The Board of Directors is responsible for the Group’s risk management. The CEO and the Group Executive Committee are responsible for defi ning and putting risk management pro-cedures into use, and for seeing to it that risks are taken into account in strategic planning. The business units are responsible for managing the risks involved in their operations. The Group’s risk management function, in turn, supports the implementa-tion of the risk management policy and develops group-wide ways of working. The external and internal auditors monitor the proper functioning of the risk management process.
Strategic and business risks
Strategic and business risks relate to the nature of the business and are often diffi cult to quantify. Among others, strategic risks
relate to Outokumpu’s business portfolio, the market posi-tion and major investments. Business risks, in turn, are con-nected with the operating environment, customers’ behavior and the economic outlook. Outokumpu’s key strategic and business risks are presented in the following.
The global stainless steel market
The stainless steel market is divided into three main markets: Asia, Europe and the Americas. There are signifi cant trade fl ows between the regions despite some trade political barri-ers. Outokumpu’s key production facilities are located in Eu-rope and it has a global sales and distribution network. Ou-tokumpu’s main market area is Europe, and in recent years Asia has accounted for an increased share of sales, thanks to strong demand. The changes taking place in the market areas as well as regional differences – such as the prevailing supply and demand or price levels – can have an effect on Outo-kumpu’s competitive position and fi nancial performance.
Because of the very good demand prospects for stainless steel in China, a lot of new production capacity is being built there. China’s production and demand are estimated to be in balance by the end of the decade, and the country may be-come a net exporter to the other main regions. This may lead to tougher competition in the sector, with prices falling over the longer term. It is nevertheless not certain that China’s de-mand for stainless steel will continue growing in line with forecasts or that new capacity will come on stream as planned. Outokumpu is preparing for a possible overcapacity situation and the adverse effects of it by maintaining cost-effi cient pro-duction, broadening its product offering, improving its deliv-ery reliability and developing distribution channels. As set out in the strategy, Outokumpu will also study ways of strengthening its position outside Europe in the years ahead.

17Outokumpu 2004
Cyclical nature of stainless steel demand
Demand for Outokumpu’s main product, austenitic stainless steel, is sensitive not only to fl uctuations in actual end-user de-mand, but also to the changes in the price of nickel, its most valuable alloy element. Stockists often speculate on changes in the nickel price in timing their buying, and this too can affect Outokumpu’s sales volumes. Outokumpu seeks to mitigate this risk in several ways, such as by increasing the number of direct end-use customers. Over the short-term, variations in the price of nickel can also feed through into Outokumpu’s earnings.
Raw materials and energy
Apart from its own ferrochrome production, Outokumpu is dependent on external suppliers for the raw materials it uses and, as a rule enters into long-term agreements with them. The availability and price of many raw materials and energy are subject to fl uctuation. A tightening up of the availability of raw materials and energy or a signifi cant rise in their prices may have an adverse effect on Outokumpu’s operations and profi ts if the risk mitigation measures by Outokumpu prove insuffi cient or if the price rise cannot be passed on to custom-ers. The carbon dioxide emissions trading that started in the European Union from the beginning of 2005 will in the early stages affect Outokumpu mainly through a possible rise in the price of electrical energy because the emissions allowances now received are by and large suffi cient. Outokumpu has prepared to meet higher electricity prices not only through hedging, but also by stepping up the effi ciency of the use of energy at its plants, concluding long-term delivery agreements and acquir-
ing stakes in power generation companies. Price risks are dis-cussed in greater detail in note 18 to the consolidated fi nancial statements on pages 82–83.
Competition in the stainless industry
Competition in the stainless steel industry is fi erce, and factors such as competitors’ increases in production capacity, a de-crease in prices or the development of better or new products and services can weaken Outokumpu’s position in relation to its competitors. Producers also compete with manufacturers of substitute materials, such as other metals, plastics and compos-ites. Outokumpu’s competitiveness and long-term profi tability depend to a signifi cant extent upon its ability to maximize ca-pacity utilization rates, maintain cost-effi cient production and strengthen its position in the markets for higher value-added products as well as its prowess in creating long-term customer relationships. On the other hand, stainless steel is fi nding many new applications where other materials, such as carbon steel, have previously been used. One of the key advantages of stain-less steel over competing materials is its low life-cycle costs.
Operational risks
Operational risks arise as a consequence of inadequate or failed internal processes, people’s actions, systems or external events. Risks of this kind are often connected with a plant’s operations, projects, information technology or infrastructure, and if they materialize, this can lead to liability, loss of property, suspen-sion of operations or environmental impacts. Outokumpu has defi ned the implementation of procedures for identifying,
Implementation of procedures for identifying, assessing and reducing operational risks as a key risk management priority.

18
assessing and reducing operational risks as a key risk manage-ment priority. Risk surveys are carried out on an ongoing basis to assess such risks and to keep them under control. Part of Outokumpu’s operational risks are covered by insurance.
M&A activity and management resources
Outokumpu’s growth, competitive position and profi tability have been bolstered signifi cantly in recent years through acqui-sitions and the integration of the companies acquired. Outo-kumpu’s continuing success will depend largely on its manage-ment and other key employees. Outokumpu has not had dif-fi culties in hiring and retaining skilled personnel.
Property damage and business interruptions
Major part of Outokumpu’s production is located in large in-dustrial areas comprising a number of separate buildings and production lines. The production of stainless steel furthermore involves production and logistics integration between the fa-cilities in Tornio, Avesta, and Sheffi eld and in other smaller fa-cilities. The production is capital intensive and a large part of the Group’s operating capital is tied up in the above-mentioned facilities. For example, a fi re or a serious machine failure can lead to major property damage or loss of production, or have other indirect adverse effects on Outokumpu’s operations. Ou-tokumpu endeavors to guard against such risks by continually evaluating its production facilities and processes from the risk management perspective and by arranging reasonable insur-ance coverage for a large part of these risks.
Financial risks
Financial risks comprise market, liquidity and credit risks. One of the main market risks is the price of nickel, which is used as a raw material in stainless steel. A signifi cant portion of the risk due to fl uctuations in the nickel price is passed on to the cus-tomer in the form of an alloy surcharge that is added to the base price. Price fl uctuations nonetheless also have a major impact on the Group’s working capital requirement. The principal task of Outokumpu’s fi nancial risk management is to reduce the im-pacts on earnings caused by price fl uctuations and other factors of uncertainty as well as to ensure suffi cient liquidity. Financial risk management is discussed in detail in note 18 to the con-solidated fi nancial statements on pages 82–83.
Risk management

19Outokumpu 2004
Global GDP rose by about 4% in 2004, one of the strongest levels in the last decade. Growth was buoyant in the US, Japanese activity continued to improve, and China enjoyed another year of
rapid expansion. Growth also strengthened in many develop-ing economies in Asia and Eastern Europe. The weakest region was the euro area, especially Germany and Italy, where activity remained very sluggish.
Business and consumer surveys remain generally supportive, and suggest that the global economic expansion will remain fi rm during the fi rst half of 2005. However, the pace of growth is clearly moderating. This is already apparent in the US, where worries about the sustainability of the current account defi cit have been increasing, and Japanese growth has also been slow-ing sharply. There is also little sign of activity improving in Western Europe, where hopes of recovery are being under-mined by the strength of the euro. Growth in China remains remarkably strong, but even here growth is expected to moder-ate over the next few months.
Demand in key end-uses for stainless moderating
from a high level
The main end-uses for stainless steel were strong during 2004. However, activity showed signs of slowing toward the end of the year, and growth in many sectors is expected to moderate during 2005.
Global demand from the process industries and from the industrial machinery and equipment sectors was buoyant dur-ing 2004 as companies increased investment in response to strong demand. Investment spending rose at double-digit rates
in the US and China. Business surveys suggest that spending in these areas will continue at a high, though slightly less rapid level, in 2005. In Europe, investment spending is expected to remain subdued.
Spending in the catering and household sector was strong during 2004. The most spectacular growth took place in devel-oping Asia and in Eastern Europe. In the US, consumers con-tinued to spend at record levels, and there was also a recovery in Japanese consumption. In Western Europe, household spending was fi rm in Britain and Spain but remained very weak in Germany. Higher interest rates are expected to dampen glo-bal spending a little during 2005.
In the transportation sector, worldwide vehicle production in 2004 achieved the highest growth rate for fi ve years. Chinese output rose by nearly 20%, but sales and production in the US and Europe were little changed from 2003, and the outlook in these regions remains lackluster. With developing markets con-tinuing to grow strongly, the global vehicle market is expected to show further solid growth over 2005. Orders in the aero-space industry are also expected to strengthen as the aviation business continues a slow recovery.
The construction sector enjoyed an excellent year in 2004. The US market was particularly strong, underpinned by low interest rates, and construction spending continued to rise at a spectacular rate in China. Activity in Eastern Europe was also healthy, and there was a modest improvement in Japan. Growth in Western Europe remained anemic, however. Higher interest rates and a possible housing price bubble in some markets sug-gest that global activity in construction will moderate during 2005.
Global economic activity should remainfi rm into early 2005.
Market review

20
Stainless steel consumption up nearly 17% in the
past two years
Judged against the strong economic background, demand for stainless steel was slightly disappointing in 2004: global appar-ent consumption of cold rolled and hot rolled fl at products rose by an estimated 6%. However, the fi gures were distorted by massive Chinese stock building in late 2003, and subsequent de-stocking in the fi rst half of 2004. Over 2003-2004, world consumption rose by almost 17%. In terms of the major mar-kets, the US was the strongest in 2004, with consumption growing by about 7%. Western European consumption grew by just over 4%, which is satisfactory given the weakness of eco-nomic activity in the region. Chinese apparent consumption rose by a modest 6%, constrained by heavy de-stocking.
European conversion margins showed an encouraging im-provement in 2004. According to CRU, average conversion margins for cold rolled stainless steel in the benchmark Ger-man market (transaction price of grade 304 minus the cost of raw materials) rose by nearly 5% compared to the 2003 aver-age, while average base prices rose by 2%. In the US and Asia, prices were on a fi rm rising trend in 2004, partly due to the increasing alloy surcharge.
These positive trends in European consumption and con-version margins look even more impressive given the impact of the alloy surcharge during the year. The alloy surcharge is added to the base price of stainless steel when the prices of the main alloying elements rise above a certain threshold level. In July 2003, the alloy surcharge on cold rolled 304 was about
350 EUR/tonne, but as the prices of the raw materials spiraled, so the alloy surcharge rose, peaking at 935 EUR in October 2004. The base price rose by only 45 EUR over the same peri-od. From a customer’s point of view, the transaction price of stainless 304 had thus risen by some 630 EUR/tonne, or about 36%, between mid-2003 and late 2004.
The rapid increase in stainless prices due to the rising alloy surcharge, and the volatility of the surcharge, had a detrimental impact on the austenitic stainless steel market in 2004. The stocking and de-stocking cycle was exacerbated as customers either bought heavily or adopted a wait-and-see approach in response to falls or increases in the surcharge. There was also some evidence of substitution away from nickel containing 300-series to other materials in response to high prices. How-ever, in the past substitution losses have usually been tempo-rary, and austenitic stainless typically regains market share when the nickel price falls.
Raw materials prices rose strongly
The rise in the alloy surcharge was, above all, attributable to the rise in the nickel price. The 2004 average price of USD 6.27/lb was the highest ever, and 44% above the year-before level. The main reason for the increase was under-investment in new supply in earlier years, compounded by strong demand and by a shortage of scrap. The resulting market defi cit saw the stock-consumption ratio fall to the lowest-ever level. The general expectation is that nickel prices will remain high and volatile for at least the fi rst half of 2005. Although supply is
Market review
Annual market prices
2000 2001 2002 2003 2004
Change, %2004/2003
Stainless steelTransaction price €/kg 2.07 1.65 1.72 1.80 2.25 25.0Base price €/kg 1.52 1.28 1.41 1.40 1.43 2.1Conversion margin €/kg 1.03 0.80 0.91 0.87 0.91 4.6
Nickel US$/lb 3.92 2.70 3.07 4.37 6.27 43.5€/kg 9.35 6.64 7.16 8.52 11.11 30.4
Ferrochrome (Cr-content) US$/lb 0.43 0.32 0.31 0.43 0.69 60.5€/kg 1.03 0.79 0.73 0.84 1.22 45.2
Molybdenum US$/lb 2.61 2.39 3.94 5.40 16.39 203.5€/kg 6.22 5.90 9.18 10.52 29.05 176.1
Iron scrap US$/t 90 97 102 147 236 60.5 €/t 83 93 107 130 190 46.2
Copper US$/lb 0.82 0.72 0.71 0.81 1.30 60.5€/kg 1.96 1.76 1.65 1.57 2.30 46.5
Sources:
Stainless steel: CRU - German transaction price, base price and conversion margin (2 mm cold rolled sheet), estimates for
deliveries during the period. CRU has revised the formula for conversion margin in March 2005. Figures are presented
according to the new formula.
Nickel and copper: London Metal Exchange (LME) cash quotations converted into USD/lb and EUR/kg.
Ferrochrome: CRU - US imported high carbon 50-55% Cr.
Molybdenum: Metal Bulletin - molybdenum oxide, Europe.
Iron scrap: Metal Bulletin - HMS 1 fob Rotterdam.

21Outokumpu 2004
now rising quickly, fi rm demand is expected to keep the mar-ket very tight.
The price of the other main alloying element for stainless steel, ferrochrome, also rose strongly in 2004. The average price of 69 USc/lb was 60% above the 2003 level. The increase was partly attributable to fi rm demand, but dollar-denominated prices also rose in response to a sharp increase in costs at the South African producers, which dominate the market. Low stock levels suggest that prices will remain high over the near term.
Molybdenum price trends in 2004 were impressive. From an average of USD 5.40/lb in 2003, the price of molybdenum oxide delivered in Europe rocketed to more than USD 30/lb by the end of 2004. At USD 16.39/lb, the average price in 2004 was the highest for 25 years. The increase was attributable to a combination of strong demand and inadequate investment in supply, exacerbated by lower exports out of China. As with the other alloying metals, prices are expected to remain high for at least the fi rst half of 2005.
Stainless steel mills also had to cope with big increases in other raw material costs, notably for iron scrap. Extremely strong demand for steel products, and thus for scrap raw mate-rial, resulted in the average dollar price of scrap rising by about 60% during 2004 compared to 2003. The increase was so large that stainless steel producers in Europe introduced an iron scrap component to the alloy surcharge during the second quarter to compensate for part of the additional cost. It is like-ly to remain in force also this year given that scrap prices are expected to remain high.
Encouraging year for other stainless products
The other stainless steel products also suffered from the volatil-ity of alloy prices, and some stainless-intensive investment projects were delayed. Even so, 2004 was a generally encourag-ing year.
In hot rolled coil, the European market was very strong at the beginning of 2004, but weakened toward the year-end. The fall was partly due to alloy price volatility, which put pressure on margins. Chinese demand for hot rolled increased substan-tially in the fourth quarter and is expected to remain strong into 2005 due to a short-fall of hot rolling capacity as new Chi-nese cold rolling facilities ramp up. Demand from Eastern Eu-rope is also expected to remain fi rm.
The quarto plate market developed well during 2004. Euro-pean base prices rose strongly and look likely to rise further in early 2005. Demand from Asia was healthy and deliveries with-in Europe were also fi rm, especially in the fi rst half. Demand was underpinned by strong activity in sectors such as chemical tankers, pulp and paper, liquefi ed natural gas (LNG) and de-salination. Demand for long products was also good during 2004, especially in the US, and prices improved modestly. Market supply for some products is expected to be tight in early 2005, and prospects for the fi rst half of the year look pos-itive.
The year was more mixed for the precision strip market. Demand was subdued in the fi rst half of 2004, but a signifi cant recovery was seen in the second half, which in turn enabled prices to be increased. Increased competition in both Europe
Ferrochrome
price
Nickel price
and stocks
Source: LME and CRU.
Stainless
steel price
Source: CRU.
€/kg US$/lb US$/lb1 000tonnes
Price
StocksSource: CRU.
Transaction price
Base price
Conversion margin

22
Further ahead, capacity growth, and especially capacity growth in China, will be a key issue for the stainless industry. A number of large Chinese projects are in prospect, and their im-pact from 2006 onwards will be considerable. Even so, if global consumption continues to rise at the same rate as in the last ten years, then global capacity utilization rates in both slab and cold rolling are likely to remain relatively high during the next few years. The rapid growth of Chinese capacity will, however, substantially change the world trade pattern in stainless steel fl at products, and China could become broadly self-suffi cient in cold rolled stainless steel by the end of the decade.
Consumption of copper products rose strongly
In volume terms, 2004 was an excellent year for copper and copper alloy products. US consumption rose by more than 9%, helped by substantial re-stocking in the early part of the year, and Asian consumption improved by a similar level thanks to continuing strong growth in China. In contrast, the weak eco-nomic background resulted in Western European demand rising by only about 2.5%, and prices remained under pressure. The high and volatile price of copper, and rising premiums on cathode, increased the pressure on conversion margins in all markets.
In the US, contract prices on many products are expected to rise, refl ecting the strength of the market through most of 2004. However, demand in all regions slackened during the last few months of the year and remained rather slow in early 2005. European mills also face tough competition because of the weak US dollar. Across the whole copper products business,
and Asia, exacerbated by dollar weakness, suggests that down-ward pressure on prices is likely in the early months of 2005. The near-term outlook for the tube and fi ttings market is also uncertain. Global demand weakened in the second half of 2004 and base prices fell to their lowest level for several years. Weak demand in Europe and rising capacity at many tube mills makes any increase in base prices unlikely in the short term.
Global stainless utilization rates high
According to CRU, typical German base prices for cold rolled 304 were stable at 1 425 EUR/tonne in the last four months of 2004, though a fall of around 40 EUR/tonne was reported in January 2005. The low level of European economic activity is constraining demand, and the volatility of the alloy surcharge remains a distorting infl uence on the pattern of consumer buy-ing. European producers also face diffi culties stemming from the strength of the euro, which is reducing the euro-denomi-nated cost of imports into Europe.
Nevertheless, orders have improved in early 2005 and the short-term fundamentals of the stainless steel industry remain satisfactory. Global melting capacity is predicted to grow by less than 5% in 2005, while cold rolling capacity is predicted to rise by about 6%, more or less in line with growth in world de-mand. Global utilization rates, which were at a reasonable level in 2004, are therefore expected to remain satisfactory during 2005. This provides a supportive background, suggesting that average base prices and conversion margins in 2005 would re-main at good levels, in spite of the slight decline at the begin-ning of the year.
Market review

23Outokumpu 2004
any improvement in volumes or conversion margins during 2005 is therefore likely to be rather modest.
Improved investment activity boosting
technology sales
The years 2001 to 2003 were extremely diffi cult for technology sales, as companies cut back investments in response to low metals prices and poor profi tability. As prices and sentiment in the metals markets improved, investment activity recovered, and Outokumpu Technology’s order intake strengthened mark-edly in the second half of 2004. Activity in ferrous markets was particularly buoyant. Orders were strongest in Asia, Australia and South America.
The outlook for technology sales in 2005 is positive. New capacity is needed in mines and metallurgical facilities in both the ferrous and non-ferrous sectors. The mood in the markets remains bullish, and industry profi tability is running at a high level. Given this background, investment activity in the metals industry is expected to be very strong over the next few years.
Conversion margin of
copper products
Average conversion margin for Outokumpu’s copper products. Includes changes in product mix and exchange rates.
€/kg

24
Demand for stainless steel is growing fastest of all metals and the use of it is bound strongly to the rising standard of living. During the past ten years, global demand has increased by nearly
7% per annum. Since 2003 China has taken the leading posi-tion as the largest and clearly the fastest growing market. Last year, the consumption of cold rolled stainless steel in China ac-counted for more than a quarter of the global consumption.
Stainless steel is corrosion resistant, strong, hygienic and re-cyclable. These properties make stainless steel an ideal choice for various demanding industrial and consumer applications – to the pulp and paper as well as chemicals industry, construc-tion, car industry, food processing, household appliances and even razor blades. A number of life-cycle studies indicate that in many applications the total cost of stainless steel is lower than that of competing materials.
Outokumpu’s main product is stainless steel coil, in which it has a market share of about 25% in Europe and 8% world-wide. Outokumpu also produces stainless steel sheet and plate, precision strip, long products, tubes and various tube fi ttings, fl anges and welding consumables. The product range covers both standard and special grades and the products are available in various dimensions and surface fi nishes. Furthermore, Outo-kumpu is widely recognized as a leader in technical support, as well as in research and development. A comprehensive network of sales companies, service centers and sales agents in more than 40 countries complement the extensive product range of the Outokumpu plants in Finland, Sweden, Britain and the US.
Outokumpu has a strong market position because it is one of the world’s largest and most cost-effi cient producers of stain-less steel. The annual slab production capacity will rise to 2.75 million tonnes and the capacity for cold rolled products and white hot strip will reach 1.9 million tonnes when the Tornio expansion comes fully on stream.
The objective is to maximize the benefi ts deriving
from investments and restructurings
The large-scale investment program that was launched at the Tornio plant in 1999 is one of the cornerstones of the restruc-turing of Outokumpu’s stainless operations. The objective is to create a production structure, in which each plant has a clearly defi ned role. The cost-effi cient Tornio plant in Finland pro-duces large volumes of standard products, the Avesta plant in Sweden is specialized in wide and thick products, and the cold rolling mill in Kloster in thin stainless steel strips.
Effi cient commissioning of the Tornio expansion and bring-ing the increasing volumes and new products into the market in a well-controlled manner will remain Outokumpu’s key tar-get in order to ensure that the profi tability targets are achieved. Furthermore, operational performance will be improved across the organization via the Excellence programs as of April and other development projects. The emphasis will be on utilizing raw materials effectively and optimizing the internal material fl ows in order to reduce working capital, strengthening of the melt shop performance and delivery reliability as well as im-proving quality and occupational safety.
The key objective is to maximize the benefi ts derivingfrom the Tornio expansion.
Outokumpu Stainless

25Outokumpu 2004
Sales
€ million
Operating profi t
€ million
Sales by market area
Europe 70%(Finland 5%)
North and SouthAmerica 11%
Asia 17%
Others 1%Australia and Oceania 1%
In the coming years, Outokumpu’s priority will be on im-proving operational performance and fi nancial results through internal development programs. However, possibilities to in-crease capacity in order to gain economies of scale, to develop the distribution and service center network and to broaden the product range with bright annealed and ferritic grades, are ar-eas that are continuously studied. To reach the leading position worldwide, Outokumpu needs to obtain production capacity also outside Europe. Therefore greenfi eld investments and suit-able acquisitions or alliances are being contemplated.
Investment projects proceeded, restructurings
continued
The EUR 1.1 billion Tornio expansion program proceeded sig-nifi cantly during 2004. The modernization of the older melt shop was carried out in the third quarter, and the commission-ing of the new stands to increase the capacity of the hot rolling mill to 1.65 million tonnes was completed in September. The idled walking beam furnace in the hot rolling mill will go into operation again by the end of March after which the full capac-ity is available. Ramping-up of the new cold rolling capacity (RAP5) is continuing according to plan. All the RAP5 products have been produced, and the full capacity is planned to be tech-nically available in mid-2005. Market conditions are taken into account in the production volumes and product mix.
The Panteg cold rolling mill in Britain was closed in March 2004 as planned. In September, a decision was made to close the operations of Stelco Hardy, which produces welded stain-
Comparable
Offi cial

26
less steel tubes in Wales, by the end of March 2005. The deci-sion was taken against a background of continued losses, and a provision of EUR 3 million was recognized for the closure.
In December 2004, Outokumpu decided to invest EUR 53 million in the cold rolling mill producing thin strip in Kloster, Sweden. The investment will spread over a two-year period with the majority to be spent in 2006. The investment will raise the plant’s annual capacity from 25 000 tonnes to 45 000 tonnes and enable the production of even thinner and wider strip. The investment includes a new cold rolling mill, a bright annealing line and a slitting line. The new capacity is scheduled to be in place by the end of 2006.
At the Kemi mine the gradual move to underground min-ing by 2007 is proceeding according to plan. Increase in long products capacity in the US was inaugurated in October.
Comparable operating profi t quadrupled
Global demand for stainless steel in 2004 grew by an estimated 6%. The growth was led by China, and in Europe the growth came to 4%. Very high and volatile raw material prices resulted in a signifi cant fl uctuation in demand as stockists optimized the timing of their buying. In Europe the demand for cold rolled products weakened after the summer and remained slug-gish in the last quarter. Asian demand, especially for white hot strip, improved markedly after the summer and was very strong in the last quarter.
Sales of Outokumpu Stainless were up by 34% compared to previous year and the comparable operating profi t quadrupled to EUR 425 million. Total stainless steel deliveries stayed at the 2003 level, but deliveries for cold rolled products and white hot strip increased by 12%, thus improving profi tability. The 2% higher European cold rolled base price improved profi tability. Outokumpu also benefi ted from the high ferrochrome price through its own ferrochrome production. The rise in raw mate-rial prices had a positive effect on operating profi t because of
Outokumpu Stainless
4.2.2004Consolidation of the tubes and fi ttings businesses
26.4.2004Sheffi eld stainless steel service center inaugurated
4.5.2004Outokumpu wins order for fl ue-gas cleaning application
2.6.2004Environmental impact assessment starts at Tornio
5.8.2004New architectural contract for Coil Products Sheffi eld
30.8.2004The world’s fi rst overpass bridge in stainless steel ordered in Spain
31.8.2004Outokumpu aiming for the number one position in stainless steel
17.9.2004Outokumpu to close its tubular operations at Stelco Hardy in Wales
27.10.2004Stainless steel for chemical tankers in China
17.11.2004Lighter stainless steel bumpers contribute to improved fuel effi ciency in cars
25.11.2004Hot Rolled Plate receives major order for a bridge project in Hong Kong
3.12.2004Outokumpu to expand value-added thin gauge stainless capacity at Kloster
9.12.2004Major duplex order for Avesta

27Outokumpu 2004
timing difference between inventory turnover and alloy surcharge.
The rise in the cold rolled base price in Europe evened out toward the end of the year, and the price level has declined slightly at the beginning of 2005. In addition to the trend in the base price, the factors contributing on Outokumpu’s profi t-ability in 2005 are the growth in delivery volumes of stainless steel, an improved product mix and lower unit conversion costs. Total deliveries of fi nished products are estimated to grow by well over 20% this year, depending on the market situation. Outokumpu Stainless’ comparable operating profi t in January–June 2005 is estimated to be at least at the level of the same period a year earlier.
Research and development
The Avesta research center concentrates on product and appli-cation development whereas the emphasis of the research cent-er in Tornio is on process development and improving the quality of production processes. The small research and devel-opment team in Sheffi eld is developing stainless steel surface properties as well as demanding special products. The innova-tion team responsible for the HyTens® material – designed for the transportation and car industry – concentrates on solutions for vehicle components. In addition, new train construction solutions were developed based on ultra-high strength laser-welded sandwich panels. Research and development resources in Tor nio were committed to the installation and ramp-up of the hot rolling system and to revamping of the older melt shop. The development and optimization of new production routes for ferritic products continued. The fl exibility of the RAP tech-nology is showing potential also in ferritics production. The total research and development expenses were about EUR 16 million in 2004.
Key fi gures
€ million 2004 2003
Sales
Coil Products 3 503 2 749
Special Products 1 650 1 297
North America 367 252
Others (883) (848)
Total 4 637 3 450
Comparable operating profi t
Coil Products 320 98
Special Products 69 (1)
North America 22 5
Others 14 4
Total 425 106
Sales of the Group sales, % 64 56
Operating profi t 442 99
Operating profi t margin, % 10 3
Operating capital on Dec. 31 4 108 3 493
Return on operating capital, % 12 3
Capital expenditure 276 373
Depreciation 173 159
Deliveries of main products
1 000 tonnes 2004 2003
Cold rolled 891 867
White hot strip 432 316
Others 464 592
Total 1 787 1 775
Production
1 000 tonnes 2004 2003
Coil Products
Steel slabs 1 945 1 868
– of which Long Products’ share 287 349
Cold rolling mill production
– Cold rolled 866 807
– White hot strip 578 469
Special Products
Ferrochrome 264 250
Tubes 67 69
Quarto plate 127 116
Long products 1) 190 194
Precision strip 23 22
North America
Quarto plate, bar and tube 87 76
1) Other than slabs.
Personnel
Dec. 31 2004 2003
Coil Products 4 402 4 466
Special Products 3 279 3 342
North America 381 362
Others 1 008 1 060
Total 9 070 9 230
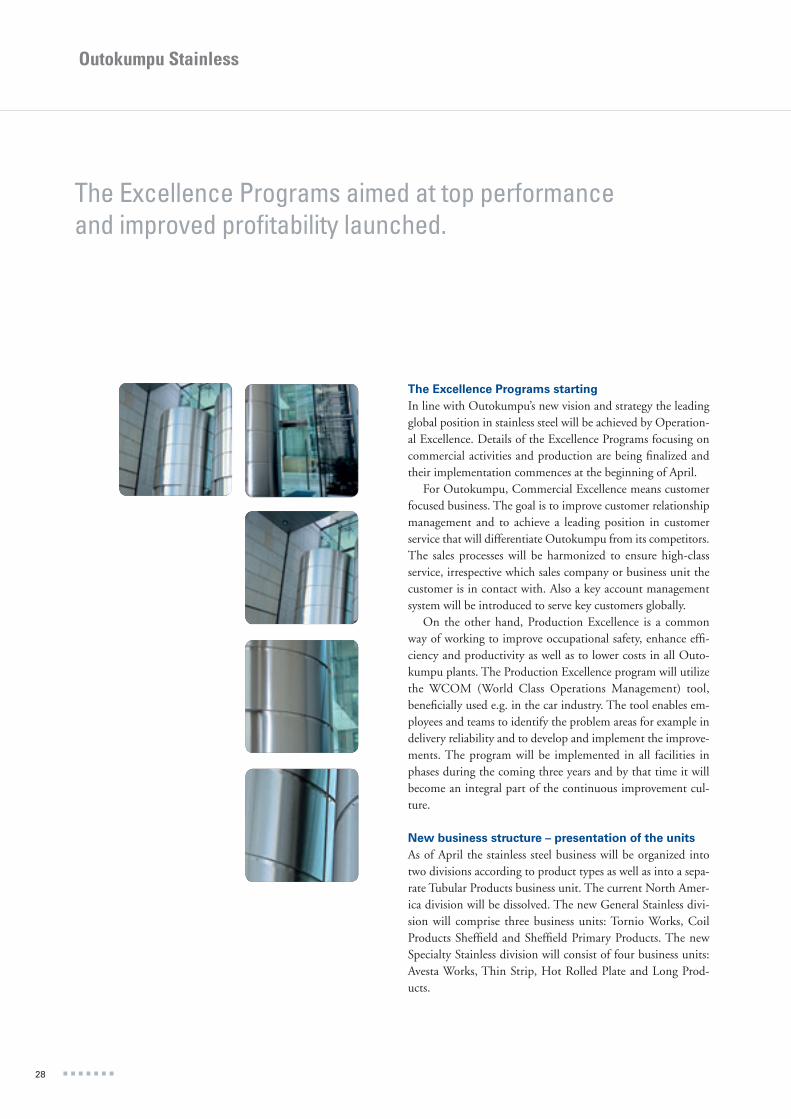
28
Outokumpu Stainless
The Excellence Programs starting
In line with Outokumpu’s new vision and strategy the leading global position in stainless steel will be achieved by Operation-al Excellence. Details of the Excellence Programs focusing on commercial activities and production are being fi nalized and their implementation commences at the beginning of April.
For Outokumpu, Commercial Excellence means customer focused business. The goal is to improve customer relationship management and to achieve a leading position in customer service that will differentiate Outokumpu from its competitors. The sales processes will be harmonized to ensure high-class service, irrespective which sales company or business unit the customer is in contact with. Also a key account management system will be introduced to serve key customers globally.
On the other hand, Production Excellence is a common way of working to improve occupational safety, enhance effi -ciency and productivity as well as to lower costs in all Outo-kumpu plants. The Production Excellence program will utilize the WCOM (World Class Operations Management) tool, benefi cially used e.g. in the car industry. The tool enables em-ployees and teams to identify the problem areas for example in delivery reliability and to develop and implement the improve-ments. The program will be implemented in all facilities in phases during the coming three years and by that time it will become an integral part of the continuous improvement cul-ture.
New business structure – presentation of the units
As of April the stainless steel business will be organized into two divisions according to product types as well as into a sepa-rate Tubular Products business unit. The current North Amer-ica division will be dissolved. The new General Stainless divi-sion will comprise three business units: Tornio Works, Coil Products Sheffi eld and Sheffi eld Primary Products. The new Specialty Stainless division will consist of four business units: Avesta Works, Thin Strip, Hot Rolled Plate and Long Prod-ucts.
The Excellence Programs aimed at top performance and improved profi tability launched.

29Outokumpu 2004
Tornio Works
The Tornio Works in Finland produces large volumes of stand-ard stainless steel grades. Within the product range the focus is on cold rolled, dry brushed and the new semi-cold rolled 2E product. Following the completion of the massive investments, the Tornio facility is the world’s largest integrated stainless steel facility and one of the most cost-effi cient producers worldwide. The Tornio Works’ capacities are: 1.65 million tonnes for melt-ing, 1.65 million tonnes for hot rolling and 1.2 million tonnes for the cold rolling mills. The steel melting process in Tornio is integrated with the ferrochrome production enabling the usage of molten ferrochrome. The Kemi underground mine produces more than one million tonnes of chromite ore per year, from which about 270 000 tonnes of ferrochrome is extracted.
Avesta Works
The Avesta Works in Sweden is a world-class supplier of 2 me-ter wide, thick cold and white hot rolled products and con-tinuously produced plate (CPP) to the process industry. The integrated Avesta production facility covers the entire process chain from the melt shop through the hot rolling operation to cold rolling. Avesta’s capacities are: about 600 000 tonnes for melting, one million tonnes for hot rolling and 300 000 tonnes for cold rolling. Avesta supplies Sheffi eld and Nyby cold rolling mills with black hot band material and plate to the hot rolled plate operations.
Thin Strip
Outokumpu’s thin strip operations include the cold rolling mills at Nyby and Kloster in Sweden and the specialty strip op-erations in Sheffi eld, Britain. These mills have a combined de-livery capacity of about 215 000 tonnes. Thin strips are main-ly used in plate heat exchangers, heating elements, fl exible tubes, head gaskets and telecom applications. The ongoing in-vestment program at Kloster will increase the overall capacity to 45 000 tonnes per year and enable the production of thin-ner and wider products.
Hot Rolled Plate
With its 50% share of the market, Outokumpu is the market leader in quarto plates that are used in the pulp and paper in-dustry, oil and gas industry, power plants and chemical tankers. Outokumpu produces quarto plate in Degerfors, Sweden and in New Castle, the US. Hot rolled plate is produced in Avesta. These facilities are complemented by European plate service centers. Outokumpu’s annual hot rolled plate and quarto plate delivery capacity is about 170 000 tonnes.
Long Products
Outokumpu’s long products operation encompasses wire rod and bar products as well as billets and blooms, which are the feedstock for bar rod, fl ange and seamless tube production. Manufacturing units for long products are in Degerfors, Swe-den, Sheffi eld in Britain, Richburg in the US, and a joint ven-ture Fagersta Stainless in Sweden. Outokumpu’s long products delivery capacity is about 80 000 tonnes per year.
Tubular Products
Outokumpu is one of the largest producers of stainless steel process tubes in Europe with a 15% market share. Tubular Products business unit manufactures and sells welded stainless steel tubes, pipes, fi ttings and fl anges. Tubular products are manufactured in Sweden, Finland, Belgium, the US and Can-ada. In tubes, Outokumpu’s delivery capacity is about 100 000 tonnes per year.
Kemi mine production
2004 2003
Ore excavated, million tonnes 1.2 1.1
Chromite concentrates, 1 000 tonnes 580 549
Ore reserves and mineral resources
Dec. 31, 2004 Million tonnes Grade
Ore reserves
Proved 51 25% Cr2O3
Mineral reserves
Measured 4 28% Cr2O3
Indicated 14 29% Cr2O3
Inferred 77 29% Cr2O3
The information has been prepared in accordance with the “Australasian Code
for Reporting of Mineral Resources and Ore Reserves, 2004 Edition”. A mineral
resource is a concentration or occurrence of material of intrinsic economic inte-
rest in or on the Earth’s crust in such form, quality and quantity that there are
reasonable prospects for eventual economic extraction. An ore reserve is the
economically mineable part of the measured and/or indicated mineral resource.
Ore reserves are not included in the mineral resources . Cr2O3 = chromium
oxide.
Coil Products Sheffi eld
Coil Products Sheffi eld in Britain produces stainless steel coil and sheet with either a bright annealed, brushed or HyClad® surface. The unit focuses on service to complement Tornio’s role as a low cost producer of standard material. Sheffi eld’s strengths are its geographical closeness to the main markets in Britain and continental Europe, and its premier stock facility enabling fast deliveries. Coil Products Sheffi eld’s total delivery capacity is about 320 000 tonnes per year.
Sheffi eld Primary Products
Sheffi eld Primary Products includes the Sheffi eld melt shop in Britain with a capacity of about 500 000 tonnes. The unit also comprises the long products rolling operations in Degerfors, Sweden. The unit produces slabs, blooms, as well as cast and rolled billets that are used as raw material feed in Outokumpu’s long products and hot rolled plate operations.

30
Outokumpu Copper’s main products are air-con-ditioning and refrigeration (ACR) tubes and heat exchangers, radiator strips, oxygen-free cop-per rods and busbars, architectural and roofi ng
products, sanitary and industrial tubes as well as welding elec-trodes. Outokumpu Copper concentrates on utilizing the su-perior properties of copper. In recent years, the focus of pro-duction has shifted to high value-added products such as super-conducting wires, components for electrical and electronic ap-pliances as well as coils for air-conditioners and heat exchang-ers. Strong technological know-how also provides a solid foun-dation for developing innovative applications in close coopera-tion with customers. Outokumpu is the world’s second largest manufacturer of fabricated copper products with a 10% share, and it has a strong market position in the US, Europe and Asia. Outokumpu also manufactures brass rod products that are used in the construction and automotive industries, and has an 8% market share in Europe.
Outokumpu Copper’s fi nancial result, like that of its com-petitors, has remained unsatisfactory in diffi cult operating en-vironment. Improving profi tability is still Outokumpu Cop-per’s key objective. Better profi tability is being sought by opti-mizing production capacity as well as by enhancing cost com-petitiveness and yield on capital.
Outokumpu Copper
Sales by market area
Europe 44%(Finland 2%)
North and SouthAmerica 38%
Asia 17%
Others 1%
Copper’s heat transfer, electrical conductivity and signal transmission properties are needed in developing living comfort, communications, energy production and construction.

31Outokumpu 2004
Operating profi t
Official
Comparable
Sales
€ million
Consolidation within copper products continues
Boliden’s copper tube and brass business in Sweden, the Nether-lands, Britain and Belgium was transferred to Outokumpu at the completion of the Boliden transaction at the end of 2003. The units acquired from Boliden along with the tube mills in Pori, Finland, Zaratamo in Spain and Västerås in Sweden were transferred to the new Tube and Brass division. The former Boli-den business was integrated, and as part of the process of ration-alizing the tube business, the Waalwijk sanitary tube mill in the Netherlands was closed in October 2004. Customers are now served from the other tube mills. In addition, a decision was made to transfer the operations of the small alloy wire plants in Edinburgh and Aldridge, both in Britain, to Pori in Finland, and to Appleton in the US.
In February 2004, Outokumpu and SMI of Italy completed an arrangement whereby Outokumpu exchanged its 50% hold-ing in the Spanish company LOCSA – Laminados Oviedo-Cór-doba S.A. for SMI’s superconducting wire manufacture in Italy as well as its ACR tube manufacture in China. The deal strength-ened Outokumpu’s position as the leading manufacturer of su-perconducting wire. Outokumpu’s other plants manufacturing superconducting wire are located in Pori, Finland as well as in Waterbury, the US. Via the deal, Outokumpu’s position as the world’s largest manufacturer of high-quality copper tubes for
€ million
Outokumpu is studying alternatives for exiting the fabricated copper products business, because the Group’s strategy is geared to achieving the leading position in stainless steel.

32
air-conditioning and refrigeration equipment and systems im-proved further with the addition of 6 000 tonnes of capacity at the mill in China.
In February 2004, Outokumpu Copper obtained full own-ership in its subsidiary Neumayer, which manufactures various alloy wire products in Austria. Now the business can be devel-oped more energetically with a focus on products with a high value-added component.
In September 2004, the electronic coating businesses of Outokumpu Wasacopper Oy and the Turku plant of Aurajoki Oy were combined into a new company, AuraCoat Oy. Outo-kumpu Wasacopper has a 20% holding in the new company and Aurajoki 80%. The company employs about 70 people and has annual sales of about EUR 7 million.
A favorable settlement was reached in the patent infringe-ment dispute in China concerning Cast & Roll™ technology for producing air-conditioning and refrigeration tubes. In Feb-ruary 2005, Outokumpu received a lump sum settlement.
Earnings still unsatisfactory
The consumption of copper and copper alloy products world-wide was very strong in 2004 and demand grew by 7% on the previous year. There was good growth in demand in the US and China, but growth remained subdued in Western Europe.
Outokumpu Copper’s sales were up 26% on the fi gure a year ago. This was attributable mainly to the increased delivery volumes resulting from the Boliden transaction. In addition, the rise in the price of copper that is used as a raw material added to the sales fi gure. Outokumpu Copper’s profi tability was still unsatisfactory, though the offi cial operating profi t was up markedly on the previous year. Comparable operating prof-it, taking into account both non-recurring items and the LI-
FO-FIFO inventory adjustment, came in slightly below the year-ago fi gure. Following the Boliden transaction, the average conversion margins received by Outokumpu Copper declined and the product mix was weaker than in 2003.
Due to the high and volatile price of copper and the rise in cathode premiums, customers try to keep their stocks as small as possible. Demand is nonetheless expected to hold up mod-erately well in the fi rst part of 2005. On the basis of present market demand and the order backlog, Outokumpu Copper’s comparable operating profi t in January–June 2005 is expected to improve on the same period of last year.
Outokumpu Copper
20.1.2004American Brass earns stringent quality certifi cation
11.2.2004Outokumpu´s and SMI´s asset swap fi nalized
26.2.2004The Neumayer deal fi nalized
30.3.2004Outokumpu to appeal for the grounds and amount of the cartel fi ne relating to air-conditioning tubes
9.6.2004Discussions to close down copper tube production in the Netherlands commences
7.7.2004Wasacopper and Aurajoki to join their electrolytic coating business
31.8.2004Outokumpu looking for options to divest its copper products business
3.9.2004Outokumpu fi ned for EUR 36 million for participation in a copper sanitary tube cartel – Outokumpu will appeal

33Outokumpu 2004
Research and development
Outokumpu Copper’s research and development centers with their pilot plants are located in Pori, Finland and in Västerås, Sweden. Individual development projects are also carried out in close cooperation with customers. Outokumpu furthermore has a 50% stake in a technology joint venture that it has estab-lished with Lennox International. The JV company develops new and innovative heating, ventilation, air-conditioning and refrigeration applications. The priority areas for Outokumpu Copper’s R&D activities lie within customer applications, fl ex-ible and innovative production technologies and other devel-opment projects that open up new business opportunities. Among the most important R&D projects carried out in 2004 were the fi nalization of the MicroMill process for commercial use in Delaware, the US as well as Flashless Conform, which is further developed from Conform technology and is being com-mercialized at Pori. Outokumpu Copper’s research and devel-opment expenses came to EUR 11 million in 2004.
Regional businesses comprise the Americas, the Europe, and the Tube
and Brass divisions. The Global businesses consists of the Automotive
Heat Exchangers and the Appliance Heat Exchangers & Asia divisions.
The 2003 fi gures for Harjavalta Metals, which was sold to Boliden, are
included in Others.
Key fi gures
€ million 2004 2003
Sales
Regional businesses 1 226 721
Global businesses 879 707
Others (56) 200
Total 2 050 1 628
Comparable operating profi t
Regional businesses 12 (1)
Global businesses 16 27
Others (6) 1
Total 23 27
Sales of the Group sales, % 28 27
Operating profi t 52 (6)
Operating profi t margin, % 3 neg.
Operating capital on Dec. 31 953 732
Return on operating capital, % 6 neg.
Capital expenditure 59 106
Depreciation 60 78
Deliveries of fabricated products
1 000 tonnes 2004 2003
Regional businesses 403 228
Global businesses 212 193
Internal deliveries (52) (1)
Total 562 420
Order backlog on Dec. 31, 1 000 tonnes 78) 66
Personnel
Dec. 31 2004 2003
Regional businesses 3 645 3 558
Global businesses 4 132 3 834
Others 176 193
Total 7 953 7 585
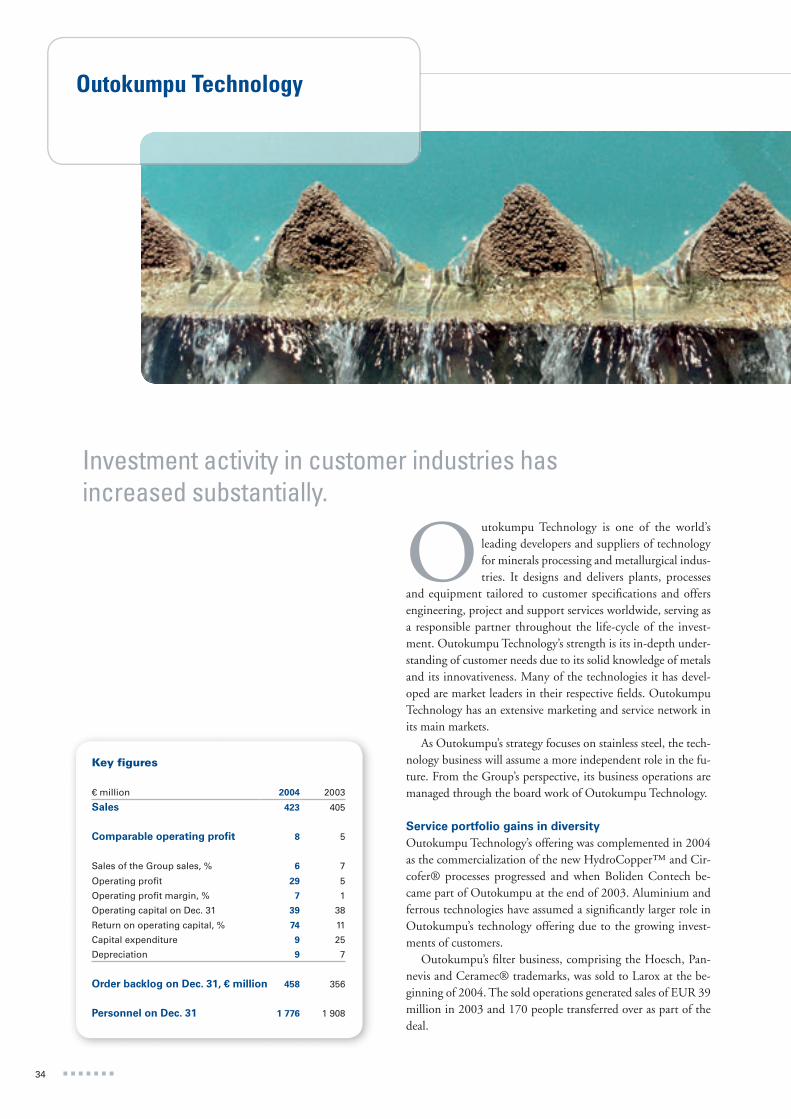
34
Outokumpu Technology is one of the world’s leading developers and suppliers of technology for minerals processing and metallurgical indus-tries. It designs and delivers plants, processes
and equipment tailored to customer specifi cations and offers engineering, project and support services worldwide, serving as a responsible partner throughout the life-cycle of the invest-ment. Outokumpu Technology’s strength is its in-depth under-standing of customer needs due to its solid knowledge of metals and its innovativeness. Many of the technologies it has devel-oped are market leaders in their respective fi elds. Outokumpu Technology has an extensive marketing and service network in its main markets.
As Outokumpu’s strategy focuses on stainless steel, the tech-nology business will assume a more independent role in the fu-ture. From the Group’s perspective, its business operations are managed through the board work of Outokumpu Technology.
Service portfolio gains in diversity
Outokumpu Technology’s offering was complemented in 2004 as the commercialization of the new HydroCopper™ and Cir-cofer® processes progressed and when Boliden Contech be-came part of Outokumpu at the end of 2003. Aluminium and ferrous technologies have assumed a signifi cantly larger role in Outokumpu’s technology offering due to the growing invest-ments of customers.
Outokumpu’s fi lter business, comprising the Hoesch, Pan-nevis and Ceramec® trademarks, was sold to Larox at the be-ginning of 2004. The sold operations generated sales of EUR 39 million in 2003 and 170 people transferred over as part of the deal.
Outokumpu Technology
Investment activity in customer industries has increased substantially.
Key fi gures
€ million 2004 2003
Sales 423 405
Comparable operating profi t 8 5
Sales of the Group sales, % 6 7
Operating profi t 29 5
Operating profi t margin, % 7 1
Operating capital on Dec. 31 39 38
Return on operating capital, % 74 11
Capital expenditure 9 25
Depreciation 9 7
Order backlog on Dec. 31, € million 458 356
Personnel on Dec. 31 1 776 1 908

35Outokumpu 2004
Operating profi t
Sales
Record-high order backlog
The market situation for technology sales improved signifi -cantly thanks to a recovery in investments by the mining and metal industries. Demand picked up for ferrous metals tech-nologies in particular. In 2004, Outokumpu Technology re-ceived new orders worth EUR 535 million in total, and the order backlog was EUR 458 million at the end of the year.
The major orders received were for pelletizing plants for LKAB in Sweden and for Gol-E-Gohar in Iran, a copper sol-vent extraction plant for Minera Escondida in Chile, a zinc plant for Iran Zinc Production Company in Iran, a ferro-chrome plant for Hernic Ferrochrome in South Africa, a deliv-ery of thickener technology for the Ravensthorpe nickel project in Australia, the delivery of two sinter plants for Jindal’s iron and steel companies in India, deliveries of concentrators to In-dia, Kazakhstan and South Africa, a sulphuric acid plant to Egypt, and letters of intent and design agreements on the ex-pansion of the copper plants of Codelco’s Chuquicamata in Chile and HydroCopper™ plants in Mongolia and Canada.
Financial result unsatisfactory in spite of improved
order backlog
Technology’s result improved on the previous year but the EUR 8 million comparable operating profi t was still unsatisfactory. The robust order intake is expected to continue, as the profi t-ability of the customer industries is good and customers are willing to invest. Technology’s earnings are expected to improve further in 2005.
Sales by market area
Europe 18%(Finland 3%)
North and SouthAmerica 20%
Asia 36%
Others 9%
Australia and Oceania 17%
Offi cial
Comparable
€ million
€ million

36
Research and development
The most signifi cant research projects were the test runs of the Circofer® direct reduction process for iron concentrate togeth-er with an industrial partner as well as iron concentrate pelletiz-ing and sintering test runs carried out for customers at the Frankfurt research center in Germany. In addition, Circofer® technology was successfully tested for the processing of titani-um raw material as part of the process chain of titanium oxide pigment manufacture.
The commercialization of the HydroCopper™ process was pursued. It yielded concrete results when two letters of intent were signed.
The sales of Outokumpu Research, Technology’s research center in Pori, amounted to EUR 13 million in 2004 and it had 195 employees. Outokumpu Research became part of Ou-tokumpu Technology at the beginning of 2004, leading to even higher effi ciency in commercialization of research. R&D coop-eration with the units sold to Boliden at the end of 2003 con-tinued at the same scale. Filtering technology research was car-ried out for Larox.
The fi rst customer test run was performed at the Hydro-Copper™ demonstration plant. The customer was the Mon-golian company Erdenet Mining Corporation. The campaign lasted four months and was successful, producing high-grade copper metal. Numerous batch tests were performed on the concentrates of many customers with the HydroCopper™ process – this shows that there is widespread interest in the technology. Toward the end of the year, an agreement was made on the thorough pilot testing of the raw materials of the Cana-dian bcMetals Corporation.
Other signifi cant R&D projects included copper ore process development for the Spanish company Cobre Las Cruces, di-rect reduction of oxidized zinc ore and zinc concentrate, testing of ferroalloy technology on customers’ raw materials, new ver-sions of smart analyzers and new materials technology applica-tions. Thanks to Outokumpu Research’s long-term develop-ment of solvent extraction technology, Outokumpu Technol-ogy received an order for the world’s largest copper solvent-ex-traction plant. It will be delivered to the Escondida mine in Chile.
In 2004, the research and development expenses were EUR 13 million.
Outokumpu Technology
9.1.2004Sale of the fi lter business to Larox completed
16.4.2004A major ferrochrome plant order from Hernic of South Africa
26.5.2004A letter of intent on delivery of the HydroCopper technology to Mongolia
7.6.2004Modern zinc production technology to Iran
4.8.2004Technology to deliver a new copper concentrator to Kazakhstan
6.8.2004Outokumpu’s technology for the Gol-E-Gohar pelletizing plant in Iran
2.9.2004Technology to deliver the world’s largest copper solvent extraction plant for Minera Escondida in Chile
9.9.2004Technology to deliver a sulphuric acid plant to Egypt
20.9.2004Outokumpu wins two sinter plant contracts in India
5.11.2004A letter of intent on delivery of the HydroCopper process to Canada
17.11.2004Technology to deliver a pelletizing plant for LKAB in Sweden
17.12.2004Technology awarded minerals processing contracts at Ravensthorpe, Australia
13.1.2005Extensive conceptual engineering contract for the expansion of Codelco’s Chuquicamata copper plant
8.2.2005Marketing of Titan´s BioHeap leaching technology starts

37Outokumpu 2004
Reporting under Other operations covers mainly business development and Corporate Manage-ment expenses that are not allocated to the busi-nesses. In addition, Outokumpu’s industrial hold-
ings and the Hitura nickel mine are reported under Other op-erations.
Business Support Unit
The Business Support Unit (BSU) brings together group-wide expertise and processes that support the businesses. The unit has been comprised of fi nancial services, procurement, IT and business processes, sales, M&A and legal affairs, intellectual property rights, environment, health and safety (EHS), treas-ury and risk management, human resources, fi nancial control and tax planning, as well as corporate communications.
As Outokumpu changes over to a new management system and organizational model on April 1, 2005 the BSU functions will be reorganized and transferred mainly to Corporate Manage-ment and to the new commercial and production functions.
Industrial holdings
Among Outokumpu’s major industrial holdings at the end of 2004 were its 26.5 % interest in a mining and smelting com-pany Boliden, and 32% holding in Okmetic, which manufac-tures silicon wafers. Of the associated companies, EUR 87 mil-lion of Boliden’s net profi t and EUR 11 million of Okmetic’s net loss have been consolidated into Outokumpu’s fi nancial re-sults for 2004. In December 2004 in connection with the Boli-den’s share offering, Outokumpu sold part of its holding in Boliden. Subsequently, Outokumpu’s stake declined from 49% to 26.5%. The market value of Outokumpu´s shareholding in Boliden and Okmetic totaled EUR 254 million at the end of 2004.
In March 2005, Outokumpu further reduced its sharehol-ing in Boliden to 16.1% and recorded an EUR 25 million non-recurring gain on the sale. As a result, Boliden will no longer be consolidated as an associated company in the Outokumpu accounts.
Other operations
Key fi gures
€ million 2004 2003
Sales 163 263
Comparable operating profi t (39) (72)
Sales of the Group sales, % 2 4
Operating profi t (55) 93
Operating profi t margin, % neg. 35
Capital expenditure 129 58
Depreciation 9 28
Personnel on Dec. 31 666 636

38
Human resources
The cornerstones of Outokumpu’s human resource management are the three key HR processes: De-velopment Dialogue, O’People Employee Survey and Management Review Process. Furthermore,
Outokumpu emphasizes continuous development of its per-sonnel.
The purpose of Development Dialogue, which is held at least once a year with each employee, is to ensure that the ob-jectives set are clear-cut and understood correctly. At the same time, it offers an occasion for giving and receiving feedback. Via the O’People Employee Survey, the units in turn measure the workplace atmosphere and its development. The third HR process is the Management Review Process. The results of this assessment are used in developing the organization, in internal recruitment and in supporting job rotation. The aim is to pro-mote personal growth in step with job tasks and to ensure ca-reer rotation within the Group. These three HR processes are in place at all the business units, and use of them was expanded in 2004. Based on the employees’ development needs, Outo-kumpu carries out either its own training and development programs or calls in outside consultants.
Training and development
Five group-wide development programs were carried out in 2004: two O’Talent seminars, two Leading the Way programs and one Outokumpu Management Development Program. About 100 people again took part in them. In addition, the business units ran development programs tailored at their
Top performance springs from motivated and skilled people.
specifi c needs. Employees from all personnel groups partici-pated in these programs.
The Management Review Process that was launched in 2003 was carried out across all the Stainless units and started within Copper and Technology. In 2005, Technology will further en-large the scope of the process to cover the entire organization.
Technology reruns the O’People Employee Survey
A repeat survey was carried out among the Technology employ-ees in 2004. The survey indicated that job tasks are felt to be interesting and challenging. Commitment to the employer had improved although there was no change in the overall satisfac-tion index. Supervisors’ work received better marks than in the previous survey. The respondents were particularly appreciative of the way in which supervisors encouraged their staff to un-dertake development and training opportunities. In this re-spect, supervisors were more supportive than in international peer groups. The response rate rose from 62% to 75%. The survey pointed out that a clear area for development is the need to communicate Technology’s direction and objectives more energetically, since these were felt to be less clear than in the previous survey. Another evident development area is the need to organize work more effectively and to clarify areas of respon-sibility and roles within the international matrix organization.
Preparations are being made for conducting a full-scale em-ployee survey at Outokumpu’s stainless steel units in the spring of 2005.

39Outokumpu 2004
Renewal of the European personnel
participation system
The Outokumpu Personnel Forum (OPF) that was held in May 2004 saw the ratifi cation of the agreement that had been negotiated with the personnel and concerned reform of the personnel participation system according to the European Works Council directive, which had been started at Outo-kumpu in 1994 and at AvestaPolarit in 2002. The OPF meet-ing is held once a year and is attended by 25 employee-elected representatives from different countries in Europe. On the agenda for the meeting are current matters for the Group, and it offers an opportunity for an exchange of ideas and experi-ences between the employees and management.
The OPF employee representatives elect eight members to the Group Working Committee, which acts as a liaison chan-nel between the employees and management in the period be-tween OPF meetings. Three employer representatives are also members of the Group Working Committee. The Committee meets with top management at least four times a year, and it has an opportunity to comment on the Group’s strategy and major projects.
Structural changes ongoing – a strategic focus
on stainless
In recent years, Outokumpu’s personnel has been involved in sweeping changes as the Group has reshaped its business portfo-lio in line with its strategy. In August 2004, the Group an-nounced its objective of becoming the leading company in stain-less steel and stated its intention to exit the fabricated copper products business. This marked a sharpening of Outokumpu’s new vision, strategy of focusing on stainless steel and a new management system and business organization in early 2005.
From the beginning of April the Group Executive Commit-tee will be directly in charge of the stainless steel business. Technology will have a more independent role and copper products business will be managed on a separate basis until the business has been divested.
As part of the new organizational structure that will come into effect at the beginning of April the Business Support Unit (BSU) organization will be dissolved. The BSU staff support-ing the technology sales and the copper products business will transfer to the business organizations of Technology and Cop-per. The revamped function and service organization will con-centrate solely on stainless steel.
Personnel by country
Dec. 31 2004 2003
Europe
Finland 5 036 5 061
Sweden 3 987 3 930
Britain 2 099 2 260
The Netherlands 731 933
Germany 561 655
Spain 467 448
Italy 287 204
Belgium 268 270
France 259 316
Czech Republic 189 159
Austria 114 112
Estonia 68 68
Russia 62 66
Poland 30 28
Denmark 27 27
Norway 21 21
Hungary 19 18Other European countries 19 16
14 244 14 592
North and South America
The United States 3 613 3 307
Chile 172 200
Canada 109 152Other American countries 26 30
3 920 3 689
Asia
China 492 326
Thailand 282 277
Malaysia 260 224
Indonesia 24 23Other Asian countries 33 46
1 091 896
Australia 158 133
Africa 52 49
Group total 19 465 19 359

40
The process aiming at divesting the fabricated copper prod-ucts business is underway. Divestiture of the copper products business will bring a signifi cant reduction in the Group’s head-count, because Outokumpu Copper employs nearly 8 000 people in Europe, the US and Asia.
Becoming the undisputed number one in stainless steel fi rst in Europe and later worldwide calls for excellence in both pro-duction and commercial functions. Major inputs into both will be made through the Excellence Programs that will get started in early April and in which human resource development and leadership occupy a central role. Other challenges for human resource management are the improvement of internal mobil-ity, attracting and retaining talented employees and the devel-opment of rewarding practices.
Value dialogue re-launched
The Outokumpu way has been crystallized into the following values:
• Outstanding performance• Superior knowledge• Individual achievement• Creating success with customers• Leading the way
Outokumpu’s core values combine the requirements set by the Group strategy, the traditional strengths derived from the company’s history and the expectations of individuals. In ac-cordance with the Group’s leadership principles, every Outo-kumpu employee is entitled to good leadership.
Because the core value dialogue in 2002 did not cover Ou-tokumpu’s stainless steel business, the process will be relaunched this year. The core values will be discussed in parallel with the implementation of the new brand. The objective is to docu-ment Outokumpu’s way of working so that the entire organiza-tion can get solidly behind it.
2004 2003
Sales/person, € million 0.4 0.3
Incentives of total remuneration costs, % 3.0 3.8
Training costs of total remuneration costs, % 1.3 1.1
Training days/person 3.3 3.7
Days lost due to strikes 659 7 047
Turnover, % 8.4 7.4
Key fi gures
Personnel age profi le
(permanent employees)Personnel by years of service
(permanent employees)
Educational background of
permanent employees
Primary 39%
Secondary and lower tertiary 52%
Higher tertiary 9%
New permanent
employees, 1 257
Primary 27%
Secondary and lower tertiary 57%
Higher tertiary 16%
Human resources

41Outokumpu 2004
Environment, health and safety
Today, the environmental impacts of Outokumpu’s operations derive primarily from emissions and energy consumption of stainless steel production. The key environmental targets are to decrease fu-
gitive emissions, improve energy-effi ciency, promote the utili-zation of by-products, reduce water consumption and decrease discharges to water. In health and safety area, the most impor-tant target is to decrease the frequency of accidents signifi cant-ly. This is also one of the key areas in the Production Excellence Program, which starts in April 2005.
A step forward in environmental
management systems
Outokumpu aims that all its major production sites have certi-fi ed environmental management systems in place by the end of 2005. During 2004, the stainless steel bar plant in Richburg, the US and the cold rolling mill in Sheffi eld, Britain as well as the copper tube plant in Zhongshan, China certifi ed their en-vironmental management systems. Now altogether 28 sites have a certifi ed environmental management systems in place. The work for certifi cation continues at seven stainless steel and four copper products sites.
Emissions well under control
Emissions remained mostly under permit limits during 2004. However, there were a few minor breaches of permit conditions that were registered according to local practices. For example, one of the dust fi lters of the cold rolling mill in Tornio did not
Our aim is to improve the level of environmental protection and occupational safety continuously.
work properly and emitted dust into surroundings for three weeks in December.
Majority of particle emissions originate from the stainless steel plants in Tornio, Sheffi eld and Avesta as well as from the hot rolling mill in New Castle. The modernization of the older melt shop at Tornio has markedly decreased the specifi c emis-sion of dust. Since the production volume has also simultane-ously been increased, the absolute emission decrease is not so large, but still about 100 tonnes per year. The emissions of ni-trogen oxides have decreased in Avesta, Nyby and Sheffi eld due to implementation of the latest burner technology in annealing furnaces and introduction of a new technology for managing pickling fumes. Most of the metal discharges to water originate from Tornio and Avesta and from the copper products mills at Pori and Buffalo. The metal discharges have decreased espe-cially at Pori thanks to investments. The Group’s carbon diox-ide emissions in 2004 amounted to about 1 140 000 tonnes, of which Tornio accounted for 670 000 tonnes.
In January 2004, radioactivity of a process control sample in the Sheffi eld melt shop showed that a small amount of radioac-tive material had been melted together with the scrap. The steel produced or the fi lter dust was not radioactive but the radioac-tive elements had remained in the slag. The slag was stored properly and is waiting for the delivery for further treatment in the fi rst quarter of 2005. Some radioactivity in slag was also detected in the Avesta melt shop in January 2005. Also this slag has been stored properly and is waiting for the delivery for fur-ther treatment.

42
Environment, health and safety
Metal discharges to water(copper, nickel, zinc,
molybdenum, chrome, lead, arsenic)
tonnes
Particle emissions to air
tonnes
Meeting environmental challenges
Outokumpu cooperates with the authorities and organizations on the development of environmental and safety practices. Company experts participate in preparation of legislation as members of working groups and give comments and state-ments on issues at both international and national forums. The main issues in 2004 were waste and landfi ll statutes and legisla-tion on climate change prevention, protection of waters and the new European chemicals policy.
Outokumpu responds to the challenges of tightened waste legislation by decreasing the amount of process waste, increas-ing recycling and designing fi ttingly working landfi ll areas when utilization of waste is not possible. At Tornio, a research program is ongoing to develop new products out of steel mak-ing slag instead of landfi lling it. The production and sale of these by-products started in 2004, and about 50 000 tonnes was sold for construction material and insulation material in road construction. A signifi cant reduction of landfi ll waste is also taking place in Sheffi eld. Outokumpu is participating in the Green Business Network initiative, in which products are made out of waste in line with the principles of sustainable de-velopment. The raw material is our own packing waste and other industry waste in the area. The initiative also has a social aspect offering training and employment opportunities for long-term unemployed persons.
At Avesta, a new method has been developed to recycle the hydroxide sludge generated in the neutralization process of pickling acids. The treated sludge acts as a slag-forming agent in the AOD converter thus replacing the previously used cal-cium fl uoride. The method, which has been tested in produc-tion scale, decreases landfi ll waste. The results are promising.
At Tornio, an extensive environmental impact assessment procedure was launched in 2004 for a possible increase in pro-duction.
Improved energy-effi ciency – a response for possible
increase in the price of electric energy
Outokumpu stainless steel plants in Finland, Sweden and Brit-ain belong to the emission trading system, which started in January 2005 in the European Union. The plants in Finland and Sweden got their quotas according to the national alloca-tion plans by the end of 2004, but in Britain the process was delayed and the national allocation is pending. All Outokumpu sites have adequate environmental permits for emission trading system as well as systems for monitoring and forecasting carbon dioxide emissions in place.
In Finland and Sweden Outokumpu got enough carbon di-oxide emission allowances for the planned production. This is due to long-term and systematic work to save energy by par-ticipating in voluntary national energy savings programs. Hence the emission trading system will in the early stages affect Outokumpu mainly through a possible rise in the price of elec-trical energy. Outokumpu has prepared to meet higher electric-ity prices not only through hedging, but also by stepping up the effi ciency of the use of energy at its plants, concluding long-term delivery agreements and acquiring stakes of electric-ity production based on renewable energy sources. In 2004, Outokumpu’s consumption of electric energy was 3 TWh in the Nordic countries and some 1 TWh outside the Nordic countries.
Outokumpu participates together with authorities in pre-paring the national allocation criteria of green house gas emis-
Accidents(accidents/million hours worked,
employees and contractors)
Environmental data for Outokumpu Stainless has been reported extensively only since 2003.

43Outokumpu 2004
sions for so-called Kyoto period 2008–2012. The national al-location plans should be in place in the middle of 2006. Euro-pean commission has initiated the discussion about emission cut objectives after the fi rst Kyoto period.
Environmental permits
All Outokumpu sites have valid environmental permits in place or applications have been fi led. Many sites have applied for new permits because of changes in their operations or the im-plementation of EU’s environmental legislation (IPPC direc-tive). Some of the sites have already been granted the environ-mental permit according to IPPC in 2004.
In 2004, after requesting the preliminary ruling from the European Court of Justice, the Supreme Administrative Court of Finland issued its decision concerning the waste interpreta-tion in the decision about the Kemi mine environmental per-mit. The decision was that barren rock and tailings are to be considered as waste according to the EU’s waste directive. The Supreme Administrative Court has not yet issued its decision on the interpretations of slag produced in the ferrochrome pro-duction, metal scrap used as raw material at Tornio melt shop as well as on the appeal of the new environmental permit of the Kemi mine.
Environmental investments and expenditure
Total environmental investments amounted to EUR 52 mil-lion in 2004. The largest investment, EUR 20 million, was the dust recovery system in connection with the modernization of the older Tornio melt shop. Dust recovery was also improved at the Tornio hot rolling mill, by investing EUR 2.5 million for a new electrostatic fi lter. A total of EUR 8 million was invested
in water treatment systems at Tornio, Wildwood and Zutphen. Altogether the landfi ll investments at Tornio, Kemi and Shef-fi eld were EUR 4 million. Operating costs for environmental protection amounted to EUR 47 million in 2004. Of that amount, reclamation of old mine sites accounted for EUR 0.5 million.
Environmental liabilities and risks
In the US, the PGT groundwater case is now closed. This issue is explained in more detail in the note 29 to the consolidated fi nancial statements on page 93.
Demolishing and remediation of the Kenosha connector strip plant that was closed in 1999 have been fi nalized and the land has been transferred to the city of Kenosha with no re-maining liabilities. The previous owner covered the costs. In Gusum, Sweden the industrial area of Gräsdalen has been part-ly remedied in connection to operational changes. Pumping and treating of groundwater is ongoing at Tornio, Wildwood, Montreal and Grenada sites.
Soil and groundwater surveys continued and renovation plans were prepared at six Stainless and eight Copper sites. In addition, reclamation work continued at closed mine sites. Pro-visions for soil risks and waste management amounted to a to-tal of EUR 31 million. Provisions for reclamation of closed mines were about EUR 5 million.
The legal proceedings related to the occasional emission non-compliances at the Zutphen brass strip mill in 2000–2001 are underway.
Outokumpu is not a party in any signifi cant juridical or ad-ministrative proceedings concerning environmental issues, nor is it aware of any environmental risks that would have a mate-rial impact on the Group’s fi nancial position.
Health and safety
In 2004, the Group’s accident frequency was 18 accidents per million man-hours and no major accidents occurred. At Outo-kumpu’s major stainless steel plants a thorough safety manage-ment assessment and review was carried out, and as a result an extensive safety-training program was started.
Year 2005 is the second group-wide safety theme year. A new safety target for the Group was set at 5 accidents per mil-lion man-hours before 2009.
Reporting on corporate social responsibility
Development of group-level corporate social responsibility re-porting continued in 2004. For example, Outokumpu’s cur-rent reporting practices were compared with the Global Re-porting Initiative (GRI) principles. Furthermore, peer compa-nies were also benchmarked. During 2005, a corporate social responsibility policy for the Group will be established and a re-porting system will be set up for corporate social responsibility issues. Outokumpu’s fi rst corporate social responsibility report will be published in spring 2006.
Further information on environmental issues is available at www.outokumpu.com as well as in the Outokumpu and Envi-ronment report, which will be published in spring 2005.
Sick leave days(per million hours worked,
employees and contractors)
Sick leave days caused by accidents.

44
Review by the Board of Directors 45Auditor’s report 54
Consolidated fi nancial statements, IFRS Consolidated income statement 55 Consolidated balance sheet 56
Consolidated cash fl ow statement 58 Consolidated statement of changes in equity 59 Notes to the consolidated fi nancial statements 60
1. Accounting principles for the consolidated accounts 60 2. Transition to IFRS 65 3. Segment information 69 4. Acquisitions and disposals 71 5. Long-term construction contracts 74 6. Other operating income 74 7. Other operating expenses 74 8. Function expenses by nature 74 9. Employee benefi t expenses 75 10. Financial income and expenses 75 11. Income taxes 76 12. Earnings per share 78 13. Dividend per share 78 14. Intangible assets 78 15. Property, plant and equipment 80 16. Investments in associated companies 81 17. Available-for-sale fi nancial assets 82 18. Financial risk management 82 19. Fair values of derivative instruments 84 20. Inventories 85 21. Trade and other receivables 85 22. Cash and cash equivalents 86 23. Equity 86 24. Employee benefi t obligations 88 25. Provisions 90 26. Interest-bearing liabilities 91 27. Trade and other payables 92 28. Commitments and contingent liabilities 92 29. Disputes and litigations 93 30. Related party transactions 93 31. Subsidiaries by business area on December 31, 2004 94 32. Events after the balance sheet date 95
Key fi nancial fi gures Key fi nancial fi gures of the Group 96 Share-related key fi gures 97 Defi nitions of key fi nancial fi gures 98 Key fi nancial fi gures by business 99 Financial development by quarter 100
Parent company fi nancial statements, FAS Income statement of the parent company 102 Cash fl ow statement of the parent company 102 Balance sheet of the parent company 103 Notes to the parent company fi nancial statements 104
Outokumpu Oyj’s fiOutokumpu Oyj’s fi nancial statements for 2004 nancial statements for 2004
Consolidated fi nancial statements presented in this annual report have been prepared in accordance with International Financial
Reporting Standards (IFRS). Outokumpu started to apply IFRS in its third-quarter interim report, which was published on October 26,
2004. Prior to IFRS, Outokumpu’s fi nancial reporting was based on Finnish Accounting Standards (FAS). Outokumpu’s date of transition
to IFRS was January 1, 2003.
Accounting principles applied in the IFRS fi nancial statements are presented on pages 60–64. In graphs and tables, data for the
years 2003–2004 are presented according to IFRS and for prior years according to FAS.
All fi gures in the annual report have been rounded and consequently the sum of individual fi gures can deviate from the presented
sum fi gure.

45Outokumpu 2004
IFRS standards adopted
Outokumpu has been applying International Financial Report-ing Standards (IFRS) in its fi nancial reporting from the third-quarter interim report 2004 onwards. Outokumpu’s date of transition to IFRS was January 1, 2003. However, for the adop-tion of IAS 39 (Financial Instruments: Recognition and Meas-urement) and IAS 32 (Financial Instruments: Disclosure and Presentation), the date of transition was January 1, 2004. As for fi nancial instruments, Outokumpu has utilized the exemption for a fi rst-time adopter of IFRS not to restate comparative infor-mation for 2003. Prior to IFRS, Outokumpu’s fi nancial report-ing was based on Finnish Accounting Standards (FAS). The most signifi cant effects of the transition to IFRS concerned the treatment of positive and negative goodwill, pension and inven-tory accounting, recognition of fi nancial instruments and the presentation of market price gains and losses.
Financial performance improved
Outokumpu’s fi nancial result for 2004 improved signifi cantly on the previous year in step with the strengthened global economic recovery, better market conditions and progress in the Tornio ramp-up. The Group’s sales rose by 20% to EUR 7 136 million (2003: EUR 5 922 million) and the offi cial operating profi t more than doubled to EUR 468 million (2003: EUR 214 million). The profi tability improvement was mainly attributable to Outokumpu Stainless. Also, the fi nancial performance of Outokumpu Copper and Outokumpu Technology developed favorably. Net profi t for the fi nancial year rose to EUR 390 million (2003: EUR 112 mil-lion) and earnings per share to EUR 2.13 (2003: EUR 0.65).
Net cash generated from operating activities was, however, EUR 128 million negative (2003: EUR 194 million positive). The Group’s working capital increased substantially due to soar-
ing raw material prices, and capital expenditure was still rela-tively high at EUR 473 million. Therefore, the Group’s gearing remained above the target level at 97.2% in spite of the clearly improved net profi t for the period.
The Board of Directors is proposing to the Annual General Meeting that a dividend of EUR 0.50 per share be paid for 2004.
Global demand for stainless steel up 6%
The economic recovery strengthened and broadened during 2004. Growth was especially strong in the US and activity in Japan also improved markedly. Rapid expansion continued in China. Growth also fi rmed in many other developing economies in Asia and Eastern Europe. As a result, global GDP rose by about 4%, one of the strongest showings in 20 years. The main disappointment was in the eurozone, notably in Germany and Italy, where growth remained very sluggish. The main end-uses for metals were strong during 2004, in line with the general eco-nomic background. However, activity showed signs of slowing toward the end of the year, and growth in many sectors is ex-pected to moderate during 2005.
Both production of and consumption for stainless steel in-creased by an estimated 6% in 2004. Growth was led by China and followed by the US. The increase in consumption was slow-est in Europe, at 4%, but better than in 2003. Very high and volatile raw material prices resulted in a signifi cant fl uctuation in demand as stockists optimized the timing of their buying. In Eu-rope, demand was healthy during the fi rst fi ve months, support-ed partly by some competitors’ production problems and in-creasing alloy costs, but slowed down toward the summer. In Europe, demand for cold rolled products weakened after the summer and remained sluggish in the last quarter. Asian demand was very strong in the fi rst quarter but slowed down clearly in
Review by the Board of DirectorsReview by the Board of Directors

46
Earnings per share
€
the second quarter due to de-stocking and the Chinese govern-ment’s measures to cool down the local economy. Asian demand, especially for white hot strip, improved markedly after the sum-mer and was very strong in the last quarter. The US cold rolled stainless steel market recovered signifi cantly in the fi rst quarter and remained very strong throughout the year.
The nickel market was extremely volatile and prices at his-torically high 2004. Volatility was mainly driven by speculative activity rather than market fundamentals. The high nickel prices resulted in an increased supply of stainless scrap, which reduced the use of primary nickel. Some of the end users also substituted high nickel alloyed stainless steel with lower nickel-containing grades. These factors helped the undersupplied market seen in the fi rst half of the year to return to balance in the second half. Altogether, the consumption of nickel grew by 2% in 2004. The average nickel price for 2004 was 43% higher than in 2003.
Demand for ferrochrome increased by 8% in 2004 due to strong growth in stainless steel production. The price of ferro-chrome rose in the fi rst and second quarters, but stabilized for the second half of the year. The average ferrochrome price was 60% higher than in 2003. Also, the average prices for molybde-num and iron scrap rose signifi cantly compared to 2003.
In Europe, the cold rolled base price improved in the fi rst half of the year due to strong demand and increasing alloy surcharge, that drove speculative buying. Base price came up against down-ward pressure in the second half when demand weakened. Ac-cording to CRU, the German cold rolled average base price (2 mm cold rolled 304 sheet) was 2% higher and conversion margin 10% higher than in 2003. In the US, the cold rolled base price improved in the fi rst half of the year and stabilized thereaf-ter. In Asia, the transaction prices for cold rolled material and white hot strip decreased in the second quarter due to lower de-mand and raw material costs, but recovered strongly toward the end of 2004.
The base price of quarto plate improved in Europe and de-mand increased toward the end of the year. The project market for tubular products was good in Europe, but the standard prod-ucts business was markedly softer. The base price of tubes im-proved before the summer, but has been under pressure since then. The long products market improved globally, but the trend in Europe was below global average. Precision strip prices re-mained low. In the US, demand for quarto plate, tubular and long products improved signifi cantly at the beginning of 2004 and has since remained at good levels.
For copper and copper alloy products, 2004 was a year of con-trasting fortunes. In global terms, consumption was very strong and rose by 7% from the previous year. However, activity varied sharply between regions. US consumption rose more than 9%, helped by substantial restocking in the early part of the year, and Asian consumption improved at a similar rate thanks to further dynamic growth in China. In contrast, Western European demand remained lackluster, and conversion margins were under pressure. The high and volatile price of copper, and spiraling premiums on cathode, exacerbated the pressure on conversion margins.
Sales by business
€ million 2004 2003 Change, %
Stainless 4 637 3 450 34
Copper 2 050 1 628 26
Technology 423 405 4
Zinc – 396 –
Other operations 163 263 (38)
Intra-group sales (136) (220) (38)
The Group 7 136 5 922 20
Sales Profi t
€ million € million
Review by the Board of Directors
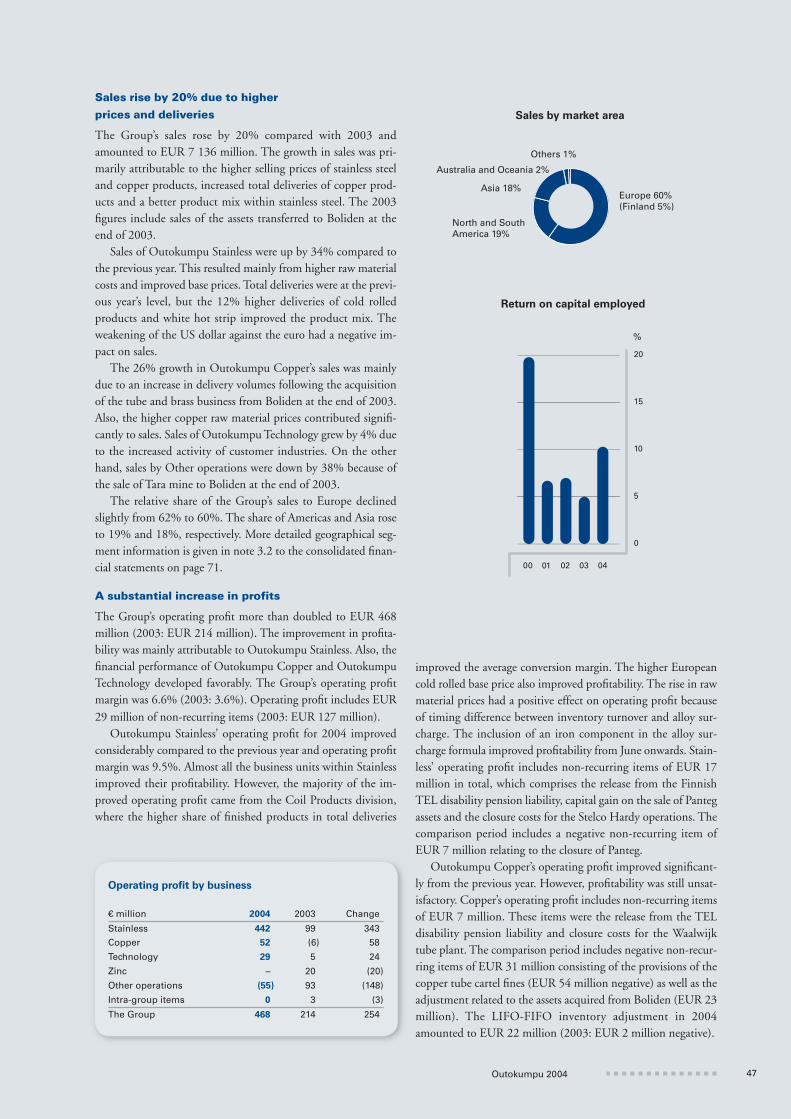
47Outokumpu 2004
Sales rise by 20% due to higher
prices and deliveries
The Group’s sales rose by 20% compared with 2003 and amounted to EUR 7 136 million. The growth in sales was pri-marily attributable to the higher selling prices of stainless steel and copper products, increased total deliveries of copper prod-ucts and a better product mix within stainless steel. The 2003 fi gures include sales of the assets transferred to Boliden at the end of 2003.
Sales of Outokumpu Stainless were up by 34% compared to the previous year. This resulted mainly from higher raw material costs and improved base prices. Total deliveries were at the previ-ous year’s level, but the 12% higher deliveries of cold rolled products and white hot strip improved the product mix. The weakening of the US dollar against the euro had a negative im-pact on sales.
The 26% growth in Outokumpu Copper’s sales was mainly due to an increase in delivery volumes following the acquisition of the tube and brass business from Boliden at the end of 2003. Also, the higher copper raw material prices contributed signifi -cantly to sales. Sales of Outokumpu Technology grew by 4% due to the increased activity of customer industries. On the other hand, sales by Other operations were down by 38% because of the sale of Tara mine to Boliden at the end of 2003.
The relative share of the Group’s sales to Europe declined slightly from 62% to 60%. The share of Americas and Asia rose to 19% and 18%, respectively. More detailed geographical seg-ment information is given in note 3.2 to the consolidated fi nan-cial statements on page 71.
A substantial increase in profi ts
The Group’s operating profi t more than doubled to EUR 468 million (2003: EUR 214 million). The improvement in profi ta-bility was mainly attributable to Outokumpu Stainless. Also, the fi nancial performance of Outokumpu Copper and Outokumpu Technology developed favorably. The Group’s operating profi t margin was 6.6% (2003: 3.6%). Operating profi t includes EUR 29 million of non-recurring items (2003: EUR 127 million).
Outokumpu Stainless’ operating profi t for 2004 improved considerably compared to the previous year and operating profi t margin was 9.5%. Almost all the business units within Stainless improved their profi tability. However, the majority of the im-proved operating profi t came from the Coil Products division, where the higher share of fi nished products in total deliveries
Operating profi t by business
€ million 2004 2003 Change
Stainless 442 99 343
Copper 52 (6) 58
Technology 29 5 24
Zinc – 20 (20)
Other operations (55) 93 (148)
Intra-group items 0 3 (3)
The Group 468 214 254
Return on capital employed
%
improved the average conversion margin. The higher European cold rolled base price also improved profi tability. The rise in raw material prices had a positive effect on operating profi t because of timing difference between inventory turnover and alloy sur-charge. The inclusion of an iron component in the alloy sur-charge formula improved profi tability from June onwards. Stain-less’ operating profi t includes non-recurring items of EUR 17 million in total, which comprises the release from the Finnish TEL disability pension liability, capital gain on the sale of Panteg assets and the closure costs for the Stelco Hardy operations. The comparison period includes a negative non-recurring item of EUR 7 million relating to the closure of Panteg.
Outokumpu Copper’s operating profi t improved signifi cant-ly from the previous year. However, profi tability was still unsat-isfactory. Copper’s operating profi t includes non-recurring items of EUR 7 million. These items were the release from the TEL disability pension liability and closure costs for the Waalwijk tube plant. The comparison period includes negative non-recur-ring items of EUR 31 million consisting of the provisions of the copper tube cartel fi nes (EUR 54 million negative) as well as the adjustment related to the assets acquired from Boliden (EUR 23 million). The LIFO-FIFO inventory adjustment in 2004 amounted to EUR 22 million (2003: EUR 2 million negative).
Europe 60%(Finland 5%)
North and South America 19%
Asia 18%
Others 1%
Australia and Oceania 2%
Sales by market area

48
Outokumpu Technology’s operating profi t remained unsatis-factory in spite of the clear increase from the previous year. The rise in operating profi t resulted mainly from non-recurring items of EUR 21 million, which were attributable to the gain on the sale of the fi lter business and the release from the TEL disability pension liability. The comparison period did not include non-recurring items.
Other operations’ operating loss resulted mainly from such business development and Corporate Management expenses that are not allocated to businesses. In addition to this, the oper-ating result includes negative non-recurring items of EUR 16 million, which comprises the loss from the sale of Boliden shares and the release from the TEL disability pension liability. Other operations’ operating profi t in 2003 included non-recur-ring items of EUR 165 million, which related to capital gains on various asset disposals.
The Group’s share of results in associated companies rose to EUR 78 million (2003: EUR 15 million negative) due to new Boliden’s good performance. At the end of December, Outo-kumpu’s remaining 26.5% stake in Boliden had a carrying value of EUR 256 million, which is slightly lower than its current market value.
The Group’s net fi nancial expenses decreased to EUR 69 mil-lion (2003: EUR 91 million). Net interest expenses remained low relative to the amount of net interest-bearing debt due to low interest rate level. Market price gains and losses arising mainly from metals exchange deals and the recognition of elec-tricity derivatives were EUR 24 million in total. However, the underlying physical exposures had a negative impact on the Group’s operating profi t.
The Group’s profi t before taxes rose to EUR 477 million (2003: EUR 108 million). The Group’s effective tax rate was low at 18.4% due to reduction in the Finnish corporate income tax rate and utilization of tax losses, on which no deferred tax asset had previously been recognized. Net profi t for the fi nancial year increased to EUR 390 million (2003: EUR 112 million). Earn-ings per share amounted to EUR 2.13 (2003: EUR 0.65). The return on capital employed rose to 10.3% and the return on equity to 17.0% (2003: 5.0% and 5.4%).
Capital structure still below target
Net cash generated from operating activities decreased from the previous year and was EUR 128 million negative (2003: EUR 194 million positive). The negative cash fl ow resulted mainly from the increase in working capital due to the very high raw material prices and larger business volume. Internal measures for managing working capital did not suffi ce to offset the impact of the signifi cant rise in raw material prices.
The Group’s net interest-bearing debt increased from the pre-vious year and stood at EUR 2 435 million (2003: EUR 2 025 million). The Group’s equity-to-assets ratio strengthened to 35.8% (Dec. 31, 2003: 33.0%), and gearing was 97.2% (Dec. 31, 2003: 97.2%). Key issues for bringing gearing down to the 75% target level are good profi ts, the freeing up of work-ing capital through operational excellence and the potential di-
vestment of fabricated copper products business. It is estimated that at the year-end the Group had excess working capital of some EUR 400 million due to increased raw material prices compared with the long-term averages.
The Group’s liquidity remained satisfactory throughout the year in spite of signifi cant increase and fl uctuation in working capital. At year-end, cash and cash equivalents amounted to EUR 211 million. The Group had committed and available credit facilities as well as other agreed and undrawn loans total-ing EUR 684 million.
Capital expenditure heading down
The Group’s total capital expenditure declined from the previous year and amounted to EUR 473 million (2003: EUR 622 mil-lion). Apart from the ongoing Tornio expansion, the biggest sin-gle capital expenditure item, EUR 76 million, was the share sub-scription in the Boliden rights issue in March 2004. Capital ex-penditure in 2005 is estimated to decrease markedly from 2004 and to normalize close to the level of depreciation.
Key fi nancial indicators on fi nancial position
€ million 2004 2003
Interest-bearing liabilities
Long-term 1 975 1 777
Current 1 150 1 045
Total interest-bearing liabilities 3 125 2 821
Interest-bearing assets (690) (796)
Net interest-bearing debt 2 435 2 025
Net interest-bearing debt in relation to sales, % 34.1 34.2
Total equity 2 506 2 083
Debt-to-equity ratio, % 97.2 97.2
Equity-to-assets ratio, % 35.8 33.0
Net cash generated from operating activities (128) 194
Net fi nancial expenses 69 91
Net fi nancial expenses in relation to sales, % 1.0 1.5
Interest cover 6.0 2.1
Capital expenditure by business
€ million 2004 2003
Stainless 276 373
Copper 59 106
Technology 9 25
Zinc – 60
Other operations 129 58
The Group 473 622
Review by the Board of Directors

49Outokumpu 2004
The Tornio expansion program progressed signifi cantly dur-ing 2004. The modernization of the older melt shop was carried out in the third quarter and the commissioning of the new stands in order to increase the capacity of the hot rolling mill to 1.65 million tonnes was completed in September. The idled furnace in the hot rolling mill will go into operation in the fi rst quarter of 2005 after which the full technical capacity is available. Ramp-ing-up of the new cold rolling capacity (RAP5) is continuing ac-cording to plan. All the RAP5 products have been produced, and the full capacity is planned to be technically available in mid-2005. The market conditions are taken into account in the ramp-up volumes and product mix. Due to strong Asian demand and relatively good prices the RAP5 production has recently been steered toward white hot strip products at the expense of cold rolled material.
The ramp-up of the Kemi underground mine is proceeding as planned and the increase in long products capacity in the US was inaugurated in October 2004.
In December 2004, Outokumpu decided to invest about EUR 53 million in the Kloster thin strip cold rolling mill in Swe-den. The capital expenditure will be spread over a two-year peri-od, with the bulk to be spent in 2006. The investment will ex-pand the mill’s overall capacity from 25 000 tonnes to 45 000 tonnes per year and enable the production of thinner and wider products. The main components of the investment are a new cold rolling mill, a bright annealing line and a slitting line. The new capacity is scheduled to be in place by the end of 2006.
In February 2004, Outokumpu completed the transaction whereby it acquired the remaining 50% ownership in Neumayer GmbH, a subsidiary of Outokumpu Copper, which fabricates various alloy wire products in Leobersdorf, Austria. As considera-tion, Outokumpu Oyj transferred 309 597 treasury shares to the seller.
Proceeds from the sale of the Boliden shares
EUR 130 million
In December 2004, Outokumpu sold, in conjunction with Boli-den’s share offering, 47 million shares in Boliden AB (publ) at a price of SEK 25 per share. The total proceeds from the sale for Outokumpu amounted to EUR 130 million. The sale of shares is in accordance with Outokumpu’s strategy of decreasing its share-holding in Boliden over time. Following the sale, Outokumpu’s shareholding in Boliden fell to 26.5%. The sale of the shares had a EUR 19 million negative non-recurring impact on Outo-kumpu’s fi nancial results. Due to Boliden’s good earnings in the fourth quarter, the capital loss was larger than initially estimated, but at the same time Boliden contributed favorably to Outo-kumpu’s results through the share of results in associated compa-nies.
As a result of the Boliden transaction in 2003, Outokumpu had a subordinated note of EUR 166 million from Boliden in its balance sheet. Boliden repaid the whole amount in two install-ments in the last quarter of 2004 as part of its loan portfolio re-structuring and following its successful equity offering.
Net cash fl ow from operations
€ million
Net interest-bearing debt
% € million
Net interest-bearing debt
% of sales
Capital expenditure and depreciation
% € million

50
Outokumpu’s strategic direction clear:
aiming to be number one in stainless
In August 2004, the Board stated that the Group’s future strate-gic direction will be based on leadership in stainless steel, and that Outokumpu is looking at various options for exiting from its fabricated copper products business. The process of divesting Outokumpu Copper is underway and as of today the Board is not in a position to assess any possible impact on the Group’s fi nancial position.
In January 2005, the Board outlined that Outokumpu is an international stainless steel and technology company. According to the new vision statement, Outokumpu’s vision is to be the undisputed number one in stainless, with success based on op-erational excellence. To this end, two key strategic objectives were defi ned: “Value creation through building superior produc-tion and distribution capabilities in all major markets globally” and “Value realization through production and commercial ex-cellence”. The ultimate goal is to secure a signifi cant and sus-tained increase in shareholder value.
Outokumpu’s short-term priority is to deliver on the promises from the previous strategic phase of growth and transformation in 2000-2004. At the same time, new goals are being set for the coming fi ve-year period – to secure the position of number one in stainless in Europe. Outokumpu’s future success will be achieved by building and strengthening operational excellence in both commercial and production arena. The fi nal step is to leverage operational excellence in other regions to achieve global leader-
ship, i.e., to reach the undisputed number one position globally in stainless in the coming ten years. In the light of Outokumpu’s tar-get of continuing to grow faster than the market, the operational excellence efforts will be supported by further development of the Group’s current asset-base, value chain and product offering.
New fi nancial objectives, dividend policy
unchanged
The Group’s fi nancial objectives were also aligned with the new vision. Outokumpu’s overall fi nancial objective is to generate the maximum sustainable economic value added. Specifi c group-level fi nancial objectives for growth, profi tability and fi nancial strength are: to continue to grow faster than the market, to have a return on capital employed of over 13% and to be consistently the best among peers, and to have gearing below 75%. Outo-kumpu’s dividend policy remains unchanged. The dividend pay-out ratio over a business cycle should be at least one-third of the period’s profi t.
Management system and business organization
trimmed toward operational excellence
The new organizational structure, effective April 1, 2005, also supports the new vision. The Group Executive Committee fo-cuses on running the stainless business directly, and the new roles of the functional leaders of commercial and production operations will be essential in driving the operational excellence efforts together with the business units.
Debt-to-equity ratio
%
Review by the Board of Directors
Equity-to-assets ratio
%

51Outokumpu 2004
Outokumpu’s stainless business will be organized into two di-visions according to product types as well as into a separate Tubu-lar Products business unit. The new General Stainless division will comprise three business units: Tornio Works, Coil Products Sheffi eld, and Sheffi eld Primary Products. The new Specialty Stainless division will consist of four business units: Avesta Works, Thin Strip, Hot Rolled Plate, and Long Products. Corpo-rate Management and support functions will be realigned to sup-port the new management system and business organization.
Under the new structure, Outokumpu Technology will be managed, from the Group perspective, at arms-length as a stand-alone business through its board work. Accordingly, it will con-tinue to be developed as part of the Group but more independ-ently. Until the divestment of the fabricated copper products business is completed, Outokumpu Copper will be managed separately. Both the technology and copper businesses will re-port to the Deputy CEO.
The new external reporting structure, which will go into ef-fect in the second-quarter interim report, will be announced in June 2005.
Changes in the Board of Directors and Group
Executive Committee
Mr. Juha Rantanen was appointed CEO of the Outokumpu Group effective from January 1, 2005. Mr. Rantanen joined Outokumpu on October 1, 2004. Outokumpu’s former CEO, Dr. Jyrki Juusela retired at the end of 2004. In accordance with Outokumpu’s corporate governance principles, Mr. Juha Ran-tanen resigned on September 30, 2004 from Outokumpu’s Board of Directors, and Mr. Ole Johansson moved up as Vice Chairman of the Board on October 1, 2004. Mr. Johansson be-came also the new Chairman of the Board’s Audit Committee.
In connection with the new management system and busi-ness organization, the Board has appointed a new Group Execu-tive Committee, effective April 1, 2005, and defi ned its mem-bers’ duties as follows: Juha Rantanen (CEO), Karri Kaitue (Deputy CEO), Pekka Erkkilä (EVP – General Stainless & Pro-duction Operations), Olof Faxander (EVP – Specialty Stainless), Esa Lager (CFO) and Andrea Gatti (EVP – Commercial Opera-tions). The Executive Vice President – Human Resources is still to be appointed.
The current Group Executive Committee will continue in of-fi ce until March 31, 2005, as follows: Juha Rantanen, CEO, Karri Kaitue, Deputy CEO, Pekka Erkkilä, Tapani Järvinen (to continue as President of Outokumpu Technology reporting to the Deputy CEO as of April 1, 2005), Esa Lager, Juho Mäkinen (to continue as Special Adviser to the CEO from April 1, 2005 until his retirement on July 31, 2005), Kalevi Nikkilä (to retire on March 31, 2005), Vesa-Pekka Takala (to continue as Corpo-rate Controller reporting to the CFO as of April 1, 2005) and Risto Virrankoski (to retire on February 15, 2005).
Shareholders’ Nomination Committee
A Shareholders’ Nomination Committee was set up based on the resolution passed by the Annual General Meeting on April 2, 2004. It was given the task of preparing proposals on the com-
position of the Board of Directors along with director remuneration for the following General Meeting. The members of the Committee were: Markku Tapio (Chairman) representing the Finnish State, Pertti Parmanne representing the Finnish So-cial Insurance Institution, Kari Puro representing Ilmarinen, and Mikael Silvennoinen representing the OP-Delta investment fund. The Chairman of Outokumpu’s Board, Heimo Karinen, served as an expert member. The committee submitted its pro-posals on January 31, 2005.
Environment, health and safety
Environmental emissions and discharges were mostly below per-mission levels in 2004. Minor breaches occurred in Sheffi eld, Degerfors, Tornio and Wildwood sites. The biggest environmen-tal investments were made at Tornio. The upgrading of the dust fi lter systems at the Tornio melt shop and hot rolling mill amounts to EUR 22 million and a signifi cant reduction is an-ticipated in dust emissions. Also, a new hazardous waste land fi lling area is under construction at Tornio.
Outokumpu’s stainless steel plants in Finland and Sweden received carbon dioxide emissions trading allowances and emis-sion permits according to the national allocation plans in 2004. In Britain the process was delayed, but the fi nal allocations should be available by the end of February 2005 at the latest. The received allowances are suffi cient for Outokumpu’s planned production in 2005–2007. Monitoring and forecasting systems for carbon dioxide emissions are in place.
An environmental impact assessment is underway for possi-ble increase in production at Tornio. A separate impact assess-ment process concerning the main Tornio shipping channel was also started. The surveys related to soil and groundwater con-tamination continued at eight Copper and six Stainless sites. Groundwater remedial actions are ongoing in Tornio and three sites in the US. Outokumpu’s appeal concerning the defi nition of ferrochrome slag and steel scrap as waste has gone before the Supreme Administrative Court of Finland.
All the Outokumpu units have valid environmental permits in place or they are in the process for applying for them. Outo-kumpu is not a party in any signifi cant juridical or administra-tive proceeding concerning environmental issues, nor is it aware of any environmental risks that could have a material adverse ef-fect on the Group’s fi nancial position.
In 2004, the accident frequency was at 18 accidents per mil-lion man-hours, and no major accidents were reported. A safety management assessment and safety review of the main sites in the Stainless business area were conducted in 2004. Consequent-ly, an extensive safety-training program has been started. Year 2005 will be a group-wide safety theme year. A new safety target for the Group was set at 5 accidents per million man-hours be-fore 2009.
R&D is engaged in new products and applications
Expenditure on research and development during 2004 amount-ed to EUR 40 million or 0.6 % of the net sales (2003: EUR 48 million and 0.8 %). 68 new patent applications were fi led (2003:74). In addition to new products, R&D focused on in-
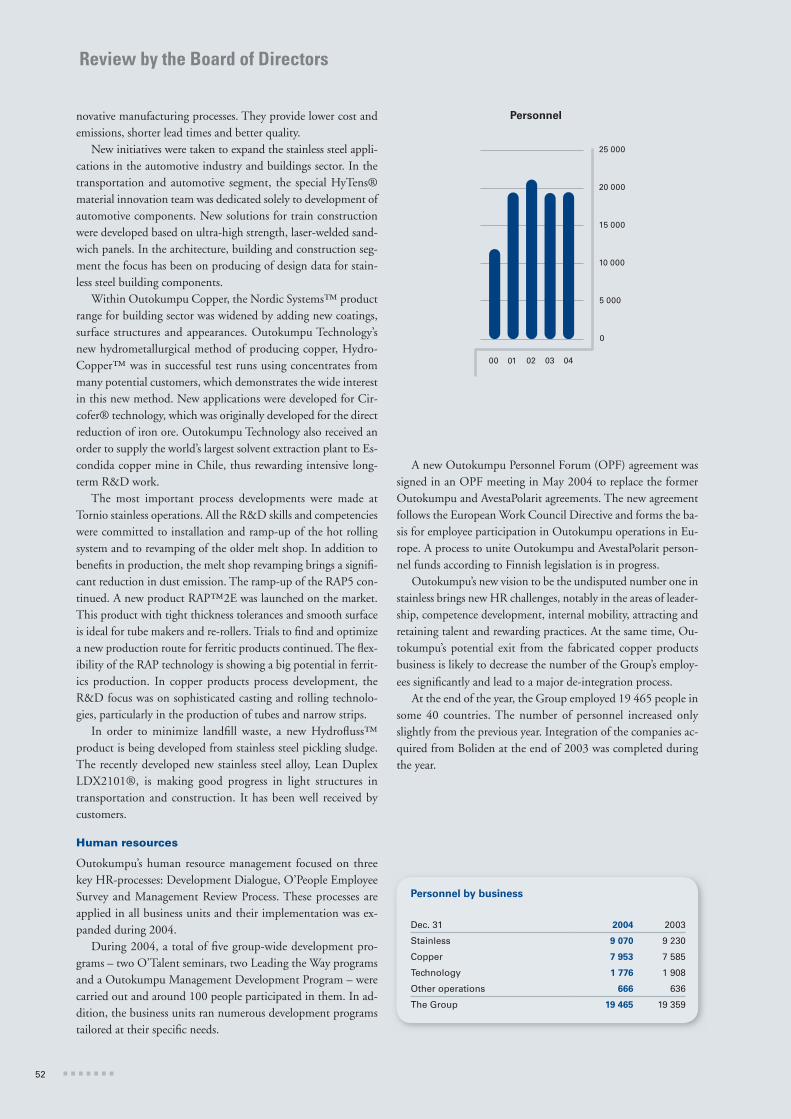
52
novative manufacturing processes. They provide lower cost and emissions, shorter lead times and better quality.
New initiatives were taken to expand the stainless steel appli-cations in the automotive industry and buildings sector. In the transportation and automotive segment, the special HyTens® material innovation team was dedicated solely to development of automotive components. New solutions for train construction were developed based on ultra-high strength, laser-welded sand-wich panels. In the architecture, building and construction seg-ment the focus has been on producing of design data for stain-less steel building components.
Within Outokumpu Copper, the Nordic Systems™ product range for building sector was widened by adding new coatings, surface structures and appearances. Outokumpu Technology’s new hydrometallurgical method of producing copper, Hydro-Copper™ was in successful test runs using concentrates from many potential customers, which demonstrates the wide interest in this new method. New applications were developed for Cir-cofer® technology, which was originally developed for the direct reduction of iron ore. Outokumpu Technology also received an order to supply the world’s largest solvent extraction plant to Es-condida copper mine in Chile, thus rewarding intensive long-term R&D work.
The most important process developments were made at Tornio stainless operations. All the R&D skills and competencies were committed to installation and ramp-up of the hot rolling system and to revamping of the older melt shop. In addition to benefi ts in production, the melt shop revamping brings a signifi -cant reduction in dust emission. The ramp-up of the RAP5 con-tinued. A new product RAP™2E was launched on the market. This product with tight thickness tolerances and smooth surface is ideal for tube makers and re-rollers. Trials to fi nd and optimize a new production route for ferritic products continued. The fl ex-ibility of the RAP technology is showing a big potential in ferrit-ics production. In copper products process development, the R&D focus was on sophisticated casting and rolling technolo-gies, particularly in the production of tubes and narrow strips.
In order to minimize landfi ll waste, a new Hydrofl uss™ product is being developed from stainless steel pickling sludge. The recently developed new stainless steel alloy, Lean Duplex LDX2101®, is making good progress in light structures in transportation and construction. It has been well received by customers.
Human resources
Outokumpu’s human resource management focused on three key HR-processes: Development Dialogue, O’People Employee Survey and Management Review Process. These processes are applied in all business units and their implementation was ex-panded during 2004.
During 2004, a total of fi ve group-wide development pro-grams – two O’Talent seminars, two Leading the Way programs and a Outokumpu Management Development Program – were carried out and around 100 people participated in them. In ad-dition, the business units ran numerous development programs tailored at their specifi c needs.
A new Outokumpu Personnel Forum (OPF) agreement was signed in an OPF meeting in May 2004 to replace the former Outokumpu and AvestaPolarit agreements. The new agreement follows the European Work Council Directive and forms the ba-sis for employee participation in Outokumpu operations in Eu-rope. A process to unite Outokumpu and AvestaPolarit person-nel funds according to Finnish legislation is in progress.
Outokumpu’s new vision to be the undisputed number one in stainless brings new HR challenges, notably in the areas of leader-ship, competence development, internal mobility, attracting and retaining talent and rewarding practices. At the same time, Ou-tokumpu’s potential exit from the fabricated copper products business is likely to decrease the number of the Group’s employ-ees signifi cantly and lead to a major de-integration process.
At the end of the year, the Group employed 19 465 people in some 40 countries. The number of personnel increased only slightly from the previous year. Integration of the companies ac-quired from Boliden at the end of 2003 was completed during the year.
Personnel by business
Dec. 31 2004 2003
Stainless 9 070 9 230
Copper 7 953 7 585
Technology 1 776 1 908
Other operations 666 636
The Group 19 465 19 359
Personnel
Review by the Board of Directors

53Outokumpu 2004
Repurchase and transfer of the company’s
own shares
The Board of Directors has valid authorizations from the An-nual General Meeting of 2004 to repurchase and transfer of company’s own shares (treasury shares). The authorizations are valid until the next Annual General Meeting. The authorization to repurchase the company’s own shares has not been used. Ou-tokumpu Oyj currently holds 498 533 treasury shares, which it has acquired in 2001.
On February 10, 2005, the Board of Directors confi rmed the management remuneration of the third scheme that expired at the end of 2004. Under the said scheme, approximately 280 490 treasury shares will be transferred to the designated persons on February 14, 2005.
The repurchase and transfer of the company’s own shares is discussed in greater detail in note 23 to the consolidated fi nan-cial statements on pages 86–88.
Competition law issues
In September 2004, Outokumpu received a notifi cation from the European Commission concerning participation by Outo-kumpu’s copper tube business in a cartel with respect to sanitary tubes in the European Union. The Commission concluded that Outokumpu had participated in a cartel and fi ned Outokumpu EUR 36 million. Outokumpu has appealed the sanitary tube decision with respect to the grounds for the calculation of the fi ne and the amount of the fi ne itself. In connection with the transition to IFRS, a provision of EUR 36 million related to the sanitary tube cartel fi ne was recognized already in the December 2003 income statement.
The business outlook for the fi rst half
of 2005 set to hold steady
Global economic growth is expected to slow from the current 4% to closer to 3% in 2005. Western Europe is expected to re-main the weakest of the major regions, hindered by the strength of the euro. Momentum in the US and Japan has also began to moderate. Doubts about the sustainability of the US current ac-count defi cit have been increasing, and worries remain as to whether China will succeed in slowing growth to a more sustain-able level. Also, high energy prices could damp down the world business climate.
Business and consumer surveys remain positive, suggesting that the global economic growth will remain fi rm into the fi rst half of 2005. Although the base price of stainless steel has sof-tened somewhat, global capacity utilization rates are expected to remain high in 2005, providing a supportive background for prices and margins. The ramp-up of Outokumpu’s new cold rolling mill (RAP5) in Tornio will continue to improve profi ta-bility through higher volumes and lower unit conversion costs. Furthermore, the product mix is expected to improve further. It is currently estimated that the increase in Outokumpu’s total de-liveries of fi nished products will be well above 20% in 2005 de-pending on the market situation.
Given the higher volumes and lower unit conversion costs, but also slightly softening base price of stainless steel, Outo-kumpu management estimates that the Group’s operating profi t excluding non-recurring items, during the fi rst half of 2005 will be at least at the level of the corresponding period in 2004.
Board of Directors’ proposal for
profi t distribution
In accordance with the Board of Directors’ established dividend policy, the payout ratio over a business cycle should be at least one-third of the company’s profi t for the period. In its annual dividend proposal to the Annual General Meeting, the Board of Directors will, in addition to fi nancial results, take into consid-eration the company’s investment and development needs.
The Board of Directors is proposing to the Annual General Meeting to be held on April 5, 2005 that a dividend of EUR 0.50 per share be paid from the profi ts for the fi nancial year ended December 31, 2004 and that any remaining distributable funds be allocated to retained earnings. The suggested dividend record date is April 8, 2005 and the dividend will be paid on April 15, 2005. All the shares transferred on February 14, 2005 from the company to the persons belonging to the manage-ment’s share remuneration scheme are also entitled to a full divi-dend for 2004.
According to the fi nancial statements at December 31, 2004, the Group’s distributable funds total EUR 1 010 million and those of the parent company EUR 567 million. The proposed dividend corresponds to 23.6% of the Group’s profi t for the fi -nancial year attributable to equity holders of the Company.
Espoo, February 10, 2005
Heimo KarinenOle JohanssonEvert HenkesArto HonkaniemiJorma HuuhtanenLeena SaarinenSoili SuonojaArto Vilppola
Juha RantanenCEO

54
To the shareholders of Outokumpu Oyj
We have audited the accounting records, the fi nancial statements and the administration of Outokumpu Oyj for the period January 1–December 31, 2004. The fi nancial statements prepared by the Board of Directors and the Chief Executive Offi cer include the report of the Board of Directors, the consolidated fi nancial statements of the Outokumpu Group prepared
in accordance with International Financial Reporting Standards (IFRS), and the parent company’s fi nancial statements prepared in accordance with prevailing rules and regulations in Finland. Based on our audit we express an opinion on these fi nancial statements and on the parent company’s administration.
We have conducted the audit in accordance with Finnish Standards on Auditing. Those standards require that we perform the audit to obtain reasonable assurance about whether the fi nancial statements are free of material misstatement. An audit includes examining on a test basis evidence supporting the amounts and disclosures in the fi nancial statements, assessing the accounting principles used and signifi cant estimates made by the management as well as evaluating the overall fi nancial statement presentation. The purpose of our audit of administration has been to examine that the members of the Board of Directors and the Chief Executive Offi cer of the parent com-pany have legally complied with the rules of the Finnish Companies Act.
In our opinion the consolidated fi nancial statements prepared in accordance with International Financial Re-porting Standards give a true and fair view of the consolidated result of operations, as well as of the fi nancial posi-tion of the Outokumpu Group. The consolidated fi nancial statements have been prepared in accordance with prevailing rules and regulations in Finland and can be adopted.
The parent company’s fi nancial statements have been prepared in accordance with the Finnish Accounting Act and other rules and regulations governing the preparation of fi nancial statements. The parent company’s fi nancial statements give a true and fair view, as defi ned in the Finnish Accounting Act, of the company’s result of operations and of the fi nancial position. The parent company’s fi nancial statements can be adopted and the members of the Board of Directors and the Chief Executive Offi cer of the parent company can be discharged from liability for the period audited by us. The proposal by the Board of Directors regarding the distributable funds is in compliance with the Finnish Companies Act.
Espoo, March 1, 2005
PricewaterhouseCoopers OyAuthorized Public Accountants
Markku MarjomaaAuthorized Public Accountant
Auditor’s reportAuditor’s report

55Outokumpu 2004
€ million Note 2004 2003
Sales 3, 5 7 136 5 922
Cost of sales 8 (6 202) (5 315)
Gross margin 934 608
Other operating income 6 63 210Selling and marketing expenses 8 (210) (206)Administrative expenses 8 (244) (272)Research and development expenses 8 (41) (55)Other operating expenses 7 (35) (71)
Operating profi t 468 214
Share of results of associated companies 16 78 (15)
Financial income and expenses 10Net interest expenses (95) (99)Market price gains and losses 24 (1)Other fi nancial income and expenses 2 9
Total fi nancial income and expenses (69) (91)
Profi t before taxes 477 108
Income taxes 11 (87) 4
Net profi t for the fi nancial year 390 112
Attributable to:
Equity holders of the Company 383 111Minority interest 7 1
Earnings per share for profi t attributable to the equity
holders of the Company:
Earnings per share, € 12 2.13 0.65Diluted earnings per share, € 2.13 0.65
Average number of shares 180 056 920 171 623 035
All fi gures in the fi nancial statements have been rounded and consequently the sum of individual fi gures can deviate from the presented sum fi gure.
Consolidated fi nancial statements, IFRSConsolidated fi nancial statements, IFRS
Consolidated income statementConsolidated income statement

56
Consolidated balance sheetConsolidated balance sheet
€ million Note 2004 2003
ASSETS
Non-current assets
Intangible assets 14 620 601
Property, plant and equipment 15 2 743 2 668
Investments in associated companies 1) 16 291 255
Available-for-sale fi nancial assets 1) 17 53 18
Derivative fi nancial instruments 1) 19 2 –
Deferred tax assets 11 44 69
Trade and other receivables 21
Interest-bearing 1) 63 207
Non interest-bearing 11 12
Total non-current assets 3 827 3 830
Current assets
Inventories 20 1 579 1 219
Available-for-sale fi nancial assets 1) 17 8 6
Derivative fi nancial instruments 1) 19 44 64
Trade and other receivables 21
Interest-bearing 1) 18 15
Non interest-bearing 1 390 1 032
Cash and cash equivalents 1) 22 211 231
Total current assets 3 250 2 567
TOTAL ASSETS 7 077 6 397
1) Included in net interest-bearing debt.

57Outokumpu 2004
€ million Note 2004 2003
EQUITY AND LIABILITIES
Equity attributable to the equity holders of the Company
Share capital 308 304Unregistered share capital – 0Premium fund 700 681Other reserves 27 14Retained earnings 1 049 938Net profi t for the fi nancial year 383 111
2 468 2 048
Minority interest 38 35
Total equity 23 2 506 2 083
Non-current liabilities
Long-term debt 1) 26 1 971 1 777
Derivative fi nancial instruments 1) 19 4 –
Deferred tax liabilities 11 255 248
Pension obligations 24 139 186
Provisions 25 38 72
Trade and other payables 27 10 13
Total non-current liabilities 2 417 2 297
Current liabilities
Current debt 1) 26 1 103 986
Derivative fi nancial instruments 1) 19 15 33
Income tax liabilities 11 29 33
Provisions 25 29 31
Trade and other payables 27
Interest-bearing 1) 32 26
Non interest-bearing 947 909
Total current liabilities 2 154 2 017
TOTAL EQUITY AND LIABILITIES 7 077 6 397
1) Included in net interest-bearing debt.

58
Consolidated cash fl ow statementConsolidated cash fl ow statement
€ million Note 2004 2003
Cash fl ow from operating activities
Net profi t for the fi nancial year 390 112Adjustments for
Taxes 11 87 (4)Depreciation 14, 15 251 304Share of results of associated companies 16 (78) 15Profi t/loss on sale of property, plant and equipment 6, 7 (3) (119)Interest income 9 (23) (14)Dividend income 9 (3) (3)Interest expense 9 118 112Other adjustments (7) (5)
341 286Change in working capital
Change in trade and other receivables (332) (60)Change in inventories (354) (36)Change in trade and other payables 37 53Change in provisions (61) (44)
(710) (87)
Dividends received 3 3Interest received 23 14Interest paid (112) (110)Income tax paid (63) (24)
Net cash generated from operating activities (128) 194
Cash fl ow from investing activities
Acquisition of subsidiaries, net of cash 4 0 (56)Acquisition of shares in associated companies 16 (76) –Acquisition of available-for-sale fi nancial assets 17 (26) (11)Purchases of property, plant and equipment 15 (337) (447)Purchases of intangible assets 14 (39) (55)Proceeds from disposal of subsidiaries, net of cash 4 18 362Proceeds from sale of shares in associated companies 16 127 28Proceeds from sale of property, plant and equipment 15 8 2Proceeds from sale of available-for-sale fi nancial assets 17 6 23Loan repayments received from associated companies 30 172 2Change in other long-term receivables (6) (9)
Net cash used in investing activities (152) (161)
Cash fl ow before fi nancing activities (280) 33
Cash fl ow from fi nancing activities
Borrowings of long-term debt 379 734Repayments of long-term debt (144) (384)Change in current debt 25 (344)Dividends paid (36) (69)Proceeds from share subscriptions 19 6Other fi nancing cash fl ow (8) 37
Net cash generated from fi nancing activities 235 (20)
Other adjustments 30 4
Net change in cash and cash equivalents (16) 17
Cash and cash equivalents at the beginning of the fi nancial year 231 222Foreign exchange rate effect on cash and cash equivalents (4) (8)Net change in cash and cash equivalents (16) 17Cash and cash equivalents at the end of the fi nancial year 22 211 231

59Outokumpu 2004
Consolidated statement of changes in equityConsolidated statement of changes in equity
Attributable to the equity holders of the Company
€ million Sh
are
cap
ital
Un
reg
iste
red
sh
are
cap
ital
Sh
are
pre
miu
m f
un
d
Oth
er r
eser
ves
Fair
val
ue
rese
rves
Trea
sury
sh
ares
Cu
mu
lati
ve t
ran
slat
ion
d
iffer
ence
s
Ret
ain
ed e
arn
ing
s
Min
ori
ty in
tere
st
Tota
l eq
uit
y
Equity on Jan. 1, 2003 293 0 630 15 – (14) (18) 1 101 43 2 050
Net investment hedges – – – – – – 1 – – 1
Change in translation differences – – – – – – (44) – 0 (44)
Items recognised directly in equity – – – – – – (43) – 0 (43)
Net profi t for the fi nancial year – – – – – – – 111 1 112
Total recognisedincome and expenses – – – – – – (43) 111 1 69
Dividends paid – – – – – – – (69) – (69)
Transfers from unregistered share capital 0 (0) – – – – – – – 0
Shares subscribed with options 1 0 4 – – – – – – 5
Converted bonds 1 – 2 – – – – – – 3
Share offering 9 – 45 – – – – – – 54
Outokumpu Oyj shares owned by associated companies – – – – – – – (26) – (26)
Transfer of treasury shares – – – – – 2 – – – 2
Other changes – – (0) (1) – – – 5 (9) (5)Equity on Dec. 31, 2003 304 0 681 14 – (12) (61) 1 122 35 2 083
Cash fl ow hedges – – – – (2) – – – – (2)
Fair value gains on available-for-sale fi nancial assets – – – – 16 – – – – 16
Net investment hedges – – – – – – (2) – – (2)
Change in translation differences – – – – – – 4 – 0 4
Items recognised directly in equity – – – – 15 – 2 – 0 17
Net profi t for the fi nancial year – – – – – – – 383 7 390
Total recognisedincome and expenses – – – – 15 – 2 383 7 407
Dividends paid – – – – – – – (36) – (36)
Transfers from unregistered share capital 0 (0) – – – – – – – 0
Shares subscribed with options 4 – 15 – – – – – – 19
Converted bonds 1 – 3 – – – – – – 4
Outokumpu Oyj shares owned by associated companies – – – – – – – 26 – 26
Transfer of treasury shares – – 0 – – 6 – – – 6
Other changes – – 1 (1) – – – 1 (4) (3)Equity on Dec. 31, 2004 308 – 700 13 15 (5) (59) 1 496 38 2 506

60
1. Accounting principles for the consolidated
accounts
Principal activities
Outokumpu Oyj is a Finnish public limited liability company organ-ized under the laws of Finland and domiciled in Espoo. The parent company, Outokumpu Oyj, has been listed on the Helsinki stock ex-change since 1988.
Outokumpu is an international stainless steel and technology com-pany. Customers representing a wide range of industries use our metal products, technology and services worldwide. Outokumpu Oyj and its subsidiaries (together “the Outokumpu Group” or “the Group”) have been organized into three strategic entities in 2004: Outokumpu Stain-less, Outokumpu Copper and Outokumpu Technology.
In 2004, Outokumpu operated in about 40 countries and em-ployed some 19 500 people. The Group’s sales amounted to EUR 7.1 billion, of which 95% was generated outside Finland.
Basis for preparation of the fi nancial statements
These are the fi rst consolidated fi nancial statements of Outokumpu in accordance with International Financial Reporting Standards (IFRS). Prior to IFRS, Outokumpu’s fi nancial reporting was based on Finnish Accounting Standards (FAS). The consolidated fi nancial statements are presented in millions of euros and have been prepared under the historical cost conventions, unless otherwise stated in the accounting principles.
In 2004, the Group adopted IFRS standards and the adoption was done according to the IFRS 1 (First-time Adoption of IFRS). Outo-kumpu’s date of transition to IFRS was January 1, 2003. However, for the adoption of IAS 39 (Financial Instruments: Recognition and Measurement) and IAS 32 (Financial Instruments: Disclosure and Presentation), the date of transition was January 1, 2004. For fi nancial instruments, Outokumpu utilized the exemption for a fi rst-time adop-ter of IFRS not to restate comparative information for 2003. The ef-fects of the adoption of IFRS are summarized in note 2, Transition to IFRS. Comparative fi gures for 2003 presented in these fi nancial state-ments have been restated to comply with IFRS.
Standards applied before their effective date
The following standards, as amended in 2003, have been applied in the preparation of the fi nancial statements before their effective date January 1, 2005:
IAS 1 Presentation of Financial StatementsIAS 2 InventoriesIAS 10 Events After the Balance Sheet DateIAS 17 LeasesIAS 21 The Effects of Changes in Foreign Exchange RatesIAS 24 Related Party DisclosuresIAS 27 Consolidated and Separate Financial StatementsIAS 28 Investments in AssociatesIAS 31 Interests in Joint VenturesIAS 32 Financial Instruments: Disclosure and PresentationIAS 33 Earnings per ShareIAS 39 Financial Instruments: Recognition and Measurement
Notes to the consolidated fi nancial statements

61Outokumpu 2004
Use of estimates
The preparation of the fi nancial statements in accordance with IFRS requires management to make estimates and assumptions that affect the reported amounts of assets and liabilities, as well as the disclosure of contingent assets and liabilities at the date of the fi nancial state-ments, and the reported amounts of income and expenses during the reporting period. Accounting estimates are employed in the fi nancial statements to determine reported amounts, including the realizability of certain assets, the useful lives of tangible and intangible assets, in-come taxes and other items. Although these estimates are based on management’s best knowledge of current events and actions, actual re-sults may differ from the estimates.
Principles of consolidation
The consolidated fi nancial statements include the parent company Outokumpu Oyj and all subsidiaries where over 50 % of the subsidi-ary’s voting rights are controlled directly or indirectly by the parent company, or the parent company is otherwise in control of the com-pany. Associated companies, where Outokumpu holds voting rights of 20–50% and in which Outokumpu has signifi cant infl uence, but not control, over the fi nancial and operating policies, are included in the consolidated fi nancial statements using the equity method. When Ou-tokumpu’s share of losses exceeds the interest in the associated com-pany, the carrying amount is reduced to nil and recognition of further losses is discontinued except to the extent that the Group has incurred obligations in respect of the associated companies. The interest in an associated company is the carrying amount of the investment under the equity method together with any long-term interest that, in sub-stance, forms part of the investor’s net investment in the associated company. Joint ventures over whose activities Outokumpu has joint control, established by contractual agreement, are consolidated using the equity method.
Acquired companies are accounted for using the purchase method according to which the assets and liabilities of the acquired company are measured at fair value at the date of acquisition. The cost of good-will is the excess of the cost of the business combination over the ac-quirer’s interest in the net fair value of the identifi able assets, liabilities and contingent liabilities. In accordance with the exemption under IFRS 1, acquisitions prior to the IFRS transition date have not been restated but the previous values are taken as the deemed cost. Prior to the IFRS transition date, the difference between the acquisition cost and the subsidiary’s equity at the time of acquisition has been allocat-ed, where applicable, to the underlying assets. The remainder of the difference has been shown as goodwill on consolidation and amortized on a straight-line basis over the asset’s expected useful life. Under IFRS, goodwill on consolidation is not amortized but tested for impairment annually. Subsidiaries acquired during the fi nancial year are included in the consolidated fi nancial statements from the date of their acquisi-tion and disposed subsidiaries are included up to their date of sale.
All intra-group transactions, receivables, liabilities and unrealized margins, as well as distribution of profi ts within the Group, are elimi-nated.
Minority interest is presented separately from the net profi t and disclosed as a separate item in the equity.
Segment reporting
Business segments provide products or services that are subject to risks and returns that are different from those of other business segments. Geographical segments provide products or services within a particular economic environment that is subject to risks and returns that are dif-ferent from those of segments in other economic environments. Outo-kumpu’s primary reporting segments are its business segments, namely Outokumpu Stainless, Outokumpu Copper and Outokumpu Tech-nology. Other operations consists mainly of such business develop-ment and Corporate Management expenses that are not allocated to businesses. Pricing of inter-segment transactions is based on current market prices. Secondary reporting segments are geographical and based on the main areas where Outokumpu has activities and sales: Finland, Sweden, Britain, other Europe, North America, Asia and Aus-tralia as well as other countries.
Foreign currency transactions
Items of each subsidiary included in the consolidated fi nancial state-ments are measured using the currency that best refl ects the economic substance of the underlying events and circumstances relevant to that subsidiary (“the functional currency”). The consolidated fi nancial statements are presented in euros, which is the functional currency of the parent company. Foreign currency transactions are translated into euros using the exchange rates prevailing at the dates of the transac-tions. Receivables and liabilities in foreign currencies are translated in-to euros at the exchange rates prevailing at the balance sheet date. For-eign exchange gains and losses resulting from the settlement of such transactions and from the translation of monetary assets and liabilities denominated in foreign currencies are recognized in fi nancial income and expenses in the income statement. Foreign exchange differences arising in respect of fi nancial instruments are included in fi nancial in-come and expenses, except for certain cases where hedge accounting is applied. Income statements and cash fl ows of subsidiaries, whose func-tional and reporting currencies are not the euro, are translated into euros at the average exchange rates during the fi nancial period. Their balance sheets are translated at the exchange rates prevailing at the bal-ance sheet date and the translation differences are entered in equity. When a subsidiary is sold, possible translation differences are recog-nized in the income statement as part of the gain or loss on the sale.
Revenue recognition
Sales of goods are recognized after the signifi cant risks and rewards that are connected with ownership have been transferred to the buyer, and the Group retains neither a continuing managerial involvement to the degree usually associated with ownership, nor effective control of those goods. Revenues from services are recorded when the service has been performed. Sales are shown net of indirect sales taxes and discounts. Revenue from long-term construction contracts within Outokumpu Technology is recognized based on the stage of completion when the outcome of the project can be reliably measured. The stage of comple-tion is measured by using the cost-to-cost method under which the percentage of completion is defi ned as the ratio of costs incurred to total estimated costs.

62
Research and development costs
Research and development costs are expensed as they are incurred, ex-cept for certain development costs, which are capitalized when it is probable that a development project will generate future economic benefi ts, and certain criteria, including commercial and technological feasibility, have been met. Capitalized development expenses, compris-ing materials, supplies, direct labor and related overhead costs are am-ortized on a systematic basis over their expected useful lives.
Income taxes
The Group’s income tax expense includes taxes of the group compa-nies based on taxable profi t for the period, together with tax adjust-ments for previous periods and the change in deferred income taxes. The income tax effects of items recognized directly in equity are simi-larly recognized. The share of results in associated companies is report-ed in the income statement as calculated from net profi t, and thus in-cluding the income tax charge. Deferred income taxes are stated using the balance sheet liability method, as measured with enacted tax rates, to refl ect the net tax effects of all temporary differences between the fi nancial reporting and tax bases of assets and liabilities. The main temporary differences arise from the depreciation difference on prop-erty, plant and equipment, fair valuation of net assets in acquired com-panies, fair valuation of available-for-sale fi nancial assets and deriva-tives, intra-group inventory profi ts, pension and other provisions, un-taxed reserves and tax losses and credits carried forward. Deductible temporary differences are recognized as a deferred tax asset to the ex-tent that it is probable that future taxable profi ts will be available, against which the deductible temporary difference can be utilized.
Goodwill and other intangible assets
Goodwill arising on an acquisition represents the excess of the cost of the acquisition over the fair value of the net identifi able assets, liabili-ties and contingent liabilities acquired. Goodwill is stated at cost and is not amortized, but tested annually for impairment. In respect of as-sociated companies, the carrying amount of goodwill is included in the carrying amount of the investment.
Other intangible assets include customer relations, capitalized de-velopment expenses, patents, copyrights, licenses and software. The valuation of intangible assets acquired in a business combination is based on fair value. Other intangible assets are stated at cost and am-ortized on a straight-line basis over expected useful lives. Development costs or acquisition costs of new software clearly associated with an identifi able product, which will be controlled by the Group and has probable economic benefi t exceeding its cost beyond one year, are rec-ognized as an intangible asset and depreciated over the software’s ex-pected useful life. Associated costs include staff costs of the develop-ment team and an appropriate portion of overhead. An intangible asset is recognized only if it is probable that the future economic benefi ts that are attributable to the asset will fl ow to the Group, and the cost of the asset can be measured reliably. All other expenditure is expensed as incurred.Periods of amortization used for intangible assets are:Intangible rights up to 20 yearsSoftware 3–5 years
Property, plant and equipment
Property, plant and equipment acquired by group companies are stated at historical cost, except the assets of acquired companies that were stat-ed at their fair values at the date of acquisition. Depreciation is calcu-
lated based on the useful lives of the assets and adjusted for impairment charges, if any. The carrying value of the property, plant and equipment in the balance sheet represents the cost less accumulated depreciation and any impairment charges. Interest costs on borrowings to fi nance the construction of property, plant and equipment are capitalized during the period of time that is required to complete and prepare the asset for its intended use. Other borrowing costs are expensed.Depreciation is based on the following expected useful lives:Buildings 25–40 yearsHeavy machinery 15–20 yearsLight machinery and equipment 5–15 years
Land is not depreciated and mine properties are depreciated using the units-of-production method based on the depletion of ore reserves. Expected useful lives of non-current assets are reviewed at each balance sheet date and, where they differ signifi cantly from previous estimates, depreciation periods are changed accordingly. Ordinary repairs and maintenance costs are charged to the income statement during the fi -nancial year in which they are incurred. The cost of major renovations is included in the asset’s carrying amount when it is probable that the Group will derive future economic benefi ts in excess of the originally assessed standard of performance of the existing asset. Major renova-tions are depreciated over the useful lives of the related assets. Gains and losses on sales and disposals are determined by comparing the re-ceived proceeds with the carrying amount and are included in operat-ing profi t.
Government grants
Government or other grants are recognized as income on a systematic basis over the periods necessary to match them with the related costs, which they are intended to compensate. Investment grants are recog-nized as revenue on a systematic basis over the useful life of the asset. In the balance sheet, investments grants are deducted from the value of the asset they relate to.
Impairments
Property, plant and equipment and other non-current assets, including goodwill and intangible assets, are reviewed for potential impairment whenever events or changes in circumstances indicate that the carrying amount of an asset may not be recoverable. Goodwill is in all cases tested annually. For the purposes of assessing impairment, assets are grouped at the lowest cash generating unit level for which there are separately identifi able, mainly independent, cash infl ows and outfl ows. An impairment loss is the amount by which the carrying amount of the assets exceeds the recoverable amount. The recoverable amount is the asset’s value in use. The value in use is determined by reference to dis-counted future net cash fl ows expected to be generated by the asset. A previously recognized impairment loss is reversed only if there has been a change in the estimates used to determine the recoverable amount. However, the reversal must not cause that the adjusted value is higher than the carrying amount that would have been determined if no impairment loss had been recognized in prior years. Impairment losses recognized for goodwill are not reversed.
Leases
Leases of property, plant and equipment where the Group has substan-tially all the rewards and risks of ownership are classifi ed as fi nance leases. Finance leases are capitalized at the commencement of the lease term at the lower of the fair value of the leased property or the esti-
Notes to the consolidated fi nancial statements

63Outokumpu 2004
mated present value of the underlying lease payments. Each lease pay-ment is allocated between the capital liability and fi nance charges, so as to achieve a constant interest rate on the fi nance balance outstand-ing. The corresponding rental obligations, net of fi nance charges, are included in interest-bearing liabilities with the interest element of the fi nance charge being recognised in the income statement over the lease period. Property, plant and equipment acquired under fi nance lease contracts are depreciated over the shorter of the useful life of the asset or lease period. Leases of assets, where the lessor retains all the risks and benefi ts of ownership, are classifi ed as operating leases. Payments made thereunder, and under rental agreements, are expensed on a straight-line basis over the lease periods.
Financial instruments
IAS 39 (Financial Instruments: Recognition and Measurement) and IAS 32 (Financial Instruments: Disclosure and Presentation) have been adopted as of January 1, 2004. Outokumpu has utilized the ex-emption for a fi rst-time adopter of IFRS not to restate comparative information for 2003.
Financial instruments are classifi ed as loans and receivables, held-to-maturity investments, available-for-sale fi nancial assets, fi nancial li-abilities at amortized cost and fi nancial assets and liabilities at fair val-ue through profi t and loss. Equity securities are designated as available-for-sale fi nancial assets. Interest-bearing securities and convertible loan receivables are designated as fi nancial assets at fair value through profi t and loss.
Available-for-sale investments, as well as fi nancial assets and liabili-ties at fair value through profi t and loss, are measured at fair value and the valuation is based on quoted rates and market prices or appropriate valuation models. Unlisted equity securities for which fair value can-not be reliably measured are recognized at cost less impairment. Fair value changes of available-for-sale investments are recognized directly in equity. In the event such an asset is disposed of, the accumulated fair value changes are released from equity to fi nancial income and expens-es in the income statement. Purchases and sales of available-for-sale fi nancial assets are recognized at the trade date.
Loans and receivables as well as all fi nancial liabilities, except for derivatives, are recognized at the settlement date and measured at am-ortized cost using the effective interest rate method. Transaction costs are included in the initially recognized amount. Financial assets and liabilities at fair value through profi t and loss are recognized at the trade date and measured at fair value.
All derivatives, including embedded derivatives, are initially recog-nized at fair value on the date Outokumpu has entered into the de-rivative contract, and are subsequently remeasured at fair value. Deter-mination of fair values is based on quoted market prices and rates, discounting of cash fl ows and option valuation models.
Fair values of currency forwards and swaps, interest rate swaps and metal forwards are determined by discounting the future nominal cash fl ows with relevant interest rates and then converting the discounted cash fl ows to the base currency using spot rates. Fair values of electric-ity forwards are determined by discounting the base currency denomi-nated future values with relevant interest rates. The fair value of cur-rency and metal options is determined by utilizing commonly applied option valuation models. Other optionalities included in electricity de-rivatives are measured at fair value with their own valuation models.
Part of derivatives and other fi nancial instruments may be desig-nated as hedging instruments, in which case hedge accounting is ap-
plied. If hedge accounting is not applied, all fair value changes in de-rivatives are recognized directly in fi nancial income and expenses in the income statement. If hedge accounting is applied, the accounting for hedging instruments is dependent on the particular nature of the hedging relationship.
Hedging programs are documented according to the requirement of IAS 39 and designated hedging instruments are subject to prospec-tive and retrospective testing of effectiveness. Fair value changes in de-rivatives, which are assigned to hedge forecasted transactions (cash fl ow hedging), are recognized in equity to the extent that the hedge is effective. Such accumulated fair value changes are released into income as adjustments to sales or purchases in the period when the hedged cash fl ow affects income. The ineffective portion of the gain or loss of the hedging instrument is recognized in income.
Fair value changes in designated hedging instruments, which are assigned to hedge translation risk related to net investments in foreign operations, are recognized in equity to the extent that the hedge is ef-fective. Accumulated gains and losses from hedges are recognized as income only if the hedged subsidiary is sold or liquidated. The ineffec-tive portion of the gain or loss of the hedging instrument is recognized in income.
All recognized fair value changes to equity are net of tax.
Inventories
Inventories are stated at the lower of cost or net realizable value. Cost is determined by the fi rst-in, fi rst-out (FIFO) method. The cost of fi n-ished goods and work in progress comprises raw materials, direct labor, other direct costs and related production overheads, but excludes bor-rowing costs. Net realizable value is the estimated selling price in the ordinary course of business, less the estimated costs of completion and the estimated costs necessary to make the sale.
Trade receivables
Trade receivables are carried at their anticipated realizable value, which is the original invoice amount less an estimated valuation allowance for impairment of these receivables. A valuation allowance for impairment of trade receivables is made when there is objective evidence that the Group will not be able to collect all amounts due according to the original terms of the receivables.
Cash and cash equivalents
Cash and cash equivalents comprise cash in hand, deposits held at call with banks, other short-term highly liquid investments with original maturities of three months or less, and bank overdrafts. Bank over-drafts are included within borrowings in current liabilities in the bal-ance sheet.
Treasury shares
When the company or its subsidiaries purchases the company’s own shares, the consideration paid, including any attributable transaction costs net of income taxes, is deducted from equity as treasury shares until they are cancelled. When such shares are subsequently sold or reissued, any consideration received is included in equity.

64
Provisions
Provisions are recognized in the balance sheet when Outokumpu has a present legal or constructive obligation as a result of a past event, and it is probable that an outfl ow of economic benefi ts will be required to settle the obligation and a reliable estimate can be made of the amount of the obligation. Provisions can arise from restructuring plans, oner-ous contracts and from environmental, litigation or tax risks.
Employee benefi ts
Group companies in different countries have various pension plans in accordance with local conditions and practices. The plans are classifi ed as either defi ned contribution plans or defi ned benefi t plans. The con-tributions to defi ned contribution plans are charged to the income statement in the year to which they relate. The present value of the obligation of defi ned benefi t plans is determined using the projected unit credit method and the plan assets are measured at fair value at the measurement date. In calculating the Group’s obligation with respect to a plan, the extent to which the cumulative unrecognized actuarial gain or loss exceeds the greater of the present value of the defi ned ben-efi t obligation and the fair value of plan assets by more than 10% is identifi ed. That excess portion is recognized in the income statement over the expected average remaining working lives of the employees participating in the plan. Otherwise, the actuarial gain or loss is not recognized. In accordance with the exemption under IFRS 1, all cu-mulative actuarial gains and losses have been recognized in retained earnings at the date of transition, January 1, 2003.
Equity and equity-related compensation benefi ts
Stock options have been granted based on Outokumpu’s 2003 option program. The options will be distributed to key personnel in accord-ance with terms and conditions of the option program, if the earnings criteria for options are met. Holders of options have the right to sub-scribe for shares at a price that is based on the volume-weighted aver-age price of the Outokumpu Oyj share on the Helsinki stock exchange during the periods defi ned in the terms and conditions of the Outo-kumpu 2003 option program. The share subscription price with stock options will be reduced on each dividend record date by the amount of dividends to be declared after the close of the period for determining the subscription price and prior to the share subscription. When the options are exercised, the proceeds received, net of any transaction costs, are credited to share capital and the share premium reserve.
The Group’s management and other key personnel have partici-pated in a share remuneration scheme. Pursuant to the scheme, remuneration is based on the relative performance of Outokumpu Oyj’s share price, and remuneration is paid provided that the average change in Outokumpu’s share price equals or exceeds the average trend in a reference index. The costs of share remuneration schemes are rec-ognized in the income statement as personnel expenses (60% in cash and 40% in Outokumpu shares paid from treasury shares) in the pe-riod in which they are earned. Remuneration is paid by the decision of the Board of Directors.
Outokumpu will apply IFRS 2 (Share-based Payment) from the beginning of 2005, and comparative information will be restated ac-cordingly.
Dividends
The dividend proposed by the Board of Directors is not deducted from distributable equity until approved by a General Meeting of Shareholders.
Earnings per share
Earnings per share is calculated by dividing the net profi t attributable to the shareholders of the company by the weighted average number of shares in issue during the year, excluding shares purchased by Outo-kumpu and held as treasury shares. Diluted earnings per share is calcu-lated as if the warrants and options were exercised at the beginning of the period. In addition to the weighted average number of shares out-standing, the denominator includes the incremental shares obtained through the assumed exercise of the warrants and options. The as-sumption of exercise is not refl ected in earnings per share when the exercise price of the warrants and options exceeds the average market price of the shares during the period. The warrants and options have a diluting effect only when the average market price of the share during the period exceeds the exercise price of the warrants and options.
Notes to the consolidated fi nancial statements

65Outokumpu 2004
2. Transition to IFRS
General information
Outokumpu converted from Finnish Accounting Standards (FAS) to International Financial Reporting Standards (IFRS) in its third-quar-ter interim report in 2004. Outokumpu’s date of transition to IFRS was January 1, 2003. However, for the adoption of IAS 39 (Financial Instruments: Recognition and Measurement) and IAS 32 (Financial Instruments: Disclosure and Presentation), the date of transition was January 1, 2004. The fi nancial statements for 2003 and the fi rst and second quarter interim reports in 2004 were originally prepared in ac-cordance with FAS.
The following section presents the major changes in accounting principles and effects of the transition to IFRS on Outokumpu’s con-
solidated fi nancial statements for 2003. On October 11, 2004 Outo-kumpu published comparative IFRS information for the periods Janu-ary-December 2003, January-March 2004 and January-June 2004. The information was unaudited and some minor adjustments have been made. Outokumpu has adopted IFRS 1 (First-time Adoption of IFRS) and used the exemptions from the requirements of IAS 19 (Employee Benefi ts), IFRS 3 (Business Combinations), IAS 39 and IAS 32. From Outokumpu’s point of view, the most signifi cant effects of the transition to IFRS related to the treatment of positive and negative goodwill, pen-sion and inventory accounting, recognition of fi nancial instruments and presentation of market price gains and losses.
Reconciliation of shareholders’ equity
€ million Dec. 31, 2003 Jan. 1, 2003Shareholders’ equity according to FAS 1 924 1 906
Effects of adopting IFRSRecognition of negative goodwill in equity 151 190Reversal of goodwill amortization 44 –Restatement of business combinations 23 –Inventory valuation 26 28Pension obligations (97) (129)Provisions (42) (13)Deferred taxes on IFRS adjustments 27 24Matching of share remuneration scheme (8) (6)Other (1) 7
Shareholders’ equity according to IFRS 2 048 2 007
Reconciliation of net profi t for the period
€ million 2003Net profi t for the period according to FAS 92
Effects of adopting IFRSReversal of goodwill amortization 44Reversal of negative goodwill amortization (40)Restatement of business combinations 23Inventory valuation (1)Adjustment to the gain from the Boliden transaction 13Change in pension obligations (2)Change in provisions (29)Change in deferred taxes on IFRS adjustments 12Matching of share remuneration scheme (3)Other 1
Net profi t for the period according to IFRS 111

66
Notes to the consolidated fi nancial statements
Consolidated income statement from January 1 through December 31, 2003
€ million Footnote FAS
Effect oftransition
to IFRS IFRS
Sales 1,7 5 921 1 5 922
Costs and expenses 1,2,3,7 (5 836) (4) (5 840)
Unusual items 4 119 8 127
Other operating income and expenses 7 6 (1) 5
Amortization of positive and negative goodwill 5 (4) 4 –
Operating profi t 206 8 214
Share of results in associated companies (15) – (15)
Financial income and expenses 1Net interest expenses (98) (1) (99)
Market price gains and losses 0 (1) (1)
Other fi nancial income and expenses 7 2 9
Profi t before taxes and minority interest 100 8 108
Income taxes 6 (8) 12 4
Minority interest 0 (1) (1)
Net profi t for the period 92 19 111
Key fi gures
2003 2003
FAS IFRS
Operating profi t margin, % 3.5 3.6
Return on capital employed, % 5.0 5.0
Return on shareholders’ equity, % 4.7 5.4
Capital employed at end of period, € million 3 972 4 108
Net interest-bearing debt at end of period, € million 2 013 2 025
Equity-to-assets ratio at end of period, % 32.3 33.0
Debt-to-equity ratio at end of period, % 102.8 97.2
Earnings per share, € 0.54 0.65
Average number of shares outstanding, in thousands 1) 171 623 171 623
Shareholders’ equity per share at end of period, € 10.84 11.54
Number of shares outstanding at end of period, in thousands 1) 177 451 177 451
Capital expenditure, € million 622 622
Depreciation, € million 307 304
1) Excluding treasury shares.

67Outokumpu 2004
Consolidated balance sheet
Dec. 31, 2003 Jan. 1, 2003
€ million Footnote FAS
Effect oftransition
to IFRS IFRS FAS
Effect oftransition
to IFRS IFRS
ASSETS
Non-current assets
Intangible assets 5 380 221 601 373 184 557
Property, plant and equipment 7 2 665 3 2 668 3 088 5 3 093
Long-term fi nancial assetsInterest-bearing 1,7 490 (10) 480 166 (4) 162
Deferred tax assets 6 68 1 69 82 14 96
Other non interest-bearing 2,4,7 13 (1) 12 22 (6) 16
Total non-current assets 3 616 214 3 830 3 731 193 3 924
Current assets
Inventories 3 1 181 38 1 219 1 235 39 1 274
ReceivablesInterest-bearing 1,7 68 17 85 76 7 83
Non interest-bearing 7 1 036 (4) 1 032 1 059 3 1 062
Cash and cash equivalents 7 236 (5) 231 226 (5) 221
Total current assets 2 521 46 2 567 2 596 44 2 640
TOTAL ASSETS 6 137 260 6 397 6 327 237 6 564
SHAREHOLDERS’ EQUITY AND LIABILITIES
Shareholders’ equity 1 924 124 2 048 1 906 101 2 007
Minority interest 34 1 35 40 3 43
Non-current liabilities
Interest-bearing 1,7 1 782 (5) 1 777 1 493 (8) 1 485
Deferred tax liabilities 6 272 (24) 248 320 (11) 309
Pension obligations 2 – 186 186 – 232 232
Provisions 4 – 72 72 – 44 44
Other non interest-bearing 2,4,7 112 (98) 13 147 (116) 31
Total non-current liabilities 2 166 131 2 297 1 960 141 2 101
Current liabilities
Interest-bearing 1,7 1 016 29 1 045 1 352 31 1 383
Provisions 4 – 31 31 – 35 35
Other non interest-bearing 2,4,7 997 (55) 942 1 069 (74) 995
Total current liabilities 2 013 4 2 017 2 421 (8) 2 413
TOTAL SHAREHOLDERS’ EQUITY
AND LIABILITIES 6 137 260 6 397 6 327 237 6 564

68
Footnotes
1. Financial instruments
Outokumpu has applied the December 2003 versions of IAS 39 (Fi-nancial Instruments: Recognition and Measurement) and IAS 32 (Fi-nancial Instruments: Disclosure and Presentation) as of January 1, 2004. Outokumpu utilized the exemption for a fi rst-time adopter of IFRS not to restate comparative information for 2003. Accordingly, recognition and measurement of fi nancial instruments and treatment of cash fl ow hedges for 2003 are presented according to FAS principles.
Under FAS, Outokumpu’s foreign exchange, interest rate and most metal derivatives were measured at fair value in the balance sheet, whereas all electricity derivatives and unrealized gains on certain metal derivatives were presented only in the notes to the fi nancial statements. Under IFRS and as of January 1, 2004, all derivative contracts have been reported at fair value under fi nancial assets and liabilities. Some commercial contracts include embedded derivatives, which under IFRS have been separated from their host contracts and are treated as fi nancial instruments.
Market price gains and losses are caused by changes in currency and interest rates as well as in metal, electricity and security prices. Af-ter January 1, 2004 market price gains and losses on fi nancial instru-ments have been reported under fi nancial items in the income state-ment. This has led to reclassifi cation from sales as well as from costs and expenses to fi nancial items in the income statement. Presentation of market price gains and losses under sales or costs and expenses is done only in connection with effective hedge accounting that meets the requirements of IAS 39.
Under IFRS, receivables and debt are accounted for at amortized cost using the effective interest rate method. Amortized costs are in-cluded in the calculation of the effective interest rate over the expected life of the instrument. The costs may include e.g. fees, premiums or discounts and transaction costs.
Investments in equity instruments, except for investments in asso-ciated companies and joint ventures, are classifi ed as available-for-sale fi nancial assets. These investments are measured at fair value. Unlisted securities, for which the values cannot be measured reliably, are recog-nized at cost. Unrealized gains and losses on available-for-sale fi nancial assets are recognized directly in equity. When the investment is sold, the accumulated fair value adjustment is recognized in income.
Investments in money market instruments and fi xed income securi-ties are classifi ed in fi nancial assets at fair value through profi t and loss.
2. Employee benefi ts
Outokumpu has various pension plans in accordance with local prac-tices in the countries where it operates. Under FAS, the Group’s pen-sion liabilities were reported according to local regulations. In the IFRS fi nancial statements, pension obligations are treated in accord-ance with IAS 19 (Employee Benefi ts).
The Finnish pension scheme (TEL) has been accounted for as a defi ned contribution plan under FAS. Under IFRS, the disability ele-ment of TEL is calculated as a defi ned benefi t plan. Outokumpu has utilized the exemption given in IFRS 1 (First-time Adoption of IFRS) to recognize the cumulative actuarial gains and losses of all defi ned benefi t pension plans in the balance sheet at the date of transition to IFRS. The corridor method under IAS 19 is applied to actuarial gains and losses arising after the date of transition.
At the date of transition to IFRS, the Group’s pension obligations increased by EUR 129 million. The largest increases by country were as follows: Finland EUR 52 million, the US EUR 33 million, Ireland EUR 26 million, Britain EUR 9 million and Norway EUR 6 million.
Pension obligations reported under FAS have been reclassifi ed in the IFRS balance sheet.
3. Inventories
According to IAS 2 (Inventories), inventories are valued using the fi rst-in-fi rst-out (FIFO) valuation method. Under FAS, Outokumpu has used FIFO except for Outokumpu Copper, whose raw material inven-tories have been valued using the last-in-fi rst-out (LIFO) valuation method. Under IFRS, all Outokumpu inventories are valued using the FIFO method. At the date of transition to IFRS, the Group’s inven-tory value increased by EUR 28 million.
4. Provisions
As a result of the adoption of IFRS, an environmental provision of EUR 13 million was recognized at the date of transition. The provi-sion relates to the closing of old dumping areas and removal of prob-lem waste in Tornio. Contrary to previous guidance, the EUR 36 mil-
Notes to the consolidated fi nancial statements
Statement of changes in shareholders’ equity
€ millionShare
capital
Unreg-istered
sharecapital
Sharepremium
fundOtherfunds
Retained earnings Total
Shareholders’ equity on Dec. 31, 2002, FAS 293 0 630 15 968 1 906
Effect of transition to IFRS – – – – 101 101Shareholders’ equity on Jan. 1, 2003, IFRS 293 0 630 15 1 069 2 007
Transfers from unregistered share capital 0 (0) – – – 0Shares subscribed with options 1 0 4 – – 5Converted bonds 1 – 2 – – 3Share offering 9 – 45 – – 54Outokumpu Oyj shares owned by associated companies – – – – (26) (26)Transfer of treasury shares – – – – 2 2Change in translation difference – – – (0) (43) (43)Dividends paid – – – – (69) (69)Other changes – – (0) (1) 5 4Net profi t for the period – – – – 111 111Shareholders’ equity on Dec. 31, 2003, IFRS 304 0 681 14 1 049 2 048

69Outokumpu 2004
lion provision related to the copper sanitary tubes cartel fi ne imposed by the European Commission was, in connection with the IFRS tran-sition, recognized already in the December 2003 income statement. Under FAS, provisions were reported in other non interest-bearing li-abilities.
5. Business combinations
Business combinations before the date of transition to IFRS are re-ported as they were recognized under FAS. This is in line with the ex-emption given to a fi rst-time adopter not to apply IFRS 3 (Business Combinations) retrospectively to past business combinations. Acquisi-tions after January 1, 2003, are recognized in accordance with IFRS 3. Hence, the EUR 23 million excess of Outokumpu’s interest in the net fair value of the acquired Boliden fabrication operations’ identifi able assets, liabilities and contingent liabilities over the acquisition cost was recognized in the income statement in December 2003. The previ-ously recognized goodwill, EUR 50 million, from the acquisition of the quarto plate business of ThyssenKrupp Nirosta in February 2003 has been reclassifi ed as intangible asset under IFRS.
Goodwill is not amortized under IFRS but instead tested annually for impairment. Goodwill amortization entries after the date of transi-tion to IFRS have been reversed. At the IFRS opening balance sheet the total amount of goodwill was EUR 522 million.
Goodwill has been allocated to the business areas or divisions and tested for impairment based on their discounted future cash fl ows. The cash generating units for goodwill impairment testing have been de-fi ned based on how Outokumpu management monitors the Group’s business operations. Outokumpu’s cash generating units are as follows. Outokumpu Stainless: Coil Products, Special Products and North America; Outokumpu Copper: Americas, Europe, Tube and Brass, Automotive Heat Exchangers, Appliance Heat Exchangers & Asia; and Outokumpu Technology.
As a result of impairment tests performed at the date of transition to IFRS and at the end of 2003, no impairment losses were recognized.
Under IFRS 3, the concept of negative goodwill is abolished. Previ-ously recognized negative goodwill has been de-recognized with a cor-responding adjustment to equity at the opening IFRS balance sheet.
According to IFRS 3, a part of the negative goodwill from the for-mation of AvestaPolarit in 2001 was allocated to the minority interest, and consequently EUR 154 million of the negative goodwill was net-ted against the goodwill arising from the acquisition of the AvestaPo-larit minority interest in 2002. The rest of the negative goodwill, EUR 190 million, was recognized in equity at the date of transition to IFRS.
6. Income taxes
Deferred taxes have been entered in accordance with IAS 12 (Income Taxes) for IFRS adjustments causing temporary differences. Conse-quently deferred taxes are not recognized for items, such as goodwill and negative goodwill and other permanently tax free or non-deduct-ible items. The decrease in deferred taxes on IFRS adjustments at the date of transition amounted to EUR 24 million.
7. Other changes
Share remuneration schemes have been entered as expenses for the pe-riods in which they have been earned. The other changes relate mainly to the treatment and reporting of fi nance leases. The income statement and balance sheet also include minor reclassifi cations between account groups.
3. Segment information
Outokumpu’s business activities were organized into three strategic primary segments in 2004: Outokumpu Stainless, Outokumpu Cop-per and Outokumpu Technology. Activities outside the segments are reported under Other operations.
Outokumpu Stainless
Demand for stainless steel grows fastest of all metals in the world. Ou-tokumpu is one of the largest producers of stainless steel and widely recognized as a leader in technical support as well as in research and development. Outokumpu’s plants, mainly in Finland, Sweden, Brit-ain and the US, produce a wide range of stainless steel products in-cluding hot and cold rolled coil, sheet and plate, precision strip as well as tubular and long products. Additionally, Outokumpu offers a com-prehensive selection of fi ttings, fl anges and welding consumables. Products are available in various dimensions, grades and surface fi n-ishes. Outokumpu produces part of raw material at its own chromium mine and ferrochrome facility. The excellent properties of stainless steel make it an ideal choice in various demanding industrial and end-use applications such as food processing and chemicals industries, oil platforms, construction and automotive industries, cutlery and razor blades.
Outokumpu Copper
Copper has superior properties – heat transfer, electrical conductivity and signal transmission – over other metals that are in wide commer-cial use. These properties are needed to enhance comfort in everyday living, communications, energy production and construction.
Outokumpu Copper’s mills are located in 15 countries. Main products include air-conditioning and refrigeration tubes, strips for automotive radiators and electrical connectors, architectural and roof-ing products, sanitary tubes and welding electrodes. Production has been shifted to higher value-added products, such as superconducting wires, components for electrical and electronic appliances as well as coils for air-conditioning and heat transfer appliance manufacturers.
Outokumpu Technology
Outokumpu is one of the world’s leading developers and suppliers of technology for minerals processing and metallurgical industry. Outo-kumpu Technology designs and delivers plants, processes and equip-ment tailored for each customer’s needs, and provides engineering, project and support services globally.
Other operations
Other operations consists of activities outside the primary segments as well as industrial holdings. Business development and Corporate Man-agement expenses that are not allocated to the businesses are also re-ported under Other operations.
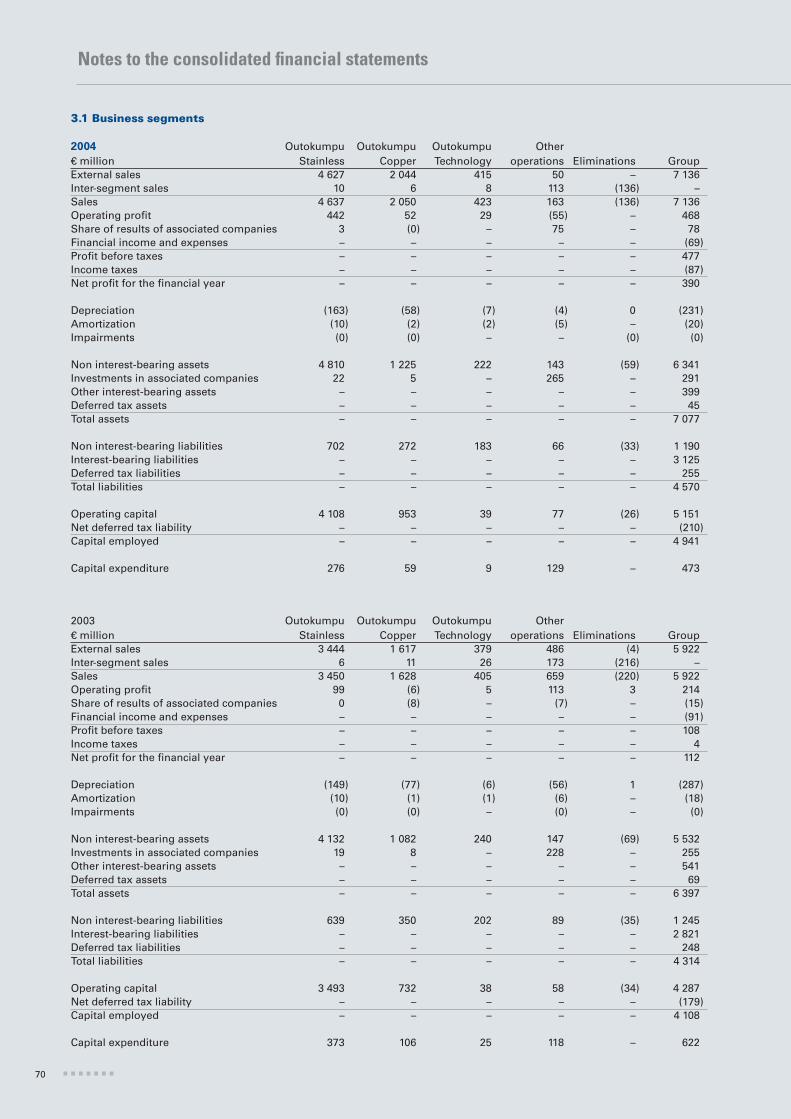
70
Notes to the consolidated fi nancial statements
3.1 Business segments
2004
€ millionOutokumpu
StainlessOutokumpu
CopperOutokumpuTechnology
Otheroperations Eliminations Group
External sales 4 627 2 044 415 50 – 7 136Inter-segment sales 10 6 8 113 (136) –Sales 4 637 2 050 423 163 (136) 7 136Operating profi t 442 52 29 (55) – 468Share of results of associated companies 3 (0) – 75 – 78Financial income and expenses – – – – – (69)Profi t before taxes – – – – – 477Income taxes – – – – – (87)Net profi t for the fi nancial year – – – – – 390
Depreciation (163) (58) (7) (4) 0 (231)Amortization (10) (2) (2) (5) – (20)Impairments (0) (0) – – (0) (0)
Non interest-bearing assets 4 810 1 225 222 143 (59) 6 341Investments in associated companies 22 5 – 265 – 291Other interest-bearing assets – – – – – 399Deferred tax assets – – – – – 45Total assets – – – – – 7 077
Non interest-bearing liabilities 702 272 183 66 (33) 1 190Interest-bearing liabilities – – – – – 3 125Deferred tax liabilities – – – – – 255Total liabilities – – – – – 4 570
Operating capital 4 108 953 39 77 (26) 5 151Net deferred tax liability – – – – – (210)Capital employed – – – – – 4 941
Capital expenditure 276 59 9 129 – 473
2003€ million
OutokumpuStainless
OutokumpuCopper
OutokumpuTechnology
Otheroperations Eliminations Group
External sales 3 444 1 617 379 486 (4) 5 922Inter-segment sales 6 11 26 173 (216) –Sales 3 450 1 628 405 659 (220) 5 922Operating profi t 99 (6) 5 113 3 214Share of results of associated companies 0 (8) – (7) – (15)Financial income and expenses – – – – – (91)Profi t before taxes – – – – – 108Income taxes – – – – – 4Net profi t for the fi nancial year – – – – – 112
Depreciation (149) (77) (6) (56) 1 (287)Amortization (10) (1) (1) (6) – (18)Impairments (0) (0) – (0) – (0)
Non interest-bearing assets 4 132 1 082 240 147 (69) 5 532Investments in associated companies 19 8 – 228 – 255Other interest-bearing assets – – – – – 541Deferred tax assets – – – – – 69Total assets – – – – – 6 397
Non interest-bearing liabilities 639 350 202 89 (35) 1 245Interest-bearing liabilities – – – – – 2 821Deferred tax liabilities – – – – – 248Total liabilities – – – – – 4 314
Operating capital 3 493 732 38 58 (34) 4 287Net deferred tax liability – – – – – (179)Capital employed – – – – – 4 108
Capital expenditure 373 106 25 118 – 622

71Outokumpu 2004
3.2 Geographical segments
Fin
lan
d
Sw
eden
Bri
tain
Oth
erE
uro
pe
No
rth
A
mer
ica
Asi
a an
d
Au
stra
lia
Oth
erco
un
trie
s
Inte
r ar
ea
Gro
up
tota
l2004
€ millionSales by destination 1) 340 322 455 3 156 1 263 1 399 201 – 7 136Sales by origin 2) 2 922 2 492 1 596 1 588 1 079 444 57 (3 042) 7 136Operating profi t 2) 234 157 (14) 5 57 28 1 – 468Assets 2) 3 163 1 200 595 614 507 238 24 – 6 341Operating capital 2) 2 802 976 406 392 370 201 4 – 5 151Capital expenditure 2) 333 43 14 45 33 5 0 – 473
2003€ million Fi
nla
nd
Sw
eden
Bri
tain
Oth
erE
uro
pe
No
rth
A
mer
ica
Asi
a an
d
Au
stra
lia
Oth
erco
un
trie
s
Inte
r ar
ea
Gro
up
tota
l
Sales by destination 1) 393 295 401 2 594 935 1 086 218 – 5 922Sales by origin 2) 2 420 1 832 1 091 1 706 858 465 66 (2 516) 5 922Operating profi t 2) 61 62 (45) 89 27 19 1 – 214Assets 2) 2 656 1 043 481 646 465 222 19 – 5 532Operating capital 2) 2 297 820 325 385 299 160 1 – 4 287Capital expenditure 2) 327 123 31 112 24 5 0 – 622
1) Sales by destination is presented for external sales.2) Sales, operating profi t, assets, operating capital and capital expenditure are presented by the locations of the group companies or associated
companies.
Consideration
€ millionPaid in cash –Fair value of shares in LOCSA 10Direct costs related to the acquisitions 1Fair value of transferred treasury shares 3Total consideration 14Fair value of the acquired net assets (11)Goodwill 3
The fair value of the treasury shares is based on the market value of the share on the date of the acquisition.
Specifi cation of the acquired net assets Seller’s € million Fair value carrying amountCash and cash equivalents 0 0Intangible assets 0 0Property, plant and equipment 10 10Inventories 16 16Receivables 6 6Liabilities (23) (23)Acquired net assets 9 9Acquired minority 2 1Fair value of the acquired net assets 11
Considerations paid in cash –Cash and cash equivalents in acquired subsidiaries 0Cash outfl ow on the acquisitions 0
4. Acquisitions and disposals
Acquisitions in 2004
In 2004, Outokumpu made only some minor acquisitions. In February, Outokumpu acquired SMI Group’s superconductors business in Italy and its air-conditioning and refrigeration tube operations in China in exchange for its shareholding in LOCSA - Laminados Oviedo-Córdoba, S.A. of Spain. In February, Outokumpu also acquired the remaining 50% ownership in Neumayer GmbH, which is an Austrian subsidiary of Outokumpu Copper fabricating various alloy wire products. As con-sideration Outokumpu Oyj transferred 309 597 treasury shares to the seller.
The acquired businesses from the SMI Group contributed sales of EUR 25 million and net loss of EUR 0 million to the Group for the period February–December 2004. These acquisitions have been summarized below.

72
Notes to the consolidated fi nancial statements
Specifi cation of the net assets in acquired subsidiaries and businesses
€ millionCash and cash equivalents 4Intangible assets 54Property, plant and equipment 34Investments in associated companies 4Inventories 50Receivables 47Non interest-bearing liabilities (46)Pension benefi t obligations (22)Interest-bearing liabilities (10)Net deferred tax liability (0)Acquired net assets 115
Total consideration 92
Considerations paid in cash 59Direct costs related to the acquisitions 1Cash and cash equivalent in acquired subsidiaries and businesses (4)Total cash outfl ow on the acquisitions 56
Acquisition of Boliden’s copper products fabrication and technology sales operations in 2003
In December, Outokumpu acquired Boliden’s copper products fabrication and technology sales operations. As considera-tion Outokumpu issued, and Boliden subscribed for, 5 000 000 new shares in Outokumpu Oyj in deviation from the share-holders’ pre-emptive subscription rights.
Because the business was acquired on Dec. 30, 2003 it did not contribute sales or net profi t to the Group in 2003.
Consideration
€ millionPaid in cash –Direct costs related to the acquisition 0Fair value of issued shares 54Adjustments to consideration (21)Total consideration 32Fair value of the acquired net assets (54)Excess of Outokumpu’s interest in the net fair value of acquired net assets over cost (21)
The main reason for the excess of Outokumpu’s interest in the net fair value of acquired net assets over cost was the fair value of property, plant and equipment as well as inventory. The gain is recognised in Other operating income in the income statement.
Specifi cation of the acquired net assets Seller’s € million Fair value carrying amountCash and cash equivalents 4 4Intangible assets 1 1Property, plant and equipment 32 37Investments in associated companies 4 4Inventories 44 42Receivables 47 47Non interest-bearing liabilities (46) (46)Pension benefi t obligations (22) (22)Interest-bearing liabilities (10) (10)Net deferred tax liability (0) (1)Acquired net assets 54 56
Consideration paid in cash –Cash and cash equivalents in acquired subsidiaries (4)Cash outfl ow on the acquisition (4)
Acquisitions in 2003
In December, Outokumpu acquired Boliden’s copper products fabrication and technology sales operations. Furthermore in February, Outokumpu acquired ThyssenKrupp Nirosta’s quarto plate operations. These acquisitions have been summarized below.

73Outokumpu 2004
The EUR 115 million deferred gain related to the Boliden transaction, was 49% of the total gain and corresponded to Outokumpu’s ownership in Boliden at Dec. 30, 2003. The deferred gain will be released proportionally as Outokumpu’s ownership in Boliden decreases, and entirely once Outokumpu’s ownership in Boliden decreases below 20%.
Acquisition of ThyssenKrupp Nirosta’s quarto plate operations in 2003
In February, Outokumpu acquired ThyssenKrupp Nirosta’s quarto plate operations. Because the acquired business is a part of Outokumpu Stainless’ Hot Rolled Plate business unit, the contributed sales
or net profi t to the Group cannot be determined separately.
Consideration
€ millionPaid in cash 59Direct costs related to the acquisition 1Total consideration 60Fair value of the acquired net assets 60
Specifi cation of the acquired net assets Seller’s € million Fair value carrying amountCustomer lists (intangible assets) 45 –Trademarks (intangible assets) 8 –Property, plant and equipment 2 2Inventories 6 6Acquired net assets 60 8
Consideration paid in cash 59Direct costs related to the acquisition 1Cash outfl ow on the acquisition 60
Disposals in 2004 and 2003
In January 2004, Outokumpu Technology’s fi lter business was sold to Larox Oyj. The total consideration was EUR 31 million.In December 2003, Outokumpu sold its mining and smelting operations within zinc and copper to Boliden. The total
consideration was EUR 864 million. Boliden’s consideration to Outokumpu for the acquired mining and smelting assets consisted of a cash payment of EUR 373 million, issue of a subordinated note of EUR 159 million to Outokumpu and issuance of new shares (82 446 475) to Outokumpu, corresponding to 49% of all shares in Boliden at a fair value as per Dec. 31, 2003 of EUR 247 million.
In November 2003, Outokumpu sold its precious metals assets to Dragon Mining NL. The total consideration was EUR 12 million. These disposals have been summarized below.
Net assets of the disposed subsidiaries and businesses
€ million 2004 2003Intangible assets 3 67Property, plant and equipment 3 480Investments in associated companies – 17Inventories 7 133Receivables 2 121Liabilities 0 (186)
15 632Gains on disposals 16 129Deferred gain on disposal – 115Total consideration 31 876
Received in cash 20 379Direct costs related to the disposals (2) (8)Cash and cash equivalents in disposed subsidiaries and units 0 (9)Cash infl ow from the disposals 18 362

74
5. Long-term construction contracts
Sales include EUR 233 million (2003: EUR 146 million) of income recognized based on the stage of completion of long-term construction contracts within Outokumpu Technology. Revenue recognized from long-term construction contracts in progress amounted to EUR 185 million (2003: EUR 121 million) and advances received to EUR 30 million, respectively (Dec. 31, 2003: EUR 24 million).
6. Other operating income
€ million 2004 2003Gain on the sale of the fi lter business 16 –Panteg closure 8 –Gain on the Boliden transaction – 120Excess of Outokumpu’s interest in the net fair value of acquired net assets over costs – 23Gain on the sale of Arctic Platinum Partnership (49%) – 26Gain on the sale of the Inmet shares – 10Gain on the sale of the precious metals assets – 9Gains on sale of other intangible and tangible assets 9 7Other income items 30 15
63 210
7. Other operating expenses
€ million 2004 2003Loss on the sale of the Boliden shares (19) –Provisions for the copper tube cartel fi nes – (54)Losses on disposals of intangible and tangible assets and scrapping (4) (5)Impairment of intangible and tangible assets (0) (1)Other expense items (12) (11)
(35) (71)
8. Function expenses by nature
€ million 2004 2003Raw materials and merchandise (4 310) (2 995)Fuels and supplies (335) (341)Energy expenses (239) (251)Freights (267) (224)Maintenance (146) (122)Employee benefi t expenses (933) (1 050)Rents and leases (43) (42)Hire processing (55) (32)Depreciation and amortization (251) (304)Production for own use 24 29Change in inventories 346 81Other expenses (488) (596)
(6 697) (5 847)
Expenses by function include cost of sales, selling and marketing, administrative as well as research and development. Operating income and expenses comprise following non-recurring items, which have affected fi nancial performance for
the period.
Notes to the consolidated fi nancial statements
Non-recurring items
€ million 2004 2003Release of the Finnish TEL disability pension liability 36 –Gain on the sale of the fi lter business 16 –Stelco Hardy closure provision (3) –Waalwijk closure costs (7) –Loss on the sale of the Boliden shares (19) –Gain on the Boliden transaction (1) 120Excess of Outokumpu’s interest in the net fair value of acquired net assets over cost – 23Gain on the sale of Arctic Platinum Partnership (49%) – 26Gain on the sale of the Inmet shares – 10Gain on the sale of the precious metals assets – 9Panteg closure 7 (7)Provisions for the copper tube cartel fi nes – (54)
29 127

75Outokumpu 2004
9. Employee benefi t expenses
€ million 2004 2003Wages and salaries (725) (790)Termination benefi ts (5) (5)Social security (112) (77)Pension costs
Defi ned benefi t plans 16 (18)Defi ned contribution plans (46) (78)Other post-employment benefi ts (5) 1
Other personnel expenses 1) (56) (83)(933) (1 050)
1) Includes EUR 2 million (2003: EUR 1 million) of profi t-sharing bonuses based on the Finnish Personnel Funds Act.
10. Financial income and expenses
€ million 2004 2003Dividend income 3 3Interest income
Derivatives 4 0Other 19 14
Other fi nancial income 4 4Interest expenses
Current and long-term debt (110) (107)Finance lease arrangements (2) (2)Capitalized interests 6 14Derivatives (5) (4)
Other fi nancial expenses (12) (13)Exchange gains and losses
Derivatives 33 38Other (32) (38)
Other market price gains and lossesDerivatives 24 –Other 0 –
(69) (91)
Exchange gains and losses in the income statement
€ million 2004 2003In sales – 49In purchases and other expenses – (9)In fi nancial income and expenses 1 0
1 40

76
Notes to the consolidated fi nancial statements
11. Income taxes
Income taxes in the income statement
€ million 2004 2003Current taxes (57) (18)Deferred taxes (30) 22Total income taxes (87) 4
€ million 2004 2003Hypothetical income taxes at Finnish tax rate on consolidated profi t before tax (138) (31)Effect of different tax rates outside Finland 9 (9)Non-deductible expenses and tax exempt income 4 75Losses for which no deferred tax benefi t is recognized (23) (29)Changes in the carrying amounts of deferred tax assets from prior years 30 11Taxes for prior years (5) 1Impact of the changes in the tax rates on deferred tax balances 17 0Net results of associated companies 12 (4)Effects of consolidation and eliminations 2 (16)Other items 5 5Income taxes in the consolidated income statement (87) 4
Majority of the impact of the changes in the tax rates was attributable to the decrease in the Finnish tax rate from 29% to 26% on Jan. 1, 2005.
Deferred income taxes in the balance sheet
€ million 2004 2003Deferred tax assets 44 69Deferred tax liabilities (255) (248)Net deferred tax liability (210) (179)
€ million 2004 2003Deferred taxes on Jan. 1 (179) (214)Income statement charge (30) 22Translation differences (2) (5)Acquisitions and disposals of subsidiaries (1) 18Taxes recognized in equity 1 –Deferred taxes on Dec. 31 (210) (179)
The difference between income taxes at the statutory tax rate in Finland (29%) and income taxes recognized in the consoli-dated income statement is reconciled as follows:
Deferred taxes have been reported as a net balance of those group companies that fi le a consolidated tax return or that may otherwise be consolidated for current tax purposes.
The gross movements of the deferred income tax balances

77Outokumpu 2004
Movement in deferred tax assets and liabilities during the fi nancial year
2004
€ million Jan. 1
Recognized in the
income statement
Recognized in equity
Translation differences
Acquisitions/disposals of subsidiaries Dec. 31
Deferred tax liabilitiesDepreciation difference and other untaxed reserves (245) (41) – (1) – (287)
Fair value adjustments (10) 7 0 – (1) (4)
Effects of consolidation and eliminations (6) (3) – – – (9)
Other taxable temporary differences (79) 26 – 0 – (53)
(340) (11) 0 (1) (1) (353)
Deferred tax assetsTax losses carried forward 57 (3) – 0 – 54
Fair value adjustments 5 (5) 1 – – 1
Pension obligations 17 (3) – 0 – 14
Accrual of cartel fi nes 10 (10) – – – 0
Effects of consolidation and eliminations 6 14 – – – 20
Other tax deductible temporary differences 67 (12) – (1) – 55
162 (19) 1 0 – 143
Net deferred tax liability (179) (30) 1 (2) (1) (210)
Jan. 1
Recognized in the
incomestatement
Recognized in equity
Translation differences
Acquisitions/disposals of subsidiaries Dec. 31
2003
€ millionDeferred tax liabilities
Depreciation difference and other untaxed reserves (292) 15 – 3 30 (245)Fair value adjustments (32) 2 – 0 19 (10)Effects of consolidation and eliminations (3) (3) – – – (6)Other taxable temporary differences (80) (12) – 0 14 (79)
(408) 2 – 3 63 (340)
Deferred tax assetsTax losses carried forward 94 (1) – (3) (33) 57Fair value adjustments 7 (3) – – 1 5Pension obligations 29 1 – (1) (12) 17Accrual of cartel fi nes – 10 – – – 10Effects of consolidation and eliminations 2 4 – – – 6Other tax deductible temporary differences 62 10 – (3) (1) 67
194 20 – (7) (45) 162
Net deferred tax liability (214) 22 – (5) 18 (179)
Deferred taxes recognized directly in equity
€ million 2004 2003Land and buildings – –Hedging reserve 1 –Available-for-sale fi nancial assets 0 –
1 –
Deferred tax assets of EUR 123 million (2003: EUR 145 million) have not been recognized in the consolidated fi nancial state-ments because the realization of the tax benefi t included in these assets is not probable. Majority of these unrecognized deferred tax assets relate to tax losses amounting to EUR 360 million (2003: EUR 405 million), which can be carried forward in the future. EUR 13 million (2003: EUR 48 million) of these tax losses will expire within next fi ve years and the rest earliest in 2010. The consolidated balance sheet includes deferred tax assets of EUR 31 million (Dec. 31, 2003: EUR 27 million) in subsidi-aries, which have generated losses in current or in prior year. The recognition of the assets is based on result estimates, which indicate that the realization of these deferred tax assets is probable. Deferred tax liability on undistributed earnings of subsidi-aries has not been recognized in the consolidated balance sheet because distribution of the earnings is in the control of the Group and such distribution is not probable within foreseeable future. The amount of such undistributed earnings at the end of the year was EUR 6 million (Dec. 31, 2003: EUR 554 million). The difference compared with the previous year results mainly from the new Finnish dividend taxation system, which came into effect on Jan. 1, 2005. The new system enables distribution of earnings in Finnish subsidiaries without any compensatory tax.

78
12. Earnings per share2004 2003
Profi t attributable to the equity holders of the Company, € million 383 111
Weighted average number of shares, in thousands 180 057 171 623
Earnings per share, € 2.13 0.65
Diluted earnings per share is calculated by adjusting average number of shares outstanding to assume conversion of all diluting potential shares. The Group has diluting options (2003 option program). The options have a diluting effect, when the exercise price with an option is lower than the market value of the Company share. The diluting effect is the number of shares that the Company has to issue gratuitously because the received funds from the exercised options do not cover the fair value of the shares. The fair value of the Company’s share is determined as the average market price of the shares dur-ing the period. The convertible bond is converted into shares and the net profi t is adjusted to eliminate the interest expense, net of tax. The subscription period for the 1998 option program ended on Mar. 31, 2004 and for the 1999 convertible bond on Apr. 5, 2004.
Profi t attributable to the equity holders of the Company, € million 383 111
Weighted average number of shares, in thousands 180 057 171 623Effect of the 1998 option warrants, in thousands – 213Effect of the 1999 convertible bond, in thousands – 730Effect of 2003A options, in thousands 115 –Diluted average number of shares, in thousands 180 172 172 566
Diluted earnings per share, € 2.13 0.65
13. Dividend per share
The dividends paid in 2004 were EUR 0.20 per share and in 2003 EUR 0.40 per share. At the Annual General Meeting on Apr. 5, 2005, a dividend of EUR 0.50 per share is proposed, corresponding to total dividends of EUR 90 million for 2004. This dividend payable is not refl ected in the fi nancial statements.
Notes to the consolidated fi nancial statements
14. Intangible assets
€ million
Intangibleasset,
internally generated
Intangibleasset,
acquired Goodwill TotalHistorical cost on Jan. 1, 2004 43 135 474 653Additions 0 34 2 36Acquisition of subsidiaries 1 – 2 4Disposals (2) (1) (2) (5)Reclassifi cations (35) 38 – 3Translation differences 0 0 (3) (3)Historical cost on Dec. 31, 2004 8 207 474 687
Accumulated depreciation on Jan. 1, 2004 (11) (43) 2 (52)Acquisition of subsidiaries (1) 0 – (1)Disposals 1 1 0 2Reclassifi cations 7 (5) – 1Amortization during the period (1) (19) – (20)Impairments – – (0) (0)Translation difference 0 0 1 1Accumulated depreciation on Dec. 31, 2004 (5) (67) 3 (69)
Carrying value on Dec. 31, 2004 3 140 477 620
Carrying value on Dec. 31, 2003 32 92 477 601

79Outokumpu 2004
Depreciation and amortization by function
€ million 2004 2003Cost of sales (16) (8)Selling and marketing expenses (0) (0)Administrative expenses (4) (9)Research and development expenses (0) (0)
(20) (17)
Impairment testing of goodwill
Goodwill is allocated to the Group’s cash-generating units (CGUs) according to the business organization.
Goodwill allocation to the segments and divisions
€ million 2004 2003Outokumpu Stainless 386 387
Coil Products 10 10Special Products 8 7North America – –
Outokumpu CopperAmericas – –Europe 13 10Tube and Brass – –Automotive Heat Exchangers 9 10Appliance Heat Exchangers & Asia 4 4
Outokumpu Technology 47 48477 477
The recoverable amount of a CGU is determined based on value-in-use calculations. These calculations are based on the cash fl ow projections in the strategic plans approved by the management covering a fi ve-year period. The estimated sales and production volumes are derived from the utilization of existing property, plant and equipment. The most important assumptions are the product and market mix as well as the conversion margins. In defi ning its planning assumptions Outokumpu makes use of growth, demand and price estimates by market research institutions. Discount rate is the weighted average pre-tax cost of capital (WACC) as defi ned for Outokumpu. The components of WACC are risk-free yield rate, market risk premium, industry specifi c beta, cost of debt and targetted capital structure. The WACC used in the calculations was 8% in 2004 (2003: 8.8%). Cash fl ows beyond the fi ve-year period are calculated using terminal value method, where the EBITDA (=earnings before interest, taxes, amortizations and depreciation) of the fi fth planning period is multiplied by six and discounted using the WACC described above. As a result of the performed impairment tests, no impairment losses have been recognized.

80
Notes to the consolidated fi nancial statements
15. Property, plant and equipment
€ million LandMine
properties Buildings
Machinery and
equipment
Othertangible
assets
Advancespaid and construc-
tion in progress Total
Historical cost on Jan. 1, 2004 64 31 905 3 314 98 482 4 894Additions 2 – 67 142 2 123 336Acquisition of subsidiaries – – – 14 – 0 14Disposals (1) – (10) (62) (5) (2) (80)Reclassifi cations (6) 3 26 435 7 (464) 0Translation differences (1) – (5) (29) (2) (1) (37)Historical cost on Dec. 31, 2004 58 34 983 3 813 100 138 5 127
Accumulated depreciation on Jan. 1, 2004 (5) (6) (334) (1 842) (39) – (2 226)Acquisition of subsidiaries – – – (4) – – (4)Disposals 0 – 5 56 1 – 62Reclassifi cations 2 – (1) (4) (3) (2) (8)Depreciation during the period 0 0 (33) (193) (5) – (231)Impairments – – – (0) – – (0)Translation differences 0 – 2 19 2 – 23Accumulated depreciation on Dec. 31, 2004 (3) (6) (360) (1 968) (44) (2) (2 383)
Carrying value on Dec. 31, 2004 55 27 623 1 845 56 137 2 743
Carrying value on Dec. 31, 2003 59 25 572 1 472 59 482 2 668
Depreciation by function
€ million 2004 2003Cost of sales (210) (269)Selling and marketing expenses (5) (5)Administrative expenses (11) (10)Research and development expenses (5) (3)
(231) (287)
Interest capitalized on investment projects during the fi nancial year was EUR 6 million. Total interest capitalized on Dec. 31, 2004 was EUR 78 million. The capitalization rate used to determine the amount of borrowing costs eligible for capitalization is 3.9%.
Assets leased by fi nance lease agreements
Machinery and
equipment2004
€ million Buildings TotalHistorical cost 4 71 75Accumulated depreciation (1) (7) (8)Carrying value on Dec. 31 3 64 67
Machinery and
equipment2003€ million Buildings TotalHistorical cost 4 26 29Accumulated depreciation (1) (2) (3)Carrying value on Dec. 31 3 24 27

81Outokumpu 2004
16. Investments in associated companies
€ million 2004 2003Investments in associated companies at cost
Historical cost on Jan. 1 407 62Translation differences 0 (0)Additions 75 353Disposals (201) (8)Historical cost on Dec. 31 281 407
Equity adjustment to investments in associated companies on Jan. 1 (151) 15Change in translation differences 5 0Dividends received during fi nancial period (0) (0)Disposals and other changes 78 (151)Share of results of associated companies 78 (15)Equity adjustment to investments in associated companies on Dec. 31 10 (151)
Carrying value of investments in associated companies on Dec. 31 291 255
Associated companies and joint ventures
Owner-ship, %Domicile
ABB Industriunderhåll AB Sweden 49Advanced Heat Transfer LLC The United States 50AuraCoat Oy Finland 20Boliden AB (publ) Sweden 27Fagersta Stainless AB Sweden 50Kopparlunden Development AB Sweden 50Okmetic Oyj Finland 32Outokumpu (Thailand) Co., Ltd. Thailand 49Outokumpu Nordic Brass AB Sweden 50Rapid Power Oy Finland 33
Principal associated companies
2004 Profi t/ loss
Owner-ship, %€ million Domicile Assets Liabilities Sales
Boliden AB (publ) Sweden 2 219 1 226 1 965 116 27Okmetic Oyj 1) Finland 92 48 42 (32) 32Fagersta Stainless AB Sweden 84 42 155 6 50
2003 Profi t/ loss
Owner-ship, %€ million Domicile Assets Liabilities Sales
Laminados Oviedo-Córdoba S.A. Spain 59 48 54 (17) 50Okmetic Oyj 1) Finland 121 48 50 (10) 32Arctic Platinum Partnership 2) Finland – – 0 (6) 49
1) Okmetic’s fi gures for 2004 are based on the information published for the period ending on Sep. 30, 2004. However, comparison fi gures are based on the entire fi nancial year 2003. Outokumpu’s share of Okmetic’s profi ts for 2004 and 2003 are consolidated from the 12-month periods ending at the end of September.
2) Arctic Platinum Partnership was sold to Gold Fields on Sep. 11, 2003. The share of the net result has been included in the income statement until the date of the disposal.
The carrying values of investments in associated companies include publicly listed shares for EUR 265 million (2003: EUR 241 million). The market value of these investments was EUR 254 million on Dec. 31, 2004 (Dec. 31, 2003: EUR 367 million). The market value of these investments was higher than the carrying value on Feb. 10, 2005.

82
18. Financial risk management
The main objective of the Group’s fi nancial risk management is to re-duce the impacts of price fl uctuations in fi nancial markets and other factors of uncertainty on earnings, cash fl ows and balance sheet, as well as to ensure suffi cient liquidity.
The Board has approved the risk management policy, which among others, defi nes fi nancial risk management guidelines for the Group. The Board oversees the Group’s risk management framework. CEO and the Group Executive Committee have approved more de-tailed operating procedures for fi nancial risk management. CEO and the Group Executive Committee approve risk limits based on Group’s risk tolerance and monitor fi nancial risks and implementation of risk management procedures. Group’s fi nance management is responsible for development and implementation of fi nancial risk management procedures.
Financial risks consist of market, default and liquidity risks. The business units hedge their market risks against the Group’s treasury, which does most of the fi nancial contracts with banks and other fi nan-cial institutions. Treasury is also responsible for managing certain group-level risks, such as interest rate risk and foreign currency translation risk.
Market risk
Market risks are caused by changes in foreign exchange and interest rates, as well as commodity, energy and security prices. These changes may have a signifi cant impact on the Group’s earnings, cash fl ows and balance sheet.
In order to mitigate adverse impacts of market price changes Ou-to kumpu uses derivative contracts. IAS 39 hedge accounting is applied
to hedge forecasted electricity purchases of the Finnish production fa-cilities and to hedge net investment in the foreign subsidiaries. Deriva-tives, for which hedge accounting is not applied, have been entered into for the purpose of reducing adverse impacts of market price changes on earnings and cash fl ows related to business and fi nancing activities. In this description of fi nancial risk management, the term hedging, has been used in its broadest sense and therefore it also in-cludes usage of non-hedge-accounted derivatives.
Non-hedge-accounted long-term electricity and interest rate deriva-tives cause timing differences between both derivative gains/losses and electricity purchases and interest expenses. Currency forwards made to fi x exchange rates of sales and purchase orders cause similar type of tim-ing differences between exchange gains/losses and sales/purchases .
Exchange rate risk
Major part of the Group’s sales is in euros and US dollars. A signifi cant part of expenses arise in euros, US dollars, Swedish kronas and British pounds. The Group’s Asian businesses also include local currency risks, all of which cannot be effectively hedged.
Outokumpu hedges most of its fair value risk. Cash fl ow risk re-lated to fi rm commitments is hedged to large extent and forecasted cash fl ows are hedged selectively, based on separate decisions. Outo-kumpu does not currently hedge its income statement translation risk and translation of equity is hedged selectively. The total non-euro-de-nominated equity of the Group’s foreign subsidiaries and associated companies was EUR 1 513 million on December 31, 2004 (2003: EUR 1 512 million). Approximately 9.3% (2003: 2.2%) of the net in-vestment exposure was hedged.
Notes to the consolidated fi nancial statements
17. Available-for-sale fi nancial assets
€ million 2004
Carrying value on Jan. 1 24
Translation differences 0
Additions 26
Disposals (6)
Fair value changes 16
Impairments –
Gains and losses on disposals in the income statement 1
Carrying value on Dec. 31 61
Listed equity securities 6
Unlisted equity securities 55
Less:Non-current listed equity securities 0
Non-current unlisted equity securities (53)
Current available-for-sale fi nancial assets 8
Fair value 61
Acquisition value (45)
Fair value changes 16
Deferred tax liability 0
Fair value reserve in equity 16
Available-for-sale fi nancial assets comprise listed and unlisted equity securities. These have been valued at fair value from Jan. 1, 2004 onwards. Available-for-sale fi nancial assets include equity securities with carrying value of EUR 30 million, for which the fair value cannot be reliably determined. These assets are measured at cost less possible impairment.

83Outokumpu 2004
On December 31, the Group had the following outstanding for-eign exchange derivative contract amounts (the nominal amounts do not represent the amounts exchanged by the parties, and those amounts may also include positions, which have been closed off ):
€ million 2004 2003Currency forwards 1 247 1 620Currency options, purchased 7 280Currency options, written 8 270Currency swaps 21 40
Interest rate risk
The Group’s interest rate risk is monitored as cash fl ow and fair value risks. In order to manage the balance between risk and cost effi ciently, most of the loans and fi nancial investments have short-term interest rate as a reference rate. Interest rate swaps have been used to reduce cash fl ow risk.
Euro, Swedish krona, US dollar and British pound have substantial contribution to overall interest rate risk. Approximately 80% of the Group’s interest-bearing liabilities have interest period of less than one year.
On December 31, the Group had the following outstanding interest rate derivative contract amounts (the nominal amounts do not repre-sent the amounts exchanged by the parties, and those amounts may include also positions, which have been closed off ):
€ million 2004 2003Interest rate swaps 172 210
Commodity and energy price risk
Outokumpu uses substantial amount of raw materials and energy, for which prices are determined in regulated markets, such as London Met-al Exchange and Nord Pool ASA. Timing differences between raw ma-terial purchase and pricing of products, changes in inventory levels and the capability to pass on increases in raw material and energy prices to end-product prices, all affect hedging requirements and activities.
The most important commodity price risks are caused by nickel and copper price fl uctuations. Majority of stainless steel sales contracts include an alloy adjustment factor clause, with the aim of reducing the risk arising from the time difference between raw material purchase and product pricing. Outokumpu uses metal derivatives to reduce the impacts of nickel and copper price changes on earnings and cash fl ows. Nickel and copper price changes also have a major impact on the Group’s working capital and cash fl ow before fi nancing. This cash fl ow risk cannot be fully hedged with derivatives.
On December 31, the Group had the following outstanding metal derivative contract amounts (the nominal amounts do not represent the amounts exchanged by the parties, and those amounts may include also positions, which have been closed off ):
Tonnes 2004 2003Forward and futures copper contracts 50 150 101 400Copper options, purchased 20 522 –Forward and futures nickel contracts 1 758 4 300Nickel options, purchased – 720Forward and futures zinc contracts 39 000 299 700Forward and futures aluminium contracts 2 550 2 800Forward and futures gold contracts (tr. oz.) – 146 800Forward and futures silver contracts (tr. oz.) – 886 800
Outokumpu has energy intensive production processes utilizing mainly electrical energy but also natural gas, liquefi ed petroleum gas and some other fuels. Spot and forward prices of many energy prod-ucts are relatively volatile.
Electrical energy utilized by the Group’s Nordic production facili-ties is purchased and managed centrally. In other facilities, electrical energy is purchased locally. Electricity price risk is reduced with price fi xed supply contracts and derivatives. Part of the electricity derivatives are included in the hedging program, which meets the requirements of IAS 39. The hedging program was launched on April 1, 2004. The Group has not used derivatives to reduce the risk caused by changes in fuel prices.
On December 31, 2004 the Group had exchange traded electricity derivatives of 0.1 TWh (2003: 0.0 TWh) and other derivatives of 5.0 TWh (2003: 3.5 TWh). The electricity consumption of the Group’s Nordic production facilities was 3.1 TWh (2003: 4.7 TWh).
Securities price risk
Outokumpu has investments in equity securities and from time to time the portfolio may also include fi xed income securities. On December 31, 2004 the biggest single security investment was the shareholding in the associated company Boliden AB. Securities price risk has not been hedged with derivatives.
Default risk
The Group’s accounts receivables are generated by a large number of customers worldwide. Credit risk related to business operations is re-duced for example with credit insurances and letters of credit.
The Group’s treasury manages a major part of the credit risk related to fi nancial instruments. Outokumpu seeks to reduce these risks by limiting the counterparties to banks, other fi nancial institutions, bro-kers and suppliers of electrical power, which have good credit standing. All investments related to liquidity management are made in liquid instruments with low credit risk.
Liquity risk
The Group’s treasury raises most of the Group’s interest-bearing debt centrally. The Group seeks to reduce liquidity and refi nancing risks with balanced maturity profi le of loans as well as by keeping suffi cient amount of credit lines available. Effi cient cash and liquidity manage-ment is also reducing liquidity risk.
In 2004, Outokumpu issued two bonds: EUR 125 million and EUR 75 million. Maturities of the bonds are three and seven years, correspondingly. The main funding programs and standby credit fa-cilities include the Finnish Commercial Paper Program totaling EUR 650 million, the Euro-Commercial Paper Program totaling USD 250 million, the committed Revolving Credit Facility of EUR 875 million and the committed fi nancing facility of EUR 500 million. On Decem-ber 31, 2004, Outokumpu had committed and available credit facili-ties and other agreed and undrawn loans totaling EUR 684 million. Group’s loan agreements include typical covenants. Committed loan facilities also include equity ratio covenants.

84
Notes to the consolidated fi nancial statements
19. Fair values of derivative instruments
€ million
2004 Positive
fair value
2004 Negative fair value
2004 Net
fair value
2003 Net
fair valueCurrency derivatives
Currency forwardsCurrency options, purchasedCurrency options, writtenCurrency swaps
35 9 26 290 0 0 50 0 0 (4)– 1 (1) (3)
Interest rate derivativesInterest rate swaps – 2 (2) (3)
Metal derivatives Forward and futures copper contracts 5 2 3 1Copper options, purchased 0 – 0 0Forward and futures nickel contracts 1 0 1 7Nickel options, purchased – – – 0Forward and futures zinc contracts 4 4 0 0Forward and futures aluminium contracts 0 – 0 0Forward and futures gold contracts – – – 0Forward and futures silver contracts – – – 0
Electricity derivativesPublicly traded electricity derivatives – – 0 –Other electricity derivatives 3 3 0 6
49 22 27 38
Long-term derivativesInterest rate derivatives – (1)
Electricity derivatives (2) (3)
Short-term derivatives 47 18
Fair values are estimated based on market rates and prices, discounted future cash fl ows, and in respect of optionson evaluation models.
Cumulative translation
difference in equity 2004,
€ million
Net investment hedges on Dec. 31, 2004
Fair value,€ millionCurrency Nominal value
USD million 1) 32 2 1GBP million 21 1 1SEK million 763 0 0
1) Hedging has ended on Jan. 3, 2005.
Net investment in foreign subsidiaries is hedged with currency forwards. The portion of gains and losses on effective hedges, net of tax is recognized in equity. The ineffective portion is recognized in income. On Dec. 31, 2003, EUR 6 million of net exchange gains on fi nancial instruments were deferred.

85Outokumpu 2004
20. Inventories
€ million 2004 2003Raw materials and consumables 415 348Work in progress 535 425Finished goods and merchandise 616 438Advance payments 12 8
1 579 1 219
In 2004, EUR 7 million (2003: EUR 5 million) was recognized as expense, with which the carrying value of the inventories was written down to refl ect its net realizable value.
21. Trade and other receivables
€ million 2004 2003
Non-current
Interest-bearingLoans receivable 59 207Held for trading investments 3 0
63 207
Non interest-bearing Trade receivables 0 3Defi ned benefi t pension assets 4 5Other receivables 7 3
11 12
Current
Interest-bearingLoans receivable 6 13Held for trading investments 9 0Prepaid interest expenses 0 1Accrued interest income 1 1Other interest-bearing items 1 0
18 15
Electricity purchase hedges on Dec. 31, 2004In fair
value reserve in equity€ million Nominal amounts, TWh Fair value
2005 0.1 0 (1)2006 0.2 0 (1)2007 – – –2008 – – –2009 – – –
€ millionFair value changes as of Apr. 1, 2004 (2)Deferred tax liability 1Fair value reserve in equity (2)
Forecasted purchases of electricity by the Finnish production facilities are hedged with electricity forwards. The portion of unrealized gains and losses on effective hedges, net of tax is recognized in equity. Other fair value changes are recognized in income.
The portion of realized gains and losses on effective hedges is recognized in income as adjustment to purchases in the period when the hedged cash fl ow affects income. Other realized gains and losses are recognized in fi nancial income and expenses.

86
€ million 2004 2003Current
Non interest-bearing Trade receivables 1 249 901Income tax receivable 6 8Prepaid insurance expenses 12 8VAT receivable 73 71Grants and subsidies receivable 14 1Other accruals 16 21Other receivables 19 24
1 390 1 032
Doubtful receivables deducted from trade receivables
Doubtful trade receivables on Jan. 1 13 12Additions 4 4Deductions (2) (3)Recovery of doubtful receivables 0 (1)Doubtful trade receivables on Dec. 31 14 13
Notes to the consolidated fi nancial statements
22. Cash and cash equivalents
€ million 2004 2003Cash at bank and in hand 196 210Short-term bank deposits 15 20
211 231
Fair value of cash and cash equivalents does not signifi cantly differ from the carrying value. The effective interest rate of short-term bank deposits was 2.03% and these deposits had an average maturity of 47 days.
23. Equity
Share capital and premium fund
Sharecapital
Premium fund€ million Number of shares, 1 000 Total
On Jan. 1, 2003 171 111 293 630 923Share offering 5 143 9 45 54Costs of the share offering (0) 0Shares subscribed with options 660 1 5 6Converted bonds 255 0 2 2On Dec. 31, 2003 177 451 304 681 985Shares subscribed with options 2 176 4 15 19Converted bonds 500 1 3 4Gain on the sale of the subscription rights on treasury shares 0 0Other 0 0On Dec. 31, 2004 180 752 308 700 1 008
Treasury shares 499
Total number of shares on Dec. 31, 2004 181 251
According to the Articles of Association, the maximum number of Outokumpu Oyj shares is 706 million. Account equivalent value of a share is EUR 1.70, and the maximum share capital is EUR 1.2 billion.
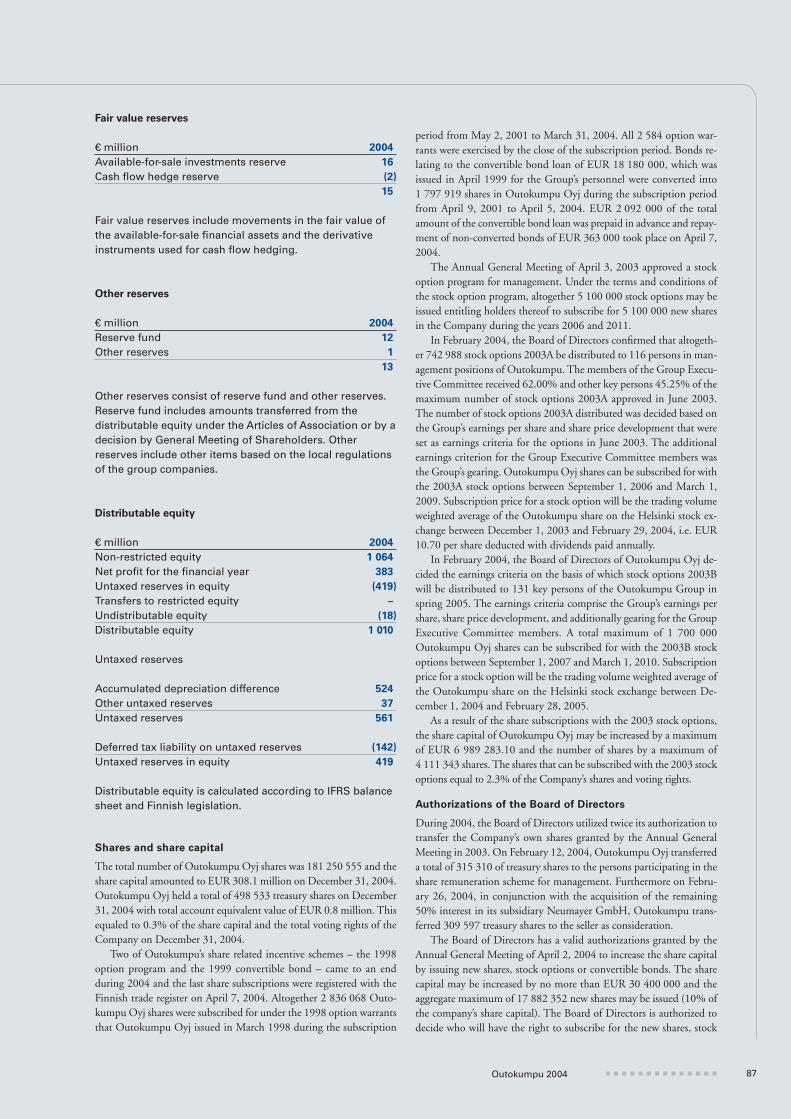
87Outokumpu 2004
Fair value reserves
€ million 2004
Available-for-sale investments reserve 16
Cash fl ow hedge reserve (2)
15
Fair value reserves include movements in the fair value of the available-for-sale fi nancial assets and the derivative instruments used for cash fl ow hedging.
Other reserves
€ million 2004
Reserve fund 12
Other reserves 1
13
Other reserves consist of reserve fund and other reserves. Reserve fund includes amounts transferred from the distributable equity under the Articles of Association or by a decision by General Meeting of Shareholders. Other reserves include other items based on the local regulations of the group companies.
Distributable equity
€ million 2004
Non-restricted equity 1 064
Net profi t for the fi nancial year 383
Untaxed reserves in equity (419)
Transfers to restricted equity –
Undistributable equity (18)
Distributable equity 1 010
Untaxed reserves
Accumulated depreciation difference 524
Other untaxed reserves 37
Untaxed reserves 561
Deferred tax liability on untaxed reserves (142)
Untaxed reserves in equity 419
Distributable equity is calculated according to IFRS balance sheet and Finnish legislation.
Shares and share capital
The total number of Outokumpu Oyj shares was 181 250 555 and the share capital amounted to EUR 308.1 million on December 31, 2004. Outokumpu Oyj held a total of 498 533 treasury shares on December 31, 2004 with total account equivalent value of EUR 0.8 million. This equaled to 0.3% of the share capital and the total voting rights of the Company on December 31, 2004.
Two of Outokumpu’s share related incentive schemes – the 1998 option program and the 1999 convertible bond – came to an end during 2004 and the last share subscriptions were registered with the Finnish trade register on April 7, 2004. Altogether 2 836 068 Outo-kumpu Oyj shares were subscribed for under the 1998 option warrants that Outokumpu Oyj issued in March 1998 during the subscription
period from May 2, 2001 to March 31, 2004. All 2 584 option war-rants were exercised by the close of the subscription period. Bonds re-lating to the convertible bond loan of EUR 18 180 000, which was issued in April 1999 for the Group’s personnel were converted into 1 797 919 shares in Outokumpu Oyj during the subscription period from April 9, 2001 to April 5, 2004. EUR 2 092 000 of the total amount of the convertible bond loan was prepaid in advance and repay-ment of non-converted bonds of EUR 363 000 took place on April 7, 2004.
The Annual General Meeting of April 3, 2003 approved a stock option program for management. Under the terms and conditions of the stock option program, altogether 5 100 000 stock options may be issued entitling holders thereof to subscribe for 5 100 000 new shares in the Company during the years 2006 and 2011.
In February 2004, the Board of Directors confi rmed that altogeth-er 742 988 stock options 2003A be distributed to 116 persons in man-agement positions of Outokumpu. The members of the Group Execu-tive Committee received 62.00% and other key persons 45.25% of the maximum number of stock options 2003A approved in June 2003. The number of stock options 2003A distributed was decided based on the Group’s earnings per share and share price development that were set as earnings criteria for the options in June 2003. The additional earnings criterion for the Group Executive Committee members was the Group’s gearing. Outokumpu Oyj shares can be subscribed for with the 2003A stock options between September 1, 2006 and March 1, 2009. Subscription price for a stock option will be the trading volume weighted average of the Outokumpu share on the Helsinki stock ex-change between December 1, 2003 and February 29, 2004, i.e. EUR 10.70 per share deducted with dividends paid annually.
In February 2004, the Board of Directors of Outokumpu Oyj de-cided the earnings criteria on the basis of which stock options 2003B will be distributed to 131 key persons of the Outokumpu Group in spring 2005. The earnings criteria comprise the Group’s earnings per share, share price development, and additionally gearing for the Group Executive Committee members. A total maximum of 1 700 000 Outokumpu Oyj shares can be subscribed for with the 2003B stock options between September 1, 2007 and March 1, 2010. Subscription price for a stock option will be the trading volume weighted average of the Outokumpu share on the Helsinki stock exchange between De-cember 1, 2004 and February 28, 2005.
As a result of the share subscriptions with the 2003 stock options, the share capital of Outokumpu Oyj may be increased by a maximum of EUR 6 989 283.10 and the number of shares by a maximum of 4 111 343 shares. The shares that can be subscribed with the 2003 stock options equal to 2.3% of the Company’s shares and voting rights.
Authorizations of the Board of Directors
During 2004, the Board of Directors utilized twice its authorization to transfer the Company’s own shares granted by the Annual General Meeting in 2003. On February 12, 2004, Outokumpu Oyj transferred a total of 315 310 of treasury shares to the persons participating in the share remuneration scheme for management. Furthermore on Febru-ary 26, 2004, in conjunction with the acquisition of the remaining 50% interest in its subsidiary Neumayer GmbH, Outokumpu trans-ferred 309 597 treasury shares to the seller as consideration.
The Board of Directors has a valid authorizations granted by the Annual General Meeting of April 2, 2004 to increase the share capital by issuing new shares, stock options or convertible bonds. The share capital may be increased by no more than EUR 30 400 000 and the aggregate maximum of 17 882 352 new shares may be issued (10% of the company’s share capital). The Board of Directors is authorized to decide who will have the right to subscribe for the new shares, stock

88
Notes to the consolidated fi nancial statements
options or convertible bonds. The Board of Directors may deviate from the shareholders’ pre-emptive subscription right, provided that such deviation is justifi ed by an important fi nancial reason for the Company, such as strengthening the Company’s capital structure or fi nancing corporate acquisitions or restructurings. The Board of Direc-tors decides the subscription price and the other terms and conditions of the issue of shares, stock options or convertible bonds. The Board of Directors may decide that the subscription price for new shares can be paid by means of contribution in kind, set-off or otherwise subject to specifi c terms and conditions determined by the Board of Directors. The authorization is valid until the Annual General Meeting in 2005, however no longer than one year from the decision of the General Meeting. By February 10, 2005, the Board of Directors had not used this authorization.
The Board of Directors has a valid authorization granted by the Annual General Meeting of April 2, 2004 to repurchase the Compa-ny’s own shares. The maximum number of shares to be repurchased is 8 900 000. The number of own shares in the Company’s possession may not exceed 5% of the total of the Company’s shares. Shares may be repurchased pursuant to a decision of the Board of Directors through purchases in public trading at the Helsinki stock exchange at the prevailing market price. Shares may be repurchased for improving of the Company’s capital structure, or to be used as consideration when acquiring assets for the Company’s business or as consideration in possible corporate acquisitions, in the manner and to the extent de-cided by the Board of Directors. Repurchased shares may also be used as a part of incentive and bonus schemes directed to the personnel of the Company. The authorization is valid until the Annual General Meeting in 2005, however no longer than one year from the decision of the General Meeting. By February 10, 2005, the Board of Directors had not used this authorization.
The Board of Directors has a valid authorization granted by the Annual General Meeting of April 2, 2004 to transfer the Company’s own shares. The maximum number of shares to be transferred is 10 000 000. Shares may be transferred on one or several occasions. The Board of Directors is authorized to decide on the recipients of the shares and the procedure and terms to be applied. The Board of Direc-tors may decide to transfer shares in deviation of the pre-emptive right of the shareholders to the Company’s shares. Shares can be transferred as consideration when acquiring assets for the Company’s business or as consideration in possible corporate acquisitions, in the manner and to the extent decided by the Board of Directors. The Board of Direc-tors may decide to sell shares through public trading at the Helsinki stock exchange in order to obtain funds for the Company for invest-ments and possible corporate acquisitions. Shares can also be trans-ferred as a part of incentive and bonus schemes directed to the person-nel of the Company, including the Chief Executive Offi cer and his/her deputy. Except as specifi cally authorized, the Board of Directors may not deviate from the shareholders’ pre-emptive right to shares in favor of persons that are closely connected to the Company in the meaning of chapter 1, section 4, subsection 1 of the Finnish Companies Act. The transfer price may not be less than the fair market value of the shares at the time of the transfer set in public trading at the Helsinki stock exchange. The consideration can be paid by means of contribu-tion in kind, set-off or otherwise subject to specifi c terms and condi-tions determined by the Board of Directors. The authorization is valid until the Annual General Meeting in 2005, however no longer than one year from the decision of the General Meeting.
On February 10, 2005, the Board of Directors used the above-mentioned authorization and confi rmed the management remuneration of the third and last scheme that expired at the end of 2004. Approximately 280 490 treasury shares that the Company currently holds will be transferred to the assigned persons as share part of the total remuneration on February 14, 2005.
24. Employee benefi t obligations
Outokumpu has established several defi ned benefi t and defi ned contri-bution pension plans in various countries. The most signifi cant pen-sion plan in Finland is the Finnish Statutory Employment Pension Scheme (TEL), in which benefi ts are directly linked to employee earn-ings. The disability component of TEL has been accounted for as a defi ned benefi t plan. In December 2004, the Finnish Ministry of So-cial Affairs and Health approved certain changes, effective from Janu-ary 1, 2006 onwards, to the principles for calculating disability pen-sion liabilities under TEL. According to the new practice, TEL’s disa-bility pension component will be accounted for as a defi ned contribu-tion plan. Due to this change and based on the year-end actuarial cal-culations, Outokumpu has released EUR 36 million of this obligation in December 2004 and the rest, EUR 6 million, will be released by the end of 2005. The Group’s foreign pension plans include both defi ned contribution and defi ned benefi t plans.
Other post-employment benefi ts realte mainly to retirement medi-cal arrangements in the US.
ITP-pension plans operated by Alecta in Sweden and plans oper-ated by Stichting Bedrjfspensioenfonds voor de metaalindustrie in the Netherlands are multi-employer defi ned benefi t pension plans. It has, however, not been possible to get suffi cient information for the calcu-lation of obligations and assets by employer from the plan operators, and therefore these plans have been accounted for as defi ned contribu-tion plans in the fi nancial statements.

89Outokumpu 2004
Pension and other post-employment benefi ts
Amounts recognized in the income statement
€ million 2004 2003Defi ned benefi t pension expenses 16 (18)Defi ned contribution pension expenses (46) (78)Other post-employment benefi ts (5) 1
(35) (96)
By functionDefi ned benefi tpension plans
Other post-employment benefi ts
€ million 2004 2003 2004 2003Cost of sales 12 (13) (2) (2)Selling and marketing expenses (1) (3) (2) 0Administrative expenses 4 (1) (1) 3Research and development expenses 1 (1) 0 –
16 (18) (5) 1
Pension cost in employee benefi t expensesDefi ned benefi tpension plans
Other post-employment benefi ts
€ million 2004 2003 2004 2003Current service cost (23) (24) (1) (1)Interest cost (31) (34) (3) (3)Expected return on plan assets 27 30 – –Recognized net actuarial gains and losses 0 0 0 –Employee contributions 4 3 – –Past service cost 4 0 0 5Gains and losses on curtailments and settlements 36 7 (2) –
16 (18) (5) 1
Actual return on plan assets 26 39 – –
Amounts recognized in the balance sheet
Other post-employment benefi ts
Defi ned benefi tpension plans
€ million 2004 2003 2004 2003Present value of funded obligations 491 462 – –Fair value of plan assets (413) (379) – –Present value of unfunded obligations 45 81 50 48Unrecognized actuarial gains and losses (26) (23) (12) (9)Unrecognized past service cost – – 1 1Net liability 96 142 39 40
Balance sheet reconciliation
Net liability on Jan. 1 142 177 40 52Net periodic pension cost in income statement (16) 18 5 (1)Employer contributions (26) (27) (4) (3)Translation differences (3) (5) (3) (8)Impact of acquired and disposed companies – (22) – –Net liability on Dec. 31 96 142 39 40
Defi ned benefi t pension and other post-employment benefi t obligations 139 186Defi ned benefi t pension assets (note 21) (4) (5)Net liability 135 181
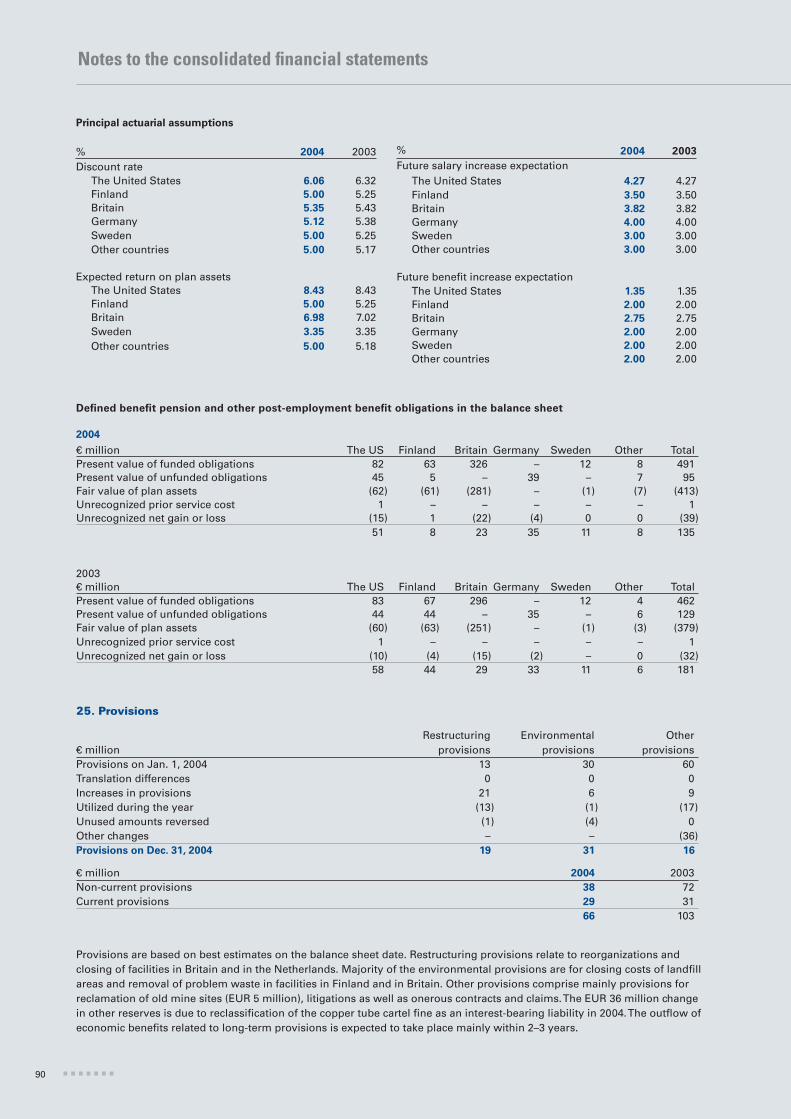
90
€ millionRestructuring
provisionsEnvironmental
provisionsOther
provisionsProvisions on Jan. 1, 2004 13 30 60Translation differences 0 0 0Increases in provisions 21 6 9Utilized during the year (13) (1) (17)Unused amounts reversed (1) (4) 0Other changes – – (36)Provisions on Dec. 31, 2004 19 31 16
€ million 2004 2003Non-current provisions 38 72Current provisions 29 31
66 103
25. Provisions
Provisions are based on best estimates on the balance sheet date. Restructuring provisions relate to reorganizations and closing of facilities in Britain and in the Netherlands. Majority of the environmental provisions are for closing costs of landfi ll areas and removal of problem waste in facilities in Finland and in Britain. Other provisions comprise mainly provisions for reclamation of old mine sites (EUR 5 million), litigations as well as onerous contracts and claims. The EUR 36 million change in other reserves is due to reclassifi cation of the copper tube cartel fi ne as an interest-bearing liability in 2004. The outfl ow of economic benefi ts related to long-term provisions is expected to take place mainly within 2–3 years.
Principal actuarial assumptions
% 2004 2003Discount rate
The United States 6.06 6.32Finland 5.00 5.25Britain 5.35 5.43Germany 5.12 5.38Sweden 5.00 5.25Other countries 5.00 5.17
Expected return on plan assetsThe United States 8.43 8.43Finland 5.00 5.25Britain 6.98 7.02Sweden 3.35 3.35Other countries 5.00 5.18
Notes to the consolidated fi nancial statements
% 2004 2003
Future salary increase expectationThe United States 4.27 4.27Finland 3.50 3.50Britain 3.82 3.82Germany 4.00 4.00Sweden 3.00 3.00Other countries 3.00 3.00
Future benefi t increase expectationThe United States 1.35 1.35Finland 2.00 2.00Britain 2.75 2.75Germany 2.00 2.00Sweden 2.00 2.00Other countries 2.00 2.00
Defi ned benefi t pension and other post-employment benefi t obligations in the balance sheet
2004
€ million The US Finland Britain Germany Sweden Other TotalPresent value of funded obligations 82 63 326 – 12 8 491Present value of unfunded obligations 45 5 – 39 – 7 95Fair value of plan assets (62) (61) (281) – (1) (7) (413)Unrecognized prior service cost 1 – – – – – 1Unrecognized net gain or loss (15) 1 (22) (4) 0 0 (39)
51 8 23 35 11 8 135
2003€ million The US Finland Britain Germany Sweden Other TotalPresent value of funded obligations 83 67 296 – 12 4 462Present value of unfunded obligations 44 44 – 35 – 6 129Fair value of plan assets (60) (63) (251) – (1) (3) (379)Unrecognized prior service cost 1 – – – – – 1Unrecognized net gain or loss (10) (4) (15) (2) – 0 (32)
58 44 29 33 11 6 181

91Outokumpu 2004
26. Interest-bearing liabilities
€ million 2004 2003Non-current
Bonds and debentures 311 111Loans from fi nancial institutions 1 427 1 443Pension loans 149 145Finance lease liabilities 67 59Other long-term loans 18 19
1 971 1 777
Finance lease liabilities
Minimum lease payments
€ million 2004 2003Not later than 1 year 8 31–2 years 8 52–3 years 8 53–4 years 8 54–5 years 5 5Later than 5 years 49 51
Future fi nance charges (13) (11)Present value of minimum lease payments 72 62
€ million 2004 2003Current
Convertible bonds – 5Loans from fi nancial institutions 358 356Pension loans 25 17Finance lease liabilities 6 2Bills payable – 1Other current loans 715 606
1 103 986
Present value of minimum lease payments
€ million 2004 2003Not later than 1 year 6 21–2 years 6 32–3 years 6 33–4 years 6 34–5 years 4 4Later than 5 years 45 46
Present value of minimum lease payments 72 62
Bonds and debentures
€ million Interest rate, % In currency 2004 2003Fixed interest rate
Bonds and debentures2002–2007 7.05 SEK 200 million 22 222002–2008 6.90 EUR 89 million 89 892004–2011 5.00 EUR 75 million 75 –Convertible bond1999–2004 3.75 EUR 5 million – 5
186 116Floating interest rate
Bonds and debentures2004–2007 2.67 EUR 125 million 125 –
311 116
Repayment schedule of long-term debt on Dec. 31, 2004
€ million 2005 1) 2006 2007 2008 2009 2010– TotalBonds and debentures EUR 125 89 75 289
SEK 22 22Loans from fi nancial institutions EUR 29 37 89 396 62 244 857
GBP 149 149USD 26 35 86 57 3 207CAD 18 18CNY 4 4SEK 20 20 198 10 248
Pension loans EUR 23 24 24 24 22 48 165SEK 1 1 1 4 7
Finance lease liabilities EUR 4 4 3 3 4 45 62USD 2 2 3 3 10
Other long-term loans EUR 8 4 6 3 1 22SEK 1 3 4
93 130 380 922 117 423 2 0641) Repayments in 2005 are included in current debt.
Average maturity of long-term debt was 4 years and the average interest rate 3.44%.

92
Notes to the consolidated fi nancial statements
Carrying and fair values of borrowings
2004 2004 2003 2003€ million Carrying value Fair value Carrying value Fair valueLong-term debt 1 971 2 005 1 777 1 810Current debt 1 103 1 103 986 986
The fair value of interest-bearing liabilities is higher compared with the carrying value mainly due to the valuation of fi xed rate bonds, bank and pension loans with the current relatively low interest rates.
27. Trade and other payables
€ million 2004 2003Non-current
Non interest-bearingTrade payables 0 0Other long-term liabilities 10 13
10 13
Current
Interest-bearingAccrued interest expenses 32 26
Non interest-bearingTrade payables 567 493Advances received 70 76Prepaid interest income 0 0Accrued employee-related liabilities 134 136VAT payable 26 22Withholding tax and social security liabilities 20 11Other accruals 99 80Other payables 31 91
947 909
28. Commitments and contingent liabilities
€ million 2004 2003Pledges on Dec. 31Mortgages to secure own borrowings 110 142Other pledges to secure own borrowings 2 2
Guarantees on Dec. 31On behalf of associated companies
For fi nancing 4 6On behalf of other parties
For fi nancing 10 28For other commitments 28 24
The real estate mortgages given relate to properties in Tornio (EUR 66 million), Pori (EUR 26 million) and Pietarsaari (EUR 6 million) in Finland. For property located in Avesta in Sweden the corresponding amount is EUR 4 million. Additionally EUR 8 million corporate mortgage on Outokumpu Stainless AB’s assets has been given as security.
Present value of minimum lease
payments on operating leases
€ million 2004 2003Not later than 1 year 33 361–2 years 27 282–3 years 22 223–4 years 15 174–5 years 11 12Later than 5 years 38 45Present value of minimum lease payments 146 160
Major off-balance sheet investment
commitments on Dec. 31
€ million 2004 2003The Tornio expansion project 44 98Increase in long products capacity in the US – 14
Outokumpu Oyj sold to the Mutual Pension Insurance Com-pany Varma-Sampo part of its real estate located in Espoo, Finland in 2002. Outokumpu Oyj sold fi ve offi ce buildings and parcels of totaling approximately three hectares for the con-sideration of EUR 50 million. In connection with the sale, Outokumpu Oyj concluded operating lease agreements with Varma-Sampo for 10–15 years.
The Group has entered into long-term (15 years) supply agreements of industrial gases for the production facilities in Tornio, Avesta and Sheffi eld. These agreements do not qualify as fi nance lease agreements.

93Outokumpu 2004
29. Disputes and litigations
Princeton Gamma-Tech, Inc. (“PGT”), a subsidiary acquired in 1985, has been designated, together with certain other parties, a potentially responsible party for ground water contamination at and around its production facilities in Princeton, New Jersey, by the United States Environmental Protection Agency (“USEPA”). USEPA has subse-quently sued PGT to recover costs of investigation and clean up of the site. The alleged cause of the contamination relates to a time prior to the acquisition of PGT by Outokumpu. PGT is discussing with USEPA the suitable clean-up method. Outokumpu has received par-tial compensation for the costs incurred from prior owners and PGT has made claims to others who, it is believed, have contributed to the contamination. PGT has also made claims to and has initiated litiga-tion against its insurance carriers under insurance policies in effect during the relevant period to recover the above costs. Some of the car-riers settled the claims against them before commencement of the trial in October 1996.
PGT has reached a comprehensive settlement with USEPA and corresponding authorities of New Jersey which settlement has been ap-proved by the federal district court judge and is therefore fi nal. PGT’s insurance carriers have funded the settlement pursuant to separate set-tlement agreements that has been entered into with each of the carri-ers. In light of the above, it is not anticipated that PGT would incur any further costs for any further clean up activities.
In March 2001, the European Commission initiated an investiga-tion concerning alleged participation by Outokumpu Oyj and Outo-kumpu Copper Products Oy in price and market-sharing cartel with respect to copper tubes and fi ttings in the European Union. Outo-kumpu has cooperated fully with the European Commission in con-nection with the investigation. The investigation involving Outo-kumpu has subsequently been divided into two separate proceedings: investigation into alleged price fi xing and market sharing in the indus-trial copper tubes sector and investigation into alleged price fi xing and market sharing in the sanitary copper tube sector.
Pursuant to its investigations the European Commission has in its decision dated December 16, 2003, found Outokumpu Oyj and Ou-tokumpu Copper Products Oy having infringed the applicable EU competition laws by participating in agreements and concerted prac-tices consisting of price fi xing and market sharing in the industrial tubes sector during a period between May 3, 1988 and March 22, 2001. As a result, the European Commission imposed an aggregate fi ne of EUR 18 million on Outokumpu Oyj and Outokumpu Copper Products Oy. Outokumpu has lodged an appeal in this matter that is currently pending.
In connection with its investigation into alleged price fi xing and market sharing in the copper sanitary tube sector, the European Com-mission has on September 1, 2003 issued a Statement of Objections, in which it accuses Outokumpu Oyj and Outokumpu Copper Prod-ucts Oy for having infringed applicable EU competition laws for par-ticipation in agreements and concerted practices consisting of price fi xing and market sharing in the sanitary tube sector during a period between June 1988 and March 2001. As a result, the European Com-mission has in its decision dated 3 September 2004 imposed an aggre-gate fi ne of EUR 36 million on Outokumpu Oyj and Outokumpu Copper Products Oy. This fi ne has in connection with transition to IFRS been recognized in income in 2003. Outokumpu has lodged an appeal in this matter that is currently pending.
In June 1998, the US International Trade Commission initiated an investigation relating to an alleged dumping of cold rolled stainless steel sheet and strip (including foil) against Britain. A preliminary de-posit rate of 13.45% was determined, which applied to shipments from Britain to the US between December 17, 1998 and July 27,
1999. A fi nal deposit rate of 14.84% was issued in July 1999, which has applied to shipments from Britain to the US from July 27, 1999.
Management believes that the foregoing actions taken by the US authorities do not have any material adverse effect on the Group’s fi -nancial position.
In addition to the litigation described above, some Group compa-nies are involved in disputes incidental to their business. Management believes that the outcome of such disputes will not have a material ef-fect on the Group’s fi nancial position.
30. Related party transactions
€ million 2004 2003Transactions and balances with
associated companies
Sales 49 29Purchases (269) (8)Interest income 0 0Derivatives (5) 0
Long-term receivablesLoans receivable 0 0Subordinated loans receivable 2 160
Current receivablesLoans receivable 5 9Accounts receivable 2 12Derivatives 1 7Other receivables 2 1
Current liabilitiesAccounts payable 2 3Derivatives 0 20Other current liabilities 0 0
Loans receivable from associated
companies and joint ventures 1)
Loans receivable on Jan. 1 169 9Withdrawals 9 162Repayments (172) (2)Loans receivable on Dec. 31 7 169
1) Loans to associated companies and joint ventures include both current and
non-current receivables.
The interest rates of loans granted to associated companies are based on market rates. EUR 5 million of the loans is expected to mature by the end of 2005 and the rest EUR 2 million by the end of 2009.
Employee benefi ts for key management
€ million 2004 2003Short-term employee benefi ts 4 4Post-employment benefi ts 3 1Other long-term benefi ts 0 0
7 5
Key management consists of the members of the Board of Directors, CEO and other members of the Group Executive Committee. There were no outstanding loans receivable from key management on Dec. 31, 2004 (Dec. 31, 2003: EUR – million).

94
Co
un
try
Nat
ure
of a
ctiv
ity
Gro
up
ho
ldin
g, %
Outokumpu CopperOutokumpu Copper Products Oy *) Finland ■ 100Outokumpu Copper B.V. The Netherlands ■ 100Outokumpu Copper Limited Britain ■ 100Outokumpu Copper, Inc. The United States ■ 100Outokumpu Copper Holdings Inc. The United States ■ 100Outokumpu Copper Kenosha, Inc. The United States ■ 100
Outokumpu Copper Neumayer Holding GmbH 1), 2) Austria ■ 100
Outokumpu Heatcraft B.V. The Netherlands ■ 55Outokumpu Holton Limited Britain ▲ 100Outokumpu Copper Neumayer GmbH 1) Austria ▲ 100Outokumpu Copper Nippert Ltd. 1) Britain ▲ 100Outokumpu Advanced Superconductors Inc. The United States ▲ 100Outokumpu American Brass, Inc. The United States ▲ 100Outokumpu Castform Oy Finland ▲ 100Outokumpu Copper Franklin, Inc. The United States ▲ 100Outokumpu Copper Partner AB Sweden ▲ 100Outokumpu Copper Strip AB Sweden ▲ 100Outokumpu Copper Strip B.V. The Netherlands ▲ 100Outokumpu Copper Products (Malaysia) Sdn. Bhd. Malaysia ▲ 100Outokumpu Copper Tube (Changzhou) Ltd 2) China ▲ 100Outokumpu Copper Tube (Zhongshan) Ltd. China ▲ 100Outokumpu Copper Products AB Sweden ▲ 100Outokumpu Copper Tubes, S.A. Spain ▲ 100Outokumpu Heatcraft Czech s.r.o. Czech Republic ▲ 55Outokumpu Heatcraft de Mexico S. de R.L. de C.V. Mexico ▲ 55Outokumpu Heatcraft France SAS France ▲ 55Outokumpu Heatcraft Italia s.r.l. Italy ▲ 55Outokumpu Heatcraft USA LLC The United States ▲ 55
Outokumpu Heatcraft Heat Exchanger (Zhongshan) Co. Ltd. China ● 55
Outokumpu Heatcraft Trading (Shanghai) Co. China ▲ 55Outokumpu Hitachi Copper Tube (Thailand) Ltd. Thailand ▲ 64Outokumpu Livernois Engineering LLC The United States ▲ 55Outokumpu Poricopper Oy Finland ▲ 100Outokumpu Pori Tube Oy 3) Finland ▲ 100Outokumpu Wasacopper Oy Finland ▲ 90Outokumpu Fabrication Technologies AB Sweden ▲ 100Outokumpu Copper Nippert Inc. The United States ▲ 100Outokumpu Copper Valleycast LLC The United States ▲ 100Outokumpu Plating Inc. The United States ▲ 100
Outokumpu Copper Superconductors Italy S.p.A 1), 2) Italy ▲ 95
Neumayer Corporation The United States ● 100Outokumpu Rawmet (UK) Limited Britain ◗ 100Outokumpu Centro Servizi S.p.A. Italy ◗▲ 100Outokumpu Copper Thatcher Ltd Britain ◗▲ 100Outokumpu Copper Fabrication AB *) Sweden ■ 100Outokumpu Copper LDM B.V. The Netherlands ▲ 100Outokumpu Copper Nonferro Metal GmbH Germany ● 100Outokumpu Holding UK Limited Britain ■ 100Outokumpu Copper MKM Limited Britain ▲ 100Outokumpu Copper Metal Supplies Limited Britain ● 100Outokumpu Copper Brass International Limited Britain ● 100Outokumpu Copper Brass SA France ● 100Outokumpu Copper Gusum AB Sweden ■ 100Outokumpu Copper BCZ SA Belgium ▲ 100Outokumpu Copper BCZ (France) Eurl 1) France ● 100Outokumpu Copper BCZ GmbH Germany ● 100Boliden Cuivre & Zinc Espana SA Spain ● 100Outokumpu Copper BCZ (Polska) Sp. z o.o. Poland ● 100Outokumpu Copper HME B.V. The Netherlands ▲ 100Outokumpu Copper HME S A France ● 100Outokumpu Copper Securus GmbH Germany ● 100Outokumpu Copper Tube Hungary Kereskedelmi Kft. Hungary ● 100Outokumpu Copper CDC SA 1) Belgium ● 100
31. Subsidiaries by business area on December 31, 2004
Co
un
try
Nat
ure
of a
ctiv
ity
Gro
up
ho
ldin
g, %
Outokumpu StainlessOutokumpu Stainless Steel Oy *) Finland ■ 100Outokumpu Benelux B.V. 1) The Netherlands ■ 100Outokumpu Stainless Holdings Ltd Britain ■ 100Outokumpu Stainless Holding GmbH Germany ■ 100Outokumpu Stainless, Inc. The United States ■ 100AvestaPolarit East, Inc. The United States ■ 100Outokumpu Chrome Oy Finland ✖▲ 100Outokumpu PSC Benelux B.V. The Netherlands ▲ 100Outokumpu Stainless B.V. The Netherlands ▲ 100Hertecant N.V. 4) Belgium ▲ 88P.T. Avesta Welding 1) Indonesia ▲ 100Outokumpu Stainless Tubular Products Ltd. 1), 4) Canada ▲ 88AvestaPolarit ABE, S.A. de C.V. 4) Mexico ▲ 88AB Örnsköldsviks Mekaniska Verkstad (ÖMV) 4) Sweden ▲ 88Outokumpu Stainless Tubular Products AB 1), 4) Sweden ▲ 88Outokumpu Prefab AB Sweden ▲ 100Outokumpu Press Plate AB Sweden ▲ 100Avesta Welding AB 1) Sweden ▲ 100AB Husqvarna Elektrolytpolering 4) Sweden ▲ 88Outokumpu PSC Germany GmbH Germany ▲ 100Outokumpu Stainless Oy Finland ▲ 100Outokumpu Stainless Tubular Products Oy Ab 1), 4) Finland ▲ 88AS Outokumpu Stainless Tubular Products 1), 4) Estonia ▲ 88Outokumpu Stainless Bar, Inc. The United States ▲ 100Outokumpu Stainless Pipe, Inc. The United States ▲ 100Outokumpu Stainless Plate, Inc. The United States ▲ 100Outokumpu Stainless Ltd Britain ●▲ 100Outokumpu S.p.A. Italy ●▲ 100Outokumpu Stainless AB Sweden ■▲◆ 100Handelmij Roestvrij B.V. 1) The Netherlands ● 100Outokumpu Pty Ltd Australia ● 100Outokumpu N.V. Belgium ● 100Outokumpu S.A. 1) Spain ● 100Outokumpu (Pty) Ltd South Africa ● 100Outokumpu Asia Pacifi c Ltd China ● 100Outokumpu Ltd Ireland ● 100Outokumpu Ges.m.b.H Austria ● 100Outokumpu K.K. Japan ● 100Outokumpu UAB 1) Lithuania ● 100Outokumpu AS Norway ● 100Outokumpu Sp z o.o. Poland ● 100Outokumpu Stainless Tubular Producs S.A.R.L.1), 4) France ● 88Outokumpu S A France ● 100E.L.F.E. SA Etires Lamines Forges Estampes 4) France ● 88Outokumpu Nordic AB Sweden ● 100Outokumpu GmbH Germany ● 100Outokumpu (S.E.A.) Pte Ltd. Singapore ● 100Outokumpu Distribution Oy Finland ● 100SH–Trade Oy 4) Finland ● 88Outokumpu A/S Denmark ● 100Outokumpu s.r.o. Czech Republic ● 100Outokumpu Kft Hungary ● 100ZAO Outokumpu 1) Russia ● 100Outokumpu Baltic Oü Estonia ● 100Outokumpu Stainless Coil, Inc. The United States ● 100Avesta Welding Products, Inc. 1) The United States ● 100AvestaPolarit Gebouwen B.V. The Netherlands ◗ 100AvestaPolarit Pension Trustees Ltd Britain ◗ 1002843617 Canada Inc. Canada ◗ 100Visent Invest AB Sweden ◗ 100Visenta Försäkrings AB Sweden ◗ 100AvestaPolarit Holding GmbH & Co. KG Germany ◗ 100Kandelinin Seuraajat Oy Finland ◗ 100Outokumpu Rossija Oy *) Finland ◗ 100ZAO Outokumpu Moskva Russia ◗ 100ZAO Outokumpu St. Petersburg Russia ◗ 100OOO Outokumpu Norilsk Russia ◗ 100
Notes to the consolidated fi nancial statements

95Outokumpu 2004
Co
un
try
Nat
ure
of a
ctiv
ity
Gro
up
ho
ldin
g, %
Outokumpu TechnologyOutokumpu Technology Oy *) Finland ■ 100Boliden Contech Chile S.A. Chile ▲ 100Boliden Contech GmbH Germany ▲ 100Kumpu GmbH 1) Germany ▲ 100Outokumpu Technology Turula Oy Finland ▲ 100Outokumpu Wenmec AB Sweden ▲ 100SepTor Tehnologies B.V. The Netherlands ▲ 100Outokumpu Technology B.V. 1) The Netherlands ●▲ 100Outokumpu Mexicana, S.A. de C.V. Mexico ● 100Outokumpu Tecnologia Brasil Ltda. Brazil ● 100Pannevis Inc. The United States ● 100Outokumpu Technology AB *) Sweden ● ◗ 100Outokumpu Technology Australasia Pty. Ltd. Australia ● ◗ 100Outokumpu Technology Chile Limitada Chile ● ◗ 100Outokumpu Technology GmbH 1) Germany ● ◗ 100Outokumpu Technology Inc. The United States ● ◗ 100Outokumpu Technology Ltd. Canada ● ◗ 100Outokumpu Technology Minerals Oy Finland ● ◗ 100Outokumpu Technology Pty. Ltd. Australia ● ◗ 100Outokumpu Technology (Pty) Ltd. South Africa ● ◗ 100Outokumpu Technology S.A.C. Peru ● ◗ 100Outokumpu Research Oy *) Finland ◆ 100Aisco Systems Inc. Chile y Compañia Limitada Chile ◗ 100MPE Service Oy Finland ◗ 96Outokumpu Technology A/S Norway ◗ 100Outokumpu Technology Ltd. Britain ◗ 100Petrobau Ingenieur Bulgaria EOOD Bulgaria ◗ 100ZAO Mineral Processing Engineers Russia ◗ 60Eberhard Hoesch & Söhne GmbH Germany ❋ 100Edifo AB Sweden ❋ 100International Project Services Ltd. Oy Finland ❋ 100Kumpu Engineering, Inc. The United States ❋ 100
Other operationsMining
Outokumpu Nickel Resources B.V. The Netherlands ■ 100Outokumpu Zinc B.V *) The Netherlands ■ 100Outokumpu Mining Oy Finland ✖ 100Norsulfi d A/S *) Norway ✔ 100Viscaria AB *) Sweden ✔ 100Outokumpu Minera Española S.A. Spain ◆ 100Outokumpu Mines, Inc. *) Canada ◆ 100OAO Kola-Mining Russia ◆ 96Outokumpu Exploration Ventures Pty. Ltd. Australia ❋ 100Outokumpu Mining Australia Pty. Ltd. Australia ❋ 100Outokumpu Zinc Australia Pty. Ltd. Australia ❋ 100
Corporate services
Granefors Bruk AB *) Sweden ■ 100Outokumpu Sales Oy *) Finland ● 100Outokumpu, Lda. 1) **) Portugal ● 100Outokumpu Copper (U.S.A.), Inc. The United States ● 100Outokumpu Deutschland GmbH Germany ● 100
Outokumpu Istanbul Dis Ticaret Limited Sirketi
*)
Turkey ● 98
Outokumpu Poland Sp. z o.o. *) Poland ● 100Outokumpu Shanghai Co. Ltd 3) China ● 100Kopparlunden AB Sweden ◗ 100Orijärvi Oy *) Finland ◗ 100Outokumpu Alueverkko Oy *) Finland ◗ 100Outokumpu Business Support Unit AB *) Sweden ◗ 100Outokumpu Rawmet, S.A. Spain ◗ 100Pancarelian Ltd. *) Bermuda ◗ 100Outokumpu Engineering Enterprises, Inc. *) The United States ❋ 100Outokumpu España, S.A. *) Spain ❋ 100Outokumpu France S.A. *) France ❋ 100Outokumpu Italia S.r.L *) Italy ❋ 100Outokumpu Scandinavia AB Sweden ❋ 100
Co
un
try
Nat
ure
of a
ctiv
ity
Gro
up
ho
ldin
g, %
Industrial holdings
Princeton Gamma-Tech, Inc. The United States ▲ 82Princeton Gamma-Tech U.K. Ltd. Britain ● 82
Foreign branches
Outokumpu Asia Pacifi c Ltd., branch offi ce in Rep. of KoreaOutokumpu Asia Pacifi c Ltd., agencies in China and TaiwanOutokumpu Copper Kenosha, Inc, branch offi ce in MexicoOutokumpu Baltic Oü, branch offi ce in LatviaOutokumpu Mining Oy, branch offi ce in SpainOutokumpu Sales Oy, agencies in China Outokumpu Sales Oy, branch offi ce in BritainOutokumpu Sales Oy, branch offi ce in SpainOutokumpu Sales Oy, branch offi ce in Italy Outokumpu Sales Oy, branch offi ce in Rep. of KoreaOutokumpu Sales Oy, branch offi ce in FranceOutokumpu Sales Oy, branch offi ce in SingaporeOutokumpu Sales Oy, branch offi ce in DenmarkOutokumpu (S.E.A.) Pte. Ltd., agency in Vietnam
Merged and dissolved subsidiaries
AvestaPolarit ABE ABAvestaPolarit Finance B.V.AvestaPolarit Immobiliare S.p.A. (Commerciale Acciai S.p.A.)Calamo Nords ABFinero B.V.Finnbend OyFinnpipe OyJARO Fittings Oy AbKHD Aluminium Technology GmbHOutokumpu Benelux B.V.Outokumpu Business Support Unit Inc. Outokumpu Copper Resources B.V.Outokumpu Ecomills OyOutokumpu Japan K.K.Outokumpu Nickel B.V.Outokumpu PSC Nordic ABOutokumpu (UK) Limited
Legend
■ Management or holding
▲ Production
● Marketing
✖ Operational mine
✔ Mine production discontinued/sold
◆ Exploration or research
◗ Service
❋ Dormant
This list does not include all dormant companies or all holding companies. However, all companies owned directly by the parent company are included. The Group holding corresponds to the Group’s share of voting rights.
1) Name change2) Acquired3) Founded4) Group holding change*) Shares and stock held by the parent company
**) Parent company’s ownership 65 %
32. Events after the balance sheet date
Outokumpu management does not have knowledge of any signifi cant events after the balance sheet date, which would have had an impact on the fi nancial statements.

96
Key fi nancial fi gures
Key fi nancial fi gures of the Group
FAS FAS FAS IFRS IFRS
2000 2001 2002 2003 2004
Scope of activity
Sales € million 3 693 5 324 5 558 5 922 7 136
- change in sales % 27.0 44.2 4.4 6.6 20.5
- exports from and sales outside Finland, of total sales % 90.7 91.8 92.4 93.4 95.2
Capital employed on Dec. 31 € million 2 199 3 266 4 331 4 108 4 941
Operating capital on Dec. 31 € million 2 331 3 507 4 569 4 287 5 151
Capital expenditure € million 242 914 2 042 622 473
- in relation to sales % 6.6 17.2 36.7 10.5 6.6
Depreciation and amortization € million 192 266 264 304 251
Research and development costs € million 35 41 47 48 40
- in relation to sales % 0.9 0.8 0.8 0.8 0.6
Personnel on Dec. 31 11 932 19 428 21 130 19 359 19 465
- average for the year 12 193 19 010 20 196 21 442 19 761
Profi tability
Operating profi t € million 427 183 267 214 468
- in relation to sales % 11.6 3.4 4.8 3.6 6.6
Share of results in associated companies € million 2 2 (7) (15) 78
Profi t before extraordinary items € million 372 147 213 – –
- in relation to sales % 10.1 2.8 3.8 – –
Profi t before taxes € million 391 147 213 108 477
- in relation to sales % 10.6 2.8 3.8 1.8 6.7
Net profi t for the fi nancial year € million 315 76 159 112 390
- in relation to sales % 8.5 1.4 2.9 1.9 5.5
Return on equity % 19.8 6.9 8.0 5.4 17.0
Return on capital employed % 19.8 6.7 7.0 5.0 10.3
Return on operating capital % 18.5 6.3 6.6 4.8 9.9
Financing and fi nancial position
Liabilities € million 1 605 3 009 4 381 4 314 4 570
Net interest-bearing debt € million 582 1 175 2 385 2 025 2 435
- in relation to sales % 15.7 22.1 42.9 34.2 34.1
Net fi nancial expenses € million 57 38 46 91 69
- in relation to sales % 1.5 0.7 0.8 1.5 1.0
Net interest expenses € million 54 56 75 98 95
- in relation to sales % 1.4 1.1 1.4 1.7 1.3
Interest cover 7.9 3.6 3.8 2.1 6.0
Share capital 1) € million 212 212 294 304 308
Other equity € million 1 405 1 879 1 652 1 779 2 198
Equity-to-assets ratio % 50.6 41.6 31.1 33.0 35.8
Debt-to-equity ratio % 36.0 56.2 122.6 97.2 97.2
Net cash generated from operating activities € million 248 346 334 194 (128)
Dividends € million 99.6 75.2 68.6 35.5 90.4 2)
1) The 2003 and 2002 fi gures include unregistered share capital.2) The Board of Directors’ proposal to the Annual General Meeting.

97Outokumpu 2004
Share-related key fi gures
1) The share-related key fi gures for 2000–2001 have been adjusted to refl ect the rights offering in 2002 based on the pre-emptive subscription right of shareholders.2) The Board of Directors’ proposal to the Annual General Meeting.3) Excluding treasury shares.4) The average number of shares for 2004 diluted with the 2003A options was 180 171 663. No diluting effect on earnings per share in 2004.5) 1998 option warrants were traded on the Helsinki stock exchange from June 21, 2001 to March 24, 2004.
FAS FAS FAS IFRS IFRS
2000 1) 2001 1) 2002 2003 2004
Earnings per share € 2.15 0.55 1.15 0.65 2.13
Cash fl ow per share € 1.81 2.52 2.42 1.13 (0.71)
Equity per share € 11.70 11.37 11.14 11.54 13.65
Dividend per share € 0.72 0.55 0.40 0.20 0.50 2)
Dividend/earnings ratio % 33.5 100.0 43.5 32.0 23.6
Dividend yield % 9.9 5.1 4.8 1.9 3.8
Price/earnings ratio 3.4 19.4 7.2 16.7 6.2
Development of share priceAverage trading price € 9.74 8.50 10.28 8.75 12.52
Lowest trading price € 6.56 6.42 8.14 6.87 9.93
Highest trading price € 14.29 10.81 12.67 11.41 14.46
Trading price at the end of period € 7.28 10.72 8.30 10.77 13.15
Change during the period % (42.7) 47.2 (22.6) 29.8 22.1
Change in the HEX-index during the period % (10.6) (32.4) (34.4) 4.4 3.3
Market capitalization at the end of period 3) € million 1 002 1 461 1 420 1 911 2 377
Development in trading volumeTrading volume 1 000 shares 24 028 37 155 58 198 75 574 123 832
In relation to weightedaverage number of shares % 17.4 27.1 42.3 44.0 68.5
Adjusted average number of shares 3) 137 643 380 137 127 433 137 658 458 171 623 035 180 702 386 4)
Number of shares at the end of period 3) 137 643 380 136 277 653 171 110 613 177 450 725 180 752 022
1998 option warrants 5)
Price developmentAverage trading price € 2 278 3 087 1 732 2 273
Lowest trading price € 2 278 957 320 1 250
Highest trading price € 2 278 3 672 2 880 3 055
Trading price at the end of period € 2 278 1 051 2 400 1 900
Trading volume pcs. 40 1 288 1 263 1 239
Number at the end of period 2 584 2 584 2 179 –

98
Defi nitions of key fi nancial fi gures
Capital employed = Total equity + net interest-bearing debt
Operating capital = Capital employed + net tax liability
Research and development costs = Research and development expenses in the income statement(including expenses covered by grants received)
Return on equity =Net profi t for the fi nancial year
× 100Total equity (average for the period)
Return on capital employed (ROCE) =Operating profi t
× 100Capital employed (average for the period)
Return on operating capital (ROOC) =Operating profi t
× 100Operating capital (average for the period)
Net interest-bearing debt = Total interest-bearing debt – total interest-bearing assets
Interest cover =Profi t before taxes + net interest expensesNet interest expenses
Equity-to-assets ratio =Total equity
× 100Total assets – advances received
Debt-to-equity ratio =Net interest-bearing debt
× 100Total equity
Earnings per share =Net profi t for the fi nancial year attributable to the equity holdersAdjusted average number of shares during the period
Cash fl ow per share =Net cash generated from operating activitiesAdjusted average number of shares during the period
Equity per share =Equity attributable to the equity holdersAdjusted number of shares at the end of period
Dividend per share =Dividend for the fi nancial yearAdjusted number of shares at the end of period
Dividend/earnings ratio =Dividend for the fi nancial year
× 100Net profi t for the fi nancial year attributable to the equity holders
Dividend yield =Dividend per share
× 100Adjusted trading price at the end of period
Price/earnings ratio (P/E) =Adjusted trading price at the end of periodEarnings per share
Average trading price =EUR amount traded during the periodAdjusted number of shares traded during the period
Market capitalization
at end of period = Number of shares at the end of period × trading price at the end of period
Trading volume = Number of shares traded during the period, and in relation to the weighted average number of shares during the period
Key fi nancial fi gures

99Outokumpu 2004
Key fi nancial fi gures by business
FAS FAS FAS IFRS IFRS
2000 2001 2002 2003 2004
Outokumpu Stainless
Sales € million 1 177 2 851 3 002 3 450 4 637
Share of the Group’s sales % 28 50 52 56 64
Operating profi t € million 246 139 204 99 442
Operating profi t margin % 21 5 7 3 10
Operating capital on Dec. 31 € million 843 1 857 3 038 3 493 4 108
Return on operating capital % 30 10 8 3 12
Capital expenditure € million 84 405 633 373 276
Depreciation € million 60 120 127 159 173
Personnel on Dec. 31 2 438 9 004 9 147 9 230 9 070
Outokumpu Copper
Sales € million 1 855 1 622 1 669 1 628 2 050
Share of the Group’s sales % 44 28 29 27 28
Operating profi t € million 87 61 53 (6) 52
Operating profi t margin % 5 4 3 neg. 3
Operating capital on Dec. 31 € million 1 002 966 935 732 953
Return on operating capital % 9 6 6 neg. 6
Capital expenditure € million 70 114 149 106 59
Depreciation € million 75 74 77 78 60
Personnel on Dec. 31 5 588 5 669 7 564 7 585 7 953
Outokumpu Technology
Sales € million 242 328 399 405 423
Share of the Group’s sales % 6 6 7 7 6
Operating profi t € million 10 5 4 5 29
Operating profi t margin % 4 2 1 1 7
Operating capital on Dec. 31 € million 32 48 35 38 39
Return on operating capital % 31 13 10 11 74
Capital expenditure € million 3 79 8 25 9
Depreciation € million 5 5 6 7 9
Personnel on Dec. 31 1 197 1 646 1 737 1 908 1 776
Zinc
Sales € million 385 453 418 396 –
Share of the Group’s sales % 9 8 7 6 –
Operating profi t € million 46 33 3 20 –
Operating profi t margin % 12 7 1 5 –
Operating capital on Dec. 31 € million 188 393 361 – –
Return on operating capital % 25 11 1 9 –
Capital expenditure € million 27 241 23 60 –
Depreciation € million 13 26 35 33 –
Personnel on Dec. 31 762 1 183 1 117 – –
Other operations
Sales € million 586 480 336 263 163
Share of the Group’s sales % 14 8 6 4 2
Operating profi t € million 9 (51) 18 93 (55)
Operating profi t margin % 2 neg. 5 35 neg.
Operating capital on Dec. 31 € million 307 221 209 51 77
Return on operating capital % 3 neg. 8 68 neg.
Capital expenditure € million 59 75 1 229 58 129
Depreciation € million 39 42 20 28 9
Personnel on Dec. 31 1 947 1 926 1 565 636 666
Figures in this table are unaudited.

100
Financial development by quarter
€ million I/03 II/03 III/03 IV/03 I/04 II/04 III/04 IV/04 Sales
Outokumpu StainlessCoil Products 704 697 661 687 849 894 767 994Special Products 349 327 273 348 363 459 379 449North America 64 59 64 65 78 94 98 98Others (241) (231) (148) (228) (188) (285) (210) (203)Outokumpu Stainless total 876 852 850 872 1 102 1 162 1 034 1 338
Outokumpu CopperRegional businesses 185 174 172 191 304 326 308 289Global businesses 180 191 173 163 204 244 224 207Others 44 38 61 57 (15) (18) (16) (7)Outokumpu Copper total 409 403 405 411 493 552 516 489
Outokumpu Technology 89 81 98 137 81 104 91 147
Zinc 93 95 98 110 – – – –
Other operations 67 61 61 74 41 39 41 42
Intra-group sales (51) (53) (48) (68) (37) (31) (33) (35)The Group 1 483 1 439 1 464 1 536 1 680 1 826 1 649 1 981
Operating profi t
Outokumpu StainlessCoil Products 45 35 1 10 102 88 69 77Special Products 0 2 (8) 5 11 25 5 30North America 0 0 4 1 5 6 5 7Others 2 (4) 10 (4) 2 (1) (1) 12Outokumpu Stainless total 47 33 7 12 120 118 78 126
Outokumpu CopperRegional businesses (2) (1) 2 2 17 7 (1) 10Global businesses 5 10 4 6 11 4 4 6Others 2 (3) 0 (23) (4) 0 (2) 0Outokumpu Copper total 5 6 6 (15) 24 11 1 16
Outokumpu Technology (6) (1) 1 11 9 (1) 1 19
Zinc 6 3 5 6 – – – –
Other operations (18) (20) 11 120 (9) (2) (7) (37)
Intra-group sales 1 0 1 1 (2) 2 0 0The Group 35 21 31 134 142 129 73 124
Share of results in associated companies (3) (3) (4) (5) 15 9 31 23Financial income and expenses (29) (27) (18) (17) 10 (18) (29) (32)Profi t (loss) before taxes 3 (9) 9 112 167 120 75 116Income taxes (3) (4) (8) 19 (34) (24) (20) (9)Net profi t (loss) for the period 0 (13) 1 131 133 96 55 107
Attributable to
Equity holders of the Company (1) (14) 2 131 130 95 53 106Minority interest (1) (1) 1 0 (3) (1) (2) (1)
Figures in this table are unaudited.
Key fi nancial fi gures

101Outokumpu 2004
Euro exchange rates Closing rates Average rates
2000 2001 2002 2003 2004 2003 2004
USD 0.931 0.881 1.049 1.263 1.362 1.131 1.244
GBP 0.624 0.609 0.651 0.705 0.705 0.692 0.679
SEK 8.831 9.301 9.153 9.080 9.021 9.124 9.124
AUD 1.677 1.728 1.856 1.680 1.746 1.738 1.691
The European Central Bank’s euro exchange rates.
Sales
Operating profi t Profi t before taxes
€ million%
€ million
€ million

102
Income statement of the parent company
€ million Note 2004 2003
Sales 113 111
Cost of sales (107) (99)
Gross margin 6 12
Administrative expenses (69) (57)Research and development expenses (3) (2)Other operating income and expenses 4 3 4
Operating loss 2–4 (63) (42)
Financial income and expenses 5 (5) 126
Loss/profi t before extraordinary items (67) 84
Extraordinary items 6 60 (9)
Loss/profi t before
appropriations and taxes (7) 75
Appropriations Change in depreciation difference (1) (0)
Income taxes 7 (5) (26)
Loss/profi t for the fi nancial year (14) 49
According to the Finnish regulations, in addition to the consolidated fi nancial statements separate fi nancial statements of the parent company have to be presented.
The income statement and balance sheet items of the parent company are mainly intra-group and thus eliminated in the consolidated fi nancial statements.
Cash fl ow statement of the parent company
€ million 2004 2003
Cash fl ow from operating activities
Loss/profi t for the fi nancial year (14) 49Adjustments Depreciation 8 6 Unrealized exchange gains and losses (3) (32) Interest income (89) (72) Interets expenses 97 85 Income taxes 5 26 Other non-cash income and expenses (63) 9 Other adjustments 1) (1) 10
(47) 32
Change in working capital Decrease in current non interest-bearing receivables 44 18 Decrease in current non interest-bearing liabilities (9) (71)
35 (53)
Interest paid (93) (79)Interest received 84 72Income taxes paid – (0)
(9) (7)
Net cash generated from operating activities (35) 21
Cash fl ow from investing activities
Capital expenditure for fi xed assets (22) (11)Investments in subsidiaries and other equity investments (28) (9)Proceeds from sale of fi xed assets 13 2Decrease in long-term fi nancial assets 65 15
Net cash generated from investing activities 28 (4)
Cash fl ow before fi nancing activities (7) 17
Cash fl ow from fi nancing activities
Borrowings of long-term debt 658 710Repayments of long-term debt (109) (72)Change in current debt (25) 452Dividends paid (36) (69)Proceeds from share subscriptions 19 6Cash fl ow from group contributions (101) (16)Other fi nancing cash fl ow (425) (973)
Net cash generated from fi nancing activities (20) 37
Net change in cash and cash equivalents (26) 54Net change in cash and
cash equivalents in the balance sheet (26) 54
1) Includes write-downs and reversals of write-downs on shares as well as gains and losses on sale of fi xed assets.
Parent company fi nancial statements, FASParent company fi nancial statements, FAS

103Outokumpu 2004
Balance sheet of the parent company
€ million Note 2004 2003
ASSETS
Fixed assets and other
long-term investments 8
Intangible assets 55 38
Property and equipment 23 21
Long-term fi nancial assets 3 066 3 128
Total fi xed assets and other
long-term investments 3 145 3 188
Current assets
Receivables 10 2 208 1 688
Cash and cash equivalents 96 122
Total current assets 2 304 1 810
TOTAL ASSETS 5 449 4 997
€ million Note 2004 2003
SHAREHOLDERS’ EQUITY
AND LIABILITIES
Shareholders’ equity 9 Share capital 308 304Unregistered share capital – 0Premium fund 707 688Treasury shares 5 11Retained earnings 581 562Loss/profi t for the fi nancial year (14) 49
1 587 1 613Untaxed reserves
Accumulated depreciation difference 3 1
Liabilities
Long-term 10
Interest-bearing 1 758 1 253
Non interest-bearing 3 –
Current 10
Interest-bearing 1 909 1 902
Non interest-bearing 189 228
Total liabilities 3 859 3 383
TOTAL SHAREHOLDERS’ EQUITY
AND LIABILITIES 5 449 4 997

104
Notes to the parent company fi nancial statements
1. Accounting principles
The fi nancial statements of Outokumpu Oyj have been prepared according to Finnish Accounting Standards (FAS).
Foreign currency items and derivative
fi nancial instruments
Foreign currency transactions during the year are recorded in the ac-counts at the exchange rate effective at the time of transaction. Re-ceivables and liabilities in foreign currencies are translated into euros at the closing rate on the balance sheet date. Advances paid and received appear in the balance sheet at the exchange rate effective on the day on which they were paid or received.
Currency, interest rate and metal derivatives are initially recognized at fair value on the date derivative contract is entered into and are sub-sequently remeasured at their fair value. Determination of fair values is based on quoted market prices and rates, discounting of cash fl ows and option valuation models.
However, positive fair values of derivatives, which have been ac-quired for trading purposes, are not recognized in the fi nancial state-ments. Fair value changes of currency, interest rate and metal deriva-tives are recognized in fi nancial income and expenses. Realized gains and losses of electricity forwards, which are related to purchase of elec-tricity for the Finnish production facilities, are recognized as adjust-ments to purchases. Realized gains and losses of other derivatives are recognized in fi nancial income and expenses.
Fixed assets and other long-term investments
The carrying values of fi xed assets are stated at historical cost less ac-cumulated amortization and depreciation. Assets held under fi nance or operating leases are not recorded on the balance sheet, and the lease rentals are charged to income as incurred. Depreciation and amortiza-tion is based on historical cost and the estimated useful life of invest-ments. Depreciation and amortization is calculated on a straight-line or declining-balance. Estimated useful lives for various fi xed asset classes are:
− intangible rights 5–10 years− other long-term expenses 5–10 years− buildings 25–40 years− machinery and equipment 5–20 years− other fi xed assets 4–40 years.
Property, plant and equipment, other non-current tangible assets and intangible assets are reviewed for impairment losses whenever events or changes in circumstances indicate that the carrying amount may not be recoverable. Assets whose carrying values exceed their re-coverable amount are written down to an amount determined using discounted net future cash fl ows expected to be generated by the as-set.
Long-term fi nancial assets include fi nancial investments and re-ceivables intended to be held for over one year.
Cash and marketable securities
Cash and cash equivalents include cash in hand, funds held on call ac-counts and on deposit up to three months, as well as other funds equivalent to cash. Marketable securities include deposits with a matu-rity exceeding three months and debt securities intended for resale within one year. Marketable securities are valued at the lower of cost or market.
Parent company fi nancial statements, FAS
Sales
Sale of goods is recognized on delivery and revenues from services are recorded when the services have been performed. Sales are shown net of indirect sales taxes and discounts.
Research and development costs
Research and development costs are expensed as incurred.
Other operating income and expenses
Other operating income and expenses include income and expenses generated in other than normal business activities, such as gains and losses on disposal of fi xed assets, scrapping and rental income.
Contingent losses
Provision is made for contingent losses which are almost certain to ma-terialize in the future and the amount of which can be reasonably esti-mated. Depending on their nature, provisions are presented under long-term or current liabilities in the balance sheet.
Extraordinary items
Group contributions paid or received are reported in extraordinary items.
Income taxes
Income taxes presented in the income statement consist of accrued taxes for the fi nancial year and tax adjustments to prior years. Deferred tax liabilities or assets have not been included in the balance sheet, but hypothetical deferred tax liabilities and assets are presented in the notes to the fi nancial statements. These deferred tax liabilities or assets have been determined for all temporary differences between the tax bases of assets and liabilities and their fi nancial reporting amounts, using the tax rates effective for future periods.
2. Personnel expenses
€ million 2004 2003Board of Directors’, CEO’sand deputy CEO’s fees and salaries 2 1Other wages 29 16Pension contributions 5 7Other personnel expenses 1) 2 2
37 271) No profi t-sharing bonuses based on the Finnish
Personnel Funds Act were paid in 2004 (2003: EUR – million).
Average number of personnel 285 275Personnel on Dec. 31 285 272

105Outokumpu 2004
€ million 2004 2003
3. Depreciation and amortization
Depreciation and amortization by group of assets Intangible assets 3 3 Other long-term expenses 4 2 Buildings 0 0 Machinery and equipment 1 1 Other fi xed assets 0 0
8 6
Depreciation and amortization by function Cost of sales 5 0 Administrative expenses 4 6
8 6
4. Other operating income and expenses
Other operating income Rental income 0 0 Gains on sale of fi xed assets and shares 5 1 Gain on the sale of precious metal assets – 2 Other income items 3 4
7 7Other operating expenses Expenses from the Boliden transaction – (1) Losses on disposal of fi xed assets and sale of shares (4) (0) Other expense items (0) (2)
(4) (3)
Total other operating income and expenses 3 4
5. Financial income and expenses
Dividend income 3 146Interest income on long-term fi nancial assets 26 29Interest income on current assets 63 43Other fi nancial income 2 1Interest expenses (97) (85)Other fi nancial expenses (6) (9)Exchange gains and losses 3 1
(5) 126Financial income from and expenses to subsidiaries Dividend income 2 146 Interest income on long-term fi nancial assets 26 29 Interest income on current assets 58 36 Other fi nancial income 1 1 Interest expenses (18) (11)
69 201
€ million 2004 2003
6. Extraordinary items
Group contributions 60 (9)
7. Income taxes
Taxes for the fi nancial year (2) (26)Tax adjustments for prior years (3) 0
(5) (26)
Hypothetical deferred taxes in the balance sheet Deferred tax assets 3 4

106
8. Fixed assets and other long-term investments Accumulated Carrying Historical cost depreciation on value on€ million on Jan. 1, 2004 Additions Disposals Dec. 31, 2004 Dec. 31, 2004Intangible assets 47 25 (1) (16) 55
Property and equipment Land 8 – (0) – 8 Buildings 4 – – (2) 2 Machinery and equipment 10 1 (0) (7) 4 Other fi xed assets 2 – – (1) 1 Construction in progress 6 8 (5) – 8 30 8 (6) (10) 23Long-term fi nancial assets Shareholdings in subsidiaries 2 327 2 (14) – 2 315 Treasury shares 11 – (6) – 5 Other long-term equity investments 20 25 (3) – 42 Other loans receivable 769 134 (198) – 705 3 127 160 (221) – 3 066
Total fi xed assets 3 204 193 (227) (25) 3 145
Depreciations Accumulated Accumulated depreciation Accumulated depreciation on on disposals Depreciation depreciation on € million Jan. 1, 2004 and transfers during period Dec. 31, 2004Intangible assets (9) 0 (7) (16)
Property and equipment Buildings (2) – (0) (2) Machinery and equipment (6) 0 (1) (7) Other fi xed assets (1) – (0) (1) (9) 0 (1) (10)
Total fi xed assets (18) 0 (8) (25)
9. Shareholders’ equity
€ million 2004 2003Share capital on Jan. 1 304 293Transfers from unregistered share capital 0 0Share offering – 9Shares subscribed with options 4 1Converted bonds 1 1Share capital on Dec. 31 308 304
Unregistered share capital on Jan. 1 0 0Transfers to registered share capital (0) (0)Unregistered share options – 0Unregistered share capital on Dec. 31 – 0
Premium fund on Jan. 1 688 636Share offering – 45Gain on the sale of treasury shares 0 –Shares subscribed with options 15 5Converted bonds 3 2Premium fund on Dec. 31 707 688
Treasury shares on Jan.1 11 14Transfer of treasury shares (6) (3)Treasury shares on Dec. 31 5 11
€ million 2004 2003Retained earnings on Jan. 1 562 84Previous year’s profi t 49 544Dividends paid (36) (69)Transfer of treasury shares 6 2Retained earnings on Dec. 31 581 562
Loss/profi t for the fi nancial year (14) 49
Total shareholders’ equity on Dec. 31 1 587 1 613
Distributable funds Retained earnings 581 562Loss/profi t for the fi nancial year (14) 49Distributable funds on Dec. 31 567 611
Parent company fi nancial statements, FAS

107Outokumpu 2004
10. Receivables and liabilities
€ million 2004 2003Receivables Loans receivable 1 906 1 489 Accounts receivable 20 21 Prepaid expenses and accrued income 16 11 Other receivables 267 166
2 208 1 688
Long-term liabilitiesInterest-bearing Bonds 200 – Loans from fi nancial institutions 1 144 1 146 Pension loans 115 105 Other long-term loans 300 2
1 758 1 253Non interest-bearing Other long-term liabilities 3 –
Current liabilities Interest-bearing Convertible bonds – 5 Loans from fi nancial institutions 268 273 Pension loans 18 11 Other current loans 1 623 1 614
1 909 1 902Non interest-bearing Accounts payable 17 20 Accrued expenses and prepaid income 38 21 Other current liabilities 133 186
189 228
Total liabilities 3 859 3 383
Receivables from and liabilities to subsidiaries
Long-term receivables Loans receivable 677 744
Current receivables Loans receivable 1 901 1 486 Accounts receivable 14 20 Prepaid expenses and accrued income 15 11 Other receivables 212 90
2 142 1 607Long-term liabilities Other long-term loans 300 –
Current liabilities Current loans 1 009 1 047 Accounts payable 4 2 Accrued expenses and prepaid income 3 1 Other current liabilities 117 170
1 132 1 220
€ million 2004 2003Receivables from associated companies Long-term Loans receivable 2 2 Current Prepaid expenses and accrued income 0 0 Loans receivable 5 –
5 0Prepaid expenses and accrued income Prepaid interest expenses and accrued interest income 16 11 Income tax receivable – 0 Other – 0
16 11
Accrued expenses and prepaid income Accrued employee related expenses 3 3 Accrued interest expenses and prepaid interest income 20 17 Other 15 1
38 21
11. Commitments and contingent liabilities
€ million 2004 2003Pledges on Dec. 31 Mortgages to secure own borrowings 26 39
Guarantees on Dec. 31 On behalf of subsidiaries For fi nancing 107 153 For other commitments 142 110 On behalf of other parties For fi nancing 0 0 For other commitments 3 2
252 265
Mortgages are given to secure pension loans.
Minimum future lease payments on operating leases on Dec. 31
€ million 2004 2003Not later than 1 year 6 5Later than 1 year 44 49
51 55

108
Shares and share capital
On December 31, 2004, Outokumpu Oyj’s fully paid and regis-tered share capital totaled EUR 308 125 943.50 and it consisted of 181 250 555 shares. The account equivalent value of a share is EUR 1.70. Each share entitles its holder to one vote at general meetings of shareholders. The Company’s shares have been en-tered in the Finnish book-entry securities system.
According to the Articles of Association, the share capital of Outokumpu Oyj is a minimum of EUR 150 000 000 and a maximum of EUR 1 200 000 000. The issued share capital may be increased or decreased within these limits without amending the Articles of Association.
Listing of shares
Outokumpu Oyj’s shares are listed on the Helsinki stock ex-change. The trading symbol is OUT1V and a trading lot is 200 shares.
Treasury shares
At the end of 2004, the Company held 498 533 treasury shares. The repurchases have been made between April 9 and November 27, 2001. Following the transfer of treasury shares to participants for the last incentive period in the share remuneration scheme on February 14, 2005, Outokumpu holds 218 603 treasury shares. This corresponds to 0.1% of the Company’s shares and voting rights.
State ownership
The Finnish State holds 37.8% of the Company’s shares and vot-ing rights. According to a resolution passed by the Finnish Parlia-ment in June 2001, the state’s shareholding in Outokumpu can be reduced down to 10%. Any reduction below this level would require a new parliamentary resolution.
Redemption obligation
According to the Articles of Association, a shareholder whose proportion of all the Company’s shares or aggregate voting rights
Outokumpu Oyj’s shares and shareholders
reaches or exceeds 33 1/3 or 50% is obligated, upon request by the other shareholders, to redeem their shares at a price calcu-lated in the manner specifi ed in the Articles of Association. The redemption obligation does not apply to a shareholder whose shareholding or voting threshold had been reached or exceeded prior to the registration of this redemption obligation with the Finnish Trade Register on May 18, 1994, provided that the shareholder’s aggregate shareholding or voting rights remain above the said threshold.
Board’s authorization to increase share capital
On April 2, 2004, the Annual General Meeting authorized the Board of Directors to increase the Company’s share capital by issuing new shares, granting stock options and/or issuing con-vertible bonds. On the basis of this authorization, the Compa-ny’s share capital may be increased by a maximum of EUR 30 400 000 by issuing a maximum of 17 882 352 new shares for subscription.
The Board of Directors is authorized to decide who will have the right to subscribe for the new shares, stock options or con-vertible bonds. The Board of Directors may deviate from the shareholders’ pre-emptive subscription right, provided that such deviation is justifi ed by an important fi nancial reason such as strengthening the Company’s capital structure, or fi nancing
Shareholders by group
January 31, 2005
The Finnish State 37.8%
Private Finnish investors 9.4%
The Finnish Social Insurance Institution 11.3%
Other Finnish organizations 18.1%
Internationalshareholders 23.4%

109Outokumpu 2004
Principal shareholders on January 31, 2005
Shareholder Number of shares %
The Finnish State 68 440 597 37.8
The Finnish Social Insurance Institution 20 518 448 11.3
Ilmarinen Mutual Pension Insurance Company 3 055 436 1.7
OP-Delta investment fund 1 727 239 1.0
Finnish State Pension Fund 1 500 000 0.8
Etera Mutual Pension Insurance Company 1 395 411 0.8
Pohjola Finland Value Investment Fund 1 020 000 0.6
Nordea Life Assurance Company Finland 772 175 0.4
Fortum Pension Foundation 696 636 0.4
Mutual Insurance Company Pension-Fennia 600 420 0.3
Nominee accounts held at custodian banks 1) 41 227 688 22.7
Other shareholders total 40 296 505 22.2
Total number of shares 181 250 555 100.0
1) Shareholding of the companies belonging to the Capital Group Companies Inc. has on November 8, 2004 increased to
6.5% of Outokumpu shares. According to the information available to Outokumpu, no other nominee holdings exceed
5% of the total number of shares.
Shareholders by group on January 31, 2005
Shareholder group Number of shares %
Privately held companies 5 011 458 2.8
Publicly held companies 27 068 0.0
Financial and insurance institutions 12 125 086 6.7
The public sector and public organizations
The Finnish State 68 440 597 37.8
The Finnish Social Insurance Institution 20 518 448 11.3
Occupational pension schemes 10 316 112 5.7
Other 165 157 0.1
Non-profi t organizations 5 151 613 2.8
Households/private persons 17 012 368 9.4
International shareholders 42 480 327 23.4
Shares not transferred to book-entry securities system 2 321 0.0
Total 181 250 555 100.0
Distribution of shareholding on January 31, 2005
Number of Number of % of Total % of share Averageshares shareholders shareholders shares capital shareholding
1–100 1 837 10.9 108 011 0.1 59
101–500 6 701 39.7 1 867 289 1.0 279
501–1 000 3 427 20.3 2 614 334 1.4 763
1 001–10 000 4 525 26.8 12 781 557 7.1 2 825
10 001–100 000 330 2.0 8 701 861 4.8 26 369
100 001–1 000 000 59 0.3 16 290 363 9.0 276 108
over 1 000 000 7 0.0 97 657 131 53.9 13 951 019
16 886 100.0 140 020 546 77.3 8 292
Nominee accounts held at custodian banks 41 227 688 22.7
Shares not transferred to book-entry securities system 2 321 0.0
Total 181 250 555 100.0
110
corporate acquisitions or restructurings. The Board of Directors decides the subscription price and the other terms and condi-tions connected with the issue of shares, stock options or con-vertible bonds. The Board of Directors may decide that the sub-scription price for new shares can be paid through contributions in kind, set-off or otherwise subject to specifi c terms and condi-tions determined by the Board of Directors. The authorization to issue new shares is valid until the Annual General Meeting in 2005, but no longer than 12 months from the decision of the General Meeting. The Board has not exercised the authorization .
Board’s authorization to repurchase the Company’s
own shares
On April 2, 2004, the Annual General Meeting authorized the Board of Directors to repurchase the Company’s own shares (treasury shares). A maximum of 8 900 000 shares can be repur-chased, but the number of treasury shares cannot exceed 5% of the Company’s total registered number of shares. Shares may be repurchased in accordance with a decision by the Board of Direc-tors through purchases in public trading on the Helsinki stock exchange at the prevailing market price. Shares may be repur-chased to improve the Company’s capital structure, or to be used as a consideration when acquiring assets for the Company’s busi-ness or in possible corporate acquisitions, in the manner and to the extent decided by the Board of Directors. Repurchased shares may also be used as an element in incentive and bonus schemes directed to the Company’s personnel. The authorization to repur-chase shares is valid until the Annual General Meeting in 2005, but no longer than 12 months from the decision of the General Meeting. The Board has not exercised this authorization.
Board’s authorization to transfer the Company’s
own shares
During 2004, the Board of Directors exercised the authorization to transfer the Company’s own shares given by 2003 Annual General Meeting on two occasions. On February 12, 2004, Ou-tokumpu transferred 315 310 of its own shares to Company personnel in the 2001 share remuneration scheme. On February 26, 2004, Outokumpu transferred 309 597 own shares as a con-sideration in a corporate transaction through which the Com-pany acquired the remaining 50% of Neumayer GmbH, an Ou-tokumpu subsidiary.
On April 2, 2004, the Annual General Meeting authorized the Board of Directors to transfer a maximum of 10 000 000 of the Company’s own shares on one or several occasions. The Board of Directors was authorized to decide on the recipients of the shares and the procedure and terms to be applied. The Board of Directors may decide to transfer shares in deviation from the pre-emptive right of the shareholders to the Company’s shares. Shares can be transferred as a consideration when acquiring as-sets for the Company’s business or as a consideration in possible corporate acquisitions, in the manner and to the extent decided by the Board of Directors. The Board of Directors can decide to sell shares through public trading on the Helsinki stock exchange
to obtain funds for the Company for investments and possible corporate acquisitions. Shares can also be transferred as an ele-ment in incentive and bonus schemes directed to the Company’s personnel, including the CEO and his/her deputy. The transfer price may not be less than the fair market value of the shares at the time of the transfer as set in public trading on the Helsinki stock exchange. The authorization to transfer shares is valid until the Annual General Meeting in 2005, but no longer than 12 months from the decision of the General Meeting.
On February 10, 2005, the Board of Directors confi rmed re-munerations for the third incentive period under the share remuneration scheme. A total of 279 930 treasury shares were transferred to participants in the scheme on February 14, 2005.
1998 option program
By the end of the subscription period, which started on May 2, 2001 and ended on March 31, 2004, a total of 2 836 068 Outo-kumpu Oyj shares had been subscribed for on the basis of the 1998 option program. The maximum number, a total of 2 584 stock options, were exercised.
The stock options were issued in March 1998. Based on the reference index model, and in deviation from shareholder’s pre-emptive rights, a total of 2 600 stock options entitling subscrip-tion for a maximum of 2 600 000 of the Company’s shares were initially offered for subscription to employees in management positions in the Outokumpu Group. Sixteen stock options were returned to Outokumpu in accordance with the terms and con-ditions and were annulled on October 30, 2001. At the begin-ning of subscription period, a total of 94 persons in managerial positions held stock options allocated on the basis of relative share price performance and Group earnings per share.
The subscription price for shares to be subscribed for with stock options was based on the volume-weighted average price for the Outokumpu Oyj share on the Helsinki stock exchange between October 1, 2000 and March 31, 2001. At the begin-ning of the subscription period this was EUR 10.45 per share. According to the terms and conditions of the stock options, an-nual dividends were deducted from the subscription price. The stock options were traded on the Helsinki stock exchange from June 21, 2001 to March 24, 2004. Following the dividend pay-out in the spring of 2003, and in accordance with the terms and conditions of the stock options amended as a result of the rights offering in 2002, each option entitled its holder to subscribe for 1 097.56 shares in Outokumpu Oyj at a price of EUR 8.56 per share.
1999 convertible bond
By the end of conversion period, which started on April 9, 2001 and ended on April 5, 2004, a total of 1 797 919 Outokumpu Oyj shares had been subscribed for on the basis of the 1999 con-vertible bond program amounting to EUR 18 180 000.
A total of 742 Outokumpu employees subscribed for the convertible bonds, which formed a part of the incentive program for the Outokumpu Group personnel in Finland. The loan pe-
Outokumpu Oyj’s shares and shareholders

111Outokumpu 2004
Increase in share capital 2000 – 2004
Number of shares Share capital, €
Share capital on Jan. 1, 2000 124 529 660 211 700 422.00
Share subscriptions under the 1999 convertible bond
Apr. 9–Nov. 30, 2001 +170 390 211 990 085.00
Apr. 8–Nov. 29, 2002 +872 161 213 472 758.70
Rights offering Nov. 28–Dec. 17, 2002
Primary subscriptions registered on Dec. 23, 2002 +46 944 402 293 278 242.10
Secondary subscriptions registered on Jan. 3, 2003 +142 506 293 520 502.30
Share subscriptions under the 1999 convertible bond
Apr. 8–Nov. 28, 2003 +255 417 293 954 711.20
Share subscriptions under the 1998 option warrants
Sep. 10–Dec. 19, 2003 +659 629 295 076 080.50
Share issue to Boliden Mineral AB on Dec. 31, 2003 +5 000 000 303 576 080.50
Share subscriptions under the 1998 option warrants
Dec. 20–31, 2003 +2 195 303 579 812.00
Jan. 1–Mar. 31, 2004 +2 174 244 307 276 026.80
Share subscriptions under the 1999 convertible bond
Jan. 2–Apr. 5, 2004 +499 951 308 125 943.50
Share capital on Dec. 31, 2004 181 250 555 308 125 943.50
Treasury shares on Dec. 31, 2004 498 533 847 506.10
Number of shares outstanding on Dec. 31, 2004 180 752 022 307 278 437.40
riod was fi ve years and the annual interest rate 3.75%. Initially each EUR 1 000 convertible bond entitled holders thereof to subscribe for 110 shares in the Company. Following the amend-ments resulting from the rights offering in 2002, each EUR 1 000 convertible bond entitled holders thereof to subscribe for 120.73 Outokumpu Oyj shares at a conversion price of EUR 8.28 per share. EUR 2 092 000 of the total amount of the con-vertible bond loan was prepaid in advance, and repayment of non-converted bonds totaled EUR 363 000.
2000–2002 share remuneration schemes
In March 2000, the Annual General Meeting approved a share remuneration scheme as part of the incentive program for Group management and other key personnel. The scheme com-prises three incentive periods, each with a term of three years. The periods commenced on January 1, 2000, January 1, 2001 and January 1, 2002. The Board of Directors decided on the persons entitled to participate in the scheme for each incentive period. At the close of the incentive period at the end of 2002, the 2000 scheme included 149 persons. At the end of 2003, the
2001 scheme covered 154 persons, and the 2002 scheme at the the end of 2004 covered 142 persons.
In connection with the scheme, remuneration is based on the relative performance of the Company’s share price, and is paid provided that the average change in Outokumpu’s share price equals or exceeds the average trend in the reference index. The maximum remuneration will be paid if the Company’s share price has outperformed the reference index by at least 15%. The reference index is comprised of a combination of the Dow Jones World Mining Index (40%) and the Dow Jones Europe Steel Index (60%). Remuneration under the schemes is paid 60% in cash and 40% in Outokumpu shares. Persons entitled to remuneration under the scheme must retain shares they receive for at least one year from the date of their receipt.
Remunerations for the fi rst incentive period were paid in February 2003 when 282 660 treasury shares were transferred to participants as the share element of the total remuneration. Remuneration for the second incentive period was paid in Feb-ruary 12, 2004 when 315 310 treasury shares were transferred to participants.

112
Outokumpu Oyj’s shares and shareholders
On February 10, 2005, the Board of Directors approved remuneration according to the maximum remuneration for the third incentive period. A total of 279 930 treasury shares were transferred to participants on February 16, 2005. The share-holding distributed via the remuneration scheme amounts to 0.2% of the Company’s shares and the voting rights.
2003 option program
The Annual General Meeting held in 2003 passed a resolution on a stock option program for management. Stock options are part of the Group’s incentive and commitment-building system for key employees, and the objective is to encourage recipients to work in the long term to increase shareholder value. The reward system is based on both earnings and the Company’s relative performance, with rewards geared to accomplishments.
Under the terms and conditions of the stock option program, a total of 5 100 000 stock options may be issued, entitling hold-ers of stock options to subscribe for 5 100 000 new shares in the Company in the period 2006 to 2011. Stock options will be marked 2003A, 2003B and 2003C and will be distributed by decision of the Board of Directors, without additional consid-eration, in 2004, 2005 and 2006, in deviation from sharehold-ers’ pre-emptive rights, to the key persons employed by or re-cruited by the Outokumpu Group.
In deciding on the number of stock options to be distributed annually in total and to each individual, the Board of Directors
Market capitalization
€ million million shares €
Monthly trading volume Dividend/share
will assess the Group’s earnings trend and performance by com-paring, for example, the trend in earnings per share with the trend for the same key ratio in peer companies. In making their assessment, the Board will take into account any exceptional conditions and the effect on the Group’s earnings per share of any acquisition or divestiture, M&A arrangement or other simi-lar major change.
The 2003 option program also comprises a share ownership plan whereby members of the Group Executive Committee are obligated to purchase Outokumpu shares with 10% of the in-come they obtain from stock options.
The subscription price for shares through the exercise of stock option 2003A is the trading volume-weighted average price of the Outokumpu Oyj share on the Helsinki stock exchange from December 1, 2003 to February 29, 2004, with stock option 2003B it is the trading volume-weighted average price of the Outokumpu Oyj share on the Helsinki stock exchange from De-cember 1, 2004 to February 28, 2005, and with stock options 2003C it is the trading volume-weighted average price of the Outokumpu Oyj share on the Helsinki stock exchange from De-cember 1, 2005 to February 28, 2006. On each dividend record date, the share subscription price of stock options will be re-duced by the amount of dividends to be decided after the close of the period for determining the subscription price and prior to share subscription.
Including January 2005.
Dividend/share, €
Dividend/earnings ratio, %
%

113Outokumpu 2004
The subscription period for shares with stock option 2003A is from September 1, 2006 to March 1, 2009, with stock option 2003B it is from September 1, 2007 to March 1, 2010 and with stock option 2003C it is from September 1, 2008 to March 1, 2011.
In February 2004, the Board of Directors confi rmed that a total of 742 988 stock options 2003A be distributed to 116 per-sons in management positions of Outokumpu. The maximum number of 2003A stock options was 1 700 000. Members of the Group Executive Committee received 62% and other key per-sons received 45,25% of the maximum number of 2003A stock options. The number of 2003A stock options distributed was decided on the basis of the earnings criteria established in June, and which were the Group’s earnings per share and share price performance outperforming the share price trend of peer compa-nies. The additional earnings criterion for Group Executive Committee members was the Group’s gearing. In accordance with the terms and conditions of the option program, the sub-scription price for a stock option was EUR 10.70 per share, with annual dividends being deducted.
On February 16, 2005, the Board of Directors decided that a total of 1 148 820 stock options 2003B be distributed to 130 persons in management positions in the Outokumpu Group. The maximum number of 2003B stock options was 1 700 000.Members of the Group Executive Committee received 55.2% and other key persons 75% of the maximum number of 2003B stock options. The number of 2003B stock options distributed was decided on the basis of the earnings criteria established in February 2004, and which were the Group’s earnings per share and share price performance outperforming the share price trend of peer companies. The additional earnings criterion for the Group Executive Committee members was the Group’s gearing. In accordance with the terms and conditions of the option pro-gram, the subscription price for a stock option was EUR 13.56 per share, with annual dividends being deducted.
Following the subscriptions with 2003 stock options, and if the stock options 2003C are fully exercised, Outokumpu Oyj’s share capital may be increased by a maximum of EUR 6 052 277.10 and the number of shares by a maximum of 3 560 163. The number of shares that can be subscribed for on the basis of the stock options corresponds to 2.0% of Company’s shares and voting rights.
Management shareholding
On January 31, 2005, members of the Board of Directors and the Group Executive Committee held a total of 56 382 Com-pany shares, corresponding to 0.03% of the Company’s shares and voting rights.
On January 31, 2005, members of the new Group Executive Committee, effective in April 2005, held a total of 9 370 Com-pany shares. On February 14, 2005, the shareholding of the new
Group Executive Committee increased by 10 940 shares when the share element of the third incentive period of the share remuneration scheme was transferred to participants. After this, the total shareholding of the new Executive Committee corre-sponds to 0.01% of the Company’s shares and voting rights.
If the 2003A and 2003B options were exercised in their en-tirety, shareholdings and aggregate voting rights held by the members of the new Group Executive Committee would in-crease by 0.1 percentage points.
Details of management shareholdings are given on pages 119, 122–123 and 126.
Dividend proposal for 2004
The Board of Directors has established a dividend policy accord-ing to which the payout ratio over a business cycle should be at least one-third of the company’s net profi t for the period. In its annual dividend proposal, the Board takes into account both the fi nancial results and the Group’s investment and development needs.
For the fi nancial year 2004, a dividend of EUR 0.50 is pro-posed, corresponding to 23.6% of the Group’s profi t for the fi -nancial year attributable to equity holders of the company. The effective dividend yield is therefore 3.8%. The average dividend payout ratio during the past fi ve years is 35.4%.

114
Outokumpu Oyj’s shares and shareholders
FAS FAS FAS IFRS IFRS
2000 1) 2001 1) 2002 2003 2004
Earnings per share € 2.15 0.55 1.15 0.65 2.13
Equity per share € 11.70 11.37 11.14 11.54 13.65
Dividend per share € 0.72 0.55 0.40 0.20 0.50 2)
Dividend/earnings ratio % 33.5 100.0 43.5 32.0 23.6
Dividend yield % 9.9 5.1 4.8 1.9 3.8
Price/earnings ratio 3.4 19.4 7.2 16.7 6.2
Development of share price
Average trading price € 9.74 8.50 10.28 8.75 12.52
Lowest trading price € 6.56 6.42 8.14 6.87 9.93
Highest trading price € 14.29 10.81 12.67 11.41 14.46
Trading price at the end of period € 7.28 10.72 8.30 10.77 13.15
Change during the period % (42.7) 47.2 (22.6) 29.8 22.1
Change in the HEX-index during the period % (10.6) (32.4). (34.4) 4.4 3.3
Market capitalization at the end of period € million 1 002 1 478 1 432 1 923 2 383
Development in trading volume
Trading volume 1 000 shares 24 028 37 155 58 198 75 574 123 832
In relation to weighted
average number of shares % 17.4 27.1 42.3 44.0 68.5
Adjusted average number of shares 3) 137 643 380 137 127 433 137 658 458 171 623 035 180 702 386
Number of shares at the end of period 3) 137 643 380 136 277 653 171 110 613 177 450 725 180 752 022
Share-related key fi gures
1) The share-related key fi gures for 2000–2001 have been adjusted to refl ect the rights offering in 2002 based on the pre-emptive subscription right of shareholders.2) The Board of Directors’ proposal to the Annual General Meeting.3) Excluding treasury shares.
Peer group
share price performance
OutokumpuAcerinoxArcelor
ThyssenKruppPosco
Index
Including January 2005.
Share price
€
Share price performance and trading volume for the Outokumpu share as well as the key share-related fi gures are presented in the following table.

115Outokumpu 2004
The Outokumpu Group’s parent company, Outo-kumpu Oyj, is a public limited liability company incorporated and domiciled in Finland. In its cor-porate governance and management, Outokumpu
Oyj complies with Finnish legislation, the Company’s Articles of Association and the Corporate Governance policy resolved and approved by the Board of Directors.
Outokumpu complies with the Corporate Governance Rec-ommendations for Listed Companies published jointly in De-cember 2003 by the Helsinki stock exchange, the Central Chamber of Commerce of Finland and the Confederation of Finnish Industry and Employers. In one exception to these rec-ommendations, Outokumpu has both the Board Nomination and Compensation Committee and the Shareholders’ Nomina-tion Committee appointed by the Annual General Meeting of Shareholders. Furthermore, Outokumpu complies with the regulations and recommendations issued by the Helsinki stock exchange.
Group structure
Up to March 31, 2005, the Outokumpu Group’s business or-ganization comprises Corporate Management, Business Opera-tions, the Business Support Unit and Industrial Holdings, the last of these being the Group’s non-core industrial holdings.
Corporate Management consists of the CEO of the parent company Outokumpu Oyj, members of the Group Executive Committee, and other executives and experts who assist the CEO and the Group Executive Committee members. The task of Corporate Management is to manage the Group as a whole,
and its duties include developing and implementing the Group strategy, directing and supervising the activities of operational business units, establishing and maintaining uniform princi-ples and policies for key corporate functions, establishing and maintaining reporting and control systems, managing internal and external communications as well as investor relations, over-seeing the legality of operations and compliance with the par-ent company’s operational guidelines and decisions, assisting the CEO and deciding on major operational matters at the Group level.
Up to March 31, 2005, operations conducted by the Outo-kumpu Group take place within strategic business entities called Business Areas. These are Stainless, Copper and Technol-ogy. Each Business Area consists of operational Business Units and/or groups of Business Units, i.e. Divisions. Activities sup-porting Group businesses have been centralized in a separate Business Support Unit that reports to the member of the Group Executive Committee, who is responsible for corporate admin-istration. Industrial Holdings comprise non-core units, the management of which is decided separately.
The Outokumpu Group’s new organizational structure, ef-fective as of April 1, 2005, supports the new strategy and vi-sion. The focus of the Group Executive Committee will be on direct management of the stainless steel business, and from the Group perspective, Outokumpu Technology will be managed at arms-length as a stand-alone business through Technology’s board of directors. Outokumpu Copper will be managed sepa-rately until divestment of the fabricated copper products busi-ness is completed. The change in the Group’s business structure
Outokumpu’s corporate governance

116
means that the Business Area level will disappear and the Busi-ness Support Unit will be dissolved. Corporate Management and support functions will be realigned to support the new management system and business organization.
The stainless steel business will be organized into two Divi-sions according to the types of product produced, and a sepa-rate Tubular Products Business Unit will be established. The new General Stainless Division will comprise three Business Units: Tornio Works, Coil Products Sheffi eld, and Sheffi eld Primary Products. The new Specialty Stainless Division will consist of four Business Units: Avesta Works, Thin Strip, Hot Rolled Plate and Long Products.
The Outokumpu Group will be managed in accordance with its business organization, in which the legal company structure of the Group provides the legal framework for opera-tions. Clear fi nancial and operational targets have been defi ned for all the Group’s operational business units.
Tasks and responsibilities of governing bodies
The ultimate responsibility for the Group management and Group operations lies with the governing bodies of Outokumpu Oyj: the General Meeting of Shareholders, the Board of Direc-tors and the Chief Executive Offi cer and President (CEO). The Group Executive Committee assists the CEO.
General Meeting of Shareholders
The General Meeting of Shareholders normally convenes once a year. Under the Finnish Companies Act, certain important deci-sions fall within the exclusive domain of the General Meeting of Shareholders. These decisions include the approval of fi nancial statements, decisions on dividends and increasing or decreasing share capital, amendments to the Articles of Association and election of the Board of Directors and auditors.
The Board of Directors convenes a General Meeting of Shareholders. The Board can decide to convene a General Meeting on its own initiative, but is obliged to convene a Gen-eral Meeting if the auditor or shareholders holding at least 10% of the Company’s shares so request.
Furthermore, each shareholder has the right to bring a Company-related matter of their choice before a General Meet-ing of Shareholders provided that a written request to do this has been received by the Board of Directors early enough to al-low the matter to be placed on the agenda included in the no-tice announcing that a General Meeting is being convened.
According to its Articles of Association, Outokumpu has only a single class of shares. All shares therefore have equal vot-ing power at General Meetings of Shareholders.
Board of Directors
The tasks and responsibilities of the Company’s Board of Direc-tors are determined on the basis of the Finnish Companies Act as well as other applicable legislation. The Board has general au-
thority to decide and act in all matters not reserved for other corporate governing bodies by law or under the provisions of the Company’s Articles of Association. The Board’s general task is to organize the Company’s management and operations. In all situ-ations, the Board must act in accordance with the Company’s best interests. The Board has set itself the objective of directing the Company’s business and strategies in a manner that secures a signifi cant and sustained increase in the value of the Company for its shareholders.
The Board of Directors has established rules of procedure, which defi ne its tasks and operating principles. The main duties of the Board of Directors are as follows:
With respect to directing the Company’s business and strategies:• To decide on the Group’s basic strategies and monitor their
implementation;• To decide on annual plans for the Group’s capital expendi-
ture, monitor their implementation, review such plans quar-terly and decide on changes;
• To decide on individual investments or items of expenditure that are included in approved capital expenditure plans and have a value exceeding EUR 30 million, as well as on other major and strategically-important investments, acquisitions or divestitures; and
• To decide on any major group-level fi nancing arrangements.
With respect to organizing the Company’s management and operations:• To nominate and dismiss the CEO and his deputy, and to de-
cide on their terms of service, including incentive schemes, on the basis of a proposal made by the Board Nomination and Compensation Committee;
• To nominate and dismiss members of the Group Executive Committee, to defi ne their areas of responsibility, and to de-cide on terms of service, including incentive schemes, on the basis of a proposal by the Board Nomination and Compensa-tion Committee;
• To decide on the composition of boards of directors of the Group’s subsidiaries in which the CEO is a member;
• To monitor the adequacy and allocation of the Group’s top management resources;
• To decide on any signifi cant changes to the Group’s business organization;
• To defi ne the Group’s ethical values and methods of working;• To ensure that policies outlining the principles of corporate
governance are in place;• To ensure that policies outlining the principles of managing
the Company’s insider issues are in use; and• To ensure that the Company has other guidelines concerning
matters which the Board deems necessary and fall within the scope of the Board’s duties and authority.
Outokumpu’s corporate governance

117Outokumpu 2004
With respect to the preparation of matters to be resolved by General Meetings of Shareholders:• To establish a dividend policy and issue a proposal on divi-
dend distribution; and • To make other proposals to General Meetings of Share-
holders.
With respect to fi nancial control and risk management:• To discuss and approve interim reports and annual accounts;• To monitor signifi cant risks related to the Group’s operations
and management of such risks; and• To ensure that adequate procedures concerning risk manage-
ment are in place.
The Board of Directors also assesses its own activities on a regu-lar basis.
A decision by the Board of Directors shall be the opinion supported by more than half the members present at a meeting. In the event of a tie, the Chairman shall have the casting vote.
The Annual General Meeting elects the members of the Board of Directors for a term expiring at the close of the fol-lowing Annual General Meeting. The entire Board is therefore elected at each Annual General Meeting. Under the Articles of Association, the Board of Directors itself elects a Chairman and a Vice Chairman from among its members. A Board member may be removed from offi ce at any time by a resolution passed by a General Meeting of Shareholders. Proposals to the Annual General Meeting concerning the election of Board members which have been made known to the Board prior to the An-nual General Meeting will be made public if a given proposal is supported by shareholders holding a minimum of 10% of all the Company’s shares and voting rights and if the person pro-posed has consented to such nomination.
Under the Articles of Association, the Board shall have a minimum of fi ve and a maximum of twelve members. At the 2004 Annual General Meeting, nine members were elected to the Board of Directors. The CEO of Outokumpu is not a Board member. On September 30, 2004, Mr. Juha Rantanen tendered his resignation from the Board of Directors when he had earlier in July been appointed CEO of Outokumpu with effect from January 1, 2005.
The Company’s largest shareholders have confi rmed that they are in favor of adopting a principle according to which members of the Company’s Board of Directors should, as a rule, be qualifi ed experts from outside the Company. Of the eight current members of the Board, seven are independent of the Company (Heimo Karinen, Evert Henkes, Arto Honkanie-mi, Jorma Huuhtanen, Ole Johansson, Leena Saarinen and Soili Suonoja) and fi ve are independent of both the Company and its signifi cant shareholders (Heimo Karinen, Evert Henkes, Ole Johansson, Leena Saarinen and Soili Suonoja).
The Board of Directors shall meet at least fi ve times a year. In 2004, the Board met 11 times. The average attendance of members at Board meetings was 97%.
Board committees
The Board of Directors has set up two permanent committees from among its members and confi rmed rules of procedure for these committees. Reports on the work of these committees are made to the full Board of Directors.
The Audit Committee comprises three Board members who are independent of the Company: Ole Johansson (Chairman), Jorma Huuhtanen and Leena Saarinen. The task of the Audit Committee is to deal with matters relating to fi nancial state-ments, auditing work, internal controls, the scope of internal and external audits, billing by auditors, the Group’s fi nancial policies and other procedures for managing the Group’s risks. In addition, the Committee prepares a recommendation to the Company’s largest shareholders concerning the election of an external auditor and auditing fees. The Audit Committee met three times during 2004.
The Nomination and Compensation Committee comprises the Chairman of the Board and two other Board members who are independent of the Company: Heimo Karinen (Chairman), Evert Henkes and Arto Honkaniemi. The tasks of the Com-mittee do not comply in all respects with the Corporate Gov-ernance Recommendations for Listed Companies published by the Helsinki stock exchange, the Central Chamber of Com-merce of Finland and the Confederation of Finnish Industry and Employers. The task of the Nomination and Compensa-tion Committee is to prepare proposals for the Board of Direc-tors concerning appointment of the company’s top manage-ment – excluding the Board of Directors – and the principles
118
ples of their compensation. The Nomination and Compensa-tion Committee met 12 times during 2004.
For attending to specifi c tasks, the Board of Directors can also set up temporary working groups from among its mem-bers. These working groups report to the Board.
Shareholders’ Nomination Committee
Outokumpu’s 2004 Annual General Meeting decided to estab-lish a Shareholders’ Nomination Committee to prepare propos-als for the following General Meeting of Shareholders on the composition of the Board of Directors and director remuneration. The 2004 Annual General Meeting also decided that the Share-holders’ Nomination Committee should consist of the repre-sentatives of Outokumpu’s four largest registered shareholders in the Finnish book-entry securities system as of December 1, 2004, with the Chairman of Outokumpu’s Board of Directors as an expert member.
On December 1, 2004, Outokumpu’s four largest registered shareholders were: The Finnish State, The Finnish Social Insur-ance Institution, the Ilmarinen Mutual Pension Insurance Company and the OP-Delta investment fund. These share-holders chose the following as their representatives on the Shareholders’ Nomination Committee: Markku Tapio, Direc-tor General, State Shareholdings Unit (The Finnish State); Pertti Parmanne, Director of the Central Organisation of the Finnish Trade Unions, SAK (The Finnish Social Insurance In-stitution); Kari Puro, President and CEO (Ilmarinen) and Mi-kael Silvennoinen, CEO of OKO (OP-Delta investment fund). Heimo Karinen, the Chairman of Outokumpu’s Board served as an expert member and Markku Tapio as Chairman. The Committee submitted its proposals on Board composition and director remuneration on January 31, 2005. The Outokumpu Board will incorporate these proposals into the notice an-nouncing the Annual General Meeting of Shareholders.
CEO and Deputy CEO
The CEO is responsible for the Company’s day-to-day opera-tions with the objective of securing signifi cant and sustainable growth in the value of the Company to its shareholders. It is the CEO’s responsibility to make sure that existing laws and regula-tions are observed throughout the Group. The CEO is responsi-ble for ensuring that Board decisions are implemented properly. The CEO chairs meetings of the Group Executive Committee.
The Deputy CEO is responsible for attending to the CEO’s duties in the event that the CEO is prevented from attending to them.
Group Executive Committee
The Group Executive Committee’s task is to assist the CEO in managing the Group, to prepare matters to be dealt with by the Board of Directors and the CEO, to act as the CEO’s advisor, and to share information between the CEO, the members of the Group Executive Committee and the Group’s businesses.
The Group Executive Committee deals with all matters of central importance for managing the Group, such as issues relat-ing to the Group’s strategies, capital expenditure, acquisitions or divestments, reporting, corporate image, the management of in-vestor relations, compensation systems, as well as defi nes the main principles for risk management and human resources pol-icy. The Group Executive Committee also monitors the Group’s operations.
Until March 31, 2005, members of the Group Executive Committee are the CEO and his deputy, Business Area Presi-dents, and Executive Vice Presidents in charge of certain corpo-rate or expert functions. Executive Committee members who are in charge of corporate and expert functions monitor and guide operations in their own area of responsibility across the whole Group. In 2004, the Group Executive Committee had nine members.
In connection with the new business organization, the Board of Directors appointed a new Group Executive Committee with effect from April 1, 2005. Members of this new committee are the CEO and his Deputy, Executive Vice President General Stainless Division and Production Operations, Executive Vice President – Specialty Stainless, Executive Vice President - Com-mercial Operations, Executive Vice President - Human Re-sources and the Chief Financial Offi cer. From April 1, 2005, the Group Executive Committee will have seven members.
The Group Executive Committee meets 1–2 times a month.
Remuneration and other benefi ts of Board
members, the CEO and members of the Group
Executive Committee
Monthly fees for members of the Board of Directors as confi rmed by the Annual General Meeting are the following: Chairman EUR 3 600, Vice Chairman EUR 2 700, other members EUR 2 200. All members of the Board of Directors are to be paid a meeting fee of EUR 300. A meeting fee is also paid for meetings of Board committees. Board members are not paid a fee on any other basis than that of their Board membership.
CEO Juha Rantanen’s annual salary, with employee benefi ts is about EUR 595 000. The amount is calculated based on the January 2005 earnings.
The period of notice for the CEO is six months on both sides. If the Company terminates the CEO’s employment for a reason or reasons unconnected with his performance or events interpreted as his having failed in his duties, the Company will make a compensation payment. The amount of this payment will total the CEO’s basic salary in the preceding 24 months plus the monetary value of his employee benefi ts at the moment of termination.
The performance-related bonus paid to the CEO and mem-bers of the Group Executive Committee in addition to their sal-ary and employee benefi ts is determined on the basis of the Group’s return on capital employed. The maximum amount of this bonus is 50% of annual salary based on basic monthly earn-
Outokumpu’s corporate governance

119Outokumpu 2004
Fees, salaries and employee benefi ts paid to the members of the Board of Directors and the Group Executive Committee are presented below.
ings. No separate remuneration is paid to the CEO or members of the Group Executive Committee for membership of the Com-mittee or the other internal governing bodies of the Group.
Members of the Group Executive Committee are entitled, subject to a decision by the Board of Directors, to retire at the age of 60. Pension benefi ts of members of the Group Executive Committee amount to 60% of the total average annual salary in the last fi ve full years of service. Two members of the Group Ex-ecutive Committee are entitled to retire at the age of 60 on the basis of their prior employment with AvestaPolarit Oyj Abp.
The Company has not given any guarantees or other similar commitments on behalf of the members of the Board of Direc-
tors or the Group Executive Committee. Neither members of the Board of Directors or the Group Executive Committee, or closely related persons or institutions, have any signifi cant busi-ness relationships with the Company.
Share ownership and options
The table below shows the number of Outokumpu Oyj shares held by members of the Board of Directors and the Group Ex-ecutive Committee on January 31, 2005, the shares received through the share remuneration scheme on February 14, 2005 and number of new shares they are entitled to subscribe with options.
2004 Salaries and fees Performance/project- Share 1998
€ with employee benefi ts related bonuses remuneration options Total
Members of the Board of Directors 296 700 – – – 296 700
CEO 586 285 54 773 252 899 252 000 1 145 957
Other Group Executive Committee members 2 001 647 27 732 569 167 260 437 2 858 983
The share remuneration presented in the table refer to the remuneration from the second remuneration period, which was paid in
February 2004. 60% of the remuneration was paid in cash and 40% in Outokumpu shares. Shares and options received through share-
related schemes are also included in the table on page 126.
2003 Salaries and fees Performance/project- Share 1998
€ with employee benefi ts related bonuses remuneration options Total
Members of the Board of Directors 299 034 – – – 299 034
CEO 439 636 128 784 143 657 80 000 792 077
Other Group Executive Committee members 1 709 028 217 435 523 430 351 522 2 801 414
The share remuneration presented in the table refer to the remuneration from the fi rst remuneration period, which was paid in
February 2003.
Members of the Group Executive Commitee members Group Executive Committee
Pcs. Board of Directors Jan.1–Mar. 31, 2005 members as of Apr. 1, 2005
Shares 3 918 52 464 9 370
Share remuneration scheme 1) – 31 660 10 940
Options 2003A – 176 450 87 975
Options 2003B 2) – 231 120 152 490
1) On February 10, 2005, the Board confi rmed the remuneration of the scheme that expired at the end of 2004. The table presents
the remuneration paid in Outokumpu shares. 2) The Board confi rmed the fi nal amount of stock options on February 16, 2005.
Shareholdings and options of members of the Board of Directors and the current and new Group Executive Committee on
January 31, 2005 are set out on pages 122–123 and 126. Details of the terms and conditions of the share remuneration scheme
and the option program are given on pages 111–113.

120
Control systems
The Group’s operations are controlled and steered by means of the already-described corporate governance system. The Group is organized into operational business units and divisions provid-ing clear channels of fi nancial responsibility within the Group and promoting supervision of the operations and administration of the Group’s different parts. Outokumpu employs the report-ing systems required for operational business control and effec-tive monitoring of the Group’s assets and interests.
Ultimate responsibility for accounting and fi nancial controls rests with the Board of Directors. It is the CEO’s duty to attend to the practical arrangements concerning accounting and the control mechanism.
Realization of the objectives set is monitored monthly by means of an operational planning and fi nancial control report-ing system. In addition to actual data, the system provides up-to-date forecasts and plans for the current year and the next 12 months. The accumulation of economic value added is moni-tored in Outokumpu’s internal quarterly reports and this infor-mation is published in the Annual Report.
The Board of Directors has the ultimate responsibility for the Group’s risk management. The CEO and the Group Execu-tive Committee are responsible for defi ning and implementing risk management procedures and ensuring that risks are taken into account in the Group’s strategic planning. The Business Units are responsible for managing the risks related to their own operations. The Group’s fi nance and risk management function supports the implementation of risk management pol-icy and develops practical ways of working. External and inter-nal auditors monitor the proper functioning of the risk man-agement process.
Outokumpu has classed risks that affect its operations in three categories: risks relating to strategy and business, opera-tional risks and fi nancial risks. Risk management is discussed in more detail on pages 16–18. Financial risks are discussed in more detail in note 18 to the consolidated fi nancial statements on pages 82–83.
The internal audit function provides consultative auditing on areas and matters that are agreed separately with the Board Audit Committee and the Group Executive Committee. The focus of the audit is on business risks and on the sharing of in-formation. The internal audit acts in close cooperation with the Group’s fi nance and risk management function, fi nancial and business control and the external auditors. The internal audit function reports to the Board Audit Committee.
The CEO, members of the Group Executive Committee and other directors working at Corporate Management are re-sponsible for ensuring that day-to-day operations of the Group comply with existing laws and regulations, the Company’s op-erating principles and decisions by the Board of Directors.
Managing of insider issues
Outokumpu applies insider rules that are similar in content to the recommendations issued by the Helsinki stock exchange. Outokumpu has also started to prepare for changes to its insider system connected with the European Commission’s market abuse directive.
The Company’s permanent insiders on the basis of their po-sition are members of the Board of Directors, the CEO and his deputy, members of the Group Executive Committee, secretary to the Board of Directors and the Group Executive Commit-tee, secretaries and assistants of members of the Group Execu-tive Committee, the responsible auditor in the Company’s elected fi rm of independent public accountants, and members of the Group Working Committee of the Outokumpu Person-nel Forum. Similarly, the group of permanent insiders includes other persons designated by the CEO who are responsible for key Group functions and who regularly receive insider infor-mation in the course of their duties.
Permanent insiders must not purchase or sell securities is-sued by the Company in the 14 days prior to publication of in-terim reports or annual accounts (the so-called closed period).
The insider rules also contain regulations on a temporary suspension of trading in the Company’s shares. Persons defi ned as project-specifi c insiders are those who in the course of their duties in connection with a project, as a member of a coopera-tion committee or other working group, or in some other way, receive information concerning the Group which might, if made public, materially affect the valuation of the Company’s listed securities. Similarly, project-specifi c insiders also include persons outside the Company who might, through auditing, consulting or specialist tasks, or otherwise, receive information of the aforementioned kind.
Secretary of the Board and Group Executive Committee is responsible for coordinating and supervising insider issues. Up-to-date information on holdings by Outokumpu’s permanent insiders can be found at the Outokumpu website.
Auditors
Under the Articles of Association, the Company shall have a minimum of one and a maximum of two auditors who are audi-tors or fi rms of independent public accountants authorized by the Central Chamber of Commerce of Finland.
The Annual General Meeting elects the auditors to a term of offi ce ending at the close of the next Annual General Meeting. Proposals to the Annual General Meeting concerning the elec-tion of auditors which have been made known to the Board pri-or to the Annual General Meeting will be made public if the proposal is supported by shareholders holding a minimum of 10% of all the Company’s shares and voting rights and if the per-son or company proposed has consented to such nomination.
Outokumpu’s corporate governance

121Outokumpu 2004
The Company’s auditors submit the statutory auditor’s re-port to the Company’s shareholders in connection with the Company’s fi nancial statements. The auditors also report their fi ndings to the Board of Directors on a regular basis.
PricewaterhouseCoopers has been responsible for auditing the Group’s companies worldwide since 1994. The parent com-pany, Outokumpu Oyj, is audited by PricewaterhouseCoopers Oy, and the responsible auditor is Markku Marjomaa, Author-ized Public Accountant. PricewaterhouseCoopers Oy is also re-sponsible for overseeing and coordinating the auditing of all Group companies.
Both Outokumpu and PricewaterhouseCoopers highlight the requirement for an auditor to be independent of the com-pany being audited. In its global independence policy, Pricewa-terhouseCoopers has stated its commitment to applying the Code of Ethics of the International Federation of Accountants (IFAC). Outokumpu’s Board Audit Committee continuously monitors the global level of non-audit services purchased by the Group from PricewaterhouseCoopers.
In 2004, auditors were paid fees totaling EUR 6 million, of which non-auditing services accounted for EUR 2 million.
Communications
The aim of the Outokumpu’s external communications is to support the correct valuation of the Company’s listed securities by providing the markets with suffi cient information on Outokumpu’s business structure, fi nancial position, market developments and, in particular, the Group’s objectives and strategy for attaining these objectives.
Outokumpu’s website is at www.outokumpu.com and con-tains the information that has been made public based on the disclosure requirements for listed companies.

122
Board of Directors
Heimo Karinen, b. 1939, Finnish citizen,
M.Sc. (Eng.)
Outokumpu Board member 1999–, Chairman of the Board
2003−, Chairman of the Nomination and Compensation
Committee
CEO and Chairman of the Board: Kemira Oyj 1991–99
Owns 1 029 Outokumpu shares.
Ole Johansson, b. 1951, Finnish citizen,
B.Sc. (Econ.)
Outokumpu Board member 2002–, Vice-Chairman of the
Board 2004−, Chairman of the Audit Committee
President & CEO 2000–: Wärtsilä Corporation
Board member: Confederation of Finnish Industries,
Technology Industries of Finland, Varma Mutual Pension
Insurance Company, Central Chamber of Commerce of
Finland, International Chamber of Commerce
Supervisory board member: Rautaruukki Group
Owns 1 789 Outokumpu shares.
Vice Chairman
Chairman
Evert Henkes, b. 1943, Dutch citizen,
B.Sc. (Econ.)
Outokumpu Board member 2003–, member of the
Nomination and Compensation Committee
CEO 1998–2003: Shell Chemicals Ltd.
Board member: BPB plc, Tate & Lyle plc, CNOOC Ltd,
SempCorp Industries Ltd
Advisory board member: Air Products and Chemicals Inc.
Owns no Outokumpu shares.
Arto Honkaniemi, b. 1946, Finnish citizen,
LL.M., B.Sc. (Econ.)
Outokumpu Board member 1999–, member of the Nomination
and Compensation Committee
Industrial Counsellor 1998–: Ministry of Trade and Industry
Board member: Kemira GrowHow Oyj
Owns no Outokumpu shares.

123Outokumpu 2004
Leena Saarinen, b. 1960, Finnish citizen,
M.Sc. (Food technology)
Outokumpu Board member 2003–, member of the Audit
Committee
Managing Director 2003–: Unilever Bestfoods,
Nordic Foodsolution National Manager 2002–: Suomen
Unilever Oy and board member 1999 and 2001–
Owns 800 Outokumpu shares.
Jorma Huuhtanen, b. 1945, Finnish citizen,
Licentiate (Med.)
Outokumpu Board member 2001–, member of the Audit
Committee
Director-General 2000–: Finnish Social Insurance Institution
Member of Parliament 1987–2000
Member of the Council of State of Finland 1992–95
Supervisory board member: Fortum Corporation
Owns no Outokumpu shares.
Soili Suonoja, b. 1944, Finnish citizen,
Teacher of Home Economics, MBA
Outokumpu Board member 2003–
CEO 1989–2000: Amica Restaurants Ltd., Amica Services Ltd.
Board member: Finland Post Corporation, Alko Inc., Finnish
Road Enterprise, Lassila & Tikanoja Plc, Lännen Tehtaat Oyj,
the Finnish Association of Professional Board Members
Owns 300 Outokumpu shares.
Arto Vilppola, b. 1962, Finnish citizen,
Process technician
Outokumpu Board member 2004–
Production Foreman, Outokumpu Stainless Oy
Employed by the Outokumpu Group since 1990
Owns no Outokumpu shares.

124
Juha Rantanen, b. 1952, Finnish citizen,
M.Sc. (Econ.), MBA
CEO 2005–
Chairman of the Group Executive Committee 2005–
Outokumpu Board member and Vice Chairman 2003–2004
Responsibility: Group management
Employed by the Outokumpu Group since 2004
Chairman of the board of directors: Finpro Association
Member of the executive committee of the board: Confederation of Finnish Industries
Board member: Technology Industries of Finland, Association of Finnish Steel and
Metal Producers
Supervisory board member: Varma Mutual Pension Insurance Company
Group Executive Committee as of April 1, 2005
Karri Kaitue, b. 1964, Finnish citizen,
LL.Lic.
Deputy CEO 2005–
Member of the Group Executive Committee 2002–, Vice Chairman
of the Group Executive Committee 2005–
Responsibility: commercial operations, Outokumpu Technology,
portfolio businesses, strategy and corporate planning, business
development, M&A and legal affairs, communications, investor
relations, corporate social responsibility
Employed by the Outokumpu Group since 1990
Pekka Erkkilä, b. 1958, Finnish citizen,
M.Sc. (Eng.)
Executive Vice President – General Stainless & Production Operations
Member of the Group Executive Committee 2003–
Responsibility: the General Stainless division, production operations: Production
Excellence program, material fl ow optimization, R&D, EHS, procurement
Employed by the Outokumpu Group since 1983
Board member: Eurofer, International Stainless Steel Forum (ISSF), Jernkontoret,
Finnish Association of Mining and Metallurgical Engineers
Olof Faxander, b. 1970, Swedish citizen,
M.Sc., B.Sc. (Soc. Sc.)
Executive Vice President – Specialty Stainless
Member of the Group Executive Committee 2005–
Responsibility: the Specialty Stainless division
Employed by the Outokumpu Group since 2001

125Outokumpu 2004
Esa Lager, b. 1959, Finnish citizen,
M.Sc. (Econ.), LL.M.
Chief Financial Offi cer (CFO)
Member of the Group Executive Committee 2001–
Responsibility: fi nancial control and tax planning, treasury and
risk management, business processes and IT, shared services
Employed by the Outokumpu Group since 1990
Board member: Olvi Oyj, Okmetic Oyj
Supervisory board member: Sampo Life Insurance Company Limited
Andrea Gatti, b. 1962, Italian citizen,
M.Sc. (Econ.)
Executive Vice President – Commercial Operations
Member of the Group Executive Committee 2005–
Responsibility: Commercial Excellence program,
sales strategy and planning, marketing, sales
company network, stock and processing and
selected key accounts
Employed by the Outokumpu Group since 2002
Timo Vuorio, b. 1949, Finnish citizen,
M.Sc. (Econ.)
Executive Vice President – Human Resources
Member of the Group Executive Committee 2005–
Responsibility: HR strategy and key HR processes:
competence management and people development,
recruitment, industrial relations, compensation,
development of leadership and organization,
and the Management Review Process
Employed by the Outokumpu Group as of May 1, 2005

126
Juha Rantanen, CEO
Karri Kaitue, Deputy CEO
Pekka Erkkilä, Executive Vice President – Outokumpu Stainless
Esa Lager, Executive Vice President – Finance and Administration
Tapani Järvinen, b. 1946, Finnish citizen,Lic.Tech.Executive Vice President – Outokumpu TechnologyMember of the Group Executive Committee 2000–Employed by the Outokumpu Group since 1985 To continue as President of Outokumpu Technology reporting to Deputy CEO as of April 1, 2005
Juho Mäkinen, b. 1945, Finnish citizen,D.Tech.Executive Vice President – EHS and technologiesMember of the Group Executive Committee 2000–Board member 1996–97, member of the Group Executive Board 1997–2000Employed by the Outokumpu Group since 1975To continue as Special Adviser to the CEO from April 1, 2005 until his retirement on July 31, 2005
Kalevi Nikkilä, b. 1945, Finnish citizen,D.Tech.Executive Vice President – Outokumpu CopperMember of the Group Executive Committee 2000–Employed by the Outokumpu Group since 1991To retire on March 31, 2005
Vesa-Pekka Takala, b. 1966, Finnish citizen,M.Sc. (Econ.)Executive Vice President – Corporate ControllerMember of the Group Executive Committee 2004–Employed by the Outokumpu Group since 1990To continue as Corporate Controller reporting to the CFO as of April 1, 2005
Risto Virrankoski, b. 1946, Finnish citizen,B.Sc. (Econ.)Senior Adviser to the CEODeputy CEO 2001–2004Member of the Group Executive Committee 2000–,Vice Chairman of the Group Executive Committee 2001–2004Board member 1986–97, member of the Executive Board 1997–2000Employed by the Outokumpu Group since 1969Retired on February 15, 2005
Group Executive Committee January 1–March 31, 2005
Shares and options of the Group Executive Committee members
Share Shares remuneration scheme 1) Options 2003A Options 2003B 2)
Juha Rantanen 500 – – 60 000Karri Kaitue 1 930 2 950 21 700 19 320Pekka Erkkilä 2 180 4 550 31 000 27 600Olof Faxander – – 9 050 18 750Andrea Gatti – – 4 525 7 500Esa Lager 4 760 3 440 21 700 19 320Timo Vuorio – – – –Tapani Järvinen 10 282 4 830 21 700 19 320Juho Mäkinen 5 315 3 970 15 500 19 320Kalevi Nikkilä 9 486 4 750 24 800 19 320Vesa-Pekka Takala 3 670 1 970 9 050 19 320
Risto Virrankoski 14 341 5 200 31 000 27 600
1) On February 10, 2005, the Board confi rmed the remuneration of the scheme that expired at the end of 2004. The table presents the remuneration paid in Outokumpu shares.
2) The Board confi rmed the fi nal amount of stock options on February 16, 2005.

127Outokumpu 2004
The Annual General Meeting of Outokumpu Oyj will be held on Tuesday, April 5, 2005 at 1.00 pm (Finnish time) at the Di-poli Congress Centre, in Espoo, Finland.
In order to attend the Annual General Meeting a shareholder must be registered in the Company’s shareholders’ register main-tained by the Finnish Central Securities Depository Ltd (Suomen Arvopaperikeskus Oy) on March 24, 2005. Nominee-registered shareholders who wish to attend the Annual General Meeting should temporarily re-register the shares under their own name. Such re-registration must be made no later than March 24, 2005. In order to arrange a temporary re-registration, nominee-registered shareholders should contact their bank or other custo-dian. Shareholders, whose shares have not been entered into the Finnish book-entry securities system, should mention this when giving notice to attend in order to receive further instructions.
Shareholders who wish to attend the Annual General Meet-ing must notify the Company by no later than April 1, 2005 at 4.00 pm (Finnish time). Notifi cation can be made by telephone +358 9 421 2813, by fax +358 9 421 2920 or by e-mail [email protected]. Notifi cation can also be made by a letter addressed to Outokumpu Oyj, Share Register, P.O. Box 140, 02201 Espoo, Finland. The letter must reach the Company on April 1, 2004 at the latest.
A shareholder may attend and vote at the meeting in person or by proxy. However, in accordance with Finnish practice, Ou-tokumpu does not send proxy forms to its shareholders. Share-holders wishing to vote by proxy should submit their own proxy forms to the Company during the registration period.
Additional information on the Annual General Meeting is available at www.outokumpu.com.
Annual General Meeting and payment of dividends in 2005
Annual General Meeting April 5Ex-dividend date April 6Record date for dividend payment April 8Dividend payout April 15
The Board of Directors proposes to the Annual General Meeting that a dividend of EUR 0.50 per share be paid for the fi nancial year 2004.
Financial reports in 2005
Financial Statements Bulletin February 10Annual Report Week starting March 21First-quarter interim repor April 27Second-quarter interim report July 26Third-quarter interim report October 25
Investor information is available at the Group’s English language website www.outokumpu.com. The website also covers annual
Annual General Meeting and Investor Relations
reports, interim reports, as well as stock exchange and press re-leases, which are published in both Finnish and English.
Alternatively fi nancial reports can be obtained from Outo-kumpu Oyj/Corporate Communications, Riihitontuntie 7 B, P.O. Box 140, 02201 Espoo, Finland, tel. +358 9 421 2416, fax +358 9 421 2429 and e-mail [email protected]. Subscriptions to the e-mailing list for press releases and the mail-ing list for printed annual reports can be made via the same e-mail address.
Shareholder mailings are made on the basis of the contact in-formation in the shareholders’ register maintained by the Finnish Central Securities Depository Ltd. A shareholder should inform his/her account operator, or in case of a nominee-registered share-holder the relevant bank or other custodian, about changes in contact details.
Outokumpu share basics
Listing Helsinki stock exchangeTrading symbol OUT1VTrading lot 200 sharesNumber of shares 181 250 555
Investor Relations
The main task of Outokumpu’s Investor Relations function is to support the correct valuation of the Outokumpu share by provid-ing information about the company’s activities, fi nancial position, goals and strategy, thus enabling the markets to form a true and fair view of Outokumpu as an investment prospect. Our aim is to communicate in open, timely and clear manner and to treat all parties equally.
Outokumpu observes a two-week closed period prior to the publication of fi nancial statements and interim reports. During these periods, we do not arrange meetings with investors or com-ment on result forecasts.
Should you require further information about Outokumpu, please contact one of the following persons:
Päivi LaajarantaIR AssistantTel. +358 9 421 4070, fax +358 9 421 2125E-mail: [email protected]äivi Laajaranta coordinates meeting requests.
Johanna SintonenVice President – Investor RelationsTel. +358 9 421 2438, fax +358 9 421 2125E-mail: [email protected]
Kari LassilaSenior Vice President – Investor Relations and Economic ResearchTel. +358 9 421 2555, fax +358 9 421 2125E-mail: [email protected]

128
Analysts covering Outokumpu
The following analysts prepare investment analysis on Outokumpu. The persons mentioned below cover Outokumpu on their own initiative.
Company/Analyst Tel. E-mail
ABG Sundal CollierOlof Cederholm +46 8 5662 8268 [email protected]
Alfred BergCarl-Henrik Frejborg +358 9 2283 2712 [email protected]
CAI CheuvreuxSasu Ristimäki +44 20 7621 5173 [email protected]
Carnegie Investment Bank AB Johan Sjöberg +46 8 676 8755 [email protected]
Danske EquitiesFasial Kalim Ahmad +45 3 344 0426 [email protected]
Dresdner Kleinwort Wasserstein Simon Toyne +44 20 7475 2464 [email protected]
Enskilda Securities AB Helsinki BranchMarkus Steinby +358 9 6162 8723 [email protected]
eQ Bank Ltd.Juha Iso-Herttua +358 9 2312 3326 [email protected]
Evli Pankki OyjMika Karppinen +358 9 4766 9643 [email protected]
FIM Securities Ltd.Mikko Linnanvuori +358 9 6134 6353 mikko.linnanvuori@fi m.com
Handelsbanken Capital Markets Gustav Lucander +358 10 444 2409 [email protected]
J.P. Morgan Albert Minassian +44 20 7325 1288 [email protected]
Kaupthing SofiJohan Lindh +358 9 4784 0268 [email protected]
Mandatum Stockbrokers Ltd.Henry Nurminen +358 10 236 4709 [email protected]
Merrill LynchRussell Skirrow +44 20 7996 4723 [email protected]
Morgan StanleyCharles Spencer +44 20 7425 6602 [email protected]
Opstock Securities Jari Räisänen +358 10 252 4408 [email protected]
Outokumpu OyjCorporate ManagementRiihitontuntie 7 B, P.O. Box 140, FIN-02201 ESPOO, FinlandTel. +358 9 4211, Fax +358 9 421 3888E-mail: [email protected]
Domicile: Espoo, FinlandBusiness ID: 0215254-2

www.outokumpu.com
0007EN
. Kreab
/Libris, H
elsinki, Fin
land
. March
2005.
OU
TO
KU
MP
U A
NN
UA
L RE
PO
RT
2004
Outokumpu is an international stainless steel and technology
company. Our vision is to be the undisputed number one in
stainless, with success based on operational excellence.
Customers in a wide range of industries use our metal
products, technologies and services worldwide. We are
dedicated to helping our customers gain competitive
advantage. We call this promise the Outokumpu factor.