annual report 2004some cars sold in a matter of seconds. such features make japan’s automobile...
TRANSCRIPT
ANNUAL REPORT 2004
AN
NU
AL
REP
ORT
2004

Trends in the Used-Car Market■ JAPAN’S USED-CAR MARKET
Used-car registrations first exceeded those for new cars in 1992, and the used-car market has grown steadily ever since. In 2003,
whereas new-car registrations totaled approximately six million, used-car registrations amounted to more than eight million.
(However, calculations of used-car registrations may be artificially high since ownership titles are changed when automobiles are trad-
ed from business to business. The actual number of units is estimated at four million, or half the number of registrations.)
The ratio of new cars (approximately six million) to used cars (approximately four million) is estimated at 3:2. Although Japan’s used-
car market has shown little fluctuation in recent years, considering that the new-car to used-car ratio in Europe and North
America is approximately 1:2, the Japanese used-car market still has room for growth.
■ THE RISE OF AUCTIONS
As stated above, since the new-car to used-car ratio is higher than that of Europe and North America, the Japanese automobile mar-
ket features an overabundance of used cars. Hence, used-car prices change every two to three weeks on the auction market, and,
in many cases, used cars that are left in long-term inventory become dead stock. New-car dealer stores and used-car businesses
must dispose of their inventories of dead-stock automobiles that they are unable to sell on their own. This situation has led to the rise
in the number of auction sites that conduct B-to-B resale of automobiles.
Auction sites are often run by the Japan Used Car Distributors Association and have increased in activity with the emergence of
such independent auction administration companies as USS Co., Ltd. (securities code: 4732), and Aucnet Inc. (securities code: 9669).
Today’s auctions consist of on-site auctions, in which the vehicles are transported to any actual site, and TV auctions, which use satel-
lite communications without physically moving the actual cars. USS conducts both TV auctions and on-site auctions, while
Aucnet specializes in TV auctions.
Approximately six million automobiles are put up for auction annually at Japan’s approximately 150 auction sites, and more than
50% of these automobiles are successfully sold. Moreover, recent years have seen an increase in the use of computer systems, with
some cars sold in a matter of seconds. Such features make Japan’s automobile auctions among the most advanced in the
world.
■ USED-CAR MARKET
Japan’s used-car industry comprises three main functions covering the process by which cars are sold by one owner and purchased
by a new owner. All three of these functions have been established as businesses.
1) The vehicle is purchased from a customer and sold wholesale through an auction site. WHOLESALE (C to B )
2) Auction sites are run, with fees taken on vehicle transactions. The AUCTION BUSINESS (B to B)
3) The vehicle is supplied to an auction site and sold to a new customer. RETAIL (B to C)
Companies in this industry work to expand their businesses with emphasis on their respective function of expertise, with
many variations existing side by side.
01
02
06
09
12
13
36
37
Trends in the Used-Car Market
To Our Stakeholders
How Gulliver’s Business Operates
Sales Process—Auctions and the Dolphinet System
Directors and Auditors
Financial Section
Corporate Data
Gulliver’s History
Cautionary Statement with Respect to Forward-Looking Statements
This annual report contains statements about Gulliver’s future business plans
and strategies as well as estimates. Statements regarding the Company’s
projected business results are not based on historical facts and are subject to
various risks and uncertainties.
CONTENTS

01ANNUAL REPORT 2004
Registrations of new carsSales of new cars Source: Automobile Inspection & Registration AssociationSources: Japan Automobile DealersAssociation, Japan Mini Vehicles Association
0
2
4
6
8
1990 1991 1992 1993 1994 1995 1996 1997 1998 1999 2000 2001 20032002
TRENDS IN VOLUME OF NEW-CAR SALES AND NO. OF USED-CAR REGISTRATIONS (Millions of cars)
0
10
20
30
40
50
60
70
1988 1989 1990 1991 1992 1993 1994 1995 1996 19971998 1999 2000 2001 20032002
TRENDS OF AUTOMOBILE OWNERSHIP(Millions of cars)
0
2
4
6
1985 1986 1987 1988 1989 1990 1991 1992 1993 1994 1995 1996 1997 1998 1999 2000 2001 20032002
Source: Monthly Used CarSource: Monthly Used Car
No. of cars actually sold
NO. OF CARS PUT UP FOR AUCTION AND NO. ACTUALLY SOLD (Millions of cars) AUCTION COMPANIES’ MARKET SHARE(No. of cars put up for auction in 2003)
No. of cars put up for auction
Total of USS26.8%
Other18.5%
JU affiliated18.2%
12.1%6.7%
5.2%
5.7%
JAATotal of Hanaten
TAA 5 districts
Total of Arai AA
Total of CAA
Aucnet
KCAA
4.5%2.6%
THE FLOW OF JAPAN’S USED-CAR INDUSTRY
S E L LB to C
W H O L E S A L EC to B
New-car dealersUsed-car dealer storesUsed-car purchasingdealer stores
Auction sites
AUCTIONB to B
Customersselling
used cars
Used-car dealer stores●New-car dealer storeaffiliates
●IndependentsUsed-car
purchasingcustomers

0
20,000
40,000
60,000
80,000
100,000
120,000
0
1,000
2,000
4,000
3,000
5,000
7,000
6,000
0
500
1,000
2,500
2,000
1,500
3,000
4,000
3,500
1995 1996 1997 1998 1999 2000 2001 2002 2003 2004 1995 1996 1997 1998 1999 2000 2001 2002 2003 2004 1995 1996 1997 1998 1999 2000 2001 2002 2003 2004
02
■Earnings
The fiscal year ended February 29, 2004, marked the 10th con-
secutive year of increases in both revenue and profit for Gulliver
International Co., Ltd., since its establishment in 1994.
Consolidated net sales increased 28.4%, compared with the
previous fiscal year, to ¥121,885 million. Consolidated operat-
ing income grew 45.8%, to ¥7,648 million, and net income
grew 45.9%, to ¥4,050 million.
The total number of Gulliver dealer stores for the fiscal year
ended February 29, 2004, was 492 (down 19 from the previous
fiscal year), comprising 205 directly managed stores (up 27)
and 287 franchise stores (down 46). In directly managed
stores, the Company succeeded in increasing its vehicle-
handling volume by opening new stores and expanding per-
dealer store patronage. In addition, by augmenting personnel
education and training programs at Gulliver dealer stores and
improving precision on the part of the Company’s head office in
leading auction site sales, we also succeeded in raising our
per-vehicle gross margin. Regarding franchise dealer stores,
although royalties revenues declined as a result of the decrease
in the number of stores, we obtained contracts with 24 new
franchise dealer stores. Both Dolphinet based sales volume
and revenue from Dolphinet fees also increased.
The Company maintained high levels of ROE and ROA at
fiscal year-end, working out to 28.8% and 33.1%, respectively.
We have also sustained a positive free cash flow position for
several years now, which, in addition to Gulliver International’s
zero debts payable status on a non-consolidated basis, indi-
cates the soundness of our financial base.
Gulliver International considers the return of profit to its
shareholders to be one of the most vital tasks of its business
operations. Our basic policy is to emphasize dividend payout
and provide returns commensurate with our earnings. In line
with this policy and in reflection of the achievement of
increased income for the term, the annual shareholders’ divi-
dend has been increased by ¥35 compared with the previous
fiscal year, to ¥115 per share. Our payout ratio thus worked out
to 30.1%, just slightly higher than in the previous fiscal year.
Retained earnings will be used efficiently and effectively in
the Company’s efforts to further expand future profitability and
increase corporate value as well as will be applied in such
areas as the opening of new directly managed dealer stores,
To Our StakeholdersConsolidated basisNon-consolidated basis Consolidated basisNon-consolidated basis Consolidated basisNon-consolidated basis
NET INCOME (Millions of yen)OPERATING INCOME (Millions of yen)NET SALES (Millions of yen)

03ANNUAL REPORT 2004
fortifying internal infrastructure, and personnel education and
training so as to augment its competitive strength and enhance
its level of service.
*On a net sales and operating income basis.
■ Affirming Our Status as a Premier Company
On August 1, 2003, Gulliver was listed on the First Section of
the Tokyo Stock Exchange (TSE). This development followed
both our over-the-counter IPO in December 1998—only four
years after our October 1994 establishment—and our Second
Section TSE listing, which we achieved in the record short time
frame of six years and one month in December 2000. Thus, our
First Section listing was also achieved in the remarkably swift
span of eight years and ten months. We owe this progress
entirely to our valued stakeholders, customers, and business
partners, as well as our employees. It is to our employees to
whom we owe a great debt of gratitude for their untiring pursuit
of their goals.
However, what we have accomplished until now is merely
the laying of the foundation from which to realize the purpose
for which we were established: to bring about a distribution
revolution in Japan’s automobile industry. Our true challenge
still lies ahead. Thus, while a First Section TSE listing is a land-
mark, it is but a checkpoint along the way and certainly not our
final goal.
Recently, I have noticed that our employees are shedding
their venture-business mind-set and are displaying more self-
confidence than ever before. All Gulliver employees are fully
devoting themselves to implementing customer-satisfying ser-
vice enhancement and store management, providing relaxed
and worry-free enjoyment of automobile ownership to as many
people as possible, and to ensuring the healthy development of
their industry. Through these efforts, it is my belief that we will
become an essential and premier company.
■ Social Contributions
In addition, with project support obtained from the National
Federation of UNESCO Associations in Japan and enlisting the
participation of Gulliver’s celebrity spokesman, Hideki Matsui of
the New York Yankees, the Company has announced the
implementation of its “Gulliver Presents: Hideki Matsui Home
Run Charity, World Heritage Study Program*” charity project.
It is our hope to continue to make contributions, however
Kenichi Hatori President
Photo by Yasuhito Egi

04
humble, to the betterment of society as a responsible publicly
traded company.
*With applications accepted from the children who will take
charge of Japan’s future, the program is intended to imbue
them with ambition and foster grand aspirations by studying
and visiting world heritage sites and experiencing firsthand the
vastness of the world and the creativity of our ancestors.
Corresponding to Matsui’s jersey number 55, Gulliver will con-
tribute ¥550,000 for every home run hit by Matsui in regular-
season games during 2004. (This information is based on the
Company’s announcement made on March 24, 2004).
■Today’s Used-Car Industry
In recent years, the used-car industry has seen an increasing
shift from the core business toward expansion into other sec-
tors. In the car-purchasing industry, such major automakers as
Toyota and Nissan have entered the market. It is sometimes
I believe that Japan’s used-car industry is approaching a
crucial turning point. With the lackluster condition of the
Japanese economy, many used-car operations are struggling. I
think companies that concentrate simply on reaping the most
profit out of each individual vehicle sold, or offer no post-sales
service or warranty, will find it very difficult to survive in the
months and years ahead without changing their ways. It is cru-
cial to achieve low-cost operations with minimal expenses and
raise revenues by steadily increasing the number of vehicles
traded, even at relatively low per-vehicle profit. Equally impor-
tant is the ability to understand the customer’s point of view
when providing service and put the customer’s mind at ease.
■Working to Bring About a Distribution
Revolution in Japan’s Automobile Industry
In the past, Japan’s used-car industry tended to be perceived
by consumers as lacking transparency. Despite quality vari-
claimed that their entry into the market would bring more inten-
sified competition to the industry. However, I consider this to
be a blessing rather than a curse because, whereas traditional-
ly the Japanese used-car business has been perceived as
somewhat shady and lacking in transparency, the entry of
major automakers into the market has served to increase con-
sumers’ confidence in the industry. Moreover, there are still
some areas of the used-car purchasing market that remain
dormant, and increasing overall awareness of the purchasing
market will certainly be of benefit to Gulliver. In fact, the number
of people using our services continues to rise, with expansion
seen not only in our traditional market segment of the younger
generation, but also among customers in their 40s and 50s.
It is a fact that billboards advertising used-car purchasing
franchises are increasing along Japan’s highways. However,
Gulliver still lacks any true competitors: the reason being that,
although other companies’ franchises may resemble ours
externally, they have not taken the same steps that we have to
transcend traditional business models and practiced low-cost
operations. There is also a substantial difference in the quality
of service brand strength and market recognition.
ances from car to car and even though used cars are products
that are prone to price fluctuation depending on different
regions or trends, information on vehicle condition and reason-
ableness of price was not openly available. However, there are
many fine vehicles on the used-car market. Gulliver’s desire
has been to improve the industry’s image and make its benefits
known to as much of the consumer population as possible.
In October 1994, I launched this business specializing in
used-car purchasing. My ambition was to bring about a distri-
bution revolution in Japan’s automobile industry and maximize
the appeal of used cars so that everyone would be able to
exchange their cars freely to suit their lifestyle needs. That is
why today Gulliver is progressing steadily toward the goal of a
revolution in automobile distribution that was set a decade ago.
For Gulliver, the purchasing of automobiles is a means to
achieve a goal, not a goal in itself.
Gulliver has adopted the medium-term goal of annual Group
purchases of one million units and is working to capture an
unparalleled market share in the used-car industry. I believe
that achieving the goal of one million units is essential to bring-
ing about the automobile distribution revolution for which we

05ANNUAL REPORT 2004
strive. Our immediate task will be to attain 500,000 units in pur-
chases, which is double the 250,000-unit figure attained for the
fiscal year under review.
■Achieving Greater Brand Power
To reach our goal of one million units purchased, we must
attract a greater number of customers. According to one mar-
ket survey, approximately 70% of the population never consid-
er visiting any car businesses other than new-car dealer stores.
Although awareness of the business of specialization in used-
car purchasing has grown significantly, the fact remains that a
substantial segment of the consumer population still consider
new-car dealer stores to offer the best value on vehicle trade-
ins. Hence, finding ways to attract this segment of the market
is one of our immediate tasks. To accomplish this task, I
believe that we must further improve the Gulliver brand.
■Sales Strategy
The number of vehicles sold through Gulliver’s Dolphinet
System (hereinafter “Dolphinet”) during the term under review
reached a new record high of almost 4.4 million units. When
we launched Dolphinet in 1998 with the aim of establishing our
own sales route, we were often told that we would not be able
to sell cars simply by showing pictures on a display terminal,
and there was also significant opposition from within our
Company. However, Dolphinet provides highly detailed infor-
mation on the used cars for sale, including minute blemish data
and records of past repair work, and, as the recognition that
customers can rest assured when buying used cars with the
system has gradually permeated the market, we realize now
that more and more customers are placing their trust in and
making use of Dolphinet.
Membership in GAuc* is also rising, having passed the
9,000-member mark, and auction-winning bids made with
Part of this involves our dealer store strategy. In the months
and years ahead, we will continue to strengthen our directly
managed operations, open approximately 30 new dealer stores
annually, and replace existing dealer stores (by changing loca-
tions and opening new stores). In approaching replacements
and new openings, we will find ways to attract a greater num-
ber of customers and give our dealer stores a fresh style on a
par with new-car dealer stores. Our new dealer stores will be
larger with increased floor space and will break away from our
traditional use of a bright yellow color scheme, the Gulliver
mark, and the “used-car purchasing” signboard.
In June 2003, Gulliver signed Hideki Matsui, of the New York
Yankees baseball team, as its celebrity spokesman. Matsui
continues to ascend the ranks of the world’s top athletes and
undertake the challenge of competing in American Major
League Baseball. In addition to his high-profile status, we
believe that Matsui is a strategic fit with our ambitious spirit.
Contracting Matsui as our celebrity spokesman should provide
a significant boost to our brand power.
GAuc units have risen as well. Hence, Dolphinet’s usage in
auctions is also expanding. We are also expanding the network
of our Gold Lounge fee-based membership system and contin-
ually adding new services for members.
The Dolphinet sales volume currently represents only a frac-
tion of overall sales. While we will, of course, continue to use
actual auction sites to sell our cars, we will also further promote
the use of Dolphinet, which is a much lower-cost system. In the
future, we would like to have the Dolphinet sales volume
account for 50% of all cars that we purchase.
* GAuc is a membership system that uses Dolphinet to provide automobile industrybusinesses with vehicles that are recently bought by Gulliver before they are putup for auction. Members use special GAuc terminals to sell cars to their own cus-tomers. Recently, membership in our web GAuc, which uses low-cost Internetlines, is also on the rise.
May 2004
Kenichi HatoriPresident

06
How Gulliver’s Business Operates
(Used-Car Auction or Dolphinet System)
C=CustomerB=Business
Used-Car Dealer Business(Except Gulliver) Gulliver
NON-GULLIVER AND GULLIVER BUSINESS MODELS
■Gulliver’s Original Business Model
Traditional Used-Car Dealerships
The average vehicle inventory period for used-car dealer stores is
considered to be approximately two to three months. Because
there is a surplus of supply in Japan’s used-car market and auc-
tion prices for used cars tend to change within two to three
weeks, thus inducing price degradation on long-term inventory,
used-car companies constantly shoulder inventory risk.
Moreover, display sales operations must have customer draw-
ing appeal. Raising such appeal requires a certain amount of
property and number of display vehicles, which, in turn, increases
personnel costs, resulting in a substantial display cost. These
inventory risks and display costs engender a philosophy of pur-
chasing as low as possible and selling as high as possible. Due to
this environment, the public perception of the used-car industry
has been one of non-transparent, industry-imposed price setting.
The Gulliver Advantage
Gulliver has substantially reduced the time from purchase to sale
to between 7 and 10 days by selling all vehicles it purchases
through auctions. By promptly auctioning off our vehicles, we
have alleviated inventory risk and reduced display costs. Thus, by
reducing inventory time we have constructed a system by which
we generate profit even at low gross margins by handling large
volume. The used-car industry is also faced with the concern of
chronic shortages of popular models. Hence, business value in
this industry is determined by the ability to secure popular mer-
chandise.
According to some opinions, industry competition has recently
intensified due to full-fledged entry into the market by major
automakers. However, Gulliver’s competitors operate under busi-
ness models that differ little from the traditional used-car dealer
store—with its inherent inventory risks and display costs—and
they are completely different from Gulliver in their post-purchase
operations. Gulliver has continued to grow steadily by implement-
ing a level of thorough low-cost operations unrivaled in the indus-
try, thus enabling it to pass on the savings to its customers.
■The Purchasing Process
When cars are brought into a Gulliver dealer store, not only are
the make, model year, and mileage checked, but also such items
as the existence of scratches and blemishes and the condition of
the car’s interior. Further note is made of any beneficial points,
such as the installation of optional components, and then all data
are compiled in an assessment sheet. When all checks are com-
pleted, these assessment sheets are faxed to Gulliver’s Head
Office, where professional assessors determine the purchase
price and report back to the dealer store. Dealer store staff are
then able to put themselves in the position of the customer—who
will be parting with his or her beloved vehicle—and provide highly
satisfactory negotiations. For customers relinquishing their cars,
the greatest concern is price. At Gulliver, we believe that, by offer-
ing prices commensurate with market value, we can provide
peace of mind to used-car customers. Because used-car prices
tend to change within two to three weeks, purchase prices must
be determined based on an assessment of fluctuating auction

07ANNUAL REPORT 2004
5 to 10 minutes
Customer Inspection Assessment Sheet Head OfficeDetermining
Purchasing Price
7 to 10 days
Ship
ment
FAX
Used-Car Auction
Agreement
THE PURCHASING PROCESS
rates and an accurate prediction of winning bid prices. With the
inclusion of different models and classes, there are more than
6,000 different automobile models, both domestic and foreign, in
market circulation. In addition, when such items as mileage, year,
color, features, and repair records are factored in, the result is a
near-infinite variety of vehicles. Gulliver employs a system where-
by professional assessors at its Head Office provide comprehen-
sive assessments based on a database of 450,000 entries
reflecting the most recent auction prices. By so doing, we are
able to offer clearly based prices for any type of car, eliminate
inconsistency in price setting, and offer a uniform level of high-
quality service nationwide.
■ ISO Certification for Its Purchasing Business
In November 2001, Gulliver became the first in the industry to
attain certification in the ISO 9001 quality assurance system
(2000 version) for the assessment and price computation opera-
tions of its used-car purchasing business. Through the implemen-
tation of the ISO 9001 quality management system, we will
enhance the quality of our assessment services (the accuracy and
speed of our price calculations) and other highly precise assess-
ments along with the negotiations provided by our nationwide
network of dealer stores.
■Contact Center and Dispatched
Purchasing Service
Gulliver’s Contact Center handles customer inquiries and consul-
tation. By either telephone (toll free: 0120-22-1616) or the Internet
(http://221616.com), customers can easily reach our Contact
Center to make assessment inquiries. A sales representative from
one of our nationwide dispatch centers then visits the customer
directly. Sales representatives’ schedules are managed by the
Contact Center, and these operations are conducted in a highly
efficient manner.
■Dealer Store Network
Gulliver’s dealer store network currently consists of approximately
500 branches throughout Japan. As of February 29, 2004, there
were 205 directly managed stores and 287 franchise stores. One
of the keys to our success was our swift capture of the largest
share of Japan’s used-car purchasing market, which was a com-
pletely new industry at the time of our establishment, and we
have been quick to expand our nationwide franchise operations.
Having thus established its basic infrastructure, starting in fiscal
2000, the Company shifted its focus from franchised-based oper-
ations to directly managed operations in a determined effort to
further expand profitability.
In addition to the conversion to large dealer stores, we are also
changing our traditional Gulliver mark and shifting our catch slo-
gan from “used-car purchasing specialist” to “all about cars.”
Through these and other actions, we are making a full-out appeal
to the comprehensive support we provide to consumers regard-
ing all things related to automobiles, which is spearheaded by our
core business of used-car purchasing.
Going forward, we will continue to open new directly managed
dealer stores at a rate of approximately 30 branches a year, as
NegotiationsAssessment result
Sale agreement
Dolphinet System

08
well as replace (location changes and new openings) existing dealer
stores. To accelerate these efforts, we are taking such initiatives
as the tie-up with Daiwa House Industry Co., Ltd., in October
2003, and augmentation of our dealer store development workforce.
Gulliver’s aggressive opening of new directly managed dealer
stores has made the swift cultivation of quality human resources
an urgent need. Our personnel training efforts have traditionally
consisted of a range of training courses, including introductory
training for new hires. However, in the fiscal year under review,
we began to augment our training operations by introducing such
new programs as our Store Manager Audition system.
The Store Manager Audition system extends to the opportunity
to sit for Gulliver’s store manager certification examination to
dealer store staff applicants free of classification according to
duration of employment, past performance record, current job
title, or gender. All Gulliver employees who have completed their
initial probationary period are eligible to apply. Under the previ-
ously employed system of store manager certification, training
was conducted only for assistant store managers who met cer-
tain qualifications based on sales records and store management
and who had been recommended by their superiors.
We have also implemented a number of initiatives to improve
business skills among dealer store employees. For example, to
improve staff skills, we have put in place a market analyzer (MA)
System. The MA System consolidates all information necessary
for sales negotiations, including the structure of the used-car
market, in computers installed at each reception table as a
means to improve the flow and efficiency of such negotiations.
This is intended to raise the rate of successful contract negotia-
tions, quickly vitalize lagging employees or new hires, and
improve the overall quality of business negotiations with our cus-
tomers. In addition, we have also increased the number of man-
agers overseeing multiple dealer stores, thus reinforcing our
administrative framework and preparing it for further openings of
new dealer stores.
■Celebrity Spokesman Hideki Matsui
To audiences male and female, young and old, the popularity of
professional baseball player Hideki Matsui, of the New York
Yankees, is unrivaled. In June 2003, Gulliver signed on Matsui as
its official celebrity spokesman. Not content simply on dominance
of Japanese baseball, Matsui resolved to undertake the challenge
of ascending the ranks of Major League Baseball in North
America. As a company striving to bring about a vehicle distribu-
tion revolution and pioneering numerous new services and sys-
tems unrestrained by traditional industry practices, Gulliver
strongly identifies with Matsui. We also feel that Matsui’s refusal
to be satisfied merely with the status quo and consummate mod-
esty in his endeavors are a perfect fit with our own philosophy.
The adoption of Matsui as our official celebrity spokesman should
be highly effective, not only in our external publicity, but also in
raising our employees’ outlook on their professional duties.
Gulliver advertisement featuring Hideki Matsui
Close-up of the new Gulliver mark
New-style Gulliver dealer store
New-style Gulliverdealer store

09ANNUAL REPORT 2004
Sales Process—Auctions and the Dolphinet System
A used-car auction
■Stable Sales Routes Established
Through the Use of Auctions
There are approximately 150 auction sites throughout Japan,
to which numerous used-car dealers gather in search of popu-
lar models. The high popularity and high quality of cars put up
for auction by Gulliver are highly rated, and approximately 70%
of all Gulliver cars are successfully sold, in comparison to the
national average for auction sales of just above 50%.
The purchase prices of used cars bought by Gulliver are cal-
culated by professional assessors at Gulliver’s Head Office
based on a database of more than 450,000 entries. This data-
base ascertains the latest prices from every auction site in real
time, with approximately 20,000 entries updated each month.
By applying this database, we are able to offer fair purchase
prices that are commensurate with current auction rates. Thus,
by accurately ascertaining market saleable cars and saleable
prices, we are able to avoid dead stock and maintain a high
rate of successful auction sales.
Some opinions view negatively the reliance on auction sites
that are run by third parties for one’s sales routes. However,
since auction sites usually have a shortage of vehicles for auc-
tion, and since auction sites are in competition with each other,
they must constantly secure vehicles for auction so as to main-
tain their appeal. Hence, the number of vehicles handled is
extremely high, and Gulliver cars—with their high popularity and
high quality—are often given preferential treatment in terms of
cost. Thus, such negative opinions do not accurately grasp
actual circumstances.
■Gulliver’s Original Sales Route,
the “Dolphinet System”
As a means to maintaining its own sales routes, in 1998
Gulliver launched its Dolphinet System (hereinafter referred to
simply as “Dolphinet”), leveraging both satellite communica-
tions and graphics technology. Dolphinet is used to sell auto-
mobiles in the brief 7- to 10-day time frame following purchase
by Gulliver dealer stores, after which they are placed at auc-
tions. The Dolphinet display monitor provides not only such
basic information as images of the vehicle but also such
detailed data as past repair records and whether there are any
scratches or dents. The vehicle’s exterior is further assessed
on a scale of 100 and its interior rated according to a five-stage
system, thus providing comprehensive vehicle value data.
Consumers who find it difficult to discern a used car’s value
try their best to do so by examining the vehicle itself. However,
detailed information is seldom disclosed, making the decision
to purchase difficult. With Dolphinet, such problems are allevi-
ated without the need for hands-on examination of the vehicle
by providing professional assessment and price setting as well
as the open disclosure of detailed data.
0
10
20
30
40
0
20
40
60
80
1999 2000 2001 2002 2003 20042000 2001 2002 2003 2004
NUMBER OF CARS SOLD BYTHE DOLPHINET SYSTEM
(Thousands)
Gulliver Auctions overall
Source: Monthly Used Car (Rate of overall auction car sales)
RATE OF OVERALL AUCTION CARSALES AND RATE OF GULLIVERCARS SOLD AT AUCTIONS (%)
10
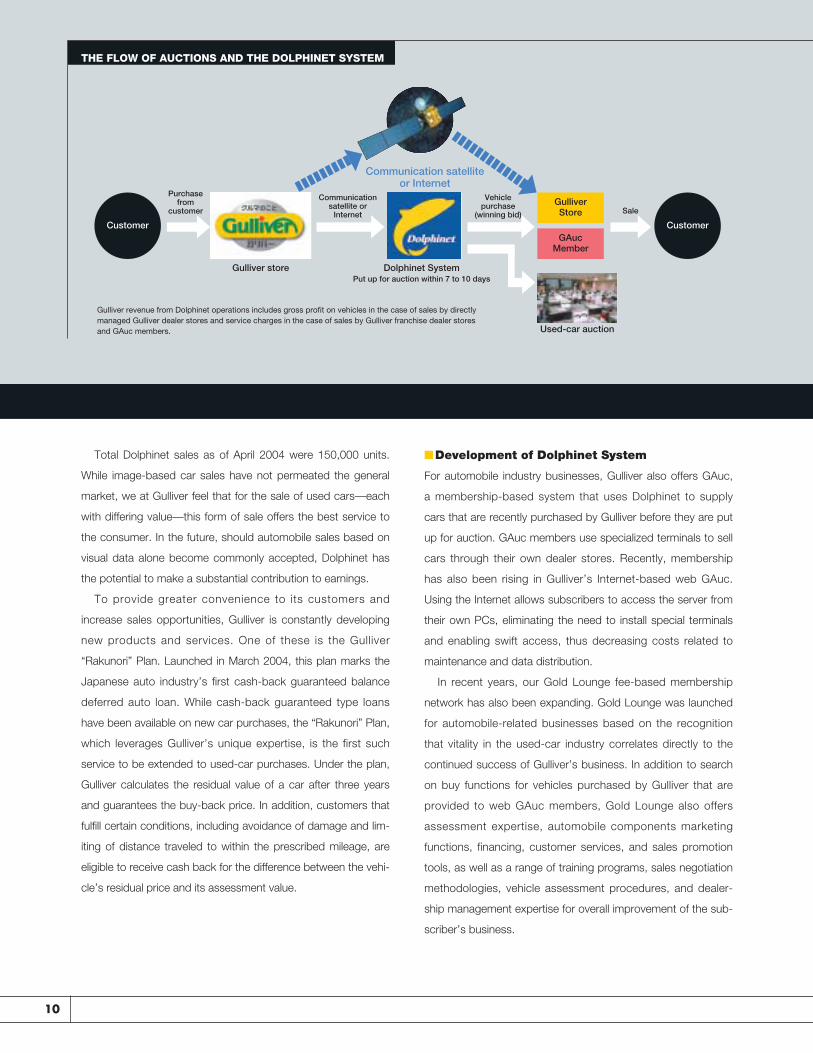
Communication satellite or Internet
Purchasefrom
customer
Communicationsatellite or
Internet
Vehicle purchase
(winning bid) Sale
▲
❚❚❚❚❚❚❚❚❚❚❚❚❚
▲
❚❚❚❚❚❚
❚❚❚
Gulliver store Dolphinet SystemPut up for auction within 7 to 10 days
GulliverStore
GAucMember
Customer Customer
Used-car auction
Gulliver revenue from Dolphinet operations includes gross profit on vehicles in the case of sales by directlymanaged Gulliver dealer stores and service charges in the case of sales by Gulliver franchise dealer storesand GAuc members.
THE FLOW OF AUCTIONS AND THE DOLPHINET SYSTEM
Total Dolphinet sales as of April 2004 were 150,000 units.
While image-based car sales have not permeated the general
market, we at Gulliver feel that for the sale of used cars—each
with differing value—this form of sale offers the best service to
the consumer. In the future, should automobile sales based on
visual data alone become commonly accepted, Dolphinet has
the potential to make a substantial contribution to earnings.
To provide greater convenience to its customers and
increase sales opportunities, Gulliver is constantly developing
new products and services. One of these is the Gulliver
“Rakunori” Plan. Launched in March 2004, this plan marks the
Japanese auto industry’s first cash-back guaranteed balance
deferred auto loan. While cash-back guaranteed type loans
have been available on new car purchases, the “Rakunori” Plan,
which leverages Gulliver’s unique expertise, is the first such
service to be extended to used-car purchases. Under the plan,
Gulliver calculates the residual value of a car after three years
and guarantees the buy-back price. In addition, customers that
fulfill certain conditions, including avoidance of damage and lim-
iting of distance traveled to within the prescribed mileage, are
eligible to receive cash back for the difference between the vehi-
cle’s residual price and its assessment value.
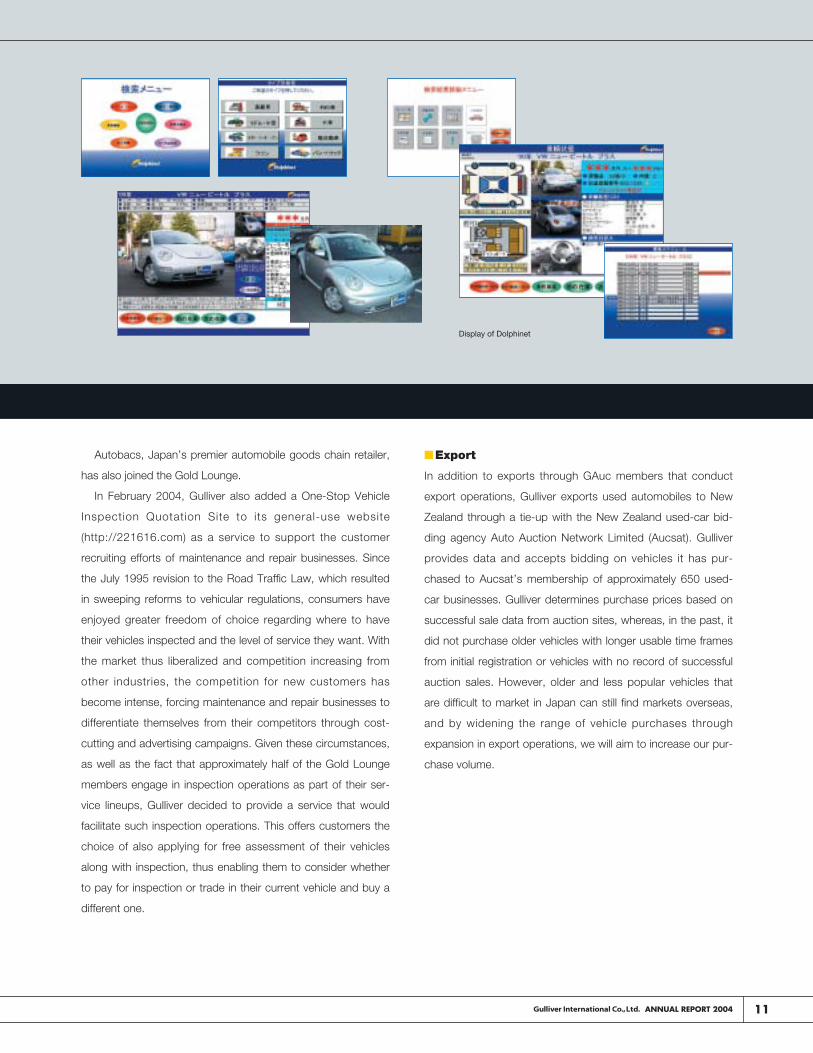
■Development of Dolphinet System
For automobile industry businesses, Gulliver also offers GAuc,
a membership-based system that uses Dolphinet to supply
cars that are recently purchased by Gulliver before they are put
up for auction. GAuc members use specialized terminals to sell
cars through their own dealer stores. Recently, membership
has also been rising in Gulliver’s Internet-based web GAuc.
Using the Internet allows subscribers to access the server from
their own PCs, eliminating the need to install special terminals
and enabling swift access, thus decreasing costs related to
maintenance and data distribution.
In recent years, our Gold Lounge fee-based membership
network has also been expanding. Gold Lounge was launched
for automobile-related businesses based on the recognition
that vitality in the used-car industry correlates directly to the
continued success of Gulliver’s business. In addition to search
on buy functions for vehicles purchased by Gulliver that are
provided to web GAuc members, Gold Lounge also offers
assessment expertise, automobile components marketing
functions, financing, customer services, and sales promotion
tools, as well as a range of training programs, sales negotiation
methodologies, vehicle assessment procedures, and dealer-
ship management expertise for overall improvement of the sub-
scriber’s business.
11ANNUAL REPORT 2004
Autobacs, Japan’s premier automobile goods chain retailer,
has also joined the Gold Lounge.
In February 2004, Gulliver also added a One-Stop Vehicle
Inspection Quotation Site to its general-use website
(http://221616.com) as a service to support the customer
recruiting efforts of maintenance and repair businesses. Since
the July 1995 revision to the Road Traffic Law, which resulted
in sweeping reforms to vehicular regulations, consumers have
enjoyed greater freedom of choice regarding where to have
their vehicles inspected and the level of service they want. With
the market thus liberalized and competition increasing from
other industries, the competition for new customers has
become intense, forcing maintenance and repair businesses to
differentiate themselves from their competitors through cost-
cutting and advertising campaigns. Given these circumstances,
as well as the fact that approximately half of the Gold Lounge
members engage in inspection operations as part of their ser-
vice lineups, Gulliver decided to provide a service that would
facilitate such inspection operations. This offers customers the
choice of also applying for free assessment of their vehicles
along with inspection, thus enabling them to consider whether
to pay for inspection or trade in their current vehicle and buy a
different one.
■Export
In addition to exports through GAuc members that conduct
export operations, Gulliver exports used automobiles to New
Zealand through a tie-up with the New Zealand used-car bid-
ding agency Auto Auction Network Limited (Aucsat). Gulliver
provides data and accepts bidding on vehicles it has pur-
chased to Aucsat’s membership of approximately 650 used-
car businesses. Gulliver determines purchase prices based on
successful sale data from auction sites, whereas, in the past, it
did not purchase older vehicles with longer usable time frames
from initial registration or vehicles with no record of successful
auction sales. However, older and less popular vehicles that
are difficult to market in Japan can still find markets overseas,
and by widening the range of vehicle purchases through
expansion in export operations, we will aim to increase our pur-
chase volume.
Display of Dolphinet
12
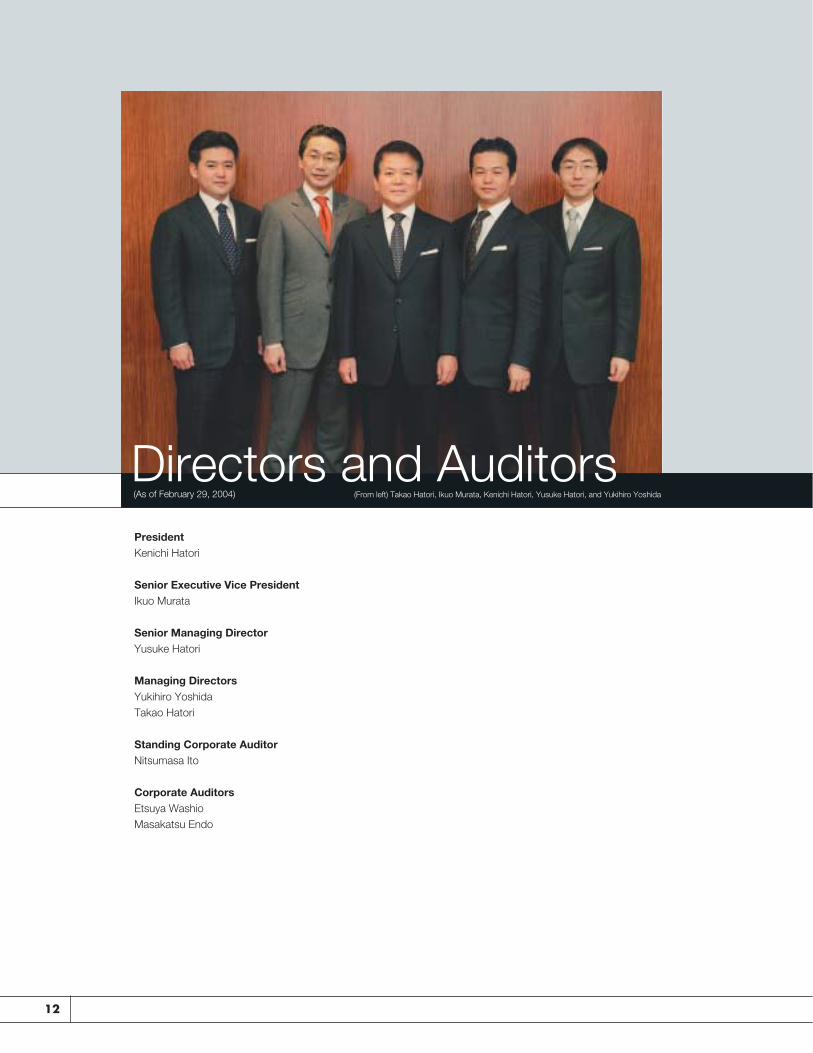
PresidentKenichi Hatori
Senior Executive Vice PresidentIkuo Murata
Senior Managing DirectorYusuke Hatori
Managing DirectorsYukihiro YoshidaTakao Hatori
Standing Corporate AuditorNitsumasa Ito
Corporate AuditorsEtsuya WashioMasakatsu Endo
Directors and Auditors(As of February 29, 2004) (From left) Takao Hatori, Ikuo Murata, Kenichi Hatori, Yusuke Hatori, and Yukihiro Yoshida

13ANNUAL REPORT 2004
Consolidated Financial HighlightsFor the years ended February 29, 2004 and February 28, 2003Gulliver International Co., Ltd.
Thousands ofThousands Thousands U.S. dollars
of yen of yen (Note 1)
2004 2003 2004
For the year:Net sales ¥121,885,207 ¥94,957,515 $1,111,888Operating income 7,648,729 5,244,913 69,775Net income 4,050,512 2,777,175 36,950
At year-end:Total assets 26,225,811 20,057,544 239,242Total shareholders’ equity 15,554,769 12,565,484 141,897
Per share data (Yen/U.S. dollars):Net income:
Basic ¥000,0393.36 ¥00,0275.67 $0,0003.59Diluted 384.92 274.49 3.51
Cash dividends 115.00 80.00 1.05Shareholders’ equity 1,539.49 1,258.87 14.04
Ratios (%):Return on equity (Note 2) 28.8 23.5Return on assets (Note 3) 33.1 26.9Equity ratio 59.3 62.6
Employees:Number of employees 1,448 1,199
Non-Consolidated Six-Year SummaryYears ended February 28 or 29Gulliver International Co., Ltd.
Thousandsof yen
1999 2000 2001 2002 2003 2004
For the year:Net sales ¥25,429,560 ¥42,340,143 ¥58,285,250 ¥82,503,511 ¥91,071,908 ¥114,991,215Operating income 1,181,799 2,514,698 2,541,888 4,033,953 5,032,169 7,165,957Net income 552,391 1,036,557 1,251,516 1,780,142 2,667,689 3,863,649
At year-end:Total assets 6,851,202 15,516,320 18,286,974 18,339,282 18,931,226 24,512,307Total shareholders’ equity 1,652,686 9,422,714 10,580,780 10,962,262 12,329,634 15,132,056
Per share data (Yen/U.S. dollars):Net income:
Basic 94.15 146.87 124.17 171.22 264.80 374.83Diluted — — — — 263.67 366.79
Cash dividends 5.00 5.00 20.00 45.00 80.00 115.00Shareholders’ equity 254.57 1,257.70 1,008.76 1,078.78 1,235.24 1,497.65
Ratios (%):Return on equity (Note 2) 49.2 18.7 12.5 16.5 22.9 28.1Return on assets (Note 3) 21.9 22.5 15.0 22.0 27.0 33.0Equity ratio 24.1 60.7 57.9 59.8 65.1 61.7Dividends ratio 5.5 3.6 16.7 25.9 30.0 30.1
Common stock (Shares):Number of shares issued 6,492,000 7,492,000 10,488,800 10,488,800 10,488,800 10,557,200
Employees:Number of employees 350 559 733 1,035 1,177 1,420
Notes: 1. Translation into U.S. dollars has been made on the basis of ¥109.62=$1, the effective exchange rate at February 29, 2004.Notes: 2. ROE=Net income/shareholders’ equity (yearly average) X 100Notes: 3. ROA=Operating income/total assets (yearly average) X 100

14
Management’s Discussion and Analysis
Net Sales
Net sales for the fiscal year ended
February 29, 2004, increased 28.4%,
compared with the previous fiscal year,
to ¥121,885 million. Vehicle net sales,
which account for the greatest portion
of Gulliver’s net sales, rose 28.1%, to
¥108,046 million, while the volume of
vehicle sales cl imbed 27.3%, to
128,615 units. As “the used-car pur-
chasing expert,” the primary operations
of Gulliver’s dealer stores comprise the
purchasing of used vehicles, and the
number of directly managed dealer
stores increased by 27, to 205 (includ-
ing purchasing dispatch centers). The
number of vehicles purchased also
expanded as per-dealer store patron-
age increased. Both of these factors
contributed to the growth in vehicle
sales. Factors contributing to increased
patronage include dynamic advertising
and PR programs, with Gulliver’s use of
Hideki Matsui of the New York Yankees
as its celebrity spokesperson beginning
in June 2003, and rapidly spreading
recognition of the Company’s used-car
purchasing specialist business.
On the other hand, the number of
franchise dealer stores declined by 46, to
287, and there was an easing off of roy-
alties revenues. The Company obtained
contracts with 24 new franchise dealer
stores—5 more than in the previous fis-
cal year—thus recording ¥192 million in
revenue from franchise admission fees.
Vehicles purchased by Gulliver are
sold both at nationwide auctions, fol-
lowing a brief inventory period of 7 to 10
days, as well as through sales routes
established with its own Dolphinet visual
graphics sales system. The number of
dealer stores equipped with the
Dolphinet System increased by 1,520
compared with the previous fiscal year,
to 9,946 (not including Gulliver dealer
stores), and the number of vehicles sold
through the Dolphinet System also
increased, up 38.1%, to 44,404 units,
as a result of a rise in the number of
vehicles successfully tendered through
web GAuc (an Internet-based sales sys-
tem furnished by Gulliver primarily to
used-car dealers free of any member-
ship charge).
Cost of Sales, SG&A Expenses,
Other Revenue, and Expenditures
Cost of sales increased 28.4% com-
pared with the previous fiscal year, to
¥93,200 million. Selling, general and
administrative (SG&A) expenses also
increased, up 22.7%, to ¥21,035 mil-
lion, primarily reflecting increases in per-
sonnel expenses, depreciation and
amortization, and property rental fees
resulting from the increase in the num-
ber of dealer stores as well as increased
advert ising expenses from the
Company’s dynamic advertising pro-
grams. As a result, operating income
climbed 45.8% compared with the pre-
vious fiscal year, to ¥7,648 million, and
the operating income margin edged up
0.8 percentage point, to 6.3%.
In other income (expenses), net,
expenses rose ¥2 million, to ¥123 million,
due primarily to the approximately ¥135
million in losses on the retirement of fixed
assets that were incurred during the fiscal
year. Net income for the term increased
45.9%, to ¥4,050 million, with the net
income margin working out to 3.3%, an
increase of 0.4 percentage point.
Segment Earnings
Used-Car Sales
Although vehicle sales prices hovered at
approximately the same level as that of
the previous fiscal year, the number of
vehicles handled by Gulliver increased
steadily, and net sales in this segment
rose 29.8%, compared with the previ-
ous fiscal year, to ¥114,884 million.
The Company succeeded in raising its
per-vehicle gross margin compared with
the previous term on the strength of
increased vehicle handling volume, which
it achieved through new dealer store
openings and expanded per-dealer store
patronage, as well as augmented per-
sonnel education and training programs
at Gulliver dealer stores and heightened
precision on the part of the Company’s
Head Office in leading auction site sales.
As a result, operating income advanced
29.5%, to ¥7,701 million.
Franchise Operations
The number of vehicles handled dipped
slightly compared with the previous
term due to the decline in the number of
franchise dealer stores. Nevertheless,
the Company succeeded in obtaining
contracts with 24 new franchise dealer
stores. In addit ion, revenue from
Dolphinet fees also increased as the
volume of Dolphinet-based sales
expanded. As a result, net sales
climbed 8.1%, to ¥7,001 million, and
operating income grew 39.5%, to
¥3,277 million.
Financial Condition
The Company’s total capital outlays for
the term under review amounted to
¥1,636 million. Investment in buildings,
structures, and fixtures related to the
opening of new Gulliver dealer stores and
the relocation or expansion of existing
dealer stores amounted to ¥943 million.
The Gulliver International Group’s
total assets increased ¥6,168 million, or
30.8%, compared with the previous fis-
cal year-end, to ¥26,225 million. Current
assets totaled ¥17,585 million mainly
because of increases in cash and
deposits and accounts receivable that
resulted from the Company’s strong
sales activities and growth in vehicle-
handling volume. Fixed assets amount-
ed to ¥8,640 million due to an increase
in property and equipment that resulted
from the increase in directly managed
dealer stores and associated new acquisi-
tions of buildings, structures, and fixtures.
15ANNUAL REPORT 2004
Total liabilities rose ¥310.4 million, or
41.9%, to ¥10,518 mill ion. Current
liabilities rose to ¥9,780 million due
to higher accounts payable—trade
because of the increase in the number
of vehicles handled.
Shareholders’ equity increased
¥2,989 million, or 23.8%, to ¥15,554 mil-
lion. This increase was due primarily to
growth in consolidated retained earnings
that reflected the Company’s net income
for the term. Capital amounted to ¥3,954
million as a result of the issuance of new
shares through the Company’s use of
stock options during the term. As a
result, Gulliver’s equity ratio eased off by
3.3 percentage points, to 59.3%.
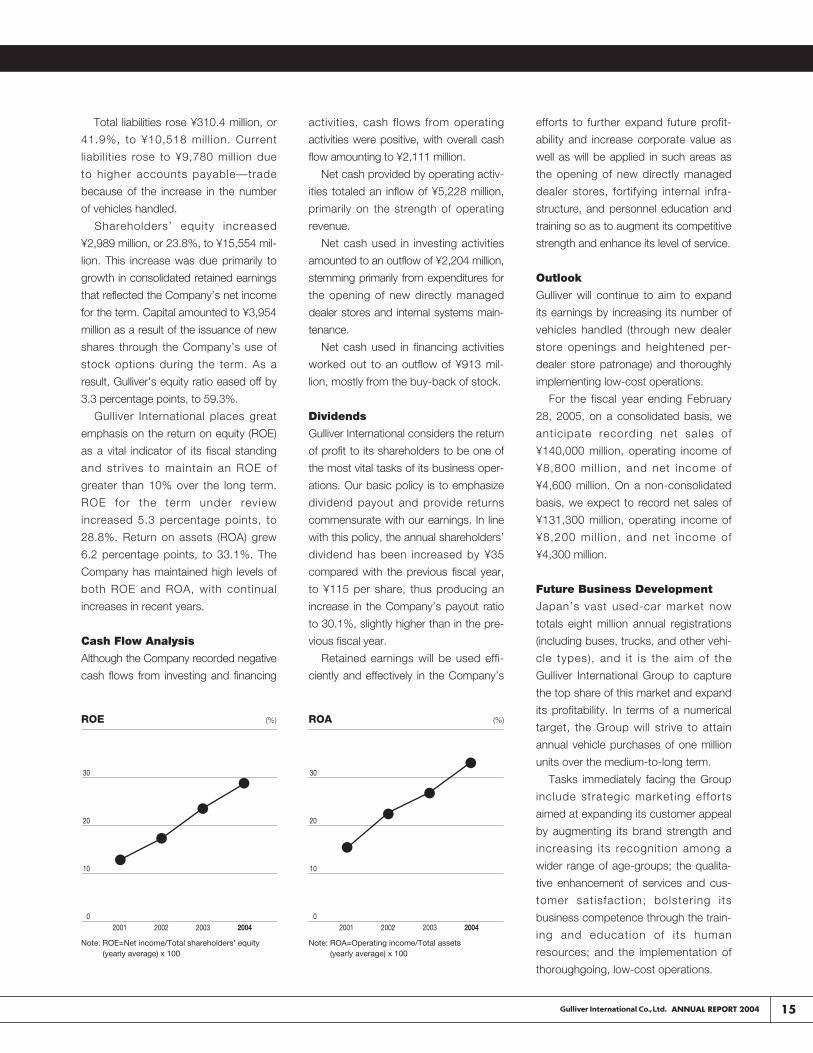
Gulliver International places great
emphasis on the return on equity (ROE)
as a vital indicator of its fiscal standing
and str ives to maintain an ROE of
greater than 10% over the long term.
ROE for the term under review
increased 5.3 percentage points, to
28.8%. Return on assets (ROA) grew
6.2 percentage points, to 33.1%. The
Company has maintained high levels of
both ROE and ROA, with continual
increases in recent years.
Cash Flow Analysis
Although the Company recorded negative
cash flows from investing and financing
activities, cash flows from operating
activities were positive, with overall cash
flow amounting to ¥2,111 million.
Net cash provided by operating activ-
ities totaled an inflow of ¥5,228 million,
primarily on the strength of operating
revenue.
Net cash used in investing activities
amounted to an outflow of ¥2,204 million,
stemming primarily from expenditures for
the opening of new directly managed
dealer stores and internal systems main-
tenance.
Net cash used in financing activities
worked out to an outflow of ¥913 mil-
lion, mostly from the buy-back of stock.
Dividends
Gulliver International considers the return
of profit to its shareholders to be one of
the most vital tasks of its business oper-
ations. Our basic policy is to emphasize
dividend payout and provide returns
commensurate with our earnings. In line
with this policy, the annual shareholders’
dividend has been increased by ¥35
compared with the previous fiscal year,
to ¥115 per share, thus producing an
increase in the Company’s payout ratio
to 30.1%, slightly higher than in the pre-
vious fiscal year.
Retained earnings will be used effi-
ciently and effectively in the Company’s
efforts to further expand future profit-
ability and increase corporate value as
well as will be applied in such areas as
the opening of new directly managed
dealer stores, fortifying internal infra-
structure, and personnel education and
training so as to augment its competitive
strength and enhance its level of service.
Outlook
Gulliver will continue to aim to expand
its earnings by increasing its number of
vehicles handled (through new dealer
store openings and heightened per-
dealer store patronage) and thoroughly
implementing low-cost operations.
For the fiscal year ending February
28, 2005, on a consolidated basis, we
anticipate recording net sales of
¥140,000 million, operating income of
¥8,800 mil l ion, and net income of
¥4,600 million. On a non-consolidated
basis, we expect to record net sales of
¥131,300 million, operating income of
¥8,200 mil l ion, and net income of
¥4,300 million.
Future Business Development
Japan’s vast used-car market now
totals eight million annual registrations
(including buses, trucks, and other vehi-
cle types), and it is the aim of the
Gulliver International Group to capture
the top share of this market and expand
its profitability. In terms of a numerical
target, the Group will strive to attain
annual vehicle purchases of one million
units over the medium-to-long term.
Tasks immediately facing the Group
include strategic marketing efforts
aimed at expanding its customer appeal
by augmenting its brand strength and
increasing its recognition among a
wider range of age-groups; the qualita-
tive enhancement of services and cus-
tomer satisfaction; bolstering its
business competence through the train-
ing and education of i ts human
resources; and the implementation of
thoroughgoing, low-cost operations.
Note: ROE=Net income/Total shareholders’ equity (yearly average) x 100
ROE (%)
Note: ROA=Operating income/Total assets (yearly average) x 100
ROA (%)
0
10
20
30
2001 2002 2003 20040
10
20
30
2001 2002 2003 2004

16
Consolidated Balance SheetsAs of February 29, 2004 and February 28, 2003Gulliver International Co., Ltd.
Thousands ofThousands Thousands U.S. dollars
of yen of yen (Note 2)
ASSETS 2004 2003 2004
Current assets:Cash and cash equivalents ¥08,624,831 ¥06,513,298 $078,679Short-term investments (Note 3) 236,689 78,188 2,159Accounts receivable:
Trade 5,130,911 3,260,617 46,806Allowance for doubtful accounts (88,984) (34,104) (812)
5,041,927 3,226,513 45,994Inventories 1,974,624 1,703,495 18,013Deferred income tax assets (Note 12) 409,198 216,802 3,733Other current assets 1,298,356 816,588 11,844
Total current assets 17,585,627 12,554,887 160,423
Property and equipment:Land 327,075 323,011 2,984Buildings and structures 4,376,664 3,532,784 39,926Furniture, fixtures and equipment 1,819,221 1,483,277 16,596Construction in progress 39,293 31,642 358
6,562,255 5,370,715 59,864Less—Accumulated depreciation (2,187,222) (1,677,871) (19,953)
Net property and equipment 4,375,032 3,692,845 39,911
Investments and other assets:Investment securities (Note 3) 228,040 189,909 2,080Leasehold and guarantee deposits (Note 4) 2,154,048 1,708,191 19,650Deferred income tax assets (Note 12) 203,508 177,436 1,856Software costs, net 1,201,535 1,217,628 10,961Other assets 750,673 785,356 6,848Allowance for doubtful accounts (272,655) (268,713) (2,487)
Total investments and other assets 4,265,150 3,809,811 38,908
¥26,225,811 ¥20,057,544 $239,242
The accompanying notes are an integral part of these statements.

17ANNUAL REPORT 2004
Thousands ofThousands Thousands U.S. dollars
of yen of yen (Note 2)
LIABILITIES AND SHAREHOLDERS’ EQUITY 2004 2003 2004
Current liabilities:Short-term bank loans (Note 5) ¥00,550,000 ¥00,450,000 $005,017Accounts payable:
Trade 2,796,848 1,848,934 25,514Other 1,871,250 1,588,417 17,070
Accrued income taxes (Note 12) 2,531,239 1,295,061 23,091Accrued bonuses 380,639 282,126 3,472Deferred income tax liabilities (Note 12) — 167 —Other current liabilities 1,740,616 1,205,806 15,879
Total current liabilities 9,870,594 6,670,514 90,043
Long-term liabilities:Guarantee deposits received (Note 6) 647,437 743,102 5,906Other liabilities — 50 —
Total long-term liabilities 647,437 743,152 5,906
Minority interest in consolidated subsidiaries 153,008 78,393 1,396
Shareholders’ equity (Note 9):Common stock:
Authorized 40,000,000 sharesIssued 10,557,200 shares in 2004Issued 10,488,800 shares in 2003 3,954,882 3,849,820 36,078
Additional paid-in capital 3,943,997 3,725,460 35,979Retained earnings 9,727,986 6,706,077 88,743Unrealized holding losses on available-for-sale securities (2,646) (27,284) (24)
17,624,219 14,254,073 160,776
Less—Treasury stock (2,069,450) (1,688,588) (18,878)
Total shareholders’ equity 15,554,769 12,565,484 141,897
¥26,225,811 ¥20,057,544 $239,242

18
Consolidated Statements of IncomeFor the years ended February 29, 2004 and February 28, 2003Gulliver International Co., Ltd.
Thousands ofThousands Thousands U.S. dollars
of yen of yen (Note 2)
2004 2003 2004
Net sales ¥121,885,207 ¥94,957,515 $1,111,888
Costs and expenses:Cost of sales 93,200,970 72,575,504 850,219Selling, general and administrative expenses (Note 10) 21,035,508 17,137,097 191,895
114,236,478 89,712,601 1,042,113
Operating income 7,648,729 5,244,913 69,775
Other income (expenses):Losses on disposal of software, property and equipment (Note 11) (135,091) (121,746) (1,232)Other, net 11,426 1,004 104
(123,664) (120,742) (1,128)
Income before income taxes and minority interest 7,525,065 5,124,170 68,647
Income taxes (Note 12):Current 3,644,702 2,239,150 33,249Deferred (236,617) 92,047 (2,159)
3,408,085 2,331,197 31,090
Minority interest, net of taxes 66,467 15,797 606
Net income ¥004,050,512 ¥02,777,175 $0,036,950
U.S. dollarsYen Yen (Note 2)
2004 2003 2004
Net income per share (Note 2 (m)):Basic ¥000,0393.36 ¥000,275.67 $0,0003.59Diluted 384.92 274.49 3.51
Cash dividends per share (Note 2 (m)) 115 80 1.05
The accompanying notes are an integral part of these statements.

19ANNUAL REPORT 2004
Thousands of yen
UnrealizedForeign holding
Number of Additional currency losses onshares of Common paid-in Retained translation available-for- Treasury
common stock stock capital earnings adjustments sale securities stock
Balance at February 28, 2002 10,488,800 ¥3,849,820 ¥3,725,460 ¥4,547,559 ¥4,345 ¥(20,710) ¥(1,013,502)Net income for the year 2,777,175Unrealized holding losses on available-for-sale securities (6,574)
Foreign currency translation adjustments (4,345)
Cash dividends paid (555,957)Bonuses to directors and corporate auditors (62,700)
Purchase of treasury stock (675,086)
Balance at February 28, 2003 10,488,800 3,849,820 3,725,460 6,706,077 — (27,284) (1,688,588)Net income for the year 4,050,512Unrealized holding losses on available-for-sale securities 24,638
Cash dividends paid (955,453)Bonuses to directors and corporate auditors (73,150)
Purchase of treasury stock (1,190,886)Reissuance of treasury stock 113,475 810,024Common stock issued 68,400 105,062 105,062
Balance at February 29, 2004 10,557,200 ¥3,954,882 ¥3,943,997 ¥9,727,986 ¥ — ¥ (2,646) ¥(2,069,450))
Thousands of U.S. dollars (Note 2)
UnrealizedForeign holding
Additional currency losses onCommon paid-in Retained translation available-for- Treasury
stock capital earnings adjustments sale securities stock
Balance at February 28, 2003 $35,120 $33,985 $61,176 $— $(249) $(15,404))Net income for the year 36,950Unrealized holding losses on available-for-sale securities 225
Cash dividends paid (8,716)Bonuses to directors and corporate auditors (667)
Purchase of treasury stock (10,864)Reissuance of treasury stock 1,035 7,389Common stock issued 958 958
Balance at February 29, 2004 $36,078 $35,979 $88,743 $— $ (24) $(18,878)
The accompanying notes are an integral part of these statements.
Consolidated Statements of Shareholders’ EquityFor the years ended February 29, 2004 and February 28, 2003Gulliver International Co., Ltd.

20
Consolidated Statements of Cash FlowsFor the years ended February 29, 2004 and February 28, 2003Gulliver International Co., Ltd.
Thousands ofThousands Thousands U.S. dollars
of yen of yen (Note 2)
2004 2003 2004
Operating activities:Income before income taxes and minority interest ¥7,525,065 ¥5,124,170 $68,647Adjustments for:
Depreciation and amortization 1,026,411 875,833 9,363Losses on disposal of software, property and equipment 135,091 121,746 1,232
Increase in accounts receivable—trade (1,826,907) (318,389) (16,666)Increase in inventories (271,129) (124,389) (2,473)Increase (decrease) in accounts payable—trade 935,097 (394,196) 8,530Other, net 122,436 (894,454) 1,117
Subtotal 7,646,064 4,390,321 69,751Interest and dividend income received 619 3,194 6Interest expenses paid (9,484) (4,793) (87)Income taxes paid (2,408,524) (2,295,372) (21,972)
Net cash provided by operating activities 5,228,674 2,093,348 47,698
Investing activities:Payments for purchase of short-term investments (229,470) (498,532) (2,093)Proceeds from sales of short-term investments 74,125 700,332 676Payments for purchase of property and equipment (1,260,407) (1,155,622) (11,498)Payments for purchase of software and intangible assets (539,374) (568,682) (4,920)Decrease in time deposits — 552,521 —Other, net (248,911) (13,728) (2,271)
Net cash used in investing activities (2,204,038) (983,711) (20,106)
Financing activities:Increase in short-term bank loans, net 100,000 200,000 912Cash dividends paid (955,453) (555,957) (8,716)Purchase of treasury stock (1,190,886) (675,086) (10,864)Proceeds from sales of treasury stock 923,500 — 8,425Other, net 209,737 19,850 1,913
Net cash used in financing activities (913,103) (1,011,192) (8,330)
Effect of exchange rate changes on cash and cash equivalents — (4,345) —
Net increase in cash and cash equivalents 2,111,533 94,099 19,262Cash and cash equivalents at beginning of year 6,513,298 6,419,198 59,417
Cash and cash equivalents at end of year ¥8,624,831 ¥6,513,298 $78,679
The accompanying notes are an integral part of these statements.

21ANNUAL REPORT 2004
Notes to Consolidated Financial StatementsFor the years ended February 29, 2004 and February 28, 2003Gulliver International Co., Ltd.
1. Nature of Operations
Gulliver International Co., Ltd. (the “Company”) and its consolidated subsidiaries are mainly engaged in thepurchase and sale of used cars through a nationwide network and franchising business.
2. Summary of Significant Accounting Policies
The accompanying consolidated financial statements have been prepared from the accounts maintained bythe Company and its consolidated subsidiaries in accordance with the provisions set forth in the JapaneseCommercial Code and Japanese Securities and Exchange Law, and in conformity with accounting princi-ples and practices generally accepted in Japan, which are different in certain respects as to the applicationand disclosure requirements of the International Accounting Standards. The consolidated financial state-ments are not intended to present the consolidated financial position, results of operations and cash flowsin accordance with accounting principles and practices generally accepted in countries and jurisdictionsother than Japan. However, certain items presented in the consolidated financial statements filed with theDirector of the Kanto Finance Bureau in Japan have been reclassified and relevant notes have been added,if appropriate, for the convenience of readers outside Japan. Certain prior-year amounts have also beenreclassified to conform to the current year’s presentation. All figures in the accompanying consolidatedfinancial statements and their notes are rounded to thousands of yen, with figures of less than a thousandyen being omitted.
Amounts in U.S. dollars are included solely for the convenience of readers outside Japan. The rate of¥109.62=U.S.$1, the rate of exchange on February 29, 2004, has been used in translation. The inclusion ofsuch amounts is not intended to imply that Japanese yen have been or could be readily converted, realizedor settled in U.S. dollars at this or any other rate.
(a) Basis of ConsolidationThe accompanying consolidated financial statements include the accounts of the Company and its threesubsidiaries, as shown below.
Country of Fiscalincorporation year-end
G Trading Co., Ltd. Japan February 29E-Investment Co., Ltd. Japan February 29Gulliver Europe Ltd. Switzerland December 31
All significant intercompany accounts and transactions and unrealized intercompany profits are eliminatedin consolidation.
The financial statements of subsidiaries are included in the consolidated financial statements on the basisof their respective fiscal years after making appropriate adjustments for material transactions during theperiods from their respective year-ends to the date of the consolidated financial statements, as required.
Upon acquisition of a subsidiary, all of the subsidiary’s assets and liabilities are revalued to their respec-tive fair value at the date of acquisition.
(b) Cash and Cash EquivalentsCash and cash equivalents comprise cash on hand, bank deposits withdrawable on demand and all highlyliquid investments with original maturities of three months or less which present insignificant risk of changein value.

22
(c) Short-Term Investments and Investment SecuritiesSecurities have been classified into four categories: trading securities, held-to-maturity debt securities, equitysecurities of unconsolidated subsidiaries and affiliates, and available-for-sale securities. Debt securities with amaturity date of one year or less are classified as current and debt securities with a maturity date of more thanone year and equity securities other than trading securities are classified as noncurrent.
Held-to-maturity securities are carried at amortized cost under the straight-line method. Marketable avail-able-for-sale securities are stated at market value with unrealized gains and losses, net of applicable taxes,being reported in a separate component of shareholders’ equity. The cost of securities sold is determinedbased on the moving-average method. Available-for-sale securities that do not have readily determinablefair values are reported at cost.
(d) Allowance for Doubtful AccountsAn allowance is provided for “normal receivables” based on the Company’s historical write-off experiencerate and an estimate of irrecoverable amounts for doubtful receivables on an individual account basis.
(e) InventoriesVehicles for resale are stated at cost, cost being determined by the individual cost method.
Other merchandise is stated at cost, cost being determined by the first-in, first-out method.Supplies are valued under the last invoice cost method.
(f) Property and EquipmentProperty and equipment are stated at cost. Depreciation is computed using the declining-balance method,except for buildings acquired on or after April 1, 1998, for which it is computed using the straight-linemethod.
The range of the estimated useful lives for property and equipment is as follows:Buildings and structures 15 to 20 years Motor vehicles 02 to 6 years
Expenditures for maintenance, repairs and minor renewals are charged to income as incurred.
(g) Finance LeasesLease payments under finance lease contracts are charged to income as incurred. Under Japaneseaccounting principles, finance leases where ownership of the assets does not transfer to the lessee at theend of the lease period may be accounted for as operating leases with an appropriate footnote disclosure.
(h) Capitalized Software CostsThe costs of software for internal use are amortized based on the straight-line method over its estimateduseful life, five years.
( i ) Intangible and Other AssetsAmortization of intangible assets and long-term prepaid expenses included in “Other assets” is computedusing the straight-line method.
Common stock issue costs are charged to income as incurred.
( j) Accrued BonusesAccrued employees’ bonuses are provided at the estimated amount to be paid.
(k) Income TaxesIncome taxes consist of corporate income tax, local inhabitants’ taxes and enterprise tax.
Income taxes are determined using the “asset and liability approach,” in which deferred income taxassets and liabilities are recognized for the expected future tax consequences of temporary differencesbetween the carrying amounts and the tax bases of assets and liabilities.

23ANNUAL REPORT 2004
(l) DerivativesDerivative financial instruments are stated at fair value. Deferred hedge accounting is applied to hedginginstruments which meet certain criteria.
(m) Net Income and Dividends per ShareThe computation of net income per share is based on the weighted average number of shares of commonstock outstanding during each period.
Effective from the year ended February 29, 2004, the Company adopted the Statement of FinancialAccounting Standard No. 2 “Earnings per Share” and the relevant implementation guidance issued by theAccounting Standards Board of Japan. Prior to adopting the new statement, net income per share was cal-culated based on the net income shown on the consolidated statements of income. The net income pershare calculation therefore excluded bonuses to directors and statutory auditors, since, under the JapaneseCommercial Code, these are recognized as an appropriation of retained earnings in the consolidated state-ments of retained earnings, rather than as expenses in the consolidated statements of income. However,the new statement requires that net income should be adjusted by deducting bonuses paid to directors andstatutory auditors as well as the payment of dividends to shareholders of preferred stocks to be recognizedas an appropriation of retained earnings from net income shown in the consolidated statements of incomeand the calculation of net income per share be made on that adjusted net income basis. Basic net incomeper share for the year ended February 29, 2004 calculated using the previous method and under the newstatement is ¥401.65 and ¥393.36, respectively, and diluted net income per share for that period on bothbases is ¥393.04 and ¥384.92, respectively.
Cash dividends per share represent interim dividends paid and annual dividends declared as applicableto the respective years.
(n) Appropriation of Retained EarningsUnder the Commercial Code and the Articles of Incorporation of the Company, a proposal by the Board ofDirectors for the appropriation of retained earnings, including the payment of annual cash dividends, shouldbe approved by the shareholders’ meeting which must be held within three months after the end of eachfiscal year. The appropriation of retained earnings is recorded in the accompanying consolidated financialstatements following the approval of the shareholders’ meeting. As is customary practice in Japan, the pay-ment of bonuses to directors and corporate auditors is made out of retained earnings instead of beingcharged to income for the year and constitutes a part of the appropriation referred to above.
3. Short-Term Investments and Investments in Securities
Held-to-maturity securities and available-for-sale securities as of February 29, 2004 and February 28, 2003were analyzed as follows:
Thousands of yen
2004 Carrying amount Market value Difference
Held-to-maturity securities:With available market value:
Securities whose market value does not exceedtheir carrying amount ¥229,187 ¥228,820 ¥366
Without market value —
Total ¥229,187

24
Thousands of yen
2004 Carrying amount Acquisition cost Difference
Available-for-sale securities:With available market value:
Securities whose carrying amount does not exceed their acquisition cost ¥103,041 ¥107,504 ¥4,462
Without market value 132,500
Total ¥235,541
Thousands of yen
2003 Carrying amount Market value Difference
Held-to-maturity securities:With available market value ¥ — ¥— ¥—
Without market value 52,910
Total ¥52,910
Thousands of yen
2003 Carrying amount Acquisition cost Difference
Available-for-sale securities:With available market value:
Securities whose carrying amount does not exceed their acquisition cost ¥080,658 ¥127,742 ¥47,083
Without market value 134,529
Total ¥215,187
Thousands of U.S. dollars
2004 Carrying amount Market value Difference
Held-to-maturity securities:With available market value:
Securities whose market value does not exceed their carrying amount $2,090 $2,087 $3
Without market value —
Total $2,090
Thousands of U.S. dollars
2004 Carrying amount Acquisition cost Difference
Available-for-sale securities:With available market value:
Securities whose carrying amount does not exceed their acquisition cost $0,940 $980 $40
Without market value 1,209
Total $2,149

25ANNUAL REPORT 2004
Proceeds from sales as well as the relevant gains/losses in respect of available-for-sale securities soldduring the year ended February 29, 2004 and February 28, 2003 were summarized as follows:
Thousands Thousands Thousands ofof yen of yen U.S. dollars
2004 2003 2004
Proceeds from sales ¥21,178 ¥6,032 $193Gains on sales 687 5,190 6Losses on sales — — —
The aggregate annual maturities of bonds included in held-to-maturity securities and available-for-salesecurities outstanding as of February 29, 2004 and February 28, 2003 were as follows:
Thousands Thousands Thousands ofof yen of yen U.S. dollars
2004 2003 2004
Within one year ¥229,187 ¥52,910 $2,0901-5 years — — —5-10 years — — —Over ten years — — —
4. Leasehold and Guarantee Deposits
Leasehold and guarantee deposits are mainly those paid to lessors in connection with the lease of facilitiesfor shops and office space. As is customary practice in Japan, non-interest bearing leasehold and guaran-tee deposits are paid to the lessors, which are generally returnable to the Company only when the leaseagreements are terminated.
5. Short-Term Bank Loans
The average interest rate applicable to short-term bank loans as of February 29, 2004 and February 28,2003 was 0.831% and 0.675%, respectively.
6. Guarantee Deposits Received
Guarantee deposits received were non-interest bearing guarantee deposits paid by franchisees for fran-chise agreements, which are returnable to franchisees upon termination of the franchise agreements.

26
7. Leases
(a) Finance LeasesLeased assets and related expenses in respect of the Company’s finance leases, other than those whichtransfer ownership of the leased assets to the lessee, are accounted for using a method similar to that foroperating leases. Finance lease charges for the years ended February 29, 2004 and February 28, 2003 were¥321,260 thousand ($2,930 thousand) and ¥288,579 thousand, respectively. Had the leased assets beencapitalized on the balance sheets, the following items would have been recognized on the consolidated bal-ance sheets and the consolidated statements of income at, and for the years ended, February 29, 2004 andFebruary 28, 2003.
Thousands Thousands Thousands ofof yen of yen U.S. dollars
2004 2003 2004
Furniture, fixtures and equipment—at cost ¥1,180,524 ¥1,176,720 $10,769Software—at cost 100,151 75,397 914Other — 5,980 —
Less—Accumulated depreciation (808,100) (722,423) (7,372)
¥0,472,575 ¥0,535,676 $04,311
Depreciation ¥0,304,461 ¥0,269,244 $02,777Interest expense 17,377 21,445 159
The depreciation above is computed based on the straight-line method over the lease term of the leasedassets, the residual value of which is deemed to be zero.
The present values of future finance lease payments at February 29, 2004 and February 28, 2003 wereas follows:
Thousands Thousands Thousands ofof yen of yen U.S. dollars
2004 2003 2004
Within one year ¥281,378 ¥262,213 $2,567Over one year 216,616 299,921 1,976
¥497,994 ¥562,134 $4,543
(b) Operating LeasesThe minimum rental commitments under noncancellable operating leases as of February 29, 2004 andFebruary 28, 2003 are as follows:
Thousands Thousands Thousands ofof yen of yen U.S. dollars
2004 2003 2004
Within one year ¥07,716 ¥— $070Over one year 38,319 — 350
¥46,036 ¥— $420
8. Derivatives and Hedging Activities
The Company entered into interest rate swap agreements as hedging instruments. These agreements aredesigned to hedge the Company’s exposures to interest rate fluctuations upon its debt. The Company doesnot hold or issue any financial instruments for trading or speculative purposes. The Company’s manage-ment believes that there is no credit risk associated with the swaps since they are executed with domesticcreditworthy financial institutions. Deferred hedge accounting was applied to these derivatives.

27ANNUAL REPORT 2004
9. Shareholders’ Equity
The Commercial Code requires that at least 50% of the issue price of new shares be included in the statedcapital. The portion to be recorded as stated capital is determined by resolution of the Board of Directors.Proceeds in excess of the stated capital are credited to additional paid-in capital.
The Commercial Code provides that an amount equivalent to a minimum of 10% of cash dividends andbonuses paid to directors and statutory auditors be appropriated as a legal reserve until the reserve reachesa certain limit, which is 25% of the stated capital, less certain capital reserves.
The Commercial Code provides that both additional paid-in capital and the legal reserve may be trans-ferred to the stated capital by a resolution of the Board of Directors, or may be used to reduce a deficit fol-lowing the approval of a shareholders’ meeting. In addition, under the Commercial Code, additional paid-incapital and the legal reserve may be available for dividends to the extent that the total amount of additionalpaid-in capital and the legal reserve do not fall below 25% of the stated capital. The legal reserve of theCompany and its subsidiaries is included in the retained earnings on the consolidated balance sheet and isnot shown separately.
10. Selling, General and Administrative Expenses
Selling, general and administrative expenses mainly consisted of the following:
Thousands Thousands Thousands ofof yen of yen U.S. dollars
2004 2003 2004
Employees’ salaries and bonuses ¥6,981,498 ¥5,878,272 $63,688Rental expenses 2,271,527 1,956,359 20,722Advertising expenses 2,736,516 1,738,410 24,964
11. Other Income (Expenses)
“Losses on disposal of software, property and equipment” were summarized as follows:
Thousands Thousands Thousands ofof yen of yen U.S. dollars
2004 2003 2004
Property and equipment ¥ (16,477) ¥040,535 $ (151)Software 151,567 81,211 1,383
Total ¥135,091 ¥121,746 $1,232

28
12. Income Taxes
The Company is subject to several taxes based on income, which resulted in a statutory tax rate of approxi-mately 42.0% in the aggregate. On March 31, 2003, the Japanese National Diet approved various changesto the calculation of the statutory local enterprise tax for companies with capital in excess of ¥100 million,effective April 1, 2004. Under the amended legislation, the enterprise tax will be the sum of three tax com-ponents: a) an income-based component, b) a value-added component and c) a capital-based component,whereas there was only an “income tax based component” before the amendment. Concurrently, the basicenterprise tax rate for the “income-based component” has been reduced from 9.6% to 7.2%.
As a result of this amendment, the tax rate to be applied to deferred tax assets and liabilities for theexpected future tax consequences of temporary differences between the carrying amounts and tax bases ofassets and liabilities, that are expected to reverse in the year beginning March 1, 2005 or later, decreasedfrom 42.0% to 40.6% as at February 29, 2004. For temporary differences that are expected to reverse in theyear ending February 28, 2005, a tax rate of 42.0% has continued to be used at that date. This resulted in areduction in deferred tax assets at February 29, 2004 of ¥6,626 thousand ($60 thousand) and a reduction inunrealized holding losses on available-for-sale securities of ¥3 thousand ($0 thousand), compared with theasset that would have been recognized if a tax rate of 42.0% had been fully applied to all temporary differ-ences. Net income for the year ended February 29, 2004 was also reduced by ¥6,626 thousand ($60 thou-sand) as a result of these changes in statutory local enterprise tax regulations.
The effective tax rate for the years ended February 29, 2004 and February 28, 2003 differed from thestatutory tax rate for the following reasons:
2004 2003
Statutory tax rate: 42.0% 42.0%Expenses not deductible for income tax purposes,entertainment expenses and other 0.8 1.4
Tax charged upon undistributed net income 2.4 1.0Local inhabitants’ taxes levied per capita 1.3 1.6Other (1.2) (0.5)
Effective tax rate 45.3% 45.5%
Major components of deferred income tax assets as of February 29, 2004 and February 29, 2003 are asfollows:
Thousands Thousands Thousands ofof yen of yen U.S. dollars
2004 2003 2004
Deferred income tax assetsCurrent assets:
Enterprise tax payable ¥202,646 ¥108,475 $1,849Accrued bonuses 125,054 54,363 1,140Losses on valuation of inventories 15,845 9,211 145Other 65,653 44,752 599
Total ¥409,198 ¥216,802 $3,733
Investments and other assets:Allowance for doubtful accounts ¥120,284 ¥112,220 $1,097Losses on valuation of investment securities 45,776 46,452 418Other 37,448 18,762 341
Total ¥203,508 ¥177,436 $1,856

29ANNUAL REPORT 2004
13. Segment Information
The Company has two business segments, covering its used-car sales and franchising businesses. The carsales business mainly involves the purchase and sale of used cars through the Company’s directly man-aged dealership organization. The franchising business includes earning royalty income on franchise con-tracts, providing staff education services and acting as an agent for used-car transactions.
Certain financial information relating to these two operating segments is summarized below.
Thousands of yen
Used-car Franchising Corporate/2004 sales business business (eliminations) Consolidated
Sales to external customers ¥114,884,047 ¥7,001,159 ¥ — ¥121,885,207Intersegment sales/transfers — — — —
Total 114,884,047 7,001,159 — 121,885,207Operating costs and expenses 107,182,697 3,723,325 3,330,455 114,236,478
Operating income 7,701,349 3,277,834 (3,330,455) 7,648,729Segment assets 12,797,050 2,188,898 11,239,862 26,225,811Depreciation and amortization 643,760 27,916 354,733 1,026,411
Expenditures to acquire long-lived assets 1,739,685 134,973 296,373 2,171,033
Thousands of yen
Used-car Franchising Corporate/2003 sales business business (eliminations) Consolidated
Sales to external customers ¥88,478,636 ¥6,478,878 ¥ — ¥94,957,515Intersegment sales/transfers — — — —
Total 88,478,636 6,478,878 — 94,957,515Operating costs and expenses 82,533,678 4,129,337 3,049,586 89,712,601
Operating income 5,944,958 2,349,541 (3,049,586) 5,244,913Segment assets 9,749,407 1,905,027 8,403,109 20,057,544Depreciation and amortization 386,652 139,673 349,507 875,833
Expenditures to acquire long-lived assets 1,015,721 264,884 489,788 1,770,394
Thousands of U.S. dollars
Used-car Franchising Corporate/2004 sales business business (eliminations) Consolidated
Sales to external customers $1,048,020 $63,867 $ — $1,111,888Intersegment sales/transfers — — — —
Total 1,048,020 63,867 — 1,111,888Operating costs and expenses 977,765 33,965 30,382 1,042,113
Operating income 70,255 29,902 (30,382) 69,775Segment assets 116,740 19,968 102,535 239,242Depreciation and amortization 5,873 255 3,236 9,363
Expenditures to acquire long-lived assets 15,870 1,231 2,704 19,805

30
Operating costs and expenses shown as “Corporate” are mainly administrative division expenses of theCompany’s headquarters. The major components of “Segment assets” shown as “Corporate” are theCompany’s surplus funds included in “Cash and cash equivalents” and short-term investments, and assetsof the administrative division.
There are no major geographic areas other than Japan in which sales and assets are material. The ratio offoreign customer sales to consolidated sales is also immaterial, meaning less than 10%.
14. Related Party Transactions
The Company’s transactions with its directors for the years ended February 29, 2004 and February 28, 2003were as follows:
Thousands Thousands Thousands ofof yen of yen U.S. dollars
2004 2003 2004
Sales of vehicles ¥13,590 ¥11,049 $124Purchase of vehicles 921 — 8Rental expense for company houses 14,482 11,510 132
The terms and conditions of these transactions were determined in accordance with the Company’sinternal rules.
The Company sold vehicles and supplies to Tokyo My Car Co., Ltd., which is wholly owned by YusukeHatori, a director of the Company. The Company’s directors own the majority of the voting rights of itsBoard of Directors. Sales for the years ended February 29, 2004 and February 28, 2003 were ¥34,174 thou-sand ($311 thousand) and ¥11,139 thousand, respectively. The terms and conditions of these sales trans-actions were the same as those available to other customers in the ordinary course of business.
Kenichi Hatori, a director, guaranteed the Company’s obligations in connection with used-car auctionsand the Company’s leased assets for the years ended February 29, 2004 and February 28, 2003. Suchguarantees are provided by the directors to the Company without any compensation being paid.
15. Subsequent Events
The following appropriation of the Company’s retained earnings in respect of the year ended February 29,2004 was approved by the shareholders at the annual general meeting held on May 26, 2004.
Thousands Thousands ofof yen U.S. dollars
Cash dividends (¥75 per share) ¥757,789 $6,912Bonuses to directors and corporate auditors 83,600 762
Total ¥841,389 $7,675

31ANNUAL REPORT 2004
The Board of Directors
Gulliver International Co., Ltd.
We have audited the accompanying consolidated balance sheets of Gulliver International Co., Ltd. and its subsidiaries as of
February 29, 2004 and February 28, 2003, and the related consolidated statements of income, shareholders’ equity, and cash
flows for the years then ended, all expressed in Japanese Yen. These consolidated financial statements are the responsibility of
the Company’s management. Our responsibility is to express an opinion on these consolidated financial statements based on
our audits.
We conducted our audits in accordance with auditing standards, procedures and practices generally accepted and applied in
Japan. Those standards require that we plan and perform the audit to obtain reasonable assurance about whether the consoli-
dated financial statements are free of material misstatement. An audit includes examining, on a test basis, evidence supporting
the amounts and disclosures in the consolidated financial statements. An audit also includes assessing the accounting princi-
ples used and significant estimates made by management, as well as evaluating the overall consolidated financial statement
presentation. We believe that our audits provide a reasonable basis for our opinion.
In our opinion, the consolidated financial statements referred to above present fairly, in all material respects, the consolidated
financial position of Gulliver International Co., Ltd. and its subsidiaries as of February 29, 2004 and February 28, 2003, and the
consolidated results of their operations and their cash flows for the years then ended in conformity with accounting principles
and practices generally accepted in Japan (see Note 2).
The amounts expressed in U.S. dollars, which are provided solely for the convenience of the reader, have been translated on
the basis set forth in Note 2 to the accompanying consolidated financial statements.
Yusei Audit Corporation
Tokyo, Japan
May 26, 2004
Report of Independent Auditors

32
Non-Consolidated Balance Sheets (Unaudited)As of February 29, 2004 and February 28, 2003(Supplemental Information)Gulliver International Co., Ltd.
Thousands ofThousands Thousands U.S. dollars
of yen of yen (Note 1)
ASSETS 2004 2003 2004
Current assets:Cash and cash equivalents ¥07,811,087 ¥05,655,527 $071,256Short-term investments 236,689 78,188 2,159Accounts receivable:
Trade 4,805,523 3,083,870 43,838Allowance for doubtful accounts (86,171) (37,523) (786)
4,719,352 3,046,347 43,052Inventories 1,528,096 1,415,060 13,940Deferred income tax assets 383,209 207,346 3,496Other current assets 1,119,708 864,126 10,214
Total current assets 15,798,145 11,266,599 144,117
Property and equipment:Land 327,075 323,011 2,984Buildings and structures 4,371,645 3,527,873 39,880Furniture, fixtures and equipment 1,806,723 1,476,031 16,482Construction in progress 39,293 31,642 358
6,544,739 5,358,557 59,704Less—Accumulated depreciation (2,179,368) (1,674,478) (19,881)
Net property and equipment 4,365,370 3,684,080 39,823
Investments and other assets:Investment securities 538,189 532,538 4,910Leasehold and guarantee deposits 1,983,472 1,640,375 18,094Deferred income tax assets 199,802 176,569 1,823Software costs, net 1,196,204 1,216,905 10,912Other assets 694,043 680,341 6,331Allowance for doubtful accounts (262,921) (266,189) (2,398)
Total investments and other assets 4,348,791 3,980,545 39,672
¥24,512,307 ¥18,931,226 $223,612
Notes: 1. Translation into U.S. dollars has been made on the basis of ¥109.62=$1, the effective exchange rate at February 29, 2004.
2. Retained earnings included the legal reserve, which was ¥39,556 thousand ($360 thousand) and ¥39,556 thousand as of February 29, 2004 and February 28, 2003, respectively.

33ANNUAL REPORT 2004
Thousands ofThousands Thousands U.S. dollars
of yen of yen (Note 1)
LIABILITIES AND SHAREHOLDERS’ EQUITY 2004 2003 2004
Current liabilities:Accounts payable:
Trade ¥02,761,961 ¥01,783,863 $025,195Other 1,535,059 1,373,701 14,003
Accrued income taxes 2,338,400 1,209,793 21,332Accrued bonuses 369,914 275,139 3,375Other current liabilities 1,727,477 1,215,937 15,759
Total current liabilities 8,732,813 5,858,438 79,664
Long-term liabilities:Guarantee deposits received 647,437 743,102 5,906Other liabilities — 50 —
Total long-term liabilities 647,437 743,152 5,906
Shareholders’ equity:Common stock:
Authorized 40,000,000 sharesIssued 10,557,200 shares in 2004Issued 10,488,800 shares in 2003 3,954,882 3,849,820 36,078
Additional paid-in capital 3,943,997 3,725,460 35,979Retained earnings (Note 2) 9,305,273 6,470,226 84,886Unrealized holding losses on available-for-sale securities (2,646) (27,284) (24)
17,201,506 14,018,222 156,919
Less—Treasury stock (2,069,450) (1,688,588) (18,878)
Total shareholders’ equity 15,132,056 12,329,634 138,041
¥24,512,307 ¥18,931,226 $223,612

34
Non-Consolidated Statements of Income (Unaudited)For the years ended February 29, 2004 and February 28, 2003(Supplemental Information)Gulliver International Co., Ltd.
Thousands ofThousands Thousands U.S. dollars
of yen of yen (Note)
2004 2003 2004
Net sales ¥114,991,215 ¥91,071,908 $1,048,998
Costs and expenses:Cost of sales 87,343,009 69,274,012 796,780Selling, general and administrative expenses 20,482,247 16,765,726 186,848
107,825,257 86,039,738 983,628
Operating income 7,165,957 5,032,169 65,370
Other income (expenses):Losses on disposal of software, property and equipment (135,091) (116,816) (1,232)Other, net 36,509 8,493 333
(98,581) (108,323) (899)
Income before income taxes 7,067,376 4,923,845 64,471
Income taxes:Current 3,420,807 2,158,825 31,206Deferred (217,079) 97,329 (1,980)
3,203,728 2,256,155 29,226
Net income ¥003,863,649 ¥02,667,689 $0,035,246
U.S. dollarsYen Yen (Note)
2004 2003 2004
Net income per share:Basic ¥000,0374.83 ¥00,0264.80 $0,0003.42Diluted 366.79 263.67 3.35
Cash dividends per share 115 80 1.05
Note: Translation into U.S. dollars has been made on the basis of ¥109.62= $1, the effective exchange rate at February 29, 2004

35ANNUAL REPORT 2004
Non-Consolidated Statements of Shareholders’ Equity (Unaudited)For the years ended February 29, 2004 and February 28, 2003(Supplemental Information)Gulliver International Co., Ltd.
Thousands of yen
Unrealizedholding gains/
Number of Additional (losses) onshares of Common paid-in Retained available-for- Treasury
common stock stock capital earnings sale securities stock
Balance at February 28, 2002 10,488,800 ¥3,849,820 ¥3,725,460 ¥4,421,194 ¥(20,710) ¥(1,013,502)Net income for the year 2,667,689Unrealized holding losses on available-for-sale securities (6,574)
Cash dividends paid (555,957)Bonuses to directors and corporate auditors (62,700)
Purchase of treasury stock (675,086)
Balance at February 28, 2003 10,488,800 3,849,820 3,725,460 6,470,226 (27,284) (1,688,588)Net income for the year 3,863,649Unrealized holding losses on available-for-sale securities 24,638
Cash dividends paid (955,453)Bonuses to directors and corporate auditors (73,150)
Purchase of treasury stock (1,190,886)Reissuance of treasury stock 113,475 810,024Common stock issued 68,400 105,062 105,062
Balance at February 29, 2004 10,557,200 ¥3,954,882 ¥3,943,997 ¥9,305,273 ¥ (2,646) ¥(2,069,450)
Thousands of U.S. dollars (Note)
Unrealizedholding gains/
Additional (losses) onCommon paid-in Retained available-for- Treasury
stock capital earnings sale securities stock
Balance at February 28, 2003 $35,120 $33,985 $59,024 $(249) $(15,404)Net income for the year 35,246Unrealized holding losses on available-for-sale securities 225
Cash dividends paid (8,716)Bonuses to directors and corporate auditors (667)Purchase of treasury stock (10,864)Reissuance of treasury stock 1,035 7,389Common stock issued 958 958
Balance at February 29, 2004 $36,078 $35,979 $84,886 $ (24) $(18,878))
Note: Translation into U.S. dollars has been made on the basis of ¥109.62= $1, the effective exchange rate at February 29, 2004.

36
GULLIVER INTERNATIONAL CO., LTD.
Head Office
5F, Shin-Tokyo Building,
3-3-1 Marunouchi, Chiyoda-ku,
Tokyo 100-0005, Japan
IR Section
Telephone: 81-3-5208-5503
Fax: 81-3-5208-5513
URL: (investor relations) http://www.glv.co.jp
(vehicle information) http://221616.com
Established
October 25, 1994
Fiscal Year
The end of February
Paid-in Capital
¥3,954 million
Number of Employees
1,420
Total Number of Shares Authorized
40,000,000
Total Number of Shares Issued
10,557,200
Unit of Shares
10 shares
Securities Code
7599
Transfer Agent
The Chuo Mitsui Trust & Banking
Company, Limited
3-33-1 Shiba, Minato-ku,
Tokyo 105-8574, Japan
Stock Exchange Listing
Tokyo
Number of Shareholders
4,132
Major Shareholders (As of February 29, 2004)
Number of shares Percentage of totalheld (Shares) shares issued (%)
Forward Co., Ltd. 2,800,000 26.52Yusuke Hatori 946,500 8.96Takao Hatori 946,500 8.96Goldman Sachs International Ltd. 773,520 7.32The Master Trust Bank of Japan, Ltd. (Held in trust account) 736,880 6.97Gulliver International Co., Ltd. 453,343 4.29Kenichi Hatori 423,490 4.01Deutsche Bank AG London PP Nontreaty Clients 613 320,500 3.03Bank of New York for Goldman Sachs International (Equity) 269,860 2.55Japan Trustee Services Bank, Ltd. (Held in trust account) 255,800 2.42
CORPORATE DATA (As of February 29, 2004)
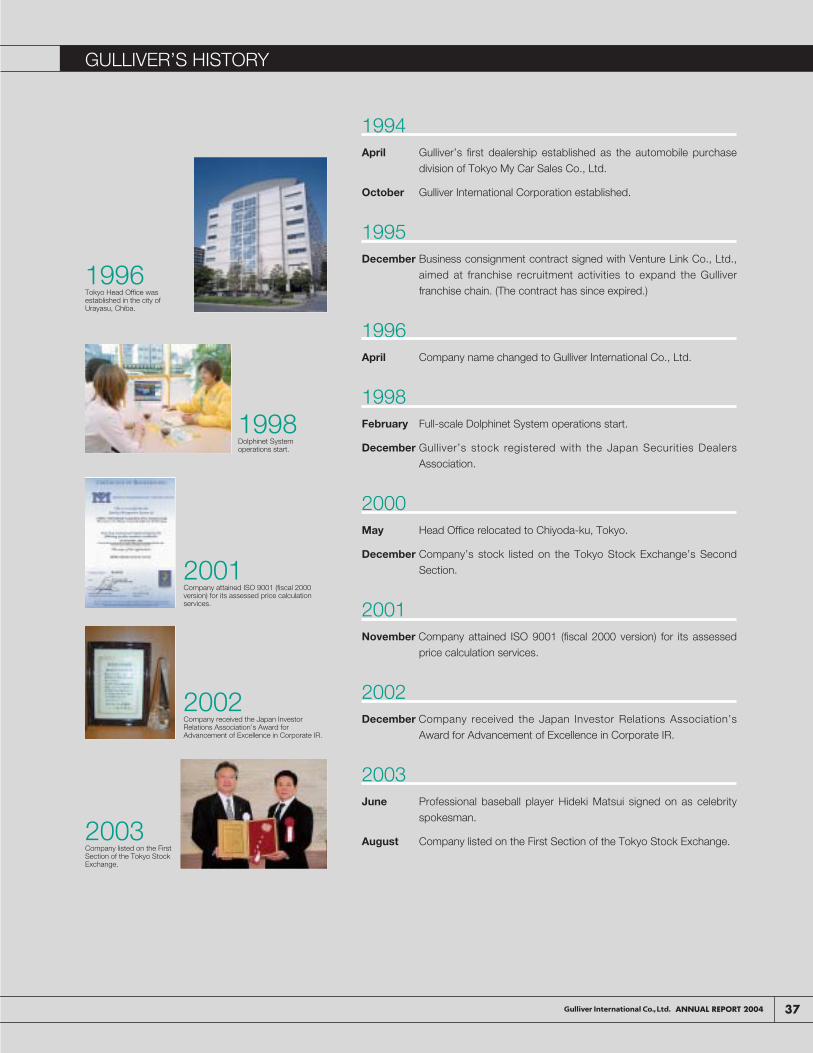
GULLIVER’S HISTORY
37ANNUAL REPORT 2004
1994April Gulliver’s first dealership established as the automobile purchase
division of Tokyo My Car Sales Co., Ltd.
October Gulliver International Corporation established.
1995December Business consignment contract signed with Venture Link Co., Ltd.,
aimed at franchise recruitment activities to expand the Gulliverfranchise chain. (The contract has since expired.)
1996April Company name changed to Gulliver International Co., Ltd.
1998February Full-scale Dolphinet System operations start.
December Gulliver’s stock registered with the Japan Securities DealersAssociation.
2000May Head Office relocated to Chiyoda-ku, Tokyo.
December Company’s stock listed on the Tokyo Stock Exchange’s SecondSection.
2001November Company attained ISO 9001 (fiscal 2000 version) for its assessed
price calculation services.
2002December Company received the Japan Investor Relations Association’s
Award for Advancement of Excellence in Corporate IR.
2003June Professional baseball player Hideki Matsui signed on as celebrity
spokesman.
August Company listed on the First Section of the Tokyo Stock Exchange.
1996Tokyo Head Office wasestablished in the city ofUrayasu, Chiba.
1998Dolphinet Systemoperations start.
2003Company listed on the FirstSection of the Tokyo StockExchange.
2001Company attained ISO 9001 (fiscal 2000version) for its assessed price calculationservices.
2002Company received the Japan InvestorRelations Association’s Award forAdvancement of Excellence in Corporate IR.

http://www.glv.co.jp
http://221616.com
This report is printed on recycled paper made from 100% used paper (whiteness 87%) and by using soybean oil ink.
It is printed without the use of water to prevent hazardous liquid waste.
Printed on recycled paper madefrom 100% used paper(whiteness 87%)
Printed in Japan
AN
NU
AL R
EPO
RT 2
004