annual report 2005 - morningstar, inc
TRANSCRIPT

Year ended 31 December 2005 Annual report and accounts 98th financial year Premuda This report is based on Premuda’s annual report For the period ending 31 December 2005. The Premuda financial statements were audited by Deloitte & Touche S.p.A. and are available in Italian.

2

3
TABLE OF CONTENTS Board of Directors 5 Group’s Structure 7 Group’s Fleet 9 Financial highlights 11 Premuda Spa: Management report 13 Premuda Group: Management report 23 Financial Statements 39 Notes 47

4
5
Board of directors president Alcide Rosina vice president Giacomo Costa managing director Stefano Rosina directors Raffaele Agrusti Amerigo Borrini Claudio Campana Antonio Gozzi Anna Rosina Alessandro Zapponini general Stefano Rosina managers Marco Tassara
Board of statutory auditors president Giorgio Carbone auditors Giuseppe Alessio Vernì Alfio Lamanna alternate auditors Luigi Barberi Pier Luca Bubbi
Audit company Deloitte & Touche S.p.A. The mandate of the Board of Directors and the Board of Statutory Auditors will expire once the Financial Statements at December 31, 2007 are approved.

6

Holding CompanyShip-Management Company
Shipowning Company Commercial Company
90%
Monaco
Premuda(Monaco) Sam
Premuda International Sah
100%
Sider Navi Spa
25%
TBN Bulk 18.500 tpl TBN Bulk 18.500 tpl TBN Bulk 18.500 tpl TBN Bulk 18.500 tpl TBN Bulk 18.100 tpl TBN Bulk 18.100 tpl
100%
Perth - Australia
Australian FPSO Management Pty. Ltd.
Premuda Spa
Luxembourg
Napoli
(1)
(1)
m/t. Four Islandm/t. Four Baym/t. Framuram/t. Four Springsm/t. Four Moonm/t. Four Etoilesm/v. Four Coalm/t. F our Sun *m/t. F our Smile *m/t. F our Schooner *m/t. F our Glens **m/t. F our Lochs **
100%Premuda (Atlantic) Inc.Houston - USAMadeira
Moon Shipping - Serviçose Navegaçao Lda.
TBN Aframax 113.000 dwt ICE ClassTBN Aframax 113.000 dwt ICE Class
100%
MadeiraJep Navegaçao Lda.
Madeira
Madeira
Panamax Navegaçao Lda.
Premuda CharteringNavegaçao Lda.
MadeiraBrig Shipping Lda.
m/v. Four Earth
TBN Bulk 34.000 tpl TBN Bulk 34.000 tpl
m/t. Four Ketch *
100%
100%
100%
100%100%
Suezmax Navegaçao Lda.Madeira
Madeira
Four Vanguard - Serviçose Navegaçao Lda.
FPSO Four Vanguard
100%
m/v. Four Ironm/v. Four Sterlingm/v. Four Euro
m/v. Sider Larkm/v. Sider Power
Madeira
Madeira
Premuda BulkNavegaçao Lda.
Sider Navegaçao Lda.
75%
50%
* : long term time-charter** : bare-boat
Group structureoperative Companies at 31 March 2006

8
9
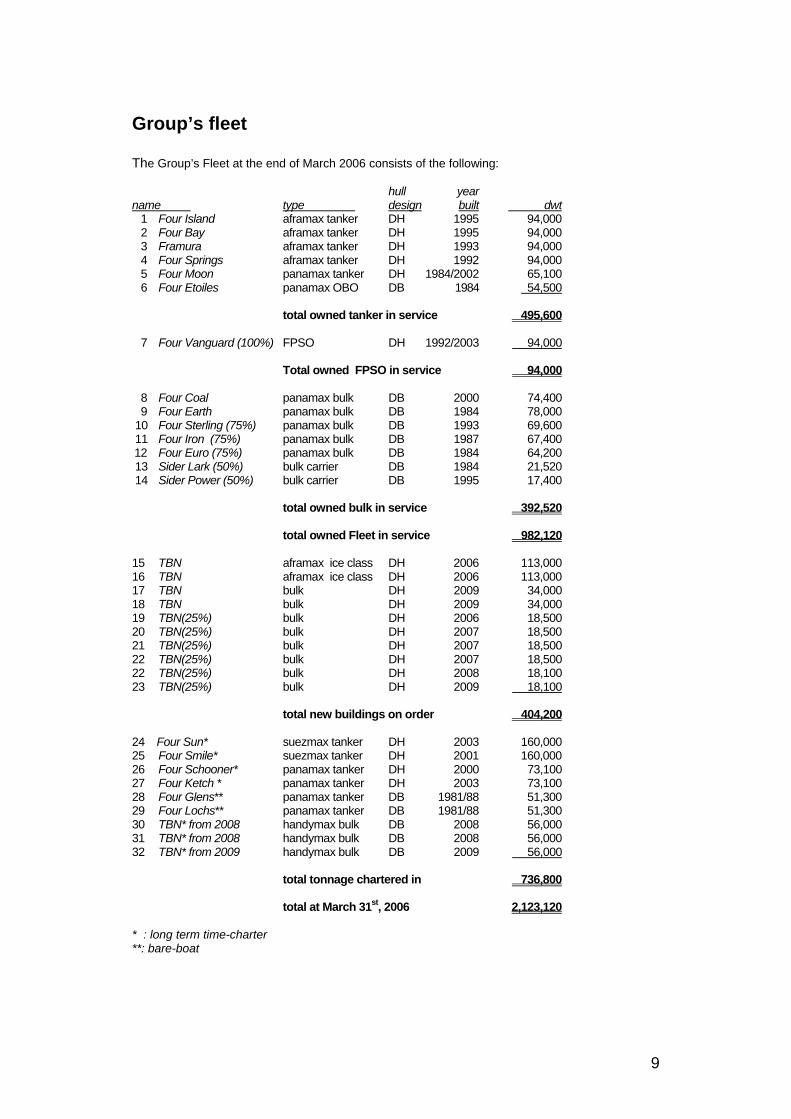
Group’s fleet The Group’s Fleet at the end of March 2006 consists of the following: hull year name type design built dwt
1 Four Island aframax tanker DH 1995 94,000 2 Four Bay aframax tanker DH 1995 94,000 3 Framura aframax tanker DH 1993 94,000 4 Four Springs aframax tanker DH 1992 94,000 5 Four Moon panamax tanker DH 1984/2002 65,100 6 Four Etoiles panamax OBO DB 1984 54,500 total owned tanker in service 495,600 7 Four Vanguard (100%) FPSO DH 1992/2003 94,000 Total owned FPSO in service 94,000 8 Four Coal panamax bulk DB 2000 74,400 9 Four Earth panamax bulk DB 1984 78,000 10 Four Sterling (75%) panamax bulk DB 1993 69,600 11 Four Iron (75%) panamax bulk DB 1987 67,400 12 Four Euro (75%) panamax bulk DB 1984 64,200 13 Sider Lark (50%) bulk carrier DB 1984 21,520 14 Sider Power (50%) bulk carrier DB 1995 17,400 total owned bulk in service 392,520 total owned Fleet in service 982,120 15 TBN aframax ice class DH 2006 113,000 16 TBN aframax ice class DH 2006 113,000 17 TBN bulk DH 2009 34,000 18 TBN bulk DH 2009 34,000 19 TBN(25%) bulk DH 2006 18,500 20 TBN(25%) bulk DH 2007 18,500 21 TBN(25%) bulk DH 2007 18,500 22 TBN(25%) bulk DH 2007 18,500 22 TBN(25%) bulk DH 2008 18,100 23 TBN(25%) bulk DH 2009 18,100 total new buildings on order 404,200 24 Four Sun* suezmax tanker DH 2003 160,000 25 Four Smile* suezmax tanker DH 2001 160,000 26 Four Schooner* panamax tanker DH 2000 73,100 27 Four Ketch * panamax tanker DH 2003 73,100 28 Four Glens** panamax tanker DB 1981/88 51,300 29 Four Lochs** panamax tanker DB 1981/88 51,300 30 TBN* from 2008 handymax bulk DB 2008 56,000 31 TBN* from 2008 handymax bulk DB 2008 56,000 32 TBN* from 2009 handymax bulk DB 2009 56,000 total tonnage chartered in 736,800 total at March 31st, 2006 2,123,120 * : long term time-charter **: bare-boat

10
11
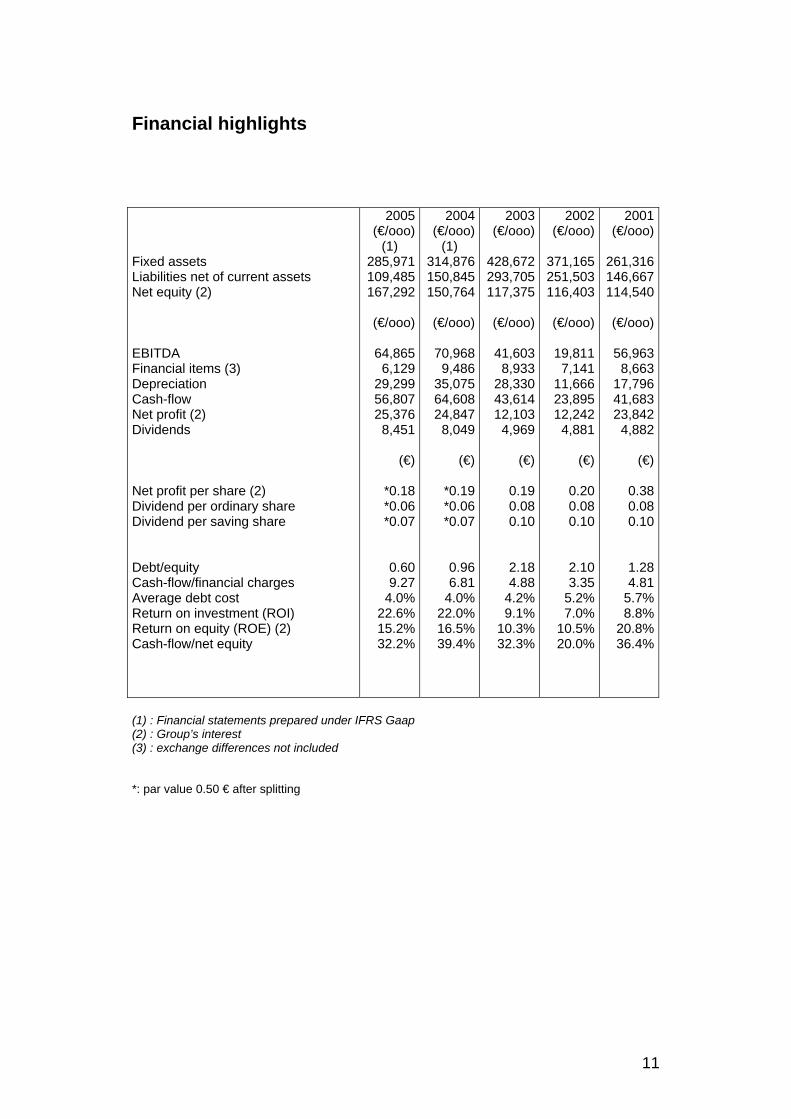
Financial highlights Fixed assets Liabilities net of current assets Net equity (2) EBITDA Financial items (3) Depreciation Cash-flow Net profit (2) Dividends Net profit per share (2) Dividend per ordinary share Dividend per saving share Debt/equity Cash-flow/financial charges Average debt cost Return on investment (ROI) Return on equity (ROE) (2) Cash-flow/net equity
2005(€/ooo)
(1) 285,971109,485167,292
(€/ooo)
64,8656,129
29,29956,80725,376
8,451
(€)
*0.18*0.06*0.07
0.609.27
4.0%22.6%15.2%32.2%
2004(€/ooo)
(1) 314,876150,845150,764
(€/ooo)
70,9689,486
35,07564,60824,847
8,049
(€)
*0.19*0.06*0.07
0.966.81
4.0%22.0%16.5%39.4%
2003(€/ooo)
428,672293,705117,375
(€/ooo)
41,6038,933
28,33043,61412,103
4,969
(€)
0.190.080.10
2.184.88
4.2%9.1%
10.3%32.3%
2002 (€/ooo)
371,165 251,503 116,403
(€/ooo)
19,811
7,141 11,666 23,895 12,242
4,881
(€)
0.20 0.08 0.10
2.10 3.35
5.2% 7.0%
10.5% 20.0%
2001(€/ooo)
261,316146,667114,540
(€/ooo)
56,9638,663
17,79641,68323,842
4,882
(€)
0.380.080.10
1.284.81
5.7%8.8%
20.8%36.4%
(1) : Financial statements prepared under IFRS Gaap (2) : Group’s interest (3) : exchange differences not included *: par value 0.50 € after splitting

12

13
Management Report Premuda S.p.A.

14
15
Dear Shareholders, As a start, we hereby wish to remind you that for the years 2005, 2006 and 2007, the Company’s Board of Directors has as its members Raffaele Agrusti, Amerigo Borrini, Claudio Campana, Giacomo Costa, Antonio Gozzi, Alcide Rosina, Anna Rosina, Stefano Rosina and Alessandro Zapponini. The President of the Board is Alcide Rosina, whose powers include among others the legal representation towards third parties as well as the ordinary and extraordinary business management, excluding however those acts assigned by law to the Board, and acts having a certain economic relevance with amounts exceeding specified limits such as: sale and purchase of ships; contracts for the use of vessels exceeding 36 months; acquisition and sale of subsidiaries; granting of medium/long-term loans to subsidiaries; provision of guarantees. The Managing Director is Stefano Rosina, who, apart from having powers of legal representation towards third parties, is in charge of running and coordinating the commercial activity and fleet operations, as well as the activity and management of Group Companies. The Vice President is Giacomo Costa. The Board has established two Committees, one for Internal Control and one for Remuneration. The purpose of the Committee for Internal Control is to review and assess issues related to the company’s activity and has proposal and consultancy functions. Its members are Giacomo Costa, and Claudio Campana. The meetings of this Committee are attended by the President of the Board of Statutory Auditors. The members of the Committee for Remuneration are the President and Raffaele Agrusti, and Antonio Gozzi. The purpose of this Committee is to advise the Board of Directors as to the remuneration of the President and the Managing Director and to set the remuneration criterias for the Senior Management of the Company and Group. The meetings of this Committee are also attended by the President of the Board of Statutory Auditors. In 2005, the Board of Directors met at five occasions. The meetings were all attended by the Board of Statutory Auditors. The attendees received, in application of a consolidated methodology, updated information on the market performance; commercial coverage and technical management of the Fleet; the dynamics of costs and the evolution of the economic results; on the performance and activity of subsidiary companies; the financial position; as well as all other operations and events that are of interest to the management. During the Financial Year there were no unusual transactions in relation to the ordinary business management to be reported and there were no transactions with related parties or in situations of conflict of interest. In 2005 as in the previous year, the only inter-group transactions that took place were related to the Group’s operational structure and were all concluded with or between subsidiaries or affiliated companies. These transactions consisted mainly of management activities, time-charters and financial support to which ordinary fees or remunerations were applied, always in line with normal practice and market value. In 2005 we continued to operate the m/tt. Four Glens and Four Lochs, which were in the year 2000, sold to Navigazione Italiana S.p.A. (main shareholder of Premuda S.p.A.) and chartered back, at the same time, under a bare boat agreement. The Bare Boat charter,

16
which was due to expire in August 2005, was renewed with a variable duration, in option to Premuda S.p.A. Subsidiaries or affiliates The activities carried out by our subsidiaries and affiliates during the Financial Year are detailed here under. However, for further information on each company, please refer to “the Notes on Financial Statements”. 1.0 Premuda International S.A.H., Luxembourg, a fully owned subsidiary, is the holding
company of the Group’s foreign assets. Its Financial Statements for 2005 showed a profit of € 16,740,795 (compared to a profit of € 4,249,317 registered in 2004).
Premuda International S.A.H. owns the following companies: 1.1 Premuda (Monaco) S.A.M., a 90% subsidiary, which carries out the commercial
and operational management of all the Group’s units registered under a foreign flag, realizing a profit of € 66,617 (compared to a profit of € 24,910 in 2004).
1.2 Brig Shipping Lda., Madeira, a fully owned subsidiary, formerly the owner of the
panamax tanker Four Brig, sold in October 2004. During the mentioned Financial Year, this subsidiary carried out exclusively financial activities and realized a profit of € 2,181,730, almost entirely generated by positive exchange differences (compared to a profit of € 2,686,144 in 2004).
1.3 Premuda Chartering Navegaçao Lda., Madeira, a fully owned subsidiary operating
in the oil transportation trading . In 2005 the company realized a profit of € 31,074 (compared to a profit of € 215,672 in 2004).
1.4 Premuda (Atlantic) Inc., Delaware, a fully owned subsidiary managing the
chartering of the fleet in the American area. In 2005 the company realized a profit of US$ 100,760 (compared to a profit of US$ 17,040 in 2004).
1.5 Premuda Bulk Navegaçao Lda., Madeira, a 75% subsidiary, owner of the three
panamax bulk carriers Four Iron, Four Sterling and Four Euro. In 2005 the company realized a profit of € 8,550,631 (Compared to a profit of € 9,303,732 in 2004).
1.6 Moon Shipping Serviços and Navegaçao Lda, Madeira, a fully owned subsidiary,
who ordered two new aframax Ice Class tankers to be delivered in 2006. The company closed the Financial Year with a loss of € 52,306.
1.7 JEP Navegaçao Lda, Madeira, a fully owned subsidiary, who sold a newbuilding
aframax tanker in June 2005 on delivery from Hyundai shipyard. The company had acquired the shipbuilding contract in August 2004. The result for the financial year shows a profit of € 7,744,187 (compared to a loss in 2004 of € 3,461).
1.8 Panamax Navegaçao Lda. - Madeira, a formerly 50% subsidiary that became fully
owned in 2005. In February 2004 this company sold its two vessels and chartered back the Four Ketch for three years.
During the Financial Year the company realized a profit of € 969,915 (compared to a profit of € 5,658,227 in 2004 which was mostly generated by the sale of the vessels).

17
1.9 Four Vanguard Serviços and Navegaçao Lda., Madeira, a 90% subsidiary (fully owned since early 2006), owner of FPSO Four Vanguard, operational since 2003 for the extraction of crude oil in Australia. In 2005, the company realized a profit of € 122,129 (compared to a profit of € 654,153 in 2004).
1.10 Australian FPSO Management PTY LTD, Australia, a fully owned subsidiary, responsible for the technical and operational management of the FPSO Four Vanguard. In 2005, the company realized a profit of AU$ 205,150 (approximately € 127,000) compared to a profit of AU$ 58,515 in 2004.
1.11 Suezmax Navegaçao Lda. Madeira, a fully owned subsidiary providing
administrative services to the other subsidiaries located in Madeira. The company generated a loss of € 153,164 (compared to a loss of € 123,226 in 2004).
--------------- The shareholding in the affiliates is listed below:
a) Sider Navegaçao Lda., Madeira, 50% owned through Premuda International S.A.H., operates in the minibulk sector mainly with sale and purchase and bare boat activities. The Company achieved a total profit of € 5,423,370, of which € 2,711,685 our share (in 2004 its profit was € 3,774,801, of which € 1,887,400 our share).
b) Sider Navi S.p.A., Naples, 25% directly owned by Premuda S.p.A. and non
operational for most of the year, has ordered 6 bulk-carrier units of 18,500 dwt with a delivery scheduled between 2006/2009. In 2005, the company generated a loss of € 186,746 which is justified by the launching of its activity.
Please refer to the Consolidated Financial Statements for a more detailed analysis of the markets in which the Company and its subsidiaries operate. Data and various information In line with the existing legislation in the majority of EU countries, Italy introduced a flat-rate taxation for the income of shipping companies through the system of tonnage tax. According to this new legislation, the income generated by the ships listed in the International Register is determined on the basis of their tonnage. The application of the new taxation regime is on a voluntary basis, however once implemented it must be applied for a minimum of ten years and must refer to all owned units. Vessels chartered to third parties under bare boat are excluded from this system – the income for these vessels is determined analytically – however the flat-rate taxation includes the capital gains that may arise from the sale of ships, with some limitations for units already owned as of the date of first application of the new regime. Premuda S.p.A. formally implemented the new income taxation regime since January the 1st 2005.
---------------
18
The average exchange rate euro/dollar was 1.248 in comparison to the 1.2441 rate registered in 2004. At the end of 2005 the euro/dollar exchange rate was 1.1797 (1.3621 at the end of 2004), with a 15.5% increase in value of the US currency compared to the end of 2004. It is important to highlight that our revenue is almost exclusively generated in dollars and that the vessels’ value is quoted on the market in this currency, whereas usually only part of the costs are born in dollars. Therefore, generally, a strong dollar has a positive impact, both in terms of Balance Sheet as well as Profit and Loss. However it is important to consider the effects that the exchange of loans in dollars into euro at the year-end exchange rate may have on the Financial Statements.
--------------- The free share capital increase, approved by the Board of Directors on 21st March 2005, was duly performed in May, according to the calendar agreed with Borsa Italiana. After we allocated one new ordinary share (maturity 1st January 2005) for each twenty ordinary and/or savings shares owned, the Share Capital was increased from € 67,064,976 to € 70,418,225, being 140,761,507 ordinary shares and 74,943 savings shares, each of which having a par value of € 0.50 each.
--------------- The Premuda ordinary share was regularly listed on the Stock Exchange. It is to be noted that 139,559,898 shares were exchanged in 2005, against 82,056,092 in the previous year. The total value of the trading through the Stock Exchange was € 233.4 million, compared to € 106.9 million registered in 2004. According to figures issued by Borsa Italiana S.p.A., this security had a positive performance of +30.42% on an annual basis, compared to 13.85% of securities on the MIB index. Based on the available data, at the 2005 year end the Company had 5,696 shareholders, which is 2,967 more than the previous year.
--------------- An agreement between the Company’s Shareholders is currently in effect for the 2005-2007 period, aiming to ensure uniformity and stability of management policies control. This agreement forbids the transfer of allocated shares and regulates the appointment of the Company officers, identifying Navigazione Italiana S.p.A. as the only body that can control Premuda S.p.A. through the Shareholder’s Agreement without, however, exercising management and co-ordination activities, pursuant to art. 2497 of the Italian Civil Code. The shares allocated in the Agreement represent 45% of the ordinary share capital and were allocated by Navigazione Italiana S.p.A. (27.5%), Assicurazioni Generali S.p.A. (12.5%) and by Duferco Italia Holding S.p.A. (5.0%). The Financial Statements as of 31st December 2005 were audited by Deloitte & Touche S.p.A., whose appointment for the three-year period 2004-2006 was approved at the Shareholders’ Meeting of 29th April 2004. Deloitte & Touche S.p.A. also audited the half-year Report 2005.
--------------- In accordance with the provisions of art. 2428 of the Italian Civil Code, we hereby inform

19
you that: - the Company did not carry out any research and development activity; - the Company does not own treasury shares; - the Company does not own shares or quotas of parent companies; - none of the subsidiaries own Company shares; - the Company has put in place hedging activities for risks arising from the variations in
exchange rates and interest rates through derivative financial instruments. More details are given in the Notes to the Financial Statements.
---------------
The shares held and/or traded by Directors, Statutory auditors and General Managers are mentioned in a specific prospectus (drawn up in accordance with art. 79 of the Regulation implementing the Legislative Decree No. 58/98) enclosed with the audited Italian Financial Statements. As of 31st December 2004, no purchase options on the Company’s shares were in place. Subsequently, upon a proposal of the Committee for Remuneration, the Board approved an option plan for the purchase of up to 2,000,000 Premuda shares for each of the 2005, 2006 and 2007 years. These options can be exercised by the President, the Managing Director and by the General Manager of the Company for 24 months starting from 1st January of the year following the year of allocation, at a price equivalent to the average price of the security registered a month prior to the option right assignation date (€ 1.80 per share for the options allocated in 2005). Following a proposal by the Committee for Remuneration, the Board also resolved to continue offering a bonus scheme to the Group’s senior management, linked to the results achieved each year and to the strengthening of the equity achieved over a period of three years. The 2005 global amount to be paid to senior managers, already entered into the Profit and Loss Account through a specific allocation, is of € 0.9 million. We have already allocated to a specific fund the 2005 pro-quota (corresponding to approximately € 0.9 million) of the potential bonus to be paid at the end of the three-year period.
--------------- Pursuant to article 1.3 of the Code of Corporate Governance of stock-listed companies, duties carried out by Directors in other stock-listed companies, i.e. financial companies, banks, insurance companies or companies of considerable size, are listed in a separate sheet attached to the Italian version of this report.
--------------- The company has set-up an implementation plan in conformity with the Legislative Decree 196/2003 (concerning the protection of personal data).
--------------- We hereby note that for the 2005 Financial Statements of Premuda S.p.A., national accounting standards were applied, as allowed by the provisions for the implementation of European Regulation n. 1606 of July 2002. In application of these provisions, the Group’s consolidated financial statements were prepared according to international
20
financial reporting standards (IFRSs) as issued by the International Accounting Standards Board (IASB). The comparative financial data for the previous period has been reclassified and restated as in the consolidation of the Semi-annual Report (which was also prepared according to international accounting standards).
---------------
Significant events after the balance sheet date and business outlook The sale of the Sider Capri and Sider Ponza multis, both built in 2002 and each totalling 10,300 dwt was concluded in January resulting in a capital gain of approximately 250,000 Euro.
21
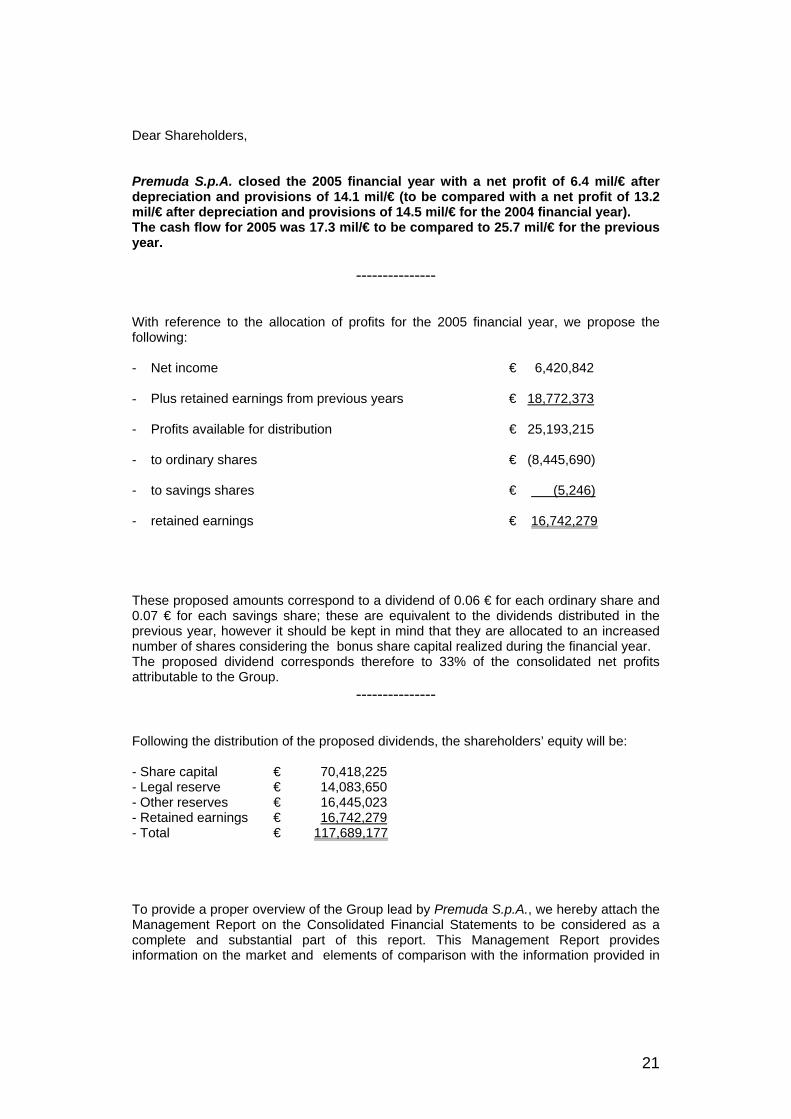
Dear Shareholders, Premuda S.p.A. closed the 2005 financial year with a net profit of 6.4 mil/€ after depreciation and provisions of 14.1 mil/€ (to be compared with a net profit of 13.2 mil/€ after depreciation and provisions of 14.5 mil/€ for the 2004 financial year). The cash flow for 2005 was 17.3 mil/€ to be compared to 25.7 mil/€ for the previous year.
---------------
With reference to the allocation of profits for the 2005 financial year, we propose the following: - Net income € 6,420,842 - Plus retained earnings from previous years € 18,772,373 - Profits available for distribution € 25,193,215 - to ordinary shares € (8,445,690) - to savings shares € (5,246) - retained earnings € 16,742,279 These proposed amounts correspond to a dividend of 0.06 € for each ordinary share and 0.07 € for each savings share; these are equivalent to the dividends distributed in the previous year, however it should be kept in mind that they are allocated to an increased number of shares considering the bonus share capital realized during the financial year. The proposed dividend corresponds therefore to 33% of the consolidated net profits attributable to the Group.
--------------- Following the distribution of the proposed dividends, the shareholders’ equity will be: - Share capital € 70,418,225 - Legal reserve € 14,083,650 - Other reserves € 16,445,023 - Retained earnings € 16,742,279 - Total € 117,689,177 To provide a proper overview of the Group lead by Premuda S.p.A., we hereby attach the Management Report on the Consolidated Financial Statements to be considered as a complete and substantial part of this report. This Management Report provides information on the market and elements of comparison with the information provided in

22
the previous financial years as well as elements on the performance of the fleet, the cost and revenues of the ships managements and all significant events dated after the balance sheet and the business outlook. In conclusion of our report we would like to thank all the Group’s employees for their precious cooperation, on land and at sea, and assure them of our gratitude and firm confidence for the future. 24 March 2006 the Board of Directors

23
Management Report on the consolidated financial statements

24

25
Dear Shareholders, The market was largely satisfactory for the 2005 fiscal year for all of the three company’s sectors, though to a lesser extent than the previous year. The scenarios for each sector are outlined below. Tanker sector In 2005 the tanker fleet grew by 7.7% with reference to the 2004 fiscal year, by this exceeding 346 million dead weight tons. This strong growth confirms and accelerates the trend noticed in recent years which is materialized by a 19.2% increase over the last four years. At the end of 2005, the order book for new tankers corresponded to 82.2 million dwt, or 24.6% of the active fleet (in comparison to a percentage of 27.9% at the end of 2004).
--------------- The volume of demolitions in 2005 was 4.1 million dwt, representing a clear reduction compared to 2004 (-48%); the price of demolished tonnage fell to 305 dollars in 2005 against 365 dollars in 2004 (-16.4%).
---------------
In 2005, sale and purchase transactions for second hand tonnage were kept at a very high level, as to volumes and prices. Sales involved 338 units of 31.8 million dwt and corresponding to 12.0 billion dollars (in 2004, 414 units of 42.6 dwt were sold for a global amount of 11.7 billion dollars). Out of the 338 vessels transferred there were 34 VLCC’s, 52 suezmax’, 64 aframax’ and 188 handysize.
--------------- Freight rates were certainly satisfactory, though decreasing when compared to the record level of 2004, as illustrated in table 5 below. The yearly average is the result of an ascending performance which begun in the first quarter and then declined until the last period of the year when the consequences of the hurricanes devastating the Gulf of Mexico gave wind to a significant rebound.
--------------- Despite the fact that freight rates for the first two months of 2006 were higher than the 2005 average, it is however reasonable to forecast a final average to be lower than 2005, although satisfactory. Further details on this sector are presented in the following tables. Table 1 illustrates the demand for tonnage and shows the volumes of crude oil and refined products transported by sea: in 2005 crude oil and refined products were increased respectively by 3% and 6.2%.

26
(Table 1) Quantities transported by sea (millions of tons) year crude oil products quantity change quantity change 2000 1,656 - 518 - 2001 1,684 1.7% 545 5.1% 2002 1,667 - 1.0% 544 - 0.2% 2003 1,770 6.2% 582 7.0% 2004 1,850 4.5% 621 6.7% 2005 1,905 3.0% 659 6.2% Since the increasing trend for short routes (e.g., Venezuela/United States as opposed to Arabian Gulf/United States) continued in 2005, the impact generated by the quantities transported, on the vessels’ demand, is not as important as it would be thought.
---------------
The tables below analyse the extent and features of the tanker fleet in recent years, including deliveries of new tonnage, scrapping activity and orders acquired by shipyards. Tanker fleet Order book (Table 2) at end of year (million dwt) As at end of 2005 2001 2002 2003 2004 2005 Total % of fleet VLCC + 200,000 125.5 124.8 126.1 131.7 139.4 27.9 20.0% Suezmax 120-200,000 39.4 41.8 43.4 45.7 49.5 9.5 19.3% Aframax 80-120,000 50.6 53.7 58.9 62.3 68.0 16.7 24.6% Panamax 55-80,000 14.9 14.5 14.6 16.5 18.9 8.8 46.7% Small 10- 55,000 60.2 60.4 62.1 65.6 70.6 22.3 31.5% 290.6 295.2 305.1 321.7 346.4 82.2 24.6% (Table 3) Deliveries of new tonnage/demolitions (in million dwt) 2001 2002 2003 2004 2005 VLCC + 200.000 7.8 8.6 12.0 10.9 11.8 10.0 8.9 1.1 9.2 0.3 Suezmax 120-200.000 2.5 4.2 3.7 1.6 3.7 2.2 4.2 1.5 4.0 0.3 Aframax 80-120.000 1.5 1.5 3.8 1.5 8.3 3.2 5.6 2.3 7.0 1.6 Panamax 55- 80.000 0.3 0.4 0.6 0.4 1.6 1.2 2.7 1.0 3.2 0.5 Small 10- 55.000 2.1 1.2 3.3 2.7 5.2 2.9 6.7 1.9 6.2 1.4 Total . 14.2 15.9 23.4 17.1 30.5 19.5 28.1 7.8 29.7 4.1
--------------- The age profile of the tanker fleet is indicated in table 4.

27
(Table 4) Age profile of the tanker fleet as at 1 March 2006
(million dwt) 0-9 years 10-14 years 15-19 years > 20 years total VLCC + 200.000 83,608 37,762 14,150 4,831 140,351 Suezmax 120-200,000 30,428 11,472 4,848 3,317 50,066 Aframax 80-120,000 41,186 11,125 10,068 6,473 68,853 Panamax 60-80,000 10,720 1,825 2,101 4,616 19,263 Small 10-60,000 36,260 7,600 7,327 19,983 71,169 202,203 69,784 38,495 39,220 349,702 The age of the fleet is obviously a very significant element in the assessment of its future extent and thus the magnitude of the tonnage available. During the last few years, the average age has progressively decreased and it is evident that the renewal process will proceed according to the volume of new deliveries and the tonnage due for compulsory demolition in upcoming years (with particular reference to 2010).
--------------- Table number 5 illustrates the average freight rates (Usd/Day - time charter equivalent) for spot voyages, for different tonnage classes. (Table 5) average freight rates for spot voyages year clean aframax suezmax VLCC . $/g chg $/g chg $/g chg $/g chg 1997 15,718 - 21,109 - 23,753 - 34,691 - 1998 12,486 -21% 16,425 -22% 21,277 -10% 31,968 -8% 1999 9,872 -21% 13,059 -20% 15,189 -29% 19,775 -38% 2000 18,467 87% 33,150 154% 39,390 159% 50,353 155% 2001 24,950 35% 30,759 -7% 30,420 -23% 36,017 -28% 2002 13,940 -44% 18,954 -38% 18,647 -39% 22,029 -39% 2003 22,032 58% 34,212 80% 41,648 123% 52,433 138% 2004 27,707 26% 49,592 45% 74,975 80% 96,055 83% 2005 29,954 8% 41,650 -16% 53,579 -29% 60,319 -37% clean: 20/35,000 dwt vessels used to transport clean petroleum products aframax: 80/110.000 dwt vessels. suezmax: 110/160,000 dwt vessels. VLCC: Modern construction 250/320,000 dwt vessels. The table demonstrates the exceptional level of tanker rates within the 2003/2005 period, for all fleet sectors.
Bulk sector In 2005 the bulk fleet grew by 7.0% to reach almost 345 million dead weight tons. This strong growth confirms the trend of the last four years, during which the fleet increased by 17.1%. At the end of 2005, the order-book for new bulk carriers was equivalent to 64.0 million dwt, which corresponds to 18.6% of the active fleet (this percentage was 20.8% at the end of 2004).

28
--------------- As in the previous year, the volume of demolitions in 2005 was at a very low total of 1.0 million dwt. Prices of tonnage sold for demolition dropped from 380 to 330 dollars per ton (-13.2%).
--------------- In 2005, sales transactions on the second hand market were kept at very high levels, both from the volume and price point of view. Sales involved 403 units (42 capesize, 99 panamax, 100 handymax and 162 handy) totalling 22.8 million dwt and a value of 9.1 billion dollars (sales in 2004 involved 544 units equalling 28.6 dwt. and a value of 9.4 billion dollars).
--------------- Freight rates were certainly satisfactory, even though decreasing in comparison to the record levels of 2004, as illustrated in table 5 below. The year average is the result of a declining performance; As a matter of fact, despite exceedingly high levels in the beginning of the year and some rallying in the autumn, a constantly downward trend has followed. The decrease in the steel production, the deceleration of the Chinese Economy and the considerable minor impact of port congestion (which in 2004 had blocked significant parts of the fleet) were important factors to this performance. The declining trend in the market continued in the first months of 2006 and it is difficult to forecast a significant recovery in freight rates. However, in absolute terms these rates remain acceptable. Further details on the drybulk sector are presented in the following tables. Table 1 shows the volumes of dry bulk commodities transported by sea. There is a significant increase in quantities transported, from 2,042 million tons in 2000 to 2,536 million tons in 2005 (+24.2%). (Table 1) Quantities transported by sea (millions of tons) year minerals coal grain other total changes 2000 448 524 264 806 2,042 - 2001 451 556 260 828 2,095 2.6% 2002 481 579 271 841 2,172 3.7% 2003 519 632 264 876 2,291 5.5% 2004 589 654 273 910 2,426 5.9% 2005 651 682 273 930 2,536 4.6%
---------------

29
The tables below analyse the extent and features of the bulker fleet in recent years, including deliveries of new tonnage, scrapping activity and orders finalized by shipyards. Extent of fleet Order book (Table 2) as at end of year (million dwt) as at end of 2005 2002 2003 2004 2005 Total % of fleet Capesize 100.000+ 89.2 93.5 102.1 110.8 26.2 23.7% Panamax 60-100.000 79.8 80.1 86.4 93.7 21.1 22.6% Handymax 40-60.000 54.4 57.2 61.1 66.4 12.1 18.3% Handy 10-40.000 72.1 71.3 72.7 74.1 4.6 6.2% 294.6 302.1 322.3 344.9 64.0 18.6% (Table 3) Deliveries of new tonnage/demolitions (in million dwt) 2002 2003 2004 2005 Capesize 100.000+ 3.7 1.3 5.0 0.6 7.4 0.0 8.8 0.2 Panamax 60-100.000 4.6 1.4 1.9 0.6 6.3 0.0 7.2 0.2 Handymax 40-60.000 4.4 0.5 3.3 0.6 4.1 0.1 5.4 0.2 Handy 10-40.000 1.6 2.8 1.4 2.2 1.9 0.3 1.9 0.4 14.3 6.0 11.6 4.0 19.7 0.5 23.4 1.0 In the 2002-2005 four year period, the bulk fleet increased significantly from 294.6 to 344.9 million tons (+17.1%). The age profile of the bulk fleet on March the 1st 2006 is presented in table 4. (Table 4) Age profile of the bulk fleet on March the 1st 2006
(million dwt) 0-9 years 10-14 years 15-19 years >20years total Capesize + 100,000 57,360 20,107 18,559 16,720 112,745 Panamax 60-100,000 51,344 13,368 8,964 21,199 94,875 Handymax 40-60,000 37,455 8,819 6,247 14,553 67,075 Handy 10- 40,000 17,634 5,233 5,693 45,344 73,904 163,793 47,527 39,464 97,816 348,599 The fleet’s age is obviously a very significant element allowing an estimate of the fleet’s consistency in the future and therefore the importance of available tonnage on the market. We can however observe that in the last couple of years, the average age has progressively decreased and it is therefore evident that the renewal process will continue increasing, as a result of the delivery of new buildings and the expected demolitions (which can only increase considering the very low volumes observed in recent years).
---------------

30
Table number 5 illustrates the progress of bulk freight rates for spot voyages (Usd/day – time charter equivalent), for different tonnage categories. (Table 5) Average freight rates for spot voyages year Capesize Panamax Handymax $/g var% $/g var% $/g var% 2000 24,724 - 10,700 - 8,970 - 2001 15,524 -37% 8,709 -19% 8,206 -9% 2002 11,654 -25% 7,284 -16% 8,761 +6% 2003 37,563 +228% 19,091 +162% 16,706 +93% 2004 70,395 +87% 33,950 +78% 31,987 +91% 2005 51,613 -27% 22,931 -32% 24,020 -25% The above table shows the exceptionally high level of the freight rates applied to all the fleet’s sectors in the 2003-2005 three year period. FPSO sector
Considering, the exceedingly high level of crude oil prices, the off-shore petroleum sector is undergoing a substantial development. There are currently 110 FPSO’s and a growth of approximately 400% is to be noticed in the last decade. The existing and scheduled FPSO’s can be substantially divided in two groups:
The first group is mainly characterized by high technology and a high level of investment, for operation at great depths in extensive, high potential petroleum fields. The complexity of the equipment is also due to the increasing exploitation of wells from which an ever increasing quantity of gas is extracted together with the crude oil. This therefore involves working with gas processing facilities in order to allow transportation by gas carrier vessels.
The second group of FPSO’s , is less complex technologically, requires a lower level of investment and involves shallow to medium depth petroleum wells with a low percentage of gas in respect to the crude oil that is extracted. The good level of freight rates in the tanker market has created some difficulty in finding hulls to be coverted into FPSOs and is therefore reflected in the increasing value of this type of vessels.
VLCCs are the best suited vessels for conversion into FPSOs for the Brazilian and West African petroleum fields , while Aframaxes are the most requested for the Far eastern and Australian market, currently undergoing a substantial development.
Despite its substantial complexity and the level of investment required, the FPSO sector will most likely continue to expand considering the increasing demand for crude oil.
31
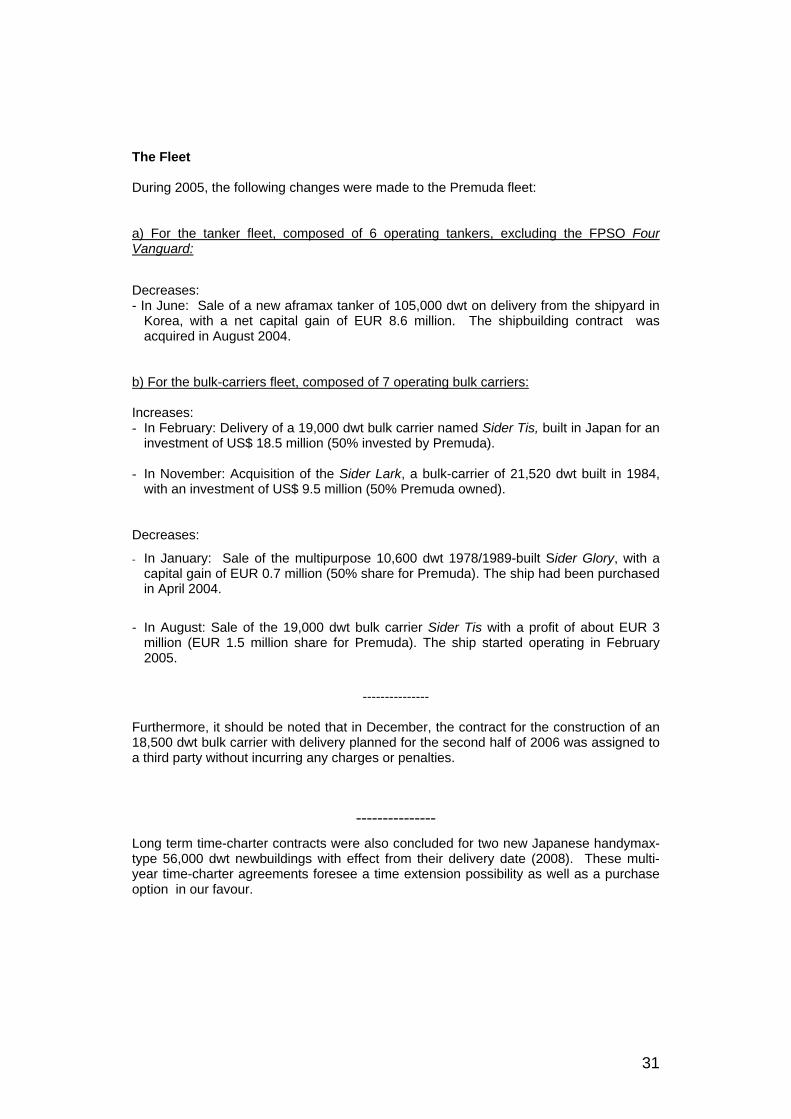
The Fleet During 2005, the following changes were made to the Premuda fleet: a) For the tanker fleet, composed of 6 operating tankers, excluding the FPSO Four Vanguard:
Decreases: - In June: Sale of a new aframax tanker of 105,000 dwt on delivery from the shipyard in
Korea, with a net capital gain of EUR 8.6 million. The shipbuilding contract was acquired in August 2004.
b) For the bulk-carriers fleet, composed of 7 operating bulk carriers: Increases: - In February: Delivery of a 19,000 dwt bulk carrier named Sider Tis, built in Japan for an
investment of US$ 18.5 million (50% invested by Premuda). - In November: Acquisition of the Sider Lark, a bulk-carrier of 21,520 dwt built in 1984,
with an investment of US$ 9.5 million (50% Premuda owned). Decreases:
- In January: Sale of the multipurpose 10,600 dwt 1978/1989-built Sider Glory, with a capital gain of EUR 0.7 million (50% share for Premuda). The ship had been purchased in April 2004.
- In August: Sale of the 19,000 dwt bulk carrier Sider Tis with a profit of about EUR 3 million (EUR 1.5 million share for Premuda). The ship started operating in February 2005.
---------------
Furthermore, it should be noted that in December, the contract for the construction of an 18,500 dwt bulk carrier with delivery planned for the second half of 2006 was assigned to a third party without incurring any charges or penalties.
--------------- Long term time-charter contracts were also concluded for two new Japanese handymax-type 56,000 dwt newbuildings with effect from their delivery date (2008). These multi-year time-charter agreements foresee a time extension possibility as well as a purchase option in our favour.
32
--------------- It is to be noted that in addition to our own fleet, various other vessels, tankers and bulk carriers, were taken on a time-charter basis and employed in 2005, as well as two tankers on a bare-boat charter.
---------------
The FPSO Four Vanguard continued to operate successfully in Australia on the Woollybutt oil field. The contract related to its employment was renegotiated, on request of both parties and extended until mid-2009 with various options for a possible extension until 2016.
--------------
During the year, the following investments (our share 25%) were also implemented for vessels that by the end of 2005 had not yet started operating: - In June: an order in Indonesia for two bulk carriers of 18,500 dwt for delivery in
respectively the first and second halves of 2007; - In August: an order in Japan for two bulk carriers of 18,500 dwt for delivery during
respectively, the second half of 2006 and 2007; - In November: an order in Japan for two 18,100 dwt bulk carriers for delivery during
respectively the second half of 2008 and the first half of 2009.
------------------ Changes to Premuda’s own fleet that occurred after the year end: Increases: - In January: the acquisition of the 17,400 dwt bulk carrier Sider Power, built in 1995,
with an investment of US$ 10.7 million (50% of which was invested by us); - In February: the acquisition of the bulk panamax Four Earth built in 1984 and of 78,000
dwt with an investment of US$ 14.5 million; Decreases: - In January: the sale of the two multipurpose units Sider Capri and Sider Ponza, both of
10,300 dwt, with a capital gain of about EUR 250,000.
--------------- After year end, the following transactions were also concluded: - In February: an order to the Vietnamese Pha Rung Shipyard for two “Diamond 34” units,
bulk carriers of 34,000 dwt, with delivery foreseen in 2009. The ships, with high technical specifications and 34-tonne cranes, are characterised by a full double hull. The overall investment is estimated at a value of about US$ 55 million.
33
- In February: contracts for the time-charter of a Japanese handy-max-type 56,000 dwt
newbuilding with effect from the delivery date (2009). Like the other two similar contracts concluded in 2005, the multi-year time-charter agreements also foresee the right to extend the agreements and the option to buy the ships, both in our favour.
---------------
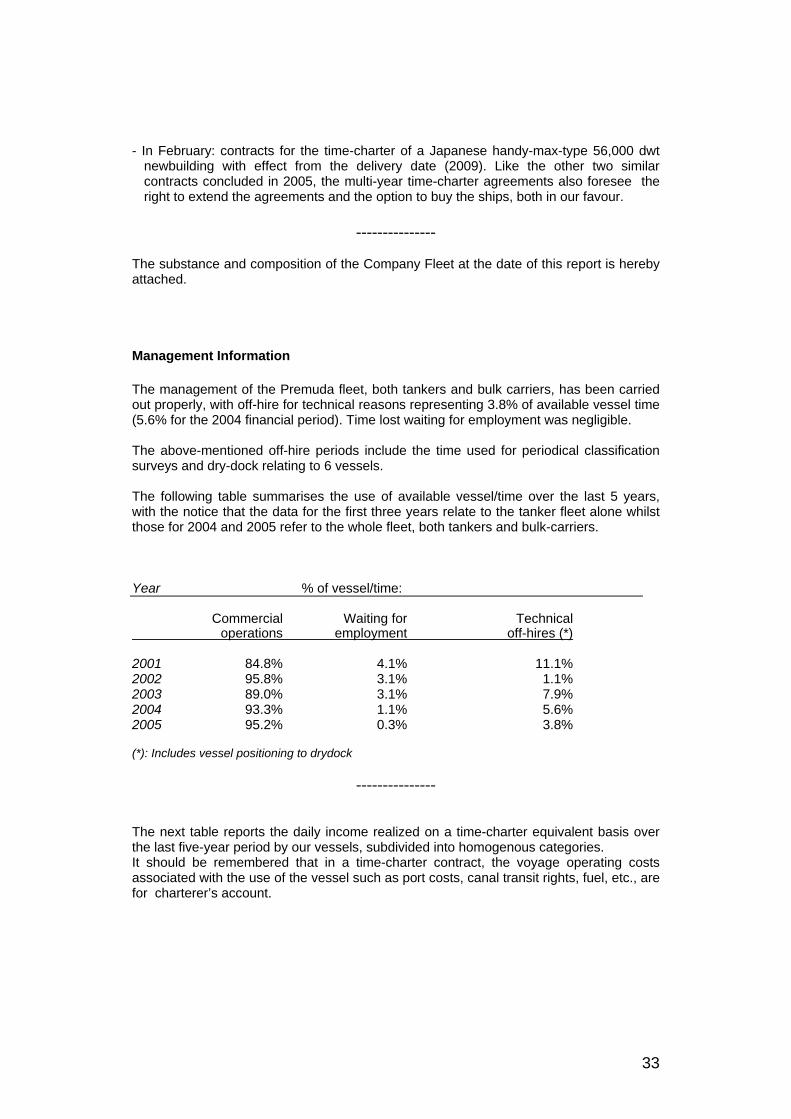
The substance and composition of the Company Fleet at the date of this report is hereby attached. Management Information The management of the Premuda fleet, both tankers and bulk carriers, has been carried out properly, with off-hire for technical reasons representing 3.8% of available vessel time (5.6% for the 2004 financial period). Time lost waiting for employment was negligible. The above-mentioned off-hire periods include the time used for periodical classification surveys and dry-dock relating to 6 vessels. The following table summarises the use of available vessel/time over the last 5 years, with the notice that the data for the first three years relate to the tanker fleet alone whilst those for 2004 and 2005 refer to the whole fleet, both tankers and bulk-carriers. Year % of vessel/time: Commercial Waiting for Technical operations employment off-hires (*) 2001 84.8% 4.1% 11.1% 2002 95.8% 3.1% 1.1% 2003 89.0% 3.1% 7.9% 2004 93.3% 1.1% 5.6% 2005 95.2% 0.3% 3.8% (*): Includes vessel positioning to drydock
---------------
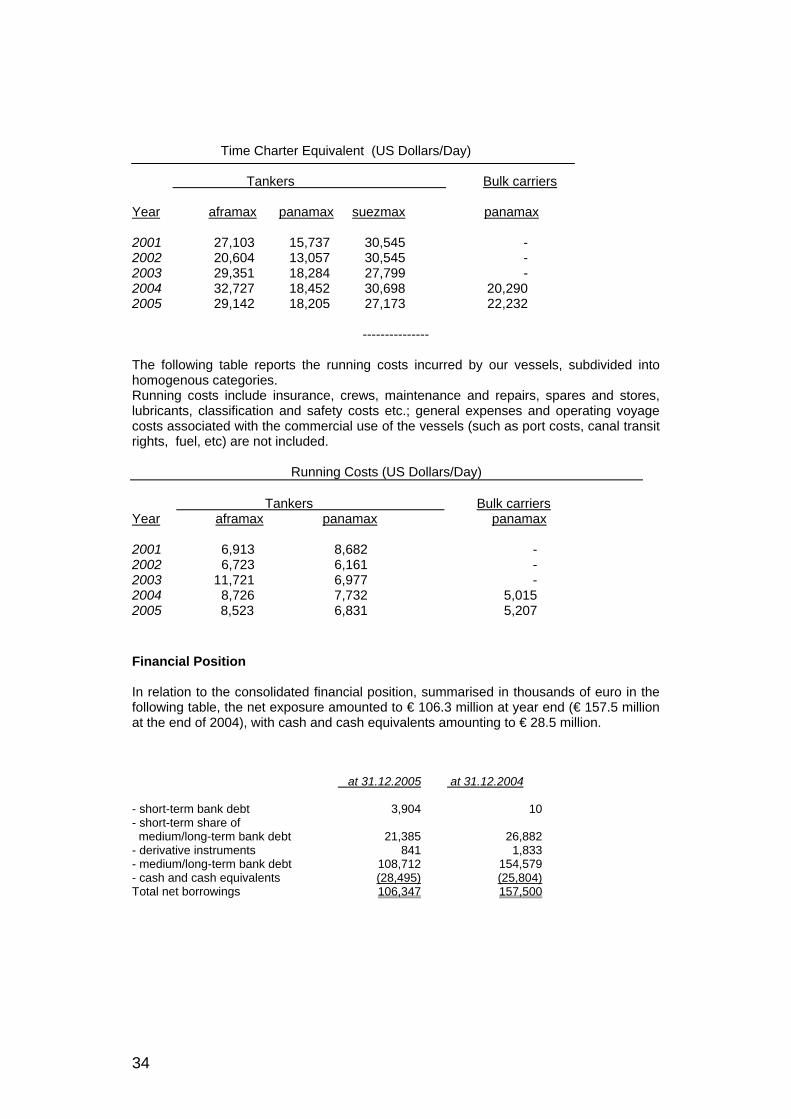
The next table reports the daily income realized on a time-charter equivalent basis over the last five-year period by our vessels, subdivided into homogenous categories. It should be remembered that in a time-charter contract, the voyage operating costs associated with the use of the vessel such as port costs, canal transit rights, fuel, etc., are for charterer’s account.
34
Time Charter Equivalent (US Dollars/Day) Tankers Bulk carriers Year aframax panamax suezmax panamax 2001 27,103 15,737 30,545 - 2002 20,604 13,057 30,545 - 2003 29,351 18,284 27,799 - 2004 32,727 18,452 30,698 20,290 2005 29,142 18,205 27,173 22,232
---------------
The following table reports the running costs incurred by our vessels, subdivided into homogenous categories. Running costs include insurance, crews, maintenance and repairs, spares and stores, lubricants, classification and safety costs etc.; general expenses and operating voyage costs associated with the commercial use of the vessels (such as port costs, canal transit rights, fuel, etc) are not included.
Running Costs (US Dollars/Day) Tankers Bulk carriers Year aframax panamax panamax 2001 6,913 8,682 - 2002 6,723 6,161 - 2003 11,721 6,977 - 2004 8,726 7,732 5,015 2005 8,523 6,831 5,207
Financial Position In relation to the consolidated financial position, summarised in thousands of euro in the following table, the net exposure amounted to € 106.3 million at year end (€ 157.5 million at the end of 2004), with cash and cash equivalents amounting to € 28.5 million. at 31.12.2005
at 31.12.2004
- short-term bank debt 3,904 10- short-term share of medium/long-term bank debt 21,385 26,882- derivative instruments 841 1,833- medium/long-term bank debt 108,712 154,579- cash and cash equivalents (28,495) (25,804)Total net borrowings 106,347 157,500
35
Compared to the previous year, the net exposure has decreased by € 51.2 million, equivalent to 32.5%. At the moment, almost all Premuda S.p.A loans are denominated in Euro, whilst loans related to foreign-flag ships are expressed in US dollars. The amount of the borrowings and their structuring appears to be completely satisfactory in relation to the size and quality of our Fleet and its ability to generate adequate cash flow.
---------------
At the end of the financial year, commitments pending for new investments in progress totalled about € 87.1 million, distributed over a 12 months period; at the present date, the related long-term loans are already in place. Additional investments committed during the first quarter of 2006 amount to about € 46.6 million, distributed over the three-year period 2006-2009. Other data and information At 31 December 2005, Premuda S.p.A. and its associated companies employed 416 people, of whom 345 were seafarers. With respect to 31 December 2004 the number of seafarers increased by 11 and the number of administrative staff decreased by 4. The average euro/dollar exchange rate was 1.248 compared to 1.2441 in 2004. At the end of 2005, the exchange rate was 1.1797 with a dollar appreciation of 15.5% in relation to the figure at the end of 2004, when its value stood at 1.362. The Consolidated Financial Statements (and the Premuda S.p.A. Financial Statements) as at 31 December 2005 have been audited by Deloitte & Touche S.p.A., who also prepared the limited review of the Half-Year Report. Management developments and significant events after the issuance of the balance sheet With regard to the management of the Premuda fleet, both tankers and bulk carriers, there are no significant events or situations to be noted since the issuance of the balance sheet . For 2006, our planning anticipates periodical dry-dock and reclassifications for 5 units, with technical off-hires for the entire Fleet amounting to 4.7% of vessel/time (3.8% in 2005). As far as the running costs of the vessels are concerned, our target is to keep them at approximately the same level as those recorded last year, which are in line with international standards, although we are aware that the upwards trend of insurance costs will probably continue in 2006, due to the continuing difficulties of the international insurance market.

36
Operating voyage costs will certainly be penalized by extremely high fuel and lubricant prices, but this factor only partially concern our fleet, considering that fuel for vessels employed on a time-charter basis is for charterer’s account. Financial charges (in part already fixed at satisfactory levels) should not present any disagreeable surprise, notwithstanding a general estimate of increases in interest rates. As far as the level of commercial risk of the Fleet is concerned, it should be noted that at the present time, about 70% of the owned tankers, 40% of the owned bulk carriers and 90% of the chartered tonnage are already covered by satisfactory contracts. As almost all income is expressed in US dollars, its conversion into balance sheet data, expressed in euro, may be negatively influenced by a weak dollar, only partially compensated by those costs sustained in the same currency (a proportion of the crew costs, insurance, spares and stores, luboils and maintenance) and by interest expense on loans denominated in dollars. Taken as a whole, it is reasonable to envisage that – unless unpredictable significant negative events occur – the 2006 financial year should also be satisfactory.

37
Dear Shareholders, Please be aware that the Consolidated Financial Statements for 2005 have been prepared in accordance with the IFRS International Accounting Standards of the International Accounting Standard Board; consequently, the figures of the 2004 Financial Statement have been appropriately adjusted and reclassified to facilitate proper comparison. The consolidated results for the 2005 Financial year show final profit of € 27.5 million after depreciation and amortisation expenses of € 29.3 million (in the 2004 Financial year there was a profit of € 29.5 million after depreciation and amortisation expenses totalling € 35.1 million).
Net of minority interests, the profit amounts to € 25.4 million (€ 24.8 million for the 2004 financial period), thus confirming in absolute terms the best Group results registered to this date. Cashflow, also without taking into consideration minority interest, amounts to € 54.7 million compared to € 59.9 million for the 2004 financial year.
The result for the 2005 financial year follows those of the previous five years which have all been particularly satisfactory: this has permitted substantial improvement of the financial situation and the continuous strengthening of the net value of the Group whose net equity – after the payment of € 25.6 million as dividends – has increased during the period by 86% (€ 77.5 million of which € 11.5 million provided by the Shareholders through share capital transactions). After the aforesaid payment – by the Mother Company – of the proposed dividends, the Consolidated Shareholders’ Equity will be structured as follows: - Share capital €/000 70,418 - Legal reserve €/000 14,084 - Other reserves €/000 16,445 - Retained earnings €/000 57,894 Total Group Shareholders’ Equity €/000 158,841 - Minority interests €/000 9,194 Total Consolidated Shareholders’ Equity €/000 168,035 The results obtained can certainly be attributed to the remarkable appreciation of freight rates in the last three years and to the capital gains obtained from the timely sale of some units. It is, however, worth to note that the Group met the market in suitable conditions, thanks to the important plan of new investments decided despite the actual market trend at the beginning of 1998, and thanks to the series of timely tonnage acquisitions and divestitures. In concluding our report we would like to thank all the Group’s employees for their precious cooperation, on land and at sea, who deserve our gratitude and firm confidence for the future. 24 March 2006 The Board of Directors

38
39
Financial Statements on 31 December 2005

40
CONSOLIDATED BALANCE SHEET ON 31 DECEMBER 2005
(thousands of Euros) ASSETS 31.12.2005 31.12.2004 FIXED ASSETS: Tangible fixed assets 267,491 305,387 Vessels 246,223 276,648 Vessels under construction 19,794 27,189 Land and buildings 954 1,008 Other fixed assets 520 542 Participations 5,815 3,215 Associated companies 5,811 2,207 Other companies 4 1,008 Other financial assets 12,435 4,239 Loans 12,378 4,146 Other investments 57 93 Prepaid taxes 230 2,035 TOTAL FIXED ASSETS 285,971 314,876 CURRENT ASSETS Inventories 2,762 3,438 Spares, stores and consumables 2,188 1,756 Voyages in progress 574 1,682 Trade receivables 20,175 19,500 Clients 10,411 9,291 Accrued income and prepayments 4,617 4,190 Others receivables 5,147 6,019 Current financial assets - 8,516 Cash and cash equivalents 28,495 25,804 TOTAL CURRENT ASSETS 51,432 57,258 TOTAL ASSETS 337,403 372,134

41
CONSOLIDATED BALANCE SHEET ON 31 DECEMBER 2005
(thousands of Euros)
LIABILITIES AND SHAREHOLDERS’ EQUITY 31.12.2005 31.12.2004 SHAREHOLDERS’ EQUITY Share capital 70,418 67,065 Share premium reserve - 281 Legal reserve 14,084 3,334 Other reserves 16,445 21,982 Retained profit 40,969 33,255 Profit (loss) for the year 25,376 24,847 GROUP SHAREHOLDERS’ EQUITY 167,292 150,764 MINORITY INTEREST: Capital and reserves 7,062 8,581 Profit (loss) for the year 2,132 4,686 TOTAL SHAREHOLDERS’ EQUITY 176,486 164,031 LONG-TERM LIABILITIES Bank loans 108,712 154,579 Provisions for risks and charges 681 2,079 Provisions for staff severance indemnity 1,555 1,623 Deferred tax liabilities - 440 TOTAL LONG-TERM LIABILITIES 110,948 158,721 CURRENT LIABILITIES Short-term bank debts 25,289 26,892 Derivative financial instruments 841 1,833 Suppliers 10,353 7,432 Tax liabilities 630 486 Accrued liabilities and deferred income 7,267 6,210 Other payables 5,589 6,529 TOTAL CURRENT LIABILITIES 49,969 49,382 TOTAL LIABILITIES 160,917 208,103 TOTAL LIABILITIES AND SHAREHOLDERS’ EQUITY 337,403 372,134

42

CONSOLIDATED PROFIT AND LOSS ACCOUNT FOR THE YEAR 2005
(thousands of Euros)
Financial Year2005
Financial Year2004
Net revenues 150,958 161,915Voyage costs (6,160) (13,085)Time Charter revenues 144,798 148,830Charter hire (33,646) (34,286)Running costs (39,431) (42,910)Fleet margin 71,721 71,634Profit on vessel sale 8,564 9,114Administrative expenses (16,109) (11,937)Other income/(costs) 689 2,157Depreciation (29,299) (35,075)Operating profit 35,566 35,893Financial items (8,517) (8,125)Profit/loss from associated companies 2,666 1,950Profit before tax 29,715 29,718Tax on profit (2,207) (185)Net profit 27,508 29,533Minority interest 2,132 4,686Group's net profit 25,376 24,847

44
CONSOLIDATED CASH FLOW STATEMENT
(thousands of Euros) 31.12.2005 31.12.2004 A NET CASH POSITION AT YEAR BEGINNING (1,088) (18,617) B CASH FLOW FROM OPERATING ACTIVITIES Profit for the year 27,508 29,533 Depreciation 29,299 35,075 Net change in other provisions (1,398) (4,644) (Profit) / loss on assets disposal (8,564) (9,114) (Profit) / impairment of associated companies (2,666) (1,950) Net provision for employee severance accruals (68) 67 Subtotal: Cash flow from operating activities before working capital changes 44,111 48,967 Decrease (increase) of receivables 7,841 3,092 Decrease (increase) of inventories 676 4,174 (Decrease) increase of suppliers and other current liabilities 2,190 (14,927) Net variance in deferred taxation 1,365 (196) Total cash flow from operating activities 56,183 41,110 C CASH FLOWS FROM INVESTING ACTIVITIES Investments in assets: - tangible (33,512) (37,764) - financial (1,250) Sale of tangible fixed assets 50,673 112,644 Sale of financial fixed assets 1,316 3,548 Total cash flow from investing activities 17,227 78,428 D CASH FLOW FROM FINANCING ACTIVITIES New loans 30,000 Loan repayments (45,867) (100,328) Bond repayments (29,553) Net decrease (increase) of financial fixed assets (8,196) 4,437 Dividends (8,048) (4,969) Share capital increase 11,253 Variance in minority interest (6,205) (9,597) Other variances (800) (3,252) Total cash flow from financing activities (69,116) (102,009) E CASH FLOW OF THE PERIOD (B + C + D) 4,294 17,529 F NET CASH POSITION AT YEAR END (A + E) 3,206 (1,088)

45
STATEMENTS OF VARIATION IN THE CONSOLIDATED SHAREHOLDERS’ EQUITY (thousands of Euros)
Share capital
Share premium account
Legal reserve
Other reserves
Retained profit
Profit for the year
Group interest subtotal
Minority interest Total
Balance at 31.12.2003 54,532 205 2,992 26,779 26,274 12,103 122,885 18,178 141,063 Allocation of the 2003 result for the Parent Company - legal reserve - - 342 - - (342) - - - - dividends - - - - - (4,969) (4,969) - (4,969) - retained profit - - - - 1,529 (1,529) - - - Allocation of the 2003 result for subsidiaries - - - - 5,263 (5,263) - - - Issue of share capital 12,420 76 - - (1,242) - 11,254 1,999 13,253Capital repayment - - - - - - - (11,596) (11,596)Exchange differences - - - (3,964) 685 - (3,279) - (3,279)Purchase/sale of own shares 113 - - - - - 113 - 113 Other - - - (833) 746 - (87) - (87)Consolidated result for the year 2004 - - - - - 24,847 24,847 4,686 29,533 Balance at 31.12.2004 67,065 281 3,334 21,982 33,255 24,847 150,764 13,267 164,031 Allocation of the 2004 result for the Parent Company - legal reserve - (281) 10,750 - (10,469) - - - - dividends - - - - (8,049) (8,049) - (8,049) - retained profit - - - - 13,217 (13,217) - - - Allocation of the 2004 result for subsidiaries - - - (5,537) 17,167 (11,630) - - - Issue of share capital 3,353 - - - (3,353) - - - Capital repayment/dividends - - - - - - - (6,205) (6,205)Other - - - - (799) - (799) - (799) Consolidated result for the year 2005 - - - - - 25,376 25,376 2,132 27,508 Balance at 31.12.2005 70,418 - 14,084 16,445 40,969 25,376 167,292 9,194 176,486

46

47
Notes to Consolidated Financial Statements

48
49
Statement of compliance with IFRS and accounting principles These Consolidated Financial Statements of the Premuda Group are the first to be prepared in compliance with the International Financial Reporting Standards (IFRS) issued by the International Accounting Standards Board (IASB). They are reported in thousands of Euro and compared with last year’s financial statements, duly reclassified and adjusted under the new standards. The Consolidated Financial Statements on 31 December 2005 consist of the Balance Sheet, the Profit & Loss Account, the Cash Flow Statement, the Statement of Variances in the Shareholders’ Equity and the Notes. The International Financial Reporting Standards were implemented for the first time when drawing up the Half Year Report as of 30 June 2005, which included an appendix of the reconciliation statements on the original figures compared to those previously dawn up in accordance with Italian accounting principles and showing the most significant differences. A copy of those statements is enclosed with the Italian version of these Consolidated Financial Statements, together with the relevant Auditors’ Report. These Consolidated Financial Statements have been prepared according to the accounting principles currently in force, in line with those applied for the 2005 Half Year Report and for the original reconciliation statements. The Consolidated Financial Statements are expressed in Euro, functional currency consistent with the Group’s financial structure. Scope of consolidation The Consolidated Companies operate in the shipping industry for liquid and dry bulk transportation, employing owned and chartered vessels, with the exception of the holding company Premuda International S.A.H. and of Premuda (Monaco) S.A.M. responsible for the operational and business management of the foreign flag vessels. Furthermore, Australian FPSO Management PTY LTD is in charge of the technical and operational management of the FPSO Four Vanguard, while Suezmax Navegaçao Lda provides administration services for other Group companies. Subsidiary companies are those, directly or indirectly, controlled by the Parent Company or where the latter sets forth financial and operating policies so as to benefit from its activity or actual control. The companies included in the scope of consolidation on a line-by-line basis as at 31 December 2005 are: Premuda S.p.A. Parent Company Registered office: Trieste Share capital: Euro 70,418,225

50
Companies directly controlled: Premuda International S.A.H. Registered office: Luxembourg Share capital: Euro 52,000,000 Ownership: 99,9% Companies indirectly controlled (through Premuda International S.A.H.): Premuda (Monaco) S.A.M. Registered office: Monte Carlo Share capital: Euro 305,000 Ownership: 90% Brig Shipping Lda. Registered office: Madeira Share capital: Euro 10,005,000 Ownership: 100% Premuda Chartering Navegaçao Lda. Registered office: Madeira Share capital: Euro 5.000 Ownership: 100%
Four Vanguard – Serviços e Navegaçao Lda. Registered office: Madeira Share capital: Euro 27,243,505 Ownership: 90%
Panamax Navegaçao Lda. Registered office: Madeira Share capital: Euro 5,000 Ownership: 100% Suezmax Navegaçao Lda. Registered office: Madeira Share capital: Euro 5,000 Ownership: 100% Moon Shipping Serviços e Navegaçao Lda. Registered office: Madeira Share capital: Euro 16,597,027 Ownership: 100% Premuda Bulk Navegaçao Lda. Registered office: Madeira Share capital: Euro 7,955,804 Ownership: 75% Premuda (Atlantic) Inc. Registered office: Delaware Share capital: US$ 1,000
51
Ownership: 100% JEP Navegaçao Lda. Registered office: Madeira Share capital: Euro 8,505,000 Ownership: 100% Australian FPSO Management Pty Ltd Registered office: Australia Share capital: Australian Dollar 100 Ownership: 100% Investments in associates:
Sider Navi S.p.A. Registered office: Naples Share capital: Euro 1,000,000 Ownership: 25% direct Sider Navegaçao Lda. Registered office: Madeira Share capital: Euro 5,000 Ownership: 50% indirect Refer to table attached for further information on the Group’s composition. Consolidation principles The main consolidation principles include the following: - The book value of the controlled companies was written off for the relevant
Shareholders’ Equity against the entry of assets and liabilities on a line-by-line basis, and showing in the retained earnings the difference arising therefrom.
Minority interests were booked separately. Investments in associates were valued as explained in the following paragraph on
valuation criteria. - Credit and debit entries as well as costs and revenues among consolidated
Companies were written off. In particular, profits and losses arising out of transactions carried out among Group Companies not yet realised towards third parties were also written off.
- The Euro translation of the financial statements expressed in foreign currency was
carried out at the “current exchange rate". For both Balance Sheet and Profit & Loss Account items, the end period exchange
rate was used, since a valuation of the latter adopting the average exchange rate for the period had not brought about significant changes.
Exchange rate differences arising from the translation of original shareholders’ equities at the current exchange rates, compared to those used in the previous
52
financial statements, were directly entered in the consolidated Shareholders’ Equity under the entry “reserves from translation difference”.
For further information refer to the reconciliation between Shareholders’ Equity and
net profit for the year of the Parent Company and of the consolidated financial statements attached hereto.
Valuation criteria The valuation criteria used for drawing up the Consolidated Financial Statements are the following: - The Fleet is booked at the purchase cost; extraordinary charges, increasing the
production value of the vessels, are capitalised on same. As far as vessels directly ordered from shipbuilding yards are concerned, their cost value is made up of the contractual price, agreed extra prices, costs for directly purchased plant and equipment, initial shipping charges, costs for employed personnel during fitting out, and charges for interests on sums paid to the Shipbuilding Yards before delivery of the vessels.
Fleet depreciation is determined based on the cost of each unit, less the estimated
scrap value, divided by the years of residual life, based on the assumption of a useful life of twenty-five years for newly built tankers and of twenty years for bulk carriers.
The cost component of vessels subject to restoration during periodical stays in
drydock is depreciated during the time elapsed until the following drydock (usually 30 months).
- Land and buildings are stated at purchase cost and depreciated on a straight-line
basis over 33 years. - Fixtures, furnishings, machinery, office equipment and motor vehicles are stated at
purchase cost. Depreciation is calculated on a straight-line basis according to the estimated useful life shown below:
fixtures and furnishings, 8 years machinery and office equipment 5 years motor vehicles 4 years Assets carrying an artistic, but non-significant value, are stated at purchase cost. - Investments in associates are entered in at Net Equity. Other investments are stated
at cost, reduced in case of losses and where, for the near future, no profits are expected in an amount that would make it possible to cover such losses; the original value is reinstated in the subsequent years only if the reasons for the adjustment to the value of such investments cease to exist.
- Long-term investments include receivables entered at their recoverable value. - Assets in respect of tax advances are recorded to the extent that same are reasonably
recoverable.

53
- Fixed assets are subject to periodical valuation so as to find out indicators showing a loss of value. If such indicators exist, the recoverable value is determined, equalling the higher between the selling price and the value in use. The latter is determined by discounting of expected cash flows at the current interest rate. Where the recoverable value was below the entry value, the arising impairment was booked in the Profit & Loss Account. The book value is restored to the extent a reasonable certainty about their recoverability exists.
- Bare boat charter contracts are usually considered as operating leases. If their
contractual terms define them as financial leases, pursuant to IAS 17, the vessels are entered as lease assets.
- Accruals and prepayments are determined on an accrual basis. - Owned shares are recorded in the impaired Shareholders’ Equity. - Inventories are valued using the FIFO method (first in, first out) taking the market
value into account. Costs for voyages not yet completed at the closing date are booked as “voyages in
progress”, net of the whole loss (if negative) and including the pro-rata profit (if positive).
- Receivables are booked at their recoverable value. - The provision for staff severance indemnity is allocated on employees’ wages and
salaries in compliance with the laws and the service agreements in force. The booked value is calculated on an actuarial basis pursuant to the IAS 19 provisions.
- Payables are booked at their par value. - Income from services is recognized once the services are rendered. Income from
services in progress is calculated according to the progress report. Income from time charter is calculated on the accrual basis of the charter period. Income from asset disposal is recognized once risks and benefits linked to the asset are transferred to the buyer.
- Maintenance costs comprise all the expenses incurred during the year for the on-
going maintenance of the relevant fleet class. Costs relating to periodical maintenance of vessels are capitalised and depreciated during the period until the next drydock.
- Other costs are determined on an accrual basis. - Dividends are entered when they become payable. - Taxes are entered in compliance with the tax laws in force in the country where the
Group operates; tax effects on time differences arising between taxable income and the profit and loss results are booked under the entries “deferred taxes” and “prepaid taxes”.
- Exchange rate differences arising after credit collection and debt payment in foreign
currency are booked in the Profit & Loss Account. Receivables and Payables originally shown in a foreign currency are converted to Euro at the end-of-period exchange
54
rates. Exchange rate differences arising out of the above conversion are booked in the Profit & Loss Account, whereby profits resulting from such differences, if positive, are not available for distribution.
- Loans are valued at cost, net of acquisition costs, which are charged to Profit & Loss
using the amortised cost method. - Group assets and liabilities are exposed to financial risk related to exchange rate and
interest rate. The Group’s policy tries to minimize such risks by way of hedging with financial instruments, usually resulting from forward purchase/sale of foreign currencies and swap transactions from floating to fixed loan rates. Derivatives are originally entered at cost, and afterwards adjusted to the fair value. Changes in the fair value of hedging derivatives that prove effective pursuant to IAS 39 are directly booked to the Shareholders’ Equity. Their potential ineffective portion, as well as changes in the fair value of other derivatives, including freight derivatives, are booked in the Profit & Loss Account.
- The fair value of stock option plans is included in the personnel cost on an accrual
basis and has a balancing entry in the shareholder’s equity. Its impact is not significant for the year 2005.
- The Cash Flow Statement was prepared taking into account the relevant cash flows
and by applying the indirect accounting method. The adoption of international accounting standards did not have a significant impact on the Cash Flow Statement, except for those arising out of the changes in the presentation scheme.
- The drawing up of the Financial Statements and their related Notes in accordance with
the international accounting standards requires the Management to carry out estimates and assumptions which may have a certain impact on some of the balance sheet values. Therefore, actual results may differ from initial estimates. Valuations are reviewed on a periodical basis and their direct effects are immediately booked in the Profit & Loss Account.
- All asset values entered in the Balance Sheet have never been revaluated. - Amounts shown in these Notes are in thousands of Euro. Balance sheet ASSETS FIXED ASSETS
Tangible fixed assets Vessels This item records the book value of owned vessels deducting the relevant accumulated depreciation, as detailed in the following page. The cost component regarding periodical

55
Four Four Four Four Four Four Tankers Four Sider Sider Four Four Four Four Bulk Four Overall Vessels Framura Island Bay Springs Moon Glens Lochs subtotal Etoiles * Capri Ponza Coal Iron Euro Sterling subtotal Vanguard total
Vessel cost 42,237 34,968 45,147 16,130 25,178 - - 163,660 14,154 13,738 13,743 18,003 8,536 5,954 12,646 86,774 119,842 370,276
Accumulated depreciation (19,103) (6,954) (18,324) (1,212) (3,063) - - (48,656) (12,548) (1,383) (1,404) (1,601) (1,451) (1,378) (1,183) (20,948) (28,064) (97,668)
Balance at 31.12.04 23,134 28,014 26,823 14,918 22,115 - - 115,004 1,606 12,355 12,339 16,402 7,085 4,576 11,463 65,826 91,778 272,608
Dry dock component 720 747 720 520 246 600 330 3,883 960 - - - 800 850 318 2,928 - 6,811
Accumulated depreciation (320) (320) (320) (320) (123) (180) (209) (1,792) (192) - - - (400) (255) (132) (979) - (2,771)
Balance at 31.12.04 400 427 400 200 123 420 121 2,091 768 - - - 400 595 186 1,949 - 4,040 Net 31.12.04 23,534 28,441 27,223 15,118 22,238 420 121 117,095 2,374 12,355 12,339 16,402 7,485 5,171 11,649 67,775 91,778 276,648 Increases: Vessel - - - - - - - - - - - - - - - - (6,114)+ (6,114) Dry dock component - - 816 2,380 - - 750 3,946 - - - 370 - - 420 790 - 4,736 Depreciation Vessel (1,569) (1,592) (1,591) (1,075) (1,519) - - (7,346) - (687) (687) (943) (1,594) (1,337) (1,103) (6,351) (11,574) (25,271) Dry dock component (320) (320) (550) (407) (123) (240) (309) (2,269) (384) - - (148) (400) (340) (235) (1,507) - (3,776) Vessel cost 42,237 34,968 45,147 16,130 25,178 - - 163,660 14,154 13,738 13,743 18,003 8,536 5,954 12,646 86,774 113,728 364,162 Accumulated depreciation (20,672) (8,546) (19,915) (2,287) (4,582) - - (56,002) (12,548) (2,070) (2,091) (2,544) (3,045) (2,715) (2,286) (27,299) (39,638) (122,939)
Balance at 31.12.05 21,565 26,422 25,232 13,843 20,596 - - 107,658 1,606 11,668 11,652 15,459 5,491 3,239 10,360 59,475 74,090 241,223 Dry dock component 720 747 816 2,380 246 600 750 6,259 960 - - 370 800 850 420 3,400 - 9,659 Accumulated depreciation (640) (640) (150) (207) (246) (420) (188) (2,491) (576) - - (148) (800) (595) (49) (2,168) - (4,659)
Balance at 31.12.05 80 107 666 2,173 - 180 562 3,768 384 - - 222 - 255 371 1,232 - 5,000 Net 31.12.05 21,645 26,529 25,898 16,016 20,596 180 562 111,426 1,990 11,668 11,652 15,681 5,491 3,494 10,731 60,707 74,090 246,223 * OBO vessel included in Bulk units because of its prevailing use in the period + reversal of costs for extraordinary repairs, which were capitalised in the past and subsequently covered by insurance indemnities
56
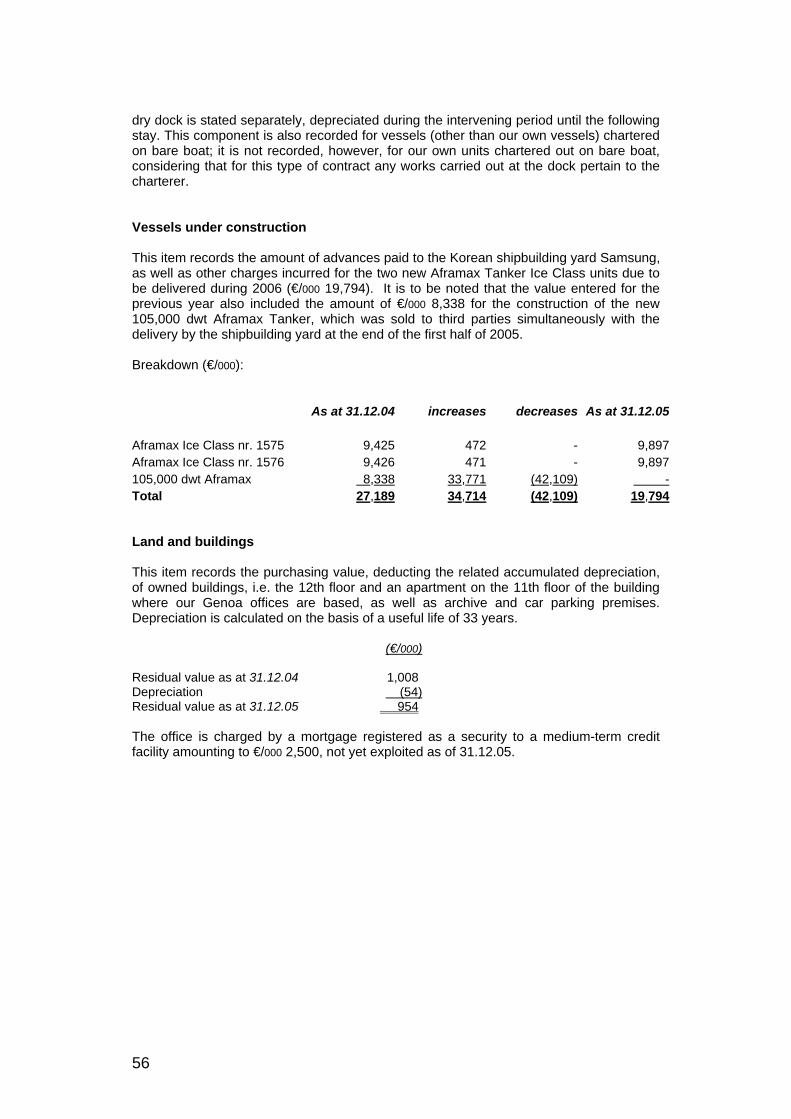
dry dock is stated separately, depreciated during the intervening period until the following stay. This component is also recorded for vessels (other than our own vessels) chartered on bare boat; it is not recorded, however, for our own units chartered out on bare boat, considering that for this type of contract any works carried out at the dock pertain to the charterer. Vessels under construction This item records the amount of advances paid to the Korean shipbuilding yard Samsung, as well as other charges incurred for the two new Aframax Tanker Ice Class units due to be delivered during 2006 (€/000 19,794). It is to be noted that the value entered for the previous year also included the amount of €/000 8,338 for the construction of the new 105,000 dwt Aframax Tanker, which was sold to third parties simultaneously with the delivery by the shipbuilding yard at the end of the first half of 2005. Breakdown (€/000): As at 31.12.04 increases decreases As at 31.12.05 Aframax Ice Class nr. 1575 9,425 472 - 9,897Aframax Ice Class nr. 1576 9,426 471 - 9,897105,000 dwt Aframax 8,338 33,771 (42,109) -Total 27,189 34,714 (42,109) 19,794 Land and buildings This item records the purchasing value, deducting the related accumulated depreciation, of owned buildings, i.e. the 12th floor and an apartment on the 11th floor of the building where our Genoa offices are based, as well as archive and car parking premises. Depreciation is calculated on the basis of a useful life of 33 years. (€/000) Residual value as at 31.12.04 1,008 Depreciation (54) Residual value as at 31.12.05 954 The office is charged by a mortgage registered as a security to a medium-term credit facility amounting to €/000 2,500, not yet exploited as of 31.12.05.

57
Other fixed assets Detailed as follows: office fixtures and machinery motor furnishings (*) and plants vehicles total Cost 807 950 92 1,849 Accumulated depreciation (598) (634) (75) (1,307) Balance at 31.12.04 209 316 17 542 Increases 18 38 120 176 Depreciation for the year 2005 (42) (116) (35) (193) Decreases (28) (39) (51) (118) Relevant depreciation 27 36 50 113 Balance at 31.12.05 184 235 101 520 Summary: Cost 797 949 161 1,907 Accumulated depreciation (613) (714) (60) (1,387) Balance at 31.12.05 184 235 101 520
(*) of which €/000 43 not depreciable
Participations Associated companies
These are represented by the 25% share in Sider Navi S.p.A. (€/000 1,214) and by the 50% share in Sider Navegaçao Lda. (€/000 4,597), accounted for under the equity method.
Other companies These are represented by minor shareholdings whose amount can be ignored. The variation with respect to the previous year is due to the transfer of our 2.25% shareholding in UMS – Generali Marine S.p.A. at market value, basically equal to its book value. Other financial assets They are represented by interest-bearing amounts resulting from minority shareholders of Four Vanguard – Serviços e Navegaçao Lda. (€/000 2,543) and from the affiliate companies Sider Navi Spa (€/000 9,000) and Sider Navegaçao Lda. (€/000 835), as well as by caution moneys (€/000 57) with Telecom, Enel, etc. Prepaid taxes Prepaid taxes registered for the amount of €/000 230 refer basically to costs and charges which can be deducted in forthcoming years. The considerable reduction with respect to the previous year is mainly due to the Parent Company’s decision to exercise the option

58
to calculate the taxable income generated by vessels on a lump-sum basis under the so-called “Tonnage Tax”. CURRENT ASSETS
Inventories Spares, stores and consumables This item refers to fuel, lubricants and paints on board the vessels and spare parts on 31.12.05 for the amount of €/000 2,188 (all accounted for under the FIFO method and taking into account the market value), as opposed to the corresponding value of €/000 1,756 as at 31.12.04. Voyages in progress This item accounts for ongoing voyages at the end of the period, for the amount of €/000 574 (€/000 1,682 as at 31.12.04) Trade receivables Clients This item accounts for the year-end balances of definitely realisable trade receivables, concerning active charters, demurrages and other, net of the relevant depreciation of funds.
Accrued income and prepayments Accrued income refers to the quotas pertaining to the period of income not yet realised as of 31.12.05, mainly related to interest income and other income. Prepayments refer to quotas of costs incurred during the period, but pertaining to the following period (mainly insurance, rents payable, membership contributions and other charges not relating to navigation). Other receivables This item refers to year-end balances for short-term credits: amounts due from insurance companies for indemnities for failure, advances to agents, loans to personnel, various advances, etc..
Current financial assets No longer present in the financial statements for 2005, this item registered on 31.12.04 referred to the short-term loan to the affiliate company Sider Navegaçao Lda., which has been fully repaid during the six-month period. Cash and cash equivalents This item represents the year-end balances relating to liquidity with banks and company funds. A more detailed analysis of the variation occurred during the year can be found in the Cash Flow Statement.
59
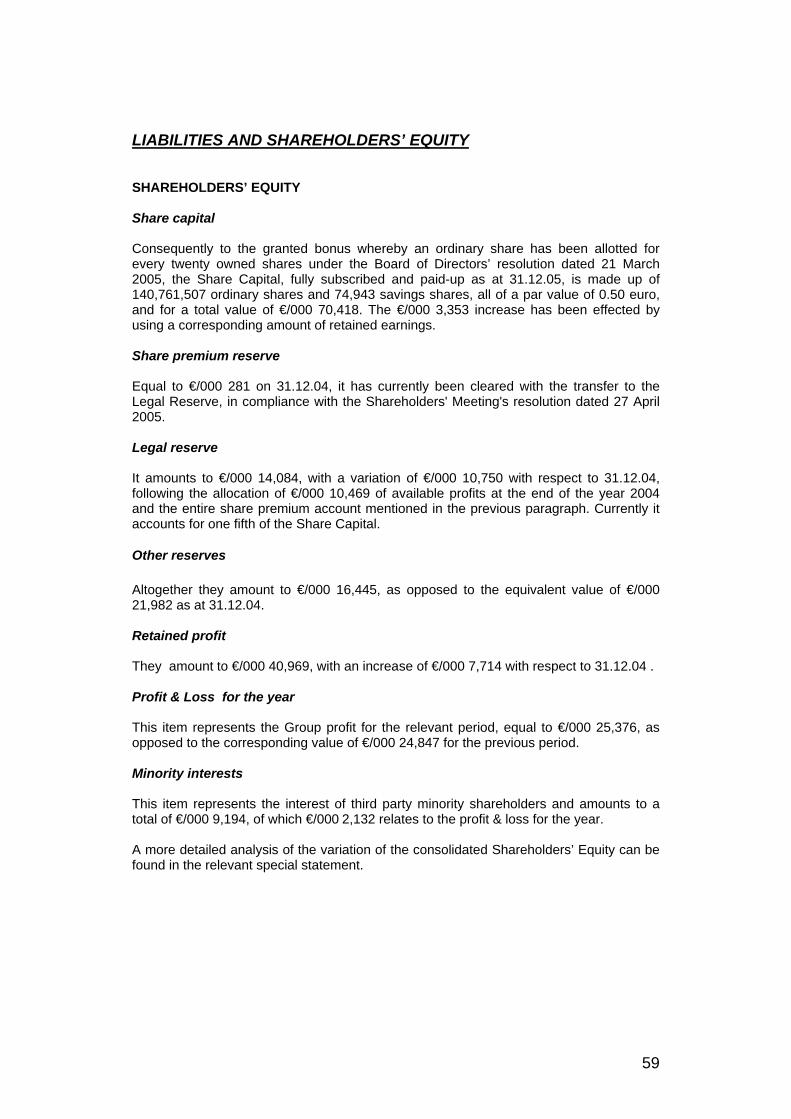
LIABILITIES AND SHAREHOLDERS’ EQUITY SHAREHOLDERS’ EQUITY Share capital Consequently to the granted bonus whereby an ordinary share has been allotted for every twenty owned shares under the Board of Directors’ resolution dated 21 March 2005, the Share Capital, fully subscribed and paid-up as at 31.12.05, is made up of 140,761,507 ordinary shares and 74,943 savings shares, all of a par value of 0.50 euro, and for a total value of €/000 70,418. The €/000 3,353 increase has been effected by using a corresponding amount of retained earnings.
Share premium reserve Equal to €/000 281 on 31.12.04, it has currently been cleared with the transfer to the Legal Reserve, in compliance with the Shareholders' Meeting's resolution dated 27 April 2005. Legal reserve It amounts to €/000 14,084, with a variation of €/000 10,750 with respect to 31.12.04, following the allocation of €/000 10,469 of available profits at the end of the year 2004 and the entire share premium account mentioned in the previous paragraph. Currently it accounts for one fifth of the Share Capital.
Other reserves Altogether they amount to €/000 16,445, as opposed to the equivalent value of €/000 21,982 as at 31.12.04. Retained profit They amount to €/000 40,969, with an increase of €/000 7,714 with respect to 31.12.04 . Profit & Loss for the year This item represents the Group profit for the relevant period, equal to €/000 25,376, as opposed to the corresponding value of €/000 24,847 for the previous period. Minority interests This item represents the interest of third party minority shareholders and amounts to a total of €/000 9,194, of which €/000 2,132 relates to the profit & loss for the year. A more detailed analysis of the variation of the consolidated Shareholders’ Equity can be found in the relevant special statement.

60
LONG TERM LIABILITIES Bank loans The amounts due to banks are detailed as follows (in thousands of euro): Expiring More than one Within up to More than one year five years five years Total medium/long-term: BNL m/t. Framura 1,513 6,050 1,134 8,697 Zero Coupon Bond - 2,744 - 2,744 Efibanca m/t. Four Island and Four Bay 3,820 17,488 10,853 32,161 Unicredit - 29,546 - 29,546 Commerzbank m/t. Four Coal 773 3,093 7,545 11,411 m/t. Four Moon 1,386 5,541 3,116 10,043 m/t. Four Springs 1,660 6,637 3,320 11,617 Banca Intesa m/t. Four Iron 565 1,695 - 2,260 m/t. Four Sterling 698 2,793 2,094 5,585 Fortis Bank FPSO Four Vanguard 10,970 5,063 - 16,033 Medium/long-term subtotal 21,385 80,650 28,062 130,097 Overdraft and other 3,904 - - 3,904 Total 25,289 80,650 28,062 134,001 It should be noted that the values expiring “within one year” are entered in the financial statements under "Current liabilities” as "Short-term bank debts”. Details: Banca Nazionale del Lavoro A loan granted during 2001 and secured by a mortgage on the m/t. Framura, for an original amount of US$ 15 million and currently expressed in Euros, to be repaid in 40 equal instalments for the principal amount, of which the first has been repaid on 31.12.01 and the last is due on 30.09.11. Interests are charged based on the relevant EURIBOR plus margin. The average rate applied for the year 2005 was equal to 3.044%. For the instalment due on 31.03.2006, the rate is equal to 3.392%. Banca Nazionale del Lavoro A ten-year loan for the amount of 12,017,952 Euros, drawn on 06.09.2000 and to be repaid with a single payment on termination date (06.09.2010). The loan is secured by a pledge on ten-year Zero Coupon Bonds issued by BNL with a corresponding nominal value, and it is entered in the financial statement net of the
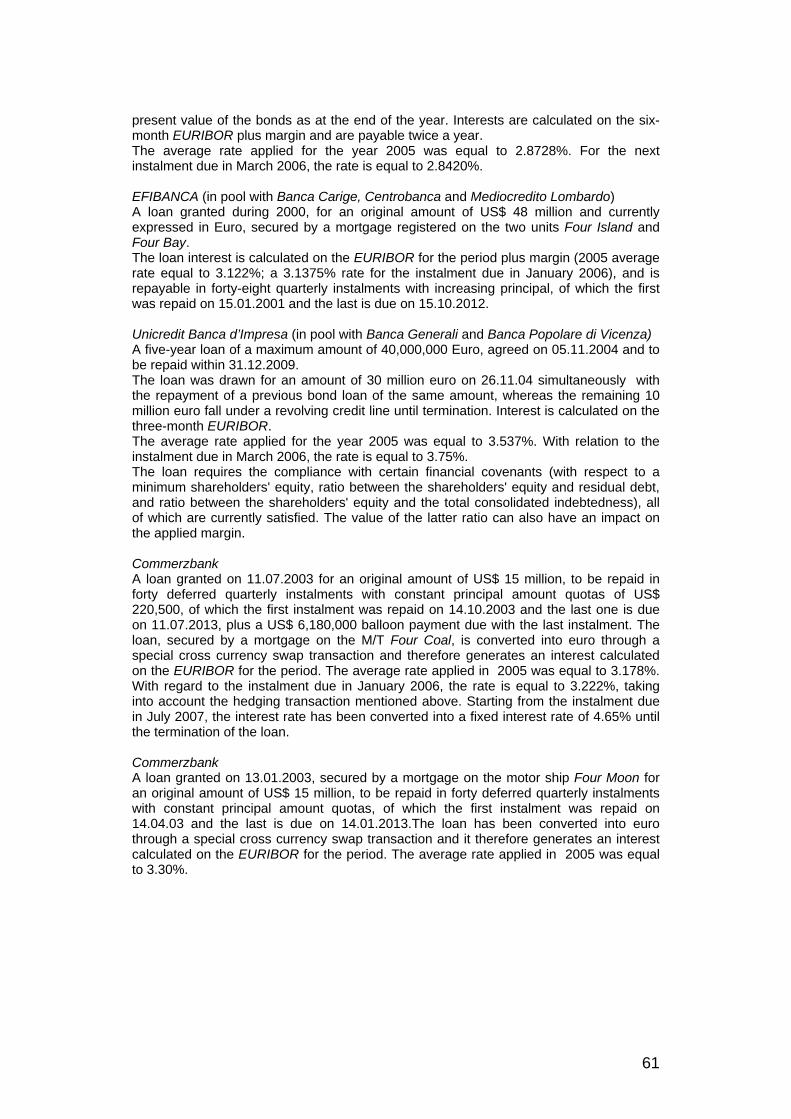
61
present value of the bonds as at the end of the year. Interests are calculated on the six-month EURIBOR plus margin and are payable twice a year. The average rate applied for the year 2005 was equal to 2.8728%. For the next instalment due in March 2006, the rate is equal to 2.8420%. EFIBANCA (in pool with Banca Carige, Centrobanca and Mediocredito Lombardo) A loan granted during 2000, for an original amount of US$ 48 million and currently expressed in Euro, secured by a mortgage registered on the two units Four Island and Four Bay. The loan interest is calculated on the EURIBOR for the period plus margin (2005 average rate equal to 3.122%; a 3.1375% rate for the instalment due in January 2006), and is repayable in forty-eight quarterly instalments with increasing principal, of which the first was repaid on 15.01.2001 and the last is due on 15.10.2012. Unicredit Banca d’Impresa (in pool with Banca Generali and Banca Popolare di Vicenza) A five-year loan of a maximum amount of 40,000,000 Euro, agreed on 05.11.2004 and to be repaid within 31.12.2009. The loan was drawn for an amount of 30 million euro on 26.11.04 simultaneously with the repayment of a previous bond loan of the same amount, whereas the remaining 10 million euro fall under a revolving credit line until termination. Interest is calculated on the three-month EURIBOR. The average rate applied for the year 2005 was equal to 3.537%. With relation to the instalment due in March 2006, the rate is equal to 3.75%. The loan requires the compliance with certain financial covenants (with respect to a minimum shareholders' equity, ratio between the shareholders' equity and residual debt, and ratio between the shareholders' equity and the total consolidated indebtedness), all of which are currently satisfied. The value of the latter ratio can also have an impact on the applied margin. Commerzbank A loan granted on 11.07.2003 for an original amount of US$ 15 million, to be repaid in forty deferred quarterly instalments with constant principal amount quotas of US$ 220,500, of which the first instalment was repaid on 14.10.2003 and the last one is due on 11.07.2013, plus a US$ 6,180,000 balloon payment due with the last instalment. The loan, secured by a mortgage on the M/T Four Coal, is converted into euro through a special cross currency swap transaction and therefore generates an interest calculated on the EURIBOR for the period. The average rate applied in 2005 was equal to 3.178%. With regard to the instalment due in January 2006, the rate is equal to 3.222%, taking into account the hedging transaction mentioned above. Starting from the instalment due in July 2007, the interest rate has been converted into a fixed interest rate of 4.65% until the termination of the loan. Commerzbank A loan granted on 13.01.2003, secured by a mortgage on the motor ship Four Moon for an original amount of US$ 15 million, to be repaid in forty deferred quarterly instalments with constant principal amount quotas, of which the first instalment was repaid on 14.04.03 and the last is due on 14.01.2013.The loan has been converted into euro through a special cross currency swap transaction and it therefore generates an interest calculated on the EURIBOR for the period. The average rate applied in 2005 was equal to 3.30%.
62
Starting from the instalment expiring in January 2006, the interest rate has been converted into a fixed interest rate of 3.98% until the termination of the loan. Commerzbank (together with Banca Mediocredito) A loan granted on 01.12.2003, secured by a mortgage on the motor ship Four Springs for an original amount of 18 million dollars, to be repaid in thirty-six deferred quarterly instalments with constant principal amount quotas, of which the first instalment was repaid on 01.03.04 and the last is due on 01.12.2012.The loan has been converted into euro through a special cross currency swap transaction and therefore generates an interest calculated on the EURIBOR for the period. With regard to the instalment due in March 2005, the average rate applied inr 2005 equals to 3.525%, taking into account the hedging transaction mentioned above. Banca Intesa A loan granted on the 29.12.03, secured by a mortgage on the motor ships Four Iron, Four Sterling and Four Euro for an original overall amount of 19 million dollars (of which 10 relate to the Four Sterling, 6 to the Four Iron and 3 to the Four Euro), to be repaid in half-yearly deferred quarterly instalments with constant principal amount quotas equal to 500,000 dollars for each unit, of which the first instalments were repaid on the 30.06.04 and the last (relating to the Four Sterling) is due on 31.12.13. Interest is calculated on the LIBOR rate for the period (2005 average rate, equal to 4.359%; with regard to the instalments expiring in June 2006, the interest rate is equal to 5.85%). It should be noted that on 30.09.05 an advance repayment was made for the amount of 4.5 million dollars and therefore the subsequent instalments have been redefined accordingly. Fortis Bank (together with NIB, Vereins und Westbank, Natexis, MPS Merchant and Banco di San Giorgio) A loan of an original amount of 61 million dollars, lowered to 19 million at the end of 2005, is secured by a mortgage on the FPSO Four Vanguard and by the assignment of the operation contract. The loan, which generated interest calculated on the LIBOR for the period (4.794% as an average for 2005), has been converted into euro on 29.12.2005 and will therefore generate interest calculated on the EURIBOR rate for the forthcoming period. The repayment shall be effected in quarterly instalments with final payment on the 5th of May 2007. It should be noted that during the year 2005 the following loans were paid off in advance:
MCC (together with Centrobanca, Banca Intesa BCI and Banca Popolare di Bergamo – Credito Varesino) A loan granted on 07.06.2002 for an original amount of 12.9 million euro, secured by a second mortgage on the M/T Framura, Four Island and Four Bay. This loan, whose interest is calculated on the EURIBOR rate for the period (average rate for 2005 equal to 3.52%), repayable in nineteen quarterly instalments with increasing principal amount portions, of which the first instalment was repaid on the 30.09.2002 and the last would have been due on 31.03.2007, was paid off in advance at the end of September 2005. Deutsche Schiffsbank - Brema
2 loans for an original amount of 10,500,000 Euros each, secured by mortgages registered on the M/T Sider Capri and Sider Ponza, repayable in thirty-six deferred quarterly instalments with constant quotas of the principal amount, for which the first

63
instalment was repaid on 31.03.2003 and the last is due on 31.12.2011, with a balloon payment of 3,750,000 euro to be effected with the last instalment. These loans, whose interest is calculated on the EURIBOR rate for the period (average rate applied for the year 2005 equal to 3.306%), were paid off in advance at the end of 2005. Furthermore, it should be noted that there is an ongoing interest rate risk related to the above mentioned transactions, covered by financial derivative transactions for a total amount of 110 million euro. Provisions for risks and charges The item registered, equivalent to €/000 681 on 31.12.05, as opposed to a corresponding value of €/000 2,079 on 31.12.04, represents the overall allocations for litigations, third party claims and other liabilities. Provisions for staff severance indemnity This item refers to the amounts accrued for employee severance indemnities, determined on an actuarial basis, as previously stated under the Valuation Criteria. Deferred tax liabilities The item, registered in the previous year’s financial statements and no longer present in the financial statements as of 31.12.05, represented the amount due for deferred taxation, mainly relating to the spreading among a number of periods of the taxation due for capital gains realised in previous years. CURRENT LIABILITIES Short-term bank debts This item represents overdrafts and the short-term quota of medium/long-term loans, as stated in the description of the bank loan detail table previously shown. Derivative financial instruments This item represents the year-end valuation at fair value of derivative financial instruments created against interest rate risks in relation to the medium/long-term loans mentioned above. Suppliers This item indicates current amounts due to other suppliers. The amount of this exposure reflects the business volume. Balances for the end of the period are stated.
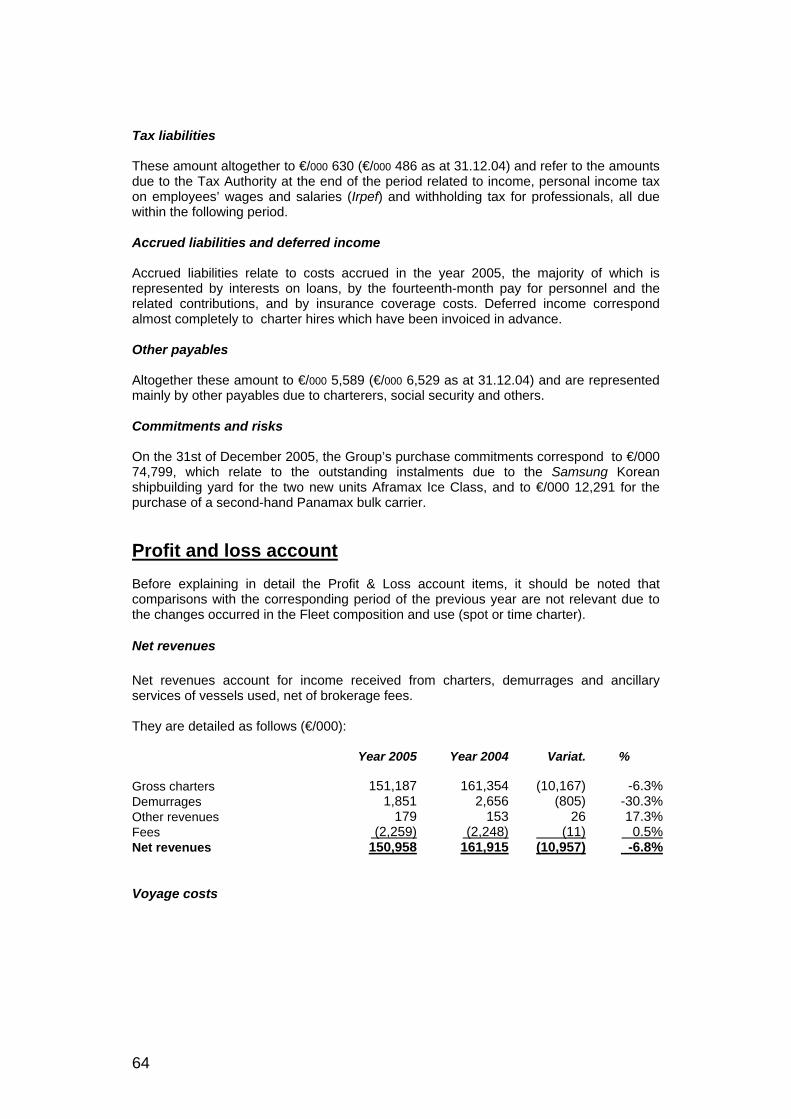
64
Tax liabilities These amount altogether to €/000 630 (€/000 486 as at 31.12.04) and refer to the amounts due to the Tax Authority at the end of the period related to income, personal income tax on employees’ wages and salaries (Irpef) and withholding tax for professionals, all due within the following period. Accrued liabilities and deferred income Accrued liabilities relate to costs accrued in the year 2005, the majority of which is represented by interests on loans, by the fourteenth-month pay for personnel and the related contributions, and by insurance coverage costs. Deferred income correspond almost completely to charter hires which have been invoiced in advance. Other payables Altogether these amount to €/000 5,589 (€/000 6,529 as at 31.12.04) and are represented mainly by other payables due to charterers, social security and others. Commitments and risks On the 31st of December 2005, the Group’s purchase commitments correspond to €/000 74,799, which relate to the outstanding instalments due to the Samsung Korean shipbuilding yard for the two new units Aframax Ice Class, and to €/000 12,291 for the purchase of a second-hand Panamax bulk carrier.
Profit and loss account Before explaining in detail the Profit & Loss account items, it should be noted that comparisons with the corresponding period of the previous year are not relevant due to the changes occurred in the Fleet composition and use (spot or time charter).
Net revenues Net revenues account for income received from charters, demurrages and ancillary services of vessels used, net of brokerage fees. They are detailed as follows (€/000): Year 2005 Year 2004 Variat. % Gross charters 151,187 161,354 (10,167) -6.3%Demurrages 1,851 2,656 (805) -30.3%Other revenues 179 153 26 17.3%Fees (2,259) (2,248) (11) 0.5%Net revenues 150,958 161,915 (10,957) -6.8%
Voyage costs

65
Voyage costs are charges directly incurred for individual voyages, i.e., among others, fuel consumption, port costs, canal transit rights, extraordinary insurance (with relation to local risks). It should be noted that with regard to time charters, these costs are paid directly by the charterer. Breakdown (€/000): Year 2005 Year 2004 Variat. % Fuel 3,934 5,574 (1,640) -29.4%Port costs 2,175 6,747 (4,572) -67.8%Other 50 763 (714) -93.5%Total 6,160 13,085 (6,925) -52.9%
Charter hires This item represents the compensation that Premuda pays to third parties for vessel charters. Rents payable are detailed as follows (€/000): Year 2005 Year 2004 Variat. % Bare Boat 2,798 3,380 (582) -17.2%Time charter 30,848 30,906 (58) -0.2%Total 33,646 34,286 (640) -1.9% It is to be noted that bare boat rents payable refer to the M/T Four Glens and Four Lochs, owned by the holding company Navigazione Italiana S.p.A.
Running costs This item represents the charges incurred for the navigation activity, such as crew, maintenance, certifications, insurance, lubricants and other costs. It should be noted that, with regard to bare boat charters, these costs are for charterer’s account. Breakdown (€/000): Year 2005 Year 2004 Variat. % Crew 18,616 20,882 (2,266) -10.9%Maintenance 11,777 12,968 (1,191) -9.2%Insurance 6,599 6,490 109 1.7%Lubricants 1,154 1,138 16 1.4%Other 1,285 1,432 (147) -10.3%Total 39,431 42,910 (3,479) -8.1%

66
It should be noted that the amounts registered for the Year 2004 also include, under the items Crew and Maintenance, the costs incurred by the Australian facility for the management of the FPSO unit (for a total amount of approximatelyt (€/000 3,871), which are registered in 2005 under the item “administrative expenses”.
Profit on vessel sale This item represents the net profit realized from the sale (which was carried out at the same time as the delivery by the Hyundai shipbuilding yard) of the new 105,000 dwt aframax unit. The amount registered for the year 2004 represents the corresponding profit realized through the sale of the M/T Four Clipper, Four Ketch and Four Brig to third parties.
Administrative expenses They represent the costs incurred by the Group’s on-land facilities, including administrative personnel remuneration and social security costs, as well as overheads, company officers’ remuneration and expenses, other operating charges and other costs not directly attributable to the vessels. Year 2005 Year 2004 Variat. % Remuneration 6,390 4,392 1,998 45.5%Social security costs 1,912 1,069 843 78.9%Employee severance indemnity 298 216 82 38.0%Other charges 461 442 19 4.3%Subtotal: Head office personnel 9,061 6,119 2,942 48.1% Overheads 2,843 2,044 799 39.1%Sundry company expenses 4,184 3,806 378 9.9%Other charges/(income) 21 (32) 53 -162.5%Total 16,109 11,937 4,171 34.9%
The significant variation from the previous year is mainly due to the costs incurred by the Australian FPSO Management PTY LTD, previously included under the Four Vanguard unit operating expenses.
Other income/costs These are residual amounts of insignificant value.
67
Depreciation The depreciation rates applied and the criteria used to determine the depreciation pertaining to the year can be found under the corresponding Balance Sheet items as well as in the “valuation criteria” section.
Financial items These are detailed as follows (€/000): Year 2005 Year 2004 Variat. % Interest income: Banks 855 227 628 276.8%Securities 512 513 (1) -0.2%Holdings 6 131 (125) -95.4%Affiliates 302 126 176 140.2%Other income 16 338 (322) -95.3%Income subtotal 1.691 1,335 356 26.6% Interest expense Short-term to banks (27) (308) 281 -91.4%Loans (6,728) (7,963) 965 -12.6%Bonds - (1,483) 1,483 -100.0%Swap spreads (400) (397) (3) 0.9%Fees and expenses (509) (529) 20 -3.8%Other charges (156) (411) 255 -62.0%Charge subtotal (7,820) (10,821) 3,001 -27.7%Exchange differences (2,388) 1,361 (3,749) -275.5%Total (8,517) (8,125) (392) 4.8% Financial revenues have grown due to the increase of available cash. Similarly, financial charges have benefited from the constant reduction of net financial liabilities. Exchange rate differences, on the contrary, are negative, as a consequence of the revaluation of loans expressed in dollars and following the strengthening of the US dollar with respect to 31.12.04.
Profit/loss from associated companies These indicate the impact of the net equity valuation of the affiliate companies Sider Navegaçao Lda and Sider Navi Spa.

68
Tax on profit This item accounts for taxes relating to the period, detailed as follows (€/000): Year 2005 Year 2004 Variat. % Current 526 500 26 5.2%Deferred (123) (462) 339 -73.4%Prepaid 1,804 147 1,657 1,127.2%Total 2,207 185 2,022 1,093.0% Deferred taxes relate mainly to the spreading of the taxation of capital gains realized during previous periods. Prepaid taxes relate mainly to provisions for taxed funds and directors’ fees not paid during the period. The significant amount of prepaid taxes for 2005 results from the introduction of a new taxation method under the so-called “Tonnage Tax” for the Parent Company. By applying this method, the amount of new credits for prepaid taxes to be entered in the financial statements is very low, whereas prepaid taxes recorded in the past are entered under the profit and loss statement. The result is therefore significant during the first period of application of this regime.
Net profit This item is the consolidated profit (loss) for the period, gross and net of minority interests. Segment information Premuda Group mainly operates with either its own or chartered vessels in three business sectors: - Oil and derivative products (tanker sector) - Transport of bulk dry loads (bulk sector) - Oil off-shore (FPSO) sector The following table contains the Profit and Loss Statement for the Year 2005, divided by business sector.

69
Tanker Bulk FPSO Undivided Total Net revenues 80,070 36,490 34,398 - 150,958Voyage costs (5,531) (439) (190) - (6,160)Time Charter revenues 74,539 36,051 34,208 - 144,798Charter hire (28,968) (4,678) - - (33,646)Running costs (16,901) (7,643) (14,887) - (39,431)Fleet margin 28,670 23,730 19,321 - 71,721 Profit on vessel sale 8,564 - - - 8,564 Administrative expenses - - (4,509) (11,600) (16,109)Other income/(costs) - - - 689 689Depreciation (9,635) (7,845) (11,574) (245) (29,299)Operating profit 27,599 15,885 3,238 (11,156) 35,566 Financial items (8,517)Profit/loss from associated companies 2,666Profit before tax 29,715 Tax on profit (2,207)Net profit 27,508 Minority interest 2,132Group’s net profit 25,376 No geographical subdivision is to be reported considering that our vessels operate in a single global market and the operation of individual units is not limited to certain areas. This remark excludes the FPSO Four Vanguard which operates permanently in Australia under a long-term contract. . Consolidated Cash Flow Statement The Cash Flow Statement has been drawn up following the indirect method for cash flow. The amounts shown do not highlight significant variations with reference to the method adopted in the past (under the national accounting principles) based on sources and uses relating to net working capital variations. The operating activity generated a liquidity of 56.2 million Euro, among which 44.1 million resulted from the reduction of the net working capital. The investment activity generated a liquidity of 17.2 million Euro, resulting from the sale of the new aframax 105,000 dwt unit. The financial activity absorbed a liquidity of 69.1 million Euro, mainly due to the repayment system of medium/long-term loans and to the distribution of dividends.