annual report 2006 - vernimmen.net figures 8 report on operations ... other important...
TRANSCRIPT

2006Annual Report
Ann
ualR
epor
t20
06
www.indesitcompany.com


annu
alre
port
2006
summary
Letter to shareholders 3
2006 events 4
Inside figures 8
Report on operations 10
Attachments to the report on operations 24
Consolidated financial statements at 12/31/2006 27
Explanatory notes 32
Independent Auditors’ report 108
Glossary 109
Contacts 110
Indesit Company

2
“Every ten years we have introducedradical changes bringing us in linewith the most advanced of ourcompetitors.The future requires commitmentfrom our best resources and anincreasingly wide-ranging vision.”

3
Shareholders,
2006 saw a strong return to growth by our Company. We achieved anappreciable improvement in profitability, market share and financial position.This performance received the authoritative endorsement of the stockmarket,where our equity rose 40%.
Other important acknowledgments of Indesit Company’s standing came whenit won an “Oscar di Bilancio” for best corporate governance and the “PremioEtica e Impresa” for best relations with communities, in recognition of ouragreement with the trade unions in Refrontolo.
Appreciation of our products took the form of the “Five Stars” given to ourAqualtis washing machine in the Melbourne “Standard Tests” for energy andwater saving, due the machine’s innovative technology and Class A++ rating.The Aqualtis also won Lion d’Or at Cannes and another award at the New YorkFestival for its TV commercial.
In the white goods industry, our Company is now the no. 2 in Europe bymarket share. It is our ambition to work towards becoming the no. 1. To thisend, we have stepped up re-organization processes, focusing on a moreintegrated and result-oriented management structure. At the same time we haveincreased our investments in research & development, especially on improvingproduct reliability and quality and on our capacity for real time reaction toconsumers’ growing needs.
We are fully aware that the competitive scenario is in continual evolution,which is why continual change has been a fundamental rule in our Companyfor some years now. Every ten years we have introduced radical changesbringing us in line with the most advanced of our competitors. We willcontinue to apply “change as a rule” in building a future requiring intensecommitment from our best resources - human, technological and financial - and an increasingly wide-ranging vision.
In assessing our results to date and setting new, more ambitious targets, weshall remain faithful to our Company’s values and principles, defined at theoutset by its founder Aristide Merloni, in the conviction that “there is no valuein the economic success of any industrial initiative if it is not also accompaniedby commitment to social progress.”
We have maintained this commitment in the past and continue to do so inthe present, also by investing in new markets, and we intend to stay true to itin the future.
After a year of broadly positive results, we look forward to new challenges withthe confidence that comes from our enterprise’s solidity, the professionalismand dedication of our employees, the vocation for change underlying our work,and the unchanging heritage of our values, our true hallmark.
Vittorio Merloni(Chairman)

januaryStart up of the 3-year industrial plan for 2006-2008
The Plan presented to the financial community focuses on sustainable growth of the main economic and financial indicators and sets some very ambitious targets.
februarySow to reap: IndesitCompany’s drive for quality
A programme of activities was initiated to further improve quality throughout the Company. “Sow to reap: Indesit Company’s drive for quality” has two objectives: to fostergreater knowledge of quality and involve all levels of the organization in understanding its importance. Project output includes training courses, a teaching video, folders and posters and “quality corners” in all the production plants.
marchIn an undersea worldThe Aqualtis campaign
A concept by Leo Burnett Italia, under the creative direction of Enrico Dorizza,produced the dreaming gaze of a little boyas he imagines what’s happening inside awashing machine that’s working. This TVad was directed by Dario Piana and themagic of the images is enhanced by someextraordinary music - Vangelis’s “Ask theMountains”. Indesit Company presented the campaign in Milan in the first week of March.
aprilEurocucina 2006
On 5th April, the curtain rose on the 16thEurocucina, the world’s most importantmodular kitchen expo. On display alongside the top names in the Italian kitchen segment were numerous foreignbrands - German, Austrian, French,Spanish and Russian. Indesit’s stand exhibited new products from its Indesit,Ariston and Scholtès brands.
mayInsight is the new Intranet
Insight simplifies, informs, unites, createsvalue. The Company’s new worldwideintranet replaces the three former localintranets that had accompanied us overthe years and is designed to be ourprincipal instrument of internalcommunication. Providing a continual stream of news on activitiesand projects within the Group, it shortensdistances between people, poolsknowledge and fosters involvement.
juneFestival of the Economy
Indesit Company is to take part in the “Festival Internazionaledell’Economia” from 1st to 4th June inTrento. The Festival will present theeconomic sciences to students,international experts and journalists and anyone else interested in what hasbecome a universally relevant discipline.
2006 events
4

julyScholtès at the Guggenheim
Scholtès was on display at theGuggenheim Museum, New York, with architect Zaha Hadid. The futuristic“Z. Island by DuPontCorian” project creates an intelligent ambience that satisfies both our aesthetic sense and our requirement for functionality and innovation. The event was organizedby DuPont in collaboration withErnestomeda and Scholtès.
augustOver £500,000 to ChildLine
Through its Hotpoint brand, Indesitdonated over £500,000 to ChildLine, a UKcharity supporting children. The donationcheque was handed over in a ceremony at ChildLine’s Counselling Centre inLondon on 24th August. Hotpoint hassupported ChildLine since 2004 throughcharity activities and events in whichIndesit’s UK employees take part.
septemberThe “Polittico dell’Intercessione” at Fabriano
Painted by Gentile da Fabriano around 1420for the Florentine church of San NiccolòOltrarno, the “Intercession Polyptych” was restored by experts from the Opificiodelle Pietre Dure in Florence, thanks to vitalfunding from Indesit Company. The workwas displayed at the Fabriano headquartersfor some months.
octoberGlobal Compact
Indesit joined the Global Compact, an initiative promoted by Kofi Annan andwhose objective is to spread best practicein the field of corporate social responsibility. Presented at the UN in 2000, the programme invites companies to abide by ten universal principles in the areas of human rights, workplace conditions and theenvironment.
novemberSuppliers Convention in Turin (Lingotto)
Around 500 representatives of IndesitGroup’s main suppliers, from four continents, took part in the event, at which the guest speaker was SergioMarchionne, Fiat Group CEO. QualityAward cups were presented to the three suppliers who achieved the best performance in terms of quality
decemberStockmarket high
On 13th December, Indesit Companyshare reached its high for the year - 13.15 euro - on the Milan bourse.
5

awards & acknowledgments
Oscar di Bilancio 2006Indesit Company won the “Oscar di Bilancio 2006” in the corporate governance category for its successfulmanagement of changes required by new legislation and heightened sensibility to the need for ethical conduct of business.
Premio Etica & ImpresaIndesit Company won the first PremioEtica & Impresa, the first national competition to judge the best agreementsand best social responsibility practicesbetween employers and workers. IndesitCompany was awarded in the “Territory” category for the most significant project with the greatest social impact.
EcohitechAward 2006Indesit Company won the 8th EcohitechAward, for 2006, with its Aqualtis. The award is the most important in the field of eco-compatible, low-energy consumption technology.
Comet bestsupplier of the yearIndesit Company leads the market in the UK: a major endorsement came at the 2006 Comet Awards, where the Company received BestTraining and Best Supplier awards.
CSRAwardsThe numerous awards received at the close of the year reflected Indesit’s unwavering focus on eco-compatible, low-energy technologies and water saving and on social issues.
Trade CommunicationAwardIndependentElectricalRetailerThe Hotpoint brand received an award for “Best press and TV campaign” from the Independent Electrical Retailer Magazine.
6

5 stars for the AqualtisThe Aqualtis was the first washing machine to pass the Australian StandardTests conducted by the Vipac Engineersand Scientists Laboratory in Melbourne(certified by NATA - National Association of Testing Authorities,Australia), and win Five Stars in the Water Rating category. The washing machine was judged themost successful in terms of water saving, a cause for which the Australian government has fought for years.
Gold LionCannes 2006An Italian company wins the Lion d'Or again after 12 years. At the 53rdInternational Advertising Festival in Cannes, Indesit Company won the Lion d'Or with its TV commercial for the Ariston Aqualtis washing machine.

8
annu
alre
port
2006
inside figures
Income statement (million euro)
2004 2005 2006
Revenue 3,100 3,064 3,249
EBITDA 348 11.2% 264 8.6% 303 9.3%
EBIT 199 6.4% 122 4.0% 160 4.9%
Profit before taxation 160 5.2% 93 3.0% 132 4.1%
Group profit 100 3.3% 51 1.6% 77 2.4%
Tax rate 37% 46% 42%
Cash flow statement (million euro)
2004 2005 2006
Cash flows from operating activities 227 192 273
Cash flows from investing activities (219) (167) (145)
Share capital increases 7 6 3
Dividend payment (36) (37) (37)
Free cash flow (21) (5) 94
Cash flows from financing activities (140) (7) (109)
Cash flows, net (161) (12) (15)
Financial statement (million euro)
01/01/2005 12/31/2005 12/31/2006
Net working capital 93 78 40
Non-current operating assets 1,233 1,269 1,252
Other current assets and liabilities and non-current liabilities (370) (310) (317)
Net invested capital 956 1.037 976
Net financial indebtedness 512 517 424
Equity attributable to the Group 433 505 546
Minority interests 11 14 7
Equity and financial liabilities 956 1,037 976
51
100
40
02
50
02
60
02
76
Group net profit(million euro)
264
348
40
02
50
02
60
02
303
EBITDA(million euro)
3,0643,100
40
02
50
02
60
02
3,249
Consolidated revenue(million euro)
Western Europe
Other countries
Eastern Europe
Refrigeration
Laundry
Cooking
Services
2006 revenueby geographical area
2006 revenueby product
27%
23%
43%
7%
60%
33%
7%
Western Europe
Other countries
Eastern Europe
Refrigeration
Laundry
Cooking
Services
2006 revenueby geographical area
2006 revenueby product
27%
23%
43%
7%
60%
33%
7%

9
Stockmarket information (at 12/31)*
2004 2005 2006
EBITDA per share (euro) 3.55 2.62 2.96
Basic EPS (euro) 1.00 0.50 0.74
Diluted EPS (euro) 1.00 0.50 0.74
Average no. of ordinary shares used for basic EPS calculation (thousand) 98,033.10 100,514.30 102,251.80
Average no. of ordinary shares used for diluted EPS calculation (thousand) 99,946.30 101,161.50 102,479.60
Free cash flow per share (euro) 0.33 (0.05) 0.92
Dividend (euro) 0.361 0.361 0.385
Year lowest share price (euro) 11.50 8.23 8.46
Year average share price (euro) 13.83 10.45 9.87
Year higher share price (euro) 15.14 13.32 12.90
Year-end share price (euro) 12.67 8.74 12.33
Average share price/EPS basic 13.83 20.9 13.3
Book value per share ** 4.5 5.2 5.4
Share price/Net equity per share 3.07 2.0 1.8
Pay out ratio (%) 31.6 73.2 52.1
Dividend per share/share price (%) 2.6 3.5 3.9
Share capital (thousand euro) 91.1 92.2 92.6
Market capitalization (million euro) *** 1,242,092 892,292 1,267,213
Debt+Equity/Revenue (%) ** 0.31 0.34 0.30
Net financial indebtedness/EBITDA 1.47 1.96 1.40
Data referred to ordinary shares only. * All per share data are calculated with the average no. of ordinary shares used for the EPS basic.** 2004 figures are stated using the balance sheet figures at 01/01/2005, the date IAS 32 and IAS 39 came into force.*** Calculated using ordinary and savings share price at year-end.
2
4
6
8
10
12
14
16
2004 2005 2006
Indesit Company ordinary share 2004-2006(euro)

10
Report on operations ending 12/31/2006
CEO’s comment
I ndesit Company had an extremely good year in 2006, benefiting froman improvement in market conditions with respect to the prior year and
from all the groundwork performed in the past.The Group is set to achieve the objectives established in the three-yearplan for 2006-2008 presented in October 2005: the results achieved thisyear (revenue of 3,248.6 million euro, up 6%; operating profit of 160.2million euro, up 31%; positive free cash flow) were undoubtedlyconsistent with the targets.There was a general recovery in the various markets during 2006. By contrastwith 2005, the volume of sales was higher in Western Europe, as well as inEastern Europe and the CIS.The Group took advantage of these favourable macroeconomic conditions tostrengthen its position in all main markets via price competitiveness and thelaunch of new products. Indeed, the market share of Indesit Company rose byabout 0.3% with respect to 2005, confirming the Group's position as thesecond-largest player in Europe. All product lines achieved an increase in the volume of production andrevenue. The results of the Refrigeration and Laundry business units were

11
6%revenue
+
especially satisfactory, with progress by the latter assisted by the excellentperformance of the new Aqualtis washing machine.Growth by the free standing segment, where the weighting of laundry andrefrigeration products is greater, exceeded that of the built-in segment, whichis dominated by cooking products. In the built-in segment, the market shareof Indesit Company is below the Group average and, as such, is a key focus ofthe three-year plan. In this context, Indesit Company has obtained especiallyencouraging results in the CIS and in the UK, which was targeted by aspecific built-in plan that raised sales by 13.6% and market share by 1.5%.This trend was contrasted in Spain and France.Average unit revenue (Price/Mix) decreased by 1.5% while, overall, retailprices were essentially stable (slightly higher in Western Europe and lower inEastern Europe). The reduction in unit revenue was not only greater than themarket average, but also more than the objectives set in the 2006-2008 three-year plan. This was partially due to a desire to raise the volume of sales inorder to improve market share, as well as to the stronger growth of the Indesitbrand with respect to the Group's other brand names.Brand policy has continued to concentrate on the principal brand names.Advertising investment was focused on the Indesit and Ariston/Hotpointbrands. The new products were launched solely under these brand names.The sales of the two principal brands (Indesit and Ariston/Hotpoint) haverisen from 90% of total revenue from products in 2005 to 92% in 2006.Work to contain procurement and production costs continued in 2006. As aconsequence of attentive policies for the purchasing of key raw materials(especially steel), including the signature of annual supply contracts towardsthe end of last year, the Group did not suffer the effects of higher steel pricesduring the year. Inflationary pressures on certain components, due to higherprices for such raw materials as nickel, copper and aluminium, have beenoffset by improved efficiency and, as envisaged in the business plan, byincreased purchasing from low-cost countries. In particular, purchasing ofraw materials and components from these countries has increased from 24%to 30%, while local purchasing by factories situated in low-cost countries rosefrom 20% to 36%.Work on the redistribution of production continued in accordance with thethree-year plan during 2006. The total direct labour hours dedicated toproduction in low-cost countries rose from 34% to 40%.The continuation of redistribution activities has further lowered payroll costsas a percentage of revenue from 16.2% in 2005 to 15.2% in 2006. The factoriesin Lódz (Poland) and Lipetzk (Russia) have almost reached full capacityoperating levels. In addition, the conversion of the Melano factory (Italy) fromrefrigeration to cooking was completed during 2006 and the decision wastaken to build two more factories in Poland.The Group has benefited from the work to contain and rationalise costs thatbegan in 2005. Selling and distribution expenses have decreased from 16.1%of revenue to 15.8%, despite the higher volume of sales. Similarly, general andadministrative expenses have declined both in absolute terms and as apercentage of revenue, to 4.3% from 4.7% in 2005.The results of financial management were especially good: in particular, wellahead of the timing forecast in the medium-term plan, the free cash flow
3,064
Revenue (million euro)
4.0%
EBIT (%)
3,249
3,100
6.4%
40
02
50
02
60
02
4.9%
Revenue and EBIT(%)

12
annu
alre
port
2006
annu
alre
port
2006
94Net financialindebtedness
millioneuro
generated by the Group resulted in a reduction in net financial indebtednessby 94 million euro.Net working capital has fallen from 2.5% of revenue to 1.2% due toimprovements in each of its components: collection of trade receivables,inventory turnover and the number of days taken to pay suppliers.Net investment during the year amounted to 130 million euro (152 millioneuro in 2005), of which 95 million euro for property, plant and equipment and35 million euro for intangible assets, including 17 million euro from thecapitalisation of development costs. The reduction with respect to the prioryear principally relates to property, plant and equipment, given theconstruction of a logistics hub in Lipetzk (Russia) during 2005. The policy ofgreater focus on capital investment processes, adopted from 2005, hascontinued. This is designed to contain the level of net invested capital while,at the same time, guaranteeing the resources needed for the development ofstrategic initiatives. Moving in this direction, a significant and growingproportion of capital investment, about 33% (25% in 2005), has been allocatedto the development of new products. Again with a view to improvinggovernance and containing capital investment, by focusing on activities in thehousehold appliances sector, work continued in 2006 on the reorganisation ofcertain minority investments. This involved the disposal of equity intereststhat are no longer strategic, the purchase of minority interests in subsidiariesthat were subsequently absorbed, and the write-off of other equityinvestments.The combined effect of higher operating profits and the focus on capitalinvested, down by 5.9%, has resulted in an increase in the return oninvestment - before taxation - to 15.9% (12.2% in 2005).The dividend policy is unchanged and the 2006 dividend per share (ordinaryand savings) distributed by the Parent Company was the same as in the prioryear. There were a number of significant product innovations during 2006, akey element in the strategy of Indesit Company, with investments of 17 millioneuro (capitalised development costs) and research costs of 8 million euro.
less
25%
24%
16%
2%
33%
Manufacturingprocess improv.
Manufacturingrebalancing
IT
New production capacity
New products
2006 investments by destination (%)
40
02
50
02
60
02
2.5%
3.0%
1.2%
Net working capital (%)

13
In the Laundry segment, the launch of Aqualtis has been completed in allprincipal markets. Flexibility, comfort and care are the key values that havecontributed to the success of this product from the time it was launched in Italyduring 2005, where it became market leader in the retail price segment above500 euro - traditionally the domain of our competitors. This success wasrepeated in 2006 in all world markets.In the Refrigeration segment, new Giugiaro styles have been launched to re-affirm the Group's leadership of the Russian market. In addition, the restylingof Ariston products in the free-standing sector has allowed new features to beintroduced such as, for example, the everfresh function, while the new 55 cmplatform has been launched for the built-in market with an energy rating in theA+ class.There was a wealth of important innovations in the built-in segment during2006, confirmed by the success at Eurocucina of the new Experience linemarked by the revolutionary 48 cm oven, with the same capacity as a traditional60 cm oven, and a new range of gas and induction hobs.The Innovation and Technology Department, formed just one year ago, hasstrongly stimulated research into materials, production technology, innovativetechnologies for washing and conservation, acoustics and vibration, electronictechnologies, communication technologies, energy and technologies foradvanced and ergonomic user interfaces.Confirming the Group's interest in environmental matters, a research projecthas recently been launched for the reduction of CO2 emissions into theatmosphere. The technology developed as part of this project will enableappliances to adapt automatically, by reducing their energy consumption inrelation to the load on the power grid.Major advances have been made on the development of new sensors andswitches for washing machines and dishwashers. These will significantly reducethe consumption of precious resources, such as water and energy, and increasethe speed and quietness of household appliances.
15.9percent
ROI+Net invested capital (million euro)
EBIT (million euro)ROI (%)
12.2%
20.8%
199 122 160
15.9%
40
02
956 1,037976
50
02
60
02
Net invested capital, EBIT and ROI
ROI 2004 calcolated on NWC atyear-end. ROI 2005 and 2006
calcolated on year average NWC.

14
In addition, highly innovative systems of conservation are at an advanced stageof development which, combined with low temperatures, will improve thequality and life of food stored by Indesit products.Following the multiple, significant organisational changes made in 2005, 2006was a year of welcome stability: the divisions created and/or reorganised in theprior year were able to focus on the achievement of their established objectivesand the strengthening of their second and third-tier organisations. The onlysignificant change during the year was the direct reporting of the fourcommercial areas to the CEO. The current organisational structure isconsidered suitable for the coming years and no significant changes areexpected. Management and the Human Resources Committee are content withthe system of short-term (MBO) and medium-term (LTIP) objectivesintroduced to encourage the generation of cash flows. These are helping to buildawareness of this important concept at all levels within the Group.

Sales of household appliances in Europe
Sales of white goods to retailers (industry shipment) during 2006 were upwith respect to 2005 by 2.3% in Western Europe and 5.8% in Eastern Europe.The positive trend in Western Europe encompassed all markets, with slightlyabove average growth in Spain. In Eastern Europe, the strongest growth wasseen in Hungary, while the market contracted in Romania. Growth in the CISwas 5.9%.
Retail prices rose in Western Europe, especially during the second half of theyear, with an overall increase of 1.5%, while there were adverse conditions inEastern Europe with a decline of 3.8%.
Currency markets
Compared with 2005, during 2006 the euro(1) fell by 3.1% against the ruble and3.2% against the zloty, but rose by 7.7% against the Turkish lira and 0.9% againstthe US dollar. The exchange rate against the British pound was essentially stableduring 2006 with respect to 2005.
Significant events during the year and subsequent to year end
Between January and May 2006, following negotiations with the varioussocial partners concerned, the decision was taken to implement redundancyplans at the Carinaro, Teverola and Refrontolo factories. Similarly, action wastaken to reorganise production at the Kinmel Park, Blythe Bridge,Peterborough and Yate factories in the UK.
In March 2006, the decision was taken and announced to close access to thedefined-benefit pension scheme for UK employees and to start a defined-contribution pension plan for new members.
In June 2006, General Electric exercised a put option with respect to a further8% of the share capital of General Domestic Appliances Holdings Ltd,
15
(1) Determined withreference to the average
monthly rates reported byUfficio Italiano Cambi.

involving the payment of 49.8 million euro, as shown in the cash flowstatement. Following the exercise of this option, Indesit Company now owns84% of this UK company, which is consolidated as a wholly-owned subsidiaryin accordance with IFRS 3.
In July 2006, a multicurrency line of credit for a maximum of 350.0 millioneuro was arranged with a syndicate of leading domestic and internationalbanks, to replace an earlier line of credit that was due to expire. This line ofcredit has a duration of five years.
A number of transactions were carried out between December 2006 andMarch 2007 to rationalise the Group structure, as described in note 10.4Further information on corporate transactions with related parties.
There have not been any significant events subsequent to year end.
Approach taken
All amounts are stated in millions of euro. All comparisons contained in thisreport and in the consolidated financial statements are made with respect toinformation for the prior year (stated in brackets). Percentages (margins andchanges) are determined with reference to amounts stated in thousands of euro.The Group reporting to Indesit Company SpA is hereafter referred to IndesitCompany or simply the Group. When the commentary relates to the ParentCompany or individual subsidiary companies, their names and legal form arestated in full.
Summary of consolidated results
The Group's principal economic indicators are reported in the following table.
Sales rose by 6.0% in 2006 as a whole, due to an increase in volume of about 7.5%and a reduction in unit revenue of 1.5%.
16
annu
alre
port
2006
Summary of consolidated income statement (million euro)
2006 2005 Change
% % %
Revenue 3,248.6 100.0% 3,064.2 100.0% 184.4 6.0%
Gross operating margin 303.0 9.3% 263.7 8.6% 39.3 14.9%
Operating profit 160.2 4.9% 122.3 4.0% 37.9 31.0%
Profit before taxation 131.6 4.1% 92.8 3.0% 38.8 41.8%
Group profit 76.7 2.4% 50.4 1.6% 26.3 52.2%

(2) EBITDA: operatingprofit reported in theconsolidated income
statement, stated gross of the depreciation
reported in note 8.7.
The gross operating profit (EBITDA)(2) amounted to 303.0 million euro in2006 (263.7 million euro), representing 9.3% (8.6%) of revenue. Non-recurring charges, mainly incurred for restructuring work, of 39.0 millioneuro (36.0 million euro) were in line with the Group's budget. EBITDAbefore non-recurring charges was 341.9 million euro (299.6 million euro),representing 10.5% (9.8%) of revenue. This growth in EBITDA was due toboth the higher volume of sales and an improvement in percentage margins.Positive results have been achieved, most especially by reducing the cost ofsales as a percentage of sales. The efficiencies deriving from implementationof the business plan and improved purchasing more than offset the adverseprice/mix effect. Action to contain selling and distribution expenses andgeneral and administrative expenses has also been successful, with areduction in their incidence on sales from 16.1% to 15.8% for selling anddistribution expenses, and from 4.7% to 4.3% for general and administrativeexpenses. With reference to the nature of costs, there was a marked reductionin the cost of services and payroll as a percentage of sales.
The operating profit (EBIT) was 160.2 million euro (122.3 million euro),representing 4.9% (4.0%) of revenue. In addition to the effects discussed inrelation to EBITDA, the improvement in EBIT was also due to the morecareful management of investments which, while meeting the targetsestablished in the business plan, has lowered the incidence of depreciationand amortisation as a percentage of revenue. Similarly, EBIT excluding non-recurring charges was 199.1 million euro (158.2 million euro), representing6.1% (5.2%) of revenue.
Net financial charges were essentially stable. Profit before taxation (PBT) was131.6 million euro (92.8 million euro), representing 4.1% (3.0%) of revenue.
Net profit amounted to 76.7 million euro (50.4 million euro). The tax chargewas 54.9 million euro (42.4 million euro). The effective tax rate (tax charge asa percentage of PBT) has decreased from 45.7% to 41.7%.
In Western Europe, sales of finished products have continued to grow, withstrong results in Italy and Spain. In France, the slight contraction experiencedduring the first half of 2006 was fully offset by the healthy performance ofsales in the second part of the year and, more especially, in the final quarter.There was also a slight increase in UK sales during 2006, following verydifficult conditions in 2005. Overall, there was an improvement in segment
17
Results by geographical area (million euro)
Revenue Segment result % on revenue
2006 2005 Change 2006 2005 Change 2006 2005 Change
Western Europe 1,973.8 1,922.4 51.4 132.7 109.7 23.0 6.7% 5.7% 1.0%
Eastern Europe 1,050.8 943.5 107.3 196.7 158.9 37.7 18.7% 16.8% 1.9%
Other countries 224.1 198.3 25.7 23.5 20.7 2.9 10.5% 10.4% 0.1%
Total 3,248.6 3,064.2 184.4 352.9 289.3 63.6 10.9% 9.4% 1.4%
60
02
61%
32%
7%
50
02
63%
31%
6%
Western Europe
Other countries
Eastern Europe
Revenue by geographical area

results, both in absolute terms and as a percentage of sales.With the sole exception of Romania, there was strong growth in all EastEuropean markets during 2006. There was also an improvement in thissegment's results, both in absolute terms and as a percentage of sales.With regard to the Other countries, the most significant growth came fromTurkey despite the effects deriving from the depreciation of the localcurrency.
Summary of the consolidated financial position
Cash flows from operating activities during 2006 totalled 272.8 million euro(191.8 million euro). In addition to better gross profitability, this change wasdue to the improved management of working capital (down from 2.5% to1.2% of sales) and lower tax payments. Free Cash Flow amounted to 93.9million euro (-5.5 million euro), thus reducing net financial indebtedness to423.6 million euro.
18
annu
alre
port
2006
Summary of consolidated financial position (million euro)
12/31/2006 12/31/2005
Trade receivables 573.2 555.2
Inventories 353.4 342.8
Trade payables (886.1) (820.3)
Net working capital 40.5 77.7
Non-current operating assets 1,252.3 1,269.3
Other current assets and liabilities and non-current liabilities (316.9) (310.5)
Net invested capital 975.8 1,036.6
Net financial indebtedness 423.6 517.5
Equity attributable to the Group 545.6 504.6
Minority interests 6.6 14.4
Equity and financial liabilities 975.8 1,036.6
Cash flows from operating activities 272.8 191.8
Net working capital/Revenue (12 months) 1.2% 2.5%
Net financial indebtedness/Equity 0.8 1.0

Reconciliation with the equity and profit for the year of the Parent Company
In accordance with CONSOB Communication no. DEM/6064293 dated 28July 2006, the equity and profit for the year of the Parent Company arereconciled below with the related consolidated amounts.
Intercompany and related-party transactions, and significant, non-business or unusual transactions
Transactions between Group companies are settled on arms’-length terms,having regard for the quality of the goods and services provided. Note 10 of theexplanatory notes describes the nature of the principal transactions arrangedby the parent and other Group companies with related parties including, inparticular, associates, subsidiaries and parent companies and their othersubsidiaries. This note also contains the detailed information required byCONSOB regulations and IAS 24. In accordance with CONSOB Resolution no.15519 dated 07/27/2006 and CONSOB Communication no. DEM/6064293dated 07/28/2006, Attachments 4 and 5 to the financial statements present theconsolidated income statement and balance sheet showing non-recurringitems and transactions with related parties separately, together with thepercentage incidence with respect to each account caption.
Transactions with related parties are not significant to the economic andfinancial position of the Group. Further information on the procedures adopted by the Group with regard tosignificant and related-party transactions can be found in the annualCorporate Governance report of Indesit Company SpA (posted on thecompany's website).
19
Reconciliation with the equity and profit for the year of the Parent Company (million euro)
12/31/2006 12/31/2005
Results Equity Results Equity
Financial statements of the Parent Company 54.3 409.8 99.3 388.2
Consolidation adjustments
Difference between carrying amountof and equity of Group companies 115.7 141.1 79.4 119.8
Dividends received from subsidiaries (93.8) - (125.7) -
Measurement of companies using the equity method (1.6) (0.8) (2.4) 1.7
Effect of aligning individual financial statements with Group accounting policies (0.6) 0.1 (1.2) 0.5
Elimination of intercompany profits 2.9 (5.1) 1.1 (8.0)
Tax effect of adjustments (0.4) 0.6 0.2 2.5
Total consolidation adjustments 22.2 135.9 (48.6) 116.5
Consolidated financial statements 76.4 545.6 50.7 504.6
0,8X
DEBT TOEquity ratio

20
Board of Directors
Chairman Vittorio Merloni
Chief Executive Officer Marco Milani
Directors Innocenzo CipollettaAdriano De MaioAlberto FrescoMario GrecoCarl H. HahnHugh Malim Andrea MerloniAntonella MerloniEster MerloniLuca Cordero di MontezemoloRoberto Ruozi
Board of Statutory Auditors
Chairman Angelo Casò
Auditors Demetrio MinutoPaolo Omodeo Salè
Alternate Auditors Maurizio Paternò di Montecupo Serenella Rossano
Human Resources Committee
Alberto Fresco (Chairman)Mario GrecoCarl H. Hahn
Audit Committee
Roberto Ruozi (Chairman)Innocenzo CipollettaHugh Malim
Innovation and Technology Committee
Members who are directors Adriano De Maio (Chairman)Andrea Merloni Vittorio MerloniMarco Milani
Members who are not directors Valerio AisaEnrico ColaSilvio CorriasMarco Iansiti Adriano MencariniDavide MilonePasquale PistorioMassimo RosiniGiuseppe SalvucciAndrea Uncini (secretary)
Representative of the savings shareholders
Adriano Gandola
Independent Auditor
KPMG SpA

The Shareholders' Meeting held on 05/05/2004 authorised totalremuneration of 920,000 euro for the Board of Directors (plus thereimbursement of expenses and insurance cover). The Board of Directorsresolved to allocate this amount in the form of attendance fees of 10,000 eurofor each board meeting and 5,000 euro for each committee meeting.The attendance fees of the Chairman are fixed at 20,000 euro for each boardmeeting and 5,000 euro for each committee meeting. The Chairman and theChief Executive Officer also benefit from remuneration for the special dutiesperformed pursuant to art. 2389.3 of the Italian Civil Code.The remuneration of the Board of Statutory Auditors totals 140,000 euro, ofwhich 60,000 euro for the Chairman and 40,000 euro for each of the standingauditors.Further information is available in the Annual Report on CorporateGovernance and in the Attachments to this report.
Information on stock option plans
The stock option plans are described in the explanatory notes to theconsolidated financial statements (note 8.33), which describes the plans andprovides the information required by law and the relevant CONSOBcommunications.
Corporate Governance
The system of corporate governance adopted by Indesit Company isessentially consistent with the principles established in the “Code of Conductfor Listed Companies” (hereafter, the “Code”), and with international bestpractice. On 03/22/007, the Company's Board of Directors approved theAnnual Report on Corporate Governance, which provides a completedescription of the governance model adopted by the Company and reportson the implementation of the Code.The Parent Company has adopted the ordinary model of administration andcontrol (envisaged under Italian law), with the presence of a Board ofDirectors, a Board of Statutory Auditors and Independent Auditors. Thedirectors and officers are appointed at the Shareholders' Meeting and remainin office for a period of three years. The significant presence of IndependentDirectors, as defined in the Code, and the important role they play on boththe Board and Board Committees (Human Resources Committee, AuditCommittee and Innovation and Technology Committee), ensures that theinterests of all shareholders are appropriately balanced and guarantees a highlevel of discussion at Board meetings.Further information is available in the Annual Report on CorporateGovernance.
21

European directives relating to the sector (WEEEand RoHS)
The European Union adopted the WEEE (Waste Electrical and ElectronicEquipment) Directive in December 2002, which makes manufacturersresponsible at a European level for the recovery and disposal of waste products.
The directive imposes forms of collective responsibility (for products puton the market prior to 08/13/2005: old waste) and individualresponsibility (for products put on the market after 08/13/2005: newwaste) which are described in the explanatory notes.
At this time, certain major EU countries (principally the UK, in terms ofGroup operations) have not yet completed the process of adopting theseEU regulations. Other countries have adopted them, establishingtransition periods of, typically, one or two years during which theseregulations will not be effective (principally Italy).
The European Council and Parliament also adopted Directive2002/95/EC (known as the RoHS - Restriction of the Use of CertainHazardous Substances in Electrical and Electronic Equipment) inDecember 2002. This directive states that new electrical and electronicequipment put on the market from 07/01/2006 must not contain certainpolluting materials. Indesit Company has acted to ensure compliancewith this directive by informing all suppliers that components which arenot compliant with RoHS will not be accepted; work to dispose of residualnon-compliant inventories is currently in progress. The overall effect onthe realisable value of inventories at 12/31/2006 is not significant.
Treasury shares and shares in the ParentCompany
Indesit Company S.p.A. did not purchase or sell any treasury shares orshares in the Parent Company during the year, whether directly or via thirdparties. Information on the treasury shares held by the Parent Company isprovided in that company's explanatory notes.
22

23
Financial instruments
Information about the policies adopted for the management of financial risksis provided in the explanatory notes (note 9).
Forecast for operations
Demand for white goods is expected to remain buoyant in both Western andEastern Europe, at levels similar to those experienced in 2006. Followingstrong rises during the first half of 2006, prices for the principal raw materialshave now eased back. The Group is working to achieve the three-year plan byimplementing the planned industrial and commercial strategies. The outlookfor 2007 remains positive with a further increase in sales and profitability,consistent with the established objectives.
03/22/2007For the Board of DirectorsThe ChairmanVittorio Merloni

24
annu
alre
port
2006
attachments to the report on operations during the year ended 12/31/2006
Attachment 1 - Investments held by directors, statutory auditors, general managers and executives with strategicresponsibilities at 12/31/2006
Number Numberof shares Number Number of shares
Name and Company Nature of holding (2) held of shares of shares held at thesurname held at the end acquired sold end of the
of the prior currentyear year
Merloni Vittorio Indesit Company SpA - ordinary shares direct 1,698,300 - 360,000 1,338,300
indirect via Fineldo SpA 44,002,029 300,000 44,302,029
indirect via Merloni Progetti SpA 157,787 185,000 340,726 2,061
indirect via Merloni Progetti Int. SA 934,995 934,995
indirect via Indesit Company SpA, own shareswithout voting rights at general meetings 11,039,750 - - 11,039,750
via Franca Carloni, wife 254,840 - - 254,840
Indesit Company France SA direct 1 - - 1
Milani Marco Indesit Company SpA - ordinary shares direct - 175,000 88,000 87,000 (1)
Indesit Company France SA direct 1 - - 1
Indesit Company Beyaz Esya ve Ticaret AS direct - 2 - 2
Merloni Ester Indesit Company SpA - ordinary shares indirect via Fines SpA 7,415,190 7,415,190
direct 5,042,400 - - 5,042,400
Merloni Andrea Indesit Company SpA - ordinary shares direct 255,635 255,635 -
indirect via Alpha 67 Srl Unipersonale 254,840 254,840
Merloni Antonella Indesit Company SpA - ordinary shares direct 264,330 450 - 264,780
Fresco Alberto Indesit Company SpA - ordinary shares direct - 100,000 100,000 - (1)
Malim Hugh Indesit Company SpA - ordinary shares direct - 100,000 100,000 - (1)
De Maio Adriano Indesit Company SpA - ordinary shares direct 1,000 - - 1,000
Sasso Andrea Indesit Company SpA - ordinary shares direct - 10,000 10,000 - (1)
Executives with Indesit Company
strategic International Business SA direct 1 - 1 -
responsibility Indesit Company SpA - ordinary shares direct - - - -
Indesit Company France SA direct 1 - - 1
Indesit Company Beyaz Esya ve Ticaret AS direct - 7 - 7
(1) The changes in 2006 derive from the exercise of stock option plans.(2) Including shares held through wives or husbands not legally divorced and through underage sons.

25
Attachment 2 - Remuneration paid to directors, statutory auditors, general managers and executives with strategic responsibilities at 12/31/2006
Remunerationsfor position Non-cash Bonuses
Name and Position Period in office Duration in company benefits and other Other Notessurname during the year of preparing (euro) incentives remun-
mandate the financial (euro) erationstatements (euro)(euro)
Vittorio Merloni Chairman of the Board 01/01/2006 - 12/31/2006 2006 financialstatements 1,935,000.00 - 1,215,000.00 -
Marco Milani CEO 01/01/2006 - 12/31/2006 2006 financialstatements 380,000.00 4,929.33 1,778,000.00 500,000.00 (1)
Innocenzo Cipolletta Board Director 01/01/2006 - 12/31/2006 2006 financialstatements 80,000.00 - - -
Luca Cordero 2006 financialdi Montezemolo Board Director 01/01/2006 - 12/31/2006 statements 20,000.00 - - -
Adriano De Maio Board Director 01/01/2006 - 12/31/2006 2006 financialstatements 55,000.00 - - -
Alberto Fresco Board Director 01/01/2006 - 12/31/2006 2006 financialstatements 75,000.00 - - -
Mario Greco Board Director 01/01/2006 - 12/31/2006 2006 financialstatements 55,000.00 - - - (2)
Carl H. Hahn Board Director 01/01/2006 - 12/31/2006 2006 financialstatements 50,000.00 - - -
Hugh Charles 2006 financialBlagden Malim Board Director 01/01/2006 - 12/31/2006 statements 80,000.00 - - -
Andrea Merloni Board Director 01/01/2006 - 12/31/2006 2006 financialstatements 85,000.00 - - 80,000.00 (3)
Antonella Merloni Board Director 01/01/2006 - 12/31/2006 2006 financialstatements 50,000.00 - - -
Ester Merloni Board Director 01/01/2006 - 12/31/2006 2006 financial statements 60,000.00 - - -
Roberto Ruozi Board Director 01/01/2006 - 12/31/2006 2006 financial statements 80,000.00 - - -
Angelo Casò Chairman of the 2007 financialBoard of Statutory statementsAuditors 01/01/2006 - 12/31/2006 62,400.00 - - -
Demetrio Minuto Auditor 01/01/2006 - 12/31/2006 2007 financial statements 41,600.00 - - -
Paolo Omodeo Salè Auditor 01/01/2006 - 12/31/2006 2007 financialstatements 41,600.00 - - -
Andrea Sasso General Manager 01/01/2006 - 12/31/2006 Indefinite - 10,481.32 - 1,730,621.61 (4)
- Executiveswith strategic responsibility - Indefinite - 8,762.11 1,714,500.00 677,436.48 (5)
(1) Remuneration as an executive of Indesit Company.(2) Remuneration paid to Eurizon Financial Group.(3) Remuneration as Chairman of the Board of Directors of Wrap SpA.(4) Remuneration as an executive of Indesit Company, including termination indemnity.(5) Executives with strategic responsibility in Indesit Company are three (other than General Manager). Remunerations are indicated at aggregate level.


Consolidated financial statements at 12/31/2006
Indesit Company

28
annu
alre
port
2006 Consolidated income statement for the year ended 12/31/2006 (1) (million euro)
Note 2006 2005
Revenue 8.1 3,248.6 3,064.2
Cost of sales 8.2 (2,437.4) (2,311.1)
Selling and distribution expenses 8.3 (512.1) (493.5)
General and administrative expenses 8.4 (139.8) (143.9)
Other income 8.5 4.9 7.6
Other expenses 8.6 (4.0) (1.1)
Operating profit 8.7 160.2 122.3
Net financial expenses 8.8 (26.6) (29.3)
Share of profit (losses) of associates 8.9 (2.0) (0.1)
Profit before tax 131.6 92.8
Income tax expenses 8.10 (54.9) (42.4)
Profit for the year 76.7 50.4
of which:
Attributable to minority interests 8.11 0.3 (0.3)
Attributable to the Group 76.4 50.7
Basic earnings per share 8.23 0.74 0.50
Diluted earnings per share 8.23 0.74 0.50
(1) Pursuant toCONSOB Resolution
no. 15519 dated07/27/2006, the
effects of related-party and non-
recurring transactionson the consolidated
income statement arereported in
Attachment 4 and innotes 10.4 and 8.7,
respectively.

29
Consolidated balance sheet as of 12/31/2006 (1) (million euro)
Note 12/31/2006 12/31/2005Assets
Property, plant and equipment 8.12 751.2 776.9
Goodwill and other intangible assets with an indefinite useful life 8.13 325.5 318.9
Other intangible assets with a finite life 8.14 114.5 106.7
Investments in associates 8.15 12.5 21.7
Other investments 8.16 0.6 2.3
Deferred tax assets 8.17 47.8 42.9
Other non-current financial assets 8.25 79.3 89.3
Total non-current assets 1,331.4 1,358.7
Inventories 8.18 353.4 342.8
Trade receivables 8.19 573.2 555.2
Current financial assets 8.25 11.1 6.7
Tax receivables 8.20 87.9 66.2
Other receivables and current assets 8.21 27.9 31.0
Cash and cash equivalents 8.25 184.5 199.7
Assets held for sale 8.22 1.8 5.9
Total current assets 1,239.8 1,207.4
Total assets 2,571.2 2,566.1
Equity
Share capital 92.6 92.2
Reserves 316.2 259.2
Retained earnings 60.5 102.5
Profit attributable to the Group 76.4 50.7
Equity attributable to the Group 8.23 545.6 504.6
Minority interests 8.24 6.6 14.4
Total equity 552.2 519.1
Liabilities
Medium and long-term interest-bearingloans and borrowings 8.25 402.7 494.1
Employee benefits 8.26 98.7 108.6
Provisions for risks and charges 8.27 53.9 42.2
Deferred tax liabilities 8.28 74.1 73.2
Other non-current liabilities 8.29 23.4 27.0
Total non-current liabilities 652.8 745.2
Banks and other financial payables 8.25 295.7 319.1
Provisions for risks and charges 8.27 24.7 26.6
Trade payables 8.30 886.1 820.3
Tax payables 8.31 63.6 57.7
Other payables 8.32 96.0 78.2
Total current liabilities 1,366.1 1,301.8
Total liabilities 2,018.9 2,047.0
Total equity and liabilities 2,571.2 2,566.1
(1) Pursuant toCONSOB Resolution
no. 15519 dated07/27/2006, the effects
of related-partytransactions on the
consolidated balancesheet are reported inAttachment 5 and in
note 10.4. The effectsof non-recurring
transactions on thebalance sheet and
financial position aredescribed in note 8.7.

30
annu
alre
port
2006 Consolidated cash flow statement for the year ended 12/31/2006 (1) (million euro)
Note 2006 2005
Total profit 8.34 76.7 50.4
Income taxes 8.34 54.9 42.4
Depreciation and amortisation 8.34 142.8 141.4
Other non-monetary income and expenses, net 8.35 50.6 41.6
Change in trade receivables 8.36 (18.1) 70.7
Change in inventories 8.36 (10.6) (12.3)
Change in trade payables 8.36 85.2 (23.8)
Change in other assets and liabilities 8.37 (40.6) (34.7)
Income taxes paid 8.34 (44.2) (57.2)
Interest paid 8.35 (32.2) (32.6)
Interest received 8.35 8.3 5.9
Cash flows from operating activities 272.8 191.8
Payments for acquisition of property, plant and equipment 8.38 (120.7) (142.1)
Proceeds from disposal of property, plant and equipment 8.38 5.0 3.5
Payment for acquisition of intangible assets 8.39 (34.6) (34.7)
Proceeds from the sale of non-current financial assets and other investments 8.40 13.0 11.4
Payments for acquisition of non-current financial assets and other investments 8.40 (7.6) (4.9)
Cash flows from (used in) investing activities (145.0) (166.8)
Proceeds from share capital increases 8.41 3.2 6.3
Dividends paid 8.41 (37.1) (36.7)
New medium/long-term financial payables 8.42 0.6 12.0
Repayment of borrowing for acquisition of GDAH 8.43 (49.8) (48.7)
Other repayments of medium/long-term financial payables - (29.1)
Change in current financial payables 8.44 (59.9) 58.8
Cash flows from (used in) financing activities (143.1) (37.4)
Net cash flows (15.2) (12.5)
Cash and cash equivalents, start of year 8.25.2 199.7 212.2
Cash and cash equivalents, end of year 8.25.2 184.5 199.7
Total change in cash and cash equivalents (15.2) (12.5)
(1) Pursuant to CONSOB Resolution no. 15519 dated 07/27/2006, the financial effects of non-recurring transactions are reported in note 8.7.

31
Statement of changes in consolidated equity for the year ended 12/31/2006 (1) (million euro)
Share capital 92.2 - - - - - 0.4 0.4 - - - 92.6
Share premium reserve 31.3 - - - - - 2.8 2.8 - - - 34.1
Legal reserve 15.3 - - - - - - - 4.6 - - 19.9
Translation reserve 55.7 - - (2.7) (2.7) - - - - - - 53.0
Other reserves 156.9 0.3 1.5 - 1.8 - (0.5) (0.5) 51.0 - - 209.2
Retained earnings 102.5 - - - - (37.1) - (37.1) (4.9) - 60.5
Profit attributable to the Group 50.7 - - - - - - - (50.7) - 76.4 76.4
Equity attributable to the Group 504.6 0.3 1.5 (2.7) (0.9) (37.1) 2.7 (34.5) - - 76.4 545.6
Minority interests 14.4 - - (0.5) (0.5) - - - - (7.6) 0.3 6.6
Total equity 519.1 0.3 1.5 (3.2) (1.4) (37.1) 2.7 (34.5) - (7.6) 76.7 552.2
Openingbalances
Measure-ment of
derivatives
Measure-ment of
stockoptions
Translationof foreigncurrencyfinancial
state-ments
Totaldirect
effects on equity
Paymentof
dividends
Exercise of stockoptions
Totaleffect oftransac-
tions withshare-
holders
Allocationof profit for the
year
Changesin scope
of consoli-dation andacquisitionof minori-
ties
Profit forthe year
Closingbalances
Statement of changes in consolidated shareholders' equity for the year ended 12/31/2005 (million euro)
Share capital 91.1 - - - - - 1.1 1.1 - - - 92.2
Share premium reserve 26.1 - - - - - 5.2 5.2 - - - 31.3
Legal reserve 11.6 - - - - - - - 3.7 - - 15.3
Translation reserve 6.9 - - 48.8 48.8 - - - - - - 55.7
Other reserves 120.1 0.4 2.0 - 2.4 - - - 34.4 - - 156.9
Retained earnings 77.3 - - - - (36.7) - (36.7) 61.9 - - 102.5
Profit attributable to the Group 100.0 - - - - - - - (100.0) - 50.7 50.7
Equity attributable to the Group 433.2 0.4 2.0 48.8 51.1 (36.7) 6.3 (30.3) (0.0) - 50.7 504.6
Minority interests 10.9 - - 0.6 0.6 - - - - 3.2 (0.3) 14.4
Total equity 444.1 0.4 2.0 49.4 51.8 (36.7) 6.3 (30.3) (0.0) 3.2 50.4 519.1
Openingbalances
Measure-ment of
derivatives
Measure-ment of
stockoptions
Translationof foreigncurrencyfinancial
state-ments
Totaldirect
effects onequity
Paymentof divi-dends
Exercise ofstock
options
Totaleffect oftransac-
tions withshare-
holders
Allocationof profit for the
year
Changesin scope
of consoli-dation andacquisitionof minori-
ties
Profit forthe year
Closingbalances

1. Group structure and activities
2. Approval of the consolidated financial statements at 12/31/2006
3. Significant subsequent events
4. Statement of compliance with IFRS and basisof presentation
5. Changes in accounting policies, new accounting standards, changesin accounting estimates and reclassifications
6. Changes in the scope of consolidation
7. Segment reporting7.1 Reporting by geographical segment (primary segment)7.2 Reporting by business segment (secondary segment)
8. Notes to the consolidated income statement, balance sheet and cash flow statement8.1 Revenue8.2 Cost of sales8.3 Selling and distribution expenses8.4 General and administrative expenses8.5 Other income8.6 Other expenses8.7 Operating profit8.8 Net financial expenses8.9 Share of profits (losses) from associates8.10 Income tax8.11 Profit attributable to minority interests8.12 Property, plant and equipment8.13 Goodwill and other intangible assets with an indefinite useful life8.14 Other intangible assets with a finite useful life8.15 Investments in associates8.16 Other investments8.17 Deferred tax assets
Explanatory notes

8.18 Inventories8.19 Trade receivables8.20 Tax receivables8.21 Other receivables and current assets8.22 Assets held for sale8.23 Equity attributable to the Group8.24 Minority interests8.25 Net financial position8.26 Employee benefits8.27 Provisions for risks and charges8.28 Deferred tax liabilities8.29 Other non-current liabilities8.30 Trade payables8.31 Tax payables8.32 Other payables8.33 Share-based payments (stock options)8.34 Total profit, income taxes, depreciation and amortisation,
income taxes paid8.35 Other non-monetary income and expenses, net8.36 Change in trade receivables, inventories, trade payables8.37 Change in other assets and liabilities8.38 Payments for acquisition of property, plant and equipment
and proceeds from disposal of property, plant and equipment8.39 Payments for acquisition of intangible assets8.40 Proceeds from the sale of non-current financial assets and other investments
and payments for acquisition of non-current financial and other investments8.41 Proceeds from share capital increases and dividends paid8.42 New medium/long-term financial payables8.43 Repayment of borrowing for acquisition of GDAH8.44 Change in current financial payables
9. Financial instruments
10. Disclosure required by IAS 24 on the remunerationof management and on related parties10.1 Remuneration of management10.2 List of related parties10.3 Schedules summarising the transactions with related parties10.4 Further information on corporate transactions with related parties
Indesit Company

34
annu
alre
port
2006 1. Group structure and activities
Indesit Company is a Group led by Indesit Company SpA, an Italiancompany based in Fabriano (near Ancona), which is active in the productionand sale of white goods, namely household appliances for the cooking sector(cookers, ovens and hobs), the refrigeration sector (refrigerators andfreezers), the laundry sector (washing machines, dryers and combinedwasher-dryers) and the dishwashing sector.The Group operates mainly in Europe, Turkey and the CIS with 18 factories.The primary and secondary segments of reporting, as defined by IAS 14, arerepresented respectively by the geographical segment (Western Europe,Eastern Europe and Other countries) and by the cooking, refrigeration,laundry and services segment. In particular, the CIS is included in EasternEurope and Turkey is included in Other countries.The household appliances sector is highly seasonal, which affects all the maineconomic and financial parameters. The reporting by business segmentrequired by IAS 14 is provided in note 7.
2. Approval of the consolidated financial statements at 12/31/2006
The consolidated financial statements at 12/31/2006 were approved by theBoard of Directors on 03/22/2007 and have been audited.
3. Significant subsequent events
There have not been any significant events subsequent to year end.
4. Statement of compliance with IFRS and basis of presentation
The consolidated financial statements of the Indesit Company Group havebeen prepared in accordance with the International Financial ReportingStandards - IFRSsTM (hereafter referred to as IFRS or IAS) issued by theInternational Accounting Standards Board (IASB), as interpreted by theInternational Financial Reporting Interpretations Committee (IFRIC) andadopted by the European Union.
The consolidated financial statements at 12/31/2006 have also been preparedin accordance with CONSOB's instructions regarding the format of financialstatements, in application of art. 9 of Legislative Decree 38/2005 and otherCONSOB regulations and instructions concerning financial statements.
The consolidated financial statements at 12/31/2006 are presented on acomparative basis and comprise the balance sheet, the income statement, thecash flow statement, the statement of changes in consolidated equity and

35
these notes. The income statement format adopted by the Group classifiescosts based on the reason for which they were incurred, which is deemed tobe more meaningful than a classification by type of expenditure, since itreflects the format of internal reporting and is consistent with internationalpractice in the household appliances sector. The presentation of the balancesheet distinguishes between current and non-current assets and liabilities.The cash flow statement is presented using the indirect method.
With regard to the Parent Company's separate financial statements, inapplication of CONSOB Communication no. 15519 dated 07/27/2006,Indesit Company SpA prepares the income statement in the format whichclassifies expenditure by nature. This decision was made to ensure continuitywith the formats adopted for the presentation of results under Italian GAAP,since these are deemed to be the most appropriate given the dual role of theParent Company, both as an operating company that supplies goods andservices to other Group companies, and as the holding company for theequity investments held in them. In order to ensure consistency for the usersof the financial statements, an attachment to the Parent Company'sindividual financial statements presents the income statement, classified bypurpose of expenditure, in the format and using the criteria adopted for thepreparation of the consolidated income statement.
Principal accounting policies
Basis of preparation
The currency of presentation of the consolidated financial statements is theeuro, and the financial statement balances are stated in millions of euro(except where stated otherwise). The consolidated financial statements areprepared on an historical cost basis, except for derivative financialinstruments, financial assets held for sale and financial instruments classifiedas available for sale, which are stated at their fair value. The accountingpolicies are applied on a consistent basis by all Group companies. There areno financial assets held to maturity. Financial transactions are recorded withreference to the trade date.The accounting policies adopted for the preparation of the consolidatedfinancial statements at 12/31/2006 have also been applied on a consistentbasis to all the comparative financial information.
Accounting estimates
The preparation of consolidated financial statements involves makingassumptions and estimates that affect the amount of assets and liabilities andthe related disclosure, as well as the amount of contingent assets and liabilitiesat the balance sheet date. These estimates are used to measure the property,plant and equipment and intangible assets subject to impairment, as well as torecognise provisions for doubtful accounts, inventory obsolescence,

36
annu
alre
port
2006 depreciation and amortisation and the write-down of assets, employee benefits,
taxation, and risks and charges. The estimates and underlying assumptions arebased on historical experience and various other factors that are believed to bereasonable under the circumstances. Estimates and assumptions are reviewedregularly and, if later estimates differ from those made initially, the effects areimmediately reflected in the income statement. If the changes in estimate relateto both the current and future periods, their effects are reflected in the incomestatements for the periods concerned.
Basis of consolidation
SubsidiariesSubsidiaries are entities over which Indesit Company SpA exercises control byvirtue of the power to govern, directly or indirectly, their financial and operatingpolicies and to obtain benefits from their activities. In general, companies inwhich Indesit Company holds more than 50% of the voting rights, consideringany potential voting rights that may be exercised at the time, are deemed to besubsidiaries. The financial statements of subsidiaries are consolidated on a line-by-line basis from the time that control commences until the date on whichcontrol ceases. Significant transactions between Group companies areeliminated in full. Unrealised gains and losses on transactions with subsidiariesare eliminated in full. The equity and results attributable to minority interestsare determined with reference to their voting rights, without considering anypotential voting rights. Any surplus arising on the elimination of investmentsagainst the book value of the related equity at the time of initial consolidation isallocated as an increase in the carrying amount of the assets, liabilities andcontingent liabilities concerned; any residual amounts are classified as goodwill.The balance sheet date of all Group companies is 12/31.Dormant subsidiaries and those with an insignificant volume of business are notconsolidated on a line-by-line basis, since they do not have a material effect onthe balance sheet, the financial position or the results of operations of the Group.This list of companies consolidated on a line-by-line basis is presented inAttachment 1 to the Notes.
AssociatesAssociates are those entities over which Indesit Company exercises significantinfluence, but does not control their financial and operating policies or obtainbenefits from their activities. In general, companies in which Indesit Companyholds directly or indirectly between 20% and 50% of the share capital or votingrights, considering any potential voting rights that may be exercised orconverted, are deemed to be associates.Associates are measured using the equity method from the time thatsignificant influence commences over their operations until the date on whichsuch influence ceases. If the Group's interest in the losses of an associateexceeds the book value of the related investment, such book value is writtenoff and the additional losses are covered by a specific provision to the extentthat Indesit Company is obliged to cover the losses of such company or, in any

37
case, to fulfill obligations on its behalf. Unrealised gains and losses ontransactions with associates are eliminated in proportion to the interest held.
Investments in other companiesInvestments in other companies in which, in general, the Group holds lessthan 20% of the share capital or voting rights are initially measured at cost andsubsequently adjusted to fair value through the income statement. Where fairvalue cannot be reliably determined, these investments are measured at cost asadjusted to reflect any impairment losses. Dividends are recognised asfinancial income from investments when the right to collect them isestablished, which generally coincides with the shareholders' resolution.
Treatment of foreign currency transactions
Foreign currency transactionsAll transactions are recorded in the functional currency of the principaloperating environment in which each Group company operates. Transactionsnot carried out in the functional currency of Group companies are translatedusing the exchange rates ruling at the time of the related transactions.Monetary assets and liabilities are translated using the exchange rates rulingat the balance sheet date and any exchange rate differences are recognised inthe income statement. Non-monetary assets and liabilities recorded athistorical cost in foreign currencies are translated using the historical ratesapplying at the time of the related transactions. Non-monetary assets andliabilities measured at fair value in foreign currencies are translated using theexchange rates ruling at the time that their fair value was determined.
Translation of financial statementsThe financial statements of companies whose functional currency differsfrom that used to prepare the consolidated financial statements (Euro) andwhich do not operate in hyper-inflationary economies, are translated asfollows:
a) assets and liabilities, including the goodwill and fair value adjustmentsarising on consolidation, are translated using the exchange rates ruling atthe balance sheet date;
b) revenue and expenses are translated using the monthly average exchangerate for the year, which is deemed to approximate the exchange ratesruling at the dates when the individual transactions took place;
c) translation differences are recognised in a specific equity reserve.
On disposal of the economic entity that gave rise to translation differences,the related cumulative translation differences are reclassified from equity tothe income statement. The cumulative translation differences werereclassified to other reserves on the first-time adoption of IFRS, accordinglythe gains and losses deriving from future disposals will only include thetranslation differences arising from 01/01/2004 onwards.

38
annu
alre
port
2006 The financial statements of foreign operations in hyper-inflationary economies
whose functional currency differs from that used to prepare the consolidatedfinancial statements (euro) are translated using the exchange rates ruling at thebalance sheet date, after restating the non-monetary balances in the balancesheet and the income statement using a general price index.
Net investments in foreign operationsThe exchange differences arising from the translation of net investments infunctional currencies other than the euro, generally comprisingintercompany loans, are taken to the translation reserve. Such differences arereleased to the income statement upon disposal.
Derivative financial instruments
If the conditions established in IAS 39 are met regarding the formaldesignation of derivative financial instruments as hedges and themeasurement of their effectiveness both ex ante and ex post, then they arerecorded on a hedge accounting basis, as described below.
Fair Value Hedges (hedges of assets and liabilities)If a derivative financial instrument is designated to hedge the risk of changesin the fair value of a recognised asset or liability (the underlyings), the gainor loss from subsequent fair-value adjustments to the hedging instrument isrecognised in the income statement together with the gain or loss derivingfrom the measurement of the related underlyings.
Cash Flow HedgesIf a derivative financial instrument is designated as a hedge of the risk ofvariability in the cash flows of a recognised asset or liability or a highlyprobable forecasted transaction, the effective part of gains or losses on suchfinancial instrument is recognised in the cash flow hedging reserve, withinequity, while the ineffective portion (if any) is taken to the income statement.If the hedge of a forecasted transaction subsequently results in therecognition of a non-financial asset or liability, the cash flow hedging reserveis removed from equity and included in the initial cost of such non-financialasset or liability. If the hedge of a forecasted transaction subsequently resultsin the recognition of a financial asset or liability, the cash flow hedgingreserve is released to the income statement in the period when the assetacquired or liability assumed has an effect on the income statement. In othercases, the cash flow hedging reserve is recognised to the income statement ina manner consistent with the hedged transaction, i.e. when its economiceffects are recognised. If a hedging instrument expires, is sold or isterminated early with respect to the timing of the hedged forecast transactionand the latter is no longer expected to take place, the related cash flowhedging reserve is released immediately to the income statement. If a hedginginstrument expires, is sold or is terminated early with respect to the timing ofthe hedged forecast transaction, but the latter is still expected to occur, thecumulative gain or loss remains in equity until the transaction takes place.

39
Hedge of a net investment in a foreign operationIf a derivative financial instrument is designated to hedge a net investment ina foreign operation, the gains or losses deriving from the relatedmeasurement at fair value are recognised directly in equity, to the extent thatthe hedge is deemed to be effective, while the ineffective portion (if any) isrecognised in the income statement.
If on the other hand financial instruments do not meet the requirements forthe application of hedge accounting, they are stated at fair value and therelated effects are recognised directly in the income statement.
Property, plant and equipment
Owned assetsProperty, plant and equipment are stated at purchase cost or, if self-constructed, at production cost, comprising the cost of materials, labour anda reasonable portion of overheads and related charges, less accumulateddepreciation and impairment of value determined on the basis describedbelow. If necessary and significant, the cost of property, plant and equipmentincludes an initial estimate of dismantling and removal costs. Ordinarymaintenance expenses are charged to the income statement, while the costsof replacing certain parts of property, plant and equipment and extraordinarymaintenance costs are capitalised when it is probable that they will generatemeasurable economic benefits in the future. The financial expenses incurredto finance the purchase or production of property, plant and equipment areonly capitalised if the loans concerned relate solely to that asset.
Finance leasesProperty, plant and equipment held under finance leases, in relation to whichIndesit Company has assumed substantially all the risks and rewards ofownership, are recognised at fair value at inception of the lease or, if lower, atthe present value of the minimum lease payments, depreciated over theirestimated useful lives and adjusted for any impairment loss determined onthe basis described below. The liability to the lessor is classified amongfinancial payables in the balance sheet.
DepreciationProperty, plant and equipment are depreciated on a straight-line basis overtheir estimated useful lives. Significant parts of plant and machinery withdifferent useful lives are depreciated separately. Useful lives are monitored ona constant basis, having regard for changes in the intensity with which theseassets are used. Any changes in the depreciation schedules are applied on aprospective basis.Carrying amount is verified with reference to the estimated present value ofexpected future cash flows and adjusted, where necessary, every time eventssuggest that the carrying amount of property, plant and equipment may beimpaired, or when there is a marked decrease in their market value,significant technological changes or evidence of significant obsolescence. The

40
annu
alre
port
2006 impairment is reversed if the reasons for recognition cease to apply. Land,
whether or not used for the construction of civil or industrial buildings, is notdepreciated since it is deemed to have an indefinite useful life.The useful lives of property, plant and equipment are grouped into thefollowing categories:
Intangible assets
Intangible assets are stated at cost, determined on the basis described forproperty, plant and equipment, when it is likely that the use of such assets willgenerate economic benefits and their cost can be determined reliably.Intangible assets with a finite useful life are amortised and stated net of boththe related accumulated amortisation, calculated on a straight-line basis overtheir estimated useful lives, having regard for the period during which theyare expected to generate economic benefits, and any impairment loss.Intangible assets with an indefinite useful life, comprising certain brandnames and goodwill, are not amortised but their recoverability is tested forimpairment annually, or more frequently if specific events suggest that theircarrying amounts may be impaired. Subsequent expenditure on recognisedintangible assets is capitalised only if it increases the future economic benefitsembodied in the specific asset to which it relates; otherwise, it is charged tothe income statement as incurred. The financial expenses incurred to financethe purchase or production of a specific intangible asset are only capitalisedif the loans concerned relate solely to that asset.
GoodwillGoodwill is an intangible asset with an indefinite life, deriving from businesscombinations recognised using the purchase method, and is recorded toreflect the positive difference between purchase cost and the Group's interestat the time of acquisition, after having recognised all assets, liabilities andidentifiable contingent liabilities attributable to both the Group and thirdparties at their full fair value. This method of accounting applies to allacquisitions made subsequent to 12/31/2002. The value of goodwill derivingfrom earlier acquisitions was determined by using the amount recorded inaccordance with Italian GAAP.Goodwill is tested with reference to the cash generating units that benefit fromthe synergies deriving from the acquisition. The expected cash flows arediscounted at the cost of capital, having regard for the specific risks associated
Category Useful lives
Buildings and temporary constructions from 10 to 33 years
Plant and machinery from 5 to 20 years
Industrial and commercial equipment from 3 to 20 years
Other assets:
- vehicles and internal transport from 3 to 6 years
- furniture, IT and office machines from 3 to 10 years

41
with the unit concerned. Impairment is recognised if the recoverable amount,represented by the discounted cash flows, is less than the related carryingamount.The gains and losses arising on the disposal of businesses or lines of businessthat were acquired with the payment of goodwill are determined taking intoaccount the residual amount of such goodwill. Any impairment losses ingoodwill charged to the income statement are not reversed even if the relatedreasons cease to apply.
Research and development expensesExpenditure on research activities, undertaken with the prospect of gainingnew knowledge are charged to the income statement as incurred.Expenditure on development activities incurred to create new products orimprove existing products, or to develop and improve production processes,are capitalised if the innovations made result in technically feasible processesand commercially saleable products, on condition that there is an intentionto complete the development project, sufficient resources are available forsuch completion, and the economic costs and benefits deriving from suchinnovations can be measured reliably. Capitalised expenditure includes bothinternal and external design costs (including payroll and materials) and theportion of general production costs reasonably attributable to the projectsconcerned. Capitalised development expenditure is treated as an intangibleasset with a finite life and is amortised over the expected period of economicbenefit, which is generally taken to be five years. Adjustments are recorded toreflect any impairment losses subsequent to initial recognition.Other development expenditures are charged to the income statement in theyear incurred.
Other intangible assetsOther intangible assets expected to generate measurable future economicbenefits are deemed to have a finite life and are stated at cost. They areamortised on a straight-line basis over the period of expected economicbenefit, which is deemed to be 20 years for brands with a finite life andbetween five and ten years for other assets. Adjustments are recorded toreflect any impairment losses subsequent to initial recognition.
Trade receivables
Trade receivables, generally due within one year, are stated at the fair value ofthe initial consideration, increased by the related transaction costs.Subsequently, they are stated at amortised cost, adjusted to reflect anyimpairment losses represented by the difference between carrying amountand the estimated future cash flows. If the impairment loss decreases in a laterperiod, the loss previously recorded is partly or fully reversed and the valueof the receivable is restored to an amount that does not exceed the amortisedcost that would have been reported had the loss not been recognised.Trade receivables sold with or without recourse for which the conditionsestablished in IAS 39 for the derecognition of financial assets do not apply

42
annu
alre
port
2006 continue to be recognised in the balance sheet, while receivables sold without
recourse which satisfy all the conditions of IAS 39 for the derecognition offinancial assets are derecognised at the time of disposal.
Other current and non-current financial assets
Held-to-maturity securities are initially measured at cost, increased by thetransaction costs incurred to acquire these financial assets. Subsequently,they are measured at amortised cost using the effective interest method, netof any impairment loss.Financial assets held for trading are classified as current assets and measuredat fair value, with recognition of any gains or losses in the income statement.Securities and other financial assets classified as available for sale are stated attheir fair value. Gains and losses deriving from fair value measurements arerecognised directly in equity, except for impairment losses and exchange ratelosses which are charged to the income statement. The deferred gains and lossesrecognised in equity are released to the income statement at the time of sale.Receivables due after one year that do not earn interest or which earn interestat below market rates are discounted using market rates.The interest earned on financial assets, determined using the effectiveinterest method, is credited to the income statement. The fair value offinancial assets held for trading and those available for sale is represented bytheir market price at the balance sheet date.
Inventories
Inventories are stated at the lower of cost and net realisable value. Cost isdetermined on a weighted-average cost basis and includes purchasing-relatedexpenses, inclusive of indirect charges, and the costs of converting productsand bringing them to their present location and condition. Net realisable valueis determined with reference to market prices after deducting completioncosts and selling expenses. Obsolete and slow-moving materials and finishedproducts are written down to reflect their estimated realisable value.
Cash and cash equivalents
Cash and cash equivalents, stated at nominal value, comprise cash on hand,bank and postal deposits and similar assets that can be converted into cash(three months) and are not subject to significant fluctuations in value.
Impairment of assets
At each balance sheet date, the carrying amounts of the Group's intangibleassets with an indefinite life, goodwill and intangible assets in progress aretested for impairment, on the basis described in the relevant paragraphs. With

43
the exclusion of inventories and deferred tax assets and except as discussed inrelation to property, plant and equipment, other assets are tested forimpairment if events suggest that they may have incurred an impairment loss.If the test shows that the recognised assets or a cash-generating unit (CGU)have incurred an impairment loss, their recoverable amount is estimated andthe excess carrying amount is charged to the income statement. Theimpairment loss of a CGU is allocated first to reduce the related goodwill, ifany, and then to reduce the carrying amount of other assets.The recoverable amount of an asset or a CGU is determined by discountingthe cash flows that such asset or CGU is expected to generate. Thediscounting rate applied is the cost of capital, having regard for the specificrisks associated with the asset or CGU concerned. The recoverable amount ofinvestments in securities held to maturity and receivables recorded atamortised cost is represented by the present value of future cash flows,discounted using the effective interest rate determined at the time of initialrecognition. The recoverable amount of other assets is represented by thegreater of their net selling price or their value in use, determined bydiscounting estimated future cash flows using a market rate.Impairment losses in respect of goodwill are not reversed. Any impairmentlosses of securities held to maturity and receivables stated at amortised costare reversed if any subsequent increases in their recoverable amount can bedetermined on an objective basis.If an impairment loss in respect of an individual asset cannot be determined,the Group identifies the impairment loss in respect of the CGU to which itbelongs.
Share capital
Share capital, including the portion represented by savings shares, is stated atnominal value. The buy-back of treasury shares, stated at cost includingrelated charges, is recorded as a change in equity; the nominal value oftreasury shares is deducted from share capital, while the difference betweencost and nominal value is deducted from the equity reserves. Dividends arerecognised as a liability in the period in which they are declared.
Financial liabilities
Financial liabilities are initially recognised at their fair value, net of relatedcharges, and subsequently measured at amortised cost using the effectiveinterest method. The difference between amortised cost and repayment valueis recorded in the income statement over the life of the liability in proportionto the related interest accrued. Where hedge accounting applies, the financialliabilities hedged by derivative instruments are measured on a basisconsistent with the hedging instrument.

44
annu
alre
port
2006 Trade payables and other payables
Trade payables and other payables due on normal commercial terms,generally within one year, are recorded at the fair value of the initialconsideration, increased by the related transaction costs. Following initialrecognition, they are stated at amortised cost and any differences are reflectedin the income statement over the life of the liability using the effective interestmethod. Trade payables and other payables, generally due within one year,are not discounted.
Employee benefits
Obligations for contributions to defined contribution plans and similarbenefits are charged to the income statement on an accruals basis. The netobligation in respect of defined benefit plans, principally represented byseverance indemnities in Italy and pension funds in the UK, is recognisedat the expected amount of future benefits that employees will earn andhave earned in the current and prior years. These benefits are discountedand the resulting obligation is stated net of the fair value of any pensionplan assets. The net obligation is determined separately for each plan usingactuarial assumptions and is calculated each year, or more frequently, withthe support of an independent actuary using the projected unit creditmethod. The benefits are discounted using the rate for a bond with an AArating and a maturity date that is consistent with the timing of the relatedpayments to employees. The actuarial gains and losses arising subsequentto 01/01/2004, the IFRS transition date, are recognised in the incomestatement on a straight-line basis over the residual working lives ofemployees, to the extent that their cumulative net value exceeds 10% of thegreater of the obligation arising under defined benefit plans and the fairvalue of the plan assets servicing these plans (corridor method) at the endof the prior year.
Stock optionsThe remuneration recognised to employees and directors by the granting ofstock options is charged to the income statement with a matching entry inequity. Such cost is determined with reference to the fair value of the optionsat the time they are granted. The cost of stock options, determined on theabove basis, is charged to the income statement over the related vestingperiod. The fair value of the options at the grant date is determined usingfinancial models that take account of the terms and conditions under whichsuch options were granted.
Provisions for risks and charges
The provisions for risks and charges are recognised to cover the Group'sobligations, of a legal or constructive nature (under contracts or for otherreasons), deriving from past events. Provisions for risks and charges are

45
recognised if it is probable that an outflow of economic benefits will berequired to settle the obligation and the amounts concerned can be estimatedreliably. If the settlement of such obligations is expected to take place aftermore than one year and the effects of this are significant, they are discountedusing a rate that takes account of the cost of money and the specific risksassociated with the liabilities concerned. Any changes in the estimatedamount of provisions are reflected in the income statement in the yearidentified. In the event of discounting, the increase in the provision due to thepassage of time and the effect of any changes in the discounting rate arerecognised as a financial expense.The principal liabilities covered by provisions are described below.
WarrantiesProvisions for legally-required and voluntary warranty costs are recognisedwhen the underlying products are sold. The provision is determined withreference to the call rate for the products still under warranty cover, theperiod of time between sell in and sell out (start of the warranty period) andthe average unit cost of the work performed.
RestructuringProvisions for restructuring are recognised at the time constructiveobligation arises, such as when the Group informs interested parties aboutthe restructuring plan or makes sufficiently specific announcements whichinduce interested parties to believe that the related obligation will be met.
Onerous contractsProvisions for onerous contracts are recognised when the expected benefitsare lower than the related costs. They are accrued in a specific provision inthe year in which the losses become known and measurable.
Product disposal (WEEE)The European Union adopted the WEEE (Waste Electrical and ElectronicEquipment) directive in December 2002, which makes manufacturersresponsible at a European level for the recovery and disposal of wasteproducts.The Directive describes the following levels of responsibility:
a) old waste (regarding products put on the market before 08/13/2005): thecosts of disposal are incurred collectively by the manufacturers whichcontribute in proportion to their market share;
b) new waste (regarding products put on the market after 08/13/2005): eachmanufacturer is responsible for the disposal of its own products.
The Group only makes provisions to the extent that local legislation hasadopted the directive concerned and confirms the principle of individualresponsibility laid down in the community regulations.Provisions are therefore recorded to cover the charges deriving from theapplication of the WEEE regulations in relation to new waste arising in thecountries that have already adopted the directive. The provision is recorded

46
annu
alre
port
2006 with reference to the visible fees established in each nation, as well as the
benefits deriving from the steady increase in the efficiency of productdisposal processes and the greater disposability of the products concerned.This liability is discounted using a reference rate over a period of time thatrepresents the life cycles of the products concerned. The costs relating to oldwaste are charged to the income statement in the year they are incurred. Inthis regard, the directive allows manufacturers to increase the selling price ofgoods by a visible fee, for a period of about eight years, to cover the relateddisposal costs. The amounts collected for this reason are subsequently paidover to the consortia, established in most of the countries in which thedirective applies, responsible for the disposal of the waste products. Thevisible fee is recorded among trade receivables and other payables, withoutany effect on revenue or the cost of sales.
Other provisionsProvisions are recognised for other future charges deriving from court cases,disputes and other obligations when the requirements for the recognition ofa liability are met, being in the accounting period in which such chargesbecome known and measurable reliably.
Income
RevenueRevenue from the sale of goods is recognised when the significant risks andrewards of ownership have been transferred to the buyer. Revenue from thesale of goods is generally recognised when they are handed over to thetransport firms which, under the terms of current contracts, marks the timewhen the above risks and rewards are transferred. Revenue is not recognisedif its recoverability is considered to be uncertain.Revenue is stated net of discounts, allowances, rebates and returns, and doesnot include the proceeds from the disposal of raw materials and scrap.Revenue from services is recognised in the income statement based on thestage of completion at the balance sheet date, determined with reference tothe work performed or, alternatively, to the percentage of completion withrespect to the total.
DividendsCollectible dividends are recognised as revenue when they are declared at therelated shareholders' meeting.
GrantsGrants from the Government or other bodies, recognised in the form ofdirect payments or tax benefits, are recognised as deferred income in thebalance sheet, among other liabilities, at the time their collection becomereasonably certain and when compliance with all the requirements to obtainthem is assured. They are recognised as revenue in the income statement ona systematic basis in order to match the accounting recognition of the costsfor which such grants were made.

47
Grants related to income are taken to the income statement at the time therequirements for their recognition are met, and when it becomes certain thatthey will be recognised in order to offset the eligible costs.
Other incomeOther income includes all forms of non-financial revenue not covered aboveand is recognised on the basis described in relation to revenue from goodssold and services rendered.
Expenses
The costs of purchasing goods and services are recognised when the amountsconcerned can be determined reliably. The costs of purchasing goods arerecognised on delivery which, under the terms of current contracts, marksthe time when the related risks and rewards are transferred. The costs ofservices are recognised on an accruals basis with reference to the time theyare received.
Cost of salesCost of sales includes all the costs of manufacturing finished products,comprising raw materials, the purchase of components, the cost of direct andindirect, internal and external processing, industrial depreciation, allproduction-related charges, and the provisions for costs to be incurred inrelation to products sold, as well as research costs and any development coststhat are not capitalised.
Selling, distribution, general and administrative expensesSelling, distribution, general and administrative expenses comprise all thecosts incurred to market products and provide services, the costs ofdistributing products to the Group's warehouses and to customers, generaland administrative expenses and related charges, as well as all the other non-financial expenses that are not part of the core business.
Operating and finance lease paymentsPayments made under operating leases are expensed on an accruals basisto match the economic benefits deriving from the leased assets. If sucheconomic benefits are lower than the related charges, falling under thecategory of onerous contracts, the difference between the discountedcharges and benefits is recorded as an expense in the income statement.Finance leases give rise to the recognition of depreciation on the assetsrecognised and of financial charges representing interest on the loanobtained under the lease. Financial charges are spread over the term of the leases in order toproduce a constant interest rate on the remaining balance of the liability.
Net financing costsNet financing costs include the interest payable on borrowings, cashdiscounts allowed to customers for early payments with respect to the agreed

48
annu
alre
port
2006 terms of sale, financial income from cash and cash equivalents, dividends,
and exchange gains and losses, as well as the economic effects recorded in theincome statement of measuring the transactions that hedge interest-rate andexchange-rate risks.
Share of profits (losses) from associates
Share of profits (losses) from associates includes the effects deriving fromapplication of the equity method.
Income tax
Income tax is recognised in the income statement, except for that relating totransactions recognised directly in equity, in which case it is also recognisedin equity. Income tax includes current and deferred tax. Current tax is basedon an estimate of the amount that Indesit Company expects to pay, using forall Group companies the tax rate in force at the balance sheet date in each ofthe countries concerned.Deferred tax is provided using the liability method, considering all thetemporary differences that emerge between the tax value of assets andliabilities and their carrying amounts in the consolidated financialstatements. Deferred tax is not recognised in respect of goodwill or thoseassets and liabilities that do not affect taxable income. Income taxes derivingfrom the distribution of dividends are recognised at the time the relatedpayable is recognised. The recoverability of deferred tax assets is verified ateach balance sheet date and any amounts for which recovery is no longerlikely are charged to the income statement.Deferred taxation is recognised using the tax rates expected to be in force inthe countries concerned for the tax periods in which the related temporarydifferences are forecast to reverse.Deferred tax assets are recognised to the extent it is probable that futuretaxable income will be available to recover such taxes. Current and deferredtax assets and liabilities are offset when due to the same tax authority, if theperiods of reversal are the same and a legal right of offset exists.Deferred taxation is recognised in relation to the distributable profits ofsubsidiaries if there is an intention to distribute such profits.
Non-current assets held for sale and discontinued operations
Assets held for sale are measured at the lower of their carrying amount at thetime their sale was decided or their fair value, net of estimated selling costs. Allcosts, income and write-downs, if any, are recognised in the income statementand reported separately.Operating activities that represent a separate major line of business orgeographical area of operations are classified separately in the income

49
statement and the balance sheet at the time of disposal, or when they meet theconditions for classification as assets held for sale.
Earnings per share
Basic earnings per share is calculated with reference to the profit for the periodof the Group and the weighted average number of shares outstanding during theperiod. Treasury shares are excluded from this calculation. Diluted earnings pershare is determined by adjusting the basic earnings per share to take account ofthe theoretical conversion of all potential shares, being all financial instrumentsthat are potentially convertible into ordinary shares, with a diluting effect.
5. Changes in accounting policies, new accounting standards, changes in accounting estimates and reclassifications
The accounting policies adopted are unchanged with respect to those appliedfor the preparation of the consolidated financial statements at 12/31/2005.Commencing from 01/01/2006, Turkey is no longer treated as a hyper-inflationary economy. Accordingly, the financial statements of the companiesoperating there are now prepared in accordance with IAS 21. They wereprepared in accordance with IAS 29 until 12/31/2005.
At the reporting date, there are no significant estimates regarding theunforeseeable outcome of future events and other causes of uncertainty thatmight result in significant adjustments being made to the value of assets andliabilities in the coming year.
With reference to note 8.8 Net financial expenses in the notes to theconsolidated income statement, balance sheet and cash flow statement,certain reclassifications have been made with respect to interest income andexpense. In particular, with a view to improving the financial informationpresented, these captions now include the financial effects of discounting theliability for employee benefits (pension funds and leaving indemnities) whichwere previously classified separately in the Other caption; consequently, thecomparative information for 2005 has also been reclassified.
With a view to providing clearer segment reporting, the dishwasher business(previously reported separately) has been included within the laundry segment,since it is not significant to total revenue; consequently, the comparativeinformation for 2005 has also been reclassified.
The IASB has issued a number of amendments to the IAS, effective from01/01/2006. These amendments are described below together withinformation on the approach adopted by the Group.
In December 2004, the IASB issued an amendment to IAS 19 allowing

50
annu
alre
port
2006 companies to elect to recognise actuarial gains and losses immediately as they
arise in a specific equity caption, and explaining how to allocate a Groupdefined benefit plan among the various Group companies. The Group didnot elect for this option envisaged by this amendment and continues to applythe corridor method, as described in the note on employee benefits.
In April 2005, the IASB issued an amendment to IAS 39 allowingcompanies to qualify a financial instrument as cash flow hedges, thusextending the application of hedge accounting to intragroup transactions,if the consolidated financial statements are exposed to exchange rate risk.The Group elected for this option, although the effects were notsufficiently significant to require the modification of the comparativeinformation at 12/31/2005.
In June 2005, the IASB issued an amendment to IAS 39 limiting the use of thefair value option to those financial instruments that meet certain criteria,essentially in order to ensure greater consistency between the measurementof financial assets and liabilities and the related hedging instruments. Theeffects of this amendment were not sufficiently significant to requiremodification of the comparative information at 12/31/2005.
In August 2005, the IASB issued a further amendment to IAS 39 and IFRS 4covering the accounting treatment of the liabilities deriving from guarantees.The effects of this amendment have not been significant.
The changes in accounting policies and interpretations to be applied in theperiods subsequent to the date of these financial statements are describedbelow. The Group is currently evaluating the impact of making these changes.
In August 2005, the IASB issued IFRS 7 on the disclosures to be made on thesignificance of financial instruments for an entity's performance and financialposition, together with a related amendment of IAS 1 on the disclosures to bemade regarding the entity's capital. IFRS 7 and the amendment to IAS 1 takeeffect from 01/01/2007.
In November 2006, the IASB issued IFRS 8 on operating segments, which willreplace IAS 14 from 01/01/2009. The new standard requires the segmentdetails provided in the financial statements to be based on the managementinformation used to make operating decisions and allocate resources to thevarious segments and, accordingly, on the internal reports that are reviewedregularly by management for the analysis of performance.
Lastly, during 2006 the IASB issued IFRIC 8 on the scope of IFRS 2(effective from 01/01/2007), IFRIC 9 on the reassessment of embeddedderivatives (effective from 01/01/2007), IFRIC 10 on the non-reversabilityof impairment losses recognised in interim financial statements, and IFRIC11-IFRS 2 on group and treasury share transactions, effective from01/01/2008.

51
6. Changes in the scope of consolidation
In March 2006, Indesit Company Belgium SA was formed to sell products inthe Belgian market, which was previously served by an exclusive distributor.This company has been consolidated on a line-by-line basis.
7. Segment reporting
7.1 Reporting by geographical segment (primary segment)
The primary segment comprises the geographical areas in which the Groupis active. The geographical areas are classified as follows:
1) Western Europe: Italy, France, Belgium, the Netherlands, Great Britain,Germany, Spain, Portugal and other smaller countries;
2) Eastern Europe: CIS, Poland, Romania, Bulgaria, Hungary, CzechRepublic, Slovak Republic and other smaller countries;
3) Other countries: Turkey, South America, North America, Africa,Australia, Middle East and Far East.
Segment revenue is calculated based on the final destination of the productsand segment results take account of all the expense that can be directlyallocated to the geographical areas concerned. The expense allocated to thevarious geographical areas does not include Corporate general andadministrative expenses or restructuring charges.Inter-segment revenue comprises the revenue earned by companiesconsolidated on a line-by-line basis from sales of products in markets thatbelong to a different geographical segment to their own. Assets, liabilities andcapital investment are allocated with reference to the final destination of theproducts sold; accordingly, on a direct basis with regard to trade receivablesand inventories and using indirect criteria with regard to property, plant andequipment and intangible assets, capital investment and liabilities.The following tables present the Group's operating information analysed bygeographical area based on the final destination of the products.

52
annu
alre
port
2006 Segment reporting - Primary Segment as of 12/31/2006 (million euro)
Western Europe Eastern Europe Other countries Eliminations Consolidated
Third party revenue 1,973.8 1,050.8 224.1 3,248.6
Intersegment revenue 260.5 363.3 68.4 (692.2) -
Total sales 2,234.3 1,414.1 292.5 (692.2) 3,248.6
Segment results 132.7 196.7 23.5 - 352.9
Unallocated income and expenses (192.7)
Operating profit 160.2
Net financial expenses (26.6)
Share of profit (losses) of associates (2.0)
Income tax (54.9)
Profit attributable to minority interests (0.3)
Profit attributable to the Group 76.4
Other information
Segment non-current assets 595.0 217.2 39.3 851.4
Segment current assets 589.9 226.0 110.8 926.6
Tax assets 135.7
Financial assets 274.9
Other unallocated consolidated assets 382.5
Total assets 1.184,9 443,1 150,1 - 2,571.2
Equity 552.2
Segment non-current liabilities 110.6 40.8 9.2 160.6
Segment current liabilities 574.9 255.7 60.2 890.9
Tax liabilities 137.7
Financial liabilities 698.4
Other unallocated consolidated liabilities 131.3
Total equity and liabilities 685.5 296.6 69.5 - 2,571.2
Capital investment 89.7 34.6 6.0 130.2
Unallocated capital investment 5.6
Total capital investment 135.9
Depreciation and amortization (69.6) (44.8) (6.7) (121.1)
Unallocated depreciation and amortization (21,6)
Total depreciation and amortization (69.6) (44.8) (6.7) (142.8)
Other non-monetary income and expenses (12.1) (12.5) (1.4) (26.0)
Other unallocated non-monetary income and expenses (24.6)
Total non-monetary income and expenses (12.1) (12.5) (1.4) (50.6)

53
Segment reporting - Primary Segment as of 12/31/2005 (million euro)
Western Europe Eastern Europe Other countries Eliminations Consolidated
Third party revenue 1,922.4 943.5 198.3 3,064.2
Intersegment revenue 102.2 359.7 66.5 (528.4) -
Total sales 2,024.5 1,303.3 264.8 (528.4) 3,064.2
Segment results 109.7 158.9 20.7 - 289.3
Unallocated income and expenses (167.1)
Operating profit 122.3
Net financial expenses (29.3)
Share of profit (losses) of associates (0.1)
Income tax (42.4)
Profit attributable to minority interests 0.3
Profit attributable to the Group 50.7
Other information
Segment non-current assets 596.6 218.7 35.9 851.3
Segment current assets 593.5 223.3 80.1 896.9
Tax assets 109.0
Financial assets 295.7
Other unallocated consolidated assets 413.2
Total assets 1,190.1 442.0 116.0 - 2,566.1
Equity 519.1
Segment non-current liabilities 96.2 55.2 10.5 161.8
Segment current liabilities 526.7 239.8 48.7 815.1
Tax liabilities 130.9
Financial liabilities 813.2
Other unallocated consolidated liabilities 125.9
Total equity and liabilities 622.8 294.9 59.2 - 2,566.1
Capital investment 80.9 52.4 4.9 138.2
Unallocated capital investment 17.2
Total capital investment 155.4
Depreciation and amortization (70.0) (39.3) (6.0) (115.3)
Unallocated depreciation and amortization (26.0)
Total depreciation and amortization (70.0) (39.3) (6.0) (141.4)
Other non-monetary income and expenses (6.8) (10.2) (2.0) (19.0)
Other unallocated non-monetary income and expenses (22.6)
Total non-monetary income and expenses (6.8) (10.2) (2.0) (41.6)

54
annu
alre
port
2006 The Group's operating information analysed by the geographical location of
activities is presented below.
7.2 Reporting by business segment (secondary segment)
The secondary segment comprises the Group's business segments. For thepurposes of segment reporting, the Group's products are classified into thefollowing business segments:
1) the Cooking segment comprises cookers, ovens, microwave ovens,extractors and hobs;
2) the Refrigeration segment comprises refrigerators and freezers;3) the Laundry segment comprises washing machines, washer-dryers, dryers
and dishwashers;4) the Services segment comprises services to customers, the sale of
extended warranties and transport.
Business segment by geographical location as of 12/31/2006 (million euro)
Western Europe Eastern Europe Other countries Eliminations Consolidated
Non-current assets 831.0 324.7 35.6 - 1,191.3
Current assets 1,435.1 294.8 100.1 (901.8) 928.2
Tax assets 135.7
Financial assets 274.9
Other consolidated assets 41.0
Total assets 2,266.1 619.5 135.8 (901.8) 2,571.2
Capital investment 93.5 36.5 5.8 - 135.9
Business segment by geographical location as of 12/31/2005 (million euro)
Western Europe Eastern Europe Other countries Eliminations Consolidated
Non-current assets 850.2 314.7 37.6 - 1,202.5
Current assets 1,581.9 249.9 65.4 (995.1) 902.1
Tax assets 109.0
Financial assets 295.7
Other consolidated assets 56.7
Total assets 2,432.1 564.6 103.0 (995.1) 2,566.1
Capital investment 97.1 46.7 11.7 - 155.4

55
Segment reporting - Secondary Segment as of 12/31/2006 (million euro)
Cooking Cooling Washing Services Consolidated
Third party revenue 739.4 881.6 1,399.8 227.9 3,248.6
Other information
Segment non-current assets 182.3 295.3 363.2 10.5 851.3
Segment current assets 206.8 248.7 394.5 58.1 908.1
Tax assets 135.7
Financial assets 274.9
Other consolidated assets 401.2
Total assets 389.1 543.9 757.7 68.6 2,571.2
Capital investment 36.3 34.9 59.1 - 130.2
Unallocated capital investment 5.6
Total capital investment 36.3 34.9 59.1 - 135.9
Segment reporting - Secondary Segment as of 12/31/2005 (million euro)
Cooking Cooling Washing Services Consolidated
Third party revenue 721.7 822.3 1,306.0 214.2 3,064.2
Other information
Segment non-current assets 176.5 309.3 349.5 16.0 851.3
Segment current assets 191.0 227.9 387.9 57.5 864.3
Tax assets 109.0
Financial assets 295.7
Other consolidated asset 445.8
Total assets 367.4 537.3 737.4 73.5 2,566.1
Capital investment 28.9 42.8 66.6 - 138.2
Unallocated capital investment 17.2
Total capital investment 28.9 42.8 66.6 - 155.4
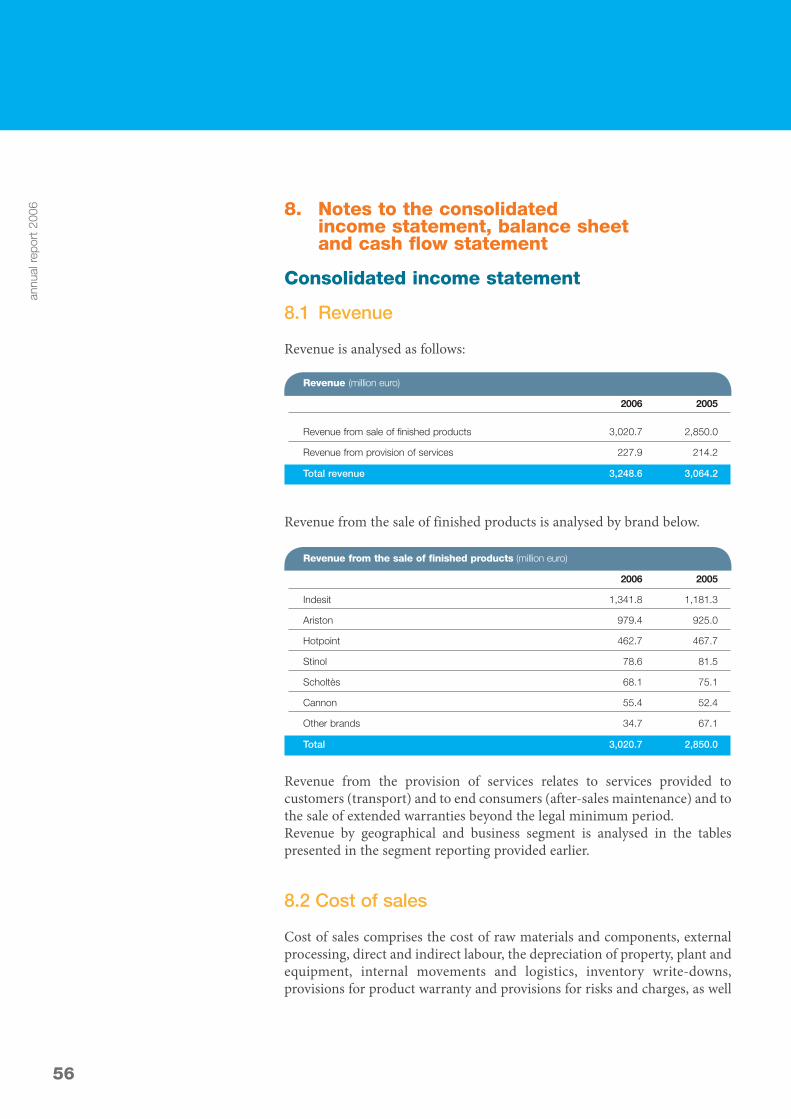
56
annu
alre
port
2006 8. Notes to the consolidated
income statement, balance sheet and cash flow statement
Consolidated income statement
8.1 Revenue
Revenue is analysed as follows:
Revenue from the sale of finished products is analysed by brand below.
Revenue from the provision of services relates to services provided tocustomers (transport) and to end consumers (after-sales maintenance) and tothe sale of extended warranties beyond the legal minimum period.Revenue by geographical and business segment is analysed in the tablespresented in the segment reporting provided earlier.
8.2 Cost of sales
Cost of sales comprises the cost of raw materials and components, externalprocessing, direct and indirect labour, the depreciation of property, plant andequipment, internal movements and logistics, inventory write-downs,provisions for product warranty and provisions for risks and charges, as well
Revenue from the sale of finished products (million euro)
2006 2005
Indesit 1,341.8 1,181.3
Ariston 979.4 925.0
Hotpoint 462.7 467.7
Stinol 78.6 81.5
Scholtès 68.1 75.1
Cannon 55.4 52.4
Other brands 34.7 67.1
Total 3,020.7 2,850.0
Revenue (million euro)
2006 2005
Revenue from sale of finished products 3,020.7 2,850.0
Revenue from provision of services 227.9 214.2
Total revenue 3,248.6 3,064.2

57
as research, development expenses that are not capitalised and all otherproduction overheads.
The 5.5% change in the cost of sales, compared with a 6.0% rise in revenue,reflects increased volumes, improved manufacturing efficiencies and anincrease in purchasing from low-cost countries.
Cost of sales is analysed by type of expenditure in the following table.
The principal change in the captions that comprise cost of sales relates to thecosts incurred for the purchase of raw materials. The 4.2% increase in thesecosts was less than the growth in revenue due to further efficiencies in theprocurement process, as mentioned above.
Service costs rose by 13.1%. The principal changes related to the cost ofenergy, maintenance and technical support.
The increase in “Other costs and revenue” was mainly due to additionalprovisions for risks and charges, lower capitalisations and lower income frominsurance reimbursements.
The non-recurring charges included in cost of sales (within other costs andrevenue in the classification by type of expenditure) totalled 33.7 million euro(35.3 million euro) and principally comprise redundancy costs of 23.4 millioneuro (19.9 million euro), plant closure costs (impairment of property, plantand equipment and other liabilities) totalling 7.7 million euro (7.1 millioneuro) and plant start-up and other costs relating to the redistribution ofproduction (e.g. the cost of moving plant between factories, extraordinarymaintenance work carried out on the relocated plant etc.) of 2.6 million euro(8.3 million euro). Non-recurring charges are analysed in the table included innote 8.7 Operating profit.
Research costs totalling 8.0 million euro (6.5 million euro) were charged to theincome statement.
Cost of sales (million euro)
2006 2005
Change in the inventories of finished products (23.5) (4.7)
Purchase of raw materials, components, materials and change in inventories (1,770.3) (1,698.3)
Services (181.0) (160.0)
Payroll costs (346.2) (351.3)
Depreciation and amortization (108.0) (107.2)
Other income and expenses (8.3) 10.4
Total (2,437.4) (2,311.1)

58
annu
alre
port
2006 8.3 Selling and distribution expenses
Selling and distribution expenses comprise all the costs incurred to marketproducts and provide services, as well as the costs of distributing products tothe Group's warehouses and to customers. The following table analyses thenature of selling and distribution costs. Selling and distribution expenses areanalysed by type in the following table.
The principal services consisted of distribution expenses of 162.8 millioneuro (141.2 million euro) and advertising and promotion expenses of 89.1million euro (84.4 million euro). The 15.3% increase in distribution expensesexceeded the percentage rise in the volume of sales, mainly because thevolume transported increased more than the volume of sales and because ofhigher unit transport costs following the redistribution of production.Other costs and revenue mainly comprise provisions, the write-down ofreceivables and taxes other than income taxes.The provisions for bad debts and losses on receivables amounted to 12.9million euro in 2006 (13.6 million euro).
The non-recurring costs included in selling and distribution expenses(within other costs and revenue in the classification by type of expenditure)totalled 2.0 million euro (none in 2005). These costs include charges for arecall campaign launched at the start of 2007 regarding a batch of washingmachines with functional defects sold at the end of 2006.
8.4 General and administrative expenses
General and administrative expenses include all general management andadministrative costs, and all expenditure not directly attributable toproduction or sales units or to research and development. General andadministrative expenses are analysed by type in the following table.
Selling and distribution expenses (million euro)
2006 2005
Purchase of raw materials, components, materials and change in inventories (10.5) (5.8)
Services (353.0) (348.3)
Payroll costs (97.3) (99.9)
Depreciation and amortization (8.1) (3.2)
Other income and expenses (43.1) (36.3)
Total (512.1) (493.5)

59
8.5 Other income
Other income is analysed as follows:
8.6 Other expenses
Other expenses principally comprise losses on the disposal of fixed assets andcosts associated with the reorganisation of activities in Italy, France andRussia totalling 3.3 million euro (0.7 million euro). These items all representnon-recurring charges.
8.7 Operating profit
As required by IAS 1, operating profit is analysed by type of cost in thefollowing table.
General and administrative expenses (million euro)
2006 2005
Purchase of raw materials, components, materials and change in inventories (1.1) (1.0)
Services (65.5) (66.6)
Payroll costs (48.8) (44.4)
Depreciation and amortization (26.6) (31.0)
Other income and expenses 2.2 (0.9)
Total (139.8) (143.9)
Other income (million euro)
2006 2005
Gains on disposal of assets 0.3 3.3
Lease income 0.8 1.2
Export grants 1.8 1.9
Insurance reimbursements 0.9 0.3
Other 1.0 0.8
Total 4.9 7.6

60
annu
alre
port
2006
The change in inventories is analysed by type below:
In absolute terms, payroll costs were essentially unchanged between years,while they have decreased significantly as a percentage of revenue. Thenumber of employees is 17,284 (17,306). The workforce is analysed asfollows:
As required by CONSOB Communication no. DEM/6064293 dated07/28/2006, non-recurring income and expenses are detailed in the followingtable. They mainly comprise restructuring charges.
Operating profit (million euro)
2006 2005
Revenue 3,248.6 3,064.2
Change in inventories of finished products (23.5) (4.7)
Purchase of raw materials, components and consumables (1,781.9) (1,705.1)
Services (599.6) (575.0)
inc. stock options (0.9) (1.7)
Payroll costs (492.3) (495.5)
inc. stock options (0.1) (0.3)
Depreciation and amortization (142.8) (141.4)
Other income and expenses (48.3) (20.3)
Operating profit 160.2 122.3
Change in inventories (million euro)
2006 2005
Raw materials, components and consumables 33.8 8.9
Finished products (23.5) (4.7)
Total 10.4 4.3
No. of employees
12/31/2006 12/31/2005
Executives 130 131
Clerical staff 5,489 5,449
Factory workers 11,665 11,726
Total 17,284 17,306

61
Isolating the effect of recognising non-recurring income and expenses, theoperating profit from continuing activities is indicated below:
Attachment 4 (consolidated income statement for the year ended 12/31/2006,prepared in accordance with CONSOB Resolution no. 15519 dated 07/27/2006and CONSOB Communication no. DEM/6064293 dated 07/28/2006) to thesenotes summarise the overall effect of non-recurring charges on theconsolidated income statement. Non-recurring charges have an immediatecash flow effect, except for the redundancy costs recorded in accordance withIAS 37 which, on average, are incurred over the 12 months following theaccounting recognition. Total payables and provisions for non-recurringtransactions at 12/31/2006 amount to 7.1 million euro (1.1 million euro) andthe cash flow absorbed by them was 33.0 million euro.
8.8 Net financial expensesNet financial expenses at 12/31/2006 are analysed as follows:
Restructuring charges (million euro)
2006 2005
Redundancies UK (7.4) (7.5)
Redundancies Italy (14.9) (4.1)
Redundancies other countries (1.1) (8.2)
Charges for disposal of industrial assets in areas involved in restructuring plans (10.9) (7.8)
Start-up charges in new industrial areas (2.6) (8.3)
Provision for recall campaign (2.0) -
Total (39.0) (36.0)
Operating profit (million euro)
2006 2005
Revenue 3,248.6 3,064.2
Operating profit 160.2 122.3
Operating profit 4.9% 4.0%
Non recurring items (39.0) (36.0)
Operating profit of recurring activities 199.1 158.2
Operating profit of recurring activities 6.1% 5.2%
Financial expenses (million euro)
2006 2005
Interest income 14.1 8.4
Interest expense (31.4) (38.9)
Exchange rate fluctuations (5.1) 4.9
Commission (4.3) (3.8)
Total (26.6) (29.3)

62
annu
alre
port
2006 Interest income comprises:
Interest income from pension funds includes the net yield expected from theassets that service the Group's defined benefit pension plans.
Interest expense comprises:
The change in the mark-to-market adjustment reflects the increase in the fairvalue of the floating-to-fixed IRS arranged in relation to the nominal value ofthe bond placed with US institutional investors.
Exchange fluctuations are analysed as follows:
The exchange losses recorded were mainly due to the depreciation of theTurkish lira.
Interest income (million euro)
2006 2005
Interest on bank current accounts 8.4 7.0
Mark-to-market derivatives 0.7 (2.3)
Interest income on pension scheme 5.1 3.7
Total 14.1 8.4
Interest expense (million euro)
2006 2005
Bond interest (9.9) (7.9)
Interest on medium/long-term bank loans (4.3) (2.9)
Interest on liability for GDAH acquisition (6.1) (8.5)
Interest on short-term borrowing (13.7) (12.7)
Other interest expense (2.6) (4.1)
Mark-to-market derivatives realted to loans 7.5 (0.1)
Interest expense on pension funds and TFR (2.3) (2.8)
Total (31.4) (38.9)
Exchange fluctuation (million euro)
2006 2005
Realised exchange rate fluctuations, net (5.9) 4.7
Unrealised exchange rate fluctuations, net 0.8 0.2
Exchange rate fluctuations, net (5.1) 4.9

63
8.9 Share of profits (losses) from associates
Profits and losses from associates are analysed below.
The transactions involving the investments in Merloni Progetti SpA andFaber Factor SpA were carried out with related parties, as described in note10.4 Further information on corporate transactions with related parties. Theimpairment of the value of the investment in Faber Factor SpA and thecorresponding price adjustment were recorded after that company was putinto liquidation.
8.10 Income tax
The taxation charged to the income statement is analysed below.
The following table reconciles the theoretical tax charge, determined usingthe current tax rate in Italy, with the reported tax charge.
Profits and losses from associates (million euro)
2006 2005
Gain on disposal of investment in MPE - 3.8
Gain on disposal of investment in Merloni Progetti 2.7 -
Impairment of the investment in Fabriano Basket (1.0) (3.7)
Impairment of the investment in Faber Factor (1.1) -
Adjustment of selling price of Faber Factor (3.1) (1.2)
Devaluation of other equity investments (0.9) -
Revaluation of other equity investments 1.3 1.0
Total (2.0) (0.1)
Income tax (million euro)
2006 2005
IRES (4.8) (4.8)
IRAP (11.4) (11.0)
Other direct taxes charged by nations where the Group operates (42.7) (43.7)
Change in deferred tax assets, net 3.9 17.0
Total (54.9) (42.4)

64
annu
alre
port
2006
Deferred tax assets (million euro)
Tax Duration of Tax rate Deferred tax Deferred tax TotalCompany losses recoverability assets assets not
recognised recognised
Indesit Company Luxembourg SA 74.4 indefinite 22.00% 3.6 12.8 16.4
Indesit Company UK Ltd 54.7 indefinite 30.00% 10.8 5.6 16.4
Indesit Company Portugal Electrodomésticos SA 19.9 6 years 26.50% - 5.3 5.3
Fabrica Portugal SA 9.9 6 years 26.50% - 2.6 2.6
Indesit Company Magyarország Kft 13.9 indefinite 16.00% - 2.2 2.2
Indesit Company Deutschland GmbH 4.2 indefinite 40.86% - 1.7 1.7
Indesit Electrodomésticos SA 23.5 15 years 35.00% 3.2 5.0 8.2
Other companies n.a. n.a. n.a. 0.1 - 0.1
Total 200.4 17.7 35.3 52.8
Taxation represents 41.7% (45.7%) of profit before tax (PBT).
As described in note 8.17, the deferred tax assets recognised in relation toprior-year tax losses amount to 17.7 million euro (20.9 million euro), whilethose not recognised amount to 35.3 million euro (22.5 million euro).
The situation is analysed in the following table.
Tax reconciliation (million euro)
2006 2005
Profit before tax 131.6 92.8
Theoretical tax charge (33%) (43.4) (30.6)
Actual tax charge (54.9) (42.4)
Difference (11.5) (11.8)
Effects relating to the Parent Company and companies based in Italy
IRAP (11.4) (11.0)
Taxation of dividends to be distributed by subsidiaries (6.5) (5.6)
Prior year items and undeductible expenses (2.0) (1.8)
Taxation on undeductible stock option expense (0.3) (0.7)
Effect of untaxed gains on disposal of investments 0.5 1.2
Other effects (1.2) 1.8
Total effects relating to the Parent Company and companies based in Italy (21.0) (16,0)
Effects relating to companies operating in other countriesand tax differentials with respect to companies based in Italy 9.5 4.2
Total differences (11.5) (11.8)

65
8.11 Profit attributable to minority interests
Profit attributable to minority interests relates to the companies which are notwholly owned by the Indesit Group including, in particular, Indesit PortugalSA, Aermarche SpA, Wuxi Indesit Home Appliance Co. Ltd and ArgentronSA. The situation is analysed in the table presented in note 8.24.
Consolidated balance sheet
8.12 Property, plant and equipment
The changes in property, plant and equipment are analysed in the tablepresented on the following page.
The depreciation charge for the year was 110.8 million euro (115.5 million euro).
The reclassification to Assets held for sale is described in note 8.22.
The carrying amounts of land and buildings, plant and machinery, andindustrial and commercial equipment includes 33.1 million euro (athistorical exchange rates) deriving from recognition of their fair value on theacquisition of GDAH in 2002, as described in note 8.13.
The carrying amount of the property, plant and equipment of the companyoperating in Turkey was previously restated for the effects of hyper-inflation, asrequired by IAS 29, and adjusted for any impairment. Following a new test of therecoverability in use of the carrying amount of these assets, no basis was foundfor writing back the adjustments already made or for recording furtheradjustments.
Outstanding orders placed for the supply of property, plant and equipmentamount to 6.2 million euro (10.1 million euro).
Advances to the suppliers of property, plant and equipment not yet deliveredor constructed amount to 0.3 million euro (3.2 million euro).
Reclassifications of 4.7 million euro relate to intangible assets recorded whenassets under construction entered into service. At that time, the investment in hardware was separated from the investmentin software.The ownership of property is not restricted by liens and charges.

66
annu
alre
port
2006
Assets under finance leases
The net carrying amount of assets held under finance leases amounts to 3.5million euro and relates to Industrial and commercial buildings, 2.8 millioneuro, Land, 0.6 million euro, and Other tangible assets, 0.1 million euro.
The finance lease of Industrial and commercial buildings and Land relates tothe building in Croissy (France) and the related land. This contract has a termof 15 years and expires in 2011. The Group expects to make the agreed end-of-lease purchase payment. The building is mortgaged for the amount of theoutstanding finance lease liability.
Changes during 2006 (million euro)
12/31/2005 Changes during the year 12/31/2006
Land and buildings 403.5 (122.8) 280.7 3.6 (6.4) 3.0 (15.0) 15.1 2.2 (3.4) 1.0 414.6 (133.8) 280.9
Plant and machinery 764.2 (464.6) 299.6 16.6 (28.6) 26.2 (46.1) 30.1 - (5.1) 2.6 777.3 (482.0) 295.3
Industrial and commercialequipment 378.4 (303.6) 74.9 18.6 (11.7) 10.7 (35.3) 29.1 - (0.6) 0.8 413.7 (327.4) 86.4
Assets under construction 63.9 - 63.9 57.7 0.0 - - (77.7) - (2.5) 41.5 - 41.5
Other assets 175.5 (117.6) 57.9 4.8 (1.8) 1.8 (14.4) (1.2) - (2.7) 2.8 174.6 (127.5) 47.1
Total 1,785.5 (1,008.6) 776.9 101.3 (48.4) 41.7 (110.8) (4.7) 2,2 (14.2) 7.2 1,821.8 (1,070.6) 751.2
TotalAcc.amort. andimpairment
losses
Historicalcost
Additions Decreases Use ofaccumu-
lateddepr.
Depr. andimpair-
ment los-ses
Reclass.from assetsunder con-
struction
Reclass.to assetsavailablefor sale
Exchangerate diffe-rences onhistorical
cost
Exch. ratediff. on
accumula-ted depr.
Historial cost
Acc.amort. andimpairment
losses
Total
Changes during 2005 (million euro)
12/31/2004 Changes during the year 12/31/2005
Land and buildings 365.7 (115.5) 250.2 10.2 (5.6) 1.2 (14.7) 31.7 (4.9) 6.5 6.1 403.5 (122.8) 280.7
Plant and machinery 728.1 (439.4) 288.7 38.2 (17.4) 16.5 (52.0) 8.5 - 6.8 10.3 764.2 (464.6) 299.6
Industrial and commercialequipment 369.0 (284.3) 84.7 17.7 (1.8) 0.5 (23.5) (4.8) - (1.7) 3.8 378.4 (303.6) 74.9
Assets under construction 55.4 - 55.4 50.4 (0.1) - - (46.7) - 4.9 63.9 - 63.9
Other assets 163.1 (96.0) 67.1 7.0 (4.2) 2.6 (25.6) 11.3 (1.9) 0.4 1.1 175.5 (117.6) 57.9
Total 1.681,4 (935.2) 746.1 123.6 (29.1) 20.8 (115.4) - (6.8) 16.9 21.2 1,785.5 (1,008.6) 776.9
TotalAcc.amort. andimpairment
losses
Historicalcost
Additions Decreases Use ofaccumu-
lateddepr.
Depr. andimpairment
losses
Reclass.from
assetsunder con-
struction
Reclass.to assetsavailablefor sale
Exch. ratedifferenceson histori-
cal cost
Exch. ratediff. on
accumula-ted depr.
Historical cost
Acc.amort. and
impair-ment los-
ses
Total

67
The minimum lease payments are analysed by maturity below:
Non-cancellable operating leases
The minimum lease payments under non-cancellable operating leases areanalysed by maturity below.
The principal assets held under non-cancellable operating leases comprisethe factory at Blythe Bridge and the warehouse at Raunds in the UK. The firstinvolves minimum lease payments of 42.5 million euro over 99 years endingin 2069. The contract envisages adjustments to the annual lease charge every25 years. The next adjustment will take place in 2010. The contract does notenvisage renewal or the purchase of the assets concerned. The secondinvolves total minimum future payments of 40.5 million euro. The contractexpires in 2020/2021, and envisages adjustments to the annual lease chargeevery five years. The contract does not envisage renewal or the purchase ofthe assets concerned.
The income statement reflects lease charges incurred under operating leasesof 15.7 million euro (16.4 million euro).
Finance leases (million euro)
12/31/2006
Within 1 year 0.5
Between 1 and 5 years 1.9
Beyond 5 years -
Total minimum lease payments 2.3
Non-cancellable operating leases (million euro)
12/31/2006
Within 1 year 12.2
Between 1 and 5 years 34.5
Beyond 5 years 63.3
Total minimum lease payments 110.0

8.13 Goodwill and other intangible assetswith an indefinite useful life
Goodwill and other intangible assets with an indefinite useful life at12/31/2006 and 2005 are analysed in the following tables.
The brand names with an indefinite useful life and the goodwill relate to theacquisition of General Domestic Appliances Holdings Ltd (GDAH), a UKcompany, in 2002. On allocating the purchase price of GDAH, 160.3 millioneuro (at historical exchange rates) was attributed to brands with an indefinitelife and 164.9 million euro (at historical exchange rates) to goodwill. Thisgoodwill is denominated in pounds sterling and, accordingly, is subject toexchange rate fluctuations arising on the translation to euro.
The brand names with an indefinite useful life are Hotpoint and Cannon.These brand names are deemed to have an indefinite useful life since they arestrategic to the Group being, respectively, the leader of the UK market forhousehold appliances and the leader in the ovens sector, especially doubleovens. The value of these brand names is denominated in pounds sterlingand, accordingly, is subject to exchange rate fluctuations arising on thetranslation to euro.
68
annu
alre
port
2006
Changes during 2006 (million euro)
12/31/2005 Change during the year 12/31/2006
Goodwill 169.8 (7.5) 162.3 - 3.3 (0.0) 173.3 (7.7) 165.6
Brands with an indefinite useful life 168.8 (12.1) 156.6 - 3.2 - 172.3 (12.3) 159.9
Total 338.6 (19.7) 318.9 - 6.6 (0.0) 345.5 (20.0) 325.5
TotalAccumulatedimpairment
losses
Historicalcost
Change inscope of
consolidation
Exch. rate differences
arising inthe year
Impairmentlosses
during theyear
Historicalcost
Accumulatedimpairment
losses
Total
01/01/2005 Change during the year 12/31/2005
Goodwill 165.0 (7.3) 157.7 0.3 4.3 - 169.8 (7.5) 162.3
Brands with an indefinite useful life 165.0 (11.8) 153,2 - 3.4 - 168.8 (12.1) 156.6
Totale 330.0 (19.1) 310.9 0.3 7.7 - 338.6 (19.7) 318.9
TotalAccumulatedimpairment
losses
Historicalcost
Change inscope of
consolidation
Exch. ratedifferences
arising inthe year
Impairmentlosses
during theyear
Historicalcost
Accumulatedimpairment
losses
Total

The value of intangible assets with an indefinite useful life is subjected to animpairment test at least once every year. The tests performed at 12/31/2005and 12/31/2006 did not identify the need to adjust the carrying amount ofthese assets. For the purposes of this test, part of the goodwill identified at thetime of acquisition and expressed at current exchange rates, 38.8 millioneuro, was attributed to the cash-generating unit (CGU) represented by theUK market and part, 121.4 million euro, was attributed to the Group CGUsthat are expected to benefit from the synergies released as a result of theacquisition.The recoverable amount of the CGU represented by the UK market (UKCGU) and the CGU represented by the Group (Group CGU) makesreference to the value-in-use of the assets concerned. The related calculationsdiscount the forecast cash flows included in the business plans of the UKCGU for the next five years, and those of the Group CGU for the next threeyears (the period covered by the three-year plan). The cash flows used toestimate the recoverable amount of the CGUs are based on the medium-termplans prepared by management, having regard for past experience andforecasts for the business considering expected market trend.
The principal assumptions underpinning the Business Plan of the UK CGUare set out below:
1) volume of sales: annual average growth of 2.2% during the period coveredby the plan;
2) price trend: annual average decrease of 1.3% during the period covered bythe plan;
3) gross profit (difference between revenue and cost of sales): annual averageincrease of 2.5% in the period covered by the plan.
The assumptions contained in the Business Plan of the Group CGU are thosereported in the Business Plan published on 10/26/2005.
Forecast cash flows have been discounted using the weighted-average cost ofcapital (WACC) of 8.26% (7.51%) for the UK CGU and 7.95% (7.02%) for theGroup CGU. The terminal value of the CGUs was determined by assuming along-term cash flow equal to the cash flow generated in the final year of thebusiness plan, and a nominal long-term growth factor (g) of 2.00%, equal toinflation, representing therefore a situation with virtually no real growth. Theimpairment test on the UK CGU was carried out with the assistance of anindependent expert.
69

8.14 Other intangible assets with a finite useful life
Other intangible assets are analysed as follows:
Development expenditure totalling 16.6 million euro (22.0 million euro)were capitalised in 2006, including 9.1 million euro in relation to projects forthe launch of new products not yet ready to be sold which, accordingly, havenot been amortised.
The Licences and software caption comprises the capitalised internal andexternal cost of IT projects carried out by the Group, and the cost of softwarelicences that will benefit future years. The average residual life of theseintangible assets is three years. This caption includes capitalised projectstotalling 10.7 million euro that have not yet entered into service and which,therefore, have not been amortised.
The Brands with a finite useful life caption includes 14.7 million euro relatingto the Creda brand, which was recognised on the acquisition of GDAH. Thisbrand is subjected to regular impairment testing and, overall, has suffered an
70
annu
alre
port
2006
Other intangible assets with a finite useful life (million euro)
12/31/2005 Changes during 2006 12/31/2006
Development expenses 63.9 (21.5) 42.5 16.6 - (11.9) 0.2 (9.6) 9.7 71.2 (23.6) 47.5
Licences and software 79.6 (41.3) 38.3 17.8 (0.2) (16.2) 5.8 0.4 (0.7) 103.6 (58.2) 45.4
Brands with a finite useful life 21.5 (3.5) 18.0 - - (3.3) - (0.1) 0.8 21.4 (6.1) 15.3
Other 8.3 (0.4) 7.9 0.1 - (0.6) (1.3) - - 7.2 (0.9) 6.2
Total 173.4 (66.7) 106.7 34.6 (0.2) (32.0) 4.7 (9.3) 9.8 203.3 (88.8) 114.5
TotalAccumulatedamort. and impairment
losses
Historicalcost
Additionsand
capitaliza-tions during
the year
Decreases Amort. and impairment
losses in the year
Recl. fromassets
under con-struction
Exch. rate differences
on historicalcost
Exch. rate differences
on accumul.depreciation
Historical cost
Accumulatedamort. and impairment
losses
Total
12/31/2004 Changes during 2005 12/31/2005
Development expenses 40.1 (11.5) 28.7 22.0 - (8.3) - 1.8 (1.7) 63.9 (21.5) 42.5
Licences and software 69.4 (24.6) 44.8 8.8 - (16.1) - 1.5 (0.6) 79.6 (41.3) 38.3
Brands with a finite useful life 21.6 (3.0) 18.6 - - (1.1) - (0.1) 0.6 21.5 (3.5) 18.0
Other 7.3 (0.3) 7.0 1.0 - (0.1) - - - 8.3 (0.4) 7.9
Total 138.5 (39.4) 99.1 31.7 - (25.6) - 3.2 (1.7) 173.4 (66.7) 106.7
TotalAccumulatedamort. and impairment
losses
Historicalcost
Additions and
capitaliza-tions during
the year
Decreases Amort. and impairment
losses in the year
Recl. fromassets
under con-struction
Exch. rate differences
on historicalcost
Exch. rate differences
on accumul.depreciation
Historical cost
Accumulatedamort. and impairment
losses
Total

impairment loss of 7.3 million euro having regard for the residual useful lifeof the brand in the marketplace. In particular, having regard for the cashflows expected from Creda products, the amount charged to the 2006 incomestatement as a consequence of impairment testing was 2.3 million euro, inaddition to amortisation of 1.0 million euro, with a total effect on the incomestatement of 3.3 million euro. This reflects the effect of new plans for theCreda brand, which have reduced its useful life from 20 to five years.
The Other intangible assets caption principally comprises industrial patentswith an average residual useful life of five years.
8.15 Investments in associates
Investments in associates are analysed below:
The 33% interest in Merloni Progetti SpA was sold during 2006. Additionaldetails are provided in note 10.4 Further information on corporatetransactions with related parties.
Key information relating to the principal associates is presented below:
71
Investments in associates (million euro)
12/31/2006 12/31/2005
Merloni Progetti - 7.9
Haier Indesit (QuigDao) Washing Machine Co. Ltd 7.2 8.0
Haier Indesit (QuigDao) Electrical Appl. Co. Ltd 4.5 4.9
Other minor 0.8 0.9
Total investments in associates 12.5 21.7
Key information relating to the principal associates (million euro)
12/31/2006
Assets Liabilities Revenue Profit
Haier Indesit (QuigDao) Washing Machine Co. Ltd 39.9 18.5 58.0 1.7
Haier Indesit (QuigDao) Electrical Appl. Co. Ltd 22.8 10.0 75.3 2.9
12/31/2005
Assets Liabilities Revenue Profit
Merloni Progetti SpA 64.6 37.1 55.6 0.3
Haier Indesit (QuigDao) Washing Machine Co. Ltd 50.7 25.2 76.1 1.4
Haier Indesit (QuigDao) Electrical Appl. Co. Ltd 35.5 22.3 48.9 1.8

8.16 Other investments
Other investments comprise investments in other companies which generallyrepresent less than 20% of their equity capital or voting rights, and other non-current financial assets.
The investments held by Indesit Company are not listed and their securitiesare not traded in a regulated market. Accordingly, their fair value cannot bedetermined reliably since there were no transactions involving thesesecurities during the past year.
The change reflects the write-off of the investments in Faber Factor SpA, 1.1million euro, and Meurice Ets, 0.5 million euro, and the sale of theinvestments in SS Fabriano Basket SpA, 0.2 million euro, and Co.Pro. SpA,0.1 million euro.
8.17 Deferred tax assets
Deferred tax assets and the related changes during the year are analysed inthe following table:
72
annu
alre
port
2006
Deferred tax assets (million euro)
Opening Credited/charged Credited/charged Exchange Closing balance to income statement to equity rate effect balance
12/31/2005 12/31/2006
Property, plant and equipment 1.3 (1.5) - (0.1) (0.3)
Intangible assets 5.2 (0.4) - 0.0 4.9
Other investments 0.1 (0.1) - - 0.0
Inventories 3.1 (0.8) - 0.1 2.3
Financial payables 2.9 2.0 - 0.0 4.9
Deferred payroll 13.6 (1.9) - 0.2 11.9
Provisions for risks 8.9 2.3 - 0.2 11.4
Other 21.0 2.5 - (0.4) 23.1
Tax losses carried forward 20.9 (3.4) - 0.2 17.7
Total 77.1 (1.3) - 0.2 76.0
Amounts offset (34.2) 6.0 - - (28.2)
Total net 42.9 4.7 - 0.2 47.8

The amounts offset relate to the deferred tax liabilities that reduce these deferredtax assets since they are due to the same tax authorities, are legally offsettableand relate to temporary differences that will reverse at the same time.
8.18 Inventories
Inventories are analysed as follows:
The provision for obsolescence totals 12.9 million euro (11.8 million euro) andthe accrual for the year was 1.9 million euro (1.6 million euro).
8.19 Trade receivables
Trade receivables comprise amounts due from customers as a result ofcommercial transactions and the provision of services, stated net of theallowance for doubtful accounts of 35.4 million euro (36.7 million euro).Advances to suppliers at 12/31/2006 amount to 2.5 million euro (4.5 millioneuro).The Group sells a portion of its trade receivables under a revolvingsecuritisation programme. This transaction involves the without-recoursesale of a portfolio of receivables to a company that finances such purchases bythe issue of securities guaranteed by the receivables acquired. The securitiesare subdivided into different risk classes in relation to their rating. The higherrisk classes are subscribed for by the Group. In accordance with IAS 39, thereceivables sold under the securitisation programme, amounting to 112.9million euro (111.3 million euro), continue to be recognised as tradereceivables in the balance sheet and securities issued amounting to 34.5million euro (32.2 million euro) have been classified to this caption creditingfinancial payables.
73
Inventories (million euro)
12/31/2006 12/31/2005
Raw materials and semi-finished parts 121.1 92.6
Finished products 232.3 250.2
Total inventories 353.4 342.8

8.20 Tax receivables
The amounts due from the tax authorities in the countries in which theGroup operates relate to advance taxation and VAT recoverable. Theseamounts are analysed below:
8.21 Other receivables and current assets
Other receivables and current assets are analysed as follows:
8.22 Assets held for sale
Assets held for sale relate to the building owned by Indesit CompanyPortugal, with a carrying amount of 1.6 million euro, and to land owned byIndesit Company Polska, with a carrying amount of 0.2 million euro. At12/31/2005, this caption included the amounts recoverable from the sale ofan aircraft owned by Aermarche SpA and building in Thionville (France).The aircraft was sold during 2006, while the building in Thionville has beenreclassified to property, plant and equipment following the termination ofnegotiations with a potential purchaser.
74
annu
alre
port
2006
Tax receivables (million euro)
12/31/2006 12/31/2005
Advance taxation 37.8 21.3
VAT 35.9 29.2
IRPEF on advance of termination benefits 1.4 2.2
Tax credit for Polish Economic Zone 12.8 13.5
Total 87.9 66.2
Other receivables and current assets (million euro)
12/31/2006 12/31/2005
Due from employees 4.0 3.6
Insurance reimbursements 0.9 3.0
Grants due from public bodies 15.1 15.7
Due from social security and pension institutions 0.8 0.7
Other receivables 7.0 7.9
Total 27.9 31.0

8.23 Equity attributable to the Group
The statement of changes in equity is presented in a separate schedule.Share capital comprises ordinary shares and savings shares, as analysedbelow.
The change in share capital during the year was due to the exercise of stockoptions, involving the issue of 422,500 shares.
The number of shares in the table is stated gross of the treasury shares held.Net of the treasury shares held directly by Indesit Company SpA, 11,039,750,there are 102,378,684 ordinary shares outstanding.
No new stock options were granted in 2006. The total cost charged to theincome statement was 1.0 million euro (2.0 million euro).
The nominal value of the ordinary and savings shares is 0.90 euro.
The holders of ordinary shares and savings shares enjoy the ownership andparticipation rights granted under Italian law and the articles of associationof Indesit Company SpA. In addition to the right to participate in thedistribution of profits and the return of capital, the ordinary shares also carrythe right to vote at ordinary and extraordinary shareholders’ meetings. Thesavings shares, on the other hand, have greater ownership rights but reducedadministrative rights. The greater ownership rights comprise:
1) the right to an allocation of profit for the year (after allocating 5% to thelegal reserve) representing up to 5% of the nominal value of the savingsshares;
2) the right, if a dividend of less than 5% was paid in a given year, to collectthis shortfall in the preference dividend in the following two years;
3) the right, if a dividend is declared at the shareholders’ meeting, to receivea total dividend that is higher than that paid on the ordinary shares by 2%of the nominal value of the savings shares.
In addition, in the event of a share capital reduction to cover losses, thenominal value of the savings shares is only reduced by the amount of thelosses that exceed the total nominal value of the other shares.The lower administrative rights with respect to the ordinary shares consist ofthe absence of voting rights at ordinary and extraordinary shareholders’meetings.
75
Group shareholders’ equity
12/31/2006 12/31/2005
Number Euro Number Euro
Ordinary shares 113,418,434 102,076,591 112,995,934 101,696,340.6
Savings shares 511,282 460,154 511,282 460,153.8
Total 113,929,716 102,536,744 113,507,216 102,156,494.4

The following table analyses the share capital structure of the ParentCompany at 12/31/2006, indicating the outstanding stock options and thetreasury shares held (amounts in euro). The above include both ordinary andsavings shares.
The description of, changes in and restrictions applying to the principalreserves are described below. The detailed analysis of these changes ispresented in a separate schedule.
Reserves
a) Share premium reserve: this reserve, 34.1 million euro, has increased by2.8 million euro following the exercise of stock options.
b) Legal reserve: this reserve, 19.9 million euro, reflects allocation of 5% ofthe Parent Company’s profit each year. The increase was 4.6 million euro.
c) Translation reserve: the translation reserve amounts to 53.0 million euroand reflects the exchange rate differences arising on the translation offoreign currency financial statements.
d) Other reserves, 209.2 million euro. The other reserves are analysed as follows:
1. Extraordinary reserve, 171.5 million euro. This reserve has increased by51.0 million euro following allocation of the Parent Company’s residualprofit for 2005. The total includes 5.3 million euro that is restricted inrelation to the investment required in the territorial agreement for thefactory at Comunanza (Italy). This reserve also includes 13.0 millioneuro that is tied up in order to obtain fiscal benefits associated withinvestment programmes financed by government grants.
76
annu
alre
port
2006
Share capital
Authorised Authorised Issued and No. of shares share capital no. of shares fully-paid issued and
(euro) share capital (euro) fully paid
Share capital following the conversion of savings shares into ordinary shares in 2001 98,832,569 109,813,966 98,832,569 109,813,966
1st and 2nd stock option plans for employees authorised on 09/19/1998 and 10/23/2001 respectively 5,400,000 6,000,000 2,264,175 2,515,750
1st stock option plan for Directors authorisedon 10/23/2001 1,260,000 1,400,000 1,260,000 1,400,000
2nd stock option plan for Directors authorisedon 05/06/2002 180,000 200,000 180,000 200,000
Total 105,672,569 117,413,966 102,536,744 113,929,716

2. Reserve for government grants, 20.6 million euro, that were principallymade to the Parent Company. This reserve was unchanged in 2006.
3. Other residual reserves of 17.1 million euro, which principallycomprise the revaluation reserve and the reserves for stock options andderivative instruments recognised as cash-flow hedges. The changes inthese reserves during the year totalled 1.3 million euro following thenet movement in outstanding stock options and the mark-to-market ofcash-flow hedges.
e) Retained earnings: these amount to 60.5 million euro and have decreasedby 37.1 million euro on the payment of dividends and by 4.9 million euroon the allocation of profit for 2005.
As indicated above with regard to the changes in reserves, the dividendspaid in 2006 amounted to 37.1 million euro (36.7 million euro)representing 0.36 euro per ordinary share and 0.38 euro per savings share(also 0.36 euro per ordinary share and 0.38 euro per savings share). Theincrease in the total dividend paid in 2006 is explained by the exercise ofstock options, which raised the number of ordinary shares outstanding.
The Board meeting held on 03/22/2007 approved these consolidatedfinancial statements and recommended that a dividend of 0.385 euro perordinary share and 0.403 euro per savings share be declared at theshareholders’ meeting. The size of the dividend per share was determinedby assuming that all options exercisable by the date of the shareholders’meeting will be exercised, and includes the portion relating to treasuryshares, 0.037 euro per share, determined with reference to the number ofsuch shares held at the time of the Board meeting.
The following table shows the calculation of the basic earnings per share(Basic EPS) and the diluted earnings per share (Diluted EPS) reported in theconsolidated income statement.
77
Basic EPS
12/31/2006 12/31/2005
Basic attributable earnings (million euro) 76.4 50.7
Unit earnings attributed to savings shares (euro) 0.784 0.526
Number of savings shares (thousand) 511.3 511.3
Earnings attributed to savings shares (million euro) (0.40) (0.27)
Basic attributable earnings (million euro) 76.0 50.4
Basic average number of ordinary shares (thousand) 102,251.8 100,514.3
Basic EPS (euro) 0.74 0.50

8.24 Minority interests
Minority interests have decreased by 7.8 million euro following the purchaseby Indesit Company SpA of additional shares in Aermarche SpA and WrapSpA. Further information on these transactions is provided in note 10.4.
The minority interests are analysed in the following table:
8.25 Net financial position
The net financial position and net financial indebtedness of the Group areanalysed below. Non-current financial assets have been included in thecalculation of net financial indebtedness in order to represent fairly theGroup’s overall exposure, considering that the principal component of non-current financial assets consists of deposits restricted to guarantee loansobtained, as described further in note 8.25.4.
78
annu
alre
port
2006 Diluted EPS
12/31/2006 12/31/2005
Basic attributable earnings (million euro) 76.0 50.4
Basic average number of ordinary shares (thousand) 102,251.8 100,514.3
Average number of shares granted to Directors without payment (thousand) 85.8 413.6
Average number of shares granted to employees without payment (thousand) 142.0 233.6
Total 102,479.6 101,161.5
Diluted EPS (euro) 0.74 0.50
Minority interests (million euro)
12/31/2006 12/31/2005
Equity Results for Equity Results for the year the year
Wrap SpA - - 3.2 0.1
Wuxi Indesit Home Appliances Co. Ltd 2.8 (0.5) 3.0 (0.5)
Fabrica Portugal SA (0.2) - (0.2) -
Argentron SA 1.8 0.9 1.8 0.3
Aermarche SpA 2.3 - 6.6 (0.2)
Total 6.6 0.3 14.4 (0.3)

8.25.1 Current financial assets
Current financial assets principally include financial receivables, 6.7 millioneuro (0.0 million euro), and the fair value adjustment of the current portionof derivative financial instruments recorded in accordance with IAS 39, 3.0million euro (5.1 million euro), as analysed in note 9.
8.25.2 Cash and cash equivalents
Cash and cash equivalents include bank and postal deposits, as well ascheques and other amounts on hand. The changes in liquidity during the yearare analysed in the consolidated cash flow statement.
8.25.3 Banks and other financial payables
Banks and other financial payables mainly comprise amounts due within thecurrent year.
This caption is analysed hereafter.
79
Net financial position (million euro)
Note 12/31/2006 12/31/2005
Current financial assets 8.25.1 11.1 6.7
Cash and cash equivalents 8.25.2 184.5 199.7
Banks and other financial payables 8.25.3 (295.7) (319.1)
Net financial position - short term (100.1) (112.8)
Medium/long-term financial payables 8.25.5 (402.7) (494.1)
Net financial position (1) (502.8) (606.8)
Other non-current financial assets 8.25.4 79.3 89.3
Net financial indebtedness (423.6) (517.5)
(1) As defined in CONSOBCommunication
DEM/6064293 dated07/28/2006, applying theCESR recommendations
dated 01/10/2005.
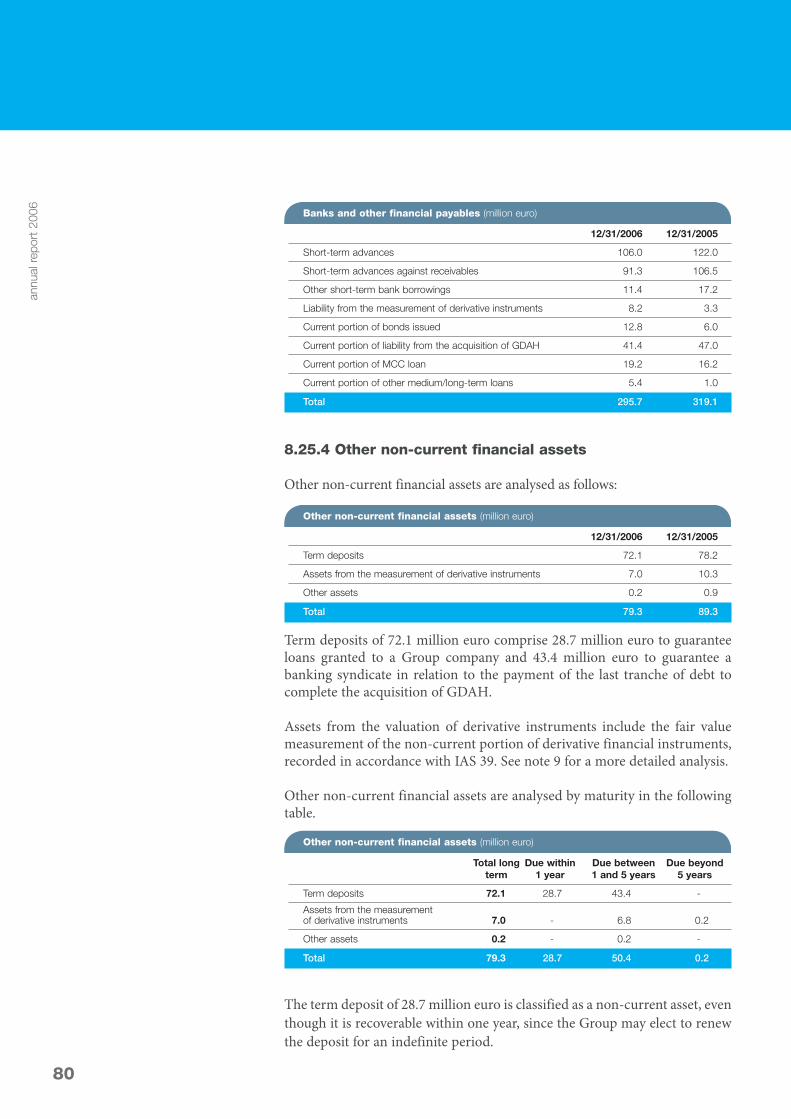
8.25.4 Other non-current financial assets
Other non-current financial assets are analysed as follows:
Term deposits of 72.1 million euro comprise 28.7 million euro to guaranteeloans granted to a Group company and 43.4 million euro to guarantee abanking syndicate in relation to the payment of the last tranche of debt tocomplete the acquisition of GDAH.
Assets from the valuation of derivative instruments include the fair valuemeasurement of the non-current portion of derivative financial instruments,recorded in accordance with IAS 39. See note 9 for a more detailed analysis.
Other non-current financial assets are analysed by maturity in the followingtable.
The term deposit of 28.7 million euro is classified as a non-current asset, eventhough it is recoverable within one year, since the Group may elect to renewthe deposit for an indefinite period.
80
annu
alre
port
2006 Banks and other financial payables (million euro)
12/31/2006 12/31/2005
Short-term advances 106.0 122.0
Short-term advances against receivables 91.3 106.5
Other short-term bank borrowings 11.4 17.2
Liability from the measurement of derivative instruments 8.2 3.3
Current portion of bonds issued 12.8 6.0
Current portion of liability from the acquisition of GDAH 41.4 47.0
Current portion of MCC loan 19.2 16.2
Current portion of other medium/long-term loans 5.4 1.0
Total 295.7 319.1
Other non-current financial assets (million euro)
12/31/2006 12/31/2005
Term deposits 72.1 78.2
Assets from the measurement of derivative instruments 7.0 10.3
Other assets 0.2 0.9
Total 79.3 89.3
Other non-current financial assets (million euro)
Total long Due within Due between Due beyondterm 1 year 1 and 5 years 5 years
Term deposits 72.1 28.7 43.4 -
Assets from the measurement of derivative instruments 7.0 - 6.8 0.2
Other assets 0.2 - 0.2 -
Total 79.3 28.7 50.4 0.2

8.25.5 Medium and long-term financial payables
Medium and long-term financial payables are analysed as follows:
The bonds were subscribed for by institutional investors (US PrivatePlacement) in September 2004. They are analysed in the following table.
The interest and exchange rate risks relating to the above-mentioned USPrivate Placement have been hedged by a Cross Currency Swap which isdescribed in the paragraph on financial instruments below.
The change in the fair value of the bonds, due to fluctuations in the exchangerate with the dollar, should be considered together with the change in the fairvalue of the Cross Currency Swap, indicated further below.
The amounts due to banks totalling 94.6 million euro comprise loans fromMCC SpA to finance the factories in Russia and Poland, 66.3 million euro, thelast instalments on which fall due in 2013, and loans from HSBC of 28.2million euro.
The amount due on the acquisition of GDAH relates to the non-currentportion, 38.3 million euro, of the liability to General Electric for the sixth andfinal instalment relating to the acquisition of GDAH.
81
Bond
Nominal value Nominal value Fair value Maturity Rate Type of hedge
Million Usd Million euro Million euro
Notes - Series A 65.0 53.9 47.0 09/17/2009 Fixed CCS
Notes - Series B 70.0 58.1 50.8 09/17/2011 Fixed CCS
Notes - Series C 148.0 122.8 108.9 09/17/2014 Fixed CCS
Notes - Series E 25.0 20.7 18.6 09/17/2016 Fixed CCS
Total notes issued in Usd 308.0 255.6 225.3
Notes - Series D n.a. 18.3 18.1 09/17/2014 Fixed IRS
Total notes issued in euro n.a. 273.9 243.4
Medium and long-term financial payables (million euro)
12/31/2006 12/31/2005
Bonds 243.4 283.4
Due to banks 84.1 104.8
Due on the acquisition of GDAH 38.3 83.7
Other payables 36.9 22.2
Total 402.7 494.1

Other medium and long-term financial payables are analysed as follows:
The change in the liability arising from the measurement of derivativesmainly reflects the mark-to-market adjustment of the Cross Currency Swaparranged to hedge the bonds. This has moved from positive 11.5 million euroto negative 21.9 million euro, consistent with the change in the relatedunderlying. Further information on this measurement is provided in note 9Financial instruments and the related detailed table.
Until 12/31/2005, the Group had a syndicated, committed revolving line ofcredit of 115.0 million pounds sterling which expired in April 2006. Asmentioned in the section of the Report on operations that describessignificant events during the year and subsequent to year end, this facility wasreplaced during 2006 by a multicurrency line of credit, for a maximum of350.0 million euro and with a duration of five years, arranged with asyndicate of leading domestic and international banks. This line of credit wasunused at 12/31/2006.
The Group is obliged to comply with certain financial covenants in relationto the bonds, the loans from MCC and the syndicated line of credit. Thefinancial parameters applying at the balance sheet date are set out below:
In addition to the financial covenants, the bond and the committed lines ofcredit require Indesit Company SpA and, in certain cases, a number of Groupcompanies to comply with other affirmative and negative covenants that areconsistent with market standards for transactions of a similar nature,amount, maturity and risk profile.Failure to comply with these financial covenants would, following the elapseof a given period of time available to correct such non-compliance, give thecounterparty a right to the early repayment of the related borrowings.The above parameters are monitored constantly by the Group and, at12/31/2006, all the convenants have been respected.Medium and long-term payables are analysed by maturity in the following table.
82
annu
alre
port
2006
Covenant
Covenant limit
EBITDA / Net financial expenses 3.5
Net borrowing / EBITDA 3.0
Equity 320 million euro
Other medium/long-term financial payables (million euro)
12/31/2006 12/31/2005
Due to Ministry of Industry 1.2 1.5
Lease payables 1.7 2.1
Due to Simest 9.8 9.8
Liability from the measurement of derivatives 23.9 7.5
Other 0.5 1.3
Total 36.9 22.2

83
8.26 Employee benefits
Employee benefits reflects the liability in relation to defined benefit plansestablished for employees, such as the employee severance indemnities ofItalian Group companies and the pension funds operated by IndesitCompany UK Ltd, deferred bonus plans and other pension funds. Thesituation is analysed in the following table.
The employee severance indemnities are payable by the companies operatingin Italy under art. 2120 of the Italian Civil Code which, in accordance withIAS 19, are treated as a defined benefit plan.The UK pension plans comprise two defined benefit pension funds, oneEnglish and the other Irish, operated by Indesit Company UK Ltd. These arevoluntary pension funds with 5,494 members at 12/31/2006. With regard tothese plans, in March 2006 the decision was taken and announced by theGroup to close access to the defined-benefit pension scheme for UKemployees and to start a defined-contribution pension plan for newmembers.
The deferred bonus plans relate to Indesit Company UK Ltd and represent theliability for the retirement awards that will be made when employees reach apre-determined length of service with the company. The pension funds in othercountries relate to the companies operating in France and the Netherlands.
The following schedule reconciles the assets and liabilities recorded in thebalance sheet and the charges made to the income statement, and presentsthe principal actuarial assumptions concerning the employee severanceindemnities and the UK pension plans.
Employee benefits (million euro)
12/31/2006 12/31/2005
Employee severance indemnities 59.2 63.8
UK pension plans 35.2 40.7
Deferred bonus plans 2.6 2.3
Pension funds in other nations 1.7 1.9
Total 98.7 108.6
Medium and long-term financial payables (million euro)
Medium/long-term Due between Duefinancial 1 and 5 beyond 5liabilities years years
Bonds 243.4 125.0 118.4
Due to banks 84.1 77.7 6.3
Due on the acquisition of GDAH 38.3 38.3 -
Other payables 36.9 21.3 15.7
Total 402.7 262.3 140.4
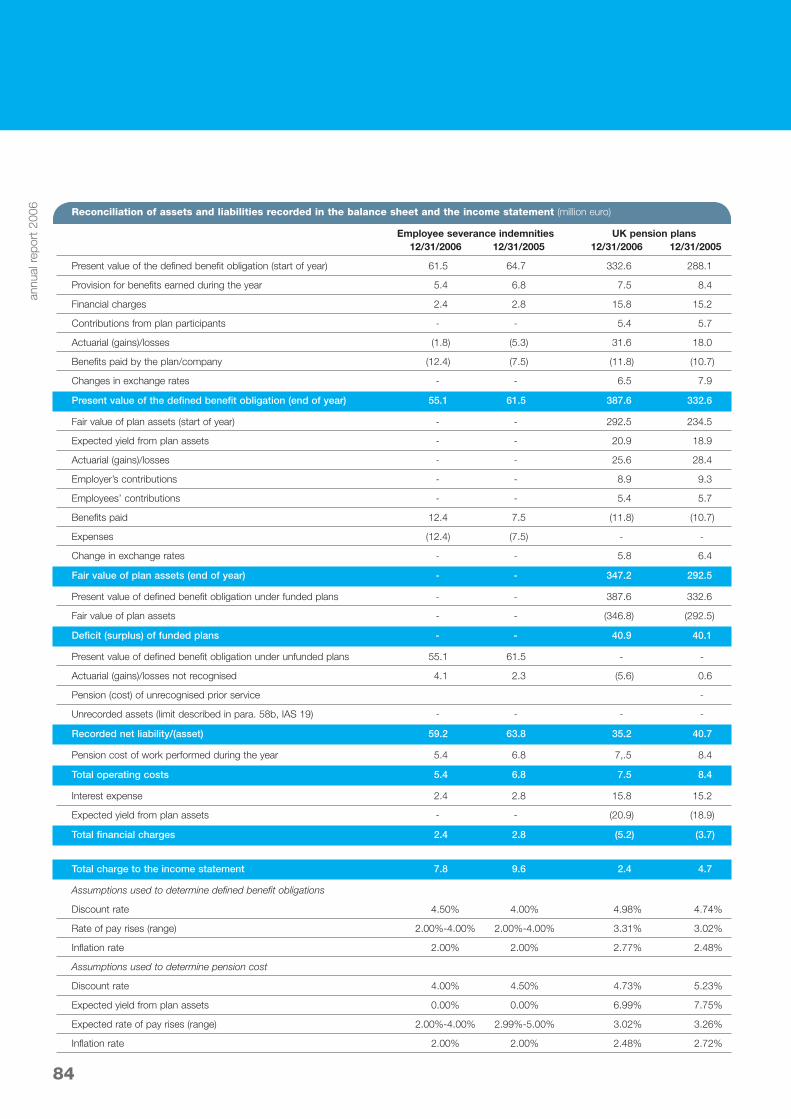
84
annu
alre
port
2006 Reconciliation of assets and liabilities recorded in the balance sheet and the income statement (million euro)
Employee severance indemnities UK pension plans12/31/2006 12/31/2005 12/31/2006 12/31/2005
Present value of the defined benefit obligation (start of year) 61.5 64.7 332.6 288.1
Provision for benefits earned during the year 5.4 6.8 7.5 8.4
Financial charges 2.4 2.8 15.8 15.2
Contributions from plan participants - - 5.4 5.7
Actuarial (gains)/losses (1.8) (5.3) 31.6 18.0
Benefits paid by the plan/company (12.4) (7.5) (11.8) (10.7)
Changes in exchange rates - - 6.5 7.9
Present value of the defined benefit obligation (end of year) 55.1 61.5 387.6 332.6
Fair value of plan assets (start of year) - - 292.5 234.5
Expected yield from plan assets - - 20.9 18.9
Actuarial (gains)/losses - - 25.6 28.4
Employer’s contributions - - 8.9 9.3
Employees’ contributions - - 5.4 5.7
Benefits paid 12.4 7.5 (11.8) (10.7)
Expenses (12.4) (7.5) - -
Change in exchange rates - - 5.8 6.4
Fair value of plan assets (end of year) - - 347.2 292.5
Present value of defined benefit obligation under funded plans - - 387.6 332.6
Fair value of plan assets - - (346.8) (292.5)
Deficit (surplus) of funded plans - - 40.9 40.1
Present value of defined benefit obligation under unfunded plans 55.1 61.5 - -
Actuarial (gains)/losses not recognised 4.1 2.3 (5.6) 0.6
Pension (cost) of unrecognised prior service -
Unrecorded assets (limit described in para. 58b, IAS 19) - - - -
Recorded net liability/(asset) 59.2 63.8 35.2 40.7
Pension cost of work performed during the year 5.4 6.8 7,.5 8.4
Total operating costs 5.4 6.8 7.5 8.4
Interest expense 2.4 2.8 15.8 15.2
Expected yield from plan assets - - (20.9) (18.9)
Total financial charges 2.4 2.8 (5.2) (3.7)
Total charge to the income statement 7.8 9.6 2.4 4.7
Assumptions used to determine defined benefit obligations
Discount rate 4.50% 4.00% 4.98% 4.74%
Rate of pay rises (range) 2.00%-4.00% 2.00%-4.00% 3.31% 3.02%
Inflation rate 2.00% 2.00% 2.77% 2.48%
Assumptions used to determine pension cost
Discount rate 4.00% 4.50% 4.73% 5.23%
Expected yield from plan assets 0.00% 0.00% 6.99% 7.75%
Expected rate of pay rises (range) 2.00%-4.00% 2.99%-5.00% 3.02% 3.26%
Inflation rate 2.00% 2.00% 2.48% 2.72%

The employee benefits charged to the income statement are recorded in thefollowing captions:
The financial costs of the liabilities for employee benefits are discussed innote 8.8.
8.27 Provisions for risks and charges
The provisions for risks and charges cover estimated current and non-currentliabilities the exact timing or extent of which cannot be determined. Thecontent of this caption at the end of 2006 and 2005 and the changes duringthe year are analysed in the following tables.
The provision for agents’ termination indemnities represents the estimatedliability for payments to agents should their mandates be terminated byIndesit Company SpA.
85
Changes in 2006 (million euro)
Opening Provisions Utilisations Closing Current Non-current balance balance portion portion
Provision for warranties 47.3 17.8 (9.1) 56.1 19.4 36.7
Provision for agents’ termination indemnities 1.3 0.2 (0.1) 1.4 - 1.4
Provisions for restructuring 6.3 0.3 (4.3) 2.3 2.3 -
Provision for WEEE 0.8 2.8 - 3.7 - 3.7
Provision for onerous contracts 4.8 - (0.5) 4.3 - 4.3
Provision for disputes 8.2 6.3 (3.8) 10.8 3.0 7.8
Total 68.8 27.5 (17.8) 78.6 24.7 53.9
Changes in 2005 (milioni di euro)
Opening Provisions Utilisations Closing Current Non-currentbalance balance portion portion
Provision for warranties 43.7 10.2 (6.6) 47.3 19.0 28.4
Provision for agents’ termination indemnities 1.0 0.4 (0.2) 1.3 - 1.3
Provisions for restructuring 10.8 6.8 (11.3) 6.3 6.3 -
Provision for WEEE - 0.8 - 0.8 - 0.8
Provision for onerous contracts 5.2 1.1 (1.5) 4.8 - 4.8
Provision for disputes 8.8 4.1 (4.7) 8.2 1.4 6.9
Total 69.5 23.4 (24.2) 68.8 26.6 42.2
Employee benefits charged to the income statement (million euro)
2006 2005
Cost of sales (9.1) (13.7)
Selling and distribution expenses (2.6) (1.0)
General and administrative expenses (1.3) (0.4)
Total (12.9) (15.2)

The provisions for restructuring include 2.0 million euro relating to thereorganisation plan of Indesit Company France SA and 0.3 million eurorelating to Indesit Company Deutschland GmbH.
The provision for WEEE covers the charges deriving from application of theproduct disposal regulations, with sole reference to new waste.
The provision for onerous contracts was recorded by Indesit Company UKLtd in relation to the discounted liability for installments under an operatinglease on a building that is no longer used.
The provision for disputes reflects the best possible estimate of the likelyliability for disputes and contingencies based on the information available.The principal risks covered by the provision relate to environmental liabilitiesof 3.0 million euro (1.4 million euro) identified following the closure of theFrench factory and the surveys performed in preparation for the sale of thebuilding, the cost of the recall campaign launched at the start of 2007regarding a batch of washing machines with functional defects sold at the endof 2006, 2.0 million euro (not recorded in 2005), and other disputes totalling5.8 million euro (6.8 million euro).
Except as described above, the estimates made in relation to outstandingliabilities have not changed at 12/31/2006 with respect to the situation as of12/31/2005.
8.28 Deferred tax liabilities
Deferred tax liabilities and the related changes during the year are analysedin the following table:
86
annu
alre
port
2006
Deferred tax liabilities (million euro)
Opening balance Credited/charged Credited/charged Exchange Closing balance12/31/2005 to income statement to Equity rate effect 12/31/2006
Property, plant and equipment 31.9 (2.9) - 0.6 29.6
Intangible assets with a finite life 55.8 0.9 - (0.8) 55.9
Inventories 5.0 (5.3) - - (0.3)
Medium/long-term financial payables 3.6 0.0 - (0.0) 3.6
Employee benefits 2.2 0.4 - - 2.6
Government grants 0.6 (0.0) - - 0.6
Provisions for risks and charges 0.5 (0.3) - (0.1) 0.1
Other 3.6 0.7 - 0.0 4.3
Distributable retained earnings 4.2 1.4 0.2 - 5.8
Total 107.4 (5.2) 0.2 (0.2) 102.2
Amounts offset (34.2) 6.0 - - (28.2)
Total net 73.2 0.8 0.2 (0.2) 74.1

The amounts offset relate to the deferred tax liabilities that reduce deferredtax assets since they are due to the same tax authorities, are legally offsettableand relate to temporary differences that will reverse at the same time.
8.29 Other non-current liabilities
Other non-current liabilities solely relate to deferred government grants andother bodies. These grants are analysed by country below:
Deferred government grants totalling 4.2 million euro in Italy (3.5 millioneuro) and 2.9 million euro (1.5 million euro) in Poland were credited to theincome statement during the year.
The grants collected in Italy mainly relate to planned investment by "Distrettodell’Elettrodomestico Società Consortile arl" of 9.7 million euro and to theAlbacina factory under Law 488. Access to these grants is subject torestrictions that are currently respected. The grants collected in Poland principally relate to tax credits for investmentto build a factory in the Lódz special economic zone. Access to these grantsis subject to certain restrictions that are currently respected. The accountingtreatment of these tax credits has involved, in accordance with IAS 20, therecognition of non-current liabilities that will be released to the incomestatement to match the depreciation charged on the capital investmentconcerned.
8.30 Trade payables
Trade payables comprise all the amounts due for the purchase of goods andservices from the Group’s suppliers. Payables are stated at the nominal value.All payables fall due within one year and, accordingly, no amounts have beendiscounted. The amounts due to suppliers reported among trade payablescomprise without distinction the amounts due to both suppliers of rawmaterials, components and services and suppliers of capital goods.
87
Other non-current liabilities (million euro)
12/31/2006 12/31/2005
Italy 11.1 15.3
Poland 12.2 11.3
Other countries 0.2 0.4
Total 23.4 27.0

8.31 Tax payables
Tax payables comprise the liability for current taxes and other tax payables.
8.32 Other payables
Other payables are analysed as follows:
8.33 Share-based payments (stock options)
Stock option plan for Group managers and supervisors
The resolutions adopted at the extraordinary meetings held on 09/16/1998(as modified at the meetings held on 05/05/2000 and 05/07/2001) and on10/23/2001 authorised, pursuant to art. 2441.8 of the Italian Civil Code, twoincreases in share capital by up to 2,700,000 euro each, via the issue of acombined maximum of 6,000,000 ordinary shares, par value 0.90 euro each,to service the stock option plan for Group managers and supervisors. TheBoard of Directors, in the person of the Chairman, determines the number ofoptions to be granted each year and identifies - on the recommendation ofthe Chief Executive Officer - the beneficiaries of the options. The optionsgranted subsequent to 07/24/2003 envisage a vesting period of three years forthe first 50% and four years for the remaining 50%, while the options grantedpreviously envisaged a vesting period of two years and three yearsrespectively.
88
annu
alre
port
2006
Tax payables (million euro)
12/31/2006 12/31/2005
Current taxes payable 14.5 12.6
Amounts witheld from employees, professionals and freelance workers 17.6 17.7
VAT payable 30.7 26.2
Capital taxes 0.3 0.3
Environmental taxes 0.1 0.5
Other taxes 0.3 0.4
Total 63.6 57.7
Other payables (million euro)
12/31/2006 12/31/2005
Due to social security and pension institutions 40.7 34.8
Due to employees 42.9 30.9
Other payables 12.4 12.5
Total 96.0 78.2

The options granted to the Chief Executive Officer, as an employee of IndesitCompany SpA, under the stock option plan linked to objectives establishedin the MTP (medium-term plan) for the period 2004-2006 have expiredfollowing replacement of the 2004-2006 MTP by the 2006-2008 MTP.
Stock option plan for directors with significant duties who are not employees
The extraordinary meetings held on 10/23/2001 and 05/06/2002 authorisedtwo share capital increases, by the issue of a maximum of 1,600,000 newshares, to service a stock option plan for the directors of the Company whoperform significant duties. The options granted, exercisable between03/31/2004 and 03/31/2006, were all exercised. The strike price was 4.76 eurofor the 1,400,000 options granted in 2001 (all exercised) and 9.70 euro for the200,000 options granted in 2002.
The options granted to the Chairman under the stock option plan linked toobjectives established in the MTP (medium-term plan) for the period 2004-2006, approved at the shareholders’ meeting held on 05/05/2004, haveexpired following replacement of the 2004-2006 MTP by the 2006-2008 MTP.
No new plans were authorised during 2006 and no stock options weregranted.
The parameters used to determine the fair value of stock options are set outin the following table.
The stock options granted to the Chairman and the Chief Executive Officerwere measured at the end of May 2006, when they expired.The stock option plans are analysed in the following tables.
89
Stock options
Parameters Chief Executive Chairman Executives Officer
Strike price 12.56 14.70 12.65
Expected volatility 27.77% 29.7% 31.39%
Grant date 07/27/2004 05/05/2004 07/24/2003
No. of options 900,000 1,000,000 260,000
Duration of options (years) 2.67 2.90 3.50
Expected dividends 2.61% 2.61% 2.97%
Risk-free interest rate 3.00% 2.78% 4.00%
Fair value of stock options (million euro) 0.5 0.4 0.2
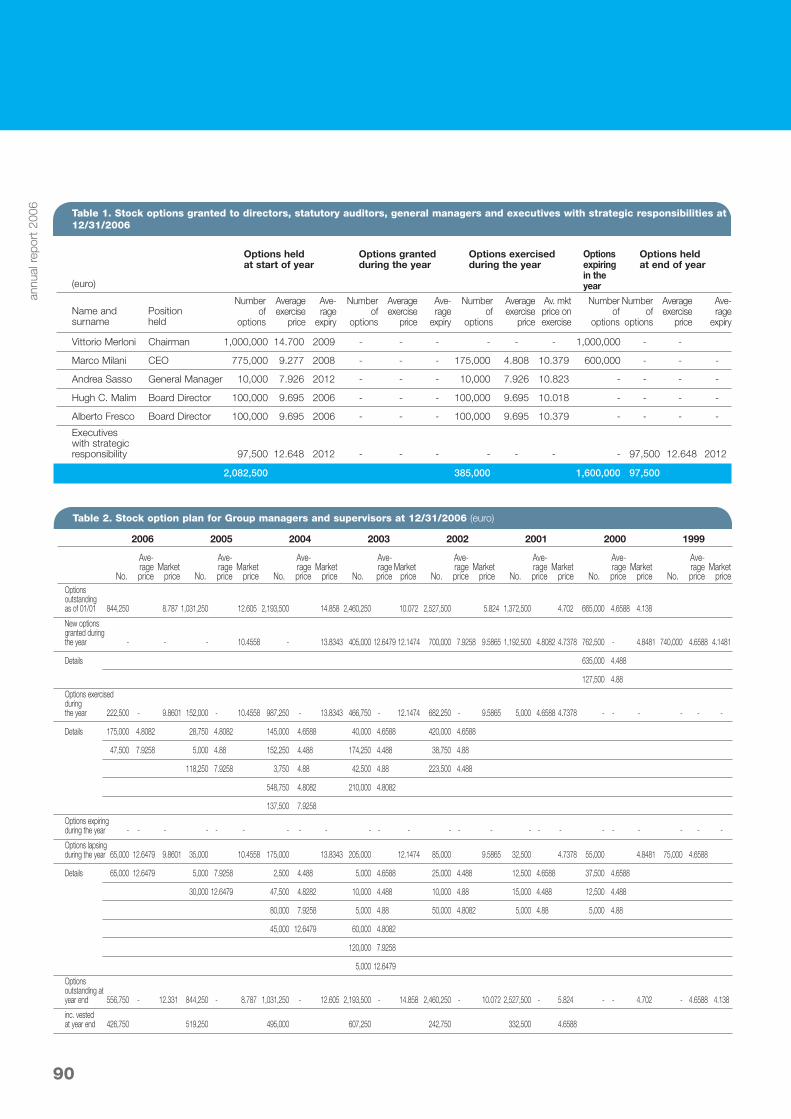
90
annu
alre
port
2006 Table 1. Stock options granted to directors, statutory auditors, general managers and executives with strategic responsibilities at
12/31/2006
(euro)
Vittorio Merloni Chairman 1,000,000 14.700 2009 - - - - - - 1,000,000 - -
Marco Milani CEO 775,000 9.277 2008 - - - 175,000 4.808 10.379 600,000 - - -
Andrea Sasso General Manager 10,000 7.926 2012 - - - 10,000 7.926 10.823 - - - -
Hugh C. Malim Board Director 100,000 9.695 2006 - - - 100,000 9.695 10.018 - - - -
Alberto Fresco Board Director 100,000 9.695 2006 - - - 100,000 9.695 10.379 - - - -
Executives with strategic responsibility 97,500 12.648 2012 - - - - - - - 97,500 12.648 2012
2,082,500 385,000 1,600,000 97,500
Name andsurname
Positionheld
Number of
options
Averageexercise
price
Ave-rage
expiry
Numberof
options
Averageexercise
price
Ave-rage
expiry
Numberof
options
Averageexercise
price
Av. mktprice onexercise
Numberof
options
Numberof
options
Averageexercise
price
Ave-rage
expiry
Options held at start of year
Options grantedduring the year
Options exercisedduring the year
Optionsexpiringin theyear
Options held at end of year
Table 2. Stock option plan for Group managers and supervisors at 12/31/2006 (euro)
Options outstanding as of 01/01 844,250 8.787 1,031,250 12.605 2,193,500 14.858 2,460,250 10.072 2,527,500 5.824 1,372,500 4.702 665,000 4.6588 4.138
New options granted duringthe year - - - 10.4558 - 13.8343 405,000 12.6479 12.1474 700,000 7.9258 9.5865 1,192,500 4.8082 4.7378 762,500 - 4.8481 740,000 4.6588 4.1481
Details 635,000 4.488
127,500 4.88
Options exercised during the year 222,500 - 9.8601 152,000 - 10.4558 987,250 - 13.8343 466,750 - 12.1474 682,250 - 9.5865 5,000 4.6588 4.7378 - - - - - -
Details 175,000 4.8082 28,750 4.8082 145,000 4.6588 40,000 4.6588 420,000 4.6588
47,500 7.9258 5,000 4.88 152,250 4.488 174,250 4.488 38,750 4.88
118,250 7.9258 3,750 4.88 42,500 4.88 223,500 4.488
548,750 4.8082 210,000 4.8082
137,500 7.9258
Options expiring during the year - - - - - - - - - - - - - - - - - - - - - - - -
Options lapsing during the year 65,000 12.6479 9.8601 35,000 10.4558 175,000 13.8343 205,000 12.1474 85,000 9.5865 32,500 4.7378 55,000 4.8481 75,000 4.6588
Details 65,000 12.6479 5,000 7.9258 2,500 4.488 5,000 4.6588 25,000 4.488 12,500 4.6588 37,500 4.6588
30,000 12.6479 47,500 4.8282 10,000 4.488 10,000 4.88 15,000 4.488 12,500 4.488
80,000 7.9258 5,000 4.88 50,000 4.8082 5,000 4.88 5,000 4.88
45,000 12.6479 60,000 4.8082
120,000 7.9258
5,000 12.6479
Options outstanding at year end 556,750 - 12.331 844,250 - 8.787 1,031,250 - 12.605 2,193,500 - 14.858 2,460,250 - 10.072 2,527,500 - 5.824 - - 4.702 - 4.6588 4.138
inc. vested at year end 426,750 519,250 495,000 607,250 242,750 332,500 4.6588
No.
Ave-rageprice
Marketprice No.
Ave-rageprice
Marketprice No.
Ave-rageprice
Marketprice No.
Ave-rageprice
Marketprice No.
Ave-rageprice
Marketprice No.
Ave-rageprice
Marketprice No.
Ave-rageprice
Marketprice No.
Ave-rageprice
Marketprice
2006 2005 2004 2003 2002 2001 2000 1999

Cash flow statement
8.34 Total profit, income taxes, depreciation and amortisation, income taxes paid
Total profit, income taxes, depreciation and amortisation, all non-monetaryitems, are reported directly on the face of the consolidated income statement,to which reference is made. With regard to the provision for income taxes, thetax payments made in 2006 were essentially in line with the provisions fortaxation recorded in the prior year. The differences between the provisionsfor the prior year and the payments made are affected by the amount ofadvance taxation paid, which varies depending on the tax regulations of thecountries in which the Group operates.
8.35 Other non-monetary income and expenses, net
The other non-monetary income and expenses, net, comprise all non-monetary items recorded in the income statement, except for income taxes,depreciation and amortisation and the provisions deducted directly fromasset accounts (allowance for doubtful accounts and provisions forobsolescence). Accordingly, they include provisions for warranties,provisions for risks and charges, disposal gains and losses, unrealisedexchange rate fluctuations, and accrued interest income and expense. Theinterest collected and paid, reported separately, was essentially the same asthe amounts recorded in the income statement.
91
Table 3. Stock option plan for directors with significant duties who are not employees
Options outstanding as of 1/1 200,000 9.6954 1,300,000 1,600,000 1,600,000 1,400,000 4.76 - -
Details 200,000 9.6954 1,100,000 4.76 1,400,000 4.76 1,400,000 4.76
200,000 9.6954 200,000 9.6954 200,000 9.6954
New options granted during the year - - - - - - - 200,000 9.6954 1,400,000 4.76
Options exercised during the year 200,000 9.6954 1,100,000 4.76 300,000 4.76 - - - - - -
Options expiring during the year - - - - - - - - - - -
Options lapsing during the year - - - - - - - - - - -
Options outstanding at year end - 200,000 1,300,000 1,600,000 1,600,000 1,400,000 4.76
Details 200,000 9.6954 1,100,000 4.76 1,400,000 4.76 1,400,000 4.76
200,000 9.6954 200,000 9.6954 200,000 9.6954
inc. vested at year end - 200,000 1,300,000 - - - - - -
Details 200,000 9.6954 1,100,000 4.76 - - - - - -
200,000 9.6954
Numberof options
Strikeprice
Numberof options
Strikeprice
Numberof options
Strikeprice
Numberof options
Strikeprice
Numberof options
Strikeprice
Numberof options
Strikeprice
2006 2005 2004 2003 2002 2001

8.36 Change in trade receivables, inventories, trade payables
This caption reports the cash used in or generated by the changes in networking capital, which comprises trade receivables, inventories and tradepayables. The changes in trade payables relate solely to the supply of rawmaterials, goods and services, and exclude the changes in amounts due forinvestments, which are reported in the section of the cash flow statement forcash flows generated (absorbed) by investing activities.
8.37 Change in other assets and liabilities
This caption reports the change in all other current and non-current assetsand liabilities, net of the effect on them of provisions for non-monetaryincome and expenses. This represents the changes in the related balanceswith a direct effect on the absorption or generation of cash.
8.38 Payments for acquisition of property, plant and equipment and proceeds fromdisposal of property, plant and equipment
The cash flow from additions to property, plant and equipment reflectinvestment in the replacement of plant and in new plant, mainly by thecompanies operating in Italy, Poland, the UK and the CIS. In this context,there were also changes in payables, receivables and advances to suppliers ofproperty, plant and equipment.
8.39 Payments for acquisition of intangible assets
The cash flow from investment in intangible assets relates to the purchase oflicences and software, and the capitalisation of development costs which areanalysed in note 8.14. The cash flows from (used in) investing activitiesinclude the amounts capitalised since these involve payments for the relatedinternal costs incurred (mainly payroll). These payments essentially reflectthe costs capitalised during the year.
92
annu
alre
port
2006

8.40 Proceeds from the sale of non-current financial assets and other investments and payments for acquisition of non-current financial and other investments
The proceeds from the disposal of non-current financial assets in 2006mainly relate to the consideration collected on the sale of the 33% interest inMerloni Progetti SpA while, in 2005, they mainly related to the sale of theinvestment in Merloni Progetti Energia SpA.
The investments in financial and other fixed assets mainly comprise thepurchase from minority shareholders of additional interests in Wrap SpA andAermarche SpA, while in 2005 they related to the acquisition of FabrianoBasket and Wuxi.
8.41Proceeds from share capital increases and dividends paid
The increase in the share capital of Indesit Company SpA relates to the issueof new shares to service the exercise of stock options by the directors andmanagement of the company. The dividend payment made in 2006 wasauthorised with reference to the individual financial statements of the ParentCompany at 12/31/2005. These changes are analysed in note 8.23.
8.42 New medium/long-term financial payables
The new medium/long-term financial payables relate to a loan received fromthe Ministry of Industry.
8.43 Repayment of borrowing for acquisition of GDAH
This amount relates to the payment for a further 8% of the capital of GeneralDomestic Appliances Holdings Ltd (GDAH), involving the payment of 49.8million euro. Following the exercise of this option by General Electric, IndesitCompany now owns 84% of this UK company, which is consolidated as awholly-owned subsidiary in accordance with IFRS 3.
93
8.44 Change in current financial payables
The change in current financial payables includes the change in short-termbank borrowing since this represents a technical form of short-termborrowing.
9. Financial instruments
Risk management policies
Indesit Company manages the principal financial risks in accordance withthe guidelines set out in the Treasury Policy approved by the Board ofDirectors.
The following types of risk are managed by the Group:• liquidity;• exchange rate;• interest rate;• commodity prices;• financial counterparties.
The Treasury Policy also provides guidelines for the release by the ParentCompany of forms of support for the lines of credit granted to subsidiaries.
Liquidity risk
Liquidity risk consists of the lack of sufficient financial resources to meetfinancial obligations on a timely and economic basis on the due dates. Thecash flows, financing requirements and liquidity of Group companies aremonitored and managed centrally by the Group Treasury, with a view tomaintaining a balanced financial structure in terms of the diversification,duration and maturity of debt, the flexible access to finance on market terms,and the availability of minimum reserves of liquidity that are readilyconvertible into cash on market terms.
Exchange rate and interest rate risk
The Group is subject to the risk of exchange rate fluctuations because itoperates in an international context where transactions involve the use ofvarious currencies and interest rates. The exposure to exchange rate riskderives from the different geographical distribution of the Group’smanufacturing activities with respect to the geographical distribution of themarkets in which its products are sold, and from the use of external sourcesof finance denominated in foreign currencies.The Group assesses regularly its exposure to the risk of changes in exchangerates and interest rates and manages such risks, partly by recourse to the useof derivative financial instruments, in accordance with its risk managementpolicies.
94
annu
alre
port
2006

As part of such policies, the use of derivative financial instruments is reservedfor managing the effect of exchange rate and interest rate fluctuations on thecash flows and balance sheet accounts generated by the business activitiesand/or financial requirements of the Group. Positions that generate types ofrisk not strictly correlated with the Group’s business activities cannot betaken.
The Group designates derivative financial instruments as fair value hedgesmainly to manage the exchange rate risk associated with foreign currencyfinancial instruments and the interest rate risk associated with fixed rateloans and borrowings. The Group also designates derivative financialinstruments as cash flow hedges in order to fix the exchange rates forforecasted foreign currency transactions and the interest paid on loans, witha view to achieving a predetermined, optimal mix between fixed and floatingrates for outstanding loans. Derivative financial instruments may also beused as hedges, even if they are not recorded as fair value or cash flow hedges.Exposure to the exchange rate risk associated with commercial and/orfinancial transactions is generally hedged by using forward rate agreementsand currency options. Exposure to interest rate risk is generally hedged byusing interest rate swaps.
Commodity price risk
The Group is subject to market risk deriving from fluctuations in the pricesin the commodities used in the production process. The Group regularlyassesses its exposure to the risk of changes in the prices of commodities andmanages such risks mainly by fixing their prices in contracts with suppliers.If the commodities concerned or other goods with highly correlated pricesare listed on official markets, derivative financial instruments can also beused in accordance with the Group’s risk management policies. The hedgingof commodity price risk via derivative instruments generally involves the useof forward price agreements and currency options.
Financial counterparty risk
Financial counterparty risk consists in the possible deterioration in thecredit-worthiness or solvency of the financial counterparties concerned.Transactions involving the employment of liquidity and the use of hedginginstruments are arranged with leading domestic and international banks andreviewed regularly with regard to their concentration and the ratings of suchcounterparties.
Transactions outstanding at year end
The transactions outstanding at 12/31/2006 and their fair values are reportedin the table on page 97, which also indicates the change in the value of theunderlyings (where applicable). This is followed by detailed information onthe individual transactions.
95

The currency options previously acquired to hedge the risk of exchangefluctuations against sterling were closed out during 2006.The floating-to-fixed interest rate swaps on loans were arranged to hedge twoloans from MCC SpA with a residual nominal value of 34.9 million euro. The forward transactions designated as cash flow hedges were arranged tohedge the purchase of commodities and semi-finished products. Thesecomprise the forward purchase of Usd and the forward sale of Eur with a totalnominal value of 41.2 million dollars.The cross currency swap was arranged to hedge the interest-rate andexchange-rate risks deriving from commitments in relation to the US PrivatePlacement of bonds with a nominal value of 308.0 million dollars. Thistransaction converted the fixed-rate US dollar bonds into floating-rate euro.The interest rate swap on the bonds relates to the euro tranche of the USprivate placement, 18.3 million euro, and was arranged to hedge the interestrate risk which was swapped from fixed to floating at the time the loan wasarranged.The forward transactions were arranged to hedge the exchange-rate riskassociated with the exposures to the following main currencies: ruble,Hungarian forint, Turkish lira and sterling with a total notional valueequivalent to 104.7 million euro. The Collar, represented by a purchased option Call Usd/Put euro (totalling57.1 million dollars and 51.9 million euro) expiring on 10/01/2007, and a soldoption Call euro/Put Usd (totalling 57.1 million dollars and 49.9 millioneuro) expiring on 10/01/2007, was arranged to hedge the exchange-rate riskon the amount due for the acquisition of GDAH.The basis swap was arranged to hedge the interest-rate risk on the deposit of57.1 million dollars made by Indesit Company UK Holdings Ltd to guaranteepayment of the final installment on the amount due for the acquisition ofGDAH, and effectively transforms a flow of interest in dollars into a flow ofinterest in euro. The interest rate swaps on bonds with a nominal value of 274.8 million euro,representing 100% of the US Private Placement, were arranged to transformthe floating-rate exposure into a fixed rate for the period 2007-2011.
96
annu
alre
port
2006

10. Disclosure required by IAS 24 on the remuneration of management and on related parties
10.1 Remuneration of management
In addition to the executive and non-executive directors and the statutoryauditors, the managers with strategic responsibility for operations, planningand control include the Chief Commercial Officer, the Chief Financial Officer,the Industrial Technical Officer and the Supply Chain Officer. Theremuneration of the above persons is shown below.
97
Financial instruments
Cash flow hedges
Currency options Currency 0.9 (0.9) n.a. -
IRS on loans Interest rate (0.3) (1.5) 1.2 n.a. (0.1) (0.2) (0.3)
Forward Price (0.0) - (0.0) n.a. (0.0) (0.0)
Total (0.3) (0.7) 0.3 n.a. - - (0.1) (0.2) (0.3)
Fair value hedges
CCS on bonds Currency/Interest rate (21.9) 11.5 (33.4) 32.0 1.8 (23.7) (21.9)
IRS on bonds Interest rate 0.7 1.9 (1.2) 1.2 0.5 0.1 0.7
Total (21.2) 13.3 (34.6) 33.2 0.5 2.0 (23.7) - (21.2)
Other hedges
Forward Currency (0.6) 0.6 (1.2) n.a. (0.6) (0.6)
Collar on GDAH acquisition Currency (6.8) (5.8) (1.0) n.a. 0.0 (6.8) (6.8)
Basis Swap on GDAH acquisition Interest rate (0.7) (2.3) 1.7 n.a. (0.1) (0.5) (0.7)
IRS on bonds Interest rate 7.5 (0.1) 7.6 n.a. 6.4 1.0 7.5
Total (0.7) (7.7) 7.0 n.a. 6.4 1.0 (0.1) (8.0) (0.7)
Grand total (22.2) 5.0 (27.2) 33.2 7.0 3.0 (23.9) (8.2) (22.2)
Nature of riskhedged
Fair value ofderivatives as
of 12/31/2006
Fair value ofderivatives
as of12/31/2005
Change infair value ofderivatives
as of12/31/2006
vs.12/31/2005
Change infair value ofunderlyings
as of12/31/2006
vs.12/31/2005
Othernon-
currentfinancial
assets
Currentfinancial
assets
Medium/long-term
financialpayables
Banksand other
financialpayables Total
Classifications at 12/31/2006
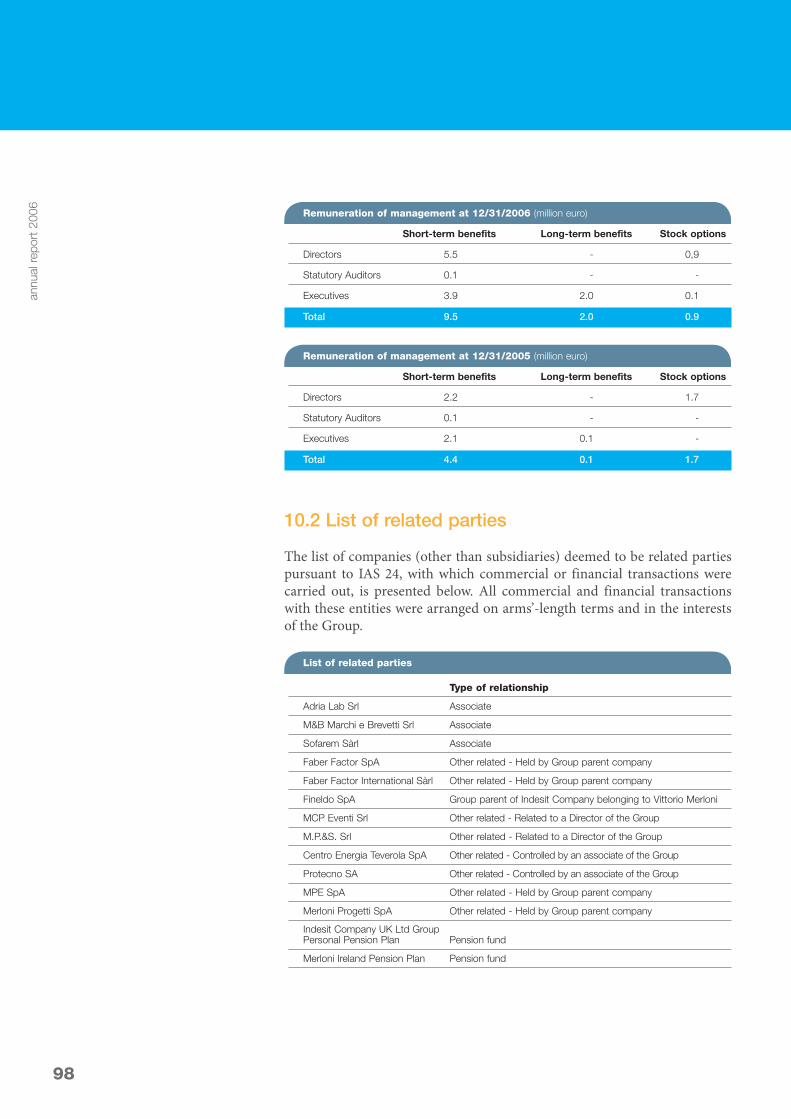
10.2 List of related parties
The list of companies (other than subsidiaries) deemed to be related partiespursuant to IAS 24, with which commercial or financial transactions werecarried out, is presented below. All commercial and financial transactionswith these entities were arranged on arms’-length terms and in the interestsof the Group.
98
annu
alre
port
2006 Remuneration of management at 12/31/2006 (million euro)
Short-term benefits Long-term benefits Stock options
Directors 5.5 - 0,9
Statutory Auditors 0.1 - -
Executives 3.9 2.0 0.1
Total 9.5 2.0 0.9
Remuneration of management at 12/31/2005 (million euro)
Short-term benefits Long-term benefits Stock options
Directors 2.2 - 1.7
Statutory Auditors 0.1 - -
Executives 2.1 0.1 -
Total 4.4 0.1 1.7
List of related parties
Type of relationship
Adria Lab Srl Associate
M&B Marchi e Brevetti Srl Associate
Sofarem Sàrl Associate
Faber Factor SpA Other related - Held by Group parent company
Faber Factor International Sàrl Other related - Held by Group parent company
Fineldo SpA Group parent of Indesit Company belonging to Vittorio Merloni
MCP Eventi Srl Other related - Related to a Director of the Group
M.P.&S. Srl Other related - Related to a Director of the Group
Centro Energia Teverola SpA Other related - Controlled by an associate of the Group
Protecno SA Other related - Controlled by an associate of the Group
MPE SpA Other related - Held by Group parent company
Merloni Progetti SpA Other related - Held by Group parent company
Indesit Company UK Ltd Group Personal Pension Plan Pension fund
Merloni Ireland Pension Plan Pension fund

99
In addition to the above companies, the following physical persons are alsodeemed to be related parties: members of the Board of Directors and theBoard of Statutory Auditors, managers with strategic responsibility formanagement, planning and control activities, and the close family membersof these parties, as defined in IAS 24.
Nature of relations with the principal related parties
Indesit Company UK Ltd group personal pension plan and MerloniIreland pension planIndesit Company UK Ltd and the employees concerned contribute to theIndesit Company UK Ltd group personal pension plan and the MerloniIreland pension plan under the pension rules applicable in the UK. Theunfunded liability of these pension plans is recorded in the employee benefitscaption. Further information is provided in note 8.26.
M&B Marchi e BrevettiM&B Marchi e Brevetti Srl, 50% held, owns the Ariston brand name which islicenced to Indesit Company until 2060 for a fee that covers the brandmanagement costs incurred by M&B Marchi e Brevetti Srl.
The Merloni Progetti groupThe Merloni Progetti Group (and, in particular, Merloni Progetti SpA andProtecno SA) obtains contracts for the construction of plant and leasesproperty to Indesit Company.
10.3 Schedules summarising the transactions with related parties
The table on the next pages summarises the balances and transactions withthe related parties identified above, distinguishing between the transactionswith the parent company, associates and other related parties. Furthermore,in accordance with CONSOB Resolution no. 15519 dated 08/27/2006 andCONSOB Communication no. DEM/6064293 dated 08/28/2006,Attachments 4 and 5 present the consolidated income statement and balancesheet showing the transactions with related parties separately and indicatingtheir percentage incidence with respect to each account caption.
There have not been any significant, atypical and/or unusual transactionswith related parties (except those with regard to the pension funds describedabove).

100
annu
alre
port
2006 10.4 Further information on corporate
transactions with related parties
Further information is provided below on the transactions to rationalise theGroup structure carried out with related parties, the economic and financialeffects of which are shown in the table on the next page. All the followingtransactions were supported by independent appraisals since they took placewith related parties.
In December 2006, Indesit Company SpA sold its interest in Merloni ProgettiSpA (33% of share capital) to Fineldo SpA for 10.6 million euro. Thetransaction resulted in a capital gain of 2.7 million euro. Also in December2006, Indesit Company SpA acquired the entire minority interest in WrapSpA to become the sole shareholder. The total purchase price was 3.4 millioneuro, of which 3.2 million euro was paid to Fineldo SpA. The merger of thiscompany into Indesit Company SpA pursuant to art. 2505 of the Italian CivilCode was also approved in the same month. The merger was completed inMarch 2007, with tax and statutory effect from 01/01/2007. Again inDecember 2006, Indesit Company SpA acquired shares in Aermarche SpAfrom M.P.&S. Srl., Merloni Progetti SpA and Fineldo SpA all minorityshareholders, for a total of 4.3 million euro, thereby raising its investment to90.2% of share capital. The acquisition of this company was completed inFebruary 2007 with the purchase of the residual 9.8% interest from Fines SpAfor 2.2 million euro.

101
Tables summarizing the transactions with related parties (million euro)
2006 2005
Revenue
Other related - 0.3
Associates 0.6 4.3
Parent Company - 0.3
Total 0.6 4.9
Cost of sales
Associates (4.7) (16.0)
Other related (10.4) (1.6)
Total (15.2) (17.6)
Selling and distribution expenses
Other related (2.1) -
Associates (0.1) -
Total (2.2) -
General and administrative expenses
Associates (1.7) (1.8)
Other related 0.1 (3.0)
Parent Company 0.3 -
Total (1.2) (4.8)
Net financial expenses
Other related - 0.3
Parent Company (0.3) (0.4)
Total (0.3) (0.1)
Share of profit (losses) of associates
Parent Company (0.4) 2.6
Total (0.4) 2.6

102
annu
alre
port
2006 Tables summarizing the transactions with related parties (million euro)
12/31/2006 12/31/2005
Intangible assets with a definite life
Associates 0.6 0.7
Total 0.6 0.7
Property, plant and equipment
Associates 1.5 24.2
Total 1.5 24.2
Current financial assets
Other related - 0.2
Associates 0.2 0.2
Total 0.2 0.4
Trade receivables
Associates 0.8 3.2
Other related 0.2 0.5
Parent Company 0.2
Total (1.0) 3.9
Trade payables
Associates (3.0) (14.8)
Other related (1.5) (0.9)
Parent Company (0.2) (0.2)
Total (4.7) (15.9)
Other payables
Parent Company (3.1) -
Total (3.1) -

103
Attachment 1. List of companies consolidated on a line-by-line basis
Name Location Share capital Group interest
direct indirect
Indesit Company Luxembourg SA Luxembourg Eur 100,289,985 99.99 -
Indesit Electrodomésticos SA Spain Eur 11,500,000.01 78.95 21.05
Merloni Domestic Appliances Ltd UK Gbp 90,175,500 19.60 80.40
Indesit Company Portugal Electrodomésticos SA Portugal Eur 16,825,000 - 99.44
Indesit Company International BV The Netherlands Eur 272,270 - 100.00
Indesit Pts Ltd UK Gbp 1,000 - 100.00
Indesit Company France SA France Eur 17,000,000 - 99.99
Scholtès Nederland BV The Netherlands Eur 79,412 - 100.00
Fabrica Portugal SA Portugal Eur 11,250,000 - 96.40
Indesit Company Beyaz Esya Sanayi ve Ticaret AS Turkey Trl 12,300,000 - 100.00
Indesit Company Beyaz Esya Pazarlama AS Turkey Trl 17,000,000,000 100.00 -
Indesit Company Financial Services Luxembourg SA Luxembourg Eur 5,170,000 99.99 0.01
Indesit Company Deutschland GmbH Germany Eur 550,000 - 99.75
Indesit Company Ireland Reinsurance Ltd Ireland Usd 750,000 - 100.00
Wrap SpA Italy Eur 27,766,950 100.00 -
Closed Joint Stock Company Indesit International Russia Rub 1,664,165,000 100.00 - (1)
Indesit Company Polska Spz oo Poland Pln 540,876,500 100.00 - (1)
Argentron SA Argentina Ars 22,000,000 - 71.18 (1)
Indesit Company Magyarország Kft Hungary Huf 3,283,660,000 - 100.00
Indesit Company Ceská sro Cech Republic Czk 1,000,000 100.00 -
Indesit Company International Business SA Switzerland Chf 250,000 - 100.00
Indesit Company UK Finance Ltd UK Eur 95,750,000 99.00 1.00
Indesit Company Uk Holdings Ltd UK Eur 163,000,000 - 100.00
General Domestic Appliances Holdings Ltd UK Gbp 26,000,000 - 84.00
Aermarche SpA Italy Eur 25,000,000 90.20 -
AEI Gala Ltd UK Gbp 1,000 - 84.00 (2)
Airdum Ltd UK Gbp 15,000 - 84.00 (2)
Cannon Industries Ltd UK Gbp 1,500,000 - 84.00 (2)
Creda Appliances Ltd UK Gbp 100 - 84.00 (2)
Creda Domestic Appliances Service Ltd UK Gbp 1,000 - 84.00 (2)
Creda Ltd UK Gbp 5,850,000 - 84.00 (2)
Fixt Ltd UK Gbp 2 - 84.00 (2)
General Domestic Appliances International Ltd UK Gbp 100,000 - 84.00 (2)
Hotpoint Sales Ltd UK Gbp 775,000 - 84.00 (2)
Hotpoint UK Ltd UK Gbp 50 - 84.00 (2)
Industrial Design Unit Ltd UK Gbp 100 - 84.00 (2)
Jackson Appliances Ltd UK Gbp 750,000 - 84.00 (2)
Indesit Company UK Ltd UK Gbp 5,010,000 - 84.00 (2)
Xpelair Ltd UK Gbp 825,000 - 84.00 (2)
Ariston Group Services Ltd UK Gbp 100 - 84.00 (2)
RTC International Ltd UK Gbp 50,000 - 100.00
Wuxi Indesit Home Appliance Co. Ltd China Usd 13,600,000 - 70.00
Indesit Company South America SA Luxembourg Eur 800,000 - 100.00 (1)
Indesit Company Belgium SA Belgium Eur 150,000 - 100.00(1) Includes the percentage held subject to a resale clause. (2) Companies consolidated 100% due to the Put and Call Agreement with the minority shareholders, whose residual interest is classified
among the financial payables (see note 8.25.5).

104
annu
alre
port
2006 Attachment 2. List of investments valued using the equity method
Name Location Share Groupcapital interest
direct indirect
Haier Indesit (QuigDao) Washing Machines Co. Ltd China Usd 24,000,000 30.00 -
Haier Indesit (QuigDao) Electrical Appliance Co. Ltd China Usd 12,000,000 15.00 15.00
Attachment 3. List of other investments in subsidiary and associated companies
Name Location Share Groupcapital interest
direct indirect
Adria Lab Srl Italy Eur 150,000 40.00 -
ECODOM Consorzio Italiano per il Recupero e Riciclaggio Elettrodomestici Italy Eur 69,000 43.48 -
Indesit Company Bulgaria Ltd Bulgaria Bgn 7,805,000 100.00 -
Indesit Company Domestic Appliances Hellas Mepe Greece Eur 18,000 - 100.00
Indesit Company Norge Ltd Norway Nok 100,000 - 100.00
Indesit Company Österreich GmbH Austria Eur 11,250,000 - 100.00
Indesit Company Singapore Pte Ltd Singapore Sgd 100,000 - 100.00
M&B Marchi e Brevetti Srl Italy Eur 20,000 50.00 -
Tradeplace BV The Netherlands Eur 30,000 20.00 -

105
Percentage weight over consolidated income statements items
2006 2005
Balances of which of which with Balances of which of which withnon recurring related parties non recurring related parties
Revenue 100.0% - - 100.0% - 0.2%
Cost of sales 100.0% 1.4% 0.6% 100.0% 1.5% 0.8%
Selling and distribution expenses 100.0% 0.4% 0.4% 100.0% - -
General and administrative expenses 100.0% - 0.9% 100.0% - 3.3%
Other income 100.0% - - 100.0% - -
Other expenses 100.0% 82.2% - 100.0% 63.8% -
Operating profit 100.0% 100.0%
Net financial expenses 100.0% - 1.0% 100.0% - 0.3%
Share of profit (losses) of associates 100.0% 20.3% 20.3% 100.0% n.s. n.s.
Profit before tax 100.0% 100.0%
Income tax expenses 100.0% (22.4%) (12.9%) 100.0% (25.7%) (13.4%)
Profit for the year 100.0% 100.0%
Attachment 4. Consolidated income statement for the year ended 12/31/2006, prepared in accordance with CONSOB Resolutionno. 15519 dated 07/27/2006 and CONSOB Communication no. DEM/6064293 dated 07/28/2006 (million euro)
2006 2005
Balances of which of which with Balances of which of which withnon recurring related parties non recurring related parties
Revenue 3,248.6 - 0.6 3,064.2 - 4.9
Cost of sales (2,437.4) (33.7) (15.2) (2,311.1) (35.3) (17.6)
Selling and distribution expenses (512.1) (2.0) (2.2) (493.5) - -
General and administrative expenses (139.8) - (1.2) (143.9) - (4.8)
Other income 4.9 - - 7.6 - -
Other expenses (4.0) (3.3) - (1.1) (0.7) -
Operating profit 160.2 122.3
Net financial expenses (26.6) - (0.3) (29.3) - (0.1)
Share of profit (losses) of associates (2.0) (0.4) (0.4) (0.1) 2.6 2.6
Profit before tax 131.6 92.8
Income tax expenses (1) (54.9) 12.3 n.a. (42.4) 10.9 n.a.
Profit for the year 76.7 50.4
(1) Tax effects calculated referring to tax rate of the countries in which the operations took place.

106
annu
alre
port
2006 Attachment 5. Consolidated balance sheet as of 12/31/2006, prepared in accordance with CONSOB Resolution no. 15519 dated
07/27/2006 and CONSOB Communication no. DEM/6064293 dated 07/28/2006(million euro and percentage weight over consolidated balance sheet items)
12/31/2006 12/31/2005
Balances of which with Weight Balances of which with Weight related parties % related parties %
Assets
Property, plant and equipment 751.2 1.5 0.2% 776.9 24.2 3.1%
Goodwill and other intangible assets with an indefinite useful life 325.5 - - 318.9 - -
Other intangible assets with a finite life 114.5 0.6 0.6% 106.7 0.7 0.7%
Investments in associates 12.5 - - 21.7 - -
Other investments 0.6 - - 2.3 - -
Deferred tax assets 47.8 - - 42.9 - -
Other non-current financial assets 79.3 - - 89.3 - -
Total non-current assets 1,331.4 2.1 0.1% 1,358.7 24.9 1.8%
Inventories 353.4 - - 342.8 - -
Trade receivables 573.2 1.0 0.2% 555.2 3.9 0.7%
Current financial assets 11.1 0.2 1.4% 6.7 0.4 6.0%
Tax receivables 87.9 - - 66.2 - -
Other receivables and current assets 27.9 - - 31.0 - -
Cash and cash equivalents 184.5 - - 199.7 - -
Assets held for sale 1.8 - - 5.9 - -
Total current assets 1,239.8 1.1 0.1% 1,207.4 4.3 0.4%
Total assets 2,571.2 3.2 0.1% 2,566.1 29.2 1.1%
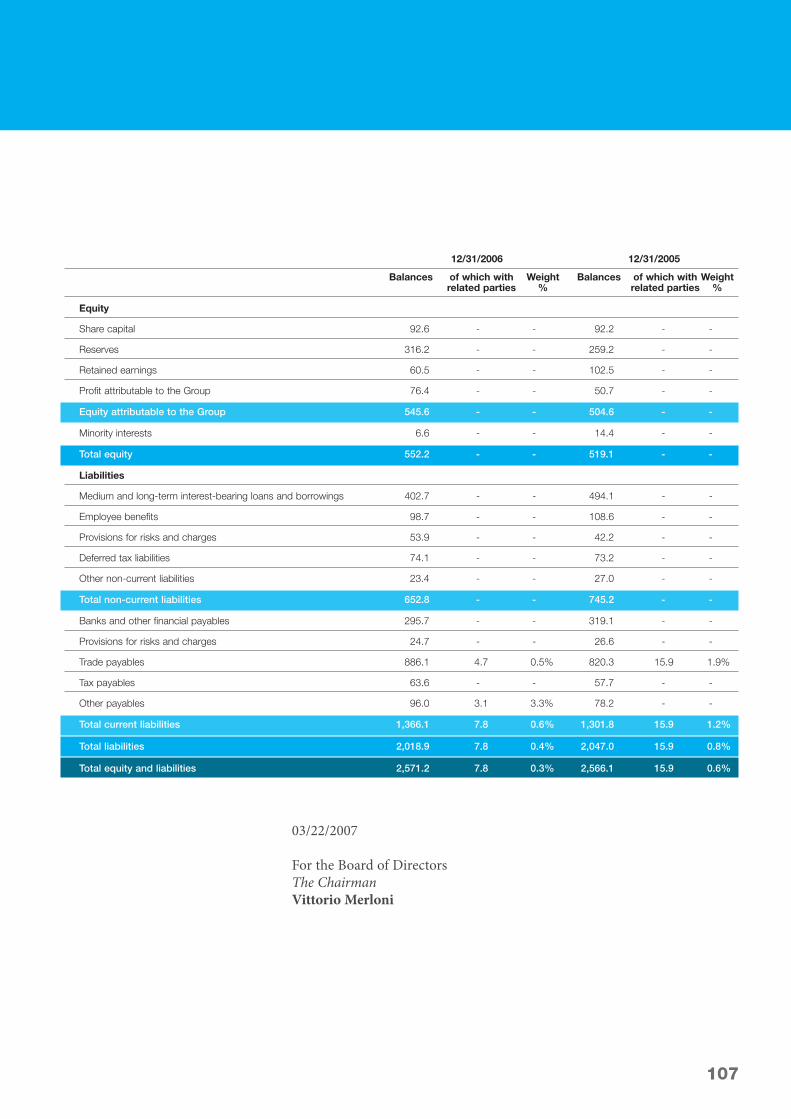
03/22/2007
For the Board of DirectorsThe ChairmanVittorio Merloni
107
12/31/2006 12/31/2005
Balances of which with Weight Balances of which with Weight related parties % related parties %
Equity
Share capital 92.6 - - 92.2 - -
Reserves 316.2 - - 259.2 - -
Retained earnings 60.5 - - 102.5 - -
Profit attributable to the Group 76.4 - - 50.7 - -
Equity attributable to the Group 545.6 - - 504.6 - -
Minority interests 6.6 - - 14.4 - -
Total equity 552.2 - - 519.1 - -
Liabilities
Medium and long-term interest-bearing loans and borrowings 402.7 - - 494.1 - -
Employee benefits 98.7 - - 108.6 - -
Provisions for risks and charges 53.9 - - 42.2 - -
Deferred tax liabilities 74.1 - - 73.2 - -
Other non-current liabilities 23.4 - - 27.0 - -
Total non-current liabilities 652.8 - - 745.2 - -
Banks and other financial payables 295.7 - - 319.1 - -
Provisions for risks and charges 24.7 - - 26.6 - -
Trade payables 886.1 4.7 0.5% 820.3 15.9 1.9%
Tax payables 63.6 - - 57.7 - -
Other payables 96.0 3.1 3.3% 78.2 - -
Total current liabilities 1,366.1 7.8 0.6% 1,301.8 15.9 1.2%
Total liabilities 2,018.9 7.8 0.4% 2,047.0 15.9 0.8%
Total equity and liabilities 2,571.2 7.8 0.3% 2,566.1 15.9 0.6%

Independent Auditors’ report
108
annu
alre
port
2006

109
glossaryA / AA / A+ class
Call rate
CGU (Cash Generating Unit)
Corporate Governance
Defined benefit plan
Defined contribution plan
EBITDA/EBIT
EPS (Earning Per Share)
Fair Value option
Fair value
Financial covenant
Free cash flow
Hedge accounting
IAS/IFRSTM
Impairment test
Net working capital
Operating Cash Flow (OCF)
PMS (Performance Management System)
Projected Unit Credit (PUCM)
Purchase price allocation
Retirement awards
RoHS
Securitization
Sell in
Sell out
Special economic zone
Stock option
Supply chain
Vesting period
WACC (Weighted Average Cost of Capital)
WEEE (Waste Electrical and ElectronicEquipment)
WRAP (Web Ready Appliances Protocol)
European certification given to appliances combining high performance and minimum energy consumption.
Number of service requests over total products sold.
The smallest identifiable group of activities that generate incoming cash flows and are largely independentof incoming cash flows from other activities or groups of activities.
Rules and codes of conduct disciplining the control of a company, its ownership structure and theefficiency of its management in pursuing business objectives.
Fixed income pension scheme that a company must pay its retired employees. Fixed contribution pensionscheme. The amount of income will depend on the contribution payments and on yields.
Fixed contribution pension scheme. The amount of income will depend on the contribution payments andon yields.
Earnings before interest, taxes, depreciation and amortization (gross operating margin) / Earnings beforeinterest and taxes (operating margin).
Net profits (losses) for the year over the number of shares in circulation.
The possibility of stating at fair value certain assets and liabilities with specific characteristics.
Price at which an asset may be traded or a liability extinguished in a free transaction between informedand consenting parties.
Clauses stipulated to discipline financial events (esp. loans and credit lines).
Cash flows from operating business and investment activities net of dividend payouts and capital increases.
A method that designates a hedging instrument, normally a derivative, as an offset to changes in the fairvalue or cash flows of a hedged item.
International Accounting Standards/International Financial Reporting Standards.
An assessment carried out at each balance sheet reference date to search for indications that assets mayhave undergone lasting loss of value and to estimate recoverable values.
The difference between short-term assets and short-term liabilities of a trade and financial nature.
Cash flows generated by operating business.
A system for assessing employees’ professional performance, so they can improve and develop their careerson the basis of their aptitudes and competencies.
An actuarial method of stating balance sheet items (esp. employee severance indemnity).
Fair value statement of all the major assets and liabilities of an acquired company.
Awards and ceremonies accorded to meritorious employees on retirement.
EC Directive disciplining the use of hazardous substances in electrical and electronic equipment.
A company’s sales to commercial intermediaries; goods entering a point of sale.
Without recourse transfer of a portfolio of receivables in exchange for an issue of securities secured by thereceivables themselves.
Sales by retailers to consumers; goods leaving a point of sale.
A geographical area with laws different from those of the country to which the area belongs, usually forthe purpose of attracting foreign investment.
A faculty granted by enterprises to their managers whereby the latter may buy or subscribe a certainnumber of company shares at a favourable, predetermined price and within a limited period of time.
The organizational and IT structure that manages and co-ordinates business processes, from procurementof materials and components through to delivery of finished products.
The time required before options on shares can be exercised and the shares can be subscribed by the holderunder a given stock option plan.
The average cost of a company’s various sources of funding, including both debt and equity; usually usedan indicator to track a company’s operating cash flows and assess its financial position and EVA (economicvalue added).
EU Directive regulating the end of the life cycle of household appliances.
An exclusive technology enabling household appliances to dialogue amongst themselves and with theoutside world. Wrap is also the Group company specializing in electronics research.

austriaIndesit Company HausgeräteVertriebs. GmbH
Bundesstrasse 668740 Zeltweg
bulgariaIndesit Company Bulgaria SrluWorld Trade Center
36 Dragan Tsancov Blvd.Block B, Office 4121057 Sofia
Czech republicIndesit Company Ceska Sro
U Nákladového nádrazí, 2/1949130 00 Praha 3
germanyIndesit Company Deutschland GmbH
Trakehner Strasse 7-9D-60487 Frankfurt/Main
hungaryIndesit Company Magyarorzag Kft
Szépvölgyi Business ParkSzépvölgyi út 35-37. A ép., II em.H-1037 Budapest
italyIndesit Company SpA
> Viale Aristide Merloni, 4760044 Fabriano (AN)
> Viale Certosa, 24720151 Milano
norwayIndesit Company Norske Ltd
Norway ASNils Hansens Vei, 130667 Oslo
belgiumIndesit Company Belgium SA
161, Drève Richelle - Bat IWaterloo Office Park1410 Waterloo
chinaIndesit CompanyRepresentative Office
1901&1910 Shanghai Times Square93 Huai Hai RoadShanghai 200021
franceIndesit Company France SA
3 Bd. G. Bidault,Croissy Beaubourg77437 Marne La Vallée Cedex 2
greeceIndesit Company DomesticAppliances Hellas Mepe
29 Michalakopoulou Street11528 Athens
irelandIndesit Company IrelandReinsurance Ltd
49 Airways Industries EstateSantry - Dublin 17
polandIndesit Company Polska Spzoo
Ul. Dàbrowskiego, 21693-231 Lódz
luxembourgIndesit Company Luxembourg SA
19-21 Bd. du Prince Henri1724 Luxembourg
registered officeIndesit Company SpAViale Aristide Merloni, 4760044 Fabriano (AN) - ItalyTel. +39 0732 6611
statutory dataShare capital 102,536,744.40 euroRegistered with Ancona Court Tax Code/Vat Reg. no. 00693740425
communicationand corporateidentityTel. +39 0732 662356Fax +39 0732 662380e-mail: [email protected]
investor relationsTel. +39 0732 6611Tel. +39 02 300 83 111e-mail:[email protected]
www.indesitcompany.com
annu
alre
port
2006
annu
alre
port
2006
contacts
110

portugalIndesit Company PortugalElectrodomésticos SA
Rua Abranches Ferrão, 10-14º DEdificio Atlanta Park ll1600-001 Lisboa
singaporeIndesit Company Singapore Pte Ltd
138 Cecil Street,#08-01A Cecil Court069538 Singapore
the netherlandsIndesit Company Nederland BV
Veldzigt 223454 PW De Meern
ukIndesit Company UK Ltd
Morley WayPeterborough PE2 9JB
romaniaIndesit CompanyRepresentative Office
Bvd Basarabiei, 28 - Sector 2Bucharest
spainIndesit Electrodomésticos SA
Edificio Europa III,C/ San Rafael n. 1Portal 4 Bajo G28108 Alcobendas Madrid
turkeyIndesit Company Beyaz EsyaPazarlama AS
Balmumcu cad. Karahasan sok.no.15Balmumcu Besiktas80700 Istanbul
russiaIndesit International
Business Park, WC Pavillion, 46Prospect Mira - Moscow
switzerlandIndesit CompanyInternational Business SA
Centro Gerre 2000Via Pobiette 116928 Manno (Lugano)
ukraineIndesit Company International BV
4, Muzeyny Lane01001 Kiev
111

annu
alre
port
2006
published byIndesit CompanyCommunication and identity department
financial informationIndesit CompanyFinancial statements department
consultancy & coordinationErgon Comunicazione
graphics19novanta communication partners
photosBob KriegerEnzo SignorelliIndesit Company image bank
films and printingLarovere - Italy


2006Annual Report
Ann
ualR
epor
t20
06
www.indesitcompany.com