annual report 2006 growth - wilmar international report 2006 positioned for increase market share in...
TRANSCRIPT

Annual Report 2006
positioned for
Increase Market Share in Key Consuming Countries
growth
Expand Merchandising and Processing Capabilities
Increase Oil Palm Plantation Acreage
Des
ign
and
prod
uctio
n by
Su
Yean
g Pt
e Lt
d
Wilm
ar Intern
ational L
imite
d An
nual Re
po
rt 20
06 PO
SITION
ED FO
R GRO
WTH

We Invest
Increase Market Share
Expand Merchandising and Processing Capabilitiesof palm and lauric oils to maintain its leadership position.
of palm oil and other processed agricultural commodities in key consuming countries, particularly in China and India.
Palm oil is one of the fastest growing segments of the global vegetable oil markets due to the rising global demand for food and alternative energy as well as the rapid increase in production by Indonesia and Malaysia. Asian demand for processed agricultural commodities will remain robust, driven by high economic growth, large population base and low per capita consumption.Against this backdrop, Wilmar has embarked on a three-pronged strategy to position itself for growth.
Observation tower at plantation in Padang, Sumatra

Increase Oil Palm Plantation Acreage
You Harvest 2 Corporate Profi le
8 Chairman’s Statement
12 Financial Highlights
14 Board of Directors
18 Key Management Team
19 Corporate Information
20 Operations Review
32 Human Capital Management
34 Corporate Social Responsibility
38 Risk Management
42 Corporate Governance
53 Financials
Contents
through greenfi eld projects and acquisitions to become a major plantation player.

Wilmar International Limited, set up in 1991 as a palm oil trading company, is today one of Asia’s largest integrated agribusiness groups. It is one of the region’s largest palm oil refi ners and crushers of copra and palm kernel. It is also a sizeable plantation owner with extensive palm fruit processing facilities in Indonesia.
VISIONARY LEADERSHIP, PROVEN MANAGEMENT
From its early days, the Group’s focus has been on
building an integrated agribusiness model. This has
enabled Wilmar to grow quickly through the years and
compete successfully in the international market place.
Today, the Group has assets totaling some US$1.8 billion
and is among the top 20 listed companies by market
capitalisation, on the Singapore Exchange.
Wilmar’s success is driven by its visionary leadership
and a proven management team with expertise in
merchandising, development of large integrated
manufacturing complexes, plantation management and
risk management of commodities.
Driving with Visionary Leadership
Corporate Profi le
2 Wilmar International Limited Annual Report 2006

FULLY INTEGRATED BUSINESS MODEL
By vertically integrating its operations, the Group has
been able to create synergies for operational effi ciency
and extract margins at every step of the value chain
– from cultivation and milling to refi ning, processing,
merchandising and distribution of a wide range of palm
and lauric oils, and related products.
Wilmar’s large and integrated manufacturing complexes
benefi t from economies of scale through the sharing of
common infrastructure and overhead costs, lowering the
unit cost of its products. Through integration, the Group
enjoys operational effi ciency and lower transportation cost
as the output from one plant is the feedstock for another
plant, within the same manufacturing complex. The Group
achieves further integration and cost savings by using
waste products from its plants as feedstock for its co-
generation plants, to produce steam and electricity for its
manufacturing complexes.
As part of its integrated business model, Wilmar has built
dedicated ports and jetties with deep draft next to its
manufacturing complexes to facilitate shipping, minimise
risk of delays and reduce logistics costs. The Group’s
multiple manufacturing locations and scale of operations
allow it to reduce freight costs by shipping in large vessels
from the closest port to various destinations. It also owns
and operates a fl eet of liquid bulk vessels to complement
and increase fl exibility in its operations.
Processing
Capturing Margin Across the Value Chain
Shipping and DistributionOrigination
From cultivation and milling to refi ning, processing, merchandising and distribution, Wilmar has been able to create synergies for operational effi ciency and extract margins at every step of the value chain.
3
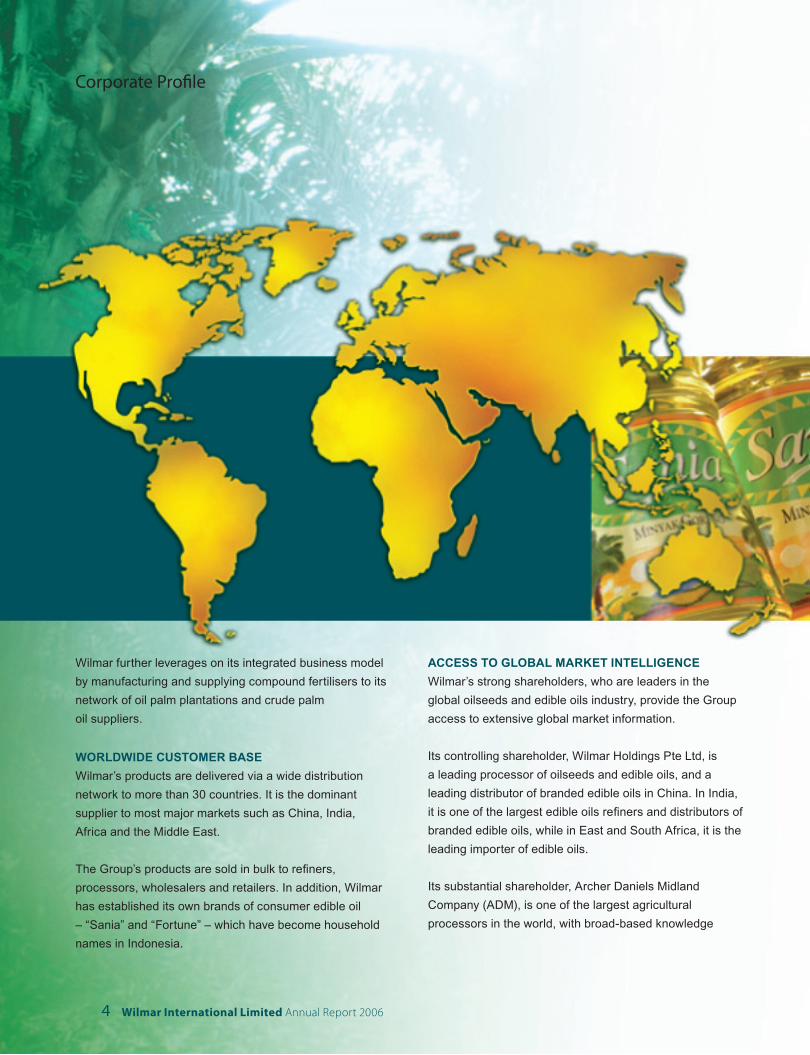
Wilmar further leverages on its integrated business model
by manufacturing and supplying compound fertilisers to its
network of oil palm plantations and crude palm
oil suppliers.
WORLDWIDE CUSTOMER BASE
Wilmar’s products are delivered via a wide distribution
network to more than 30 countries. It is the dominant
supplier to most major markets such as China, India,
Africa and the Middle East.
The Group’s products are sold in bulk to re ners,
processors, wholesalers and retailers. In addition, Wilmar
has established its own brands of consumer edible oil
– “Sania” and “Fortune” – which have become household
names in Indonesia.
ACCESS TO GLOBAL MARKET INTELLIGENCE
Wilmar’s strong shareholders, who are leaders in the
global oilseeds and edible oils industry, provide the Group
access to extensive global market information.
Its controlling shareholder, Wilmar Holdings Pte Ltd, is
a leading processor of oilseeds and edible oils, and a
leading distributor of branded edible oils in China. In India,
it is one of the largest edible oils re ners and distributors of
branded edible oils, while in East and South Africa, it is the
leading importer of edible oils.
Its substantial shareholder, Archer Daniels Midland
Company (ADM), is one of the largest agricultural
processors in the world, with broad-based knowledge
Corporate Profi le
4 Wilmar International Limited Annual Report 2006
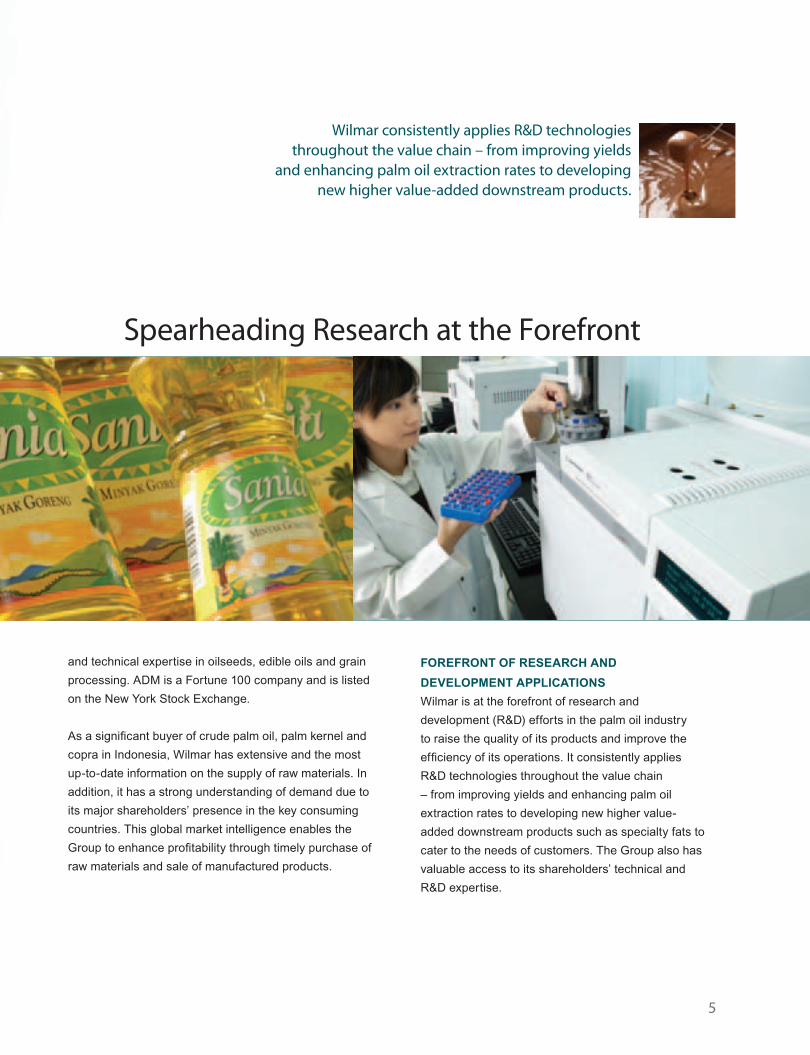
Wilmar consistently applies R&D technologies throughout the value chain – from improving yields
and enhancing palm oil extraction rates to developing new higher value-added downstream products.
and technical expertise in oilseeds, edible oils and grain
processing. ADM is a Fortune 100 company and is listed
on the New York Stock Exchange.
As a signifi cant buyer of crude palm oil, palm kernel and
copra in Indonesia, Wilmar has extensive and the most
up-to-date information on the supply of raw materials. In
addition, it has a strong understanding of demand due to
its major shareholders’ presence in the key consuming
countries. This global market intelligence enables the
Group to enhance profi tability through timely purchase of
raw materials and sale of manufactured products.
Spearheading Research at the Forefront
FOREFRONT OF RESEARCH AND
DEVELOPMENT APPLICATIONS
Wilmar is at the forefront of research and
development (R&D) efforts in the palm oil industry
to raise the quality of its products and improve the
effi ciency of its operations. It consistently applies
R&D technologies throughout the value chain
– from improving yields and enhancing palm oil
extraction rates to developing new higher value-
added downstream products such as specialty fats to
cater to the needs of customers. The Group also has
valuable access to its shareholders’ technical and
R&D expertise.
5
Corporate Profi le
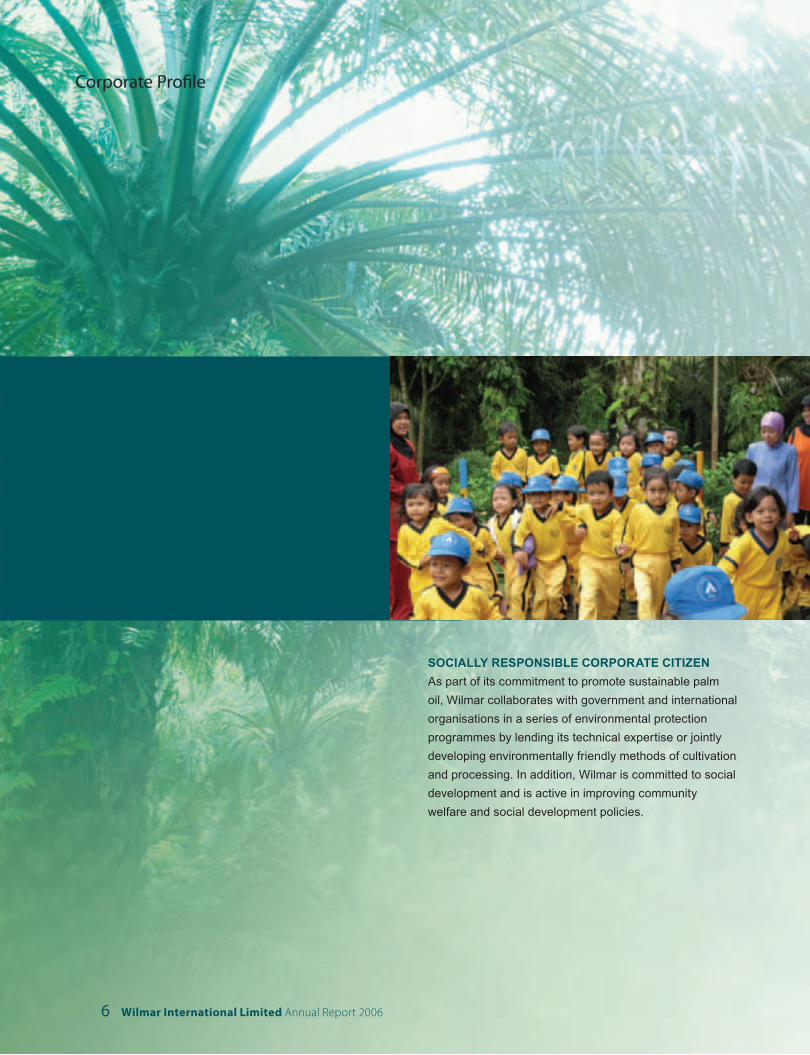
SOCIALLY RESPONSIBLE CORPORATE CITIZEN
As part of its commitment to promote sustainable palm
oil, Wilmar collaborates with government and international
organisations in a series of environmental protection
programmes by lending its technical expertise or jointly
developing environmentally friendly methods of cultivation
and processing. In addition, Wilmar is committed to social
development and is active in improving community
welfare and social development policies.
6 Wilmar International Limited Annual Report 2006
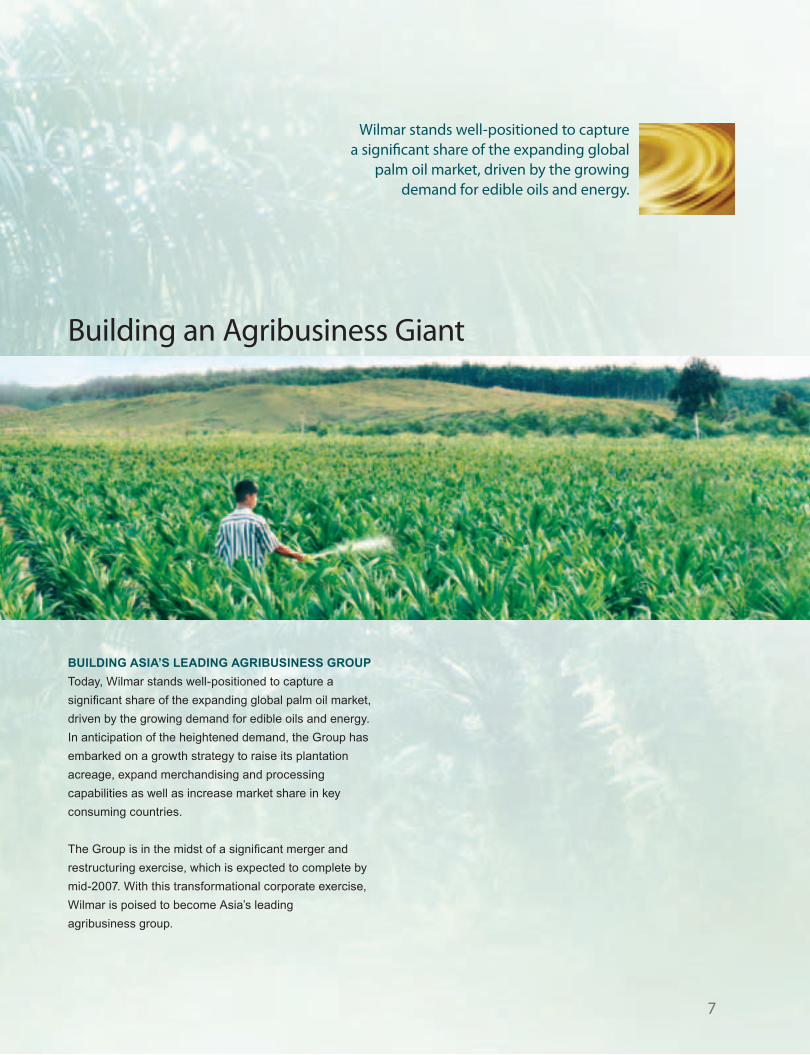
Wilmar stands well-positioned to capture a signifi cant share of the expanding global
palm oil market, driven by the growing demand for edible oils and energy.
Building an Agribusiness Giant
BUILDING ASIA’S LEADING AGRIBUSINESS GROUP
Today, Wilmar stands well-positioned to capture a
signifi cant share of the expanding global palm oil market,
driven by the growing demand for edible oils and energy.
In anticipation of the heightened demand, the Group has
embarked on a growth strategy to raise its plantation
acreage, expand merchandising and processing
capabilities as well as increase market share in key
consuming countries.
The Group is in the midst of a signifi cant merger and
restructuring exercise, which is expected to complete by
mid-2007. With this transformational corporate exercise,
Wilmar is poised to become Asia’s leading
agribusiness group.
7
Chairman’s Statement
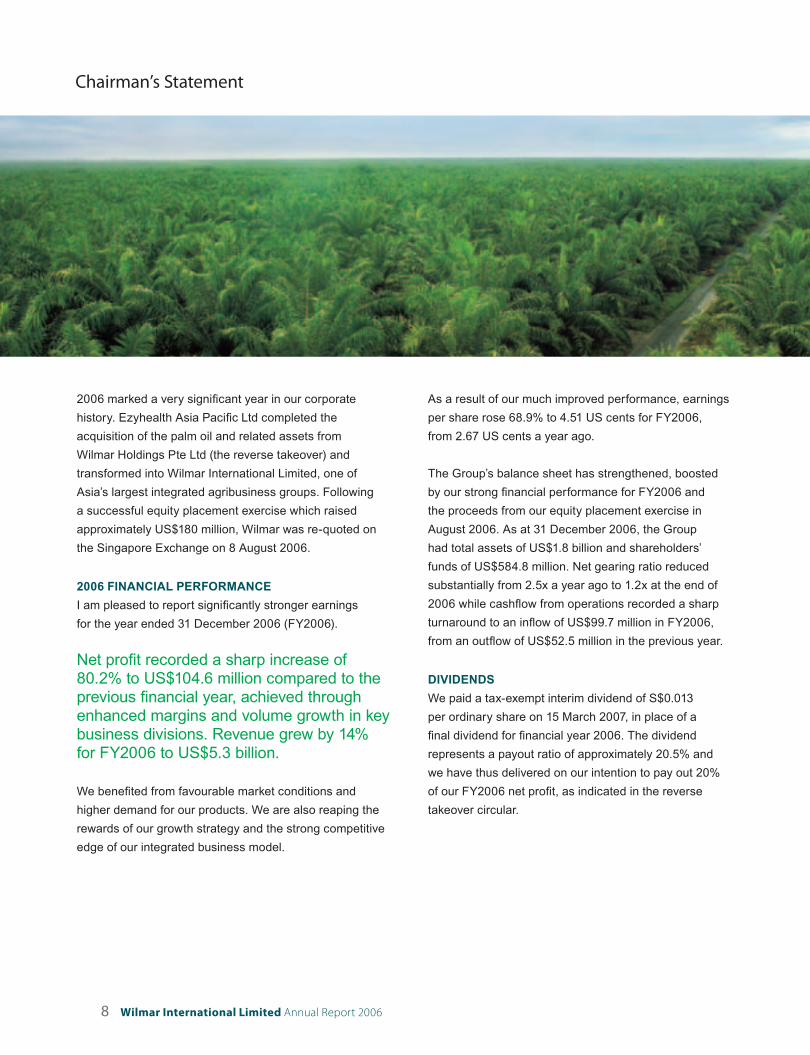
2006 marked a very signifi cant year in our corporate
history. Ezyhealth Asia Pacifi c Ltd completed the
acquisition of the palm oil and related assets from
Wilmar Holdings Pte Ltd (the reverse takeover) and
transformed into Wilmar International Limited, one of
Asia’s largest integrated agribusiness groups. Following
a successful equity placement exercise which raised
approximately US$180 million, Wilmar was re-quoted on
the Singapore Exchange on 8 August 2006.
2006 FINANCIAL PERFORMANCE
I am pleased to report signifi cantly stronger earnings
for the year ended 31 December 2006 (FY2006).
Net profi t recorded a sharp increase of 80.2% to US$104.6 million compared to the previous fi nancial year, achieved through enhanced margins and volume growth in key business divisions. Revenue grew by 14% for FY2006 to US$5.3 billion.
We benefi ted from favourable market conditions and
higher demand for our products. We are also reaping the
rewards of our growth strategy and the strong competitive
edge of our integrated business model.
As a result of our much improved performance, earnings
per share rose 68.9% to 4.51 US cents for FY2006,
from 2.67 US cents a year ago.
The Group’s balance sheet has strengthened, boosted
by our strong fi nancial performance for FY2006 and
the proceeds from our equity placement exercise in
August 2006. As at 31 December 2006, the Group
had total assets of US$1.8 billion and shareholders’
funds of US$584.8 million. Net gearing ratio reduced
substantially from 2.5x a year ago to 1.2x at the end of
2006 while cashfl ow from operations recorded a sharp
turnaround to an infl ow of US$99.7 million in FY2006,
from an outfl ow of US$52.5 million in the previous year.
DIVIDENDS
We paid a tax-exempt interim dividend of S$0.013
per ordinary share on 15 March 2007, in place of a
fi nal dividend for fi nancial year 2006. The dividend
represents a payout ratio of approximately 20.5% and
we have thus delivered on our intention to pay out 20%
of our FY2006 net profi t, as indicated in the reverse
takeover circular.
8 Wilmar International Limited Annual Report 2006
9
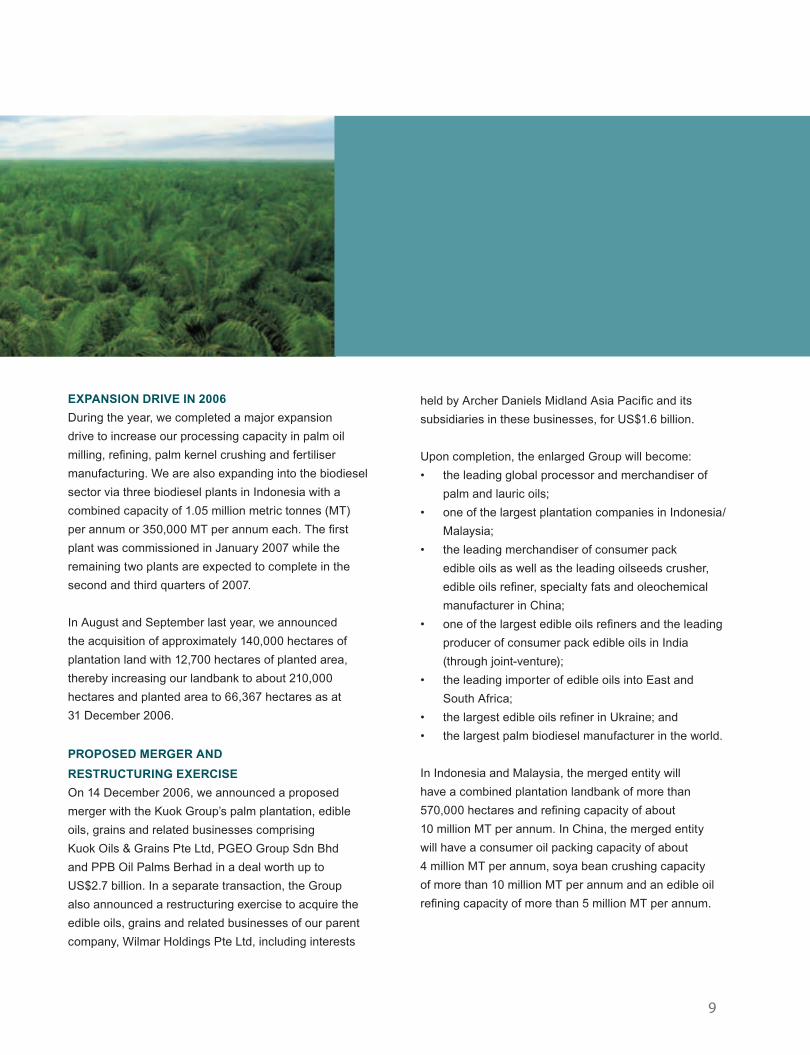
EXPANSION DRIVE IN 2006
During the year, we completed a major expansion
drive to increase our processing capacity in palm oil
milling, refi ning, palm kernel crushing and fertiliser
manufacturing. We are also expanding into the biodiesel
sector via three biodiesel plants in Indonesia with a
combined capacity of 1.05 million metric tonnes (MT)
per annum or 350,000 MT per annum each. The fi rst
plant was commissioned in January 2007 while the
remaining two plants are expected to complete in the
second and third quarters of 2007.
In August and September last year, we announced
the acquisition of approximately 140,000 hectares of
plantation land with 12,700 hectares of planted area,
thereby increasing our landbank to about 210,000
hectares and planted area to 66,367 hectares as at
31 December 2006.
PROPOSED MERGER AND
RESTRUCTURING EXERCISE
On 14 December 2006, we announced a proposed
merger with the Kuok Group’s palm plantation, edible
oils, grains and related businesses comprising
Kuok Oils & Grains Pte Ltd, PGEO Group Sdn Bhd
and PPB Oil Palms Berhad in a deal worth up to
US$2.7 billion. In a separate transaction, the Group
also announced a restructuring exercise to acquire the
edible oils, grains and related businesses of our parent
company, Wilmar Holdings Pte Ltd, including interests
held by Archer Daniels Midland Asia Pacifi c and its
subsidiaries in these businesses, for US$1.6 billion.
Upon completion, the enlarged Group will become:
• the leading global processor and merchandiser of
palm and lauric oils;
• one of the largest plantation companies in Indonesia/
Malaysia;
• the leading merchandiser of consumer pack
edible oils as well as the leading oilseeds crusher,
edible oils refi ner, specialty fats and oleochemical
manufacturer in China;
• one of the largest edible oils refi ners and the leading
producer of consumer pack edible oils in India
(through joint-venture);
• the leading importer of edible oils into East and
South Africa;
• the largest edible oils refi ner in Ukraine; and
• the largest palm biodiesel manufacturer in the world.
In Indonesia and Malaysia, the merged entity will
have a combined plantation landbank of more than
570,000 hectares and refi ning capacity of about
10 million MT per annum. In China, the merged entity
will have a consumer oil packing capacity of about
4 million MT per annum, soya bean crushing capacity
of more than 10 million MT per annum and an edible oil
refi ning capacity of more than 5 million MT per annum.
The minimal duplication in operations and the strengths
of the various entities in the merger and restructuring,
result in a very strategic fi t. By streamlining the
operations of the various entities, capitalising on the
multiple location processing facilities and with better
access to market information, the enlarged Wilmar will
be able to reap synergies from the merger and better
position itself for growth.
Through the proposed merger and restructuring exercise, Wilmar is poised to become Asia’s leading agribusiness group.
We are currently working with various parties involved
in the transactions including our fi nancial advisors, to
fi nalise the necessary documentation and to obtain all
necessary regulatory and shareholder approvals. These
corporate exercises are targeted to complete in the
second quarter of 2007.
OUTLOOK AND PROSPECTS
We are optimistic about the outlook for palm oil due to
the rising demand for food and energy globally. Barring
a collapse in energy prices, we expect palm oil prices
to remain favourable and hence, we will continue to
increase our oil palm plantation acreage. Through the
merger, we will have a very large landbank and greater
expertise to develop oil palm plantations, especially
in Indonesia. The merged entity will own a combined
planted area of approximately 170,000 hectares and it is
our intention to plant about 40,000 hectares per annum
to become a major plantation group within 10 years.
As the production of palm oil will continue to grow
rapidly in Indonesia and Malaysia, we will expand our
merchandising and processing capabilities in line with
production growth.
Chairman’s Statement
Demand for quality processed agricultural commodities
in Asia, especially in China and India, is expected to
remain robust driven by high economic growth, large
population base and low per capita consumption. Given
the merged entity’s signifi cant presence in China and
India in processed agricultural commodities, we are well-
positioned to capture the growth opportunities in these
two markets.
COMMITMENT TO CORPORATE SOCIAL
RESPONSIBILITY AND SUSTAINABLE PALM OIL
As a responsible corporate citizen, we regard our social
obligations seriously by complying with environmental
and pollution standards, and contributing to the welfare
of the communities in which we operate. We manage our
operations in a manner consistent with internationally-
recognised best practices.
Our commitment is further demonstrated by our active
involvement in activities promoting sustainable palm
oil. These include participation in the Roundtable
on Sustainable Palm Oil’s (RSPO) two-year trial
implementation project to fi eld-test and review a set of
principles and criteria for sustainable palm oil production,
and supporting the Zoological Society of London’s
research on the conservation of endangered species. We
have also participated in evaluations and audits on our
environmental and social performance by the International
Finance Corporation and Control Union Certifi cations of
the Netherlands. (Please refer to the section “Corporate
Social Responsibility” for more information.)
10 Wilmar International Limited Annual Report 2006

11
IN APPRECIATION
Upon completion of the reverse takeover exercise on
14 July 2006, the Board of Directors was reconstituted to
include new members – Mr Martua Sitorus,
Mr Teo Kim Yong, Mr Stephen Yu, Mr Yeo Teng Yang,
Mr Tay Kah Chye and Mr Kwah Thiam Hock.
Mr William Camp was appointed to the Board on
31 October 2006, while Mr Stephen Yu resigned and was
appointed as the Alternate Director to Mr Camp on the
same day. I would like to extend a warm welcome to our
new Directors and thank Mr Leong Horn Kee for
agreeing to continue his service on the Board. I would
also like to thank the former Board members –
Mr Yeo Wee Kiong, Mrs Janice Yeo, Mr Ng Ede Phang
and Mr Tysun Ihm for their past contributions and
especially for their co-operation and support leading to the
successful completion of the reverse takeover exercise.
I would like to express our sincere appreciation to our
employees for their contribution, commitment and
dedication, which brought Wilmar to where it is today. Our
sincere appreciation also goes to our suppliers, customers
and bankers for their strong support over the years.
Last but not least, I would like to thank our shareholders
for their support and confi dence in us and I look forward
to their continued support as we strive to enhance
shareholder value.
Kuok Khoon HongChairman & Chief Executive Offi cer
19 March 2007

Financial Highlights
Income Statement (US$ million) 2003 2004 2005 2006
Group Revenue 3,752 4,889 4,652 5,302
Net Profi t After Tax 32 60 58 105
Earnings Per Share (US cents) 1.45 2.77 2.67 4.51
Balance Sheet (US$ million) 2003 2004 2005 2006
Long Term Assets 395 418 589 780
Total Assets 1,127 1,185 1,569 1,844
Shareholders’ Fund 164 218 266 585
GROUP REVENUE(US$ MILLION)
’03 ’04 ’05 ’06
6000
5000
4000
3000
2000
1000
0
3,75
24,
889
4,65
2
5,30
2
NET PROFIT AFTER TAX(US$ MILLION)
’03 ’04 ’05 ’06
120
100
80
60
40
20
0
32 60 58 105
EARNINGS PER SHARE(US CENTS)
’03 ’04 ’05 ’06
5
4
3
2
1
0
1.45
2.77 2.
674.
51
12 Wilmar International Limited Annual Report 2006
13
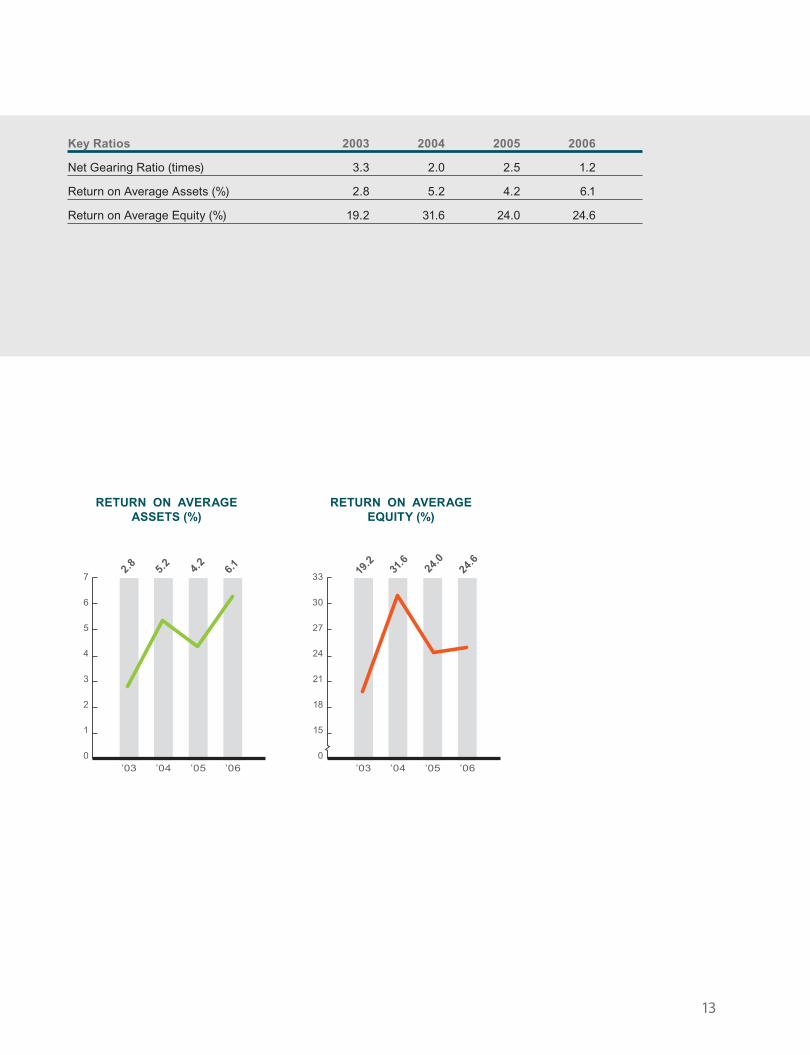
Key Ratios 2003 2004 2005 2006
Net Gearing Ratio (times) 3.3 2.0 2.5 1.2
Return on Average Assets (%) 2.8 5.2 4.2 6.1
Return on Average Equity (%) 19.2 31.6 24.0 24.6
RETURN ON AVERAGEASSETS (%)
’03 ’04 ’05 ’06
7
6
5
4
3
2
1
0
2.8
5.2 4.
26.1
RETURN ON AVERAGEEQUITY (%)
’03 ’04 ’05 ’06
19.2
31.6
24.0
24.6
33
30
27
24
21
18
15
0
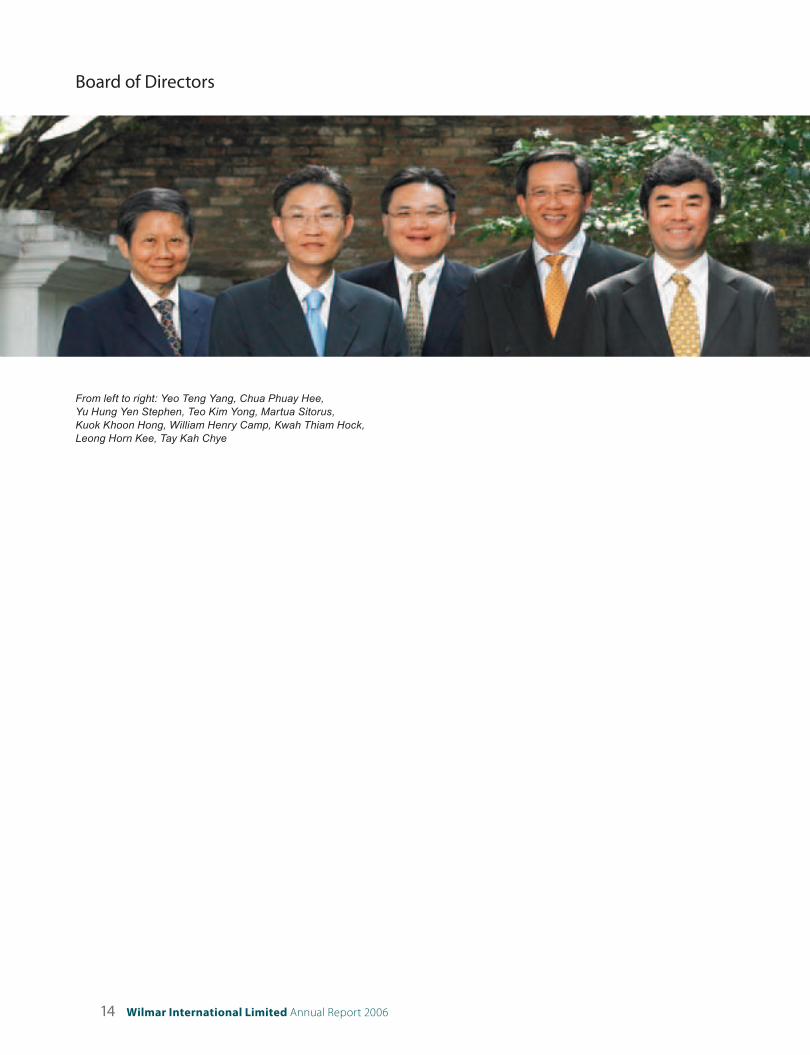
Board of Directors
From left to right: Yeo Teng Yang, Chua Phuay Hee,Yu Hung Yen Stephen, Teo Kim Yong, Martua Sitorus,Kuok Khoon Hong, William Henry Camp, Kwah Thiam Hock,Leong Horn Kee, Tay Kah Chye
14 Wilmar International Limited Annual Report 2006

15
KUOK KHOON HONGChairman & Chief Executive Offi cer
Mr Kuok is the Co-founder, Chairman and Chief
Executive Offi cer of the Group. He is in charge of
overall management of the Group with a particular
focus on new business development. He has extensive
experience in the industry and has been involved in
the grain, edible oils and oilseed business since 1973.
Mr Kuok has completed many projects involving the
establishment of oil palm plantation in Asia and the
processing of grains, edible oils and oilseeds. He
has held several key executive positions in various
companies, including General Manager of Federal Flour
Mills Bhd from 1986 to 1991, and Managing Director of
Kuok Oils & Grains Pte Ltd from 1989 to 1991. Mr Kuok
graduated from the then University of Singapore with a
Bachelor of Business Administration degree.
CHUA PHUAY HEEExecutive Director
Mr Chua is in charge of Finance and Corporate
Services, which include Finance, Corporate Secretarial,
Legal, Information Technology, Risk Management and
Investor Relations. Mr Chua joined the Group in 2002.
His past positions include Chief Financial Offi cer and
Chief Risk Offi cer of Keppel TatLee Bank, Singapore.
Prior to that, he spent 9 years with the Monetary
Authority of Singapore in various capacities relating to
insurance regulation, human resource management
and securities industry regulation. He is a director
of Industrial Bank Co., Ltd., a company listed on the
Shanghai Stock Exchange. Mr Chua received his
Masters of Science (Actuarial Science) degree from
Northeastern University, Boston, USA, and a Bachelor
of Science (First Class Honours) degree in Mathematics
from the then Nanyang University, Singapore.
MARTUA SITORUSExecutive Director & Chief Operating Offi cer
Mr Sitorus is the Co-founder, Executive Director and
Chief Operating Offi cer of the Group. Being experienced
in the area of edible oils, he is in charge of operations
and the development of plantations, infrastructure,
factories and facilities. Mr Sitorus has been instrumental
in the development of Wilmar’s business operations in
Indonesia. He holds a degree in Economics from HKBP
Nomensen University in Medan, Indonesia.

TEO KIM YONGExecutive Director
Mr Teo is in charge of commercial activities and the
Group’s merchandising of palm and lauric oils. Mr Teo
joined the Group in 1992 and has extensive experience
in the merchandising of edible products. His past
positions include Marketing Manager of Sime Darby
Edible Products and International Marketing Manager of
Hwa Hong Oil Industries. He also served as a director
of Gardner Smith, Singapore, Marketing Director of
Keck Seng Pte Ltd and Managing Director of Kimlimco
Pte Ltd. Mr Teo graduated from the then University of
Singapore with a Bachelor of Business Administration
degree.
WILLIAM HENRY CAMPNon-Executive Director
Mr Camp is the Executive Vice President, Global
Processing of Archer Daniels Midland Company (ADM),
a company listed on the New York Stock Exchange,
with responsibilities for ADM’s global manufacturing,
grain handling and transportation operations. He has
almost 30 years’ experience within the agricultural
industry. Mr Camp joined ADM in 1985 and has held
various senior management positions, including
Senior Vice President with responsibilities for ADM’s
global oilseeds, cocoa, and wheat milling operations,
President-ADM South American division, President-
ADM North American Oilseed Processing division and
President-ADM Transportation. He holds a Bachelor of
Business Administration degree from the University of
Illinois, USA. Mr Camp is a director of Agri Core United,
a company listed on the Toronto Stock Exchange.
YU HUNG YEN, STEPHENAlternate Director to William Henry Camp
Mr Yu is currently the Corporate Vice President of
Archer Daniels Midland Company (ADM) and the
Managing Director of the Asia Pacifi c region. He has
been involved in the grains and oilseeds business since
1986. Mr Yu holds a Masters of Business Administration
degree from New York University and a Bachelor of
Science degree from Carnegie Mellon University, USA.
YEO TENG YANGLead Independent Director
Mr Yeo is the lead independent director. He currently
sits on the boards of various companies as a non-
executive director, including United International
Securities Ltd, Singapore. Mr Yeo has extensive
experience in banking and fi nance. From 1995 to
2000, he was the Senior Executive Vice-President with
United Overseas Bank, Singapore, and held several
responsibilities in the bank’s international banking
business, treasury, stockbroking, fund management,
risk management and corporate services. He also
served as a Board Member of Korea First Bank, South
Korea, from 2000 to 2005. Mr Yeo holds a Bachelor
of Social Sciences degree from the then University of
Singapore and a Masters degree in Economics and
Finance from Yale University, USA.
Board of Directors
16 Wilmar International Limited Annual Report 2006
17
LEONG HORN KEEIndependent Director
Mr Leong has been an independent director since
2000. He is currently an Executive Director of Far East
Organization. He has extensive experience in both
the public and private sectors. He has served in the
Singapore Government’s Administrative Service, and
has worked in various industries such as investments,
venture capital, merchant banking, hotels, food and
beverage, and property development. He was a member
of Parliament for 22 years from 1984 to 2006 and the
Chairman of Parliament’s Public Accounts Committee
from 2004 to 2006. He was appointed Singapore’s
Non-resident Ambassador to Mexico in 2006. Mr Leong
holds a Production Engineering and Management
degree (Honours) from Loughborough University of
Technology UK, an Economics (Honours) degree from
the University of London, UK and a Masters of Business
Administration from INSEAD, France.
TAY KAH CHYEIndependent Director
Mr Tay is currently the President and Chief Executive
Offi cer of ASEAN Finance Corporation (AFC), a
regional merchant bank based in Singapore and owned
by various leading banks and fi nancial institutions
in ASEAN. He joined AFC in 1991 as Senior Vice
President and assumed the current position in 1991.
Mr Tay has vast experience in banking and fi nance.
Prior to joining AFC, Mr Tay was with Citibank N.A.
Singapore Branch, where he started his banking career
in 1973. His last held position in Citibank was Vice
President and Head of its Corporate Marketing Group.
During his 18 years with Citibank, he held various
positions in banking operations, credit management
and marketing. Mr Tay is also the Honorary Secretary
General of ASEAN Bankers Association, a regional
banking industry group, and a member on the board
of directors in, among others, Aventures Capital
Management Private Limited and the Cambodia Mekong
Bank Public Limited Company. Mr Tay holds a Bachelor
of Social Sciences in Economics degree from the then
University of Singapore.
KWAH THIAM HOCKIndependent Director
Mr Kwah sits on the board of various companies
including IFS Capital Limited and Select Catering
Services Limited. He started his career in 1964 with
the Port of Singapore Authority. From 1969 to 1970,
he was an Assistant Accountant with the Singapore
Textile Industries Limited. Subsequently, he served as
the Secretary and Assistant Accountant in Singapore
Spinners Private Limited from 1970 to 1973 and later in
1974, he moved on to become the Regional Accountant
and Deputy Manager of its related company, IMC
(Singapore). Mr Kwah left to join ECICS Holdings Ltd
in 1976 and rose to become its President and Chief
Executive Offi cer. He stepped down from ECICS
Holdings Ltd in 2003 to assume the position of Principal
Offi cer and Chief Executive Offi cer of ECICS Limited,
a wholly-owned subsidiary of listed IFS Capital Limited.
Mr Kwah retired from ECICS Limited in December
2006. He is a Fellow, Certifi ed Public Accountant of
Australia, ICPAS and ACCA. He graduated from the
then University of Singapore in 1973 with a Bachelor of
Accountancy degree.

Key Management Team
Kuok Khoon HongChairman & Chief Executive Offi cer
Martua SitorusExecutive Director &Chief Operating Offi cer
Chua Phuay HeeExecutive Director(Finance & Corporate Services)
Teo Kim YongExecutive Director (Commercial)
Goh Ing SingGroup General Manager(Plantation Division)
Matthew John MorgenrothGroup Technical Head
Hendri SakstiHead of Operations, Indonesia
Rahul KaleHead of Biofuels & Oleochemicals
Sng Miow ChingGroup Financial Controller
Patrick Tan Soo ChayHead of Internal Audit
18 Wilmar International Limited Annual Report 2006

19
Corporate Information
BOARD OF DIRECTORS
Kuok Khoon Hong (Chairman)Appointed on 24 March 2006
Martua SitorusAppointed on 14 July 2006
Chua Phuay HeeAppointed on 24 March 2006
Teo Kim YongAppointed on 14 July 2006
William Henry CampAppointed on 31 October 2006
Yu Hung Yen, StephenAppointed on 31 October 2006 as alternate to William Henry Camp
Yeo Teng YangAppointed on 14 July 2006
Leong Horn Kee
Tay Kah ChyeAppointed on 14 July 2006
Kwah Thiam HockAppointed on 14 July 2006
EXECUTIVE COMMITTEE
Kuok Khoon Hong (Chairman)
Martua Sitorus
Chua Phuay Hee
Teo Kim Yong
AUDIT COMMITTEE
Tay Kah Chye (Chairman)
Kwah Thiam Hock
Yeo Teng Yang
NOMINATING COMMITTEE
Kwah Thiam Hock (Chairman)
Kuok Khoon Hong
Tay Kah Chye
REMUNERATION COMMITTEE
Kwah Thiam Hock (Chairman)
Kuok Khoon Hong
Yeo Teng Yang
Leong Horn Kee
RISK MANAGEMENT COMMITTEE
Yeo Teng Yang (Chairman)
Kuok Khoon Hong
Leong Horn Kee
COMPANY SECRETARY
Colin Tan Tiang Soon
REGISTERED OFFICE
56 Neil Road, Singapore 088830
Telephone: (65) 6216 0244
Facsimile: (65) 6836 1709
SHARE REGISTRAR
Tricor Barbinder Share
Registration Services
8 Cross Street
#11-00 PWC Building
Singapore 048424
AUDITORS
Ernst & Young
One Raffl es Quay
#18-01 North Tower
Singapore 048583
(Partner-in-Charge: Max Loh Khum Whai)
Appointed on 14 July 2006
PRINCIPAL BANKERS
DBS Bank Ltd
Oversea-Chinese Banking
Corporation Limited
ABN AMRO Bank
Bank of Tokyo-Mitsubishi UFJ Ltd
Fortis Bank SA/NV
ING Bank NV
Malayan Banking Berhad
Rabobank
Standard Chartered Bank
PT Bank Central Asia, Tbk
PT Bank Mandiri (Persero), Tbk
Southern Bank Berhad

20 Wilmar International Limited Annual Report 2006
Operations Review
MERCHANDISING AND REFINERY
Palm and LauricsWilmar’s ability to extract value along the entire value
chain from origination to destination is enhanced by
its effi cient logistics management and merchandising
distribution network.
The Group’s primary focus for its merchandising and
refi nery division is on tropical oil, namely palm and lauric
oils. (Lauric oils comprise palm kernel oil and coconut
oil, used primarily for the production of specialty fats
and in the oleochemical industry to produce soaps,
detergents, cosmetics, shampoo, plastics, lubricants
and pharmaceutical products.)
Industry trend in 2006
Following the trend in previous years, the supply of
palm oil rose again in 2006. Production by Malaysia
and Indonesia, the two largest palm oil producers in
the world, increased by about 2.5 million metric
tonnes (MT).
Prices of palm oil went up in 2006 due to the increase
in demand for edible use from China and India, and
power generation from Europe. Industry projections
of additional global demand of 4 to 5 million MT of
biodiesel between 2007 and 2009, gave the market a
strong psychological boost. As palm oil is now part of
the energy complex, the persistently high mineral oil
prices have put a fl oor price to palm oil.
Robust merchandising activities
In FY2006, the total volume of palm and laurics
merchandised by the Group increased 23.3% to
8,100,100 MT from 6,570,800 MT in FY2005. The
growth was in tandem with increased global demand
for palm and lauric oils for food and energy.
21
In merchandising, Wilmar has the advantage of
leveraging on its parent company’s operations in
China, India, Africa and Ukraine, and sales network in
other markets. All decision-making on merchandising
activities throughout the various regions is centralised
in the merchandising department situated at the Group’s
headquarters in Singapore. Manned by an experienced
team, the department is responsible for co-ordinating
sales in various markets and developing new customers
and markets.
The Group’s current fl eet of seven vessels with an
aggregate cargo capacity of 60,640 dead weight
tonnage, improves fl exibility and operational effi ciency,
and optimises supply chain management.
Production growth through capacity expansion
Total production volume for palm and laurics amounted
to 6,064,700 MT in FY2006, a 21.9% increase over
4,973,900 MT in FY2005. The growth was in line
with the increase in the Group’s refi ning capacity. In
FY2006, Wilmar’s palm oil mills supplied about 22% of
the Group’s crude palm oil requirements. The rest were
sourced from third-party suppliers.
As at 31 December 2006, the Group’s production
facilities included the following:
• 18 refi ning plants in nine locations in Sumatra,
Kalimantan and Butterworth, with a combined
capacity of 5,339,400 MT per annum.
• 17 fractionation plants in nine locations in Sumatra,
Kalimantan and Butterworth with a total capacity of
5,177,700 MT per annum.
• 17 palm kernel and copra crushing facilities in
12 locations in Sumatra, Sulawesi and Kalimantan
with a total capacity of 1,894,200 MT per annum.
Included in the Group’s production facilities above are
new facilities commissioned in 2006, comprising:
• Three refi ning plants with a total capacity of
1,485,000 MT per annum.
• Three fractionation plants with a total capacity of
1,485,000 MT per annum.
• Four palm kernel crushing plants with a total
capacity of 264,000 MT per annum.
22 Wilmar International Limited Annual Report 2006
Operations Review
In FY2005, Wilmar entered into a 50 : 50 joint venture
with TSH Resources Bhd in its foray into Sabah,
East Malaysia. The joint venture operates
refi ning (capacity of 825,000 MT per annum),
fractionation (660,000 MT per annum) and palm kernel
crushing (165,000 MT per annum) plants in Kunak
Jaya. Both the refi nery and fractionation plants were
commissioned in December 2006 while the crushing
plant was commissioned in March 2007. The Sabah
state is a major producer of palm oil while Kunak,
with its deep seaport and proximity to China, provides
logistical advantage for the shipment of refi ned products
to China.
Improved margins from favourable market
conditions and greater effi ciency
Merchandising and processing margins improved to
US$12.44 per MT in FY2006 from US$9.05 per MT the
year before. Favourable market conditions, cost savings
from higher production capacity and plant utilisation
contributed to the fi rmer margins.
Refi ning margins are infl uenced by the availability of
raw materials and the demand for refi ned products. The
Group usually enjoys higher margins in the second half
of the year due to seasonality factors resulting in higher
supply of raw materials and higher demand for refi ned
products for the festive seasons.
Outlook and prospects
The outlook for the palm oil industry continues to be
bright. In 2006, both Indonesia and Malaysia produced
about 32 million MT of palm oil, with the potential to

23
almost double to 60 million MT in 10 years’ time. The
expected rise in production is due to the rapid expansion
of acreage, especially in Indonesia. As palm oil remains
the cheapest high quality vegetable oil for food and
energy uses, demand will continue to grow in the future.
The governments of Indonesia and Malaysia are actively
promoting the bioenergy sector which should benefi t the
palm oil industry in the long run.
The proposed merger with the Kuok Group, which has
a strong manufacturing presence in Malaysia, will result
in Wilmar becoming the world’s leading merchandiser
and processor of palm oil with a combined refi ning
capacity of approximately 10 million MT per annum.
The multiple processing locations, enhanced market
intelligence and scale of the enlarged group will provide
synergies and further strengthen its ability to tap the
growth opportunities in the palm oil sector.
MERCHANDISING AND REFINERY
Soya Bean and Soya Bean MealWilmar also engages in the merchandising of non-palm
oil related products, namely soya bean, soya bean meal,
crude soya bean oil and other grains, for and on behalf
of its parent company, Wilmar Holdings Pte Ltd (WHPL)
and its group of companies in China. The WHPL Group
owns 12 crushing facilities in China.
In FY2006, soya bean and soya bean meal
merchandised on behalf of the WHPL Group amounted
to 6,687,500 MT, compared to 6,663,200 MT in
FY2005. Wilmar earned a fi xed margin of US$1.00 per
MT in FY2006, an upward revision from the margin of
US$0.25 per MT in FY2005.
Upon completion of the acquisition of WHPL’s edible
oils, grains and related businesses, this segment will be
reported as part of the oilseed crushing business
in China.

24 Wilmar International Limited Annual Report 2006
Operations Review
PLANTATIONS AND PALM OIL MILLS
Wilmar’s oil palm plantations are located in Sumatra and
Kalimantan, Indonesia. Besides the fresh fruit bunches
(FFB) from its own plantations, Wilmar also processes
FFB from third-party suppliers, including small
landholders under the Plasma Programme developed
by the Group. The Plasma Programme is a government
initiative whereby plantation companies such as Wilmar
help the small landholders develop their plantation plots.
The crude palm oil and palm kernel produced by our
mills are supplied primarily to our refi neries and palm
kernel crushing plants.
Landbank and new plantings
As at end-2006, Wilmar’s total plantation land stood at
more than 210,000 hectares of which 66,367 hectares
have been planted. Of its total landbank, approximately
140,000 hectares were acquired in August and
September 2006, including 12,700 hectares
of planted area.
The table below shows the breakdown of planted and
mature hectarage owned by Wilmar and managed under
the Plasma Programme:
In hectares Planted Mature Immature–––––––––––––––––––––––Wilmar 66,367 55,318 11,049–––––––––––––––––––––––––––––––––––––––––––––––Plasma Programme 32,132 29,983 2,149–––––––––––––––––––––––––––––––––––––––––––––––
In FY2006, Wilmar planted an area of 4,931 hectares.
The Group originally set a target of 15,000 hectares per
annum for new plantings, which will be revised upward
to 40,000 hectares when the proposed merger with the
Kuok Group’s plantation business is completed. This
expansion plan is mainly focused in Kalimantan where
most of the new landbank is located.
Higher FFB yields
In FY2006, Wilmar’s plantations produced a total of
995,194 MT of FFB, achieving a yield of 21.2 MT of FFB
per hectare, an increase of 16.5% compared to 18.2 MT
per hectare in FY2005. Total tonnage of FFB produced
in FY2005 was 816,558 MT.
The strong improvement in FFB yield was due to factors
such as favourable agricultural and climatic conditions
as well as a higher proportion of planted area reaching
prime yield stage. Plantations acquired in the previous
year also produced better yields from increased
agricultural inputs and better management control.
While the overall yield for FY2006 showed an increase,
it was adversely affected in the fourth quarter due to a
drought in South Sumatra affecting approximately 20%
of the Group’s total planted area. The impact will fl ow
through to the fi rst quarter of FY2007 and early FY2008.

25
Increased milling capacity
At the end of the fi nancial year, Wilmar owned 20 mills
in Indonesia. Total processing capacity was about
7,080,000 MT per annum compared to 5,370,000 MT
per annum from 15 mills at end-FY2005. The total
volume of FFB processed in 2006 was 3,977,076 MT, an
increase of about 22% from 3,266,332 MT processed
in 2005. The signifi cant growth in the volume of FFB
processed was largely attributable to the operation of
new mills during the year.
The oil extraction rate increased slightly from 20.7% in
2005 to 20.9% in 2006, while the kernel extraction rate
improved from 4.8% to 5%.
Best management practices
The Group is committed to the use of best management
practices to ensure the continued success of its
plantation business. Best management practices
include good fi eld and harvesting standards and timely
applications of adequate fertilisers to optimise crop
yields. Wilmar has over the years, built up a strong team
of hands-on managers and staff who are committed
to the common objective of achieving the highest
standards for our plantations.
Staff morale and camaraderie are maintained within the
workforce through caring for their social well-being and
livelihood as well as community development projects to
improve the conditions of surrounding communities. The
Group also complies with government regulations and
maintains cordial relationships with local government
offi cials, studies measures for continuous improvement
and keeps abreast of new developments in the industry.
For more information, please refer to the Corporate
Social Responsibility section.
Outlook and prospects
Wilmar is optimistic about the outlook for the palm oil
industry due to the rising global demand of palm oil for
food and alternative energy, and high mineral oil prices.
Upon completion of the proposed merger with the
Kuok Group’s palm plantation business, the enlarged
plantation division will own a combined landbank of
more than 570,000 hectares of which approximately
170,000 hectares are planted. The Group’s objective
is to plant about 40,000 hectares per annum and to
achieve a total planted area in excess of 500,000
hectares within a decade.
26 Wilmar International Limited Annual Report 2006
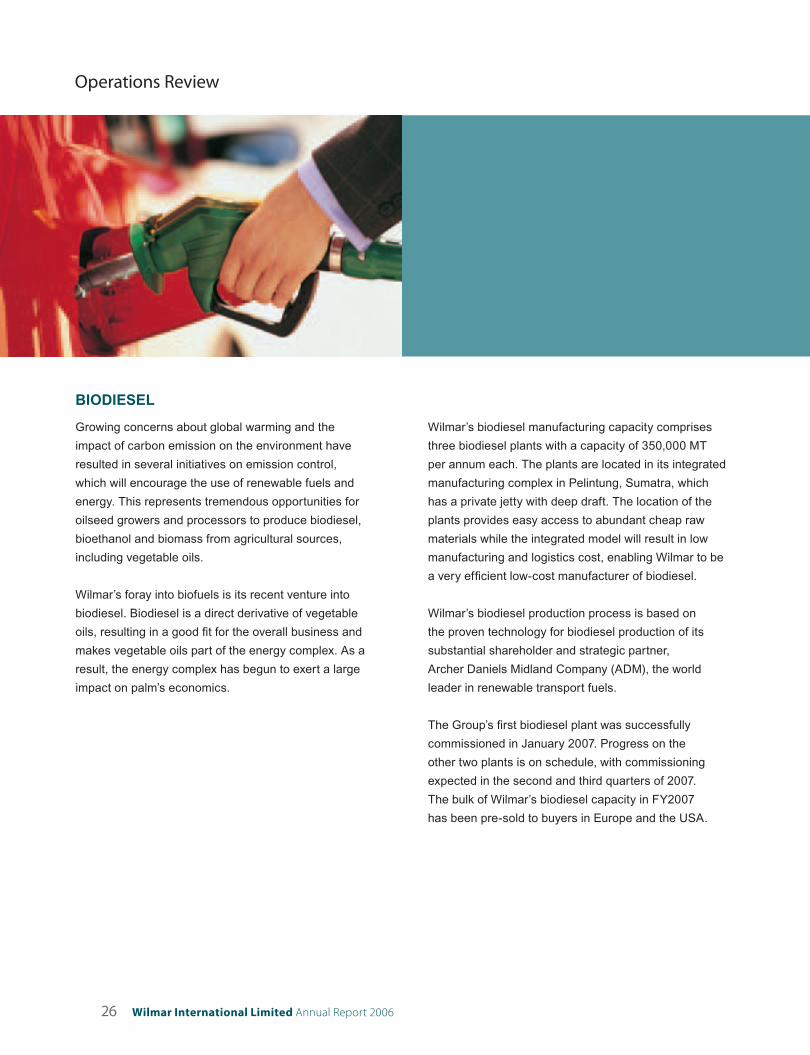
BIODIESEL
Growing concerns about global warming and the
impact of carbon emission on the environment have
resulted in several initiatives on emission control,
which will encourage the use of renewable fuels and
energy. This represents tremendous opportunities for
oilseed growers and processors to produce biodiesel,
bioethanol and biomass from agricultural sources,
including vegetable oils.
Wilmar’s foray into biofuels is its recent venture into
biodiesel. Biodiesel is a direct derivative of vegetable
oils, resulting in a good fi t for the overall business and
makes vegetable oils part of the energy complex. As a
result, the energy complex has begun to exert a large
impact on palm’s economics.
Wilmar’s biodiesel manufacturing capacity comprises
three biodiesel plants with a capacity of 350,000 MT
per annum each. The plants are located in its integrated
manufacturing complex in Pelintung, Sumatra, which
has a private jetty with deep draft. The location of the
plants provides easy access to abundant cheap raw
materials while the integrated model will result in low
manufacturing and logistics cost, enabling Wilmar to be
a very effi cient low-cost manufacturer of biodiesel.
Wilmar’s biodiesel production process is based on
the proven technology for biodiesel production of its
substantial shareholder and strategic partner,
Archer Daniels Midland Company (ADM), the world
leader in renewable transport fuels.
The Group’s fi rst biodiesel plant was successfully
commissioned in January 2007. Progress on the
other two plants is on schedule, with commissioning
expected in the second and third quarters of 2007.
The bulk of Wilmar’s biodiesel capacity in FY2007
has been pre-sold to buyers in Europe and the USA.
Operations Review
27
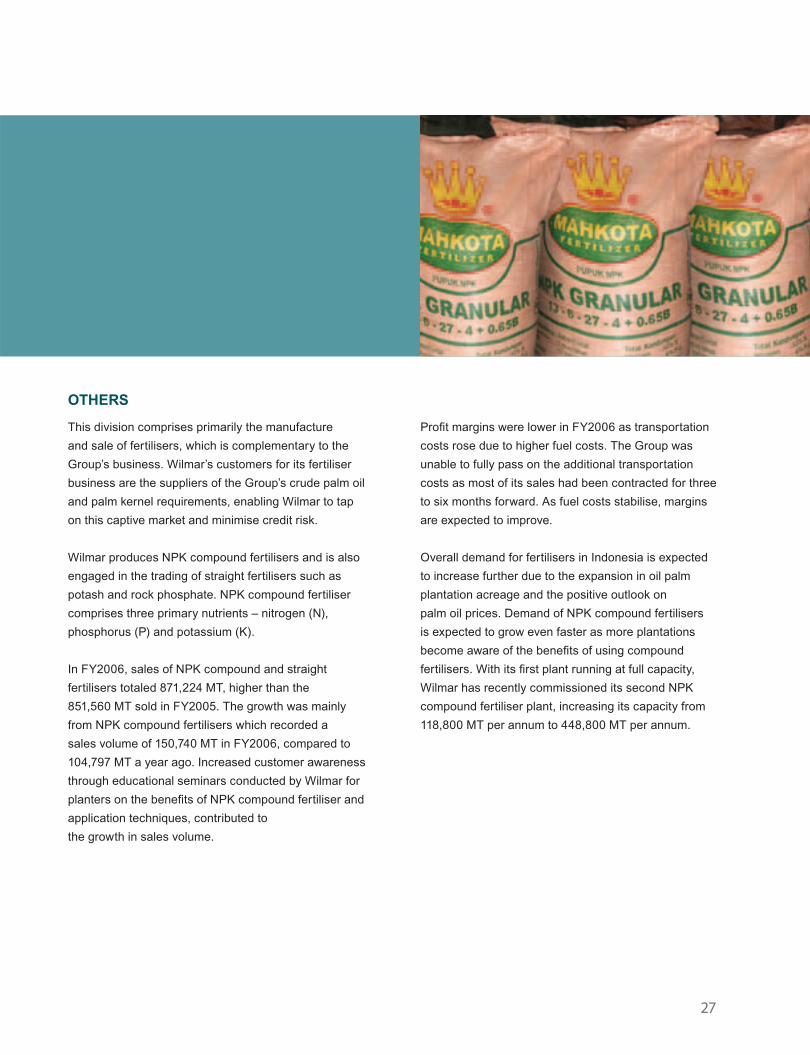
OTHERS
This division comprises primarily the manufacture
and sale of fertilisers, which is complementary to the
Group’s business. Wilmar’s customers for its fertiliser
business are the suppliers of the Group’s crude palm oil
and palm kernel requirements, enabling Wilmar to tap
on this captive market and minimise credit risk.
Wilmar produces NPK compound fertilisers and is also
engaged in the trading of straight fertilisers such as
potash and rock phosphate. NPK compound fertiliser
comprises three primary nutrients – nitrogen (N),
phosphorus (P) and potassium (K).
In FY2006, sales of NPK compound and straight
fertilisers totaled 871,224 MT, higher than the
851,560 MT sold in FY2005. The growth was mainly
from NPK compound fertilisers which recorded a
sales volume of 150,740 MT in FY2006, compared to
104,797 MT a year ago. Increased customer awareness
through educational seminars conducted by Wilmar for
planters on the benefi ts of NPK compound fertiliser and
application techniques, contributed to
the growth in sales volume.
Profi t margins were lower in FY2006 as transportation
costs rose due to higher fuel costs. The Group was
unable to fully pass on the additional transportation
costs as most of its sales had been contracted for three
to six months forward. As fuel costs stabilise, margins
are expected to improve.
Overall demand for fertilisers in Indonesia is expected
to increase further due to the expansion in oil palm
plantation acreage and the positive outlook on
palm oil prices. Demand of NPK compound fertilisers
is expected to grow even faster as more plantations
become aware of the benefi ts of using compound
fertilisers. With its fi rst plant running at full capacity,
Wilmar has recently commissioned its second NPK
compound fertiliser plant, increasing its capacity from
118,800 MT per annum to 448,800 MT per annum.

28 Wilmar International Limited Annual Report 2006
RESEARCH AND DEVELOPMENT
The Group’s research and development (R&D) activities
are focused on improving the quality and range of
its products, meeting customers’ requirements and
improving operational effi ciency. The R&D activities
undertaken are as follows:
Specialty fats
Specialty fats products include cocoa butter equivalents
(CBE), cocoa butter replacers (CBR), cocoa butter
substitutes (CBS), specially formulated fi lling fats,
creaming fats, ice-cream fats, milk fat replacers,
margarines, shortenings, frying fats and many tailor-
made fats to suit customers’ requirements. Relative
to Wilmar’s group revenue, these products are of low
volume, high margin and high value-add. The Group
recognises the potential and long-term benefi ts of
having a competitive edge in specialty fats and devotes
a lot of R&D efforts into this area.
With the negative news surrounding trans fat and its
link to cardiovascular disease, the Group focuses on
developing trans fat-free or low trans fat baking and
frying shortenings, as well as other forms of cooking
fats such as creaming fats, fi lling fats and coating fats to
offer healthier options to consumers.
New variations of specialty fats products are constantly
being developed to offer the best possible solutions to
customers. In addition, continuous evaluation is done
on various specialty fats products to determine and
improve on their quality, for example:
• Frying fats are evaluated on its shelf life, shelf life of
fried food, greasiness and crispiness of fried food
as well as foaming effect of the fat;
• Baking fats are evaluated on texture, volume,
structure and taste;
• CBS, CBE and CBR are evaluated on taste,
shrinkage, demoulding and effects of using different
percentages; and
• Ice-cream fats are evaluated on creaminess,
meltdown, taste and volume.
Refi ning and fractionation
Studies are done on the fractionation process to raise
yield, shorten the process time and to achieve special
characteristics (for the production of specialty fats
ingredients). Research is also done on cost-saving
techniques in the refi ning process through the effi cient
use of support materials.
Operations Review

29
Plantations
The Group’s R&D activities in relation to it plantations
are centred on improving seed variety for higher yield.
Progeny studies are also being conducted to further
identify parental palms with good combining ability.
Currently, the superior seeds are produced for the
Group’s own use.
Other trials being conducted include:
• Evaluation of the effects of different fertiliser regime
on the development of immature palms to determine
the optimal application rates;
• Use of organic acids and different fertiliser regime
on mature palms to improve fertiliser effi ciency for
optimal palm yield;
• Study on the effects of drip irrigation on the
performance of mature palms in the dry region of
South Sumatra. This involves a system of irrigation
whereby the water is dripped from the irrigation tube;
• Trunk injection with various insecticides for the
control of leaf-eating caterpillars; and
• Tests on cultural and biological methods for the
control of oryctes beetle.
In addition, the Group collaborates with other agencies,
such as the Potash and Phosphate Institute (South East
Asian Programme), on best management practices to
achieve maximum economic yield.
Biodiesel
Wilmar’s biodiesel R&D effort involves developing
competitive low pour point biodiesel using different
processes, additives and alternative feedstock. There
is also on-going development of value-added products
using glycerin, a by-product of biodiesel production.
Wilmar is also working on other biofuels and
alternate biomass.
Fertiliser
The R&D activities undertaken are:
• Effect of NPK compound fertiliser on the growth and
yield of food crops (rice and maize) and horticulture
products (citrus, etc).
• Evaluation on the impact of Wilmar’s own brand
of NPK compound fertiliser, on yield compared
to the usage of traditional straight fertilisers. The
yield component includes production of fresh fruit
bunches and oil extraction rate. Early results have
shown that by using Wilmar’s NPK compound, the
growth and yield of palms are signifi cantly improved
and are better than using straight fertilisers.

30 Wilmar International Limited Annual Report 2006
AWARDS
Over its years in operation, Wilmar consistently sets
high standards and strives for improvement in every
area of its business. As a result, it has received
numerous awards, certifi cations and commendations
from various organisations. Some recent awards
received are:
Plantations
• Green Gold Label Certifi cate from Control Union
Certifi cations (The Netherlands) – awarded to
Wilmar for Chain of Custody and Processing
Standards in January 2007. The certifi cation
indicates that the crude palm oil from Wilmar’s
plantations and used by its refi neries in producing
refi ned products, are sustainably produced and
traceable for the entire production process
and chain.
• ISO 9001 : 2000 and ISO 14001 : 2004 – awarded
to Wilmar’s plantation company, PT Asiatic Persada
Group by SGS Systems and Services Certifi cation
Pty Ltd (Australia).
• Zero Accident Award from the Ministry of Labour
and Transmigration of Indonesia – awarded to three
of Wilmar’s plantation companies in South Sumatra
(PT Tania Selatan, PT Buluh Cawang Plantations
and PT Musi Banyuasin Indah). This award is a
commendation on the plantation companies’ safety
and health programmes which resulted in zero
accidents for the period 1 January 2005 to
30 November 2006.
Merchandising and refi nery
• Primaniyarta Export Award 2006 from the
Indonesian Government for Best Performing
Exporter in the category of Foreign Capital
Investment Company, product from natural
resources – awarded to Wilmar’s subsidiary,
PT Multimas Nabati Asahan.
Others
• Wilmar’s house brand, Sania cooking oil, was
ranked No. 3 in July 2006 in the Indonesian Best
Brand Survey 2006. The survey criteria included
brand awareness, customer satisfaction and loyalty,
and market share, among others.
Operations Review
Primaniyarta Export Award 2006
31
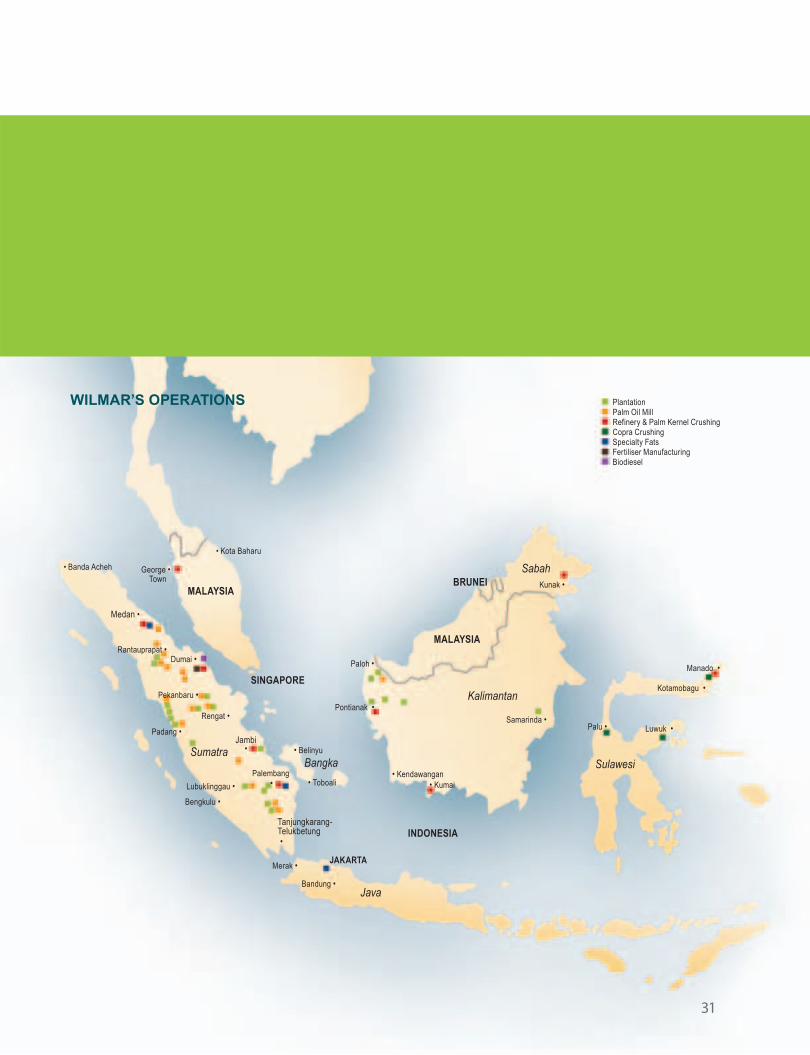
WILMAR’S OPERATIONS
Medan •
• Banda Acheh
Rantauprapat •Dumai •
Pekanbaru •
Rengat •
Padang •
George • Town
• Kota Baharu
MALAYSIA
SINGAPORE
Sumatra
Lubuklinggau •
Bengkulu •
Palembang
Pontianak •
Paloh •
Samarinda •
Kunak •
Palu •
Kotamobagu •
Manado •
Luwuk •
Sulawesi
INDONESIA
MALAYSIA
BRUNEISabah
Kalimantan
• Kendawangan• Kumai
• Belinyu
Bangka
• Toboali
Jambi•
•
Tanjungkarang-Telukbetung•
Java Bandung •
Merak •JAKARTA
PlantationPalm Oil MillRefinery & Palm Kernel CrushingCopra CrushingSpecialty FatsFertiliser ManufacturingBiodiesel
32 Wilmar International Limited Annual Report 2006
Human Capital Management
Wilmar seeks to attract and retain employees who
are able, honest and driven, through competitive
compensation packages and excellent career
development opportunities. It believes in creating a
conducive and inspiring working environment to bring
out the full potential of every employee.
While individual achievements are applauded, teamwork
is accorded greater value as the Group fi rmly believes
that the success of an organisation comes from the
efforts of a team. In this respect, Wilmar’s staff are
strongly encouraged to work as part of a bigger team
towards the common goal of enhancing the fi nancial
performance and reputation of the Group.
STAFF TRAINING AND DEVELOPMENT
Wilmar’s staff training and development programmes
are targeted at employees at every level and in every
location. It views continuous staff education and
development as necessary and benefi cial to the Group
as employees are armed with the relevant
knowledge and skills to meet challenges of the
business environment.
Staff training, whether conducted in-house or through
participation in public seminars and workshops, include
technical skills upgrade, supervisory skills development,
managerial and leadership training, corporate
culture and values, work ethics, management trainee
programmes, quality control, problem-solving and
International Standards Organisation (ISO) certifi cation
training. At the Group plantations, training centres are
established and managed by skilled and experienced
in-house trainers. This facilitates attendance by staff to
achieve higher technical competency levels.
To keep up with industry trends, staff attend annual
international conferences relating to the edible
oils industry. These are platforms for experts and
industrialists to discuss the trends and developments of
the edible oils industry and markets.
Wilmar also provides career development opportunities
through job rotation within and between functional
units, enabling staff to broaden their skills set and
knowledge base, and exposing staff to different roles
and responsibilities. Staff are offered inter-departmental
transfer, short-term overseas assignments or long-term
overseas postings to the Group’s various business units.
SAP/IT TRAINING
The Group has embarked on a major drive to implement
the SAP Enterprise Resource Planning (ERP) system
as the backbone of its information technology (IT)
infrastructure. Heavy emphasis is placed on training
the users and IT staff on SAP system, communications
networking and relevant software and hardware
architecture. Key users and IT staff are regularly
redeployed and sent for short assignments to assist in
new implementation projects.

33
Employees in the factories look forward to the annual
Family Gathering Day where management, staff and
their families celebrate familial ties, whether it is the
corporate family or between relatives. There are also
celebrations to mark the Company’s Anniversary Day
and signifi cant festive occasions.
The quarterly in-house publication, the Jendela, is
a valuable communication tool to keep employees
informed of events in the corporate head offi ce and the
various units.
Whether through recreational or social events, these
activities foster team building and employee networking.
The commitment, dedication and loyalty of its
employees have contributed signifi cantly to the Group’s
success over the years, and it is this strong partnership
between management and staff that will continue to play
a crucial role in Wilmar’s development and expansion
into Asia’s leading agribusiness group.
2003 2004 2005 2006––––––––––––––––––––––––No. of Employees 14,822 14,880 20,123 23,313–––––––––––––––––––––––––––––––––––––––––––––––
PERFORMANCE ASSESSMENT
All operating units within Wilmar are assessed by Key
Performance Indicators (KPIs). For each operating
unit, different and specifi c performance evaluation is
used. For instance, depending on relevance, the unit
is assessed on indicators such as capacity utilisation,
yield and sales volume. Employees’ incentives and
bonuses are calculated based on the KPI results of their
respective units as well as on individual performance.
With the KPI system, employees are able to keep track
of their performance on a monthly basis and are
rated accordingly.
STAFF COMMUNICATION AND WELFARE
The Group takes a keen interest in developing a
conducive working and living environment for its
employees. It has several on-going initiatives to
promote internal communication and develop a sense
of community living.
At the Indonesian plantations, the Group fosters
community spirit through monthly get-together lunches
and sports activities, among others. Facilities for tennis,
badminton, volleyball and table-tennis are provided to
encourage participation. In addition, there are annual
sports competitions between the various plantations.
The Group also conducts half-yearly organisation
effectiveness surveys to gather feedback from
employees.
Workforce as at 31 December 2006
Total number of employees 23,313
Indonesia 99.1%
Singapore 0.6%
Malaysia 0.3%
Plantation 33.7%
Temporary/Contract workers 29.6%
Management 0.9%
Administration 10.6%
Marketing 1.6%
Factory 23.6%
34 Wilmar International Limited Annual Report 2006
Corporate Social Responsibility
As a major edible oils producer and merchandiser,
Wilmar’s long-term business success is closely linked
to the well-being of the communities and environment it
operates in. The Group sets stringent corporate social
responsibility (CSR) policies and procedures to guide
its business managers in their investment decisions and
daily operations.
As developing a comprehensive CSR framework is a
dynamic and on-going process, the Group regularly
engages and consults with stakeholders and other
interested parties on environmental and social issues.
ENVIRONMENT SUSTAINABILITY
The Group considers environmental protection and
enhancement to be important factors in the conduct
of its operations. Its plantations and processing plants
adhere strictly to the local environmental and plantation
development regulations as well as to internationally
recognised best practices. These include:
Zero burning in land clearing
Wilmar adheres strictly to the policy of zero burning.
Zero burning not only keeps the air pollution-free but
yields several benefi ts as well. The remnant debris
comprising bushes or small trees which are felled are
left to biodegrade, releasing nutrients slowly, thus
adding valuable organic matter to the soils, reducing
the use of fertilisers during planting period and lowering
carbon dioxide emission.
Approved land use
Wilmar is committed to only developing plantations
on land which is approved by the government for the
cultivation of oil palms.
Maintain soil fertility
To maintain soil fertility, best management practices are
implemented. These include minimising soil erosion by
establishing legume cover crops during planting and
terracing in hilly terrain, allowing organic matter levels
to be built up in the soil through frond placement and
empty fruit bunch mulching, judicious and discriminatory
fertiliser application and the use of appropriate
equipment to minimise soil compaction.
Integrated pest management
To increase effi ciency and reduce environmental
impact, Wilmar adopts an integrated pest management
approach which emphasises cultural control, biological
control, and monitoring and census system. The use of
safe and approved pesticides is kept to a minimum and
as a last resort. Understanding the pest’s life cycle and
its natural enemies is also part of integrated
pest management.
Optimise fertiliser use
Dependence on inorganic fertilisers is reduced through
nutrient recycling from utilisation of processing waste or
by-products. Empty fruit bunches are recycled back to
35
the fi elds for mulching. Palm oil mill effl uent is used to
irrigate the palms for irrigational and nutritional benefi ts.
A discriminatory system of fertiliser recommendation is
used to ensure optimal palm performance and minimal
environmental impact.
Encourage use of renewables
Waste products such as palm kernel shell and mill
fi bre are used as feedstock for co-generation plants to
produce steam and electricity.
Effi cient water use
This includes incorporating an effi cient land application
of palm oil mill effl uent system, minimising use of water
in processing mills and harvesting fresh water
and rainfall.
Waste treatment
All processing plants have waste treatment equipment
and system in place. Internal environmental personnel
monitor compliance with environmental standards and
identify opportunities for continuous improvement.
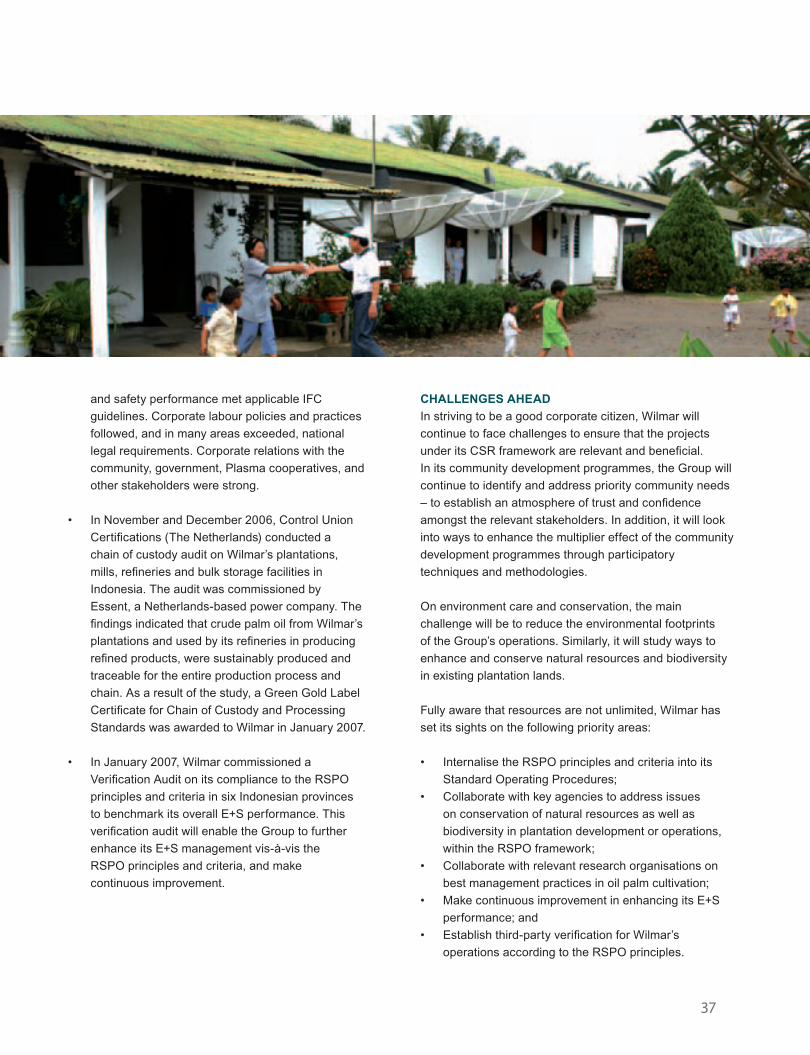
COMMUNITY WELFARE
Wilmar is committed to contributing to the local
communities in which it operates by providing
opportunities for residents to carve a livelihood for
themselves to raise their economic and social
well-being.
Wilmar’s efforts in the larger communities include
programmes to promote the health and welfare of the
resident population. Wilmar is committed to making
improvements to the physical environment such as the
construction of roads, bridges and places of worship as
well as providing the necessary funds for their repairs
and upkeep.
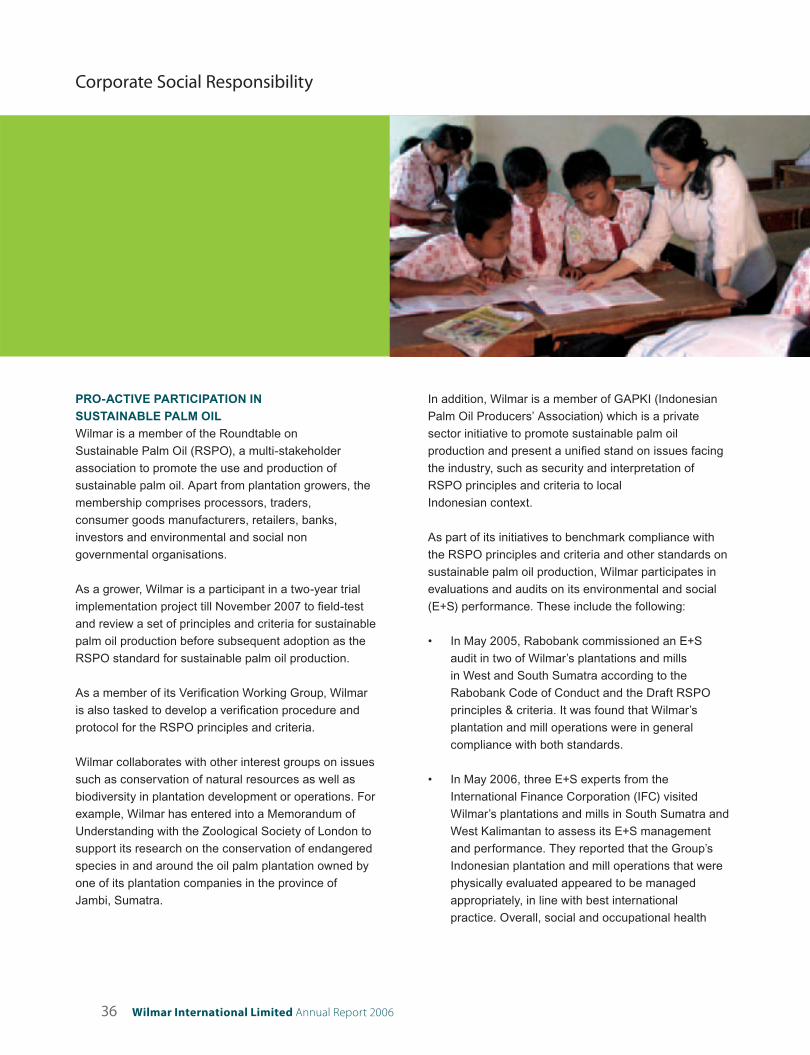
Believing that the education of children is necessary
for the progress of a community, Wilmar subsidises the
recruitment of teachers for schools in the areas.
For its plantation workers, Wilmar provides infrastructure
and amenities such as polyclinics, community halls,
crèches, schools, places of worship and recreational
facilities.
As a participant of the Plasma Programme, a project
designed to assist small landholders to become
independent plantation growers in Indonesia, Wilmar helps
the small landholders to develop good quality oil palm
plantations and work hand-in-hand with them to ensure
that the plantations are effi ciently managed. Wilmar is also
committed to purchase all the fresh fruit bunches produced
by them.
36 Wilmar International Limited Annual Report 2006
Corporate Social Responsibility
PRO-ACTIVE PARTICIPATION IN
SUSTAINABLE PALM OIL
Wilmar is a member of the Roundtable on
Sustainable Palm Oil (RSPO), a multi-stakeholder
association to promote the use and production of
sustainable palm oil. Apart from plantation growers, the
membership comprises processors, traders,
consumer goods manufacturers, retailers, banks,
investors and environmental and social non
governmental organisations.
As a grower, Wilmar is a participant in a two-year trial
implementation project till November 2007 to fi eld-test
and review a set of principles and criteria for sustainable
palm oil production before subsequent adoption as the
RSPO standard for sustainable palm oil production.
As a member of its Verifi cation Working Group, Wilmar
is also tasked to develop a verifi cation procedure and
protocol for the RSPO principles and criteria.
Wilmar collaborates with other interest groups on issues
such as conservation of natural resources as well as
biodiversity in plantation development or operations. For
example, Wilmar has entered into a Memorandum of
Understanding with the Zoological Society of London to
support its research on the conservation of endangered
species in and around the oil palm plantation owned by
one of its plantation companies in the province of
Jambi, Sumatra.
In addition, Wilmar is a member of GAPKI (Indonesian
Palm Oil Producers’ Association) which is a private
sector initiative to promote sustainable palm oil
production and present a unifi ed stand on issues facing
the industry, such as security and interpretation of
RSPO principles and criteria to local
Indonesian context.
As part of its initiatives to benchmark compliance with
the RSPO principles and criteria and other standards on
sustainable palm oil production, Wilmar participates in
evaluations and audits on its environmental and social
(E+S) performance. These include the following:
• In May 2005, Rabobank commissioned an E+S
audit in two of Wilmar’s plantations and mills
in West and South Sumatra according to the
Rabobank Code of Conduct and the Draft RSPO
principles & criteria. It was found that Wilmar’s
plantation and mill operations were in general
compliance with both standards.
• In May 2006, three E+S experts from the
International Finance Corporation (IFC) visited
Wilmar’s plantations and mills in South Sumatra and
West Kalimantan to assess its E+S management
and performance. They reported that the Group’s
Indonesian plantation and mill operations that were
physically evaluated appeared to be managed
appropriately, in line with best international
practice. Overall, social and occupational health
37
and safety performance met applicable IFC
guidelines. Corporate labour policies and practices
followed, and in many areas exceeded, national
legal requirements. Corporate relations with the
community, government, Plasma cooperatives, and
other stakeholders were strong.
• In November and December 2006, Control Union
Certifi cations (The Netherlands) conducted a
chain of custody audit on Wilmar’s plantations,
mills, refi neries and bulk storage facilities in
Indonesia. The audit was commissioned by
Essent, a Netherlands-based power company. The
fi ndings indicated that crude palm oil from Wilmar’s
plantations and used by its refi neries in producing
refi ned products, were sustainably produced and
traceable for the entire production process and
chain. As a result of the study, a Green Gold Label
Certifi cate for Chain of Custody and Processing
Standards was awarded to Wilmar in January 2007.
• In January 2007, Wilmar commissioned a
Verifi cation Audit on its compliance to the RSPO
principles and criteria in six Indonesian provinces
to benchmark its overall E+S performance. This
verifi cation audit will enable the Group to further
enhance its E+S management vis-à-vis the
RSPO principles and criteria, and make
continuous improvement.
CHALLENGES AHEAD
In striving to be a good corporate citizen, Wilmar will
continue to face challenges to ensure that the projects
under its CSR framework are relevant and benefi cial.
In its community development programmes, the Group will
continue to identify and address priority community needs
– to establish an atmosphere of trust and confi dence
amongst the relevant stakeholders. In addition, it will look
into ways to enhance the multiplier effect of the community
development programmes through participatory
techniques and methodologies.
On environment care and conservation, the main
challenge will be to reduce the environmental footprints
of the Group’s operations. Similarly, it will study ways to
enhance and conserve natural resources and biodiversity
in existing plantation lands.
Fully aware that resources are not unlimited, Wilmar has
set its sights on the following priority areas:
• Internalise the RSPO principles and criteria into its
Standard Operating Procedures;
• Collaborate with key agencies to address issues
on conservation of natural resources as well as
biodiversity in plantation development or operations,
within the RSPO framework;
• Collaborate with relevant research organisations on
best management practices in oil palm cultivation;
• Make continuous improvement in enhancing its E+S
performance; and
• Establish third-party verifi cation for Wilmar’s
operations according to the RSPO principles.
38 Wilmar International Limited Annual Report 2006
Risk Management
OVERVIEW
The management of risk is key to the Group’s fi nancial
soundness and integrity, and risk evaluation forms an
integral part of its business strategy development.
Risks must be identifi ed, measured, monitored and
managed within a robust framework, and returns must
commensurate with the risks taken. Wilmar has an
experienced risk management team which identifi es,
measures, manages and controls risks, including
exposures to prices of commodities, foreign currency
exchange rates, interest rates and credit.
MARKET AND CREDIT RISKS
As a result of its global operating and fi nancing
activities, the Group is exposed to various types of
market and credit risks, including changes in commodity
prices, foreign currency exchange rates and
interest rates.
COMMODITY PRICE RISK
The prices of agricultural commodities are determined
by factors such as weather, government policies,
global demographic changes and competition from
substitution products.
When sourcing raw materials and selling the
manufactured outputs, the Group is exposed to price
fl uctuations in the commodities markets because the
sale and purchase commitments do not normally match
at the end of each business day. Wilmar generally uses
forward physical and/or exchange traded commodity
futures contracts to manage such risks.
FOREIGN EXCHANGE RISK
Foreign exchange risk refers to the exposure arising
from movements in foreign currency exchange rates.
The majority of Wilmar’s products are exported and
quoted in USD, while local sales and costs of operation,
purchases of raw materials in Indonesia and Malaysia
are mainly denominated in the local currency.
Fluctuation in currency exchange rates will result in
foreign currency exchange gains or losses arising from
translations of foreign currency monetary assets and
liabilities to USD as at the balance sheet dates.

39
The Group manages its foreign currency exposures by
constructing natural hedges when it matches sales and
purchases in any single currency or through fi nancial
instruments, such as foreign currency forward exchange
contracts. The primary purpose of the foreign currency
forward exchange contract is to protect against the
volatility associated with foreign currency purchases
and sales of raw materials and other assets and
liabilities created in the normal course of business.
INTEREST RATE RISK
Interest rate risk refers to the exposure on interest rate
fl uctuation on the Group’s working capital fi nancing.
Its interest expense may vary depending on the stock
holding period assumed at the time of entering into the
transaction versus the actual time taken to deliver the
physical product and realise the proceeds of sale from
the end-customer. The Group uses mainly short-term
banking facilities to fund its operations and most of its
borrowings are transaction-related.
Consequently, interest expense is dependent on the
volume of transactions and the stock holding period,
and it is subsequently priced into the products. As such,
short-term interest rate movements have minimal impact
on the net contribution margin.
For long-term borrowings, Wilmar usually enters into
interest rates swap contracts to manage our interest
rate risk.
CREDIT RISK
The majority of the Group’s sales are export sales,
for which it typically requires letters of credit from
its customers or cash against the presentation of
documents of title. For domestic sales, which are not
signifi cant, the Group may grant its customers credit
terms from the date of issuance of invoice.
Wilmar evaluates new customers’ credit worthiness
by considering their fi nancial standing and operating
track record, as well as conduct background checks
through its industrial contacts. Based on the information
obtained, Wilmar will decide on the actual credit terms
and limits to be granted. As a practice, it will usually
require a letter of credit for sales to new customers.
For existing customers, the Group will review
periodically the credit terms granted. It will consider
a customer’s current fi nancial strength, payment
history, transaction volume and duration of its business
relationship with the Group. It also monitors the
outstanding trade debts to ensure that corrective steps
are taken to collect these outstanding debts.
40 Wilmar International Limited Annual Report 2006
RISK GOVERNANCE
Wilmar’s risk governance structure comprises three levels,
namely:
• Risk Management Committee at the Board level;
• Executive Risk Committee; and
• Risk management by the head of the merchandising
team.
The Board-level Risk Management Committee, chaired
by an independent director, oversees the Executive
Risk Committee, reviews the overall risk management
guidelines/framework, reviews and recommends risk
limits, as well as assesses the adequacy and effectiveness
of the risk management policies and systems.
The Executive Risk Committee comprises executive
directors. Its responsibilities include, amongst others, the
monitoring and improvement of the overall effectiveness of
its risk management system, the review of trade positions
and limits to manage its overall risk exposure.
Risk Management
The Head of Merchandising is responsible for
monitoring the merchandising team, as well as
adherence with the trading policies and limits set by the
Risk Management Committee and the Board.
To ensure proper segregation of authority and
responsibility to achieve effective governance and
oversight, the Group has a Middle Offi ce independent
of the Front and Back Offi ce. The Middle Offi ce is
responsible for the capture and measurement of Group-
wide risks, as well as for monitoring limit breaches. The
Middle Offi ce circulates a daily risk exposure report,
which is reviewed by the Executive Risk Committee
for any signifi cant risk issues. The Middle Offi ce also
sends out regular risk alerts to the merchandising team,
Executive Risk Committee and/or the Risk Management
Committee when risk exposure is seen to be reaching
trigger levels.

41
The documented risk management policy clearly
defi nes the procedures for monitoring, controlling and
reporting risk in a timely and accurate manner. Wilmar
has also put in place overall risk tolerance threshold
recommended by the Risk Management Committee
and approved by the Board.
The risk tolerance threshold refers to the maximum
potential loss if all unsecured trading and operations
across all products and geographical regions
materialise at the same time. The risk tolerance
threshold is based on a percentage of total
shareholders’ funds, and/or the budgeted annual
operating profi t, after taking into account, inter alia,
the Board’s view on the overall production capacity
of refi ning and processing operations, the prices
(and price trend) of raw materials, its overall view of
the market upon which trading activities take place,
the track record of management in managing its risk
exposures in the prior period, and the fi nancial budgets
including projected sales volumes and turnover.
RISK MANAGEMENT REVIEW
To further improve the Group’s risk management
process, an independent consultant, Deloitte & Touche
Enterprise Risk Services Pte Ltd, was engaged to review
the risk management framework of the Group’s palm oil-
related trading activities to identify gaps and recommend
appropriate improvements.
Recommendations were made by the consultant to
strengthen the risk management process, including
improvements on certain documentation, such
as formalising certain reports, reporting structure
and policies. Wilmar has implemented these
recommendations where necessary.
42 Wilmar International Limited Annual Report 2006
Following the completion of the reverse takeover
(RTO) by Wilmar Holdings Pte Ltd on 14 July 2006, a
new Board of Directors was reconstituted to provide
leadership and direction to the Company. The Company
continues to be committed to maintain high standards
of corporate governance practices in line with the Best
Practices Guide issued by SGX-ST and the principles
set out in the Corporate Governance Code 2005
(Code). This report sets out the practices that have
been implemented by the Company.
PRINCIPLE 1
The Board’s Conduct of its Affairs
The Board sets the overall business direction of the
Group, with particular focus on business expansion
and synergies. The Board reviews the strategic
plans, business development proposals and risk
management policies of the Group directly or through
the respective committees. The Board is committed to
the enhancement of the long-term shareholder value.
Corporate Governance
In addition to its statutory responsibilities, the Board is
primarily responsible for:
• Approving the Group’s strategic plans, key
operational initiatives, major investment and funding
decisions;
• Reviewing the fi nancial performance of the Group
on a quarterly basis; and
• Identifying principal risks of the Group’s businesses
and ensuring the implementation of appropriate
systems to manage these risks.
Two new Board committees, namely the Executive
Committee and the Risk Management Committee
have been established with a view to assist the Board
in supervising the Group’s business operations within
a framework of prudent and effective controls, and to
oversee risk management matters respectively.
The Board holds at least four formal meetings a
year. Since the completion of the RTO, the Board
convened three meetings in the second half of 2006.
The Company has provided for telephonic and
videoconference meetings in its Articles of Association
so as to better facilitate Board members to participate in
Board and Board Committee meetings.
43
Executive Committee
The Executive Committee (Exco) assists the Board in
the formulation of business policies and the supervision
of the day-to-day management of the operations of
the Group. The members of the Exco are
Mr Kuok Khoon Hong (Chairman), Mr Martua Sitorus,
Mr Chua Phuay Hee and Mr Teo Kim Yong, all of whom
are executive directors of the Company.
The Board delegates to the Exco the discretion to
approve capital expenditure, investments, acquisitions
and disposals of assets of the Group, obtain banking
facilities and approve loans to companies within the
Group not exceeding the threshold of US$10 million or
5% of the net tangible assets of the Group, Company or
the respective subsidiary, whichever is the lower. The
Exco is also tasked with the oversight of the
Senior Management’s delegated responsibility in the
following functions:
• Drawing up the Group’s annual budget and
business plan for the Board’s approval;
• Carrying through business strategies as approved
in the annual budget and business plan;
• Implementing appropriate systems of internal
accounting and other controls;
• Adopting suitably competitive human resource
practices and compensation policies; and
• Ensuring that the Group operates within the
approved budgets.
Risk Management Committee
To provide further assurance to the Board and Audit
Committee, a Risk Management Committee (RMC) was
set up. The RMC is chaired by Mr Yeo Teng Yang, the
Lead Independent Director, with Mr Kuok Khoon Hong
and Mr Leong Horn Kee as members.
The RMC oversees matters relating to the strategic
management of risks and risk exposure, and monitors
the implementation and compliance of risk management
policies. Risk management policies for the Group are
in place and are regularly reviewed and updated in
accordance with industry practices.

44 Wilmar International Limited Annual Report 2006
Corporate Governance
The Company arranged its legal advisors to brief all newly appointed Directors on their duties and obligations. In addition,
the senior management regularly briefs and familiarises Directors on the business activities of the Company. As part of the
Company’s continuing efforts to update Directors on the latest listed corporate developments, Directors are invited to attend
on-going enrichment programs organised by recognised institutions.
––––––––––––––––––––––––––––––––––––––––––––––––––––––––––––––––––––––––––––––––––––––––––––––––––––––––––––––––––––––––––––––––––––––
Board of Audit Risk Management Directors Committee (AC) Committee (RMC)––––––––––––––––––––––––––––––––––––––––––––––––––––––––––––––––––––––––––––––––––––––––––––––––––––––––––––––––––––––––––––––––––––––
No. of meetings held 3 2 2
––––––––––––––––––––––––––––––––––––––––––––––––––––––––––––––––––––––––––––––––––––––––––––––––––––––––––––––––––––––––––––––––––––––
Name & Attendance of Director Attendance Member Attendance Member Attendance––––––––––––––––––––––––––––––––––––––––––––––––––––––––––––––––––––––––––––––––––––––––––––––––––––––––––––––––––––––––––––––––––––––
Executive Directors
Kuok Khoon Hong 3 – – Yes 2Martua Sitorus 3 – – – –Chua Phuay Hee 3 – – – –Teo Kim Yong 3 – – – –
––––––––––––––––––––––––––––––––––––––––––––––––––––––––––––––––––––––––––––––––––––––––––––––––––––––––––––––––––––––––––––––––––––––
Non-Executive Directors
William Henry Camp (a)1 – – – –Yu Hung Yen, Stephen (alternate to William Henry Camp) (b)2 Yes (b)1 – – (resigned on 31.10.06)
––––––––––––––––––––––––––––––––––––––––––––––––––––––––––––––––––––––––––––––––––––––––––––––––––––––––––––––––––––––––––––––––––––––
Independent Non-Executive Directors
Yeo Teng Yang 3 Yes 1 Yes 2 (appointed on 31.10.06)Leong Horn Kee 2 – – Yes 2Tay Kah Chye 3 Yes 2 – –Kwah Thiam Hock 3 Yes 2 – –
––––––––––––––––––––––––––––––––––––––––––––––––––––––––––––––––––––––––––––––––––––––––––––––––––––––––––––––––––––––––––––––––––––––
The Directors’ attendance at Board and Board Committee meetings between 14 July 2006 and 31 December 2006 is set out
as follows:
The other committees did not convene any meeting between the date of RTO completion and the end of December 2006.
Notes(a) Mr William Henry Camp, a nominee of Archer Daniels Midland Company (ADM), was appointed as a Non-Executive Director (NED) on 31 October 2006.
His proposal to appoint Mr Yu Hung Yen, Stephen as his alternate was approved by the Board. Mr Camp has given authorisation to Mr Yu to attend Board meetings, on his behalf in his absence.
(b) Mr Yu, a nominee of ADM, was appointed by the Company as a Non-Executive Director (NED) on 14 July 2006. He stepped down as NED and member of the Audit Committee and Remuneration Committee on 31 October 2006. His current appointment as Non-Executive Alternate Director (to Mr Camp) took effect on 31 October 2006.

45
The composition and the effectiveness of the Board
are reviewed on an annual basis by the Nominating
Committee to ensure that it has the appropriate mix of
expertise and experience to fulfi ll its duties.
PRINCIPLE 3
Chairman and Chief Executive Offi cer
Mr Kuok Khoon Hong, the Chairman and Chief
Executive Offi cer (CEO), is instrumental in growing the
business of the Group. He provides strong leadership
and is overall in-charge of the management and
strategic operations of the Group. All strategic and
major decisions made by the Chairman and CEO are
reviewed and approved by the Board.
He ensures that additional Board meetings are held
where necessary and reviews all papers before they
are presented to the Board to enable them to be fully
cognizant of the affairs of the Group. He facilitates
discussions and solicits contributions from Board
members, in particular the Non-Executive Directors.
The role of the Chairman and CEO is not separate
as there is adequate accountability and transparency as
refl ected by internal controls established within
the Group. The adoption of single leadership structure
speeds up the decision-making and implementation
process to seize potential business opportunities to
further grow the Group. Moreover, the appointment of a
Lead Independent Director provides shareholders with
another effective communication channel to address
their concerns and acts as a counter balance to the
decision-making process.
PRINCIPLE 2
Board Composition and Guidance
The Board currently has nine members comprising four
Executive Directors and fi ve Non-Executive Directors of
whom four are Independent Directors.
The assessment of “independence” is determined based
on the Code. The Board considers an “independent”
director as one who has no relationship with the Group
that could interfere with the exercise of the directors’
independent judgment of the Group’s affairs. With more
than one third of the Board deemed to be independent,
the Board is able to independently assess and monitor
the Company’s business operations.
The Board is made up of directors with a wide range
of skills, experience and qualities in the fi elds of
operations, fi nancial and risk management. Key
information about the Directors is presented in the
section entitled “Board of Directors” in this
annual report.
The Board has examined its size and assessed the
impact of the number on its effectiveness. It is of the
view that the current board size complies with the Code
and is effective in facilitating decision-making.
On 14 December 2006, the Company announced
the proposed merger of the Company with
PPB Oil Palms Berhad, Kuok Oils & Grains Pte Ltd
and PGEO Group Sdn Bhd. Upon the completion of
the merger, representatives of the Kuok Group will be
invited to join the Board.
46 Wilmar International Limited Annual Report 2006
Corporate Governance
PRINCIPLE 4
Board Membership
The composition of the Nominating Committee (NC)
was reconstituted on 14 July 2006 upon the completion
of the RTO. The NC comprises three directors,
a majority of whom including the Chairman,
are Independent Directors. The members are
Mr Kwah Thiam Hock (Chairman), Mr Kuok Khoon Hong
and Mr Tay Kah Chye.
The NC meets at least once a year. Its focus is guided
by the Terms of Reference adopted from the Code.
The NC’s duties and functions are as follows:
1. To make recommendations to the Board on all
Board appointments and re-nominations
having regard to the directors’ contribution
and performance.
2. To ensure that all directors submit themselves for
re-nomination and re-election at regular intervals, at
least once in every three years.
3. To determine annually whether a director is
independent, guided by the independent guidelines
contained in the Code.
4. To decide whether a director is able to and has
adequately carried out his duties as a director
of the Company, in particular where the director
concerned has multiple board representations or
if they are in confl ict with the interests of
the Company.
5. To decide how the Board’s performance may be
evaluated and propose objective performance
criteria.
Board appointments during the year are made by
way of Board resolution after the NC has reviewed
their credentials and assess their contributions to the
Company and recommendation.
Under the Articles of Association, one third of the
Directors, except for the Managing Director (or any
equivalent appointment, howsoever described), are
required to retire by rotation at least once every three
years and are subject to re-election by the shareholders
at the annual general meeting (AGM). All newly
appointed directors during the year shall hold offi ce only
until the AGM following their appointments.
Mr Leong Horn Kee, who was last re-elected on
30 April 2004 and being the longest in offi ce, retires
by rotation in accordance with Article 104, has been
nominated for re-election at the forthcoming AGM.
All the Directors appointed during the fi nancial year
2006, except for Mr Kuok Khoon Hong and
Mr Chua Phuay Hee who have been re-elected at
the last AGM held on 28 April 2006, have submitted
themselves for re-election at the 2007 AGM.
PRINCIPLE 5
Board Performance
The NC has adopted a revised set of Board
performance appraisal criteria which was endorsed
by the Board. The performance evaluation exercise
will enable the NC to identify areas of improvement to
the Board’s effectiveness as a whole. The evaluation
process is carried out by way of an assessment
checklist through which each NC member is required
to complete and to assess individually the Board’s
overall effectiveness based on factors including
the Board’s understanding on the Group’s business
operations, development of strategic directions and
the effectiveness of Board meetings to facilitate
discussion and decision on important critical and major
corporate matters. The collated fi ndings are reported
and recommendations are made to the Board for
consideration and for further improvements to help the
Board to discharge its duties more effectively.
The Board plans to develop and implement a fair
and effective performance assessment of
individual directors.
47
PRINCIPLE 6
Access to Information
The Board is provided with complete, adequate and
timely information prior to Board meetings and on an
on-going basis.
The Board has separate, independent and unrestricted
access to Senior Management of the Group at all times.
Requests for information from the Board are dealt with
promptly by Senior Management. The Board is informed
of all material events and transactions as and when
they occur.
The Company Secretary attends all Board meetings
and is responsible to ensure that established
procedures and all relevant statutes and regulations
that are applicable to the Company are complied
with. The Company Secretary works together with
the management staff of the Company to ensure the
Company complies with all relevant rules
and regulations.
PRINCIPLE 7
Procedures for Developing Remuneration Policies
The Remuneration Committee (RC) has also been
reconstituted and a majority of whom are Independent
Directors. The RC members are Mr Kwah Thiam Hock
(Chairman), Mr Kuok Khoon Hong, Mr Yeo Teng Yang
and Mr Leong Horn Kee. In discharging their duties, the
members have access to the advice from the human
resources department, and if required, the advice from
outside experts.
The main duty of the RC is to review and recommend
to the Board, an appropriate framework of remuneration
for Directors and key executives of the Group.
The RC administers the Share Option Scheme which
was established on 30 June 2000 in accordance with
the rules as approved by shareholders. There were no
outstanding options as at the date of the completion
of the RTO. No options have been granted during the
fi nancial year ended 31 December 2006.
PRINCIPLES 8 & 9
Level and Mix Remuneration & Disclosure
on Remuneration
The remuneration packages for Executive Directors
comprised both a fi xed and a variable component.
The variable component is performance-related and
a signifi cant proportion of the Executive Directors’
remuneration package is linked to the Company’s
performance and individual directors’ performance.
Executive Directors do not receive Directors’ fees
from the Company or from its subsidiaries/associate
companies if they are appointed to such Boards.
The non-Executive Directors are paid a fi xed fee.
Payment of Directors’ fees is subject to shareholders’
approval at the AGM. The RC is of the view that the
remuneration of non-Executive Directors is appropriate;
taking into account factors such as effort and time
spent, and responsibilities of the Directors.

48 Wilmar International Limited Annual Report 2006
Corporate Governance
PRINCIPLE 10
Accountability of the Board and Management
The Board and the Management constantly strive
towards delivering maximum sustainable value to the
shareholders of the Company.
Shareholders are provided with quarterly results
available through the SGX-ST website and the
Company’s latest events and information are posted on
its website.
PRINCIPLE 11
Audit Committee
The Audit Committee (AC) comprises three independent
directors, Mr Tay Kah Chye (Chairman), Mr Kwah Thiam Hock
and Mr Yeo Teng Yang.
The operations of the AC are regulated by its charter. The
Board is of the opinion that the members of the AC have
suffi cient accounting, fi nancial, management expertise or
experience to discharge their duties.
The breakdown (in percentage) of the remuneration of the Directors of the Company for the year ended 31 December 2006
is as follows:
––––––––––––––––––––––––––––––––––––––––––––––––––––––––––––––––––––––––––––––––––––––––––––––––––––––––––––––––––––––––––––––––––––––
Directors’ Variable RemunerationName of Directors Fee Salary Benefi ts Bonus Total Band
––––––––––––––––––––––––––––––––––––––––––––––––––––––––––––––––––––––––––––––––––––––––––––––––––––––––––––––––––––––––––––––––––––––
Executive DirectorsKuok Khoon Hong Nil 59% 3% 38% 100% S$500,001-750,000Martua Sitorus Nil 59% 3% 38% 100% S$500,001-750,000Teo Kim Yong Nil 72% 2% 26% 100% S$500,001-750,000Chua Phuay Hee Nil 76% – 24% 100% S$250,001-500,000
––––––––––––––––––––––––––––––––––––––––––––––––––––––––––––––––––––––––––––––––––––––––––––––––––––––––––––––––––––––––––––––––––––––
Non-Executive DirectorsWilliam Henry Camp Nil – – – – Not applicableYu Hung Yen, Stephen Nil – – – – Not applicable (Alternate Director to William Henry Camp)
––––––––––––––––––––––––––––––––––––––––––––––––––––––––––––––––––––––––––––––––––––––––––––––––––––––––––––––––––––––––––––––––––––––
Independent Non-Executive DirectorsYeo Teng Yang 100% – – – 100% S$250,000 and belowLeong Horn Kee 100% – – – 100% S$250,000 and belowTay Kah Chye 100% – – – 100% S$250,000 and belowKwah Thiam Hock 100% – – – 100% S$250,000 and below
––––––––––––––––––––––––––––––––––––––––––––––––––––––––––––––––––––––––––––––––––––––––––––––––––––––––––––––––––––––––––––––––––––––
Directors’ fees in respect of the fi nancial year ended 31 December 2006 are subject to approval by shareholders at the
forthcoming AGM.
The Code requires the remuneration of the top fi ve key executives who are not Directors of the Company to be disclosed
within bands of S$250,000. The Company believes that disclosure of remuneration is disadvantageous to its business
interests, given competitive industry conditions and the sensitivity of disclosure of staff remuneration matters.

49
The members of the AC meet at least four times a year
and perform the following functions:
• To review the criteria for the appointment of a
professional public accounting fi rm as the external
auditors to the Company;
• To review with the external auditors, their evaluation
of the system of internal accounting controls;
• To review and approve, the scope and results
of the external audit, its cost effectiveness and
the independence and objectivity of the external
auditors;
• To review with the external auditors, their audit
report, fi ndings and recommendations. Where the
external auditor also supply a substantial volume of
non-audit services to the Company, to review the
nature and extent of such services to maintain the
independence of the Auditors.
• To review and approve the fi nancial statements
of the Company and the consolidated fi nancial
statements of the Group for submission to the
Board of Directors for approval.
• To review the assistance given by the Company’s
offi cers to the external auditors;
• To nominate external auditors for re-appointment;
• To ensure that the internal audit function is
adequately resourced and has appropriate standing
within the Group/Company. For the avoidance
of doubt, the internal audit function can be either
in-house, outsourced to a reputable accounting/
auditing third-party fi rm or performed by a major
shareholder, holding company, parent company or
controlling enterprise with an internal audit staff;
• To review the scope and results of the internal
audit procedures;
• To ensure the adequacy of the audit function
annually;
• To ensure that a review of the effectiveness of the
Company’s material internal controls, including
fi nancial, operational and compliance controls, and
risk management is conducted annually;
• To review interested person transactions; and
• To meet with the external and internal auditors
without the presence of the management at least
once a year.
The AC has explicit authority to investigate any matters
within the scope of its duties, and power to obtain
independent professional advice. It has been given full
access to and co-operation by the management and
reasonable resources to discharge its duties properly
and full discretion to invite other directors or executives
to attend its meetings.
Since the completion of the RTO in July 2006, the AC
met twice to review, inter alia, the following:
• The fi nancial statements of the Company and the
Group before each of the announcements of the
Company’s quarterly results. During the process,
the AC reviewed, among other things, the key areas
of management judgment applied for adequate
provision and disclosure, critical accounting policies
and any signifi cant changes made that would have
an impact on the fi nancials;
• The external auditors’ plans for the purpose of
discussing the scope of the audit and reporting
obligations before the audit commences. All
signifi cant audit fi ndings and recommendations
made by the external auditors were discussed,
and where appropriate, implementation
of such recommendations were followed up
with management;
50 Wilmar International Limited Annual Report 2006
• The independence and objectivity of the external
auditors through discussions with the external
auditors as well as reviewing the nature and volume
of non-audit services provided by them. The AC
is satisfi ed that such services do not affect the
independence or objectivity of the external auditors;
• The internal audit fi ndings raised by the internal
auditors. During the process, material non-
compliance and internal control weaknesses
were reviewed and discussed. The AC ensured
that appropriate follow-up actions had been taken
regularly with the management on outstanding
internal audit issues; and
• The reporting on Interested Person Transactions
to ensure that current procedures for monitoring of
Interested Person Transactions had been complied
with. These transactions are reviewed quarterly with
the internal auditors and annually with the external
auditors. The AC is satisfi ed that the guidelines and
review procedures established to monitor Interested
Person Transactions have been complied with.
The AC has recommended to the Board the re-
appointment of Ernst & Young as the Company’s
external auditors at the forthcoming AGM.
PRINCIPLES 12 & 13
Internal Controls and Audit
Reporting to the AC, the internal audit department
carried out internal audit reviews and performed checks
and compliance tests of the Group’s systems of internal
control, including fi nancial and operational controls and
risk management. Ad-hoc reviews are also conducted
on areas of concern identifi ed by management and
the AC.
The internal audit department, headed by
Mr Patrick Tan, has unrestricted access to all
records, properties, functions and co-operation from
management and staff as necessary to effectively
discharge its responsibilities, and is independent of the
activities it audits.
The Board is of the view that the Group currently has
an adequate internal control system in place during
the fi nancial year under review to provide reasonable
but not absolute assurance that there are no material
loss or fi nancial misstatement, assets are safeguarded,
proper accounting records are maintained, and fi nancial
information used with the business and for publication
is reliable. The Board notes that no system of internal
control could provide absolute assurance against
the occurrence of material errors, poor judgment in
decision-making, human error, losses, fraud or
other irregularities.
PRINCIPLES 14 & 15
Communication with Shareholders
In line with continuous obligations of the Company
pursuant to the Singapore Exchange’s Listing Rules,
the Board’s policy is that all shareholders should be
equally informed of all major developments impacting
the Group.
All shareholders of the Company receive the annual
reports and notices of general meetings. Shareholders
are given the opportunity to voice their views and
ask directors questions regarding the Company. The
Chairmen of the Audit Committee, Risk Management
Committee, Remuneration Committee and Nominating
Committee will normally be present at annual general
meetings to answer any questions relating to the work of
these committees.
DEALINGS IN SECURITIES
The Group has procedures in place prohibiting dealings
in the Company’s shares by all staff while in possession
of price sensitive information and during the period
commencing two weeks prior to the announcement of
the Company’s quarterly results and one month prior
to the announcement of the Company’s yearly results.
Directors and executives are also expected to observe
insider-trading laws at all times even when dealing in
securities during the permitted trading period.
Corporate Governance
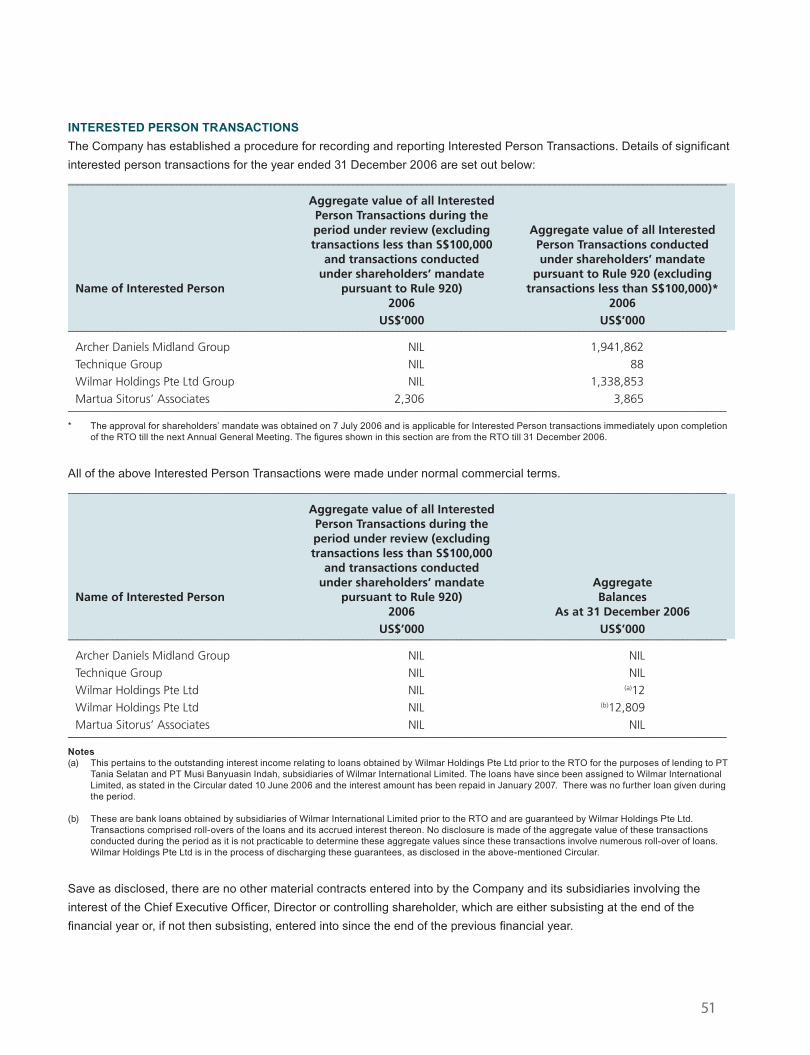
51
INTERESTED PERSON TRANSACTIONS
The Company has established a procedure for recording and reporting Interested Person Transactions. Details of signifi cant
interested person transactions for the year ended 31 December 2006 are set out below:
––––––––––––––––––––––––––––––––––––––––––––––––––––––––––––––––––––––––––––––––––––––––––––––––––––––––––––––––––––––––––––––––––––––
Aggregate value of all Interested Person Transactions during the period under review (excluding Aggregate value of all Interested transactions less than S$100,000 Person Transactions conducted and transactions conducted under shareholders’ mandate under shareholders’ mandate pursuant to Rule 920 (excluding
Name of Interested Person pursuant to Rule 920) transactions less than S$100,000)* 2006 2006 US$’000 US$’000––––––––––––––––––––––––––––––––––––––––––––––––––––––––––––––––––––––––––––––––––––––––––––––––––––––––––––––––––––––––––––––––––––––
Archer Daniels Midland Group NIL 1,941,862Technique Group NIL 88Wilmar Holdings Pte Ltd Group NIL 1,338,853Martua Sitorus’ Associates 2,306 3,865
––––––––––––––––––––––––––––––––––––––––––––––––––––––––––––––––––––––––––––––––––––––––––––––––––––––––––––––––––––––––––––––––––––––
* The approval for shareholders’ mandate was obtained on 7 July 2006 and is applicable for Interested Person transactions immediately upon completion of the RTO till the next Annual General Meeting. The fi gures shown in this section are from the RTO till 31 December 2006.
All of the above Interested Person Transactions were made under normal commercial terms.
––––––––––––––––––––––––––––––––––––––––––––––––––––––––––––––––––––––––––––––––––––––––––––––––––––––––––––––––––––––––––––––––––––––
Aggregate value of all Interested Person Transactions during the period under review (excluding transactions less than S$100,000 and transactions conducted under shareholders’ mandate Aggregate
Name of Interested Person pursuant to Rule 920) Balances 2006 As at 31 December 2006 US$’000 US$’000––––––––––––––––––––––––––––––––––––––––––––––––––––––––––––––––––––––––––––––––––––––––––––––––––––––––––––––––––––––––––––––––––––––
Archer Daniels Midland Group NIL NILTechnique Group NIL NILWilmar Holdings Pte Ltd NIL (a)12Wilmar Holdings Pte Ltd NIL (b)12,809Martua Sitorus’ Associates NIL NIL
––––––––––––––––––––––––––––––––––––––––––––––––––––––––––––––––––––––––––––––––––––––––––––––––––––––––––––––––––––––––––––––––––––––
Notes(a) This pertains to the outstanding interest income relating to loans obtained by Wilmar Holdings Pte Ltd prior to the RTO for the purposes of lending to PT
Tania Selatan and PT Musi Banyuasin Indah, subsidiaries of Wilmar International Limited. The loans have since been assigned to Wilmar International Limited, as stated in the Circular dated 10 June 2006 and the interest amount has been repaid in January 2007. There was no further loan given during the period.
(b) These are bank loans obtained by subsidiaries of Wilmar International Limited prior to the RTO and are guaranteed by Wilmar Holdings Pte Ltd. Transactions comprised roll-overs of the loans and its accrued interest thereon. No disclosure is made of the aggregate value of these transactions conducted during the period as it is not practicable to determine these aggregate values since these transactions involve numerous roll-over of loans. Wilmar Holdings Pte Ltd is in the process of discharging these guarantees, as disclosed in the above-mentioned Circular.
Save as disclosed, there are no other material contracts entered into by the Company and its subsidiaries involving the
interest of the Chief Executive Offi cer, Director or controlling shareholder, which are either subsisting at the end of the
fi nancial year or, if not then subsisting, entered into since the end of the previous fi nancial year.

52 Wilmar International Limited Annual Report 2006
Corporate Headquarters, Singapore

53
54 Financial Review
58 Directors’ Report
62 Statement by Directors
63 Independent Auditors’ Report
64 Consolidated Profit and Loss Account
65 Balance Sheets
66 Statements of Changes in Equity
68 Consolidated Cash Flow Statement
70 Notes to the Financial Statements
125 Statistics of Shareholdings
127 Notice of Annual General Meeting
Proxy Form
Financials
54 Wilmar International Limited Annual Report 2006
OVERVIEWWilmar International Limited, formerly known as Ezyhealth Asia Pacific Ltd, was transformed into one of Asia’s largest integrated agribusiness groups when it completed the acquisition of the palm oil and related assets from Wilmar Holdings Pte Ltd (the reverse takeover) in July 2006 and an equity placement exercise in August 2006.
The financial year 2006 marked its maiden year of reporting as Wilmar International Limited. It recorded a strong set of results with net profit after tax of US$104.6 million, a sharp 80.2% jump over the previous year. This resulted in earnings per share of 4.51 US cents, a 68.9% increase.
The results included a US$14.3 million accounting charge for goodwill arising from the reverse takeover in July 2006. Included in FY2006 results is an accounting gain (before tax) of US$17.4 million arising from the fair valuation of its plantations. In accordance with FRS 41, biological assets are measured at each balance sheet date at their fair value less estimated point of sale costs.
The strong financial results together with new equity from its placement exercise strengthened the Group’s shareholders’ funds to US$584.8 million. In addition, return on average equity for FY2006 was a respectable 24.6%.
The Group announced on 14 December 2006, the proposed merger with Kuok Group’s palm plantations, edible oils, grains and related businesses in a deal amounting to US$2.7 billion, as well as the acquisition of its parent company, Wilmar Holdings Pte Ltd’s edible oils, grains and related businesses, including interests held by ADM, in a deal worth US$1.6 billion. These transactions are expected to complete by the end of June 2007.
EARNINGSEarnings increased as a result of significantly improved performance in the Merchandising and Refinery of Palm and Laurics, as well as the Plantations and Palm Oil Mills segments.
Growth in sales and production volume as well as higher palm prices were the main reasons for the strong performance of these business segments.
Increased demand for palm was created by the anticipated rise in demand for renewable energy, whilst increasingly affluent countries like India and China continue to fuel the demand for palm oil for edible use. With higher demand for palm and higher crude and mineral oil prices, palm oil prices in FY2006 were much firmer.
Apart from the positive external factors, the Group’s performance was also aided by higher production yield in its plantations and the completion of its capacity expansion in milling and refinery facilities.
Financial Review
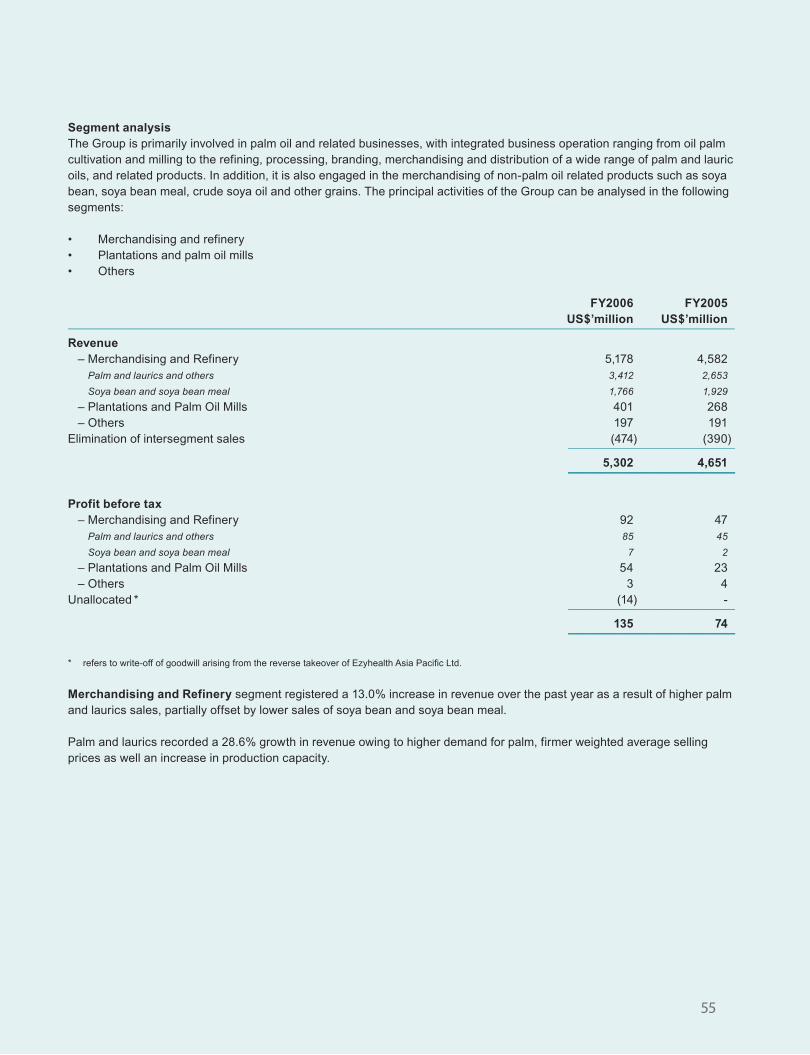
55
Segment analysisThe Group is primarily involved in palm oil and related businesses, with integrated business operation ranging from oil palm cultivation and milling to the refining, processing, branding, merchandising and distribution of a wide range of palm and lauric oils, and related products. In addition, it is also engaged in the merchandising of non-palm oil related products such as soya bean, soya bean meal, crude soya oil and other grains. The principal activities of the Group can be analysed in the following segments:
• Merchandising and refinery• Plantations and palm oil mills• Others
FY2006 FY2005 US$’million US$’million–––––––––––––––––––––––––––––––––––––––––––––––––––––––––––––––––––––––––––––––––––––––––––––––––––––––––––––––––––––––––––––––––––––––––––––––––––––––––––
Revenue – Merchandising and Refinery 5,178 4,582 Palm and laurics and others 3,412 2,653
Soya bean and soya bean meal 1,766 1,929
– Plantations and Palm Oil Mills 401 268 – Others 197 191Elimination of intersegment sales (474) (390)
–––––––––––––––––––––––––––––––––––––––
5,302 4,651––––––––––––––––––––––––––
Profit before tax – Merchandising and Refinery 92 47 Palm and laurics and others 85 45
Soya bean and soya bean meal 7 2
– Plantations and Palm Oil Mills 54 23 – Others 3 4Unallocated * (14) -
–––––––––––––––––––––––––––––––––––––––
135 74––––––––––––––––––––––––––
* refers to write-off of goodwill arising from the reverse takeover of Ezyhealth Asia Pacific Ltd.
Merchandising and Refinery segment registered a 13.0% increase in revenue over the past year as a result of higher palm and laurics sales, partially offset by lower sales of soya bean and soya bean meal.
Palm and laurics recorded a 28.6% growth in revenue owing to higher demand for palm, firmer weighted average selling prices as well an increase in production capacity.
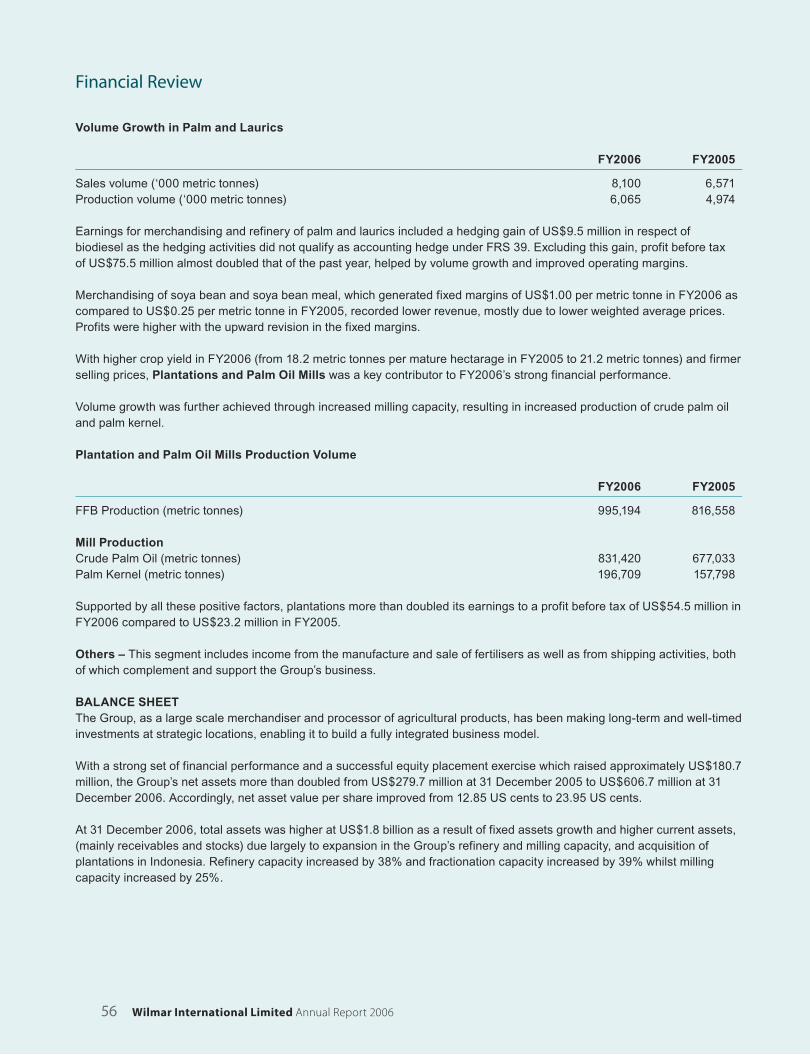
56 Wilmar International Limited Annual Report 2006
Volume Growth in Palm and Laurics
FY2006 FY2005–––––––––––––––––––––––––––––––––––––––––––––––––––––––––––––––––––––––––––––––––––––––––––––––––––––––––––––––––––––––––––––––––––––––––––––––––––––––––––
Sales volume (‘000 metric tonnes) 8,100 6,571Production volume (‘000 metric tonnes) 6,065 4,974
Earnings for merchandising and refinery of palm and laurics included a hedging gain of US$9.5 million in respect of biodiesel as the hedging activities did not qualify as accounting hedge under FRS 39. Excluding this gain, profit before tax of US$75.5 million almost doubled that of the past year, helped by volume growth and improved operating margins.
Merchandising of soya bean and soya bean meal, which generated fixed margins of US$1.00 per metric tonne in FY2006 as compared to US$0.25 per metric tonne in FY2005, recorded lower revenue, mostly due to lower weighted average prices. Profits were higher with the upward revision in the fixed margins.
With higher crop yield in FY2006 (from 18.2 metric tonnes per mature hectarage in FY2005 to 21.2 metric tonnes) and firmer selling prices, Plantations and Palm Oil Mills was a key contributor to FY2006’s strong financial performance.
Volume growth was further achieved through increased milling capacity, resulting in increased production of crude palm oil and palm kernel.
Plantation and Palm Oil Mills Production Volume
FY2006 FY2005–––––––––––––––––––––––––––––––––––––––––––––––––––––––––––––––––––––––––––––––––––––––––––––––––––––––––––––––––––––––––––––––––––––––––––––––––––––––––––
FFB Production (metric tonnes) 995,194 816,558
Mill ProductionCrude Palm Oil (metric tonnes) 831,420 677,033Palm Kernel (metric tonnes) 196,709 157,798
Supported by all these positive factors, plantations more than doubled its earnings to a profit before tax of US$54.5 million in FY2006 compared to US$23.2 million in FY2005.
Others – This segment includes income from the manufacture and sale of fertilisers as well as from shipping activities, both of which complement and support the Group’s business.
BALANCE SHEETThe Group, as a large scale merchandiser and processor of agricultural products, has been making long-term and well-timed investments at strategic locations, enabling it to build a fully integrated business model.
With a strong set of financial performance and a successful equity placement exercise which raised approximately US$180.7 million, the Group’s net assets more than doubled from US$279.7 million at 31 December 2005 to US$606.7 million at 31 December 2006. Accordingly, net asset value per share improved from 12.85 US cents to 23.95 US cents.
At 31 December 2006, total assets was higher at US$1.8 billion as a result of fixed assets growth and higher current assets, (mainly receivables and stocks) due largely to expansion in the Group’s refinery and milling capacity, and acquisition of plantations in Indonesia. Refinery capacity increased by 38% and fractionation capacity increased by 39% whilst milling capacity increased by 25%.
Financial Review
57
Working capital at 31 December 2006 was a negative US$46.7 million mainly due to short-term funding of long-term assets and high working capital requirements.The Group does not view the imbalance between short-term and long-term borrowings as a cause for concern with the current ratio at 0.96x which is only slightly below 1x, largely because it is confident that it will be able to meet its funding needs from external borrowings and internally generated funds. Net cashflow from operations contributed an inflow of US$99.7 million in FY2006, which was a vast improvement over FY2005’s outflow of US$52.5 million. The liquidity risk is also mitigated by support from its bankers in terms of raising debt, and this is evident from its significant banking facilities amounting to US$1.4 billion of which US$681.4 million was not utilised at end December 2006. Nevertheless, it is reviewing the financing structure with a view to optimising the debt structure and this will be done in conjunction with the proposed merger and acquisition announced in December 2006.
The Group’s working capital requirements is inherently high owing to the nature of the business i.e.
• Main product sales are agricultural-based commodities whose prices have risen in recent years• Raw materials are also commodity-based which amount to more than 90% of the costs of sales• Quick turnaround of the processing operations, resulting in efficient utilisation of the production capacity• High volume of turnover.
The high working capital is however mitigated by a short working capital cycle which has been consistently kept within a month on the average.
Whilst total borrowings increased from US$689.7 million to US$759.6 million as a result of investments and higher working capital due to expansion, net gearing ratio improved sharply to 1.2x as at 31 December 2006 because of the stronger balance sheet.
USE OF PROCEEDS FROM PLACEMENT OF SHARESNet proceeds received from the equity placement exercise of 356.25 million of shares amounted to US$172.6 million. During the year, more than half of these proceeds have been applied towards capital expenditure, and the rest, for general working capital.
Proceeds for capital expenditure were used in the following ways:
• New palm oil mills and acquisition of new plantations – US$43.8 million• Expansion in refinery capacity – US$28.0 million• Biodiesel – US$14.3 million and others – US$9.1 million.

58 Wilmar International Limited Annual Report 2006
The directors are pleased to present their report to the members together with the audited consolidated financial statements of Wilmar International Limited (“the Company”) and its subsidiaries (collectively, “the Group”) and the balance sheet and statement of changes in equity of the Company for the financial year ended 31 December 2006.
DIRECTORSThe directors of the Company in office at the date of this report are:
Kuok Khoon Hong (appointed on 24 March 2006, re-designated on 14 July 2006)Martua Sitorus (appointed on 14 July 2006)Chua Phuay Hee (appointed on 24 March 2006, re-designated on 14 July 2006)Teo Kim Yong (appointed on 14 July 2006)William Henry Camp (appointed on 31 October 2006)Yu Hung Yen Stephen * (appointed on 31 October 2006 as alternate to William Henry Camp)Yeo Teng Yang (appointed on 14 July 2006)Leong Horn Kee Tay Kah Chye (appointed on 14 July 2006)Kwah Thiam Hock (appointed on 14 July 2006)
* appointed as director on 14 July 2006 and resigned on 31 October 2006.
ARRANGEMENTS TO ENABLE DIRECTORS TO ACQUIRE SHARES AND DEBENTURES Except as disclosed in this report, neither at the end of nor at any time during the financial year was the Company a party to any arrangement whose objects are, or one of whose object is, to enable the directors of the Company to acquire benefits by means of the acquisition of shares or debentures of the Company or any other body corporate.
DIRECTORS’ INTERESTS IN SHARES AND DEBENTURESThe following directors, who held office at the end of the financial year, had, according to the register of directors’ shareholdings required to be kept under Section 164 of the Singapore Companies Act, Cap. 50, an interest in shares of the Company and its related corporations (other than wholly-owned subsidiaries) as stated below:
Direct Interest Deemed interest ––––––––––––––––––––––––––––––––––––––––––– –––––––––––––––––––––––––––––––––––––––––––
As at 1.1.06 As at 1.1.06 or date of or date of appointment appointment or completion or completion date of reverse date of reverse takeover offer As at 31.12.06 takeover offer As at 31.12.06–––––––––––––––––––––––––––––––––––––––––––––––––––––––––––––––––––––––––––––––––––––––––––––––––––––––––––––––––––––––––––––––––––––––––––––––––––––––––––
COMPANYWilmar International Limited(Ordinary shares)Kuok Khoon Hong – – 2,075,000,000 2,075,000,000 Martua Sitorus – – 2,075,000,000 2,075,000,000
The interests in shares of the Company as at 21 January 2007 held by the above-mentioned directors were the same as those as at 31 December 2006.
IMMEDIATE HOLDING COMPANYWilmar Holdings Pte Ltd(Ordinary shares)Kuok Khoon Hong – – 113,233,476 113,233,476Martua Sitorus – – 114,434,660 114,434,660Teo Kim Yong 999,036 999,036 – –
Directors’ Report
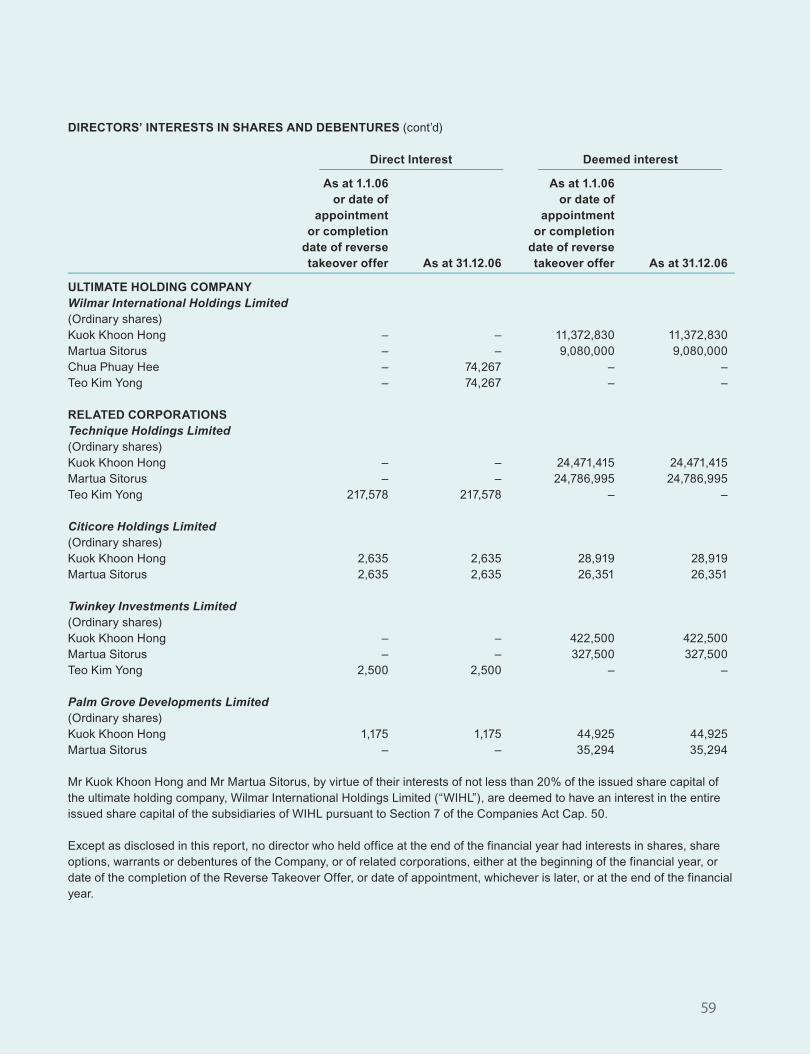
59
DIRECTORS’ INTERESTS IN SHARES AND DEBENTURES (cont’d)
Direct Interest Deemed interest ––––––––––––––––––––––––––––––––––––––––––– –––––––––––––––––––––––––––––––––––––––––––
As at 1.1.06 As at 1.1.06 or date of or date of appointment appointment or completion or completion date of reverse date of reverse takeover offer As at 31.12.06 takeover offer As at 31.12.06–––––––––––––––––––––––––––––––––––––––––––––––––––––––––––––––––––––––––––––––––––––––––––––––––––––––––––––––––––––––––––––––––––––––––––––––––––––––––––
ULTIMATE HOLDING COMPANYWilmar International Holdings Limited (Ordinary shares)Kuok Khoon Hong – – 11,372,830 11,372,830Martua Sitorus – – 9,080,000 9,080,000Chua Phuay Hee – 74,267 – –Teo Kim Yong – 74,267 – –
RELATED CORPORATIONS Technique Holdings Limited(Ordinary shares)Kuok Khoon Hong – – 24,471,415 24,471,415Martua Sitorus – – 24,786,995 24,786,995Teo Kim Yong 217,578 217,578 – –
Citicore Holdings Limited(Ordinary shares)Kuok Khoon Hong 2,635 2,635 28,919 28,919Martua Sitorus 2,635 2,635 26,351 26,351
Twinkey Investments Limited(Ordinary shares)Kuok Khoon Hong – – 422,500 422,500Martua Sitorus – – 327,500 327,500Teo Kim Yong 2,500 2,500 – –
Palm Grove Developments Limited(Ordinary shares)Kuok Khoon Hong 1,175 1,175 44,925 44,925Martua Sitorus – – 35,294 35,294
Mr Kuok Khoon Hong and Mr Martua Sitorus, by virtue of their interests of not less than 20% of the issued share capital of the ultimate holding company, Wilmar International Holdings Limited (“WIHL”), are deemed to have an interest in the entire issued share capital of the subsidiaries of WIHL pursuant to Section 7 of the Companies Act Cap. 50.
Except as disclosed in this report, no director who held office at the end of the financial year had interests in shares, share options, warrants or debentures of the Company, or of related corporations, either at the beginning of the financial year, or date of the completion of the Reverse Takeover Offer, or date of appointment, whichever is later, or at the end of the financial year.

60 Wilmar International Limited Annual Report 2006
DIRECTORS’ CONTRACTUAL BENEFITSExcept as disclosed in the financial statements, since the end of the previous financial year, no director of the Company who held office at the end of the financial year has received or become entitled to receive a benefit by reason of a contract made by the Company or a related corporation with the director, or with a firm of which the director is a member, or with a company in which the director has a substantial financial interest.
MATERIAL CONTRACTSIn December 2006, the Company entered into a conditional sale and purchase agreement with Wilmar Holdings Pte Ltd (“WHPL”) for the acquisition of all its interests in its subsidiaries and its associated companies (“Proposed WHPL Acquisition”) that the Company does not already own. Save as aforementioned, there were no material contracts of the Group and of the Company involving the interests of each director or controlling shareholder, either still subsisting at the end of the financial year or if not then subsisting, entered into since the end of the previous financial year.
SHARE OPTIONS The Company’s Executives’ Share Option Scheme (“ESOS”) which was approved and adopted at the Company’s annual general meeting held on 30 June 2000 continues to remain in force after the completion date of the Reverse Takeover Offer (“RTO”).
The Remuneration Committee administers the ESOS and the members are Mr Kwah Thiam Hock (Chairman), Mr Kuok Khoon Hong, Mr Yeo Teng Yang and Mr Leong Horn Kee, the majority of whom are independent directors.
The ESOS entitles eligible participants to subscribe for ordinary shares in the Company at a price equal to the average of the closing prices of the shares on the SGX-ST on the five trading days immediately preceding the date of the grant of the option (“Market Price”) or at a discount to the Market Price (up to a maximum limit of 20%). The number of shares in respect of which options may be granted when aggregated with those granted under any other share option schemes of the Company and for the time being in force, shall not exceed 15% of the issued shares in the capital of the Company on the date preceding the date of the relevant grant.
During the year, all outstanding options to subscribe for 3,850,000 shares in the Company that were carried forward to 1 January 2006 have been exercised and the shares were allotted in March 2006. No options have been granted for the year ended 31 December 2006.
Since the completion of the RTO till the end of the financial year:
• No options have been granted to the controlling shareholders of the Company and their associates;• No eligible participant has received 5% or more of the total options under the ESOS;• No options have been granted to directors and employees of the holding company and its subsidiaries;• No options that entitle the holder to participate, by virtue of the options, in any share issue of any other corporation have been granted; and• No options have been granted at a discount.
AUDIT COMMITTEEThe Audit Committee (“AC”) members at the date of this report are Mr Tay Kah Chye (Chairman), Mr Kwah Thiam Hock and Mr Yeo Teng Yang.
The AC performs the function specified by Section 201B(5) of the Companies Act, Chapter 50, the Listing Manual of Singapore Exchange Securities Trading Limited (“SGX-ST”), and the Code of Corporate Governance.
The principal responsibility of the AC is to assist the Board of Directors in fulfilling its oversight responsibilities. The operations of the AC are regulated by its charter. The Board is of the opinion that the members of the AC have sufficient accounting, financial, management expertise or experience to discharge their duties.
Directors’ Report

61
AUDIT COMMITTEE (cont’d)Since the completion of the RTO in July 2006, the AC met twice to review, inter alia, the scope of work and strategies of both the internal and external auditors, and the results arising therefrom, including their evaluation of the system of internal controls. The AC also reviewed the assistance given by the Company’s officers to the auditors. The financial statements of the Group and the Company were reviewed by the AC prior to the submission to the directors of the Company for adoption. The AC also met with the external and internal auditors, without the presence of management, to discuss issues of concern to them.
The AC has, in accordance with Chapter 9 of the Listing Manual of the SGX-ST, reviewed the requirements for approval and disclosure of interested person transactions, reviewed the procedures set up by the Group and the Company to identify and report and where necessary, seek approval for interested persons transactions and, with the assistance of the internal auditors, reviewed interested persons transactions.
The Board had commissioned Deloitte & Touche Enterprise Risk Services Pte Ltd to conduct a risk management audit on the Group and report its findings to the Board. The AC has reviewed the risk management procedures of the Group, including the findings on the risk management audit conducted by Deloitte & Touche Enterprise Risk Services Pte Ltd and submitted the findings to the Board. Recommendations were made by the consultant to strengthen the risk management process, including improvements on certain documentation, such as formalizing certain reports, reporting structure and policies. The Group has implemented these recommendations where applicable.
The AC was satisfied that proper risk management procedures were in place. It will consider regularly the need to conduct independent risk management reviews and disclose their decision and results of such reviews conducted to shareholders and the Singapore Exchange.
The AC was satisfied with the independence and objectivity of the external auditors and has nominated Ernst & Young for re-appointment as auditors of the Company for the forthcoming Annual General Meeting.
Further details regarding the AC are disclosed in the Report on Corporate Governance.
AUDITORSErnst & Young have expressed their willingness to accept re-appointment as auditors.
On behalf of the Board
Kuok Khoon HongDirector
Chua Phuay HeeDirector
Singapore19 March 2007
62 Wilmar International Limited Annual Report 2006
We, Kuok Khoon Hong and Chua Phuay Hee, being two of the directors of Wilmar International Limited, do hereby state that, in the opinion of the directors,
(a) the accompanying balance sheets, consolidated profit and loss account, statements of changes in equity and consolidated cash flow statement together with notes thereto are drawn up so as to give a true and fair view of the state of affairs of the Group and of the Company as at 31 December 2006, and the results of the business, changes in equity and cash flows of the Group and the changes in equity of the Company for the year ended on that date, and
(b) at the date of this statement, there are reasonable grounds to believe that the Company will be able to pay its debts as and when they fall due.
On behalf of the Board
Kuok Khoon HongDirector
Chua Phuay HeeDirector
Singapore19 March 2007
Statement by Directors
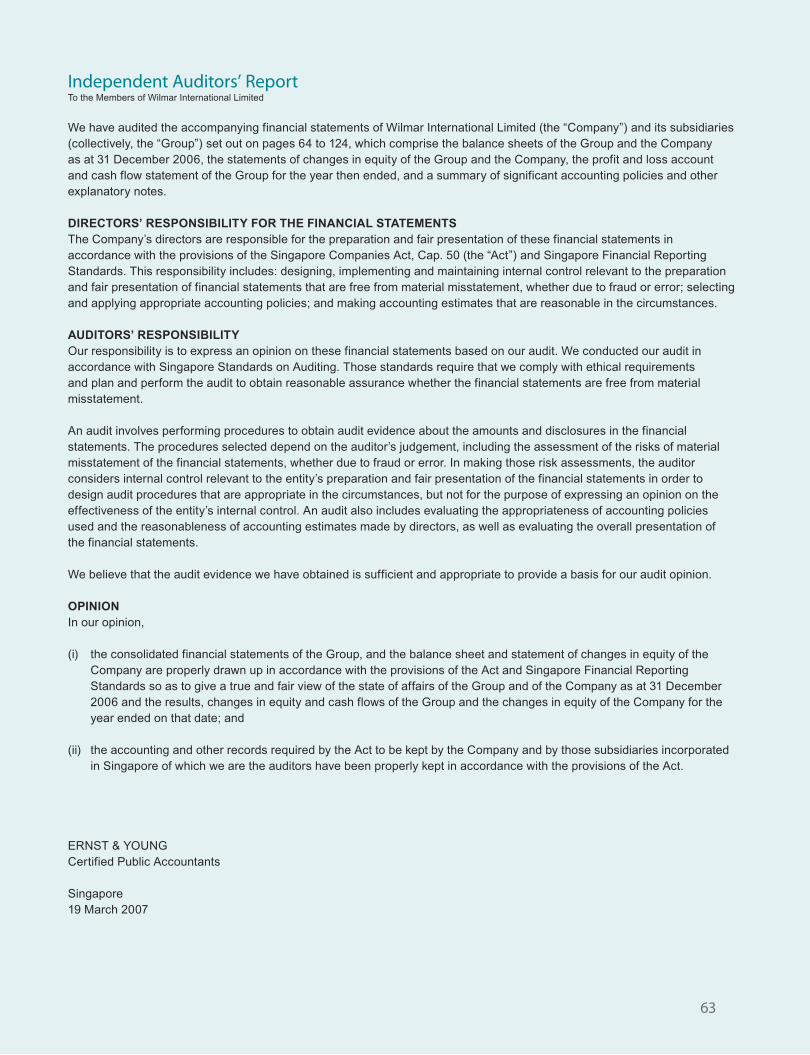
63
Independent Auditors’ ReportTo the Members of Wilmar International Limited
We have audited the accompanying financial statements of Wilmar International Limited (the “Company”) and its subsidiaries (collectively, the “Group”) set out on pages 64 to 124, which comprise the balance sheets of the Group and the Company as at 31 December 2006, the statements of changes in equity of the Group and the Company, the profit and loss account and cash flow statement of the Group for the year then ended, and a summary of significant accounting policies and other explanatory notes.
DIRECTORS’ RESPONSIBILITY FOR THE FINANCIAL STATEMENTSThe Company’s directors are responsible for the preparation and fair presentation of these financial statements in accordance with the provisions of the Singapore Companies Act, Cap. 50 (the “Act”) and Singapore Financial Reporting Standards. This responsibility includes: designing, implementing and maintaining internal control relevant to the preparation and fair presentation of financial statements that are free from material misstatement, whether due to fraud or error; selecting and applying appropriate accounting policies; and making accounting estimates that are reasonable in the circumstances.
AUDITORS’ RESPONSIBILITYOur responsibility is to express an opinion on these financial statements based on our audit. We conducted our audit in accordance with Singapore Standards on Auditing. Those standards require that we comply with ethical requirements and plan and perform the audit to obtain reasonable assurance whether the financial statements are free from material misstatement.
An audit involves performing procedures to obtain audit evidence about the amounts and disclosures in the financial statements. The procedures selected depend on the auditor’s judgement, including the assessment of the risks of material misstatement of the financial statements, whether due to fraud or error. In making those risk assessments, the auditor considers internal control relevant to the entity’s preparation and fair presentation of the financial statements in order to design audit procedures that are appropriate in the circumstances, but not for the purpose of expressing an opinion on the effectiveness of the entity’s internal control. An audit also includes evaluating the appropriateness of accounting policies used and the reasonableness of accounting estimates made by directors, as well as evaluating the overall presentation of the financial statements.
We believe that the audit evidence we have obtained is sufficient and appropriate to provide a basis for our audit opinion.
OPINIONIn our opinion,
(i) the consolidated financial statements of the Group, and the balance sheet and statement of changes in equity of the Company are properly drawn up in accordance with the provisions of the Act and Singapore Financial Reporting Standards so as to give a true and fair view of the state of affairs of the Group and of the Company as at 31 December 2006 and the results, changes in equity and cash flows of the Group and the changes in equity of the Company for the year ended on that date; and
(ii) the accounting and other records required by the Act to be kept by the Company and by those subsidiaries incorporated in Singapore of which we are the auditors have been properly kept in accordance with the provisions of the Act.
ERNST & YOUNGCertified Public Accountants
Singapore19 March 2007

64 Wilmar International Limited Annual Report 2006
Note 2006 2005 US$’000 US$’000–––––––––––––––––––––––––––––––––––––––––––––––––––––––––––––––––––––––––––––––––––––––––––––––––––––––––––––––––––––––––––––––––––––––––––––––––––––––––––
Sales 4 5,301,632 4,651,560Cost of sales 5 (4,815,345) (4,215,625)
––––––––––––––––––––––––––––––––––––––
Gross profit 486,287 435,935
Net gains arising from changes in fair value of biological assets 17,352 1,693Other operating income 6 21,560 13,553Selling and distribution expenses (263,147) (287,813)Administrative expenses (37,030) (24,841)Other operating expenses 7 (20,632) (4,627)Finance costs 8 (69,122) (60,415)Share of results of associates 133 47
––––––––––––––––––––––––––––––––––––––
Profit before tax 9 135,401 73,532Tax expense 10 (29,087) (14,914)
––––––––––––––––––––––––––––––––––––––
Profit for the year 106,314 58,618––––––––––––––––––––––––––
Attributable to:Equity holders of the Company 104,612 58,049Minority interests 1,702 569
––––––––––––––––––––––––––––––––––––––
106,314 58,618––––––––––––––––––––––––––
Earnings per share (US cents) 11 4.51 2.67––––––––––––––––––––––––––
Consolidated Profit and Loss Accountfor the financial year ended 31 December 2006
The accompanying accounting policies and explanatory notes form an integral part of the financial statements.

65
Group Company Note 2006 2005 2006 2005 US$’000 US$’000 US$’000 US$’000–––––––––––––––––––––––––––––––––––––––––––––––––––––––––––––––––––––––––––––––––––––––––––––––––––––––––––––––––––––––––––––––––––––––––––––––––––––––
Non-current assetsProperty, plant and equipment 12 460,300 365,811 – 183Investment securities 13 44 38 – 205Investments in subsidiaries 14 – – 552,244 2,345Investments in associates 15 9,038 606 – –Plasma investments 16 11,109 10,727 – –Biological assets 17 223,542 154,932 – –Intangible asset 18 34,587 34,587 – –Other receivables 19 35,650 19,341 16,000 –Deferred tax assets 10 5,423 2,634 – –
––––––––––––––––––––––––––––––––––––––––––––––––––––––––––––––––––––––––––––––––––
779,693 588,676 568,244 2,733
Current assetsInventories 20 366,810 288,938 – –Trade receivables 21 558,176 390,243 – 75Other receivables 19 83,512 274,653 403,215 1,279Derivative financial instruments 22 11,401 6,958 – –Cash and bank balances 23 43,980 19,512 6,465 1,458
––––––––––––––––––––––––––––––––––––––––––––––––––––––––––––––––––––––––––––––––––
1,063,879 980,304 409,680 2,812
Current liabilitiesTrade payables 24 319,291 165,822 – 55Other payables 25 62,577 61,101 206,712 2,385Derivative financial instruments 22 604 414 – –Interest-bearing loans and borrowings 26 716,430 621,359 12,000 29Tax payable 11,717 6,717 35 –
––––––––––––––––––––––––––––––––––––––––––––––––––––––––––––––––––––––––––––––––––
1,110,619 855,413 218,747 2,469
Net current (liabilities)/assets (46,740) 124,891 190,933 343
Non-current liabilitiesOther payables 25 23,752 317,335 – –Interest-bearing loans and borrowings 26 43,161 68,359 16,000 70Deferred tax liabilities 10 59,378 48,147 – –
––––––––––––––––––––––––––––––––––––––––––––––––––––––––––––––––––––––––––––––––––
126,291 433,841 16,000 70
––––––––––––––––––––––––––––––––––––––––––––––––––––––––––––––––––––––––––––––––––
Net assets 606,662 279,726 743,177 3,006––––––––––––––––––––––––––––––––––––––––––––––––––––––––
Equity attributable to equity holders of the CompanyShare capital 27 280,278 62,585 716,417 7,868Share premium – 1,792 – 18,716Reserves 304,564 202,037 26,760 (23,578)
––––––––––––––––––––––––––––––––––––––––––––––––––––––––––––––––––––––––––––––––––
584,842 266,414 743,177 3,006Minority interests 21,820 13,312 – –
––––––––––––––––––––––––––––––––––––––––––––––––––––––––––––––––––––––––––––––––––
Total equity 606,662 279,726 743,177 3,006––––––––––––––––––––––––––––––––––––––––––––––––––––––––
Balance Sheetsas at 31 December 2006
The accompanying accounting policies and explanatory notes form an integral part of the financial statements.
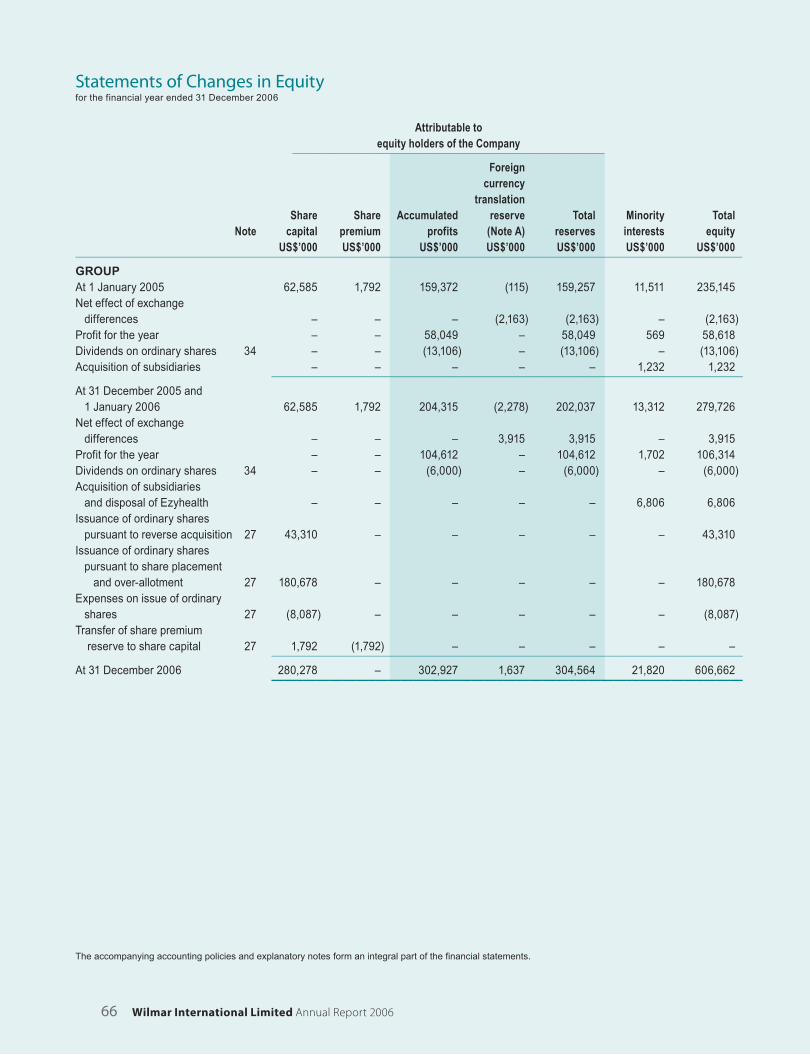
66 Wilmar International Limited Annual Report 2006
Attributable to equity holders of the Company –––––––––––––––––––––––––––––––––––––––––––––––––––––––––––––––––––––––––
Foreign currency translation Share Share Accumulated reserve Total Minority Total Note capital premium profits (Note A) reserves interests equity US$’000 US$’000 US$’000 US$’000 US$’000 US$’000 US$’000–––––––––––––––––––––––––––––––––––––––––––––––––––––––––––––––––––––––––––––––––––––––––––––––––––––––––––––––––––––––––––––––––––––––––––––––––––––––––––
GROUPAt 1 January 2005 62,585 1,792 159,372 (115) 159,257 11,511 235,145Net effect of exchange differences – – – (2,163) (2,163) – (2,163)Profit for the year – – 58,049 – 58,049 569 58,618Dividends on ordinary shares 34 – – (13,106) – (13,106) – (13,106)Acquisition of subsidiaries – – – – – 1,232 1,232
–––––––––––––––––––––––––––––––––––––––––––––––––––––––––––––––––––––––––––––––––––––––––––––––––––––––––––
At 31 December 2005 and 1 January 2006 62,585 1,792 204,315 (2,278) 202,037 13,312 279,726Net effect of exchange differences – – – 3,915 3,915 – 3,915Profit for the year – – 104,612 – 104,612 1,702 106,314Dividends on ordinary shares 34 – – (6,000) – (6,000) – (6,000)Acquisition of subsidiaries and disposal of Ezyhealth – – – – – 6,806 6,806Issuance of ordinary shares pursuant to reverse acquisition 27 43,310 – – – – – 43,310Issuance of ordinary shares pursuant to share placement and over-allotment 27 180,678 – – – – – 180,678Expenses on issue of ordinary shares 27 (8,087) – – – – – (8,087)Transfer of share premium reserve to share capital 27 1,792 (1,792) – – – – –
–––––––––––––––––––––––––––––––––––––––––––––––––––––––––––––––––––––––––––––––––––––––––––––––––––––––––––
At 31 December 2006 280,278 – 302,927 1,637 304,564 21,820 606,662–––––––––––––––––––––––––––––––––––––––––––––––––––––––––––––––––––––––––
Statements of Changes in Equityfor the financial year ended 31 December 2006
The accompanying accounting policies and explanatory notes form an integral part of the financial statements.

67
Attributable to equity holders of the Company –––––––––––––––––––––––––––––––––––––––––––––––––––––––––––––––––––––––––––––––––––
Foreign currency Accumulated translation Share Share (losses)/ reserve Total Total Note capital premium profits (Note A) reserves equity US$’000 US$’000 US$’000 US$’000 US$’000 US$’000––––––––––––––––––––––––––––––––––––––––––––––––––––––––––––––––––––––––––––––––––––––––––––––––––––––––––––––––––––––––––––––––––––––––––––––––––––
COMPANYAt 1 January 2005 7,868 18,716 (19,475) – (19,475) 7,109Loss for the year – – (4,103) – (4,103) (4,103)
–––––––––––––––––––––––––––––––––––––––––––––––––––––––––––––––––––––––––––––––––––––––––––––––––––––––
At 31 December 2005 and 1 January 2006 7,868 18,716 (23,578) – (23,578) 3,006Profit for the year – – 50,338 – 50,338 50,338Shares arising from exercise of share options 27 121 – – – – 121Issuance of ordinary shares pursuant to reverse acquisition 27 517,121 – – – – 517,121Issuance of ordinary shares pursuant to share placement and over-allotment 27 180,678 – – – – 180,678Expenses on issue of ordinary shares 27 (8,087) – – – – (8,087)Transfer of share premium reserve to share capital 27 18,716 (18,716) – – – –
–––––––––––––––––––––––––––––––––––––––––––––––––––––––––––––––––––––––––––––––––––––––––––––––––––––––
At 31 December 2006 716,417 – 26,760 – 26,760 743,177–––––––––––––––––––––––––––––––––––––––––––––––––––––––––––––––––––––
Note A:The foreign currency translation reserve records exchange differences arising from the translation of the financial statements of foreign operations whose functional currencies are different from that of the Group’s presentation currency.
The accompanying accounting policies and explanatory notes form an integral part of the financial statements.
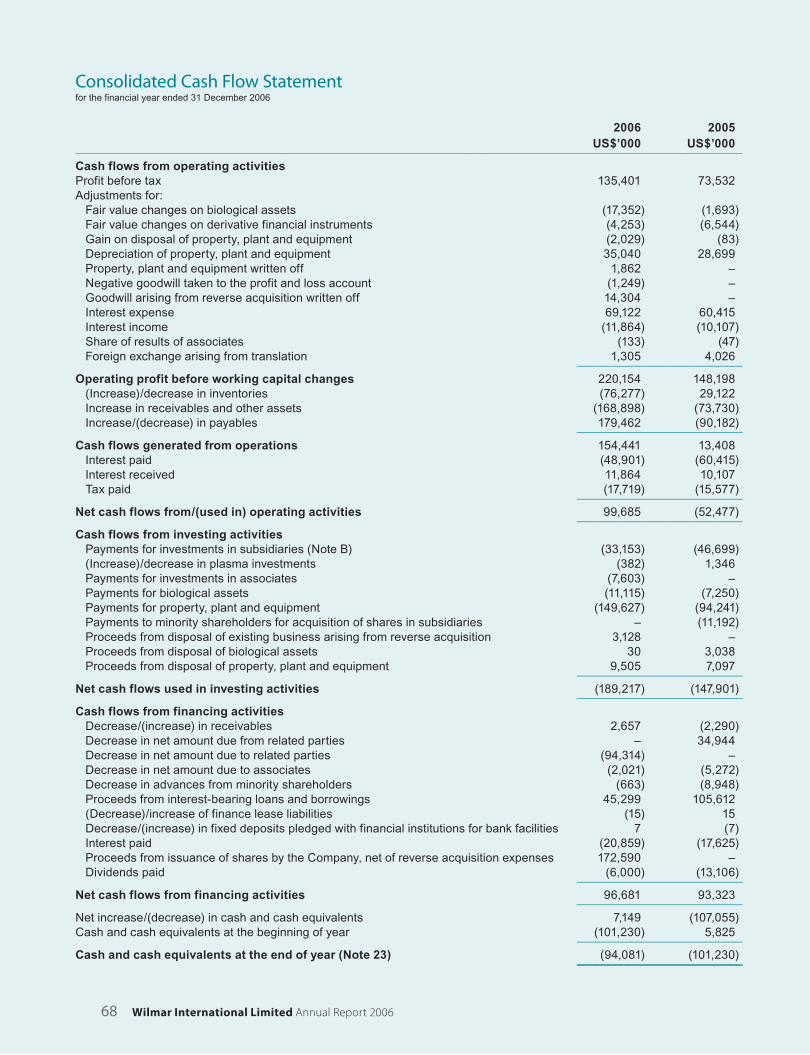
68 Wilmar International Limited Annual Report 2006
2006 2005 US$’000 US$’000–––––––––––––––––––––––––––––––––––––––––––––––––––––––––––––––––––––––––––––––––––––––––––––––––––––––––––––––––––––––––––––––––––––––––––––––––––––––––––
Cash flows from operating activitiesProfit before tax 135,401 73,532Adjustments for: Fair value changes on biological assets (17,352) (1,693) Fair value changes on derivative financial instruments (4,253) (6,544) Gain on disposal of property, plant and equipment (2,029) (83) Depreciation of property, plant and equipment 35,040 28,699 Property, plant and equipment written off 1,862 – Negative goodwill taken to the profit and loss account (1,249) – Goodwill arising from reverse acquisition written off 14,304 – Interest expense 69,122 60,415 Interest income (11,864) (10,107) Share of results of associates (133) (47) Foreign exchange arising from translation 1,305 4,026
––––––––––––––––––––––––––––––––––––––
Operating profit before working capital changes 220,154 148,198 (Increase)/decrease in inventories (76,277) 29,122 Increase in receivables and other assets (168,898) (73,730) Increase/(decrease) in payables 179,462 (90,182)
––––––––––––––––––––––––––––––––––––––
Cash flows generated from operations 154,441 13,408 Interest paid (48,901) (60,415) Interest received 11,864 10,107 Tax paid (17,719) (15,577)
––––––––––––––––––––––––––––––––––––––
Net cash flows from/(used in) operating activities 99,685 (52,477)––––––––––––––––––––––––––––––––––––––
Cash flows from investing activities Payments for investments in subsidiaries (Note B) (33,153) (46,699) (Increase)/decrease in plasma investments (382) 1,346 Payments for investments in associates (7,603) – Payments for biological assets (11,115) (7,250) Payments for property, plant and equipment (149,627) (94,241) Payments to minority shareholders for acquisition of shares in subsidiaries – (11,192) Proceeds from disposal of existing business arising from reverse acquisition 3,128 – Proceeds from disposal of biological assets 30 3,038 Proceeds from disposal of property, plant and equipment 9,505 7,097
––––––––––––––––––––––––––––––––––––––
Net cash flows used in investing activities (189,217) (147,901)––––––––––––––––––––––––––––––––––––––
Cash flows from financing activities Decrease/(increase) in receivables 2,657 (2,290) Decrease in net amount due from related parties – 34,944 Decrease in net amount due to related parties (94,314) – Decrease in net amount due to associates (2,021) (5,272) Decrease in advances from minority shareholders (663) (8,948) Proceeds from interest-bearing loans and borrowings 45,299 105,612 (Decrease)/increase of finance lease liabilities (15) 15 Decrease/(increase) in fixed deposits pledged with financial institutions for bank facilities 7 (7) Interest paid (20,859) (17,625) Proceeds from issuance of shares by the Company, net of reverse acquisition expenses 172,590 – Dividends paid (6,000) (13,106)
––––––––––––––––––––––––––––––––––––––
Net cash flows from financing activities 96,681 93,323––––––––––––––––––––––––––––––––––––––
Net increase/(decrease) in cash and cash equivalents 7,149 (107,055)Cash and cash equivalents at the beginning of year (101,230) 5,825
––––––––––––––––––––––––––––––––––––––
Cash and cash equivalents at the end of year (Note 23) (94,081) (101,230)––––––––––––––––––––––––––
Consolidated Cash Flow Statement for the financial year ended 31 December 2006
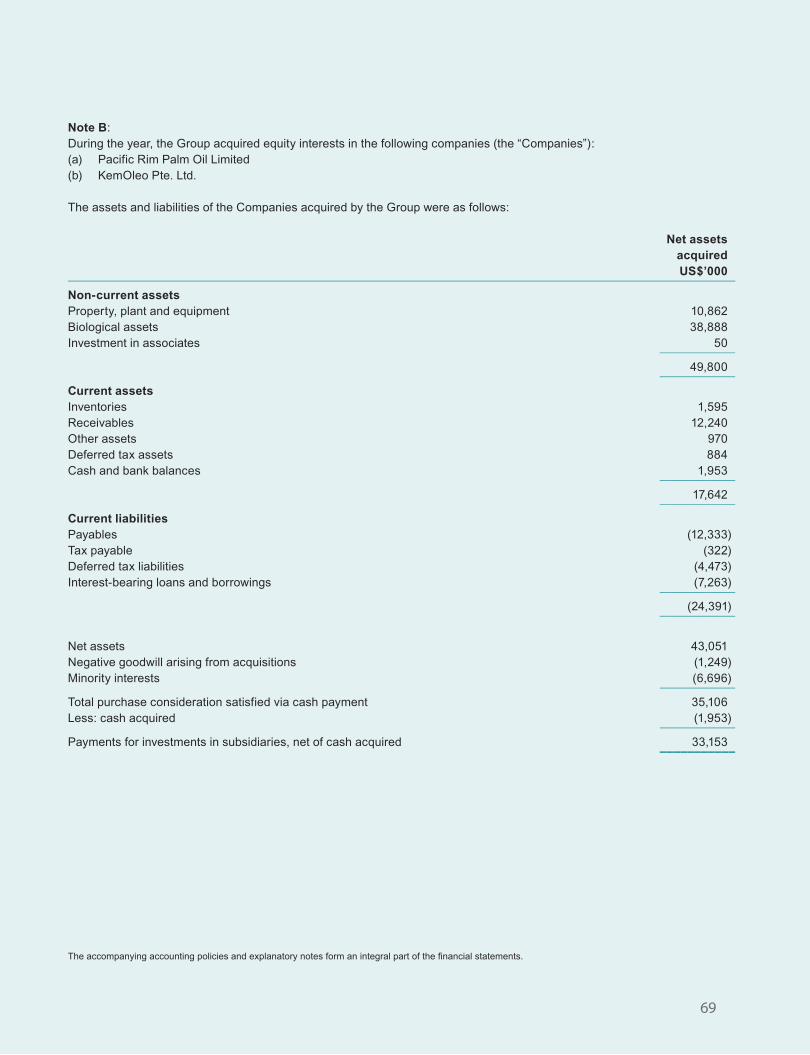
69
Note B:During the year, the Group acquired equity interests in the following companies (the “Companies”):(a) Pacific Rim Palm Oil Limited (b) KemOleo Pte. Ltd.
The assets and liabilities of the Companies acquired by the Group were as follows:
Net assets acquired US$’000–––––––––––––––––––––––––––––––––––––––––––––––––––––––––––––––––––––––––––––––––––––––––––––––––––––––––––––––––––––––––––––––––––––––––––––––––––––––
Non-current assetsProperty, plant and equipment 10,862Biological assets 38,888Investment in associates 50
–––––––––––––––––
49,800–––––––––––––––––
Current assetsInventories 1,595Receivables 12,240Other assets 970Deferred tax assets 884Cash and bank balances 1,953
–––––––––––––––––
17,642–––––––––––––––––
Current liabilitiesPayables (12,333)Tax payable (322)Deferred tax liabilities (4,473)Interest-bearing loans and borrowings (7,263)
–––––––––––––––––
(24,391)–––––––––––––––––
Net assets 43,051Negative goodwill arising from acquisitions (1,249)Minority interests (6,696)
–––––––––––––––––
Total purchase consideration satisfied via cash payment 35,106Less: cash acquired (1,953)
–––––––––––––––––
Payments for investments in subsidiaries, net of cash acquired 33,153–––––––––––
The accompanying accounting policies and explanatory notes form an integral part of the financial statements.

70 Wilmar International Limited Annual Report 2006
1. CORPORATE INFORMATIONWilmar International Limited (the “Company”), formerly known as Ezyhealth Asia Pacific Ltd (“Ezyhealth”), is a limited liability company, which is incorporated in Singapore and publicly traded on the Singapore Exchange.
Pursuant to a conditional put and call option agreement signed between the Company and Wilmar Holdings Pte Ltd (“WHPL”) on 23 December 2005, the Company had on 14 July 2006 completed the acquisition of a total of 52 companies (“Acquired Group”) from WHPL (Note 2). The consolidated financial statements for the Group is prepared and presented as a continuation of the Acquired Group (the acquirer for reverse acquisition accounting purposes) and accordingly, the comparative figures presented in the consolidated financial statements are those of the Acquired Group.
In the Company’s (the legal parent) separate financial statements, the investment in the Acquired Group (the legal subsidiary) is accounted for in accordance with the requirements of FRS 27 “Consolidated and Separate Financial Statements” [Note 3.5 (b)].
With effect from 14 July 2006, the immediate and ultimate holding companies are Wilmar Holdings Pte Ltd and Wilmar International Holdings Limited, which are incorporated in Singapore and the British Virgin Islands, respectively.
The registered office and principal place of business of the Company is located at 56, Neil Road, Singapore 088830.
The principal activities of the Company are those of an investment holding company and provision of management services to its subsidiary companies. The principal activities of the subsidiaries are disclosed in Note 14 to the financial statements.
2. REVERSE ACQUISITION UNDERTAKEN BY THE COMPANYPursuant to a conditional put and call option agreement signed between the Company and WHPL on 23 December 2005, the Company had on 14 July 2006 completed the acquisition of the Acquired Group from WHPL for a purchase consideration of S$1,290,000,000 (equivalent to US$775,707,000).
The purchase consideration was satisfied by the allotment and issuance of 21.5 billion new shares in the capital of the Company at S$0.06 per new share. Following the allotment and issuance of these shares, the Company became a 98.8% subsidiary of WHPL.
Concurrent with the acquisition of the Acquired Group, the Company had also completed the disposal of its entire existing business undertaking to Nucourt Media Pte Ltd which marked the exit of the business providing healthcare and medical diagnostics services and health publication and events undertaken by the Ezyhealth group.
During the year, all options to subscribe for 3,850,000 shares in the Company that were outstanding as at 1 January 2006 have been exercised and the shares were allotted in March 2006.
The shares in the Company were consolidated on 19 July 2006 on the basis of one share for every ten shares held by shareholders, fractions being disregarded.
On 7 August and 18 August 2006, the Company further allotted and issued 300 million new shares and 56.25 million new shares (pursuant to an over-allotment option) at S$0.80 per share respectively for cash in connection with the Company’s compliance placement exercise.
Notes to the Financial Statements31 December 2006

71
2. REVERSE ACQUISITION UNDERTAKEN BY THE COMPANY (cont’d)The acquisition of the Acquired Group has been accounted for in the consolidated financial statements as a reverse acquisition as set out in Note 3.6. For the purpose of reverse acquisition accounting, the cost of acquisition by the Acquired Group (the legal subsidiary) of the Company (the legal parent) is recorded as equity. The cost of acquisition is determined using the fair value of the issued equity of the Company before the acquisition, being 26,170,000 consolidated shares at S$1.10 per share, totalling S$28,787,000 (equivalent to US$17,310,000). It is deemed to be incurred by the Acquired Group in the form of equity issued to the owners of the legal parent.
The Company and its subsidiaries before the acquisition of the Acquired Group being the acquiree for reverse acquisition accounting purposes, contributed accumulated losses amounting to approximately S$39,210,000 (equivalent to US$23,578,000) to the Group during the year.
3. SUMMARY OF SIGNIFICANT ACCOUNTING POLICIES
3.1 Basis of preparationThe consolidated financial statements of the Group and the balance sheet and statement of changes in equity of the Company have been prepared in accordance with Singapore Financial Reporting Standards (“FRS”).
The financial statements have been prepared on a historical cost basis except for land and buildings, biological assets, derivative financial instruments and held for trading and available-for-sale financial assets that have been measured at their fair values.
The financial statements are presented in US Dollars (USD or US$) and all values are rounded to the nearest thousand (US$’000) except when otherwise indicated.
The accounting policies have been consistently applied by the Group and the Company and are consistent with those used in the previous financial year.
3.2 FRS and INT FRS not yet effectiveThe Group and the Company have not applied the following FRS and INT FRS that have been issued but not yet effective:
Effective date (Annual periods beginning on or after)–––––––––––––––––––––––––––––––––––––––––––––––––––––––––––––––––––––––––––––––––––––––––––––––––––––––––––––––––––––––––––––––––––––––––––––––––––––––––––
FRS 1 : Amendment to FRS 1 (revised), Presentation of financial statements (Capital Disclosures) 1 January 2007
FRS 40 : Investment Property 1 January 2007
FRS 107 : Financial Instruments: Disclosures 1 January 2007
INT FRS 107 : Applying the Restatement Approach under FRS 29, Financial Reporting in Hyperinflationary Economies 1 March 2006
INT FRS 108 : Scope of FRS 102, Share-based Payment 1 May 2006
INT FRS 109 : Reassessment of Embedded Derivatives 1 June 2006
INT FRS 110 : Interim Financial Reporting and Impairment 1 November 2006

72 Wilmar International Limited Annual Report 2006
3. SUMMARY OF SIGNIFICANT ACCOUNTING POLICIES (cont’d)
3.2 FRS and INT FRS not yet effective (cont’d)The directors expect that the adoption of the above pronouncements will have no material impact to the financial statements in the period of initial application, except for FRS 107 and the amendment to FRS 1 as indicated below.
FRS 107, Financial Instruments: Disclosures and amendment to FRS 1 (revised), Presentation of Financial Statements (Capital Disclosures)
FRS 107 introduces new disclosures to improve the information about financial instruments. It requires the disclosure of qualitative and quantitative information about exposure to risks arising from financial instruments, including specified minimum disclosures about credit risk, liquidity risk and market risk, including sensitivity analysis to market risks. The amendment to FRS 1 requires the Group to make new disclosures to enable users of the financial statements to evaluate the Group’s objectives, policies and processes for managing capital. The Group will apply FRS 107 and the amendment to FRS 1 from annual periods beginning 1 January 2007.
3.3 Significant accounting estimates and judgementsEstimates, assumptions concerning the future and judgements are made in the preparation of the financial statements. They affect the application of the Group’s accounting policies, reported amounts of assets, liabilities, income and expenses, and disclosures made. They are assessed on an on-going basis and are based on experience and relevant factors, including expectations of future events that are believed to be reasonable under the circumstances.
Key sources of estimation uncertaintyThe key assumptions concerning the future and other key sources of estimation uncertainty at the balance sheet date, that have a significant risk of causing a material adjustment to the carrying amounts of assets and liabilities within the next financial year are discussed below.
(i) Impairment of goodwillThe Group determines whether goodwill is impaired at least on an annual basis. This requires an estimation of the value in use of the cash-generating units to which the goodwill is allocated. Estimating the value in use requires the Group to make an estimate of the expected future cash flows from the cash-generating unit and also to choose a suitable discount rate in order to calculate the present value of those cash flows. The carrying amount of the Group’s goodwill at 31 December 2006 was US$34,587,000 (2005: US$34,587,000).
(ii) Depreciation of property, plant and equipmentThe cost of property, plant and equipment is depreciated on a straight-line basis over their useful lives. Management estimates the useful lives of these property, plant and equipment to be within 4 to 20 years. These are common life expectancies applied in the industry. The carrying amount of the Group’s plant and equipment at 31 December 2006 was US$219,119,000 (2005: US$164,879,000). Changes in the expected level of usage and technological developments could impact the economic useful lives and the residual values of these assets, therefore future depreciation charges could be revised.
(iii) Income taxes The Group has exposure to income taxes in various jurisdictions. Significant judgement is involved in determining
the group-wide provision for income taxes. There are certain transactions and computations for which the ultimate tax determination is uncertain during the ordinary course of business. The Group recognises liabilities for expected tax issues based on estimates of whether additional taxes will be due. Where the final tax outcome of these matters is different from the amounts that were initially recognised, such differences will impact the income tax and deferred tax provisions in the period in which such determination is made. The carrying amount of the Group’s current tax payable and deferred tax liabilities at 31 December 2006 was US$11,717,000 (2005: US$6,717,000) and US$59,378,000 (2005: US$48,147,000) respectively.
Notes to the Financial Statements31 December 2006

73
3. SUMMARY OF SIGNIFICANT ACCOUNTING POLICIES (cont’d)
3.3 Significant accounting estimates and judgements (cont’d)
(iv) Biological assets The Group’s biological assets are stated at fair value less point-of-sale costs. This requires independent valuer’s
assessment of the fair value of the biological assets. Changes in the conditions of the biological assets could impact the fair value of the assets. The carrying amount of the Group’s biological assets at 31 December 2006 is US$223,542,000 (2005: US$154,932,000).
3.4 Functional and foreign currency
(a) Foreign currency transactions Transactions in foreign currencies are measured in the respective functional currencies of the Company and its
subsidiaries and are recorded on initial recognition in the functional currencies at exchange rates approximating those ruling at the transaction dates. Monetary assets and liabilities denominated in foreign currencies are translated at the rate of exchange ruling at the balance sheet date. Non-monetary items that are measured in terms of historical cost in a foreign currency are translated using the exchange rates as at the dates of the initial transactions. Non-monetary items measured at fair value in a foreign currency are translated using the exchange rates at the date when the fair value was determined.
Exchange differences arising on the settlement of monetary items or on translating monetary items at the balance sheet date are recognised in the profit and loss account except for exchange differences arising on monetary items that form part of the Group’s net investment in foreign subsidiaries, which are recognised initially in a separate component of equity as foreign currency translation reserve in the consolidated balance sheet and recognised in the consolidated profit and loss account on disposal of the subsidiary.
Differences on foreign currency borrowings that provide a hedge against a net investment in a foreign operation are also taken directly to the foreign currency translation reserve until the disposal of the net investment, at which time they are recognised in the profit and loss account. Tax charges and credits attributable to exchange differences on those borrowings are also dealt with in the foreign currency translation reserve.
(b) Foreign currency translationThe results and financial position of foreign operations are translated into USD using the following procedures:
• Assets and liabilities for each balance sheet presented are translated at the exchange rate ruling at that balance sheet date; and
• Income and expenses for each income statement are translated at average exchange rates for the year, which approximates the exchange rates at the dates of the transactions.
All resulting exchange differences are recognised in a separate component of equity as foreign currency translation reserve.
On disposal of a foreign operation, the cumulative amount of exchange differences deferred in equity relating to that foreign operation is recognised in the profit and loss account as a component of the gain or loss on disposal.
74 Wilmar International Limited Annual Report 2006
3. SUMMARY OF SIGNIFICANT ACCOUNTING POLICIES (cont’d)
3.5 Subsidiaries and principles of consolidation
(a) SubsidiariesA subsidiary is an entity over which the Group has the power to govern the financial and operating policies so as to obtain benefits from its activities. The Group generally has such power when it directly or indirectly, holds more than 50% of the issued share capital, or controls more than half of the voting power, or controls the composition of the board of directors.
In the Company’s separate financial statements, investments in subsidiaries are accounted for at cost less impairment losses.
(b) Principles of consolidation The consolidated financial statements comprise the financial statements of the Company and its subsidiaries as
at the balance sheet date. The financial statements of the subsidiaries used in the preparation of the consolidated financial statements are prepared for the same reporting date as the holding company. Consistent accounting policies are applied to like transactions and events in similar circumstances.
All intra-group balances, transactions, income and expenses and profits and losses resulting from intra-group transactions that are recognised in assets, are eliminated in full.
Subsidiaries are fully consolidated from the date of acquisition, being the date on which the Group obtains control, and continue to be consolidated until the date that such control ceases.
Minority interests represent the portion of profit or loss and net assets in subsidiaries not held by the Group. They are presented in the consolidated balance sheet within equity, separately from the parent shareholders’ equity, and are separately disclosed in the consolidated profit and loss account.
3.6 Reverse acquisitionThe acquisition of the Acquired Group on 14 July 2006 as set out in Note 2 has been accounted for as a reverse acquisition and the legal subsidiary (the Acquired Group) is considered the acquirer for accounting purposes. Accordingly, the Group’s consolidated profit and loss account, balance sheet, statement of changes in equity and cash flow statement for the year ended 31 December 2005 are that of the Acquired Group’s financial statements.
Since such consolidated financial statements represent a continuation of the financial statements of the Acquired Group:
(a) the assets and liabilities of the Acquired Group are recognised and measured in the consolidated balance sheet at their pre-combination carrying amounts;
(b) the retained earnings and other equity balances recognised in those consolidated financial statements are the retained earnings and other equity balances of the Acquired Group immediately before the business combination;
(c) the amount recognised as issued equity instruments in those consolidated financial statements is determined by adding to the issued equity of the Acquired Group immediately before the business combination the costs of the combination of the acquisition (Note 2). However, the equity structure appearing in those consolidated financial statements (i.e. the number and type of equity instruments issued) reflect the equity structure of the legal parent (the Company), including the equity instruments issued by the Company to reflect the combination; and
(d) the comparative figures presented in these consolidated financial statements are that of the Acquired Group.
Notes to the Financial Statements31 December 2006

75
3. SUMMARY OF SIGNIFICANT ACCOUNTING POLICIES (cont’d)
3.6 Reverse acquisition (cont’d)Consolidated financial statements prepared following a reverse acquisition shall reflect the fair values of the assets,liabilities and contingent liabilities of the legal parent (the Company). Therefore, the cost of the business combination for the acquisition is allocated to the identifiable assets, liabilities and contingent liabilities of the legal parent that satisfy the recognition criteria at their fair values as at 14 July 2006. The excess of the cost of the combination over the Acquired Group’s interest in the net fair value of those items is recognised as goodwill.
Reverse acquisition accounting applies only in the consolidated financial statements. In the legal parent (the Company’s) separate financial statements, the investment in the legal subsidiary (the Acquired Group) is accounted for at cost less accumulated impairment losses in the Company’s balance sheet.
3.7 Associates An associate is an entity, not being a subsidiary or a joint venture, in which the Group has significant influence. This generally coincides with the Group having 20% or more of the voting power, or has representation on the board of directors.
The Group’s investments in associates are accounted for using the equity method. Under the equity method, the investment in associate is carried in the balance sheet at cost plus post-acquisition changes in the Group’s share of net assets of the associate. The Group’s share of the profit or loss of the associate is recognised in the consolidated profit and loss account. Where there has been a change recognised directly in the equity of the associate, the Group recognises its share of such changes. After application of the equity method, the Group determines whether it is necessary to recognise any additional impairment loss with respect to the Group’s net investment in the associate. The associate is equity accounted for from the date the Group obtains significant influence until the date the Group ceases to have significant influence over the associate.
Goodwill relating to an associate is included in the carrying amount of the investment.
Any excess of the Group’s share of the net fair value of the associate’s identifiable assets, liabilities and contingent liabilities over the cost of the investment is excluded from the carrying amount of the investment and is instead included as income in the determination of the Group’s share of the associate’s profit or loss in the period in which the investment is acquired.
When the Group’s share of losses in an associate equals or exceeds its interest in the associate, including any other unsecured receivables, the Group does not recognise further losses, unless it has incurred obligations or made payments on behalf of the associate.
The most recent available audited financial statements of the associates are used by the Group in applying the equity method. Where the dates of the audited financial statements used are not co-terminous with those of the Group, the share of results is arrived at from the last audited financial statements available and un-audited management financial statements to the end of the accounting period. Consistent accounting policies are applied for like transactions and events in similar circumstances.
In the Company’s separate financial statements, investments in associates are accounted for at cost less impairment losses.
76 Wilmar International Limited Annual Report 2006
3. SUMMARY OF SIGNIFICANT ACCOUNTING POLICIES (cont’d)
3.8 Property, plant and equipmentAll items of property, plant and equipment are initially recorded at cost. Subsequent to recognition, property, plant and equipment are stated at cost or valuation less accumulated depreciation and any accumulated impairment losses. Land and buildings are subsequently revalued on an asset-by-asset basis, to their fair values. Fair value is determined from market-based evidence by appraisal that is undertaken by professionally qualified valuers. Revaluations are made annually to ensure that their carrying amount does not differ materially from their fair value at the balance sheet date.
When an asset is revalued, any increase in the carrying amount is credited directly to the asset revaluation reserve. However, the increase is recognised in the profit and loss account to the extent that it reverses a revaluation decrease of the same asset previously recognised in the profit and loss account. When an asset’s carrying amount is decreased as a result of a revaluation, the decrease is recognised in the profit and loss account. However, the decrease is debited directly to the asset revaluation reserve to the extent of any credit balance existing in the reserve in respect of that asset.
Any accumulated depreciation as at the revaluation date is eliminated against the gross carrying amount of the asset and the net amount is restated to the revalued amount of the asset. The revaluation surplus included in the asset revaluation reserve in respect of an asset, is transferred directly to accumulated profits on retirement or disposal of the asset.
Depreciation of an asset begins when it is available for use and is computed on a straight-line basis over the estimated useful life of the asset as follows:
• Land and land rights – amortised over the period of leases• Buildings – 4 to 20 years• Plant and machineries – 4 to 20 years• Furniture, fittings and office equipment – 4 to 20 years• Motor vehicles and trucks – 4 to 8 years
The entire useful life of a vessel from the date the vessel was first put to use is estimated to be 25 years. The remaining useful life of vessels acquired by the Group is determined to be 6 to 13 years.
The cost of construction-in-progress represents all costs, including borrowing costs, incurred on the construction of the assets. The accumulated costs will be reclassified to the appropriate property, plant and equipment account when the construction is completed. No depreciation is provided on construction-in-progress.
Interest on borrowings to finance the construction of property, plant and equipment is capitalised during the period of time that is required to complete and prepare each asset for its intended use. All other borrowing costs are expensed.
Repairs and maintenance are taken to the profit and loss account during the financial period in which they are incurred. The cost of major renovations and restorations is included in the carrying amount of the asset when it is probable that future economic benefits in excess of the originally assessed standard of performance of the existing asset will flow to the Group, and is depreciated over the remaining useful life of the asset.
The carrying values of property, plant and equipment are reviewed for impairment when events or changes in circumstances indicate that the carrying value may not be recoverable.
Notes to the Financial Statements31 December 2006

77
3. SUMMARY OF SIGNIFICANT ACCOUNTING POLICIES (cont’d)
3.8 Property, plant and equipment (cont’d)The residual values, useful life and depreciation method are reviewed at each financial year-end to ensure that the amount, method and period of depreciation are consistent with previous estimates and the expected pattern of consumption of the future economic benefits embodied in the items of property, plant and equipment.
An item of property, plant and equipment is derecognised upon disposal or when no future economic benefits are expected from its use or disposal. Any gain or loss arising on derecognition of the asset is included in the profit and loss account in the year the asset is derecognised.
3.9 Biological assetsBiological assets, which include mature and immature oil palm plantations, are stated at fair value less estimated point-of-sale costs, with any resultant gain or loss recognised in the profit and loss account. Oil palm plantations are considered mature when 60% of oil palm per block are bearing fruits with an average weight of 3 kilograms or more per bunch. Point-of-sale costs include all costs that would be necessary to sell the assets.
The fair value of the oil palm plantations is estimated by reference to independent professional valuations using the discounted cash flows of the underlying biological assets. The expected cash flows from the whole life cycle of the oil palm plantations is determined using the market price of the estimated yield of the agricultural produce, being fresh palm fruit bunches, net of maintenance and harvesting costs and any costs required to bring the oil palm plantations to maturity. The estimated yield of the oil palm plantations is affected by the age of the oil palm trees, the location, soil type and infrastructure. The market price of the fresh palm fruit bunches is largely dependent on the prevailing market price of the processed products after harvest, being crude palm oil and palm kernel.
3.10 Plasma investmentPlasma investment comprises accumulated costs and borrowing costs incurred in the development of oil palm plantations under the “Plasma Scheme”. Under the “Plasma Scheme”, the Group assumes responsibility for developing oil palm plantations to the productive stage using the bank loans provided for this purpose. When a Plasma plantation is completed and ready to be transferred to the plasma landholders, the corresponding bank loans are also transferred to the plasma landholders.
When the carrying amount of the plasma investment is higher than its estimated recoverable amount, it is written down immediately to its recoverable amount.
3.11 Intangible asset – GoodwillGoodwill acquired in a business combination is initially measured at cost being the excess of the cost of the business combination over the Group’s interest in the net fair value of the identifiable assets, liabilities and contingent liabilities. Following initial recognition, goodwill is measured at cost less any accumulated impairment losses. Goodwill is reviewed for impairment, annually or more frequently if events or changes in circumstances indicate that the carrying value may be impaired.
For the purpose of impairment testing, goodwill acquired in a business combination is, from the acquisition date, allocated to each of the Group’s cash-generating units, or groups of cash-generating units, that are expected to benefit from the synergies of the combination, irrespective of whether other assets or liabilities of the Group are assigned to those units or groups of units. Each unit or group of units to which the goodwill is so allocated:
• Represents the lowest level within the Group at which the goodwill is monitored for internal management purposes; and
• Is not larger than a segment based on either the Group’s primary or the Group’s secondary reporting format.
78 Wilmar International Limited Annual Report 2006
3. SUMMARY OF SIGNIFICANT ACCOUNTING POLICIES (cont’d)
3.11 Intangible asset – Goodwill (cont’d)A cash-generating unit (or group of cash-generating units) to which goodwill has been allocated is tested for impairment annually and whenever there is an indication that the unit may be impaired, by comparing the carrying amount of the unit, including the goodwill, with the recoverable amount of the unit. Where the recoverable amount of the cash-generating unit (or group of cash-generating units) is less than the carrying amount, an impairment loss is recognised.
Where goodwill forms part of a cash-generating unit (or group of cash-generating units) and part of the operation within that unit is disposed of, the goodwill associated with the operation disposed of is included in the carrying amount of the operation when determining the gain or loss on disposal of the operation. Goodwill disposed of in this circumstance is measured based on the relative values of the operation disposed of and the portion of the cash-generating unit retained.
The Group does not reverse in a subsequent period, any impairment loss recognised for goodwill.
3.12 Impairment of non-financial assetsThe Group assesses at each reporting date whether there is an indication that an asset may be impaired. If any such indication exists, or when annual impairment testing for an asset is required, the Group makes an estimate of the asset’s recoverable amount.
An asset’s recoverable amount is the higher of an asset’s or cash-generating unit’s fair value less costs to sell and its value in use and is determined for an individual asset, unless the asset does not generate cash inflows that are largely independent of those from other assets or groups of assets. In assessing value in use, the estimated future cash flows are discounted to their present value using a pre-tax discount rate that reflects current market assessments of the time value of money and the risks specific to the asset. Where the carrying amount of an asset exceeds its recoverable amount, the asset is considered impaired and is written down to its recoverable amount. Impairment losses of continuing operations are recognised in the profit and loss account as ‘other operating expenses’ or treated as a revaluation decrease for assets carried at revalued amount to the extent that the impairment loss does not exceed the amount held in the asset revaluation reserve for that same asset.
An assessment is made at each reporting date as to whether there is any indication that previously recognised impairment losses recognised for an asset other than goodwill may no longer exist or may have decreased. If such indication exists, the recoverable amount is estimated. A previously recognised impairment loss is reversed only if there has been a change in the estimates used to determine the asset’s recoverable amount since the last impairment loss was recognised. If that is the case the carrying amount of the asset is increased to its recoverable amount. That increased amount cannot exceed the carrying amount that would have been determined, net of depreciation, had no impairment loss been recognised for the asset in prior years. Reversal of an impairment loss is recognised in the profit and loss account unless the asset is carried at revalued amount, in which case the reversal in excess of impairment loss previously recognised through the profit and loss account is treated as a revaluation increase. After such a reversal, the depreciation charge is adjusted in future periods to allocate the asset’s revised carrying amount, less any residual value, on a systematic basis over its remaining useful life.
3.13 Financial assets Financial assets are classified as either financial assets at fair value through profit or loss, loans and receivables, held to maturity investments or available-for-sale financial assets, as appropriate. Financial assets are recognised on the balance sheet when, and only when, the Group becomes a party to the contractual provisions of the financial instrument.
Notes to the Financial Statements31 December 2006
79
3. SUMMARY OF SIGNIFICANT ACCOUNTING POLICIES (cont’d)
3.13 Financial assets (cont’d)When financial assets are recognised initially, they are measured at fair value, plus, in the case of financial assets not at fair value through profit or loss, directly attributable transaction costs. The Group determines the classification of its financial assets after initial recognition and, where allowed and appropriate, re-evaluates this designation at each financial year-end.
(a) Financial assets at fair value through profit or lossFinancial assets classified as held for trading (including derivative financial instruments) are classified as financial assets at fair value through profit or loss. Financial assets are classified as held for trading if they are acquired for the purpose of selling in the near term. Derivative financial instruments are also classified as held for trading unless they are designated as effective hedging instruments. Gains or losses on financial assets classified as at fair value through profit or loss are recognised in the profit and loss account.
The Group does not designate any financial assets not held for trading as financial assets at fair value through profit and loss.
(b) Held-to-maturity investmentsNon-derivative financial assets with fixed or determinable payments and fixed maturity are classified as held-to-maturity when the Group has the positive intention and ability to hold the assets to maturity. Investments intended to be held for an undefined period are not included in this classification. Other long-term investments that are intended to be held-to-maturity, such as bonds, are subsequently measured at amortised cost using the effective interest method. This cost is computed as the amount initially recognised minus principal repayments, plus or minus the cumulative amortisation using the effective interest method of any difference between the initially recognised amount and the maturity amount and minus any reduction for impairment or uncollectibility. This calculation includes all fees and points paid or received between parties to the contract that are an integral part of the effective interest rate, transaction costs and all other premiums and discounts. For investments carried at amortised cost, gains and losses are recognised in the profit and loss account when the investments are derecognised or impaired, as well as through the amortisation process.
(c) Loans and receivables Non-derivative financial assets with fixed or determinable payments that are not quoted in an active market
are classified as loans and receivables. Such assets are carried at amortised cost using the effective interest method, less impairment losses. Gains and losses are recognised in the profit and loss account when the loans and receivables are derecognised or impaired, as well as through the amortisation process.
The Group classifies the following financial assets as loans and receivables:
• Cash and bank balances
• Trade and other receivables, including amounts due from subsidiaries, associates, related companies and loans to related companies.
80 Wilmar International Limited Annual Report 2006
3. SUMMARY OF SIGNIFICANT ACCOUNTING POLICIES (cont’d)
3.13 Financial assets (cont’d)
(d) Available-for-sale financial assetsThe Group classifies its investment securities as available-for-sale financial assets.
Available-for-sale financial assets are those non-derivative financial assets that are designated as available-for-sale or are not classified in any of the three preceding categories. After initial recognition, available-for-sale financial assets are measured at fair value with gains or losses being recognised in the fair value adjustment reserve until the investment is derecognised or until the investment is determined to be impaired at which time the cumulative gain or loss previously reported in equity is included in the profit and loss account.
The fair value of investments that are actively traded in organised financial markets is determined by reference to the relevant Exchange’s quoted market bid prices at the close of business on the balance sheet date. For investments where there is no active market, fair value is determined using valuation techniques.
Investments in equity instruments that do not have a quoted market price in an active market and whose fair value cannot be reliably measured are measured at cost less impairment losses.
3.14 Cash and cash equivalentsCash and cash equivalents comprise cash on hand, demand deposits, and short-term, highly liquid investments that are readily convertible to known amounts of cash and which are subject to an insignificant risk of changes in value. These also include bank overdrafts that form an integral part of the Group’s cash management.
3.15 Impairment of financial assetsThe Group assesses at each balance sheet date whether there is any objective evidence that a financial asset or group of financial assets is impaired.
(a) Assets carried at amortised costIf there is objective evidence that an impairment loss on financial assets carried at amortised cost has been incurred, the amount of the loss is measured as the difference between the asset’s carrying amount and the present value of estimated future cash flows discounted at the financial asset’s original effective interest rate. The carrying amount of the asset is reduced through the use of an allowance account. The amount of the loss is recognised in the profit and loss account.
If, in a subsequent period, the amount of the impairment loss decreases and the decrease can be related objectively to an event occurring after the impairment was recognised, the previously recognised impairment loss is reversed. Any subsequent reversal of an impairment loss is recognised in the profit and loss account, to the extent that the carrying value of the asset does not exceed its amortised cost at the reversal date.
(b) Assets carried at costIf there is objective evidence that an impairment loss on a financial asset carried at cost has been incurred, the amount of the loss is measured as the difference between the asset’s carrying amount and the present value of estimated future cash flows discounted at the current market rate of return for a similar financial asset. Such impairment losses are not reversed in subsequent periods.
Notes to the Financial Statements31 December 2006
81
3. SUMMARY OF SIGNIFICANT ACCOUNTING POLICIES (cont’d)
3.15 Impairment of financial assets (cont’d)
(c) Available-for-sale financial assetsIf an available-for-sale financial asset is impaired, an amount comprising the difference between its cost (net of any principal payment and amortisation) and its current fair value, less any impairment loss previously recognised in the profit and loss account, is transferred from equity to the income statement. Reversals in respect of equity instruments classified as available-for-sale are not recognised in the profit and loss account. Reversals of impairment losses on debt instruments are reversed through the profit and loss account, if the increase in fair value of the instrument can be objectively related to an event occurring after the impairment loss was recognised in the profit and loss account.
3.16 Derecognition of financial assets and liabilities
(a) Financial assetsA financial asset (or, where applicable a part of a financial asset or part of a group of similar financial assets) is derecognised where:
• The contractual rights to receive cash flows from the asset have expired; or
• The Group retains the contractual rights to receive cash flows from the asset, but has assumed an obligation to pay them in full without material delay to a third party under a ‘pass-through’ arrangement; or
• The Group has transferred its rights to receive cash flows from the asset and either (a) has transferred substantially all the risks and rewards of the asset, or (b) has neither transferred nor retained substantially all the risks and rewards of the asset, but has transferred control of the asset.
Where the Group has transferred its rights to receive cash flows from an asset and has neither transferred nor retained substantially all the risks and rewards of the asset nor transferred control of the asset, the asset is recognised to the extent of the Group’s continuing involvement in the asset.
On derecognition of a financial asset in its entirety, the difference between the carrying amount and the sum of (a) the consideration received (including any new asset obtained less any new liability assumed) and (b) any cumulative gain or loss that has been recognised directly in equity is recognised in the profit and loss account.
(b) Financial liabilitiesA financial liability is derecognised when the obligation under the liability is discharged or cancelled or expires.
Where an existing financial liability is replaced by another from the same lender on substantially different terms, or the terms of an existing liability are substantially modified, such an exchange or modification is treated as a derecognition of the original liability and the recognition of a new liability, and the difference in the respective carrying amounts is recognised in the profit and loss account.

82 Wilmar International Limited Annual Report 2006
3. SUMMARY OF SIGNIFICANT ACCOUNTING POLICIES (cont’d)
3.17 Inventories
(a) Physical inventories, futures and other forward contractsPhysical inventories of palm based products, edible oils, oil seeds and other agricultural commodities are valued at the lower of cost and spot prices prevailing at the balance sheet date.
The Group has committed purchase and sales contracts for palm oil and other agricultural commodities that are entered into as part of its manufacturing and sale activities. The prices and physical delivery of the sales and purchases are fixed in the contracts and these contracts are not recognised in the financial statements until physical deliveries take place.
Gains or losses arising from matched non-physical delivery forward contracts and futures contracts of palm based products, soya beans, other edible oils, oil seeds and other agricultural commodities are recognised immediately in the profit and loss account. There forward and futures contracts are entered into as part and parcel of the business of the Group to manage the price risk of its physical inventory.
The Group also enters into commodity derivatives such as futures and options contracts on behalf of its related companies to hedge fluctuations in commodity prices. These commodity derivatives include products such as soya beans and non palm products. The notional principal amounts of the commodity contracts are off-balance sheet items. Any differences resulting from the fair value assessment will be transferred back to its related corporations.
Outstanding forward and futures contracts of palm based products, edible oils, oil seeds and other agricultural commodities are valued at their fair values at the balance sheet date. Where available, quoted market prices are used as a measure of fair values for the outstanding contracts. Where the quoted market prices are not available, fair values are based on management’s best estimate and are arrived at by reference to the market prices of another contract that is substantially similar. Unrealised losses arising from the valuation are set off against unrealised gains on an aggregate basis.
(b) Other inventories Other inventories are stated at lower of cost and net realisable value. Cost is determined using the weighted
average method. Net realisable value is the estimated selling price less the costs of completion and selling expenses.
3.18 Financial liabilitiesFinancial liabilities include trade payables, which are normally settled on 18 day terms, other amounts payable, payables to related parties and interest-bearing loans and borrowings. Financial liabilities are recognised on the balance sheet when, and only when, the group becomes a party to the contractual provisions of the financial instrument. Financial liabilities are initially recognised at fair value of the consideration received less directly attributable transaction costs and subsequently measured at amortised cost using the effective interest method.
Gains and losses are recognised in the profit and loss account when the liabilities are derecognised as well as through the amortisation process. The liabilities are derecognised when the obligation under the liability is discharged or cancelled or expired.
3.19 Borrowing costsBorrowing costs are generally expensed as incurred. Borrowing costs are capitalised if they are directly attributable to the acquisition, construction or production of a qualifying asset. Capitalisation of borrowing costs commences when the activities to prepare the asset for its intended use or sale are in progress and the expenditures and borrowing costs are being incurred. Borrowing costs are capitalised until the assets are ready for their intended use. If the resulting carrying amount of the asset exceeds its recoverable amount, an impairment loss is recorded.
Notes to the Financial Statements31 December 2006
83
3. SUMMARY OF SIGNIFICANT ACCOUNTING POLICIES (cont’d)
3.20 ProvisionsProvisions are recognised when the Group has a present obligation (legal or constructive) where, as a result of a past event, it is probable that an outflow of resources embodying economic benefits will be required to settle the obligation and a reliable estimate can be made of the amount of the obligation.
Provisions are reviewed at each balance sheet date and adjusted to reflect the current best estimate. If it is no longer probable that an outflow of resources embodying economic benefits will be required to settle the obligation, the provision is reversed.
3.21 Employee benefits
(a) Defined contribution plansThe Group participates in the national pension schemes as defined by the laws of the countries in which it has operations. In particular, the Singapore companies in the Group make contributions to the Central Provident Fund scheme in Singapore, a defined contribution pension scheme. Contributions to national pension schemes are recognised as an expense in the period in which the related service is performed.
(b) Employee leave entitlementEmployee entitlements to annual leave are recognised when they accrue to employees. A provision is made for the estimated liability for leave as a result of services rendered by employees up to the balance sheet date.
(c) Provision for employee service entitlementsFor certain companies in Indonesia, the Group recognises a provision for employee service entitlements in accordance with Labor Law No. 13/2003 dated 25 March 2003. The provision is based on an actuarial calculation by an independent actuary using the “Projected Unit Credit Method”. Actuarial gains or losses are recognised as income or expense when the cumulative actuarial gains or losses exceed 10% of the defined benefit obligation. These gains or losses are recognised over the expected remaining working lives of employees. Past service cost is amortised over the remaining working lives of each employee.
3.22 Leases
(a) As lesseeFinance leases, which transfer to the Group substantially all the risks and rewards incidental to ownership of the leased item, are capitalised at the inception of the lease at the fair value of the leased asset or, if lower, at the present value of the minimum lease payments. Any initial direct costs are also added to the amount capitalised. Lease payments are apportioned between the finance charges and reduction of the lease liability so as to achieve a constant rate of interest on the remaining balance of the liability. Finance charges are charged to the profit and loss account. Contingent rents, if any, are charged as expenses in the periods in which they are incurred.
Capitalised leased assets are depreciated over the shorter of the estimated useful life of the asset and the lease term, if there is no reasonable certainty that the Group will obtain ownership by the end of the lease term.
Operating lease payments are recognised as an expense in the profit and loss account on a straight-line basis over the lease term. The aggregate benefit of incentives provided by the lessor is recognised as a reduction of rental expense over the lease term on a straight-line basis.
(b) As lessorLeases where the Group retains substantially all the risks and rewards of ownership of the asset are classified as operating leases. Initial direct costs incurred in negotiating an operating lease are added to the carrying amount of the leased asset and recognised over the lease term on the same bases as rental income.

84 Wilmar International Limited Annual Report 2006
3. SUMMARY OF SIGNIFICANT ACCOUNTING POLICIES (cont’d)
3.23 RevenueRevenue is recognised to the extent that it is probable that the economic benefits will flow to the Group and the revenue can be reliably measured.
(a) Sale of goodsRevenue from sales arising from physical delivery of palm based products, soya beans, other edible oils, oil seeds and other agricultural commodities is recognised when significant risks and rewards of ownership of goods are transferred to the buyer.
(b) Ship charter incomeRevenue from voyage charters is recognised on a time apportionment basis.
(c) Interest incomeInterest income is recognised as interest accrues (using the effective interest method) unless collectibility is in doubt.
(d) Rental and storage incomeRental and storage income is recognised on a straight-line basis over the lease terms on ongoing leases.
(e) Dividend incomeDividend income is recognised when the right to receive payment is established.
3.24 Income taxes
(a) Current taxCurrent tax assets and liabilities for the current and prior periods are measured at the amount expected to be recovered from or paid to the taxation authorities. The tax rates and tax laws used to compute the amount are those that are enacted or substantively enacted by the balance sheet date.
(b) Deferred taxDeferred income tax is provided using the liability method on temporary differences at the balance sheet date between the tax bases of assets and liabilities and their carrying amounts for financial reporting purposes.
Deferred tax liabilities are recognised for all taxable temporary differences, except:
• Where the deferred tax liability arises from the initial recognition of goodwill or of an asset or liability in a transaction that is not a business combination and, at the time of the transaction, affects neither accounting profit nor taxable profit or loss; and
• In respect of taxable temporary differences associated with investments in subsidiaries, associates and interests in joint ventures, where the timing of the reversal of the temporary differences can be controlled and it is probable that the temporary differences will not reverse in the foreseeable future.
Deferred income tax assets are recognised for all deductible temporary differences (other than those mentioned above), carry-forward of unused tax credits and unused tax losses, to the extent that it is probable that taxable profit will be available against which the deductible temporary differences, and the carry-forward of unused tax credits and unused tax losses can be utilised.
Notes to the Financial Statements31 December 2006
85
3. SUMMARY OF SIGNIFICANT ACCOUNTING POLICIES (cont’d)
3.24 Income taxes (cont’d)
(b) Deferred tax (cont’d) The carrying amount of deferred income tax assets is reviewed at each balance sheet date and reduced to the
extent that it is no longer probable that sufficient taxable profit will be available to allow all or part of the deferred income tax asset to be utilised. Unrecognised deferred income tax assets are reassessed at each balance sheet date and are recognised to the extent that it has become probable that future taxable profit will allow the deferred tax asset to be recovered.
Deferred income tax assets and liabilities are measured at the tax rates that are expected to apply to the year when the asset is realised or the liability is settled, based on tax rates (and tax laws) that have been enacted or substantively enacted at the balance sheet date.
Income tax relating to items recognised directly in equity is recognised in equity.
Deferred tax assets and deferred tax liabilities are offset, if a legally enforceable right exists to set off current tax assets against current tax liabilities and the deferred taxes relate to the same taxable entity and the same taxation authority.
(c) Sales tax (GST or VAT)Revenues, expenses and assets are recognised net of the amount of sales tax except:
• Where the sales tax incurred on a purchase of assets or services is not recoverable from the taxation authority, in which case the sales tax is recognised as part of the cost of acquisition of the asset or as part of the expense item as applicable; and
• Receivables and payables that are stated with the amount of sales tax included.
The net amount of sales tax recoverable from, or payable to, the taxation authority is included as part of receivables or payables in the balance sheet.
3.25 Derivative financial instruments and hedging activitiesForward foreign exchange contracts are entered into on behalf of related companies and used to hedge these entities’ exposure to foreign currency risks. The notional principal amounts of the forward foreign exchange contracts are off-balance sheet items. The fair values of the forward foreign exchange contracts are recognised in the financial statements. Any realised or unrealised gains and losses will be refunded to or recovered from the related corporations.
The fair values of forward foreign exchange contracts have been calculated using the rates quoted by the Group’s bankers to terminate the contracts at the balance sheet date.

86 Wilmar International Limited Annual Report 2006
Notes to the Financial Statements31 December 2006
4. SALES
Group 2006 2005 US$’000 US$’000
––––––––––––––––––––––––––––––––––––––––––––––––––––––––––––––––––––––––––––––––––––––––––––––––––––––––––––––––––––––––––––––––––––––––––––––––––––
Sales of palm based products, soya beans, edible oils, oil seeds and other agricultural commodities 5,293,672 4,647,515Shipping charter income 7,960 4,045
––––––––––––––––––––––––––––––––––––––
5,301,632 4,651,560––––––––––––––––––––––––––
5. COST OF SALES
Group 2006 2005 US$’000 US$’000
––––––––––––––––––––––––––––––––––––––––––––––––––––––––––––––––––––––––––––––––––––––––––––––––––––––––––––––––––––––––––––––––––––––––––––––––––––
Cost of inventories recognised as expense – physical delivery 4,658,558 4,085,683Labour costs and other overheads 157,395 130,468Net losses on non-physical delivery forward contracts (“paper trades”) # 3,923 3,681Net realised (gains)/losses from futures and options transactions * (15,776) 174Net foreign exchange losses/(gains) 11,245 (4,381)
––––––––––––––––––––––––––––––––––––––
4,815,345 4,215,625––––––––––––––––––––––––––
# Net losses relates to the realised losses arising from non-physical delivery forward contracts (“paper trades”) entered into for the purpose of managing
the price risk of physical inventory.
* Net realised (gains)/losses relates to the realised (gains)/losses arising from futures and options transactions entered into for the purpose of managing
the price risk of palm oil and other agricultural commodities.
6. OTHER OPERATING INCOME
Group 2006 2005 US$’000 US$’000
––––––––––––––––––––––––––––––––––––––––––––––––––––––––––––––––––––––––––––––––––––––––––––––––––––––––––––––––––––––––––––––––––––––––––––––––––––
Interest income – from associates 1,277 801 – from related companies 8,392 8,010 – from fixed deposits 814 28 – late interest charge to trade debtors 670 989 – from other sources 711 279
11,864 10,107Rental and storage income 508 405Scrap sales 1,379 773Sales of spare parts 86 118Gain on disposal of property, plant and equipment 2,029 83Bad debts recovered 157 239Negative goodwill taken to the profit and loss account 1,249 –Write-back of accounts payables 988 48Others 3,300 1,780
––––––––––––––––––––––––––––––––––––––
21,560 13,553––––––––––––––––––––––––––
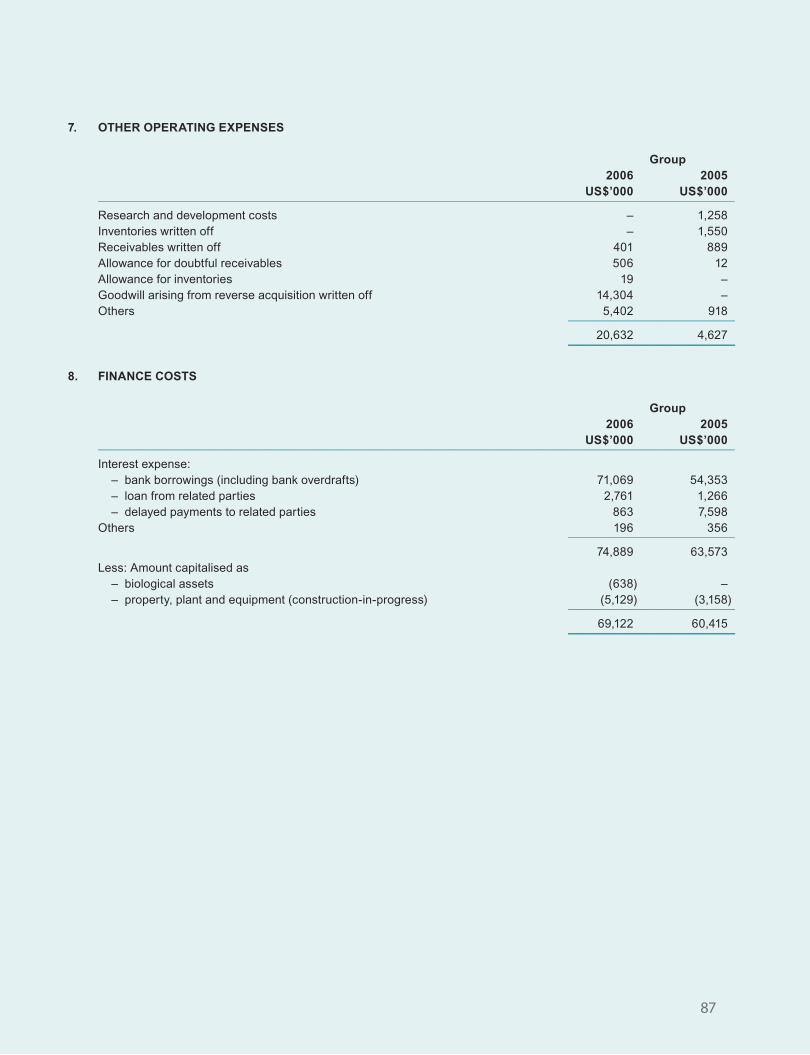
87
7. OTHER OPERATING EXPENSES
Group 2006 2005 US$’000 US$’000
––––––––––––––––––––––––––––––––––––––––––––––––––––––––––––––––––––––––––––––––––––––––––––––––––––––––––––––––––––––––––––––––––––––––––––––––––––
Research and development costs – 1,258Inventories written off – 1,550Receivables written off 401 889Allowance for doubtful receivables 506 12Allowance for inventories 19 –Goodwill arising from reverse acquisition written off 14,304 –Others 5,402 918
–––––––––––––––––––––––––––––––––––––––
20,632 4,627––––––––––––––––––––––––––
8. FINANCE COSTS
Group 2006 2005 US$’000 US$’000
––––––––––––––––––––––––––––––––––––––––––––––––––––––––––––––––––––––––––––––––––––––––––––––––––––––––––––––––––––––––––––––––––––––––––––––––––––
Interest expense: – bank borrowings (including bank overdrafts) 71,069 54,353 – loan from related parties 2,761 1,266 – delayed payments to related parties 863 7,598Others 196 356
–––––––––––––––––––––––––––––––––––––––
74,889 63,573Less: Amount capitalised as – biological assets (638) – – property, plant and equipment (construction-in-progress) (5,129) (3,158)
–––––––––––––––––––––––––––––––––––––––
69,122 60,415––––––––––––––––––––––––––

88 Wilmar International Limited Annual Report 2006
Notes to the Financial Statements31 December 2006
9. PROFIT BEFORE TAX
Group 2006 2005 US$’000 US$’000
––––––––––––––––––––––––––––––––––––––––––––––––––––––––––––––––––––––––––––––––––––––––––––––––––––––––––––––––––––––––––––––––––––––––––––––––––––
The following items have been included in arriving at profit before tax:Depreciation of property, plant and equipment– Land and land rights 548 391– Buildings 6,062 5,856– Plants and machineries 22,305 16,465– Furniture, fittings and office equipment 1,266 980– Vessels 1,946 2,366– Motor vehicles and trucks 3,560 2,776
–––––––––––––––––––––––––––––––––––––––
35,687 28,834Less: Amount capitalised as part of costs of biological assets (647) (135)
–––––––––––––––––––––––––––––––––––––––
35,040 28,699––––––––––––––––––––––––––
Staff costs during the financial years comprise: – Salaries 45,671 33,968 – CPF and other pension funds 457 478 – Other staff related expenses 2,147 3,739Rental expense – operating lease 670 573
––––––––––––––––––––––––––
10. TAX EXPENSE
(a) Major components of income tax expense
The major components of income tax expense for the years ended 31 December 2006 and 2005 are:
Group 2006 2005 US$’000 US$’000
–––––––––––––––––––––––––––––––––––––––––––––––––––––––––––––––––––––––––––––––––––––––––––––––––––––––––––––––––––––––––––––––––––––––––––––
Profit and loss accountCurrent income taxCurrent taxation 18,742 13,857Under provision in respect of previous years 919 224
Deferred income taxMovement in temporary differences 9,422 1,106Benefits from previously unrecognised tax losses 4 (273)
–––––––––––––––––––––––––––––––––––––––
Income tax expense recognised in the profit and loss account 29,087 14,914––––––––––––––––––––––––––
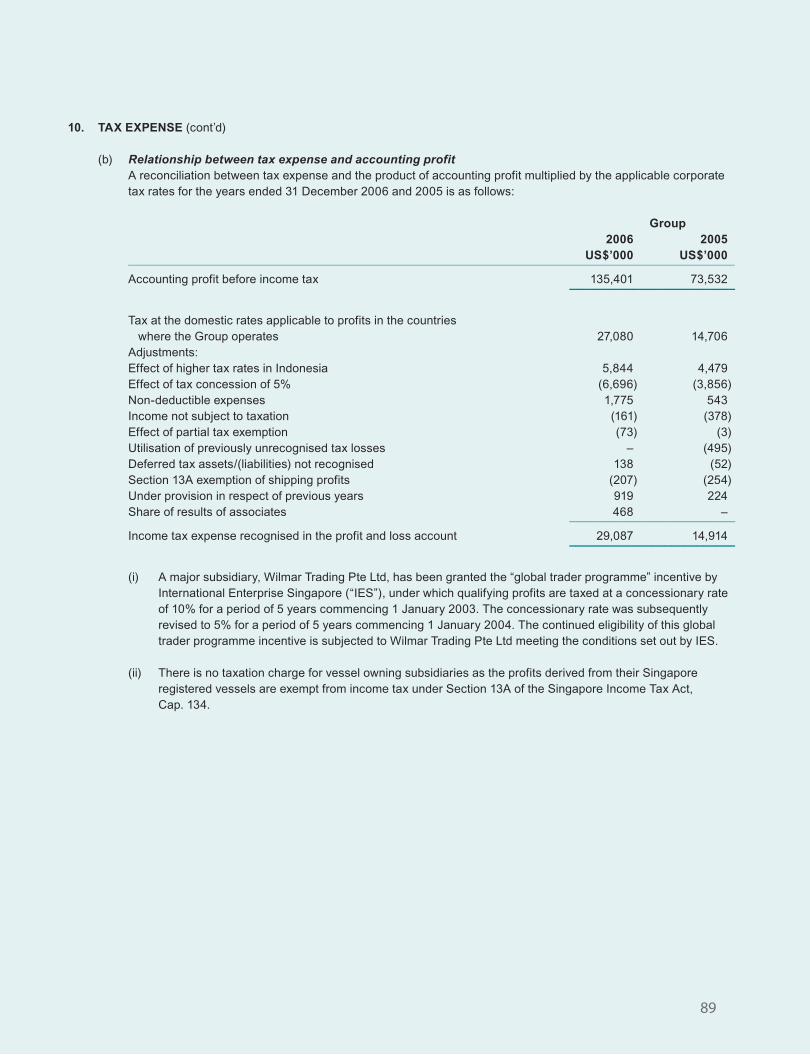
89
10. TAX EXPENSE (cont’d)
(b) Relationship between tax expense and accounting profit A reconciliation between tax expense and the product of accounting profit multiplied by the applicable corporate
tax rates for the years ended 31 December 2006 and 2005 is as follows:
Group 2006 2005 US$’000 US$’000
–––––––––––––––––––––––––––––––––––––––––––––––––––––––––––––––––––––––––––––––––––––––––––––––––––––––––––––––––––––––––––––––––––––––––––––
Accounting profit before income tax 135,401 73,532––––––––––––––––––––––––––
Tax at the domestic rates applicable to profits in the countries where the Group operates 27,080 14,706Adjustments:Effect of higher tax rates in Indonesia 5,844 4,479Effect of tax concession of 5% (6,696) (3,856)Non-deductible expenses 1,775 543Income not subject to taxation (161) (378)Effect of partial tax exemption (73) (3)Utilisation of previously unrecognised tax losses – (495)Deferred tax assets/(liabilities) not recognised 138 (52)Section 13A exemption of shipping profits (207) (254)Under provision in respect of previous years 919 224Share of results of associates 468 –
––––––––––––––––––––––––––––––––––––––
Income tax expense recognised in the profit and loss account 29,087 14,914––––––––––––––––––––––––––
(i) A major subsidiary, Wilmar Trading Pte Ltd, has been granted the “global trader programme” incentive by International Enterprise Singapore (“IES”), under which qualifying profits are taxed at a concessionary rate of 10% for a period of 5 years commencing 1 January 2003. The concessionary rate was subsequently revised to 5% for a period of 5 years commencing 1 January 2004. The continued eligibility of this global trader programme incentive is subjected to Wilmar Trading Pte Ltd meeting the conditions set out by IES.
(ii) There is no taxation charge for vessel owning subsidiaries as the profits derived from their Singapore registered vessels are exempt from income tax under Section 13A of the Singapore Income Tax Act, Cap. 134.

90 Wilmar International Limited Annual Report 2006
Notes to the Financial Statements31 December 2006
10. TAX EXPENSE (cont’d)
(c) Deferred income tax
Group 2006 2005 US$’000 US$’000
–––––––––––––––––––––––––––––––––––––––––––––––––––––––––––––––––––––––––––––––––––––––––––––––––––––––––––––––––––––––––––––––––––––––––––––
Deferred tax liabilitiesDifference in depreciation (16,119) (15,371)Expenditure currently deductible for tax but deferred for accounting purposes (615) (615)Fair valuation gains of biological assets (42,644) (32,161)
––––––––––––––––––––––––––––––––––––––
(59,378) (48,147)––––––––––––––––––––––––––
Deferred tax assets Tax losses 473 927Provisions 4,206 1,707Others 744 –
––––––––––––––––––––––––––––––––––––––
5,423 2,634––––––––––––––––––––––––––
11. EARNINGS PER SHARE (US CENTS)Basic earnings per share amounts are calculated by dividing profit for the year that is attributable to ordinary equity holders of the Company by the weighted average number of ordinary shares outstanding during the year.
The following table reflects the profit and loss account and share data used in the computation of basic earnings per share for the years ended 31 December:
Group 2006 2005 US$’000 US$’000
–––––––––––––––––––––––––––––––––––––––––––––––––––––––––––––––––––––––––––––––––––––––––––––––––––––––––––––––––––––––––––––––––––––––––––––
Profit for the year attributable to ordinary shares 104,612 58,049––––––––––––––––––––––––––
Weighted average number of ordinary shares (‘000) 2,318,336 2,176,555––––––––––––––––––––––––––
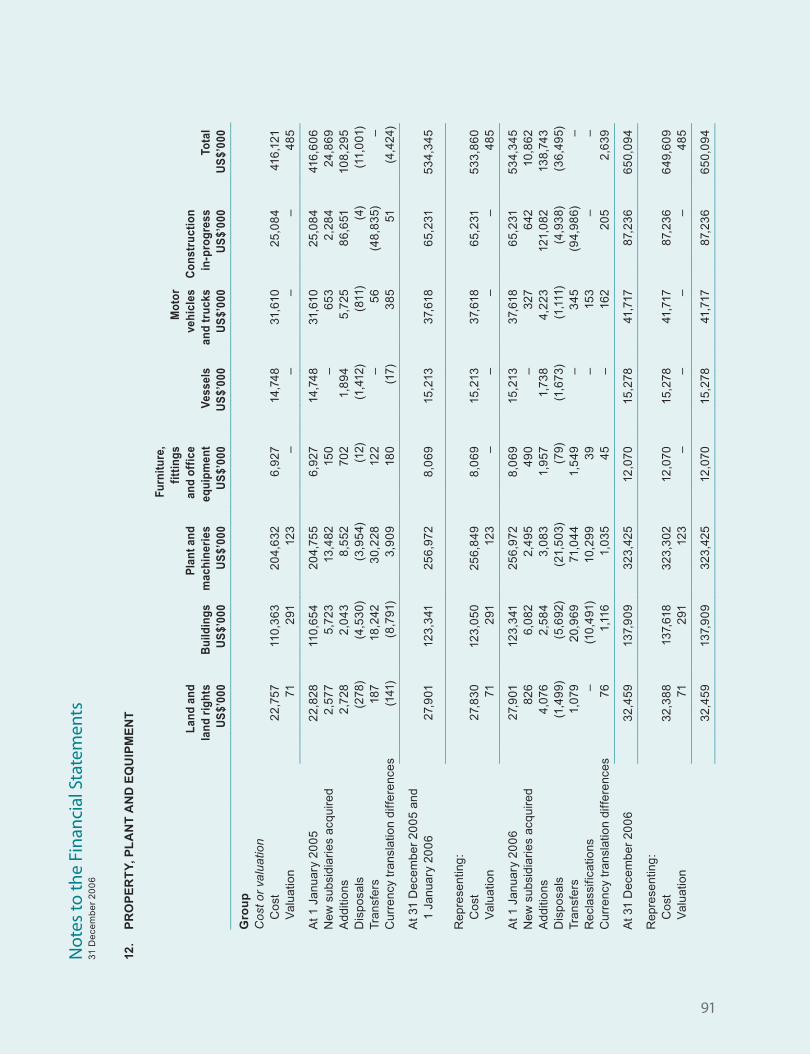
91
12.
PR
OP
ER
TY
, PL
AN
T A
ND
EQ
UIP
ME
NT
Furn
itur
e,
fi
ttin
gs
M
oto
r
Lan
d an
d
Pla
nt a
nd
and
offi
ce
ve
hicl
es
Con
stru
ctio
n
lan
d ri
ghts
B
uild
ing
s m
achi
ner
ies
equi
pm
ent
Ves
sels
an
d tr
uck
s in
-pro
gre
ss
Tota
l
US
$’00
0 U
S$’
000
US
$’00
0 U
S$’
000
US
$’00
0 U
S$’
000
US
$’00
0 U
S$’
000
––––
––––
––––
––––
––––
––––
––––
––––
––––
––––
––––
––––
––––
––––
––––
––––
––––
––––
––––
––––
––––
––––
––––
––––
––––
––––
––––
––––
––––
––––
––––
––––
––––
––––
––––
––––
––––
––––
––––
––––
––––
––––
––––
––––
––––
––––
––––
–
Gro
up
Cos
t or
valu
atio
n
Co
st
22
,757
11
0,3
63
20
4,6
32
6,9
27
14,7
48
31,6
10
25,0
84
416
,121
V
alua
tion
71
291
12
3 –
– –
– 4
85
––––
––––
––––
––––
––––
––––
––––
––––
––––
––––
––––
––––
––––
––––
––––
––––
––––
––––
––––
––––
––––
––––
––––
––––
––––
––––
––––
––––
––––
––––
––––
––––
––––
––––
––––
––––
––––
––
At 1
Jan
uary
20
05
22
,828
11
0,6
54
20
4,75
5 6
,927
14
,74
8 31
,610
25
,08
4 41
6,6
06
New
sub
sidi
arie
s ac
quir
ed
2,5
77
5,72
3 13
,48
2 15
0 –
65
3 2
,28
4 24
,86
9A
ddi
tions
2
,728
2
,04
3 8
,552
70
2 1,
89
4 5,
725
86
,651
10
8,2
95
Dis
po
sals
(2
78)
(4,5
30
) (3
,95
4)
(12)
(1
,412
) (8
11)
(4)
(11,
001
)Tr
ansf
ers
18
7 18
,242
3
0,2
28
122
– 5
6 (4
8,8
35)
–
Cur
renc
y tr
ansl
atio
n di
ffe
renc
es
(141
) (8
,791
) 3
,90
9 18
0 (1
7)
38
5 51
(4
,424
)––
––––
––––
––––
––––
––––
––––
––––
––––
––––
––––
––––
––––
––––
––––
––––
––––
––––
––––
––––
––––
––––
––––
––––
––––
––––
––––
––––
––––
––––
––––
––––
––––
––––
––––
––––
––––
––––
At 3
1 D
ece
mb
er
20
05
and
1
Janu
ary
20
06
27,9
01
123
,341
25
6,9
72
8,0
69
15,2
13
37,6
18
65,
231
5
34,
34
5––
––––
––––
––––
––––
––––
––––
––––
––––
––––
––––
––––
––––
––––
––––
––––
––––
––––
––––
––––
––––
––––
––––
––––
––––
––––
––––
––––
––––
––––
––––
––––
––––
––––
––––
––––
––––
––––
Re
pre
sent
ing
:
C
ost
27
,83
0 12
3,0
50
256
,84
9 8
,06
9 15
,213
37
,618
6
5,2
31
53
3,8
60
V
alua
tion
71
291
12
3 –
– –
– 4
85
––––
––––
––––
––––
––––
––––
––––
––––
––––
––––
––––
––––
––––
––––
––––
––––
––––
––––
––––
––––
––––
––––
––––
––––
––––
––––
––––
––––
––––
––––
––––
––––
––––
––––
––––
––––
––––
––
At 1
Jan
uary
20
06
27,9
01
123
,341
25
6,9
72
8,0
69
15,2
13
37,6
18
65,
231
5
34,
34
5N
ew s
ubsi
diar
ies
acqu
ire
d 8
26
6,0
82
2,4
95
49
0 –
327
642
10
,86
2A
ddi
tions
4,
076
2,5
84
3,0
83
1,9
57
1,73
8 4,
22
3 12
1,0
82
138
,74
3D
isp
osa
ls
(1,4
99
) (5
,69
2)
(21,
50
3)
(79
) (1
,673
) (1
,111
) (4
,93
8)
(36
,49
5)Tr
ansf
ers
1,
079
20,
96
9 71
,04
4 1,
54
9 –
34
5 (9
4,9
86
) –
Re
clas
sific
atio
ns
– (1
0,4
91)
10,2
99
39
– 15
3 –
–C
urre
ncy
tran
slat
ion
diff
ere
nce
s 76
1,
116
1,0
35
45
– 16
2 2
05
2,6
39
––––
––––
––––
––––
––––
––––
––––
––––
––––
––––
––––
––––
––––
––––
––––
––––
––––
––––
––––
––––
––––
––––
––––
––––
––––
––––
––––
––––
––––
––––
––––
––––
––––
––––
––––
––––
––––
––
At 3
1 D
ece
mb
er
20
06
32,4
59
137,
90
9 32
3,4
25
12,0
70
15,2
78
41,7
17
87,2
36
65
0,0
94
––––
––––
––––
––––
––––
––––
––––
––––
––––
––––
––––
––––
––––
––––
––––
––––
––––
––––
––––
––––
––––
––––
––––
––––
––––
––––
––––
––––
––––
––––
––––
––––
––––
––––
––––
––––
––––
––
Re
pre
sent
ing
:
C
ost
32
,38
8 13
7,61
8 32
3,3
02
12,0
70
15,2
78
41,7
17
87,2
36
64
9,6
09
V
alua
tion
71
291
12
3 –
– –
– 4
85
––––
––––
––––
––––
––––
––––
––––
––––
––––
––––
––––
––––
––––
––––
––––
––––
––––
––––
––––
––––
––––
––––
––––
––––
––––
––––
––––
––––
––––
––––
––––
––––
––––
––––
––––
––––
––––
––
32
,45
9 13
7,9
09
323
,425
12
,070
15
,278
41
,717
87
,23
6 6
50,
09
4––
––––
––––
––––
––––
––––
––––
––––
––––
––––
––––
––––
––––
––––
––––
––––
––––
––––
––––
––––
––––
––––
––––
––––
––––
––––
––––
––––
––––
––––
––––
––––
––––
––––
––––
––––
––––
––––
Not
es to
the
Fina
ncia
l Sta
tem
ents
31 D
ece
mb
er
20
06

92 Wilmar International Limited Annual Report 2006
Notes to the Financial Statements31 December 2006
Not
es to
the
Fina
ncia
l Sta
tem
ents
31 D
ecem
ber
2006
12.
PR
OP
ER
TY
, PL
AN
T A
ND
EQ
UIP
ME
NT
(co
nt’d
)
Furn
itur
e,
fi
ttin
gs
M
oto
r
Lan
d an
d
Pla
nt a
nd
and
offi
ce
ve
hicl
es
Con
stru
ctio
n
lan
d ri
ghts
B
uild
ing
s m
achi
ner
ies
equi
pm
ent
Ves
sels
an
d tr
uck
s in
-pro
gre
ss
Tota
l
US
$’00
0 U
S$’
000
US
$’00
0 U
S$’
000
US
$’00
0 U
S$’
000
US
$’00
0 U
S$’
000
––––
––––
––––
––––
––––
––––
––––
––––
––––
––––
––––
––––
––––
––––
––––
––––
––––
––––
––––
––––
––––
––––
––––
––––
––––
––––
––––
––––
––––
––––
––––
––––
––––
––––
––––
––––
––––
––––
––––
––––
––––
––––
––––
––––
––––
––––
––––
–
Gro
up
Acc
um
ula
ted
dep
reci
atio
nA
t 1 J
anua
ry 2
00
5 1,
39
2 31
,174
78
,26
4 4,
34
6 9,
481
21
,147
–
145,
80
4D
ep
reci
atio
n ch
arg
e fo
r th
e ye
ar
391
5,
85
6 16
,46
5 9
80
2,3
66
2,7
76
– 28
,83
4D
isp
osa
ls
– (2
64)
(1
,78
0)
(5)
(1,4
12)
(52
6)
– (3
,987
)C
urre
ncy
tran
slat
ion
diff
ere
nce
s 1
(4,1
93)
1,
96
8 (7
6)
(15)
19
8 –
(2,1
17)
––––
––––
––––
––––
––––
––––
––––
––––
––––
––––
––––
––––
––––
––––
––––
––––
––––
––––
––––
––––
––––
––––
––––
––––
––––
––––
––––
––––
––––
––––
––––
––––
––––
––––
––––
––––
––––
––
At 3
1 D
ece
mb
er
20
05
and
1
Janu
ary
20
06
1,78
4 32
,573
9
4,91
7 5,
245
10,4
20
23
,59
5 –
168
,53
4D
ep
reci
atio
n ch
arg
e fo
r th
e ye
ar
54
8 6
,06
2 2
2,3
05
1,2
66
1,9
46
3,5
60
– 3
5,6
87D
isp
osa
ls
– (5
85)
(1
2,7
06
) (4
6)
(970
) (7
93)
–
(15,
100
)Tr
ansf
ers
–
(1,2
52)
1,25
0 2
– –
– –
Re
clas
sific
atio
ns
– (3
,79
6)
3,6
69
22
– 10
5 –
–C
urre
ncy
tran
slat
ion
diff
ere
nce
s 8
169
426
26
– 4
4 –
673
––––
––––
––––
––––
––––
––––
––––
––––
––––
––––
––––
––––
––––
––––
––––
––––
––––
––––
––––
––––
––––
––––
––––
––––
––––
––––
––––
––––
––––
––––
––––
––––
––––
––––
––––
––––
––––
––
At 3
1 D
ece
mb
er
20
06
2,3
40
33
,171
10
9,8
61
6,5
15
11,3
96
26
,511
–
189,
794
––––
––––
––––
––––
––––
––––
––––
––––
––––
––––
––––
––––
––––
––––
––––
––––
––––
––––
––––
––––
––––
––––
––––
––––
––––
––––
––––
––––
––––
––––
––––
––––
––––
––––
––––
––––
––––
––
Net
car
ryin
g am
oun
tA
t 31
De
cem
be
r 2
00
5 2
6,1
17
90,
768
162
,05
5 2
,824
4,
793
14,0
23
65,
231
3
65,
811
––––
––––
––––
––––
––––
––––
––––
––––
––––
––––
––––
––––
––––
––––
––––
––––
––––
––––
––––
––––
––––
––––
––––
––––
––A
t 31
De
cem
be
r 2
00
6 3
0,11
9 10
4,73
8 21
3,5
64
5,5
55
3,8
82
15,2
06
87,2
36
46
0,3
00
––––
––––
––––
––––
––––
––––
––––
––––
––––
––––
––––
––––
––––
––––
––––
––––
––––
––––
––––
––––
––––
––––
––––
––––
––
The
Gro
up’s
pro
pe
rty,
pla
nt a
nd
equ
ipm
ent i
nclu
de b
orr
owin
g co
sts
incu
rre
d in
co
nne
ctio
n w
ith t
he c
ons
truc
tion
of a
pla
nt.
The
bo
rrow
ing
cost
s ca
pita
lise
d as
co
st o
f pla
nt a
nd
equ
ipm
ent d
urin
g th
e ye
ar e
nde
d 31
De
cem
be
r 2
00
6 am
oun
ted
to U
S$
5,12
9,0
00
(20
05
: US
$3
,15
8,0
00
). C
ert
ain
pro
pe
rty,
pla
nt a
nd
equ
ipm
ent a
re p
led
ge
d as
se
curi
ty fo
r th
e ba
nk b
orr
owin
gs (
Not
e 2
6).
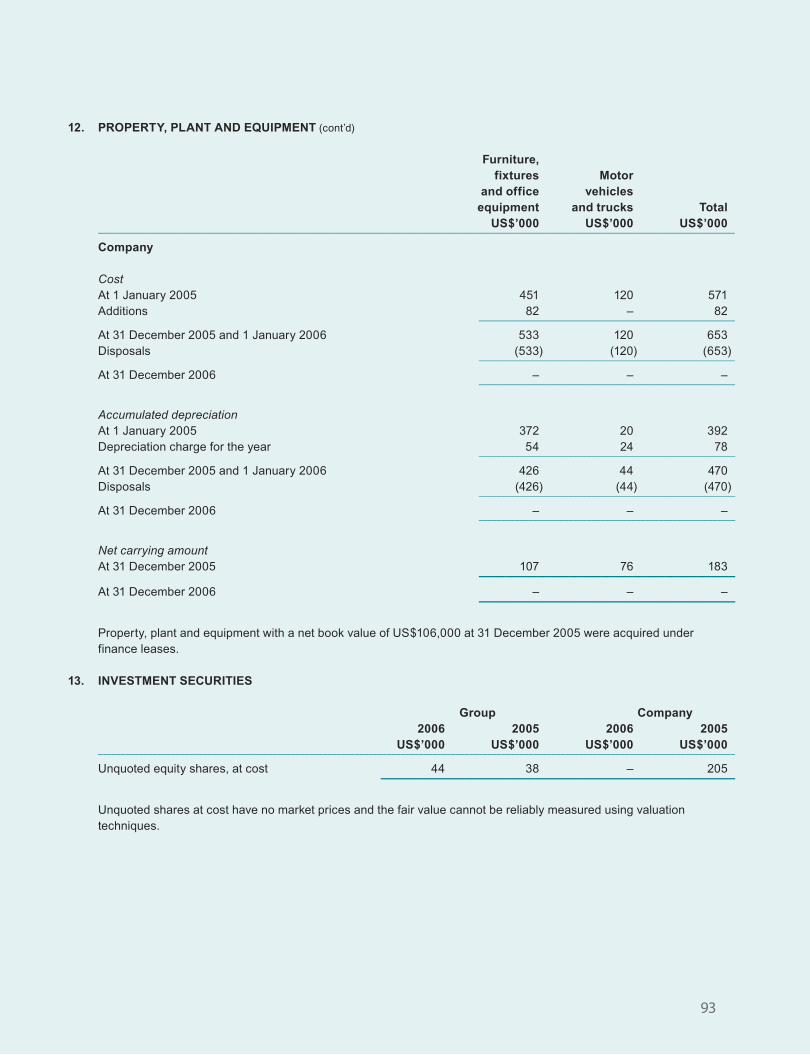
93
12. PROPERTY, PLANT AND EQUIPMENT (cont’d)
Furniture, fixtures Motor and office vehicles equipment and trucks Total US$’000 US$’000 US$’000––––––––––––––––––––––––––––––––––––––––––––––––––––––––––––––––––––––––––––––––––––––––––––––––––––––––––––––––––––––––––––––––––––––––––––––––––––
Company
CostAt 1 January 2005 451 120 571Additions 82 – 82
–––––––––––––––––––––––––––––––––––––––––––––––––––––––––––
At 31 December 2005 and 1 January 2006 533 120 653Disposals (533) (120) (653)
–––––––––––––––––––––––––––––––––––––––––––––––––––––––––––
At 31 December 2006 – – ––––––––––––––––––––––––––––––––––––––––––––––––––––––––––––
Accumulated depreciationAt 1 January 2005 372 20 392Depreciation charge for the year 54 24 78
–––––––––––––––––––––––––––––––––––––––––––––––––––––––––
At 31 December 2005 and 1 January 2006 426 44 470Disposals (426) (44) (470)
–––––––––––––––––––––––––––––––––––––––––––––––––––––––––
At 31 December 2006 – – ––––––––––––––––––––––––––––––––––––––––––––––––––––––––––
Net carrying amount At 31 December 2005 107 76 183
––––––––––––––––––––––––––––––––––––––––At 31 December 2006 – – –
––––––––––––––––––––––––––––––––––––––––
Property, plant and equipment with a net book value of US$106,000 at 31 December 2005 were acquired under finance leases.
13. INVESTMENT SECURITIES
Group Company 2006 2005 2006 2005 US$’000 US$’000 US$’000 US$’000
–––––––––––––––––––––––––––––––––––––––––––––––––––––––––––––––––––––––––––––––––––––––––––––––––––––––––––––––––––––––––––––––––––––––––––
Unquoted equity shares, at cost 44 38 – 205–––––––––––––––––––––––––––––––––––––––––––––––––––––––
Unquoted shares at cost have no market prices and the fair value cannot be reliably measured using valuation techniques.
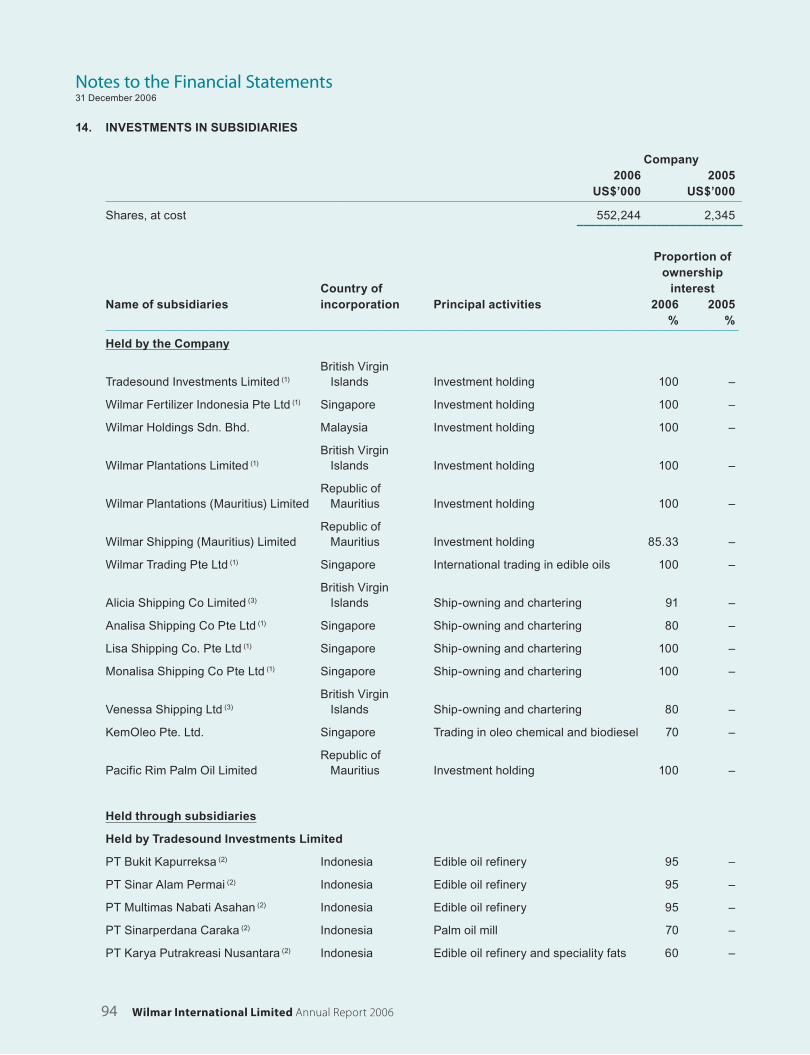
94 Wilmar International Limited Annual Report 2006
Notes to the Financial Statements31 December 2006
14. INVESTMENTS IN SUBSIDIARIES
Company 2006 2005 US$’000 US$’000
––––––––––––––––––––––––––––––––––––––––––––––––––––––––––––––––––––––––––––––––––––––––––––––––––––––––––––––––––––––––––––––––––––––––––––––––––––
Shares, at cost 552,244 2,345–––––––––––––––––––––––––
Proportion of ownership Country of interestName of subsidiaries incorporation Principal activities 2006 2005 % %––––––––––––––––––––––––––––––––––––––––––––––––––––––––––––––––––––––––––––––––––––––––––––––––––––––––––––––––––––––––––––––––––––––––––––––––––––
Held by the Company
British Virgin Tradesound Investments Limited (1) Islands Investment holding 100 –
Wilmar Fertilizer Indonesia Pte Ltd (1) Singapore Investment holding 100 –
Wilmar Holdings Sdn. Bhd. Malaysia Investment holding 100 –
British Virgin Wilmar Plantations Limited (1) Islands Investment holding 100 –
Republic of Wilmar Plantations (Mauritius) Limited Mauritius Investment holding 100 –
Republic of Wilmar Shipping (Mauritius) Limited Mauritius Investment holding 85.33 –
Wilmar Trading Pte Ltd (1) Singapore International trading in edible oils 100 –
British Virgin Alicia Shipping Co Limited (3) Islands Ship-owning and chartering 91 –
Analisa Shipping Co Pte Ltd (1) Singapore Ship-owning and chartering 80 –
Lisa Shipping Co. Pte Ltd (1) Singapore Ship-owning and chartering 100 –
Monalisa Shipping Co Pte Ltd (1) Singapore Ship-owning and chartering 100 –
British Virgin Venessa Shipping Ltd (3) Islands Ship-owning and chartering 80 –
KemOleo Pte. Ltd. Singapore Trading in oleo chemical and biodiesel 70 –
Republic of Pacific Rim Palm Oil Limited Mauritius Investment holding 100 –
Held through subsidiaries
Held by Tradesound Investments Limited
PT Bukit Kapurreksa (2) Indonesia Edible oil refinery 95 –
PT Sinar Alam Permai (2) Indonesia Edible oil refinery 95 –
PT Multimas Nabati Asahan (2) Indonesia Edible oil refinery 95 –
PT Sinarperdana Caraka (2) Indonesia Palm oil mill 70 –
PT Karya Putrakreasi Nusantara (2) Indonesia Edible oil refinery and speciality fats 60 –
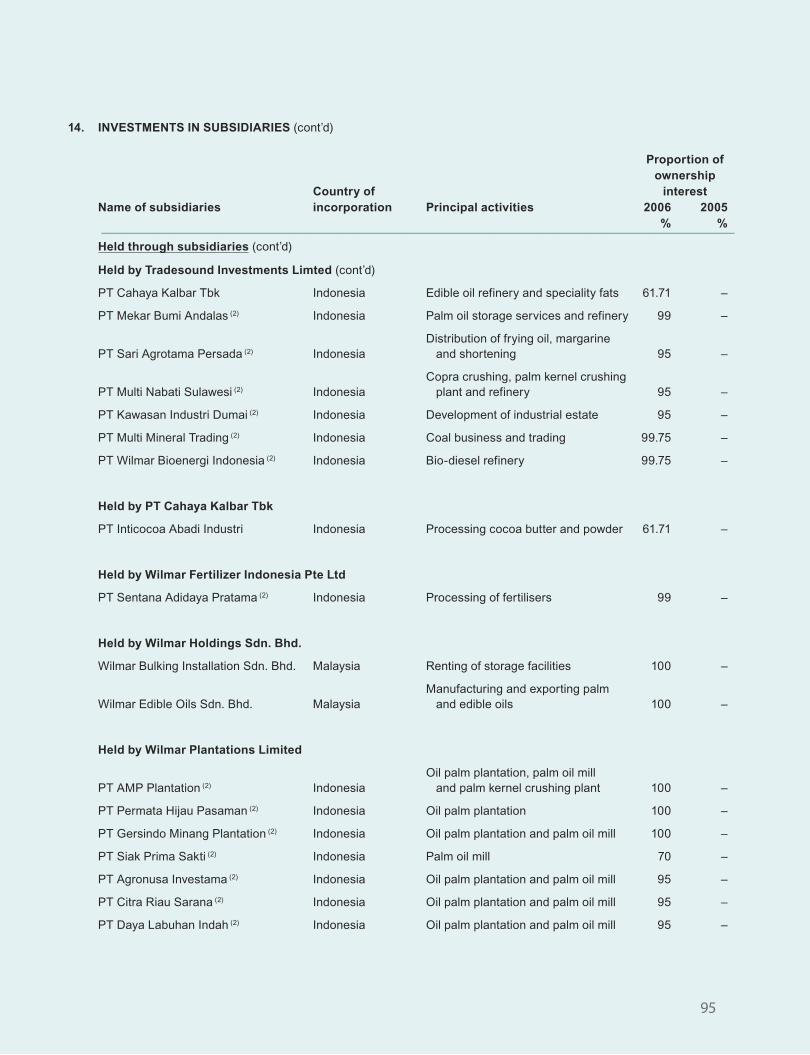
95
14. INVESTMENTS IN SUBSIDIARIES (cont’d)
Proportion of ownership Country of interestName of subsidiaries incorporation Principal activities 2006 2005 % %––––––––––––––––––––––––––––––––––––––––––––––––––––––––––––––––––––––––––––––––––––––––––––––––––––––––––––––––––––––––––––––––––––––––––––––––––––
Held through subsidiaries (cont’d)
Held by Tradesound Investments Limted (cont’d)
PT Cahaya Kalbar Tbk Indonesia Edible oil refinery and speciality fats 61.71 –
PT Mekar Bumi Andalas (2) Indonesia Palm oil storage services and refinery 99 –
Distribution of frying oil, margarine PT Sari Agrotama Persada (2) Indonesia and shortening 95 –
Copra crushing, palm kernel crushing PT Multi Nabati Sulawesi (2) Indonesia plant and refinery 95 –
PT Kawasan Industri Dumai (2) Indonesia Development of industrial estate 95 –
PT Multi Mineral Trading (2) Indonesia Coal business and trading 99.75 –
PT Wilmar Bioenergi Indonesia (2) Indonesia Bio-diesel refinery 99.75 –
Held by PT Cahaya Kalbar Tbk
PT Inticocoa Abadi Industri Indonesia Processing cocoa butter and powder 61.71 –
Held by Wilmar Fertilizer Indonesia Pte Ltd
PT Sentana Adidaya Pratama (2) Indonesia Processing of fertilisers 99 –
Held by Wilmar Holdings Sdn. Bhd.
Wilmar Bulking Installation Sdn. Bhd. Malaysia Renting of storage facilities 100 –
Manufacturing and exporting palm Wilmar Edible Oils Sdn. Bhd. Malaysia and edible oils 100 –
Held by Wilmar Plantations Limited
Oil palm plantation, palm oil mill PT AMP Plantation (2) Indonesia and palm kernel crushing plant 100 –
PT Permata Hijau Pasaman (2) Indonesia Oil palm plantation 100 –
PT Gersindo Minang Plantation (2) Indonesia Oil palm plantation and palm oil mill 100 –
PT Siak Prima Sakti (2) Indonesia Palm oil mill 70 –
PT Agronusa Investama (2) Indonesia Oil palm plantation and palm oil mill 95 –
PT Citra Riau Sarana (2) Indonesia Oil palm plantation and palm oil mill 95 –
PT Daya Labuhan Indah (2) Indonesia Oil palm plantation and palm oil mill 95 –
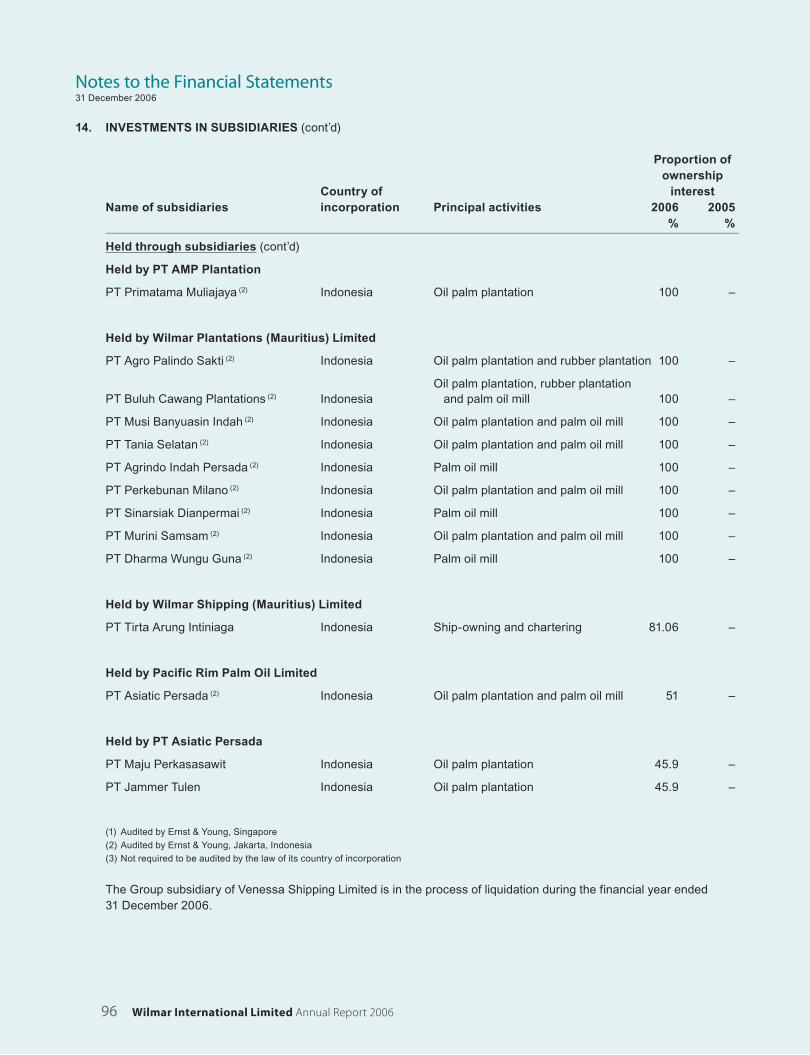
96 Wilmar International Limited Annual Report 2006
Notes to the Financial Statements31 December 2006
14. INVESTMENTS IN SUBSIDIARIES (cont’d)
Proportion of ownership Country of interestName of subsidiaries incorporation Principal activities 2006 2005 % %––––––––––––––––––––––––––––––––––––––––––––––––––––––––––––––––––––––––––––––––––––––––––––––––––––––––––––––––––––––––––––––––––––––––––––––––––––
Held through subsidiaries (cont’d)
Held by PT AMP Plantation
PT Primatama Muliajaya (2) Indonesia Oil palm plantation 100 –
Held by Wilmar Plantations (Mauritius) Limited
PT Agro Palindo Sakti (2) Indonesia Oil palm plantation and rubber plantation 100 –
Oil palm plantation, rubber plantation PT Buluh Cawang Plantations (2) Indonesia and palm oil mill 100 –
PT Musi Banyuasin Indah (2) Indonesia Oil palm plantation and palm oil mill 100 –
PT Tania Selatan (2) Indonesia Oil palm plantation and palm oil mill 100 –
PT Agrindo Indah Persada (2) Indonesia Palm oil mill 100 –
PT Perkebunan Milano (2) Indonesia Oil palm plantation and palm oil mill 100 –
PT Sinarsiak Dianpermai (2) Indonesia Palm oil mill 100 –
PT Murini Samsam (2) Indonesia Oil palm plantation and palm oil mill 100 –
PT Dharma Wungu Guna (2) Indonesia Palm oil mill 100 –
Held by Wilmar Shipping (Mauritius) Limited
PT Tirta Arung Intiniaga Indonesia Ship-owning and chartering 81.06 –
Held by Pacific Rim Palm Oil Limited
PT Asiatic Persada (2) Indonesia Oil palm plantation and palm oil mill 51 –
Held by PT Asiatic Persada
PT Maju Perkasasawit Indonesia Oil palm plantation 45.9 –
PT Jammer Tulen Indonesia Oil palm plantation 45.9 –
(1) Audited by Ernst & Young, Singapore
(2) Audited by Ernst & Young, Jakarta, Indonesia
(3) Not required to be audited by the law of its country of incorporation
The Group subsidiary of Venessa Shipping Limited is in the process of liquidation during the financial year ended 31 December 2006.

97
15. INVESTMENTS IN ASSOCIATES
Group 2006 2005 US$’000 US$’000
––––––––––––––––––––––––––––––––––––––––––––––––––––––––––––––––––––––––––––––––––––––––––––––––––––––––––––––––––––––––––––––––––––––––––––––––––––
Unquoted shares, at cost 8,997 1,245Share of post-acquisition reserves 41 (639)
––––––––––––––––––––––––––––––––––––––
Carrying amount of investments 9,038 606–––––––––––––––––––––––––
Proportion of ownership Country of interestName of associates incorporation Principal activities 2006 2005 % %––––––––––––––––––––––––––––––––––––––––––––––––––––––––––––––––––––––––––––––––––––––––––––––––––––––––––––––––––––––––––––––––––––––––––––––––––––
Held by Wilmar Plantations Limited
British Virgin Sheringham International Limited (1) Islands Investment holding 38.1 –
British Virgin Josovina Commodities Ltd Islands Investment holding 48.01 –
Held by Sheringham International Limited
PT Bumipratama Khatulistiwa (2) Indonesia Oil palm plantation and palm oil mill 34.29 –
Held by Tradesound Investments Limited
PT Bumi Karyatama Raharja (2) Indonesia Production of bleaching earth 40 –
Held by Wilmar Edible Oils Sdn. Bhd.
Josovina Commodities Sdn. Bhd. Malaysia Commodities trading 49 –
TSH-Wilmar Sdn. Bhd. (3) Malaysia Palm oil refinery 50 –
Production of power supply TSH-Wilmar (BF) Sdn. Bhd. (3) Malaysia (electricity and steam) 50 –
Held by KemOleo Pte. Ltd.
United States HBI USA LLC (1) of America Product brokerage 21.7 –
(1) Not required to be audited by the law of its country of incorporation
(2) Audited by Ernst & Young, Jakarta, Indonesia
(3) Audited by Ernst & Young, Malaysia
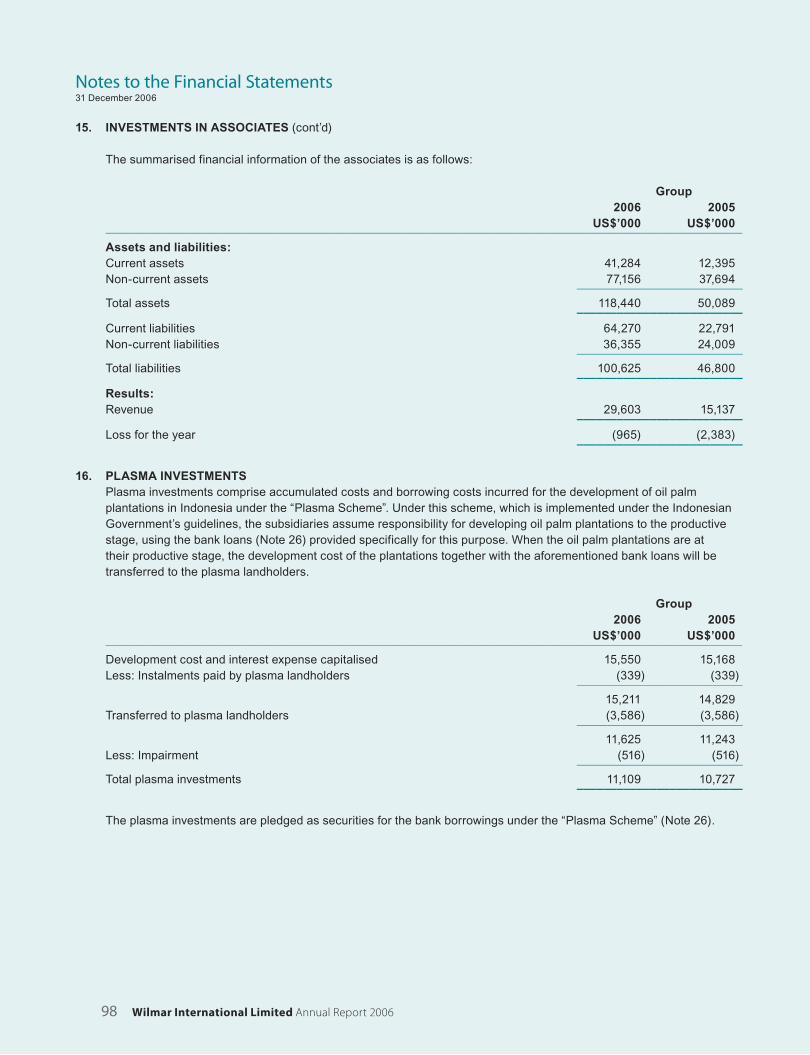
98 Wilmar International Limited Annual Report 2006
Notes to the Financial Statements31 December 2006
15. INVESTMENTS IN ASSOCIATES (cont’d)
The summarised financial information of the associates is as follows:
Group 2006 2005 US$’000 US$’000
––––––––––––––––––––––––––––––––––––––––––––––––––––––––––––––––––––––––––––––––––––––––––––––––––––––––––––––––––––––––––––––––––––––––––––––––––––
Assets and liabilities:Current assets 41,284 12,395Non-current assets 77,156 37,694
––––––––––––––––––––––––––––––––––––––
Total assets 118,440 50,089–––––––––––––––––––––––––
Current liabilities 64,270 22,791Non-current liabilities 36,355 24,009
––––––––––––––––––––––––––––––––––––––
Total liabilities 100,625 46,800–––––––––––––––––––––––––
Results:Revenue 29,603 15,137
–––––––––––––––––––––––––Loss for the year (965) (2,383)
–––––––––––––––––––––––––
16. PLASMA INVESTMENTSPlasma investments comprise accumulated costs and borrowing costs incurred for the development of oil palm plantations in Indonesia under the “Plasma Scheme”. Under this scheme, which is implemented under the Indonesian Government’s guidelines, the subsidiaries assume responsibility for developing oil palm plantations to the productive stage, using the bank loans (Note 26) provided specifically for this purpose. When the oil palm plantations are at their productive stage, the development cost of the plantations together with the aforementioned bank loans will be transferred to the plasma landholders.
Group 2006 2005
US$’000 US$’000––––––––––––––––––––––––––––––––––––––––––––––––––––––––––––––––––––––––––––––––––––––––––––––––––––––––––––––––––––––––––––––––––––––––––––––––––––
Development cost and interest expense capitalised 15,550 15,168Less: Instalments paid by plasma landholders (339) (339)
––––––––––––––––––––––––––––––––––––––
15,211 14,829Transferred to plasma landholders (3,586) (3,586)
––––––––––––––––––––––––––––––––––––––
11,625 11,243Less: Impairment (516) (516)
––––––––––––––––––––––––––––––––––––––
Total plasma investments 11,109 10,727–––––––––––––––––––––––––
The plasma investments are pledged as securities for the bank borrowings under the “Plasma Scheme” (Note 26).

99
17. BIOLOGICAL ASSETS
Group 2006 2005
US$’000 US$’000––––––––––––––––––––––––––––––––––––––––––––––––––––––––––––––––––––––––––––––––––––––––––––––––––––––––––––––––––––––––––––––––––––––––––––––––––––
At 1 January 154,932 120,070New subsidiaries acquired 38,888 28,822Additions 11,115 7,250Disposals (30) (3,038)Capitalisation of interest 638 –Capitalisation of depreciation 647 135
––––––––––––––––––––––––––––––––––––––
206,190 153,239Increase in fair value less point-of-sale costs 17,352 1,693
––––––––––––––––––––––––––––––––––––––
At 31 December 223,542 154,932–––––––––––––––––––––––––
(a) Analysis of biological assetsAt the end of the financial year, biological assets comprised oil palm trees, which range from newly established plantations to plantations that are 21 years old:
2006 2006 2005 2005 (In hectares) US$’000 (In hectares) US$’000
–––––––––––––––––––––––––––––––––––––––––––––––––––––––––––––––––––––––––––––––––––––––––––––––––––––––––––––––––––––––––––––––––––––––––––––
Planted area:– Mature * 57,188 209,867 46,678 151,374– Immature 11,049 13,675 5,038 3,558
––––––––––––––––––––––––––––––––––––––––––––––––––––––––––––––––––––––––––––––––––
68,237 223,542 51,716 154,932–––––––––––––––––––––––––––––––––––––––––––––––––––––––
* Mature planted area included rubber plantation
(b) Analysis of oil palm productionDuring the year ended 31 December 2006 the Group harvested approximately 995,194 tonnes (2005: 816,559 tonnes) of fresh palm fruit bunches, which had a fair value less estimated point-of-sale costs of US$85,788,000 (2005: US$56,051,000). The fair value of fresh palm fruit bunches was determined with reference to their market prices.
(c) At 31 December 2006, the fair value of biological assets of the Group mortgaged as securities for bank term loans amounted to US$133,521,000 (2005: US$97,765,000).
(d) Based on approval from Minister of Agriculture, Republic of Indonesia to develop oil palm plantations, the Group is committed to develop a total of 11,049 hectares (2005: 5,038 hectares) of oil palm plantations.
(e) The interest capitalised is actual interest incurred on the bank borrowings to finance the development of oil palm plantations.
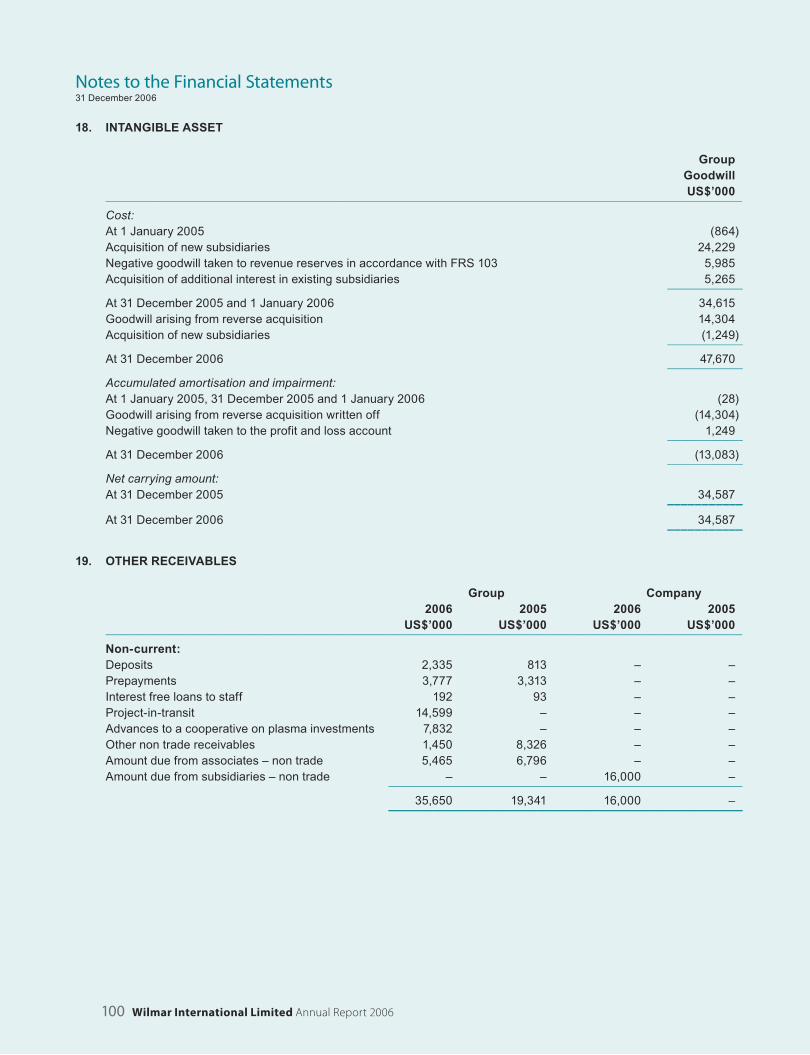
100 Wilmar International Limited Annual Report 2006
Notes to the Financial Statements31 December 2006
18. INTANGIBLE ASSET
Group Goodwill US$’000––––––––––––––––––––––––––––––––––––––––––––––––––––––––––––––––––––––––––––––––––––––––––––––––––––––––––––––––––––––––––––––––––––––––––––––––––––
Cost:At 1 January 2005 (864)Acquisition of new subsidiaries 24,229Negative goodwill taken to revenue reserves in accordance with FRS 103 5,985Acquisition of additional interest in existing subsidiaries 5,265
–––––––––––––––––
At 31 December 2005 and 1 January 2006 34,615Goodwill arising from reverse acquisition 14,304Acquisition of new subsidiaries (1,249)
–––––––––––––––––
At 31 December 2006 47,670–––––––––––––––––
Accumulated amortisation and impairment:At 1 January 2005, 31 December 2005 and 1 January 2006 (28)Goodwill arising from reverse acquisition written off (14,304)Negative goodwill taken to the profit and loss account 1,249
–––––––––––––––––
At 31 December 2006 (13,083)–––––––––––––––––
Net carrying amount:At 31 December 2005 34,587
–––––––––––At 31 December 2006 34,587
–––––––––––
19. OTHER RECEIVABLES
Group Company 2006 2005 2006 2005
US$’000 US$’000 US$’000 US$’000––––––––––––––––––––––––––––––––––––––––––––––––––––––––––––––––––––––––––––––––––––––––––––––––––––––––––––––––––––––––––––––––––––––––––––––––––––
Non-current:Deposits 2,335 813 – –Prepayments 3,777 3,313 – –Interest free loans to staff 192 93 – –Project-in-transit 14,599 – – –Advances to a cooperative on plasma investments 7,832 – – –Other non trade receivables 1,450 8,326 – –Amount due from associates – non trade 5,465 6,796 – –Amount due from subsidiaries – non trade – – 16,000 –
––––––––––––––––––––––––––––––––––––––––––––––––––––––––––––––––––––––––––––––––––
35,650 19,341 16,000 ––––––––––––––––––––––––––––––––––––––––––––––––––––––––

101
19. OTHER RECEIVABLES (cont’d)
Group Company 2006 2005 2006 2005
US$’000 US$’000 US$’000 US$’000––––––––––––––––––––––––––––––––––––––––––––––––––––––––––––––––––––––––––––––––––––––––––––––––––––––––––––––––––––––––––––––––––––––––––––––––––––
Current:Deposits 150 146 – 26Prepayments 3,477 2,659 23 7Interest free loans to staff 347 164 – –Advances to third parties 105 1,680 – –Loans to a joint venture partner – 1,339 – –Advances to a cooperative on plasma investments – 4,309 – –Tax recoverable 6,195 8,860 – –Other non trade receivables 7,805 4,291 915 15Advances for property, plant and equipment 17,099 5,159 – –Advances to suppliers 34,530 26,135 – –Amount due from associates – non trade 12,759 10,786 – –Amount due from related companies – non trade 1,045 209,125 – –Amount due from subsidiaries – non trade – – 402,277 1,231
––––––––––––––––––––––––––––––––––––––––––––––––––––––––––––––––––––––––––––––––––
83,512 274,653 403,215 1,279–––––––––––––––––––––––––––––––––––––––––––––––––––––––
Amount due from associates (non-current)The non-current non trade balances receivable from associates are unsecured, non-interest bearing and have no fixed terms of repayment. These balances are not expected to be repaid within the next 12 months.
Amounts due from associates and related companies (current)The current non trade balances receivable from associates and related companies are unsecured, non-interest bearing, and have no fixed terms of repayment except for an amount of US$11,366,000 (2005: US$10,710,000) due from associates which bear interest at 12.50% (2005: 6.93% to 14.00%) per annum.
20. INVENTORIES
Group 2006 2005
US$’000 US$’000––––––––––––––––––––––––––––––––––––––––––––––––––––––––––––––––––––––––––––––––––––––––––––––––––––––––––––––––––––––––––––––––––––––––––––––––––––
Raw materials 99,106 72,913Consumables 29,322 40,228Finished goods 211,690 175,797Stock in transit 26,692 –
––––––––––––––––––––––––––––––––––––––
Total inventories at lower of cost and net realisable value 366,810 288,938–––––––––––––––––––––––––
The Group has pledged a floating charge over inventories as security over bank term loans and bank overdraft (Note 26).

102 Wilmar International Limited Annual Report 2006
Notes to the Financial Statements31 December 2006
21. TRADE RECEIVABLES
Group Company 2006 2005 2006 2005
US$’000 US$’000 US$’000 US$’000––––––––––––––––––––––––––––––––––––––––––––––––––––––––––––––––––––––––––––––––––––––––––––––––––––––––––––––––––––––––––––––––––––––––––––––––––––
Trade receivables 285,240 246,320 – 75Amount due from associates – trade 1,017 30,479 – –Amount due from related parties – trade 273,987 115,294 – –
––––––––––––––––––––––––––––––––––––––––––––––––––––––––––––––––––––––––––––––––––
560,244 392,093 – 75Less: Allowance for doubtful receivables (2,068) (1,850) – –
––––––––––––––––––––––––––––––––––––––––––––––––––––––––––––––––––––––––––––––––––
558,176 390,243 – 75–––––––––––––––––––––––––––––––––––––––––––––––––––––––
Receivables including amounts due from associates and related parties are denominated in the following currencies:
Group Company 2006 2005 2006 2005
US$’000 US$’000 US$’000 US$’000––––––––––––––––––––––––––––––––––––––––––––––––––––––––––––––––––––––––––––––––––––––––––––––––––––––––––––––––––––––––––––––––––––––––––––––––––––
United States Dollars 442,987 315,321 – –Indonesian Rupiah 105,143 71,028 – –Others 10,046 3,894 – 75
––––––––––––––––––––––––––––––––––––––––––––––––––––––––––––––––––––––––––––––––––
558,176 390,243 – 75–––––––––––––––––––––––––––––––––––––––––––––––––––––––
Trade receivables from third parties, associates and related parties are unsecured and non-interest bearing. They are recognised at their original invoice amounts which represent their fair values on initial recognition.
The Group has pledged a floating charge over trade receivables as security over bank term loans and bank overdraft (Note 26).
22. DERIVATIVE FINANCIAL INSTRUMENTS
Derivative financial instruments included in the balance sheet at 31 December are as follows:
Group 2006 2005
Assets Liabilities Assets Liabilities US$’000 US$’000 US$’000 US$’000––––––––––––––––––––––––––––––––––––––––––––––––––––––––––––––––––––––––––––––––––––––––––––––––––––––––––––––––––––––––––––––––––––––––––––––––––––
Forward currency contracts 4,858 (227) 6,926 (266)Futures, options and swap contracts 6,543 (377) 32 (148)
––––––––––––––––––––––––––––––––––––––––––––––––––––––––––––––––––––––––––––––––––
11,401 (604) 6,958 (414)–––––––––––––––––––––––––––––––––––––––––––––––––––––––

103
23. CASH AND BANK BALANCES
Group Company 2006 2005 2006 2005
US$’000 US$’000 US$’000 US$’000––––––––––––––––––––––––––––––––––––––––––––––––––––––––––––––––––––––––––––––––––––––––––––––––––––––––––––––––––––––––––––––––––––––––––––––––––––
Cash at banks and in hand 26,314 19,505 6,465 230Short term deposits 17,666 7 – 1,228
––––––––––––––––––––––––––––––––––––––––––––––––––––––––––––––––––––––––––––––––––
43,980 19,512 6,465 1,458–––––––––––––––––––––––––––––––––––––––––––––––––––––––
For the purpose of the consolidated statement of cash flows, cash and cash equivalents comprise the following as at 31 December:
Group Company 2006 2005 2006 2005
US$’000 US$’000 US$’000 US$’000––––––––––––––––––––––––––––––––––––––––––––––––––––––––––––––––––––––––––––––––––––––––––––––––––––––––––––––––––––––––––––––––––––––––––––––––––––
Cash at bank and in hand and short term deposits 43,980 19,512 6,465 1,458Bank overdrafts (Note 26) (138,061) (120,742) – –
––––––––––––––––––––––––––––––––––––––––––––––––––––––––––––––––––––––––––––––––––
Cash and cash equivalents (94,081) (101,230) 6,465 1,458–––––––––––––––––––––––––––––––––––––––––––––––––––––––
Short term deposits are made for varying periods of between one day and three months depending on the immediate cash requirements of the Group, and earn interest at the respective short term deposit rates. The weighted average effective interest rate of short term deposits is 6.41% (2005: 0.64%) per annum.
Cash and cash equivalents denominated in foreign currencies at 31 December are as follows:
Group Company 2006 2005 2006 2005
US$’000 US$’000 US$’000 US$’000––––––––––––––––––––––––––––––––––––––––––––––––––––––––––––––––––––––––––––––––––––––––––––––––––––––––––––––––––––––––––––––––––––––––––––––––––––
United States Dollar 10,845 (2,562) 6,452 –Indonesian Rupiah (111,892) (103,983) – –Others 6,966 5,315 13 1,458
––––––––––––––––––––––––––––––––––––––––––––––––––––––––––––––––––––––––––––––––––
(94,081) (101,230) 6,465 1,458–––––––––––––––––––––––––––––––––––––––––––––––––––––––
Bank overdrafts are included in the determination of cash and cash equivalents because they form an integral part of the Group’s cash management.

104 Wilmar International Limited Annual Report 2006
Notes to the Financial Statements31 December 2006
24. TRADE PAYABLES
Group Company 2006 2005 2006 2005
US$’000 US$’000 US$’000 US$’000––––––––––––––––––––––––––––––––––––––––––––––––––––––––––––––––––––––––––––––––––––––––––––––––––––––––––––––––––––––––––––––––––––––––––––––––––––
Trade payables 129,227 86,306 – 55Due to associates – trade 258 4,596 – –Due to related parties – trade 189,806 74,920 – –
––––––––––––––––––––––––––––––––––––––––––––––––––––––––––––––––––––––––––––––––––
319,291 165,822 – 55–––––––––––––––––––––––––––––––––––––––––––––––––––––––
Trade payables are non-interest bearing and are normally settled on 18 (2005: 18) days term.
Payables including amounts due to associates and related parties are denominated in the following currencies:
Group Company 2006 2005 2006 2005
US$’000 US$’000 US$’000 US$’000––––––––––––––––––––––––––––––––––––––––––––––––––––––––––––––––––––––––––––––––––––––––––––––––––––––––––––––––––––––––––––––––––––––––––––––––––––
United States Dollars 290,972 127,486 – – Indonesian Rupiah 25,894 35,233 – – Others 2,425 3,103 – 55
––––––––––––––––––––––––––––––––––––––––––––––––––––––––––––––––––––––––––––––––––
319,291 165,822 – 55–––––––––––––––––––––––––––––––––––––––––––––––––––––––
25. OTHER PAYABLES
Group Company 2006 2005 2006 2005
US$’000 US$’000 US$’000 US$’000––––––––––––––––––––––––––––––––––––––––––––––––––––––––––––––––––––––––––––––––––––––––––––––––––––––––––––––––––––––––––––––––––––––––––––––––––––
Current:Accrued operating expenses 35,566 27,135 814 185Advances from customers 780 1,121 – –Due to associates – non trade 2,234 3,613 – –Due to related parties – non trade 2,102 7,295 – –Other liabilities 21,895 21,937 856 –Due to subsidiaries – non trade – – 205,042 –Others * – – – 2,200
––––––––––––––––––––––––––––––––––––––––––––––––––––––––––––––––––––––––––––––––––
62,577 61,101 206,712 2,385–––––––––––––––––––––––––––––––––––––––––––––––––––––––
* Others comprise allowance for impairment loss on various assets arising from the reverse acquisition.

105
25. OTHER PAYABLES (cont’d)
Group Company 2006 2005 2006 2005
US$’000 US$’000 US$’000 US$’000––––––––––––––––––––––––––––––––––––––––––––––––––––––––––––––––––––––––––––––––––––––––––––––––––––––––––––––––––––––––––––––––––––––––––––––––––––
Non-current:Due to related parties – non trade – 297,200 – –Advances from ultimate holding company 33 32 – –Advances from minority shareholders 14,254 14,916 – –Provision for employee gratuity (Note 28) 9,465 5,187 – –
––––––––––––––––––––––––––––––––––––––––––––––––––––––––––––––––––––––––––––––––––
23,752 317,335 – ––––––––––––––––––––––––––––––––––––––––––––––––––––––––
The amount due to associates and related parties (current) are unsecured, non-interest bearing and repayable on demand.
Advances from ultimate holding company and minority shareholders are unsecured, non-interest bearing and are not expected to be repaid within the next twelve months.
26. INTEREST-BEARING LOANS AND BORROWINGS
Effective 2006 Maturity interest rate Group Company
% US$’000 US$’000––––––––––––––––––––––––––––––––––––––––––––––––––––––––––––––––––––––––––––––––––––––––––––––––––––––––––––––––––––––––––––––––––––––––––––––––––––
Non-current:Bank term loans 2008 - 2011 9.93 36,614 16,000Bank term loans – Plasma investments 2008 - 2010 14.00 6,547 –
––––––––––––––––––––––––––––––––––––––
43,161 16,000––––––––––––––––––––––––––
Current:Bank term loans 2007 11.01 119,661 12,000 Bank term loans – Plasma investments 2007 14.25 1,329 –Short term loans 2007 10.60 46,988 –Pre-shipment loans 2007 6.28 291,589 –Trust receipts/bill discounts 2007 6.25 118,802 –Bank overdrafts (Note 23) 2007 12.25 138,061 –
––––––––––––––––––––––––––––––––––––––
716,430 12,000––––––––––––––––––––––––––
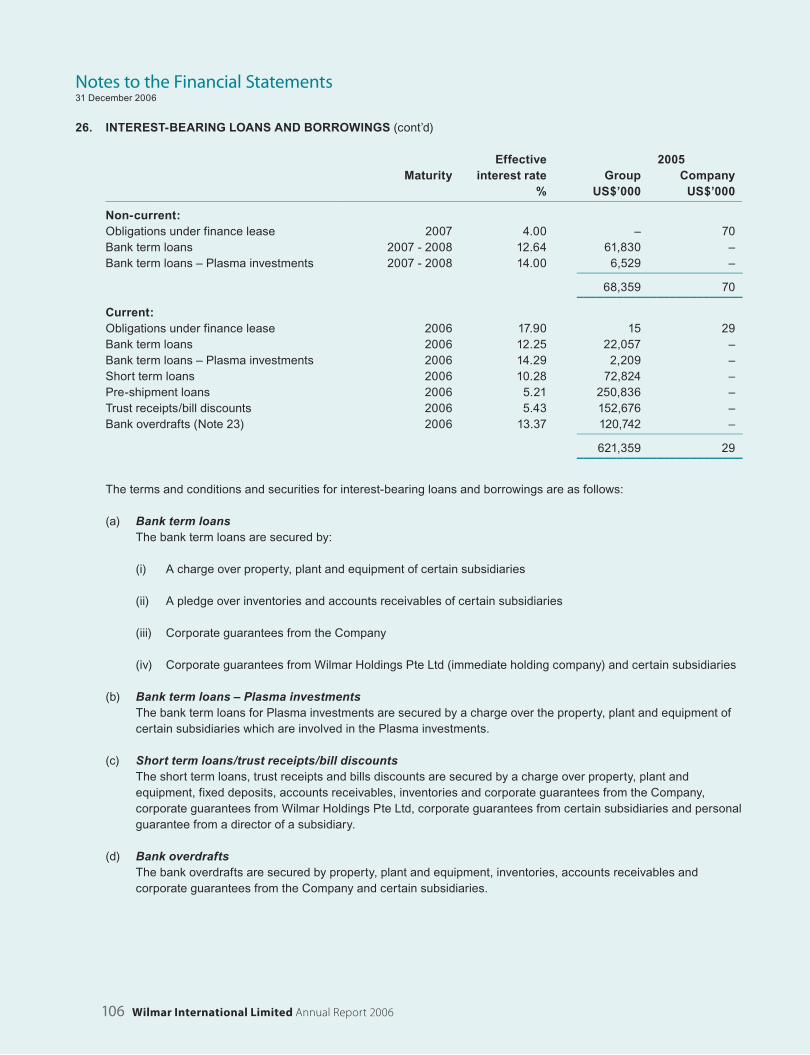
106 Wilmar International Limited Annual Report 2006
Notes to the Financial Statements31 December 2006
26. INTEREST-BEARING LOANS AND BORROWINGS (cont’d)
Effective 2005 Maturity interest rate Group Company
% US$’000 US$’000––––––––––––––––––––––––––––––––––––––––––––––––––––––––––––––––––––––––––––––––––––––––––––––––––––––––––––––––––––––––––––––––––––––––––––––––––––
Non-current:Obligations under finance lease 2007 4.00 – 70Bank term loans 2007 - 2008 12.64 61,830 –Bank term loans – Plasma investments 2007 - 2008 14.00 6,529 –
––––––––––––––––––––––––––––––––––––––
68,359 70–––––––––––––––––––––––––
Current:Obligations under finance lease 2006 17.90 15 29Bank term loans 2006 12.25 22,057 –Bank term loans – Plasma investments 2006 14.29 2,209 –Short term loans 2006 10.28 72,824 –Pre-shipment loans 2006 5.21 250,836 –Trust receipts/bill discounts 2006 5.43 152,676 –Bank overdrafts (Note 23) 2006 13.37 120,742 –
––––––––––––––––––––––––––––––––––––––
621,359 29–––––––––––––––––––––––––
The terms and conditions and securities for interest-bearing loans and borrowings are as follows:
(a) Bank term loans The bank term loans are secured by:
(i) A charge over property, plant and equipment of certain subsidiaries
(ii) A pledge over inventories and accounts receivables of certain subsidiaries
(iii) Corporate guarantees from the Company
(iv) Corporate guarantees from Wilmar Holdings Pte Ltd (immediate holding company) and certain subsidiaries (b) Bank term loans – Plasma investments The bank term loans for Plasma investments are secured by a charge over the property, plant and equipment of
certain subsidiaries which are involved in the Plasma investments.
(c) Short term loans/trust receipts/bill discounts The short term loans, trust receipts and bills discounts are secured by a charge over property, plant and
equipment, fixed deposits, accounts receivables, inventories and corporate guarantees from the Company, corporate guarantees from Wilmar Holdings Pte Ltd, corporate guarantees from certain subsidiaries and personal guarantee from a director of a subsidiary.
(d) Bank overdrafts The bank overdrafts are secured by property, plant and equipment, inventories, accounts receivables and
corporate guarantees from the Company and certain subsidiaries.

107
26. INTEREST-BEARING LOANS AND BORROWINGS (cont’d)
The bank facilities up to a limit of US$1,315,621,000 (2005: US$1,120,677,000) are guaranteed by:
(i) Wilmar Holdings Pte Ltd
(ii) Companies within the Group
(iii) Personal guarantee given by certain directors of companies within the Group
27. SHARE CAPITAL
Group Company Number Number of ordinary of ordinary shares shares ‘000 US$’000 ‘000 US$’000––––––––––––––––––––––––––––––––––––––––––––––––––––––––––––––––––––––––––––––––––––––––––––––––––––––––––––––––––––––––––––––––––––––––––––––––––––
Issued and fully paid:At 1 January 2005, 31 December 2005 and 1 January 2006 (1) 21,765,550 62,585 261,700 7,868Shares arising from exercise of share options (2) – – 3,850 121Shares arising from the reverse acquisition (3) – 43,310 21,500,000 517,121
––––––––––––––––––––––––––––––––––––––––––––––––––––––––––––––––––––––––––––––––––
Total before Consolidation (4) 21,765,550 105,895 21,765,550 525,110––––––––––––––––––––––––––––––––––––––––––––––––––––––––––––––––––––––––––––––––––
Total after Consolidation (4) 2,176,555 105,895 2,176,555 525,110Shares arising from Share Placement and Over-allotment (5) 356,250 180,678 356,250 180,678Expenses arising from the reverse acquisition – (8,087) – (8,087)Transfer of share premium reserve to share capital – 1,792 – 18,716
––––––––––––––––––––––––––––––––––––––––––––––––––––––––––––––––––––––––––––––––––
At 31 December 2006 2,532,805 280,278 2,532,805 716,417–––––––––––––––––––––––––––––––––––––––––––––––––––––––
The holders of ordinary shares are entitled to receive dividends as and when declared by the Company. All ordinary shares carry one vote per share without restrictions.
In accordance with the Companies (Amendment) Act 2005, on 30 January 2006, the shares of the Company ceased to have a par value.
(1) The equity structure (number and types of equity issued) at balance sheet date represents that of the Company, being the legal parent. However, for the purpose of reverse acquisition accounting, the amount of share capital of the Group as at 1 January 2005, 31 December 2005 and 1 January 2006 represents that of the Acquired Group before the reverse acquisition.
(2) Conversion of options of 3,850,000 shares at S$0.05 per share (Note 2).

108 Wilmar International Limited Annual Report 2006
Notes to the Financial Statements31 December 2006
27. SHARE CAPITAL (cont’d)
(3) Issue of 21.5 billion consideration shares at S$0.06 per share, pursuant to the acquisition of the Acquired Group (Note 2).
The adjustment arose from reverse acquisition accounting and represents the cost of acquisition of the Acquired Group (legal subsidiary) by the Company (legal parent). The cost of acquisition is determined using the fair value of the issued equity of the Company before the acquisition, being 26.17 million shares at S$1.10 per share, which represents the fair market value of the Company being the quoted and traded price of the shares as at 14 July 2006 (date of completion of acquisition). It is deemed to be incurred by the legal subsidiary (i.e. the acquirer for accounting purposes) in the form of equity issued to the owners of the legal parent (i.e. the acquiree for accounting purposes). This amount was further increased by US$26 million in respect of capitalisation of debt.
(4) Consolidation of shares on the basis of one share for every ten shares held by shareholders (Note 2).
(5) Further allotment and issue of 300 million shares and 56.25 million shares (pursuant to an over-allotment option) at S$0.80 per share respectively (Note 2).
28. PROVISION FOR EMPLOYEE GRATUITYThe Group recognises provision for employee gratuity in accordance with Indonesian Labour Law No. 13/2003 dated 25 March 2003. The provision is based on an actuarial calculation by an independent actuary using the “Projected Unit Credit Method”. Actuarial gains or losses are recognised as income or expenses when the cumulative actuarial gains or losses exceed 10% of the defined benefit obligation. These gains or losses are recognised over the expected remaining working lives of employees. Past service cost is amortised over the remaining working lives of each employee.
The provision for employee gratuity recognised by the Group amounted to US$9,465,000 and US$5,187,000 as at 31 December 2006 and 2005 respectively. The related expense recognised in the current financial year was US$3,575,000 (2005: US$1,956,000).
The estimated liabilities for employee gratuity based on the actuary reports have been determined using the following assumptions:
2006 2005––––––––––––––––––––––––––––––––––––––––––––––––––––––––––––––––––––––––––––––––––––––––––––––––––––––––––––––––––––––––––––––––––––––––––––––––––––
Discount rate 11% per annum 11% per annumWages and salary increase 10% per annum 10% per annumRetirement age 55 years of age 55 years of ageMortality rate CSO – 1980 CSO – 1980Method Projected unit credit Projected unit credit
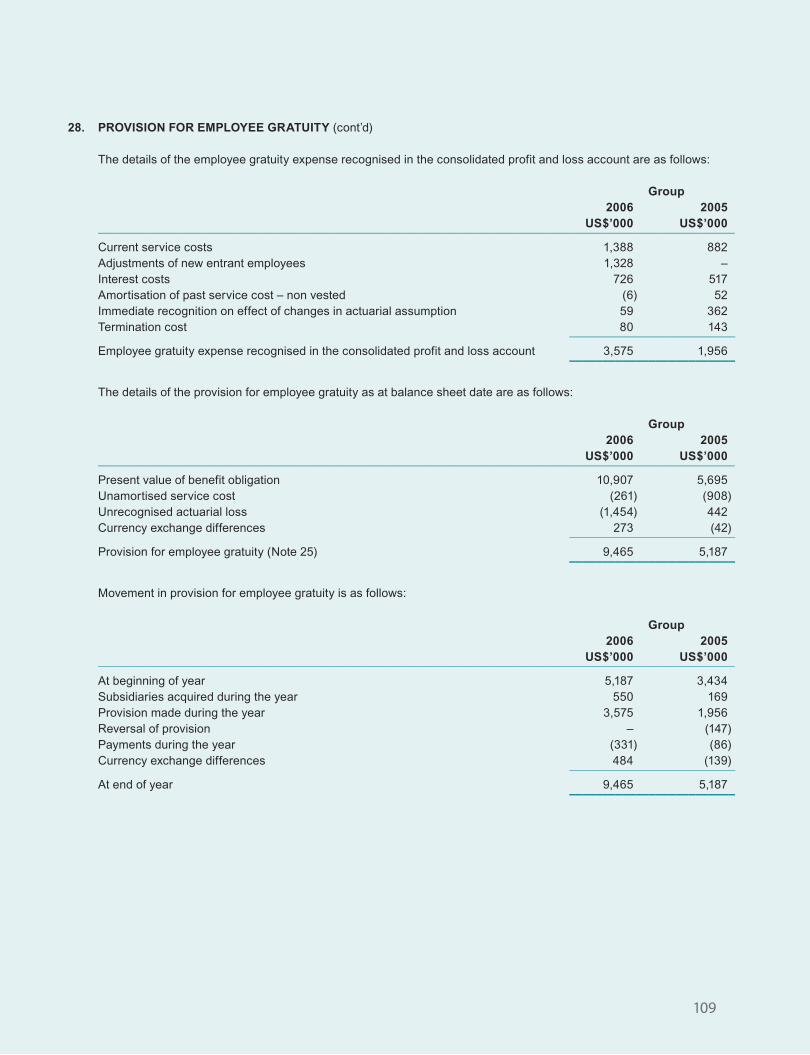
109
28. PROVISION FOR EMPLOYEE GRATUITY (cont’d)
The details of the employee gratuity expense recognised in the consolidated profit and loss account are as follows:
Group 2006 2005 US$’000 US$’000––––––––––––––––––––––––––––––––––––––––––––––––––––––––––––––––––––––––––––––––––––––––––––––––––––––––––––––––––––––––––––––––––––––––––––––––––––
Current service costs 1,388 882Adjustments of new entrant employees 1,328 –Interest costs 726 517Amortisation of past service cost – non vested (6) 52Immediate recognition on effect of changes in actuarial assumption 59 362Termination cost 80 143
––––––––––––––––––––––––––––––––––––––
Employee gratuity expense recognised in the consolidated profit and loss account 3,575 1,956–––––––––––––––––––––––––
The details of the provision for employee gratuity as at balance sheet date are as follows:
Group 2006 2005 US$’000 US$’000––––––––––––––––––––––––––––––––––––––––––––––––––––––––––––––––––––––––––––––––––––––––––––––––––––––––––––––––––––––––––––––––––––––––––––––––––––
Present value of benefit obligation 10,907 5,695Unamortised service cost (261) (908)Unrecognised actuarial loss (1,454) 442Currency exchange differences 273 (42)
––––––––––––––––––––––––––––––––––––––
Provision for employee gratuity (Note 25) 9,465 5,187–––––––––––––––––––––––––
Movement in provision for employee gratuity is as follows:
Group 2006 2005 US$’000 US$’000––––––––––––––––––––––––––––––––––––––––––––––––––––––––––––––––––––––––––––––––––––––––––––––––––––––––––––––––––––––––––––––––––––––––––––––––––––
At beginning of year 5,187 3,434Subsidiaries acquired during the year 550 169Provision made during the year 3,575 1,956Reversal of provision – (147)Payments during the year (331) (86)Currency exchange differences 484 (139)
––––––––––––––––––––––––––––––––––––––
At end of year 9,465 5,187–––––––––––––––––––––––––
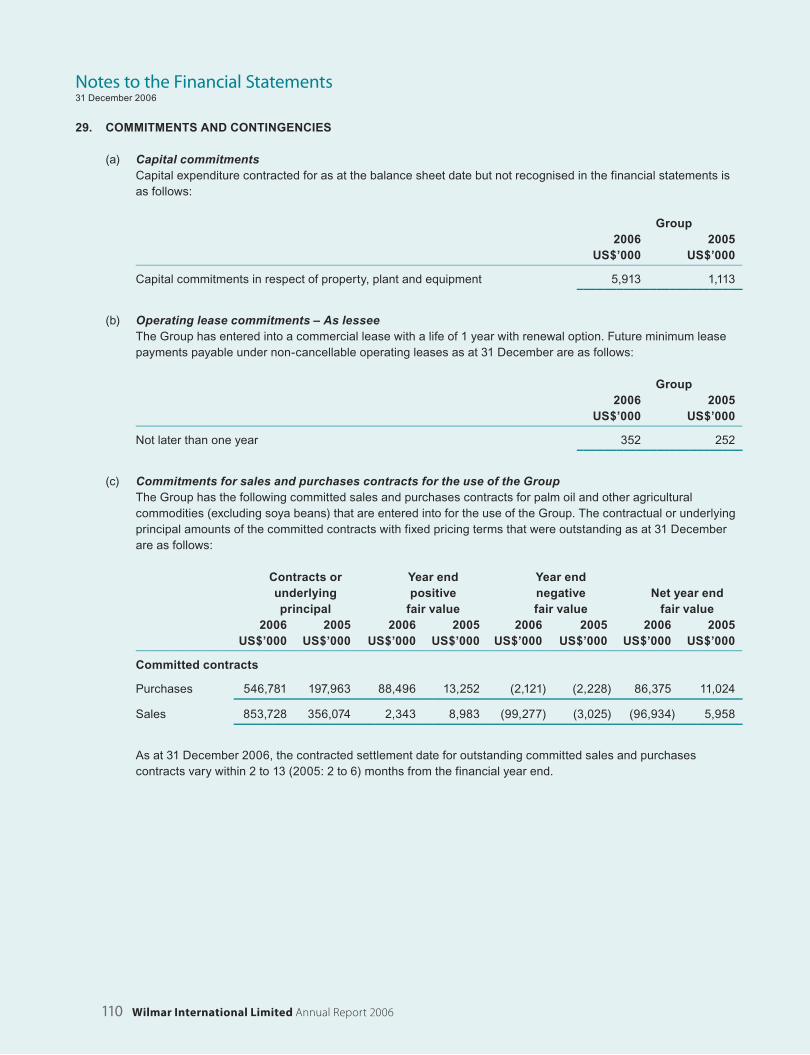
110 Wilmar International Limited Annual Report 2006
Notes to the Financial Statements31 December 2006
29. COMMITMENTS AND CONTINGENCIES
(a) Capital commitments Capital expenditure contracted for as at the balance sheet date but not recognised in the financial statements is
as follows:
Group 2006 2005 US$’000 US$’000
–––––––––––––––––––––––––––––––––––––––––––––––––––––––––––––––––––––––––––––––––––––––––––––––––––––––––––––––––––––––––––––––––––––––––––––
Capital commitments in respect of property, plant and equipment 5,913 1,113–––––––––––––––––––––––––
(b) Operating lease commitments – As lesseeThe Group has entered into a commercial lease with a life of 1 year with renewal option. Future minimum lease payments payable under non-cancellable operating leases as at 31 December are as follows:
Group 2006 2005 US$’000 US$’000
–––––––––––––––––––––––––––––––––––––––––––––––––––––––––––––––––––––––––––––––––––––––––––––––––––––––––––––––––––––––––––––––––––––––––––––
Not later than one year 352 252–––––––––––––––––––––––––
(c) Commitments for sales and purchases contracts for the use of the GroupThe Group has the following committed sales and purchases contracts for palm oil and other agricultural commodities (excluding soya beans) that are entered into for the use of the Group. The contractual or underlying principal amounts of the committed contracts with fixed pricing terms that were outstanding as at 31 December are as follows:
Contracts or Year end Year end underlying positive negative Net year end principal fair value fair value fair value 2006 2005 2006 2005 2006 2005 2006 2005 US$’000 US$’000 US$’000 US$’000 US$’000 US$’000 US$’000 US$’000–––––––––––––––––––––––––––––––––––––––––––––––––––––––––––––––––––––––––––––––––––––––––––––––––––––––––––––––––––––––––––––––––––––––––––––
Committed contracts
Purchases 546,781 197,963 88,496 13,252 (2,121) (2,228) 86,375 11,024–––––––––––––––––––––––––––––––––––––––––––––––––––––––––––––––––––––––––––––––
Sales 853,728 356,074 2,343 8,983 (99,277) (3,025) (96,934) 5,958–––––––––––––––––––––––––––––––––––––––––––––––––––––––––––––––––––––––––––––––
As at 31 December 2006, the contracted settlement date for outstanding committed sales and purchases contracts vary within 2 to 13 (2005: 2 to 6) months from the financial year end.

111
29. COMMITMENTS AND CONTINGENCIES (cont’d)
(d) Commitments for sales and purchases contracts on behalf of related companiesThe Group has the following committed sales and purchases contracts for soya beans that are entered into on behalf of related companies. The contractual or underlying principal amounts of the committed contracts with fixed pricing terms that were outstanding as at 31 December are as follows:
Contracts or Year end Year end underlying positive negative Net year end principal fair value fair value fair value 2006 2005 2006 2005 2006 2005 2006 2005 US$’000 US$’000 US$’000 US$’000 US$’000 US$’000 US$’000 US$’000–––––––––––––––––––––––––––––––––––––––––––––––––––––––––––––––––––––––––––––––––––––––––––––––––––––––––––––––––––––––––––––––––––––––––––––
Committed contracts
Purchases 57 271,438 – 2,462 – (6,387) – (3,925)–––––––––––––––––––––––––––––––––––––––––––––––––––––––––––––––––––––––––––––––
Sales 39 141,869 – 1,433 – (1,754) – (321)–––––––––––––––––––––––––––––––––––––––––––––––––––––––––––––––––––––––––––––––
As at 31 December 2006, the contracted settlement date for outstanding committed sales and purchases contracts vary within 1 to 3 (2005: 1 to 3) months from the financial year end.
(e) Other forwards and future contracts
(i) Futures, options and swap contracts for palm oil related products and other agricultural commodities (excluding soya beans) entered for the use of the Group.
Futures, options and swap contracts are entered into to manage the fluctuations in prices of certain palm
oil related products and other agricultural commodities. The contractual or underlying principal amounts of the aforesaid futures, options and swap contracts with fixed pricing terms that were outstanding as at 31 December are as follows:
Contracts or Year end Year end underlying positive negative Net year end principal fair value fair value fair value 2006 2005 2006 2005 2006 2005 2006 2005 US$’000 US$’000 US$’000 US$’000 US$’000 US$’000 US$’000 US$’000–––––––––––––––––––––––––––––––––––––––––––––––––––––––––––––––––––––––––––––––––––––––––––––––––––––––––––––––––––––––––––––––––––––––––––––
Futures and options
Purchases 3,860 508 84 32 – – 84 32Sales 74,600 10,277 2,562 – (377) (148) 2,185 (148)
78,460 10,785 2,646 32 (377) (148) 2,269 (116)SwapsPurchases 16,712 – 3,897 – – – 3,897 –
–––––––––––––––––––––––––––––––––––––––––––––––––––––––––––––––––––––––––––––––Total 95,172 10,785 6,543 32 (377) (148) 6,166 (116)
–––––––––––––––––––––––––––––––––––––––––––––––––––––––––––––––––––––––––––––––
As at 31 December 2006, the contracted settlement dates for outstanding futures, options and swap contracts vary within 2 to 12 (2005: 3 to 6) months from the financial year end.
Any realised/unrealised gains and losses from these futures, options and swap contracts are recognised in the profit and loss account.

112 Wilmar International Limited Annual Report 2006
Notes to the Financial Statements31 December 2006
29. COMMITMENTS AND CONTINGENCIES (cont’d)
(e) Other forwards and future contracts (cont’d)
(ii) Futures and options contracts entered into by the Group on behalf of related companies and related parties The Group has futures and options sales contracts for non-palm oil products such as soya beans that are
entered into on behalf of related companies and related parties. The contractual or underlying principal amounts of futures and options contracts with fixed pricing terms that were outstanding as at 31 December are as follows:
Contracts or Year end Year end underlying positive negative Net year end principal fair value fair value fair value 2006 2005 2006 2005 2006 2005 2006 2005 US$’000 US$’000 US$’000 US$’000 US$’000 US$’000 US$’000 US$’000–––––––––––––––––––––––––––––––––––––––––––––––––––––––––––––––––––––––––––––––––––––––––––––––––––––––––––––––––––––––––––––––––––––––––––––
Futures and options
Sales 445,427 446,341 3,596 2,088 (10,560) (10,497) (6,694) (8,409)–––––––––––––––––––––––––––––––––––––––––––––––––––––––––––––––––––––––––––––––
As at 31 December 2006, the contracted settlement dates for outstanding futures and options contracts vary within 2 to 11 (2005: 2 to 11) months from the financial year end.
Any realised/unrealised gains and losses from these futures and options contracts are refunded to and recovered from the respective related companies and related parties.
(iii) Forward foreign exchange contracts entered for the use of the Group Forward foreign exchange contracts are entered into by the Group to hedge anticipated transactions in
major foreign currencies. Accordingly, any realised gains and losses resulted from fair value assessment will be recognised in the profit and loss account.
Contracts or Year end Year end underlying positive negative Net year end principal fair value fair value fair value 2006 2005 2006 2005 2006 2005 2006 2005 US$’000 US$’000 US$’000 US$’000 US$’000 US$’000 US$’000 US$’000–––––––––––––––––––––––––––––––––––––––––––––––––––––––––––––––––––––––––––––––––––––––––––––––––––––––––––––––––––––––––––––––––––––––––––––
Forward foreign exchange contracts
Indonesian Rupiah 6,000 – – – (85) – (85) –Singapore Dollar 2,000 – 3 – – – 3 –United States Dollar 271,244 198,900 4,855 6,926 (142) (266) 4,713 6,660
–––––––––––––––––––––––––––––––––––––––––––––––––––––––––––––––––––––––––––––––––––––––––––––––––––––––––––––––––––––––
279,244 198,900 4,858 6,926 (227) (266) 4,631 6,660––––––––––––––––––––––––––––––––––––––––––––––––––––––––––––––––––––––––––––––––
At 31 December 2006, the settlement dates on forward foreign exchange contracts range between 1 to 12 (2005: 1 to 12) months.
The net unrealised positive fair value of the forward foreign exchange contracts as at 31 December 2006 of approximately US$4,631,000 (2005: US$6,660,000) was recognised in the profit and loss account.
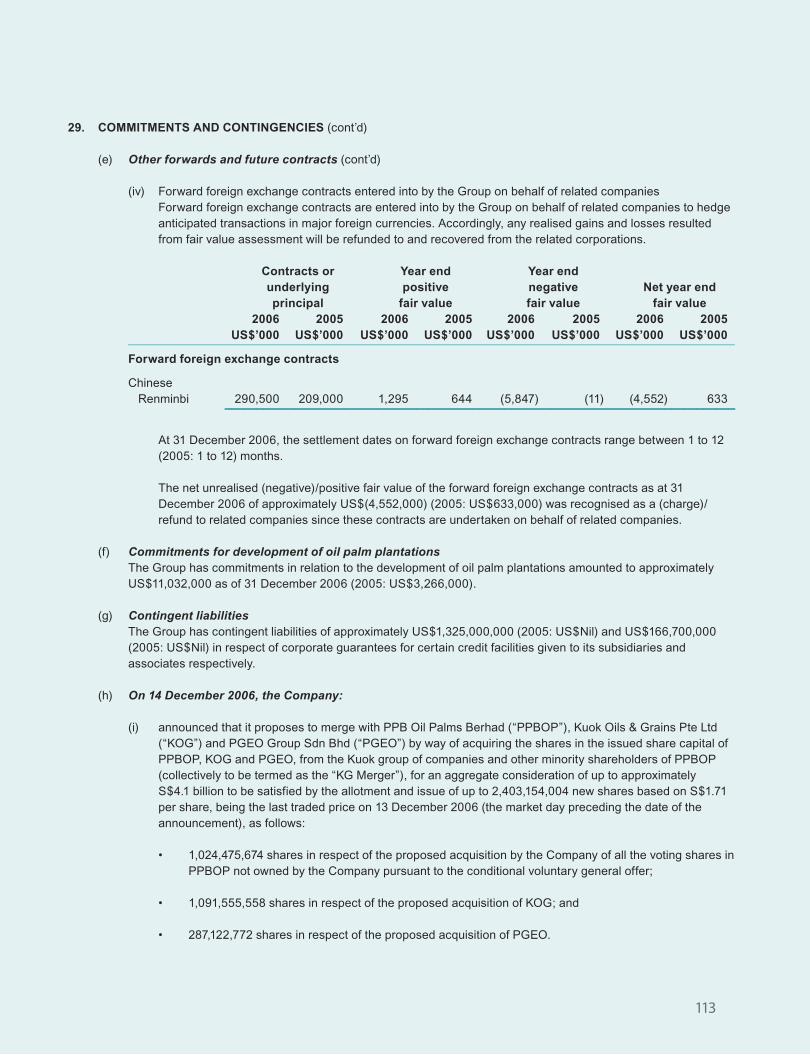
113
29. COMMITMENTS AND CONTINGENCIES (cont’d)
(e) Other forwards and future contracts (cont’d)
(iv) Forward foreign exchange contracts entered into by the Group on behalf of related companies Forward foreign exchange contracts are entered into by the Group on behalf of related companies to hedge
anticipated transactions in major foreign currencies. Accordingly, any realised gains and losses resulted from fair value assessment will be refunded to and recovered from the related corporations.
Contracts or Year end Year end underlying positive negative Net year end principal fair value fair value fair value 2006 2005 2006 2005 2006 2005 2006 2005 US$’000 US$’000 US$’000 US$’000 US$’000 US$’000 US$’000 US$’000–––––––––––––––––––––––––––––––––––––––––––––––––––––––––––––––––––––––––––––––––––––––––––––––––––––––––––––––––––––––––––––––––––––––––––––
Forward foreign exchange contracts
Chinese Renminbi 290,500 209,000 1,295 644 (5,847) (11) (4,552) 633
––––––––––––––––––––––––––––––––––––––––––––––––––––––––––––––––––––––––––––––––
At 31 December 2006, the settlement dates on forward foreign exchange contracts range between 1 to 12 (2005: 1 to 12) months.
The net unrealised (negative)/positive fair value of the forward foreign exchange contracts as at 31 December 2006 of approximately US$(4,552,000) (2005: US$633,000) was recognised as a (charge)/refund to related companies since these contracts are undertaken on behalf of related companies.
(f) Commitments for development of oil palm plantations The Group has commitments in relation to the development of oil palm plantations amounted to approximately
US$11,032,000 as of 31 December 2006 (2005: US$3,266,000).
(g) Contingent liabilities The Group has contingent liabilities of approximately US$1,325,000,000 (2005: US$Nil) and US$166,700,000
(2005: US$Nil) in respect of corporate guarantees for certain credit facilities given to its subsidiaries and associates respectively.
(h) On 14 December 2006, the Company:
(i) announced that it proposes to merge with PPB Oil Palms Berhad (“PPBOP”), Kuok Oils & Grains Pte Ltd (“KOG”) and PGEO Group Sdn Bhd (“PGEO”) by way of acquiring the shares in the issued share capital of PPBOP, KOG and PGEO, from the Kuok group of companies and other minority shareholders of PPBOP (collectively to be termed as the “KG Merger”), for an aggregate consideration of up to approximately S$4.1 billion to be satisfied by the allotment and issue of up to 2,403,154,004 new shares based on S$1.71 per share, being the last traded price on 13 December 2006 (the market day preceding the date of the announcement), as follows:
• 1,024,475,674 shares in respect of the proposed acquisition by the Company of all the voting shares in PPBOP not owned by the Company pursuant to the conditional voluntary general offer;
• 1,091,555,558 shares in respect of the proposed acquisition of KOG; and
• 287,122,772 shares in respect of the proposed acquisition of PGEO.
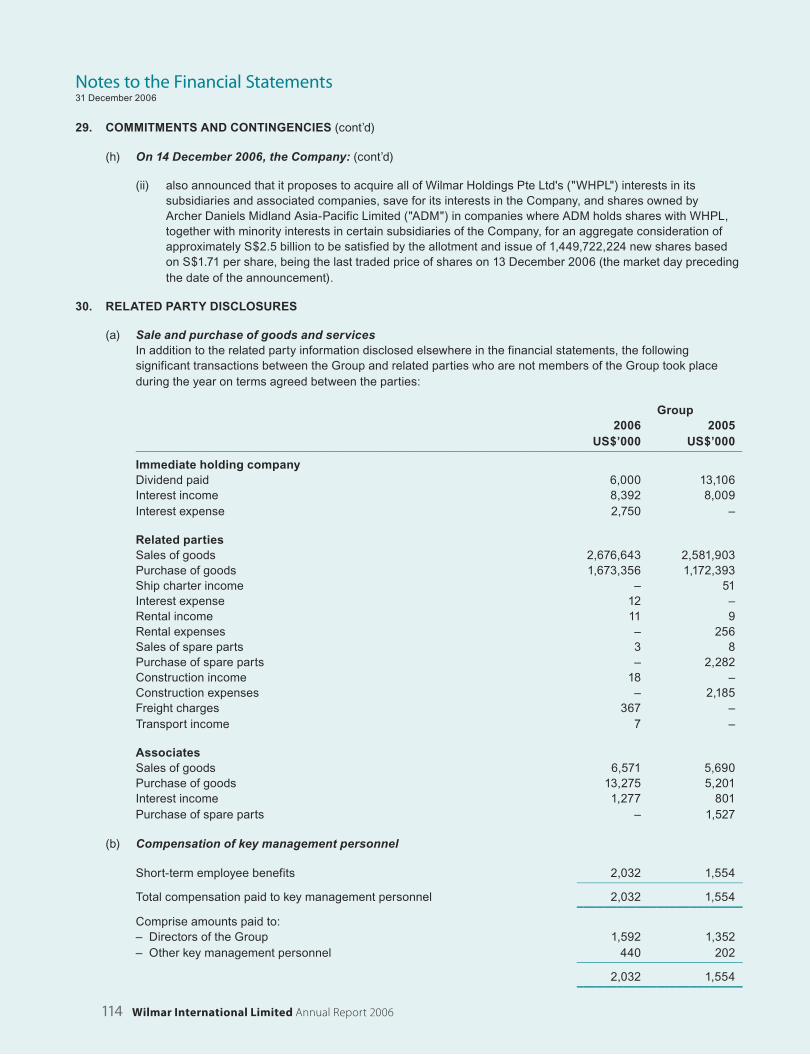
114 Wilmar International Limited Annual Report 2006
Notes to the Financial Statements31 December 2006
29. COMMITMENTS AND CONTINGENCIES (cont’d)
(h) On 14 December 2006, the Company: (cont’d)
(ii) also announced that it proposes to acquire all of Wilmar Holdings Pte Ltd's ("WHPL") interests in its subsidiaries and associated companies, save for its interests in the Company, and shares owned by Archer Daniels Midland Asia-Pacific Limited ("ADM") in companies where ADM holds shares with WHPL, together with minority interests in certain subsidiaries of the Company, for an aggregate consideration of approximately S$2.5 billion to be satisfied by the allotment and issue of 1,449,722,224 new shares based on S$1.71 per share, being the last traded price of shares on 13 December 2006 (the market day preceding the date of the announcement).
30. RELATED PARTY DISCLOSURES
(a) Sale and purchase of goods and servicesIn addition to the related party information disclosed elsewhere in the financial statements, the following significant transactions between the Group and related parties who are not members of the Group took place during the year on terms agreed between the parties:
Group 2006 2005 US$’000 US$’000–––––––––––––––––––––––––––––––––––––––––––––––––––––––––––––––––––––––––––––––––––––––––––––––––––––––––––––––––––––––––––––––––––––––––––––
Immediate holding companyDividend paid 6,000 13,106Interest income 8,392 8,009Interest expense 2,750 –
Related partiesSales of goods 2,676,643 2,581,903Purchase of goods 1,673,356 1,172,393Ship charter income – 51Interest expense 12 –Rental income 11 9Rental expenses – 256Sales of spare parts 3 8Purchase of spare parts – 2,282Construction income 18 –Construction expenses – 2,185Freight charges 367 –Transport income 7 –
AssociatesSales of goods 6,571 5,690Purchase of goods 13,275 5,201Interest income 1,277 801Purchase of spare parts – 1,527
(b) Compensation of key management personnel
Short-term employee benefits 2,032 1,554––––––––––––––––––––––––––––––––––––––
Total compensation paid to key management personnel 2,032 1,554–––––––––––––––––––––––––
Comprise amounts paid to:– Directors of the Group 1,592 1,352– Other key management personnel 440 202
––––––––––––––––––––––––––––––––––––––
2,032 1,554–––––––––––––––––––––––––
115
31. FINANCIAL RISK MANAGEMENT OBJECTIVES AND POLICIESThe Group’s financial risk management policy seeks to ensure that adequate financial resources are available for the development of the Group’s business whilst managing its interest rate, foreign exchange liquidity, and credit risks. The Group uses relevant financial instruments to hedge the risk of such commercial exposures, such financial instruments are not held for trade or speculative purposes. These market risk management activities are governed by its risk management system.
(a) Commodity price managementThe price of agricultural commodities are subject to wide fluctuations due to unpredictable factors such as weather, government policies, changes in global demand resulting from population growth and changes in standards of living, and global production of similar and competitive crops. During its ordinary course of business, the value of the Group’s open sales and purchase commitments and inventory of raw material changes continuously in line with movements in the prices of the underlying commodity. To the extent that its open sales and purchase commitments do not match at the end of each business day, the Group is subject to price fluctuations in the commodities market. The Group generally uses forward physical and/or exchange traded commodity futures and options contracts to mitigate such risk.
While the Group is exposed to fluctuations in agricultural commodities prices, its policy is to minimize their risks arising from such fluctuations by hedging its sales either through direct purchases of a similar commodity or through futures contracts on the commodity exchanges. The prices on the commodity exchanges are quoted up to twelve months forward.
In the course of hedging its sales either through direct purchases or through futures contracts on the commodity exchanges, the Group may also be exposed to the inherent risk associated with trading activities conducted by its personnel. In order to manage such risk exposure, the Group has put in place a risk management system.
(b) Foreign exchange riskThe Group operates in several countries and, as a result, is exposed to movements in foreign currency exchange rates. Other than sales to third party customers within Indonesia and Malaysia which are denominated in the local currency, most of its products are exported and quoted in United States Dollars while its purchases and business operations in Indonesia and Malaysia are mainly denominated in the local currency.
The Group reports its financial results in United States Dollars. Any fluctuations in currency exchange rates will result in exchange gains or losses arising from transactions carried out in the foreign currencies as well as translations of foreign currency monetary assets and liabilities as at the balance sheet dates.
The Group seeks to manage its foreign currency exposures by constructing natural hedges when it matches sales and purchases in any single currency or through financial instruments, such as foreign currency forward exchange contracts. The primary purpose of the foreign currency forward exchange contracts is to protect against the volatility associated with foreign currency purchases and sales of raw materials and other assets and liabilities created in the normal course of business. The Group primarily utilises foreign currency forward exchange contracts to manage committed sales contracts. The foreign currency hedging policy aims to minimize the impact of foreign currency fluctuations on its results of operations.
116 Wilmar International Limited Annual Report 2006
Notes to the Financial Statements31 December 2006
31. FINANCIAL RISK MANAGEMENT OBJECTIVES AND POLICIES (cont’d)
(c) Cash flow and fair value interest rate risks The Group’s interest risk mainly arises from borrowings. Borrowings at variable rates expose the Group to cash
flow interest rate risk. Borrowings obtained at fixed rates expose the Group to fair value interest rate risk.
(d) Credit risk The Group has no significant concentration of credit risk.
The majority of the Group’s sales are export sales. For export sales, the Group typically requires a letter of credit from its customers or cash against the presentation of documents of title. For domestic sales, the Group may grant its customers credit terms of up to 30 days from the date of issuance of invoice. The decision whether to extend credit to its customers depends, inter alia, on the following factors:
For new customers, the Group evaluates the customer’s credit worthiness by considering the customer’s financial standing, operating track record as well as conduct background checks through its industry contacts. Based on the information obtained, the Group will decide on the actual credit terms and limits to be granted. As a practice, the Group usually will require sales to new customers to be on cash in advance or on letters of credit basis.
For existing customers, the Group will review periodically the credit terms and limits granted. As part of its regular credit review, the Group will consider a customer’s current financial strength, payment history, transaction volume and duration of its business relationship with the customer. The Group also monitors outstanding overdue trade debts on a monthly basis to ensure that corrective steps are taken to collect the outstanding debts.
If a customer fails to make payment within the credit term granted, the Group will contact the customer to follow up on the payment status of the overdue receivable. If the customer still does not settle the overdue receivable within a reasonable time, the Group will proceed to issue the customer a letter of demand and may consider legal action to recover the overdue receivable. Under such circumstances, management may decide to make specific allowance for doubtful receivable on these overdue balances.
(e) Liquidity riskThe Group maintains sufficient liquidity by closely monitoring its cash flow. Due to the dynamic nature of its underlying business, the Group adopts prudent liquidity risk management policies in maintaining sufficient credit facilities, including the use of trade finance for the Group’s raw material purchases. The Group also aims at maintaining flexibility in funding by keeping credit facilities available. As at 31 December 2006, the Group has available credit facilities of approximately US$1,440,997,000 (2005: US$1,154,000,000) of which US$759,591,000 (2005: US$689,718,000) was utilised.

117
32. FINANCIAL INSTRUMENTS
(a) Fair valuesThe fair values of a finanacial instrument is the amount at which the instument could be exchanged or settled between knowledge and willing parties in an arm’s length transaction, other than in a forced or liquidation sale.
Financial instruments whose carrying amount approximates fair valueManagement has determined that the carrying amounts of cash and short term deposits, current trade and other receivables, current trade and other payables and current interest-bearing loans and borrowings, based on their notional amounts, reasonably approximate their fair values because these are mostly short term in nature or are re-paid frequently.
Financial instrument carried at other fair valueInvestment securities, comprising unquoted shares and plasma investments are stated at cost as they have no market prices and the fair value cannot be reliably measured using valuation techniques.
Methods and assumptions used to determine fair valuesThe methods and assumptions used by management to determine fair values of financial instruments other than those whose carrying amounts reasonably approximate their fair values as mentioned earlier, are as follows : Financial assets and liabilities Methods and assumptions–––––––––––––––––––––––––––––––––––––––––––––––––––––––––––––––––––––––––––––––––––––––––––––––––––––––––––––––––––––––––––––––––––––––––––––
• Other non-current receivables Fair value has been determined using discounted estimated • Other non-current payables cash flows. Where repayment terms are not fixed, future cash• Interest-bearing loans and borrowings flows are projected based on management’s best estimates. The discount rates used are the current market incremental
lending rates for similar types of lending, borrowing and leasing arrangements
–––––––––––––––––––––––––––––––––––––––––––––––––––––––––––––––––––––––––––––––––––––––––––––––––––––––––––––––––––––––––––––––––––––––––––––
• Biological assets Fair value has been estimated by reference to independent valuations using discounted cash flows of the underlying biological assets. The expected cash flows from the whole life cycle of the oil palm plantations are determined using the market price and the estimated yield of fresh fruit bunches (“FFB”), net of maintenance and harvesting costs and any costs required to bring the oil palm plantations to maturity. The estimated yield of the oil palm plantations is affected by the age of the oil palm, the location, soil type and infrastructure. The market price of the FFB is largely dependent on the prevailing market price of the processed products after harvest, being crude palm oil and palm kernel. Point-of-sale costs include all costs that would be necessary to sell the assets.
–––––––––––––––––––––––––––––––––––––––––––––––––––––––––––––––––––––––––––––––––––––––––––––––––––––––––––––––––––––––––––––––––––––––––––––
• Forward currency contracts Fair value of forward currency contracts is calculated by reference to current forward exchange rates for contracts with similar maturity profiles.
–––––––––––––––––––––––––––––––––––––––––––––––––––––––––––––––––––––––––––––––––––––––––––––––––––––––––––––––––––––––––––––––––––––––––––––
• Futures, options and swap contracts Where available, quoted market prices are used as a measure of fair values for the outstanding contracts. Where the quoted market prices are not available, fair values are based on management’s best estimate and are arrived at by reference to the market prices of another contract that is substantially similar.

Not
es to
the
Fina
ncia
l Sta
tem
ents
31 D
ece
mb
er
20
06
32.
FIN
AN
CIA
L I
NS
TR
UM
EN
TS
(co
nt’d
)
(b)
Inte
res
t ra
te r
isk
The
tab
le b
elo
w s
ets
out
the
Gro
up’s
exp
osu
re to
inte
rest
rat
e ri
sks.
Inc
lude
d in
the
tab
les
are
the
asse
ts a
nd
liabi
litie
s at
car
ryin
g am
oun
ts,
cate
go
rise
d by
the
ear
lier
of c
ont
ract
ual r
ep
rici
ng o
r m
atur
ity d
ate
s.
Fi
xed
rate
s Fl
oatin
g ra
tes
––
––––
––––
––––
––––
––––
––––
––––
––––
––––
––––
––––
––––
––––
––––
––––
––––
––––
––––
– ––
––––
––––
––––
––––
––––
––––
––––
––––
––––
––––
––––
––––
––––
––––
––––
––––
––––
––––
–
N
on-
W
ithin
Mor
e th
an
With
in
M
ore
than
in
tere
st
1 ye
ar
1-2
year
s 2-
3 ye
ars
3-4
year
s 4-
5 ye
ars
5 y
ears
1
year
1-
2 ye
ars
2-3
year
s 3-
4 ye
ars
4-5
year
s 5
year
s be
arin
g To
tal
U
S$’
000
US
$’00
0 U
S$’
000
US
$’00
0 U
S$’
000
US
$’00
0 U
S$’
000
US
$’00
0 U
S$’
000
US
$’00
0 U
S$’
000
US
$’00
0 U
S$’
000
US
$’00
0––
––––
––––
––––
––––
––––
––––
––––
––––
––––
––––
––––
––––
––––
––––
––––
––––
––––
––––
––––
––––
––––
––––
––––
––––
––––
––––
––––
––––
––––
––––
––––
––––
––––
––––
––––
––––
––––
––––
––––
––––
––––
––––
––––
––––
––––
––––
––
2006
– G
roup
Cas
h an
d ba
nk
ba
lanc
es
11,3
08
– –
– –
– 16
,968
–
– –
– –
15,7
04
43,9
80Tr
ade
and
othe
r
rece
ivab
les
11,3
66
– –
– –
– –
– –
– –
– 66
5,97
2 67
7,33
8In
vent
orie
s –
– –
– –
– –
– –
– –
– 36
6,81
0 36
6,81
0B
iolo
gica
l ass
ets
– –
– –
– –
– –
– –
– –
223,
542
223,
542
Pro
pert
y, p
lant
and
equi
pmen
t –
– –
– –
– –
– –
– –
– 46
0,30
0 46
0,30
0O
ther
ass
ets
– –
– –
– –
– –
– –
– –
71,6
02
71,6
02––
––––
––––
––––
––––
––––
––––
––––
––––
––––
––––
––––
––––
––––
––––
––––
––––
––––
––––
––––
––––
––––
––––
––––
––––
––––
––––
––––
––––
––––
––––
––––
––––
––––
––––
––––
––––
––––
––––
––––
––––
––––
––––
––––
––––
––––
––––
––––
–––
Tota
l ass
ets
22,6
74
– –
– –
– 16
,968
–
– –
– –
1,80
3,93
0 1,
843,
572
––––
––––
––––
––––
––––
––––
––––
––––
––––
––––
––––
––––
––––
––––
––––
––––
––––
––––
––––
––––
––––
––––
––––
––––
––––
––––
––––
––––
––––
––––
––––
––––
––––
––––
––––
––––
––––
––––
––––
––––
––––
––––
––––
––––
––––
––––
––––
––––
–
Inte
rest
-bea
ring
loan
s
and
borr
owin
gs
– –
– –
– –
730,
137
16,0
00
– –
– –
13,4
54
759,
591
Oth
er li
abili
ties
– –
– –
– –
– –
– –
– –
477,
319
477,
319
––––
––––
––––
––––
––––
––––
––––
––––
––––
––––
––––
––––
––––
––––
––––
––––
––––
––––
––––
––––
––––
––––
––––
––––
––––
––––
––––
––––
––––
––––
––––
––––
––––
––––
––––
––––
––––
––––
––––
––––
––––
––––
––––
––––
––––
––––
––––
––––
–
Tota
l lia
bilit
ies
– –
– –
– –
730,
137
16,0
00
– –
– –
490,
773
1,23
6,91
0––
––––
––––
––––
––––
––––
––––
––––
––––
––––
––––
––––
––––
––––
––––
––––
––––
––––
––––
––––
––––
––––
––––
––––
––––
––––
––––
––––
––––
––––
––––
––––
2006
– C
ompa
nyC
ash
and
bank
ba
lanc
es
– –
– –
– –
6,46
5 –
– –
– –
– 6,
465
Trad
e an
d ot
her
re
ceiv
able
s –
– –
– –
– 12
,144
16
,000
–
– –
– 39
1,07
1 41
9,21
5O
ther
ass
ets
– –
– –
– –
– –
– –
– –
552,
244
552,
244
––––
––––
––––
––––
––––
––––
––––
––––
––––
––––
––––
––––
––––
––––
––––
––––
––––
––––
––––
––––
––––
––––
––––
––––
––––
––––
––––
––––
––––
––––
––––
––––
––––
––––
––––
––––
––––
––––
––––
––––
––––
––––
––––
––––
––––
––––
––––
––––
–
Tota
l ass
ets
– –
– –
– –
18,6
09
16,0
00
– –
– –
943,
315
977,
924
––––
––––
––––
––––
––––
––––
––––
––––
––––
––––
––––
––––
––––
––––
––––
––––
––––
––––
––––
––––
––––
––––
––––
––––
––––
––––
––––
––––
––––
––––
––––
––––
––––
––––
––––
––––
––––
––––
––––
––––
––––
––––
––––
––––
––––
––––
––––
––––
–
Inte
rest
-bea
ring
loan
s
and
borr
owin
gs
– –
– –
– –
12,0
00
16,0
00
– –
– –
– 28
,000
Oth
er li
abili
ties
– –
– –
– –
– –
– –
– –
206,
747
206,
747
––––
––––
––––
––––
––––
––––
––––
––––
––––
––––
––––
––––
––––
––––
––––
––––
––––
––––
––––
––––
––––
––––
––––
––––
––––
––––
––––
––––
––––
––––
––––
––––
––––
––––
––––
––––
––––
––––
––––
––––
––––
––––
––––
––––
––––
––––
––––
––––
–
Tota
l lia
bilit
ies
– –
– –
– –
12,0
00
16,0
00
– –
– –
206,
747
234,
747
––––
––––
––––
––––
––––
––––
––––
––––
––––
––––
––––
––––
––––
––––
––––
––––
––––
––––
––––
––––
––––
––––
––––
––––
––––
––––
––––
––––
––––
––––
––––
––
118 Wilmar International Limited Annual Report 2006

32.
FIN
AN
CIA
L I
NS
TR
UM
EN
TS
(co
nt’d
)
(b)
Inte
res
t ra
te r
isk
(co
nt’d
)
Fi
xed
rate
s Fl
oatin
g ra
tes
––
––––
––––
––––
––––
––––
––––
––––
––––
––––
––––
––––
––––
––––
––––
––––
––––
––––
––––
– ––
––––
––––
––––
––––
––––
––––
––––
––––
––––
––––
––––
––––
––––
––––
––––
––––
––––
––––
–
N
on-
W
ithin
Mor
e th
an
With
in
M
ore
than
in
tere
st
1 ye
ar
1-2
year
s 2-
3 ye
ars
3-4
year
s 4-
5 ye
ars
5 y
ears
1
year
1-
2 ye
ars
2-3
year
s 3-
4 ye
ars
4-5
year
s 5
year
s be
arin
g To
tal
U
S$’
000
US
$’00
0 U
S$’
000
US
$’00
0 U
S$’
000
US
$’00
0 U
S$’
000
US
$’00
0 U
S$’
000
US
$’00
0 U
S$’
000
US
$’00
0 U
S$’
000
US
$’00
0––
––––
––––
––––
––––
––––
––––
––––
––––
––––
––––
––––
––––
––––
––––
––––
––––
––––
––––
––––
––––
––––
––––
––––
––––
––––
––––
––––
––––
––––
––––
––––
––––
––––
––––
––––
––––
––––
––––
––––
––––
––––
––––
––––
––––
––––
––––
––
2005
– G
roup
Cas
h an
d ba
nk
ba
lanc
es
– –
– –
– –
10,0
96
– –
– –
– 9,
416
19,5
12Tr
ade
and
othe
r
rece
ivab
les
208,
850
– –
– –
– 10
,710
–
– –
– –
464,
677
684,
237
Inve
ntor
ies
– –
– –
– –
– –
– –
– –
288,
938
288,
938
Bio
logi
cal a
sset
s –
– –
– –
– –
– –
– –
– 15
4,93
2 15
4,93
2P
rope
rty,
pla
nt a
nd
equi
pmen
t –
– –
– –
– –
– –
– –
– 36
5,81
1 36
5,81
1O
ther
ass
ets
– –
– –
– –
– –
– –
– –
55,5
50
55,5
50––
––––
––––
––––
––––
––––
––––
––––
––––
––––
––––
––––
––––
––––
––––
––––
––––
––––
––––
––––
––––
––––
––––
––––
––––
––––
––––
––––
––––
––––
––––
––––
––––
––––
––––
––––
––––
––––
––––
––––
––––
––
Tota
l ass
ets
208,
850
– –
– –
– 20
,806
–
– –
– –
1,33
9,32
4 1,
568,
980
––––
––––
––––
––––
––––
––––
––––
––––
––––
––––
––––
––––
––––
––––
––––
––––
––––
––––
––––
––––
––––
––––
––––
––––
––––
––––
––––
––––
––––
––––
––––
––––
––––
––––
––––
––––
––––
––––
––––
––––
––––
Inte
rest
-bea
ring
loan
s
and
borr
owin
gs
– 2,
482
1,
638
– –
– 68
5,59
8 –
– –
– –
– 68
9,71
8O
ther
liab
ilitie
s –
– –
– –
– 40
,202
–
– –
– –
559,
334
599,
536
––––
––––
––––
––––
––––
––––
––––
––––
––––
––––
––––
––––
––––
––––
––––
––––
––––
––––
––––
––––
––––
––––
––––
––––
––––
––––
––––
––––
––––
––––
––––
––––
––––
––––
––––
––––
––––
––––
––––
––––
––––
Tota
l lia
bilit
ies
– 2,
482
1,
638
–
– –
725,
800
–
– –
– –
559,
334
1,28
9,25
4––
––––
––––
––––
––––
––––
––––
––––
––––
––––
––––
––––
––––
––––
––––
––––
––––
––––
––––
––––
––––
––––
––––
––––
––––
––––
––––
––––
––––
––––
––––
––––
––––
––––
––––
––––
––––
––––
––––
––––
––––
––
2005
– C
ompa
nyC
ash
and
bank
ba
lanc
es
– –
– –
– –
1,45
8 –
– –
– –
– 1,
458
Trad
e an
d ot
her
re
ceiv
able
s –
– –
– –
– –
– –
– –
– 1,
354
1,35
4P
rope
rty,
pla
nt a
nd
equi
pmen
t –
– –
– –
– –
– –
– –
– 18
3 18
3O
ther
ass
ets
– –
– –
– –
– –
– –
– –
2,55
0 2,
550
––––
––––
––––
––––
––––
––––
––––
––––
––––
––––
––––
––––
––––
––––
––––
––––
––––
––––
––––
––––
––––
––––
––––
––––
––––
––––
––––
––––
––––
––––
––––
––––
––––
––––
––––
––––
––––
––––
––––
––––
––––
Tota
l ass
ets
– –
– –
– –
1,45
8
– –
– –
– 4,
087
5,54
5––
––––
––––
––––
––––
––––
––––
––––
––––
––––
––––
––––
––––
––––
––––
––––
––––
––––
––––
––––
––––
––––
––––
––––
––––
––––
––––
––––
––––
––––
––––
––––
––––
––––
––––
––––
––––
––––
––––
––––
––––
––
Inte
rest
-bea
ring
loan
s
and
borr
owin
gs
99
– –
– –
– –
– –
– –
– –
99O
ther
liab
ilitie
s –
– –
– –
– –
– –
– –
– 2,
440
2,44
0––
––––
––––
––––
––––
––––
––––
––––
––––
––––
––––
––––
––––
––––
––––
––––
––––
––––
––––
––––
––––
––––
––––
––––
––––
––––
––––
––––
––––
––––
––––
––––
––––
––––
––––
––––
––––
––––
––––
––––
––––
––
Tota
l lia
bilit
ies
99
– –
– –
– –
– –
– –
– 2,
440
2,53
9––
––––
––––
––––
––––
––––
––––
––––
––––
––––
––––
––––
––––
––––
––––
––––
––––
––––
––––
––––
––––
––––
––––
––––
––––
––––
––––
––––
––––
––––
––––
––––
––––
––––
––––
––––
––––
––––
––––
––––
––––
––
119

120 Wilmar International Limited Annual Report 2006
Notes to the Financial Statements31 December 2006
33. SEGMENT INFORMATION
(a) Reporting formatThe primary segment reporting format is determined to be business segments as the Group’s risks and rates of return are affected predominantly by differences in the products and services produced. Secondary information is reported geographically. The operating businesses are organised and managed separately according to the nature of the products and services provided, with each segment representing a strategic business unit that offers different products and serves different markets.
(b) Business segments The Group comprises the following main business segments:
• Merchandising and refinery Merchandising of palm oil, lauric related products and non-palm oil related products. In addition, this
business segment also includes the operation of palm oil processing and refinery plants.
• Plantations and palm oil mills Oil palm cultivation and milling.
• Others Including the business of manufacture and distribution of fertiliser products and ship-chartering services.
(c) Geographical segmentsThe Group’s geographical segments are based on the location of the Group’s assets. Sales to external customers disclosed in geographical segments are based on the geographical location of its customers.
(d) Allocation basis and transfer pricingSegment results, assets and liabilities include items directly attributable to a segment as well as those that can be allocated on a reasonable basis. Unallocated items comprise mainly corporate assets, income tax and deferred tax assets and liabilities, interest-bearing loans and related expenses.
Transfer prices between business segments are set on an arm’s length basis in a manner similar to transactions with third parties. Segment revenue, expenses and results include transfers between business segments. These transfers are eliminated on consolidation.

121
33
. S
EG
ME
NT
IN
FO
RM
AT
ION
(co
nt’d
)
(e)
Bu
sin
es
s s
eg
me
nts
(i)
The
follo
win
g ta
ble
pre
sent
s re
venu
e an
d re
sults
info
rmat
ion
rega
rdin
g th
e G
roup
’s b
usin
ess
se
gmen
ts fo
r the
ye
ars
ende
d 31
De
cem
be
r 20
06
and
20
05
.
M
erch
and
isin
g P
lant
atio
ns
and
an
d re
fin
ery
pal
m o
il m
ills
Oth
ers
Elim
inat
ion
Tota
l
2006
20
05
2006
20
05
2006
20
05
2006
20
05
2006
20
05
US
$’00
0 U
S$’
000
US
$’00
0 U
S$’
000
US
$’00
0 U
S$’
000
US
$’00
0 U
S$’
000
US
$’00
0 U
S$’
000
––––
––––
––––
––––
––––
––––
––––
––––
––––
––––
––––
––––
––––
––––
––––
––––
––––
––––
––––
––––
––––
––––
––––
––––
––––
––––
––––
––––
––––
––––
––––
––––
––––
––––
––––
––––
––––
––––
––––
––––
––––
––––
––––
––––
––––
–
Rev
enu
e:S
ales
to e
xter
nal c
usto
mer
s 5,
115,
136
4,48
0,20
5 15
,421
6,
371
171,
075
164,
984
– –
5,30
1,63
2 4,
651,
560
Inte
r-se
gmen
t sal
es
62,8
17
102,
318
385,
837
261,
978
25,8
83
25,9
47
(474
,537
) (3
90,2
43)
– –
––––
––––
––––
––––
––––
––––
––––
––––
––––
––––
––––
––––
––––
––––
––––
––––
––––
––––
––––
––––
––––
––––
––––
––––
––––
––––
––––
––––
––––
––––
––––
––––
––––
––––
––––
––
Tota
l rev
enue
5,
177,
953
4,58
2,52
3 40
1,25
8 26
8,34
9 19
6,95
8 19
0,93
1 (4
74,5
37)
(390
,243
) 5,
301,
632
4,65
1,56
0––
––––
––––
––––
––––
––––
––––
––––
––––
––––
––––
––––
––––
––––
––––
––––
––––
––––
––––
––––
––––
––––
––––
––––
––––
––––
––––
––––
––––
––––
––––
––––
––––
––––
––––
––––
Res
ults
:S
egm
ent r
esul
ts
136,
616
86,3
45
63,2
02
28,8
57
7,01
2 8,
591
– –
206,
830
123,
793
Una
lloca
ted
(exp
ense
s)/in
com
e
(2
,440
) 10
,107
Fina
nce
cost
s
(6
9,12
2)
(60,
415)
Sha
re o
f res
ults
of a
ssoc
iate
s 13
3 47
–
– –
– –
– 13
3 47
––––
––––
––––
––––
––––
––––
––––
––––
––––
––––
––––
––––
––––
––––
––––
––––
––––
––––
––––
––––
––––
––––
––––
––––
––––
––––
––––
––––
––––
––––
––––
––––
––––
––––
––––
––
Pro
fit b
efor
e ta
x
13
5,40
1 73
,532
Tax
expe
nse
(29,
087)
(1
4,91
4)––
––––
––––
––––
––––
––––
––––
––
Pro
fit fo
r the
yea
r
10
6,31
4 58
,618
––––
––––
––––
––––
–––

Not
es to
the
Fina
ncia
l Sta
tem
ents
31 D
ece
mb
er
20
06
33
. S
EG
ME
NT
IN
FO
RM
AT
ION
(co
nt’d
)
(e)
Bu
sin
es
s s
eg
me
nts
(co
nt’d
)
(ii)
The
fo
llow
ing
tab
le p
rese
nts
asse
ts,
liabi
litie
s an
d ot
her
segm
ent
info
rmat
ion
rega
rdin
g th
e G
roup
’s b
usin
ess
se
gmen
ts f
or
the
year
s en
ded
31 D
ece
mb
er
20
06
and
20
05
.
M
erch
and
isin
g P
lant
atio
ns
and
an
d re
fin
ery
pal
m o
il m
ills
Oth
ers
Elim
inat
ion
Tota
l
2006
20
05
2006
20
05
2006
20
05
2006
20
05
2006
20
05
US
$’00
0 U
S$’
000
US
$’00
0 U
S$’
000
US
$’00
0 U
S$’
000
US
$’00
0 U
S$’
000
US
$’00
0 U
S$’
000
––––
––––
––––
––––
––––
––––
––––
––––
––––
––––
––––
––––
––––
––––
––––
––––
––––
––––
––––
––––
––––
––––
––––
––––
––––
––––
––––
––––
––––
––––
––––
––––
––––
––––
––––
––––
––––
––––
––––
––––
––––
––––
––––
––––
––––
–
As
se
ts a
nd
lia
bil
itie
s:
Seg
men
t ass
ets
1,61
0,54
3 1,
273,
189
495,
300
399,
319
1,19
7,09
4 19
0,55
9 (1
,468
,403
) (2
94,6
93)
1,83
4,53
4 1,
568,
374
Inve
stm
ents
in a
ssoc
iate
s 8,
802
878
236
(272
) –
– –
– 9,
038
60
6––
––––
––––
––––
––––
––––
––––
––––
––––
––––
––––
––––
––––
––––
––––
––––
––––
––––
––––
––––
––––
––––
––––
––––
––––
––––
––––
––––
––––
––––
––––
––––
––––
––––
––––
––––
Tota
l ass
ets
1,61
9,34
5 1,
274,
067
495,
536
399,
047
1,19
7,09
4
190,
559
(1,4
68,4
03)
(294
,693
) 1,
843,
572
1,56
8,98
0––
––––
––––
––––
––––
––––
––––
––––
––––
––––
––––
––––
––––
––––
––––
––––
––––
––––
––––
––––
––––
––––
––––
––––
––––
––––
––––
––––
––––
––––
––––
––––
––––
––––
––––
––––
Seg
men
t lia
bilit
ies
and
to
tal l
iabi
litie
s 1,
330,
983
1,05
1,96
1 38
1,67
4 33
6,65
9 43
9,59
0 17
7,85
6 (9
15,3
37)
(277
,222
) 1,
236,
910
1,28
9,25
4––
––––
––––
––––
––––
––––
––––
––––
––––
––––
––––
––––
––––
––––
––––
––––
––––
––––
––––
––––
––––
––––
––––
––––
––––
––––
––––
––––
––––
––––
––––
––––
––––
––––
––––
––––
Oth
er s
egm
ent i
nfo
rmat
ion
:C
apita
l exp
endi
ture
:
– P
rope
rty,
pla
nt a
nd e
quip
men
t 81
,199
49
,020
31
,226
41
,145
26
,318
18
,130
–
– 13
8,74
3 10
8,29
5In
tang
ible
ass
et
5,57
1
5,57
1 29
,016
29
,016
–
– –
– 34
,587
34
,587
Dep
reci
atio
n an
d am
ortis
atio
n 19
,428
16
,789
11
,862
8,
501
4,39
7 3,
544
– –
35,6
87
28,8
34
122 Wilmar International Limited Annual Report 2006
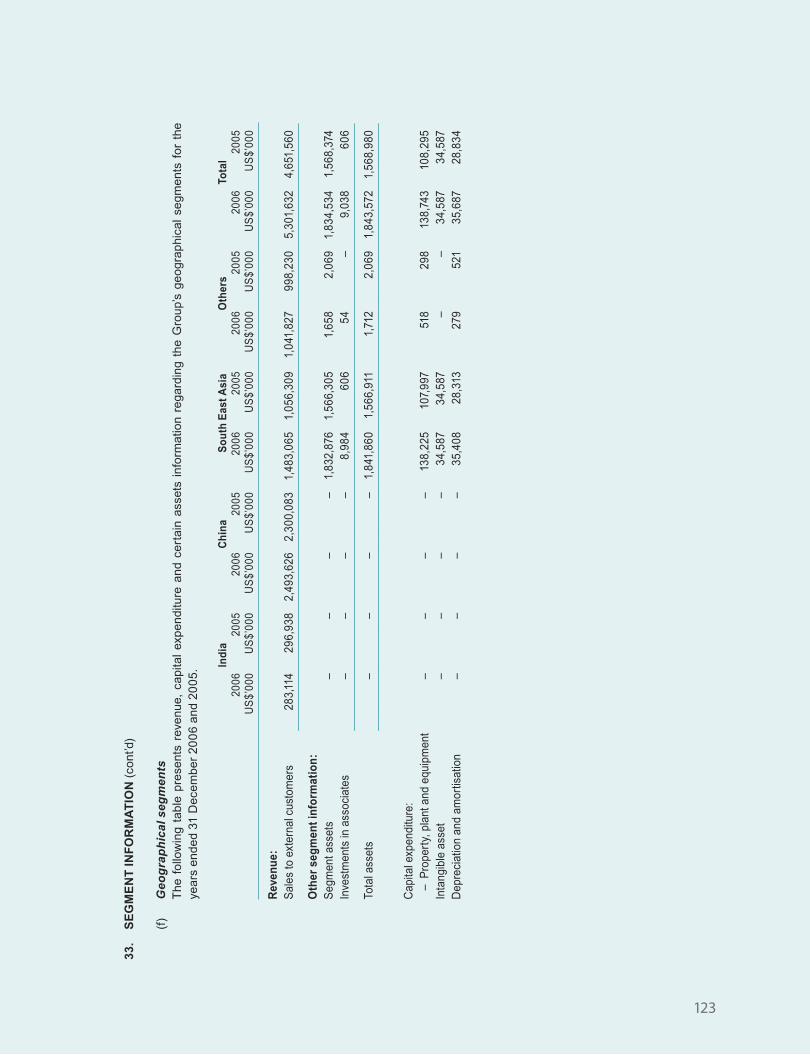
123
33
. S
EG
ME
NT
IN
FO
RM
AT
ION
(co
nt’d
)
(f)
Ge
og
rap
hic
al s
eg
me
nts
T
he f
ollo
win
g ta
ble
pre
sent
s re
venu
e, c
apita
l ex
pen
ditu
re a
nd
cert
ain
asse
ts i
nfo
rmat
ion
rega
rdin
g th
e G
roup
’s g
eo
grap
hica
l se
gmen
ts f
or
the
year
s en
ded
31 D
ece
mb
er
20
06
and
20
05
.
In
dia
C
hin
a S
outh
Eas
t Asi
a O
ther
s To
tal
20
06
2005
20
06
2005
20
06
2005
20
06
2005
20
06
2005
U
S$’
000
US
$’00
0 U
S$’
000
US
$’00
0 U
S$’
000
US
$’00
0 U
S$’
000
US
$’00
0 U
S$’
000
US
$’00
0––
––––
––––
––––
––––
––––
––––
––––
––––
––––
––––
––––
––––
––––
––––
––––
––––
––––
––––
––––
––––
––––
––––
––––
––––
––––
––––
––––
––––
––––
––––
––––
––––
––––
––––
––––
––––
––––
––––
––––
––––
––––
––––
––––
––––
–––
Rev
enu
e:S
ales
to e
xter
nal c
usto
mer
s 28
3,11
4 29
6,93
8
2,49
3,62
6 2,
300,
083
1,48
3,06
5 1,
056,
309
1,
041,
827
998,
230
5,
301,
632
4,65
1,56
0 ––
––––
––––
––––
––––
––––
––––
––––
––––
––––
––––
––––
––––
––––
––––
––––
––––
––––
––––
––––
––––
––––
––––
––––
––––
––––
––––
––––
––––
––––
––––
––––
––––
––––
––––
––––
Oth
er s
egm
ent i
nfo
rmat
ion
:S
egm
ent a
sset
s –
– –
– 1,
832,
876
1,
566,
305
1,6
58
2,0
69
1,83
4,53
4 1,
568,
374
Inve
stm
ents
in a
ssoc
iate
s –
– –
– 8,
984
606
54
– 9,
038
606
––––
––––
––––
––––
––––
––––
––––
––––
––––
––––
––––
––––
––––
––––
––––
––––
––––
––––
––––
––––
––––
––––
––––
––––
––––
––––
––––
––––
––––
––––
––––
––––
––––
––––
––––
––
Tota
l ass
ets
– –
– –
1,84
1,86
0
1,56
6,91
1
1,71
2
2,06
9
1,84
3,57
2 1,
568,
980
––––
––––
––––
––––
––––
––––
––––
––––
––––
––––
––––
––––
––––
––––
––––
––––
––––
––––
––––
––––
––––
––––
––––
––––
––––
––––
––––
––––
––––
––––
––––
––––
––––
––––
––––
––
Cap
ital e
xpen
ditu
re:
–
Pro
pert
y, p
lant
and
equ
ipm
ent
– –
– –
138,
225
10
7,99
7 51
8 29
8 13
8,74
3 10
8,29
5 In
tang
ible
ass
et
– –
– –
34,5
87
34,5
87
– –
34,5
87
34,5
87
Dep
reci
atio
n an
d am
ortis
atio
n –
– –
– 35
,408
28
,313
27
9 52
1 35
,687
28
,834
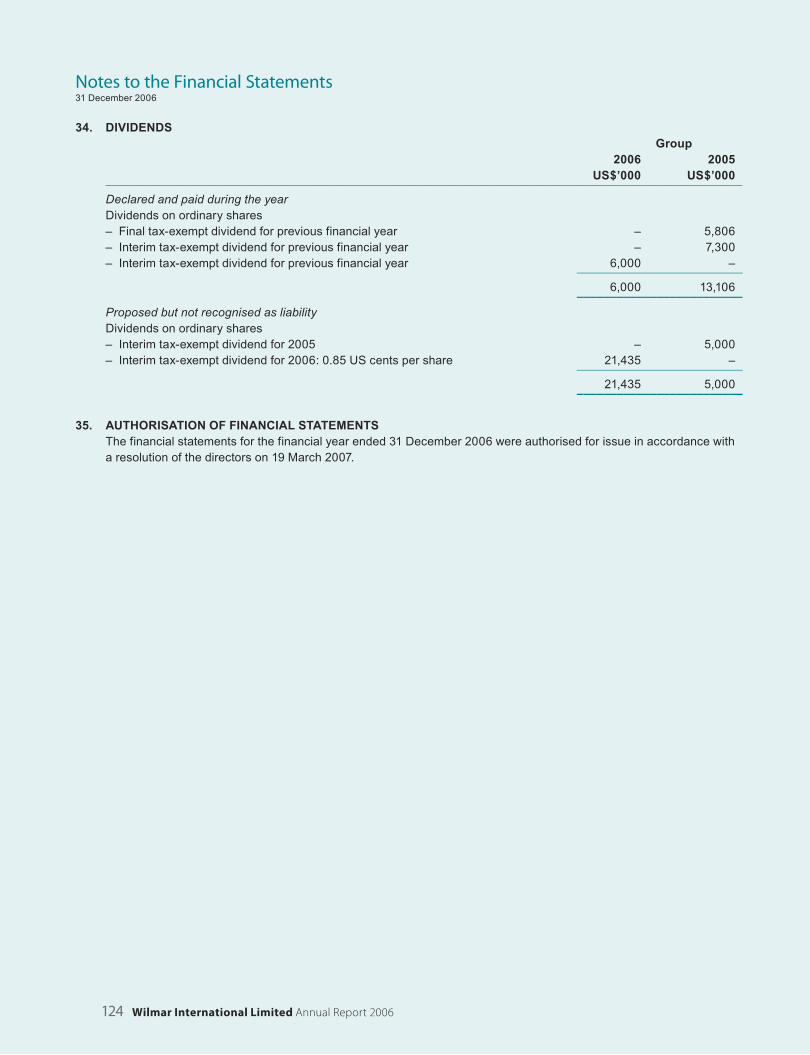
124 Wilmar International Limited Annual Report 2006
Notes to the Financial Statements31 December 2006
34. DIVIDENDS Group 2006 2005 US$’000 US$’000––––––––––––––––––––––––––––––––––––––––––––––––––––––––––––––––––––––––––––––––––––––––––––––––––––––––––––––––––––––––––––––––––––––––––––––––––––
Declared and paid during the yearDividends on ordinary shares– Final tax-exempt dividend for previous financial year – 5,806– Interim tax-exempt dividend for previous financial year – 7,300– Interim tax-exempt dividend for previous financial year 6,000 –
––––––––––––––––––––––––––––––––––––––
6,000 13,106–––––––––––––––––––––––––
Proposed but not recognised as liabilityDividends on ordinary shares– Interim tax-exempt dividend for 2005 – 5,000– Interim tax-exempt dividend for 2006: 0.85 US cents per share 21,435 –
––––––––––––––––––––––––––––––––––––––
21,435 5,000–––––––––––––––––––––––––
35. AUTHORISATION OF FINANCIAL STATEMENTS
The financial statements for the financial year ended 31 December 2006 were authorised for issue in accordance with a resolution of the directors on 19 March 2007.
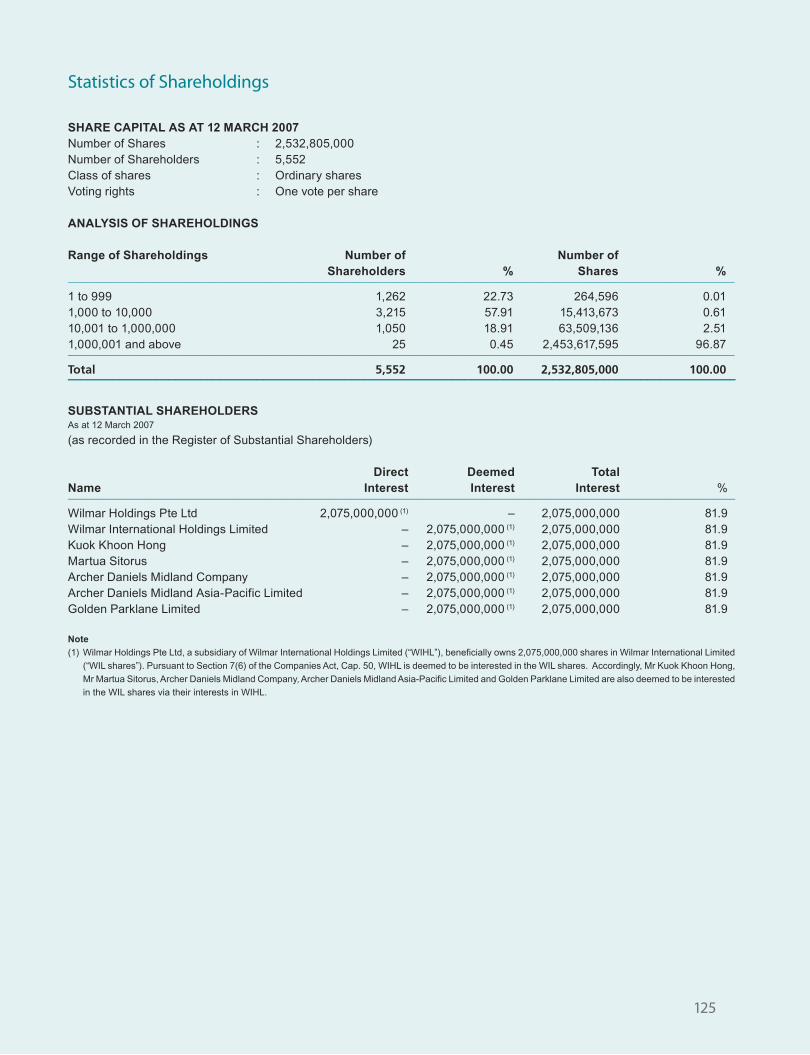
125
Statistics of Shareholdings
SHARE CAPITAL AS AT 12 MARCH 2007Number of Shares : 2,532,805,000Number of Shareholders : 5,552Class of shares : Ordinary sharesVoting rights : One vote per share
ANALYSIS OF SHAREHOLDINGS
Range of Shareholdings Number of Number of Shareholders % Shares %–––––––––––––––––––––––––––––––––––––––––––––––––––––––––––––––––––––––––––––––––––––––––––––––––––––––––––––––––––––––––––––––––––––––––––––––––––––––––––
1 to 999 1,262 22.73 264,596 0.011,000 to 10,000 3,215 57.91 15,413,673 0.6110,001 to 1,000,000 1,050 18.91 63,509,136 2.511,000,001 and above 25 0.45 2,453,617,595 96.87–––––––––––––––––––––––––––––––––––––––––––––––––––––––––––––––––––––––––––––––––––––––––––––––––––––––––––––––––––––––––––––––––––––––––––––––––––––––––––
Total 5,552 100.00 2,532,805,000 100.00––––––––––––––––––––––––––––––––––––––––––––––––––––––––––––––––––––––––––––––––––––––––––––––––––––––––––
SUBSTANTIAL SHAREHOLDERSAs at 12 March 2007
(as recorded in the Register of Substantial Shareholders)
Direct Deemed TotalName Interest Interest Interest %––––––––––––––––––––––––––––––––––––––––––––––––––––––––––––––––––––––––––––––––––––––––––––––––––––––––––––––––––––––––––––––––––––––––––––––––––––––––––––
Wilmar Holdings Pte Ltd 2,075,000,000 (1) – 2,075,000,000 81.9Wilmar International Holdings Limited – 2,075,000,000 (1) 2,075,000,000 81.9Kuok Khoon Hong – 2,075,000,000 (1) 2,075,000,000 81.9Martua Sitorus – 2,075,000,000 (1) 2,075,000,000 81.9Archer Daniels Midland Company – 2,075,000,000 (1) 2,075,000,000 81.9Archer Daniels Midland Asia-Pacific Limited – 2,075,000,000 (1) 2,075,000,000 81.9Golden Parklane Limited – 2,075,000,000 (1) 2,075,000,000 81.9
Note
(1) Wilmar Holdings Pte Ltd, a subsidiary of Wilmar International Holdings Limited (“WIHL”), beneficially owns 2,075,000,000 shares in Wilmar International Limited
(“WIL shares”). Pursuant to Section 7(6) of the Companies Act, Cap. 50, WIHL is deemed to be interested in the WIL shares. Accordingly, Mr Kuok Khoon Hong,
Mr Martua Sitorus, Archer Daniels Midland Company, Archer Daniels Midland Asia-Pacific Limited and Golden Parklane Limited are also deemed to be interested
in the WIL shares via their interests in WIHL.
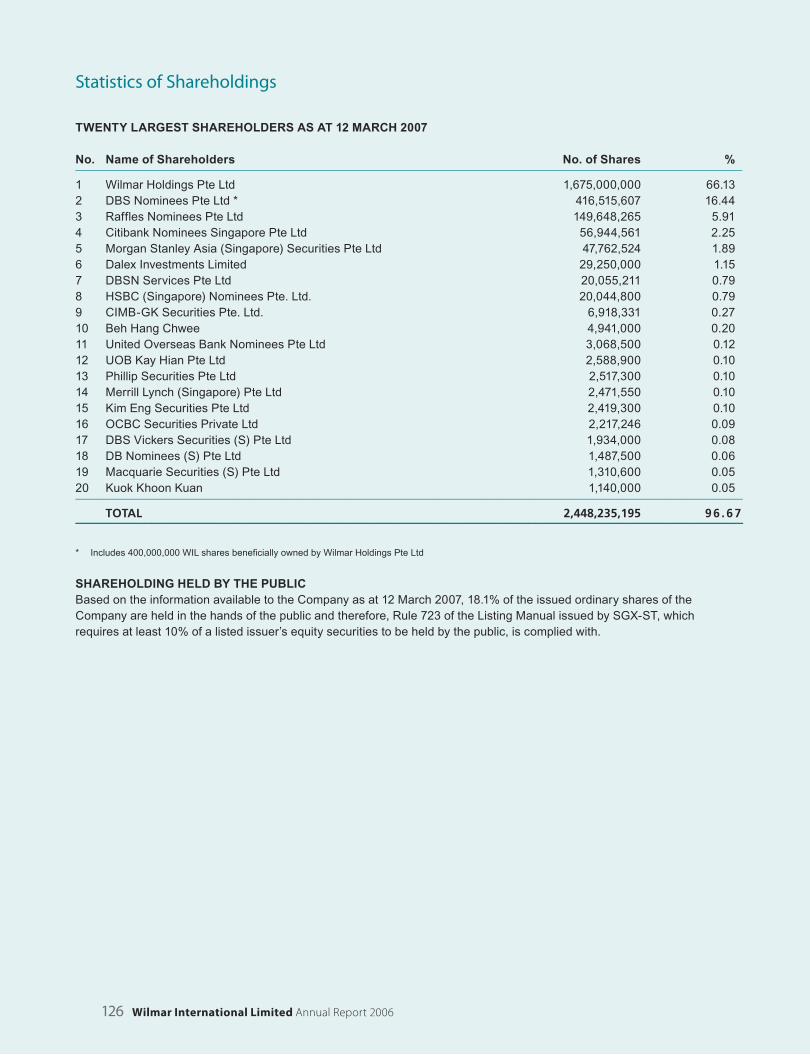
126 Wilmar International Limited Annual Report 2006
TWENTY LARGEST SHAREHOLDERS AS AT 12 MARCH 2007
No. Name of Shareholders No. of Shares %–––––––––––––––––––––––––––––––––––––––––––––––––––––––––––––––––––––––––––––––––––––––––––––––––––––––––––––––––––––––––––––––––––––––––––––––––––––––––––
1 Wilmar Holdings Pte Ltd 1,675,000,000 66.132 DBS Nominees Pte Ltd * 416,515,607 16.443 Raffles Nominees Pte Ltd 149,648,265 5.914 Citibank Nominees Singapore Pte Ltd 56,944,561 2.255 Morgan Stanley Asia (Singapore) Securities Pte Ltd 47,762,524 1.896 Dalex Investments Limited 29,250,000 1.157 DBSN Services Pte Ltd 20,055,211 0.798 HSBC (Singapore) Nominees Pte. Ltd. 20,044,800 0.799 CIMB-GK Securities Pte. Ltd. 6,918,331 0.2710 Beh Hang Chwee 4,941,000 0.2011 United Overseas Bank Nominees Pte Ltd 3,068,500 0.1212 UOB Kay Hian Pte Ltd 2,588,900 0.1013 Phillip Securities Pte Ltd 2,517,300 0.1014 Merrill Lynch (Singapore) Pte Ltd 2,471,550 0.1015 Kim Eng Securities Pte Ltd 2,419,300 0.1016 OCBC Securities Private Ltd 2,217,246 0.0917 DBS Vickers Securities (S) Pte Ltd 1,934,000 0.0818 DB Nominees (S) Pte Ltd 1,487,500 0.0619 Macquarie Securities (S) Pte Ltd 1,310,600 0.0520 Kuok Khoon Kuan 1,140,000 0.05––––––––––––––––––––––––––––––––––––––––––––––––––––––––––––––––––––––––––––––––––––––––––––––––––––––––––––––––––––––––––––––––––––––––––––––––––––––––––––
TOTAL 2,448,235,195 96 .67––––––––––––––––––––––––––––––––––––––––––––––––––––––––––––––––––––––––––––––––––––––––––––––––––––––––––
* Includes 400,000,000 WIL shares beneficially owned by Wilmar Holdings Pte Ltd
SHAREHOLDING HELD BY THE PUBLICBased on the information available to the Company as at 12 March 2007, 18.1% of the issued ordinary shares of the Company are held in the hands of the public and therefore, Rule 723 of the Listing Manual issued by SGX-ST, which requires at least 10% of a listed issuer’s equity securities to be held by the public, is complied with.
Statistics of Shareholdings
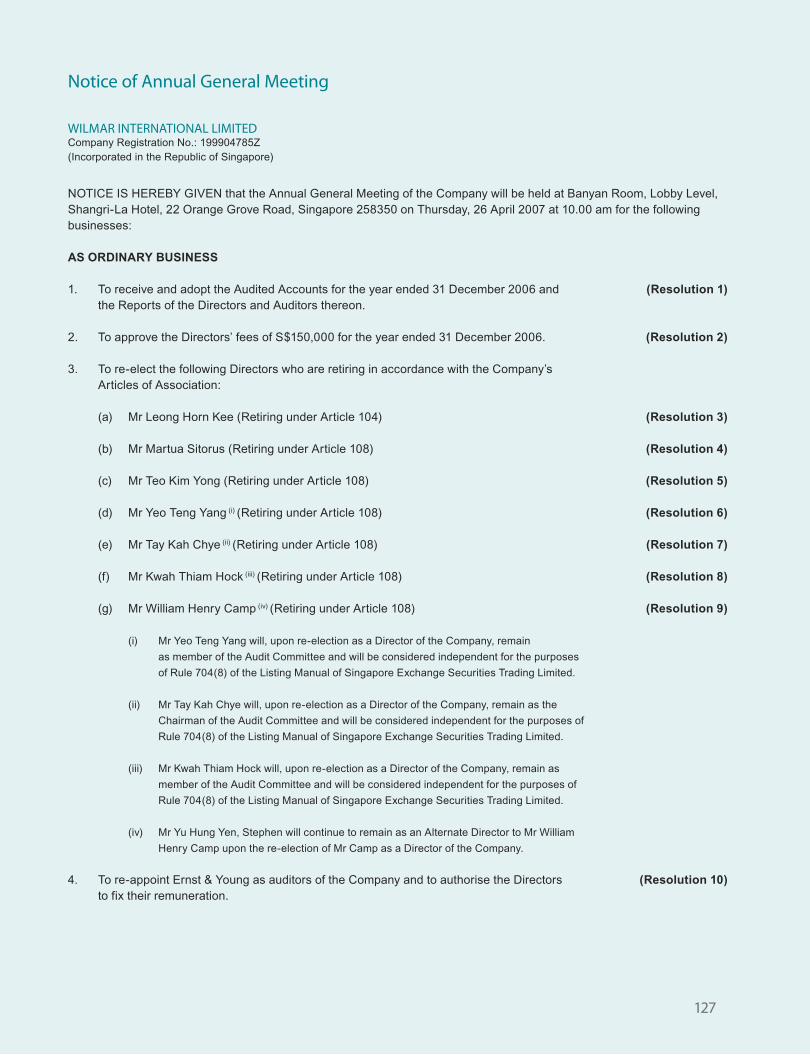
127
Notice of Annual General Meeting
NOTICE IS HEREBY GIVEN that the Annual General Meeting of the Company will be held at Banyan Room, Lobby Level, Shangri-La Hotel, 22 Orange Grove Road, Singapore 258350 on Thursday, 26 April 2007 at 10.00 am for the following businesses:
AS ORDINARY BUSINESS
1. To receive and adopt the Audited Accounts for the year ended 31 December 2006 and (Resolution 1) the Reports of the Directors and Auditors thereon.
2. To approve the Directors’ fees of S$150,000 for the year ended 31 December 2006. (Resolution 2)
3. To re-elect the following Directors who are retiring in accordance with the Company’s Articles of Association:
(a) Mr Leong Horn Kee (Retiring under Article 104) (Resolution 3)
(b) Mr Martua Sitorus (Retiring under Article 108) (Resolution 4)
(c) Mr Teo Kim Yong (Retiring under Article 108) (Resolution 5)
(d) Mr Yeo Teng Yang (i) (Retiring under Article 108) (Resolution 6)
(e) Mr Tay Kah Chye (ii) (Retiring under Article 108) (Resolution 7)
(f) Mr Kwah Thiam Hock (iii) (Retiring under Article 108) (Resolution 8)
(g) Mr William Henry Camp (iv) (Retiring under Article 108) (Resolution 9)
(i) Mr Yeo Teng Yang will, upon re-election as a Director of the Company, remain
as member of the Audit Committee and will be considered independent for the purposes
of Rule 704(8) of the Listing Manual of Singapore Exchange Securities Trading Limited.
(ii) Mr Tay Kah Chye will, upon re-election as a Director of the Company, remain as the
Chairman of the Audit Committee and will be considered independent for the purposes of
Rule 704(8) of the Listing Manual of Singapore Exchange Securities Trading Limited.
(iii) Mr Kwah Thiam Hock will, upon re-election as a Director of the Company, remain as
member of the Audit Committee and will be considered independent for the purposes of
Rule 704(8) of the Listing Manual of Singapore Exchange Securities Trading Limited.
(iv) Mr Yu Hung Yen, Stephen will continue to remain as an Alternate Director to Mr William
Henry Camp upon the re-election of Mr Camp as a Director of the Company.
4. To re-appoint Ernst & Young as auditors of the Company and to authorise the Directors (Resolution 10) to fix their remuneration.
WILMAR INTERNATIONAL LIMITEDCompany Registration No.: 199904785Z (Incorporated in the Republic of Singapore)
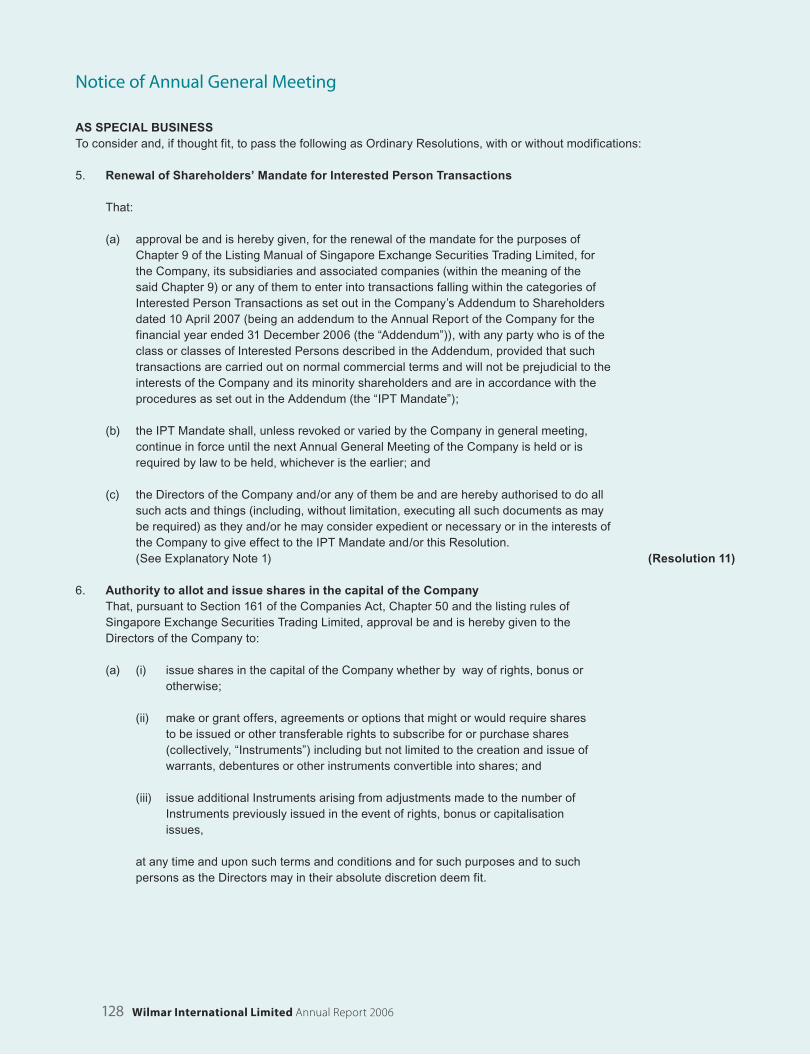
128 Wilmar International Limited Annual Report 2006
AS SPECIAL BUSINESSTo consider and, if thought fit, to pass the following as Ordinary Resolutions, with or without modifications:
5. Renewal of Shareholders’ Mandate for Interested Person Transactions
That:
(a) approval be and is hereby given, for the renewal of the mandate for the purposes of Chapter 9 of the Listing Manual of Singapore Exchange Securities Trading Limited, for the Company, its subsidiaries and associated companies (within the meaning of the said Chapter 9) or any of them to enter into transactions falling within the categories of Interested Person Transactions as set out in the Company’s Addendum to Shareholders dated 10 April 2007 (being an addendum to the Annual Report of the Company for the financial year ended 31 December 2006 (the “Addendum”)), with any party who is of the class or classes of Interested Persons described in the Addendum, provided that such transactions are carried out on normal commercial terms and will not be prejudicial to the interests of the Company and its minority shareholders and are in accordance with the procedures as set out in the Addendum (the “IPT Mandate”);
(b) the IPT Mandate shall, unless revoked or varied by the Company in general meeting, continue in force until the next Annual General Meeting of the Company is held or is required by law to be held, whichever is the earlier; and
(c) the Directors of the Company and/or any of them be and are hereby authorised to do all such acts and things (including, without limitation, executing all such documents as may be required) as they and/or he may consider expedient or necessary or in the interests of the Company to give effect to the IPT Mandate and/or this Resolution.
(See Explanatory Note 1) (Resolution 11)
6. Authority to allot and issue shares in the capital of the CompanyThat, pursuant to Section 161 of the Companies Act, Chapter 50 and the listing rules of Singapore Exchange Securities Trading Limited, approval be and is hereby given to the Directors of the Company to:
(a) (i) issue shares in the capital of the Company whether by way of rights, bonus or otherwise;
(ii) make or grant offers, agreements or options that might or would require shares to be issued or other transferable rights to subscribe for or purchase shares (collectively, “Instruments”) including but not limited to the creation and issue of warrants, debentures or other instruments convertible into shares; and
(iii) issue additional Instruments arising from adjustments made to the number of Instruments previously issued in the event of rights, bonus or capitalisation issues,
at any time and upon such terms and conditions and for such purposes and to such persons as the Directors may in their absolute discretion deem fit.
Notice of Annual General Meeting
129
(b) (notwithstanding the authority conferred by the shareholders may have ceased to be in force) issue shares in pursuance of any Instrument made or granted by the Directors while the authority was in force,
provided always that
(i) the aggregate number of shares to be issued pursuant to this resolution (including shares to be issued in pursuance of Instruments made or granted pursuant to this resolution) does not exceed 50% of the issued shares in the capital of the Company, of which the aggregate number of shares (including shares to be issued in pursuance of Instruments made or granted pursuant to this resolution) to be issued other than on a pro rata basis to shareholders of the Company does not exceed 20% of the issued shares in the capital of the Company, and for the purpose of this resolution, the percentage of issued shares shall be based on the number of issued shares in the capital of the Company at the time this resolution is passed, after adjusting for:
(1) new shares arising from the conversion or exercise of convertible securities that may be approved by shareholders from time to time;
(2) new shares arising from exercising share options or vesting of share awards outstanding or subsisting at the time this resolution is passed; and
(3) any subsequent consolidation or subdivision of the Company’s shares; and
(ii) the authority conferred by this resolution shall, unless revoked or varied by the Company at a general meeting, continue in force until the conclusion of the next Annual General Meeting or the date by which the next Annual General Meeting of the Company is required of the Company by law to be held, whichever is the earlier.
(See Explanatory Note 2) (Resolution 12)
7. Authority to grant options and issue shares under the Executives’ Share Option Scheme of the Company
That authority be and is hereby given to the Directors of the Company to offer and grant options from time to time in accordance with the provisions of the Executives’ Share Option Scheme of the Company (the “Share Scheme”) and, pursuant to Section 161 of the Companies Act, Chapter 50, to allot and issue from time to time such number of shares in the capital of the Company as may be required to be issued pursuant to the exercise of options granted under the Share Scheme, provided that the aggregate number of shares to be issued pursuant to the Share Scheme shall not exceed 15% of the issued shares in the capital of the Company from time to time, as determined in accordance with the provisions of the Share
Scheme. (See Explanatory Note 3) (Resolution 13)
By Order of the BoardColin Tan Tiang SoonCompany Secretary
Singapore10 April 2007
Notice of Annual General Meeting
130 Wilmar International Limited Annual Report 2006
Explanatory Notes:1. The Ordinary Resolution 11 proposed in item no. 5 above, if passed, will renew effective up to the next Annual General
Meeting (unless earlier revoked or varied by the Company in general meeting) the IPT Mandate for the Company, its subsidiaries and associated companies that are considered “entities at risk” to enter in the ordinary course of business into certain types of transactions with specified classes of the Company’s interested persons. The IPT Mandate, approval of which was previously given by shareholders at the Extraordinary General Meeting of the Company held on 7 July 2006, will be expiring at the forthcoming Annual General Meeting. Information relating to the renewal of the IPT Mandate can be found in the Addendum to this Notice.
2. The Ordinary Resolution 12 proposed in item no. 6 above, if passed, will authorise the Directors of the Company from the date of the above Meeting until the next Annual General Meeting to issue shares and convertible securities in the Company up to an amount not exceeding in aggregate 50% of the issued shares in the capital of the Company of which the total number of shares and convertible securities issued other than on a pro rata basis to existing shareholders shall not exceed 20% of the issued shares in the capital of the Company at the time the resolution is passed, for such purposes as they consider would be in the interests of the Company. This authority will, unless revoked or varied at a general meeting, expire at the next Annual General Meeting of the Company.
3. The Ordinary Resolution 13 proposed in item no. 7 above, if passed, will empower the Directors of the Company to offer and grant options under the Executives’ Share Option Scheme (“Share Scheme”) and to allot and issue shares pursuant to the exercise of such options under the Share Scheme.
Notes:
1. A Member of the Company entitled to attend and vote at the Meeting is entitled to appoint a proxy to attend and vote in his stead.
2. A proxy need not be a Member of the Company.
3. If the appointor is a corporation, the proxy, must be executed under seal or the hand of its duly authorised officer or attorney.
4. The instrument or form appointing a proxy, duly executed, must be deposited at the office of Tricor Barbinder Share Registration Services at 8 Cross Street,
#11-00 PWC Building, Singapore 048424 not less than 48 hours before the time appointed for the Meeting.
Notice of Annual General Meeting
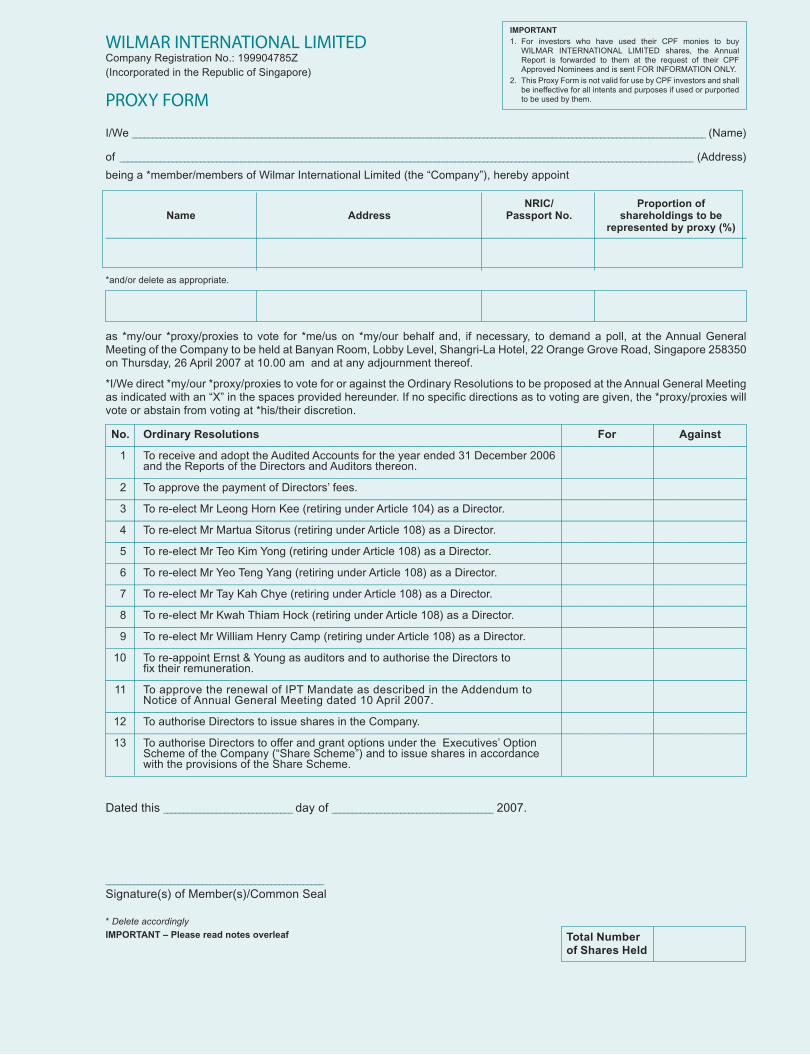
I/We ______________________________________________________________________________________________________________________________________________ (Name)
of ______________________________________________________________________________________________________________________________________________ (Address)
being a *member/members of Wilmar International Limited (the “Company”), hereby appoint
NRIC/ Proportion of Name Address Passport No. shareholdings to be represented by proxy (%)–––––––––––––––––––––––––––––––––––––––––––––––––––––––––––––––––––––––––––––––––––––––––––––––––––––––––––––––––––––––––––––––––––––––––––––––––––––
*and/or delete as appropriate.
as *my/our *proxy/proxies to vote for *me/us on *my/our behalf and, if necessary, to demand a poll, at the Annual General Meeting of the Company to be held at Banyan Room, Lobby Level, Shangri-La Hotel, 22 Orange Grove Road, Singapore 258350 on Thursday, 26 April 2007 at 10.00 am and at any adjournment thereof.
*I/We direct *my/our *proxy/proxies to vote for or against the Ordinary Resolutions to be proposed at the Annual General Meeting as indicated with an “X” in the spaces provided hereunder. If no specific directions as to voting are given, the *proxy/proxies will vote or abstain from voting at *his/their discretion.
No. Ordinary Resolutions For Against––––––––––––––––––––––––––––––––––––––––––––––––––––––––––––––––––––––––––––––––––––––––––––––––––––––––––––––––––––––––––––––––––––––––––––––––––––– 1 To receive and adopt the Audited Accounts for the year ended 31 December 2006
and the Reports of the Directors and Auditors thereon.––––––––––––––––––––––––––––––––––––––––––––––––––––––––––––––––––––––––––––––––––––––––––––––––––––––––––––––––––––––––––––––––––––––––––––––––––––– 2 To approve the payment of Directors’ fees.––––––––––––––––––––––––––––––––––––––––––––––––––––––––––––––––––––––––––––––––––––––––––––––––––––––––––––––––––––––––––––––––––––––––––––––––––––– 3 To re-elect Mr Leong Horn Kee (retiring under Article 104) as a Director.––––––––––––––––––––––––––––––––––––––––––––––––––––––––––––––––––––––––––––––––––––––––––––––––––––––––––––––––––––––––––––––––––––––––––––––––––––– 4 To re-elect Mr Martua Sitorus (retiring under Article 108) as a Director.––––––––––––––––––––––––––––––––––––––––––––––––––––––––––––––––––––––––––––––––––––––––––––––––––––––––––––––––––––––––––––––––––––––––––––––––––––– 5 To re-elect Mr Teo Kim Yong (retiring under Article 108) as a Director.––––––––––––––––––––––––––––––––––––––––––––––––––––––––––––––––––––––––––––––––––––––––––––––––––––––––––––––––––––––––––––––––––––––––––––––––––––– 6 To re-elect Mr Yeo Teng Yang (retiring under Article 108) as a Director.––––––––––––––––––––––––––––––––––––––––––––––––––––––––––––––––––––––––––––––––––––––––––––––––––––––––––––––––––––––––––––––––––––––––––––––––––––– 7 To re-elect Mr Tay Kah Chye (retiring under Article 108) as a Director.––––––––––––––––––––––––––––––––––––––––––––––––––––––––––––––––––––––––––––––––––––––––––––––––––––––––––––––––––––––––––––––––––––––––––––––––––––– 8 To re-elect Mr Kwah Thiam Hock (retiring under Article 108) as a Director.–––––––––––––––––––––––––––––––––––––––––––––––––––––––––––––––––––––––––––––––––––––––––––––––––––––––––––––––––––––––––––––––––––––––––––––––––––––– 9 To re-elect Mr William Henry Camp (retiring under Article 108) as a Director.–––––––––––––––––––––––––––––––––––––––––––––––––––––––––––––––––––––––––––––––––––––––––––––––––––––––––––––––––––––––––––––––––––––––––––––––––––––– 10 To re-appoint Ernst & Young as auditors and to authorise the Directors to
fix their remuneration.––––––––––––––––––––––––––––––––––––––––––––––––––––––––––––––––––––––––––––––––––––––––––––––––––––––––––––––––––––––––––––––––––––––––––––––––––––– 11 To approve the renewal of IPT Mandate as described in the Addendum to
Notice of Annual General Meeting dated 10 April 2007.–––––––––––––––––––––––––––––––––––––––––––––––––––––––––––––––––––––––––––––––––––––––––––––––––––––––––––––––––––––––––––––––––––––––––––––––––––––– 12 To authorise Directors to issue shares in the Company.––––––––––––––––––––––––––––––––––––––––––––––––––––––––––––––––––––––––––––––––––––––––––––––––––––––––––––––––––––––––––––––––––––––––––––––––––––– 13 To authorise Directors to offer and grant options under the Executives’ Option
Scheme of the Company (“Share Scheme”) and to issue shares in accordance with the provisions of the Share Scheme.
Dated this ________________________________ day of ________________________________________ 2007.
______________________________________________________
Signature(s) of Member(s)/Common Seal
* Delete accordingly
IMPORTANT – Please read notes overleaf
WILMAR INTERNATIONAL LIMITEDCompany Registration No.: 199904785Z (Incorporated in the Republic of Singapore)
PROXY FORM
Total Number of Shares Held
IMPORTANT1. For investors who have used their CPF monies to buy
WILMAR INTERNATIONAL LIMITED shares, the Annual Report is forwarded to them at the request of their CPF Approved Nominees and is sent FOR INFORMATION ONLY.
2. This Proxy Form is not valid for use by CPF investors and shall be ineffective for all intents and purposes if used or purported to be used by them.
131
Notes:
1. A member of the Company entitled to attend and vote at the Annual General Meeting is entitled to appoint not more than two proxies to attend and vote in his stead. Such proxy need not be a member of the Company.
2. Where a member of the Company appoints two proxies, he shall specify the proportion of his shareholding (expressed as a percentage of the whole) to be represented by each such proxy.
3. The instrument appointing a proxy or proxies must be under the hand of the appointor or his attorney duly authorised in writing. Where the instrument appointing a proxy or proxies is executed by a corporation, it must be executed either under its common seal or under the hand of its attorney or duly authorised officer.
4. A corporation which is a member of the Company may authorise by resolution of its directors or other governing body such person as it thinks fit to act as its representative at the Annual General Meeting, in accordance with its Articles of Association and Section 179 of the Companies Act, Chapter 50 of Singapore.
5. The instrument appointing a proxy or proxies, together with the power of attorney or other authority (if any) under which it is signed, or notarially certified copy thereof, must be deposited at the office of Tricor Barbinder Share Registration Services at 8 Cross Street, #11-00 PWC Building, Singapore 048424 not later than 48 hours before the time set for the Annual General Meeting.
6. A member should insert the total number of shares held. If the member has shares entered against his name in the Depository Register (as defined in Section 130A of the Companies Act, Chapter 50 of Singapore), he should insert that number of shares. If the member has shares registered in his name in the Register of Members of the Company, he should insert that number of shares. If the member has shares entered against his name in the Depository Register and shares registered in his name in the Register of Members of the Company, he should insert the aggregate number of shares. If no number is inserted, this form of proxy will be deemed to relate to all the shares held by the member of the Company.
7. The Company shall be entitled to reject the instrument appointing a proxy or proxies if it is incomplete, improperly completed or illegible or where the true intentions of the appointor are not ascertainable from the instructions of the appointor specified in the instrument appointing a proxy or proxies. In addition, in the case of members of the Company whose shares are entered against their names in the Depository Register, the Company may reject any instrument appointing a proxy or proxies lodged if such members are not shown to have shares entered against their names in the Depository Register 48 hours before the time appointed for holding the Annual General Meeting as certified by The Central Depository (Pte) Limited to the Company.
8. A Depositor shall not be regarded as a member of the Company entitled to attend the Annual General Meeting and to speak and vote thereat unless his name appears on the Depository Register 48 hours before the time set for the Annual General Meeting.

We Invest
Increase Market Share
Expand Merchandising and Processing Capabilitiesof palm and lauric oils to maintain its leadership position.
of palm oil and other processed agricultural commodities in key consuming countries, particularly in China and India.
Palm oil is one of the fastest growing segments of the global vegetable oil markets due to the rising global demand for food and alternative energy as well as the rapid increase in production by Indonesia and Malaysia. Asian demand for processed agricultural commodities will remain robust, driven by high economic growth, large population base and low per capita consumption.Against this backdrop, Wilmar has embarked on a three-pronged strategy to position itself for growth.
Observation tower at plantation in Padang, Sumatra
Annual Report 2006
positioned for
Increase Market Share in Key Consuming Countries
growth
Expand Merchandising and Processing Capabilities
Increase Oil Palm Plantation Acreage
Wilmar International LimitedCo. Reg. No. 199904785Z
56 Neil Road, Singapore 088830
Tel (65) 6216 0244
Telex RS 23171 WILMAR
www.wilmar-international.com Des
ign
and
prod
uctio
n by
Su
Yean
g Pt
e Lt
d
Wilm
ar Intern
ational L
imite
d An
nual Re
po
rt 20
06 PO
SITION
ED FO
R GRO
WTH