annual report 2007 - honda parts oem finderhondapartscatalog.com/annual-report-2007.pdfenvironmennt...
TRANSCRIPT

Annual Report 2007Annual Report 2007Honda Motor Co., Ltd.Honda Motor Co., Ltd.
Year Ended March 31, 2007

SRSCSCSCSSEnnvironmennt
etySafePhilaanthropy
OperationserationserationsO
CSR Report
Annual Report 2007
Philanthropy Report2007
Corporate Profile
Honda Motor Co., Ltd. operates under the basic principles of “Respect for the Individual” and “The ThreeJoys”—commonly expressed as The Joy of Buying, The Joy of Selling and The Joy of Creating. “Respect forthe Individual” reflects our desire to respect the unique character and ability of each individual person,trusting each other as equal partners in order to do our best in every situation. Based on this, “The ThreeJoys” expresses our belief and desire that each person working in, or coming into contact with our company,directly or through or products, should share a sense of joy through that experience.
In line with these basic principles, since its establishment in 1948, Honda has remained on the leadingedge by creating new value and providing products of the highest quality at a reasonable price, for worldwidecustomer satisfaction. In addition, the Company has conducted its activities with a commitment to protectingthe environment and enhancing safety in a mobile society.
The Company has grown to become the world’s largest motorcycle manufacturer and one of the leadingautomakers. With a global network of 507* subsidiaries and affiliates accounted for under the equity method,Honda develops, manufactures and markets a wide variety of products, ranging from small general-purposeengines and scooters to specialty sports cars, to earn the Company an outstanding reputation fromcustomers worldwide.*As of March 31, 2007
(Cover)Left: TRX450R ATV
This high-performance all-terrain vehicle (ATV)handles road surfaces with ease and deliverspowerful racing performance.
Middle: CR-V SUV (for the North American market)Since its launch in September 2006, thiscompact sport-utility vehicle (SUV) has earnedpraise from customers around the world.
Right: HRR lawn mowerThis serious push lawn mower handles tasksranging from lawn trimming to full-scalegarden care.
Reports Published by Honda
Through its reports on these topics, Honda providesits stakeholders with annual overviews of itsinitiatives and evaluations of its performance. Thesemedia also provide opportunities for communicationbetween Honda and its stakeholders in eachdomain. We look forward to enhancing thesecommunications in the future.
Honda discloses the majority of its informationon the web sites shown on the right.
Honda’s Major Areas Disclosure Web SitesCorporate profile http://world.honda.com/profile/CSR http://world.honda.com/CSR/Investor relations http://world.honda.com/investors/Environment http://world.honda.com/environment/Community http://world.honda.com/community/Safety http://world.honda.com/safety/Promoting safer driving http://world.honda.com/safety/safer-driving/
Environmental Report
This report describes Honda’s position on environmentalinitiatives, environmental performance for the fiscal yearended March 31, 2007, and future environmental targets.http://world.honda.com/environment/reports/
CSR Report
This report provides an overview of Honda’s position oncorporate social responsibility (CSR) activities and anoverview of its performance in the areas of business, theenvironment, corporate citizenship, and quality and safetyduring the fiscal year ended March 31, 2007.http://world.honda.com/CSR/
Annual Report
This report outlines Honda’s operating performance forthe fiscal year ended March 31, 2007, and describesfuture initiatives.http://world.honda.com/investors/annualreport/
Driving Safety Promotion Report
This report (available only in Japanese) summarizesHonda’s efforts to promote safe driving and principalactivities in this area in 2006.
Philanthropy Report
This report explains Honda’s position on philanthropy andprofiles major performance areas during the fiscal yearended March 31, 2007.http://world.honda.com/community/

Contents
2 Financial Highlights
4 To Our Shareholders
11 Review of OperationsSummary of Operating Results by BusinessMotorcycle BusinessAutomobile BusinessPower Product and Other BusinessesFinancial Services Business
27 Special Feature: Targeting the World’s Cleanest Diesel Engine
35 Environment and Safety
40 Preparing for the Future
41 Risk Factors
43 Corporate Governance
50 Board of Directors, Corporate Auditors and Operating Officers
53 Financial Section
127 Principal Manufacturing Facilities
128 Corporate Information
130 Honda’s History
132 Investor Information
1
Caution with Respect to Forward-Looking StatementsThis annual report contains “forward-looking statements” as defined in Section 27A of the Securities Act of 1933, as amended, and Section 21Eof the Securities Exchange Act of 1934, as amended.
Such statements are based on management’s assumptions and beliefs taking into account information currently available to it. Therefore,please be advised that Honda’s actual results could differ materially from those described in these forward-looking statements as a result ofnumerous factors, including general economic conditions in Honda’s principal markets and foreign exchange rates between the Japanese yenand the U.S. dollar, the Euro and other major currencies, as well as other factors detailed from time to time.

Financial DataHonda Motor Co., Ltd., and SubsidiariesYears ended or at March 31
U.S. dollarsYen (millions except
(millions except per share data) per share data)
2005 2006 2007 2007
Net sales and other operating revenue ¥8,650,105 ¥ 9,907,996 ¥11,087,140 $ 93,919
Operating income 630,920 868,905 851,879 7,216
Income before income taxes, minority interest and equity in income of affiliates 668,364 829,904 792,868 6,716
Equity in income of affiliates 96,057 99,605 103,417 876
Net income 486,197 597,033 592,322 5,018
Cash dividends paid during the period 47,797 71,061 140,482 1,190
Research and development 467,754. 510,385 551,847 4,675
Total assets 9,368,236 10,631,400 12,036,500 101,961
Stockholders’ equity 3,289,294 4,125,750 4,482,611 37,972
Capital expenditures (excluding purchase of operating lease assets) 373,980 457,841 627,066 5,312Depreciation (excluding property on operating leases) 225,752 262,225 361,747 3,064
Per share dataNet income ¥ 260.34. ¥ 324.33. ¥ 324.62. $ 2.75.Dividends paid 25.5. 38.5. 77. 0.65.Stockholders’ equity 1,778.24. 2,259.26. 2,460.28. 20.84.
(Notes) 1. On July 1, 2006, the Board of Directors declared a two-for-one stock split of the Company’s common stock. All share-related information in this financialhighlights are stated according to the number of shares following the stock split.
2. The information in the consolidated financial statements for the year under review is presented according to the method used until the preceding fiscalyear, and is adjusted to reflect the current method. For details, please refer to the note to the consolidated financial statements entitled “3. Revisions ofClassifications” in the financial section.
3. The consolidated financial statements as of and for the year ended March 31, 2007 have been translated into U.S. dollars at the rate of ¥118.05=U.S.$1, the approximate exchange rate prevailing on the Tokyo Foreign Exchange Market on March 31, 2007. Those U.S. dollar amounts presented inthe consolidated financial statements and related notes are included solely for the reader. This translation should not be construed as a representationthat all the amounts shown could be converted into U.S. dollars.
Operating DataYears ended March 31
Unit Sales Breakdown Motorcycles Automobiles Power Products
(Thousands) 2006 2007 Change 2006 2007 Change 2006 2007 Change
Japan 368 337 (8.4)% 696 672 (3.4)% 487 527 8.2%
North America 615 503 (18.2) 1,682 1,788 6.3 2,827 3,103 9.8%
Europe 353 329 (6.8) 291 324 11.3 1,477 1,625 10.0%
Asia 7,907 7,895 (0.2) 521 620 19.0 717 760 6.0%
Other Regions 1,028 1,305 26.9 201 248 23.4 368 406 10.3%
Total 10,271 10,369 1.0% 3,391 3,652 7.7% 5,876 6,421 9.3%
Net Sales Power Product and
Breakdown Motorcycle Business Automobile Business Financial Services Business Other Businesses
Yen (millions) 2006 2007 Change 2006 2007 Change 2006 2007 Change 2006 2007 Change
Japan ¥ 99,009 ¥ 101,753 2.8% ¥1,447,388 ¥1,412,726 (2.4)% ¥ 21,140 ¥ 21,497 1.7% ¥126,507 ¥145,214 14.8%
North America 349,741 308,293 (11.9) 4,722,354 5,179,139 9.7 267,485 364,892 36.4% 123,779 128,552 3.9%
Europe 208,092 219,773 5.6 717,360 917,199 27.9 10,108 12,642 25.1% 73,861 87,143 18.0%
Asia 324,026 383,389 18.3 731,833 861,612 17.7 1,966 3,150 60.2% 27,626 35,003 26.7%
Other Regions 244,944 357,409 45.9 385,759 518,404 34.4 6,170 7,520 21.9% 18,848 21,830 15.8%
Total ¥1,225,812 ¥1,370,617 11.8% ¥8,004,694 ¥8,889,080 11.0% ¥306,869 ¥409,701 33.5% ¥370,621 ¥417,742 12.7%
2
Financial Highlights

3
12,000
10,000
8,000
6,000
4,000
2,000
003 04 05 06 07
Net Sales and OtherOperating Revenue
Yen (billions)1,000
750
500
250
0
10.0
7.5
5.0
2.5
003 04 05 06 07
(%)
Operating Income andOperating Margin
Yen (billions)
Operating Income (left scale)Operating Margin (right scale)
600
450
300
150
0
20.0
15.0
10.0
5.0
003 04 05 06 07
Net Income andReturn on Equity (ROE)
Net Income (left scale)ROE (right scale)
(%)Yen (billions)
12,000
10,000
8,000
6,000
4,000
2,000
003 04 05 06 07
Unit Sales[Motorcycles]
(Thousands)4,000
3,000
2,000
1,000
003 04 05 06 07
[Automobiles]
(Thousands)8,000
6,000
4,000
2,000
003 04 05 06 07
[Power Products]
(Thousands)
12,500
10,000
7,500
5,000
2,500
0
2,500
2,000
1,500
1,000
500
003 04 05 06 07
Total Assets (left scale)Stockholders’ Equity (left scale)Stockholders’ Equity per Common Share(right scale)
(Yen)
Total Assets, Stockholders’ Equity andStockholders’ Equity per Common Share
Yen (billions)600
400
200
003 04 05 06 07
Capital ExpenditureDepreciation
Capital Expenditure andDepreciation(excluding property on operating leases)
Yen (billions)
120
100
80
60
40
20
003 04 05 06 07
Equity in Incomeof Affiliates
Yen (billions)
Japan North America Europe Asia Other Regions
Primary Data for Five YearsYears ended or at March 31

4
The Year in Review
During fiscal 2007, ended March 31, 2007, Honda set in place a number ofmeasures aimed at global growth and advancement. To propel ourselvesforward over the medium to long term, we outlined specific measures for ourthree initiatives that are; developing advanced systems at our productionfacilities in Japan, solidifying the foundation for growth in our overseas busi-ness and working to reduce our CO2 emissions on a global level bypromoting innovative products and production facilities. We also accelerated
To Our Shareholders
Takeo FukuiPresident and Chief Executive Officer

5
efforts to strengthen the core characteristics that make Honda unique inorder to continue creating new value for our customers, such as by com-mercializing the HondaJet and solar cell businesses, bringing these projectsa step closer to reality.
EnvironmentAs to the economic conditions surrounding Honda during fiscal 2007,although crude oil prices became relatively more stable other raw materialsprices continued to significantly increase. In the United States, despiteslowing growth in personal consumption and capital investment, strong eco-nomic growth continued, albeit at a slightly slower rate, and the economiesof Europe sustained a gradual recovery. Rapid economic growth also per-sisted in Asian countries, particularly China and India. In Japan, increasesin capital investments and other factors supported a gradual economicrecovery, although personal consumption was lackluster.
Overview of Fiscal 2007 Operating PerformanceTumultuous change characterized the business environment in key worldmarkets. Amid increasingly stringent competition, we remained proactive inour efforts to launch products that create new value. These undertakingspaid off in the form of higher unit sales in each of our businesses—motorcycles, automobiles and power products—and revenues grew for theseventh consecutive year as each of our businesses expanded.
Despite a demanding competitive environment, increased overseas unitsales and the currency effects caused by the depreciation of the Japaneseyen rose profits, but income fell for a variety of reasons. We experienced thenegative impact of changes in our model mix, as significantly increasinggasoline prices prompted a shift in demand toward compact cars. The costof steel, aluminium and precious metals substantially increased, and selling,general and administrative expenses accompanied the rise in unit sales.R&D expenses also rose, as we spent more on safety and environmentaltechnologies and worked to improve the attractiveness of our products.Furthermore, the gain that we posted in fiscal 2006 on the return of thesubstitutional portion of the Employees’ Pension Funds to the Japanesegovernment was absent in fiscal 2007.
Motorcycle BusinessIn key Asian markets, demand for motorcycles as an essential mode oftransportation continued to grow. Sales in Latin America remained strong,mainly in Brazil, where economic performance was stable.
Since mid-2005, Indonesia, which is a major market for our products inAsia, has been affected by substantially increasing gasoline prices, coupledwith substantially high inflation and interest rates, which depressed overalldemand. However, a turnaround in this situation from mid-2006 allowed ourequity-method affiliate there to stage a recovery in sales.
HondaJet

6
Honda Aircraft Company groundbreakingceremony
To Our Shareholders
The CR-V, posting strong sales in all markets(North American market version shown)
Automobile BusinessOn a global basis, a sharp rise in gasoline prices spurred demand forautomobiles featuring good fuel economy, leading to steady increases insales of Honda vehicles in North America and Europe. Sales remainedstrong in China, India, Brazil and other emerging economies. In particular,strong worldwide sales of the new Civic, introduced in September 2005,continued in fiscal 2007. Sales of the new CR-V, which we launched inSeptember 2006, also recorded strong worldwide sales results andcontributed to the steady expansion of unit sales.
Power Product and Other BusinessesUnit sales in the power product business increased in all regions in fiscal2007, mainly in North America and Europe. This rise was supported byproducts that play a role in customer lifestyles, such as lawn mowers andgenerators, as well as engines for OEM*1 use in construction equipmentand generators.
In December 2006, we established a subsidiary in Japan to manufactureand sell next-generation thin-film solar cells that we developed using propri-etary technologies. Sales began in Japan on a limited regional basis in June2007, and by fall 2007 we expect to commence mass production on anannual capacity of 27.5 megawatts and full-fledged sales.
Fulfilling an objective that Honda has set through R&D since the time ofits establishment, in October 2004 we formed a joint venture with GeneralElectric Company, and in 2006, that venture secured orders to supplycompact turbofan engines to two aircraft manufacturers. Furthering theseefforts, in August 2006 we established a subsidiary in the United States toconstruct R&D, manufacturing and sales of compact jets. In October 2006,we began accepting orders for HondaJet, a compact business jet. Deliveriesand associated revenue are scheduled to begin in 2010.*1: OEM (Original equipment manufacturing)
OEM refers to a manufacturing of products and components supplied for sale under a third-partybrand.
Future Initiatives
The environment in which Honda operates is likely to grow increasinglychallenging. Honda will address this situation by accelerating efforts tostrengthen the core characteristics that make Honda unique as we createnew value and continue to deliver products and services that exceed theexpectations of our customers. In May 2006, I discussed three themes forachieving this vision—”Establishing advanced manufacturing systemsand capabilities,” “Strengthening the foundation for global growth” and“Strengthening our commitment to reducing our environmentalfootprint”—and we continue to move forward along these lines.
I would now like to introduce our recent initiatives under these themes,and talk about the measures we have implemented.

7
Acura Design Studio, which opened inMay 2007
Groundbreaking ceremony for new factoryin Indiana
Establishing Advanced Manufacturing Systems and CapabilitiesFirst, let me outline our initiatives to create advanced systems in the realmof manufacturing and R&D, as these areas support the ongoing globalexpansion of Honda’s businesses.
In terms of strengthening our manufacturing systems, the new Yoriiplant—scheduled to begin operations in 2010—will feature high-qualityand highly efficient production and logistics systems, allowing us to makestate-of-the-art automobiles quickly and in response to diverse customerdemands. Also taking the environment into consideration, each of the carsproduced at this plant will produce 20% lower CO2 emissions, comparedwith vehicles produced in 2000. As demand in various regions aroundthe world for fuel-efficient vehicles is rising more quickly than we hadanticipated, we have decided to build a new engine plant nearby, inOgawa, Saitama. This plant is scheduled to begin production in mid-2009.
Amid expanding global demand for our motorcycles, both small andlarge, we have elected to strengthen our manufacturing system byconcentrating motorcycle production at our Kumamoto plant by the endof 2009, incorporating functions that will make it one of the world’s leadingfactories. This move will enable us to enhance production technologiesand expertise, which we can subsequently share with our plants worldwide.
Moving to the topic of strengthening our R&D system from amanufacturing standpoint, for motorcycles we will work to respond toincreasingly diverse consumer needs and provide products that areattractive and highly competitive by pursuing ease of use, improving ridingperformance, adding features and making them more fun to ride. We havereorganized our R&D structure to meet these objectives. In automobiles aswell, we have reorganized our R&D structure into Honda and Acura brandareas, prompted by the expansion of our premium Acura brand, which hasgained a strong foothold in North America. We have created a productdevelopment system to clearly emphasize individual brand characteristics.In May 2007, we opened the Acura Design Studio in the United States toemphasize the important role that design strategy plays in defining thecharacteristics of the Acura brand.
Strengthening the Foundation for Global GrowthAddressing the topic of strengthening the foundation for global growth, thisfall we will undertake a full model change for the Accord, a core model inNorth America. We are reconfiguring our production system in responseto the rising demand for fuel-efficient cars, stemming from significantlyincreasing gasoline prices. In April 2007, we began manufacturing the Civic,which we have already produced at our East Liberty plant and at line one ofour plant in Canada, at line two of our plant in Canada. In line with strongongoing sales of the CR-V, from fall 2007 we will begin manufacturing thismodel at our plant in Mexico. We are also planning to begin production ina new plant in Indiana, in the United States, and a new engine factory inCanada in 2008. Honda is reinforcing its North American business founda-tions by putting in place a manufacturing system that can respond flexibly,both to increasing demand and to market shifts.

8
To Our Shareholders
The FCX Concept fuel cell vehicle, whichoffers greatly improved environmental anddriving performance
In Europe, we have experienced an increase in sales of locallymanufactured models with diesel engines, mainly the new Civic and thenew CR-V. In response, we plan to raise production at our U.K. plant toits annual capacity of 250,000 units in late 2007.
In China, Guangzhou Honda Automobile Co., Ltd., an affiliate accountedfor under the equity method, began operating a second factory in Septem-ber 2006. Together with the annual production capacity of this plant, whichspecializes in producing automobiles for export, our total annual productioncapacity in China has reached 530,000 units. In March 2007, operationsbegan at a new plant in China that manufactures transmissions and engineparts, raising our local content and cost performance. In April 2007,Guangzhou Honda established Guanzghou Honda Automobile Research &Development Co., Ltd. The purposes of this company are to promote localautonomy, enhance product development and enhance our ability to deliverproducts that meet the needs of clients in this market.
In the rapidly growing Indian market, in addition to raising annualproduction from 50,000 units to 100,000 units in 2007, we have begunbuilding a second factory with an annual capacity of 60,000 units thatwill begin operations at the end of 2009.
Demand for motorcycles and automobiles in South America continues togrow, spurred by strong economic performance. In Brazil, in January 2007we raised annual capacity at our motorcycle plant from 1 million units to1.35 million units, and this level is scheduled to rise to 1.5 million units bythe end of 2007. At our automobile plant, we also plan to double annualcapacity to 100,000 units in mid-2007.
Strengthening Our Efforts to Reduce OurEnvironmental FootprintConcluding on the theme of strengthening our efforts to reduce our environ-mental footprint, Honda currently puts the highest priority on its efforts toaddress global environmental issues. We have announced targets forreducing CO2 emission levels for all products and manufacturing activitiesthroughout the world, and we are progressing diligently toward these goals.
In terms of products, we are introducing new technologies to raise the fuelefficiency of gasoline-powered automobiles, showcased in the advancedVTEC*2 engine and the Variable Cylinder Management System*3. We areenthusiastically integrating advanced environmental technologies into ourproducts. For example, in 2009 we plan to introduce a new dedicated hybridvehicle, a clean diesel engine that will achieve tailpipe emissions on par withgasoline-powered automobiles, and a new fuel cell vehicle.
In manufacturing, we are stepping up efforts to reduce the environmentalimpact of each of our factories. We are also conducting broad-rangingresearch and development on a variety of energy-related production topics,such as using biotechnology to produce ethanol and solar power togenerate hydrogen.
*2 VTEC: Variable Valve Timing & Lift Electronic Control System
*3 Variable Cylinder Management SystemA six-cylinder V6 engine using this system fires on all six cylinders when high output is needed,such as when starting to move or accelerating. When cruising or at other times when less poweris required, the engine uses only the three cylinders on one side, improving fuel efficiency.
Accelerating Efforts to Strengthen the Core Characteristics that Make Honda Unique
9
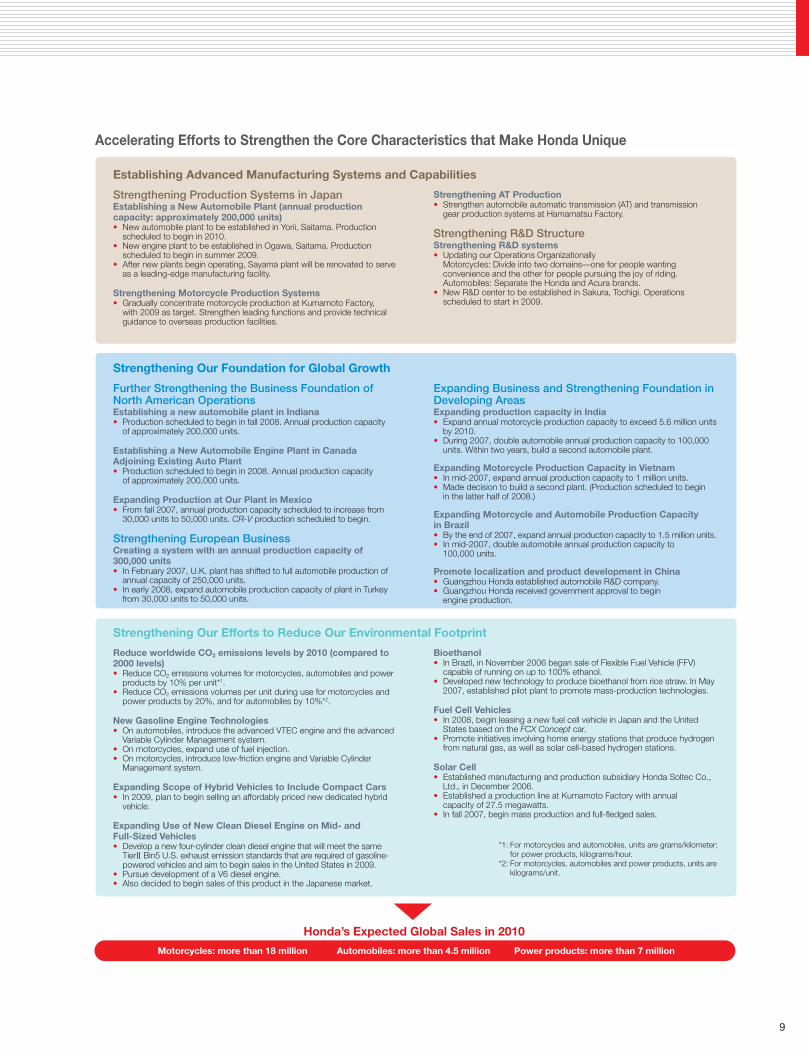
Establishing Advanced Manufacturing Systems and Capabilities
Strengthening Production Systems in JapanEstablishing a New Automobile Plant (annual productioncapacity: approximately 200,000 units)• New automobile plant to be established in Yorii, Saitama. Production
scheduled to begin in 2010.• New engine plant to be established in Ogawa, Saitama. Production
scheduled to begin in summer 2009.• After new plants begin operating, Sayama plant will be renovated to serve
as a leading-edge manufacturing facility.
Strengthening Motorcycle Production Systems• Gradually concentrate motorcycle production at Kumamoto Factory,
with 2009 as target. Strengthen leading functions and provide technicalguidance to overseas production facilities.
Strengthening AT Production• Strengthen automobile automatic transmission (AT) and transmission
gear production systems at Hamamatsu Factory.
Strengthening R&D StructureStrengthening R&D systems• Updating our Operations Organizationally
Motorcycles: Divide into two domains—one for people wantingconvenience and the other for people pursuing the joy of riding.Automobiles: Separate the Honda and Acura brands.
• New R&D center to be established in Sakura, Tochigi. Operationsscheduled to start in 2009.
Strengthening Our Foundation for Global Growth
Further Strengthening the Business Foundation ofNorth American OperationsEstablishing a new automobile plant in Indiana• Production scheduled to begin in fall 2008. Annual production capacity
of approximately 200,000 units.
Establishing a New Automobile Engine Plant in CanadaAdjoining Existing Auto Plant• Production scheduled to begin in 2008. Annual production capacity
of approximately 200,000 units.
Expanding Production at Our Plant in Mexico• From fall 2007, annual production capacity scheduled to increase from
30,000 units to 50,000 units. CR-V production scheduled to begin.
Strengthening European BusinessCreating a system with an annual production capacity of300,000 units• In February 2007, U.K. plant has shifted to full automobile production of
annual capacity of 250,000 units.• In early 2008, expand automobile production capacity of plant in Turkey
from 30,000 units to 50,000 units.
Expanding Business and Strengthening Foundation inDeveloping AreasExpanding production capacity in India• Expand annual motorcycle production capacity to exceed 5.6 million units
by 2010.• During 2007, double automobile annual production capacity to 100,000
units. Within two years, build a second automobile plant.
Expanding Motorcycle Production Capacity in Vietnam• In mid-2007, expand annual production capacity to 1 million units.• Made decision to build a second plant. (Production scheduled to begin
in the latter half of 2008.)
Expanding Motorcycle and Automobile Production Capacityin Brazil• By the end of 2007, expand annual production capacity to 1.5 million units.• In mid-2007, double automobile annual production capacity to
100,000 units.
Promote localization and product development in China• Guangzhou Honda established automobile R&D company.• Guangzhou Honda received government approval to begin
engine production.
Strengthening Our Efforts to Reduce Our Environmental Footprint
Reduce worldwide CO2 emissions levels by 2010 (compared to2000 levels)• Reduce CO2 emissions volumes for motorcycles, automobiles and power
products by 10% per unit*1.• Reduce CO2 emissions volumes per unit during use for motorcycles and
power products by 20%, and for automobiles by 10%*2.
New Gasoline Engine Technologies• On automobiles, introduce the advanced VTEC engine and the advanced
Variable Cylinder Management system.• On motorcycles, expand use of fuel injection.• On motorcycles, introduce low-friction engine and Variable Cylinder
Management system.
Expanding Scope of Hybrid Vehicles to Include Compact Cars• In 2009, plan to begin selling an affordably priced new dedicated hybrid
vehicle.
Expanding Use of New Clean Diesel Engine on Mid- andFull-Sized Vehicles• Develop a new four-cylinder clean diesel engine that will meet the same
TierII Bin5 U.S. exhaust emission standards that are required of gasoline-powered vehicles and aim to begin sales in the United States in 2009.
• Pursue development of a V6 diesel engine.• Also decided to begin sales of this product in the Japanese market.
Bioethanol• In Brazil, in November 2006 began sale of Flexible Fuel Vehicle (FFV)
capable of running on up to 100% ethanol.• Developed new technology to produce bioethanol from rice straw. In May
2007, established pilot plant to promote mass-production technologies.
Fuel Cell Vehicles• In 2008, begin leasing a new fuel cell vehicle in Japan and the United
States based on the FCX Concept car.• Promote initiatives involving home energy stations that produce hydrogen
from natural gas, as well as solar cell-based hydrogen stations.
Solar Cell• Established manufacturing and production subsidiary Honda Soltec Co.,
Ltd., in December 2006.• Established a production line at Kumamoto Factory with annual
capacity of 27.5 megawatts.• In fall 2007, begin mass production and full-fledged sales.
*1: For motorcycles and automobiles, units are grams/kilometer;for power products, kilograms/hour.
*2: For motorcycles, automobiles and power products, units arekilograms/unit.
Honda’s Expected Global Sales in 2010
Motorcycles: more than 18 million Automobiles: more than 4.5 million Power products: more than 7 million

10
160
120
80
40
0
2.0
1.5
1.0
0.5
003 04 05 06 07 08
(Yen) (%)
Dividends per Share
Years ended March 31
Dividends per shareDividends per share (before stock split)Dividends yield
To Our Shareholders
Returning Profits to Shareholders
Honda strives to carry out its operations from a global perspective and toincrease its corporate value. With respect to the redistribution of profitsto its shareholders, which we consider to be one of the most importantmanagement issues, Honda’s basic policy for dividends is to make distribu-tions after taking into account its long-term consolidated earnings perfor-mance. Honda will also acquire its own shares at the optimal timing withthe goals of improving efficiency of the Company’s capital structure andfacilitating efforts to enhance capital agility.
The present goal is to maintain a shareholder return ratio (i.e., the ratio ofthe total of the dividend payment and the repurchase of Company shares toconsolidated net income) of approximately 30%.
Retained earnings will be allocated toward financing R&D activities thatare essential for the future growth of Honda and capital expenditures andinvestment programs that will expand operations for the purpose ofimproving business results and strengthening Honda’s financial condition.
For fiscal 2007, Honda set a year-end cash dividend of ¥20 per share,bringing total cash dividends for the year to ¥67 per share, when adding inthe interim dividend of ¥30 and a third-quarter dividend of ¥17 per share.Honda also implemented a two-for-one stock split on July 1, 2006. Hadthis stock split not been carried out, dividends would have been equal to¥134 per share, a ¥34 increase over the previous year.
For the fiscal year ending March 31, 2008, we plan to pay quarterlydividends of ¥20 per share, amounting to annual dividends of ¥80 pershare, up ¥13.
We will continue doing our utmost to meet the expectations of ourshareholders.
In Closing
Honda’s overriding quest is to become a company that society wants toexist throughout the world. To this end, we will strive to provide greaterlevels of enjoyment and inspiration to our customers and emphasize thecharacteristics that make Honda unique.
We look forward to the continued understanding and support ofshareholders and other investors as we embrace the challenges ofthe future.
June 22, 2007
Takeo FukuiPresident and Chief Executive Officer

11
Review of Operations
12 Summary of Operating Results
by Business
14 Motorcycle Business
19 Automobile Business
25 Power Product and Other Businesses
26 Financial Services Business

Summary of Operating Results by Business
Revenue from unaffiliated customers increased 11.8%, to ¥1,370.6 billion, from theprevious fiscal year, due mainly to increased unit sales and the positive impact ofcurrency translation effects. Operating income decreased 11.7 %, to ¥100.6 billion,from the previous fiscal year, due mainly to increased SG&A expenses, increased R&Dexpenses and the gain on the return of the substitutional portion of employees’ pen-sion funds to the Japanese government recorded in fiscal 2006. This contributed tooffsetting the positive impact of increased profit attributable to higher revenue and thecurrency effects that were caused by the depreciation of the Japanese yen.
Revenue from unaffiliated customers increased 11.0%, to ¥8,889.0 billion, due to increasedunit sales and the positive impact of currency translation effects. Operating incomedecreased 4.6%, to ¥599.5 billion, due mainly to the negative impact of changes in themodel mix, substantially increased raw material costs, increased SG&A expenses,increased R&D expenses and the gain on the return of the substitutional portion ofemployees’ pension funds to the Japanese government recorded in fiscal 2006, whichoffset the positive impacts of increased profit attributable to higher revenue, continuing costreduction effects and the currency effects caused by the depreciation of the Japanese yen.
Revenue from unaffiliated customers in power product and other businesses increased12.7%, to ¥417.7 billion, due mainly to increased unit sales of power products and thepositive impact of currency translation effects. Operating income was ¥36.1 billion, anincrease of 0.6% from the previous fiscal year, due mainly to the positive impact ofincreased profit attributable to higher revenue and the currency effects caused by thedepreciation of the Japanese yen, which offset the negative impact of the increasedSG&A expenses and the gain on the return of the substitutional portion of employees’pension funds to the Japanese government that was recorded in fiscal 2006.
Revenue from unaffiliated customers in our financial services business increased33.5%, to ¥409.7 billion. Operating income increased 27.6%, to ¥115.5 billion,benefiting from increased profit attributable to higher revenue and positive impact ofcurrency effects caused by the depreciation of the Japanese yen, despite higherinterest rates to raise funds.
Motorcycle Business
Automobile Business
Power Product and Other Businesses
Financial Services Business
Review of Operations (Year ended March 31, 2007)
12
Net Sales ¥1,370.6 billion (11.8%)Operating Income ¥100.6 billion (–11.7%)
Net Sales ¥8,889.0 billion (11.0%)Operating Income ¥599.5 billion (–4.6%)
Net Sales ¥417.7 billion (12.7%)Operating Income ¥36.1 billion (0.6%)
Net Sales ¥409.7 billion (33.5%)Operating Income ¥115.5 billion (27.6%)

Percentage of Unit Sales by Region
337
Japan
503
North America
7,895
Asia 1,305
OtherRegions
Europe
329
(Thousands of units)
Net Sales/Operating Income
1,600
1,200
800
400
0
Yen (billions)
03 04 05 06 07
160
120
80
40
0
Yen (billions)
Net Sales (left scale)Operating Income (right scale)
Years ended March 31
13
Unit Sales by Region
672
1,788
620
324
Japan
North America
Asia248
OtherRegions
Europe
(Thousands of units)
527
3,103
760
1,625
Japan North America
Asia406
OtherRegions
Europe
(Thousands of units)
29.7%
32.1%
12.8%
11.0%
14.4%
10,369thousand
Japan (3%)Other Regions
(13%) North America (5%)Europe (3%)
Asia (76%)
Year endedMarch 31, 2007
29.7%
32.1%
12.8%
11.0%
14.4%
Other Regions(7%)
Japan(18%)
North America(49%)
Europe(9%)
Asia(17%)
3,652thousand
Year endedMarch 31, 2007
29.7%
32.1%
12.8%
11.0%
14.4%
Other Regions(7%)
Japan(8%)
North America(48%)
Europe(25%)
Asia(12%)
6,421thousand
Year endedMarch 31, 2007
10,000
8,000
6,000
4,000
2,000
003 04 05 06 07
1,000
800
600
400
200
0
Yen (billions) Yen (billions)
Net Sales (left scale)Operating Income (right scale)
Years ended March 31
500
400
300
200
100
003 04 05 06 07
50
40
30
20
10
0
Yen (billions) Yen (billions)
Net Sales (left scale)Operating Income (right scale)
Years ended March 31
500
400
300
200
100
003 04 05 06 07
300
240
180
120
60
0
Yen (billions) Yen (billions)
Net Sales (left scale)Operating Income (right scale)
Years ended March 31

Motorcycle Business
14
8,000
6,000
4,000
2,000
0
50
40
30
20
(Thousands of units) (%)
01 02 03 04 05 06
Other companiesHero HondaHonda Motorcycle and Scooter IndiaHonda’s share
Source: Honda
(Reference) Units sold on a wholesale basis
Overall Indian Market andHonda’s Market Share (Year)
Initiatives in Emerging Markets
800
600
400
200
0
50
40
30
20Apr.06
May Jun. Jul. Aug. Sep. Oct. Nov. Dec. Jan.07
Feb. Mar.
* Units sold on a wholesale basis
(%)
Monthly Sales and Market Share over the Past Year
Source: Honda
(Thousands of units)
Other companiesHero HondaHonda Motorcycle and Scooter IndiaHonda’s share
CBZ Extreme
CD Deluxe
1. India—Honda’s Largest Market
Ongoing Market Expansion, but Increasingly ChallengingCompetitionAgainst the backdrop of overall robust economic performance, the size ofthe Indian market continued to expand since motorcycle makers launched anumber of highly competitive models. Honda’s unit sales* in fiscal 2007 rose13.3%, to 3,930,000 units, from the previous fiscal year. This total representsthe combined sales of Hero Honda Motors Limited (Hero Honda), an affiliateaccounted for under the equity method, which saw an 11.4% increase insales from the previous fiscal year, to 3,239,000 units, and Honda Motor-cycle and Scooter India Private Limited (Honda Motorcycle and ScooterIndia), a consolidated subsidiary, which experienced a 23.0% rise in sales to691,000 units. From the second half of fiscal 2007, sales benefited from theNovember 2006 launch of the new CBZ Extreme and the December intro-duction of full model change versions of CD Dawn and CD Deluxe, which aretwo of the core models, spurring a recovery in Honda’s market share.
* Wholesale units sold locally
Boosting Production Capacity to Meet Growing Demand in theLong TermDemand in India continues to expand for motorcycles, which are an essen-tial mode of transportation in this market. Consequently, by approximately2010 total demand is expected to rise to the 12,000,000-unit level. To meetthis growing demand, Hero Honda is adding to the annual productioncapacity of 3,900,000 units at its two existing plants by building a third plantwith an annual production capacity of 500,000 units. In September 2006,Honda Motorcycle and Scooter India also raised its annual productioncapacity to 1,000,000 units.

15
6,000
5,000
4,000
3,000
2,000
1,000
0
60
50
40
30
20
10
001 02 03 04 05 06
(Thousands of units) (%)
Other companiesAstra HondaHonda’s share
Source: Honda
Overall Indonesian Market andHonda’s Market Share (Year)
(Reference) Units sold on a wholesale basis
200
150
100
0
20
15
10
5
0
(%)
MaySep.05
Nov. Jan.06
Jul. Sep. Nov. Jan.07
Mar. Mar.
Units sold per month on wholesale basisInflation rate (right scale)Policy interest rate (right scale)
YOY Growth Rate in Units Sold onWholesale Basis (left scale)
(%)
50
Demand Recovery in line with declining both inflation rate and policy Interest Rate
Worseningcredit conditions
Rising inflation rate Inflation rate declines
Decline in policy interest rate
Demand recovery
Demand stagnation
Sources: Information on inflation rates and policyinterest rates from the Bank of Indonesia; units sold per month on wholesale basis from Honda
Rising policyinterest rates
Rupiahdeflation
Soaringgasolineprices
Models Introduced inFiscal 2007
Vario
Mega Pro
Models Introduced inFiscal 2008
Revo
2. Indonesia—the World’s Third Largest MotorcycleMarket
Financial Policies in the First Half of Fiscal 2007 Lead toSluggish MarketIn Indonesia—the world’s third largest motorcycle market, following Chinaand India—overall demand in calendar 2006* came to approximately4,630,000 units, down 13.8% from the previous year. In fall 2005, theIndonesian government raised interest rates in an effort to curb the climbingrate of inflation initiated by rising gasoline prices. This move, in turn, causeda credit crunch that dampened consumer purchasing power.
In this problematic market environment, P.T. Astra Honda Motors (AstraHonda), an affiliate accounted for under the equity method, endeavored toarouse demand by launching the Mega Pro and Tiger 2000, as well as forthe Vario, a newly introduced scooter equipped with an automatic transmis-sion (AT) that automatically changes gears according to speed and enginerevolutions. Nevertheless, unit sales declined 11.6% from the previous year,to 2,340,000 units.
* Wholesale units sold locally
Easing of Financial Policies Contributes to Recovery fromSecond Half of Fiscal 2007Looking at the economic environment in Indonesia, in fall 2006 inflation andinterest rate policy returned to single-digit levels. In calendar 2007, overallmotorcycle demand is expected to return to 2005 levels. As in India, eco-nomic expansion in Indonesia is expected to continue prompting high ratesof market expansion. Astra Honda continues to promote sales growth bylaunching new models and strengthening its sales promotion efforts. Thecompany is also encouraging rider safety through an enhanced riding trainerat its dealerships to create an environment that promotes motorcycles.
16
1,500
1,000
500
0
100
80
60
40
20
001 02 03 04 05 06
(Thousands of units) (%)
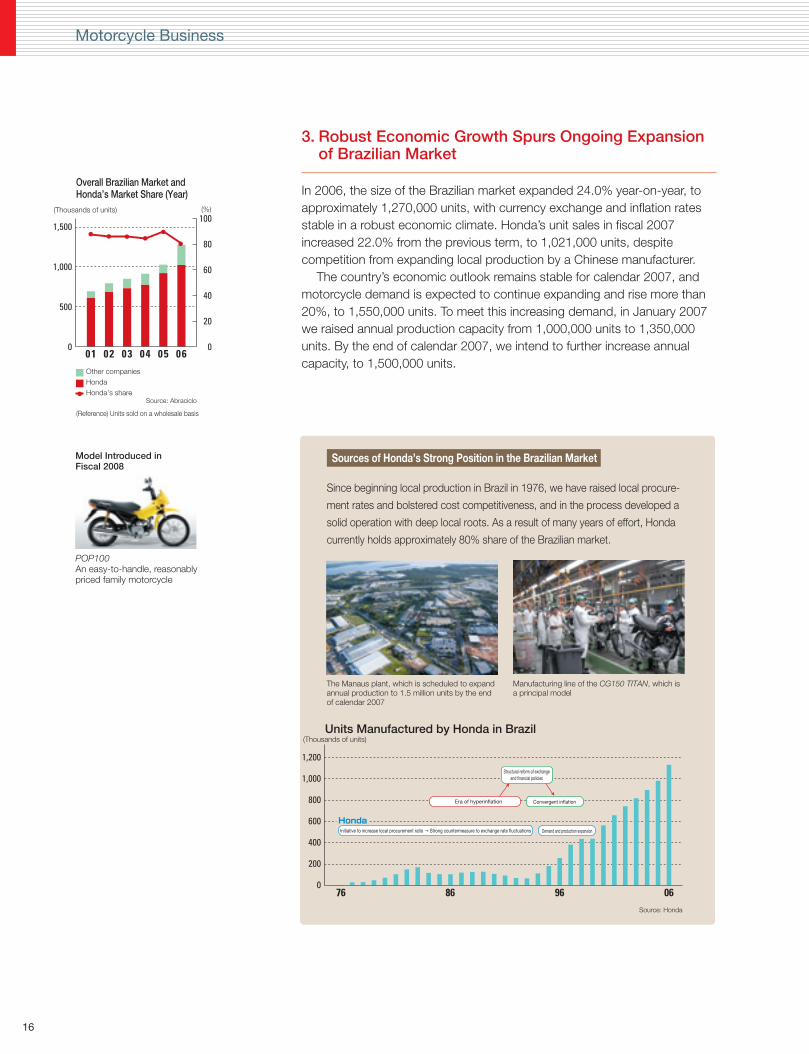
Other companiesHondaHonda’s share
Source: Abraciclo
Overall Brazilian Market andHonda’s Market Share (Year)
(Reference) Units sold on a wholesale basis
Since beginning local production in Brazil in 1976, we have raised local procure-
ment rates and bolstered cost competitiveness, and in the process developed a
solid operation with deep local roots. As a result of many years of effort, Honda
currently holds approximately 80% share of the Brazilian market.
The Manaus plant, which is scheduled to expandannual production to 1.5 million units by the endof calendar 2007
Manufacturing line of the CG150 TITAN, which isa principal model
1,200
1,000
800
600
400
200
0
(Thousands of units)
76 86 96 06
Units Manufactured by Honda in Brazil
Convergent inflationEra of hyperinflation
Demand and production expansionInitiative to increase local procurement ratio → Strong countermeasure to exchange rate fluctuations
Source: Honda
Structural reform of exchangeand financial policies
Honda
Sources of Honda’s Strong Position in the Brazilian Market
POP100An easy-to-handle, reasonablypriced family motorcycle
Model Introduced inFiscal 2008
Motorcycle Business
3. Robust Economic Growth Spurs Ongoing Expansionof Brazilian Market
In 2006, the size of the Brazilian market expanded 24.0% year-on-year, toapproximately 1,270,000 units, with currency exchange and inflation ratesstable in a robust economic climate. Honda’s unit sales in fiscal 2007increased 22.0% from the previous term, to 1,021,000 units, despitecompetition from expanding local production by a Chinese manufacturer.
The country’s economic outlook remains stable for calendar 2007, andmotorcycle demand is expected to continue expanding and rise more than20%, to 1,550,000 units. To meet this increasing demand, in January 2007we raised annual production capacity from 1,000,000 units to 1,350,000units. By the end of calendar 2007, we intend to further increase annualcapacity, to 1,500,000 units.

VTX1300C
Motorcycles ATVs
Gold Wing
CRF450X
CRF150R
FourTrax Rancher
TRX450R
CBR1000RR
Cruiser
Touring
Enduro
Motocross
Utility
Sport
Sport
Models suited for long-distance riding over paved surfaces and focused on rideability
On-road motorcycles:
Primarily for recreational and competitive racing in forests and on sandy trails
Off-road models:
Used mainly for practical applications, such as in agriculture
Mainly for recreational use
17
Business Development in Developed Countries of Matured Markets
1. Soaring Gasoline Prices and Rising Interest RatesAffect North American Market
The U.S. market is divided into motorcycles and ATVs. In calendar 2006, theU.S. motorcycle market for on-road models expanded, spurred by newmodel launches by various manufacturers, but off-road category demand forenduro models suffered a decline as soaring gasoline prices and concernsabout the economy prompted customers to curtail recreational spending.Consequently, overall demand remained approximately on par with the pre-vious year. At the same time, in calendar 2006 the U.S. ATV market wasrelatively strong in the sport category, in response to the introduction of newproducts by various manufacturers. Higher interest rates and concernsabout an economic slowdown affected demand in the utility category,however, driving down overall ATV demand compared with the precedingfiscal year.
In fiscal 2007, Honda’s unit sales in North America fell 18.2%, to503,000 units. In the motorcycle category, sales of new sports and off-roadmodels were strong, but enduro models experienced a sales decline as aresult of the shifts in the market environment. In the ATV category, saleswere strong for new models, such as the FourTrax Rancher series, launchedin December 2006, following a full model change. However, shifts in themarket environment caused overall sales to decline.

18
400
300
200
100
0Italy Spain France Germany The United
Kingdom
200420052006
Source: Honda
(Thousands of units)
Motorcycle Demand in Key EuropeanCountries (Registered Vehicles) (Year)
CBF1000Touring–sport model made in Italy
DeauvilleTouring model made in Spain
SH125i / SH150iStrongest selling Italian-made model in fiscal 2007
MotorcyclesScooter
1,200
1,000
800
600
400
200
0 9796 9998 01 0200 03 04 05 06
60
40
20
0
(Thousands of units) (%)
Over 250cc126~250ccSecond-class motor-driven cyclesFirst-class motor-driven cyclesHonda’s share
Overall Japanese Demand,by Category (Year)
Source: Japanese Automobile ManufacturersAssociation
Motorcycle Business
1,400
1,200
1,000
800
600
400
200
0
25
20
15
10
5
001 02 03 04 05 06
(Thousands of units) (%)
Other companiesHondaHonda’s share
Source: Honda and government data fromindividual countries
Total Registered Vehicle Demandin Europe (Year)
2. The Japanese Market, Impacted by a Declining Birthrate
In fiscal 2007, demand in the Japanese motorcycle market for motorcyclesunder 50cc of engine displacement—the largest demand category—fell asa result of the declining number of youth in the population, resulting in thedeclining number of licensed motorcycle drivers. Overall, demand declinedapproximately 2%, to 730,000 units.
Looking at recent trends in the Japanese motorcycle market, restrictions onmotorcycles with passengers traveling on expressways have been lifted, auto-matic-only vehicle licenses have been introduced, and the ETC*1 system hasbeen expanded to include motorcycles. Each of these changes has helped toimprove the riding environment, a culmination of years of effort. As a result,demand stopped declining in certain categories during fiscal 2007.
Due to the decline in demand for inexpensively priced scooters under 50cc, infiscal 2007 Honda’s unit shipments decreased 7.0%, to 343,000 units. In fiscal2008, we expect demand to shrink slightly to approximately 720,000 units.
To meet anticipated increases in the diverse recreational mobility needs ofJapanese customers, we will work to meet customers’ demand focusing oncustomers’ satisfaction, developing “Dream Shops” in Japan which offerproducts and services of high value, centering on sport models.
*1: ETC System (Electronic Toll Collection System)This system for paying expressway tolls without stopping at toll booths uses a wireless system fortoll collection by communicating between the antenna of a vehicle-mounted ETC unit and a tollcollection machine.
3. Expanding Demand in Southern Europe, Particularlyfor Scooters
The motorcycle market in Europe in calendar 2006 was characterized bygrowing demand in Southern Europe, including Italy, Spain and France,driving up demand 8.5%, to approximately 1,310,000 units*2. A licensingsystem revision in Spain in October 2004, raised from 50cc to 125cc themaximum size of motorcycles that could be ridden legally with a standardautomobile license, prompting a surge in demand in this country. Demand inFrance and Germany also surged in advance of the January 2007 introduc-tion of Euro3*3 emissions restrictions in 15 European countries.
Honda’s unit sales in Europe in fiscal 2007 came to 297,000 units, down6.6%. Sales of SH125i, SH150i and other scooters were robust, but sales oflarge super sport models and motorcycles in the 125cc class were lackluster.
*2: Number of motorcycles registered in the European market (12 countries: Italy, Spain, France,Germany, the United Kingdom, the Netherlands, Belgium, Austria, Switzerland, Portugal, theCzech Republic and Hungary)
*3: Euro3: An emission regulation that calls for a 55% reduction against previous levels of carbonmonoxide (CO), a reduction in hydrocarbons of between 33% and 70%, depending on vehicle typeand a 50% reduction in nitrogen oxides (NOx).

19
Automobile Business
6,000
4,000
2,000
001 02 03 04 05 06
Registered vehiclesMini-carsHonda’s share
Source: Registered vehicles: Japan Automobile Dealers Association Mini-cars: Japan Mini Vehicles Association
15
10
5
0
(Thousandsof units) (%)
Total Japanese Market Demandby Category (Year)
1,000
800
600
400
200
002 03 04 05 06 07
Years ended March 31
Registered vehiclesMini-cars
Honda’s Unit Sales
(Thousandsof units)
Models Introduced inFiscal 2007
Stream
CR-V
Elysion Prestige
Crossroad
7.0
6.5
6.0
5.5
5.096 97 98 99 00 01 02 03 04 05 06
5 .0 5 .15 .3
5 .6
5 .8
6 .0
6 .26 .4
6 .66 .8
6 .9
* Average vehicle age: Number of years between initial new vehicle registration and March 31 of each year for cars currently in use
Average Vehicle Age* (growing longer annually)
Source: Automobile Inspection & Registration Information Association
(Years)
1. Japanese Market Affected by Declining Birthrate,Aging Population and Shifting Consumer Preferences
Total automobile demand in Japan in calendar 2006 declined roughly 2%,to approximately 5,740,000 units. Various manufacturers launched newmini-car models, which pushed demand in this segment up 5.2%, toapproximately 2,020,000 units. Demand for registered vehicles, however,decreased 5.4%, to approximately 3,720,000 units.
Bolstered by the introduction of the Zest at the end of the preceding fiscalyear, Honda’s sales of mini-cars grew 16.8% in fiscal 2007, to 283,000units. Conversely, registered vehicle sales dropped 12.6%, to 408,000 units,impacted negatively by a harsh market environment despite favorable salesof the Stream and CR-V following full model changes.
Given such ongoing issues as an aging population, a declining birthrateand increasingly diverse consumer preferences, as well as the trend towarda longer average period of car ownership, market conditions are expectedto remain severe. Against this backdrop, the Fit—Honda’s highest-sellingmass production model—will undergo a full model change in fall 2007,in the effort to ensure that the vehicle retains its appeal. At the same time,Honda will endeavor to provide services to its 9 million existing customersto ensure that they enjoy the full automobile ownership experience.

CR-V
20
70.0
60.0
50.0
40.0
3.50
3.00
2.50
2.00
1.50
(US$/barrel)
Jan.05
Mar. May Jul. Sep. Nov. Jan.06
Mar. May Jul. Sep. Nov. Jan.07
Mar. May
Crude oil (WTI) (left scale)Regular gasoline (right scale)
(US$/gallon)
Crude Oil Prices and Prices of Regular Gasoline in the United States
Source: EIA (Energy Information Administration)
1,500
1,000
500
002 03 04 05 06 07
Years ended March 31
Passenger carsLight trucks
Honda’s Unit Sales inthe United States
(Thousandsof units)
200
180
160
140
120
100
8002 03 04 05 06
Demand for Light Trucks Overalland by Segment
Entry-level CUVs (crossovers)Light truck totalFull-size SUVs and pickups
Source: Global Insight2002 = 100
200
180
160
140
120
100
8002 03 04 05 06
Demand for Passenger Cars Overalland by Segment
SubcompactsPassenger car total
Source: Global Insight2002 = 100
Models Introduced in Fiscal2007 (United States)
Fit
15,000
10,000
5,000
001 02 03 04 05 06
10
8
6
4
2
0
Source: Global Insight
Passenger carsLight trucksHonda’s share
(%)
Total U.S. Market Demandby Category (Year)
(Thousandsof units)
Acura MDX
Acura RDX
Automobile Business
2. Growing North American Demand for Fuel-EfficientVehicles
Total demand in the United States in calendar 2006 fell 2.6% from the pre-ceding year, to approximately 16,550,000 units. Soaring gasoline prices inthe summer buying season pushed up demand for fuel-efficient cars. Thistrend enhanced demand for subcompact cars and crossover-utility vehicles(CUVs), which aim for SUV* utility and are based on passenger car platforms.
* Sport-utility vehicle (SUV): A vehicle designed and developed for recreational purposes
Honda enjoyed a 2.8% increase in sales in the United States during fiscal2007, to 1,529,000 units. We benefited from the launch of the Fit, which firstwent on sale in April, and the introduction of the CR-V, an entry-level CUV,in September following a full model change. In the area of manufacturing,we responded to rising demand for the fuel-efficient Civic by starting pro-duction in April 2007 on the second line in Canada. As part of this process,we shifted production of the Pilot from this line to our plant in Alabama.
In calendar 2007, we expect overall U.S. automobile demand to fallslightly below the level of calendar 2006, coming to slightly less than16,400,000 units. Affecting this demand, the U.S. economic environment

21
Light trucks
Passenger cars
Annual Capacity (Units)
U.S.
Canada
Mexico
Ohio
Marysville
East Liberty
Lincoln
Greensburg
Alliston
El Salto
Alabama
Indiana
440 ,000
240 ,000
300 ,000
200 ,000
No. 1 Line195 ,000
30 ,000
No. 2 Line195 ,000
Accord
Civic
Civic
Civic
Civic
Accord
AcuraRDX
CR-V
Pilot Odyssey
Element
Ridgeline AcuraMDX
CR-V
AcuraTL
AcuraCSX
1
2
4
5
6
3
Finished Auto Plants in North America
Production Bases in North America (Automobiles)
1211
3
3
4
2 2
5
6
From fall 2008
From April 2007
From February 2007
Finished Auto Plants Marysville plant East Liberty plant Alabama plant New Indiana plant (scheduled to begin production in fall 2008) Canada plant Mexico plant
Engine Plants Anna engine plant Alabama plant New Canada engine plant (scheduled to begin production in fall 2008)
Transmission Plants Ohio transmission plant Georgia transmission plant
123
12
12
3
456
From fall 2007
The new Accord Coupeconcept car
should benefit from strong employment and personal consumption, but weexpect a deteriorating housing situation to have a negative impact on auto-mobile demand. Although relatively warm winter weather in calendar 2006brought a temporary respite in gasoline prices, prices have again soared.We expect demand for fuel-efficient cars to rise in response.
On the sales front, in fall 2007 we will implement a full model change ofthe Accord, which is our core model. Production of the CR-V, which con-tinues to experience brisk demand, is scheduled to begin at our plant inMexico. With respect to development, in May 2007 we opened the AcuraDesign Studio in the United States, reflecting the important role that designstrategy plays in defining the characteristics of the Acura brand.
The United States is one of the few advanced countries with a clearlygrowing population, and we expect stable growth in the automobile marketthere to continue expanding. In response to market growth and to furthersolidify our operating foundation in North America, we are building a new autoplant in Indiana with an annual capacity of 200,000 units and an engine plantin Canada, both of which are scheduled to begin operations in fall 2008.

22
1,000800600400200
003 04 05 06
Source: The Association of European Businesses (AEB)
Foreign brandsPurely domestic brands
(Thousandsof units)
Rising Sales of Foreign Brandsin the Russian Market (Year)
20,000
15,000
10,000
5,000
001 02 03 04 05 06
3
2
1
0
*1 Eastern Europe: Poland, the Czech Republic, Slovakia, Hungary, Bulgaria, Romania, Croatia, Slovenia, Estonia, Latvia, Lithuaania, Belorussia, Russia
Source: Eastern Europe: Global InsightWestern Europe: Association Auxiliare de
l’Automobile (AAA)
Eastern Europe*1 (gasoline vehicles and diesel-powered cars)Western Europe (gasoline vehicles)Western Europe (diesel-powered cars)Honda’s share
(Thousandsof units) (%)
Total Passenger Car Demandand Perecentage of Diesel-Powered Cars (Year)
4,000
3,000
2,000
1,000
0 01 02 03 04 0605
Number of Registered Vehicles in Major European Countries (The Growing Russian Market)
Germany
The United Kingdom
Italy
France
Russia
Spain
Central Europe*3
*3 Central Europe: Poland, Hungary, the Czech Republic, Slovakia
(Thousandsof units)
Source: European Automobile Manufacturers’ Association, Global Insight (figures for Russia for 2002~2006 and Central Europe for 2002~2003)
350
300
250
200
150
100
50
002 03 04 05 06 07
Honda’s Unit Sales in Europe andPercentage of Diesel-Powered Cars
80
60
40
20
0
Years ended March 31(Thousandsof units) (%)
OthersFR-VJazzHR-V
CR-VAccordCivicDiesel-PoweredCars
Automobile Business
3. Ongoing Demand for Diesel-Powered Cars in WesternEurope and Sharp Demand Growth in Eastern Europe,Centered on Russia
In calendar 2006, total demand for passenger cars in Western Europe*2
came to approximately 14,620,000 units, up 1.8% from the previous year.Germany—Europe’s largest market—experienced a 4.5% year-on-year risein demand, to approximately 3,470,000 units, as consumers sought to makepurchases ahead of a January 2007 increase in the value-added tax (VAT).Demand increased in Italy and Spain against a background of strongeconomic performance.
Further, demand for diesel-powered cars remained strong, helped by theirimpressive fuel and power efficiency. This demand, as well as a growingawareness of their environmental benefits, pushed diesels above 50% as apercentage of registered passenger cars in calendar 2006.
Amid the emerging countries of Eastern Europe, as a producer of abun-dant crude oil, natural gas and other energy resources, Russia continues itsrapid economic growth. In line with its strong economic performance, infiscal 2006 passenger car demand in the country expanded 25.5%, toapproximately 1,870,000 units. Foreign brands increased rapidly in theRussian passenger car market and gained a majority share of the market.
*2 Western Europe: 15 EU countries (Ireland, United Kingdom, Italy, Austria, the Netherlands, Greece,Sweden, Spain, Denmark, Germany, Finland, France, Belgium, Poland and Luxembourg)and the 3 European Free Trade Association Countries (Iceland, Switzerland and Norway)
Honda’s unit sales in fiscal 2007 came to 327,000 units, up 14.8% from theprevious year. In Western Europe, the new Civic enjoyed positive sales, whileconsumers also responded positively to the CR-V following its launch inJanuary 2007. Sales were also robust in Eastern Europe, propelled by adoubling of sales in Russia, compared with the preceding year.
Since equipping the Accord with the first Honda-developed diesel enginein January 2004, we have expanded our lineup and sales of diesel-poweredcars. In fiscal 2007, diesel-powered cars accounted for 27.4% of unit salesin this market, or 89,000 units. In fiscal 2008, we are targeting diesel-powered car sales to exceed 100,000 units.
From a production standpoint, in February 2007 we responded to brisksales of the locally produced Civic and CR-V by beginning full-scale opera-tions at our second U.K. plant. In addition, we shifted some of the mechani-cal processes for manufacturing diesel engines from Japan to the UnitedKingdom as part of our ongoing shift toward local production.

23
60
40
20
002 03 04 05 06 07
Years ended March 31
CR-VCivicCityAccord
Honda’s Unit Sales in India(Year)
(Thousandsof units)
1,200
1,000
800
600
400
200
001 02 03 04 05 06
Source: Global Insight
8
6
4
2
0
Honda’s share
Total Market in India (ExcludingCommercial Vehicles) (Year)
(%) (Thousands
of units)
5,000
4,000
3,000
2,000
1,000
001 02 03 04 05 06
8
6
4
2
0
Honda’s share
Source: Global Insight
Overall Market for PassengerCars in China (Year)
(Thousandsof units) (%)
300
200
100
001 02 03 04 05 06
OthersCivicCR-VFit
CityOdysseyAccord
Honda’s Unit Sales in China(Year)
(Thousandsof units)
4. Growing Asian Markets, Centered on China and India
q China Growing into the World’s Second Largest AutomobileMarket
In calendar 2006, the Chinese automobile market, including commercialvehicles, grew 25.3%, to approximately 7,220,000 units*, following theUnited States as the world’s second-largest market. Economic expansionis enabling a growing segment of society to purchase automobiles, andthe move toward motorization is rippling outward from urban centers intothe countryside, enlarging the market.
However, in December 2006 China’s National Development and ReformCommission announced policies designed to address a surplus of facilitiesof small and medium-sized manufacturers in the country by restructuringautomobile production and encouraging development of their own brands.Attention continues to focus on the potential impact of this development.
Source: China Association of Automobile Manufacturers
In this climate, Guangzhou Honda Automobile Co., Ltd. (GuangzhouHonda), and Dongfeng Honda Automobile Co., Ltd. (Dongfeng Honda),affiliates accounted for under the equity method, posted strong unit sales,helped by the City and the Civic, which launched in April 2006. As a result,in fiscal 2007 these two companies delivered combined sales of 323,000units, up 25.9% from the previous year.
From a production standpoint, to meet growing demand, in February2006 Dongfeng Honda expanded its capacity to 120,000 vehicles per yearand, in September 2006 Guangzhou Honda began production at its secondplant, which has an annual capacity of 120,000 units. In expanding theircapacity, the two plants introduced leading-edge technologies that take intoconsideration the global and production environments.
In addition to raising capacity for finished cars, Honda Auto PartsManufacturing Co., Ltd., began operations in March 2007, to providethe advanced automatic transmissions (AT) that require advancedmanufacturing technology.
To support the provision of products that meet the needs of customersin China, Guangzhou Honda established a wholly owned R&D subsidiary,Guangzhou Honda Automobile Research & Development Co., Ltd., inApril 2007.
w The Growing Indian MarketSupported by brisk economic expansion, total automobile demand in India,excluding commercial vehicles, increased to approximately 1,240,000 unitsin calendar 2006, up 18.2% from the preceding year.
Honda’s sales in this market in fiscal 2007, came to 60,000 units, up40.3%. In addition to the core City model, the Civic, which launched in July2006, posted favorable sales.
To meet growing demand, at the end of calendar 2007 Honda Ciel CarsIndia Limited plans to expand its annual capacity from 50,000 units to100,000 units, and in May 2007 the company acquired a site with the goalof building a second plant.

24
80
60
40
20
001 02 03 04 05 06
FFVs (only Brazil)Gasoline vehicles
(Thousandsof units)
Honda’s Unit Sales(Year)
3,000
2,000
1,000
001 02 03 04 05 06
BrazilArgentinaVenezuelaChile
ColombiaEquadorPeruHonda’s share
6
4
2
0
Source: Global Insight
The South American Automobile Market (Including Commercial Vehicles)
(Thousandsof units) (%)
Thailand
Indonesia
Malaysia
The Philippines
0 400200 600500300100 700
0506
0506
0506
0506
Source: Global Insight
HondaOther manufacturers
Total Honda Unit Sales in KeyASEAN Countries (Year)
(Thousands of units)
Automobile Business
e Political Uncertainty and Natural Disaster Affects Demand in theASEAN Market
In the key ASEAN countries, such factors as soaring gasoline prices andrising interest rates, as well as political instability in Thailand, caused theautomobile market to shrink.
In Indonesia, Honda’s sales in fiscal 2007 fell compared with the preced-ing year affected by its economical situation, but strong sales performanceby the new Civic prompted year-on-year increases in Honda’s sales inThailand and Malaysia. Introduced into each of these markets in the secondhalf of fiscal 2007, the new CR-V registered brisk sales. To expand localizedproduction, in April 2007 we began the production in Thailand of camshafts,connecting rods, crankshafts and other engine parts that requiresophisticated technologies.
5. Expanding Market Demand and the Growth ofAlternative Fuel (Ethanol) Vehicles in Brazil
Brazil, the largest market in South America, is experiencing robust economicgrowth. Buoyed by such factors as rising incomes and falling interest rates,total demand in calendar 2006 (excluding large trucks and buses), reachedapproximately 1,830,000 units, up 13.1% from the previous year. As marketexpansion is expected to continue, we anticipate total demand growth incalendar 2007 of more than 15%, to 2,110,000 units.
In fiscal 2007, Honda’s unit sales rose 18.0%, to 67,000 units. Sales ofthe new Civic, which went on sale in April 2006, were extremely favorable.
The Expanding Market for Flexible Fuel Vehicles (FFVs)Following the first oil shock in the latter 1970s, the Brazilian governmentbegan promoting ethanol fuels as an alternative to petroleum fuels. The mar-ket for FFVs, which can run on a mixture of ethanol and gasoline—and isless expensive than gasoline—has expanded to the point where as of March2007, more than 80% of passenger cars were FFVs. In November 2006,Honda introduced the Civic FFV, followed by the Fit FFV in December.
In fiscal 2008, we expect favorable sales of the Civic and the sale of FFVsto raise unit sales approximately 25% from the previous year and areexpanding supply capacity in preparation. In January 2007, Honda raisedannual production capacity from 50,000 units to 80,000 units. Midwaythrough calendar 2007, we expect to further raise this level to 100,000 units.
100
80
60
40
20
003 04 05 06
82 .8%
07 Mar.
(%)
Source: ANFAVEA
Percentage of Vehicles in Brazil that are FFVs FFV
Gasoline
Passenger cars + commercial vehicles(Excluding large trucks and buses)

25
Power Product and Other Businesses
freewatt™ Micro-CHP Home Heating and Power System
Power Product Engines
Lawnmowers
Generators
Outboard Engines
Pumps
Tillers
Snowblowers
Trimmers
Home-Use Cogeneration Units
The GCV160 power product engine Power product engines offering excellent quality, performance and durability are used in home lawn mowers, which find large markets in Europe and the Americas.
The HRR lawnmowerThis full-fledged push lawnmower handles tasks ranging from lawn trimming to garden care. Lawn mowers are typical fixtures of homes in Europe and the Americas.
The EU1000 generator The compact and powerful, yet quiet, EU1000 generator stably supplies electricity of excellent quality and can be used in a wide range of environments.
EB5000 The EB5000 generator can be used at construction sites
The BF75 outboard engine Based on its U.S. survey of com-petitive information on marine engines, J.D. Power and Associates of the United States accorded Honda the highest customer satisfaction ranking in the electronic fuel-injected (EFI) four-stroke outboard engine segment.
The WH20X pumpHigh-pressure pumps are compact, lightweight and capable of distributing water over a large area, suiting them for use in water sprinklers.
The FG100 tiller Small yet powerful, Honda’s tillers are operated with only a single lever, can be easily used by anyone and are ideal for horticultural and home gardening applications.
The HS928TA snowblower Easy to operate, with adjustable speed and a small turning radius, Honda snowblowers operate quietly, so they can be operated in the early-morning hours without worry of disturbing the neighbors.
The UMK trimmerComing to life with just a light pull on the starter rope, our trimmers are good for applications ranging from clearing weeds from the garden to clearing away underbrush in mountainous areas.
Enhancing Customer Enjoyment of Power Products
Honda’s history in the power product business began in 1953, with theintroduction of the model “H,” its first general purpose engine. Since thattime, we have developed this business to include a host of products that usesuch engines, including tillers, generators, outboard engines, lawnmowersand snowblowers. Currently, approximately 70% of Honda’s general purposeengines are supplied to original equipment manufacturers (OEM)*.
*OEM: (Original Equipment Manufacturing)OEM refers to a manufacturing of products and components supplied for sale under a third-party brand.
Sales were brisk in fiscal 2007, with unit sales increasing in all regionscompared with the preceding term. Honda posted strong sales in NorthAmerica—the largest market for this segment—of engines provided on anOEM basis for use in lawnmowers, generators and pressure washers. Salesof engines on an OEM basis for use in lawn mowers, generators andconstruction equipment were also favorable in Europe.
Our OEM business received a major boost from brisk sales in NorthAmerica, reflecting the launch of new lawn mower models. With demand forgenerators down across all markets, we also recorded a year-on-year decline

26
Honda Soltec: Scheduled to start operationin fall 2007
Financial Services Business
Power Product and Other Businesses/Financial Services Business
in generator sales. In Europe, despite flagging sales of core push lawn-mowers, due to inclement weather, and a decline in generator sales attribut-able to rising sales of lower-priced Chinese models, overall sales wereapproximately the same level as the previous year, thanks to an increase inOEM engine sales.
Since 2003, Honda’s sales of home-use cogeneration* units to gascompanies in Japan have exceeded 45,000 units. In March 2007, ClimateEnergy LLC of the United States began sales of Freewatt, a compact home-use system that combines the Honda cogeneration unit with ClimateEnergy’s heating unit.
* Cogeneration refers to the application of energy derived from a single source to two or more applica-tions, such as using the heat supplied during the combustion process that drives an engine for otherheating or cooling purposes. In addition to being highly efficient during operation, such systemsreduce CO2 emissions by reducing the need for other forms of energy.
Solar BusinessHonda has developed a next-generation thin film solar cell that requires onlyhalf as much energy to manufacture as conventional solar cells made ofcrystalline silicon. In December 2006, Honda established Honda Soltec Co.,Ltd., in Ozu-machi, Kumamoto Prefecture, to sell these solar cells. Althoughwe plan to begin sales in autumn 2007, we began sales of solar cells madeby Honda Engineering in June 2007 in only the Kanto area (including Tokyo).
Financial Services Business, Supporting Honda’sCore Businesses
Honda offers a variety of financial services to support sales of Hondamotorcycles, automobiles and other products. These services are providedthrough financial subsidiaries in Japan, North America, Europe and otherareas. The services of these subsidiaries include loans, leases and otherfinancial services, such as wholesale financial services to dealerships.Financial services are particularly prevalent in the United States, whereHonda’s financing services are used for approximately half of all itsautomobile purchases.
Honda maintains some of the best credit and receivables managementin the industry, which is reflected in its low rates of credit loss anddelinquent payments.
In fiscal 2007, operating income rose 27.6%, to ¥115.5 billion. Particularlyin the United States, financial services subsidiaries experienced changes inthe costs of raising fund due to interest rate shifts, as well as movement incredit loss percentages and used vehicle prices, which affected reserve levels.


35
Environment and Safety
Honda proactively employs advanced environmental and safety technologies,reflecting its commitment not only to comply with regulations, but also topass on the “joy of mobility” to future generations.
FCX Concept Fuel Cell VehicleIn 2008, we plan to begin limited sales based on this concept model inJapan and the United States.
Environmental Initiatives
From its earliest days, Honda has developed environmental initiatives to meet the challenges of each era. In 1992,Honda established the “Honda Environment Statement,” which clarifies our position on environmental conservation.Since then, we have carried out our environmental activities in line with this statement.
In fiscal 2006, Honda achieved all of its own fiscal 2006 environmental impact reduction targets. In fiscal 2007,we took the initiative in announcing our new global CO2 reduction targets for products and production activities for2010. This stringent target requires us to reduce CO2 emissions by 10% for products and production activities by2010 compared to fiscal 2000. We have recently set and announced new environmental impact reduction targetsfor 2010 within Japan. These achievements and targets indicate our determination to further advance our effortsto address environmental issues and be at the forefront of the times in the area of the environment.

36
Working to Achieve 2010 Global CO2
Reduction Targets for Products andProduction ActivitiesHonda’s goal is to manufacture products that produce
the lowest level of CO2 emissions at plants that alsoemit the least CO2. We have established targets toreduce CO2 emissions from our products andproduction activities worldwide.
CO2 reduction target for products 10% reduction (g/km)
20% reduction (per unit produced)
CO2 reduction target for production activities
10% reduction (g/km)
10% reduction (per unit produced)
10% reduction (kg/hour of operation)
20% reduction (per unit produced)
CO2 reductionfor products:
Majoractivities:
To meet its CO2 reduction targets for (calendar year) 2010, Honda intends to invest worldwide in technologies to improve fuel efficiency and expand the application of its programmed fuel injection (FI) systems.
• Fuel injection: Install in the majority of motorcycle models released worldwide by the end of 2010
• Variable Cylinder Management system: Improve fuel efficiency by 30% or more, compared with the 2005 level.
Honda is implementing a variety of technologies to improve fuel efficiency and reduce CO2 emissions.
• Hybrid vehicles: Honda is developing a dedicated hybrid vehicle to advance global hybrid development. We plan to introduce this hybrid vehicle in 2009.
• Diesel vehicles: Honda is developing a new generation of clean diesel engines, which we plan to install in vehicles for the North American market within the next two years.
• Gasoline vehicles: Honda plans to further improve fuel efficiency through advanced engine design.
• Fuel cell vehicles: In 2008, Honda plans to begin limited sales in Japan and the United States of a next-generation fuel cell vehicle based on the FCX Concept.
Honda is committed to the effort to achieve cleaner emissions and improvement in fuel efficiency ahead of the regulations of each country and region.
• Next-generation general-purpose engines: Improve fuel efficiency by approximately 20% compared with other conventional engines
• Compact household cogeneration system: A reduction of approximately 30% in CO2 emissions is expected. Together with Climate Energy, LLC, Honda began sales of this system in March 2006.
CO2 reductionfor productionactivities:
<CO2 reduction target for Motorcycles>
<CO2 reduction target for Automobiles><CO2 reduction target for Power Products><CO2 reduction target for production activities>
For more than 90% of products sold worldwide, including Japan, North America, Europe, Thailand, India, China, Indonesia, Vietnam, Brazil, the Philippines, Malaysia and Pakistan.For more than 90% of products sold worldwide, including Japan, North America, Europe, Asia, the Pacific, China and Latin America.Including all products sold worldwide except outboard.In addition to Honda Motor Co., Ltd., all Honda manufacturing plants and major parts suppliers in Japan and worldwide are subject to this target. It includes almost 100% of Honda’s consolidated subsidiaries, affiliated companies, and manufacturing plants of major affiliated companies.
*1: We have already reduced emissions by 13.2%. compared to fiscal 2001. We will continue to strive to reduce CO2 emissions further with the CO2 reduction target of 10% by 2010 unchanged.
*2: We have already achieved the target. However, we see production increasing in regions with a high CO2 emissions coefficient. We will hold our CO2 reduction target unchanged and will continue to strive to further reduce CO2 emissions toward 2010.
*3: The basic unit of production for power products increased due to products that are higher-value-added as well as larger.
100
90
80
70
(%)
00 06
100
90.5 90
10 (target)
120
100
80
60
(%)
00 06 10 (target)
Progress of CO2 Reduction by Fiscal 2007 for Products and Production Activities
2010 CO2 Emissions Targets for Products and Production Activities Worldwide (compared to fiscal 2000)
100
80
104.4
100
90
80
70
(%)
00 06
10094.0
90
10 (target)
100
90
80
70
(%)
00 06 10 (target)
100
80
10090807060
(%)
00 06 10 (target)
70.7
100
90100
90
80
70
(%)
00 06 10 (target)
86.8
100
9093.1
Average CO2 emission from Honda’s products worldwide
Average CO2 emission from Honda’s manufacturing process per unit
Scope of Data Collection
13.2% reduction*1
29.3% reduction*2 4.4% reduction*3
Motorcycles 6.0% reduction 6.9% reduction
9.5% reduction
Automobiles Power Products
Motorcycles Automobiles Power Products
Motorcycles Automobiles Power Products
Environment and Safety

37
Honda’s Advanced Environmental InitiativesHonda’s mission is to operate manufacturing facilitiesthroughout the world that place as little burden onthe environment as possible as they manufactureproducts with superior environmental performance.Following is a look at the environmental performanceof automobiles in our major regions. Through ourunique technologies, Honda introduces productsthat demonstrate environmental performance thatexceeds the regulations established in each regionfor the reduction of emissions and improvement offuel efficiency. It is our responsibility to contribute tothe achievement of a sustainable mobility society bymeeting people’s mobility needs while minimizing theenvironmental impacts caused by our products. Inthe product domain, we are implementing measuresbased on the following three approaches.
1. Further improvements in the reduction of emis-sions from internal combustion engines andimprovement of fuel efficiency
2. Evolution of hybrid vehicles3. Promotion of alternative fuel-powered vehicles
1. Further Improvements in the Reduction ofEmissions from Internal Combustion Enginesand Improvement of Fuel Efficiency
• North America (the United States)In the United States, Honda continues to lead theautomotive industry in corporate average fueleconomy for cars and trucks combined. Moreover,in terms of cleaner emissions all Honda and Acurabrand vehicles meet or exceed the U.S. EPA*1’s strin-gent TierII Bin5*2 exhaust gas standard for cleanemissions.
• EuropeIn Europe, since the introduction of the 2001 Civic(with some local variations) Honda has promotedreductions in exhaust emissions by ensuring that allmodels meet the Euro4 emissions standard whenthey undergo full model changes. By increasing thefuel economy of existing models and introducinghybrid and diesel vehicles, we are steadily reducingvehicle CO2 emissions, particularly for diesel vehicles.Since the Accord equipped with a Honda-developed2.2-liter engine went on sale in December 2003, we
have equipped the FR-V (called Edix in Japan) withthis engine. In January 2006, we also began offeringthe new Civic with this engine. In January 2007, wereleased a new CR-V equipped with a diesel particu-late filter (DPF)*3 to achieve higher fuel efficiency andcleaner exhaust.
• AsiaIn Thailand, Honda’s locally produced Jazz (called Fitin Japan) has already achieved the Euro4 emissionsstandard, which is to be required in the future. Sincethe introduction of the Jazz, all models introduced inThailand have achieved the Euro4 emissions stan-dard. The new Civic, introduced in 2005, and the newCR-V, introduced in 2006, are also made in Thailandand are compliant with the Euro4*4 emissionsstandard.
• ChinaHonda has attained Europe’s Euro4*4 emissions stan-dards ahead of Chinese regulations for all modelsintroduced in the country. In July 2007, the Companyplans to release the Civic Hybrid, a vehicle with evenhigher fuel efficiency than the City (called Fit ARIA inJapan) and the Civic, which are already at the top oftheir class in this area.
2. Evolution of Hybrid Vehicles
In November 1999, Honda introduced the Insight,the first hybrid vehicle equipped with the Honda inte-grated motor assist (IMA*5) system, achieving theworld’s highest fuel economy among mass-producedgasoline-powered vehicles. In December 2001, weintroduced the Civic Hybrid, and in December 2004,we began sales in North America of the AccordHybrid, adopting Honda’s Variable Cylinder Manage-ment system for its V6 engine. Further, in November2005 we began sales of an all-new Civic Hybrid,equipped with the new 3-Stage i-VTEC + IMA HondaHybrid System. In the future, Honda is developing anew dedicated hybrid vehicle suitable for family use inmajor automobile markets in the world. With this newdedicated hybrid vehicle, Honda will achieve furtheradvancement of fuel efficient technologies and areduction in cost. We plan to contribute to the reduc-tion of CO2 emissions by delivering hybrid vehiclesthat are priced affordably enough to be practical formore customers throughout the world.

38
3. Promotion of Alternative Fuel-PoweredVehicles
• North America (the United States)In 2005, we were the first company in the worldto lease a fuel cell vehicle to an individual owner.Honda’s track record now extends to 23 FCX fuel cellvehicles leased in North America (a total of 34 leasesof the FCX in Japan and the United States). In 2007,we also delivered one of these vehicles to Americanactress Q’orianka Kilcher. In Torrance, California, weare converting natural gas to hydrogen and using thehydrogen to power fuel cell vehicles. We are in theprocess of testing hydrogen fueling stations, such asthe Home Energy Station, which also provides hydro-gen to generate heat and electric power in homes.We have substantially enhanced the power andhighway fuel economy of the third generation naturalgas-powered Civic GX, following the first-generationin 1998 and the second-generation in 2001. As thesevehicles have advanced, we have offered affordablea home refueling appliance for natural gas-poweredvehicles. Honda is thus playing a leading role inpromoting alternative fuel-powered vehicles.
• Other Regions (Brazil)In Brazil, where ethanol produced from sugar cane iscommonly used as fuel, since the mid-1980s Hondahas offered motorcycles and automobiles that run ona mixture of ethanol and gasoline. The ethanol ratio offuels in Brazil is increasing, and a 100% ethanolfuel—E100—is now available. To meet this challenge,Honda introduced flex-fuel models of the Civic inNovember 2006 and the Fit in December, both ofwhich can operate on any gasoline–ethanol mixture.
For further details on Honda’s environmental activities, please refer to Honda’s Environmental Report 2007.URL: http://www.honda.co.jp/environmental-report/2007/
Freewatt, manufactured by Climate Energy, LLC(Honda’s cogeneration unit at left)
• Other Product DeploymentSince Honda released its home-use cogeneration unitin Japan in March 2003, total unit sales through gascompanies have reached 45,000. In March 2007, theCompany launched Freewatt, a compact home-usecogeneration system developed in cooperation withClimate Energy, LLC, in North America. We begansales in the cold northeastern United States and aimto expand into other cold regions of the country.
*1: EPAThe U.S. Environmental Protection Agency
*2: TierII Bin5This standard for exhaust emissions was established in the UnitedStates by the Environmental Protection Agency based on the U.S.Clean Air Act and went into effect in 2004. Regulating the value ofNOx for emissions category BIN5: 0.07g/mile. To meet TierII Bin5standards, we have cut emissions by 75% or more from theprevious levels.
*3: Diesel particulate filter (DPF)This ceramic filter attracts and strains out black smoke and otherparticulate matter from the exhaust of diesel vehicles, cleaningtheir emissions.
*4: Euro4Emissions regulations implemented in Europe from 2005. AlthoughChina and many Asian countries have introduced European regula-tions, at present they only require compliance with Euro3 standards.Euro4 is a stringent level that Thailand is considering adoptingfrom 2008.
*5: Honda IMA (Integrated Motor Assist)A new hybrid system developed independently by Honda. While theengine is the primary power source, an electric motor will assist dur-ing acceleration. Due to a design that is more simple than a conven-tional hybrid system, a structure that is both lighter weight and morecompact in size was achieved. Using energy efficiently, this newhybrid system achieves high fuel efficiency during both city andhighway driving.
Environment and Safety

39
Safety TechnologiesHonda will develop safety technologies to enhanceaccident prediction and prevention, technologies tohelp reduce injuries to passengers and pedestriansfrom car accidents, and technologies for enhancingcompatibility, while expanding our lineup of productsincorporating such technologies. The Zest mini-car,introduced in March 2006, was the first mini-car toachieve the maximum rating of six stars in the 2006New Car Assessment*1 collision safety tests for over-all collision safety performance in both the driver’sseat and the front passenger’s seat. Honda has longadvanced real-world safety research that even takespedestrians into account. The Company employs theworld’s first indoor omnidirectional collision test facilityto more accurately recreate actual collision condi-tions. Honda continues to pursue its own safety goalsabove and beyond regulatory standards.
licensing systems in Japan. These had beenextended to 24 other countries as of March 31, 2007.
For motorcycles, in Thailand and Indonesia wehave introduced a new training device for safe drivingcalled Riding Trainer, and we held seminars atdealerships to provide safety advice. In Turkey, weworked to develop motorcycle safety promotionactivities, such as by expanding course offerings andclass days for our popular workshops held in a trafficeducation center.
For automobiles, in April 2006 we began develop-ing a Russian version of the Rainbow Dealer System,which certifies dealerships that satisfy Honda’s safetycriteria. In Vietnam, we have been particularly focusedon road safety activities, educating dealership salesstaff as role models for safe driving.
By listening closely to opinions from our customersand society at large, Honda is seeking to furtherextend its safety developments in the future.
Omnidirectional collision testingSource: Japan’s National Agency for Automotive Safety
& Victims’ Aid
At the Bukit Batok Driving Centre in Singapore, we haveintroduced a children’s traffic safety education programdeveloped in Japan and opened a motorcycle school forchildren and their parents.
Safety Initiatives
As a manufacturer of mobility products, Honda is committed to making products that provide high levels ofsafety, not only for drivers and passengers but also for pedestrians. At the same time, we engage in activitiesthat promote safe driving and actively work to solve issues related to traffic systems.
To create a mobility society with fewer traffic accidents and greater comfort, Honda is pursuing safety for allpeople through technology and education based on the idea of living in safety and harmony.
Promoting Safer DrivingHonda intends to enhance its contribution to trafficsafety in mobility societies, including Asian countries.Honda also intends to remain active in a variety oftraffic safety programs, including advanced drivingand motorcycle training provided by local dealerships.
Our activities to promote safer driving includereflecting the characteristics of traffic information and
*1: The New Car Assessment is an automotive safety assessment car-ried out by the Ministry of Land, Infrastructure and Transportation andthe National Agency for Automotive Safety & Victims’ Aid. The overallevaluation of collision safety performance is a battery of three tests: afull-wrap frontal collision test, an offset frontal collision test and a sidecollision test. Vehicles are assessed by point values calculated foreach test method employed, the points for the three tests are addedtogether, and the sum is expressed as a graded rating from one upto a maximum of six stars.
40
Preparing for the Future
Preparing for the Future
Looking globally, the U.S. economy is showing signsof a moderate downturn, while European economiesare expected to continue recovering and Asianeconomies are expected to continue expanding.Japan’s economy is forecast to sustain its gradualrecovery. However, the global environment in whichHonda’s management operates still remains uncertainbecause of global political and economic uncertain-ties, fluctuations in oil and raw material prices andcurrency movements. As a result, we expect theoperating environment to remain difficult.
It is under these circumstances that Honda seeksto strengthen its corporate structure quickly and flex-ibly to meet the requirements of our customers andsociety and the changes in its business environment.Also, in order to improve the competitiveness of itsproducts, Honda will endeavor to enhance its R&D,production and sales ability. Furthermore, Honda willcontinue striving to earn even more trust and under-standing from society through Companywide activi-ties. Honda recognizes that further enhancing thefollowing specific areas is essential to its success:
1. Research and DevelopmentAlong with efforts to develop even more effectivesafety and environmental technologies, Honda willenhance creativity in its advanced technology andproducts, and will seek to create and swiftly introducenew value-added products that meet specific needsin various markets around the world. Honda will alsocontinue its efforts to research future technologies.
2. Production EfficiencyHonda will seek to establish efficient and flexible pro-duction systems and expand production capacity atits global production bases, with the aim of increasingits capability of supplying high quality products.
3. Sales EfficiencyHonda will remain proactive in its efforts to expandproduct lines through the innovative use of IT and toupgrade sales and service structure, in order tofurther satisfy its customers.
4. Product QualityResponding to increasing consumer demand, Hondawill seek to upgrade its quality control throughenhancing the functions of and coordination among
the development, purchasing, production, sales andservice departments.
5. Safety TechnologiesHonda will seek to develop safety technologies foraccident prediction and prevention, technologies toreduce injuries to passengers and pedestrians fromcar accidents, and technologies for reducingaggressivity, as well as expand its line-up of productsincorporating such technologies. Honda will reinforceand continue to advance its contributions to trafficsafety in motorized societies in Japan and overseas.Honda also intends to remain active in a variety oftraffic safety programs, including advanced drivingand motorcycling training schemes provided by localdealerships.
6. The EnvironmentHonda will step up its efforts to create better, cleanerand more fuel-efficient engine technologies and tofurther improve recyclables throughout its productlines. The Company also plans to make furtherprogress with fuel cells and solar cells, and to pro-mote commercialization of solar cells. In addition,Honda will further its efforts to minimize its environ-mental impact. To this end, we set global targets toreduce the environmental burden as measured by theLife Cycle Assessment*, in all areas of business,spanning production, logistics and sales.* Life Cycle Assessment:
A comprehensive system for quantifying the impact Honda’s productshave on the environment at different stages in their life cycles, frommaterial procurement and energy consumption to waste disposal.
7. Continuing to Increase Society’s Trust inand Understanding toward Honda
In addition to continuing to provide products incorpo-rating Honda’s advanced safety and environmentaltechnologies, Honda will continue striving to earneven more trust and understanding from society by,among other things, undertaking activities for corpo-rate governance, compliance, and risk managementand contributing to society.
Through these Company-wide activities, we will striveto materialize Honda’s visions of “Value Creation(Creating New Value for our Customers),”“Glocalization (Expanding Regional Operations),” and“Commitment to the Future (Developing Safety andEnvironmental Solutions),” with the aim of sharing joywith Honda’s customers, thus becoming a companyvalued by society.

41
Risk Factors
Relating to Honda’s Industry
1. Honda may be adversely affected bymarket conditions
Honda conducts its operations in Japan and through-out the world, including North America, Europe andAsia. A continued economic slowdown, recession orsustained loss of consumer confidence in these mar-kets, which may be caused by rising fuel prices orother factors, could trigger a decline in demand forautomobiles, motorcycles and power products thatmay adversely affect Honda’s results of operations.
2. Prices for automobiles, motorcycles andpower products can be volatile
Prices for automobiles, motorcycles and power prod-ucts in certain markets may experience sharpchanges over short periods of time. This volatility iscaused by many factors, including increasingly fiercecompetition, short-term fluctuations in demand fromunderlying economic conditions, changes in importregulations, shortages of certain supplies, high mate-rial prices and sales incentives by Honda or othermanufacturers or dealers. There can be no assurancethat such price volatility will not continue or intensifyor that price volatility will not occur in markets that todate have not experienced such volatility. Over-capacity within the industry has increased and willlikely continue to increase if the economic downturncontinues in Honda’s major markets or worldwide,leading, potentially, to further increased price pres-sure. Price volatility in any or all of Honda’s marketscould adversely affect Honda’s results of operationsin a particular period.
General Risks Relating to Honda’sBusiness
(Currency and Interest Rate Risks)
1. Honda’s operations are subject to currencyfluctuations
Honda has manufacturing operations throughout theworld, including Japan, and exports products andcomponents to various countries. Honda purchasesmaterials and parts, and sells its products in foreigncurrencies. Therefore, currency fluctuations mayaffect Honda’s pricing of products sold and materials
purchased. Accordingly, currency fluctuations havean effect on Honda’s results of operations and finan-cial condition, as well as Honda’s competitiveness,which will over time affect its results. Since Hondaexports many products and components from Japanand generates a substantial portion of its revenues incurrencies other than the Japanese yen, Honda’sresults of operations would be adversely affected byan appreciation of the Japanese yen against othercurrencies, particularly the U.S. dollar.
2. Honda’s hedging of currency and interestrate risk exposes Honda to other risks
Although it is impossible to hedge against all currencyor interest risk, Honda uses derivative financial instru-ments to reduce the substantial effects of currencyfluctuations and interest rate exposure on its cashflow and financial condition. These instrumentsinclude foreign currency forward contracts, currencyswap agreements and currency option contracts, aswell as interest rate swap agreements. Honda hasentered into, and expects to continue to enter into,such hedging arrangements. As with all hedginginstruments, there are risks associated with the use ofsuch instruments. While limiting to some degree ourrisk fluctuations in currency exchange and interestrates by utilizing such hedging instruments, Hondapotentially forgoes benefits that might result fromother fluctuations in currency exchange and interestrates. Honda also is exposed to the risk that itscounterparties to hedging contracts will default ontheir obligations. Honda manages exposure tocounterparty credit risk by limiting the counterpartiesto major international banks and financial institutionsmeeting established credit guidelines. However, anydefault by such counterparties might have an adverseeffect on Honda.
(Legal and Regulatory Risks)
1. The automobile, motorcycle and powerproduct industries are subject to extensiveenvironmental and other governmentalregulation
Regulations regarding vehicle emission levels, fueleconomy, noise, safety and noxious substances, aswell as levels of pollutants from production plants,are extensive within the automobile, motorcycle andpower product industries. These regulations are
42
subject to change, and are often made more restric-tive. The costs to comply with these regulations canbe significant to Honda’s operations.
2. Honda is reliant on the protection andpreservation of its intellectual property
Honda owns or otherwise has rights in a number ofpatents and trademarks relating to the products itmanufactures, which have been obtained over aperiod of years. These patents and trademarks havebeen of value in the growth of Honda’s business andmay continue to be of value in the future. Honda doesnot regard any of its businesses as being dependentupon any single patent or related group of patents.However, an inability to protect this intellectual prop-erty generally, or the illegal breach of some or a largegroup of Honda’s intellectual property rights, wouldhave an adverse effect on Honda’s operations.
(Risks Relating to Honda’s Operations)
1. Honda’s financial services businessconducts business under highlycompetitive conditions in an industrywith inherent risks
Honda’s financial services business offers customersvarious financing plans designed to increase theopportunity for sales of its products. However, cus-tomers can also obtain financing for the lease or pur-chase of Honda’s products through a variety of othersources that compete with its financing services,including commercial banks and finance and leasingcompanies. The financial services offered by us alsoinvolve risks relating to residual value, credit risk andcost of capital. Competition for customers and/orthese risks that are specific to the financing businessmay affect Honda’s results of operations in the future.
2. Honda relies on various suppliers for theprovision of certain raw materials andcomponents
Honda purchases raw materials, and certain compo-nents and parts, from numerous external suppliers,and relies on some key suppliers for some items andthe raw materials it uses in the manufacture of itsproducts. Honda’s ability to continue to obtain thesesupplies in an efficient and cost-effective manner issubject to a number of factors, some of which are notwithin Honda’s control. These factors include the
ability of its suppliers to provide a continued sourceof supply and Honda’s ability to compete with otherusers in obtaining the supplies. Loss of a key supplierin particular may affect our production and increaseour costs.
3. Honda conducts its operations in variousregions of the world
Honda conducts its businesses worldwide and inseveral countries through joint ventures with localentities, in part due to the legal and other require-ments of those countries. These businesses are sub-ject to various regulations, including the legal andother requirements of each country. If these regula-tions or the business conditions or policies of theselocal entities change, it may have an adverse affecton Honda’s business, financial condition or resultsof operations.
4. Honda may be adversely affected by wars,use of force by foreign countries, terrorism,multinational conflicts, natural disasters,epidemics and labor strikes
Honda conducts its businesses worldwide, and itsoperations may variously be subject to wars, use offorce by foreign countries, terrorism, multinationalconflicts, natural disasters, epidemics, labor strikesand other events beyond its control which may delayor disrupt Honda’s local operations in the affectedregions, including the purchase of raw materials andparts, the manufacture, sales and distribution of prod-ucts and the provision of services. Delays or disrup-tions in one region may in turn affect our globaloperations. If such delay or disruption occurs andcontinues for a long period of time, Honda’s business,financial condition or results of operations may beadversely affected.
Risk Factors

43
Regional Operations (China)
Regional OperatingBoard(China)
Regional Operations (Asia/Oceania)
Regional Operations (Europe, the Middle & Near East and Africa)
Regional OperatingBoard
(Asia and Oceania)
(As of June 22, 2007)
Regional OperatingBoard
(Europe, the Middle & Near East and Africa)
Regional Operations (Latin America)
Board of Directors 20 directors(Outside Directors 2 directors)
Board of Auditors 6 auditors(Outside Auditors 3 auditors)
President & CEO
Regional OperatingBoard
(Latin America)
Regional Operations (North America)
Regional Sales Operations
(Japan)
Regional Operating Board
(North America)
Regional Operating Board (Japan)
Domestic Factories
Compliance Officer Risk Management Officer
Honda Engineering Co., Ltd.
Honda R&D Co., Ltd.
Corporate Auditors Office 2 staff
Audit Office 28 staff
Quality Audit & Compliance Division
Corporate Project
Business Management Operations
Business Support Operations
Purchasing Operations
Production Operations
Customer Service Operations
Power Product Operations
Automobile Operations
Motorcycle Operations
IT Division
Certification & Regulation Compliance Division
Quality Innovation Center
Aero Engine Business Planning OfficeAircraft Operation Office
New Business Development and Planning Office
Corporate Planning DivisionCorporate Communications Division
Honda Driving Safety Promotion Center
9 directors
Executive Council
Business Ethics Improvement Proposal Line
Business Ethics Committee 5 officers
Management Organization of the Company’s Corporate Governance for Decision-Making, Execution, Supervision and Others
Corporate Governance
Basic Position
Based on its fundamental corporate philosophy, theCompany is working to enhance corporate gover-nance as one of its most important managementissues. Our aim is to have our customers and society,as well as our shareholders and investors, place evengreater trust in us and to ensure that Honda is “acompany that society wants to exist.”
To ensure objective control of the Company’s man-agement, outside directors and corporate auditorsare appointed to the Board of Directors and theBoard of Auditors, which are responsible for thesupervision and auditing of the Company. Honda hasalso introduced an operating officer system, aimed atstrengthening both the execution of business opera-tions at the regional and local levels and the super-vision by the Board of Directors. The term of office ofeach director is limited to one year, and the amountof remuneration payable to them is determined
according to a standard that reflects their perfor-mance in the Company. Our goal in doing this is tomaximize the flexibility with which our directorsrespond to changes in the operating environment.
With respect to business execution, Honda hasestablished a system for operating its organizationalunits that reflects its fundamental corporate philoso-phy. For example, separate headquarters have beenset up for each region, business and function, and ageneral manager from the Board of Directors or anoperating officer has been assigned to each head-quarters and main division. In addition, the ExecutiveCouncil deliberates important matters concerningmanagement, and regional operating councils deliber-ate important matters concerning management oftheir respective regions. The result is a system thatfunctions effectively and efficiently, and addresses theneeds of customers and societies around the world ina swift and appropriate manner.
With respect to internal control, each division within

44
Corporate Governance
the Company is working autonomously to strengthenlegal and ethical compliance and risk management.The task of the Audit Office is to carry out effectiveaudits of the performance of each division’s business.
To enhance even further the trust and understand-ing shareholders and investors have in it, Honda’sbasic policy emphasizes the appropriate disclosure ofcompany information, such as by disclosing financialresults on a quarterly basis and timely and accuratelygiving public notice of and disclosing its managementstrategies. Honda will continue raising its level oftransparency in the future.
(1) Management OrganizationBoard of DirectorsThe Board of Directors consists of 20 directors,including two outside directors, and determinesimportant items that are related to business executionor that are designated by law and supervisesbusiness execution.
In the year under review, the Board of Directorsmet eight times.
Outside DirectorsThe Company has appointed outside director SatoruKishi to receive advice on its corporate activities froman objective, broad-ranging and advanced viewpointbased on extensive experience and a high level ofinsight in corporate management.
The Company has appointed outside directorKensaku Hogen to receive advice on its corporateactivities from an objective, broad-ranging andadvanced viewpoint based on extensive experienceand a high level of insight in diplomacy.
Outside director Satoru Kishi attended nearly all ofthe Board of Directors’ meetings held during the fiscalyear and commented as necessary during thedeliberation of proposals.
Outside director Kensaku Hogen attended nearlyall of the Board of Directors’ meetings held during thefiscal year and commented as necessary during thedeliberation of proposals.
There is no particular relationship between theCompany and outside director Satoru Kishi.
There is no particular relationship between theCompany and outside director Kensaku Hogen.
The Board of Directors also provides informationon items of business and other topics as necessaryto outside directors.
Board of AuditorsThe Board of Auditors consists of six corporate audi-tors, including three outside corporate auditors. Inaccordance with the Company’s auditing standards,auditing policies, apportionment of responsibilitiesand other such matters as determined by the Boardof Auditors, each corporate auditor audits the direc-tors’ execution of duties. Corporate auditors accom-plish these audits through various means, includingattending meetings of the Board of Directors andinspecting the state of the Company’s assets andliabilities. In addition, a Corporate Auditors’ Officewas established to provide direct support to theBoard of Auditors.
The Company maintains Standards for Reportingto Corporate Auditors to ensure that relevant mattersare reported to corporate auditors in a timely andaccurate manner. The standards require regularreports to be submitted to corporate auditors on thebusiness conditions of the Company and its subsid-iaries, the maintenance and operation of internal con-trol systems and any other matters that would have asubstantial impact on the Company or its subsidiar-ies. In addition, corporate auditors are required toattend Executive Council and other importantmeetings.
In the year under review, the Board of Auditors met13 times.
The Board of Auditors has certified ShinichiSakamoto, a corporate auditor of the Company, asan “audit committee financial expert,” as set out inthe rules of the Securities and Exchange Commissionpursuant to Section 407 of the U.S. Sarbanes-OxleyAct of 2002. As stipulated in Item 8, Article 121, ofthe Company Law Enforcement Regulations, ShinichiSakamoto has substantial knowledge related tofinance and accounting.
In the year under review, meetings between theCompany’s corporate auditors and its independentauditor were held on five occasions. At those meet-ings, the independent auditor provided the corporateauditors with explanations and reports on accountingaudit plans and results, and opinions were exchanged.
The corporate auditors coordinate closely with theAudit Office, which is responsible for internal audits,with respect to audit policies and schedules. In theyear under review, corporate auditors and the AuditOffice, either independently or in collaboration,conducted business audits of a total of 130

45
companies among Honda’s domestic and overseassubsidiaries and affiliates.
Outside Corporate AuditorsThe Company has appointed outside corporate audi-tor Koukei Higuchi to receive audits of its corporateactivities from a broad-ranging and advanced view-point based on extensive experience and a high levelof insight in corporate management.
The Company has appointed outside corporateauditor Fumihiko Saito to receive audits of its corpo-rate activities from a broad-ranging and advancedviewpoint based on extensive experience and a highlevel of insight in legal affairs.
The Company has appointed outside corporateauditor Yuji Matsuda to receive audits of its corporateactivities from a broad-ranging and advanced view-point based on extensive experience and a high levelof insight in corporate management.
Outside corporate auditor Koukei Higuchi attendednearly all of the Board of Directors’ meetings heldduring the fiscal year and commented as necessaryduring the deliberation of proposals.
Outside corporate auditor Kuniyasu Yamada (whostepped down in June 2007) attended nearly all ofthe Board of Directors’ meetings held during the fiscalyear and commented as necessary during the delib-eration of proposals.
Outside corporate auditor Fumihiko Saito attendednearly all of the Board of Directors’ meetings heldduring the fiscal year and commented as necessaryduring the deliberation of proposals.
There is no particular relationship betweenthe Company and outside corporate auditorKoukei Higuchi.
There is no particular relationship betweenthe Company and outside corporate auditorFumihiko Saito.
Fumihiko Saito serves as a partner of Saito LawOffice. There is no particular relationship betweenSaito Law Office and the Company.
There is no particular relationship betweenthe Company and outside corporate auditorYuji Matsuda.
Yuji Matsuda serves as president and director ofMitsubishi UFJ Trust and Banking Corp. There is noparticular relationship between this organization andthe Company.
The Board of Directors also provides informationon items of business and other topics as necessaryto outside directors.
Directors’ RemunerationThe total amount of remuneration and bonusesof directors and corporate auditors is determinedaccording to criteria that reflect their performancein the Company.
Remuneration for directors and corporate auditorsis paid based on criteria approved by the Board ofDirectors, and it is paid within the extent of themaximum amount resolved by the Ordinary GeneralMeeting of Shareholders.
Bonuses for directors and corporate auditors arepaid based on a decision of the Ordinary GeneralMeeting of Shareholders, taking into considerationthe Company’s profits during the fiscal year, pastbonuses paid and various other factors.
The total remuneration paid to directors and cor-porate auditors during fiscal 2007 was ¥879 million:¥772 million to the 21 directors (including one directorwho retired during the year) and ¥106 million to thesix corporate auditors. The remuneration paid todirectors includes remuneration paid by subsidiariesof the Company to directors who had businessexecution responsibilities for the subsidiaries. Theremuneration paid to corporate auditors includesamounts paid by subsidiaries of the Company tocorporate auditors who also served as corporateauditors for those subsidiaries.
Executive bonuses paid during fiscal 2007 totaled¥590 million: ¥513 million to the 21 directors whowere directors at the end of fiscal 2006 and ¥77 mil-lion to the six corporate auditors who were corporateauditors as at the end of fiscal 2006.
In the fiscal year under review, retirement allow-ances paid to three directors (including two operatingofficers who previously served as directors) totaled¥330 million, in accordance with a resolution of theGeneral Meeting of Shareholders.
The total remuneration and other compensationpaid to outside directors and outside corporateauditors during the fiscal year under review was ¥67million to the two outside directors and three outsidecorporate auditors.
Decisions Regarding Director CandidatesCandidates for directors are decided at meetings of

46
Corporate Governance
the Board of Directors. Candidates for corporateauditors are decided by resolution of the Board ofDirectors, subject to agreement of the Board ofCorporate Auditors.
Accounting AuditsTo ensure proper auditing of the Company’saccounts, the Board of Corporate Auditors and theBoard of Directors receive auditing reports based onthe Company Law, the Securities and Exchange Lawand the U.S. Securities Exchange Act. In addition,they supervise the election of independent auditors,their remuneration and their non-audit services.
In the fiscal year under review, the Companyelected KPMG AZSA & Co. as its independent auditorunder the Company Law, the Securities andExchange Law and the U.S. Securities Exchange Act.
A total of 48 people from KPMG AZSA & Co. pro-vided auditing services for Honda: three Japanesecertified public accountants (Masanori Sato, KensukeSodegawa and Shuji Ohtsu ) and 45 assistants (eightcertified public accountants, 16 assistant accoun-tants, three U.S. certified public accountants and18 others).
In fiscal 2007, the Company and its consolidatedsubsidiaries paid a total of ¥2,708 million in fees toKPMG AZSA & Co. and its affiliated accounting firm,KPMG, for audit certification services under theCompany Law, the Securities and Exchange Lawand the U.S. Securities Exchange Act. In fiscal 2007,the Company’s overseas consolidated subsidiariespaid a total of ¥214 million in fees to KPMG AZSA &Co. and its affiliated accounting firm, KPMG, fornon-auditing services.
Policy and Procedures for Obtaining Board ofAuditors’ Prior ConsentTo ensure that the independent auditor and its affiliateinvolved in audit certification services under the U.S.Securities Exchange Act behave in accordance withall applicable laws and regulations and maintain com-plete independence from the Company, they mustobtain the prior consent of the Company’s Board ofAuditors before they carry out auditing services,auditing related services, tax services and otherservices for Honda.
The Company’s initial policy required that eachcontractual agreement have a separate prior consent
from the Board of Auditors. In order to make thedecision-making process more efficient, however, weare enhancing procedural efficiency by establishingcategories of matters requiring comprehensive priorconsent. These categories are reviewed regularly bythe Board of Auditors.
Any matter that does not fall under one of thesecategories still requires separate consent of the Boardof Auditors.
(2) Business Execution SystemOrganizationAs for execution of business, the Company has sixregional operations around the world to develop busi-ness based on its fundamental corporate philosophy.These operations adopt long-term perspectives andmaintain close ties with local communities.
The Company’s four business operations—motorcycles, automobiles, power products andservice parts—formulate the medium- and long-termplans for their business development, and eachoperation aims to maximize its business performanceon a global basis. Each functional operation—such asCustomer Service Operations, Production Opera-tions, Purchasing Operations, Business ManagementOperations and Business Support Operations—supports the other functional operations, with the aimof increasing Honda’s effectiveness and efficiencies.
Research and development activities are con-ducted principally at the independent subsidiariesof the Company.
Honda R&D Co., Ltd., is responsible forresearch and development on products, while HondaEngineering Co., Ltd., handles research and develop-ment in the area of production technology. TheCompany actively carries out research and develop-ment in advanced technologies with the aim of creat-ing products that are distinctive and internationallycompetitive.
Business Execution Officer SystemThe Company has assigned a general manager fromthe Board of Directors or an operating officer to eachregional, business and functional division, as well asto each research and development subsidiary. Byensuring swift, optimal decision-making in each regionand workplace, the Company is building a highlyeffective and efficient business execution system.

47
Executive CouncilThe Company has established the Executive Council,consisting of the Company’s 10 RepresentativeDirectors (nine from June 22, 2007), including thePresident, the Vice President and the Senior Manag-ing Directors. Along with discussing in advance theitems to be resolved at meetings of the Board ofDirectors, the Executive Council discusses importantmanagement issues within the scope of authorityconferred upon it by the Board of Directors.
In the year under review, the Executive Council met27 times.
Regional Operating BoardsTo enhance the independence of each regionaloperation and ensure swift decision-making, regionaloperating boards have been established at eachregional operation to discuss important managementissues in the region within the scope of authorityconferred upon it by the Executive Council.
Status of Measures Related toShareholders and Others with VestedInterests
(1) Measures to Invigorate Ordinary GeneralMeetings of Shareholders and Ensure theSmooth Exercise of Voting RightsTo invigorate the annual Ordinary General Meeting ofShareholders, the Company holds the meeting asearly as possible. The Company also presents easy-to-understand reports using video and slides, anddisplays its products at the conference room.
The Company sends convocation notices beforethe date required by law, and also allows share-holders to exercise their voting rights via the Internet,using personal computers or mobile phones. Convo-cation notices are sent in English to overseas inves-tors. In these and other ways, the Company strivesto make the exercise of rights as smooth as possible.
(2) IR ActivitiesFor analysts and institutional investors, the Companyholds meetings to present its results four times a yearand meetings with the president twice a year. Com-pany representatives visit and hold information meet-ings as needed for major Japanese and overseasinstitutional investors to explain the Honda Group’s
future business strategies. Representatives basedin North America and Europe also hold informationmeetings for institutional investors as appropriate. Inaddition, the Company holds information meetings forinvestors at motor shows and other major events,where presentations on such topics as Honda Groupstrategies are made by the president or relevantdirector. Moreover, the Company conducts regulartours of facilities in Japan and overseas for share-holders and other investors.
The latest information for investors is available onthe Company’s website (http://www.honda.co.jp/investors/ in Japanese; http://world.honda.com/investors/ in English). All new information is uploadedto the site simultaneously in Japanese and English.
The Company issues a regular publication forshareholders, containing information about its busi-nesses, products, financial status and other matters.
(3) Respecting the Perspective of StakeholdersSeeking to earn the unwavering trust of customersand society, the Honda Group has formulated a setof behavioral guidelines, which is observed by allindividual associates (employees).
In addition to supplying products incorporating themost advanced safety and environmental technolo-gies, the Company pursues environmental protectionactivities, safe driving campaigns and social contribu-tion activities covering all aspects of its operations,including production, logistics and sales. These initia-tives reflect the Company’s effort to earn the trust andunderstanding of society via its corporate activities.
The Company provides information about its cor-porate activities via financial reports and other disclo-sures according to law. We also publish yearly reportson environmental protection activities, safe drivingcampaigns and social contribution activities, whichare posted on our website. In addition, we publish acorporate social responsibility (CSR) report that com-prehensively explains our activities related to theenvironment, safety and society.
Internal Control System: FundamentalPosition and Implementation Status
Basic PositionTo earn the trust of customers and society, theCompany’s divisions, under the guidance of theirrespective corporate officers, have systems in place

48
Corporate Governance
to ensure a systematic approach to compliance andrisk management, in accordance with the BasicPolicy concerning the Maintenance of Internal ControlSystems adopted by the Board of Directors. Thesesystems include the formulation of behavioral guide-lines and procedures for self-assessment. The Com-pany also has a system to support initiatives of eachdivision.
Moreover, effective audits are carried out tomonitor the execution status of each division.
Group Governance SystemBehavioral Guidelines
The “Honda Conduct Guideline,” formulated toguide the behavior of all associates, is posted onthe Company’s website (http://www.honda.co.jp/conductguideline/ in Japanese; http://world.honda.com/conductguideline/ in English).In addition, each division produces moredetailed behavioral guidelines according toits specific attributes.
Self-Assessment ChecklistEach division of the Company approaches compli-ance and risk management in a systematic way.For example, each division has a checklist thatclarifies specific laws and risks to consider relatedto its particular business, and conducts regularself-assessments. The results of the self-assessments are reported to the corporate officerin charge of each division, and the overall statusof compliance and risk management is evaluatedregularly by the Executive Council.
Compliance SystemThe Company has appointed a Compliance Officer,who is a director in charge of compliance-relatedinitiatives. Other key elements of our compliancesystem include the Business Ethics Committee andthe Business Ethics Improvement Proposal Line.
Business Ethics CommitteeHonda’s Business Ethics Committee is chairedby the Compliance Officer and consists ofdirectors and operating officers. The Committeedeliberates matters related to corporate ethicsand compliance.
It met two times in the year under review.
Business Ethics Improvement Proposal LineHonda places high priority on open communica-tions in its divisions. It has also set up the BusinessEthics Improvement Proposal Line to receive sug-gestions related to corporate ethics issues. Bydevising appropriate responses to suggestionsreceived, Honda is constantly working to enhancecorporate ethics. The system is designed to pro-tect informants, who can either reveal their identityor remain anonymous.
The Business Ethics Committee supervises theoperation of the Business Ethics ImprovementProposal Line and submits status reports to theBoard of Auditors.
Risk Management SystemEach division works to prevent and address its par-ticular set of risks. In addition, the Honda CrisisResponse Rules are designed to address Company-wide crises, such as major natural disasters.
The Company has appointed a Risk ManagementOfficer, who is a director in charge of risk manage-ment related initiatives. It also established theCompany-wide Response Headquarters to addresscrisis situations.
Retention and Management of Information onExecution of Business by DirectorsDocuments and other information related to theexecution of business by directors are retained andmanaged appropriately, according to the documentmanagement policies of Honda and its majorregional subsidiaries.
Business AuditsThe Audit Office is an independent supervisorydepartment under the direct control of the president.This office audits the performance of each depart-ment and works to improve the internal auditing ofsubsidiaries and affiliates in each region.
Disclosure CommitteeThe Disclosure Committee, which consists of relevantdirectors, deliberates matters related to the accuracyand appropriateness of corporate information to bedisclosed in business results announcements andfinancial reports.

49
Code of EthicsThe Company has also established a “Code ofEthics” as set forth in the rules of the U.S. Securitiesand Exchange Commission regulations pursuant toSection 406 of the Sarbanes-Oxley Act of 2002.
Companies listed on the NYSE must comply with cer-tain standards regarding corporate governance underSection 303A of the NYSE Listed Company Manual.
However, listed companies that are foreign privateissuers, such as Honda, are permitted to followhome country practice in lieu of certain provisions ofSection 303A.
The following table shows the significant differ-ences between the corporate governance practicesfollowed by U.S. listed companies under Section303A of the NYSE-listed Company Manual and thosefollowed by Honda.
Corporate Governance Practices Followed byNYSE-listed U.S. Companies
A NYSE-listed U.S. company must have a majority of directors meetingthe independence requirements under Section 303A of the NYSE-ListedCompany Manual.
A NYSE-listed U.S. company must have an audit committee composedentirely of independent directors, and the audit committee must have atleast three members.
A NYSE-listed U.S. company must have a nominating/corporate gover-nance committee composed entirely of independent directors.
A NYSE-listed U.S. company must have a compensation committeecomposed entirely of independent directors.
A NYSE-listed U.S. company must generally obtain shareholder approvalwith respect to any equity compensation plan.
Corporate Governance Practices Followed by Honda
For Japanese companies that employ a corporate governance systembased on a board of corporate auditors (the “corporate auditor system”),including Honda, Japan’s company law has no independence require-ment with respect to directors. The task of overseeing management and,together with the accounting audit firm, accounting is assigned to thecorporate auditors, who are separate from the company’s managementand who satisfy the independency requirements under Japan’s CompanyLaw. In the case of Japanese companies that employ the board of corpo-rate auditors system, including Honda, at least half of the corporateauditors must be “outside” corporate auditors who must meet additionalindependence requirements under Japan’s company law. An outsidecorporate auditor is defined as a corporate auditor who has not served asa director, accounting councilor, executive officer, manager or any otheremployee of the company or any of its subsidiaries. Currently, Honda hasthree outside corporate auditors which constitute 50% of Honda’scorporate auditors.
Like a majority of Japanese listed companies, Honda employs the corpo-rate auditor system as described above. Under this system, the board ofcorporate auditors is a legally separate and independent body from theboard of directors. The main function of the board of corporate auditors issimilar to that of independent directors, including those who are membersof the audit committee, of a U.S. company: to monitor the performance ofthe directors, and review and express opinion on the method of auditingby the company’s accounting audit firm and on such accounting auditfirm’s audit reports, for the protection of the company’s shareholders.
Japanese companies that employ a corporate auditor system, includingHonda, are required to have at least three corporate auditors. Currently,Honda has six corporate auditors. Each corporate auditor has a four-yearterm. In contrast, the term of each director of Honda is one year.
With respect to the requirements of Rule 10A-3 under the U.S. SecuritiesExchange Act of 1934 relating to listed company audit committees,Honda relies on an exemption under that rule which is available to foreignprivate issuers with boards of corporate auditors meeting certain criteria.
Honda’s directors are elected at a meeting of shareholders. Its Board ofDirectors does not have the power to fill vacancies thereon.Honda’s corporate auditors are also elected at a meeting of shareholders.A proposal by Honda’s Board of Directors to elect a corporate auditormust be approved by a resolution of its Board of Auditors. The Board ofAuditors is empowered to request that Honda’s directors submit a pro-posal for election of a corporate auditor to a meeting of shareholders. Thecorporate auditors have the right to state their opinion concerning electionof a corporate auditor at the meeting of shareholders.
Maximum total amounts of compensation for Honda directors andcorporate auditors are proposed to, and voted on, by a meeting ofshareholders. Once the proposals for such maximum total amounts ofcompensation are approved at the meeting of shareholders, each of theBoard of Directors and Board of Auditors determines the compensationamount for each member within the respective maximum total amounts
Currently, Honda does not adopt stock option compensation plans. IfHonda adopts such plans, Honda must obtain shareholder approval forstock options only if the stock options are issued with specifically favor-able conditions or price concerning the issuance and exercise of thestock options.

50
Name Area of Responsibility or Principal Occupations
Chairman and Representative Director Satoshi AokiPresident and Representative Director Takeo FukuiExecutive Vice President and Representative Director Koichi Kondo Chief Operating Officer for Regional Sales Operations (Japan)
Chairman and Director of American Honda Motor Co., Inc.
Senior Managing and Representative Director Minoru Harada Chief Operating Officer for Motorcycle Operations
Purchasing Operations Support
Senior Managing and Representative Director Atsuyoshi Hyogo Chief Operating Officer for Regional Operations (China)
President of Honda Motor (China) Investment Corporation, Limited
Senior Managing and Representative Director Satoshi Toshida Chief Operating Officer for Power Product Operations
Senior Managing and Representative Director Koki Hirashima Chief Operating Officer for Production Operations
Risk Management Officer
General Supervisor, Information Systems
Senior Managing and Representative Director Mikio Yoshimi Chief Operating Officer for Business Support Operations
Chief Officer of Driving Safety Promotion Center
Compliance Officer
Government & Industrial Affairs
Senior Managing and Representative Director Takanobu Ito Chief Operating Officer for Automobile Operations
Senior Managing and Representative Director Masaaki Kato General Supervisor, Quality
President and Director of Honda R&D Co., Ltd.
Board of Directors, Corporate Auditors and Operating Officers
Directors
Front row: Chairman and President and Executive Vice President andRepresentative Director Representative Director Representative Director
Satoshi Aoki Takeo Fukui Koichi Kondo
Back row: Senior Managing and Senior Managing and Senior Managing and Senior Managing and Senior Managing and Senior Managing and Senior Managing andRepresentative Director Representative Director Representative Director Representative Director Representative Director Representative Director Representative Director
Takanobu Ito Koki Hirashima Atsuyoshi Hyogo Minoru Harada Satoshi Toshida Mikio Yoshimi Masaaki Kato

51
Name Area of Responsibility or Principal Occupations
Managing Director Toru Onda Chief Operating Officer for Purchasing Operations
Managing Director Akira Takano Chief Operating Officer for Customer Service Operations
Managing Director Shigeru Takagi Chief Operating Officer for Regional Operations (Europe, the Middle & Near East and Africa)
President and Director of Honda Motor Europe Limited
Managing Director Tetsuo Iwamura Chief Operating Officer for Regional Operations (North America)
President and Director of Honda North America, Inc.
President and Director of American Honda Motor Co., Inc.
Managing Director Tatsuhiro Oyama Chief Operating Officer for Regional Operations (Asia & Oceania)
President and Director of Asian Honda Motor Co., Ltd.
Managing Director Fumihiko Ike Chief Operating Officer for Business Management Operations
Director Satoru Kishi Advisor of the Board of The Bank of Tokyo-Mitsubishi UFJ, Ltd.
Director Kensaku HogenDirector and Advisor Hiroyuki YoshinoDirector Sho Minekawa Chief Operating Officer for Regional Operations (Latin America)
President and Director of Honda South America Ltda.
President and Director of Moto Honda da Amazonia Ltda.
President and Director of Honda Automoveis do Brasil Ltda.
(Notes) 1. Mr. Satoru Kishi and Mr. Kensaku Hogen satisfy the required conditions for the outside director provided for in Article 2, Paragraph 1, Item 15 of theCompany Law.
2. The term of office of a Director is one year after his/her election to office at the close of the ordinary general meeting of shareholders on June 22, 2007.
Name Area of Responsibility or Principal Occupations
Corporate Auditor (Full-time) Hiroshi OkuboCorporate Auditor (Full-time) Koji MiyajimaCorporate Auditor (Full-time) Shinichi SakamotoCorporate Auditor Koukei Higuchi Advisor of the Board of Tokio Marine & Nichido Fire Insurance Co., Ltd.
Corporate Auditor Fumihiko Saito Representative of Saito Law Office
Corporate Auditor Yuji Matsuda President and Director of Mitsubishi UFJ Trust Investment Technology Institute Co., Ltd.
(Notes) 1. Corporate Auditors Mr. Koukei Higuchi, Mr. Fumihiko Saito and Mr. Yuji Matsuda are outside corporate auditors as provided for in Article 2, Paragraph1, Item 16 of the Company Law.
2. The term of Corporate Auditors (full-time) Mr. Hiroshi Okubo, Mr. Koji Miyajima and a Corporate Auditor Mr. Fumihiko Saito is four years after his/herelection to office at the close of the ordinary general meeting of shareholders on June 23, 2004.
3. The term of a Corporate Auditor (full-time) Mr. Shinichi Sakamoto is four years after his/her election to office at the close of the ordinary generalmeeting of shareholders on June 23, 2005.
4. The term of Corporate Auditors Mr. Koukei Higuchi and Mr. Yuji Matsuda is four years after his/her election to office at the close of the ordinary generalmeeting of shareholders on June 22, 2007.
Corporate Auditors

52
Operating OfficersName Principal Occupations
Managing Officer Akio Hamada President and Director of Honda of America Mfg., Inc.
Managing Officer Takashi Yamamoto General Manager of Saitama Factory of Production Operations
Managing Officer Suguru Kanazawa Executive Vice President and Director of Honda Motor Europe Limited
President and Director of Honda of the U.K. Manufacturing Ltd.
Operating Officer Manabu Nishimae Deputy Chief Operating Officer for Regional Sales Operations (Japan)
General Manager of Automobile Sales Operations for Regional Sales Operations (Japan)
General Manager of Aftermarket Operations in Regional Sales Operations (Japan)
General Manager of Asimo Business Office in Regional Sales Operations (Japan)
Operating Officer Masaya Yamashita General Manager of Kumamoto Factory of Production Operations
Operating Officer Hiroshi Kobayashi President and Director of Honda Canada Inc.
Operating Officer Hiroshi Oshima Corporate Communications, Motor Sports
General Manager of Corporate Communications Division
Operating Officer Tsutomu Saka General Manager of Hamamatsu Factory of Production Operations
Operating Officer Hidenobu Iwata General Manager of Suzuka Factory of Production Operations
Operating Officer Gen Tsujii Production for Production Operations
General Manager of Automobile Production Planning Office in Production Operations
President and Director of Honda Engineering Co., Ltd.
Operating Officer Koichi Fukuo Quality, Certification & Regulation Compliance
Operating Officer Hiroshi Soda Executive Vice President and Director of Honda North America, Inc.
Executive Vice President and Director of American Honda Motor Co., Inc.
Operating Officer Takuji Yamada President and Director of Honda Motor Europe (North) GmbH
Operating Officer Hideki Okada General Manager of Regional Operation Planning Office in Regional Operations
(North America)
Executive Vice President and Director of American Honda Motor Co., Inc.
Operating Officer Masahiro Takedagawa President and Director of Honda Siel Cars India Ltd.
President and Director of Honda Motor India Private Ltd.
Operating Officer Yoichi Hojo General Manager of Automobile Purchasing Division 2 in Purchasing Operations
Operating Officer Tsuneo Tanai Executive Vice President and Director of Honda of America Mfg., Inc.
Operating Officer Yoshiyuki Matsumoto Automobile Products for Automobile Operations
Operating Officer Eiji Okawara Production in China in Production Operations
President of Guangzhou Honda Automobile Co., Ltd.
Operating Officer Ko Katayama Manufacturing of Honda Canada Inc.
Operating Officer Masahiro Yoshida Human Resources and Associate Relations for Business Support Operations
General Manager of Human Resources Division for Business Support Operations
Operating Officer Seiji Kuraishi Vice President of Honda Motor (China) Investment Corporation, Ltd.
Operating Officer Takashi Nagai Executive Vice President and Director of Asian Honda Motor Co., Ltd.
(Note) The Company has introduced an operating officer system to facilitate transfer of authority to regions and local workplaces and effectively separate thesupervisory and executive roles, while also making the Board of Directors more versatile.
As of June 23, 2007
Board of Directors, Corporate Auditors and Operating Officers

53
Financial SectionContents
054 Financial Review070 Consolidated Balance Sheets072 Consolidated Statements of Income073 Consolidated Statements of Stockholders’ Equity
and Comprehensive Income075 Consolidated Statements of Cash Flows076 Notes to Consolidated Financial Statements118 Management’s Report on Internal Control over Financial Reporting119 Reports of Independent Registered Public Accounting Firm121 Selected Quarterly Financial Data (Unaudited and Not Reviewed)122 Consolidated Balance Sheets Divided into Non-Financial
Services Businesses and Finance Subsidiaries (Unaudited)123 Consolidated Statements of Cash Flows Divided into Non-Financial
Services Businesses and Finance Subsidiaries (Unaudited)124 Financial Summary

54
Financial Review
03 04 05 06 070
2,000
4,000
6,000
8,000
10,000
12,000
Net Sales and Other Operating RevenueYears ended March 31
Yen (billions)
03 04 05 06 070
200
400
600
800
0
100
200
300
400
Net Income and Net Income per Common ShareYears ended March 31
Yen (billions) (Yen)
Net Income (left)
Net Income per Common Share(right)
Operating and Financial ReviewNet Sales and Other Operating RevenueHonda’s consolidated net sales and other operating revenue(hereafter, “net sales”) for fiscal year 2007, ended March 31,2007, grew 11.9%, compared with fiscal year 2006, to¥11,087.1 billion. Behind this increase were higher unit sales inthe motorcycle business in Other regions, higher overseas unitsales in the automobile business and higher unit sales in allregions in power product and other businesses, as well as thepositive impact of currency effects. Honda estimates that if theexchange rate of the Japanese yen had remained unchangedfrom the previous fiscal year, consolidated net sales andoperating revenue for the period would have increased byapproximately 7.4%.
Domestic net sales decreased by 0.8% to ¥1,681.1 billion,but overseas net sales were up 14.5% from fiscal year 2006,to ¥9,405.9 billion.
Cost of SalesDespite the cost reduction effects, the cost of sales rose12.2%, to ¥7,865.1 billion. The cost of sales was affected byincreased unit sales, substantially increased raw materialsprices, such as steel, aluminum and precious grade metals, aswell as the negative impact of currency effects caused by thedepreciation of the Japanese yen.
Selling, General and Administrative Expenses/Researchand Development ExpensesSelling expenses increased in line with higher unit sales, higherfreight costs as the result of substantially increased crude oilprices, higher expenses related to product quality and the im-pact of currency effects. G&A expenses increased due mainlyto the impact of currency effects and the effects from newlyconsolidated subsidiaries. Total of SG&A expenses rose 9.8%from fiscal year 2006, to ¥1,818.2 billion.
R&D expenses also grew 8.1%, to ¥551.8 billion, as wespent more on safety and environmental technologies andworked to enhance the attractiveness of our products.
Operating IncomeOperating income declined 2.0%, compared with thepreceding year, to ¥851.8 billion. In addition to the above men-tioned factors, changes in model mix due mainly to shift of cus-tomers’ demands towards more fuel efficient (compact) modelsespecially in U.S. market negatively affected operating income.
Other Income and ExpensesOther income and expenses, net, fell ¥20.0 billion, due to anincrease in losses on the valuation of interest rate swaps andother derivatives.
Income before Income Taxes, Minority Interest andEquity in Income of AffiliatesIncome before income taxes, minority interest and equity inincome of affiliates fell 4.5%, to ¥792.8 billion.
Income Tax ExpenseIncome tax expense decreased by 10.5%, to ¥283.8 billion.The effective tax rate was 35.8%, a decrease by 2.4 percent-age points from the previous fiscal year. Additional detailed in-formation is described in Note (11) to the accompanyingconsolidated financial statements.
Minority Interest in Income of ConsolidatedSubsidiariesThe amount deducted for minority interest in income of con-solidated subsidiaries grew 31.6% from the previous year, to¥20.1 billion, due mainly to the impact of a newly consolidatedsubsidiary.
Equity in Income of AffiliatesEquity in income of affiliates grew 3.8%, to ¥103.4 billion.
Net IncomeNet income was down 0.8% from the previous year, to ¥592.3billion.

55
In fiscal year 2006, operating income and income beforeincome taxes, minority interest and equity in income of affiliateswere impacted by the posting of a ¥138.0 billion gain on thereturn of the substitutional portion of the Employees PensionFunds (hereafter, “gain on return”) to the Japanese govern-ment, which also affected income after tax.
Review of OperationsMotorcycle BusinessUnit sales of Honda motorcycles, all-terrain vehicles (ATVs)and personal watercraft (PWC) in fiscal 2007 amounted to10,369,000 units, an increase of 1.0%, from the previousfiscal year. Unit sales in Japan were 337,000 units, a decreaseof 8.4%. Overseas unit sales in the motorcycle totaled10,032,000 units, an increase of 1.3%, due mainly to anincrease in unit sales in Other regions, especially in LatinAmerica. Revenue from unaffiliated customers increased11.8%, to ¥1,370.6 billion, from the previous fiscal year, duemainly to increased unit sales and the positive impact of cur-rency translation effects. Operating income decreased 11.7 %,to ¥100.6 billion, from the previous fiscal year, due mainly toincreased SG&A expenses, higher R&D expenses and the gainon return which was recorded in the fiscal year ended March31, 2006, offsetting the positive impact of increased profitattributable to higher revenue and positive currency effects.The operating margin was 7.3%.
Unit Sales
Thousands
Years ended March 31 2006 2007 % change
Japan 368 337 (8.4)%North America 615 503 (18.2)Europe 353 329 (6.8)Asia 7,907 7,895 (0.2)Other Regions 1,028 1,305 26.9
Total 10,271 10,369 1.0%
Net Sales
Yen (millions)
Years ended March 31 2006 2007 % change
Japan ¥0,099,009 ¥0,101,753 2.8%North America 349,741 308,293 (11.9)Europe 208,092 219,773 5.6Asia 324,026 383,389 18.3Other Regions 244,944 357,409 45.9
Total ¥1,225,812 ¥1,370,617 11.8%
JapanIn Japan, total demand for motorcycles in fiscal year 2007, wasapproximately 730,000 units, down from the previous year.Demand increased for second-class motor-driven cycles(51cc–125cc) and small-size two-wheeled motor vehicles (over251cc), but fell for first-class motor-driven cycles (up to 50cc)and mini-size two-wheeled motor vehicles (126cc–250cc).
To meet increasingly diverse customer needs, we strength-ened the Honda Dream Shop and other parts of our sales net-work, and strove to develop even more appealing motorcycles.Nevertheless, unit sales of motorcycles fell 8.4% in fiscal year2007, to 337,000 units.
We adopted advanced technologies from specialized racingmotorcycles in small-size two-wheeled motor vehicles, andsales of the fun-to-ride and maneuverable CBR1000RR supersports model were favorable, but sales of the CB1300 SuperBol d’Or decreased. In mini-size two-wheeled motor vehicles,sales of the Hornet, a naked sports model with refined andexciting styling, were strong. On the other hand, Forza salesdeclined. Sales of first- and second-class motor-driven cycles,such as the Today and the Duo, decreased.
North AmericaLooking at calendar year 2006, demand in the United Statesfor motorcycles, ATVs and personal watercraft came roughlyequal to the previous year’s demand. Demand for road bikesgrew, but demand for ATVs—particularly utility ATVs—declined.
Of this number, Honda motorcycle sales fell 18.2%, to503,000 units, in fiscal year 2007. Sales of the CBR1000RR, asuper sports model, and our new off-road model, theCRF150R, were strong, but higher interest rates and economicuncertainty impacted demand for leisure products. Particularlyaffected by this impact were sales of off road-models, mainlyEnduro*1 models such as CRF50F and CRF70F, whichdropped 15.1%, to 282,000 units.
As one of our safety initiatives, we launched the world’s firstmass-market motorcycle with an airbag system, the Gold Wingtouring bike, in the United States and Canada.
Although sales of the FourTrax Rancher series of utilityATVs, which underwent a full model change in December2006, were strong, total unit sales of ATVs and personal water-craft came to 221,000 units in fiscal year 2007, down 21.9%.*1 EnduroA motor sport involving long races on relatively flat off-road courses andlasting between two and 12 hours
2,500
5,000
10,000
12,500
7,5008,080 978
1,370
10,369
9,206996
1,097
1,225
0
300
600
1,200
1,500
900
003 04 05 06 07 03 04 05 06 07
10,482 10,271
Unit Sales Years ended March 31
(Thousands)
Net Sales Years ended March 31
Yen (billions)
JapanNorth AmericaEurope
AsiaOther Regions
JapanNorth AmericaEurope
AsiaOther Regions

56
EuropeIn calendar year 2006, total European motorcycle demand*2
increased from the previous year, to approximately 1,290,000units, particularly in Spain due to changes in licensing systemsas well as economic expansion, followed by increases in Italy,France and the United Kingdom.
In fiscal year 2007, unit sales decreased 6.8%, to 329,000units. Sales were strong for the SH300i, which launched inDecember 2006. Sales of PS125i, PS150i and Silver Wing 400scooters were also stable, as were sales of the Deauville tour-ing bike model. However, sales of large super sports modelsand models mainly in the 125cc class declined.*2 Motorcycle registrations in Europe (10 countries)
AsiaIn Asia, demand for motorcycles as an essential mode of trans-portation has continued to grow. In fiscal year 2007, unit salesin Asia of completed products of Honda and its consolidatedsubsidiaries, and unit sales of parts to Honda’s affiliatesaccounted for under the equity method for purposes of localproduction by such affiliates in the aggregate, declined 0.2%,to 7,895,000 units.
The Honda Group is working hard to expand local busi-nesses in the region through its active promotion of local pro-curement of parts used in overseas production. In Asia, thisstrategy has resulted in an increase in sales of Honda-brandmotorcycles that are manufactured and sold by affiliatesaccounted for under the equity method in India and China,but do not include any parts supplied by Honda or its consoli-dated subsidiaries, therefore not included in the consolidatedunit sales.
Total demand in India in calendar 2006 expanded toapproximately 8,390,000 units, buoyed by growing market ofmotorcycles which is the largest category. Hero Honda MotorsLimited, an affiliate accounted for under the equity method,enjoyed strong sales of its mainstay Splendor, Splendor Plusand Super Splendor models. In December 2006, the Companylaunched the new CD Dawn and CD Deluxe models, whichfeature class-leading fuel efficiency. Honda Motorcycle andScooter India Private Limited, a consolidated subsidiary,reported strong sales of the Shine equipped with a newlydeveloped engine and the Activa scooter. In India in fiscal year2007, total unit sales of completed motorcycles of Honda andits consolidated subsidiaries, and unit sales of parts to Honda’saffiliates accounted for under the equity method for purposesof local production by such affiliates in the aggregate, grew10.3%, to 2,134,000 units.
In calendar year 2006, the Indonesian market experiencedincreasing inflation and interest rates, caused by a sharp rise ingasoline prices, which substantially dampened consumer pur-chasing power in the first half of the year. Fortunately, a mid-year monetary policy relaxation helped ease the inflation rate.Companies in Indonesia responded by strengthening measuresto expand sales, but total demand fell to approximately4,630,000 units nevertheless. P.T. Astra Honda Motors, anaffiliate accounted for under the equity method, experiencedstrong sales of Vario, an automatic transmission (AT) equippedscooter launched in September 2006. Sales of Karizma by P.T.Astra Honda Motors, however, declined. As a result, in fiscal
year 2007 total unit sales of completed motorcycles of Hondaand its consolidated subsidiaries, and unit sales of parts toHonda’s affiliates accounted for under the equity method forpurposes of local production by such affiliates in the aggre-gate, fell 7.7%, to 2,467,000 units from the previous fiscalyear.
In Thailand, total demand in calendar year 2006 came toapproximately 2,060,000 units, down from the previous year. Amaturing motorcycle market, the sharp rise in gasoline prices,political upheaval and irregular weather all had some impacton these results. Unit sales in fiscal year 2007 fell 7.5%, to1,401,000 units from the previous year, although two AT-equipped scooters—the Click, which launched in fiscal year2006, and the Air Blade, which went on sale in June 2006—were favorable.
Total demand for motorcycles in Vietnam in calendar year2006 benefited greatly from the country’s thorough abolition ofa regulation limiting riders to one per motorcycle. This movecaused the market to expand and pushed up demand toapproximately 2,370,000 units. Similarly, in fiscal year 2007,unit sales significantly increased 25.3%, to 787,000 units.
China’s 2005 implementation of Euro2 emission standardscaused motorcycle demand to plunge, but in calendar year2006, this demand returned to 2004 level, expanding toapproximately 14,830,000 units. Sundiro Honda MotorcycleCo., Ltd., an affiliate accounted for under the equity method,experienced strong sales of the M-Power, which launched inJune 2006. Sales of the Fight Hawk, featuring a large halfcowl, were also strong. Similarly, another affiliate accounted forunder the equity method, Wuyang-Honda Motors (Guangzhou)Co., Ltd., introduced the SCR110—the first model in China tobe equipped with programmed fuel injection (PGM-FI)—inSeptember 2006. In February 2007, the company alsolaunched the SCR125 sports bike. Both models enjoyed favor-able sales. As parts for manufacturing these new models arenot supplied by Honda or its consolidated subsidiaries, theirnumbers are not included in Honda’s consolidated unit sales.For this reason, together with the decrease in unit sales ofother models, total unit sales of completed motorcycles ofHonda and its consolidated subsidiaries, and unit sales ofparts to Honda’s affiliates accounted for under the equitymethod for purposes of local production by such affiliates inthe aggregate, fell 39.3%, to 204,000 units.
To meet increasing demand in the region, two new plantsbegan operations—one in the Philippines in May 2006, andthe other in July in Pakistan.
Other RegionsOther regions—including Latin America, the Middle & NearEast, Africa and Oceania—unit sales grew 26.9%, to1,305,000 units from the previous fiscal year. In Brazil, whereeconomic performance was stable, Honda posted solid salesof such models as the Biz 125 and the CG125 Fan.
In June 2006, we began local production in Argentina tomeet rising demand.
Automobile BusinessHonda’s unit sales of automobiles amounted to 3,652,000units, up 7.7% from the previous fiscal year. In Japan, unit
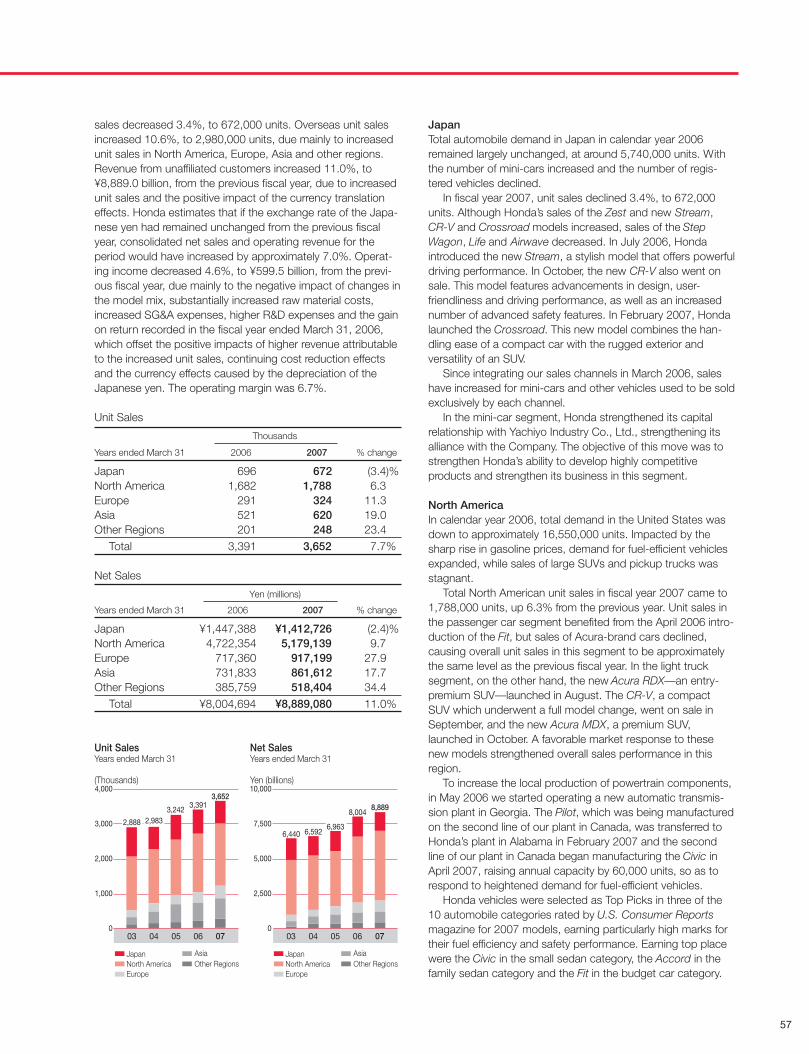
57
sales decreased 3.4%, to 672,000 units. Overseas unit salesincreased 10.6%, to 2,980,000 units, due mainly to increasedunit sales in North America, Europe, Asia and other regions.Revenue from unaffiliated customers increased 11.0%, to¥8,889.0 billion, from the previous fiscal year, due to increasedunit sales and the positive impact of the currency translationeffects. Honda estimates that if the exchange rate of the Japa-nese yen had remained unchanged from the previous fiscalyear, consolidated net sales and operating revenue for theperiod would have increased by approximately 7.0%. Operat-ing income decreased 4.6%, to ¥599.5 billion, from the previ-ous fiscal year, due mainly to the negative impact of changes inthe model mix, substantially increased raw material costs,increased SG&A expenses, higher R&D expenses and the gainon return recorded in the fiscal year ended March 31, 2006,which offset the positive impacts of higher revenue attributableto the increased unit sales, continuing cost reduction effectsand the currency effects caused by the depreciation of theJapanese yen. The operating margin was 6.7%.
Unit Sales
Thousands
Years ended March 31 2006 2007 % change
Japan 696 672 (3.4)%North America 1,682 1,788 6.3Europe 291 324 11.3Asia 521 620 19.0Other Regions 201 248 23.4
Total 3,391 3,652 7.7%
Net Sales
Yen (millions)
Years ended March 31 2006 2007 % change
Japan ¥1,447,388 ¥1,412,726 (2.4)%North America 4,722,354 5,179,139 9.7Europe 717,360 917,199 27.9Asia 731,833 861,612 17.7Other Regions 385,759 518,404 34.4
Total ¥8,004,694 ¥8,889,080 11.0%
JapanTotal automobile demand in Japan in calendar year 2006remained largely unchanged, at around 5,740,000 units. Withthe number of mini-cars increased and the number of regis-tered vehicles declined.
In fiscal year 2007, unit sales declined 3.4%, to 672,000units. Although Honda’s sales of the Zest and new Stream,CR-V and Crossroad models increased, sales of the StepWagon, Life and Airwave decreased. In July 2006, Hondaintroduced the new Stream, a stylish model that offers powerfuldriving performance. In October, the new CR-V also went onsale. This model features advancements in design, user-friendliness and driving performance, as well as an increasednumber of advanced safety features. In February 2007, Hondalaunched the Crossroad. This new model combines the han-dling ease of a compact car with the rugged exterior andversatility of an SUV.
Since integrating our sales channels in March 2006, saleshave increased for mini-cars and other vehicles used to be soldexclusively by each channel.
In the mini-car segment, Honda strengthened its capitalrelationship with Yachiyo Industry Co., Ltd., strengthening itsalliance with the Company. The objective of this move was tostrengthen Honda’s ability to develop highly competitiveproducts and strengthen its business in this segment.
North AmericaIn calendar year 2006, total demand in the United States wasdown to approximately 16,550,000 units. Impacted by thesharp rise in gasoline prices, demand for fuel-efficient vehiclesexpanded, while sales of large SUVs and pickup trucks wasstagnant.
Total North American unit sales in fiscal year 2007 came to1,788,000 units, up 6.3% from the previous year. Unit sales inthe passenger car segment benefited from the April 2006 intro-duction of the Fit, but sales of Acura-brand cars declined,causing overall unit sales in this segment to be approximatelythe same level as the previous fiscal year. In the light trucksegment, on the other hand, the new Acura RDX—an entry-premium SUV—launched in August. The CR-V, a compactSUV which underwent a full model change, went on sale inSeptember, and the new Acura MDX, a premium SUV,launched in October. A favorable market response to thesenew models strengthened overall sales performance in thisregion.
To increase the local production of powertrain components,in May 2006 we started operating a new automatic transmis-sion plant in Georgia. The Pilot, which was being manufacturedon the second line of our plant in Canada, was transferred toHonda’s plant in Alabama in February 2007 and the secondline of our plant in Canada began manufacturing the Civic inApril 2007, raising annual capacity by 60,000 units, so as torespond to heightened demand for fuel-efficient vehicles.
Honda vehicles were selected as Top Picks in three of the10 automobile categories rated by U.S. Consumer Reportsmagazine for 2007 models, earning particularly high marks fortheir fuel efficiency and safety performance. Earning top placewere the Civic in the small sedan category, the Accord in thefamily sedan category and the Fit in the budget car category.
03 04 05 06 07 03 04 05 06 07
4,000
2,000
3,000
1,000
2,888
6,440
2,9833,242
6,5926,963
0
10,000
7,500
5,000
2,500
0
3,3913,652
8,0048,889
Unit Sales Years ended March 31
(Thousands)
Net Sales Years ended March 31
Yen (billions)
JapanNorth AmericaEurope
AsiaOther Regions
JapanNorth AmericaEurope
AsiaOther Regions

58
EuropeTotal demand in Europe* in calendar year 2006 amounted toapproximately 14,620,000 units, roughly the same level as in2005.
Unit sales for fiscal year 2007 climbed 11.3%, to 324,000units from the previous year. Recording strong sales resultswere the five-door Civic and the Accord, as well as the CR-V,a compact SUV that was launched in January 2007 whichunderwent a full model change, and the three-door Civic.
In production, consolidated subsidiary Honda of the U.K.Manufacturing Ltd. responded to rising demand for the Civicand the CR-V, ramping up to full production in calendar year2007 by starting two-shift production in February at its secondplant. The company is strengthening its production systemthrough the gradual transfer of diesel engine production fromJapan.* Source: European Automobile Manufacturers’ Association (ACEA),
passenger car category (15 countries in the European Union, threecountries in the European Free Trade Association)
AsiaIn Asia in fiscal year 2007, total unit sales of completed auto-mobiles of Honda and its consolidated subsidiaries, and unitsales of parts to Honda’s affiliates accounted for under theequity method for purposes of local production by such affili-ates in the aggregate, grew 19.0%, to 620,000 units from theprevious fiscal year.
Total demand amounted to approximately 5,200,000 unitsin China in calendar year 2006, rising substantially from theprevious year. Particularly strong were sales of the City byGuangzhou Honda Automobile Co., Ltd., an affiliate accountedfor under the equity method, and Civic sales by DongfengHonda Automobile Co., Ltd., also an equity-method affiliate. InSeptember 2006, the Acura brand was introduced in China, inthe brand’s first launch outside North America, through sales ofthe Acura RL and the Acura TL. In fiscal year 2007, total unitsales of completed automobiles of Honda and its consolidatedsubsidiaries, and unit sales of parts to Honda’s affiliatesaccounted for under the equity method for purposes of localproduction by such affiliates in the aggregate, significantlyincreased 37.6%, to 361,000 units from the previous fiscalyear. In production, in September 2006 operations began atthe second plant of Guangzhou Honda Automobile Co., Ltd.,which has an annual production capacity of 120,000 units. InMarch 2007, production also began at a new plant in Chinathat manufactures automobile transmissions and otherpowertrain components. These advances are in line withHonda’s move to strengthen its structure to meet burgeoningChinese demand.
In India, where the market continues to expand, an Indian-made Civic model went on sale in July 2006, contributing tohigher unit sales.
In Vietnam, consolidated subsidiary Honda Vietnam Co.,Ltd., began local production of the Civic in July 2006.
Other RegionsDue to expansion in Latin America, the Pacific, and the Middle& Near East, unit sales in Other regions rose 23.4% in fiscalyear 2007, to 248,000 units.
In Brazil, Honda began local production of the Civic in April2006, and sales of this model were strong. In November 2006,we introduced the Civic FFV, a flexible-fuel vehicle that runs on100% ethanol or any gasoline-ethanol mixture, followed by thelaunch of the Fit FFV in December. Australian sales of the Civic,Jazz and the new CR-V were strong.
Power Product and Other BusinessesHonda’s unit sales of power products totaled 6,421,000 units,up 9.3% from the previous fiscal year. In Japan, unit salestotaled 527,000 units, an increase of 8.2%. Overseas unit salescame to 5,894,000 units, an increase of 9.4%, due mainly toincreased unit sales in North America and Europe. Revenue inpower product and other businesses, including intersegmentsales within Honda, increased 14.7%, to ¥438.9 billion, fromthe previous fiscal year, due mainly to increased unit sales ofpower products and the positive impact of currency translationeffects. Operating income was ¥36.1 billion, an increase of0.6% from the previous fiscal year, due mainly to the positiveimpact of increased profit attributable to higher revenue andthe currency effects caused by the depreciation of the Japa-nese yen, which offset the negative impact of the increasedSG&A expenses and the gain on return which was recorded inthe fiscal year ended March 31, 2006. The operating marginwas 8.2%.
Unit Sales
Thousands
Years ended March 31 2006 2007 % change
Japan 487 527 8.2%North America 2,827 3,103 9.8Europe 1,477 1,625 10.0Asia 717 760 6.0Other Regions 368 406 10.3
Total 5,876 6,421 9.3%
03 04 05 06 07
2,000
4,000
8,000
6,000
4,5845,047
5,876
326342
382
0
6,421
438
03 04 05 06 070
120
240
360
480
5,300 341
Unit Sales Years ended March 31
(Thousands)
Net Sales Years ended March 31
Yen (billions)
JapanNorth AmericaEurope
AsiaOther Regions

59
JapanIn Japan, unit sales rose 8.2%, to 527,000 units from the previ-ous fiscal year. Sales of snowblowers, compact home-usecogeneration systems*1, the GX-series engines supplied topump and generator manufacturers on an OEM*2 basisapplications increased.
North AmericaIn North America, sales were strong for GCV series engines—mainly for OEM use in lawn mowers, as well as GX- and GC-series engines for such OEM applications as generators andhigh-pressure washers. Sales of completed equipmentexpanded, due to Honda’s introduction of the new HRR lawnmower, but sales of generators declined as a result of overallmarket shrinkage. As a result of these factors, unit sales frompower product grew 9.8% in fiscal year 2007, to 3,103,000units.
During the year, Honda ranked highest in the electronic fuel-injected (EFI) four-stroke outboard segment for a third con-secutive year in the United States according to the customersatisfaction study*3 conducted by J.D. Power and Associates.
EuropeIn Europe, OEM sales of GCV-series engines for lawn mowerswere favorable, as were sales of GX-series engines for OEMuse in generators and construction equipment. As a result, unitsales grew 10.0%, to 1,625,000 units.
AsiaUnit sales in Asia expanded 6.0%, to 760,000 units, due toincreased sales of pumps and other equipment in China andIndia.
Other RegionsIn other regions, increased unit sales of GX-series engines forOEM production, mainly in South Africa, pushed up sales10.3%, to 406,000 units from the previous fiscal year.*1: Compact, home-use cogeneration system
Honda has combined its original electromagnetic inverter technologieswith the world’s smallest(i) natural gas engine (GE160V) in an efficientlayout to create a small, lightweight cogeneration unit. Due to itscompactness, the unit can be installed in the home and boasts anoverall energy efficiency of 85%. It also emits approximately 30% lesscarbon dioxide than conventional natural gas-powered generators orhot-water heating units using natural gas.(ii)(i): A Honda development, the reciprocal gas engine(ii): Data from Honda test results. Data compares electricity from the gridwith hot-water heating units that use natural gas.
*2: OEM (Original equipment manufacturing)OEM refers to a manufacturing of products and components suppliedfor sale under a third-party brand.
*3: Disclaimer: J.D. Power and Associates 2005–2007 U.S. Marine EngineCompetitive Information StudiesSM. 2007 Study is based on responsesfrom 12,140 U.S. owners who registered a new boat between June2005 and May 2006. www.jdpower.com
In fiscal year 2007, Honda introduced two four-stroke outboardengines, the BF90 and BF75 that underwent a full modelchange, responding to needs throughout the world by simulta-neously addressing demands for high levels of both environ-mental performance, power performance and fuel efficiency.Honda also began sales in Japan of the EU55is generator,which employs electromagnetic inverter technology to supply a
high level of power, but emit a low level of noise, and of theEU6500is generator in North America. In Japan, we introduceda compact home-use cogeneration system with improved gen-eration efficiency which underwent a full model change. Wealso launched this model in the United States. In addition,Honda launched the Punch X compact tiller in Japan, and theF501 and FE500 compact tillers in Europe which underwent afull model change. In China, we launched the new EM10000high-output 10kVA generator, which is compact and equippedwith a newly developed alternator.
Financial Services BusinessHonda offers a variety of financial services to its customers anddealers, with the aim of supporting sales of Honda products.These services are provided through finance subsidiaries inJapan, the United States, Canada, the United Kingdom,Germany, Brazil and Thailand.
In fiscal year 2007, net sales of our financial services busi-ness, including intersegment sales within Honda, rose 32.9%,to ¥413.3 billion from the previous fiscal year, due mainly to ahigher loan balance accompanying the expansion of automo-bile business in North America, increased net sales in operatingleases, as well as positive currency translation effects. Operat-ing income also expanded 27.6%, to ¥115.5 billion from theprevious fiscal year, due mainly to the increased profit attribut-able to higher revenue benefiting from a higher loan balanceand positive currency translation effects, which offset thenegative impact of the increased interest rates. The operatingmargin came to 28.0%.
Our finance subsidiaries in North America have historicallyaccounted for all leases as direct finance leases. However,starting in the year ended March 31, 2007, some of the leaseswhich do not qualify for direct financing leases accountingtreatment are accounted for as operating leases. Generally,direct financing lease revenues and interest income consist ofthe recognition of finance lease revenue at inception of thelease arrangement and subsequent recognition of the interestincome component of total lease payments using the effectiveinterest method. In comparison, operating lease revenuesinclude the recognition of the gross lease payment amounts ona straight line basis over the term of the lease arrangement,and operating lease vehicles are depreciated to their estimatedresidual value on a straight line basis over the term of the lease.It is not anticipated that the differences in accounting for oper-ating leases and direct finance leases will have a material netimpact on the Company’s results of operations overall, how-ever, operating lease revenues and associated depreciation ofleased assets do result in differing presentation and timingcompared to those of direct financing leases.
Finance Subsidiaries-Receivables, Net
Yen (millions)
Years ended March 31 2006 2007 % change
Non-current ¥3,139,591 ¥3,208,778 2.2%Current 1,700,914 1,935,921 13.8
Total ¥4,840,505 ¥5,144,699 6.3%

60
Geographical InformationJapanIn Japan, revenue from domestic and export sales was¥4,774.1 billion, up 7.6% compared to the previous fiscal year,due primarily to the increased revenue from exports in auto-mobile business which offset the negative impact of thedecreased unit sales in domestic automobile business. Operat-ing income was ¥228.1 billion, down 38.5%, compared to theprevious fiscal year, due primarily to the negative impact of thechanges in the model mix, substantially increased raw materialcosts, increased SG&A expenses, increased R&D expensesand the absence of a gain on the return of the substitutionalportion of the Employee Pension Funds of the Japanese gov-ernment which was present in fiscal year 2006, which offsetthe positive impact of the increased profit attributable to higherrevenue, continuing cost reduction effects and the currencyeffects caused by the depreciation of the Japanese yen. Theoperating margin was 4.8%.
North AmericaIn North America, which mainly consists of the United States,revenue increased 9.9%, to ¥6,172.6 billion, due mainly toincreased unit sales in the automobile business and the posi-tive impact of currency translation effects. Operating incomeincreased 29.1%, to ¥456.8 billion, from the previous fiscalyear, due primarily to the positive impacts of increased profitattributable to higher revenue, continuing cost reductioneffects, decreased SG&A expenses and the currency effectscaused by the depreciation of the Japanese yen, which offsetthe negative impacts of the change in model mix and sub-stantially increased raw material costs. The operating marginwas 7.4%.
EuropeIn Europe, revenue increased 13.3%, to ¥1,347.7 billion, com-pared to the previous fiscal year, due primarily to increased unitsales in the automobile and power product businesses and thepositive impact of currency translation effects. Operating
income increased 21.6%, to ¥31.9 billion, from the previousfiscal year, due mainly to the positive impacts of increasedprofit attributable to higher revenue, continuing cost reductionand the currency effects caused by the depreciation of theJapanese yen, which offset the negative impacts of the changein model mix and increased SG&A expenses. The operatingmargin was 2.4%.
AsiaIn Asia, revenue increased 27.5%, to ¥1,271.4 billion from theprevious fiscal year, due primarily to increased unit sales in theautomobile business and the positive impact of currency trans-lation effects. Operating income increased 18.7%, to ¥77.1 bil-lion, from the previous fiscal year, due mainly to the positiveimpacts of increased profit attributable to higher revenue,which offset the negative impact of increased SG&A expenses.The operating margin was 6.1%.
Other RegionsIn other regions, revenue increased 39.5%, to ¥797.6 billion,compared to the previous fiscal year, due mainly to increasedunit sales in all of the business segments and the positiveimpact of currency translation effects. Operating income rose26.4%, to ¥72.2 billion, from the previous fiscal year, duemainly to the positive impact of the increased profit attributableto higher revenue, and the currency effects caused by thedepreciation of the Japanese yen, offsetting the negativeimpact of increased SG&A expenses. The operating marginwas 9.1%.
As described in Note (1) (v) and Note (3) to our consolidatedfinancial statements, certain revisions for misclassifications andreclassifications have been made to the prior years’ consoli-dated financial statements to conform to the presentation usedfor the fiscal year ended March 31, 2007.
The finance subsidiaries-receivables category above includes items that havebeen reclassified as trade receivables and other assets. For more detailedinformation, refer to Note (4) to the consolidated financial statements,Finance Subsidiaries-Receivables and Securitizations.
480
360
240
120
0
6,000
4,500
3,000
1,500
003 04 05 06 07 03 04 05 06 07
240
413
245 259
310
3,327
5,144
3,641
4,1494,840
Finance Subsidiaries-Receivables, Net Years ended March 31
Yen (billions)
Net Sales Years ended March 31
Yen (billions)
Non-current Current
Research and DevelopmentUsing the most advanced technologies, Honda Motor Com-pany and its consolidated subsidiaries conduct R&D activitiesaimed at creating distinctive products that are internationallycompetitive. The Group’s main R&D divisions operate indepen-dently as subsidiaries, allowing technicians to pursue theirtasks with significant freedom.
Product-related research and development is spearheadedby the Honda R&D Co., Ltd., Honda R&D Americas, Inc., in theUnited States and Honda R&D Europe (Deutschland) GmbH inGermany. Research and development on production technolo-gies centers on Honda Engineering Co., Ltd., in Japan andHonda Engineering North America, Inc. All of these entitieswork in close association with our other entities and businessin their respective regions. Total consolidated R&D expendi-tures for the year ended March 31, 2007 amounted to ¥551.8billion. Main R&D activities conducted by each businesssegment are outlined below.
Motorcycle BusinessHonda is committed to developing motorcycles with newvalue-added features that meet the individual needs ofcustomers around the world, and to implementing timely local

61
development of regional products at its overseas locations. Atthe same time, we focus on developing industry-leadingtechnologies that address safety and environmental issues.
Breakthroughs during fiscal 2007 include the developmentin the United States and Canada of the Gold Wing touring bikeequipped with the world’s first motorcycle airbag system. InNorth America and Europe, the CBR600RR underwent a fullmodel change, achieving lower weight than the previous modelthrough a more compact engine installed in a newly designedFine Die-Cast aluminum frame. It also employs a newlydesigned compact, electrically controlled steering damper thatfacilitates further enhanced riding performance. In Asia, webegan production and sales at an equity-method affiliate inIndia of the Glamour-FI 125cc motorcycle, equipped with aPGM-FI electronic fuel-injection system, which meets newdemands for low fuel consumption and clean performancethrough exhaust emissions. In China, we commenced produc-tion and sales at an equity-method affiliate of two new models:CBF150 motorcycle, mounted with a newly developed Core 2150cc engine with low fuel consumption and robust powerachieved through substantially reduced friction loss andimproved cooling performance; and SCR110 scooter, whichemploys PGM-FI low-friction technologies to become the firstmodel in the country to clear Euro3 motorcycle emission gasstandards.
Other technological R&D highlights include the announceddevelopment of Honda’s Variable Cylinder Management (VCM)system, which is based on high-performance Variable ValveTiming and Lift, Electronic Control (VTEC) technologies forthree-phase control over the number of active cylinders, facili-tating low fuel consumption and high power capacity. We alsodeveloped an engine that offers one of the world’s lowest levelsof friction, achieved by improving fuel efficiency through a two-plug system and reducing mechanical resistance in the engine.
Research and development expenses (which do not includeresearch and development at equity-method affiliatesdescribed above) in the Motorcycle Business segment infiscal 2007 totaled ¥90.1 billion.
Automobile BusinessIn the Automobile Business segment, we strive to developinnovative technologies and products through creativity-oriented development in response to customer needs. We alsoactively develop technologies that address environmentalissues and provide enhanced safety performance.
Major achievements during the year include a full modelchange for the CR-V in markets around the world. For four-wheel drive models, we introduced a new real-time 4WDsystem that improves rear-wheel torque transmissibility by bol-stering the existing dual-pump system with a one-way camunit. In Japan, we melded steering maneuver and voice guid-ance in the Honda Smart Parking Assist System, which is usedon the Life. Further, we released the Crossroad, an automobilethat transcends existing categories by combining the designand functionality of an SUV, the convenient size of a compactcar, and the three-row, seven-seat configuration of a minivan.In North America, we commenced sales of the Acura RDXentry-premium SUV, which features a newly developed 2.3-literi-VTEC (intelligent VTEC) turbo engine and Super-Handling All
Wheel Drive (SH-AWD) to provide good fuel economy, highoutput and excellent driving performance. Breakthroughs inother regions included sales of flexible fuel vehicle (FFV) ver-sions of the Civic and Fit in Brazil that can be powered byethanol or an ethanol-gasoline mixture.
Another technology development milestone was the devel-opment of a clean diesel engine on par with a gasoline enginefor environmental performance. This is achieved through anewly developed NOx catalyst that efficiently purifies NOxgases to nitrogen through a reduction reaction using ammoniaproduced within the catalytic converter. In addition, we havedeveloped an evolutionary VTEC engine with high power andlow fuel consumption and emissions, attained by combiningVTEC and Valve Timing Control (VTC)—which dynamicallycontrols the intake valve lift amount and aperture angle—forcontinuously variable control.
In the field of automotive fuel cell technologies, Hondaannounced the operation of its next-generation fuel cell-powered FCX Concept, with the compact, high efficiencyHonda FC STACK run through the central tunnel, to deliverradically improved performance in terms of driving, as well asenvironmental performance.
Research and development expenses in the AutomobileBusiness segment in fiscal 2007 totaled ¥447.0 billion.
Power Product and Other BusinessesIn the Power Product Business, we seek to develop productsthat match customers’ lifestyles and needs while strengtheningour lineup of offerings that address environmental issues.
In fiscal 2007, BF90 four-stroke marine outboard motorunderwent a full model change. This motor features such intelli-gent technologies as a VTEC structure based on a 1.5-literpassenger car engine, PGM-FI, a Lean Burn Control systemand the world’s first air-fuel timing ignition control for a marineoutboard. The BF90 is lightweight and compact, while achiev-ing excellent drive performance and economizing on fuelconsumption. We also carried out a model change for ourcompact, home-use cogeneration system, scoring improve-ments in power generation efficiency and reducing the CO2
emissions ratio. An electronic control variable jet to automati-cally optimize fuel flow is also employed to enhance cold-startperformance.
Other technical development spawned a high-expansion-ratio engine with an original intake/compression stroke andexpansion/exhaust stroke structure that was prototyped duringfiscal 2007.
In other businesses, ongoing research into jet engines andHondaJet, our advanced, compact business jet, has reachedfruition with development moving toward commercialproduction.
Research and development expenses in this segment infiscal 2007 amounted to ¥14.6 billion.
Fundamental ResearchIn the area of fundamental research, Honda pursues steadyand varied research activities into technologies that may lead toinnovative applications in the future.
During the year, we announced a new brain-machine inter-face creating basic technology for manipulating robots using

62
human brain activity as a result of joint research with AdvancedTelecommunications Research Institute International. Hondahas also developed a biofabric with excellent levels of durability,aesthetics and smoothness for use as an automobile interiorfinish. As this fabric is derived from plant materials, the materialmanufacturing process results in an energy savings of 10% to15%, compared with such conventional oil-based fabrics aspolyester. Further, through joint research with the ResearchInstitute of Innovative Technology for the Earth we have estab-lished a technological base for ethanol production from soft-biomass, cellulose from plant stalk and leaf matter, such ascultivated rice byproducts, that are not suitable for human con-sumption. This step from cellulose to bioethanol productionsurmounts a problem that had been thwarting progress inthis field.
Expenses incurred in fundamental research are distributedamong Honda’s business segments.
improvement, streamlining and modernization of productionfacilities, and improvement of Sales and R&D facilities.
In the financial services segment, capital expendituresexcluding property on operating leases amounted to ¥0.9 bil-lion in the fiscal year ended March 31, 2007, while capitalexpenditures for property on operating leases were ¥366.7 bil-lion. Capital expenditures in power product and other busi-nesses in the fiscal year ended March 31, 2007, totaling ¥16.3billion, were deployed to upgrade, streamline, and modernizemanufacturing facilities for power products, and to improveR&D facilities for power products.
The Company did not sell or dispose of any major facilitiesin the fiscal year ended March 31, 2007.
Spending by business segment is shown below.
Yen (millions)
Years ended March 31 2006 2007
Motorcycle Business ¥052,246 ¥068,880Automobile Business 392,934 540,859Financial Services 1,316 933Power Product and Other Businesses 011,345 016,394
Total ¥457,841 ¥627,066
Purchase of operating lease assets ¥000—00 ¥366,795
Capital ExpendituresCapital expenditures in fiscal 2007 were applied to the expan-sion of manufacturing facilities, streamlining efforts, and thereplacement of older equipment. Other expenditures includedfunds used to augment sales and R&D facilities.
Total capital expenditures for the year amounted to ¥993.8billion, up ¥536.0 billion from the previous year. Also, total capi-tal expenditures excluding property on operating leases for theyear amounted to ¥627.0 billion, up ¥169.2 billion from theprevious year.
In the motorcycle business, we made capital expendituresof ¥68.8 billion in the fiscal year ended March 31, 2007. Fundswere allocated to the introduction of new models, as well asthe improvement, streamlining and modernization of produc-tion facilities, and improvement of Sales and R&D facilities.
In the automobile business, we made capital expenditures of¥540.8 billion in the fiscal year ended March 31, 2007. Fundswere allocated to the introduction of new models, as well as the
03 04 05 06 070
200
400
600
0
2.0
4.0
6.0
R&D Expenses and R&D Expenses as a Percentage of Net SalesYears ended March 31
Yen (billions) (%)
R&D Expenses (left)
R&D Expenses as a Percentage of Net Sales (right)
Plans after Fiscal 2007Honda plans to build a new engine plant in Ogawa-machi Hiki-gun, Saitama with an investment of approximately ¥25,000million. The annual production capacity of this new plant will beapproximately 200,000 units. This new plant should beginoperation in 2009. The amount of this capital expenditure isincluded in the plan of new auto plant in Yorii-machi Oosato-gun, Saitama with an investment of approximately ¥70,000million, which was announced last fiscal year.
03 04 05 06 070
200
400
600
Capital Expenditures
Depreciation
Capital Expenditures and DepreciationYears ended March 31
Yen (billions)

63
The estimated amount of capital expenditures in fiscal 2008 isshown below.
Yen (millions)
Year ending March 31 2008
Motorcycle Business ¥092,800Automobile Business 588,000Financial Services 1,300Power Product and Other Businesses 27,900
Total ¥710,000
The estimated amount of capital expenditures in fiscal 2008 forfinancial services does not include property on operating leases.
Liquidity and Capital ResourcesOverview of Capital Requirements, Sources and UsesThe policy of Honda is to support its business activities bymaintaining sufficient capital resources, a sufficient level ofliquidity and a sound balance sheet.
Honda’s main business is the manufacturing and sale ofmotorcycles, automobiles and power products. To support thisbusiness, it also provides retail financing and automobile leas-ing services for customers, as well as wholesale financingservices for dealers.
In its manufacturing and sales business, Honda requiresoperating capital mainly to purchase parts and materialsrequired for production, as well as to control inventory of fin-ished products and cover receivables from dealers. Honda alsorequires funds for capital expenditures, mainly to introduce newmodels, upgrade, rationalize and renew production facilities, aswell as to expand and reinforce Sales and R&D facilities.
Honda meets its operating capital requirements mainlythrough cash generated by operations. Honda funds its finan-cial programs for customers and dealers primarily from corpo-rate bonds, medium-term notes, commercial paper, andsecuritization of finance receivables. The year-end balance ofliabilities associated with fund-raising by finance subsidiarieswas ¥4,470.4 billion as of March 31, 2007.
Cash FlowsConsolidated cash and cash equivalents amounted to ¥945.5billion as of March 31, 2007, up ¥228.7 billion, or 31.9%, from ayear earlier, mainly owing to the increases in net cash provided byoperating and financing activities, offset in part by the increase innet cash used in investing activities as described below.
Net cash provided by operating activities amounted to¥904.5 billion. Factors increasing operating cash flowsincluded continued significant growth in sales and stable oper-ating margins (excluding the effect of the non-cash gain onreturn in the prior year), accompanied by lower increases in netoperating assets and liabilities in the current year.
Net cash used in investing activities totaled ¥1,130.7 billion.Factors increasing net cash used in investing cash flows weremainly due to ¥597.9 billion in capital expenditures associatedwith introducing new models, upgrading, streamlining andrenewing production facilities, and the improvement of Salesand R&D facilities. Other factors were ¥240.2 billion increase inacquisition of finance subsidiaries-receivables and ¥365.5 bil-lion increase of property on operating leases associated with
higher sales of automobiles in North America and elsewhere.Net cash provided by financing activities was ¥423.4 billion.
During the year, Honda raised ¥306.0 billion in short-term debtthrough the issue of commercial paper, and also raised ¥969.4billion in long-term debt through the issue of bonds andmedium-term notes to meet capital requirements associatedmainly with an increase in liabilities of finance subsidiaries, aswell as to repay ¥677.5 billion in long-term debt. By contrast,Honda also made ¥26.6 billion in payments for purchase oftreasury stock and ¥140.4 billion in cash dividends paid.
LiquidityThe ¥945.5 billion in cash and cash equivalents at end of yearcorresponds to approximately 1.0 month of net sales, andHonda believes it has sufficient liquidity for its business opera-tions. At the same time, Honda is aware of the possibility thatvarious factors, such as recession-induced market contractionand financial and foreign exchange market volatility, mayadversely affect liquidity.
For this reason, finance subsidiaries carry total short-termborrowings of ¥1,842.1 billion in the form of commercial paperissued regularly to replace debt. This serves as alternativeliquidity for a back-up credit line equivalent to ¥826.1 billion.Honda believes it currently has sufficient credit limits, extendedby prominent international banks.
Honda believes it has adequate liquidity to meet its cashobligations for the near future at least for the year endingMarch 31, 2008.
Honda’s short- and long-term debt securities are rated bycredit rating agencies, such as Moody’s Investor Service, Inc.,and Standard & Poor’s Rating Services. Based on major cur-rent ratings, which are shown below, Honda will be able toraise funds even if it requires more capital than its present levelof liquidity would allow.
The following table shows the ratings of Honda’s unsecureddebt securities by Moody’s and Standard & Poor’s as of thedate of the filing of this Form 20-F.
Credit Ratings for
Short-term Long-termunsecured unsecured
debt securities debt securities
Moody’s Investors Service P-1 Aa3Standard & Poor’s Rating Services A-1 A+
The above ratings are based on information provided byHonda and other information deemed credible by the ratingagencies. They are also based on the agencies’ assessment ofcredit risk associated with designated securities issued byHonda. Each rating agency uses different standards for calcu-lating Honda’s credit rating, and also makes its own assess-ments. Ratings can be revised or nullified by agencies at anytime. These ratings are not meant to serve as a recommenda-tion for trading in or holding debt.
Off-Balance Sheet ArrangementsSpecial Purpose EntityFor the purpose of accelerating the receipt of cash related to ourfinance receivables, we periodically securitize and sell pools ofthese receivables. In these securitizations, we sell a portfolio of

64
Tabular Disclosure of Contractual ObligationsThe following table shows our contractual obligations at March 31, 2007:
Yen (millions)
Payments due by period
Total Less than 1 year 1-3 years 3-5 years After 5 years
Long-term debt ¥2,681,152 ¥775,409 ¥1,374,355 ¥504,705 ¥26,683Operating leases 128,978 25,354 34,703 23,543 45,378Purchase commitments(*) 78,027 78,027 — — —(*) Honda had commitments for purchases of property, plant and equipment at March 31, 2007.
Honda expects to contribute ¥33,953 million to its domesticpension plans and ¥37,187 million to its foreign pension plansin the year ending March 31, 2008.
At March 31, 2007, we had no material capital lease obliga-tions or long-term liabilities reflected on our balance sheet un-der U.S. GAAP other than those set forth in the table above.
Application of Critical Accounting PoliciesCritical accounting policies are those which require us to applythe most difficult, subjective or complex judgments, oftenrequiring us to make estimates about the effect of matters thatare inherently uncertain and which may change in subsequentperiods, or for which the use of different estimates that couldhave reasonably been used in the current period would havehad a material impact on the presentation of our financialcondition and results of operations.
The following is not intended to be a comprehensive list ofall our accounting policies. Our significant accounting policiesare more fully described in Note (1) to the accompanyingconsolidated financial statements.
We have identified the following critical accounting policieswith respect to our financial presentation.
(Product Warranty)We warrant our products for specific periods of time.
Product warranties vary depending upon the nature of theproduct, the geographic location of their sales and otherfactors.
We recognize costs for general warranties on products wesell and product recalls. We provide for estimated warrantycosts at the time products are sold to customers or the timenew warranty programs are initiated. Estimated warranty costsare provided based on historical warranty claim experiencewith consideration given to the expected level of future
warranty costs, including current sales trends, the expectednumber of units to be affected and the estimated average re-pair cost per unit for warranty claims. Our products containcertain parts manufactured by third party suppliers. Since sup-pliers typically warrant these parts, the expected receivablesfrom warranties of these suppliers are deducted from our esti-mates of accrued warranty obligations.
We believe our accrued warranty liability is a “criticalaccounting estimate” because changes in the calculation canmaterially affect net income, and require us to estimate thefrequency and amounts of future claims, which are inherentlyuncertain.
Our policy is to continuously monitor warranty cost accrualsto determine their adequacy of the accrual. Therefore, warrantyexpense accruals are maintained at an amount we deemadequate to cover estimated warranty expenses.
Actual claims incurred in the future may differ from theoriginal estimates, which may result in material revisions to thewarranty expense accruals.
Additional detailed information about the changes inprovisions for the product warranties for each of the years inthe two-year period ended March 31, 2007 is described inNote (18) to the accompanying consolidated financialstatements.
(Credit Losses)Our finance subsidiaries provide wholesale financing to dealersand retail lending and direct financing leases to customersmainly in order to support sales of our products, principally inNorth America. We classify the receivables derived from thoseservices as finance subsidiaries-receivables. Certain financereceivables related to sales of inventory are included in tradereceivables and other assets in the consolidated balancesheets.
finance receivables to a special purpose entity, which is estab-lished for the limited purpose of buying and reselling financereceivables. We remain as a servicer of the finance receivablesand are paid a servicing fee for our services. The special purposeentity transfers the receivables to a trust or bank conduit, whichissues interest-bearing asset-backed securities or commercialpaper, respectively, to investors. We retain certain subordinatedinterests in the sold receivables in the form of subordinated certifi-cates, servicing assets and residual interests in certain cash re-serves provided as credit enhancements for investors. We applysignificant assumptions regarding prepayments, credit losses andaverage interest rates in estimating expected cash flows from thetrust or bank conduit, which affect the recoverability of our
retained interests in the sold finance receivables. We periodicallyevaluate these assumptions and adjust them, if appropriate, toreflect the performance of the finance receivables.
GuaranteeAt March 31, 2007, we guaranteed ¥41.1 billion of employeebank loans for their housing costs. If an employee defaults onhis/her loan payments, we are required to perform under theguarantee. The undiscounted maximum amount of our obliga-tion to make future payments in the event of defaults is ¥41.1billion. As of March 31, 2007, no amount was accrued for anyestimated losses under the obligations, as it was probable thatthe employees would be able to make all scheduled payments.

65
To determine the overall allowance for credit loss amount,receivables are segmented into pools with common character-istics such as product and collateral types, credit grades, andoriginal loan terms. For each of these pools, we estimatelosses primarily based on our historic loss experiences, delin-quency rates, recovery rates and scale and composition of theportfolio, taking factors into consideration such as changingeconomic conditions and changes in operational policies andprocedures.
We believe our allowance for credit losses is a “criticalaccounting estimate” because it requires us to make assump-tions about inherently uncertain items such as future economictrends, quality of finance subsidiaries-receivables and otherfactors. We review the adequacy of the allowance for creditlosses, and the allowance for credit losses is maintained at anamount that we deem sufficient to cover the estimated credit
losses incurred on our owned portfolio of finance receivables.However, actual losses may differ from the original estimates asa result of actual results varying from those assumed in ourestimates.
As an example of the sensitivity of the allowance calculation,the following scenario demonstrates the impact that a deviationin one of the primary factors estimated as a part of our allow-ance calculation would have on the provision and allowance forcredit losses. If we had experienced a 10% increase in netcredit losses during fiscal 2007 in our North America portfolio,the provision for fiscal 2007 and the allowance balance at theend of fiscal 2007 would have increased by approximately ¥5.5billion and ¥2.8 billion, respectively. Note that this sensitivityanalysis may be asymmetric, and are specific to the baseconditions in fiscal 2007.
Additional Narrative of the Change in Credit Loss as BelowThe following table shows information related to our credit loss experience in our North America portfolio:
Yen (billions)
Fiscal years ended March 31 2005 2006 2007
Charge-offs (net of recoveries) ¥0,023.1 ¥0,022.8 ¥0,026.2Provision for credit losses 31.7 27.4 25.5Allowance for credit losses 29.2 30.1 28.7Ending receivable balance 3,613.6 4,166.5 4,351.8Average receivable balance, net 3,333.5 3,938.2 4,330.8Charge-offs as a % of average receivable balance 0.70% 0.58% 0.61%Allowance as a % of ending receivable balance 0.81% 0.72% 0.66%
Fiscal Year 2007 Compared with Fiscal Year 2006Net charge-offs in our North American portfolio increased by¥3.4 billion, or 15%. Higher originations of finance receivablesdue to business expansion in fiscal year 2006 compared to fis-cal year 2005 resulted in higher charge-offs in fiscal year 2007.
The provision for credit losses decreased by ¥1.9 billion, or7% and the allowance for credit losses decreased by ¥1.4 bil-lion, or 5%. The decreases were due to lower estimates oflosses incurred as of March 31, 2007 even though financereceivables increased.
(Losses on Lease Residual Values)End-customers of leased vehicles typically have an option tobuy the leased vehicle for the contractual residual value of thevehicle or to return the vehicle to our finance subsidiariesthrough the dealer at the end of the lease term. Likewise, deal-ers have the option to buy the vehicle returned by the cus-tomer or to return the vehicle to our finance subsidiaries. Thelikelihood that the leased vehicle will be purchased variesdepending on the difference between the actual market valueof the vehicle at the end of the lease term and the contractualvalue determined at the inception of the lease. Our financesubsidiaries in North America have historically accounted for allleases as direct finance leases. However, starting in the yearended March 31, 2007, some of the leases which do notqualify for direct financing leases accounting treatment areaccounted for as operating leases.
We initially determine the contract residual values by usingour estimate of future used vehicle values, taking into consider-ation data obtained from third parties. We are exposed to riskof loss on the disposition of returned lease vehicles when theproceeds from the sale of the vehicles are less than the con-tractual residual values at the end of the lease term. We peri-odically review the estimate of residual values. Downwardadjustments are made for declines in estimated residual valuesthat are deemed to be other-than-temporary. For direct financ-ing leases, our finance subsidiaries in North America purchaseinsurance to cover a portion of the estimated residual value.The adjustments on the uninsured portion of the vehicle’sresidual value are recognized as a loss in the period in whichthe estimate changed. For vehicle leases accounted for asoperating leases, adjustments to estimated residual valuesresult in changes to the remaining depreciation expense to berecognized prospectively on a straight-line basis over theremaining term of the lease.
The primary components in estimating losses on leaseresidual values are the expected frequency of returns, or thepercentage of leased vehicles we expect to be returned bycustomers at the end of the lease term, and the expected lossseverity, or the expected difference between the residual valueand the amount we receive through sales of returned vehiclesplus proceeds from insurance, if any. We estimate losses onlease residual values by evaluating several different factors,including trends in historical and projected used vehicle valuesand general economic measures.

66
We believe that our estimated losses on lease residualvalues is a “critical accounting estimate” because it is highlysusceptible to market volatility and requires us to makeassumptions about future economic trends and lease residualvalues, which are inherently uncertain. We believe that theassumptions used are appropriate. However, actual lossesincurred may differ from original estimates.
If future auction values for all Honda and Acura vehicles inour North American direct financing lease portfolio as of March31, 2007, were to decrease by approximately ¥10,000 per unitfrom our present estimates, the total impact would be anincrease in losses on lease residual values by about ¥0.8 bil-lion. Similarly, if future return rates for our existing portfolio of allHonda and Acura vehicles were to increase by one percentagepoint from our present estimates, the total impact would be anincrease in losses on lease residual values by about ¥0.1 bil-lion. For operating lease portfolio as of March 31 with the sameprerequisite shown above, the impacts would be immaterial.Note that this sensitivity analysis may be asymmetric, and arespecific to the base conditions in fiscal 2007.
(Pension and Other Postretirement Benefits)We have various pension plans covering substantially all of ouremployees in Japan and certain employees in foreign coun-tries. Benefit obligations and pension costs are based onassumptions of many factors, including the discount rate, therate of salary increase and the expected long-term rate ofreturn on plan assets. The discount rate and expected long-
term rate of return on plan assets are determined based on ourevaluation of current market conditions, including changes ininterest rates. The salary increase assumptions reflect our ac-tual experience as well as near-term outlook. Our assumed dis-count rate and rate of salary increase as of March 31, 2007were 2.0% and 2.3%, respectively, and our assumed expectedlong-term rate of return for the year ended March 31, 2007was 4.0% for Japanese plans. Our assumed discount rate andrate of salary increase as of March 31, 2007 were 5.2–6.0%and 2.9–6.4%, respectively, and our assumed expected long-term rate of return for fiscal 2007 was 6.8-8.0% for foreignplans.
We believe that the accounting estimates related to ourpension plans is “critical accounting estimate” becausechanges in these estimates can materially affect our financialcondition and results of operations.
Actual results may differ from our assumptions, and the dif-ference is accumulated and amortized over future periods.Therefore, the difference will be generally reflected as our rec-ognized expenses and recorded obligations in future period.We believe that the assumptions currently used are appropri-ate, however, differences in actual expenses or changes in as-sumptions could affect our pension costs and obligations,including our cash requirements to fund such obligations.
The following table shows the effect of a 0.5% change inthe assumed discount rate and the expected long-term rate ofreturn on our funded status, equity, and pension expense.
Japanese Plans Yen (billions)
Assumptions Percentage point change (%) Funded status Equity Pension expense
Discount rate +0.5/–0.5 –88.1/+99.3 +47.9/–59.8 –5.2/+6.3Expected long-term rate of return +0.5/–0.5 — — –3.3/+3.3
Foreign Plans Yen (billions)
Assumptions Percentage point change (%) Funded status Equity Pension expense
Discount rate +0.5/–0.5 –43.4/+49.8 +30.7/–35.8 –6.3/+7.3Expected long-term rate of return +0.5/–0.5 — — –1.8/+1.8(*1) Note that this sensitivity analysis may be asymmetric, and are specific to the base conditions at March 31, 2007.(*2) Funded status for fiscal 2007 is affected by March 31, 2007 assumptions. Pension expense for fiscal 2007 is affected by March 31, 2006 assumptions.
Quantitative and Qualitative Disclosure About MarketRiskHonda is exposed to market risks, which are changes in for-eign currency exchanges rates, in interest rates and in prices ofmarketable equity securities. Honda is a party to derivative fi-nancial instruments in the normal course of business in orderto manage risks associated with changes in foreign currencyexchange rates and in interest rates. Honda does not hold anyderivative financial instruments for trading purposes.
(Foreign Currency Exchange Rate Risk)Foreign currency forward exchange contracts and purchased
option contracts are normally used to hedge sale commitmentsdenominated in foreign currencies (principally U.S. dollars).
Foreign currency written option contracts are entered into incombination with purchased option contracts to offset pre-mium amounts to be paid for purchased option contracts.
The tables on the next page provide information about ourderivatives related to foreign currency exchange rate risk as ofMarch 31, 2006 and 2007. For forward exchange contractsand currency options, the table presents the contract amountsand fair value. All forward exchange contracts and currencyoptions to which we are a party have original maturities of lessthan one year.

67
(Interest Rate Risks)Honda is exposed to market risk for changes in interest ratesrelated primarily to its debt obligations and finance receivables.In addition to short-term financing such as commercial paper,Honda has long-term debt with both fixed and floating rates.Our finance receivables are primarily fixed rate. Interest rateswap agreements are mainly used to convert floating ratefinancing (normally three-five years) to fixed rate financing inorder to match financing costs with income from finance re-ceivables. Foreign currency and interest rate swap agreementsused among different currencies, also serve to hedge foreign
currency exchange risk as well as interest rate risk.The following tables provide information about Honda’s
financial instruments that were sensitive to changes in interestrates at March 31, 2006 and 2007. For finance receivables andlong-term debt, these tables present principal cash flows, fairvalue and related weighted average interest rates. For interestrate swaps and currency & interest rate swaps, the table pre-sents notional amounts, fair value and weighted average inter-est rates. Variable interest rates are determined using formulassuch as LIBOR+α and an index.
Foreign Exchange Risk
2006 2007Yen (millions) Average Yen (millions) Average
Contract contractual Contract contractualamounts Fair value rate (Yen) amounts Fair value rate (Yen)
Forward Exchange ContractTo sell US$ ¥270,070 (1,771) 115.88 ¥336,005 1,299) 117.84To sell EUR 132,694 (3,333) 138.57 60,305 (963) 154.35To sell CA$ 19,225 (1) 100.59 16,548 (67) 100.88To sell GBP 82,546 (984) 201.67 173,894 (1,352) 228.48To sell other foreign currencies 82,985 310) — 36,344 (670) —To buy US$ 5,535 45) 115.78 9,864 (122) 114.93To buy other foreign currencies 992 22) — 11,358 (85) —Cross-currencies 304,078 2,228) — 334,676 (1,533) —
Total ¥898,125 (3,484) ¥978,994 (3,493)
Currency OptionOption purchased to sell US$ ¥058,446 520) — ¥,0,0— —) —Option written to sell US$ 104,576 (323) — — —) —Option purchased to sell other currencies 4,982 19) — 2,317 24) —Option written to sell other currencies 8,544 (85) — 3,476 (42) —
Total ¥176,548 131) ¥5,793 (18)
Finance Subsidiaries-Receivables
2006 2007Yen (millions) Yen (millions)
AverageExpected maturity dateinterest
Total Fair value Total Within 1 year 1-2 year 2-3 year 3-4 year 4-5 year Thereafter Fair value rate
Direct Finance Leases*1:JP¥ ¥0,024,450 — ¥0,026,894 15,811 5,571 3,247 1,465 800 — — 4.82%US$ 1,846,959 — 1,426,173 558,263 531,211 309,651 27,039 9 — — 4.75%Other 348,691 — 439,499 127,160 97,709 108,119 102,209 4,285 17 — 4.52%
Total—Direct Finance Leases ¥2,220,100 — ¥1,892,566 701,234 634,491 421,017 130,713 5,094 17 —
Other Finance Receivables:JP¥ ¥0,412,415 377,036 ¥0,402,970 135,176 103,753 75,794 48,250 25,086 14,911 398,869 4.82%US$ 1,982,413 1,935,956 2,485,210 876,988 525,019 466,471 350,458 210,906 55,368 2,545,210 7.03%Other 428,934 405,397 487,922 265,085 94,556 67,451 40,621 17,573 2,636 411,955 7.48%
Total—Other Finance Receivables ¥2,823,762 2,718,389 ¥3,376,102 1,277,249 723,328 609,716 439,329 253,565 72,915 3,356,034Retained interest in the sold pools of finance receivables*2 94,634 94,634 88,110 — — — — — — 88,110
Total*3 ¥5,138,496 — ¥5,356,778 — — — — — — 2,407—
*1 : Under U.S. generally accepted accounting principles, disclosure of fair values of direct finance leases is not required.*2 : The retained interest in the sold pools of finance receivables is accounted for as “trading” securities and is reported at fair value.*3 : The finance subsidiaries-receivables include finance subsidiaries-receivables included in trade receivables and other assets in the consolidated balance
sheets. Additional detailed information is described in Note (4) to the accompanying consolidated financial statements.

68
Long-Term Debt (including current maturities)
2006 2007Yen (millions) Yen (millions)
AverageExpected maturity dateinterest
Total Fair value Total Within 1 year 1-2 year 2-3 year 3-4 year 4-5 year Thereafter Fair value rate
Japanese yen bonds ¥0,231,200 228,555 ¥0,230,129 50,050 30,048 60,049 59,992 29,990 — 229,379 0.89%Japanese yen medium-term notes (Fixed rate) 374,624 374,887 367,900 114,000 103,400 70,500 62,000 18,000 — 368,425 0.80%Japanese yen medium-term notes (Floating rate) 100,696 101,328 85,200 24,500 38,000 19,700 — 3,000 — 85,525 0.77%U.S. dollar medium-term notes (Fixed rate) 336,512 334,377 354,500 35,409 107,539 88,147 58,764 41,135 23,506 357,121 4.52%U.S. dollar medium-term notes (Floating rate) 986,010 995,905 1,171,527 444,023 480,341 153,140 35,259 58,764 — 1,183,041 5.38%U.S. dollar commercial paper 204,893 204,893 — — — — — — — — —Loans and others—primarily fixed rate 302,710 303,969 471,896 107,427 129,322 94,169 101,964 35,837 3,177 471,384 4.14%
Total ¥2,536,645 2,543,914 ¥2,681,152 775,409 888,650 485,705 317,979 186,726 26,683 2,694,875 —
Interest Rate Swaps
2006 2007Yen (millions) Yen (millions)
Notional Expected maturity date Average Averageprincipal Contract Contract Within receive paycurrency Receive/Pay amounts Fair value amounts 1 year 1-2 year 2-3 year 3-4 year 4-5 year Thereafter Fair value rate rate
JP¥ Float/Fix ¥0,001,455 (3) ¥0,005,858 150 4,582 326 800 — — —) 1.01% 1.45%US$ Float/Fix 2,712,564 39,965) 2,933,563 1,195,922 964,636 633,560 120,409 19,036 — 8,661) 5.35% 4.65%
Fix/Float 337,726 (6,426) 355,921 35,414 108,016 88,538 59,025 41,318 23,610 (1,878) 4.52% 5.50%Float/Float 52,274 (311) 90,899 32,464 49,581 8,854 — — — (205) 5.20% 5.36%
CA$ Float/Fix 433,089 4,445) 490,691 126,528 134,859 116,808 89,792 22,704 — 2,186) 4.09% 3.94%Fix/Float 71,663 (1,067) 75,961 6,817 18,832 18,677 6,373 25,196 66 (346) 3.95% 4.44%Float/Float 185,057 (303) 195,325 74,134 64,383 37,207 14,701 4,834 66 (302) 4.04% 4.13%
GBP Float/Fix 54,927 32) 48,314 16,408 10,321 11,377 10,208 — — 333) 4.81% 4.90%Fix/Float 8,993 —) 1,931 1,563 368 — — — — —) 5.11% 5.62%
Total ¥3,857,748 36,332) ¥4,198,463 1,489,400 1,355,578 915,347 301,308 113,088 23,742 8,449)
Currency & Interest Rate Swaps
2006 2007Yen (millions) Yen (millions)
Receiving Paying Expected maturity date Average Averageside side Contract Contract Within receive paycurrency currency Receive/Pay amounts Fair value amounts 1 year 1-2 year 2-3 year 3-4 year 4-5 year Thereafter Fair value rate rate
JP¥ US$ Fix/Float ¥393,389 (22,996) ¥386,064 117,555 109,379 76,071 64,740 18,319 — (21,728) 0.80% 5.61%Float/Float 103,823 (5,520) 87,414 25,374 40,496 18,516 3,028 — — (4,940) 0.77% 5.58%
JP¥ CA$ Fix/Float 2,772 (610) 2,790 — — 2,790 — — — (628) 0.95% 4.75%Other Other Fix/Float 70,041 736) 70,387 — — — 70,387 — — 6,425 3.75% 5.50%
Float/Float 14,333 241) 61,879 — 22,471 39,408 — — — 3,334 3.99% 5.42%
Total ¥584,358 (28,149) ¥608,534 142,929 172,346 136,785 138,155 18,319 — (17,537)
(Equity Price Risk)Honda is exposed to equity price risk as a result of its holdingsof marketable equity securities. Marketable equity securitiesincluded in Honda’s investment portfolio are held for purposesother than trading, and are reported at fair value, with unreal-ized gains or losses, net of deferred taxes included in accumu-
lated other comprehensive income (loss) in the stockholders’equity section of the consolidated balance sheets. At March31, 2006 and 2007, the estimated fair value of marketableequity securities was ¥141.8 billion and ¥169.2 billion,respectively.

69
Legal ProceedingsVarious legal proceedings are pending against us. We believethat such proceedings constitute ordinary routine litigation inci-dental to our business. With respect to product liability, per-sonal injury claims or lawsuits, we believe that any judgmentthat may be recovered by any plaintiff for general and specialdamages and court costs will be adequately covered by ourinsurance and reserves. Punitive damages are claimed in cer-tain of these lawsuits. We are also subject to potential liabilityby other various lawsuits and claims.
75 purported class actions on behalf of all purchasers ofnew motor vehicles in the United States since January 1, 2001,have been filed in various state and federal courts againstAmerican Honda Motor Co., Inc., Honda Canada, Inc., GeneralMotors, Ford, Daimler Chrysler, Toyota, Nissan, andVolkswagen and their Canadian affiliates, the National Automo-bile Dealers Association and the Canadian Automobile DealersAssociation. Several of the state court actions also nameHonda Motor Co., Ltd. as a defendant, as well as other Japa-nese and German parent companies of United States basedsubsidiaries. The federal court actions have been consolidatedfor coordinated pretrial proceedings in federal court in Maineand 37 California cases have been consolidated in the statecourt in San Francisco. Additionally, there are pending cases inseven other states.
The nearly identical complaints allege that the manufacturerdefendants, aided by the association defendants, conspiredamong themselves and with their dealers to prevent UnitedStates citizens from purchasing vehicles produced for theCanadian market and sold by dealers in Canada. The com-plaints allege that new vehicle prices in Canada are 10 to 30%lower than those in the United States and that preventing thesale of these vehicles to United States citizens resulted in thepayment of supracompetitive prices by United States consum-ers. The complaints seek treble damages under the antitrustlaws, but do not specify damages. The federal court has certi-fied a class for injunctive relief and damages. We believe ouractions have been lawful and are vigorously defending thesecases.
In accordance with Statement of Financial Accounting Stan-dards (SFAS) No. 5, “Accounting for Contingencies”, Hondahas recorded a contingent liability when it is probable that anobligation has been incurred and the amount of loss can bereasonably estimated. After consultation with legal counsel,and taking into account all known factors pertaining to existinglawsuits and claims, we believe that the overall results of alllawsuits and pending claims should not result in liability to usthat would be likely to have an adverse material effect on ourconsolidated financial position and results of operations.

70
CONSOLIDATED BALANCE SHEETS
Honda Motor Co., Ltd. and Subsidiaries U.S. dollarsMarch 31, 2006 and 2007 Yen (millions)
(millions) (note 2)
Assets 2006* 2007 2007
Current assets:
Cash and cash equivalents ¥00,716,788 ¥0,945,546 $008,010
Trade accounts and notes receivable, net of allowance
for doubtful accounts of ¥10,689 million in 2006 and
¥8,199 million ($69 million) in 2007 (notes 4 and 20) 963,320 1,055,470 8,941
Finance subsidiaries–receivables, net (notes 4, 9 and 20) 1,230,912 1,426,224 12,082
Inventories (note 5) 1,036,304 1,183,116 10,022
Deferred income taxes (note 11) 221,294 215,172 1,823
Other current assets (notes 7, 9 and 16) 406,985 426,863 3,615
Total current assets 4,575,603 5,252,391 44,493
Finance subsidiaries–receivables, net (notes 4, 9 and 20) 2,982,425 3,039,826 25,750
Investments and advances:
Investments in and advances to affiliates (note 6) 408,993 487,538 4,130
Other, including marketable equity securities (note 7) 298,460 254,610 2,157
Total investments and advances 707,453 742,148 6,287
Property on operating leases (note 8):
Vehicles — 345,909 2,930
Less accumulated depreciation — 9,700 82
Net property on operating leases — 336,209 2,848
Property, plant and equipment, at cost (note 9):
Land 384,447 429,373 3,637
Buildings 1,149,517 1,322,394 11,202
Machinery and equipment 2,562,507 2,988,064 25,312
Construction in progress 115,818 204,318 1,731
4,212,289 4,944,149 41,882
Less accumulated depreciation and amortization 2,397,022 2,865,421 24,273
Net property, plant and equipment 1,815,267 2,078,728 17,609
Other assets (notes 4, 9, 11 and 16) 550,652 587,198 4,974
Total assets ¥10,631,400 ¥12,036,500 $101,961
See accompanying notes to consolidated financial statements.* See note 3.
Consolidated Balance Sheets

71
U.S. dollarsYen (millions)
(millions) (note 2)
Liabilities, Minority Interests and Stockholders’ Equity 2006* 2007 2007
Current liabilities:
Short-term debt (note 9) ¥00,693,557 ¥01,265,868 $010,723
Current portion of long-term debt (note 9) 657,645 775,409 6,568
Trade payables:
Notes 31,698 33,276 282
Accounts 1,015,409 1,133,280 9,600
Accrued expenses 786,972 807,341 6,839
Income taxes payable (note 11) 110,160 76,031 644
Other current liabilities (notes 9, 11 and 16) 198,226 196,322 1,664
Total current liabilities 3,493,667 4,287,527 36,320
Long-term debt, excluding current portion (note 9) 1,879,000 1,905,743 16,144
Other liabilities (notes 9, 10, 11, 13 and 16) 1,045,523 1,237,712 10,484
Total liabilities 6,418,190 7,430,982 62,948
Minority interests in consolidated subsidiaries 87,460 122,907 1,041
Stockholders’ equity:
Common stock, authorized 7,086,000,000 shares
in 2006 and in 2007;
issued 1,834,828,430 shares in 2006 and in 2007 86,067 86,067 729
Capital surplus 172,529 172,529 1,461
Legal reserves (note 12) 35,811 37,730 320
Retained earnings (note 12) 4,267,886 4,654,890 39,432
Accumulated other comprehensive income (loss), net
(notes 7, 11, 13, 15 and 17) (407,187) (427,166) (3,619)
Treasury stock, at cost 8,680,000 shares in 2006 and
12,835,522 shares in 2007 (29,356) (41,439) (351)
Total stockholders’ equity 4,125,750 4,482,611 37,972
Commitments and contingent liabilities (notes 18 and 19)
Total liabilities, minority interests and stockholders’ equity ¥10,631,400 ¥12,036,500 $101,961

72
Consolidated Statements of Income
Honda Motor Co., Ltd. and Subsidiaries U.S. dollarsYears ended March 31, 2005, 2006 and 2007 Yen (millions)
(millions) (note 2)
2005* 2006* 2007 2007
Net sales and other operating revenue (note 4) ¥8,650,105 ¥9,907,996 ¥11,087,140 $93,919
Operating costs and expenses:
Cost of sales (note 4) 6,038,172 7,010,357 7,865,142 66,626
Selling, general and administrative 1,513,259 1,656,365 1,818,272 15,402
Research and development 467,754 510,385 551,847 4,675
8,019,185 9,177,107 10,235,261 86,703
Gain on transfer of the substitutional portion of
the Employees’ Pension Funds (note 13) — 138,016 — —
Operating income 630,920 868,905 851,879 7,216
Other income (notes 1 (q) and 7):
Interest 10,696 27,363 42,364 359
Other 60,541 2,214 13,243 112
71,237 29,577 55,607 471
Other expenses (notes 1 (q) and 7):
Interest 11,655 11,902 12,912 109
Other 22,138 56,676 101,706 862
33,793 68,578 114,618 971
Income before income taxes, minority interest and
equity in income of affiliates 668,364 829,904 792,868 6,716
Income tax (benefit) expense (note 11):
Current 151,146 319,945 300,294 2,544
Deferred 115,519 (2,756) (16,448) (140)
266,665 317,189 283,846 2,404
Income before minority interest and
equity in income of affiliates 401,699 512,715 509,022 4,312
Minority interest in income of consolidated subsidiaries (11,559) (15,287) (20,117) (170)
Equity in income of affiliates (note 6) 96,057 99,605 103,417 876
Net income ¥6,486,197 ¥6,597,033 ¥6,592,322 $05,018
U.S. dollarsYen (note 2)
2005 2006 2007 2007
Basic net income per common share (note 1 (o)) ¥0,0260.34. ¥0,0324.33. ¥0,0324.62. $002.75.
See accompanying notes to consolidated financial statements.* See note 3.

73
Consolidated Statements of Stockholders’ Equity and Comprehensive Income
Honda Motor Co., Ltd. and SubsidiariesYears ended March 31, 2005, 2006 and 2007 Yen (millions)
Accumulatedother Total
Common Capital Legal Retained comprehensive Treasury stockholders’stock surplus reserves earnings income (loss), net stock equity
Balance at March 31, 2004 ¥86,067 ¥172,719 ¥32,418 ¥3,589,434 ¥(854,573) ¥(151,665) ¥2,874,400Transfer to legal reserves 2,270 (2,270) —Cash dividends (47,797) (47,797)Comprehensive income (loss):
Net income 486,197 486,197Other comprehensive income (loss), net of tax (note 15)
Adjustments from foreign currency translation 40,476 40,476Unrealized gains (losses) on marketable securities:
Unrealized holding gains (losses) (3,668) (3,668)Reclassification adjustments for losses (gains) realized in net income 1,346 1,346
Unrealized gains (losses) on derivative instruments:Unrealized holding gains (losses) —Reclassification adjustments for losses (gains) realized in net income —
Minimum pension liabilities adjustment 22,485 22,485Total comprehensive income 546,836
Purchase of treasury stock (84,160) (84,160)Reissuance of treasury stock 2 — 13 15Retirement of treasury stock (190) (216,181) 216,371 —Balance at March 31, 2005 86,067 172,531 34,688 3,809,383 (793,934) (19,441) 3,289,294Transfer to legal reserves 1,123 (1,123) —Cash dividends (71,061) (71,061)Comprehensive income (loss):
Net income 597,033 597,033Other comprehensive income (loss), net of tax (note 15)
Adjustments from foreign currency translation 249,160 249,160Unrealized gains (losses) on marketable securities:
Unrealized holding gains (losses) 29,807 29,807Reclassification adjustments for losses (gains) realized in net income (841) (841)
Unrealized gains (losses) on derivative instruments:Unrealized holding gains (losses) (26) (26)Reclassification adjustments for losses (gains) realized in net income (38) (38)
Minimum pension liabilities adjustment 108,685 108,685Total comprehensive income 983,780
Purchase of treasury stock (77,067) (77,067)Reissuance of treasury stock (125) 928 803Retirement of treasury stock (2) (66,221) 66,224 1Balance at March 31, 2006 ¥86,067 ¥172,529 ¥35,811 ¥4,267,886 ¥(407,187) ¥(29,356) ¥4,125,750

74
Yen (millions)Accumulated
other TotalCommon Capital Legal Retained comprehensive Treasury stockholders’
stock surplus reserves earnings income (loss), net stock equity
Balance at March 31, 2006 ¥86,067 ¥172,529 ¥35,811 ¥4,267,886 ¥(407,187) ¥(29,356) ¥4,125,750Cumulative effect of adjustments resulting from the adoption of SAB No. 108, net of tax (note 1(u)) — — — (62,640) 18,149 — (44,491)Adjusted balances as of March 31, 2006 86,067 172,529 35,811 4,205,246 (389,038) (29,356) 4,081,259Transfer to legal reserves 1,919 (1,919) —Cash dividends (140,482) (140,482)Comprehensive income (loss):
Net income 592,322 592,322Other comprehensive income (loss), net of tax (note 15)
Adjustments from foreign currency translation 96,775 96,775Unrealized gains (losses) on marketable securities:
Unrealized holding gains (losses) 1,004 1,004Reclassification adjustments for losses (gains) realized in net income (5,575) (5,575)
Unrealized gains (losses) on derivative instruments:Unrealized holding gains (losses) (337) (337)Reclassification adjustments for losses (gains) realized in net income 421 421
Minimum pension liabilities adjustment 8,908 8,908Total comprehensive income 693,518
Adjustment for initially applying SFAS No. 158, net of tax (note 13) (139,324) (139,324)Purchase of treasury stock (30,974) (30,974)Reissuance of treasury stock (277) 18,891 18,614Retirement of treasury stock —Balance at March 31, 2007 ¥86,067 ¥172,529 ¥37,730 ¥4,654,890 ¥(427,166) ¥(41,439) ¥4,482,611
U.S. dollars (millions) (note2)Accumulated
other TotalCommon Capital Legal Retained comprehensive Treasury stockholders’
stock surplus reserves earnings income (loss), net stock equity
Balance at March 31, 2006 $729 $1,461 $303 $36,153 $(3,449) $(249) $34,948Cumulative effect of adjustments resulting from the adoption of SAB No. 108, net of tax (note 1(u)) — — — (530) 153 — (377)Adjusted balances as of March 31, 2006 729 1,461 303 35,623 (3,296) (249) 34,571Transfer to legal reserves 17 (17) —Cash dividends (1,190) (1,190)Comprehensive income (loss):
Net income 5,018 5,018Other comprehensive income (loss), net of tax (note 15)
Adjustments from foreign currency translation 820 820Unrealized gains (losses) on marketable securities:
Unrealized holding gains (losses) 8 8Reclassification adjustments for losses (gains) realized in net income (47) (47)
Unrealized gains (losses) on derivative instruments:Unrealized holding gains (losses) (3) (3)Reclassification adjustments for losses (gains) realized in net income 4 4
Minimum pension liabilities adjustment 75 75Total comprehensive income 5,875
Adjustment for initially applying SFAS No. 158, net of tax (note 13) (1,180) (1,180)Purchase of treasury stock (262) (262)Reissuance of treasury stock (2) 160 158Retirement of treasury stock —Balance at March 31, 2007 $729 $1,461 $320 $39,432 $(3,619) $(351) $37,972
See accompanying notes to consolidated financial statements.
Consolidated Statements of Stockholders’ Equity and Comprehensive Income
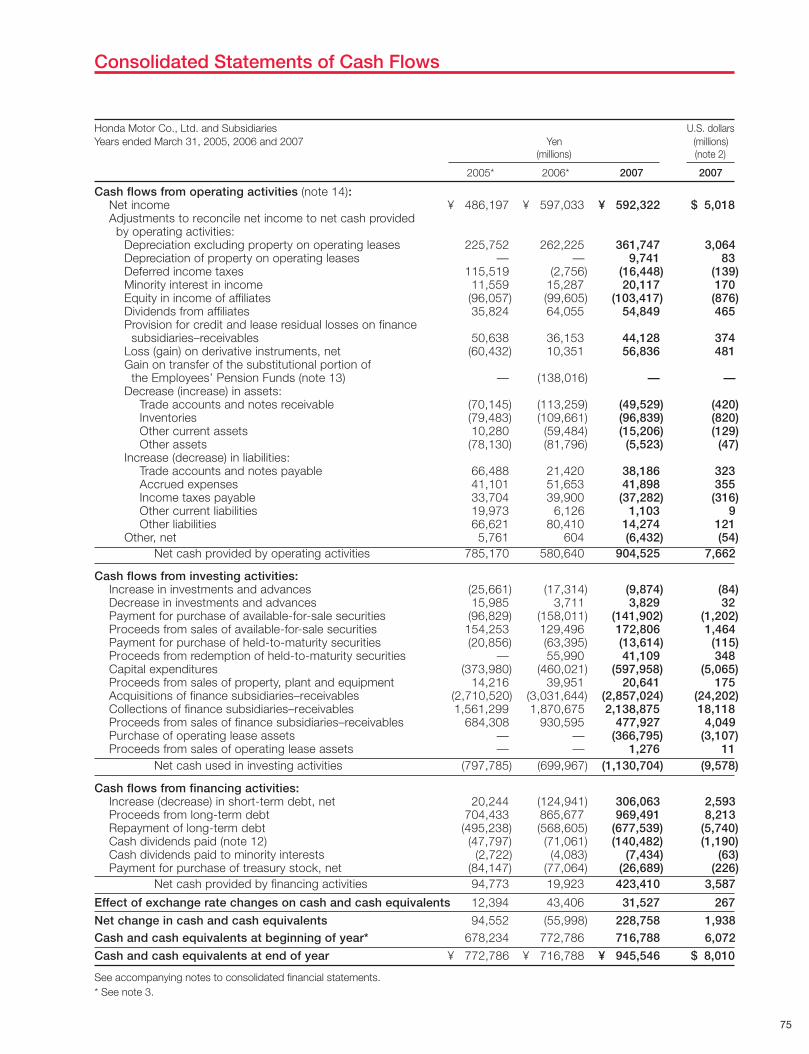
75
Consolidated Statements of Cash Flows
Honda Motor Co., Ltd. and Subsidiaries U.S. dollarsYears ended March 31, 2005, 2006 and 2007 Yen (millions)
(millions) (note 2)
2005* 2006* 2007 2007
Cash flows from operating activities (note 14):Net income ¥0,486,197 ¥0,597,033 ¥0,592,322 $05,018Adjustments to reconcile net income to net cash provided by operating activities:
Depreciation excluding property on operating leases 225,752 262,225 361,747 3,064Depreciation of property on operating leases — — 9,741 83Deferred income taxes 115,519 (2,756) (16,448) (139)Minority interest in income 11,559 15,287 20,117 170Equity in income of affiliates (96,057) (99,605) (103,417) (876)Dividends from affiliates 35,824 64,055 54,849 465Provision for credit and lease residual losses on finance subsidiaries–receivables 50,638 36,153 44,128 374Loss (gain) on derivative instruments, net (60,432) 10,351 56,836 481Gain on transfer of the substitutional portion of the Employees’ Pension Funds (note 13) — (138,016) — —Decrease (increase) in assets:
Trade accounts and notes receivable (70,145) (113,259) (49,529) (420)Inventories (79,483) (109,661) (96,839) (820)Other current assets 10,280 (59,484) (15,206) (129)Other assets (78,130) (81,796) (5,523) (47)
Increase (decrease) in liabilities:Trade accounts and notes payable 66,488 21,420 38,186 323Accrued expenses 41,101 51,653 41,898 355Income taxes payable 33,704 39,900 (37,282) (316)Other current liabilities 19,973 6,126 1,103 9Other liabilities 66,621 80,410 14,274 121
Other, net 5,761 604 (6,432) (54)Net cash provided by operating activities 785,170 580,640 904,525 7,662
Cash flows from investing activities:Increase in investments and advances (25,661) (17,314) (9,874) (84)Decrease in investments and advances 15,985 3,711 3,829 32Payment for purchase of available-for-sale securities (96,829) (158,011) (141,902) (1,202)Proceeds from sales of available-for-sale securities 154,253 129,496 172,806 1,464Payment for purchase of held-to-maturity securities (20,856) (63,395) (13,614) (115)Proceeds from redemption of held-to-maturity securities — 55,990 41,109 348Capital expenditures (373,980) (460,021) (597,958) (5,065)Proceeds from sales of property, plant and equipment 14,216 39,951 20,641 175Acquisitions of finance subsidiaries–receivables (2,710,520) (3,031,644) (2,857,024) (24,202)Collections of finance subsidiaries–receivables 1,561,299 1,870,675 2,138,875 18,118Proceeds from sales of finance subsidiaries–receivables 684,308 930,595 477,927 4,049Purchase of operating lease assets — — (366,795) (3,107)Proceeds from sales of operating lease assets — — 1,276 11
Net cash used in investing activities (797,785) (699,967) (1,130,704) (9,578)
Cash flows from financing activities:Increase (decrease) in short-term debt, net 20,244 (124,941) 306,063 2,593Proceeds from long-term debt 704,433 865,677 969,491 8,213Repayment of long-term debt (495,238) (568,605) (677,539) (5,740)Cash dividends paid (note 12) (47,797) (71,061) (140,482) (1,190)Cash dividends paid to minority interests (2,722) (4,083) (7,434) (63)Payment for purchase of treasury stock, net (84,147) (77,064) (26,689) (226)
Net cash provided by financing activities 94,773 19,923 423,410 3,587
Effect of exchange rate changes on cash and cash equivalents 12,394 43,406 31,527 267
Net change in cash and cash equivalents 94,552 (55,998) 228,758 1,938Cash and cash equivalents at beginning of year* 678,234 772,786 716,788 6,072
Cash and cash equivalents at end of year ¥0,772,786 ¥0,716,788 ¥0,945,546 $08,010
See accompanying notes to consolidated financial statements.* See note 3.

76
1. General and Summary of SignificantAccounting Policies
(a) Description of Business
Honda Motor Co., Ltd. (the “Company”) and its subsidiaries
(collectively “Honda”) develop, manufacture, distribute and
provide financing for the sale of its motorcycles, automobiles
and power products. Honda’s manufacturing operations are
principally conducted in 32 separate factories, four of which
are located in Japan. Principal overseas manufacturing facili-
ties are located in the United States of America, Canada,
Mexico, the United Kingdom, France, Italy, Spain, China,
India, Indonesia, Malaysia, Pakistan, the Philippines, Taiwan,
Thailand, Vietnam, Brazil and Turkey.
(b) Basis of Presenting Consolidated Financial Statements
The Company and its domestic subsidiaries maintain their
books of account in conformity with financial accounting
standards of Japan, and its foreign subsidiaries generally
maintain their books of account in conformity with those of
the countries of their domicile.
The consolidated financial statements presented herein
have been prepared in a manner and reflect the adjustments
which are necessary to conform them with U.S. generally
accepted accounting principles.
(c) Consolidation Policy
The consolidated financial statements include the accounts
of the Company, its subsidiaries and those variable interest
entities where the Company is the primary beneficiary under
the Financial Accounting Standard Boards (FASB) Interpreta-
tion (FIN) No. 46 (revised December 2003), “Consolidation of
Variable Interest Entities”. All significant intercompany
balances and transactions have been eliminated in
consolidation.
Investments in affiliates in which the Company has the
ability to exercise significant influence over their operating
and financial policies, but where the Company does not have
a controlling financial interest are accounted for using the
equity method.
(d) Use of Estimates
Management of Honda has made a number of estimates and
assumptions relating to the reporting of assets, liabilities, rev-
enues and expenses, and the disclosure of contingent assets
and liabilities to prepare these consolidated financial state-
ments in conformity with U.S. generally accepted accounting
principles. Significant items subject to such estimates and
assumptions include, but are not limited to, allowance for
Notes to Consolidated Financial StatementsHonda Motor Co., Ltd. and Subsidiaries
credit losses, losses on lease residual values, realizable
values of inventories, realization of deferred tax assets,
impairment of long-lived assets, product warranty obliga-
tions, and the fair values of assets and obligations related to
employee benefits. Actual results could differ from those
estimates.
(e) Revenue Recognition
Sales of manufactured products are recognized when per-
suasive evidence of an arrangement exists, delivery has
occurred, title and risk of loss have passed to the customers,
the sales price is fixed or determinable, and collectibility is
probable.
Honda provides dealer incentives passed on to the end
customers generally in the form of below-market interest rate
loans or lease programs. The amount of interest or lease
subsidies paid is the difference between the amount offered
to retail customers and a market-based interest or lease rate.
Honda also provides dealer incentives retained by the dealer,
which generally represent discounts provided by Honda to
the dealers. These incentives are classified as a reduction of
sales revenue as the consideration is paid in cash and Honda
does not receive an identifiable benefit in exchange for this
consideration. The estimated costs are accrued at the time
the product is sold to the dealer.
Operating lease revenues are recorded on a straight-line
basis over the term of the lease.
Interest income from finance receivables is recognized
using the interest method. Finance receivable origination fees
and certain direct origination costs are deferred, and the net
fee or cost is amortized using the interest method over the
contractual life of the finance receivables.
Finance subsidiaries of the Company periodically sell
finance receivables. Gain or loss is recognized equal to the
difference between the cash proceeds received and the car-
rying value of the receivables sold and is recorded in the
period in which the sale occurs. Honda allocates the
recorded investment in finance receivables between the
portion(s) of the receivables sold and portion(s) retained
based on the relative fair values of those portions on the date
the receivables are sold. Honda recognizes gains or losses
attributable to the change in the fair value of the retained
interests, which are recorded at estimated fair value and
accounted for as “trading” securities. Honda determines the
fair value of the retained interests by discounting the future
cash flows. Those cash flows are estimated based on pre-
payments, credit losses and other information as available
and are discounted at a rate which Honda believes is com-
mensurate with the risk free rate plus a risk premium. A

77
servicing asset or liability is amortized in proportion to and
over the period of estimated net servicing income. Servicing
assets and servicing liabilities at March 31, 2006 and 2007
were not significant.
(f) Cash Equivalents
Honda considers all highly liquid debt instruments with an
original maturity of three months or less to be cash
equivalents. Cash equivalents consist of money market funds
and commercial paper, and amount to ¥96,325 million and
¥117,182 million ($993 million) as of March 31, 2006 and
2007, respectively.
(g) Inventories
Inventories are stated at the lower of cost, determined
principally by the first-in, first-out method, or market.
(h) Investments in Securities
Honda classifies its debt and equity securities in the following
categories: available-for-sale, trading, or held-to-maturity.
Debt securities that are classified as “held-to-maturity” secu-
rities are reported at amortized cost. Debt and equity securi-
ties classified as “trading” securities are reported at fair value,
with unrealized gains and losses included in earnings. Other
marketable debt and equity securities are classified as “avail-
able-for-sale” securities and are reported at fair value, with
unrealized gains or losses, net of deferred taxes included in
accumulated other comprehensive income (loss) in the
stockholders’ equity section of the consolidated balance
sheets. Honda did not hold any “trading” securities at March
31, 2006 and 2007, except for retained interests in the sold
pools of finance receivables, which are accounted for as
“trading” securities and included in finance subsidiaries-
receivables.
Honda periodically compares the fair value of investment
securities with their cost basis. If the fair value of investment
securities has declined below our cost basis and such
decline is judged to be other-than-temporary, Honda recog-
nizes the impairment of the investment securities and the
carrying value is reduced to its fair value through a charge to
income. The determination of other-than-temporary impair-
ment is based upon an assessment of the facts and circum-
stances related to each investment security. In determining
the nature and extent of impairment, Honda considers such
factors as financial and operating conditions of the issuer, the
industry in which the issuer operates, degree and period of
the decline in fair value and other relevant factors.
Non-marketable equity securities are carried at cost, and
are examined the possibility of impairment periodically.
(i) Goodwill
Honda accounts for goodwill in accordance with Statement
of Financial Accounting Standards (SFAS) No. 142, “Goodwill
and Other Intangible Assets”. Goodwill, all of which is allo-
cated to Honda’s reporting units, is not amortized but instead
is tested for impairment at least annually. Honda completed
its annual tests for March 31, 2005, 2006, and 2007 and
concluded no impairment needed to be recognized. The
carrying amount of goodwill at March 31, 2006 and 2007
was ¥27,951 million and ¥30,590 million ($259 million),
respectively.
(j) Property on Operating Leases
Property on operating leases is reported at cost, less accu-
mulated depreciation. Depreciation of the vehicles is gener-
ally provided on a straight-line basis to an estimated residual
value over the lease term. The residual values of the vehicles
related to the operating leases are estimated at inception by
using our estimate of future used vehicle values, taking into
consideration data obtained from third parties.
(k) Depreciation
Depreciation of property, plant and equipment is calculated
principally by the declining-balance method based on esti-
mated useful lives and salvage values of the respective
assets.
The estimated useful lives used in computing depreciation
of property, plant and equipment are as follows:
Asset Life
Buildings 3 to 50 years
Machinery and equipment 2 to 20 years
(l) Impairment of Long-Lived Assets and Long-Lived
Assets to Be Disposed Of
Honda’s long-lived assets and identifiable intangibles assets
other than goodwill having finite useful lives are reviewed for
impairment whenever events or changes in circumstances
indicate that the carrying amount of an asset may not be
recoverable. Recoverability of assets to be held and used is
measured by a comparison of the carrying amount of an
asset to future net cash flows (undiscounted and without
interest charges) expected to be generated by the asset. If
such assets are considered to be impaired, the impairment to
be recognized is measured by the amount by which the car-
rying amount of the assets exceeds the estimated fair value
of the assets. Assets to be disposed of by sale are reported
at the lower of the carrying amount or estimated fair value
less costs to sell.

78
(m) Income Taxes
Income taxes are accounted for under the asset and liability
method. Deferred tax assets and liabilities are recognized for
the future tax consequences attributable to differences
between the financial statement carrying amounts of existing
assets and liabilities and their respective tax bases and oper-
ating loss and tax credit carryforwards. Deferred tax assets
and liabilities are measured using enacted tax rates expected
to apply to taxable income in the years in which those tem-
porary differences are expected to be recovered or settled.
The effect on deferred tax assets and liabilities of a change in
tax rates is recognized in earnings in the period that includes
the enactment date.
(n) Product-Related Expenses
Advertising and sales promotion costs are expensed as
incurred. Advertising expenses for each of the years in the
three-year period ended March 31, 2007 were ¥246,997 mil-
lion, ¥287,901 million and ¥308,409 million ($2,613 million),
respectively. Provisions for estimated costs related to product
warranty are made at the time the products are sold to cus-
tomers or new warranty programs are initiated. Estimated
warranty expenses are provided based on historical warranty
claim experience with consideration given to the expected
level of future warranty costs as well as current information
on repair costs. Included in warranty expenses accruals are
costs for general warranties on vehicles Honda sells and
product recalls.
(o) Basic Net Income per Common Share
Basic net income per common share has been computed by
dividing net income available to common stockholders by the
weighted average number of common shares outstanding
during each year. The weighted average number of common
shares outstanding for the years ended March 31, 2005,
2006 and 2007 was 1,867,535,957, 1,840,799,671 and
1,824,675,228 respectively. There were no potentially dilutive
shares outstanding during the years ended March 31, 2005,
2006 or 2007.
The Company executed a two-for-one stock split for the
Company’s common stock effective July 1, 2006. All per
share information has been adjusted retroactively for all
periods presented to reflect this stock split.
(p) Foreign Currency Translation
Foreign currency financial statement amounts are translated
into Japanese yen on the basis of the year-end rate for all
assets and liabilities and the weighted average rate for the
year for all income and expense amounts. The resulting
translation adjustments are included in accumulated other
comprehensive income (loss) in the stockholders’ equity
section of the consolidated balance sheets.
Foreign currency receivables and payables are translated
at the applicable current rates on the balance sheet date. All
revenues and expenses associated with foreign currencies
are converted at the rates of exchange prevailing when such
transactions occur. The resulting exchange gains or losses
are reflected in other income (expense) in the consolidated
statements of income.
Foreign currency transaction gains (losses) included in
other income (expenses) - other for each of the years in the
three-year period ended March 31, 2007 are as follows:
U.S. dollarsYen (millions)
(millions) (note 2)
2005 2006 2007 2007
¥(17,146) ¥(38,880) ¥(48,261) $(409)
(q) Derivative Financial Instruments
Honda has entered into foreign exchange agreements and
interest rate agreements to manage currency and interest
rate exposures. These instruments include foreign currency
forward contracts, currency swap agreements, currency
option contracts and interest rate swap agreements.
Honda recognizes at fair value of all derivative financial
instruments in its consolidated balance sheet.
Honda applies hedge accounting for certain foreign
currency forward contracts related to forecasted foreign cur-
rency transactions between the Company and its subsidiar-
ies. These are designated as cash flow hedges on the date
derivative contracts entered into. The Company has a cur-
rency rate risk management policy documented. In addition,
it documents all relationships between derivative financial
instruments designated as cash flow hedges and the relevant
hedged items to identify the relationship between them. The
Company assesses, both at the hedge’s inception and on an
ongoing basis, whether the derivative financial instruments
designated as cash flow hedge are highly effective to offset
changes in cash flows of hedged items.
When it is determined that a derivative financial instrument
is not highly effective as a cash flow hedge, when the
hedged item matures, is sold or is terminated, or when it is
identified that the forecasted transaction is no longer prob-
able, the Company discontinues hedge accounting. To the
extent derivative financial instruments are designated as cash
flow hedges and have been assessed as being highly effec-
tive, changes in their fair value are recognized in other com-
prehensive income (loss). The amounts are reclassified into

79
earnings in the period when forecasted hedged transactions
affect earnings. When these cash flow hedges prove to be
ineffective, changes in the fair value of the derivatives are
immediately recognized in earnings.
Changes in the fair value of derivative financial instruments
not designated as accounting hedges are recognized in
earnings in the period of the change.
The amount recognized in earnings included in other
income (expenses)—other during the year ended March 31,
2005, 2006 and 2007 are ¥44,905 million gain, ¥55,516 mil-
lion loss and ¥48,485 million ($411 million) loss, respectively.
In relation to this, the Company included gains and losses on
translation of debts of finance subsidiaries denominated in
foreign currencies intended to be hedged of ¥10,667 million
gain, ¥45,046 million gain and ¥8,351 million ($71 million)
loss in other income (expenses)—other during the years
ended March 31, 2005, 2006 and 2007, respectively. In
addition, net realized gains and losses on interest rate swap
contracts not designated as accounting hedges by mainly
finance subsidiaries of ¥28,000 million loss, ¥827 million gain
and ¥3,309 million ($28 million) gain are included in other
income (expenses)—other during the years ended March 31,
2005, 2006 and 2007, respectively. These gains and losses
are presented on a net basis.
Honda doesn’t hold any derivative financial instruments
for trading purposes.
(r) Shipping and Handling Costs
Shipping and handling costs included in selling, general and
administrative expenses for each of the years in the three-
year period ended March 31, 2007 are as follows:
U.S. dollarsYen (millions)
(millions) (note 2)
2005 2006 2007 2007
¥159,472 ¥181,675 ¥219,361 $1,858
(s) Asset Retirement Liability
Honda applies Financial Accounting Standards Board (FASB)
Interpretation (FIN) No. 47, “Accounting for Conditional Asset
Retirement Obligations—an interpretation of FASB Statement
No.143”. FIN47 clarifies the term conditional asset retirement
obligation as used in SFAS No.143 and requires a liability to
be recorded if the fair value of the obligation can be reason-
ably estimated. Asset retirement obligations covered by this
Interpretation include those for which an entity has a legal
obligation to perform an asset retirement activity, however
the timing and (or) method of settling the obligation are con-
ditional on a future event that may or may not be within the
control of the entity.
(t) New Accounting Pronouncements
In March 2006, the Financial Accounting Standards Board
(FASB) issued Statement of Financial Accounting Standards
(SFAS) No. 156, “Accounting for Servicing of Financial
Assets”. This statement amends SFAS No. 140, “Accounting
for Transfers and Servicing of Financial Assets and Extin-
guishments of Liabilities”, with respect to the accounting for
separately recognized servicing assets and servicing liabili-
ties. SFAS No. 156 gives revised guidance as to when servic-
ing assets and servicing liabilities should be recognized. It
also revises guidance regarding the initial and subsequent
measurement of servicing assets and liabilities. SFAS No.
156 is effective as of the beginning of an entity’s first fiscal
year that begins after September 15, 2006. Management is
currently in process of quantifying the financial impact of
adoption. It is not anticipated that adoption will have a mate-
rial impact on the Company’s financial position or results of
operations.
In June 2006, the Financial Accounting Standards Board
(FASB) issued FASB Interpretation (FIN) No. 48, “Accounting
for Uncertainty in Income Taxes”. This Interpretation clarifies
the accounting for uncertainty in income taxes recognized in
an enterprise’s financial statements in accordance with SFAS
No. 109, “Accounting for Income Taxes”. This Interpretation
prescribes a two step process for the recognition and mea-
surement in the financial statement of a tax position taken or
expected to be taken in a tax return. This statement is effec-
tive as of an entity’s first fiscal year that begins after
December 15, 2006. Management is currently in the process
of quantifying the financial impact of adoption.
In September 2006, the Financial Accounting Standards
Board (FASB) issued Statement of Financial Accounting
Standards (SFAS) No.157, “Fair Value Measurements”. This
statement defines fair value, establishes a framework for
measuring fair value in generally accepted accounting prin-
ciples, and expands disclosures about fair value measure-
ments. This Statement applies under other accounting
pronouncements that require or permit fair value measure-
ments and does not require any new fair value measure-
ments. This statement is effective as of an entity’s first fiscal
year that begins after November 15, 2007, with early adop-
tion encouraged. Management is currently in the process of
determining whether to early adopt this statement and quan-
tifying the financial impact of adoption. It is not anticipated
that adoption will have a material impact on the Company’s
financial position or results of operation.
In September 2006, the Financial Accounting Standards
Board (FASB) issued Statement of Financial Accounting
Standards (SFAS) No. 158, “Employers’ Accounting for
Defined Benefit Pension and Other Postretirement Plans—an

80
amendment of FASB Statements No. 87, 88, 106, and
132(R)”. This statement amends SFAS No. 87, “Employers’
Accounting for Pensions”, SFAS No. 88, “Employers’
Accounting for Settlements and Curtailments of Defined
Benefit Pension and for Termination Benefits”, SFAS No. 106,
“Employers’ Accounting for Postretirement Benefits Other
Than Pensions”, and SFAS No. 132(R), “Employers’ Disclo-
sures about Pensions and Other Postretirement Benefits”.
This statement requires an employer to recognize the
overfunded or underfunded status as an asset or liability in its
statement of financial position and to recognize changes in
that funded status in comprehensive income in the year in
which the changes occur. This statement replaces SFAS No.
87’s requirement to report at least minimum pension liability
measured as excess at the accumulated benefit obligation
over the fair value at the plan assets. The Company and its
consolidated subsidiaries adopted SFAS No.158 on March
31, 2007. Detailed information about the impact of the adop-
tion of SFAS No. 158 is provided in note 13 to the accompa-
nying consolidated financial statements.
This statement also changes the date at which benefit
obligations are to be measured to the date of the year-end
statement of financial position. The measurement provisions
of this statement are effective for fiscal years ending after
December 15, 2008.
In February 2007, the Financial Accounting Standards
Board (FASB) issued Statement of Financial Accounting
Standards (SFAS) No. 159, “The Fair Value Option for Finan-
cial Assets and Financial Liabilities—including an amendment
of SFAS No.115”. This statement permits entities to choose
to measure at fair value many financial instruments and cer-
tain other items that are not currently required to be mea-
sured at fair value. Subsequent changes in fair value for
designated items will be required to be reported in earnings
in the current period. The statement also establishes presen-
tation and disclosure requirements for similar types of assets
and liabilities measured at fair value. The statement is effec-
tive for financial statements issued for fiscal years beginning
after November 15, 2007, with early adoption being permit-
ted. Management is currently in process of determining
whether to early adopt this statement and quantifying the
financial impact of adoption.
(u) Cumulative Effect of Prior Year Adjustments
In September 2006, the Securities and Exchange Com-
mission (SEC) issued Staff Accounting Bulletin No. 108,
“Considering the Effects of Prior Year Misstatements when
Quantifying Misstatements in Current Year Financial State-
ments” (“SAB No. 108”). SAB No. 108 provides interpretive
guidance on how the effects of the carryover or reversal of
prior year misstatements should be considered in quantifying
current year misstatements for the purpose of materiality
assessment. SAB No. 108 requires that registrants quantify a
current year misstatement using an approach that considers
both the impact of prior year misstatements that remain on
the balance sheet and those that were recorded in the cur-
rent year income statement. The Company historically quan-
tified misstatements and assessed materiality based on a
current year income statement approach. The transition pro-
visions of SAB No. 108 permit the Company to adjust for the
cumulative effect on retained earnings of immaterial errors
related to prior years.
The Company adopted SAB No. 108 effective beginning
of the fiscal year ended March 31, 2007, and adjusted the
items described below in the accompanying consolidated
financial statements as of the beginning of the fiscal year
ended March 31, 2007 to correct the prior year misstate-
ments, which were considered to be immaterial to the con-
solidated statements of income and consolidated balance
sheets in prior years under the income statement approach.
The net impact of these adjustments decreased the
Company’s beginning retained earnings and beginning accu-
mulated other comprehensive loss for 2007 by ¥62,640 mil-
lion ($530 million), net of tax effect of ¥31,235 million ($265
million), and ¥18,149 million ($153 million), respectively, for
the items described below and incremental effects on the
consolidated balance sheet are shown in the table below:
1. The Company and its certain domestic subsidiaries in
Japan historically calculated depreciation of property, plant
and equipment, using a salvage value determined as 5% of
the acquisition cost. However, since the sales proceeds
received for the liquidated assets and their economical value
at the end of its useful life historically have been nominal, the
Company and its certain domestic subsidiaries assessed the
adequacy of the salvage value and concluded that they
should have calculated depreciation using the salvage value
of ¥1 for its properly, plant and equipment. The Company
and its certain domestic subsidiaries recalculated deprecia-
tion expenses retrospectively considering the corrected
salvage value. The reassessment indicated that an accumu-
lated overstatement of property, plant and equipment in the
consolidated financial statements had occured.
2. Equity in income of affiliates should be recognized based
on affiliates’consolidated financial statements in accordance
with U.S. generally accepted accounting principles. However,
the Company historically recognized equity in income of affili-
ates based on the results of operations of the parent-only
financial statements of the affiliates, as the Company

81
assessed that the difference between the total amounts of
equity in income on the consolidation basis and those on the
parent-only basis had been immaterial to the Company’s
consolidated financial statements under the income
statement approach. This misstatement resulted in an accu-
mulated understatement of equity in income of affiliates and
the carrying value of the investments in affiliates in the
consolidated financial statements.
3. The Company reclassified the residual tax effect of mini-
mum pension liabilities included in accumulated other com-
prehensive income during the year ended March 31, 2006,
which related to corporate tax rate changes in the past
based on the proportional allocation over the expiration of
unrecognized obligation. However, the residual tax effect
should have been reclassified only when the pension plan is
liquidated or dissolved under the portfolio approach. This
misstatement resulted in an understatement of accumulated
other comprehensive loss and corresponding overstatement
in income tax benefit.
The impact of the affected line items in the consolidated
balance sheet at the beginning of fiscal year ended March
31, 2007 is as follows.
Consolidated Balance Sheet
Yen (millions)
Cumulative Effect ofPrior Year Adjustment
Assets 1 2 3 as of April 1, 2006
Investments and advances:
Investments in and advances to affiliates (4,546) 36,274 — 31,728
Total investments and advances (4,546) 36,274 — 31,728
Property, plant and equipment, at cost:
Less accumulated depreciation and amortization 109,308 — — 109,308
Net property, plant and equipment (109,308) — — (109,308)
Other assets 43,722 — — 43,722
Total assets (70,132) 36,274 — (33,858)
Yen (millions)
Cumulative Effect ofPrior Year Adjustment
Liabilities, Minority Interests and Stockholders’ Equity 1 2 3 as of April 1, 2006
Other liabilities (1,818) 14,305 — 12,487
Total liabilities (1,818) 14,305 — 12,487
Minority interests in consolidated subsidiaries (1,854) — — (1,854)
Stockholders’ equity:
Retained earnings (66,460) 21,969 (18,149) (62,640)
Accumulated other comprehensive income (loss), net — — 18,149 18,149
Total stockholders’ equity (66,460) 21,969 — (44,491)
Total liabilities, minority interests and stockholders’ equity (70,132) 36,274 — (33,858)
(v) Reclassifications and Revisions of Classifications
Certain revisions for misclassifications and reclassifications
have been made to the prior years’ consolidated financial
statements to conform to the presentation used for the fiscal
year ended March 31, 2007. Detailed information is provided
in note 3.

82
2. Basis of Translating Financial Statements
The consolidated financial statements are expressed in Japa-
nese yen. However, the consolidated financial statements as
of and for the year ended March 31, 2007 have been trans-
lated into United States dollars at the rate of ¥118.05 =
U.S.$1, the approximate exchange rate prevailing on the
Tokyo Foreign Exchange Market on March 31, 2007. Those
U.S. dollar amounts presented in the consolidated financial
statements and related notes are included solely for the
reader. This translation should not be construed as a repre-
sentation that all the amounts shown could be converted into
U.S. dollars.
3. Revisions of Classifications
finance subsidiaries, which were classified in other current
liabilities and deferred income taxes, have been revised to be
classified in other liabilities and other assets, respectively.
(d) The long-term portion of accrued expenses and prepaid
expenses related to pension benefit plans, which were
included in accrued expenses and other current assets have
been revised to be classified in other liabilities and other
assets, respectively. The long-term portion of deferred tax
liabilities, which were included in other current liabilities, and
deferred tax assets, have also been revised to classified in
other liabilities and other assets.
(e) The long-term portion of prepaid expenses, deferred
income and accrued expenses related to extended vehicle
service contracts of the subsidiaries in the United States,
which were included in other current assets, trade payables
accounts and accrued expenses, respectively, have been
revised to be classified in other liabilities and other assets.
The long-term portion of related deferred tax liabilities, which
were included in other current liabilities, and deferred income
taxes have also been revised to be classified in other
liabilities and other assets.
(f) Certain consolidated subsidiaries’ assets, which were clas-
sified in investment and advances—other, have been revised
to be classified in other assets.
Certain revisions for misclassifications have been made to
the prior years’ consolidated financial statements.
(a) Minority interest and minority interest in income, which
were included in other liabilities and other expenses-other,
respectively, have been revised to be disclosed indepen-
dently in consolidated balance sheets and consolidated
statements of income. Minority interest in income and cash
dividends paid to minority interests, which were included in
other liabilities and other, net, in cash flows from operating
activities, have been revised to be disclosed independently in
cash flows from operating activities and cash flows from
financing activities, respectively, in the consolidated state-
ments of cash flows.
(b) Auction rate securities, which were classified as cash
equivalents, have been revised to be classified as available-
for-sale securities due within one year, which are included in
other current assets in the consolidated balance sheets.
Payment for purchase of auction rate securities and pro-
ceeds from sales of auction rate securities have been revised
to be classified in payment for purchase of available-for-sale
securities and proceeds from sales of available-for-sale
securities in the consolidated statements of cash flows,
respectively.
(c) The long-term portion of deferred tax liabilities and
deferred tax assets related to the lease transactions of

83
The impact of the affected line items in the consolidated balance sheet at March 31, 2006 and in the consolidated state-
ments of income and the consolidated statements of cash flows for the years ended March 31, 2005 and 2006 are as follows:
Consolidated Balance Sheet
Yen (millions)
2006 2006Previously After
Assets reported (a) (b) (c) (d) (e) (f) Total revised
Cash and cash equivalents 747,327 (30,539) (30,539) 716,788
Deferred income taxes 198,033 80,859 (33,845) (23,753) 23,261 221,294
Other current assets 450,002 30,539 (22,097) (51,459) (43,017) 406,985
Total current assets 4,625,898 — — 80,859 (55,942) (75,212) — (50,295) 4,575,603
Investments and advances:
Other, including marketable
equity securities 286,092 12,368 12,368 298,460
Total investments and advances 695,085 — — — — — 12,368 12,368 707,453
Other assets 453,006 22,097 87,917 (12,368) 97,646 550,652
Total assets 10,571,681 — — 80,859 (33,845) 12,705 — 59,719 10,631,400
Yen (millions)
2006 2006Liailities, Minority Interests Previously Afterand Stockholders’ Equity reported (a) (b) (c) (d) (e) (f) Total revised
Trade payables:
Accounts 1,099,902 (84,493) (84,493) 1,015,409
Accrued expenses 930,115 (105,605) (37,538) (143,143) 786,972
Other current liabilities 466,332 (268,106) (268,106) 198,226
Total current liabilities 3,989,409 — — (268,106) (105,605) (122,031) — (495,742) 3,493,667
Other liabilities 577,522 (87,460) 348,965 71,760 134,736 468,001 1,045,523
Total liabilities 6,445,931 (87,460) — 80,859 (33,845) 12,705 — (27,741) 6,418,190
Minority interests in
consolidated subsidiaries — 87,460 87,460 87,460
Total liabilities, minority interests
and stockholders’ equity 10,571,681 — — 80,859 (33,845) 12,705 — 59,719 10,631,400
Consolidated Statements of Income
Yen (millions)
2006 2006Previously Afterreported (a) revised
Income before income taxes, minority interest and equity in income of affiliates 814,617 15,287 829,904
Income before minority interest and equity in income of affiliates 497,428 15,287 512,715
Minority interest in income of consolidated subsidiaries — (15,287) (15,287)
Net income 597,033 — 597,033
Yen (millions)
2005 2005Previously Afterreported (a) revised
Income before income taxes, minority interest and equity in income of affiliates 656,805 11,559 668,364
Income before minority interest and equity in income of affiliates 390,140 11,559 401,699
Minority interest in income of consolidated subsidiaries — (11,559) (11,559)
Net income 486,197 — 486,197

84
Consolidated Statements of Cash Flows
Yen (millions)
2006 2006Previously Afterreported (a) (b) (d) (e) Total revised
Cash flows from operating activities
Adjustments to reconcile net income to
net cash provided by operating activities:
Minority interest in income — 15,287 15,287 15,287
Decrease (increase) in assets:
Other current assets (75,771) 7,765 8,522 16,287 (59,484)
Other assets (61,482) (7,765) (12,549) (20,314) (81,796)
Increase (decrease) in liabilities:
Trade accounts and notes payable 41,360 (19,940) (19,940) 21,420
Accrued expenses 98,273 (36,426) (10,194) (46,620) 51,653
Other liabilities 5,740 4,083 36,426 34,161 74,670 80,410
Other, net 15,891 (15,287) (15,287) 604
Net cash provided by operating activities 576,557 4,083 — — — 4,083 580,640
Cash flows from investing activities:
Payment for purchase of available-for-sale securities (6,915) (151,096) (151,096) (158,011)
Proceeds from sales of available-for-sale securities 5,666 123,830 123,830 129,496
Net cash used in investing activities (672,701) — (27,266) — — (27,266) (699,967)
Cash flows from financing activities:
Cash dividends paid to minority interests — (4,083) (4,083) (4,083)
Net cash provided by financing activities 24,006 (4,083) — — — (4,083) 19,923
Effect of exchange rate changes on
cash and cash equivalents 45,927 (2,521) (2,521) 43,406
Net change in cash and cash equivalents (26,211) — (29,787) — — (29,787) (55,998)
Cash and cash equivalents at beginning of year 773,538 (752) (752) 772,786
Cash and cash equivalents at end of year 747,327 — (30,539) — — (30,539) 716,788

85
Yen (millions)
2005 2005Previously Afterreported (a) (b) (d) (e) Total revised
Cash flows from operating activities
Adjustments to reconcile net income to
net cash provided by operating activities:
Minority interest in income — 11,559 11,559 11,559
Decrease (increase) in assets:
Other current assets (11,797) 14,332 7,745 22,077 10,280
Other assets (52,198) (14,332) (11,600) (25,932) (78,130)
Increase (decrease) in liabilities:
Trade accounts and notes payable 76,338 (9,850) (9,850) 66,488
Accrued expenses 71,469 (26,239) (4,129) (30,368) 41,101
Other liabilities 19,826 2,722 26,239 17,834 46,795 66,621
Other, net 17,320 (11,559) (11,559) 5,761
Net cash provided by operating activities 782,448 2,722 — — — 2,722 785,170
Cash flows from investing activities:
Payment for purchase of available-for-sale securities (1,608) (95,221) (95,221) (96,829)
Proceeds from sales of available-for-sale securities 13,140 141,113 141,113 154,253
Net cash used in investing activities (843,677) — 45,892 — — 45,892 (797,785)
Cash flows from financing activities:
Cash dividends paid to minority interests — (2,722) (2,722) (2,722)
Net cash provided by financing activities 97,495 (2,722) — — — (2,722) 94,773
Effect of exchange rate changes on
cash and cash equivalents 12,851 (457) (457) 12,394
Net change in cash and cash equivalents 49,117 — 45,435 — — 45,435 94,552
Cash and cash equivalents at beginning of year 724,421 (46,187) (46,187) 678,234
Cash and cash equivalents at end of year 773,538 — (752) — — (752) 772,786
4. Finance Subsidiaries–Receivables and Securitizations
Finance subsidiaries-receivables represent finance receiv-
ables generated by finance subsidiaries. Certain finance
receivables related to sales of inventory are included in trade
receivables and other assets in the consolidated balance
sheets. Finance receivables include wholesale financing to
dealers and retail financing and direct financing leases to
consumers.
The allowance for credit losses is maintained at an
amount management deems adequate to cover estimated
losses on finance receivables. The allowance is based on
management’s evaluation of many factors, including current
economic trends, industry experience, inherent risks in the
portfolio and the borrower’s ability to pay.
Finance subsidiaries of the Company purchase insurance
to cover a substantial amount of the estimated residual value
of vehicles leased to customers. The allowance for losses on
lease residual values is maintained at an amount manage-
ment deems adequate to cover estimated losses on the
uninsured portion of the vehicles’ lease residual values. The
allowance is also based on management’s evaluation of
many factors, including current economic conditions,
industry experience and the finance subsidiaries’ historical
experience with residual value losses.

86
Finance subsidiaries-receivables, net, consisted of the following at March 31, 2006 and 2007:
U.S. dollarsYen (millions)
(millions) (note 2)
2006 2007 2007
Direct financing leases ¥2,220,100 ¥1,892,566 $16,032
Retail 2,405,926 2,923,944 24,769
Wholesale 403,499 437,242 3,704
Term loans to dealers 14,337 14,916 126
Total finance receivables 5,043,862 5,268,668 44,631
Retained interests in the sold pools of finance receivables 94,634 88,110 746
5,138,496 5,356,778 45,377
Less:
Allowance for credit losses 35,316 35,020 297
Allowance for losses on lease residual values 37,774 33,928 287
Unearned interest income and fees 224,901 143,131 1,212
4,840,505 5,144,699 43,581
Less:
Finance receivables included in trade receivables, net 470,002 509,697 4,318
Finance receivables included in other assets, net 157,166 168,952 1,431
Finance subsidiaries-receivables, net 4,213,337 4,466,050 37,832
Less current portion 1,230,912 1,426,224 12,082
Noncurrent finance subsidiaries-receivables, net ¥2,982,425 ¥3,039,826 $25,750
The following schedule shows the contractual maturities of finance receivables for each of the five years following March 31,
2007 and thereafter:
YenYears ending March 31 (millions)
2008 ¥1,978,483
2009 1,357,819
2010 1,030,733
2011 570,042
2012 258,659
After five years 72,932
3,290,185
Total ¥5,268,668
Net sales and other operating revenue and cost of sales include finance income and related cost of finance subsidiaries for
each of the years in the three-year period ended March 31, 2007 as follows:
U.S. dollarsYen (millions)
(millions) (note 2)
2005 2006 2007 2007
Finance income ¥259,188 ¥310,937 ¥413,334 $3,501
Finance cost 54,815 115,636 188,844 1,600

87
Finance subsidiaries of the Company periodically sell finance
receivables. Finance subsidiaries sold retail finance receiv-
ables subject to limited recourse provisions totaling approxi-
mately ¥731,508 million, ¥930,629 million and ¥562,488
million ($4,765 million) to investors in fiscal years 2005, 2006
and 2007, respectively. Pre-tax net gains or losses on such
sales resulted in losses of ¥4,291 million, ¥11,849 million and
a gain of ¥1,175 million ($10 million) in fiscal years 2005,
2006 and 2007, respectively, which are included in loss on
sale of receivables.
Finance subsidiaries sold direct financing lease receiv-
ables subject to limited recourse provisions totaling approxi-
mately ¥100,374 million in fiscal year 2006. Pre-tax net gains
or losses on such sales resulted in a net gain of ¥483 million
is included in loss on sale of receivables for fiscal year 2006.
The leases sold during fiscal year 2006 had 100% insurance
coverage of the residual value of the vehicles collateralizing
those leases. Finance subsidiaries did not sell any direct
financing lease receivable in fiscal year 2007.
Retained interests in securitizations were comprised of the following at March 31 2006 and 2007:
U.S. dollarsYen (millions)
(millions) (note 2)
2006 2007 2007
Subordinated certificates ¥52,572 ¥44,198 $374
Residual interests 42,062 43,912 372
Total ¥94,634 ¥88,110 $746
Key economic assumptions used in initially estimating the fair values at the date of the securitizations during each of the
years in the three-year period ended March 31, 2007 are as follows:
2005 2006 2007
Weighted average life (years) 1.64 to 1.77 1.60 to 1.75 1.66 to 1.77
Prepayment speed 1.25% to 1.30% 1.00% to 1.30% 1.25% to 1.30%
Expected credit losses 0.30% to 0.70% 0.35% to 0.55% 0.23% to 0.27%
Residual cash flows discount rate 6.55% to 12.00% 6.53% to 12.00% 5.43% to 12.00%
At March 31, 2007, the significant assumptions used in estimating the retained interest in the sold pools of finance
receivables are as follows:
Weighted averageassumption
Prepayment speed 1.27%
Expected credit losses 0.24%
Residual cash flows discount rate 8.80%
The sensitivity of the current fair value to immediate 10% and 20% adverse changes from expected levels for each significant
assumption above mentioned were immaterial.
The following illustration presents quantitative information about balances of outstanding securitized portfolios as of March 31,
2006 and 2007.
U.S. dollarsYen (millions)
(millions) (note 2)
2006 2007 2007
Securitized receivables
Retail ¥1,402,552 ¥1,208,409 $10,236
Direct finance leases 97,711 67,758 574
Total securitized receivables ¥1,500,263 ¥1,276,167 $10,810

88
5. Inventories
Inventories at March 31, 2006 and 2007 are summarized as follows:
U.S. dollarsYen (millions)
(millions) (note 2)
2006 2007 2007
Finished goods ¥0,687,230 ¥0,772,917 $06,547
Work in process 28,218 34,970 296
Raw materials 320,856 375,229 3,179
¥1,036,304 ¥1,183,116 $10,022
6. Investments and Advances-Affiliates
Investments in affiliates are accounted for using the equity
method. Differences between the cost of investments in affili-
ates and the amount of underlying equity in net assets of the
affiliates principally represent investor level goodwill.
Honda considers whether the fair value of any of its equity
method investments have declined below their carrying value
whenever adverse events or changes in circumstances indi-
cate that recorded values may not be recoverable. If Honda
considered any such decline to be other than temporary
based on various factors, then a write-down would be
recorded to estimated fair value.
Significant investments in affiliates accounted for under
the equity method at March 31, 2006 and 2007 are Showa
Corporation (33.5%), Keihin Corporation (42.2%),
Guangzhou Honda Automobile Co., Ltd. (50.0%), Dongfeng
Honda Engine Co., Ltd. (50.0%), and P.T. Astra Honda Motor
(50.0%).
Certain adjustments were recorded to investments and
advances to affiliates as of April 1, 2006, please refer to note
1(u) for further information.
The difference between the carrying amount of investment
in affiliates and the amount of underlying equity in net assets
is not material as of March 31, 2006 and 2007.
Investments in affiliates include equity securities which have quoted market values at March 31, 2006 and 2007 compared
with related carrying amounts as follows:
U.S. dollarsYen (millions)
(millions) (note 2)
2006 2007 2007
Carrying amount ¥130,802 ¥184,879 $1,566
Market value 444,250 412,892 3,498
Certain combined financial information in respect of affiliates accounted for under the equity method at March 31, 2006 and
2007, and for each of the years in the three-year period ended March 31, 2007 is shown below:
U.S. dollarsYen (millions)
(millions) (note 2)
2006 2007 2007
Current assets ¥1,056,428 ¥1,434,855 $12,155
Other assets, principally property, plant and equipment 1,063,235 1,317,057 11,157
Total assets 2,119,663 2,751,912 23,312
Current liabilities 762,660 1,038,968 8,801
Other liabilities 182,503 306,418 2,596
Total liabilities 945,163 1,345,386 11,397
Stockholders’ equity ¥1,174,500 ¥1,406,526 $11,915

89
U.S. dollarsYen (millions)
(millions) (note 2)
2005 2006 2007 2007
Net sales ¥3,039,751 ¥3,426,348 ¥4,598,573 $38,954
Net income 220,596 229,640 268,577 2,275
Cash dividends received by Honda during the year 35,824 64,055 54,849 465
Sales to affiliates by the Company and its subsidiaries and
sales among such affiliates are made on the same basis as
sales to unaffiliated parties.
Honda’s equity in undistributed income of affiliates at
March 31, 2006 and 2007 included in retained earnings was
¥275,874 million and ¥354,552 million ($3,003 million),
respectively.
Trade receivables and trade payables include the following balances with affiliates at March 31, 2006 and 2007, and
purchases and sales include the following transactions with affiliates for each of the years in the three-year period ended
March 31, 2007. Honda mainly purchases materials, supplies and services from affiliates, and sells parts used in its products,
equipment and services to affiliates.
U.S. dollarsYen (millions)
(millions) (note 2)
2006 2007 2007
Trade receivables from ¥059,292 ¥077,317 $0,655
Trade payables to 112,547 155,603 1,318
U.S. dollarsYen (millions)
(millions) (note 2)
2005 2006 2007 2007
Purchases from ¥595,589 ¥611,711 ¥1,083,686 $9,180
Sales to 148,352 155,195 329,398 2,790
Mr. Minekawa, a Director of the Company, served as the
President of Guangzhou Honda Automobile Co., Ltd., one of
our affiliates in China until June 23, 2005. In fiscal year 2006
from April to June, Honda sold automobile parts, equipment
and services to the affiliated company in the amount of
¥10,008 million. In fiscal year 2005, Honda sold automobile
parts, equipment and services to the affiliated company in
the amount of ¥37,023 million.

90
7. Investments and Advances
Investments and advances at March 31, 2006 and 2007 consisted of the following:
U.S. dollarsYen (millions)
(millions) (note 2)
2006* 2007 2007
CurrentAuction rate securities ¥30,539 ¥41,318 $350
Corporate debt securities 13,100 311 3
U.S. government and agency debt securities 18,733 2,993 25
Commercial paper 5,998 — —
Advances 829 581 5
¥69,199 ¥45,203 $383
* See note 3.
Investments and advances due within one year are included in other current assets.
U.S. dollarsYen (millions)
(millions) (note 2)
2006* 2007 2007
NoncurrentMarketable equity securities ¥141,846 ¥169,280 $1,434
Convertible preferred stocks 22,934 — —
Convertible notes 56,635 — —
Government bonds 2,999 2,999 25
U.S. government and agency debt securities 2,937 10,034 85
Non-marketable equity securities accounted for under the cost methodNon-marketable preferred stocks 6,000 2,000 17
Other 13,357 11,639 99
Guaranty deposits 30,110 30,847 261
Advances 2,209 2,481 21
Other 19,433 25,330 215
¥298,460 ¥254,610 $2,157
* See note 3.
Certain information with respect to marketable securities at March 31, 2006 and 2007, is summarized below:
U.S. dollarsYen (millions)
(millions) (note 2)
2006 2007 2007
Available-for-saleCost ¥060,905 ¥107,573 $0,911
Fair value 172,385 210,598 1,784
Gross unrealized gains 111,540 103,113 874
Gross unrealized losses 60 88 1
Held-to-maturityAmortized cost ¥043,767 ¥016,337 $138
Fair value 43,428 16,348 138
Gross unrealized gains 1 26 0
Gross unrealized losses 340 15 0

91
Maturities of debt securities classified as held-to-maturity at March 31, 2007 were as follows:
U.S. dollarsYen (millions)
(millions) (note 2)
Due within one year ¥03,304 $028
Due after one year through five years 11,035 93
Due after five years through ten years 1,998 17
Total ¥16,337 $138
Realized gains and losses from available-for-sale securities
included in other expenses (income)—other for each of the
years in the three-year period ended March 31, 2007, were,
¥2,206 million net gains, ¥462 million net losses and ¥10,463
million ($89 million) net gains, respectively.
Gross unrealized losses on marketable securities and fair value of the related securities, aggregated by length of time that
individual securities have been in a continuous unrealized loss position at March 31, 2007 were as follows:
U.S. dollarsYen (millions)
(millions) (note 2)
Unrealized UnrealizedFair value losses Fair value losses
Available-for-sale
Less than 12 months ¥329 ¥(88) $03 $((1)
12 months or longer — — — —
¥329 ¥(88) $03 $((1)
Held-to-maturity
Less than 12 months ¥3,540 ¥0(1) $30 $(0)
12 months or longer 3,938 (14) 33 (0)
¥7,478 ¥(15) $63 $(0)
Honda judged this decline in fair value of investment securi-
ties to be temporary, with considering such factors as finan-
cial and operating conditions of the issuer, the industry in
which the issuer operates, degree and period of the decline
in fair value and other relevant factors.
8. Property on Operating Leases
Future minimum lease rentals expected to be received from property on operating leases at March 31, 2007 are as follows:
YenYears ending March 31 (millions)
2008 ¥061,045
2009 60,168
2010 46,470
2011 6,885
2012 112
Total future minimum lease rentals ¥174,680
Future minimum rentals as shown above should not necessarily be considered indicative of future cash collections.

92
9. Short-term and Long-term Debt
Short-term debt at March 31, 2006 and 2007 is as follows:
U.S. dollarsYen (millions)
(millions) (note 2)
2006 2007 2007
Short-term bank loans ¥314,124 ¥0,311,117 $02,635
Medium-term notes 152,246 182,355 1,545
Commercial paper 227,187 772,396 6,543
¥693,557 ¥1,265,868 $10,723
The weighted average interest rates on short-term debt outstanding at March 31, 2006 and 2007 were 3.21% and 4.00%,respectively.
Long-term debt at March 31, 2006 and 2007 is as follows:
U.S. dollarsYen (millions)
(millions) (note 2)
2006 2007 2007
Honda Motor Co., Ltd.:Loans, maturing through 2031:
Unsecured, principally from banks ¥0,000,603 ¥0,000,516 $00,004
603 516 4
Subsidiaries:
Commercial paper 205,573 — —
Loans, maturing through 2030
Secured, principally from banks 19,765 18,581 157
Unsecured, principally from banks 94,509 134,949 1,143
0.69% Japanese yen unsecured bond due 2006 60,000 — —
0.81% Japanese yen unsecured bond due 2006 1,000 — —
0.47% Japanese yen unsecured bond due 2007 50,000 50,000 424
0.79% Japanese yen unsecured bond due 2008 30,000 30,000 254
0.99% Japanese yen unsecured bond due 2009 30,000 30,000 254
1.14% Japanese yen unsecured bond due 2009 — 30,000 254
0.31% Japanese yen unsecured bond due 2010 200 150 1
0.66% Japanese yen unsecured bond due 2010 30,000 30,000 254
0.94% Japanese yen unsecured bond due 2010 30,000 30,000 254
1.51% Japanese yen unsecured bond due 2011 — 30,000 254
3.65% Thai baht unsecured bond due 2007 6,040 7,340 62
5.32% Thai baht unsecured bond due 2008 — 3,670 31
5.46% Thai baht unsecured bond due 2009 — 5,505 47
Medium-term notes, maturing through 2019 1,981,201 2,282,138 19,332
Less unamortized discount, net 2,246 1,697 13
2,536,042 2,680,636 22,708
Total long-term debt 2,536,645 2,681,152 22,712
Less current portion 657,645 775,409 6,568
¥1,879,000 ¥1,905,743 $16,144

93
The loans maturing through 2031 and through 2030 are
either secured by property, plant and equipment or subject to
collateralization upon request, and their interest rates range
from 0.69% to 16.17% per annum at March 31, 2007 and
weighted average interest rate on total outstanding long-term
debt at March 31, 2006 and 2007 is 4.35% and 3.96%,
respectively. Property, plant and equipment with a net book
value of approximately ¥22,592 million and ¥23,654 million
($200 million) at March 31, 2006 and 2007, respectively,
were subject to specific mortgages securing indebtedness.
Furthermore, finance subsidiaries-receivables of approxi-
mately ¥8,993 million and ¥1,931 million ($16 million) at
March 31, 2006 and 2007 respectively, were pledged as
Certain of the Company’s subsidiaries have entered into cur-
rency swap and interest rate swap agreements for hedging
currency and interest rate exposures resulting from the issu-
ance of long-term debt. Fair value of contracts related to
currency swaps and interest rate swaps is included in other
assets/liabilities and/or other current assets/liabilities in the
consolidated balance sheets, as appropriate (see note 16).
Unless a right of setoff exists, the offsetting of assets and
liabilities is not made in the consolidated balance sheets.
At March 31, 2007, Honda had unused line of credit facili-
ties amounting to ¥1,127,722 million ($9,553 million), of
which ¥390,278 million ($3,306 million) related to commercial
paper programs and ¥737,444 million ($6,247 million) related
to medium-term notes programs. Honda is authorized to
obtain financing at prevailing interest rates under these
programs.
At March 31, 2007, Honda also had committed lines of
credit amounting to ¥840,889 million ($7,123 million), none of
which was in use. The committed lines are used to back up
the commercial paper programs. Borrowings under those
committed lines of credit generally are available at the prime
interest rate.
As is customary in Japan, both short-term and long-term
bank loans are made under general agreements which pro-
vide that security and guarantees for present and future
indebtedness will be given upon request of the bank, and
that the bank shall have the right to offset cash deposits
against obligations that have become due or, in the event of
default, against all obligations due to the bank. Certain
debenture trust agreements provide that Honda must give
additional security upon request of the trustee.
collateral by a financial subsidiary for certain loans.
At March 31, 2006, ¥205,573 million of commercial paper
borrowings were classified as long-term, as it is the respec-
tive finance subsidiary’s intention to refinance them on a
long-term basis and it has established the necessary credit
facilities to do so. During fiscal year 2007, management
decided not to classify the commercial paper as long term
since management has no intention of refinancing them on a
long-term basis. The weighted average interest rate on com-
mercial paper at March 31, 2006 was approximately 4.32%.
Medium-term notes are unsecured, and their interest rates
range from 0.63% to 4.66% at March 31, 2006 and from
0.77% to 5.38% at March 31, 2007.
The following schedule shows the maturities of long-term debt for each of the five years following March 31, 2007 and
thereafter:
YenYears ending March 31: (millions)
2008 ¥0,775,409
2009 888,650
2010 485,705
2011 317,979
2012 186,726
After five years 26,683
1,905,743
Total ¥2,681,152

94
10. Other Liabilities
Other liabilities at March 31, 2006 and 2007 are summarized as follows:
U.S. dollarsYen (millions)
(millions) (note 2)
2006* 2007 2007
Accrued liabilities for product warranty, excluding current portion ¥0,137,503 ¥0,153,409 $01,300
Additional minimum pension liabilities (note 13) 171,773 — —
Pension and other postretirement benefits (note 13) 117,286 524,457 4,443
Deferred income taxes 406,727 316,048 2,677
Other 212,234 243,798 2,064
¥1,045,523 ¥1,237,712 $10,484
* See note 3.
11. Income Taxes
Total income taxes for each of the years in the three-year period ended March 31, 2007 were allocated as follows:
U.S. dollarsYen (millions)
(millions) (note 2)
2005 2006 2007 2007
Income from continuing operations ¥266,665 ¥317,189 ¥283,846 $2,404
Other comprehensive income (note 15) 12,718 154,370 935 8
¥279,383 ¥471,559 ¥284,781 $2,412
Income before income taxes and equity in income of affiliates by domestic and foreign source and income tax expense
(benefit) for each of the years in the three-year period ended March 31, 2007 consisted of the following:
Yen(millions)
Income taxesIncome beforeincome taxes Current Deferred Total
2005*:
Japanese ¥148,860 ¥057,066 ¥024,134 ¥081,200
Foreign 519,504 94,080 91,385 185,465
¥668,364 ¥151,146 ¥115,519 ¥266,665
2006*:
Japanese ¥317,997 ¥103,697 ¥038,225 ¥141,922
Foreign 511,907 216,248 (40,981) 175,267
¥829,904 ¥319,945 ¥,0(2,756) ¥317,189
2007:
Japanese ¥182,433 ¥089,155 ¥,(13,798) ¥075,357
Foreign 610,435 211,139 (2,650) 208,489
¥792,868 ¥300,294 ¥,(16,448) ¥283,846

95
U.S. dollars(millions) (note 2)
Income taxesIncome beforeincome taxes Current Deferred Total
2007:
Japanese $1,545 $0,755 $(117) $0,638
Foreign 5,171 1,789 (23) 1,766
$6,716 $2,544 $(140) $2,404
* See note 3.
The statutory income tax rate is approximately 40% for each of the years in the three-year period ended March 31, 2007. The
foreign subsidiaries are subject to taxes based on income at rates ranging from 16% to 40%.
The effective tax rate for Honda for each of the years in the three-year period ended March 31, 2007 differs from the
Japanese statutory income tax rate for the following reasons:
2005 2006 2007
Statutory income tax rate 40.0% 40.0% 40.0%
Valuation allowance provided for current year operating losses of subsidiaries 0.5 0.3 0.4
Difference in statutory tax rates of foreign subsidiaries (1.9) (2.3) (3.7)
Reversal of valuation allowance due to utilization of operating loss carryforwards (1.1) (0.8) (0.2)
Research and development credit (2.3) (3.0) (3.3)
Tax authority assessment relating to prior years* 1.8 — —
Other adjustments relating to prior years — 3.1 —
Other 2.9 0.9 2.6
Effective tax rate 39.9% 38.2% 35.8%
* The prior year income taxes in 2005 are due to assessment by the Japanese tax authorities as a result of their transfer pricing audit relating tothe Company’s motorcycle business in Brazil.
The tax effects of temporary differences that give rise to significant portions of the deferred tax assets and deferred tax liabilities
at March 31, 2006 and 2007 are presented below:
U.S. dollarsYen (millions)
(millions) (note 2)
2006 2007 2007
Deferred tax assets:
Inventories ¥(030,012 ¥0(35,114 $(0,297
Allowance for dealers and customers 141,141 153,328 1,299
Accrued bonus 35,968 40,628 344
Property, plant and equipment 17,817 61,409 520
Foreign tax credit 9,267 10,427 88
Operating loss carryforwards 75,131 39,781 337
Minimum pension liabilities adjustment 68,566 — —
Pension and other postretirement benefits 62,829 210,378 1,782
Other 121,951 141,104 1,196
Total gross deferred tax assets 562,682 692,169 5,863
Less valuation allowance 70,239 35,447 300
Net deferred tax assets 492,443 656,722 5,563

96
U.S. dollarsYen (millions)
(millions) (note 2)
2006 2007 2007
Deferred tax liabilities:
Inventories (11,018) (13,650) (116)
Prepaid pension expenses (29,019) (34,422) (292)
Property, plant and equipment,
excluding lease transactions (67,263) (59,680) (506)
Lease transactions (357,578) (405,516) (3,435)
Undistributed earnings of subsidiaries
and affiliates (81,675) (106,273) (900)
Net unrealized gains on marketable securities (44,580) (41,039) (347)
Other (52,059) (27,262) (230)
Total gross deferred tax liabilities (643,192) (687,842) (5,826)
Net deferred tax (liability) asset ¥(150,749) ¥0(31,120) $0,(263)
Deferred income tax assets and liabilities at March 31, 2006 and 2007 are reflected in the consolidated balance sheets under
the following captions:
U.S. dollarsYen (millions)
(millions) (note 2)
2006* 2007 2007
Current assets—Deferred income taxes ¥(221,294 ¥(215,172 $(1,823
Other assets 37,686 71,583 606
Other current liabilities (3,002) (1,827) (15)
Other liabilities (406,727) (316,048) (2,677)
Net deferred tax (liability) asset ¥(150,749) ¥0(31,120) $0,(263)
* See note 3.
In assessing the realizability of deferred tax assets, man-
agement considers whether it is more likely than not that
some portion or all of the deferred tax assets will not be real-
ized. The ultimate realization of deferred tax assets is depen-
dent upon the generation of future taxable income over the
periods in which those temporary differences become
deductible and operating loss carryforwards utilized. Man-
agement considered the scheduled reversal of deferred tax
liabilities, projected future taxable income and tax planning
strategies in making this assessment. Based upon the level
of historical taxable income and projections for future taxable
income over the periods which the deferred tax assets are
deductible, management believes it is more likely than not
that Honda will realize the benefits of these deductible differ-
ences and operating loss carryforwards, net of the existing
valuation allowances at March 31, 2006 and 2007.
The net change in the total valuation allowance for the
years ended March 31, 2005 was decrease of ¥11,989
million, for the year ended March 31, 2006 was increase of
¥10,502 million, and for the year ended March 31, 2007 was
decrease of ¥34,792 million ($295 million). The valuation
allowance primarily relates to deferred tax assets associated
with net operating loss carryforwards incurred by certain
foreign subsidiaries.

97
At March 31, 2007, certain of the Company’s subsidiaries have operating loss carryforwards for income tax purposes of
¥128,162 million ($1,086 million), which are available to offset future taxable income, if any. Periods available to offset future
taxable income vary in each tax jurisdiction and range from one year to an indefinite period as follows:
U.S. dollarsYen (millions)
(millions) (note 2)
Within 1 year ¥000,528 $0,0051 to 5 years 10,599 905 to 15 years 11,947 101Indefinite periods 105,088 890
¥128,162 $1,086
At March 31, 2006 and 2007, Honda did not recognize
deferred tax liabilities of ¥60,703 million and ¥78,252 million
($663million), respectively, for certain portions of the undis-
tributed earnings of the Company’s foreign subsidiaries
because such portions were considered permanently rein-
vested. At March 31, 2006 and 2007, the undistributed earn-
ings not subject to deferred tax liabilities were ¥2,676,892
million and ¥2,995,170 million ($25,372 million), respectively.
12. Dividends and Legal Reserves
The Company law of Japan enforced on May 1, 2006 pro-
vides that earnings in an amount equal to 10% of dividends
of retained earnings shall be appropriated as a capital sur-
plus or a legal reserve on the date of distribution of retained
earnings until an aggregated amount of capital surplus and a
legal reserve equals 25% of stated capital. The Japanese
Commercial Code, effective until the enforcement of the
Company law of Japan, provided that earnings in an amount
equal to at least 10% of appropriations of retained earnings
that were paid in cash shall be appropriated as a legal
reserve until an aggregated amount of capital surplus and the
legal reserve equaled 25% of stated capital. Certain foreign
subsidiaries are also required to appropriate their earnings to
legal reserves under the laws of the respective countries.
Dividends and appropriations to the legal reserves
charged to retained earnings during the years in the three-
year period ended March 31, 2007 represent dividends paid
out during those years and the related appropriations to the
legal reserves. Dividends per share for each of the years in
the three-year period ended March 31, 2007 were ¥25.5,
¥38.5 and ¥77 ($0.65), respectively. The accompanying con-
solidated financial statements do not include any provision
for the dividend of ¥20 ($0.17) per share aggregating
¥36,456 million ($309 million) proposed and resolved in the
general stockholders’ meeting held in June 2007.
The Company executed a two-for-one stock split for the
Company’s common stock effective July 1, 2006. Information
pertaining to dividends per share has been adjusted retroac-
tively for all periods presented to reflect this stock split.
13. Pension and Other Postretirement Benefits
The Company and its subsidiaries have various pension
plans covering substantially all of their employees in Japan
and certain employees in foreign countries. Benefits under
the plans are primarily based on the combination of years of
service and compensation. The funding policy is to make
periodic contributions as required by applicable regulations.
Plan assets consist primarily of listed equity securities and
bonds.
Retirement benefits for directors, excluding certain ben-
efits, are provided in accordance with management policy.
There are occasions where officers other than directors
receive special lump-sum payments at retirement. Such pay-
ments are charged to income as paid since amounts vary
with circumstances and it is impractical to compute a liability
for future payments.
In January 2003, the Emerging Issues Task Force (EITF)
reached a final consensus on Issue No. 03-2 “Accounting for
the Transfer to the Japanese Government of the Substitu-
tional Portion of Employee Pension Fund Liabilities” (“EITF
03-2”). EITF 03-2 addresses accounting for a transfer to the
Japanese government of a substitutional portion of an
Employees’ Pension Fund (“EPF”) plan, which is a defined

98
benefit pension plan established under the Welfare Pension
Insurance Law. EITF 03-2 requires employers to account for
the separation process of the substitutional portion from the
entire EPF plan (which includes a corporation portion) upon
completion of the transfer to the government of the substitu-
tional portion of the benefit obligation and related plan
assets. The separation process is considered the culmination
of a series of steps in a single settlement transaction. Under
this approach, the difference between the fair value of the
obligation and the assets required to be transferred to the
government should be accounted for and separately
disclosed as a subsidy.
As stipulated in the Japanese Welfare Pension Insurance
Law, the “Honda Employees’ Pension Fund (a confederated
welfare pension fund, the “Fund”)”, of which the Company
and a part of its domestic subsidiaries and affiliates
accounted for under the equity method were members, has
obtained approval from the Japanese Minister of Health,
Labor and Welfare for exemption from benefits obligations
related to past employee service with respect to the substitu-
tional portion of the Fund on July 1, 2005 and completed its
transfer on March 9, 2006. Previously on April 1, 2004, the
Company received approval of exemption from the obligation
for benefits related to future employee services with respect
to the fund. As a result, the Company recognized a gain of
¥228,681 million, which is the difference between the settled
accumulated benefit obligation and the assets transferred to
the government; a gain of ¥56,448 million for the
derecognition of previous accrued salary progression; and
settlement loss of ¥147,113 million for the related unrecog-
nized loss. Collectively, the Company recognized a net gain
of ¥138,016 million for the fiscal year ended March 31, 2006.
The Company and its consolidated subsidiaries adopted
SFAS No.158, “Employers’ Accounting for Defined Benefit
Pension and Other Postretirement Plans—an amendment of
FASB Statements No. 87, 88, 106, and 132(R)” on March 31,
2007, recognized its overfunded or underfunded status as an
asset or liability in its consolidated balance sheets.
The incremental effect of applying SFAS No. 158 at March 31, 2007, on balance sheet items is as follows:
Yen (millions)
Before AfterApplication of Application of
SFAS 158 Adjustments SFAS 158
Other assets ¥00,575,851 ¥(011,347 ¥00,587,198
Total assets 12,025,153 11,347 12,036,500
Accrued expenses 847,008 (39,667) 807,341
Total current liabilities 4,327,194 (39,667) 4,287,527
Other liabilities 1,047,374 190,338 1,237,712
Total liabilities 7,280,311 150,671 7,430,982
Accumulated other comprehensive loss, net* (287,842) (139,324) (427,166)
Total stockholders’ equity 4,621,935 (139,324) 4,482,611
U.S. dollars (millions) (note 2)
Before AfterApplication of Application of
SFAS 158 Adjustments SFAS 158
Other assets $004,878 $(0,096 $004,974
Total assets 101,865 96 101,961
Accrued expenses 7,175 (336) 6,839
Total current liabilities 36,656 (336) 36,320
Other liabilities 8,873 1,612 10,485
Total liabilities 61,672 1,276 62,948
Accumulated other comprehensive loss, net* (2,439) (1,180) (3,619)
Total stockholders’ equity 39,152 (1,180) 37,972
* The incremental effect of applying SFAS No. 158 on accumulated other comprehensive loss, net, includes tax effect of ¥72,881 million ($617 million).

99
Reconciliations of beginning and ending balances of the pension benefit obligations and the fair value of the plan assets are as
follows:
Yen (millions)
Japanese plans Foreign plans
2006 2007 2006 2007
Change in benefit obligations:Benefit obligations at beginning of year ¥(1,641,593) ¥(1,133,325) ¥(301,379) ¥(395,416)
Service cost (41,271) (42,115) (25,121) (30,492)Interest cost (31,788) (23,809) (18,838) (22,373)Plan participants’ contributions (94) — (111) (129)Actuarial gain (loss) 9,198 (4,165) (22,421) 21,746Benefits paid 33,957 31,638 2,949 3,731Amendment 20,652 — (1,584) (10)Transfer of the substitutional portion 517,614 — — —Business combination — (34,643) — (906)Foreign exchange translation — — (28,911) (10,908)
Benefit obligations at end of year (1,133,325) (1,206,419) (395,416) (434,757)
Change in plan assets:Fair value of plan assets at beginning of year 842,542 712,331 257,165 358,075
Actual return on plan assets 98,450 36,223 27,240 46,161Employer contributions 37,687 33,649 49,912 40,163Plan participants’ contributions 94 — 111 129Benefits paid (33,957) (31,638) (2,949) (3,731)Transfer of the substitutional portion (232,485) — — —Business combination — 32,270 — 875Foreign exchange translation — — 26,596 7,795
Fair value of plan assets at end of year 712,331 782,835 358,075 449,467
Funded status (420,994) (423,584) (37,341) 14,710
Unrecognized actuarial loss (gain) 354,172 — 100,047 —Unrecognized net transition obligations 3,733 — 317 —Unrecognized prior service cost (benefit) (75,797) — 8,345 —
Net amount recognized (138,886) — 71,368 —
Adjustments to recognize additional minimum liabilities (notes 10 and 15):
Intangible assets — — (316) —Amount included in accumulated other comprehensive income (loss) (171,158) — (299) —
Amounts recognized in the consolidated balance sheets are as follows:
Yen (millions)
Japanese plans Foreign plans
2006 2007 2006 2007
Noncurrent assets ¥(00000—. ¥(0,003,283 ¥075,367 ¥(051,000Current liabilities (33,281) (5,272) (3,999) (6)Noncurrent liabilities (276,763) (421,595) (615) (36,284)
Total (310,044) (423,584) 70,753 14,710
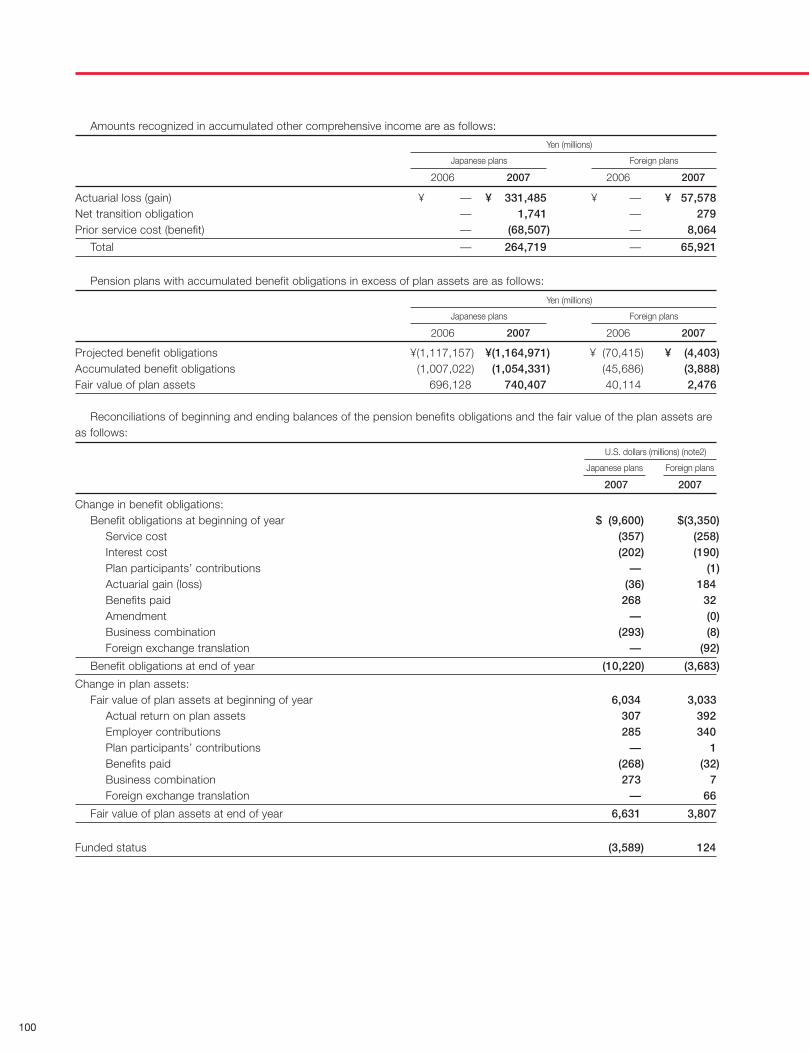
100
Amounts recognized in accumulated other comprehensive income are as follows:
Yen (millions)
Japanese plans Foreign plans
2006 2007 2006 2007
Actuarial loss (gain) ¥(00000—. ¥(0,331,485 ¥00000—. ¥(057,578Net transition obligation — 1,741 — 279Prior service cost (benefit) — (68,507) — 8,064
Total — 264,719 — 65,921
Pension plans with accumulated benefit obligations in excess of plan assets are as follows:
Yen (millions)
Japanese plans Foreign plans
2006 2007 2006 2007
Projected benefit obligations ¥(1,117,157) ¥(1,164,971) ¥0(70,415) ¥00(4,403)Accumulated benefit obligations (1,007,022) (1,054,331) (45,686) (3,888)Fair value of plan assets 696,128 740,407 40,114 2,476
Reconciliations of beginning and ending balances of the pension benefits obligations and the fair value of the plan assets areas follows:
U.S. dollars (millions) (note2)
Japanese plans Foreign plans
2007 2007
Change in benefit obligations:Benefit obligations at beginning of year $0(9,600) $(3,350)
Service cost (357) (258)Interest cost (202) (190)Plan participants’ contributions — (1)Actuarial gain (loss) (36) 184Benefits paid 268 32Amendment — (0)Business combination (293) (8)Foreign exchange translation — (92)
Benefit obligations at end of year (10,220) (3,683)
Change in plan assets:Fair value of plan assets at beginning of year 6,034 3,033
Actual return on plan assets 307 392Employer contributions 285 340Plan participants’ contributions — 1Benefits paid (268) (32)Business combination 273 7Foreign exchange translation — 66
Fair value of plan assets at end of year 6,631 3,807
Funded status (3,589) 124

101
Amounts recognized in the consolidated balance sheets are as follows:
U.S. dollars (millions) (note2)
Japanese plans Foreign plans
2007 2007
Noncurrent assets $(00,028 $(0,432Current liabilities (45) (0)Noncurrent liabilities (3,572) (308)
Total (3,589) 124
Amounts recognized in accumulated other comprehensive income are as follows:
U.S. dollars (millions) (note2)
Japanese plans Foreign plans
2007 2007
Actuarial loss (gain) $(02,807 $(0,488Net transition obligation 15 2Prior service cost (benefit) (580) 68
Total 2,242 558
Pension plans with accumulated benefit obligations in excess of plan assets:
U.S. dollars (millions) (note2)
Japanese plans Foreign plans
2007 2007
Projected benefit obligations $0(9,868) $0,0(37)Accumulated benefit obligations (8,931) (33)Fair value of plan assets 6,272 21
Pension expense for each of the years in the three-year period ended March 31, 2007 included the following:
U.S. dollarsYen (millions)
(millions) (note 2)
2005 2006 2007 2007
Japanese plans:Service cost-benefits earned during the year ¥(40,963 ¥(41,271 ¥(42,115 $(357
Interest cost on projected benefit obligations 32,368 31,788 23,809 202
Expected return on plan assets (33,589) (33,102) (27,580) (234)
Amortization of actuarial loss (gain) 32,799 28,394 16,326 138
Amortization of net transition obligation 1,035 1,992 1,992 17
Amortization of prior service cost (benefit) (5,913) (6,945) (7,289) (62)
¥(67,663 ¥(63,398 ¥(49,373 $(418
Foreign plans:Service cost-benefits earned during the year ¥(17,560 ¥(25,121 ¥(30,492 $(258
Interest cost on projected benefit obligations 14,445 18,838 22,373 190
Expected return on plan assets (17,418) (21,013) (27,597) (234)
Amortization of actuarial loss (gain) 1,948 4,192 5,041 43
Amortization of net transition obligation 76 62 41 0
Amortization of prior service cost (benefit) 552 577 752 6
¥(17,163 ¥(27,777 ¥(31,102 $(263

102
The estimated actuarial loss (gain), net transition obliga-
tion and prior service benefit for all domestic defined pension
plans that will be amortized from accumulated other compre-
hensive income into net periodic benefit cost over the next
fiscal year are ¥14,290 million, ¥1,741 million and ¥7,289
million, respectively. And the estimated actuarial loss (gain),
net transition obligation and prior service cost for all foreign
defined pension plans that will be amortized from accumu-
lated other comprehensive income into net periodic benefit
cost over the next fiscal year are ¥4,341 million, ¥41 million
and ¥772 million, respectively.
Weighted-average assumptions used to determine benefit obligation at March 31, 2006 and 2007 were as follows:
2006 2007
Japanese plans:Discount rate 2.0% 2.0%
Rate of salary increase 2.2% 2.3%
Foreign plans:Discount rate 4.9–5.8% 5.2–6.0%
Rate of salary increase 3.5–5.2% 2.9–6.4%
Weighted-average assumptions used to determine net periodic benefit cost for each of the years in the three-year period
ended March 31, 2007 were as follows:
2005 2006 2007
Japanese plans:Discount rate 2.0% 2.0% 2.0%
Rate of salary increase 2.3% 2.3% 2.2%
Expected long-term rate of return 4.0% 4.0% 4.0%
Foreign plans:Discount rate 5.8–6.8% 5.4–6.3% 4.9–5.8%
Rate of salary increase 3.5–6.7% 3.5–6.7% 3.5–5.2%
Expected long-term rate of return 6.8–8.5% 6.8–8.0% 6.8–8.0%
Honda determines the expected long-term rate of return based on the expected long-term return of the various asset
categories. Honda considers the current expectations for future returns and the actual historical returns of each plan asset
category.
Measurement date
Honda uses a March 31 measurement date for their plans excluding certain foreign subsidiaries which use a December 31
measurement date for their plans.
Plan Assets
Honda’s domestic and foreign pension plan weighted-average asset allocations at March 31, 2006 and 2007, by asset category
are as follows:
2006 2007
Japanese plans:
Equity securities 48% 43%
Debt securities 37% 36%
Other 15% 21%
100% 100%
Foreign plans:
Equity securities 65% 70%
Debt securities 24% 27%
Other 11% 3%
100% 100%

103
Honda investment policies for the domestic and foreign pension benefit are designed to maximize total returns that are avail-
able to provide future payments of pension benefits to eligible participants under accepted risks. Honda sets target assets allo-
cations for the individual asset categories based on the estimated returns and risks in the long future. Plan assets are invested
in individual equity and debt securities using the target assets allocation.
Obligations
The accumulated benefit obligations for all domestic defined benefit plans at March 31, 2006 and 2007 were ¥1,019,764 million
and ¥1,088,890 million ($9,224 million), respectively. The accumulated benefit obligations for all foreign defined benefit plans at
March 31, 2006 and 2007 were ¥303,509 million and ¥340,527 million ($2,885 million), respectively.
Cash flows
Honda expects to contribute ¥33,953 million to its domestic pension plans and ¥37,187 million to its foreign pension plans in
the year ending March 31, 2008.
Estimated future benefit Payment
The following table presents estimated future gross benefit payments:
Yen (millions)
Japanese plans Foreign plans
2008 ¥040,130 ¥04,540
2009 42,885 5,138
2010 45,546 6,144
2011 43,660 7,178
2012 45,339 8,582
2013–2017 250,746 74,946
Certain of the Company’s subsidiaries in North America provide certain health care and life insurance benefits to retired
employees. Such benefits have no material effect on Honda’s financial position and results of operations.
14. Supplemental Disclosures of Cash Flow Information
U.S. dollarsYen (millions)
(millions) (note 2)
2005 2006 2007 2007
Cash paid during the year for:Interest ¥099,475 ¥134,609 ¥187,268 $1,586Income taxes 159,041 282,986 351,225 2,975
During the fiscal year ended March 31, 2005, the Com-
pany retired shares totaling 46,000,000 shares at a cost of
¥216,371 million by offsetting with capital surplus of ¥190
million and unappropriated retained earnings of ¥ 216,181
million based on the resolution of board of directors.
During the year ended March 31, 2006, the Company
reissued certain of its treasury stock at fair value of ¥802
million to the minority shareholder of subsidiary, which the
Company made a wholly owned subsidiary, and the
Company retired shares totaling 11,000,000 shares at a cost
of ¥66,224 million by offsetting with capital surplus of ¥2 mil-
lion and unappropriated retained earnings of ¥ 66,221 million
based on the resolution of board of directors.
During the year ended March 31, 2007, the Company
reissued certain of its treasury stock at fair value of ¥18,521
million ($155 million) to the outside shareholder of affiliates to
obtain 100% share of these companies.

104
15. Accumulated Other Comprehensive Income (Loss)
The components and related changes in accumulated other comprehensive income (loss) for each of the years in the three-year
period ended March 31, 2007 are as follows:
U.S. dollarsYen (millions)
(millions) (note 2)
2005 2006 2007 2007
Adjustments from foreign currency translation:Balance at beginning of year ¥(665,413) ¥(624,937) ¥(375,777) $(3,183)
Adjustments for the year 40,476 249,160 96,775 820
Balance at end of year (624,937) (375,777) (279,002) (2,363)
Net unrealized gains on marketable securities:Balance at beginning of year 36,066 33,744 62,710 531
Reclassification adjustments for realized (gain) loss on marketable securities 1,346 (841) (5,575) (47)
Increase (decrease) in net unrealized gains on marketable securities (3,668) 29,807 1,004 8
Balance at end of year 33,744 62,710 58,139 492
Net unrealized gains (losses) on derivative instruments:Balance at beginning of year — — (64) (1)
Reclassification adjustments for realized (gain) loss on derivative instruments — (38) 421 4
Increase (decrease) in net unrealized gains on derivative instruments — (26) (337) (3)
Balance at end of year — (64) 20 0
Minimum pension liabilities adjustment:Balance at beginning of year (225,226) (202,741) (94,056) (796)
Cumulative effect of adjustments resulting from the adoption of SAB No. 108, net of tax (note 1(u)) — — 18,149 153
Adjusted balances at beginning of year (225,226) (202,741) (75,907) (643)
Adjustments for the year 22,485 108,685 8,908 75
Adjustment for initially applying SFAS No. 158, net of tax (note 13) — — 66,999 568
Balance at end of year (202,741) (94,056) — —
Pension and other postretirement benefits adjustmentAdjustment for initially applying SFAS No. 158, net of tax (note 13) — — (206,323) (1,748)
Balance at end of year — — (206,323) (1,748)
Total accumulated other comprehensive income (loss):Balance at beginning of year (854,573) (793,934) (407,187) (3,449)
Cumulative effect of adjustments resulting from the adoption of SAB No. 108, net of tax (note 1(u)) — — 18,149 153
Adjusted balances at beginning of year (854,573) (793,934) (389,038) (3,296)
Adjustments for the year 60,639 386,747 101,196 857
Adjustment for initially applying SFAS No. 158,
net of tax (note 13) — — (139,324) (1,180)
Balance at end of year ¥(793,934) ¥(407,187) ¥(427,166) $(3,619)

105
The tax effects allocated to each component of other comprehensive income (loss) and reclassification adjustments are as
follows:
Yen(millions)
Tax (expense)Before-tax or benefit Net-of-tax
amount (note 11) amount
2005:Adjustments from foreign currency translation ¥(039,469 ¥(001,007 ¥(040,476Unrealized gains (losses) on marketable securities:
Unrealized holding gains (losses) arising during the year (6,104) 2,436 (3,668)Reclassification adjustments for losses (gains) realized in net income 2,114 (768) 1,346
Net unrealized gains (losses) (3,990) 1,668 (2,322)
Minimum pension liabilities adjustment 37,878 (15,393) 22,485
Other comprehensive income (loss) ¥0(73,357 ¥0(12,718) ¥0(60,639
2006:Adjustments from foreign currency translation ¥(301,737 ¥0(52,577) ¥(249,160Unrealized gains (losses) on marketable securities:
Unrealized holding gains (losses) arising during the year 49,675 (19,868) 29,807Reclassification adjustments for losses (gains) realized in net income (1,395) 554 (841)
Net unrealized gains (losses) 48,280 (19,314) 28,966
Unrealized gains (losses) on derivative instruments:Unrealized holding gains (losses) arising during the year (43) 17 (26)Reclassification adjustments for losses (gains) realized in net income (64) 26 (38)
Net unrealized gains (losses) (107) 43 (64)
Minimum pension liabilities adjustment 191,207 (82,522) 108,685
Other comprehensive income (loss) ¥(541,117 ¥(154,370) ¥(386,747
2007:
Adjustments from foreign currency translation ¥(095,275 ¥(001,500 ¥(096,775
Unrealized gains (losses) on marketable securities:
Unrealized holding gains (losses) arising during the year 1,408 (404) 1,004
Reclassification adjustments for losses (gains) realized in net income (9,520) 3,945 (5,575)
Net unrealized gains (losses) (8,112) 3,541 (4,571)
Unrealized gains (losses) on derivative instruments
Unrealized holding gains (losses) arising during the year (562) 225 (337)
Reclassification adjustments for losses (gains) realized in net income 703 (282) 421
Net unrealized gains (losses) 141 (57) 84
Minimum pension liabilities adjustment 14,827 (5,919) 8,908
Other comprehensive income (loss) ¥(102,131 ¥000,(935) ¥(101,196

106
U.S. dollars(millions) (note 2)
Tax (expense)Before-tax or benefit Net-of-tax
amount (note 11) amount
2007:Adjustments from foreign currency translation $807 $(13 $820Unrealized gains (losses) on marketable securities:
Unrealized holding gains (losses) arising during the year 12 (3) 8Reclassification adjustments for losses (gains) realized in net income (81) 33 (47)
Net unrealized gains (losses) (69) 30 (39)
Unrealized gains (losses) on derivative instruments:Unrealized holding gains (losses) arising during the year (5) 2 (3)Reclassification adjustments for losses (gains) realized in net income 6 (2) 4
Net unrealized gains (losses) 1 0 1
Minimum pension liabilities adjustment 126 (51) 75
Other comprehensive income (loss) $865 $0(8) $857
16. Fair Value of Financial Instruments
The estimated fair values of significant financial instruments at March 31, 2006 and 2007 are as follows:
U.S. dollarsYen (millions)
(millions) (note 2)
2006 2007 2007
Carrying Estimated Carrying Estimated Carrying Estimatedamount fair value amount fair value amount fair value
Finance subsidiaries–receivables (a) ¥2,843,819 ¥2,813,023 ¥3,434,721 ¥3,444,144 $29,095 $29,175
Marketable securities 172,385 172,385 210,598 210,598 1,784 1,784
Held-to-maturity securities 43,767 43,428 16,337 16,348 138 138
Convertible preferred stocks
Host contracts 8,943 8,943 — — — —
Embedded derivatives 13,991 13,991 — — — —
22,934 22,934 — — — —
Convertible notes (b)
Host contracts 8,156 8,156 — — — —
Embedded derivatives 48,479 48,479 — — — —
56,635 56,635 — — — —
Debt (3,230,202) (3,237,471) (3,947,020) (3,960,743) (33,435) (33,551)
Foreign exchange instruments (c)
Asset position ¥0,004,477 ¥0,004,477 ¥0,003,735 ¥0,003,735 $00,032 $00,032
Liability position (35,979) (35,979) (24,783) (24,783) (210) (210)
Net ¥00(31,502) ¥00(31,502) ¥00(21,048) ¥00(21,048) $00(178) $00(178)
Interest rate instruments (d)
Asset position ¥0,036,334 ¥0,036,334 ¥0,010,866 ¥0,010,866 $00,092 $00,092
Liability position (2) (2) (2,417) (2,417) (20) (20)
Net ¥0,036,332 ¥0,036,332 ¥0,008,449 ¥0,008,449 $00(072 $00(072

107
(a) The carrying amounts of finance subsidiaries-receivables
at March 31, 2006 and 2007 in the table exclude
¥1,996,686 million and ¥1,709,978 million ($14,486 mil-
lion) of direct financing leases, net, classified as finance
subsidiaries-receivables in the consolidated balance
sheets, respectively. The carrying amounts of finance sub-
sidiaries-receivables at March 31, 2006 and 2007 in the
table also include ¥627,168 million and ¥678,649 million
($5,749 million) of finance receivables classified as trade
receivables and other assets in the consolidated balance
sheets.
(b) A subsidiary had a forward sale contract in relation to a
portion of the above convertible notes. The carrying
amount and estimated fair value of the derivative financial
instrument as of March 31, 2006 is ¥5,462 million, asset
position.
In the year ended March 31, 2007, the subsidiary
exercised the forward sale contract, and there was no
balance of the derivative financial instrument as of
March 31, 2007.
(c) The fair values of foreign currency forward exchange contracts, foreign currency option contracts and foreign currency swap
agreements are included in other liabilities and other current assets/liabilities in the consolidated balance sheets as follows
(see note 9):
U.S. dollarsYen (millions)
(millions) (note 2)
2006 2007 2007
Other current assets ¥(04,477 ¥0(3,735 $(032
Other current liabilities (35,113) (24,783) (210)
Other liabilities (866) — —
¥(31,502) ¥(21,048) $(178)
(d) The fair values of interest rate swap agreements are included in other assets/liabilities and other current assets/liabilities in
the consolidated balance sheets as follows (see note 9):
U.S. dollarsYen (millions)
(millions) (note 2)
2006 2007 2007
Other current assets ¥03,101 ¥03,890 $(33
Other assets 33,233 6,976 59
Other current liabilities — (2,417) (20)
Other liabilities (2) — —
¥36,332 ¥(8,449 $(72
The estimated fair values have been determined using
relevant market information and appropriate valuation method-
ologies. However, these estimates are subjective in nature and
involve uncertainties and matters of significant judgment and,
therefore, cannot be determined with precision. The effect of
using different assumptions and/or estimation methodologies
may be significant to the estimated fair values.
The methodologies and assumptions used to estimate the
fair values of financial instruments are as follows:
Cash and cash equivalents, trade receivables and trade
payables
The carrying amounts approximate fair values because of the
short maturity of these instruments.
Finance subsidiaries-receivables
The fair values of retail receivables and term loans to dealers
were estimated by discounting future cash flows using the
current rates for these instruments of similar remaining
maturities. Given the short maturities of wholesale receiv-
ables, the carrying amount of such receivables approximates
fair value. The fair value of the retained interest in the sold
pools of finance receivables were estimated by calculating
the present value of the future cash flows using a discount
rate commensurate with the risks involved.
Marketable securities
The fair value of marketable securities was estimated using
quoted market prices.
108
Held-to-maturity securities
The fair value of held-to-maturity security was estimated
using quoted market prices.
Convertible notes and convertible preferred stock
investment
Convertible instruments were bifurcated into two portions for
accounting purposes. The note and preferred stock portions
of these convertible instruments were treated as available-
for-sale and were marked-to-market through other compre-
hensive income (loss). The fair value was determined based
on an analysis of interest rate movements and an assess-
ment of credit worthiness. The embedded derivative was
marked-to-market through the statement of income and fair
value was estimated using a trinomial convertible bond
pricing model.
Honda is a party to derivative financial instruments in the
normal course of business to reduce their exposure to
fluctuations in foreign exchange rates and interest rates.
Currency swap agreements are used to convert long-term
debt denominated in a certain currency to long-term debt
denominated in other currencies. Foreign currency forward
exchange contracts and purchased option contracts are
normally used to hedge sale commitments denominated in
foreign currencies (principally U.S. dollars). Foreign currency
written option contracts are entered into in combination with
purchased option contracts to offset premium amounts to be
paid for purchased option contracts. Interest rate swap
agreements are mainly used to convert floating rate financ-
ing, such as commercial paper, to (normally three-five years)
fixed rate financing in order to match financing costs with
income from finance receivables. These instruments involve,
to varying degrees, elements of credit, exchange rate and
interest rate risks in excess of the amount recognized in the
consolidated balance sheets.
The aforementioned instruments contain an element of
risk in the event the counterparties are unable to meet the
terms of the agreements. However, Honda minimizes the risk
exposure by limiting the counterparties to major international
banks and financial institutions meeting established credit
guidelines. Management of Honda does not expect any
counterparty to default on its obligations and, therefore, does
not expect to incur any losses due to counterparty default.
Honda generally does not require or place collateral for these
financial instruments.
Foreign currency forward contracts and currency swap
agreements are agreements to exchange different currencies
at a specified rate on a specific future date. Foreign currency
option contracts are contracts that allow the holder of the
option the right but not the obligation to exchange different
currencies at a specified rate on a specific future date. For-
eign currency forward exchange contracts, foreign currency
option contracts and currency swap agreements outstanding
at March 31, 2006 were ¥898,125 million, ¥176,548 million
and ¥584,358 million, respectively and totaled ¥1,659,031
million. At March 31, 2007, foreign currency forward
exchange contracts, foreign currency option contracts and
currency swap agreements outstanding were ¥978,994 mil-
lion ($8,293 million), ¥5,793 million ($49 million) and
¥608,534 million ($5,155 million), respectively and totaled
¥1,593,321 million ($13,497 million).
Cash flow hedge
The Company applies hedge accounting for certain foreign
currency forward exchange contracts related to forecasted
foreign currency transactions between the Company and its
subsidiaries. Changes in the fair value of derivative financial
instruments designated as cash flow hedges are recognized
in other comprehensive income (loss). The amounts are
reclassified into earnings in the same period when forecasted
hedged transactions affect earnings. The amount recognized
in accumulated other comprehensive income (loss) was ¥64
million loss in the fiscal year ended March 31, 2006 and ¥20
million ($0 million) gain in the fiscal year ended March 31,
Debt
The fair values of bonds and notes were estimated based on
the quoted market prices for the same or similar issues. The
fair value of long-term loans was estimated by discounting
future cash flows using rates currently available for loans of
similar terms and remaining maturities. The carrying amounts
of short-term bank loans and commercial paper approximate
fair values because of the short maturity of these instruments.
Foreign exchange and interest rate instruments
The fair values of foreign currency forward exchange
contracts and foreign currency option contracts were esti-
mated by obtaining quotes from banks. The fair values of
currency swap agreements and interest rate swap agree-
ments were estimated by discounting future cash flows using
rates currently available for these instruments of similar terms
and remaining maturities.
17. Risk Management Activities and Derivative Financial Instruments

109
2007, respectively. All amounts recorded in accumulated
other comprehensive income (loss) as year-end are expected
to be recognized in earnings within the next twelve months.
The period that hedges the changes in cash flows related to
the risk of foreign currency rate is at most around two
months.
There are no derivative financial instruments where hedge
accounting has been discontinued due to the forecasted
transaction no longer being probable. The Company
excludes financial instruments’ time value component from
the assessment of hedge effectiveness, of which amount
was ¥421 million loss for the year ended March 31, 2006,
and ¥1,187 million ($10 million) loss for the year ended
March 31, 2007, respectively. There are no derivative
financial instruments that have been assessed as being
ineffectiveness.
Derivative financial instruments not designated as
accounting hedges
Changes in the fair value of derivative financial instruments
not designated as accounting hedges are recognized in
earnings in the period of the change.
Interest rate swap agreements generally involve the
exchange of fixed and floating rate interest payment obliga-
tions without the exchange of the underlying principal
amount. At March 31, 2006 and 2007, the notional principal
amounts of interest rate swap agreements were ¥3,857,748
million and ¥4,198,463 million ($35,565 million), respectively.
to make future payments in the event of defaults is ¥46,737
million and ¥41,151 million ($349 million), respectively, at
March 31, 2006 and 2007. At March 31, 2007, no amount
has been accrued for any estimated losses under the obliga-
tions, as it is probable that the employees will be able to
make all scheduled payments.
Honda warrants its vehicles for specific periods of time.
Product warranties vary depending upon the nature of the
product, the geographic location of its sale and other factors.
18. Commitments and Contingent Liabilities
At March 31, 2007, Honda had commitments for purchases
of property, plant and equipment of approximately ¥78,027
million ($661 million).
Honda has entered into various guarantee and indemnifi-
cation agreements. At March 31, 2006 and 2007, Honda
has guaranteed ¥46,737 million and ¥41,151 million ($349
million) of bank loan of employees for their housing costs,
respectively. If an employee defaults on his/her loan pay-
ments, Honda is required to perform under the guarantee.
The undiscounted maximum amount of Honda’s obligation
The changes in provisions for those product warranties for each of the years in the two-year period ended March 31, 2007
are as follow:
U.S. dollarsYen (millions)
(millions) (note 2)
2006 2007 2007
Balance at beginning of year ¥268,429 ¥283,947 $2,405
Warranty claims paid during the period (126,834) (113,454) (961)
Liabilities accrued for warranties issued during the period 125,732 143,280 1,214
Changes in liabilities for pre-existing warranties during the period 332 605 5
Foreign currency translation 16,288 2,725 23
¥283,947 ¥317,103 $2,686
With respect to product liability, personal injury claims or
lawsuits, Honda believes that any judgment that may be
recovered by any plaintiff for general and special damages
and court costs will be adequately covered by Honda’s insur-
ance and reserves. Punitive damages are claimed in certain
of these lawsuits. Honda is also subject to potential liability
under other various lawsuits and claims. In accordance with
Statement of Financial Accounting Standards (SFAS) No. 5,
“Accounting for Contingencies”, Honda has recorded a con-
tingent liability when it is probable that an obligation has
been incurred and the amount of loss can be reasonably
estimated. Honda reviews these pending lawsuits and claims
periodically and adjusts the amounts recorded for these
contingent liabilities, if necessary, by considering the nature
of lawsuits and claims, the progress of the case and the
opinions of legal counsel. Honda does not record liabilities for

110
19. Leases
Honda is the lessee under several operating leases, primarily for office and other facilities, and certain office equipment.
Future minimum lease payments under noncancelable operating leases that have initial or remaining lease terms in excess of
one year at March 31, 2007 are as follows:
YenYears ending March 31 (millions)
2008 ¥025,354
2009 19,349
2010 15,354
2011 12,752
2012 10,791
After five years 45,378
Total minimum lease payments ¥128,978
Rental expenses under operating leases for each of the years in the three-year period ended March 31, 2007 were ¥44,619
million, ¥46,102 million and ¥46,910 million ($397 million), respectively.
20. Allowances for Trade Receivable and Finance Subsidiaries-receivables
The allowances for trade receivable and finance subsidiaries-receivables for the years ended March 31, 2005, 2006 and 2007
are set forth in the following table:
Yen (millions)
Additions Deductions
Balance at Charged to Balance atbeginning costs and Bad debts Translation end ofof period expenses written off difference period
March 31, 2005:
Trade accounts and notes receivable
Allowance for doubtful accounts ¥10,919 ¥00,693 ¥02,121 ¥0,219 ¥09,710
Finance subsidiaries-receivables
Allowance for credit losses ¥24,411 ¥33,365 ¥27,575 ¥725 ¥30,926
Allowance for losses on lease residual values 26,124 17,273 10,156 784 34,025
¥50,535 ¥50,638 ¥37,731 ¥1,509 ¥64,951
March 31, 2006:
Trade accounts and notes receivable
Allowance for doubtful accounts ¥09,710 ¥03,825 ¥03,320 ¥0,474 ¥10,689
Finance subsidiaries-receivables
Allowance for credit losses ¥30,926 ¥28,155 ¥29,373 ¥3,242 ¥32,950
Allowance for losses on lease residual values 34,025 7,998 7,974 3,725 37,774
¥64,951 ¥36,153 ¥37,347 ¥6,967 ¥70,724
lawsuits or potential claims that it believes will not result in an
unfavorable outcome or when a reasonable estimate of the
amount of probable loss cannot be determined. After consul-
tation with legal counsel, and taking into account all known
factors pertaining to existing lawsuits and claims, Honda
believes that the ultimate outcome of such lawsuits and
pending claims should not result in liability to Honda that
would be likely to have an adverse material effect on its
consolidated financial position, results of operations or
cash flows.

111
Yen (millions)
Additions Deductions
Balance at Charged to Balance atbeginning costs and Bad debts Translation end ofof period expenses written off difference period
March 31, 2007:
Trade accounts and notes receivable
Allowance for doubtful accounts ¥10,689 ¥02,918 ¥05,850 ¥0,442 ¥08,199
Finance subsidiaries-receivables
Allowance for credit losses ¥32,950 ¥27,286 ¥27,273 ¥0,549 ¥33,512
Allowance for losses on lease residual values 37,774 16,842 20,807 119 33,928
¥70,724 ¥44,128 ¥48,080 ¥0,668 ¥67,440
U.S. dollars (millions) (note 2)
Additions Deductions
Balance at Charged to Balance atbeginning costs and Bad debts Translation end ofof period expenses written off difference period
March 31, 2007:
Trade accounts and notes receivable
Allowance for doubtful accounts $090 $025 $050 $4 $069
Finance subsidiaries-receivables
Allowance for credit losses $279 $231 $231 $5 $284
Allowance for losses on lease residual values 320 143 177 1 287
$599 $374 $408 $6 $571
21. Segment Information
Honda has four reportable segments: the Motorcycle busi-
ness, the Automobile business, the Financial services busi-
ness and the Power product and other businesses, which
are based on Honda’s organizational structure and character-
istics of products and services. Operating segments are
defined as components of Honda’s about which separate
financial information is available that is evaluated regularly by
management in deciding how to allocate resources and in
assessing performance. The accounting policies used for
these reportable segments are consistent with the account-
ing policies used in Honda’s consolidated financial state-
ments.
Principal products and functions of each segment are as follows:
Segment Principal products and services Functions
Motorcycle business Motorcycles, all-terrain vehicles (ATVs), Research & Development personal watercrafts and relevant parts Manufacturing
Sales and related services
Automobile business Automobiles and relevant parts Research & DevelopmentManufacturingSales and related services
Financial services business Financial, insurance services Retail loan and lease related to Honda productsOthers
Power product and Power products and relevant Research & Development other businesses parts, and others Manufacturing
Sales and related servicesOthers

112
Segment Information
As of and for the year ended March 31, 2005
Yen (millions)
Financial Power ProductMotorcycle Automobile Services and Other Segment ReconcilingBusiness Business Business Businesses Total Items Consolidated
Net sales and other operating revenue:
External customers ¥1,097,754 ¥6,963,635 ¥0,255,741 ¥332,975 ¥8,650,105 ¥000,0(—. ¥8,650,105
Intersegment — — 3,447 9,869 13,316 (13,316) —
Total 1,097,754 6,963,635 259,188 342,844 8,663,421 (13,316) 8,650,105
Cost of sales, SG&A and R&D expenses 1,028,422 6,511,253 169,287 323,539 8,032,501 (13,316) 8,019,185
Gain on transfer of the substitutional portion
of the Employee’s Pension Funds — — — — — — —
Segment income 69,332 452,382 89,901 19,305 630,920 — 630,920
Equity in income of affiliates 29,921 65,183 — 953 96,057 — 96,057
Assets 848,671 4,265,636 4,333,605 261,843 9,709,755 (341,519) 9,368,236
Investments in affiliates 79,143 249,876 — 17,279 346,298 — 346,298
Depreciation and amortization 28,606 189,150 419 7,577 225,752 — 225,752
Capital expenditures 41,845 317,271 1,941 12,923 373,980 — 373,980
Provision for credit and lease residual losses
on finance subsidiaries-receivables ¥0,000,0—. ¥0,000,0—. ¥0,050,638 ¥000,0—. ¥0,050,638 ¥000,0(—. ¥0,050,638
As of and for the year ended March 31, 2006
Yen (millions)
Financial Power ProductMotorcycle Automobile Services and Other Segment ReconcilingBusiness Business Business Businesses Total Items Consolidated
Net sales and other operating revenue:
External customers ¥1,225,812 ¥8,004,694 ¥306,869 ¥370,621 ¥9,907,996 ¥000,0(—. ¥9,907,996
Intersegment — — 4,068 11,941 16,009 (16,009) —
Total 1,225,812 8,004,694 310,937 382,562 9,924,005 (16,009) 9,907,996
Cost of sales, SG&A and R&D expenses 1,127,157 7,492,257 220,352 353,350 9,193,116 (16,009) 9,177,107
Gain on transfer of the substitutional portion
of the Employee’s Pension Funds 15,319 115,935 — 6,762 138,016 — 138,016
Segment income 113,974 628,372 90,585 35,974 868,905 — 868,905
Equity in income of affiliates 30,700 67,439 — 1,466 99,605 — 99,605
Assets 1,006,308 4,843,148 5,008,718 294,170 11,152,344 (520,944) 10,631,400
Investments in affiliates 87,041 304,477 — 13,194 404,712 — 404,712
Depreciation and amortization 30,232 222,165 771 9,057 262,225 — 262,225
Capital expenditures 52,246 392,934 1,316 11,345 457,841 — 457,841
Provision for credit and lease residual losses
on finance subsidiaries-receivables ¥0,000,0—. ¥0,000,0—. ¥036,153 ¥000,0—. ¥0,036,153 ¥000,0(—. ¥0,036,153
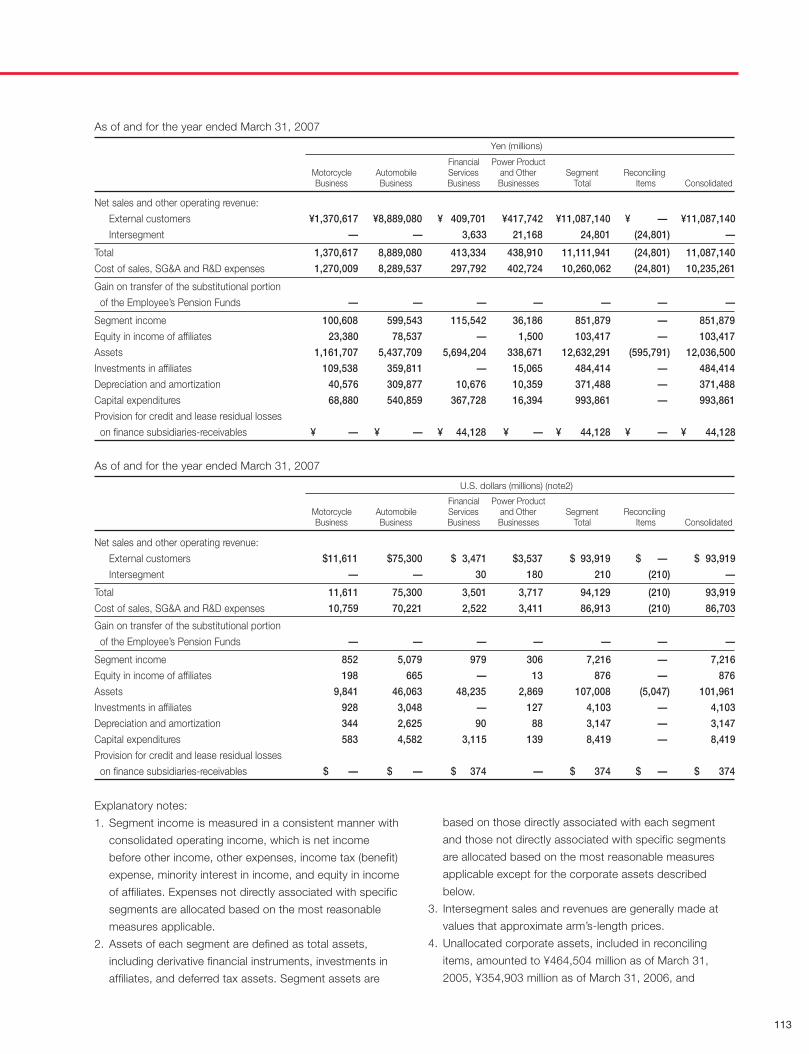
113
As of and for the year ended March 31, 2007
Yen (millions)
Financial Power ProductMotorcycle Automobile Services and Other Segment ReconcilingBusiness Business Business Businesses Total Items Consolidated
Net sales and other operating revenue:
External customers ¥1,370,617 ¥8,889,080 ¥0,409,701 ¥417,742 ¥11,087,140 ¥000,0(—. ¥11,087,140
Intersegment — — 3,633 21,168 24,801 (24,801) —
Total 1,370,617 8,889,080 413,334 438,910 11,111,941 (24,801) 11,087,140
Cost of sales, SG&A and R&D expenses 1,270,009 8,289,537 297,792 402,724 10,260,062 (24,801) 10,235,261
Gain on transfer of the substitutional portion
of the Employee’s Pension Funds — — — — — — —
Segment income 100,608 599,543 115,542 36,186 851,879 — 851,879
Equity in income of affiliates 23,380 78,537 — 1,500 103,417 — 103,417
Assets 1,161,707 5,437,709 5,694,204 338,671 12,632,291 (595,791) 12,036,500
Investments in affiliates 109,538 359,811 — 15,065 484,414 — 484,414
Depreciation and amortization 40,576 309,877 10,676 10,359 371,488 — 371,488
Capital expenditures 68,880 540,859 367,728 16,394 993,861 — 993,861
Provision for credit and lease residual losses
on finance subsidiaries-receivables ¥0,000,0—. ¥0,000,0—. ¥0,044,128 ¥000,0—. ¥00,044,128 ¥000,0(—. ¥00,044,128
As of and for the year ended March 31, 2007
U.S. dollars (millions) (note2)
Financial Power ProductMotorcycle Automobile Services and Other Segment ReconcilingBusiness Business Business Businesses Total Items Consolidated
Net sales and other operating revenue:
External customers $11,611 $75,300 $03,471 $3,537 $093,919 $000—. $093,919
Intersegment — — 30 180 210 (210) —
Total 11,611 75,300 3,501 3,717 94,129 (210) 93,919
Cost of sales, SG&A and R&D expenses 10,759 70,221 2,522 3,411 86,913 (210) 86,703
Gain on transfer of the substitutional portion
of the Employee’s Pension Funds — — — — — — —
Segment income 852 5,079 979 306 7,216 — 7,216
Equity in income of affiliates 198 665 — 13 876 — 876
Assets 9,841 46,063 48,235 2,869 107,008 (5,047) 101,961
Investments in affiliates 928 3,048 — 127 4,103 — 4,103
Depreciation and amortization 344 2,625 90 88 3,147 — 3,147
Capital expenditures 583 4,582 3,115 139 8,419 — 8,419
Provision for credit and lease residual losses
on finance subsidiaries-receivables $00,0—. $00,0—. $00,374 — $000,374 $000—. $000,374
Explanatory notes:
1. Segment income is measured in a consistent manner with
consolidated operating income, which is net income
before other income, other expenses, income tax (benefit)
expense, minority interest in income, and equity in income
of affiliates. Expenses not directly associated with specific
segments are allocated based on the most reasonable
measures applicable.
2. Assets of each segment are defined as total assets,
including derivative financial instruments, investments in
affiliates, and deferred tax assets. Segment assets are
based on those directly associated with each segment
and those not directly associated with specific segments
are allocated based on the most reasonable measures
applicable except for the corporate assets described
below.
3. Intersegment sales and revenues are generally made at
values that approximate arm’s-length prices.
4. Unallocated corporate assets, included in reconciling
items, amounted to ¥464,504 million as of March 31,
2005, ¥354,903 million as of March 31, 2006, and

114
¥377,873 million ($3,201 million) as of March 31, 2007
respectively, which consist primarily of cash and cash
equivalents and marketable securities held by the
Company. Reconciling items also include elimination of
intersegment transactions.
5. Depreciation and amortization of Financial Services
Business include ¥ 9,741 million ($83 million) of deprecia-
tion of property on operating leases for the year ended
March 31, 2007.
6. Capital expenditure of Financial Services Business
includes ¥ 366,795 million ($3,107 million) of purchase of
operating lease assets for the year ended March 31,
2007.
External Sales and Other Operating Revenue by Product or Service Groups
U.S. dollarsYen (millions)
(millions) (note 2)
2005 2006 2007 2007
Motorcycles and relevant parts ¥0,933,740 ¥1,051,855 ¥01,221,638 $10,349
All-terrain vehicles (ATVs), personal watercraft and relevant parts 164,014 173,957 148,979 1,262
Automobiles and relevant parts 6,963,635 8,004,694 8,889,080 75,300
Financial, insurance services 255,741 306,869 409,701 3,471
Power products and relevant parts 229,760 263,651 287,302 2,433
Others 103,215 106,970 130,440 1,104
Total ¥8,650,105 ¥9,907,996 ¥11,087,140 $93,919
Geographical Information
As of and for the year ended March 31, 2005
Yen (millions)
Japan United States Other Countries Total
Sales to external customers ¥1,983,182 ¥ 4,138,049 ¥2,528,874 ¥8,650,105
Long-lived assets 894,065 428,467 360,680 1,683,212
As of and for the year ended March 31, 2006
Yen (millions)
Japan United States Other Countries Total
Sales to external customers ¥2,021,999 ¥4,876,436 ¥3,009,561 ¥9,907,996
Long-lived assets 949,713 499,599 487,208 1,936,520
As of and for the year ended March 31, 2007
Yen (millions)
Japan United States Other Countries Total
Sales to external customers ¥2,061,720 ¥5,291,683 ¥3,733,737 ¥11,087,140
Long-lived assets 993,078 929,107 619,544 2,541,729
As of and for the year ended March 31, 2007
U.S. dollars (millions) (note 2)
Japan United States Other Countries Total
Sales to external customers $17,465 $44,826 $31,628 $93,919
Long-lived assets 8,412 7,871 5,248 21,531
The above information is based on the location of the Company and its subsidiaries.

115
Supplemental Geographical Information
In addition to the disclosure required by U.S.GAAP, Honda provides the following supplemental information as required by
Japanese Securities and Exchange Law:
(1) Overseas sales and revenues based on the location of the customer
U.S. dollarsYen (millions)
(millions) (note 2)
2005 2006 2007 2007
North America ¥4,575,076 ¥5,463,359 ¥5,980,876 $50,664
Europe 870,795 1,009,421 1,236,757 10,477
Asia 977,011 1,085,451 1,283,154 10,870
Other regions 528,018 655,721 905,163 7,668
Explanatory notes:
Major countries or regions in each geographic area:
North America United States, Canada, Mexico
Europe United Kingdom, Germany, France, Italy, Belgium
Asia Thailand, Indonesia, China, India
Other Regions Brazil, Australia
(2) Supplemental geographical information based on the location of the Company and its subsidiaries
As of and for the year ended March 31, 2005
Yen (millions)
North Other ReconcilingJapan America Europe Asia Regions Total Items Consolidated
Net sales and other
operating revenue:
External customers ¥1,983,182 ¥4,585,650 ¥0,858,936 ¥773,753 ¥448,584 ¥08,650,105 ¥0,(000,0—. ¥8,650,105
Transfers between
geographic areas 2,155,756 119,904 184,136 86,810 17,373 2,563,979 (2,563,979) —
Total 4,138,938 4,705,554 1,043,072 860,563 465,957 11,214,084 (2,563,979) 8,650,105
Cost of sales, SG&A and
R&D expenses 3,954,039 4,384,400 1,001,829 799,871 432,764 10,572,903 (2,553,718) 8,019,185
Gain on transfer of the substitutional
portion of the Employees’ Pension
Funds — — — — — — — —
Operating income 184,899 321,154 41,243 60,692 33,193 641,181 (10,261) 630,920
Assets 2,480,052 5,254,246 649,547 541,331 203,605 9,128,781 239,455 9,368,236
Long-lived assets ¥0,894,065 ¥0,502,284 ¥0,118,339 ¥121,095 ¥047,429 ¥01,683,212 ¥0,(000,0—. ¥1,683,212

116
As of and for the year ended March 31, 2006
Yen (millions)
North Other ReconcilingJapan America Europe Asia Regions Total Items Consolidated
Net sales and other
operating revenue:
External customers ¥2,021,999 ¥5,475,261 ¥1,001,177 ¥856,892 ¥552,667 ¥09,907,996 ¥0,(000,0—. ¥09,907,996
Transfers between
geographic areas 2,415,874 141,064 188,341 140,501 19,023 2,904,803 (2,904,803) —
Total 4,437,873 5,616,325 1,189,518 997,393 571,690 12,812,799 (2,904,803) 9,907,996
Cost of sales, SG&A and
R&D expenses 4,204,939 5,262,382 1,163,213 932,394 514,527 12,077,455 (2,900,348) 9,177,107
Gain on transfer of the substitutional
portion of the Employees’ Pension
Funds 138,016 — — — — 138,016 — 138,016
Operating income 370,950 353,943 26,305 64,999 57,163 873,360 (4,455) 868,905
Assets 2,695,212 6,128,303 800,786 717,933 309,209 10,651,443 (20,043) 10,631,400
Long-lived assets ¥0,949,713 ¥0,589,596 ¥0,157,819 ¥167,148 ¥072,244 ¥01,936,520 ¥0,(000,0—. ¥01,936,520
As of and for the year ended March 31, 2007
Yen (millions)
North Other ReconcilingJapan America Europe Asia Regions Total Items Consolidated
Net sales and other
operating revenue:
External customers ¥2,061,720 ¥6,002,797 ¥1,228,564 ¥1,024,680 ¥769,379 ¥11,087,140 ¥0,(000,0—. ¥11,087,140
Transfers between
geographic areas 2,712,403 169,847 119,161 246,723 28,259 3,276,393 (3,276,393) —
Total 4,774,123 6,172,644 1,347,725 1,271,403 797,638 14,363,533 (3,276,393) 11,087,140
Cost of sales, SG&A and
R&D expenses 4,545,988 5,715,817 1,315,736 1,194,250 725,377 13,497,168 (3,261,907) 10,235,261
Gain on transfer of the substitutional
portion of the Employees’ Pension
Funds — — — — — — — —
Operating income 228,135 456,827 31,989 77,153 72,261 866,365 (14,486) 851,879
Assets 2,985,123 6,834,409 948,922 935,963 414,147 12,118,564 (82,064) 12,036,500
Long-lived assets ¥0,993,078 ¥1,028,132 ¥0,198,232 ¥0,228,802 ¥093,485 ¥02,541,729 ¥0,(000,0—. ¥02,541,729

117
As of and for the year ended March 31, 2007
U.S. dollars (millions) (note2)
North Other ReconcilingJapan America Europe Asia Regions Total Items Consolidated
Net sales and other
operating revenue:
External customers $17,465 $50,849 $10,408 $08,680 $6,517 $093,919 $0000—. $093,919
Transfers between
geographic areas 22,977 1,438 1,009 2,090 240 27,754 (27,754) —
Total 40,442 52,287 11,417 10,770 6,757 121,673 (27,754) 93,919
Cost of sales, SG&A and
R&D expenses 38,509 48,418 11,146 10,116 6,145 114,334 (27,631) 86,703
Gain on transfer of the substitutional
portion of the Employees’ Pension
Funds — — — — — — — —
Operating income 1,933 3,869 271 654 612 7,339 (123) 7,216
Assets 25,287 57,894 8,038 7,929 3,508 102,656 (695) 101,961
Long-lived assets $08,412 $08,709 $1,679 $01,938 $0,793 $021,531 $0000—. $021,531
Explanatory notes:
1. Major countries or regions in each geographic area:
North America United States, Canada, Mexico
Europe United Kingdom, Germany,
France, Italy, Belgium
Asia Thailand, Indonesia, China, India
Other Regions Brazil, Australia
2. Operating income of each geographical region is mea-
sured in a consistent manner with consolidated operating
income, which is net income before other income, other
expenses, income tax (benefit) expense, minority interest
in income and equity in income of affiliates.
3. Assets of each geographical region are defined as total
assets, including derivative financial instruments, invest-
ments in affiliates, and deferred tax assets.
4. Sales and revenues between geographic areas are gener-
ally made at values that approximate arm’s-length prices.
5. Unallocated corporate assets, included in reconciling
items, amounted to ¥464,504 million as of March 31,
2005 , ¥354,903 million as of March 31, 2006, and
¥377,873 million ($3,201 million) as of March 31, 2007
respectively, which consist primarily of cash and cash
equivalents and marketable securities held by the
Company. Reconciling items also include elimination of
transactions between geographic areas.
22. Subsequent Event
The Board of Directors, at its meeting held on May 15, 2007,
resolved that the Company will purchase its own shares
pursuant to Article 156 of the Company Law, which applies
pursuant to Article 165, Paragraph 3, of that law. The main
purpose for the acquisition are enhancing its capital effi-
ciency and enabling greater flexibility in its capital policies.
(1) Type of shares and maximum number of shares to be
acquired:
Shares of Common Stock 10,000,000 shares
(2) Maximum amount of acquisition:
38 billion yen
(3) Period of acquisition:
Starting on May 16, 2007 and ending on June 12,
2007
(4) Method of acquisition:
Purchase through ToSTNet-2 (as a closing-price
transaction) over the Tokyo Stock Exchange
Total number and amount of shares the Company acquired
during the period were 8,204,000 shares and
¥34,128,640,000.

118
Management’s Report on Internal Control over Financial Reporting
The management of Honda is responsible for establishing and maintaining adequate internal control overfinancial reporting (as defined in Rules 13a-15(f) and 15d-15(f) under the U.S. Securities Exchange Act of1934). The Company’s internal control over financial reporting is designed to provide reasonable assuranceregarding the reliability of financial reporting and the preparation of financial statements for external purposesin accordance with U.S. generally accepted accounting principles and includes those policies and proceduresthat (1) pertain to the maintenance of records that in reasonable detail accurately and fairly reflect thetransactions and dispositions of the assets of the Company; (2) provide reasonable assurance thattransactions are recorded as necessary to permit preparation of financial statements in accordance with U.S.generally accepted accounting principles, and that receipts and expenditures of the Company are beingmade only in accordance with authorizations of management and directors of the Company; and (3) providereasonable assurance regarding prevention or timely detection of unauthorized acquisition, use or dispositionof the Company’s assets that could have a material effect on the financial statements.
Because of its inherent limitations, internal control over financial reporting may not prevent or detectmisstatements. Also, projections of any evaluation of effectiveness to future periods are subject to the riskthat controls may become inadequate because of changes in conditions or because the degree ofcompliance with policies or procedures may deteriorate.
Our management, including our Chief Executive Officer and Chief Operating Officer for BusinessManagement Operations (who is our principal financial officer), assessed the effectiveness of internal controlover financial reporting as of March 31, 2007 based on the criteria established in “Internal Control-IntegratedFramework” published by the Committee of Sponsoring Organizations of the Treadway Commission(“COSO”). Based on that assessment, our management concluded that our internal control over financialreporting was effective as of March 31, 2007.
Management’s assessment of the effectiveness of internal control over financial reporting has been auditedby KPMG AZSA & Co., an independent registered public accounting firm, as stated in their report which isincluded herein.
Takeo FukuiChief Executive Officer
Fumihiko IkeChief Operating Officer for Business Management Operations
July 17, 2007
119
Report of Independent Registered Public Accounting Firm
The Board of Directors and StockholdersHonda Motor Co., Ltd.:
We have audited the accompanying consolidated balance sheets of Honda Motor Co., Ltd. and subsidiaries as of March 31,2006 and 2007, and the related consolidated statements of income, stockholders’ equity and comprehensive income, andcash flows for each of the years in the three-year period ended March 31, 2007, expressed in Japanese yen. Theseconsolidated financial statements are the responsibility of the Company’s management. Our responsibility is to express anopinion on these consolidated financial statements based on our audits.
We conducted our audits in accordance with the standards of the Public Company Accounting Oversight Board (UnitedStates). Those standards require that we plan and perform the audit to obtain reasonable assurance about whether thefinancial statements are free of material misstatement. An audit includes examining, on a test basis, evidence supporting theamounts and disclosures in the financial statements. An audit also includes assessing the accounting principles used andsignificant estimates made by management, as well as evaluating the overall financial statement presentation. We believethat our audits provide a reasonable basis for our opinion.
In our opinion, the consolidated financial statements referred to above present fairly, in all material respects, the financialposition of Honda Motor Co., Ltd. and subsidiaries as of March 31, 2006 and 2007, and the results of their operations andtheir cash flows for each of the years in the three-year period ended March 31, 2007 in conformity with U.S. generallyaccepted accounting principles.
As described in Note 13 to the consolidated financial statements, the Company adopted the provisions of Statement ofFinancial Accounting Standards No. 158, Employers’ Accounting for Defined Benefit Pension and Other Postretirement Plans- an amendment of FASB Statements of No. 87,88,106 and 132(R) as of March 31, 2007. As described in Note 1(u) to theconsolidated financial statements, the Company changed its method of quantifying errors as of March 31, 2007. Also asfurther described in Note 3, the Company made certain classification adjustments to its consolidated financial statements asof and for the years ended March 31, 2006 and 2005.
We also have audited, in accordance with the standards of the Public Company Accounting Oversight Board (United States),the effectiveness of the Company’s internal control over financial reporting as of March 31, 2007, based on criteriaestablished in Internal Control - Integrated Framework issued by the Committee of Sponsoring Organizations of theTreadway Commission , and our report dated July 17, 2007 expressed an unqualified opinion on management’s assessmentof, and the effective operation of, internal control over financial reporting.
The accompanying consolidated financial statements as of and for the year ended March 31, 2007 have been translated intoUnited States dollars solely for the convenience of the reader. We have recomputed the translation and, in our opinion, theconsolidated financial statements expressed in yen have been translated into dollars on the basis set forth note 2 to theconsolidated financial statements.
Tokyo, JapanJuly 17, 2007

120
The Board of Directors and StockholdersHonda Motor Co., Ltd.:
We have audited management’s assessment, included in the accompanying Management’s Report on Internal Control overFinancial Reporting, that Honda Motor Co., Ltd. and subsidiaries maintained effective internal control over financial reportingas of March 31, 2007, based on criteria established in Internal Control-Integrated Framework issued by the Committee ofSponsoring Organizations of the Treadway Commission. The Company’s management is responsible for maintaining effectiveinternal control over financial reporting and for its assessment of the effectiveness of internal control over financial reporting.Our responsibility is to express an opinion on management’s assessment and an opinion on the effectiveness of theCompany’s internal control over financial reporting based on our audit.
We conducted our audit in accordance with the standards of the Public Company Accounting Oversight Board (UnitedStates). Those standards require that we plan and perform the audit to obtain reasonable assurance about whether effectiveinternal control over financial reporting was maintained in all material respects. Our audit included obtaining an understandingof internal control over financial reporting, evaluating management’s assessment, testing and evaluating the design andoperating effectiveness of internal control, and performing such other procedures as we considered necessary in thecircumstances. We believe that our audit provides a reasonable basis for our opinion.
A company’s internal control over financial reporting is a process designed to provide reasonable assurance regarding thereliability of financial reporting and the preparation of financial statements for external purposes in accordance with U.S.generally accepted accounting principles. A company’s internal control over financial reporting includes those policies andprocedures that (1) pertain to the maintenance of records that, in reasonable detail, accurately and fairly reflect thetransactions and dispositions of the assets of the company; (2) provide reasonable assurance that transactions are recordedas necessary to permit preparation of financial statements in accordance with U.S. generally accepted accounting principles,and that receipts and expenditures of the company are being made only in accordance with authorizations of managementand directors of the company; and (3) provide reasonable assurance regarding prevention or timely detection of unauthorizedacquisition, use, or disposition of the company’s assets that could have a material effect on the financial statements.
Because of its inherent limitations, internal control over financial reporting may not prevent or detect misstatements. Also,projections of any evaluation of effectiveness to future periods are subject to the risk that controls may become inadequatebecause of changes in conditions, or that the degree of compliance with the policies or procedures may deteriorate.
In our opinion, management’s assessment that Honda Motor Co., Ltd. and subsidiaries maintained effective internal controlover financial reporting as of March 31, 2007, is fairly stated, in all material respects, based on the criteria established inInternal Control-Integrated Framework issued by the Committee of Sponsoring Organizations of the Treadway Commission.Also, in our opinion, Honda Motor Co., Ltd. and subsidiaries maintained, in all material respects, effective internal controlover financial reporting as of March 31, 2007, based on the criteria established in Internal Control-Integrated Frameworkissued by the Committee of Sponsoring Organizations of the Treadway Commission.
We also have audited, in accordance with the standards of the Public Company Accounting Oversight Board (United States),the consolidated balance sheets of Honda Motor Co., Ltd. and subsidiaries as of March 31, 2006 and 2007, and the relatedconsolidated statements of income, stockholders’ equity and comprehensive income, and cash flows for each of the years inthe three-year period ended March 31, 2007, expressed in Japanese yen, and our report dated July 17, 2007 expressed anunqualified opinion on those consolidated financial statements.
Tokyo, JapanJuly 17, 2007
Report of Independent Registered Public Accounting Firm

121
Selected Quarterly Financial Data (Unaudited and Not Reviewed)
Yen (millions except per share amounts)
Year ended March 31, 2006 Year ended March 31, 2007
I II III IV I II III IV
Net sales andother operating revenue ¥2,264,579 ¥2,337,670 ¥2,472,006 ¥2,833,741 ¥2,599,724 ¥2,630,874 ¥2,768,652 ¥3,087,890
Operating income 170,393 162,694 194,986 340,832 203,521 193,024 205,110 250,224
Income before income taxes 148,042 173,245 170,000 338,617 191,365 163,643 198,785 239,075
Net income 110,666 133,708 133,146 219,513 143,402 127,909 144,827 176,184
Basic net income per American depositary share ¥59.87 ¥72.45 ¥72.41 ¥119.89 ¥78.46 ¥70.05 ¥79.45 ¥96.70
Tokyo Stock Exchange:
(TSE) (in yen)
High ¥2,835 ¥3,310 ¥3,570 ¥3,750 ¥4,285 ¥4,030 ¥4,740 ¥4,940
Low 2,510 2,690 3,070 3,050 3,270 3,410 3,910 4,050
New York Stock Exchange:
(NYSE) (in U.S. dollars)
High $26.00 $29.08 $29.70 $31.74 $37.95 $35.00 $39.87 $40.82
Low 23.75 24.06 26.50 27.10 29.13 29.43 33.49 34.64
*1 All quarterly financial data is unaudited and has not been reviewed by the independent registered public accounting firm (KPMG AZSA & Co.).*2 Certain revisions for misclassifications and reclassifications have been made to the prior years’ consolidated financial statements to conform to the
presentation used for the fiscal year ended March 31, 2007. Detailed information is described in note 3.*3 The Company executed a two-for-one stock split for the Company’s common stock effective July 1, 2006. All per share information has been adjusted
retroactively for all periods presented to reflect this stock split. The prices of shares on the Tokyo Stock Exchange prior to the split have beenretroactively for consistency. Consequently, the prices shown here are not the actual prices of shares on the Tokyo Stock Exchange.

122
Yen (millions)
At March 31, 2006 and 2007 2006 2007
AssetsNon-financial services businesses
Current Assets: ¥03,686,503 ¥04,109,667Cash and cash equivalents 697,196 921,309Trade accounts and notes receivable 504,101 546,790Inventories 1,036,304 1,183,116Other current assets 1,448,902 1,458,452
Investments and advances 955,338 1,013,215Property, plant and equipment, at cost 1,795,173 2,059,514Other assets 337,800 367,342
Total assets 6,774,814 7,549,738
Finance subsidiariesCash and cash equivalents 19,592 24,237Finance subsidiaries—short-term receivables, net 1,240,581 1,451,606Finance subsidiaries—long-term receivables, net 2,982,832 3,040,572Property on operating leases — 336,209Other assets 765,713 841,580Total assets 5,008,718 5,694,204
Eliminations (1,152,132) (1,207,442)Total assets ¥10,631,400 ¥12,036,500
Liabilities, Minority Interests and Stockholders’ EquityNon-financial services businesses
Current liabilities: ¥02,165,901 ¥02,359,648Short-term debt 171,122 243,487Current portion of long-term debt 9,138 19,713Trade payables 1,059,666 1,182,894Accrued expenses 658,274 671,467Other current liabilities 267,701 242,087
Long-term debt 34,396 55,468Other liabilities 688,240 910,966Total liabilities 2,888,537 3,326,082
Finance subsidiariesShort-term debt 1,369,177 1,842,119Current portion of long-term debt 653,276 758,855Accrued expenses 175,286 178,236Long-term debt 1,858,362 1,869,470Other liabilities 398,806 421,673Total liabilities 4,454,907 5,070,353
Eliminations (925,254) (965,453)Total liabilities 6,418,190 7,430,982Minority interests in consolidated subsidiaries 87,460 122,907
Common stock 86,067 86,067Capital surplus 172,529 172,529Legal reserves 35,811 37,730Retained earnings 4,267,886 4,654,890Accumulated other comprehensive income (loss) (407,187) (427,166)Treasury stock (29,356) (41,439)
Total stockholders’ equity 4,125,750 4,482,611
Total liabilities, minority interests and stockholders’ equity ¥10,631,400 ¥12,036,500Notes:1. The Company and its subsidiaries engaged in financial services are referred to as finance subsidiaries. Other subsidiaries are referred to as non-financial services businesses.2. See note 3 to the consolidated financial statements.
Consolidated Balance Sheets Divided into Non-Financial ServicesBusinesses and Finance Subsidiaries (Unaudited)

123
Yen (millions)
2006 2007
Non-financial Non-financialservices Finance Reconciling services Finance Reconciling
Years ended March 31, 2006 and 2007 businesses subsidiaries items Consolidated businesses subsidiaries items Consolidated
Cash flows from operating activities:Net income ¥(543,200 ¥(053,847 ¥00,0(14) ¥597,033 ¥(537,186 ¥(055,149 ¥00,0(13) ¥0592,322Adjustments to reconcile net income to net cash provided by operating activities:
Depreciation 261,454 771 — 262,225 360,812 10,676 — 371,488Deferred income taxes 22,037 (24,793) — (2,756) (35,483) 19,035 — (16,448)Minority interests in income 15,277 10 — 15,287 20,102 15 — 20,117Equity in income of affiliates (99,605) — — (99,605) (103,417) — — (103,417)Dividends from affiliates 64,055 — — 64,055 54,849 — — 54,849Loss (gain) on derivative instruments, net 11,683 (1,332) — 10,351 28,370 28,466 — 56,836Gain on transfer of the substitutional portion of the Employees’ Pension Funds (138,016) — — (138,016) — — — —Decrease (increase) in trade accounts and notes receivable (44,881) (72,695) 4,317 (113,259) (5,445) (34,318) (9,766) (49,529)Decrease (increase) in inventories (109,661) — — (109,661) (96,839) — — (96,839)Increase (decrease) in trade payables 25,357 — (3,937) 21,420 41,965 — (3,779) 38,186Other, net 33,892 47,664 (7,990) 73,566 8,613 14,185 14,162 36,960
Net cash provided by operating activities 584,792 3,472 (7,624) 580,640 810,713 93,208 604 904,525
Cash flows from investing activities:Decrease (increase) in investments and advances (64,220) — 14,697 (49,523) 93,311 — (40,957) 52,354Capital expenditures (458,705) (1,316) — (460,021) (597,025) (933) — (597,958)Proceeds from sales of property, plant and equipment 39,645 306 — 39,951 20,364 277 — 20,641Decrease (increase) in finance subsidiaries–receivables — (231,909) 1,535 (230,374) — (256,274) 16,052 (240,222)Purchase of operating lease assets — — — — — (366,795) — (366,795)Proceeds from sales of operating lease assets — — — — — 1,276 — 1,276
Net cash used in investing activities (483,280) (232,919) 16,232 (699,967) (483,350) (622,449) (24,905) (1,130,704)
Cash flows from financing activities:Increase (decrease) in short-term debt, net (66,144) (54,391) (4,406) (124,941) 32,964 241,349 31,750 306,063Proceeds from long-term debt 25,995 851,710 (12,028) 865,677 25,424 949,360 (5,293) 969,491Repayment of long-term debt (11,485) (566,422) 9,302 (568,605) (18,077) (664,906) 5,444 (677,539)Proceeds from issuance of common stock — 1,490 (1,490) — — 7,613 (7,613) —Cash dividends paid (71,075) — 14 (71,061) (140,495) — 13 (140,482)Cash dividends paid to minority interests (4,083) — — (4,083) (7,434) — — (7,434)Payment for purchase of treasury stock, net (77,064) — — (77,064) (26,689) — — (26,689)
Net cash provided by (used in) financing activities (203,856) 232,387 (8,608) 19,923 (134,307) 533,416 24,301 423,410
Effect of exchange rate changes on cash and cash equivalents 42,398 1,008 — 43,406 31,057 470 — 31,527
Net change in cash and cash equivalents (59,946) 3,948 — (55,998) 224,113 4,645 — 228,758Cash and cash equivalents at beginning of year 757,142 15,644 — 772,786 697,196 19,592 — 716,788
Cash and cash equivalents at end of year ¥(697,196 ¥(019,592 ¥00(0,—. ¥716,788 ¥(921,309 ¥(024,237 ¥00,(0—. ¥0945,546Notes:1. Non-financial services businesses lend to finance subsidiaries. These cash flows are included in the decrease (increase) in investments and advances, increase (decrease) in short-term
debt, proceeds from long-term debt, and repayment of longterm debt. The amount of the loans to finance subsidiaries is a ¥13,242 million increase for the year ended March 31, 2006,and a ¥48,570 million decrease for the year ended March 31, 2007, respectively.
2. Decrease (increase) in trade accounts and notes receivable for finance subsidiaries is due to the reclassification of finance subsidiaries-receivables which relate to sales of inventory inthe unaudited consolidated statements of cash flows presented above.
3. See note 3 to the consolidated financial statements.
Consolidated Statements of Cash Flows Divided into Non-FinancialServices Businesses and Finance Subsidiaries (Unaudited)

124
Financial Summary
Honda Motor Co., Ltd. and SubsidiariesYears ended or at March 31
1997 1998 1999 2000
Sales, income, and dividendsNet sales and other operating revenue ¥5,293,302 ¥5,999,738 ¥6,231,041 ¥6,098,840Operating income 397,328 456,852 540,978 418,639Income before income taxes, minority interest and equity in income of affiliates 395,333 445,583 523,168 419,658Income taxes 189,044 201,278 229,624 170,434Minority interest in income (4,611) (2,232) (2,657) (3,595)Equity in income of affiliates 19,490 18,552 14,158 16,786Net income 221,168 260,625 305,045 262,415As percentage of sales 4.2% 4.3% 4.9% 4.3%Cash dividends paid during the period 13,640 16,563 20,463 20,463Research and development 251,128 285,863 311,632 334,036Interest expense 27,514 27,655 27,890 18,920
Assets, long-term debt, and stockholders’ equityTotal assets ¥4,239,794 ¥4,870,128 ¥5,073,660 ¥4,935,976Long-term debt 734,255 677,750 673,084 574,566Total stockholders’ equity 1,388,430 1,607,914 1,763,855 1,930,373
Capital expenditures (excluding purchase of operating lease assets) 217,782 309,517 237,080 222,891Purchase of operating lease assetsDepreciation (excluding property on operating leases) 141,351 153,337 177,666 172,139Depreciation of property on operating leases
Per common shareNet income:
Basic ¥0,0113.50. ¥0,0133.74. ¥0,0156.52. ¥0,0134.65.Diluted 113.48. 133.72. 156.52. 134.65.
Cash dividends paid during the period 7.0. 8.5. 10.5. 10.5.Stockholders’ equity 712.52. 825.07. 905.10. 990.53.
Sales progressSales amounts:*
Japan ¥1,826,284 ¥1,710,813 ¥1,556,333 ¥1,612,19135% 29% 25% 26%
Overseas 3,467,018 4,288,925 4,674,708 4,486,64965% 71% 75% 74%
Total ¥5,293,302 ¥5,999,738 ¥6,231,041 ¥6,098,840100% 100% 100% 100%
Unit sales:Motorcycles 5,325 5,257 4,295 4,436Automobiles 2,184 2,343 2,333 2,473Power Products 2,521 2,857 3,412 4,057
Number of employees 101,100 109,400 112,200 112,400
Exchange rate (yen amounts per U.S. dollar)Rates for the period-end ¥0,000,124 ¥0,000,132 ¥0,000,121 ¥0,000,106Average rates for the period 113 123 128 112
* The geographic breakdown of sales amounts is based on the location of customers.

125
Yen U.S. dollars(millions) (millions)
2001 2002 2003 2004 2005 2006 2007 2007
¥6,463,830 ¥7,362,438 ¥7,971,499 ¥8,162,600 ¥8,650,105 ¥09,907,996 ¥11,087,140 $093,919401,438 661,202 724,527 600,144 630,920 868,905 851,879 7,216
388,419 555,854 619,413 653,680 668,364 829,904 792,868 6,716178,439 231,150 245,065 252,740 266,665 317,189 283,846 2,404
(3,443) (4,512) (9,658) (11,753) (11,559) (15,287) (20,117) (170)25,704 42,515 61,972 75,151 96,057 99,605 103,417 876
232,241 362,707 426,662 464,338 486,197 597,033 592,322 5,0183.6% 4.9% 5.4% 5.7% 5.6% 6.0% 5.3%
22,412 24,360 30,176 33,541 47,797 71,061 140,482 1,190352,829 395,176 436,863 448,967 467,754 510,385 551,847 4,67521,400 16,769 12,207 10,194 11,655 11,902 12,912 109
¥5,719,020 ¥7,064,787 ¥7,821,403 ¥8,380,549 ¥9,368,236 ¥10,631,400 ¥12,036,500 $101,961368,173 716,614 1,140,182 1,394,612 1,559,500 1,879,000 1,905,743 16,144
2,230,291 2,573,941 2,629,720 2,874,400 3,289,294 4,125,750 4,482,611 37,972
285,687 303,424 316,991 287,741 373,980 457,841 627,066 5,312366,795 3,107
170,342 194,944 220,874 213,445 225,752 262,225 361,747 3,0649,741 83
Yen U.S. dollars
¥0,0119.17. ¥0,0186.11. ¥0,0219.71. ¥0,0243.45. ¥0,0260.34. ¥00,0324.33. ¥00,0324.62. $002.75.119.17. 186.11. 219.71. 243.45. 260.34. 324.33. 324.62. 2.75.
11.5. 12.5. 15.5. 17.5. 25.5. 38.5. 77 0.65.1,144.43. 1,320.77. 1,367.34. 1,527.45. 1,778.24. 2,259.26. 2,460.28. 20.84.
Yen U.S. dollars(millions) (millions)
¥1,740,340 ¥1,868,746 ¥1,748,706 ¥1,628,493 ¥1,699,205 ¥01,694,044 ¥01,681,190 $14,241.27% 25% 22% 20% 20% 17% 15%
4,723,490 5,493,692 6,222,793 6,534,107 6,950,900 8,213,952 9,405,950 79,67873% 75% 78% 80% 80% 83% 85%
¥6,463,830 ¥7,362,438 ¥7,971,499 ¥8,162,600 ¥8,650,105 ¥09,907,996 ¥11,087,140 $93,919.100% 100% 100% 100% 100% 100%
Thousands
5,118 6,095 8,080 9,206 10,482 10,271 10,3692,580 2,666 2,888 2,983 3,242 3,391 3,6523,884 3,926 4,584 5,047 5,300 5,876 6,421
114,300 120,600 126,900 131,600 137,827 144,785 167,231
¥0,000,124 ¥,0,000133 ¥,0,000120 ¥0,000,106 ¥0,000,107 ¥00,000,117 ¥00,000,118111 125 122 113 108 113 117

126
Notes:
(1) The consolidated financial statements as of and for the year
ended March 31, 2007 have been translated into United
States dollars at the rate of ¥118.05 = U.S.$1, the approxi-
mate exchange rate prevailing on the Tokyo Foreign
Exchange Market on March 31, 2007. Those U.S. dollar
amounts presented in the consolidated financial statements
and related notes are included solely for the reader. This
translation should not be construed as a representation that
all the amounts shown could be converted into U.S. dollars.
(2) Net income per common (or American depositary) share
amounts are computed based on Statement of Financial
Accounting Standards (SFAS) No. 128, “Earnings per
Share.” All net income per common (or American deposi-
tary) share data presented prior to fiscal 1998 has been
restated to conform with the provisions of SFAS No. 128.
(3) Effective fiscal 2000, due to the change in method of busi-
ness segment categorization, all prior years’ unit sales
under Sales progress have been restated to reflect the
change: i.e., unit sales of all-terrain vehicles (ATVs) are now
included in Motorcycles, but were previously included in
Power Products.
(4) Previously, revenue from domestic sales of general-purpose
engines to customers who install them in products that are
subsequently exported were recorded as overseas sales.
However, owing to various factors including changes in
transaction formats and contract terms, as of fiscal 2002,
such sales are now recorded as domestic sales. The sales
amount from such sales for fiscal 2002 amounted to ¥5,468
million.
(5) Certain gains and losses on sale and disposal of property,
plant and equipment, which were previously recorded in
other income (expenses), have been reclassified to selling,
general and administrative expenses in the year ended
March 31, 2004. In addition, net realized gains and losses
on interest rate swap contracts not designated as account-
ing hedges by finance subsidiaries, which were previously
recorded in cost of sales, have been reclassified to and
included in other income (expenses)–other. Operating
income prior to fiscal 2003 has been presented to conform
with the reclassifications mentioned above.
(6) On April 26, 2006, the Board of Directors declared a two-
for-one stock split of the Company’s common stock. All
shareholders of record on June 30, 2006 will receive one
additional share of common stock for each share on July 1,
2006. Information pertaining to shares and earnings per
share has been restated in the accompanying consolidated
financial statements and notes to the consolidated financial
statements to reflect this split.
(7) The Company executed a two-for-one stock split for the
Company’s common stock effective July 1, 2006. All per
share information has been adjusted retroactively for all
periods presented to reflect this stock split.
(8) Certain revisions for misclassifications and reclassifications
have been made to the prior years’ consolidated financial
statements to conform to the presentation used for the
fiscal year ended March 31, 2007.
(a) Minority interest in income, which were included in
other expenses-other, has been revised to be disclosed
independently in consolidated statements of income.
(b) The long-term portion of deferred tax liabilities and
deferred tax assets related to the lease transactions of
finance subsidiaries, which were classified in other current
liabilities and deferred income taxes, have been revised to
be classified in other liabilities and other assets,
respectively.
(c) The long-term portion of accrued expenses and prepaid
expenses related to pension benefit plans, which were
included in accrued expenses and other current assets
have been revised to be classified in other liabilities and
other assets, respectively. The long-term portion of
deferred tax liabilities, which were included in other current
liabilities, and deferred tax assets, have also been revised
to classified in other liabilities and other assets.
(d) The long-term portion of prepaid expenses, deferred
income and accrued expenses related to extended vehicle
service contracts of the subsidiaries in the United States,
which were included in other current assets, trade
payables accounts and accrued expenses, respectively,
have been revised to be classified in other liabilities and
other assets. The long-term portion of related deferred tax
liabilities, which were included in other current liabilities,
and deferred income taxes have also been revised to be
classified in other liabilities and other assets.
H

127
Principal Manufacturing Facilities
Region Location Start of Number of Principal Products ManufacturedOperations Employees
Japan Sayama, Saitama Nov. 1964 5,286 AutomobilesHamamatsu, Shizuoka Apr. 1954 3,376 Motorcycles, power products and transmissionsSuzuka, Mie May 1960 7,102 AutomobilesOhzu-machi, Kikuchi-gun, Kumamoto Mar. 1976 2,923 Motorcycles, all-terrain vehicles, power products
and engines
North U.S.A. Marysville, Ohio Sep. 1979 6,895 Motorcycles and automobilesAmerica q Anna, Ohio Jul. 1985 2,850 Engines
East Liberty, Ohio Dec. 1989 2,596 Automobilesw Lincoln, Alabama Nov. 2001 4,563 Automobilese Swepsonville, North Carolina Aug. 1984 566 Power productsr Timmonsville, South Carolina Jul. 1998 1,603 All-terrain vehicles
Canada t Alliston, Ontario Nov. 1986 4,585 AutomobilesMexico y El Salto Mar. 1988 1,487 Motorcycles and automobiles
Europe U.K. u Swindon, Wiltshire Jul. 1989 4,046 Automobiles and enginesFrance i Ormes Jan. 1985 171 Power productsItaly o Atessa Apr. 1977 760 Motorcycles, power products and enginesSpain !0 Barcelona May 1980 293 Motorcycles
Asia China !1 Guangzhou Apr. 2005 1,096 Automobiles!2 Chongqing Oct. 1994 881 Power products
India !3 Greater Noida Dec. 1997 1,331 Automobiles!4 Gurgaon May 2001 2,598 Motorcycles
Indonesia !5 Karawang Feb. 2003 1,218 AutomobilesMalaysia !6 Alor Gajah Jan. 2003 1,204 AutomobilesPakistan !7 Lahore Oct. 1993 587 AutomobilesPhilippines !8 Manila May 1973 646 Motorcycles and power products
!9 Laguna Mar. 1992 687 AutomobilesTaiwan @0 Pingtung Jan. 2003 661 AutomobilesThailand @1 Ayutthaya Jan. 1993 2,546 Automobiles
@2 Bangkok Apr. 1965 2,697 Motorcycles and power productsVietnam @3 Vinhphuc Dec. 1997 1,108 Motorcycles and automobiles
Others Brazil @4 Sumare Sep. 1997 1,947 Automobiles@5 Manaus Jan. 1977 6,462 Motorcycles and power products
Turkey @6 Gebze Dec. 1997 539 Automobiles
[
q
wer
t
y
@4
@5
u
!0o
i
@6
!4
!7
!3
!5
!6!8!9
!1@0
!2
@3@1@2

128
Company Name Honda Motor Co., Ltd.Established September 24, 1948Lines of Business Motorcycles, Automobiles, Financial Services and Power Products and OthersHead Office 1-1, 2-chome, Minami-Aoyama, Minato-ku, Tokyo, Japan
Principal Subsidiaries
Percentage Main Lines of BusinessRegion
CountryCompanyof Ownership and
Motorcycle Automobile Financial Services Power Product &Incorporation Voting InterestBusiness Business Business Other Businesses Function
Japan Saitama Honda R&D Co., Ltd. 100.0 ○ ○ ○ Research & developmentManufacturing and sales of
Tochigi Honda Engineering Co., Ltd. 100.0 ○ ○ ○ equipment and developmentof production technology
Saitama Yachiyo Industry Co., Ltd. 050.5 ○ ○ ManufacturingMiyazaki Honda Lock Mfg. Co., Ltd. 100.0 ○ ○ ○ ManufacturingShizuoka Yutaka Giken Co., Ltd. 69.7 ○ ○ ○ ManufacturingNagano Asama Giken Co., Ltd. 81.7 ○ ○ ○ ManufacturingSaitama Honda Foundry Co., Ltd. 82.1 ○ ○ ○ ManufacturingTokyo Honda Motorcycle Japan Co., Ltd. 100.0 ○ SalesTokyo Honda Finance Co., Ltd. 100.0 ○ FinanceMie Mobilityland Corporation 100.0 ○ Others (Leisure)Tokyo Honda Trading Corporation 100.0 ○ ○ ○ Others (Trading)Mie Honda Logistics Inc. 100.0 ○ ○ ○ Others (Physical distribution)
North U.S.A. American Honda Motor Co., Inc. 100.0 ○ ○ ○ SalesAmerica Coordination of subsidiaries’Honda North America, Inc. 100.0 ○ ○ ○ ○ operation
Honda of America Mfg., Inc. 100.0 ○ ○ ManufacturingAmerican Honda Finance Corporation 100.0 ○ FinanceHonda Manufacturing of Alabama, LLC 100.0 ○ ManufacturingHonda of South Carolina Mfg., Inc. 100.0 ○ ManufacturingHonda Transmission Mfg. of America, Inc. 100.0 ○ ManufacturingHonda Precision Parts of Georgia, LLC 100.0 ○ ManufacturingHonda Power Equipment Mfg., Inc. 100.0 ○ ○ ManufacturingHonda R&D Americas, Inc. 100.0 ○ ○ ○ Research & developmentCardington Yutaka Technologies Inc. 100.0 ○ ○ ManufacturingCelina Aluminum Precision Technology Inc. 100.0 ○ ManufacturingHonda Trading America Corporation 100.0 ○ ○ ○ Others (Trading)
Manufacturing and sales ofHonda Engineering North America, Inc. 100.0 ○ ○ ○ equipment and development
of production technologyCanada Honda Canada Inc. 100.0 ○ ○ ○ Manufacturing and sales
Honda Canada Finance Inc. 100.0 ○ FinanceMexico Honda de Mexico, S.A. de C.V. 100.0 ○ ○ ○ Manufacturing and sales
Europe Belgium Honda Europe NV 100.0 ○ ○ ○ Sales
U.K. Honda Motor Europe Limited 100.0 ○ ○ ○ ○ Coordination of subsidiaries’operation and sales
Honda of the U.K. Manufacturing Ltd. 100.0 ○ ManufacturingHonda Finance Europe plc 100.0 ○ Finance
France Honda Motor Europe (South) S.A. 100.0 ○ ○ SalesHonda Europe Power Equipment, S.A. 100.0 ○ Manufacturing and sales
Germany Honda Motor Europe (North) GmbH 100.0 ○ ○ ○ SalesHonda Bank GmbH 100.0 ○ FinanceHonda R&D Europe (Deutschland) GmbH 100.0 ○ ○ Research & development
Italy Honda Italia Industriale S.p.A. 100.0 ○ ○ Manufacturing and salesSpain Montesa Honda S.A. 100.0 ○ Manufacturing and sales
Corporate Information

129
Percentage Main Lines of BusinessRegion
CountryCompanyof Ownership and
Motorcycle Automobile Financial Services Power Product &Incorporation Voting InterestBusiness Business Business Other Businesses Function
Asia China Honda Motor (China) Investment Corporation, Limited 100.0 ○ ○ ○ Holding company and salesJialing-Honda Motors Co., Ltd. 70.0 ○ Manufacturing and salesHonda Automobile (China) Co., Ltd. 65.0 ○ Manufacturing
India Honda Motorcycle and Scooter India Private Limited 100.0 ○ Manufacturing and salesHonda Siel Cars India Limited 97.4 ○ Manufacturing and sales
Indonesia P.T. Honda Precision Parts Manufacturing 100.0 ○ ManufacturingP.T. Honda Prospect Motor 51.0 ○ Manufacturing and sales
Malaysia Honda Malaysia SDN. BHD. 51.0 ○ Manufacturing and salesPakistan Honda Atlas Cars (Pakistan) Limited 51.0 ○ Manufacturing and salesPhilippines Honda Philippines, Inc. 99.6 ○ ○ Manufacturing and sales
Honda Cars Philippines, Inc. 74.2 ○ Manufacturing and salesTaiwan Honda Taiwan Co., Ltd. 100.0 ○ Sales
Thailand Asian Honda Motor Co., Ltd. 100.0 ○ ○ ○ ○ Coordination of subsidiaries’operation and sales
Honda Leasing (Thailand) Company Limited 100.0 ○ FinanceHonda Automobile (Thailand) Co., Ltd. 89.0 ○ Manufacturing and salesThai Honda Manufacturing Co., Ltd. 60.0 ○ ○ Manufacturing
Vietnam Honda Vietnam Co., Ltd. 70.0 ○ ○ Manufacturing and sales
Others Brazil Honda South America Ltda. 100.0 ○ ○ ○ ○Coordination of subsidiaries’operation and holding company
Honda Automoveis do Brasil Ltda. 100.0 ○ Manufacturing and salesMoto Honda da Amazonia Ltda. 100.0 ○ ○ Manufacturing and salesHonda Componentes da Amazonia Ltda. 100.0 ○ Manufacturing
Turkey Honda Turkiye A.S. 100.0 ○ ○ Manufacturing and salesAustralia Honda Australia Pty. Ltd. 100.0 ○ SalesNew Zealand Honda New Zealand Limited 100.0 ○ Sales
Note: Percentage Ownership and Voting Interest include ownership through consolidated subsidiaries.
Major Affiliated Companies Accounted for Under the Equity Method
Percentage Main Lines of BusinessRegion
CountryCompanyof Ownership and
Motorcycle Automobile Financial Services Power Product &Incorporation Voting InterestBusiness Business Business Other Businesses Function
Japan Saitama Showa Corporation 33.5 ○ ○ ○ ManufacturingTokyo Keihin Corporation 42.2 ○ ○ ○ ManufacturingSaitama TS Tech Co., Ltd. 22.7 ○ ○ ManufacturingShizuoka F.C.C. Co., Ltd. 20.7 ○ ○ ○ ManufacturingNagano Nissin Kogyo Co., Ltd. 34.7 ○ ○ ManufacturingSaitama H-one Co., Ltd. 23.5 ○ ○ ○ ManufacturingAichi Musashi Seimitsu Industry Co., Ltd. 26.2 ○ ○ ○ ManufacturingSaitama F-Tech Inc. 20.6 ○ ManufacturingToyama Tanaka Seimitsu Kogyo Co., Ltd. 24.3 ○ ○ ○ Manufacturing
North U.S.A. KTH Parts Industries, Inc. 39.3 ○ ManufacturingAmerica Jefferson Industries Corp. 29.4 ○ Manufacturing
Kehin Indiana Precision Technology, Inc. 25.9 ○ ManufacturingFindlex Corporation 25.9 ○ ○ Manufacturing
Canada F&P Mfg., Inc. 35.0 ○ Manufacturing
Asia China Sundiro Honda Motorcycle Co., Ltd. 50.0 ○ Manufacturing and salesWuyang-Honda Motors (Guangzhou) Co., Ltd. 50.0 ○ Manufacturing and salesDongfeng Honda Automobile Co., Ltd. 50.0 ○ Manufacturing and salesGuangzhou Honda Automobile Co., Ltd. 50.0 ○ Manufacturing and salesDongfeng Honda Engine Co., Ltd. 50.0 ○ Manufacturing
India Hero Honda Motors Ltd. 26.0 ○ Manufacturing and salesIndonesia P.T. Astra Honda Motor 50.0 ○ Manufacturing and salesMalaysia Armstrong Auto Parts SDN. BHD. 23.4 ○ ○ Manufacturing
Other Brazil Musashi do Brasil Ltda. 25.1 ○ ○ Manufacturing
Note: Percentage Ownership and Voting Interest include ownership through consolidated subsidiaries.
(As of March 31, 2007)

130
Year Noteworthy Events Major Products and Technologies
1946 Soichiro Honda establishes Honda Technical Research Institute1947 Honda’s first product, the A-type bicycle engine, produced1948 Honda Motor Co., Ltd. incorporated (capital: ¥1 million, employees: 34)1949 Dream D-type, Honda’s first motorcycle, produced1953 H-type engine, Honda’s first power product, produced1957 Listed on the Tokyo Stock Exchange1958 Super Cub motorcycle released1959 American Honda Motor Co., Inc. established (Honda’s first overseas subsidiary)1960 Motorcycle production begins at Suzuka Factory
Honda R&D Co., Ltd. established1961 Honda racing team sweeps first 5 places in Isle of Man TT Race (125cc, 250cc)1962 American Depositary Receipts (ADRs) issued at market price. Adopts consolidated accounting
using U.S. Securities and Exchange Commission (SEC) standardsConstruction of Suzuka Circuit completed
1963 Honda Benelux N.V. (Belgium) begins production of motorcycles (Honda’s first overseasproduction. The first Japanese company to open a manufacturing facility in the EEC)Honda’s first sports car (S500) and light truck (T360) released
1964 Asian Honda Motor Co., Ltd. (Thailand) establishedAutomobile production begins at Sayama Factory (presently Saitama Factory)
1965 Thai Honda Manufacturing Co., Ltd. (Bangkok) establishedHonda (U.K.) Limited established in LondonHonda wins its first F1 victory, in Mexico
1967 Automobile production begins at Suzuka FactoryMotorcycle production begins in Thailand
1969 Canadian Honda Motor Ltd. established in Toronto (presently Honda Canada Inc.)Automobile and motorcycle production begins in Malaysia (N360)
1971 Honda Motor do Brazil Ltda. established in Sao Paulo (presently Honda South America Ltda.)Knockdown motorcycle production begins in Mexico
1972 CVCC engine, world’s first to comply with the U.S. Clean Air Act of 1975, released1973 Motorcycle production begins in the Philippines
Civic CVCC introduced1974 Motorcycle production begins in Indonesia1975 Automobile production begins in Indonesia (TN Truck, Life, Civic)1976 Kumamoto Factory begins operation
Motorcycle production begins at Honda Italia Industriale S.p.A.Accord introduced
1977 ADRs listed on the New York Stock Exchange (NYSE)Consolidated financial disclosure begins
1979 Quarterly financial disclosure beginsHonda of America Mfg., Inc. begins motorcycle production (The first Japanese automaker toopen a manufacturing facility in the U.S.)
1981 Listed on the London Stock Exchange1982 Honda of America Mfg., Inc. begins automobile production1983 Listed on the Zurich, Geneva and Basel stock exchanges1984 Automobile production begins in Thailand (Accord)1985 Listed on the Paris Stock Exchange
Motorcycle engine production begins in the U.S.Motorcycle production begins in IndiaMotorcycle engine production begins in Malaysia
1986 Automobile production begins at Honda Canada Inc. (Accord)Motorcycle production begins in SpainPower product production begins in France
1987 Cumulative motorcycle production reaches 50 million units, a world first1988 Automobile production begins in Mexico
High-performance VTEC engine announced
Honda’s History
Dream D-type (1949)
Super Cub (1958)
T360 (1963)
S500 (1963)
Dream CB750FOUR (1969)
Civic CVCC (1973)
Accord (1976)

131
1989 Common stock-to-ADR exchange ratio changed from 10 shares of common stock to 1 ADR,to 2 shares of common stock to 1 ADR.Second automobile plant in the U.S. begins production in East Liberty, OhioHonda Motor Europe Ltd. (U.K.) established
1991 Honda posts its 60th Grand Prix victory in the Brazil GP1992 Automobile production in the U.K. begins (Accord)
Automobile production begins in the Philippines1994 Automobile production begins in Pakistan1995 Honda introduced first gasoline-powered vehicle to meet ULEV (Ultra Low Emission Vehicle)
standards in California, the U.S.Cumulative automobile production reaches 30 million units
1996 Motorcycle production begins in Turkey1997 Construction of Twin Ring Motegi completed (Tochigi Prefecture)
Automobile production begins in Brazil (Civic)Automobile production begins in Turkey (Civic)Cumulative motorcycle production reaches 100 million unitsMotorcycle production begins in VietnamAutomobile production begins in India (City)
1998 The 50th anniversary of the founding of Honda1999 Automobile production begins at Guangzhou Honda Automobile Co., Ltd. in China (Accord)
Fuel cell vehicle FCX-V1 and FCX-V2 announced2000 ASIMO humanoid robot announced2001 Motorcycle production begins at new production company in India
Second automobile plant in the U.K. begins operationsMinimum investment unit lowered to 100 shares, from 1,000Honda Manufacturing of Alabama, LLC in the U.S. begins operations
2002 Common stock-to-ADR exchange ratio changed from 2 shares of common stock to 1 ADR, to1 share of common stock to 2 ADRsNew automobile plant in Taiwan begins operationsHonda FCX fuel cell vehicle first to receive certification for the commercial use in the U.S.Lease marketing started in Japan and the U.S.
2003 New automobile plant in Malaysia begins operationsNew automobile plant in Indonesia begins operationsCumulative automobile production reaches 50 million unitsHonda FC STACK, a next-generation fuel cell stack capable of starting in sub-zero tempera-tures, announced
2004 Honda Motor (China) Investment Co., Ltd. establishedHonda Motor RUS LLC (Russia) establishedDongfeng Honda Automobile Co. Ltd. in China begins automobile production (CR-V)Honda enter cooperative agreement with General Electric to jointly market our independentlydeveloped HF118 jet engine
2005 Cumulative motorcycle production reaches 150 million unitsCumulative worldwide production of the Super Cub series reaches 50 million units
2006 Honda Philippines begins mass production at new motorcycle plantIntegrated three dealer channels into one Honda brandCumulative production of power products reaches 70 million unitsHonda establishes subsidiary in UkraineImplementation of two-for-one stock split for common sharesCommon stock-to-ADR exchange ratio changed from 0.5 share of common stock to one ADR,to one share of common stock to one ADRNew automobile plant in Vietnam begins operations (Civic)Launched the Gold Wing Airbag, the first mass-market motorcycle with an airbag systemCommercialized HondaJet operations and began accepting ordersResolved to implement quarterly dividendsNew company to conduct solar cell business establishedFlexible fuel vehicle introduced in Brazil (Civic FFV, Fit FFV )
2007 New plant of powertrain components in China begins operations
Year Noteworthy Events Major Products and Technologies
Gold Wing Airbag (2006)
NSX (1990)
Odyssey (1994)
CR-V (1995)
Fit (2001)
FCX (2002)
HondaJet

132
Investor Information
Honda Motor Co., Ltd.
Company Information
� Established September 24, 1948
� Lines of Business Motorcycles, Automobiles, Financial Services and Power Products and Others
� Fiscal year-end March 31
� Independent RegisteredPublic Accounting Firm KPMG AZSA & Co.
� Web Site•Corporate Web Sitehttp://www.honda.co.jp•IR Web Sites[Japanese] http://www.honda.co.jp/investors/[English] http://world.honda.com/investors/
IR Offices
[JAPAN]Honda Motor Co., Ltd.1-1, 2-chome, Minami-Aoyama, Minato-ku, Tokyo107-8556, JapanTEL: 81-(0)3-3423-1111 (Switchboard)
[U.S.A.]Honda North America, Inc.New York Office540 Madison Avenue, 32nd Floor,New York, NY 10022, U.S.A.TEL: 1-212-355-9191
[U.K.]Honda Motor Europe LimitedPublic Relations Division470 London Road, Slough,Berkshire SL3 8QY, U.K.TEL: 44 (0) 1753-590-590
Stock Information
� Securities Code7267
� Number of Shares Authorized7,086,000,000 shares
� Total Number of Shares Issued1,834,828,430 shares
� Number of Shareholders179,366
� Number of Shares per Trading Unit100 shares
� Stock Exchange Listings[Japan]Tokyo, Osaka, Nagoya, Fukuoka and Sapporo stockexchanges[Overseas]New York, London, Swiss and Paris stock exchangesNote: Honda has submitted requests for delisting from the Swiss and Paris stockexchange.
� General Meeting of ShareholdersJune
� Record Dates for DividendsJune 30September 30December 31March 31
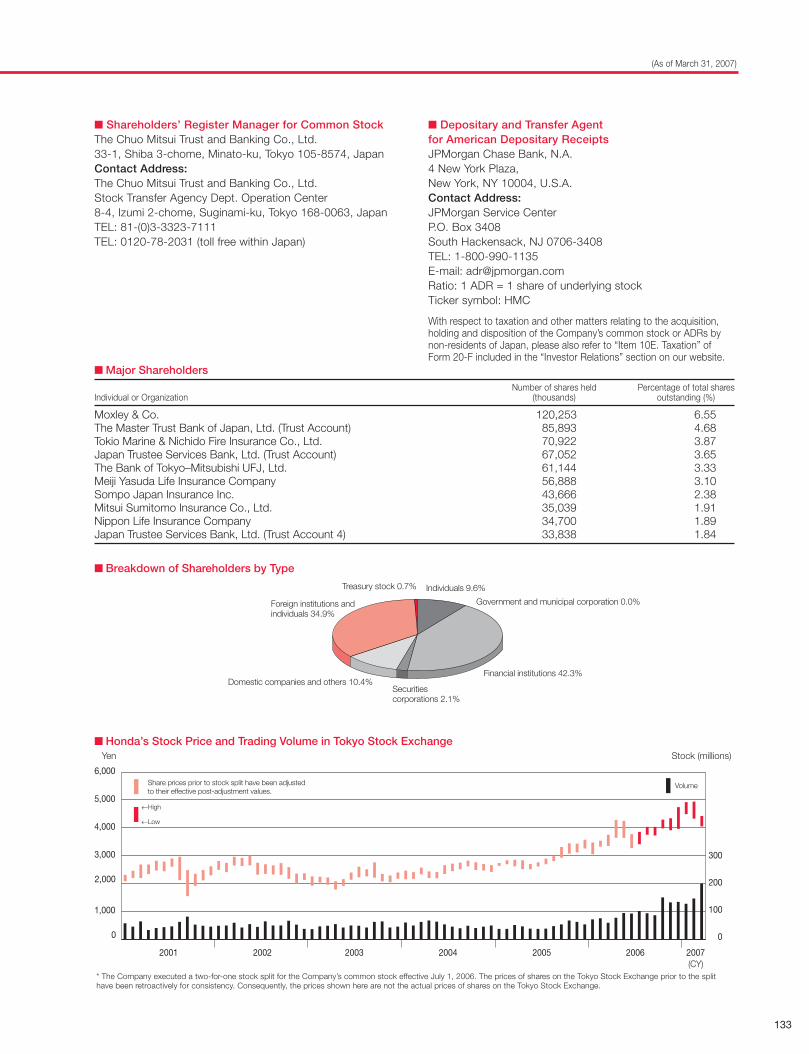
133
� Honda’s Stock Price and Trading Volume in Tokyo Stock Exchange
(As of March 31, 2007)
� Shareholders’ Register Manager for Common StockThe Chuo Mitsui Trust and Banking Co., Ltd.33-1, Shiba 3-chome, Minato-ku, Tokyo 105-8574, JapanContact Address:The Chuo Mitsui Trust and Banking Co., Ltd.Stock Transfer Agency Dept. Operation Center8-4, Izumi 2-chome, Suginami-ku, Tokyo 168-0063, JapanTEL: 81-(0)3-3323-7111TEL: 0120-78-2031 (toll free within Japan)
� Depositary and Transfer Agentfor American Depositary ReceiptsJPMorgan Chase Bank, N.A.4 New York Plaza,New York, NY 10004, U.S.A.Contact Address:JPMorgan Service CenterP.O. Box 3408South Hackensack, NJ 0706-3408TEL: 1-800-990-1135E-mail: [email protected]: 1 ADR = 1 share of underlying stockTicker symbol: HMC
With respect to taxation and other matters relating to the acquisition,holding and disposition of the Company’s common stock or ADRs bynon-residents of Japan, please also refer to “Item 10E. Taxation” ofForm 20-F included in the “Investor Relations” section on our website.
� Major Shareholders
Number of shares held Percentage of total sharesIndividual or Organization (thousands) outstanding (%)
Moxley & Co. 120,253 6.55The Master Trust Bank of Japan, Ltd. (Trust Account) 85,893 4.68Tokio Marine & Nichido Fire Insurance Co., Ltd. 70,922 3.87Japan Trustee Services Bank, Ltd. (Trust Account) 67,052 3.65The Bank of Tokyo–Mitsubishi UFJ, Ltd. 61,144 3.33Meiji Yasuda Life Insurance Company 56,888 3.10Sompo Japan Insurance Inc. 43,666 2.38Mitsui Sumitomo Insurance Co., Ltd. 35,039 1.91Nippon Life Insurance Company 34,700 1.89Japan Trustee Services Bank, Ltd. (Trust Account 4) 33,838 1.84
� Breakdown of Shareholders by Type
Treasury stock 0.7%
Financial institutions 42.3%
Individuals 9.6%
Securities corporations 2.1%
Government and municipal corporation 0.0%
Domestic companies and others 10.4%
Foreign institutions and individuals 34.9%
Yen Stock (millions)
* The Company executed a two-for-one stock split for the Company’s common stock effective July 1, 2006. The prices of shares on the Tokyo Stock Exchange prior to the splithave been retroactively for consistency. Consequently, the prices shown here are not the actual prices of shares on the Tokyo Stock Exchange.
0
1,000
2,000
3,000
4,000
5,000
6,000
2001 2002 2003 2004 2005 2006 2007(CY)
300
200
100
0
Share prices prior to stock split have been adjusted to their effective post-adjustment values.
←High
←Low
Volume

This annual report is printed on 100% recycled paper using soy ink with no volatile organic content. Furthermore, a waterless printing process was used to prevent toxic emissions. Printed in Japan