annual report 2008/09az498215.vo.msecnd.net/.../annual_report_0809_en.pdf · · 2014-06-17annual...
TRANSCRIPT

Annual Report 2008/09 Bang & Olufsen Group
CVR no. 41257911

Annual Report 2008/09 Bang & Olufsen Group
CVR no. 41257911
If you wish to skip directly to a specific page, click on the pagenumber from CONTENTS on page 3. You will then go directly tothat page.
CONTENTS - click right HERE.

3
5 Dear Bang & Olufsen shareholder
7 Corporate information etc.
8 Bang & Olufsen - a brief history
15 Five-yearsummary,mainandkeyfigures
18 Statement by the Management on the annual report
19 Independent auditor’s report
20 Structure, management and directorships
25 Directors’ report, Bang & Olufsen a/s Group
31 Branded business
33 Business-to-business areas
35 Expectationsforthe2009/10financialyear
37 Knowledge resources
43 Environment
47 Corporate Governance
49 Shareholder information
53 Statements sent to NASDAQ OMX Copenhagen A/S
55 Capital structure
57 Commercial risks
61 Financial report and notes
CONTENTS
Back to CONTENTS

4 Back to CONTENTS

5
DEAR BANG & OluFSEN ShAREhOlDER,
The 2008/09 financial year was extremely tough for Bang & Olufsen, not only for the company and its employees, but also for you, our shareholders. It was gratifying to see the support demonstrated by our shareholders by them subscribing fully to the rights issue that was required to consolidate Bang & Olufsen’s future.
The price the A shareholders had to pay was the unification of the two share classes. Since May, therefore, only one share class has been in existence with a 100 per cent free flow on the shares. The rights issue resulted in an inflow of close to DKK 433 million.
The global financial crisis has turned into a global recession which has resulted in a significant slowdown in private consumption. This has impacted strongly on almost all product categories, especially sales of luxury goods.
For Bang & Olufsen, the downturn in sales was considerable in the major, established European markets while new markets such as the East and Russia were less hard hit. Consequently, sales were unsatisfactory and resulted in a highly negative result.
Sales to the automotive industry developed positively and produced a small profit. Sales to hotels and real estate developments, however, were affected by the recession.
A contributory factor behind the negative sales trends was that, over the past years, the development of new products has been significantly delayed while, at the same time, the products failed to meet the sales expectations and requirements for new products. Traditionally, 25 per cent of Bang & Olufsen’s sales must be accounted for by new products, i.e. during the first 12 months following their launch.
During the 2008/09 financial year, the second half-year saw the launch of a new audio system as well as new TVs which, in terms of technology and design, are at the very forefront. At the beginning of 2009, the new BeoSound 5 audio system was launched representing an entirely new way of playing digitally stored music. On the video side, Bang & Olufsen launched the very large plasma TV, BeoVision 4-103, which has set new, global standards in terms of size and functionality. The 103 inch TV has been positively received in the new markets. March saw the launch of the BeoVision 8 lCD TV, in a 40 inch version and incorporating the latest technology which targets a broader consumer segment and is regarded as an entry product.
It has been crucial for Bang & Olufsen that cost levels reflect the decline in sales. Consequently a significant reduction in break-even turnover was undertaken by means of deep cost reductions.
however, within the product development area, only limited savings have been undertaken and the changes relate to rationalisation only.
A central global sales organisation has been established and cash tied up in receivables and inventories has been reduced. These initiatives are due in no small part to the changes to Bang & Olufsen’s management. The new CEO Karl Kristian hvidt Nielsen took up his position at the start of the financial year.
The recent measures should contribute to making Bang & Olufsen profitable once again. New, exciting products will be launched for the benefit and enjoyment of customers, dealers and, not least, for Bang & Olufsen and its shareholders.
Kind regards,
Jørgen WorningChairman
Back to CONTENTS

6 Back to CONTENTS

7
Bang & Olufsen a/s, Peter Bangs Vej 15, 7600 Struer, DenmarkTel.: +45 96 84 11 22, fax: +45 97 85 18 88, website: www.bang-olufsen.com
CVR no.: 41257911
Place of domicile: Struer
Financial year: 1 June – 31 May
Adoption of the annual report: The annual report is expected to be adopted at the Annual GeneralMeeting, which is held on 18 September, 2009.
Annual General Meeting: The Annual General Meeting will be held on Friday, 18 September, 2009at 16.30 at Struer hallerne.
Environmental reviews The product-related environmental review ”To the last detail” – a story about environmental awareness as toldthroughthedevelopment,production,useanddisposalofaspecificproduct.
Voluntary environmental review, including consumption of raw materials.
These reviews are available at www.bang-olufsen.com or from Bang & Olufsen’s Safety,health & Environment department on +45 96 84 10 18.
Statutory green accounts for the anodisation plant. A Danish version can be requested at Bang & Olufsen’s Safety, health & Environment department on +45 96 84 10 18.
Financial calendar2009: Tuesday, 11 August: Annual Report (2008/09) Friday, 18 September: Annual General Meeting Thursday, 8 October: Interim Report (1st quarter 2009/10)
2010: Thursday, 21 January: half-year report (2009/10) Tuesday, 13 April: Interim Report (3rd quarter 2009/10) Monday, 23 August: Annual Report (2009/10) Monday, 27 September: Annual General Meeting Thursday, 7 October: Interim Report (1st quarter 2010/11)
CORpORATE INFORMATION ETC.
Bang & Olufsen a/s
The Group’s overall corporate structure
100 %Bang & OlufsenOperations a/s
100 %Bang & Olufsen
s.r.o.
100 %Bang & Olufsen
ICEpower a/s
100 %Bang & Olufsen
GPS Taiwan
51 %OÜ BO-Soft
Back to CONTENTS

8
BANG & OluFSEN - A BRIEF hISTORy
Bang & Olufsen develops, manufactures and sells a wide range of luxury audio/video products, including television sets, music systems, loudspeakers, telephones and multimedia products that combine new technology with stylish design, quality and user-friendliness.
Within the CarFi sector – sound systems for cars – the development of unique sound systems for Audi and Aston Martin models is ongoing, and a partnership has been established with Mercedes-AMG. Moreover, several of the world’s leading hotels have been equipped with Bang & Olufsen audio/video products. The majority of all development and product development is centred at the company’s head office in Struer, Denmark.
At the end of the financial year, Bang & Olufsen employed 2,100 people while the company’s products are currently sold in more than 70 countries across the world.
HistoryBang & Olufsen was founded in 1925 by two young Danish engineers, peter Bang and Svend Olufsen, who met as students and shared an enthusiasm for the new phenomenon of the age: the radio.
The first pioneering product, however, was not the mains radio, which the two engineers dreamed about, but the “Eliminator” – a mains receiver that eliminated the need for batteries. The timing was perfect – the Eliminator arrived in the market as electricity became commonplace in Danish households. Consequently, Bang & Olufsen built the Company’s first production facility in 1927. In the final months of the Second World War, the factory was destroyed by Danish Nazi sympathisers as revenge for Bang & Olufsen’s refusal to work for the occupying forces, and because many of its employees were involved in the Danish Resistance.
In the post-war years, Bang & Olufsen faced a double challenge: to survive and rebuild the factory. Succeeding in both, during the 1950s and 60s, Bang & Olufsen established a recognised name for itself in the Danish market as “The Danish Quality Brand”.
When, at the end of the 1960s, competition from Asian manufacturers forced scores of Danish and European radio and TV factories to close, Bang & Olufsen allied itself with a group of architects and designers and set about focusing on the ideas behind the products as well as on their design and
1
2
3
Back to CONTENTS

9
1. Svend Olufsen and peter Bang, 19332 The new factory in Gimsing, 19283. The “Eliminator” 1926-304. Advertisement, 19395. Architect Ib Fabiansen’s sectional furniture, 19596. “The Danish Quality Brand”, extract from the maincatalogue, 1960
quality. Around the same time, Bang & Olufsen started exporting its products.
In the late 1980s and the early 1990s, Bang & Olufsen experienced difficulties staying profitable. A large-scale disposal of non-core activities was undertaken and a new distribution strategy launched: no longer should Bang & Olufsen’s products be sold through multi-brand radio/TV stores, but through dedicated outlets which only dealt in Bang & Olufsen products.
Since then, Bang & Olufsen shops (B1 Shops) have accounted for an increasing share of overall sales. Bang & Olufsen has also focused on developing a Shop-in-Shop concept where individual dealers can sell Bang & Olufsen’s products providing a separate section of the shop is designed according to Bang & Olufsen’s demands and specifications.
In the new millenium, Bang & Olufsen continued to establish shops worldwide, including a number of shops in new growth regions such as India, China and Russia. Bang & Olufsen also established the business area Automotive, which develops, produces and sells luxury sound systems for cars. The emphasis on core skills and the distribution strategy
proved highly successful and from the late 90s until 2008 Bang & Olufsen again experienced growth in both revenue and earnings.
In light of the economic downturn that began to take hold in the second half of Fy 2007/08 in some of Bang & Olufsen’s most important markets and a period of less successful product launches and a lack of product launches, the company introduced a new overall strategy plan entitled “pole position Strategy 2008” in the autumn of 2008, which is designed to help make the company profitable through a focused product development approach, strengthened sales efforts and an adjustment of the cost level.
4
5
6
Back to CONTENTS

10
Bang & Olufsen’s platform
Branded businessBang & Olufsen’s luxury audio/video products are world renowned for their combination of superior audio/video quality, user-friendliness and design. Several international magazines have carried positive reviews of Beolab 5, including Stereophile Magazine, which hailed Beolab 5 as “unquestionably the most radical loudspeaker ever developed”. On the video front Bang & Olufsen recently launched a 40 inch version of the lCD TV, BeoVision 8, which, with its high gloss screen, Full hD, digital surround sound and MpEG4 DVB receiver, contains the latest technology at an attractive price. Bang & Olufsen also made its mark by debuting the 103 inch plasma TV, BeoVision 4-103. Moreover, Bang & Olufsen’s latest audio solution, BeoSound 5, has attracted attention as the new audiomaster product for digitally stored music and internet radio. One of the features of the BeoSound 5 is the MOTS (More Of The Same) function, which is a technology owned by Bang & Olufsen. MOTS analyses the music library and selects music that corresponds to the music listened to.
For many years, system integration has been pivotal to Bang & Olufsen’s product strategy. An example of system integration is products containing more than one source of entertainment in a single unit, such as TV sets with an integrated dvd-player or an audio system with a built-in radio, cd and dvd-player.
The Beolink system is another example of system integration, enabling users to connect and combine all types of Bang & Olufsen products in their homes. The Beolink system allows the user to distribute audio/video from the main Bang & Olufsen system to other rooms in the house.
With the Beo5, the user needs only one remote for all rooms of the house. The Beo5 is a portable central command device which offers a range of new functions in addition to those already known from Beo4. For example, it can be configured specifically to the individual user’s requirements. The Beo5, therefore, amounts to a unique, personal remote control which contains precisely those functions required for each individual user’s home.
Over the past few years, the branded business has extended into new areas. Bang & Olufsen Automotive sells luxury sound systems for cars in the
2
3
1
Back to CONTENTS

11
high-end segment and makes up an important part of Bang & Olufsen’s core business.
In the Automotive segment, Bang & Olufsen collaborates with Audi (Germany), the sportscar manufacturer Aston Martin (uK) and Mercedes-AMG (Germany), the latter company manufacturing specially designed and tuned versions of Mercedes cars. In addition, Automotive has signed a contract with a potential new partner in the premium segment regarding the first phases in the development of sound systems for this partner.
The In-car sound systems have won widespread recognition. The BeoSound DBS system, for instance, came first in a group test of sound systems for luxury cars in the well respected magazine, AutoFocus. In addition, Automotive’s sound systems for Audi were voted Best Car-hiFi brand 2008 by the readers of the leading German car magazine Auto, Motor und Sport.
Through its Enterprise department, Bang & Olufsen sells audio/video products for luxury hotels and major property developments. The company’s products are currently represented in more than 200 five-star hotels across the world. In addition, Bang &
Olufsen Enterprise has initiated and expanded a number of partnerships with leading property developers for the supply of audio/video products for exclusive property projects, primarily in the Middle East and Asia.
Shops Sales take place through two types of dedicated Bang & Olufsen shops:
· B1 Shops, which mainly sell Bang & Olufsen products
· Shop-in-Shops in which a substantial area of the shop is designed for, and exclusively dedicated to, Bang & Olufsen’s products.
Irrespective of where customers purchase Bang & Olufsen products, they will encounter well-trained staff especially as Bang & Olufsen invests substantial sums in training shop staff.
Bang & Olufsen’s products are currently available from 758 B1 shops and 385 Shop-in-Shops. The B1 shops account for 81 per cent of the turnover, with the Shop-in-Shop outlets accounting for 19 per cent. Bang & Olufsen’s strategy is to continue to focus on these two types of shops with
4
5
6
1. BeoVision 4-1032. BeoSound 9000 and Beolab 53. B1 shop layout anno 20094. hanging of stand tubes for anodizing5. Beo5 remote control6. production of BeoCenter 2
Back to CONTENTS

12
the B1 shops as the most important, and the Shop-in-Shop outlets as a significant distribution channel in areas where the demographics do not justify a B1 shop. Bang & Olufsen owns 46 B1 shops directly, mainly in Australia, the uS and in the uK.
MarketsBang & Olufsen’s products are available around the world and 91 per cent of the company’s turnover derives from exports. In a number of markets, operations are handled by Bang & Olufsen’s own subsidiaries, c.f. overview Note 44, while sales and distribution development in certain overseas markets is organised by highly qualified business partners.
ProductionBang & Olufsen has outsourced all production of electronics components for the company’s audio and video products. Instead, it sources a large number of product-related sub-components and semi-finished products from various suppliers. Bang & Olufsen concentrates on producing components where, over a period of many years, the company has developed special expertise primarily in relation to colour dyeing (anodisation), processing and surface treatment of aluminium.
The individual products are assembled and mounted at Bang & Olufsen’s own production facilities in Struer, Denmark and Koprivnice, Czech Republic.
In addition to the physical components, Bang & Olufsen’s proprietary software and technology form part of the products. These features help to differentiate the products in terms of user-friendliness and other factors, such as sound and picture processing.
Most of Bang & Olufsen’s products are manufactured in a large number of varieties, depending on the customer’s specific requirements.
Product developmentDevelopment of audio and video products and CarFi products generally takes place in Struer, Denmark. The company also has a small software innovation and development unit in Aarhus, Denmark, which works closely together with Aarhus university. In total, around 300 of Bang & Olufsen’s employees are involved with product development in Struer, Denmark. In addition, around 30 people are employed in the development department located at the factory in Koprivnice and 35 people in the Estonian business,
2 3
1
Back to CONTENTS

13
1. Beolab 92. Aston Martin DBS3. Mandarin Oriental in Miami4. ICEpower 250A5. Speaker in Audi Q76. BeoVision 8-40 and Beolab 3
OÜ BO-Soft, in which the Group has a 51 per cent stake.
For the 500 engineers and technicians involved in the development of new Bang & Olufsen products, the opportunities for direct interaction with the production departments are important for ensuring that the finished products have the desired features and are of the right quality.
Bang & Olufsen has a well-established innovation culture, which has evolved over a number of years. As part of this culture and the innovative environment, Bang & Olufsen has divided its product development activities into separate stages. As part of the pole position strategy plan which was launched in October 2008, this innovation culture was further developed in order to improve the handling of the increased technology content. This will ensure optimum re-application of technology in individual products without restricting Bang & Olufsen’s renowned differentiation.
Compared with other manufacturers of consumer electronics, Bang & Olufsen takes an unconventional approach to product development and design-driven innovation. One important area where Bang &
Olufsen’s approach stands out is the early concept development stage, during which the company devotes considerable resources in creating innovative and long-lasting concepts and designs.
Non-branded business Alongside the branded business, Bang & Olufsen is engaged in non-branded activities with regard to the development, production and sales of compact, digital amplifier units. The subsidiary, Bang & Olufsen ICEpower a/s, is responsible for the patented ICEpower technology – a technology that enables small digital amplifiers to provide extremely high performance with particularly low heat output and thus with reduced energy consumption.
As a result of the compact design, reliability, energy savings, competitive prices and sound quality, Bang & Olufsen ICEpower’s digital amplifier modules are in demand for use in, for instance, mobile phones. This technology can be found in a wide range of models from Samsung. The ICEpower technology is also a key feature of Bang & Olufsen’s active speakers and sound systems for cars.
4 5
6
Back to CONTENTS

14 Back to CONTENTS
DKK million
600
400
200
0
-200
-400
-600
DKK million
600
400
200
0
-200
-400
-600
%
30
20
10
0
-10
-20
-30
04/0
5
05/0
6
06/0
7
07/0
8
08/0
9
04/0
5
05/0
6
06/0
7
07/0
8
08/0
9
04/0
5
05/0
6
06/0
7
07/0
8
08/0
9
04/0
5
05/0
6
06/0
7
07/0
8
08/0
9
Operating profit DKK million
600
400
200
0
-200
-400
-600
Cash flow
Result before tax Return on equity
-229
259
-346
372
38016
439
431
17
530
52422
195
154 7
-496
-523 -26
-104
192

15
FIVE-yEAR SuMMARy, MAIN AND KEy FIGuRES
Group (DKK million) 2008/09 2007/08 2006/07 2005/06 2004/05
Profit and loss account
Net turnover 2,790 4,092 4,376 4,225 3,742
Of which from foreign markets, % 91 88 85 82 82
Operating profit/loss (496) 195 530 439 372
Financial items, net (30) (30) (16) (7) 7
Result before tax (523) 154 524 431 380
Result for the year (383) 112 373 296 265
Result for the year, shareholders of the parent company (385) 105 367 294 265
Balance sheet
Total assets, end of year 2,664 2,817 2,962 2,915 2,784
Share capital 362 121 121 125 124
Equity, end of year 1,520 1,484 1,682 1,742 1,715
Equity attributable to shareholders of
the parent company, end of year 1,518 1,472 1,676 1,738 1,713
Minority interests 2 12 6 4 2
Cash flows for the year 192 (104) (346) (229) 259
Of which cash flows from:
Operating activities 113 332 521 395 740
Investment activities (339) (254) (378) (379) (233)
- of which investment in tangible non-current assets (111) (190) (158) (185) (123)
- of which investment in intangible non-current assets (212) (125) (210) (171) (125)
- of which investment in equity interests (27) - - - -
Financing activities 418 (181) (488) (246) (248)
Employment
Number of employees, end of year 2,051 2,579 2,520 2,422 2,331
Parantheses denote negative figures.
Back to CONTENTS

16
FIVE-yEAR SuMMARy, MAIN AND KEy FIGuRES (CONTINuED)
Group (DKK million) 2008/09 2007/08 2006/07 2005/06 2004/05
Key figures
EBITDA (208) 483 789 670 616
EBITDA-margin, % (7) 12 18 16 16
profit ratio (EBIT), % (18) 5 12 10 10
Return on assets, % (20) 7 21 20 18
Return on invested capital, excl. goodwill, % (13) 29 51 52 48
Return on equity, % (26) 7 22 17 16
Current ratio 1.9 1.9 1.9 2.4 2.5
Equity ratio, % 57 53 57 60 62
Financial gearing 0.1 0.2 0.0 (0.1) (0.3)
Net turnover/Invested capital excl. goodwill 1.8 2.4 2.8 3.3 2.9
Earnings per share (nom. DKK 10), DKK, original 9 31 25 22
Earnings per share (nom. DKK 10), DKK,
adjusted for dilution due to the rights issue (16) 4 15 12 11
Diluted earnings per share (nom. DKK 10), DKK, original 9 31 25 22
Diluted earnings per share (nom. DKK 10), DKK,
adjusted for dilution due to the rights issue (16) 4 15 12 11
Intrinsic value per share (nom. DKK 10), DKK 42 123 139 140 141
Quotation as at 31 May, original 45 265 698 684 389
Quotation as at 31 May, adjusted for
dilution due to the rights issue 45 128 337 330 188
price/earnings (3) 29 22 28 18
price/earnings, diluted (3) 29 22 28 18
Quotation/intrinsic value per share 1.1 2.2 5.0 4.9 2.8
Dividend paid/proposed per share (nom. DKK 10), DKK 0.00 3.00 20.00 16.00 12.00
Number of shares, end of year 36,244,014 12,081,338 12,081,338 12,450,925 12,414,240
Number of own shares, end of year 110,076 767,787 619,923 669,587 435,479
Average number of shares in circulation, original 11,376,530 11,683,175 11,872,382 12,097,376
Average dilutive effect of outstanding share options, original - 12,513 41,676 2,066
Average number of shares in circulation - diluted, original 11,376,530 11,695,688 11,914,058 12,099,442
Average number of shares in circulation,
adjusted for dilution due to the rights issue 24,581,720 23,585,489 24,221,216 24,613,475 25,079,926
Average dilutive effect of outstanding share options,
adjusted for dilution due to the rights issue - - 25,942 86,401 4,283
Average number of shares in circulation - diluted,
adjusted for dilution due to the rights issue 24,581,720 23,585,489 24,247,158 24,699,876 25,084,209
Main and key figures are prepared in accordance with IFRS and “Recommendations and Key Figures 2005” from The Dansih Association
of Financial Analysts.
Share related key figures are presented before and after adjustment due to the dilution resulting from the bonus element related to the
rights issue in the spring of 2009.
Parantheses denote negative figures.
Back to CONTENTS

17
The key figures are defined as follows:
EBITDA:
Result before interests, tax, depreciation, amortisation and impairment losses
EBITDA-margin:
Result before interests, tax, depreciation,
amortisation and impairment losses x 100
Net turnover
Profit ratio:
Operating profit/loss x 100
Net turnover
Return on assets:
Operating profit/loss x 100
Average operational assets
Return on invested capital, excl. goodwill:
Operating profit/loss before depreciation and goodwill write offs
Average invested capital, excl. goodwill
Return on equity:
Bang & Olufsen a/s’ share of result for the year x 100
Average equity, excl. minority interests
Current ratio:
Current assets
Current liabilities
Equity ratio:
Equity, end of year x 100
Total equity and liabilities, end of year
Financial gearing:
Interest bearing debt (net) end of year
Equity, end of year
Net turnover/invested capital, excl. goodwill:
Net turnover x 100
Average invested capital, excl. goodwill
Earnings per share (nom. DKK 10), DKK:
Result after tax
Average number of shares in circulation
Diluted earnings per share (nom. DKK 10), DKK:
Result after tax
Average number of shares in circulation - diluted
Adjusted number of shares:
Original number of shares before the rights issue
Effect of dilution due to the rights issue (0.4824)
Earnings per share (nom. DKK 10), DKK, adjusted:
Result after tax
Adjusted average number of shares in circulation
Diluted earnings per share (nom. DKK 10), DKK, adjusted:
Result after tax
Adjusted average number of shares in circulation - diluted
Intrinsic value per share (nom. DKK 10), DKK:
Equity, end of year
Number of shares, end of year
Price/earnings:
Quotation
Earnings per share (nom. DKK 10)
Price/earnings, diluted
Quotation
Diluted earnings per share (nom. DKK 10)
Back to CONTENTS

18
The Board of Directors of Bang & Olufsen a/s
Jørgen Worning (Chairman)
lars Brorsen (Deputy Chairman)
Niels Bjørn Christiansen
Thorleif Krarup
Rolf Eriksen
Jesper Olesen
Knud Olesen
peter Skak Olufsen
Anette Revsgaard Sejbjerg
STATEMENT By ThE MANAGEMENT ON ThE ANNuAl REpORT
The Board of Directors and the Board of Management have today discussed and approved the annual report of Bang & Olufsen a/s for the financial year 1 June 2008 – 31 May 2009.
The annual report has been prepared in accordance with International Financial Reporting Standards as adopted by the Eu and additional Danish disclosure requirements for annual reports for listed companies.
We consider the applied accounting policies appropriate for the annual report to provide a true and fair view of the Group’s and the parent’s
financial position at 31 May 2009 and of their financial performance and their cash flows for the financial year 1 June 2008 – 31 May 2009.
We believe that the Directors´ report gives a fair presentation of developments in the Group´s and the parent´s activities and finances, results for the year and of the Group´s financial position in general as well as a fair description of the most significant risks and uncertainties to which the Group is exposed.
We recommend the annual report for adoption at the Annual General Meeting.
Struer, 11 August 2009
The Board of Management of Bang & Olufsen a/s
Karl Kristian hvidt Nielsen (president & CEO)
Back to CONTENTS

19
INDEpENDENT AuDITOR’S REpORT
To the shareholders of Bang & Olufsen a/sWe have audited the annual report of Bang & Olufsen a/s for the financial year 1 June 2008 – 31 May 2009, which comprises the statement by Management on the annual report, Directors’ report, income statement, balance sheet, statement of changes in equity, cash flow statement and notes, including the accounting policies, for the Group as well as the parent. The annual report has been prepared in accordance with International Financial Reporting Standards as adopted by the Eu and additional Danish disclosure requirements for annual reports for listed companies.
Management’s responsibility for the annual reportManagement is responsible for the preparation and fair presentation of an annual report in accordance with International Financial Reporting Standards as adopted by the Eu and additional Danish disclosure requirements for annual reports for listed companies. This responsibility includes: designing, implementing and maintaining internal control relevant to the preparation and fair presentation of an annual report that is free from material misstatement, whether due to fraud or error, selecting and applying appropriate accounting policies, and making accounting estimates that are reasonable in the circumstances.
Auditor’s responsibility and basis of opinionOur responsibility is to express an opinion on this annual report based on our audit. We conducted our audit in accordance with Danish and International Standards on Auditing. Those Standards require that we comply with ethical requirements and plan and perform the audit to obtain reasonable assurance whether the annual report is free from material misstatement.
An audit involves performing procedures to obtain audit evidence about the amounts and disclosures in the annual report. The procedures selected depend on the auditor’s judgement, including the assessment of the risks of material misstatement of the annual report, whether due to fraud or error. In making those risk assessments, the auditor considers internal control relevant to the entity’s preparation and fair presentation of an annual report in order to design audit procedures that are appropriate in the circumstances, but not for the purpose of expressing an opinion on the effectiveness of the entity’s internal control. An audit also includes evaluating the appropriateness of accounting policies used and the reasonableness of accounting estimates made by Management, as well as evaluating the overall presentation of the annual report.
We believe that the audit evidence we have obtained is sufficient and appropriate to provide a basis for our audit opinion.
Our audit has not resulted in any qualification.
OpinionIn our opinion, the annual report gives a true and fair view of the Group’s and the parent’s financial position at 31 May 2009, and of their financial performance and their cash flows for the financial year 1 June 2008 – 31 May 2009 in accordance with International Financial Reporting Standards as adopted by the Eu and additional Danish disclosure requirements for annual reports for listed companies.
Copenhagen, 11 August 2009
DeloitteState Authorised public Accounting Company
Jens RudkjærState Authorised public Accountant
henrik Z. hansenState Authorised public Accountant
Back to CONTENTS

20
STRuCTuRE, MANAGEMENT AND DIRECTORShIpS
Jørgen Worning
(1940)
Chairman
year of first appointment,
1991
M.Sc. (Engineering)
Directorships
Chairman of FlSmidth &
Co. A/S, FlSmidth A/S and
AlK-Abelló A/S.
Number of shares in
Bang & Olufsen a/s:
7,200
Board of Directors
Lars Brorsen
(1952)
Deputy Chairman
year of first appointment,
1998
M.Sc. (Economics)
Directorships
CEO of Jost-Werke
Gmbh. Vorsitzender der
Geschaftsführung von
Jost-World Gmbh and 14
subsidiaries. Member of
the management board of
langholm Gmbh.
Number of shares in
Bang & Olufsen a/s:
27,500
Thorleif Krarup
(1952)
year of first appointment,
2003
B.Sc. (Economics) and
B.Com. (Business Finance
and Management
Accounting)
Directorships
Chairman of Exiqon A/S
and Sport One Danmark
A/S. Deputy chairman
of lFI A/S, h. lundbeck
A/S and AlK-Abelló
A/S. Member of the
board of directors of the
lundbeck Foundation,
Group4Securicor plc and
Brightpoint Inc.
Number of shares in
Bang & Olufsen a/s:
309
Peter Skak Olufsen
(1942)
year of first appointment,
1972
Agronomist
Directorships
peter Skak Olufsen runs
the manor Quistrup. In
addition, he is chairman
of Aktieselskabet Fiil-Sø,
hunsballe Frø A/S, Fiilsø
Svineavl A/S and Fonden Nr.
Vosborg. Deputy chairman
of Idagaardfonden. Member
of the board of directors
of Jp/politikens hus A/S,
EuroGrass BV, Kongenshus
Mindepark for hedens
Opdyrkere and Sven
Torben og Margrethe
Westenholz Slægtsfond.
Number of shares in
Bang & Olufsen a/s:
49,000
Niels Bjørn Christiansen
(1966)
year of first appointment,
2007
M.Sc. (Engineering), MBA
Directorships
president & CEO of
Danfoss A/S. Deputy
chairman of Sauer-
Danfoss Inc. and member
of the board of directors
of TrygVesta A/S, Axcel II
and III, William Demant
holding A/S. Chairman,
deputy chairman or
member of the board of
directors in 11 Danfoss
subsidiaries including
Danfoss universe.
Number of shares in
Bang & Olufsen a/s:
300
Company Bang & Olufsen a/s
Struer
CVR no. 41257911
Brand building and Group staff functions as well as
the development of Bang & Olufsen’s audio/video
products.
Back to CONTENTS

21
Board of Management
Karl Kristian Hvidt
Nielsen
(1964)
president & CEO of
Bang & Olufsen a/s since
1 August 2008
M.Sc. (Engineering),
B.Com in Marketing
Directorships *
Member of the board of
directors of EskoArtwork,
panmi Invest 1 ApS and
phase One A/S. Member
of the management board
of hvidt Nielsen ApS.
Number of shares in
Bang & Olufsen a/s:
8,391
Rolf Eriksen
(1944)
year of first appointment,
2008
Display Artist
Directorships
CEO of h&M, hennes &
Mauritz AB since 2000.
Member of the board
of directors of hennes &
Mauritz A/S.
Number of shares in
Bang & Olufsen a/s:
1,140
Anette Revsgaard
Sejbjerg
(1966)
year of first appointment,
2007 (Employee-elected)
Time Study Engineer
Number of shares in
Bang & Olufsen a/s:
330
Jesper Olesen
(1978)
year of first appointment,
2007 (Employee-elected)
Engineering Worker
Number of shares in
Bang & Olufsen a/s:
180
Knud Olesen
(1952)
year of first appointment,
2003 (Employee-elected)
Technical project Manager
Number of shares in
Bang & Olufsen a/s:
837
* With the exception of 100 per cent owned Bang & Olufsen subsidiaries. Back to CONTENTS

22 Back to CONTENTS
Company Board of Directors Board of Management
Bang & Olufsen Operations a/s Jørgen Worning (Chairman) Karl Kristian hvidt Nielsen
Struer (100 % owned) lars Brorsen (Deputy Chairman) John Christian Bennett-Therkildsen
CVR-no. 26035406 Niels Bjørn Christiansen
Thorleif Krarup
Rolf Eriksen
Purchasing, production and logistics Jesper Olesen *
for the Bang & Olufsen Group as well Knud Olesen *
as sales of Bang & Olufsen’s peter Skak Olufsen
audio/video-products. Anette Revsgaard Sejbjerg *
Bang & Olufsen s.r.o lars Jørgensen (CEO)
Koprivnice (100 % owned)
Handles production and development of
some of the Group’s audio-products.
OÜ BO-Soft Jaan lievand (CEO)
Tallinn (51 % owned)
Software development.
* Employee-elected
STRuCTuRE AND MANAGEMENT (CONTINuED)

23Back to CONTENTS
Company Board of Directors Board of Management
Bang & Olufsen ICEpower a/s Karl Kristian hvidt Nielsen (Chairman) peter A.V. Sommer (CEO)
Lyngby-Tårbæk (100 % owned) Jens peter Zinck
CVR-no. 25053591 Kim Bo hansen
peter petersen
Develops, produces and markets
products based on highly efficient
amplifier technologies.
Bang & Olufsen GPS Kim Bo hansen (Chairman) peter Seidelin hune
Taipei City, Taiwan (100 % owned) John Christian Bennett-Therkildsen
lars hardboe Galsgaard
Sourcing company.
Bang & Olufsen a/s, The Board of Directors Compensations Committee
Jørgen Worning
lars Brorsen
Thorleif Krarup
Main banker for all companies
Danske Bank A/S
Auditors for all companies
Deloitte
Dormant companies are not included.

24 Back to CONTENTS

25
DIRECTORS’ REpORT, BANG & OluFSEN A/S GROup
The Group recorded a total turnover of DKK 2,790 million for the 2008/09 financial year against DKK 4,092 million last year, which is in line with the announced.
The Group’s gross margin was 39.6 per cent against 46.2 per cent in 2007/08.
Operating losses totalled DKK 496 million, of which DKK 106 million relates to restructuring costs, against operating profits of DKK 195 million for the 2007/08 financial year. Result before tax was negative at DKK 523 million against the Group’s stated expectations for a negative result of DKK 510 million. Result before tax for the 2007/08 financial year was positive at DKK 154 million.
The result before tax was negatively affected by two lawsuits, where Bang & Olufsen was sued by French dealers. At first, Bang & Olufsen won both cases, but subsequently lost on appeal in June 2009. As a result of the ruling of June 2009, DKK 12.3 million has been expensed.
In the 2008/09 financial year, Bang & Olufsen Automotive recorded a turnover of DKK 174 million and a positive result, which is in line with previously announced expectations.
The Group’s pole position strategy plan, which was launched in October 2008, was implemented as planned during the financial year.
In keeping with the strategy plan, Bang & Olufsen has focused the product development aimed at launching more new products. Among others, a global launch of the digital music system BeoSound 5, BeoVision 4-103 and BeoVision 8-40 was completed.
The Group also succeeded in reducing general cost levels, which has resulted in a lowering of the breakeven turnover.
The Group has significantly reduced its working capital following a reduction in its cash tied up in receivables and inventories. This has contributed to positive cash flows from operating activities.
As expected, the 2008/09 financial year saw a net reduction in the number of B1 shops of 64 to 758 shops.
During the fourth quarter, the Group completed a fully subscribed preferential subscription rights issue, which yielded gross proceeds of approx. DKK 459 million corresponding to net proceeds of approx. DKK 433 million after costs relating to the offer.
Bang & Olufsen expects that the 2009/10 financial year as a whole will result in a break-even result before tax based on a turnover level a little below the previously announced DKK 3,200 million.
Back to CONTENTS

26
Comments to the development
The result before tax for the 2008/09 financial year was in line with expectations a loss of DKK 523 million against a profit of DKK 154 million last year. The result was affected by restructuring costs of DKK 106 million relating to the Group’s strategy plan.
The result before tax was also negatively affected by two lawsuits, where Bang & Olufsen was sued by French dealers. One of the lawsuits concerned the commercial conditions for selling and marketing Bang & Olufsen’s products, while the other related to a dealer who felt badly treated by Bang & Olufsen France S.A. in connection with the opening of a new sales outlet. At first, Bang & Olufsen won both cases, but subsequently lost on appeal. having initially won both cases, Bang & Olufsen expected the original verdicts to be upheld and, therefore, no provisions for the outcome of the two cases was made at the end of the third quarter. The effect of the two lawsuits is DKK 12.3 million, which was expensed in the fourth quarter of the financial year.
Bang & Olufsen expects to appeal both verdicts to a higher court within the foreseeable future.
A verdict was also given in the case referred to in the prospectus where Bang & Olufsen France S.A. was sued in the French courts by Claudnat S.A. and JW Nat SARl for having misused its option to terminate the plaintiffs’ distribution agreement with Bang & Olufsen France S.A. The outcome was as expected, and Bang & Olufsen is now awaiting the counterpart’s decision whether to appeal.
Pole Position strategy plan implemented as expected
The new overall strategy plan entitled ”pole position Strategy 2008”, which will secure the future operations and development of Bang & Olufsen through a series of initiatives, has been implemented as expected.
Focused product development Bang & Olufsen aims to focus on fewer product categories, primarily centred on exclusive audio and video products. In the 2008/09 financial year, Bang & Olufsen launched a number of new products on schedule and met the previously announced expectations that turnover from launch products in
the audio and video segment should account for about 10 per cent of audio and video turnover.
Development of one shared digital technology platform Bang & Olufsen intends to develop one shared digital technology platform, which, in the future, will constitute the technological basis for the Group’s products across the product portfolio and help to significantly reduce development time. Bang & Olufsen began the development of the shared technology platform in the 2008/09 financial year and expects to launch the first product based on the new technology platform at the end of the 2009/10 financial year in the form of a new audio product.
Establishment of a single global sales organisation During the 2008/09 financial year, Bang & Olufsen focused on ensuring more efficient support to, and development of, Bang & Olufsen’s dealer network through establishment of a single global sales organisation. In keeping with this strategy, the Group has prepared and initiated the establishment of a Shared Service Centre, which will ensure professional and efficient servicing of the Group’s dealers. In addition, Bang & Olufsen has set up a training programme for the Group’s Retail Development Managers with a view to providing the Group’s dealers with professional advice and business-oriented support.
Increase in the number of B1 shops in the Group’s most important Emerging Markets Despite the expected net reduction in the number of B1 shops in the 2008/09 financial year, Bang & Olufsen has succeeded in increasing the number of B1 shops in China and Russia/ukraine by one and four shops respectively.
The strategy plan also contains a series of specific cost savings in the global sales organisation and in the production and administration functions in Denmark. These initiatives have been completed as planned over two restructuring rounds.
Back to CONTENTS

27
Net turnover and gross margin
The Group’s net turnover for the financial year totalled DKK 2,790 million against DKK 4,092 million for the same period last year. This equates to a decrease in turnover of 31.8 per cent.
Net turnover according to business area
(DKK million) 2008/09 2007/08
Audio and video business 2,546 3,869 Automotive 174 123 Branded business, total 2,720 3,992
Bang & Olufsen ICEpower a/s 85 118 Non-branded business, total 85 118
Intra-group turnover (15) (18)
Net turnover in total 2,790 4,092
The decrease in turnover, which can be ascribed to the audio and video business, has been caused by the economic downturn as well as the lack of product launches in the first three quarters of the financial year.
The audio and video business – turnover according to product categories
(DKK million) 2008/09 2007/08
Video 1,201 1,844 loudspeakers 500 823 Audio 485 618 Telephones 130 235 Spare parts, accessories etc, 230 349
Turnover in total 2,546 3,869
For the 2008/09 financial year, the Group’s gross margin was 39.6 per cent against 46.2 per cent in 2007/08. The lower gross margin is largely owing to the fact that some of the production costs are fixed costs.
Back to CONTENTS

28
Cost levels reduced as planned
The Group has focused on reducing general cost levels, which has resulted in a lowering of the breakeven turnover.
The 2008/09 financial year saw high levels of activity within the product development area focusing on the Group’s launches in 2009/10 and the development of the Group’s shared digital platform, which, in the future, will constitute the technological basis for the Group’s products across the product portfolio.
The Group’s incurred development costs totalled DKK 537 million against DKK 530 million in 2007/08. The net effect of capitalisation was positive at DKK 60 million. Expensed development costs totalled DKK 463 million whereas expensed development costs in 2007/08 were DKK 546 million and the net effect of capitalisation was negative at DKK 16 million.
Distribution and marketing costs declined during the financial year by DKK 75 million from DKK 1,004 million to DKK 929 million. losses and changes in provisions for losses on receivables and dealer loans were expensed at DKK 60 million in the 2008/09 financial year against DKK 49 million the previous year.
Administration costs etc. declined by DKK 44 million from DKK 149 million to DKK 105 million in the 2008/09 financial year.
Comments to developments in the fourth quarter of the 2008/09 financial year (Unaudited)
During the fourth quarter, Bang & Olufsen was able to complete a launch of important products as planned:
BeoVision 8-40BeoVision 8-40 is offered at a highly attractive price point as the Group’s entry product within the video portfolio. The television is equipped with a 40 inch high glare screen, Full hD, digital surround sound, MpEG4 DVB receiver as well as a range of technologies that produce impressive picture and sound quality.
BeoVision 4-103BeoVision 4-103 is a unique concept which, in size and function, sets new standards. The concept is at the core of the intelligent home due to its numerous opportunities for combining sound and picture experiences with home Automation systems via Master link Gateway and the TV’s Beo5 remote control.
BeoVision 7-40 Blu-rayTowards the end of the financial year, Bang & Olufsen’s high-end concept, BeoVision 7-40, was updated with a Blu-ray player, which offers the potential for film experiences of the highest quality, as well as the 100/120 hz technology, which offers improved picture quality.
Optimisation of existing conceptsIn addition, Bang & Olufsen has optimised existing concepts, including BeoVision 7-32 and BeoVision 6, which have been updated with an integrated DVB-hD module and two hDMI inputs, which provide for the high Definition (hD) material of the future.
Turnover for the Bang & Olufsen a/s Group as a whole for the fourth quarter 2008/09 was, as announced, DKK 617 million against DKK 885 million last year, a decline of DKK 268 million, or 30.3 per cent. New launches in the fourth quarter exceeded expectations in respect of timing and market reception.
Of the DKK 268 million decline in turnover, DKK 73 million can be attributed to lower turnover in Denmark, Germany and the uK. In local currency, turnover declined by 29.0 per cent and 35.1 per cent in the Danish and German markets respectively, while the uK experienced a more positive trend in the fourth quarter where the decline in local currency amounted to 3.3 per cent only.
In the fourth quarter, turnover for the branded business fell by DKK 252 million, from DKK 842 million last year to DKK 590 million this year.
The Group’s gross margin was 36.9 per cent for the quarter against 46.4 per cent in the same quarter last year. The lower gross margin is largely owing to the fact that some of the production costs are fixed costs which take time to reduce.
Gross profit decreased by DKK 183 million from DKK 411 million to DKK 228 million.
Back to CONTENTS

29
During the quarter, development costs decreased by DKK 43 million. Distribution and marketing costs declined by DKK 37 million as a result of the restructuring and the focusing of the sales and marketing organisation. Finally, administration costs decreased from DKK 38 million to DKK 16 million as a result of the cost adjustments.
Result before tax for the fourth quarter was negative at DKK 109 million against a negative result of DKK 37 million for the period last year. After tax, the result for the quarter was negative at DKK 65 million against a negative result of DKK 25 million last year.
Back to CONTENTS

30 Back to CONTENTS
Number of shops per segment Turnover share per segment
(active shops at the end of each year)
Definitions of shop segments
B1: Shops, which mainly sell Bang & Olufsen products
SIS: Shop-in-Shop with a sales area dedicated for Bang & Olufsen products
31/5 2008
31/5 2009
2007/08
2008/09
%
90
80
70
60
50
40
30
20
10
0
B1 SIS Other B1 SIS Other
Number
of shops
900
800
700
600
500
400
300
200
100
0
822
758
421
385
14 3
81 81
19 19

31
BRANDED BuSINESS
Developments in the markets
The Group experienced a significant decline in turnover in all markets in the 2008/09 financial year. The general decline in turnover, which accelerated after the end of the first quarter, is largely owing to the general economic downturn. This has led to a marked decline in consumer confidence and private consumption. Coupled with the fact that the market for exclusive audio and video products is sensitive to market fluctuations, this resulted in declining sales.
The decline in turnover can also be attributed to less successful and lacking product launches. In the first three quarters of the 2008/09 financial year, Bang & Olufsen launched very few new products and certain product launches failed to meet sales expectations.
Product launches
Bang & Olufsen has focused its product development activities aimed at launching more new products. The initial results of this effort already materialised in the second part of the 2008/09 financial year where a number of important new products were launched:
BeoSound 5Bang & Olufsen completed a global launch of the digital music system, BeoSound 5, which, through an intelligent and advanced multi-dimensional mathematical algorithm (MOTS), analyses the music collection and selects music that corresponds to the music listened to. In contrast to other services in the market, which typically compare genres, artists and the like, MOTS analyses the music based on parameters such as syncopation, key tonality and rhythm. The MOTS algorithm is owned by Bang & Olufsen.
Master Link GatewayIn line with the Group’s strategy of offering complete integration of different products and functions in the home, Bang & Olufsen launched Master link Gateway, which links the Beolink system to 120 manufacturers of home Automation systems, such as lK/Schneider, lutron, Crestron and Busch Jaeger.
Flexible concept for BeoVision 7During the period under review, Bang & Olufsen also introduced a flexible concept for BeoVision 7, which, being accessible in several variants, provides for a more flexible pricing structure.
DVB-HD modulBang & Olufsen has launched a DVB-hD module, which supports MpEG2 and MpEG4, in order to meet the new standards within digital TV transmission. The new DVB-hD module has been integrated and successfully launched for the first TV models.
BeoVision 8-40BeoVision 8-40 is offered at a highly attractive price point and is the Group’s entry product within the video portfolio. The television is equipped with a 40 inch high glare screen, Full hD, digital surround sound, MpEG4 DVB receiver as well as a range of technologies that produce impressive picture and sound quality.
BeoVision 4-103BeoVision 4-103 is a unique concept which, in size and function, sets new standards. The concept is at the core of the intelligent home due to its numerous opportunities for combining sound and picture experiences with home Automation systems via Master link Gateway and TV’s Beo5 remote control.
BeoVision 7-40 Blu-rayTowards the end of the financial year, Bang & Olufsen’s high-end concept, BeoVision 7-40, was updated with a Blu-ray player, which offers the potential for film experiences of the highest quality, as well as the 100/120 hz technology, which offers improved picture quality.
Optimisation of existing conceptsIn addition, Bang & Olufsen has optimised existing concepts, including BeoVision 7-32 and BeoVision 6, which have been updated with an integrated DVB-hD module and two hDMI inputs, which provide for the high Definition (hD) material of the future.
AutomotiveDuring the financial year, Automotive expanded its portfolio with both Audi and Aston Martin and a co-operation agreement is in place with Mercedes-AMG. In addition, Automotive has signed a contract with a potential new partner regarding the initial stages in the development of sound systems for this partner.
Back to CONTENTS

32
Distribution development
As expected, the 2008/09 financial year saw a net reduction in the number of B1 shops of 64. 40 B1 shops were opened or upgraded, while 104 shops were closed or converted to shop in shops. The reduction in the number of shops primarily relates to the European markets while there was a net addition of one B1 shop in China and four B1 shops in Russia/ukraine during the financial year. This is in line with the Group’s ambition to increase the number of shops in emerging markets.
As at the end of May 2009, there were 758 B1 shops across the world compared to 822 shops at the end of the 2007/08 financial year.
The share of turnover accounted for by B1 shops is 81 per cent. The number of shop in shops is 385 compared to 421 at the end of the last financial year. The organic growth for Bang & Olufsen shops, which have been in operation for more than 24 months, was -33 per cent for B1 shops and -34 per cent for shop in shops for the financial year as a whole.
Back to CONTENTS

33
ASSOCIATED COMpANIES
Bang & Olufsen Enterprise
For the 2008/09 financial year, Bang & Olufsen Enterprise achieved a turnover of DKK 115 million against DKK 155 million last year. Enterprise, which markets products to 5-star hotels and major property developments across the world, was affected by the global downturn during the 2008/09 financial year, which resulted in large hotel and development projects being cancelled or postponed.
Enterprise, however, achieved a satisfactory turnover in the fourth quarter of the 2008/09 financial year where the business unit recorded a turnover of DKK 50 million against DKK 47 million for the same period last year, i.e. an increase of DKK 3 million.
Turnover in Bang & Olufsen Enterprise has traditionally derived from Europe, but during the 2008/09 financial year, especially turnover in the Middle East increased satisfactorily, and the business unit continues to retain a sound order book, which supports the ambition for reasonable growth over the coming years.
Bang & Olufsen Automotive
For the 2008/09 financial year, Bang & Olufsen Automotive achieved a turnover of DKK 174 million against DKK 123 million for the same period last year, which is satisfactory. In the fourth quarter, turnover totalled DKK 41 million against DKK 42 million for the 2007/08 financial year. Automotive’s turnover derives from sales of branded high-end sound systems for cars in the high-end segment. The Automotive business unit continues to see positive development and made a positive contribution to the Group’s results in 2008/09. The segment is, therefore, an important element in Bang & Olufsen’s core business.
During the 2008/09 financial year, the partnership with Audi was further expanded and now encompasses Bang & Olufsen Sound Systems for Audi A4/S4, Audi A5/S5, Audi R8 and Audi Q5 as well as Bang & Olufsen Advanced Sound Systems for Audi A8/S8 and Audi Q7. The development of more sound systems in partnership with Audi is proceeding according to plan, including the development of a second generation Advanced Sound System for more Audi models. The initial models on this platform are expected to be launched during the 2009/10 financial year.
The partnership with Aston Martin is just as successful and the BeoSound DBS and BeoSound DB9 systems, which have been specially developed for Aston Martin, have been extremely well received by the market. The successful partnership is expected to maintain its positive development over the coming year with more product launches.
The partnership with Mercedes-AMG is also going according to plan with the first concrete result of the partnership expected to be launched during the 2009/10 financial year.
As previously announced, Bang & Olufsen Automotive recently signed a contract with a potential new partner concerning the first stages of the development of sound systems for this partner.
Bang & Olufsen ICEpower a/s
For the 2008/09 financial year, turnover for Bang & Olufsen ICEpower a/s totalled DKK 85 million against DKK 118 million last year.
A significant part of the turnover continues to derive from the sale of standard amplifier modules and customised solutions for quality manufacturers in the global audio market. In addition, Bang & Olufsen ICEpower a/s receives royalties from sales of amplifier technology and acoustic solutions for major OEM partners, including Samsung.
In the second half of 2008/09, Bang & Olufsen ICEpower a/s experienced a decline in incoming orders from the company’s largest customers, which has had a negative impact on the result.
Research and product development activity, however, continues at a high level.
BuSINESS-TO-BuSINESS AREAS
Back to CONTENTS

34 Back to CONTENTS

35
EXpECTATIONS FOR ThE 2009/10 FINANCIAl yEAR
Product portfolio
The year is expected to see a range of exciting and differentiated product innovations which will help to maintain a balanced product mix. Of the expected launches in 2009/10 the following can be mentioned:
New TV familyTowards the end of the 2009 calendar year, Bang & Olufsen expects to launch a new TV family with considerable placement flexibility in that it will allow the viewer to adjust the screen on the wall for a direct view of the screen from different angles, and it can also be mounted on an elegant stand. The new TV family will be launched with integrated stereo loudspeakers and digital surround sound module, and the DVB-hD (Full hD) module will be an option.
New model for the BeoVision 7 familyBang & Olufsen is also far along with the development of an entirely new TV model for the BeoVision 7 family. This TV will be a 55 inch Full hD model, which among other things builds on the 100/120 hz technology. Among the other functions are integrated lED light, which improves the contrast, and sublime sound quality with built-in digital surround sound module and integrated Adaptive Sound Technology. This TV will also offer an integrated DVB-hD (Full hD) module and Blu-ray player as an option.
New audio productA new audio product for playing digitally stored music is also under development. It is a plug and play solution with user-friendly operations. An ipod can be linked to this product, which can also be connected to a BeoSound 5 system.
Addition to the acoustic portfolioThe loudspeaker portfolio will be expanded by a new subwoofer, which among other things builds on a technology that makes it vibration-free. The tulip-shaped subwoofer will offer a number of positioning options as it can be placed on the floor or mounted on the wall.
New telephoneBang & Olufsen is currently developing a telephone with a loudspeaker for, among other things, hands-free conversations and conference calls. The telephone is also designed for use in
connection with internet telephony. The telephone is characterised by superb sound quality.
BeoTimeBang & Olufsen has announced the launch of a watch in the Group’s range of gift items. The Management believes that the design is different from everything else on the market in this segment. The watch can also be used as a remote control for other Bang & Olufsen products and has a built-in movement sensor that allows the built-in display to be reversed for left-hand operation.
Distribution development
On the backdrop of the challenging retail environment, Bang & Olufsen will concentrate its efforts on business support for existing shops in the 2009/10 financial year. The Group expects a net decline in the number of shops, albeit at a significantly lower level than in the 2008/09 financial year.
The Group expects a net addition of B1 shops in the parts of the world, which is expected to see the highest economic growth in the future. Within the next two years, the aim, therefore, is to significantly increase the number of B1 shops in the Group’s important emerging markets, including Russia and China, and to ensure a better penetration in markets where the Group is already present but with a limited market position. The expansion into new markets will, in the long-term, help to spread the Group’s geographical exposure so that turnover in Europe over the long-term will account for a smaller part of the Group’s overall turnover.
Expectations for the Group´s result for 2009/10
Bang & Olufsen expects, based on the implemented restructuring initiatives combined with a strong product launch programme, to achieve a break-even result before tax in the 2009/10 financial year based on a turnover level a little below the previously announced DKK 3,200 million.
An improvement in the result, however, can only be expected in the second quarter at the earliest based on the planned product launches.
Back to CONTENTS

36 Back to CONTENTS

37
KNOWlEDGE RESOuRCES
Bang & Olufsen’s vision is to constantly question the ordinary in search of surprising, long-lasting experiences. A vision that demands a very high level of innovation in product development as well as in day-to-day operations, i.e. production, distribution, organisation and management. Bang & Olufsen, therefore, focuses strongly on maintaining and developing the skills that form the core of the company’s innovative abilities. In practice, this means that within these areas, Bang & Olufsen constantly tests the limits of the possible.
Product development
product development of audio/video products and CarFi products generally takes place in Struer, Denmark. The company also has a small software innovation and development unit in Aarhus, Denmark, which works closely together with Aarhus university. In total, around 300 of Bang & Olufsen’s employees are involved in product development at Struer, Denmark.
For the 500 engineers and technicians involved in the development of new Bang & Olufsen products, the opportunities for direct interaction with the production departments are important for ensuring thatthefinishedproductshavethedesiredfeaturesand are of the right quality.
Bang & Olufsen has a well-established innovation culture, which has evolved over a number of years. As part of this culture and the innovative environment, Bang & Olufsen has divided its product development activities into separate stages. As part of the pole position strategy plan which was launched in October 2008, this innovation culture was further developed in order to improve the handling of the increased technology content. This will ensure optimum re-application of technology in individual products without restricting Bang & Olufsen’s renowned differentiation.
Compared with other manufacturers of consumer electronics, Bang & Olufsen takes an unconventional approach to product development and design-driven innovation. One important area where Bang & Olufsen’s approach stands out is the early concept development stage, during which the company devotes considerable resources in creating innovative and long-lasting concepts and designs.
Bang & Olufsen attempts to predict lifestyle trends from four to seven years into the future. At the same
time, Bang & Olufsen operates a so-called technology radar consisting of information about and an overview of expected future technologies compiled by specialists, who constantly monitor developments. The technology radar and the data on lifestyle trends provide customer insight, which is also used as background information for the creative development process.
Bang & Olufsen’s development model is a three-stage process containing a number of milestones at which the product Steering Team, consisting of the Management Board and relevant individuals from other functions determine the further development of the project.
Responsibility for the early stages of concept development, when the concept is born, lies with the product Innovation Department, known as the IdeaFactory. In this department, around 20 concept developers with various skills in concept and strategy development, operation and prototype production work together with three or four designers.
The stage from Concept Go to Concept Commitment utilises general strategy and master plans combined with a needs analysis, research, technology search, completed pre-projects, inspiration search and idea generation in a single intuitive, design-driven process involving development engineers, concept developers from the IdeaFactory and external designers. The outcome of this process is a detailed concept description that is presented to the product Steering Teamforfinalapproval.Approvedconceptsareprocessedfurtherandsupportedfinancially,technologically, idea-, project- and marketing-wise until Concept Commitment, at which time the concept’soverallspecificationsaredetermined.
In the stage from Concept Commitment to SpecificationCommitment(productdevelopmentstage), the integrated product development process between the IdeaFactory, the development department, the production units and relevant key suppliersisfurtherintensified.Asaresult,theproductspecificationsarefurtherrefinedanddetailsaredefinedinafinaldesignroadmap.Iterationsalsooccur as new ideas or opportunities arise during the process,orifideascannotbeachievedasfirstassumed.AtSpecificationCommitment,thetechnicaldesignisfinalised,producingadetailedplan for the project economy and launching periods. ConcurrentlywithoraftertheSpecificationCommitment, Bang & Olufsen conducts a business
Back to CONTENTS

38
1
6
3
7
4
9
2
5
8
1. The cube, used for acoustic measuring 2. Aluminium surface for BeoCenter 2 3. Assembling of loudspeakers, Automotive 4. The Farm, headquarters in Struer 5. Aluminium production 6. Anodisation 7. The factory in Koprivnice, The Czech Republic 8. ICEpower, lyngby 9. BeoCom 1401 production, Koprivnice
Back to CONTENTS
39
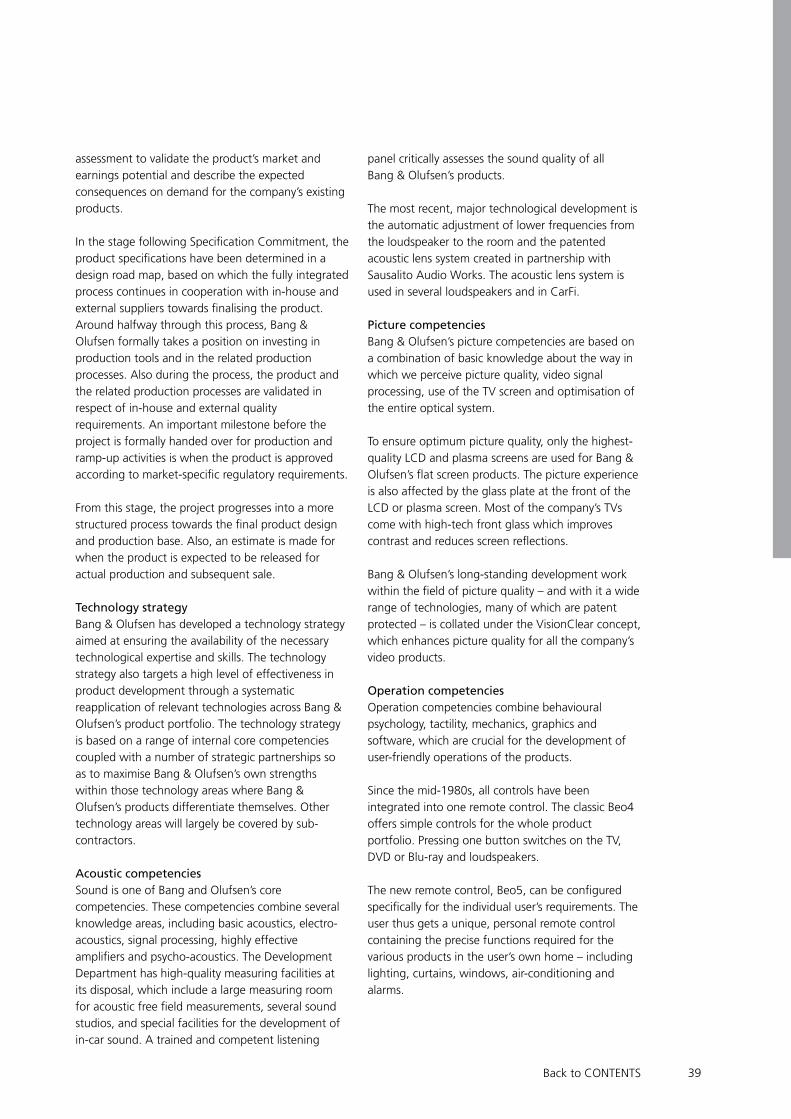
assessment to validate the product’s market and earnings potential and describe the expected consequences on demand for the company’s existing products.
InthestagefollowingSpecificationCommitment,theproductspecificationshavebeendeterminedinadesign road map, based on which the fully integrated process continues in cooperation with in-house and externalsupplierstowardsfinalisingtheproduct.Around halfway through this process, Bang & Olufsen formally takes a position on investing in production tools and in the related production processes. Also during the process, the product and the related production processes are validated in respect of in-house and external quality requirements. An important milestone before the project is formally handed over for production and ramp-up activities is when the product is approved accordingtomarket-specificregulatoryrequirements.
From this stage, the project progresses into a more structuredprocesstowardsthefinalproductdesignand production base. Also, an estimate is made for when the product is expected to be released for actual production and subsequent sale.
Technology strategyBang & Olufsen has developed a technology strategy aimed at ensuring the availability of the necessary technological expertise and skills. The technology strategy also targets a high level of effectiveness in product development through a systematic reapplication of relevant technologies across Bang & Olufsen’s product portfolio. The technology strategy is based on a range of internal core competencies coupled with a number of strategic partnerships so as to maximise Bang & Olufsen’s own strengths within those technology areas where Bang & Olufsen’s products differentiate themselves. Other technology areas will largely be covered by sub-contractors.
Acoustic competenciesSound is one of Bang and Olufsen’s core competencies. These competencies combine several knowledge areas, including basic acoustics, electro-acoustics, signal processing, highly effective amplifiersandpsycho-acoustics.TheDevelopmentDepartment has high-quality measuring facilities at its disposal, which include a large measuring room foracousticfreefieldmeasurements,severalsoundstudios, and special facilities for the development of in-car sound. A trained and competent listening
panel critically assesses the sound quality of all Bang & Olufsen’s products.
The most recent, major technological development is the automatic adjustment of lower frequencies from the loudspeaker to the room and the patented acoustic lens system created in partnership with Sausalito Audio Works. The acoustic lens system is used in several loudspeakers and in CarFi.
Picture competenciesBang & Olufsen’s picture competencies are based on a combination of basic knowledge about the way in which we perceive picture quality, video signal processing, use of the TV screen and optimisation of the entire optical system.
To ensure optimum picture quality, only the highest-quality lCD and plasma screens are used for Bang & Olufsen’sflatscreenproducts.Thepictureexperienceis also affected by the glass plate at the front of the lCD or plasma screen. Most of the company’s TVs come with high-tech front glass which improves contrastandreducesscreenreflections.
Bang & Olufsen’s long-standing development work withinthefieldofpicturequality–andwithitawiderange of technologies, many of which are patent protected – is collated under the VisionClear concept, which enhances picture quality for all the company’s video products.
Operation competenciesOperation competencies combine behavioural psychology, tactility, mechanics, graphics and software, which are crucial for the development of user-friendly operations of the products.
Since the mid-1980s, all controls have been integrated into one remote control. The classic Beo4 offers simple controls for the whole product portfolio. pressing one button switches on the TV, DVD or Blu-ray and loudspeakers.
Thenewremotecontrol,Beo5,canbeconfiguredspecificallyfortheindividualuser’srequirements.Theuser thus gets a unique, personal remote control containing the precise functions required for the various products in the user’s own home – including lighting, curtains, windows, air-conditioning and alarms.
Back to CONTENTS

40
Mechanical competenciesBang & Olufsen has accumulated competencies with regard to anodisation, processing and surface treatment of aluminium. To take an example, the aluminium surface of a BeoCenter 2 is treated so the aluminium contains minute pores, allowing signs and figurestobeprintedontothesurface.Thetoughness of an anodised surface is always greater than that of normal plastic surfaces or painted surfaces. Bang & Olufsen’s anodisation plant can colour aluminium surfaces in a variety of colours.
The Development Department possesses special skills in terms of producing robust constructions of critical mechanical details and integrating high quality movable mechanics in the products.
Product integrationproduct integration has for several years been a focus area for Bang & Olufsen, and the company has accumulated great competencies in this area. Bang & Olufsen considers many different aspects of integration. First, it means integrating more than one source of entertainment in a single product. Then there is the concept of linking different products to each other, even if they are situated in different rooms, via the Beolink system. Finally, Bang & Olufsen also integrates new products into existing ones, and Bang & Olufsen products can also to some extent be integrated into products of other brands.
International development departmentIn recent years, Bang & Olufsen has made dedicated efforts to globalise product development in order to exploitbothcostandcompetency-basedbenefitsavailable in other countries. This will continue going forward.
Bang & Olufsen has established a development department in connection with the factory in Koprivnice in the Czech Republic. This provides opportunities for integrated product development and production maturity. partnering with the university in Ostrava, the Czech Republic, the company has access to the skills and competencies of the university and the company interacts with the university in the relevant engineering study programmes. The department employs around 30 people who focus on mechanical and acoustic competencies. The Czech employees possess the necessary skills and competencies to complete a full constructionprocess,oncethespecificationshavebeen determined by the development department in Denmark. In future, the Czech development
department will be responsible for the implementation of acoustic, stand and audio projects.
Bang & Olufsen also draws on the some 35 people employed in the Estonian company OÜ BO-Soft, which is 51 per cent owned by the company.
Collaboration with external designersDevelopment takes place in close collaboration with a numberofexternaldesignfirms.Typically,stafffromthe IdeaFactory provide technological and market input to the designers, after which the designers return with a design proposal. This mutual process leads to a product concept. When matured and approved, a concept is transferred to the development department, which is responsible for constructing and effectuating new concepts.
The designers have a very independent approach and substantialinfluenceonproductdevelopmentinorder to ensure optimum interaction between aesthetics, userfriendliness and technology. Bang & Olufsenhasacloserelationshipwithaboutfivedesign companies who have worked for the company for a number of years.
Partnership with universitiespartnerships with knowledge centres, including universities, are an integral part of life at Bang & Olufsen and an important factor in the ongoing development of the company’s core competencies. This is a long-standing tradition for Bang & Olufsen and the company partners with universities in Europe and North America. This process places strong emphasis on both research and its practical application. Bang & Olufsen’s development engineers also participate in professional networks and conferences.
The partnership is based on an updated research strategy based on participation in research in all core competency areas. Each area has a technology specialist, who is responsible for the research undertakenbyPhDstudentsfinancedbyBang&Olufsen. To further enhance co-operation with universities, Bang & Olufsen sponsors permanent lectureships within its core competencies as well as funding the stays of visiting professors in Struer, Denmark.
Bang & Olufsen recently embarked on a research partnership with Aarhus university, the School of Engineering in Aarhus and the university of Surrey in the uK. The aim is to give Bang & Olufsen specialists
Back to CONTENTS

41
access to the latest research and establish contact withgraduateswithinspecificareas.Bang&Olufsenhas also launched a Bang & Olufsen Scholarship schemewhichoffersfinancialsupportforstudentsworking on a thesis relevant to the company’s core competencies. In addition, Bang & Olufsen sponsors a three-week Innovation Camp at Struer, Denmark, attended by a large number of students and teachers from six European countries. The purpose of the Innovation Camp is to strengthen international co-operation and understanding with regard to the different cultures and traditions within the engineering profession.
Partnerships with suppliersBang & Olufsen enjoys close partnerships with leading suppliers – selected in accordance with the strategy - in areas in which Bang & Olufsen does not itself possess the requisite knowledge and competencies. These partners not only supply components for Bang & Olufsen’s production, but also knowledge and skills for the development of the products. This is, for instance, the case in respect of flatscreens,loudspeakerunits,opticaldrivessuchasBlu-ray, digital video broadcasting (DVB), wireless ethernet and software development for various products.
Production
In recent years, Bang & Olufsen has been continually and systematically involved with product and distribution development as well as implementing rationalisation measures in all areas, including the reduction of production and capacity costs. The guiding principles behind this work have been innovation,simplificationandfocus.In2006,thistargetted approach resulted in the establishment of a new factory in Koprivnice in the Czech Republic. The factory is an important component in Bang & Olufsen’s future, balanced production in that a range of more labour-intensive tasks will be undertaken in the Czech Republic. The factory has, for instance, taken over some pre-assembly work as well as the completion of a substantial part of Bang & Olufsen’s audio products. This means that production in Struer will place stronger emphasis on the introduction of newproducts–particularlyflat-screenTVs.Concurrent with these changes, new skills will be needed from employees in the Danish production and several hundred employees have already taken part in a range of intensive courses. The same is the
case with the production employees in the Czech Republic who have received intensive training to ensure that the extremely high quality levels apply equally to the Danish and Czech production processes.
Bang & Olufsen’s production and development departmentsholdISO9001certification.Thecompany’sAutomotiveproductioniscertifiedaccording to ISO/TS 16949, a quality standard used in the car industry.
Distribution
In addition to its in-house training programmes, Bang & Olufsen also provides training programmes for dealers, shop staff and technicians with a view to strengthening sales and giving the customers a good experience of Bang & Olufsen. The company has established a training programme directed at new shop owners, new shop managers and new shop staff. A training plan is set up for each group and implemented through Bang & Olufsen’s sales training programme. Bang & Olufsen has approximately 25 employees providing product training and teaching sales processes.
During the year under review, Bang & Olufsen established a ”retail business school” programme for the company’s Retail Development Managers. The aim of the new programme is to train dedicated businessconsultantstoconductqualifiedandintelligent dialogues with dealers based on best practice.
Moreover, Bang & Olufsen has focused on enhancing the support and development of the dealer network through one overall, global sales organisation. The company has, therefore, established a Shared Service Centre so as to ensure professional and effective servicing of our dealers.
Another important element is the e-learning portal, BEOCADeMy, which through internet-based courses and follow-up on class teaching keeps sellers and technicians updated on product knowledge and sales. As well as making courses available for the company’s own employees, Bang & Olufsen each year trains a substantial number of salespersons, technicians and installation staff through BEOCADeMy.
Back to CONTENTS

42
Organisation/Management
Several independent surveys have, in the past few years, shown that Bang & Olufsen enjoys a strong image – as a business as well as a workplace. Inside Bang & Olufsen, a great deal of work is centred on enhancing the working environment as well as providing opportunities for management and employees in terms of career development and the upgrading of skills. Duringthepastfinancialyear,alargenumberofemployees participated in training programmes of a shorter or longer duration. Over the past few years, Bang & Olufsen has directed considerable attention to competence development for managers and employees. Such efforts will be ongoing. During the financialyear,forinstance,theso-calledIPMAcertification,underwhichalargenumberofTechnical project Managers receive training in order to strengthen Bang & Olufsen’s project management skills, continued.
Back to CONTENTS

43
ENVIRONMENT
Environmental policy
Bang & Olufsen takes a holistic approach to the environmental impact our production and our products have on our employees, customers and surroundings. Consequently, the word “environment” encompasses the working environment, the product environment as well as the external environment.
As an environmentally responsible company, Bang & Olufsen wishes to develop sustainable products. Regard for our products’ useful qualities, design and lifetime must be balanced against the impact on our surroundings.
In particular, this means that we: · Develop and produce products under conditions that meet the requirements of ISO 14001 and OhSAS 18001 standards.
· Continually prevent or improve:-Theworkingenvironmentforthebenefitofour
employees’ health and safety. - Industrial accidents and work-related illnesses. - Environmental impact from our activities and
products on our surroundings.· Communicate openly about our environmental
issues.· Maintain a high standard of information for our employees so that our environmental work is transparent and a natural part of our daily work
· Ensure that individuals who work for, and on behalf of, Bang & Olufsen have the necessary knowledge about the environment to enable them to perform their work in a responsible manner.
Environmental issues
The Bang & Olufsen logo is a guarantee for quality. Bang & Olufsen wants customers to buy Bang & Olufsen products in the knowledge that we have made all key decisions on their behalf – also in respect of environmental issues.
Bang & Olufsen develops high quality products that last for many years. Owing to their timeless design, 20-30 year-old Bang & Olufsen products that are in perfect working order can still be found in many
homes. On average, Bang & Olufsen products have a lifetime of 10-15 years with no deterioration in their picture and sound quality. In order to maintain high quality throughout a product’s lifetime, it is tested prior to being launched in the market. Consequently, the product can withstand cold, heat, bumps, sunlight, dust etc. In the event that a product develops a fault, it can, of course, be repaired. Mechanical spare parts such as back parts and front materials are also available should scratches or other damage occur. The high quality and long lifetime of our products has a positive effect on the environment.
On the supplier side, Bang & Olufsen has worked actively with Corporate Social Responsibility (CSR) for the past four years. The CSR guidelines are set out in Bang & Olufsen’s Code of Conduct to which all suppliers must sign up. Suppliers are divided into three risk groups where those in the high-risk group are subject to a three-part audit. Bang & Olufsen recognises that responsible supplier management is an ongoing process. Consequently, the aim is not to use the Code of Conduct to terminate a relationship with a supplier where an audit reveals critical deviations. Rather, the company initiates joint action plans designed to improve the supplier’s environmental and social standards. The implemented re-audits show improvements at the suppliers within the areas covered by Bang & Olufsen’s Code of Conduct.
The result of life cycle analysis of Bang & Olufsen’s productsshowsthatthemostsignificantenvironmental impact is energy consumption in customers’ homes. It has, therefore, been natural for Bang & Olufsen to focus its environmental efforts on reducing stand-by consumption since this is often regardedasawasteofenergy.Toasignificantextent, Bang & Olufsen is at the leading edge of the latest Eup directive .
In December 2008, the Eu Commission adopted the firstimplementingmeasureundertheEUPDirective.As a result, electric and electronic products must have a standby and/or off mode function and may not consume more than 1W in standby/off mode. This requirement, which came into force on 7 January 2009, will be increased in 2013 to a maximum of 0.5W.
1 Council Directive 2005/32/EC. EUP is an abbreviation of the directive’s English title, Energy Using Products. For the
electronics industry, this primarily relates to the reduction of the products’ energy consumption during the user phase.
Back to CONTENTS

44
Bang & Olufsen, of course, meets all current requirements and will continue to focus on minimising stand-by consumption.
The Eu Commission has also presented a proposal regarding the environmental requirements for TVs in respect of maximum power consumption when switched on. The proposal also sets out requirements relating to power consumption during standby and requirements for automatically switching to standby. Although the proposal has not yet been adopted, Bang & Olufsen has already begun to implement these requirements in the TVs under development.
Moreover, the Eu is considering the introduction of A-G energy labelling for TVs, a system already used for white goods. The Commission and the Eu parliament have not yet reached agreement on the drafting of this proposal. Bang & Olufsen is monitoring the development of the bill concerning energy labelling of TVs.
Over the past year, the company has monitored international product environment legislation that may impact on the company’s products and sales. Internationally, the general trend is for the adoption and implementation of European legislation – including the WEEE2 and RohS3 directives . The company keeps abreast of any new requirements that can affect its products. There are currently no indications that new requirements will impact on the annual accounts.
The revised battery directive4 came into force on 26 September 2008 and contains a requirement regarding the content of materials in batteries including lead, cadmium and mercury as well as their labelling. There is also a requirement that products containing batteries should be designed so that the batteries are easy to remove by consumers or waste processors.
The most important issue for the company in connection with the implementation of the revised battery directive is manufacturer responsibility and the implementation of the WEEE directive. Manufacturers of batteries or products that contain batteries are obliged to collect, handle and ensure the utilisation of batteries. As the majority of Bang & Olufsen’s products contain batteries, the company is affected by these requirements. Bang & Olufsen meets these obligations by participating in collective schemes around Europe. Enrolment in such schemes takes place on an ongoing basis as the European countries implement the battery directive.
In December 2006, the Eu Commission adopted the new chemical regulation REACh5. The part of REACh that deals with materials and preparations has no direct bearing on Bang & Olufsen as the company does not import materials from non-European countries. however, based on REACh, Bang & Olufsen has initiated an internal chemical reduction programme under which the purchase and use of CMR materials class 1 and 2 are prohibited in order to create a better working environment for its employees.
REACh also covers chemicals in products and the import of such products – although not in the form of a ban but an obligation to inform consumers. In partnership with the Environmental protection Agency and DhI6, Bang & Olufsen participated in the pre-project: The Consequences of REACh for electronic companies – Requirements for Downstream use of preparations and production of Chemicals”. As a result, Bang & Olufsen has, with regard to chemicals in products, decided that its contracts must stipulate that suppliers must not sell products to the company that contain materials that appear on the list of Substances of Very high Concern (SVhC). This list has been prepared by the European Chemicals Agency on behalf of the
2 Council Directive 2002/96/EC. WEEE is an abbreviation of the directive’s English title Waste Electrical and Electronic
Equipment. The directive determines manufacturer responsibility for the collection and reprocessing of end of life
electronic products.3 Council Directive 2002/95/EC. RoHS is an abbreviation of the directive’s English title Restriction of use of certain Hazardous
Substances. For the electronics industry, this primarily relates to the switch to lead-free soldering.4 Council Directive 2006/66/EC on batteries and accumulators.5 Council Directive no. 1907 of 18 December, 2006. REACH is an abbreviation of the directive’s English title: Registration,
Evaluation, Authorisation of Chemicals.6 CMR: Carciogenic, Mutagenic or toxic Reproduction.7 DHI – Institute for Water and Environment – works to advance technological development and competence within the
fields of water, environment and health.
Back to CONTENTS

45
European Commission. The SVhC list is continually updated and Bang & Olufsen is currently identifying whether there is a need for dispensations in respect of, for instance, the company’s cables.
The immediate assessment is that REACh currently does not impact on Bang & Olufsen. however, as the list of SVhC is continually updated, developments will be monitored to ascertain whether there are materials that are essential to Bang & Olufsen and its products.
There are no external environmental issues that have, orcouldhave,asignificantimpactonBang&Olufsen’sfinancialposition.Bang&Olufsen’sMechanics Factory is approved in accordance with the Danish Environmental protection Act’s section 5. With regard to changes to processes and production layout, the objective is to eliminate or limit pollution whenever possible. The company maintains a regular dialogue with the authorities to create the best solutions and minimise pollution, e.g. by using cleaner technology (BAT8).
If processed correctly, electronic scrap is a valuable source for recovering raw materials. In large parts of the world, discarded electric and electronic products are collected and processed at approved waste processors where they are separated into different material fractions – metal, printed circuit boards, plastic, glass and screens. The separation is often carried out by hand. Alternatively, shredders are used to automatically sort the metal and plastic fractions for subsequent use for the production of new raw materials. Copper and other metals from printed circuit boards are also recycled. Materials that cannot be recycled are sent for incineration which generates energy. Otherwise they are despatched as waste.
Future disposal is also considered when Bang & Olufsen designs new products. All plastic parts are
labelled so that waste processors can identify the type of plastic. Bang & Olufsen carries out disassembly tests to demonstrate how products are to be separated at the time of disposal, what material fractions the product consists of and what proportion of the product can be recycled. In addition, proposals for manufacturing improvements areputforwardwhichbenefitfutureproducts.Suchdisassembly tests show that over 65 per cent of material components in Bang & Olufsen’s TVs can be recycled. The Eu directive concerning the disposal of electric and electronic waste (WEEE) states that a minimum of 65 per cent of all collected electronics for entertainment purposes must be recycled – which Bang & Olufsen naturally complies with.
Bang & Olufsen prepares annual statutory green accounts for its anodising plant. Anodising is an electro-chemical treatment of aluminium which results in a highly durable surface structure. This surface structure means that with ordinary use, the aluminium element will retain its original attractive appearance for many years. In addition to the green accounts, the company prepares an annual, voluntary environmental review which details the environmental aspects of production at Bang & Olufsen’s factories as well as the company’s working environment conditions.
For a number of products and business areas, an environmental review ”To the last detail, an account of environmental awareness told through the development, production, use and disposal of a specificproduct”hasbeenprepared.
”To the last detail” and the environmental review can be downloaded at www.bang-olufsen.com. The green accounts are available from the Environment Department on +45 96 84 10 18.
8 BAT is an environmental term ”Best Available Technology” (best accessible – or cleaner technology).
Back to CONTENTS

46 Back to CONTENTS

47
CORpORATE GOVERNANCE
under the guidelines for corporate governance issued by NASDAQ OMX Copenhagen A/S, the company must consider these on the basis of the “comply or explain” principle.
In general, the Bang & Olufsen Group follows the NASDAQ OMX Copenhagen A/S’ recommendations for corporate governance, subject to a few exceptions:
1. Shareholders’ role and interaction with corporate management
The Annual General Meeting
In accordance with the company’s Articles of Association, notice of the Annual General Meeting must be given no less than eight days and no more than four weeks prior to the meeting. The notice must contain a complete agenda and an explanation of the items on the agenda where such explanation is relevant. proposals for agenda items must be submitted to the Board of Directors in writing by 15 August of the year in question.
Investor meetings
Investor meetings and telephone conferences are held following the publication of each quarterly statement to provide participants with the opportunity to put questions to the Management Board. Telephone conferences are subsequently available at www.bang-olufsen.com. It is also possible to contact the company’s Investor Relations function which is charged with maintaining an ongoing dialogue with current and potential shareholders.
2. The role of stakeholders and its importance to the company
For many years, the Board of Directors has been attentive to the company’s relationship with its stakeholders,afactthatisreflectedinthecompany’sannual environmental statement which has been prepared since 1995/96. Equally, social issues both inside the company and beyond play an important role in the life of Bang & Olufsen in general. In view of the work already under way, the company does notfinditnecessarytosetoutaformalpolicyforthisarea as the Board of Directors regularly monitors the Management Board’s approach to these issues.
3. Openness and transparency
The company complies with the statutory regulations concerning the publication of material information relevanttoshareholders’andthefinancialmarkets’evaluation of the company, its activities, business objectives, strategies and results. The Board of Directors has approved guidelines aimed to ensure that such information complies with statutory regulations. All announcements are issued via Company News Service, NASDAQ OMX Copenhagen A/S’ distribution company, and can subsequently be accessed from the company’s website www.bang-olufsen.com. All announcements are issued in both Danish and English.
The company publishes quarterly, half year and annual reports.
4. Board of Directors’ tasks and responsibilities
The Board of Directors has overall management responsibility for the company. In keeping with general practice in Denmark, the Board of Directors and the Management Board act independently of each other and have different responsibilities. The Management Board handles the day-to-day management of the company while the Board of Directors supervises the work of the Management Board and is responsible for general strategic management.
5. The composition of the Board of Directors
With regard to Bang & Olufsen a/s, all board members elected at the Annual General Meeting stand for election each year. In general, six to eight board meetings are held annually together with ad hoc meetings as required. Board members elected by the AGM comprise a group of experienced international business people. The age limit for members of the Board of Directors is 70.
As the Board of Directors deems it irrelevant, no information is provided on the recruitment criteria determined by the board, including the requirements regardingprofessionalqualifications,internationalexperience, educational background and the like.
Back to CONTENTS

48
The Board of Directors does not employ formalised self-assesment. The Chairmanship evaluates the work of the Board of Directors on an ongoing basis.In contrast to the recommendations, Bang & Olufsen a/s does not operate guidelines for the number of directorships board members may have. The deciding factors are the individual member’s capacity, competence and contribution. The Board of Directors’ rules of procedure lay down regulations concerning the tasks and responsibilities between the members of the Management Board and the Board of Directors.
6. The Board of Management’s and the Board of Directors’ remuneration
The Board of Directors has set up a compensation committee which carries out negotiations concerning the Board of Management’s remuneration. The members of this committee appear on page 23.
Incentive programmes are published comprehensively in the Annual Report in accordance with relevant rules and regulations. Members of the Board of Directors donotbenefitfromincentiveprogrammes.
Bang & Olufsen’s Annual Report does not contain information concerning the amount of remuneration paid to individual members of the Board of Directors and Management Board.
The Board of Directors believes the important factors are the total amount of remuneration and related trends.
7. Risk management
please refer to page 57 and 58 of this report.
8. Audit
The company’s auditors are elected by the Annual General Meeting after recommendation from the Board of Directors. The audit fee is approved by the Board of Directors.
Back to CONTENTS

49
ShAREhOlDER INFORMATION
IR Policy
Bang & Olufsen aims to provide:
- NASDAQ OMX Copenhagen A/S- Current and potential investors- Share analysts and stockbrokers
with all relevant information about the Group rapidly and concisely.
This information is intended to:
- Increase investor awareness of Bang & Olufsen in Denmark and abroad.
- provide investors with structured, current and planned information that will satisfy the requirements for decisions relating to investments in Bang & Olufsen shares.
The information, and the provision of such information, must always comply with current regulations as issued by NASDAQ OMX Copenhagen A/S and in accordance with current legislation.
Internal rules regarding insider information and trade in the company’s shares
pursuant to the Danish Securities Trading Act, the company maintains an insider register of persons who, owing to their position, are deemed to have access to insider information about the company. The company has established internal rules for such individuals.
The individuals, who are listed in the insider register and subject to the internal rules, are members of the Board of Directors and the Management Board of Bang & Olufsen a/s, other directors and senior managers who report directly to the Board of Directors or the Management Board of Bang & Olufsen a/s, the elected auditors and other employees of Bang & Olufsen a/s who may have access to insider information.
Also included are board members and members of the Management Board, other directors and senior managers in Bang & Olufsen a/s’ subsidiaries, including the Group’s foreign companies if their positions are deemed to provide them with access to insider information.
All board members, members of the Management Board and other insider-registered employees in the Bang & Olufsen a/s group may only buy or sell shares in Bang & Olufsen a/s for a period of 4 weeks after publication of the company’s Interim Reports or Annual Reports.
The Bang & Olufsen share
As at 31 May, 2009, Bang & Olufsen’s share capital has a nominal value of DKK 362,440,140.
under article 4 of the Articles of Association, on 16 April, 2009, the Board of Directors decided to increase the company’s share capital by DKK 241,626,760 nominal value (24,162,676 shares at a nominal value of DKK 10.00).
The offer was executed with pre-emption rights for the company’s existing shareholders at the ratio of 1:2. The new shares were subscribed at a price of 19 per share at a nominal value of DKK 10.00.
The capital increase was fully subscribed and resulted in gross proceeds of approx. DKK 459 million and net proceeds of approx. DKK 433 million. Consequently, the Board of Directors registered the resolution passed at the General Meeting on 4 March, 2009, to abolish the company’s share classes so that the company will have one share class only in future (subject to completion of the offering).
Bang & Olufsen’s shares are listed on NASDAQ OMX Copenhagen A/S. The company’s identification code is DK 001021842-9.
Each share with a nominal value of DKK 10.00 represents 1 vote.
At 31 May, 2008, the closing price of Bang & Olufsen’s B shares was 265. With 10,995,795 B shares, this equates to a market value of approx. DKK 2,908 million. Following the share capital increase in April 2009, the closing price as at 31 May, 2009 was 45. With a share capital of 36,244,014 shares, this equates to a market value of approx. DKK 1,613 million.
Shares in circulationIssued shares 36,244,014 - own shares (110,076) 36,133,938
Back to CONTENTS

50
Own sharesAs at 31 May, 2009, Bang & Olufsen a/s had a portfolio of own shares of DKK 1,100,760 nominal value equating to 0.3 per cent of the share capital.
Shares held by members of the Management BoardAs at 31 May, 2009, members of Bang & Olufsen a/s’ Management Board held DKK 83,910 nominal value.
Shares held by the Board of DirectorsAs at 31 May, 2009, members of Bang & Olufsen a/s’ Board of Directors held DKK 867,960 shares nominal value.
Share option programmeBang & Olufsen’s share option programme comprises a number of the Group’s directors. As at 31 May, 2009, the total pool of options amounted to 566,697. These can be exercised during the period 2009 - 2014. For further details please refer to note 5.
Information about shareholders
As at 31 May, 2009, Bang & Olufsen a/s had approx. 34,400 registered shareholders corresponding to an ownership interest of approx. 79 per cent of the share capital. Approx. 33,500 of these shareholders are resident in Denmark.
Of the listed capital, approx. 74 per cent is placed in Denmark, approx. 10 per cent in holland, approx. 8 per cent in the uS and 3 per cent in the uK.
As at 31 May, 2009, the following individuals or legal entities hold 5 per cent or more of the company’s capital or share capital’s voting rights: Nominal amount Capital Votes DKK 1,000 % % Arbejdsmarkedets Tillægspension, Kongens Vænge 8, 3400 hillerød 50,784 14.01 14.01Aviva plc. St. helen´s 1 undershaft, london, EC3p 3DQ, united Kingdom 36,244 8.02 8.02Den professionelle Forening lD, Vendersgade 28, 1363 København K. 22,042 6.08 6.08Færchfonden, lille Østergade 8A, 7500 holstebro 18,480 5.10 5.10
Market value of shares compared to equity
as at 31 may
Market value of sharesEquity
DKK million
9,000
8,000
7,000
6,000
5,000
4,000
3,000
2,000
1,000
0
04/0
5
05/0
6
06/0
7
07/0
8
08/0
9
Back to CONTENTS

51
Rules concerning the appointment and replacement of members of the Company’s Board of Directors and changes to the Company’s Articles of Association
The Company’s Articles of Association specify the following rules concerning the appointment and replacement of members of the Company’s Board of Directors and changes to the Company’s Articles of Association:
The Company is headed by a Board of Directors which – besides any representatives elected by the Company’s employees pursuant to the statutory provisions – consists of between 4 and 8 members elected by the General Meeting. Board members elected at the General Meeting stand down at Ordinary General Meeting and may be re-elected.
Board members elected by the General Meeting comprise a group of experienced international business executives. The age limit for members of the Board of Directors is 70.
The Board of Directors does not apply formalised self-evaluation. The Chairmanship evaluates the work of the Board of Directors on an ongoing basis. In contrast to the recommendations, Bang & Olufsen a/s does not operate guidelines for the number of directorships board members may have. The deciding factors are the individual member’s capacity, competence and contribution.
All matters considered at the General Meeting shall be settled by simple majority vote.
Resolutions concerning amendments to the Articles of Association or the winding up of the company require two-thirds of the share capital to be represented at the General Meeting, and that the resolution is passed by two-thirds of the votes cast as well as of the voting share capital represented at the General Meeting. If two-thirds of the share capital is not represented at the General Meeting, but the proposed resolution is passed by two-thirds of the votes cast as well as of the voting share capital represented at the General Meeting, a new General Meeting will be convened as soon as possible at which the resolution proposed may be passed by two-thirds of the votes cast, regardless of the proportion of the share capital represented.
proxies for the first General Meeting are also valid for the second meeting unless explicitly revoked. Where
a proposal to amend the Articles of Association has been submitted or adopted by the Board of Directors, the proposal may be finally adopted at one General Meeting by a majority of two-thirds of the votes cast as well as of the voting share capital represented at the General Meeting, regardless of the proportion of the share capital represented.
Other information in accordance with the Financial Statements Act § 107 a
The contracts signed by Bang & Olufsen concerning the supply of sound systems to the automotive industry contain ”change of control” clauses. This applies both to the agreement with Audi, and the agreement with Aston Martin lagonda ltd. As a consequence of these clauses, should a change of control of Bang & Olufsen take place, Audi and Aston Martin lagonda ltd. are entitled to terminate the contract between the parties.
The original loan of DKK 74.5 million from Danske Bank to Bang & Olufsen s.r.o with a carrying amount of DKK 52.1 million as at 31 May, 2009 includes a clause to the effect that the loan can be called if a shareholder obtains controlling influence of Bang & Olufsen a/s.
The original loan of DKK 52.0 million from Danske Bank to Bang & Olufsen s.r.o with a carrying amount of DKK 36.4 million as at 31 May, 2009 includes a clause to the effect that the loan can be called if a shareholder obtains controlling influence of Bang & Olufsen a/s.
The Company’s Articles of Association state the following:
until 31 May, 2012, the Board of Directors is authorised, in one or more stages, to increase the company’s share capital by up to DKK 2,500,000 through the issue of shares offered to employees of the Bang & Olufsen Group at a price corresponding to the current market price or lower, and on terms to be decided by the company’s Board of Directors.
The increase will take place in the form of cash payment without any pre-emption rights for the shareholders. The new shares issued in accordance with this authorisation will be negotiable instruments issued to bearer. No restrictions will apply to the transferability of the shares, and no shareholder will be entitled to have his/her shares redeemed in whole
Back to CONTENTS

52
or in part. In all respects, the new shares will carry the same rights as the former B shares.
The new shares are eligible for dividends and other rights in the company from a date to be determined by the Board of Directors, however not later than one year after the date of registration.
On behalf of the company, the Board of Directors is authorised, in the period until 26 March, 2010, to acquire up to 10 per cent of the company’s share capital against payment which shall not be more than 10 per cent greater or lower than for the shares at NASDAQ OMX Copenhagen A/S quoted price.
The Board of Directors is authorised, in the period until 31 December 2009, in one or more stages, to increase the company’s share capital by up to DKK 250,000,000 nominal value (corresponding to 25,000,000 shares of DKK 10.00 each), c.f. Companies Act § 37, always provided, however, that the first exercise of the authority must be for a minimum nominal amount of DKK 30,000,000 shares (corresponding to 3,000,000 shares of DKK 10.00 each) by cash payment with pre-emptive rights for the company’s existing A and B shareholders so that all shareholders are entitled to subscribe to new shares in proportion to their holdings of A or B shares, as decided by the company’s Board of Directors in each individual case.
Regardless of whether the pre-emptive right is taken up by A or B shareholders, the shares issued pursuant to the authorisation will be B shares and will be negotiable instruments to be issued to the bearer, but may be registered in the name of the holder in the company’s register of shareholders. No restrictions apply to the negotiability of the shares and no shareholders will be obliged to redeem shares in full or in part. The shares will have the same rights as the existing B shares and the shares will give the shareholders the right to dividend and other rights in the company from the time of the registration of the capital increase in the Danish Commerce and Companies Agency.
On 16 April, 2009, the Board of Directors used this authorisation to issue 24,162,676 new shares equating to DKK 241,626,760 nominal value. hereafter, there remains authorisation for DKK 8,373,240.
Since the execution of the offer, the resolution passed at the General Meeting on 4 March, 2009 to abolish the company’s share classes so that the company will have one share class only in future, was executed.
The Board of Directors can carry out the necessary changes to the Articles of Association in connection with the changes in the capital increase in accordance with the above-mentioned provision.
Dividend policy
The Group’s dividend policy aims at paying between one third and one half of the annual profits after tax as dividend. Based on the company’s result, the Board of Directors proposes to the General Meeting that no dividend be paid out for the 2008/09 financial year.
Dividend payment
No dividend is expected.
The following share analysts covered Bang & Olufsen at the end of the financial year
ABG Sundal Collier Alm. Brand MarketsBankinvest-groupCarnegie Bank A/SCheuvreux Danske Equities Enskilda Securities Gudme Raaschou BankhandelsbankenJyske Bank Nordeaproactive Independent IdeasSal. OppenheimSydbank
Website
Bang & Olufsen invites investors and other stakeholders to visit the company’s website: www.bang-olufsen.com, where a wide range of information of interest to the investors is available, i.e. announcements, annual reports, quarterly and half-yearly reports, the financial calendar and, not least, the company’s history and a presentation of its products.
Investor contact
Back to CONTENTS

53
Financial statements:
13August,2008 AnnualReportforthefinancialyear2007/0819 October, 2008 Interim Report for the 1st quarter 2008/09 15 January, 2009 half year report 2008/09 14 April, 2009 Interim Report for the 3rd quarter 2008/09
Other statements:
4 June, 2008 Financial calendar for Bang & Olufsen a/s7July,2008 Bang&Olufsena/sdowngradesprofitexpectations2007/0815July,2008 Bang&OlufsensignificantlyexpandspartnershipwithAudi6 August, 2008 Bang & Olufsen in partnership with Mercedes-AMG
27 August, 2008 Record order for Bang & Olufsen3 September, 2008 Bang & Olufsen’s Board of Directors recommend a change of voting procedures
to the Board and the election of Rolf Eriksen, the CEO of h&M to the Board5 September, 2008 Convene the Annual General Meeting of Bang & Olufsen a/s
15 September, 2008 Bang & Olufsen to launch sound systems for two Aston Martin models 23 September, 2008 New multi-million order for Bang & Olufsen in Dubai 23 September, 2008 proxies to the Board of Directors in Bang & Olufsen a/s 26 September, 2008 Annual General Meeting of Bang & Olufsen a/s 26 September, 2008 Major shareholder announcement 21 October, 2008 Bang & Olufsen rolls out overall strategy plan19December,2008 Bang&Olufsenannouncesexpectationsforthefinancialyear 26 January, 2009 The Færch Foundation to become major shareholder in Bang & Olufsen a/s 11 February, 2009 Notice of an extraordinary general meeting of Bang & Olufsen a/s 2 March, 2009 proxies to the Board of Directors in Bang & Olufsen a/s4 March, 2009 Minutes of an extraordinary general meeting of Bang & Olufsen a/s14April,2009 RevisedfinancialcalendarforBang&Olufsena/s 16 April, 2009 Announcement of prospectus 12 May, 2009 Bang & Olufsen a/s completes fully subscribed rights issue and merger of share classes 12 May, 2009 Registration of capital increase and merger of share classes completed 12 May, 2009 Major shareholder announcement 13 May, 2009 Major shareholder announcement 14 May, 2009 Major shareholder announcement27May,2009 Bang&Olufsena/s-financialcalendar
Statements regarding insider trading:
31 October, 2008 3 November, 2008 27 April, 2009 29 April, 20094 May, 20096 May, 2009
11 May, 2009 12 May, 2009 12 May, 2009
The statements can be read in full at www.bang-olufsen.com under Company – Investors – Company announcements.
STATEMENTS SENT TO NASDAQ OMX COpENhAGEN A/SDuRING ThE pERIOD JuNE 2008 - MAy 2009
Back to CONTENTS

54 Back to CONTENTS

55
Bang & Olufsen operates in a sector with very frequent and significant changes in technology. Distribution development largely takes place through retailer-owned shops, but in certain markets it might from time to time be necessary for the Group to acquire established retail networks. The draw on liquidity in individual financial years is characterized by considerable seasonal variations. The Group will occasionally be faced with small or medium-sized acquisition opportunities within new business areas and new fields of technology.
Based on this, Bang & Olufsen has a need for sufficient capital reserves and the Group will
therefore, as a long-term average, aim at an equity ratio of 40-50 per cent and a net interest-bearing debt in a range between 0.25 and 2.00 times earnings before interest, tax, depreciations, amortisations and impairment losses (EBITDA). As at 31 May 2009 the equity ratio equals 57.1 per cent, while it, as at 31 May 2008, equalled 52.7 per cent.
As at the balance sheet date the financial gearing and the ratio between the net interest-bearing debt and EBITDA can be calculated as below:
CApITAl STRuCTuRE
2008/09 2007/08
Mortgage loans 236.8 244.2loans from banks etc. 141.3 197.7Cash (258.1) (107.1)Net interest-bearing debt 120.0 334.8
Equity 1,520.1 1,483.8
Financial gearing 0.08 0.23
EBITDA (207.5) 482.7
Net interest-bearing debt/EBITDA (0.58) 0.69
Back to CONTENTS

56
The year’s net flow in key currencies
DKK million
1,000
900
800
700
600
500
400
300
200
100
0
-100
-200
EuR
CZK
GBp
Ch
F
SEK
uSD
Au
D
SGD
Back to CONTENTS

57
Markets and competitionAlthough the Group’s products are marketed globally, most of the turnover derives from Europe. The company is a niche player in an industry dominated by major international electronics businesses.
The company differentiates itself in terms of design, quality and innovation. Over a number of years, the company has established a selective distribution system with dedicated Bang & Olufsen dealers. The combination of innovative products and a dedicated distribution has positioned the company as a supplier of luxury goods rather than exclusively A/V products.
The company can be affected by economic trends in the countries where the Group’s products are sold, as well as by new technological initiatives by the industry’s main players.
Sales trends are seasonal with the main emphasis on the period from October to January. In order to comply with the commercial challenges, substantial investments are made in product development and flexibleproduction.
SuppliersThe Group is dependent on a large number of suppliers, primarily from Europe and Asia, and strives to maintain long-term supplier relations with regard to the purchase of development services and production goods. Bang & Olufsen endeavours to ensure that supplies of critical raw materials are assured through contracts and agreements and, when possible, through co-operation with several suppliers.
EmployeesBang & Olufsen wishes to retain its position as an exciting and attractive workplace to attract and retain highlyqualifiedemployeesatalltimes.Consequently,focus is on individual personal and career development which is secured through maintaining and creating interesting and challenging jobs throughout the Group. Each year, the Group, therefore, actively contributes to, and invests in, a range of training programmes for its employees.
InsuranceBang & Olufsen’s insurance policy stipulates that insurance policies must cover any damage arising to Bang & Olufsen’s assets and any claims that Bang & Olufsen may incur so that such damage or claims do not impact on the company’s capital and future operationstoanysignificantextent.Consistentwith
this, the Group can be self-insured in respect of minor risks, while major risks are fully insured. When deemedfinanciallybeneficial,insurancescontainanexcess.
In respect of the above, a global insurance programme has been established to include all-risk, operational losses, business and product responsibility.
Bang & Olufsen has a written contingency plan and works continually with risk management in order to protect against damage to own and contractors’ facilities.
The Group’s management of financial risksAs a result of the Bang & Olufsen Group’s extensive internationalactivities,theprofit&lossaccount,balance sheet and equity are exposed to a number of financialrisksatanygiventime.
These risks comprise:
· Foreign exchange rate risk· Interest rate risk· Credit risk· liquidity risk
Bang & Olufsen continually assesses these risks at Group level. As it is the Group’s policy not to speculateinfinancialinstruments,itsfinancialmanagement is solely directed towards the managementoffinancialrisksinrelationtooperationsandfinancing.
Foreign exchange riskIn 2008/09, 91 per cent (2007/08: 88 per cent) of the Group’s turnover is in foreign currency. Since the Group’s purchasing policy is to match purchasing and sales currencies to the greatest possible extent, the figuredoesnotexpresstheGroup’sforeignexchangerate risk.
TheGrouphasnetinflowsinEUR,GBPandCHFwhileUSDaccountsforthemostsignificantexposureontheoutflowside.Forthe2008/09financialyear,exposure in uSD has been almost neutral, which is also expected to be the case in 2009/10.
The Group’s foreign exchange rate risks are managed centrallybytheparentcompany’sfinancedepartmentbased on a foreign exchange rate policy approved by the Board of Directors. Forward contracts are used to continually cover net positions. These forward contractsareclassifiedashedgingandfulfilthe
COMMERCIAl RISKS
Back to CONTENTS

58
accounting requirements for hedging future cash flow.Forwardcontractsareusedforcommercialtransactions only.
The Group’s net monetary items in foreign currencies appear in note 42.
The Group has hedged 75 per cent of the expected netinflowsinGBPandCHFfor2009/10.Asaresult,a 5 per cent change in the exchange rate for GBp could be expected to impact on the Group´s result by approx, DKK 3 million. A 5 per cent change in the exchange rate for ChF could be expected to impact on the Group´s result by approx. DKK 2 million.
For 2008/09, exchange rate changes of 5 per cent for GBp, 5 per cent for ChF and 10 per cent for uSD in relation to the Danish krone were expected to impact on the Group´s pre-tax result by 7 per cent, 7 per cent and 2 per cent respectively.
Besides the foreign exchange rate risk relating to current transactions, the Bang & Olufsen Group’s equity is affected by foreign exchange rate risks relating to the translation of the Group’s foreign subsidiaries from local currencies to DKK. The translationriskisofnosignificancetoBang&Olufsen’s annual report.
Interest rate riskThe Group’s interest rate risk relates to interest-bearing debt and interest-bearing assets.
The Group’s interest-bearing assets consist mainly of liquid funds, which at year end totalled DKK 258 million (2007/08: DKK 107 million). liquid funds yield interest on the short-term money market. The interest rateriskisdeemedtobeinsignificantinthatachangein the interest rate level of 0.5 per cent for 2008/09 would have impacted on the Group’s result before tax by approx. DKK 0.5 million.
At year end, the Group’s interest-bearing debt totalled DKK 378 million (2007/08: DKK 442 million) corresponding to 14.1 per cent of the balance sheet total. (2007/08: 15.7 per cent).
Of the interest-bearing debt, DKK 225.3 million falls dueafterfiveyears.FurtherinformationisprovidedinNotes 32 and 33.
Due to the low debt level and the fact that borrowingsareexclusivelyinfixedinterestloans,the
Group’sinterestraterisksareinsignificantandarenotexpectedtoimpactsignificantlyontheGroup’sresult.
Credit riskTheGroup’smostimportantprimaryfinancialinstruments comprise trade receivables and bank deposits. The amounts at which these balance sheet items are recognised correspond to the maximum credit risk.
Attheendofthefinancialyear,theGroupwassellingits products through 1,146 dealers worldwide. The Group is, therefore, exposed to a risk of losses on receivables.
The individual dealers, including their geographical location, are subject to ongoing evaluation. When deemed necessary, the Group employs bank guarantees or debtor insurance against outstanding debts.
Forthe2008/09financialyear,DKK61millionwasexpensed for losses and changes to provisions for losses on receivables (DKK 2007/08 DKK 48 million).
Liquidfundsareplacedwithfinancialinstitutionswithhigh credit ratings. Derivatives, including foreign exchange forward contracts, are entered into with such institutions only. It is deemed, therefore, that the creditriskrelatingtoliquidfundsisofnosignificanceto Bang & Olufsen’s annual report.
Liquidity risk Thefinancialreserveiscontinuallyassessedandmanagedbytheparentcompany’sfinancedepartment. It is ensured that, at any given time, thereissufficient,flexibleandunusedassurancecreditavailableprovidedbymajor,reputablefinancialinstitutions.Onthebasisofitsfinancialreservearrangements, no liquidity issues are expected.
Theliquidityrisk,therefore,isnotsignificantinrelation to Bang & Olufsen’s annual report.
Back to CONTENTS

COuRAGE TO CONSTANTly QuESTION ThE ORDINARy IN SEARCh OF SuRpRISING, lONG-lASTING EXpERIENCES.
59Back to CONTENTS

60 Back to CONTENTS

61
Financial report
63 profit and loss account 64 Balance Sheet 67 Cash flow statement 68 Statement of changes in equity
Notes
73 1 Accounting principles applied 83 2 Significant accounting estimates and judgements 84 3 Segment-information
Notes to the profit and loss account 87 4 Net turnover 88 5 Expenses, further information 95 6 Dividend 96 7 Financial income 96 8 Financial costs 96 9 Tax on result for the year 97 10 Minority interests’ share of result for the year 98 11 Earnings per share Notes to the balance sheet 99 12 Intangible assets 101 13 Tangible assets 103 14 Investment property 104 15 Impairment of non-current assets 105 16 Investments in subsidiaries 105 17 Investments in associates 106 18 Other financial receivables 106 19 Deferred tax assets 107 20 Inventories 108 21 Trade receivables 108 22 Receivables from subsidiaries 108 23 Receivables from associates 109 24 Income tax receivable
109 25 Other receivables 109 26 Share capital 111 27 Retained earnings 111 28 Minority interests 111 29 pensions 113 30 Deferred tax 114 31 provisions 116 32 Current and non-current financial liabilities, mortgage loans 117 33 Current and non-current financial liabilities, loans from banks etc. 118 34 Other non-current liabilities 119 35 Income tax 119 36 Other payables
Notes to the cash flow statement 120 37 Adjustments 120 38 Change in working capital 120 39 Cash and cash equivalents
Notes - without cross reference 120 40 Fees to the auditors 121 41 Contingent liabilities and other financial commitments 122 42 Financial instruments 124 43 Related parties 126 44 Companies in the Bang & Olufsen Group
FINANCIAl REpORT AND NOTES
Back to CONTENTS

62 Back to FINANCIAl REpORT AND NOTES

63
pROFIT AND lOSS ACCOuNT
Notes …
4 …
5 …
5 …
5 …
5 …
5 …
6 …
7 …
8 …
9 …
10 …
11 …
Bang & Olufsen a/s Group Parent company
(DKK million) 2008/09 2007/08 2008/09 2007/08
Net turnover 2,789.5 4,092.0 426.3 948.1
production costs (1,683.8) (2,199.6) (422.7) (526.4)
Gross profit 1,105.7 1,892.4 3.6 421.7
Development costs (462.7) (545.5) (490.8) (565.5)
Distribution and marketing costs (928.5) (1,003.5) - -
Administration costs etc. (104.5) (148.7) (34.3) (42.9)
Restructuring costs (105.5) - (20.8) -
Operating profit/loss (495.5) 194.7 (542.3) (186.7)
Result of investments in associates after tax 2.3 (11.2)
Dividend 231.0 916.5
Financial income 11.4 20.0 64.7 59.0
Financial costs (41.2) (49.8) (53.6) (36.1)
Financial items, net (29.8) (29.8) 11.1 22.9
Result before tax (523.0) 153.7 (300.2) 752.7
Tax on result for the year 140.2 (41.4) 138.4 25.8
Result for the year (382.8) 112.3 (161.8) 778.5
Attributable to:
Shareholders of the parent company (385.1) 104.7
Minority interests 2.3 7.6
(382.8) 112.3
Earnings per share
Earnings per share, DKK (15.7) 4.4
Diluted earnings per share, DKK (15.7) 4.4
Earnings per share from continuing operations, DKK (15.7) 4.4
Diluted earnings per share from continuing operations, DKK (15.7) 4.4
Proposed distribution of profit:
Retained earnings (161.8) 742.3
proposed dividend for the financial year - 36.2
(161.8) 778.5
No dividend is proposed for the financial year 2008/09 (DKK 3.00 per share in 2007/08).
Parantheses denote negative figures or figures to be deducted. Notes: See pages 73 - 126
Back to FINANCIAl REpORT AND NOTES

64
Bang & Olufsen a/s Group Parent company
(DKK million) 31/5 09 31/5 08 31/5 09 31/5 08
Intangible assets
Goodwill 44.8 44.8 3.2 3.2
Acquired rights 50.8 41.1 47.4 35.9
Completed development projects 200.6 218.8 191.2 204.5
Development projects in progress 185.0 112.5 173.8 97.0
Total intangible assets 481.2 417.2 415.6 340.6
Tangible assets
land and buildings 269.9 274.4 82.0 83.7
plant and machinery 229.5 221.8 8.8 8.8
Other equipment 48.4 50.0 29.0 30.9
leasehold improvements 32.2 28.7 - 0.1
Tangible assets in progress and
prepayment for tangible assets 33.2 80.8 - 6.7
Total tangible assets 613.2 655.7 119.8 130.2
Investment property 49.1 52.8 125.0 73.2
Financial assets
Investments in subsidiaries 719.5 722.8
Investments in associates 9.5 6.3 5.6 2.0
Other financial receivables 60.4 52.0 3.0 3.0
Total financial assets 69.9 58.3 728.1 727.8
Deferred tax assets 103.8 22.7 53.0 -
Total non-current assets 1,317.2 1,206.7 1,441.5 1,271.8
Inventories 597.8 801.4 1.2 1.4
Receivables
Trade receivables 407.9 593.0 - -
Receivables from subsidiaries 759.6 921.4
Receivables from associates 1.4 - - -
Income tax receivables 21.7 39.7 0.2 9.2
Other receivables 31.6 38.9 2.3 12.6
prepayments 28.4 30.5 11.4 7.0
Total receivables 491.0 702.1 773.5 950.2
Cash 258.1 107.1 217.7 5.3
Total current assets 1,346.9 1,610.6 992.4 956.9
Total assets 2,664.1 2,817.3 2,433.9 2,228.7
Notes …
12, 15 …
13, 15 …
14 …
16 …
17 …
18 …
19 …
20 …
21 …
22 …
23 …
24 …
25 …
BAlANCE ShEETASSETS
Notes: See pages 73 - 126
Back to FINANCIAl REpORT AND NOTES

65
Bang & Olufsen a/s Group Parent company
(DKK million) 31/5 09 31/5 08 31/5 09 31/5 08
Equity
Share capital 362.4 120.8 362.4 120.8
Share premium 232.1 14.6 232.1 14.6
Translation reserve (39.6) (42.9)
Reserve for cash flow hedges (1.0) - (1.0) -
Retained earnings 963.9 1,379.2 1,371.6 1,522.8
Equity attributable to shareholders of the parent company 1,517.8 1,471.7 1,965.1 1,658.2
Minority interests 2.3 12.1
Total equity 1,520.1 1,483.8 1,965.1 1,658.2
Non-current liabilities
pensions 7.0 9.5 - -
Deferred tax 4.8 64.2 - 72.7
provisions 78.1 77.3 2.8 3.1
Mortgage loans 230.3 235.7 230.3 198.5
loans from banks etc. 95.7 101.1 51.0 48.9
Other non-current liabilities 6.7 6.6 6.5 3.4
Total non-current liabilities 422.6 494.4 290.6 326.6
Current liabilities
Mortgage loans, short-term part 6.5 8.5 6.5 6.9
loans from banks etc., short-term part 32.6 42.9 10.4 35.4
Other loans from banks 13.0 53.7 12.9 53.6
provisions 65.7 46.0 0.4 0.3
Trade payables 188.3 216.0 41.7 49.7
payables to associates - 1.8 - 0.1
Income tax 21.2 66.3 0.1 -
Other payables 324.6 320.0 106.2 97.9
Deferred income 69.5 83.9 - -
Total current liabilities 721.4 839.1 178.2 243.9
Total liabilities 1,144.0 1,333.5 468.8 570.5
Total equity and liabilities 2,664.1 2,817.3 2,433.9 2,228.7
Notes …
26 …
27 …
28 …
29 …
30 …
31 …
32 …
33 …
34 …
32 …
33 …
31 …
35 …
36 …
BAlANCE ShEETEQuITy AND lIABIlITIES
Parantheses denote negative figures or figures to be deducted. Notes: See pages 73 - 126
Back to FINANCIAl REpORT AND NOTES

66
Purchase of intangible assets and
amortisation
Purchase of tangible assets and
depreciation
Amortisation
purchase of intangible assets
DKK million
250
200
150
100
50
0
04/0
5
05/0
6
06/0
7
07/0
8
08/0
9
Depreciation
purchase of tangible assets
DKK million
250
200
150
100
50
0
04/0
5
05/0
6
06/0
7
07/0
8
08/0
9
Back to FINANCIAl REpORT AND NOTES

67
Bang & Olufsen a/s Group Parent company
(DKK million) 2008/09 2007/08 2008/09 2007/08
Result for the year (382.8) 112.3 (161.8) 778.5
Depreciation, amortisation and impairment losses 285.7 299.2 176.1 166.1
Adjustments (92.6) 92.6 (140.0) (27.9)
Change in working capital 357.8 (22.2) 216.3 (682.1)
Interest received etc. 11.4 20.0 64.7 59.0
Interest paid etc. (41.2) (49.8) (53.6) (36.1)
Income tax paid (25.1) (120.3) (13.3) 32.0
Cash flows from operating activities 113.2 331.8 88.4 289.5
purchase of intangible non-current assets (211.5) (124.9) (204.4) (109.6)
purchase of tangible non-current assets (111.4) (190.4) (14.4) (25.0)
purchase of investment property - - (5.2) (1.9)
purchase of investments in subsidiaries - - - (0.2)
Sale of intangible non-current assets 10.8 1.5 - 1.6
Sale of tangible non-current assets 7.9 23.3 0.4 -
Capital increase, Bang & Olufsen Medicom a/s (3.6) - (3.6) -
Capital increase, Bang & Olufsen GpS Taiwan - - (0.7) -
purchase of 10 % equity interest in
Bang & Olufsen ICEpower a/s (23.0) - (23.0) -
Change in financial receivables (8.4) 36.2 - (2.8)
Cash flows from investment activities (339.2) (254.3) (250.9) (137.9)
Capital increase 459.1 - 459.1 -
Costs related to capital increase (25.8) - (25.8) -
proceeds from loans 14.8 200.0 - 200.0
Repayment of long-term loans (37.9) (48.7) (30.4) (39.8)
Dividend paid (41.4) (247.7) (36.2) (241.6)
Dividend, own shares 1.9 14.0 1.9 14.0
Dividend from associates 1.0 - 1.0 -
purchase of own shares - (100.2) - (100.2)
Sale of own shares 42.2 1.6 42.2 1.6
Sale of subscription rights 3.8 - 3.8 -
Cash flows from financing activities 417.7 (181.0) 415.6 (166.0)
Changes in cash and cash equivalents 191.7 (103.5) 253.1 (14.4)
Cash and cash equivalents 1 June 53.4 156.9 (48.3) (33.9)
Cash and cash equivalents 31 May 245.1 53.4 204.8 (48.3)
CASh FlOW STATEMENT
Notes …
37 …
38 …
39 …
Parentheses denote capital expenditure. Notes: See pages 73 - 126
Back to FINANCIAl REpORT AND NOTES

68
Bang & Olufsen a/s, Group
(DKK million)
Equity attributable to equity holders of the parent company Minority Total
interests
Reserve for
Share Translation cash flow Retained Equity
Share capital premium reserve hedges earnings Group
Equity 1 June 2007 120.8 14.6 (17.3) 0.1 1,557.7 6.0 1,681.9
Equity and exchange rate adjustments
in subsidiaries - - (25.6) - 32.2 - 6.6
Change in fair value of derivative
financial instruments - - - (0.1) - - (0.1)
Net income recognised directly
in equity - - (25.6) (0.1) 32.2 - 6.5
Retained earnings - - - - 104.7 7.6 112.3
Total recognised income and expense for the year - - (25.6) (0.1) 136.9 7.6 118.8
Employee shares - - - - 10.4 - 10.4
Grant of share options - - - - 11.1 - 11.1
Change in deferred tax regarding share options - - - - (6.1) - (6.1)
Option for minority interest - - - - (2.2) 2.2 -
Transfer to minority interests - - - - (2.4) 2.4 -
purchase of own shares - - - - (100.2) - (100.2)
Sale of own shares - - - - 1.6 - 1.6
Dividend paid regarding 2006/07 - - - - (241.6) (6.1) (247.7)
Dividend, own shares - - - - 14.0 - 14.0
- - - - (315.4) (1.5) (316.9)
Equity 31 May 2008 120.8 14.6 (42.9) - 1,379.2 12.1 1,483.8
STATEMENT OF ChANGES IN EQuITy
Parantheses denote negative figures or figures to be deducted.
Back to FINANCIAl REpORT AND NOTES

69
Bang & Olufsen a/s, Group
(DKK million)
Equity attributable to equity holders of the parent company Minority Total
interests
Reserve for
Share Translation cash flow Retained Equity
Share capital premium reserve hedges earnings Group
Equity 1 June 2008 120.8 14.6 (42.9) - 1,379.2 12.1 1,483.8
Equity and exchange rate adjustments
in subsidiaries - - 3.3 - (15.6) - (12.3)
Change in fair value of derivative
financial instruments - - - (1.0) - - (1.0)
Net income recognised directly
in equity - - 3.3 (1.0) (15.6) - (13.3)
Retained earnings - - - - (385.1) 2.3 (382.8)
Total recognised income and expense for the year - - 3.3 (1.0) (400.7) 2.3 (396.1)
Capital increase 241.6 217.5 - - - - 459.1
Costs related to capital increase - - - - (25.8) - (25.8)
Tax on costs related to capital increase - - - - 1.0 - 1.0
purchase of 10 % equity interest in
Bang & Olufsen ICEpower a/s - - - - (16.1) (6.9) (23.0)
Employee shares - - - - 4.7 - 4.7
Grant of share options - - - - 6.1 - 6.1
Sale of own shares - - - - 46.0 - 46.0
Sale of subscription rights - - - - 3.8 - 3.8
Dividend paid regarding 2007/08 - - - - (36.2) (5.2) (41.4)
Dividend, own shares - - - - 1.9 - 1.9
241.6 217.5 - - (14.6) (12.1) 432.4
Equity 31 May 2009 362.4 232.1 (39.6) (1.0) 963.9 2.3 1,520.1
Parantheses denote negative figures or figures to be deducted.
Back to FINANCIAl REpORT AND NOTES

70
Bang & Olufsen a/s, parent company
(DKK million)
Reserve for Equity
Share cash flow Retained parent
Share capital premium hedges earnings company
Equity 1 June 2007 120.8 14.6 0.1 1,055.2 1,190.7
Change in fair value of derivative
financial instruments - - (0.1) - (0.1)
Net income recognised directly
in equity - - (0.1) - (0.1)
Retained earnings - - - 778.5 778.5
Total recognised income and expense for the year - - (0.1) 778.5 778.4
Employee shares - - - 10.4 10.4
Grant of share options - - - 11.0 11.0
Change in deferred tax regarding share options - - - (6.1) (6.1)
purchase of own shares - - - (100.2) (100.2)
Sale of own shares - - - 1.6 1.6
Dividend paid regarding 2006/07 - - - (241.6) (241.6)
Dividend, own shares - - - 14.0 14.0
- - - (310.9) (310.9)
Equity 31 May 2008 120.8 14.6 - 1,522.8 1,658.2
Parantheses denote negative figures or figures to be deducted.
Back to FINANCIAl REpORT AND NOTES

71
Bang & Olufsen a/s, parent company
(DKK million)
Reserve for Equity
Share cash flow Retained parent
Share capital premium hedges earnings company
Equity 1 June 2008 120.8 14.6 - 1,522.8 1,658.2
Change in fair value of derivative
financial instruments - - (1.0) - (1.0)
Gain on intra-group business combination - - - 9.1 9.1
Net income recognised directly
in equity - - (1.0) 9.1 8.1
Retained earnings - - - (161.8) (161.8)
Total recognised income and expense for the year - - (1.0) (152.7) (153.7)
Capital increase 241.6 217.5 - - 459.1
Costs related to capital increase - - - (25.8) (25.8)
Tax on costs related to capital increase - - - 1.0 1.0
Employee shares - - - 4.7 4.7
Grant of share options - - - 6.1 6.1
Sale of own shares - - - 46.0 46.0
Sale of subscription rights - - - 3.8 3.8
Dividend paid regarding 2007/08 - - - (36.2) (36.2)
Dividend, own shares - - - 1.9 1.9
241.6 217.5 - 1.5 460.6
Equity 31 May 2009 362.4 232.1 (1.0) 1,371.6 1,965.1
Specification of movements in share capital: 2008/09 2007/08 2006/07 2005/06 2004/05
Share capital, beginning of year 120.8 120.8 124.5 124.1 123.8
Capital increase 241.6 - - 0.4 0.3
Capital reduction - - (3.7) - -
Share capital, end of year 362.4 120.8 120.8 124.5 124.1
Parantheses denote negative figures or figures to be deducted.
Back to FINANCIAl REpORT AND NOTES

72 Back to FINANCIAl REpORT AND NOTES

73
Accounting principles applied
Basic principles
The annual report for Bang & Olufsen a/s, which comprises the separate financial statements for the parent company, Bang & Olufsen
a/s, and the consolidated financial statements for the Bang & Olufsen Group, has been prepared in accordance with the International
Financial Reporting Standards (IFRS) and further Danish disclosure requirements for the presentation of financial statements for listed
companies. Further Danish disclosures requirements for the presentation of financial statements are imposed by the Statutory Order on
Adoption of IFRS (the Danish announcement on Adoption of IFRS) issued in accordance with the Danish Financial Statements Act and by
NASDAQ OMX Copenhagen A/S. IFRS is implemented so that the annual report also complies with the regulations in financial reporting
standards endorsed by the European union.
The presentation currency in the financial statements is DKK, which is considered the functional currency for the Group.
The effect of new financial reporting requirements
All new and amended Standards and Interpretations, which are relevant for the Bang & Olufsen Group, and which have become effective
as for financial periods beginning on 1 June 2008, have been applied in the preparation of the annual report.
The application of new and amended Standards and Interpretations has not resulted in any changes of amounts in the annual report for
2008/09 or previous years. The Group’s accounting principles applied are consequently unchanged compared to 2007/08.
At the time of the announcement of this annual report, a number of new or amended Standards or Interpretations are still not effective.
The assessment of the Management is that these Standards and Interpretations will not have any material impact on the annual report.
General information about recognition and measurement
Assets are recognised in the balance sheet, when it is probable that future economic benefits resulting from an event occurring before,
or on, the balance sheet date will flow to the Group, and the value of the asset can be measured reliably. Assets are derecognised in the
balance sheet, when it is no longer probable that future economic benefits will flow to the Group.
liabilities are recognised in the balance sheet, when it is probable that the Group will give up future economic benefits as a consequence
of a legal or constructive obligation resulting from an event occurring before, or on, the balance sheet date, and the value of the liability
can be measured reliably. liabilities are derecognised in the balance sheet, when it is no longer probable that the Group will give up
future economic benefits to meet the obligation.
Intra-group acquisitions are recognised in the acquirer’s balance sheet at the transferring company’s carrying amount at the acquisition
date. The comparative figures are not restated.
purchases and sales of financial assets and liabilities are recognised at the trade date of the agreement.
On initial recognition, financial instruments are measured at fair value, and other assets and liabilities are measured at cost price.
Subsequently assets and liabilities are measured as described below for each financial statement item. Certain financial assets and
liabilities are measured at amortised cost price, by which a constant effective rate of interest is recognised over the duration. Amortised
cost price is calculated as initial cost price less instalments and addition/deduction of the accumulated amortisation of the difference
between the cost price and the nominal amount. Consequently the difference between initial cost and the maturity amount is allocated
over the duration of the asset/liability.
When recognising and measuring, due consideration is made for losses and risks that arise before the financial statements are presented
and which confirm or invalidate conditions, which existed on the balance sheet date.
Income is recognised in the profit and loss account, when it is earned. Furthermore all costs incurred to achieve the earnings of the year,
including depreciation and amortisation, impairment losses and provisions, are recognised in the profit and loss account as well as reversal
of amounts due to changes in accounting judgements and estimates, if the amounts have previously been recognised in the profit and
loss account.
Notes ...
1 ...
ACCOuNTING pRINCIplES ApplIED
Back to FINANCIAl REpORT AND NOTES

74
Consolidation
For a list of subsidiaries and associates, please refer to note 44.
Consolidation practice
The consolidated financial statements comprise the parent company, Bang & Olufsen a/s, and the subsidiaries, which are the companies in
which the Group holds more than 50 % of the voting rights or in other ways has a controlling influence on the company’s financial and
operational policies. Companies, which are not subsidiaries, but in which the Bang & Olufsen Group holds 20 % or more of the voting
rights or in other ways has a significant influence on the operational or financial management, are regarded as associates. Associates are
consolidated in the item “Result from investments in associates after tax”.
When assessing whether or not Bang & Olufsen a/s has a controlling or significant influence, potential voting rights that are currently
exercisable or convertible are considered.
The consolidated financial statements have been prepared on the basis of the audited financial statements of the parent company and its
subsidiaries by adding uniform items from the individual companies. In the process of consolidation, intra-group income and expenses,
shareholding, dividend, accounts receivables and payables and unrealised intra-group profits and losses have been eliminated.
Newly acquired subsidiaries are included in the consolidated financial statements as from the date of acquisition, and companies sold are
included until the date of sale. Comparative figures are not adjusted for newly acquired or sold companies.
The parent company’s investments in the consolidated subsidiaries, measured at historical cost price, are netted against the parent
company’s share of the subsidiaries’ fair value of the identifiable net assets and contingent liabilities at the time of the acquisition.
Goodwill is calculated at the time of the acquisition as the difference between the cost price and the fair value of the assets, the liabilities
and the contingent liabilities acquired. For business combinations taking place on or after 1 June 2004, goodwill is recognised in the
balance sheet under intangible non-current assets. This goodwill is not amortised; instead quarterly impairment tests are performed. If the
cost of acquisition is lower than the fair value of the net assets acquired, the difference is recognised directly in the profit and loss account
at the time of the acquisition.
Goodwill acquired before 1 June 2004 but after 1 June 2002 was recognised in the balance sheet under intangible non-current assets and
amortised on a straight-line basis over its estimated useful life, which was determined on the basis of Management’s experience of the
individual business areas, although a maximum of 20 years applied.
For acquisitions before 1 June 2002 goodwill was calculated at the time of the acquisition as the difference between the cost price and
the acquired company’s net asset value calculated in accordance with the Group’s accounting principles applied. Goodwill was amortised
directly over the equity.
For business combinations before 1 June 2004 the accounting classification and accounting treatment are maintained according to the
former accounting principles applied. Goodwill as from before 1 June 2004 is recognised based on the cost price that was recognised
according to the former accounting principles applied with deduction of amortisation and impairment losses until 31 may 2004. Goodwill
is not amortised after 1 June 2004; instead it is tested for impairment quarterly as of 1 June 2004.
Additions and disposals of shops are treated as either business combinations, ref. the above description, or as additions and disposals of
individual assets and liabilities. The treatment is based on a specific assessment.
Minority interests
Minority interests include third party shareholders’ share of the net asset value and the result for the year in subsidiaries, which are not
100 % owned.
The part of the subsidiaries’ result, which can be attributed to minority interests, forms an integral part of the profit or loss for the year.
Minority interests’ share of the equity is stated as an integral part of the equity.
When minority interests are obligated to cover a share of any losses, this is recognised as an asset. An individual assessment of the need
for provisions for losses is made.
Back to FINANCIAl REpORT AND NOTES

75
Foreign exchange
The profit and loss account
Transactions in foreign currency are during the year translated at the exchange rate effective on the transaction date. Gains and losses
arising from the difference between the exchange rate on the transaction date and the exchange rate prevailing at the date of payment
are recognised in the profit and loss account as financial income or financial costs.
Receivables and payables
Receivables, payables and other monetary items in foreign currency, which exist at the balance sheet date, are translated at the exchange
rates prevailing at this date. Currency gains and losses arising from the differences between the exchange rate prevailing at the balance
sheet date and the exchange rate prevailing at the transaction date are recognised in the profit and loss account as financial income or
financial costs.
Translation of foreign subsidiaries
When recognising foreign subsidiaries with a functional currency different from Bang & Olufsen a/s’ presentation currency, profit and loss
accounts are translated using average exchange rates, while balance sheet items are translated using the exchange rates prevailing on
the balance sheet date. Differences arising on the translation of the foreign subsidiaries’ opening equity to the exchange rates prevailing
at the balance sheet date, and the differences arising on the translation of the profit and loss accounts of the foreign subsidiaries from
average exchange rates to balance sheet date exchange rates, are recognised in the equity.
Derivative financial instruments
Derivative financial instruments are initially recognised in the balance sheet at fair value and are subsequently measured at the balance
sheet date’s fair value. Derivative financial instruments are recognised in other receivables and other payables.
Changes in the fair value of derivative financial instruments, which meets the conditions for hedging the fair value of a recognised asset
or a recognised liability, are recognised in the profit and loss account together with any changes in the fair value of the hedged asset or
the hedged liability.
Changes in the fair value of derivative financial instruments, which meets the conditions for hedging future cash flows, are recognised
directly in the equity. Income and expenses relating to such hedge transactions are transferred from the equity when the hedged position
is realised, and are recognised in the value of the hedged position.
For derivative financial instruments, which do not qualify as hedging instruments, changes in the fair value are recognised in the profit
and loss account as financial income or financial costs.
The profit and loss account
Net turnover
Net turnover is recognised in the profit and loss account, when delivery and transfer of the risks of ownership to the customer has taken
place, if the revenue can be measured reliably, and payment is expected to be received. Turnover is recognised net of value added tax and
discounts related to the sale.
Sales of goods
Turnover regarding sales of goods is recognised in the profit and loss account, if the transfer of the risks of ownership to the customer has
taken place before the end of the financial year.
Rendering of services
Turnover associated with the rendering of services, which among other things includes sales of hours in connection with development
projects, is recognised as the services are rendered.
Back to FINANCIAl REpORT AND NOTES

76
Royalty
Royalty is recognised on a straight-line basis during the period covered by the royalty agreement.
Rental income
Rental income is recognised in the period, where the letting out of the property takes place.
Production costs
production costs comprise wages, consumption of stock and indirect costs, including salaries, depreciation/amortisation and impairment
losses, which are incurred with the purpose of achieving the net turnover for the year.
Development costs
Development costs, which do not meet the criteria for capitalisation, are recognised in the profit and loss account as development costs
along with amortisation and impairment losses on capitalised development projects.
Distribution and marketing costs
Distribution and marketing costs comprise costs relating to sales and distribution of the Group’s products, including salaries for sales
personnel, advertising and exhibition costs, depreciation/amortisation and impairment losses. Costs in subsidiaries, which are responsible
exclusively for the sales of the Group’s products, are allocated to distribution and marketing costs.
Administration costs etc.
Administration costs comprise costs for the administrative personnel, management and office costs etc. including depreciation/
amortisation and impairment losses.
Result of investments in associates
In the Group’s profit and loss account the share of result after tax in associates after proportional elimination of intra-group gains and
losses is recognised as “Result from investments in associates after tax”.
Dividend
Dividend from subsidiaries and associates is recognised in the parent company’s profit and loss account in the financial year, where the
dividend is declared. In situations where the dividend declared exceeds the earnings after the acquisition of the company, the dividend is
recognised as a write-down of the cost price of the investment instead of in the profit and loss account.
Financial income and costs
Financial income and costs include interest, amortisation premium or allowance, fair value adjustments and realised and unrealised
foreign exchange gains and losses.
Tax
Tax for the year, which includes the current tax and changes in deferred tax for the year, is recognised in the profit and loss account with
the share that is attributable to the result for the year and directly on equity with the share, which can be attributed to entries made
directly on the equity.
The parent company is included in a mandatory Danish joint taxation scheme with all companies controlled by the parent company. The
calculated Danish tax of the jointly taxed income is distributed among the jointly taxed companies in proportion to their taxable income
(full distribution with reimbursement for tax deficits).
The Group is included in the on-account tax scheme. Any allowances, deductions or refunds related to the payments of tax are included
in financial income or costs.
Back to FINANCIAl REpORT AND NOTES

77
The balance sheet
Intangible non-current assets
Goodwill
Goodwill is initially recognised in the balance sheet at historical cost price as described under “Consolidation practice”. Subsequently
goodwill is measured at historical cost price less accumulated impairment losses. Goodwill is not amortised.
Development projects
Development projects, that are clearly defined and identifiable, and which are expected to be marketed as new products in potential
markets, are recognised as intangible non-current assets.
Development projects are recognised at cost price and are amortised over the expected useful life when the criteria for capitalisation are met.
Development costs that do not meet the criteria for recognition in the balance sheet are recognised in the profit and loss account when
incurred.
The cost price comprises salaries, wages, materials, services and depreciation of other equipment, plant and machinery that relate to the
Group’s development activities.
Subsidies concerning development projects are deducted in the incurred costs.
Interest expenses related to financing development projects are recognised in the profit and loss account.
Capitalised development projects are measured at the lower of cost price less accumulated amortisation and impairment losses and
recoverable amount.
After the completion of the development work, development projects are amortised on a straight-line basis over the estimated useful life.
The amortisation period is normally 3-6 years.
Acquired rights
Acquired rights comprise software, key money and patents. These are measured at cost price less accumulated amortisation and
impairment losses.
Acquired rights are amortised on a straight-line basis over the shorter of the estimated useful life and the term of the contract.
Tangible non-current assets
Tangible non-current assets are measured at cost price with deduction of accumulated depreciation and impairment losses.
The cost price comprises the acquisition price and costs directly related to the acquisition until the time, when the asset is ready for use.
For self-constructed non-current assets, the cost price comprises direct costs for wage consumption, materials, components and sub-
suppliers.
The cost price of a tangible non-current asset is divided into individual components, which are depreciated separately, if the expected
useful life differs for the individual components.
Subsidies concerning tangible non-current assets are deducted in the cost price.
Interest expenses related to financing the production of tangible non-current assets are recognised in the profit and loss account.
For tangible non-current assets held under finance leases, the cost price equals the lower of fair value of the assets and net present value
of future minimum lease payments. The interest rate implicit in the lease or the incremental borrowing rate is used as discount rate, when
calculating net present value.
Back to FINANCIAl REpORT AND NOTES

78
Depreciation
Depreciation is carried out on a straight-line basis over the expected useful life of the assets considering the assets’ residual values. The
following depreciation periods are used:
land and buildings:
land None
Buildings 40 years
Interior refurbishment/special installations 10 years
plant and machinery:
Single purpose production tools 3 - 6 years
Other plant and machinery 8 - 10 years
Other equipment 3 - 10 years
leasehold improvements are depreciated on a straight-line basis over the term of the lease, though not exceeding 10 years.
Investment property
Investment property is property held to earn rental income or for capital appreciation rather than for use in the production, the supply of
goods or services or for administrative purposes in the company that owns the property.
Investment property is measured at cost price with deduction of accumulated depreciation and impairment losses. Investment property is
depreciated on a straight-line basis over 40 years.
Subsidies concerning investment property are deducted in the cost price.
Impairment losses on non-current assets
The carrying amount of both investment property and intangible and tangible non-current assets is reviewed each quarter to determine if
there are indications of decreases in value not reflected by ordinary depreciation/amortisation. If this is the case, the recoverable amount
of the asset is determined, and if the amount is lower than the carrying amount, an impairment loss is recognised, so that the carrying
amount is reduced to the asset’s recoverable amount. The recoverable amount for an asset is the higher of the net sales price and the
value in use. If it is not possible to determine a recoverable amount for an individual asset, the asset is assessed within the smallest group
of assets for which a reliable recoverable amount can be determined in an overall assessment.
Goodwill and development projects in progress are tested for impairment each quarter irrespective of whether there is any indication of
impairment.
Financial non-current assets
Investments in subsidiaries and associates are measured at historical cost price in the balance sheet of the parent company. If the historical
cost price exceeds the recoverable amount, an impairment loss is recognised, so that the carrying amount is reduced to the investments’
recoverable amount.
In situations where the dividend distributed exceeds the accumulated earnings after the acquisition of the company, the dividend is
recognised as a write-down of the cost price of the investment.
Investments in associates are measured in the balance sheet of the Group at the net asset value according to the Group’s accounting
principles applied, after proportional elimination of intra-group profits and losses.
Other financial receivables
Other financial receivables primarily comprise loans to external parties and are measured at amortised cost price corresponding to face
value less provisions for losses.
provisions for losses are based on an individual assessment of each account outstanding.
Back to FINANCIAl REpORT AND NOTES

79
Inventories
Inventories are measured at the lower of cost price according to the FIFO principle and net realisable value.
Cost price of raw materials, consumables and purchased goods comprises the invoice price with added delivery costs. The cost price of
finished goods and work in progress comprises the purchase price of materials and direct labour costs plus indirect production costs.
Indirect production costs include indirect materials and wages, maintenance and depreciation on plant and machinery, factory buildings
and other equipment used in the production process as well as costs of factory administration and management.
Costs of financing are not included in the cost price.
Receivables
Receivables are measured in the balance sheet at amortised cost price corresponding to face value less provisions for losses.
provisions for losses are based on an individual assessment of each outstanding account.
Equity
Dividend
Dividend is recognised as a liability at the time of approval by the Annual General Meeting.
Own shares
Acquisition fees, fees received in connection with the disposal of own shares and dividend received on own shares are recognised in the
equity under retained earnings.
Share premium account
The reserve consists of paid-in premium in connection with the subscription of shares.
The reserve is a distributable reserve, and therefore it can be used for declaration of dividend or to cover deficits.
Translation reserve
The translation reserve for exchange rate differences in the consolidated financial statements consists of exchange rate differences that occur
when translating the foreign subsidiaries’ financial statements from their functional currency into Bang & Olufsen a/s’ presentation currency.
On disposal of the net investment the exchange rate differences on that foreign subsidiary are recognised in the profit and loss account.
The reserve is a distributable reserve.
The translation reserve has been reset to zero as at 1 June 2004 in accordance with IFRS 1.
Incentive programmes
The Group’s incentive programmes comprise a share option programme for a number of directors and employee shares.
Share option programme
The share option programme solely comprises equity-settled share options.
The value of the services rendered by the employees in return for the share options granted is measured at the fair value of the share
options. The fair value of the share options is measured on the grant date and is recognised as an expense in the profit and loss account
during the period from the grant date to the vesting date. The counter item to this is recognised directly in equity.
At initial recognition of the share options an estimate is made over the number of share options expected to vest. Subsequently, until the
vesting date, the estimate is adjusted for changes in the expected number. Thus the number of share options actually recognised equals
the number that ultimately vested.
Back to FINANCIAl REpORT AND NOTES

80
The fair value of the share options is calculated on the basis of the Black-Scholes option pricing formula. When calculating the fair value
of the share options, the terms and conditions that are linked to the share options are taken into consideration.
The tax consequence of the share option programme is recognised.
Employee shares
The employee shares have been granted to the employees in the Danish companies of the Bang & Olufsen Group as free shares or with
a right to subscribe for shares at a quotation below the market quotation. The discount element of the employee shares is recognised at
the grant date as an expense in the profit and loss account. The counter item to this is recognised directly in equity. The tax consequence
of the employee share arrangement is recognised. The discount element is calculated as the difference between the subscription price and
the fair value of the employee share calculated on the basis of the Black-Scholes option pricing formula.
Liabilities
Pensions
The Bang & Olufsen Group operates pension plans for certain groups of employees in Denmark and abroad. Typically, these plans are
defined contribution plans.
Costs regarding defined contribution plans are recognised continuously in the profit and loss account in the period, where the pension
is earned, and the contribution payable is recognised in the balance sheet under other payables. The premium payments (e.g. a fixed
amount or a fixed percentage of the salary) are made into independent insurance companies, which are responsible for the pension
obligations. Once the pension contributions for the defined contribution plans have been paid, the Bang & Olufsen Group has no further
pension obligations to current or former employees.
For defined benefit plans annual actuarial calculations are made of the present value of the future benefits to be paid under the plan. The
present value is calculated based on conditions about the future development in among other things salary levels, interest rates, inflation
and mortality. The actuarially calculated present value of the defined benefit obligation with deduction of the fair value of any plan assets
is recognised in the balance sheet.
If the net defined benefit plan is an asset it is only recognised if it corresponds to or is lower than any cumulative unrecognised net
actuarial losses and future refunds from the plan or it would result in reductions in future contributions to the plan.
Differences between the expected development in plan assets and in the defined benefit obligation and the realised values are actuarial
gains and losses. Actuarial gains and losses are recognised only if the accumulated values exceed the highest of 10 % of the defined
benefit obligation or 10 % of the fair value of the plan assets as at the beginning of the financial year (“The Corridor Method”). Amounts
that fall outside the corridor are recognised over the remaining working years for the employees concerned.
Provisions
provisions comprise provisions for warranty, provisions for fairness and other provisions. provisions for warranty comprise obligations
to repair products within the warranty period. provisions for fairness comprise obligations to repair products after the warranty period.
The provisions are recognised and measured on the basis of the company’s experience with warranty repairs and other obligations. The
provisions are discounted if this has a material effect on the measurement of the obligation.
Deferred tax and income tax
provision for deferred tax is calculated according to the balance sheet liability method on the basis of all temporary differences between
the tax base and the carrying amount of assets and liabilities.
The tax base of assets is determined considering the planned use of the asset. In the calculation of deferred tax, the tax base of any losses
and provisions etc. is included, if it is likely that these can be offset against future taxable income. If the deferred tax constitutes a positive
amount, this is recognised in the balance sheet as a deferred tax asset.
Income tax is recognised as the tax expected to be liable on the year’s taxable income less prepaid tax.
Back to FINANCIAl REpORT AND NOTES

81
Financial liabilities
Fixed interest loans, such as mortgage loans or bank loans, are recognised at the date of the loan at the received proceeds less transaction
costs. In subsequent periods, the loans are measured at amortised cost price corresponding to the present value using the effective rate of
interest, so that the difference between the proceeds and the nominal amount (debt discount) is recognised in the profit and loss account
over the term of the loan.
Other financial liabilities are measured at amortised cost price, which is practically the same as the nominal value.
Prepayments and deferred income
prepayments comprise incurred costs related to the following financial years. Deferred income comprises received payments related to
income in the following financial years.
Cash flow statement
The presentation of the cash flow statement follows the indirect method, based on the result for the year.
The cash flow statement shows the cash flows for the year, the year’s change in cash and cash equivalents as well as cash and cash
equivalents at the beginning and end of the year.
Cash flows from operating activities
Cash flows from operating activities are stated as the result for the year adjusted for non-liquid profit and loss account items and changes
to the working capital. The working capital comprises current assets less current liabilities, excluding items, which are recognised as cash
and cash equivalents.
Cash flows from investment activities
Cash flows from investment activities comprise the acquisition and sale of investment property and intangible, tangible and financial non-
current assets.
Cash flows from financing activities
Cash flows from financing activities comprise borrowings and instalments on non-current liabilities, dividend paid and proceeds from
increases in the share capital as well as sales and repurchase of own shares.
Cash and cash equivalents
Cash and cash equivalents comprise cash less current bank debt, which forms part of the Group’s ongoing cash flow management. Cash
flows in foreign currency, including cash flows in foreign subsidiaries, are translated at average monthly exchange rates, which do not
deviate materially from the exchange rates prevailing on the date of payment.
Back to FINANCIAl REpORT AND NOTES

82
Segment information
The Group’s main activities and primary segments are:
· Branded business
· Non-branded business – comprising the ICEpower Group and share of result after tax in the associated company
Bang & Olufsen Medicom a/s
The Group’s geographical areas and secondary segments are:
· Scandinavia
· Central Europe
· Rest of Europe
· North America
· Asia
· Rest of the world
Scandinavia comprises Denmark, Sweden, Norway and Finland.
Central Europe comprises Germany, Switzerland and Austria.
The secondary segments are broken down according to the location of customers and assets.
The division into segments is, in all material respects, in accordance with the Group’s management structure and the internal financial
management.
The segment figures have been prepared using the same accounting principles applied as for the consolidated financial statements.
Segment income and expenses and segment assets and liabilities comprise those items, which can be directly allocated to the segment.
Intra-group trade takes place on market terms.
Non-current assets in the segment comprise those assets, which are used directly in the operations of the segment, including intangible
non-current assets and investments in subsidiaries and associates.
Current assets in the segment comprise those current assets, which are used directly in the operations of the segment, including
inventories, trade receivables, other receivables, prepayments and cash.
Segment liabilities comprise liabilities derived from the operations of the segment, including trade payables and other payables.
Back to FINANCIAl REpORT AND NOTES

83
Notes ...
2 ...
SIGNIFICANT ACCOuNTING ESTIMATES AND JuDGEMENTS
Significant accounting estimates and judgements
When preparing the annual report it is necessary that Management makes a number of accounting estimates and judgements, which
influence the carrying amount of certain assets and liabilities and the recognised revenue and costs for the financial years. Significant
judgements are among others made when assessing provisions, contingent liabilities, development projects and trade receivables.
Management bases the judgements on historical experience and other assumptions that are believed to be reasonable under the given
circumstances. The result of the assumptions is used to evaluate the carrying amount of the assets and liabilities and the recognised
revenue and costs, which is not obvious from other material. The actual results can differ from the estimated results.
The following accounting estimates and judgements are assessed to be material for the annual report:
Provisions for warranty and fairness
The Bang & Olufsen Group repairs or replaces products that do not function satisfactorily both within the warranty period and in certain
situations after the warranty period. Consequently provisions are made for future returns. The provisions are made based on historical
statistics of returns and based on Management’s judgements.
The future returns can differ from the historical pattern, but it is the assessment of Management that the estimate of the provisions is
reasonable and appropriate.
Contingent liabilities
Contingent liabilities, including the outcome of pending lawsuits, are naturally uncertain. Management has estimated these based on
legal assessments in the individual cases. It is the assessment of Management that the estimates are reasonable.
Development projects
In connection with the capitalisation of development costs, the expected useful life of the product is to be determined. Bang & Olufsen
has assessed that the amortisation period is usually 3-6 years.
Trade receivables
Specific estimates of trade receivables are made on an assessment of the dealer’s historical ability to pay and the specific circumstances.
Back to FINANCIAl REpORT AND NOTES

84
Branded business Non-branded business
2008/09 2007/08 2008/09 2007/08
Primary segment - activities
Net turnover 2,719.9 3,991.7 85.0 117.9
Internal turnover (7.9) (7.9) (7.5) (9.7)
External turnover 2,712.0 3,983.8 77.5 108.2
Gross profit 1,067.6 1,823.3 45.8 76.7
Depreciations and amortisations (269.2) (292.7) (4.1) (4.1)
Impairment losses recognised in the profit and loss account (12.4) (2.4) - -
Operating profit (EBIT) (505.7) 159.4 10.2 35.3
Result from investments in associates 1.1 - 1.2 (11.2)
Result before tax
Result for the year
Non-current assets 1,259.4 1,204.0 28.5 21.9
Current assets 1,294.7 1,529.4 28.8 28.4
Total assets 2,554.1 2,733.4 57.3 50.3
Equity 1,449.1 1,567.3 45.7 36.6
Non-current liabilities 417.0 420.5 0.2 0.1
Current liabilities 688.0 745.6 11.4 13.6
Total equity and liabilities 2,554.1 2,733.4 57.3 50.3
Capital additions 315.0 307.6 7.9 7.7
Investments in associates 6.4 6.3 3.1 (1.7)
Average number of employees:
Denmark 1,545 1,755 30 39
Abroad 725 746 3 1
2,270 2,501 33 40
(DKK million)
Segment information
Notes …
3 …
SEGMENT INFORMATION
Parantheses denote negative figures or figures to be deducted.
Back to FINANCIAl REpORT AND NOTES

85
Bang & Olufsen a/s
unallocated items Other/eliminations Group
2008/09 2007/08 2008/09 2007/08 2008/09 2007/08
- - (15.4) (17.6) 2,789.5 4,092.0
- - 15.4 17.6 - -
- - - - 2,789.5 4,092.0
- - (7.7) (7.6) 1,105.7 1,892.4
- - - - (273.3) (296.8)
- - - - (12.4) (2.4)
- - - - (495.5) 194.7
- - - - 2.3 (11.2)
(523.0) 153.7
(382.8) 112.3
103.8 32.3 (74.5) (51.5) 1,317.2 1,206.7
21.6 50.2 1.8 2.6 1,346.9 1,610.6
125.4 82.5 (72.7) (48.9) 2,664.1 2,817.3
98.8 (68.1) (73.5) (52.0) 1,520.1 1,483.8
5.4 73.8 - - 422.6 494.4
21.2 76.8 0.8 3.1 721.4 839.1
125.4 82.5 (72.7) (48.9) 2,664.1 2,817.3
- - - - 322.9 315.3
- - - - 9.5 4.6
- - - - 1,575 1,794
- - - - 728 747
- - - - 2,303 2,541
Parantheses denote negative figures or figures to be deducted.
Back to FINANCIAl REpORT AND NOTES

86
(DKK million)
Segment information (continued)
Notes …
3 …
Secondary segment - geography
Total Total Total
assets capital additions external turnover
2008/09 2007/08 2008/09 2007/08 2008/09 2007/08
Scandinavia 1,796.8 1,970.6 301.0 248.3 341.5 673.6
Central Europe 131.8 128.2 3.1 1.3 707.6 966.0
Rest of Europe 594.3 630.3 8.6 52.5 1,171.5 1,703.1
North America 59.4 31.8 5.4 2.2 168.0 234.2
Asia 64.0 43.8 4.0 5.7 290.4 389.0
Rest of the world 17.8 12.6 0.8 5.3 110.5 126.1
Total 2,664.1 2,817.3 322.9 315.3 2,789.5 4,092.0
Export share 91 % 88 %
Back to FINANCIAl REpORT AND NOTES

87
Bang & Olufsen a/s Group Parent company
(DKK million) 2008/09 2007/08 2008/09 2007/08
Net turnover
Geographical breakdown
Denmark 237.3 490.9 424.9 948.1
Norway 33.1 63.8 - -
Sweden 59.0 100.4 - -
Finland 12.1 18.5 - -
Scandinavia 341.5 673.6 424.9 948.1
Germany 476.9 612.0 - -
Switzerland 188.0 287.5 - -
Austria 42.7 66.5 - -
Central Europe 707.6 966.0 - -
The uK 321.4 466.0 - -
France 148.7 216.4 - -
Spain/portugal 131.8 258.2 - -
Italy 114.7 196.2 - -
Belgium 74.6 105.5 - -
holland 193.2 271.1 - -
Rest of Europe 187.1 189.7 1.4 -
Rest of Europe 1,171.5 1,703.1 1.4 -
uSA 168.0 234.2 - -
North America 168.0 234.2 - -
Japan 40.7 59.4 - -
Singapore 67.0 79.3 - -
Rest of Asia 182.7 250.3 - -
Asia 290.4 389.0 - -
Middle East 84.3 58.5 - -
Rest of the world 26.2 67.6 - -
Rest of the world 110.5 126.1 - -
Total 2,789.5 4,092.0 426.3 948.1
Breakdown by categories
Sales of goods 2,757.1 4,037.8 - -
Rendering of services 3.9 33.8 220.5 286.1
Royalty 23.3 15.3 123.9 580.0
Rental income from property 5.2 5.1 81.9 82.0
Total 2,789.5 4,092.0 426.3 948.1
Notes …
4 …
NOTES TO ThE pROFIT AND lOSS ACCOuNT
Back to FINANCIAl REpORT AND NOTESBack to pROFIT AND lOSS ACCOuNT

88
Group Parent company
(DKK million) 2008/09 2007/08 2008/09 2007/08
Expenses, further information
production costs, development costs, distribution
and marketing costs, administration costs etc. and
restructuring costs include, among others, the
amounts stated below, about which the following
information is provided:
Development costs
Development costs incurred before capitalisation 537.0 529.9 561.7 552.0
Amount thereof capitalised (201.3) (130.9) (194.9) (117.7)
Total amortisation and impairment losses on development projects 141.4 146.5 138.4 131.2
Development costs recognised
in restructuring costs (14.4) - (14.4) -
Development costs recognised in the profit and loss account 462.7 545.5 490.8 565.5
Classification based on the nature of expense
Restructuring costs
Restructuring costs divided by functions:
production costs 11.0 - 5.9 -
Development costs 14.4 - 14.4 -
Distribution and marketing costs 74.3 - - -
Administration costs etc. 5.8 - 0.5 -
Restructuring costs 105.5 - 20.8 -
Functions including restructuring costs:
production costs 1,694.8 2,199.6 428.6 526.4
Development costs 477.1 545.5 505.2 565.5
Distribution and marketing costs 1,002.8 1,003.5 - -
Administration costs etc. 110.3 148.7 34.8 42.9
Total 3,285.0 3,897.3 968.6 1,134.8
Intangible non-current assets
Amortisation of intangible non-current assets is recognised
in the following items in the profit and loss account:
production costs 1.4 1.2 2.4 1.0
Development costs 134.7 151.7 132.0 136.4
Distribution and marketing costs - 0.7 - -
Administration costs etc. 1.7 0.1 0.2 0.1
Restructuring costs 0.5 - - -
138.3 153.7 134.6 137.5
Impairment losses on intangible non-current assets are
recognised in the following items in the profit and loss account:
Development costs 7.3 - 7.3 -
Distribution and marketing costs 0.5 2.4 - -
Restructuring costs 4.1 - 4.1 -
11.9 2.4 11.4 -
No impairment losses on intangible non-current
assets have been reversed.
Notes …
5 …
Parantheses denote negative figures or figures to be deducted.
Back to FINANCIAl REpORT AND NOTES Back to pROFIT AND lOSS ACCOuNT

89
Group Parent company
(DKK million) 2008/09 2007/08 2008/09 2007/08
Expenses, further information (continued)
Tangible non-current assets
Depreciation of tangible non-current assets is recognised
in the following items in the profit and loss account:
production costs 104.8 114.1 9.5 11.1
Development costs 11.8 12.0 9.0 9.4
Distribution and marketing costs 13.4 12.4 - -
Administration costs etc. 1.3 1.0 0.8 0.8
131.3 139.5 19.3 21.3
Impairment losses on tangible non-current assets are
recognised in the following item in the profit and loss account:
Restructuring costs 0.5 - - -
0.5 - - -
No impairment losses on tangible
non-current assets have been reversed.
Investment property
Depreciation of investment property is recognised
in the following items in the profit and loss account:
production costs 3.7 3.6 8.7 5.3
Development costs - - 1.4 1.6
Administration costs etc. - - 0.7 0.4
3.7 3.6 10.8 7.3
No impairment losses on investment property
have been recognised.
No impairment losses on investment property
have been reversed.
Employees
Remuneration to the Board of Directors 3.7 3.6 3.7 3.6
Remuneration to the Board of Management 6.0 16.0 6.0 16.0
Share-based payment 10.8 20.6 5.0 12.4
Wages, salaries and fees 824.0 835.6 326.2 306.2
pensions 33.3 39.5 12.0 20.2
Other social security costs 43.3 36.4 4.3 4.0
921.1 951.7 357.2 362.4
Average number of full-time employees:
Denmark 1,575 1,794 710 719
Abroad 728 747 - -
2,303 2,541 710 719
Employee costs are recognised in the following
items in the profit and loss account:
production costs 260.5 337.3 110.1 121.0
Development costs 252.9 256.0 222.2 228.0
Distribution and marketing costs 255.2 266.9 - -
Administration costs etc. 87.3 91.5 8.9 13.4
Restructuring costs 65.2 - 16.0 -
921.1 951.7 357.2 362,4
Notes …
5 …
Back to FINANCIAl REpORT AND NOTESBack to pROFIT AND lOSS ACCOuNT

90
(DKK million)
Expenses, further information (continued)
Remuneration of the Board of Directors, the Board of Management and other key management personnel:
Group
2008/09 2007/08
Board of Board of Board of Board of
Directors, Management, Other key Directors, Management, Other key
parent parent management parent parent management
company company personnel company company personnel
Wages, salaries and fees 3.7 6.0 6.8 3.6 6.6 5.5
Severance pay - - 0.4 - 8.3 -
Bonus - - 2.7 - 1.1 0.8
pensions - - 1.0 - - 0.8
Remuneration 3.7 6.0 10.9 3.6 16.0 7.1
Share-based payment - 0.6 3.1 - 6.1 2.4
Total remuneration 3.7 6.6 14.0 3.6 22.1 9.5
Parent company
2008/09 2007/08
Board of Board of Board of Board of
Directors, Management, Other key Directors, Management, Other key
parent parent management parent parent management
company company personnel company company personnel
Wages, salaries and fees 3.7 6.0 3.9 3.6 6.6 2.9
Severance pay - - 0.4 - 8.3 -
Bonus - - 1.4 - 1.1 -
pensions - - 0.6 - - 0.4
Remuneration 3.7 6.0 6.3 3.6 16.0 3.3
Share-based payment - 0.6 1.6 - 6.1 1.5
Total remuneration 3.7 6.6 7.9 3.6 22.1 4.8
Notes …
5 …
Back to FINANCIAl REpORT AND NOTES Back to pROFIT AND lOSS ACCOuNT

91
(DKK million)
Expenses, further information (continued)
Share-based payment
Share option programme, Group
The Bang & Olufsen Group’s share option programme comprises a number of directors in the Group. As at 31 May 2009, the total pool
of options totals 566,697 options, which can be exercised in the period 2009-2014. Exercise of the share options is dependent on the
owner of the option being employed at the time of the exercise. There are no further conditions for the acquisition of the options.
The share options can only be settled with shares. To a limited extent, Bang & Olufsen a/s has purchased own shares to cover the share
option programme. The shares are recognised directly in the equity. The holding of own shares totals 110,076 shares as at 31 May 2009
(767,787 shares as at 31 May 2008).
Before the share issue in May 2009, the market value of the ordinary share was DKK 85, while the offer price for the new shares was
DKK 19. The number of share options is, according to the share option agreements, increased to compensate for this dilution, so that the
fair value of share options at the time of the issue remains unchanged.
The exercise prices, which are linked to vesting in the financial years 2005/06 and 2006/07, are based on exercise prices of 241 and 290
(500 and 601 before inclusion of the adjustment factor), which are adjusted by 5 % on the date of the company’s financial statement
announcement to NASDAQ OMX Copenhagen A/S, initially at the announcement in August 2006 and August 2007 respectively. The
annual addition no longer applies or is limited to the extent that dividend is paid out on the latest Annual General Meeting before
the announcement in question. The exercise price, which is linked to vesting in the financial year 2007/08, is fixed at 302 (625 before
inclusion of the adjustment factor). The exercise price, which is linked to vesting in the financial year 2008/09, is fixed at 103 (214 before
inclusion of the adjustment factor). The comparative figures have not been restated.
Share options, Board of Other Total number Exercise price
Bang & Olufsen Group Management directors of shares per option Exercise period
Outstanding 1 June 2007 140,000 53,500 193,500 573 August 2007 - August 2011
Exercised 2007/08 - (3,000) (3,000) *525 August 2007 - August 2010
Allocated 2007/08 13,500 74,400 87,900 625 August 2010 - August 2013
Forfeited 2007/08 (13,500) (3,000) (16,500) 625 August 2010 - August 2013
Outstanding 31 May 2008 140,000 121,900 261,900 594 August 2008 - August 2013
As at 31 May 2008, the share options are divided as follows:
Vesting period:
Financial year 2005/06 70,000 18,000 88,000 *533 August 2007 - August 2010
Financial year 2006/07 70,000 32,500 102,500 *624 August 2008 - August 2011
Financial year 2007/08 - 71,400 71,400 625 August 2010 - August 2013
Outstanding 31 May 2008 140,000 121,900 261,900 594 August 2008 - August 2013
* The exercise price is adjusted cf. above.
Notes …
5 …
Parantheses denote negative figures or figures to be deducted.
Back to FINANCIAl REpORT AND NOTESBack to pROFIT AND lOSS ACCOuNT

92
(DKK million)
Expenses, further information (continued)
Share options, Board of Other Total number Exercise price
Bang & Olufsen a/s Management directors of shares per option Exercise period
Outstanding 1 June 2008 140,000 121,900 261,900 594 August 2008 - August 2013
Allocated 2008/09 13,000 80,300 93,300 214 August 2011 - August 2014
Forfeited 2008/09 (35,000) - (35,000) *533 August 2007 - August 2010
Forfeited 2008/09 (35,000) - (35,000) *624 August 2008 - August 2011
Forfeited 2008/09 - (8,700) (8,700) 625 August 2010 - August 2013
Forfeited 2008/09 - (3,125) (3,125) 214 August 2011 - August 2014
Outstanding before share issue 83,000 190,375 273,375 481 August 2009 - August 2014
Change in number due to
dilution from share issue 89,057 204,265 293,322
Outstanding 31 May 2009 172,057 394,640 566,697 232 August 2009 - August 2014
Outstanding 1 June 2008 290,216 252,694 542,910 287 August 2008 - August 2013
Allocated 2008/09 26,949 166,459 193,408 103 August 2011 - August 2014
Forfeited 2008/09 (72,554) - (72,554) *257 August 2007 - August 2010
Forfeited 2008/09 (72,554) - (72,554) *301 August 2008 - August 2011
Forfeited 2008/09 - (18,035) (18,035) 302 August 2010 - August 2013
Forfeited 2008/09 - (6,478) (6,478) 103 August 2011 - August 2014
Outstanding 31 May 2009 172,057 394,640 566,697 232 August 2009 - August 2014
As at 31 May 2009, the share options are divided as follows:
Vesting period:
Financial year 2005/06 72,554 37,313 109,867 *266 August 2007 - August 2010
Financial year 2006/07 72,554 67,371 139,925 *312 August 2008 - August 2011
Financial year 2007/08 - 129,975 129,975 302 August 2010 - August 2013
Financial year 2008/09 26,949 159,981 186,930 103 August 2011 - August 2014
Outstanding 31 May 2009 172,057 394,640 566,697 232 August 2009 - August 2014
* The exercise price is adjusted cf. above.
2008/09 2007/08
The following amounts regarding the share option programme have
been recognised as part of the employee costs in the Group 6.1 10.2
Options Options
The recognition according to the Black-Scholes option pricing formula granted in granted in
is based on the following conditions: 2008/09 2007/08
Expected volatility 52.1 % 22.3 %
5 year risk-free interest rate 4.27 % 4.31 %
In 2008/09 and 2007/08 an average addition for the Bang & Olufsen a/s share of 1.40 % and 2.66 % respectively has been used in the
calculation. The expected maturity is fixed for the end of the vesting period.
like last year the volatility is based on the historical volatility. The volatility is calculated based on 1 year’s historical data.
Calculated on the basis of the closing price of 44.5 as at 31 May 2009 the net asset value totals DKK 0.0 million. The closing price as at
31 May 2008 was 264.5 corresponding to a calculated net asset value of DKK 0.0 million.
Notes …
5 …
Back to FINANCIAl REpORT AND NOTES Back to pROFIT AND lOSS ACCOuNT

93
(DKK million)
Expenses, further information (continued)
Share option programme, parent company
A number of directors in Bang & Olufsen a/s are comprised by the Group’s share option programme. As at 31 May 2009, the pool of
unexercised options totals 340,330 options, which can be exercised in the period 2009-2014.
Share options, Board of Other Total number Exercise price
Bang & Olufsen a/s Management directors of shares per option Exercise period
Outstanding 1 June 2007 140,000 27,000 167,000 572 August 2007 - August 2011
Allocated 2007/08 13,500 30,400 43,900 625 August 2010 - August 2013
Forfeited 2007/08 (13,500) (3,000) (16,500) 625 August 2010 - August 2013
Outstanding 31 May 2008 140,000 54,400 194,400 587 August 2008 - August 2013
As at 31 May 2008, the share options are divided as follows:
Vesting period:
Financial year 2005/06 70,000 9,000 79,000 *533 August 2007 - August 2010
Financial year 2006/07 70,000 18,000 88,000 *624 August 2008 - August 2011
Financial year 2007/08 - 27,400 27,400 625 August 2010 - August 2013
Outstanding 31 May 2008 140,000 54,400 194,400 587 August 2008 - August 2013
Outstanding 1 June 2008 140,000 54,400 194,400 587 August 2008 - August 2013
Allocated 2008/09 13,000 33,400 46,400 214 August 2011 - August 2014
Forfeited 2008/09 (35,000) - (35,000) *533 August 2007 - August 2010
Forfeited 2008/09 (35,000) - (35,000) *624 August 2008 - August 2011
Forfeited 2008/09 - (3,500) (3,500) 625 August 2010 - August 2013
Forfeited 2008/09 - (3,125) (3,125) 214 August 2011 - August 2014
Outstanding before share issue 83,000 81,175 164,175 504 August 2009 - August 2014
Change in number due to
dilution from share issue 89,057 87,098 176,155
Outstanding 31 May 2009 172,057 168,273 340,330 243 August 2009 - August 2014
Outstanding 1 June 2008 290,216 112,769 402,985 283 August 2008 - August 2013
Allocated 2008/09 26,949 69,237 96,186 103 August 2011 - August 2014
Forfeited 2008/09 (72,554) - (72,554) *257 August 2007 - August 2010
Forfeited 2008/09 (72,554) - (72,554) *301 August 2008 - August 2011
Forfeited 2008/09 - (7,255) (7,255) 302 August 2010 - August 2013
Forfeited 2008/09 - (6,478) (6,478) 103 August 2011 - August 2014
Outstanding 31 May 2009 172,057 168,273 340,330 243 August 2009 - August 2014
As at 31 May 2009, the share options are divided as follows:
Vesting period:
Financial year 2005/06 72,554 18,657 91,211 *266 August 2007 - August 2010
Financial year 2006/07 72,554 37,313 109,867 *312 August 2008 - August 2011
Financial year 2007/08 - 49,544 49,544 302 August 2010 - August 2013
Financial year 2008/09 26,949 62,759 89,708 103 August 2011 - August 2014
Outstanding 31 May 2009 172,057 168,273 340,330 243 August 2009 - August 2014
* The exercise price is adjusted cf. above.
Notes …
5 …
Parantheses denote negative figures or figures to be deducted.
Back to FINANCIAl REpORT AND NOTESBack to pROFIT AND lOSS ACCOuNT

94
(DKK million)
Expenses, further information (continued)
2008/09 2007/08
The following amounts regarding the share option programme have
been recognised as part of the employee costs in the parent company 3.0 8.3
Options Options
The recognition according to the Black-Scholes option pricing formula granted in granted in
is based on the following conditions: 2008/09 2007/08
Expected volatility 52.1 % 22.3 %
5 year risk-free interest rate 4.27 % 4.31 %
In 2008/09 and 2007/08 an average addition for the Bang & Olufsen a/s share of 1.40 % and 2.66 % respectively has been
used in the calculation. The expected maturity is fixed for the end of the vesting period.
like last year the volatility is based on the historical volatility. The volatility is calculated based on 1 year’s historical data.
Calculated on the basis of the closing price of 44.5 as at 31 May 2009 the net asset value totals DKK 0.0 million. The closing price as at
31 May 2008 was 264.5 corresponding to a calculated net asset value of DKK 0.0 million.
Employee shares, Group
The period 1 June 2008 to 31 May 2009:
In the autumn of 2008 the employees in the Danish companies in the Bang & Olufsen Group were granted employee shares. The grant
depended on the seniority of the employee. The employee shares were granted at no cost for the employees.
In accordance with Danish law, the employee shares are held in restricted accounts until the end of the seventh calendar year after the
grant. Thus, the employee shares cannot be sold or in other ways be at the employees disposal during the 7 years.
The employee shares were granted by use of Bang & Olufsen a/s’ holding of own shares.
The employees in the Group were granted 21,911 employee shares corresponding to 0.18 % of the share capital in Bang & Olufsen a/s
at the date of the grant. The granted employee shares had a fair value of DKK 216.50 per share.
The fair value is calculated as at 22 August 2008, which was the date of the grant. The fair value corresponds to the market value of the
shares on the grant date.
The discount element per employee share is DKK 216.50, which is recognised in the profit and loss account.
2008/09
In the Bang & Olufsen Group the following amount has been recognised
as part of the employee costs regarding the employee shares 4.7
Notes …
5 …
Back to FINANCIAl REpORT AND NOTES Back to pROFIT AND lOSS ACCOuNT

95
(DKK million)
Expenses, further information (continued)
The period 1 June 2007 to 31 May 2008:
In the autumn of 2007 the employees in the Danish companies in the Bang & Olufsen Group were granted employee shares. The grant
depended on the seniority of the employee. The employee shares were granted at no cost for the employees.
In accordance with Danish law, the employee shares are held in restricted accounts until the end of the seventh calendar year after the
grant. Thus, the employee shares cannot be sold or in other ways be at the employees disposal during the 7 years.
The employee shares were granted by use of Bang & Olufsen a/s’ holding of own shares.
The employees in the Group were granted 17,029 employee shares corresponding to 0.14 % of the share capital in Bang & Olufsen a/s.
The granted employee shares had a fair value of DKK 610.00 per share. The fair value is calculated as at 13 August 2007, which was the
date of the grant. The fair value corresponds to the market value of the shares on the grant date.
The discount element per employee share is DKK 610.00, which is recognised in the profit and loss account.
2007/08
In the Bang & Olufsen Group the following amount has been recognised
as part of the employee costs regarding the employee shares 10.4
Employee shares, parent company
The period 1 June 2008 to 31 May 2009:
The employees in Bang & Olufsen a/s were granted 9,153 employee shares corresponding to 0.08 % of the share capital in Bang &
Olufsen a/s at the date of the grant. The granted employee shares had a fair value of DKK 216.50 per share. The fair value is calculated
as at 22 August 2008, which was the date of the grant. The fair value corresponds to the market value of the shares on the grant date.
2008/09
In Bang & Olufsen a/s the following amount has been recognised
as part of the employee costs regarding the employee shares 2.0
The period 1 June 2007 to 31 May 2008:
The employees in Bang & Olufsen a/s were granted 6,756 employee shares corresponding to 0.06 % of the share capital in Bang &
Olufsen a/s. The granted employee shares had a fair value of DKK 610.00 per share. The fair value is calculated as at 13 August 2007,
which was the date of the grant. The fair value corresponds to the market value of the shares on the grant date.
2007/08
In Bang & Olufsen a/s the following amount has been recognised
as part of the employee costs regarding the employee shares 4.1
parent company
2008/09 2007/08
Dividend
Dividend received from subsidiaries 230.0 916.5
Dividend received from associates 1.0 -
Dividend received 231.0 916.5
Notes …
5 …
6 …
Back to FINANCIAl REpORT AND NOTESBack to pROFIT AND lOSS ACCOuNT

96
Group Parent company
(DKK million) 2008/09 2007/08 2008/09 2007/08
Financial income
Interest income from banks etc. 2.2 4.4 0.5 1.6
Interest income from subsidiaries 64.2 40.7
Interest income from associates - 0.1 - 0.1
Exchange rate gains, net - - - 16.4
Other financial income 9.2 15.5 - 0.2
Financial income 11.4 20.0 64.7 59.0
Financial costs
Interest costs on mortgage loans 16.0 11.8 13.5 10.0
Interest costs on bank loans etc. 14.6 14.8 14.5 11.9
Interest costs to subsidiaries 14.9 11.5
Exchange rate losses, net 7.2 12.3 8.1 -
Other financial costs 3.4 10.9 2.6 2.7
Financial costs 41.2 49.8 53.6 36.1
Tax on result for the year
parent company:
Current tax - (29.6) - (29.6)
Change in current tax due to change in tax rate - 0.6 - 0.6
Change in deferred tax (132.8) (16.3) (132.8) (16.3)
Change in deferred tax due to change in tax rate - (8.5) - (8.5)
Adjustment to previous years, current tax (9.1) 16.2 (9.1) 16.2
Adjustment to previous years, deferred tax 2.5 11.8 2.5 11.8
Total, parent company (139.4) (25.8) (139.4) (25.8)
Subsidiaries:
Current tax 16.5 98.4
Corrections - 1.7
Change in current tax due to change in tax rate - (11.3)
Change in deferred tax (18.5) (0.6)
Change in deferred tax due to change in tax rate - 0.6
Adjustment to previous years, current tax (6.9) (22.6)
Adjustment to previous years, deferred tax 7.1 1.0
Total, subsidiaries (1.8) 67.2
Total tax for the year (141.2) 41.4 (139.4) (25.8)
Tax for the year is recognised as follows:
Tax recognised in the profit and loss account (140.2) 41.4 (138.4) (25.8)
Tax recognised directly in equity, deferred tax asset (1.0) - (1.0) -
Notes …
7 …
8 …
9 …
Parantheses denote negative figures or figures to be deducted.
Back to FINANCIAl REpORT AND NOTES Back to pROFIT AND lOSS ACCOuNT

97
Notes …
9 …
10 …
Group Parent company
(DKK million) 2008/09 2007/08 2008/09 2007/08
Tax on result for the year (continued)
Tax on result for the year is specified as follows:
Calculated tax of result before tax (130.8) 38.4 (72.8) 188.2
Tax effect of:
Non-deductible costs and
non-taxable income 2.3 3.8 1.3 0.5
Deviating tax rate in foreign subsidiaries (6.2)
Reduction of the tax rate from 28 % to 25 % - (18.6) - (7.9)
Adjustment of tax relating to previous years (6.4) 6.4 (6.6) 28.0
Non-capitalised tax losses 1.7 3.5 - -
Foreign withholding tax 0.2 - - -
Non-taxable dividend from investments in subsidiaries (60.0) (229.1)
Other (1.0) (2.1) (0.3) (5.5)
(140.2) 41.4 (138.4) (25.8)
Danish income tax rate 25.0 % 25.0 % 25.0 % 25.0 %
Tax effect of:
Non-deductible costs and
non-taxable income (0.4 %) 2.5 % (0.4 %) 0.1 %
Deviating tax rate in foreign subsidiaries 1.1 % 6.5 %
Reduction of the tax rate from 28 % to 25 % - (12.1 %) - (1.0 %)
Adjustment of tax relating to previous years 1.2 % 4.2 % 2.3 % 3.7 %
Non-capitalised tax losses (0.3 %) 2.2 % - -
Foreign withholding tax - - - -
Non-taxable dividend from investments in subsidiaries 20.6 % (30.4 %)
Other 0.2 % (1.4 %) 0.1 % (0.8 %)
Average effective tax rate for the year 26.8 % 26.9 % 47.6 % (3.4 %)
Income tax paid including tax paid on account for the jointly-taxed Danish companies amounts to DKK 13.3 million in 2008/09
(DKK 82.0 million in 2007/08). The parent company pays current tax for jointly taxed Danish companies.
Minority interests’ share of result for the year
Bang & Olufsen ICEpower a/s - 2.4
OÜ BO-Soft 2.3 5.2
Minority interests’ share of result for the year 2.3 7.6
Parantheses denote negative figures or figures to be deducted.
Back to FINANCIAl REpORT AND NOTESBack to pROFIT AND lOSS ACCOuNT

98
Notes …
11 …
Group
(DKK million) 2008/09 2007/08
Earnings per share
The calculation of earnings per share and diluted earnings per share for the present year and the comparison year is adjusted in
accordance with IAS 33, Earnings per Share, since the number of outstanding shares has increased following the rights issue, which
included a bonus element, to existing share holders.
The market value of the ordinary share was DKK 85 immediately before the share issue in May 2009, and the offer price for the new
shares was DKK 19, cf. prospectus published at 16 April 2009.
Result for the year (382.8) 112.3
Minority interests’ share of result for the year (2.3) (7.6)
The shareholders of the parent company's
share of result for the year (385.1) 104.7
Average number of shares 25,660,229 25,046,676
Average number of own shares (1,078,509) (1,461,187)
Average number of shares in circulation 24,581,720 23,585,489
Average dilutive effect of outstanding share options - -
Average number of shares in circulation - diluted 24,581,720 23,585,489
Earnings per share, DKK (15.7) 4.4
Diluted earnings per share, DKK (15.7) 4.4
Earnings per share from continuing operations, DKK (15.7) 4.4
Diluted earnings per share from continuing operations, DKK (15.7) 4.4
The calculation of earnings per share from continuing operations is made on the same basis as the calculation of earnings per share, since
no discontinued operations exist in 2008/09 or 2007/08.
In the period until 1 August 2009 the average number of circulating shares is unchanged.
Parantheses denote negative figures or figures to be deducted.
Back to FINANCIAl REpORT AND NOTES Back to pROFIT AND lOSS ACCOuNT

99
(DKK million)
Intangible assets
Completed Development
Acquired development projects in
Group Goodwill rights projects progress Total
Cost price 1 June 2007 44.8 144.8 795.4 116.2 1,101.2
Amortisation and impairment losses 1 June 2007 - (100.4) (550.8) - (651.2)
Carrying amount 1 June 2007 44.8 44.4 244.6 116.2 450.0
Cost price 1 June 2007 44.8 144.8 795.4 116.2 1,101.2
Exchange rate adjustment to year-end rate (0.1) - - - (0.1)
Additions during the year 2.5 3.8 17.8 100.8 124.9
Disposals during the year - (0.1) (128.5) (1.6) (130.2)
Completed development projects - - 102.9 (102.9) -
Cost price 31 May 2008 47.2 148.5 787.6 112.5 1,095.8
Amortisation and impairment losses 1 June 2007 - (100.4) (550.8) - (651.2)
Amortisation during the year - (7.2) (146.5) - (153.7)
Reversed amortisation on disposals during the year - 0.2 128.5 - 128.7
Impairment losses during the year (2.4) - - - (2.4)
Amortisation and impairment losses 31 May 2008 (2.4) (107.4) (568.8) - (678.6)
Carrying amount 31 May 2008 44.8 41.1 218.8 112.5 417.2
Cost price 31 May 2008 47.2 148.5 787.6 112.5 1,095.8
Amortisation and impairment losses 31 May 2008 (2.4) (107.4) (568.8) - (678.6)
Carrying amount 31 May 2008 44.8 41.1 218.8 112.5 417.2
Cost price 1 June 2008 47.2 148.5 787.6 112.5 1,095.8
Exchange rate adjustment to year-end rate (0.3) - - - (0.3)
Additions during the year 0.5 19.1 40.8 154.9 215.3
Disposals during the year - (6.3) (95.4) - (101.7)
Completed development projects - - 82.4 (82.4) -
Cost price 31 May 2009 47.4 161.3 815.4 185.0 1,209.1
Amortisation and impairment losses 1 June 2008 (2.4) (107.4) (568.8) - (678.6)
Exchange rate adjustment to year-end rate 0.3 - - - 0.3
Amortisation during the year - (8.3) (130.0) - (138.3)
Reversed amortisation on disposals during the year - 5.2 95.4 - 100.6
Impairment losses during the year (0.5) - (11.4) - (11.9)
Amortisation and impairment losses 31 May 2009 (2.6) (110.5) (614.8) - (727.9)
Carrying amount 31 May 2009 44.8 50.8 200.6 185.0 481.2
Cost price 31 May 2009 47.4 161.3 815.4 185.0 1,209.1
Amortisation and impairment losses 31 May 2009 (2.6) (110.5) (614.8) - (727.9)
Carrying amount 31 May 2009 44.8 50.8 200.6 185.0 481.2
No contractual obligations regarding purchase of intangible assets exist.
Notes …
12 …
NOTES TO ThE BAlANCE ShEET
Parantheses denote negative figures or figures to be deducted.
Back to FINANCIAl REpORT AND NOTESBack to BAlANCE ShEET ASSETS

100
(DKK million)
Intangible assets (continued)
Completed Development
Acquired development projects in
Parent company Goodwill rights projects progress Total
Cost price 1 June 2007 3.2 126.2 581.0 108.4 818.8
Amortisation and impairment losses 1 June 2007 - (88.0) (360.7) - (448.7)
Carrying amount 1 June 2007 3.2 38.2 220.3 108.4 370.1
Cost price 1 June 2007 3.2 126.2 581.0 108.4 818.8
Additions during the year - 4.0 14.5 91.1 109.6
Disposals during the year - (0.1) (36.2) (1.6) (37.9)
Completed development projects - - 100.9 (100.9) -
Cost price 31 May 2008 3.2 130.1 660.2 97.0 890.5
Amortisation and impairment losses 1 June 2007 - (88.0) (360.7) - (448.7)
Amortisation during the year - (6.3) (131.2) - (137.5)
Reversed amortisation on disposals during the year - 0.1 36.2 - 36.3
Amortisation and impairment losses 31 May 2008 - (94.2) (455.7) - (549.9)
Carrying amount 31 May 2008 3.2 35.9 204.5 97.0 340.6
Cost price 31 May 2008 3.2 130.1 660.2 97.0 890.5
Amortisation and impairment losses 31 May 2008 - (94.2) (455.7) - (549.9)
Carrying amount 31 May 2008 3.2 35.9 204.5 97.0 340.6
Cost price 1 June 2008 3.2 130.1 660.2 97.0 890.5
Additions during the year, intra-group business combination - - 91.5 3.5 95.0
Additions during the year - 19.1 40.1 149.0 208.2
Disposals during the year - (5.0) (95.4) - (100.4)
Completed development projects - - 75.7 (75.7) -
Cost price 31 May 2009 3.2 144.2 772.1 173.8 1,093.3
Amortisation and impairment losses 1 June 2008 - (94.2) (455.7) - (549.9)
Additions during the year, intra-group business combination - - (82.2) - (82.2)
Amortisation during the year - (7.6) (127.0) - (134.6)
Reversed amortisation on disposals during the year - 5.0 95.4 - 100.4
Impairment losses during the year - - (11.4) - (11.4)
Amortisation and impairment losses 31 May 2009 - (96.8) (580.9) - (677.7)
Carrying amount 31 May 2009 3.2 47.4 191.2 173.8 415.6
Cost price 31 May 2009 3.2 144.2 772.1 173.8 1,093.3
Amortisation and impairment losses 31 May 2009 - (96.8) (580.9) - (677.7)
Carrying amount 31 May 2009 3.2 47.4 191.2 173.8 415.6
No contractual obligations regarding purchase of intangible assets exist.
Notes …
12 …
Parantheses denote negative figures or figures to be deducted.
Back to FINANCIAl REpORT AND NOTES Back to BAlANCE ShEET ASSETS

101
(DKK million)
Tangible assets
leasehold Tangible
land and plant and Other improve- assets in
Group buildings machinery equipment ments progress Total
Cost price 1 June 2007 480.5 1,080.8 242.7 68.4 62.2 1,934.6
Depreciation and impairment losses 1 June 2007 (228.4) (877.0) (172.0) (39.3) - (1,316.7)
Carrying amount 1 June 2007 252.1 203.8 70.7 29.1 62.2 617.9
Cost price 1 June 2007 480.5 1,080.8 242.7 68.4 62.2 1,934.6
Exchange rate adjustment to year-end rate 8.5 0.9 1.6 (3.9) 0.4 7.5
Reclassification 12.6 17.4 (30.0) - - -
Additions during the year 24.9 60.9 20.5 9.3 74.8 190.4
Completed assets 0.3 40.1 1.3 - (41.7) -
Disposals during the year (2.3) (51.2) (15.7) (4.9) (14.9) (89.0)
Cost price 31 May 2008 524.5 1,148.9 220.4 68.9 80.8 2,043.5
Depreciation and impairment losses 1 June 2007 (228.4) (877.0) (172.0) (39.3) - (1,316.7)
Exchange rate adjustment to year-end rate (0.4) (0.2) 1.0 2.3 - 2.7
Reclassification (1.3) (4.7) 6.0 - - -
Depreciation during the year (20.2) (93.6) (18.3) (7.4) - (139.5)
Reversed depreciation on disposals during the year 0.2 48.4 12.9 4.2 - 65.7
Depreciation and impairment losses 31 May 2008 (250.1) (927.1) (170.4) (40.2) - (1,387.8)
Carrying amount 31 May 2008 274.4 221.8 50.0 28.7 80.8 655.7
Cost price 31 May 2008 524.5 1,148.9 220.4 68.9 80.8 2,043.5
Depreciation and impairment losses 31 May 2008 (250.1) (927.1) (170.4) (40.2) - (1,387.8)
Carrying amount 31 May 2008 274.4 221.8 50.0 28.7 80.8 655.7
Cost price 1 June 2008 524.5 1,148.9 220.4 68.9 80.8 2,043.5
Exchange rate adjustment to year-end rate (5.5) (3.7) (1.0) 0.2 (0.5) (10.5)
Additions during the year 9.8 50.3 18.8 12.2 20.3 111.4
Completed assets 9.7 48.5 0.9 1.2 (60.3) -
Disposals during the year (1.6) (37.7) (10.2) (9.3) (7.1) (65.9)
Cost price 31 May 2009 536.9 1,206.3 228.9 73.2 33.2 2,078.5
Depreciation and impairment losses 1 June 2008 (250.1) (927.1) (170.4) (40.2) - (1,387.8)
Exchange rate adjustment to year-end rate (0.2) 1.1 0.6 - - 1.5
Depreciation during the year (18.3) (86.0) (18.3) (8.7) - (131.3)
Reversed depreciation on disposals during the year 1.6 35.2 7.6 8.4 - 52.8
Impairment losses during the year - - - (0.5) - (0.5)
Depreciation and impairment losses 31 May 2009 (267.0) (976.8) (180.5) (41.0) - (1,465.3)
Carrying amount 31 May 2009 269.9 229.5 48.4 32.2 33.2 613.2
Cost price 31 May 2009 536.9 1,206.3 228.9 73.2 33.2 2,078.5
Depreciation and impairment losses 31 May 2009 (267.0) (976.8) (180.5) (41.0) - (1,465.3)
Carrying amount 31 May 2009 269.9 229.5 48.4 32.2 33.2 613,2
Notes …
13 …
Parantheses denote negative figures or figures to be deducted.
Back to FINANCIAl REpORT AND NOTESBack to BAlANCE ShEET ASSETS

102
(DKK million)
Tangible assets (continued)
Tangible assets in general
Neither in 2008/09 nor 2007/08 subsidies regarding acquisitions of tangible assets have been received, and there are no unfulfilled
conditions regarding subsidies that have been received in the past. No contractual obligations regarding purchase of tangible assets exist.
Property
The cash value of property in Denmark according to the most recent valuation is DKK 331.8 million (DKK 297.0 million in 2007/08).
The cash value of property contains land and buildings as well as investment property. The cost price of foreign property is DKK 138.6
million (DKK 139.1 million in 2007/08).
leasehold Tangible
land and plant and Other improve- assets in
Parent company buildings machinery equipment ments progress Total
Cost price 1 June 2007 201.3 22.7 133.6 1.3 0.6 359.5
Depreciation and impairment losses 1 June 2007 (111.9) (12.9) (106.3) (1.2) - (232.3)
Carrying amount 1 June 2007 89.4 9.8 27.3 0.1 0.6 127.2
Cost price 1 June 2007 201.3 22.7 133.6 1.3 0.6 359.5
Additions during the year 2.9 0.8 14.7 - 6.6 25.0
Completed assets - - 0.3 - (0.5) (0.2)
Disposals during the year (0.5) (0.2) (1.0) - - (1.7)
Cost price 31 May 2008 203.7 23.3 147.6 1.3 6.7 382.6
Depreciation and impairment losses 1 June 2007 (111.9) (12.9) (106.3) (1.2) - (232.3)
Depreciation during the year (8.1) (1.8) (11.4) - - (21.3)
Reversed depreciation on disposals during the year - 0.2 1.0 - - 1.2
Depreciation and impairment losses 31 May 2008 (120.0) (14.5) (116.7) (1.2) - (252.4)
Carrying amount 31 May 2008 83.7 8.8 30.9 0.1 6.7 130.2
Cost price 31 May 2008 203.7 23.3 147.6 1.3 6.7 382.6
Depreciation and impairment losses 31 May 2008 (120.0) (14.5) (116.7) (1.2) - (252.4)
Carrying amount 31 May 2008 83.7 8.8 30.9 0.1 6.7 130.2
Cost price 1 June 2008 203.7 23.3 147.6 1.3 6.7 382.6
Additions during the year 4.1 1.5 8.8 - - 14.4
Completed assets - 0.5 0.9 - (6.5) (5.1)
Disposals during the year (0.5) (1.0) (2.4) (0.3) (0.2) (4.4)
Cost price 31 May 2009 207.3 24.3 154.9 1.0 - 387.5
Depreciation and impairment losses 1 June 2008 (120.0) (14.5) (116.7) (1.2) - (252.4)
Depreciation during the year (5.8) (1.9) (11.6) - - (19.3)
Reversed depreciation on disposals during the year 0.5 0.9 2.4 0.2 - 4.0
Depreciation and impairment losses 31 May 2009 (125.3) (15.5) (125.9) (1.0) - (267.7)
Carrying amount 31 May 2009 82.0 8.8 29.0 - - 119.8
Cost price 31 May 2009 207.3 24.3 154.9 1.0 - 387.5
Depreciation and impairment losses 31 May 2009 (125.3) (15.5) (125.9) (1.0) - (267.7)
Carrying amount 31 May 2009 82.0 8.8 29.0 - - 119.8
Notes …
13 …
Parantheses denote negative figures or figures to be deducted.
Back to FINANCIAl REpORT AND NOTES Back to BAlANCE ShEET ASSETS

103
Notes …
13 …
14 …
(DKK million)
Tangible assets (continued)
Tangible assets in general
Neither in 2008/09 nor 2007/08 subsidies regarding acquisitions of tangible assets have been received, and there are no unfulfilled
conditions regarding subsidies that have been received in the past. No contractual obligations regarding purchase of tangible assets exist.
Property
The cash value of property in Denmark according to the most recent valuation is DKK 331.8 million (DKK 243.0 million in 2007/08).
The cash value of property contains land and buildings as well as investment property.
Group Parent company
Investment property 2008/09 2007/08 2008/09 2007/08
Cost price 1 June 80.3 80.3 183.2 181.1
Depreciation and impairment losses 1 June (27.5) (23.9) (110.0) (102.7)
Carrying amount 1 June 52.8 56.4 73.2 78.4
Cost price 1 June 80.3 80.3 183.2 181.1
Additions during the year, intra-group business combination - - 79.0 -
Additions during the year - - 5.2 1.9
Completed assets - - 5.1 0.2
Disposals during the year - - (1.1) -
Cost price 31 May 80.3 80.3 271.4 183.2
Depreciation and impairment losses 1 June (27.5) (23.9) (110.0) (102.7)
Additions during the year, intra-group business combination - - (26.7) -
Depreciation during the year (3.7) (3.6) (10.8) (7.3)
Reversed depreciation on disposals during the year - - 1.1 -
Depreciation and impairment losses 31 May (31.2) (27.5) (146.4) (110.0)
Carrying amount 31 May 49.1 52.8 125.0 73.2
Cost price 31 May 80.3 80.3 271.4 183.2
Depreciation and impairment losses 31 May (31.2) (27.5) (146.4) (110.0)
Carrying amount 31 May 49.1 52.8 125.0 73.2
The Group’s investment property is a house that is used only for rental purposes, and the property that is used by the associated company
Bang & Olufsen Medicom a/s. Some of the parent company’s buildings are investment property, since these are owned solely for rental to
the other companies in the Group.
All investment property is located in Struer and is used for production, storage and offices. Due to the location of the investment
property it is not possible to estimate the fair value of the property, since the fair value is completely dependent on the companies in the
Group’s continued use of the property. Furthermore it is not possible to establish a range of estimates within which the fair value of the
investment property is most likely to be. Independent valuers have not been used.
No contractual obligations to purchase, construct or develop investment property exist. Furthermore no contractual obligations regarding
repairs, maintenance or enhancements of the investment property exist.
Parantheses denote negative figures or figures to be deducted.
Back to FINANCIAl REpORT AND NOTESBack to BAlANCE ShEET ASSETS

104
(DKK million)
Investment property (continued)
Investment property, Group
Rental income from the investment property of DKK 5.2 million has been received in 2008/09 (DKK 5.1 million in 2007/08). In the same
period the direct operating expenses regarding the investment property that generated rental income were DKK 3.1 million (DKK 3.9
million in 2007/08).
The properties are leased on operating leases with a remaining duration of 24 months. According to the existing operating leases a rental
income of DKK 5.4 million will be received in 2009/10.
Investment property, parent company
In 2008/09 DKK 43.0 million have been received in rental income from the investment property (DKK 42.9 million in 2007/08). In the
same period the direct operating expenses regarding the investment property that generated rental income were DKK 18.8 million (DKK
18.1 million in 2007/08).
The parent company’s investment property is rented to the subsidiaries on operating leases with a lease term of 3 months. According to
the existing operating leases the parent company will receive a rental income of DKK 11.7 million in the 3 months, which are included in
the lease term of the operating leases.
Impairment of non-current assets
Intangible assets – impairment losses during the year
In 2008/09 an impairment loss of DKK 11.4 million is recognised on completed development projects in the Group and the parent
company. DKK 7.3 million is related to an impairment loss on the development project regarding Advance Sound System to Audi Q7.
The impairment loss is recognised due to sales below expectations for the model concerned. The remaining part of the impairment loss is
related to 3 smaller development projects, which are written down due to the fact that the products are being phased out of the product
programme (in connection with the Group's strategy "pole position").
In the Group an impairment loss on goodwill of DKK 0.5 million (DKK 2.4 million in 2007/08) is recognised. The impairment losses are
recognised in the English subsidiary in connection with the purchase of shops.
No impairment losses on other intangible assets except for the above mentioned are recognised in 2008/09 or 2007/08 in the Group or
the parent company.
The assessment of the recoverable amount of the intangible assets is based on calculations of value in use of the assets.
The value in use is calculated based on expected future cash flows from the assets according to the budgets approved by management
over the expected lifetime of the assets, and a discount rate before tax of 10 %.
Tangible assets – impairment losses during the year
In 2008/09 an impairment loss of DKK 0.5 million on leasehold improvements is recognised in the English subsidiary due to the
discontinued use of certain leased premises in connection with the establishment of the single, global sales organisation.
No impairment losses on other tangible assets than the above mentioned are recognised in 2008/09 in the Group or the parent company.
No impairment losses on tangible assets were recognised in the Group or the parent company in 2007/08.
The assessment of the recoverable amount of the tangible assets is based on calculations of value in use of the assets. The value in use
is calculated based on expected future cash flows from the assets according to the budgets approved by management over the expected
lifetime of the assets, and a discount rate before tax of 10 %.
Financial assets – impairment losses during the year
No impairment losses on financial assets are recognised in the Group or the parent company in 2008/09 or 2007/08, except from what
appears from note 18.
Notes …
14 …
15 …
Back to FINANCIAl REpORT AND NOTES Back to BAlANCE ShEET ASSETS

105
Group Parent company
(DKK million) 2008/09 2007/08 2008/09 2007/08
Investments in subsidiaries
Cost price 1 June 722.8 722.6
Additions during the year 23.7 0.2
Disposals during the year (27.0) -
Cost price 31 May 719.5 722.8
For a list of subsidiaries please refer to note 44.
Investments in associates
Cost price 1 June 19.0 19.0 2.0 2.0
Additions during the year 3.6 - 3.6 -
Cost price 31 May 22.6 19.0 5.6 2.0
Revaluations and impairment losses 1 June (12.7) (3.2)
Share of result for the year after tax 2.3 (11.2)
Negative investment offset against receivable (1.7) 1.7
Distributed dividend (1.0) -
Revaluations and impairment losses 31 May (13.1) (12.7)
Carrying amount 31 May 9.5 6.3 5.6 2.0
Bang & Olufsen’s share
Owners Total Total Share Result for Result for
Name and registered office share assets liabilities capital Equity the year Equity the year
Bang & Olufsen Medicom a/s, Struer 35 % 26.4 17.7 9.4 8.7 3.5 3.1 1.2
John Bjerrum Nielsen A/S, Bramming 33 % 43.6 21.3 10.0 19.3 3.3 6.4 1,1
Notes …
16 …
17 …
Parantheses denote negative figures or figures to be deducted.
Back to FINANCIAl REpORT AND NOTESBack to BAlANCE ShEET ASSETS

106
Group Parent company
(DKK million) 2008/09 2007/08 2008/09 2007/08
Other financial receivables
Other financial receivables (gross) 1 June 69.7 105.4 3.0 0.2
Exchange rate adjustment to year-end rate (2.1) (7.7) - -
Movements during the year (net) 10.8 (28.0) - 2.8
Other financial receivables (gross) 31 May 78.4 69.7 3.0 3.0
Write-down for expected losses 1 June (17.7) (17.2) - -
Exchange rate adjustment to year-end rate 0.7 0.7 - -
Change in write-down during the year (4.6) (18.4) - -
Actual losses during the year 3.6 17.2 - -
Write-down for expected losses 31 May (18.0) (17.7) - -
Other financial receivables (net) 31 May 60.4 52.0 3.0 3.0
The write-down of other financial receivables is recognised in the profit and loss account as part of distribution and marketing costs.
The write-down is based on an individual assessment of the ability to pay of each individual debtor. The Group and the parent company
have no overdue other financial receivables, for which no write-down is recognised.
The fair value of other financial receivables in the Group amounts to DKK 59.4 million (DKK 49.6 million in 2007/08). The fair value in the
parent company amounts to DKK 2.2 million (DKK 2.0 million in 2007/08). The fair value is calculated as the present value of the future
expected cash flows from the receivables.
Deferred tax assets
Non- Tax loss
current Inven- Receiv- carry-
Group assets tories ables provisions forwards Other Total
Deferred tax assets 1 June 2007 3.7 0.2 1.5 11.8 3.7 0.3 21.2
Exchange rate adjustment to year-end rate 0.1 - - - - - 0.1
Recognised in the profit and loss account (0.2) 0.5 4.6 0.3 (3.7) (0.1) 1.4
Deferred tax assets 31 May 2008 3.6 0.7 6.1 12.1 - 0.2 22.7
Transferred from deferred taxes (73.2) - - 0.5 - - (72.7)
Exchange rate adjustment to year-end rate (0.2) - (0.2) (0.3) - - (0.7)
Recognised in the profit and loss account (5.3) (9.7) (1.4) 8.9 158.8 2.2 153.5
Recognised in equity - - - - 1.0 - 1.0
Deferred tax assets 31 May 2009 (75.1) (9.0) 4.5 21.2 159.8 2.4 103.8
Parent company
Deferred tax assets 31 May 2008 - - - - - - -
Transferred from deferred taxes (73.2) - - 0.5 - - (72.7)
Additions during the year, intra-group
business combination (4.6) - - - - - (4.6)
Recognised in the profit and loss account (15.8) - (1.5) - 146.6 - 129.3
Recognised in equity - - - - 1.0 - 1.0
Deferred tax assets 31 May 2009 (93.6) - (1.5) 0.5 147.6 - 53.0
Notes …
18 …
19 …
Parantheses denote negative figures or figures to be deducted.
Back to FINANCIAl REpORT AND NOTES Back to BAlANCE ShEET ASSETS

107
Group Parent company
(DKK million) 2008/09 2007/08 2008/09 2007/08
Deferred tax assets (continued)
Deferred tax assets relate to the subsidiaries in Denmark, Norway, Sweden, Germany, the uK, Belgium, France, Italy, Spain, Australia and
Singapore. Deferred tax assets have been calculated based on local tax rates. In the jointly-taxed Danish companies a deferred tax asset,
gross of DKK 159,8 million has been recognised in 2008/09 (DKK 147,6 million in the parent company in 2008/09,
DKK 0.0 million in the Group and the parent company in 2007/08) based on tax loss carry-forwards, which can be carried forward
indefinitely. This deferred tax asset has been recognised due to the management´s expectations of the Group´s long-term earnings.
Deferred tax assets relating to the subsidiary in the uS have not been recognised in 2008/09 or 2007/08. The unrecognised deferred tax
assets amount to DKK 83.5 million (DKK 79.1 million in 2007/08). The basis for the unrecognised deferred tax assets includes tax losses
of DKK 163.2 million (DKK 141.8 million in 2007/08). The tax losses can be carried forward for a period of 1 - 20 years.
Inventories
Raw materials 121.4 124.1 - -
Work in progress 34.4 40.0 - -
Spare parts 150.6 166.4 - -
Finished goods 291.4 470.9 1.2 1.4
Inventories 31 May 597.8 801.4 1.2 1.4
The following amounts of the carrying amount are
expected to be realised after more than 12 months:
Spare parts 108.0 96.4 - -
Inventories 31 May 108.0 96.4 - -
The Group pursues a policy of being able to supply spare parts for product repairs for up to 12 years after the products are sold
Consequently, a large proportion of the spare parts is not expected to be sold until after 12 months.
Carrying amount of inventories recognised at
net realisable value 0.9 0.7 - -
Inventory consumption recognised as part of
production costs during the year 1,289.0 1,754.3 0.2 0.1
Write-down of inventories recognised as part of
production costs during the year 37.7 23.1 - -
Reversal of write-down of inventories recognised
as part of production costs during the year 20.7 17.5 - -
The reversal of write-down of inventories during the year was made due to the fact that sales of the inventories, which were written-
down, exceeding the expected. The reversal of write-down of inventories last year was made due to the same circumstances.
Notes …
19 …
20 …
Back to FINANCIAl REpORT AND NOTESBack to BAlANCE ShEET ASSETS

108
Group Parent company
(DKK million) 2008/09 2007/08 2008/09 2007/08
Trade receivables
Trade receivables (gross) 31 May 500.3 662.5 - -
Write-down for expected losses 1 June (69.5) (52.9) - -
Exchange rate adjustment to year-end rate (0.3) 2.7 - -
Change in write-down during the year (55.8) (30.5) - -
Actual losses during the year 33.2 11.2 - -
Write-down for expected losses 31 May (92.4) (69.5) - -
Trade receivables (net) 31 May 407.9 593.0 - -
All trade receivables fall due within 1 year.
The write-down of trade receivables is recognised in the profit and loss account as part of distribution and marketing costs. The write-
down is based on an individual assessment of the ability to pay of each individual debtor. The Group and parent company have no overdue
trade receivables, for which no write-down is recognised.
The fair value of trade receivables in the Group amounts to DKK 407.9 million (DKK 593.0 million in 2007/08), while the fair value in the
parent company amounts to DKK 0.0 million (DKK 0.0 million in 2007/08). The carrying amount of receivables that fall due within 1 year is
expected to be a reasonable approximation of the fair value.
Receivables from subsidiaries
Receivables from subsidiaries (net) 31 May 759.6 921.4
All receivables from subsidiaries fall due within 1 year.
There has been no need for write-down of receivables from subsidiaries.
The fair value of receivables from subsidiaries amounts to DKK 759.6 million (DKK 921.4 million in 2007/08). The carrying amount of
receivables that fall due within 1 year is expected to be a reasonable approximation of the fair value.
Receivables from associates
Receivables from associates (net) 31 May 1.4 2.1 - -
Negative investment offset against receivable - (1.7) - -
Transferred to payables to associates - (0.4) - -
Receivables from associates (net) 31 May 1.4 - - -
All receivables from associates fall due within 1 year.
There has been no need for write-down of receivables from associates.
The fair value of receivables from associates in the Group amounts to DKK 1.4 million (DKK 0.0 million in 2007/08).
The fair value of receivables from associates in the parent company amounts to DKK 0.0 million (DKK 0.0 million in 2007/08). The carrying
amount of receivables that fall due within 1 year is expected to be a reasonable approximation of the fair value.
Notes …
21 …
22 …
23 …
Parantheses denote negative figures or figures to be deducted.
Back to FINANCIAl REpORT AND NOTES Back to BAlANCE ShEET ASSETS

109
Group Parent company
(DKK million) 2008/09 2007/08 2008/09 2007/08
Income tax receivable
Income tax receivable 1 June 39.7 27.0 9.2 28.4
Exchange rate adjustment to year-end rate (1.4) (0.4) - -
Additions during the year, intra-group business combination - - 12.8 -
Adjustment previous years (9.1) (1.6) 9.1 (16.2)
The year’s current tax incl. jointly taxed subsidiaries 2.8 1.0 - 29.6
Change in tax rate - - - (0.6)
Income tax paid 11.0 29.7 13.3 -
Income tax refunded (9.1) (2.5) - (32.0)
Intra-group transfers due to joint taxation (44.2) -
Transferred to income tax payable (12.2) (13.5) - -
Income tax receivable 31 May 21.7 39.7 0.2 9.2
DKK 0.0 million of the income tax receivable in the Group is expected to be received after 1 year (DKK 0.0 million in 2007/08). DKK 0.0
million of the income tax receivable in the parent company is expected to be received after 1 year (DKK 0.0 million in 2007/08).
Other receivables
Value added tax receivable 8.4 17.5 - 9.8
Deposits 9.4 7.4 1.3 1.3
Other receivables 13.8 14.0 1.0 1.5
Other receivables 31 May 31.6 38.9 2.3 12.6
All other receivables fall due within 1 year.
There has been no need for write-down of other receivables.
The fair value of other receivables in the Group amounts to DKK 31.6 million (DKK 38.9 million in 2007/08), while the fair value in the
parent company amounts to DKK 2.3 million (DKK 12.6 million in 2007/08). The carrying amount of receivables that fall due within
1 year is expected to be a reasonable approximation of the fair value.
Share capital
As at 31 May, the share capital comprises:
36,244,014 shares of DKK 10.00 362.4 - 362.4 -
1,085,543 ordinary shares of DKK 10.00 (multiple voting shares) - 10.8 - 10.8
10,995,795 ordinary shares of DKK 10.00 - 110.0 - 110.0
362.4 120.8 362.4 120.8
During the spring 2009, Bang & Olufsen a/s completed a capital increase in the form of a rights issue. At the same time the share classes
were merged into one share class.
Each share of DKK 10.00 gives 1 vote after the merger of the share classes. previously each ordinary share (multiple voting share) of
DKK 10.00 gave 10 votes, while each ordinary share of DKK 10.00 gave 1 vote.
Notes …
24 …
25 …
26 …
Parantheses denote negative figures or figures to be deducted.
Back to FINANCIAl REpORT AND NOTESBack to BAlANCE ShEET ASSETSBack to BAlANCE ShEET EQuITy AND lIABIlITIES

110
Group Parent company
(DKK million) 2008/09 2007/08 2008/09 2007/08
Share capital (continued)
Number of shares 1 June - - - -
Merger of share classes, former ordinary shares
(multiple voting shares) 1,085,543 - 1,085,543 -
Merger of share classes, former ordinary shares 10,995,795 - 10,995,795 -
Capital increase 24,162,676 - 24,162,676 -
Number of shares 31 May 36,244,014 - 36,244,014 -
Number of ordinary shares (multiple voting shares) 1 June 1,085,543 1,085,543 1,085,543 1,085,543
Merger of share classes (1,085,543) - (1,085,543) -
Number of ordinary shares (multiple voting shares) 31 May - 1,085,543 - 1,085,543
Number of ordinary shares 1 June 10,995,795 10,995,795 10,995,795 10,995,795
Merger of share classes (10,995,795) - (10,995,795) -
Number of ordinary shares 31 May - 10,995,795 - 10,995,795
Own shares:
Number of shares 110,076 - 110,076 -
Number of ordinary shares - 767,787 - 767,787
Number of own shares 110,076 767,787 110,076 767,787
Nominal value, DKK million 1.1 7.7 1.1 7.7
% of share capital, year-end 0.3 6.4 0.3 6.4
The Group’s own shares are reserved for the partial coverage of the share option programme, cf. note 5.
Acquisitions during the year:
Number of shares 200 164,893 200 164,893
Nominal value, DKK million - 1.6 - 1.6
% of share capital, year-end - 1.4 - 1.4
Total acquisition sum, DKK million - 100.2 - 100.2
The acquisitions were undertaken in accordance with the authority from the Annual General Meeting to purchase own shares with the
purpose of subsequent capital reductions and the coverage of the share option programme.
Disposals during the year:
Number of shares 657,911 20,029 657,911 20,029
Nominal value, DKK million 6.6 0.2 6.6 0.2
% of share capital, year-end 1.8 0.1 1.8 0.1
Total sales sum, DKK million 46.0 1.6 46.0 1.6
In 2008/09 21,911 own shares were used (20,029 in 2007/08). Of these 0 were used for the exercise of share options and 21,911 have
been granted as employee shares (in 2007/08 3,000 were used for the exercise of share options and 17,029 were granted as employee
shares).
Notes …
26 …
Parantheses denote negative figures or figures to be deducted.
Back to FINANCIAl REpORT AND NOTES Back to BAlANCE ShEET EQuITy AND lIABIlITIES

111
Group
(DKK million) 2008/09 2007/08
Retained earnings
In the 2008/09 financial year DKK 36.2 million have been paid as dividend corresponding to DKK 3.00 per share (DKK 241.6 million
corresponding to DKK 20.00 per share in 2007/08). At the Annual General Meeting 18 September 2009 no dividend for the financial
year 2008/09 will be proposed.
Minority interests
Balance 1 June 12.1 6.0
Transfer to minority interests - 2.4
Minority interests’ share of result for the year 2.3 7.6
Dividend paid (12.1) (6.1)
Option for minority interest - 2.2
Balance 31 May 2.3 12.1
Pensions
Defined contribution plans:
In defined contribution plans, Bang & Olufsen recognises the premium payments (e.g. a fixed amount or a fixed percentage of the salary) for
independent insurance companies, which are responsible for the pension obligations, in the profit and loss account as they are paid. Once the
pension contributions for defined contribution plans have been paid, Bang & Olufsen has no further pension obligations to current or former
employees. The pension plans in the Danish and the majority of the foreign companies are all defined contribution plans.
In the Group DKK 33.7 million (DKK 38.8 million in 2007/08) have been recognised in the profit and loss account as costs related to
defined contribution plans. In the parent company DKK 12.0 million (DKK 20.2 million in 2007/08) have been recognised as costs related
to defined contribution plans.
Defined benefit plans:
In defined benefit plans, Bang & Olufsen is obliged to pay a certain benefit (e.g. retirement benefit as a fixed sum of the salary at
retirement). In defined benefit plans Bang & Olufsen carries the risk, since changes to the calculation basis result in changes in the
actuarially calculated capital value.
The major defined benefit plans in the Group include employees in Germany and Norway. In the consolidated financial statements, a net
obligation of DKK 6.2 million (DKK 8.3 million in 2007/08) has been recognised relating to the Group’s obligations to current or former
employees concerning defined benefit plans. The obligation is calculated after deduction of the plan assets. The parent company has no
defined benefit plans.
In the Group an income of DKK 0.4 million (an expense of DKK 0.7 million in 2007/08) has been recognised in the profit and loss
account regarding defined benefit plans.
Notes …
27 …
28 …
29 …
Parantheses denote negative figures or figures to be deducted.
Back to FINANCIAl REpORT AND NOTESBack to BAlANCE ShEET EQuITy AND lIABIlITIES

112
Group Parent company
(DKK million) 2008/09 2007/08 2008/09 2007/08
Pensions (continued)
present value of defined benefit obligation 26.5 29.0
Fair value of plan assets (20.1) (20.3)
unrecognised actuarial gains and losses (0.2) (0.4)
Defined benefit plans 31 May, net 6.2 8.3
Of which included as part of the liabilities 7.0 9.5
Of which included as part of the assets (0.8) (1.2)
Development in the present value of
the defined benefit obligation:
present value of the defined benefit obligation 1 June 29.0 28.1
Exchange rate adjustment to year-end rate (0.8) 0.2
Current service cost 0.5 1.3
Interest costs 0.9 1.3
Recognised actuarial gains and losses (3.0) (1.6)
Benefits paid (0.1) (0.3)
present value of the defined benefit obligation 31 May 26.5 29.0
Defined benefit obligation from plans that are wholly unfunded 5.6 4.1
Defined benefit obligation from plans that
are wholly or partly funded 20.9 24.9
Development in the fair value of plan
assets regarding defined benefit plans:
Fair value of plan assets 1 June 20.3 18.1
Exchange rate adjustment to year-end rate (0.9) 0.2
Expected return on plan assets 0.7 0.9
Recognised actuarial gains and losses (0.5) 0.5
Administration costs (0.1) (0.1)
Benefits paid (0.1) (0.1)
Contributions by the employer 0.7 0.8
Fair value of plan assets 31 May 20.1 20.3
Amounts recognised in the profit and loss account:
Current service cost 0.5 1.3
Interest costs on the obligation 0.9 1.3
Expected return on plan assets (0.7) (0.9)
Recognised actuarial gains and losses (1.2) (1.1)
Administration costs 0.1 0.1
Total amount recognised for defined benefit plans (0.4) 0.7
Total amount recognised for defined contribution plans 33.7 38.8 12.0 20.2
Total amount recognised in the profit and loss account, cf. note 5 33.3 39.5 12.0 20.2
Actual return on plan assets regarding
the defined benefit plans 1.4 -
Notes …
29 …
Parantheses denote negative figures or figures to be deducted.
Back to FINANCIAl REpORT AND NOTES Back to BAlANCE ShEET EQuITy AND lIABIlITIES

113
(DKK million)
Pensions (continued)
The defined benefit plan in Germany is partly funded by means of an independent pension fund. As at 31 May 2009, the actuarially
calculated net obligation is recognised in the Group’s balance sheet at DKK 3.9 million (DKK 4.8 million in 2007/08). The net obligation
is calculated as the present value of the future payments of DKK 11.7 million (DKK 12.3 million in 2007/08) less the fair value of the
pension fund's assets of DKK 7.8 million (DKK 7.5 million in 2007/08). The actuarial calculation is based on a calculation rate of 6.0 %
p.a., an expected rate of salary increase of 2.0 % p.a. and an expected rate of return of 4.0 % p.a. In the Group’s profit and loss account
the plan is recognised as an income of DKK 0.8 million (DKK 0.7 million in 2007/08).
The defined benefit plan in Norway is also partly funded by means of an independent pension fund. As at 31 May 2009 the actuarially
calculated net receivable is recognised in the Group’s balance sheet at DKK 0.9 million (DKK 1.2 million in 2007/08). The net receivable
is calculated as the fair value of the plan assets of DKK 6.2 million (DKK 8.9 million in 2007/08) less the present value of the future
payments of DKK 5.5 million (DKK 9.5 million in 2007/08) and added unrecognised actuarial losses of DKK 0.2 million (DKK 0.6 million in
2007/08). The actuarial calculation is based on a calculation rate of 5.0 % p.a., an expected rate of salary increase of 3.3 % p.a. and an
expected rate of return of 6.0 % p.a. In the Group’s profit and loss account the plan is recognised as an expense of DKK 0.4 million (DKK
0.6 million in 2007/08).
Deferred tax
Non- Share-
current Inven- Receiv- based
Group assets tories ables provisions payment Other Total
Deferred tax 1 June 2007 85.5 0.3 (8.4) (5.7) (3.9) - 67.8
Exchange rate adjustment to year-end rate (0.3) - - - - - (0.3)
Recognised in the profit and loss account (22.8) 7.5 14.6 (7.2) (2.2) 0.7 (9.4)
Recognised in equity - - - - 6.1 - 6.1
Deferred tax 31 May 2008 62.4 7.8 6.2 (12.9) - 0.7 64.2
Exchange rate adjustment to year-end rate 0.1 - - - - - 0.1
Transferred to deferred tax assets (73.2) - - 0.5 - - (72.7)
Recognised in the profit and loss account 17.6 (7.7) (5.5) 11.8 - (3.0) 13.2
Deferred tax 31 May 2009 6.9 0.1 0.7 (0.6) - (2.3) 4.8
Parent company
Deferred tax 1 June 2007 85.1 - - (1.6) (3.9) - 79.6
Recognised in the profit and loss account (11.9) - - 1.1 (2.2) - (13.0)
Recognised in equity - - - - 6.1 - 6.1
Deferred tax 31 May 2008 73.2 - - (0.5) - - 72.7
Transferred to deferred tax assets (73.2) - - 0.5 - - (72.7)
Deferred tax 31 May 2009 - - - - - - -
Deferred tax has been calculated based on local tax rates.
Notes …
29 …
30 …
Parantheses denote negative figures or figures to be deducted.
Back to FINANCIAl REpORT AND NOTESBack to BAlANCE ShEET EQuITy AND lIABIlITIES

114
(DKK million)
Provisions
Jubilee- Restruc- Other
Group Warranty Fairness benefits turing obligations Total
provisions 1 June 2007 83.8 25.5 12.6 - 8.4 130.3
Exchange rate adjustment to year-end rate (1.1) (0.8) - - (0.7) (2.6)
provisions during the year 42.9 10.1 1.7 - 2.0 56.7
provisions used during the year (43.8) (7.2) (1.1) - (0.7) (52.8)
provisions reversed during the year (5.4) (1.0) (3.6) - - (10.0)
Change in calculation of present
value during the year 0.8 0.7 0.3 - (0.1) 1.7
provisions 31 May 2008 77.2 27.3 9.9 - 8.9 123.3
Exchange rate adjustment to year-end rate (0.6) (0.2) - - 0.3 (0.5)
provisions during the year 25.4 9.2 1.5 35.5 1.2 72.8
provisions used during the year (35.5) (8.4) (1.2) - (0.7) (45.8)
provisions reversed during the year (4.2) (1.8) (1.8) - (0.8) (8.6)
Change in calculation of present
value during the year 0.7 1.3 0.6 - - 2.6
provisions 31 May 2009 63.0 27.4 9.0 35.5 8.9 143.8
The expected due dates of the provisions
as at 31 May 2008 are as follows:
Falls due 1 - 5 years 41.2 18.3 3.1 - 8.2 70.8
Falls due after 5 years - 0.1 5.8 - 0.6 6.5
Non-current provisions 41.2 18.4 8.9 - 8.8 77.3
Falls due within 1 year 36.0 8.9 1.0 - 0.1 46.0
provisions 31 May 2008 77.2 27.3 9.9 - 8.9 123.3
The expected due dates of the provisions
as at 31 May 2009 are as follows:
Falls due 1 - 5 years 33.0 17.3 2.8 8.6 8.2 69.9
Falls due after 5 years 0.1 - 5.4 2.2 0.5 8.2
Non-current provisions 33.1 17.3 8.2 10.8 8.7 78.1
Falls due within 1 year 29.9 10.1 0.8 24.7 0.2 65.7
provisions 31 May 2009 63.0 27.4 9.0 35.5 8.9 143.8
Notes …
31 …
Parantheses denote negative figures or figures to be deducted.
Back to FINANCIAl REpORT AND NOTES Back to BAlANCE ShEET EQuITy AND lIABIlITIES
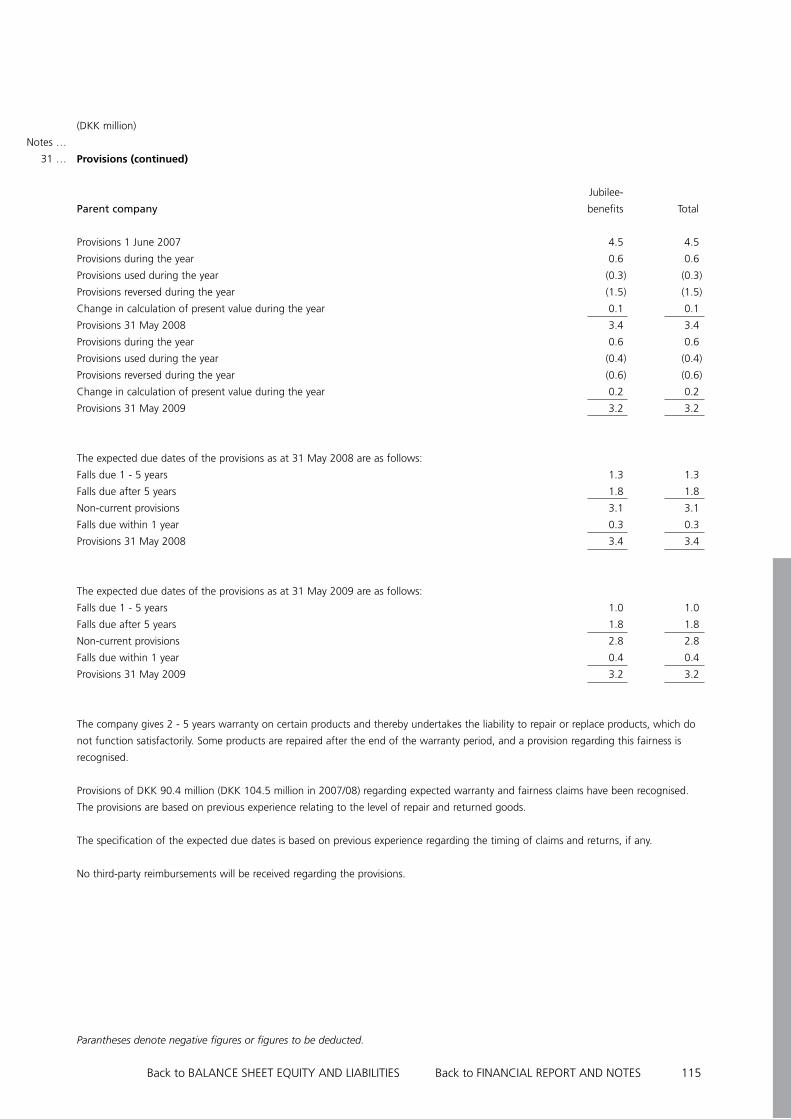
115
(DKK million)
Provisions (continued)
Jubilee-
Parent company benefits Total
provisions 1 June 2007 4.5 4.5
provisions during the year 0.6 0.6
provisions used during the year (0.3) (0.3)
provisions reversed during the year (1.5) (1.5)
Change in calculation of present value during the year 0.1 0.1
provisions 31 May 2008 3.4 3.4
provisions during the year 0.6 0.6
provisions used during the year (0.4) (0.4)
provisions reversed during the year (0.6) (0.6)
Change in calculation of present value during the year 0.2 0.2
provisions 31 May 2009 3.2 3.2
The expected due dates of the provisions as at 31 May 2008 are as follows:
Falls due 1 - 5 years 1.3 1.3
Falls due after 5 years 1.8 1.8
Non-current provisions 3.1 3.1
Falls due within 1 year 0.3 0.3
provisions 31 May 2008 3.4 3.4
The expected due dates of the provisions as at 31 May 2009 are as follows:
Falls due 1 - 5 years 1.0 1.0
Falls due after 5 years 1.8 1.8
Non-current provisions 2.8 2.8
Falls due within 1 year 0.4 0.4
provisions 31 May 2009 3.2 3.2
The company gives 2 - 5 years warranty on certain products and thereby undertakes the liability to repair or replace products, which do
not function satisfactorily. Some products are repaired after the end of the warranty period, and a provision regarding this fairness is
recognised.
provisions of DKK 90.4 million (DKK 104.5 million in 2007/08) regarding expected warranty and fairness claims have been recognised.
The provisions are based on previous experience relating to the level of repair and returned goods.
The specification of the expected due dates is based on previous experience regarding the timing of claims and returns, if any.
No third-party reimbursements will be received regarding the provisions.
Notes …
31 …
Parantheses denote negative figures or figures to be deducted.
Back to FINANCIAl REpORT AND NOTESBack to BAlANCE ShEET EQuITy AND lIABIlITIES

116
(DKK million)
Current and non-current financial liabilities, mortgage loans
Falls due Falls due Falls due Falls due after
Group within 1 year 1 - 5 years after 5 years 1 year total
Fixed rate loans, interest rate level 5.8 - 6.4 % 4.8 12.5 181.1 193.6
Fixed rate loans, interest rate level 4.0 - 5.0 % 1.7 7.4 29.3 36.7
Carrying amount 31 May 2009 6.5 19.9 210.4 230.3
Fixed rate loans, interest rate level 5.8 - 6.4 % 6.9 14.0 184.5 198.5
Fixed rate loans, interest rate level 4.0 - 5.0 % 1.6 6.5 30.7 37.2
Carrying amount 31 May 2008 8.5 20.5 215.2 235.7
Parent company
Fixed rate loans, interest rate level 5.8 - 6.4 % 4.8 12.5 181.1 193.6
Fixed rate loans, interest rate level 4.0 - 5.0 % 1.7 7.4 29.3 36.7
Carrying amount 31 May 2009 6.5 19.9 210.4 230.3
Fixed rate loans, interest rate level 5.8 - 6.4 % 6.9 14.0 184.5 198.5
Carrying amount 31 May 2008 6.9 14.0 184.5 198.5
The fair value of the current and non-current financial liabilities, mortgage loans in the Group amounts to DKK 235.4 million
(DKK 242.2 million in 2007/08), while the fair value in the parent company amounts to DKK 235.4 million (DKK 206.0 million in 2007/08).
The fair value is calculated as the present value of the expected future instalments and interest payments.
Notes …
32 …
Back to FINANCIAl REpORT AND NOTES Back to BAlANCE ShEET EQuITy AND lIABIlITIES

117
(DKK million)
Current and non-current financial liabilities, loans from banks etc.
Falls due Falls due Falls due Falls due after
Group within 1 year 1 - 5 years after 5 years 1 year, total
Fixed rate loans, interest rate level 5.8 - 6.4 % - 25.0 - 25.0
Fixed rate loans, interest rate level 4.0 - 5.0 % 17.8 55.8 14.9 70.7
Fixed rate loans, interest rate level 2.0 - 3.0 % 14.8 - - -
Carrying amount 31 May 2009 32.6 80.8 14.9 95.7
Fixed rate loans, interest rate level 5.8 - 6.4 % 25.0 12.5 - 12.5
Fixed rate loans, interest rate level 4.0 - 5.0 % 17.9 66.2 22.4 88.6
Carrying amount 31 May 2008 42.9 78.7 22.4 101.1
Parent company
Fixed rate loans, interest rate level 5.8 - 6.4 % - 25.0 - 25.0
Fixed rate loans, interest rate level 4.0 - 5.0 % 10.4 26.0 - 26.0
Carrying amount 31 May 2009 10.4 51.0 - 51.0
Fixed rate loans, interest rate level 5.8 - 6.4 % 25.0 12.5 - 12.5
Fixed rate loans, interest rate level 4.0 - 5.0 % 10.4 36.4 - 36.4
Carrying amount 31 May 2008 35.4 48.9 - 48.9
The fair value of the current and non-current financial liabilities, loans from banks etc. in the Group amounts to DKK 128.3 million
(DKK 144.0 million in 2007/08), while the fair value in the parent company amounts to DKK 61.4 million (DKK 84.3 million in 2007/08).
The fair value is calculated as the present value of the expected future instalments and interest payments.
Notes …
33 …
Back to FINANCIAl REpORT AND NOTESBack to BAlANCE ShEET EQuITy AND lIABIlITIES

118
(DKK million)
Other non-current liabilities
Falls due Falls due after
Group 1 - 5 years 1 year, total
Accrued deposit 3.1 3.1
Other non-current liabilities 3.6 3.6
Carrying amount 31 May 2009 6.7 6.7
Accrued deposit 3.0 3.0
Other non-current liabilities 3.6 3.6
Carrying amount 31 May 2008 6.6 6.6
Parent company
Accrued deposit 3.1 3.1
Other non-current liabilities 3.4 3.4
Carrying amount 31 May 2009 6.5 6.5
Other non-current liabilities 3.4 3.4
Carrying amount 31 May 2008 3.4 3.4
The fair value of other non-current liabilities in the Group amounts to DKK 6.5 million (DKK 5.7 million in 2007/08), while the fair value
in the parent company amounts to DKK 6.3 million (DKK 2.9 million in 2007/08). The fair value is calculated as the present value of the
expected future instalments and interest payments.
Notes …
34 …
Back to FINANCIAl REpORT AND NOTES Back to BAlANCE ShEET EQuITy AND lIABIlITIES

119
Group Parent company
(DKK million) 2008/09 2007/08 2008/09 2007/08
Income tax
Accrued income tax 1 June 66.3 122.3 - -
Exchange rate adjustment to year-end rate (1.5) (0.8) - -
Corrections - 0.4 - -
Adjustment previous years (27.0) (18.7) - -
The year’s current tax incl. jointly taxed subsidiaries 18.8 69.7 - -
Income tax paid during the year (23.2) (93.1) - -
Other - - 0.1 -
Transferred to income tax receivable (12.2) (13.5) - -
Accrued income tax 31 May 21.2 66.3 0.1 -
DKK 0.0 million of the accrued income tax in the Group is expected to be paid after 1 year (DKK 0.0 million in 2007/08).
DKK 0.0 million of the accrued income tax in the parent company is expected to be paid after 1 year (DKK 0.0 million in 2007/08).
Other payables
payroll-related items 130.0 143.1 56.8 55.3
Taxes and duties 64.4 39.7 17.7 -
phantom shares - 0.2 - 0.2
Restructuring 9.1 - 2.6 -
Other payables 121.1 137.0 29.1 42.4
Other payables, total 324.6 320.0 106.2 97.9
All other payables fall due within 1 year.
The fair value of other payables in the Group amounts to DKK 324.6 million (DKK 320.0 million in 2007/08), while the fair value
in the parent company amounts to DKK 106.2 million (DKK 97.9 million in 2007/08). The carrying amount of payables that
fall due within 1 year is expected to be a reasonable approximation of the fair value.
Notes …
35 …
36 …
Parantheses denote negative figures or figures to be deducted.
Back to FINANCIAl REpORT AND NOTESBack to BAlANCE ShEET EQuITy AND lIABIlITIES

120
NOTES TO ThE CASh FlOW STATEMENT Group Parent company
(DKK million)
2008/09 2007/08 2008/09 2007/08
Adjustments
Change in other liabilities 18.1 (6.7) (0.2) (1.1)
Financial income etc. (11.4) (20.0) (64.7) (59.0)
Financial costs etc. 41.2 49.8 53.6 36.1
Result of investments in associates after tax (2.3) 11.2
Dividend from associates (1.0) -
Gain/loss on sale of non-current assets 1.4 - - 0.5
Tax on result for the year (140.2) 41.4 (138.4) (25.8)
Various adjustments 0.6 16.9 10.7 21.4
Total adjustments (92.6) 92.6 (140.0) (27.9)
Change in working capital
Change in receivables 194.5 131.9 225.8 (674.8)
Change in inventories 203.6 (107.1) 0.2 (1.0)
Change in accounts payables etc. (40.3) (47.0) (9.7) (6.3)
Total change in working capital 357.8 (22.2) 216.3 (682.1)
Cash and cash equivalents
Cash and cash equivalents consists of:
Cash 258.1 107.1 217.7 5.3
Other loans from banks (13.0) (53.7) (12.9) (53.6)
Cash and cash equivalents 31 May 245.1 53.4 204.8 (48.3)
There are no restrictions in the Group’s or the parent company’s use of cash and cash equivalents.
Fees to auditors elected at the Annual General Meeting
Statutory audit:
Deloitte 4.6 4.3 0.6 0.5
Statutory audit, total 4.6 4.3 0.6 0.5
Other services:
Deloitte 2.0 1.9 1.9 0.4
Other services, total 2.0 1.9 1.9 0.4
Fees to auditors elected at the Annual General Meeting, total 6.6 6.2 2.5 0.9
Notes …
37 …
38 …
39 …
40 …
Parantheses denote negative figures or figures to be deducted.
Back to FINANCIAl REpORT AND NOTES Back to CASh FlOW STATEMENT

121
NOTES – WIThOuT CROSS REFERENCE Group Parent company
(DKK million)
2008/09 2007/08 2008/09 2007/08
Contingent liabilities and other financial commitments
Rental and leasing commitments regarding operating leases etc.
The Group and the parent company have entered into a number of operating leases and rental agreements regarding plant and
machinery, shops and other property. There is a big diversity in the length of the agreements. The longest agreement runs for 11 years.
All agreements contain conditions regarding renewal. The Group and the parent company are entitled to determine, whether or not the
agreements are renewed. None of the agreements impose restrictions in the Group’s or the parent company’s rights of disposal.
leasing commitments relating to plant and machinery etc. 30.3 41.6 18.2 26.7
leasing commitments relating to establishment of shops 258.6 185.8 - -
leasing commitments relating to office and factory property 96.8 108.1 65.3 64.2
Total 385.7 335.5 83.5 90.9
Which can be specified as follows:
payment due within 1 year 93.0 75.9 17.9 18.5
payment due between 1 and 5 years 199.5 179.6 36.3 42.2
payment due after 5 years 93.2 80.0 29.3 30.2
Total 385.7 335.5 83.5 90.9
Rental and leasing payments for the year 97.0 78.5 27.5 26.4
Of which minimum rental and lease payments 97.0 78.5 27.5 26.4
Expected future income from non-cancellable
sublease agreements, total - 6.3 - -
Neither in the Group nor in the parent company contingent rental or lease payments have been recognised in the profit and loss account
in 2008/09 or 2007/08.
In connection with the establishment of shops in previous financial years, the Group has entered into a number of long-term rental
agreements. The agreements include conditions concerning the right to sublet.
At the balance sheet date neither the Group nor the parent company has entered into any non-cancellable lease agreements regarding
assets held under operating leases, from which sublease payments are received.
Guarantees
Total guarantees as at 31 May 19.3 24.7 7.3 7.9
Of which regarding subsidiaries 0.3 0.3 - -
Of which regarding associates 5.2 5.2 5.2 5.2
None of the guarantees are expected to result in any losses.
Notes …
41 …
Back to FINANCIAl REpORT AND NOTES

122
Contingent liabilities and other financial commitments (continued)
Letters of intent
Bang & Olufsen Operations a/s has issued letters of intent to the subsidiaries in the uS and Japan.
VAT and other taxes
The Danish companies in the Group are jointly registered and are jointly and severally liable for VAT and other taxes.
Mortgages and securities
land and buildings and investment property have been mortgaged in the amount of DKK 385.8 million (DKK 385.8 million as at 31
May 2008) as security for the Group’s mortgage and bank debt of DKK 365.1 million (DKK 388.2 million as at 31 May 2008). land and
buildings and investment property have been mortgaged in the amount of DKK 385.8 million (DKK 142.0 million as at 31 May 2008) as
security for the parent company’s mortgage and bank debt of DKK 298.2 million (DKK 289.7 million as at 31 May 2008). Other tangible
non-current assets related to the land and buildings and investment property are included in the security. The carrying amount of the
Group’s mortgaged land and buildings and investment property is DKK 199.8 million (DKK 207.9 million as at 31 May 2008), while the
carrying amount in the parent company is DKK 199.8 million (DKK 155.6 million as at 31 May 2008). No intangible assets are pledged as
security for liabilities. No financial assets are pledged as security for liabilities.
As security of all receivables and payables with Danske Bank a statement has been made to the effect that no shares in the subsidiaries of
Bang & Olufsen a/s can be sold or pledged as security without the consent of the bank.
The loan of initially DKK 74.5 million from Danske Bank to Bang & Olufsen s.r.o, with a remaining debt of DKK 52.1 million as at 31 May
2009 (DKK 59.7 as at 31 May 2008) includes a clause stating, that the loan can be called, if a shareholder obtains controlling influence of
Bang & Olufsen a/s.
The loan of initially DKK 52.0 million from Danske Bank to Bang & Olufsen a/s, with a remaining debt of DKK 36.4 million as at 31 May
2009 (DKK 46.8 as at 31 May 2008) includes a clause stating, that the loan can be called, if a shareholder obtains controlling influence of
Bang & Olufsen a/s.
Lawsuits
The companies in the Group are parties to a few pending lawsuits. It is the assessment of the Management, that the outcome of the
lawsuits will not influence the Group’s financial position. No further information is given regarding the lawsuits, as further information
might harm the Group.
Financial instruments
The extent and nature of the Group’s and parent company’s financial instruments appear from the profit and loss account, balance
sheet and notes in accordance with the accounting principles applied. Information regarding conditions that can affect amount, dates of
payment or reliability of future payments, where such information is not directly evident from the consolidated or the parent company’s
financial statements, or follows from common practice, is given below.
Notes …
41 …
42 …
Back to FINANCIAl REpORT AND NOTES

123
(DKK million)
Financial instruments (continued)
Monetary items* in the balance sheet of the Group as at 31 May translated to DKK:
2008/09 2007/08
Currency payment/maturity Assets liabilities Net Assets liabilities Net
EuR 0-12 months 316.4 151.9 164.5 456.9 158.3 298.6
> 12 months 29.4 44.9 (15.5) 21.2 7.8 13.4
GBp 0-12 months 90.8 22.9 67.9 111.5 30.7 80.8
> 12 months 17.7 - 17.7 9.2 - 9.2
SEK 0-12 months 17.4 5.4 12.0 18.6 6.9 11.7
> 12 months 1.3 - 1.3 1.9 - 1.9
Jpy 0-12 months 6.5 2.4 4.1 9.1 1.9 7.2
> 12 months - - - - 0.2 (0.2)
ChF 0-12 months 26.7 22.9 3.8 29.5 5.7 23.8
> 12 months - - - - 0.1 (0.1)
uSD 0-12 months 41.1 56.0 (14.9) 64.0 29.2 34.8
> 12 months 2.8 1.8 1.0 3.1 2.2 0.9
CZK 0-12 months 1.5 6.0 (4.5) 6.1 42.0 (35.9)
> 12 months - - - 5.3 52.2 (46.9)
SGD 0-12 months 10.4 1.2 9.2 24.3 3.1 21.2
> 12 months 0.2 0.1 0.1 0.1 0.1 -
AuD 0-12 months 13.2 10.3 2.9 21.3 13.3 8.0
> 12 months 3.5 2.0 1.5 - 2.0 (2.0)
Other 0-12 months 11.4 0.3 11.1 14.2 6.0 8.2
> 12 months 4.3 3.8 0.5 7.5 - 7.5
Monetary items* in the balance sheet of the parent company as at 31 May translated to DKK:
2008/09 2007/08
Currency payment/maturity Assets liabilities Net Assets liabilities Net
EuR 0-12 months 25.4 9.9 15.5 48.3 18.7 29.6
GBp 0-12 months 5.9 0.3 5.6 - 0.1 (0.1)
SEK 0-12 months 2.8 - 2.8 1.1 0.2 0.9
Jpy 0-12 months 0.7 - 0.7 - - -
ChF 0-12 months 1.6 - 1.6 0.5 - 0.5
uSD 0-12 months - 16.0 (16.0) 10.6 3.2 7.4
CZK 0-12 months 1.5 - 1.5 10.6 - 10.6
SGD 0-12 months 0.4 - 0.4 - - -
AuD 0-12 months 2.7 - 2.7 - - -
Other 0-12 months 0.1 0.1 - 1.2 0.3 0.9
* Monetary items are cash and cash equivalents etc., receivables and payables, which are settled in cash.
Notes …
42 …
Parantheses denote negative figures or figures to be deducted.
Back to FINANCIAl REpORT AND NOTES

124
Group Parent company
(DKK million)
2008/09 2007/08 2008/09 2007/08
Financial instruments (continued)
Categories of financial instruments
Other financial receivables 60.4 52.0 3.0 3.0
Trade receivables 407.9 593.0 - -
Receivables from subsidiaries 759.6 921.4
Receivables from associates 1.4 - - -
Other receivables 31.6 38.9 2.3 12.6
Cash 258.1 107.1 217.7 5.3
loans and receivables 759.4 791.0 982.6 942.3
Other non-current liabilities 6.7 6.6 6.5 3.4
Mortgage loans 236.8 244.2 236.8 205.4
loans from banks etc. 141.3 197.7 74.3 137.9
Trade payables 188.3 216.0 41.7 49.7
payables to associates - 1.8 - 0.1
Other payables 324.6 320.0 106.2 97.9
Financial liabilities measured at amortised costs 897.7 986.3 465.5 494.4
Hedging
The Group and the parent company have entered into cash flow hedges, which partially hedges the expected cash flows in ChF
and GBp as at 31 May 2009. There were no forward contracts in the Group and the parent company as at 31 May 2008.
Related parties
No related parties have a controlling influence in the Bang & Olufsen Group or Bang & Olufsen a/s.
The related parties that have significant influence in Bang & Olufsen a/s, are the board of directors, the board of management and certain
other key management personnel and the close family members of these persons. Related parties also include companies in which these
persons have significant interests.
The related parties that have significant influence in the Bang & Olufsen Group, are the board of directors, the board of management
and certain other key management personnel in Bang & Olufsen a/s and certain members of the board of management and other key
management personnel in other companies in the Group and the close family members of these persons. Related parties also include
companies in which these persons have significant interests. The related parties in Bang & Olufsen a/s also comprise the companies in
which the company have a controlling interest, cf. note 44.
The related parties in Bang & Olufsen a/s and the Bang & Olufsen Group also comprise the associates Bang & Olufsen Medicom a/s and
John Bjerrum Nielsen A/S, in which Bang & Olufsen a/s has significant influence, cf. note 17.
Bang & Olufsen’s share in the subsidiaries and associates are shown in note 44.
Board of directors, board of management and other key management personnel
Except from what follows from the employment and shareholdings, if any, there have been no transactions with the board of directors,
the board of management and other key management personnel. Remuneration and share option programmes are shown in note 5.
Notes …
42 …
43 …
Back to FINANCIAl REpORT AND NOTES

125
Group Parent company
(DKK million)
2008/09 2007/08 2008/09 2007/08
Related parties (continued)
Subsidiaries and associates
The transactions with the subsidiaries and the
associates have included the following:
purchase of raw materials from associates 22.2 42.7 - -
Rendering of services from associates 0.1 1.0 - -
Rental income from associates 4.9 4.8 4.9 -
Rendering of services and subsidies to associates - 4.2 - 4.2
Rendering of services from subsidiaries 86.2 88.4
Rendering of services to subsidiaries 122.7 255.8
Royalty income from subsidiaries 123.9 580.0
Rental income from subsidiaries 80.9 82.0
The transactions with the subsidiaries have been eliminated in the consolidated financial statements in accordance with the accounting
principles applied.
During 2008/09 Bang & Olufsen a/s has contributed DKK 3.6 million to the associated company Bang & Olufsen Medicom a/s in
connection with a capital increase in the company.
Outstanding balances with subsidiaries and associates
Bang & Olufsen a/s’ and the Bang & Olufsen Group’s outstanding balances with the subsidiaries and the associates appear from the
balance sheet. The outstanding balances carry interest. The interest charged on the outstanding balances is shown in notes 7 and 8.
The terms of payment on the outstanding balances regarding purchase of goods are current month + 30 days. There are no securities
regarding the outstanding balances, and there have been no need for write-downs of the outstanding balances. Furthermore, there have
been no actual losses regarding the outstanding balances in 2008/09 or 2007/08.
Other transactions
Bang & Olufsen a/s has received DKK 230.0 million as dividend from the subsidiaries (DKK 916.5 million in 2007/08). Dividend of
DKK 1.0 million has been received from the associates in 2008/09 (DKK 0.0 million in 2007/08).
Bang & Olufsen a/s has issued guarantees for the related parties, cf. note 41. None of the guarantees are expected to result in any losses.
No other transactions with the related parties have taken place.
Notes …
43 …
Back to FINANCIAl REpORT AND NOTES

126
(DKK million)
Companies in the Bang & Olufsen Group Bang & Number
Olufsen of not
Share capital Group’s disclosed
Company name place of registration Currency local currency share subsidiaries
Branded business
Bang & Olufsen a/s Struer, DK DKK 362,440,140 100 %
Bang & Olufsen Operations a/s Struer, DK DKK 156,000,000 100 %
Scandinavia
Bang & Olufsen Danmark a/s København, DK DKK 3,000,000 100 %
Bang & Olufsen AS Oslo, N NOK 3,000,000 100 %
Bang & Olufsen Svenska AB Stockholm, S SEK 4,150,000 100 %
Central Europe
Bang & Olufsen Deutschland G.m.b.h. München, D EuR 1,022,584 100 % 2
Bang & Olufsen AG Bassersdorf, Ch ChF 200,000 100 %
Bang & Olufsen Ges. m.b.h Tulin, A EuR 1,744,148 100 %
United Kingdom/Benelux
Bang & Olufsen united Kingdom ltd. Berkshire, GB GBp 2,600,000 100 % 2
S.A. Bang & Olufsen Belgium N.V. Dilbeek, B EuR 942,000 100 %
Bang & Olufsen b.v. Naarden, Nl EuR 18,000 100 %
Rest of Europe
Bang & Olufsen France S.A. levallois-perret, F EuR 3,585,000 100 % 1
Bang & Olufsen España S.A. Madrid, E EuR 1,803,036 100 % 2
Bang & Olufsen Italia S.p.A. Milano, I EuR 774,000 100 %
North America
Bang & Olufsen America Inc. Arlington heights, uSA uSD 34,000,000 100 % 3
Asia
Bang & Olufsen Japan K. K. Tokyo, Jp Jpy 100,000,000 100 %
Bang & Olufsen Asia pte ltd. Singapore, SG SGD 2 100 %
Bang & Olufsen Wholesale pty ltd. hawthorn, AuS AuD 6,000,001 100 % 3
Middle East
Bang & Olufsen Middle East FZ-llC Dubai, uAE EuR 113,116 100 %
Other
Bang & Olufsen Expansion a/s Struer, DK DKK 7,000,000 100 %
Bang & Olufsen s.r.o Koprivnice, CZ CZK 187,800,000 100 %
OÜ BO-Soft Tallin, EE EEK 40,000 51 %
Bang & Olufsen GPS Taiwan Taipei, TW TWD 5,000,000 100 %
Non-branded business
Bang & Olufsen ICEpower a/s* lyngby-Tårbæk, DK DKK 1,939,750 100 % 2
Associates
John Bjerrum Nielsen A/S Bramming, DK DKK 10,000,000 33 %
Bang & Olufsen Medicom a/s Struer, DK DKK 9,372,000 35 %
Dormant companies have not been included.
* As of 1 June 2008 Bang & Olufsen a/s acquired the remaining 10 % shares in Bang & Olufsen ICEpower a/s.
Notes …
44 …
Back to FINANCIAl REpORT AND NOTES

127Back to FINANCIAl REpORT AND NOTES

128
printing: datagraf a/s