annual report 2008 - showa1.com · years ended 31st march, 2007 and 2008 • throughout this...
TRANSCRIPT

SHOWA CORPORATION1-14-1, Fujiwara-cho, Gyoda City, Saitama 361-8506, JapanTel : +81-48-554-1151Fax : +81-48-556-8393http://www.showa1.com
Printed in Japan on recycled paper with soy ink
ANNUAL REPORT 2008
SHOWA CORPORATION
005_0281001372009.indd 1 2008/09/30 2:08:27

Financial and Operating Highlights .................... 1
Message from the President ................................ 2
10th Interim Operational Policies ........................ 3
Showa’s Technology ............................................ 4
Review of Operations .......................................... 6
Showa’s Global Network ..................................... 8
Topics ................................................................... 10
Contents
Profile
Forward-looking statements:Forward-looking statements made in this annual report concerning performance or business strategies have been determined according to assumptions and beliefs based on information available at the time and contain elements of risk and uncertainty.
Financial Section .................................................. 12
Corporate Information ......................................... 30
Board of Directors and Corporate Auditors ........ 31
Corporate Data .................................................... 31
31
Board of Directors and Corporate AuditorsAs of 20th June 2008
As of 31st March 2008Corporate Data
Showa’s Stock PriceNikkei Average
Showa's Stock Price (’02/4=100)(Yen)
0
50
100
150
200
250
’02/4 ’03/17 410 7 10 ’04/1 4 7 10 ’05/1 4 7 10 ’06/1 4 7 10 ’07/1 4 ’08/1 37 10
Showa Corporation manufactures and markets high-precision components for motor vehicles
including shock absorbers, steering systems and drive train products for automobiles, and
motorcycles, as well as components for outboard marine engines. The company is one of the
leading manufacturers of shock absorbers for automobiles and motorcycles in the world today.
Established in 1938 the company began motor vehicle parts production in 1946. In 1970 the
company became affiliated with Honda Motor Co., Ltd., a leader of automobiles and motorcycles
manufacturing of the world today. When merged with Seiki Giken Kogyo Co., Ltd., a power
steering products manufacturer, the company was renamed “Showa Corporation” in 1993.
In 1964 Showa’s shares were listed on second section of Tokyo Stock Exchange (TSE), then in
1985 the company shares were upgraded to first section of TSE.
Headquartered in Gyoda City, Saitama Pref., Japan, Showa operates five manufacturing plants,
three research & development facilities and two affiliated manufacturers within Japan.
The company’s global business operation, a network of twenty-seven manufacturing facilities
that includes twelve consolidated subsidiaries, spreads over 12 nations including Japan. (*)
Showa Corporation’s business activities revolve around customer satisfaction, as emphasized
by the company principle “To meet customer needs with highest quality and most competitive
product.” Furthermore, at Showa, we strive to maintain our forward-looking stance and continue
to encourage technological, operational and administrative innovation.
Environmental preservation for the benefit of future generation is a great concern and a
continuing theme at Showa Corporation. We actively support a range of environmental
preservation initiatives through our product offerings and corporate activities.
Showa Corporation and its global affiliates embrace the company’s business philosophy
described above. The company and its affiliates strive to expand their business providing more
benefits to our customers and shareholders as well as to the communities and societies where we
operate.
(*) Excluding technical collaborations in Malaysia, Pakistan, and Thailand.
Ten Largest ShareholdersShares
(Thousands)Percent of
total (%)
Honda Motor Co., Ltd. 25,447 33.5 Japan Trustee Service Bank Ltd.
(Trust Account) 5,481 7.2The Master Trust Bank of Japan, Ltd.
(Trust Account) 4,415 5.8DANSKE BANK CLIENTS HOLDINGS 2,838 3.7Trust & Custody Services Bank, Ltd.
(Securities Investment Trust Account) 2,219 2.9The Bank of Tokyo-Mitsubishi UFJ, Ltd. 2,151 2.8 MORGAN STANLEY & CO. INC. 1,362 1.8 RBC DEXIA INVESTOR SERVICES BANK A/C LUXEMBURG NON RESIDENT/DOMESTIC RATE 1,238 1.6Showa Corporation Business Partner's Shareholding Association 1,195 1.6Sanyo Foods Co., Ltd. 996 1.3
PresidentKazuto Iiyama
Executive Vice PresidentYasuhisa Maekawa
Executive Managing DirectorsKenshi HiraiTakeshi Kawamoto
Managing DirectorsYoshitaka TerazawaMitsuhiro Nishida
Teturo Aoyama
Norio UkaiHisao Hirono
Akira Kadoya
DirectorsMitsuhiro ChibaMitsutaka Sugino
Kazuhiro Takagi
Teru Oda
Atsushi Izumina
Akira Wada
Takeshi Nagao
Corporate AuditorsKoichi UchibabaTetsuo Nishikiori
Hiroshi Iwakami
Masahiko Sano
Common Stock
Authorized:180,000,000 sharesIssued: 76,020,019 shares
Number of Shareholders
7,318
Common Stock Traded
Tokyo
Shareholders’ Register Managerfor Common Stock
Mitsubishi UFJ Trust and Banking Corporation7-10-11,Higashisuna,Koto-ku, Tokyo 137-8081,Japan
005_0281001372009.indd 31 2008/09/30 2:08:27
1
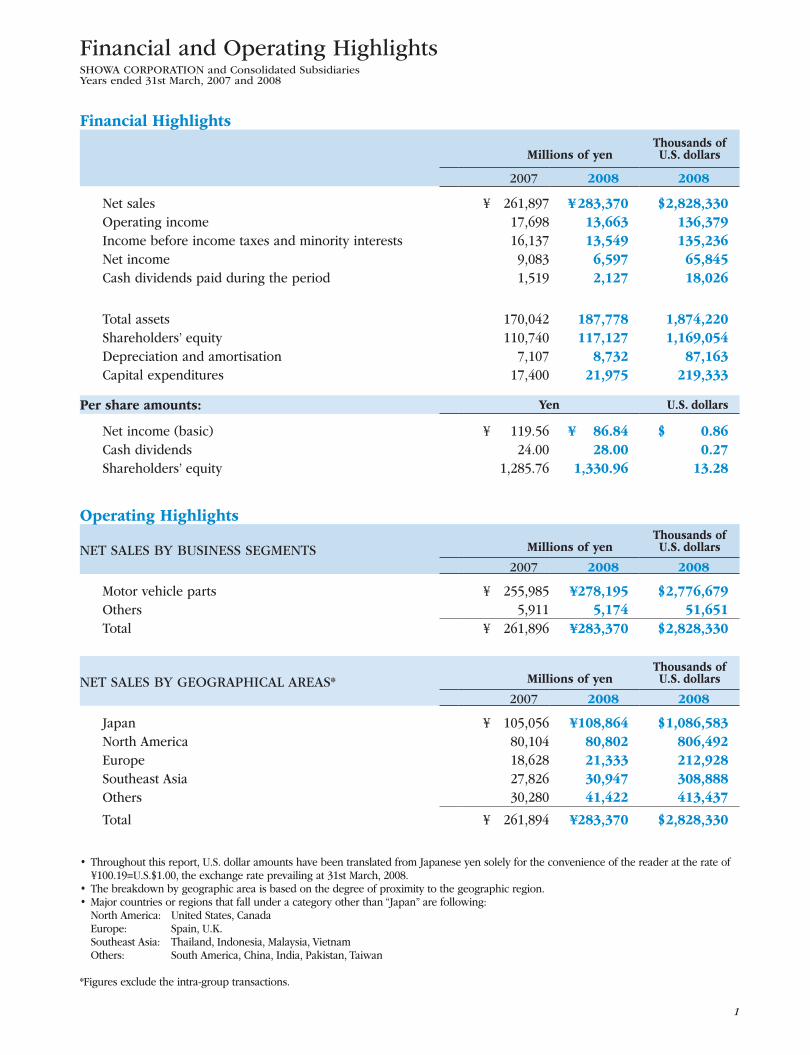
Financial and Operating HighlightsSHOWA CORPORATION and Consolidated SubsidiariesYears ended 31st March, 2007 and 2008
•Throughoutthisreport,U.S.dollaramountshavebeentranslatedfromJapaneseyensolelyfortheconvenienceofthereaderattherateof ¥100.19=U.S.$1.00,theexchangerateprevailingat31stMarch,2008.
•Thebreakdownbygeographicareaisbasedonthedegreeofproximitytothegeographicregion.•Majorcountriesorregionsthatfallunderacategoryotherthan“Japan”arefollowing: NorthAmerica: UnitedStates,Canada Europe: Spain,U.K. SoutheastAsia: Thailand,Indonesia,Malaysia,Vietnam Others: SouthAmerica,China,India,Pakistan,Taiwan
*Figuresexcludetheintra-grouptransactions.
Financial Highlights
Millions of yenThousands ofU.S. dollars
2007 2008 2008
Net sales ¥ 261,897 ¥ 283,370 $ 2,828,330Operatingincome 17,698 13,663 136,379Incomebeforeincometaxesandminorityinterests 16,137 13,549 135,236Netincome 9,083 6,597 65,845Cashdividendspaidduringtheperiod 1,519 2,127 18,026
Total assets 170,042 187,778 1,874,220Shareholders’equity 110,740 117,127 1,169,054Depreciationandamortisation 7,107 8,732 87,163Capitalexpenditures 17,400 21,975 219,333
Per share amounts: Yen U.S. dollars
Netincome(basic) ¥ 119.56 ¥ 86.84 $ 0.86Cashdividends 24.00 28.00 0.27Shareholders’equity 1,285.76 1,330.96 13.28
Operating Highlights
NETSAlESBYBUSINESSSEGMENTS Millions of yenThousands ofU.S. dollars
2007 2008 2008
Motorvehicleparts ¥ 255,985 ¥278,195 $ 2,776,679Others 5,911 5,174 51,651Total ¥ 261,896 ¥283,370 $ 2,828,330
NETSAlESBYGEOGRAPHICAlAREAS* Millions of yenThousands ofU.S. dollars
2007 2008 2008
Japan ¥ 105,056 ¥108,864 $ 1,086,583NorthAmerica 80,104 80,802 806,492Europe 18,628 21,333 212,928Southeast Asia 27,826 30,947 308,888Others 30,280 41,422 413,437
Total ¥ 261,894 ¥283,370 $ 2,828,330
010_0281001372009.indd 1 2008/10/06 11:24:05
2
Message from the President
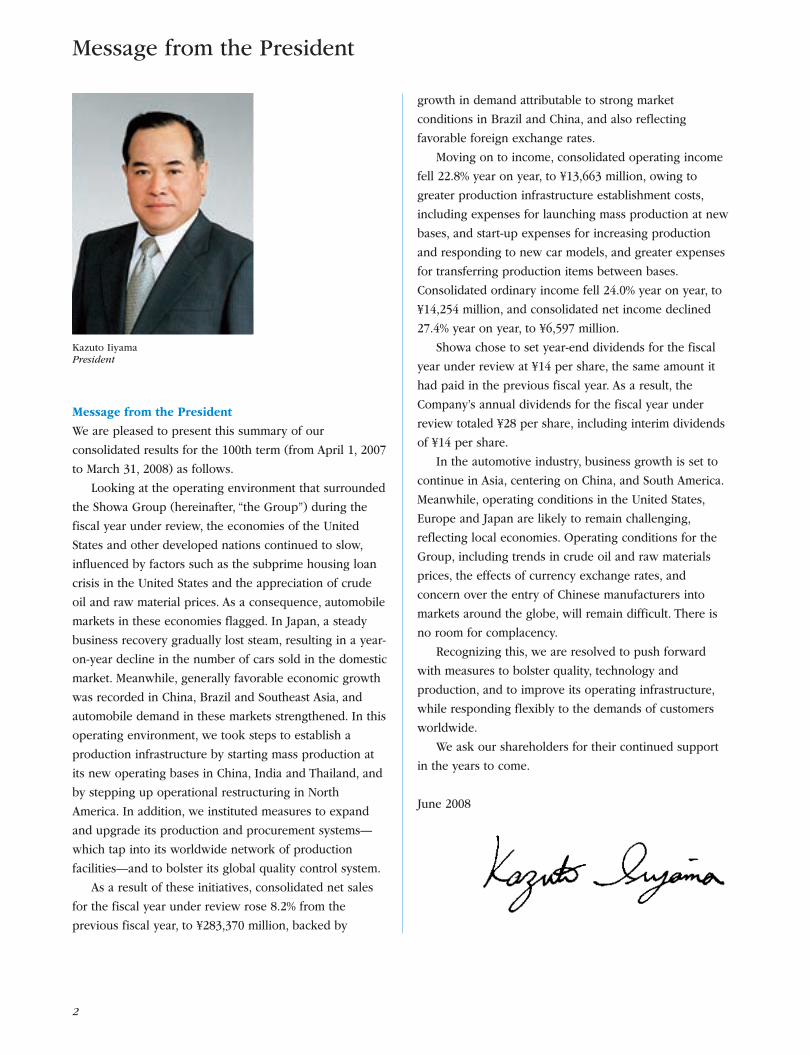
Wearepleasedtopresentthissummaryofour
consolidatedresultsforthe100thterm(fromApril1,2007
toMarch31,2008)asfollows.
lookingattheoperatingenvironmentthatsurrounded
theShowaGroup(hereinafter,“theGroup”)duringthe
fiscalyearunderreview,theeconomiesoftheUnited
Statesandotherdevelopednationscontinuedtoslow,
influencedbyfactorssuchasthesubprimehousingloan
crisisintheUnitedStatesandtheappreciationofcrude
oilandrawmaterialprices.Asaconsequence,automobile
marketsintheseeconomiesflagged.InJapan,asteady
businessrecoverygraduallyloststeam,resultinginayear-
on-yeardeclineinthenumberofcarssoldinthedomestic
market.Meanwhile,generallyfavorableeconomicgrowth
wasrecordedinChina,BrazilandSoutheastAsia,and
automobiledemandinthesemarketsstrengthened.Inthis
operatingenvironment,wetookstepstoestablisha
productioninfrastructurebystartingmassproductionat
itsnewoperatingbasesinChina,IndiaandThailand,and
bysteppingupoperationalrestructuringinNorth
America.Inaddition,weinstitutedmeasurestoexpand
andupgradeitsproductionandprocurementsystems—
whichtapintoitsworldwidenetworkofproduction
facilities—andtobolsteritsglobalqualitycontrolsystem.
Asaresultoftheseinitiatives,consolidatednetsales
forthefiscalyearunderreviewrose8.2%fromthe
previousfiscalyear,to¥283,370million,backedby
growthindemandattributabletostrongmarket
conditionsinBrazilandChina,andalsoreflecting
favorableforeignexchangerates.
Movingontoincome,consolidatedoperatingincome
fell22.8%yearonyear,to¥13,663million,owingto
greaterproductioninfrastructureestablishmentcosts,
includingexpensesforlaunchingmassproductionatnew
bases,andstart-upexpensesforincreasingproduction
andrespondingtonewcarmodels,andgreaterexpenses
fortransferringproductionitemsbetweenbases.
Consolidatedordinaryincomefell24.0%yearonyear,to
¥14,254million,andconsolidatednetincomedeclined
27.4%yearonyear,to¥6,597million.
Showachosetosetyear-enddividendsforthefiscal
yearunderreviewat¥14pershare,thesameamountit
hadpaidinthepreviousfiscalyear.Asaresult,the
Company’sannualdividendsforthefiscalyearunder
reviewtotaled¥28pershare,includinginterimdividends
of¥14pershare.
Intheautomotiveindustry,businessgrowthissetto
continueinAsia,centeringonChina,andSouthAmerica.
Meanwhile,operatingconditionsintheUnitedStates,
EuropeandJapanarelikelytoremainchallenging,
reflectinglocaleconomies.Operatingconditionsforthe
Group,includingtrendsincrudeoilandrawmaterials
prices,theeffectsofcurrencyexchangerates,and
concernovertheentryofChinesemanufacturersinto
marketsaroundtheglobe,willremaindifficult.Thereis
noroomforcomplacency.
Recognizingthis,weareresolvedtopushforward
withmeasurestobolsterquality,technologyand
production,andtoimproveitsoperatinginfrastructure,
whilerespondingflexiblytothedemandsofcustomers
worldwide.
Weaskourshareholdersfortheircontinuedsupport
intheyearstocome.
June2008
MessagefromthePresident
KazutoIiyamaPresident
010_0281001372009.indd 2 2008/10/06 11:24:06

3
10th Interim Operational Policies(FromApril1,2008toMarch31,2011)
The Showa Group (hereinafter “the Group”) has established a medium-term business plan for the period from April 2008 to March 2011. In the plan, the Group adopted a number of basic policies. Namely, we seek to establish the corporate foundations for the future by achieving world-class quality and technologies, accompanied by workplace restructuring to facilitate human resource development. We will take action based on the following five basic strategies, to achieve the targets set in the medium-term business plan:
1 Production base restructuring
Anticipating further operational expansion worldwide, the Group is continuing to expand its operations to meet customer demand. Showa will seek to restructure its production infrastructure, to develop optimal production systems on a global scale and a system in which its facilities worldwide complement each other. With these initiatives, we aim to meet customer needs with greater flexibility, and, at the same time, develop an efficient production system that takes advantage of the Group’s collective strength.
2 Realization of world-class quality
The Group consists of functional parts manufacturers. As such, its survival depends on product quality and the customer confidence deriving from that quality. To maintain and increase customer confidence around the world, Showa will continue with its comprehensive commitment to improving quality. As part of this commitment, we trace problems back to the product origins, including early development stages and material selection, and take full action to establish a global quality control method compliant with the characteristics of bases around the globe.
3 Refining world-leading technological capabilities
Showa aspires to develop innovative new mechanisms by expanding and upgrading its basic research, which is directed at improving the functions of its family of products, by initiating joint product development involving R&D departments, and by improving simulation technologies to study the influences of product specifications on finished vehicles. At the same time, we will aim to strengthen technologies that contribute to innovations in development processes and production lines.
4 Taking corporate value to the highest level in the industry
Showa will take aggressive action to improve its operating revenue, ranging from steady improvements in manufacturing basics, including the development of an efficient production system that completely eliminates practices that are impossible, irregular or wasteful, to dramatic efficiency improvements through technical innovation. We aim to raise its corporate value to the highest level in the industry by fulfilling its corporate social responsibilities, including global corporate governance reinforcement, in addition to taking steps to obligations to improve revenue and ensure consistent product supply.
5 Development of a corporate culture for personnel training
The teamwork of employees in a broad array of assigned roles, including those who control the quality of parts and products and those who develop products and production facilities, in addition to those who engage in production itself, is essential for the stable production of competitive products. For this reason, and with a renewed awareness that “individuals” are the original foundation for companies, Showa will review its human resources systems—including its management and education systems—and advance efforts to develop a corporate culture that offers its employees opportunities for individual growth.
010_0281001372009.indd 3 2008/10/06 11:24:06

4
Showa’sTechnology
Automotive Components
1. Shock Absorbers 3. Propeller Shafts
2. Steering Systems
PumpHPS
4. Differential Gears
EPS
Amongtheautomobilecomponents,greatimportanceisplacedontheperformanceandreliabilityofsteeringsystems.Inadditiontoaccuratelytransmittingthedriver’ssteeringoperationstotheautomobile,thesteeringsystemistheman/machineinterfacedeliveringinformationonrunningconditionsfromtheautomobiletothedriver.“PowerSteeringsystem”refertoacomponentaddedtoassiststeeringeffortsandprovidedriverswithcomfortablemaneuverability.PowerSteeringsystemsareclassifiedintohydraulicpowersteeringsystem(HPS),whichusestheengine’spowerasadrivesource,andelectricpowersteeringsystem(EPS),utilizingthevehicle’sbattery.Showahasafulllineofpowersteeringmodels.
Shockabsorbersarecriticalproductsthatdetermineanautomobile’scharacter,notonlybyimprovingridequalitybutalsobyfunctioningtocontroltheattitudeandstabilityoftheautomobilebody.Becauseoftheirsuperiorperformanceandquality,Showabrandshockabsorbershaveearnedthesatisfactionofcustomersaroundtheworld.Showahasmanyyearsofexperiencewithstrutmodules,andisalsoworkingonsuspensionmodulescombinedwithperipheralcomponents.
Theroleofadifferentialmechanismistoabsorbthedifferenceinrotationbetweentherightandleftwheelsthatoccurswhenanautomobileiscornering.Theseproductsdemanddurability,transmissionefficiency,andquietoperation.Showa’sdiffer-entialgearsachieveweightreductionwhileexhibitinghighperformance,fromsubcompactcarstoSUVs.
Thepropellershaftsfunctionistotransmitthedrivingforcegeneratedbytheenginetothewheelaxis.Theyarelongandcylindrical,androtateathighspeed.Thus,theseproductsrequiresvibrationandnoisepreventionalongwithhighdurability.Showasuppliesvarioustechnologieswhichstructuralanalysisenablescomponentpartreductionandlighterweight.Further,frictionweldingprocedureswereintroducedtoachievehighprecision,dynamicbalance,andultra–strongpartconnections.
010_0281001372009.indd 4 2008/10/06 11:24:06

5
5. Gas Springs
2. Drive Unit Products
Motorcycle Components
Power Trim and Tilt Units
Gasspringsassisttheopeningandclosingofautomobileenginecompartmenthoodsandreargates,byusinggasreactionforce.Theyarealsoequippedwithspeed-adjustmentdevicesthatenable operators to open and closethehoodandtrunkatopti-malspeed.Toanswerdiverseneeds,Showadevelopsavarietyofproducts.
Powertrimandtiltunitscanactivelychange the outboard engine angle, and providethefollowingthreefunctions.Thetrimfunctionprovidesgoodscrewefficiencyandsteadycruisingbyadjustingtheangleoftheoutboardenginewhilerunning.Thetiltfunctionenablesownerstopreventoutboardenginedamagefromshellfishadhe-sions,byraisingtheoutboardengineabovethewater’ssurfacewhenmoored.Whendriftwoodorotherobjectsstriketheoutboardenginewhileunderway,shocksareabsorbed,helpingtopreventdamagetotheoutboardengineandboat.
Outboard Engine Components
Rear cushion
The rear cushion is attached to the rearforkdirectlyorthroughalink. Bycontrollingtheattitudeandenergyabsorptionofthemotorcyclebody,therearcushionimprovestheabilityoftherearwheeltofollowroadcontours.
FormotorcycleandATVdriveunitproducts,Showahasachievedlighterweightsthroughanalysisoffunctions,shapes,andmaterials,whilemain-tainingexcellentdurability,trans-missionefficiency,andquietoperation.
1. Shock AbsorbersShowamotorcycleshockabsorbersareusedextensivelyinvariousmotorcycleracesaroundtheworld.Fromracingmachinestoscooters,weputourtechnologyandexperiencetoexcellentusetomeetawidevarietyofperformanceneeds.
Frontfork
Thefrontforkisakeystructuralcom-ponentofamotorcycle,holdingthefrontwheelandprovidingthesteeringfunction.Thisvitalpartdemandsexcellentabilitytocloselyfollowroadcontoursthroughsmoothoperationandsteadydampingforce,whileretaininghighrigidity.
010_0281001372009.indd 5 2008/10/06 11:24:07

6
ReviewofOperations
Breakdown of our consolidated net salesByproduct,netsalesofmotorcyclecomponents
increased3.6%fromthepreviousfiscalyear,to86,250millionyen.Netsalesforautomobilecomponentsgrew11.1%yearonyear,to191,950millionyen.Netsalesofotherproducts,mostofwhicharemotorboatcomponents,declined12.5%yearonyear,to5,170millionyen.
Bydestination,netsalesofmotorcyclecomponentsforJapanplummeted,mainlybecauseoflowerdomesticsales.Incontrast,netsalesofautomobilecomponentsforJapan,centeringonpowersteeringsystems,rosedomestically.Asaresult,totalnetsalesforJapanrose2.8%yearonyear,to102,340millionyen.
InNorthAmerica,netsalesdeclinedonalocal
currencybasisforboththeUnitedStatesandCanada.However,totalnetsalesforNorthAmericaincreased0.8%yearonyear,to80,870millionyen,becauseoftheweakeningoftheyen.
InSouthAmerica,netsalesofmotorcyclecomponentsandautomobilecomponentsforBrazilincreased,thankstofavorablecustomerconditions.Fortheregion,netsalesroseatanimpressiveyear-on-yearrateof37.1%,toreach26,290millionyen,assistedinpartbytheyen’sweakeningagainstlocalcurrencies.
InEurope,netsaleswerehigherforbothautomobilecomponentsforBritainandmotorcyclecomponentsforSpain.Again,becauseoftheyen’sdepreciation,netsalesfortheregionclimbed16.9%yearonyear,to21,720millionyen.
InSoutheastAsia,netsalesremainedunchangedformotorcycleandautomobilecomponentsforThailand.Meanwhile,netsalesforIndonesiaincreased,theresultofamarketrecovery.TotalnetsalesforSoutheastAsiaexpandedsharplyatayear-on-yearrateof13.6%,to32,020millionyen,attributabletoincreaseddemandformotorcyclecomponentsandautomobilecomponents,andtheweakeryen.
By product By customer’s location
0
100
200
300
0
100
200
300
’07 ’07’08 ’08
261.8Other5.9
Motorcyclecomponents
83.2
261.8
80.2
18.5
44.3
99.5
Automotivecomponents
172.7
19.1
283.35.2
191.9
86.2
283.3
80.8
26.2
21.7
52.1
102.3
0
50
100
150
200
By product
0
50
100
150
200
’08 ’08’07 ’07
By customer’s location
172.7
Drive train products22.1
Power steeringsystems
70.8
Shock absorbers55.6
Others24.1
172.7
68.6
69.5
11.2
21.6EPS28.5
1.5
191.9
25.6
84.2
59.2
22.8
38.6
191.9
70.4
76.2
13.3
29.5
2.4
InChina,netsalesofmotorcyclecomponentsincreasedslightly.However,totalsalesfortheregionclimbed24.3%yearonyear,to16,300millionyen,theresultofasubstantialriseinsalesofautomobilecomponents.
Netsalesforotherregionsdeclined24.8%fromthepreviousfiscalyear,to3,830millionyen.
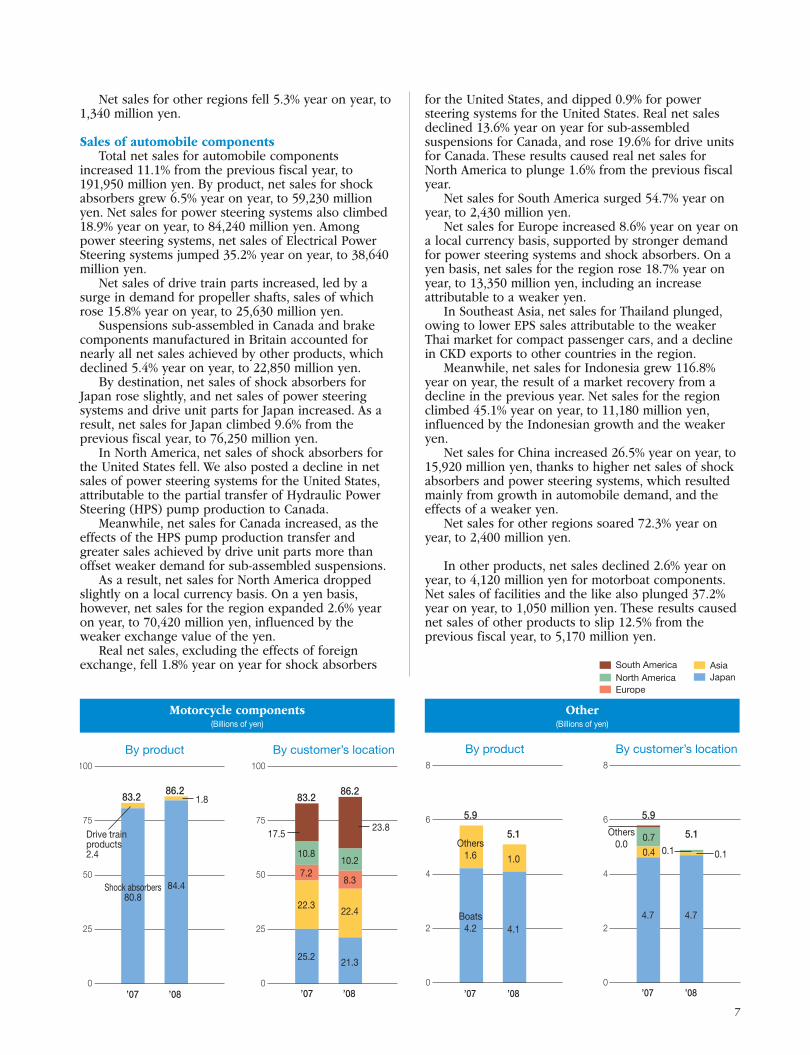
Sales of motorcycle components Byproduct,netsalesgrew4.5%yearonyear,to
84,440millionyenforshockabsorbers.Bycontrast,netsalesofdriveunitpartsdeclined24.9%yearonyear,to1,810millionyen.Asaresult,totalnetsalesofmotorcyclecomponentsgrew3.6%yearonyear,to86,250millionyen.
Bydestination,netsalesforJapandeclined15.5%yearonyear,to21,300millionyen,owingprimarilytoafallinsalesdomestically.
NetsalesforNorthAmericafell5.4%yearonyear,to10,260millionyen,influencedbythestrikeatamajormanufacturer.
NetsalesforSouthAmericarosesubstantiallyatayear-on-yearrateof35.6%,to23,860millionyen,becauseofincreaseddemandfromHonda,whichwasperformingstrongly,andtheeffectsoffavorablecurrencyexchangerates.
NetsalesforEuropegrewslightlyonalocalcurrencybasis.Onayenbasis,however,netsalesfortheregionexpanded14.9%fromthepreviousfiscalyear,dueinparttotheeffectsoftheyen’sdepreciationagainstlocalcurrencies.
InSoutheastAsia,netsalesforThailandrose0.6%yearonyear,inspiteofflaggingmarketsandtheimpactoffuelpriceincreases.NetsalesforIndonesiagrew3.6%yearonyear,asthemarketrecoveredfromitscontractioninthepreviousyear.Totalnetsalesfortheregionrose1.5%yearonyear,to20,750millionyen,againreflectinginparttheweakeryen.
NetsalesforChinadeclined19.6%fromthepreviousfiscalyear,to370millionyen.
Automotive components(Billions of yen)
Fiscal 2008 Results(Billions of yen)
010_0281001372009.indd 6 2008/10/06 11:24:08
7
Netsalesforotherregionsfell5.3%yearonyear,to1,340millionyen.
Sales of automobile componentsTotalnetsalesforautomobilecomponents
increased11.1%fromthepreviousfiscalyear,to191,950millionyen.Byproduct,netsalesforshockabsorbersgrew6.5%yearonyear,to59,230millionyen.Netsalesforpowersteeringsystemsalsoclimbed18.9%yearonyear,to84,240millionyen.Amongpowersteeringsystems,netsalesofElectricalPowerSteeringsystemsjumped35.2%yearonyear,to38,640millionyen.
Netsalesofdrivetrainpartsincreased,ledbyasurgeindemandforpropellershafts,salesofwhichrose15.8%yearonyear,to25,630millionyen.
Suspensionssub-assembledinCanadaandbrakecomponentsmanufacturedinBritainaccountedfornearlyallnetsalesachievedbyotherproducts,whichdeclined5.4%yearonyear,to22,850millionyen.
Bydestination,netsalesofshockabsorbersforJapanroseslightly,andnetsalesofpowersteeringsystemsanddriveunitpartsforJapanincreased.Asaresult,netsalesforJapanclimbed9.6%fromthepreviousfiscalyear,to76,250millionyen.
InNorthAmerica,netsalesofshockabsorbersfortheUnitedStatesfell.WealsopostedadeclineinnetsalesofpowersteeringsystemsfortheUnitedStates,attributabletothepartialtransferofHydraulicPowerSteering(HPS)pumpproductiontoCanada.
Meanwhile,netsalesforCanadaincreased,astheeffectsoftheHPSpumpproductiontransferandgreatersalesachievedbydriveunitpartsmorethanoffsetweakerdemandforsub-assembledsuspensions.
Asaresult,netsalesforNorthAmericadroppedslightlyonalocalcurrencybasis.Onayenbasis,however,netsalesfortheregionexpanded2.6%yearonyear,to70,420millionyen,influencedbytheweakerexchangevalueoftheyen.
Realnetsales,excludingtheeffectsofforeignexchange,fell1.8%yearonyearforshockabsorbers
0
25
50
75
100
25
50
75
100
By product
0
By customer’s location
’08 ’08’07 ’07
Shock absorbers80.8
83.2 83.2
10.8
7.2
22.3
25.2
Drive trainproducts 2.4
17.5
86.2
10.2
8.3
22.4
21.3
23.8
86.2
84.4
1.8
0
2
4
6
8
0
2
4
6
8
By product
’08 ’08
Others0.0
’07 ’07
By customer’s location
5.9 5.9
4.7
0.7
0.4Others
1.6
Boats4.2
5.1
1.0
4.1
5.1
4.7
0.1 0.1
fortheUnitedStates,anddipped0.9%forpowersteeringsystemsfortheUnitedStates.Realnetsalesdeclined13.6%yearonyearforsub-assembledsuspensionsforCanada,androse19.6%fordriveunitsforCanada.TheseresultscausedrealnetsalesforNorthAmericatoplunge1.6%fromthepreviousfiscalyear.
NetsalesforSouthAmericasurged54.7%yearonyear,to2,430millionyen.
NetsalesforEuropeincreased8.6%yearonyearonalocalcurrencybasis,supportedbystrongerdemandforpowersteeringsystemsandshockabsorbers.Onayenbasis,netsalesfortheregionrose18.7%yearonyear,to13,350millionyen,includinganincreaseattributabletoaweakeryen.
InSoutheastAsia,netsalesforThailandplunged,owingtolowerEPSsalesattributabletotheweakerThaimarketforcompactpassengercars,andadeclineinCKDexportstoothercountriesintheregion.
Meanwhile,netsalesforIndonesiagrew116.8%yearonyear,theresultofamarketrecoveryfromadeclineinthepreviousyear.Netsalesfortheregionclimbed45.1%yearonyear,to11,180millionyen,influencedbytheIndonesiangrowthandtheweakeryen.
NetsalesforChinaincreased26.5%yearonyear,to15,920millionyen,thankstohighernetsalesofshockabsorbersandpowersteeringsystems,whichresultedmainlyfromgrowthinautomobiledemand,andtheeffectsofaweakeryen.
Netsalesforotherregionssoared72.3%yearonyear,to2,400millionyen.
Inotherproducts,netsalesdeclined2.6%yearonyear,to4,120millionyenformotorboatcomponents.Netsalesoffacilitiesandthelikealsoplunged37.2%yearonyear,to1,050millionyen.Theseresultscausednetsalesofotherproductstoslip12.5%fromthepreviousfiscalyear,to5,170millionyen.
Motorcycle components(Billions of yen)
Other(Billions of yen)
South AmericaNorth AmericaEurope
AsiaJapan
010_0281001372009.indd 7 2008/10/06 11:24:08
’06 ’07 ’08
’06 ’07 ’08’06 ’07 ’08
’06 ’07 ’08
’06 ’07 ’08
’06 ’07 ’08
SOUTHEAST ASIA
Southeast asia
South America
China
Sales By Region
Japan
North America
Europe
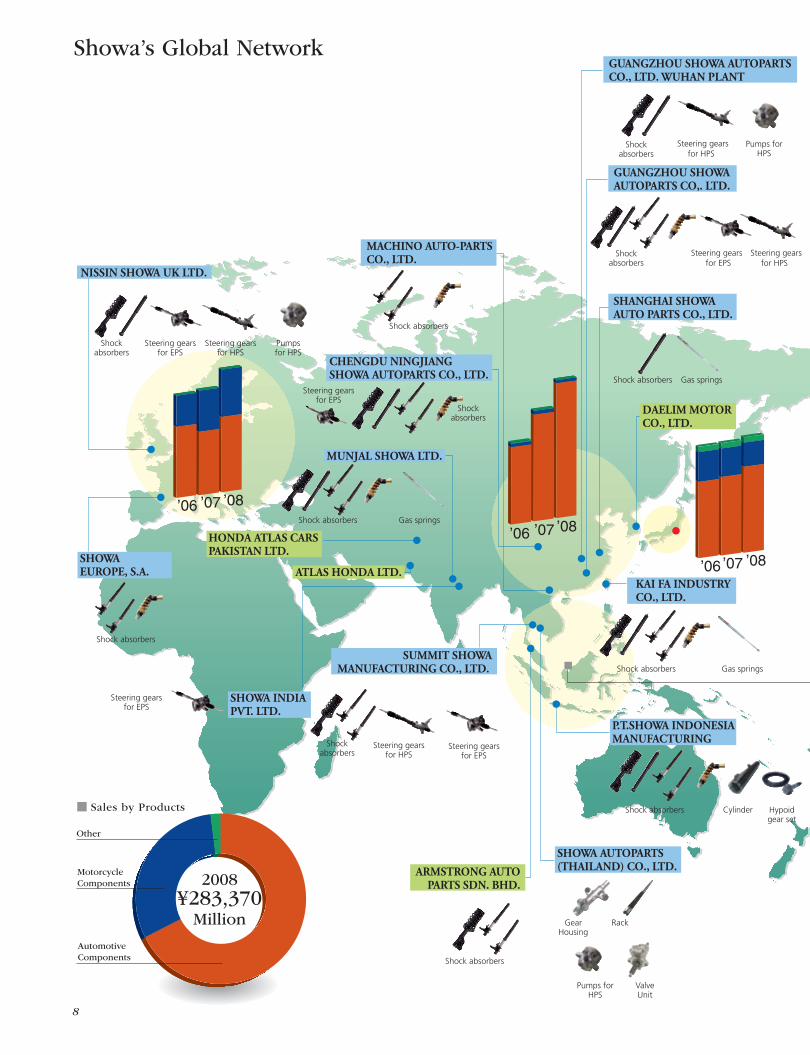
2008¥283,370
MillionOther
MotorcycleComponents
AutomotiveComponents
Sales by Products
2008¥283,370
Million
Shockabsorbers
Shock absorbers
Shockabsorbers
Gas springs
Shock absorbers
Shock absorbers
Shock absorbers
Shock absorbers
Shockabsorbers
Steering gearsfor HPS
Steering gearsfor EPS
Steering gearsfor EPS
Gas springs
Propeller shafts Front and rearsuspensionmodules
Steering gearsfor EPS
Shock absorbers
Shock absorbers
Gas springs
Shock absorbers
Shock absorbers
Shockabsorbers
Steering gears for HPS Pumps for HPSShock absorbers
Steering gearsfor EPS
Steering gearsfor HPS
Pumpsfor HPS
for EPS for HPSSteering gears
Shockabsorbers
Steering gears
Steering gearsfor EPS
Pumps forHPS
GearHousing
Rack
ValveUnit
Cylinder Hypoidgear set
for HPSSteering gears Pumps for
HPS
Pumps for HPS
NISSIN SHOWA UK LTD.
AMERICAN SHOWA INC. Los Angeles Office
SHOWA CANADA INC.
SHANGHAI SHOWAAUTO PARTS CO., LTD.
P.T.SHOWA INDONESIAMANUFACTURING
SHOWA AUTOPARTS(THAILAND) CO., LTD.
HONDA ATLAS CARSPAKISTAN LTD.
CHENGDU NINGJIANG SHOWA AUTOPARTS CO., LTD.
ATLAS HONDA LTD.
GUANGZHOU SHOWAAUTOPARTS CO,. LTD.
MACHINO AUTO-PARTSCO., LTD.
SUMMIT SHOWAMANUFACTURING CO., LTD.
ARMSTRONG AUTOPARTS SDN. BHD.
MUNJAL SHOWA LTD.
DAELIM MOTORCO., LTD.
SHOWA EUROPE, S.A.
SHOWA INDIA PVT. LTD.
KAI FA INDUSTRY CO., LTD.
AMERICAN SHOWA INC. Sunbury Plant & Head Office
SHOWA DO BRASIL LTDA.
AMERICAN SHOWA INC. Blanchester Plant
SHOWA INDUSTRIA ECOMERCIO LTDA.
GUANGZHOU SHOWA AUTOPARTSCO., LTD. WUHAN PLANT
Production BaseShowa Corporation
Major Technical Collaboration
Showa Group Automotive componentsMotorcycle componentsOther
8
Showa’sGlobalNetwork
010_0281001372009.indd 8 2008/10/06 11:24:12

’06 ’07 ’08
’06 ’07 ’08’06 ’07 ’08
’06 ’07 ’08
’06 ’07 ’08
’06 ’07 ’08
SOUTHEAST ASIA
Southeast asia
South America
China
Sales By Region
Japan
North America
Europe
2008¥283,370
MillionOther
MotorcycleComponents
AutomotiveComponents
Sales by Products
2008¥283,370
Million
Shockabsorbers
Shock absorbers
Shockabsorbers
Gas springs
Shock absorbers
Shock absorbers
Shock absorbers
Shock absorbers
Shockabsorbers
Steering gearsfor HPS
Steering gearsfor EPS
Steering gearsfor EPS
Gas springs
Propeller shafts Front and rearsuspensionmodules
Steering gearsfor EPS
Shock absorbers
Shock absorbers
Gas springs
Shock absorbers
Shock absorbers
Shockabsorbers
Steering gears for HPS Pumps for HPSShock absorbers
Steering gearsfor EPS
Steering gearsfor HPS
Pumpsfor HPS
for EPS for HPSSteering gears
Shockabsorbers
Steering gears
Steering gearsfor EPS
Pumps forHPS
GearHousing
Rack
ValveUnit
Cylinder Hypoidgear set
for HPSSteering gears Pumps for
HPS
Pumps for HPS
NISSIN SHOWA UK LTD.
AMERICAN SHOWA INC. Los Angeles Office
SHOWA CANADA INC.
SHANGHAI SHOWAAUTO PARTS CO., LTD.
P.T.SHOWA INDONESIAMANUFACTURING
SHOWA AUTOPARTS(THAILAND) CO., LTD.
HONDA ATLAS CARSPAKISTAN LTD.
CHENGDU NINGJIANG SHOWA AUTOPARTS CO., LTD.
ATLAS HONDA LTD.
GUANGZHOU SHOWAAUTOPARTS CO,. LTD.
MACHINO AUTO-PARTSCO., LTD.
SUMMIT SHOWAMANUFACTURING CO., LTD.
ARMSTRONG AUTOPARTS SDN. BHD.
MUNJAL SHOWA LTD.
DAELIM MOTORCO., LTD.
SHOWA EUROPE, S.A.
SHOWA INDIA PVT. LTD.
KAI FA INDUSTRY CO., LTD.
AMERICAN SHOWA INC. Sunbury Plant & Head Office
SHOWA DO BRASIL LTDA.
AMERICAN SHOWA INC. Blanchester Plant
SHOWA INDUSTRIA ECOMERCIO LTDA.
GUANGZHOU SHOWA AUTOPARTSCO., LTD. WUHAN PLANT
Production BaseShowa Corporation
Major Technical Collaboration
Showa Group Automotive componentsMotorcycle componentsOther
9
ValveUnit
GearHousing
Rack
Shockabsorbers
Rearcushion
Hypoidgear set
CylinderFront and rearsuspensionmodules
Shockabsorbers
Steering gearsfor EPS
Pumps forHPS
Steering gearsfor HPS
Propellershafts
Automobile products
Motorcycle products
Gassprings
Notes: EPSmeanselectricpowersteering HPSmeanshydraulicpowersteering
010_0281001372009.indd 9 2008/10/06 11:24:18

10
1. New Shock Absorber (Front Fork) Developed
Showahassuccessfullydevelopedanewtypeofshock
absorberformotorcycles.Mostexistingmotorcycles
havecartridgeshockabsorbers.Theyarebuiltwitha
dualstructure,inwhichthedampersforgenerating
dampingforceareseparatelyhoused.Inthenewshock
absorbercalledBigPistonFrontfork,orBPFforshort,a
larger-diameterpistoninsideaslidepipeconstituting
partofthefrontforkdirectlyslidestofunctionasa
damper.Thisdesignenablesgreaterdampingforceand
facilitatessmoothpistonoperationfromthestarttothe
fullbottomposition.Thenewfrontforktherefore
moderatesitsposturechangewhenreducingspeedand
improvesbodystability.
Alreadyusedinanumberofraces,theBPFis
demonstratingitsstrengthsoncircuitcourses.Inthe
future,wewilldevelopamassproductionmodelfor
generalmotorcycles,toprovidemotorcyclingfanswith
asafeandenjoyableride.
2. Showa Exhibits at the 40th Motor Show
The40thTokyoMotorShowranfor17daysfrom
October26toNovember11atMakuhariMessein
Chiba.AdoptingasitsthemeThe thrill of driving, the
fun of cruising,wetookpartintheshowasan
exhibitoranddisplayed22productsinanexhibition
boothdecoratedinred,whiteandgray.Itemson
displayincluded:
—Anewmotorcycleshockabsorberdesignedto
directlyslidethepistoninsidetheslidepipetodeliver
highdampingforceandensuresmoothoperation
—Formula1damperswithanextensivetrackrecord,
whichachievehighlevelsoftechnologyandreliability
—AconceptdamperfortheCivicTypeRoffering
excellentandsportydrivingperformance
Inaddition,theboothwasequippedwithasection
thatenabledvisitorstoexperienceasteeringfeelwith
theelectricpowersteeringsysteminarealall-terrain
vehicle(ATV).
To introduce our products and technologies to a
wideaudience,wealsodisplayedproductswith
impressivesafetyandenvironmentalfeatures,suchas
—Apropellershaftwithacrashstrokeofatleast100
mmtohelpimproveshockabsorption
—Pinionshaftsfordifferentialgearswith
environmentallyfriendlysurfacetreatmentwith
combinedplasmanitration,maintainingseizure-
resistantsurfacecharacteristicscomparablewith
conventionalmodels.
3. Global Expansion of Power Steering Systems
Growingenvironmentalawarenessislikelytoleadto
anincreaseindemandforenvironmentallyfriendly
electricpowersteering(EPS)systems.Asourcustomers
areshiftingfromhydraulicpowersteering(HPS)
systemstoEPSmodels,EPSdemandissettogrow
worldwide.Giventhattheincreasingdemandwill
promptanexpansionofoverseasproductioninthe
ShowaGroup,Showa’soperationsinJapanneedto
achievenewtechnologicaladvancesandquality
refinement.
Atpresent,weoperatethepowersteeringbusiness
forHPS/EPSatninesitesinsevencountries.The
GotembaPlantinJapanliesattheheartofthis
business.Tomeettheneedsofourworldwide
customers,ourfacilitiesinJapanmusttaketheleadin
strengtheningcollaborationwithinShowaandin
boostingouroverallcapabilities,andalsomustprepare
themselvestoserveasmotherfactoriesandtoestablish
ourproductioninfrastructure.
Tobuildaglobalproductionstructuregoingforward,
itisnownecessarytoassigndifferentmanufacturing
functionstoseparateplantsaftergivingoverall
considerationtoproductioncapacity,technicallevels
andinvestmenteffectsatindividualoverseasbases.
Topics
Cartridge
Conventionaltype New type
Pressurizeddiameterof the piston: 39.6 mm (12.3 cm2)
Pressurizeddiameterof the piston:20 mm(3.14 cm2)
BPF
010_0281001372009.indd 10 2008/10/06 11:24:19
11
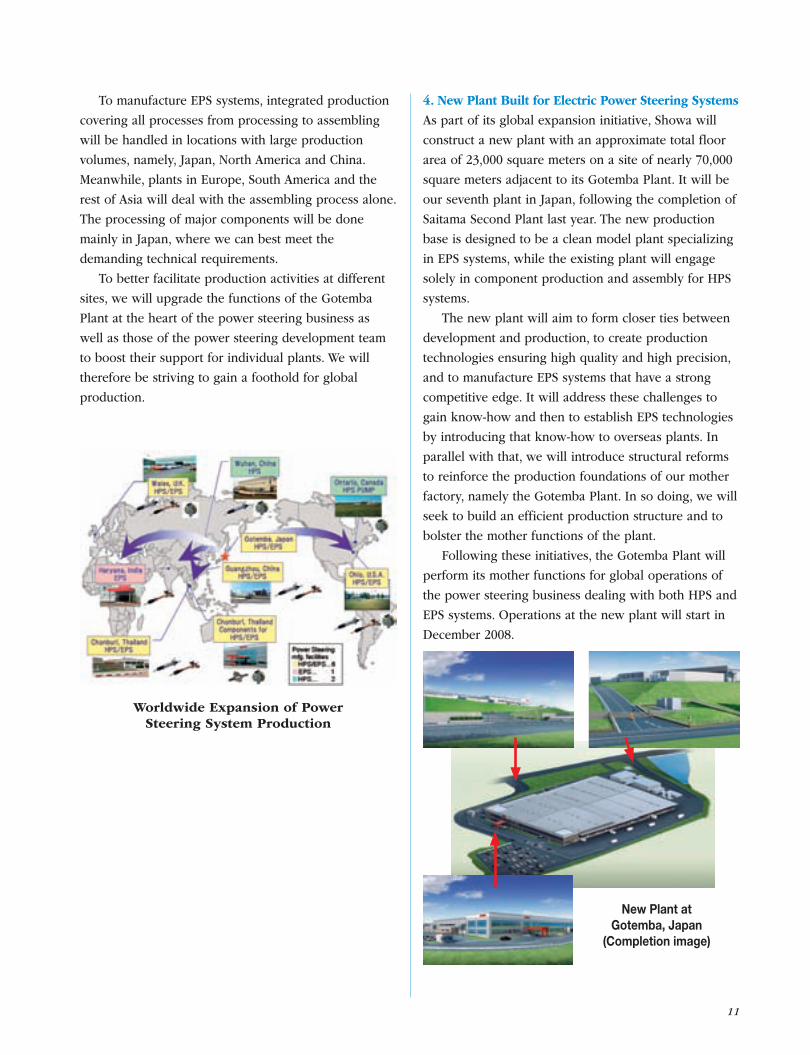
TomanufactureEPSsystems,integratedproduction
coveringallprocessesfromprocessingtoassembling
willbehandledinlocationswithlargeproduction
volumes,namely,Japan,NorthAmericaandChina.
Meanwhile,plantsinEurope,SouthAmericaandthe
restofAsiawilldealwiththeassemblingprocessalone.
Theprocessingofmajorcomponentswillbedone
mainlyinJapan,wherewecanbestmeetthe
demandingtechnicalrequirements.
Tobetterfacilitateproductionactivitiesatdifferent
sites,wewillupgradethefunctionsoftheGotemba
Plantattheheartofthepowersteeringbusinessas
wellasthoseofthepowersteeringdevelopmentteam
toboosttheirsupportforindividualplants.Wewill
thereforebestrivingtogainafootholdforglobal
production.
4. New Plant Built for Electric Power Steering Systems
Aspartofitsglobalexpansioninitiative,Showawill
constructanewplantwithanapproximatetotalfloor
areaof23,000squaremetersonasiteofnearly70,000
squaremetersadjacenttoitsGotembaPlant.Itwillbe
ourseventhplantinJapan,followingthecompletionof
SaitamaSecondPlantlastyear.Thenewproduction
baseisdesignedtobeacleanmodelplantspecializing
inEPSsystems,whiletheexistingplantwillengage
solelyincomponentproductionandassemblyforHPS
systems.
Thenewplantwillaimtoformclosertiesbetween
developmentandproduction,tocreateproduction
technologiesensuringhighqualityandhighprecision,
andtomanufactureEPSsystemsthathaveastrong
competitiveedge.Itwilladdressthesechallengesto
gainknow-howandthentoestablishEPStechnologies
byintroducingthatknow-howtooverseasplants.In
parallelwiththat,wewillintroducestructuralreforms
toreinforcetheproductionfoundationsofourmother
factory,namelytheGotembaPlant.Insodoing,wewill
seektobuildanefficientproductionstructureandto
bolsterthemotherfunctionsoftheplant.
Followingtheseinitiatives,theGotembaPlantwill
performitsmotherfunctionsforglobaloperationsof
thepowersteeringbusinessdealingwithbothHPSand
EPSsystems.Operationsatthenewplantwillstartin
December2008.
Worldwide Expansion of Power Steering System Production
New Plant at Gotemba, Japan
(Completion image)
010_0281001372009.indd 11 2008/10/06 11:24:20

12
Financial Section Consolidated Financial Review ................................... 13 (Unaudited and Not Reviewed)
Consolidated Balance Sheets ..................................... 16
Consolidated Statements of Income ........................... 18
Consolidated Statements of Changes in Net Assets .. 19
Consolidated Statements of Cash Flows .................... 20
Notes to Consolidated Financial Statements .............. 21
Report of Independent Auditors .................................. 29
011_0281001372009.indd 12 2008/09/13 10:47:00

13
Consolidated Financial Review
OverviewBusiness results1) Overview for the fiscal year under review
The Showa Group sought to expand and upgrade its production infrastructure to better meet customer needs. We have realized this with initiatives to facilitate a mass production launch at new operational bases in China, India and Thailand and elsewhere, as demand for automobiles grew in China and other Asian mar-kets, and sales expanded favorably for its major customers. At the same time, we have moved forward with operational restructuring in North America. In addition, the Group worked to improve its procurement activities, which take advantage of operational bases distributed worldwide, and proceeded with global initiatives to bolster our quality control organization.
Consolidated net sales for the fiscal year under review increased 8.2% from the previous fiscal year, to ¥283,370 million, reflecting sales growth attributable to strong market conditions in Brazil and China, and foreign exchange con-vers ion. Consol idated operat ing income dropped 22.8% year on year, to ¥13,663 million, owing to production infrastructure expansion costs, including expenses for launching mass production at new bases, start-up expenses for increasing production and responding to new car models, and expenses for transferring pro-duction items between bases. Consolidated ordinary income plunged 24.0% year on year, to ¥14,254 million, and consolidated net income declined 27.4% year on year, to ¥6,597 million.
2) Results for the fiscal year under review by business segment
(1) Motor vehicle parts(Japan)
Net sales dropped for motorcycle compo-nents, as a result of an export decline caused by market deterioration and advances in local production. However, net sales increased for automobile components centering on power steering systems, thanks in part to the effects of new car models. As a result, net sales for Japan increased.
(North America)Net sales for our U.S. subsidiary declined,
with lower sales of large motorcycles and a weakening of the automobile market as the underlying factors. The Canadian subsidiary experienced sales growth attributable to sales of hydraulic pumps, with its production trans-ferred from the U.S. subsidiary, and sales of propeller shafts with increased customer out-put of four-wheel-drive cars. However, net sales of sub-assembled suspensions fell in our Canadian subsidiary, owing to production transfers for certain car models carried out by customers and a revision of the customer-supplied parts costs. Consequently, total net sales for the Canadian subsidiary showed almost no change from the previous fiscal year. Dr iven by the e f fects o f fo re ign exchange conversion, however, net sales for the subsidiary increased on a yen basis.
50
100
150
200
250
300
’04 ’05 ’06
Net Sales
(Billions of yen)
219.5
’07
250.4 261.8
’08
233.5
283.3
0 0
2
4
6
8
10
12
14
0
20
40
60
80
100
120
140
(Billions of yen) (Yen)
101.0
121.0 119.5
137.5
’04 ’05
Net Income/Net Income per Share
Net IncomeNet Income per Share
7.59.1
’06 ’07
10.49.0
’08
6.5
86.84
0
50
100
150
200
(Billions of yen) (Yen)
0
400
800
1,200
1,600
Total AssetsShareholders’ EquityShareholders’ Equity per Share
’04 ’05
Total Assets/Shareholders’ Equity/Shareholders’ Equity per Share
133.1
73.5
’06 ’07
151.3
’08
65.3
120.5
170.0187.7
110.7 117.1
87.8967.81,156.0
1,285.7
1,330.9
860.6
011_0281001372009.indd 13 2008/09/13 10:47:00

14
(Europe)Net sales increased for the British subsid-
iary, thanks to the effects of new car model, releases drove demand up for power steering systems and other automobile components. The Spanish subsidiary experienced a sales decline for existing motorcycle models, how-ever, overall number for motorcycle parts increased due to aggressive activities for expanding sales. As a result, net sales remained almost unchanged for motorcycle shock absorbers manufactured by the sub-sidiary. Influenced by foreign exchange con-version, net sales for the Spanish subsidiary increased on a yen basis.
(Southeast Asia)Our Indonesian subsidiary posted higher
net sales, driven by greater exports of shock absorbers for automobiles and the sale of gearparts, production of which got underway. Net sales fell sharply for the subsidiary in Thailand on weaker results for motorcycle shock absorbers and power steering systems attributable to factors such as sluggish mar-ket conditions. However, the subsidiary’s net sales grew on a yen basis, due to the effects of foreign exchange conversion.
(Other regions)Net sales climbed sharply for our operation
in Brazil, led by increased sales of shock absorbers for motorcycles owing to strong market conditions. Net sales also achieved
substantial growth in China, where the boom-ing automobile market drove sales of shock absorbers and power steering systems.As a result of the developments stated above, net sales for the motor vehicle parts segment rose 8.7% from the previous fiscal year, to ¥278,195 million. Operating income for this segment fell 21.5% year on year, to ¥13,006 million.
(2) Other segmentsNet sales for other segments decreased
12.5% from the previous fiscal year, to ¥5,174 million. Operating income for the other seg-ments declined 41.9% year on year, to ¥657 million.
3) Business forecasts for the next fiscal yearThe subprime housing loan issue is having a
growing effect on business conditions in the United States. The deflationary spiral in the United States is anticipated to gather momen-tum as a result. The European economy is also showing more signs of weakening. Asia, center-ing on China, is predicted to remain on a growth path overall. However, concern that the slow-down in the United States and other regions will have repercussions for Asia cannot be eliminat-ed. Moreover, the economic downturn is expected to continue in Japan. There is concern that deceleration becomes an underlying trend for the global economy overall.In the automotive industry, business expansion is likely to continue in Asia, centering on China,
0
3
6
9
12
18
15
Capital ExpendituresDepreciation and Amortisation
’04 ’05 ’06
Capital Expenditures/Depreciation and Amortisation
(Billions of yen)
6.4 6.1
8.7
’07
6.7
11.7
’08
17.4
5.27.1
20.1
4.9
6.6
0
2
4
6
8
10
’04 ’05 ’06
R&D Expenses
(Billions of yen)
7.8
’07
7.4
’08
6.97.1
12.213.2
0
3
6
9
12
15
’04 ’05 ’06
Return on Equity
(%)
’07 ’08
13.0
9.8
6.6
011_0281001372009.indd 14 2008/09/13 10:47:01

15
and South America. Meanwhile, operating con-ditions in the United States, Europe and Japan are anticipated to remain difficult, reflecting busi-ness trends. Changing business conditions, including trends in crude oil and raw material prices, the effects of currency exchange, and concern about the entry of Chinese manufactur-ers into global markets, do not allow for opti-mism.In this operating environment, the Showa Group believes it must take greater advantage of the Group’s collective strength to make its products more competitive in quality and cost in markets around the globe.The Group seeks to achieve the target set out in its medium-term business plan—namely, achieving world-class quality and technolo-gies—by taking action to bolster the operating foundations and improve corporate culture on a global scale. These measures include initiatives to raise quality and production efficiency, which trace problems back to product origins through reviews of material properties and manufactur-ing processes, and activities for stepping up mutually complementary relations in production items between overseas bases, undertaken simultaneously with the reinforcement of mother plant functions in Japan.
The Group forecasts consolidated results for the next fiscal year (from April 1, 2008 to March 31, 2009) as set out below. These forecasts are based on factors that include fluctuations in the assumed exchange rate, higher raw material prices, expansion and improvement of opera-tional bases in Japan and overseas, and greater expenditures on measures aimed at bolstering our operating foundations.
Consolidated net sales ¥282,000 million (down 0.5% year on year)
Consolidated operating income ¥9,300 million
(down 31.9% year on year) Consolidated ordinary income ¥9,700 million
(down 32.0% year on year) Consolidated net income ¥3,200 million
(down 51.5% year on year)
The forecasts presented above are based on average exchange rates for the full term of ¥101 per dollar and ¥152 per euro.
Challenges aheadThe Group is operating in an environment of
increasingly fierce competition, characterized by risks and uncertainties, including demand trends at major automobile markets in Japan and coun-tries in North America, South America, Europe and Asia, fluctuations in currency exchange rates, changes in prices of crude oil, raw materials and other items, and the introduction of new legal restrictions and tax systems.Responding flexibly to customer demand world-wide and raising product competitiveness in areas such as quality and cost have become indispens-able in this operat ing environment. Showa Corporation will bolster the Group’s comprehen-sive strengths and operating foundations, with ini-tiatives to strengthen the roles that Japanese affili-ates play in supporting overseas operational bases as their “mothers” across a broad range of areas, including quality, technology and production assis-tance.
011_0281001372009.indd 15 2008/09/13 10:47:01
16
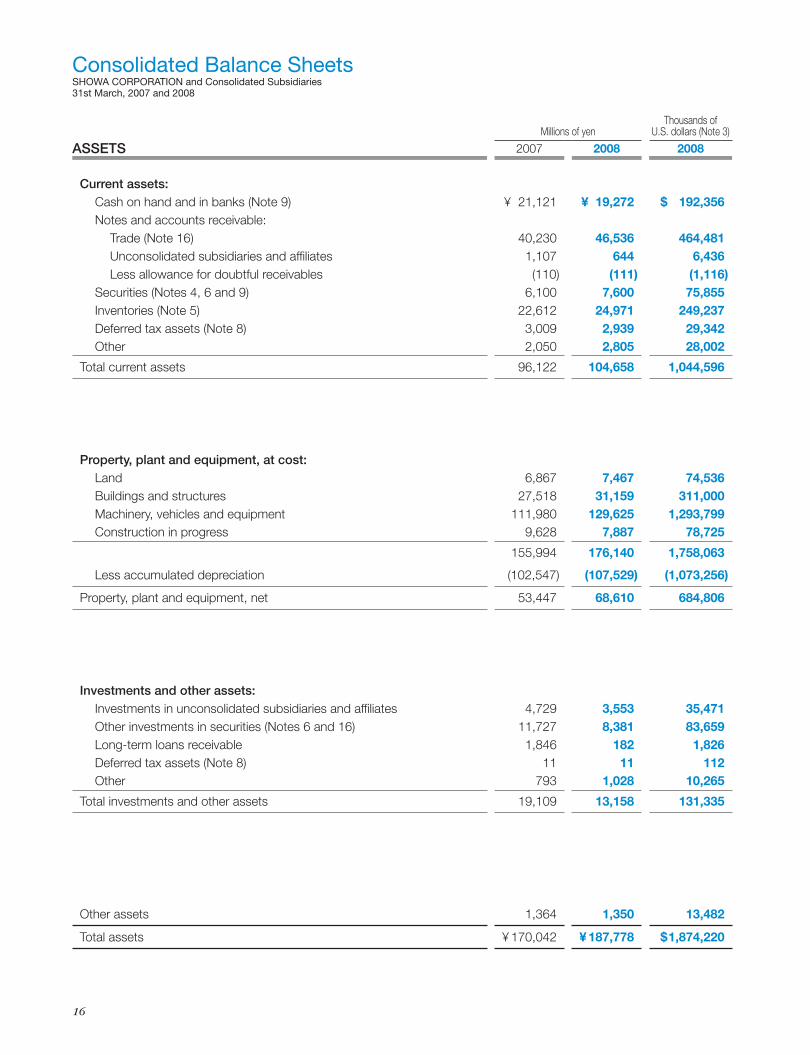
SHOWA CORPORATION and Consolidated Subsidiaries31st March, 2007 and 2008
Consolidated Balance Sheets
Millions of yenThousands of
U.S. dollars (Note 3)
ASSETS 2007 2008 2008
Current assets:Cash on hand and in banks (Note 9) ¥ 21,121 ¥ 19,272 $ 192,356Notes and accounts receivable:
Trade (Note 16) 40,230 46,536 464,481Unconsolidated subsidiaries and affiliates 1,107 644 6,436Less allowance for doubtful receivables (110) (111) (1,116)
Securities (Notes 4, 6 and 9) 6,100 7,600 75,855Inventories (Note 5) 22,612 24,971 249,237Deferred tax assets (Note 8) 3,009 2,939 29,342Other 2,050 2,805 28,002
Total current assets 96,122 104,658 1,044,596
Property, plant and equipment, at cost:Land 6,867 7,467 74,536Buildings and structures 27,518 31,159 311,000Machinery, vehicles and equipment 111,980 129,625 1,293,799Construction in progress 9,628 7,887 78,725
155,994 176,140 1,758,063
Less accumulated depreciation (102,547) (107,529) (1,073,256)
Property, plant and equipment, net 53,447 68,610 684,806
Investments and other assets:Investments in unconsolidated subsidiaries and affiliates 4,729 3,553 35,471Other investments in securities (Notes 6 and 16) 11,727 8,381 83,659Long-term loans receivable 1,846 182 1,826Deferred tax assets (Note 8) 11 11 112Other 793 1,028 10,265
Total investments and other assets 19,109 13,158 131,335
Other assets 1,364 1,350 13,482
Total assets ¥ 170,042 ¥ 187,778 $ 1,874,220
011_0281001372009.indd 16 2008/09/13 10:47:01

17
Millions of yenThousands of
U.S. dollars (Note 3)
LIABILITIES AND NET ASSETS 2007 2008 2008
Current liabilities:Short-term borrowings (Notes 7 and 9) ¥ 3,690 ¥ 10,339 $ 103,195Notes and accounts payable:
Trade 38,307 44,867 447,824Construction 870 965 9,640Unconsolidated subsidiaries and affiliates 15 8 86Other 3 3 35
Accrued income taxes (Note 8) 1,232 1,100 10,984Accrual for warranty expenses 1,893 1,239 12,373Other 5,985 6,567 65,550
Total current liabilities 51,999 65,092 649,690
Long-term liabilities:Accrued retirement benefits (Note 13) 3,557 3,391 33,851Deferred tax liabilities (Note 8) 2,576 963 9,618Accrual for warranty expenses 692 750 7,491Other 475 452 4,514
Total long-term liabilities 7,302 5,558 55,475
Net assets (Note 15):Shareholders’ equity:
Common stock, no par value:Authorised: 180,000,000 sharesIssued:
31st March, 2007 — 76,020,019 shares 12,698 — —31st March, 2008 — 76,020,019 shares — 12,698 126,746
Capital surplus 13,558 13,558 135,330Retained earnings 66,376 70,784 706,500Less treasury stock, at cost (50) (51) (518)
Total shareholders’ equity 92,583 96,989 968,057
Valuation and translation adjustments:Net unrealised holding gains on securities 6,080 4,069 40,614Unrealised (losses) gains on derivative instruments, net (14) 14 145Translation adjustments, net (967) 38 385
Total valuation and translation adjustments 5,097 4,122 41,146
Minority interests 13,059 16,015 159,850
Total net assets 110,740 117,127 1,169,054
Contingent liabilities (Note 10)
Total liabilities and net assets ¥ 170,042 ¥ 187,778 $ 1,874,220
See accompanying notes to consolidated financial statements.
011_0281001372009.indd 17 2008/09/13 10:47:01
18
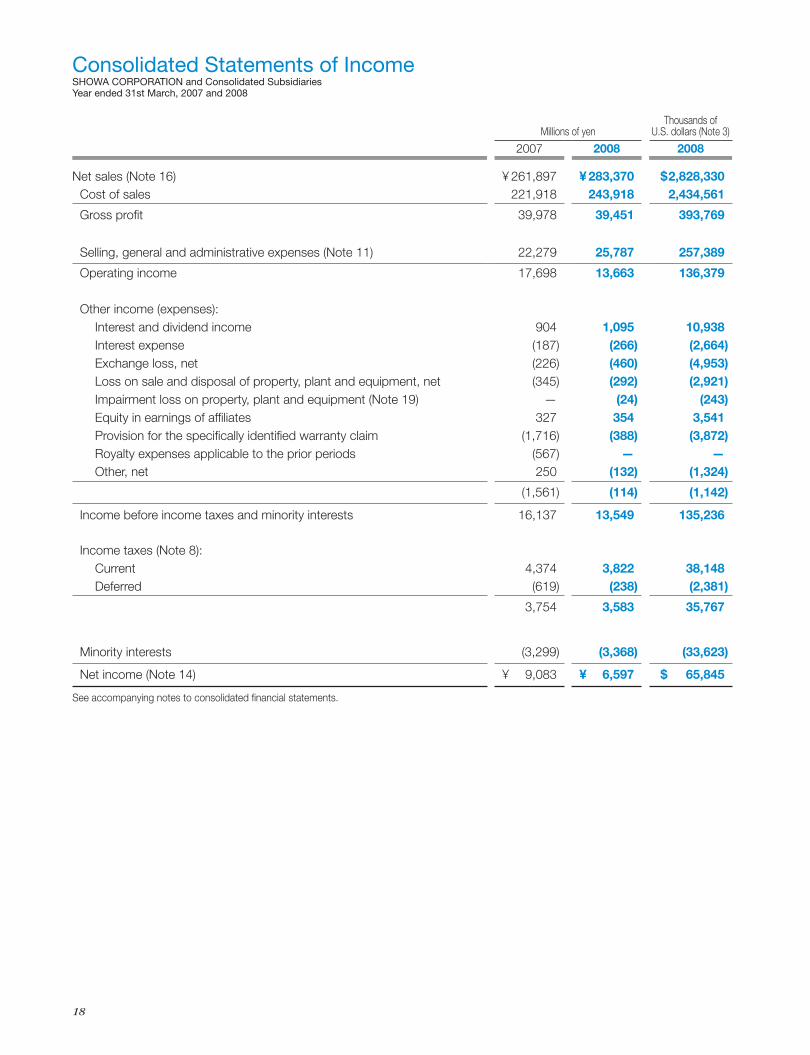
SHOWA CORPORATION and Consolidated SubsidiariesYear ended 31st March, 2007 and 2008
Consolidated Statements of Income
Millions of yenThousands of
U.S. dollars (Note 3)
2007 2008 2008
Net sales (Note 16) ¥ 261,897 ¥ 283,370 $ 2,828,330Cost of sales 221,918 243,918 2,434,561
Gross profit 39,978 39,451 393,769
Selling, general and administrative expenses (Note 11) 22,279 25,787 257,389
Operating income 17,698 13,663 136,379
Other income (expenses):Interest and dividend income 904 1,095 10,938Interest expense (187) (266) (2,664)Exchange loss, net (226) (460) (4,953)Loss on sale and disposal of property, plant and equipment, net (345) (292) (2,921)Impairment loss on property, plant and equipment (Note 19) — (24) (243)Equity in earnings of affiliates 327 354 3,541Provision for the specifically identified warranty claim (1,716) (388) (3,872)Royalty expenses applicable to the prior periods (567) — —Other, net 250 (132) (1,324)
(1,561) (114) (1,142)
Income before income taxes and minority interests 16,137 13,549 135,236
Income taxes (Note 8):Current 4,374 3,822 38,148Deferred (619) (238) (2,381)
3,754 3,583 35,767
Minority interests (3,299) (3,368) (33,623)
Net income (Note 14) ¥ 9,083 ¥ 6,597 $ 65,845
See accompanying notes to consolidated financial statements.
011_0281001372009.indd 18 2008/09/13 10:47:01

19
SHOWA CORPORATION and Consolidated SubsidiariesYear ended 31st March, 2007 and 2008
Consolidated Statements of Changes in Net Assets
Shareholders’ equity Valuation and translation adjustments
Number ofsharesissued
Commonstock, nopar value
Capitalsurplus
Retainedearnings
Lesstreasury
stock,at cost
Netunrealised
holdinggains onsecurities
Unrealised (losses) gains on derivatives instruments,
net
Translationadjustments,
netMinorityinterests
Totalnet assets
(Thousands) (Millions of yen)
Balance at 31st March, 2006 76,020 ¥12,698 ¥13,558 ¥58,812 ¥(48) ¥5,501 ¥ — ¥ (2,696) ¥ 9,989 ¥ 97,815
Cash dividends paid — — — (1,519) — — — — — (1,519)
Net income — — — 9,083 — — — — — 9,083
Purchases of treasury stock — — — — (1) — — — — (1)
Net changes of item other
than shareholders’ equity — — — — — 578 (14) 1,728 3,070 5,362
Balance at 31st March, 2007 76,020 12,698 13,558 66,376 (50) 6,080 (14) (967) 13,059 110,740
Cash dividends paid — — — (2,127) — — — — — (2,127)
Net income — — — 6,597 — — — — — 6,597
Decrease due to inclusion of
subsidiaries in consolidation (62) (62)
Purchases of treasury stock — — — — (1) — — — — (1)
Net changes of item other
than shareholders’ equity — — — — — (2,010) 29 1,006 2,955 1,980
Balance at 31st March, 2008 76,020 ¥12,698 ¥13,558 ¥70,784 ¥(51) ¥4,069 ¥ 14 ¥ 38 ¥ 16,015 ¥117,127
Shareholders’ equity Valuation and translation adjustments
Number ofsharesissued
Commonstock, nopar value
Capitalsurplus
Retainedearnings
Lesstreasury
stock,at cost
Netunrealised
holdinggains onsecurities
Unrealised (losses) gains on derivatives instruments,
net
Translationadjustments,
netMinorityinterests
Totalnet assets
(Thousands) (Thousands of U.S. dollars)(Note 3)
Balance at 31st March, 2007 76,020 $126,746 $135,330 $662,505 $(506) $60,685 $(148) $ (9,661) $130,351 $1,105,304
Cash dividends paid — — — (21,231) — — — — — (21,231)
Net income — — — 65,845 — — — — — 65,845
Decrease due to inclusion of
subsidiaries in consolidation (619) (619)
Purchases of treasury stock — — — — (12) — — — — (12)
Net changes of item other
than shareholders’ equity — — — — — (20,071) 293 10,047 29,498 19,768
Balance at 31st March, 2008 76,020 $126,746 $135,330 $706,500 $(518) $40,614 $ 145 $ 385 $159,850 $1,169,054
See accompanying notes to consolidated financial statements.
011_0281001372009.indd 19 2008/09/13 10:47:01

20
SHOWA CORPORATION and Consolidated SubsidiariesYear ended 31st March, 2007 and 2008
Consolidated Statements of Cash Flows
Millions of yenThousands of
U.S. dollars (Note 3)
2007 2008 2008
Cash flows from operating activitiesIncome before income taxes and minority interests ¥16,137 ¥13,549 $135,236Depreciation and amortisation 7,107 8,732 87,163Increase (decrease) in allowance for doubtful receivable 12 (6) (68)Impairment loss on property, plant and equipment — 24 243Increase (decrease) in accrual for warranty expenses 1,171 (580) (5,794)Decrease in accrued retirement benefits (92) (148) (1,482)Equity in earnings of affiliates (327) (354) (3,541)Loss on sale and disposal of property, plant and equipment, net 345 292 2,921Increase in trade receivables (2,977) (4,609) (46,007)Decrease (increase) in inventories 780 (2,003) (20,001)Increase in trade payables 1,087 5,010 50,013Other, net (6,044) (4,166) (41,589)
Net cash provided by operating activities 17,201 15,739 157,095
Cash flows from investing activitiesIncrease in time deposit (2,441) (2,147) (21,439)Purchases of property, plant and equipment (14,477) (21,273) (212,327)Proceeds from sale of property, plant and equipment 46 24 239Purchases of other investments in securities (7) (3) (31)Increase in investments in affiliates (4,220) (184) (1,836)Increase in long-term loans receivable (1,535) — —Other, net (71) (214) (2,144)
Net cash used in investing activities (22,707) (23,799) (237,539)
Cash flows from financing activitiesIncrease in short-term borrowings 31 6,498 64,857Issuance of stock of consolidated subsidiary 882 — —Cash dividends (1,518) (2,125) (21,213)Cash dividends to minority shareholders (591) (845) (8,437)Other, net (6) (1) (12)
Net cash (used in) provided by financing activities (1,202) 3,526 35,193
Effect of exchange rate changes on cash and cash equivalents (52) 236 2,363Net decrease in cash and cash equivalents (6,759) (4,296) (42,885)
Cash and cash equivalents at beginning of year 31,287 24,527 244,809
Increase in cash and cash equivalents due to inclusion of subsidiaries in consolidation — 1,205 12,031
Cash and cash equivalents at end of year (Note 9) ¥24,527 ¥21,436 $213,955
Supplemental disclosures of cash flow informationCash paid for:
Interest ¥ 196 ¥ 261 $ 2,612Income taxes 5,630 4,265 42,575
See accompanying notes to consolidated financial statements.
011_0281001372009.indd 20 2008/09/13 10:47:01

21
1. Basis of PreparationShowa Corporation (the “Company”) and its domestic subsid-iaries maintain their accounting records in accordance with accounting principles generally accepted in Japan, and foreign subsidiaries of the Company maintain their books of account in conformity with those of their countries of domicile. The accompanying consolidated financial statements have been compiled from the consolidated financial statements prepared by the Company as required under the Financial Instruments and Exchange Law of Japan and, therefore, have been pre-pared in conformity with accounting principles generally accepted in Japan, which are different in certain respects as to the application and disclosure requirements of International Financial Reporting Standards.
The notes to the consolidated financial statements include information which is not required under accounting principles generally accepted in Japan but is presented herein as addi-tional information solely for the convenience of readers outside Japan.
As permitted by the Financial Instruments and Exchange Law of Japan, amounts of less than one million yen have been omitted. Consequently, the totals shown in the accompanying consolidated financial statements (both in yen and U.S. dollars) do not necessarily agree with the sums of the individual amounts.
Certain amounts in the prior year’s consolidated finan-cial statements have been reclassified to conform to the current year’s presentation.
2. Summary of Significant Accounting Policies(a) Principles of ConsolidationThe consolidated financial statements include the accounts of the Company’s 12 and 14 domestic and foreign subsidiaries for the years ended 31st March, 2007 and 2008, respectively. All significant inter-company balances and transactions have been eliminated in consolidation.
Investments in 3 affiliates are accounted for by the equity method with appropriate adjustments for inter-company profits and dividends.
The Company does not consolidate nor apply the equity method with respect to the Company’s one of the subsidiaries, as the Company determined the subsidiary to be insignificant to total assets, sales, net income and retained earnings of the accompanying consolidated financial statements.
The excess of cost over underlying net assets at fair value at the date of acquisition is amortised over the following period on a straight-line basis or fully charged to income as incurred if the amount is immaterial:
Showa do Brasil Ltda. 20 yearsOther an estimated useful period
not exceeding 20 years(b) Foreign Currency TranslationThe revenue and expense accounts of the foreign subsidiaries are translated into yen at the average rate of exchange in effect during the year. Except for shareholders’ equity, the bal-ance sheet accounts are translated at the rate of exchange in effect at the balance sheet date. The components of share-holders’ equity are translated at their historical exchange rates. Translation adjustments are presented as a component of val-uation and translation adjustments and minority interests.(c) SecuritiesSecurities other than equity securities issued by subsidiaries and affiliates are classified into three categories; trading, held-to-maturity or other securities. Trading securities are carried at fair value and held-to-maturity securities are carried at amor-tised cost. Marketable securities classified as other securities are carried at fair value with changes in unrealised holding
SHOWA CORPORATION and Consolidated SubsidiariesNotes to Consolidated Financial Statements
gains or losses, net of the applicable income taxes, directly included in net assets. Non-marketable securities classified as other securities are carried at cost. Cost of securities sold is determined by the moving average method.(d) InventoriesInventories of the Company are principally stated at cost deter-mined by the weighted average method, while inventories held by the consolidated subsidiaries are principally stated at the lower of cost or market determined by the first in, first out method or the weighted average method.(e) Property, Plant and Equipment and DepreciationProperty, plant and equipment is stated at cost. Depreciation of buildings of the Company, acquired on or after 1st April, 2007 is computed by straight-line method and depreciation of the other property, plant and equipment of the Company is computed by declining-balance method. Domestic consolidat-ed subsidiaries of the Company adopt the declining-balance method, while the straight-line method is principally applied to property, plant and equipment of foreign subsidiaries.Changes in Method of Accounting
(i) Prior to the year ended 31st March, 2007, the Company had adopted declining-balance method for depreciation of buildings. On 1st April, 2007, the Company changed its method of depreciation for buildings, acquired on or after 1st April, 2007, to straight-line method.
During the year ended 31st March, 2008, the Company made a significant investment to build a plant in Gyoda, Saitama, which was completed in the first half year, and also decided in the second half year to construct a large-sized new plant in Gotemba, Shizuoka. As a result, the total amount of those actual and expected investments in buildings exceeded the Company’s book value of buildings at the beginning of the year ended 31st March, 2008.
In addition, the new plant in Gotemba is expect-ed only to manufacture electric power steering parts and to be constantly used over a long period of time.
Under this situation, the Company reassessed expense allocation and changed its method of depre-ciation of aforementioned buildings.
This change was made because the Company expects to constantly recover these investments over a long period of time and better reflect how the assets are expected to be used over time based on the above reassessment, and as a result, it better allocates the cost of depreciation.
In addition, since buildings acquired on or prior to 31st March, 2007 have continuously incurred large amount of repairing expenses due to aging and since their economic values have declined, these buildings continued to be depreciated using the declining-balance method, in order to better allocate the costs of depreciation.
(ii) Effective 1st April, 2007, the Company and its domestic consolidated subsidiaries have changed their method of depreciation based on an amend-ment to Corporation Tax Law of Japan for property, plant and equipment acquired on or after 1st April, 2007, except for buildings of the Company.
The effect of these changes of (i) and (ii) above for the year ended 31st March, 2008, was to decrease depreciation expense of buildings acquired on or after 1st April, 2007 by ¥69 million ($693 thousand), increase depreciation expense of tangible fixed assets other than those buildings above by ¥348 million ($3,479 thousand), and decrease operating
011_0281001372009.indd 21 2008/09/13 10:47:01

22
of the employees. Principal actuarial gain or loss is amortised in the year following the year in which the gain or loss is recog-nised by the declining-balance method over 15 years which are shorter than the average remaining years of service of the employees.
The allowance for directors’ and statutory auditors’ retire-ment benefits, included in Long-term liabilities — other, is pro-vided for the payment of retirement benefits to directors and statutory auditors at an amount that would be payable in accordance with its internal rules and regulation if all eligible directors and statutory auditors were to resign at the fiscal year end.(j) Derivative Financial InstrumentsThe Company and certain consolidated subsidiaries utilise for-ward foreign exchange contracts in order solely to hedge against risks of adverse fluctuations in foreign currency exchange rates. The Company and consolidated subsidiaries do not enter into such financial instruments for trading or speculative purposes.
Derivatives are carried at fair value, with any changes in unrealised gains or losses charged or credited to operations, except for those which meet the criteria for deferral hedge accounting under which unrealised gains or losses are deferred as a component of valuation and translation adjust-ments.(k) Income TaxesIncome taxes is computed based on income before income taxes included in the consolidated statement of income.
Deferred tax assets and liabilities are determined based on the differences between financial reporting and the tax bases of the assets and liabilities, and are measured using the enact-ed tax rates and laws which will be in effect when the differ-ences are expected to reverse.(l) Cash and Cash EquivalentsFor the purposes of consolidated statements of cash flows, the Company considers all highly liquid investments with insig-nificant risk of changes in value, with maturities of generally three months or less when purchased, to be cash equivalents.
3. U.S. Dollar AmountsThe translation of yen amounts into U.S. dollar amounts is included solely for the convenience and has been made, as a matter of arithmetic computation only, at the rate of ¥100.19 = U.S.$1.00, the exchange rate prevailing at 31st March, 2008. The translation should not be construed as a representation that yen amounts have been, could have been, or could in the future be, converted into U.S. dollars at the above or any other rate.
4. New Accounting StandardsPresentation of Net Assets in the Balance SheetEffective for the year ended 31st March, 2007, “Accounting Standard for Presentation of Net Assets in the Balance Sheet” (“Accounting Standard No. 5” issued by the Accounting Standards Board of Japan on 9th December, 2005), and “Guidance on the Accounting Standard for Presentation of Net Assets in the Balance Sheet” (“Accounting Implementation Guidance No. 8” issued by the Accounting Standards Board of Japan on 9th December, 2005), have been adopted.
The amount corresponding to total net assets for the year ended 31st March, 2007 under the previous standards was ¥97,695 million.Presentation of Certificate of Deposits Issued in JapanCertificate of deposits issued in Japan, which were previously included in Cash on hand and in banks, have been reclassified to Securities in the consolidated balance sheets to conform to the current year’s presentation.
income and income before income taxes and minor-ity interests by ¥268 mill ion ($2,681 thousand), respectively.
Additional Information(i) Effective 1st April, 2007, the Company and its
domestic consolidated subsidiaries have changed its estimate of their residual values of property, plant and equipment based on an amendment to the Corporation Tax Law of Japan. According to this amendment, the difference between equivalents of 5% of acquisition cost and memorandum value of property, plant and equipment acquired on or before 31st March, 2007, are depreciated by the straight-line method over 5 years commencing in the year following the year in which the book value of the assets reaches the statutory limits of depreciation. The effect of this change, was to decrease operating income and income before income taxes and minor-ity interests by ¥321 million ($3,207 thousand), respectively.
(ii) In addition, two foreign consolidated subsidiaries in North America changed and extended their estimat-ed useful lives of machineries. This change was made to better reflect how the assets are used and expected to be used over time taking into consider-ation significant investments made to replace old machineries and improve productivity and capacity of in-house production for manufacturing automotive parts. The effect of this change was to increase operating income and income before income taxes and minority interests by ¥510 million ($5,099 thou-sand), respectively.
(f) Accrual for Warranty ExpensesAccrual for warranty expenses have been provided for future warranty expenses under the basic parts supply contracts with customers as a total of the following:
(i) an estimate of warranty expenses to be incurred during the remaining warranty periods based on his-torical warranty claim experiences and an estimate of the probability of future warranty expenses; and
(ii) an estimate of specifically identified warranty claim. Accrual for warranty expenses which will be utilised within
one year is presented in Current liabilities, and those which will be utilised after one year are presented in Long-term liabilities.(g) Research and Development ExpensesResearch and development expenses are charged to income as incurred.(h) LeasesFinance leases, except those where the legal title of the under-lying property is transferred from the lessor to the lessee by the end of the lease term, are accounted for as operating leases.(i) Retirement BenefitsAccrued retirement benefits for employees of the Company and its several consolidated subsidiaries are provided princi-pally at an amount calculated based on the retirement benefit obligation and the fair value of the pension plan assets as of the balance sheet date, as adjusted for the unrecognised net retirement benefit obligation at transition, unrecognised actuar-ial gain or loss and unrecognised prior service cost. The retire-ment benefit obligation has been attributed to each period by the straight-line method over the estimated years of service of the eligible employees.
Net retirement benefit obligation at transition is amortised principally over 15 years. Prior service cost is amortised as incurred by the straight-line method principally over 15 years which are shorter than the average remaining years of service
011_0281001372009.indd 22 2008/09/13 10:47:01

23
This reclassification was made based on an amendment to “Practical Guidelines on Accounting Standards for Financial Instruments” and “Q&A on Account ing for F inancia l Instruments” issued by the Japanese Institute of Certified Public Accountants effective for the year ended 31st March, 2008.
5. InventoriesInventories consist of the following:
Millions of yenThousands of U.S. dollars
31st March, 2007 2008 2008
Finished goods ¥ 3,138 ¥ 3,500 $ 34,936Work in process 3,602 4,106 40,984Raw materials and supplies 15,871 17,364 173,317
¥ 22,612 ¥ 24,971 $ 249,237
6. SecuritiesMarketable securitiesInformation regarding marketable securities classified as other securities at 31st March, 2007 and 2008 was as follows:
Other securitiesMillions of yen
31st March, 2007Acquisition
costCarrying
valueUnrealised
gain
Securities whose carrying value exceeds their acquisition cost:
Stocks ¥1,197 ¥11,536 ¥10,339Debt securities — — —Other — — —
Subtotal 1,197 11,536 10,339Securities whose acquisition cost exceeds their carrying value:
Stocks — — —Debt securities — — —Other — — —
Subtotal — — —Total ¥1,197 ¥11,536 ¥10,339
Millions of yen Thousands of U.S. dollars
31st March, 2008Acquisition
costCarrying
valueUnrealised
gainAcquisition
costCarrying
valueUnrealised
gain
Securities whose carrying value exceeds their acquisition cost:
Stocks ¥1,200 ¥8,196 ¥6,996 $11,981 $81,810 $69,828Debt securities — — — — — —Other — — — — — —
Subtotal 1,200 8,196 6,996 11,981 81,810 69,828Securities whose acquisition cost exceeds their carrying value:
Stocks — — — — — —Debt securities — — — — — —Other — — — — — —
Subtotal — — — — — —Total ¥1,200 ¥8,196 ¥6,996 $11,981 $81,810 $69,828
Non-marketable securitiesInformation regarding non-marketable securities classified as other securities at 31st March, 2007 and 2008 was as follows:
Millions of yen31st March, 2007 Book value
Other securities:Certificate of deposits ¥6,100Unlisted securities 191
Millions of yenThousands of U.S. dollars
31st March, 2008 Book value Book value
Other securities:Certificate of deposits ¥7,600 $75,855Unlisted securities 185 1,849
Maturities of other securities at 31st March, 2008 were as fol-lows:
Due within one year Due after one year
Millions of yenThousands of U.S. dollars Millions of yen
Thousands of U.S. dollars
Certificate of deposits ¥ 7,600 $75,855 — —
7. Short-Term BorrowingsShort-term borrowings were unsecured with average interest rates of 4.01 % and 5.03 % for the years ended 31st March, 2007 and 2008, respectively.
8. Income TaxesIncome taxes applicable to the Company comprised corpora-tion tax, inhabitants’ taxes and enterprise tax which, in the aggregate, resulted in a statutory tax rate of 40.0% for the years ended 31st March, 2007 and 2008. Income taxes of the consolidated subsidiaries were based on the tax rates applica-ble in their countries of incorporation.
The effective tax rates reflected in the consolidated state-ments of income for the years ended 31st March, 2007 and 2008 differ from the statutory tax rate for the following reasons:Year ended 31st March, 2007 2008
Statutory tax rate 40.0% 40.0%Effect of:
Different tax rates applied to foreign subsidiaries (9.5) (13.6)Foreign tax credits (1.9) (2.5)Tax credits for research and development expenses (2.8) (1.7)Non-taxable income (2.0) (0.5)Elimination of dividend income 4.1 3.2Valuation allowance 0.0 1.5Expenses not deductible for income tax purposes 0.3 1.0
Per capita inhabitants tax 0.2 0.2Refunds of prior periods’ income taxes paid by foreign subsidiary (4.4) —Other, net (0.7) (1.2)Effective tax rates 23.3% 26.4%
011_0281001372009.indd 23 2008/09/13 10:47:01
24
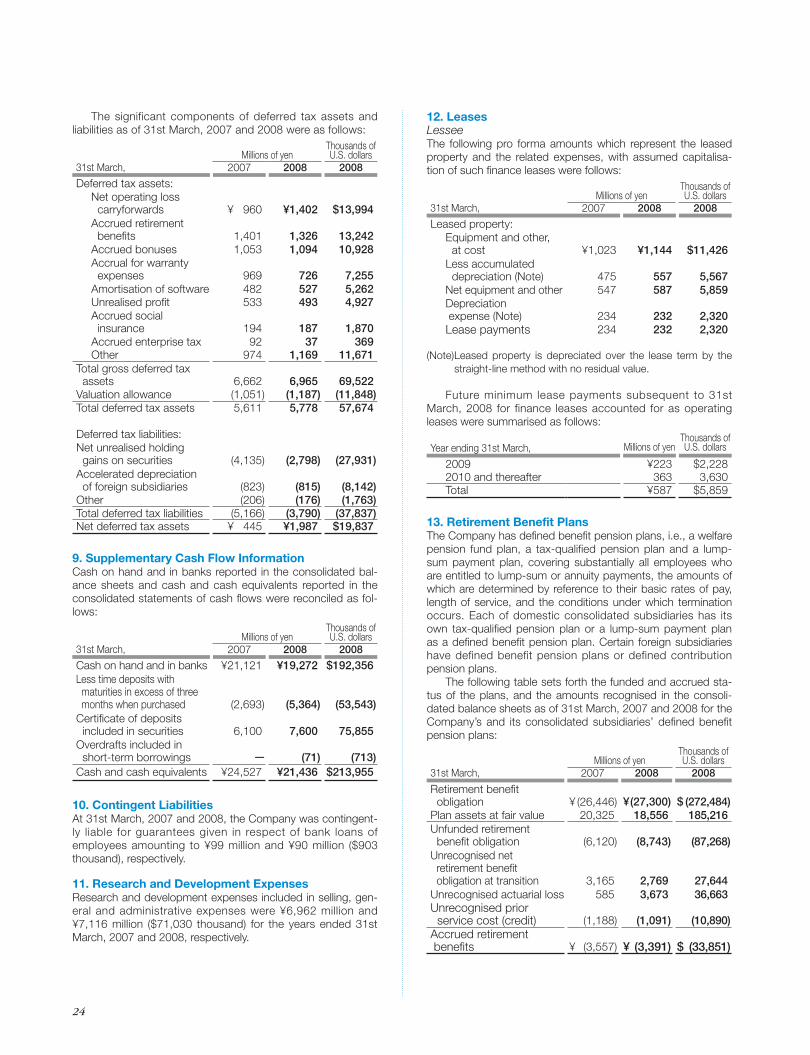
12. LeasesLesseeThe following pro forma amounts which represent the leased property and the related expenses, with assumed capitalisa-tion of such finance leases were follows:
Millions of yenThousands of U.S. dollars
31st March, 2007 2008 2008
Leased property:Equipment and other, at cost ¥1,023 ¥1,144 $11,426Less accumulated depreciation (Note) 475 557 5,567Net equipment and other 547 587 5,859Depreciation expense (Note) 234 232 2,320Lease payments 234 232 2,320
(Note) Leased property is depreciated over the lease term by the straight-line method with no residual value.
Future minimum lease payments subsequent to 31st March, 2008 for finance leases accounted for as operating leases were summarised as follows:
Millions of yenThousands of U.S. dollarsYear ending 31st March,
2009 ¥223 $2,2282010 and thereafter 363 3,630Total ¥587 $5,859
13. Retirement Benefit PlansThe Company has defined benefit pension plans, i.e., a welfare pension fund plan, a tax-qualified pension plan and a lump-sum payment plan, covering substantially all employees who are entitled to lump-sum or annuity payments, the amounts of which are determined by reference to their basic rates of pay, length of service, and the conditions under which termination occurs. Each of domestic consolidated subsidiaries has its own tax-qualified pension plan or a lump-sum payment plan as a defined benefit pension plan. Certain foreign subsidiaries have defined benefit pension plans or defined contribution pension plans.
The following table sets forth the funded and accrued sta-tus of the plans, and the amounts recognised in the consoli-dated balance sheets as of 31st March, 2007 and 2008 for the Company’s and its consolidated subsidiaries’ defined benefit pension plans:
Millions of yenThousands of U.S. dollars
31st March, 2007 2008 2008
Retirement benefit obligation ¥ (26,446) ¥ (27,300) $ (272,484)Plan assets at fair value 20,325 18,556 185,216Unfunded retirement benefit obligation (6,120) (8,743) (87,268)Unrecognised net retirement benefit obligation at transition 3,165 2,769 27,644Unrecognised actuarial loss 585 3,673 36,663Unrecognised prior service cost (credit) (1,188) (1,091) (10,890)Accrued retirement benefits ¥ (3,557) ¥ (3,391) $ (33,851)
The significant components of deferred tax assets and liabilities as of 31st March, 2007 and 2008 were as follows:
Millions of yenThousands of U.S. dollars
31st March, 2007 2008 2008
Deferred tax assets:Net operating loss carryforwards ¥ 960 ¥1,402 $13,994Accrued retirement benefits 1,401 1,326 13,242Accrued bonuses 1,053 1,094 10,928Accrual for warranty expenses 969 726 7,255Amortisation of software 482 527 5,262Unrealised profit 533 493 4,927Accrued social insurance 194 187 1,870Accrued enterprise tax 92 37 369Other 974 1,169 11,671
Total gross deferred tax assets 6,662 6,965 69,522Valuation allowance (1,051) (1,187) (11,848)Total deferred tax assets 5,611 5,778 57,674
Deferred tax liabilities:Net unrealised holding gains on securities (4,135) (2,798) (27,931)Accelerated depreciation of foreign subsidiaries (823) (815) (8,142)Other (206) (176) (1,763)Total deferred tax liabilities (5,166) (3,790) (37,837)Net deferred tax assets ¥ 445 ¥1,987 $19,837
9. Supplementary Cash Flow InformationCash on hand and in banks reported in the consolidated bal-ance sheets and cash and cash equivalents reported in the consolidated statements of cash flows were reconciled as fol-lows:
Millions of yenThousands of U.S. dollars
31st March, 2007 2008 2008
Cash on hand and in banks ¥21,121 ¥19,272 $192,356Less time deposits with maturities in excess of three months when purchased (2,693) (5,364) (53,543)Certificate of deposits included in securities 6,100 7,600 75,855Overdrafts included in short-term borrowings — (71) (713)Cash and cash equivalents ¥24,527 ¥21,436 $213,955
10. Contingent LiabilitiesAt 31st March, 2007 and 2008, the Company was contingent-ly liable for guarantees given in respect of bank loans of employees amounting to ¥99 million and ¥90 million ($903 thousand), respectively.
11. Research and Development ExpensesResearch and development expenses included in selling, gen-eral and administrative expenses were ¥6,962 million and ¥7,116 million ($71,030 thousand) for the years ended 31st March, 2007 and 2008, respectively.
011_0281001372009.indd 24 2008/09/13 10:47:01

25
15. Net Assets and Cash DividendsThe Company’s common stock has no par value in accor-dance with the Japanese Corporate Law (JCL). Under JCL, at least 50% of the amount actually paid in or provided in consid-eration for newly issued stocks is designated as stated com-mon stock and proceeds in excess of the amount designated as stated common stock are recorded as capital surplus.
The JCL requires an amount equal to at least 10% of dis-tributions of retained earnings be appropriated as legal reserve, which are included in capital surplus and retained earnings, until legal reserve equals 25% of stated common stock. In addition, common stock, capital surplus and retained earnings, including legal reserves, can generally be transferred to each other upon resolution of the shareholders’ meeting.
Capital surplus and retained earnings less legal reserves and certain adjustments thereto may be available for dividends by resolution of the board of directors’ meeting. The accompa-nying consolidated financial statements did not include any provision for the dividends of ¥14 ($0.13) per share totaling ¥1,063 million ($10,615 thousand), which were subsequently proposed by the Board of Directors in respect of the year ended 31st March, 2008 and approved by shareholders at the annual shareholders’ meeting held on 20th June, 2008.
16. Related Party TransactionsThe Company is a 33.5% — owned affiliate of Honda Motor Co., Ltd. (Honda). Net sales to Honda included in consolidated net sales were ¥63,372 million and ¥63,354 million ($632,342 thousand) for the years ended 31st March, 2007 and 2008, respectively. In addition, trade accounts receivable from Honda were ¥9,406 million and ¥9,771 million ($97,528 thousand) as of 31st March, 2007 and 2008, respectively. In addition, the Company had the investment in Honda amounted to ¥9,165 million and ¥6,344 million ($63,323 thousand) as of 31st March, 2007 and 2008, respectively, which was included in other investments in securities in the consolidated balance sheets.
The terms of transactions referred to above were negotiat-ed and have been determined on an arm’s-length basis.
The company purchased 19% of voting shares of Showa do Brasil Ltda., a consolidated subsidiary, from Moto Honda da Amazonia Ltda., which is a subsidiary of Honda Motor Co., Ltd., during the year ended 31st March, 2007. The purchased price was ¥1,990 million and negotiated and determined based on the third party valuation.
The components of retirement benefit expenses for the years ended 31st March, 2007 and 2008 were outlined as fol-lows:
Millions of yenThousands of U.S. dollars
Year ended 31st March, 2007 2008 2008
Service cost ¥1,401 ¥1,428 $14,254Interest cost 531 558 5,578Expected return on plan assets (750) (812) (8,105)Amortisation of net retirement benefit obligation at transition 395 395 3,949Amortisation of actuarial loss 121 103 1,031Amortisation of prior service cost (92) (98) (978)Total ¥1,607 ¥1,575 $15,728
The assumptions used in accounting for the above plans are as follows:
2007 2008
Discount rates Primarily 2.0% Primarily 2.0%Rates of expected return on plan assets Primarily 4.0% Primarily 4.0%
14. Amounts Per ShareYen U.S. dollars
Year ended 31st March, 2007 2008 2008
Net income:Basic ¥ 119.56 ¥ 86.84 $ 0.87
Cash dividends 24.00 28.00 0.28
Yen U.S. dollars31st March, 2007 2008 2008
Net assets ¥1,285.76 ¥1,330.96 $ 13.28
The computation of basic net income per share is based on the net income available for distribution to shareholders of common stock and the weighted average number of shares of common stock outstanding during the year, and diluted net income per share is computed based on the net income avail-able for distribution to the shareholders and the weighted aver-age number of shares of common stock outstanding for the year after giving effect to the dilutive potential of shares of common stock to be issued upon the conversion of convert-ible bonds for the year.
The disclosure of diluted net income per share for the years ended 31st March, 2007 and 2008 was omitted because there were no dilutive instruments, respectively.
Cash dividends per share represent the cash dividends proposed by the Board of Directors as applicable to the respective years together with the interim cash dividends paid.
Amounts per share of net assets are computed based on net assets (excluding minority interests) available for distribu-tion to the shareholders and the number of shares of common stock outstanding at the year end.
011_0281001372009.indd 25 2008/09/13 10:47:01

26
17. Segment InformationThe Company and consolidated subsidiaries are primarily engaged in the manufacture and sale of products in Japan and overseas, in one major segment: the motor vehicle parts segment.
The business and geographical segment information including overseas sales for the Company and consolidated subsidiaries for the years ended 31st March, 2007 and 2008 was outlined as follows:Business segments
Year ended 31st March, 2007 Millions of yen
Motor vehicle parts Other TotalEliminations or corporate Consolidated
I. Sales and operating incomeSales to third parties ¥ 255,985 ¥5,911 ¥ 261,897 ¥ — ¥ 261,897Intergroup sales and transfers — — — — —
Total sales 255,985 5,911 261,897 — 261,897Operating expenses 239,418 4,779 244,198 — 244,198Operating income ¥ 16,566 ¥1,132 ¥ 17,698 ¥ — ¥ 17,698II. Assets, depreciation and capital expenditures
Identifiable assets ¥ 129,024 ¥4,715 ¥ 133,740 ¥ 36,302 ¥ 170,042Depreciation and amortisation 7,023 64 7,087 20 7,107Capital expenditures 17,214 162 17,377 23 17,400
Year ended 31st March, 2008 Millions of yen
Motor vehicle parts Other TotalEliminations or corporate Consolidated
I. Sales and operating incomeSales to third parties ¥ 278,195 ¥ 5,174 ¥ 283,370 ¥ — ¥ 283,370Intergroup sales and transfers — — — — —
Total sales 278,195 5,174 283,370 — 283,370Operating expenses 265,189 4,517 269,706 — 269,706Operating income ¥ 13,006 ¥ 657 ¥ 13,663 ¥ — ¥ 13,663II. Assets, depreciation, impairment loss and capital expenditures
Identifiable assets ¥ 161,081 ¥ 4,181 ¥ 165,262 ¥ 22,515 ¥ 187,778Depreciation and amortisation 8,607 97 8,705 27 8,732Impairment loss on property, plant and equipment 24 — 24 — 24Capital expenditures 20,791 1,148 21,940 35 21,975
Year ended 31st March, 2008 Thousands of U.S. dollars
Motor vehicle parts Other TotalEliminations or corporate Consolidated
I. Sales and operating incomeSales to third parties $ 2,776,679 $ 51,651 $ 2,828,330 $ — $ 2,828,330Intergroup sales and transfers — — — — —
Total sales 2,776,679 51,651 2,828,330 — 2,828,330Operating expenses 2,646,864 45,086 2,691,951 — 2,691,951Operating income $ 129,814 $ 6,564 $ 136,379 $ — $ 136,379II. Assets, depreciation, impairment loss and capital expenditures
Identifiable assets $ 1,607,757 $ 41,732 $ 1,649,490 $ 224,729 $ 1,874,220Depreciation and amortisation 85,912 977 86,889 274 87,163Impairment loss on property, plant and equipment 243 — 243 — 243Capital expenditures 207,520 11,466 218,986 352 219,339
011_0281001372009.indd 26 2008/09/13 10:47:02
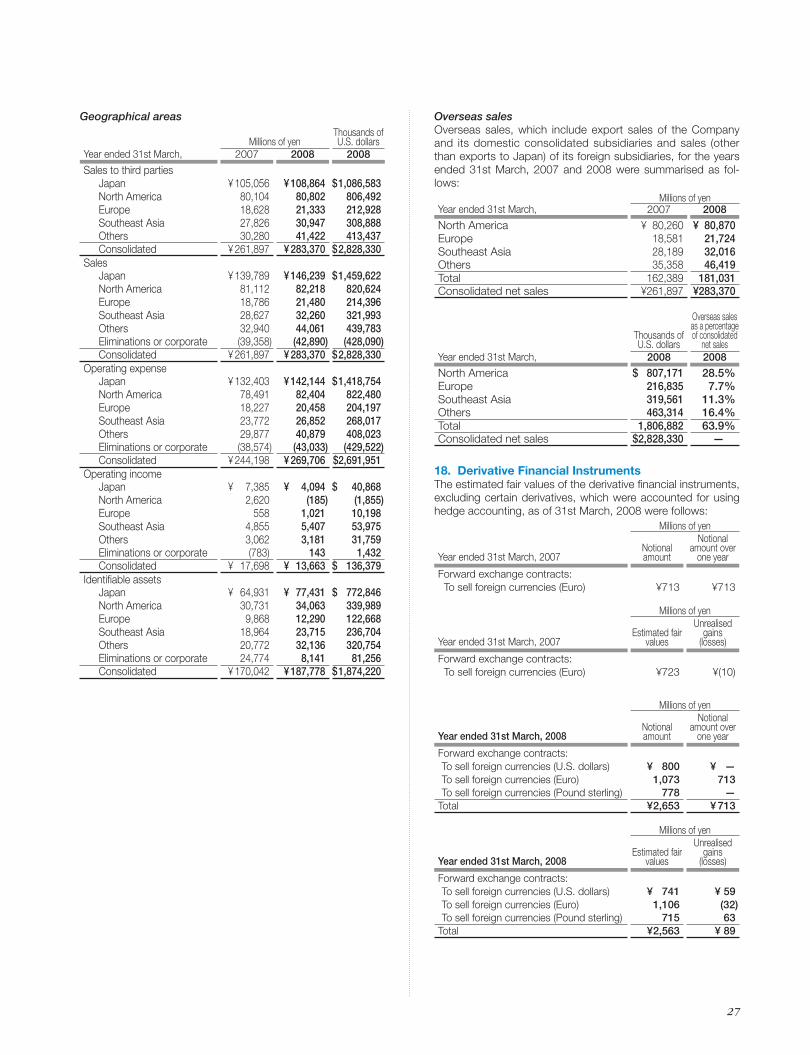
27
Geographical areas
Millions of yenThousands of U.S. dollars
Year ended 31st March, 2007 2008 2008
Sales to third partiesJapan ¥ 105,056 ¥ 108,864 $ 1,086,583North America 80,104 80,802 806,492Europe 18,628 21,333 212,928Southeast Asia 27,826 30,947 308,888Others 30,280 41,422 413,437Consolidated ¥ 261,897 ¥ 283,370 $ 2,828,330
SalesJapan ¥ 139,789 ¥ 146,239 $ 1,459,622North America 81,112 82,218 820,624Europe 18,786 21,480 214,396Southeast Asia 28,627 32,260 321,993Others 32,940 44,061 439,783Eliminations or corporate (39,358) (42,890) (428,090)Consolidated ¥ 261,897 ¥ 283,370 $ 2,828,330
Operating expenseJapan ¥ 132,403 ¥ 142,144 $ 1,418,754North America 78,491 82,404 822,480Europe 18,227 20,458 204,197Southeast Asia 23,772 26,852 268,017Others 29,877 40,879 408,023Eliminations or corporate (38,574) (43,033) (429,522)Consolidated ¥ 244,198 ¥ 269,706 $2,691,951
Operating incomeJapan ¥ 7,385 ¥ 4,094 $ 40,868North America 2,620 (185) (1,855)Europe 558 1,021 10,198Southeast Asia 4,855 5,407 53,975Others 3,062 3,181 31,759Eliminations or corporate (783) 143 1,432Consolidated ¥ 17,698 ¥ 13,663 $ 136,379
Identifiable assetsJapan ¥ 64,931 ¥ 77,431 $ 772,846North America 30,731 34,063 339,989Europe 9,868 12,290 122,668Southeast Asia 18,964 23,715 236,704Others 20,772 32,136 320,754Eliminations or corporate 24,774 8,141 81,256Consolidated ¥ 170,042 ¥ 187,778 $ 1,874,220
Overseas salesOverseas sales, which include export sales of the Company and its domestic consolidated subsidiaries and sales (other than exports to Japan) of its foreign subsidiaries, for the years ended 31st March, 2007 and 2008 were summarised as fol-lows:
Millions of yenYear ended 31st March, 2007 2008
North America ¥ 80,260 ¥ 80,870Europe 18,581 21,724Southeast Asia 28,189 32,016Others 35,358 46,419Total 162,389 181,031Consolidated net sales ¥261,897 ¥283,370
Thousands of U.S. dollars
Overseas sales as a percentage of consolidated
net salesYear ended 31st March, 2008 2008
North America $ 807,171 28.5%Europe 216,835 7.7%Southeast Asia 319,561 11.3%Others 463,314 16.4%Total 1,806,882 63.9%Consolidated net sales $2,828,330 —
18. Derivative Financial InstrumentsThe estimated fair values of the derivative financial instruments, excluding certain derivatives, which were accounted for using hedge accounting, as of 31st March, 2008 were follows:
Millions of yen
Year ended 31st March, 2007Notional amount
Notional amount over
one year
Forward exchange contracts: To sell foreign currencies (Euro) ¥713 ¥713
Millions of yen
Year ended 31st March, 2007Estimated fair
values
Unrealised gains
(losses)
Forward exchange contracts: To sell foreign currencies (Euro) ¥723 ¥(10)
Millions of yen
Year ended 31st March, 2008Notional amount
Notional amount over
one year
Forward exchange contracts:To sell foreign currencies (U.S. dollars) ¥ 800 ¥ —To sell foreign currencies (Euro) 1,073 713To sell foreign currencies (Pound sterling) 778 —
Total ¥ 2,653 ¥ 713
Millions of yen
Year ended 31st March, 2008Estimated fair
values
Unrealised gains
(losses)
Forward exchange contracts:To sell foreign currencies (U.S. dollars) ¥ 741 ¥ 59To sell foreign currencies (Euro) 1,106 (32)To sell foreign currencies (Pound sterling) 715 63
Total ¥ 2,563 ¥ 89
011_0281001372009.indd 27 2008/09/13 10:47:02

28
Thousands of U.S. dollars
Year ended 31st March, 2008Notional amount
Notional amount over
one year
Forward exchange contracts:To sell foreign currencies (U.S. dollars) $ 7,993 $ —To sell foreign currencies (Euro) 10,719 7,118To sell foreign currencies (Pound sterling) 7,772 —
Total $ 26,486 $ 7,118
Thousands of U.S. dollars
Year ended 31st March, 2008Estimated fair
values
Unrealised gains
(losses)
Forward exchange contracts:To sell foreign currencies (U.S. dollars) $ 7,397 $ 596To sell foreign currencies (Euro) 11,048 (329)To sell foreign currencies (Pound sterling) 7,142 630
Total $ 25,587 $ 898
19. Impai rment Loss on Proper ty, P lant and Equipment
When the Company reviews possible impairments, fixed assets are grouped into business assets and idle assets. Business assets in use are classified by the type of business for management accounting purpose and assets not in use are identified individually and grouped as idle assets.
For the year ended 31st March, 2008, the Company rec-ognised an impairment loss of ¥24 million ($243 thousand) included in other expenses which was associated with idle machineries located in Shizuoka Prefecture, since the machin-eries were not likely to be used or sold. The impairment loss was measured as the amount by which the carrying amount of the asset exceeds its recoverable amount, and the memoran-dum price is applied as the recoverable amount.
20. Product RecallOn 20th September, 2007, Honda Motor Co., Ltd. (Honda), a main customer of the Company, reported defective vehicles because of problems with a continuously variable transmis-sions pump (CVT Pump) manufactured by the Company to Ministry of Land, Infrastructure, Transport and Tourism.
Honda conducted this recall due to improper inspection for certain vehicles which was conducted when Honda recalled defective vehicles because of the same problem in November 2005.
Since the Company did not reimburse any warranty expenses incurred relating to the recall made in November 2005, no reimbursement is expected for the recall made in September 2007.
011_0281001372009.indd 28 2008/09/13 10:47:02
29
Report of Independent Auditors
The Board of DirectorsSHOWA CORPORATION
We have audited the accompanying consolidated balance sheets of SHOWA CORPORATION
and consolidated subsidiaries as of 31st March, 2007 and 2008, and the related consolidated
statements of income, changes in net assets, and cash flows for the years then ended, all
expressed in yen. These financial statements are the responsibility of the Company’s
management. Our responsibility is to express an opinion on these financial statements based
on our audits.
We conducted our audits in accordance with auditing standards generally accepted in Japan.
Those standards require that we plan and perform the audit to obtain reasonable assurance
about whether the financial statements are free of material misstatement. An audit includes
examining, on a test basis, evidence supporting the amounts and disclosures in the financial
statements. An audit also includes assessing the accounting principles used and significant
estimates made by management, as well as evaluating the overall financial statement
presentation. We believe that our audits provide a reasonable basis for our opinion.
In our opinion, the financial statements referred to above present fairly, in all material
respects, the consolidated financial position of SHOWA CORPORATION and consolidated
subsidiaries at 31st March, 2007 and 2008, and the consolidated results of their operations and
their cash flows for the years then ended in conformity with accounting principles generally
accepted in Japan.
The U.S. dollar amounts in the accompanying consolidated financial statements with respect
to the year ended 31st March, 2008, are presented solely for convenience. Our audit also
included the translation of yen amounts into U.S. dollar amounts and, in our opinion, such
translation has been made on the basis described in Note 3.
20th June, 2008
Report of Independent Auditors
011_0281001372009.indd 29 2008/09/13 10:47:02
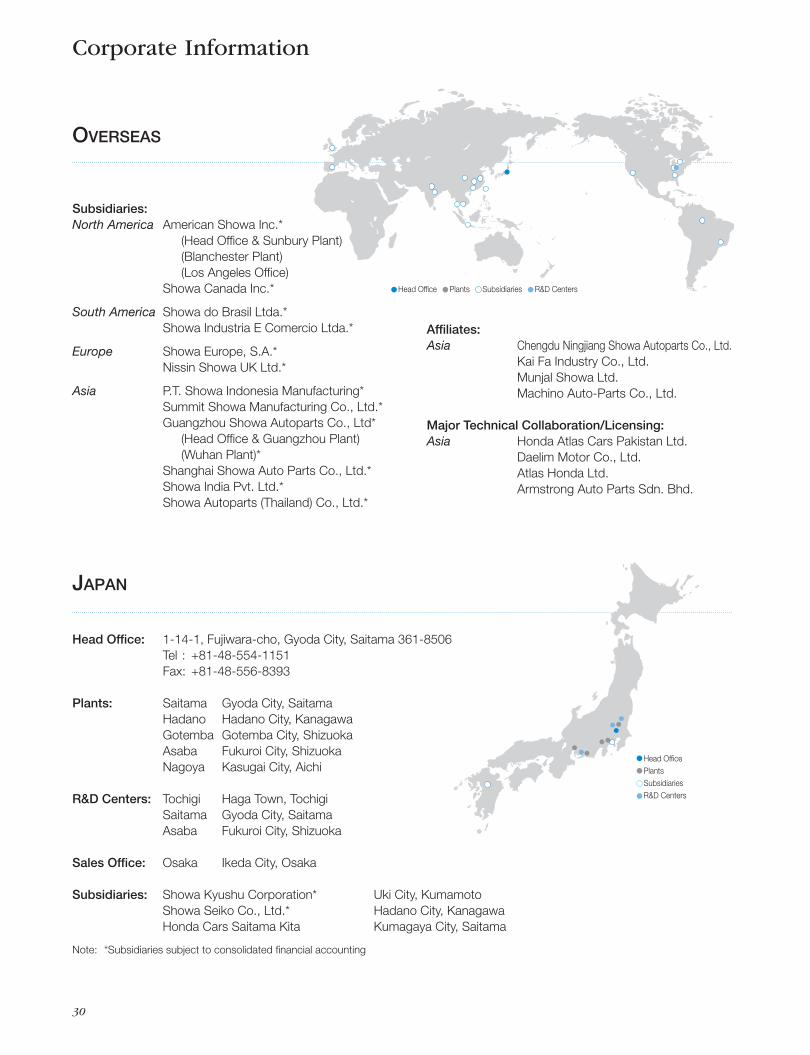
30
Overseas
Japan
Corporate Information
Head Office Plants Subsidiaries R&D Centers
Subsidiaries:North America American Showa Inc.* (Head Office & Sunbury Plant) (Blanchester Plant) (Los Angeles Office) Showa Canada Inc.*
South America Showa do Brasil Ltda.* Showa Industria E Comercio Ltda.*
Europe Showa Europe, S.A.* Nissin Showa UK Ltd.*
Asia P.T. Showa Indonesia Manufacturing* Summit Showa Manufacturing Co., Ltd.* Guangzhou Showa Autoparts Co., Ltd* (Head Office & Guangzhou Plant) (Wuhan Plant)* Shanghai Showa Auto Parts Co., Ltd.* Showa India Pvt. Ltd.* Showa Autoparts (Thailand) Co., Ltd.*
Affiliates:Asia Chengdu Ningjiang Showa Autoparts Co., Ltd. Kai Fa Industry Co., Ltd. Munjal Showa Ltd. Machino Auto-Parts Co., Ltd.
Major Technical Collaboration/Licensing:Asia Honda Atlas Cars Pakistan Ltd. Daelim Motor Co., Ltd. Atlas Honda Ltd. Armstrong Auto Parts Sdn. Bhd.
Head Office: 1-14-1, Fujiwara-cho, Gyoda City, Saitama 361-8506 Tel : +81-48-554-1151 Fax: +81-48-556-8393
Plants: Saitama Gyoda City, Saitama Hadano Hadano City, Kanagawa Gotemba Gotemba City, Shizuoka Asaba Fukuroi City, Shizuoka Nagoya Kasugai City, Aichi
R&D Centers: Tochigi Haga Town, Tochigi Saitama Gyoda City, Saitama Asaba Fukuroi City, Shizuoka
Sales Office: Osaka Ikeda City, Osaka
Subsidiaries: Showa Kyushu Corporation* Uki City, Kumamoto Showa Seiko Co., Ltd.* Hadano City, Kanagawa Honda Cars Saitama Kita Kumagaya City, Saitama
Note: *Subsidiaries subject to consolidated financial accounting
Head OfficePlantsSubsidiariesR&D Centers
011_0281001372009.indd 30 2008/09/13 10:47:02

Financial and Operating Highlights .................... 1
Message from the President ................................ 2
10th Interim Operational Policies ........................ 3
Showa’s Technology ............................................ 4
Review of Operations .......................................... 6
Showa’s Global Network ..................................... 8
Topics ................................................................... 10
Contents
Profile
Forward-looking statements:Forward-looking statements made in this annual report concerning performance or business strategies have been determined according to assumptions and beliefs based on information available at the time and contain elements of risk and uncertainty.
Financial Section .................................................. 12
Corporate Information ......................................... 30
Board of Directors and Corporate Auditors ........ 31
Corporate Data .................................................... 31
31
Board of Directors and Corporate AuditorsAs of 20th June 2008
As of 31st March 2008Corporate Data
Showa’s Stock PriceNikkei Average
Showa's Stock Price (’02/4=100)(Yen)
0
50
100
150
200
250
’02/4 ’03/17 410 7 10 ’04/1 4 7 10 ’05/1 4 7 10 ’06/1 4 7 10 ’07/1 4 ’08/1 37 10
Showa Corporation manufactures and markets high-precision components for motor vehicles
including shock absorbers, steering systems and drive train products for automobiles, and
motorcycles, as well as components for outboard marine engines. The company is one of the
leading manufacturers of shock absorbers for automobiles and motorcycles in the world today.
Established in 1938 the company began motor vehicle parts production in 1946. In 1970 the
company became affiliated with Honda Motor Co., Ltd., a leader of automobiles and motorcycles
manufacturing of the world today. When merged with Seiki Giken Kogyo Co., Ltd., a power
steering products manufacturer, the company was renamed “Showa Corporation” in 1993.
In 1964 Showa’s shares were listed on second section of Tokyo Stock Exchange (TSE), then in
1985 the company shares were upgraded to first section of TSE.
Headquartered in Gyoda City, Saitama Pref., Japan, Showa operates five manufacturing plants,
three research & development facilities and two affiliated manufacturers within Japan.
The company’s global business operation, a network of twenty-seven manufacturing facilities
that includes twelve consolidated subsidiaries, spreads over 12 nations including Japan. (*)
Showa Corporation’s business activities revolve around customer satisfaction, as emphasized
by the company principle “To meet customer needs with highest quality and most competitive
product.” Furthermore, at Showa, we strive to maintain our forward-looking stance and continue
to encourage technological, operational and administrative innovation.
Environmental preservation for the benefit of future generation is a great concern and a
continuing theme at Showa Corporation. We actively support a range of environmental
preservation initiatives through our product offerings and corporate activities.
Showa Corporation and its global affiliates embrace the company’s business philosophy
described above. The company and its affiliates strive to expand their business providing more
benefits to our customers and shareholders as well as to the communities and societies where we
operate.
(*) Excluding technical collaborations in Malaysia, Pakistan, and Thailand.
Ten Largest ShareholdersShares
(Thousands)Percent of
total (%)
Honda Motor Co., Ltd. 25,447 33.5 Japan Trustee Service Bank Ltd.
(Trust Account) 5,481 7.2The Master Trust Bank of Japan, Ltd.
(Trust Account) 4,415 5.8DANSKE BANK CLIENTS HOLDINGS 2,838 3.7Trust & Custody Services Bank, Ltd.
(Securities Investment Trust Account) 2,219 2.9The Bank of Tokyo-Mitsubishi UFJ, Ltd. 2,151 2.8 MORGAN STANLEY & CO. INC. 1,362 1.8 RBC DEXIA INVESTOR SERVICES BANK A/C LUXEMBURG NON RESIDENT/DOMESTIC RATE 1,238 1.6Showa Corporation Business Partner's Shareholding Association 1,195 1.6Sanyo Foods Co., Ltd. 996 1.3
PresidentKazuto Iiyama
Executive Vice PresidentYasuhisa Maekawa
Executive Managing DirectorsKenshi HiraiTakeshi Kawamoto
Managing DirectorsYoshitaka TerazawaMitsuhiro Nishida
Teturo Aoyama
Norio UkaiHisao Hirono
Akira Kadoya
DirectorsMitsuhiro ChibaMitsutaka Sugino
Kazuhiro Takagi
Teru Oda
Atsushi Izumina
Akira Wada
Takeshi Nagao
Corporate AuditorsKoichi UchibabaTetsuo Nishikiori
Hiroshi Iwakami
Masahiko Sano
Common Stock
Authorized:180,000,000 sharesIssued: 76,020,019 shares
Number of Shareholders
7,318
Common Stock Traded
Tokyo
Shareholders’ Register Managerfor Common Stock
Mitsubishi UFJ Trust and Banking Corporation7-10-11,Higashisuna,Koto-ku, Tokyo 137-8081,Japan
005_0281001372009.indd 31 2008/09/30 2:08:27

SHOWA CORPORATION1-14-1, Fujiwara-cho, Gyoda City, Saitama 361-8506, JapanTel : +81-48-554-1151Fax : +81-48-556-8393http://www.showa1.com
Printed in Japan on recycled paper with soy ink
ANNUAL REPORT 2008
SHOWA CORPORATION
005_0281001372009.indd 1 2008/09/30 2:08:27