annual report 2009 - brinker international report 2009. ... with craveable menu items that align...
TRANSCRIPT

annual report 2009

You had a presence that energized a room. And now, even in your absence, reminders of you are everywhere…
In photos of you, where your smile speaks volumes.In restaurants across the world, whose leaders were once your protégés.
In our global company that bears your name.
You did much more than build successful businesses — you built up the people around you. You captivated us with your humor, and humbled us with your wisdom.
Thank you, Norman, for serving us a great taste of life.
Entrepreneur • Visionary • Mentor • Polo Hall of Famer • Olympic AthletePhilanthropist • Celebrated Restaurateur • Husband • Father • Chairman Emeritus • Our Beloved Leader and Friend
Norman Brinker, 1931–2009
With much love and admiration from all 125,000 BrinkerHeads
Æ
To our Team Members, Guests, Supplier Partners, Franchise Partners and Shareholders2009 has been a year of transformation for Brinker International as we worked through one of the most difficult operating environments in our company history.
Continued Challenge
Throughout the year, external challenges for the consumer intensified, including a volatile financial market, rising unemployment and the ongoing real estate crisis. At the same time, restaurant companies grappled with the high cost of
commodities and the fixed costs of operations, both of which were more difficult to cover in a softened sales environment. The economic effects on the casual dining industry were well publicized and resulted in a few casualties – with several brands forced to restructure significantly and some permanently closing their doors.
In the face of such adversity, Brinker International had the opportunity to prove its mettle by responding in a way that enables us to emerge from this challenging time a more robust and competitive company. Although we succeeded on many fronts in fiscal year 2009, we are not satisfied with our own performance.
During the last 12 months, we shifted our focus internally, taking proactive steps to strengthen our business model, improve our balance sheet, increase shareholder returns, and position our brands for accelerated profitability as we move forward. A significant step involved our decision to sell a majority interest in Romano’s Macaroni Grill®. Despite a highly unfavorable credit environment, we were able to complete the transaction in December.
As the economy continues to evolve, we understand the need to become a more nimble organization – one that can react quickly to the rapid changes and uncertain atmosphere in which we operate. We are working diligently to strike a balance between certainty and speed to market, recognizing that more than ever, competing in today’s environment is more art than science.
Our People Make the Difference
Maintaining our competitive position in a highly challenging environment requires disciplined management, a persistent focus on results, ongoing flexibility and boundless creativity. Guiding us through this time of challenge and
change is one of the strongest leadership teams I have ever had the pleasure of working with.
In fiscal year 2009, we took significant steps to leverage the tremendous talent in our organization by appointing key leaders to new or expanded roles. Todd Diener was named President of both Chili’s® Grill & Bar and On The Border Mexican Grill & Cantina®. Wyman Roberts became Chief Marketing Officer for Brinker in addition to his ongoing role as President of Maggiano’s Little Italy®. We also promoted Kelli Valade to Chief Operating Officer for both Chili’s and On The Border.
Over more than 34 years of doing business, Brinker Team Members have adapted through times of great challenge and great prosperity with equal resilience. This resilience, combined with a strong cash flow and steadfast dedication to guest satisfaction, reinforces our confidence in the long-term viability of Brinker brands. Through it all, we remain committed to our mission of Serving the world a great taste of life through the Power of Welcome™.
A Sharpened Focus
Despite the ongoing economic downturn, our guests still desire dining options that offer high quality food, priced at a good value, and served in a welcoming atmosphere with outstanding hospitality. Throughout 2009, we sharpened our
focus on financially responsible actions designed to meet our guests’ needs and align with our core strategies. Although the marketplace changed dramatically, we remain committed to actions that grow our base business by engaging our guests, differentiating Brinker brands from the competition, reducing the costs associated with managing our restaurants, and establishing our presence in key markets around the world.
Partnering for Growth
We continue to shift a greater portion of restaurant development to our new and existing franchise network in both domestic and international markets. The move to a higher franchise mix has helped to diversify the risk in our portfolio
as we ended the year at 39 percent franchise, opening 77 domestic and international restaurants in fiscal year 2009.

A Global Perspective
While the outlook for growth in the U.S. has slowed, the global marketplace offers a wealth of opportunity for Brinker International. Our global franchise partners enthusiastically embrace the signature flavors, unique atmosphere and
vibrant personality of our brands, and eagerly share the BrinkerHead spirit of Hospitality within their own communities.
The Brinker Global Business Development Team took our international presence to new heights in fiscal year 2009 by expanding our strength in key markets and blazing new trails in areas of promise around the world. The team celebrated several significant milestones during the year as they opened 50 new franchised restaurants, including Bangalore, India, which was our 200th international location. Our first restaurants in El Salvador, Portugal, Turkey, Singapore and Guam also opened. With each new franchise agreement and restaurant opening, Brinker moves closer to its goal of establishing 500 international restaurants by 2014.
At the end of fiscal year 2009, our international presence consisted of 201 restaurants in 27 countries and two territories outside the United States. Those totals, when added to our domestic locations, translate to 1,689 restaurants worldwide.
Craveable Food
Food and Beverage excellence is an ongoing strategy for Brinker and its brands. Our goal is to satisfy and delight guests with craveable menu items that align with our brands’ unique positioning. To deliver on that promise, our brands invest
in training and certification of our heart of house Team Members, and work closely with ingredient suppliers to ensure consistent quality. And because we understand our guests’ desire to manage expenses during these challenging economic times, all three brands are focused on creating short-term promotions as well as long-term menu strategies that offer outstanding food at a great value.
Our flagship brand, Chili’s Grill & Bar, stands apart from others in the grill and bar segment by offering a variety of dishes that “Pepper In” great flavor. In 2009, Chili’s expanded its signature favorites, with new flavors of its best-selling Chicken Crispers®, Big Mouth Burgers® and Baby Back Ribs. New Big Mouth Burger Bites, perfect for sharing, became the most popular burger on the menu. Chili’s also expanded offerings for its Triple Dipper™ Dinner, and added four new choices to the brand’s Guiltless Grill® menu. Value choices at Chili’s include the guest favorite “Bottomless Express™ Lunch” featuring all-you-can-eat soup, salad and chips, plus promotions such as “10 Under $7.”
On The Border Mexican Grill & Cantina introduced a fresh new look on its menus in fiscal year 2009. The transformation began with the Fajita Revolution, a commitment to offering the perfect fajita, grilled to order for each guest. And in the Spring, On The Border implemented a complete menu re-launch that highlights the brand’s commitment to freshness, innovation and signature Mexican favorites. Guests love the newly expanded Create Your Own Combo special value menu offered all day, everyday; and they enjoy new dishes such as Taco Melts, Mahi Mahi Tacos and Border SmartSM Citrus Chipotle Chicken Salad. And delivering on our guests’ priorities for value, speed and healthy options, the brand’s new Border Lunch menu features dishes that can be delivered to the table quickly.
The made-from-scratch heritage continues at Maggiano’s Little Italy with innovative offerings created by talented executive chefs using the freshest ingredients available. Inspired by Little Italy neighborhoods across the country, the brand added three new dishes – Lobster Fettuccine, Chicken Francese and Beef Braciole – to its Little Italy Favorites menu in 2009. And in keeping with Italian-American tradition, the brand added new tiers to its signature family-style menu, giving guests three distinct options and price points.
Signature Hospitality
At Brinker, “The Power of Welcome™” sets us apart. It’s the way we establish emotional connections with our guests and Team Members. It’s our exclusive brand of hospitality, and it makes a powerful difference within our restaurants,
our support center and within our communities. The Power of Welcome is part of the very fabric of our company culture, and it’s woven throughout every aspect of our business – from our hiring practices, to our training, our operations, our charitable giving, as well as our guest and team member feedback programs.
A Commitment to Give Back
An important component of our hospitality promise is to Give Back to the communities we serve. During fiscal 2009, all three Brinker brands conducted national fundraising campaigns within the restaurants. In the first quarter, Chili’s
Grill & Bar conducted its fifth annual “Create-A-Pepper to Fight Childhood Cancer” campaign, raising more than $6 million dollars for St. Jude Children’s Research Hospital®. To date, the brand has raised more than $25 million as part of its 10-year, $50 million pledge to the hospital. In September, Chili’s was honored with the National Restaurant Association’s Restaurant Neighbor Award for its long-term partnership with St. Jude.
In October, On The Border Mexican Grill & Cantina raised more than $350,000 within its restaurants during the second annual “Fiesta for the Cure” campaign benefiting Susan G. Komen for the Cure®. Around the country, Team Members also participated in Race for the Cure® and Breast Cancer 3-Day events, effectively “walking the talk” in their communities for this very important cause.
Maggiano’s Little Italy made wishes come true for 52 critically ill children by donating more than $300,000 to the Make-A-Wish Foundation®. Money was raised primarily through in-restaurant fundraising, including the brand’s “Eat-A-Dish for Make-A-Wish” and “Become A Star” programs. Restaurant teams got personally involved in granting wishes by hosting launch parties for children and their families in Maggiano’s banquet rooms.
At our Restaurant Support Center in Dallas, Team Members regularly lend their time, talents and donations to organizations close to our hearts such as The Wilkinson Center, The North Texas Food Bank, The Rise School, Limbs for Life Foundation and Texas Scottish Rite Hospital for Children®. We also call on the community to partner with us in special events such as the Annual On The Border Golf Classic benefitting The Kenny Can Foundation and Susan G. Komen for the Cure.
Through our corporate contributions program, Brinker gives back to organizations that enrich the lives of people throughout North Texas. In addition to our support of health and social services organizations, we also recognize the power of the performing arts to entertain, enlighten and inspire members of the communities we serve. We are very proud of our title sponsorship of the Brinker International Forum, featuring internationally renowned performing and visual artists, benefiting the new Dallas Center for the Performing Arts.
Team Members across the country donate money from their paychecks to sustain the Brinker Family Fund, which offers financial aid to BrinkerHeads in times of personal crisis. During fiscal year 2009, the Family Fund paid out more than $1 million to assist 540 Team Members and their families, including those living in areas devastated by Hurricanes Gustav and Ike.
A Lasting Legacy
As we reflect on the past 12 months, a time of significant challenge and change for our country and our industry, no single milestone is as meaningful to BrinkerHeads as the loss of our company namesake and beloved Chairman
Emeritus, Norman Brinker, on June 9.
Norman’s contributions to the restaurant industry, and casual dining in particular, are unparalleled. His influence and mentorship spurred many leaders on to successful careers in an industry that now employs more than 13 million, making it one of the largest private employers in the nation.
Through his leadership and his life experience, Norman taught us to be unfailingly respectful to our guests and our Team Members, to choose optimism and hope even in the midst of great obstacles, and to relentlessly pursue success in a fiercely competitive marketplace.
Many things have changed since Norman’s first restaurant job in 1957, but his legacy, his influence and his wisdom live on in the hearts of all who knew him. And although they may have never met him personally, restaurant workers around the world owe Norman a debt of gratitude for the vast and thriving industry he helped to create and grow.
At Brinker International, we feel privileged to have known and worked alongside Norman for so many years, and we are proud to be part of the company that bears his name.
Sincerely,
Douglas H. Brooks Chairman of the Board Chief Executive Officer and President


UNITED STATESSECURITIES AND EXCHANGE COMMISSION
Washington, D.C. 20549
FORM 10-KANNUAL REPORT PURSUANT TO SECTION 13 OR 15(d) OF
THE SECURITIES EXCHANGE ACT OF 1934For the fiscal year ended June 24, 2009 Commission File No. 1-10275
BRINKER INTERNATIONAL, INC.(Exact name of registrant as specified in its charter)
Delaware 75-1914582(State or other jurisdiction of (I.R.S. employerincorporation or organization) identification no.)
6820 LBJ Freeway, Dallas, Texas 75240(Address of principal executive offices) (Zip Code)
Registrant’s telephone number,including area code (972) 980-9917
Securities registered pursuant to Section 12(b) of the Act:Title of Each Class
Common Stock, $0.10 par valueSecurities registered pursuant to Section 12(g) of the Act: None
Indicate by check mark if the registrant is a well-known seasoned issuer, as defined in Rule 405 of theSecurities Act. Yes � No �
Indicate by check mark if the registrant is not required to file reports pursuant to Section 13 orSection 15(d) of the Act. Yes � No �
Indicate by check mark whether the registrant has submitted electronically and posted on its corporate Website, if any, every Interactive Data File required to be submitted and posted pursuant to Rule 405 ofRegulation S-T during the preceding 12 months (or for such shorter period that the registrant was required tosubmit and post such files). Yes � No �
Indicate by check mark whether the registrant (1) has filed all reports required to be filed by Section 13 or15(d) of the Securities Exchange Act of 1934 during the preceding 12 months (or for such shorter period that theregistrant was required to file such reports), and (2) has been subject to such filing requirements for the past90 days. Yes � No �
Indicate by check mark if disclosure of delinquent filers pursuant to Item 405 of Regulation S-K (229.405 ofthis chapter) is not contained herein, and will not be contained, to the best of the registrant’s knowledge, indefinitive proxy or information statements incorporated by reference in Part III of this Form 10-K or anyamendment to this Form 10-K. �
Indicate by check mark whether the registrant is a large accelerated filer, an accelerated filer, or anon-accelerated filer. See definition of ‘‘accelerated filer’’ in Rule 12b-2 of the Exchange Act.:
Large accelerated filer � Accelerated filer � Non-accelerated filer � Smaller reporting company �(Do not check if a smaller
reporting company)
Indicate by check mark whether the registrant is a shell company (as defined in Rule 12b-2 of theAct). Yes � No �
State the aggregate market value of the voting and non-voting common equity held by non-affiliatescomputed by reference to the price at which the common equity was last sold, or the average bid and asked priceof such common equity, as of the last business day of the registrant’s most recently completed second fiscalquarter. $1,019,741,370.
Indicate the number of shares outstanding of each of the registrant’s classes of common stock, as of thelatest practicable date.
Class Outstanding at August 12, 2009
102,143,399 sharesCommon Stock, $0.10 par value


DOCUMENTS INCORPORATED BY REFERENCE
We have incorporated portions of our Annual Report to Shareholders for the fiscal year endedJune 24, 2009 into Part II hereof, to the extent indicated herein. We have also incorporated by referenceportions of our Proxy Statement for our annual meeting of shareholders on October 29, 2009, to be datedon or about September 15, 2009, into Part III hereof, to the extent indicated herein.
PART I
Item 1. BUSINESS.
General
References to ‘‘Brinker,’’ ‘‘the Company,’’ ‘‘we,’’ ‘‘us,’’ and ‘‘our’’ in this Form 10-K are references toBrinker International, Inc. and its subsidiaries and any predecessor companies of BrinkerInternational, Inc.
We own, develop, operate and franchise the Chili’s Grill & Bar (‘‘Chili’s’’), On The Border MexicanGrill & Cantina (‘‘On The Border’’), and Maggiano’s Little Italy (‘‘Maggiano’s’’) restaurant brands. TheCompany was organized under the laws of the State of Delaware in September 1983 to succeed to thebusiness operated by Chili’s, Inc., a Texas corporation, which was organized in August 1977. We completedthe acquisitions of On The Border in May 1994 and Maggiano’s in August 1995. We sold Macaroni Grill toMac Acquisition LLC, an affiliate of San Francisco-based Golden Gate Capital, in December 2008 andpurchased an 18.2% ownership interest in the new entity.
Restaurant Brands
Chili’s Grill & Bar
Chili’s is a recognized leader in the Bar & Grill category of casual dining. Hospitality has been thefoundation of who we are and how we serve our guests for more than 34 years. Every day at Chili’slocations around the world, our guests are greeted with ‘‘Welcome to Chili’s’’.
Chili’s menu features signature offerings such as Big Mouth Burgers and Bites, smoked in-house BabyBack Ribs, hand-battered Chicken Crispers, Sizzling Fajitas and our Triple Dipper Appetizer, to name justa few. Our all-day varied menu strives to have something for everyone and affordable selections duringboth lunch and dinner dayparts. We pride ourselves on offering substantial portions of flavorful, highquality food at affordable prices. In most of our Chili’s restaurants, you will find a Margarita Bar serving avariety of specialty margaritas, including our signature Presidente Margarita, and a full selection ofalcoholic beverages. Chili’s also offers time-starved guests the convenience of great quality food, via ourTo-Go menu and separate To-Go entrances in the majority of our restaurants.
During the year ending June 24, 2009, entree selections ranged in menu price from $5.99 to $16.99.The average revenue per meal, including alcoholic beverages, was approximately $13.27 per person.During this same year, food and non-alcoholic beverage sales constituted approximately 86.4% of Chili’stotal restaurant revenues, with alcoholic beverage sales accounting for the remaining 13.6%. Our averageannual sales volume per Chili’s restaurant during this same year was $3.2 million.
On The Border Mexican Grill & Cantina
On The Border is a full-service, casual dining Mexican restaurant brand. Our new menu offers a widevariety of Mexican favorites, with a focus on fresh, signature and value-oriented Mexican items. TheCreate Your Own Combo proposition was enhanced to better meet the guest demand for relevant valueand affordability with more fresh options. The updated menu also includes fresh new salads like our CitrusChipotle Chicken Salad; a new, signature OTB Fresh Grill; a Fajita Grill with new, customizable,top-quality fajitas; and a refreshed OTB Taco Stand introducing indulgent items like Taco Melts and fresh
1

classics like Grilled Mahi Mahi Tacos. The menu is complemented by a full offering of beverages like thePerfect Patron margarita, the Fresh, Shaken margarita and our new Sangria.
On The Border offers full bar service, in-restaurant dining and signature patio dining in all locations.On The Border also offers the convenience of a To-Go menu and To-Go entrance to expedite take-outservice. In addition to To-Go, On The Border offers catering service, from simple drop-off delivery tofull-service event planning.
During the year ending June 24, 2009, entree selections ranged in menu price from $6.29 to $15.49.The average revenue per meal, including alcoholic beverages, was approximately $14.38 per person.During this same year, food and non-alcoholic beverage sales constituted approximately 81.8% of the OnThe Border’s total restaurant revenues, with alcoholic beverage sales accounting for the remaining 18.2%.Our average annual sales volume per On The Border restaurant during this same year was $2.8 million.
Maggiano’s Little Italy
Maggiano’s is a full-service, national, casual dining Italian restaurant brand with a passion for makingpeople feel special. Each Maggiano’s restaurant is a classic Italian-American restaurant in the style of NewYork’s Little Italy in the 1940s. Our Maggiano’s restaurants feature individual and family-style menus, andmost of our restaurants also have extensive banquet facilities that can host large party events. We have afull lunch and dinner menu offering chef-prepared, classic Italian-American fare in the form of appetizers,entrees with bountiful portions of pasta, chicken, seafood, veal and prime steaks, and desserts. OurMaggiano’s restaurants also offer a full range of alcoholic beverages, including a selection of qualitypremium wines. In addition, Maggiano’s offers delivery service from simple drop-off to pre-event set-up.
During the year ending June 24, 2009, entree selections ranged in menu price from $8.25 to $40.75.The average revenue per meal, including alcoholic beverages, was approximately $25.88 per person.During this same year, food and non-alcoholic beverage sales constituted approximately 81.6% ofMaggiano’s total restaurant revenues, with alcoholic beverage sales accounting for the remaining 18.4%.Sales from our banquet facilities made up 19.9% of our total restaurant revenues for the year. Our averageannual sales volume per Maggiano’s restaurant during this same year was $8.3 million.
Business Strategy
Our long-term vision is to be the dominant, global casual-dining restaurant portfolio company. Toachieve our vision, we are focused on building a business model that will enable us to achieve sustainablegrowth in a variety of economic environments in order to create long-term value for our shareholders. Webelieve the key to reaching this goal resides within our existing restaurants by leveraging the strongpositioning and operating strength of our world-class brands to grow profitable ongoing comparablerestaurant sales, while also growing our international presence. The basis of this business model isgrounded in our five areas of focus:
• Hospitality;
• Food and beverage excellence;
• Restaurant atmosphere;
• Pace and convenience; and
• International expansion.
Our organization is focused on these five areas that are designed to grow our base business byengaging and delighting our guests, differentiating our brands from competitors throughout the industry,reducing the costs associated with managing our restaurants and establishing a strong presence in keymarkets around the world. We are monitoring our results closely, as well as the current business
2

environment, in order to pace the implementation of our initiatives appropriately. Our goal is to emergefrom the current economic recession with strong brands, a healthy balance sheet and improved operatingprofit.
We strongly believe disciplined investments in these five strategic priorities will strengthen our brandsand allow us to improve our competitive position and deliver more profitable growth over the long termfor our shareholders. For example, we believe that the craveable food and signature beverages as well asthe flavors and offerings we continue to create at each of our brands, the warm, welcoming and revitalizedatmospheres, and technologies and process improvements related to pace and convenience will give ourguests new reasons to dine with us more often. Another top area of focus remains creating a culture ofhospitality that will differentiate Brinker brands from all others in the industry. Through our investments inteam member training and guest measurement programs, we are gaining significant traction in this areaand providing our guests a reason to make our brands their preferred choice when dining out. And, withsignificant economic pressures in the United States as well as globally, international expansion allowsfurther diversification of our portfolio, enabling us to build strength in a variety of markets and economicconditions. Presently, our growth is driven by cultivating relationships with joint venture partners andfranchisees.
The casual dining industry is a highly competitive business which is sensitive to changes in economicconditions, trends in lifestyles and fluctuating costs. Our top priority remains increasing profitable trafficover time. We believe that this focus, combined with disciplined use of capital and efficient management ofoperating expenses, will enable us to maintain its position as an industry leader through the currenteconomic recession. We remain confident in the financial health of our company, the long-term prospectsof the industry, as well as in our ability to perform effectively in an extremely competitive marketplace anda variety of economic environments.
Franchise Development
In fulfilling our long-term vision, and being mindful of our five areas of focus, our restaurant brandswill continue to expand primarily through our franchisees and joint venture partners.
As part of our strategy to expand through our franchisees, our overall percentage of franchiseoperations (domestically and internationally) increased in fiscal 2009. The following table illustrates thepercentages of franchise operations as of June 24, 2009 for the Company and by restaurant brand:
Percentage of FranchiseOperated Restaurants
(domestic and international)
Brinker . . . . . . . . . . . . . . . . . . . . . . . . . . . . . . . . . . . . . . 39%Chili’s . . . . . . . . . . . . . . . . . . . . . . . . . . . . . . . . . . . . . . . 42%On The Border . . . . . . . . . . . . . . . . . . . . . . . . . . . . . . . . 24%Maggiano’s . . . . . . . . . . . . . . . . . . . . . . . . . . . . . . . . . . . 0%
International
We continue our international growth through development agreements with new and existingfranchisees and joint venture partners introducing our brands into new countries, as well as expandingthem in existing countries. At June 24, 2009, we had 42 total development arrangements. During the fiscalyear 2009, our international franchisees opened 38 Chili’s restaurants and five On The Border restaurants.In the same year, we entered into new or renewed development agreements with five franchisees for thedevelopment of 44 Chili’s restaurants and six On The Border restaurants. The areas of development forthese locations include all or portions of the countries Dominican Republic, Mexico, Oman, Puerto Rico,Russian Federation and United Arab Emirates.
3

As we develop our brands internationally, we will selectively pursue expansion through various means,including franchising and joint ventures. A typical international franchise development agreement providesfor payment of development fees and franchise fees in addition to subsequent royalty fees based on thegross sales of each restaurant. We expect future development agreements to remain limited to enterpriseshaving significant experience as restaurant operators and proven financial ability to support and developmulti-unit, as well as, in some instances, multi-brand operations.
Domestic
Domestic expansion is focused primarily through growth in our number of franchised restaurants. Weare accomplishing this part of our growth through existing, new or renewed development obligations withnew or existing franchisees. In addition, we have also sold and may sell company-owned restaurants to ourfranchisees (new or existing). At June 24, 2009, 22 total domestic development arrangements existed.Similar to our international franchise agreements, a typical domestic franchise development agreementprovides for payment of development and initial franchise fees in addition to subsequent royalty andadvertising fees based on the gross sales of each restaurant. We expect future domestic franchisedevelopment agreements to remain limited to enterprises having significant experience as restaurantoperators and proven financial ability to support and develop multi-unit operations. In some instances, wehave and may enter into development agreements for multiple brands with the same franchisee.
Domestic expansion efforts continue to focus not only on major metropolitan areas in the UnitedStates but also on smaller market areas and non-traditional locations (such as airports, college campuses,toll plazas, and food courts) that can adequately support our restaurant brands.
During the year ended June 24, 2009, not including any restaurants we sold to our franchisees, ourdomestic franchisees opened 27 Chili’s restaurants and seven On The Border restaurants. We also enteredinto a new development agreement with an existing franchisee for the development of eight Chili’srestaurants. The areas of development for these franchise locations include all or portions of the States ofIllinois, Iowa, Minnesota, Missouri, North Dakota and South Dakota. In connection with this developmentagreement, we sold nine Company-owned Chili’s restaurants to this franchisee.
Company Development
Our near-term focus continues to be less on domestic development of new company-operatedrestaurants than we have historically done, allowing us to focus on our other strategic initiatives and areasof focus. At such time as the business environment permits, we will evaluate development of new company-operated restaurants.
4

The following table illustrates the system-wide restaurants opened in fiscal 2009 and the plannedopenings in fiscal 2010:
Fiscal 2009 Fiscal 2010Openings(1) Projected Openings
Chili’s:Company-operated . . . . . . . . . . . . . . . . . . . . . . . . 8 —Franchise(2) . . . . . . . . . . . . . . . . . . . . . . . . . . . . . 27 15 - 20
On The Border:Company-operated . . . . . . . . . . . . . . . . . . . . . . . . — 1Franchise(2) . . . . . . . . . . . . . . . . . . . . . . . . . . . . . 7 1 - 3
Maggiano’s . . . . . . . . . . . . . . . . . . . . . . . . . . . . . . . . 2 1International:
Company-operated(3) . . . . . . . . . . . . . . . . . . . . . . 2 —Franchise(3) . . . . . . . . . . . . . . . . . . . . . . . . . . . . . 43 35 - 38
Total . . . . . . . . . . . . . . . . . . . . . . . . . . . . . . . . . 89 53 - 63
(1) The numbers in this column are the total of new restaurant openings and openings ofrelocated restaurants during fiscal 2009.
(2) The numbers on this line for fiscal 2010 are projected domestic franchise openings.
(3) The numbers on this line are for all brands.
We periodically reevaluate company-owned restaurant sites to ensure that site attributes have notdeteriorated below our minimum standards. In the event site deterioration occurs, each brand makes aconcerted effort to improve the restaurant’s performance by providing physical, operating and marketingenhancements unique to each restaurant’s situation. If efforts to restore the restaurant’s performance toacceptable minimum standards are unsuccessful, the brand considers relocation to a proximate, moredesirable site, or evaluates closing the restaurant if the brand’s measurement criteria, such as return oninvestment and area demographic trends, do not support relocation. Since inception, relating to ourcurrent restaurant brands, we have closed 225 restaurants, including 55 in fiscal 2009. We perform acomprehensive analysis that examines restaurants not performing at a required rate of return. A portion ofthese closed restaurants were performing below our standards or were near or at the expiration of theirlease term. Our strategic plan is targeted to support our long-term growth objectives, with a focus oncontinued development of those restaurant brands that have the greatest return potential for the Companyand our shareholders.
5

Our capital investment in new restaurants may differ in the future due to building designspecifications, site location, and site characteristics. The following table illustrates the approximate averagecapital investment for company-owned restaurants opened in fiscal 2009:
Chili’s On the Border(3) Maggiano’s
Land(1) . . . . . . . . . . . . . . . . . . . . . . . . . $1,215,000 — $1,797,000Building . . . . . . . . . . . . . . . . . . . . . . . . . 1,940,000 — 4,695,000Furniture & Equipment . . . . . . . . . . . . . . 525,000 — 1,265,000Other(2) . . . . . . . . . . . . . . . . . . . . . . . . . 55,000 — 36,000
Total . . . . . . . . . . . . . . . . . . . . . . . . . . $3,735,000 — $7,793,000
(1) This amount represents the average cost for land acquisition, capital lease values net oflandlord contributions (or an equivalent amount for operating lease costs also net oflandlord contributions) based on estimated lease payments and other costs that will beincurred through the term of the lease.
(2) This amount includes liquor licensing costs which can vary significantly depending on thejurisdiction where the restaurants are located.
(3) We did not open any On The Border restaurants in fiscal 2009. Average capital investmentfor an On The Border restaurant in fiscal 2008 varied due to differences in square footage:$1.6 million to $0.9 million for land, $1.8 million to $0.8 million for building, $0.5 forfurniture and equipment and less than $0.1 million for other expenses.
Restaurant Management
In fiscal 2009, we made some significant organizational changes around our business modelsupporting our restaurant brands. These changes are designed to maximize our talent, streamline decisionmaking to improve quality and productivity, prepare and allow us to move quickly and efficiently, bringmore big ideas to our brands and ensure our guests experience The Power of Welcome each and every timethey frequent our restaurants.
Specifically, our Chili’s and On The Border brands share one president; one set of operationalsupervisors organized into geographic regions, not by brands; one franchise operations team; and blendedfinance, marketing and peopleworks teams. We have also designated one vice president to oversee ourculinary teams and report to our Chief Marketing Officer. We believe these changes will not merge orchange the unique identities of our brands, but will allow us to strengthen each brand by leveraging ourshared services and adopting best practices across all brands. We continue to utilize common and sharedinfrastructure, including, among other services, accounting, information technology, purchasing, legal andrestaurant development.
At the restaurant level, management structure varies by brand. The individual restaurants themselvesare led by a management team including a general manager and, on average, between two to six additionalmanagers. The level of restaurant supervision depends upon the operating complexity and sales volume ofeach brand and each location.
We believe that there is a high correlation between the quality of restaurant management and thelong-term success of a brand. In that regard, we encourage increased experience at all managementpositions through various short and long-term incentive programs, which may include equity ownership.These programs, coupled with a general management philosophy emphasizing quality of life, have enabledus to attract and retain team members.
6

We ensure consistent quality standards in all brands through the issuance of operations manualscovering all elements of operations and food and beverage manuals, which provide guidance forpreparation of brand-formulated recipes. Routine visitation to the restaurants by all levels of supervisionenforces strict adherence to our overall brand standards and operating procedures.
Each brand is responsible for maintaining each brand’s operational training program. The trainingprogram typically includes a three to four month training period for restaurant management trainees. Wealso provide continued management training for managers and supervisors to improve effectiveness orprepare them for more responsibility. Training teams consisting of groups of team members experienced inall facets of restaurant operations train team members to open new restaurants.
Purchasing
Our ability to maintain consistent quality throughout each of our restaurant brands depends uponacquiring products from reliable sources. Our pre-approved suppliers and our restaurants are required toadhere to strict product and safety specifications established through our quality assurance and culinaryprograms. These requirements ensure that high quality products are served in each of our restaurants. Westrategically negotiate directly with major suppliers to obtain competitive prices. We also use purchasecommitment contracts when appropriate to stabilize the potentially volatile pricing associated with certaincommodity items. All essential products are available from pre-qualified distributors to be delivered to anyof our restaurant brands. Additionally, as a purchaser of a variety of protein products, we do require ourvendors to adhere to humane processing standards for their respective industries and encourage them toevaluate new technologies for food safety and humane processing improvements. Because of the relativelyrapid turnover of perishable food products, inventories in the restaurants, consisting primarily of food,beverages and supplies, have a modest aggregate dollar value in relation to revenues.
Advertising and Marketing
Our brands generally focus on the eighteen to fifty-four year-old age group, which constitutesapproximately half of the United States population. Though members of this target segment grew up onfast food, we believe that for many meal occasions, these consumers value the benefits of the casual diningcategory, particularly the higher food quality and enhanced dining experience. To reach this target group,we use a mix of television, radio, print, outdoor or online advertising, with each of our restaurant brandsutilizing one or more of these mediums to meet the brand’s communication strategy and budget. Ourbrands have also developed and use to varying degrees sophisticated consumer marketing researchtechniques to monitor guest satisfaction and evolving expectations.
Our franchise agreements generally require advertising contributions to us by the franchisees. We usethese contributions for the purpose of helping retain an advertising agency, obtaining consumer insights,developing and producing brand-specific creative materials and purchasing national or regional media tomeet the brand’s strategy. Some franchisees also spend additional amounts on local advertising. Any suchlocal advertising must first be approved by us.
Team Members
At June 24, 2009, we employed approximately 77,100 team members, of whom approximately 700were restaurant support center personnel, 4,600 were restaurant area directors, managers or trainees and71,800 were employed in non-management restaurant positions. Our executive officers have an average ofapproximately 25 years of experience in the restaurant industry.
We consider our team member relations to be positive and continue to focus on improving our teammember turnover rate. We use various tools and programs to help us hire our new team members. Some ofthese tools aid in determining if our prospective team members (hourly and management) have the properskills for working at our restaurants. Most team members, other than restaurant management and
7

restaurant support center personnel, are paid on an hourly basis. We believe that we provide workingconditions and wages that compare favorably with those of our competition. Our team members are notcovered by any collective bargaining agreements.
Trademarks
We have registered and/or have pending, among other marks, ‘‘Brinker International’’, ‘‘Chili’s’’,‘‘Chili’s Bar & Bites’’, ‘‘Chili’s Margarita Bar’’, ‘‘Chili’s Southwest Grill & Bar’’, ‘‘Chili’s Too’’, ‘‘On TheBorder’’, ‘‘On The Border Mexican Cafe’’, ‘‘On The Border Mexican Grill & Cantina’’, ‘‘Maggiano’s’’, and‘‘Maggiano’s Little Italy’’, as trademarks with the United States Patent and Trademark Office.
Available Information
We maintain an internet website with the address of http://www.brinker.com. You may obtain, free ofcharge, at our website, copies of our reports filed with, or furnished to, the Securities and ExchangeCommission (the ‘‘SEC’’) on Forms 10-K, 10-Q, and 8-K. Any amendments to such reports are alsoavailable for viewing and copying at our internet website. These reports will be available as soon asreasonably practicable after filing such material with, or furnishing it to, the SEC. In addition, you mayview and obtain, free of charge, at our website, copies of our corporate governance materials, including,Corporate Governance Guidelines, Governance and Nominating Committee Charter, Audit CommitteeCharter, Compensation Committee Charter, Executive Committee Charter, Code of Conduct and EthicalBusiness Policy, and Problem Resolution Procedure/Whistle Blower Policy.
Item 1A. RISK FACTORS.
We wish to caution you that our business and operations are subject to a number of risks anduncertainties. The factors listed below are important factors that could cause actual results to differmaterially from our historical results and from those projected in forward-looking statements contained inthis report, in our other filings with the SEC, in our news releases, written or electronic communications,and verbal statements by our representatives.
You should be aware that forward-looking statements involve risks and uncertainties. These risks anduncertainties may cause our or our industry’s actual results, performance or achievements to be materiallydifferent from any future results, performances or achievements contained in or implied by these forward-looking statements. Forward-looking statements are generally accompanied by words like ‘‘believes,’’‘‘anticipates,’’ ‘‘estimates,’’ ‘‘predicts,’’ ‘‘expects,’’ and other similar expressions that convey uncertaintyabout future events or outcomes.
Risks Related to Our Business
Competition may adversely affect our operations and financial results.
The restaurant business is highly competitive as to price, service, restaurant location, nutritional anddietary trends and food quality, and is often affected by changes in consumer tastes, economic conditions,population and traffic patterns. We compete within each market with locally-owned restaurants as well asnational and regional restaurant chains, some of which operate more restaurants and have greater financialresources and longer operating histories than ours. There is active competition for management personneland hourly team members. We face growing competition as a result of the trend toward convergence ingrocery, deli and restaurant services, including the offering by the grocery industry of convenient meals inthe form of improved entrees and side dishes, as well as the trend in quick service and fast casualrestaurants toward higher quality food and beverage offerings. We compete primarily on the quality,variety and value perception of menu items, as well as the quality and efficiency of service, theattractiveness of facilities and the effectiveness of advertising and marketing programs.
8

The global economic crisis adversely impacted our business and financial results in fiscal 2009 and aprolonged recession could materially affect us in the future.
The restaurant industry is dependent upon consumer discretionary spending. The global economiccrisis has reduced consumer confidence to historic lows impacting the public’s ability and/or desire tospend discretionary dollars as a result of job losses, home foreclosures, significantly reduced home values,investment losses in the financial markets, personal bankruptcies and reduced access to credit, resulting inlower levels of guest traffic in our restaurants. If this difficult economic situation continues for a prolongedperiod of time and/or deepens in magnitude, our business, results of operations and ability to comply withthe covenants under our credit facility could be materially affected. Continued deterioration in guest trafficand/or a reduction in the average amount guests spend in our restaurants will negatively impact ourrevenues. This will result in sales deleverage, spreading fixed costs across a lower level of sales, and will, inturn cause downward pressure on our profitability. The result could be further reductions in staff levels,asset impairment charges and potential restaurant closures. In addition, the adverse fiscal condition of anystates where we operate restaurants could result in these state governments issuing IOUs rather than taxrefunds or employee paychecks, which could affect guest spending patterns in these locations.
Future recessionary effects on us are unknown at this time and could have a potential material adverseeffect on our financial position and results of operations. There can be no assurance that the government’splan to stimulate the economy will restore consumer confidence, stabilize the financial markets, increaseliquidity and the availability of credit, or result in lower unemployment.
The current economic crisis could have a material adverse impact on our landlords or other tenants inretail centers in which we or our franchisees are located, which in turn could negatively affect ourfinancial results.
If the recession continues or increases in severity, our landlords may be unable to obtain financing orremain in good standing under their existing financing arrangements, resulting in failures to pay requiredconstruction contributions or satisfy other lease covenants to us. In addition other tenants at retail centersin which we or our franchisees are located or have executed leases may fail to open or may ceaseoperations. If our landlords fail to satisfy required co-tenancies, such failures may result in us or ourfranchisees terminating leases or delaying openings in these locations. Also, decreases in total tenantoccupancy in retail centers in which we are located may affect guest traffic at our restaurants. All of thesefactors could have a material adverse impact on our operations.
Inflation may increase our operating expenses.
We have experienced impact from inflation. Inflation has caused increased food, labor and benefitscosts and has increased our operating expenses. We have in the recent past experienced increased foodcosts due to the diversion of food crop production to non-traditional uses, as well as increased food costsdue to increased fuel costs for our vendors. As operating expenses increase, we, to the extent permitted bycompetition, recover increased costs by increasing menu prices, or by reviewing, then implementing,alternative products or processes, or by implementing other cost reduction procedures. We cannot ensure,however, that we will be able to continue to recover increases in operating expenses due to inflation in thismanner.
Changes in governmental regulation may adversely affect our ability to maintain our existing andfuture operations and to open new restaurants.
We are subject to the Fair Labor Standards Act (which governs such matters as minimum wages,overtime and other working conditions), along with the Americans with Disabilities Act, the ImmigrationReform and Control Act of 1986, various family leave mandates and a variety of other laws enacted, orrules and regulations promulgated by federal, state and local governmental authorities that govern these
9
and other employment matters. We expect increases in payroll expenses as a result of federal and statemandated increases in the minimum wage, and although such increases are not expected to be material, wecannot assure you that there will not be material increases in the future. Enactment and enforcement ofvarious federal, state and local laws, rules and regulations on immigration and labor organizations mayadversely impact the availability and costs of labor for our restaurants in a particular area or across theUnited States. Other labor shortages or increased team member turnover could also increase labor costs.In addition, our vendors may be affected by higher minimum wage standards or availability of labor, whichmay increase the price of goods and services they supply to us.
Each of our and our franchisees’ restaurants is also subject to licensing and regulation by alcoholicbeverage control, health, sanitation, safety and fire agencies in the state, county and/or municipality wherethe restaurant is located. We are also subject to laws and regulations, which vary from jurisdiction tojurisdiction, relating to nutritional content and menu labeling. Compliance with these laws and regulationsmay lead to increased costs and operational complexity, changes in sales mix and profitability, andincreased exposure to governmental investigations or litigation. We generally have not encountered anymaterial difficulties or failures in obtaining and maintaining the required licenses and approvals that couldimpact the continuing operations of an existing restaurant, or delay or prevent the opening of a newrestaurant. Although we do not, at this time, anticipate any occurring in the future, we cannot assure youthat we or our franchisees will not experience material difficulties or failures that could impact thecontinuing operations of an existing restaurant, or delay the opening of restaurants in the future.
We are also subject to federal and state environmental regulations, and although these have not had amaterial negative effect on our operations, we cannot ensure that there will not be a material negativeeffect in the future. More stringent and varied requirements of local and state governmental bodies withrespect to zoning, land use and environmental factors could delay, prevent or make cost prohibitive thecontinuing operations of an existing restaurant or the development of new restaurants in particularlocations.
Our profitability may be adversely affected by increases in energy costs.
Our success depends in part on our ability to absorb increases in utility costs, in particular electricityand natural gas. Various regions of the United States in which we operate multiple restaurants haveexperienced in the recent past significant increases in utility prices. These increases have affected costs andif they occur again, it would have possible adverse effects on our profitability to the extent not otherwiserecoverable through price increases or alternative products, processes or cost reduction procedures.Further, higher prices for petroleum-based fuels may be passed on to us by vendors putting furtherpressure on margins.
Shortages or interruptions in the availability and delivery of food and other supplies may increasecosts or reduce revenues.
Possible shortages or interruptions in the supply of food items and other supplies to our restaurantscaused by inclement weather, natural disasters such as floods, drought and hurricanes, the inability of ourvendors to obtain credit in a tightened credit market, food safety warnings or advisories or the prospect ofsuch pronouncements, or other conditions beyond our control could adversely affect the availability,quality and cost of items we buy and the operations of our restaurants. Our inability to effectively managesupply chain risk could increase our costs and limit the availability of products critical to our restaurantoperations.
10

Successful mergers, acquisitions, divestitures and other strategic transactions are important to ourfuture growth and profitability.
We evaluate potential mergers, acquisitions, franchisees of new and existing restaurants, joint ventureinvestments, and divestitures as part of our strategic planning initiative. These transactions involve variousinherent risks, including accurately assessing:
• the value, future growth potential, strengths, weaknesses, contingent and other liabilities andpotential profitability of acquisition candidates;
• our ability to achieve projected economic and operating synergies;
• unanticipated changes in business and economic conditions affecting an acquired business; and
• our ability to complete divestitures on acceptable terms and at or near the prices estimated asattainable by us.
If we are unable to meet our growth plan, our profitability in the future may be adversely affected.
Our ability to meet our growth plan is dependent upon, among other things, our and our franchisees’ability to:
• increase gross sales and operating profits at existing restaurants with food and beverage options andhigh quality service desired by our guests;
• identify adequate sources of capital to fund and finance strategic initiatives, including remodeling ofexisting restaurants and new restaurant development;
• identify available, suitable and economically viable locations for new restaurants;
• obtain all required governmental permits (including zoning approvals and liquor licenses) on atimely basis;
• hire all necessary contractors and subcontractors, obtain construction materials at suitable prices,and maintain construction schedules; and
• hire and train or retain qualified managers and team members for the restaurants.
The success of our franchisees is important to our future growth.
We have significantly increased the percentage of restaurants owned and operated by our franchisees.This increase reduces our immediate control over these restaurants and may expose us to risks nototherwise encountered if we maintained ownership and control of same. These risks include franchiseedefaults in their obligations to us arising from financial or other difficulties encountered by them, such aspayments to us or maintenance and improvements obligations; limitations on enforcement of franchiseobligations due to bankruptcy or insolvency proceedings; inability to participate in business strategychanges due to financial constraints; and failure to comply with food quality and preparation requirementssubjecting us to litigation even when we are not legally liable for a franchisee’s actions or failure to act.
Our sales volumes generally decrease in winter months.
Our sales volumes fluctuate seasonally and are generally higher in the summer months and lower inthe winter months, which may cause seasonal fluctuations in our operating results.
11

Unfavorable publicity relating to one or more of our restaurants in a particular brand may taintpublic perception of the brand.
Multi-unit restaurant businesses can be adversely affected by publicity resulting from poor foodquality, illness or health concerns or operating issues stemming from one or a limited number ofrestaurants. In particular, since we depend heavily on the Chili’s brand for a majority of our revenues,unfavorable publicity relating to one or more Chili’s restaurants could have a material adverse effect onthe Chili’s brand, and consequently on our business, financial condition and results of operations.
We are dependent on information technology and any material failure of that technology could impairour ability to efficiently operate our business.
We rely on information systems across our operations, including, for example, point-of-sale processingin our restaurants, management of our supply chain, collection of cash, payment of obligations and variousother processes and procedures. Our ability to efficiently manage our business depends significantly on thereliability and capacity of these systems. The failure of these systems to operate effectively, problems withmaintenance, upgrading or transitioning to replacement systems, or a breach in security of these systemscould cause delays in customer service and reduce efficiency in our operations. Significant capitalinvestments might be required to remediate any problems.
We outsource certain business processes to third-party vendors that subject us to risks, includingdisruptions in business and increased costs.
Some business processes that are dependent on technology are outsourced to third parties. Suchprocesses include gift card tracking and authorization, credit card authorization and processing, insuranceclaims processing, certain payroll and payables processing, tax filings and other accounting processes. Wemake a diligent effort to ensure that all providers of outsourced services are observing proper internalcontrol practices, such as redundant processing facilities; however, there are no guarantees that failureswill not occur. Failure of third parties to provide adequate services could have an adverse effect on ourresults of operations, financial condition or ability to accomplish our financial and management reporting.
Disruptions in the financial markets may adversely impact the availability and cost of credit andconsumer spending patterns.
The disruptions to the financial markets and continuing economic downturn has adversely impactedthe availability of credit already arranged and the availability and cost of credit in the future. Thedisruptions in the financial markets also had an adverse effect on the U.S. and world economy, which hasnegatively impacted consumer spending patterns. There can be no assurance that various U.S. and worldgovernment present and future responses to the disruptions in the financial markets will restore consumerconfidence, stabilize the markets or increase liquidity or the availability of credit.
Declines in the market price of our common stock or changes in other circumstances that may indicatean impairment of goodwill could adversely affect our financial position and results of operations.
We perform our annual goodwill impairment test in the second quarter of each fiscal year inaccordance with the statement of Financial Accounting Standards No. 142, ‘‘Goodwill and OtherIntangible Assets.’’ Interim goodwill impairment tests are also required when events or circumstanceschange between annual tests that would more likely than not reduce the fair value of our reporting unitsbelow their carrying value. It is possible that a change in circumstances such as the decline in the marketprice of our common stock or changes in consumer spending levels, or in the numerous variablesassociated with the judgments, assumptions and estimates made in assessing the appropriate valuation ofour goodwill, could negatively impact the valuation of our brands and create the potential for a non-cashcharge to recognize impairment losses on some or all of our goodwill. If we were required to write down a
12

portion of our goodwill and record related non-cash impairment charges, our financial position and resultsof operations would be adversely affected.
Changes to estimates related to our property and equipment, or operating results that are lower thanour current estimates at certain restaurant locations, may cause us to incur impairment charges oncertain long-lived assets.
We make certain estimates and projections with regards to individual restaurant operations, as well asour overall performance in connection with our impairment analyses for long-lived assets in accordancewith Statement of Financial Accounting Standards No. 144, ‘‘Accounting for the Impairment or Disposal ofLong-Lived Assets.’’ An impairment charge is required when the carrying value of the asset exceeds theestimated fair value or undiscounted future cash flows of the asset. The projection of future cash flowsused in this analysis requires the use of judgment and a number of estimates and projections of futureoperating results. If actual results differ from our estimates, additional charges for asset impairments maybe required in the future. If impairment charges are significant, our results of operations could beadversely affected.
Failure to protect the integrity and security of individually identifiable data of our guests andteammates could expose us to litigation and damage our reputation.
We receive and maintain certain personal information about our guests and teammates. The use ofthis information by us is regulated at the federal and state levels, as well as by certain third party contracts.If our security and information systems are compromised or our business associates fail to comply withthese laws and regulations and this information is obtained by unauthorized persons or usedinappropriately, it could adversely affect our reputation, as well as operations, results of operations andfinancial condition, and could result in litigation against us or the imposition of penalties. As privacy andinformation security laws and regulations change, we may incur additional costs to ensure it remains incompliance.
Identification of material weakness in internal control may adversely affect our financial results.
We are subject to the ongoing internal control provisions of Section 404 of the Sarbanes-Oxley Act of2002. Those provisions provide for the identification of material weaknesses in internal control. If such amaterial weakness is identified, it could indicate a lack of adequate controls to generate accurate financialstatements. We routinely assess our internal controls, but we cannot assure you that we will be able totimely remediate any material weaknesses that may be identified in future periods, or maintain all of thecontrols necessary for continued compliance. Likewise, we cannot assure you that we will be able to retainsufficient skilled finance and accounting team members, especially in light of the increased demand forsuch individuals among publicly traded companies.
Other risk factors may adversely affect our financial performance.
Other risk factors that could cause our actual results to differ materially from those indicated in theforward-looking statements by affecting, among many things, pricing, consumer spending and consumerconfidence, include, without limitation, changes in economic conditions and financial and credit markets(including rising interest rates and costs for consumers and reduced disposable income); credit availability;increased costs of food commodities; increased fuel costs and availability for our team members, customersand suppliers; health epidemics or pandemics or the prospects of these events (such as reports on swineflu); consumer perceptions of food safety; changes in consumer tastes and behaviors; governmentalmonetary policies; changes in demographic trends; availability of employees; terrorist acts; energyshortages and rolling blackouts; and weather (including, major hurricanes and regional winter storms) andother acts of God.
13
Item 1B. UNRESOLVED STAFF COMMENTS.
None.
Item 2. PROPERTIES.
Restaurant Locations
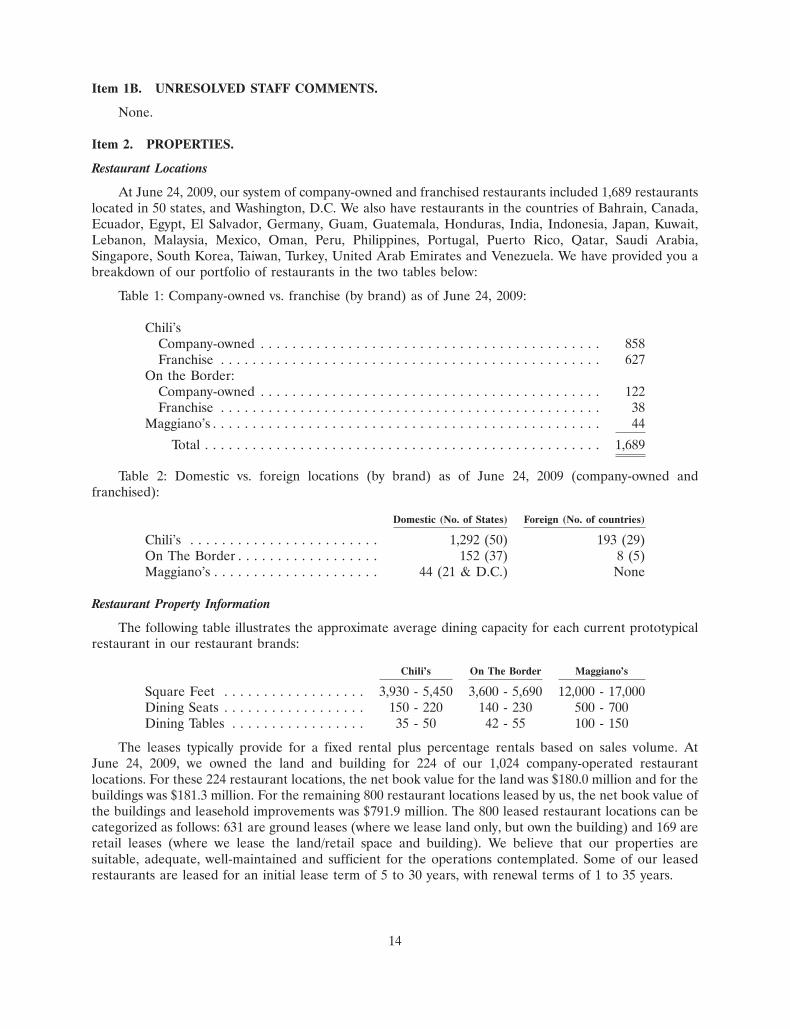
At June 24, 2009, our system of company-owned and franchised restaurants included 1,689 restaurantslocated in 50 states, and Washington, D.C. We also have restaurants in the countries of Bahrain, Canada,Ecuador, Egypt, El Salvador, Germany, Guam, Guatemala, Honduras, India, Indonesia, Japan, Kuwait,Lebanon, Malaysia, Mexico, Oman, Peru, Philippines, Portugal, Puerto Rico, Qatar, Saudi Arabia,Singapore, South Korea, Taiwan, Turkey, United Arab Emirates and Venezuela. We have provided you abreakdown of our portfolio of restaurants in the two tables below:
Table 1: Company-owned vs. franchise (by brand) as of June 24, 2009:
Chili’sCompany-owned . . . . . . . . . . . . . . . . . . . . . . . . . . . . . . . . . . . . . . . . . . . 858Franchise . . . . . . . . . . . . . . . . . . . . . . . . . . . . . . . . . . . . . . . . . . . . . . . . 627
On the Border:Company-owned . . . . . . . . . . . . . . . . . . . . . . . . . . . . . . . . . . . . . . . . . . . 122Franchise . . . . . . . . . . . . . . . . . . . . . . . . . . . . . . . . . . . . . . . . . . . . . . . . 38
Maggiano’s . . . . . . . . . . . . . . . . . . . . . . . . . . . . . . . . . . . . . . . . . . . . . . . . . 44
Total . . . . . . . . . . . . . . . . . . . . . . . . . . . . . . . . . . . . . . . . . . . . . . . . . . 1,689
Table 2: Domestic vs. foreign locations (by brand) as of June 24, 2009 (company-owned andfranchised):
Domestic (No. of States) Foreign (No. of countries)
Chili’s . . . . . . . . . . . . . . . . . . . . . . . . 1,292 (50) 193 (29)On The Border . . . . . . . . . . . . . . . . . . 152 (37) 8 (5)Maggiano’s . . . . . . . . . . . . . . . . . . . . . 44 (21 & D.C.) None
Restaurant Property Information
The following table illustrates the approximate average dining capacity for each current prototypicalrestaurant in our restaurant brands:
Chili’s On The Border Maggiano’s
Square Feet . . . . . . . . . . . . . . . . . . 3,930 - 5,450 3,600 - 5,690 12,000 - 17,000Dining Seats . . . . . . . . . . . . . . . . . . 150 - 220 140 - 230 500 - 700Dining Tables . . . . . . . . . . . . . . . . . 35 - 50 42 - 55 100 - 150
The leases typically provide for a fixed rental plus percentage rentals based on sales volume. AtJune 24, 2009, we owned the land and building for 224 of our 1,024 company-operated restaurantlocations. For these 224 restaurant locations, the net book value for the land was $180.0 million and for thebuildings was $181.3 million. For the remaining 800 restaurant locations leased by us, the net book value ofthe buildings and leasehold improvements was $791.9 million. The 800 leased restaurant locations can becategorized as follows: 631 are ground leases (where we lease land only, but own the building) and 169 areretail leases (where we lease the land/retail space and building). We believe that our properties aresuitable, adequate, well-maintained and sufficient for the operations contemplated. Some of our leasedrestaurants are leased for an initial lease term of 5 to 30 years, with renewal terms of 1 to 35 years.
14

Other Properties
We own an office building containing approximately 108,000 square feet which we use for part of ourcorporate headquarters and menu development activities. We lease an additional office complexcontaining approximately 198,000 square feet for the remainder of our corporate headquarters which iscurrently utilized by us or reserved for future expansion of our headquarters. Because of our operationsthroughout the United States, we also lease office space in Arizona, California, Colorado, Florida,Georgia, New Jersey and Texas for use as regional operation offices. The size of these office leases rangefrom approximately 100 square feet to approximately 4,000 square feet.
Item 3. LEGAL PROCEEDINGS.
Certain current and former hourly restaurant employees filed a lawsuit against us in CaliforniaSuperior Court alleging violations of California labor laws with respect to meal and rest breaks. Thelawsuit seeks penalties and attorneys’ fees and was certified as a class action in July 2006. On July 22, 2008,the California Court of Appeals decertified the class action on all claims with prejudice. On October 22,2008, the California Supreme Court granted writ to review the decision of the Court of Appeals. We intendto vigorously defend our position. It is not possible at this time to reasonably estimate the possible loss orrange of loss, if any.
We are engaged in various other legal proceedings and have certain unresolved claims pending. Theultimate liability, if any, for the aggregate amounts claimed cannot be determined at this time. However,our management, based upon consultation with legal counsel, is of the opinion that there are no matterspending or threatened which are expected to have a material adverse effect, individually or in theaggregate, on our consolidated financial condition or results of operations.
Item 4. SUBMISSION OF MATTERS TO A VOTE OF SECURITY HOLDERS.
None.
15

PART II
Item 5. MARKET FOR REGISTRANT’S COMMON EQUITY, RELATED STOCKHOLDERMATTERS AND ISSUER PURCHASES OF EQUITY SECURITIES.
Our common stock is traded on the New York Stock Exchange (‘‘NYSE’’) under the symbol ‘‘EAT’’.Bid prices quoted represent interdealer prices without adjustment for retail markup, markdown and/orcommissions, and may not necessarily represent actual transactions. The following table sets forth thequarterly high and low closing sales prices of the common stock, as reported by the NYSE.
Fiscal year ended June 24, 2009:
High Low
First Quarter . . . . . . . . . . . . . . . . . . . . . . . . . . . . . . . . . . . . . . . . $20.84 $16.75Second Quarter . . . . . . . . . . . . . . . . . . . . . . . . . . . . . . . . . . . . . . $18.01 $ 3.99Third Quarter . . . . . . . . . . . . . . . . . . . . . . . . . . . . . . . . . . . . . . . $14.80 $ 8.30Fourth Quarter . . . . . . . . . . . . . . . . . . . . . . . . . . . . . . . . . . . . . . $19.33 $14.92
Fiscal year ended June 25, 2008:
High Low
First Quarter . . . . . . . . . . . . . . . . . . . . . . . . . . . . . . . . . . . . . . . . $30.14 $26.21Second Quarter . . . . . . . . . . . . . . . . . . . . . . . . . . . . . . . . . . . . . . $28.30 $19.00Third Quarter . . . . . . . . . . . . . . . . . . . . . . . . . . . . . . . . . . . . . . . $20.06 $15.32Fourth Quarter . . . . . . . . . . . . . . . . . . . . . . . . . . . . . . . . . . . . . . $23.86 $17.67
As of August 12, 2009, there were 877 holders of record of our common stock.
During the fiscal year ended June 24, 2009, we continued to declare quarterly cash dividends for ourshareholders. We have set forth the dividends paid for the fiscal year in the following table:
Dividend Per Shareof Common Stock Declaration Date Record Date Payment Date
$0.11 August 21, 2008 September 12, 2008 September 24, 2008$0.11 October 30, 2008 December 4, 2008 December 17, 2008$0.11 February 10, 2009 March 12, 2009 March 25, 2009$0.11 May 28, 2009 June 15, 2009 June 24, 2009
16

14AUG200920341812
The following graph compares the cumulative five-year total return provided shareholders on BrinkerInternational, Inc.’s common stock relative to the cumulative total returns of the S&P 500 Index and theS&P Restaurants Index.
COMPARISON OF 5 YEAR CUMULATIVE TOTAL RETURN*Among Brinker International, Inc., The S&P 500 Index
And The S&P Restaurants Index
$0
$20
$40
$60
$80
$100
$120
$140
$160
$180
$200
6/30/04 6/29/05 6/28/06 6/27/07 6/25/08 6/24/09
Brinker International, Inc. S&P 500 S&P Restaurants
The graph assumes a $100 initial investment and the reinvestment of dividends in our stock and eachof the indexes on June 30, 2004 and its relative performance is tracked through June 24, 2009. The valuesshown are neither indicative nor determinative of future performance.
2004 2005 2006 2007 2008 2009
Brinker International . . . . . . . . . . . . . . . . $100.00 $116.71 $104.58 $131.06 $ 89.59 $ 75.45S&P 500 . . . . . . . . . . . . . . . . . . . . . . . . . $100.00 $106.32 $115.50 $139.28 $121.01 $ 89.29S&P Restaurants(1) . . . . . . . . . . . . . . . . . $100.00 $120.54 $149.69 $182.28 $182.90 $185.18
(1) The S&P Restaurants Index is comprised of Darden Restaurants, Inc., McDonald’s Corp., StarbucksCorp., Wendy’s International, Inc., and Yum! Brands Inc.
Except as described in the immediately preceding paragraphs, during the three-year period ended onAugust 12, 2009, we issued no securities which were not registered under the Securities Act of 1933, asamended.
17
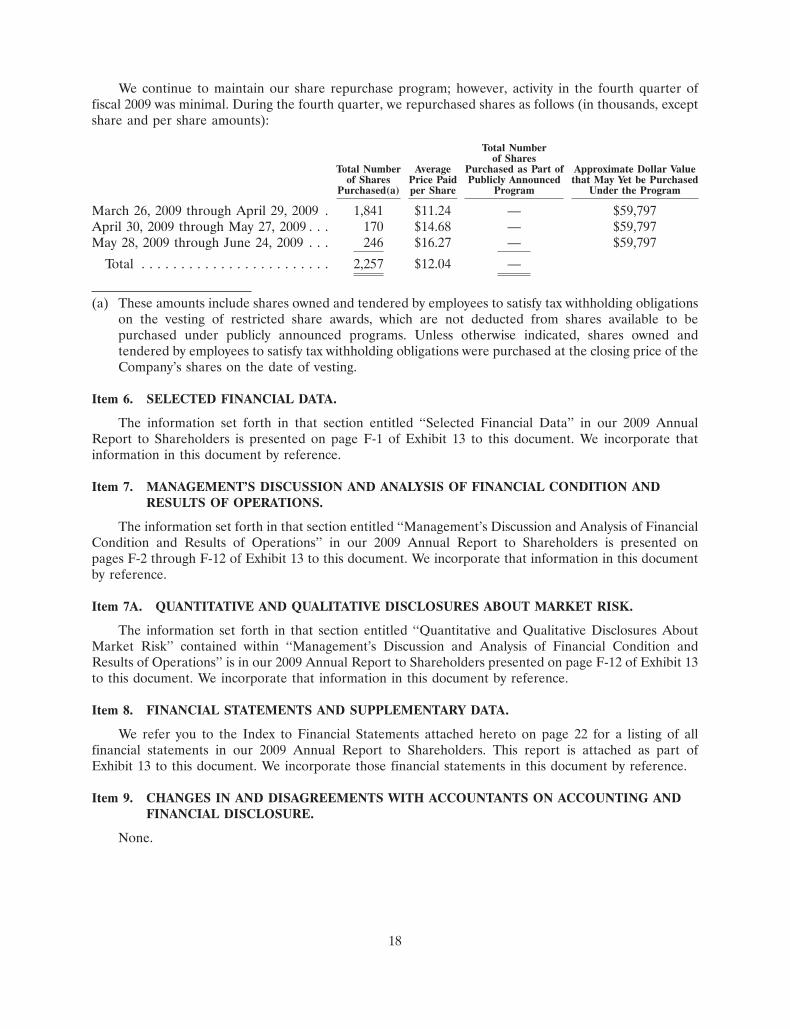
We continue to maintain our share repurchase program; however, activity in the fourth quarter offiscal 2009 was minimal. During the fourth quarter, we repurchased shares as follows (in thousands, exceptshare and per share amounts):
Total Numberof Shares
Total Number Average Purchased as Part of Approximate Dollar Valueof Shares Price Paid Publicly Announced that May Yet be Purchased
Purchased(a) per Share Program Under the Program
March 26, 2009 through April 29, 2009 . 1,841 $11.24 — $59,797April 30, 2009 through May 27, 2009 . . . 170 $14.68 — $59,797May 28, 2009 through June 24, 2009 . . . 246 $16.27 — $59,797
Total . . . . . . . . . . . . . . . . . . . . . . . . 2,257 $12.04 —
(a) These amounts include shares owned and tendered by employees to satisfy tax withholding obligationson the vesting of restricted share awards, which are not deducted from shares available to bepurchased under publicly announced programs. Unless otherwise indicated, shares owned andtendered by employees to satisfy tax withholding obligations were purchased at the closing price of theCompany’s shares on the date of vesting.
Item 6. SELECTED FINANCIAL DATA.
The information set forth in that section entitled ‘‘Selected Financial Data’’ in our 2009 AnnualReport to Shareholders is presented on page F-1 of Exhibit 13 to this document. We incorporate thatinformation in this document by reference.
Item 7. MANAGEMENT’S DISCUSSION AND ANALYSIS OF FINANCIAL CONDITION ANDRESULTS OF OPERATIONS.
The information set forth in that section entitled ‘‘Management’s Discussion and Analysis of FinancialCondition and Results of Operations’’ in our 2009 Annual Report to Shareholders is presented onpages F-2 through F-12 of Exhibit 13 to this document. We incorporate that information in this documentby reference.
Item 7A. QUANTITATIVE AND QUALITATIVE DISCLOSURES ABOUT MARKET RISK.
The information set forth in that section entitled ‘‘Quantitative and Qualitative Disclosures AboutMarket Risk’’ contained within ‘‘Management’s Discussion and Analysis of Financial Condition andResults of Operations’’ is in our 2009 Annual Report to Shareholders presented on page F-12 of Exhibit 13to this document. We incorporate that information in this document by reference.
Item 8. FINANCIAL STATEMENTS AND SUPPLEMENTARY DATA.
We refer you to the Index to Financial Statements attached hereto on page 22 for a listing of allfinancial statements in our 2009 Annual Report to Shareholders. This report is attached as part ofExhibit 13 to this document. We incorporate those financial statements in this document by reference.
Item 9. CHANGES IN AND DISAGREEMENTS WITH ACCOUNTANTS ON ACCOUNTING ANDFINANCIAL DISCLOSURE.
None.
18

Item 9A. CONTROLS AND PROCEDURES.
Disclosure Controls and Procedures
Based on their evaluation of our disclosure controls and procedures (as defined in Rules 13a-15 and15d-15 under the Securities Exchange Act of 1934 [the ‘‘Exchange Act’’]), as of the end of the periodcovered by this Annual Report on Form 10-K, our principal executive officer and principal financial officerhave concluded that our disclosure controls and procedures were effective.
Management’s Report on Internal Control over Financial Reporting
‘‘Management’s Report on Internal Control over Financial Reporting’’ and the attestation report ofthe independent registered public accounting firm of KPMG, LLP on internal control over financialreporting are in our 2009 Annual Report to Shareholders and are presented on pages F-35 through F-37 ofExhibit 13 to this document. We incorporate these reports in this document by reference.
Internal Control over Financial Reporting
There were no changes in our internal control over financial reporting during our fourth quarterended June 24, 2009, that have materially affected or are reasonably likely to materially affect, our internalcontrol over financial reporting.
Item 9B. OTHER INFORMATION.
None.
PART III
Item 10. DIRECTORS, EXECUTIVE OFFICERS AND CORPORATE GOVERNANCE.
If you would like information about:
• our executive officers,
• our Board of Directors, including its committees, and
• our Section 16(a) reporting compliance,
you should read the sections entitled ‘‘Election of Directors—Information About Nominees’’,‘‘Committees of the Board of Directors’’, ‘‘Executive Officers’’, and ‘‘Section 16(a) Beneficial OwnershipReporting Compliance’’ in our Proxy Statement to be dated on or about September 15, 2009, for theannual meeting of shareholders on October 29, 2009. We incorporate that information in this document byreference.
The Board of Directors has adopted a code of ethics that applies to all of the members of Board ofDirectors and all of our employees, including, the principal executive officer, principal financial officer,principal accounting officer or controller, or persons performing similar functions. A copy of the code isposted on our internet website at the internet address: http://www.brinker.com/corp_gov/ethical_business_policy.asp. You may obtain free of charge copies of the code from our website at the above internetaddress.
Item 11. EXECUTIVE COMPENSATION.
If you would like information about our executive compensation, you should read the section entitled‘‘Executive Compensation—Compensation Discussion and Analysis’’ in our Proxy Statement to be datedon or about September 15, 2009, for the annual meeting of shareholders on October 29, 2009. Weincorporate that information in this document by reference.
19

Item 12. SECURITY OWNERSHIP OF CERTAIN BENEFICIAL OWNERS AND MANAGEMENTAND RELATED STOCKHOLDER MATTERS.
If you would like information about our security ownership of certain beneficial owners andmanagement and related stockholder matters, you should read the sections entitled ‘‘DirectorCompensation for Fiscal 2009’’, ‘‘Compensation Discussion and Analysis’’, and ‘‘Stock Ownership ofCertain Persons’’ in our Proxy Statement to be dated on or about September 15, 2009, for the annualmeeting of shareholders on October 29, 2009. We incorporate that information in this document byreference.
Item 13. CERTAIN RELATIONSHIPS AND RELATED TRANSACTIONS, AND DIRECTORINDEPENDENCE.
If you would like information about certain relationships and related transactions, you should read thesection entitled ‘‘Compensation Committee Interlocks and Insider Participation’’ in our Proxy Statementto be dated on or about September 15, 2009, for the annual meeting of shareholders on October 29, 2009.We incorporate that information in this document by reference.
If you would like information about the independence of our non-management directors and thecomposition of the Audit Committee, Compensation Committee and Governance and NominatingCommittee, you should read the sections entitled ‘‘Director Independence’’ and ‘‘Committees of the Boardof Directors’’ in our Proxy Statement to be dated on or about September 15, 2009, for the annual meetingof shareholders on October 29, 2009. We incorporate that information in this document by reference.
Item 14. PRINCIPAL ACCOUNTANT FEES AND SERVICES.
If you would like information about principal accountant fees and services, you should read thesection entitled ‘‘Ratification of Independent Auditors’’ in our Proxy Statement to be dated on or aboutSeptember 15, 2009, for the annual meeting of shareholders on October 29, 2009. We incorporate thatinformation in this document by reference.
PART IV
Item 15. EXHIBITS AND FINANCIAL STATEMENT SCHEDULES.
(a)(1) Financial Statements.
We make reference to the Index to Financial Statements attached to this document on page 22 for alisting of all financial statements attached as Exhibit 13 to this document.
(a)(2) Financial Statement Schedules.
None.
(a)(3) Exhibits.
We make reference to the Index to Exhibits preceding the exhibits attached hereto on page E-1 for alist of all exhibits filed as a part of this document.
20

SIGNATURES
Pursuant to the requirements of Section 13 or 15(d) of the Securities Exchange Act of 1934, theregistrant has duly caused this report to be signed on its behalf by the undersigned, thereunto dulyauthorized.
BRINKER INTERNATIONAL, INC.,a Delaware corporation
By: /s/ CHARLES M. SONSTEBY
Charles M. Sonsteby,Executive Vice President and
Chief Financial Officer
Dated: August 24, 2009
Pursuant to the requirements of the Securities Exchange Act of 1934, we have signed in our indicatedcapacities on August 24, 2009.
Name Title
/s/ DOUGLAS H. BROOKS Chairman of the Board, President, and ChiefExecutive Officer (Principal Executive Officer)Douglas H. Brooks
Executive Vice President and Chief Financial/s/ CHARLES M. SONSTEBYOfficer (Principal Financial and Accounting
Charles M. Sonsteby Officer)
/s/ HARRIET EDELMANDirector
Harriet Edelman
/s/ MARVIN J. GIROUARDDirector
Marvin J. Girouard
/s/ JOHN W. MIMSDirector
John W. Mims
/s/ GEORGE R. MRKONICDirector
George R. Mrkonic
/s/ ERLE NYEDirector
Erle Nye
/s/ JAMES E. OESTERREICHERDirector
James E. Oesterreicher
/s/ ROSENDO G. PARRADirector
Rosendo G. Parra
/s/ CECE SMITHDirector
Cece Smith
21


INDEX TO FINANCIAL STATEMENTS
The following is a listing of the financial statements which are attached hereto as part of Exhibit 13.
Page
Selected Financial Data . . . . . . . . . . . . . . . . . . . . . . . . . . . . . . . . . . . . . . . . . . . . . . . . . . . . . F-1
Management’s Discussion and Analysis of Financial Condition and Results of Operations . . . . . F-2
Consolidated Statements of Income—Fiscal Years Ended June 24, 2009, June 25, 2008, andJune 27, 2007 . . . . . . . . . . . . . . . . . . . . . . . . . . . . . . . . . . . . . . . . . . . . . . . . . . . . . . . . . . . F-13
Consolidated Balance Sheets—June 24, 2009 and June 25, 2008 . . . . . . . . . . . . . . . . . . . . . . . . F-14
Consolidated Statements of Shareholders’ Equity—Fiscal Years Ended June 24, 2009, June 25,2008, and June 27, 2007 . . . . . . . . . . . . . . . . . . . . . . . . . . . . . . . . . . . . . . . . . . . . . . . . . . . F-15
Consolidated Statements of Cash Flows—Fiscal Years Ended June 24, 2009, June 25, 2008, andJune 27, 2007 . . . . . . . . . . . . . . . . . . . . . . . . . . . . . . . . . . . . . . . . . . . . . . . . . . . . . . . . . . . F-16
Notes to Consolidated Financial Statements . . . . . . . . . . . . . . . . . . . . . . . . . . . . . . . . . . . . . . . F-17
Reports of Independent Registered Public Accounting Firm . . . . . . . . . . . . . . . . . . . . . . . . . . . F-35
Management’s Responsibility for Consolidated Financial Statements . . . . . . . . . . . . . . . . . . . . . F-37
Management’s Report on Internal Control over Financial Reporting . . . . . . . . . . . . . . . . . . . . . F-37
All schedules are omitted as the required information is inapplicable or the information is presentedin the financial statements or related notes.
22
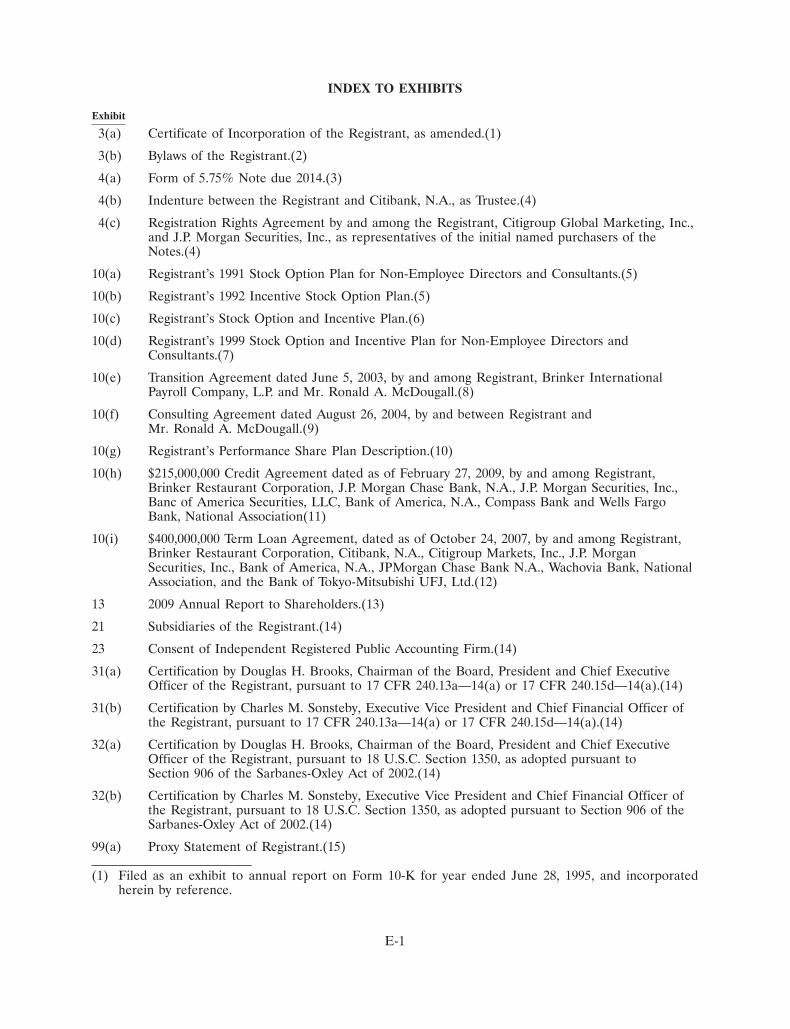
INDEX TO EXHIBITS
Exhibit
3(a) Certificate of Incorporation of the Registrant, as amended.(1)
3(b) Bylaws of the Registrant.(2)
4(a) Form of 5.75% Note due 2014.(3)
4(b) Indenture between the Registrant and Citibank, N.A., as Trustee.(4)
4(c) Registration Rights Agreement by and among the Registrant, Citigroup Global Marketing, Inc.,and J.P. Morgan Securities, Inc., as representatives of the initial named purchasers of theNotes.(4)
10(a) Registrant’s 1991 Stock Option Plan for Non-Employee Directors and Consultants.(5)
10(b) Registrant’s 1992 Incentive Stock Option Plan.(5)
10(c) Registrant’s Stock Option and Incentive Plan.(6)
10(d) Registrant’s 1999 Stock Option and Incentive Plan for Non-Employee Directors andConsultants.(7)
10(e) Transition Agreement dated June 5, 2003, by and among Registrant, Brinker InternationalPayroll Company, L.P. and Mr. Ronald A. McDougall.(8)
10(f) Consulting Agreement dated August 26, 2004, by and between Registrant andMr. Ronald A. McDougall.(9)
10(g) Registrant’s Performance Share Plan Description.(10)
10(h) $215,000,000 Credit Agreement dated as of February 27, 2009, by and among Registrant,Brinker Restaurant Corporation, J.P. Morgan Chase Bank, N.A., J.P. Morgan Securities, Inc.,Banc of America Securities, LLC, Bank of America, N.A., Compass Bank and Wells FargoBank, National Association(11)
10(i) $400,000,000 Term Loan Agreement, dated as of October 24, 2007, by and among Registrant,Brinker Restaurant Corporation, Citibank, N.A., Citigroup Markets, Inc., J.P. MorganSecurities, Inc., Bank of America, N.A., JPMorgan Chase Bank N.A., Wachovia Bank, NationalAssociation, and the Bank of Tokyo-Mitsubishi UFJ, Ltd.(12)
13 2009 Annual Report to Shareholders.(13)
21 Subsidiaries of the Registrant.(14)
23 Consent of Independent Registered Public Accounting Firm.(14)
31(a) Certification by Douglas H. Brooks, Chairman of the Board, President and Chief ExecutiveOfficer of the Registrant, pursuant to 17 CFR 240.13a—14(a) or 17 CFR 240.15d—14(a).(14)
31(b) Certification by Charles M. Sonsteby, Executive Vice President and Chief Financial Officer ofthe Registrant, pursuant to 17 CFR 240.13a—14(a) or 17 CFR 240.15d—14(a).(14)
32(a) Certification by Douglas H. Brooks, Chairman of the Board, President and Chief ExecutiveOfficer of the Registrant, pursuant to 18 U.S.C. Section 1350, as adopted pursuant toSection 906 of the Sarbanes-Oxley Act of 2002.(14)
32(b) Certification by Charles M. Sonsteby, Executive Vice President and Chief Financial Officer ofthe Registrant, pursuant to 18 U.S.C. Section 1350, as adopted pursuant to Section 906 of theSarbanes-Oxley Act of 2002.(14)
99(a) Proxy Statement of Registrant.(15)
(1) Filed as an exhibit to annual report on Form 10-K for year ended June 28, 1995, and incorporatedherein by reference.
E-1

(2) Filed as an exhibit to current report on Form 8-K dated May 28, 2009, and incorporated herein byreference.
(3) Included in exhibit 4(d) to annual report on Form 10-K for year ended June 30, 2004, and incorporatedherein by reference.
(4) Filed as an exhibit to registration statement on Form S-4 filed June 25, 2004, SEC File No. 333-116879,and incorporated herein by reference.
(5) Filed as an exhibit to annual report on Form 10-K for the year ended June 25, 1997, and incorporatedherein by reference.
(6) Filed as Appendix A to Proxy Statement of Registrant, filed on September 11, 2008, and incorporatedherein by reference.
(7) Filed as an exhibit to quarterly report on Form 10-Q for the quarter ended December 28, 2005, andincorporated herein by reference.
(8) Filed as an exhibit to annual report on Form 10-K for the year ended June 25, 2003, and incorporatedherein by reference.
(9) Filed as an exhibit to annual report on Form 10-K for the year ended June 30, 2004, and incorporatedherein by reference.
(10) Filed as an exhibit to quarterly report on Form 10-Q for the quarter ended March 29, 2006, andincorporated herein by reference.
(11) Filed as an exhibit to quarterly report on Form 10-Q for the quarter ended March 25, 2009, andincorporated herein by reference.
(12) Filed as an exhibit to quarterly report on Form 10-Q for the quarter ended December 26, 2007, andincorporated herein by reference.
(13) Portions filed herewith, to the extent indicated herein.
(14) Filed herewith.
(15) To be filed on or about September 15, 2009.
E-2


EXHIBIT 13
BRINKER INTERNATIONAL, INC.
SELECTED FINANCIAL DATA
(In thousands, except per share amounts and number of restaurants)
Fiscal Years
2009 2008 2007 2006 2005
Income Statement Data:Revenues . . . . . . . . . . . . . . . . . . . . . . . . . . . . . . $3,620,580 $4,235,223 $4,376,904 $4,151,291 $3,749,539
Operating Costs and Expenses:Cost of sales . . . . . . . . . . . . . . . . . . . . . . . . . . . 1,010,515 1,200,763 1,222,198 1,160,931 1,059,822Restaurant expenses . . . . . . . . . . . . . . . . . . . . . . 2,050,653 2,397,908 2,435,866 2,283,737 2,085,529Depreciation and amortization . . . . . . . . . . . . . . 161,800 165,229 189,162 190,206 179,908General and administrative . . . . . . . . . . . . . . . . . 152,591 170,703 194,349 207,080 153,116Other gains and charges . . . . . . . . . . . . . . . . . . . 134,787 203,950 (8,999) (17,262) 52,779
Total operating costs and expenses . . . . . . . . . . 3,510,346 4,138,553 4,032,576 3,824,692 3,531,154
Operating income . . . . . . . . . . . . . . . . . . . . . . . . . 110,234 96,670 344,328 326,599 218,385Interest expense . . . . . . . . . . . . . . . . . . . . . . . . . . 33,330 45,862 30,929 22,857 25,260Other, net . . . . . . . . . . . . . . . . . . . . . . . . . . . . . . (9,834) (4,046) (5,071) (1,656) 1,526
Income before provision for income taxes . . . . . . . . 86,738 54,854 318,470 305,398 191,599Provision for income taxes . . . . . . . . . . . . . . . . . . . 7,572 3,132 88,421 91,448 33,143
Income from continuing operations . . . . . . . . . . 79,166 51,722 230,049 213,950 158,456(Loss) income from discontinued operations, net
of taxes . . . . . . . . . . . . . . . . . . . . . . . . . . . — — — (1,555) 1,763
Net income . . . . . . . . . . . . . . . . . . . . . . . $ 79,166 $ 51,722 $ 230,049 $ 212,395 $ 160,219
Basic net income per share:Income from continuing operations . . . . . . . . . . $ 0.78 $ 0.50 $ 1.90 $ 1.66 $ 1.19
(Loss) income from discontinued operations . . . . $ — $ — $ — $ (0.01) $ 0.02
Net income per share . . . . . . . . . . . . . . . . . . . $ 0.78 $ 0.50 $ 1.90 $ 1.65 $ 1.21
Diluted net income per share:Income from continuing operations . . . . . . . . . . $ 0.77 $ 0.49 $ 1.85 $ 1.63 $ 1.14
(Loss) income from discontinued operations . . . . $ — $ — $ — $ (0.01) $ 0.01
Net income per share . . . . . . . . . . . . . . . . . . . $ 0.77 $ 0.49 $ 1.85 $ 1.62 $ 1.15
Basic weighted average shares outstanding . . . . . . . . 101,852 103,101 121,062 128,766 132,795
Diluted weighted average shares outstanding . . . . . . 102,713 104,897 124,116 130,934 141,344
Balance Sheet Data:Working capital (deficit)(a) . . . . . . . . . . . . . . . . . . $ (39,667) $ (70,801) $ 111,706 $ 246,649 $ 375,283Total assets . . . . . . . . . . . . . . . . . . . . . . . . . . . . . 1,948,947 2,193,122 2,318,021 2,221,779 2,156,124Long-term obligations(a) . . . . . . . . . . . . . . . . . . . . 893,141 1,071,209 969,468 629,600 607,208Shareholders’ equity . . . . . . . . . . . . . . . . . . . . . . . 646,924 595,089 805,089 1,075,832 1,100,282Cash dividends per share . . . . . . . . . . . . . . . . . . . . $ 0.44 $ 0.42 $ 0.34 $ 0.20 $ —Number of Restaurants Open (End of Period):Company-operated . . . . . . . . . . . . . . . . . . . . . . . . 1,024 1,265 1,312 1,290 1,268Franchised/Joint venture . . . . . . . . . . . . . . . . . . . . 665 623 489 332 320
Total . . . . . . . . . . . . . . . . . . . . . . . . . . . 1,689 1,888 1,801 1,622 1,588
(a) Prior year amounts have been updated to conform with fiscal 2009 presentation.
F-1

MANAGEMENT’S DISCUSSION AND ANALYSIS OFFINANCIAL CONDITION AND RESULTS OF OPERATIONS
GENERAL
The following Management’s Discussion and Analysis of Financial Condition and Results ofOperations (‘‘MD&A’’) is intended to help you understand our company, our operations, and our currentoperating environment. For an understanding of the significant factors that influenced our performanceduring the past three fiscal years, the MD&A should be read in conjunction with the consolidated financialstatements and related notes included in this annual report. Our MD&A consists of the following sections:
• Overview—a general description of our business and the casual dining segment of the restaurantindustry
• Results of Operations—an analysis of our consolidated statements of income for the three yearspresented in our consolidated financial statements
• Liquidity and Capital Resources—an analysis of cash flows including capital expenditures, aggregatecontractual obligations, share repurchase activity, known trends that may impact liquidity, and theimpact of inflation
• Critical Accounting Estimates—a discussion of accounting policies that require critical judgmentsand estimates
OVERVIEW
We are principally engaged in the ownership, operation, development, and franchising of the Chili’sGrill & Bar (‘‘Chili’s’’), On The Border Mexican Grill & Cantina (‘‘On The Border’’) and Maggiano’sLittle Italy (‘‘Maggiano’s’’) restaurant brands. At June 24, 2009, we owned, operated, or franchised 1,689restaurants. We sold Romano’s Macaroni Grill (‘‘Macaroni Grill’’) to Mac Acquisition LLC (‘‘MacAcquisition’’), an affiliate of San Francisco-based Golden Gate Capital, in December 2008 and purchasedan 18.2% ownership interest in the new entity.
Fiscal 2009 was another challenging year for us and the casual dining industry. The economicenvironment significantly impacted our results; however, we are committed to strengthening our businessmodel and improving profitability despite the significant challenges we currently face. We are focused oninitiatives that will allow our business to operate as efficiently as possible and will allow us to maintain ourposition as an industry leader. We believe that the significant downturn in the economy, including financialmarket volatility, unemployment and the housing crisis will continue to negatively impact consumerconfidence and put pressure on spending. Our negative traffic trends indicate that our guests are limitingdiscretionary spending by reducing the frequency of their visits to our restaurants or scaling back on checktotals. We also experienced a decline in gift card sales of approximately 15% during the holiday seasoncompared to the prior year which negatively impacted fiscal 2009 revenue. We will continually evaluatehow we manage the business and make necessary changes in response to competition and the economicfactors affecting the restaurant industry.
Our goal is to take actions that will enable us to emerge from this recession in a position of strengthwith a strong balance sheet and improved operating profit. We are exhibiting discipline in our capitalallocation and are taking steps to create sustainable margin improvements through cost controls andoperational efficiencies. These steps will help maintain the health of our balance sheet and will provide thestable financial base needed to maintain our business through a depressed operating environment. We aredriving profit improvements through a disciplined approach to operations, company-owned new restaurantdevelopment and the closure of underperforming restaurants. Effective management of food costs and afocus on labor productivity and reducing fixed costs is helping us gain sustainable margin improvements.Our emphasis on the operations of our existing restaurants has resulted in lower turnover which has
F-2

positively impacted labor cost and efficiency. Additionally, generating strong cash flows has long been oneof our hallmarks and we have taken steps to solidify our cash flows to provide the necessary flexibility toaddress current challenges and help drive the business forward. We have completed the closure ofunderperforming restaurants in fiscal 2009 and reduced our fiscal 2009 capital expenditures byapproximately $90 million from our initial plan. Virtually all company-owned domestic new restaurantdevelopment in fiscal 2010 has been curtailed; however, we will continue development under ourinternational joint venture arrangements. Enhanced free cash flows resulting from our financial disciplineand proceeds from the sale of Macaroni Grill have allowed us to reduce our debt levels and will provideflexibility for further debt reductions.
We are committed to our long term strategies and initiatives centered on our five areas of focus—hospitality; food and beverage excellence; restaurant atmosphere; pace and convenience; and internationalexpansion. These strategic priorities are designed to strengthen our brands and build on the long-termhealth of the company by engaging and delighting our guests, differentiating our brands from thecompetition, reducing the costs associated with managing our restaurants and establishing a strongpresence in key markets around the world. However, we will monitor the results closely as well as thecurrent business environment in order to pace the implementation of our initiatives appropriately.
We strongly believe investments in these five strategic priorities will strengthen our brands and allowus to improve our competitive position and deliver profitable growth over the long term for ourshareholders. For example, we believe that the unique and delicious food and signature drinks; the newflavors and offerings we continue to create at each of our brands; and the warm, welcoming and revitalizedatmospheres will give our guests new reasons to dine with us more often. Another top area of focusremains creating a culture of hospitality that will differentiate our brands from all others in the industry.Through our investments in team member training and guest measurement programs, we are gainingtraction in this area and providing guests a reason to make our brands their preferred choice when diningout. We have recently combined the Chili’s and On the Border leadership teams. This change was made tostreamline decision making, enhance sharing of best practices and leverage our talent across the portfolio.We believe this structure will enhance our focus on actions that will improve the guest experience. And,with growing economic pressures in the United States and globally, international expansion allows furtherdiversification of our portfolio, enabling us to build strength in a variety of markets and economicconditions. Our growth will be driven by cultivating relationships with franchisees and joint venturepartners. Our growing percentage of franchise operations both domestically and internationally enable usto improve margins as royalty payments impact the bottom line.
The casual dining industry is a competitive business which is sensitive to changes in economicconditions, trends in lifestyles and fluctuating costs. Our top priority remains increasing profitable trafficover time. We believe that this focus, combined with discipline around the use of capital and efficientmanagement of operating expenses, will enable us to maintain our position as an industry leader. Weremain confident in the financial health of our company, the long-term prospects of the industry as well asin our ability to perform effectively in a competitive marketplace and a variety of economic environments.
F-3

RESULTS OF OPERATIONS FOR FISCAL YEARS 2009, 2008, AND 2007
The following table sets forth income and expense items as a percentage of total revenues for theperiods indicated:
Percentage of Total RevenuesFiscal Years
2009 2008 2007
Revenues . . . . . . . . . . . . . . . . . . . . . . . . . . . . . . . . . . . . . . . . . . . . . . . . . 100.0% 100.0% 100.0%
Operating Costs and Expenses:Cost of sales . . . . . . . . . . . . . . . . . . . . . . . . . . . . . . . . . . . . . . . . . . . . . 27.9% 28.4% 27.9%Restaurant expenses . . . . . . . . . . . . . . . . . . . . . . . . . . . . . . . . . . . . . . . 56.7% 56.6% 55.7%Depreciation and amortization . . . . . . . . . . . . . . . . . . . . . . . . . . . . . . . . 4.5% 3.9% 4.3%General and administrative . . . . . . . . . . . . . . . . . . . . . . . . . . . . . . . . . . 4.2% 4.0% 4.4%Other gains and charges . . . . . . . . . . . . . . . . . . . . . . . . . . . . . . . . . . . . 3.7% 4.8% (0.2)%
Total operating costs and expenses . . . . . . . . . . . . . . . . . . . . . . . . . . . 97.0% 97.7% 92.1%
Operating income . . . . . . . . . . . . . . . . . . . . . . . . . . . . . . . . . . . . . . . . . . 3.0% 2.3% 7.9%Interest expense . . . . . . . . . . . . . . . . . . . . . . . . . . . . . . . . . . . . . . . . . . . . 0.9% 1.1% 0.7%Other, net . . . . . . . . . . . . . . . . . . . . . . . . . . . . . . . . . . . . . . . . . . . . . . . . (0.3)% (0.1)% (0.1)%
Income before provision for income taxes . . . . . . . . . . . . . . . . . . . . . . . . . 2.4% 1.3% 7.3%Provision for income taxes . . . . . . . . . . . . . . . . . . . . . . . . . . . . . . . . . . . . 0.2% 0.1% 2.0%
Net income . . . . . . . . . . . . . . . . . . . . . . . . . . . . . . . . . . . . . . . . . . . . 2.2% 1.2% 5.3%
REVENUES
Revenues for fiscal 2009 decreased to $3,620.6 million, a 14.5% decrease from the $4,235.2 milliongenerated for fiscal 2008. The decrease in revenue was primarily attributable to net declines in capacity atcompany-owned restaurants as well as a decrease in comparable restaurant sales across all brands asfollows:
Fiscal Year Ended June 24, 2009
Price ComparableCapacity Increase Mix Shift Sales
Brinker International . . . . . . . . . . . . . . . . . . . . . . . . . . . . . . (10.7)% 3.0% (1.0)% (6.0)%Chili’s . . . . . . . . . . . . . . . . . . . . . . . . . . . . . . . . . . . . . . . (1.6)% 3.2% (0.8)% (5.6)%On The Border . . . . . . . . . . . . . . . . . . . . . . . . . . . . . . . . (5.1)% 3.4% (1.4)% (4.4)%Maggiano’s . . . . . . . . . . . . . . . . . . . . . . . . . . . . . . . . . . . 3.7% 1.5% (2.2)% (7.3)%Macaroni Grill(1) . . . . . . . . . . . . . . . . . . . . . . . . . . . . . . . (14.6)% 2.8% (1.1)% (9.8)%
(1) Macaroni Grill capacity and comparable restaurant sales for the fiscal year ended June 24, 2009includes the impact through the sale date of December 18, 2008.
Our capacity decreased 10.7% in fiscal 2009 (as measured by average-weighted sales weeks). Thereduction in capacity was primarily due to the sale of 198 restaurants (189 of which were Macaroni Grills)and 55 restaurant closures (five of which were Macaroni Grills) during fiscal 2009, partially offset by thedevelopment of new company-owned restaurants. Including the impact of the sale of Macaroni Grill andother restaurant sales to franchisees, we experienced a net decrease of 241 company-owned restaurantssince June 25, 2008.
F-4

Comparable restaurant sales decreased 6.0% in fiscal 2009 compared to fiscal 2008. The decrease incomparable restaurant sales resulted from a decline in guest traffic and unfavorable product mix shiftsacross all brands, partially offset by an increase in menu prices across all brands.
Revenues for fiscal 2008 decreased to $4,235.2 million, a 3.2% decrease from the $4,376.9 milliongenerated for fiscal 2007. The decrease in revenue was primarily attributable to net declines in capacity atcompany-owned restaurants as well as a decrease in comparable restaurant sales as follows:
Fiscal Year Ended June 25, 2008
Price ComparableCapacity Increase Mix Shift Sales
Brinker International . . . . . . . . . . . . . . . . . . . . . . . . . . . . . . (4.3)% 2.9% 0.5% (0.5)%Chili’s . . . . . . . . . . . . . . . . . . . . . . . . . . . . . . . . . . . . . . . (5.9)% 3.1% 0.8% 0.8%On The Border . . . . . . . . . . . . . . . . . . . . . . . . . . . . . . . . 5.5% 2.5% (0.2)% (3.3)%Maggiano’s . . . . . . . . . . . . . . . . . . . . . . . . . . . . . . . . . . . 6.4% 2.8% (1.9)% 0.4%Macaroni Grill . . . . . . . . . . . . . . . . . . . . . . . . . . . . . . . . . (4.8)% 2.2% 1.1% (4.4)%
Our capacity decreased 4.3% in fiscal 2008 primarily due to the sale of 95 Chili’s restaurants to PepperDining, Inc. on June 27, 2007 as well as the sale of 76 Chili’s restaurants to ERJ Dining IV, LLC duringfiscal 2008. The reduction in capacity was also due to 44 restaurant closures (27 of which were MacaroniGrills) during fiscal 2008, partially offset by the development of new company-owned restaurants.Including the impact of restaurant sales to franchisees, we experienced a net decrease of 47 company-owned restaurants since June 27, 2007.
Comparable restaurant sales decreased 0.5% in fiscal 2008 compared to fiscal 2007. The decrease incomparable restaurant sales resulted from a decline in guest traffic across all brands and unfavorableproduct mix shifts at On The Border and Maggiano’s. These decreases were partially offset by an increasein menu prices at all brands and favorable mix shifts at Chili’s and Macaroni Grill.
COSTS AND EXPENSES
Cost of sales, as a percent of revenues, decreased 0.5% in fiscal 2009. Cost of sales was favorablyimpacted by decreased commodity usage from efforts to reduce waste, menu item changes, menu priceincreases and favorable product mix shifts, partially offset by unfavorable commodity price changesprimarily in beef, poultry, produce and cooking oils. Cost of sales, as a percent of revenues, increased 0.5%in fiscal 2008 primarily due to increased inventory costs, partially offset by an increase in menu prices andan increase in franchise revenues. The cost increase was primarily driven by unfavorable pricing for beef,ribs, chicken, and dairy products. The increase was also due to unfavorable product mix shifts related tonew menu items.
Restaurant expenses, as a percent of revenues, increased 0.1% in fiscal 2009 primarily driven by salesdeleverage on fixed costs, partially offset by lower restaurant opening expenses due to fewer restaurantopenings and lower labor costs due to efficiency improvements. Restaurant expenses, as a percent ofrevenues, increased 0.9% in fiscal 2008 primarily due to minimum wage increases and higher insurancecosts. The increase was partially offset by a decrease in restaurant opening expenses.
Depreciation and amortization decreased $3.4 million in fiscal 2009. The decrease in depreciationexpense was primarily driven by restaurant closures and fully depreciated assets, partially offset by anincrease in depreciation due to remodel investments and the addition of new restaurants. Depreciation andamortization decreased $23.9 million in fiscal 2008. The decrease in depreciation expense was primarilydue to the sale of restaurants to franchisees as well as the classification of Macaroni Grill assets as held forsale in September 2007, at which time the assets were no longer depreciated. These decreases werepartially offset by the addition of new restaurants and remodel investments.
F-5

General and administrative expenses decreased $18.1 million in fiscal 2009. The decrease wasprimarily due to reduced salary expense from lower headcount driven by organizational changes and thesale of Macaroni Grill, a decrease in professional fees, and income related to transitional services providedto Macaroni Grill that offset the internal cost of providing the services. The decrease was partially offset byhigher annual performance based compensation expense. General and administrative expenses decreased$23.6 million in fiscal 2008. The decrease was primarily due to lower annual performance and stock-basedcompensation expense as well as reduced salary and team member related expenses subsequent to acorporate restructuring that eliminated certain administrative positions during fiscal 2008.
Other gains and charges in fiscal 2009 includes a $71.2 million charge primarily related to long-livedasset impairments and lease termination charges resulting from the decision to close or decline leaserenewals for 43 underperforming restaurants, including eight international restaurants, based on acomprehensive analysis that examined restaurants not performing at required levels of return. Werecorded a goodwill impairment charge of $7.7 million as a result of the international restaurant closings.Additionally during fiscal 2009, we incurred a $14.3 million charge related to the impairment of long-livedassets associated with 16 underperforming restaurants based on the excess of the carrying amount of thelong-lived assets over the estimated fair value. We also completed the sale of Macaroni Grill to MacAcquisition and recorded a loss on the sale of $40.4 million. Lastly, we made some organizational changesdesigned to streamline decision making across our brands resulting in a $6.0 million net charge forseverance and other costs. Other gains and charges in fiscal 2008 includes $155.7 million in charges relatedto the sale of Macaroni Grill primarily due to the write down of the brand’s long-lived assets held for saleto estimated fair value less costs to sell. In addition, we made the decision to close or decline leaserenewals for 61 restaurants based on a comprehensive analysis that examined restaurants not performingat required levels of return. As a result, we incurred a $51.1 million charge primarily related to theimpairment of long-lived assets at these restaurants as well as lease obligation charges for the restaurantsthat closed in fiscal 2008. Additionally, we recorded a $7.5 million charge related to the impairment oflong-lived assets associated with two underperforming restaurants based on the excess of the carryingamount of the long-lived assets over the estimated fair value. During fiscal 2008, we also made the decisionto reduce future domestic company-owned restaurant development as well as discontinue certain projectsthat did not align with our strategic goals. As a result, we incurred a $13.2 million charge related to assetwrite-offs and a $7.2 million net charge for severance and other benefits. These charges were partiallyoffset by a $29.7 million gain related to the sale of 76 company-owned Chili’s restaurants to ERJDining IV, LLC. Other gains and charges in fiscal 2007 includes $19.1 million in gains related to the sale ofcompany-owned restaurants to franchisees, including 95 Chili’s restaurants to Pepper Dining, Inc. Alsoincluded is a $3.2 million gain related to the termination of interest rate swaps on an operating leasecommitment. These gains were partially offset by a $12.9 million charge related to the impairment oflong-lived assets at 13 restaurants as well as lease obligation charges for seven of the restaurants thatclosed during fiscal 2007.
Interest expense decreased $12.5 million in fiscal 2009 primarily due to lower average borrowingbalances on our credit facilities and lower interest rates on our debt carrying variable interest rates,partially offset by a decrease in capitalized interest due to a reduction in company-owned restaurantsdeveloped in fiscal 2009 compared to fiscal 2008. Additionally, we repurchased and retired $10.0 million ofthe 5.75% notes at a discount in April 2009 and recorded a $1.3 million gain on the extinguishment of debt.Interest expense increased $14.9 million in fiscal 2008 primarily due to outstanding borrowings on our$400 million three-year term loan agreement used to fund share repurchases in fiscal 2007 and for generalcorporate purposes. The increase was partially offset by a decrease in interest rates on our debt carryingvariable interest rates.
Other, net increased $5.8 million in fiscal 2009 primarily due to a gain from insurance proceeds. Theincrease was also attributed to lease income from Mac Acquisition as part of the sale agreement. Other,net decreased $1.0 million in fiscal 2008 due to the realized gains from the liquidation of our investments
F-6
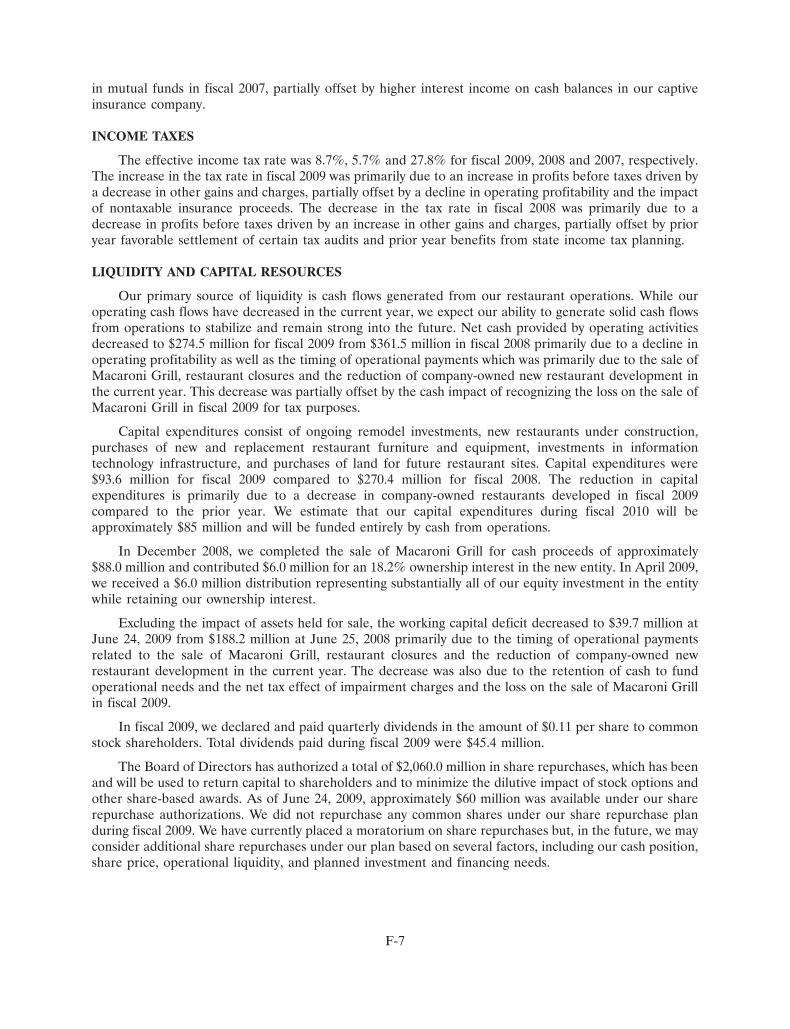
in mutual funds in fiscal 2007, partially offset by higher interest income on cash balances in our captiveinsurance company.
INCOME TAXES
The effective income tax rate was 8.7%, 5.7% and 27.8% for fiscal 2009, 2008 and 2007, respectively.The increase in the tax rate in fiscal 2009 was primarily due to an increase in profits before taxes driven bya decrease in other gains and charges, partially offset by a decline in operating profitability and the impactof nontaxable insurance proceeds. The decrease in the tax rate in fiscal 2008 was primarily due to adecrease in profits before taxes driven by an increase in other gains and charges, partially offset by prioryear favorable settlement of certain tax audits and prior year benefits from state income tax planning.
LIQUIDITY AND CAPITAL RESOURCES
Our primary source of liquidity is cash flows generated from our restaurant operations. While ouroperating cash flows have decreased in the current year, we expect our ability to generate solid cash flowsfrom operations to stabilize and remain strong into the future. Net cash provided by operating activitiesdecreased to $274.5 million for fiscal 2009 from $361.5 million in fiscal 2008 primarily due to a decline inoperating profitability as well as the timing of operational payments which was primarily due to the sale ofMacaroni Grill, restaurant closures and the reduction of company-owned new restaurant development inthe current year. This decrease was partially offset by the cash impact of recognizing the loss on the sale ofMacaroni Grill in fiscal 2009 for tax purposes.
Capital expenditures consist of ongoing remodel investments, new restaurants under construction,purchases of new and replacement restaurant furniture and equipment, investments in informationtechnology infrastructure, and purchases of land for future restaurant sites. Capital expenditures were$93.6 million for fiscal 2009 compared to $270.4 million for fiscal 2008. The reduction in capitalexpenditures is primarily due to a decrease in company-owned restaurants developed in fiscal 2009compared to the prior year. We estimate that our capital expenditures during fiscal 2010 will beapproximately $85 million and will be funded entirely by cash from operations.
In December 2008, we completed the sale of Macaroni Grill for cash proceeds of approximately$88.0 million and contributed $6.0 million for an 18.2% ownership interest in the new entity. In April 2009,we received a $6.0 million distribution representing substantially all of our equity investment in the entitywhile retaining our ownership interest.
Excluding the impact of assets held for sale, the working capital deficit decreased to $39.7 million atJune 24, 2009 from $188.2 million at June 25, 2008 primarily due to the timing of operational paymentsrelated to the sale of Macaroni Grill, restaurant closures and the reduction of company-owned newrestaurant development in the current year. The decrease was also due to the retention of cash to fundoperational needs and the net tax effect of impairment charges and the loss on the sale of Macaroni Grillin fiscal 2009.
In fiscal 2009, we declared and paid quarterly dividends in the amount of $0.11 per share to commonstock shareholders. Total dividends paid during fiscal 2009 were $45.4 million.
The Board of Directors has authorized a total of $2,060.0 million in share repurchases, which has beenand will be used to return capital to shareholders and to minimize the dilutive impact of stock options andother share-based awards. As of June 24, 2009, approximately $60 million was available under our sharerepurchase authorizations. We did not repurchase any common shares under our share repurchase planduring fiscal 2009. We have currently placed a moratorium on share repurchases but, in the future, we mayconsider additional share repurchases under our plan based on several factors, including our cash position,share price, operational liquidity, and planned investment and financing needs.
F-7

As of June 25, 2008, we had credit facilities aggregating $550.0 million, consisting of a revolving creditfacility of $300 million and uncommitted credit facilities of $250 million. In fiscal 2009, we completed therenewal of our revolving credit facility which was set to expire in October 2009. The new facility wasreduced to $250 million, bears interest at LIBOR plus an applicable margin, which is a function of ourcredit rating at such time, but is subject to a maximum of LIBOR plus 3.75% and expires in February 2012.Based on our current credit rating, the revolving credit facility carries an interest rate of LIBOR plus3.25%. The decision to downsize our total borrowing capacity under the new revolving credit facility was aresult of the Macaroni Grill divestiture, reduced new company-owned restaurant development and ourfocus on debt repayment.
In fiscal 2009, Standard and Poor’s (‘‘S&P’’) reaffirmed our debt rating of BBB- (investment grade)with a stable outlook. However, Moody’s downgraded our corporate family rating to Ba1 (non-investmentgrade) and our senior unsecured note rating to Ba2 (non-investment grade) with a stable outlook. Underthe terms and conditions of our uncommitted credit facility agreements, we had to maintain an investmentgrade rating with both S&P and Moody’s in order to utilize the credit facilities. As a result of our splitrating, our uncommitted credit facilities totaling $250 million are no longer available and the spread overLIBOR has increased since prior year-end on our term loan to LIBOR plus 0.95% at June 24, 2009.Outstanding balances on the uncommitted credit facilities were repaid in the second quarter of fiscal 2009with funds drawn on the revolving credit facility. The balance on the revolving credit facility was paid downto zero by the end of fiscal 2009. As of June 24, 2009, we have $250 million available to us under ourrevolving credit facility and we are in compliance with all financial debt covenants.
Our balance sheet is a primary focus as we have committed to reducing our leverage allowing us toretain the investment grade rating from S&P and ultimately regain our investment grade rating fromMoody’s. Cash payments on credit facilities and long-term debt in fiscal 2009 totaled $177.7 million. Wecurrently plan to continue utilizing available free cash flow to pay down debt in fiscal 2010. We have alsoreduced capital expenditures for fiscal 2009, curtailed virtually all company-owned new restaurantdevelopment in fiscal 2010, placed a moratorium on all share repurchase activity, and kept dividends stableto ensure we maintain adequate cash flow to meet our current obligations and continue to pay down debt.
We believe that our various sources of capital, including cash flow from operating activities andavailability under our existing credit facility are adequate to finance operations as well as the repayment ofcurrent debt obligations. We are not aware of any other event or trend that would potentially affect ourliquidity. In the event such a trend develops, we believe that there are sufficient funds available under ourcredit facility and from our internal cash generating capabilities to adequately manage our ongoingbusiness.
F-8

Payments due under our contractual obligations for outstanding indebtedness, purchase obligations asdefined by the Securities and Exchange Commission (‘‘SEC’’), and the expiration of credit facilities as ofJune 24, 2009 are as follows:
Payments Due by Period(in thousands)
Less than 1-3 3-5 More thanTotal 1 Year Years Years 5 Years
Long-term debt(a) . . . . . . $762,628 $ 16,675 $423,350 $322,603 $ —Capital leases . . . . . . . . . . 78,887 5,039 10,363 10,758 52,727Operating leases . . . . . . . . 723,659 108,646 199,233 163,565 252,215Purchase obligations(b) . . . 161,767 36,365 34,769 25,408 65,225
Amount of Credit Facility Expiration by Period(in thousands)
Total Less than 1-3 3-5 More thanCommitment 1 year Years Years 5 Years
Credit facility . . . . . . . . . . $250,000 $ — $250,000 $ — $ —
(a) Long-term debt consists of amounts owed on the three-year term loan, 5.75% notes, andaccrued interest on fixed-rate obligations totaling $83.4 million. No amount was outstandingunder the credit facility as of June 24, 2009.
(b) A ‘‘purchase obligation’’ is defined as an agreement to purchase goods or services that isenforceable and legally binding on us and that specifies all significant terms, including: fixedor minimum quantities to be purchased; fixed, minimum or variable price provisions; and theapproximate timing of the transaction. Our purchase obligations primarily consist oflong-term obligations for the purchase of fountain beverages, energy, andtelecommunication services and exclude agreements that are cancelable without significantpenalty.
In addition to the amounts shown in the table above, $27.7 million of unrecognized tax benefits havebeen recorded as liabilities in accordance with Financial Accounting Standards Board (‘‘FASB’’)Interpretation No. 48, ‘‘Accounting for Uncertainty in Income Taxes’’ (‘‘FIN 48’’). The timing and amountsof future cash payments related to the FIN 48 liabilities are uncertain.
IMPACT OF INFLATION
We have experienced impact from inflation. Inflation has caused increased food, labor and benefitscosts and has increased our operating expenses. To the extent permitted by competition, increased costsare recovered through a combination of menu price increases and reviewing, then implementing,alternative products or processes, or by implementing other cost reduction procedures.
CRITICAL ACCOUNTING ESTIMATES
Our significant accounting policies are disclosed in Note 1 to our consolidated financial statements.The following discussion addresses our most critical accounting estimates, which are those that are mostimportant to the portrayal of our financial condition and results, and that require significant judgment.
Stock Based Compensation
Statement of Financial Accounting Standards (‘‘SFAS’’) No. 123 (Revised 2004), ‘‘Share-BasedPayment,’’ (‘‘SFAS 123R’’), requires the measurement and recognition of compensation cost at fair valuefor all share-based payments, including stock options. We determine the fair value of our stock option
F-9

awards using the Black-Scholes option valuation model. The Black-Scholes model requires judgmentalassumptions including expected life and stock price volatility. We base our expected life assumptions onhistorical experience regarding option life. Stock price volatility is calculated based on historical prices andthe expected life of the options. We determine the fair value of our performance shares using a MonteCarlo simulation model. The Monte Carlo method is a statistical modeling technique that requires highlyjudgmental assumptions regarding our future operating performance compared to our plan designatedpeer group in the future. The simulation is based on a probability model and market-based inputs that areused to predict future stock returns. We use the historical operating performance and correlation of stockperformance to the S&P 500 composite index of us and our peer group as inputs to the simulation model.These historical returns could differ significantly in the future and as a result, the fair value assigned to theperformance shares could vary significantly to the final payout. We believe the Monte Carlo simulationmodel provides the best evidence of fair value at the grant date and is an appropriate technique for valuingshare-based awards under SFAS 123R. SFAS 123R also requires that we recognize compensation expensefor only the portion of share-based awards that are expected to vest. Therefore, we apply estimatedforfeiture rates that are derived from our historical forfeitures of similar awards.
Income Taxes
In determining net income for financial statement purposes, we make certain estimates and judgmentsin the calculation of tax expense and the resulting tax liabilities and in the recoverability of deferred taxassets that arise from temporary differences between the tax and financial statement recognition ofrevenue and expense. When considered necessary, we record a valuation allowance to reduce deferred taxassets to a balance that is more likely than not to be recognized. We use an estimate of our annual effectivetax rate at each interim period based on the facts and circumstances available at that time while the actualeffective tax rate is calculated at year-end.
In the ordinary course of business, there may be many transactions and calculations where theultimate tax outcome is uncertain. At the beginning of fiscal 2008, we adopted the provisions of FIN 48.The adoption of this standard was consistent with FASB Staff Position (‘‘FSP’’) FIN 48-1, ‘‘Definition ofSettlement in FASB Interpretation No. 48’’, that was issued in May 2007 and that provides guidance onhow to determine whether a tax position is effectively settled for the purpose of recognizing unrecognizedtax benefits.
In addition to the risks related to the effective tax rate described above, the effective tax rate reflectedin forward-looking statements is based on current tax law. Any significant changes in the tax laws couldaffect these estimates.
Property and Equipment
Property and equipment are depreciated on a straight-line basis over the estimated useful lives of theassets. The useful lives of the assets are based upon our expectations for the period of time that the assetwill be used to generate revenues. We periodically review the assets for changes in circumstances, whichmay impact their useful lives.
Impairment of Long-Lived Assets and Goodwill
We review property and equipment for impairment when events or circumstances indicate that thecarrying amount of a restaurant’s assets may not be recoverable. We test for impairment using historicalcash flows and other relevant facts and circumstances as the primary basis for our estimates of future cashflows. This process requires the use of estimates and assumptions, which are subject to a high degree ofjudgment. In addition, at least annually we assess the recoverability of goodwill related to our restaurantbrands. This impairment test requires us to estimate fair values of our restaurant brands by makingassumptions regarding future profits and cash flows, expected growth rates, terminal values, and other
F-10

factors. In the event that these assumptions change in the future, we may be required to record impairmentcharges related to goodwill.
Self-Insurance
We are self-insured for certain losses related to health, general liability and workers’ compensation.We maintain stop loss coverage with third party insurers to limit our total exposure. The self-insuranceliability represents an estimate of the ultimate cost of claims incurred and unpaid as of the balance sheetdate. The estimated liability is not discounted and is established based upon analysis of historical data andactuarial estimates, and is reviewed on a quarterly basis to ensure that the liability is appropriate. If actualtrends, including the severity or frequency of claims, differ from our estimates, our financial results couldbe impacted.
Recent Accounting Pronouncements
In December 2006, the FASB issued SFAS No. 157, ‘‘Fair Value Measurements,’’ (‘‘SFAS 157’’).SFAS 157 clarifies the definition of fair value, describes methods used to appropriately measure fair value,and expands fair value disclosure requirements, but does not change existing guidance as to whether or notan instrument is carried at fair value. For financial assets and liabilities, SFAS 157 is effective for fiscalyears beginning after November 15, 2007, which required that we adopt these provisions in first quarterfiscal 2009. For nonfinancial assets and liabilities, SFAS 157 is effective for fiscal years beginning afterNovember 15, 2008, which will require us to adopt these provisions in fiscal 2010. We do not expect theadoption of SFAS 157 to have a material impact on our consolidated financial statements.
In December 2007, the FASB issued SFAS No. 141R, ‘‘Business Combinations,’’ (‘‘SFAS 141R’’).Under SFAS 141R, all business combinations will be accounted for by applying the acquisition method.SFAS 141R requires most identifiable assets, liabilities, noncontrolling interests, and goodwill acquired in abusiness combination to be recorded at full fair value. SFAS 141R is effective for annual reporting periodsbeginning on or after December 15, 2008 and will be effective for us beginning in the first quarter of fiscal2010 for business combinations occurring on or after the effective date.
In December 2007, the FASB issued SFAS No. 160, ‘‘Noncontrolling Interests in ConsolidatedFinancial Statements—an amendment of ARB No. 51,’’ (‘‘SFAS 160’’). SFAS 160 will requirenoncontrolling interests (previously referred to as minority interests) to be treated as a separatecomponent of equity, not as a liability or other item outside of permanent equity. The Statement applies tothe accounting for noncontrolling interests and transactions with noncontrolling interest holders inconsolidated financial statements. SFAS 160 is effective for periods beginning on or after December 15,2008, which required that we adopt these provisions beginning in the third quarter of fiscal 2009. Theadoption of SFAS 160 did not have a material impact on our financial statements.
In June 2008, the FASB issued FSP EITF 03-6-1, ‘‘Determining Whether Instruments Granted inShare-Based Payment Transactions Are Participating Securities.’’ FSP EITF 03-6-1 provides that unvestedshare-based payment awards that contain nonforfeitable rights to dividends that are paid or unpaid areparticipating securities and shall be included in the computation of earnings per share based on thetwo-class method. The two-class method is an earnings allocation method for computing earnings pershare when an entity’s capital structure includes either two or more classes of common stock or commonstock and participating securities. FSP EITF 03-6-1 is effective for fiscal years beginning afterDecember 15, 2008, which will require us to adopt these provisions in fiscal 2010. We do not expect theadoption of FSP EITF 03-6-1 to have a material impact on our financial statements.
In May 2009, the FASB issued SFAS No. 165, ‘‘Subsequent Events’’ (‘‘SFAS 165’’) which establishesthe requirements for evaluating, recording and disclosing events or transactions occurring after the balancesheet date in an entity’s financial statements. SFAS 165 is effective for interim and annual periods ending
F-11
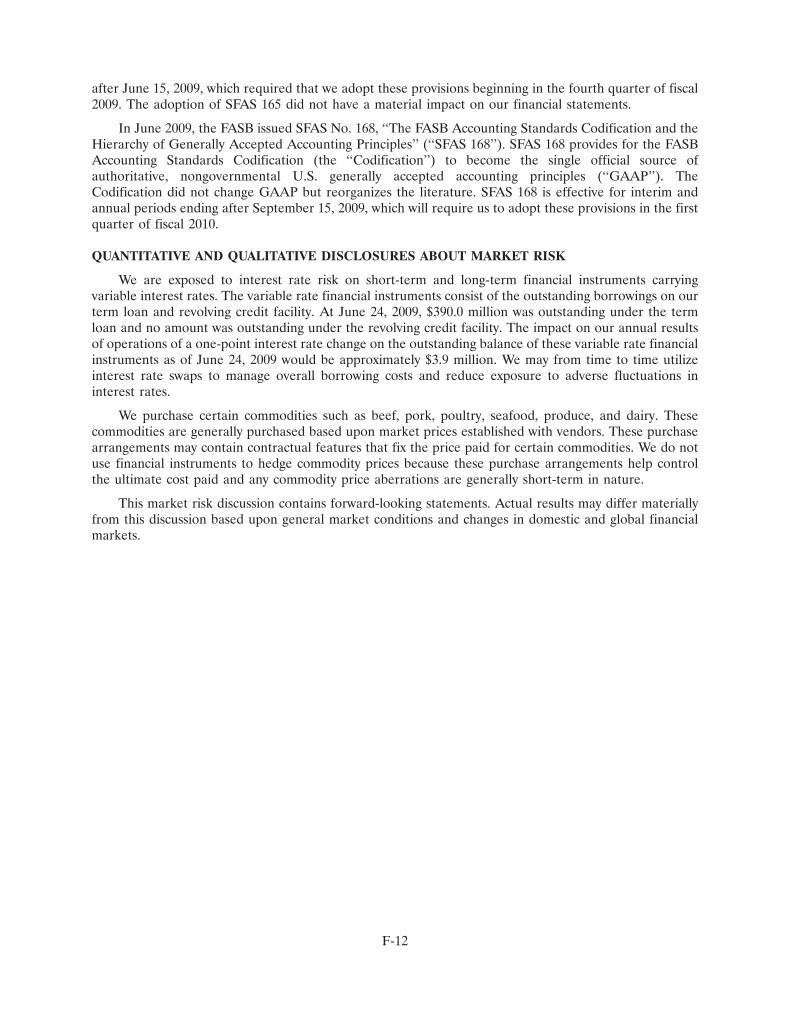
after June 15, 2009, which required that we adopt these provisions beginning in the fourth quarter of fiscal2009. The adoption of SFAS 165 did not have a material impact on our financial statements.
In June 2009, the FASB issued SFAS No. 168, ‘‘The FASB Accounting Standards Codification and theHierarchy of Generally Accepted Accounting Principles’’ (‘‘SFAS 168’’). SFAS 168 provides for the FASBAccounting Standards Codification (the ‘‘Codification’’) to become the single official source ofauthoritative, nongovernmental U.S. generally accepted accounting principles (‘‘GAAP’’). TheCodification did not change GAAP but reorganizes the literature. SFAS 168 is effective for interim andannual periods ending after September 15, 2009, which will require us to adopt these provisions in the firstquarter of fiscal 2010.
QUANTITATIVE AND QUALITATIVE DISCLOSURES ABOUT MARKET RISK
We are exposed to interest rate risk on short-term and long-term financial instruments carryingvariable interest rates. The variable rate financial instruments consist of the outstanding borrowings on ourterm loan and revolving credit facility. At June 24, 2009, $390.0 million was outstanding under the termloan and no amount was outstanding under the revolving credit facility. The impact on our annual resultsof operations of a one-point interest rate change on the outstanding balance of these variable rate financialinstruments as of June 24, 2009 would be approximately $3.9 million. We may from time to time utilizeinterest rate swaps to manage overall borrowing costs and reduce exposure to adverse fluctuations ininterest rates.
We purchase certain commodities such as beef, pork, poultry, seafood, produce, and dairy. Thesecommodities are generally purchased based upon market prices established with vendors. These purchasearrangements may contain contractual features that fix the price paid for certain commodities. We do notuse financial instruments to hedge commodity prices because these purchase arrangements help controlthe ultimate cost paid and any commodity price aberrations are generally short-term in nature.
This market risk discussion contains forward-looking statements. Actual results may differ materiallyfrom this discussion based upon general market conditions and changes in domestic and global financialmarkets.
F-12
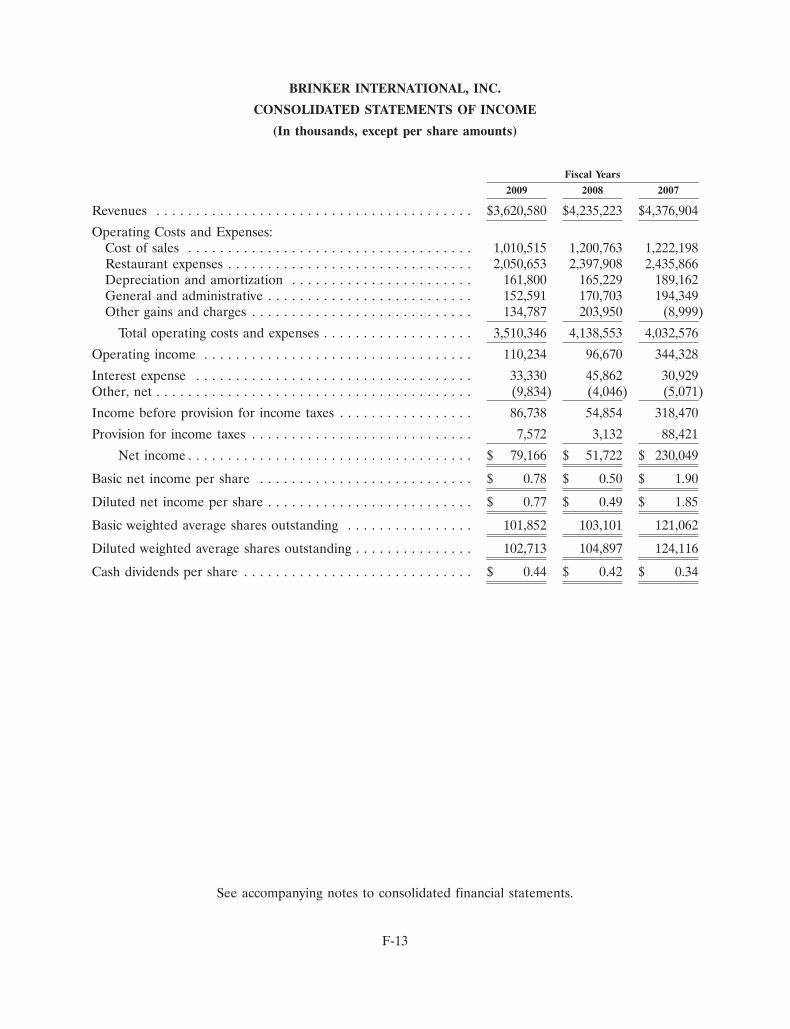
BRINKER INTERNATIONAL, INC.
CONSOLIDATED STATEMENTS OF INCOME
(In thousands, except per share amounts)
Fiscal Years
2009 2008 2007
Revenues . . . . . . . . . . . . . . . . . . . . . . . . . . . . . . . . . . . . . . . . $3,620,580 $4,235,223 $4,376,904
Operating Costs and Expenses:Cost of sales . . . . . . . . . . . . . . . . . . . . . . . . . . . . . . . . . . . . 1,010,515 1,200,763 1,222,198Restaurant expenses . . . . . . . . . . . . . . . . . . . . . . . . . . . . . . . 2,050,653 2,397,908 2,435,866Depreciation and amortization . . . . . . . . . . . . . . . . . . . . . . . 161,800 165,229 189,162General and administrative . . . . . . . . . . . . . . . . . . . . . . . . . . 152,591 170,703 194,349Other gains and charges . . . . . . . . . . . . . . . . . . . . . . . . . . . . 134,787 203,950 (8,999)
Total operating costs and expenses . . . . . . . . . . . . . . . . . . . 3,510,346 4,138,553 4,032,576
Operating income . . . . . . . . . . . . . . . . . . . . . . . . . . . . . . . . . . 110,234 96,670 344,328
Interest expense . . . . . . . . . . . . . . . . . . . . . . . . . . . . . . . . . . . 33,330 45,862 30,929Other, net . . . . . . . . . . . . . . . . . . . . . . . . . . . . . . . . . . . . . . . . (9,834) (4,046) (5,071)
Income before provision for income taxes . . . . . . . . . . . . . . . . . 86,738 54,854 318,470
Provision for income taxes . . . . . . . . . . . . . . . . . . . . . . . . . . . . 7,572 3,132 88,421
Net income . . . . . . . . . . . . . . . . . . . . . . . . . . . . . . . . . . . . $ 79,166 $ 51,722 $ 230,049
Basic net income per share . . . . . . . . . . . . . . . . . . . . . . . . . . . $ 0.78 $ 0.50 $ 1.90
Diluted net income per share . . . . . . . . . . . . . . . . . . . . . . . . . . $ 0.77 $ 0.49 $ 1.85
Basic weighted average shares outstanding . . . . . . . . . . . . . . . . 101,852 103,101 121,062
Diluted weighted average shares outstanding . . . . . . . . . . . . . . . 102,713 104,897 124,116
Cash dividends per share . . . . . . . . . . . . . . . . . . . . . . . . . . . . . $ 0.44 $ 0.42 $ 0.34
See accompanying notes to consolidated financial statements.
F-13
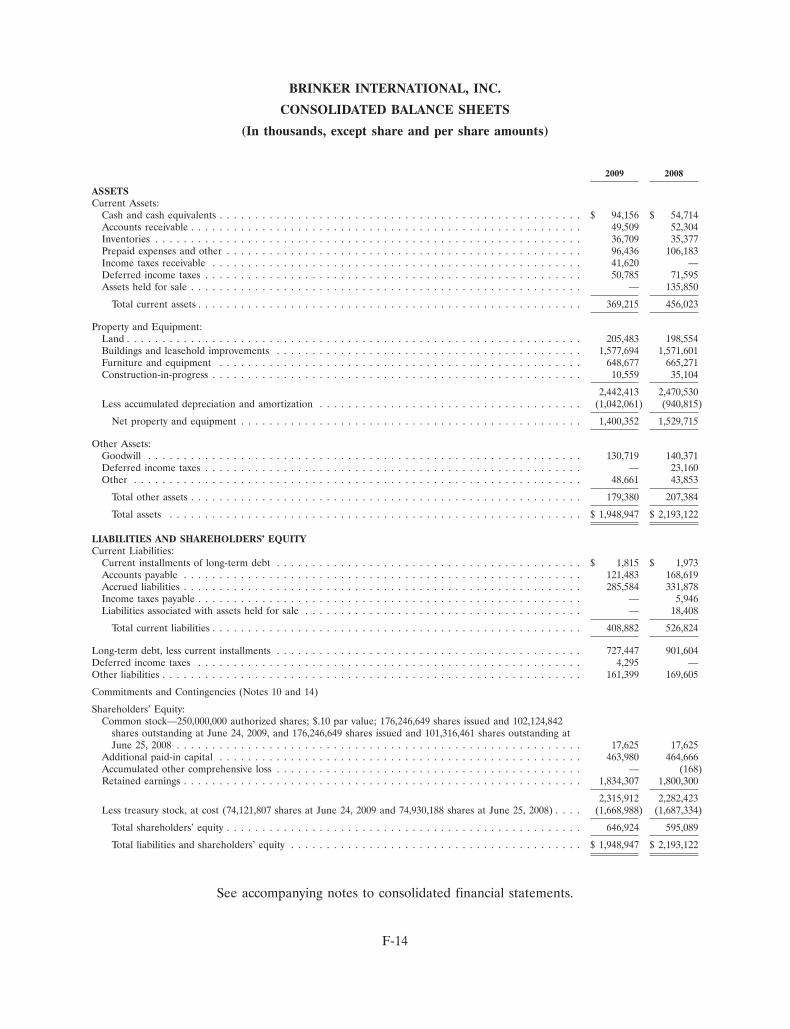
BRINKER INTERNATIONAL, INC.
CONSOLIDATED BALANCE SHEETS
(In thousands, except share and per share amounts)
2009 2008
ASSETSCurrent Assets:
Cash and cash equivalents . . . . . . . . . . . . . . . . . . . . . . . . . . . . . . . . . . . . . . . . . . . . . . . . . . . $ 94,156 $ 54,714Accounts receivable . . . . . . . . . . . . . . . . . . . . . . . . . . . . . . . . . . . . . . . . . . . . . . . . . . . . . . . 49,509 52,304Inventories . . . . . . . . . . . . . . . . . . . . . . . . . . . . . . . . . . . . . . . . . . . . . . . . . . . . . . . . . . . . 36,709 35,377Prepaid expenses and other . . . . . . . . . . . . . . . . . . . . . . . . . . . . . . . . . . . . . . . . . . . . . . . . . . 96,436 106,183Income taxes receivable . . . . . . . . . . . . . . . . . . . . . . . . . . . . . . . . . . . . . . . . . . . . . . . . . . . . 41,620 —Deferred income taxes . . . . . . . . . . . . . . . . . . . . . . . . . . . . . . . . . . . . . . . . . . . . . . . . . . . . . 50,785 71,595Assets held for sale . . . . . . . . . . . . . . . . . . . . . . . . . . . . . . . . . . . . . . . . . . . . . . . . . . . . . . . — 135,850
Total current assets . . . . . . . . . . . . . . . . . . . . . . . . . . . . . . . . . . . . . . . . . . . . . . . . . . . . . . 369,215 456,023
Property and Equipment:Land . . . . . . . . . . . . . . . . . . . . . . . . . . . . . . . . . . . . . . . . . . . . . . . . . . . . . . . . . . . . . . . . 205,483 198,554Buildings and leasehold improvements . . . . . . . . . . . . . . . . . . . . . . . . . . . . . . . . . . . . . . . . . . . 1,577,694 1,571,601Furniture and equipment . . . . . . . . . . . . . . . . . . . . . . . . . . . . . . . . . . . . . . . . . . . . . . . . . . . 648,677 665,271Construction-in-progress . . . . . . . . . . . . . . . . . . . . . . . . . . . . . . . . . . . . . . . . . . . . . . . . . . . . 10,559 35,104
2,442,413 2,470,530Less accumulated depreciation and amortization . . . . . . . . . . . . . . . . . . . . . . . . . . . . . . . . . . . . . (1,042,061) (940,815)
Net property and equipment . . . . . . . . . . . . . . . . . . . . . . . . . . . . . . . . . . . . . . . . . . . . . . . . 1,400,352 1,529,715
Other Assets:Goodwill . . . . . . . . . . . . . . . . . . . . . . . . . . . . . . . . . . . . . . . . . . . . . . . . . . . . . . . . . . . . . 130,719 140,371Deferred income taxes . . . . . . . . . . . . . . . . . . . . . . . . . . . . . . . . . . . . . . . . . . . . . . . . . . . . . — 23,160Other . . . . . . . . . . . . . . . . . . . . . . . . . . . . . . . . . . . . . . . . . . . . . . . . . . . . . . . . . . . . . . . 48,661 43,853
Total other assets . . . . . . . . . . . . . . . . . . . . . . . . . . . . . . . . . . . . . . . . . . . . . . . . . . . . . . . 179,380 207,384
Total assets . . . . . . . . . . . . . . . . . . . . . . . . . . . . . . . . . . . . . . . . . . . . . . . . . . . . . . . . . . $ 1,948,947 $ 2,193,122
LIABILITIES AND SHAREHOLDERS’ EQUITYCurrent Liabilities:
Current installments of long-term debt . . . . . . . . . . . . . . . . . . . . . . . . . . . . . . . . . . . . . . . . . . . $ 1,815 $ 1,973Accounts payable . . . . . . . . . . . . . . . . . . . . . . . . . . . . . . . . . . . . . . . . . . . . . . . . . . . . . . . . 121,483 168,619Accrued liabilities . . . . . . . . . . . . . . . . . . . . . . . . . . . . . . . . . . . . . . . . . . . . . . . . . . . . . . . . 285,584 331,878Income taxes payable . . . . . . . . . . . . . . . . . . . . . . . . . . . . . . . . . . . . . . . . . . . . . . . . . . . . . . — 5,946Liabilities associated with assets held for sale . . . . . . . . . . . . . . . . . . . . . . . . . . . . . . . . . . . . . . . — 18,408
Total current liabilities . . . . . . . . . . . . . . . . . . . . . . . . . . . . . . . . . . . . . . . . . . . . . . . . . . . . 408,882 526,824
Long-term debt, less current installments . . . . . . . . . . . . . . . . . . . . . . . . . . . . . . . . . . . . . . . . . . . 727,447 901,604Deferred income taxes . . . . . . . . . . . . . . . . . . . . . . . . . . . . . . . . . . . . . . . . . . . . . . . . . . . . . . 4,295 —Other liabilities . . . . . . . . . . . . . . . . . . . . . . . . . . . . . . . . . . . . . . . . . . . . . . . . . . . . . . . . . . . 161,399 169,605
Commitments and Contingencies (Notes 10 and 14)
Shareholders’ Equity:Common stock—250,000,000 authorized shares; $.10 par value; 176,246,649 shares issued and 102,124,842
shares outstanding at June 24, 2009, and 176,246,649 shares issued and 101,316,461 shares outstanding atJune 25, 2008 . . . . . . . . . . . . . . . . . . . . . . . . . . . . . . . . . . . . . . . . . . . . . . . . . . . . . . . . . 17,625 17,625
Additional paid-in capital . . . . . . . . . . . . . . . . . . . . . . . . . . . . . . . . . . . . . . . . . . . . . . . . . . . 463,980 464,666Accumulated other comprehensive loss . . . . . . . . . . . . . . . . . . . . . . . . . . . . . . . . . . . . . . . . . . . — (168)Retained earnings . . . . . . . . . . . . . . . . . . . . . . . . . . . . . . . . . . . . . . . . . . . . . . . . . . . . . . . . 1,834,307 1,800,300
2,315,912 2,282,423Less treasury stock, at cost (74,121,807 shares at June 24, 2009 and 74,930,188 shares at June 25, 2008) . . . . (1,668,988) (1,687,334)
Total shareholders’ equity . . . . . . . . . . . . . . . . . . . . . . . . . . . . . . . . . . . . . . . . . . . . . . . . . . 646,924 595,089
Total liabilities and shareholders’ equity . . . . . . . . . . . . . . . . . . . . . . . . . . . . . . . . . . . . . . . . . $ 1,948,947 $ 2,193,122
See accompanying notes to consolidated financial statements.
F-14

BRINKER INTERNATIONAL, INC.
CONSOLIDATED STATEMENTS OF SHAREHOLDERS’ EQUITY
(In thousands)
AccumulatedAdditional OtherCommon Stock Paid-In Retained Treasury Comprehensive
Shares Amount Capital Earnings Stock Income (Loss) Total
Balances at June 28, 2006 . . . . . . . . . . . . . . . 125,307 $17,625 $406,626 $1,602,786 $ (951,978) $ 773 $1,075,832
Net income . . . . . . . . . . . . . . . . . . . . . . . . — — — 230,049 — — 230,049Currency translation adjustment . . . . . . . . . . . — — — — — (37) (37)Change in fair value of investments, net of tax . . — — — — — 181 181Realized gain on sale of investments, net of tax . — — — — — (954) (954)
Comprehensive income . . . . . . . . . . . . . . . 229,239
Cash dividends ($0.34 per share) . . . . . . . . . . . — — — (41,524) — — (41,524)Stock-based compensation . . . . . . . . . . . . . . . — — 31,510 — — — 31,510Purchases of treasury stock . . . . . . . . . . . . . . (18,617) — — — (569,347) — (569,347)Issuances of common stock . . . . . . . . . . . . . . 3,409 — (15) — 66,302 — 66,287Tax benefit from stock options exercised . . . . . . — — 13,092 — — — 13,092Issuance of restricted stock, net of forfeitures . . 28 — (548) — 548 — —
Balances at June 27, 2007 . . . . . . . . . . . . . . . 110,127 17,625 450,665 1,791,311 (1,454,475) (37) 805,089
Net income . . . . . . . . . . . . . . . . . . . . . . . . — — — 51,722 — — 51,722Currency translation adjustment . . . . . . . . . . . — — — — — (131) (131)
Comprehensive income . . . . . . . . . . . . . . . 51,591
Adjustment to initially apply FIN 48 . . . . . . . . — — — 847 — — 847Cash dividends ($0.42 per share) . . . . . . . . . . . — — — (43,580) — — (43,580)Stock-based compensation . . . . . . . . . . . . . . . — — 16,100 — — — 16,100Purchases of treasury stock . . . . . . . . . . . . . . (9,130) — (465) — (240,319) — (240,784)Issuances of common stock . . . . . . . . . . . . . . 345 — (2,472) — 7,749 — 5,277Tax benefit from stock options exercised . . . . . . — — 549 — — — 549Forfeitures of restricted stock, net of issuances . . (26) — 289 — (289) — —
Balances at June 25, 2008 . . . . . . . . . . . . . . . 101,316 17,625 464,666 1,800,300 (1,687,334) (168) 595,089
Net income . . . . . . . . . . . . . . . . . . . . . . . . — — — 79,166 — — 79,166Currency translation adjustment . . . . . . . . . . . — — — — — (2,068) (2,068)Realized loss on currency translation . . . . . . . . — — — — — 2,236 2,236
Comprehensive income . . . . . . . . . . . . . . . 79,334
Cash dividends ($0.44 per share) . . . . . . . . . . . — — — (45,159) — — (45,159)Stock-based compensation . . . . . . . . . . . . . . . — — 17,518 — — — 17,518Purchases of treasury stock . . . . . . . . . . . . . . (30) — (3,116) — (623) — (3,739)Issuances of common stock . . . . . . . . . . . . . . 816 — (13,721) — 18,371 — 4,650Tax benefit from stock options exercised . . . . . . — — (769) — — — (769)Issuances of restricted stock, net of forfeitures . . 23 — (598) — 598 — —
Balances at June 24, 2009 . . . . . . . . . . . . . . . 102,125 $17,625 $463,980 $1,834,307 $(1,668,988) $ — $ 646,924
See accompanying notes to consolidated financial statements.
F-15

BRINKER INTERNATIONAL, INC.
CONSOLIDATED STATEMENTS OF CASH FLOWS
(In thousands)
Fiscal Years
2009 2008 2007
Cash Flows from Operating Activities:Net income . . . . . . . . . . . . . . . . . . . . . . . . . . . . . . . . . . . . . . . . . . . . . . $ 79,166 $ 51,722 $ 230,049Adjustments to reconcile net income to net cash provided by operating
activities:Depreciation and amortization . . . . . . . . . . . . . . . . . . . . . . . . . . . . . . . 161,800 165,229 189,162Restructure charges and other impairments . . . . . . . . . . . . . . . . . . . . . . 91,791 225,945 13,812Deferred income taxes . . . . . . . . . . . . . . . . . . . . . . . . . . . . . . . . . . . . 47,654 (68,064) (18,823)Loss (Gain) on sale of assets . . . . . . . . . . . . . . . . . . . . . . . . . . . . . . . . 37,178 (29,682) (21,207)Stock-based compensation . . . . . . . . . . . . . . . . . . . . . . . . . . . . . . . . . . 18,054 16,577 29,870Other . . . . . . . . . . . . . . . . . . . . . . . . . . . . . . . . . . . . . . . . . . . . . . . . (823) 283 (130)
Changes in assets and liabilities, excluding effects of acquisitions anddispositions:Accounts receivable . . . . . . . . . . . . . . . . . . . . . . . . . . . . . . . . . . . . . 322 (972) 3,394Inventories . . . . . . . . . . . . . . . . . . . . . . . . . . . . . . . . . . . . . . . . . . . (2,578) (6,640) 3,229Prepaid expenses and other . . . . . . . . . . . . . . . . . . . . . . . . . . . . . . . 2,956 1,454 25,541Other assets . . . . . . . . . . . . . . . . . . . . . . . . . . . . . . . . . . . . . . . . . . 1,545 459 (5,168)Income taxes payable . . . . . . . . . . . . . . . . . . . . . . . . . . . . . . . . . . . . (48,886) 2,581 (1,945)Accounts payable . . . . . . . . . . . . . . . . . . . . . . . . . . . . . . . . . . . . . . (43,512) 13,320 (1,978)Accrued liabilities . . . . . . . . . . . . . . . . . . . . . . . . . . . . . . . . . . . . . . (68,237) (20,458) 19,966Other liabilities . . . . . . . . . . . . . . . . . . . . . . . . . . . . . . . . . . . . . . . . (1,895) 9,786 19,225
Net cash provided by operating activities . . . . . . . . . . . . . . . . . . . . . . 274,535 361,540 484,997
Cash Flows from Investing Activities:Payments for property and equipment . . . . . . . . . . . . . . . . . . . . . . . . . . . (93,613) (270,413) (430,532)Proceeds from sale of assets . . . . . . . . . . . . . . . . . . . . . . . . . . . . . . . . . . 82,829 127,780 180,966Decrease (Increase) in restricted cash . . . . . . . . . . . . . . . . . . . . . . . . . . . . 4,688 (34,435) —Payments for purchases of restaurants . . . . . . . . . . . . . . . . . . . . . . . . . . . . — (2,418) —Investment in equity method investee . . . . . . . . . . . . . . . . . . . . . . . . . . . . (4,612) (8,711) —Proceeds from sale of investments . . . . . . . . . . . . . . . . . . . . . . . . . . . . . . — — 5,994
Net cash used in investing activities . . . . . . . . . . . . . . . . . . . . . . . . . . (10,708) (188,197) (243,572)
Cash Flows from Financing Activities:Net (payments) borrowings on credit facilities . . . . . . . . . . . . . . . . . . . . . . (160,757) (323,586) 338,188Net proceeds from issuance of long-term debt . . . . . . . . . . . . . . . . . . . . . . — 399,287 —Payments on long-term debt . . . . . . . . . . . . . . . . . . . . . . . . . . . . . . . . . . (19,735) (1,062) (12,979)Purchases of treasury stock . . . . . . . . . . . . . . . . . . . . . . . . . . . . . . . . . . . (3,739) (240,784) (569,347)Proceeds from issuances of treasury stock . . . . . . . . . . . . . . . . . . . . . . . . . 4,650 5,277 66,287Payments of dividends . . . . . . . . . . . . . . . . . . . . . . . . . . . . . . . . . . . . . . (45,355) (42,914) (40,906)Excess tax benefits from stock-based compensation . . . . . . . . . . . . . . . . . . . 551 330 7,139
Net cash used in financing activities . . . . . . . . . . . . . . . . . . . . . . . . . . (224,385) (203,452) (211,618)
Net change in cash and cash equivalents . . . . . . . . . . . . . . . . . . . . . . . . . . 39,442 (30,109) 29,807Cash and cash equivalents at beginning of year . . . . . . . . . . . . . . . . . . . . . 54,714 84,823 55,016
Cash and cash equivalents at end of year . . . . . . . . . . . . . . . . . . . . . . . . . $ 94,156 $ 54,714 $ 84,823
See accompanying notes to consolidated financial statements.
F-16

BRINKER INTERNATIONAL, INC.
NOTES TO CONSOLIDATED FINANCIAL STATEMENTS
1. SUMMARY OF SIGNIFICANT ACCOUNTING POLICIES
(a) Nature of Operations
We are principally engaged in the ownership, operation, development, and franchising of the Chili’sGrill & Bar (‘‘Chili’s’’), On The Border Mexican Grill & Cantina (‘‘On The Border’’) and Maggiano’sLittle Italy (‘‘Maggiano’s’’) restaurant brands. At June 24, 2009, we owned, operated, or franchised 1,689restaurants in the United States and 27 countries and two territories outside of the United States. We soldRomano’s Macaroni Grill (‘‘Macaroni Grill’’) to Mac Acquisition LLC (‘‘Mac Acquisition’’), an affiliate ofSan Francisco-based Golden Gate Capital, in December 2008 and purchased an 18.2% ownership interestin the new entity.
(b) Basis of Presentation
Our consolidated financial statements include the accounts of Brinker International, Inc. and ourwholly-owned subsidiaries. All intercompany accounts and transactions have been eliminated inconsolidation.
We have a 52/53 week fiscal year ending on the last Wednesday in June. Fiscal years 2009, 2008, and2007, which ended on June 24, 2009, June 25, 2008, and June 27, 2007, respectively, each contained52 weeks.
Certain prior year amounts in the accompanying consolidated financial statements have beenreclassified to conform with fiscal 2009 presentation. These reclassifications have no effect on our netincome or financial position as previously reported.
(c) Use of Estimates
The preparation of the consolidated financial statements in conformity with generally acceptedaccounting principles in the United States of America requires management to make estimates andassumptions that affect the reported amounts of assets and liabilities and the disclosure of contingentassets and liabilities at the date of the consolidated financial statements and the reported amounts ofrevenues and costs and expenses during the reporting period. Actual results could differ from thoseestimates.
(d) Revenue Recognition
We record revenue from the sale of food, beverages and alcohol as products are sold. Initial feesreceived from a franchisee to establish a new franchise are recognized as income when we have performedour obligations required to assist the franchisee in opening a new franchise restaurant, which is generallyupon the opening of such restaurant. Continuing royalties, which are a percentage of net sales offranchised restaurants, are accrued as income when earned. Proceeds from the sale of gift cards arerecorded as deferred revenue and recognized as income when the gift card is redeemed by the holder orthe likelihood of redemption, based upon our historical redemption patterns, becomes remote.
(e) Financial Instruments
Our policy is to invest cash in excess of operating requirements in income-producing investments andto pay down debt. Income-producing investments with original maturities of three months or less arereflected as cash equivalents.
F-17
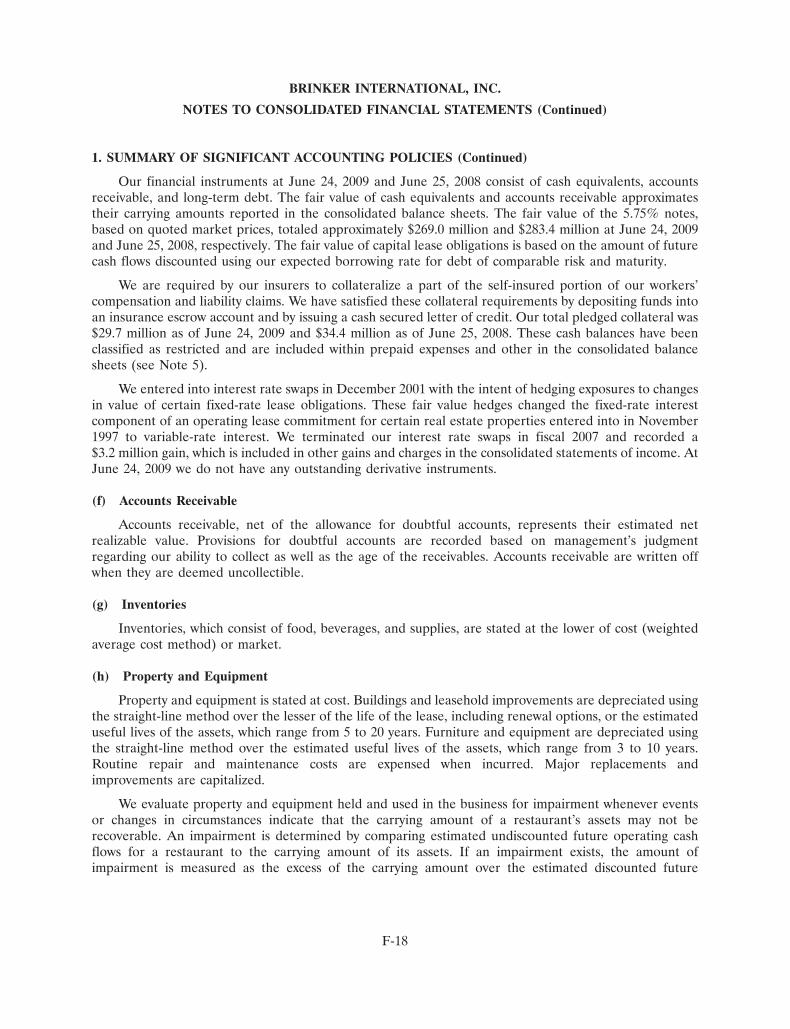
BRINKER INTERNATIONAL, INC.
NOTES TO CONSOLIDATED FINANCIAL STATEMENTS (Continued)
1. SUMMARY OF SIGNIFICANT ACCOUNTING POLICIES (Continued)
Our financial instruments at June 24, 2009 and June 25, 2008 consist of cash equivalents, accountsreceivable, and long-term debt. The fair value of cash equivalents and accounts receivable approximatestheir carrying amounts reported in the consolidated balance sheets. The fair value of the 5.75% notes,based on quoted market prices, totaled approximately $269.0 million and $283.4 million at June 24, 2009and June 25, 2008, respectively. The fair value of capital lease obligations is based on the amount of futurecash flows discounted using our expected borrowing rate for debt of comparable risk and maturity.
We are required by our insurers to collateralize a part of the self-insured portion of our workers’compensation and liability claims. We have satisfied these collateral requirements by depositing funds intoan insurance escrow account and by issuing a cash secured letter of credit. Our total pledged collateral was$29.7 million as of June 24, 2009 and $34.4 million as of June 25, 2008. These cash balances have beenclassified as restricted and are included within prepaid expenses and other in the consolidated balancesheets (see Note 5).
We entered into interest rate swaps in December 2001 with the intent of hedging exposures to changesin value of certain fixed-rate lease obligations. These fair value hedges changed the fixed-rate interestcomponent of an operating lease commitment for certain real estate properties entered into in November1997 to variable-rate interest. We terminated our interest rate swaps in fiscal 2007 and recorded a$3.2 million gain, which is included in other gains and charges in the consolidated statements of income. AtJune 24, 2009 we do not have any outstanding derivative instruments.
(f) Accounts Receivable
Accounts receivable, net of the allowance for doubtful accounts, represents their estimated netrealizable value. Provisions for doubtful accounts are recorded based on management’s judgmentregarding our ability to collect as well as the age of the receivables. Accounts receivable are written offwhen they are deemed uncollectible.
(g) Inventories
Inventories, which consist of food, beverages, and supplies, are stated at the lower of cost (weightedaverage cost method) or market.
(h) Property and Equipment
Property and equipment is stated at cost. Buildings and leasehold improvements are depreciated usingthe straight-line method over the lesser of the life of the lease, including renewal options, or the estimateduseful lives of the assets, which range from 5 to 20 years. Furniture and equipment are depreciated usingthe straight-line method over the estimated useful lives of the assets, which range from 3 to 10 years.Routine repair and maintenance costs are expensed when incurred. Major replacements andimprovements are capitalized.
We evaluate property and equipment held and used in the business for impairment whenever eventsor changes in circumstances indicate that the carrying amount of a restaurant’s assets may not berecoverable. An impairment is determined by comparing estimated undiscounted future operating cashflows for a restaurant to the carrying amount of its assets. If an impairment exists, the amount ofimpairment is measured as the excess of the carrying amount over the estimated discounted future
F-18

BRINKER INTERNATIONAL, INC.
NOTES TO CONSOLIDATED FINANCIAL STATEMENTS (Continued)
1. SUMMARY OF SIGNIFICANT ACCOUNTING POLICIES (Continued)
operating cash flows of the asset and the expected proceeds upon sale of the asset. Assets held for sale arereported at the lower of the carrying amount or fair value less costs to sell.
(i) Operating Leases
Rent expense for leases that contain scheduled rent increases is recognized on a straight-line basisover the lease term, including cancelable option periods where failure to exercise such options would resultin an economic penalty such that the renewal appears reasonably assured. The straight-line rent calculationand rent expense includes the rent holiday period, which is the period of time between taking control of aleased site and the rent commencement date.
Contingent rents are generally amounts due as a result of sales in excess of amounts stipulated incertain restaurant leases and are included in rent expense as they are incurred. Landlord contributions arerecorded when received as a deferred rent liability and amortized as a reduction of rent expense on astraight-line basis over the lesser of the lease term, including renewal options, or 20 years.
(j) Capitalized Interest
Interest costs capitalized during the construction period of restaurants were approximately$0.7 million, $3.7 million and $6.0 million during fiscal 2009, 2008, and 2007, respectively.
(k) Advertising
Advertising production costs are expensed in the period when the advertising first takes place. Otheradvertising costs are expensed as incurred. Advertising costs were $113.2 million, $133.6 million and$135.5 million in fiscal 2009, 2008, and 2007, respectively, and are included in restaurant expenses in theconsolidated statements of income.
(l) Goodwill
Goodwill represents the residual purchase price after allocation to all other identifiable net assetsacquired. Goodwill is not subject to amortization but is tested for impairment annually or more frequentlyif events or changes in circumstances indicate that the asset might be impaired. Statement of FinancialAccounting Standards (‘‘SFAS’’) No. 142, ‘‘Goodwill and Other Intangible Assets,’’ requires a two-stepprocess for testing impairment of goodwill. First, the fair value of each reporting unit is compared to itscarrying value to determine whether an indication of impairment exists. If an impairment is indicated, thenthe fair value of the reporting unit’s goodwill is determined by allocating the unit’s fair value to its assetsand liabilities (including any unrecognized intangible assets) as if the reporting unit had been acquired in abusiness combination. The amount of impairment for goodwill is measured as the excess of its carryingvalue over its implied fair value. See Note 6 for additional disclosures related to goodwill.
(m) Sales Taxes
Sales taxes collected from guests are excluded from revenues. The obligation is included in accruedliabilities until the taxes are remitted to the appropriate taxing authorities.
F-19

BRINKER INTERNATIONAL, INC.
NOTES TO CONSOLIDATED FINANCIAL STATEMENTS (Continued)
1. SUMMARY OF SIGNIFICANT ACCOUNTING POLICIES (Continued)
(n) Self-Insurance Program
We utilize a paid loss self-insurance plan for health, general liability and workers’ compensationcoverage. Predetermined loss limits have been arranged with insurance companies to limit our peroccurrence cash outlay. Accrued liabilities include the estimated incurred but unreported costs to settleunpaid claims and estimated future claims.
We utilize a wholly-owned captive insurance company for our general liability and workers’compensation coverage. We make premium payments to the captive insurance company and accrue forclaims costs based on the actuarially predicted ultimate losses, and the captive insurance company thenpays administrative fees and the insurance claims.
(o) Income Taxes
Income taxes are accounted for under the asset and liability method prescribed by SFAS No. 109,‘‘Accounting for Income Taxes.’’ Deferred tax assets and liabilities are recognized for the future taxconsequences attributable to differences between the financial statement carrying amounts of existingassets and liabilities and their respective tax bases. Deferred tax assets and liabilities are measured usingenacted tax rates expected to apply to taxable income in the years in which those temporary differences areexpected to be recovered or settled. The effect on deferred tax assets and liabilities of a change in tax ratesis recognized in income in the period that includes the enactment date.
(p) Stock-Based Compensation
Stock-based compensation is accounted for under SFAS No. 123 (Revised 2004), ‘‘Share-BasedPayment,’’ (‘‘SFAS 123R’’), which requires the measurement and recognition of compensation cost at fairvalue for all share-based payments, including stock options. Stock-based compensation expense for fiscal2009, 2008 and 2007 includes compensation expense, recognized over the applicable vesting periods, fornew share-based awards and for share-based awards granted prior to, but not yet vested, as of June 29,2005. We record compensation expense using a graded-vesting schedule over the vesting period, or to thedate on which retirement eligibility is achieved, if shorter (non-substantive vesting period approach).
Certain employees are eligible to receive stock options, performance shares, restricted stock andrestricted stock units, while non-employee members of the Board of Directors are eligible to receive stockoptions, restricted stock and restricted stock units. Performance shares represent a right to receive sharesof common stock upon satisfaction of performance goals or other specified metrics at the end of athree-year cycle. Performance shares are paid out in common stock and will be fully vested upon issuance.The fair value of performance shares is determined on the date of grant based on a Monte Carlosimulation model. The fair value of restricted stock and restricted stock units are based on our closingstock price on the date of grant.
Stock-based compensation expense totaled approximately $17.5 million, $15.6 million and$29.9 million for fiscal 2009, 2008 and 2007, respectively. The total income tax benefit recognized in theconsolidated statements of income related to stock-based compensation was approximately $6.5 million,$6.1 million and $10.5 million during fiscal 2009, 2008 and 2007, respectively.
F-20
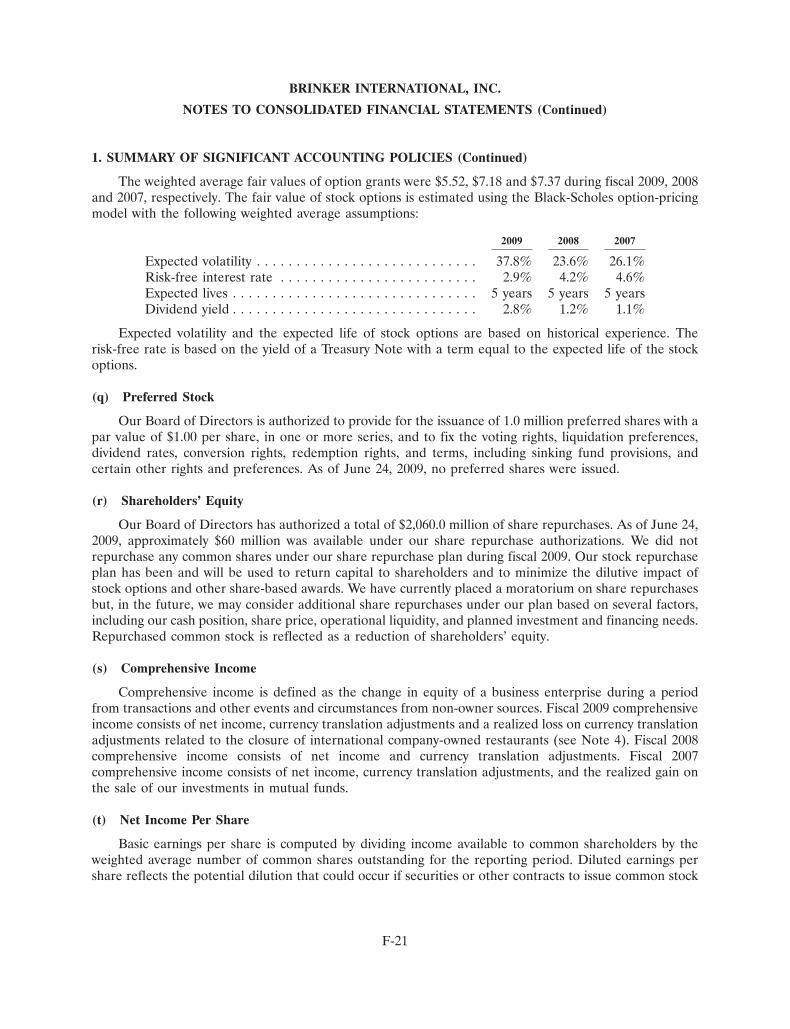
BRINKER INTERNATIONAL, INC.
NOTES TO CONSOLIDATED FINANCIAL STATEMENTS (Continued)
1. SUMMARY OF SIGNIFICANT ACCOUNTING POLICIES (Continued)
The weighted average fair values of option grants were $5.52, $7.18 and $7.37 during fiscal 2009, 2008and 2007, respectively. The fair value of stock options is estimated using the Black-Scholes option-pricingmodel with the following weighted average assumptions:
2009 2008 2007
Expected volatility . . . . . . . . . . . . . . . . . . . . . . . . . . . . 37.8% 23.6% 26.1%Risk-free interest rate . . . . . . . . . . . . . . . . . . . . . . . . . 2.9% 4.2% 4.6%Expected lives . . . . . . . . . . . . . . . . . . . . . . . . . . . . . . . 5 years 5 years 5 yearsDividend yield . . . . . . . . . . . . . . . . . . . . . . . . . . . . . . . 2.8% 1.2% 1.1%
Expected volatility and the expected life of stock options are based on historical experience. Therisk-free rate is based on the yield of a Treasury Note with a term equal to the expected life of the stockoptions.
(q) Preferred Stock
Our Board of Directors is authorized to provide for the issuance of 1.0 million preferred shares with apar value of $1.00 per share, in one or more series, and to fix the voting rights, liquidation preferences,dividend rates, conversion rights, redemption rights, and terms, including sinking fund provisions, andcertain other rights and preferences. As of June 24, 2009, no preferred shares were issued.
(r) Shareholders’ Equity
Our Board of Directors has authorized a total of $2,060.0 million of share repurchases. As of June 24,2009, approximately $60 million was available under our share repurchase authorizations. We did notrepurchase any common shares under our share repurchase plan during fiscal 2009. Our stock repurchaseplan has been and will be used to return capital to shareholders and to minimize the dilutive impact ofstock options and other share-based awards. We have currently placed a moratorium on share repurchasesbut, in the future, we may consider additional share repurchases under our plan based on several factors,including our cash position, share price, operational liquidity, and planned investment and financing needs.Repurchased common stock is reflected as a reduction of shareholders’ equity.
(s) Comprehensive Income
Comprehensive income is defined as the change in equity of a business enterprise during a periodfrom transactions and other events and circumstances from non-owner sources. Fiscal 2009 comprehensiveincome consists of net income, currency translation adjustments and a realized loss on currency translationadjustments related to the closure of international company-owned restaurants (see Note 4). Fiscal 2008comprehensive income consists of net income and currency translation adjustments. Fiscal 2007comprehensive income consists of net income, currency translation adjustments, and the realized gain onthe sale of our investments in mutual funds.
(t) Net Income Per Share
Basic earnings per share is computed by dividing income available to common shareholders by theweighted average number of common shares outstanding for the reporting period. Diluted earnings pershare reflects the potential dilution that could occur if securities or other contracts to issue common stock
F-21
BRINKER INTERNATIONAL, INC.
NOTES TO CONSOLIDATED FINANCIAL STATEMENTS (Continued)
1. SUMMARY OF SIGNIFICANT ACCOUNTING POLICIES (Continued)
were exercised or converted into common stock. For the calculation of diluted net income per share, thebasic weighted average number of shares is increased by the dilutive effect of stock options and restrictedshare awards, determined using the treasury stock method. We had approximately 7.4 million stock optionsand restricted share awards outstanding at June 24, 2009, 5.8 million stock options and restricted shareawards outstanding at June 25, 2008, and 28,000 stock options and restricted share awards outstanding atJune 27, 2007 that were not included in the dilutive earnings per share calculation because the effect wouldhave been antidilutive.
(u) Segment Reporting
Operating segments are components of an enterprise about which separate financial information isavailable that is evaluated regularly by the chief operating decision maker in deciding how to allocateresources and in assessing performance. SFAS No. 131, ‘‘Disclosures about Segments of an Enterprise andRelated Information’’ permits two or more operating segments to be aggregated into a single operatingsegment if they have similar economic characteristics and are similar in the following areas:
• The nature of products and services
• Nature of production processes
• Type or class of customer
• Methods used to distribute products or provide services
• The nature of the regulatory environment, if applicable
Our three brands have similar types of products, contracts, customers, and employees and all operateas full-service restaurants offering lunch and dinner in the casual-dining segment of the industry. Inaddition, we have similar long-term average margins across all of our brands. Therefore, we believe wemeet the criteria for aggregating operating segments into a single reporting segment.
(v) Subsequent Events
We evaluated events occurring between the end of our most recent fiscal year and August 24, 2009,the date the financial statements were issued.
2. SALE OF MACARONI GRILL
In August 2008, we entered into an agreement with Mac Acquisition for the sale of Macaroni Grill.The assets and liabilities associated with these restaurants were classified as held for sale in theconsolidated balance sheet for the fiscal year ended June 25, 2008. Macaroni Grill operating results wereincluded in continuing operations for fiscal 2009 (through the sale date of December 18, 2008) and prioryears in accordance with the reporting provisions of SFAS No. 144, ‘‘Accounting for the Impairment orDisposal of Long-Lived Assets,’’ as we will have involvement in the ongoing operations of Macaroni Grill.The sale was completed on December 18, 2008. We received cash proceeds of approximately $88.0 millionand recorded a loss of $40.4 million in other gains and charges in the consolidated statement of income infiscal 2009. The net assets sold totaled approximately $110 million and consisted primarily of property andequipment of $105 million. Assets previously held for sale of $21.3 million were retained by us and areincluded in property, plant and equipment as of June 24, 2009. The land and buildings related to theselocations were leased to Mac Acquisition as part of the sale agreement.
F-22
BRINKER INTERNATIONAL, INC.
NOTES TO CONSOLIDATED FINANCIAL STATEMENTS (Continued)
2. SALE OF MACARONI GRILL (Continued)
On December 18, 2008, we contributed $6.0 million representing an 18.2% ownership interest in thenew entity. We account for the investment under the equity method of accounting and record our share ofthe net income or loss from the investee within operating income since the operations of Macaroni Grillare similar to our ongoing operations. This amount is included in restaurant expense in our consolidatedstatements of income due to the immaterial nature of the amount. In April 2009, we received a $6.0 milliondistribution representing substantially all of our equity investment while retaining our ownership interest.
As part of the sale, we entered into an agreement with Mac Acquisition whereby we provide corporatesupport services for the new entity for one year following closing with an option for one additional year.
During fiscal 2008, we recorded impairment charges of $152.7 million to write-down the net assets ofMacaroni Grill to their estimated fair value less costs to sell in accordance with SFAS 144. This amount hasbeen included in other gains and charges in the consolidated statements of income. Our estimate of fairvalue was based on the executed purchase agreement.
3. OTHER EQUITY METHOD INVESTMENTS AND RESTAURANT DISPOSITIONS
In November 2007, we entered into an agreement with CMR, S.A.B. de C.V. for a joint ventureinvestment in a new corporation to develop 50 Chili’s and Maggiano’s restaurants in Mexico. We made a$4.6 million and an $8.7 million capital contribution to the joint venture in fiscal 2009 and fiscal 2008,respectively. We account for the investment under the equity method of accounting and record our shareof the net income or loss of the investee within operating income since the operations of the joint ventureare similar to our ongoing operations. This amount has been included in restaurant expense in ourconsolidated statements of income due to the immaterial nature of the amount. At June 24, 2009, 16Chili’s restaurants were operating in the joint venture.
In May 2007, we entered into an agreement with ERJ Dining IV, LLC to sell 76 company-ownedChili’s restaurants for approximately $121.9 million. The sale was completed in November 2007 and werecorded a gain of $29.7 million in other gains and charges in the consolidated statement of income infiscal 2008. The net assets sold totaled approximately $88.2 million and consisted primarily of property andequipment of $86.4 million and goodwill of $2.7 million.
In January 2007, we entered into an agreement with Pepper Dining, Inc. to sell 95 company-ownedChili’s restaurants for approximately $155.0 million. The sale was completed in June 2007 and we recordeda gain of $17.1 million in other gains and charges in the consolidated statement of income in fiscal 2007.The net assets sold totaled approximately $127.9 million and consisted primarily of property andequipment of $126.1 million and goodwill of $3.9 million.
F-23
BRINKER INTERNATIONAL, INC.
NOTES TO CONSOLIDATED FINANCIAL STATEMENTS (Continued)
4. OTHER GAINS AND CHARGES
2009 2008 2007
Restaurant closure charges . . . . . . . . . . . . . . . . . . $ 71,178 $ 51,143 $ 12,854Charges related to the sale of Macaroni Grill
(see Note 2) . . . . . . . . . . . . . . . . . . . . . . . . . . . 40,362 155,661 —Restaurant impairment charges . . . . . . . . . . . . . . . 14,254 7,450 —Impairment of goodwill . . . . . . . . . . . . . . . . . . . . . 7,713 — —Severance and other benefits . . . . . . . . . . . . . . . . . 6,047 7,237 —Gains on the sale of assets, net (also see Note 3) . . (3,861) (29,684) (19,116)Development-related costs . . . . . . . . . . . . . . . . . . . — 13,223 —Other gains and charges, net . . . . . . . . . . . . . . . . . (906) (1,080) (2,737)
$134,787 $203,950 $ (8,999)
In fiscal 2009, we recorded $71.2 million in charges primarily related to long-lived asset impairmentsresulting from the decision to close or decline lease renewals for 43 company-owned restaurants, includingeight international restaurants. The charges related to the domestic restaurant closures include$44.2 million of long-lived asset impairments, $14.1 million in lease termination charges and $1.2 million ofcharges related to the write-off of other assets and liabilities. The charges related to the internationalrestaurant closures include $5.6 million of long-lived asset impairments and $2.1 million of charges relatedto realized foreign currency translation losses. Additionally, we recorded a goodwill impairment charge of$7.7 million as a result of the international restaurant closings. The decision to close the restaurants anddecline lease renewals was based on a comprehensive analysis that examined restaurants not performing atrequired levels of return.
Additionally, we recorded a $14.3 million charge in fiscal 2009 related to the impairment of long-livedassets associated with 16 underperforming restaurants. The impairment charge was measured as the excessof the carrying amount of the long-lived assets over the fair value based on projected discounted futureoperating cash flows of the restaurant.
In fiscal 2009, we made organizational changes designed to streamline decision making and maximizeour leadership talent while achieving better operational efficiencies across our brands. As a result, weincurred $6.0 million in severance and other benefits, net of income related to the forfeiture of stock-basedcompensation awards resulting from these actions. We also incurred gains of $3.9 million related to thesale of nine restaurants to a franchisee and other land sales.
In fiscal 2008, we recorded $51.1 million in charges primarily related to long-lived asset impairmentsresulting from the decision to close or decline lease renewals for 61 company-owned restaurants. Thecharges include $39.8 million of long-lived asset impairments and $9.3 million in lease obligation charges.The decision to close the restaurants and decline lease renewals was based on a comprehensive analysisthat examined restaurants not performing at required levels of return. Also included is a $1.9 millioncharge related to the decrease in the estimated sales value of land associated with previously closedrestaurants. Additionally, we recorded a $7.5 million charge related to the impairment of long-lived assetsassociated with two underperforming restaurants. The impairment charge was measured as the excess ofthe carrying amount of the long-lived assets over the fair value based on projected discounted futureoperating cash flows of the restaurants.
F-24

BRINKER INTERNATIONAL, INC.
NOTES TO CONSOLIDATED FINANCIAL STATEMENTS (Continued)
4. OTHER GAINS AND CHARGES (Continued)
In fiscal 2008, we also made the decision to reduce future domestic company-owned restaurantdevelopment as well as discontinue certain projects that did not align with our strategic goals. As a result,we evaluated our infrastructure needed to support this evolving business model, which resulted in therestructuring of our Restaurant Support Center and the elimination of certain administrative positions. Inconnection with these actions, we incurred $13.2 million in charges related to asset write-offs for sitesunder development and other discontinued projects. In addition, we incurred approximately $7.2 million inseverance, vacation and other benefits, net of income related to the forfeiture of stock-based compensationawards.
In fiscal 2007, we recorded $12.9 million in charges resulting from the decision to close 13 restaurants.The charges include $10.7 million of long-lived asset impairments and $2.2 million in lease terminationcharges.
5. PREPAID EXPENSES AND OTHER
Prepaid expenses and other consist of the following (in thousands):
2009 2008
Prepaid opening supplies . . . . . . . . . . . . . . . . . . . . . . . . . . . . $ 40,842 $ 41,543Restricted cash (see Note 1) . . . . . . . . . . . . . . . . . . . . . . . . . 29,749 34,435Other . . . . . . . . . . . . . . . . . . . . . . . . . . . . . . . . . . . . . . . . . . 25,845 30,205
$ 96,436 $106,183
6. GOODWILL
The changes in the carrying amount of goodwill for the fiscal years ended June 24, 2009 and June 25,2008 are as follows (in thousands):
2009 2008
Balance at beginning of year . . . . . . . . . . . . . . . . . . . . . . . . . $140,371 $138,876Impairment of goodwill (see Note 4) . . . . . . . . . . . . . . . . . (7,713) —Goodwill arising from acquisitions . . . . . . . . . . . . . . . . . . . — 1,357Other . . . . . . . . . . . . . . . . . . . . . . . . . . . . . . . . . . . . . . . . (1,939) 138
Balance at end of year . . . . . . . . . . . . . . . . . . . . . . . . . . . . . $130,719 $140,371
F-25
BRINKER INTERNATIONAL, INC.
NOTES TO CONSOLIDATED FINANCIAL STATEMENTS (Continued)
7. ACCRUED AND OTHER LIABILITIES
Accrued liabilities consist of the following (in thousands):
2009 2008
Payroll . . . . . . . . . . . . . . . . . . . . . . . . . . . . . . . . . . . . . . . . . $ 72,510 $ 94,389Gift cards . . . . . . . . . . . . . . . . . . . . . . . . . . . . . . . . . . . . . . . 74,926 85,897Property tax . . . . . . . . . . . . . . . . . . . . . . . . . . . . . . . . . . . . . 23,160 32,996Insurance . . . . . . . . . . . . . . . . . . . . . . . . . . . . . . . . . . . . . . . 30,021 32,512Sales tax . . . . . . . . . . . . . . . . . . . . . . . . . . . . . . . . . . . . . . . . 23,991 30,433Other . . . . . . . . . . . . . . . . . . . . . . . . . . . . . . . . . . . . . . . . . . 60,976 55,651
$285,584 $331,878
Other liabilities consist of the following (in thousands):
2009 2008
Straight-line rent . . . . . . . . . . . . . . . . . . . . . . . . . . . . . . . . . . $ 59,198 $ 57,099Insurance . . . . . . . . . . . . . . . . . . . . . . . . . . . . . . . . . . . . . . . 42,361 43,146Landlord contributions . . . . . . . . . . . . . . . . . . . . . . . . . . . . . 31,137 30,907Unrecognized tax benefits . . . . . . . . . . . . . . . . . . . . . . . . . . . 21,783 23,701Other . . . . . . . . . . . . . . . . . . . . . . . . . . . . . . . . . . . . . . . . . . 6,920 14,752
$161,399 $169,605
8. INCOME TAXES
The provision for income taxes consists of the following (in thousands):
2009 2008 2007
Current income tax expense (benefit):Federal . . . . . . . . . . . . . . . . . . . . . . . . . . . . . . . $(40,988) $ 59,500 $ 94,418State . . . . . . . . . . . . . . . . . . . . . . . . . . . . . . . . . (1,166) 10,959 13,259Foreign . . . . . . . . . . . . . . . . . . . . . . . . . . . . . . . 1,808 1,808 1,431
Total current income tax expense (benefit) . . . . (40,346) 72,267 109,108
Deferred income tax expense (benefit):Federal . . . . . . . . . . . . . . . . . . . . . . . . . . . . . . . 41,878 (62,646) (18,756)State . . . . . . . . . . . . . . . . . . . . . . . . . . . . . . . . . 6,040 (6,489) (1,931)
Total deferred income tax expense (benefit) . . . 47,918 (69,135) (20,687)
$ 7,572 $ 3,132 $ 88,421
F-26
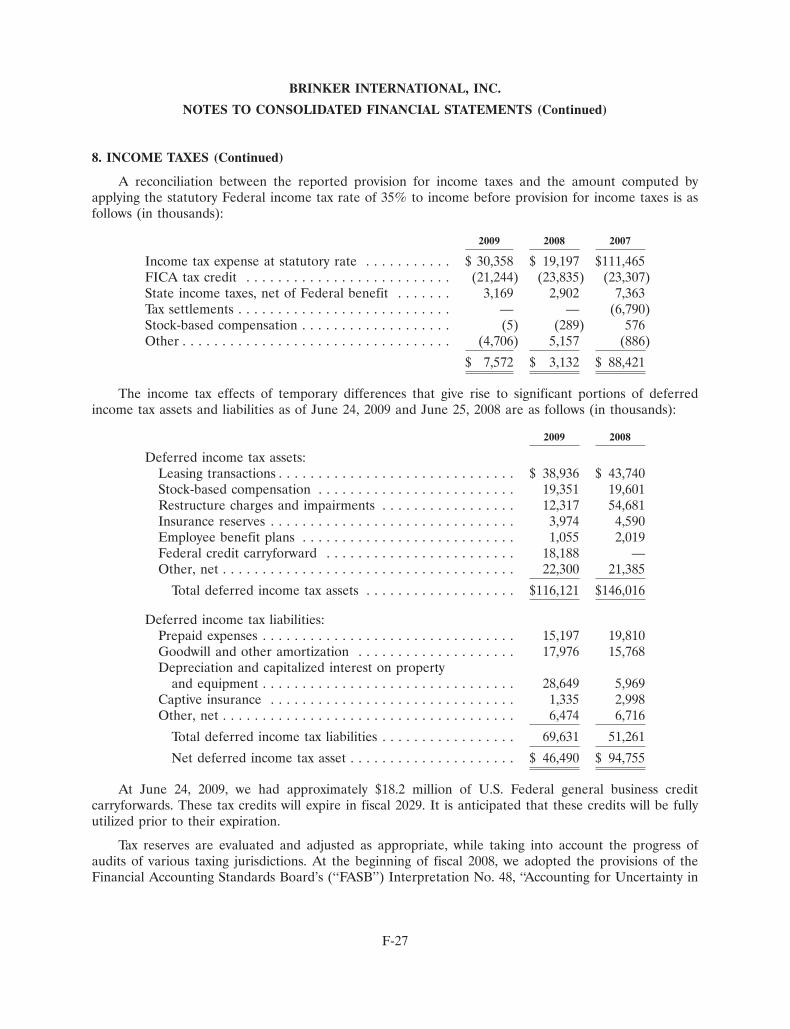
BRINKER INTERNATIONAL, INC.
NOTES TO CONSOLIDATED FINANCIAL STATEMENTS (Continued)
8. INCOME TAXES (Continued)
A reconciliation between the reported provision for income taxes and the amount computed byapplying the statutory Federal income tax rate of 35% to income before provision for income taxes is asfollows (in thousands):
2009 2008 2007
Income tax expense at statutory rate . . . . . . . . . . . $ 30,358 $ 19,197 $111,465FICA tax credit . . . . . . . . . . . . . . . . . . . . . . . . . . (21,244) (23,835) (23,307)State income taxes, net of Federal benefit . . . . . . . 3,169 2,902 7,363Tax settlements . . . . . . . . . . . . . . . . . . . . . . . . . . . — — (6,790)Stock-based compensation . . . . . . . . . . . . . . . . . . . (5) (289) 576Other . . . . . . . . . . . . . . . . . . . . . . . . . . . . . . . . . . (4,706) 5,157 (886)
$ 7,572 $ 3,132 $ 88,421
The income tax effects of temporary differences that give rise to significant portions of deferredincome tax assets and liabilities as of June 24, 2009 and June 25, 2008 are as follows (in thousands):
2009 2008
Deferred income tax assets:Leasing transactions . . . . . . . . . . . . . . . . . . . . . . . . . . . . . . $ 38,936 $ 43,740Stock-based compensation . . . . . . . . . . . . . . . . . . . . . . . . . 19,351 19,601Restructure charges and impairments . . . . . . . . . . . . . . . . . 12,317 54,681Insurance reserves . . . . . . . . . . . . . . . . . . . . . . . . . . . . . . . 3,974 4,590Employee benefit plans . . . . . . . . . . . . . . . . . . . . . . . . . . . 1,055 2,019Federal credit carryforward . . . . . . . . . . . . . . . . . . . . . . . . 18,188 —Other, net . . . . . . . . . . . . . . . . . . . . . . . . . . . . . . . . . . . . . 22,300 21,385
Total deferred income tax assets . . . . . . . . . . . . . . . . . . . $116,121 $146,016
Deferred income tax liabilities:Prepaid expenses . . . . . . . . . . . . . . . . . . . . . . . . . . . . . . . . 15,197 19,810Goodwill and other amortization . . . . . . . . . . . . . . . . . . . . 17,976 15,768Depreciation and capitalized interest on property
and equipment . . . . . . . . . . . . . . . . . . . . . . . . . . . . . . . . 28,649 5,969Captive insurance . . . . . . . . . . . . . . . . . . . . . . . . . . . . . . . 1,335 2,998Other, net . . . . . . . . . . . . . . . . . . . . . . . . . . . . . . . . . . . . . 6,474 6,716
Total deferred income tax liabilities . . . . . . . . . . . . . . . . . 69,631 51,261
Net deferred income tax asset . . . . . . . . . . . . . . . . . . . . . $ 46,490 $ 94,755
At June 24, 2009, we had approximately $18.2 million of U.S. Federal general business creditcarryforwards. These tax credits will expire in fiscal 2029. It is anticipated that these credits will be fullyutilized prior to their expiration.
Tax reserves are evaluated and adjusted as appropriate, while taking into account the progress ofaudits of various taxing jurisdictions. At the beginning of fiscal 2008, we adopted the provisions of theFinancial Accounting Standards Board’s (‘‘FASB’’) Interpretation No. 48, ‘‘Accounting for Uncertainty in
F-27
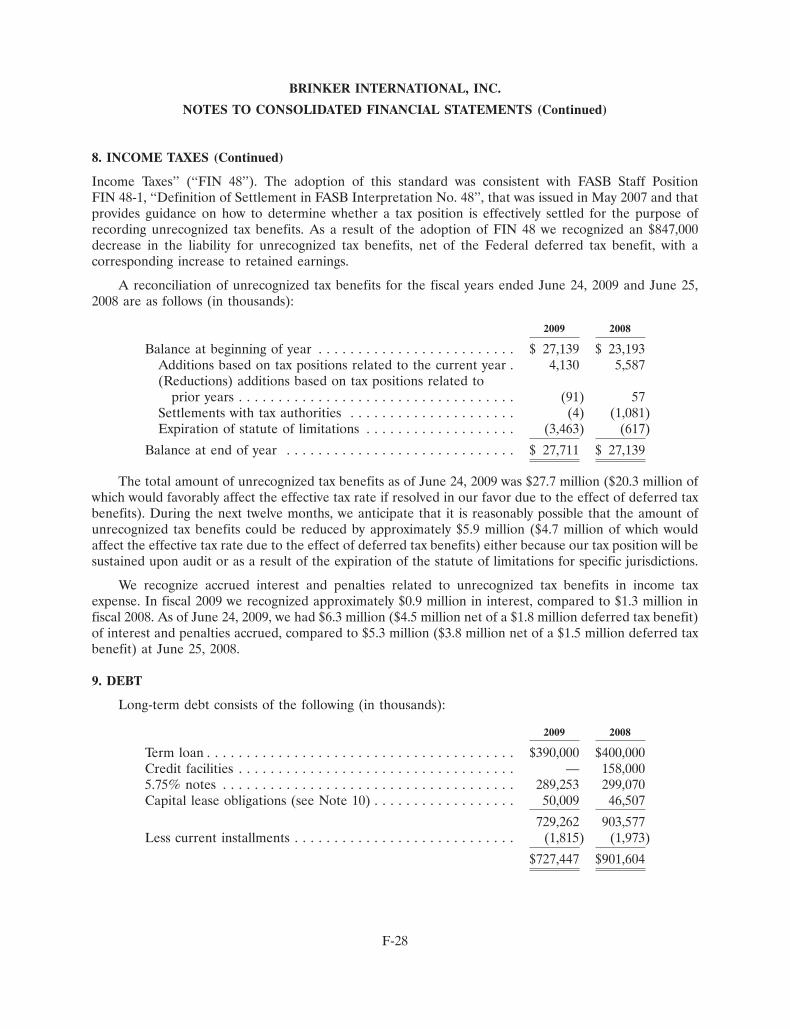
BRINKER INTERNATIONAL, INC.
NOTES TO CONSOLIDATED FINANCIAL STATEMENTS (Continued)
8. INCOME TAXES (Continued)
Income Taxes’’ (‘‘FIN 48’’). The adoption of this standard was consistent with FASB Staff PositionFIN 48-1, ‘‘Definition of Settlement in FASB Interpretation No. 48’’, that was issued in May 2007 and thatprovides guidance on how to determine whether a tax position is effectively settled for the purpose ofrecording unrecognized tax benefits. As a result of the adoption of FIN 48 we recognized an $847,000decrease in the liability for unrecognized tax benefits, net of the Federal deferred tax benefit, with acorresponding increase to retained earnings.
A reconciliation of unrecognized tax benefits for the fiscal years ended June 24, 2009 and June 25,2008 are as follows (in thousands):
2009 2008
Balance at beginning of year . . . . . . . . . . . . . . . . . . . . . . . . . $ 27,139 $ 23,193Additions based on tax positions related to the current year . 4,130 5,587(Reductions) additions based on tax positions related to
prior years . . . . . . . . . . . . . . . . . . . . . . . . . . . . . . . . . . . (91) 57Settlements with tax authorities . . . . . . . . . . . . . . . . . . . . . (4) (1,081)Expiration of statute of limitations . . . . . . . . . . . . . . . . . . . (3,463) (617)
Balance at end of year . . . . . . . . . . . . . . . . . . . . . . . . . . . . . $ 27,711 $ 27,139
The total amount of unrecognized tax benefits as of June 24, 2009 was $27.7 million ($20.3 million ofwhich would favorably affect the effective tax rate if resolved in our favor due to the effect of deferred taxbenefits). During the next twelve months, we anticipate that it is reasonably possible that the amount ofunrecognized tax benefits could be reduced by approximately $5.9 million ($4.7 million of which wouldaffect the effective tax rate due to the effect of deferred tax benefits) either because our tax position will besustained upon audit or as a result of the expiration of the statute of limitations for specific jurisdictions.
We recognize accrued interest and penalties related to unrecognized tax benefits in income taxexpense. In fiscal 2009 we recognized approximately $0.9 million in interest, compared to $1.3 million infiscal 2008. As of June 24, 2009, we had $6.3 million ($4.5 million net of a $1.8 million deferred tax benefit)of interest and penalties accrued, compared to $5.3 million ($3.8 million net of a $1.5 million deferred taxbenefit) at June 25, 2008.
9. DEBT
Long-term debt consists of the following (in thousands):
2009 2008
Term loan . . . . . . . . . . . . . . . . . . . . . . . . . . . . . . . . . . . . . . . $390,000 $400,000Credit facilities . . . . . . . . . . . . . . . . . . . . . . . . . . . . . . . . . . . — 158,0005.75% notes . . . . . . . . . . . . . . . . . . . . . . . . . . . . . . . . . . . . . 289,253 299,070Capital lease obligations (see Note 10) . . . . . . . . . . . . . . . . . . 50,009 46,507
729,262 903,577Less current installments . . . . . . . . . . . . . . . . . . . . . . . . . . . . (1,815) (1,973)
$727,447 $901,604
F-28

BRINKER INTERNATIONAL, INC.
NOTES TO CONSOLIDATED FINANCIAL STATEMENTS (Continued)
9. DEBT (Continued)
As of June 25, 2008, we had credit facilities aggregating $550 million, consisting of a revolving creditfacility of $300 million and uncommitted credit facilities of $250 million. In fiscal 2009, we completed therenewal of our revolving credit facility which was set to expire in October 2009. The new facility wasreduced to $250 million, bears interest at LIBOR plus an applicable margin, which is a function of ourcredit rating at such time, but is subject to a maximum of LIBOR plus 3.75% and expires in February 2012.Based on our current credit rating, the revolving credit facility carries an interest rate of LIBOR plus3.25% (3.56% as of June 24, 2009), although no balance was outstanding under this facility at June 24,2009. The decision to downsize our total borrowing capacity under the new revolving credit facility was aresult of the Macaroni Grill divestiture, reduced new company-owned restaurant development and ourfocus on debt repayment.
In fiscal 2009, Standard and Poor’s (‘‘S&P’’) reaffirmed our debt rating of BBB- (investment grade)with a stable outlook. However, Moody’s downgraded our corporate family rating to Ba1 (non-investmentgrade) and our senior unsecured note rating to Ba2 (non-investment grade) with a stable outlook. Underthe terms and conditions of our uncommitted credit facility agreements, we had to maintain an investmentgrade rating with both S&P and Moody’s in order to utilize the credit facilities. As a result of our splitrating, our uncommitted credit facilities totaling $250 million are no longer available. Outstandingbalances on the uncommitted credit facilities were repaid in the second quarter of fiscal 2009 with fundsdrawn on the revolving credit facility. The balance on the revolving credit facility was paid down to zero bythe end of fiscal 2009. As of June 24, 2009, we have $250 million available to us under our revolving creditfacility.
In October 2007, we entered into a three-year term loan agreement for $400 million. The term loanbears interest at LIBOR plus an applicable margin, which is a function of our credit rating at such time, butis subject to a maximum of LIBOR plus 1.5% and expires in October 2010. At June 24, 2009, $390 millionwas outstanding and, based on our current credit rating, we are paying interest at a rate of LIBOR plus0.95% (1.26%).
In May 2004, we issued $300.0 million of 5.75% notes and received proceeds totaling approximately$298.4 million prior to debt issuance costs. The notes require semi-annual interest payments and mature inJune 2014. In April 2009, we repurchased and retired $10.0 million of the notes at a discount and recordeda $1.3 million gain on the extinguishment of debt in interest expense in the consolidated statement ofincome in fiscal 2009.
Our debt agreements contain various financial covenants that, among other things, require themaintenance of certain leverage and fixed charge coverage ratios. We are currently in compliance with allfinancial covenants.
F-29

BRINKER INTERNATIONAL, INC.
NOTES TO CONSOLIDATED FINANCIAL STATEMENTS (Continued)
9. DEBT (Continued)
Excluding capital lease obligations (see Note 10) our long-term debt maturities for the five yearsfollowing June 24, 2009 are as follows (in thousands):
Fiscal Long-TermYear Debt
2010 . . . . . . . . . . . . . . . . . . . . . . . . . . . . . . . . . . . . . . . . . . . . . . . . . . . $ —2011 . . . . . . . . . . . . . . . . . . . . . . . . . . . . . . . . . . . . . . . . . . . . . . . . . . . 390,0002012 . . . . . . . . . . . . . . . . . . . . . . . . . . . . . . . . . . . . . . . . . . . . . . . . . . . —2013 . . . . . . . . . . . . . . . . . . . . . . . . . . . . . . . . . . . . . . . . . . . . . . . . . . . —2014 . . . . . . . . . . . . . . . . . . . . . . . . . . . . . . . . . . . . . . . . . . . . . . . . . . . —Thereafter . . . . . . . . . . . . . . . . . . . . . . . . . . . . . . . . . . . . . . . . . . . . . . . 289,253
$679,253
10. LEASES
(a) Capital Leases
We lease certain buildings under capital leases. The asset value of $36.9 million at June 24, 2009 and$32.6 million at June 25, 2008, and the related accumulated amortization of $10.6 million and $9.1 millionat June 24, 2009 and June 25, 2008, respectively, are included in property and equipment. Amortization ofassets under capital leases is included in depreciation and amortization expense.
(b) Operating Leases
We lease restaurant facilities, office space, and certain equipment under operating leases having termsexpiring at various dates through fiscal 2093. The restaurant leases have renewal clauses of 1 to 35 years atour option and, in some cases, have provisions for contingent rent based upon a percentage of sales inexcess of specified levels, as defined in the leases. Rent expense for fiscal 2009, 2008, and 2007 was$130.7 million, $145.6 million, and $149.1 million, respectively. Contingent rent included in rent expensefor fiscal 2009, 2008, and 2007 was $6.6 million, $9.0 million, and $10.9 million, respectively.
F-30
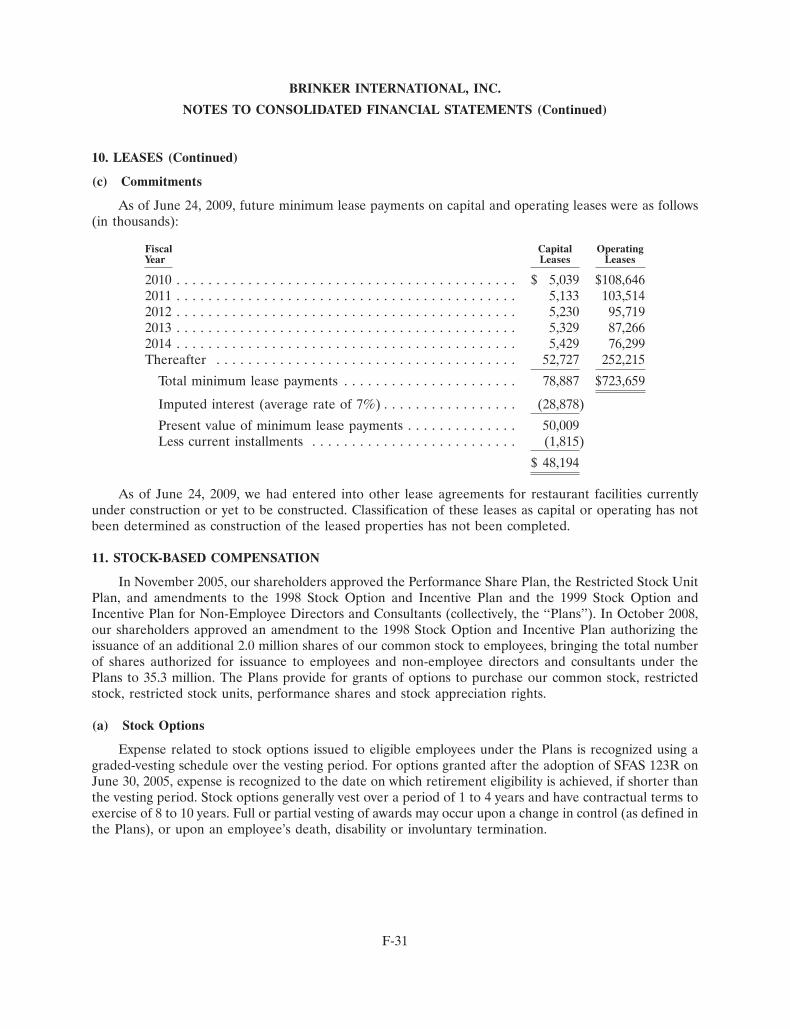
BRINKER INTERNATIONAL, INC.
NOTES TO CONSOLIDATED FINANCIAL STATEMENTS (Continued)
10. LEASES (Continued)
(c) Commitments
As of June 24, 2009, future minimum lease payments on capital and operating leases were as follows(in thousands):
Fiscal Capital OperatingYear Leases Leases
2010 . . . . . . . . . . . . . . . . . . . . . . . . . . . . . . . . . . . . . . . . . . . $ 5,039 $108,6462011 . . . . . . . . . . . . . . . . . . . . . . . . . . . . . . . . . . . . . . . . . . . 5,133 103,5142012 . . . . . . . . . . . . . . . . . . . . . . . . . . . . . . . . . . . . . . . . . . . 5,230 95,7192013 . . . . . . . . . . . . . . . . . . . . . . . . . . . . . . . . . . . . . . . . . . . 5,329 87,2662014 . . . . . . . . . . . . . . . . . . . . . . . . . . . . . . . . . . . . . . . . . . . 5,429 76,299Thereafter . . . . . . . . . . . . . . . . . . . . . . . . . . . . . . . . . . . . . . 52,727 252,215
Total minimum lease payments . . . . . . . . . . . . . . . . . . . . . . 78,887 $723,659
Imputed interest (average rate of 7%) . . . . . . . . . . . . . . . . . (28,878)
Present value of minimum lease payments . . . . . . . . . . . . . . 50,009Less current installments . . . . . . . . . . . . . . . . . . . . . . . . . . (1,815)
$ 48,194
As of June 24, 2009, we had entered into other lease agreements for restaurant facilities currentlyunder construction or yet to be constructed. Classification of these leases as capital or operating has notbeen determined as construction of the leased properties has not been completed.
11. STOCK-BASED COMPENSATION
In November 2005, our shareholders approved the Performance Share Plan, the Restricted Stock UnitPlan, and amendments to the 1998 Stock Option and Incentive Plan and the 1999 Stock Option andIncentive Plan for Non-Employee Directors and Consultants (collectively, the ‘‘Plans’’). In October 2008,our shareholders approved an amendment to the 1998 Stock Option and Incentive Plan authorizing theissuance of an additional 2.0 million shares of our common stock to employees, bringing the total numberof shares authorized for issuance to employees and non-employee directors and consultants under thePlans to 35.3 million. The Plans provide for grants of options to purchase our common stock, restrictedstock, restricted stock units, performance shares and stock appreciation rights.
(a) Stock Options
Expense related to stock options issued to eligible employees under the Plans is recognized using agraded-vesting schedule over the vesting period. For options granted after the adoption of SFAS 123R onJune 30, 2005, expense is recognized to the date on which retirement eligibility is achieved, if shorter thanthe vesting period. Stock options generally vest over a period of 1 to 4 years and have contractual terms toexercise of 8 to 10 years. Full or partial vesting of awards may occur upon a change in control (as defined inthe Plans), or upon an employee’s death, disability or involuntary termination.
F-31

BRINKER INTERNATIONAL, INC.
NOTES TO CONSOLIDATED FINANCIAL STATEMENTS (Continued)
11. STOCK-BASED COMPENSATION (Continued)
Transactions during fiscal 2009 were as follows (in thousands, except option prices):
WeightedWeighted AverageAverage Remaining Aggregate
Number of Exercise Contractual IntrinsicOptions Price Life (Years) Value
Options outstanding at June 25, 2008 . . . 7,614 $21.86Granted . . . . . . . . . . . . . . . . . . . . . . . . 893 18.94Exercised . . . . . . . . . . . . . . . . . . . . . . . (427) 10.89Forfeited or canceled . . . . . . . . . . . . . . . (707) 22.49
Options outstanding at June 24, 2009 . . . 7,373 $22.08 4.4 $289
Options exercisable at June 24, 2009 . . . . 5,802 $21.91 3.8 $289
At June 24, 2009, unrecognized compensation expense related to stock options totaled approximately$3.1 million and will be recognized over a weighted average period of 2.0 years. The intrinsic value ofoptions exercised totaled approximately $3.3 million, $1.5 million and $38.8 million during fiscal 2009, 2008and 2007, respectively.
(b) Restricted Share Awards
Restricted share awards consist of performance shares, restricted stock and restricted stock units.Performance shares and most restricted stock units issued to eligible employees under the Plans generallyvest in full on the third anniversary of the date of grant, while restricted stock units issued to eligibleemployees under our career equity plan generally vest upon each employee’s retirement from theCompany. Expense is recognized ratably over the vesting period, or to the date on which retirementeligibility is achieved, if shorter. Restricted stock and restricted stock units issued to eligible employeesunder our long-term incentive plans generally vest one-third per year beginning on the first or thirdanniversary of the date of grant. Restricted stock and restricted stock units issued to non-employeedirectors under the Plans vest in full on the fourth anniversary of the date of grant and are expensed whengranted. Full or partial vesting of awards may occur upon a change in control (as defined in the Plans), orupon an employee’s death, disability or involuntary termination.
Transactions during fiscal 2009 were as follows (in thousands, except fair values):
Number of WeightedRestricted Average
Share Fair ValueAwards Per Award
Restricted share awards outstanding at June 25, 2008 . . . . . . . 2,754 $22.92Granted . . . . . . . . . . . . . . . . . . . . . . . . . . . . . . . . . . . . . . . . 1,026 16.77Vested . . . . . . . . . . . . . . . . . . . . . . . . . . . . . . . . . . . . . . . . . (837) 22.20Forfeited . . . . . . . . . . . . . . . . . . . . . . . . . . . . . . . . . . . . . . . . (343) 22.52
Restricted share awards outstanding at June 24, 2009 . . . . . . . 2,600 $20.76
At June 24, 2009, unrecognized compensation expense related to restricted share awards totaledapproximately $14.4 million and will be recognized over a weighted average period of 2.1 years. The fair
F-32

BRINKER INTERNATIONAL, INC.
NOTES TO CONSOLIDATED FINANCIAL STATEMENTS (Continued)
11. STOCK-BASED COMPENSATION (Continued)
value of shares that vested during fiscal 2009, 2008, and 2007 totaled approximately $12.7 million,$3.2 million and $1.8 million, respectively.
12. SAVINGS PLANS
We sponsor a qualified defined contribution retirement plan (‘‘Plan I’’) covering all employees whohave attained the age of twenty-one and have completed one year and 1,000 hours of service. Plan I allowseligible employees to contribute, subject to IRS limitations on total annual contributions, up to 50% oftheir base compensation and 100% of their eligible bonuses, as defined in the plan, to various investmentfunds. We match in cash at a rate of 100% of the first 3% an employee contributes and 50% of the next 2%the employee contributes with immediate vesting. In fiscal 2009, 2008, and 2007, we contributedapproximately $8.1 million, $8.9 million, and $8.2 million, respectively.
We also sponsor a non-qualified defined contribution plan covering a select group of highlycompensated employees, as defined in the plan. Eligible employees are allowed to defer receipt of up to50% of their base compensation and bonus, as defined in the plan. There is no company match, butemployee contributions earn interest based on a rate determined and announced in November prior to thestart of the plan year. Employee contributions and earnings thereon vest immediately. A Rabbi Trust isused to fund obligations of the non-qualified plan. The market value of the trust assets is included in otherassets and the liability to plan participants is included in other liabilities.
13. SUPPLEMENTAL CASH FLOW INFORMATION
Cash paid for interest and income taxes is as follows (in thousands):
2009 2008 2007
Income taxes, net of refunds . . . . . . . . . . . . . . . . . . $ 5,219 $62,260 $100,593Interest, net of amounts capitalized . . . . . . . . . . . . . 34,473 48,919 26,167
Non-cash investing and financing activities are as follows (in thousands):
2009 2008 2007
Retirement of fully depreciated assets . . . . . . . . . . . $50,887 $21,778 $ 40,133
14. CONTINGENCIES
As of June 24, 2009, we remain secondarily liable for lease payments totaling $193.7 million as a resultof the sale of Macaroni Grill, the sale of other brands, and the sale of restaurants to franchisees in previousperiods. This amount represents the maximum potential liability of future payments under the guarantees.These leases have been assigned to the buyers and expire at the end of the respective lease terms, whichrange from fiscal 2010 through fiscal 2023. In the event of default, the indemnity and default clauses in ourassignment agreements govern our ability to pursue and recover damages incurred. No material liabilitieshave been recorded as of June 24, 2009.
Certain current and former hourly restaurant employees filed a lawsuit against us in CaliforniaSuperior Court alleging violations of California labor laws with respect to meal and rest breaks. Thelawsuit seeks penalties and attorney’s fees and was certified as a class action in July 2006. On July 22, 2008,the California Court of Appeal decertified the class action on all claims with prejudice. On October 22,
F-33

BRINKER INTERNATIONAL, INC.
NOTES TO CONSOLIDATED FINANCIAL STATEMENTS (Continued)
14. CONTINGENCIES (Continued)
2008, the California Supreme Court granted a writ to review the decision of the Court of Appeal. Weintend to vigorously defend our position. It is not possible at this time to reasonably estimate the possibleloss or range of loss, if any.
We are engaged in various other legal proceedings and have certain unresolved claims pending. Theultimate liability, if any, for the aggregate amounts claimed cannot be determined at this time. However,management, based upon consultation with legal counsel, is of the opinion that there are no matterspending or threatened which are expected to have a material adverse effect, individually or in theaggregate, on our consolidated financial condition or results of operations.
15. QUARTERLY RESULTS OF OPERATIONS (UNAUDITED)
The following table summarizes the unaudited consolidated quarterly results of operations for fiscal2009 and 2008 (in thousands, except per share amounts):
Fiscal Year 2009Quarters Ended
Sept. 24 Dec. 24 March 25 June 24
Revenues . . . . . . . . . . . . . . . . . . . . . . . . . . . . . . . $ 984,407 $ 949,425 $ 857,378 $ 829,370Income (loss) before provision for income taxes . . . $ 32,355 $ (44,498) $ 49,210 $ 49,671
Net income (loss) . . . . . . . . . . . . . . . . . . . . . . . . . $ 23,781 $ (21,764) $ 35,003 $ 42,146
Basic net income (loss) per share . . . . . . . . . . . . . $ 0.23 $ (0.21) $ 0.34 $ 0.41Diluted net income (loss) per share(a) . . . . . . . . . . $ 0.23 $ (0.21) $ 0.34 $ 0.41
Basic weighted average shares outstanding . . . . . . . 101,630 101,841 101,882 102,051Diluted weighted average shares outstanding . . . . . 102,762 102,278 102,752 103,054
Fiscal Year 2008Quarters Ended
Sept. 26 Dec. 26 March 26 June 25
Revenues . . . . . . . . . . . . . . . . . . . . . . . . . . . . . . . $1,054,686 $1,029,785 $1,077,183 $1,073,569Income (loss) before provision for income taxes . . . $ 52,863 $ 78,106 $ (70,158) $ (5,957)
Net income (loss) . . . . . . . . . . . . . . . . . . . . . . . . . $ 37,600 $ 54,480 $ (38,818) $ (1,540)
Basic net income (loss) per share . . . . . . . . . . . . . $ 0.35 $ 0.53 $ (0.38) $ (0.02)Diluted net income (loss) per share(a) . . . . . . . . . . $ 0.34 $ 0.52 $ (0.38) $ (0.02)
Basic weighted average shares outstanding . . . . . . . 106,464 103,498 101,175 101,267Diluted weighted average shares outstanding . . . . . 109,155 105,339 102,377 102,717
(a) Due to the net loss in the second quarter of fiscal 2009 and the third and fourth quarters of fiscal 2008,diluted loss per share is calculated using the basic weighted average number of shares. Using theactual diluted weighted average shares would result in anti-dilution of earnings per share.
F-34

Report of Independent Registered Public Accounting Firm
The Board of DirectorsBrinker International, Inc.:
We have audited the accompanying consolidated balance sheets of Brinker International, Inc. andsubsidiaries (‘‘the Company’’) as of June 24, 2009 and June 25, 2008, and the related consolidatedstatements of income, shareholders’ equity, and cash flows for each of the years in the three-year periodended June 24, 2009. These consolidated financial statements are the responsibility of the Company’smanagement. Our responsibility is to express an opinion on these consolidated financial statements basedon our audits.
We conducted our audits in accordance with the standards of the Public Company AccountingOversight Board (United States). Those standards require that we plan and perform the audit to obtainreasonable assurance about whether the financial statements are free of material misstatement. An auditincludes examining, on a test basis, evidence supporting the amounts and disclosures in the financialstatements. An audit also includes assessing the accounting principles used and significant estimates madeby management, as well as evaluating the overall financial statement presentation. We believe that ouraudits provide a reasonable basis for our opinion.
In our opinion, the consolidated financial statements referred to above present fairly, in all materialrespects, the financial position of Brinker International, Inc. and subsidiaries as of June 24, 2009 andJune 25, 2008, and the results of their operations and their cash flows for each of the years in thethree-year period ended June 24, 2009, in conformity with U.S. generally accepted accounting principles.
We also have audited, in accordance with the standards of the Public Company Accounting OversightBoard (United States), the Company’s internal control over financial reporting as of June 24, 2009, basedon criteria established in Internal Control—Integrated Framework issued by the Committee of SponsoringOrganizations of the Treadway Commission and our report dated August 24, 2009 expressed an unqualifiedopinion on the effectiveness of the Company’s internal control over financial reporting.
As discussed in Note 8 of the consolidated financial statements, the Company adopted the provisionsof the Financial Accounting Standards Board’s Interpretation No. 48, ‘‘Accounting for Uncertainty inIncome Taxes, an interpretation of FASB Statement No. 109,’’ in fiscal year 2008.
KPMG LLP
Dallas, TexasAugust 24, 2009
F-35

Report of Independent Registered Public Accounting Firm
The Board of DirectorsBrinker International, Inc.:
We have audited Brinker International, Inc.’s (‘‘the Company’’) internal control over financialreporting as of June 24, 2009, based on criteria established in Internal Control—Integrated Frameworkissued by the Committee of Sponsoring Organizations of the Treadway Commission (COSO). TheCompany’s management is responsible for maintaining effective internal control over financial reportingand for its assessment of the effectiveness of internal control over financial reporting, included in theaccompanying Management’s Report on Internal Control. Our responsibility is to express an opinion onthe Company’s internal control over financial reporting based on our audit.
We conducted our audit in accordance with the standards of the Public Company AccountingOversight Board (United States). Those standards require that we plan and perform the audit to obtainreasonable assurance about whether effective internal control over financial reporting was maintained inall material respects. Our audit included obtaining an understanding of internal control over financialreporting, assessing the risk that a material weakness exists, and testing and evaluating the design andoperating effectiveness of internal control based on the assessed risk. Our audit also included performingsuch other procedures as we considered necessary in the circumstances. We believe that our audit providesa reasonable basis for our opinion.
A company’s internal control over financial reporting is a process designed to provide reasonableassurance regarding the reliability of financial reporting and the preparation of financial statements forexternal purposes in accordance with generally accepted accounting principles. A company’s internalcontrol over financial reporting includes those policies and procedures that (1) pertain to the maintenanceof records that, in reasonable detail, accurately and fairly reflect the transactions and dispositions of theassets of the company; (2) provide reasonable assurance that transactions are recorded as necessary topermit preparation of financial statements in accordance with generally accepted accounting principles,and that receipts and expenditures of the company are being made only in accordance with authorizationsof management and directors of the company; and (3) provide reasonable assurance regarding preventionor timely detection of unauthorized acquisition, use, or disposition of the company’s assets that could havea material effect on the financial statements.
Because of its inherent limitations, internal control over financial reporting may not prevent or detectmisstatements. Also, projections of any evaluation of effectiveness to future periods are subject to the riskthat controls may become inadequate because of changes in conditions, or that the degree of compliancewith the policies or procedures may deteriorate.
In our opinion, the Company maintained, in all material respects, effective internal control overfinancial reporting as of June 24, 2009, based on criteria established in Internal Control—IntegratedFramework issued by COSO.
We also have audited, in accordance with the standards of the Public Company Accounting OversightBoard (United States), the consolidated balance sheets of Brinker International, Inc. and subsidiaries as ofJune 24, 2009 and June 25, 2008, and the related consolidated statements of operations, shareholders’equity, and cash flows for each of the years in the three-year period ended June 24, 2009, and our reportdated August 24, 2009 expressed an unqualified opinion on those consolidated financial statements.
KPMG LLP
Dallas, TexasAugust 24, 2009
F-36

MANAGEMENT’S RESPONSIBILITY FOR CONSOLIDATED FINANCIAL STATEMENTS
Management is responsible for the reliability of the consolidated financial statements and relatednotes, which have been prepared in conformity with U. S. generally accepted accounting principles andinclude amounts based upon our estimate and judgments, as required. The consolidated financialstatements have been audited and reported on by our independent registered public accounting firm,KPMG LLP, who were given free access to all financial records and related data, including minutes of themeetings of the Board of Directors and Committees of the Board. We believe that the representationsmade to the independent auditors were valid and appropriate.
We maintain a system of internal controls over financial reporting designed to provide reasonableassurance of the reliability of the consolidated financial statements. Our internal audit function monitorsand reports on the adequacy of the compliance with the internal control system and appropriate actionsare taken to address significant control deficiencies and other opportunities for improving the system asthey are identified. The Audit Committee of the Board of Directors, which is comprised solely of outsidedirectors, provides oversight to the financial reporting process through periodic meetings with ourindependent auditors, internal auditors, and management. Both our independent auditors and internalauditors have free access to the Audit Committee. Although no cost-effective internal control system willpreclude all errors and irregularities, we believe our controls as of and for the year ended June 24, 2009provide reasonable assurance that the consolidated financial statements are reliable.
MANAGEMENT’S REPORT ON INTERNAL CONTROL OVER FINANCIAL REPORTING
Management is responsible for establishing and maintaining adequate internal control over financialreporting. We have assessed the effectiveness of our internal control over financial reporting based on theframework in Internal Control—Integrated Framework issued by the Committee of SponsoringOrganizations of the Treadway Commission. Based on our assessment, we concluded that our internalcontrol over financial reporting was effective as of June 24, 2009.
Because of inherent limitations, internal control over financial reporting may not prevent or detectmisstatements. Also, projection of any evaluation of effectiveness to future periods are subject to the riskthat controls may become inadequate because of changes in conditions, or that the degree of compliancewith the policies and procedures may deteriorate.
The effectiveness of our internal control over financial reporting as of June 24, 2009 has been auditedby KPMG LLP, an independent registered public accounting firm, as stated in its attestation report whichis included herein.
/s/ DOUGLAS H. BROOKS
DOUGLAS H. BROOKSPresident and Chief Executive Officer
/s/ CHARLES M. SONSTEBY
CHARLES M. SONSTEBYExecutive Vice President and Chief Financial Officer
F-37
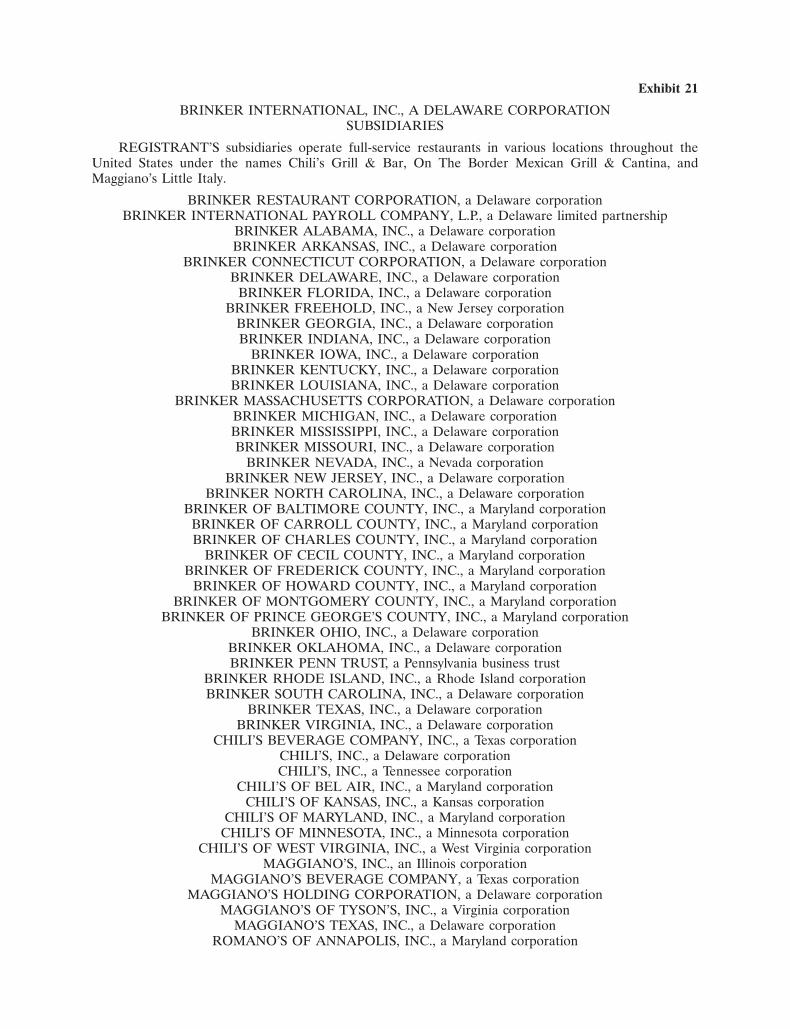
Exhibit 21
BRINKER INTERNATIONAL, INC., A DELAWARE CORPORATIONSUBSIDIARIES
REGISTRANT’S subsidiaries operate full-service restaurants in various locations throughout theUnited States under the names Chili’s Grill & Bar, On The Border Mexican Grill & Cantina, andMaggiano’s Little Italy.
BRINKER RESTAURANT CORPORATION, a Delaware corporationBRINKER INTERNATIONAL PAYROLL COMPANY, L.P., a Delaware limited partnership
BRINKER ALABAMA, INC., a Delaware corporationBRINKER ARKANSAS, INC., a Delaware corporation
BRINKER CONNECTICUT CORPORATION, a Delaware corporationBRINKER DELAWARE, INC., a Delaware corporation
BRINKER FLORIDA, INC., a Delaware corporationBRINKER FREEHOLD, INC., a New Jersey corporation
BRINKER GEORGIA, INC., a Delaware corporationBRINKER INDIANA, INC., a Delaware corporation
BRINKER IOWA, INC., a Delaware corporationBRINKER KENTUCKY, INC., a Delaware corporationBRINKER LOUISIANA, INC., a Delaware corporation
BRINKER MASSACHUSETTS CORPORATION, a Delaware corporationBRINKER MICHIGAN, INC., a Delaware corporationBRINKER MISSISSIPPI, INC., a Delaware corporationBRINKER MISSOURI, INC., a Delaware corporation
BRINKER NEVADA, INC., a Nevada corporationBRINKER NEW JERSEY, INC., a Delaware corporation
BRINKER NORTH CAROLINA, INC., a Delaware corporationBRINKER OF BALTIMORE COUNTY, INC., a Maryland corporation
BRINKER OF CARROLL COUNTY, INC., a Maryland corporationBRINKER OF CHARLES COUNTY, INC., a Maryland corporation
BRINKER OF CECIL COUNTY, INC., a Maryland corporationBRINKER OF FREDERICK COUNTY, INC., a Maryland corporation
BRINKER OF HOWARD COUNTY, INC., a Maryland corporationBRINKER OF MONTGOMERY COUNTY, INC., a Maryland corporation
BRINKER OF PRINCE GEORGE’S COUNTY, INC., a Maryland corporationBRINKER OHIO, INC., a Delaware corporation
BRINKER OKLAHOMA, INC., a Delaware corporationBRINKER PENN TRUST, a Pennsylvania business trust
BRINKER RHODE ISLAND, INC., a Rhode Island corporationBRINKER SOUTH CAROLINA, INC., a Delaware corporation
BRINKER TEXAS, INC., a Delaware corporationBRINKER VIRGINIA, INC., a Delaware corporation
CHILI’S BEVERAGE COMPANY, INC., a Texas corporationCHILI’S, INC., a Delaware corporationCHILI’S, INC., a Tennessee corporation
CHILI’S OF BEL AIR, INC., a Maryland corporationCHILI’S OF KANSAS, INC., a Kansas corporation
CHILI’S OF MARYLAND, INC., a Maryland corporationCHILI’S OF MINNESOTA, INC., a Minnesota corporation
CHILI’S OF WEST VIRGINIA, INC., a West Virginia corporationMAGGIANO’S, INC., an Illinois corporation
MAGGIANO’S BEVERAGE COMPANY, a Texas corporationMAGGIANO’S HOLDING CORPORATION, a Delaware corporation
MAGGIANO’S OF TYSON’S, INC., a Virginia corporationMAGGIANO’S TEXAS, INC., a Delaware corporation
ROMANO’S OF ANNAPOLIS, INC., a Maryland corporation

Exhibit 23
Consent of Independent Registered Public Accounting Firm
The Board of DirectorsBrinker International, Inc.:
We consent to the incorporation by reference in Registration Statement Nos. 33-56491, 333-02201,333-93755, 333-42224, 333-105720, 333-125289, and 333-157050 on Form S-8, Registration StatementNo. 333-74902 on Form S-3 and Registration Statement No. 333-116879 on Form S-4 of BrinkerInternational, Inc. of our reports dated August 24, 2009, with respect to the consolidated balance sheets ofBrinker International, Inc. as of June 24, 2009 and June 25, 2008, and the related consolidated statementsof income, shareholders’ equity and cash flows for each of the years in the three-year period endedJune 24, 2009, and the effectiveness of internal control over financial reporting as of June 24, 2009, whichreports appear in the 2009 Annual Report on Form 10-K of Brinker International, Inc.
Our report dated August 24, 2009, with respect to the consolidated balance sheets of BrinkerInternational, Inc. and subsidiaries as of June 24, 2009 and June 25, 2008, and the related consolidatedstatements of income, shareholders’ equity and cash flows for each of the years in the three-year periodended June 24, 2009 refers to the adoption of the provisions of the Financial Accounting StandardsBoard’s Interpretation No. 48, ‘‘Accounting for Uncertainty in Income Taxes, an interpretation of FASBStatement No. 109,’’ in fiscal year 2008.
KPMG LLP
Dallas, TexasAugust 24, 2009

Exhibit 31(a)
CERTIFICATION
I, Douglas H. Brooks, certify that:
1. I have reviewed this Annual Report on Form 10-K of Brinker International, Inc.;
2. Based on my knowledge, this report does not contain any untrue statement of a material fact or omitto state a material fact necessary to make the statements made, in light of the circumstances underwhich such statements were made, not misleading with respect to the period covered by this report;
3. Based on my knowledge, the financial statements, and other financial information included in thisannual report, fairly present in all material respects the financial condition, results of operations andcash flows of the registrant as of, and for, the periods presented in this annual report;
4. The registrant’s other certifying officer(s) and I are responsible for establishing and maintainingdisclosure controls and procedures (as defined in Exchange Act Rules 13a-15(e) and 15d-15(e)) andinternal control over financial reporting (as defined in Exchange Act Rules 13a-15(f) and 15d-15(f))for the registrant and have:
a. Designed such disclosure controls and procedures, or caused such disclosure controls andprocedures to be designed under our supervision, to ensure that material information relating tothe registrant, including its consolidated subsidiaries, is made known to us by others within thoseentities, particularly during the period in which this report is being prepared;
b. Designed such internal control over financial reporting, or caused such internal control overfinancial reporting to be designed under our supervision, to provide reasonable assuranceregarding the reliability of financial reporting and the preparation of financial statements forexternal purposes in accordance with generally acceptable accounting principles;
c. Evaluated the effectiveness of the registrant’s disclosure controls and procedures and presentedin this report our conclusions about the effectiveness of the disclosure controls and procedures,as of the end of the period covered by this report based on such evaluation; and
d. Disclosed in this report any change in the registrant’s internal control over financial reportingthat occurred during the registrant’s most recent fiscal quarter (the registrant’s fourth fiscalquarter in the case of an annual report) that has materially affected, or is reasonably likely tomaterially affect, the registrant’s internal control over financial reporting; and
5. The registrant’s other certifying officer(s) and I have disclosed, based on our most recent evaluation ofinternal control over financial reporting, to the registrant’s auditors and the audit committee of theregistrant’s board of directors (or persons performing the equivalent functions);
a. All significant deficiencies and material weaknesses in the design or operation of internal controlover financial reporting which are reasonably likely to adversely affect the registrant’s ability torecord, process, summarize and report financial information; and
b. Any fraud, whether or not material, that involves management or other employees who have asignificant role in the registrant’s internal control over financial reporting.
Dated: August 24, 2009
/s/ DOUGLAS H. BROOKS
Douglas H. BrooksChairman of the Board, President andChief Executive Officer(Principal Executive Officer)

Exhibit 31(b)
CERTIFICATION
I, Charles M. Sonsteby, certify that:
1. I have reviewed this Annual Report on Form 10-K of Brinker International, Inc.;
2. Based on my knowledge, this report does not contain any untrue statement of a material fact or omitto state a material fact necessary to make the statements made, in light of the circumstances underwhich such statements were made, not misleading with respect to the period covered by this report;
3. Based on my knowledge, the financial statements, and other financial information included in thisreport, fairly present in all material respects the financial condition, results of operations and cashflows of the registrant as of, and for, the periods presented in this report;
4. The registrant’s other certifying officer(s) and I are responsible for establishing and maintainingdisclosure controls and procedures (as defined in Exchange Act Rules 13a-15(e) and 15d-15(e)) andinternal control over financial reporting (as defined in Exchange Act Rules 13a-15(f) and 15d-15(f))for the registrant and have:
a. Designed such disclosure controls and procedures, or caused such disclosure controls andprocedures to be designed under our supervision, to ensure that material information relating tothe registrant, including its consolidated subsidiaries, is made known to us by others within thoseentities, particularly during the period in which this report is being prepared;
b. Designed such internal control over financial reporting, or caused such internal control overfinancial reporting to be designed under our supervision, to provide reasonable assuranceregarding the reliability of financial reporting and the preparation of financial statements forexternal purposes in accordance with generally acceptable accounting principles;
c. Evaluated the effectiveness of the registrant’s disclosure controls and procedures and presentedin this report our conclusions about the effectiveness of the disclosure controls and procedures,as of the end of the period covered by this report based on such evaluation; and
d. Disclosed in this report any change in the registrant’s internal control over financial reportingthat occurred during the registrant’s most recent fiscal quarter (the registrant’s fourth fiscalquarter in the case of an annual report) that has materially affected, or is reasonably likely tomaterially affect, the registrant’s internal control over financial reporting; and
5. The registrant’s other certifying officer(s) and I have disclosed, based on our most recent evaluation ofinternal control over financial reporting, to the registrant’s auditors and the audit committee of theregistrant’s board of directors (or persons performing the equivalent functions);
a. All significant deficiencies and material weaknesses in the design or operation of internal controlover financial reporting which are reasonably likely to adversely affect the registrant’s ability torecord, process, summarize and report financial information; and
b. Any fraud, whether or not material, that involves management or other employees who have asignificant role in the registrant’s internal control over financial reporting.
Dated: August 24, 2009
/s/ CHARLES M. SONSTEBY
Charles M. SonstebyExecutive Vice President andChief Financial Officer(Principal Financial Officer)
Exhibit 32(a)
CERTIFICATION
Pursuant to 18 U.S.C. Section 1350, the undersigned officer of Brinker International, Inc. (the‘‘Company’’), hereby certifies that the Company’s Annual Report on Form 10-K for the year endedJune 24, 2009 (the ‘‘Report’’) fully complies with the requirements of Section 13(a) or 15(d), as applicable,of the Securities Exchange Act of 1934 and that the information contained in the Report fairly presents, inall material respects, the financial condition and results of operations of the Company.
Dated: August 24, 2009
By: /s/ DOUGLAS H. BROOKS
Name: Douglas H. BrooksTitle: Chairman of the Board, President and
Chief Executive Officer(Principal Executive Officer)

Exhibit 32(b)
CERTIFICATION
Pursuant to 18 U.S.C. Section 1350, the undersigned officer of Brinker International, Inc. (the‘‘Company’’), hereby certifies that the Company’s Annual Report on Form 10-K for the year endedJune 24, 2009 (the ‘‘Report’’) fully complies with the requirements of Section 13(a) or 15(d), as applicable,of the Securities Exchange Act of 1934 and that the information contained in the Report fairly presents, inall material respects, the financial condition and results of operations of the Company.
Dated: August 24, 2009
By: /s/ CHARLES M. SONSTEBY
Name: Charles M. SonstebyTitle: Executive Vice President and
Chief Financial Officer(Principal Financial Officer)


Board of directors
douglas H. BrooksChairman of the Board,Chief Executive Officer and PresidentBrinker International, Inc.
Harriet edelmanRetired Senior Vice President & CIOAvon Products, Inc.
Marvin J. GirouardRetired Chairman of the BoardPier 1 Imports, Inc.
John W. MimsChief Marketing and Sales OfficerMillennium & Copthorne Hotels Worldwide
George r. MrkonicRetired President and Vice ChairmanBorders Group, Inc.
erle NyeChairman EmeritusTXU Corp.
rosendo G. ParraRetired Senior Vice President Dell Inc.
cece smithRetired Managing General PartnerPhillips-Smith-Machens Venture Partners
PriNciPal officers
douglas H. BrooksChairman of the Board, Chief Executive Officer and President
Valerie l. davissonExecutive Vice President and Chief People Works Officer
todd e. dienerExecutive Vice President, Chili’s Grill & Bar President andOn The Border President
charles M. sonstebyExecutive Vice President and Chief Financial Officer
roger f. thomsonExecutive Vice President, Chief Administrative Officer,General Counsel and Secretary
Michael B. WebbermanExecutive Vice President of Brand Solutions
Guy J. constantSenior Vice President of Finance
david r. doyleSenior Vice President and Controller
Michael l. furlowSenior Vice President of Information Solutions
Jeffrey a. HobanSenior Vice President, Assistant General Counsel,and Assistant Secretary
John l. realeSenior Vice President and Global BusinessDevelopment President
Wyman t. robertsSenior Vice President, Chief Marketing Officer and Maggiano’s Little Italy President
sHareHolder iNforMatioN
executive officesBrinker International, Inc.6820 LBJ FreewayDallas, TX 75240(972) 980-9917
annual MeetingThursday, October 29, 2009 at 9:00 a.m.Addison Conference Centre15650 Addison RoadAddison, TX 75001
independent Public accountantsKPMG LLP717 N. Harwood, Suite 3100Dallas, TX 75201
NYSE Symbol: EAT
stock transfer agent and registrarBNY Mellon Shareowner Services480 Washington BoulevardJersey City, NJ 07310-1900Customer Service (800) 213-5156TDD for Hearing Impaired (800) 231-5469Foreign Shareowners (201) 680-6578You can now access your Brinker Shareholder Account online via Investors Service Direct®.Visit us on the web at www.bnymellon.com/shareowner/isd and follow the easy access instructions.
10-K availabilityThe company will furnish to any shareholder, without charge, a copy of the company’s annual report filed with the Securities and Exchange Commission on Form 10-K for the 2009 fiscal year from our website at: www.brinker.com or upon written request from the shareholder.
Please send your written request to:Secretary/Investor RelationsBrinker International, Inc.6820 LBJ FreewayDallas, TX 75240
ceo/cfo certificationsOn November 20, 2008, the company submitted its annual Section 303A CEO Certification to the New York Stock Exchange.The company also filed the CEO and CFO certifications required under Section 302 of the Sarbanes-Oxley Act of 2002 with the Securities and Exchange Commission as exhibits to its Annual Report on Form 10-K for the year ended June 24, 2009.
Chili’s Grill & Bar, On The Border Mexican Grill & Cantina, and Maggiano’s Little Italy are registred and/or proprietary trademarks of Brinker International Payroll Company, L.P.

6820 LBJ Freeway, Dallas, TX 75240 • www.brinker.com
Cert no. SW-COC-XXXX