annual report 2009 - sharedata.co.za · annual report 2009 cipla medpro a leading supplier of an...
TRANSCRIPT

ANNUAL REPORT 2009
WE’LL MAKE IT BETTER
2ANNUAL REPORT 2009ANNUAL REPORT 2009
Dear Shareholders
This year our company has crossed the landmark fi gure of
R1 billion in sales, ending the year on R1,262 billion. This
means that sales are up 26,9% on last year.
2009 was an eventful year. A new government in South
Africa had to deal with the ramifi cations of a worldwide
recession. We at Cipla faced the same challenges. Despite all
the challenges, IMS statistics show that Cipla grew to become
the fourth largest pharmaceutical company by value in South
Africa. We outstripped the market and our major competitors
in growth and EV index. Barring unforeseen setbacks and
eventualities we are confi dent we can end 2010 on the same
high note.
South Africa needs more and more access to affordable
medicines and Cipla is in the enviable position to deliver just
that.
An explosion of chronic diseases continues and Cipla’s
pipeline and portfolio of chronic medicines will treat more and
more patients.
In the area of healthcare, governments around the world
preach on behalf of their own national needs by promoting
indigenous industry. Our government should take the initiative
and support our local industry and especially our company
who has invested hundreds of millions of Rands in looking
after the health of the nation.
The future is promising, God willing. We are ready to take
advantage from the collaborations and agreements we have
signed during 2009. We welcome our new partners Biomab
(who specialise in monoclonal antibody and biosimilar
medication) to our country, and we continue to thank our
very very special partners Cipla India, for the wonderful loyalty
and friendship we have experienced over many years.
I continue to emphasise the bond that binds us in our thinking
and caring for what we do in our respective countries.
Lastly, we believe our fi rst responsibility is to the doctors,
pharmacists, nurses and patients and all others who use our
products and services. We are responsible to our employees
who work with us; we are responsible to the communities
in which we live and work; and we are responsible to our
shareholders. When we operate according to this value
system our shareholders will realise a very fair return.
Thank you
Jerome Smith
CEO
Foreword
ANNUAL REPORT 2009
1
Contents
Vision
To heal South Africa and to become the biggest and the
most admired pharmaceutical company in South Africa.
Mission
Cipla commits itself to endeavour to satisfy our customers’
needs in every manner possible: through excellent service,
by developing and marketing an effective, safe and quality
product and by offering our product at a price affordable
to all patients. We further commit ourselves to contributing
to continued medical education and research into new
drug delivery systems in the belief that this contribution
will improve technical know-how and ultimately benefi t all
patients in South Africa.
We intend to be the employer of choice in the
pharmaceutical sector developing our most valuable asset,
human capital, irrespective of race, colour or creed so that
they may realise their full potential and ambitions. We
pledge personal respect, fair compensation and a clean
and safe working environment. It is our wish that we be
recognised as innovators in the fi eld of pharmaceutical
marketing rather than just followers, be the investors’
pick and achieve sustainable, above average returns for
the investor. It is our dream that through our policy of
dedication and commitment we will create an environment
whereby Cipla will come to be recognised as the preferred
partner in medicine.
Foreword inside front cover
Vision and mission 1
Cipla at a glance 2
Group fi nancial highlights 3
Group structure 4
Value added statement 5
Chairman’s report 6
CEO’s report 8
CFO’s report 10
Directorate 12
Operational reviews:
Cipla Medpro 14
Cipla Medpro Manufacturing 16
Sustainability report 18
Corporate governance 24
Annual fi nancial statements
Directors’ responsibility statement 28
Company Secretary’s report 29
Independent Auditor’s report 30
Directors’ report 31
Statements of fi nancial position 34
Statements of comprehensive income 35
Statements of changes in equity 36
Statements of cash fl ow 37
Notes to the fi nancial statements 38
Annexure A – interest in subsidiary companies 94
Analysis of shareholders 96
Share trading statistics 97
Notice of annual general meeting 98
Terms and abbreviations 102
Form of proxy attached
Corporate information inside back cover
Shareholders’ diary inside back cover
Vision and mission
ANNUAL REPORT 2009
1

2ANNUAL REPORT 2009
2ANNUAL REPORT 2009
Cipla Medpro
A leading supplier of an extensive range of pharmaceutical,
healthcare and veterinary products headquartered in Cape
Town. Within the pharmaceutical sector, Cipla Medpro is the
fourth largest and fastest growing pharmaceutical company
according to IMS (this excludes its veterinary or agrichemical
sales, sales to the state, export or OTC sales to mass market).
In late 2009, the company was awarded the Frost & Sullivan
“South African Generic Pharmaceuticals Company of the
Year” award.
Cipla Medpro has a strong relationship and supply agreement
with leading Indian pharmaceutical company Cipla India. This
allows the group unlimited access to Cipla India’s extensive
pipeline of products and dossiers across a broad range of
therapeutic categories.
Cipla Medpro Manufacturing
A uniquely-designed, sophisticated MCC-approved
pharmaceutical manufacturing facility based in Durban,
KwaZulu-Natal. Being one of the fi rst local manufacturers
to attain international PIC/S standards, CMM (in addition
to manufacturing some of the group’s own products) also
offers local and multinational pharmaceutical companies high
volume manufacturing solutions in line with MCC cGMP
standards. CMM is also one of only two facilities in South
Africa offering manufacturing capability for effervescent
formulations.
Cipla at a glance
Listed on the JSE, CMSA is South Africa’s fourth largest pharmaceutical company by Rand value (Source: IMS, January 2010). CMSA is
18,2% owned by empowerment consortium Sweet Sensation 67 (Pty) Limited which is represented on the main board by two non-
executive directors. CMSA comprises two divisions:
3ANNUAL REPORT 2009
3ANNUAL REPORT 2009
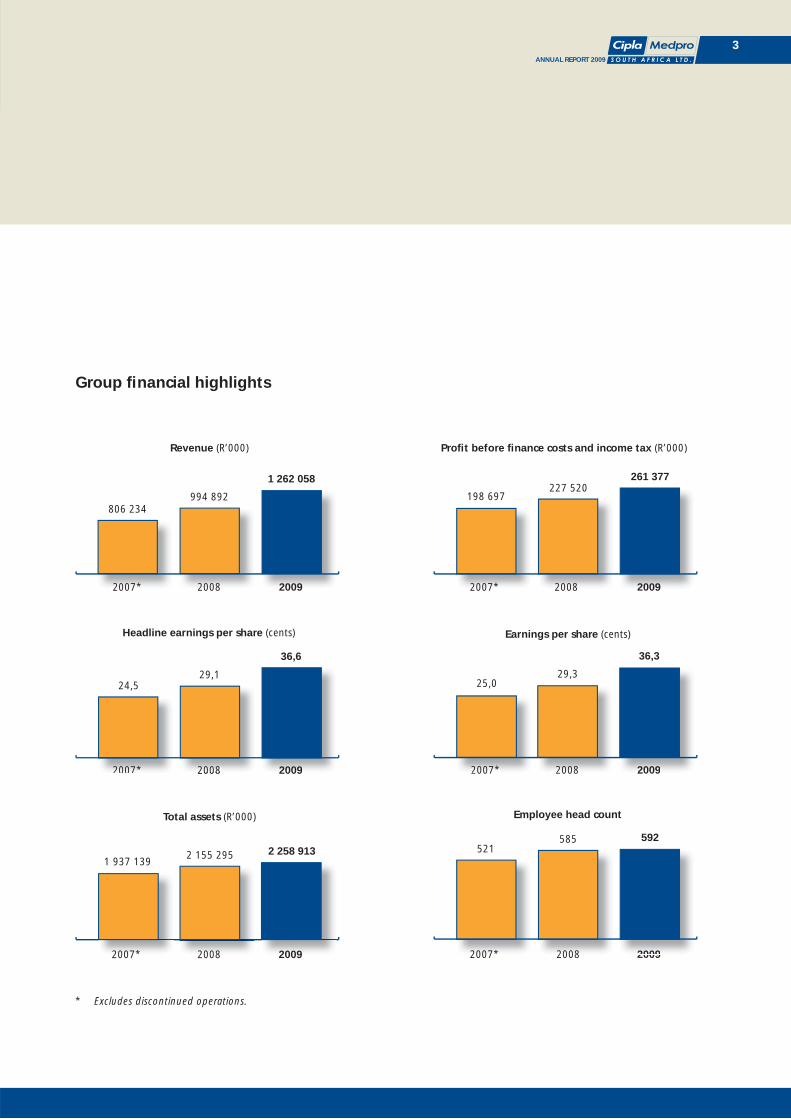
* Excludes discontinued operations.
Group fi nancial highlights
2007* 2008
Earnings per share (cents)
2009
25,029,3
36,3
200920082007*2007* 2008
Headline earnings per share (cents)
2009200920082007*
24,529,1
36,6
2007* 2008 2009200920082007*
521585 592
Employee head count
2007* 2008
Revenue (R’000)
806 234994 892
2009
1 262 058
2007* 2008 2009
198 697227 520
261 377
Profi t before fi nance costs and income tax (R’000)
2007* 2008 2009
1 937 1392 155 295 2 258 913
Total assets (R’000)
200920082007*

4ANNUAL REPORT 2009
4ANNUAL REPORT 2009
Cipla Medpro Cardio
Respiratory(Pty) Limited
Smith and Couzin
(Pty) Limited
Cipla MedproARV
(Pty) Limited
Group structure
1 During the year, the following dormant companies were deregistered: • Adroit Pharmaceuticals (Pty) Limited • Zedchem (Pty) Limited • Kamillen Pharmaceuticals (Pty) Limited • Kamillen Products (Botswana) (Pty) Limited
Universal Pharmaceuticals (Pty) Limited was liquidated.
2 Acquired 50% of Medpro Pharmaceutica Africa (Pty) Limited on 1 January 2009.
CIPLA MEDPRO SOUTH AFRICA LIMITEDRegistration number: 2002/018027/06
Inyanga Trading 386(Pty) Limited
Cipla MedproHoldings
(Pty) Limited
Cipla Medpro Manufacturing(Pty) Limited
Cipla Dibcare(Pty) Limited
Cipla Health Care (Pty) Limited
Cipla-Medpro(Pty) Limited
Medpro Pharmaceutica(Pty) Limited
Cipla Personal Care (Pty) Limited
Cipla Vet(Pty) Limited
Cipla Life Sciences (Pty) Limited
Cipla Agrimed(Pty) Limited
75%
43%
43%
50% 50%
67%
Xeragen Laboratories (Pty) Limited
Galilee Marketing (Pty) Limited
Dormantsubsidiaries1
Medpro Pharmaceutica
Africa(Pty) Limited2
Cipla Agricare(Pty) Limited
Medpro Gen(Pty) Limited
Medpro Holdings
(Pty) Limited
Medpro-On-Line(Pty) Limited
Cipla Medpro Distribution
Centre(Pty) Limited
Agropharm(Pty) Limited
Gardian Cipla(Pty) Limited
5ANNUAL REPORT 2009
5ANNUAL REPORT 2009
GROUP GROUP
2009 2008
Note R’000 R’000
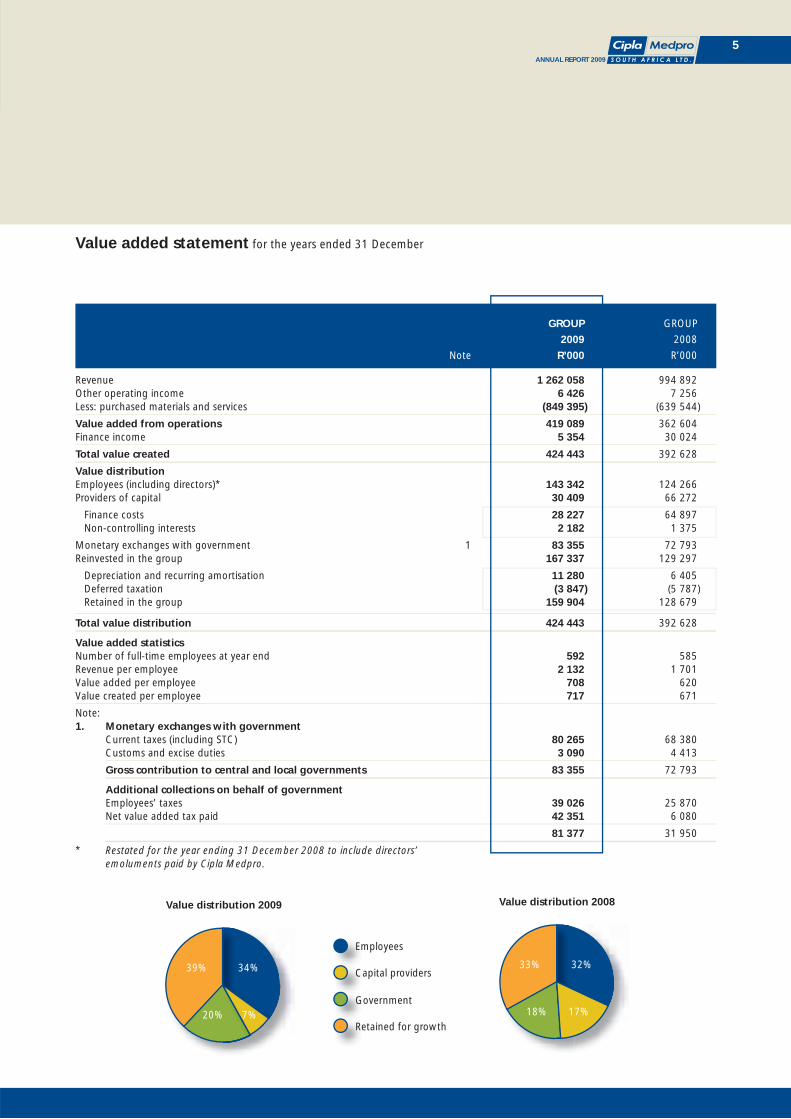
Revenue 1 262 058 994 892Other operating income 6 426 7 256 Less: purchased materials and services (849 395) (639 544)
Value added from operations 419 089 362 604 Finance income 5 354 30 024
Total value created 424 443 392 628
Value distributionEmployees (including directors)* 143 342 124 266 Providers of capital 30 409 66 272
Finance costs 28 227 64 897 Non-controlling interests 2 182 1 375
Monetary exchanges with government 1 83 355 72 793 Reinvested in the group 167 337 129 297
Depreciation and recurring amortisation 11 280 6 405 Deferred taxation (3 847) (5 787) Retained in the group 159 904 128 679
Total value distribution 424 443 392 628
Value added statisticsNumber of full-time employees at year end 592 585 Revenue per employee 2 132 1 701 Value added per employee 708 620 Value created per employee 717 671
Note:1. Monetary exchanges with government Current taxes (including STC) 80 265 68 380 Customs and excise duties 3 090 4 413
Gross contribution to central and local governments 83 355 72 793
Additional collections on behalf of government Employees’ taxes 39 026 25 870 Net value added tax paid 42 351 6 080
81 377 31 950
* Restated for the year ending 31 December 2008 to include directors’ emoluments paid by Cipla Medpro.
Value added statement for the years ended 31 December
Employees
Capital providers
Government
Retained for growth
Value distribution 2008
32%33%
18% 17%
Value distribution 2009
34%39%
20% 7%
6ANNUAL REPORT 2009
6ANNUAL REPORT 2009
Chairman’s report
2009 was an
extremely positive
year for the
CMSA group
and the board
of directors
is pleased to
present a very
satisfying set of
annual results.
Group revenues
increased 26,9%
to R1 262,1 million (2008: R994,9 million) and PBIT increased
14,9% to R261,4 million (2008: R227,5 million). Headline
earnings increased 25,7% to R160,9 million
(2008: R128,0 million) and HEPS increased 25,8% to
36,6 cents (2008: 29,1 cents).
These results are signifi cantly more pleasing having been
achieved in spite of trying circumstances such as the Adcock
bid process which diverted the board and management’s
attention for some time, and a weak exchange rate in the
fi rst half of the year. Yet despite the above, Cipla Medpro
remained the fastest growing pharmaceutical company with
the highest EV of 116,1 of the top 30 companies and passed
the R1 billion mark in sales during 2009, a very exciting
milestone and achievement for the group. This was capped
a month later when the company was awarded the Frost
& Sullivan 2009 “South African Generic Pharmaceuticals
Company of the Year” award.
Cipla Medpro remains the group’s revenue driver and it is
through this business’ strong growth and ever increasing
market shares in new and existing therapeutic categories
that the group retains its position as the fourth largest South
African pharmaceutical company.
Although it reported a loss before fi nance costs and income
tax of R35,6 million, the turnaround strategy for Cipla
Medpro Manufacturing is on track. Manufacturing output
during the year under review was increased through the
securing of three third-party manufacturing contracts
as well as producing some of the group’s own products.
Manufacturing requirements from state tenders won by Cipla
Medpro will generate further revenues for this division during
2010/2011.
The board remained stable throughout the year with all
committees meeting regularly and functioning effi ciently.
Executive directors, Jerome Smith (CEO) and Chris Aucamp
(CFO), have reaffi rmed their commitment to the group
by extending their contracts to the end of 2015 and the
board extends its appreciation to both gentlemen for their
commitment and sound day-to-day leadership of the group.
The renewal of their contracts also ensures strong continuity
for the next fi ve years, which will enable all long-term plans
for the business to be bedded down.
Due to a decision to pursue personal interests, non-executive
director Dr Gil Mahlati resigned from the board during
November 2009. The board extends its appreciation and
acknowledgement to Dr Mahlati for his contribution to the
group. In March 2010, in line with its commitment to good
corporate governance, the board appointed Sandile Zungu
and Johan du Preez as independent non-executive directors.
Johan du Preez brings with him a wealth of experience in the
pharmaceutical sector, while Sandile Zungu brings signifi cant
business acumen. On behalf of my fellow directors, I welcome
both gentlemen to the board and look forward to working
with them.
In addition to the Audit and Risk Committee (chaired by
Mpho Mosweu) and Remuneration Committee (to be chaired
by Johan du Preez), the board has formed a new Nominations
Committee (chaired by myself) to deal with nominations and
new board appointments.
Empowerment consortium Sweet Sensation 67 (Pty) Limited
retains their 82 million shareholding (18,2%) in CMSA and is
represented at board level by Bongani Caga and Nthabiseng
Mokone. The board and management within CMSA remain
focused on empowerment and we are currently more than
30% black-owned.
7ANNUAL REPORT 2009
7ANNUAL REPORT 2009
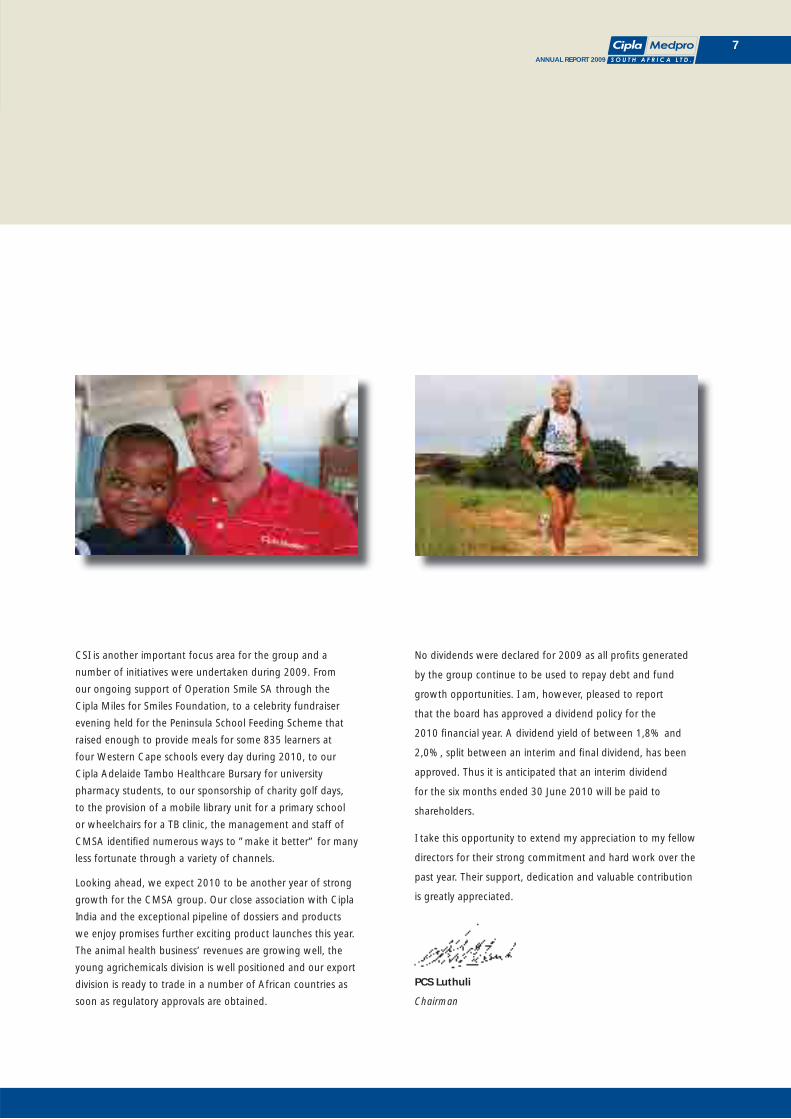
CSI is another important focus area for the group and a
number of initiatives were undertaken during 2009. From
our ongoing support of Operation Smile SA through the
Cipla Miles for Smiles Foundation, to a celebrity fundraiser
evening held for the Peninsula School Feeding Scheme that
raised enough to provide meals for some 835 learners at
four Western Cape schools every day during 2010, to our
Cipla Adelaide Tambo Healthcare Bursary for university
pharmacy students, to our sponsorship of charity golf days,
to the provision of a mobile library unit for a primary school
or wheelchairs for a TB clinic, the management and staff of
CMSA identifi ed numerous ways to ”make it better” for many
less fortunate through a variety of channels.
Looking ahead, we expect 2010 to be another year of strong
growth for the CMSA group. Our close association with Cipla
India and the exceptional pipeline of dossiers and products
we enjoy promises further exciting product launches this year.
The animal health business’ revenues are growing well, the
young agrichemicals division is well positioned and our export
division is ready to trade in a number of African countries as
soon as regulatory approvals are obtained.
No dividends were declared for 2009 as all profi ts generated
by the group continue to be used to repay debt and fund
growth opportunities. I am, however, pleased to report
that the board has approved a dividend policy for the
2010 fi nancial year. A dividend yield of between 1,8% and
2,0%, split between an interim and fi nal dividend, has been
approved. Thus it is anticipated that an interim dividend
for the six months ended 30 June 2010 will be paid to
shareholders.
I take this opportunity to extend my appreciation to my fellow
directors for their strong commitment and hard work over the
past year. Their support, dedication and valuable contribution
is greatly appreciated.
PCS Luthuli
Chairman
8ANNUAL REPORT 2009
8ANNUAL REPORT 2009
CEO’s report
It gives me great
pleasure to
present the 2009
results. The year
under review
had its fair share
of challenges,
such as the
unsuccessful
bid by Adcock
and the adverse
market conditions
brought on by the global recession, yet our growth continued.
The Cipla Medpro division once again delivered the goods
accounting for 100% of the group’s profi ts with revenues
for the year of R1 233,3 million. As with 2008, this division
continued to grow faster than the TPM with an EV of 116,1
for the year. As early as February 2009, Cipla Medpro had
increased its ranking to the fourth largest pharmaceutical
company by value. Naturally, we have our sights set on third
place.
During the year under review, we endeavoured as far as
possible to stick to the formula we know and do best, that is
launch, market, sell and manufacture an extensive range of
products targeting numerous therapeutic categories, many
of them chronic medicines, at affordable prices. And as we
planned, it worked. We passed our milestone of R1 billion in
sales and launched four fi rst-to-market generic medicines with
a total potential Rand value of R170 million. We also started
manufacturing some of our own OTC products for both the
local market and export while moving into the agrichemicals
sector and growing our animal health businesses signifi cantly.
And we also made good progress in expanding our footprint
into a number of African countries.
The generics industry in South Africa continues to grow. By
the end of 2009, the local generic medicines unit market
share was just over 56%. As the cost of living increases that
fi gure, in all likelihood, will rise. Coupled with the ever-
increasing number of people suffering from chronic illnesses,
from respiratory to HIV/AIDS and diabetes, the solution in
providing effective and ongoing treatment lies in generic
medicines.
Thanks to our strong partnership with Cipla India, the largest
standalone generic company in the world and number one
pharmaceutical company in India by value, we are poised to
be a signifi cantly greater provider of those medicines to the
local market. Dossiers fl ow continuously from Cipla India and
currently some 210 dossiers await registration at the MCC.
In January 2010, Forbes India magazine ran an article entitled
“5 People Who Will Save The World”. Named alongside
German Chancellor Angela Merckel, US President Barack
Obama, Renault-Nissan CEO Carlos Ghosn and management
guru CK Prahalad, was Dr Yusuf Hamied, Chairman of Cipla
India.
Dr Hamied was acknowledged for his longstanding battle
against the big pharmaceutical companies of the world who
he claims are holding over three billion people in the third
world to ransom by using their monopoly status to charge
higher prices. A man of strong conviction, in 2000 Dr Hamied
and Cipla India offered HIV treatments to Africa for less than
USD1 a day, a massive reduction on the USD10 000 to
USD15 000 western companies were charging per annum.
He followed that up by supplying a drug that prevents HIV
transmission from mother to child free of cost to Africa.
The turnaround strategy for the Durban-based CMM facility
is on track to deliver results. Whilst this division posted a loss
before fi nance costs and income tax of R35,6 million
(2008: R15,3 million), we are confi dent that this position will
improve in due course. The facility is currently manufacturing
six products for Cipla Medpro, three third-party contracts with
local and multinational companies were secured in 2009 and
a further R80 million in revenue has been earmarked from the
RT289 tender work won by Cipla Medpro over the next two
years. In addition, once regulatory approvals are obtained in
Africa, additional products will be manufactured by CMM.

9ANNUAL REPORT 2009
9ANNUAL REPORT 2009
Due to strategic reasons, the launch of our oncology division
has been delayed until later in the year or early 2011. We
currently have 20 molecules (36 dosage strengths) registered,
targeting a host of cancers (including breast, lung and
colon). Biosimilar medicines are believed by many globally to
be the future of medicine and this presents a very exciting
opportunity for us. Last year we launched South Africa’s fi rst
biosimilar insulin and recently we have concluded a signifi cant
collaboration with Biomab, the dedicated monoclonal
antibody, biotech and biosimilars division of the Chinese
pharmaceutical company Desano.
The year ahead is promising for the CMSA group. Further
product launches are planned, some extremely signifi cant,
whilst we will continue to grow our existing brands, many
of which are market leaders in their categories. The OTC
products division is enjoying strong growth as more and
more people look to self-medicate in the face of high living
costs, and we expect revenues from this sector to increase
signifi cantly off the back of strong consumer marketing
campaigns and greater product distribution through mass
market stores and pharmacy chains. We will also soon be
expanding into the sports supplementation market.
JS Smith
CEO

10ANNUAL REPORT 2009
10ANNUAL REPORT 2009
CFO’s report
The group has
demonstrated
strong growth
over the past
fi nancial year,
and has
succeeded
in achieving
headline earnings
of R160,9 million
(2008:
R128,0 million),
an increase of 25,7%. This translates into an increase of
25,8% to 36,6 cents (2008: 29,1 cents) at the HEPS level,
based on 440,1 million (2008: 439,8 million) weighted
average number of shares in issue for the 2009 fi nancial year
(before the effects of dilutive share options).
The reconciliation to headline earnings includes the following
amounts, all net of tax:
• Loss on the disposal of property, plant and equipment of
R1,0 million (2008: R0,1 million); and
• 2008 also included a gain on the disposal of intangible
assets of R0,9 million and a loss on the disposal of
discontinued operations of R0,1 million (2009: Rnil).
EPS improved by 23,9% to 36,3 cents (2008: 29,3 cents).
When the pre-tax costs of R13,6 million incurred due to
the Adcock bid process are excluded, and after adjusting
for the full effect of the interest rate swaps during the year,
normalised EPS is up 28,1% to 38,7 cents (2008: 30,2 cents).
Normalised HEPS for the year increased 29,7% to 38,9 cents
(2008: 30,0 cents).
Revenues grew by 26,9% to R1 262,1 million
(2008: R994,9 million). Gross profi t increased by 25,7% to
R620,4 million (2008: R493,3 million), even though the gross
profi t margin declined slightly to 49,2% (2008: 49,6%).
However, there has been an improvement from 46,4% at
30 June 2009 due to the strengthening of the ZAR in the
second half of 2009, the full effect of the SEP increase
and better forward exchange rate hedging. Cipla Medpro
achieved a gross margin of 50,7% (2008: 52,1% and
30 June 2009: 48,4%).
PBIT for the year is R261,4 million (2008: R227,5 million), an
increase of 14,9%. The operating profi t includes the costs
incurred during the Adcock process of R13,6 million
(2008: Rnil) and foreign exchange adjustments of
R22,5 million (2008: R21,4 million), inclusive of the
revaluation losses on hedging instruments. These foreign
exchange adjustments, as well as staff bonuses and increased
sales and marketing expenses in the second half of the year,
resulted in the group PBIT margin contracting slightly in the
second half of 2009 (20,4%) when compared to the fi rst
six months (21,1%). The overall PBIT margin for the year is
20,7% (2008: 22,9%).
The net fi nance costs decreased to R22,9 million
(2008: R34,9 million) mainly due to the movement on interest
rate swaps of R5,0 million, a reduction in the preference
share interest charge of R13,7 million and the capitalisation of
certain borrowing costs, offset by an increase of R7,4 million
in interest on the overdraft facility. Finance income, which
includes swap settlements of R1,9 million
(2008: R10,6 million), reduced to R5,4 million
(2008: R30,0 million) mainly due to interest income on
positive bank balances decreasing by R8,6 million when
compared to the prior year. However, interest cover has
improved from 3,5 to 9,3 times.
After an improvement in the effective tax rate to 32,0%
(2008: 32,5%), profi t after tax for the year of R162,1 million
(2008: R130,1 million) was achieved. The main factors
resulting in the effective tax rate being higher than the
11ANNUAL REPORT 2009
11ANNUAL REPORT 2009
statutory tax rate are:
• Non-deductible preference share interest of R21,0 million
(2008: R34,7 million);
• Non-deductible IFRS 2 expenses of R6,1 million
(2008: R4,6 million); and
• STC of R2,1 million (2008: R3,5 million).
When the effects of cash on hand are excluded, interest-
bearing borrowings increased to R417,4 million
(2008: R315,2 million). At 31 December 2009, the group was
overdrawn to the extent of R60,1 million, compared to a net
cash surplus of R31,7 million at 31 December 2008, primarily
due to the factory upgrade and working capital requirements.
Debtors days has improved to 66 days (2008: 70 days and
30 June 2009: 75 days), while creditors days has stabilised
at 174 days (2008: 206 days and 30 June 2009: 187 days).
Inventory days has increased marginally to 106 days
(2008: 101 days and 30 June 2009: 97 days).
Cash fl ows generated from operating activities are
R10,2 million (2008: R142,5 million). This decrease is mainly
due to the decrease in trade and other payables of
R140,6 million to a normalised level of R236,2 million
(2008: R376,8 million), while R118,6 million
(2008: R170,4 million) was invested mainly in the upgraded
facility and the acquisition of intangible assets. A net
R16,6 million was generated through fi nancing activities
(2008: R100,1 million was utilised to settle debt). During the
2009 year, an additional R60,5 million of debt fi nancing was
raised through instalment sale agreements and additional loan
facilities, while R50,2 million was utilised to settle a portion of
the preference shares.
I would like to thank my fellow directors and employees for
their contributions and continued support throughout the
year.
C Aucamp
CFO

12ANNUAL REPORT 2009
12ANNUAL REPORT 2009
Directorate
Sibusiso Luthuli
Non-executive chairman (independent)
CA (SA)
S’bu Luthuli has chaired the board since 2003 and has
recently accepted the appointment as CEO of the Eskom
Pension and Provident Fund. Prior to this he was the CEO of
Ithala Limited, and before that, he was with the Specialised
Property and Asset Finance division of Nedbank. He is also a
non-executive director of Telkom SA Limited, and has served
on various other board and audit committees.
Jerome Smith
CEO
Group CEO since September 2007, Jerome Smith has spent
his career in the pharmaceutical industry. In 1992, he founded
the business Medpro Pharmaceutica/Cipla Medpro, one of
the fi rst generic medicines businesses in South Africa. With
a strong belief that healthcare is a right, not a privilege, and
determined to ensure the provision of world class, affordable
medicines in South Africa, he strategically aligned the business
with Indian pharmaceutical giant Cipla India. He has led Cipla
Medpro to its current standing as South Africa’s fourth largest
and fastest growing pharmaceutical company.
Chris Aucamp
CFO
CA (SA)
Chris Aucamp has been Financial Director of Cipla Medpro
for 14 years, prior to which he worked for SARS for two
years and then in commerce as a fi nancial director of a FMCG
company. Appointed as group CFO in October 2007, he has
extensive knowledge of the pharmaceutical industry and
oversees all the day-to-day fi nancial affairs of both the Cipla
Medpro and CMM divisions. Chris was an integral member of
the team that oversaw the capital raising and acquisition of
Cipla Medpro by Enaleni Pharmaceuticals Limited in 2005.
Bongani Caga
Non-executive director
LLB; LLM (Masters) International Business Law
Bongani Caga is a director of Umnombo Consulting as
well as Sweet Sensation 67 (Pty) Limited, which is our BEE
consortium. He is also a deputy chairman of Sunspace, the
company that manufactured the Sumbandila Satellite on
behalf of the Department of Science and Technology. He is a
former legal executive with New Africa Mining Fund, which
was a Private Equity Mining Fund, capitalised at
R560 million. Before joining the Fund, Bongani was an
Investment Banker in the Corporate Finance division of
Standard Corporate and Merchant bank (SCMB). At SCMB
his career highlight was being part of the advisory team to
government on the listing of Telkom on the JSE and New
York Stock exchanges. Previously, he worked as a legal
analyst with the Special Investigations Unit and the Truth
and Reconciliation Commission in East London. Bongani was
awarded a Nelson Mandela Scholarship to study for a Masters
degree in International Business Law, with Leiden University in
the Netherlands.
Mpho Mosweu
Non-executive director (independent)
CA (SA); MBL
Mpho Mosweu is head of the Techno Industries Business
Unit at the Industrial Development Corporation. She is
involved in various audit committees and has signifi cant
commercial experience, which together with her technical and
governance acumen, adds signifi cant value to the board of
CMSA.
13ANNUAL REPORT 2009
13ANNUAL REPORT 2009
Nthabiseng Mokone
Non-executive director
CA (SA)
Nthabiseng Mokone is currently head of Amabubesi Health
Services and its Private Equity fund. As head of Amabubesi
Health Services, she is responsible for strategy formulation
and execution and for overseeing the execution of the
transactions relating to Healthcare. She has spent time in
deal origination, structuring, capital raising and execution
and continues to provide executive support to the directors
of Amabubesi. In her role, she has participated in some of
the major deals done by Amabubesi and continues to add
value to the investee companies by representing Amabubesi
at their respective boards. She moved to ABC South Africa, a
subsidiary of African Banking Corporation Holdings Limited,
where she held the position of group head accountant,
from Pioneer Foods’ Sacko Milling in Krugersdorp. Her
career started in 1996 when she joined Transtel, a division of
Transnet, and in 2002 moved to Transnet Group Finance to
start Training Outside Public Practice until 2003. Some of her
representations include Medipost, Kawari and Silverbridge
Holdings.
Sandile Zungu
Non-executive director (independent)
BSc (Mechanical Engineering); MBA
Sandile Zungu is the executive chairman and founder of
Zungu Investments Company (Zico) which has diversifi ed
holdings in various sectors including Financial Services,
Media, Resources and Gaming. He has a wealth of corporate
experience and was previously the chairman of Barnard
Jacobs Mellet Holdings. He is currently chairman of the
Africa Vanguard group of companies (part of Zico) as well
as non-executive director of Grindrod Limited, Supercare
Cleaning Services, G4S Cash Management Services and
Outdoor Network. He also serves as the Presidential Advisory
on the BBBEE Advisory Council, the board of trustees of the
International Marketing Council, the Advisory Board of the
University of Cape Town (UCT) Graduate School of Business
and on the management committee of Business Unity SA. In
addition to a BSc degree and a MBA from the UCT Graduate
School of Business, Sandile also has a certifi cation in Global
Leadership from the Harvard Business School in Boston, USA.
Johan du Preez
Non-executive director (independent)
MPharm; MBA
Johan du Preez is the founder and managing director of
SAAD Investment Holdings, an investment company primarily
focusing on establishing new fi nancial services entities. He
has been involved in various industries locally and in the USA,
including Pharmaceutical Retail, Medical Insurance and Risk
Management, Investment Management, Life Insurance and
Financing. Johan brings extensive corporate experience to the
CMSA board, having previously held the positions of CEO of
ADATO Capital, Glacier by Sanlam (previously called Innofi n)
and Sanlam Health. He has a MPharm from the University of
Pretoria, as well as a MBA from the National University in San
Diego, California.
14ANNUAL REPORT 2009
14ANNUAL REPORT 2009
Operational review: Cipla Medpro
Accounting for 100% of the group’s profi ts with revenues of
R1 233,3 million (2008: R937,4 million) and PBIT of
R307,4 million (2008: R254,1 million), 2009 saw positive
results for this business despite adverse market conditions.
Cipla Medpro retained its standing as the fastest growing
pharmaceutical company in South Africa and the fourth
largest by value.
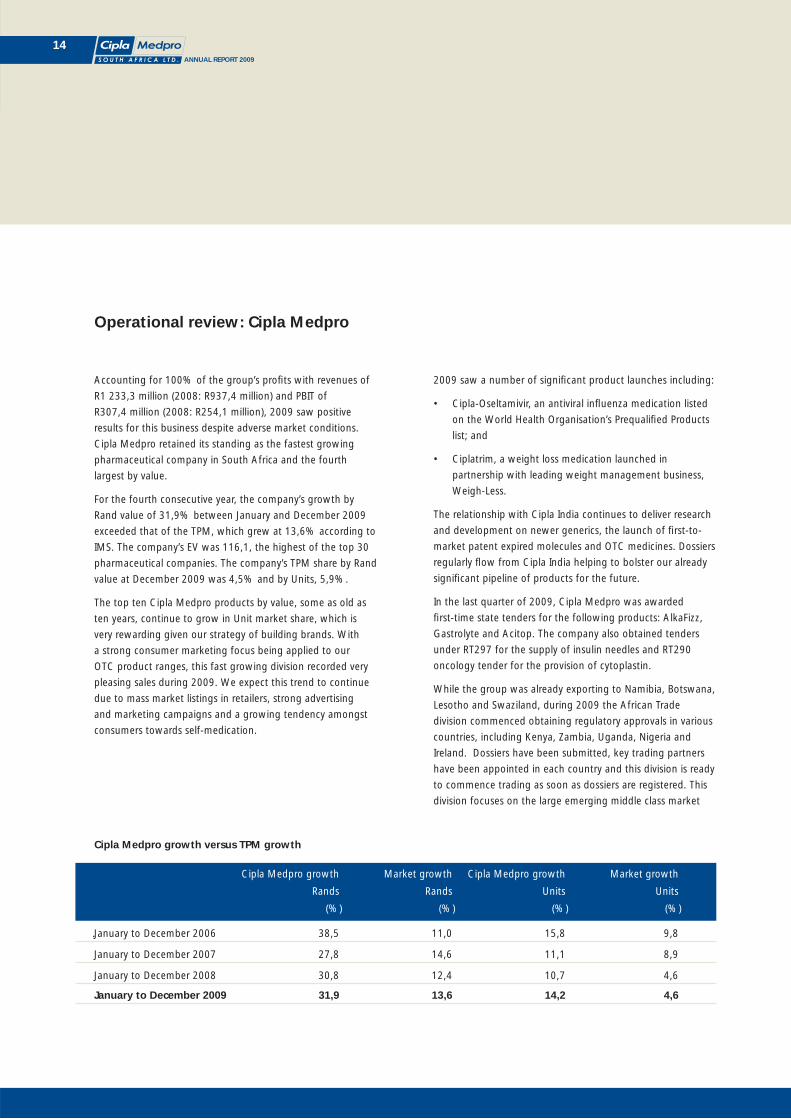
For the fourth consecutive year, the company’s growth by
Rand value of 31,9% between January and December 2009
exceeded that of the TPM, which grew at 13,6% according to
IMS. The company’s EV was 116,1, the highest of the top 30
pharmaceutical companies. The company’s TPM share by Rand
value at December 2009 was 4,5% and by Units, 5,9%.
The top ten Cipla Medpro products by value, some as old as
ten years, continue to grow in Unit market share, which is
very rewarding given our strategy of building brands. With
a strong consumer marketing focus being applied to our
OTC product ranges, this fast growing division recorded very
pleasing sales during 2009. We expect this trend to continue
due to mass market listings in retailers, strong advertising
and marketing campaigns and a growing tendency amongst
consumers towards self-medication.
2009 saw a number of signifi cant product launches including:
• Cipla-Oseltamivir, an antiviral infl uenza medication listed
on the World Health Organisation’s Prequalifi ed Products
list; and
• Ciplatrim, a weight loss medication launched in
partnership with leading weight management business,
Weigh-Less.
The relationship with Cipla India continues to deliver research
and development on newer generics, the launch of fi rst-to-
market patent expired molecules and OTC medicines. Dossiers
regularly fl ow from Cipla India helping to bolster our already
signifi cant pipeline of products for the future.
In the last quarter of 2009, Cipla Medpro was awarded
fi rst-time state tenders for the following products: AlkaFizz,
Gastrolyte and Acitop. The company also obtained tenders
under RT297 for the supply of insulin needles and RT290
oncology tender for the provision of cytoplastin.
While the group was already exporting to Namibia, Botswana,
Lesotho and Swaziland, during 2009 the African Trade
division commenced obtaining regulatory approvals in various
countries, including Kenya, Zambia, Uganda, Nigeria and
Ireland. Dossiers have been submitted, key trading partners
have been appointed in each country and this division is ready
to commence trading as soon as dossiers are registered. This
division focuses on the large emerging middle class market
Cipla Medpro growth versus TPM growth
Cipla Medpro growth Market growth Cipla Medpro growth Market growth
Rands Rands Units Units
(%) (%) (%) (%)
January to December 2006 38,5 11,0 15,8 9,8
January to December 2007 27,8 14,6 11,1 8,9
January to December 2008 30,8 12,4 10,7 4,6
January to December 2009 31,9 13,6 14,2 4,6
15ANNUAL REPORT 2009
15ANNUAL REPORT 2009
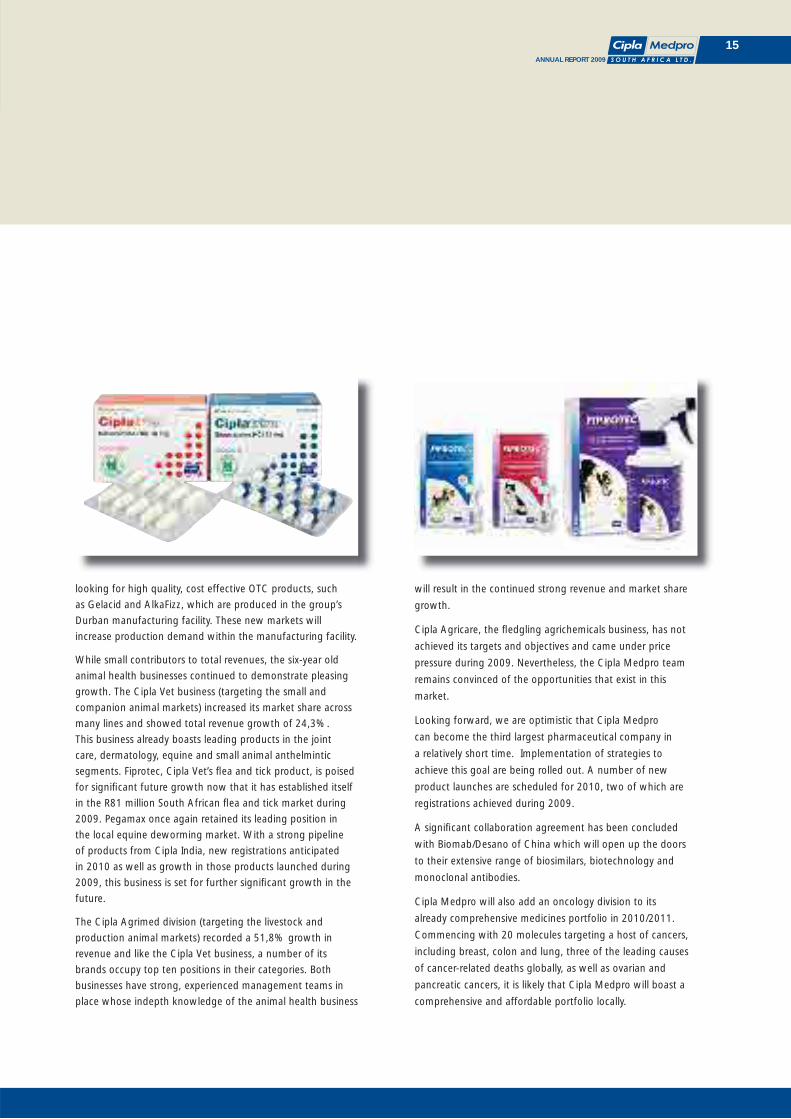
looking for high quality, cost effective OTC products, such
as Gelacid and AlkaFizz, which are produced in the group’s
Durban manufacturing facility. These new markets will
increase production demand within the manufacturing facility.
While small contributors to total revenues, the six-year old
animal health businesses continued to demonstrate pleasing
growth. The Cipla Vet business (targeting the small and
companion animal markets) increased its market share across
many lines and showed total revenue growth of 24,3%.
This business already boasts leading products in the joint
care, dermatology, equine and small animal anthelmintic
segments. Fiprotec, Cipla Vet’s fl ea and tick product, is poised
for signifi cant future growth now that it has established itself
in the R81 million South African fl ea and tick market during
2009. Pegamax once again retained its leading position in
the local equine deworming market. With a strong pipeline
of products from Cipla India, new registrations anticipated
in 2010 as well as growth in those products launched during
2009, this business is set for further signifi cant growth in the
future.
The Cipla Agrimed division (targeting the livestock and
production animal markets) recorded a 51,8% growth in
revenue and like the Cipla Vet business, a number of its
brands occupy top ten positions in their categories. Both
businesses have strong, experienced management teams in
place whose indepth knowledge of the animal health business
will result in the continued strong revenue and market share
growth.
Cipla Agricare, the fl edgling agrichemicals business, has not
achieved its targets and objectives and came under price
pressure during 2009. Nevertheless, the Cipla Medpro team
remains convinced of the opportunities that exist in this
market.
Looking forward, we are optimistic that Cipla Medpro
can become the third largest pharmaceutical company in
a relatively short time. Implementation of strategies to
achieve this goal are being rolled out. A number of new
product launches are scheduled for 2010, two of which are
registrations achieved during 2009.
A signifi cant collaboration agreement has been concluded
with Biomab/Desano of China which will open up the doors
to their extensive range of biosimilars, biotechnology and
monoclonal antibodies.
Cipla Medpro will also add an oncology division to its
already comprehensive medicines portfolio in 2010/2011.
Commencing with 20 molecules targeting a host of cancers,
including breast, colon and lung, three of the leading causes
of cancer-related deaths globally, as well as ovarian and
pancreatic cancers, it is likely that Cipla Medpro will boast a
comprehensive and affordable portfolio locally.
16ANNUAL REPORT 2009
16ANNUAL REPORT 2009
Operational review: Cipla Medpro Manufacturing
As expected, this division posted a loss of R35,6 million
before fi nance costs and income tax (2008: R15,3 million).
The main reason for the increased loss in 2009 was due
to the cancellation of the Reckitt Benckiser contract at the
end of 2008. Nevertheless, the facility made good progress
during the year and the effects of the turnaround strategy are
beginning to be evident.
Already one of South Africa’s largest manufacturing plants
and approved by the MCC, CMM successfully completed a
major upgrade to international PIC/S standards during 2009.
The facility is currently producing some of the group’s own
products – Laxette, Pynmed, AlkaFizz, Gastrolyte, Efavirenz
and Abfl ex, and additional products will be introduced during
2010.
Being one of the fi rst local manufacturers to attain PIC/S
standards enables the group to offer local and multinational
pharmaceutical companies high volume manufacturing
solutions in line with MCC cGMP and PIC/S standards. CMM
is also one of only two facilities in South Africa offering
manufacturing capability for effervescent formulations.
Three third-party manufacturing contracts with local and
multinational companies were secured during 2009. Initial
orders were conservative, however, we are optimistic that
volumes will increase as the relationships grow. Additional
contract manufacturing negotiations are ongoing and will
deliver results.
Manufacturing requirements for products awarded in the
state tenders for 2010/2011 will generate approximately
R80 million in revenues for this division too.
CMM employs 286 staff on site for whom training is
paramount. The HR and QA departments ensure ongoing
cGMP training and development across all departments and
levels in addition to the day-to-day recruitment and industrial
relations duties. A key organisational objective is to achieve a
diverse workforce broadly representative of our population,
and to provide an inclusive environment that encourages
staff development through mentorship, training and self
directed learning programmes. The HR department utilises
people development systems which use practical and effective
methodology and incorporates the best new practice.

17ANNUAL REPORT 2009
17ANNUAL REPORT 2009
The facility is uniquely designed in that there is physical
segregation between stores, primary and secondary
processing areas. This minimises the risk of contamination
and ensures material fl ow is uni-directional so as to negate
the possibility of error. All incoming materials are received in
accordance with cGMP principles and are housed in different
warehouses, i.e. primary, secondary, etc. All warehouses,
including the fi nished goods store, are temperature and
humidity controlled in accordance with the required material
storage conditions.
CMM currently has four dispensaries, each with laminar air
fl ow units designed to protect the operator and product
from exposure during dispensing activities, three granulation
suites equipped with a range of granulators and driers, one
blending room for mixing powders and granules, compression
and encapsulation departments equipped with technologically
advanced European machines which are optimised to reduce
changeover times and coating suites with state of the art
coaters. Our two high-tech coaters are capable of coating
large batch sizes in optimum time and coating capabilities
include solvent, aqueous and sugar coating.
From an engineering perspective, a fully validated,
computerised maintenance system is in place to ensure that
all preventive maintenance and calibrations are done in a
systematic, electronic and optimal format, thus signifi cantly
reducing the potential for human error. This capability
is unique in the local pharmaceutical manufacturing
environment.
Automation of packaging operations is currently receiving
attention and will be the next phase in our continuous
improvement programme for both the primary and secondary
packaging areas. CMM’s unique modular design signifi cantly
differentiates this facility from other contract manufacturers
and affords each processing and packing cubicle a dedicated
Air Handling Unit, resulting in a great deal of fl exibility which
translates into fast turnaround times.
A full engineering support team is on site to maintain the
equipment and ensure continuous machine operation
and minimise downtimes through an extensive preventive
maintenance programme, while a highly skilled team of
qualifi ed professionals across all areas and departments
ensure that quality assurance, quality systems, technology
transfer and manufacturing processes are maintained to
international standards.
18ANNUAL REPORT 2009
18ANNUAL REPORT 2009
Sustainability report
Employees
CMSA employs approximately 650 staff – 56% are employed
within its Cipla Medpro sales and distribution business and
the balance at the Cipla Medpro Manufacturing facility.
The group seeks to be an employer of choice within the
pharmaceutical sector and the HR and management teams
are dedicated to attracting and retaining the best talent and
providing employees with a working environment conducive
to career growth and advancement.
Skills development
Training requirements and programmes within the rapidly
growing group are extensive, diverse and continual. The
training department, based at the group’s head offi ce in Cape
Town, consistently evaluates training and skills development
requirements across all staff levels and divisions within the
group and implements suitable programmes which are then
monitored, and post-training support is provided when
required.
The training department works closely with the HR
department when addressing skills development needs – from
ensuring the almost 300 Durban-based manufacturing staff,
from pharmacists to cleaners, receive ongoing cGMP training
in accordance with regulatory requirements, to inducting new
recruits at all levels, to constantly keeping the medical and
product knowledge of the 175-strong national sales force
current.
Distribution Centre training – Cape Town
In 2009, 28 Cape Town-based Distribution Centre staff
underwent a Good Wholesaling Practice course which
incorporated ethics and professional practice, pharmaceutical
supply chain management, cold chain management and
occupational health and safety. Following that exam, the top
fi ve employees were enrolled in the 18-month Pharmacist’s
Assistant Basic course. Upon completion the company will
then enrol these staff members in the post-basic level course.
Both of the above programmes are ongoing. The next
Distribution Centre skills programme in Good Wholesaling
Practice and preliminary exam will take place in December
2010, with the qualifying group of the top fi ve candidates
embarking on the Pharmacist’s Assistant Basic course. The
courses cover the required unit standards and uses outcomes-
based assessments to evaluate competency, skills and
knowledge.
CMM training – Durban
The group’s Durban-based pharmaceutical manufacturing
facility operates under stringent MCC cGMP guidelines as well
as being one of the fi rst in South Africa to meet international
PIC/S standards and guidelines.
For the staff on-site training is paramount. The HR and QA
departments ensure that there is continual cGMP training,
development and assessments across all departments and
levels, in accordance with an approved training plan for the
company and each individual, whilst HR handles the day-to-
day recruitment and industrial relations duties.
In 2009/2010, the company admitted 15 employees to
the Pharmacist Assistant Learnership programme, with a
completion date in December 2010.
Further education
Financial aid was provided to ten employees at the CMM
plant and to nine employees at the Cape Town-based division
during 2009/2010, to allow employees to further their studies
through study assistance loans provided by the group.
Cipla Adelaide Tambo Healthcare Bursary
By the end of 2009, two black pharmacy students were able
to complete their Bachelor of Science degrees in Pharmacy at
the University of KwaZulu-Natal as a result of CMSA funding
provided in the form of a bursary, whilst a third pharmacy
student is due to fi nish mid-2010.
The fi rst student has recently completed his one-year
internship at the Durban manufacturing facility, the second
began her internship in January 2010, and the third will
commence his internship during the second half of 2010. The
internship programme allows the students to gain exposure in
all facets of a pharmaceutical business. Two new students will
be enrolled in the bursary scheme during 2010 with a further
three expected to start in 2011.
19ANNUAL REPORT 2009
19ANNUAL REPORT 2009
Employee health services
All of CMH’s staff are members of a compulsory medical aid
scheme and this is now being introduced to CMM employees.
CMH staff have recently joined a pension fund, while CMM
staff have remained on their provident fund.
At CMM, all employees in direct contact with product have
undergone medical assessments in 2010. Employees now
have access to an on-site clinic staffed by a doctor and
nursing sister, once a week. Awareness programmes will be
introduced to ensure the general wellness of all employees,
which include:
• An Occupational Health Management Programme
– Hazardous exposure identifi cation and
management, i.e. noise and audiograms; and
– Certifying employees fi t to work, i.e. driver
medicals.
• Compensation for Occupational Injuries and Diseases Act,
1993
– Workman’s Compensation covers IOD and
Occupational Diseases; and
– COIDA Claims Management, i.e. IODs.
• Incapacity Management (i.e. labour relations legislation)
– Absenteeism and productivity assessments;
– Rehabilitation back-to-work programmes;
– Ill health retirement assessment; and
– Substance abuse management.
• Occupational Health Education
– i.e. Noise induced hearing loss.
Human rights
The company is committed to ensure that all employees
operate in a work environment that is compliant with all
relevant charters and labour regulations. To support this
culture the relevant policies have been introduced to ensure
compliance.
Safety, health and environment
CMM is committed to developing and maintaining a work
environment that is safe and risk free.
• External audits both from potential and current customers
have been conducted, with no signifi cant fi ndings. Our
SHE department has implemented a SHE internal audit
plan since 2008 which certifi es legal compliance. All
fi ndings are noted, corrected and audited to ensure
the recommendations of the fi ndings have been
implemented.
• All employees are encouraged to report all incidents
on site. Incidents are tracked on a monthly basis and
are investigated and reported to the health and safety
committee.
• All employees and contractors complete induction
training which includes safety, health and environmental
aspects.
• Health and safety representatives on each shift,
and in each department, have been recognised and
receive ongoing and up-to-date training. In addition,
the induction procedure requires that all employees
attend SHE induction, thereby ensuring awareness and
compliance with the SHE policy at the outset.
• Regular safety meetings are held and potential risks are
identifi ed and action plans put in place to correct and
prevent the reoccurrence thereof.
• Regular, unplanned evacuation drills at the plant are
conducted to evaluate adherence to the evacuation policy
as well as to identify opportunities for improvement.
• All employees are currently monitored in a medical
surveillance programme, which is conducted at least once
a year.
20ANNUAL REPORT 2009
20ANNUAL REPORT 2009
Environment
• Pollution – all efforts are made to ensure that no
uncontrolled products or chemicals pollute the
environment. Emergency procedures and spills kits are
available on site. All persons handling chemicals have
been trained in chemical or product spill procedures.
• Waste management – all waste is sent to designated
sites and is tracked on a monthly basis. Currently
waste is comprised of general waste (non-hazardous),
microbiological waste (hazardous), chemical waste from
the lab (hazardous) and product waste (hazardous)
which is sent for safe disposal. The waste service provider
has been audited and will continue to be audited on
an annual basis. Currently paper and cardboard is
being recycled but this process has not been formally
implemented yet. Paper, cardboard and plastic recycling
will be a priority in 2010.
• Conservation of resources – a carbon footprinting exercise
is currently being undertaken and will be completed by
June 2010. In addition, power factor correction is in the
process of being implemented throughout and currently
two electric boilers are in use on site, with the plan to
only use one and save on electrical consumption. Monthly
inspections are done on all utility lines to ensure optimal
effi ciency of the energy services.
Code of ethics
A code of ethics policy has been introduced to create an
awareness of the company’s values and standards. The
company supports an environment in which personal growth
is supported and encouraged. Performance excellence is
promoted to balance current competencies with the present
and future needs of the company and in support of the
individual’s aspirations, and is in line with the company’s
Employment Equity policy and strategy.
Training and development initiatives are generally funded by
the company. Needs are identifi ed through the performance
management system and one-on-one development
discussions with their managers.
Categories of training and development required include:
• Adult Basic Education initiatives to support Affi rmative
Action and Employment Equity;
• Accelerated training and fast-tracking;
• Mentorship programmes and processes;
• Training and development for succession;
• Diversity;
• Specialised skills;
• Supervisory/managerial;
• Company specifi c skills/knowledge/values; and
• Interpersonal skills and other performance improvement
skills.
Stakeholder engagements and communication
CMSA is committed to regular, relevant and consistent
communication with all its stakeholders, including the
communities in which it operates, its customers, suppliers,
unions, shareholders, regulatory bodies and employees.
Sustainability report continued

21ANNUAL REPORT 2009
21ANNUAL REPORT 2009
Stakeholder Engagement and communication method
Employees • Regular, routine meetings across all divisions and regions.
• Notice boards visibly placed in all offi ces and departments, company-wide SMSs are
distributed regularly and a staff newsletter is circulated to disperse relevant work,
policy, procedure or corporate information, as well as the social aspects within the work
environment.
• Executive and middle management strategy meetings are held regularly.
• Staff attend regular training workshops.
• An annual sales meeting is held in Cape Town at the beginning of each year to deliver new
strategies, goals, targets and objectives for each division.
Investors and healthcare analysts • Bi-annual presentations are held for investors and healthcare analysts at the release of the
annual and interim results as required by the JSE.
• The company operates two websites containing investor related information.
• SENS announcements pertaining to corporate activity are released in terms of the
JSE requirements.
• Site visits to CMM are arranged periodically for investors.
Shareholders • Adverts are placed in the English and Afrikaans media on the day results are released.
• Annual and interim results are uploaded to the CMSA website after release on SENS.
• Shareholders may contact the CEO and CFO for disclosable information when the company
is not in a closed period.
• Annual and interim results booklets and the annual report are distributed to all investors.
• SENS announcements are released whenever the company needs to convey information
relating to directors’ share dealings or statutory corporate activity.
• A requisite AGM is held in Cape Town.
Corporate bankers and funders • The CFO and Company Secretary work closely with the corporate bankers regarding the
group’s performance, it’s fi nance requirements in the short and long-term, and foreign
exchange dealings.
Customers (consumers/patients, • A large national sales force details many of the customer groups.
healthcare providers, doctors, • Numerous advertising and marketing initiatives are undertaken within specifi ed
pharmacists, national and pharmaceutical industry parameters.
provincial departments of health, • Representatives and marketing staff regularly attend industry conferences and congresses.
medical aid societies) • Customer care call lines and a customer care e-mail address are available and advertised on
product packaging; Cipla Medpro medical department staff with signifi cant expertise deal
with product and ailment queries from consumers and medical professionals.
• Relevant corporate or product-related news is communicated via press releases and group
websites.
• CME functions are arranged and facilitated for medical practitioners/pharmacists in order
to promote industry learning and continuing education amongst practitioners.

22ANNUAL REPORT 2009
22ANNUAL REPORT 2009
Stakeholder Engagement and communication method
Pharmaceutical industry • Representation on industry bodies, such as NAPM.
Regulatory bodies • Regular site inspections and correspondence with regulatory bodies occur.
Trade unions • Employees within the bargaining unit have the opportunity to join a union of their choice.
Currently we do not have a recognised union on site, despite employees contributing to
two different unions.
Bargaining councils • The company has elected not to affi liate to a bargaining council at this time.
Suppliers • Skilled procurement departments are in place at both Cipla Medpro and CMM to negotiate
with and work closely with suppliers regarding raw and packaging material requirements.
• Supplier audits are conducted periodically.
• The BEE status of suppliers is ascertained in line with CMSA’s BEE policy.
Partners • Senior staff from both divisions work closely with Cipla India.
• Site visits in South Africa and India are regularly arranged.
• Best practice, advice and knowledge is shared freely.
• Dedicated technology transfer teams work closely with all partners to facilitate the smooth
introduction of new products into the manufacturing facility.
Sustainability report continued
23ANNUAL REPORT 2009
23ANNUAL REPORT 2009
Transformation
CMSA is committed to BBBEE and to that end seeks to drive
empowerment within its operations, and externally such as via
procurement. The company strives to:
• Be an equal opportunity employer, giving preference to
and increase the number of employees from previously
disadvantaged communities;
• Foster a culture of equity for all employees and awareness
of diversity; and
• Empower employees through incentive schemes and
upliftment projects, such as numeracy and literacy
training for CMM staff.
BEE ownership is currently in excess of 30% and the current
board includes fi ve black directors, which ensures 62,5%
representation. The board also comprises 25% black female
directors. Currently 274 of the 286 CMM staff (more than
95%) are HDI individuals.
Corporate Social Investment
The board and management of CMSA acknowledge their
responsibility towards the community in which it operates
and a number of CSI initiatives were undertaken during
2009. In addition to the Cipla Adelaide Tambo Healthcare
Bursary scheme and Cipla Medpro’s ongoing Diamond Smile
sponsorship of Operation Smile SA, Cipla Medpro last year
held a fundraising dinner/celebrity auction in benefi t of the
Peninsula School Feeding Scheme. This was the second
year such an event had been arranged. 2008’s event raised
enough money to sponsor meals for children at two schools
for the year. The 2009 event raised enough funds to continue
providing meals every day for 2010 to the two existing
schools as well as for learners at another two schools.
At the end of 2009 and into 2010, the company once
again underwrote the costs of the third Cipla Miles for
Smiles Challenge, where this time well known chef and
extreme adventurer David Grier became the fi rst to kayak
solo from Mozambique to Madagascar, thereafter running
approximately 2 500 km up the length of the island. Again
the challenge and subsequent fundraising drive which will
continue through much of 2010, was to raise funds to enable
Operation Smile SA to facilitate the much needed surgical
missions in rural areas to correct children’s cleft lips and/or
palates.

24ANNUAL REPORT 2009
24ANNUAL REPORT 2009
Corporate governance
CMSA subscribes to a culture of openness, integrity
and accountability in terms of its corporate governance
philosophy. To that end it strives to continuously monitor,
assess and improve all operational and corporate practices in
order to best comply with the principles and practices of the
King III Report.
The board is of the view that, save for items specifi cally
disclosed hereunder, the company has complied with
the principles of King II during the year under review.
The company is currently reviewing and updating, where
appropriate, all documents and policies to ensure we are in
compliance with the guidelines of King III, which became
effective from 1 March 2010.
Board of directors
The board of directors comprises six non-executive directors
(four of which are independent) and two executive directors.
The roles of Chairman and CEO are separate in accordance
with best practice principles. Independent non-executive
director S’bu Luthuli chairs the board. During November 2009,
Dr Mahlati resigned and in March 2010, two independent
non-executive director appointments were made, viz. Messrs
du Preez and Zungu. In accordance with the requirements
of the King III Report, the board has satisfi ed itself that each
independent director does not have any business interests or
other relationship that could interfere materially with their
capacity to act in an independent manner. The names and
brief curriculum vitas of the directors are set out on pages 12
and 13 of this report.
The board of CMSA has been established to retain full and
effective control over the company and its subsidiaries. It
functions in accordance with a formal board charter and its
responsibilities include, inter alia:
• Giving strategic direction to the company;
• Ensuring that procedures and practices are in place to
protect the company’s assets and reputation;
• Monitoring and evaluating the implementation of
strategies, policies, management performance and
business plans;
• Ensuring that the company complies with relevant laws,
regulations and codes of best practice;
• Assessing its performance and effectiveness, as a whole,
and of the individual directors;
• Ensuring that the company has a succession plan for its
executive directors; and
• Familiarising itself with issues of concern to stakeholders.
All directors have unrestricted access to all company
information, records, documents and property. Directors
receive detailed information packs on all operating
subsidiaries and group affairs to facilitate effective preparation
and decision making. Non-executive directors have full access
to management and the Company Secretary, and may seek
independent professional advice at the company’s expense.
Directors must at all times observe the legal requirements
in respect of the declaration of interests and do everything
reasonably possible to avoid a confl ict of interest in the
execution of their duties. Any possible confl ict of interest must
at all times be declared upfront and the director concerned
may not participate in a discussion, or vote, on the subject
matter. Directors must observe the provisions of the buying
or selling of their shares in respect of any relevant rules,
legislative or regulatory procedures. Directors are prohibited
from any share dealings in closed periods and are required to
obtain clearance from the CEO, CFO or Company Secretary
prior to trading in the company’s shares; directors are obliged
to provide the CFO with all information required by the
company to comply with its disclosure duties in terms of the
Listings Requirements of the JSE by no later than 24 hours
after the share dealing.
25ANNUAL REPORT 2009
25ANNUAL REPORT 2009
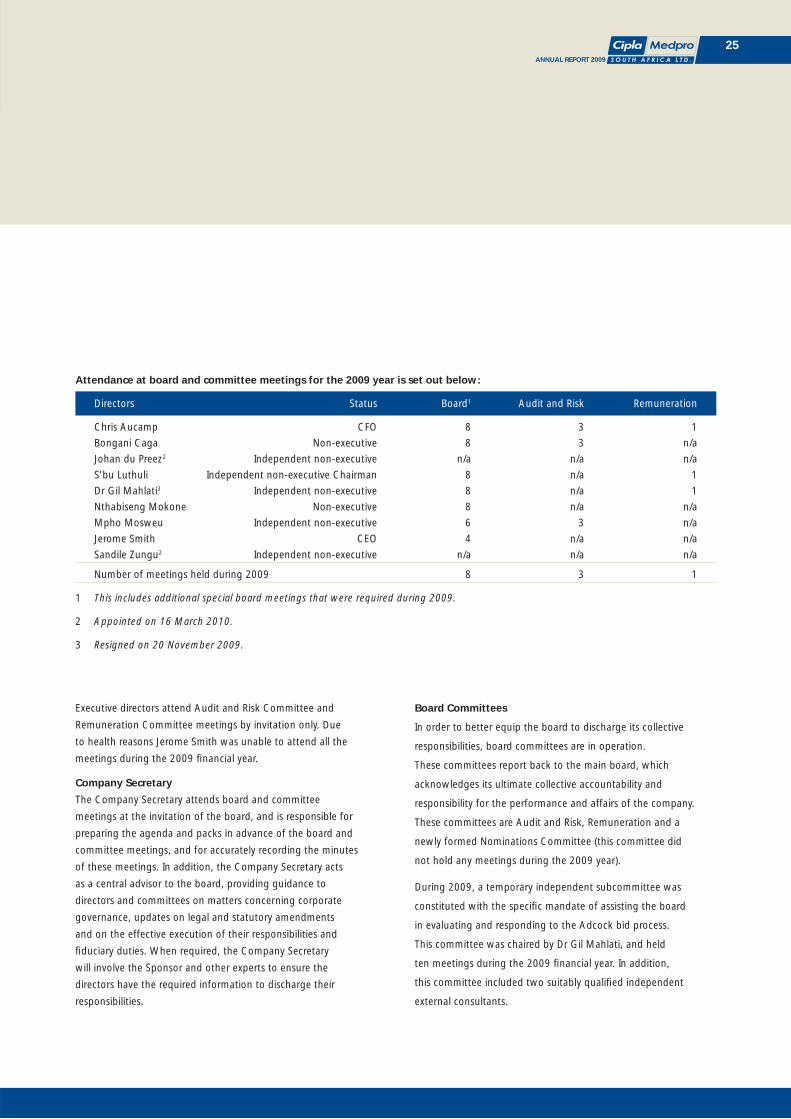
Executive directors attend Audit and Risk Committee and
Remuneration Committee meetings by invitation only. Due
to health reasons Jerome Smith was unable to attend all the
meetings during the 2009 fi nancial year.
Company Secretary
The Company Secretary attends board and committee
meetings at the invitation of the board, and is responsible for
preparing the agenda and packs in advance of the board and
committee meetings, and for accurately recording the minutes
of these meetings. In addition, the Company Secretary acts
as a central advisor to the board, providing guidance to
directors and committees on matters concerning corporate
governance, updates on legal and statutory amendments
and on the effective execution of their responsibilities and
fi duciary duties. When required, the Company Secretary
will involve the Sponsor and other experts to ensure the
directors have the required information to discharge their
responsibilities.
Board Committees
In order to better equip the board to discharge its collective
responsibilities, board committees are in operation.
These committees report back to the main board, which
acknowledges its ultimate collective accountability and
responsibility for the performance and affairs of the company.
These committees are Audit and Risk, Remuneration and a
newly formed Nominations Committee (this committee did
not hold any meetings during the 2009 year).
During 2009, a temporary independent subcommittee was
constituted with the specifi c mandate of assisting the board
in evaluating and responding to the Adcock bid process.
This committee was chaired by Dr Gil Mahlati, and held
ten meetings during the 2009 fi nancial year. In addition,
this committee included two suitably qualifi ed independent
external consultants.
Attendance at board and committee meetings for the 2009 year is set out below:
Directors Status Board1 Audit and Risk Remuneration
Chris Aucamp CFO 8 3 1
Bongani Caga Non-executive 8 3 n/a
Johan du Preez2 Independent non-executive n/a n/a n/a
S’bu Luthuli Independent non-executive Chairman 8 n/a 1
Dr Gil Mahlati3 Independent non-executive 8 n/a 1
Nthabiseng Mokone Non-executive 8 n/a n/a
Mpho Mosweu Independent non-executive 6 3 n/a
Jerome Smith CEO 4 n/a n/a
Sandile Zungu2 Independent non-executive n/a n/a n/a
Number of meetings held during 2009 8 3 1
1 This includes additional special board meetings that were required during 2009.
2 Appointed on 16 March 2010.
3 Resigned on 20 November 2009.

26ANNUAL REPORT 2009
26ANNUAL REPORT 2009
Corporate governance continued
Audit and Risk Committee
The Audit and Risk Committee consists of two members, both
of whom are non-executive directors, and are appropriately
qualifi ed for their roles on the committee. The committee
functions in accordance with its terms of reference as
approved by the board. The committee is chaired by Mpho
Mosweu and meets at appropriate times during the year to
assist the board with all matters relating to external reporting
and risk management including:
• Reviewing publicly released fi nancial information;
• Establishing processes for monitoring the effectiveness of
internal controls and safeguarding of assets;
• Developing risk management strategies;
• Appointment and monitoring of independent external
auditors, approving their fees and setting principles for
utilising the external auditors for non-audit services;
• Compliance with statutory and regulatory services; and
• Review of the group’s insurance portfolio and foreign
exchange risk management policies.
The external and internal auditors have unrestricted access
to the Chairperson of the committee and report to the
committee at each meeting in accordance with established
principles. The CFO and Company Secretary attend meetings
of the committee by invitation only and were in attendance
at all meetings of the committee held during the year under
review. In addition, the external and internal auditors attend
the meetings by invitation.
In order to comply with the King III Report and the proposed
new Companies Act, the board has resolved to restructure
the committee in order to comprise three independent non-
executive directors. Mpho Mosweu will continue to chair the
committee, but Bongani Caga will step down and Sandile
Zungu and Johan du Preez will join the committee in 2010.
With appropriate input from the Audit and Risk Committee,
the board regularly reviews the effectiveness of the company’s
risk management and internal control systems. These systems are designed to ensure the accuracy of fi nancial reporting and to safeguard the company’s assets. The systems include documented organisation structures and operating policies and procedures. The board’s risk management strategy includes matters relating to enterprise risk, including strategic, operational, fi nancial and compliance risks.
Internal auditWorking together with the group’s external auditors, Mazars, the group Internal Audit Manager reports into the Audit and Risk Committee to assist the company in further formalising and managing its risk management process. An external fi rm of auditors, RAFT Consulting, assists the group Internal Audit Manager in discharging her responsibilities to the Audit and Risk Committee.
Remuneration CommitteeThe Remuneration Committee consists of two members, both of whom are non-executive directors. The committee functions in accordance with a formal charter approved by the board. During 2009, the committee was chaired by Dr Gil Mahlati who resigned late in the year. His position as Remuneration Committee Chairman has been replaced by Johan du Preez. S’bu Luthuli will remain as the second member of the committee.
The committee meets at appropriate times during the year to assist the board with all matters relating to the reward and retention of directors and senior executives in the group including:
• Appraisal of the performance of executive directors;
• Determining the conditions of employment, service agreements and basic remuneration for executives;
• Developing appropriate short and long-term incentives for executives;
• Recommending fees for non-executive directors;
• Setting the policy for the company’s share option scheme; and
• Monitoring executive succession planning.

27ANNUAL REPORT 2009
27ANNUAL REPORT 2009
Nominations Committee
This newly formed committee was established to ensure
that the board is suitably constituted taking into account
skills requirements, experience and diversity required to lead
the group forward, as well as to assume responsibility to
shareholders for the strategic direction of the CMSA group.
A key requirement is to ensure that the majority of the board
members are non-executive directors, and that the majority of
these members are independent.
The Nominations Committee is chaired by S’bu Luthuli and
has as its responsibilities:
• To identify and recommend suitable candidates as non-
executive board and/or committee members; and
• To ensure succession plans and strategies for the group
CEO and key senior executives within the business.
28ANNUAL REPORT 2009
Directors’ responsibility statement
The directors are responsible for the preparation and fair presentation of the group annual fi nancial statements and the annual fi nancial
statements of Cipla Medpro South Africa Limited, comprising the statements of fi nancial position at 31 December 2009, and the statements
of comprehensive income, the statements of changes in equity and statements of cash fl ow for the year then ended, and the notes to the
fi nancial statements, which include a summary of signifi cant accounting policies and other explanatory notes, and the directors’ report, in
accordance with International Financial Reporting Standards and in the manner required by the Companies Act of South Africa.
The directors’ responsibility includes: designing, implementing and maintaining internal control relevant to the preparation and fair
presentation of fi nancial statements that are free from material misstatement, whether due to fraud or error; selecting and applying
appropriate accounting policies; and making accounting estimates that are reasonable in the circumstances.
The directors’ responsibility also includes maintaining adequate accounting records and an effective system of risk management.
The directors have made an assessment of the group and company’s ability to continue as a going concern and there is no reason to believe
these businesses will not be going concerns in the year ahead.
The auditor is responsible for reporting on whether the group annual fi nancial statements and the annual fi nancial statements of Cipla
Medpro South Africa Limited are fairly presented in accordance with the applicable fi nancial reporting framework.
Approval of the group annual fi nancial statements and the annual fi nancial statements of Cipla Medpro South Africa Limited
The group annual fi nancial statements and annual fi nancial statements of Cipla Medpro South Africa Limited, as identifi ed in the fi rst
paragraph, for the year ended 31 December 2009, set out on pages 31 to 95, were approved by the board of directors on 15 April 2010 and
signed on their behalf by:
PCS Luthuli JS Smith
Chairman CEO
Durban
15 April 2010
29ANNUAL REPORT 2009
Company Secretary’s report
I, Mark Daly, Company Secretary of Cipla Medpro South Africa Limited, certify that, to the best of my knowledge and belief, all returns as are
required of a public company have, in respect of the year ended 31 December 2009, been lodged with the Registrar of Companies and that
all such returns are true, correct and up to date.
MW Daly
Company Secretary
Durban
15 April 2010

30ANNUAL REPORT 2009
Independent Auditor’s report to the members of Cipla Medpro South Africa Limited
Report on the annual fi nancial statements
We have audited the group annual fi nancial statements and the annual fi nancial statements of Cipla Medpro South Africa Limited,
which comprise the consolidated and separate statements of fi nancial position at 31 December 2009, and the consolidated and separate
statements of comprehensive income, the consolidated and separate statements of changes in equity and consolidated and separate
statements of cash fl ow for the year then ended, and the notes to the fi nancial statements which include a summary of signifi cant
accounting policies and other explanatory notes, and the directors’ report, as set out on pages 31 to 95.
Directors’ responsibility for the fi nancial statements
The company’s directors are responsible for the preparation and fair presentation of these fi nancial statements in accordance with
International Financial Reporting Standards, and in the manner required by the Companies Act of South Africa. This responsibility includes:
designing, implementing and maintaining internal control relevant to the preparation and fair presentation of fi nancial statements that
are free from material misstatement, whether due to fraud or error; selecting and applying appropriate accounting policies; and making
accounting estimates that are reasonable in the circumstances.
Auditor’s responsibility
Our responsibility is to express an opinion on these fi nancial statements based on our audit. We conducted our audit in accordance with
International Standards on Auditing. Those standards require that we comply with ethical requirements and plan and perform the audit to
obtain reasonable assurance whether the fi nancial statements are free from material misstatement.
An audit involves performing procedures to obtain audit evidence about the amounts and disclosures in the fi nancial statements. The
procedures selected depend on the auditor’s judgement, including the assessment of the risks of material misstatement of the fi nancial
statements, whether due to fraud or error. In making those risk assessments, the auditor considers internal control relevant to the entity’s
preparation and fair presentation of the fi nancial statements in order to design audit procedures that are appropriate in the circumstances,
but not for the purpose of expressing an opinion on the effectiveness of the entity’s internal control. An audit also includes evaluating the
appropriateness of accounting policies used and the reasonableness of accounting estimates made by management, as well as evaluating the
overall presentation of the fi nancial statements.
We believe that the audit evidence we have obtained is suffi cient and appropriate to provide a basis for our audit opinion.
Opinion
In our opinion, these fi nancial statements present fairly, in all material respects, the consolidated and separate fi nancial position of Cipla
Medpro South Africa Limited at 31 December 2009, and its consolidated and separate fi nancial performance and consolidated and separate
cash fl ows for the year then ended in accordance with International Financial Reporting Standards, and in the manner required by the
Companies Act of South Africa.
Mazars Mazars House
Registered Auditor Rialto Road
Partner: Conrad Burger Grand Moorings Precinct
Registered Auditor Century City
7441
15 April 2010

31ANNUAL REPORT 2009
Directors’ report
The directors have pleasure in presenting their report which forms part of the audited annual fi nancial statements of Cipla Medpro South
Africa Limited and the consolidated fi nancial statements of the group for the year ended 31 December 2009.
The directors are pleased to announce a satisfactory set of annual results for 2009. The year in review saw good progress in both divisions,
with Cipla Medpro growth continuing to outperform that of the Total Private Market.
Nature of business
Cipla Medpro South Africa Limited is one of the leading pharmaceutical companies in South Africa. The group engages in the manufacture,
marketing and supply of pharmaceutical products.
Financial results and review of operations
The fi nancial results of the group for the year ended 31 December 2009 are set out in the attached fi nancial statements.
The review of operations for the year is fully covered in the Chairman’s, CEO’s and CFO’s reports.
Acquisitions and disposals of businesses
During January 2009, the group acquired a 50% controlling interest in Medpro Pharmaceutica Africa (Pty) Limited. Details of this acquisition
are set out in note 24 of the fi nancial statements. This acquisition has been accounted for under IFRS 3 Business Combinations and
IAS 38 Intangible Assets.
Subsidiary companies
Details of the subsidiary companies are set out in note 19 and Annexure A of the fi nancial statements.
Capital expenditure
The upgrade of Cipla Medpro Manufacturing’s 4 000 square metre Mobeni site and pharmaceutical manufacturing facility is substantially
complete having commenced during January 2007. The R311 million upgrade has seen Cipla Medpro Manufacturing become one of the fi rst
PIC/S compliant facilities in South Africa, matching the highest standards for pharmaceutical manufacturers in the world.
Dividends
No dividend has been declared during the year and none has been recommended (2008: Rnil). At 31 December 2009, the dividend policy
was that all earnings generated by the group be used to repay debt and fund growth opportunities. However, on 19 March 2010, the
company announced that a dividend policy for the 2010 fi nancial year (with a dividend yield of between 1,8% and 2,0%, split between an
interim and fi nal dividend) had been approved by the board. It is therefore anticipated that an interim dividend for the six months ending
30 June 2010 will be paid to shareholders.
Share capital
The authorised share capital of the company comprises 500 000 000 ordinary shares of 0,1 cent each and the issued share capital of the
company is R449 856 (consisting of 449 856 116 ordinary shares of 0,1 cent each) (2008: R443 266 consisting of 443 265 635 ordinary
shares of 0,1 cent each).
At the AGM of the company held on 22 July 2009, the requisite majority of Cipla Medpro South Africa Limited shareholders approved
an ordinary resolution placing the control of 10% of the authorised but unissued share capital of the company under the authority of
the directors. In accordance with such general authority the company issued 6 590 481 ordinary shares to the CMSA Share Option Trust,
equating to approximately 1,5% of the company’s issued share capital at 31 December 2009. The shares were issued at an average price of
R3,29 per share, representing the 30-day volume weighted average market price of the company’s shares preceding the May 2008 and June
2009 option grant dates. These shares were listed on the JSE on 27 November 2009 and rank pari passu with the existing ordinary shares of
the company.
The following shareholders own more than 5% of the issued share capital of the company:
• Sweet Sensation 67 (Pty) Limited is the owner of 82 000 000 ordinary shares in the company, equivalent to 18,2% of the issued share
capital;
• The Government Employees Pension Fund owns 37 580 267 ordinary shares in the company, equivalent to 8,4% of the issued share
capital; and
• Liberty Life Association of Africa Limited owns 33 795 198 ordinary shares in the company, equivalent to 7,5% of the issued share
capital.
The unissued share capital is under the control of the directors of the company until the next AGM of shareholders. Further details of the
authorised and issued share capital of the company are given in note 11 of the annual fi nancial statements.
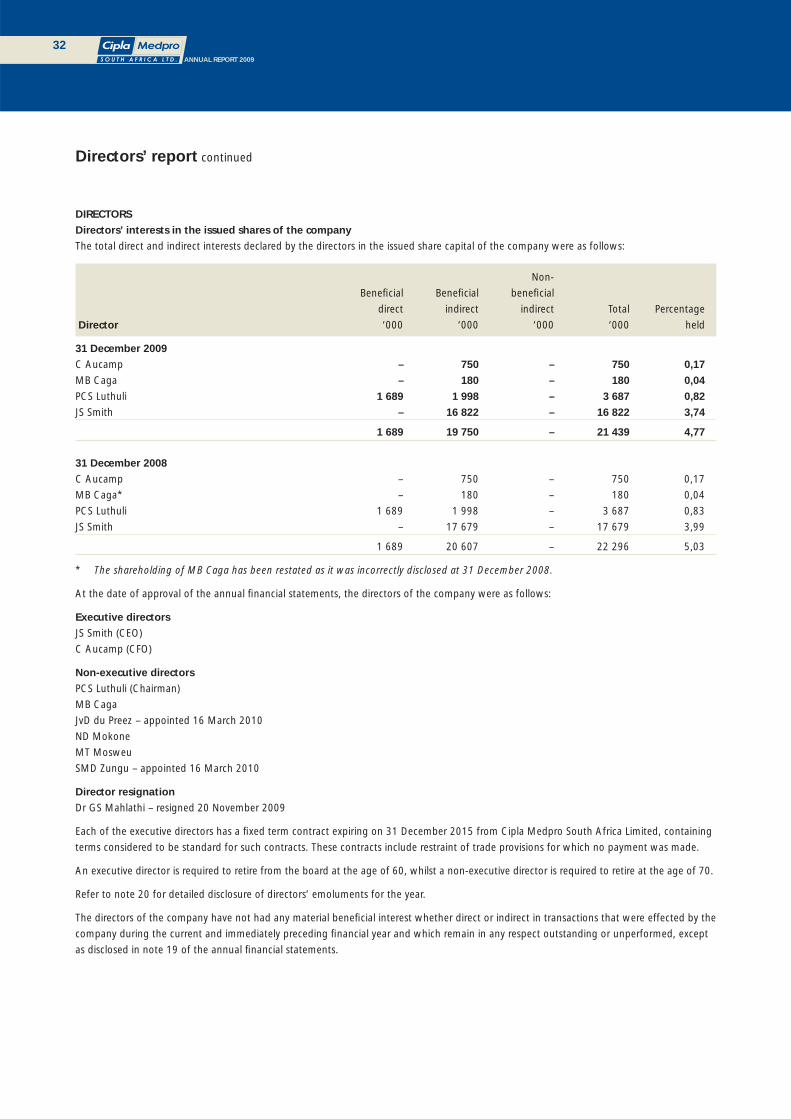
32ANNUAL REPORT 2009
DIRECTORS
Directors’ interests in the issued shares of the company
The total direct and indirect interests declared by the directors in the issued share capital of the company were as follows:
Non-
Benefi cial Benefi cial benefi cial
direct indirect indirect Total Percentage
Director ‘000 ‘000 ‘000 ‘000 held
31 December 2009
C Aucamp – 750 – 750 0,17
MB Caga – 180 – 180 0,04
PCS Luthuli 1 689 1 998 – 3 687 0,82
JS Smith – 16 822 – 16 822 3,74
1 689 19 750 – 21 439 4,77
31 December 2008
C Aucamp – 750 – 750 0,17
MB Caga* – 180 – 180 0,04
PCS Luthuli 1 689 1 998 – 3 687 0,83
JS Smith – 17 679 – 17 679 3,99
1 689 20 607 – 22 296 5,03
* The shareholding of MB Caga has been restated as it was incorrectly disclosed at 31 December 2008.
At the date of approval of the annual fi nancial statements, the directors of the company were as follows:
Executive directors
JS Smith (CEO)
C Aucamp (CFO)
Non-executive directors
PCS Luthuli (Chairman)
MB Caga
JvD du Preez – appointed 16 March 2010
ND Mokone
MT Mosweu
SMD Zungu – appointed 16 March 2010
Director resignation
Dr GS Mahlathi – resigned 20 November 2009
Each of the executive directors has a fi xed term contract expiring on 31 December 2015 from Cipla Medpro South Africa Limited, containing
terms considered to be standard for such contracts. These contracts include restraint of trade provisions for which no payment was made.
An executive director is required to retire from the board at the age of 60, whilst a non-executive director is required to retire at the age of 70.
Refer to note 20 for detailed disclosure of directors’ emoluments for the year.
The directors of the company have not had any material benefi cial interest whether direct or indirect in transactions that were effected by the
company during the current and immediately preceding fi nancial year and which remain in any respect outstanding or unperformed, except
as disclosed in note 19 of the annual fi nancial statements.
Directors’ report continued

33ANNUAL REPORT 2009
Special resolutions
At the AGM held in July 2009, shareholders approved, via special resolution, for the company and/or its subsidiaries by way of a general
approval contemplated in sections 85 (2) and 85 (3) of the Companies Act, to acquire the issued ordinary shares of the company, upon such
terms and conditions and in such amounts as the directors of the company may from time to time determine, but subject to the Articles of
Association of the company, the provisions of the Companies Act and the JSE Listings Requirements, and the provisos as listed in the notice
of meeting dated 17 June 2009 included in the 2008 group annual report.
Going concern
The directors consider that the company and the group have adequate resources to continue operating for the foreseeable future. It is
therefore appropriate to adopt the going concern basis in preparing the company and group annual fi nancial statements. The directors
are satisfi ed that the group is in a sound fi nancial position and has access to adequate borrowing facilities to meet its foreseeable cash
requirements.
Auditors
The auditors of the company are Mazars.
Company Secretary
The business and postal addresses of the Company Secretary, which are also the registered addresses of the company, are as refl ected below:
Registered offi ce Postal address
1474 South Coast Road PO Box 32003
Mobeni Mobeni
4052 4060
Subsequent events
The directors are not aware of any matter or circumstance which is material to the fi nancial affairs of the company and the group, which has
occurred between 31 December 2009 and the date of approval of the annual fi nancial statements, that has not been otherwise dealt with in
the company and group annual fi nancial statements.
PCS Luthuli JS Smith
Chairman CEO
Durban
15 April 2010

34ANNUAL REPORT 2009
Statements of fi nancial position as at 31 December
GROUP GROUP COMPANY COMPANY
2009 2008 2009 2008
Notes R’000 R’000 R’000 R’000
ASSETS
Non-current assets
Property, plant and equipment 3 389 012 287 174 316 599 239 841
Intangible assets 4 1 428 577 1 402 745 1 427 1 427
Investments in subsidiaries 5 – – 831 185 834 154
Other investments 6 4 4 – –
Loans receivable 7 – – 23 304 7 959
Deferred tax 8 18 695 7 100 16 879 6 614
Total non-current assets 1 836 288 1 697 023 1 189 394 1 089 995
Current assets
Inventory 9 181 673 190 542 12 213 4 500
Income tax receivable 1 137 1 135 1 117 1 117
Trade and other receivables, including derivatives 10 230 970 222 839 39 078 68 460
Loans receivable 7 5 162 3 505 2 162 345
Cash and cash equivalents 23.4 3 683 40 251 160 170
Total current assets 422 625 458 272 54 730 74 592
Total assets 2 258 913 2 155 295 1 244 124 1 164 587
EQUITY
Issued share capital 11 450 443 450 443
Share premium 11 1 040 924 1 019 296 1 040 924 1 019 296
Treasury shares 11 (23 304) (7 970) – –
Retained earnings 558 475 392 515 (12 225) 8 627
Total equity attributable to equity holders of the parent 1 576 545 1 404 284 1 029 149 1 028 366
Non-controlling interest 11 3 822 1 640 – –
Total equity 1 580 367 1 405 924 1 029 149 1 028 366
LIABILITIES
Non-current liabilities
Loans and borrowings 12 346 376 344 470 27 106 –
Accrued operating leases 2 403 554 2 072 –
Amounts due to subsidiaries 5 – – 113 312 90 038
Deferred tax 8 9 542 1 794 – –
Total non-current liabilities 358 321 346 818 142 490 90 038
Current liabilities
Bank overdrafts 23.4 63 826 8 542 50 028 8 542
Loans and borrowings 12 8 430 1 926 7 968 1 926
Income tax payable 11 793 15 298 – –
Trade and other payables, including derivatives 13 236 176 376 787 14 489 35 715
Total current liabilities 320 225 402 553 72 485 46 183
Total liabilities 678 546 749 371 214 975 136 221
Total equity and liabilities 2 258 913 2 155 295 1 244 124 1 164 587

35ANNUAL REPORT 2009
Statements of comprehensive income for the years ended 31 December
GROUP GROUP COMPANY COMPANY
2009 2008 2009 2008
Notes R’000 R’000 R’000 R’000
Revenue 1 262 058 994 892 49 210 58 191
Cost of sales (641 700) (501 553) (53 480) (53 011)
Gross profi t 620 358 493 339 (4 270) 5 180
Other income 6 426 7 256 13 882 13 619
Selling and distribution expenses (224 200) (164 712) (11 266) (7 839)
Administrative expenses (93 687) (81 267) (27 585) (20 760)
Other expenses (47 520) (27 096) (6 527) (5 813)
Profi t (loss) before fi nance costs and income tax 14 261 377 227 520 (35 766) (15 613)
Net fi nance costs and fi nance income 15 (22 873) (34 873) (1 407) 2 135
Finance costs (28 227) (64 897) (5 801) (813)
Finance income 5 354 30 024 4 394 2 948
Profi t (loss) before income tax 238 504 192 647 (37 173) (13 478)
Income tax expense 16 (76 418) (62 593) 10 265 2 556
Profi t (loss) for the year 162 086 130 054 (26 908) (10 922)
Profi t (loss) attributable to:
Equity holders of the parent 159 904 128 679 (26 908) (10 922)
Non-controlling interest 2 182 1 375 – –
Profi t (loss) for the year 162 086 130 054 (26 908) (10 922)
Other comprehensive income for the year (net of income tax) – – – –
Total comprehensive income (loss) for the year 162 086 130 054 (26 908) (10 922)
Total comprehensive income (loss) attributable to:
Equity holders of the parent 159 904 128 679 (26 908) (10 922)
Non-controlling interest 2 182 1 375 – –
Total comprehensive income (loss) for the year 162 086 130 054 (26 908) (10 922)
Earnings per share:
Basic earnings per share (cents) 17 36,3 29,3
Diluted earnings per share (cents) 17 36,3 29,2

36ANNUAL REPORT 2009
Statements of changes in equity for the years ended 31 December
Attributable to equity holders of the parent
Non-
Share Share Treasury Retained controlling Total
capital premium shares earnings Total interest equity
Notes R’000 R’000 R’000 R’000 R’000 R’000 R’000
GROUP
Balance at 1 January 2008 443 1 019 296 (8 707) 259 190 1 270 222 152 1 270 374
Total comprehensive income for the year – – – 128 679 128 679 1 375 130 054
Shares issued from the CMSA
Share Option Trust – – 737 – 737 – 737
IFRS 2 Share-based Payments 22 – – – 4 646 4 646 – 4 646
Acquisition of non-controlling interest – – – – – 113 113
Balance at 31 December 2008 443 1 019 296 (7 970) 392 515 1 404 284 1 640 1 405 924
Total comprehensive income for the year – – – 159 904 159 904 2 182 162 086
Issue of share capital 11 7 21 654 – – 21 661 – 21 661
Share issue expenses 11 – (26) – – (26) – (26)
Shares issued from the CMSA
Share Option Trust – – 6 327 – 6 327 – 6 327
Shares acquired by the CMSA
Share Option Trust – – (21 661) – (21 661) – (21 661)
IFRS 2 Share-based Payments 22 – – – 6 056 6 056 – 6 056
Balance at 31 December 2009 450 1 040 924 (23 304) 558 475 1 576 545 3 822 1 580 367
COMPANY
Balance at 1 January 2008 443 1 019 296 – 14 903 1 034 642 – 1 034 642
Total comprehensive loss for the year – – – (10 922) (10 922) – (10 922)
IFRS 2 Share-based Payments 22 – – – 4 646 4 646 – 4 646
Balance at 31 December 2008 443 1 019 296 – 8 627 1 028 366 – 1 028 366
Total comprehensive loss for the year – – – (26 908) (26 908) – (26 908)
Issue of share capital 11 7 21 654 – – 21 661 – 21 661
Share issue expenses 11 – (26) – – (26) – (26)
IFRS 2 Share-based Payments 22 – – – 6 056 6 056 – 6 056
Balance at 31 December 2009 450 1 040 924 – (12 225) 1 029 149 – 1 029 149
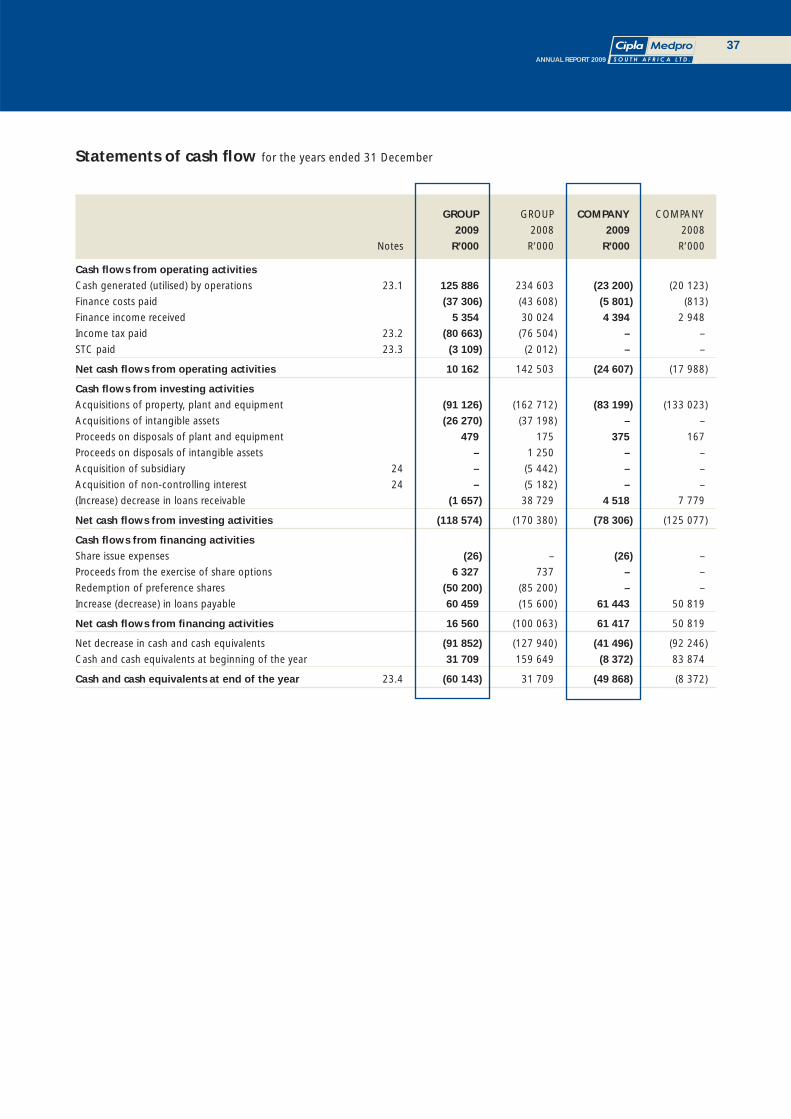
37ANNUAL REPORT 2009
Statements of cash fl ow for the years ended 31 December
GROUP GROUP COMPANY COMPANY
2009 2008 2009 2008
Notes R’000 R’000 R’000 R’000
Cash fl ows from operating activities
Cash generated (utilised) by operations 23.1 125 886 234 603 (23 200) (20 123)
Finance costs paid (37 306) (43 608) (5 801) (813)
Finance income received 5 354 30 024 4 394 2 948
Income tax paid 23.2 (80 663) (76 504) – –
STC paid 23.3 (3 109) (2 012) – –
Net cash fl ows from operating activities 10 162 142 503 (24 607) (17 988)
Cash fl ows from investing activities
Acquisitions of property, plant and equipment (91 126) (162 712) (83 199) (133 023)
Acquisitions of intangible assets (26 270) (37 198) – –
Proceeds on disposals of plant and equipment 479 175 375 167
Proceeds on disposals of intangible assets – 1 250 – –
Acquisition of subsidiary 24 – (5 442) – –
Acquisition of non-controlling interest 24 – (5 182) – –
(Increase) decrease in loans receivable (1 657) 38 729 4 518 7 779
Net cash fl ows from investing activities (118 574) (170 380) (78 306) (125 077)
Cash fl ows from fi nancing activities
Share issue expenses (26) – (26) –
Proceeds from the exercise of share options 6 327 737 – –
Redemption of preference shares (50 200) (85 200) – –
Increase (decrease) in loans payable 60 459 (15 600) 61 443 50 819
Net cash fl ows from fi nancing activities 16 560 (100 063) 61 417 50 819
Net decrease in cash and cash equivalents (91 852) (127 940) (41 496) (92 246)
Cash and cash equivalents at beginning of the year 31 709 159 649 (8 372) 83 874
Cash and cash equivalents at end of the year 23.4 (60 143) 31 709 (49 868) (8 372)

38ANNUAL REPORT 2009
General informationCMSA is listed on the main board of the JSE and is domiciled in the Republic of South Africa.
These annual fi nancial statements were authorised for issue by the directors on 15 April 2010.
1. Signifi cant accounting policies a) Statement of compliance The consolidated fi nancial statements and separate company fi nancial statements have been prepared in accordance with IFRS
and interpretations adopted by the IFRIC Committee.
b) Basis of preparation The fi nancial statements are presented in ZAR, rounded to the nearest thousand. They are prepared on the historical cost basis
except for certain fi nancial assets and fi nancial liabilities that are measured at fair value. The methods used to measure fair
values are discussed in accounting policy (u).
The preparation of fi nancial statements in conformity with IFRS requires management to make judgements, estimates and
assumptions that affect the application of policies and reported amounts of assets and liabilities, income and expenses. The
estimates and associated assumptions are based on historical experience and various other factors that are believed to be
reasonable under the circumstances, the results of which form the basis of making the judgements about carrying values of
assets and liabilities that are not readily apparent from other sources. Actual results may differ from these estimates.
The estimates and underlying assumptions are reviewed on an ongoing basis. Revisions to accounting estimates are recognised
in the period in which the estimate is revised if the revision affects only that period or in the period of the revision and future
periods if the revision affects both current and future periods. Refer to note 4 (Intangible assets) and note 22 (Share options and
share-based payments) for further details.
The accounting policies set out below have been consistently applied by all group entities and to all periods presented in these
consolidated fi nancial statements, with the exception of new standards and interpretations adopted during the 2009 year (refer
to note 25).
c) Basis of consolidation (i) Investment in subsidiaries Subsidiaries are those entities controlled by the group. Control exists when the group has the power, directly or indirectly,
to govern the fi nancial and operating policies of an entity so as to obtain benefi ts from its activities. In assessing control,
potential voting rights that are presently exercisable are taken into account. The fi nancial statements of subsidiaries are
included in the consolidated fi nancial statements from the effective date that control commences until the date that
control ceases.
(ii) Special-purpose entities The group has established a SPE for the purposes of holding share options on behalf of employees of the group. The
group does not have a direct or indirect shareholding in this entity. An SPE is consolidated if, based on an evaluation of
the substance of its relationship with the group and the SPE’s risks and rewards, the group concludes that it controls the
SPE.
The SPE which is controlled by the group has been established under terms that impose strict limitations on the decision-
making powers of the SPE’s management and that result in the group receiving all of the benefi ts related to the SPE’s
operation and net assets.
(iii) Associates Associates are those entities in which the group has signifi cant infl uence, but no control, over the fi nancial and operating
policies. Signifi cant infl uence is presumed to exist when the group holds between 20 and 50 percent of the voting power
of another entity. Associates are accounted for using the equity method and are initially recognised at cost. The group’s
investment includes goodwill identifi ed on acquisition, net of any accumulated impairment losses. The consolidated
fi nancial statements include the group’s share of the income and expenses and equity movements of associates, after
adjustments to align the accounting policies with those of the group, from the date that signifi cant infl uence commences
until the date that signifi cant infl uence ceases. When the group’s share of losses exceeds its interest in an associate, the
carrying amount of that interest (including any long-term investments) is reduced to nil and the recognition of further
losses is discontinued except to the extent that the group has an obligation or has made payments on behalf of the
associate.
Notes to the fi nancial statements for the years ended 31 December
39ANNUAL REPORT 2009
1. Signifi cant accounting policies continued
c) Basis of consolidation continued
(iv) Transactions eliminated on consolidation
Intragroup balances and transactions, and any unrealised gains and losses or income and expenses arising from
intragroup transactions, are eliminated in preparing the consolidated fi nancial statements. Unrealised gains arising from
transactions with associates are eliminated against the investment to the extent of the group’s interest in the associate.
Unrealised losses are eliminated in the same way as unrealised gains, but only to the extent that there is no evidence of
impairment.
d) Foreign currency
Transactions in foreign currencies are translated into South African Rand at the foreign exchange rate ruling at the date of the
transaction. Monetary assets and liabilities denominated in foreign currencies are translated into South African Rand at the
foreign exchange rate ruling at the reporting date. Foreign exchange differences arising on translation are recognised in profi t
or loss.
Non-monetary assets and liabilities denominated in foreign currencies that are measured on the historical cost basis are
translated using the exchange rate at the date of the transaction. Non-monetary assets and liabilities denominated in foreign
currencies that are stated at fair value are translated at foreign exchange rates ruling at the dates the fair values were
determined.
e) Financial instruments
(i) Non-derivative fi nancial instruments
Non-derivative fi nancial instruments comprise investments in equity and debt securities, trade and other receivables, cash
and cash equivalents, loans and borrowings and trade and other payables.
Non-derivative fi nancial instruments are recognised initially at fair value plus, for instruments not at fair value through
profi t or loss, any directly attributable transaction costs. Subsequent to initial recognition non-derivative fi nancial
instruments are measured as described below.
A fi nancial instrument is recognised if the group becomes a party to the contractual provisions of the instrument.
Financial assets are derecognised if the group’s contractual rights to the cash fl ows from the fi nancial assets expire or if
the group transfers the fi nancial asset to another party without retaining control or substantially all risks and rewards of
the asset. Regular way purchases and sales of fi nancial assets are accounted for at trade date, i.e. the date that the group
commits itself to purchase or sell the asset. Financial liabilities are derecognised if the group’s obligations specifi ed in the
contract expire or are discharged or cancelled.
Cash and cash equivalents comprise cash balances and call deposits. Bank overdrafts that are repayable on demand and
form an integral part of the group’s cash management are included as a component of cash and cash equivalents for the
purpose of the statements of cash fl ow. Cash and cash equivalents are measured at fair value.
Accounting for fi nance income and expense is discussed in accounting policy (q).
Financial assets at fair value through profi t or loss
An instrument is classifi ed at fair value through profi t or loss if it is held for trading or is designated as such upon initial
recognition. Upon initial recognition attributable transaction costs are recognised in profi t or loss when incurred. Financial
instruments at fair value through profi t or loss are measured at fair value, and changes therein are recognised in profi t or loss.
Financial guarantees
Financial guarantees are initially measured at fair value and subsequently measured at the higher of the amount
determined in accordance with IAS 37 Provisions, Contingent Liabilities and Contingent Assets, and the amount initially
recognised less, when appropriate, cumulative amortisation recognised in accordance with IAS18 Revenue.
Other
Other non-derivative fi nancial instruments are measured at amortised cost using the effective interest method, and for
any non-derivative fi nancial assets, less any impairment losses. The discount rate used is the market rate of interest for a
similar instrument of an issuer with a similar credit rating.

40ANNUAL REPORT 2009
1. Signifi cant accounting policies continued e) Financial instruments continued
(ii) Derivative fi nancial instruments
The group holds derivative fi nancial instruments to economically hedge its foreign currency and interest rate risk
exposures. Derivatives are recognised initially at fair value; attributable transaction costs are recognised in profi t or
loss when incurred. Subsequent to initial recognition, derivatives are measured at fair value, and gains or losses are
recognised through profi t or loss. The group does not apply hedge accounting as per the requirements of
IAS 39 Financial Instruments: Recognition and Measurement.
(iii) Share capital
Ordinary shares
Ordinary shares are classifi ed as equity and carried at original cost. Incremental costs directly attributable to the issue of
new shares or options are recognised as a deduction from equity.
Treasury shares
Where any group entity purchases the company’s equity share capital (treasury shares), the consideration paid, including
any directly attributable incremental costs (net of income taxes), is deducted from equity attributable to the company’s
equity shareholders until the shares are cancelled or reissued. Where such shares are subsequently reissued, any
consideration received (net of any directly attributable incremental transaction costs and the related income tax effects) is
included in equity attributable to the company’s equity shareholders.
Preference shares
Preference shares are classifi ed as a liability if it is redeemable on a specifi c date or at the option of the shareholders or if
dividend payments are not discretionary. Dividends thereon are recognised in the statement of comprehensive income as
interest expense.
f) Property, plant and equipment
(i) Recognition and measurement
Items of property, plant and equipment are measured at cost less accumulated depreciation and accumulated impairment
losses. The cost of property, plant and equipment at 1 January 2004, the date of transition to IFRS, was determined by
reference to its fair value at that date.
Cost includes expenditure that is directly attributable to the acquisition of the asset. The cost of self-constructed assets
includes the cost of materials and direct labour, any other costs directly attributable to bringing the asset to a working
condition for its intended use, and the costs of dismantling and removing the items and restoring the site on which they
are located.
Purchased software that is integral to the functionality of the related equipment is capitalised as part of that equipment.
Borrowing costs related to the acquisition or construction of qualifying assets are capitalised in accordance with the
group’s accounting policy on borrowing costs (refer to accounting policy (j)).
When parts of an item of property, plant and equipment have different useful lives, they are accounted for as separate
items (major components) of property, plant and equipment.
Gains and losses on disposal of an item of property, plant and equipment are determined by comparing the proceeds
from disposal with the carrying amount of property, plant and equipment and are recognised within profi t or loss.
(ii) Subsequent costs
The cost of replacing part of an item of property, plant and equipment is recognised in the carrying amount of the item
if it is probable that the future economic benefi ts embodied within the part will fl ow to the group and its cost can be
measured reliably. The costs of the day-to-day servicing of property, plant and equipment are recognised in profi t or loss
as incurred.
Notes to the fi nancial statements for the years ended 31 December
41ANNUAL REPORT 2009
1. Signifi cant accounting policies continued
f) Property, plant and equipment continued
(iii) Depreciation
Depreciation is recognised in profi t or loss on a systematic basis over the estimated useful lives of each part of an item
of property, plant and equipment. Leased assets are depreciated over the shorter of the lease term and their useful lives.
Land is not depreciated.
The depreciation rates applicable to each category of property, plant and equipment are as follows:
Asset category Useful life
Leasehold improvements 5 to 16 years (2008: up to 50 years)
Plant and machinery 2 to 25 years (UOP) (2008: 5 to 15 years)
Motor vehicles 5 years
Furniture and equipment
• Offi ce furniture 5 to 6 years
• Lab equipment 3 years (UOP) (2008: 3 years)
• Computer equipment 2 to 3 years
• Computer software 3 years
• Burglar alarms 3 to 10 years
• Library assets 3 years
Depreciation methods, useful lives and residual values are reassessed at each reporting date.
g) Intangible assets
(i) Goodwill
Acquisitions prior to 1 January 2004
As part of its transition to IFRS, the group elected to restate only those business combinations that occurred on or after
1 January 2004. In respect of acquisitions prior to 1 January 2004, goodwill represents the amount recognised under the
group’s previous accounting framework, SA GAAP.
Acquisitions on or after 1 January 2004
For acquisitions on or after 1 January 2004, goodwill represents the excess of the cost of the acquisition over the group’s
interest in the net fair value of the identifi able assets, liabilities and contingent liabilities of the acquiree. When the excess
is negative (negative goodwill), it is recognised immediately in profi t or loss.
Acquisitions of non-controlling interests
Goodwill arising on the acquisition of a non-controlling interest in a subsidiary represents the residual after measuring
the cost of the additional investment and the fair value of the identifi able net assets at the date of exchange.
Subsequent measurement
Goodwill is measured at cost less accumulated impairment losses. In respect of equity-accounted investees, the carrying
amount of goodwill is included in the carrying amount of the investment.
(ii) Research and development
Expenditure on research activities, undertaken with the prospect of gaining new scientifi c or technical knowledge and
understanding, is recognised in profi t or loss when incurred.
Development activities involve a plan or design for the production of new or substantially improved products and
processes. Development expenditure is capitalised only if development costs can be measured reliably, the product or
process is technically and commercially feasible, future economic benefi ts are probable, and the group intends to and has
suffi cient resources to complete development and to use or sell the asset. The expenditure capitalised includes the cost
of materials, direct labour and overhead costs that are directly attributable to preparing the asset for its intended use.
Borrowing costs related to the development of qualifying assets are recognised in accordance with the group’s policy on
borrowing costs (refer to accounting policy (j)). Other development expenditure is recognised in profi t or loss as incurred.
Capitalised development expenditure is measured at cost less accumulated amortisation and accumulated impairment
losses.
42ANNUAL REPORT 2009
1. Signifi cant accounting policies continued
g) Intangible assets continued
(iii) Other intangible assets
The useful lives of all other intangible assets acquired by the group are assessed to determine if the useful life is fi nite or
indefi nite. Useful lives of intangible assets are reviewed at least at the end of each fi nancial year and altered if estimates
have changed signifi cantly. Any change is accounted for by changing the amortisation charge for the current and future
periods.
Intangible assets with fi nite useful lives are measured at cost less accumulated amortisation and accumulated impairment
losses. Amortisation is recognised in profi t or loss on a straight-line basis over the estimated useful lives of intangible
assets, other than goodwill, from the date that they are available for use.
Intangible assets with indefi nite useful lives and goodwill are measured at cost and are not amortised, but are tested for
impairment at least annually or whenever any indication of impairment exists.
The following intangible assets currently have an indefi nite useful life:
• Pharmaceutical dossiers;
• Trademarks and registrations; and
• Brands.
The useful life of computer software is two to three years.
(iv) Subsequent expenditure
Subsequent expenditure is capitalised only when it increases the future economic benefi ts embodied in the specifi c
asset to which it relates. All other expenditure, including expenditure on internally generated goodwill and brands, is
recognised in profi t or loss when incurred.
h) Investments in subsidiaries
The purchase method of accounting is used to account for the acquisition of subsidiaries. The cost of an acquisition is measured
as the fair value of the assets given up, equity instruments issued or liabilities incurred or assumed at the date of exchange
plus costs directly attributable to the acquisition. Identifi able assets acquired and liabilities and contingent liabilities assumed in
a business combination are measured initially at their fair values at the acquisition date, irrespective of the extent of any non-
controlling interest. The excess of the cost of acquisition over the fair value of the group’s share of the identifi able net assets
acquired is goodwill (refer to accounting policy (g)). If the cost of the acquisition is less than the fair value of the net assets of
the subsidiary acquired, the difference is recognised immediately in profi t or loss.
i) Leased assets
Leases in terms of which the group assumes substantially all the risks and rewards of ownership are classifi ed as fi nance leases.
Upon initial recognition the leased asset is measured at an amount equal to the lower of its fair value and the present value of
the minimum lease payments. Subsequent to initial recognition, the asset is accounted for in accordance with the accounting
policy applicable to that asset (refer to accounting policy (f)).
Other leases are classifi ed as operating leases whereby the leased assets are not recognised on the group’s statement of
fi nancial position.
j) Borrowing costs
Borrowing costs directly attributable to the acquisition, construction or production of qualifying assets are capitalised as part
of the cost of that asset until such time as the asset is ready for its intended use. All other borrowing costs are expensed in the
period in which they are incurred.
k) Inventories
Inventories are measured at the lower of cost and net realisable value. The cost of inventories is based on the weighted average
cost method, and includes expenditure incurred in acquiring the inventories and bringing them to their existing location and
condition. In the case of manufactured inventories and work in progress, cost includes an appropriate share of production
overheads based on normal operating capacity. Net realisable value is the estimated selling price in the ordinary course of
business, less the estimated costs of completion and selling expenses. Obsolete, redundant and slow-moving inventories are
identifi ed on a regular basis and are written down to their estimated net realisable values.
Notes to the fi nancial statements for the years ended 31 December
43ANNUAL REPORT 2009
1. Signifi cant accounting policies continued
l) Impairment
(i) Financial assets
A fi nancial asset is assessed at each reporting date to determine whether there is any objective evidence that it is
impaired. A fi nancial asset is considered to be impaired if objective evidence indicates that one or more events have had
a negative effect on the estimated future cash fl ows of that asset.
An impairment loss in respect of a fi nancial asset measured at amortised cost is calculated as the difference between its
carrying amount, and the present value of the estimated future cash fl ows discounted at the original effective interest
rate.
Individually signifi cant fi nancial assets are tested for impairment on an individual basis. The remaining fi nancial assets are
assessed collectively in groups that share similar credit risk characteristics.
All impairment losses and reversals of impairment losses are recognised in profi t or loss. An impairment loss is reversed if
the reversal can be related objectively to an event occurring after the impairment loss was recognised.
(ii) Non-fi nancial assets
The carrying amounts of the group’s non-fi nancial assets, other than inventories (refer to accounting policy (k)) and
deferred tax assets (refer to accounting policy (r)), are reviewed at each reporting date to determine whether there is any
indication of impairment. If any such indication exists, then the asset’s recoverable amount is estimated. For goodwill and
intangible assets that have indefi nite lives or that are not yet available for use, the recoverable amount is estimated at
each reporting date.
An impairment loss is recognised if the carrying amount of an asset or its cash-generating unit exceeds its recoverable
amount. A cash-generating unit is the smallest identifi able asset group that generates cash fl ows that largely are
independent from other assets and groups.
Impairment losses are recognised in profi t or loss. Impairment losses recognised in respect of cash-generating units are
allocated fi rst to reduce the carrying amount of any goodwill allocated to the units and then to reduce the carrying
amount of the other assets in the unit (group of units) on a pro rata basis.
The recoverable amount of an asset or cash-generating unit is the greater of its value in use and its fair value less costs
to sell. In assessing value in use, the estimated future cash fl ows are discounted to their present value using a pre-tax
discount rate that refl ects current market assessments of the time value of money and the risks specifi c to the asset.
An impairment loss in respect of goodwill is not reversed. In respect of other assets, impairment losses recognised in
prior periods are assessed at each reporting date for any indications that the loss has decreased or no longer exists. An
impairment loss is reversed if there has been a change in the estimates used to determine the recoverable amount. An
impairment loss is reversed only to the extent that the asset’s carrying amount does not exceed the carrying amount that
would have been determined, net of depreciation or amortisation, if no impairment loss had been recognised
m) Employee benefi ts
(i) Defi ned contribution plans
A defi ned contribution plan is a post-employment benefi t plan under which the group pays fi xed contributions to a
separate entity and will have no legal or constructive obligation to pay further amounts. Obligations for contributions to
defi ned contribution plans are recognised as an employee benefi t expense in profi t or loss when they are due.
(ii) Termination benefi ts
Termination benefi ts are recognised as an expense when the group is demonstrably committed, without realistic
possibility of withdrawal, to a formal detailed plan to either terminate employment before the normal retirement date, or
to provide termination benefi ts as a result of an offer made to encourage voluntary redundancy. Termination benefi ts for
voluntary redundancies are recognised if the group has made an offer encouraging voluntary redundancy, it is probable
that the offer will be accepted, and the number of acceptances can be estimated reliably.
44ANNUAL REPORT 2009
1. Signifi cant accounting policies continued
m) Employee benefi ts continued
(iii) Short-term benefi ts
Short-term employee benefi t obligations are measured on an undiscounted basis and are expensed as the related service
is provided.
A liability is recognised for the amount expected to be paid under short-term cash bonuses or performance bonuses
and leave pay if the group has a present legal or constructive obligation to pay this amount as a result of past service
provided by the employee and the obligation can be estimated reliably.
(iv) Share-based payment transactions
The grant date fair value of options granted to employees is recognised as an employee expense, with a corresponding
increase in equity, over the period in which the employees become unconditionally entitled to the options. The amount
recognised as an expense is adjusted to refl ect the actual number of share options that vest, except for when forfeiture is
only due to share prices not achieving the threshold for vesting.
n) Provisions
A provision is recognised if, as a result of a past event, the group has a present legal or constructive obligation that can be
estimated reliably, and it is probable that an outfl ow of economic benefi ts will be required to settle the obligation. Provisions are
determined by discounting the expected future cash fl ows at a pre-tax rate that refl ects current market assessments of the time
value of money and the risks specifi c to the liability.
Restructuring
A provision for restructuring is recognised when the group has approved a detailed and formal restructuring plan, and the
restructuring either has commenced or has been announced publicly. Future operating costs are not provided for.
o) Revenue
Goods sold
Revenue from the sale of goods is measured at the fair value of the consideration received or receivable, net of returns and
allowances, trade discounts and volume rebates, and value added tax. Revenue is recognised when the signifi cant risks and
rewards of ownership have been transferred to the buyer, recovery of the consideration is probable, the associated costs and
possible return of goods can be estimated reliably, there is no continuing management involvement with the goods and the
amount of revenue can be estimated reliably.
Transfers of risks and rewards vary depending on the individual terms of the contract of sale.
p) Lease payments
Payments made under operating leases are recognised in profi t or loss on a straight-line basis over the term of the lease.
Minimum lease payments made under fi nance leases are apportioned between the fi nance expense and the reduction of the
outstanding liability. The fi nance expense is allocated to each period during the lease term so as to produce a constant periodic
rate of interest on the remaining balance of the liability. Contingent lease payments are charged to profi t or loss in the period in
which they are incurred.
q) Finance income and expenses
Finance income comprises interest income on funds invested, dividend income and changes in the fair value of fi nancial assets
at fair value through profi t or loss. Interest income is recognised as it accrues, using the effective interest method. Dividend
income is recognised on the date that the group’s right to receive payment is established, which in the case of quoted securities
is the ex-dividend date.
Finance expenses comprise interest expense on borrowings, unwinding of the discount on provisions, dividends on preference
shares classifi ed as liabilities and changes in the fair value of fi nancial assets at fair value through profi t or loss. All borrowing
costs are recognised in profi t or loss using the effective interest method.
r) Taxation
Income tax expense comprises current and deferred tax. Income tax expense is recognised in profi t or loss except to the extent
that it relates to items recognised directly in equity, in which case it is recognised in equity.
Notes to the fi nancial statements for the years ended 31 December

45ANNUAL REPORT 2009
1. Signifi cant accounting policies continued
r) Taxation continued
Current tax is the expected tax payable on the taxable income for the year, using tax rates enacted or substantively enacted at
the reporting date, and any adjustment to tax payable in respect of previous years.
Deferred tax is recognised using the balance sheet method, providing for temporary differences between the carrying
amounts of assets and liabilities for fi nancial reporting purposes and the amounts used for taxation purposes. Deferred tax
is not recognised for the following temporary differences: the initial recognition of goodwill, the initial recognition of assets
or liabilities in a transaction that is not a business combination and that affects neither accounting nor taxable profi t, and
differences relating to investments in subsidiaries to the extent that they probably will not reverse in the foreseeable future.
Deferred tax is measured at the tax rates that are expected to be applied to the temporary differences when they reverse, based
on the laws that have been enacted or substantively enacted by the reporting date.
Deferred tax assets and liabilities are offset if there is a legally enforceable right to offset current tax liabilities and assets, and
they relate to income taxes levied by the same tax authority on the same taxable entity, or on different tax entities, but they
intend to settle current tax liabilities and assets on a net basis or their tax assets and liabilities will be realised simultaneously.
A deferred tax asset is recognised to the extent that it is probable that future taxable profi ts will be available against which
temporary differences can be utilised. Deferred tax assets are reviewed at each reporting date and are reduced to the extent
that it is no longer probable that the related tax benefi t will be realised.
Additional income taxes that arise from the distribution of dividends are recognised at the same time as the liability to pay the
related dividend is recognised.
s) Earnings per share
The group principle basic and diluted EPS data for its ordinary shares. Basic EPS is calculated by dividing the profi t or loss
attributable to ordinary shareholders of the company by the weighted average number of ordinary shares outstanding during
the period. Diluted EPS is determined by adjusting the profi t or loss attributable to ordinary shareholders and the weighted
average number of ordinary shares outstanding for the effects of all dilutive potential ordinary shares, which comprises share
options granted to employees.
t) Segment reporting
The group’s principle format for segment reporting is based on business segments. This basis is indicative of the group’s
management and internal structure for fi nancial reporting to decision makers. Geographical segments are not represented as
the group operates mainly in South Africa.
Inter-segment pricing is determined on an arm’s length basis.
Segment results, assets and liabilities include items directly attributable to a segment as well as those that can be allocated on
a reasonable basis. Unallocated items comprise mainly income tax assets and liabilities. Segment capital expenditure is the total
cost incurred during the period to acquire property, plant and equipment, and intangible assets other than goodwill.
u) Determination of fair values
A number of the group’s accounting policies and disclosures require the determination of fair value, for both fi nancial and
non-fi nancial assets and liabilities. Fair values have been determined for measurement and/or disclosure purposes based on the
following methods. Where applicable, further information about the assumptions made in determining fair values is disclosed in
the notes specifi c to that asset or liability.
(i) Property, plant and equipment
The fair value of property, plant and equipment recognised as a result of a business combination is based on market
values. The market value of property is the estimated amount for which a property could be exchanged on the date
of valuation between a willing buyer and a willing seller in an arm’s length transaction after proper marketing wherein
the parties had each acted knowledgeably, prudently and without compulsion. The market value of items of plant,
equipment, fi xtures and fi ttings is based on the quoted market prices for similar items.
(ii) Intangible assets
The fair value of intangible assets acquired in a business combination is based on the discounted estimated future cash
fl ows expected to be derived from the use and eventual sale of the assets.
46ANNUAL REPORT 2009
1. Signifi cant accounting policies continued
u) Determination of fair values continued
(iii) Inventory
The fair value of inventory acquired in a business combination is determined based on its estimated selling price in the
ordinary course of business less the estimated costs of completion and sale, and a reasonable profi t margin based on the
effort required to complete and sell the inventory.
(iv) Investments in equity securities
The fair value of fi nancial assets at fair value through profi t or loss is determined by reference to their quoted bid price at
the reporting date.
(v) Trade and other receivables
The fair value of trade and other receivables is estimated as the present value of future cash fl ows, discounted at the
market rate of interest at the reporting date.
(vi) Derivatives
The fair value of forward exchange contracts is based on their listed market price, if available. If a listed market price
is not available, then fair value is estimated by discounting the difference between the contractual forward price and
the current forward price for the residual maturity of the contract using a risk-free interest rate (based on government
bonds).
The fair value of interest rate swaps is based on broker quotes. These quotes are tested for reasonableness by discounting
estimated future cash fl ows based on the terms and maturity of each contract and using market interest rates for a
similar instrument at the reporting date.
(vii) Non-derivative fi nancial liabilities
Fair value is calculated based on the present value of future principal and interest cash fl ows, discounted at the market
rate of interest at the reporting date.
The fair value of fi nancial guarantees is the price that an independent party is willing to accept in order to assume the
risk attached to the guarantee.
(viii) Share-based payment transactions
The fair value of employee share options is measured using a binomial lattice model. Measurement inputs include share
price on measurement date, exercise price of the instrument, expected volatility, expected life of the instrument, expected
dividends, and the risk-free interest rate.
v) Government grants
Government grants relating to assets are recognised as deferred income in the statement of fi nancial position in the year that
it becomes receivable. The deferred income is recognised as income in the statement of comprehensive income over the life of
the underlying asset as the asset is depreciated.
Notes to the fi nancial statements for the years ended 31 December

47ANNUAL REPORT 2009
2. Segment reporting
The group’s indentifi cation of reportable segments under the previous IAS 14 Segment Reporting remains the same as under
IFRS 8 Operating Segments, as the group previously identifi ed primary segments on the basis of the internal reports provided to the
chief operating decision maker as described within IFRS 8; therefore the principle reportable operating segments remain as business
segments which is indicative of the group’s management and internal structure for fi nancial reporting to decision makers.
Geographical segments have not been presented as the group operates mainly in South Africa. No single customer contributes to
10% or more of the total revenue.
Inter-segment pricing is determined on an arm’s length basis.
Segment results, assets and liabilities include items directly attributable to a segment as well as those that can be allocated on a
reasonable basis.
Segment capital expenditure is the total cost incurred during the period to acquire property, plant and equipment, and intangible
assets, other than goodwill.
Group fi nancing (including fi nance costs and fi nance income) and taxes are handled on a group level and are not allocated to
operating segments.
Business segments
The basis of segmentation is representative of the manner in which the chief operating decision maker reviews the business viz. on a
factory versus non-factory basis.
The group comprises the following main business segments:
Factory: Manufacture of pharmaceutical products
Non-factory: Supply and distribution of pharmaceutical products
Head offi ce: Administrative function of the group
Factory Non-factory Head offi ce Eliminations Total
GROUP 2009 R’000 R’000 R’000 R’000 R’000
Revenue
External customers 28 710 1 233 348 – – 1 262 058
Inter-segment revenue 20 500 – – (20 500) –
Total segment revenue 49 210 1 233 348 – (20 500) 1 262 058
Segment result (35 295) 294 632 (471) 2 511 261 377
Net fi nance costs (22 873)
Income tax expense (76 418)
Profi t for the year 162 086
Segment assets 1 226 128 2 366 369 – (1 353 416) 2 239 081
Unallocated tax assets 19 832
Total assets 2 258 913
Segment liabilities 214 975 1 706 288 – (1 264 052) 657 211
Unallocated tax liabilities 21 335
Total liabilities 678 546
Capital expenditure 83 199 34 197 – – 117 396
Signifi cant non-cash expenses
Depreciation (4 859) (5 983) – – (10 842)
Amortisation – (438) – – (438)

48ANNUAL REPORT 2009
2. Segment reporting continued
Factory Non-factory Head offi ce Eliminations Total
GROUP 2008 R’000 R’000 R’000 R’000 R’000
Revenue
External customers 57 507 937 385 – – 994 892
Inter-segment revenue 684 167 – (851) –
Total segment revenue 58 191 937 552 – (851) 994 892
Segment result (15 690) 226 603 77 16 530 227 520
Net fi nance costs (34 873)
Income tax expense (62 593)
Profi t for the year 130 054
Segment assets 1 156 854 2 242 618 – (1 252 412) 2 147 060
Unallocated tax assets 8 235
Total assets 2 155 295
Segment liabilities 136 220 1 751 185 – (1 155 126) 732 279
Unallocated tax liabilities 17 092
Total liabilities 749 371
Capital expenditure 133 023 66 887 – – 199 910
Signifi cant non-cash expenses
Depreciation (1 723) (3 729) – (648) (6 100)
Amortisation – (305) – – (305)
Notes to the fi nancial statements for the years ended 31 December

49ANNUAL REPORT 2009
3. Property, plant and equipment
Accumulated Carrying
Cost depreciation value
GROUP 2009 R’000 R’000 R’000
Leasehold improvements 122 981 (6 420) 116 561
Plant and machinery 254 283 (5 087) 249 196
Motor vehicles 2 402 (731) 1 671
Furniture and equipment 32 965 (11 381) 21 584
412 631 (23 619) 389 012
Opening Closing
carrying Other carrying
GROUP value acquisitions Disposals Transfers1 Depreciation3 value
Movement summary 2009 R’000 R’000 R’000 R’000 R’000 R’000
Leasehold improvements 9 530 5 612 – 105 658 (4 239) 116 561
Plant and machinery 266 104 102 659 (1 447) (115 942) (2 178) 249 196
Motor vehicles 1 165 1 064 (198) – (360) 1 671
Furniture and equipment 10 375 4 990 – 10 284 (4 065) 21 584
287 174 114 325 (1 645) – (10 842) 389 012
Accumulated Accumulated Carrying
Cost depreciation impairment2 value
GROUP 2008 R’000 R’000 R’000 R’000
Leasehold improvements 11 711 (2 181) – 9 530
Plant and machinery 278 885 (4 947) (7 834) 266 104
Motor vehicles 1 706 (541) – 1 165
Furniture and equipment 17 725 (7 350) – 10 375
310 027 (15 019) (7 834) 287 174
Acquisitions
Opening through Closing
carrying business Other carrying
GROUP value combinations acquisitions Disposals Depreciation value
Movement summary 2008 R’000 R’000 R’000 R’000 R’000 R’000
Leasehold improvements 3 036 – 7 769 – (1 275) 9 530
Plant and machinery 121 155 11 146 671 – (1 733) 266 104
Motor vehicles 609 – 906 (148) (202) 1 165
Furniture and equipment 6 109 92 7 263 (199) (2 890) 10 375
130 909 103 162 609 (347) (6 100) 287 174
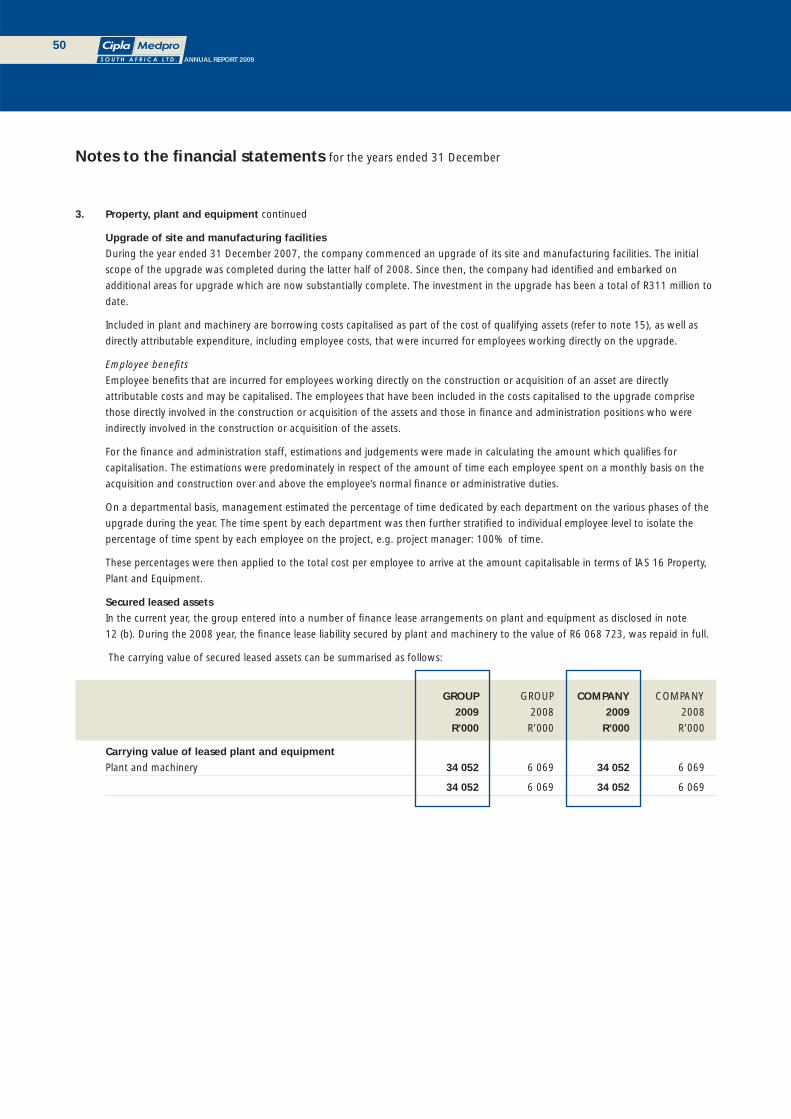
50ANNUAL REPORT 2009
3. Property, plant and equipment continued
Upgrade of site and manufacturing facilities
During the year ended 31 December 2007, the company commenced an upgrade of its site and manufacturing facilities. The initial
scope of the upgrade was completed during the latter half of 2008. Since then, the company had identifi ed and embarked on
additional areas for upgrade which are now substantially complete. The investment in the upgrade has been a total of R311 million to
date.
Included in plant and machinery are borrowing costs capitalised as part of the cost of qualifying assets (refer to note 15), as well as
directly attributable expenditure, including employee costs, that were incurred for employees working directly on the upgrade.
Employee benefi ts
Employee benefi ts that are incurred for employees working directly on the construction or acquisition of an asset are directly
attributable costs and may be capitalised. The employees that have been included in the costs capitalised to the upgrade comprise
those directly involved in the construction or acquisition of the assets and those in fi nance and administration positions who were
indirectly involved in the construction or acquisition of the assets.
For the fi nance and administration staff, estimations and judgements were made in calculating the amount which qualifi es for
capitalisation. The estimations were predominately in respect of the amount of time each employee spent on a monthly basis on the
acquisition and construction over and above the employee’s normal fi nance or administrative duties.
On a departmental basis, management estimated the percentage of time dedicated by each department on the various phases of the
upgrade during the year. The time spent by each department was then further stratifi ed to individual employee level to isolate the
percentage of time spent by each employee on the project, e.g. project manager: 100% of time.
These percentages were then applied to the total cost per employee to arrive at the amount capitalisable in terms of IAS 16 Property,
Plant and Equipment.
Secured leased assets
In the current year, the group entered into a number of fi nance lease arrangements on plant and equipment as disclosed in note
12 (b). During the 2008 year, the fi nance lease liability secured by plant and machinery to the value of R6 068 723, was repaid in full.
The carrying value of secured leased assets can be summarised as follows:
GROUP GROUP COMPANY COMPANY
2009 2008 2009 2008
R’000 R’000 R’000 R’000
Carrying value of leased plant and equipment
Plant and machinery 34 052 6 069 34 052 6 069
34 052 6 069 34 052 6 069
Notes to the fi nancial statements for the years ended 31 December

51ANNUAL REPORT 2009
3. Property, plant and equipment continued
Accumulated Carrying
Cost depreciation value
COMPANY 2009 R’000 R’000 R’000
Leasehold improvements 112 516 (1 924) 110 592
Plant and machinery 196 967 (3 631) 193 336
Motor vehicles 64 (11) 53
Furniture and equipment 15 099 (2 481) 12 618
324 646 (8 047) 316 599
Opening Other Closing
COMPANY carrying value acquisitions Disposals Transfers1 Depreciation3 carrying value
Movement summary 2009 R’000 R’000 R’000 R’000 R’000 R’000
Leasehold improvements 3 585 3 119 – 105 658 (1 770) 110 592
Plant and machinery 233 728 78 992 (1 447) (115 942) (1 995) 193 336
Motor vehicles 158 62 (135) – (32) 53
Furniture and equipment 2 370 1 026 – 10 284 (1 062) 12 618
239 841 83 199 (1 582) – (4 859) 316 599
Accumulated Accumulated Carrying
Cost depreciation impairment2 value
COMPANY 2008 R’000 R’000 R’000 R’000
Leasehold improvements 3 739 (154) – 3 585
Plant and machinery 245 235 (3 673) (7 834) 233 728
Motor vehicles 182 (24) – 158
Furniture and equipment 3 823 (1 453) – 2 370
252 979 (5 304) (7 834) 239 841
Opening Other Closing
COMPANY carrying value Acquisitions Disposals Depreciation carrying value
Movement summary 2008 R’000 R’000 R’000 R’000 R’000
Leasehold improvements – 3 739 – (154) 3 585
Plant and machinery 108 057 126 664 – (993) 233 728
Motor vehicles 154 190 (148) (38) 158
Furniture and equipment 677 2 430 (199) (538) 2 370
108 888 133 023 (347) (1 723) 239 841
1 Assets capitalised during the upgrade and previously accounted for under the capital work-in-progress category within plant
and machinery, have been transferred to their respective asset categories after a factory-wide physical asset verifi cation was
conducted.
2 As a result of the commencement of the upgrade during the year ended 31 December 2007, newly acquired plant and
machinery was integrated into the manufacturing facility, which rendered plant and machinery of R7,8 million as impaired.
These assets that were previously impaired and with a carrying value of nil, have subsequently been scrapped during 2009.
3 Depreciation is recognised on a straight-line basis over the estimated useful lives of each item of property, plant and equipment.
Further to this, and to better refl ect the expected pattern of consumption of future economic benefi ts embodied within the
asset, for certain items within the plant and machinery, lab equipment and leasehold improvements categories, an UOP basis
incorporating capacity and remaining useful life has been applied to these assets housed within the manufacturing facility.

52ANNUAL REPORT 2009
4. Intangible assets
Accumulated Accumulated Carrying
Cost amortisation impairment value
GROUP 2009 R’000 R’000 R’000 R’000
Pharmaceutical dossiers 1 312 996 – – 1 312 996
Trademarks and registrations 101 625 – (1 378) 100 247
Brands 3 261 – – 3 261
Goodwill 11 666 – – 11 666
Computer software 1 426 (1 019) – 407
1 430 974 (1 019) (1 378) 1 428 577
Opening Other Closing
GROUP carrying value acquisitions Amortisation carrying value
Movement summary 2009 R’000 R’000 R’000 R’000
Pharmaceutical dossiers 1 312 996 – – 1 312 996
Trademarks and registrations 74 249 25 998 – 100 247
Brands 3 261 – – 3 261
Goodwill 11 666 – – 11 666
Computer software 573 272 (438) 407
1 402 745 26 270 (438) 1 428 577
Accumulated Accumulated Carrying
Cost amortisation impairment value
GROUP 2008 R’000 R’000 R’000 R’000
Pharmaceutical dossiers 1 312 996 – – 1 312 996
Trademarks and registrations 75 627 – (1 378) 74 249
Brands 3 261 – – 3 261
Goodwill 11 666 – – 11 666
Computer software 1 154 (581) – 573
1 404 704 (581) (1 378) 1 402 745
Acquisitions
through
Opening business Other Closing
GROUP carrying value combinations acquisitions Disposals Amortisation carrying value
Movement summary 2008 R’000 R’000 R’000 R’000 R’000 R’000
Pharmaceutical dossiers 1 312 996 – – – – 1 312 996
Trademarks and registrations 38 932 2 749 32 731 (163) – 74 249
Brands 3 261 – – – – 3 261
Goodwill – 11 666 – – – 11 666
Computer software 242 – 636 – (305) 573
1 355 431 14 415 33 367 (163) (305) 1 402 745
Notes to the fi nancial statements for the years ended 31 December

53ANNUAL REPORT 2009
4. Intangible assets continued
Accumulated Carrying
Cost amortisation value
COMPANY 2009 R’000 R’000 R’000
Brands 1 427 – 1 427
1 427 – 1 427
Opening Closing
COMPANY carrying value Amortisation carrying value
Movement summary 2009 R’000 R’000 R’000
Brands 1 427 – 1 427
1 427 – 1 427
Accumulated Carrying
Cost amortisation value
COMPANY 2008 R’000 R’000 R’000
Brands 1 427 – 1 427
1 427 – 1 427
Opening Closing
COMPANY carrying value Amortisation carrying value
Movement summary 2008 R’000 R’000 R’000
Brands 1 427 – 1 427
1 427 – 1 427
Secured assets
As indicated within notes 12 (c) and 12 (d), the loan facilities of R100 million and R25 million respectively, are secured in part through
intellectual property. The carrying value of intellectual property held as security for these facilities amounts to R103 million
(2008: R75 million).
Assessment of the group’s intangible assets
Predicting the useful life of an intangible asset requires signifi cant judgement. The diverse categories of intangible assets will have
different useful lives, whilst a number of intangible assets may even be considered to have indefi nite useful lives. For example, the
useful life of the right associated with an exclusive patent will be fi nite and will result in an amortisation charge being recognised in
profi t and loss over a fi xed period of time. However, the useful life associated with an asset that has no patent protection but that
retains, and is expected to retain, a distinct market identity could be considered to be indefi nite and the asset would not be amortised.
CMSA has classifi ed its intangible assets as having indefi nite useful lives. This conclusion is supported by the following factors:
• The group will continue to generate revenues from the continued use of the pharmaceutical dossiers, brands and trademarks
for the foreseeable future;
• Typical product life cycles for the pharmaceutical dossiers, brands and trademarks acquired against public information on
estimates of useful lives indicate that the intangibles have an indefi nite period of foreseeable usage; and
• The stability of the pharmaceutical industry and the strong demand in markets within which these products are marketed and
sold.

54ANNUAL REPORT 2009
4. Intangible assets continued
Impairment tests for intangible assets
Detailed impairment testing is performed for goodwill and indefi nite-life intangible assets annually and for all other intangible assets
whenever impairment indicators are present.
An impairment loss is recognised if the carrying amount of the asset or its cash-generating-unit exceeds its recoverable amount. The
recoverable amount is the greater of the value-in-use and an asset’s fair value.
Our impairment review process is as follows:
For indefi nite-life intangible assets, such as brands, each year and whenever impairment indicators are present, we calculate the
recoverable amount of the asset and record an impairment loss if the resulting recoverable amount is less than the carrying value of
the intangible asset. If the resulting recoverable amount exceeds the carrying value of the intangible asset, the intangible asset is not
impaired.
Fair value is generally measured as the net present value of projected cash fl ows. In addition, a re-evaluation of the remaining useful
life of the asset is performed to determine whether continuing to classify the asset as having an indefi nite life is appropriate.
The value-in-use of intangible assets is determined primarily using the “free cash fl ow” methodology. We begin with the forecast of
all the expected future net cash fl ows available to the group after taking into account in certain instances, capital expenditure and
working capital requirements. These cash fl ows are then present valued by applying an appropriate discount rate which incorporates
the risk factors (systematic and unsystematic) associated with the cash fl ow streams. Certain judgements and assumptions are also
taken into account in arriving at the net present value of the intangible asset. Accordingly, the potential for impairment of these
intangible assets may exist if actual revenues are signifi cantly lower than those initially forecasted or actual expenditure is signifi cantly
greater than those initially forecasted. The valuations are based on information available as at the impairment review date and
are based on the expectations and assumptions that have been deemed reasonable by management. Refer to the table below for
signifi cant estimates and assumptions intrinsic in the calculation of the fair value of the intangible assets.
For fi nite-life intangible assets, such as computer software, whenever impairment indicators are present, we perform detailed
impairment testing as for indefi nite-life intangible assets (refer above).
Key assumptions applied in value-in-use calculations
Growth in revenue Determined from fi nancial budgets and forecasts covering a fi ve-year period. The growth
rates used range between 6% and 20%.
Growth rates ranging between 6% and 15% were used to value Cipla Medpro.
Pre-tax operating margin Based on previous year’s margins as well as past valuation assumptions and approved
management budgets. This rate ranges between 28% and 53%.
For the valuation of Cipla Medpro, a rate of 36% was used.
Survival periods Assumed at 15 years for the purposes of performing the valuation
(reasonable in relation to the average life of a dossier).
Book value realised on termination Gordon’s dividend growth model used to determine terminal value – assumed a 6%
growth in perpetuity.
Fair rate of return Approximates 16,8%.
Pre-tax risk-free rate R157 10-year bond rate as at respective valuation dates.
Systematic risk premium 6% – generally accepted in South Africa.
Beta 1,2
Unsystematic risk premium 4,5%
Notes to the fi nancial statements for the years ended 31 December

55ANNUAL REPORT 2009
GROUP GROUP COMPANY COMPANY
2009 2008 2009 2008
R’000 R’000 R’000 R’000
5. Investments in subsidiaries Shares at cost less impairment losses – – 31 274 34 224
Amounts due by subsidiaries – non-current – – 799 911 799 930
Investments in subsidiaries – – 831 185 834 154
Amounts due to subsidiaries – non-current – – (113 312) (90 038)
Net investments in subsidiaries – – 717 873 744 116
Loans and receivables – – 799 911 799 930
Financial liabilities measured at amortised cost – – (113 312) (90 038)
Refer to note 24 and Annexure A which detail the group’s
acquisitions during the year as well as a description of the terms
and conditions attached to inter-group borrowings.
6. Other investments Non-current investments
Financial assets designated at fair value through profi t or loss on
initial recognition 4 4 – –
4 4 – –
The fi nancial assets designated at fair value through profi t or
loss are listed equity securities that otherwise would have been
classifi ed as available-for-sale. The investment is managed and
its performance evaluated on a fair value basis in accordance
with a documented investment strategy. The fair value is based
on the market price as quoted on the London Stock Exchange
at year end.
7. Loans receivable Non-current
CMSA Share Option Trust (a) – – 23 304 7 959
– – 23 304 7 959
Current
L’amar (France) Pharmatec (Pty) Limited (b) – 160 – –
H Brand 6 CC t/a Essential Health Kuilsrivier (c) 3 000 3 000 – –
Sweet Sensation 67 (Pty) Limited (d) 2 115 298 2 115 298
Majestic Silver Trading 223 (Pty) Limited (e) 47 47 47 47
5 162 3 505 2 162 345
(a) The loan is in respect of shares issued by the company to the CMSA Share Option Trust which will be utilised to settle options
granted. The loan is interest-free and has no fi xed terms of repayment. Refer to note 22 for further details relating to share
options in issue.
(b) The loan to L’amar (France) Pharmatec (Pty) Limited is unsecured, interest-free and there are no fi xed terms of repayment. This
loan was settled during the year.
(c) The loan to H Brand 6 CC t/a Essential Health Kuilsrivier bears interest at the prime overdraft rate. The entire principal debt and
interest thereon is due to be repaid by 30 October 2010.
(d) The loan to Sweet Sensation 67 (Pty) Limited is unsecured and interest-free. There are no fi xed terms of repayment.
(e) The loan to Majestic Silver Trading 223 (Pty) Limited is unsecured and interest-free. There are no fi xed terms of repayment.

56ANNUAL REPORT 2009
8. Deferred tax
Recognised deferred tax assets and liabilities
Deferred tax assets and liabilities are attributable to the following:
Assets Assets Liabilities Liabilities Net Net
2009 2008 2009 2008 2009 2008
GROUP R’000 R’000 R’000 R’000 R’000 R’000
Property, plant and equipment – (5 193) 26 003 – 26 003 (5 193)
Trademarks – – 4 130 – 4 130 –
Inventory (111) (21) – – (111) (21)
Operating leases (173) – – 259 (173) 259
Employee benefi t accruals (1 184) – – 262 (1 184) 262
Impairment of trade receivables (35) – – 35 (35) 35
Other (4 243) – – 4 034 (4 243) 4 034
Tax losses carried forward (33 540) (4 682) – – (33 540) (4 682)
Tax (assets) liabilities (39 286) (9 896) 30 133 4 590 (9 153) (5 306)
Set off of tax 20 591 2 796 (20 591) (2 796) – –
Net tax (assets) liabilities (18 695) (7 100) 9 542 1 794 (9 153) (5 306)
Balance Recognised Balance Recognised Balance
1 January in profi t 1 January in profi t 31 December
GROUP 2008 or loss 2009 or loss 2009
Movement in temporary differences during the year R’000 R’000 R’000 R’000 R’000
Property, plant and equipment 237 (5 430) (5 193) 31 196 26 003
Trademarks 1 630 (1 630) – 4 130 4 130
Inventory (38) 17 (21) (90) (111)
Operating leases (265) 524 259 (432) (173)
Employee benefi t accruals (899) 1 161 262 (1 446) (1 184)
Impairment of trade receivables (32) 67 35 (70) (35)
Other 4 154 (120) 4 034 (8 277) (4 243)
Tax losses carried forward (4 306) (376) (4 682) (28 858) (33 540)
Tax (assets) liabilities 481 (5 787) (5 306) (3 847) (9 153)
Notes to the fi nancial statements for the years ended 31 December

57ANNUAL REPORT 2009
8. Deferred tax continued
Assets Assets Liabilities Liabilities Net Net
2009 2008 2009 2008 2009 2008
COMPANY R’000 R’000 R’000 R’000 R’000 R’000
Property, plant and equipment – (5 146) 19 689 – 19 689 (5 146)
Operating leases (80) – – 259 (80) 259
Employee benefi t accruals (375) – – 262 (375) 262
Impairment of trade receivables (15) – – 35 (15) 35
Other (4 205) – – 2 658 (4 205) 2 658
Tax losses carried forward (31 893) (4 682) – – (31 893) (4 682)
Tax (assets) liabilities (36 568) (9 828) 19 689 3 214 (16 879) (6 614)
Set off of tax 19 689 3 214 (19 689) (3 214) – –
Net tax (assets) (16 879) (6 614) – – (16 879) (6 614)
Balance Recognised Balance Recognised Balance
1 January in profi t 1 January in profi t 31 December
COMPANY 2008 or loss 2009 or loss 2009
Movement in temporary differences during the year R’000 R’000 R’000 R’000 R’000
Property, plant and equipment 237 (5 383) (5 146) 24 835 19 689
Operating leases (185) 444 259 (339) (80)
Employee benefi t accruals (247) 509 262 (637) (375)
Impairment of trade receivables (22) 57 35 (50) (15)
Other (575) 3 233 2 658 (6 863) (4 205)
Tax losses carried forward (3 266) (1 416) (4 682) (27 211) (31 893)
Tax (assets) (4 058) (2 556) (6 614) (10 265) (16 879)
Unrecognised deferred tax assets and liabilities
There were no unrecognised deferred tax assets or liabilities at year end (2008: Rnil).
There were no adjustments to deferred tax in the current or prior year that were recognised directly in equity in either the group or the
company.
Deferred tax assets and liabilities are recognised on the assumption that the assets and liabilities will either be recovered through use
in the future or will be realised through sale. A capital gains tax rate of 14% (2008: 14%) was used to compute deferred tax for assets
and liabilities which will be realised through sale, and a rate of 28% (2008: 28%) was used for deferred tax balances to be recovered
through use.
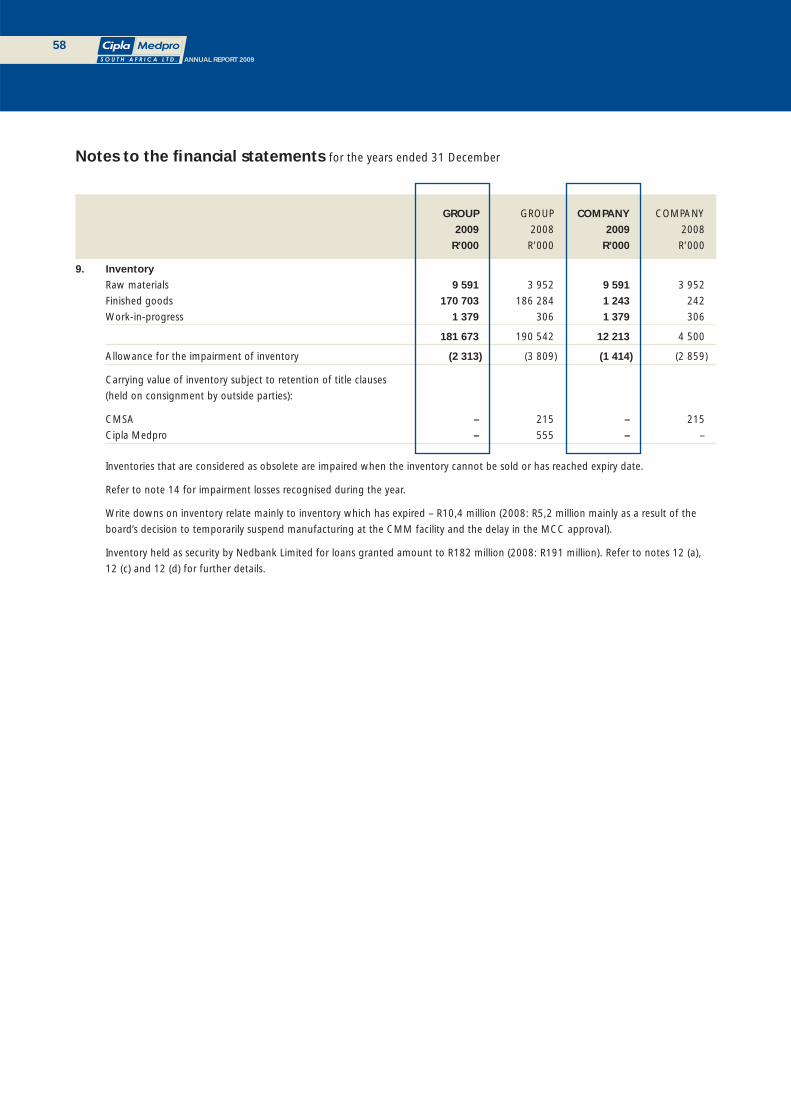
58ANNUAL REPORT 2009
GROUP GROUP COMPANY COMPANY
2009 2008 2009 2008
R’000 R’000 R’000 R’000
9. Inventory
Raw materials 9 591 3 952 9 591 3 952
Finished goods 170 703 186 284 1 243 242
Work-in-progress 1 379 306 1 379 306
181 673 190 542 12 213 4 500
Allowance for the impairment of inventory (2 313) (3 809) (1 414) (2 859)
Carrying value of inventory subject to retention of title clauses
(held on consignment by outside parties):
CMSA – 215 – 215
Cipla Medpro – 555 – –
Inventories that are considered as obsolete are impaired when the inventory cannot be sold or has reached expiry date.
Refer to note 14 for impairment losses recognised during the year.
Write downs on inventory relate mainly to inventory which has expired – R10,4 million (2008: R5,2 million mainly as a result of the
board’s decision to temporarily suspend manufacturing at the CMM facility and the delay in the MCC approval).
Inventory held as security by Nedbank Limited for loans granted amount to R182 million (2008: R191 million). Refer to notes 12 (a),
12 (c) and 12 (d) for further details.
Notes to the fi nancial statements for the years ended 31 December

59ANNUAL REPORT 2009
GROUP GROUP COMPANY COMPANY
2009 2008 2009 2008
R’000 R’000 R’000 R’000
10. Trade and other receivables, including derivatives
Trade receivables due from related parties – – 775 502
Trade receivables due from external parties 213 703 196 504 34 769 51 792
Other receivables 4 812 15 704 1 071 9 959
Prepayments 12 455 10 588 2 463 6 207
Loans and receivables 230 970 222 796 39 078 68 460
Derivatives used for economic hedging
Forward exchange contracts – 43 – –
230 970 222 839 39 078 68 460
Allowance for the impairment of trade receivables (452) (514) (73) (167)
As indicated in notes 23.4, 12 (a), 12 (c) and 12 (d), trade
receivables of R214 million (2008: R197 million) have been
ceded to the bank as security for banking and loan facilities
granted.
Financial assets designated at fair value through profi t or
loss on initial recognition*:
Forward exchange contracts
The group uses forward exchange contracts to economically
hedge its foreign currency risk. The table below sets out the
revaluation of open forward exchange contracts at
31 December 2008**:
United States Dollar (USD‘000) – 11 000 – –
Average forward exchange rate (ZAR/USD) – 9,49 – –
Forward ZAR value – 104 333 – –
Mark to market valuation – 104 376 – –
Recognised fair value gain – 43 – –
Dates of maturity
2008: 30 January 2009 to 27 February 2009
* Forward exchange contracts are level one fi nancial instruments which are measured using unadjusted quoted prices for
identical assets.
** Refer to note 13 for 2009 disclosure.
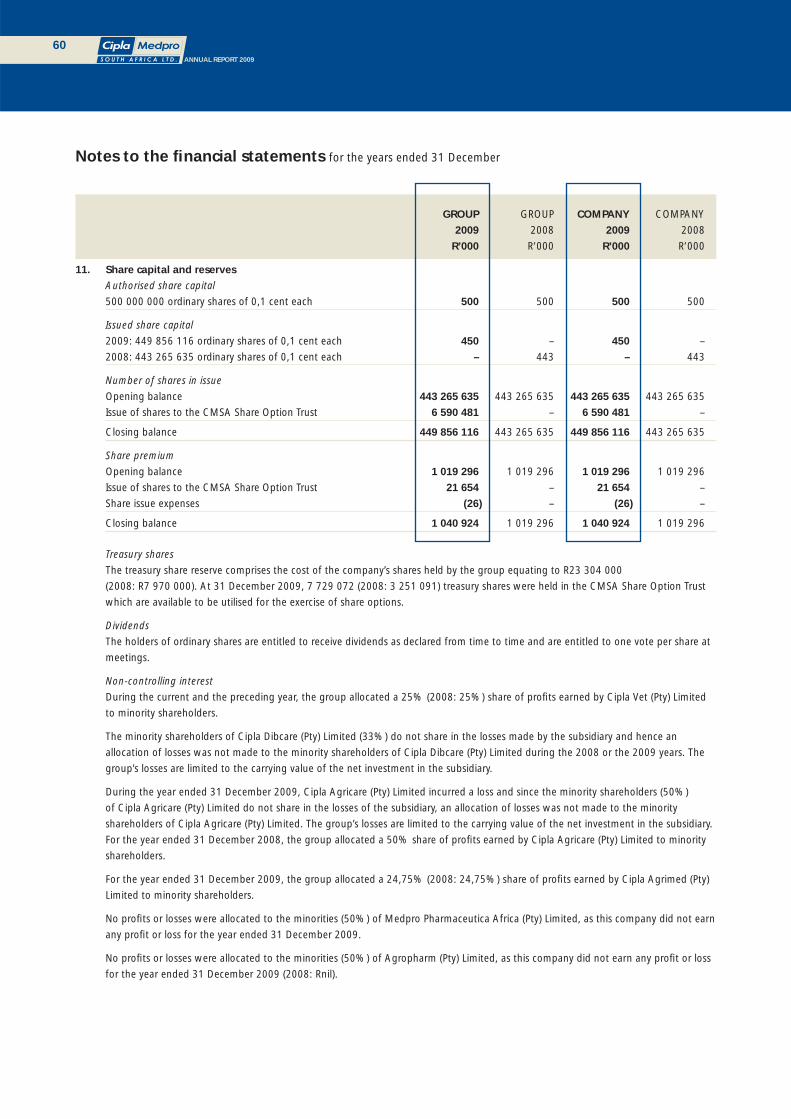
60ANNUAL REPORT 2009
GROUP GROUP COMPANY COMPANY
2009 2008 2009 2008
R’000 R’000 R’000 R’000
11. Share capital and reserves
Authorised share capital
500 000 000 ordinary shares of 0,1 cent each 500 500 500 500
Issued share capital
2009: 449 856 116 ordinary shares of 0,1 cent each 450 – 450 –
2008: 443 265 635 ordinary shares of 0,1 cent each – 443 – 443
Number of shares in issue
Opening balance 443 265 635 443 265 635 443 265 635 443 265 635
Issue of shares to the CMSA Share Option Trust 6 590 481 – 6 590 481 –
Closing balance 449 856 116 443 265 635 449 856 116 443 265 635
Share premium
Opening balance 1 019 296 1 019 296 1 019 296 1 019 296
Issue of shares to the CMSA Share Option Trust 21 654 – 21 654 –
Share issue expenses (26) – (26) –
Closing balance 1 040 924 1 019 296 1 040 924 1 019 296
Treasury shares
The treasury share reserve comprises the cost of the company’s shares held by the group equating to R23 304 000
(2008: R7 970 000). At 31 December 2009, 7 729 072 (2008: 3 251 091) treasury shares were held in the CMSA Share Option Trust
which are available to be utilised for the exercise of share options.
Dividends
The holders of ordinary shares are entitled to receive dividends as declared from time to time and are entitled to one vote per share at
meetings.
Non-controlling interest
During the current and the preceding year, the group allocated a 25% (2008: 25%) share of profi ts earned by Cipla Vet (Pty) Limited
to minority shareholders.
The minority shareholders of Cipla Dibcare (Pty) Limited (33%) do not share in the losses made by the subsidiary and hence an
allocation of losses was not made to the minority shareholders of Cipla Dibcare (Pty) Limited during the 2008 or the 2009 years. The
group’s losses are limited to the carrying value of the net investment in the subsidiary.
During the year ended 31 December 2009, Cipla Agricare (Pty) Limited incurred a loss and since the minority shareholders (50%)
of Cipla Agricare (Pty) Limited do not share in the losses of the subsidiary, an allocation of losses was not made to the minority
shareholders of Cipla Agricare (Pty) Limited. The group’s losses are limited to the carrying value of the net investment in the subsidiary.
For the year ended 31 December 2008, the group allocated a 50% share of profi ts earned by Cipla Agricare (Pty) Limited to minority
shareholders.
For the year ended 31 December 2009, the group allocated a 24,75% (2008: 24,75%) share of profi ts earned by Cipla Agrimed (Pty)
Limited to minority shareholders.
No profi ts or losses were allocated to the minorities (50%) of Medpro Pharmaceutica Africa (Pty) Limited, as this company did not earn
any profi t or loss for the year ended 31 December 2009.
No profi ts or losses were allocated to the minorities (50%) of Agropharm (Pty) Limited, as this company did not earn any profi t or loss
for the year ended 31 December 2009 (2008: Rnil).
Notes to the fi nancial statements for the years ended 31 December

61ANNUAL REPORT 2009
GROUP GROUP COMPANY COMPANY
2009 2008 2009 2008
R’000 R’000 R’000 R’000
12. Loans and borrowings
This note provides information about the contractual terms
of the group’s loans and borrowings, which are measured at
amortised cost using the effective interest rate method. For
more information about the group’s exposure to interest-rate
risk, refer to notes 18 and 26.
Nedbank Limited (a) – 1 926 – 1 926
Nedbank Limited (b) 35 074 – 35 074 –
Nedbank Limited (c) 100 000 100 000 – –
Nedbank Limited (d) 25 000 – – –
L’amar (France) Pharmatec (Pty) Limited (e) 462 – – –
Depfi n Investments (Pty) Limited (f) 194 270 244 470 – –
Total loans and borrowings 354 806 346 396 35 074 1 926
Comprising:
Current portion
Nedbank Limited 7 968 1 926 7 968 1 926
L’amar (France) Pharmatec (Pty) Limited 462 – – –
Total current portion 8 430 1 926 7 968 1 926
Total non-current portion 346 376 344 470 27 106 –
Finance lease liabilities
The future minimum lease payments under fi nance leases are
as follows:
Less than one year 11 068 – 11 068 –
Between two and fi ve years 32 166 – 32 166 –
More than fi ve years – – – –
Total future minimum lease payments 43 234 – 43 234 –
Interest (8 160) – (8 160) –
Present value of future minimum lease payments 35 074 – 35 074 –
(a) This loan facility of R16 million was settled during May 2009. It bore interest at the prime rate less 1,5% and had no fi xed
repayment terms. This loan was secured by a general notarial bond over inventory, the cession of book debts and the plant and
equipment of CMM.
(b) The liabilities held under fi nance lease arrangements are repayable over a period of six years at the prime rate less 0,5%. The
fi nance leases are secured by plant and machinery with a book value of R34 052 060 (2008: Rnil) as referred to in note 3. The
liabilities are being repaid in fi xed monthly instalments of R393 467.
(c) This loan bears interest at rates linked to the JIBAR rate. The loan is repayable in full on 30 September 2011, with interest
payable bi-annually. The loan is secured through guarantees and subordination of their claims against Cipla Medpro and
its holding company, Inyanga Trading 386 (Pty) Limited, the pledge and cession of its shares in Cipla Medpro Holdings (Pty)
Limited, a general notarial bond over the moveable assets of Cipla Medpro, the cession of trade receivables, cash balances,
insurances and claims of Cipla Medpro and Inyanga Trading 386 (Pty) Limited, and the pledge and hypothecation of rights in
intellectual property held by Cipla Medpro.
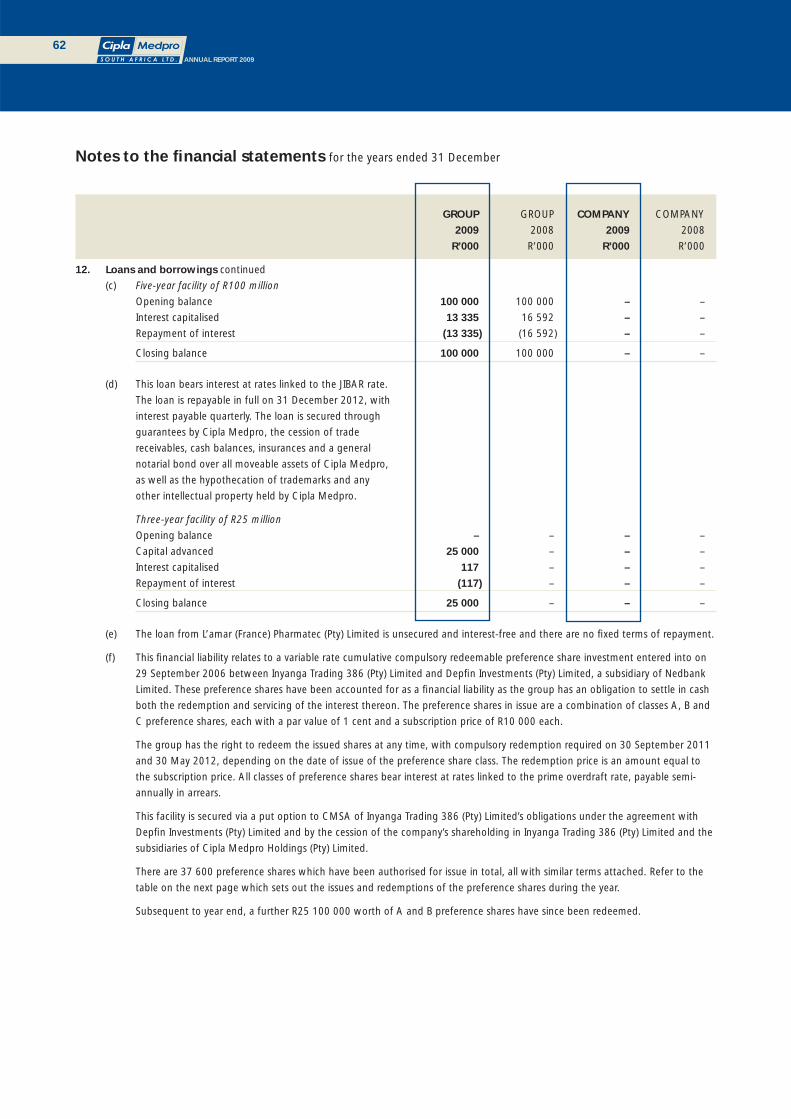
62ANNUAL REPORT 2009
GROUP GROUP COMPANY COMPANY
2009 2008 2009 2008
R’000 R’000 R’000 R’000
12. Loans and borrowings continued
(c) Five-year facility of R100 million
Opening balance 100 000 100 000 – –
Interest capitalised 13 335 16 592 – –
Repayment of interest (13 335) (16 592) – –
Closing balance 100 000 100 000 – –
(d) This loan bears interest at rates linked to the JIBAR rate.
The loan is repayable in full on 31 December 2012, with
interest payable quarterly. The loan is secured through
guarantees by Cipla Medpro, the cession of trade
receivables, cash balances, insurances and a general
notarial bond over all moveable assets of Cipla Medpro,
as well as the hypothecation of trademarks and any
other intellectual property held by Cipla Medpro.
Three-year facility of R25 million
Opening balance – – – –
Capital advanced 25 000 – – –
Interest capitalised 117 – – –
Repayment of interest (117) – – –
Closing balance 25 000 – – –
(e) The loan from L’amar (France) Pharmatec (Pty) Limited is unsecured and interest-free and there are no fi xed terms of repayment.
(f) This fi nancial liability relates to a variable rate cumulative compulsory redeemable preference share investment entered into on
29 September 2006 between Inyanga Trading 386 (Pty) Limited and Depfi n Investments (Pty) Limited, a subsidiary of Nedbank
Limited. These preference shares have been accounted for as a fi nancial liability as the group has an obligation to settle in cash
both the redemption and servicing of the interest thereon. The preference shares in issue are a combination of classes A, B and
C preference shares, each with a par value of 1 cent and a subscription price of R10 000 each.
The group has the right to redeem the issued shares at any time, with compulsory redemption required on 30 September 2011
and 30 May 2012, depending on the date of issue of the preference share class. The redemption price is an amount equal to
the subscription price. All classes of preference shares bear interest at rates linked to the prime overdraft rate, payable semi-
annually in arrears.
This facility is secured via a put option to CMSA of Inyanga Trading 386 (Pty) Limited’s obligations under the agreement with
Depfi n Investments (Pty) Limited and by the cession of the company’s shareholding in Inyanga Trading 386 (Pty) Limited and the
subsidiaries of Cipla Medpro Holdings (Pty) Limited.
There are 37 600 preference shares which have been authorised for issue in total, all with similar terms attached. Refer to the
table on the next page which sets out the issues and redemptions of the preference shares during the year.
Subsequent to year end, a further R25 100 000 worth of A and B preference shares have since been redeemed.
Notes to the fi nancial statements for the years ended 31 December

63ANNUAL REPORT 2009
GROUP GROUP COMPANY COMPANY
2009 2008 2009 2008
R’000 R’000 R’000 R’000
12. Loans and borrowings continued
(f) Compulsory redeemable preference shares
Par value: 1 cent each
Subscription price: R10 000 each
Opening balance including accrued interest 251 883 339 145 – –
Interest capitalised
A shares 4 894 12 304 – –
B shares 4 104 7 107 – –
C shares 12 004 15 293 – –
Redemption of shares
A shares (35 000) (70 000) – –
B shares (15 200) (15 200) – –
Repayment of interest
A shares (6 250) (14 232) – –
B shares (4 925) (7 484) – –
C shares (13 260) (15 050) – –
198 250 251 883 – –
Interest disclosed in trade and other payables (note 13) (3 980) (7 413) – –
Closing balance excluding accrued interest 194 270 244 470 – –

64ANNUAL REPORT 2009
GROUP GROUP COMPANY COMPANY
2009 2008 2009 2008
R’000 R’000 R’000 R’000
13. Trade and other payables, including derivatives
Trade payables due to related parties – – – –
Trade payables due to external parties 174 124 322 255 5 776 4 699
Other payables and accruals 30 422 46 567 8 713 31 016
Interest payable on preference shares 3 980 7 413 – –
Trade and other payables held at amortised cost 208 526 376 235 14 489 35 715
Derivatives used for economic hedging
Forward exchange contracts 24 641 – – –
Fair value of interest rate swaps 3 009 552 – –
236 176 376 787 14 489 35 715
Interest payable on preference shares
This relates to interest payable on variable rate cumulative
redeemable preference shares in issue. Refer to note 12 (f)
for the terms thereof.
Arrear interest payable:
3 500 A preference shares (2008: 7 000 shares) 835 2 191 – –
3 427 B preference shares (2008: 4 947 shares) 680 1 501 – –
12 500 C preference shares (2008: 12 500 shares) 2 465 3 721 – –
3 980 7 413 – –
Financial liabilities designated at fair value through profi t
or loss on initial recognition*:
Forward exchange contracts
The group uses forward exchange contracts to economically
hedge its foreign currency risk. The table below sets out the
revaluation of open forward exchange contracts at
31 December 2009**:
United States Dollar (USD’000) 56 250 – – –
Average forward exchange rate (ZAR/USD) 8,10 – – –
Forward ZAR value 456 419 – – –
Mark to market valuation 431 778 – – –
Recognised fair value loss 24 641 – – –
Dates of maturity:
2009: 29 January 2010 to 28 February 2011
* Forward exchange contracts and interest rate swaps are level one fi nancial instruments which are measured using unadjusted
quoted prices for identical liabilities.
** Refer to note 10 for 2008 disclosure.
Notes to the fi nancial statements for the years ended 31 December
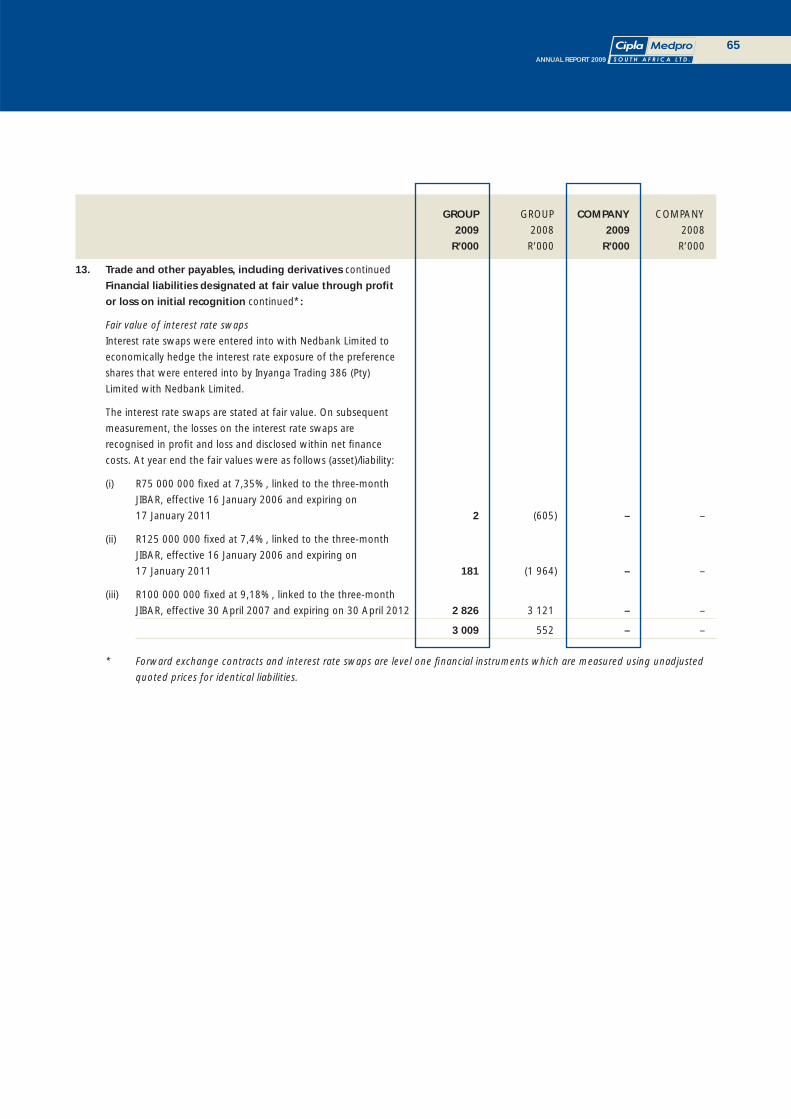
65ANNUAL REPORT 2009
GROUP GROUP COMPANY COMPANY
2009 2008 2009 2008
R’000 R’000 R’000 R’000
13. Trade and other payables, including derivatives continued
Financial liabilities designated at fair value through profi t
or loss on initial recognition continued*:
Fair value of interest rate swaps
Interest rate swaps were entered into with Nedbank Limited to
economically hedge the interest rate exposure of the preference
shares that were entered into by Inyanga Trading 386 (Pty)
Limited with Nedbank Limited.
The interest rate swaps are stated at fair value. On subsequent
measurement, the losses on the interest rate swaps are
recognised in profi t and loss and disclosed within net fi nance
costs. At year end the fair values were as follows (asset)/liability:
(i) R75 000 000 fi xed at 7,35%, linked to the three-month
JIBAR, effective 16 January 2006 and expiring on
17 January 2011 2 (605) – –
(ii) R125 000 000 fi xed at 7,4%, linked to the three-month
JIBAR, effective 16 January 2006 and expiring on
17 January 2011 181 (1 964) – –
(iii) R100 000 000 fi xed at 9,18%, linked to the three-month
JIBAR, effective 30 April 2007 and expiring on 30 April 2012 2 826 3 121 – –
3 009 552 – –
* Forward exchange contracts and interest rate swaps are level one fi nancial instruments which are measured using unadjusted
quoted prices for identical liabilities.
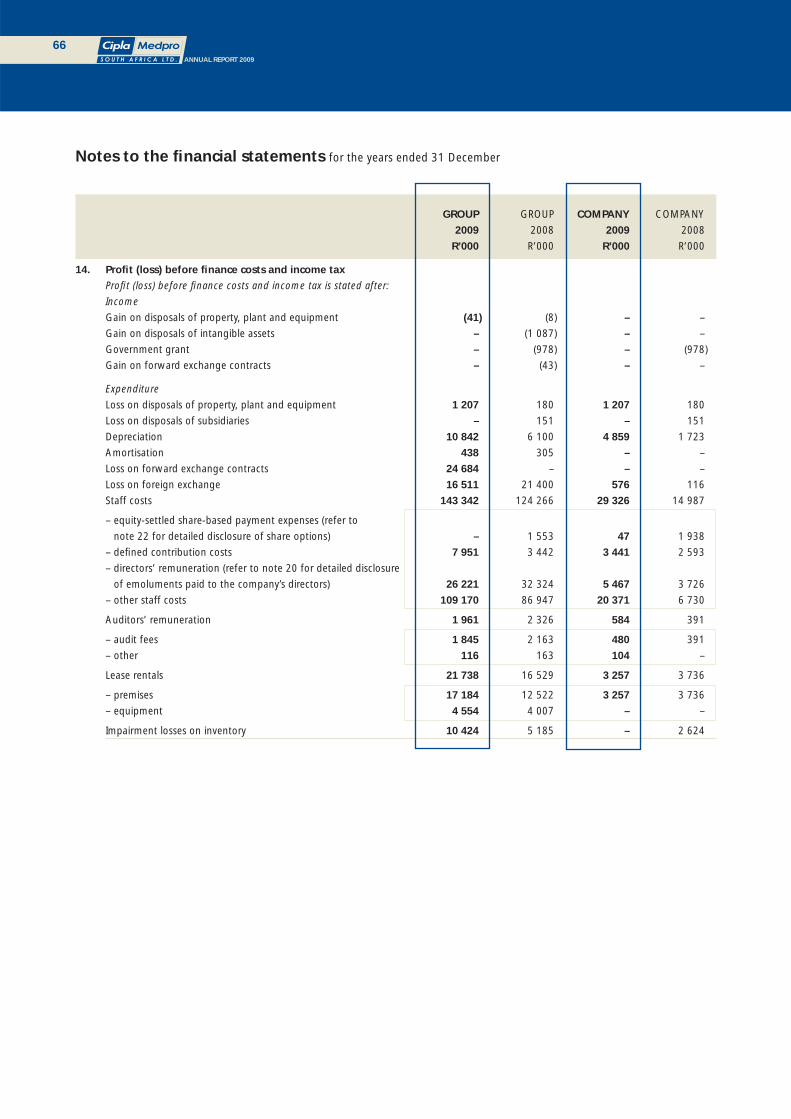
66ANNUAL REPORT 2009
GROUP GROUP COMPANY COMPANY
2009 2008 2009 2008
R’000 R’000 R’000 R’000
14. Profi t (loss) before fi nance costs and income tax
Profi t (loss) before fi nance costs and income tax is stated after:
Income
Gain on disposals of property, plant and equipment (41) (8) – –
Gain on disposals of intangible assets – (1 087) – –
Government grant – (978) – (978)
Gain on forward exchange contracts – (43) – –
Expenditure
Loss on disposals of property, plant and equipment 1 207 180 1 207 180
Loss on disposals of subsidiaries – 151 – 151
Depreciation 10 842 6 100 4 859 1 723
Amortisation 438 305 – –
Loss on forward exchange contracts 24 684 – – –
Loss on foreign exchange 16 511 21 400 576 116
Staff costs 143 342 124 266 29 326 14 987
– equity-settled share-based payment expenses (refer to
note 22 for detailed disclosure of share options) – 1 553 47 1 938
– defi ned contribution costs 7 951 3 442 3 441 2 593
– directors’ remuneration (refer to note 20 for detailed disclosure
of emoluments paid to the company’s directors) 26 221 32 324 5 467 3 726
– other staff costs 109 170 86 947 20 371 6 730
Auditors’ remuneration 1 961 2 326 584 391
– audit fees 1 845 2 163 480 391
– other 116 163 104 –
Lease rentals 21 738 16 529 3 257 3 736
– premises 17 184 12 522 3 257 3 736
– equipment 4 554 4 007 – –
Impairment losses on inventory 10 424 5 185 – 2 624
Notes to the fi nancial statements for the years ended 31 December
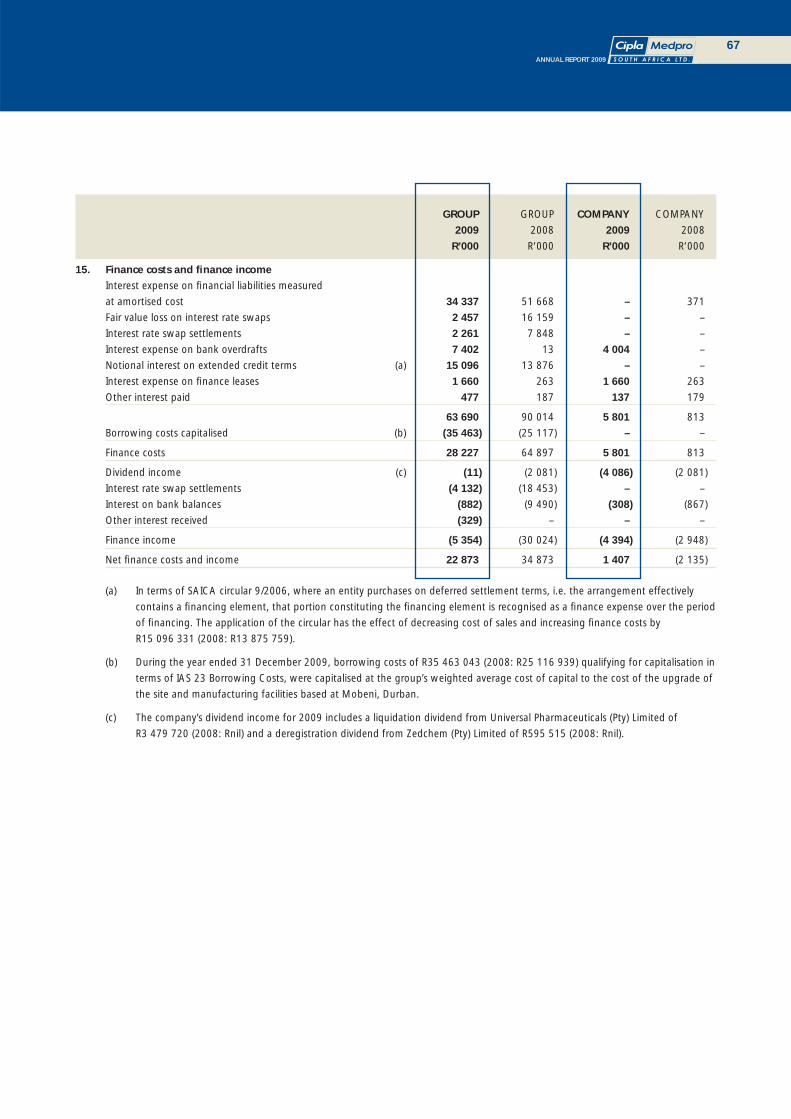
67ANNUAL REPORT 2009
GROUP GROUP COMPANY COMPANY
2009 2008 2009 2008
R’000 R’000 R’000 R’000
15. Finance costs and fi nance income
Interest expense on fi nancial liabilities measured
at amortised cost 34 337 51 668 – 371
Fair value loss on interest rate swaps 2 457 16 159 – –
Interest rate swap settlements 2 261 7 848 – –
Interest expense on bank overdrafts 7 402 13 4 004 –
Notional interest on extended credit terms (a) 15 096 13 876 – –
Interest expense on fi nance leases 1 660 263 1 660 263
Other interest paid 477 187 137 179
63 690 90 014 5 801 813
Borrowing costs capitalised (b) (35 463) (25 117) – –
Finance costs 28 227 64 897 5 801 813
Dividend income (c) (11) (2 081) (4 086) (2 081)
Interest rate swap settlements (4 132) (18 453) – –
Interest on bank balances (882) (9 490) (308) (867)
Other interest received (329) – – –
Finance income (5 354) (30 024) (4 394) (2 948)
Net fi nance costs and income 22 873 34 873 1 407 (2 135)
(a) In terms of SAICA circular 9/2006, where an entity purchases on deferred settlement terms, i.e. the arrangement effectively
contains a fi nancing element, that portion constituting the fi nancing element is recognised as a fi nance expense over the period
of fi nancing. The application of the circular has the effect of decreasing cost of sales and increasing fi nance costs by
R15 096 331 (2008: R13 875 759).
(b) During the year ended 31 December 2009, borrowing costs of R35 463 043 (2008: R25 116 939) qualifying for capitalisation in
terms of IAS 23 Borrowing Costs, were capitalised at the group’s weighted average cost of capital to the cost of the upgrade of
the site and manufacturing facilities based at Mobeni, Durban.
(c) The company’s dividend income for 2009 includes a liquidation dividend from Universal Pharmaceuticals (Pty) Limited of
R3 479 720 (2008: Rnil) and a deregistration dividend from Zedchem (Pty) Limited of R595 515 (2008: Rnil).
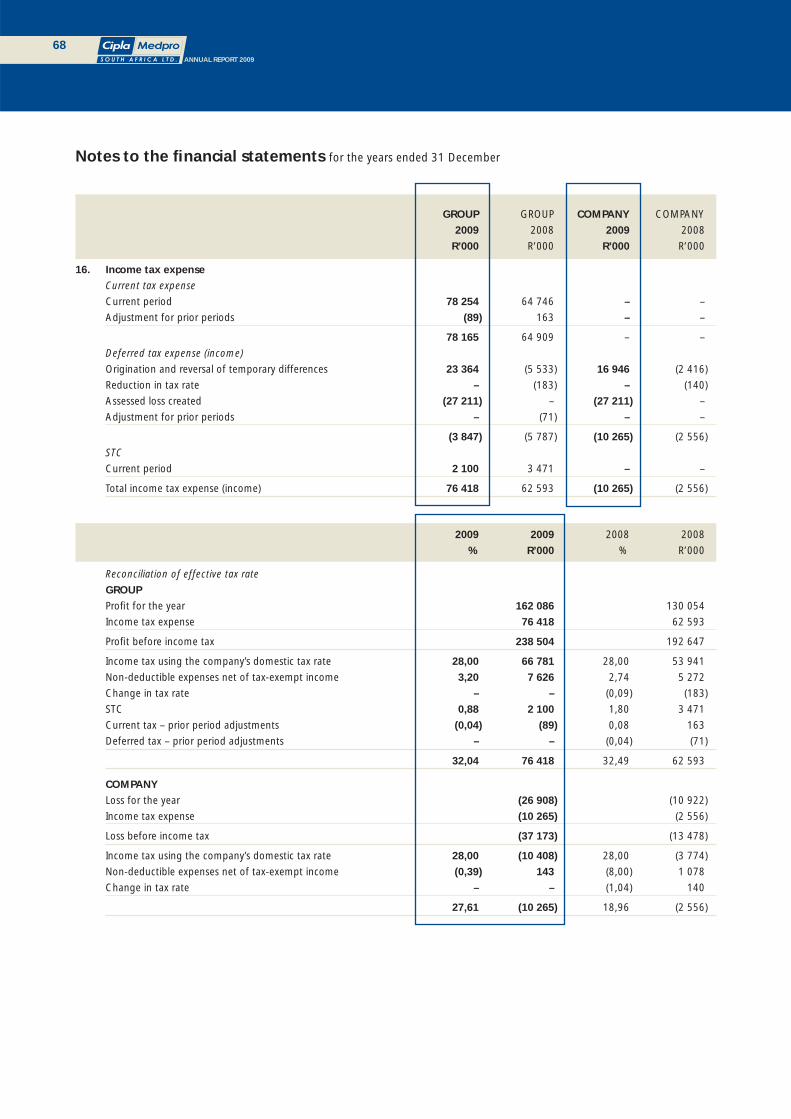
68ANNUAL REPORT 2009
GROUP GROUP COMPANY COMPANY
2009 2008 2009 2008
R’000 R’000 R’000 R’000
16. Income tax expense
Current tax expense
Current period 78 254 64 746 – –
Adjustment for prior periods (89) 163 – –
78 165 64 909 – –
Deferred tax expense (income)
Origination and reversal of temporary differences 23 364 (5 533) 16 946 (2 416)
Reduction in tax rate – (183) – (140)
Assessed loss created (27 211) – (27 211) –
Adjustment for prior periods – (71) – –
(3 847) (5 787) (10 265) (2 556)
STC
Current period 2 100 3 471 – –
Total income tax expense (income) 76 418 62 593 (10 265) (2 556)
2009 2009 2008 2008
% R’000 % R’000
Reconciliation of effective tax rate
GROUP
Profi t for the year 162 086 130 054
Income tax expense 76 418 62 593
Profi t before income tax 238 504 192 647
Income tax using the company’s domestic tax rate 28,00 66 781 28,00 53 941
Non-deductible expenses net of tax-exempt income 3,20 7 626 2,74 5 272
Change in tax rate – – (0,09) (183)
STC 0,88 2 100 1,80 3 471
Current tax – prior period adjustments (0,04) (89) 0,08 163
Deferred tax – prior period adjustments – – (0,04) (71)
32,04 76 418 32,49 62 593
COMPANY
Loss for the year (26 908) (10 922)
Income tax expense (10 265) (2 556)
Loss before income tax (37 173) (13 478)
Income tax using the company’s domestic tax rate 28,00 (10 408) 28,00 (3 774)
Non-deductible expenses net of tax-exempt income (0,39) 143 (8,00) 1 078
Change in tax rate – – (1,04) 140
27,61 (10 265) 18,96 (2 556)
Notes to the fi nancial statements for the years ended 31 December

69ANNUAL REPORT 2009
GROUP GROUP
2009 2008
R’000 R’000
17. Earnings per share
Basic earnings per share
The calculation of basic earnings per share at 31 December 2009 is based on the profi t
attributable to ordinary shareholders of R159 904 000 (2008: R128 679 000) and a weighted
average number of ordinary shares outstanding of 440 111 462 (2008: 439 783 776), calculated
as follows:
Profi t attributable to ordinary shareholders 159 904 128 679
Weighted average number of ordinary shares:
Issued ordinary shares at 1 January 443 265 635 443 265 635
Effect of own shares held in the CMSA Share Option Trust (treasury shares) (3 251 091) (7 131 000)
Shares issued to the CMSA Share Option Trust 6 590 481 –
Effect of own shares held in the CMSA Share Option Trust (treasury shares) (6 588 289) –
Effect of share options exercised during the year 94 726 3 649 141
Weighted average number of ordinary shares 440 111 462 439 783 776
Total basic earnings per share (cents) 36,3 29,3
Diluted earnings per share
The calculation of diluted basic earnings per share at 31 December 2009 is based on the profi t
attributable to ordinary shareholders of R159 904 000 (2008: R128 679 000) and a weighted
average number of ordinary shares outstanding after adjustments for the effects of all dilutive
potential ordinary shares of 441 073 790 (2008: 439 973 847), calculated as follows:
Profi t attributable to ordinary shareholders 159 904 128 679
Weighted average number of ordinary shares (diluted):
Weighted average number of ordinary shares 440 111 462 439 783 776
Effect of share options in issue 962 328 190 071
Weighted average number of ordinary shares (diluted) 441 073 790 439 973 847
Total diluted earnings per share (cents) 36,3 29,2
The average market value of the company’s shares for the purposes of calculating the dilutive effect of share options was based on
quoted market prices for the period that the options were outstanding.

70ANNUAL REPORT 2009
GROUP GROUP GROUP GROUP
2009 2009 2008 2008
R’000 R’000 R’000 R’000
17. Earnings per share continued
Headline earnings per share
The calculation of headline earnings per share at
31 December 2009 is based on the headline earnings
attributable to ordinary shareholders of R160 907 000
(2008: R128 022 000) and a weighted average number
of ordinary shares outstanding of 440 111 462
(2008: 439 783 776), calculated as follows:
Gross Net Gross Net
Reconciliation of headline earnings:
Profi t attributable to ordinary equity holders of the parent 159 904 128 679
Add: Loss on disposals of property, plant and equipment 1 166 1 003 172 148
Less: Gain on disposals of intangible assets – – (1 087) (935)
Add: Loss on disposals of discontinued operations – – 151 130
Headline earnings 160 907 128 022
Total headline earnings per share (cents) 36,6 29,1
Diluted headline earnings per share
The calculation of diluted headline earnings per share at
31 December 2009 is based on the headline earnings
attributable to ordinary shareholders of R160 907 000
(2008: R128 022 000) and a weighted average number of
ordinary shares outstanding after adjustments for the effects
of all dilutive potential ordinary shares of 441 073 790
(2008: 439 973 847):
Headline earnings 160 907 128 022
Total diluted headline earnings per share (cents) 36,5 29,1
Notes to the fi nancial statements for the years ended 31 December

71ANNUAL REPORT 2009
18. Financial risk management
The group is exposed to the following risks:
• Credit risk,
• Liquidity risk, and
• Market risk.
This note presents information about the group’s exposure to each of the above risks, the group’s objectives, policies and processes for
measuring and managing risk, and the group’s management of capital.
The board of directors has overall responsibility for the establishment and oversight of the group’s risk management framework. The
board has an Audit and Risk Committee, whose responsibility it is to develop and monitor the group’s risk management policies.
The group’s risk management policies are established to identify and analyse the risks faced by the group, to set appropriate risk limits
and controls, and to monitor risks and adherence to limits. Risk management policies and systems are reviewed regularly to refl ect
changes in market conditions and the group’s activities.
The group’s Audit and Risk Committee oversees how management monitors compliance with the group’s risk management policies
and procedures, and reviews the adequacy of the risk management framework in relation to the risks faced by the group. The group’s
Audit and Risk Committee is assisted in its oversight role by a co-sourced internal audit function comprising an independent fi rm of
internal auditors and in-house personnel. Internal audit undertakes both regular and ad hoc reviews of risk management controls and
procedures, the results of which are reported to the Audit and Risk Committee on a regular basis.
Credit risk
Credit risk is the risk of fi nancial loss to the group if a customer or counterparty to a fi nancial instrument fails to meet its contractual
obligations, and arises principally from the group’s receivables due from customers.
Trade and other receivables
The group’s exposure to credit risk is infl uenced mainly by the individual characteristics of each customer. The demographics of the
group’s customer base, including the default risk of the industry and country in which customers operate, has less of an infl uence on
credit risk. There is no geographical concentration of sales or a concentration of sales to a single customer.
Management has established a credit policy under which each new customer is analysed individually for creditworthiness before the
payment and delivery terms and conditions are offered. The group’s review includes external ratings, when available, and in some
cases bank references. Purchase limits are established for each customer, which represents the maximum open amount without
requiring approval from the directors; these limits are reviewed regularly. Customers that fail to meet the group’s benchmark
creditworthiness may transact with the group only on a prepayment basis.
More than 80 percent of the group’s customers have been transacting with the group for over fi ve years, and losses have occurred
infrequently. In monitoring customer credit risk, customers are grouped according to their credit characteristics, including whether
they are an individual or a legal entity, whether they are a wholesale, retail or end-user customer, geographic location, industry, aging
profi le, maturity and existence of previous fi nancial diffi culties. Trade and other receivables relate mainly to the group’s wholesale
customers.
Goods are sold subject to retention of title clauses, so that in the event of non-payment the group has a secured claim against
the customer. The group does not require collateral in respect of trade and other receivables. Where appropriate, credit guarantee
insurance cover is purchased.
The group establishes an allowance for impairment that represents its estimate of probable incurred losses in respect of trade and
other receivables. The main components of this allowance are a specifi c loss component that relates to individually signifi cant
exposures. This loss allowance is determined based on historical data of payment statistics for similar debtors.
Investments
The group limits its exposure to credit risk by only investing in liquid securities and only with counterparties that have a good credit
rating. In light of this strategy, management does not expect any counterparty to fail to meet its obligations.
Guarantees
The group’s policy is to provide fi nancial guarantees only to wholly owned subsidiaries. Refer to note 23.4 for further details.

72ANNUAL REPORT 2009
18. Financial risk management continued
Liquidity risk Liquidity risk is the risk that the group will not be able to meet its fi nancial obligations as they fall due. The group’s approach to
managing liquidity is to ensure, as far as possible, that it will always have suffi cient liquidity to meet its liabilities when due, under both
normal and stressed conditions, without incurring unacceptable losses or risking damage to the group’s reputation.
The group uses a standard costing system to cost its products and services, which assists it in monitoring cash fl ow requirements
and optimising its cash return on investments. Typically the group ensures that it has suffi cient cash on demand to meet expected
operational expenses for a period of 60 days, including the servicing of fi nancial obligations; this excludes the potential impact of
extreme circumstances that cannot reasonably be predicted, such as natural disasters. Refer to notes 12 and 23.4 for details of the
lines of credit maintained by the group.
Market risk Market risk is the risk that changes in market prices, such as foreign exchange rates, interest rates and equity prices will affect the
group’s income or the value of its holdings of fi nancial instruments. The objective of market risk management is to manage and
control market risk exposures within acceptable parameters, while optimising the return.
The group buys and sells derivatives as part of its approved hedging strategy, and also incurs fi nancial liabilities, in order to manage
market risks. All such transactions are carried out within the guidelines set by the Audit and Risk Committee. Generally the group uses
derivatives to economically hedge exposure to fl uctuations in foreign exchange rates and interest rates and to manage volatility in
profi t or loss.
Currency risk The group is exposed to currency risk on purchases that are denominated in a currency other than the functional currency of group
entities, i.e. ZAR. The currencies giving rise to this risk are primarily USD, EUR and AUD.
The group hedges about 75 to 85 percent of its estimated foreign currency exposure in respect of forecast purchases over the following six months, and trade and other payables denominated in a foreign currency. The group also hedges at least 90 percent of
all trade payables denominated in a foreign currency. The group uses forward exchange contracts to economically hedge its foreign
currency risk, most with a maturity of less than one year from the reporting date. When necessary, forward exchange contracts are
rolled over at maturity.
Interest rate risk From time to time, the group adopts a policy of ensuring that a portion of its exposure to changes in interest rates on borrowings is on
a fi xed rate basis. This is achieved by entering into interest rate swaps to economically hedge against fl uctuations in interest rates.
Equity price risk The group is exposed to equity price risk from equity investments. Equity investments are for strategic rather than trading purposes.
The group does not actively trade in these investments.
Capital management The group manages its capital to ensure that the group will be able to continue as a going concern, while maximising the return
to stakeholders through the optimisation of the debt and equity balance. The group’s overall strategy remains unchanged from the
previous year.
The capital structure of the group consists of net debt (i.e. loans and borrowings offset by net cash and cash equivalents) and equity
(i.e. issued share capital, reserves, retained earnings and non-controlling interests). The gearing ratio determined as the proportion
of net debt to equity, was 26,3% at year end (2008: 22,4%). The board monitors the capital structure of the group by considering
the cost of capital and the risks associated with each class of capital. The board’s policy is to maintain a strong capital base so as to
maintain investor, creditor and market confi dence and to sustain future development of the business.
The board of directors had made the decision to use all earnings generated by the group to fund growth opportunities and to repay
debt, however, the board has approved a dividend policy for 2010.
Fair values All loans and receivables and fi nancial liabilities not at fair value through profi t or loss are carried at amortised cost. The carrying value
of trade and other receivables, trade and other payables and fi nance lease liabilities approximate fair value as the effective interest rate
method is used to determine the carrying values. The time value of money has been considered in determining the carrying values
of trade receivables and payables. It is not viable to determine the fair value of inter-company receivables and payables with no fi xed
repayment or interest terms.
Notes to the fi nancial statements for the years ended 31 December

73ANNUAL REPORT 2009
19. Related parties
CMSA is the ultimate holding company. Related party relationships exist between the group, holding company, fellow subsidiaries, and
with its directors and key management personnel.
Transactions with related parties, except where otherwise noted, are conducted on an arm’s length basis and on the same payment
terms as those transacted with third parties. None of the balances are secured. Intragroup balances and material unrealised gains and
losses arising from intragroup transactions, are eliminated in preparing the consolidated fi nancial statements.
The following related party transactions occurred during the years ended 31 December:
Transactions with subsidiaries
The group is controlled by CMSA. The group’s subsidiaries are as follows:
Direct interest
Cipla Medpro Manufacturing (Pty) Limited
Galilee Marketing (Pty) Limited
Inyanga Trading 386 (Pty) Limited
Xeragen Laboratories (Pty) Limited
Indirect interest through 100% held subsidiary Inyanga Trading 386 (Pty) Limited
Cipla Medpro Holdings (Pty) Limited
Indirect interest through 100% held subsidiary Cipla Medpro Holdings (Pty) Limited
Agropharm (Pty) Limited (effective holding) – 50% (2008: 50%)
Cipla Agricare (Pty) Limited – 50% (2008: 50%)
Cipla Agrimed (Pty) Limited (effective holding) – 75,25% (2008: 75,25%)
Cipla Dibcare (Pty) Limited – 67% (2008: 67%)
Cipla Health Care (Pty) Limited
Cipla Life Sciences (Pty) Limited (effective holding) – 100% (2008: 100%)
Cipla Medpro ARV (Pty) Limited
Cipla Medpro Cardio Respiratory (Pty) Limited
Cipla Medpro Distribution Centre (Pty) Limited
Cipla Personal Care (Pty) Limited
Cipla Vet (Pty) Limited – 75% (2008: 75%)
Cipla-Medpro (Pty) Limited
Gardian Cipla (Pty) Limited
Medpro Gen (Pty) Limited
Medpro Holdings (Pty) Limited
Medpro Pharmaceutica (Pty) Limited
Medpro Pharmaceutica Africa (Pty) Limited – 50% (2008: 0%)
Medpro-On-Line (Pty) Limited
Smith and Couzin (Pty) Limited
The group also includes the CMSA Share Option Trust.
Transactions conducted with the subsidiaries that were deregistered during the year ended 31 December 2009 have also been
disclosed in the 2008 comparative fi gures where applicable. No amounts were due to or due from these deregistered subsidiaries at
31 December 2009. Refer to page 4 for the list of subsidiaries deregistered/liquidated during the year.

74ANNUAL REPORT 2009
GROUP GROUP COMPANY COMPANY
2009 2008 2009 2008
R’000 R’000 R’000 R’000
19. Related parties continued
Transactions with subsidiaries continued
a) Transactions with related parties
The following transactions were carried out by Cipla
Medpro South Africa Limited with related parties:
(i) Revenue
Cipla Medpro Holdings (Pty) Limited – – (20 499) (684)
(ii) Management fees
Cipla Medpro Holdings (Pty) Limited – – (10 990) (12 329)
(iii) Interest on inter-company loan
Cipla Medpro Holdings (Pty) Limited – – 12 265 5 628
(iv) Purchases
Cipla Medpro Holdings (Pty) Limited – – – 167
b) Loans due to (from) holding company:
Cipla Medpro Holdings (Pty) Limited – – (102 604) (74 558)
Inyanga Trading 386 (Pty) Limited – – 799 911 799 910
Universal Pharmaceuticals (Pty) Limited – – – (4 046)
Xeragen Laboratories (Pty) Limited – – (10 708) (10 820)
Zedchem (Pty) Limited – – – (595)
– – 686 599 709 891
Refer to Annexure A for the terms and conditions
attached to the above balances.
c) Loan due from the Share Option Trust
CMSA Share Option Trust – – 23 304 7 959
d) Trade receivable due to holding company
Cipla Medpro Holdings (Pty) Limited – – 775 502
e) Issue of shares to the CMSA Share Option Trust
2009: 6 590 481 (2008: nil)
Notes to the fi nancial statements for the years ended 31 December

75ANNUAL REPORT 2009
19. Related parties continued
Transactions with directors and key management personnel
a) Loans (direct/indirect)
Cipla Medpro Holdings (Pty) Limited has a loan due to L’amar (France) Pharmatec (Pty) Limited of R462 390 (2008: R159 838
due from L’amar). JS Smith and C Aucamp are both directors and hold an immaterial interest in this company.
b) Property leases
During the year, Cipla Medpro Holdings (Pty) Limited, leased property from JSSTD Properties (Pty) Limited. JS Smith is a director
of both Cipla Medpro Holdings (Pty) Limited and JSSTD Properties (Pty) Limited. Lease rentals paid during the year amounted to
R749 419 (2008: R641 725), with an amount of R447 598 due from (2008: R684 981 due to) JSSTD Properties (Pty) Limited at
31 December 2009.
c) Royalties
During the year, Medpro Pharmaceutica (Pty) Limited, a wholly owned subsidiary of Cipla Medpro Holdings (Pty) Limited, paid
royalties amounting to R864 279 (2008: R307 330) to L’amar (France) Pharmatec (Pty) Limited. JS Smith and C Aucamp are
both directors and hold an immaterial interest in this company.
d) Rentals
During the year, Cipla Medpro Holdings (Pty) Limited chartered on an ad hoc basis for entertainment purposes, a yacht owned
by JS Smith, who is also a director of this company. Fees paid during the year for the use of the yacht amounted to R227 211
(2008: R51 240).
e) Compensation
In addition to their salaries, the group also provides non-cash benefi ts in the form of share options to directors and key
personnel. Refer to note 22 for details of share options granted to these employees.

76ANNUAL REPORT 2009
20. Directors’ emoluments
Basic salary Retirement IFRS 2
for man- and Share-based
Directors’ agement Annual Other medical Total Payment Total
fees1 services bonus benefi ts benefi ts2 remuneration3 Expense 2009
31 December 2009 R’000 R’000 R’000 R’000 R’000 R’000 R’000 R’000
Executive directors
JS Smith (CEO) – 8 048 1 887 724 100 10 759 3 139 13 898
C Aucamp (CFO) – 2 373 964 432 40 3 809 1 003 4 812
Total A – 10 421 2 851 1 156 140 14 568 4 142 18 710
Non-executive directors
PCS Luthuli (Chairman) 509 – – – – 509 – 509
MB Caga 177 – – – – 177 – 177
JvD du Preez4 – – – – – – – –
Dr GS Mahlati5 353 – – – – 353 – 353
ND Mokone 92 – – – – 92 – 92
MT Mosweu 194 – – – – 194 – 194
SMD Zungu4 – – – – – – – –
Total B 1 325 – – – – 1 325 – 1 325
Total directors’
emoluments
paid (A + B) 1 325 10 421 2 851 1 156 140 15 893 4 142 20 035
Emoluments paid by:
CMSA 1 325 – – – – 1 325 4 142 5 467
Cipla Medpro – 10 421 2 851 1 156 140 14 568 – 14 568
Notes to the fi nancial statements for the years ended 31 December

77ANNUAL REPORT 2009
20. Directors’ emoluments continued
Basic salary IFRS 2
for Retirement Share-based
Directors’ management Annual Other and medical Total Payment Total
fees1 services bonus benefi ts benefi ts2 remuneration3 Expense 2008
31 December 2008 R’000 R’000 R’000 R’000 R’000 R’000 R’000 R’000
Executive directors
JS Smith (CEO) – 9 102 598 1 51 9 752 2 061 11 813
C Aucamp (CFO) – 3 055 213 1 36 3 305 647 3 952
Total A – 12 157 811 2 87 13 057 2 708 15 765
Non-executive directors
PCS Luthuli (Chairman) 531 – – – – 531 – 531
MB Caga 211 – – – – 211 – 211
Dr GS Mahlati 132 – – – – 132 – 132
ND Mokone6 60 – – – – 60 – 60
MT Mosweu6 84 – – – – 84 – 84
Total B 1 018 – – – – 1 018 – 1 018
Total directors’
emoluments
paid (A + B) 1 018 12 157 811 2 87 14 075 2 708 16 783
Emoluments paid by:
CMSA 1 018 – – – – 1 018 2 708 3 726
Cipla Medpro – 12 157 811 2 87 13 057 – 13 057
1 Directors’ fees include payments for attendance at board, Audit and Risk Committee and Remuneration Committee meetings,
as well as retainer fees.
2 These payments relate to the employer contributions to the defi ned contribution pension plan and medical aid.
3 Total remuneration refl ects the total cash payments and benefi ts paid to directors. The IFRS 2 Share-based Payment expense has
been shown separately in the next column; this refers to the amount recognised in the statement of comprehensive income in
relation to share options that have been granted to the executive directors.
4 Appointed in March 2010.
5 Resigned in November 2009.
6 Disclosure for the 2008 year has been restated to account for emoluments incorrectly disclosed in “other staff costs” in the
prior year.
Refer to note 22 which provides further details of share options in issue to directors.

78ANNUAL REPORT 2009
Notes to the fi nancial statements for the years ended 31 December
GROUP GROUP COMPANY COMPANY
2009 2008 2009 2008
R’000 R’000 R’000 R’000
21. Commitments
Operating lease commitments (as lessee)
The future minimum lease payments under non-cancellable
operating leases are as follows:
– Less than one year 11 631 9 407 3 101 3 095
– Between two and fi ve years 36 172 40 144 12 403 12 380
– More than fi ve years 4 058 6 964 3 876 6 964
51 861 56 515 19 380 22 439
The group leases certain factory facilities and property, plant and equipment under operating leases. The leases typically run for a
period of ten years, with an option to renew the lease after that date.
In determining lease classifi cation, the group evaluated whether both land and buildings were clearly operating leases or fi nance
leases. Since land title does not pass, rentals paid to the landlord for the buildings are increased to market-related rates at regular
intervals and the group does not participate in the residual value of the building, it was judged that substantially all the risks and
rewards of the building are with the landlord. Based on these factors it was concluded that the leases are operating leases.
During the year ended 31 December 2009, R21,7 million (2008: R16,5 million) was recognised (straight-line) as an expense in the
statement of comprehensive income in respect of operating leases.
Capital commitments
By 31 December 2009, R311 million (2008: R225 million) had been expended on the upgrade of the Cipla Medpro Manufacturing site
and manufacturing facilities. Subsequent to year end, R9,5 million (2008: R9,2 million) had been spent on the upgrade.
In respect of the upgrade, CMSA has outstanding orders for plant and machinery due to be delivered from abroad. At year end,
R26,1 million had approved but not contracted, whilst R2,1 million had been contracted for.

79ANNUAL REPORT 2009
22. Share options and share-based payments
In May 2005, the company established a broad-based employee share plan that allows the company to issue shares at par value to
employees. In May 2005, 575 000 shares were issued to employees in terms of this broad-based scheme. This resulted in a cost of
R575 000 being expensed to the income statement during the 2005 year.
In May 2005, the company also established a share incentive scheme which entitles directors and key management personnel to
purchase shares in the company. Such share options are exercisable at either the market price of the shares at the date of grant, or at
a price determined by the shareholders in a general meeting. In accordance with IFRS 2 Share-based Payments, an amount of
R6 056 000 (2008: R4 646 000) was recognised as the IFRS 2 expense for the year.
The fair value of services received from employees in return for share options granted are measured with reference to the fair value of
share options granted. The estimate of the fair value of the services received is measured based on the binomial lattice model which
takes into account the share price on the date of the grant, the exercise price, expected volatility, option life, expected dividends and
risk-free interest rate. All options are granted at the 30-day volume weighted average market price of CMSA’s shares preceding the
option grant date, unless otherwise authorised by the shareholders in a general meeting. All vested share options must be exercised,
paid for and taken up within seven years of grant or approval date. Share options may be taken up in two tranches: 50% of share
options vest two years after grant date and the balance of the options vest three years after grant date, with the exception of the
share options granted since 2008 which vest one year after grant date .
All options are granted in accordance with the rules of the respective schemes which have been approved by the board of directors
and the JSE.
Fair value
The group accounts for share option expenses in accordance with IFRS 2 Share-based Payments, which requires the fair value of share
options granted to employees to be valued at the grant date and expensed through the statement of comprehensive income over the
vesting period of the share options. The fair value of each option granted by CMSA has been estimated on the grant date using the
binomial lattice model. The assumptions used in determining the fair value of the options granted to directors and employees in each
fi nancial year are summarised below.
Number Number Share
Number of options of options Expected price Expected
GROUP AND of options outstanding outstanding life of at grant Exercise Expected dividend Risk-free
COMPANY granted 2009 2008 options date price volatility3 yield4 rate5
Date of grant ‘000 ‘000 ‘000 years cents cents % % %
June 2005 2 651 878 891 2 – 5 120 100 25 – 29 – 7,08 – 7,60
December 20051 4 480 310 2 360 2 – 5 331 300 25 – 27 – 7,17 – 7,34
April 2008 1 000 1 000 1 000 1 – 4 302 306 33 – 9,16
May 2008 2 928 2 928 2 928 1 – 4 290 296 33 – 9,67
June 20092 3 711 3 711 – 1 – 4 385 354 38 – 8,43
November 2009 3 120 3 120 – 1 – 4 459 478 37 – 8,43
1 The share options were granted to employees in December 2005, but issued to the share incentive trust during the 2006
fi nancial year.
2 The share options were approved by the board during April 2009.
3 The volatility of a company in the same industry was used as a proxy, commensurate with the grant date and expected life of
the option.
4 The expected dividend yield is the best estimate of the forward-looking dividend yield over the expected life of the option. At
the date of grant and valuation exercise, management has assumed that no dividend will be declared over the vesting period of
the grant.
5 The risk-free rate is the GOVI index as supplied by the Bond Exchange as a proxy for the risk-free rate, or the continuously
compounded zero coupon bond rate for a fi ve-year government bond.

80ANNUAL REPORT 2009
Notes to the fi nancial statements for the years ended 31 December
GROUP GROUP COMPANY COMPANY
2009 2008 2009 2008
R’000 R’000 R’000 R’000
22. Share options and share-based payments continued
Share-based payments recognised in retained earnings
The movement in IFRS 2 Share-based Payments expense is
as follows:
Opening balance 9 558 4 912 9 558 4 912
Share options expensed during the year 6 056 4 646 6 056 4 646
Closing balance 15 614 9 558 15 614 9 558
Employee expenses
Comprising:
Share options granted during 2005 – 1 553 – 1 553
Share options granted during 2008 1 818 3 093 1 818 3 093
Share options granted during 2009 4 238 – 4 238 –
Total expense recognised as employee costs 6 056 4 646 6 056 4 646
Share options outstanding
The movement in the number of share options can be reconciled
as follows:
Outstanding at beginning of the year6 (‘000) 7 179 3 976 7 179 3 976
Granted during the year6 (‘000) 6 831 3 928 6 831 3 928
Forfeited during the year6 (‘000) – (372) – (372)
Exercised during the year6,7 (‘000) (2 063) (475) (2 063) (475)
Forfeitures that can be granted in the future6 (‘000) – 122 – 122
Outstanding at end of the year6 (‘000) 11 947 7 179 11 947 7 179
Exercisable at 31 December6 (‘000) 140 2 203 140 2 203
6 The weighted average exercise price of share options for
each of the above groups of options are as follows:
Outstanding at beginning of the year (cents) 274 241 274 241
Granted during the year (cents) 411 299 411 299
Forfeited during the year (cents) – 341 – 341
Exercised during the year (cents) 299 100 299 100
Forfeitures that can be granted in the future (cents) – 100 – 100
Outstanding at end of the year (cents) 348 274 348 274
Exercisable at 31 December (cents) 300 299 300 299
2009 2009 2008 2008
Number Weighted Number Weighted
of options average of options average
exercised share price exercised share price
GROUP AND COMPANY ‘000 cents ‘000 cents
7 The weighted average share price at the date of exercise
of these share options was:
Exercised during the year
June – – (127) 250
December (2 063) 474 (348) 249
(2 063) (475)
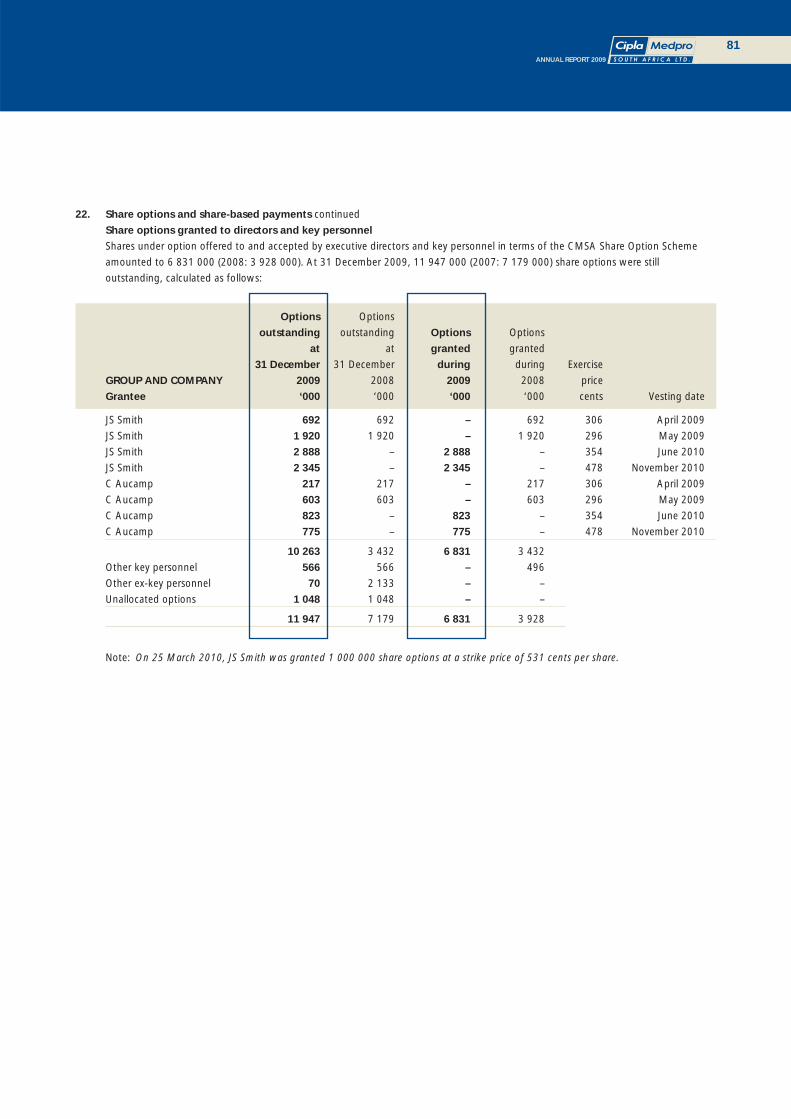
81ANNUAL REPORT 2009
22. Share options and share-based payments continued
Share options granted to directors and key personnel
Shares under option offered to and accepted by executive directors and key personnel in terms of the CMSA Share Option Scheme
amounted to 6 831 000 (2008: 3 928 000). At 31 December 2009, 11 947 000 (2007: 7 179 000) share options were still
outstanding, calculated as follows:
Options Options
outstanding outstanding Options Options
at at granted granted
31 December 31 December during during Exercise
GROUP AND COMPANY 2009 2008 2009 2008 price
Grantee ‘000 ‘000 ‘000 ‘000 cents Vesting date
JS Smith 692 692 – 692 306 April 2009
JS Smith 1 920 1 920 – 1 920 296 May 2009
JS Smith 2 888 – 2 888 – 354 June 2010
JS Smith 2 345 – 2 345 – 478 November 2010
C Aucamp 217 217 – 217 306 April 2009
C Aucamp 603 603 – 603 296 May 2009
C Aucamp 823 – 823 – 354 June 2010
C Aucamp 775 – 775 – 478 November 2010
10 263 3 432 6 831 3 432
Other key personnel 566 566 – 496
Other ex-key personnel 70 2 133 – –
Unallocated options 1 048 1 048 – –
11 947 7 179 6 831 3 928
Note: On 25 March 2010, JS Smith was granted 1 000 000 share options at a strike price of 531 cents per share.
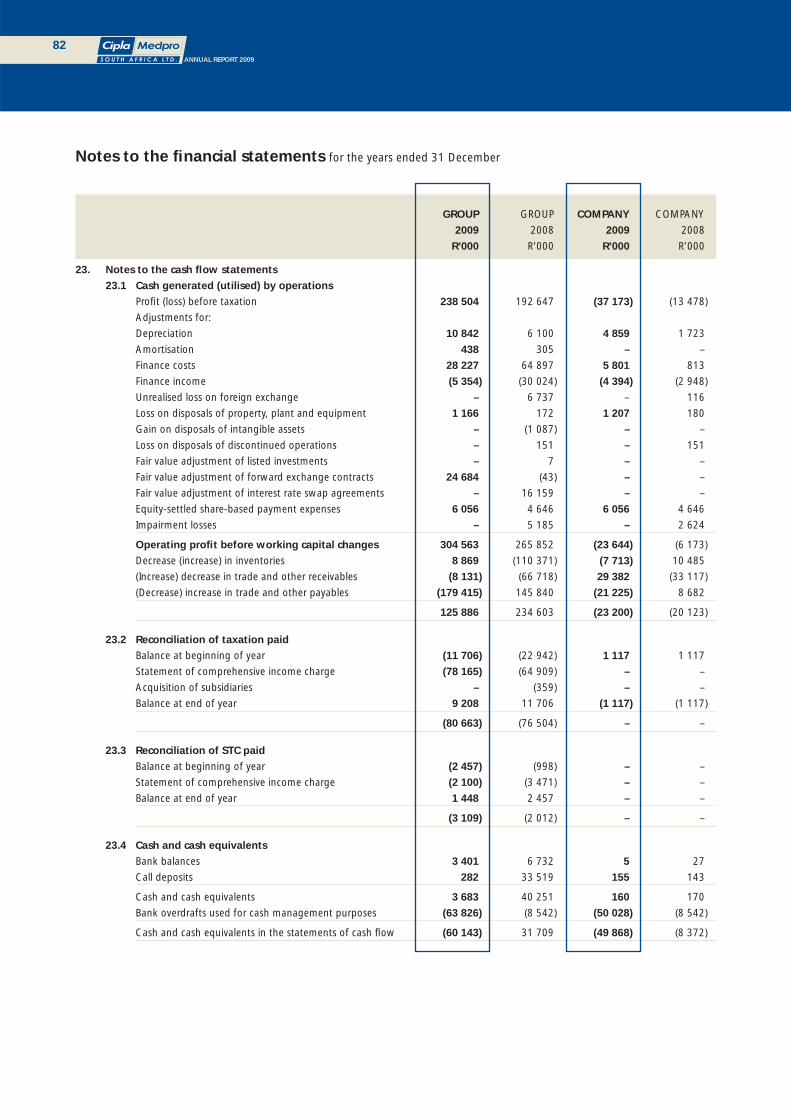
82ANNUAL REPORT 2009
GROUP GROUP COMPANY COMPANY
2009 2008 2009 2008
R’000 R’000 R’000 R’000
23. Notes to the cash fl ow statements
23.1 Cash generated (utilised) by operations
Profi t (loss) before taxation 238 504 192 647 (37 173) (13 478)
Adjustments for:
Depreciation 10 842 6 100 4 859 1 723
Amortisation 438 305 – –
Finance costs 28 227 64 897 5 801 813
Finance income (5 354) (30 024) (4 394) (2 948)
Unrealised loss on foreign exchange – 6 737 – 116
Loss on disposals of property, plant and equipment 1 166 172 1 207 180
Gain on disposals of intangible assets – (1 087) – –
Loss on disposals of discontinued operations – 151 – 151
Fair value adjustment of listed investments – 7 – –
Fair value adjustment of forward exchange contracts 24 684 (43) – –
Fair value adjustment of interest rate swap agreements – 16 159 – –
Equity-settled share-based payment expenses 6 056 4 646 6 056 4 646
Impairment losses – 5 185 – 2 624
Operating profi t before working capital changes 304 563 265 852 (23 644) (6 173)
Decrease (increase) in inventories 8 869 (110 371) (7 713) 10 485
(Increase) decrease in trade and other receivables (8 131) (66 718) 29 382 (33 117)
(Decrease) increase in trade and other payables (179 415) 145 840 (21 225) 8 682
125 886 234 603 (23 200) (20 123)
23.2 Reconciliation of taxation paid
Balance at beginning of year (11 706) (22 942) 1 117 1 117
Statement of comprehensive income charge (78 165) (64 909) – –
Acquisition of subsidiaries – (359) – –
Balance at end of year 9 208 11 706 (1 117) (1 117)
(80 663) (76 504) – –
23.3 Reconciliation of STC paid
Balance at beginning of year (2 457) (998) – –
Statement of comprehensive income charge (2 100) (3 471) – –
Balance at end of year 1 448 2 457 – –
(3 109) (2 012) – –
23.4 Cash and cash equivalents
Bank balances 3 401 6 732 5 27
Call deposits 282 33 519 155 143
Cash and cash equivalents 3 683 40 251 160 170
Bank overdrafts used for cash management purposes (63 826) (8 542) (50 028) (8 542)
Cash and cash equivalents in the statements of cash fl ow (60 143) 31 709 (49 868) (8 372)
Notes to the fi nancial statements for the years ended 31 December
83ANNUAL REPORT 2009
23. Notes to the cash fl ow statements continued
23.4 Cash and cash equivalents continued
CMSA has a multi-option facility comprising overdrafts, letters of guarantee and letters of credit for an amount of R80 million
(2008: R80 million), letters of guarantee amounting to R490 000 (2008: R490 000), an asset based fi nance facility of
R72,5 million (2008: R15 million) and a derivative facility of R30 million (2008: R7 618 498) held with Nedbank Limited. These
are secured in part through:
• Gross deed of suretyship by Cipla Medpro Holdings (Pty) Limited, Cipla Medpro Manufacturing (Pty) Limited and CMSA.
The banking facilities of Inyanga Trading 386 (Pty) Limited, are secured as follows:
• Guarantee of the obligations of Cipla Medpro;
• Pledge and cession of Inyanga Trading 386 (Pty) Limited’s shares;
• Pledge and cession of Inyanga Trading 386 (Pty) Limited’s investment in and claims against Cipla Medpro; and
• Cession of Inyanga Trading 386 (Pty) Limited’s trade debtors, deposits, cash, rights to insurances and government
authorisations.
The R5 million general banking facility comprising overdrafts, guarantees, CFC’s and letters of credit from ABSA Bank Limited
granted to Medpro Pharmaceutica (Pty) Limited, a subsidiary company of Cipla Medpro Holdings (Pty) Limited, is secured as
follows:
• The cession of trade debtors and Credit Guarantee Insurance Cover policy;
• An unlimited deed of suretyship given by Cipla Medpro Holdings (Pty) Limited; and
• The cession of the loan account by Cipla Medpro Holdings (Pty) Limited in Medpro Pharmaceutica (Pty) Limited.
Nedbank Limited has a reversionary right to the cash balances of the group.

84ANNUAL REPORT 2009
24. Acquisitions of subsidiaries
Refer to Annexure A which details the group’s subsidiary acquisitions.
Acquisition of controlling interest
During January 2008, the group acquired an additional 43% shareholding in Cipla Agrimed (Pty) Limited via its 75% held subsidiary,
Cipla Vet (Pty) Limited. This increased the group’s effective shareholding in the subsidiary to 75,25%. The total purchase consideration
was settled in cash. The excess of the consideration paid was recognised as goodwill in recognition of future economic benefi ts that
the group will earn through the acquisition. The goodwill has been allocated to one cash-generating unit for impairment testing
purposes.
2008
GROUP R’000
Associate’s net assets at acquisition date
Property, plant and equipment 103
Intangible assets 2 749
Inventories 5 277
Trade and other receivables 3 340
Deferred tax 6
Cash and cash equivalents 1 068
Loans from shareholders (3 164)
Loans from group companies (4 089)
Current tax liability (359)
Trade and other payables (4 475)
Net fair value at acquisition date 456
Less: non-controlling interest (113)
Less: carrying value of investment previously held as associate (317)
Excess over purchase consideration 6 224
Total purchase consideration 6 250
Less: cash acquired (1 068)
Net cash outfl ow 5 182
Acquisition of subsidiary
During January 2008, the group acquired a 50% interest in Cipla Agricare (Pty) Limited. The total purchase
consideration was settled in cash. The excess was recognised as goodwill in recognition of future economic
benefi ts that the group will earn through the acquisition.
Purchase consideration – cash component 5 442
Purchase consideration – liability component –
Total purchase consideration 5 442
Shareholder loans acquired –
Total cost of the additional 50% of the shares 5 442
Comprising:
Assets acquired –
Non-controlling interest –
Goodwill 5 442
Acquisitions of subsidiaries
During January 2009, the group acquired a 50% interest in Medpro Pharmaceutica Africa (Pty) Limited for fi ve Rand. The total
purchase consideration was settled in cash.
During December 2008, the group acquired a 100% interest in Cipla Medpro Manufacturing (Pty) Limited for a total purchase
consideration of R100.
Notes to the fi nancial statements for the years ended 31 December
85ANNUAL REPORT 2009
25. New standards and interpretations
25.1 Standards and interpretations effective 1 January 2009 and adopted during the current fi nancial year
During the current year, the group adopted the following standards and interpretations that are effective for annual periods
beginning on or after 1 January 2009:
• IFRS 2 Share-based Payments (amendment): Vesting Conditions and Cancellations. The amendment clarifi es the defi nition
of vesting conditions and explains that all cancellations, whether by the entity or by other parties, should receive the
same accounting treatment. Since the group already complies with this amendment, the adoption of this standard has
no impact on the group.
• IFRS 7 Financial Instruments: Disclosure (amendment). This amendment is aimed at improving the transparency in
fi nancial instrument disclosure. The amendment requires entities to classify fair value measurements by applying a three
level hierarchy as follows:
Level 1 – Quoted prices in active markets for identical assets or liabilities;
Level 2 – Inputs, other than quoted prices included within level 1, that are observable for the asset or liability, either
directly (i.e. as prices) or indirectly (i.e. derived from prices); and
Level 3 – Inputs for the asset or liability that are not based on observable market data. Level 3 instruments require
opening to closing balance reconciliations.
The group already complies with this amendment and it does therefore not impact the group.
• IFRS 8 Operating Segments: This new standard replaces IAS 14 Segment Reporting. Upon adoption of IFRS 8, the
identifi cation of an entity’s segments may or may not change. IAS 14 requires an entity to identify two sets of segments
(business and geographical), using a risks and rewards approach, with the entity’s “system of internal fi nancial reporting
to key management personnel” serving only as the starting point for the identifi cation of such segments. One set of
segments was regarded as primary and the other as secondary. If under IAS 14 an entity identifi es its primary segments
on the basis of the internal reports provided to the person whom IFRS 8 regards as the chief operating decision maker,
those might become the “operating segments” for the purposes of IFRS 8. Accordingly, the company’s identifi cation
of segments under the previous IAS 14 remains the same as under IFRS 8, as the group previously identifi ed primary
segments based on the reports provided to the chief operating decision maker. The adoption of this statement therefore,
has no impact on the group.
• IAS 1 Presentation of Financial Statements (revised): This amendment sets out the presentation of shareholder changes
in equity and the presentation of a “Statement of comprehensive income” (either part of the income statement or
separately). The amendment has no fi nancial impact, but has changed the structure of the 2009 fi nancial statements.
• IAS 10 Events After the Reporting Period (amendment): The standard requires that dividends declared after year end but
before the date of the annual fi nancial statements, must be disclosed in the notes to the annual fi nancial statements.
The group has not declared a post year end dividend and hence the adoption of this amendment has no impact on the
group.
• IAS 23 Borrowing Costs (amendment): The amendment to IAS 23 removes the option to expense all borrowing costs and
requires that an entity capitalise all borrowing costs directly attributable to the acquisition, construction or production of
a qualifying asset as part of the cost of that asset. The adoption of this amendment has no signifi cant impact as in the
past, all qualifying borrowing costs were being capitalised.
• IAS 32 Financial Instruments: Presentation and IAS 1 Presentation of Financial Statements (amendments): These
amendments are relevant to entities that have issued fi nancial instruments that are (i) puttable fi nancial instruments, or
(ii) instruments, or components of instruments, that impose on the entity an obligation to deliver to another party a
pro rata share of the net assets of the entity only on liquidation. Under the revised IAS 32, subject to specifi ed criteria
being met, these instruments will be classifi ed as equity whereas, prior to these amendments, they would have been
classifi ed as fi nancial liabilities. The adoption of these amendments do not impact the group.
86ANNUAL REPORT 2009
25. New standards and interpretations continued
25.1 Standards and interpretations effective 1 January 2009 and adopted during the current fi nancial year continued
• IAS 36 Impairment of Assets (amendment): This amendment requires that disclosure be made of all estimates used to
determine the recoverable amount of assets on the statement of fi nancial position of the annual fi nancial statements.
The group already complies with this amendment and therefore, the adoption of this amendment has no impact on
the group.
• IAS 38 Intangible Assets (amendment): The amendment to the standard requires that the entity expense advertising
costs incurred as and when the entity obtains the right of access to these goods. The group already complies with this
amendment and the adoption of this amendment thus has no impact on the group.
25.2 Standards and interpretations not yet effective for the current fi nancial year, but effective for the ensuing fi nancial year
At the date of authorisation of these fi nancial statements, the standards and interpretations listed below were in issue but not
yet effective and have not been applied in preparing these consolidated group fi nancial statements:
• IFRS 2 Share-based Payments (effective annual periods beginning on or after 1 July 2009). The current wording of IFRS 2
excludes from its scope transactions related to business combinations within the scope of IFRS 3 Business Combinations
(revised). As per IFRS 3, common control transactions and joint ventures for which control is not relevant are no longer
explicitly included in the defi nition of business combinations and hence IFRS 2 is applicable to transactions relating to
business combinations of this type.
• IFRS 3 Business Combinations, IAS 27 Consolidated and Separate Financial Satements and IAS 28 Investments in
Associates (all revised) (mandatory for business combinations in annual periods beginning on or after 1 July 2009). Earlier
application is permitted but only back to an annual reporting period that begins on or after 30 June 2007. The more
important revisions to the standards include clarity on what constitutes “acquisition costs”, treatment of adjustments
to “contingent consideration”, accounting for partial disposal of a subsidiary or acquisition of additional shares in a
subsidiary and the option to use the “full goodwill method”. The revisions will result in a higher degree of convergence
between IFRSs and US GAAP in the above areas.
• IFRS 5 Non-current Assets Held for Sale and Discontinued Operations (effective annual periods beginning on or after
1 July 2009). The amendment clarifi es that when an entity is committed to a sale plan involving the loss of control of
a subsidiary, the entity shall classify the assets and liabilities of that subsidiary as held for sale when the “held-for-sale
criteria’’ has been met, regardless of whether the entity will retain a non-controlling interest in the former subsidiary after
the sale. When the subsidiary meets the defi nition of a discontinued operation, disclosure fo discontinued operations
would be required.
• IAS 7 Statement of Cash Flows (effective annual periods beginning on or after 1 July 2009). The amendment states that
cash fl ows arising from changes in level of control, where control is not lost, are equity transactions and should therefore
be accounted for as cash fl ows from fi nancing transactions.
• IAS 12 Income Taxes (effective annual periods beginning on or after 1 July 2009). The amendment requires that a
deferred tax asset should be recognised against goodwill (and profi t or loss to the extent that it exceeds goodwill) if the
deferred tax asset existed on acquisition date, but was not recognised by the subsidiary due to whatever reason and
the asset became recognisable subsequently. This may only be done if it results from information that existed at
acquisition date.
• IAS 28 Investments in Associates (effective annual periods beginning on or after 1 July 2009). When an investment in an
associate is reduced, but signifi cant infl uence is retained, the amendment requires that a proportionate share of other
comprehensive income must be reclassifi ed to profi t or loss.
• IAS 38 Intangible Assets (effective annual periods beginning on or after 1 July 2009). The amendment states that an
identifi able intangible asset acquired in a business combination should be recognised separately from goodwill. The
amendment also states that there are no specifi c measurement techniques required to be used for the measurement of
intangible assets when no active market exists.
Notes to the fi nancial statements for the years ended 31 December

87ANNUAL REPORT 2009
25. New standards and interpretations continued
25.2 Standards and interpretations not yet effective for the current fi nancial year, but effective for the ensuing fi nancial year
continued
• IFRIC 17 Distributions of Non-cash Assets to Owners (effective annual periods beginning on or after 1 July 2009). The
interpretation clarifi es that a dividend should only be recognised once it is appropriately authorised; the dividend
payable should be measured at the fair value of the net assets to be distributed and the entity should recognise the
difference between the dividend paid and the carrying amount of the net assets distributed in profi t or loss. Further, the
interpretation also requires an entity to provide additional disclosure if the net assets held for distribution to the owners
meet the defi nition of a discontinued operation.
• AC 503 Accounting for Black Economic Empowerment Transactions (effective annual periods beginning on or after
1 July 2009). The defi nition of performance conditions has been amended to include a service requirement, in addition to
performance targets, with regards to vesting conditions as per IFRS 2 Share-based Payments.
• IFRS 5 Non-current Assets Held for Sale and Discontinued Operations (effective annual periods beginning on or after
1 January 2010). The amendment clarifi es the disclosures of non-current assets classifi ed as held for sale or discontinued
operations. The new wording addresses the uncertainty around the specifi c disclosures.
• IFRS 8 Operating Segments (effective annual periods beginning on or after 1 January 2010). The amendment aims to
eliminate the difference with the US standards on the presentation of segment disclosure, by requiring that both assets
and liabilities of each segment be presented systematically.
• IAS 1 Presentation of Financial Statements (effective annual periods beginning on or after 1 January 2010). The
amendment aims to provide clarifi cation on the classifi cation of the liability component of convertible assets as current or
non-current: this component should not be classifi ed as a current liability simply because it may be settled at any time at
the option of the holder.
• IAS 7 Statement of Cash Flows (effective annual periods beginning on or after 1 January 2010). The amendment states
that only expenditure that results in the recognition of an asset are eligible for classifi cation as investing activities in the
statement of cash fl ows. This change aims to ensure consistency between the statement of fi nancial position and the
statement of cash fl ows.
• IAS 17 Leases (effective annual periods beginning on or after 1 January 2010). When the length of a lease, containing
a land element, is such that in substance, title passes to the lessee at the end of the lease term, such lease may be
classifi ed as a fi nance lease, as opposed to an operating lease. Retrospective application of this amendment is required
on the basis of information available at the date of signature of the lease contract.
• IAS 36 Impairment of Assets (effective annual periods beginning on or after 1 January 2010). The application of
IFRS 8 Operating Segments could have an impact on the determination of operating segments. The determination may
lead to a revision of the allocation of goodwill to cash-generating units. IFRS 8 allows the aggregation of segments
with similar economic characteristics. The amendment to IAS 36 states that the relevant segments for the allocation of
goodwill are those existing before the aggregation.
• IAS 39 Financial Instruments: Recognition and Measurement (effective annual periods beginning on or after
1 January 2010). The amendments clarify the scope exemption for business combination contracts and states that only
forward contracts of which fi nalisation does not depend on the future actions of one or another party are excluded from
the scope of IAS 39. The amendment also clarifi es that amounts recognised in equity should be reclassifi ed to profi t or
loss in the same period during which the hedged cash fl ow affects profi t or loss. Finally, the amendment also explains
that loan prepayment penalties should be recognised separately from the host contract, unless the option exercise price
compensates the lender for the loss of interest income because the loan was repaid early.
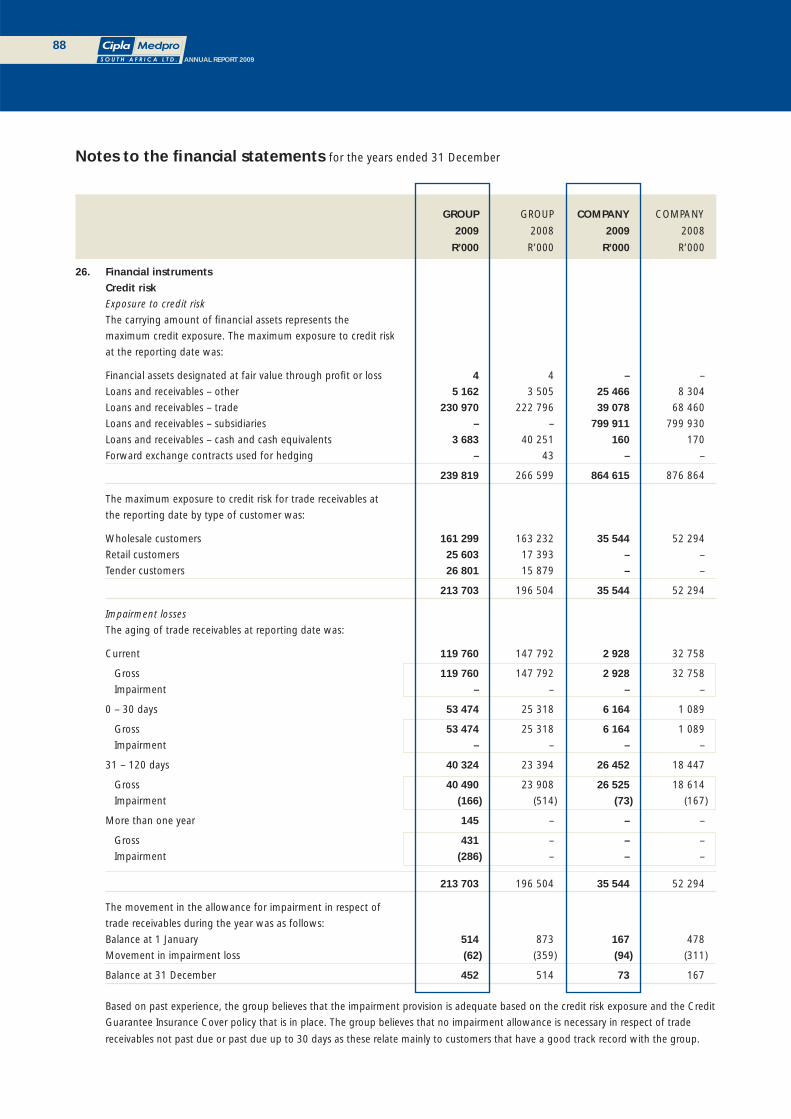
88ANNUAL REPORT 2009
Notes to the fi nancial statements for the years ended 31 December
GROUP GROUP COMPANY COMPANY
2009 2008 2009 2008
R’000 R’000 R’000 R’000
26. Financial instruments
Credit risk
Exposure to credit risk
The carrying amount of fi nancial assets represents the
maximum credit exposure. The maximum exposure to credit risk
at the reporting date was:
Financial assets designated at fair value through profi t or loss 4 4 – –
Loans and receivables – other 5 162 3 505 25 466 8 304
Loans and receivables – trade 230 970 222 796 39 078 68 460
Loans and receivables – subsidiaries – – 799 911 799 930
Loans and receivables – cash and cash equivalents 3 683 40 251 160 170
Forward exchange contracts used for hedging – 43 – –
239 819 266 599 864 615 876 864
The maximum exposure to credit risk for trade receivables at
the reporting date by type of customer was:
Wholesale customers 161 299 163 232 35 544 52 294
Retail customers 25 603 17 393 – –
Tender customers 26 801 15 879 – –
213 703 196 504 35 544 52 294
Impairment losses
The aging of trade receivables at reporting date was:
Current 119 760 147 792 2 928 32 758
Gross 119 760 147 792 2 928 32 758
Impairment – – – –
0 – 30 days 53 474 25 318 6 164 1 089
Gross 53 474 25 318 6 164 1 089
Impairment – – – –
31 – 120 days 40 324 23 394 26 452 18 447
Gross 40 490 23 908 26 525 18 614
Impairment (166) (514) (73) (167)
More than one year 145 – – –
Gross 431 – – –
Impairment (286) – – –
213 703 196 504 35 544 52 294
The movement in the allowance for impairment in respect of
trade receivables during the year was as follows:
Balance at 1 January 514 873 167 478
Movement in impairment loss (62) (359) (94) (311)
Balance at 31 December 452 514 73 167
Based on past experience, the group believes that the impairment provision is adequate based on the credit risk exposure and the Credit
Guarantee Insurance Cover policy that is in place. The group believes that no impairment allowance is necessary in respect of trade
receivables not past due or past due up to 30 days as these relate mainly to customers that have a good track record with the group.

89ANNUAL REPORT 2009
26. Financial instruments continued
Liquidity risk The following are the contractual maturities of fi nancial liabilities, including estimated interest payments and excluding the impact of
netting agreements:
Carrying Contractual Less than Between More than amount cash fl ows 12 months 1 to 5 years 5 years
R’000 R’000 R’000 R’000 R’000
GROUP 31 December 2009 Non-derivative fi nancial liabilities Secured bank loans 125 000 153 395 14 432 138 963 – Other loans at amortised cost 462 462 462 – – Cumulative redeemable preference shares 194 270 237 890 16 285 221 605 – Finance lease liabilities 35 074 43 234 11 068 32 166 – Trade and other payables (excluding derivatives) 208 526 208 526 208 526 – – Bank overdrafts 63 826 63 826 63 826 – –
627 158 707 333 314 599 392 734 –
Derivative fi nancial liabilities (assets) Interest rate swaps used for hedging 3 009 3 009 – 3 009 – Forward exchange contracts used for hedging outfl ow 24 641 24 641 24 572 69 –
27 650 27 650 24 572 3 078 –
GROUP 31 December 2008 Non-derivative fi nancial liabilities Secured bank loans 101 926 148 124 18 770 129 354 –
Cumulative redeemable preference shares 244 470 344 298 79 552 264 746 –
Trade and other payables (excluding derivatives) 376 235 376 235 376 235 – –
Bank overdraft 8 542 8 542 8 542 – –
731 173 877 199 483 099 394 100 –
Derivative fi nancial liabilities (assets) Interest rate swaps used for hedging 552 552 – 552 –
Forward exchange contracts used for hedging infl ow (43) (43) (43) – –
509 509 (43) 552 –
COMPANY 31 December 2009 Non-derivative fi nancial liabilities Finance lease liabilities 35 074 43 234 11 068 32 166 – Amounts due to subsidiaries 113 312 113 312 – – 113 312 Trade and other payables (excluding derivatives) 14 489 14 489 14 489 – – Bank overdraft 50 028 50 028 50 028 – –
212 903 221 063 75 585 32 166 113 312
COMPANY 31 December 2008 Non-derivative fi nancial liabilities Secured bank loans 1 926 1 926 1 926 – –
Amounts due to subsidiaries 90 038 90 038 – – 90 038
Trade and other payables (excluding derivatives) 35 715 35 715 35 715 – –
Bank overdraft 8 542 8 542 8 542 – –
136 221 136 221 46 183 – 90 038

90ANNUAL REPORT 2009
26. Financial instruments continued
Currency risk
Exposure to currency risk
The group’s exposure to foreign currency risk, including a sensitivity of a 10% weakening of the ZAR against these foreign currencies
are as follows:
Decrease in
profi t before
taxation
USD EUR AUD ZAR ZAR
GROUP 2009 ‘000 ‘000 ‘000 ‘000 ‘000
Trade payables – USD 21 090 155 644 (15 564)
Trade payables – EUR 89 946 (95)
Trade payables – AUD 1 807 11 998 (1 200)
The above sensitivity analysis assumes that all other variables, in particular interest rates, remain constant. The group hedges at least
90% of all trade payables denominated in a foreign currency. A 10% strengthening of the ZAR against these foreign currencies would
have an equal but opposite effect on the above currencies to the amounts shown above, on the basis that all other variables remain
constant.
Refer to notes 10 and 13 for the group’s exposure to foreign currency risk relating to USD denominated forward exchange contracts.
At year end there were no open forward exchange contracts to cover the entities’ exposure to EUR and AUD denominated trade
payables as these amounts were considered to be immaterial at year end.
2009 2008
GROUP R R
The following signifi cant ZAR spot rates applied at reporting date for the group:
USD 7,38 9,34
EUR 10,63 13,18
AUD 6,64 6,49
Notes to the fi nancial statements for the years ended 31 December

91ANNUAL REPORT 2009
GROUP GROUP COMPANY COMPANY
2009 2008 2009 2008
R’000 R’000 R’000 R’000
26. Financial instruments continued
Interest rate risk
Profi le
At the reporting date the interest rate profi le of the group’s
interest-bearing fi nancial instruments was:
Variable rate instruments
Financial assets (6 683) (43 294) (170) (160)
Financial liabilities 445 820 355 490 187 706 85 026
439 137 312 196 187 536 84 866
Interest rate sensitivity analysis
An increase of 100 basis points in interest rates at the
respective reporting dates, would have decreased equity and
decreased profi t by the amounts shown below for the fi nancial
liabilities listed. A 100 basis point decrease in interest rates
at the respective reporting dates, would have an equal but
opposite effect on the fi nancial liabilities listed. This analysis
assumes that all other variables remain constant.
Decrease in profi t before taxation:
Compulsory redeemable preference shares 2 276 2 927 – –
Five-year facility of R100 million 1 053 1 069 – –
Three-year facility of R25 million 11 – – –
Finance lease liabilities 133 – 133 –
3 473 3 996 133 –
Refer to note 12 for more details relating to these fi nancial liabilities.
Exposure to equity price risk
As indicated in note 6 the group has listed equity securities which exposes it to share price risks. The risk exposure from this
investment is minimal due to the investment portfolio comprising a multinational company and due to the immaterial nature of the
amount of the investment.
Categories of fi nancial instruments and fair values
The group’s fi nancial instruments consist primarily of deposits with banks, short-term loans receivable, trade and other receivables,
amounts due to and from subsidiaries and fellow subsidiaries, trade and other payables and loans and borrowings.

92ANNUAL REPORT 2009
26. Financial instruments continued
Categories of fi nancial instruments and fair values versus carrying amounts
The fair values of the fi nancial assets and liabilities approximate their carrying amounts. Refer to accounting policy (u) for a discussion
of how fair values are determined. The fair values of fi nancial assets and liabilities, together with their carrying amounts shown in the
balance sheet, are as follows:
GROUP GROUP
Carrying value Fair value
R’000 R’000
2009
Financial assets
Financial assets designated at fair value through profi t or loss 4 4
Listed equity securities 4 4
Loans and receivables 236 132 236 132
Trade and other receivables (excluding derivatives) 230 970 230 970
Short-term loans receivable 5 162 5 162
Cash and cash equivalents 3 683 3 683
Financial liabilities
Financial liabilities designated at fair value through profi t or loss (27 650) (27 650)
Forward exchange contracts (24 641) (24 641)
Interest rate swaps (3 009) (3 009)
Financial liabilities held at amortised cost (563 332) (563 332)
Secured bank loans (125 000) (125 000)
Other loans at amortised cost (462) (462)
Redeemable preference shares (194 270) (194 270)
Finance lease liabilities (35 074) (35 074)
Trade and other payables (excluding derivatives) (204 546) (204 546)
Dividends on redeemable preference shares (3 980) (3 980)
Bank overdrafts (63 826) (63 826)
2008
Financial assets
Financial assets designated at fair value through profi t or loss 47 47
Listed equity securities 4 4
Forward exchange contracts 43 43
Loans and receivables 226 301 266 301
Trade and other receivables (excluding derivatives) 222 796 222 796
Short-term loans receivable 3 505 3 505
Cash and cash equivalents 40 251 40 251
Financial liabilities
Financial liabilities designated at fair value through profi t or loss (552) (552)
Interest rate swaps (552) (552)
Financial liabilities held at amortised cost (722 631) (722 631)
Secured bank loans (101 926) (101 926)
Redeemable preference shares (244 470) (244 470)
Trade and other payables (excluding derivatives) (368 822) (368 822)
Dividends on redeemable preference shares (7 413) (7 413)
Bank overdraft (8 542) (8 542)
Notes to the fi nancial statements for the years ended 31 December

93ANNUAL REPORT 2009
26. Financial instruments continued
Categories of fi nancial instruments and fair values versus carrying amounts continued
COMPANY COMPANY
Carrying value Fair value
R’000 R’000
2009
Financial assets
Loans and receivables 895 729 895 729
Trade and other receivables (excluding derivatives) 39 078 39 078
Long-term loans receivable 823 215 823 215
Long-term unlisted investments 31 274 31 274
Short-term loans receivable 2 162 2 162
Cash and cash equivalents 160 160
Financial liabilities
Financial liabilities held at amortised cost (162 875) (162 875)
Finance lease liabilities (35 074) (35 074)
Amounts due to subsidiaries (113 312) (113 312)
Trade and other payables (excluding derivatives) (14 489) (14 489)
Bank overdraft (50 028) (50 028)
2008
Financial assets
Loans and receivables 910 918 910 918
Trade and other receivables (excluding derivatives) 68 460 68 460
Long-term loans receivable 807 889 807 889
Long-term unlisted investments 34 224 34 224
Short-term loans receivable 345 345
Cash and cash equivalents 170 170
Financial liabilities
Financial liabilities held at amortised cost (127 679) (127 679)
Secured bank loans (1 926) (1 926)
Amounts due to subsidiaries (90 038) (90 038)
Trade and other payables (excluding derivatives) (35 715) (35 715)
Bank overdraft (8 542) (8 542)

94ANNUAL REPORT 2009
Interest in subsidiary companies
Effective Effective Amounts due Amounts due
Issued goup group by (due to) by (due to)
share holding holding Investment Investment subsidiaries1 subsidiaries1
Date capital 2009 2008 2009 2008 2009 2008
COMPANY acquired R % % R R R R
Direct holdings
Cipla Medpro Manufacturing
(Pty) Limited 2/12/08 100 100 100 100 100 – –
Galilee Marketing
(Pty) Limited 2/10/06 100 100 100 100 100 – –
Inyanga Trading 386
(Pty) Limited 15/12/05 100 100 100 100 100 799 910 683 799 910 683
Kamillen Pharmaceuticals
(Pty) Limited 2/7/04 100 –2 100 – – – –
Kamillen Products (Botswana)
(Pty) Limited 2/7/04 Pula 100 –2 100 – – – –
Universal Pharmaceuticals
(Pty) Limited 31/8/07 2 000 –3 100 – 100 – (4 046 104)
Xeragen Laboratories
(Pty) Limited 1/9/05 120 100 100 31 274 203 31 274 203 (10 708 245) (10 820 072)
Zedchem (Pty) Limited 1/7/05 100 –2 100 – 2 949 309 – (594 798)
Total direct holdings 31 274 503 34 223 912 789 202 438 784 449 709
Indirect holdings
Adroit Pharmaceuticals
(Pty) Limited 1/9/06 100 –2 100 – –4 – –
Cipla Medpro Holdings
(Pty) Limited 16/1/065 10 100 100 1 391 053 876 1 391 053 876 (102 603 717) (74 558 369)
Total indirect holdings 1 391 053 876 1 391 053 876 (102 603 717) (74 558 369)
Total holdings 1 422 328 379 1 425 277 788 686 598 721 709 891 340
1 All amounts due by (due to) subsidiaries are unsecured and non-interest-bearing, with the exception of R102,6 million
(2008: R74,6 million) loaned by Cipla Medpro Holdings (Pty) Limited to CMSA. The loan bears interest at rates linked to the prime
overdraft rate. There are no specifi c repayment terms attached to the above loans.
2 This subsidiary was deregistered during the year.
3 This subsidiary was liquidated during the year.
4 Investment in the subsidiary was fully impaired at 31 December 2007.
5 Cipla Medpro was effectively purchased by CMSA on 1 November 2005, with control passing to the company on 1 December 2005.
On 16 January 2006, Cipla Medpro was purchased by Inyanga Trading 386 (Pty) Limited, both wholly owned subsidiaries of CMSA.
Refer to note 19 for the list of subsidiaries of which Cipla Medpro Holdings (Pty) Limited is the holding company.
Annexure A
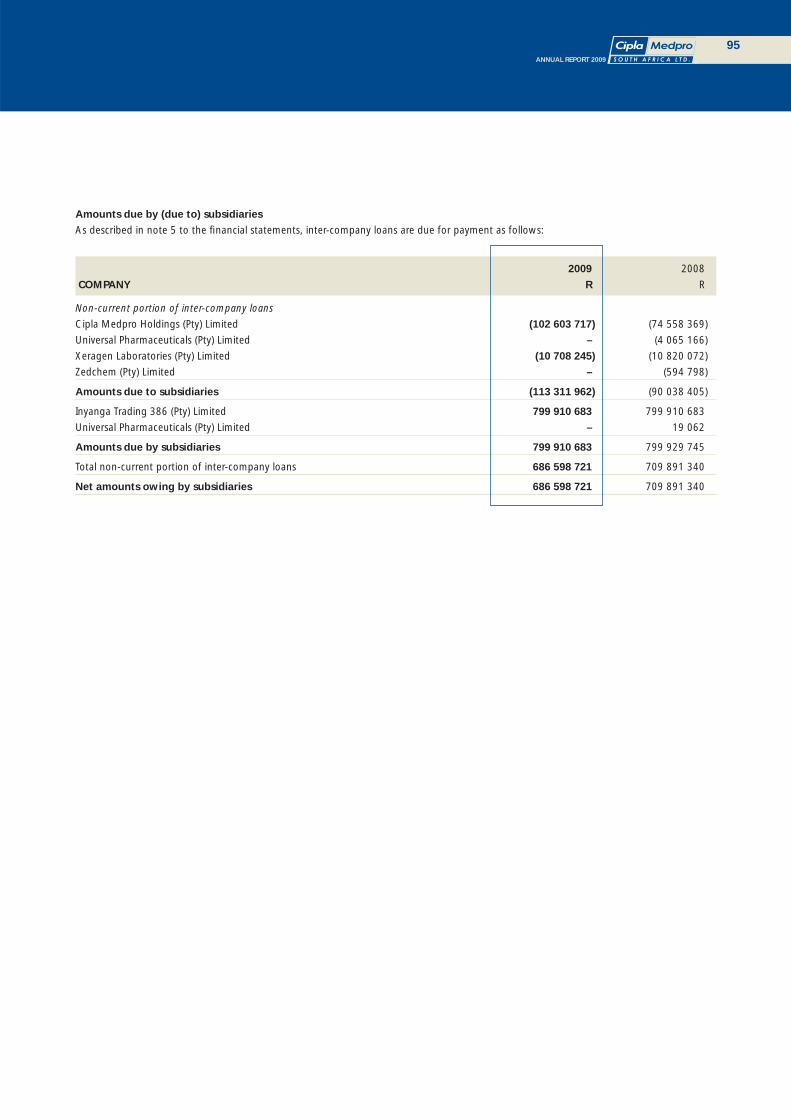
95ANNUAL REPORT 2009
Amounts due by (due to) subsidiaries
As described in note 5 to the fi nancial statements, inter-company loans are due for payment as follows:
2009 2008
COMPANY R R
Non-current portion of inter-company loans
Cipla Medpro Holdings (Pty) Limited (102 603 717) (74 558 369)
Universal Pharmaceuticals (Pty) Limited – (4 065 166)
Xeragen Laboratories (Pty) Limited (10 708 245) (10 820 072)
Zedchem (Pty) Limited – (594 798)
Amounts due to subsidiaries (113 311 962) (90 038 405)
Inyanga Trading 386 (Pty) Limited 799 910 683 799 910 683
Universal Pharmaceuticals (Pty) Limited – 19 062
Amounts due by subsidiaries 799 910 683 799 929 745
Total non-current portion of inter-company loans 686 598 721 709 891 340
Net amounts owing by subsidiaries 686 598 721 709 891 340

96ANNUAL REPORT 2009
Analysis of shareholders1
Issued shares: 449 856 116 (2008: 443 265 635)
Number Percentage Percentage
of of total Number of of total
2009 shareholders shareholders of shares shareholding
Shareholder spread
1 – 1 000 shares 885 22,87 543 701 0,12
1 001 – 10 000 shares 2 027 52,38 8 838 171 1,96
10 001 – 100 000 shares 741 19,15 22 683 488 5,04
100 001 – 1 000 000 shares 156 4,03 57 092 070 12,69
1000 001 shares and over 61 1,57 360 698 686 80,19
Total 3 870 100,00 449 856 116 100,00
Public/non-public shareholders
Non-public shareholders 7 0,18 111 298 394 24,74
Directors of the company2 4 0,09 21 439 064 4,77
Strategic holdings (more than 10%) 1 0,03 82 000 000 18,23
Empowerment 1 0,03 130 258 0,03
Share trusts3 1 0,03 7 729 072 1,71
Public shareholders 3 863 99,82 338 557 722 75,26
Total 3 870 100,00 449 856 116 100,00
Benefi cial shareholders holding 3% or more
Sweet Sensation 67 (Pty) Limited 82 000 000 18,23
Government Employees Pension Fund 37 580 267 8,35
Liberty Life Association of Africa Limited 33 795 198 7,51
STD Pharma Limited 18 721 805 4,16
JS Pharm Trust 16 821 954 3,74
1 Representative of shareholders on the share register as at 24 December 2009.
2 The breakdown of directors’ shareholdings can be found within the directors’ report.
3 Refers to the CMSA Share Option Trust.

97ANNUAL REPORT 2009
Issued shares: 449 856 116 (2008: 443 265 635)
2009 High Low Close Volume Value Number of
Month cents cents cents R transactions
January 297 225 260 24 543 786 61 889 302 772
February 310 230 300 11 283 412 31 351 242 577
March 400 300 345 25 155 577 90 416 660 1 849
April 445 295 415 34 593 908 138 414 042 1 445
May 418 351 352 9 885 732 37 030 912 826
June 399 337 380 18 594 074 66 680 582 2 924
July 421 356 391 11 492 672 44 622 248 1 251
August 422 380 415 24 246 600 95 460 658 1 070
September 442 398 442 7 951 505 32 781 966 1 080
October 510 440 483 11 432 410 54 873 094 1 631
November 495 450 460 13 479 897 63 615 601 1 658
December 520 455 495 5 498 094 26 497 858 752
198 157 667 743 634 165 15 835
Share statistics 2009 2008
High (cents) 520 414
Low (cents) 225 210
Year end (cents) 495 230
Volume of shares traded 198 157 667 230 755 571
Volume as a percentage of the number of shares in issue (%) 44,05 52,06
Value of shares traded (R‘000) 743 634 627 250
Number of transactions 15 835 9 553
Earnings yield at year end (%) 7,3 12,7
Price earnings ratio at year end (times) 13,6 7,8
Market capitalisation at year end net of treasury shares (R’000) 2 188 529 1 012 033
Market capitalisation to shareholders’ equity at year end (times) 1,4 0,7
Share trading statistics
Average share price (cents)
2009 2008
600
500
400
300
200
100
0JAN FEB MAR APR MAY JUN JUL AUG SEP OCT NOV DEC

98ANNUAL REPORT 2009
Cipla Medpro South Africa Limited(Incorporated in the Republic of South Africa)(Registration number 2002/018027/06)(JSE code: CMP and ISIN: ZAE000128179)(“CMSA”)
Notice is hereby given that the annual general meeting of CMSA will be held at the BoE Room, 5th Floor, BoE Building, Clock Tower Precinct, V&A Waterfront, Cape Town at 11:00 on Friday, 21 May 2010 for the following purposes:
1. Ordinary resolution number 1 Approval of the audited annual fi nancial statements “To receive, consider and adopt the audited annual fi nancial statements of CMSA for the fi nancial year ended 31 December 2009.”
2. Ordinary resolution number 2 Election of directors “To ratify the appointments of:
2.1. Mr JvD du Preez
2.2. Mr SMD Zungu
who were appointed as directors during the year.”
A brief curriculum vitae in respect of each director referred to in 2 above appears on page 13 of this annual report.
3. Ordinary resolution number 3 Re-election of directors “To re-elect directors of CMSA, namely:
3.1 Mr C Aucamp
3.2 Mr MB Caga
3.3 Mr PCS Luthuli
who retire by rotation in terms of CMSA’s Articles of Association but, all being eligible, offer themselves for re-election.”
A brief curriculum vitae in respect of each director referred to in 3 above appears on page 12 of this annual report.
As special business, to consider, and if deemed fi t, to pass with or without modifi cation the following ordinary and special resolutions:
4. Ordinary resolution number 4 Control of authorised but unissued shares “Resolved that all of the ordinary shares in the authorised but unissued share capital of CMSA be and are hereby placed under the
control and authority of the directors, and that the directors be and are hereby authorised and empowered, subject to the provisions of the Companies Act No. 61 of 1973, as amended (“the Companies Act”), the Articles of Association of CMSA and the Listings Requirements of the JSE Limited to allot, issue and otherwise dispose of such shares to such person or persons on such terms and conditions and at such times as the directors may from time to time in their discretion deem fi t.
This authority is restricted to 5% (fi ve percent) of the ordinary shares in issue as at 31 December 2009 and will remain in place until the next annual general meeting of CMSA’s shareholders”.
5. Ordinary resolution number 5 Approval to issue shares for cash “Resolved that the directors of CMSA be and are hereby authorised by way of a general authority, to issue all or any of the authorised
but unissued shares in the capital of CMSA for cash, as and when they in their discretion deem fi t, subject to the Companies Act, the Articles of Association of CMSA, the JSE Listings Requirements, when applicable, and the following limitations, namely that:
• the equity securities which are the subject of the issue for cash must be of a class already in issue, or where this is not the case, must be limited to such securities or rights that are convertible into a class already in issue;
• any such issue will be made only to “public shareholders” as defi ned in the JSE Listings Requirements and not related parties, unless the JSE otherwise agrees;
• the number of shares issued for cash shall not in the aggregate in any one fi nancial year exceed 2,5% (two and a half percent) of CMSA’s issued share capital of ordinary shares. The number of ordinary shares which may be issued shall be based on the number of ordinary shares in issue, added to those that may be issued in future (arising from the conversion of options/convertibles) at the date of such application, less any ordinary shares issued, or to be issued in future arising from options/convertible ordinary shares issued during the current fi nancial year; plus any ordinary shares to be issued pursuant to a rights issue which has been announced, is irrevocable and is fully underwritten, or an acquisition which has had fi nal terms announced;
• this authority be valid until CMSA’s next annual general meeting, provided that it shall not extend beyond 15 (fi fteen) months from the date that this authority is given;
Notice of annual general meeting

99ANNUAL REPORT 2009
• a paid press announcement giving full details, including the impact on net asset value and earnings per share, will be published at the time of any issue representing, on a cumulative basis within 1 (one) fi nancial year, 5% (fi ve per cent) or more of the number of shares in issue prior to the issue; and
• in determining the price at which an issue of shares may be made in terms of this authority, the maximum discount permitted will be 10% (ten per cent) of the weighted average traded price on the JSE of those shares over the 30 (thirty) business days prior to the date that the price of the issue is determined or agreed to by the directors of CMSA.”
Ordinary resolution number 5 is required, under the JSE Listings Requirements, to be passed by achieving a 75% majority of the votes cast in favour of such resolution by all members present or represented by proxy and entitled to vote, at the annual general meeting.
6. Ordinary resolution number 6 Reappointment of external auditors “To reappoint Mazars as the external auditors of CMSA for the ensuing year (the designated auditor being Mr Conrad Burger) and to
authorise the directors to determine the remuneration of the auditors.”
7. Ordinary resolution number 7 Remuneration of non-executive directors “Resolved that the remuneration of the non-executive directors for the year ending 31 December 2010 be approved on the following
basis:”
Proposed fee in ZAR Approved fee in ZAR Proposed increase for the year ending for the year ending percentage for the 31 December 2010 31 December 2009 2010 year
Type of fee R R %
Board Chairperson 576 000* 465 600* 23,7 Member 17 475# 14 550# 20,1
Audit and Risk Committee Chairperson 37 400# 35 700# 4,8 Member 31 200# 28 500# 9,5
Remuneration Committee Chairperson 37 400# 35 700# 4,8 Member 31 200# 28 500# 9,5
Nominations Committee Chairperson 37 400#
Member 31 200#
* Fee per year. # Fee per meeting.
8. Ordinary resolution number 8 Approval of remuneration policy “Resolved that CMSA’s remuneration policy, as set out below, be approved through a non-binding advisory vote.
Remuneration policy for the executive and non-executive directors:
CMSA uses an independent market-related remuneration survey to benchmark the appropriate remuneration for its directors, as well as taking into account the performance of CMSA and the prevailing rate of infl ation.”
9. Ordinary resolution number 9 Appointment of Audit and Risk Committee members “Resolved that the members of the CMSA Audit and Risk Committee be appointed in accordance with the recommendations of
King III, i.e. the committee should be constituted of three independent non-executive directors. The membership, therefore, as proposed by the board of directors is:
Mrs MT Mosweu (Chairperson) – Independent non-executive director; Mr JvD du Preez – Independent non-executive director; and Mr SMD Zungu – Independent non-executive director.”

100ANNUAL REPORT 2009
10. Special resolution number 1 Approval to repurchase shares “Resolved that CMSA and/or any subsidiary of CMSA be and is hereby authorised by way of a general approval contemplated in
sections 85(2) and 85(3) of the Companies Act, to acquire the issued ordinary shares of CMSA, upon such terms and conditions and in such amounts as the directors of CMSA may from time to time determine, but subject to the Articles of Association of CMSA, the provisions of the Companies Act and the JSE Listings Requirements, where applicable, and provided that:
• the repurchase of securities will be effected through the main order book operated by the JSE trading system and done without any prior understanding or arrangement between CMSA and the counterparty;
• this general authority shall only be valid until CMSA’s next annual general meeting, provided that it shall not extend beyond 15 (fi fteen) months from the date of passing of this special resolution;
• in determining the price at which CMSA’s ordinary shares are acquired by CMSA in terms of this general authority, the maximum premium at which such ordinary shares may be acquired will be 10% (ten percent) of the weighted average of the market price at which such ordinary shares are traded on the JSE, as determined over the 5 (fi ve) trading days immediately preceding the date of the repurchase of such ordinary shares by CMSA;
• the acquisitions of ordinary shares in the aggregate in any one fi nancial year do not exceed 20% (twenty percent) of CMSA’s issued ordinary share capital from the date of the grant of this general authority;
• CMSA and the group are in a position to repay their debt in the ordinary course of business for a period of 12 (twelve) months from CMSA fi rst acquiring securities under this general approval;
• the assets of CMSA and the group, being fairly valued in accordance with International Financial Reporting Standards, are in excess of the liabilities of CMSA and the group at the time of CMSA fi rst acquiring securities under this general approval;
• the ordinary capital and reserves of CMSA and the group are adequate for a period of 12 (twelve) months from CMSA fi rst acquiring securities under this general approval;
• the available working capital is adequate to continue the operations of CMSA and the group for a period of 12 (twelve) months from CMSA fi rst acquiring securities under this general approval;
• upon entering the market to proceed with the repurchase, CMSA’s Sponsor has complied with its responsibilities contained in Schedule 25 of the JSE Listings Requirements;
• CMSA or its subsidiaries will not repurchase securities during a prohibited period as defi ned in paragraph 3.67 of the JSE Listings Requirements unless they have in place a repurchase programme where the dates and quantities of securities to be traded during the relevant period are fi xed (not subject to any variation) and full details of the programme have been disclosed in an announcement over SENS prior to the commencement of the prohibited period;
• when CMSA has cumulatively repurchased 3% (three per cent) of the initial number of the relevant class of securities, and for each 3% (three per cent) in aggregate of the initial number of that class acquired thereafter, an announcement will be made; and
• CMSA only appoints one agent to effect any repurchase(s) on its behalf.”
Reason for and effect of special resolution number 1 The reason and effect for special resolution number 1 is to authorise CMSA and/or its subsidiaries by way of a general authority to
acquire its own issued shares on such terms, conditions and such amounts determined from time to time by the directors of CMSA, subject to the limitations set out above.
The directors of CMSA have no specifi c intention to effect the provisions of special resolution number 1 but will, however, continually review CMSA’s position, having regard to prevailing circumstances and market conditions, in considering whether to effect the provisions of special resolution number 1.
The JSE Listings Requirements require the following additional disclosure for purposes of this general authority, some of which is set out in the annual report of which this notice forms part:
• Directors – pages 12 – 13
• Major shareholders of CMSA – page 96
• Directors’ interests in securities – page 32
• Share capital of CMSA – page 60
11. Material change There have been no material changes in the affairs or fi nancial position of CMSA and its subsidiaries since the date of signature of the
audit report and the date of this notice.
Notice of annual general meeting continued

101ANNUAL REPORT 2009
12. Directors’ responsibility statement The directors, whose names are given on pages 12 and 13 of the annual report, collectively and individually accept full responsibility
for the accuracy of the information pertaining to special resolution number 1 and certify that to the best of their knowledge and belief there are no facts that have been omitted which would make any statement false or misleading, and that all reasonable enquiries to ascertain such facts have been made and that this resolution contains all such information.
13. Litigation statement In terms of section 11.26 of the Listings Requirements of the JSE, the directors, whose names are given on pages 12 and 13 of the
annual report of which this notice forms part, are not aware of any legal or arbitration proceedings, including proceedings that are pending or threatened, that may have or have had in the recent past, being at least the previous 12 (twelve) months, a material effect on the group’s fi nancial position.
14. Ordinary resolution number 10 Directors’ authorisation “Resolved that any director or the secretary of CMSA be and is hereby authorised to do all such things and sign all such documents as
may be necessary to give effect to the above resolutions.”
15. Voting and proxies A shareholder entitled to attend and vote at this meeting may appoint a proxy or proxies to attend and speak and, on a poll, vote in
his stead. Such proxy need not be a shareholder of CMSA. A proxy form is included in this report and may also be obtained from the transfer secretaries.
The attached form of proxy is only to be completed by those shareholders who are:
• Holding CMSA ordinary shares in certifi cated form; or
• Are recorded on the electronic sub-register in “own name” dematerialised form.
Shareholders who have dematerialised their shares through a Central Securities Depository Participant (CSDP) or broker and wish to attend the annual general meeting, must instruct their CSDP or broker to provide them with a Letter of Representation, or they must provide the CSDP or broker with their voting instructions in terms of the relevant custody agreement/mandate entered into between them and the CSDP or broker. Shareholders are reminded that the onus is on them to communicate with their CSDP.
Proxy forms must be lodged with the transfer secretaries, Computershare Investor Services (Pty) Limited, Ground Floor, 70 Marshall Street, Johannesburg 2001 (PO Box 61051, Marshalltown, 2107) by no later than Wednesday, 19 May 2010.
By order of the board
MW Daly Company Secretary
Durban
15 April 2010

102ANNUAL REPORT 2009
Adcock Adcock Ingram Holdings Limited (registration number 2007/106236/06), a public company incorporated in accordance with the laws of South Africa, all the ordinary shares of which are listed on the JSE with share code AIP
AGM Annual general meeting
ARV Antiretrovirals, used in the treatment of HIV/AIDS
AUD Australian Dollar
BBBEE Broad-Based black economic empowerment
BEE Black economic empowerment, as defi ned in the Broad-Based Black Economic Empowerment Act, 53 of 2003, and which means the economic empowerment of all black people, including women, workers, youth, people with disabilities and people living in rural areas, through diverse but integrated socio-economic strategies
CA (SA) Chartered Accountant (South Africa), designation governed by the Chartered Accountants Designation Act, 1993 (Act 67 of 1993), which regulates and permits the use of the CA (SA) designation exclusively by members of the South African Institute of Chartered Accountants
CEO Chief Executive Offi cer
CFC Customer Foreign Currency
CFO Chief Financial Offi cer
cGMP Current Good Manufacturing Practice
Cipla India Cipla Limited (registration number 11-2380), a public company incorporated in India
CME Continuing medical education
Cipla Medpro Cipla Medpro Holdings (Pty) Limited (registration number 2000/018468/07), a private company situated in Cape Town, and its group of subsidiaries
CMM or Cipla Medpro Manufacturing (Pty) LimitedCipla Medpro (registration number 2005/021116/07), a Manufacturing private company commonly referred to as “the factory” whose place of operation is in Mobeni, Durban
CMSA or Cipla Medpro South Africa Limited (registrationgroup or number 2002/018027/06), a public company Cipla incorporated in accordance with the laws of
South Africa, all the ordinary shares of which are listed on the JSE with share code CMP, and its group of subsidiaries (abbreviation not applicable to pages 98 to 101 or the form of proxy).
CMSA Share Cipla Medpro South Africa Limited ShareOption Trust Option Trust (trust deed number 865/2005)
COIDA Compensation for Occupational Injuries and Diseases Act, 1993
Companies Act Companies Act No. 61 of 1973
CSI Corporate social investment
EPS Earnings per share
EUR Euro
EV Evolution Index
GMP Good Manufacturing Practice
GOVI index The government bond index is a notional non-investable index that measures the performance of bonds issued by the South African government
HDI Historically disadvantaged individuals
HEPS Headline earnings per share
HR Human resources
IAS International Accounting Standards
IFRIC International Financial Reporting Interpretations Committee
IFRS International Financial Reporting Standards
IMS IMS Health is an international company that supplies the pharmaceutical industry with statistical sales data and consulting services
IOD Injury on duty
JIBAR Johannesburg Interbank Agreed Rate
JSE Johannesburg Stock Exchange
King II King Committee Report on Corporate Governance 2002
King III King Committee Report on Corporate Governance 2009
MCC Medicines Control Council of South Africa
NAPM The National Association of Pharmaceutical Manufacturers (association incorporated under Section 21, registration number 77/02941/08), is a trade association focused on the supply of generic medicines taking into account the environmental needs of the country and its members. CMSA is a member of NAPM
OTC Over-the-counter products i.e. available without prescription
PAT Profi t after income tax
PIC/S Pharmaceutical Inspection Convention/Pharmaceutical Inspection Cooperation Scheme
PBIT Profi t before fi nance costs and income tax
Prime rate Lending rate used as a basis by fi nancial institutions
Pty Proprietary
QA Quality assurance
Risk-free rate Theoretical rate of return of an investment with zero risk
SA GAAP South African General Accepted Accounting Practice
SENS The Stock Exchange News Service provided by the JSE to JSE-listed companies
SEP Single exit price, the price determined by regulation, at which medicines may be offered for sale on the South African private market
SHE Safety, health and environment
SPE Special-purpose entity
STC Secondary taxation on companies
TPM Total Private Market
UOP Units of Production, a method of depreciation based on use or output of the asset
USD United States Dollar
ZAR South African Rand
Terms and abbreviations
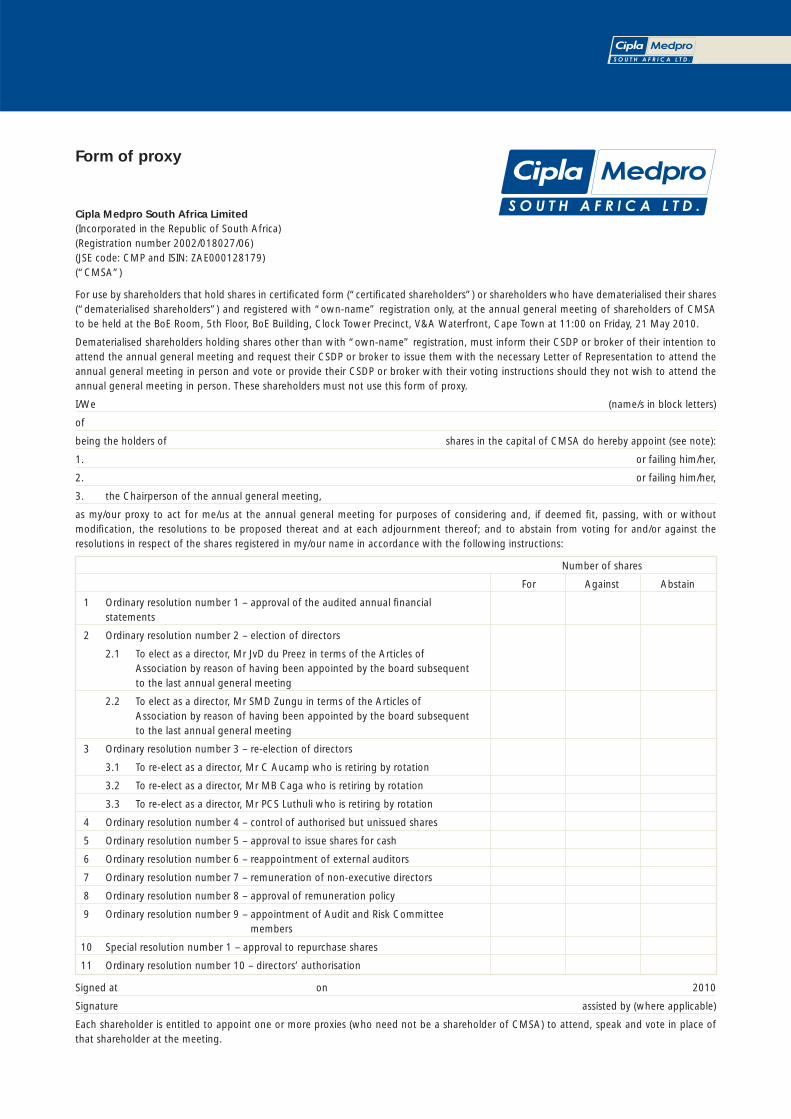
Cipla Medpro South Africa Limited(Incorporated in the Republic of South Africa)(Registration number 2002/018027/06)(JSE code: CMP and ISIN: ZAE000128179)(“CMSA”)
For use by shareholders that hold shares in certifi cated form (“certifi cated shareholders”) or shareholders who have dematerialised their shares (“dematerialised shareholders”) and registered with “own-name” registration only, at the annual general meeting of shareholders of CMSA to be held at the BoE Room, 5th Floor, BoE Building, Clock Tower Precinct, V&A Waterfront, Cape Town at 11:00 on Friday, 21 May 2010.
Dematerialised shareholders holding shares other than with “own-name” registration, must inform their CSDP or broker of their intention to attend the annual general meeting and request their CSDP or broker to issue them with the necessary Letter of Representation to attend the annual general meeting in person and vote or provide their CSDP or broker with their voting instructions should they not wish to attend the annual general meeting in person. These shareholders must not use this form of proxy.
I/We (name/s in block letters)
of
being the holders of shares in the capital of CMSA do hereby appoint (see note):
1. or failing him/her,
2. or failing him/her,
3. the Chairperson of the annual general meeting,
as my/our proxy to act for me/us at the annual general meeting for purposes of considering and, if deemed fi t, passing, with or without modifi cation, the resolutions to be proposed thereat and at each adjournment thereof; and to abstain from voting for and/or against the resolutions in respect of the shares registered in my/our name in accordance with the following instructions:
Number of shares
For Against Abstain
1 Ordinary resolution number 1 – approval of the audited annual fi nancial statements
2 Ordinary resolution number 2 – election of directors
2.1 To elect as a director, Mr JvD du Preez in terms of the Articles of Association by reason of having been appointed by the board subsequent to the last annual general meeting
2.2 To elect as a director, Mr SMD Zungu in terms of the Articles of Association by reason of having been appointed by the board subsequent to the last annual general meeting
3 Ordinary resolution number 3 – re-election of directors
3.1 To re-elect as a director, Mr C Aucamp who is retiring by rotation
3.2 To re-elect as a director, Mr MB Caga who is retiring by rotation
3.3 To re-elect as a director, Mr PCS Luthuli who is retiring by rotation
4 Ordinary resolution number 4 – control of authorised but unissued shares
5 Ordinary resolution number 5 – approval to issue shares for cash
6 Ordinary resolution number 6 – reappointment of external auditors
7 Ordinary resolution number 7 – remuneration of non-executive directors
8 Ordinary resolution number 8 – approval of remuneration policy
9 Ordinary resolution number 9 – appointment of Audit and Risk Committee members
10 Special resolution number 1 – approval to repurchase shares
11 Ordinary resolution number 10 – directors’ authorisation
Signed at on 2010
Signature assisted by (where applicable)
Each shareholder is entitled to appoint one or more proxies (who need not be a shareholder of CMSA) to attend, speak and vote in place of that shareholder at the meeting.
Form of proxy

1. The form of proxy must only be used by certifi cated shareholders or dematerialised shareholders who hold dematerialised shares in
their “own name”.
2. Shareholders are reminded that the onus is on them to communicate with their CSDP or broker.
3. A shareholder entitled to attend and vote may insert the name of a proxy or the names of two alternative proxies of the shareholder’s
choice in the space provided, with or without deleting “the Chairperson of the annual general meeting”. A proxy need not be a
shareholder of CMSA. The person whose name stands fi rst on the form of proxy and who is present at the meeting will be entitled to
act as proxy to the exclusion of those whose names follow.
4. A shareholder is entitled to one vote on a show of hands and, on a poll, one vote in respect of each share held. A shareholder’s
instructions to the proxy must be indicated by inserting the relevant number of votes exercisable by the shareholder in the appropriate
box(es). Failure to comply with this will be deemed to authorise the proxy to vote or to abstain from voting at the annual general
meeting as he/she deems fi t in respect of all the shareholder’s votes.
5. A vote given in terms of an instrument of proxy shall be valid in relation to the annual general meeting notwithstanding the death
of the person granting it, or the revocation of the proxy, or the transfer of the shares in respect of which the vote is given, unless an
intimation in writing of such death, revocation or transfer is received by the transfer secretaries not less than 48 (forty eight) hours
before the commencement of the annual general meeting.
6. If a shareholder does not indicate on this form that his/her proxy is to vote in favour of or against any resolution or to abstain from
voting, or gives contradictory instructions, or should any further resolution(s) or any amendment(s) which may properly be put before
the annual general meeting be proposed, the proxy shall be entitled to vote as he/she thinks fi t.
7. The Chairperson of the annual general meeting may reject or accept any form of proxy which is completed and/or received other than
in compliance with these notes.
8. The completion and lodging of this form of proxy will not preclude the relevant shareholder from attending the meeting and speaking
and voting in person thereat to the exclusion of any proxy appointed in terms hereof, should such shareholder wish to do so.
9. Documentary evidence establishing the authority of a person signing the form of proxy in a representative capacity must be attached
to this form of proxy, unless previously recorded by CMSA or unless this requirement is waived by the Chairperson of the annual
general meeting.
10. A minor or any other person under legal incapacity must be assisted by his/her parent or guardian, as applicable, unless the relevant
documents establishing his/her capacity are produced or have been registered by CMSA.
11. Where there are joint holders of shares:
• Any one holder may sign the form of proxy; and
• The vote(s) of the senior shareholders (for that purpose seniority will be determined by the order in which the names of
shareholders appear in CMSA’s register of shareholders) who tenders a vote (whether in person or by proxy) will be accepted to
the exclusion of the vote(s) of the other joint shareholder(s).
12. Forms of proxy should be lodged with or mailed to Computershare Investor Services (Pty) Limited:
• Hand deliveries to: Ground Floor, 70 Marshall Street, Johannesburg, 2001
• Postal deliveries to: PO Box 6105, Marshalltown, 2107
to be received by no later than Wednesday, 19 May 2010 (or 48 hours before any adjournment of the annual general meeting which
date, if necessary, will be notifi ed in the press).
13. Any alteration or correction made to this form of proxy, other than the deletion of alternatives, must be initialled by the signatory/ies.
Notes to the form of proxy

Corporate information
Cipla Medpro South Africa Limited
Registration number: 2002/018027/06
JSE code: CMP
ISIN: ZAE000128179
Company Secretary
MW Daly CA (SA)
Registered offi ce
1474 South Coast Road
Mobeni, 4052
PO Box 32003, Mobeni, 4060
Contact numbers
Tel: +27 31 451 3800
Fax: +27 31 451 3889
www.ciplamedsa.co.za
Attorneys
Deneys Reitz Incorporated
Registration number: 1984/003385/21
3 Pencarrow Crescent
La Lucia Ridge
Durban, 4051
PO Box 5003, Pencarrow Park, 4019
Transfer secretaries
Computershare Investor Services (Pty) Limited
Registration number: 2004/003647/07
Ground Floor, 70 Marshall Street
Johannesburg, 2001
PO Box 61051, Marshalltown, 2107
Sponsor
Nedbank Capital
Registration number: 1951/000009/06
155 Rivonia Road, Sandown, 2196
PO Box 1144, Johannesburg, 2000
Auditors
Mazars
Registration number: 2005/025794/07
Mazars House
Rialto Road, Grand Moorings Precinct
Century City, 7441
PO Box 2785, Cape Town, 8001
Commercial bankers
Nedbank Limited
ABSA Bank Limited
Annual general meeting 21 May 2010
Interim reporting period 30 June 2010
Interim report August 2010
Financial year end 31 December 2010
Shareholders’ diary
ANNUAL REPORT 2009

Contact us:PO Box 1096, Durbanville, 7551
www.ciplamedsa.co.za