annual report 2010 2011 - gov · annual report 2010/2011 south african police service submission of...
TRANSCRIPT

SAPS TOGETHER SQUEEZING CRIME to ZEROSAPS Members, My Family - Together Pushing Back The Frontiers Of Evil
ANNUAL REPORT 2010/2011SOUTH AFRICAN POLICE SERVICE
a
ANNUAL REPORT 2010/2011SOUTH AFRICAN POLICE SERVICE
AN
NU
AL
REPO
RT 2
010/
2011
www.saps.gov.za
SAPS TOGETHER SQUEEZING CRIME to ZEROSAPS Members, My Family - Together Pushing Back The Frontiers Of Evil

SAPS TOGETHER SQUEEZING CRIME to ZEROSAPS Members, My Family - Together Pushing Back The Frontiers Of Evil
ANNUAL REPORT 2010/2011SOUTH AFRICAN POLICE SERVICE
b

SAPS TOGETHER SQUEEZING CRIME to ZEROSAPS Members, My Family - Together Pushing Back The Frontiers Of Evil
ANNUAL REPORT 2010/2011SOUTH AFRICAN POLICE SERVICE
Compiled bySAPS Strategic Management
Design and layoutGraphic Design Studio
Marketing & AdvertisingSAPS MARKETING & PUBLIC RELATIONS
PhotographsCaptain Piet Smit
Language editingSAPS Head Office
Further information onthe Annual Report for the National Commissioner of the
South African Police Service for 2010/11could be obtained from:
The Head: Strategic Management (Head Office)Telephone: 012 3933082
RP Number: RP194/2011ISBN Number: 978-0-621-40309-1
SAPS TOGETHER SQUEEZING CRIME to ZEROSAPS Members, My Family - Together Pushing Back The Frontiers Of Evil
ANNUAL REPORT 2010/2011SOUTH AFRICAN POLICE SERVICE
SUBMISSION OF THE ANNUAL REPORT TO THE MINISTER OF POLICE
HON. EN MTHETHWA, MPMINISTER OF POLICE
I have the honour of submitting the Annual Report of the Department of Policefor the period 1 April 2010 to 31 March 2011.
GENERAL BH CELE ACCOUNTING OFFICER
Date: 2011-08-31

SAPS TOGETHER SQUEEZING CRIME to ZEROSAPS Members, My Family - Together Pushing Back The Frontiers Of Evil
ANNUAL REPORT 2010/2011SOUTH AFRICAN POLICE SERVICE
CONTENTS1. GENERAL INFORMATION i
Vision, Mission and Values i
Organisational Structure ii
Profile of the SAPS iv
Legislative Mandate v
Entities Reporting to the Minister vi
Ministers’ Statement vii
Deputy Minister’s Statement xi
Accounting Officer’s Overview xiv
Roll of Honour xvi
2. INFORMATION ON PREDETERMINED OBJECTIVES 1
2.1 Overall performance 1
2.1.1 Voted funds 1 2.1.2 Aim of Vote 1 2.1.3 Summary of Programmes 1 2.1.4 Key strategic objectives achievements 2 2.1.5 Overview of the service delivery environment for 2010/11 4 2.1.6 Overview of the organisational environment for 2010/11 4 2.1.7 Key policy developments and legislative changes 5 2.1.8 Departmental revenue, expenditure and other specific topics 6 2.1.9 Departmental expenditure 7 2.1.10 Capital investment, maintenance and asset management plan 7
2.2 Programme Performance 14
Programme 1: Administration 14 Purpose 14 Strategic Objective 14 Service Delivery Objectives and Indicators 15 Service Delivery Achievements in relation to objectives and performance measures 20
Programme 2: Visible Policing 55 Purpose 55 Strategic Objective 55 Service Delivery Objectives and Indicators 56 Service Delivery Achievements in relation to objectives and performance measures 59 Subprogramme: Crime Prevention 59 Subprogramme: Borderline Security 76 Subprogramme: Specialised Interventions 78
Programme 3: Detective Services 80 Purpose 80 Strategic Objective 80

SAPS TOGETHER SQUEEZING CRIME to ZEROSAPS Members, My Family - Together Pushing Back The Frontiers Of Evil
ANNUAL REPORT 2010/2011SOUTH AFRICAN POLICE SERVICE
Service Delivery Objectives and Indicators 81 Service Delivery Achievements in relation to objectives and performance measures 86 Subprogramme: General Investigations 86 Subprogramme: Specialised Investigations 94 Subprogramme: Criminal Record Centre 99 Subprogramme: Forensic Science Laboratory 100
Programme 4: Crime Intelligence 103 Purpose 103 Strategic Objective 103 Service Delivery Objectives and Indicators 104 Service Delivery Achievements in relation to objectives and performance measures 107 Subprogramme: Crime Intelligence Operations 107 Subprogramme: Intelligence and Information Management 107
Programme 5: Protection And Security Services 109 Purpose 109 Strategic Objective 109 Service Delivery Objectives and Indicators 110 Service Delivery Achievements in relation to objectives and performance measures 114 Subprogramme: VIP Protection Services 114 Subprogramme: Static and Mobile Security 114 Subprogramme: Ports of Entry Security 115 Subprogramme: Railway Police 116 Subprogramme: Government Security Regulator 118
3. ANNUAL FINANCIAL STATEMENTS
Report of the Audit Committee 119
Report of the Accounting Officer 121
Report of the Auditor-General 132
Appropriation Statement 137
Notes to the Appropriation Statement 149
Statement of Financial Performance 150
Statement of Financial Position 151
Statement of changes in Net Assets 152
Cash Flow Statement 153
Statement of Accounting Policies and Related Matters 154
Notes to the Annual Financial Statements (including Accounting Policies) 162
Disclosure notes to the Annual Financial Statements 173
Annexures to the Annual Financial Statements 184
4. HUMAN RESOURCE MANAGEMENT 193
ANNEXURE A: The crime challenge facing the South African Police Service
SAPS TOGETHER SQUEEZING CRIME to ZEROSAPS Members, My Family - Together Pushing Back The Frontiers Of Evil
ANNUAL REPORT 2010/2011SOUTH AFRICAN POLICE SERVICE
i
1. GENERAL INFORMATIONVision, Mission and Values of the South African Police ServiceThe Vision of the South African Police Service is to –
➤ create a safe and secure environment for all the people in South Africa.
The Mission of the South African Police Service is to –
➤ prevent and combat anything that may threaten the safety and security of any community;
➤ investigate any crimes that threaten the safety and security of any community;
➤ ensure offenders are brought to justice; and
➤ participate in efforts to address the causes of crime.
The values of the South African Police Service are to –
➤ protect everyone’s rights and to be impartial, respectful, open and accountable to the community;
➤ use the powers given to us in a responsible way;
➤ provide a responsible, effective and high-quality service with honesty and integrity;
➤ evaluate our service continuously and make every effort to improve on it;
➤ ensure an effective, efficient and economic use of resources;
➤ develop the skills of all members through equal opportunity; and
➤ cooperate with all communities, all spheres of Government and other relevant role-players.

SAPS TOGETHER SQUEEZING CRIME to ZEROSAPS Members, My Family - Together Pushing Back The Frontiers Of Evil
ANNUAL REPORT 2010/2011SOUTH AFRICAN POLICE SERVICE
ii
Structure of the South African Police Serviceas on 31 March 2011
Deputy Minister of PoliceMM Sotyu
Directorate for Priority Crime Investigation (DPCI)A Dramat
Operational ServicesLCA Pruis
Visible PolicingLJ Mothiba
Operational Response ServicesE Mawela
Protection & Security ServicesSF Masemola
Inspectorate MJ Rasegatla
Operational Committee
Ministerial Committee
Free StateNC Sengani
Kwa-Zulu NatalBM Ngobeni
LimpopoTA Mashigo
Western CapeAH Lamoer
MpumalangaTR Ntobela
North West MNZ Mbombo
Northern CapeJD Basson
GautengM Petros
Eastern CapeMS Landu
PRoviNCiAL CoMMiSSioNERS

SAPS TOGETHER SQUEEZING CRIME to ZEROSAPS Members, My Family - Together Pushing Back The Frontiers Of Evil
ANNUAL REPORT 2010/2011SOUTH AFRICAN POLICE SERVICE
iii
Con
sulta
nt
Executive Legal Officer: Advisor J Molefe
Minister of PoliceEN Mthethwa
National Commissioner of the SA Police ServiceBH Cele
Human ResourceManagmentMM Stander
Chief Operations OfficerBC Mgwenya
Crime DetectionSG Lebeya
Physical ResourceManagementAL Mafomme
Personnel ManagementNNH Mazibuko
Human Resourse UtilizationMA Nchwe
Human Resource DevelopmentCN Mbekela
Supply Chain ManagementGJ Kruser
Financial & Administration ServicesSJP Schutte
Technology Management ServicesLM Tshabalala
Detective ServiceR Lalla
Crime IntelligenceRN Mdluli
Criminal Record & Forensic Sceince ServicesJK Phahlane
DEPUTY NATioNAL CoMMiSSioNERS
SAPS TOGETHER SQUEEZING CRIME to ZEROSAPS Members, My Family - Together Pushing Back The Frontiers Of Evil
ANNUAL REPORT 2010/2011SOUTH AFRICAN POLICE SERVICE
iv
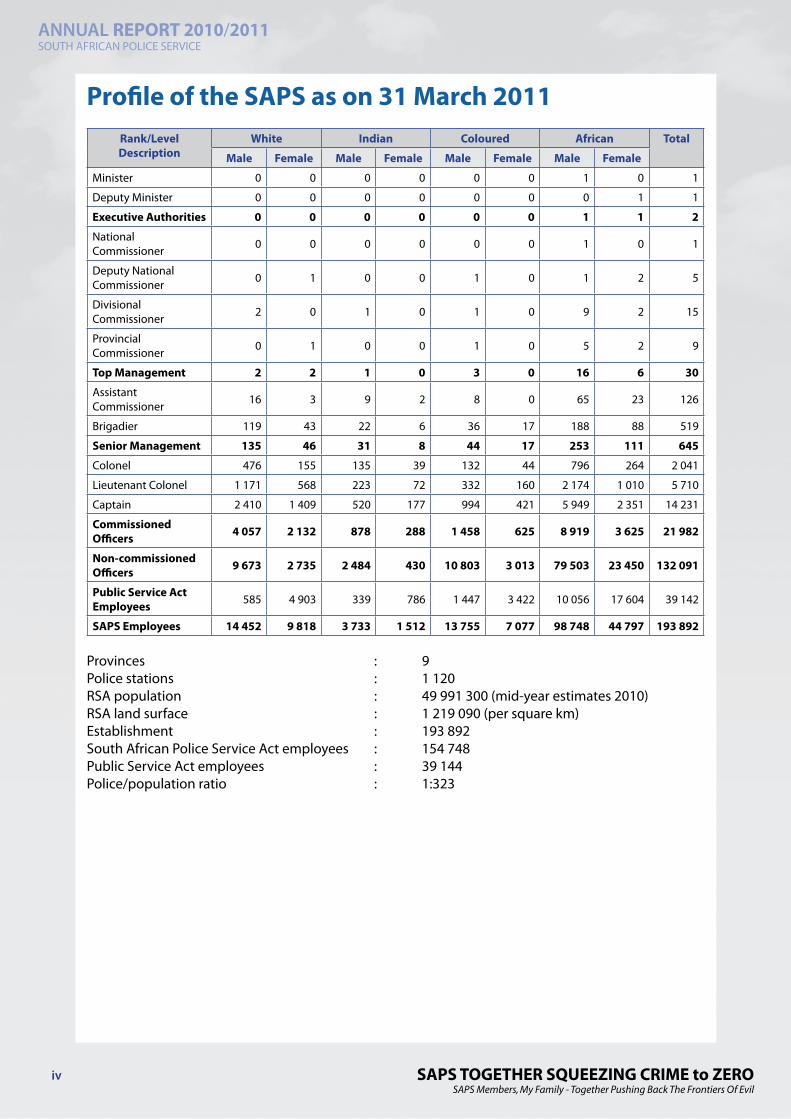
Profile of the SAPS as on 31 March 2011Rank/Level Description
White Indian Coloured African Total
Male Female Male Female Male Female Male Female
Minister 0 0 0 0 0 0 1 0 1
Deputy Minister 0 0 0 0 0 0 0 1 1
Executive Authorities 0 0 0 0 0 0 1 1 2
National Commissioner 0 0 0 0 0 0 1 0 1
Deputy National Commissioner 0 1 0 0 1 0 1 2 5
Divisional Commissioner 2 0 1 0 1 0 9 2 15
Provincial Commissioner 0 1 0 0 1 0 5 2 9
Top Management 2 2 1 0 3 0 16 6 30
Assistant Commissioner 16 3 9 2 8 0 65 23 126
Brigadier 119 43 22 6 36 17 188 88 519
Senior Management 135 46 31 8 44 17 253 111 645
Colonel 476 155 135 39 132 44 796 264 2 041
Lieutenant Colonel 1 171 568 223 72 332 160 2 174 1 010 5 710
Captain 2 410 1 409 520 177 994 421 5 949 2 351 14 231
Commissioned Officers 4 057 2 132 878 288 1 458 625 8 919 3 625 21 982
Non-commissioned Officers 9 673 2 735 2 484 430 10 803 3 013 79 503 23 450 132 091
Public Service Act Employees 585 4 903 339 786 1 447 3 422 10 056 17 604 39 142
SAPS Employees 14 452 9 818 3 733 1 512 13 755 7 077 98 748 44 797 193 892
Provinces : 9Police stations : 1 120RSA population : 49 991 300 (mid-year estimates 2010)RSA land surface : 1 219 090 (per square km)Establishment : 193 892South African Police Service Act employees : 154 748Public Service Act employees : 39 144Police/population ratio : 1:323

SAPS TOGETHER SQUEEZING CRIME to ZEROSAPS Members, My Family - Together Pushing Back The Frontiers Of Evil
ANNUAL REPORT 2010/2011SOUTH AFRICAN POLICE SERVICE
v
Legislative mandate
Overarching mandate
The overarching mandate of the South African Police Service (SAPS) is reflected in section 205 of the Constitution of the Republic of South Africa, 1996. The Objects of Policing in terms of section 205 are to-
➤ prevent, combat and investigate crime;
➤ maintain public order;
➤ protect and secure the inhabitants of the Republic and their property; and
➤ to uphold and enforce the law
The Minister of Police is responsible for policy determination, direction and overall execution of the department’s mandate in relation to the following Acts:
➤ Second-hand Goods Act, 1955 (Act No. 23 of 1955)
➤ Explosives Act, 1956 (Act No. 26 of 1956)
➤ Tear-gas Act, 1964 (Act No. 16 of 1964)
➤ Dangerous Weapons Act, 1968 (Act No. 71 of 1968)
➤ National Key Points Act, 1980 (Act No. 102 of 1980)
➤ Intimidation Act, 1982 (Act No. 72 of 1982)
➤ Control of Access to Public Premises and Vehicles Act, 1985 (Act No. 53 of 1985)
➤ Regulation of Gatherings Act, 1993 (Act No. 205 of 1993)
➤ South African Police Service Act, 1995 (Act No. 68 of 1995)
➤ Firearms Control Amendment Act, 2006 (Act No. 28 of 2006)
➤ The Private Security-Industry Regulation Act, 2001 (Act No. 56 of 2001)
➤ Protection of Constitutional Democracy Against Terrorist and Related Activities Act, 2004 (Act No. 33 of 2004)
The South African Police Service is responsible for preventing, combating and investigating any crime contained in both the common law and a plethora of Statutes.
The SAPS derives its main powers from the following key Acts:
➤ The Criminal Procedure Act, 1977 (Act No. 51 of 1977)
➤ The National Strategic Intelligence Act, 1994 (Act No. 39 of 1994)

SAPS TOGETHER SQUEEZING CRIME to ZEROSAPS Members, My Family - Together Pushing Back The Frontiers Of Evil
ANNUAL REPORT 2010/2011SOUTH AFRICAN POLICE SERVICE
vi
➤ South African Police Service Act, 1995 (Act No. 68 of 1995)
➤ The Domestic Violence Act, 1998 (Act No. 116 of 1998)
➤ The Regulation of Interception of Communications and Provision of Communication-related Information Act, 2002 (Act No. 70 of 2002)
➤ The Prevention and Combating of Corrupt Activities Act, 2004 (Act No. 12 of 2004)
Non-entity specific legislation
All legislation is non-entity specific, except for the Private Security Industry Regulation Act, 2001.
Legislation tabled in Parliament during 2010/11
➤ Civilian Secretariat for Police Bill
➤ Independent Police Investigative Directorate Bill
Entities reporting to the MinisterName of entity Legislation Nature of business
The South African Police Service The South African Police Service Act, 1995 (Act No. 68 of 1995)
To create a safe and secure environment for all people in South Africa.
The Civilian Secretariat for Police Functions currently under the South African Police Service Act, 1995, but to create their independency, the Civilian Secretariat for Police Service Act, 2011 (Act No. 2 of 2011) was published in the Government Gazette on 16 May 2011, but must still be fully implemented.
To provide support to the Minister in performing his duties.
The Independent Police Investigative Directorate
Functions currently under the South African Police Service Act, 1995, but to create their independency, the Independent Police Investigative Directorate Act, 2011 (Act No. 1 of 2011) was published in the Government Gazette on 16 May 2011, but must still be fully implemented.
To investigate complaints of alleged criminality and misconduct against members of the South African Police Service and the Metro Police Service.
The Private Security Industry Regulatory Authority
The Private Security Industry Regulation Act, 2001 (Act No. 56 of 2001)
To provide for the regulation of the Private Security Industry.

SAPS TOGETHER SQUEEZING CRIME to ZEROSAPS Members, My Family - Together Pushing Back The Frontiers Of Evil
ANNUAL REPORT 2010/2011SOUTH AFRICAN POLICE SERVICE
vii
Statement by the Minister of PoliceThe dark days of apartheid bestowed on us a legacy of crime and corruption. We inherited a criminal justice system which itself was pervaded with lawlessness and criminality.
We should not underestimate the rot that set in within all sections of society under apartheid. In its treatment of citizens and in its relations with the wider world, that system encouraged greed and corruption, murder, the proliferation of dangerous weapons in the hands of civilians, violation of its own criminal codes and, particularly among the oppressed, the breakdown of the family unit.
However, the essence of our approach is not to mourn this treacherous past; but to find solutions to a complex reality.
The winning of war against crime demands more than just a passion. It demands a systematic understanding and implementation of detailed plans and techniques in the actual conditions facing us. It demands a sober assessment of the obstacles in our way. It demands dominance in our thinking of achievement over drama.
In dealing with issues of crime, the Government proceeds from the premise that a rising quality of life also means improvement in the safety and security of citizens in their homes and environs where they live, work and engage in extramural activity.
The battle against crime cannot be separated from the war on want. In the main, incidents of contact crime such as murder, grievous bodily harm and rape occur among acquaintances in poor communities where living and entertainment environments do not allow for decent family and social life.
Specific mindsets and historical conditions drive elements of the crime problem. These are the proliferation of firearms in the hands of civilians, greed and conspicuous consumption, the psychology of patriarchal power relations and attitudes towards vulnerable members of society especially children.
Partnership policing has been and still remains a priority for visible policing. This does not refer only to communities, but to a variety of role players within government, business, municipalities, interests groups. The creation of partnerships has to occur at all levels, from national level right down to sector level.
Improving the police response is an objective that remains a priority for the department. The equitable distribution of police stations is essential in ensuring that the services provided by SAPS in support of safe and secured communities is to be realised by all our people.
Critically, focus must be placed on mobilising society to make life difficult for criminals in our midst. This should include an overhaul of gender and family relations and intolerance of abuse within communities.
Eradication of women and child abuse is central to the fight against crime. This requires deliberate programmes of education and other measures to transform gender and family relations, the retraining of justice administrators and the police, and the provision of the necessary resources to ensure safety and restore the dignity of the victims.
Whilst we are aware that this issue cannot be addressed by the police alone, we equally recognise that the police have a central role to play in addressing such crimes. The re-introduction of the Family Violence, Child Protection and Sexual Offences (FCS) units throughout the country over the last financial year provides us with a platform on which to ensure crimes against women and children are adequately
Minister of PoliceEN Mthethwa

SAPS TOGETHER SQUEEZING CRIME to ZEROSAPS Members, My Family - Together Pushing Back The Frontiers Of Evil
ANNUAL REPORT 2010/2011SOUTH AFRICAN POLICE SERVICE
viii
addressed by the police. It also speaks to our resolve to fight crimes and abuse against the vulnerable members in society.
Government views the safety and security of rural communities in South Africa as a priority. The seriousness of continued acts of violence against rural communities, as well as the high levels of stock theft requires that a concerted effort by farmers, rural communities, farm workers and the police to combat this scourge is intensified. The rural safety plan that we have started to roll out in various provinces speak to this. The government recognises the contribution the rural communities continues to make to the welfare and prosperity of the country.
Farmers, farm workers and residents within rural communities are considered soft targets by criminals. This is due to the remoteness of farms, high market value of properties, large distances between farms and villages and the inaccessibility to the police as well as basic infrastructure, such as roads.
Rural police stations are often isolated and responsible to police vast areas. The extent and high levels of poverty and unemployment within rural communities create a particular challenge to policing. Inadequate response to the needs of rural communities and resource constraints hamper the rendering of effective policing in many rural areas.
Co-operation with police services in the region and further afield will be intensified and border control will be continually tightened. In introducing these measures, we proceed from the premise that crime is a scourge that does not respect borders, with syndicates that have made the entire globe the theatre of their operations. This is also particularly relevant to Southern Africa, given its background of apartheid destabilisation, popular resistance and ensuing social dislocation.
The networks of crime have grown in their reach and sophistication across national boundaries. These include syndicates that deal with money laundering, human smuggling as well as drug trafficking and abuse.
Improving regional cooperation is required to improve efforts in combating crime. SAPS will take a leading role in helping to define the relationship between a local police station, borderline, port of entry and exit, and a police station in the neighbouring country. The establishment of effective regional policing is therefore the objective, especially near the country’s borders.The integration of the Southern African region is therefore critical, so as to bring our joint strengths to bear in the wider world. The Constitution of the Republic directs that ‘national security must reflect the resolve of South Africans, as individuals and as a nation, to live in peace and harmony, be free from fear and want and to seek a better life.’
The Government’s outcome three which is aimed at ensuring that “all people are and feel safe”, over the last financial year considerable steps have been undertaken to ensure that we address this outcome.
The release of the crime statistics earlier this month points to the fact that we are beginning to turn the tide regarding certain types of crimes. Whilst this is encouraging, we also recognise that there is still considerable work that needs to be done with regard to the reduction of levels of crime and improving service delivery within the police.
The current reduction in the crime can, to a large extent, be attributed to some of the successes that have been achieved during the last financial years, which include:
➤ The successes achieved by the Directorate for Priority Crime Investigations not only in tracking down some of the most wanted suspects, but also ensuring successful arrests and convictions in the area of organised and commercial crime.

SAPS TOGETHER SQUEEZING CRIME to ZEROSAPS Members, My Family - Together Pushing Back The Frontiers Of Evil
ANNUAL REPORT 2010/2011SOUTH AFRICAN POLICE SERVICE
ix
➤ The successful implementation of the Festive Season “When Duty Call Operations”. During which period South African Police Service (SAPS) members embarked on extensive operations to ensure that all South Africans were able to enjoy a safe and secure festive season. During this period our police operations were focused on contact and trio crimes, concentrating on aggravated robbery, including residential and business robberies and carjacking, in addition to the securing of shopping malls and the combating of ATM blasts. Border security was included in this focus, together with social crime prevention operations dealing with the most vulnerable victims of crime.
➤ One of the areas that has plagued SAPS for some time has been the functioning and growing backlogs in the Forensic Laboratories. Through a concerted focus over the last year, we have gone a long way not only in improving the functioning of the laboratories but also in reducing the backlogs that existed.
These successes together with other initiatives, such as more focused approach to community engagements and cooperation, have played a significant role in stabilising crime. Both our crime statistics and those of organised business are a testimony to the successes achieved.
A lot has been said over the last year about the country’s successful hosting of the 2010 FIFA World CupTM. The success of this event was also thanks, in no small part, to the contributions of our SAPS members. Nobody can undermine such contributions. This contribution has gone a long way in dispelling the negative perceptions about crime in South Africa and we must keep it that way.
Government has identified and prioritised the fight against corruption as a crucial area of focus. During the last financial year, the department through the DPCI has recorded significant successes in eradicating corruption both within and outside government. The initiative between our department and the department of Co-operative Governance and Traditional Affairs to address corruption at a local government level is beginning to yield significant success.
In 2009/10 we emphasised the need to strengthen Civilian oversight of the Police and in 2010/11 we introduced legislation the Civilian Secretariat for Police and Independent Investigative Directorate. Both pieces of legislation were finalised in the last financial year and indicate a determination on our part that strong policing oversight bodies are required.
These two pieces of legislation provide both the Independent Complaints Directorate and the Civilian Secretariat for Police with the necessary powers and capacity for effective oversight of the police. As these pieces of legislation come into operation the SAPS will need to ensure full co operation and understand the powers and function of these two institutions.
Our primary focus on our transformation agenda in the SAPS should be about human resource development, from recruitment to retirement. We must ensure that we are able to recruit the right kind of people and then to train and develop these people into the kind of police officer we want to see and that our country deserves. This approach to transformation must talk to the type of police service we want to create.
Training is also a crucial part of our approach to improving policing. We are now revising how and what is involved in training. Our training must tackle both the content and the manner in which we train. Training cannot be just about churning out numbers but must be ongoing and relevant. The current review of the White Paper for Safety and Security is an important process. Not only will this white paper influence and impact on the review of the SAPS Act during 2011/12 but it must also inform our approach to transforming the police and provide the policy framework direction the policing will take.
The continued attacks and killings of police officers has necessitated that we place more focus on this issue. We remain convinced that we shall thwart these heinous crimes because we have the resolve

SAPS TOGETHER SQUEEZING CRIME to ZEROSAPS Members, My Family - Together Pushing Back The Frontiers Of Evil
ANNUAL REPORT 2010/2011SOUTH AFRICAN POLICE SERVICE
x
and support across all sectors.
Finally, we remember all those men and women in blue who lost their lives in the line of duty. We remember these fallen heroes who refused to be discouraged by actions of heartless criminals. In their pursuit for safety, however rough the road may have been, their eyes and minds were firmly fixed on protecting the weak, the vulnerable and the fearful. They protected, served, empowered with excellence, right until their untimely passing.
The overall programme of national democratic transformation will gradually eliminate some of the conditions that breed social crime. So shall our contribution to creating an environment of peace, stability, economic growth and social development in the SADC Region, the continent and the rest of the world.
At the core of the government programme is the obligation to improve the quality of life of all the citizens, for them to exercise their freedoms and use their talents to help our society flourish.
SAPS TOGETHER SQUEEZING CRIME to ZEROSAPS Members, My Family - Together Pushing Back The Frontiers Of Evil
ANNUAL REPORT 2010/2011SOUTH AFRICAN POLICE SERVICE
xi
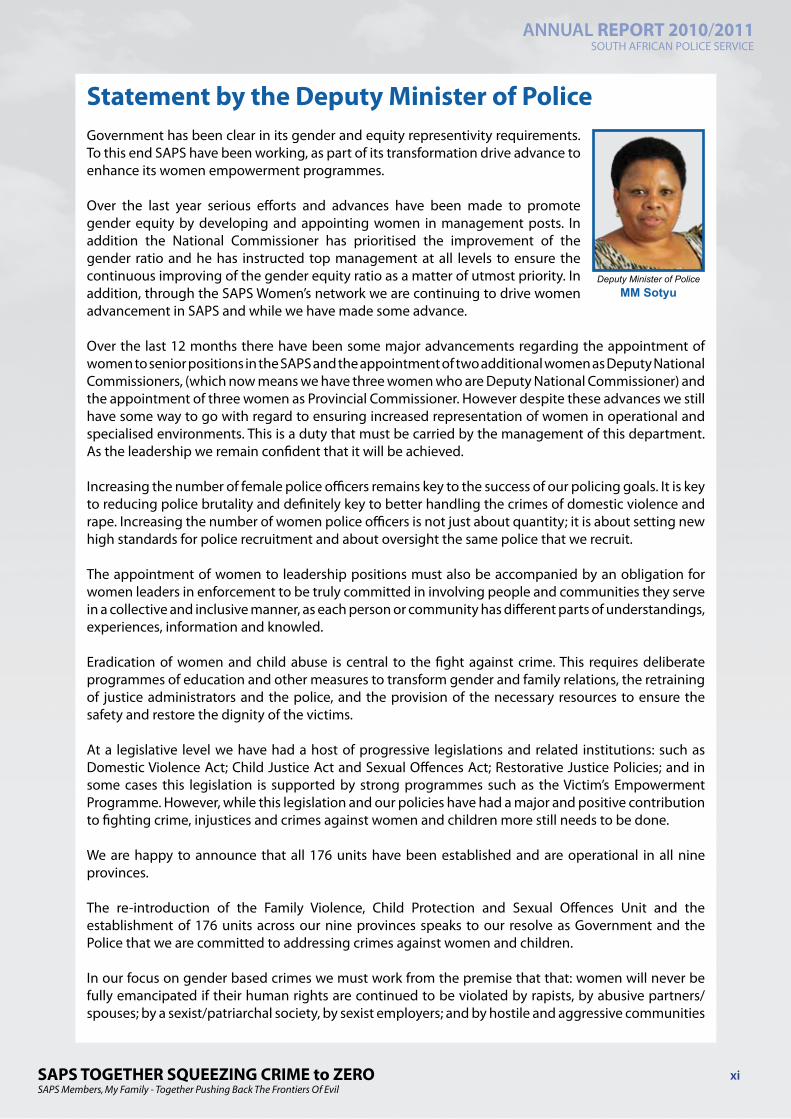
Statement by the Deputy Minister of Police Government has been clear in its gender and equity representivity requirements. To this end SAPS have been working, as part of its transformation drive advance to enhance its women empowerment programmes.
Over the last year serious efforts and advances have been made to promote gender equity by developing and appointing women in management posts. In addition the National Commissioner has prioritised the improvement of the gender ratio and he has instructed top management at all levels to ensure the continuous improving of the gender equity ratio as a matter of utmost priority. In addition, through the SAPS Women’s network we are continuing to drive women advancement in SAPS and while we have made some advance.
Over the last 12 months there have been some major advancements regarding the appointment of women to senior positions in the SAPS and the appointment of two additional women as Deputy National Commissioners, (which now means we have three women who are Deputy National Commissioner) and the appointment of three women as Provincial Commissioner. However despite these advances we still have some way to go with regard to ensuring increased representation of women in operational and specialised environments. This is a duty that must be carried by the management of this department. As the leadership we remain confident that it will be achieved.
Increasing the number of female police officers remains key to the success of our policing goals. It is key to reducing police brutality and definitely key to better handling the crimes of domestic violence and rape. Increasing the number of women police officers is not just about quantity; it is about setting new high standards for police recruitment and about oversight the same police that we recruit.
The appointment of women to leadership positions must also be accompanied by an obligation for women leaders in enforcement to be truly committed in involving people and communities they serve in a collective and inclusive manner, as each person or community has different parts of understandings, experiences, information and knowled.
Eradication of women and child abuse is central to the fight against crime. This requires deliberate programmes of education and other measures to transform gender and family relations, the retraining of justice administrators and the police, and the provision of the necessary resources to ensure the safety and restore the dignity of the victims.
At a legislative level we have had a host of progressive legislations and related institutions: such as Domestic Violence Act; Child Justice Act and Sexual Offences Act; Restorative Justice Policies; and in some cases this legislation is supported by strong programmes such as the Victim’s Empowerment Programme. However, while this legislation and our policies have had a major and positive contribution to fighting crime, injustices and crimes against women and children more still needs to be done.
We are happy to announce that all 176 units have been established and are operational in all nine provinces.
The re-introduction of the Family Violence, Child Protection and Sexual Offences Unit and the establishment of 176 units across our nine provinces speaks to our resolve as Government and the Police that we are committed to addressing crimes against women and children.
In our focus on gender based crimes we must work from the premise that that: women will never be fully emancipated if their human rights are continued to be violated by rapists, by abusive partners/spouses; by a sexist/patriarchal society, by sexist employers; and by hostile and aggressive communities
Deputy Minister of PoliceMM Sotyu

SAPS TOGETHER SQUEEZING CRIME to ZEROSAPS Members, My Family - Together Pushing Back The Frontiers Of Evil
ANNUAL REPORT 2010/2011SOUTH AFRICAN POLICE SERVICE
xii
who cannot tolerate different choice made by individuals.
In this regard homophobia and hate crimes are unacceptable, and we are saying as Government, enough is enough. We will and cannot tolerate that, some section of our citizens continue to suffer in painful silence whist their own Constitution protect them to live the lifestyle they choose, lawfully.
Hate crimes on the basis of sexual orientation must be countered just like hate crimes on the basis of race and religion, because our progressive Constitution does just that, it counteracts any sort of human rights abuse.
The police have a duty to give true meaning to the fundamental principle our Constitution, which says: “All shall have equal rights before the Law”. The Constitution is non-ambiguous on this issue, and sends a clear provision which allows all adults to choose relationships while enjoying equal protection by the Law. However SAPS cannot fight hate crimes alone. We need the community, to mobilise and organise against human rights abuse. To this end call upon communities and civil society organisations to work together, and with the Police on such issues.
As Ministry of Police and Government, we will continue working hard to tackle hate crime and ensure that all our members of community, regardless of sexual orientation, will have a confidence to report incidents at police stations without fear.
To achieve this, we will do the following:
➤ Strengthen our SAPS Victim Support Centre as a real way of a third-party reporting, which enables survivors of hate and rape crimes to report incidents in a more comfortable and convenient way. This means that victims do not have to attend a police station, which can be off-putting if someone is not comfortable discussing their sexuality with someone they don’t know
➤ Make sure that we re-train our police officers to be able to investigate thoroughly these types of crime, and to ensure that the victims receive all the support they need
➤ We must hold active dialogues with our grassroots communities on the Constitutional provision that promote a better understanding and contribute to make a commitment to ensure respect for human rights, a reality
➤ We must continue to strengthen the Independents Complaints Directorate to make sure that they are an independent and impartial oversight body over the behaviour of the Police
➤ We must mainstream lesbian concerns in the broader policy framework of women’s rights and equity because the Constitution does not regard people with different sexual orientation as a special group (like children, people with disabilities)
In focusing on crime, we have always advocated that the police alone cannot solve crime and that if we want to deal with crime in a holistic manner we need to build strong partnership both at an Intergovernmental level and with communities and community based organisations as well as will NGOs, business and the academic fraternity. Some of the key partnership areas which SAPS have engaged in during the last year include:
➤ The partnership between the Department of Basic Education (DBE) and the SAPS continued in the course of 2010/11 and resulted in a draft protocol between the two departments being developed. The School Safety programme addresses both the immediate safety concerns of school communities and provides a platform for SAPS to contribute to education as a long term investment, in safe and

SAPS TOGETHER SQUEEZING CRIME to ZEROSAPS Members, My Family - Together Pushing Back The Frontiers Of Evil
ANNUAL REPORT 2010/2011SOUTH AFRICAN POLICE SERVICE
xiii
sustainable communities.
➤ SAPS have also continued to participate in the process led by the Department of Justice and Constitutional Development for monitoring the implementation of the Child Justice Act.
➤ SAPS have continued to provide support to Department of Social Development on the Drug Demand Reduction Programme. This programme involves all departments and targets communities, parents, young people and other networks of support to people who are vulnerable to the abuse of substances. It is aimed at reducing drug and substance abuse.
➤ During 2010/11 SAPS signed a Memorandum of Understanding with Business Against Crime South Africa (BACSA) which focuses on service delivery improvement.
➤ Other business communities continue to assist SAPS in the fight against crime by sponsoring crime related projects, for example, Crime Reporting Boards, Soul City, Prime Media, Vodacom, etc. We all have an obligation to deal with the perception of crime and build a positive image of SAPS.
Finally we need to recognise the excellent work of the majority of our police officers, who daily put their lives at risk for each one of us in the interest of safety. In recognising this work we need to remember and acknowledge the police officers who lost their lives in the line of duty. Let us all be inspired by our fallen heros and heroine and commit ourselves to carrying on the work of these brave officers and ensure that they are not forgotten.
MM SoTYUDEPUTY MINISTER OF POLICE

SAPS TOGETHER SQUEEZING CRIME to ZEROSAPS Members, My Family - Together Pushing Back The Frontiers Of Evil
ANNUAL REPORT 2010/2011SOUTH AFRICAN POLICE SERVICE
xiv
Overview by the Accounting OfficerI present the Annual Report of the South African Police Service as a comprehensive account to Parliament and to the community on our performance in relation to the priorities and objectives determined for this period as reflected in the Annual Performance Plan for 2010/11. We have put much effort towards cascading the content of the Annual Performance Plan - on which this Annual Report is based - to all levels of the organisation and thereby ensuring a common understanding and dedicated focus on implementing this plan by all role-players.
As a result, we can proudly announce that all serious crime reduced by -2.4%, contact crime reduced to 1 277 per 100 000 of the population. Attempted murder and robbery with aggravating circumstances indicated the highest decreases. Trio crimes reduced to 84 per 100 000 of the population. With regard to contact crime in the railway environment, we experienced a decrease of -37.7% compared to the previous financial year and the main contributing category is sexual offences (-65.3%).
As part of police visibility, various crime prevention operations conducted resulted in 1 452 600 arrests made for all crimes. Priority crimes account for 688 937 of these arrests. In the process, 7 888 stolen or lost firearms whose serial numbers could be linked to firearm owners in South Africa and 33 638 vehicles were recovered countrywide. There were 89 748,289kg dry cannabis, 282 880 mandrax tablets, 73,952kg cocaine, 62,832kg heroin, 11 374 ecstasy tablets and 163,928kg Crystal meth (Tik-Tik) seized by the SAPS.
The successful implementation of the festive season campaign under the theme “fighting crime it begins with me” yielded positive results hence a noticeable decrease in priority crimes. Furthermore, the launch of “Operation Squeeze” resulted in a number of successes during the financial year 2010/11.
We have, together with the Justice, Crime Prevention and Security Cluster, developed a performance measure which provides a more accurate account of the investigative process for detectives. In line with this, we have managed to increase the detective capacity by 11% that is from 20 291 to 22 594 during 2010/11. As a result, a 30.84% court ready case dockets target was achieved. Furthermore, in order to enhance the Criminal Justice System, the number of previous conviction reports generated by the Criminal Record Centre within 30 days increased by 18% from 63.41% in 2009/10 to 81.46% in 2010/11.
Furthermore, the Child Justice Act, 2008 (Act No. 75 of 2008) and the Children’s Act, 2005 (Act No. 38 of 2005) came into operation on 1 April 2010 and the SAPS developed comprehensive National Instructions (official directives) to facilitate the implementation of the legislation.
In relation to the above, the detection rate for all serious crime increased from 50.47% to 51.84%, the detection rate for crimes against children increased from 66.27% to 77.42%, and the detection rate for trio crimes increased by 1.25%. However, the detection rate for crimes against women decreased with -1.88% to 71.20%.
The police do not function in isolation in executing their functions. The success of the historic event, the 2010 FIFA World CupTM, remains our lasting legacy. The South African Police Service is also proud to have initiated a world-first “International Police Cooperation Centre” which hosted almost 200 foreign police officers from 27 participating countries. These foreign police officials assisted the SAPS at the stadiums in dealing with potential threats in matches that were attended by 3 082 514 spectators. This is an example of how security forces, together with several government departments and various role players, can cooperate in ensuring that this historic event could unfold in a safe and secure environment.
The SAPS continues to grow in its human resource capacity from 190 199 members to 193 892 by
National CommissionerGeneral BH Cele

SAPS TOGETHER SQUEEZING CRIME to ZEROSAPS Members, My Family - Together Pushing Back The Frontiers Of Evil
ANNUAL REPORT 2010/2011SOUTH AFRICAN POLICE SERVICE
xv
31 March 2011. We continuously strive with the staff establishment to adequately reflect the demographics of our society in our strategic recruitment and promotion strategies with more emphasis on women empowerment in the organisation. This improvement of the SAPS resource capacity is dependent on the professionalism, discipline and integrity of every member of the SAPS. In this regard, in responding to the call by his Excellency President Jacob Zuma as he declared 2010 as the year of action and instructed government departments to “change the way government works” the SAPS management team has ensured that effective command and control systems are in place through visitations to police stations during its management meetings that were strategically conducted at the different provinces. The return to the fundamentals of discipline was supported by utilising interventions that emphasised the physical and psychological well-being of all SAPS members.
It is understandable that that there is a need for more police stations in rural areas that were for some or other reason neglected in the past. As a means to ensure the realisation of Outcome 3, Output 1: Service Delivery Quantity and Access, which relates to accessibility of government service points, an access strategy is being developed in phases in order to determine the geographical locality where new police stations should be built. Our energy has, and will continue to focus on capacitating those areas as indicated by the access strategy.
Despite the abovementioned successes, the monitoring of various major incidents such as unrest-related incidents affects the deployment of members and resources to other crucial areas for policing. During the reporting period, 971 unrest-related incidents (labour disputes, dissatisfaction with service delivery, etc.) were policed.
Although escapes from police custody decreased by 20.6%, the incidents are still highly unacceptable and this has been identified as a priority risk and continues to be addressed as such.
During the 2010/11 financial year, 93 members were murdered countrywide, i.e. 36 were murdered on duty and 57 off duty. On behalf of SAPS management, I would like to express my deepest condolences to the bereaved families of those police men and women who continue to put their lives at stake and dreadfully perish in the line of duty. We salute you for your bravery and courage.
It is with a deep sense of humility and respect that the SAPS management expresses its acknowledgement of dedication and commitment shown by the majority of its members in ensuring the safety of our communities, sometimes under difficult work circumstances. Without these individuals, we would not have realised the successes that this Annual Report illustrates. Therefore, I would like to dedicate this Annual Report to all men and women in blue who have dedicated their lives to ensure that all people in South Africa are and feel safe. This is notwithstanding those dedicated South Africans who continue to partner with us in our endeavours to ensure safer communities.
Together we will continue to squeeze the space of criminals to zero.
GENERAL BH CELE NATIONAL COMMISSIONER ACCOUNTING OFFICER

SAPS TOGETHER SQUEEZING CRIME to ZEROSAPS Members, My Family - Together Pushing Back The Frontiers Of Evil
ANNUAL REPORT 2010/2011SOUTH AFRICAN POLICE SERVICE
xvi
Roll of HonourFrom 1 April 2010 to 31 March 2011, 94 members died while on duty.
Free State
Persal Number Rank Surname Date of death
7087527-8 Constable Mashonko MK 2010-05-09
2056642-5 Reservist Sergeant Sophile DM 2010-05-09
0622240-4 Warrant Officer Makhalima MD 2010-05-27
0447296-9 Captain Masike SPJ 2010-06-19
7139722-1 Administration Clerk Mogapi KG 2010-07-21
0537166-0 Constable Tsoene AM 2010-08-10
7078054-4 Constable Makoelle TI 2010-09-12
0513139-1 Sergeant Mosadi PC 2010-12-01
0457598-9 Captain Sikolo MP 2010-12-25
KwaZulu-Natal
Persal Number Rank Surname Date of death
0531857-2 Sergeant Dlamini KN 2010-04-04
7002003-5 Constable Mchunu MZ 2010-04-07
2052074-3 Reservist Constable Gumede ZN 2010-04-29
0198463-2 Foreman Gumede EA 2010-04-29
0446698-5 Foreman Mkhwanazi MM 2010-04-29
7007482-8 Cleaner Ntshangase RS 2010-04-30
0168472-8 Lieutenant Colonel Pillay F 2010-05-26
0541594-2 Sergeant Kortjass LA 2010-07-02
0467601-7 Warrant Officer Abdool Rehmane IM 2010-08-07
0530764-3 Sergeant Patel B 2010-09-05
0447370-1 Captain Pedlar A 2010-10-01
7161197-5 Constable Magwaza PT 2011-02-21
0615686-0 Warrant Officer Pillay Y 2011-03-26
Western Cape
Persal Number Rank Surname Date of death
0545341-1 Sergeant Sobetwa K 2010-04-08
0545366-6 Constable Gagasi M 2010-04-22
0534659-2 Sergeant Fortuin ML 2011-01-12
0528977-7 Warrant Officer Abrahams M 2011-01-12
7003045-6 Constable Bangani M 2011-03-20
Northern Cape
Persal Number Rank Surname Date of death
7182544-4 Student Constable Boleme TJ 2011-01-14
Eastern Cape
Persal Number Rank Surname Date of death
7066480-3 Constable Kleinbooi S 2010-04-14

SAPS TOGETHER SQUEEZING CRIME to ZEROSAPS Members, My Family - Together Pushing Back The Frontiers Of Evil
ANNUAL REPORT 2010/2011SOUTH AFRICAN POLICE SERVICE
xvii
Eastern Cape
Persal Number Rank Surname Date of death
0910347-3 Sergeant Mbukuqwa MJ 2010-05-13
0417681-2 Captain van Zyl GJC 2010-06-15
0526005-1 Sergeant Yundu AZ 2010-07-02
7017062-2 Constable Khethabahle V 2010-08-27
0488796-4 Sergeant Majola MH 2010-09-22
0522585-0 Warrant Officer Tokwe MW 2010-11-01
7173893-2 Student Constable Abdull AEJ 2010-11-03
7086014-9 Constable Mavango TC 2010-11-27
7051348-1 Constable Nkubungu Z 2010-11-28
0445950-4 Warrant Officer Buti S 2010-12-20
0516655-1 Warrant Officer Saphepha L 2011-01-23
0498195-2 Sergeant Ndayi T 2011-01-29
7113326-7 Constable Dyantyi V 2011-03-31
North West
Persal Number Rank Surname Date of death
7176386-4 Student Constable Mochwari ML 2010-06-06
0525038-2 Warrant Officer Tihaole EN 2010-10-29
Mpumalanga
Persal Number Rank Surname Date of death
7122863-2 Reservist Constable Ngwenya SS 2010-04-25
7134377-6 Constable Molefe JL 2010-04-25
7072649-3 Constable Maroga TP 2010-04-25
2113060-4 Constable Skosana KM 2010-05-25
7073344-9 Constable Phelembe R 2010-06-08
7024003-5 Constable Mabena PJ 2010-06-11
7037040-1 Constable Nzima D 2010-07-31
7046943-1 Constable Mogane LK 2011-02-14
Limpopo
Persal Number Rank Surname Date of death
0515243-7 Warrant Officer Ngoepe LJ 2010-07-30
0606867-7 Warrant Officer Masopoga TD 2010-07-31
7052299-5 Constable Tshitevhe LG 2010-10-12
Gauteng
Persal Number Rank Surname Date of death
0638446-3 Warrant Officer Tshililo MD 2010-04-04
0636654-6 Captain Shabangu PA 2010-04-11
2054405-7 Reservist Warrant Officer Mfusi JB 2010-05-04
0631606-9 Warrant Officer Maswanganyi MG 2010-05-29
0495688-5 Foreman Makete S 2010-05-31
0469763-4 Sergeant Du Toit GJ 2010-06-05
7001020-0 Constable Ngoepe NJ 2010-07-16
0450512-3 Warrant Officer Mhlongo JO 2010-07-19

SAPS TOGETHER SQUEEZING CRIME to ZEROSAPS Members, My Family - Together Pushing Back The Frontiers Of Evil
ANNUAL REPORT 2010/2011SOUTH AFRICAN POLICE SERVICE
xviii
Gauteng
Persal Number Rank Surname Date of death
7134812-3 Constable Mbatha SP 2010-07-23
0619776-1 Warrant Officer Nyokong DR 2010-07-25
7151483-0 Student Constable Mhlongo MB 2010-07-31
0628846-4 Warrant Officer Nkuna XP 2010-08-15
7132231-1 Constable Nxadi N 2010-08-24
7128227-1 Reservist Constable Sokoso M 2010-10-23
7140218-7 Reservist Constable Lekalakala FS 2010-11-28
7071199-2 Constable Molemohi KG 2010-12-07
0469590-9 Warrant Officer Rivombo GI 2010-12-08
0630060-0 Warrant Officer Kundwani DR 2010-12-19
7150619-5 Constable Thenga LA 2010-12-19
7021657-6 Reservist Constable Davies RTG 2011-01-05
7135752-1 Constable Ngewu LNS 2011-02-05
0637579-1 Captain Nsimba JM 2011-02-12
7110450-0 Constable Mathabatha MM 2011-02-16
7124957-5 Reservist Constable Mathibe BD 2011-03-02
7118481-3 Constable Masango MJ 2011-03-10
7028700-7 Constable Legodi E 2011-03-21
0605808-6 Lieutenant Colonel Iver LS 2011-03-22
Head Office
Persal Number Rank Surname Date of death
0610107-1 Captain Tsebe LH 2010-04-15
7128017-1 Constable Tshada N 2010-05-31
0544242-7 Sergeant King T 2010-05-31
0464085-3 Colonel Maduna TP 2010-07-23
7128406-1 Captain Zaayman W 2010-07-23
0469635-2 Warrant Officer Davids CE 2010-07-23
0468658-6 Warrant Officer van Aswegen DC 2010-07-23
0430491-8 Warrant Officer Gouws T 2010-07-23
0535568-1 Sergeant de Bruin DJB 2010-07-23
0538501-6 Sergeant Henning J 2010-07-23
7057104-0 Constable Rasivhetshele A 2010-09-03
0080945-4 Warrant Officer Nortje JJ 2011-01-17

SAPS TOGETHER SQUEEZING CRIME to ZEROSAPS Members, My Family - Together Pushing Back The Frontiers Of Evil
ANNUAL REPORT 2010/2011SOUTH AFRICAN POLICE SERVICE
1
2. INFORMATION ON PREDETERMINED OBJECTIVES
2.1 Overall performance
2.1.1 Voted funds
Appropriation Main Appropriation Adjusted Appropriation
R’000
Actual Amount Spent
Over/Under Expenditure
52 556 440 53 529 740 53 529 700 40
Responsible Minister Minister of Police
Administering Department South African Police Service
Accounting Officer National Commissioner
2.1.2 Aim of the vote
In terms of the Constitution of the Republic of South Africa, 1996, the aim of the Department of Police is to prevent, combat and investigate crime; to maintain public order; to protect and secure the inhabitants of South Africa and their property; and to uphold and enforce the law.
2.1.3 Summary of Programmes
Based on its legislative mandate, the Department of Police has been organised into five programmes as summarily shown in the table below. Key measurable objectives have been identified for each programme, which makes it possible to assess the impact of each programme.
Key Departmental Programme and Subprogrammes Strategic Objectives
Programme 1 – Administration
• Ministry• Management• Corperate Services• Property Management
Regulate the overall management of the department and provide centralised support services.
Programme 2 – Visible Policing
• Crime Prevention• Borderline Security• Specialised Interventions
Discourage all crime by providing a proactive and responsive policing service that will reduce the levels of priority crime.
Programme 3 – Detective Services
• Crime Investigations• Specialised Investigations• Criminal Record Centre• Forensic Science Laboratory
Contribute to the successful prosecution of crime, by investigating, gathering and analysing evidence, thereby increasing the detection rate of priority crime.
Programme 4 – Crime Intelligence
• Crime Intelligence Operations• Intelligence and Information Management
Contribute to the neutralising of crime by gathering, collating and analysing intelligence that leads to an actionable policing activity.

SAPS TOGETHER SQUEEZING CRIME to ZEROSAPS Members, My Family - Together Pushing Back The Frontiers Of Evil
ANNUAL REPORT 2010/2011SOUTH AFRICAN POLICE SERVICE
2
Key Departmental Programme and Subprogrammes Strategic Objectives
Programme 5 – Protection and Security Services
• VIP Protection Services• Static and Mobile Security• Ports of Entry Security• Railway Police• Government Security Regulator
Minimise security violations by protecting foreign and local prominent people and securing strategic interests.
2.1.4 Key strategic objectives achievements
The department’s 2010 to 2014 Strategic Plan has specified four operational priorities for the medium term, which are linked to Outcome 3: All People in South Africa Are and Feel Safe and the related outputs of the JCPS Cluster:
Crime prevention focuses on reducing the levels of serious crime, contact crime and trio crime. Reducing levels of crime are realised through: improving the police response; improving cooperation from communities through community policing and sector policing; effectively policing public disorder; and combating corruption, among others.
➤ In 2010/11, all serious crime reduced by -2.4%, contact crime reduced to 1 277 per 100 000 of the population, with attempted murder and robbery with aggravating circumstances indicating the highest decreases and trio crime reduced to 84 per 100 000 of the population.
➤ To enhance police visibility, 29 891 crime prevention operations were conducted during 2010/11 which led to 1 452 600 arrests for all crimes, compared to 1 361 504 in 2009/10. 47.4% or 688 937 of the 1 452 600 arrests were made on priority crime. 7 888 stolen or lost firearms whose serial numbers could be linked to firearm owners in South Africa and 33 638 vehicles were recovered countrywide. Apart from other drugs that were seized by the SAPS such as mandrax, cocaine, heroin, ecstasy and Crystal meth (Tik-Tik) that pose major threats to South Africa, of particular mention is cannabis with a street value of R125 647 604 and cannabis plants with a street value of R22 355 340 that were seized by the SAPS during police actions. 18 883 unlicensed liquor premises were closed down and 1 219 215,643 litres of liquor were confiscated.
➤ Following the approval of the re-deployment of members of the SANDF in 2009 to render borderline control, the Swartwater, Rooibokkraal, Pontdrift, Musina and Madimbo (Limpopo), Sandrivier, Macadamia and Zonstraal (Mpumalanga), Pongola and Ndumo (KwaZulu-Natal) and the Ladybrand (Free State) borderline bases were handed over to the SANDF from December 2010.
➤ 12 651 crowd-related incidents were policed in 2010/11 compared to 8 907 in 2009/10.
➤ A revised Anti-corruption Strategy and support structures have been developed in terms of the Minimum Anti-corruption Capacity requirements (MACC) to ensure compliance of SAPS members and to eradicate corrupt activities in the Service.
➤ There has been a gradual improvement of the response times for serious complaints in progress. That is, from 31.11 minutes in 2009/10 to 21.43 minutes in 2010/11
Investigation of crime focuses on the rates of detection and court readiness. The Directorate for Priority Crime Investigation played a pivotal role by focusing on crimes of national priority, such as cyber crime, identity theft, corruption and organised crime. The medium term target for the investigation of crime is to increase the detection rate for contact crime to 57 per cent.
➤ The department has re-established the Family, Violence and Child Protection Units to investigate

SAPS TOGETHER SQUEEZING CRIME to ZEROSAPS Members, My Family - Together Pushing Back The Frontiers Of Evil
ANNUAL REPORT 2010/2011SOUTH AFRICAN POLICE SERVICE
3
crimes against women and children. The policing cluster model was followed and a FCS Unit was established in all of the 176 clusters by 31 March 2011. A total of 1 864 police officials and 218 support staff (Public Service Act members) were placed at the units.
➤ Special emphasis was placed on the expansion of human resource capacity of detectives which increased from 20 291 (as on 30 April 2010) to 22 594 personnel (as on 31 March 2011), an increase of 11%. Between 2009/10 and 2010/11, the detection rate for all serious crime increased from 50.47% to 51.84% and 30.84% court ready case dockets was achieved.
➤ The detection rate for crimes against children increased by 8.49%, i.e. from 66.27% to 77.42%. Assault GBH indicated an increase of 13.71% and common assault an increase of 12.85%. The detection rate for crimes against women decreased with -1.88% to 71.20%.
➤ The detection rate for commercial crime-related charges increased from 36.55% in 2009/10 to 68.4% in 2010/11 and 25.6% court ready case dockets for commercial crime-related charges was achieved. The Organised Crime Unit within the SAPS identified and investigated 179 organised crime groups composed of 492 targets. 57 of these groups were successfully terminated, resulting in the arrest of 282 suspects.
Support to the investigation of crime focuses on improving forensic services and fingerprints, and on capacitating the Criminal Record Centre and the Forensic Science Service. Emphasis is put on the incremental basis of targets for processing forensic and fingerprint evidence.
➤ As a result of increased efforts, the number of previous conviction reports generated by the Criminal Record Centre within 30 days increased by 18% from 63.41% in 2009/10 to 81.46% in 2010/11. 297 955 or 93.5% entries were analysed by the Forensic Science Laboratory within 35 days, an improvement of 7.5% compared to the 2009/10 financial year.
Crime intelligence focuses on intelligence operations relating to serious crime, drug and people smuggling syndicates, and human trafficking and to gather intelligence on syndicates and other people involved in serious crime.
➤ Crime Intelligence conducted a total of 24 384 crime intelligence operations, including 13 351 cluster operations and 11 033 ad hoc operations during 2010/11. These operations led to the arrest of 10 016 individuals and the recovery of goods valued at R1 294 820 258,82.
The department has identified three organisational priorities to support the operational focus:
Human capital development (skills development and the retention of skills).
➤ In 2010/11, the establishment of the SAPS increased from 190 199 as on 31 March 2010 to 193 892 personnel by 31 March 2011. The human resource capacity was expanded by appointing 5 844 new entry level Police Service Act and 1 726 Public Service Act personnel.
➤ To enhance the quality of investigations, 1 341 members were trained on Basic Crime Investigative Practice, 355 members were trained in the resolving of crime, 1 628 members were trained in specialised courses to establish specific skills and knowledge required by specialised detectives and 4 625 members received short interventions to develop the support skills required to enhance the competency of all detectives. 1 183 members were trained in the Station Management Learning Programme to provide the knowledge and skills required by Station Commanders to effectively manage a police station. This programme also included training in generic computer programs and key SAPS computer systems to empower Station Commanders to effectively utilise these management tools.
SAPS TOGETHER SQUEEZING CRIME to ZEROSAPS Members, My Family - Together Pushing Back The Frontiers Of Evil
ANNUAL REPORT 2010/2011SOUTH AFRICAN POLICE SERVICE
4
Budget and resource management: To increase access to communities in line with Outcome 12 (Output 1: Service Delivery Quantity and Access)
➤ 19 police facilities, from a total of 33 projects, were completed in 2010/11.
Improving information systems and ICT:
➤ In order to ensure an enabling environment, various aspects of the Information Systems and Information and Communication Technology (IS/ICT) Plan were implemented.
2.1.5 Overview of the service delivery environment
During the 2010/11 financial year, the SAPS’ service delivery environment was distinguished by the country’s hosting of the 2010 FIFA World CupTM, conducted during June and July of 2010. The securing of the 2010 FIFA World CupTM involved extensive planning both prior to and during the event. This involved the mobilisation and deployment of up to 48 000 SAPS members in and around the ten stadia that were identified for the hosting of the 32 teams involved in the tournament. The SAPS also initiated the first “International Police Cooperation Centre” to ensure the effective coordination of the approximate 200 foreign police officials from 27 of the host nations, who assisted the SAPS with the security for their various teams. The matches that took place in the various host-cities were attended by 3 082 514 people and the entire event was managed without serious incidents.
The policing of dangerous situations involving civil unrest remained a challenge for the SAPS during 2010/11, requiring the mobilisation of significant numbers of personnel. While this aspect of policing falls within the operational mandate of the SAPS, it places severe constraints on the SAPS’ budget and diverts personnel away from the basic policing functions of the prevention and investigation of serious and violent crime.
The SAPS as a member of the Southern African Regional Police Chiefs Cooperation Organisation (SARPCCO) has provided training courses to 72 members (28 from other countries and 44 from South Africa). These training courses include: the Small Arms and Light Weapons course, the Regional Detective course, the Drug Trafficking and Identification of Chemical Equipment course, the Command/Leadership course for Senior Police Women, a Stock Theft Investigators course, a Crime Intelligence Gathering Train the Trainer course and a Crime Intelligence Analysis Training course.
The Millennium Development Goals (MDGs), identified during the United Nations Millennium Summit in 2000, during which the international community reached consensus on eight key economic and social development priorities, are supported by the Medium Term Strategic Framework (MTSF), as a key driver of Government planning policy. The MTSF identifies five development objectives, all of which support the MDGs directly and which include an objective which has a specific implication for the SAPS in terms of directing the SAPS’ medium and short term planning. This development goal: “the improving of the safety of citizens by reducing incidents of crime and corruption” provides the strategic platform for the SAPS’ contribution to the MDGs. The SAPS’ Strategic and Annual Performance Plans are the mechanism within which the organisation incorporates its address of the MDGs and the MTSF strategic priorities, thereby contributing directly to the address of the MDGs by Government.
2.1.6 Overview of the organisational environment
The National Commissioner, in conjunction with the SAPS’ National Management Forum, decided to address the improvement of station-level policing directly by conducting a number of focused visits to selected stations during the course of their structured meetings. The challenges that were identified during these visits represent the key issues that the SAPS is required to address in order to improve the level of the policing service provided to the people of the country and include:

SAPS TOGETHER SQUEEZING CRIME to ZEROSAPS Members, My Family - Together Pushing Back The Frontiers Of Evil
ANNUAL REPORT 2010/2011SOUTH AFRICAN POLICE SERVICE
5
➤ Levels of command and control over all the resources allocated to the SAPS but focusing on the SAPS’ substantial staff establishment, most of which is deployed at station level.
➤ The improvement of the community’s involvement in reducing serious and violent crime through active participation in community-police structures and the reporting of crime-related information to the SAPS.
➤ The effective implementation of the SAPS’ policy and procedure, designed to regulate the effective performance of the SAPS’ key functions.
Immediate interventions on identified challenges are put in place subsequent to these visits. Monitoring mechanisms are also utilised to determine progress on those interventions.
The SAPS has dedicated significant resources to its contribution towards the improving of the Criminal Justice System, through the Justice Crime Prevention and Security Cluster. This includes the development and integration of systems and processes across departments relating to the investigation of crime, and the improvement of the skills and capacity of the Forensic and Detective Services capacities.
The finalisation of the SAPS organisational structure and the expedient filling of vacant posts have improved the functioning of the SAPS at all levels with specific emphasis on cluster and station levels.
2.1.7 Key policy developments and legislative changes
a) Major changes to policy
➣ The Child Justice Act, 2008 (Act No. 75 of 2008) and the Children’s Act, 2005 (Act No. 38 of 2005) came into operation on 1 April 2010. The SAPS developed comprehensive National Instructions (official directives) on the implementation of the legislation. Both Acts required substantial changes to the way in which policing is to be undertaken (e.g. the age at which a person is deemed to have criminal capacity was raised from seven to ten years. Children below the age of ten could, therefore, no longer be arrested. A completely new system for the treatment of children in need of care and protection had to be developed and implemented). Training material was developed and extensive training interventions were launched during the 2010/11 financial year to ensure the proper implementation of the legislation. The initial implementation of the legislation has been a success.
➣ A new ranking structure, which was initiated on 1 April 2010 required extensive changes to the levels at which authority had been delegated, as well as to the official directives of the SAPS, among others, to enhance command and control. This structure was fully implemented in the SAPS in the course of the 2010/11 financial year.
b) Legislation that affected operations
Firearms Control Amendment Act, 2006 (Act No. 28 Of 2006) Some provisions of the Firearms Control Amendment Act were put into operation in order to
provide for a mechanism to renew competency certificates in respect of firearms. The Act also provides for the extension of the validity period of some categories of firearms licenses, such as conducting business as a game ranger and conducting business in hunting from five years to ten years and for other business purposes from two years to five years. These amendments will alleviate pressures on the licensing process. The Act also places an obligation on owners of muzzle-loading firearms to obtain competency certificates, which will promote responsible ownership of firearms and the safe use of firearms. Further amendments to the Act are being

SAPS TOGETHER SQUEEZING CRIME to ZEROSAPS Members, My Family - Together Pushing Back The Frontiers Of Evil
ANNUAL REPORT 2010/2011SOUTH AFRICAN POLICE SERVICE
6
drafted where after the remainder of the Firearms Control Amendment Act will be put into operation.
The Safety at Sport and Recreational Events Act, 2010 (Act No. 2 Of 2010) The Act came into operation during the 2010/11 financial year and had a major impact on the
way in which the Service policed the events surrounding the 2010 FIFA World CupTM. All the events relating to the 2010 FIFA World CupTM was policed by the Service in a manner that drew international acclaim.
2.1.8 Departmental revenue, expenditure and other specific topics
a) Collection of departmental revenue
Table 1: Collection of departmental revenue
2007/08 2008/09 2009/10 2010/11 2010/11 % deviation from targetActual R’000 Actual R’000 Actual R’000 Actual R’000 Actual R’000
Non-taxable revenue 179 409 233 023 168 869 128 884 133 631 3,7%
* Sale of goods and services produced by Department
173 409 217 375 147 654 123 376 123 817 0,4%
* Sale of scrap, waste, arms and other used goods
6 000 5 648 21 215 5 508 9 814 78,2%
Fines, penalties and forfeits
8 021 24 336 10 043 10 621 12 275 15,6%
Interest, dividends and rent on land
986 2 235 1 365 1 272 1 116 (12,3%)
Sale of capital assets 14 588 2 515 4 879 1 178 1 141 (3,9%)
* Other capital assets 14 588 2 515 4 879 1 178 1 141 (3,9%)
Financial transactions in assets and liabilities
142 047 124 347 162 416 130 978 139 574 6,6%
Total departmental receipts
345 051 376 456 347 572 272 942 287 737 5,4%
Departmental revenue collection mostly derives from services rendered to the public such as firearm applications, photocopies of accident reports and statements, disposal of departmental assets via auctions, forfeits as a result of criminal activities and the recovery of debt raised.
Although the departmental revenue collection environment within the department is very unpredictable, the department did manage to perform credibly well.
However, the set targets were not fully realised due to the following reasons:
➣ Sale of scrap, waste arms and other used goods: The positive deviation of 78,2% is mainly due to military vehicles (caspers) that was sold via a tender process that only realised during December 2010.

SAPS TOGETHER SQUEEZING CRIME to ZEROSAPS Members, My Family - Together Pushing Back The Frontiers Of Evil
ANNUAL REPORT 2010/2011SOUTH AFRICAN POLICE SERVICE
7
➣ Fines, penalties and forfeits: The positive deviation of 15,6% is mainly due to additional revenue that was earned from the unplanned forfeits of money at airports.
➣ Interest, dividends and rent on land: The negative deviation of 12,3% in interest received (revenue) via corporate banks is due to the implementation of the cashier service environment which resulted in the decrease of cash at advance offices from R46,8 million to R11,5 million. Cognisance should also be taken of the fact that bank cost (liability) on the other hand also decreased within the department.
➣ Sale of capital assets: The negative deviation of 3.9% is due to fewer vehicles that were boarded than anticipated.
➣ Financial transactions in assets and liabilities: The positive deviation of 6.6% is mainly due to more debt own by other departments that was repaid than anticipated.
2.1.9 Departmental expenditure
Table 2: Departmental expenditure
Programmes Adjusted EstimatesR’000
Actual ExpenditureR’000
Variance%
1. Administration 18 066 960 17 871 936 (1,1%)
2. Visible Policing 21 500 927 21 702 627 0.9%
3. Detective Service 8 850 257 8 868 123 0,2%
4. Crime Intelligence 1 947 635 1 947 626 0,0%
5. Protection and Security Services 3 163 961 3 139 388 (0,8%)
Total 53 529 740 53 529 700 0,0%
2.1.10 Capital investment, maintenance and asset management plan
a) Capital investment – police facilities
The following police facilities, from a total of 33 projects, were completed in 2010/11:
Table 3: Police facilities completed in 2010/11
Province Facility Expected completion date Date completed
Newly re-established police facilities completed
Northern CapeKuruman LCRC 5 September 2010 September 2010
Kakamas police station 2 September 2010 September 2010
Gauteng Brakpan (Tsakane) police station 20 May 2010 August 2010
Free State Bloemfontein 10111 centre 13 August 2010 August 2010
MpumalangaHazyview police station 18 June 2010 June 2010
Pienaar police station 30 April 2010 January 2011
New police facilities completed
Western Cape Blue Downs police station 31 May 2010 March 2011
Free State Zamdela police station 16 June 2011 July 2010
Limpopo Ga Masemola police station 23 May 2010 September 2010
Gauteng Benoni Training College – Radio Technical Centre 21 September 2010 September 2010

SAPS TOGETHER SQUEEZING CRIME to ZEROSAPS Members, My Family - Together Pushing Back The Frontiers Of Evil
ANNUAL REPORT 2010/2011SOUTH AFRICAN POLICE SERVICE
8
Province Facility Expected completion date Date completed
Repaired and upgraded police facilities completed
Eastern CapeMount Road police station 1 April 2011 January 2011
Humewood police station 11 June 2010 June 2010
KwaZulu-NatalBergville police station 29 September 2008 March 2011
Chatsworth police station 12 January 2011 March 2011
North West Hammanskraal Training Institution 31 August 2010 December 2010
Western Cape Riebeeck West police station 7 April 2010 April 2010
Re-established police facilities completed
Gauteng Thokoza police station 21 May 2010 May 2010
Mpumalanga Mbuzini police station 1 September 2009 April 2010
Limpopo Giyani police station 31 May 2010 February 2011
Table 4: Police facilities not completed during 2010/11 and to be carried over to the 2011/12 financial year
Newly re-established police facilities in execution (NRE)
Province Facility Previous projected completion date
Revised projected completion date
Reason for deviation
Eastern Cape Bisho police station 31 March 2011 31 July 2011 The BID had to be re-advertised as there were no suitable contractors during the 1st advertisement of bid period (electrical and mechanical).
Lady Frere police station
31 March 2011 31 July 2011 Work being carried out in-house.
North West Amalia police station
15 April 2009 Feedback from DPW awaited
The contractor has stopped activities on site but contract was not suspended. Feedback from the Department of Public Works (DPW) awaited.
New police facilities in execution (N)
Province Facility Previous projected completion date
Revised projected completion date
Reason for deviation
Gauteng Benoni Training College: K53
Feedback from NDPW awaited
6 May 2011 Mechanical and electrical installations to be completed on 6 May 2011.
Diepsloot police station
02 August 2010 Court date set for 18 April 2011.
The contractor was placed “in-Mora” under Judicial Management since 2 September 2010 (a legal term used in a contract which entails that the contractor was notified that he/she did not comply with the deliverable as stipulated in the contract. The contractor is afforded an opportunity to reply or rectify. Failing to do so, the contract will be cancelled.) The project has therefore been affected by court proceedings. The next court date is 18 April 2011.
Northern Cape
Kimberley Local Criminal Record Centre (LCRC) Archives
1 February 2010 31 May 2011 The site was handed to the second contractor on 13 October 2010, in order to finalise the project.

SAPS TOGETHER SQUEEZING CRIME to ZEROSAPS Members, My Family - Together Pushing Back The Frontiers Of Evil
ANNUAL REPORT 2010/2011SOUTH AFRICAN POLICE SERVICE
9
Repair and upgrade of police facilities in execution (R&U)
Province Facility Previous projected completion date
Revised projected completion date
Reason for deviation
Gauteng Silverton: SCM 04 November 2010 20 April 2011 Extension of time was approved by DPW to complete the project on 20 April 2011.
KwaZulu-Natal
Durban North police station
15 July 2010 8 April 2011 Unauthorised scope changes were made by the DPW project manager.
Re-established police facilities in execution (RE)
Province Facility Previous projected completion date
Revised projected completion date
Reason for deviation
Gauteng Pretoria West ORS 30 April 2011 Feedback from DPW awaited
The contract has been terminated due to poor performance by the contractor. Guarantors have been appointed to complete the project. Feedback awaited from Department of Public Works.
Roodeplaat Dog School
Completion date could not be determined
Feedback from DPW awaited
The contractor was not on schedule as per the submitted project plan. Delay in appointment of secondary contractors impacts directly on completion date. Feedback awaited from Department of Public Works.
Limpopo Letsitele police station
30 May 2011 25 July 2011 The site was only handed over to the new contractor on 26 November 2010 to finalise the project.
Mpumalanga Tweefontein (Kwa-Mhlanga) police station
1 July 2010 Feedback from DPW awaited
The contract was terminated in August 2010 due to poor performance by the contractor. DPW is in the process to appoint new contractors.
North West Jouberton (Klerksdorp) police station
10 December 2010 08 April 2011 At face value, construction has been finalised. Still awaiting Works Completion Certificate from the Department of Public Works.
Western Cape
Khayelitsha Detective Offices
30 November 2010 22 July 2011 The electrical contractor is in the process of completing the installations as per specifications. The lift shaft to be completed to specifications. Expected completion date scheduled for 22 July 2011.
Definitions:
➣ New police facilitiesPolice facilities that are constructed in suburbs; townships; towns; cities; and rural areas, where no police facilities existed previously.
➣ Re-established police facilities Existing police facilities that are replaced by upgraded and new structures on its existing site.
➣ Newly re-established police facilitiesExisting police facilities that are replaced by new structures on a new site.
➣ Repaired and upgraded Existing police facilities that are repaired and upgraded to modern standards, with only minor additions.

SAPS TOGETHER SQUEEZING CRIME to ZEROSAPS Members, My Family - Together Pushing Back The Frontiers Of Evil
ANNUAL REPORT 2010/2011SOUTH AFRICAN POLICE SERVICE
10
➣ Latest projected date of completion The date of completion that is planned for, but which could change during any construction phase. Various delays to its completion may arise that could not be reasonably planned for, this could include, weather delays; labour strikes; unavailability of material; scope changes; poor performance by contractor; bankruptcy of contractors; etc.

SAPS TOGETHER SQUEEZING CRIME to ZEROSAPS Members, My Family - Together Pushing Back The Frontiers Of Evil
ANNUAL REPORT 2010/2011SOUTH AFRICAN POLICE SERVICE
11
b) A
sset
man
agem
ent
Tabl
e 5:
Veh
icle
s or
dere
d an
d de
liver
ed p
er q
uart
er fo
r the
201
0/11
fina
ncia
l yea
r
Qua
rter
1 2
010/
2011
Qua
rter
2 2
010/
2011
Qua
rter
3 2
010/
2011
Qua
rter
4 2
010/
2011
Prov
ince
Ord
er Q
1 St
art
Del
iver
ed
Q1
Del
iver
y Pe
ndin
g Q
1 En
d
Ord
er Q
2 St
art
Del
iver
ed
Q2
Del
iver
y Pe
ndin
g Q
2 En
d
Ord
er Q
3 St
art
Del
iver
ed
Q3
Del
iver
y Pe
ndin
g Q
3 En
d
Ord
er Q
4 St
art
Del
iver
ed
Q4
Del
iver
y Pe
ndin
g Q
4 En
d
Nat
iona
l Hea
d O
ffice
3940
-112
83
191
7511
957
669
41
East
ern
Cape
633
600
4218
664
169
513
5356
51
Free
Sta
te13
14
127
092
3526
412
917
021
191
0
Gau
teng
371
236
90
232
137
916
569
484
109
593
0
KwaZ
ulu-
Nat
al
141
713
40
6470
823
466
427
2745
40
Lim
popo
563
5320
3835
236
137
134
9122
50
Mpu
mal
anga
696
632
4520
334
230
124
3916
30
Nor
th W
est
492
470
443
337
303
7726
103
0
Nor
ther
n Ca
pe37
037
030
719
169
129
4617
41
Wes
tern
Cap
e10
90
109
1142
7861
415
453
873
611
0
Tota
l num
ber o
f ve
hicl
es p
er q
uart
er1
065
6799
845
597
446
4 57
02
301
2 71
51
061
3 77
33

SAPS TOGETHER SQUEEZING CRIME to ZEROSAPS Members, My Family - Together Pushing Back The Frontiers Of Evil
ANNUAL REPORT 2010/2011SOUTH AFRICAN POLICE SERVICE
12
Table 6: Personnel per vehicle ratio per province as on 31 March 2011
Province Total number of personnel on 31 March 2011
Total number of active vehicles on 31 March
2011 as per Provisioning Administration System
Personnel/vehicle ratio
National Head Office 41 981 6 544 6.42
Eastern Cape 20 098 5 893 3.41
Free State 11 981 3 064 3.91
Gauteng 36 099 9 551 3.78
KwaZulu-Natal 24 310 6 886 3.53
Limpopo 12 296 3 810 3.23
Mpumalanga 9 952 2 601 3.83
North West 9 655 2 671 3.61
Northern Cape 7 004 1 770 3.96
Western Cape 20 518 6 497 3.16
Total 193 894 49 287 3.93
Implementation of Automated Vehicle Location (AVL)
A vehicle asset management system has been developed up to station level focusing on the distribution, suitability of vehicles and personnel ratio to vehicles. Provinces and Divisions are required to purchase and distribute vehicles based on the parameters contained in the vehicle asset register.
The implementation of AVL has been phased in since 2007. The purpose of the system is to detect the locality of vehicles deployed or operating in a specific area. To date, 39 098 vehicles have been fitted with AVL. An additional 6 765 AVL units are currently being installed in all vehicles still outstanding. Approximately 20 951 members are registered and trained users of the AVL System.
Repair and maintenance of SAPS vehicles
A project plan has been compiled for the optimisation of SAPS garages to enhance service delivery and includes the following elements:
➣ The development of a garage HR plan
➣ The revision of garage functions and processes
➣ The revision of the garage accessibility and structures
➣ The implementation of performance measurement systems
➣ The optimisation of garage infrastructure and technology
During 2010/11 a shortage of 275 artisans was identified to optimise the functioning of SAPS garages. Of these, 226 posts were filled. The outstanding posts (49) would be filled during 2011/12. In order to address skill shortages in the interim, the services of external artisans were utilised.

SAPS TOGETHER SQUEEZING CRIME to ZEROSAPS Members, My Family - Together Pushing Back The Frontiers Of Evil
ANNUAL REPORT 2010/2011SOUTH AFRICAN POLICE SERVICE
13
Table 7: Active bullet-resistant vests per province at the end of March 2011
Total number of bullet resistant vests active on the Asset Register of the SAPS on 31 March 2011 (as on the Provisioning Administration System on 9 May 2011)
Province Count of serial number
National Head Office 43 198
Eastern Cape 22 421
Free State 12 813
Gauteng 38 559
KwaZulu-Natal 23 149
Limpopo 12 045
Mpumalanga 9 881
North West 11 737
Northern Cape 6 491
Western Cape 25 540
Total 205 834
A strategy was implemented where all bullet resistant vests are uniquely marked and issued against a personal inventory issue. Unique asset numbers allows SAPS to indicate the exact location and custodianship of the bullet resistant vests. Bullet resistant vests are certified twice per annum to ensure the correct accounting (quantities and distribution) and serviceability status. This mechanism enables the SAPS to conduct a needs analysis for future needs and distribution.
Table 8: Active firearms per province at the end of March 2011
Total number of firearms active on the Asset Register of the SAPS on 31 March 2011 (as on the Provisioning Administration system on 9 May 2011)
Province Count of serial number
National Head Office 93 524
Eastern Cape 22 991
Free State 13 377
Gauteng 37 589
KwaZulu-Natal 30 245
Limpopo 13 512
Mpumalanga 11 704
North West 12 583
Northern Cape 7 523
Western Cape 21 736
Total 264 784

SAPS TOGETHER SQUEEZING CRIME to ZEROSAPS Members, My Family - Together Pushing Back The Frontiers Of Evil
ANNUAL REPORT 2010/2011SOUTH AFRICAN POLICE SERVICE
14
2.2 Programme Performance
2.2.1 Programme 1: Administration
Purpose
Develop policy and manage the Department, including providing administrative support.
Strategic objective
To regulate the overall management of the department and provide centralised support services.
The Administration Programme regulates the overall management of the Department and provides centralised support services such as information technology, capital works and property management costs. It also provides training of personnel and employer contributes to medical aid benefits.
The Administration Programme comprises the following subprogrammes:
➤ Ministry
➤ Management
➤ Corporate Services
➤ Property Management

SAPS TOGETHER SQUEEZING CRIME to ZEROSAPS Members, My Family - Together Pushing Back The Frontiers Of Evil
ANNUAL REPORT 2010/2011SOUTH AFRICAN POLICE SERVICE
15
Serv
ice
deliv
ery
obje
ctiv
es a
nd in
dica
tors
Tabl
e 9:
Act
ual p
erfo
rman
ce a
gain
st ta
rget
s
Subp
rogr
amm
e: M
inis
try,
Man
agem
ent,
Corp
orat
e Se
rvic
es, P
rope
rty
Man
agem
ent
Obj
ecti
veO
utpu
tM
easu
re /
Indi
cato
rA
ctua
l per
form
ance
aga
inst
targ
et
Reas
on fo
r Var
ianc
e
Targ
etA
ctua
l
To re
gula
te th
e ov
eral
l m
anag
emen
t of t
he
depa
rtm
ent a
nd p
rovi
de
cent
ralis
ed s
uppo
rt s
ervi
ces
rela
ting
to th
e:
• M
aint
enan
ce o
f min
imum
le
vel p
erso
nnel
in
rela
tion
to th
e ap
prov
ed
esta
blis
hmen
t
Mai
ntai
n a
min
imum
num
ber
of e
mpl
oyee
s to
pro
vide
a
polic
ing
serv
ice
Perc
enta
ge o
f per
sonn
el
in te
rms
of th
e ap
prov
ed
esta
blis
hmen
t
Mai
ntai
n a
min
imum
w
orkf
orce
of 9
5% in
term
s of
th
e ap
prov
ed e
stab
lishm
ent
99.3
% a
chie
ved.
The
es
tabl
ishm
ent o
f the
SA
PS
was
193
892
out
of a
targ
et o
f 19
5 31
0 on
31
Mar
ch 2
011.
Targ
et a
chie
ved.
To re
gula
te th
e ov
eral
l m
anag
emen
t of t
he
depa
rtm
ent a
nd p
rovi
de
cent
ralis
ed s
uppo
rt s
ervi
ces
rela
ting
to th
e:
• D
evel
opm
ent o
f hum
an
reso
urce
s
Prov
isio
n of
nee
ds-b
ased
tr
aini
ngPe
rcen
tage
of l
earn
ers
decl
ared
com
pete
nt u
pon
com
plet
ion
of th
eir t
rain
ing
in te
rms
of th
e Tr
aini
ng
Prov
isio
ning
Pla
n (T
PP)
80%
of l
earn
ers
decl
ared
co
mpe
tent
aft
er c
ompl
etio
n of
thei
r tra
inin
g in
201
0/11
90.2
% o
f lea
rner
s de
clar
ed
com
pete
nt a
fter
com
plet
ion
of th
eir t
rain
ing
in 2
010/
11.
178
870
mem
bers
att
ende
d tr
aini
ng a
nd 1
61 3
50
mem
bers
com
pete
ntly
co
mpl
eted
the
trai
ning
. Thi
s co
nsis
ts o
f the
follo
win
g:
Entr
y Le
vel (
Basi
c tr
aini
ng fo
r la
tera
l ent
rant
s in
the
SAPS
) =
90%
409
mem
bers
att
ende
d tr
aini
ng a
nd 3
68 m
embe
rs
com
pete
ntly
com
plet
ed th
e tr
aini
ng.
Entr
y Le
vel B
asic
Sem
este
r 1(B
asic
trai
ning
for n
ew
recr
uits
/inta
ke) =
99.
9%
Targ
et a
chie
ved.
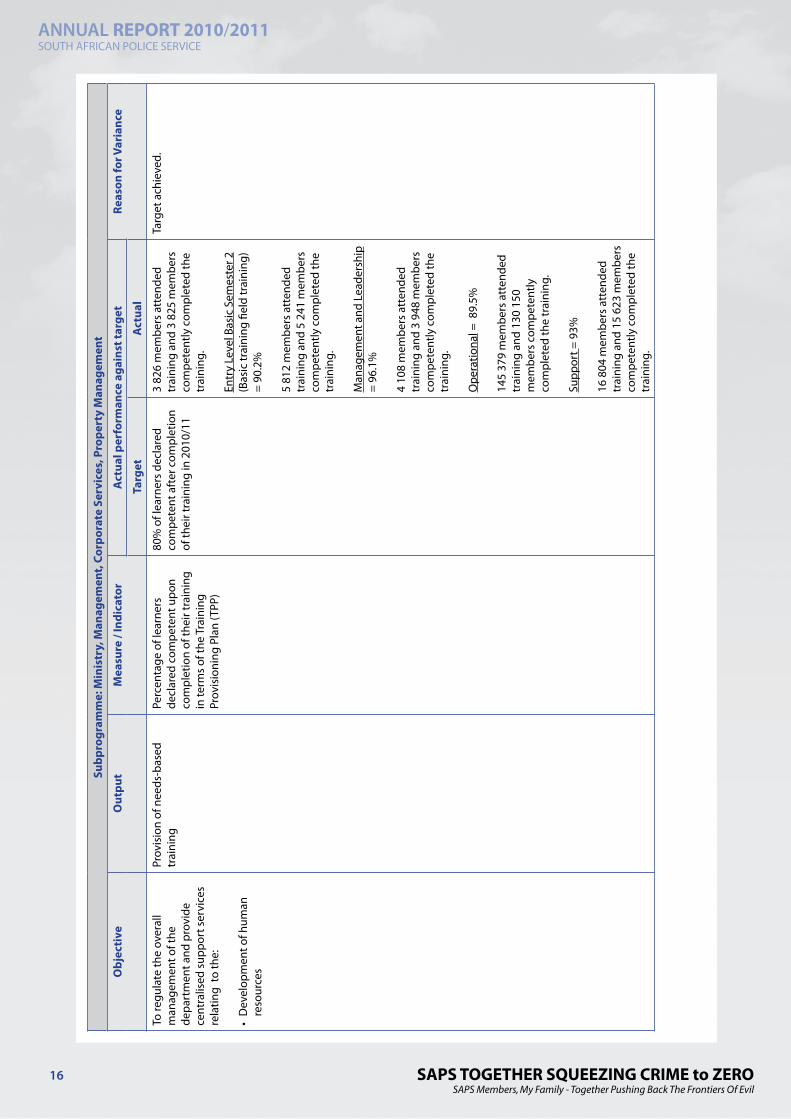
SAPS TOGETHER SQUEEZING CRIME to ZEROSAPS Members, My Family - Together Pushing Back The Frontiers Of Evil
ANNUAL REPORT 2010/2011SOUTH AFRICAN POLICE SERVICE
16
Subp
rogr
amm
e: M
inis
try,
Man
agem
ent,
Corp
orat
e Se
rvic
es, P
rope
rty
Man
agem
ent
Obj
ecti
veO
utpu
tM
easu
re /
Indi
cato
rA
ctua
l per
form
ance
aga
inst
targ
et
Reas
on fo
r Var
ianc
e
Targ
etA
ctua
l
To re
gula
te th
e ov
eral
l m
anag
emen
t of t
he
depa
rtm
ent a
nd p
rovi
de
cent
ralis
ed s
uppo
rt s
ervi
ces
rela
ting
to th
e:
• D
evel
opm
ent o
f hum
an
reso
urce
s
Prov
isio
n of
nee
ds-b
ased
tr
aini
ngPe
rcen
tage
of l
earn
ers
decl
ared
com
pete
nt u
pon
com
plet
ion
of th
eir t
rain
ing
in te
rms
of th
e Tr
aini
ng
Prov
isio
ning
Pla
n (T
PP)
80%
of l
earn
ers
decl
ared
co
mpe
tent
aft
er c
ompl
etio
n of
thei
r tra
inin
g in
201
0/11
3 82
6 m
embe
rs a
tten
ded
trai
ning
and
3 8
25 m
embe
rs
com
pete
ntly
com
plet
ed th
e tr
aini
ng.
Entr
y Le
vel B
asic
Sem
este
r 2
(Bas
ic tr
aini
ng fi
eld
trai
ning
) =
90.2
%
5 81
2 m
embe
rs a
tten
ded
trai
ning
and
5 2
41 m
embe
rs
com
pete
ntly
com
plet
ed th
e tr
aini
ng.
Man
agem
ent a
nd L
eade
rshi
p =
96.1
%
4 10
8 m
embe
rs a
tten
ded
trai
ning
and
3 9
48 m
embe
rs
com
pete
ntly
com
plet
ed th
e tr
aini
ng.
Ope
ratio
nal =
89.
5%
145
379
mem
bers
att
ende
d tr
aini
ng a
nd 1
30 1
50
mem
bers
com
pete
ntly
co
mpl
eted
the
trai
ning
.
Supp
ort =
93%
16 8
04 m
embe
rs a
tten
ded
trai
ning
and
15
623
mem
bers
co
mpe
tent
ly c
ompl
eted
the
trai
ning
.
Targ
et a
chie
ved.

SAPS TOGETHER SQUEEZING CRIME to ZEROSAPS Members, My Family - Together Pushing Back The Frontiers Of Evil
ANNUAL REPORT 2010/2011SOUTH AFRICAN POLICE SERVICE
17
Subp
rogr
amm
e: M
inis
try,
Man
agem
ent,
Corp
orat
e Se
rvic
es, P
rope
rty
Man
agem
ent
Obj
ecti
veO
utpu
tM
easu
re /
Indi
cato
rA
ctua
l per
form
ance
aga
inst
targ
et
Reas
on fo
r Var
ianc
e
Targ
etA
ctua
l
To re
gula
te th
e ov
eral
l m
anag
emen
t of t
he
depa
rtm
ent a
nd p
rovi
de
cent
ralis
ed s
uppo
rt s
ervi
ces
rela
ting
to th
e:
• D
evel
opm
ent o
f hum
an
reso
urce
s
Prov
isio
n of
nee
ds-b
ased
tr
aini
ngPe
rcen
tage
of l
earn
ers
decl
ared
com
pete
nt u
pon
com
plet
ion
of th
eir t
rain
ing
in te
rms
of th
e Tr
aini
ng
Prov
isio
ning
Pla
n (T
PP)
80%
of l
earn
ers
decl
ared
co
mpe
tent
aft
er c
ompl
etio
n of
thei
r tra
inin
g in
201
0/11
Rese
rvis
ts =
86.
7%
2 53
2 m
embe
rs a
tten
ded
trai
ning
and
2 1
95 m
embe
rs
com
pete
ntly
com
plet
ed th
e tr
aini
ng.
To re
gula
te th
e ov
eral
l m
anag
emen
t of t
he
depa
rtm
ent a
nd p
rovi
de
cent
ralis
ed s
uppo
rt s
ervi
ces
rela
ting
to th
e:
• O
ptim
isat
ion
in
mai
ntai
ning
the
bala
nce
betw
een
pers
onne
l and
op
erat
iona
l exp
endi
ture
Retu
rn o
n in
vest
men
tCo
mpe
nsat
ion
expe
nditu
re
vers
us o
pera
tiona
l ex
pend
iture
Mai
ntai
n th
e ex
pend
iture
ra
tio o
f not
mor
e th
an
73/2
7% fo
r com
pens
atio
n/op
erat
iona
l exp
endi
ture
73/2
7%Ta
rget
ach
ieve
d.
To re
gula
te th
e ov
eral
l m
anag
emen
t of t
he
depa
rtm
ent a
nd p
rovi
de
cent
ralis
ed s
uppo
rt s
ervi
ces
rela
ting
to th
e:
• O
ptim
isat
ion
in th
e m
anag
emen
t of p
hysi
cal
reso
urce
s
Man
agem
ent o
f sup
ply
chai
nPe
rcen
tage
of c
apita
l in
vest
men
t, as
set
man
agem
ent a
nd
mai
nten
ance
pla
n co
mpl
eted
100%
bul
let r
esis
tant
ves
ts
plan
ned
for t
o be
dis
trib
uted
105%
(20
372)
bul
let r
esis
tant
ve
sts
wer
e di
strib
uted
in
2010
/11,
incl
udin
g 2
129
inne
rs a
nd o
uter
s to
end
us
ers
to e
nsur
e th
at th
eir
bulle
t res
ista
nt v
ests
are
fu
nctio
nal a
s th
ey w
ere
not
usab
le.
Targ
et a
chie
ved.
Mai
ntai
n/im
prov
e on
the
ratio
of 4
.51:
1 pe
rson
nel t
o ve
hicl
es
Num
ber o
f per
sonn
el:
193
892
Num
ber o
f veh
icle
s: 4
9 28
7Ra
tio o
f per
sonn
el to
veh
icle
s at
the
end
of M
arch
201
1:
3.93
:1
Targ
et n
ot a
chie
ved
due
to
the
fact
that
pre
viou
sly
the
targ
et w
as m
easu
red
agai
nst
activ
e fu
el c
ards
as
per t
he
Tran
sit S
olut
ions
Sys
tem
. Su
bseq
uent
ly, t
he ta
rget
ha
d to
be
mor
e eff
ectiv
ely
mea
sure
d on
the
activ
e ve
hicl
e fle
et a
s pe
r the
Pr
ovis
ioni
ng A
dmin
istr
atio
n Sy
stem
(PA
S).

SAPS TOGETHER SQUEEZING CRIME to ZEROSAPS Members, My Family - Together Pushing Back The Frontiers Of Evil
ANNUAL REPORT 2010/2011SOUTH AFRICAN POLICE SERVICE
18
Subp
rogr
amm
e: M
inis
try,
Man
agem
ent,
Corp
orat
e Se
rvic
es, P
rope
rty
Man
agem
ent
Obj
ecti
veO
utpu
tM
easu
re /
Indi
cato
rA
ctua
l per
form
ance
aga
inst
targ
et
Reas
on fo
r Var
ianc
e
Targ
etA
ctua
l
To re
gula
te th
e ov
eral
l m
anag
emen
t of t
he
depa
rtm
ent a
nd p
rovi
de
cent
ralis
ed s
uppo
rt s
ervi
ces
rela
ting
to th
e:
• O
ptim
isat
ion
in th
e m
anag
emen
t of p
hysi
cal
reso
urce
s.
Man
agem
ent o
f sup
ply
chai
nPe
rcen
tage
of c
apita
l in
vest
men
t, as
set
man
agem
ent a
nd
mai
nten
ance
pla
n co
mpl
eted
Not
less
than
95%
of p
olic
e st
atio
n pr
ojec
ts c
ompl
eted
in
2010
/11
57.5
8% p
olic
e st
atio
n pr
ojec
ts c
ompl
eted
in
2010
/11
(19
from
a to
tal o
f 33
1 pol
ice
faci
litie
s w
ere
com
plet
ed)
6 ne
wly
re-e
stab
lishe
d po
lice
faci
litie
s co
mpl
eted
:•
Kuru
man
LCR
C•
Pien
aar p
olic
e st
atio
n•
Brak
pan
(Tsa
kane
) pol
ice
stat
ion
• Bl
oem
font
ein
1011
1 ce
ntre
• Ka
kam
as p
olic
e st
atio
n•
Haz
yvie
w p
olic
e st
atio
n
4 ne
w p
olic
e fa
cilit
ies
com
plet
ed•
Blue
Dow
ns p
olic
e st
atio
n•
Zam
dela
pol
ice
stat
ion
• G
a M
asem
ola
polic
e st
atio
n•
Beno
ni T
rain
ing
Colle
ge –
Ra
dio
Tech
nica
l Cen
tre
6 re
paire
d an
d up
grad
ed
polic
e fa
cilit
ies
com
plet
ed•
Mou
nt R
oad
polic
e st
atio
n•
Berg
ville
pol
ice
stat
ion
• Ch
atsw
orth
pol
ice
stat
ion
• H
amm
ansk
raal
Tra
inin
g In
stitu
tion
• Ri
ebee
ck W
est p
olic
e st
atio
n•
Hum
ewoo
d po
lice
stat
ion
Targ
et w
as n
ot a
chie
ved
due
to th
e fo
llow
ing
indi
vidu
al p
roje
ct-s
peci
fic
circ
umst
ance
s:
• Re
-adv
ertis
emen
t of B
IDs
• D
elay
ed in
stal
latio
ns o
f am
eniti
es•
Non
-del
iver
y or
po
or p
erfo
rman
ce o
f co
ntra
ctor
s re
sulti
ng in
ch
ange
of c
ontr
acto
rs
durin
g th
e pr
ojec
t cyc
le•
Cont
ract
ors
not o
n sc
hedu
le•
Del
ayed
clo
seou
t of
proj
ects
(Com
plet
ion
Cert
ifica
te Is
sue)
(See
Tab
les
3 an
d 4)
.
1 Nin
e of
the
42 p
olic
e st
atio
ns p
lann
ed fo
r dur
ing
2010
/11
wer
e co
mpl
eted
in p
revi
ous
finan
cial
yea
rs. T
here
fore
, the
rem
aini
ng 3
3 po
lice
stat
ions
wer
e pl
anne
d to
be
com
plet
ed d
urin
g th
e 20
10/1
1 fin
anci
al y
ear.
The
revi
sed
targ
et fo
r 201
0/11
was
: 9 n
ewly
re-e
stab
lishe
d po
lice
faci
litie
s, 7
new
pol
ice
faci
litie
s, 8
repa
ired
and
upgr
aded
pol
ice
faci
litie
s an
d 9
re-e
stab
lishe
d po
lice
faci
litie
s.

SAPS TOGETHER SQUEEZING CRIME to ZEROSAPS Members, My Family - Together Pushing Back The Frontiers Of Evil
ANNUAL REPORT 2010/2011SOUTH AFRICAN POLICE SERVICE
19
Subp
rogr
amm
e: M
inis
try,
Man
agem
ent,
Corp
orat
e Se
rvic
es, P
rope
rty
Man
agem
ent
Obj
ecti
veO
utpu
tM
easu
re /
Indi
cato
rA
ctua
l per
form
ance
aga
inst
targ
et
Reas
on fo
r Var
ianc
e
Targ
etA
ctua
l
To re
gula
te th
e ov
eral
l m
anag
emen
t of t
he
depa
rtm
ent a
nd p
rovi
de
cent
ralis
ed s
uppo
rt s
ervi
ces
rela
ting
to th
e:
• O
ptim
isat
ion
in th
e m
anag
emen
t of p
hysi
cal
reso
urce
s.
Man
agem
ent o
f sup
ply
chai
nPe
rcen
tage
of c
apita
l in
vest
men
t, as
set
man
agem
ent a
nd
mai
nten
ance
pla
n co
mpl
eted
Not
less
than
95%
of p
olic
e st
atio
n pr
ojec
ts c
ompl
eted
in
2010
/11
3 re
-est
ablis
hed
polic
e fa
cilit
ies
com
plet
ed•
Thok
oza
polic
e st
atio
n•
Mbu
zini
pol
ice
stat
ion
• G
iyan
i pol
ice
stat
ion
To re
gula
te th
e ov
eral
l m
anag
emen
t of t
he
depa
rtm
ent a
nd p
rovi
de
cent
ralis
ed s
uppo
rt s
ervi
ces
rela
ting
to th
e:
• D
evel
opm
ent (
with
in
the
SAPS
and
bet
wee
n re
leva
nt d
epar
tmen
ts),
sust
aina
bilit
y an
d im
plem
enta
tion
of
Info
rmat
ion
Syst
ems
and
Info
rmat
ion
and
Com
mun
icat
ions
Te
chno
logy
(IS/
ICT)
• D
evel
opm
ent,
mon
itorin
g an
d im
plem
enta
tion
of
polic
y, a
nd to
mea
sure
th
e eff
ectiv
enes
s an
d effi
cien
cy o
f the
SA
PS
Man
agem
ent o
f IS/
ICT
Perc
enta
ge o
f pla
nned
de
velo
pmen
t (w
ithin
the
SAPS
and
bet
wee
n re
leva
nt
depa
rtm
ents
), su
stai
nabi
lity
and
impl
emen
tatio
n of
sy
stem
s
70%
of I
S/IC
T pr
ojec
ts
com
plet
ed in
201
0/11
An
aver
age
of 7
5.7%
IS/
ICT
proj
ects
com
plet
ed in
20
10/1
1 (s
ee T
able
10)
.
Targ
et a
chie
ved.

SAPS TOGETHER SQUEEZING CRIME to ZEROSAPS Members, My Family - Together Pushing Back The Frontiers Of Evil
ANNUAL REPORT 2010/2011SOUTH AFRICAN POLICE SERVICE
20
Service Delivery Achievements in relation to objectives and performance measures
Labour Relations
➤ Labour Relations is a discipline that encompasses a wide range of issues pertaining to labour relations. In the past, workshops have been undertaken in Divisions and Provinces with the purpose of skilling and priming personnel on the application of HR policies and directives. This approach did not have the desired impact in resolving labour conflict. A more effective method of enhancing the understanding of policies was adopted in 2010. Instead of having the usual workshops, round table discussions were used where participants were given the opportunity to participate in a less formal setting that ensures maximum participation and understanding of a particular topic.
➤ The topics identified for the financial year under review were informed by the challenges the participants experienced within their respective environments with specific reference to the application of the following policies/directives:
➣ Absenteeism/abuse of sick leave in terms of the provisions of National Instruction 2/2004: Leave Management;
➣ Strike handling/ultimatums in terms of section 41 of the SAPS Act and 65(1) of the Labour Relations Act, 66 of 1995
➣ Conditions of service/benefits based on the Basic Conditions of Employment Act, 1997 (Act No. 75 of 1997) and applicable collective agreements including the Sue Albertyn Award on benefits;
➣ Employment equity focusing on the SAPS Equity Plan and Section 21 Report mandated by the Employment Equity Act, 55 of 1998; and
➣ Career development/job descriptions based on the Guidelines on Job Descriptions in SAPS.
➤ An agreement (Agreement 1/2010) was concluded at the SSSBC to regulate the daily allowance payable during the 2010 FIFA World CupTM. The agreement facilitated the payment of the overtime allowance without administrative hitches. A task team comprising of Organised Labour and Management was appointed to ensure that the agreement was implemented correctly. All provinces were visited by the team which explained the contents of the agreement and how disputes emanating from its implementation should be resolved. The team worked tirelessly during the event in order to ensure that the securing of the stadia and world cup events was not disrupted. This was done successfully.
Career Development
➤ Career centres play a vital role in the South African Police Service’s focused recruitment strategy which is aligned to the strategic objectives of the Department and human resource planning guidelines. Career centers for example contributed to the capacitating of the Directorate for Priority Crime Investigation. The Service was marketed as an employer of choice by participating in career expos, exhibitions and fairs as well as visiting schools and tertiary institutions.
➤ In excess of 500 generic job descriptions for all occupational categories and levels were developed, updated, and loaded on the Job Description Dynamic Module System. This included the updating

SAPS TOGETHER SQUEEZING CRIME to ZEROSAPS Members, My Family - Together Pushing Back The Frontiers Of Evil
ANNUAL REPORT 2010/2011SOUTH AFRICAN POLICE SERVICE
21
of job descriptions for top management and alignment to their performance agreements.
Performance Management
➤ Compliance to performance management practices of almost 99% has been achieved for the 2010/11 financial year. The cascading of strategic organisational priorities was facilitated via the provision of generic performance agreements for identified posts, namely: Divisional Commissioners, Provincial Commissioners, Cluster- and Station Commanders. The measurement of performance, aligned to strategic objectives, was further facilitated via customised assessment frameworks for the above-mentioned posts. Amendments were made to Provincial Commissioners’ assessment frameworks to ensure alignment with Outcome 3 of the JCPS Service Delivery Agreement in addition to the priorities reflected in the SAPS Annual Performance Plan.
Human Resources Planning and Utilisation
➤ The Department developed and implemented an Annual HR Plan for the 2010/11 financial year as well as a MTEF HR Plan for the 2010/2014 cycle in accordance with the amended Public Service Regulations; 2008 and the SAPS Employment Regulations; 2010.
➤ The establishment increased from 190 199 as on 31 March 2010 to 193 892 personnel by 31 March 2011. This means that the set target of maintaining at least 95% of the approved establishment was surpassed as 99.3% was achieved.
➤ The Service expanded its human resource capacity by appointing 5 844 new entry level Police Service Act and 1 726 Public Service Act personnel during the 2010/11 financial year. Special emphasis was placed on the expansion of human resource capacity of detectives which increased from 20 291 (as on 30 April 2010) to 22 594 personnel (as on 31 March 2011), an increase of 11%.
➤ As a result of increasing service terminations, the Department also made recommendations for the amendment of the projected losses from 4 500 to 5 000 personnel per annum. This will take effect from the 2011/12 financial year and will be maintained throughout the MTEF cycle to ensure the effective management of attrition in the Department.
➤ A new rank structure has been approved by the Minister of Police which came into operation on 1 April 2010. The introduction of a new rank structure is aimed to realise the department’s objective to become a force in the fight against crime, to facilitate the enhancement of discipline, instilling public confidence and the upliftment of morale within the police ranks. With the new rank structure, two additional rank levels have been introduced, namely Lieutenant and Major which will create additional career opportunities for members.
Recruitment
➤ The South African Police Service is striving to become a career of choice and excellence and therefore, the Recruitment Policy has been amended to ensure focus on quality and not quantity. The policy moves away from a single point decision making authority to the involvement of community structures such as Community Policing Forums, Non-Governmental Organisations, schools, churches, etc., in ensuring quality recruits. The processes are closely monitored by National Head Office which plays an oversight role. All applicants are subjected to the following processes to ensure quality, fairness, objectivity and to prevent corrupt practices in recruitment: a vetting process by Crime Intelligence; verification of qualifications, a more detailed verification process of personal particulars and a thorough reference checking prior to enlistment.

SAPS TOGETHER SQUEEZING CRIME to ZEROSAPS Members, My Family - Together Pushing Back The Frontiers Of Evil
ANNUAL REPORT 2010/2011SOUTH AFRICAN POLICE SERVICE
22
Compensation Management
➤ The SAPS continues to participate in the negotiation process regarding compensatory practices at the Public Service Coordinating Bargaining Council (PSCBC) to ensure that the views of the SAPS are considered and taken into account before structures and practices are implemented.
➤ The SAPS also participates in the negotiations for the annual cost of living adjustments for all salary levels and facilitates the implementation of the said adjustments in the SAPS in accordance with the collective agreement reached in the PSCBC.
➤ Research is currently underway on all matters pertaining to compensatory practices for the SAPS. When finalised, mandates will be obtained and the matter will be consulted/negotiated in the Safety and Security Sectoral Bargaining Council (SSSBC).
➤ Based on PSCBC Resolution 4/2010, the Minister of Police approved the implementation of the following resolutions with effect from 1 July 2010:
➣ An annual general salary adjustment of 7.5% for employees on salary bands A to MMS appointed in terms of the SAPS Act, 1995; and
➣ An increase in the housing allowance from R500 per month to R800 per month.
➤ Based on the determination made by the Minister for Public Service and Administration regarding the increase in the inclusive remuneration packages for Senior Managers, the Minister of Police approved the implementation of a 5% cost of living adjustment for senior managers appointed in terms of the South African Police Service Act, 1995 with effect from 1 January 2011.
Promotions
➤ Due to negotiations in the Safety and Security Sectoral Bargaining Council (SSSBC) on criteria to populate the ranks of Lieutenant and Major, no post promotion process was embarked upon during the 2010/11 financial year. Members promoted, were Constables who were promoted to the rank of Sergeant in terms of the grade progression process in their current posts.
➤ The promotion policy of the SAPS is currently under review and the subject of negotiation in the SSSBC and provides for a promotion to be subject to the successful completion of specific courses that my from time to time be determined by the National Commissioner for a specific post or rank. If a specific course is a requirement for promotion to a specific post, members will have to comply with the requirements before they can be considered for promotion to the post.
Human Resource Development
➤ The Division: Human Resource Development of the SAPS is an accredited Education, Training and Development (ETD) provider with the Safety and Security, Sector Education and Training Authority (SASSETA). Strict adherence to the stringent criteria of the SASSETA ensures the effective and efficient in-house provisioning of value-driven education, training and development in the SAPS with the exponential aim of increasing productivity, enhancing internal functioning, optimising operational functioning and assuring quality policing services to all clients of the community.
➤ Human resources are developed by providing needs-based training, provided in terms of the Training Provisioning Plan (TPP) which consists of the following broad categories:
➣ Entry-level training (basic training for lateral entrants)

SAPS TOGETHER SQUEEZING CRIME to ZEROSAPS Members, My Family - Together Pushing Back The Frontiers Of Evil
ANNUAL REPORT 2010/2011SOUTH AFRICAN POLICE SERVICE
23
➣ Entry-level Basic Semester 1 training (basic training for new recruits)
➣ Entry-level Basic Semester 2 training (basic field training)
➣ Management and Leadership training
➣ Operational training
➣ Support training
➣ Reservist training
➤ During the period under review a cumulative total of 178 870 employees attended either Entry level training, Operational training, Support training, and/or Management and Leadership training interventions and Reservist training. 161 350 or 90.2% learners were found competent upon completion of their training.
Priority Training Provisioning in 2010/11
Detective Training
➤ Introductory courses on the generic skills and knowledge required by detectives.
➣ 1 341 members were trained on Basic Crime Investigative Practice and 1 329 members were declared competent upon completion of their training.
➤ Resolving crime
➣ 355 members were trained and declared competent upon completion of their training.
➤ Specialised course on specific skills and knowledge required by specialised detectives.
➣ 1 628 members were trained and 1 615 were declared competent.
➤ Short interventions to develop the support skills required to enhance the competency of all detectives.
➣ 4 625 members were trained and 4 488 members were declared competent.
Client / Customer Service Development
➤ The courses are intended to the improve service delivery at SAPS-Community contact points e.g. Community Service Centers and 10111 Call Centers.
➣ 2 601 members were trained and 2 560 members were declared competent.
Victim Support
➤ The courses are intended to enhance the skills of SAPS employees to effectively support victims of crime.
➣ 3 764 members were trained and 3 739 members were declared competent.

SAPS TOGETHER SQUEEZING CRIME to ZEROSAPS Members, My Family - Together Pushing Back The Frontiers Of Evil
ANNUAL REPORT 2010/2011SOUTH AFRICAN POLICE SERVICE
24
Violence against Women & Children
➤ The courses are intended to enhance the skills of SAPS employees to effectively deal with violence against women and children.
➣ 22 403 members were trained and 22 312 members were declared competent.
Special Development Projects
Tactical Response Team Development
➤ These courses provide the required skills to members of the Tactical Response Teams. The training program consists of 3 modules namely the Rural Phase, Weapons Phase and the Urban Phase.
➣ 170 members were trained and declared competent.
Development of Station Commanders
➤ The Station Management Learning Programme provides the knowledge and skills required by Station Commanders to effectively manage a police station. Courses in generic computer programs and the key SAPS computer systems were also provided to empower Station Commanders to effectively utilise these tools.
➣ 1 183 members were trained and 1 180 members were declared competent.
K53 Driver Training
➤ These courses are presented to ensure that all required SAPS employees are in possession of a valid drivers license.
➣ 3 139 members were trained and 2 646 members were declared competent.
Emergency Care Development
➤ The purpose of these courses is to equip SAPS employees with the knowledge and skills to provide adequate medical care and assistance within their scope of application, when required.
➣ 746 members were trained and 708 members were declared competent.
Management and Leadership Development Programmes
➤ These include the Executive National Security Programme, the Middle Management Learning Programme, the Basic Management Learning Programme, the Junior Management Learning Programme and the Executive Development Institutional Phase.
➣ 4 108 members were trained and 3 948 members were declared competent.
International Training Support
➤ The SAPS as a member of the Southern African Regional Police Chiefs Cooperation Organisation (SARPCCO) has provided training courses to 72 members (28 from other countries and 44 from South Africa). These training courses include: the Small Arms and Light Weapons course, the Regional Detective course, the Drug Trafficking and Identification of Chemical Equipment course, the Command/Leadership course for Senior Police Women, a Stock Theft Investigators course, a

SAPS TOGETHER SQUEEZING CRIME to ZEROSAPS Members, My Family - Together Pushing Back The Frontiers Of Evil
ANNUAL REPORT 2010/2011SOUTH AFRICAN POLICE SERVICE
25
Crime Intelligence Gathering Train the Trainer course and a Crime Intelligence Analysis Training course.
➤ 63 SAPS members attended international training in the USA, India, Korea and Malaysia which included interventions such as Crisis Response Team, Handling of Citation Sovereign (Pilot course for Aircraft), and Disaster Risk Management.
➤ The SAPS, in collaboration with the Canada Pearson Peacekeeping Centre, held a Gender Conference on Women in Peacekeeping to discuss experiences and challenges of women whilst on Peacekeeping missions.
➤ As part of this initiative, 147 SAPS members were trained on French training interventions including Police Management and Leadership Training, Joint Peacekeeping Training, Language course in French and Operational Intervention.
Skills Development Projects (funded by the SAPS and the SASSETA)
➤ To alleviate illiteracy in the SAPS, 1 307 learners were enrolled in the Adult Basic Education and Training (ABET) programme.
➤ 150 learners received the National Certificate: Public Administration (NQF 3 and 4).
➤ 422 members were successful in four learnerships i.e. Public Sector Accounting, Information Technology and Public Administration and the National Certificate: Policing (NQF 5) Recognition of Prior Learning.
Basic Police Development
Entry Level Training (Lateral Entrants in the SAPS)
➤ 409 personnel that were appointed laterally into the SAPS were trained on Entry Level Training and 368 were declared competent.
Entry Level Basic Semester 1 (Basic Training for new recruits/intake)
➤ 3 825 trainees who completed the Basic Training Learning programme were declared competent in the learning areas of Orientation to the SAPS, Law, Community Service Center, Crime Investigation, Crime Prevention and Street Survival.
Entry Level Basic Semester 2 (Basic Training - Field Training)
➤ 5 812 trainees completed the Basic Training Semester 2 Learning Programme and 5 241 were declared competent after completion of their training.
➤ In addition, 100 members were trained in the Basic Training Forensic Science Learnership and 252 were trained in the new Basic Training Resolving of Crime and found competent.
SAPS TOGETHER SQUEEZING CRIME to ZEROSAPS Members, My Family - Together Pushing Back The Frontiers Of Evil
ANNUAL REPORT 2010/2011SOUTH AFRICAN POLICE SERVICE
26
Reservist Development
These courses are intended to enhance the skills of SAPS reservists to effectively perform their policing functions.
2 532 members were trained and 2 195 members were declared competent.
Corruption and fraud prevention
➤ The SAPS has revised its Anti-corruption Strategy to ensure compliance in terms of the Minimum Anti-corruption Capacity requirements (MACC) as approved by Cabinet. This revision was conducted in response to an audit of the extent of compliance with the MACC as conducted by the Department of Public Service and Administration in 2009/10. The SAPS was assessed as being 69% compliant with the MACC.
➤ In order to ensure effective implementation of the Strategy, the SAPS has implemented the following:
➣ Specific Anti-corruption Action Plans were implemented at divisional, provincial and station levels.
➣ An Anti-corruption Sensitisation Programme was developed by the SAPS which focused on sensitising and educating SAPS members and the public on the nature, causes and consequences of corruption. Divisions and provinces initiated the roll-out of the Sensitisation Programme during the last quarter of 2010/11, with station-level personnel being the focus of the Programme.
➣ An Integrity Management Framework which functions as a key element of the prevention pillar within the Anti-corruption Strategy has been developed and implemented. It focuses on improving levels of professionalism and integrity in the SAPS, increasing levels of direct managerial support to members, ensuring the necessary corruption-reporting policies are in place, e.g. the Whistle-blowing Policy and establishing an anti-corruption training programme within the SAPS to augment the Sensitisation Programme.
➤ 476 members were charged for inter alia corruption, defeating the ends of justice, fraud, aiding and abetting an escapee, bribery and extortion in terms of the department’s disciplinary regulations, and in terms of the Prevention and Combating of Corrupt Activities Act, 2004 (Act No. 12 of 2004). 263 members were suspended: 215 without salary and 48 with salary. 213 members were not suspended. 479 corruption charges were brought against members (three members were charged for more than one crime).
Risk management
➤ The SAPS revised its Risk Management Strategy for implementation during 2011/12 to ensure compliance with the revised Public Sector Risk Management Framework and the risk management recommendations made in the King III Report on Corporate Governance. As a result:
➣ a revised national instruction on risk management was developed in consultation with all provinces, divisions and national components and is in the process of being finalised for promulgation.
➣ A National Strategic Risk Register for the SAPS was completed and approved by the National Commissioner. Key Risk Indicators (KRIs) were developed as well as an information process

SAPS TOGETHER SQUEEZING CRIME to ZEROSAPS Members, My Family - Together Pushing Back The Frontiers Of Evil
ANNUAL REPORT 2010/2011SOUTH AFRICAN POLICE SERVICE
27
flow, for all strategic risks.
➣ Four comprehensive in-service skills development sessions were held, during which the Risk Management manual was piloted. These sessions were attended by 84 members from provinces, divisions, national components and stations.
➣ Two National Risk Committee (NRC) meetings were conducted during the reporting period to ensure implementation, monitoring and evaluation of the risk management process.

SAPS TOGETHER SQUEEZING CRIME to ZEROSAPS Members, My Family - Together Pushing Back The Frontiers Of Evil
ANNUAL REPORT 2010/2011SOUTH AFRICAN POLICE SERVICE
28
Info
rmat
ion
Syst
ems
and
Info
rmat
ion
and
Com
mun
icat
ion
Tech
nolo
gy (I
S/IC
T)
To e
nsur
e th
e de
velo
pmen
t, su
stai
nabi
lity
and
impl
emen
tatio
n of
the
Info
rmat
ion
Syst
ems a
nd In
form
atio
n an
d Co
mm
unic
atio
n Te
chno
logy
(IS/
ICT)
Pla
n, th
e SA
PS c
ompl
eted
an
aver
age
of 7
5.7%
info
rmat
ion
and
tech
nolo
gica
l pro
ject
s du
ring
the
perio
d un
der r
evie
w. T
able
10
prov
ides
an
over
view
on
the
prog
ress
of
Info
rmat
ion
Tech
nolo
gy p
roje
cts
in 2
010/
11.
Tabl
e 10
: Inf
orm
atio
n Te
chno
logy
pro
ject
s
Proj
ect
Resu
lts
Impr
ovem
ents
Targ
etA
ctua
l %
com
plet
edBe
nefit
s
Inve
stig
ate
Case
Doc
ket
Man
agem
ent
Esta
blis
hed
Inte
grat
ed C
ase
Man
agem
ent
Capa
bilit
ies;
• A
n im
prov
ed a
nd in
tegr
ated
abi
lity
for
cont
rolli
ng a
cces
s to
the
auto
mat
ed
man
agem
ent o
f rep
orte
d cr
imin
al c
ases
w
as d
esig
ned
• D
igita
l for
ms
wer
e de
sign
ed fo
r use
on
mob
ile d
evic
es b
y de
tect
ives
• Au
tom
ated
em
ail a
nd S
MS
abili
ties
wer
e de
sign
ed to
com
mun
icat
e th
e st
atus
of
crim
inal
cas
es to
the
citiz
en w
ho re
port
ed
it•
A s
ecur
ity fr
amew
ork
was
est
ablis
hed
to
guid
e th
e m
anag
emen
t, es
tabl
ishm
ent
and
mai
nten
ance
of S
APS
info
rmat
ion
secu
rity
asse
ts
• Q
uick
er a
cces
s•
Bett
er s
ecur
ity a
cces
s co
ntro
l•
Easi
er re
port
ing
of c
rimin
al c
ases
• Q
uick
er a
dmin
istr
atio
n of
repo
rted
cr
imin
al c
ases
• Ea
sier
com
mun
icat
ion
• Q
uick
er c
omm
unic
atio
n•
Low
er c
omm
unic
atio
n co
sts
• Cl
ear i
nfor
mat
ion
secu
rity
dire
ctio
n an
d gu
idan
ce•
Cons
iste
nt in
form
atio
n se
curit
y st
anda
rds
• Co
mpa
tible
sec
urity
tech
nolo
gies
70%
70%
• In
crea
sed
effici
ency
•
Incr
ease
d in
form
atio
n co
nfide
ntia
lity
• In
crea
sed
citiz
en c
onve
nien
ce•
Incr
ease
d pr
oduc
tivity
• In
crea
sed
tran
spar
ency
• In
crea
sed
citiz
en tr
ust
• In
crea
sed
info
rmat
ion
confi
dent
ialit
y•
Incr
ease
d in
form
atio
n in
tegr
ity•
Incr
ease
d in
form
atio
n av
aila
bilit
y
Crim
inal
Jus
tice
Syst
em
Info
rmat
ion
Shar
ing
An
auto
mat
ed a
bilit
y to
pro
vide
SA
PS
info
rmat
ion
to th
e re
st o
f the
Crim
inal
Just
ice
Syst
em w
as e
stab
lishe
d
• M
ore
conv
enie
nt a
cces
s to
in
form
atio
n•
Easi
er a
cces
s to
info
rmat
ion
• Q
uick
er a
cces
s to
info
rmat
ion
• Lo
wer
info
rmat
ion
gath
erin
g co
sts
70%
90%
• In
crea
sed
info
rmat
ion
shar
ing
• In
crea
sed
info
rmat
ion
avai
labi
lity
• In
crea
sed
info
rmat
ion
utili
satio
n
Crim
inal
Just
ice
Syst
em P
erfo
rman
ce
Man
agem
ent
The
infr
astr
uctu
re fo
r sto
ring
Crim
inal
Ju
stic
e Sy
stem
per
form
ance
indi
cato
rs w
as
esta
blis
hed
• M
ore
perf
orm
ance
info
rmat
ion
• Ea
sier
per
form
ance
mea
sure
men
ts•
Qui
cker
per
form
ance
m
easu
rem
ents
• Q
uick
er d
etec
tion
of w
eak
perf
orm
ance
s
70%
90%
• In
crea
sed
perf
orm
ance
ac
coun
tabi
lity
• In
crea
sed
perf
orm
ance
tr
ansp
aren
cy•
Cont
inua
l per
form
ance
im
prov
emen
ts

SAPS TOGETHER SQUEEZING CRIME to ZEROSAPS Members, My Family - Together Pushing Back The Frontiers Of Evil
ANNUAL REPORT 2010/2011SOUTH AFRICAN POLICE SERVICE
29
Proj
ect
Resu
lts
Impr
ovem
ents
Targ
etA
ctua
l %
com
plet
edBe
nefit
s
Corr
uptio
n Pe
rpet
rato
r In
form
atio
nPr
ogre
ss w
as m
ade
tow
ards
est
ablis
hing
an
aut
omat
ed c
apab
ility
that
will
pro
vide
in
form
atio
n fr
om th
e SA
PS c
rime
repo
rtin
g sy
stem
(CA
S) o
n th
e in
volv
emen
t of
depa
rtm
enta
l per
petr
ator
s in
cor
rupt
ion
acro
ss th
e Cr
imin
al Ju
stic
e Sy
stem
• Q
uick
er d
etec
tion
of in
tern
al
corr
uptio
n•
Bett
er c
orru
ptio
n ris
k re
spon
ses
• M
ore
corr
uptio
n in
tern
al c
ontr
ols
• Be
tter
com
batin
g of
inte
rnal
co
rrup
tion
70%
70%
• In
crea
sed
effec
tiven
ess
in
com
batin
g co
rrup
tion
• Im
prov
ed s
ervi
ce d
eliv
ery
• In
crea
sed
inte
grity
• In
crea
sed
citiz
en tr
ust
Crim
e Vi
ctim
s In
form
atio
nA
n au
tom
ated
cap
abili
ty to
pro
vide
vic
tims
of c
rime
info
rmat
ion
from
the
SAPS
crim
e re
port
ing
syst
em (C
AS)
was
com
plet
ed
and
are
in th
e fin
al te
stin
g ph
ase
befo
re
oper
atio
nalis
atio
n
• Be
tter
und
erst
andi
ng o
f vic
tims
of
crim
e•
Bett
er v
ictim
sup
port
• Fa
ster
vic
tim s
uppo
rt
70%
70%
• Im
prov
ed s
ervi
ce d
eliv
ery
• In
crea
sed
citiz
en s
atis
fact
ion
• In
crea
sed
citiz
en tr
ust
Iden
tity
Thef
t In
form
atio
nA
n au
tom
ated
cap
abili
ty to
pro
vide
in
form
atio
n fr
om th
e SA
PS c
rime
repo
rtin
g sy
stem
(CA
S) o
n ca
ses
whe
re id
entit
y th
eft
was
invo
lved
, was
com
plet
ed a
nd a
re in
the
final
test
ing
phas
e be
fore
ope
ratio
nalis
atio
n
• Be
tter
und
erst
andi
ng o
f ide
ntity
th
eft
• Q
uick
er d
etec
tion
of id
entit
y th
eft
• Be
tter
com
batin
g of
iden
tity
thef
t
70%
70%
• In
crea
sed
effec
tiven
ess
in
com
batin
g id
entit
y th
eft
• Im
prov
ed s
ervi
ce d
eliv
ery
• In
crea
sed
citiz
en tr
ust
Cybe
r-Cr
ime
Info
rmat
ion
An
auto
mat
ed c
apab
ility
to p
rovi
de
info
rmat
ion
from
the
SAPS
crim
e re
port
ing
syst
em (C
AS)
on
cybe
r-cr
ime
was
com
plet
ed
and
are
in th
e fin
al te
stin
g ph
ase
befo
re
oper
atio
nalis
atio
n
• Be
tter
und
erst
andi
ng o
f cy
ber-
crim
e•
Qui
cker
det
ectio
n of
cyb
er-c
rime
• Be
tter
com
batin
g of
cyb
er-c
rime
70%
70%
• In
crea
sed
effec
tiven
ess
in
com
batin
g cy
ber-
crim
e•
Impr
oved
ser
vice
del
iver
y•
Incr
ease
d ci
tizen
trus
t

SAPS TOGETHER SQUEEZING CRIME to ZEROSAPS Members, My Family - Together Pushing Back The Frontiers Of Evil
ANNUAL REPORT 2010/2011SOUTH AFRICAN POLICE SERVICE
30
The Civilian Secretariat for Police
Introduction
The Civilian Secretariat for Police derives its mandate from Section 208 of the Constitution which requires the Minister of Police to establish a Police Civilian Secretariat which operates directly under the Minister’s direction and authority.
Historically, the Civilian Secretariat has been governed by the SAPS Act, 1995. However, during the 2010/11 financial year new legislation, the Civilian Secretariat for Police Bill, was developed and passed by Parliament in order to ensure that the Civilian Secretariat for Police operates under separate legislation. This legislation was initiated following a decision by the Minister of Police to strengthen civilian oversight over the police. A policy document was subsequently developed during the 2009/10 financial year to guide this process culminating in the drafting of the legislation.
The new legislation structures the Civilian Secretariat for Police to function directly under the authority of the Minister of Police without any impediments that may affect its mandate. In terms of this Act, the Civilian Secretariat for Police will become a designated department and the Secretary for Police will serve as the Accounting Officer.
The objects of the Bill are the following:
(a) To provide for the establishment of a single Civilian Secretariat for the police service in the Republic;
(b) To define the objects, functions and powers of the Secretariat;
(c) To align the operations of the Secretariat at the national and provincial spheres of government and reorganise the Secretariat into an effective and efficient organ of state;
(d) To assist the Minister in fulfilling his/her constitutional obligations and to work under the authority and direction of the Minister;
(e) To provide the Minister with policy advice and support to further the government’s strategic policy vision and the Minister’s constitutional responsibility to determine national policing policy;
(f ) To develop effective policies, strategies and partnerships (such as community policing fora);
(g) To regulate the appointment, duties and functions, powers and the removal from office of the Secretary for the police and the heads of provincial secretariats;
(h) To provide for the establishment of a Senior Management Forum and Ministerial Executive Committee;
(i) To provide for co-operation with the Independent Police Investigative Directorate;
(j) To provide for intervention into the affairs of provincial secretariats by the Civilian Secretariat;
(k) To provide for transitional arrangements and other matters.

SAPS TOGETHER SQUEEZING CRIME to ZEROSAPS Members, My Family - Together Pushing Back The Frontiers Of Evil
ANNUAL REPORT 2010/2011SOUTH AFRICAN POLICE SERVICE
31
Service Delivery Achievements
Report of The Secretary for Police
During the 2009/10 financial year the Civilian Secretariat for Police established three functional units which focused on: Policy and Research, Monitoring and Evaluation and Partnerships. Three Chief Directors were appointed to head up each of the respective units.
At the beginning of the 2010/11 financial year the Civilian Secretariat for Police submitted a Strategic Plan, an Annual Performance Plan (APP) and budget. The agreement with the Portfolio Committee on Police was that the Strategic Plan would cover a one-year period because of the institutional and organisation reforms occurring within the Secretariat. The Secretariat did not submit the APP using the approved format but rather a draft set of programmes and activities that would occur during the 2010/11 financial year. As a result, while the report submitted to Parliament at the beginning of 2010/11 has been used to present the performance of the Civilian Secretariat there are some activities which did not have measurable targets linked to the programme or activity. During the 2010/11 financial year two of the three units functioned effectively. However, the Monitoring and Evaluation Unit did not perform at the initially anticipated levels as it experienced problems regarding both leadership and staff capacity. As a means to ensure that this unit functions optimally and is well capacitated, a new Chief Director was appointed as a replacement, together with five additional staff members during January 2011.
➤ Legislation: The Civilian Secretariat for Police assisted and facilitated three pieces of legislation that were finalised during the 2010/11 reporting period. These include:
➣ Finalisation of the Civilian Secretariat for Police Bill, which included not only processing the Bill for Parliament but also presentations made in nine provinces during the debating of this Bill. The process also involved meetings with NGOs who had raised concerns during the Parliamentary debate in order to address these concerns prior to the adoption of the Bill by Parliament. The Bill has now been signed off by the President and will be enacted by the end of July 2011.
➣ Assisting with the processing of the Independent Police Investigative Directorate Bill.
➣ Finalising regulations for the Firearms Control Amendment Act and the enactment of certain provisions of this Amendment Act.
In addition to the above, the Civilian Secretariat for Police also engaged with the Private Security Regulatory Authority (PSIRA) regarding the finalisation of the Private Security Training Regulations. The public comments on these regulations have been collated and forwarded to PSIRA for processing and to ensure that they are ready for promulgation.
The Civilian Secretariat for Police has also conducted consultations with PSIRA regarding the review of the PSIRA Act. Based on this engagement, the resolution was that the revised PSIRA Bill should be presented to Parliament as part of the 2011/12 legislative programme.
➤ Restructuring of the Secretariat: The Civilian Secretariat, based on the work done by Delloitte and Touche during the 2009/10 financial year, held consultations with the Department of Public Service and Administration (DPSA) to finalise the organisational structure and to ensure that the structure is aligned to the new legislation passed by Parliament. This was followed by the job evaluation process in order to ensure the levels on the structure were appropriate and in line with DPSA requirements. The final structure with job levels was approved and signed off by the DPSA and the Secretariat in December 2010 and is now ready for submission to the Minister. This new structure

SAPS TOGETHER SQUEEZING CRIME to ZEROSAPS Members, My Family - Together Pushing Back The Frontiers Of Evil
ANNUAL REPORT 2010/2011SOUTH AFRICAN POLICE SERVICE
32
will be implemented over a two year period starting in 2011/12.
➤ Civilian Secretariat for Police Website: The new website for the Civilian Secretariat for Police has been developed in line with the reorganised structure and the new legislation. This website will be launched subsequent to the enactment of the Bill.
➤ Communication Strategy: A new communication strategy has been developed and is aligned with the new legislation.
➤ Strategic Plan and APP: During 2010/11 the Civilian Secretariat for Police arranged with Parliament
to develop its five year Strategic Plan and APP for 2011/12. These were presented to parliament at the end of the 2010/11 financial year for approval. In developing these, in line with National Treasury prescripts, the Secretariat will now be able to monitor and account for its performance in a better way.
➤ Performance Management Programme: In addition to the development of a Strategic Plan and APP for the 2011/12 financial year, the Secretariat has also placed significant emphasis on the development of effective performance measures for staff. All staff performance agreements have been thoroughly reviewed and are now aligned with the DPSA requirements. Workshops have also been held to train staff in both the development and management of these performance measures.
➤ Alignment with Provinces: Quarterly meetings are now being held with the Heads of Department (HODs) of Provincial Departments of Safety and Liaison. In addition to these meetings, two workshops have been conducted with HODs to discuss the alignment of sector APPs and the implementation of the Secretariat legislation.
The provinces are expected to establish Provincial Secretariats within 18 months of the enactment of the legislation. Currently, only two provinces have functioning Provincial Secretariats and, as a result, the forums between the Civilian Secretariat and the Provincial Secretariat will only be fully functional after the enactment of the Civilian Secretariat for Police Bill.
➤ ICD engagement: The Civilian Secretariat for Police and the ICD held two workshops to discuss the implications of the two new pieces of legislation and to structure the engagements between the two organisations. Arising from these workshops, a task team comprising of the Civilian Secretariat for Police, the ICD and representatives of two Provincial Secretariats, has been established to address all matters relating to the ICD and Secretariat engagements and co-operation.
➤ Budget: The Secretariat has attempted to put in place stricter financial accounting and supply chain
management processes. The monitoring of the budget has been done on a monthly basis. The Secretariat has also held meetings with SAPS Supply Chain Management and Finance to identify possible weakness in the manner with which these areas are being handled. One of the weaknesses identified was the inadequate capacity of the existing supply chain and finance personnel in the Secretariat. To address this challenge, four new staff members have been appointed. Further appointments will be made after the finalisation of the Secretariat structure to ensure these two sections are urgently and appropriately capacitated.
The Secretary for Police is also currently engaging with SAPS regarding a shared services agreement. In addition, meetings are being held with newly established government departments to identify lessons that can be learnt regarding their financial and supply chain management.
During the 2010/11 financial year the Secretariat has under spent by R4 299 million in its operational cost while it overspent on personnel by R1 824 million. The under expenditure on operational costs can be attributed to two factors. Firstly an amount of R1 million was budgeted for the Victims of Crime Survey. However, it was subsequently agreed by government that this survey should be

SAPS TOGETHER SQUEEZING CRIME to ZEROSAPS Members, My Family - Together Pushing Back The Frontiers Of Evil
ANNUAL REPORT 2010/2011SOUTH AFRICAN POLICE SERVICE
33
conducted by Statistics SA and be financed through donor funding. The second factor relates to the inability by SITA to implement the automated monitoring tool within the 2010/11 financial year.
The over expenditure on personnel related to new appointments made during the 2010/11 financial year. It should be noted that these appointments are all aligned to the new organisational structure that is being finalised between the Secretariat and DPSA.
➤ Special projects: During the period under review four special projects were undertaken based on
instructions of the Minister. These included:
➣ Finalising the criminal audit of SAPS members
➣ The review of SAPS forensic laboratories
➣ The review of missing dockets
➣ Firearms amnesty (which took place over both the 2009/10 and the 2010/11 financial years)
➤ Support to the Minister: The Office of the Secretary for Police has played the following support role with regard to the Minister of Police;
➣ Assisting with international engagements including, the facilitation of an Inter Ministerial SARPCCO meeting, review of 3 international agreements and providing technical support for the Minister’s international engagements. It should be noted that a policy position on international engagement has been developed for incorporation into the White Paper review process.
➣ Administrative support provided to the Ministry of Police
➣ 25 briefing documents supplied to the Minister
➣ Two policy documents submitted to the Minister
➣ Facilitation of quarterly MinMEC Meetings
Chief Directorate: Policy And Research
During the year under review the policy and research unit component operated with a staff compliment of only 8 members under leadership of a Chief Director. These members include two directors, two deputy directors, one assistant director and two administrative assistants. The situation indicates clearly that capacity remains a challenge in delivering on the mandate.
Activities for the year under review include:
➤ State of Policing: The unit facilitated the development of Terms of Reference (ToRs) with the Reference Group to inform the research project. These Terms of Reference were accepted and adopted. However, the roll-out of the actual research project was postponed to the 2011/12 financial year. This change was to accommodate the need for the unit to rather focus on the White Paper as a priority over the State of Policing project as the review of the White Paper was initially not planned for the 2010/11 financial year. The project on the State of Policing will be revived during the new financial year after the TORs have been reviewed.
➤ Victims Perception Survey: The Secretariat initially planned to commission a survey to assess the perceptions of victims in order to draw some comparison with the annual crime statistics. However,
SAPS TOGETHER SQUEEZING CRIME to ZEROSAPS Members, My Family - Together Pushing Back The Frontiers Of Evil
ANNUAL REPORT 2010/2011SOUTH AFRICAN POLICE SERVICE
34
the JCPS cluster agreed that the survey will be conducted through Statistics South Africa. As a result, the Victims Perceptions Survey Terms of Reference that were developed by the Policy and Research Unit were later incorporated into the StatsSA project brief. The Policy and Research Unit sat on the reference group for the StatsSA survey and also accompanied StatsSA on an international study trip to determine best practice on how victim surveys are conducted in other countries. The actual survey (collation of data) was completed during March 2011 and the data processing process has commenced. It is envisaged that the final report will be released during September/October 2011.
➤ Sector Policing Review: Literature review on the Sector Policing Policy has been conducted and a draft report has been developed. Further deliberations were dependent on interactions with SAPS to finalise. SAPS also decided to undertake an internal exercise and the Civilian Secretariat is currently aligning the study done with SAPS internal survey. The final draft of the research will be ready for presentation by the end of July 2011.
➤ Metro Police Policy: The Metro Police policy has been developed and submitted to the Minister for final inputs and approval. Subsequently, the next phase of implementation which entails the physical integration process will commence.
➤ Central Firearms Registry: An investigation was commissioned into problems experienced by the CFR to identify the cause of backlogs and other issues which impacted on its effectiveness and functionality. The investigation was completed and certain recommendations identified. Some of these recommendations have already been implemented and regular assessment shows that there is some improvement in clearing the backlogs.
➤ Community Safety Forums Policy: A draft Community Safety Forum (CSF) policy has been developed and, after consultation with some of the role-players, was presented to the Development Committee (DEVCOMM) and finally to the Justice, Crime Prevention and Security (JCPS) DGs Cluster. After certain observations, comments and inputs by the JCPS DGs Cluster, the draft policy will be re-tabled for recommendation and approval by the same forum. The Partnership Unit will assist with the development of an implementation plan and the actual roll-out.
➤ Cash-in-Transit (CIT) Regulations: Two workshops were conducted with the Government State Law Advisors towards strengthening the regulating process (regulations). Business against Crime South Africa (BACSA) has been involved in this process. Although it was anticipated that stand-alone regulations would be developed and incorporated in line with various sections of the Private Security Industry Regulatory Authority (PSIRA) Act, the process decided that the regulations should be incorporated into the new PSIRA legislation which is not finalised. The regulations have been developed and will be incorporated into the new PSIRA Act. A set of minimum standards have also been developed as a best practice pending the finalisation of the regulation and are being implemented in the interim by 60% of CIT companies.
➤ Reservist Policy: Literature review was conducted on the current Reservist dispensation in the police which included an analysis of the existing National Instruction and a draft report was compiled. Further deliberations failed when the SAPS started its own review of the National Instruction which culminated in a draft that was submitted to the National Commissioner for approval. The Secretariat was excluded from these deliberations and did not get any further assistance from the SAPS nor was it privy to information. The Reservist Policy will now be incorporated into the White Paper and the SAPS may need to review their standing orders based on this White Paper.
➤ Child Justice Act Regulations: The Policy unit initiated and facilitated the development of a National instruction to meet the requirements of the the Child Justice Act (CJA). This National Instruction was completed and eventually adopted and published.
➤ Directorate for Priority Crime Investigations Policy: The Directorate for Priority Crimes
SAPS TOGETHER SQUEEZING CRIME to ZEROSAPS Members, My Family - Together Pushing Back The Frontiers Of Evil
ANNUAL REPORT 2010/2011SOUTH AFRICAN POLICE SERVICE
35
Investigation (DPCI) draft policy has been developed and is currently awaiting comments and approval from the Ministerial Committee.
➤ The Review of the White Paper for Safety and Security: Although this topic was introduced late during the financial year, literature review has been conducted and a draft work plan for the White Paper has been developed. The White Paper draft will be ready for consultation by the end of June 2011.
➤ Police Station Boundaries: Initial meetings took place with the SAPS and the Department of Justice to establish initiatives undertaken and progress on the processes. Valuable information has been collected and captured into a draft discussion document which is currently being finalised for tabling during the first quarter of the new financial year. This project was also introduced later during the review period.
➤ Policy Guidelines for Regulating the Private Security Industry: During the period under review further research was conducted around the Private Security Industry Regulatory Authority (PRISA). This included a relook at the international comparison and bench-marking. This process was aimed at strengthening the initial research. The policy review of PSIRA was presented to the Minister.
➤ Establishment of the Resource Centre: A resource centre has been established which serves as an information hub to the line function personnel and to enhance and ensure timeous and evidence based research. The centre has secured numerous reports and articles and intends to become the repository of information on safety and security and crime prevention projects information, including information from provinces. Electronic equipment that will ensure efficiency has been approved for procurement. Deliberations are still pursued in building electronic links with other libraries such as those of the SAPS and Parliament.
➤ Policy Reference Group: The Policy and Research reference group has been established and had its first meeting in Cape Town. An MOU has been concluded and signed by all members. The reference group involves both academics and civil society role players who can assist the Secretariat in developing the policy and research component of the Secretariat. The terms of reference for the group include:
➣ To advise on relevant theoretical and methodological frameworks and support to the Secretariat regarding crime prevention and effective policing strategies.
➣ To help the Secretariat keep abreast of international and local policing developments, best practices and innovations.
➣ To advise on the design of effective policy strategies, policing models and to help identify relevant partnerships for the Secretariat and the police.
➣ To advise on the latest relevant research reports, data analysis methodologies and research models. Members have been included in the reference group who are experts in their field and can provide the required academic, theoretical and practical support to the Secretariat.
➤ Crime Statistics: The unit also worked with the SAPS on the release of the annual crime statistics. Flowing from this meeting the unit is now working with SAPS on a review of how crime statistics are utilised and captured. This review will be finalised in 2011/12 financial year. As part of this review process two members of the unit were part of a study tour to the UK and Geneva to assess how crime statistics are utilised in other countries.
➤ Reports for Minister: The unit was also involved in preparing reports for the Minister for use during
international engagements and during visits to specific communities. Five such reports were
SAPS TOGETHER SQUEEZING CRIME to ZEROSAPS Members, My Family - Together Pushing Back The Frontiers Of Evil
ANNUAL REPORT 2010/2011SOUTH AFRICAN POLICE SERVICE
36
prepared by the unit.
➤ Conferences and papers: The unit prepared a presentation for the Secretary of Police that was presented to the Institute for Security Studies Conference in November 2010. This paper was subsequently published as part of the conference papers. The Unit has also prepared two articles that will be published in a journal focusing on civilian oversight. These articles will be published as part of the Acta Criminologica Journal’s Supplementary Volume to be published in 2011.
Chief Directorate: Partnership
During the year under review, the Unit undertook various programmes with different stakeholders with a view to: i. Deepening social dialogue on crime prevention and the safety of communities;
ii. Engaging communities on strategies aimed at enhancing rural safety and combating small business robberies;
iii. Tap into the collective wisdom of stakeholders to enhance existing crime prevention programmes and seek innovative and creative approaches;
iv. Improving intergovernmental partnerships in the fight against crime.
➤ Community Outreach: Public participation meetings were held with communities. These meetings assisted the Ministry to gain first-hand knowledge of the circumstances under which communities live. Areas where there is concerted engagement include Nyanga, Umlazi, Matatiele, Escourt and Vryheid.
There were also engagements with communities on criminal violence directed at foreign nationals. This work was undertaken in partnership with faith based organisations, other governance institutions and various organisations representing foreign nationals.
➤ Public Private Partnerships: There is an ongoing working partnership with BACSA. This engagement is highly fruitful for the Unit. BACSA assists in the provision of insights, particular business skills and a broad organised business network. This work has resulted in the signing of a memorandum of understanding between the National Commissioner of the South African Police Service and BACSA. Other aspects of this work include ongoing projects aimed at the fight against small business robberies.
A strong partnership has also been established with AgriSA as part of the effort to improve rural safety. The Ministry, AgriSA and the Food and Allied Workers Union have embarked on visits to various provinces in search of shared solutions to challenges.
➤ Civil Society Partnerships: The cultivation phase of civil society partnerships has progressed well. However, there is still considerable work to be done. Relationships and partnerships have been established with a whole host of organisations including trade unions, faith based organisation, some community organisations, including numerous Community Police Forums.
The trade unions that operate within the policing environment have participated actively in the meetings and workshops aimed at finding solutions to issues of crime and criminality.
➤ Inter-Governmental Partnerships: There is an ongoing working relationship with the policing operational arm. The police participate consistently on engagements with stakeholders and regularly convene meetings with the provincial CPF chairpersons.

SAPS TOGETHER SQUEEZING CRIME to ZEROSAPS Members, My Family - Together Pushing Back The Frontiers Of Evil
ANNUAL REPORT 2010/2011SOUTH AFRICAN POLICE SERVICE
37
Partnerships have also been forged with Social Development. This effort is aimed at contributing to government’s Extended Public Works Programme. Furthermore, the programme seeks to consolidate provincial experiences on crime prevention, to assist communities to learn from each other and create space for the development innovative national approaches to crime prevention.
The Unit has also dealt with numerous public complaints, including complaints from reservists.
➤ Constraints: Various challenges have impacted negatively on the Units performance. These include the following:
a. Staff shortage, as the new Secretariat structure had still to be approved; b. Staff health issues, resulting on longer periods of time spent on sick leave; c. Congested Secretariat programme.
Chief Directorate: Monitoring And Evaluation
The purpose of the unit is to monitor and evaluate SAPS’s performance in relation to service delivery, transformation and compliance to policy and legislation. In the year under review, it should be noted that a new Chief Director was appointed together with other critical supporting staff in January 2011. This has enhanced the capacity of the unit to deliver on its mandate which did not exist prior to the filling of these posts.
➤ National Monitoring and Evaluation Tool: The draft National Monitoring and Evaluation Tool (NMET) had to undergo a revision in order enable alignment to key focus areas outlined by the Minister of Police. The revision was conducted in conjunction with the M & E Forum and BAC. The draft was piloted within the nine provinces in collaboration with Provincial Departments of Community Safety. Comments and inputs received were incorporated into the final draft which will be tabled at the Heads of Secretariats Forum for approval and implementation.
The final draft of the tool was handed over to the State Information Technology Agency (SITA) to develop an electronic database. The Project Initiation Document and User Requirements have been finalised. Development is expected to commence in the first quarter of the 2011/12 financial year. It is envisaged that the system will be fully rolled-out to provinces by the end of the 2011/12 financial year.
➤ Firearms Amnesty 2010: The M & E unit played a crucial role in the Firearms Amnesty process by participating in the Task Team. The unit delivered training to provincial task teams and monitored the process. Consolidated monthly reports were produced and presented to the Secretary for Police and the National Amnesty Task Team on SAPS implementation of the 2010 Firearms Amnesty in all nine provinces. The final Amnesty Report was produced with recommendations to be implemented by SAPS.
➤ Complaints Management Mechanism: A stakeholder workshop was held with the ICD, the National Inspectorate of SAPS and M & E Forum to discuss challenges experienced with the implementation of recommendations made in relation to complaints against the police. A task team consisting of the three organisations was established to clarify roles and outline processes to ensure effective implementation of recommendations.
➤ Provincial coordination and systems development for improved service delivery: The National Monitoring and Evaluation Forum was established and officially launched on 31 May 2010, with senior delegates from all nine Safety Departments present, as officially nominated by their respective Heads of Departments. The Monitoring and Evaluation Forum had several successful meetings during the period under review. The alignment of performance indicators, key performance areas between the Secretariat and provinces, implementation of the Civilian Secretariat for Police Bill
SAPS TOGETHER SQUEEZING CRIME to ZEROSAPS Members, My Family - Together Pushing Back The Frontiers Of Evil
ANNUAL REPORT 2010/2011SOUTH AFRICAN POLICE SERVICE
38
and the transfer of certain functions of the Independent Complaints Directorate were high on the agenda of the Forum.
➤ Establishment of reference groups: A Monitoring and Evaluation Reference Group was
established. This reference group draws in expertise from civil society and Government. It aims to assist and partner with the Monitoring and Evaluation Unit in meeting its mandate.
➤ Management of Special Projects: The M & E Unit spearhead the customisation of the safety sector objectives and indicators for 2011/12. The Unit has established a structure that is composed of National Treasury, The Presidency’s Performance Monitoring and Evaluation Department, the CFO in the Presidency and the Hawks representative, with regular ongoing discussions to chart a new path for a streamlined sector, in line with the service delivery model outlined by the Presidency. This ‘’Think–Tank’’ will assist in achieving a uniform Performance Plan for the sector for the next financial year, informed by agreed sector objectives and indicators. This will further ensure that service delivery models are in line with national developments on performance management in respect of oversight responsibilities, reporting requirements and accountability measures.
Directorate: Support Services
The purpose of the directorate is to manage and provide corporate functions to the Secretariat, which relate to the rendering of human resource services, financial management and reporting, supply chain management and auxiliary services that encompasses administrative and office support services.
➤ Main Activities: The component Support Services falls under Programme: Administration in the Secretariat and is responsible for the financial management and administration within the Secretariat. It consists of four sub-components: Human Resource Management; Finance; Supply Chain Management and Auxiliary Services. This component provides the backbone support service operations to the core business of the Secretariat.
Outputs And Delivery Trends
The following are some key outputs of Support Services:-
Human Resource Management
The Sub-component has its functions divided into four areas, that is, performance management, training and skills development, strategic support and human resource administration (labour relations, recruitment and employee benefits).
An internal task team, in close co-operation with the Department of Public Service and Administration, is managing the process of restructuring the Secretariat in preparation for the Secretariat becoming a designated department as contemplated by the Civilian Secretariat for Police Service Act, 2011 (Act No. 2 of 2011). The proposed structure is in its final stages, with the work-study being completed, and will be submitted to the Minister for approval in June 2011. More than 50 new posts have been created and existing staff have been placed in appropriate posts. A process to fill key posts in line with the new organisational structure will follow once the structure is approved.
The appointment of staff in the HR sub-component has greatly enhanced the service delivery potential of the human resources function. An appropriate performance management system with career-pathing and pay progression has been put in place with the assistance of a consultant.
The HRM supported the filling of vacant posts and reduced the vacancy levels as it appears in the table below.The post of Secretary for Police was filled on the 1st of July 2010 on a five year contract and critical senior

SAPS TOGETHER SQUEEZING CRIME to ZEROSAPS Members, My Family - Together Pushing Back The Frontiers Of Evil
ANNUAL REPORT 2010/2011SOUTH AFRICAN POLICE SERVICE
39
management posts were created and filled from 1st of January 2010 to assist the Chief Directors. The human resource component provides support to the Secretary for Police in the process of restructuring and reorganising the Secretariat, in addition to providing human resource support to the staff of the Secretariat.
All vacant posts within the existing structure of the Secretariat have been filled during the period under review except one administrative post. The draft Employment Equity Policy for the Secretariat has been developed.
Induction of the new members was held during February 2011. The Workplace Skills Plan for 2010/11 financial year and quarterly reports were submitted to PESETA. A report on all performance agreements for SMS members have been submitted to DPSA in compliance with the DPSA prescripts. The employee wellness policy has been developed in preparation for the establishment of a wellness centre. A report was submitted to the Public Service Commission (PSC) for formal disputes for 20110/11. HR policies have been developed for the Secretariat. Finance
The Secretariat is still operating as a cost center falling under Programme 1: Administration of the South African Police Service and the audit of the finances of the Secretariat is done by the Auditor General. The Secretariat’s financial management is done in terms of the Public Finance Management Act (PFMA) and applicable regulations. The structural and capacity challenges that exist in the Finance Unit are being addressed as part of the organisational review of the Secretariat.
An amount of R4, 299 million on the Programme budget was not spent. This under-expenditure is attributed to the fact that the amount of R3 million that was set aside for the National Monitoring Evaluation Tool, was not utilised. SITA has not finalised the M & E tool. The initial draft M & E tool underwent a review and the revised tool is now ready for SITA to automate. This process will be conducted in earnest during the next financial year.
The amount of R1 million was set aside for the National Victim Survey. The Secretariat was informed that STATS SA would be dealing with the victim survey at its own cost.
In the light of the above, the Secretariat would have under-spent by R299 000 if the above projects were completed. The amount of R299 000 translates to an under-spend of 3% of the programme budget. There is a significant improvement on the reduction of under expenditure as compared to the previous financial year. There has been an improved control on managing the finances and expenditure trends and risks are identified and reported.
There was an over expenditure of R1,824 million on the personnel budget as a result of posts that were filled in addition to the fixed establishment.

SAPS TOGETHER SQUEEZING CRIME to ZEROSAPS Members, My Family - Together Pushing Back The Frontiers Of Evil
ANNUAL REPORT 2010/2011SOUTH AFRICAN POLICE SERVICE
40
Prog
ram
me
Perf
orm
ance
Offi
ce o
f the
Sec
reta
ry
Stra
tegi
c O
bjec
tive
Mea
sura
ble
Obj
ecti
vePe
rfor
man
ce M
easu
re
Indi
cato
rA
ctua
l Per
form
ance
Aga
inst
Tar
get
Chal
leng
es/R
easo
ns fo
r N
on P
erfo
rman
ceTa
rget
Act
ual
Dev
elop
men
t and
fin
alis
atio
n of
legi
slat
ion
for
the
Secr
etar
iat w
hich
will
em
pow
er a
nd c
apac
itate
the
Secr
etar
iat
Fina
lise
secr
etar
iat l
egis
latio
n (d
etai
l will
be
addr
esse
d in
le
gisl
ativ
e su
ppor
t to
the
Min
iste
r)
Impl
emen
tatio
n pl
an
appr
oved
by
Min
iste
r and
po
rtfo
lio c
omm
ittee
1 Bi
ll1
Bill
Effec
tivel
y en
hanc
e or
gani
satio
nal c
apac
ity
build
ing
in th
e Se
cret
aria
t
Enha
nce
DPS
A re
stru
ctur
ing
inve
stig
atio
nA
ppro
ved
orga
nisa
tiona
l st
ruct
ure
for S
ecre
taria
tN
o ta
rget
set
1 or
gano
gram
sub
mitt
ed to
M
inis
ter a
fter
fina
lisat
ion
by
DPS
A a
nd S
ecre
tary
’s offi
ce
Prov
ide
tech
nica
l sup
port
to
the
Min
iste
rRe
gula
r brie
fings
and
m
eetin
gs b
y th
e Se
cret
ary
with
the
Min
iste
r
Qua
lity
and
timeo
us re
port
s on
sup
port
pro
vide
dN
o ta
rget
set
25 re
port
s pr
epar
ed a
nd
subm
itted
and
dis
cuss
ed
with
Min
iste
r.
Ass
ist a
nd p
rovi
de s
uppo
rt
to th
e M
inis
ter w
ith re
gard
to
Inte
rnat
iona
l obl
igat
ions
Det
erm
ine
Min
iste
r’s
cale
ndar
of e
ngag
emen
ts
with
SA
DC,
SA
RPCC
O a
nd
othe
r for
eign
cou
ntrie
s
Min
iste
r’s c
alen
dar
1 w
orks
hop
for S
AD
C M
inis
ters
1 w
orks
hop
held
Det
erm
ine
polic
y re
gard
ing
inte
rnat
iona
l coo
pera
tion
and
agre
emen
ts a
s w
ell a
s in
vita
tions
requ
ests
Polic
y de
velo
ped
1 po
licy
deve
lope
d0
Inco
rpor
ated
into
the
Whi
te
Pape
r and
not
as
sepa
rate
po
licy
docu
men
t
Enga
ge a
nd li
aise
with
in
tern
atio
nal c
ount
er p
arts
M
&E
repo
rts
on
impl
emen
tatio
n of
ag
reem
ents
43
App
rove
d co
mm
unic
atio
n st
rate
gy a
nd p
lan
11
Prov
ide
inst
itutio
nal
lead
ersh
ip a
nd d
irect
ion
to
the
Secr
etar
iat
Dev
elop
ed s
trat
egic
pla
n (M
TSF/
MTE
F)A
ppro
ved
alig
ned
stra
tegi
c pl
an1
stra
tegi
c pl
an1
Mon
itore
d SM
S pe
rfor
man
ce
thro
ugh
Perf
orm
ance
Ag
reem
ents
(det
ails
of
mea
sure
men
t to
be re
flect
ed
unde
r H
R)
No
perf
orm
ance
indi
cato
r set
100%
100%

SAPS TOGETHER SQUEEZING CRIME to ZEROSAPS Members, My Family - Together Pushing Back The Frontiers Of Evil
ANNUAL REPORT 2010/2011SOUTH AFRICAN POLICE SERVICE
41
Stra
tegi
c O
bjec
tive
Mea
sura
ble
Obj
ecti
vePe
rfor
man
ce M
easu
re
Indi
cato
rA
ctua
l Per
form
ance
Aga
inst
Tar
get
Chal
leng
es/R
easo
ns fo
r N
on P
erfo
rman
ceTa
rget
Act
ual
Man
aged
Sec
reta
riat b
udge
t (a
ddre
ssed
und
er S
uppo
rt
Serv
ices
)
Budg
et o
ver/
unde
r spe
ndin
g va
rianc
e3%
var
ianc
e3
% v
aria
nce
Secr
etar
iat s
light
ly u
nder
sp
ent d
ue to
cha
nges
th
at to
ok p
lace
in s
uch
as th
e Vi
ctim
Sur
vey
and
deve
lopm
ent o
f the
M
onito
ring
Tool
.
Ensu
re im
plem
enta
tion
of
Dep
artm
enta
l leg
isla
tive
prog
ram
me
and
assi
st th
e M
inis
ter w
ith h
is s
tatu
tory
m
anda
te in
this
rega
rd
Pres
ent t
he fo
llow
ing
inst
rum
ents
to P
arlia
men
t
• Se
cret
aria
t Bill
• IC
D B
ill•
Fire
arm
s Co
ntro
l Re
gula
tions
• Pr
ivat
e se
curit
y tr
aini
ng
regu
latio
ns•
PSIR
A B
ill
Num
ber o
f Cab
inet
app
rove
d Bi
lls3
bills
2 bi
lls a
ppro
ved
PSIR
A B
ill t
o go
to C
abin
et
in 2
011
Num
ber o
f reg
ulat
ions
pr
omul
gate
d in
gov
ernm
ent
Gaz
ette
2 re
gula
tions
Regu
latio
n dr
afte
d an
d se
ctio
ns o
f the
FCA
am
endm
ent A
ct e
nact
edPS
IRA
trai
ning
regu
latio
n su
bmitt
ed to
PSI
RA fo
r fin
alis
atio
n
Ensu
re e
ffect
ive
acco
unta
bilit
y to
and
liai
son
with
Par
liam
ent
Activ
e pa
rtic
ipat
ion
and
pres
enta
tion
in p
arlia
men
t re
gard
ing
budg
et a
nd o
ther
re
port
ing
mat
ters
rela
ting
to
Secr
etar
iat
Parli
amen
tary
feed
back
on
pres
enta
tions
mad
e10
0%. P
LO a
ppoi
nted
and
al
l mee
tings
and
brie
fings
re
ques
ted
by P
arlia
men
t at
tend
ed
100%
att
enda
nce
3 br
iefin
gs o
f par
liam
ent
Repo
rtin
g fe
edba
ck o
f co
mm
ittee
act
iviti
es
Prov
inci
al v
isits
Ensu
re c
onsi
sten
cy
and
alig
nmen
t in
the
impl
emen
tatio
n of
the
Secr
etar
iat o
vers
ight
m
anda
te
Prov
inci
al a
nd n
atio
nal
stru
ctur
es a
ligne
d w
ith
legi
slat
ion
Alig
ned
prov
inci
al
orga
nisa
tiona
l str
uctu
reH
OD
s fo
rum
s to
be
held
qu
arte
rly4
mee
tings
hel
d an
d ag
reem
ent r
each
on
natio
nal
alig
nmen
t and
Sec
reta
riat
alig
ned
APP
s su
bmitt
ed to
Tr
easu
ry
Esta
blis
hed
prov
inci
al
secr
etar
iat m
anag
emen
t fo
rum
s
Func
tiona
l pro
vinc
ial
secr
etar
iat m
anag
emen
t fo
rum
s w
ith a
ctio
n pl
ans
4 qu
arte
rly m
eetin
gs4
Enga
ged
Prov
inci
al H
OD
on
civi
lian
over
sigh
tH
OD
and
Sec
reta
riat m
eetin
g re
port
s 4
quar
terly
mee
tings
4
Tech
nica
l sup
port
to M
INM
ECA
tten
danc
e of
MIN
MEC
m
eetin
gsN
o ta
rget
set
4 m
eetin
gs
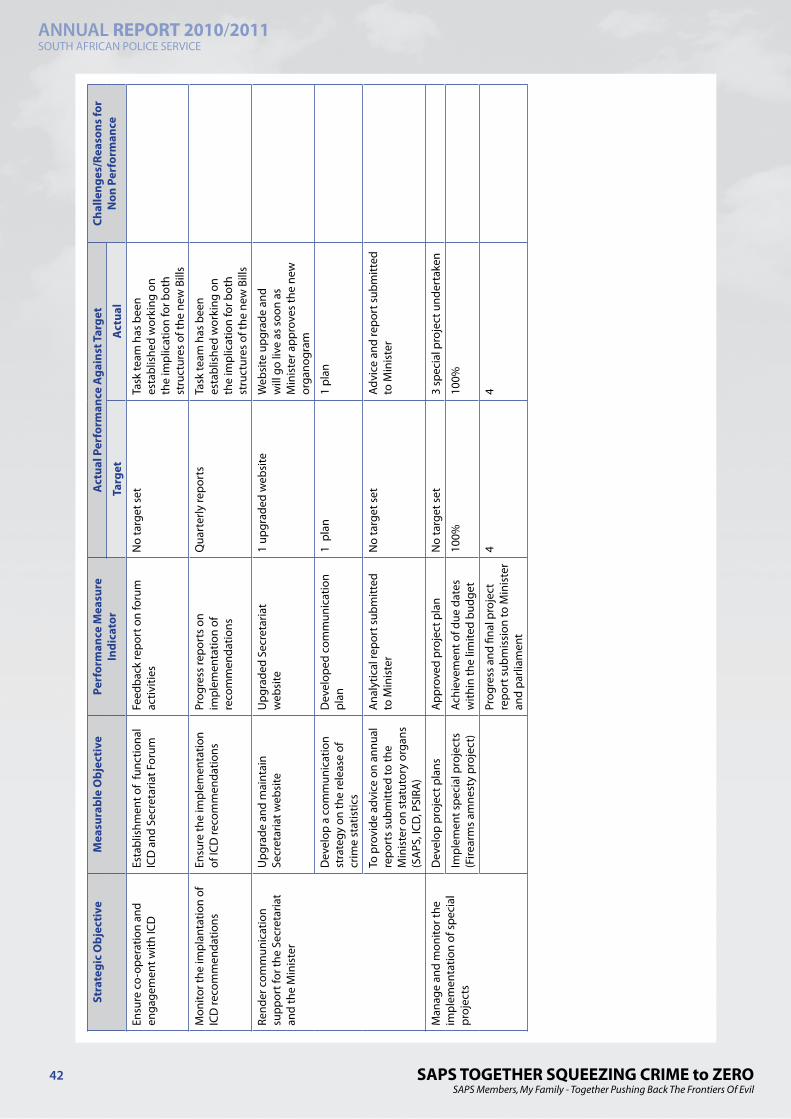
SAPS TOGETHER SQUEEZING CRIME to ZEROSAPS Members, My Family - Together Pushing Back The Frontiers Of Evil
ANNUAL REPORT 2010/2011SOUTH AFRICAN POLICE SERVICE
42
Stra
tegi
c O
bjec
tive
Mea
sura
ble
Obj
ecti
vePe
rfor
man
ce M
easu
re
Indi
cato
rA
ctua
l Per
form
ance
Aga
inst
Tar
get
Chal
leng
es/R
easo
ns fo
r N
on P
erfo
rman
ceTa
rget
Act
ual
Ensu
re c
o-op
erat
ion
and
enga
gem
ent w
ith IC
DEs
tabl
ishm
ent o
f fu
nctio
nal
ICD
and
Sec
reta
riat F
orum
Fe
edba
ck re
port
on
foru
m
activ
ities
N
o ta
rget
set
Task
team
has
bee
n es
tabl
ishe
d w
orki
ng o
n th
e im
plic
atio
n fo
r bot
h st
ruct
ures
of t
he n
ew B
ills
Mon
itor t
he im
plan
tatio
n of
IC
D re
com
men
datio
nsEn
sure
the
impl
emen
tatio
n of
ICD
reco
mm
enda
tions
Prog
ress
repo
rts
on
impl
emen
tatio
n of
re
com
men
datio
ns
Qua
rter
ly re
port
sTa
sk te
am h
as b
een
esta
blis
hed
wor
king
on
the
impl
icat
ion
for b
oth
stru
ctur
es o
f the
new
Bill
s
Rend
er c
omm
unic
atio
n su
ppor
t for
the
Secr
etar
iat
and
the
Min
iste
r
Upg
rade
and
mai
ntai
n Se
cret
aria
t web
site
Upg
rade
d Se
cret
aria
t w
ebsi
te1
upgr
aded
web
site
Web
site
upg
rade
and
w
ill g
o liv
e as
soo
n as
M
inis
ter a
ppro
ves
the
new
or
gano
gram
Dev
elop
a c
omm
unic
atio
n st
rate
gy o
n th
e re
leas
e of
cr
ime
stat
istic
s
Dev
elop
ed c
omm
unic
atio
n pl
an1
pla
n1
plan
To p
rovi
de a
dvic
e on
ann
ual
repo
rts
subm
itted
to th
e
Min
iste
r on
stat
utor
y or
gans
(S
APS
, ICD
, PSI
RA)
Ana
lytic
al re
port
sub
mitt
ed
to M
inis
ter
No
targ
et s
etAd
vice
and
repo
rt s
ubm
itted
to
Min
iste
r
Man
age
and
mon
itor t
he
impl
emen
tatio
n of
spe
cial
pr
ojec
ts
Dev
elop
pro
ject
pla
ns
App
rove
d pr
ojec
t pla
n N
o ta
rget
set
3 sp
ecia
l pro
ject
und
erta
ken
Impl
emen
t spe
cial
pro
ject
s (F
irear
ms
amne
sty
proj
ect)
Ac
hiev
emen
t of d
ue d
ates
w
ithin
the
limite
d bu
dget
100%
100%
Prog
ress
and
fina
l pro
ject
re
port
sub
mis
sion
to M
inis
ter
and
parli
amen
t
44

SAPS TOGETHER SQUEEZING CRIME to ZEROSAPS Members, My Family - Together Pushing Back The Frontiers Of Evil
ANNUAL REPORT 2010/2011SOUTH AFRICAN POLICE SERVICE
43
Chie
f Dire
ctor
ate:
Pol
icy
and
Rese
arch
Stra
tegi
c O
bjec
tive
Mea
sura
ble
Obj
ecti
vePe
rfor
man
ce M
easu
re
Indi
cato
rA
ctua
l Per
form
ance
Aga
inst
Tar
get
Chal
leng
es/R
easo
ns fo
r N
on P
erfo
rman
ceTa
rget
Act
ual
To p
rovi
de e
vide
nce
base
d st
rate
gic
rese
arch
and
pol
icy
advi
ce
A fu
lly d
evel
oped
, flex
ible
an
d re
spon
sive
rese
arch
pr
ogra
mm
e w
ith c
oncr
ete
deliv
erab
les
Polic
y ad
vice
repo
rts
to th
e Se
cret
ary/
Min
iste
r on
:3
repo
rts
5 re
port
s su
bmitt
edTw
o re
port
s ha
ve b
een
subm
itted
but
will
onl
y be
pu
blis
hed
in 2
011
Polic
y an
d re
sear
ch b
riefin
gs
No
targ
et s
etBr
iefin
gs w
ere
done
Publ
ishe
d re
port
s 2
pub
lishe
d re
port
s1
artic
le p
ublis
hed
2 ar
ticle
s su
bmitt
ed fo
r pu
blis
hing
in 2
011
Stat
e of
Pol
icin
g1
repo
rtSt
ate
of P
olic
e Re
port
Te
rms
of R
efer
ence
(ToR
s)
have
bee
n co
mpl
eted
and
di
scus
sed
with
the
Refe
renc
e G
roup
.
Uni
t was
requ
este
d to
put
re
port
on
hold
in o
rder
to
final
ise
the
Whi
te P
aper
and
th
e St
ate
of P
olic
ing
Repo
rt
wou
ld ta
ke p
lace
in 2
011/
12
finan
cial
yea
r
Vict
im p
erce
ptio
n Su
rvey
1 re
port
The
Vict
ims
of C
rime
Surv
ey
Term
s of
Ref
eren
ce h
as b
een
deve
lope
d.
Uni
t par
ticip
ated
in
Stat
sSA
sur
vey
prep
arat
ory
wor
ksho
ps. C
omm
ents
m
ade
to q
uest
ionn
aire
to
add
elem
ents
of U
nit’s
ToR.
U
nit w
as in
volv
ed in
beh
ind
the
glas
s te
stin
g of
sur
vey
ques
tionn
aire
. 2 m
embe
rs
of U
nit p
artic
ipat
ed in
an
inte
rnat
iona
l Stu
dy V
isit
on
Vict
im S
urve
y.Re
port
on
visi
t w
as s
ubm
itted
. Tra
inin
g fo
r fie
ld w
orke
rs c
ondu
cted
by
Stat
sSA
dur
ing
the
first
two
wee
ks o
f Jan
uary
and
dat
a co
llect
ion
com
plet
ed M
arch
20
11
Sect
or P
olic
ing
Revi
ew1
repo
rt1
repo
rt s
ubm
itted
Inte
ract
ions
with
SA
PS to
al
ign
SAPS
eva
luat
ion
with
ou
r rep
ort b
eing
fina
lised
Met
ro P
olic
e Po
licy
1 dr
aft p
olic
y1
draf
t pol
icy
repo
rt
deve
lope
d an
d su
bmitt
ed

SAPS TOGETHER SQUEEZING CRIME to ZEROSAPS Members, My Family - Together Pushing Back The Frontiers Of Evil
ANNUAL REPORT 2010/2011SOUTH AFRICAN POLICE SERVICE
44
Stra
tegi
c O
bjec
tive
Mea
sura
ble
Obj
ecti
vePe
rfor
man
ce M
easu
re
Indi
cato
rA
ctua
l Per
form
ance
Aga
inst
Tar
get
Chal
leng
es/R
easo
ns fo
r N
on P
erfo
rman
ceTa
rget
Act
ual
Com
mun
ity S
afet
y Fo
rum
s
Polic
yA
ppro
ved
polic
yD
raft
Com
mun
ity S
afet
y Fo
rum
s (C
SF) p
olic
y h
as
been
dev
elop
ed a
nd
subm
itted
to JC
PS.
CIT
regu
latio
nsA
ppro
ved
stan
dard
s an
d re
gula
tions
2 w
orks
hops
hel
d on
re
gula
tions
pro
cess
with
St
ate
Law
Adv
isor
s. Be
st
prac
tice
and
min
imum
st
anda
rds
deve
lop.
Re
gula
tion
be in
corp
orat
ed
in P
SIRA
Act
Rese
rvis
t Pol
icy
1 re
port
with
re
com
men
datio
ns o
n ar
eas
to b
e re
view
ed.
Lite
ratu
re re
view
on
Rese
rvis
t N
atio
nal I
nstr
uctio
n ha
s be
en
cond
ucte
d an
d a
draf
t rep
ort
has
been
dev
elop
ed. F
or
incl
usio
n in
the
Whi
te P
aper
CJA
regu
latio
nsN
atio
nal i
nstr
uctio
n fin
alis
edTh
e Ch
ild Ju
stic
e Ac
t (CJ
A)
Nat
iona
l Ins
truc
tion
was
co
mpl
eted
and
pub
lishe
d th
roug
h fa
cilit
atio
n of
the
Polic
y an
d Re
sear
ch U
nit.
DPC
I Pol
icy
Dra
ft p
olic
yTh
e D
irect
orat
e fo
r Prio
rity
Crim
e In
vest
igat
ion
(DPC
I) dr
aft p
olic
y ha
s be
en
deve
lope
d fo
r the
Min
iste
rial
Com
mitt
ee
It ha
s be
en a
gree
d th
e po
licy
will
be
cons
ider
ed a
fter
the
amen
dmen
ts a
re m
ade
to
the
DPC
I in
line
with
the
Cons
titut
iona
l Jud
gmen
t
Revi
ew o
f the
Whi
te P
aper
for
Safe
ty a
nd S
ecur
ityN
ew p
roje
ct n
o ta
rget
set
A d
iscu
ssio
n do
cum
ent
final
ised
Polic
e St
atio
n Bo
unda
ries
Dis
cuss
ion
docu
men
tD
iscu
ssio
n do
cum
ent
deve
lope
d.
To d
evel
op s
trat
egic
pa
rtne
rshi
ps w
ith p
arlia
men
t, ci
vil s
ocie
ty a
nd th
e Po
lice
Man
aged
par
tner
ship
s th
roug
h es
tabl
ishi
ng P
olic
y an
d Re
sear
ch R
efer
ence
G
roup
MO
U s
igne
d an
d ag
reed
by
all m
embe
rs1
MO
UM
OU
has
bee
n de
velo
ped
and
sign
ed b
y al
l mem
bers
.

SAPS TOGETHER SQUEEZING CRIME to ZEROSAPS Members, My Family - Together Pushing Back The Frontiers Of Evil
ANNUAL REPORT 2010/2011SOUTH AFRICAN POLICE SERVICE
45
Stra
tegi
c O
bjec
tive
Mea
sura
ble
Obj
ecti
vePe
rfor
man
ce M
easu
re
Indi
cato
rA
ctua
l Per
form
ance
Aga
inst
Tar
get
Chal
leng
es/R
easo
ns fo
r N
on P
erfo
rman
ceTa
rget
Act
ual
Cond
ucte
d re
fere
nce
gro
up
wor
ksho
psM
inut
es a
nd re
port
s of
w
orks
hops
Refe
renc
e G
roup
est
ablis
hed
and
had
3 of
the
four
in
tend
ed m
eetin
gs, i
.e. A
pril,
Ju
ly a
nd N
ovem
ber 2
010.
M
embe
rs o
f the
Ref
eren
ce
Gro
up h
ave
indi
cate
d in
tere
st a
nd a
re w
orki
ng w
ith
Uni
t on
vario
us p
roje
cts.
To s
trat
egic
ally
acc
ess
and
an
alys
e ra
w re
sear
ch S
APS
da
ta
Dev
elop
pol
icy
data
base
and
ac
cess
SA
PS d
atab
ases
• Pe
rfor
man
ce C
hart
, •
repo
rts
and
• ot
her c
rime
data
Fully
func
tiona
l dat
abas
e
Regu
lar m
eetin
gs w
ith
SAPS
effi
cien
cy s
ervi
ces
man
agem
ent
Regu
lar r
esea
rch
repo
rts
and
anal
ysis
1 da
taba
seM
onth
ly re
port
sU
nit i
s in
pro
cess
of
deve
lopi
ng p
olic
y da
taba
se
thro
ugh
Reso
urce
Cen
tre.
To c
olle
ct re
leva
nt re
sear
ch
mat
eria
l on
polic
e pr
actic
e an
d m
etho
dolo
gies
loca
lly
and
inte
rnat
iona
lly
A w
ell m
anag
ed re
sear
ch
data
base
with
cat
alog
ued
rese
arch
pap
ers,
repo
rts
and
anal
yses
Func
tiona
l dat
abas
e
Upd
ate
of re
sear
ch m
ater
ial
1 da
taba
seIn
pro
cess
of d
ata
colle
ctio
n to
sec
ure
all r
esea
rch
pape
rs
on p
olic
ing
A c
ompl
eted
inde
x of
av
aila
ble
rese
arch
mat
eria
l, da
ta s
ets
and
inte
rnal
re
sear
ch re
port
s
Com
plet
ed in
dex
No
targ
et s
etan
d co
mpi
ling
anal
yses
of
repo
rts.
Audi
t of r
esea
rch
mat
eria
l Co
nduc
ted
audi
ts1i
ndex
To w
ork
in p
artn
ersh
ip w
ith
SAPS
and
oth
er re
sear
ch
orga
nisa
tions
Join
t res
earc
h te
ams
set
up a
nd w
orki
ng o
n jo
int
rese
arch
pro
ject
s:
• Re
serv
ists
,•
Met
ro P
olic
e,•
CIT
robb
erie
s et
c..
Min
utes
of P
roje
ct Te
am
Mee
tings
A
nnua
l sem
inar
s/br
iefin
gsU
nit s
et u
p jo
int r
esea
rch
proj
ect t
eam
s in
num
ber
of a
reas
. Tea
ms
set u
p on
N
atio
nal I
nstr
uctio
ns o
n Ch
ild Ju
stic
e, M
etro
Pol
ice
and
priv
ate
secu
rity
indu
stry
re
gula
tory
aut
horit
y an
d Cr
ime
Stat
istic
s. Fo
rum
set
up
with
SA
PS o
n Re
serv
ist P
olic
y. N
o pr
ogre
ss
mad
e si
nce
SAPS
sta
rted
its
ow
n de
liber
atio
ns o
n
rese
rvis
ts
Qua
rter
ly re
sear
ch b
riefin
gs
and
sem
inar
s on
find
ings
he
ld
Qua
rter
ly R
epor
ts
Repo
rtin
g on
rese
arch
pr
ojec
tQ
uart
erly
Rep
orts

SAPS TOGETHER SQUEEZING CRIME to ZEROSAPS Members, My Family - Together Pushing Back The Frontiers Of Evil
ANNUAL REPORT 2010/2011SOUTH AFRICAN POLICE SERVICE
46
Stra
tegi
c O
bjec
tive
Mea
sura
ble
Obj
ecti
vePe
rfor
man
ce M
easu
re
Indi
cato
rA
ctua
l Per
form
ance
Aga
inst
Tar
get
Chal
leng
es/R
easo
ns fo
r N
on P
erfo
rman
ceTa
rget
Act
ual
Esta
blis
hmen
t of
info
rmat
ion
hub
of b
est p
ract
ices
and
po
licy
for u
tilis
atio
n b
y th
e Se
cret
aria
t and
any
rele
vant
st
akeh
olde
rs
Fully
func
tiona
l Nat
iona
l Re
sour
ce C
entr
e Es
tabl
ishe
d re
sour
ce
data
base
with
evi
denc
e ba
sed
info
rmat
ion
Prov
isio
n of
info
rmat
ion
Regu
lar r
epor
ts o
n N
atio
nal
reso
urce
cen
tre
utili
satio
n
1 da
taba
seN
umbe
r of r
epor
tsRe
sour
ce C
entr
e ha
s be
en
esta
blis
hed
with
rele
vant
m
ater
ials
to a
ll Ch
ief
Dire
ctor
ates
and
new
spap
ers,
and
it is
fully
func
tiona
l.Re
sour
ce c
ente
r has
issu
ed
daily
repo
rts
base
d on
in
form
atio
n co
llate
d

SAPS TOGETHER SQUEEZING CRIME to ZEROSAPS Members, My Family - Together Pushing Back The Frontiers Of Evil
ANNUAL REPORT 2010/2011SOUTH AFRICAN POLICE SERVICE
47
Chie
f Dire
ctor
ate:
Mon
itorin
g an
d Ev
alua
tion
Stra
tegi
c O
bjec
tive
Mea
sura
ble
Obj
ecti
vePe
rfor
man
ce M
easu
re
Indi
cato
rA
ctua
l Per
form
ance
Aga
inst
Tar
get
Chal
leng
es/R
easo
ns fo
r N
on P
erfo
rman
ceTa
rget
Act
ual
To p
rovi
de a
pro
fess
iona
l ci
vilia
n ov
ersi
ght c
apac
ity
thro
ugh
activ
e m
onito
ring
eval
uatio
ns o
f SA
PS s
yste
ms,
proc
ess
and
appr
oach
es
A s
ingl
e co
mpr
ehen
sive
st
ream
lined
M&
E To
ol
deve
lope
d an
d im
plem
ente
d
Mon
itorin
g an
d ev
alua
tion
plan
N
o ta
rget
set
1 pl
an
M&
E sy
stem
and
tool
im
plem
enta
tion
incl
udin
g pr
ovin
ces
No
targ
et s
et1
NM
ET
Fina
lised
dat
abas
e sy
stem
for
mon
itorin
g an
d ev
alua
tion
No
targ
et s
etD
atab
ase
is b
eing
dev
elop
edRe
visi
on o
f the
NM
ET
resu
lted
in d
elay
s in
the
deve
lopm
ent o
f the
el
ectr
onic
dat
abas
e
Mon
itor a
nd e
valu
ate
the
SAPS
per
form
ance
, ICD
re
com
men
datio
ns a
nd S
APS
co
mpl
aint
s m
echa
nism
Repo
rt o
n SA
PS p
erfo
rman
ce
mon
itore
d ag
ains
t Pe
rfor
man
ce C
hart
4 pe
rfor
man
ce re
port
s0
per
form
ance
repo
rts
Acce
ss to
the
SAPS
Pe
rfor
man
ce C
hart
not
gr
ante
d
Repo
rt o
n th
e IC
D
reco
mm
enda
tions
mon
itore
d an
d ev
alua
ted
4 pe
rfor
man
ce re
port
s0
Task
Team
com
pris
ing
of S
ecre
taria
t, SA
PS
and
ICD
est
ablis
hed
to
map
out
pro
cess
es to
ad
dres
s co
mpl
aint
s an
d re
com
men
datio
ns
SAPS
com
plai
nts
man
agem
ent m
echa
nism
m
onito
red
and
eval
uate
d
4 co
mpl
aint
s m
anag
emen
t re
port
s0
com
plai
nts
man
agem
ent
repo
rts
Task
team
com
pris
ing
of
the
Secr
etar
iat,
SAPS
and
IC
D e
stab
lishe
d to
map
ou
t a c
lear
pro
cess
to
addr
ess
com
plai
nts
and
reco
mm
enda
tions
.
Mon
itor a
nd e
valu
ate
the
2010
Fire
arm
s A
mne
sty
with
civ
il so
ciet
y pa
rtne
rs
natio
nally
and
pro
vinc
ially
Ana
lyse
impl
emen
tatio
n da
ta:
Read
ines
s of
SA
PStr
aini
ng p
rovi
ded
to a
mne
sty
task
team
s m
embe
rsA
ll am
nest
y re
late
d pr
oces
s Pr
esen
t and
repo
rt
on th
e im
pact
of t
he
impl
emen
tatio
n of
the
amne
sty
proc
ess
Wee
kly
task
team
repo
rts
Mon
thly
eva
luat
ion
repo
rts
to M
inis
ter
Eval
uatio
n re
port
with
re
com
men
datio
ns p
rese
nted
to
Min
iste
r

SAPS TOGETHER SQUEEZING CRIME to ZEROSAPS Members, My Family - Together Pushing Back The Frontiers Of Evil
ANNUAL REPORT 2010/2011SOUTH AFRICAN POLICE SERVICE
48
Stra
tegi
c O
bjec
tive
Mea
sura
ble
Obj
ecti
vePe
rfor
man
ce M
easu
re
Indi
cato
rA
ctua
l Per
form
ance
Aga
inst
Tar
get
Chal
leng
es/R
easo
ns fo
r N
on P
erfo
rman
ceTa
rget
Act
ual
Mon
itor a
nd e
valu
ate
the
lega
l im
plic
atio
ns e
man
atin
g fr
om th
e pr
omul
gatio
n of
the
FAC
Act
M&
E re
port
on
lega
l im
plic
atio
ns e
man
atin
g fr
om
the
prom
ulga
tion
of th
e FA
C Ac
t sub
mitt
ed to
the
Min
iste
r
1 re
port
1 re
port
An
incl
usiv
e M
onito
ring
and
Eval
uatio
n Fo
rum
est
ablis
hed
and
conv
ened
.
Mon
itorin
g an
d Ev
alua
tion
Foru
m m
eetin
gs a
nd re
port
s1
M&
E fo
rum
1 M
&E
Foru
m e
stab
lishe
d
Man
agem
ent o
f spe
cial
M&
E pr
ojec
ts (a
d ho
c)Im
plem
enta
tion
of p
roje
ct
in ti
me
To m
onito
r and
eva
luat
e th
e tr
ansf
orm
atio
n of
SA
PS w
ith
resp
ect t
o th
e m
anag
emen
t an
d de
ploy
men
t of h
uman
an
d m
ater
ial r
esou
rces
Mon
itore
d SA
PS s
yste
ms,
incl
udin
g th
e tr
ansf
orm
ativ
e pr
ogra
m.
Esta
blis
hed
SAPS
sys
tem
da
taba
se o
n po
lice
stat
ion
man
agem
ent a
nd p
ract
ices
an
d tr
ansf
orm
atio
n
1 SA
PS d
atab
ase
Dat
abas
e is
bei
ng d
evel
oped
Impr
oved
SA
PS s
tatio
n se
rvic
e de
liver
yRe
port
on
SAPS
reso
urce
de
ploy
men
t and
pe
rfor
man
ce a
gain
st
tran
sfor
mat
ive
prog
ram
me
incl
udin
g D
VA.
1 re
port
0 re
port
Dat
a ga
ther
ed a
t 19
polic
e st
atio
ns
Dat
a es
sent
ial t
o th
e fu
nctio
ning
of a
M&
E sy
stem
ha
d to
be
gene
rate
d.
Dev
elop
ed a
nd d
eplo
yed
inte
rven
tioni
st o
vers
ight
st
rate
gies
on
polic
e st
atio
n se
rvic
e de
liver
y in
the
form
of
a p
lan
1 pl
an0
pla
n
Stat
ion
leve
l pol
ice
prac
tice
and
gove
rnan
ce re
port
s1
repo
rt0
repo
rt

SAPS TOGETHER SQUEEZING CRIME to ZEROSAPS Members, My Family - Together Pushing Back The Frontiers Of Evil
ANNUAL REPORT 2010/2011SOUTH AFRICAN POLICE SERVICE
49
Chie
f Dire
ctor
ate:
Par
tner
ship
s
Stra
tegi
c O
bjec
tive
Mea
sura
ble
Obj
ecti
vePe
rfor
man
ce M
easu
re
Indi
cato
rA
ctua
l Per
form
ance
Aga
inst
Tar
get
Chal
leng
es/R
easo
ns fo
r N
on P
erfo
rman
ceTa
rget
Act
ual
Faci
litat
e th
e pa
rtic
ipat
ion
of c
omm
uniti
es in
crim
e pr
even
tion
initi
ativ
es
Dev
elop
crit
erio
n fo
r id
entif
ying
are
as to
im
plem
ent c
omm
unity
ou
trea
ch p
rogr
amm
es
App
rove
d co
mm
unity
ou
trea
ch p
rogr
amm
es
crite
rion
1 co
mm
unity
out
reac
h cr
iteria
1
Impl
emen
ted
qual
ity
outr
each
pro
gram
mes
Impl
emen
ted
prog
ram
mes
10 o
utre
ach
prog
ram
mes
10
Faci
litat
ed re
susc
itatio
n of
CS
F’s
as p
art o
f com
mun
ity
outr
each
pro
gram
mes
Impl
emen
t Pub
lic
Part
icip
atio
n Pr
ogra
mm
es
(Min
iste
rial I
zim
bizo
)
Repo
rt o
n th
e im
pact
of t
he
impl
emen
ted
prog
ram
mes
N
o ta
rget
set
6
Ensu
re a
n co
llabo
rativ
e eff
ort
betw
een
gove
rnm
ent a
nd
busi
ness
on
crim
e pr
even
tion
Join
t crim
e pr
even
tion
prog
ram
mes
bet
wee
n go
vern
ance
inst
itutio
ns a
nd
the
busi
ness
com
mun
ity
Dev
elop
and
sig
n off
of
mem
oran
da4
MO
U1
MO
UTi
me
cons
trai
nts
Impl
emen
ted
prog
ram
mes
No
targ
ets
set
0Pr
ogra
mm
e im
plem
ente
d by
SA
PS a
nd R
efer
ence
Gro
up
Func
tioni
ng re
fere
nce
grou
pN
o in
dica
tor s
et1
0Ti
me
cons
trai
nts
Regu
lar m
eetin
gs w
ith
busi
ness
org
anis
atio
ns4
4
Qua
rter
ly re
port
s on
bus
ines
s m
eetin
gs4
4
Ensu
re a
col
labo
rativ
e eff
ort
betw
een
gove
rnm
ent a
nd
civi
l soc
iety
org
anis
atio
ns o
n cr
ime
prev
entio
n
Enga
gem
ent o
f civ
il so
ciet
y or
gani
satio
ns in
crim
e pr
even
tion
and
safe
ty
• La
bour
•
Faith
bas
ed o
rgan
isat
ions
•
Polit
ical
org
anis
atio
ns
• W
omen
’s or
gani
satio
ns
• Yo
uth
orga
nisa
tions
•
Civi
c or
gani
satio
ns
• CP
Fs a
nd S
t Ctt
s •
Spec
ific
inte
rest
Civi
l Soc
iety
Par
tner
ship
Pla
n1
plan
1
Repo
rt o
n en
gage
men
t 4
repo
rts
6
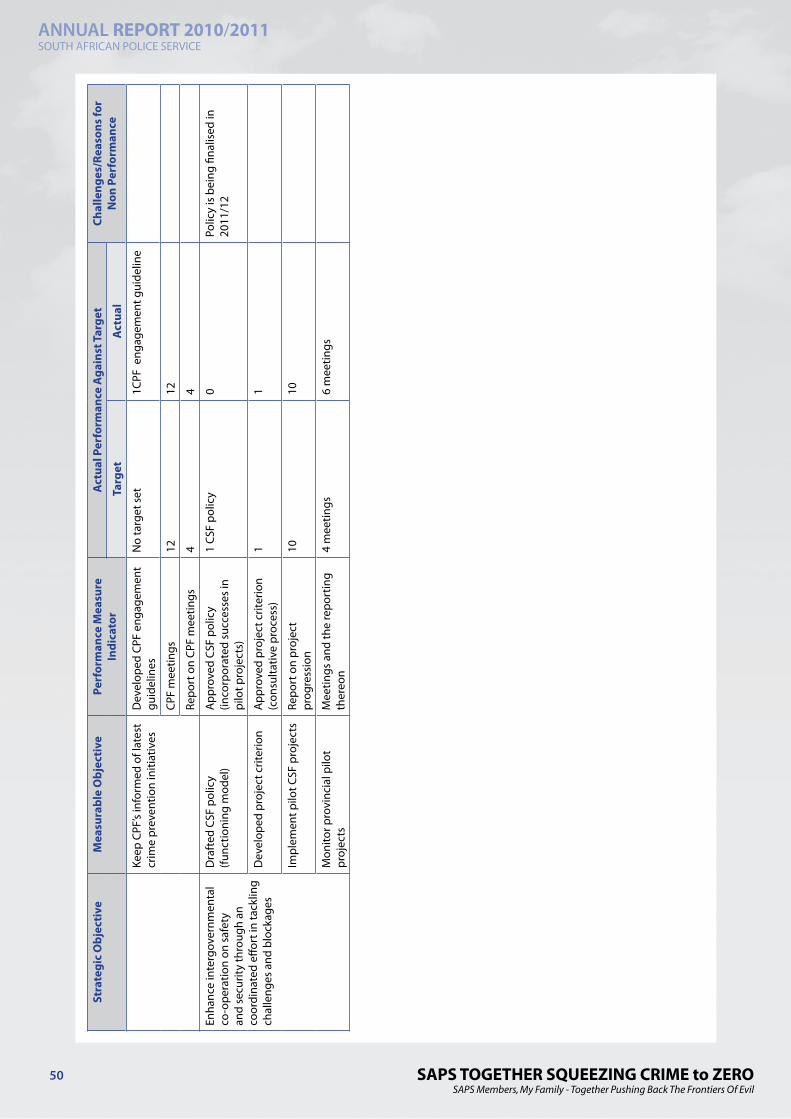
SAPS TOGETHER SQUEEZING CRIME to ZEROSAPS Members, My Family - Together Pushing Back The Frontiers Of Evil
ANNUAL REPORT 2010/2011SOUTH AFRICAN POLICE SERVICE
50
Stra
tegi
c O
bjec
tive
Mea
sura
ble
Obj
ecti
vePe
rfor
man
ce M
easu
re
Indi
cato
rA
ctua
l Per
form
ance
Aga
inst
Tar
get
Chal
leng
es/R
easo
ns fo
r N
on P
erfo
rman
ceTa
rget
Act
ual
Keep
CPF
’s in
form
ed o
f lat
est
crim
e pr
even
tion
initi
ativ
esD
evel
oped
CPF
eng
agem
ent
guid
elin
esN
o ta
rget
set
1CPF
eng
agem
ent g
uide
line
CPF
mee
tings
1212
Repo
rt o
n CP
F m
eetin
gs4
4
Enha
nce
inte
rgov
ernm
enta
l co
-ope
ratio
n on
saf
ety
and
secu
rity
thro
ugh
an
coor
dina
ted
effor
t in
tack
ling
ch
alle
nges
and
blo
ckag
es
Dra
fted
CSF
pol
icy
(func
tioni
ng m
odel
)A
ppro
ved
CSF
polic
y (in
corp
orat
ed s
ucce
sses
in
pilo
t pro
ject
s)
1 CS
F po
licy
0Po
licy
is b
eing
fina
lised
in
2011
/12
Dev
elop
ed p
roje
ct c
riter
ion
A
ppro
ved
proj
ect c
riter
ion
(con
sulta
tive
proc
ess)
1
1
Impl
emen
t pilo
t CSF
pro
ject
sRe
port
on
proj
ect
prog
ress
ion
1010
Mon
itor p
rovi
ncia
l pilo
t pr
ojec
tsM
eetin
gs a
nd th
e re
port
ing
ther
eon
4 m
eetin
gs6
mee
tings

SAPS TOGETHER SQUEEZING CRIME to ZEROSAPS Members, My Family - Together Pushing Back The Frontiers Of Evil
ANNUAL REPORT 2010/2011SOUTH AFRICAN POLICE SERVICE
51
Dire
ctor
ate:
Sup
port
Ser
vice
s
Stra
tegi
c O
bjec
tive
Mea
sura
ble
Obj
ecti
vePe
rfor
man
ce M
easu
re
Indi
cato
rA
ctua
l Per
form
ance
Aga
inst
Tar
get
Chal
leng
es/R
easo
ns fo
r N
on P
erfo
rman
ceTa
rget
Act
ual
To re
-org
anis
e an
d al
ign
the
Secr
etar
iat o
f Pol
ice
Dev
elop
and
impl
emen
t M
TSF/
MTE
F M
ediu
m Te
rm S
trat
egic
Fr
amew
ork
1 M
ediu
m Te
rm s
trat
egy
Fram
ewor
kN
ilCu
rren
tly o
pera
ting
as a
co
st c
entr
e. P
lans
in p
lace
to
com
ply
with
Tre
asur
y de
adlin
es in
pre
para
tion
for b
ecom
ing
a de
sign
ated
de
part
men
t.
Subm
it H
R Pl
an to
DPS
A
and
repo
rt o
n H
R pl
an
impl
emen
tatio
n
1 Pl
an1
HR
Plan
sub
mitt
ed to
DPS
A
App
rove
d or
gani
satio
nal
stru
ctur
e by
the
Min
iste
r of
Polic
e in
con
sulta
tion
with
th
e M
inis
ter o
f the
DPS
A
(incl
udin
g JE
) with
the
Secr
etar
iat d
irect
ion
and
legi
slat
ion
as m
anda
te
Alig
nmen
t of t
he
orga
nisa
tiona
l str
uctu
re w
ith
the
Secr
etar
iat m
anda
te
1 O
rgan
isat
iona
l Str
uctu
reO
rgan
isat
iona
l str
uctu
re
done
and
aw
aitin
g M
inis
ter’s
ap
prov
al
Min
iste
rial a
ppro
val o
n fin
al
orga
nisa
tiona
l str
uctu
re
App
ropr
iate
mat
chin
g an
d pl
acin
g im
plem
enta
tion
1 Re
port
Prel
imin
ary
mat
chin
g an
d pl
acin
g do
ne.
Mat
chin
g an
d pl
acin
g to
be
final
ised
aft
er a
ppro
val o
f ne
w s
truc
ture
Impl
emen
ted
chan
ge
man
agem
ent p
roce
ss
App
rove
d m
anag
emen
t re
port
1 Re
port
Prel
imin
ary
chan
ge
man
agem
ent d
one
and
appr
oved
.
Effec
tive
finan
cial
pla
nnin
g re
latin
g to
Hum
an R
esou
rces
Estim
ate
HR
com
pens
atio
n ne
ed fo
r 201
1/20
121
Com
pens
atio
n bu
dget
Com
pens
atio
n bu
dget
ap
prov
ed a
nd in
clud
e in
Str
ateg
ic P
lan
for t
he
2011
/201
2 fin
anci
al y
ear.
To a
ttra
ct ,
recr
uit a
nd r
etai
n ap
prop
riate
ski
lled
and
qual
ified
hum
an re
sour
ces
App
oint
qua
lified
, com
pete
nt
and
skill
ed p
erso
nnel
on
the
Secr
etar
iat e
stab
lishm
ent
Redu
ced
vaca
ncy
leve
ls
Vaca
ncy
leve
ls re
duce
d by
50
%Va
canc
y le
vels
on
exis
ting
stru
ctur
e re
duce
d by
78%
an
d in
clud
e po
sts
addi
tiona
l to
fixe
d es
tabl
ishm
ent
crea
ted
and
fille
d.
Addi
tiona
l crit
ical
sta
ff to
be
app
oint
ed o
nce
new
or
gani
satio
nal s
truc
ture
ap
prov
ed.
App
ropr
iate
app
oint
men
ts
mad
e w
ithin
3 m
onth
s of
ad
vert
isem
ents
100
%74
% fi
lled
No
suita
ble
cand
idat
es fo
und
on re
mai
nder
.
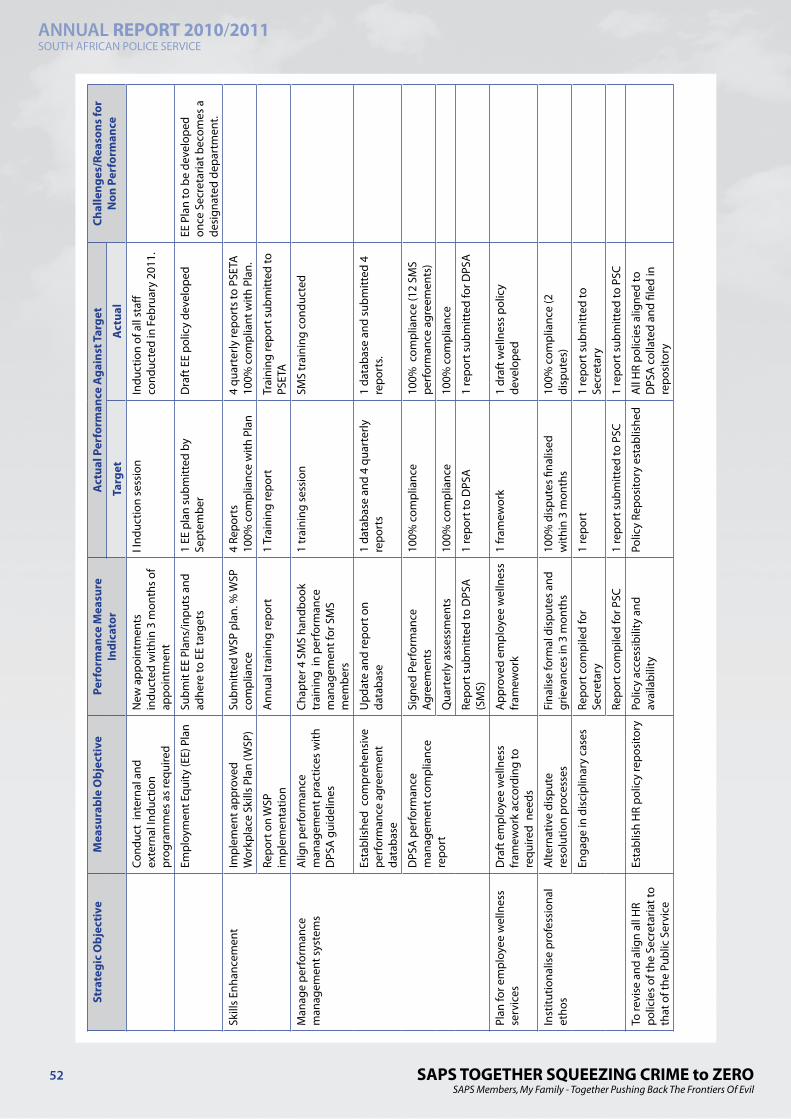
SAPS TOGETHER SQUEEZING CRIME to ZEROSAPS Members, My Family - Together Pushing Back The Frontiers Of Evil
ANNUAL REPORT 2010/2011SOUTH AFRICAN POLICE SERVICE
52
Stra
tegi
c O
bjec
tive
Mea
sura
ble
Obj
ecti
vePe
rfor
man
ce M
easu
re
Indi
cato
rA
ctua
l Per
form
ance
Aga
inst
Tar
get
Chal
leng
es/R
easo
ns fo
r N
on P
erfo
rman
ceTa
rget
Act
ual
Cond
uct
inte
rnal
and
ex
tern
al In
duct
ion
prog
ram
mes
as
requ
ired
New
app
oint
men
ts
indu
cted
with
in 3
mon
ths
of
appo
intm
ent
I Ind
uctio
n se
ssio
nIn
duct
ion
of a
ll st
aff
cond
ucte
d in
Feb
ruar
y 20
11.
Empl
oym
ent E
quity
(EE)
Pla
nSu
bmit
EE P
lans
/inpu
ts a
nd
adhe
re to
EE
targ
ets
1 EE
pla
n su
bmitt
ed b
y Se
ptem
ber
Dra
ft E
E po
licy
deve
lope
dEE
Pla
n to
be
deve
lope
d on
ce S
ecre
taria
t bec
omes
a
desi
gnat
ed d
epar
tmen
t.
Skill
s En
hanc
emen
tIm
plem
ent a
ppro
ved
Wor
kpla
ce S
kills
Pla
n (W
SP)
Subm
itted
WSP
pla
n. %
WSP
co
mpl
ianc
e4
Repo
rts
100%
com
plia
nce
with
Pla
n4
quar
terly
repo
rts
to P
SETA
100%
com
plia
nt w
ith P
lan.
Repo
rt o
n W
SP
impl
emen
tatio
n A
nnua
l tra
inin
g re
port
1 Tr
aini
ng re
port
Tr
aini
ng re
port
sub
mitt
ed to
PS
ETA
Man
age
perf
orm
ance
m
anag
emen
t sys
tem
sA
lign
perf
orm
ance
m
anag
emen
t pra
ctic
es w
ith
DPS
A g
uide
lines
Chap
ter 4
SM
S ha
ndbo
ok
trai
ning
in
perf
orm
ance
m
anag
emen
t for
SM
S m
embe
rs
1 tr
aini
ng s
essi
onSM
S tr
aini
ng c
ondu
cted
Esta
blis
hed
com
preh
ensi
ve
perf
orm
ance
agr
eem
ent
data
base
Upd
ate
and
repo
rt o
n da
taba
se
1 da
taba
se a
nd 4
qua
rter
ly
repo
rts
1 da
taba
se a
nd s
ubm
itted
4
repo
rts.
DPS
A p
erfo
rman
ce
man
agem
ent c
ompl
ianc
e re
port
Sign
ed P
erfo
rman
ce
Agre
emen
ts
100%
com
plia
nce
10
0% c
ompl
ianc
e (1
2 SM
S pe
rfor
man
ce a
gree
men
ts)
Qua
rter
ly a
sses
smen
ts10
0% c
ompl
ianc
e10
0% c
ompl
ianc
e
Repo
rt s
ubm
itted
to D
PSA
(S
MS)
1 re
port
to D
PSA
1 re
port
sub
mitt
ed fo
r DPS
A
Plan
for e
mpl
oyee
wel
lnes
s se
rvic
esD
raft
em
ploy
ee w
elln
ess
fram
ewor
k ac
cord
ing
to
requ
ired
nee
ds
App
rove
d em
ploy
ee w
elln
ess
fram
ewor
k1
fram
ewor
k1
draf
t wel
lnes
s po
licy
deve
lope
d
Inst
itutio
nalis
e pr
ofes
sion
al
etho
sA
ltern
ativ
e di
sput
e re
solu
tion
proc
esse
s Fi
nalis
e fo
rmal
dis
pute
s an
d gr
ieva
nces
in 3
mon
ths
100%
dis
pute
s fin
alis
ed
with
in 3
mon
ths
100%
com
plia
nce
(2
disp
utes
)
Enga
ge in
dis
cipl
inar
y ca
ses
Repo
rt c
ompi
led
for
Secr
etar
y 1
repo
rt1
repo
rt s
ubm
itted
to
Secr
etar
y
Repo
rt c
ompi
led
for P
SC1
repo
rt s
ubm
itted
to P
SC1
repo
rt s
ubm
itted
to P
SC
To re
vise
and
alig
n al
l HR
polic
ies
of th
e Se
cret
aria
t to
that
of t
he P
ublic
Ser
vice
Esta
blis
h H
R po
licy
repo
sito
ry
Polic
y ac
cess
ibili
ty a
nd
avai
labi
lity
Polic
y Re
posi
tory
est
ablis
hed
All
HR
polic
ies
alig
ned
to
DPS
A c
olla
ted
and
filed
in
repo
sito
ry

SAPS TOGETHER SQUEEZING CRIME to ZEROSAPS Members, My Family - Together Pushing Back The Frontiers Of Evil
ANNUAL REPORT 2010/2011SOUTH AFRICAN POLICE SERVICE
53
Stra
tegi
c O
bjec
tive
Mea
sura
ble
Obj
ecti
vePe
rfor
man
ce M
easu
re
Indi
cato
rA
ctua
l Per
form
ance
Aga
inst
Tar
get
Chal
leng
es/R
easo
ns fo
r N
on P
erfo
rman
ceTa
rget
Act
ual
To re
vise
and
alig
n al
l HR
polic
ies
of th
e Se
cret
aria
t to
that
of t
he P
ublic
Ser
vice
Dra
fted
HR
polic
ies
Revi
sed
HR
polic
ies
3 dr
aft p
olic
ies
subm
itted
by
Sept
embe
r 201
1.9
polic
ies
draf
ted
Man
age
the
finan
ces
of
the
Secr
etar
iat (
Min
istr
y) in
ac
cord
ance
to th
e PF
MA
and
N
T re
gula
tions
Dra
ft a
nd c
ost c
onso
lidat
ed
Secr
etar
iat s
trat
egic
pla
n Co
nsol
idat
ed s
trat
egic
pla
n1
stra
tegi
c pl
anCo
nsol
idat
ed S
trat
egic
Pla
n co
sted
Expe
nditu
re c
ontr
olAu
dit q
ualifi
catio
ns. N
o irr
egul
ar e
xpen
ditu
re.
Expe
nditu
re re
port
s
100%
com
plia
nce
12 re
port
s10
0% c
ompl
ianc
e12
mon
thly
exp
endi
ture
re
port
s su
bmitt
ed.
Fina
ncia
l Ris
k M
anag
emen
tRe
port
on
finan
cial
m
isco
nduc
t/no
n co
mpl
ianc
eM
onth
ly re
port
sN
o fin
anci
al m
isco
nduc
t re
port
ed.
Risk
man
agem
ent p
lan
1 Ri
sk M
anag
emen
t Pla
nD
raft
Ris
k Pl
an d
evel
oped
.
Repo
rt o
n ris
k m
anag
emen
tM
onth
lyRe
port
s su
bmitt
ed to
Se
cret
ary.
To p
rovi
de a
n in
tegr
ity b
ased
do
cum
ent m
anag
emen
t in
com
plia
nce
with
the
rele
vant
pre
scrip
ts re
latin
g to
do
cum
ent r
egis
trat
ion
and
secu
rity
stan
dard
s
Dev
elop
doc
umen
t re
gist
ratio
n, fi
ling,
retr
ieva
l an
d di
spos
al (o
r des
truc
tion)
sy
stem
s in
com
plia
nce
with
pr
escr
ipts
(Nat
iona
l Arc
hive
s Ac
t and
MIS
S)
Repo
rt o
n au
tom
ated
m
anag
emen
t doc
umen
t sy
stem
for d
evel
opm
ent
1 re
port
Curr
ent e
lect
roni
c sy
stem
be
ing
utili
sed,
and
sys
tem
un
der r
evie
w
Dev
elop
pol
icie
s an
d pr
oced
ures
App
rove
d po
licie
s an
d pr
oced
ures
1
polic
yPo
licy
and
proc
edur
es
deve
lope
d in
term
s of
A
rchi
ves
Act.
Doc
umen
t reg
istr
atio
n an
d Fi
le P
lan
deve
lope
d.
To p
rovi
de p
rocu
rem
ent
serv
ices
to th
e Se
cret
aria
t an
d th
e M
inis
try
in
com
plia
nce
with
the
PFM
A
and
othe
r rel
ated
pre
scrip
ts
Ensu
re c
ompl
ianc
e w
ith S
CM
polic
yEn
sure
full
com
plia
nce
with
al
l pre
scrip
ts o
n su
pply
cha
in
man
agem
ent
100%
com
plia
nce
100%
com
plia
nce.
Su
bmis
sion
s ch
ecke
d fo
r co
mpl
ianc
e w
ith T
reas
ury
Gui
delin
es.
Dem
and
and
acqu
isiti
onD
urat
ion
of a
cqui
sitio
nW
ithin
30
days
100
% c
ompl
ianc
e
Ass
et a
nd fa
cilit
ies
man
agem
ent
Inte
grity
bas
ed a
nd u
pdat
ed
asse
t reg
iste
rQ
uart
erly
IT
ass
et re
gist
er in
pla
ce.
Man
ual r
ecor
ds o
f fur
nitu
re
kept
and
aw
aitin
g ca
ptur
ing
on P
AS
by S
APS
.

SAPS TOGETHER SQUEEZING CRIME to ZEROSAPS Members, My Family - Together Pushing Back The Frontiers Of Evil
ANNUAL REPORT 2010/2011SOUTH AFRICAN POLICE SERVICE
54
Stra
tegi
c O
bjec
tive
Mea
sura
ble
Obj
ecti
vePe
rfor
man
ce M
easu
re
Indi
cato
rA
ctua
l Per
form
ance
Aga
inst
Tar
get
Chal
leng
es/R
easo
ns fo
r N
on P
erfo
rman
ceTa
rget
Act
ual
Logi
stic
al s
ervi
ces
and
fa
cilit
ies
man
agem
ent
Paym
ent l
ead
times
With
in 3
0 da
ysPa
ymen
ts p
roce
ssed
with
in
30 d
ays.
Dev
elop
and
mai
ntai
n a
data
base
of a
ccre
dite
d su
pplie
rs
Upd
ated
Sec
reta
riat s
uppl
ier
data
base
Qua
rter
ly u
pdat
esSu
pplie
r dat
abas
e up
date
d qu
arte
rly
Risk
man
agem
ent
App
rove
d an
d im
plem
ente
d Ri
sk M
anag
emen
t Pl
an1
Risk
Man
agem
ent P
lan.
Risk
Man
agem
ent a
nd d
raft
pl
an d
evel
oped
Info
rmat
ion
tech
nolo
gy
supp
ort
Turn
arou
nd ti
me
on lo
gged
ca
lls2
days
All
logg
ed c
alls
att
ende
d to
w
ithin
2 d
ays.

SAPS TOGETHER SQUEEZING CRIME to ZEROSAPS Members, My Family - Together Pushing Back The Frontiers Of Evil
ANNUAL REPORT 2010/2011SOUTH AFRICAN POLICE SERVICE
55
2.2.2 Programme 2: Visible Policing
Purpose
Enable police stations to institute and preserve safety and security, and provide for specialised interventions and the policing of South Africa’s borderlines.
Strategic objective
To discourage all crimes by providing a proactive and responsive policing service that will reduce the levels of priority crime.
The Visible Policing Programme comprises the following three subprogrammes:
➤ Crime Prevention provides for basic crime prevention and visible policing services rendered at police stations, including at community services centres.
➤ Borderline Security provides for the policing of borderlines.
➤ Specialised Interventions comprise the Air Wing, the Special Task Force and the crime-combating capacity, among others.

SAPS TOGETHER SQUEEZING CRIME to ZEROSAPS Members, My Family - Together Pushing Back The Frontiers Of Evil
ANNUAL REPORT 2010/2011SOUTH AFRICAN POLICE SERVICE
56
Serv
ice
deliv
ery
obje
ctiv
es a
nd in
dica
tors
Tabl
e 11
: Act
ual p
erfo
rman
ce a
gain
st ta
rget
s
Subp
rogr
amm
e: C
rim
e Pr
even
tion
Obj
ecti
veO
utpu
tM
easu
re/In
dica
tor
Act
ual p
erfo
rman
ce a
gain
st ta
rget
Reas
on fo
r Var
ianc
e
Targ
etA
ctua
l
To d
isco
urag
e al
l crim
es b
y pr
ovid
ing
a pr
oact
ive
and
resp
onsi
ve p
olic
ing
serv
ice
that
w
ill re
duce
the
leve
ls o
f prio
rity
crim
es re
latin
g to
:
• M
ore
polic
eabl
e cr
ime:
• Ag
grav
ated
robb
ery
• Ca
rjack
ing
• Tr
uck-
hija
ckin
g•
Bank
robb
ery
• Ro
bber
y of
cas
h in
tran
sit
• Ro
bber
y at
resi
dent
ial
prem
ises
• Ro
bber
y at
bus
ines
s pr
emis
es•
Com
mon
robb
ery
• O
ther
agg
rava
ted
robb
ery
• H
ouse
brea
king
and
unl
awfu
l in
trus
ion
(resi
dent
ial a
nd
non-
resi
dent
ial)
• Th
eft o
f mot
or v
ehic
les
and
mot
orcy
cles
• Th
eft o
ut o
f or f
rom
mot
or
vehi
cles
• St
ock
thef
t•
Mal
icio
us d
amag
e to
pr
oper
ty
All
of th
e ab
ove
incl
ude
atte
mpt
s
Visi
ble
crim
e de
terr
ence
Num
ber o
f pol
ice
stat
ions
re
nder
ing
a vi
ctim
frie
ndly
se
rvic
e to
vic
tims
of ra
pe,
sexu
al o
ffenc
es a
nd a
buse
An
addi
tiona
l 79
polic
e st
atio
ns re
nder
ing
a vi
ctim
frie
ndly
ser
vice
in
2010
/11
10 a
dditi
onal
Vic
tim
Supp
ort R
oom
s (V
SRs)
w
ere
esta
blis
hed
at
polic
e st
atio
ns n
amel
y at
Ja
ne F
urse
, Bot
lhok
wa,
Za
mde
la, P
iena
ar,
Brak
pan
(Tsa
kane
), Th
okoz
a, M
buzi
ni,
Haz
yvie
w, B
lue
Dow
ns
and
Giy
ani p
olic
e st
atio
ns.
Targ
et n
ot a
chie
ved.
Due
to o
ther
prio
ritie
s th
at
had
to b
e fu
nded
, inc
ludi
ng
the
2010
FIF
A W
orld
Cup
TM,
fund
ing
coul
d no
t be
allo
cate
d fo
r the
est
ablis
hmen
t of V
SRs
in 2
010/
11. A
bud
get w
ill b
e al
loca
ted
for t
his
purp
ose
durin
g th
e fo
llow
ing
finan
cial
ye
ars.
Num
ber o
f crim
e pr
even
tion
actio
ns c
ondu
cted
by
polic
e st
atio
ns fo
cusi
ng o
n:
• le
gal a
nd il
lega
l fire
arm
s•
illeg
al d
rugs
• st
olen
/rob
bed
vehi
cles
Cond
uct a
min
imum
of
25 0
00 c
rime
prev
entio
n ac
tions
in 2
010/
11
29 8
91 c
rime
prev
entio
n ac
tions
w
ere
cond
ucte
d. T
hese
in
clud
e in
telli
genc
e dr
iven
ope
ratio
ns,
targ
etin
g ‘h
ot s
pot’
area
s, ac
cord
ing
to th
e Cr
ime
Patt
ern
Ana
lysi
s (C
PA) a
nd C
rime
Thre
at
Ana
lysi
s (C
TA) i
n or
der
to p
reve
nt o
r red
uce
the
leve
ls o
f crim
e.
Targ
et a
chie
ved.

SAPS TOGETHER SQUEEZING CRIME to ZEROSAPS Members, My Family - Together Pushing Back The Frontiers Of Evil
ANNUAL REPORT 2010/2011SOUTH AFRICAN POLICE SERVICE
57
Subp
rogr
amm
e: C
rim
e Pr
even
tion
Obj
ecti
veO
utpu
tM
easu
re/In
dica
tor
Act
ual p
erfo
rman
ce a
gain
st ta
rget
Reas
on fo
r Var
ianc
e
Targ
etA
ctua
l
Cont
act c
rim
e w
hich
occ
urs
as a
resu
lt of
mor
e po
licea
ble
crim
e:
• M
urde
r and
att
empt
ed
mur
der
• Se
xual
offe
nces
Crim
es d
epen
dent
on
polic
e ac
tion
for d
etec
tion
:
• Ill
egal
pos
sess
ion
of fi
rear
ms
and
amm
uniti
on•
Dru
g-re
late
d cr
ime
• D
rivin
g un
der t
he in
fluen
ce
of a
lcoh
ol a
nd d
rugs
Visi
ble
crim
e de
terr
ence
Rate
of a
ll se
rious
crim
e,
cont
act c
rimes
and
trio
crim
esA
ll se
rious
crim
e to
be
redu
ced
by b
etw
een
1 to
1.
8% b
y 20
10/1
1
All
serio
us c
rime
redu
ced
by -2
.4%
Targ
et a
chie
ved.
Cont
act c
rimes
redu
ced
to 1
288
per 1
00 0
00
of th
e po
pula
tion
by
2010
/11
Cont
act c
rimes
redu
ced
to 1
277
per
100
000
of
the
popu
latio
n.
Targ
et a
chie
ved.
Trio
crim
es re
duce
d to
90
per
100
000
of t
he
popu
latio
n by
201
0/11
Trio
crim
es re
duce
d to
84
per
100
000
of t
he
popu
latio
n.
Targ
et a
chie
ved.
Num
ber o
f esc
apes
from
pol
ice
cust
ody
Dec
reas
e th
e nu
mbe
r of
inci
dent
s of
esc
apes
fr
om p
olic
e cu
stod
y by
50
% in
201
0/11
Dec
reas
ed b
y 20
.6%
.47
8 es
cape
inci
dent
s oc
curr
ed in
201
0/11
du
ring
whi
ch 6
69
pers
ons
esca
ped
from
pol
ice
cust
ody
com
pare
d to
602
in
cide
nts
in 2
009/
10
durin
g w
hich
857
pe
rson
s es
cape
d.
Targ
et n
ot a
chie
ved.
Alth
ough
ther
e ha
s be
en a
de
crea
se in
the
num
ber o
f in
cide
nts
of e
scap
es, t
he ta
rget
co
uld
not b
e ac
hiev
ed d
ue to
th
e fa
ct th
at, s
ince
esc
apes
w
ere
iden
tified
as
a st
rate
gic
prio
rity
risk,
mea
sure
s an
d m
echa
nism
s pu
t in
plac
e in
that
rega
rd, w
ere
not y
et
casc
aded
dow
n to
pol
ice
stat
ion
leve
l dur
ing
2010
/11,
as
this
pro
cess
was
sch
edul
ed to
be
fully
impl
emen
ted
durin
g 20
11/1
2.

SAPS TOGETHER SQUEEZING CRIME to ZEROSAPS Members, My Family - Together Pushing Back The Frontiers Of Evil
ANNUAL REPORT 2010/2011SOUTH AFRICAN POLICE SERVICE
58
Subp
rogr
amm
e: B
orde
rlin
e Se
curi
ty
Obj
ecti
veO
utpu
tM
easu
re/In
dica
tor
Act
ual p
erfo
rman
ce a
gain
st ta
rget
Reas
on fo
r Var
ianc
e
Targ
etA
ctua
l
To s
ecur
e bo
rder
lines
by
focu
sing
on
arre
st a
nd s
eizu
res
in re
spec
t of t
he fo
llow
ing
prio
ritis
ed c
rime:
• Cr
imin
al o
rgan
isat
ions
in
volv
ed in
crim
es re
latin
g to
fir
earm
s, ve
hicl
es, d
rugs
and
ill
egal
goo
ds.
• Vi
olat
ions
in te
rms
of th
e Im
mig
ratio
n Ac
t.•
Corr
uptio
n•
Mar
ine
life
reso
urce
s.•
Prec
ious
met
als
and
ston
es.
• Ill
egal
sm
uggl
ing
and
traffi
ckin
g of
hum
ans
Det
erre
nce
of il
lega
l act
iviti
es
at b
orde
rline
sN
umbe
r of p
olic
ing
actio
ns
at b
orde
rline
s fo
cusi
ng o
n pr
iorit
ised
crim
e
Cond
uct a
min
imum
of
350
polic
ing
actio
ns in
20
10/1
1
261
polic
ing
actio
ns
wer
e co
nduc
ted
in
2010
/11.
The
se in
clud
e jo
int o
pera
tions
, cro
ss
bord
er o
pera
tions
, as
sist
ance
to o
ther
po
lice
com
pone
nts
alon
g th
e bo
rder
s an
d fo
llow
-up
oper
atio
ns.
Targ
et n
ot a
chie
ved
due
to
the
com
mitm
ent o
f mem
bers
to
the
2010
FIF
A W
orld
Cup
TM
and
the
with
draw
al o
f SA
PS
mem
bers
from
bor
derli
ne
base
s w
hich
wer
e ha
nded
ove
r to
the
SAN
DF.
Subp
rogr
amm
e: S
peci
alis
ed In
terv
enti
ons
Obj
ecti
veO
utpu
tM
easu
re/In
dica
tor
Act
ual p
erfo
rman
ce a
gain
st ta
rget
Reas
on fo
r Var
ianc
e
Targ
etA
ctua
l
To p
rovi
de a
rapi
d re
spon
se
capa
bilit
y fo
r int
erve
ning
in
dang
erou
s an
d po
tent
ially
da
nger
ous
situ
atio
ns w
here
no
rmal
pol
icin
g m
ust b
e su
ppor
ted,
inc
ludi
ng th
e fo
llow
ing:
• Se
rious
and
vio
lent
crim
e in
cide
nts.
• Pu
blic
gat
herin
gs a
nd
mar
ches
.•
Hos
tage
situ
atio
ns
Stab
ilise
dan
gero
us a
nd
pote
ntia
lly d
ange
rous
si
tuat
ions
Num
ber o
f med
ium
to h
igh-
risk
inci
dent
s st
ablis
edSt
abili
se 9
5% in
cide
nts
in 2
010/
1197
.2%
inci
dent
s w
ere
succ
essf
ully
sta
bilis
ed
durin
g 20
10/1
1 (1
4 80
7 in
cide
nts
wer
e at
tend
ed
to, o
f whi
ch 1
4 38
7 w
ere
stab
ilise
d).
Targ
et a
chie
ved.

SAPS TOGETHER SQUEEZING CRIME to ZEROSAPS Members, My Family - Together Pushing Back The Frontiers Of Evil
ANNUAL REPORT 2010/2011SOUTH AFRICAN POLICE SERVICE
59
Service Delivery Achievements in relation to objectives andperformance measures
Subprogramme: Crime Prevention
Programmes in support of interdepartmental and partnership initiatives to improve services to women and children and the reduction of crime
➤ Recognising that the Department of Police alone cannot prevent crime necessitates the engagement of the SAPS in partnerships to prevent crime and in mobilising communities and specific sectors to address crimes that affect them. An effective response to crime also requires partnerships between the department and other stakeholders in the Criminal Justice System to ensure coordinated and integrated responses to crimes.
➤ As a result, the SAPS’ role in crime prevention does not take place in isolation but focuses on working with other departments and stakeholders to address crime, and in particular social fabric crimes. Cooperation does not only happens at national level where legislation and policies are defined and training programmes developed, but also at provincial and local level where stakeholders must implement legislation in a coordinated manner, as reflected below.
Gender-based violence
➤ The SAPS continued to participate in the Interdepartmental Management Team (IDMT) for the Rape and Sexual Offences programme, led by the National Prosecuting Authority (NPA). This programme focuses on prevention, improving the criminal justice response and support to victims of sexual offences. SAPS responsibilities include proactive policing (prevention) and victim support (investigation).
➤ During the period under review, the Interdepartmental Task Team on Domestic Violence, which involves the SAPS, developed and circulated a draft Domestic Violence Strategy to all stakeholders for comments and inputs. In addition to the developed strategy, the task team compiled a domestic violence booklet entitled: “A Guide to Management of Domestic Violence”. The booklet was compiled as a reference tool for service providers in all frontline service points, such as police stations, to facilitate assistance and provision of information to applicants.
➤ The SAPS participated in the round table discussions at the Commission and Protection of the Rights of Cultural, Religious and Linguistic pertaining to the Ukuthwala practice. “Ukuthwala/Hoshobedisa” refers to a practice which can be, but not always, the early and forced marriage of young girls. In certain instances this may be the elopement of consenting adults. Discussions were held around the “Ukuthwala/Hoshobedisa” custom when relating to abductions and particularly of underage sexual activities of children, and how government departments can deal with this issue in a coordinated manner. The responsibilities of the SAPS in terms of “Ukuthwala/Hoshobedisa” are as follows:
➣ where parties are not in agreement, charges of abduction and rape can be brought against the abductor;
➣ where both parties are between the ages of 12 and 15, they can be charged in terms of section 14 of the Criminal Law for consensual rape; and
➣ where one party is under the age of 16, the other can be charged with statutory rape.
➤ The SAPS participated in the development of the Sexual Offences National Policy Framework led by

SAPS TOGETHER SQUEEZING CRIME to ZEROSAPS Members, My Family - Together Pushing Back The Frontiers Of Evil
ANNUAL REPORT 2010/2011SOUTH AFRICAN POLICE SERVICE
60
the Department of Justice and Constitutional Development.
➤ The multi-disciplinary training on sexual offences was developed and finalised in consultation with Criminal Justice Departments affected by the Sexual Offences Amendment Act, 2007.
➤ The SAPS formed part of the delegation accompanying the Minister for Women, Children and Persons with Disabilities to Switzerland. The purpose of the visit was to table the country report at the Convention for the Elimination of all forms of Discrimination against Women (CEDAW). Achievements, challenges and sound practices by South African Governments were discussed at the convention.
➤ 1 117 SAPS members were trained in the Sexual Offences First Responders course during 2010/11 aimed at first responders to sexual offences, which include community service centre personnel, emergency police service personnel and detectives.
➤ To ensure that service delivery by SAPS members to the community complies with the Domestic Violence Act, 1998 (Act No. 116 of 1998), 1 983 members were trained in the Domestic Violence Programme in 2010/11.
Human trafficking
➤ During the period under review, the SAPS participated in the development and finalisation of the Human Trafficking step-by-step guideline for front line service personnel. The aim of the guidelines is to direct members in the provision of services for human trafficking victims. SAPS responsibilities in terms of the guidelines include: identifying the victims; screening of victims to determine if they are indeed victims of human trafficking; implementing procedures to be followed when the person has been identified as the victim; dealing with child victims in terms of National Instruction 3/2010 (the Care and Protection of Children in terms of the Children’s Act), preliminary enquiries and investigation and the duties of detectives when dealing with a victim of human trafficking.
➤ The SAPS participated in the official launch of the Red Card Campaign (RCC) against human trafficking and other forms of violence which was held at the Mbombela Stadium in the Mpumalanga province. The Red Card Campaign is a preventative awareness programme developed to sensitise communities, tourists and young people on the dangers of trafficking. This campaign also provides information on where to report incidents of human trafficking.
Children and youth at risk
Child justice and child protection
➤ The SAPS continues to be represented in the Inter-Sectoral Steering Committee for Child Justice led by the Department of Justice and Constitutional Development. The committee is responsible for monitoring the observation of the constitutional rights of children awaiting trial. The SAPS is represented in similar structures that have been established at provincial level to ensure SAPS representation.
➤ During the period under review, the National Instructions on the Children Act and Child Justice Act were finalised and approved by the National Commissioner. To ensure effective compliance with the responsibilities of the SAPS as described in the Children Act and Child Justice Act, an implementation plan was developed and tabled in parliament for Justice Portfolio Committee members.
➤ To give effect to SAPS responsibilities in terms of the Children Act and Child Justice Act, a training programme for vulnerable children was developed to capacitate SAPS members dealing with

SAPS TOGETHER SQUEEZING CRIME to ZEROSAPS Members, My Family - Together Pushing Back The Frontiers Of Evil
ANNUAL REPORT 2010/2011SOUTH AFRICAN POLICE SERVICE
61
children in conflict with the law and children in need of care and protection. 15 891 members were trained in this programme.
➤ To enable police officials to refer children in conflict with the law and those in need of care and protection to the relevant nearest authorities, a list of probation officers and secure care facilities were circulated to all police stations countrywide.
➤ In May 2010, the SAPS presented a national awareness programme regarding child protection and ambassadorship at Glenstantia Primary school. The event was attended by 1 370 children. In addition, a national programme was also presented on 16 June 2010 at the Union Buildings.
Youth crime prevention
➤ The SAPS continues to be represented in the Interdepartmental Youth Committee headed by the National Youth Development Agency in the Presidency. During the reporting period, government departments were consulted on the draft SAPS Manual for Youth Crime Prevention to gather inputs and comments. Provincial work sessions were also conducted in the Eastern Cape, Free State, Northern Cape, Limpopo and Gauteng provinces to gather inputs form provincial role players.
➤ The SAPS was also represented in the youth month projects that were organised by the National Youth Development Agency. The SAPS attended the main event on 16 June 2010, a rally at Thulamahashe stadium in Mpumalanga, to encourage the youth to join the police in the fight against crime.
Safer Schools Programme
➤ During 2010/11, the SAPS and the Department of Basic Education engaged in several consultative processes with the aim of formulating interdepartmental protocol geared at outlining the roles and responsibilities of both departments in creating a safe and secure schooling environment. A collaborative protocol document was jointly developed and submitted to both Ministries for approval. The objectives of the partnership are to: link police stations to schools; establish Safe School Committees, implement joint social crime prevention programmes and to mobilise communities to take ownership. Various collaborative provincial meetings between the SAPS and the Department of Basic Education led to the linkage of 9 000 public schools to establish Safe School Committees, implement joint social crime prevention programmes and to mobilise communities.
➤ During the period under review, 1 001 schools with 174 248 learners were visited to discuss drug and substance abuse, safety when crossing the road and crime-related issues.
Drug Demand Reduction Programme
➤ In March 2011, a National Biannual Summit on substance abuse was held in Durban, KwaZulu-Natal at the ICC Convention Centre. The theme for the summit was “an integrated approach towards a drug free society”. The SAPS as the key role player, participated in drafting the resolutions that would inform the new National Drug Master Plan and the National Programme of Action to combat substance abuse.
Victim Empowerment Programme (VEP)
➤ The VEP is aimed at reducing victimisation/offending, repeat victimisation/offending and preventing victimisation through the delivery of services. SAPS responsibilities with regard to victim empowerment include the development, monitoring and implementation of policies, directives and instructions aimed at improving services to victims of crime; sensitising and training SAPS members to render a professional victim friendly service; and assist in the establishment of

SAPS TOGETHER SQUEEZING CRIME to ZEROSAPS Members, My Family - Together Pushing Back The Frontiers Of Evil
ANNUAL REPORT 2010/2011SOUTH AFRICAN POLICE SERVICE
62
Victim Support Rooms.
➤ During the reporting period, the SAPS participated in the following interdepartmental initiatives aimed at reducing victimisation and preventing victimisation through the delivery of services:
➣ a workshop on the development of the Victim Empowerment Programme System within all government departments led by the Department of Social Development The aim of the workshop was to give opportunity to all victim empowerment programme stakeholders and programme managers to make inputs to the process of developing an information system to capture data of all victims receiving support from the Justice, Crime Prevention and Security Cluster (JCPS) Departments as well as to seek support from all victim empowerment programme stakeholders for the development and implementation of the Victims Register and database. The register will be managed by the SAPS, and will keep victims of violent and sexual offences updated regarding any developments relating to their reported cases.
➣ a seminar to review section 188 of the Criminal Procedure Act, 1977 (Act No. 51 of 1977).
The purpose of the seminar was to review the issue of victim participation and the repercussions in criminal court proceedings as set out in section 188 of the above Act.
➣ a Victims Rights Awareness Week (13 to 17 September 2010)
During Victim Rights Awareness Week, the SAPS was represented as a role-player in the National Victims’ Charter Programme, led by the Department of Justice and Constitutional Development, in visiting identified provinces as part of Government’s Victims Rights Week. The aim of the visits was to address specific challenges in the delivery of services to victims of crime and to assess the implementation of the Victims’ Charter by government departments. Provinces visited included the Western Cape, North West and Limpopo. During these visits training was provided to provincial victim empowerment coordinators to improve service delivery to victims of crime. The SAPS also attended the International Conference on Victim Empowerment on 29 and 30 October 2010. The conference was held in Polokwane in the Limpopo Province.
➣ a victim of crime survey coordinated by the Department of Social Development
The objectives of the survey were to: gain insight into the levels of satisfaction or dissatisfaction by victims on services provided by the JCPS; identify various areas that need improvement and to identify measures that can be implemented to improve services; and to assess whether the users understand the role of each cluster department, and victims perceptions about the safety and effectiveness of the cluster departments.
➤ The SAPS VEP training programme sensitises police officials about the needs of crime victims. The content of the training programme includes: affirming communication skills, sensitising members to victims’ needs, ensuring that victims are treated with respect, networking with other service providers and making referrals to other role players. During the period under review, 1 018 members were trained in the Victim Empowerment Programme.
Victim Support Rooms (VSRs)
➤ The SAPS VSRs are used for interviews, statement taking and consultations with victims of sexual offences, child abuse and domestic violence. During the period under review, 10 VSRs were established at the following police stations: Jane Furse, Botlhokwa, Zamdela, Pienaar, Brakpan (Tsakane), Thokoza, Mbuzini, Hazyview, Blue Downs and Giyani. This brings the current number of functioning VSRs to 900 compared to 806 at the end of March 2010.
➤ There are a number of stations that do not have office space available for building VSRs. In order

SAPS TOGETHER SQUEEZING CRIME to ZEROSAPS Members, My Family - Together Pushing Back The Frontiers Of Evil
ANNUAL REPORT 2010/2011SOUTH AFRICAN POLICE SERVICE
63
to address this issue, an arrangement was made to provide park homes that will be used as VSRs to provide for these stations. Four park home type facilities were presented and inspected and have been approved by the SAPS since they meet the requirements of a VSR. A budget would be allocated for this purpose in the following financial years.
➤ In addition to the above, an audit on the existing VSRs at police stations countrywide was conducted during 2010/11. The finalised audit included an additional 90 VSRs already in existence that was not captured previously on the national database, bringing the total number of audited VSRs to 890.
➤ Table 12 provides an overview of VSRs per province, as at 31 March 2011. These figures include VSRs at 20 satellite police stations, 22 contact points, 29 railway police stations and mobile units, 3 airport police stations, 27 Family Violence, Child Protection and Sexual Offences Units, 789 police stations and 10 newly established.
Table 12: Number of Victim Support Rooms per province
Province Total
Eastern Cape 97
Free State 52
Gauteng 146
KwaZulu-Natal 175
Mpumalanga 72
North West 40
Northern Cape 57
Limpopo 71
Western Cape 190
Total RSA 900
Local Crime Prevention Development Programme
➤ SAPS police stations work in nodes in support of the implementation of the Comprehensive Rural Development Programme (CRDP) and the Urban Renewal Programme (URP) to improve access to policing, police service delivery and integrated community safety programmes.
➤ The following additional sites were identified and capacitated on the CRDP, namely, Muyexe in Limpopo (Giyane cluster stations), Makgolokweng and Diyatalawa in the Free State (Harrysmith cluster stations) and Riemvasmaak in the Northern Cape (Kakamas cluster stations).
➤ Capacity building work sessions were conducted in various provinces regarding the CRDP and URP programmes. All police stations within the nodes, contact crime police stations and relevant role players were empowered to build capacity and strengthen partnerships between role players; to develop an integrated plan to address the causes of socio fabric factors of crime; to capacitate stations on programmes to fight crime; and to capacitate SAPS members on the Integrated Development Planning Process and the development of a station profile.
➤ Information sessions were conducted throughout the country to sensitise police stations on safety and security during the 2010 FIFA World CupTM with a focus on viewing areas, whereby big screen television sets were installed to afford communities to watch the soccer games.

SAPS TOGETHER SQUEEZING CRIME to ZEROSAPS Members, My Family - Together Pushing Back The Frontiers Of Evil
ANNUAL REPORT 2010/2011SOUTH AFRICAN POLICE SERVICE
64
Crime Stop and Primedia Crime Line
• Crime Stop is a call centre responsible for collecting information/intelligence on criminal activity from the public. When phoning 08600 10111, members of the public are assisted by trained interviewing specialists to pass on information about criminal activity to the SAPS.
• From 1 April 2010 to 31 March 2011, the call centre received 168 560 calls and 686 web tips which led to 226 positive cases compared to 299 positive cases in 2009/10. As a result, 280 arrests were made and goods valued at R1.4 million were seized.
• The partnership between the Primedia Group and the SAPS, launched in June 2007, provides members of the community to blow the whistle on crime by reporting it anonymously via sms to the number 32211 or by reporting it on the website www.crimeline.co.za. This information is passed electronically to the SAPS’s Crime Stop office, from where it is disseminated to nodal points in each province. From 1 April 2010 to 31 March 2011, 1 257 sms tips and 632 web tips were received which led to 73 positive cases. 116 arrests were made and goods valued at R4 million were seized as a result of this partnership.
The crime challenge facing the South African Police Service
➤ The main purpose of the South African Police Service is to reduce crime through crime combating (meaning both the prevention and detection of crime). The first question posed by members of the public in this regard is always whether the South African Police Service succeeds in creating a safer environment to live in. This annual report provides a detailed response to this question and illustrates how crime combating was geared towards addressing the different dimensions of the crime challenge facing South Africa.
➤ The ratios, raw figures and decreases or increases recorded in the incidence of all serious crime, contact crime and trio crime2 respectively during the 2010/11 financial year are reflected in tables 1, 2, 3 and 4. These statistics provide a synopsis of the challenges posed by crime to the South African society. From the tables the following issues already emerge: The occurrence of all serious crime, contact crime and trio crime was reduced by -5,0%, -6,9% and -10,7% respectively, while the government reduction targets for the past financial year aimed at reductions of -1,0% to -1,7%, -8,5% and -7,7% respectively. The targets for serious crime and trio crimes were thus not only met, but exceeded by a significant margin. The only exception is noted in the case of contact crime, which decreased by an overall -6,9% somewhat short of the -8,5% target. The more detailed analysis of the crime situation in Annexure A explains that the main reason for only achieving 81,2% of the contact crime reduction target is that conventional policing alone cannot effectively address the more voluminous social contact crime.
Police actions
➤ Table 13 provides an overview of the actions carried out during SAPS operations to enhance visibility, as well as the seizures/recoveries and arrests made in terms of priority crime. The actions were carried out in all station areas.
➤ There were 29 891 crime prevention operations conducted from 1 April 2010 to 31 March 2011.
2 For the different crime categories included under these three crime types see the footnotes under tables 2-4 in Annexure A.
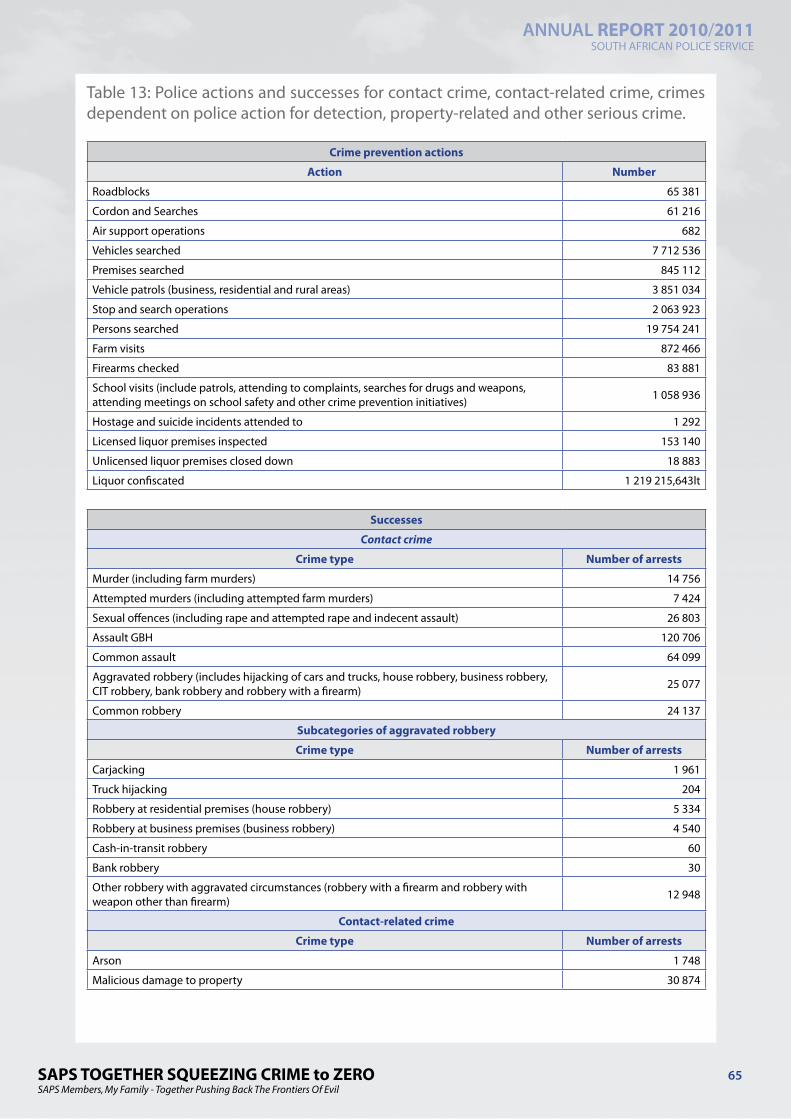
SAPS TOGETHER SQUEEZING CRIME to ZEROSAPS Members, My Family - Together Pushing Back The Frontiers Of Evil
ANNUAL REPORT 2010/2011SOUTH AFRICAN POLICE SERVICE
65
Table 13: Police actions and successes for contact crime, contact-related crime, crimes dependent on police action for detection, property-related and other serious crime.
Crime prevention actions
Action Number
Roadblocks 65 381
Cordon and Searches 61 216
Air support operations 682
Vehicles searched 7 712 536
Premises searched 845 112
Vehicle patrols (business, residential and rural areas) 3 851 034
Stop and search operations 2 063 923
Persons searched 19 754 241
Farm visits 872 466
Firearms checked 83 881
School visits (include patrols, attending to complaints, searches for drugs and weapons, attending meetings on school safety and other crime prevention initiatives) 1 058 936
Hostage and suicide incidents attended to 1 292
Licensed liquor premises inspected 153 140
Unlicensed liquor premises closed down 18 883
Liquor confiscated 1 219 215,643lt
Successes
Contact crime
Crime type Number of arrests
Murder (including farm murders) 14 756
Attempted murders (including attempted farm murders) 7 424
Sexual offences (including rape and attempted rape and indecent assault) 26 803
Assault GBH 120 706
Common assault 64 099
Aggravated robbery (includes hijacking of cars and trucks, house robbery, business robbery, CIT robbery, bank robbery and robbery with a firearm) 25 077
Common robbery 24 137
Subcategories of aggravated robbery
Crime type Number of arrests
Carjacking 1 961
Truck hijacking 204
Robbery at residential premises (house robbery) 5 334
Robbery at business premises (business robbery) 4 540
Cash-in-transit robbery 60
Bank robbery 30
Other robbery with aggravated circumstances (robbery with a firearm and robbery with weapon other than firearm) 12 948
Contact-related crime
Crime type Number of arrests
Arson 1 748
Malicious damage to property 30 874

SAPS TOGETHER SQUEEZING CRIME to ZEROSAPS Members, My Family - Together Pushing Back The Frontiers Of Evil
ANNUAL REPORT 2010/2011SOUTH AFRICAN POLICE SERVICE
66
Crimes dependent on police action for detection
Crime type Number of arrests
Illegal possession of firearms and ammunition 10 262
Drug-related crime (offences under the Drugs and Drug Trafficking Act, 1992 (Act No. 40 of 1992) and the Medicines and Related Substances Amendment Act) 92 620
Driving under the influence of liquor and drugs 46 256
Property-related and other serious crime
Crime type Number of arrests
Burglary at residential premises 43 508
Burglary at non-residential premises 7 281
Theft of motor vehicle and motorcycle 6 375
Theft out of or from motor vehicles 5 855
Stock theft 4 806
Commercial crime (fraud) 13 748
Shoplifting 55 685
Other theft 73 290
Total arrests for priority crime 688 937
Total arrests for other crime 763 663
Total 1 452 600
➤ Table 13 indicates that 1 452 600 arrests were made for all crime during policing actions, compared to 1 361 504 in 2009/10. Most arrests were made in the Gauteng province with 560 372 or 38.6% followed by the Western Cape with 220 036 or 15%. 47.4% or 688 937 of the 1 452 600 total number of arrests made were related to priority crime.
➤ From 1 April 2010 to 31 March 2011, 65 381 roadblocks and 2 063 923 stop-and-searches were conducted compared to 52 233 roadblocks and 1 524 031 stop-and-searches in 2009/10.
Sector policing
• Sector policing is an operational policing tool adopted in terms of the community policing approach of the SAPS. It provides for practical policing practices to complement community participation in accordance with policing needs and community requirements, and links up to community structures.
• Sector Policing has been rolled out to 208 or 99.5% of the 209 provincial priority stations by the end of September 2010. Sector policing is not fully implemented at Tarlton police station in Gauteng, a new police station which formerly formed part of Krugersdorp police station, due to insufficient resources and the non-existence of Community Policing sub forums in the sectors.
• Up to the end of March 2011, sector policing has been introduced to 986 (88%) of the 1 120 police stations.

SAPS TOGETHER SQUEEZING CRIME to ZEROSAPS Members, My Family - Together Pushing Back The Frontiers Of Evil
ANNUAL REPORT 2010/2011SOUTH AFRICAN POLICE SERVICE
67
Reservists
• Reservists are being used to support the SAPS in combating crime, as part of cooperative police-community relations. The reservist system provides for the active involvement of the community in policing that supports a problem-orientated approach.
• The categories in which reservists are appointed determine the nature of work that they will perform. These categories are:
- Functional deployment - Support personnel at stations - Specialised support e.g. doctors and pilots - Rural and urban safety
• In support of the recruitment of qualifying reservists as permanent members of the SAPS, 1 245 reservists were appointed in terms of the SAPS Act, 1995 and 332 in terms of the Public Service Act, 1994 from 1 April 2010 to 31 March 2011.
• The establishment of the Reserve Police Force stood at 64 360 reservists at the end of March 2011. An audit to align information on all active reservists conducted during the period under review revealed that only 26 259 are considered active reservists (performs at least 16 hours duty per month).
• During the 2010/11 financial year, 2 532 reservists were trained, of whom 2 195 or 86.7% were found competent. In addition to this, short skills programmes on the administration of the Community Service Centre, crime investigation, crime prevention and street survival were presented to improve the skills and knowledge of reservists in performing policing functions.
Rural Safety
• During the period under review a comprehensive Rural Safety Strategy to enhance safety and security, accessibility to policing and service delivery to the rural community was approved by the Minister of Police. The aim of the strategy is to address rural safety as part of an integrated and holistic day-to-day crime prevention approach based on the principles of sector policing, to address the needs of the entire rural community. The strategy is based on four pillars: improved and enhanced service delivery at local level; enhanced cooperation and coordination among all role players, improved community safety awareness in rural areas and rural development.
• The national Rural Safety Priority Committee is represented by the SAPS, Farm Workers Union, Organised Agricultural Farmers and relevant government departments. The purpose of the committee is to discuss strategies in order to identify shortcomings and challenges to address safety and security issues in the rural community. Similar structures/committees were established at provincial level.
• Incidents of violent crime aimed against rural communities are monitored regularly to establish trends and new developments. Information is shared and communicated to relevant provinces and stations to address crime in identified flashpoint areas by means of crime prevention operations. Preventative measures include inter alia, increased visibility, the involvement of sector commanders and special crime prevention operations, including road blocks and cordon and search operations.
• Rural communities are invited and encouraged to share their security concerns that will be jointly addressed with the SAPS.
2010 FIFA World CupTM
• Security forces, together with several other key government departments and role players, ensured that the 2010 FIFA World CupTM unfolded in a safe and secure environment. Inner-perimeter security duties were undertaken in five of the 10 stadiums – Port Elizabeth, Durban, Western Cape and Gauteng (Soccer City and Ellis Park). Each of the 32 playing teams was allocated a team security liaison officer and close-protection officers.
• The SAPS initiated the world-first International Police Cooperation Centre to host almost 200 foreign police officers from other participating countries. These officers assisted the SAPS at the stadiums during matches in which their country’s team participated. The centre also consisted of senior officials from the SARPCCO to coordinate information among neighbouring countries, especially movement of soccer fans across borders and the coordination of cross-border crime combating operations.
• At the National Joint Operational centre from where all security-related activities were coordinated, personnel from 22 departments worked around the clock on 12-hour shifts. This structure was duplicated in each province and at various major events.
• Within a 1.5km radius around the various stadiums on the 25 match days (outside stadiums), 704 crime-related incidents were reported to the police, the majority being minor crimes such as theft.

SAPS TOGETHER SQUEEZING CRIME to ZEROSAPS Members, My Family - Together Pushing Back The Frontiers Of Evil
ANNUAL REPORT 2010/2011SOUTH AFRICAN POLICE SERVICE
68
2010 FIFA World CupTM
• A total of 290 incidents were reported to the police inside the stadiums, taking into account the total attendance of 3 082 514 during matches.
• A total of 1 271 500 fans attended fan fests on match days; and 76 incidents were reported to police inside the various venues.
• In the 1,5km radius around the fests, 1 712 incidents were reported.
• There were 1 002 case dockets opened and investigated by dedicated police detectives countrywide.
Police reaction times
The purpose of this dimension is to measure the performance with regard to the attending of complaints in terms of reaction time in order to comply with the vision and mission statement of the SAPS. The performance indicators measuring reaction time are:
➤ Alpha complaints which measure the average reaction time (in minutes) it takes to attend to serious complaints in progress.
➤ Bravo complaints which measure the average reaction time (in minutes) it takes to attend to serious complaints that already occurred.
➤ Charlie complaints which measure the average reaction time (in minutes) it takes to attend to other complaints.
The reaction time is calculated as the time (in minutes) from the date and time a complaint is registered until the date and time the police arrive at the crime scene. At station level, only complaints attended by vehicles belonging to that station are considered for the purpose of calculating the reaction time. The illustration in table 14 below includes average complaints reaction times at provincial (inclusive of police station level averages) and national levels. It should be noted that in some instances the baseline of a specific year differs from the result of the previous year. This is ascribed to the fact that the baseline is automatically recalculated taking into consideration complaint detail that rolled over to the next year. The Marginal Performance Level (MPL) represents the minimum requirements for performance measurement purposes.

SAPS TOGETHER SQUEEZING CRIME to ZEROSAPS Members, My Family - Together Pushing Back The Frontiers Of Evil
ANNUAL REPORT 2010/2011SOUTH AFRICAN POLICE SERVICE
69
Tabl
e 14
: Pol
ice
reac
tion
times
Com
plai
nt C
ateg
ory
Des
crip
tion
Enti
ty20
08/2
009
2009
/201
020
10/2
011
Base
line
Targ
etA
ctua
lBa
selin
eTa
rget
Act
ual
Base
line
Targ
etA
ctua
l
Ave
rage
Rea
ctio
n Ti
me
– A
lpha
Com
plai
nts
Mar
gina
l Per
form
ance
Le
vel =
30
min
utes
Nat
iona
l93
.11
64.8
449
.39
49.3
933
.16
31.1
131
.11
23.0
321
.43
East
ern
Cape
514.
0692
.63
109.
3312
3.92
47.3
641
.04
41.4
629
.91
27.7
5
Free
Sta
te82
.01
53.1
346
.150
.01
38.3
26.0
826
.77
20.5
821
.92
Gau
teng
110.
878
.38
53.3
856
.29
39.5
832
.32
31.4
227
.95
24.9
8
KwaZ
ulu-
Nat
al67
.03
46.2
668
.67
73.1
125
.25
20.2
320
.14
17.4
317
.87
Lim
popo
38.1
921
.03
21.4
621
.46
17.7
320
.94
20.9
617
.78
22.6
4
Mpu
mal
anga
175.
1966
.273
.29
117.
4448
.69
38.5
138
.51
25.0
322
.51
Nor
th W
est
39.1
124
.86
24.3
344
.87
21.8
120
.820
.81
17.8
620
.63
Nor
ther
n Ca
pe35
.38
29.7
944
.09
49.5
125
.39
61.7
461
.74
22.4
727
.56
Wes
tern
Cap
e31
.95
26.9
123
.48
25.2
318
.06
16.9
117
.17
15.7
515
.95
Com
plai
nt C
ateg
ory
Des
crip
tion
Enti
ty20
08/2
009
2009
/201
020
10/2
011
Base
line
Targ
etA
ctua
lBa
selin
eTa
rget
Act
ual
Base
line
Targ
etA
ctua
l
Ave
rage
Rea
ctio
nTi
me
– Br
avo
Com
plai
nts
Mar
gina
l Per
form
ance
Le
vel =
45
min
utes
Nat
iona
l16
0.17
98.8
775
.55
75.5
552
.239
.47
39.4
731
.49
28.5
8
East
ern
Cape
448.
0296
.84
90.3
710
4.74
52.7
656
.23
55.8
436
.435
.18
Free
Sta
te11
7.46
64.8
355
.06
61.9
42.3
837
.98
37.9
824
.22
25.6
3
Gau
teng
207.
912
7.93
92.5
893
.765
.01
48.2
347
.65
43.2
635
.37
KwaZ
ulu-
Nat
al83
.77
58.1
511
0.0
115.
7734
.63
28.7
728
.88
21.4
223
.03
Lim
popo
43.3
823
.82
31.1
931
.19
19.0
525
.42
25.5
19.2
426
.68
Mpu
mal
anga
155.
1371
.34
72.4
312
9.11
47.0
656
.35
60.2
831
.52
29.5
5
Nor
th W
est
54.1
928
.13
30.3
730
.48
27.5
527
.727
.83
22.6
823
.18
Nor
ther
n Ca
pe49
.47
40.4
46.8
46.8
32.5
471
.63
71.6
328
.937
.98
Wes
tern
Cap
e42
.81
37.2
131
.14
33.7
824
.16
22.7
422
.74
19.6
320
.51

SAPS TOGETHER SQUEEZING CRIME to ZEROSAPS Members, My Family - Together Pushing Back The Frontiers Of Evil
ANNUAL REPORT 2010/2011SOUTH AFRICAN POLICE SERVICE
70
Com
plai
nt C
ateg
ory
Des
crip
tion
Enti
ty20
08/2
009
2009
/201
020
10/2
011
Base
line
Targ
etA
ctua
lBa
selin
eTa
rget
Act
ual
Base
line
Targ
etA
ctua
l
Ave
rage
Rea
ctio
nTi
me
– Ch
arlie
Co
mpl
aint
s M
argi
nal P
erfo
rman
ce
Leve
l = 4
5 m
inut
es
Nat
iona
l11
4.06
103.
1461
.19
61.1
945
.15
33.2
133
.21
27.0
125
.48
East
ern
Cape
208.
7510
5.82
117.
6312
0.05
53.6
342
.82
44.7
32.1
933
.78
Free
Sta
te73
.55
57.1
746
.38
46.3
841
.25
28.2
529
.64
23.7
423
.42
Gau
teng
123.
1986
.38
64.5
76.8
955
.940
.36
37.1
834
.42
30.0
4
KwaZ
ulu-
Nat
al71
.78
45.2
310
5.72
110.
5435
.85
28.7
28.8
119
.57
20.8
2
Lim
popo
21.5
712
.18
18.3
318
.33
15.0
819
.36
20.0
115
.59
20.4
8
Mpu
mal
anga
107.
1468
.59
57.9
267
.042
.81
31.7
131
.71
23.6
627
.34
Nor
th W
est
67.0
30.2
627
.66
35.1
24.9
25.0
325
.03
21.3
521
.61
Nor
ther
n Ca
pe43
.43
35.2
50.9
58.7
139
.32
41.8
941
.89
27.0
530
.8
Wes
tern
Cap
e36
.731
.42
29.5
31.6
124
.56
20.4
720
.47
17.4
319
.51

SAPS TOGETHER SQUEEZING CRIME to ZEROSAPS Members, My Family - Together Pushing Back The Frontiers Of Evil
ANNUAL REPORT 2010/2011SOUTH AFRICAN POLICE SERVICE
71
10111 Centres
9 734 501 calls were received by the SAPS’s 21 10111 centres in 2010/11, 14% more calls than in 2009/10 (8 537 619 calls). An estimated 70.9% (6.9 million) of all calls received are non-police related (these calls include prank calls, emergency service enquiries, road directions to hospitals or legal advice relating to domestic violence and other personal problems). A communication plan has been developed to implement a media-driven campaign to educate the public in terms of the functioning and value of the 10111 centres.
Firearms control
➤ The SAPS is responsible for issuing competency certificates, individual firearm licenses, renewals of existing firearm licenses, official licenses to applicants in order to declare such persons fit and proper to possess firearms. People seeking firearm licenses are compelled to undergo competency testing and obtain a competency certificate before being granted a firearm license. All persons who possess firearms, permit or authorisations in terms of the previous Act, the Arms and Ammunition Act, 1969 (Act No. 75 of 1969) are expected to renew such firearm licenses, permits and authorisations.
The table below indicates the comparison of applications finalised between two financial years:
Type 2009/2010 2010/2011
Competency certificates 112 315 240 422
Renewal of licenses 89 524 268 459
Firearm licenses 20 375 89 994
➤ The remarkable increase in the number of firearm licenses, renewals and competency certifications that were processed by the SAPS during the financial year can be mainly accredited to the implementation of a nine-month turnaround strategy that was intended to address outstanding applications, championed by the Minister of Police and the National Commissioner.
➤ The backlog turnaround strategy was developed by the Central Firearms Registry (CFR) together with the Civilian Secretariat for Police. This cooperation has contributed in the improvement of service delivery at the CFR and has also strengthened the relationship among the various role players. The processes and procedures in finalising applications with speed were developed and that has yielded more positive results in the processing of applications.
➤ The accreditation of business entities, associations and organisations forms an integral part in the implementation of the firearms control legislation in South Africa. There were 107 additional institutions such as training providers, shooting ranges, hunting associations and sport-shooting organisations that were accredited during 2010/11, which brings the total of all accredited institutions to 1 936 at the end of March 2011, compared to 1 829 institutions accredited at the end of March 2010, as illustrated in table 15 below.

SAPS TOGETHER SQUEEZING CRIME to ZEROSAPS Members, My Family - Together Pushing Back The Frontiers Of Evil
ANNUAL REPORT 2010/2011SOUTH AFRICAN POLICE SERVICE
72
Table 15: Accredited institutions
Province Total as at 31 March 2010 Accredited in 2010/11 Total as at 31 March 2011
Eastern Cape 169 2 171
Free State 121 6 127
Gauteng 407 20 427
KwaZulu-Natal 170 17 187
Mpumalanga 115 7 122
North West 175 5 180
Northern Cape 85 5 90
Limpopo 385 28 413
Western Cape 202 17 219
Total RSA 1 829 107 1 936
➤ The tracing of illegal firearms and the testing for legal compliance remained a priority for the SAPS. To address the proliferation of firearms, a total of 19 327 firearms and 255 924 rounds of ammunition were recovered by the SAPS during day-to-day activities and special operations (compared to 21 268 firearms and 295 085 rounds of ammunition in 2009/10). These firearms might, but will not always, include the recovery of firearms that have been previously reported as stolen or lost.
➤ The circulation of lost, stolen and found firearms plays a key role in the investigation of firearm-related crime and ultimately, the efficient control of firearms. During the period under review, 9 427 firearms were reported stolen or lost compared to 11 982 in the previous financial year. 7 888 stolen or lost firearms whose serial numbers could be linked to firearm owners in South Africa were recovered compared to 7 376 in the previous financial year. Firearms circulated as found include firearms stolen or lost during previous financial years. A great number of firearms without serial numbers have been recovered after being used in illicit activities. These may include firearms that were circulated as stolen or lost. Firearms that have been recovered without serial numbers cannot be identified or linked to the owner and, consequently their status cannot be verified on the Firearm Registration System. Table 16 provides a breakdown of stolen and lost firearms recovered, relative to the number of firearms stolen or lost as well as the recovery rate per province.
Table 16: Stolen or lost firearms recovered relative to firearms stolen or lost
Province Firearms circulated as stolen or lost
Stolen or lost firearms recovered
Recovery rate
Eastern Cape 822 1 256 152.8%
Free State 522 240 46.0%
Gauteng 3 561 1 399 39.3%
KwaZulu-Natal 1 904 2 612 137.2%
Mpumalanga 649 194 29.9%
North West 530 273 51.5%
Northern Cape 41 17 41.5%
Limpopo 427 330 77.3%
Western Cape 971 1 567 161.4%
Total RSA 9 427 7 888 83.7%
➤ During 2010/11, there was a significant reduction of recorded official firearm losses by SAPS members. There were 1 335 firearm losses recorded compared to 3 814 in 2009/10. The decrease is attributed to various interventions implemented by the SAPS such as:

SAPS TOGETHER SQUEEZING CRIME to ZEROSAPS Members, My Family - Together Pushing Back The Frontiers Of Evil
ANNUAL REPORT 2010/2011SOUTH AFRICAN POLICE SERVICE
73
➣ a bi-annual inspection of all official firearms,
➣ the implementation of improved safekeeping mechanisms for official firearms and the reduction of safety level stocks at police stations,
➣ the certification of official firearms at least twice per annum to ensure the correct accounting (quantities and distribution) and serviceability status,
➣ stocktaking to confirm compliance in terms of location and custodianship,
➣ the establishment of task teams in all provinces to focus on safekeeping and the investigation of firearm losses,
➣ the unique (dot pin) marking of official firearms which contributed to the identification of recovered firearms even though the serial numbers had been removed. There were 167 official firearms recovered in 2010/11.
➣ the utilisation of ballistic prints/specimen of all test-fired SAPS firearms on the Integrated Ballistics Information System for comparison of the specimen firearms against the crime database. During 2010/11 there were 20 328 prints/specimen acquired.
➤ Specific procedures are in place for legal firearm owners to surrender firearms and ammunition voluntary to the SAPS so that they can be destroyed. The aim is to assist persons who are in legal possession of firearms to hand in these firearms to the SAPS so that they can comply with the requirements of the firearms control legislation. From 1 April 2010 to 31 March 2011, 20 404 legal firearms and 175 944 legal rounds of ammunition were handed in voluntary (Table 17), compared to 38 153 legal firearms and 371 060 legal rounds of ammunition in the previous financial year.
Table 17: Firearms and ammunition voluntarily surrendered
Province Firearm voluntarily surrendered Ammunition voluntarily surrendered
Eastern Cape 1 155 4 637
Free State 1 696 6 092
Gauteng 6 746 85 025
KwaZulu-Natal 3 327 14 625
Limpopo 1 597 7 861
Mpumalanga 1 042 6 552
North West 1 677 9 156
Northern Cape 170 720
Western Cape 2 992 41 276
Total 20 402 175 944
➤ From 1 April 2010 to 31 March 2011, 46 527 firearms were destroyed by the SAPS, compared to 167 240 in 2009/10.
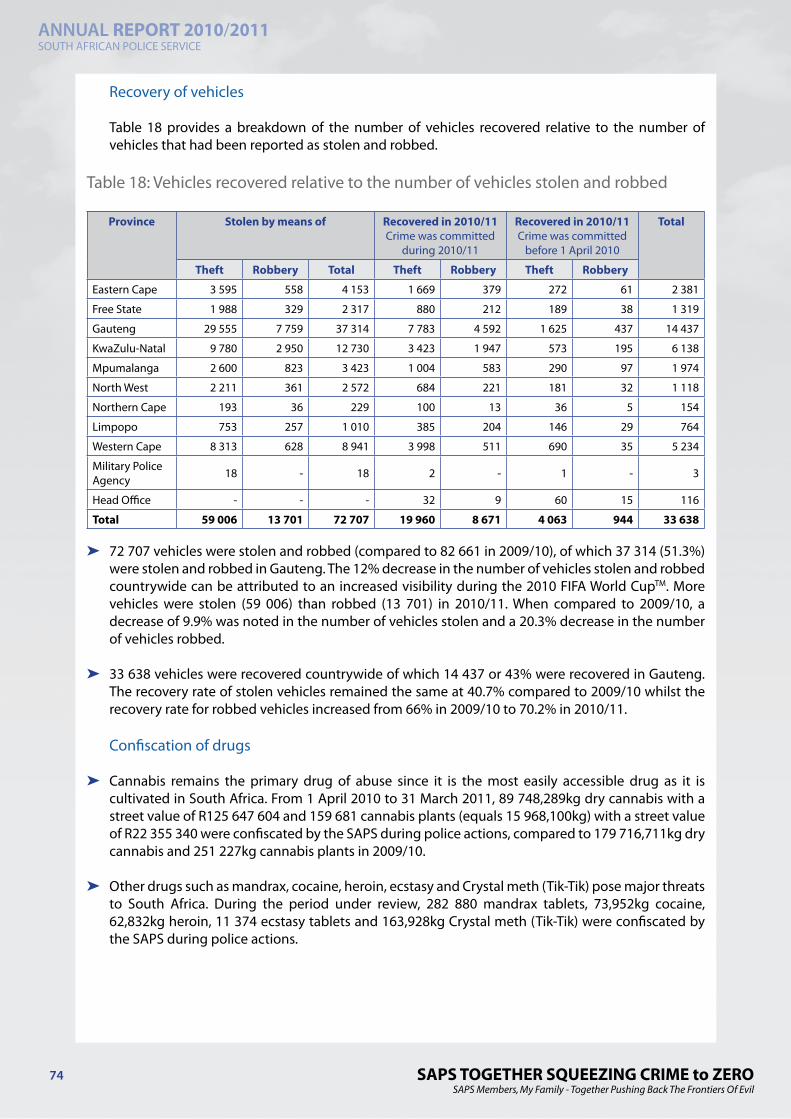
SAPS TOGETHER SQUEEZING CRIME to ZEROSAPS Members, My Family - Together Pushing Back The Frontiers Of Evil
ANNUAL REPORT 2010/2011SOUTH AFRICAN POLICE SERVICE
74
Recovery of vehicles
Table 18 provides a breakdown of the number of vehicles recovered relative to the number of vehicles that had been reported as stolen and robbed.
Table 18: Vehicles recovered relative to the number of vehicles stolen and robbed
Province Stolen by means of Recovered in 2010/11Crime was committed
during 2010/11
Recovered in 2010/11Crime was committed
before 1 April 2010
Total
Theft Robbery Total Theft Robbery Theft Robbery
Eastern Cape 3 595 558 4 153 1 669 379 272 61 2 381
Free State 1 988 329 2 317 880 212 189 38 1 319
Gauteng 29 555 7 759 37 314 7 783 4 592 1 625 437 14 437
KwaZulu-Natal 9 780 2 950 12 730 3 423 1 947 573 195 6 138
Mpumalanga 2 600 823 3 423 1 004 583 290 97 1 974
North West 2 211 361 2 572 684 221 181 32 1 118
Northern Cape 193 36 229 100 13 36 5 154
Limpopo 753 257 1 010 385 204 146 29 764
Western Cape 8 313 628 8 941 3 998 511 690 35 5 234
Military Police Agency 18 - 18 2 - 1 - 3
Head Office - - - 32 9 60 15 116
Total 59 006 13 701 72 707 19 960 8 671 4 063 944 33 638
➤ 72 707 vehicles were stolen and robbed (compared to 82 661 in 2009/10), of which 37 314 (51.3%) were stolen and robbed in Gauteng. The 12% decrease in the number of vehicles stolen and robbed countrywide can be attributed to an increased visibility during the 2010 FIFA World CupTM. More vehicles were stolen (59 006) than robbed (13 701) in 2010/11. When compared to 2009/10, a decrease of 9.9% was noted in the number of vehicles stolen and a 20.3% decrease in the number of vehicles robbed.
➤ 33 638 vehicles were recovered countrywide of which 14 437 or 43% were recovered in Gauteng. The recovery rate of stolen vehicles remained the same at 40.7% compared to 2009/10 whilst the recovery rate for robbed vehicles increased from 66% in 2009/10 to 70.2% in 2010/11.
Confiscation of drugs
➤ Cannabis remains the primary drug of abuse since it is the most easily accessible drug as it is cultivated in South Africa. From 1 April 2010 to 31 March 2011, 89 748,289kg dry cannabis with a street value of R125 647 604 and 159 681 cannabis plants (equals 15 968,100kg) with a street value of R22 355 340 were confiscated by the SAPS during police actions, compared to 179 716,711kg dry cannabis and 251 227kg cannabis plants in 2009/10.
➤ Other drugs such as mandrax, cocaine, heroin, ecstasy and Crystal meth (Tik-Tik) pose major threats to South Africa. During the period under review, 282 880 mandrax tablets, 73,952kg cocaine, 62,832kg heroin, 11 374 ecstasy tablets and 163,928kg Crystal meth (Tik-Tik) were confiscated by the SAPS during police actions.

SAPS TOGETHER SQUEEZING CRIME to ZEROSAPS Members, My Family - Together Pushing Back The Frontiers Of Evil
ANNUAL REPORT 2010/2011SOUTH AFRICAN POLICE SERVICE
75
Escapes from police custody
Table 19 provides an overview of escapes from police custody during the past four financial years.
Table 19: Escapes from police custody
Province Number of escape Incidents Number of persons who escaped from police custody (escapees)
Financial year Financial year
2007/08 2008/09 2009/10 2010/11 2007/08 2008/09 2009/10 2010/11
Eastern Cape 55 65 59 43 100 119 85 66
Free State 32 44 30 33 51 74 35 54
Gauteng 141 143 148 118 181 192 205 143
KwaZulu-Natal 81 90 72 72 130 200 111 111
Mpumalanga 69 61 56 25 88 96 129 44
North West 65 45 54 50 133 144 59 81
Northern Cape 51 41 30 28 73 54 44 33
Limpopo 40 63 42 29 57 93 54 48
Western Cape 130 167 111 80 167 172 135 89
Total 664 719 602 478 980 1 144 857 669
➤ When comparing the figures with the 2009/10 financial year, the number of incidents decreased by 20.6% (from 602 to 478), while the number of escapees decreased by 21.9% (from 857 to 669) in 2010/11. Although the SAPS did not reach the target of a 50% reduction, there was a reduction of 124 incidents compared to 2009/10 considering the number of arrests made by the SAPS and the number of people who were held in SAPS detention facilities, the condition of detention facilities at many police stations and the fact that many awaiting trail detainees are remanded back to police custody for detention after court appearances.
➤ The following table provides an overview of the circumstances under which these escape incidents took place:
Circumstances Number of incidents
Community Service Centres 111
Court holding cells 77
Police station holding cells 75
Hospitals 42
From court during appearance 35
During arrest (before taken to a police station) 30
Whilst in transit 30
During investigation 27
From the station loading zone 16
From the court loading zone 7
Other 28
➤ The most incidents (118 or 24.7%) occurred in Gauteng, followed by the Western Cape with 80 incidents (16.7%). The number of incidents decreased in seven of the nine provinces, while the number of incidents in KwaZulu-Natal remained the same during 2010/11. Limpopo province recorded an increase of 10% or three incidents compared to 2009/10.
➤ Gauteng had the most escapees in 2010/11 (143 or 21.4%), followed by KwaZulu-Natal with 111
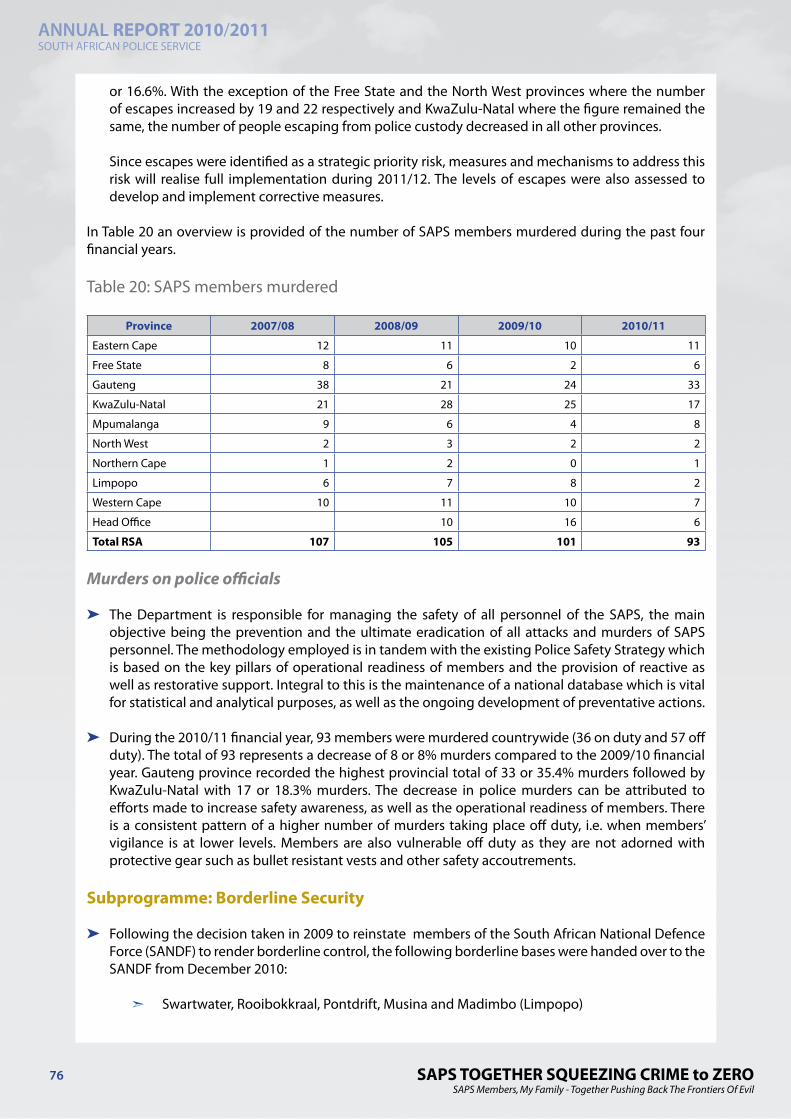
SAPS TOGETHER SQUEEZING CRIME to ZEROSAPS Members, My Family - Together Pushing Back The Frontiers Of Evil
ANNUAL REPORT 2010/2011SOUTH AFRICAN POLICE SERVICE
76
or 16.6%. With the exception of the Free State and the North West provinces where the number of escapes increased by 19 and 22 respectively and KwaZulu-Natal where the figure remained the same, the number of people escaping from police custody decreased in all other provinces.
Since escapes were identified as a strategic priority risk, measures and mechanisms to address this risk will realise full implementation during 2011/12. The levels of escapes were also assessed to develop and implement corrective measures.
In Table 20 an overview is provided of the number of SAPS members murdered during the past four financial years.
Table 20: SAPS members murdered
Province 2007/08 2008/09 2009/10 2010/11
Eastern Cape 12 11 10 11
Free State 8 6 2 6
Gauteng 38 21 24 33
KwaZulu-Natal 21 28 25 17
Mpumalanga 9 6 4 8
North West 2 3 2 2
Northern Cape 1 2 0 1
Limpopo 6 7 8 2
Western Cape 10 11 10 7
Head Office 10 16 6
Total RSA 107 105 101 93
Murders on police officials
➤ The Department is responsible for managing the safety of all personnel of the SAPS, the main objective being the prevention and the ultimate eradication of all attacks and murders of SAPS personnel. The methodology employed is in tandem with the existing Police Safety Strategy which is based on the key pillars of operational readiness of members and the provision of reactive as well as restorative support. Integral to this is the maintenance of a national database which is vital for statistical and analytical purposes, as well as the ongoing development of preventative actions.
➤ During the 2010/11 financial year, 93 members were murdered countrywide (36 on duty and 57 off duty). The total of 93 represents a decrease of 8 or 8% murders compared to the 2009/10 financial year. Gauteng province recorded the highest provincial total of 33 or 35.4% murders followed by KwaZulu-Natal with 17 or 18.3% murders. The decrease in police murders can be attributed to efforts made to increase safety awareness, as well as the operational readiness of members. There is a consistent pattern of a higher number of murders taking place off duty, i.e. when members’ vigilance is at lower levels. Members are also vulnerable off duty as they are not adorned with protective gear such as bullet resistant vests and other safety accoutrements.
Subprogramme: Borderline Security
➤ Following the decision taken in 2009 to reinstate members of the South African National Defence Force (SANDF) to render borderline control, the following borderline bases were handed over to the SANDF from December 2010:
➣ Swartwater, Rooibokkraal, Pontdrift, Musina and Madimbo (Limpopo)

SAPS TOGETHER SQUEEZING CRIME to ZEROSAPS Members, My Family - Together Pushing Back The Frontiers Of Evil
ANNUAL REPORT 2010/2011SOUTH AFRICAN POLICE SERVICE
77
➣ Sandrivier, Macadamia and Zonstraal (Mpumalanga)
➣ Pongola and Ndumo (KwaZulu-Natal)
➣ Ladybrand (Free State)
➤ Borderline bases at Beitbridge (Limpopo), Muzi (KwaZulu-Natal) and Blenheim (Free State) were closed down in totality with no deployment.
➤ During the SANDF Exit/SAPS Entry Strategy in 2004, the SAPS adopted a rotational detachment duty model whereby operational members were posted to borderline bases from different police stations for a period of two months. This operational function did not have permanent capacity, hence the withdrawn members of those borderline bases that were handed over to the SANDF in 2011, went back to their respective stations.
Table 21 provides an overview of successes achieved by the SAPS at borderlines in 2010/11.
Table 21: Successes at borderlines
Stolen and robbed vehicles
2009/10 2010/11
Arrests 76 35
Number of vehicles recovered 340 305
Illegal firearms
2009/10 2010/11
Arrests 115 120
Number of firearms recovered 179 149
Illicit drugs
2009/10 2010/11
Arrests 554 512
Quantity of cannabis seized 87 175,790kg 46 493,220kg
Violations in terms of the Immigration Act (undocumented persons)
2009/10 2010/11
Arrests 38 892 20 175
Illegal goods
2009/10 2010/11
Arrests 207 304
➤ From Table 21 it is evident that the number of arrests and recoveries in the borderline environment decreased when compared with the previous financial year. This can be attributed to the thinly spread human resources during the 2010 FIFA World CupTM and the withdrawal of SAPS members from borderline bases which were handed over to the SANDF from December 2010.

SAPS TOGETHER SQUEEZING CRIME to ZEROSAPS Members, My Family - Together Pushing Back The Frontiers Of Evil
ANNUAL REPORT 2010/2011SOUTH AFRICAN POLICE SERVICE
78
Subprogramme: Specialised Interventions
Interventions in medium to high-risk operations
➤ The SAPS National Intervention Units deal with medium to high-risk operations which include the stabilisation of serious and violent crime incidents (volatile situations), escorting dangerous criminals, safeguarding VIPs and special events, and providing specialised operational support to police stations and other government departments. During the period under review, the SAPS National Intervention Units conducted 1 960 interventions of which 82.7% or 1 620 were successfully resolved.
➤ The Special Task Force provides a rapid response capability by intervening in extreme situations which include hostage situations, interventions to combat urban and rural terror; organised crime; serious and violent crime incidents and crimes against women and children; and search-and-rescue operations. During the reporting period the Special Task Force Units conducted 196 interventions of which 59.2% or 116 were successfully resolved. Members of this Unit were also deployed to 68 potential incidents which did not materialise.
➤ The crime-combating intervention capacity within the SAPS deals with the combating of crime and the maintenance of public order. This involves monitoring various major incidents such as strikes and public gatherings. During the reporting period, 12 651 crowd-related incidents were recorded, including 11 680 peaceful incidents such as assemblies, gatherings, meetings and demonstrations and 971 unrest-related incidents (labour disputes, dissatisfaction with service delivery, etc.) compared to 7 913 peaceful incidents and 994 unrest-related incidents in 2009/10. As a result, 3 671 persons were arrested during the 971 unrest-related incidents in which violence erupted and SAPS action was required to restore peace and order. All incidents were successfully resolved.
➤ The most prevalent unrest-related incidents monitored in 2010/11 included:
➣ The national strike by South African Municipal Workers Union (SAMWU) members relating to disputes over wages.
➣ The national public servant strike demanding an increase of 8.5% and an increased housing allowance.
➣ The national strike by South African Transport and Allied Workers Union (SATAWU) and United Transport and Allied Trade Union (UTATU) members due to wage disputes with Transnet.
➣ The national strike by members of the South African Catering and Commercial Workers Union (SACCAWU) relating to wage disputes with Pick & Pay.
➣ Protests actions by residents about the lack of service delivery by local municipalities included incidents in Brandvlei, Soshanguve, Boikhutso, Zandspruit, Honeydew (Gauteng), Khutloanong (North West), Nyanga (Western Cape), Wesselton and Ermelo (Mpumalanga).
➣ Protest actions by residents in Hangberg (Western Cape) and Bapsfontein (Gauteng) against evictions and relocations.
➣ Students at the University of KwaZulu-Natal protesting about outstanding class fees.
➤ Other situations of national interest monitored during the period under review included the murder of the AWB leader in April 2010 and the 17th World Aids Day festival in December 2010.

SAPS TOGETHER SQUEEZING CRIME to ZEROSAPS Members, My Family - Together Pushing Back The Frontiers Of Evil
ANNUAL REPORT 2010/2011SOUTH AFRICAN POLICE SERVICE
79
Policing of major events
➤ To ensure that international standards are maintained during major events, the SAPS provides a concept plan to all stakeholders for planning purposes. From 1 April 2010 to 31 March 2011, 178 major events were attended to and monitored. These include the 2010 World Cup Music Festival at Orlando stadium in June 2010; 2010 FIFA World CupTM matches in June and July 2010; Tri-nations rugby matches between South Africa, Australia and New Zealand in August and September 2010; the Airtel Champions League Twenty/Twenty in September 2010; the 17th World Youth Festival in Tshwane in December 2010; and the Cape International Jazz Concert in Cape Town in March 2011.
Other specialised interventions
➤ SAPS Air Wing: 8 463.3 hours were flown by 37 helicopters and 14 airplanes of the SAPS including communication flights, shows and training and maintenance flights, of which 6 715 hours were flown exclusively for crime-related matters such as call-outs, crime prevention operations, assistance to foreign countries and Special Forces operations. Successes include 2 077 arrests, the recovery of 15 firearms, 345 vehicles, 2 406 cattle and the confiscation of 32,313kg cannabis.
➤ Specialised policing services to neighbouring countries: The SAPS renders specialised policing services to neighbouring countries which includes the deployment of members on peacekeeping missions and cross-border operations. During the period under review 154 members were deployed to Sudan compared to 156 members in 2009/10. These members were required to render assistance in developing proactive public confidence building measures, establishing and maintaining contact with the local police authorities by collaborating in day-to-day activities, performing village and town patrols with Sudanese Police and monitoring and reporting on the effectiveness of the service delivery of the local police.
➤ Diplomatic policing: The main responsibility of Diplomatic policing is to create a safe and secure environment for the foreign diplomatic community in Pretoria. Services to the diplomatic community are currently being extended to include consular offices and officials in Johannesburg, Cape Town and Durban. The Unit patrols and visits diplomatic premises on a 24-hour basis and serves 94 embassies, 25 High Commissions and 20 international organisations. Actions conducted during the period under review included 241 375 physical visits, the policing of 520 functions, the attendance of 137 accidents involving diplomatic vehicles and 226 escorts. These actions led to various arrests and the recovery of firearms, ammunition, vehicles and drugs, among other things. 172 case dockets were registered for crimes reported by diplomats.

SAPS TOGETHER SQUEEZING CRIME to ZEROSAPS Members, My Family - Together Pushing Back The Frontiers Of Evil
ANNUAL REPORT 2010/2011SOUTH AFRICAN POLICE SERVICE
80
2.2.3 Programme 3: Detective Services
Purpose
Enable the investigative work of the South African Police Service, including providing support to investigators in terms of forensic evidence and the Criminal Record Centre.
Strategic objective
Contribute to the successful prosecution of crime, by investigating, gathering and analysing evidence, thereby increasing the detection rate of priority crimes.
The Detective Services Programme comprises four subprogrammes:
➤ Crime Investigations accommodate detectives at police stations, who investigate crimes of a general nature.
➤ Specialised Investigations provides for the prevention, combating and investigation of national priority offences including the investigation of organised crime syndicates, serious and violent crime, commercial crime and corruption.
➤ The Criminal Record Centre provides for an effective and credible Criminal Record Centre/Local Criminal record Centre service in respect of crime scene management/processing and the provision of criminal history and related information.
➤ The Forensic Science Laboratory funds forensic science laboratories, which provide specialised technical analysis and support to investigators regarding evidence.

SAPS TOGETHER SQUEEZING CRIME to ZEROSAPS Members, My Family - Together Pushing Back The Frontiers Of Evil
ANNUAL REPORT 2010/2011SOUTH AFRICAN POLICE SERVICE
81
Serv
ice
deliv
ery
obje
ctiv
es a
nd in
dica
tors
Tabl
e 22
: Act
ual p
erfo
rman
ce a
gain
st ta
rget
s
Subp
rogr
amm
e: C
rim
e In
vest
igat
ions
Obj
ecti
veO
utpu
tM
easu
re/In
dica
tor
Act
ual p
erfo
rman
ce a
gain
st ta
rget
Reas
on fo
r var
ianc
e
Targ
etA
ctua
l
To c
ontr
ibut
e to
the
succ
essf
ul p
rose
cutio
n of
off
ende
rs, b
y in
vest
igat
ing,
ga
ther
ing
and
anal
ysin
g ev
iden
ce, t
here
by in
crea
sing
th
e de
tect
ion
rate
and
cou
rt
read
y ca
se d
ocke
ts o
f prio
rity
crim
es, r
elat
ing
to:
Mor
e po
licea
ble
crim
e:•
Aggr
avat
ed ro
bber
y
- Ca
rjack
ing
-
Truc
k-hi
jack
ing
-
Bank
robb
ery
-
Robb
ery
of c
ash
in
tran
sit
-
Robb
ery
at re
side
ntia
l pr
emis
es
- Ro
bber
y at
bus
ines
s pr
emis
es•
Com
mon
robb
ery
• O
ther
agg
rava
ted
robb
ery
• H
ouse
brea
king
and
un
law
ful i
ntru
sion
(re
side
ntia
l and
no
n-re
side
ntia
l)
Crim
es in
vest
igat
edD
etec
tion
rate
for c
onta
ct
crim
e, c
onta
ct-r
elat
ed c
rime,
pr
oper
ty-r
elat
ed c
rime,
cr
imes
dep
ende
nt o
n po
lice
actio
n fo
r det
ectio
n an
d ot
her s
erio
us c
rime
Det
ectio
n ra
te o
f bet
wee
n 43
- 60
% in
201
0/11
51
.84%
in 2
010/
11(1
092
861
)Ta
rget
ach
ieve
d.
Perc
enta
ge o
f cou
rt re
ady
case
doc
kets
for c
onta
ct
crim
e, c
onta
ct-r
elat
ed c
rime,
pr
oper
ty-r
elat
ed c
rime,
cr
imes
dep
ende
nt o
n po
lice
actio
n fo
r det
ectio
n an
d ot
her s
erio
us c
rime
To b
e de
term
ined
330
.84%
in 2
010/
11(1
55 9
33)
3 Thi
s in
dica
tor
as d
escr
ibed
in t
he A
nnua
l Per
form
ance
Pla
n fo
r 20
10/1
1, t
able
d on
3 M
arch
201
0, in
dica
ted
that
the
tar
get
for
cour
t re
ady
case
doc
kets
will
be
dete
rmin
ed. A
ccor
ding
to
outc
ome
3 an
d th
e re
late
d ou
tput
s of
the
JCPS
clu
ster
, sig
ned
on 2
4 O
ctob
er 2
010,
a ta
rget
of 3
5% c
ourt
read
y ca
se d
ocke
ts m
ust b
e ac
hiev
ed b
y 20
14. T
he 3
5% in
clud
es c
ourt
read
y ca
se
dock
ets
for c
rimes
aga
inst
wom
en a
nd c
hild
ren.
The
SA
PS th
eref
ore
incl
uded
this
targ
et in
its
Ann
ual R
epor
t for
201
0/11
.
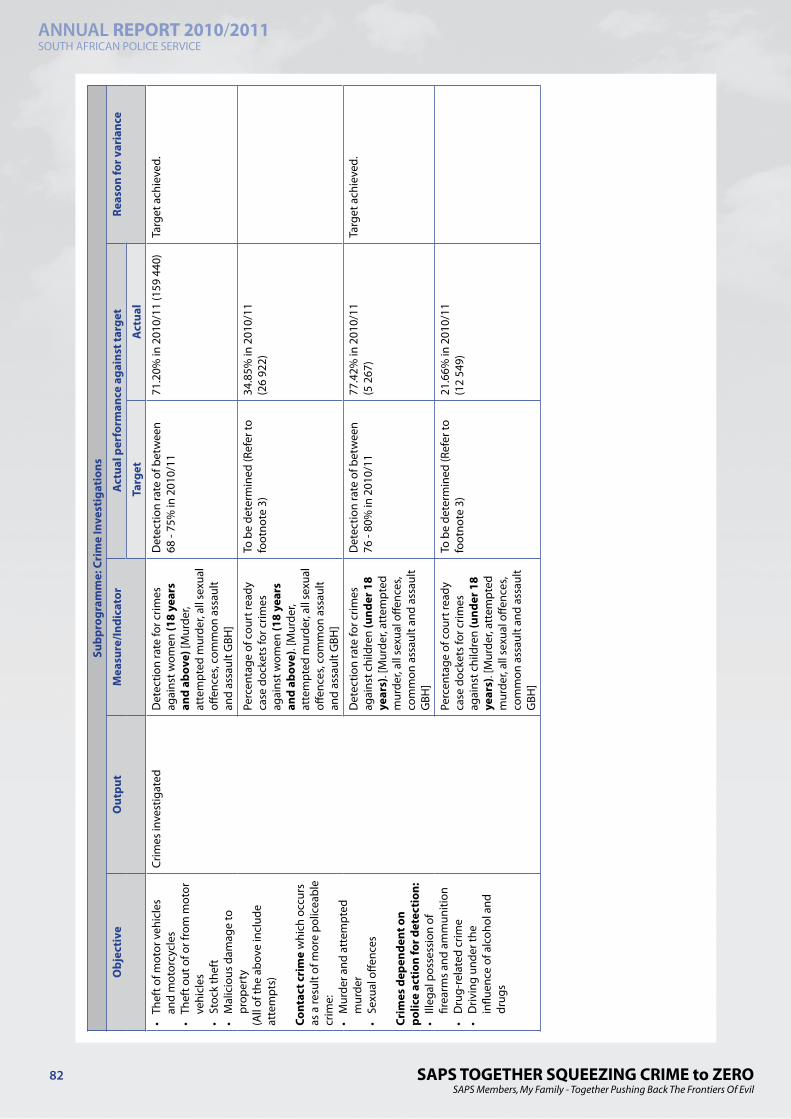
SAPS TOGETHER SQUEEZING CRIME to ZEROSAPS Members, My Family - Together Pushing Back The Frontiers Of Evil
ANNUAL REPORT 2010/2011SOUTH AFRICAN POLICE SERVICE
82
Subp
rogr
amm
e: C
rim
e In
vest
igat
ions
Obj
ecti
veO
utpu
tM
easu
re/In
dica
tor
Act
ual p
erfo
rman
ce a
gain
st ta
rget
Reas
on fo
r var
ianc
e
Targ
etA
ctua
l
• Th
eft o
f mot
or v
ehic
les
and
mot
orcy
cles
• Th
eft o
ut o
f or f
rom
mot
or
vehi
cles
• St
ock
thef
t•
Mal
icio
us d
amag
e to
pr
oper
ty
(All
of th
e ab
ove
incl
ude
atte
mpt
s)
Cont
act c
rim
e w
hich
occ
urs
as a
resu
lt of
mor
e po
licea
ble
crim
e:•
Mur
der a
nd a
ttem
pted
m
urde
r•
Sexu
al o
ffenc
es
Crim
es d
epen
dent
on
polic
e ac
tion
for d
etec
tion
:•
Illeg
al p
osse
ssio
n of
fir
earm
s an
d am
mun
ition
• D
rug-
rela
ted
crim
e•
Driv
ing
unde
r the
in
fluen
ce o
f alc
ohol
and
dr
ugs
Crim
es in
vest
igat
edD
etec
tion
rate
for c
rimes
ag
ains
t wom
en (1
8 ye
ars
and
abov
e) [M
urde
r, at
tem
pted
mur
der,
all s
exua
l off
ence
s, co
mm
on a
ssau
lt an
d as
saul
t GBH
]
Det
ectio
n ra
te o
f bet
wee
n68
- 75
% in
201
0/11
71.2
0% in
201
0/11
(159
440
)Ta
rget
ach
ieve
d.
Perc
enta
ge o
f cou
rt re
ady
case
doc
kets
for c
rimes
ag
ains
t wom
en (1
8 ye
ars
and
abov
e). [
Mur
der,
atte
mpt
ed m
urde
r, al
l sex
ual
offen
ces,
com
mon
ass
ault
and
assa
ult G
BH]
To b
e de
term
ined
(Ref
er to
fo
otno
te 3
)34
.85%
in 2
010/
11
(26
922)
Det
ectio
n ra
te fo
r crim
es
agai
nst c
hild
ren
(und
er 1
8 ye
ars)
. [M
urde
r, at
tem
pted
m
urde
r, al
l sex
ual o
ffenc
es,
com
mon
ass
ault
and
assa
ult
GBH
]
Det
ectio
n ra
te o
f bet
wee
n 76
- 80
% in
201
0/11
77.4
2% in
201
0/11
(5
267
)Ta
rget
ach
ieve
d.
Perc
enta
ge o
f cou
rt re
ady
case
doc
kets
for c
rimes
ag
ains
t chi
ldre
n (u
nder
18
year
s). [
Mur
der,
atte
mpt
ed
mur
der,
all s
exua
l offe
nces
, co
mm
on a
ssau
lt an
d as
saul
t G
BH]
To b
e de
term
ined
(Ref
er to
fo
otno
te 3
)21
.66%
in 2
010/
11
(12
549)

SAPS TOGETHER SQUEEZING CRIME to ZEROSAPS Members, My Family - Together Pushing Back The Frontiers Of Evil
ANNUAL REPORT 2010/2011SOUTH AFRICAN POLICE SERVICE
83
Subp
rogr
amm
e: S
peci
alis
ed In
vest
igat
ions
Obj
ecti
veO
utpu
tM
easu
re/In
dica
tor
Act
ual p
erfo
rman
ce a
gain
st ta
rget
Reas
on fo
r var
ianc
e
Targ
etA
ctua
l
To c
ontr
ibut
e to
the
succ
essf
ul p
rose
cutio
n of
off
ende
rs, b
y in
vest
igat
ing,
ga
ther
ing
and
anal
ysin
g ev
iden
ce, t
here
by in
crea
sing
th
e de
tect
ion
rate
and
cou
rt
read
y ca
se d
ocke
ts o
f prio
rity
crim
e, re
latin
g to
:
Corr
upti
onIn
vest
igat
ion
of c
orru
ptio
n re
late
d ch
arge
s in
term
s of
the
Prev
entio
n an
d Co
mba
ting
of C
orru
pt
Activ
ities
Act
, 200
4 (A
ct N
o.
12 o
f 200
4).
Com
mer
cial
Cri
me
To in
vest
igat
e, g
athe
r and
an
alys
e ev
iden
ce re
latin
g to
:•
Frau
d, fo
rger
y an
d ut
terin
g,•
Thef
t suc
h as
thef
t of t
rust
m
oney
and
fund
s•
The
enfo
rcem
ent o
f fif
ty-fo
ur (5
4) A
cts
of
Parli
amen
t, in
clud
ing
the
Com
pani
es A
ct, 1
973,
the
Clos
e Co
rpor
atio
n Ac
t, 19
84 a
nd th
e Ba
nks
Act,
1990
.
Crim
es in
vest
igat
edPe
rcen
tage
of c
ourt
read
y ca
se d
ocke
ts fo
r cha
rges
of
cor
rupt
ion
in re
latio
n to
ca
ses
repo
rted
To b
e de
term
ined
435
.04%
in 2
010/
11
Det
ectio
n ra
te fo
r co
mm
erci
al c
rime-
rela
ted
char
ges
Det
ectio
n ra
te o
f bet
wee
n40
- 50
% in
201
0/11
68.4
% in
201
0/11
(44
023
char
ges w
ere
refe
rred
to
cou
rt, 3
585
cha
rges
wer
e w
ithdr
awn
and
1 29
0 ch
arge
s w
ere
unfo
unde
d)
Targ
et a
chie
ved.
The
dete
ctio
n ra
te w
hich
in
crea
sed
from
36.
55%
in
2009
/10
to 6
8.4%
in 2
010/
11
can
be a
ttrib
uted
to th
e ch
ange
d ca
lcul
atio
n m
etho
d.
From
201
0/11
the
calc
ulat
ion
is b
ased
on
com
mer
cial
cr
ime
char
ges,
whi
ch w
as
prev
ious
ly b
ased
on
case
s. Th
e vo
lum
e of
cha
rges
br
ough
t int
o ca
lcul
atio
n in
crea
sed
sign
ifica
ntly
, re
sulti
ng in
a h
ighe
r out
put
(one
cas
e ca
n le
ad to
m
ultip
le c
harg
es).
Perc
enta
ge o
f cou
rt re
ady
case
doc
kets
for c
omm
erci
al
crim
e-re
late
d ch
arge
s
Cour
t rea
dy c
ases
of b
etw
een
30 -
40%
in 2
010/
1125
.6%
in 2
010/
11(O
n av
erag
e 2
304
cour
t re
ady
case
s)
Targ
et n
ot a
chie
ved
due
to th
e co
mpl
exity
of t
he
maj
ority
of c
omm
erci
al c
rime
case
s.
4 As
this
is a
new
indi
cato
r, th
e ac
tual
ach
ieve
men
t in
2010
/11
(35.
04%
) will
be
used
as
a ba
selin
e fo
r the
201
1/12
fina
ncia
l yea
r.

SAPS TOGETHER SQUEEZING CRIME to ZEROSAPS Members, My Family - Together Pushing Back The Frontiers Of Evil
ANNUAL REPORT 2010/2011SOUTH AFRICAN POLICE SERVICE
84
Subp
rogr
amm
e: S
peci
alis
ed In
vest
igat
ions
Obj
ecti
veO
utpu
tM
easu
re/In
dica
tor
Act
ual p
erfo
rman
ce a
gain
st ta
rget
Reas
on fo
r var
ianc
e
Targ
etA
ctua
l
To c
ontr
ibut
e to
the
succ
essf
ul p
rose
cutio
n of
off
ende
rs, b
y in
vest
igat
ing,
ga
ther
ing
and
anal
ysin
g ev
iden
ce, t
here
by in
crea
sing
th
e de
tect
ion
rate
and
cou
rt
read
y ca
se d
ocke
ts o
f prio
rity
crim
es, r
elat
ing
to:
Org
anis
ed c
rim
eTo
iden
tify,
inve
stig
ate
and
term
inat
e O
rgan
ised
Crim
e Pr
ojec
ts re
latin
g to
:•
Illeg
al d
rugs
and
su
bsta
nces
• Sm
uggl
ing
and
trad
ing
in
coun
terf
eit g
oods
• Th
e pl
unde
ring
of m
iner
al
and
mar
ine
reso
urce
s•
Smug
glin
g fir
earm
s•
Hum
an a
nd c
hild
tr
affick
ing
• Ca
r and
truc
k-hi
jack
ing
• Ag
grav
ated
robb
erie
s•
Cabl
e th
eft
• M
oney
laun
derin
g an
d fr
aud
Crim
es in
vest
igat
edPe
rcen
tage
of r
egis
tere
d or
gani
sed
crim
e pr
ojec
t in
vest
igat
ions
(OCP
I) su
cces
sful
ly te
rmin
ated
Succ
essf
ully
term
inat
e 50
% o
f reg
iste
red
proj
ects
in
vest
igat
ed in
201
0/11
Succ
essf
ully
term
inat
ed
30.3
% re
gist
ered
org
anis
ed
crim
e pr
ojec
t inv
estig
atio
ns.
Targ
et n
ot a
chie
ved.
Mor
e ne
twor
ks w
ere
disc
over
ed d
urin
g op
erat
ions
th
an o
rgan
ised
gro
ups
that
w
ere
initi
ally
iden
tified
du
ring
the
initi
al o
pera
tiona
l pl
anni
ng th
ereo
f.

SAPS TOGETHER SQUEEZING CRIME to ZEROSAPS Members, My Family - Together Pushing Back The Frontiers Of Evil
ANNUAL REPORT 2010/2011SOUTH AFRICAN POLICE SERVICE
85
Subp
rogr
amm
e: C
rim
inal
Rec
ord
Cent
re
Obj
ecti
veO
utpu
tM
easu
re/In
dica
tor
Act
ual p
erfo
rman
ce a
gain
st ta
rget
Reas
on fo
r var
ianc
e
Targ
etA
ctua
l
To p
rovi
de fi
nger
prin
t ev
iden
ce re
latin
g to
con
tact
cr
ime,
pro
pert
y-re
late
d cr
ime,
crim
es d
epen
dent
on
polic
e ac
tion
and
com
mer
cial
cr
ime
in re
spec
t of:
• Cr
ime
scen
e m
anag
emen
t•
Evid
ence
man
agem
ent
• Pr
esen
tatio
n of
evi
denc
e in
cou
rt•
Prov
idin
g in
form
atio
n on
cr
ime
hist
ory
Fing
erpr
int i
dent
ifica
tion
Perc
enta
ge o
f pre
viou
s co
nvic
tion
repo
rts
gene
rate
d w
ithin
30
days
76%
offe
nder
’s pr
evio
us
conv
ictio
n re
port
s fo
r cr
ime-
rela
ted
finge
rprin
ts
gene
rate
d w
ithin
30
days
in
2010
/11
81.4
6% (9
94 0
20 fr
om a
to
tal o
f 1 2
20 2
05) o
ffend
er’s
prev
ious
con
vict
ion
repo
rts
for c
rime-
rela
ted
finge
rprin
ts
wer
e ge
nera
ted
with
in 3
0 da
ys.
Targ
et a
chie
ved.
Mor
e pr
evio
us c
onvi
ctio
n re
port
s w
ere
gene
rate
d in
201
0/11
due
to th
e up
grad
ing
of th
e Au
tom
ated
Fi
nger
prin
t Ide
ntifi
catio
n Sy
stem
(AFI
S)
To p
rovi
de fo
rens
ic e
vide
nce
rela
ting
to c
onta
ct c
rime,
pr
oper
ty-r
elat
ed c
rime,
cr
imes
dep
ende
nt o
n po
lice
actio
n an
d co
mm
erci
al c
rime
in re
spec
t of:
• Cr
ime
scen
e m
anag
emen
t•
Evid
ence
man
agem
ent
• Ex
plos
ive
resp
onse
• Pr
esen
tatio
n of
evi
denc
e in
cou
rt
Fore
nsic
evi
denc
ePe
rcen
tage
of e
xhib
its
anal
ysed
by
fore
nsic
ana
lyst
s w
ithin
35
days
92%
ent
ries
rece
ived
by
the
fore
nsic
ana
lyst
, ana
lyse
d w
ithin
35
days
in 2
010/
11
93.5
% (2
97 9
55 fr
om a
tota
l of
318
665
) ent
ries
wer
e an
alys
ed b
y fo
rens
ic a
naly
sts
with
in 3
5 da
ys.
Targ
et a
chie
ved.

SAPS TOGETHER SQUEEZING CRIME to ZEROSAPS Members, My Family - Together Pushing Back The Frontiers Of Evil
ANNUAL REPORT 2010/2011SOUTH AFRICAN POLICE SERVICE
86
Service Delivery Achievements in relation to objectives and performance measures
Subprogramme: Crime Investigations
Detection rate and court ready case dockets for contact crime, contact-related crime, property-related crime, crimes dependent on police action for detection and other serious crime
➤ There are two different criteria that are utilised to evaluate the performance of the SAPS in solving crime. These are the detection rate (the ability to solve cases) and court ready case dockets. Table 23 reflects the targets on the detection rate and court ready case dockets achieved from 1 April 2010 to 31 March 2011 on contact crime, contact-related crime, property-related crime, crimes dependent on police action for detection and other serious crime.
➤ Table 23 reflects the number of charges that were reported at police stations in respect of the above
crimes. These figures were drawn from the Crime Management Information System (CMIS), which is a live system. The charges carried over are the number of charges that were carried over from the previous year/s, of which the investigation has not been concluded at that time.
➤ The total number of charges that were investigated is determined by the number of charges reported
(new charges) as well as charges that are still pending from previous financial years (charges that are still being investigated).
➤ It should be noted that, to determine the detection rate, the total number of charges referred to
court plus charges withdrawn before court and charges closed as unfounded were divided by the total number of charges investigated. Charges withdrawn before court are charges which had, for example, been sent to the Senior Public Prosecutor and a decision was made not to prosecute. The reason for this decision might be that the victim does not want to continue with the case or there was insufficient evidence or it was actually a civil matter. Charges are closed as unfounded if it is established, in the course of the investigation, that a crime has not actually been committed.
➤ A court ready case docket is a fully investigated case docket, which includes one or more charges
that can be utilised by the National Prosecuting Agency (NPA) for the prosecution of an offender. The term fully investigated entails that there is no outstanding information which requires further investigation by a detective and that all evidence (e.g. statements, DNA, etc.) has been obtained. To determine the court ready rate, the total number of charges that are marked as ‘court ready’ on the Crime Administration System (dockets booked out to court) are divided by the total number of charges that are not yet finalised in court.
Contact crime (crimes against the person)
➤ Table 23 shows that the total number of charges reported decreased by 37 977 (-5.61%), i.e. from 676 445 in 2009/10 to 638 468 in 2010/11. The highest decrease in reported charges was in respect of attempted murder with 1 917 (-11.01%) less charges and robbery aggravated with 12 292 (-10.81) less charges. Marginal decreases were noted in all the other crimes.
➤ The following percentages were achieved for the 2010/11 financial year:
Detection Rate: 56.99%Court Ready Dockets: 32.24% was achieved which will be utilised as a baseline for future
planning purposes and target setting.

SAPS TOGETHER SQUEEZING CRIME to ZEROSAPS Members, My Family - Together Pushing Back The Frontiers Of Evil
ANNUAL REPORT 2010/2011SOUTH AFRICAN POLICE SERVICE
87
The detection rate for contact crime increased with 3.53% to 56.99%. The highest increase was in respect of attempted murder with 3.15%, but marginal increases were noted in all other crimes.
Property-related crime
➤ 18 917 (-3.42%) less charges were reported in 2010/11 than in 2009/10, i.e. from 553 368 in 2009/10
to 534 451 in 2010/11. The highest decrease in reported charges was in respect of theft of motor vehicle with 7 272 (-10.13%) less charges, but theft out of or from motor vehicle indicated an increase of 2 229 (1.84%) more charges.
➤ The following percentages were achieved for the 2010/11 financial year:
Detection Rate: 15.84%Court Ready Dockets: 31.06% was achieved which will be utilised as a baseline for future
planning purposes and target setting.
The detection rate for property-related crime increased with 0.71% to 15.84%. The highest increase was in respect of theft of motor vehicle which was 1.17%.
Crimes dependent on police action for detection
➤ 19 521 (9.19%) more charges were reported in 2010/11 than in 2009/10, i.e. from 212 321 in 2009/10
to 231 842 in 2010/11. The highest increase in reported charges was in respect of drug-related crime with 15 833 (11.74%) more charges.
➤ The following percentages were achieved for the 2010/11 financial year:
Detection Rate: 98.53%Court Ready Dockets: 28.41% was achieved which will be utilised as a baseline for future
planning purposes and target setting.
The detection rate for crimes dependent on police action for detection increased with 0.75% to 98.53%. Illegal possession of firearms and ammunition indicated the highest increase of 3.24% to 93.64%.

SAPS TOGETHER SQUEEZING CRIME to ZEROSAPS Members, My Family - Together Pushing Back The Frontiers Of Evil
ANNUAL REPORT 2010/2011SOUTH AFRICAN POLICE SERVICE
88
Tabl
e 23
: Per
form
ance
of G
ener
al In
vest
igat
ions
Cont
act C
rime
(Crim
es a
gain
st th
e pe
rson
)
Crim
e ca
tego
ryTo
tal n
umbe
r of c
harg
es re
port
edTo
tal n
umbe
r of c
harg
es in
com
plet
e%
Det
ectio
n ra
teTo
tal c
harg
es in
cour
t%
Cha
rges
cour
t rea
dy
09/1
010
/11
diff
% d
iff09
/10
10/1
1di
ff%
diff
09/1
010
/11
% d
iff09
/10
10/1
1di
ff%
diff
09/1
010
/11
% d
iff
Mur
der
1683
415
940
-894
-5.3
125
973
2940
934
3613
.23
1286
4(24
.79)
1257
5(26
.84)
2.05
2820
528
095
-110
-0.3
90(
0.00
)81
34(2
8.95
)28
.95
Atte
mpt
ed
mur
der
1741
015
493
-191
7-1
1.01
6979
7505
526
7.54
1101
0(41
.22)
1044
1(44
.37)
3.15
1092
210
980
580.
530(
0.00
)38
41(3
4.98
)34
.98
Robb
ery
with
ag
grav
atin
g ci
rcum
stan
ces
1137
5510
1463
-122
92-1
0.81
2816
934
648
6479
23.0
019
004(
14.2
4)17
678(
15.7
4)1.
5021
996
2190
2-9
4-0
.43
0(0.
00)
7627
(34.
82)
34.8
2
Com
mon
ro
bber
y57
537
5488
3-2
654
-4.6
155
7075
5419
8435
.62
2363
6(34
.49)
2229
9(35
.73)
1.24
1200
411
461
-543
-4.5
20(
0.00
)33
06(2
8.85
)28
.85
Assa
ult G
BH20
5293
1986
02-6
691
-3.2
622
443
2373
912
965.
7717
5342
(74.1
1)17
2264
(76.7
8)2.
6765
481
6268
0-2
801
-4.2
80(
0.00
)24
319(
38.80
)38
.80
Com
mon
ass
ault
1972
8418
5891
-113
93-5
.77
2563
126
978
1347
5.26
1662
81(7
2.01)
1606
67(7
4.80)
2.79
3513
134
292
-839
-2.3
90(
0.00
)10
959(
31.96
)31
.96
Sexu
al o
ffenc
es68
332
6619
6-2
136
-3.1
315
727
1695
912
327.
8351
182(
71.1
7)49
199(
71.6
6)0.
4948
816
4940
258
61.
200(
0.00
)12
357(
25.01
)25
.01
Tota
l67
6445
6384
68-3
7977
-5.6
113
0492
1467
9216
300
12.4
945
9319
(53.4
6)44
5123
(56.9
9)3.
5322
2555
2188
12-3
743
-1.6
80(
0.00
)70
543(
32.24
)32
.24
Cont
act-
rela
ted
crim
e
Crim
e ca
tego
ryTo
tal n
umbe
r of c
harg
es re
port
edTo
tal n
umbe
r of c
harg
es in
com
plet
e%
Det
ectio
n ra
teTo
tal c
harg
es in
cour
t%
Cha
rges
cour
t rea
dy
09/1
010
/11
diff
% d
iff09
/10
10/1
1di
ff%
diff
09/1
010
/11
% d
iff09
/10
10/1
1di
ff%
diff
09/1
010
/11
% d
iff
Arso
n67
0165
33-1
68-2
.51
1481
1613
132
8.91
3248
(37.
12)
3225
(38.
81)
1.69
1252
1256
40.
320(
0.00
)57
8(46
.02)
46.0
2
Mal
icio
us
dam
age
to
prop
erty
1321
3412
5327
-680
7-5
.15
1212
613
268
1142
9.42
6941
8(45
.98)
6661
1(47
.79)
1.81
1933
218
429
-903
-4.6
70(
0.00
)71
43(3
8.76
)38
.76
Tota
l13
8835
1318
60-6
975
-5.0
213
607
1488
112
749.
3672
666(
45.4
9)69
836(
47.2
9)1.
8020
584
1968
5-8
99-4
.37
0(0.
00)
7721
(39.
22)
39.2
2
Prop
erty
-rel
ated
crim
e
Crim
e ca
tego
ryTo
tal n
umbe
r of c
harg
es re
port
edTo
tal n
umbe
r of c
harg
es in
com
plet
e%
Det
ectio
n ra
teTo
tal c
harg
es in
cour
t%
Cha
rges
cour
t rea
dy
09/1
010
/11
diff
% d
iff09
/10
10/1
1di
ff%
diff
09/1
010
/11
% d
iff09
/10
10/1
1di
ff%
diff
09/1
010
/11
% d
iff
Burg
lary
at
resid
entia
l pr
emise
s25
6577
2476
30-8
947
-3.4
922
221
3308
510
864
48.8
957
258(
18.8
8)53
281(
19.4
0)0.
5228
842
2899
215
00.
520(
0.00
)82
29(2
8.38
)28
.38
Burg
lary
at
non-
resid
entia
l pr
emise
s71
773
6908
2-2
691
-3.7
559
6388
5628
9348
.52
1315
9(16
.22)
1256
5(16
.30)
0.08
8066
7929
-137
-1.7
00(
0.00
)28
87(3
6.41
)36
.41

SAPS TOGETHER SQUEEZING CRIME to ZEROSAPS Members, My Family - Together Pushing Back The Frontiers Of Evil
ANNUAL REPORT 2010/2011SOUTH AFRICAN POLICE SERVICE
89
Prop
erty
-rel
ated
crim
e
Crim
e ca
tego
ryTo
tal n
umbe
r of c
harg
es re
port
edTo
tal n
umbe
r of c
harg
es in
com
plet
e%
Det
ectio
n ra
teTo
tal c
harg
es in
cour
t%
Cha
rges
cour
t rea
dy
09/1
010
/11
diff
% d
iff09
/10
10/1
1di
ff%
diff
09/1
010
/11
% d
iff09
/10
10/1
1di
ff%
diff
09/1
010
/11
% d
iff
Thef
t of m
otor
ve
hicl
es a
nd
mot
or c
ycle
s71
776
6450
4-7
272
-10.
1319
338
3246
013
122
67.8
682
79(6
.80)
7883
(7.9
7)1.
1783
2682
24-1
021.
230(
0.00
)27
82(3
3.83
)33
.83
Thef
t out
of
or fr
om m
otor
ve
hicl
es12
0862
1230
9122
291.
8463
3199
2935
9856
.83
1338
0(10
.14)
1367
2(10
.41)
0.27
5622
5520
-102
-1.8
10(
0.00
)17
85(3
2.34
)32
.34
Stoc
k th
eft
3238
030
144
-223
6-6
.91
7122
7373
251
3.52
9610
(23.
64)
9273
(24.
27)
0.63
4399
4331
-68
-1.5
50(
0.00
)14
00(3
2.33
)32
.33
Tota
l55
3368
5344
51-1
8917
-3.4
260
975
9170
330
728
50.3
910
1686
(15.1
3)96
674(
15.8
4)0.
7155
255
5499
6-2
59-0
.47
0(0.
00)
1708
3(31
.06)
31.0
6
Crim
es d
epen
dent
on
polic
e ac
tion
for d
etec
tion
Crim
e ca
tego
ryTo
tal n
umbe
r of c
harg
es re
port
edTo
tal n
umbe
r of c
harg
es in
com
plet
e%
Det
ectio
n ra
teTo
tal c
harg
es in
cour
t%
Cha
rges
cour
t rea
dy
09/1
010
/11
diff
% d
iff09
/10
10/1
1di
ff%
diff
09/1
010
/11
% d
iff09
/10
10/1
1di
ff%
diff
09/1
010
/11
% d
iff
Illeg
al p
osse
ssio
n of
fire
arm
s and
am
mun
ition
1454
214
472
-70
-0.4
885
410
2216
819
.67
1467
9(90
.40)
1471
8(93
.64)
3.24
2088
020
990
110
0.53
0(0.
00)
7601
(36.
21)
36.2
1
Drug
-rela
ted
crim
e13
4840
1506
7315
833
11.7
489
790
58
0.89
1336
40(9
8.90)
1502
02(9
9.24)
0.34
4797
750
150
2173
4.53
0(0.
00)
1522
7(30.3
6)30
.36
Driv
ing
unde
r th
e in
fluen
ce o
f al
coho
l 62
939
6669
737
585.
9713
1211
71-1
41-1
0.75
6281
9(97
.44)
6685
0(98
.13)
0.69
5065
150
369
-282
-0.5
60(
0.00
)11
692(2
3.21)
23.2
1
Tota
l21
2321
2318
4219
521
9.19
3063
3098
351.
1421
1138
(97.7
8)23
1770
(98.5
3)0.
7511
9508
1215
0920
011.
670(
0.00
)34
520(
28.41
)28
.41
Oth
er se
rious
crim
e
Crim
e ca
tego
ryTo
tal n
umbe
r of c
harg
es re
port
edTo
tal n
umbe
r of c
harg
es in
com
plet
e%
Det
ectio
n ra
teTo
tal c
harg
es in
cour
t%
Cha
rges
cour
t rea
dy
09/1
010
/11
diff
% d
iff09
/10
10/1
1di
ff%
diff
09/1
010
/11
% d
iff09
/10
10/1
1di
ff%
diff
09/1
010
/11
% d
iff
Thef
t (ot
her)
3674
4236
8095
653
0.18
3990
855
890
1598
240
.05
1363
18(3
0.52)
1315
13(3
1.35)
0.83
4309
642
098
-998
-2.3
20(
0.0)
1277
5(30
.35)
30.3
5
Frau
d84
842
8838
835
464.
1831
592
3615
845
6614
.45
3936
3(35
.08)
3970
5(32
.32)
-2.7
622
217
2199
9-2
18-0
.98
0(0.
0053
66(2
4.39)
24.3
9
Shop
liftin
g88
634
7838
3-1
0251
-11.
5736
558
121
659
.18
8818
4(98
.80)
7824
0(99
.03)
0.23
2821
926
547
-167
2-5
.93
0(0.
0079
25(2
9.85)
29.8
5
Tota
l54
0918
5348
6660
52-1
.12
7186
592
629
2076
428
.89
2638
65(4
0.50)
2494
58(4
0.57)
0.07
9353
290
644
-288
8-3
.09
0(0.
0026
066(
28.76
)28
.76
Trio
crim
e
Crim
e ca
tego
ryTo
tal n
umbe
r of c
harg
es re
port
edTo
tal n
umbe
r of c
harg
es in
com
plet
e%
Det
ectio
n ra
teTo
tal c
harg
es in
cour
t%
Cha
rges
cour
t rea
dy
09/1
010
/11
diff
% d
iff09
/10
10/1
1di
ff%
diff
09/1
010
/11
% d
iff09
/10
10/1
1di
ff%
diff
09/1
010
/11
% d
iff
Trio
Crim
e:
Car -
Jack
ing
/ho
use
robb
erie
s /b
usin
ess
robb
erie
s
4722
242
183
-503
9-1
0.67
1965
322
919
3266
16.6
210
841(
14.7
7)10
900(
16.0
2)1.
2512
451
1276
030
92.
480(
0.00
)48
15(3
7.74
)37
.74
Tota
l47
222
4218
3-5
039
-10.
6719
653
2291
932
6616
.62
1084
1(14
.77)
1090
0(16
.02)
1.25
1245
112
760
309
2.48
0(0.
00)
4815
(37.
74)
37.7
4
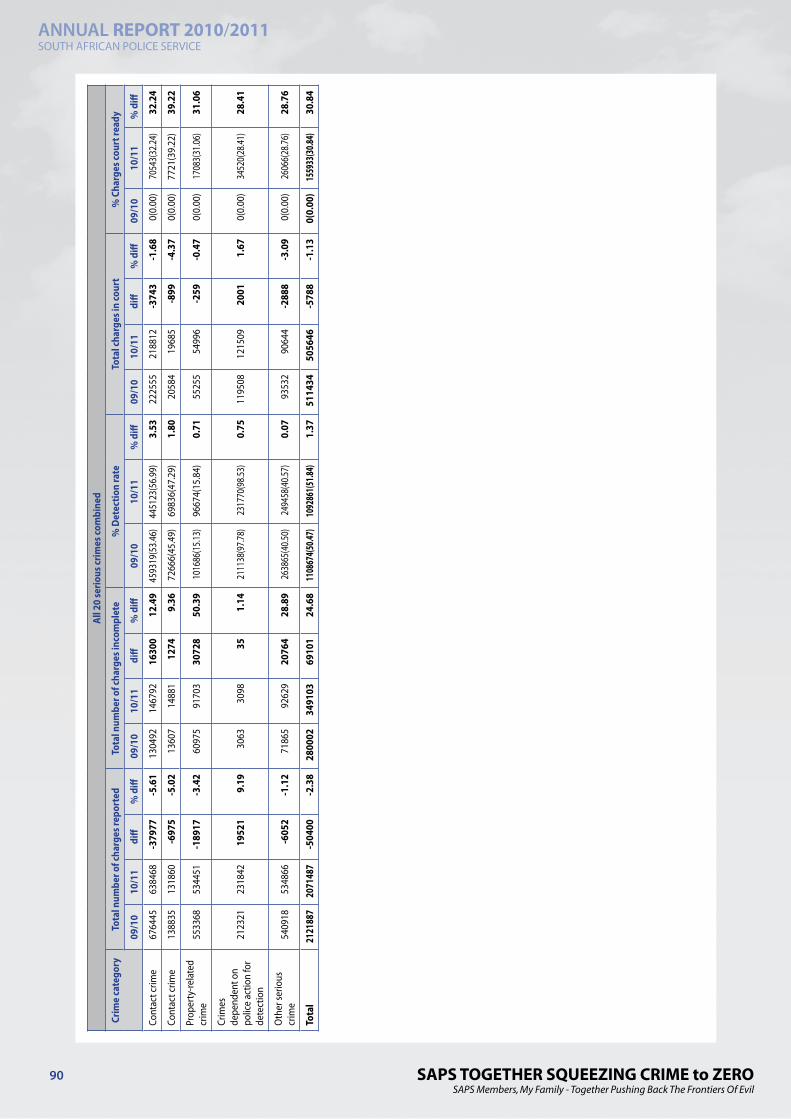
SAPS TOGETHER SQUEEZING CRIME to ZEROSAPS Members, My Family - Together Pushing Back The Frontiers Of Evil
ANNUAL REPORT 2010/2011SOUTH AFRICAN POLICE SERVICE
90
All 2
0 se
rious
crim
es co
mbi
ned
Crim
e ca
tego
ryTo
tal n
umbe
r of c
harg
es re
port
edTo
tal n
umbe
r of c
harg
es in
com
plet
e%
Det
ectio
n ra
teTo
tal c
harg
es in
cour
t%
Cha
rges
cour
t rea
dy
09/1
010
/11
diff
% d
iff09
/10
10/1
1di
ff%
diff
09/1
010
/11
% d
iff09
/10
10/1
1di
ff%
diff
09/1
010
/11
% d
iff
Cont
act c
rime
6764
4563
8468
-379
77-5
.61
1304
9214
6792
1630
012
.49
4593
19(5
3.46
)44
5123
(56.
99)
3.53
2225
5521
8812
-374
3-1
.68
0(0.
00)
7054
3(32
.24)
32.2
4
Cont
act c
rime
1388
3513
1860
-697
5-5
.02
1360
714
881
1274
9.36
7266
6(45
.49)
6983
6(47
.29)
1.80
2058
419
685
-899
-4.3
70(
0.00
)77
21(3
9.22
)39
.22
Prop
erty
-rela
ted
crim
e55
3368
5344
51-1
8917
-3.4
260
975
9170
330
728
50.3
910
1686
(15.1
3)96
674(
15.8
4)0.
7155
255
5499
6-2
59-0
.47
0(0.
00)
1708
3(31
.06)
31.0
6
Crim
es
depe
nden
t on
polic
e ac
tion
for
dete
ctio
n
2123
2123
1842
1952
19.
1930
6330
9835
1.14
2111
38(9
7.78)
2317
70(9
8.53)
0.75
1195
0812
1509
2001
1.67
0(0.
00)
3452
0(28
.41)
28.4
1
Oth
er se
rious
cr
ime
5409
1853
4866
-605
2-1
.12
7186
592
629
2076
428
.89
2638
65(4
0.50)
2494
58(4
0.57)
0.07
9353
290
644
-288
8-3
.09
0(0.
00)
2606
6(28
.76)
28.7
6
Tota
l21
2188
720
7148
7-5
0400
-2.3
828
0002
3491
0369
101
24.6
811
0867
4(50.4
7)10
9286
1(51.8
4)1.
3751
1434
5056
46-5
788
-1.1
30(
0.00
)15
5933
(30.84
)30
.84
SAPS TOGETHER SQUEEZING CRIME to ZEROSAPS Members, My Family - Together Pushing Back The Frontiers Of Evil
ANNUAL REPORT 2010/2011SOUTH AFRICAN POLICE SERVICE
91
Detection rate and court ready case dockets for crimes against children (under 18 years)
➤ Figures pertaining to some contact crimes against women (18 years and older) and children (under 18 years) which often occur in the domestic/family environment are also provided. It is evident from table 24 that 42.49% of all reported sexual offence cases, 7.20% of all reported common assault cases and 5.54% of all reported assault GBH cases was committed against children. 5.07% and 5.68% of reported attempted murder and murder cases respectively, were committed against children.
➤ From the table it is evident that the total number of charges reported decreased by 6 636 (-10.9%) in comparison with the same period in the 2009/10 financial year. Attempted murder indicated a decrease of -35.31% and murder a decrease of -24.94%.
➤ The detection rate increased with 8.49% to 77.42%. Assault GBH indicated an increase of 13.71% and common assault an increase of 12.85%.
Detection rate and court ready case dockets for crimes against women (persons 18 years and older)
➤ As illustrated in table 24, 54.11% of all reported sexual offence cases, 48.39% of all reported common assault cases and 30.52% of all reported assault GBH cases were committed against women. 18.34% and 16.27% of all reported attempted murder and murder cases respectively, were committed against women.
➤ The table also shows that the total number of charges reported decreased by 27 589 (-12.57%) in comparison with the same period in the 2009/10 financial year. Particularly, attempted murder indicated a decrease of -24.74%.
➤ The detection rate decreased with -1.88% to 71.20%. Although the total detection rate indicated a decrease, an increase of 11.69% was noted in attempted murder.
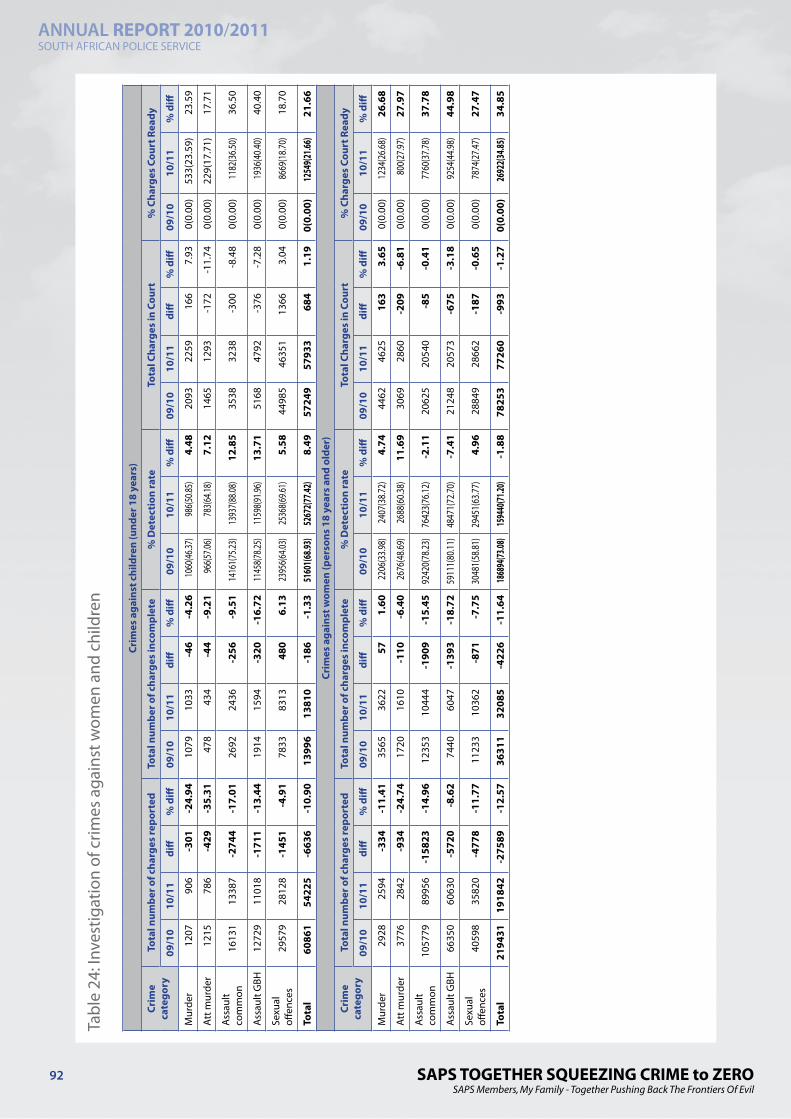
SAPS TOGETHER SQUEEZING CRIME to ZEROSAPS Members, My Family - Together Pushing Back The Frontiers Of Evil
ANNUAL REPORT 2010/2011SOUTH AFRICAN POLICE SERVICE
92
Tabl
e 24
: Inv
estig
atio
n of
crim
es a
gain
st w
omen
and
chi
ldre
n
Crim
es a
gain
st c
hild
ren
(und
er 1
8 ye
ars)
Crim
e ca
tego
ryTo
tal n
umbe
r of c
harg
es re
port
edTo
tal n
umbe
r of c
harg
es in
com
plet
e%
Det
ecti
on ra
teTo
tal C
harg
es in
Cou
rt%
Cha
rges
Cou
rt R
eady
09/1
010
/11
diff
% d
iff09
/10
10/1
1di
ff%
diff
09/1
010
/11
% d
iff09
/10
10/1
1di
ff%
diff
09/1
010
/11
% d
iff
Mur
der
1207
906
-301
-24.
9410
7910
33-4
6-4
.26
1060
(46.37
)98
6(50.8
5)4.
4820
9322
5916
67.
930(
0.00
)53
3(23
.59)
23.5
9
Att
mur
der
1215
786
-429
-35.
3147
843
4-4
4-9
.21
966(5
7.06)
783(6
4.18)
7.12
1465
1293
-172
-11.
740(
0.00
)22
9(17
.71)
17.7
1
Ass
ault
com
mon
1613
113
387
-274
4-1
7.01
2692
2436
-256
-9.5
114
161(7
5.23)
1393
7(88.0
8)12
.85
3538
3238
-300
-8.4
80(
0.00
)11
82(3
6.50)
36.5
0
Ass
ault
GBH
1272
911
018
-171
1-1
3.44
1914
1594
-320
-16.
7211
458(7
8.25)
1159
8(91.9
6)13
.71
5168
4792
-376
-7.2
80(
0.00
)19
36(4
0.40)
40.4
0
Sexu
al
offen
ces
2957
928
128
-145
1-4
.91
7833
8313
480
6.13
2395
6(64.0
3)25
368(6
9.61)
5.58
4498
546
351
1366
3.04
0(0.
00)
8669
(18.7
0)18
.70
Tota
l60
861
5422
5-6
636
-10.
9013
996
1381
0-1
86-1
.33
5160
1(68.9
3)52
672(7
7.42)
8.49
5724
957
933
684
1.19
0(0.
00)
1254
9(21.6
6)21
.66
Crim
es a
gain
st w
omen
(per
sons
18
year
s an
d ol
der)
Crim
e ca
tego
ryTo
tal n
umbe
r of c
harg
es re
port
edTo
tal n
umbe
r of c
harg
es in
com
plet
e%
Det
ecti
on ra
teTo
tal C
harg
es in
Cou
rt%
Cha
rges
Cou
rt R
eady
09/1
010
/11
diff
% d
iff09
/10
10/1
1di
ff%
diff
09/1
010
/11
% d
iff09
/10
10/1
1di
ff%
diff
09/1
010
/11
% d
iff
Mur
der
2928
2594
-334
-11.
4135
6536
2257
1.60
2206
(33.9
8)24
07(3
8.72)
4.74
4462
4625
163
3.65
0(0.
00)
1234
(26.6
8)26
.68
Att
mur
der
3776
2842
-934
-24.
7417
2016
10-1
10-6
.40
2676
(48.6
9)26
88(6
0.38)
11.6
930
6928
60-2
09-6
.81
0(0.
00)
800(
27.97
)27
.97
Ass
ault
com
mon
1057
7989
956
-158
23-1
4.96
1235
310
444
-190
9-1
5.45
9242
0(78
.23)
7642
3(76
.12)
-2.1
120
625
2054
0-8
5-0
.41
0(0.
00)
7760
(37.7
8)37
.78
Ass
ault
GBH
6635
060
630
-572
0-8
.62
7440
6047
-139
3-1
8.72
5911
1(80
.11)
4847
1(72
.70)
-7.4
121
248
2057
3-6
75-3
.18
0(0.
00)
9254
(44.9
8)44
.98
Sexu
al
offen
ces
4059
835
820
-477
8-1
1.77
1123
310
362
-871
-7.7
530
481(
58.81
)29
451(
63.77
)4.
9628
849
2866
2-1
87-0
.65
0(0.
00)
7874
(27.4
7)27
.47
Tota
l21
9431
1918
42-2
7589
-12.
5736
311
3208
5-4
226
-11.
6418
6894
(73.08
)15
9440
(71.20
)-1
.88
7825
377
260
-993
-1.2
70(
0.00
)26
922(3
4.85)
34.8
5

SAPS TOGETHER SQUEEZING CRIME to ZEROSAPS Members, My Family - Together Pushing Back The Frontiers Of Evil
ANNUAL REPORT 2010/2011SOUTH AFRICAN POLICE SERVICE
93
Family Violence, Child Protection and Sexual Offences Unit (FCS)
➤ The re-establishment of the FCS Units commenced in June 2010. The policing cluster model was followed and FCS Units were established in all 176 clusters by 31 March 2011. A total of 1 864 police officials and 218 support staff (Public Service Act members) were placed at the units. The majority of these members have previous FCS-investigative experience and training. An additional 250 FCS members attended the FCS Detective Learning Programme during the financial year. Members were exposed to the following training programmes:
➣ FCS Detective Learning Programme
➣ Resolving of Crime Learning Programme
➣ Basic Crime Investigation Programme
➣ Detective Commanders Learning Programme
➣ Sexual Offences Investigation Course
➣ First responder to Sexual Offences Course
➣ Integrated Sexual Offences Course (multi-disciplinary)
➣ Statement Taking Programme
➣ In-service Training (on the job training)
➣ FCS-related workshops.
➤ The focus areas of the FCS can be summarised as follows:
➣ Sexual Offences, i.e. rape, sexual assault, incest, etc in terms of the Criminal Law (Sexual Offences and Related Matters) Amendment Act, 2007 (Act No 32 of 2007)
➣ Person directed crime, i.e. assault with the intention to commit grievous bodily harm and attempted murder
➣ Illegal removal of persons, i.e. kidnapping and abduction
➣ Electronic media facilitated crime, i.e. exploitation of children by means of the production, distribution, importation, and possession of child pornography in terms of the Films and Publications Act, 1996 (Act No 65 of 1996).
➤ The following sentences on FCS-related crime were handed down in court during the financial year:
➣ Cases where the victim was a child (under the age of 18 years) ➛ 175 life time sentences ➛ a total of 10 345 years imprisonment
➣ Cases where the victim was an adult (older than 18 years) ➛ 131 life time sentences ➛ a total of 10 854 years imprisonment.

SAPS TOGETHER SQUEEZING CRIME to ZEROSAPS Members, My Family - Together Pushing Back The Frontiers Of Evil
ANNUAL REPORT 2010/2011SOUTH AFRICAN POLICE SERVICE
94
Subprogramme: Specialised Investigations
Organised Crime
➤ Organised crime spans a wide area: illegal drugs; plundering precious metals and diamonds; smuggling firearms and weapons; human trafficking; money laundering;, specific violent crime; non ferrous metals; vehicle related crime; endangered species; crimes against the state; and related crime. In terms of this, the Organised Crime Unit within the SAPS identified and investigated 179 organised crime groups composed of 492 targets. 57 of these groups were successfully terminated, resulting in the arrest of 282 suspects.
➤ Additional to the mandate, 1 415 arrests were made and 376 convictions were secured for specific violent crime such as the hijacking of cars and truck-hijacking, cash-in-transit robberies, bank robberies, ATM bombings, house- and business robberies. 2 910 arrests and 700 convictions resulted from non-project investigations which exclude specific violent crime.
Drug-related crime
➤ For the past decade in respect of organised crime groups, drug threats accounts for the largest proportion of known threats. Drug smuggling usually ties in with other dimensions of organised crime such as diamond, gold and abalone smuggling, as well as vehicle hijacking. Major drugs, such as mandrax, cocaine, heroin, ecstacy, CAT and Crystal meth (Tik-Tik), are the most pervasive drugs produced, distributed and consumed in South Africa.
➤ During the investigation of organised crime cases, 13 342,738kg cocaine, 246,544kg crack cocaine, 29 551,184kg cannabis, 52,602kg Crystal meth (Tik-Tik), 1,357kg heroin, 32,088kg CAT, 970 ecstasy tablets, 623 180 mandrax tablets and 19,704kg chemicals were confiscated. It should be noted that these confiscations are additional to those that are reported under Programme 2: Visible Policing.
➤ During the reporting period 32 clandestine drug laboratories were detected and dismantled. In support of the investigations into clandestine laboratories, the chemical monitoring programme responsible for monitoring precursor chemicals to prevent the diversion of the chemicals for the manufacture of illicit drugs, dealt with 122 import notifications of precursor chemicals to South Africa. Additionally, 539 export notifications of precursor chemicals were forwarded to the relevant foreign authorities for action.
Precious metals and diamonds
➤ During the reporting period, 653 persons were arrested for the illegal purchase, theft and possession of uncut diamonds and unwrought precious metals, compared to 856 arrests in 2009/10. The total value of diamonds, gold, other precious metals and cash confiscated was R25.9 million.
➤ Investigations into non-ferrous metals focused primarily on the theft of copper cables (electricity and rail cable). Organised Crime Investigation Units succeeded in arresting 123 suspects for crimes relating to the theft and possession of non-ferrous metals. 27 convictions were secured during 2010/11 compared to 141 arrests and 26 convictions in 2009/10.
Seizure of assets
➤ To create a more coordinated approach between the Organised Crime Units and Assets Forfeiture Unit (AFU), Organised Crime seconded members to the AFU to conduct investigations to trace the assets of organised criminal groups. The Assets Forfeiture task teams achieved the following in relation to the investigation of 1 009 cases:

SAPS TOGETHER SQUEEZING CRIME to ZEROSAPS Members, My Family - Together Pushing Back The Frontiers Of Evil
ANNUAL REPORT 2010/2011SOUTH AFRICAN POLICE SERVICE
95
Orders Obtained Number ValueRestraining orders 48 R127.4 millionPreservation orders 193 R21.5 millionForfeiture orders 234 R3.1 million
Implementing the Prevention of Organised Crime Act, 188 (Act No. 121 of 1998) (POCA)
➤ As a result of good cooperation between Organised Crime and the National Prosecuting Authority (NPA), the NPA appointed dedicated organised crime prosecutors since 2007, to deal with organised crime-related cases. Up to 31 March 2011, this initiative resulted in 166 prosecutions that were instituted for contravening the Prevention of Organised Crime Act. During the reporting period a total of 30 potential cases were submitted to the NPA for consideration to prosecute based on charges of racketeering.
Cross-border crime operations
➤ In order to establish better coordination and developing mutually beneficial activities, systems and processes and improved cooperation between SARPCCO countries in addressing cross-border crime were emphasised, including illegal firearms, illegal immigrants, drug smuggling, and stolen and robbed vehicles.
➤ Various cross border operations were conducted during which 261 vehicles were impounded, 14 firearms were seized, 396 illegal immigrants and 41 suspects were arrested for various crimes. 34kg cannabis, 243g heroine and 34kg CAT were seized during these operations. Various SAPS Divisions were involved including Visible Policing, Detective Services, Crime Intelligence and the DPCI.
Endangered species
➤ During the reporting period 230 persons (compared to 83 in 2009/10) were arrested for the illegal possession of abalone, the illegal possession of cycads, illegal hunting/possession/dealing in/of specially protected animals or animal products, the illegal possession/dealing in elephant ivory and illegal possession/dealing in rhino horn. The total value of items seized amounted to R62.7 million.
Charges relating to commercial crime
➤ Commercial crime refers to fraud, forgery and uttering; theft such as theft of trust money or funds that have been manipulated to such an extent that the services of a charted accountant are required to bolster investigations; and the enforcement of 54 Acts of Parliament such as the Companies Act, 1973, the Close Corporations Act, 1984, the Counterfeit Goods Act, 1997, and the Banks Act, 1990.
➤ There were 54 986 charges reported and 16 446 charges carried forward in 2010/11. The detection rate for commercial crime-related charges increased from 36.55% in 2009/10 to 68.4% in 2010/11. That is, in 2010/11, 44 023 charges were referred to court, 3 585 charges were withdrawn and 1 290 charges were unfounded.
➤ 25.6% court ready case dockets for commercial crime-related charges were achieved in 2010/11. The average monthly court ready case dockets was 2 304 and the average monthly cases not yet completed in court was 9 014.
➤ Operation Clean Audit, which focuses on corruption within local government, is one of the priorities that were addressed by the Directorate for Priority Crime Investigation. Dedicated capacity was created in the provinces to investigate and combat these cases. During 2010/11, a total of 362 cases

SAPS TOGETHER SQUEEZING CRIME to ZEROSAPS Members, My Family - Together Pushing Back The Frontiers Of Evil
ANNUAL REPORT 2010/2011SOUTH AFRICAN POLICE SERVICE
96
were received for investigation. 144 public officials and 120 members of the public appeared in court of which 60 public officials and 29 members of the public were convicted. A total of 229 cases are currently on court roll.
➤ During 2010/11, the DPCI finalised a widely publicised investment fraud case, the Krion investment scheme. This case was one of the biggest cases ever dealt with by the South African Police Service, involving some R1.5 billion in investors’ money. The mastermind behind the scheme was sentenced to an effective 25 years imprisonment on 118 409 charges, including racketeering, money laundering and other statutory offences. Others involved in the case were sentenced to between 5 and 15 years in prison.
➤ Table 25 summarises the achievements on the investigation of commercial crime cases. It illustrates that the number of reported cases decreased with 4.6% from 30 114 cases in 2009/10 to 28 720 cases in 2010/11. Internet-related fraud notably decreased from 2 533 cases in 2009/10 to 1 981 cases in 2010/11 (a decrease of 21.8%). Fraud with counterfeit cards remains a significant threat. These cases indicate an increase of 39.7% from 2 906 cases in 2009/10 to 4 059 cases in 2010/11. Although the number of persons convicted decreased by 7.6%, which is in line with the decrease in the number of new cases reported, the number of charges on which convictions were obtained, increased significantly from 22 808 to 26 475 - an increase of 16.1%.

SAPS TOGETHER SQUEEZING CRIME to ZEROSAPS Members, My Family - Together Pushing Back The Frontiers Of Evil
ANNUAL REPORT 2010/2011SOUTH AFRICAN POLICE SERVICE
97
Tabl
e 25
: Inv
estig
atio
n of
cas
es in
volv
ing
com
mer
cial
crim
e
Num
ber o
f cas
es re
ceiv
ed, a
rres
ts, c
onvi
ctio
ns a
nd v
alue
s
Crim
e de
scri
ptio
nCa
ses
rece
ived
Arr
ests
/firs
t app
eara
nces
Conv
icti
ons
Num
ber
Valu
e (R
)N
umbe
rVa
lue
(R)
Num
ber
Valu
e (R
)
Act
ual 5
Pote
ntia
l 6SA
Ci
tize
nN
on-
citi
zen
Act
ual
Pote
ntia
lCa
ses
Coun
tsA
ccus
edA
ctua
lPo
tent
ial
Inte
rnet
frau
d1
981
511
517
738
9 55
3 07
913
013
29 0
49 5
210
2441
425
11 0
09 0
870
Frau
d w
ith c
ount
erfe
it cr
edit
card
s4
059
118
053
534
412
200
279
298
565
998
301
061
128
1 64
411
44
654
877
0
Frau
d w
ith s
tole
n cr
edit
card
s33
922
599
546
51 6
5160
41
319
337
044
277
481
405
183
0
Frau
d w
ith o
ther
car
ds6
878
61 6
95 0
4325
3 74
626
94
1 91
2 92
313
737
5715
261
912
939
0
SA R
eser
ve B
ank
Act,
1989
4576
025
574
1 81
0 70
034
525
3 21
091
0 70
03
33
4 80
00
Frau
d w
ith s
tole
n (a
ltere
d)
cheq
ues
674
116
165
293
4 26
8 35
811
316
88 3
58 2
4221
6 48
052
8351
16 6
40 5
770
Frau
d w
ith c
lone
d (fa
bric
ated
) che
ques
294
31 0
99 4
394
583
750
666
11 4
12 8
634
950
1720
918
17 7
33 5
8038
000
Adva
nce
Fee
Frau
d (4
19)
371
43 8
94 5
3066
5 78
019
981
9 84
629
000
12
21
133
272
0
Blac
k do
llar f
raud
sca
ms
524
117
303
375
000
1017
2 74
8 07
41
500
000
1010
1024
2 50
00
Kite
flyi
ng89
43 2
91 6
7029
9 23
843
232
510
509
017
1717
5 95
7 90
10
Oth
er fr
aud
9 76
67
291
864
867
311
569
406
5 47
084
1 25
2 27
1 53
021
096
684
4 25
815
002
4 06
675
5 56
8 65
81
602
903
Thef
t1
042
3 41
1 02
4 56
71
121
620
428
752
8 38
7 32
537
200
550
5 18
427
161
158
274
0
Forg
ery
and
utte
ring
349
214
708
837
5 56
7 81
413
88
33 8
45 9
0252
4 80
033
151
368
996
531
10 0
00
Inso
lven
cy A
ct, 1
936
71
815
234
03
010
2 00
00
00
00
0
Corr
uptio
n Ac
t, 19
92/
Prev
entio
n an
d Co
mba
ting
of C
orru
pt A
ctiv
ities
Act
, 20
04
8629
7 67
1 41
70
381
4 35
1 28
429
5 00
09
1111
185
863
0
Prev
entio
n of
Cou
nter
feiti
ng
of C
urre
ncy
Act,
1965
7223
559
151
000
70
10 9
2039
600
00
00
0
Prev
entio
n of
Org
anis
ed
Crim
e Ac
t, 19
9815
885
060
020
076
8 42
70
68
61
180
131
0
5 An
actu
al lo
ss is
whe
re a
vic
tim h
as p
arte
d w
ith th
e go
ods
and
the
paym
ent w
as fr
audu
lent
. The
vic
tim s
uffer
ed a
n ac
tual
loss
.6 A
pot
entia
l los
s is
, for
exa
mpl
e, w
here
a b
uyer
dep
osits
a c
hequ
e be
fore
the
good
s th
at w
ere
purc
hase
d, w
ere
deliv
ered
.

SAPS TOGETHER SQUEEZING CRIME to ZEROSAPS Members, My Family - Together Pushing Back The Frontiers Of Evil
ANNUAL REPORT 2010/2011SOUTH AFRICAN POLICE SERVICE
98
Num
ber o
f cas
es re
ceiv
ed, a
rres
ts, c
onvi
ctio
ns a
nd v
alue
s
Crim
e de
scri
ptio
nCa
ses
rece
ived
Arr
ests
/firs
t app
eara
nces
Conv
icti
ons
Num
ber
Valu
e (R
)N
umbe
rVa
lue
(R)
Num
ber
Valu
e (R
)
Act
ual
Pote
ntia
l SA
Ci
tize
nN
on-
citi
zen
Act
ual
Pote
ntia
lCa
ses
Coun
tsA
ccus
edA
ctua
lPo
tent
ial
Exch
ange
Con
trol
Re
gula
tions
, 196
1 (C
urre
ncy
and
Exch
ange
s Ac
t, 19
33)
760
0 00
01
482
155
74
53 2
56 7
471
482
155
33
30
1 21
2 58
5
Com
pani
es A
ct, 1
973
4210
8 12
8 15
810
0 00
0 00
012
046
2 00
00
12
120
000
0
Clos
e Co
rpor
atio
ns A
ct, 1
984
61
100
00
00
00
00
00
Nat
iona
l Cre
dit A
ct, 2
005
583
309
04
10
02
22
00
Mag
istr
ate’
s Co
urt A
ct, 1
944
119
727
00
00
00
00
00
Mer
chan
dise
Mar
ks A
ct,
1941
71
460
000
01
320
000
01
11
500
0
Coun
terf
eit G
oods
Act
, 199
739
761
592
321
4 60
7 89
519
379
9 62
7 09
77
189
400
148
447
183
34 0
88 8
742
415
000
Oth
er c
rime
2 13
638
9 52
1 34
731
147
979
1 15
638
816
0 26
2 74
010
5 58
4 06
61
063
2 85
31
032
53 5
91 1
312
105
273
Tota
l28
720
12 8
07 8
59 1
7347
7 92
1 37
18
500
680
2 22
0 31
6 49
513
9 22
4 83
36
427
26 4
755
961
975
484
678
7 38
3 76
1

SAPS TOGETHER SQUEEZING CRIME to ZEROSAPS Members, My Family - Together Pushing Back The Frontiers Of Evil
ANNUAL REPORT 2010/2011SOUTH AFRICAN POLICE SERVICE
99
Subprogramme: Criminal Record Centre
➤ The Criminal Record Centre (CRC) is responsible for the identification and/or confirmation of previous conviction reports of persons suspected of having been involved in criminal activities that have/are being investigated by the SAPS. Therefore, rapid processing of previous conviction reports is of great importance to the SAPS and the community at large.
➤ During the 2010/11 financial year, the CRC received 1 206 333 crime-related fingerprint enquiries for possible identification and/or confirmation, 2% more than the previous financial year. Of these enquiries received, 595 707 (49.4%) resulted in previous convictions being identified and/or confirmed. 610 626 (50.6%) were first offenders.
➤ The number of previous conviction reports generated within 30 days increased with 18% from 63.41% in 2009/10 to 81.46% in 2010/11, as a direct result of the upgrade of the AFIS.
➤ During the period under review, the CRC received a total of 1 163 209 commercial/non-criminal related enquires, which is 25.2% or 233 912 more than those received in the 2009/10 financial year. These enquiries are made in order to determine whether or not persons applying for, inter alia, firearm licenses, professional driver’s permits, and new employment, have had any previous convictions.
➤ In addition to the above, the CRC performed 5 531 electronic palm prints, 11 294 Automated Fingerprint Identification System (AFIS) fingerprint identifications, 473 manual palm prints and 1 076 manual fingerprint identifications.
➤ The following table provides an overview of the performance of the fingerprint laboratories of the Local Criminal Record Centres during 2010/11 in comparison with 2009/10. The table indicates that there was an increase in the overall performance of fingerprint laboratories compared to the previous financial year.
Performance by Local Criminal Record Centres 2009/10 2010/11 % increase/decrease
Number of exhibits processed 81 676 99 108 +21.3%
Number of cases processed 16 973 23 649 +39.0%
Number of positive cases 7 539(44.4%)
9 859(41.7%)
+30.8%
Number of Micro Viper investigations(a tool which magnifies the surface of an object/item/exhibit to identify samples)
147 329 +123.8%
Number of positive Micro Viper investigations 159(108.2%)
61(18.5%)
-61.6%
Number of shoe-print investigations 192 201 +4.7%
Number of positive shoe-print investigations 142(74%)
186(92.5%)
+31%
Number of objects etched 1 282 1 621 +26%
Number of objects etched (positive) 666(52%)
727(44.8%)
+9%
Upgrade of the Automated Fingerprint Identification System
➤ The AFIS database has been converted to an Oracle database to ensure an improved and more stable environment and the central and remote site hardware was replaced with the latest certified hardware. The AFIS upgrade included the following:

SAPS TOGETHER SQUEEZING CRIME to ZEROSAPS Members, My Family - Together Pushing Back The Frontiers Of Evil
ANNUAL REPORT 2010/2011SOUTH AFRICAN POLICE SERVICE
100
➣ The central database increased from 7 to 8 million persons
➣ An additional capacity of 4 million plain impressions to increase the accuracy and capability in crime solving
➣ An additional 200 000 persons included in the palm print database (increased from 3 to 3.2 million)
➣ An increased capacity for unsolved latent palms (a palm image processed on AFIS which cannot be linked to a suspect) from 300 000 to 600 000
➣ An increased fingerprint search capacity from 8 750 to 15 000
➣ An increased search capacity in the fingerprint to unsolved latent process from 2 900 to 6 000 searches
➤ The upgrade of the system resulted in a faster response time, allowing for search results to be returned faster to the remote sites. The system completes between 11 000 and 12 000 searches in a 15-hour period in comparison to the previous system which could only process 8 750 searches in a 22-hour period.
Crime scene-related services
➤ To enhance the delivery of crime scene-related services in the provinces, ten service points were established during the period under review, namely at Maluti in the Eastern Cape, Parys (Tumahole) and Harrismith (Tsiame) in the Free State, Umlazi, Pinetown, KwaMashu and KwaDukuza in KwaZulu-Natal, Burgersfort in Limpopo, Malalane in Mpumalanga and Pudimoe in the North West Province.
Investigative Psychology Unit
➤ The Psychology Unit played a critical role in the arrests, sentencing and convictions relative to the following major cases:
➣ Contact murder of Avhatakali Netshisaulu – son of City Press editor, Mathata Tsedu – All the accused were sentenced to life imprisonment in February 2011.
➣ Orange Farms serial murders – David Nocela – The accused was convicted on all three murder charges and received three life sentences in March 2011.
➣ Westonaria serial rapist – Jack Mogale – The accused was sentenced to twenty life sentences in March 2011.
Subprogramme: Forensic Science Laboratory
➤ During 2010/11, the Forensic Service Laboratory received 260 826 entries for analysis, 25.6% more than in the previous financial year. A total of 318 665 entries were analysed (including entries from previous financial years) of which 297 955 or 93.5% was analysed within 35 days, an improvement of 7.5% compared with the 2009/10 financial year.
➤ Table 26 provides a summary of entries received and the actual time it took to analyse against the set standard of 35 days.

SAPS TOGETHER SQUEEZING CRIME to ZEROSAPS Members, My Family - Together Pushing Back The Frontiers Of Evil
ANNUAL REPORT 2010/2011SOUTH AFRICAN POLICE SERVICE
101
Table 26: Exhibits analysed by the Forensic Science Laboratory
Section Entries received for analysis
Entries analysed Entries analysed within 35 days
Ballistics
(Examination of firearms and tool marks as well as etching processes to restore numbers that have been obliterated on firearms)
87 822 93 617 93 617(100% analysed within 35 days)
Biology
(Analysis of evidentiary material of biological origin, e.g. body fluids, human tissue and hair with the aim of accomplishing the highest possible degree of human identification through forensic DNA analysis and microscopical comparison (the latter exclusively on hair))
63 627 100 026 92 024(92% analysed
within 35 days)
Chemistry
(Analysis of substances e.g. powders, tablets, liquids suspected of containing controlled pharmaceutical and/or illicit drugs)
54 404 63 044 59 261(94% analysed
within 35 days)
Questioned documents
(Analysis of questioned documents e.g. handwriting, typewriting, forged signatures and counterfeit banknotes)
50 869 57 847 49 170(85% analysed
within 35 days)
Scientific Analysis
(Analysis of organic and inorganic matters or substances e.g. plastics, synthetic fibres, fuels, vegetable medicines/poisons, soil, gold, metals and primer residue)
4 104 4 131 3 833(93% analysed
within 35 days)
Dealing with the backlog at the Forensic Science Laboratory
➤ The overall backlog within the Forensic Science Laboratory decreased by 19.25% from 59 023 to 47 660 during the 2009/10 financial year and indicated a further decrease of 66% from 47 660 un-assigned entries on 1 April 2010 to 16 200 by the end of March 2011 – the lowest figure recorded since March 2009.
➤ During 2010/11, the backlog decreased by 8.4% at the Questioned Documents Unit, by 6.7% at the Scientific Analysis Unit and by 54.9% at the Chemistry Unit. Biology and Ballistic Units recorded the most decreases in the backlog of 82.7% and 81.5% respectively.
➤ The backlog at the Forensic Science Laboratory continues to be prioritised and increased efforts are being embarked upon to ensure the eradication thereof. Un-assigned entries on hand at the Laboratory are not regarded as a backlog as they are still within the period allowed for processing.
Transversal matters – Forensic Science Laboratory
➤ During the 2010/11 financial year, the focus was on sustaining technology and eradicating the backlog within the respective disciplines.
➤ At the Biology Unit, semi-automated equipment with improved chemistries has been acquired which will provide improved results on degraded and difficult DNA samples. Upon finalisation of the prescribed validation of this equipment, it will be applied to case work samples.

SAPS TOGETHER SQUEEZING CRIME to ZEROSAPS Members, My Family - Together Pushing Back The Frontiers Of Evil
ANNUAL REPORT 2010/2011SOUTH AFRICAN POLICE SERVICE
102
➤ Evidence collection kits were introduced to facilitate the collection and laboratory processing of DNA samples, providing guidance to crime scene examiners to improve on identification and evidence recovery of DNA at crime scenes. The evidence collection kits, as designed, have assisted in protecting the integrity of exhibits and to ensure improved results in the laboratory.
➤ An internal archiving capacity will be established since the contract with Document Warehouse that was responsible for the archiving of case files, has not been renewed.
➤ To ensure the retention of forensic analysts, the revision of the entry level for forensic analysts has been done. Deserving employees were promoted and the moratorium on the consideration of ‘new’ scarce skills applications was lifted in 2010/11. The focus will now be on the streamlining of job categories in each discipline to be in line with required skills and subsequent alignment with equivalent salary bands. The development and implementation of an effective retention strategy in 2011/12 will ensure the retention of expertise/specialised skills.
➤ Forensic Services continues to embark on a drive to ensure targeted recruitment and the enlistment of the most suitable candidates. The implementation of an Occupation Specific Dispensation (OSD) for the FSL environment is under consideration.
➤ The management of Forensic Services regards the eradication of corrupt practices within the FSL environment as a high priority. Criminal and disciplinary proceedings were instituted in respect of all reported cases and these are currently under investigation. The conducting of Lifestyle Audits was initiated and will be fast-tracked and measures are being implemented to optimise the securing of exhibits (specific objectives were included in the revised CJS Revamp Plan for Forensic Services in 2011/12).
➤ Processes were implemented to curb the unnecessary and impetuous procurement of equipment/instruments and to ensure the proper management of assets. Expert Forums were established and the establishment of Research Capacity has been prioritised for 2011/12.
➤ In an effort to enhance the support to the line function, a decision was taken to centralise the support capacity of Forensic Services. The process commenced in 2010/11 and it is foreseen that the sentralised support capacity will be fully functional within the 1st semester of the 2011/12 financial year.

SAPS TOGETHER SQUEEZING CRIME to ZEROSAPS Members, My Family - Together Pushing Back The Frontiers Of Evil
ANNUAL REPORT 2010/2011SOUTH AFRICAN POLICE SERVICE
103
2.2.4 Programme 4: Crime Intelligence
Purpose
Manage crime intelligence, analyse crime information and provide technical support for investigations and crime prevention operations.
Strategic objective
Contribute to the neutralising of crime by gathering, collating and analysing intelligence that leads to an actionable policing activity.
The Crime Intelligence Programme comprises two subprogrammes:
➤ Crime Intelligence Operations provides for intelligence-based crime investigations.
➤ Intelligence and Information Management provides for the analysis of crime intelligence patterns that will facilitate crime detection, in support of crime prevention and crime investigation.

SAPS TOGETHER SQUEEZING CRIME to ZEROSAPS Members, My Family - Together Pushing Back The Frontiers Of Evil
ANNUAL REPORT 2010/2011SOUTH AFRICAN POLICE SERVICE
104
Serv
ice
deliv
ery
obje
ctiv
es a
nd in
dica
tors
Tabl
e 27
: Act
ual p
erfo
rman
ce a
gain
st ta
rget
s
Subp
rogr
amm
e: C
rim
e In
telli
genc
e O
pera
tion
s
Obj
ecti
veO
utpu
tM
easu
re/ I
ndic
ator
Act
ual p
erfo
rman
ce a
gain
st ta
rget
Reas
on fo
r var
ianc
e
Targ
etA
ctua
l
To c
ontr
ibut
e to
the
neut
ralis
ing
of c
rime
by
gath
erin
g, c
olla
ting
and
anal
ysin
g in
telli
genc
e th
at le
ads
to a
n ac
tiona
ble
polic
ing
activ
ity
rela
ting
to:
Cont
act c
rim
e:•
Mur
der a
nd a
ttem
pted
mur
der
• Se
xual
offe
nces
• Ag
grav
ated
robb
ery
-
Carja
ckin
g
- Tr
uck-
hija
ckin
g
- Ba
nk ro
bber
y
- Ro
bber
y of
cas
h in
tran
sit
-
Robb
ery
at re
side
ntia
l pre
mis
es
- Ro
bber
y at
bus
ines
s pr
emis
es•
Oth
er a
ggra
vate
d ro
bber
y
Prop
erty
-rel
ated
and
oth
er s
erio
us c
rim
e:•
Hou
sebr
eaki
ng (r
esid
entia
l and
no
n-re
side
ntia
l)•
Thef
t of m
otor
veh
icle
s•
Thef
t ou
t of o
r fro
m m
otor
veh
icle
• Co
mm
erci
al c
rime
• St
ock
thef
t•
Oth
er th
eft
• Pr
ecio
us m
etal
s an
d st
ones
• Co
rrup
tion
Crim
e In
telli
genc
e pr
ojec
ts/
oper
atio
ns/
inve
stig
atio
ns
Num
ber o
f cl
uste
r and
ad
hoc
actio
nabl
e in
telli
genc
e op
erat
ions
on
cont
act c
rime
redu
ctio
ns
Mai
ntai
n/in
crea
se th
e nu
mbe
r of o
pera
tions
/ in
vest
igat
ions
rela
tive
to
the
base
line
figur
es o
f 8 1
03
clus
ter o
pera
tions
and
6 5
59
ad h
oc o
pera
tions
in 2
010/
11
A to
tal o
f 24
384
oper
atio
ns
(13
351
clus
ter o
pera
tions
an
d 11
033
ad
hoc
oper
atio
ns) w
ere
cond
ucte
d in
201
0/11
com
pare
d to
24
368
in 2
009/
10
The
targ
et w
as su
rpas
sed
due
to th
e fo
cuse
d ap
proa
ch a
nd
the
impr
oved
use
of c
rime
inte
llige
nce/
info
rmat
ion
in, f
or e
xam
ple,
the
plan
ning
and
coo
rdin
atin
g of
ope
ratio
ns d
urin
g th
e ho
stin
g of
the
2010
FIF
A
Wor
ld C
upTM
.

SAPS TOGETHER SQUEEZING CRIME to ZEROSAPS Members, My Family - Together Pushing Back The Frontiers Of Evil
ANNUAL REPORT 2010/2011SOUTH AFRICAN POLICE SERVICE
105
Subp
rogr
amm
e: In
telli
genc
e an
d In
form
atio
n M
anag
emen
t
Obj
ecti
veO
utpu
tM
easu
re/ I
ndic
ator
Act
ual p
erfo
rman
ce a
gain
st ta
rget
Reas
on fo
r var
ianc
e
Targ
etA
ctua
l
To c
ontr
ibut
e to
the
neut
ralis
ing
of c
rime
by
gath
erin
g, c
olla
ting
and
anal
ysin
g in
telli
genc
e th
at le
ads
to a
n ac
tiona
ble
polic
ing
activ
ity
rela
ting
to:
Cont
act c
rim
e:
• M
urde
r and
att
empt
ed m
urde
r•
Sexu
al o
ffenc
es•
Aggr
avat
ed ro
bber
y
- Ca
rjack
ing
-
Truc
k-hi
jack
ing
-
Bank
robb
ery
-
Robb
ery
of c
ash
in tr
ansi
t
- Ro
bber
y at
resi
dent
ial p
rem
ises
-
Robb
ery
at b
usin
ess
prem
ises
• O
ther
agg
rava
ted
Robb
ery
Prop
erty
-rel
ated
and
oth
er s
erio
us c
rim
e:•
Hou
sebr
eaki
ng (r
esid
entia
l and
no
n-re
side
ntia
l)•
Thef
t of m
otor
veh
icle
s•
Thef
t out
of o
r fro
m m
otor
veh
icle
• Co
mm
erci
al c
rime
• St
ock
thef
t•
Oth
er th
eft
• Pr
ecio
us m
etal
s an
d st
ones
• Co
rrup
tion
Crim
es d
epen
dent
on
polic
e ac
tion
for
dete
ctio
n:•
Illeg
al p
osse
ssio
n of
fire
arm
s•
Dru
g-re
late
d cr
ime
Crim
e In
telli
genc
e pr
oduc
tsN
umbe
r of c
rime
inte
llige
nce
prod
ucts
rela
ting
to:
Ope
ratio
nal a
naly
sis
repo
rts:
• Pr
ofile
s•
Ana
lysi
s re
port
s•
Com
mun
icat
ion
anal
ysis
repo
rts
• Co
mm
unic
atio
n in
terc
eptio
n an
alys
is re
port
s
Mai
ntai
n/in
crea
se th
e nu
mbe
r of o
pera
tiona
l an
alys
is re
port
s re
lativ
e to
th
e ba
selin
e fig
ure
of 6
2 50
0 op
erat
iona
l ana
lysi
s re
port
s in
201
0/11
115
877
oper
atio
nal
anal
ysis
repo
rts
com
pile
d in
201
0/11
. The
se re
port
s co
mpr
ise
51 6
74 p
rofil
es,
45 9
09 a
naly
sis
repo
rts,
12 7
44 c
omm
unic
atio
n an
alys
is re
port
s an
d 5
550
com
mun
icat
ion
inte
rcep
tion
anal
ysis
repo
rts.
Targ
et a
chie
ved
due
to a
n in
crea
se in
the
gath
erin
g,
colla
ting
and
anal
ysis
of
inte
llige
nce
info
rmat
ion
durin
g th
e ho
stin
g of
the
2010
FIF
A W
orld
Cup
TM.
Rese
arch
and
st
atis
tical
repo
rts:
• Re
sear
ch re
port
s•
Stat
istic
al re
port
s•
Stat
ion
and
clus
ter
inte
llige
nce
repo
rts
78 0
00 re
sear
ch, s
tatis
tical
, st
atio
n an
d cl
uste
r in
telli
genc
e re
port
s in
20
10/1
1
202
099
rese
arch
and
st
atis
tical
repo
rts
in 2
010/
11.
Thes
e re
port
s co
mpr
ise
6 70
0 re
sear
ch re
port
s, 64
038
sta
tistic
al re
port
s an
d 13
1 36
1 st
atio
n an
d cl
uste
r in
telli
genc
e re
port
s.
The
dras
tic in
crea
se in
th
e st
atio
n an
d cl
uste
r in
telli
genc
e re
port
s is
a re
sult
of in
telli
genc
e ga
ther
ing
aim
ed a
t the
201
0 FI
FA W
orld
Cu
pTM.

SAPS TOGETHER SQUEEZING CRIME to ZEROSAPS Members, My Family - Together Pushing Back The Frontiers Of Evil
ANNUAL REPORT 2010/2011SOUTH AFRICAN POLICE SERVICE
106
Subp
rogr
amm
e: In
telli
genc
e an
d In
form
atio
n M
anag
emen
t
Obj
ecti
veO
utpu
tM
easu
re/ I
ndic
ator
Act
ual p
erfo
rman
ce a
gain
st ta
rget
Reas
on fo
r var
ianc
e
Targ
etA
ctua
l
Secu
rity
inte
llige
nce-
rela
ted
crim
e:•
Coun
tert
erro
rism
(e.g
. rig
htw
ing
and
relig
ious
ext
rem
ism
)•
Bord
er s
ecur
ity-r
elat
ed m
atte
rs•
Publ
ic s
tabi
lity
• VI
P se
curit
y•
Taxi
vio
lenc
e•
Inte
rgro
up v
iole
nce
• M
ajor
eve
nts
• Co
unte
r-in
telli
genc
e in
vest
igat
ions
rela
ting
to -
-
polic
e co
rrup
tion
-
secu
rity
vett
ing
• In
stitu
tiona
l int
ellig
ence
Crim
e In
telli
genc
e pr
oduc
ts

SAPS TOGETHER SQUEEZING CRIME to ZEROSAPS Members, My Family - Together Pushing Back The Frontiers Of Evil
ANNUAL REPORT 2010/2011SOUTH AFRICAN POLICE SERVICE
107
Service Delivery Achievements in relation to objectives and performance measures
Crime intelligence operations and reports contribute to the neutralising of crime by gathering, collating and analysing intelligence that leads to an actionable policing activity relating to contact crime, property-related and other serious crime, crimes dependent on police action for detection and security intelligence-related crime.
Subprogramme: Crime Intelligence Operations
➤ Cluster operations refer to police investigation and intelligence gathering techniques which include the detection, investigation, uncovering and/or the prevention of criminal conduct. Ad hoc operations refer to police investigations, which do not form part of a registered undercover or network operation, and which are usually initiated by other components in the SAPS.
➤ Crime Intelligence conducted a total of 24 384 crime intelligence operations, including 13 351 cluster operations and 11 033 ad hoc operations during 2010/11. These operations led to the arrest of 10 016 individuals and the recovery of goods valued at R1 294 820 258,82.
Subprogramme: Intelligence and Information Management
➤ From 1 April 2010 to 31 March 2011, a total of 115 877 operational analysis reports were produced.
➤ Operational analysis reports are generated by the collection capabilities and other sources to ensure the fulfillment of operational crime information needs for the investigation and combating of crime with specific reference to organised and commercial crime and to alert the SAPS about new syndicates, and a change in modus operandi of existing syndicates. These reports relate to:
➣ Profiles (resuming information/intelligence gathered on a suspect to serve as an aid to the investigating officer to locate the suspect and identify him/her beyond reasonable doubt)
➣ Analysis reports (factual reports based on evaluated information/intelligence which can be used to identify specific individuals, criminal groups, suspects or tendencies, relevant premises, contact points and methods of communication)
➣ Communication analysis reports (a report based on the result of the analysis of specific identified telephone/cellular phone numbers as provided by the various communication networks when subpoenaed to do so).
➣ Communication interception analysis reports (reports based on the result of the analysis of voice intercepted communications, intercepted text messages as well as internet service provider telecommunications)
Table 28 provides a breakdown of the operational analyses reports generated by crime intelligence.

SAPS TOGETHER SQUEEZING CRIME to ZEROSAPS Members, My Family - Together Pushing Back The Frontiers Of Evil
ANNUAL REPORT 2010/2011SOUTH AFRICAN POLICE SERVICE
108
Table 28: Types of operational analysis reports
Operational analysis reports Number of reports
Profiles 51 674
Analysis reports 45 909
Communication analysis reports 12 744
Communication interception analysis reports 5 550
Total 115 877
➤ Research and statistical reports and station and cluster intelligence reports are generated in an attempt to explain crime trends and overall crime stability. Reports are used to identify crime patterns and time patterns of crime, as well as the linkages of crime at stations and cluster stations and to identify the preventative and rehabilitative measures for specific reasons for crime and crime-related phenomena. Research and statistical reports and station and cluster intelligence reports relate to:
➣ Research reports (reports on findings of research done through social science methodology in an attempt to explain crime phenomena, e.g. docket analysis, interviews and GIS analysis).
➣ Statistical reports (descriptive reports based on crime statistics for a specific area and time period).
➣ Station and cluster intelligence reports (guidance reports compiled at cluster and station levels based on the spatial and time patterns of crime statistics, matrix case linkage analysis and fieldwork. These reports guide station commissioners on the what, where, when, why, who and how of the incidence of crime).
➤ A total of 202 099 research, statistical, station and cluster reports were produced in 2010/11.
Table 29 provides a breakdown of the research, statistical and station and cluster intelligence reports generated by crime intelligence.
Table 29: Types of intelligence reports
Number of reports
Research reports 6 700
Statistical reports 64 038
Station and cluster intelligence reports 131 361
Total 202 099

SAPS TOGETHER SQUEEZING CRIME to ZEROSAPS Members, My Family - Together Pushing Back The Frontiers Of Evil
ANNUAL REPORT 2010/2011SOUTH AFRICAN POLICE SERVICE
109
2.2.5 Programme 5: Protection and Security Services
Purpose
To provide protection and security services to all identified dignitaries and government interests.
Strategic objective
Minimise security violations by protecting foreign and local prominent people and securing strategic interests.
The Protection and Security Services Programme comprises five subprogrammes:
➤ VIP Protection Services provides for the protection, while in transit, of the President, Deputy President, former Presidents, and their spouses, and other identified VIPs.
➤ Static and Mobile Security is for protecting: other local and foreign VIPs; the places in which all VIPs including persons related to the President and the Deputy President, are present; and valuable government cargo.
➤ Ports of Entry Security provides for security at ports of entry and exit, such as border posts, airports and harbours.
➤ The Rail Police provides for security in the railway environment.
➤ The Government Security Regulator provides for security regulations, evaluations and the administration of National Key Points and strategic installations.

SAPS TOGETHER SQUEEZING CRIME to ZEROSAPS Members, My Family - Together Pushing Back The Frontiers Of Evil
ANNUAL REPORT 2010/2011SOUTH AFRICAN POLICE SERVICE
110
Serv
ice
deliv
ery
obje
ctiv
es a
nd in
dica
tors
Tabl
e 30
: Act
ual p
erfo
rman
ce a
gain
st ta
rget
s
Subp
rogr
amm
e: V
IP P
rote
ctio
n Se
rvic
e
Obj
ecti
veO
utpu
tM
easu
re/ I
ndic
ator
Act
ual p
erfo
rman
ce a
gain
st ta
rget
Reas
on fo
r var
ianc
e
Targ
etA
ctua
l
To m
inim
ise
secu
rity
viol
atio
ns b
y pr
otec
ting
the
Pres
iden
t, th
e D
eput
y Pr
esid
ent,
form
er
Pres
iden
ts a
nd o
ther
VIP
s w
hile
in tr
ansi
t.
Prot
ectio
n of
all
iden
tified
VIP
s w
hile
in
tran
sit
Perc
enta
ge o
f se
curit
y br
each
es in
re
latio
n to
sec
urity
pr
ovid
ed
100%
pro
tect
ion
prov
ided
w
ithou
t sec
urity
bre
ache
s in
20
10/1
1
Prot
ectio
n w
as p
rovi
ded
to 4
33 S
outh
Afr
ican
and
fo
reig
n di
gnita
ries
with
onl
y on
e de
emed
sec
urity
bre
ach
in 2
010/
11.
Targ
et n
ot a
chie
ved.
Thi
s re
fers
to o
ne in
sign
ifica
nt
inci
dent
whe
re a
sm
all
bann
er w
as th
row
n in
the
dire
ctio
n of
the
form
er
pres
iden
t whi
ch w
as
inte
rcep
ted
20m
aw
ay.
How
ever
, the
min
imum
se
curit
y st
anda
rds
wer
e ap
plie
d in
term
s of
sea
rch
for p
ossi
bly
dang
erou
s ob
ject
s fr
om a
ll pa
rtic
ipan
ts
as p
roce
dure
dic
tate
s an
d ap
prop
riate
ste
ps w
ere
take
n ag
ains
t the
indi
vidu
al.

SAPS TOGETHER SQUEEZING CRIME to ZEROSAPS Members, My Family - Together Pushing Back The Frontiers Of Evil
ANNUAL REPORT 2010/2011SOUTH AFRICAN POLICE SERVICE
111
Subp
rogr
amm
e: S
tati
c an
d M
obile
Obj
ecti
veO
utpu
tM
easu
re/ I
ndic
ator
Act
ual p
erfo
rman
ce a
gain
st ta
rget
Reas
on fo
r var
ianc
e
Targ
etA
ctua
l
To m
inim
ise
secu
rity
viol
atio
ns o
f VIP
s an
d th
eir
prop
erty
, and
oth
er id
entifi
ed g
over
nmen
t bu
ildin
gs, a
s w
ell a
s va
luab
le c
argo
.
Stat
ic p
rote
ctio
n of
al
l ide
ntifi
ed V
IPs,
thei
r pro
pert
y, a
nd
othe
r gov
ernm
ent
build
ings
, inc
ludi
ng
pers
ons
rela
ted
to
the
Pres
iden
t and
D
eput
y Pr
esid
ent
Perc
enta
ge o
f se
curit
y br
each
es in
re
latio
n to
sec
urity
pr
ovid
ed
100%
pro
tect
ion
prov
ided
w
ithou
t sec
urity
bre
ache
s in
20
10/1
1
Prot
ectio
n w
as p
rovi
ded
at
28 in
stal
latio
ns/g
over
nmen
t bu
ildin
gs a
nd 9
3 pr
esid
entia
l an
d na
tiona
l min
iste
rial
resi
denc
es in
201
0/11
. In
eigh
t ins
tanc
es th
ere
wer
e se
curit
y br
each
es c
ompa
red
to 1
3 se
curit
y br
each
es in
20
09/1
0.
Targ
et n
ot a
chie
ved
due
to
non
com
plia
nce
to s
tand
ard
oper
atio
nal p
roce
dure
by
mem
bers
.
Prot
ectio
n of
va
luab
le c
argo
Perc
enta
ge o
f saf
e de
liver
y of
val
uabl
e ca
rgo
100%
saf
e de
liver
y in
20
10/1
110
0% s
afe
deliv
ery.
Prot
ectio
n pr
ovid
ed to
214
ca
rgos
with
no
secu
rity
brea
ches
com
pare
d to
203
ca
rgos
with
no
secu
rity
brea
ches
in 2
009/
10.
Targ
et a
chie
ved.
Subp
rogr
amm
e: P
orts
of E
ntry
Sec
urit
y
Obj
ecti
veO
utpu
tM
easu
re/ I
ndic
ator
Act
ual p
erfo
rman
ce a
gain
st ta
rget
Reas
on fo
r var
ianc
e
Targ
etA
ctua
l
To s
ecur
e po
rts
of e
ntry
by
focu
sing
on
arre
sts
and
seiz
ures
in re
spec
t of-
• cr
imin
al o
rgan
isat
ions
invo
lved
in c
rimes
re
latin
g to
fire
arm
s, ve
hicl
es, d
rugs
and
ill
egal
goo
ds•
viol
atio
ns in
term
s of
the
Imm
igra
tion
Act
• co
rrup
tion
• m
arin
e lif
e re
sour
ces
• pr
ecio
us m
etal
s an
d st
ones
• ill
egal
sm
uggl
ing
and
traffi
ckin
g of
hum
ans
Secu
rity
and
polic
ing
at p
orts
of
entr
y
Num
ber o
f pla
nned
cr
ime
prev
entio
n an
d co
mba
ting
actio
ns to
enh
ance
th
e na
tiona
l sec
urity
an
d te
rrito
rial
inte
grity
by
focu
sing
on
-
• ill
egal
fire
arm
s•
illeg
al g
oods
and
dr
ugs
• st
olen
/rob
bed
vehi
cles
• ill
egal
mig
ratio
n•
mov
emen
t of
wan
ted
susp
ects
in
and
out
of t
he
coun
try
Cond
uct a
min
imum
of 3
848
pl
anne
d ac
tions
at p
orts
of
entr
y in
201
0/11
4 00
8 pl
anne
d cr
ime
prev
entio
n an
d co
mba
ting
actio
ns c
ondu
cted
in
2010
/11.
The
incr
ease
in th
e nu
mbe
r of
act
ions
can
be
attr
ibut
ed
to in
tens
ive
2010
FIF
A W
orld
Cu
pTM a
nd fe
stiv
e se
ason
op
erat
ions
.

SAPS TOGETHER SQUEEZING CRIME to ZEROSAPS Members, My Family - Together Pushing Back The Frontiers Of Evil
ANNUAL REPORT 2010/2011SOUTH AFRICAN POLICE SERVICE
112
Subp
rogr
amm
e: R
ailw
ay P
olic
e
Obj
ecti
veO
utpu
tM
easu
re/ I
ndic
ator
Act
ual p
erfo
rman
ce a
gain
st ta
rget
Reas
on fo
r var
ianc
e
Targ
etA
ctua
l
To p
reve
nt a
nd c
omba
t crim
e in
the
railw
ay
envi
ronm
ent b
y fo
cusi
ng o
n ar
rest
s re
latin
g to
-
Mor
e po
licea
ble
crim
e:•
Aggr
avat
ed ro
bber
y
- Ca
rjack
ing
-
Truc
k-hi
jack
ing
-
Bank
robb
ery
-
Robb
ery
of c
ash
in tr
ansi
t
- Ro
bber
y at
resi
dent
ial p
rem
ises
-
Robb
ery
at b
usin
ess
prem
ises
• Co
mm
on ro
bber
y•
Oth
er a
ggra
vate
d ro
bber
y•
Hou
sebr
eaki
ng a
nd u
nlaw
ful i
ntru
sion
(re
side
ntia
l and
non
-res
iden
tial)
• Th
eft o
f mot
or v
ehic
les
and
mot
orcy
cles
• Th
eft o
ut o
f or f
rom
mot
or v
ehic
le•
Stoc
k th
eft
• M
alic
ious
dam
age
to p
rope
rty
(all
of th
e ab
ove
incl
ude
atte
mpt
s)
Cont
act c
rim
e: w
hich
occ
urs
as a
resu
lt of
m
ore
polic
eabl
e cr
ime:
• M
urde
r and
att
empt
ed m
urde
r•
Sexu
al o
ffenc
es
Crim
es d
epen
dent
on
polic
e ac
tion
for
dete
ctio
n:•
Illeg
al p
osse
ssio
n of
fire
arm
s an
d am
mun
ition
• D
rug-
rela
ted
crim
e•
Driv
ing
unde
r the
influ
ence
of a
lcoh
ol a
nd
drug
s
Crim
e pr
even
tion
and
com
batin
g in
the
railw
ay
envi
ronm
ent
Rate
of c
onta
ct
crim
e in
the
railw
ay
envi
ronm
ent
Redu
ce b
y 8.
5% b
y 20
10/1
1 Co
ntac
t crim
e re
duce
d by
37%
in th
e ra
ilway
en
viro
nmen
t in
2010
/11.
2 11
7 co
ntac
t crim
e ca
ses
wer
e re
port
ed in
201
0/11
co
mpa
red
to 3
396
cas
es in
20
09/1
0.
The
targ
et w
as s
urpa
ssed
as
a re
sult
of in
crea
sed
visi
bilit
y in
the
railw
ay e
nviro
nmen
t. M
ore
pers
onne
l wer
e de
ploy
ed d
urin
g 20
10/1
1.

SAPS TOGETHER SQUEEZING CRIME to ZEROSAPS Members, My Family - Together Pushing Back The Frontiers Of Evil
ANNUAL REPORT 2010/2011SOUTH AFRICAN POLICE SERVICE
113
Subp
rogr
amm
e: G
over
nmen
t Sec
urit
y Re
gula
tor
Obj
ecti
veO
utpu
tM
easu
re/ I
ndic
ator
Act
ual p
erfo
rman
ce a
gain
st ta
rget
Reas
on fo
r var
ianc
e
Targ
etA
ctua
l
To re
gula
te p
hysi
cal s
ecur
ity in
the
gove
rnm
ent
sect
or a
nd s
trat
egic
inst
alla
tions
Secu
red
Nat
iona
l Ke
y Po
ints
an
d st
rate
gic
inst
alla
tions
Deg
ree
of
com
plia
nce
with
in
stitu
tiona
l fr
amew
ork
50%
from
a to
tal o
f 20
7 id
entifi
ed s
trat
egic
in
stal
latio
ns a
ppra
ised
by
31 M
arch
201
1
51.7
% (1
07) s
trat
egic
in
stal
latio
ns w
ere
audi
ted
in
2010
/11.
Targ
et a
chie
ved.
All
Nat
iona
l Key
Poi
nts
(165
) ev
alua
ted
in 2
010/
1116
4 N
atio
nal K
ey P
oint
s ev
alua
ted
in 2
010/
11.
One
Nat
iona
l Key
Poi
nt w
as
not e
valu
ated
as
a re
sult
of th
e re
-dep
loym
ent o
f m
embe
rs d
urin
g th
e 20
10
FIFA
Wor
ld C
upTM
.

SAPS TOGETHER SQUEEZING CRIME to ZEROSAPS Members, My Family - Together Pushing Back The Frontiers Of Evil
ANNUAL REPORT 2010/2011SOUTH AFRICAN POLICE SERVICE
114
Service Delivery Achievements in relation to objectives and performance measures
Subprogramme: VIP Protection Services
➤ VIP Protection Services provides for the protection of the President, Deputy President, former Presidents and other identified VIPs while in transit.
➤ During 2010/11, VIP Protection Services provided protection to –
➣ 229 presidential, national and provincial dignitaries
➣ 204 foreign dignitaries, including Heads of State, who visited South Africa
➣ 257 special and provincial events (includes protection operations for South African and foreign VIPs during the 2010 FIFA World CupTM)
➣ 167 774 South African VIP journeys within South Africa
➣ 246 South African VIP visits outside South African borders.
➤ During the reporting period, one security breach occurred during the 2nd quarter while protecting a South African VIP at the Tshwane University of Technology. No security breaches occurred during special and provincial events and visits by foreign VIPs to the country or South African VIP visits abroad.
Subprogramme: Static and Mobile
➤ Static Guard Services provides static security, i.e. protecting VIPs and their property, including those related to the President and Deputy President, as well as other local and foreign VIP’s. A total of 88 330 shifts were worked in 2010/11 to protect 28 installations/government buildings and 93 presidential and national ministerial residences. Eight security breaches were reported, excluding security breaches that occurred at the Parliamentary parks. Of the eight security breaches reported, four cases were concluded and four cases are still being investigated. No suspects involved in these cases were arrested.
➣ During the 1st quarter, one security breach relating to unauthorised entry at the Parliamentary complex at Parliament in the Western Cape was reported.
➣ During the 2nd quarter, four security breaches relating to housebreaking and theft were reported, one at Parliament in the Western Cape and three at presidential and national ministerial residences in the Western Cape and Gauteng.
➣ During the 4th quarter, three security breaches relating to unauthorised entry were reported, one at the Parliamentary complex in the Western Cape and theft out of or from motor vehicles at two national ministerial residences in Gauteng.
➤ Mobile Operations is responsible for safeguarding valuable and/or dangerous government cargo, including a material or monetary value with considerable importance or quality such as cash currency, gold bullion and currency printing material, as well as cargo causing danger, risk or harm such as explosives and ammunition, nuclear material, firearms and drugs. For the 214 cargos protected, a 100% safe delivery rate was achieved.

SAPS TOGETHER SQUEEZING CRIME to ZEROSAPS Members, My Family - Together Pushing Back The Frontiers Of Evil
ANNUAL REPORT 2010/2011SOUTH AFRICAN POLICE SERVICE
115
Subprogramme: Ports of Entry Security
➤ Fifty-three land ports, eight sea ports, one dry port and 10 international airports are operational.
➤ The Border Control Operational Coordinating Committee (BCOCC) is a subcommittee of the Justice, Crime Prevention and Security Cluster and was mandated in 2005 to strategically manage the South African Ports of Entry environment in a coordinated manner. The lead government agency and chair of the BCOCC, is the South African Revenue Services (SARS). Other departments involved in the BCOCC, are the Department of Home Affairs, the National Intelligence Agency, the Department of Transport, the Cross-Border Road Transport Agency, the Department of Public Works, the Department of Agriculture, Forestry and Fisheries, the Department of Health, the South African National Defense Force and the South African Police Service.
The BCOCC’s mandate as a coordinating structure extends to all sea, land and airports of entry and exit. During peak seasons, e.g. the Easter period, the festive season and major events, the SAPS participated in intensified crime prevention measures to monitor trends in the movement of goods and people, employ contingency plans and ensure the swift processing of travelers at various ports of entry.
➤ From 1 April 2010 to 31 March 2011, 4 008 planned crime prevention and combating actions were conducted at ports of entry to enhance the national security and territorial integrity. These operations and day-to-day activities contributed to the successes achieved at ports of entry, and are indicated in table 31 below.
Table 31: Successes achieved at Ports of Entry for the period 1 April 2010 to31 March 2011
Firearms and ammunition
2009/10 2010/11
Arrests 138 for firearms28 for ammunition
106 for firearms18 for ammunition
Number of firearms and ammunition recovered152 firearms
3 989 rounds of ammunition
319 firearms4 704 rounds of
ammunition
Illicit drugs
2009/10 2010/11
Arrests 1 051 966
Seizures
Heroin 290,817kg 925,720kg
Cocaine 686,862kg 350,205kg
Crystal meth (Tik-Tik) 31,690kg 19,143kg
Cannabis (dry) 29 521kg 17 978,869kg
Cannabis (plants) 1 895 22 118
Ecstasy tablets 324 523 518
Mandrax tablets 132 159 62 873
Crack cocaine rocks 53 246
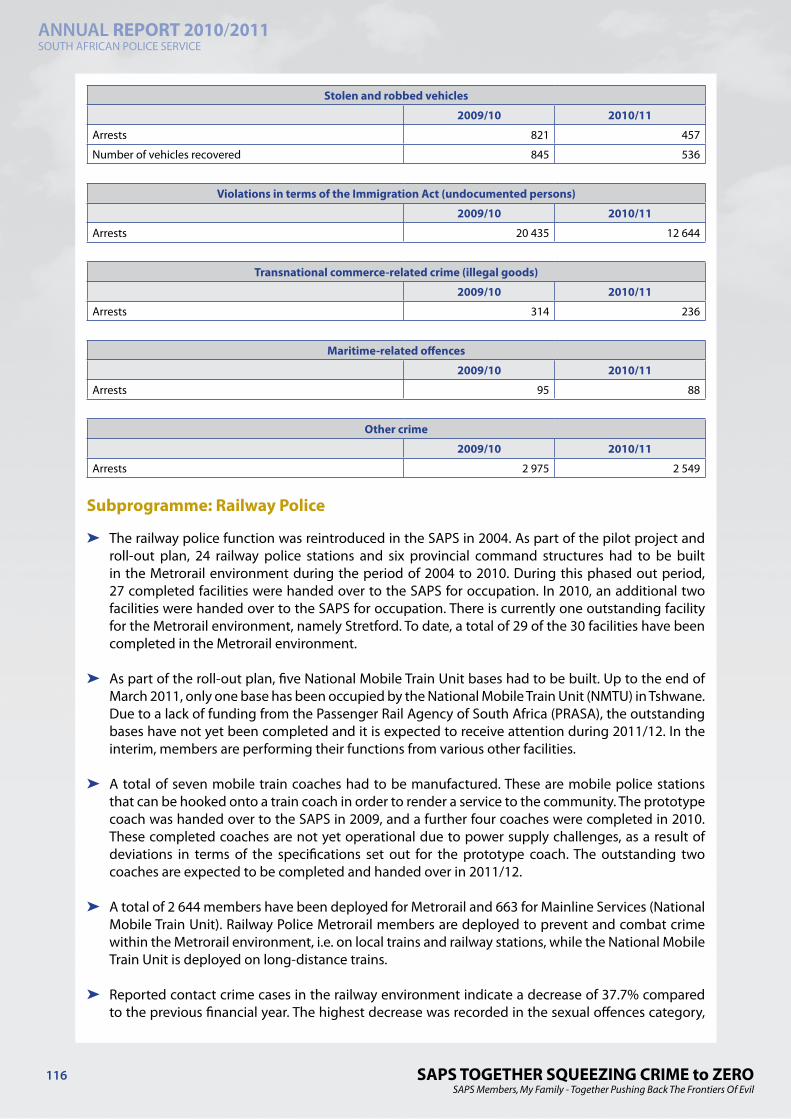
SAPS TOGETHER SQUEEZING CRIME to ZEROSAPS Members, My Family - Together Pushing Back The Frontiers Of Evil
ANNUAL REPORT 2010/2011SOUTH AFRICAN POLICE SERVICE
116
Stolen and robbed vehicles
2009/10 2010/11
Arrests 821 457
Number of vehicles recovered 845 536
Violations in terms of the Immigration Act (undocumented persons)
2009/10 2010/11
Arrests 20 435 12 644
Transnational commerce-related crime (illegal goods)
2009/10 2010/11
Arrests 314 236
Maritime-related offences
2009/10 2010/11
Arrests 95 88
Other crime
2009/10 2010/11
Arrests 2 975 2 549
Subprogramme: Railway Police
➤ The railway police function was reintroduced in the SAPS in 2004. As part of the pilot project and roll-out plan, 24 railway police stations and six provincial command structures had to be built in the Metrorail environment during the period of 2004 to 2010. During this phased out period, 27 completed facilities were handed over to the SAPS for occupation. In 2010, an additional two facilities were handed over to the SAPS for occupation. There is currently one outstanding facility for the Metrorail environment, namely Stretford. To date, a total of 29 of the 30 facilities have been completed in the Metrorail environment.
➤ As part of the roll-out plan, five National Mobile Train Unit bases had to be built. Up to the end of March 2011, only one base has been occupied by the National Mobile Train Unit (NMTU) in Tshwane. Due to a lack of funding from the Passenger Rail Agency of South Africa (PRASA), the outstanding bases have not yet been completed and it is expected to receive attention during 2011/12. In the interim, members are performing their functions from various other facilities.
➤ A total of seven mobile train coaches had to be manufactured. These are mobile police stations that can be hooked onto a train coach in order to render a service to the community. The prototype coach was handed over to the SAPS in 2009, and a further four coaches were completed in 2010. These completed coaches are not yet operational due to power supply challenges, as a result of deviations in terms of the specifications set out for the prototype coach. The outstanding two coaches are expected to be completed and handed over in 2011/12.
➤ A total of 2 644 members have been deployed for Metrorail and 663 for Mainline Services (National Mobile Train Unit). Railway Police Metrorail members are deployed to prevent and combat crime within the Metrorail environment, i.e. on local trains and railway stations, while the National Mobile Train Unit is deployed on long-distance trains.
➤ Reported contact crime cases in the railway environment indicate a decrease of 37.7% compared to the previous financial year. The highest decrease was recorded in the sexual offences category,

SAPS TOGETHER SQUEEZING CRIME to ZEROSAPS Members, My Family - Together Pushing Back The Frontiers Of Evil
ANNUAL REPORT 2010/2011SOUTH AFRICAN POLICE SERVICE
117
indicating a decrease of 65.3% from 202 cases in 2009/10 to 70 cases in 2010/11.
➤ The following table provides an overview of the decrease in reported contact crime cases:
Contact crime 2009/10 2010/11 % decrease
Murder and attempted murder 184 122 -33.7%
Sexual offences (rape and attempted rape and indecent assault) 202 70 (rape) -65.3%
Assault GBH 449 231 -48.6%
Common assault 745 468 -37.2%
Aggravated robbery (includes hijacking of cars and trucks, house robbery, business robbery, CIT robbery, bank robbery, robbery with a firearm and robbery with a weapon other than a firearm)
895 574 -35.9%
Common robbery 921 652 -29.2%
➤ 7 542 contact-related crime, crimes dependent on police action for detection, property-related and other serious crime were reported compared to 5 959 in 2009/10, an increase of 26.6%.
➤ 48 100 other crime were reported in 2010/11, compared to 24 536 in 2009/10, an increase of 96%. These crimes include crimen injuria, culpable homicide, drinking in public and crimes in terms of the Legal Succession to the South African Transport Services Act, 1989 (Act No. 9 of 1989) (e.g. illegal railway crossings and train surfing).
➤ A total of 29 374 arrests were made in 2010/11 compared to 27 887 in 2009/10.
Table 32 provides an overview of reported contact crime and other priority crime in the railway environment.
Table 32: Contact crime and other priority crime cases reported and arrests made in the railway environment in the period of 1 April 2010 to 31 March 2011
Crimes reported Arrests
Contact crime
Murder and attempted murder 122 27
Sexual offences (rape and attempted rape and indecent assault) 70 (rape) 90
Assault GBH 231 326
Common assault 468 192
Aggravated robbery (includes hijacking of cars and trucks, house robbery, business robbery, CIT robbery, bank robbery, robbery with a firearm and robbery with a weapon other than a firearm)
574 363
Common robbery 652 41
Total 2117 1 039
Subcategories of aggravated robbery
Hijacking of cars and trucks 1 12
Robbery at residential premises (house robbery) 0 8
Robbery at business premises (business robbery) 12 9
Cash-in-transit robbery 3 0
Bank robbery 0 2
Other robbery with aggravated circumstances (robbery with a firearm and robbery with weapon other than firearm) 558 332
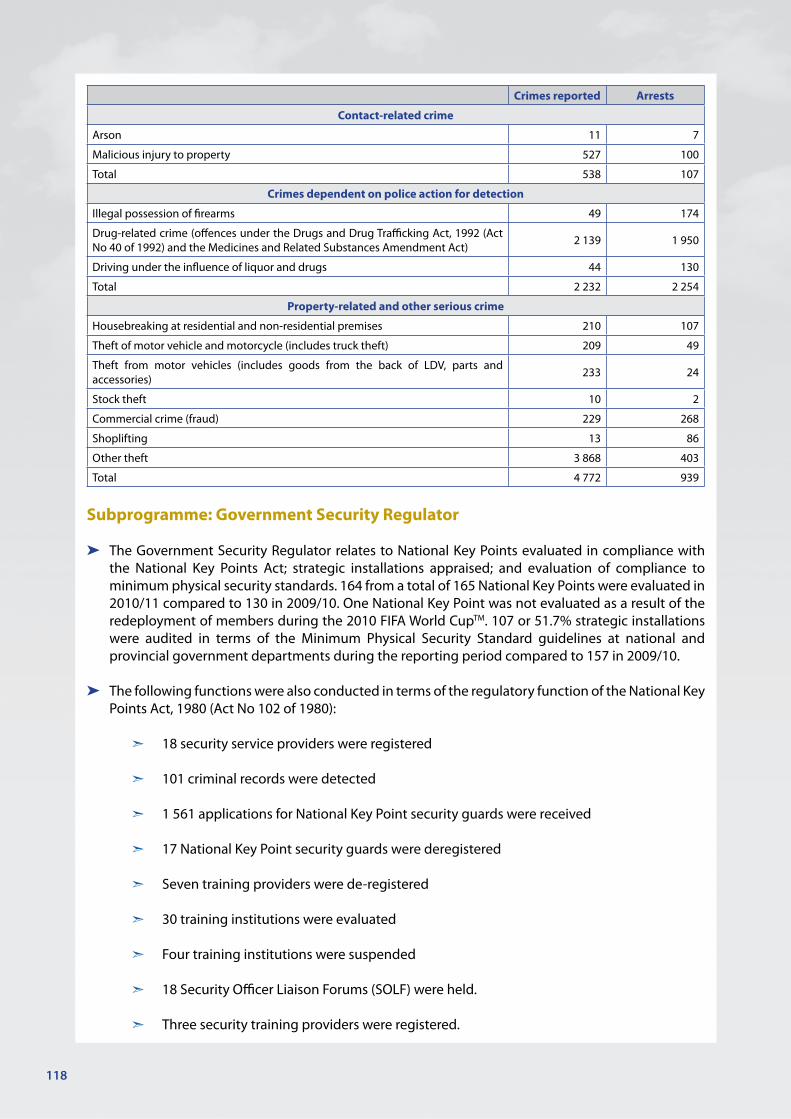
SAPS TOGETHER SQUEEZING CRIME to ZEROSAPS Members, My Family - Together Pushing Back The Frontiers Of Evil
ANNUAL REPORT 2010/2011SOUTH AFRICAN POLICE SERVICE
118
Crimes reported Arrests
Contact-related crime
Arson 11 7
Malicious injury to property 527 100
Total 538 107
Crimes dependent on police action for detection
Illegal possession of firearms 49 174
Drug-related crime (offences under the Drugs and Drug Trafficking Act, 1992 (Act No 40 of 1992) and the Medicines and Related Substances Amendment Act) 2 139 1 950
Driving under the influence of liquor and drugs 44 130
Total 2 232 2 254
Property-related and other serious crime
Housebreaking at residential and non-residential premises 210 107
Theft of motor vehicle and motorcycle (includes truck theft) 209 49
Theft from motor vehicles (includes goods from the back of LDV, parts and accessories) 233 24
Stock theft 10 2
Commercial crime (fraud) 229 268
Shoplifting 13 86
Other theft 3 868 403
Total 4 772 939
Subprogramme: Government Security Regulator
➤ The Government Security Regulator relates to National Key Points evaluated in compliance with the National Key Points Act; strategic installations appraised; and evaluation of compliance to minimum physical security standards. 164 from a total of 165 National Key Points were evaluated in 2010/11 compared to 130 in 2009/10. One National Key Point was not evaluated as a result of the redeployment of members during the 2010 FIFA World CupTM. 107 or 51.7% strategic installations were audited in terms of the Minimum Physical Security Standard guidelines at national and provincial government departments during the reporting period compared to 157 in 2009/10.
➤ The following functions were also conducted in terms of the regulatory function of the National Key Points Act, 1980 (Act No 102 of 1980):
➣ 18 security service providers were registered
➣ 101 criminal records were detected
➣ 1 561 applications for National Key Point security guards were received
➣ 17 National Key Point security guards were deregistered
➣ Seven training providers were de-registered
➣ 30 training institutions were evaluated
➣ Four training institutions were suspended
➣ 18 Security Officer Liaison Forums (SOLF) were held.
➣ Three security training providers were registered.

SAPS TOGETHER SQUEEZING CRIME to ZEROSAPS Members, My Family - Together Pushing Back The Frontiers Of Evil
ANNUAL REPORT 2010/2011SOUTH AFRICAN POLICE SERVICE
119
The Audit Committee reports in terms of section 38(1)(a) of the Public Finance Management Act, 1 of 1999, as amended and Treasury Regulations 3.1.13 and 27(1 )(1 O)(b) and (c) that it has adopted appropriate formal terms of reference as its Audit Committee Charter, and has regulated its affairs in compliance with this charter, and has discharged its responsibilities contained therein.
The Audit Committee consist of the members listed hereunder and meets at least (3) three times per annum as per its approved terms of reference. During the current year, (4) four meetings were held.
1. Meeting attendance during 2010/2011
Name of Member Number of Meetings attended
Mr B Coka (retired) ex-Chairperson1 4
Ms B Ngunjiri Chairperson 4
Lieutenant General MM Stander Deputy National Commissioner2 4
Lieutenant General B Mgwenya Deputy National Commissioner 1
Ms M Roos (retired)* External 3
Ms KT Rapoo (retired)* External 3
Mr T. Boltman External 1
Mr W. van Heerden External 1
Mr J Mpai External 1
1 Mr B Coka retired as his term of office expired effective January 29, 2011 and in his place Ms B. Ngunjiri was appointed effective January 29, 2011. Ms B Ngunjiri was appointed to the Audit Committee in August 2008.
2 Lieutenant General MM Stander membership was restructured at the appointment of Lieutenant General B Mgwenya as both the Chief Operating Officer for the SAPS as well as the new internal member of the audit committee. Her appointment therefore fills the same place previously held by Lieutenant General MM Stander effective January 29, 2011.
* Members retired as their term of office expired effective July 29, 2010.
2. Deputy National Commissioners
By delegation of the National Commissioner (Accounting Officer); the Deputy National Commissioner appears in the audit committee meeting as both an in internal member as well as a representative of the Accounting Officer. This process has been altered and in future audit committee meetings the Accounting Officer will represent himself.
3. Performance of the Audit Committee
In the conduct of its duties, the Audit Committee has, inter alia, reviewed the following:
➤ The effectiveness of the internal control systems;
➤ The effectiveness of the internal audit function;
➤ The risk areas of the entity’s operations covered in the scope of internal and external audits;
➤ The adequacy, reliability and accuracy of financial information provided by management and other
DEPARTMENT OF POLICE VOTE 24
REPORT OF THE AUDIT COMMITTEEfor the year ended 31 March 2011

SAPS TOGETHER SQUEEZING CRIME to ZEROSAPS Members, My Family - Together Pushing Back The Frontiers Of Evil
ANNUAL REPORT 2010/2011SOUTH AFRICAN POLICE SERVICE
120
users of such information;
➤ Accounting and auditing concerns identified as a result of internal and external audits;
➤ The entity’s compliance with legal and regulatory provisions;
➤ The activities of the internal audit function, including its annual work programme, co-ordination with the external auditors, the reports of significant investigations and the responses of management to specific recommendations; and
➤ The independence and objectivity of the internal and external auditors.
The Audit Committee is of the opinion, based on the information and explanations given by management and the internal auditors and discussions with the independent external auditors on the result of their audits the status in addressing the matters raised by SCOPA, that the internal accounting controls are operating, though they need strengthening and improvement to ensure that the financial records may be relied upon for preparing the annual financial statements, and accountability for assets and liabilities is maintained.
Nothing significant has come to the attention of the Audit Committee other than the matters referred to in the National Commissioner’s and Auditor-General’s reports to indicate that any material breakdown in the functioning of these controls, procedures and systems has occurred during the year under review.
The Audit Committee has evaluated the annual financial statements of the South African Police Services for the year ended 31 March 2011 and, based on the information provided to the Audit Committee, considers that it complies, in all material respects, with the requirements of the South African Police Act (Act 68 of 1995) and the Public Finance Management Act, 1 of 1999, as amended and South African Statements of Generally Recognised Accounting Practice. The Audit Committee concurs that the adoption of the going concern premise in the preparation of the annual financial statements is appropriate. At their meeting held on 25 July 2011 the Audit Committee recommended the adoption of the Annual Financial Statements by the South African Police Service.
B NGUNJIRIChairperson
DATE: 25 July 2011
DEPARTMENT OF POLICE VOTE 24
REPORT OF THE AUDIT COMMITTEEfor the year ended 31 March 2011

SAPS TOGETHER SQUEEZING CRIME to ZEROSAPS Members, My Family - Together Pushing Back The Frontiers Of Evil
ANNUAL REPORT 2010/2011SOUTH AFRICAN POLICE SERVICE
121
Report by the Accounting Officer to the Executive Authority and the Parliament of the Republic of South Africa.
1. General review of the state of financial affairs
The main appropriation for the Department included in the Estimates of National Expenditure 2010 amounted to R52 556 440 000. The Adjusted Estimates for 2010/11 included an additional amount of R973 300 000, which increased the Department’s allocation to R53 529 740 000. This represents an increase of 12, 4% over the previous financial year’s adjusted allocation of R47 621 967 000.
The total expenditure for the 2010/11 financial year amounted to R53 529 700 188, 87, which represents a spending rate of 100 %. The expenditure was made up as follows:
Expenditure 2009/10R’000
2010/11R’000
Increase/(Decrease)(%)
* Compensation of employees 33 739 819 38 415 337 13,9%
* Departmental operational costs 13 882 148 15 114 363 8,9%
Total expenditure 47 621 967 53 529 700 12,4%
The surplus on the vote for the 2010/11 financial year amounts to R39 811, 20. Spending on compensation of employees (70.8% in 2009/10 and 71, 8% in 2010/11) remained the most significant expense in the Department’s vote.
Programme spending, if compared to the adjusted allocation for the year, was as follows:
Programmes Main Appropriation R’000
Adjusted Appropriation
R’000
Actual Amount spent R’000
Variance
1. Administration 18 167 072 18 066 960 17 871 936 195 024
2. Visible Policing 20 702 464 21 500 927 21 702 627 (201 700)
3. Detective Services 8 757 701 8 850 257 8 868 123 (17 866)
4. Crime Intelligence 1 886 902 1 947 635 1 947 626 9
5. Protection and Security Services 3 042 301 3 163 961 3 139 388 24 573
TOTAL 52 556 440 53 529 740 53 529 700 40
Although very marginal in nature, virements were applied and to the following extent:
Programme 1: Administration (Under spending)
Due to spending pressures experienced with the compensation of employees, in the entire vote, the amount due to Polmed (the State’s contribution) payable in March 2011 had to compensate to allow for the payment of other compensation expenses in other programmes. However, the full State contribution payable to Polmed was still paid into their bank account on 1 April 2011, according to the agreement. This arrangement implied a partial charge against the allocations of both financial years, i.e. 2010/11 and 2011/12. As a result, Programme 1 realised a decreased level of spending. Due to technical contractual difficulties, monies allocated for the TETRA system in the Eastern Cape were redirected to
DEPARTMENT OF POLICE VOTE 24
REPORT OF THE ACCOUNTING OFFICERfor the year ended 31 March 2011

SAPS TOGETHER SQUEEZING CRIME to ZEROSAPS Members, My Family - Together Pushing Back The Frontiers Of Evil
ANNUAL REPORT 2010/2011SOUTH AFRICAN POLICE SERVICE
122
other programmes as well.
Programme 2: Visible Policing (Overspending)
Due to spending pressures experienced with the budget for the compensation of employees in this programme (subprogramme Crime Prevention), a budget overrun realised as was anticipated. Apart from this, over-commitments on the Borderline Security subprogramme projects resulted in a budget shortfall. The source of funding for these overruns is Programme 1.
Programme 3: Detective Services (Overspending)
Due to spending pressures experienced with the budget for the compensation of employees in this programme (subprogramme Crime Investigations), a budget overrun realised as forecasted. Apart from this, capital spending also overspent mainly as a result of capital purchases in respect of the CJS programmes in the FSL/CRC environments. The initial budgetary provision was made under goods and services in these subprogrammes.
Programme 5: Protection and Security Services (Under spending)
Although the compensation of employees realised an overspending for the reasons indicated above, goods and services and payments for capital assets realised budget surpluses as anticipated. The main reason for this spending trend is the organisational changes and redirection of functions that impacted on spending prioritisation and execution. These amounts supplemented the budget difficulties experienced in Programme 3.
The programme expenditure trend in the past two financial periods was as follows:
Programmes 2009/10R’000
2010/11R’000
Increase/ (Decrease)
1. Administration 16 009 520 17 871 935 11,6%
2. Visible Policing 19 769 866 21 702 627 9,8%
3. Detective Services 7 493 634 8 868 123 18,3%
4. Crime Intelligence 1 658 018 1 947 626 17,5%
5. Protection and Security Services 2 690 929 3 139 388 16,7%
Total expenditure 47 621 967 53 529 700 12,4% The Department’s estimates will increase to R66, 696 billion in 2013/14 over the medium term, at an average rate of 7, 6 % over the period.
2. Services rendered by the Department
2.1 Services rendered
Apart from the Department’s core responsibilities, various other internal and extra- departmental services were rendered in terms of the Promotion of Access to Information Act, 2000 (Act No 2 of 2000) and the Firearms Control Act, 2000 (Act No 60 of 2000). As the purpose of the Promotion of Access to Information Act, 2000 is to give full effect to the constitutional right of the public to access any
DEPARTMENT OF POLICE VOTE 24
REPORT OF THE ACCOUNTING OFFICERfor the year ended 31 March 2011

SAPS TOGETHER SQUEEZING CRIME to ZEROSAPS Members, My Family - Together Pushing Back The Frontiers Of Evil
ANNUAL REPORT 2010/2011SOUTH AFRICAN POLICE SERVICE
123
information held by the State, it is the Department’s objective to foster a culture of transparency and accountability towards the public and to actively promote a society in which the people of the Republic of South Africa have effective access to information, thereby enabling them to exercise and protect all of their rights.
The aim of the Firearms Control Act, 2000 is to address firearm-related crime by removing illegally-possessed firearms from society and to ensure effective control over firearms owned legally by individuals and Government.
A list of services rendered is included under the heading Programme performance in the Annual Report. 2.2 Tariff policy
All fees, charges and tariffs that is not or cannot be fixed by any law and that relate to revenue accruing to a revenue fund are managed by the Department’s Tariff Committee.
2.3 Auxiliary Services
The Department caters for those services that have been classified as functional responsibilities of the Department and not for so-called free services.
The functional responsibilities of the Department include the provision of -
➤ nutrition to detainees
➤ nutrition to resident members in some official quarters
➤ nutrition to members at SAPS training facilities
➤ services to members who participate in certain official activities such as sport, recreational and cultural activities
3. Capacity constraints and improvements
As reported in the previous Annual Report, the Department gradually improved its organizational structure over the past nine years by increasing the number of personnel on the fixed establishment in order to meet the capacity needs.
Since 1 April 2002 the Department embarked upon a strategy to increase its capacity, both human and physical. This process will continue for the next three financial years. Similarly, spending on capital immovable assets will also remain a prominent feature of the SAPS vote. The Department’s staff establishment as on 31 March 2011 was 193 129.
4. Use of donor funds
FranceThe Minister of Police signed an agreement with the Government of France on 9 March 2009. The
DEPARTMENT OF POLICE VOTE 24
REPORT OF THE ACCOUNTING OFFICERfor the year ended 31 March 2011

SAPS TOGETHER SQUEEZING CRIME to ZEROSAPS Members, My Family - Together Pushing Back The Frontiers Of Evil
ANNUAL REPORT 2010/2011SOUTH AFRICAN POLICE SERVICE
124
overall objective of this new project is to contribute to the creation of a safe and secure environment by reinforcing the capacity of the South African Police Service (SAPS) to fight against Transnational Organised Crime and Terrorism.
The Project consists of the following components:
Component 1
To strengthen the capacity of the South African Police Service in dealing with the threat of criminal networks and terrorism including but not limited to -
➤ developing more efficient border control
➤ strengthening the capacity of specialist investigative units
➤ developing the capacities of technical and scientific police units
➤ developing the crime intelligence information-gathering capacity on terrorism and organised crime; and
➤ developing a capacity to carry out anti-terrorist operations.
Component 2
To strengthen the interaction of the South African Police Service with neighbouring countries, by, among other things, -
➤ developing a Detective course for countries of the Southern African Regional Police Chiefs Cooperation Organization (SARPCCO)
➤ arranging international conferences and workshops
➤ providing French language courses.
The value of the project is 1.2 million Euros, which will be supplied over a period of three years.
SudanIn November 2009 a project agreement was signed between the SAPS and Norway on Sustainable Policing in Sudan. This is a regional partnership between the SAPS and the Sudanese Police Force, supported by funding from the Royal Norwegian Government.
BelgiumThe Nelson Mandela Metropolitan University’s Business School has been involved in the development and presentation of a Programme to Support the Planning and Management for Improved Organizational Performance within the Strategic Management Unit of the South African Police Service (SAPS) nationally.
The programme, which is funded by the Belgian Government as part of a bilateral support programme for South Africa, is aimed at equipping the members with the necessary knowledge and skills to become
DEPARTMENT OF POLICE VOTE 24
REPORT OF THE ACCOUNTING OFFICERfor the year ended 31 March 2011

SAPS TOGETHER SQUEEZING CRIME to ZEROSAPS Members, My Family - Together Pushing Back The Frontiers Of Evil
ANNUAL REPORT 2010/2011SOUTH AFRICAN POLICE SERVICE
125
more self-directed and accountable for the nature and quality of their own output.
The aim of this project is to have skilled and competent members within a Strategic Management environment who assist the SAPS with the provision of strategic direction and facilitate organisational developmental initiatives. The success of this training in terms of changed attitudes and behaviour and improved service delivery, has resulted in three (3) groups of thirty (30) learners each, funded by the Belgian Technical Cooperation over a three-year period. In February 2011 a group of 15 members started with another cycle of training for 2010/2011.
5. Trading entities and public entities
The Private Security Industry Regulatory Authority was established in terms of the Private Security Industry Regulation Act, 2001 (Act No 56 of 2001) with a primary objective of the regulation of the private security industry, exercising effective control over the practice of the occupation of security service provider in the public and national interest, and the interest of the private security industry itself.
No transfer of funds takes place between the authority and the SAPS budget allocation and the SAPS is not a designated department for the authority as contemplated in section 53(2) of the Public Finance Management Act.
6. Organisations that transfer payments have been made to
In terms of the Skills Development Act, 1998 (Act No 97 of 1998), and the Skills Development Levies Act, 1999 (Act No 9 of 1999), an amount of R23, 861 million was paid to the Safety and Security Sector Education and Training Authority in 2010/11.
7. Corporate governance arrangements
7.1 Fraud prevention policies The SAPS has revised its Anti-corruption Strategy to ensure compliance in terms of the Minimum Anti-corruption Capacity requirements (MACC) as approved by Cabinet. This revision of the Anti-corruption Strategy was conducted in response to an audit of the extent of compliance with the MACC as conducted by the Department of Public Service and Administration in 2009/10. The revision of the Strategy has focused specifically on ensuring the effective implementation of the four pillars of the Strategy, namely prevention, detection, investigation and restorative actions by all divisions, provinces and stations. In order to ensure effective implementation of the Strategy, specific Anti-corruption Action Plans have been developed for implementation at divisional, provincial and station levels, ensuring that all corruption combating initiatives contained in the Strategy are reflected in the Anti-corruption Action Plans.
These Anti-corruption Action Plans contain specific priorities and actions in each of the four pillars, with measureable performance indicators, baselines and targets. The divisions, provinces and stations focus on implementing the Anti-corruption Action Plan during each of the four quarters of the financial year, and provide quarterly reports on the progress made with achieving targets to the office of the National Commissioner. The provinces and divisions initiated the implementation of their Anti-corruption Action Plans during the last quarter of 2010/11 and revised Anti-corruption Action Plans for
DEPARTMENT OF POLICE VOTE 24
REPORT OF THE ACCOUNTING OFFICERfor the year ended 31 March 2011

SAPS TOGETHER SQUEEZING CRIME to ZEROSAPS Members, My Family - Together Pushing Back The Frontiers Of Evil
ANNUAL REPORT 2010/2011SOUTH AFRICAN POLICE SERVICE
126
all levels have been developed for implementation during 2011/12.
The SAPS developed an Anti-corruption Sensitization Programme. This Programme focuses on sensitizing and educating SAPS members and the public on the nature, causes and consequences of corruption. The divisions and provinces initiated the roll-out of the Sensitization Programme during 2010/11, with personnel at stations being the focus of the Programme.
The SAPS has developed an Integrity Management Framework for the SAPS that will function as a key element of the Prevention Pillar within the Anti-corruption Strategy. The Integrity Management Framework focuses on improving levels of professionalism and integrity in the SAPS, increasing levels of direct managerial support to members, ensuring the necessary corruption-reporting policies are in place, e.g. the Whistle-blowing Policy and establishing an anti-corruption training programme within the SAPS to augment the Sensitization Programme.
7.2 Management processes aimed at managing conflict of interest
The SAPS has issued an instruction regarding the declaration of interests in support of the implementation of National Treasury Practice Note 7 of 2009/10. This instruction does, however, only apply to members of the Supply Chain Management Division.
National Instruction 6 of 2005 indicates that members of selection panels must declare any interest that they may have that could influence the assessment of applicants.
7.3 Approach to risk management
The SAPS has revised its Risk Management Strategy for implementation during 2011/12 to ensure compliance with the Public Sector Risk Management Framework and the risk management recommendations made in the King III Report on Corporate Governance. As a result of revisions to the Risk Management Strategy, a draft, revised national instruction on risk management was developed in consultation with all provinces, divisions and national components. Changes to the existing national instruction were effected and are in the process of being completed by Legal Services for promulgation.
The annual Risk Management Implementation Plan was compiled and approved on 5 July 2010 for implementation. Quarterly reports regarding the implementation of the Implementation Plan were completed and submitted to the National Risk Committee and the SAPS Auditing Committee for consideration and approval. In its quarterly reports, the SAPS was able to demonstrate that the mitigation of certain risks had been achieved, resulting in the reprioritisation of risk.
Members of top management were sensitized about their roles and responsibilities towards the implementation of Risk Management, including the importance of establishing a risk management culture in the SAPS. This took place in the risk identification sessions for provinces and divisions and provincial consultation sessions in preparation of the strategic planning session for the National Commissioner.
A schedule was completed for the conducting of risk assessments in the provinces, divisions and national components, which resulted in eight provinces and ten divisions having approved risk registers.
A National Strategic Risk Register for the SAPS was completed and approved by the National
DEPARTMENT OF POLICE VOTE 24
REPORT OF THE ACCOUNTING OFFICERfor the year ended 31 March 2011

SAPS TOGETHER SQUEEZING CRIME to ZEROSAPS Members, My Family - Together Pushing Back The Frontiers Of Evil
ANNUAL REPORT 2010/2011SOUTH AFRICAN POLICE SERVICE
127
Commissioner of the SAPS. Key Risk Indicators (KRI’s), as well as an information process flow, were developed for all strategic risks. National Control Standards were developed for each of the Strategic Risks. The Strategic Risk Register for the SAPS, including KRI’s and National Control Standards, were communicated to all provinces, divisions and stations.
The Risk Management manual was piloted in four comprehensive in-service skills development sessions. These sessions were attended by 84 members from the provinces, divisions, national components and stations. Skills development enhances the establishment and empowerment of a risk management capacity at the different levels within the SAPS. Risk management sensitization, an overview of the risk management process in the SAPS, and an explanation of the Risk Register and Quarterly Risk Report templates were provided.
Two National Risk Committee (NRC) meetings were conducted in the reporting period. The National Commissioner appointed the Chief Operations Officer of the SAPS, as the chairperson of the NRC. The NRC comprises two Provincial Commissioners, the majority of the operational divisional commissioners and the key support divisional commissioners, a member of the Auditing Committee, the Chief Risk Officer and the Police Secretariat. A Charter for the NRC, including charters for the Provincial and Station Risk Committees were completed. The Charter defined their roles, membership and functions.
7.4 Implementation and assessment of the Code of Conduct The SAPS Code of Conduct was communicated to all members. It specifically focused on providing a policing service that is characterized by professionalism and integrity and has been included in the corporate documentation developed by the SAPS. The SAPS Code of Ethics was included specifically in the Strategic Plan 2010 to 2014 in order to provide a strategic platform for the continued internal and external communication of the ethical values that the SAPS subscribe to.
The Anti-corruption Sensitization Programme developed by the SAPS is being implemented on all levels, but particularly on station level and it emphasizes the role played by the Code of Conduct in structuring and setting standards for the conduct of all SAPS members. Specific elements of the Code of Conduct are included in the programme, and it focuses members on the need for the actual implementation of the Code of Conduct through the day-to-day behaviour and conduct of SAPS members.
The requirements of the King III Report
The King III report on Corporate Governance includes an extended set of recommendations regarding risk management and its implementation within organizations. The SAPS analysed these recommendations and ensured their integration into the revised Risk Management Strategy. The SAPS Risk Management Strategy for 2011/12 is therefore compliant with both the Public Sector Risk Management Framework and the recommendations regarding risk management made in the King II Report.
7.5 Effectiveness of Internal Audit and Auditing Committee
The Strategic Internal Audit Plan, which extends over three years and incorporates the Annual Plan for the 2010/2011 financial year, was approved by the Audit Committee. The approach was to formulate a risk-based plan that aligned the priorities of the Internal Auditing component with the objectives and goals of the Department and related strategic risk areas the Department faces over the next three years. The projects, among other things, include the following types of reviews:
DEPARTMENT OF POLICE VOTE 24
REPORT OF THE ACCOUNTING OFFICERfor the year ended 31 March 2011

SAPS TOGETHER SQUEEZING CRIME to ZEROSAPS Members, My Family - Together Pushing Back The Frontiers Of Evil
ANNUAL REPORT 2010/2011SOUTH AFRICAN POLICE SERVICE
128
➤ Risk-based compliance
➤ Financial discipline
➤ Cyclical reviews
The scope of the Internal Auditing component is to ascertain whether the Department’s network of risk management, control and governance processes, as designed and represented by management, are adequate and operative in a manner that will ensure the following:
➤ Risks are appropriately identified and managed.
➤ Appropriate interaction takes place with the various governance groups in the Department.
➤ Financial, managerial and functional information is accurate, reliable and timely.
➤ Employee’s actions comply with policies, standards, procedures and the applicable laws and regulations.
➤ Resources are acquired economically, used efficiently and are adequately protected.
➤ Programmes, plans and objectives are achieved.
➤ Quality and continuous improvement are fostered in the organization’s control processes.
➤ Significant legislative or regulatory matters impacting on the organization are recognized and addressed appropriately.
The Internal Auditing component is independent and no limitation is put on access to information. The accountability and reporting structures of the component are properly established and regular feedback is provided to the Auditing Committee that acts as oversight committee in evaluating the following:
➤ Progress made with the execution of internal audit reviews in terms of the approved Internal Audit Plan
➤ Results of the internal audit reviews concluded
➤ The effectiveness of the component. 7.6 Safety, health and environment-related matters
The Department established a component attending to the working environment in terms of the Occupational Health and Safety Act, 1993 (Act No 85 of 1993).
Ongoing projects aimed at improving health and safety in 2010/2011
➤ Research into proper personal protective equipment/clothing
DEPARTMENT OF POLICE VOTE 24
REPORT OF THE ACCOUNTING OFFICERfor the year ended 31 March 2011

SAPS TOGETHER SQUEEZING CRIME to ZEROSAPS Members, My Family - Together Pushing Back The Frontiers Of Evil
ANNUAL REPORT 2010/2011SOUTH AFRICAN POLICE SERVICE
129
➤ Communication Plan to promote awareness of health and safety
➤ Development of safe working procedures and standards for health and safety regarding specific duties
➤ Legal compliance audits (inspections) at the workplaces of the Department’s members of personnel
➤ Medical Surveillance Programme
➤ Induction training on health and safety at training colleges.
➤ Investigation of all reported incidents in the SAPS and report to Department of Labour in terms of OHS Act 85 of 1993.
8. Discontinued activities
None.
9. New/proposed activities
Legislation was passed to ensure that from 1 July 2009, the duties that had been performed by the former Directorate for Special Operations (DSO) in the National Prosecuting Authority would be transferred to the SAPS. This resulted in the establishment of the Directorate for Priority Crime Investigation, which included the duties of the Commercial and Organised Crime Unit of the SAPS, and formed part of the broader Detective Services of the South African Police Service. 10. Asset management
The Department is continuously striving to improve asset management to comply with the requirements of the Annual Financial Statements (AFS). In this regard the Supply Chain Management Division made a policy decision that only the Provisioning Administration System will serve as the official system from which information will be provided. To support this decision, the Divisional Commissioner has also established a Management Information Centre where all information will be verified. It is acknowledged that data integrity on the systems poses a challenge and all efforts are made to keep the current information accurate and to implement business and counting rules in compliance with all regulatory frameworks.
In addition to the Asset Register, several functionalities and interfaces have been established and implemented to enhance an integrated asset management approach in the Department. This includes the following:
➤ The Workshop Accounting System
➤ The Loss Control System
➤ NATIS
➤ The Firearm Control System
DEPARTMENT OF POLICE VOTE 24
REPORT OF THE ACCOUNTING OFFICERfor the year ended 31 March 2011

SAPS TOGETHER SQUEEZING CRIME to ZEROSAPS Members, My Family - Together Pushing Back The Frontiers Of Evil
ANNUAL REPORT 2010/2011SOUTH AFRICAN POLICE SERVICE
130
➤ The Vehicle Tracking System
➤ The Fuel Card System
➤ The POLFIN Telkom System
➤ The Action Response System (ARS) for computer equipment
➤ Reconciliation of asset additions with invoices paid.
11. Inventories
The total inventories on hand at the year-end are included in Annexure 6.
12. Events after the reporting date
Due to the fact that the Department of Public Works has taken a decision to apply for a declaratory order in the Sanlam Middestad lease agreement for the Court to make a ruling on the legality or otherwise of the lease agreement, it was decided to include it as a contingent liability.
13. Information on predetermined objectives
Quarterly reports are compiled in accordance with Treasury Regulation 5.3 in order to monitor progress regarding the implementation of the Annual Performance Plan, including the performance indicators and targets. Management uses the information in the quarterly reports to implement procedures to correct the Department’s performance in achieving its targets as described in the Annual Performance Plan.
Internal controls and procedures have been developed for performance management and describe the Department’s verification processes for performance monitoring, measurement, review and reporting.
Dedicated personnel who have been trained in strategic management principles are responsible for gathering, monitoring, evaluating and verifying performance indicators information per financial programme as described in the Annual Performance Plan.
Various electronic information systems, e.g. the Crime Administration System, the Operational Planning and Monitoring System, the Firearm Registration System that capture performance information, were implemented. In cases where there is no electronic systems to capture performance information, manual systems are used. However, the manual systems are gradually replaced by electronic systems in order to provide more accurate performance information. Control procedures are built into the various systems to assist with the verification and analysis of performance information.
14. SCOPA resolutions
The following progress has been made regarding various SCOPA resolutions:
DEPARTMENT OF POLICE VOTE 24
REPORT OF THE ACCOUNTING OFFICERfor the year ended 31 March 2011
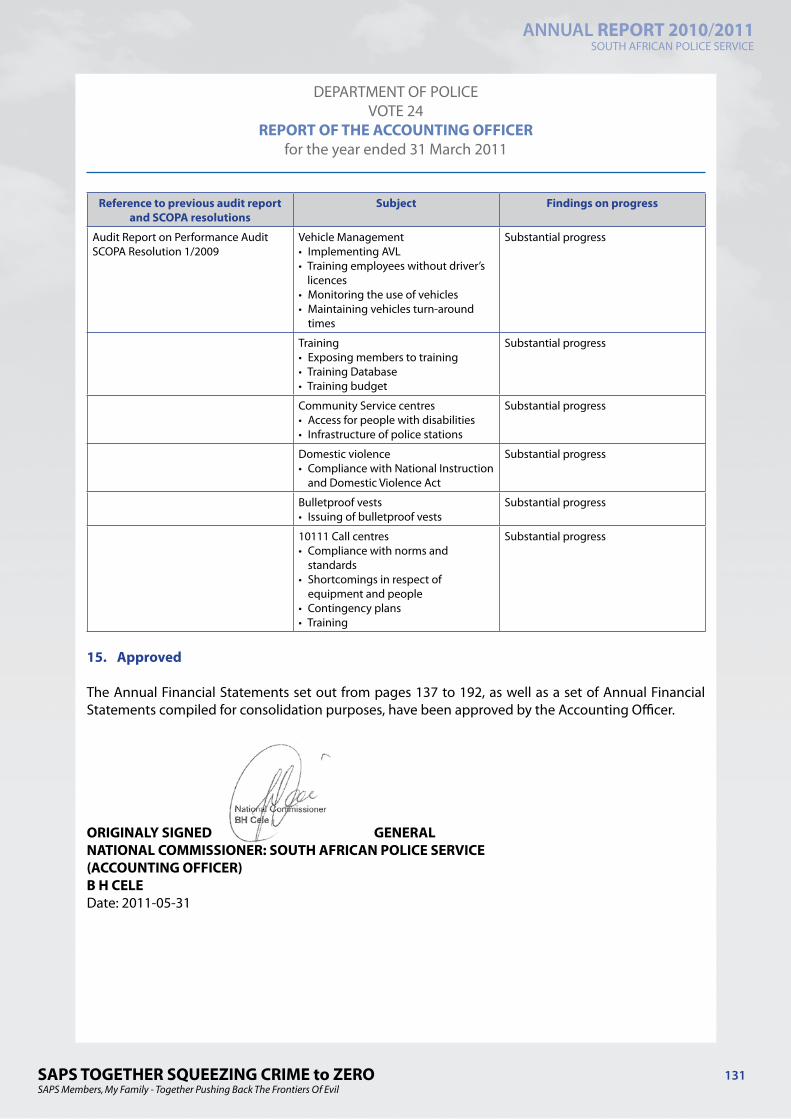
SAPS TOGETHER SQUEEZING CRIME to ZEROSAPS Members, My Family - Together Pushing Back The Frontiers Of Evil
ANNUAL REPORT 2010/2011SOUTH AFRICAN POLICE SERVICE
131
Reference to previous audit report and SCOPA resolutions
Subject Findings on progress
Audit Report on Performance AuditSCOPA Resolution 1/2009
Vehicle Management• Implementing AVL• Training employees without driver’s
licences• Monitoring the use of vehicles • Maintaining vehicles turn-around
times
Substantial progress
Training• Exposing members to training• Training Database• Training budget
Substantial progress
Community Service centres• Access for people with disabilities• Infrastructure of police stations
Substantial progress
Domestic violence • Compliance with National Instruction
and Domestic Violence Act
Substantial progress
Bulletproof vests• Issuing of bulletproof vests
Substantial progress
10111 Call centres• Compliance with norms and
standards• Shortcomings in respect of
equipment and people• Contingency plans• Training
Substantial progress
15. Approved
The Annual Financial Statements set out from pages 137 to 192, as well as a set of Annual Financial Statements compiled for consolidation purposes, have been approved by the Accounting Officer.
ORIGINALY SIGNED GENERALNATIONAL COMMISSIONER: SOUTH AFRICAN POLICE SERVICE(ACCOUNTING OFFICER)B H CELE Date: 2011-05-31
DEPARTMENT OF POLICE VOTE 24
REPORT OF THE ACCOUNTING OFFICERfor the year ended 31 March 2011

SAPS TOGETHER SQUEEZING CRIME to ZEROSAPS Members, My Family - Together Pushing Back The Frontiers Of Evil
ANNUAL REPORT 2010/2011SOUTH AFRICAN POLICE SERVICE
132
REPORT ON THE FINANCIAL STATEMENTS
Introduction
1. I have audited the accompanying financial statements of the Department of Police, which comprise the appropriation statement, and the statement of financial position as at 31 March 2011, and the statement of financial performance, statement of changes in net assets and cash flow statement for the year then ended, and a summary of significant accounting policies and other explanatory information, and the accounting officer’s report as set out on pages 121 to 131.
Accounting officer’s responsibility for the financial statements
2. The accounting officer is responsible for the preparation of these financial statements in accordance with The Departmental Financial Reporting Framework prescribed by the National Treasury and the requirements of the Public Finance Management Act of South Africa, 1999 (Act No. 1 of 1999)(PFMA), and for such internal control as management determines necessary to enable the preparation of financial statements that are free from material misstatement, whether due to fraud or error.
Auditor-General’s responsibility
3. As required by section 188 of the Constitution of the Republic of South Africa, 1996 (Act No. 108 of 1996) and, section 4 of the Public Audit Act of South Africa, 2004 (Act No. 25 of 2004) (PAA), my responsibility is to express an opinion on these financial statements based on my audit.
4. I conducted my audit in accordance with International Standards on Auditing and General Notice 1111 of 2010 issued in Government Gazette 33872 of 15 December 2010. Those standards require that I comply with ethical requirements and plan and perform the audit to obtain reasonable assurance about whether the financial statements are free from material misstatement.
5. An audit involves performing procedures to obtain audit evidence about the amounts and disclosures in the financial statements. The procedures selected depend on the auditor’s judgement, including the assessment of the risks of material misstatement of the financial statements, whether due to fraud or error. In making those risk assessments, the auditor considers internal control relevant to the entity’s preparation of the financial statements in order to design audit procedures that are appropriate in the circumstances, but not for the purpose of expressing an opinion on the effectiveness of the entity’s internal control. An audit also includes evaluating the appropriateness of accounting policies used and the reasonableness of accounting estimates made by management, as well as evaluating the overall presentation of the financial statements.
6. I believe that the audit evidence I have obtained is sufficient and appropriate to provide a basis for my audit opinion.
Opinion
7. In my opinion, the financial statements present fairly, in all material respects, the financial position of the Department of Police as at 31 March 2011, and its financial performance and cash flows for the year then ended in accordance with The Departmental Financial Reporting Framework
REPORT OF THE AUDITOR-GENERAL TO PARLIAMENT ON VOTE 24
DEPARTMENT OF POLICEfor the year ended 31 March 2011
SAPS TOGETHER SQUEEZING CRIME to ZEROSAPS Members, My Family - Together Pushing Back The Frontiers Of Evil
ANNUAL REPORT 2010/2011SOUTH AFRICAN POLICE SERVICE
133
prescribed by the National Treasury and the requirements of the PFMA.
Emphasis of matter
8. I draw attention to the matter below. My opinion is not modified in respect of this matter:
Significant uncertainty
9. With reference to note 19 to the financial statements the department is disclosing a contingent liability for the lease contract of the Pretoria building. The Department of Public Works has taken a decision to apply for a declaratory order in the Sanlam Middestad lease agreement for the court to make a ruling on the legality or otherwise of the lease agreement.
Additional matters
10. I draw attention to the matters below. My opinion is not modified in respect of these matters:
Financial reporting framework
11. The financial reporting framework prescribed by the National Treasury and applied by the department is a compliance framework. Thus my opinion would have reflected that the financial statements had been properly prepared instead of fairly presented as required by section 20(2)(a) of the PAA, which requires me to express an opinion on the fair presentation of the financial statements of the department.
Unaudited supplementary schedules
12. The supplementary information set out in annexures 1 to 6 does not form part of the financial statements and is presented as additional information. I have not audited these schedules and accordingly I do not express an opinion thereon.
REPORT ON OTHER LEGAL AND REGULATORY REQUIREMENTS 13. In accordance with the PAA and in terms of General Notice 1111 of 2010, issued in Government
Gazette 33872 of 15 December 2010, I include below my findings on the annual performance report as set out on pages 14 to 118 and material non-compliance with laws and regulations applicable to the Department of Police.
Reliability of information
14. The reported performance information was deficient in respect of the following criteria:
➣ Validity: Actual reported performance has occurred and pertains to the entity.
➣ Accuracy: Amounts, numbers and other data relating to reported actual performance have been recorded and reported appropriately.
REPORT OF THE AUDITOR-GENERAL TO PARLIAMENT ON VOTE 24
DEPARTMENT OF POLICEfor the year ended 31 March 2011

SAPS TOGETHER SQUEEZING CRIME to ZEROSAPS Members, My Family - Together Pushing Back The Frontiers Of Evil
ANNUAL REPORT 2010/2011SOUTH AFRICAN POLICE SERVICE
134
➣ Completeness: All actual results and events that should have been recorded have been included in the annual performance report.
The following audit findings relate to the above criteria:
Reported performance against indicator is not complete when compared to source information (reliability)
15. Performance indicator of programme 2 - visible policing: number of crime prevention actions conducted by police stations focusing on legal and illegal firearms, illegal drugs and stolen/robbed vehicles. The crime prevention actions conducted by police stations could not be verified on the OPAM system, as some crime operational plans had not been registered on the system.
Reported performance against indicator is not accurate when compared to source information (reliability)
16. The performance indicator, ‘Percentage of registered OCPI successfully terminated’ under programme 3: detective services, was inaccurate as the status of some terminated projects was still reflected as active on the OCPI system used for reporting.
Reported performance against indicator is not valid, accurate and complete when compared to source information (reliability)
17. The validity, accuracy and completeness of the performance indicator, ‘Specialised interventions – number of medium- to high-risk incidents stabilised’ under programme 2: visible policing could not be established, as the information captured in the monthly success reports differed from the consolidated quarterly reports used for reporting on this indicator.
Compliance with laws and regulations
18. Included below are findings on material non-compliance with laws and regulations applicable to the department.
Annual financial statements, performance report and annual report
19. The financial statements submitted for auditing did not comply with section 40(1)(c)(i) of the PFMA. Material misstatements were identified during the audit, all of which were corrected by management.
Procurement and contract management
20. The accounting officer did not take effective and/or appropriate steps to prevent irregular as well as fruitless and wasteful expenditure, as per the requirements of section 38(1)(c)(ii) of the PFMA.
21. Contract performance was not managed effectively and economically as per requirements of section 38(1)(c)(iii) of the PFMA.
22. Some goods and services that were procured on quotations were not done on a rotation basis as
REPORT OF THE AUDITOR-GENERAL TO PARLIAMENT ON VOTE 24
DEPARTMENT OF POLICEfor the year ended 31 March 2011

SAPS TOGETHER SQUEEZING CRIME to ZEROSAPS Members, My Family - Together Pushing Back The Frontiers Of Evil
ANNUAL REPORT 2010/2011SOUTH AFRICAN POLICE SERVICE
135
per practice note 8 of 2009/10 paragraph 15.3.
Strategic planning and performance management
23. The accounting officer did not ensure that the department had and maintained an effective, efficient and transparent system and internal controls in certain instances regarding performance management, which described and represented how the institution’s processes of performance planning, monitoring, measurement, review and reporting would be conducted, organised and managed, as required in terms of section 38(1)(a)(i) of the PFMA.
INTERNAL CONTROL
24. In accordance with the PAA and in terms of General Notice 1111 of 2010, issued in Government Gazette 33872 of 15 December 2010, I considered internal control relevant to my audit, but not for the purpose of expressing an opinion on the effectiveness of internal control. The matters reported below are limited to the significant deficiencies that resulted in the findings on the annual performance report and the findings on compliance with laws and regulations included in this report.
Leadership
25. Commanders at station level responsible for visible policing, did not exercise oversight responsibility over reporting on predetermined objectives to ensure that entries occurred, were authorised and were captured (i.e. that reported information was complete).
26. Commanders at unit level responsible for investigating organised crime did not exercise oversight responsibility over reporting on predetermined objectives to ensure that entries occurred, were authorised and were captured.
Performance Management
27. Commanders at station level did not exercise oversight responsibility with regards to administration of the OPAM system by ensuring that all crime prevention plans are registered on the OPAM system.
OTHER REPORTS
Investigations
28. Investigations conducted within the department Four hundred and seventy-six (476) members were charged for inter alia corruption, defeating ends of justice, fraud, aiding an escapee, bribery and extortion in terms of the department’s disciplinary regulations, in terms of the Prevention and Combating of Corrupt Activities Act, 2004 (Act No. 12 of 2004).
Two hundred and sixty-three (263) members were suspended: 215 without salary and 48 with salary. Two hundred and thirteen (213) members were not suspended. Four hundred and seventy-nine (479) corruption charges were brought against members of which three members were
REPORT OF THE AUDITOR-GENERAL TO PARLIAMENT ON VOTE 24
DEPARTMENT OF POLICEfor the year ended 31 March 2011

SAPS TOGETHER SQUEEZING CRIME to ZEROSAPS Members, My Family - Together Pushing Back The Frontiers Of Evil
ANNUAL REPORT 2010/2011SOUTH AFRICAN POLICE SERVICE
136
charged with more than one crime.
29. External investigations conducted within the department
The Public Protector conducted two investigations regarding a building in Pretoria and a building in Durban. At the date of this report, the Department of Police included the building in Pretoria as a contingent liability (refer to note 19 of the financial statements) and the Department of Public Works confirmed that there was no lease contract for the Durban building.
Performance audit
30. A performance audit was conducted on the department’s use of consultants. The audit is currently in the reporting phase. The findings will be reported in a separate report.
31 July 2011
REPORT OF THE AUDITOR-GENERAL TO PARLIAMENT ON VOTE 24
DEPARTMENT OF POLICEfor the year ended 31 March 2011

SAPS TOGETHER SQUEEZING CRIME to ZEROSAPS Members, My Family - Together Pushing Back The Frontiers Of Evil
ANNUAL REPORT 2010/2011SOUTH AFRICAN POLICE SERVICE
137
App
ropr
iati
on p
er P
rogr
amm
e
2010
/11
2009
/10
Adj
uste
d A
ppro
pria
tion
Shi
ftin
g of
Fu
nds
Vire
men
tFi
nal
App
ropr
iati
onA
ctua
l Ex
pend
itur
eVa
rian
ceEx
pend
iture
as
% o
f fina
l ap
prop
riatio
n
Fina
l A
ppro
pria
tion
Act
ual
Expe
ndit
ure
R’00
0 R’
000
R’00
0 R’
000
R’00
0 R’
000
%
R’00
0 R’
000
1.A
dmin
istr
atio
n
Curr
ent p
aym
ent
16 4
91 5
22
0 (7
52 8
41)
15 7
38 6
81
15 7
38 6
50
31
100%
14 4
55 2
38
14 4
55 2
38
Tran
sfer
s an
d su
bsid
ies
217
981
0 7
7 14
4 29
5 12
5 29
5 12
5 0
100%
219
840
219
840
Paym
ent f
or c
apita
l ass
ets
1 35
7 45
7 0
477
828
1
835
285
1 83
5 28
5 0
100%
1 33
3 39
3 1
333
393
Paym
ent f
or fi
nanc
ial a
sset
s0
0 2
876
2 87
6 2
876
0 10
0%1
049
1 04
9
2.Vi
sibl
e Po
licin
g
Curr
ent p
aym
ent
20 3
37 2
47
0 3
29 3
64
20 6
66 6
11
20 6
66 6
11
0 10
0%18
514
480
18
514
480
Tran
sfer
s an
d su
bsid
ies
156
006
0 ( 1
2 79
6)14
3 21
0 14
3 21
0 0
100%
153
080
153
080
Paym
ent f
or c
apita
l ass
ets
1 00
7 67
4 0
( 114
868
)89
2 80
6 89
2 80
6 0
100%
1 10
2 30
6 1
102
306
3.D
etec
tive
Ser
vice
s
Curr
ent p
aym
ent
8 51
6 70
7 0
( 205
307
)8
311
400
8 31
1 40
0 0
100%
7 16
0 51
8 7
160
518
Tran
sfer
s an
d su
bsid
ies
50 5
51
0 ( 6
847
)43
704
43
704
0
100%
49 8
77
49 8
77
Paym
ent f
or c
apita
l ass
ets
282
999
0 2
30 0
20
513
019
513
019
0 10
0%28
3 23
9 28
3 23
9
4.Cr
ime
Inte
llige
nce
Curr
ent p
aym
ent
1 89
9 33
5 0
6 0
60
1 90
5 39
5 1
905
386
9 10
0%1
610
463
1 61
0 43
5
Tran
sfer
s an
d su
bsid
ies
7 72
4 0
4 8
80
12 6
04
12 6
04
0 10
0%8
997
8 99
7
Paym
ent f
or c
apita
l ass
ets
40 5
76
0 ( 1
0 94
0)29
636
29
636
0
100%
38 5
86
38 5
86
5.Pr
otec
tion
and
Sec
urit
y Se
rvic
es
Curr
ent p
aym
ent
3 08
4 75
6 0
26
789
3 11
1 54
5 3
111
545
0 10
0%2
644
095
2 64
4 09
5
Tran
sfer
s an
d su
bsid
ies
6 13
8 0
( 485
)5
653
5 65
3 0
100%
5 61
3 5
613
Paym
ent f
or c
apita
l ass
ets
73 0
67
0 ( 5
0 87
7)22
190
22
190
0
100%
41 2
21
41 2
21
Tota
l53
529
740
0
0
53 5
29 7
40
53 5
29 7
00
40
100%
47 6
21 9
95
47 6
21 9
67
Reco
ncili
atio
n w
ith
Stat
emen
t of F
inan
cial
Per
form
ance
Add
: D
epar
tmen
tal r
even
ue28
7 73
7 34
7 57
2
A
id a
ssis
tanc
e 7
516
5 12
7
Act
ual a
mou
nts
per S
tate
men
t of F
inan
cial
Per
form
ance
(Tot
al R
even
ue)
53 8
24 9
93
47 9
74 6
94
Add
: A
id a
ssis
tanc
e 4
550
14 7
11
Act
ual a
mou
nts
per S
tate
men
t of F
inan
cial
Per
form
ance
(Tot
al E
xpen
ditu
re)
53 5
34 2
50
47 6
36 6
78
DEP
ART
MEN
T O
F PO
LICE
VO
TE 2
4A
PPRO
PRIA
TIO
N S
TATE
MEN
Tfo
r the
yea
r end
ed 3
1 M
arch
201
1

SAPS TOGETHER SQUEEZING CRIME to ZEROSAPS Members, My Family - Together Pushing Back The Frontiers Of Evil
ANNUAL REPORT 2010/2011SOUTH AFRICAN POLICE SERVICE
138
App
ropr
iati
on p
er E
cono
mic
cla
ssifi
cati
on
2010
/11
2009
/10
Adj
uste
d A
ppro
pria
tion
Shi
ftin
g of
Fu
nds
Vire
men
tFi
nal
App
ropr
iati
onA
ctua
l Ex
pend
itur
eVa
rian
ceEx
pend
iture
as
% o
f fina
l ap
prop
riatio
n
Fina
l A
ppro
pria
tion
Act
ual
Expe
ndit
ure
R’00
0 R’
000
R’00
0 R’
000
R’00
0 R’
000
%
R’00
0 R’
000
Curr
ent p
aym
ents
Com
pens
atio
n of
em
ploy
ees
38 4
16 1
14
0 ( 7
37)
38 4
15 3
77
38 4
15 3
37
40
100%
33 7
39 8
47
33 7
39 8
19
Goo
ds a
nd s
ervi
ces
11 9
13 4
53
0 ( 5
95 1
98)
11 3
18 2
55
11 3
18 2
55
0 10
0%10
644
947
10
644
947
Tran
sfer
s an
d su
bsid
ies
Prov
ince
s an
d m
unic
ipal
ities
23 9
43
0 1
769
25
712
25
712
0
100%
25 1
95
25 1
95
Dep
artm
enta
l age
ncie
s an
d ac
coun
ts22
787
0
1 0
74
23 8
61
23 8
61
0 10
0%20
818
20
818
Hou
seho
lds
391
670
0 5
9 05
3 45
0 72
3 45
0 72
3 0
100%
391
394
391
394
Paym
ent f
or c
apit
al a
sset
s
Build
ings
and
oth
er fi
xed
stru
ctur
es1
118
201
0 6
3 94
0 1
182
141
1 18
2 14
1 0
100%
1 07
0 12
6 1
070
126
Mac
hine
ry a
nd e
quip
men
t1
642
437
0 4
67 4
53
2 10
9 89
0 2
109
890
0 10
0%1
726
766
1 72
6 76
6
Biol
ogic
al a
sset
s1
135
0
(230
)90
5 90
5 0
100%
1 8
53
1 8
53
Paym
ent f
or fi
nanc
ial a
sset
s 0
0
2
876
2
876
2
876
0
100%
1 0
49
1 0
49
Tota
l 53
529
740
0
0 53
529
740
53
529
700
40
10
0%47
621
995
47
621
967
DEP
ART
MEN
T O
F PO
LICE
VO
TE 2
4A
PPRO
PRIA
TIO
N S
TATE
MEN
Tfo
r the
yea
r end
ed 3
1 M
arch
201
1

SAPS TOGETHER SQUEEZING CRIME to ZEROSAPS Members, My Family - Together Pushing Back The Frontiers Of Evil
ANNUAL REPORT 2010/2011SOUTH AFRICAN POLICE SERVICE
139
Det
ail p
er p
rogr
amm
e 1
- Adm
inis
trat
ion
Det
ail p
er s
ub-p
rogr
amm
e20
10/1
120
09/1
0
Adj
uste
d A
ppro
pria
tion
Shi
ftin
g of
Fu
nds
Vire
men
tFi
nal
App
ropr
iati
onA
ctua
l Ex
pend
itur
eVa
rian
ceEx
pend
iture
as
% o
f fina
l ap
prop
riatio
n
Fina
l A
ppro
pria
tion
Act
ual
Expe
ndit
ure
R’00
0 R’
000
R’00
0 R’
000
R’00
0 R’
000
%
R’00
0 R’
000
1.1
Min
iste
r
Curr
ent p
aym
ent
1 8
16
0 (5
)1
811
1 81
1 0
100%
1 72
9 1
729
1.2
Dep
uty
Min
iste
r
Curr
ent p
aym
ent
1 4
96
0 (3
)1
493
1 49
3 0
100%
1 43
2 1
432
1.3
Man
agem
ent
Curr
ent p
aym
ent
53
055
0 2
0 62
5 73
680
7
3 68
0 0
100%
50
377
50
377
Tran
sfer
s an
d su
bsid
ies
13
0 4
80
493
493
0
100%
263
2
63
Paym
ent f
or c
apita
l ass
ets
1 2
46
0 (1
08)
1 13
8 1
138
0
100%
1 1
52
1 1
52
1.4
Corp
orat
e Se
rvic
es
Curr
ent p
aym
ent
14
355
221
0 (8
49 6
91)
13 5
05 5
30
13
505
499
31
100%
12
531
516
12
531
516
Tran
sfer
s an
d su
bsid
ies
217
968
0
76
664
294
632
294
632
0
100%
219
577
2
19 5
77
Paym
ent f
or c
apita
l ass
ets
1 3
56 2
11
0 4
77 9
36
1 83
4 14
7 1
834
147
0
100%
1 3
32 2
41
1 3
32 2
41
Paym
ent f
or fi
nanc
ial a
sset
s0
0 2
876
2
876
2 8
76
0 10
0% 1
049
1
049
1.5
Prop
erty
Man
agem
ent
Curr
ent p
aym
ent
2 0
79 9
34
0 7
6 23
3 2
156
167
2 1
56 1
67
0 10
0% 1
870
184
1
870
184
Tota
l 18
066
960
0
(194
993
)17
871
967
17
871
936
31
10
0%16
009
520
16
009
520
DEP
ART
MEN
T O
F PO
LICE
VO
TE 2
4A
PPRO
PRIA
TIO
N S
TATE
MEN
Tfo
r the
yea
r end
ed 3
1 M
arch
201
1

SAPS TOGETHER SQUEEZING CRIME to ZEROSAPS Members, My Family - Together Pushing Back The Frontiers Of Evil
ANNUAL REPORT 2010/2011SOUTH AFRICAN POLICE SERVICE
140
Det
ail p
er p
rogr
amm
e 1
- Adm
inis
trat
ion
Econ
omic
cla
ssifi
cati
on
2010
/11
2009
/10
Adj
uste
d A
ppro
pria
tion
Shi
ftin
g of
Fu
nds
Vire
men
tFi
nal
App
ropr
iati
onA
ctua
l Ex
pend
itur
eVa
rian
ceEx
pend
iture
as
% o
f fina
l ap
prop
riatio
n
Fina
l A
ppro
pria
tion
Act
ual
Expe
ndit
ure
R’00
0 R’
000
R’00
0 R’
000
R’00
0 R’
000
%
R’00
0 R’
000
Curr
ent p
aym
ents
Com
pens
atio
n of
em
ploy
ees
9 98
1 90
30
(295
360
)9
686
543
9 68
6 51
231
10
0%8
875
815
8 87
5 81
5
Goo
ds a
nd s
ervi
ces
6 50
9 61
90
(457
481
)6
052
138
6 05
2 13
80
100%
5 57
9 42
35
579
423
Tran
sfer
s an
d su
bsid
ies
Prov
ince
s an
d m
unic
ipal
ities
3 57
10
(144
)3
427
3 42
70
100%
3 48
43
484
Dep
artm
enta
l age
ncie
s an
d ac
coun
ts22
787
01
074
23 8
6123
861
0 10
0%20
818
20 8
18
Hou
seho
lds
191
623
076
214
267
837
267
837
0 10
0%19
5 53
819
5 53
8
Paym
ent f
or c
apit
al a
sset
s
Build
ings
and
oth
er fi
xed
stru
ctur
es1
118
201
056
459
1 17
4 66
01
174
660
0 10
0%1
055
770
1 05
5 77
0
Mac
hine
ry a
nd e
quip
men
t23
8 12
10
421
599
659
720
659
720
0 10
0%27
5 85
027
5 85
0
Biol
ogic
al a
sset
s1
135
0(2
30)
905
905
0 10
0%1
773
1 77
3
Pay
men
t for
fina
ncia
l ass
ets
00
2 87
62
876
2 87
60
100%
1 04
91
049
Tota
l 18
066
960
0
(194
993
)17
871
967
17
871
936
31
10
0%16
009
520
16
009
520
DEP
ART
MEN
T O
F PO
LICE
VO
TE 2
4A
PPRO
PRIA
TIO
N S
TATE
MEN
Tfo
r the
yea
r end
ed 3
1 M
arch
201
1

SAPS TOGETHER SQUEEZING CRIME to ZEROSAPS Members, My Family - Together Pushing Back The Frontiers Of Evil
ANNUAL REPORT 2010/2011SOUTH AFRICAN POLICE SERVICE
141
Det
ail p
er p
rogr
amm
e 2
- Vis
ible
Pol
icin
g
Det
ail p
er s
ub-p
rogr
amm
e 20
10/1
120
09/1
0
Adj
uste
d A
ppro
pria
tion
Shi
ftin
g of
Fu
nds
Vire
men
tFi
nal
App
ropr
iati
onA
ctua
l Ex
pend
itur
eVa
rian
ceEx
pend
iture
as
% o
f fina
l ap
prop
riatio
n
Fina
l A
ppro
pria
tion
Act
ual
Expe
ndit
ure
R’00
0 R’
000
R’00
0 R’
000
R’00
0 R’
000
%
R’00
0 R’
000
2.1
Crim
e Pr
even
tion
Curr
ent p
aym
ent
18 7
43 0
490
261
190
19 0
04 2
39
19 0
04 2
390
100%
16
775
550
16
775
550
Tran
sfer
s an
d su
bsid
ies
145
515
0(1
3 47
2)13
2 04
3 13
2 04
30
100%
143
703
1
43 7
03
Paym
ent f
or c
apita
l ass
ets
971
542
0(1
63 8
39)
807
703
807
703
0 10
0% 1
001
573
1
001
573
2.2
Bord
erlin
e Se
curi
ty
Curr
ent p
aym
ent
151
933
0 (1
2 41
9)13
9 51
4 13
9 51
40
100%
159
892
1
59 8
92
Tran
sfer
s an
d su
bsid
ies
190
040
230
230
0 10
0% 3
36
336
Paym
ent f
or c
apita
l ass
ets
27 4
370
27 4
9454
931
54
931
0 10
0% 5
7 55
1 5
7 55
1
2.3
Spec
ialis
ed In
terv
enti
ons
Curr
ent p
aym
ent
1 44
2 26
50
80 5
931
522
858
1 52
2 85
80
100%
1 5
79 0
38
1 5
79 0
38
Tran
sfer
s an
d su
bsid
ies
10 3
010
636
10
937
10
937
0 10
0% 9
041
9
041
Paym
ent f
or c
apita
l ass
ets
8 69
50
21 4
7730
172
30
172
0 10
0% 4
3 18
2 4
3 18
2
Tota
l 21
500
927
0
201
700
21
702
627
21
702
627
0
100%
19 7
69 8
66
19 7
69 8
66
DEP
ART
MEN
T O
F PO
LICE
VO
TE 2
4A
PPRO
PRIA
TIO
N S
TATE
MEN
Tfo
r the
yea
r end
ed 3
1 M
arch
201
1

SAPS TOGETHER SQUEEZING CRIME to ZEROSAPS Members, My Family - Together Pushing Back The Frontiers Of Evil
ANNUAL REPORT 2010/2011SOUTH AFRICAN POLICE SERVICE
142
Det
ail p
er p
rogr
amm
e 2
- Vis
ible
Pol
icin
g
Econ
omic
cla
ssifi
cati
on
2010
/11
2009
/10
Adj
uste
d A
ppro
pria
tion
Shi
ftin
g of
Fu
nds
Vire
men
tFi
nal
App
ropr
iati
onA
ctua
l Ex
pend
itur
eVa
rian
ceEx
pend
iture
as
% o
f fina
l ap
prop
riatio
n
Fina
l A
ppro
pria
tion
Act
ual
Expe
ndit
ure
R’00
0 R’
000
R’00
0 R’
000
R’00
0 R’
000
%
R’00
0 R’
000
Curr
ent p
aym
ents
Com
pens
atio
n of
em
ploy
ees
17 0
25 7
360
215
627
17 2
41 3
6317
241
363
0 10
0%15
126
870
15 1
26 8
70
Goo
ds a
nd s
ervi
ces
3 31
1 51
10
113
737
3 42
5 24
83
425
248
0 10
0%3
387
610
3 38
7 61
0
Tran
sfer
s an
d su
bsid
ies
Prov
ince
s an
d m
unic
ipal
ities
14 0
050
1 76
315
768
15 7
680
100%
15 0
3115
031
Hou
seho
lds
142
001
0(1
4 55
9)12
7 44
212
7 44
20
100%
138
049
138
049
Paym
ent f
or c
apit
al a
sset
s
Build
ings
and
oth
er fi
xed
stru
ctur
es0
04
417
4 41
74
417
0 10
0%9
280
9 28
0
Mac
hine
ry a
nd e
quip
men
t1
007
674
0(1
19 2
85)
888
389
888
389
0 10
0%1
092
946
1 09
2 94
6
Biol
ogic
al a
sset
s0
00
00
0 10
0%80
80
Tota
l 21
500
927
0
201
700
21
702
627
21
702
627
0
100%
19 7
69 8
66
19 7
69 8
66
DEP
ART
MEN
T O
F PO
LICE
VO
TE 2
4A
PPRO
PRIA
TIO
N S
TATE
MEN
Tfo
r the
yea
r end
ed 3
1 M
arch
201
1

SAPS TOGETHER SQUEEZING CRIME to ZEROSAPS Members, My Family - Together Pushing Back The Frontiers Of Evil
ANNUAL REPORT 2010/2011SOUTH AFRICAN POLICE SERVICE
143
Det
ail p
er p
rogr
amm
e 3
- Det
ecti
ve S
ervi
ces
Det
ail p
er s
ub-p
rogr
amm
e20
10/1
120
09/1
0
Adj
uste
d A
ppro
pria
tion
Shi
ftin
g of
Fu
nds
Vire
men
tFi
nal
App
ropr
iati
onA
ctua
l Ex
pend
itur
eVa
rian
ceEx
pend
iture
as
% o
f fina
l ap
prop
riatio
n
Fina
l A
ppro
pria
tion
Act
ual
Expe
ndit
ure
R’00
0 R’
000
R’00
0 R’
000
R’00
0 R’
000
%
R’00
0 R’
000
3.1
Crim
e In
vest
igat
ions
Curr
ent p
aym
ent
6 03
9 56
90
54 0
666
093
635
6 09
3 63
50
100%
5 3
01 0
32
5 3
01 0
32
Tran
sfer
s an
d su
bsid
ies
44 3
470
(8 3
17)
36 0
30
36 0
300
100%
42
565
42
565
Paym
ent f
or c
apita
l ass
ets
166
198
05
204
171
402
171
402
0 10
0% 1
72 7
01
172
701
3.2
Crim
inal
Rec
ord
Cent
re
Curr
ent p
aym
ent
1 04
6 99
70
(164
799
)88
2 19
8 88
2 19
80
100%
727
214
7
27 2
14
Tran
sfer
s an
d su
bsid
ies
1 24
40
433
1 67
7 1
677
0 10
0% 1
290
1
290
Paym
ent f
or c
apita
l ass
ets
65 5
540
133
592
199
146
199
146
0 10
0% 4
3 97
7 4
3 97
7
3.3
Fore
nsic
Sci
ence
Lab
orat
ory
Curr
ent p
aym
ent
539
963
0(6
4 09
1)47
5 87
2 47
5 87
20
100%
377
292
3
77 2
92
Tran
sfer
s an
d su
bsid
ies
344
0 2
27
571
571
0 10
0% 1
50
150
Paym
ent f
or c
apita
l ass
ets
36 5
470
39
546
76 0
93
76 0
930
100%
20
318
20
318
3.4
Spec
ialis
ed In
vest
igat
ions
Curr
ent p
aym
ent
890
178
0 (3
0 48
3)85
9 69
5 85
9 69
50
100%
754
980
754
980
Tran
sfer
s an
d su
bsid
ies
4 61
60
810
5 42
6 5
426
0 10
0%5
872
5 87
2
Paym
ent f
or c
apita
l ass
ets
14 7
000
51 6
7866
378
66
378
0 10
0%46
243
46 2
43
Tota
l 8
850
257
0 1
7 86
6 8
868
123
8 86
8 12
3 0
100%
7 49
3 63
4 7
493
634
DEP
ART
MEN
T O
F PO
LICE
VO
TE 2
4A
PPRO
PRIA
TIO
N S
TATE
MEN
Tfo
r the
yea
r end
ed 3
1 M
arch
201
1

SAPS TOGETHER SQUEEZING CRIME to ZEROSAPS Members, My Family - Together Pushing Back The Frontiers Of Evil
ANNUAL REPORT 2010/2011SOUTH AFRICAN POLICE SERVICE
144
Det
ail p
er p
rogr
amm
e 3
- Det
ecti
ve S
ervi
ces
Econ
omic
cla
ssifi
cati
on
2010
/11
2009
/10
Adj
uste
d A
ppro
pria
tion
Shi
ftin
g of
Fu
nds
Vire
men
tFi
nal
App
ropr
iati
onA
ctua
l Ex
pend
itur
eVa
rian
ceEx
pend
iture
as
% o
f fina
l ap
prop
riatio
n
Fina
l A
ppro
pria
tion
Act
ual
Expe
ndit
ure
R’00
0 R’
000
R’00
0 R’
000
R’00
0 R’
000
%
R’00
0 R’
000
Curr
ent p
aym
ents
Com
pens
atio
n of
em
ploy
ees
6 91
4 99
10
26 6
926
941
683
6 94
1 68
30
100%
5 92
1 01
85
921
018
Goo
ds a
nd s
ervi
ces
1 60
1 71
60
(231
999
)1
369
717
1 36
9 71
70
100%
1 23
9 50
01
239
500
Tran
sfer
s an
d su
bsid
ies
Prov
ince
s an
d m
unic
ipal
ities
4 76
50
(53)
4 71
24
712
0 10
0%4
873
4 87
3
Hou
seho
lds
45 7
860
(6 7
94)
38 9
9238
992
0 10
0%45
004
45 0
04
Paym
ent f
or c
apit
al a
sset
s
Build
ings
and
oth
er fi
xed
stru
ctur
es0
02
929
2 92
92
929
0 10
0%2
808
2 80
8
Mac
hine
ry a
nd e
quip
men
t28
2 99
90
227
091
510
090
510
090
0 10
0%28
0 43
128
0 43
1
Tota
l 8
850
257
0 1
7 86
6 8
868
123
8 86
8 12
3 0
100%
7 49
3 63
4 7
493
634
DEP
ART
MEN
T O
F PO
LICE
VO
TE 2
4A
PPRO
PRIA
TIO
N S
TATE
MEN
Tfo
r the
yea
r end
ed 3
1 M
arch
201
1

SAPS TOGETHER SQUEEZING CRIME to ZEROSAPS Members, My Family - Together Pushing Back The Frontiers Of Evil
ANNUAL REPORT 2010/2011SOUTH AFRICAN POLICE SERVICE
145
Det
ail p
er p
rogr
amm
e 4
- Cri
me
Inte
llige
nce
Det
ail p
er s
ub-p
rogr
amm
e 20
10/1
120
09/1
0
Adj
uste
d A
ppro
pria
tion
Shi
ftin
g of
Fu
nds
Vire
men
tFi
nal
App
ropr
iati
onA
ctua
l Ex
pend
itur
eVa
rian
ceEx
pend
iture
as
% o
f fina
l ap
prop
riatio
n
Fina
l A
ppro
pria
tion
Act
ual
Expe
ndit
ure
R’00
0 R’
000
R’00
0 R’
000
R’00
0 R’
000
%
R’00
0 R’
000
4.1
Crim
e In
telli
genc
e O
pera
tion
s
Curr
ent p
aym
ent
746
196
0 (1
1 33
6)73
4 86
0 73
4 85
19
100%
635
618
6
35 5
90
Tran
sfer
s an
d su
bsid
ies
3 81
70
1 16
74
984
4 98
40
100%
3 9
57
3 9
57
Paym
ent f
or c
apita
l ass
ets
22 3
210
(11
820)
10 5
01
10 5
010
100%
2 4
68
2 4
68
4.2
Inte
llige
nce
and
Info
rmat
ion
Man
agem
ent
Curr
ent p
aym
ent
1 15
3 13
90
17 3
961
170
535
1 17
0 53
50
100%
974
845
9
74 8
45
Tran
sfer
s an
d su
bsid
ies
3 90
70
3 71
37
620
7 62
00
100%
5 0
40
5 0
40
Paym
ent f
or c
apita
l ass
ets
18 2
550
880
19 1
35
19 1
350
100%
36
118
36
118
Tota
l 1
947
635
0 (0
)1
947
635
1 94
7 62
6 9
100%
1 65
8 04
6 1
658
018
DEP
ART
MEN
T O
F PO
LICE
VO
TE 2
4A
PPRO
PRIA
TIO
N S
TATE
MEN
Tfo
r the
yea
r end
ed 3
1 M
arch
201
1

SAPS TOGETHER SQUEEZING CRIME to ZEROSAPS Members, My Family - Together Pushing Back The Frontiers Of Evil
ANNUAL REPORT 2010/2011SOUTH AFRICAN POLICE SERVICE
146
Det
ail p
er p
rogr
amm
e 4
- Cri
me
Inte
llige
nce
Econ
omic
cla
ssifi
cati
on
2010
/11
2009
/10
Adj
uste
d A
ppro
pria
tion
Shi
ftin
g of
Fu
nds
Vire
men
tFi
nal
App
ropr
iati
onA
ctua
l Ex
pend
itur
eVa
rian
ceEx
pend
iture
as
% o
f fina
l ap
prop
riatio
n
Fina
l A
ppro
pria
tion
Act
ual
Expe
ndit
ure
R’00
0 R’
000
R’00
0 R’
000
R’00
0 R’
000
%
R’00
0 R’
000
Curr
ent p
aym
ents
Com
pens
atio
n of
em
ploy
ees
1 69
0 73
80
(10
565)
1 68
0 17
31
680
164
9 10
0%1
412
623
1 41
2 59
5
Goo
ds a
nd s
ervi
ces
208
597
016
625
225
222
225
222
0 10
0%19
7 84
019
7 84
0
Tran
sfer
s an
d su
bsid
ies
Prov
ince
s an
d m
unic
ipal
ities
651
042
693
693
0 10
0%70
170
1
Hou
seho
lds
7 07
30
4 83
811
911
11 9
110
100%
8 29
68
296
Paym
ent f
or c
apit
al a
sset
s
Mac
hine
ry a
nd e
quip
men
t40
576
0(1
0 94
0)29
636
29 6
360
100%
38 5
8638
586
Tota
l 1
947
635
0 (0
)1
947
635
1 94
7 62
6 9
100%
1 65
8 04
6 1
658
018
DEP
ART
MEN
T O
F PO
LICE
VO
TE 2
4A
PPRO
PRIA
TIO
N S
TATE
MEN
Tfo
r the
yea
r end
ed 3
1 M
arch
201
1
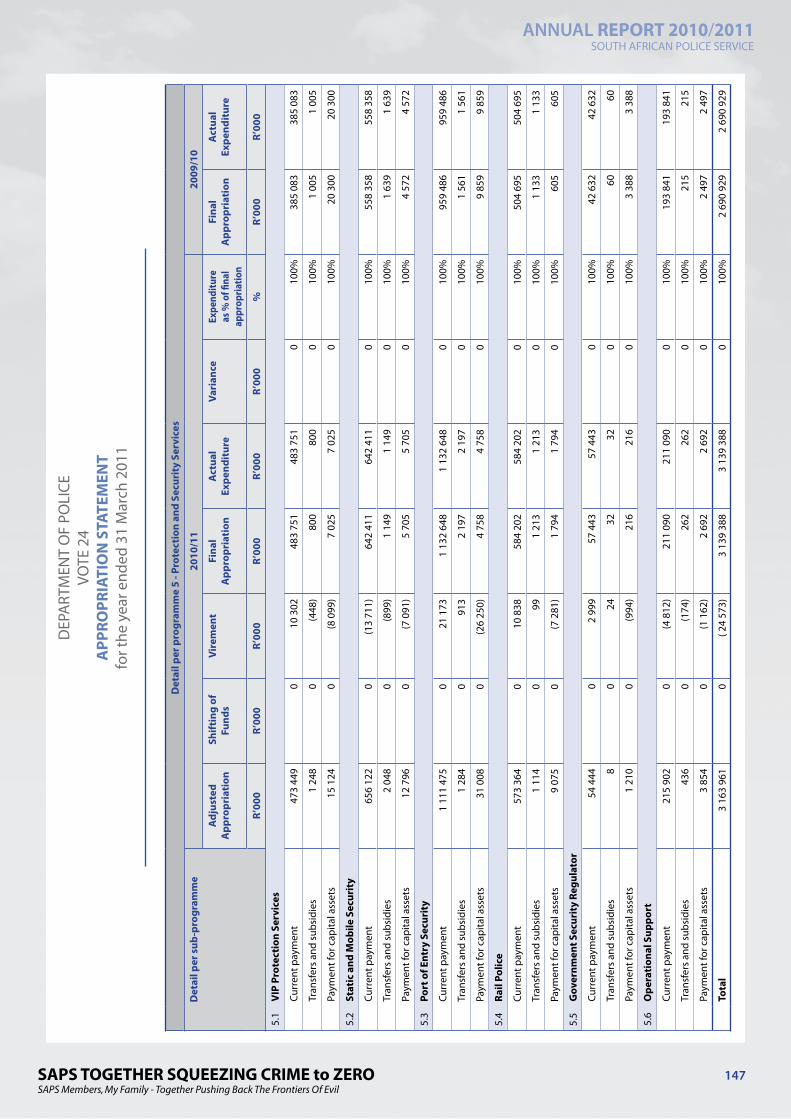
SAPS TOGETHER SQUEEZING CRIME to ZEROSAPS Members, My Family - Together Pushing Back The Frontiers Of Evil
ANNUAL REPORT 2010/2011SOUTH AFRICAN POLICE SERVICE
147
Det
ail p
er p
rogr
amm
e 5
- Pro
tect
ion
and
Secu
rity
Ser
vice
s
Det
ail p
er s
ub-p
rogr
amm
e20
10/1
120
09/1
0
Adj
uste
d A
ppro
pria
tion
Shi
ftin
g of
Fu
nds
Vire
men
tFi
nal
App
ropr
iati
onA
ctua
l Ex
pend
itur
eVa
rian
ceEx
pend
iture
as
% o
f fina
l ap
prop
riatio
n
Fina
l A
ppro
pria
tion
Act
ual
Expe
ndit
ure
R’00
0 R’
000
R’00
0 R’
000
R’00
0 R’
000
%
R’00
0 R’
000
5.1
VIP
Pro
tect
ion
Serv
ices
Curr
ent p
aym
ent
473
449
0 1
0 30
2 48
3 75
1 48
3 75
10
100%
385
083
3
85 0
83
Tran
sfer
s an
d su
bsid
ies
1 24
80
(448
)80
0 80
00
100%
1 0
05
1 0
05
Paym
ent f
or c
apita
l ass
ets
15 1
240
(8 0
99)
7 02
5 7
025
0 10
0% 2
0 30
0 2
0 30
0
5.2
Stat
ic a
nd M
obile
Sec
urit
y
Curr
ent p
aym
ent
656
122
0(1
3 71
1)64
2 41
1 64
2 41
10
100%
558
358
5
58 3
58
Tran
sfer
s an
d su
bsid
ies
2 04
80
(899
)1
149
1 14
90
100%
1 6
39
1 6
39
Paym
ent f
or c
apita
l ass
ets
12 7
960
(7 0
91)
5 70
5 5
705
0 10
0% 4
572
4
572
5.3
Port
of E
ntry
Sec
urit
y
Curr
ent p
aym
ent
1 11
1 47
50
21 1
731
132
648
1 13
2 64
80
100%
959
486
9
59 4
86
Tran
sfer
s an
d su
bsid
ies
1 28
40
913
2 19
7 2
197
0 10
0% 1
561
1
561
Paym
ent f
or c
apita
l ass
ets
31 0
080
(26
250)
4 75
8 4
758
0 10
0% 9
859
9
859
5.4
Rail
Polic
e
Curr
ent p
aym
ent
573
364
010
838
584
202
584
202
0 10
0% 5
04 6
95
504
695
Tran
sfer
s an
d su
bsid
ies
1 11
40
991
213
1 21
30
100%
1 1
33
1 1
33
Paym
ent f
or c
apita
l ass
ets
9 07
50
(7 2
81)
1 79
4 1
794
0 10
0% 6
05
605
5.5
Gov
ernm
ent S
ecur
ity
Regu
lato
r
Curr
ent p
aym
ent
54 4
440
2 9
99
57 4
43
57 4
430
100%
42
632
42
632
Tran
sfer
s an
d su
bsid
ies
80
2432
32
0 10
0% 6
0 6
0
Paym
ent f
or c
apita
l ass
ets
1 21
00
(994
)21
6 21
60
100%
3 3
88
3 3
88
5.6
Ope
rati
onal
Sup
port
Curr
ent p
aym
ent
215
902
0 (4
812
)21
1 09
0 21
1 09
00
100%
193
841
1
93 8
41
Tran
sfer
s an
d su
bsid
ies
436
0 (1
74)
262
262
0 10
0% 2
15
215
Paym
ent f
or c
apita
l ass
ets
3 85
40
(1 1
62)
2 69
2 2
692
0 10
0% 2
497
2
497
Tota
l 3
163
961
0 ( 2
4 57
3)3
139
388
3 13
9 38
8 0
100%
2 69
0 92
9 2
690
929
DEP
ART
MEN
T O
F PO
LICE
VO
TE 2
4A
PPRO
PRIA
TIO
N S
TATE
MEN
Tfo
r the
yea
r end
ed 3
1 M
arch
201
1

SAPS TOGETHER SQUEEZING CRIME to ZEROSAPS Members, My Family - Together Pushing Back The Frontiers Of Evil
ANNUAL REPORT 2010/2011SOUTH AFRICAN POLICE SERVICE
148
Det
ail p
er p
rogr
amm
e 5
- Pro
tect
ion
and
Secu
rity
Ser
vice
s
Econ
omic
cla
ssifi
cati
on
2010
/11
2009
/10
Adj
uste
d A
ppro
pria
tion
Shi
ftin
g of
Fu
nds
Vire
men
tFi
nal
App
ropr
iati
onA
ctua
l Ex
pend
itur
eVa
rian
ceEx
pend
iture
as
% o
f fina
l ap
prop
riatio
n
Fina
l A
ppro
pria
tion
Act
ual
Expe
ndit
ure
R’00
0 R’
000
R’00
0 R’
000
R’00
0 R’
000
%
R’00
0 R’
000
Curr
ent p
aym
ents
Com
pens
atio
n of
em
ploy
ees
2 80
2 74
60
62 8
692
865
615
2 86
5 61
50
100%
2 40
3 52
12
403
521
Goo
ds a
nd s
ervi
ces
282
010
0 (3
6 08
0)24
5 93
024
5 93
00
100%
240
574
240
574
Tran
sfer
s an
d su
bsid
ies
Prov
ince
s an
d m
unic
ipal
ities
951
016
11
112
1 11
20
100%
1 10
61
106
Hou
seho
lds
5 18
70
(646
)4
541
4 54
10
100%
4 50
74
507
Paym
ent f
or c
apit
al a
sset
s
Build
ings
and
oth
er fi
xed
stru
ctur
es0
013
513
513
50
100%
2 26
82
268
Mac
hine
ry a
nd e
quip
men
t73
067
0 (5
1 01
2)22
055
22 0
550
100%
38 9
5338
953
Tota
l 3
163
961
0 (2
4 57
3)3
139
388
3 13
9 38
8 0
100%
2 69
0 92
9 2
690
929
DEP
ART
MEN
T O
F PO
LICE
VO
TE 2
4A
PPRO
PRIA
TIO
N S
TATE
MEN
Tfo
r the
yea
r end
ed 3
1 M
arch
201
1

SAPS TOGETHER SQUEEZING CRIME to ZEROSAPS Members, My Family - Together Pushing Back The Frontiers Of Evil
ANNUAL REPORT 2010/2011SOUTH AFRICAN POLICE SERVICE
149
1. Detail of specifically and exclusively appropriated amounts voted (after Virement): Detail of these transactions can be viewed in note 1 (Annual Appropriation) to the annual financial statements.
2. Detail of transfers and subsidies as per Appropriation Act (after Virement):Detail of these transactions can be viewed in note 7 to the annual financial statements.
3. Detail of payments for financial assetsDetail of these transactions can be viewed in note 6 to the annual financial statements.
DEPARTMENT OF POLICE VOTE 24
NOTES TO THE APPROPRIATION STATEMENTfor the year ended 31 March 2011

SAPS TOGETHER SQUEEZING CRIME to ZEROSAPS Members, My Family - Together Pushing Back The Frontiers Of Evil
ANNUAL REPORT 2010/2011SOUTH AFRICAN POLICE SERVICE
150
Note 2010/11 2009/10
R’000 R’000
REVENUE
Annual appropriation 1 53 529 740 47 621 995
Departmental revenue 2 287 737 347 572
Aid assistance 3 7 516 5 127
TOTAL REVENUE 53 824 993 47 974 694
EXPENDITURE
Current expenditure
Compensation of employees 4 38 415 337 33 739 819
Goods and services 5 11 318 255 10 644 947
Aid assistance 3 4 199 13 125
Total current expenditure 49 737 791 44 397 891
Transfers and subsidies
Transfers and subsidies 7 500 296 437 407
Total Transfers and subsidies 500 296 437 407
Expenditure for capital assets
Tangible capital assets 8 3 292 936 2 798 745
Aid assistance 3 351 1 586
Total expenditure for capital assets 3 293 287 2 800 331
Payments for financial assets 6 2 876 1 049
TOTAL EXPENDITURE 53 534 250 47 636 678
SURPLUS FOR THE YEAR 290 743 338 016
Reconciliation of Net Surplus for the year
Voted Funds 40 28
Annual appropriation 40 28
Departmental revenue 14 287 737 347 572
Aid assistance 3 2 966 (9 584)
SURPLUS FOR THE YEAR 290 743 338 016
DEPARTMENT OF POLICE VOTE 24
STATEMENT OF FINANCIAL PERFORMANCEfor the year ended 31 March 2011

SAPS TOGETHER SQUEEZING CRIME to ZEROSAPS Members, My Family - Together Pushing Back The Frontiers Of Evil
ANNUAL REPORT 2010/2011SOUTH AFRICAN POLICE SERVICE
151
Note 2010/11 2009/10
R’000 R’000
ASSETS
Current assets 266 934 201 744
Cash and cash equivalents 9 11 681 24 666
Prepayments and advances 10 37 417 51 113
Receivables 11 210 697 118 826
Aid assistance receivable 3 7 139 7 139
Non-current assets 99 048 91 708
Receivables 12 99 048 91 708
TOTAL ASSETS 365 982 293 452
LIABILITIES
Current liabilities 230 891 164 723
Voted funds to be surrendered to the Revenue Fund 13 40 28
Departmental revenue to be surrendered to the Revenue Fund 14 6 094 3 660
Bank overdraft 15 200 832 142 883
Payables 16 13 896 10 093
Aid assistance repayable 3 3 319 1 038
Aid assistance unutilised 3 6 710 7 021
TOTAL LIABILITIES 230 891 164 723
NET ASSETS 135 091 128 729
Represented by:
Recoverable revenue 135 091 128 729
TOTAL 135 091 128 729
DEPARTMENT OF POLICE VOTE 24
STATEMENT OF FINANCIAL POSITIONas at 31 March 2011

SAPS TOGETHER SQUEEZING CRIME to ZEROSAPS Members, My Family - Together Pushing Back The Frontiers Of Evil
ANNUAL REPORT 2010/2011SOUTH AFRICAN POLICE SERVICE
152
Note 2010/11 2009/10
R’000 R’000
Recoverable revenue
Opening balance 128 729 115 862
Transfers: 6 362 12 867
Irrecoverable amounts written off 6,5 (11 707) 4 750)
Debts revised 11,5 (19 878) (18 963)
Debts recovered (included in departmental receipts) (105 674) (122 331)
Debts raised 143 621 158 911
Closing balance 135 091 128 729
DEPARTMENT OF POLICE VOTE 24
STATEMENT OF CHANGES IN NET ASSETSfor the year ended 31 March 2011

SAPS TOGETHER SQUEEZING CRIME to ZEROSAPS Members, My Family - Together Pushing Back The Frontiers Of Evil
ANNUAL REPORT 2010/2011SOUTH AFRICAN POLICE SERVICE
153
Note 2010/11 2009/10
R’000 R’000
CASH FLOWS FROM OPERATING ACTIVITIES
Receipts: 53 823 852 47 969 815
Annual appropriated funds received 1,1 53 529 740 47 621 995
Departmental revenue received 2 286 596 342 693
Aid assistance received 3 7 516 5 127
Net increase/(decrease) in working capital ( 81 712) ( 24 558)
Surrendered to Revenue Fund 13 & 14 (285 331) (354 165)
Surrendered to the RDP Fund (996) 0
Current payments (49 737 791) (44 397 891)
Transfers and subsidies paid (500 296) (437 407)
Payments for financial assets (2 876) (1 049)
Net cash flow available from operating activities 17 3 214 850 2 754 745
CASH FLOWS FROM INVESTING ACTIVITIES
Payments for capital assets 3.2 & 8 (3 293 287) (2 800 331)
Proceeds from sale of capital assets 2 1 141 4 879
Net cash flows from investing activities (3 292 146) (2 795 452)
CASH FLOWS FROM FINANCING ACTIVITIES
Increase/(Decrease) in net assets 6 362 12 867
Net cash flows from financing activities 6 362 12 867
Net increase/(decrease) in cash and cash equivalents (70 934) (27 840)
Cash and cash equivalents at beginning of period (118 217) (90 377)
Cash and cash equivalents at end of period 18 (189 151) (118 217)
DEPARTMENT OF POLICE VOTE 24
CASH FLOW STATEMENTfor the year ended 31 March 2011

SAPS TOGETHER SQUEEZING CRIME to ZEROSAPS Members, My Family - Together Pushing Back The Frontiers Of Evil
ANNUAL REPORT 2010/2011SOUTH AFRICAN POLICE SERVICE
154
The Financial Statements have been prepared in accordance with the following policies, which have been applied consistently in all material aspects, unless otherwise indicated. However, where appropriate and meaningful, additional information has been disclosed to enhance the usefulness of the Financial Statements and to comply with the statutory requirements of the Public Finance Management Act, Act 1 of 1999 (as amended by Act 29 of 1999), and the Treasury Regulations issued in terms of the Act and the Division of Revenue Act, Act 2 of 2006.
1. Presentation of the Financial Statements
1.1 Basis of preparation
The Financial Statements have been prepared on a modified cash basis of accounting, except where stated otherwise. The modified cash basis constitutes the cash basis of accounting supplemented with additional disclosure items. Under the cash basis of accounting transactions and other events are recognised when cash is received or paid.
1.2 Presentation currency
All amounts have been presented in the currency of the South African Rand (R) which is also the functional currency of the department.
1.3 Rounding
Unless otherwise stated all financial figures have been rounded to the nearest one thousand Rand (R’000).
1.4 Comparative figures
Prior period comparative information has been presented in the current year’s financial statements. Where necessary figures included in the prior period financial statements have been reclassified to ensure that the format in which the information is presented is consistent with the format of the current year’s financial statements.
1.5 Comparative figures - Appropriation Statement
A comparison between actual amounts and final appropriation per major classification of expenditure is included in the Appropriation Statement.
2. Revenue 2.1 Appropriated funds
Appropriated funds comprises of departmental allocations as well as direct charges against revenue fund (e.i. statutory appropriation)
Appropriated funds are recognised in the financial records on the date the appropriation becomes effective. Adjustments to the appropriated funds made in terms of the adjustments budget process are recognised in the financial records on the date the adjustments become effective.
DEPARTMENT OF POLICE VOTE 24
ACCOUNTING POLICIESfor the year ended 31 March 2011
SAPS TOGETHER SQUEEZING CRIME to ZEROSAPS Members, My Family - Together Pushing Back The Frontiers Of Evil
ANNUAL REPORT 2010/2011SOUTH AFRICAN POLICE SERVICE
155
Total appropriated funds received during the year are presented in the Statement of Financial Performance.
Unexpended appropriated funds are surrendered to the National/Provincial Revenue Fund. Any amounts owing to the National/Provincial Revenue Fund at the end of the financial year are recognised as payable in the statement of financial position.
2.2 Departmental revenue
All departmental revenue is recognised in the statement of financial performance when received and is subsequently paid into the National/Provincial Revenue Fund, unless stated otherwise.
Any amount owing to the National/Provincial Revenue Fund is recognised as a payable in the statement of financial position.
No accrual is made for the amount receivable from the last receipt date to the end of the reporting period. These amounts are however disclosed in the disclosure note to the annual financial statements.
2.3 Direct Exchequer receipts / payments
All direct exchequer receipts are recognised in the statement of financial performance when the cash is received and subsequently paid into the National/Provincial Revenue Fund, unless otherwise stated.
All direct exchequer payments are recognised in the statement of financial performance when final authorisation for payment is effected on the system (by no later than 31 March of each year).
Any amount owing to the National/Provincial Revenue Funds at the end of the financial year is recognised as a payable in the statement of financial position.
2.4 Aid assistance
Aids assistance is recognised as revenue when received
All in-kind aid assistance is disclosed at fair value on the date of receipt in the annexures to the Annual Financial Statements
The cash payments made during the year relating to aid assistance projects are recognised as expenditure in the statement of financial performance when final authorisation for payments is effected on the system (by no later than 31 March of each year)
The value of the assistance expensed prior to the receipt of funds is recognised as a receivable in the statement of financial position.
Inappropriately expensed amounts using aid assistance and any unutilised amounts are recognised as payables in the statement of financial position.
DEPARTMENT OF POLICE VOTE 24
ACCOUNTING POLICIESfor the year ended 31 March 2011

SAPS TOGETHER SQUEEZING CRIME to ZEROSAPS Members, My Family - Together Pushing Back The Frontiers Of Evil
ANNUAL REPORT 2010/2011SOUTH AFRICAN POLICE SERVICE
156
All CARA funds received must be recorded as revenue when funds are received. The cash payments made during the year relating to CARA earmarked projects are recognised as expenditure in the statement of financial performance when final authorisation for payments effected on the system (by no later then 31 March of each year)
Inappropriately expensed amounts using CARA funds are recognised as payables in the statement of financial position. Any unutilised amounts are transferred to retained funds as they are not surrendered to the revenue fund.
3. Expenditure
3.1 Compensation of employees 3.1.1 Short-term employee benefits
The cost of short-term employee benefits are expensed in the statement of financial performance when financial authorisation for payment is effected on the system (by no later then 31 March each year)
Short-tem employee benefits that give rise to a present legal or constructive obligation are disclosed in the disclosure notes to the financial statements. These amounts must not be recognised in the statement of financial performance or position.
Employee cost are capitalised to the cost of a capital project when an employee spends more than 50% of his/her time in the project. These payments form part of expenditure for capital assets in the statement of financial performance.
3.1.2 Post retirement benefits
Employer contribution (i.e. social contributions) are expensed in the statement of financial performance when the final authorisation for payment is effected on the system (by no later than 31 March each year).
No provision is made for retirement benefits in the financial statements of the department. Any potential liabilities are disclosed in the financial statements of the National Revenue Funds and not in the financial statements of the employer department.
Social contribution (such as medical benefits) made by the department for certain of its ex-employees are classified as transfers to households in the statement of financial performance.
3.1.3 Termination benefits
Termination benefits such as severance packages are recognised as an expense in the statement of financial performance as a transfer (to households) when the final authorisation for payment is effected on the system (by no later than 31 March of each year).
DEPARTMENT OF POLICE VOTE 24
ACCOUNTING POLICIESfor the year ended 31 March 2011

SAPS TOGETHER SQUEEZING CRIME to ZEROSAPS Members, My Family - Together Pushing Back The Frontiers Of Evil
ANNUAL REPORT 2010/2011SOUTH AFRICAN POLICE SERVICE
157
3.1.4 Other long-term employee benefits
Other long-term employee benefits (such as capped leave) are recognised as an expense in the statement of financial performance as a transfer (to households) when the final authorisation for payment is effected on the system (by no later than 31 March of each year).
Long-term employee benefits that give rise to a present legal or constructive obligation are disclosed in the disclosure notes to the financial statements.
3.2 Goods and services
Payments made for goods and/or services are recognised as an expense in the statement of financial performance when the final authorisation for payment is effected on the system (by no later than 31 March of each year).
The expense is classified as capital if the goods and/or services were acquired for a capital project or if the total purchase price exceeds the capitalisation threshold (currently R5, 000). All other expenditures are classified as current.
3.3 Interest and rent on land
Interest and rental payments are recognised as an expense in the statement of finnacial performance when the final authorisation for payment is effected on the system (by no later than 31 March of each year). This item excludes the rental for the use of buildings or other fixed structures. If it is not possible to distinguish between payment for the use of land and fixed structures on it, the whole amount should be recorded under goods and services.
3.4 Financial transactions in assets and liabilities
Debts are written off when identified as irrecoverable. Debts written-off are limited to the amount of savings and/or underspending of appropriated funds. The write off occurs at year-end or when funds are available. No provision is made for irrecoverable amounts but an estimate is included in the disclosure notes to the financial statements amounts.
All other losses are recognised when authorisation has been granted for the recognition thereof.
3.5 Transfers and subsidies
Transfers and subsidies are recognised as an expense when the final authorisation for payment is effected on the system (by no later than 31 March of each year).
3.6 Unauthorised expenditure
When confirmed unauthorised expenditure is recognised as an asset in the statement of financial position until such time as the expenditure is either approved by the relevant authority, recovered from the responsible person or written off as irrecoverable in the statement of financial performance.
DEPARTMENT OF POLICE VOTE 24
ACCOUNTING POLICIESfor the year ended 31 March 2011
SAPS TOGETHER SQUEEZING CRIME to ZEROSAPS Members, My Family - Together Pushing Back The Frontiers Of Evil
ANNUAL REPORT 2010/2011SOUTH AFRICAN POLICE SERVICE
158
Unauthorised expenditure approved with funding is derecognised from the statement of financial position when the unauthorised expenditure is approved and the related funds are received.
Where the amount is approved without funding it is recognised as expenditure in the statement of financial performance on the date of approval.
3.7 Fruitless and wasteful expenditure
Fruitless and wasteful expenditure is recognised as expenditure in the statement of financial performance according to the nature of the payment and not as a separate line item on the face of the statement. If the expenditure is recoverable it is treated as an asset until it is recovered from the responsible person or written off as irrecoverable in the statement of financial performance.
3.8 Irregular expenditure
Irregular expenditure is recognised as expenditure in the Statement of Financial Performance. If the expenditure is not condoned by the relevant authority it is treated as an asset until it is recovered or written off as irrecoverable in the Statement of Financial Performance.
4. Assets
4.1 Cash and cash equivalents
Cash and cash equivalents are carried in the statement of financial position at cost.
Bank overdrafts are shown separately on the face of the statement of financial position.
For the purposes of the cash flow statement, cash and cash equivalents comprise cash on hand, deposits held, other short-term highly liquid investments and bank overdrafts.
4.2 Other financial assets
Cash and cash equivalents are carried in the Statement of Financial Position at cost.
4.3 Prepayments and advances
Amounts prepaid or advanced are recognised in the statement of financial position when the payments are made and where the goods and services have not been received by year end.
Prepayments and advances outstanding at the end of the year are carried in the statement of financial position at cost.
4.4 Receivables
Receivables included in the statement of financial position arise from cash payments made that are recoverable from another party or from the sale of goods/rendering of services.
Receivables outstanding at year-end are carried in the statement of financial position at cost plus
DEPARTMENT OF POLICE VOTE 24
ACCOUNTING POLICIESfor the year ended 31 March 2011

SAPS TOGETHER SQUEEZING CRIME to ZEROSAPS Members, My Family - Together Pushing Back The Frontiers Of Evil
ANNUAL REPORT 2010/2011SOUTH AFRICAN POLICE SERVICE
159
any accrued interest. Amounts that are potentials irrecoverable are included in the disclosure notes.
4.5 Inventory
Inventories that qualify for recognition must be initially reflected at cost. Where inventories are acquired at no cost, or for nominal consideration, their cost shall be their fair value at the date of acquisition.
All inventory items at year-end are reflected using the weighted average cost or FIFO cost formula.
4.6 Capital assets
4.6.1 Movable assets
Initial recognition
A capital asset is recorded on receipt of the item at cost. Cost of an asset is defined as the total cost of acquisition. Where the cost cannot be determined accurately, the movable capital asset is stated at fair value. Where fair value cannot be determined, the capital asset is included in the asset register at R1.
All assets acquired prior to 1 April 2002 are included in the register R1.
Subsequent recognition
Subsequent expenditure of a capital nature is recorded in the Statement of Financial Performance as “expenditure for capital asset” and is capitalised in the asset register of the department on completion of the project.
Repairs and maintenance is expensed as current “goods and services” in the Statement of Financial Performance.
4.6.2 Immovable assets
Initial recognition
A capital asset is recorded on receipt of the item at cost. Cost of an asset is defined as the total cost of acquisition. Where the cost cannot be determined accurately, the immovable capital asset is stated at R1 unless the fair value for the asset has been reliably estimated.
Subsequent recognition
Work-in-progress of a capital nature is recorded in the statement of financial performance as “expenditure for capital asset”. On completion, the total cost of the project is included in the asset register of the department that legally owns the asset or the provincial/national department of public works.
DEPARTMENT OF POLICE VOTE 24
ACCOUNTING POLICIESfor the year ended 31 March 2011

SAPS TOGETHER SQUEEZING CRIME to ZEROSAPS Members, My Family - Together Pushing Back The Frontiers Of Evil
ANNUAL REPORT 2010/2011SOUTH AFRICAN POLICE SERVICE
160
Repairs and maintenance is expensed as current “goods and services” in the statement of financial performance.
5. Liabilities
5.1 Payables
Recognised payables mainly comprise of amounts owing to other governmental entities. These payables are carried at cost in the statement of financial position.
5.2 Contingent liabilities
Contingent liabilities are included in the disclosure notes to the financial statements when it is possible that economic benefits will flow from the department, or when an outflow of economic benefits or service potential is probable but cannot be measured reliably.
5.3 Contingent assets
Contingent assets are included in the disclosure notes to the financial statements when it is possible that an inflow of economic benefits will flow to the entity.
5.4 Commitments
Commitments are not recognised in the Statement of Financial Position as a liability or as expenditure in the Statement of Financial Performance but are included in the disclosure notes.
5.5 Accruals
Accruals are not recognised in the Statement of Financial Position as a liability or as expenditure in the Statement of Financial Performance but are included in the disclosure notes.
5.6 Employee benefits
Short-term employee benefits that give rise to a present legal or constructive obligation are disclosed in the disclosure notes to the financial statements.These amounts are not recognised in the Statement of Financial Performance or the Statement of Financial Position.
5.7 Lease commitments
Finance lease
Finance leases are not recognised as assets and liabilities in the statement of financial position. Finance lease payments are recognised as an expense in the statement of financial performance and are apportioned between the capital and interest portions. The finance lease liability is disclosed in the disclosure notes to the financial statements.
DEPARTMENT OF POLICE VOTE 24
ACCOUNTING POLICIESfor the year ended 31 March 2011
SAPS TOGETHER SQUEEZING CRIME to ZEROSAPS Members, My Family - Together Pushing Back The Frontiers Of Evil
ANNUAL REPORT 2010/2011SOUTH AFRICAN POLICE SERVICE
161
Operating lease
Operating lease payments are recognised as an expense in the statement of financial performance. The operating lease commitments are disclosed in the discloser notes to the financial statement.
5.8 Provisions
Provisions are disclosed when there is a present legal or constructive obligation to forfeit economic benefits as a result of events in the past and it is probable that an outflow of resources embodying economic benefits will be required to settle the obligation and a reliable estimate of the obligation can be made.
6. Receivables for departmental revenue
Receivables for departmental revenue are disclosed in the disclosure notes to the annual financial statements.
7. Net Assets
7.1 Capitalisation reserve
The capitalisation reserve comprises of financial assets and/or liabilities originating in a prior reporting period but which are recognised in the statement of financial position for the first time in the current reporting period. Amounts are recognised in the capitalisation reserves when identified in the current period and are transferred to the National/Provincial Revenue Fund when the underlining asset is disposed and the related funds are received.
7.2 Recoverable revenue
Amounts are recognised as recoverable revenue when a payment made in a previous financial year becomes recoverable from a debtor in the current financial year. Amounts are either transferred to the National/Provincial Revenue Fund when recovered or are transferred to the statement of financial performance when written-off.
8. Related party transactions
Specific information with regards to related party transactions is included in the disclosure notes.
9. Key management personnel
Compensation paid to key management personnel including their family members where relevant, is included in the disclosure notes.
10. Public private partnerships
A description of the PPP arrangement, the contract fees and current and capital expenditure relating to the PPP arrangement is included in the disclosure notes.
DEPARTMENT OF POLICE VOTE 24
ACCOUNTING POLICIESfor the year ended 31 March 2011

SAPS TOGETHER SQUEEZING CRIME to ZEROSAPS Members, My Family - Together Pushing Back The Frontiers Of Evil
ANNUAL REPORT 2010/2011SOUTH AFRICAN POLICE SERVICE
162
1. Annual Appropriation
1.1 Annual Appropriation 2010/11 2009/10
Final Appropriation
Actual Funds Received
Funds not requested/ not
received
Appropriation Received
R’000 R’000 R’000 R’000
Administration 17 871 967 17 871 967 0 16 009 520
Visible Policing 21 702 627 21 702 627 0 19 769 866
Detective Services 8 868 123 8 868 123 0 7 493 634
Crime Intelligence 1 947 635 1 947 635 0 1 658 046
Protection and Security Services 3 139 388 3 139 388 0 2 690 929
Total 53 529 740 53 529 740 0 47 621 995
2. Departmental revenue Note 2010/11 2009/10
R’000 R’000
Tax revenue
Sales of goods and services other than capital assets 2,1 133 630 168 869
Fines, penalties and forfeits 2,2 12 276 10 043
Interest, dividends and rent on land 2,3 1 116 1 365
Sales of capital assets 2,4 1 141 4 879
Financial transactions in assets and liabilities 2,5 139 574 162 416
Departmental revenue collected 287 737 347 572
2.1 Sales of goods and services other than capital assets 2
Sales of goods and services produced by the department 123 816 147 654
Administrative fees 16 321 42 969
Other sales 107 495 104 685
Sales of scrap, waste and other used current goods 9 814 21 215
Total 133 630 168 869
2.2 Fines, penalties and forfeits 2
Fines 873 817
Forfeits 11 403 9 226
Total 12 276 10 043
2.3 Interest, dividends and rent on land 2
Interest 1 116 1 365
Total 1 116 1 365
DEPARTMENT OF POLICE VOTE 24
NOTES TO THE ANNUAL FINANCIAL STATEMENTSfor the year ended 31 March 2011

SAPS TOGETHER SQUEEZING CRIME to ZEROSAPS Members, My Family - Together Pushing Back The Frontiers Of Evil
ANNUAL REPORT 2010/2011SOUTH AFRICAN POLICE SERVICE
163
Detail note 2 continued... Note 2010/11 2009/10
R’000 R’000
2.4 Sales of capital assets 2
Tangible capital assets 1 141 4 879
Machinery and equipment 29,2 1 135 4 875
Biological assets 29,2 6 4
Total 1 141 4 879
2.5 Financial transactions in assets and liabilities 2
Stale cheques written back 11 513 1 820
Other receipts including recoverable revenue 128 061 160 596
Total 139 574 162 416
3. Aid assistance
3.1 Assistance received in cash from RDP
Foreign
Opening Balance (6 101) 643
Revenue 7 516 1 427
Expenditure 4 239 8 171
Current 3 888 8 171
Capital 351 0
Surrender to the RDP 996 0
Closing Balance ( 3 820) (6 101)
3.2 Aid assistance received in cash from CARA Fund
Opening Balance 7 021 9 861
Revenue 0 3 700
Expenditure 311 6 540
Current 311 4 954
Capital 30 0 1 586
Closing Balance 6 710 7 021
3.3 Total
Opening Balance 920 10 504
Revenue 7 516 5 127
Expenditure 4 550 14 711
Current 4 199 13 125
Capital 351 1 586
Surrender to the RDP 996 0
Closing Balance ANNEXURE 4 2 890 920
DEPARTMENT OF POLICE VOTE 24
NOTES TO THE ANNUAL FINANCIAL STATEMENTSfor the year ended 31 March 2011

SAPS TOGETHER SQUEEZING CRIME to ZEROSAPS Members, My Family - Together Pushing Back The Frontiers Of Evil
ANNUAL REPORT 2010/2011SOUTH AFRICAN POLICE SERVICE
164
Detail note 3 continued... Note 2010/11 2009/10
R’000 R’000
Analysis of balance
Aid assistance receivable 7 139 7 139
RDP 7 139 7 139
Aid assistance unutilised 6 710 7 021
CARA Fund 6 710 7 021
Aid assistance repayable 3 319 1 038
RDP 3 319 1 038
Closing balance 2 890 920
4. Compensation of employees
4.1 Salaries and wages
Basic salary 24 543 527 21 592 754
Performance award 9 823 191 210
Service Based 53 127 39 548
Compensative/circumstantial 989 601 664 523
Other non-pensionable allowances 4 628 812 3 826 877
Total 30 224 890 26 314 912
4.2 Social contributions
Employer contributions
Pension 3 958 319 3 533 455
Medical 4 225 762 3 886 104
UIF 1 044 249
Official unions and associations 5 322 5 099
Total 8 190 447 7 424 907
Total compensation of employees 38 415 337 33 739 819
Average number of employees 190 887 185 668
5. Goods and services
Administrative fees 41 101 39 563
Advertising 24 145 21 417
Assets less than R5,000 5,1 388 234 375 501
Bursaries (employees) 3 103 2 739
Catering 22 811 23 622
Communication 702 589 686 323
Computer services 5,2 2 050 655 1 986 886
Consultants, contractors and agency/outsourced services 5,3 1 377 667 1 440 475
Entertainment 1 759 3 840
Audit cost - external 5,4 28 439 23 497
DEPARTMENT OF POLICE VOTE 24
NOTES TO THE ANNUAL FINANCIAL STATEMENTSfor the year ended 31 March 2011

SAPS TOGETHER SQUEEZING CRIME to ZEROSAPS Members, My Family - Together Pushing Back The Frontiers Of Evil
ANNUAL REPORT 2010/2011SOUTH AFRICAN POLICE SERVICE
165
Detail note 5 continued... Note 2010/11 2009/10
R’000 R’000
Inventory 5,5 2 715 971 2 550 079
Operating leases 1 704 523 1 503 186
Owned and leasehold property expenditure 5,6 947 307 807 291
Transport provided as part of the departmental activities 1 856 863
Travel and subsistence 5,7 802 743 703 538
Venues and facilities 20 890 20 673
Training and staff development 41 011 37 914
Other operating expenditure 5,8 443 451 417 540
Total 11 318 255 10 644 947
5.1 Assets less than R5,000 5
Tangible assets 308 229 283 528
Buildings and other fixed structures 40 105
Biological assets 3 53
Machinery and equipment 308 186 283 370
Intangible 80 005 91 973
Computer software 80 005 91 973
Total 388 234 375 501
5.2 Computer services 5
SITA computer services 1 487 556 1 562 458
External computer service providers 563 099 424 428
Total 2 050 655 1 986 886
5.3 Consultants, contractors and agency/outsourced services 5
Business and advisory services 16 848 12 433
Infrastructure and planning 883 5 342
Laboratory services 970 137
Legal costs 109 400 89 595
Contractors 819 466 816 569
Agency and support/outsourced services 430 100 516 399
Total 1 377 667 1 440 475
5.4 External audit fees 5
Regularity audits 26 330 22 728
Performance audits 1 119 434
Other audits 990 335
Total 28 439 23 497
DEPARTMENT OF POLICE VOTE 24
NOTES TO THE ANNUAL FINANCIAL STATEMENTSfor the year ended 31 March 2011

SAPS TOGETHER SQUEEZING CRIME to ZEROSAPS Members, My Family - Together Pushing Back The Frontiers Of Evil
ANNUAL REPORT 2010/2011SOUTH AFRICAN POLICE SERVICE
166
Detail note 5 continued... Note 2010/11 2009/10
R’000 R’000
5.5 Inventory
Learning and teaching support material 5 940 1811
Food and food supplies 2 093 1 568
Fuel, oil and gas 1 639 076 1 537 384
Other consumable materials 231 499 171 632
Maintenance material 477 280 465 795
Stationery and printing 279 819 293 877
Medical supplies 2 221 2 901
Medicine 2 838 9 305
Military stores 80 205 65 806
Total 2 715 971 2 550 079
5.6 Owned and leasehold property expenditure 5
Municipal services 527 126 455 829
Property management fees 26 318 23 190
Cleaning services 182 753 157 053
Safeguarding and security 199 939 160 932
Other 11 171 10 287
Total 947 307 807 291
5.7 Travel and subsistence 5
Local 731 806 636 322
Foreign 70 937 67 216
Total 802 743 703 538
5.8 Other operating expenditure 5
Leanerships 132 0
Professional bodies, membership and subscription fees 3 248 1 814
Resettlement costs 49 481 58 890
Protective clothing and uniform 266 273 243 043
Towing cost 42 211 36 803
Informer fees 35 396 39 212
Printing and publications 12 500 8 070
Other 34 210 29 708
Total 443 451 417 540
DEPARTMENT OF POLICE VOTE 24
NOTES TO THE ANNUAL FINANCIAL STATEMENTSfor the year ended 31 March 2011

SAPS TOGETHER SQUEEZING CRIME to ZEROSAPS Members, My Family - Together Pushing Back The Frontiers Of Evil
ANNUAL REPORT 2010/2011SOUTH AFRICAN POLICE SERVICE
167
6. Payments for financial assets Note 2010/11 2009/10
R’000 R’000
Material losses through criminal conduct 103 72
Theft 6,4 8 3
Other material losses 6,1 95 69
Other material losses written off 6,2 92 46
Debts written off 6,3 2 681 931
Total 2 876 1 049
6.1 Other material losses 6
Nature of other material losses
Incident Disciplinary steps taken/criminal proceedings
Lost cash: Advance 8 0
Lost cash: Police actions None 87 57
Incorrect payments 0 12
Total 95 69
6.2 Other material losses written off 6
Nature of losses
Lost cash: Advance 2 0
Lost cash: Police actions 79 2
Incorrect payments 11 26
Dishonored cheques 0 18
Total 92 46
6.3 Debts written off
Nature of debts written off
Salaries 6 2 577 836
State guarantees 60 33
Tax debt 14 18
Other State Departments 2 0
Vehicle accidents 28 44
Total 2 681 931
6.4 Details of theft 6
Lost cash 8 3
Total 8 3
DEPARTMENT OF POLICE VOTE 24
NOTES TO THE ANNUAL FINANCIAL STATEMENTSfor the year ended 31 March 2011

SAPS TOGETHER SQUEEZING CRIME to ZEROSAPS Members, My Family - Together Pushing Back The Frontiers Of Evil
ANNUAL REPORT 2010/2011SOUTH AFRICAN POLICE SERVICE
168
Detail note 6 continued... Note 2010/11 2009/10
R’000 R’000
6.5 Recoverable revenue written off
Salary related debt (9 036) (2 447)
Property related debt (2 624) (2 209)
Admin related debt (47) (94)
Total (11 707) (4 750)
6.6 Assets written off
Nature of write-off 29.2 & 30.2
Transport assets 463 342 647 787
Computer equipment 24 520 27 974
Furniture and Office equipment 2 120 848
Other machinery and equipment 51 121 25 771
Biological assets 674 1 284
Immovable assets 773 1 025
Total 542 550 704 689
7. Transfers and subsidies
Provinces and municipalities 7,1 25 712 25 195
Departmental agencies and accounts 7,2 23 861 20 818
Households 7,3 450 723 391 394
Total 500 296 437 407
7.1 Provinces and municipalities 7
Fines and penalties 145 402
Vehicle licences 25 567 24 793
Total 25 712 25 195
7.2 Departmental agencies and accounts 7
Safety and Security Sector Education & Training Authority 23 861 20 818
Total 23 861 20 818
7,3 Households 7
Employer social benefit 292 355 266 158
Claims against the State (Households) 123 293 87 331
Payment as an act of grace 121 93
Medical expenses detainees 34 954 37 812
Total 450 723 391 394
DEPARTMENT OF POLICE VOTE 24
NOTES TO THE ANNUAL FINANCIAL STATEMENTSfor the year ended 31 March 2011

SAPS TOGETHER SQUEEZING CRIME to ZEROSAPS Members, My Family - Together Pushing Back The Frontiers Of Evil
ANNUAL REPORT 2010/2011SOUTH AFRICAN POLICE SERVICE
169
8. Expenditure for capital assets Note 2010/11 2009/10
Tangible assets R’000 R’000
Buildings and other fixed structures 30 1 182 141 1 071 712
Machinery and equipment 29,1 2 110 241 1 726 766
Biological assets 29,1 905 1 853
Total 3 293 287 2 800 331
8.1 Analysis of funds utilised to acquire capital assets - 2010/11
Voted Funds Aid assistance Total
R’000 R’000 R’000
Tangible assets 3 292 936 351 3 293 287
Buildings and other fixed structures 1 182 141 0 1 182 141
Machinery and equipment 2 109 890 351 2 110 241
Biological assets 905 0 905
Total 3 292 936 351 3 293 287
8.2 Analysis of funds utilised to acquire capital assets - 2009/10
Tangible assets 2 798 745 1 586 2 800 331
Buildings and other fixed structures 1 070 126 1 586 1 071 712
Machinery and equipment 1 726 766 - 1 726 766
Biological assets 1 853 - 1 853
Total 2 798 745 1 586 2 800 331
Note 2010/11 2009/10
9. Cash and cash equivalents R’000 R’000
Cash on hand 11 179 23 661
Cash with commercial banks (Local) 502 1 005
Total 11 681 24 666
10. Prepayments and advances
Description
Staff advances 4 468 3 051
Travel and subsistence 31 534 46 996
Prepayments 1 405 1 056
Advances paid to other entities 10 10
Total 37 417 51 113
DEPARTMENT OF POLICE VOTE 24
NOTES TO THE ANNUAL FINANCIAL STATEMENTSfor the year ended 31 March 2011
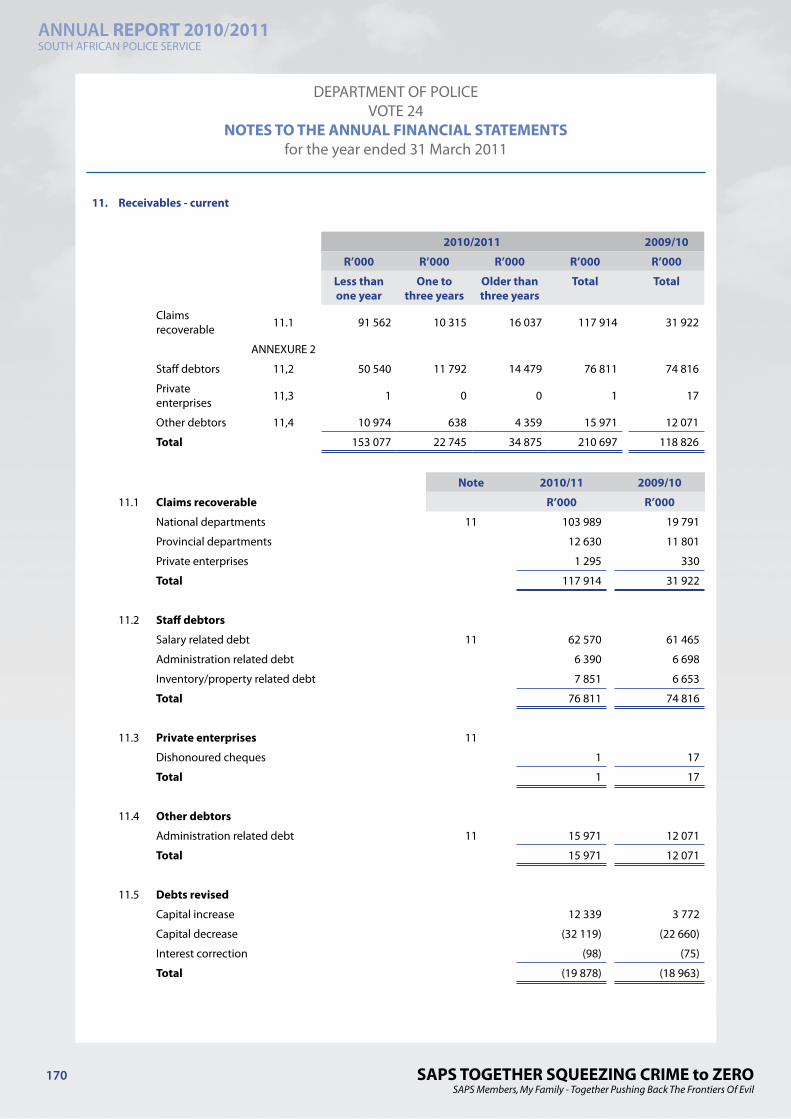
SAPS TOGETHER SQUEEZING CRIME to ZEROSAPS Members, My Family - Together Pushing Back The Frontiers Of Evil
ANNUAL REPORT 2010/2011SOUTH AFRICAN POLICE SERVICE
170
11. Receivables - current
2010/2011 2009/10
R’000 R’000 R’000 R’000 R’000
Less than one year
One to three years
Older than three years
Total Total
Claims recoverable 11.1 91 562 10 315 16 037 117 914 31 922
ANNEXURE 2
Staff debtors 11,2 50 540 11 792 14 479 76 811 74 816
Private enterprises 11,3 1 0 0 1 17
Other debtors 11,4 10 974 638 4 359 15 971 12 071
Total 153 077 22 745 34 875 210 697 118 826
Note 2010/11 2009/10
11.1 Claims recoverable R’000 R’000
National departments 11 103 989 19 791
Provincial departments 12 630 11 801
Private enterprises 1 295 330
Total 117 914 31 922
11.2 Staff debtors
Salary related debt 11 62 570 61 465
Administration related debt 6 390 6 698
Inventory/property related debt 7 851 6 653
Total 76 811 74 816
11.3 Private enterprises 11
Dishonoured cheques 1 17
Total 1 17
11.4 Other debtors
Administration related debt 11 15 971 12 071
Total 15 971 12 071
11.5 Debts revised
Capital increase 12 339 3 772
Capital decrease (32 119) (22 660)
Interest correction (98) (75)
Total (19 878) (18 963)
DEPARTMENT OF POLICE VOTE 24
NOTES TO THE ANNUAL FINANCIAL STATEMENTSfor the year ended 31 March 2011

SAPS TOGETHER SQUEEZING CRIME to ZEROSAPS Members, My Family - Together Pushing Back The Frontiers Of Evil
ANNUAL REPORT 2010/2011SOUTH AFRICAN POLICE SERVICE
171
12. Receivables - non-current Note 2010/11 2009/10
R’000 R’000
Staff debtors 99 048 91 708
Total 99 048 91 708
13. Voted funds to be surrendered to the Revenue Fund
Opening balance 28 0
Transfer from Statement of Financial Performance 40 28
Paid during the year (28) 0
Closing balance 40 28
14. Departmental revenue to be surrendered to the Revenue fund
Opening balance 3 660 10 253
Transfer from Statement of Financial Performance 287 737 347 572
Paid during the year (285 303) (354 165)
Closing balance 6 094 3 660
15. Bank overdraft
Paymaster General Account 200 832 142 883
Total 200 832 142 883
16. Payables – current
Description
Clearing accounts 16,1 8 681 9 717
Other payables 16,2 5 215 376
Total 13 896 10 093
16.1 Clearing accounts 16
Description
Amounts recovered to be cleared 8 681 9 717
Total 8 681 9 717
16.2 Other payables
Description
Salary deductions to be paid over to institutions 16 5 215 376
Total 5 215 376
DEPARTMENT OF POLICE VOTE 24
NOTES TO THE ANNUAL FINANCIAL STATEMENTSfor the year ended 31 March 2011
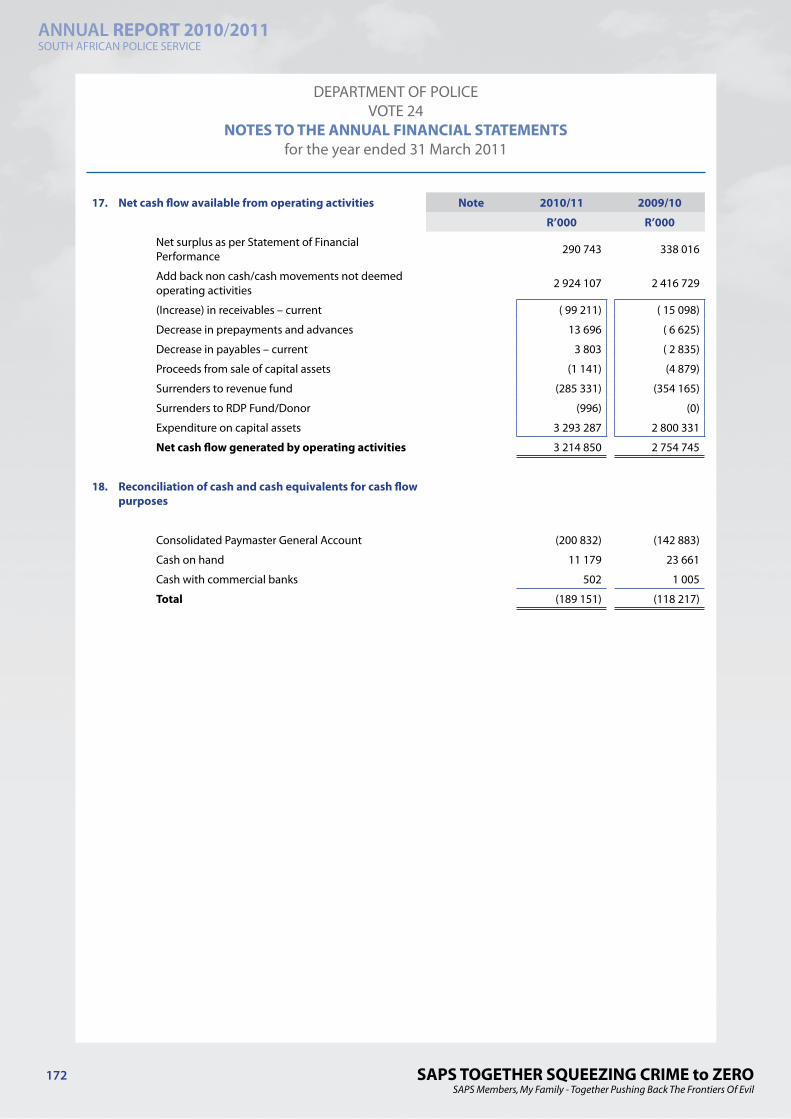
SAPS TOGETHER SQUEEZING CRIME to ZEROSAPS Members, My Family - Together Pushing Back The Frontiers Of Evil
ANNUAL REPORT 2010/2011SOUTH AFRICAN POLICE SERVICE
172
17. Net cash flow available from operating activities Note 2010/11 2009/10
R’000 R’000
Net surplus as per Statement of Financial Performance 290 743 338 016
Add back non cash/cash movements not deemed operating activities 2 924 107 2 416 729
(Increase) in receivables – current ( 99 211) ( 15 098)
Decrease in prepayments and advances 13 696 ( 6 625)
Decrease in payables – current 3 803 ( 2 835)
Proceeds from sale of capital assets (1 141) (4 879)
Surrenders to revenue fund (285 331) (354 165)
Surrenders to RDP Fund/Donor (996) (0)
Expenditure on capital assets 3 293 287 2 800 331
Net cash flow generated by operating activities 3 214 850 2 754 745
18. Reconciliation of cash and cash equivalents for cash flow purposes
Consolidated Paymaster General Account (200 832) (142 883)
Cash on hand 11 179 23 661
Cash with commercial banks 502 1 005
Total (189 151) (118 217)
DEPARTMENT OF POLICE VOTE 24
NOTES TO THE ANNUAL FINANCIAL STATEMENTSfor the year ended 31 March 2011

SAPS TOGETHER SQUEEZING CRIME to ZEROSAPS Members, My Family - Together Pushing Back The Frontiers Of Evil
ANNUAL REPORT 2010/2011SOUTH AFRICAN POLICE SERVICE
173
These amounts are not recognised in the annual financial statements and are disclosed to enhance the usefulness of the financial statements.
19. Contingent liabilities Note 2010/11 2009/10
R’000 R’000
Liable to Nature
Motor vehicle guarantees Employees ANNEXURE 1 0 146
Housing loan guarantees Employees ANNEXURE 1 42 568 71 804
Claims Private parties ANNEXURE 5 11 044 698 7 486 819
Other departments (unconfirmed balances)
ANNEXURE 3 35 704 11 521
Capped leave commitments Employees 4 881 526 4 713 642
Other: Sanlam Middestad Lease 611 692 0
Total 16 616 188 12 283 932
Due to the fact that the Department of Public Works has taken a decision to apply for a declaratory order in the Sanlam Middestad Lease Agreement for the Court to make a ruling on the legality or otherwise of the lease agreement, it was decided to include it as a contingent liability.
Note 2010/11 2009/10
20. Commitments R’000 R’000
Current expenditure
Approved and contracted 723 589 604 061
723 589 604 061
Capital expenditure (including transfers)
Approved and contracted 473 614 174 449
473 614 174 449
Total Commitments 1 197 203 778 510
21. Accruals
Listed by economic classification 30 Days 30+ Days Total Total
Goods and services 651 256 175 419 826 675 714 160
Transfers and subsidies 21 900 7 795 29 695 36 370
Capital assets 156 997 19 734 176 731 336 364
Total 830 153 202 948 1 033 101 1 086 894
DEPARTMENT OF POLICE VOTE 24
DISCLOSURE NOTES TO THE ANNUAL FINANCIAL STATEMENTSfor the year ended 31 March 2011

SAPS TOGETHER SQUEEZING CRIME to ZEROSAPS Members, My Family - Together Pushing Back The Frontiers Of Evil
ANNUAL REPORT 2010/2011SOUTH AFRICAN POLICE SERVICE
174
Detail note 21 continued... Note 2010/11 2009/10
R’000 R’000
Listed by programme level
Administration 428 901 614 424
Visible Policing 429 786 328 257
Detective Services 127 857 104 936
Crime Intelligence 28 290 25 127
Protection and Security Services 18 170 14 118
Donor funds 97 32
Total 1 033 101 1 086 894
Confirmed balances with other departments ANNEXURE 3 7 170 0
Total 7 170 0
22. Employee benefits
Leave entitlement 1 572 624 1 356 817
Thirteenth cheque 2 11
Capped leave commitments 23 554 24 639
Other 200 1 040
Total 1 596 380 1 382 507
Although capped leave in its entirety, should be provided for under this note, the amount and circumstances under which payments were made historically, it was necessary to account for only a percentage of capped leave as employee benefits and the remainder as contingent liability.
23 Lease Commitments
23.1 Operating leases expenditure
Land Buildings & other fixed structures
Machinery and
equipment
Total
2010/2011 R’000 R’000 R’000 R’000
Not later than 1 year 4 535 643 126 33 762 681 423
Later than 1 year and not later than 5 years 5 707 1 212 672 29 008 1 247 387
Later than five years 2 351 659 843 0 662 194
Total lease commitments 12 593 2 515 641 62 770 2 591 004
2009/2010
Not later than 1 year 3 702 594 348 25 598 623 648
Later than 1 year and not later than 5 years 6 755 1 137 349 22 780 1 166 884
Later than five years 2 009 598 090 0 600 099
Total lease commitments 12 466 2 329 787 48 378 2 390 631
DEPARTMENT OF POLICE VOTE 24
DISCLOSURE NOTES TO THE ANNUAL FINANCIAL STATEMENTSfor the year ended 31 March 2011

SAPS TOGETHER SQUEEZING CRIME to ZEROSAPS Members, My Family - Together Pushing Back The Frontiers Of Evil
ANNUAL REPORT 2010/2011SOUTH AFRICAN POLICE SERVICE
175
Detail note 23 continued...
23.2 Finance leases expenditure
Land Buildings & other fixed structures
Machinery and
equipment
Total
2010/2011 R’000 R’000 R’000 R’000
Not later than 1 year 0 0 40 753 40 753
Later than 1 year and not later than 5 years 0 0 13 556 13 556
Total lease commitments 0 0 54 309 54 309
24. Receivables for departmental revenue 2010/11 2009/10
R’000 R’000
Sales of goods and services other than capital assets 333 632
Fines, penalties and forfeits 68 8
Interest, dividends and rent on land 67 66
Financial transactions in assets and liabilities 1 379 2 116
Total 1 847 2 822
24.1 Analysis of receivables for departmental revenue
Opening balance 2 822 5 799
Less: Amounts received 2 822 5 799
Add: Amounts recognised 1 847 2 822
Closing balance 1 847 2 822
25. Irregular expenditure
25.1 Reconciliation of irregular expenditure
Opening Balance 1 258 994
Add: Irregular expenditure - relating to prior year 21 377 876
Add: Irregular expenditure - relating to current year 76 152 2 523
Less: Amounts condoned (91 911) (3 135)
Irregular expenditure awaiting condonation 6 876 1 258
Analysis of awaiting condonation per age classification
Current year 5 618 264
Prior years 1 258 994
Total 6 876 1 258
DEPARTMENT OF POLICE VOTE 24
DISCLOSURE NOTES TO THE ANNUAL FINANCIAL STATEMENTSfor the year ended 31 March 2011

SAPS TOGETHER SQUEEZING CRIME to ZEROSAPS Members, My Family - Together Pushing Back The Frontiers Of Evil
ANNUAL REPORT 2010/2011SOUTH AFRICAN POLICE SERVICE
176
Detail note 25 continued…
25.2 Details of irregular expenditure - current year
Incident Disciplinary steps taken/ criminal proceedings
Cases
Amount 2010/11
R’000 R’000
Advertising 2 3 461 3 461
Inventory 2 3 469 3 469
Transport 2 12 629 12 629
Contractors : Artists & Performers 6 11 950 11 950
Training 2 43 43
Security Services 0 0 90
Accommodation & Meals 11 45 209 45 209
Repairs 4 321 387
Catering 3 9 272 9 312
Day to Day Maintenance 2 58 63
Cleaning Services 1 157 195
Computer Software 1 11 11
Furniture 0 0 644
Towing Cost 0 0 1
Stationery 0 0 17
Communication 3 3 769 3 769
Renovation (Buildings) 4 554 6 270
Funeral Costs 0 0 5
Total 43 90 903 97 529
25.3 Details of irregular expenditure condoned 2010/11
Incident Condoned by (condoning authority) R’000
Advertising Accounting Officer/BAC 3 461
Inventory Accounting Officer/BAC 3 469
Transport Accounting Officer/BAC 12 629
Contractors : Artists & Performers Accounting Officer/BAC 11 950
Training Accounting Officer/BAC 43
Security Services Accounting Officer/BAC 90
Accommodation & Meals Accounting Officer/BAC 45 213
Repairs Accounting Officer/BAC 387
Catering Accounting Officer/BAC 9 312
Day to Day Maintenance Accounting Officer/BAC 63
Cleaning Services Accounting Officer/BAC 195
Computer Software Accounting Officer/BAC 11
Furniture Accounting Officer/BAC 644
Towing Cost Accounting Officer/BAC 1
Stationery Accounting Officer/BAC 17
DEPARTMENT OF POLICE VOTE 24
DISCLOSURE NOTES TO THE ANNUAL FINANCIAL STATEMENTSfor the year ended 31 March 2011

SAPS TOGETHER SQUEEZING CRIME to ZEROSAPS Members, My Family - Together Pushing Back The Frontiers Of Evil
ANNUAL REPORT 2010/2011SOUTH AFRICAN POLICE SERVICE
177
Detail note 25.3 continued… 2010/11
R’000
Communication Accounting Officer/BAC 3 769
Renovation ( Buildings) Accounting Officer/BAC 652
Funeral Costs Accounting Officer/BAC 5
Total 91 911
2010/11
25.4 Details of irregular expenditure under investigation R’000
Incident
Contractors : Artists & Performers 17
Training 70
Security Services 369
Accommodation & Meals 15
Repairs 31
Catering 3
Interpreter 5
Day to Day Maintenance 176
Cleaning Services 103
Social Functions 157
Communication 312
Renovation ( Buildings) 5 618
Total 6 876
26. Fruitless and wasteful expenditure 2010/11 2009/10
26.1 Reconciliation of fruitless and wasteful expenditure R’000 R’000
Opening balance 2 387 2 721
Adjustment to opening balance 0 ( 686)
Fruitless and wasteful expenditure – relating to prior year 693 480
Fruitless and wasteful expenditure – relating to current year 771 647
Less: Amounts condoned ( 1 026) ( 715)
Less: Amounts transferred to receivables for recovery ( 68) ( 60)
Fruitless and wasteful expenditure awaiting condonation 2 757 2 387
Analysis of awaiting condonation per economic classification
Current 2 757 2 387
Total 2 757 2 387
DEPARTMENT OF POLICE VOTE 24
DISCLOSURE NOTES TO THE ANNUAL FINANCIAL STATEMENTSfor the year ended 31 March 2011
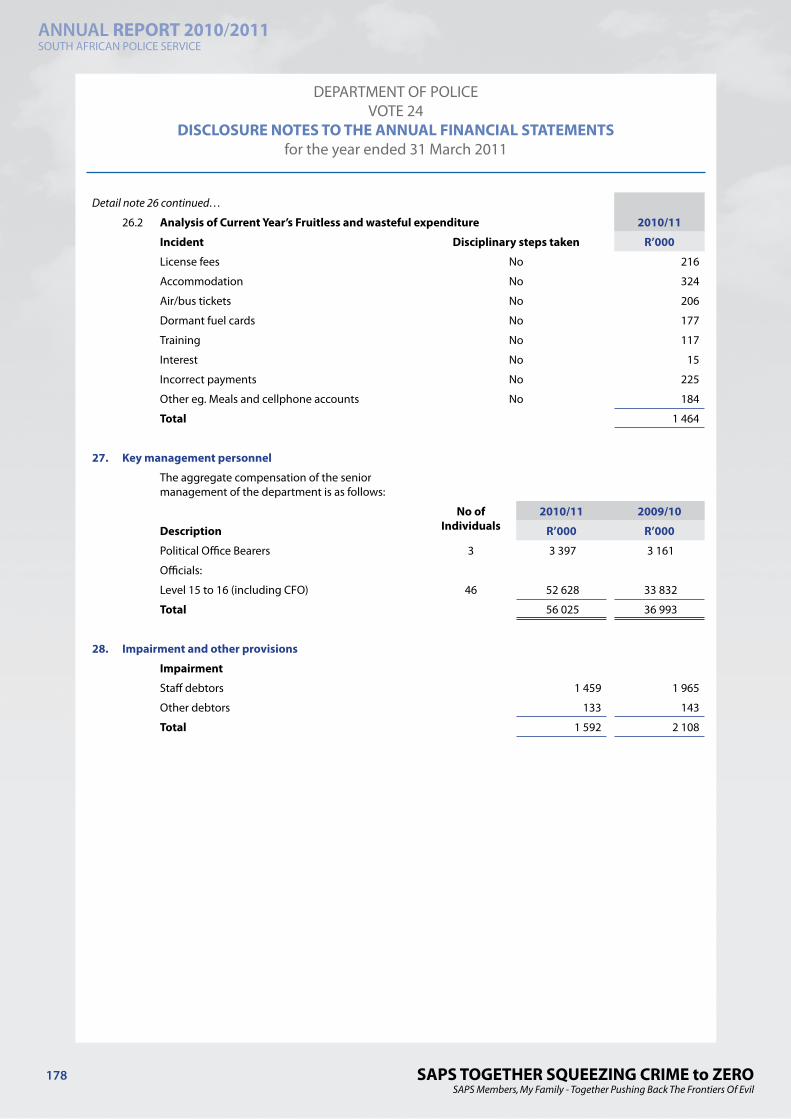
SAPS TOGETHER SQUEEZING CRIME to ZEROSAPS Members, My Family - Together Pushing Back The Frontiers Of Evil
ANNUAL REPORT 2010/2011SOUTH AFRICAN POLICE SERVICE
178
Detail note 26 continued…
26.2 Analysis of Current Year’s Fruitless and wasteful expenditure 2010/11
Incident Disciplinary steps taken R’000
License fees No 216
Accommodation No 324
Air/bus tickets No 206
Dormant fuel cards No 177
Training No 117
Interest No 15
Incorrect payments No 225
Other eg. Meals and cellphone accounts No 184
Total 1 464
27. Key management personnel
The aggregate compensation of the senior management of the department is as follows:
No ofIndividuals
2010/11 2009/10
Description R’000 R’000
Political Office Bearers 3 3 397 3 161
Officials:
Level 15 to 16 (including CFO) 46 52 628 33 832
Total 56 025 36 993
28. Impairment and other provisions
Impairment
Staff debtors 1 459 1 965
Other debtors 133 143
Total 1 592 2 108
DEPARTMENT OF POLICE VOTE 24
DISCLOSURE NOTES TO THE ANNUAL FINANCIAL STATEMENTSfor the year ended 31 March 2011

SAPS TOGETHER SQUEEZING CRIME to ZEROSAPS Members, My Family - Together Pushing Back The Frontiers Of Evil
ANNUAL REPORT 2010/2011SOUTH AFRICAN POLICE SERVICE
179
29. Movable Tangible Capital Assets
MOVEMENT IN MOVABLE TANGIBLE CAPITAL ASSETS PER ASSET REGISTER FOR THE YEAR ENDED 31 MARCH 2011
Opening balance
Current Year Adjustments to prior year
balances
Additions Disposals Closing balance
R’000 R’000 R’000 R’000 R’000
MACHINERY AND EQUIPMENT 10 951 841 2 178 1 774 754 541 186 12 187 587
Transport assets 7 662 581 318 1 432 097 463 308 8 631 688
Computer equipment 1 269 014 338 145 662 24 431 1 390 583
Furniture and Office equipment 101 105 18 22 473 2 136 121 460
Other machinery and equipment 1 919 141 1 504 174 522 51 311 2 043 856
BIOLOGICAL ASSETS 11 360 0 5 742 674 16 428
Biological assets 11 360 0 5 742 674 16 428
TOTAL MOVABLE TANGIBLE CAPITAL ASSETS 10 963 201 2 178 1 780 496 541 860 12 204 015
DEPARTMENT OF POLICE VOTE 24
DISCLOSURE NOTES TO THE ANNUAL FINANCIAL STATEMENTSfor the year ended 31 March 2011

SAPS TOGETHER SQUEEZING CRIME to ZEROSAPS Members, My Family - Together Pushing Back The Frontiers Of Evil
ANNUAL REPORT 2010/2011SOUTH AFRICAN POLICE SERVICE
180
Detail note 29 continued…
29.1 ADDITIONS TO MOVABLE TANGIBLE CAPITAL ASSET PER ASSET REGISTER FOR THE YEAR ENDED31 MARCH 2011
Cash Non-Cash Received: Paid and not yet
captured in asset register
(Capital work in
progress - current
costs)
Received current
year, not paid (Paid
current year,
received prior year)
Total
R’000 R’000 R’000 R’000 R’000 R’000
MACHINERY AND EQUIPMENT 2 110 241 101 417 (519 287) 0 82 383 1 774 754
Transport assets 1 256 488 36 035 51 003 0 88 571 1 432 097
Computer equipment 348 185 9 555 (198 473) 0 (13 605) 145 662
Furniture and Office equipment 26 736 388 (4 573) 0 (78) 22 473
Other machinery and equipment 478 832 55 439 (367 244) 0 7 495 174 522
BIOLOGICAL ASSETS 905 4 855 (18) 0 0 5 742
Biological assets 905 4 855 (18) 0 0 5 742
TOTAL ADDITIONS TO MOVABLE TANGIBLE CAPITAL ASSETS
2 111 146 106 272 (519 305) 0 82 383 1 780 496
29.2 DISPOSALS OF MOVABLE TANGIBLE CAPITAL ASSETS PER ASSET REGISTER FOR THE YEAR ENDED 31 MARCH 2011
Sold (cash) Transfer out or destroyed or
scrapped
Total Cash Received
R’000 R’000 R’000 R’000
MACHINERY AND EQUIPMENT 0 541 186 541 186 1 135
Transport assets 0 463 308 463 308 1 135
Computer equipment 0 24 431 24 431 0
Furniture and Office equipment 0 2 136 2 136 0
Other machinery and equipment 0 51 311 51 311
BIOLOGICAL ASSETS 6 668 674 6
Biological assets 6 668 674 6
TOTAL DISPOSAL OF MOVABLE TANGIBLE CAPITAL ASSETS 6 541 854 541 860 1 141
DEPARTMENT OF POLICE VOTE 24
DISCLOSURE NOTES TO THE ANNUAL FINANCIAL STATEMENTSfor the year ended 31 March 2011

SAPS TOGETHER SQUEEZING CRIME to ZEROSAPS Members, My Family - Together Pushing Back The Frontiers Of Evil
ANNUAL REPORT 2010/2011SOUTH AFRICAN POLICE SERVICE
181
Detail note 29 continued…
29.3 MOVEMENT IN MOVABLE TANGIBLE CAPITAL ASSETS PER ASSET REGISTER FOR THE YEAR ENDED 31 MARCH 2010
Opening balance
Current Year Adjustments to prior year
balances
Additions Disposals Closing Balance
R’000 R’000 R’000 R’000 R’000
MACHINERY AND EQUIPMENT 10 092 757 140 536 1 420 928 702 380 10 951 841
Transport assets 7 217 994 56 679 1 035 695 647 787 7 662 581
Computer equipment 1 135 250 (1 919) 159 819 27 974 1 269 014
Furniture and Office equipment 68 957 2 502 30 494 848 101 105
Other machinery and equipment 1 670 556 79 436 194 920 25 771 1 919 141
BIOLOGICAL ASSETS 9 008 0 3 636 1 284 11 360
Biological assets 9 008 0 3 636 1 284 11 360
TOTAL MOVABLE CAPITAL TANGIBLE ASSETS 10 101 765 140 536 1 424 564 703 664 10 963 201
29.4 Minor Assets
MINOR ASSETS OF THE DEPARTMENT FOR 31 MARCH 2011
Intangible assets
Heritage assets
Machinery and
equipment
Biological assets
Total
R’000 R’000 R’000 R’000 R’000
Opening balance 0 0 1 772 719 0 1 772 719
Adjustment to prior year balance 0 0 1 470 0 (1 470)
Additions 0 0 286 084 0 286 084
Disposals 0 0 (264 655) 0 (264 655)
TOTAL 0 0 1 795 618 0 1 795 618
Number of minor assets 0 0 757 205 0 757 205
TOTAL 0 0 757 205 0 757 205
Minor Assets
MINOR ASSETS OF THE DEPARTMENTFOR 31 MARCH 2010
Minor Assets 0 0 1 772 719 0 1 772 719
TOTAL 0 0 1 772 719 0 1 772 719
DEPARTMENT OF POLICE VOTE 24
DISCLOSURE NOTES TO THE ANNUAL FINANCIAL STATEMENTSfor the year ended 31 March 2011

SAPS TOGETHER SQUEEZING CRIME to ZEROSAPS Members, My Family - Together Pushing Back The Frontiers Of Evil
ANNUAL REPORT 2010/2011SOUTH AFRICAN POLICE SERVICE
182
Detail note 29 continued…
Intangible assets
Heritage assets
Machinery and
equipment
Biological assets
Total
Number of minor assets 0 0 736 273 0 736 273
TOTAL 0 0 736 273 0 736 273
30 Immovable Tangible Capital Assets
MOVEMENT IN IMMOVABLE TANGIBLE CAPITAL ASSETS PER ASSET REGISTER FOR THE YEAR ENDED 31 MARCH 2011
Opening balance
Current year adjustments to prior year
balances
Additions Disposals Closing balance
R’000 R’000 R’000 R’000 R’000
BUILDINGS AND OTHER FIXED STRUCTURES 13 609 (222) 7 115 807 19 695
Dwellings 5 306 0 2 506 807 7 005
Non-residential buildings 8 303 (222) 4 609 0 12 690
TOTAL IMMOVABLE TANGIBLE CAPITAL ASSETS 13 609 (222) 7 115 807 19 695
30.1 Additions
ADDITIONS TO IMMOVABLE TANGIBLE CAPITAL ASSETS PER ASSET REGISTER FOR THE YEAR ENDED 31 MARCH 2011
Cash Non-cash (Capital work-in-progress current
costs and finance
lease payments)
Received current, not paid (Paid
current year,
received prior year
Total
R’000 R’000 R’000 R’000 R’000
BUILDINGS AND OTHER FIXED STRUCTURES 1 182 141 1 166 (933 993) (242 199) 7 115
Dwellings 11 984 90 (7 440) (2 128) 2 506
Non-residential buildings 1 170 157 1 076 (926 553) (240 071) 4 609
TOTAL ADDITIONS TO IMMOVABLE TANGIBLE CAPITAL ASSETS
1 182 141 1 166 (933 993) (242 199) 7 115
DEPARTMENT OF POLICE VOTE 24
DISCLOSURE NOTES TO THE ANNUAL FINANCIAL STATEMENTSfor the year ended 31 March 2011

SAPS TOGETHER SQUEEZING CRIME to ZEROSAPS Members, My Family - Together Pushing Back The Frontiers Of Evil
ANNUAL REPORT 2010/2011SOUTH AFRICAN POLICE SERVICE
183
Detail note 30 continued…
30.2 Disposals
DISPOSALS OF IMMOVABLE TANGIBLE CAPITAL ASSETS PER ASSET REGISTER FOR THE YEAR ENDED 31 MARCH 2011
Sold for cash Transfer out or destroyed or
scrapped
Total disposals Cash received Actual
R’000 R’000 R’000 R’000
BUILDINGS AND OTHER FIXED STRUCTURES 0 807 807 0
Dwellings 0 807 807 0
Non-residential buildings 0 0 0 0
TOTAL DISPOSAL OF IMMOVABLE TANGIBLE CAPITAL ASSETS
0 807 807 0
30.3 Movement for 2009/10
MOVEMENT IN IMMOVABLE TANGIBLE CAPITAL ASSETS PER ASSET REGISTER FOR THE YEAR ENDED 31 MARCH 2010
Opening balance
Additions Disposals Closing balance
R’000 R’000 R’000 R’000
BUILDINGS AND OTHER FIXED STRUCTURES 11 787 2 847 1 025 13 609
Dwellings 5 923 107 724 5 306
Non-residential buildings 5 864 2 740 301 8 303
TOTAL IMMOVABLE TANGIBLE CAPITAL ASSETS 11 787 2 847 1 025 13 609
DEPARTMENT OF POLICE VOTE 24
DISCLOSURE NOTES TO THE ANNUAL FINANCIAL STATEMENTSfor the year ended 31 March 2011

SAPS TOGETHER SQUEEZING CRIME to ZEROSAPS Members, My Family - Together Pushing Back The Frontiers Of Evil
ANNUAL REPORT 2010/2011SOUTH AFRICAN POLICE SERVICE
184
AN
NEX
URE
1ST
ATEM
ENT
OF
FIN
AN
CIA
L G
UA
RAN
TEES
ISSU
ED A
S AT
31
MA
RCH
201
1 - L
OCA
L
Gua
rant
ee in
resp
ect o
f and
Gua
rant
or
inst
itut
ion
Ori
gina
l G
uara
ntee
d ca
pita
l am
ount
Ope
ning
bal
ance
1/
4/20
10Cu
rren
t yea
r ad
just
men
ts to
pr
ior y
ear c
losi
ng
bala
nces
Gua
rant
ee
draw
dow
nes
duri
ng
the
year
Gua
rant
ee
Repa
ymen
ts/
canc
elle
d/
Rele
ased
/ Red
uced
du
ring
the
year
Clos
ing
bala
nce
31/0
3/20
11Re
alis
ed lo
sses
not
re
cove
rabl
e i.r
.o.
clai
ms
paid
out
R’00
0R’
000
R’00
0R’
000
R’00
0R’
000
R’00
0
Mot
or V
ehic
les
STA
NN
IC63
7 14
6 0
0 14
6 0
0
Tota
l63
7 14
6 0
0 14
6 0
0
Hou
sing
STA
ND
ARD
BA
NK
4 64
7 56
54
2
856
1 90
1 0
NED
BAN
K PT
Y LT
D10
627
29
7 0
5 08
6 5
838
0
FIRS
TRA
ND
BA
NK:
FN
B32
416
67
0
3 54
8 28
935
0
ABS
A18
518
64
23
3 15
532
3
283
0
OLD
MU
TUA
L FI
N LT
243
0 0
224
19
0
HLA
NO
FIN
SER
VICE
S65
0
0 0
65
0
ITH
ALA
LIM
ITED
2 29
6 0
0 1
334
962
0
FREE
STAT
E D
EVEL
CO
RP1
047
0 0
48
999
0
VBS
MU
TUA
L BA
NK
199
0 0
0 19
9 0
MPU
MA
LAN
GA
171
0 0
47
124
0
NP
DEV
ELO
P. CO
RP. L
TD46
8 0
0 33
0 13
8 0
GRE
EN S
TART
H/L
OA
N25
7 (1
)0
167
89
0
SA H
OM
ELO
AN
S14
1 0
0 14
1 0
0
IND
LU F
IN P
TY LT
D16
0
0 0
16
0
NH
FC (M
asik
heni
)69
3 0
0 69
3 0
0
Tota
l71
804
48
3 28
7 30
006
42
568
0
Gra
nd T
otal
71 9
50
483
287
30 1
52
42 5
68
0
DEP
ART
MEN
T O
F PO
LICE
VO
TE 2
4A
NN
EXU
RES
TO T
HE
AN
NU
AL
FIN
AN
CIA
L ST
ATEM
ENTS
for t
he y
ear e
nded
31
Mar
ch 2
011

SAPS TOGETHER SQUEEZING CRIME to ZEROSAPS Members, My Family - Together Pushing Back The Frontiers Of Evil
ANNUAL REPORT 2010/2011SOUTH AFRICAN POLICE SERVICE
185
ANNEXURE 2CLAIMS RECOVERABLE
Government Entity Confirmed balance outstanding
Unconfirmed balance outstanding
TOTAL
31/03/2011 31/03/2010 31/03/2011 31/03/2010 31/03/2011 31/03/2010
R’000 R’000 R’000 R’000 R’000 R’000
Departments
THE PRESIDENCY 0 0 3 1 3 1
DEPARTMENT OF DEFENCE 0 0 104 95 104 95
DEPARTMENT OF AGRICULTURE 0 0 590 405 590 405
DEPARTMENT OF ARTS AND CULTURE 0 0 8 97 8 97
DEPARTMENT OF COMMUNICATIONS 0 0 9 3 9 3
DEPARTMENT OF CORRECTIONAL SERVICES 0 0 311 295 311 295
DEPARTMENT OF EDUCATION 0 0 923 866 923 866
DEPARTMENT OF ENVIRONMENTAL AFFAIRS AND TOURISM
0 0 461 186 461 186
DEPARTMENT OF FOREIGN AFFAIRS 0 0 9 670 9 028 9 670 9 028
DEPARTMENT OF HEALTH 0 0 4 411 4 010 4 411 4 010
DEPARTMENT OF HOME AFFAIRS 0 0 161 161 161 161
DEPARTMENT OF HOUSING 0 0 98 9 98 9
DEPARTMENT OF JUSTICE AND CONSTITUTIONAL DEV 0 0 406 399 406 399
DEPARTMENT OF LABOUR 0 0 218 251 218 251
DEPARTMENT OF LAND AFFAIRS 0 0 133 7 133 7
DEPARTMENT OF PUBLIC ENTERPRISES 0 0 5 2 5 2
DEPARTMENT OF PUBLIC WORKS 0 0 1 647 1 662 1 647 1 662
DEPARTMENT OF SOCIAL DEVELOPMENT 0 0 569 304 569 304
DEPARTMENT OF TRADE AND INDUSTRY 0 0 27 173 27 173
DEPARTMENT OF TRANSPORT 0 0 196 147 196 147
DEPARTMENT OF WATER AFFAIRS AND FORESTRY 0 0 165 533 165 533
DEPARTMENT OF MINERALS AND ENERGY 0 0 82 693 349 82 693 349
DEPARTMENT OF PUBLIC SERVICE AND ADMINISTRATION 0 0 287 12 287 12
DEPARTMENT OF SCIENCE AND TECHNOLOGY 0 0 6 3 6 3
DEPARTMENT OF POLICE VOTE 24
ANNEXURES TO THE ANNUAL FINANCIAL STATEMENTSfor the year ended 31 March 2011

SAPS TOGETHER SQUEEZING CRIME to ZEROSAPS Members, My Family - Together Pushing Back The Frontiers Of Evil
ANNUAL REPORT 2010/2011SOUTH AFRICAN POLICE SERVICE
186
ANNEXURE 2 Continues….
Government Entity Confirmed balance outstanding
Unconfirmed balance outstanding
TOTAL
31/03/2011 31/03/2010 31/03/2011 31/03/2010 31/03/2011 31/03/2010
R’000 R’000 R’000 R’000 R’000 R’000
DEPARTMENT OF SPORT AND RECREATION 0 0 71 5 71 5
DEPARTMENT OF PROVINCIAL AND LOCAL GOVERNMENT 0 0 14 8 14 8
DEPARTMENT OF STATE DEVELOPMENT 0 0 0 24 0 24
DEPARTMENT OF STATISTICS 0 0 13 0 13 0
INDEPENDENT COMPLAINTS DIRECTORATE 0 0 25 17 25 17
NATIONAL ASSEMBLY: PARLIAMENT 0 0 404 305 404 305
NATIONAL PROSECUTING AUTHORITY 0 0 182 138 182 138
NATIONAL TREASURY 0 0 49 65 49 65
NATIONAL COMMUNICATION CENTRE 0 0 130 43 130 43
SUB TOTAL 0 0 103 989 19 603 103 989 19 603
Provinces
OFFICES OF THE PREMIERS 0 0 0 2 0 2
MEC SAFETY AND SECURITY 0 0 203 187 203 187
KWAZULU NATAL: PROVINCIAL GOVERNMENT 0 0 806 483 806 483
FREE STATE PROV: PROVINCIAL GOVERNMENT 0 0 26 17 26 17
WESTERN CAPE PROV: PROVINCIAL GOVERNMENT 0 0 2 233 2 025 2 233 2 025
LIMPOPO PROV: PROVINCIAL GOVERNMENT 0 0 1 653 238 1 653 238
EASTERN CAPE PROV: PROVINCIAL GOVERNMENT 0 0 6 830 8 586 6 830 8 586
GAUTENG PROV: PROVINCIAL GOVERNMENT 0 0 377 266 377 266
NORTH WEST PROV: PROVINCIAL GOVERNMENT 0 0 384 177 384 177
MPUMALANGA: PROVINCIAL GOVERNMENT 0 0 3 5 3 5
NORTHERN CAPE: PROVINCIAL GOVERNMENT 0 0 115 3 115 3
SUB TOTAL 0 0 12 630 11 989 12 630 11 989
DEPARTMENT OF POLICE VOTE 24
ANNEXURES TO THE ANNUAL FINANCIAL STATEMENTSfor the year ended 31 March 2011

SAPS TOGETHER SQUEEZING CRIME to ZEROSAPS Members, My Family - Together Pushing Back The Frontiers Of Evil
ANNUAL REPORT 2010/2011SOUTH AFRICAN POLICE SERVICE
187
ANNEXURE 2 Continues….
Other Entities Confirmed balance outstanding
Unconfirmed balance outstanding
TOTAL
31/03/2011 31/03/2010 31/03/2011 31/03/2010 31/03/2011 31/03/2010
R’000 R’000 R’000 R’000 R’000 R’000
ICF AFRICA 0 0 6 0 6 0
INSTITUTION FOR SECURITY STUDIES 0 0 12 12 12 12
NATIONAL INTELLIGENCE AGENCY 0 0 513 7 513 7
SA SOCIAL SECURITY AGENCY 0 0 179 113 179 113
SA RESERVE BANK 0 0 0 52 0 52
SCHINDLER LIFTS 0 0 7 7 7 7
AIRPORTS COMPANY SOUTH AFRICA 0 0 3 3 3 3
VENTURESCAPES 0 0 76 72 76 72
SA SECRET SERVICE 0 0 3 3 3 3
4D DÉCOR 0 0 5 5 5 5
RED HOT EVENTS 0 0 2 2 2 2
URBAN TONIC 0 0 4 0 4 0
EVENTS MANAGEMENT SOLUTIONS 0 0 3 0 3 0
LANGE STRATEGIC COMMUNICATIONS 0 0 8 0 8 0
TRAVEL MOTIVES 0 0 0 2 0 2
SOUTH AFRICAN COMMUNIST PARTY 0 0 22 22 22 22
GREEN DOLPINE RESTAURANT 0 0 12 12 12 12
GREEN ROUTE PTY LTD 0 0 21 0 21 0
SENSE OF TASTE 0 0 0 15 0 15
SIYA ZAMA GVK BUILDING RENOVATION 0 0 417 0 417 0
SALSA CATERING 0 0 2 3 2 3
SUB TOTAL 0 0 1 295 330 1 295 330
TOTAL 0 0 117 914 31 922 117 914 31 922
DEPARTMENT OF POLICE VOTE 24
ANNEXURES TO THE ANNUAL FINANCIAL STATEMENTSfor the year ended 31 March 2011
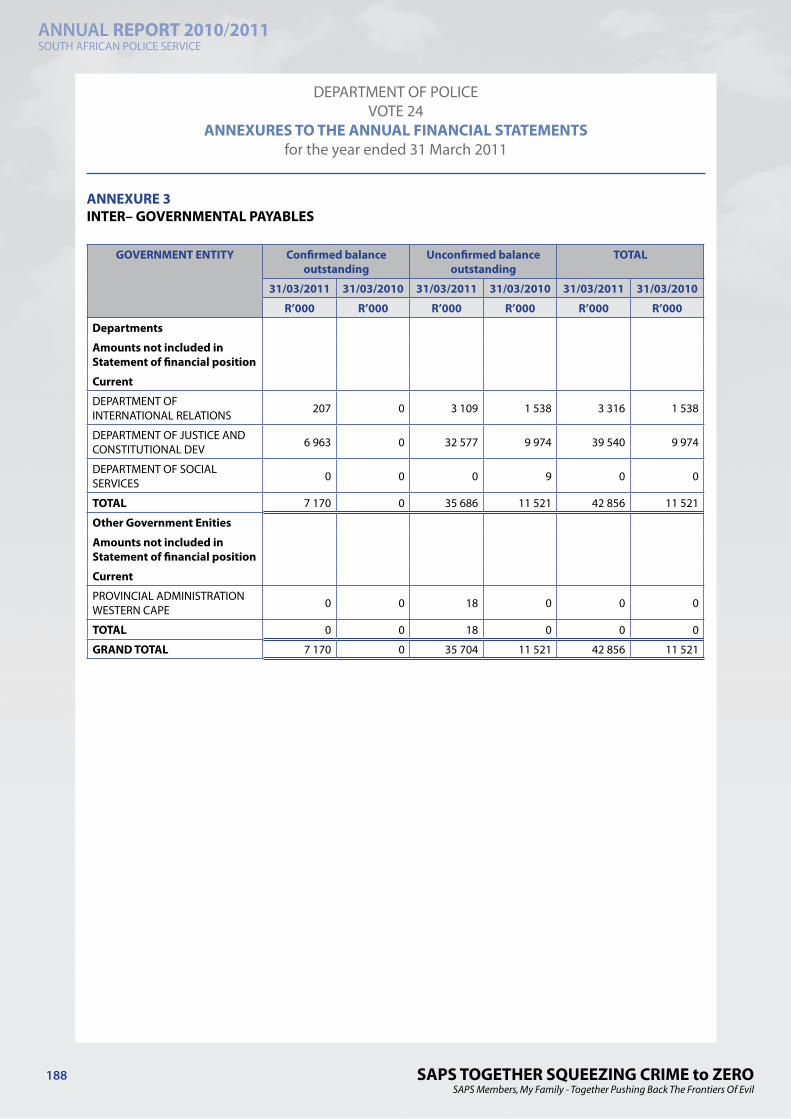
SAPS TOGETHER SQUEEZING CRIME to ZEROSAPS Members, My Family - Together Pushing Back The Frontiers Of Evil
ANNUAL REPORT 2010/2011SOUTH AFRICAN POLICE SERVICE
188
ANNEXURE 3INTER– GOVERNMENTAL PAYABLES
GOVERNMENT ENTITY Confirmed balance outstanding
Unconfirmed balance outstanding
TOTAL
31/03/2011 31/03/2010 31/03/2011 31/03/2010 31/03/2011 31/03/2010
R’000 R’000 R’000 R’000 R’000 R’000
Departments
Amounts not included in Statement of financial position
Current
DEPARTMENT OF INTERNATIONAL RELATIONS 207 0 3 109 1 538 3 316 1 538
DEPARTMENT OF JUSTICE AND CONSTITUTIONAL DEV 6 963 0 32 577 9 974 39 540 9 974
DEPARTMENT OF SOCIAL SERVICES 0 0 0 9 0 0
TOTAL 7 170 0 35 686 11 521 42 856 11 521
Other Government Enities
Amounts not included in Statement of financial position
Current
PROVINCIAL ADMINISTRATION WESTERN CAPE 0 0 18 0 0 0
TOTAL 0 0 18 0 0 0
GRAND TOTAL 7 170 0 35 704 11 521 42 856 11 521
DEPARTMENT OF POLICE VOTE 24
ANNEXURES TO THE ANNUAL FINANCIAL STATEMENTSfor the year ended 31 March 2011

SAPS TOGETHER SQUEEZING CRIME to ZEROSAPS Members, My Family - Together Pushing Back The Frontiers Of Evil
ANNUAL REPORT 2010/2011SOUTH AFRICAN POLICE SERVICE
189
AN
NEX
URE
4ST
ATEM
ENT
OF
LOC
AL
AN
D F
ORE
IGN
AID
ASS
ISTA
NCE
REC
EIV
ED F
OR
THE
YEA
R EN
DED
31
MA
RCH
201
1
Nam
e O
f Don
orPu
rpos
eO
peni
ng B
alan
ceRe
venu
eRe
venu
e Su
rren
dere
dEx
pend
itur
eCl
osin
g Ba
lanc
e
R’00
0R’
000
R’00
0R’
000
R’00
0
Rece
ived
in c
ash
Loca
l
CARA
Fun
ds7
021
00
311
6 7
10
Subt
otal
7 02
10
031
1 6
710
Fore
ign
Euro
pean
Uni
onCa
paci
ty B
uild
ing
( 4 4
69)
00
0 (4
469
)
Swis
sO
pera
tiona
l tra
inin
g D
RC(1
24)
00
0 (1
24)
Afr
ican
Ren
aiss
ance
DRC
Pro
ject
s(2
546
)0
00
(2 5
46)
Uni
ted
King
dom
DRC
Pro
ject
s42
042
00
Nor
weg
ian
DRC
Pro
ject
s25
125
125
10
251
Enhl
anga
no P
roje
ct F
ranc
e Tr
aini
ng s
uppo
rt
745
745
745
351
394
Nor
way
(Sud
an)
Trai
ning
sup
port
0
6 52
00
3 84
6 2
674
Subt
otal
(6 1
01)
7 51
61
038
4 19
7 (3
820
)
Tota
l92
0 7
516
1 03
8 4
508
2 89
0
DEP
ART
MEN
T O
F PO
LICE
VO
TE 2
4A
NN
EXU
RES
TO T
HE
AN
NU
AL
FIN
AN
CIA
L ST
ATEM
ENTS
for t
he y
ear e
nded
31
Mar
ch 2
011

SAPS TOGETHER SQUEEZING CRIME to ZEROSAPS Members, My Family - Together Pushing Back The Frontiers Of Evil
ANNUAL REPORT 2010/2011SOUTH AFRICAN POLICE SERVICE
190
AN
NEX
URE
5ST
ATEM
ENT
OF
CON
TIN
GEN
T LI
ABI
LITI
ES A
S AT
31
MA
RCH
201
1
Nat
ure
of L
iabi
lity
Ope
ning
Ba
lanc
e 01
/04/
2010
Curr
ent y
ear
adju
stm
ents
to
pri
or y
ear
bala
nces
Liab
iliti
es
incu
rred
dur
ing
the
year
Clai
ms
sett
led
duri
ng th
e ye
arCl
osin
g Ba
lanc
e 31
/03/
2011
Ori
gina
l cla
im
Am
ount
sA
mou
nts
Paid
Am
ount
s Ca
ncel
led/
Redu
ced
R’00
0R’
000
R’00
0R’
000
R’00
0R’
000
R’00
0
Clai
ms
agai
nst t
he d
epar
tmen
t
Vehi
cle
acci
dent
s 1
43 2
60
5 65
156
450
27 8
85
11
776
16
109
177
476
Lega
l exp
ense
s 1
61 4
02
6 75
422
3 16
610
542
2
064
8 4
78
380
780
Dam
age
to p
rope
rty
6 6
47
(952
)1
365
2 39
6 5
48
1 8
48
4 6
64
Ass
ault
506
141
21
560
203
012
33 8
66
6 0
65
27
801
696
847
Dam
age
to S
tate
pro
pert
y 1
0 96
1 (1
25)
2 75
85
224
2 4
56
2 7
68
8 3
70
Polic
e ac
tions
5 6
55 5
52
841
705
2 66
6 24
560
0 26
5 5
2 74
0 5
47 5
25
8 5
63 2
37
Shoo
ting
inci
dent
s 5
26 5
11
35 5
6443
8 96
557
141
9
956
4
7 18
5 9
43 8
99
Oth
er (N
ot y
et c
lass
ified
) 4
76 3
45
(298
307
)10
0 23
28
845
0 8
845
2
69 4
25
Tota
l 7
486
819
6
11 8
50
3 69
2 19
374
6 16
4 8
5 60
5 6
60 5
59
11
044
698
Not
e: A
mou
nts
on th
is s
ched
ule
refle
cts
the
actu
al a
mou
nts
paid
and
act
ual a
mou
nts
clai
med
(NO
T ES
TIM
ATED
SET
TLEM
ENT
AM
OU
NTS
) in
resp
ect o
f all
pend
ing
civi
l cla
ims
agai
nst t
he
stat
e, w
hich
may
or m
ay n
ot b
e se
ttle
d in
futu
re.
DEP
ART
MEN
T O
F PO
LICE
VO
TE 2
4A
NN
EXU
RES
TO T
HE
AN
NU
AL
FIN
AN
CIA
L ST
ATEM
ENTS
for t
he y
ear e
nded
31
Mar
ch 2
011
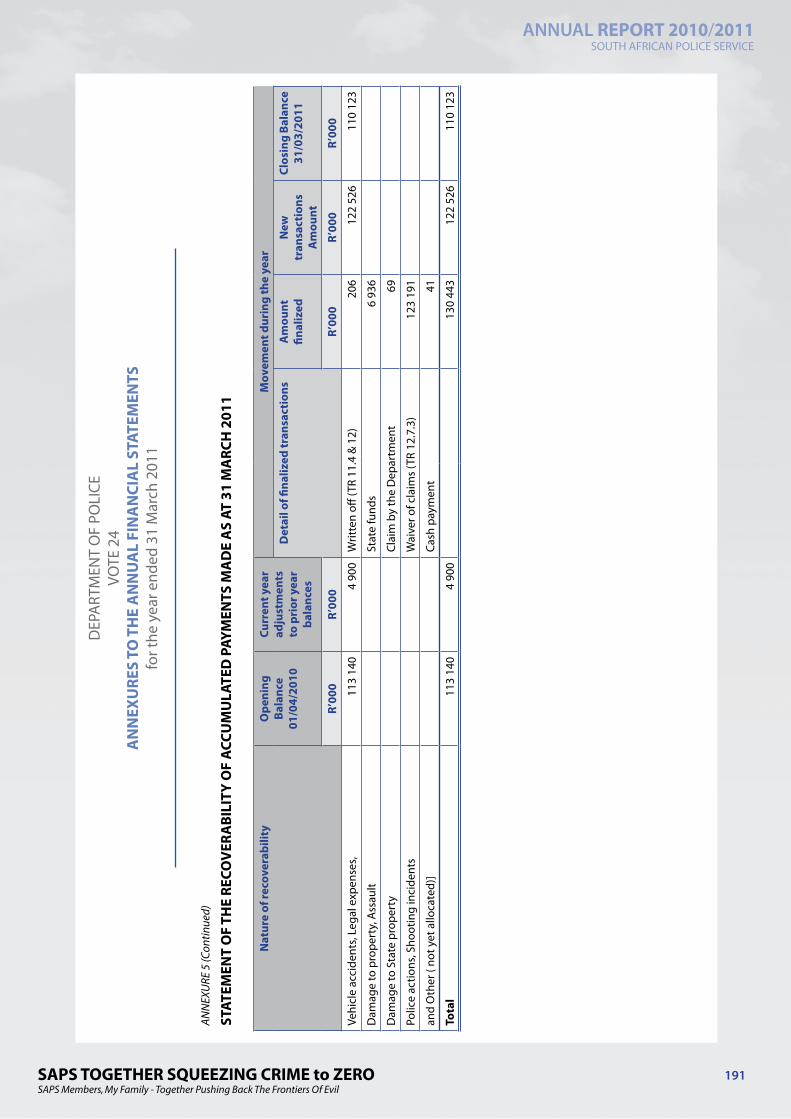
SAPS TOGETHER SQUEEZING CRIME to ZEROSAPS Members, My Family - Together Pushing Back The Frontiers Of Evil
ANNUAL REPORT 2010/2011SOUTH AFRICAN POLICE SERVICE
191
ANN
EXU
RE 5
(Con
tinue
d)
STAT
EMEN
T O
F TH
E RE
COV
ERA
BILI
TY O
F A
CCU
MU
LATE
D P
AYM
ENTS
MA
DE
AS
AT 3
1 M
ARC
H 2
011
Nat
ure
of re
cove
rabi
lity
Ope
ning
Ba
lanc
e 01
/04/
2010
Curr
ent y
ear
adju
stm
ents
to
pri
or y
ear
bala
nces
Mov
emen
t dur
ing
the
year
Det
ail o
f fina
lized
tran
sact
ions
Am
ount
fin
aliz
edN
ew
tran
sact
ions
A
mou
nt
Clos
ing
Bala
nce
31/0
3/20
11
R’00
0R’
000
R’00
0R’
000
R’00
0
Vehi
cle
acci
dent
s, Le
gal e
xpen
ses,
113
140
4
900
W
ritte
n off
(TR
11.4
& 1
2)20
6 1
22 5
26
110
123
Dam
age
to p
rope
rty,
Ass
ault
Stat
e fu
nds
6 93
6
Dam
age
to S
tate
pro
pert
yCl
aim
by
the
Dep
artm
ent
69
Polic
e ac
tions
, Sho
otin
g in
cide
nts
Wai
ver o
f cla
ims
(TR
12.7
.3)
123
191
and
Oth
er (
not y
et a
lloca
ted)
]Ca
sh p
aym
ent
41
Tota
l 1
13 1
40
4 9
00
130
443
122
526
110
123
DEP
ART
MEN
T O
F PO
LICE
VO
TE 2
4A
NN
EXU
RES
TO T
HE
AN
NU
AL
FIN
AN
CIA
L ST
ATEM
ENTS
for t
he y
ear e
nded
31
Mar
ch 2
011

SAPS TOGETHER SQUEEZING CRIME to ZEROSAPS Members, My Family - Together Pushing Back The Frontiers Of Evil
ANNUAL REPORT 2010/2011SOUTH AFRICAN POLICE SERVICE
192
ANNEXURE 6INVENTORY
Note Quantity 2010/11 Quantity 2009/10
R’000 R’000
Inventory
Opening balance 55 605 818 649 916 60 005 068 732 796
Add/(Less): Adjustments to prior year balances 1 074 166 (116 992) (351 267) (78 151)
Add: Additions/Purchases - Cash 22 060 206 412 302 27 929 813 399 103
Add: Additions - Non-cash 170 940 5 643 186 609 10 787
(Less): Disposals (1 555 953) (4 067) (1 694 411) (30 969)
(Less): Issues (22 771 122) (358 938) (30 460 892) (383 237)
Add/(Less): Adjustments 693 493 (1 139) (9 102) (411)
Closing balance 55 277 548 586 725 55 605 818 649 916
DEPARTMENT OF POLICE VOTE 24
ANNEXURES TO THE ANNUAL FINANCIAL STATEMENTSfor the year ended 31 March 2011

SAPS TOGETHER SQUEEZING CRIME to ZEROSAPS Members, My Family - Together Pushing Back The Frontiers Of Evil
ANNUAL REPORT 2010/2011SOUTH AFRICAN POLICE SERVICE
193
HUMAN RESOURCES MANAGEMENT1. Service DeliveryThe following table reflects the outcomes of the implementation of the SAPS Service Delivery Improvement Plan (SDIP).
Table 1.1: Main Service for Service Delivery Improvement Standards
Main Service Actual/potential customers
Standard of Service
Actual achievements in relation to set standards
Preventing crime
Combating crime
Investigating crime
Maintaining public order
Protecting and securing the inhabitants of the Republic and their property
Upholding and enforcing the law
Performing administrative duties
Every individual, group or government department affected by crime and violence.
Services include those the SAPS are compelled to render in terms of existing legislation and its mandate as derived from Section 205 of the Constitution of the Republic of South Africa, 1996 and the following key Acts:• South African Police
Service Act, 1995 (Act No. 68 of 1995)
• The Criminal Procedure Act, 1977 (Act No. 51 of 1977)
• The Regulation of Interception of Communications and Provision of Communication-related Information Act, 2002 (Act No. 70 of 2002)
• The National Strategic Intelligence Act, 1994 (Act No. 39 of 1994)
• The Domestic Violence Act, 1998 (Act No. 116 of 1998)
• The Prevention and Combating of Corrupt Activities Act, 2004 (Act No. 12 of 2004)
Conduct police actions to combat crime by enhancing police visibility
• 29 891 crime prevention operations were conducted. During these operations 65 381 roadblocks, 61 216 cordon and searches, 2 063 923 stop and search operations and various other actions were carried out which led to 1 452 600 arrests. 47.4% or 688 937 of these arrests were made for priority crimes.
• 7 888 stolen and lost firearms were recovered.• 19 357 firearms and 255 924 rounds of ammunition
were recovered to reduce the proliferation of firearms.
• 46 527 firearms were destructed by the SAPS.• 33 638 stolen and robbed vehicles were recovered.• 89 748kg cannabis and 159 681 cannabis plants
were seized.
Maintain public order
• 12 651 crowd-related incidents were recorded, including 11 680 peaceful incidents and 971 unrest-related incidents. 3 671 persons were arrested during unrest-related incidents.
Investigate crime
• The detection rate for all serious crime increased by 1.37%, from 50.47% in 2009/10 to 51.84% in 2010/11.
• 30.84% court ready case dockets for all serious crime was achieved.
• The detection rate for crimes against children (under 18 years) increased by 8.49% to 77.42%.
• The detection rate for crimes against women (18 years and older) decreased by -1.88% to 71.20%.
• The detection rate for commercial crime-related charges increased from 36.55% in 2009/10 to 68.4% in 2010/11. 25.6% court ready case dockets for commercial crime-related charges were achieved.
• 30.3% or 37 of 122 of registered organised crime project investigations (OCPI) were successfully terminated, which includes illegal drugs and substances; smuggling and trading in counterfeit goods; plundering mineral and marine resources; smuggling firearms; human and child trafficking; car and truck hijacking; aggravated robberies; cable theft; money laundering and fraud, to mention a few.
• 81.46% (994 020 from a total of 1 220 205) offender’s previous conviction reports for crime-related fingerprints were generated within 30 days.
• 93.5% (297 955 from a total of 318 665) forensic entries were analysed by forensic analysts within 35 days.

SAPS TOGETHER SQUEEZING CRIME to ZEROSAPS Members, My Family - Together Pushing Back The Frontiers Of Evil
ANNUAL REPORT 2010/2011SOUTH AFRICAN POLICE SERVICE
194
Table 1.2: Consultation arrangements with clients
The aim when creating consultation arrangements with clients is to: deepen partnerships with communities, and promote inter-departmental, national and international events through communication projects.
Type of arrangement Clients Actual achievements
Awareness campaigns General public, including children, youth and vulnerable groups
Various awareness campaigns were conducted in communities, giving attention to the specific needs regarding crimes prevalent in their area such as gender-based violence, the reduction of violent crimes, drug awareness, and promotion of community involvement in crime prevention.
Rural Safety Rural community A comprehensive Rural Safety Strategy to enhance safety and security, accessibility to policing and service delivery to the rural community was approved by the Minister of Police. The aim of the strategy is to address rural safety as part of an integrated and holistic day-to-day crime prevention approach based on the principles of sector policing, to addresses the needs of the entire rural community, including the farming community.
School Safety School-going children The SAPS engaged in a partnership with the Department of Basic Education to link police stations to schools; establish Safe School Committees, implement joint social crime prevention programmes and to mobilise communities to take ownership. 9 000 public schools established Safe School Committees.
1 001 schools with 174 248 learners were visited to discuss drug and substance abuse, safety when crossing the road and crime-related issues.
Crime Prevention The general public Recognising that the Department of Police alone cannot prevent crime, necessitates the engagement of the SAPS in partnerships to prevent crime and in mobilising communities and specific sectors to address crimes that affect them. During 2010/11 the SAPS:• Received 168 560 calls and 686 web tips at its Crime Stop
call centre which led to 226 positive cases.• Received 1 257 SMS tips and 632 web tips as a result of
the partnership between the Primedia group and the SAPS which led to 73 positive cases.
Firearms Control Businesses dealing in firearms and the general public
• 1 936 institutions such as training providers, shooting ranges, hunting associations and sport-shooting organisations were accredited since the implementation of the firearms control legislation (i.e. 107 additional to 1 829 institutions at the end of March 2010).
• 268 459 firearm license renewals and 240 422 competency certifications were issued from 1 April 2010 to 31 March 2011.
• Some provisions of the Firearms Control Amendment Act were put into operation in order to provide for a mechanism to renew competency certificates in respect of firearms. The Act also provides for the extension of the validity period of some categories of firearms licenses, such as conducting business as a game rancher and conducting business in hunting from five years to ten years and for other business purposes from two years to five years.

SAPS TOGETHER SQUEEZING CRIME to ZEROSAPS Members, My Family - Together Pushing Back The Frontiers Of Evil
ANNUAL REPORT 2010/2011SOUTH AFRICAN POLICE SERVICE
195
Table 1.3: Service Delivery Access Strategies
To ensure the quality and accessibility of services, priority was given by Government specifically to improve the levels of service and the accessibility of services provided by all departments to all people in the country. The SAPS has developed an Access Strategy in terms of which geographic access norms to SAPS’ service points will be developed to inform and direct the future placement and construction of the service points. The first phase of the Access Strategy will be completed by the end of 2011/12, well ahead of the schedule indicated on the SAPS by Government, thereby enabling SAPS to commence with a structured plan to address imbalances in the determined geographic access norms ahead of time.
Strategy Access
Increase access to communities by building/upgrading/improving police stations
The following police facilities were completed in 2010/11:
6 newly re-established police facilities completed:• Kuruman LCRC• Pienaar police station• Brakpan (Tsakane) police station• Bloemfontein 10111 centre• Kakamas police station• Hazyview police station
4 new police facilities completed• Blue Downs police station• Zamdela police station• Ga Masemola police station• Benoni Training College – Radio Technical Centre
6 repaired and upgraded police facilities completed• Mount Road police station• Bergville police station• Chatsworth police station• Hammanskraal Training Institution• Riebeeck West police station• Humewood police station
3 re-established police facilities completed• Thokoza police station• Mbuzini police station• Giyani police station.
Increase access to victims of crime by expanding victim support facilities
SAPS Victim Support Rooms (VSRs) are used for the consultation of victims of sexual offences, child abuse and domestic violence, interviews and statement taking. 10 additional VSRs were established at police stations in 2010/11 namely at Jane Furse, Botlhokwa, Zamdela, Pienaar, Brakpan (Tsakane), Thokoza, Mbuzini, Hazyview, Blue Downs and Giyani police stations.
Increase community participation • Sector policing provides for practical policing practices to complement community participation in accordance with policing needs and community requirements, and links up to community structures. Up to the end of March 2011, sector policing has been rolled out to 986 (88%) of the 1 120 police stations countrywide.
• Community Police Forum Structures promote the local accountability of the police and enlist the cooperation of communities with the SAPS in order to reduce crime and improve service delivery. 1 118 Community Police Forums have been established at police stations countrywide.
Electronic access through the SAPS Website
The SAPS Website can be accessed by internet users. Information regarding the SAPS is regularly updated such as information on crime prevention, community policing, publications, contact details, publications, etc. Contact details of the National Commissioner, Provincial Commissioners and Station Commanders are also available. The public can also electronically provide information on criminal activities, lodge general enquiries or comment and complement the SAPS, among others.

SAPS TOGETHER SQUEEZING CRIME to ZEROSAPS Members, My Family - Together Pushing Back The Frontiers Of Evil
ANNUAL REPORT 2010/2011SOUTH AFRICAN POLICE SERVICE
196
Strategy Access
Service Delivery Charters To ensure commitment of improved service delivery, Service Delivery Charters (SDC), a statement of service beneficiaries’ rights, services, service standards, complaints mechanisms and a service commitment statement, are available at all police stations. The SDC informs the service beneficiaries of the levels of service delivery they can expect at the point of service delivery. It also provides information on the costs involved for certain services, processes, as well as contact information.
Table 1.4: Complaints mechanism
Complaints mechanism
Telephone and postal system (telephone number and addresses of service points and commanders)
The SAPS can be contacted telephonically. Alternatively, letters of complaints can be sent to Station- , Cluster- or Unit Commanders. Contact numbers for all divisions, provincial offices, units, police stations and other contact points such as for ATM crimes, communication officials and rape crisis centres are available on the SAPS Website.
SAPS Website Complaints Mechanism A link is available on the SAPS Website where the public can electronically complain about SAPS service delivery, corruption and fraud.
Independent Police Investigative Directorate (IPID)
The IPID operates independently from the SAPS and its mandate is to ensure that independent investigations of deaths in police custody and deaths as a result of police action are carried out. The IPID may also investigate allegations of criminal offences and misconduct committed by members of the South African Police Service (SAPS) and Municipal Police Services (MPS). A complaint may be lodged in both writing and telephonically to any IPID office.
SAPS National Complaints Line 0860 13 08 06 The National Complaints Line of the SAPS is managed by the National Inspectorate. Complaints regarding poor service delivery can be made telephonically and is then investigated by members of the National Inspectorate.
Presidential Hot Line (PHL) 17737 Members of the public can lodge their queries and complaints regarding service delivery where after it is forwarded to the SAPS and attended to.
Anti-Corruption Hotline 0800 701 701 The Anti-Corruption Hotline is an initative by the Public Service Commission. This toll free number can be used to report corruption in all Government Departments anonymously. Complaints relating to the SAPS are forwarded to the SAPS for investigation.
Table 1.5: Service Information Tool
Types of Information Tools Information provided
Information products and promotional items Booklets, leaflets, posters and promotional items were developed and distributed during projects, Izimbizo, and awareness campaigns
Television and radio broadcasts “When Duty Calls”, a weekly programme on national television, informs the public regarding successes by the SAPS, crime prevention hints, recruitment drives and requests for assistance in the fight against crime.
SAPS Internet The SAPS website provides information on crime and crime prevention in South Africa.
Projects Various projects were conducted to address SAPS priorities such as aggravated robberies, firearms, drugs, tourist safety and victim support. Constant communication was provided to update members and the public on events during the 2010 FIFA World CupTM. Campaigns were conducted on the state of readiness for the General Elections in the Western Cape, KwaZulu-Natal and Gauteng. Festive Season Crime Prevention campaigns were conducted during December 2010 in all provinces.
National, provincial and station exhibitions Exhibitions were held at national shows, schools, business centres and shopping malls to communicate key messages to the community relating to illegal drugs and substance abuse, crimes against women and children, firearm safety, careers in the SAPS, etc.
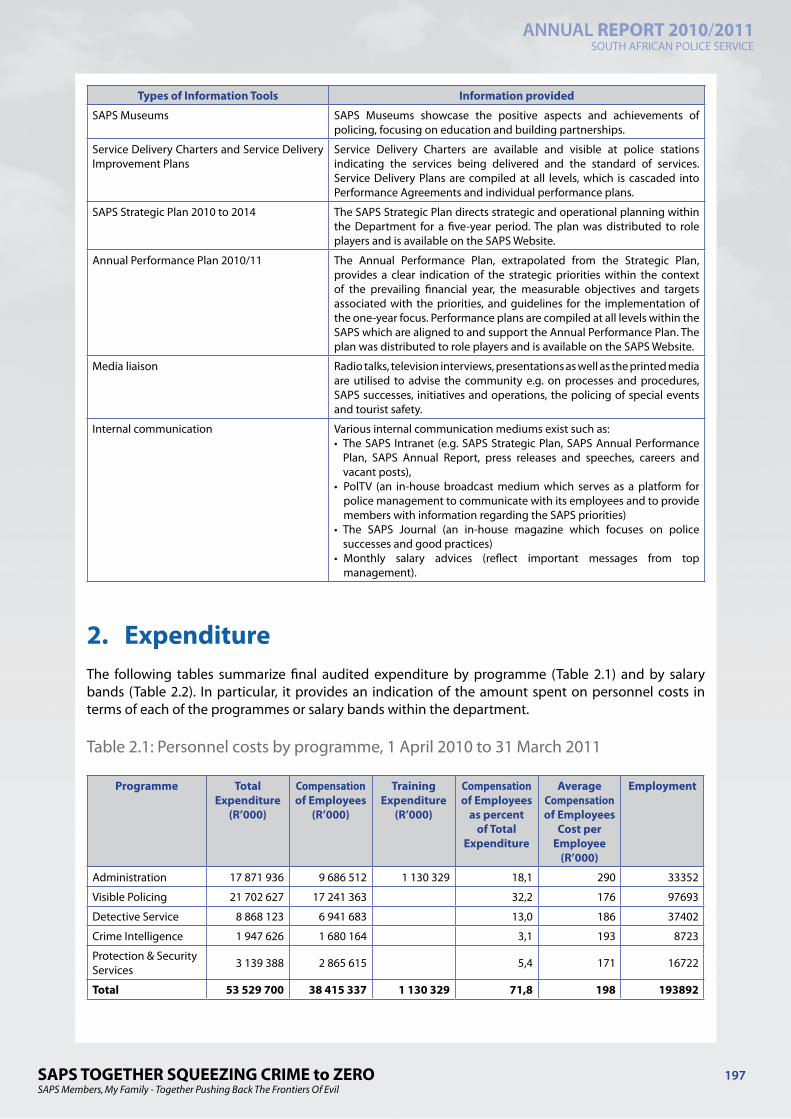
SAPS TOGETHER SQUEEZING CRIME to ZEROSAPS Members, My Family - Together Pushing Back The Frontiers Of Evil
ANNUAL REPORT 2010/2011SOUTH AFRICAN POLICE SERVICE
197
Types of Information Tools Information provided
SAPS Museums SAPS Museums showcase the positive aspects and achievements of policing, focusing on education and building partnerships.
Service Delivery Charters and Service Delivery Improvement Plans
Service Delivery Charters are available and visible at police stations indicating the services being delivered and the standard of services. Service Delivery Plans are compiled at all levels, which is cascaded into Performance Agreements and individual performance plans.
SAPS Strategic Plan 2010 to 2014 The SAPS Strategic Plan directs strategic and operational planning within the Department for a five-year period. The plan was distributed to role players and is available on the SAPS Website.
Annual Performance Plan 2010/11 The Annual Performance Plan, extrapolated from the Strategic Plan, provides a clear indication of the strategic priorities within the context of the prevailing financial year, the measurable objectives and targets associated with the priorities, and guidelines for the implementation of the one-year focus. Performance plans are compiled at all levels within the SAPS which are aligned to and support the Annual Performance Plan. The plan was distributed to role players and is available on the SAPS Website.
Media liaison Radio talks, television interviews, presentations as well as the printed media are utilised to advise the community e.g. on processes and procedures, SAPS successes, initiatives and operations, the policing of special events and tourist safety.
Internal communication Various internal communication mediums exist such as:• The SAPS Intranet (e.g. SAPS Strategic Plan, SAPS Annual Performance
Plan, SAPS Annual Report, press releases and speeches, careers and vacant posts),
• PolTV (an in-house broadcast medium which serves as a platform for police management to communicate with its employees and to provide members with information regarding the SAPS priorities)
• The SAPS Journal (an in-house magazine which focuses on police successes and good practices)
• Monthly salary advices (reflect important messages from top management).
2. ExpenditureThe following tables summarize final audited expenditure by programme (Table 2.1) and by salary bands (Table 2.2). In particular, it provides an indication of the amount spent on personnel costs in terms of each of the programmes or salary bands within the department.
Table 2.1: Personnel costs by programme, 1 April 2010 to 31 March 2011
Programme Total Expenditure
(R’000)
Compensation of Employees
(R’000)
Training Expenditure
(R’000)
Compensation of Employees
as percent of Total
Expenditure
Average Compensation of Employees
Cost per Employee
(R’000)
Employment
Administration 17 871 936 9 686 512 1 130 329 18,1 290 33352
Visible Policing 21 702 627 17 241 363 32,2 176 97693
Detective Service 8 868 123 6 941 683 13,0 186 37402
Crime Intelligence 1 947 626 1 680 164 3,1 193 8723
Protection & Security Services 3 139 388 2 865 615 5,4 171 16722
Total 53 529 700 38 415 337 1 130 329 71,8 198 193892

SAPS TOGETHER SQUEEZING CRIME to ZEROSAPS Members, My Family - Together Pushing Back The Frontiers Of Evil
ANNUAL REPORT 2010/2011SOUTH AFRICAN POLICE SERVICE
198
Table 2.2: Personnel costs by salary band, 1 April 2010 to 31 March 2011
Salary Bands Compensation of Employees
Cost
(R’000)
Percentage of Total
Compensation of Employees
Average Compensation of Employees per Employee
(R’000)
Number of Employees
Lower skilled (Levels 1-2) 855 704 2,2 72 11896
Skilled (Levels 3-5) 10 454 975 27,2 109 96356
Highly skilled production (Levels 6-8) 19 263 204 50,1 250 77168
Highly skilled supervision (Levels 9-12) 7 008 218 18,2 901 7777
Senior management (Levels 13-16) and Executive Authority 833 236 2,2 1 199 695
Total 38 415 337 100 198 193892
The following tables provide a summary per programme (Table 2.3) and salary bands (Table 2.4), of expenditure incurred as a result of salaries, overtime, homeowners allowance and medical assistance. In each case, the table provides an indication of the percentage of the personnel budget that was used for these items.

SAPS TOGETHER SQUEEZING CRIME to ZEROSAPS Members, My Family - Together Pushing Back The Frontiers Of Evil
ANNUAL REPORT 2010/2011SOUTH AFRICAN POLICE SERVICE
199
Tabl
e 2.
3: S
alar
ies,
over
time,
hom
e ow
ners
allo
wan
ce a
nd m
edic
al a
ssis
tanc
e by
pro
gram
me,
1 A
pril
2010
to 3
1 M
arch
201
1
Prog
ram
me
Sala
ries
(R
’000
)Sa
lari
es
as %
of
Com
pens
atio
n of
Em
ploy
ees
Ove
rtim
e (R
’000
)O
vert
ime
as %
of
Com
pens
atio
n of
Em
ploy
ees
Hom
e O
wne
rs
Allo
wan
ce
(R’0
00)
Hom
e O
wne
rs
Allo
wan
ce
as %
of
Com
pens
atio
n of
Em
ploy
ees
Med
ical
A
ssis
tanc
e (R
’000
)
Med
ical
A
ssis
tanc
e as
% o
f Co
mpe
nsat
ion
of E
mpl
oyee
s
Tota
l Co
mpe
nsat
ion
of E
mpl
oyee
s pe
r Pr
ogra
mm
e (R
’000
)
Adm
inis
trat
ion
4 30
1 20
711
,220
909
0,1
243
847
0,6
541
783
1,4
9 68
6 51
2
Visi
ble
Polic
ing
11 9
01 1
6831
,068
9 95
61,
868
8 85
11,
82
275
503
5,9
17 2
41 3
63
Det
ectiv
e Se
rvic
e 5
092
674
13,3
61 9
720,
226
4 00
40,
783
7 55
22,
26
941
683
Crim
e In
telli
genc
e1
240
395
3,2
10 5
540,
058
496
0,2
182
934
0,5
1 68
0 16
4
Prot
ectio
n &
Sec
urity
Ser
vice
s2
008
083
5,2
92 3
490,
212
4 02
60,
338
7 99
01,
02
865
615
Tota
l24
543
527
63,9
875
740
2,3
1 37
9 22
43,
64
225
762
11,0
38 4
15 3
37
Tabl
e 2.
4: S
alar
ies,
over
time,
hom
e ow
ners
allo
wan
ce a
nd m
edic
al a
ssis
tanc
e by
sal
ary
band
, 1 A
pril
2010
to 3
1 M
arch
201
1
Sala
ry b
ands
Sala
ries
(R
’000
)Sa
lari
es
as %
of
Com
pens
atio
n of
Em
ploy
ees
Ove
rtim
e (R
’000
)O
vert
ime
as %
of
Com
pens
atio
n of
Em
ploy
ees
Hom
e O
wne
rs
Allo
wan
ce
(R’0
00)
Hom
e O
wne
rs
Allo
wan
ce
as %
of
Com
pens
atio
n of
Em
ploy
ees
Med
ical
A
ssis
tanc
e (R
’000
)
Med
ical
A
ssis
tanc
e as
% o
f Co
mpe
nsat
ion
of E
mpl
oyee
s
Tota
l Co
mpe
nsat
ion
of E
mpl
oyee
s pe
r Sal
ary
Band
(R
’000
)
Low
er s
kille
d(L
evel
s 1-
2)
334
244
0,9
1 58
30,
044
590
0,1
355
622
0,9
855
704
Skill
ed (L
evel
s 3-
5)
7 46
1 00
219
,428
3 82
50,
763
1 91
81,
62
144
991
5,6
10 4
54 9
75
Hig
hly
skill
ed
prod
uctio
n (L
evel
s 6-
8)
14 0
87 0
4936
,747
2 65
81,
258
4 39
01,
51
448
682
3,8
19 2
63 2
04
Hig
hly
skill
ed
supe
rvis
ion
(Lev
els
9-12
) 2
444
686
6,4
117
674
0,3
115
019
0,3
262
531
0,7
7 00
8 21
8
Seni
or m
anag
emen
t (L
evel
s 13
-16)
and
Ex
ecut
ive
Auth
ority
216
546
0,6
00,
03
307
0,0
13 9
360,
083
3 23
6
Tota
l24
543
527
63,9
875
740
2,3
1 37
9 22
43,
64
225
762
11,0
38 4
15 3
37

SAPS TOGETHER SQUEEZING CRIME to ZEROSAPS Members, My Family - Together Pushing Back The Frontiers Of Evil
ANNUAL REPORT 2010/2011SOUTH AFRICAN POLICE SERVICE
200
3. Employment and VacanciesThe following tables summarize the year-end establishment, the number of employees, the vacancy rate, and whether there are any staff that are additional to the establishment. This information is presented in terms of three key variables: - programme (Table 3.1), salary band (Table 3.2) and critical occupations (Table 3.3).
Table 3.1: Employment and vacancies by programme at end of period, 1 April 2010 to 31 March 2011
Programme Year-end establishment
Number of Employees
Vacancy Rate (%) *Number of Staff Additional to the
Establishment
Administration 33498 33352 0,4 0
Visible Policing 96237 97693 -1,5 0
Detective Service 37603 37402 0,5 0
Crime Intelligence 10830 8723 19,5 0
Protection & Security Services 17142 16722 2,5 0
Total 195310 193892 0,7 0
Table 3.2: Employment and vacancies by salary band at end of period, 1 April 2010 to 31 March 2011
Salary Bands Year-end establishment
Number of Employees
Vacancy Rate (%) *Number of Staff Additional to the
Establishment
Lower skilled (Levels 1-2) 11625 11896 -2,3 0
Skilled (Levels 3-5) 94174 96356 -2,3 0
Highly skilled production (Levels 6-8) 79638 77168 3,1 0
Highly skilled supervision (Levels 9-12) 9107 7777 14,6 0
Senior management (Levels 13-16) 764 693 9,3 0
Minister and Deputy Minister 2 2 0,0 0
Total 195310 193892 0,7 0
*Note: As at 31 March 2011, a total of 1349 positions have been advertised and in process of consideration or review. Apart from this, a total number of 1248 posts were advertised before 31 March 2011 with a closing date within the new financial year. A new rank structure for the South African Police Service was introduced. With the new rank structure, two (2) additional ranks were introduced namely Lieutenant and Major, which will create additional career opportunities for members. No member was translated to the ranks of Lieutenant and Major. A phase-in approach was adopted to capacitate the ranks of Lieutenant and Major. After successful negotiations during the 2010/11 financial year with the Employee Organisations, an agreement was concluded in the Safety and Security Sectoral Bargaining Council (SSSBC) on 5 April 2011 which inter alia provides for the criteria for promotion to Lieutenant, Captain and Major. In view of the development and negotiations on criteria to populate the ranks of Lieutenant and Major, no post promotion process was embarked upon during the 2010/11 financial year.

SAPS TOGETHER SQUEEZING CRIME to ZEROSAPS Members, My Family - Together Pushing Back The Frontiers Of Evil
ANNUAL REPORT 2010/2011SOUTH AFRICAN POLICE SERVICE
201
Table 3.3: Employment and vacancies by critical occupation, 1 April 2010 to31 March 2011
Critical Occupations Year-end establishment
Number of Employees
Vacancy Rate (%)
*Number of Staff
Additional to the
Establishment
Aircraft pilots & related associate professionals 53 48 9,4 0
Architects town and traffic planners 7 5 28,6 0
Chemists 955 955 0 0
Engineers and related professionals 251 133 47 0
General legal administration & related professionals 171 169 1,2 0
Natural sciences related 7 7 0 0
Police 144533 143335 0,8 0
Psychologists and vocational counsellors 119 95 20,2 0
Total 146096 144747 0,9 0
*Note: The Head of Department/Chief Executive Officer and Senior Managers are, by their very nature, critical occupations, but have not been separately listed. Hence critical occupations have been addressed within the Occupational Classes of Aircraft Pilots; Architects; Chemists (Physical Science,Chemical Science, Pharmacists & Health Science Related); Engineer & related professionals (Electronic & Engineering science); General Legal Administration & Related Professionals (Attorneys, Legal Administration & Legal related); Natural science; Police (Functional Personnel SAPS) and Psychologists & vocational science. The critical occupations (Occupational Classes) do not reflect all the positions filled within SAPS, but only those, which are considered as a priority for the optimal functioning of SAPS’s core functions.
4. Filling of SMS PostsTable 4.1 - SMS establishment information as on 31 March 2011
SMS Bands Year-end establishment
Total Number of SMS members
per Band
% of SMS positions filled
per Bands
Total Number of SMS positions
vacant per Band
% of SMS positions vacant
per Bands
Band A 586 530 90 56 9,6
Band B 146 133 91 13 8,9
Band C 31 29 94 2 6,5
Band D 1 1 100 0 0,0
Total 764 693 91 71 9,3
Table 4.2: SMS establishment information as on 30 September 2010
SMS Bands Mid-year establishment
Total Number of SMS members
per Band
% of SMS positions filled
per Bands
Total Number of SMS positions
vacant per Band
% of SMS positions vacant
per Bands
Band A 586 526 90 60 10,2
Band B 146 134 92 12 8,2
Band C 31 23 74 8 25,8
Band D 1 1 100 0 0,0
Total 764 684 90 80 10,5

SAPS TOGETHER SQUEEZING CRIME to ZEROSAPS Members, My Family - Together Pushing Back The Frontiers Of Evil
ANNUAL REPORT 2010/2011SOUTH AFRICAN POLICE SERVICE
202
Table 4.3: Advertising and filling of SMS positions as on 31 March 2011
SMS Bands Advertising Filling of positions
Number of Vacancies per Band advertised in 6 months
of becoming vacant
Number of Vacancies per Band filled in 6 months after
becoming vacant
Number of Vacancies not filled in 6 months but filled in
12 months
Band A 79 58 5
Band B 39 28 1
Band C 10 9 0
Band D 0 0 0
Total 128 95 6
Table 4.4: Reasons for not having complied with the filling of vacant SMS positions - Advertised within 6 months and filled within 12 months after becoming vacant
Reasons for vacancies not advertised within 6 months
In compliance - Please refer to note
Reasons for vacancies not filled within 12 months
In compliance - Please refer to note
Table 4.5: Disciplinary steps taken for not complying with the prescribed timeframes for filling SMS positions within 12 months
Not applicable
Note: Positions are funded over a multi-year period according to predetermined targets of the total establishment, taking into account personnel losses. Vacant positions at a certain level or in terms of a specific business unit are therefor planned and regarded as funded only upon the date of advertisement. With reference to table 4.3, a total of 27 positions have been advertised and in process of consideration or review as on 31 March 2011. Apart from this, a total of 81 SMS posts were advertised during May and June 2011 to address senior level vacancies.
5. Job EvaluationThe Public Service Regulations, 1999 introduced job evaluation as a way of ensuring that work of equal value is remunerated equally. With regard to the SAPS, the Equate Job Evaluation System is utilized to determine the salary levels for positions on National and Provincial levels whereas the Resource Allocation Guide (RAG) is utilized to determine salary levels for station positions. Table 5.1 indicates the number of positions evaluated by utilizing the two systems.
Table 5.1: Job evaluation, 1 April 2010 to 31 March 2011
Salary Bands Number of Employees
Number of Jobs
Evaluated
% of Jobs Evaluated by Salary
Bands
Number of positions Upgraded
% of Upgraded positions Evaluated
Number of positions
Downgraded
% of Downgraded
positions Evaluated
Lower skilled(Levels 1-2) 11896 0 0 0 0 0 0
Skilled (Levels 3-5) 96356 0 0 0 0 0 0

SAPS TOGETHER SQUEEZING CRIME to ZEROSAPS Members, My Family - Together Pushing Back The Frontiers Of Evil
ANNUAL REPORT 2010/2011SOUTH AFRICAN POLICE SERVICE
203
Salary Bands Number of Employees
Number of Jobs
Evaluated
% of Jobs Evaluated by Salary
Bands
Number of positions Upgraded
% of Upgraded positions Evaluated
Number of positions
Downgraded
% of Downgraded
positions Evaluated
Highly skilled production(Levels 6-8)
77168 2 0 0 0 0 0
Highly skilled supervision(Levels 9-12)
7777 492 6,3 0 0 0 0
Senior management (Levels 13-16) 695 294 42,3 0 0 0 0
Total 193892 788 0,4 0 0 0 0
Table 5.2: Profile of employees whose positions were upgraded due to their jobs being upgraded, 1 April 2010 to 31 March 2011
None
Table 5.3: Employees whose salary level exceed the grade determined by job evaluation, 1 April 2010 to 31 March 2011 [i.t.o PSR 1.V.C.3]
None
Table 5.4: Profile of employees whose salary level exceeded the grade determined by job evaluation, 1 April 2010 to 31 March 2011 [i.t.o. PSR 1.V.C.3]
None
With regard to tables 4.2 to 4.4 vacant newly created positions are evaluated and then filled through the normal advertisement and filling procedure, therefore no individual employees were affected by job evaluations in terms of their salary levels.
6. Employment ChangesThis section provides information on changes in employment over the financial year. Turnover rates provide an indication of trends in the employment profile of the department. The following tables provide a summary of turnover rates by salary bands (Table 6.1) and by critical occupations (Table 6.2).
Table 6.1: Annual turnover rates by salary band, 1 April 2010 to 31 March 2011
Salary Bands *Employment at Beginning
of Period (April 2010)
Recruitments Terminations Turnover Rate (%)
Lower skilled (Levels 1-2) 6180 5886 170 2,8
Skilled (Levels 3-5) 95751 1629 1024 1,1
Highly skilled production (Levels 6-8) 77671 632 1135 1,5
Highly skilled supervision (Levels 9-12) 8023 46 292 3,6
Senior management (Levels 13-16) 736 9 50 6,8
Total 188361 8202 2671 1,4

SAPS TOGETHER SQUEEZING CRIME to ZEROSAPS Members, My Family - Together Pushing Back The Frontiers Of Evil
ANNUAL REPORT 2010/2011SOUTH AFRICAN POLICE SERVICE
204
*Note: Employment at the end of the previous period, as reported in the Department’s Annual Report for 2009/2010, will differ from employment at the beginning of this period due to service terminations and appointments recorded in 2010/2011 with a salary effective date prior to 31 March 2010. Significant movements between salary levels are effected as a result of in-year promotions and salary level progressions (Recruits).
Table 6.2: Annual turnover rates by critical occupation, 1 April 2010 to 31 March 2011
Critical Occupations *Employment at Beginning
of Period (April 2010)
Recruitments Terminations Turnover Rate (%)
Aircraft pilots & related associate professionals 49 0 1 2
Architects town and traffic planners 6 0 1 16,7
Chemists 883 95 23 2,6
Engineers and related professionals 135 5 7 5,2
General legal administration & related professionals 172 1 4 2,3
Natural sciences related 7 0 0 0
Police 138724 6255 1644 1,2
Psychologists and vocational counsellors 101 3 9 8,9
Total 140077 6359 1689 1,2
*Note: Employment at the end of the previous period, as reported in the Department’s Annual Report for 2009/2010, will differ from employment at the beginning of this period due to service terminations and appointments recorded in 2010/2011 with a salary effective date prior to 31 March 2010. Significant movements between salary levels are effected as a result of in-year promotions and salary level progressions (Recruits).
Table 6.3: Reasons why staff are leaving the department, 1 April 2010 to 31 March 2011
Termination Types Number % of Total Resignations
% of Total Employment
Total Total Employment
Death 714 26,7 0,4 2671 193892
Resignation 1161 43,5 0,6 2671 193892
Expiry of contract 72 2,7 0 2671 193892
Discharged due to ill health 131 4,9 0,1 2671 193892
Dismissal-misconduct 81 3 0 2671 193892
Retirement 481 18 0,2 2671 193892
Other 31 1,2 0 2671 193892
Total 2671 100 1,4 2671 193892

SAPS TOGETHER SQUEEZING CRIME to ZEROSAPS Members, My Family - Together Pushing Back The Frontiers Of Evil
ANNUAL REPORT 2010/2011SOUTH AFRICAN POLICE SERVICE
205
Table 6.4: Promotions by critical occupation, 1 April 2010 to 31 March 2011
Critical Occupations Employment at the End of Period
Promotions to another Salary
Level
Salary Level Promotions as a %
of Employment
Aircraft pilots & related associate professionals 48 0 0
Architects town and traffic planners 5 0 0
Chemists 955 0 0
Engineers and related professionals 133 0 0
General legal administration & related professionals 169 0 0
Natural sciences related 7 0 0
Police 143335 1329 0,9
Psychologists and vocational counsellors 95 0 0
Total 144747 1329 0,9
Table 6.5: Promotions by salary band, 1 April 2010 to 31 March 2011
Salary Bands Employment at the End of Period
Promotions to another Salary Level
Salary Level Promotions as a % of
Employment
Lower skilled (Levels 1-2) 11896 183 1,5
Skilled (Levels 3-5) 96356 25 0
Highly skilled production (Levels 6-8) 77168 1401 1,8
Highly skilled supervision (Levels 9-12) 7777 0 0
Senior management (Levels 13-16) 695 93 13,4
Total 193892 1702 0,9

SAPS TOGETHER SQUEEZING CRIME to ZEROSAPS Members, My Family - Together Pushing Back The Frontiers Of Evil
ANNUAL REPORT 2010/2011SOUTH AFRICAN POLICE SERVICE
206
7. E
mpl
oym
ent E
quit
yTh
e ta
bles
in th
is s
ectio
n ar
e ba
sed
on th
e fo
rmat
s pr
escr
ibed
by
the
Empl
oym
ent E
quity
Act
, 55
of 1
998.
Tabl
e 7.
1: To
tal n
umbe
r of e
mpl
oyee
s (in
cl. e
mpl
oyee
s w
ith d
isab
ilitie
s) in
eac
h of
the
follo
win
g oc
cupa
tiona
l cat
egor
y as
on
31 M
arch
201
1
Occ
upat
iona
l Cat
egor
ies
Mal
e,
Afr
ican
Mal
e,
Colo
ured
Mal
e,
Indi
anM
ale,
Tota
l Bl
acks
Mal
e,
Whi
teFe
mal
e,
Afr
ican
Fem
ale,
Co
lour
edFe
mal
e,
Indi
anFe
mal
e,
Tota
l Bl
acks
Fem
ale,
W
hite
Tota
l
Legi
slat
ors,
seni
or o
ffici
als
and
man
ager
s28
048
3336
113
712
317
814
849
695
Prof
essi
onal
s 27
4738
427
734
0815
9318
4835
220
824
0817
0291
11
Cler
ks
6893
972
311
8176
595
1565
230
9879
719
547
4993
3331
1
Serv
ice
and
sale
s w
orke
rs85
399
1178
430
4510
0228
1178
625
370
3314
491
2917
530
3314
4222
Craf
t and
rela
ted
trad
es w
orke
rs
417
8943
549
288
250
025
786
9
Plan
t and
mac
hine
ope
rato
rs a
nd
asse
mbl
ers
143
85
156
62
00
20
164
Elem
enta
ry o
ccup
atio
ns
2869
470
1933
5847
1777
296
820
8134
5520
Tota
l98
748
1375
537
3311
6236
1445
244
797
7077
1512
5338
698
1819
3892
Mal
e,
Afr
ican
Mal
e,
Colo
ured
Mal
e,
Indi
anM
ale,
Tota
l Bl
acks
Mal
e,
Whi
teFe
mal
e,
Afr
ican
Fem
ale,
Co
lour
edFe
mal
e,
Indi
anFe
mal
e,
Tota
l Bl
acks
Fem
ale,
W
hite
Tota
l
Empl
oyee
s w
ith d
isab
ilitie
s 41
869
2751
431
112
223
1015
516
011
40

SAPS TOGETHER SQUEEZING CRIME to ZEROSAPS Members, My Family - Together Pushing Back The Frontiers Of Evil
ANNUAL REPORT 2010/2011SOUTH AFRICAN POLICE SERVICE
207
Tabl
e 7.
2: To
tal n
umbe
r of e
mpl
oyee
s in
eac
h of
the
follo
win
g oc
cupa
tiona
l ban
ds a
s on
31
Mar
ch 2
011
Occ
upat
iona
l Cat
egor
ies
Mal
e,
Afr
ican
Mal
e,
Colo
ured
Mal
e,
Indi
anM
ale,
Tota
l Bl
acks
Mal
e,
Whi
teFe
mal
e,
Afr
ican
Fem
ale,
Co
lour
edFe
mal
e,
Indi
anFe
mal
e,
Tota
l Bl
acks
Fem
ale,
W
hite
Tota
l
Top
man
agem
ent
173
121
27
00
73
33
Seni
or m
anag
emen
t26
246
3234
013
511
617
814
146
662
Prof
essi
onal
ly q
ualifi
ed a
nd
expe
rienc
ed29
7646
435
837
9816
4912
8920
611
216
0772
377
77
Skill
ed te
chni
cal a
nd a
cade
mic
ally
qu
alifi
ed41
018
5689
2426
4913
311
256
7587
1632
794
9963
6816
7716
8
Sem
i-ski
lled
and
disc
retio
nary
de
cisi
on m
akin
g48
369
6683
842
5589
412
8831
668
4758
578
3700
421
7096
356
Uns
kille
d an
d de
fined
dec
isio
n m
akin
g61
0687
074
7050
122
4180
464
2046
6460
1189
6
Tota
l98
748
1375
537
3311
6236
1445
244
797
7077
1512
5338
698
1819
3892
Tabl
e 7.
3: R
ecru
itmen
t for
the
perio
d 1
Apr
il 20
09 to
31
Mar
ch 2
011
Occ
upat
iona
l Cat
egor
ies
Mal
e,
Afr
ican
Mal
e,
Colo
ured
Mal
e,
Indi
anM
ale,
Tota
l Bl
acks
Mal
e,
Whi
teFe
mal
e,
Afr
ican
Fem
ale,
Co
lour
edFe
mal
e,
Indi
anFe
mal
e,
Tota
l Bl
acks
Fem
ale,
W
hite
Tota
l
Top
man
agem
ent
00
00
01
00
10
1
Seni
or m
anag
emen
t6
00
61
10
01
08
Prof
essi
onal
ly q
ualifi
ed a
nd
expe
rienc
ed17
51
236
71
210
746
Skill
ed te
chni
cal a
nd a
cade
mic
ally
qu
alifi
ed16
832
2922
919
113
418
1616
844
632
Sem
i-ski
lled
and
disc
retio
nary
de
cisi
on m
akin
g47
871
2657
548
782
139
2995
056
1629
Uns
kille
d an
d de
fined
dec
isio
n m
akin
g30
5253
440
3626
8319
1224
07
2159
1858
86
Tota
l37
2164
296
4459
329
2837
398
5432
8912
582
02

SAPS TOGETHER SQUEEZING CRIME to ZEROSAPS Members, My Family - Together Pushing Back The Frontiers Of Evil
ANNUAL REPORT 2010/2011SOUTH AFRICAN POLICE SERVICE
208
Tabl
e 7.
4: P
rogr
essi
on to
ano
ther
sal
ary
notc
h fo
r the
per
iod
1 A
pril
2010
to 3
1 M
arch
201
1
Occ
upat
iona
l Cat
egor
ies
Mal
e,
Afr
ican
Mal
e,
Colo
ured
Mal
e,
Indi
anM
ale,
Tota
l Bl
acks
Mal
e,
Whi
teFe
mal
e,
Afr
ican
Fem
ale,
Co
lour
edFe
mal
e,
Indi
anFe
mal
e,
Tota
l Bl
acks
Fem
ale,
W
hite
Tota
l
Top
man
agem
ent
143
118
28
00
82
30
Seni
or m
anag
emen
t24
937
2931
512
983
128
103
4659
3
Prof
essi
onal
ly q
ualifi
ed a
nd
expe
rienc
ed12
5615
488
1498
219
493
8027
600
131
2448
Skill
ed te
chni
cal a
nd a
cade
mic
ally
qu
alifi
ed38
3239
217
944
0344
519
5346
230
627
2131
1910
688
Sem
i-ski
lled
and
disc
retio
nary
de
cisi
on m
akin
g22
893
3279
425
2659
768
117
981
2962
403
2134
616
6850
292
Uns
kille
d an
d de
fined
dec
isio
n m
akin
g29
4731
833
3298
3922
2121
511
2447
3558
19
Tota
l31
191
4183
755
3612
915
1522
739
3731
755
2722
550
0169
870
Tabl
e 7.
5: Te
rmin
atio
ns fo
r the
per
iod
1 A
pril
2010
to 3
1 M
arch
201
1
Occ
upat
iona
l Cat
egor
ies
Mal
e,
Afr
ican
Mal
e,
Colo
ured
Mal
e,
Indi
anM
ale,
Tota
l Bl
acks
Mal
e,
Whi
teFe
mal
e,
Afr
ican
Fem
ale,
Co
lour
edFe
mal
e,
Indi
anFe
mal
e,
Tota
l Bl
acks
Fem
ale,
W
hite
Tota
l
Top
man
agem
ent
30
14
21
00
10
7
Seni
or m
anag
emen
t14
12
1717
20
13
643
Prof
essi
onal
ly q
ualifi
ed a
nd
expe
rienc
ed10
710
1713
492
260
228
3829
2
Skill
ed te
chni
cal a
nd a
cade
mic
ally
qu
alifi
ed61
458
2369
521
778
118
9712
611
35
Sem
i-ski
lled
and
disc
retio
nary
de
cisi
on m
akin
g48
379
1157
335
309
577
373
4310
24
Uns
kille
d an
d de
fined
dec
isio
n m
akin
g10
113
111
57
405
146
217
0
Tota
l13
2216
155
1538
370
456
7319
548
215
2671

SAPS TOGETHER SQUEEZING CRIME to ZEROSAPS Members, My Family - Together Pushing Back The Frontiers Of Evil
ANNUAL REPORT 2010/2011SOUTH AFRICAN POLICE SERVICE
209
Tabl
e 7.
6: D
isci
plin
ary
actio
ns fo
r the
per
iod
1 A
pril
2010
to 3
1 M
arch
201
1
Dis
cipl
inar
y A
ctio
nsM
ale,
A
fric
anM
ale,
Co
lour
edM
ale,
In
dian
Mal
e, To
tal
Blac
ksM
ale,
W
hite
Fem
ale,
A
fric
anFe
mal
e,
Colo
ured
Fem
ale,
In
dian
Fem
ale,
To
tal
Blac
ks
Fem
ale,
W
hite
Tota
l
Corr
ectio
nal c
ouns
elin
g 10
542
114
818
102
012
117
9
Dem
otio
n0
00
00
00
00
00
Dis
mis
sal
380
7415
469
2817
30
203
520
Fina
l writ
ten
war
ning
30
397
440
432
2213
237
147
4
Fine
82
320
523
1051
6823
112
365
1160
Susp
ende
d di
smis
sal
704
178
2690
870
3313
248
810
34
Case
with
draw
n42
317
912
614
6621
111
338
721
Not
qui
lty
509
6619
594
3935
70
4210
685
Susp
ende
d w
ithou
t pay
men
t 19
21
223
02
02
128
Verb
al w
arni
ng
3231
063
73
20
52
77
Writ
ten
war
ning
36
412
713
504
4624
141
394
593
Post
pone
men
t of s
anct
ion
00
00
00
00
00
0
Tota
l36
6210
0111
447
7737
718
878
827
443
5471
Tabl
e 7.
7: S
kills
dev
elop
men
t for
the
perio
d 1
Apr
il 20
10 to
31
Mar
ch 2
011
Occ
upat
iona
l Cat
egor
ies
Mal
e,
Afr
ican
Mal
e,
Colo
ured
Mal
e,
Indi
anM
ale,
Tota
l Bl
acks
Mal
e,
Whi
teFe
mal
e,
Afr
ican
Fem
ale,
Co
lour
edFe
mal
e,
Indi
anFe
mal
e,
Tota
l Bl
acks
Fem
ale,
W
hite
Tota
l
Top
man
agem
ent
46
212
01
00
10
13
Seni
or m
anag
emen
t28
849
3637
320
213
721
1016
855
798
Prof
essi
onal
ly q
ualifi
ed a
nd
expe
rienc
ed33
1254
447
543
3117
6514
5323
611
218
0175
186
48
Skill
ed te
chni
cal a
nd a
cade
mic
ally
qu
alifi
ed36
438
5892
2850
4518
013
025
5841
1308
640
7789
4172
7016
6
Sem
i-ski
lled
and
disc
retio
nary
de
cisi
on m
akin
g33
343
6019
606
3996
812
8218
989
2884
253
2212
687
764
253
Uns
kille
d an
d de
fined
dec
isio
n m
akin
g81
3514
8020
898
2366
558
7893
516
6829
155
1747
2
Tota
l 81
520
1399
041
7799
687
1693
932
299
5384
1031
3871
460
1016
1350
*Not
e: T
otal
num
ber o
f mem
bers
dec
lare
d co
mpe
tent
in a
ll tr
aini
ng in
terv
entio
ns c
ompl
eted
dur
ing
the
perio
d 1
Apr
il 20
10 to
31
Mar
ch 2
011
as p
er th
e Tr
aini
ng A
dmin
istr
atio
n Sy
stem
on
11
Apr
il 20
11.

SAPS TOGETHER SQUEEZING CRIME to ZEROSAPS Members, My Family - Together Pushing Back The Frontiers Of Evil
ANNUAL REPORT 2010/2011SOUTH AFRICAN POLICE SERVICE
210
8. Performance RewardsTable 8.1: Signing of performance agreements by SMS members as on 31 May 2010
SMS Bands Year-end establishment
Total Number of SMS members per Band
Total Number of Signed Performance
Agreements
Signed Performance Agreements as a
Percentage of Total Number of SMS
Members
Band A 586 494 409 83
Band B 146 116 93 80
Band C 31 27 16 59
Band D 1 1 1 100
Total 764 638 519 81
Note: The signing of performance agreements is captured on the SAPS PERSAP system. The information above reflects the total number of senior managers that, according to the system, signed their performance agreement by 31 May 2010. Information of senior managers that were not required to conclude a performance agreement (i.e. external deployment, newly appointed, etc), were excluded from the above.
Table 8.2: Reasons for not having concluded performance agreements for all SMS members.
In total 119 senior managers did not have signed performance agreements by this date. The hosting of the FIFA Soccer World Cup led to a massive deployment of human resources for the duration of the tournament. This in turn impacted on the ability for senior managers to conclude their performance agreements by the given date. It must also be noted that the SAPS Employment Regulations allow four months after the beginning of the financial year to conclude a performance agreement. At the end of July 2010, one month after completion of the FIFA Soccer World Cup, 99.1% of the senior managers had signed their performance agreements.
Table 8.3: Disciplinary steps taken against SMS members for not having concluded performance agreements.
No disciplinary steps were taken.
To encourage good performance, the department has granted the following performance rewards during the year under review.
Table 8.4: Performance rewards by race and gender, 1 April 2010 to 31 March 2011
Demographics *Number of Beneficiaries
Total Employment
% of Total within Group
Cost(R’000)
Average Cost per Beneficiary (R)
African, Female 12 44797 0,03 125 10 417
African, Male 10 98748 0,01 163 16 300
Asian, Female 0 1512 0,00 0 0,00
Asian, Male 1 3733 0,03 34 34 000
Coloured, Female 0 7077 0,00 0 0,00
Coloured, Male 0 13755 0,00 0 0,00
Total Blacks, Female 12 53386 0,02 125 10 417
Total Blacks, Male 11 116236 0,01 197 17 909
White, Female 1 9818 0,01 9 9 000
White, Male 2 14452 0,01 24 12 000
Total 26 193892 0,01 355 13 654

SAPS TOGETHER SQUEEZING CRIME to ZEROSAPS Members, My Family - Together Pushing Back The Frontiers Of Evil
ANNUAL REPORT 2010/2011SOUTH AFRICAN POLICE SERVICE
211
*Note: Performance rewards paid in the 2010/2011 financial year were for services rendered in the 2009/2010 financial year. Performance rewards were only paid to employees attached to the Civilian Secretariat for Police. Due to spending pressure experienced in the compensation environment, essentially for the payment of allowances to members with the hosting of the 2010 Soccer World Cup, the Department decided to reprioritize the amount initally reserved for the payment of performance rewards, thus suplementing the provision made for expenses for hosting the Soccer World Cup.
Table 8.5: Performance rewards by salary band for personnel below senior management, 1 April 2010 to 31 March 2011
Salary Bands *Number of Beneficiaries
Total Employment
% of Total per Level and Employment
Cost
(R’000)
Average Cost per Beneficiary
(R)
Lower skilled (Levels 1-2) 0 11896 0,00 0 0
Skilled (Levels 3-5) 8 96356 0,00 37 4 625
Highly skilled production (Levels 6-8) 5 77168 0,00 37 7 400
Highly skilled supervision (Levels 9-12) 9 7777 0,10 144 16 000
Total 22 193197 0,00 218 9 909
*Note: Performance rewards paid in the 2010/2011 financial year were for services rendered in the 2009/2010 financial year. The classification of beneficiaries were done in accordance with the salary band profile of employees as at 31 March 2011. Performance rewards were only paid to employees attached to the Civilian Secretariat for Police. Due to spending pressure experienced in the compensation environment, essentially for the payment of allowances to members with the hosting of the 2010 Soccer World Cup, the Department decided to reprioritize the amount initally reserved for the payment of performance rewards, thus suplementing the provision made for expenses for hosting the Soccer World Cup.
Table 8.6: Performance Rewards by Critical Occupation, 1 April 2010 to 31 March 2011
Critical Occupations Number of Beneficiaries
Total Employment
% of Total Employment
Cost
(R’000)
Average Cost per
Beneficiary (R)
Aircraft pilots & related associate professionals 0 48 0,00 0 0
Architects town and traffic planners 0 5 0,00 0 0
Chemists 0 955 0,00 0 0
Engineers and related professionals 0 133 0,00 0 0
General legal administration & related professionals 2 169 1,20 48 24 000
Natural sciences related 0 7 0,00 0 0
Police 0 143335 0,00 0 0
Psychologists and vocational counsellors 0 95 0,00 0 0
Total 2 144747 0,00 48 24 000

SAPS TOGETHER SQUEEZING CRIME to ZEROSAPS Members, My Family - Together Pushing Back The Frontiers Of Evil
ANNUAL REPORT 2010/2011SOUTH AFRICAN POLICE SERVICE
212
Table 8.7: Performance rewards by salary band for senior management, 1 April 2010 to 31 March 2011
SMS Bands *Number of Beneficiaries
Total Employment
% of Total per Band and Employment
Cost
(R’000)
Average Cost per
Beneficiary (R)
Band A 4 530 0,80 136 34 000
Band B 0 133 0,00 0 0
Band C 0 29 0,00 0 0
Band D 0 1 0,00 0 0
Minister and Deputy Minister 0 2 0,00 0 0
Total 4 695 0,60 136 34 000
*Note: Performance rewards paid in the 2010/2011 financial year were for services rendered in the 2009/2010 financial year. Performance rewards were only paid to employees attached to the Civilian Secretariat for Police. Due to spending pressure experienced in the compensation environment, essentially for the payment of allowances to members with the hosting of the 2010 Soccer World Cup, the Department decided to reprioritize the amount initally reserved for the payment of performance rewards, thus suplementing the provision made for expenses for hosting the Soccer World Cup.
9. Foreign WorkersThe Department did not employ any foreign workers for the period 1 April 2010 to 31 March 2011.
10. LeaveThe Public Service Commission identified the need for careful monitoring of sick leave within the public service. The following tables provide an indication of the use of sick leave (Table 9.1) and disability leave (Table 9.2). In both cases, the estimated cost of the leave is also provided.
Table 10.1: Sick leave for 1 January 2010 to 31 December 2010
Salary Bands Total Days
% Days with
Medical Certification
Number of
Employees using Sick
Leave
% of Total Employees using Sick
Leave
Average Days per
Employee
Estimated Cost
(R’000)
Total number
of Employees using Sick
Leave
Total number of days
with medical
certification
Lower skilled (Levels 1-2) 24145 92,1 2156 1,6 11 5 144 135624 22245
Skilled (Levels 3-5) 646074 93 68886 50,8 9 212 157 135624 601092
Highly skilled production(Levels 6-8)
570345 94,3 52420 38,7 11 338 039 135624 537949
Highly skilled supervision (Levels 9-12)
108988 94 11813 8,7 9 100 385 135624 102446
Senior management (Levels 13-16)
2741 93,6 349 0,3 8 7 666 135624 2565
Total 1352293 93,6 135624 100 10 663 391 135624 1266297
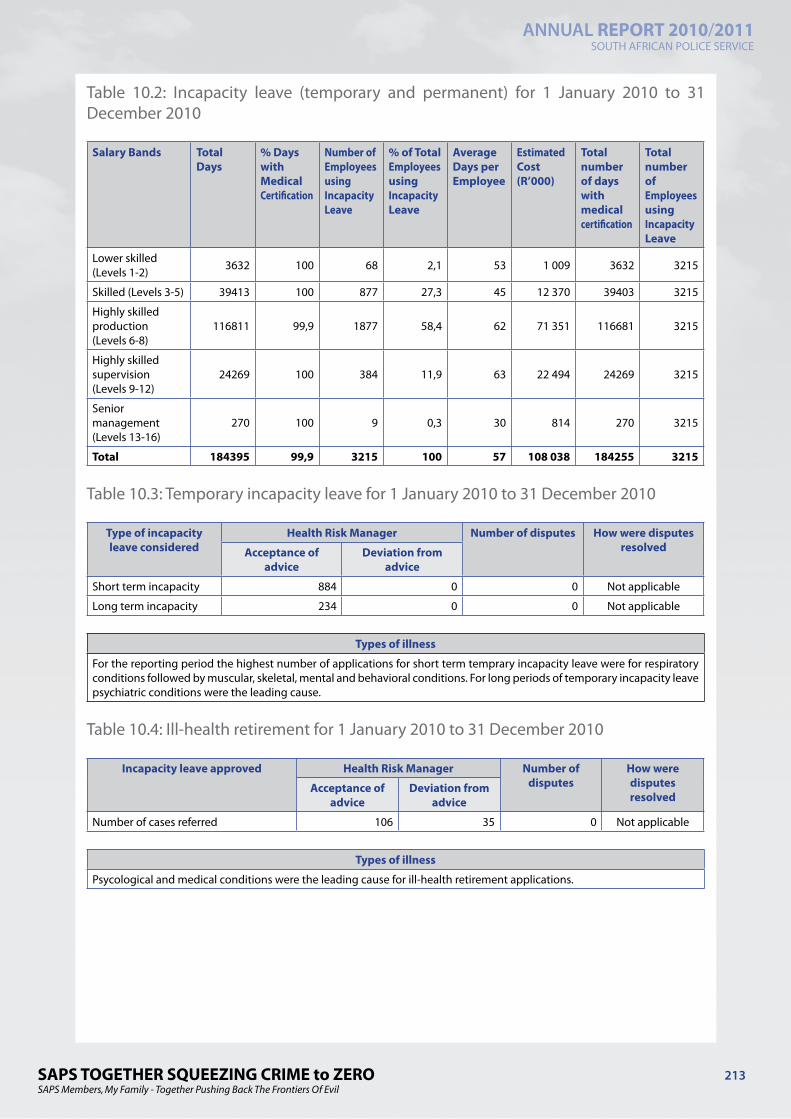
SAPS TOGETHER SQUEEZING CRIME to ZEROSAPS Members, My Family - Together Pushing Back The Frontiers Of Evil
ANNUAL REPORT 2010/2011SOUTH AFRICAN POLICE SERVICE
213
Table 10.2: Incapacity leave (temporary and permanent) for 1 January 2010 to 31 December 2010
Salary Bands Total Days
% Days with Medical Certification
Number of Employees using Incapacity Leave
% of Total Employees using Incapacity Leave
Average Days per Employee
Estimated Cost (R’000)
Total number of days with medical certification
Total number of Employees using Incapacity Leave
Lower skilled (Levels 1-2) 3632 100 68 2,1 53 1 009 3632 3215
Skilled (Levels 3-5) 39413 100 877 27,3 45 12 370 39403 3215
Highly skilled production(Levels 6-8)
116811 99,9 1877 58,4 62 71 351 116681 3215
Highly skilled supervision (Levels 9-12)
24269 100 384 11,9 63 22 494 24269 3215
Senior management (Levels 13-16)
270 100 9 0,3 30 814 270 3215
Total 184395 99,9 3215 100 57 108 038 184255 3215
Table 10.3: Temporary incapacity leave for 1 January 2010 to 31 December 2010
Type of incapacity leave considered
Health Risk Manager Number of disputes How were disputes resolvedAcceptance of
adviceDeviation from
advice
Short term incapacity 884 0 0 Not applicable
Long term incapacity 234 0 0 Not applicable
Types of illness
For the reporting period the highest number of applications for short term temprary incapacity leave were for respiratory conditions followed by muscular, skeletal, mental and behavioral conditions. For long periods of temporary incapacity leave psychiatric conditions were the leading cause.
Table 10.4: Ill-health retirement for 1 January 2010 to 31 December 2010
Incapacity leave approved Health Risk Manager Number of disputes
How were disputes resolved
Acceptance of advice
Deviation from advice
Number of cases referred 106 35 0 Not applicable
Types of illness
Psycological and medical conditions were the leading cause for ill-health retirement applications.

SAPS TOGETHER SQUEEZING CRIME to ZEROSAPS Members, My Family - Together Pushing Back The Frontiers Of Evil
ANNUAL REPORT 2010/2011SOUTH AFRICAN POLICE SERVICE
214
Table 10.5: Expenditure incurred for Temporary and Ill-health retirements (Health Risk Manager) for the period 1 January 2010 to 31 December 2010
Total expenditure incurred (R’000)
Average timeframe for payments made to service provider
R5 920 16 days
Table 10.6: Annual Leave for 1 January 2010 to 31 December 2010
Salary Bands Total Days Taken Average days per Employee
Number of Employees who took leave
Lower skilled (Levels 1-2) 50017 20 2543
Skilled (Levels 3-5) 1497691 19 78684
Highly skilled production (Levels 6-8) 1522685 23 66284
Highly skilled supervision (Levels 9-12) 419182 24 17499
Senior management (Levels 13-16) 15612 23 692
Total 3505187 21 165702
Table 10.7: Capped Leave for 1 January 2010 to 31 December 2010
Salary Bands Total days of capped leave
taken
Average number of
days taken per employee
Number of Employees who
took Capped leave
Total number of capped leave
(June 2000) available at 31
December 2010
Lower skilled (Levels 1-2) 10 3 3 3234
Skilled (Levels 3-5) 2501 6 413 237635
Highly skilled production (Levels 6-8) 20119 6 3143 4314659
Highly skilled supervision (Levels 9-12) 6908 7 1003 1600826
Senior management (Levels 13-16) 57 3 18 70687
Total 29595 6 4580 6227041
11. HIV/AIDS and Health Promotion ProgrammesCategories of employees identified to be at high
risk of contracting HIV / AIDS and related diseasesKey steps taken to reduce the risk
Detectives Detective surgical gloves are issued to all functional members, detectives, forensic scientists and fingerprint experts.
Functional police members During safety, health and environment training, the need for gloves and safe working procedures are explained to members in accordance with the regulations for Hazardous Biological Agents.
Forensic scientists All members have access to post-exposure prophylactic drugs that are paid for by the SAPS as employer.
Fingerprint experts All occupational accidents involving body fluids and blood contamination are reported and being dealt with by the Section: SHE Management, Head Office.

SAPS TOGETHER SQUEEZING CRIME to ZEROSAPS Members, My Family - Together Pushing Back The Frontiers Of Evil
ANNUAL REPORT 2010/2011SOUTH AFRICAN POLICE SERVICE
215
Table 11.2: Details of Health Promotion and HIV/AIDS Programmes Programmes
Question Yes No Details, if Yes
1. Has the department designated a member of the SMS to implement the provisions contained in Part VI E of Chapter 1 of the Public Service Regulations, 2001? If so, provide her/his name and position.
x Divisional Commissioner NNM MazibukoHead: Personnel Services, SAPSPrivate Bag X94Pretoria, 0001Tel no: 012 393 1504Fax no: 012 393 2454
2. Does the department have a dedicated unit or have you designated specific staff members to promote health and well being of your employees? If so, indicate the number of employees who are involved in this task and the annual budget that is available for this purpose.
x The Employee Health & Wellness consists of four sections namely; Social Work Services, Psychological Services, Spiritual Services and Quality of Work-Life comprising of professionals who are mainly responsible for the psycho-socio and spiritual well-being of all SAPS employees as well as their immediate family members. There is approximately 600 professionals employed within the EHW environment rendering care and support services to SAPS employees nationally. The section Quality of Work-Life (QWL) comprise of HIV&AIDS and Disability Management, which is a budgeted Programme. To date, there has been an annual budget of R5 million and R4 million respectively for both programmes.
3. Has the department introduced an Employee Assistance or Health Promotion Programme for your employees? If so, indicate the key elements/services of the programme.
x The component Employee Health and Wellness delivers services of which the key elements are wellness support programmes such as stress and trauma management, suicide prevention, spiritually based programmes, life-skills, personal financial management, colleague sensitivity, HIV&AIDS awareness programmes and disability sensitization programmes. The wellness support programmes are currently being expanded to include health promotion programmes whereby employees are being tested for HIV and other chronic conditions such as high blood pressure, diabetes, cholesterol and body mass index on a voluntary basis.
4. Has the department established (a) committee(s) as contemplated in Part VI E.5 (e) of Chapter 1 of the Public Service Regulations, 2001? If so, please provide the names of the members of the committee and the stakeholder(s) that they represent.
x The Division Personnel Management within SAPS is the custodian of the National Wellness Strategic Forum which is a monitoring vehicle of all aspects related to the health and wellness of SAPS employees including their immediate family members. The forum consists of representatives from various Divisions within SAPS such as Divisional Commissioners of Personnel Management (chairperson), Human Resource Development, Legal Services, Supply Chain Management, Human Resource Utilization as well as and Organized Labour unions (POPCRU and SAPU). There are also key external role-players such as Department of Public Works, POLMED, QUALSA (administrator to POLMED), Metropolitan Health Group (managed health care provider to POLMED); GEMS and SAPS’s Health Risk Manager (PHS). Similar structures have been established in the Provinces. Both the national and provincial wellness fora are being convened on a quarterly basis and strategic reports are being shared amongst all the role-players regarding the health and wellness of employees.

SAPS TOGETHER SQUEEZING CRIME to ZEROSAPS Members, My Family - Together Pushing Back The Frontiers Of Evil
ANNUAL REPORT 2010/2011SOUTH AFRICAN POLICE SERVICE
216
Question Yes No Details, if Yes
5. Has the department reviewed the employment policies and practices of your department to ensure that these do not unfairly discriminate against employees on the basis of their HIV status? If so, list the employment policies/practices so reviewed.
x SAPS has recently revised the HIV&AIDS Workplace Policy to include other communicable diseases such as TB, cholera, malaria etc. The draft policy is currently being consulted with various role-players for comments and inputs. It further makes provision for information, education and communication, preventative measures, medical testing as well as care and support structures and services available for employees and their immediate family members. The draft policy also outlines principles of confidentiality counselling and testing of members as well as availability and accessibility of health and wellness services.
The SAPS 5 year HIV&AIDS Strategic Plan 2007-2011 was developed and aligned to the National Strategic Plan. Currently, all interventions relating to HIV&AIDS management in the workplace are being implemented by professionals (social workers, psychologists, psychometrics, and chaplains) as mandated by the strategic plan.
6. Has the department introduced measures to protect HIV-positive employees or those perceived to be HIV-positive from discrimination? If so, list the key elements of these measures.
x The Policy on Employees of the SAPS living with HIV/AIDS was approved in August 2001. SAPS also abides by the Employment Equity Act, the Basic Conditions of Employment Act as well as the Labour Relations Act, which prohibit discrimination against employees on the basis of their status.
7. Does the department encourage its employees to undergo Voluntary Counselling and Testing? If so, list the results that you have achieved.
x An increased number of SAPS employees continuously partake in the HIV Counselling and Testing (HCT) programme. Mobile Wellness on Wheels services are available in all Provinces. The Employee Health and Wellness as well as other service providers such as POLMED forged partnership in marketing the Health Weeks campaigns/ drive within SAPS. Furthermore, the Health Risk Manager also ensures that rigorous HIV Counselling and Testing sessions are being conducted on an ongoing basis with increased testing sites. Employees are encouraged to optimally utilize the testing services which have been made available for them in order to know their general health status, manage it accordingly and to register on the relevant Disease Management Programmes if and when necessary.
Furthermore, SAPS also provides care and support to all employees in need by means of various Wellness Support Groups. The department is also embarking on an ongoing drive of providing advocacy workshops to senior managers through the Peer Education Programme with the purpose of setting positive examples and pledging care and support to those infected and affected by various health problems including HIV&AIDS.
8. Has the department developed measures/indicators to monitor & evaluate the impact of your health promotion programme? If so, list these measures/indicators.
x Organizational indicators, e.g. suicide rates and trends regarding referrals and medical boards, are constantly monitored.

SAPS TOGETHER SQUEEZING CRIME to ZEROSAPS Members, My Family - Together Pushing Back The Frontiers Of Evil
ANNUAL REPORT 2010/2011SOUTH AFRICAN POLICE SERVICE
217
12. Labour RelationsTable 12.1: Collective agreements, 1 April 2010 to 31 March 2011
Number Name of agreement Date signed
Agreement 1/2010 Agreement on a Special Daily Allowance for Policing Duties at Special Events 17-May-10
Agreement 1/2011 Agreement on Sexual Harassment in the Workplace 18-Jan-11
Table 12.2: Misconduct and discipline hearings finalised, 1 April 2010 to 31 March 2011
Outcome of Disciplinary Hearings Number % of Total
Correctional counseling 179 3,3
Demotion 0 0,0
Dismissal 520 9,5
Final written warning 474 8,7
Fine 1160 21,2
Suspended dismissal 1034 18,9
Case withdrawn 721 13,2
Not guilty 685 12,5
Suspended without payment 28 0,5
Verbal warning 77 1,4
Written warning 593 10,8
Total 5471 100
Table 12.3: Types of misconduct addressed and disciplinary hearings, 1 April 2010 to31 March 2011
Regulation 20 Nature Number Persons Found Guilty
% of Total
(a) Fails to comply with, or contravenes an Act, regulation or legal obligation. 698 11,5
(b) Wilfully or negligently mismanages the finances of the State. 23 0,4
(c) Without permission possesses or uses the property of the State, another employee or a visitor. 112 1,8
(d) Intentionally or negligently damages and or causes loss of State property. 144 2,4
(e) Endangers the lives of others by disregarding safety rules or regulations. 56 0,9
(f ) Prejudices the administration, discipline or efficiency of a department, office or institution of the State. 349 5,7
(g) Misuses his or her position in the Service to promote or to prejudice the interest of any political party. 4 0,1
(h)
Accepts any compensation in cash or otherwise from a member of the public or another employee for performing her or his duties without written approval from the employer.
9 0,1
(i) Fails to carry out a lawful order or routine instruction without just or reasonable cause. 525 8,6

SAPS TOGETHER SQUEEZING CRIME to ZEROSAPS Members, My Family - Together Pushing Back The Frontiers Of Evil
ANNUAL REPORT 2010/2011SOUTH AFRICAN POLICE SERVICE
218
Regulation 20 Nature Number Persons Found Guilty
% of Total
(j) Absents himself or herself from work without reason or permission.
692 11,4
(k) Commits an act of sexual harassment. 26 0,4
(l) Unfairly discriminates against others on the basis of race, gender, disability, sexuality or other grounds prohibited by the Constitution.
7 0,1
(m) Without written approval of the employer performs work for compensation in a private capacity for another person or organisation either during or outside working hours.
9 0,1
(n) Without authorisation, sleeps on duty. 14 0,2
(o) While on duty, is under the influence of an intoxicating, illegal, unauthorised, habit-forming drugs, including alcohol.
160 2,6
(p) While on duty, conducts herself or himself in an improper, disgraceful and unacceptable manner.
245 4,0
(q) Contravenes any prescribed Code of Conduct for the Service or the Public Service, whichever may be applicable to him or her.
258 4,2
(r) Incites other employees to unlawful conduct or conduct in conflict with accepted procedure.
8 0,1
(s) Displays disrespect towards others in the workplace or demonstrates abusive or insolent behaviour.
158 2,6
(t) Intimidates or victimises other employees. 15 0,2
(u) Prevent other employees from belonging to any trade union.
1 0,0
(v) Operates any money lending scheme for employees during working hours or from the premises of service.
0 0,0
(w) Gives a false statement or evidence in the execution of his or her duties.
20 0,3
(x) Falsifies records or any other documentation. 37 0,6
(y) Participates in any unlawful labour or industrial action. 23 0,4
(z) Commits a common law or statutory offence. 2480 40,8
Total 6073 100
Table 12.4: Grievances lodged for the period 1 April 2010 to 31 March 2011
Number of Grievances Addressed Number % of Total
Not resolved 94 8
Resolved 1084 92
Total 1178 100
Table 12.5: Disputes lodged with Councils for the period 1 April 2010 to 31 March 2011
Number of Disputes Lodged Number % of total
SSSBC 762 97
PSCBC 21 3
Total 783 100
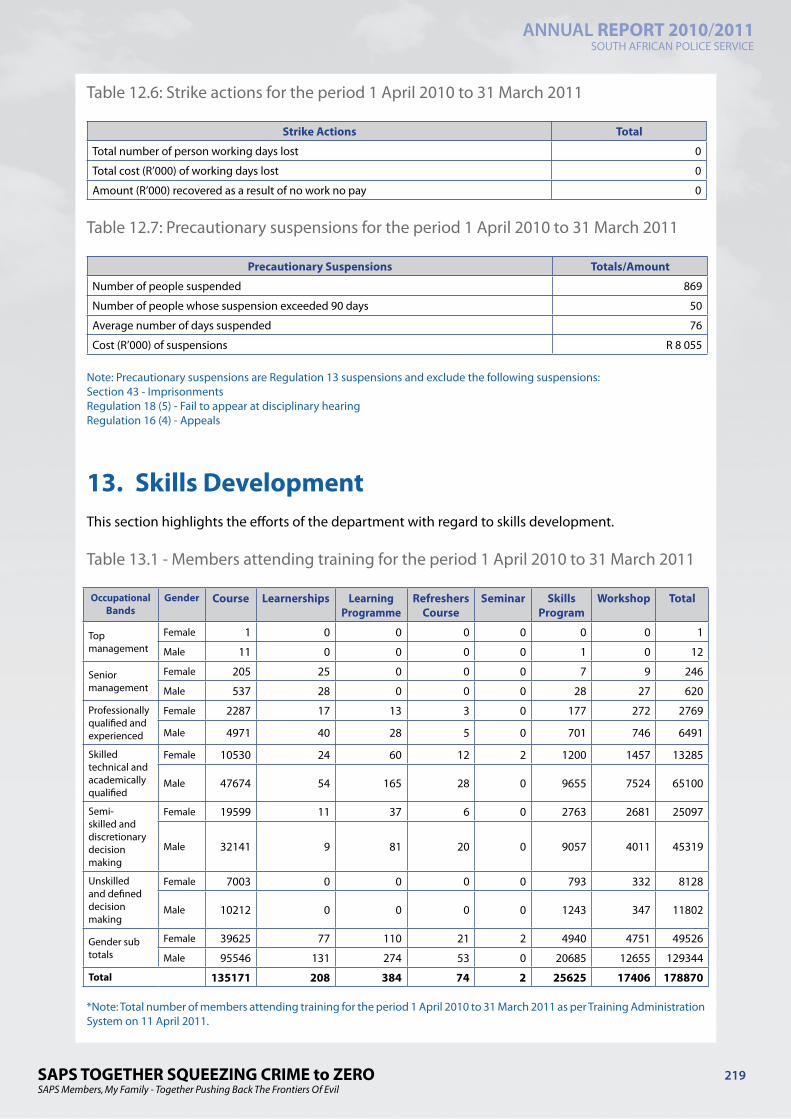
SAPS TOGETHER SQUEEZING CRIME to ZEROSAPS Members, My Family - Together Pushing Back The Frontiers Of Evil
ANNUAL REPORT 2010/2011SOUTH AFRICAN POLICE SERVICE
219
Table 12.6: Strike actions for the period 1 April 2010 to 31 March 2011
Strike Actions Total
Total number of person working days lost 0
Total cost (R’000) of working days lost 0
Amount (R’000) recovered as a result of no work no pay 0
Table 12.7: Precautionary suspensions for the period 1 April 2010 to 31 March 2011
Precautionary Suspensions Totals/Amount
Number of people suspended 869
Number of people whose suspension exceeded 90 days 50
Average number of days suspended 76
Cost (R’000) of suspensions R 8 055
Note: Precautionary suspensions are Regulation 13 suspensions and exclude the following suspensions:Section 43 - ImprisonmentsRegulation 18 (5) - Fail to appear at disciplinary hearingRegulation 16 (4) - Appeals
13. Skills DevelopmentThis section highlights the efforts of the department with regard to skills development.
Table 13.1 - Members attending training for the period 1 April 2010 to 31 March 2011
Occupational Bands
Gender Course Learnerships Learning Programme
Refreshers Course
Seminar Skills Program
Workshop Total
Top management
Female 1 0 0 0 0 0 0 1
Male 11 0 0 0 0 1 0 12
Senior management
Female 205 25 0 0 0 7 9 246
Male 537 28 0 0 0 28 27 620
Professionally qualified and experienced
Female 2287 17 13 3 0 177 272 2769
Male 4971 40 28 5 0 701 746 6491
Skilled technical and academically qualified
Female 10530 24 60 12 2 1200 1457 13285
Male 47674 54 165 28 0 9655 7524 65100
Semi-skilled and discretionary decision making
Female 19599 11 37 6 0 2763 2681 25097
Male 32141 9 81 20 0 9057 4011 45319
Unskilled and defined decision making
Female 7003 0 0 0 0 793 332 8128
Male 10212 0 0 0 0 1243 347 11802
Gender sub totals
Female 39625 77 110 21 2 4940 4751 49526
Male 95546 131 274 53 0 20685 12655 129344
Total 135171 208 384 74 2 25625 17406 178870
*Note: Total number of members attending training for the period 1 April 2010 to 31 March 2011 as per Training Administration System on 11 April 2011.

SAPS TOGETHER SQUEEZING CRIME to ZEROSAPS Members, My Family - Together Pushing Back The Frontiers Of Evil
ANNUAL REPORT 2010/2011SOUTH AFRICAN POLICE SERVICE
220
Table 13.2: Members found competent in training provided for the period 1 April 2010 to 31 March 2011
Occupational Bands Gender Course Learnerships Learning Programme
Refreshers Course
Skills Program
Workshop Total
Top managementFemale 1 0 0 0 0 0 1
Male 11 0 0 0 1 0 12
Senior managementFemale 182 25 0 0 7 9 223
Male 493 28 0 0 27 27 575
Professionally qualified and experienced
Female 2128 17 13 3 119 272 2552
Male 4673 40 28 5 604 746 6096
Skilled technical and academically qualified
Female 9521 24 60 12 893 1451 11961
Male 42561 54 165 28 7997 7400 58205
Semi-skilled and discretionary decision making
Female 18283 11 37 6 1990 2676 23003
Male 29664 9 81 20 7482 3994 41250
Unskilled and defined decision making
Female 6284 0 0 0 369 331 6984
Male 9235 0 0 0 910 343 10488
Gender sub totals Female 36399 77 110 21 3378 4739 44724
Male 86637 131 274 53 17021 12510 116626
Total 123036 208 384 74 20399 17249 161350
*Note: Total number of members declared competent in all training interventions completed during the period 1 April 2010 to 31 March 2011 was drawn from the Training Administration System on 11 April 2011. Seminars do not incorporate a competancy assessment.
14. Injury On DutyThe following table provides basic information on injury on duty.
Table 14.1: Injury on duty reported, 1 April 2010 to 31 March 2011
Nature of injury on duty Number % of total
Required medical attention with no temporary disablement 674 7,4
Required medical attention with temporary disablement 7761 84,7
Permanent disablement 653 7,1
Fatal 76 0,8
Total 9164 100

SAPS TOGETHER SQUEEZING CRIME to ZEROSAPS Members, My Family - Together Pushing Back The Frontiers Of Evil
ANNUAL REPORT 2010/2011SOUTH AFRICAN POLICE SERVICE
221
15. Utilization Of ConsultantsSee page 164 which refers to Goods and Services of which “Consultants, Contractors and Special Services” is a sub-classification.

SAPS TOGETHER SQUEEZING CRIME to ZEROSAPS Members, My Family - Together Pushing Back The Frontiers Of Evil
ANNUAL REPORT 2010/2011SOUTH AFRICAN POLICE SERVICE
222

SAPS TOGETHER SQUEEZING CRIME to ZEROSAPS Members, My Family - Together Pushing Back The Frontiers Of Evil
ANNEXURE A
1
THE CRIME CHALLENGE FACING THE SOUTH AFRICAN POLICE SERVICE1. IntroductionThe present report deals with the reported national serious crime figures and ratios for the 2010/2011 financial year (that is the period 1 April 2010 - 31 March 2011). These are compared to the figures recorded during the preceding financial years since 2003/2004. The provincial crime figures are also analysed in more detail and some comments made on aspects influencing the crime situation. More detailed crime figures and maps are provided on the SAPS website at www.saps.gov.za.
2. The National Crime SituationAnalysis of the national crime situation is facilitated by grouping the 20 serious crime tendencies discussed in this report into the following broad crime types:
➤ Contact crime (crimes against the person);
➤ Contact-related crime;
➤ Property-related crime;
➤ Other serious crime; and
➤ Crime detected as a result of police action.
During 2010/2011 a total of 2 071 487 (approximately 2,1 million) serious crime cases were registered in the RSA, compared to the 2 121 887 cases registered during 2009/2010. This means that the total number of serious crimes was reduced by -2,4% or 50 400 cases. This decrease exceeds the target determined by Government, namely to reduce the total volume of serious crime by -1,0% to -1,8% per annum. The ratio of serious crime per 100 000 of the population decreased by -3,7% (from 4 302.1 to 4 143.6). The above reduction target determined by Government was originally intended to apply to all 20 categories of serious crime discussed in this report. However, the Portfolio Committee on Police requested that the target should in future not include the three categories of crime labeled as crimes mainly detected as a result of police action. If these crimes are excluded from the calculation, the remaining number of crimes decreased from 1 909 566 to 1 839 645 cases (i.e. by 69 921 cases or -3,7%), with a concomitant ratio decrease of -5,0% (from 3 871.6 to 3 679.9). Crime detected as a result of police action should increase if the police actually do what they are supposed to be doing and should thus logically not be included among those crimes which are expected to decrease if the police are effective in their crime combating efforts. To include these crimes in a reduction target would therefore be counter-productive. The -5,0% decrease is thus the correct yardstick and exceeds the government target two-and-a-half times.
Figure 1 illustrates the numbers of cases registered and proportional contribution of each of the broad crime types to the total crime picture in South Africa. Of the approximately 2,1 million cases, almost a third (30,8% or 638 468 cases) were contact crimes; about a quarter (25,8% or 534 866 cases) were other serious crimes; another quarter (25,8% or 534 451 cases) were property-related crimes; 11,2% (231 842 cases) were crimes detected as a result of police action; and 6,4% (131 860 cases) were contact-related crimes (more information on the specific proportions will be provided in each section dealing with the types of crime in question).
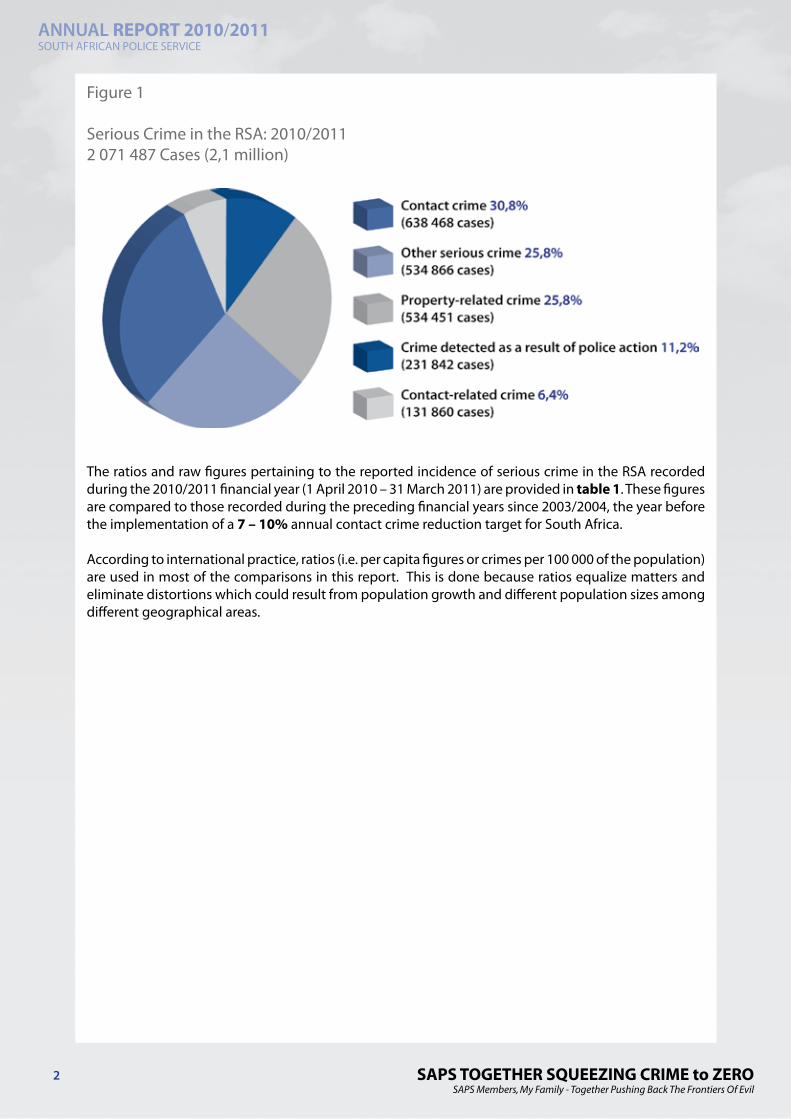
SAPS TOGETHER SQUEEZING CRIME to ZEROSAPS Members, My Family - Together Pushing Back The Frontiers Of Evil
ANNUAL REPORT 2010/2011SOUTH AFRICAN POLICE SERVICE
2
Figure 1
Serious Crime in the RSA: 2010/20112 071 487 Cases (2,1 million)
The ratios and raw figures pertaining to the reported incidence of serious crime in the RSA recorded during the 2010/2011 financial year (1 April 2010 – 31 March 2011) are provided in table 1. These figures are compared to those recorded during the preceding financial years since 2003/2004, the year before the implementation of a 7 – 10% annual contact crime reduction target for South Africa.
According to international practice, ratios (i.e. per capita figures or crimes per 100 000 of the population) are used in most of the comparisons in this report. This is done because ratios equalize matters and eliminate distortions which could result from population growth and different population sizes among different geographical areas.

SAPS TOGETHER SQUEEZING CRIME to ZEROSAPS Members, My Family - Together Pushing Back The Frontiers Of Evil
ANNUAL REPORT 2010/2011SOUTH AFRICAN POLICE SERVICE
3
Tabl
e 1
Seri
ous c
rim
e du
ring
the
2003
/200
4 to
201
0/20
11 fi
nanc
ial y
ears
and
the
perc
enta
ge in
crea
ses/
decr
ease
s in
crim
e be
twee
n 20
09/2
010
and
2010
/201
1
Crim
e ca
tego
ryIn
cide
nce
of c
rim
e pe
r 100
000
of t
he p
opul
atio
nRa
w fi
gure
s/fr
eque
ncie
s
2003
/ 20
0420
04/
2005
2005
/ 20
0620
06/
2007
2007
/ 20
0820
08/
2009
2009
/ 20
1020
10/
2011
%
Incr
ease
/ D
ecre
ase
10/1
1 vs
09
/10
2003
/ 20
0420
04/
2005
2005
/ 20
0620
06/
2007
2007
/ 20
0820
08/
2009
2009
/ 20
1020
10/
2011
%
Incr
ease
/ D
ecre
ase
10/1
1 vs
09
/10
Cont
act C
rim
e
Mur
der
42.7
40.3
39.6
40.5
38.6
37.3
34.1
31.9
-6,5
%19
824
18 7
9318
528
19 2
0218
487
18 1
4816
834
15 9
40-5
,3%
Tota
l sex
ual o
ffenc
es14
2.5
148.
414
5.2
137.
613
3.4
144.
813
8.5
132.
4-4
,4%
66 0
7969
117
68 0
7665
201
63 8
1870
514
68 3
3266
196
-3,1
%
Att
empt
ed m
urde
r64
.852
.643
.842
.539
.337
.635
.331
.0-1
2,2%
30 0
7624
516
20 5
7120
142
18 7
9518
298
17 4
1015
493
-11,
0%
Ass
ault
with
the
inte
nt
to in
flict
grie
vous
bod
ily
harm
560.
753
5.3
484.
046
0.1
439.
141
8.5
416.
239
7.3
-4,5
%26
0 08
224
9 36
922
6 94
221
8 03
021
0 10
420
3 77
720
5 29
319
8 60
2-3
,3%
Com
mon
ass
ault
605.
757
5.0
485.
344
3.2
413.
939
6.1
400.
037
1.8
-7,1
%28
0 94
226
7 85
722
7 55
321
0 05
719
8 04
919
2 83
819
7 28
418
5 89
1-5
,8%
Robb
ery
with
agg
rava
ting
circ
umst
ance
s28
8.1
272.
225
5.3
267.
124
7.3
249.
323
0.6
203.
0-1
2,0%
133
658
126
789
119
726
126
558
118
312
121
392
113
755
101
463
-10,
8%
Com
mon
robb
ery
206.
019
5.0
159.
415
0.1
135.
812
1.7
116.
710
9.8
-5,9
%95
551
90 8
2574
723
71 1
5664
985
59 2
3257
537
54 8
83-4
,6%
Cont
act-
rela
ted
Crim
e
Ars
on
19.0
17.6
16.3
16.6
15.5
14.1
13.6
13.1
-3,7
%8
806
8 18
47
622
7 85
87
396
6 84
66
701
6 53
3-2
,5%
Mal
icio
us d
amag
e to
pr
oper
ty34
1.2
323.
730
7.7
302.
528
6.2
275.
826
7.9
250.
7-6
,4%
158
247
150
785
144
265
143
336
136
968
134
261
132
134
125
327
-5,2
%
Prop
erty
-rel
ated
Cri
me
Burg
lary
at r
esid
entia
l pr
emis
es64
5.2
592.
855
9.9
526.
849
7.1
506.
552
0.2
495.
3-4
,8%
299
290
276
164
262
535
249
665
237
853
246
616
256
577
247
630
-3,5
%
Burg
lary
at n
on-r
esid
entia
l pr
emis
es13
9.3
120.
311
6.0
123.
313
1.7
143.
814
5.5
138.
2-5
,0%
64 6
2956
048
54 3
6758
438
62 9
9570
009
71 7
7369
082
-3,7
%
Thef
t of m
otor
veh
icle
and
m
otor
cycl
e19
0.0
180.
018
3.3
182.
116
7.7
156.
014
5.5
129.
0-1
1,3%
88 1
4483
857
85 9
6486
298
80 2
2675
968
71 7
7664
504
-10,
1%
Thef
t out
of o
r fro
m m
otor
ve
hicl
e37
0.8
318.
829
6.6
261.
723
3.4
225.
024
5.1
246.
20,
4%17
1 98
214
8 51
213
9 09
012
4 02
911
1 66
110
9 54
812
0 86
212
3 09
11,
8%
Stoc
k-th
eft
89.0
70.1
61.3
60.8
60.1
61.7
65.7
60.3
-8,2
%41
273
32 6
7528
742
28 8
2828
778
30 0
4332
380
30 1
44-6
,9%

SAPS TOGETHER SQUEEZING CRIME to ZEROSAPS Members, My Family - Together Pushing Back The Frontiers Of Evil
ANNUAL REPORT 2010/2011SOUTH AFRICAN POLICE SERVICE
4
Crim
e ca
tego
ryIn
cide
nce
of c
rim
e pe
r 100
000
of t
he p
opul
atio
nRa
w fi
gure
s/fr
eque
ncie
s
2003
/ 20
0420
04/
2005
2005
/ 20
0620
06/
2007
2007
/ 20
0820
08/
2009
2009
/ 20
1020
10/
2011
%
Incr
ease
/ D
ecre
ase
10/1
1 vs
09
/10
2003
/ 20
0420
04/
2005
2005
/ 20
0620
06/
2007
2007
/ 20
0820
08/
2009
2009
/ 20
1020
10/
2011
%
Incr
ease
/ D
ecre
ase
10/1
1 vs
09
/10
Crim
e D
etec
ted
as a
Res
ult o
f Pol
ice
Act
ion
Illeg
al p
osse
ssio
n of
fir
earm
s an
d am
mun
ition
36.3
33.3
28.7
30.3
28.2
28.8
29.5
28.9
-2,0
%16
839
15 4
9713
453
14 3
5413
476
14 0
4514
542
14 4
72-0
,5%
Dru
g-re
late
d cr
ime
135.
118
0.3
204.
122
0.9
228.
124
0.7
273.
430
1.4
10,2
%62
689
84 0
0195
690
104
689
109
134
117
172
134
840
150
673
11,7
%
Driv
ing
unde
r the
in
fluen
ce o
f alc
ohol
or
drug
s53
.764
.270
.680
.710
1.2
115.
412
7.6
133.
44,
5%24
886
29 9
2733
116
38 2
6148
405
56 1
6562
939
66 6
976,
0%
Oth
er S
erio
us C
rim
e
All
thef
t not
men
tione
d el
sew
here
1 30
7.5
1 15
1.1
922.
787
6.0
826.
180
9.5
745.
073
6.3
-1,2
%60
6 46
053
6 28
143
2 62
941
5 16
339
5 29
639
4 12
436
7 44
236
8 09
50,
2%
Com
mer
cial
crim
e12
0.4
115.
811
5.6
130.
213
6.4
159.
117
2.0
176.
82,
8%55
869
53 9
3154
214
61 6
9065
286
77 4
7484
842
88 3
884,
2%
Shop
liftin
g15
5.0
142.
813
7.5
138.
214
0.0
165.
917
9.7
156.
8-1
2,7%
71 8
8866
525
64 4
9165
489
66 9
9280
773
88 6
3478
383
-11,
6%
Som
e Su
bcat
egor
ies
of A
ggra
vate
d Ro
bber
y A
lrea
dy A
ccou
nted
for U
nder
Agg
rava
ted
Robb
ery
Abo
ve
Carja
ckin
g-
--
--
--
--
13 7
9312
434
12 8
2513
599
14 2
0114
915
13 9
0210
627
-23,
6%
Truc
k hi
jack
ing
--
--
--
--
-90
193
082
989
21
245
1 43
71
412
999
-29,
2%
Robb
ery
of c
ash
in tr
ansi
t-
--
--
--
--
192
220
383
467
395
386
358
291
-18,
7%
Bank
robb
ery
--
--
--
--
-54
5859
129
144
102
9339
-58,
1%
Robb
ery
at re
side
ntia
l pr
emis
es-
--
--
--
--
9 35
19
391
10 1
7312
761
14 4
8118
438
18 7
8616
889
-10,
1%
Robb
ery
at b
usin
ess
prem
ises
--
--
--
--
-3
677
3 32
04
387
6 68
99
862
13 9
2014
534
14 6
670,
9%

SAPS TOGETHER SQUEEZING CRIME to ZEROSAPS Members, My Family - Together Pushing Back The Frontiers Of Evil
ANNUAL REPORT 2010/2011SOUTH AFRICAN POLICE SERVICE
5
2.1 Contact Crime
Contact crime involves physical contact between the perpetrators and victims. Such contact may last anything from a second or two (e.g. where a perpetrator grabs the handbag from a victim’s hand and runs off with it) to an ordeal of several days (e.g. where a perpetrator kidnaps a victim during a carjacking, rapes her repeatedly and eventually kills her). Physical contact between victims and perpetrators will always have a more serious psychological impact than cases in which property is stolen from the victims in the latter’s absence (e.g. during a housebreaking when the victim is away from home or otherwise unaware of the crime’s occurrence at the time it is committed). Contact crime basically consists of violence against the person, irrespective of the nature of such violence. It includes the following categories of offences:
Table 1a: Categories of crime classified as contact crime
Crime category Proportion of all contact crime
% N
Murder 2,5% 15 940
Attempted murder 2,4% 15 493
Assault GBH 31,1% 198 602
Common assault 29,1% 185 891
Sexual offences 10,4% 66 196
Aggravated robbery 15,9% 101 463
Common robbery 8,6% 54 883
Figure 2
Contact Crime in the RSA: 2010/2011638 468 Cases (30,8%) – Nearly a third of all serious crime
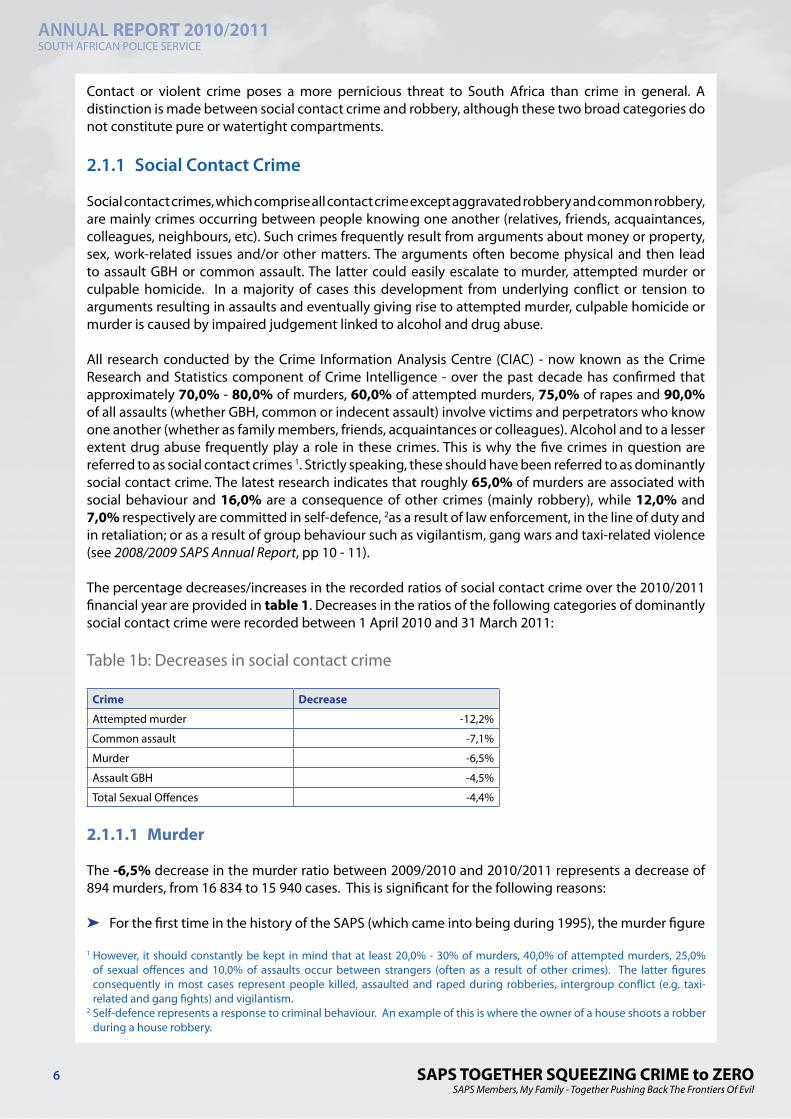
SAPS TOGETHER SQUEEZING CRIME to ZEROSAPS Members, My Family - Together Pushing Back The Frontiers Of Evil
ANNUAL REPORT 2010/2011SOUTH AFRICAN POLICE SERVICE
6
Contact or violent crime poses a more pernicious threat to South Africa than crime in general. A distinction is made between social contact crime and robbery, although these two broad categories do not constitute pure or watertight compartments.
2.1.1 Social Contact Crime
Social contact crimes, which comprise all contact crime except aggravated robbery and common robbery, are mainly crimes occurring between people knowing one another (relatives, friends, acquaintances, colleagues, neighbours, etc). Such crimes frequently result from arguments about money or property, sex, work-related issues and/or other matters. The arguments often become physical and then lead to assault GBH or common assault. The latter could easily escalate to murder, attempted murder or culpable homicide. In a majority of cases this development from underlying conflict or tension to arguments resulting in assaults and eventually giving rise to attempted murder, culpable homicide or murder is caused by impaired judgement linked to alcohol and drug abuse.
All research conducted by the Crime Information Analysis Centre (CIAC) - now known as the Crime Research and Statistics component of Crime Intelligence - over the past decade has confirmed that approximately 70,0% - 80,0% of murders, 60,0% of attempted murders, 75,0% of rapes and 90,0% of all assaults (whether GBH, common or indecent assault) involve victims and perpetrators who know one another (whether as family members, friends, acquaintances or colleagues). Alcohol and to a lesser extent drug abuse frequently play a role in these crimes. This is why the five crimes in question are referred to as social contact crimes 1. Strictly speaking, these should have been referred to as dominantly social contact crime. The latest research indicates that roughly 65,0% of murders are associated with social behaviour and 16,0% are a consequence of other crimes (mainly robbery), while 12,0% and 7,0% respectively are committed in self-defence, 2as a result of law enforcement, in the line of duty and in retaliation; or as a result of group behaviour such as vigilantism, gang wars and taxi-related violence (see 2008/2009 SAPS Annual Report, pp 10 - 11).
The percentage decreases/increases in the recorded ratios of social contact crime over the 2010/2011 financial year are provided in table 1. Decreases in the ratios of the following categories of dominantly social contact crime were recorded between 1 April 2010 and 31 March 2011:
Table 1b: Decreases in social contact crime
Crime Decrease
Attempted murder -12,2%
Common assault -7,1%
Murder -6,5%
Assault GBH -4,5%
Total Sexual Offences -4,4%
2.1.1.1 Murder
The -6,5% decrease in the murder ratio between 2009/2010 and 2010/2011 represents a decrease of 894 murders, from 16 834 to 15 940 cases. This is significant for the following reasons:
➤ For the first time in the history of the SAPS (which came into being during 1995), the murder figure
1 However, it should constantly be kept in mind that at least 20,0% - 30% of murders, 40,0% of attempted murders, 25,0% of sexual offences and 10,0% of assaults occur between strangers (often as a result of other crimes). The latter figures consequently in most cases represent people killed, assaulted and raped during robberies, intergroup conflict (e.g. taxi-related and gang fights) and vigilantism.
2 Self-defence represents a response to criminal behaviour. An example of this is where the owner of a house shoots a robber during a house robbery.
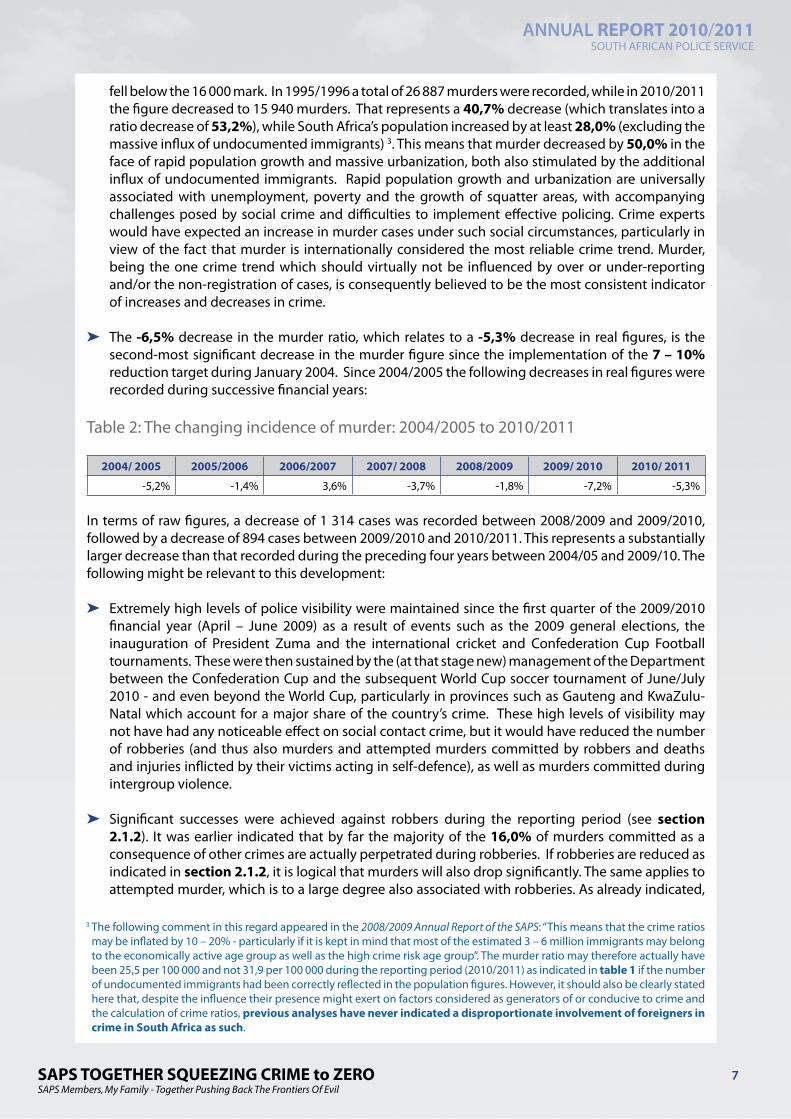
SAPS TOGETHER SQUEEZING CRIME to ZEROSAPS Members, My Family - Together Pushing Back The Frontiers Of Evil
ANNUAL REPORT 2010/2011SOUTH AFRICAN POLICE SERVICE
7
fell below the 16 000 mark. In 1995/1996 a total of 26 887 murders were recorded, while in 2010/2011 the figure decreased to 15 940 murders. That represents a 40,7% decrease (which translates into a ratio decrease of 53,2%), while South Africa’s population increased by at least 28,0% (excluding the massive influx of undocumented immigrants) 3. This means that murder decreased by 50,0% in the face of rapid population growth and massive urbanization, both also stimulated by the additional influx of undocumented immigrants. Rapid population growth and urbanization are universally associated with unemployment, poverty and the growth of squatter areas, with accompanying challenges posed by social crime and difficulties to implement effective policing. Crime experts would have expected an increase in murder cases under such social circumstances, particularly in view of the fact that murder is internationally considered the most reliable crime trend. Murder, being the one crime trend which should virtually not be influenced by over or under-reporting and/or the non-registration of cases, is consequently believed to be the most consistent indicator of increases and decreases in crime.
➤ The -6,5% decrease in the murder ratio, which relates to a -5,3% decrease in real figures, is the second-most significant decrease in the murder figure since the implementation of the 7 – 10% reduction target during January 2004. Since 2004/2005 the following decreases in real figures were recorded during successive financial years:
Table 2: The changing incidence of murder: 2004/2005 to 2010/2011
2004/ 2005 2005/2006 2006/2007 2007/ 2008 2008/2009 2009/ 2010 2010/ 2011
-5,2% -1,4% 3,6% -3,7% -1,8% -7,2% -5,3%
In terms of raw figures, a decrease of 1 314 cases was recorded between 2008/2009 and 2009/2010, followed by a decrease of 894 cases between 2009/2010 and 2010/2011. This represents a substantially larger decrease than that recorded during the preceding four years between 2004/05 and 2009/10. The following might be relevant to this development:
➤ Extremely high levels of police visibility were maintained since the first quarter of the 2009/2010 financial year (April – June 2009) as a result of events such as the 2009 general elections, the inauguration of President Zuma and the international cricket and Confederation Cup Football tournaments. These were then sustained by the (at that stage new) management of the Department between the Confederation Cup and the subsequent World Cup soccer tournament of June/July 2010 - and even beyond the World Cup, particularly in provinces such as Gauteng and KwaZulu-Natal which account for a major share of the country’s crime. These high levels of visibility may not have had any noticeable effect on social contact crime, but it would have reduced the number of robberies (and thus also murders and attempted murders committed by robbers and deaths and injuries inflicted by their victims acting in self-defence), as well as murders committed during intergroup violence.
➤ Significant successes were achieved against robbers during the reporting period (see section 2.1.2). It was earlier indicated that by far the majority of the 16,0% of murders committed as a consequence of other crimes are actually perpetrated during robberies. If robberies are reduced as indicated in section 2.1.2, it is logical that murders will also drop significantly. The same applies to attempted murder, which is to a large degree also associated with robberies. As already indicated,
3 The following comment in this regard appeared in the 2008/2009 Annual Report of the SAPS: “This means that the crime ratios may be inflated by 10 – 20% - particularly if it is kept in mind that most of the estimated 3 – 6 million immigrants may belong to the economically active age group as well as the high crime risk age group”. The murder ratio may therefore actually have been 25,5 per 100 000 and not 31,9 per 100 000 during the reporting period (2010/2011) as indicated in table 1 if the number of undocumented immigrants had been correctly reflected in the population figures. However, it should also be clearly stated here that, despite the influence their presence might exert on factors considered as generators of or conducive to crime and the calculation of crime ratios, previous analyses have never indicated a disproportionate involvement of foreigners in crime in South Africa as such.
SAPS TOGETHER SQUEEZING CRIME to ZEROSAPS Members, My Family - Together Pushing Back The Frontiers Of Evil
ANNUAL REPORT 2010/2011SOUTH AFRICAN POLICE SERVICE
8
attempted murders decreased by -12,2% during 2010/2011. This is, with the exception of the decrease in shoplifting, the largest decrease among all the categories of crime discussed in this report during 2010/2011 and double the decrease recorded in 2009/2010 (which stood at -6,1%).
➤ The arrest of robbers (sometimes ending in casualties among them, particularly if they offer violent resistance) will in all probability not only reduce murders as a result of robbery, but in addition remove perpetrators of social contact crime from society. It is a known fact that robbers are violent people who frequently also commit social contact crime (murder, attempted murder, assault and sexual offences) against their own family members, friends and acquaintances. On the other hand, the question can then be asked why, if these robbers had been arrested and in that way prevented from committing social assaults and resultant murders, the assault GBH and common assault figures did not decrease as significantly as the murder, attempted murder and robbery figures. The explanation could be that analysis of trends during big events over the past decade has consistently indicated that the more policeable crimes such as robbery, housebreaking, theft of motor vehicle and theft out of/from motor vehicle, etc decreased significantly. At the same time the less policeable and more purely social contact crimes such as assaults and sexual offences usually increased, particularly as a result of more socializing and a rise in alcohol consumption. Big events offer more opportunity for celebrations accompanied by alcohol consumption, increasing the likehood of arguments occurring - particularly among people knowing one another. This will generate upward pressure on less policeable crimes such as assault and sexual offences.
Finally, it is necessary to emphasize that crimes are registered on the basis of the facts available or circumstances obtaining at the time such crimes are reported to or discovered by the police. This is done because the registered crime and accompanying detailed data are used in operational analysis within 24 hours of being recorded and provide the basis for intelligence-led policing. During subsequent investigation and eventual prosecution once suspects are charged with the crimes, the detectives and/or prosecutors may drop, add or change charges. This could also happen during court cases or once a verdict is reached in court. The result could be that the pattern (counts) of crime may change quite significantly from what had originally been recorded. A docket analysis conducted during 2006 and covering a representative sample of 9 638 contact crime dockets registered during the year 2000, indicated that eventually only 58,7% and 56,9% of attempted murder and murder verdicts respectively corresponded with the charges as originally registered. In the case of original murder charges, 34,6% and 5,7% of the guilty verdicts were eventually obtained in relation to charges of culpable homicide and assault GBH respectively. In the case of original attempted murder charges, 25,0% and 3,8% of the guilty verdicts were eventually obtained in relation to charges of assault GBH and unlawful discharging of a firearm respectively. In the case of assault GBH, common assault and rape, 93,0%, 94,1% and 92,8% of the guilty verdicts respectively corresponded with the charges as originally registered. The reason for the high disparity between original murder and attempted murder charges and guilty verdicts, is that in the case of these crimes it is essential to prove the intention to kill. The majority of murders as well as attempted murders, particularly in South Africa, are social in nature. It will consequently not always be clear when the crime is registered whether the intention had actually been to kill.
2.1.1.2 Assault GBH and common assault
Assault GBH and common assault experienced decreases of -4,5% and -7,1% respectively. The government target of a -8,5% ratio reduction was clearly not achieved in respect of these two largest contributors to the overall contact crime figure. However, the -4,5% and -7,1% reductions recorded during 2010/2011 represent a clear improvement on the -0,5% reduction in assault GBH and 1,0% increase in common assault recorded during 2009/2010. These mainly social contact crimes together account for nearly 80,0% of all social contact crime.
It remained difficult to achieve this target since the implementation of the 7 – 10% annual reduction target per contact crime category during January 2004. This is evident from the following ratio decreases recorded from 2004/2005 till date:

SAPS TOGETHER SQUEEZING CRIME to ZEROSAPS Members, My Family - Together Pushing Back The Frontiers Of Evil
ANNUAL REPORT 2010/2011SOUTH AFRICAN POLICE SERVICE
9
Table 3: The changing incidence of assaults: 2004/2005 to 2010/2011
Crime 2004/ 2005 2005/ 2006 2006/ 2007 2007/ 2008 2008/ 2009 2009/ 2010 2010/ 2011
Assault GBH -4,5% -9,6% -4,9% -4,6% -4,7% -0,5% -4,5%
Common assault -5,1% -15,6% -8,7% -6,6% -4,3% 1,0% -7,1%
The reason for the difficulty experienced in efforts to decrease the incidence of assault GBH and common assault can probably be found in the following potential explanations:
➤ It has already been indicated that assaults (GBH and common) are largely a social phenomenon occurring between people knowing each other, with alcohol and drug abuse also considered as conducive to these crimes. It is further known that these crimes frequently occur in localities not readily covered by conventional policing (patrols, roadblocks, stop-and-search operations) such as the privacy of homes and places of employment, as well as clubs, shebeens, taverns, bars and other social gathering places. To reduce these crimes significantly, communities will have to alter their lifestyle.
People will find it difficult and even impossible to change their lifestyle if their living conditions are grim and their present lifestyle represents an adaptation to such conditions. If, for example, somebody lives in appalling conditions (e.g. a cold and wet shack); has no work or secure income; possesses a low level of education which does not assist in finding a job or creating an own income; and there is nothing in the environment to keep such an individual busy in a positive way (e.g. through recreational activity), the chances are good that such a person will become involved in the abuse of cheap alcohol. This will occur in social conditions already tense because of damaged self-esteem and an intense competition for extremely scarce resources.
➤ During the past three years the whole world experienced an economic recession (some experts even refer to an economic meltdown or depression) and many countries reportedly experienced a dramatic increase in some property-related and commercial crimes (specifically shoplifting, theft and fraud), as well as in social or domestic violent crime. It seems as if there is at least some truth in the old saying that “when economic hardship enters through the front door, love flies out at the back door”. This may also have exerted an upward pressure on the incidence of assault.
➤ In section 2.1.1.1 mention has already been made of the fact that although the big events in South Africa since the beginning of 2009 have resulted in increased visible policing and a reduction of the more policeable crimes, these developments may have increased the opportunities for less policeable crimes such as assault GBH and common assault to occur because of more socializing, tension and excitement in society.
To systematically reduce crime of this nature under the unfavourable conditions described above, the following measures need to be considered:
➤ Massive economic development and a growth in the informal sector to create jobs and eliminate unemployment as far as possible.
➤ The development of suitable human settlements in which people can live a meaningful life and develop a strong, positive self-esteem.
➤ Providing education to the youth that will develop their discipline, self-esteem, entrepreneurial skills and understanding of crime, as well as the dangers of being drawn into it.
➤ Policing geared to achieve the following:

SAPS TOGETHER SQUEEZING CRIME to ZEROSAPS Members, My Family - Together Pushing Back The Frontiers Of Evil
ANNUAL REPORT 2010/2011SOUTH AFRICAN POLICE SERVICE
10
➣ Reduction of crime levels (particularly of violent crime) to such an extent that human settlement development is possible.
➣ Reduction and elimination of those crimes which inhibit local and foreign investment and tourism – particularly the trio crimes of carjacking, house robbery and business robbery.
➣ Creating awareness – through effective prosecution of as many cases as possible - that social and domestic violence is totally unacceptable and will not be tolerated, particularly where women and children are concerned.
When the 7 – 10% contact crime reduction target was determined in 2004, it was clearly indicated that these were actually not police targets only, but South African targets. The more social contact crimes such as assault GBH and common assault will only decrease significantly if all relevant government departments (among which the Police Service is but one), non-governmental organisations (NGOs) and particularly the communities themselves work hand-in-hand to reduce these crimes and the underlying conditions giving rise to them.
2.1.1.3 Sexual offences
Table 1 indicates a ratio decrease of -4,4%, from 138.5 sexual offences per 100 000 of the RSA population in 2009/2010 to 132.4 per 100 000 in 2010/2011. This represents a decrease of 2 136 cases, from 68 332 to 66 196. This is an exact repeat of the -4,4% ratio decrease recorded in 2009/2010. The main reason why historical comparisons between the latter figures and the figures for preceding years are extremely difficult and even impossible, is that sexual offences as presently defined differ substantially from those recorded in the past – i.e. prior to December 2007. The definition of rape (formerly understood as referring exclusively to vaginal penetration by a male sexual organ) has e.g. been widened to also include vaginal, oral and anal penetration of a sexual nature by whatever means (and thus also male rape) which previously fell under the category of indecent assault. The concept of sexual offences then also goes further to add a whole range of transgressions which never previously formed part of rape or indecent assault – such as sex work, pornography, public indecency and human trafficking. The addition of these sexual offences mainly detected as a result of police action makes it impossible to compare the present sexual offences figures as portrayed in table 1 with figures for rape and indecent assault recorded in the past. If all sexual offences cases registered in 2010/2011 which would have qualified as rape and indecent assault cases prior to 16 December 2007 are identified and counted, the result adds up to 56 272 cases. If the same calculation is done for 2008/2009 and 2009/2010, the combined rape and sexual assault figures for these three years are as follows:
➤ 2008/2009 54 126
➤ 2009/2010 55 097
➤ 2010/2011 56 272
This means that between the 2008/2009 and 2009/2010 financial years an increase of 1,8% and from 2009/2010 to 2010/2011 an increase of 2,1% was recorded. It should again be emphasized that the average of approximately 55 165 rape and sexual assault cases recorded over the past three financial years since the implementation of the current sexual offences legislation should not be compared to the average of ±53 000 rapes recorded during the financial years prior to 2007/2008. If one wants to compare the figures it will be more correct to compare the current average with the average of 62 867 rapes and indecent assaults reported in terms of the old definitions applying prior to 2007/2008. From this financial year (2010/2011) a special effort will have to be made to separate sexual offences into those reported by the public (which basically comprise rape or sexual penetration and indecent assault – now called sexual assault) and those sexual offences which are detected by means of police action (such as those relating to sex work or prostitution and pornography). The reason for this is that
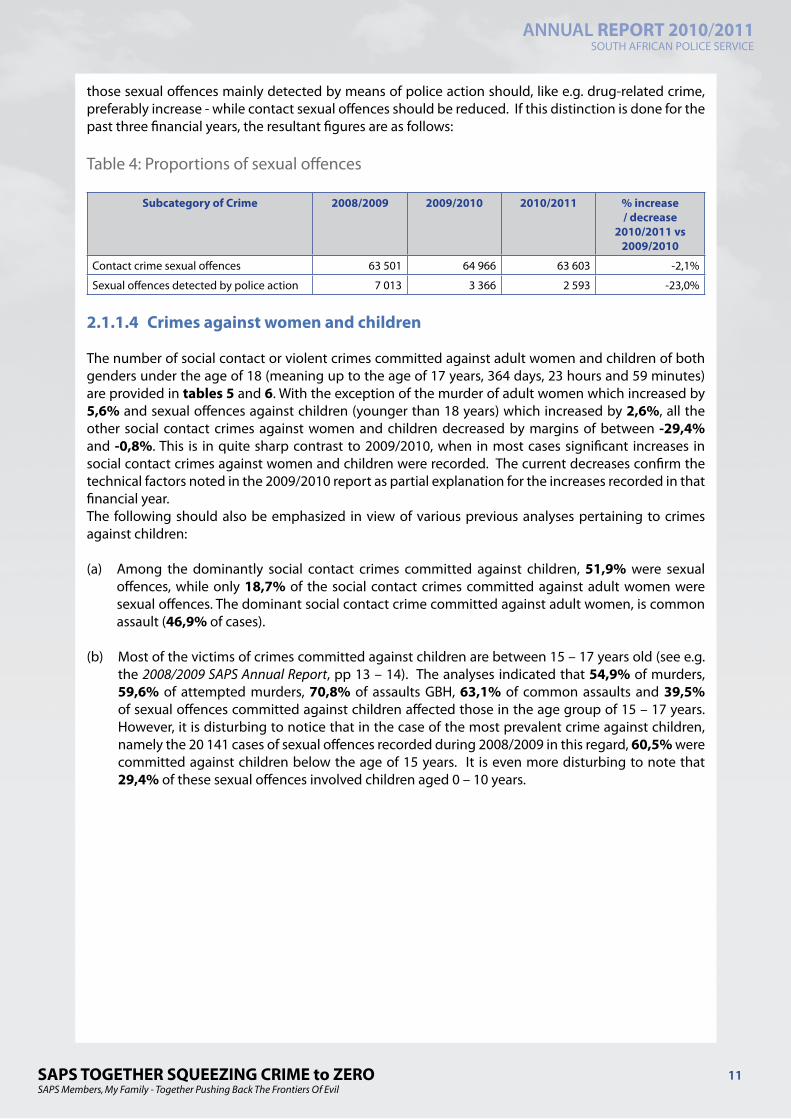
SAPS TOGETHER SQUEEZING CRIME to ZEROSAPS Members, My Family - Together Pushing Back The Frontiers Of Evil
ANNUAL REPORT 2010/2011SOUTH AFRICAN POLICE SERVICE
11
those sexual offences mainly detected by means of police action should, like e.g. drug-related crime, preferably increase - while contact sexual offences should be reduced. If this distinction is done for the past three financial years, the resultant figures are as follows:
Table 4: Proportions of sexual offences
Subcategory of Crime 2008/2009 2009/2010 2010/2011 % increase / decrease
2010/2011 vs 2009/2010
Contact crime sexual offences 63 501 64 966 63 603 -2,1%
Sexual offences detected by police action 7 013 3 366 2 593 -23,0%
2.1.1.4 Crimes against women and children
The number of social contact or violent crimes committed against adult women and children of both genders under the age of 18 (meaning up to the age of 17 years, 364 days, 23 hours and 59 minutes) are provided in tables 5 and 6. With the exception of the murder of adult women which increased by 5,6% and sexual offences against children (younger than 18 years) which increased by 2,6%, all the other social contact crimes against women and children decreased by margins of between -29,4% and -0,8%. This is in quite sharp contrast to 2009/2010, when in most cases significant increases in social contact crimes against women and children were recorded. The current decreases confirm the technical factors noted in the 2009/2010 report as partial explanation for the increases recorded in that financial year. The following should also be emphasized in view of various previous analyses pertaining to crimes against children:
(a) Among the dominantly social contact crimes committed against children, 51,9% were sexual offences, while only 18,7% of the social contact crimes committed against adult women were sexual offences. The dominant social contact crime committed against adult women, is common assault (46,9% of cases).
(b) Most of the victims of crimes committed against children are between 15 – 17 years old (see e.g. the 2008/2009 SAPS Annual Report, pp 13 – 14). The analyses indicated that 54,9% of murders, 59,6% of attempted murders, 70,8% of assaults GBH, 63,1% of common assaults and 39,5% of sexual offences committed against children affected those in the age group of 15 – 17 years. However, it is disturbing to notice that in the case of the most prevalent crime against children, namely the 20 141 cases of sexual offences recorded during 2008/2009 in this regard, 60,5% were committed against children below the age of 15 years. It is even more disturbing to note that 29,4% of these sexual offences involved children aged 0 – 10 years.

SAPS TOGETHER SQUEEZING CRIME to ZEROSAPS Members, My Family - Together Pushing Back The Frontiers Of Evil
ANNUAL REPORT 2010/2011SOUTH AFRICAN POLICE SERVICE
12
Table 5: Crimes against women of 18 years and older: 2006/2007 – 2010/2011
Crime category 2006/ 2007 2007/ 2008 2008/ 2009 2009/ 2010 2010/ 2011 Difference 2010/2011
vs 2009/2010
% Increase/ decrease
Murder 2 602 2 544 2 436 2 457 2 594 137 5,6%
Attempted murder 3 362 3 016 2 966 3 008 2 842 -166 -5,5%
All sexual offences 34 816 31 328 30 124 36 093 35 820 -273 -0,8%
Common assault 100 390 94 286 91 390 94 176 89 956 -4 220 -4,5%
Assault GBH 69 132 64 084 61 509 62 143 60 630 -1 513 -2,4%
Total 210 302 195 258 188 425 197 877 191 842 -6 035 -3,0%
Table 6: Crimes against children younger than 18 years: 2006/2007 – 2010/2011
Crime category 2006/ 2007 2007/ 2008 2008/ 2009 2009/ 2010 2010/ 2011 Difference 2010/2011
vs 2009/2010
% Increase/ decrease
Murder 972 1 015 843 965 906 -59 -6,1%
Attempted murder 889 852 782 1 113 786 -327 -29,4%
All sexual offences 25 428 22 124 20 141 27 417 28 128 711 2,6%
Common assault 16 871 16 091 14 544 14 982 13 387 -1 595 -10,6%
Assault GBH 13 947 13 625 12 422 12 062 11 018 -1 044 -8,7%
Total 58 107 53 707 48 732 56 539 54 225 -2 314 -4,1%
2.1.2 Robberies
2.1.2.1 Common Robbery
Common robbery decreased by -5,9%, from 116.7 per 100 000 to 109.8 per 100 000 of the population. The decrease recorded during 2009/2010 stood at -4,1%.
2.1.2.2 Aggravated Robbery
Aggravated robbery decreased by -12,0% - from 230.6 per 100 000 to 203.0 per 100 000. Except for the -12,2% decrease in attempted murder and the -12,7% decrease in shoplifting, this represents the most significant decrease among the 20 categories of crime in table 1 and exceeds the government target by a considerable margin. It is also the largest decrease in this crime recorded since 2003/2004. The -7,5% decrease in 2009/2010 is the second-largest decrease in aggravated robbery recorded since 2003/2004.
Robbery with aggravating circumstances includes the following subcategories of robbery:
➤ Carjacking;
➤ truck hijacking;
➤ robbery at residential premises (house robbery);
➤ robbery at non-residential premises (business robbery);

SAPS TOGETHER SQUEEZING CRIME to ZEROSAPS Members, My Family - Together Pushing Back The Frontiers Of Evil
ANNUAL REPORT 2010/2011SOUTH AFRICAN POLICE SERVICE
13
➤ cash-in-transit (CIT) robbery;
➤ bank robbery; and
➤ other aggravated robberies not mentioned elsewhere on this list, which are mainly aggravated robberies occurring on the streets and in other public or open spaces. These are described as “street robberies” in this report.
Table 7: Robbery with aggravating circumstances disaggregated according to the percentage contribution of each subtrend in terms of raw figures
Subcategory Cases reported Distribution per
subcategory during
2010/2011
Real case increase / decrease
% increase/ decrease2009/2010 2010/2011
Street/public robbery 64 670 57 951 57,1% -6 719 -10,4%
Robbery at residential premises 18 786 16 889 16,6% -1 897 -10,1%
Robbery at business premises 14 534 14 667 14,5% 133 0,9%
Carjacking 13 902 10 627 10,5% -3 275 -23,6%
Truck hijacking 1 412 999 1,0% -413 -29,2%
CIT robbery 358 291 0,3% -67 -18,7%
Bank robbery 93 39 0,0% -54 -58,1%
Total 113 755 101 463 100,0% -12 292 -10,8%
Figure 3: Different Subcategories of Aggravated Robbery during the 2010/2011 Financial Year (Total Cases 101 463)
Aggravated robbery, despite being a contact crime itself, is also the second-largest generator of other contact crimes, particularly attempted murder and murder. This is because victims are sometimes killed and/or seriously injured during such robberies. The vast majority of house robberies, carjackings, business robberies, truck hijackings, cash-in-transit (CIT) heists and bank robberies are committed with firearms. Shots are frequently fired at victims and may hit them. The victims in many cases return fire in self-defense and may also hit the robbers, or even innocent bystanders. A number of attempted

SAPS TOGETHER SQUEEZING CRIME to ZEROSAPS Members, My Family - Together Pushing Back The Frontiers Of Evil
ANNUAL REPORT 2010/2011SOUTH AFRICAN POLICE SERVICE
14
murders involving people wounded under the above circumstances can consequently be generated during a single case of such robbery.
Calculations based on the figures in table 1 indicate that robbery with aggravating circumstances accounted for 4,9% of all South Africa’s serious crime and 15,9% of its contact crime during the past financial year (see figures 1 and 2). Table 7 and figure 3 depict the following:
➤ The number of cases relating to each subtrend of robbery with aggravating circumstances recorded during the 2009/2010 and 2010/2011 financial years;
➤ the percentage contribution of each subtrend to the total aggravated robbery figure during 2010/2011, ordered from the most important contributor (street/public robbery) to the least (bank robbery);
➤ the increase or decrease in the number of cases recorded for each subtrend; and
➤ the percentage increase or decrease between 2009/2010 and 2010/2011 this represents for each of those subtrends.
Street robbery decreased by a significant (in excess of the target) -10,4% - and that upon significant decreases of -7,4% and -10,4% recorded during 2008/2009 and 2009/2010 respectively. This notwithstanding, it still accounted for the majority (57,1%) of all aggravated robberies recorded during the present reporting period. Since the introduction of the 7 – 10% reduction target in 2004, street or public robbery has decreased from 105 690 cases in 2003/2004 to 57 951 cases during the reporting period of 2010/2011. That represents a decrease of -45,2% or an average of -6,5% per year.
For the first time in six years the TRIO crimes did not experience significant increases or simply a stabilization as recorded during 2009/2010, but decreased by -10,7%. The percentage increases/decreases in street robbery and TRIO crimes since the introduction of the 7-10% reduction target in 2004 are depicted below.
Figure 4: Public or Street Robbery
April to March

SAPS TOGETHER SQUEEZING CRIME to ZEROSAPS Members, My Family - Together Pushing Back The Frontiers Of Evil
ANNUAL REPORT 2010/2011SOUTH AFRICAN POLICE SERVICE
15
Figure 5: Robbery at Residential Premises
April to March
Figure 6: Carjacking
April to March

SAPS TOGETHER SQUEEZING CRIME to ZEROSAPS Members, My Family - Together Pushing Back The Frontiers Of Evil
ANNUAL REPORT 2010/2011SOUTH AFRICAN POLICE SERVICE
16
Figure 7: Robbery at Non-residential Premises
April to March
Table 8: Increases/decreases in Trio crimes
Crime 2004/ 2005 2005/ 2006 2006/ 2007 2007/ 2008 2008/ 2009 2009/ 2010 2010/ 2011
Carjacking -9,9% 3,1% 6,0% 4,4% 5,0% -6,8% -23,6%
House robbery 0,4% 8,3% 25,4% 13,5% 27,3% 1,9% -10,1%
Business robbery -9,7% 32,1% 52,5% 47,4% 41,1% 4,4% 0,9%
It is abundantly clear from the trends depicted above that all three the TRIO crimes, but particularly house and business robberies, had increased significantly over the four years prior to 2009/2010 (that is during 2005/2006, 2006/2007, 2007/2008 and 2008/2009). These increases were followed by a small decrease in carjacking and marginal increases in business and house robberies during 2009/2010 and significant decreases of -23,6% in carjacking and -10,1% in house robbery during the current reporting period (2010/2011). Business robbery increased marginally by 0,9%. Quite often over the past two years different business groupings or associations such as Business Against Crime (BAC), the Consumer Goods Council, etc have already indicated that business robberies are actually on the decrease –and this by significant percentages. However, it should be emphasized that this development only has bearing on members or associates of these business groupings, which are also larger businesses such as e.g. the larger supermarkets and shopping malls. The smaller, single-owner and emerging black businesses in the old CBD areas, townships and even suburbs still remain vulnerable to this kind of crime, which can have a devasting impact on one of the primary job-creating sectors in the RSA. An analysis of 1 995 business robbery cases recorded on the Crime Administration System for the period January – March 2011 revealed that the following types of business were targeted:
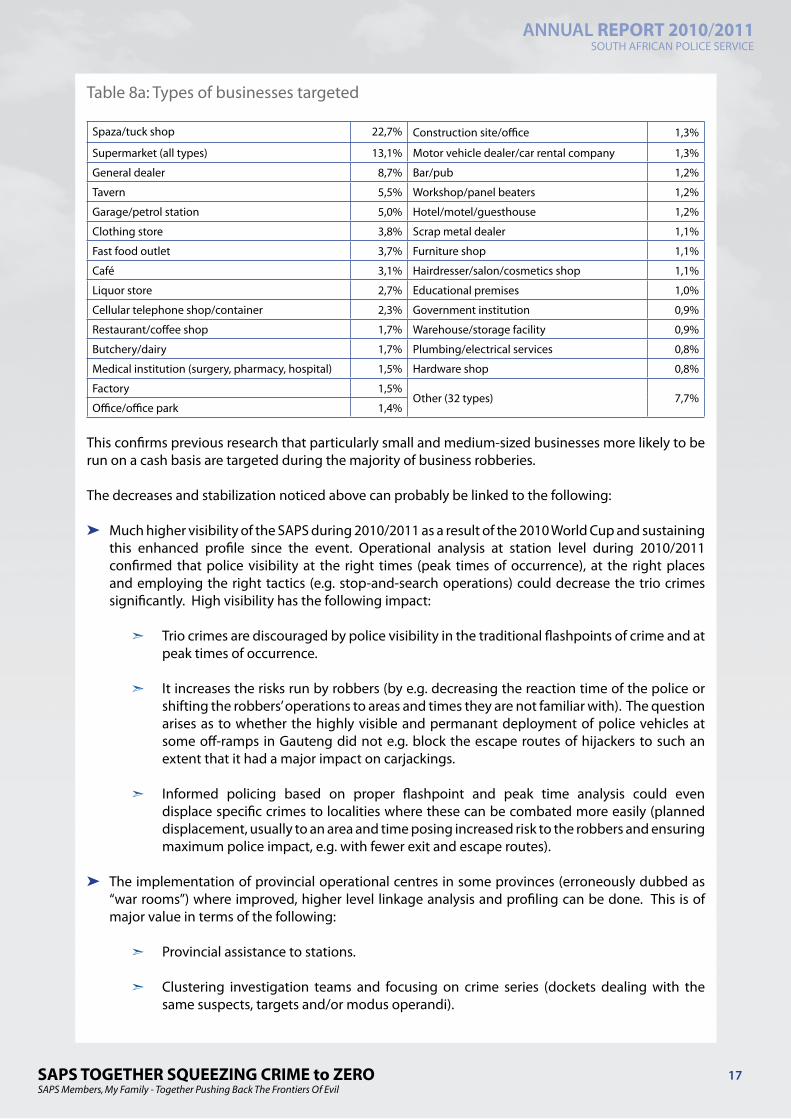
SAPS TOGETHER SQUEEZING CRIME to ZEROSAPS Members, My Family - Together Pushing Back The Frontiers Of Evil
ANNUAL REPORT 2010/2011SOUTH AFRICAN POLICE SERVICE
17
Table 8a: Types of businesses targeted
Spaza/tuck shop 22,7% Construction site/office 1,3%
Supermarket (all types) 13,1% Motor vehicle dealer/car rental company 1,3%
General dealer 8,7% Bar/pub 1,2%
Tavern 5,5% Workshop/panel beaters 1,2%
Garage/petrol station 5,0% Hotel/motel/guesthouse 1,2%
Clothing store 3,8% Scrap metal dealer 1,1%
Fast food outlet 3,7% Furniture shop 1,1%
Café 3,1% Hairdresser/salon/cosmetics shop 1,1%
Liquor store 2,7% Educational premises 1,0%
Cellular telephone shop/container 2,3% Government institution 0,9%
Restaurant/coffee shop 1,7% Warehouse/storage facility 0,9%
Butchery/dairy 1,7% Plumbing/electrical services 0,8%
Medical institution (surgery, pharmacy, hospital) 1,5% Hardware shop 0,8%
Factory 1,5%Other (32 types) 7,7%
Office/office park 1,4%
This confirms previous research that particularly small and medium-sized businesses more likely to be run on a cash basis are targeted during the majority of business robberies.
The decreases and stabilization noticed above can probably be linked to the following:
➤ Much higher visibility of the SAPS during 2010/2011 as a result of the 2010 World Cup and sustaining this enhanced profile since the event. Operational analysis at station level during 2010/2011 confirmed that police visibility at the right times (peak times of occurrence), at the right places and employing the right tactics (e.g. stop-and-search operations) could decrease the trio crimes significantly. High visibility has the following impact:
➣ Trio crimes are discouraged by police visibility in the traditional flashpoints of crime and at peak times of occurrence.
➣ It increases the risks run by robbers (by e.g. decreasing the reaction time of the police or shifting the robbers’ operations to areas and times they are not familiar with). The question arises as to whether the highly visible and permanant deployment of police vehicles at some off-ramps in Gauteng did not e.g. block the escape routes of hijackers to such an extent that it had a major impact on carjackings.
➣ Informed policing based on proper flashpoint and peak time analysis could even displace specific crimes to localities where these can be combated more easily (planned displacement, usually to an area and time posing increased risk to the robbers and ensuring maximum police impact, e.g. with fewer exit and escape routes).
➤ The implementation of provincial operational centres in some provinces (erroneously dubbed as “war rooms”) where improved, higher level linkage analysis and profiling can be done. This is of major value in terms of the following:
➣ Provincial assistance to stations.
➣ Clustering investigation teams and focusing on crime series (dockets dealing with the same suspects, targets and/or modus operandi).

SAPS TOGETHER SQUEEZING CRIME to ZEROSAPS Members, My Family - Together Pushing Back The Frontiers Of Evil
ANNUAL REPORT 2010/2011SOUTH AFRICAN POLICE SERVICE
18
➣ Identification of intelligence collection targets.
The above measures are important in order to ensure that the combating of Trio crimes is not only focused on the runners or foot soldiers committing these crimes, but also on the criminals at higher levels (e.g. the finger men, leaders and receivers). Some kinds of aggravated robbery are more organised than others. Truck-hijacking, carjacking, CIT and bank robbery are much more organised than street robbery and house robbery. If transgressors involved in organised crime are arrested, this will usually have a much more immediate and visible impact on crime.
➤ It is also possible that the application of microdot technology in more and more vehicles is starting to pay off as far as carjackings are concerned.
In table 9 the number of suspects charged in connection with all subcategories of aggravated robbery during 2010/2011 are compared to the number of cases relating to all these subcategories of aggravated robbery registered over the same period.
Table 9: Suspects charged in connection with aggravated robbery: 2010/2011
Subcategory of robbery Cases of aggravated robbery per
subcategory for 2010/2011
Number of suspects charged during
2010/2011
Suspects charged as % of cases registered
Street/public robbery 57 951 12 948 22,3%
House robbery 16 889 5 334 31,6%
Business robbery 14 667 4 540 31,0%
Carjacking 10 627 1 961 18,5%
Truckjacking 999 204 20,4%
Cash in transit robbery 291 60 20,6%
Bank robbery 39 30 76,9%
Total Aggravated Robbery 101 463 25 077 24,7%
It should be emphasized that all the suspects charged in connection with the indicated crimes during the 2010/2011 financial year are not always linked to cases registered during this specific financial year. Some suspects may have been charged in connection with cases registered during previous financial years. The table is presented in this specific way simply to indicate the proportionality of successes against the extent of the crimes. The following should also be noted:
➤ Some of the suspects may have been charged in connection with a whole series of cases. All these robberies are usually repeat crimes. Very few perpetrators will commit such crime on a once-off basis. Where proper linkage analysis is done, it is not out of the ordinary to link a perpetrator or group of perpetrators to 30 – 40 case dockets over a relatively brief period of time. It will thus not be correct to make the deduction that if there had been 16 889 house robberies in 2010/2011 and during the same year 5 334 suspects were arrested, arrests had been made in 31,6% of the cases, while no arrests were made in 68,4% of the cases. The reasons are as follows:
➣ Some of those charged may have been arrested in connection with a whole series of crimes.
➣ A number of suspects may be charged in connection with only one robbery.
➣ One suspect or group thus charged may also have been responsible for a whole range of other cases included in the figures for aggravated robbery, but could possibly not be linked to all of them.

SAPS TOGETHER SQUEEZING CRIME to ZEROSAPS Members, My Family - Together Pushing Back The Frontiers Of Evil
ANNUAL REPORT 2010/2011SOUTH AFRICAN POLICE SERVICE
19
What the table is actually illustrating, is that quite a number of suspects committing aggravated robbery are charged. If it is accepted that these very same suspects had also committed cases with which they were not linked and thus not charged, it may very well be that the 25 077 suspects charged could have committed a majority of the 101 463 cases of aggravated robbery. It is at least evident from research that each aggravated robbery is not committed by a different robber or group of robbers.
Research and operational analysis over the past five–seven years indicated that aggravated robberies can be committed by different types of perpetrators. This could range from a single perpetrator acting wholly on his own, right through to groups of 10–15 or even more perpetrators. Such a perpetrator or perpetrators could also either act on their own or operate upon instruction or also to the benefit of others as part of organized crime. Perpetrators may thus commit aggravated robberies as part of a bigger syndicate with higher levels of command; simply supply such a syndicate with contraband without actually being part of it; or may commit their crime in response to orders for specific types of contraband emanating from a syndicate not (at least directly) linked to the actual perpetrators at all. The following findings are relevant to this discussion:
➤ Most street robbers operate at street level in central business districts (CBDs) and megatownships as individuals or in extremely small groups. They mainly rob cash or cellular telephones and in some cases small, expensive articles such as watches. This subcategory of aggravated robbery is in all probability in most cases not organized at all. The only contact point with organized crime could in many cases be if cellular telephones and/or other small items (such as jewellery or laptop computers) are sold to given receivers on a regular basis.
➤ Most house robbers operate in small (two–three person) groups, often with a single firearm, selecting their targets on the basis of appearances (an impression that a target may offer rich pickings). They rob mainly between 22:00 and 04:00 at night, because they want their victims present in order to open safes and/or hand over cash, cellular telephones or jewellery. Most of them have no contact with a next level of receivers, meaning that this crime can rarely be described as truly organized crime. House robbery is only an organized crime if the robbers strike with a specific target in mind and in response to prior intelligence, i.e. when they are sent by somebody at a higher level to a specific address in order to rob some specific items (e.g. the Rolex gang/s).
➤ Business robbers can basically be divided into two categories. Most of them rob small and even unregistered businesses (e.g. spaza shops and shebeens), but also sometimes targeting medium-sized businesses. Their loot consists mainly of cash, cellular telephones and other small items that can easily be informally traded. That is why they frequently rob cash-based businesses in residential areas or even enterprises run from residences as such. The perpetrators may even be the same criminals also commiting house robbery. This category of business robbers is in most cases neither organized themselves, nor linking up with organized crime at a higher level.
A smaller category of business robbers rob medium-sized to large stores or businesses. These groups of frequently 10-15 members operate in very much the same way than CIT robbers. Their targets are specifically cash in bulk, jewellery, expensive computer or other electronic equipment, stocks of cellular telephones, etc. Like CIT robbers, these groups are more organized and will either link up with or be part of higher levels of organized crime.
➤ Carjackers mostly differ from the groups above. They are usually part of hijacking syndicates or serve as suppliers to highly-organized syndicates at a higher level of organized crime. Most carjackings are committed with the following in mind:
➣ Exporting the vehicles to another country.
➣ Cloning the vehicles and re-entering them into the legal market.

SAPS TOGETHER SQUEEZING CRIME to ZEROSAPS Members, My Family - Together Pushing Back The Frontiers Of Evil
ANNUAL REPORT 2010/2011SOUTH AFRICAN POLICE SERVICE
20
➣ Dismantling the vehicles for spare parts.
To achieve the above aims with hijacked vehicles (particularly the first two), requires the involvement of organized crime. It can only succeed with higher-level planning; corruption of Police, Home affairs, SARS and licencing officials; and will involve money laundering.
According to table 1, CIT robberies and bank robberies decreased by 67 and 54 cases respectively. That translates into a -18,7% decrease in CIT robberies (from 358 cases in 2009/2010 to 291 cases in 2010/2011) and a -58,1% decrease in bank robbery (from 93 cases in 2009/2010 to 39 cases in 2010/2011). The success represented by the arrests of 60 CIT and 30 bank robbery suspects during the reporting period increased the risks faced by those committing these types of crime and probably played a significal role in the decrease of the statistics. However, this probably also caused upward pressure on another and related crime, namely ATM blasts.
There is no specific common law crime defining ATM bombings. Depending on the circumstances of each case, these crimes can be registered under one or a combination of the following felonies: Murder, attempted murder, aggravated robbery, malicious damage to property, theft and transgressions of different sections of the Explosives Act. SABRIC keeps a database on ATM bombings, which are reported to them by their members in the banking fraternity. They share the information with all relevant stakeholders, including the SAPS. According to the SABRIC database, an increase of 152 incidents (61,5%) related to ATM bombings was recorded between 2009/2010 and 2010/2011. This is of particular concern because the increase follows upon significant decreases over the preceding two financial years. From 2007/2008 to 2008/2009 a -10,2% decrease (from 431 cases to 387 cases) and between 2008/2009 and 2009/2010 a -36,2% decrease (from 378 to 247 cases) was recorded. Most ATM bombings (57,1%) occurred in Gauteng, followed by North West (12,4%), Limpopo (10,4%) and Mpumalanga (10,4%). Those recorded in the latter three provinces mainly occurred in areas of those provinces bordering on Gauteng.
To conclude the sections on robberies and social contact crimes, it should be emphasized that trio crimes were reduced by -10,7%, from 47 222 cases to 42 183. This is well above the governments target of a 7–10% decrease. In the case of all contact crime, a -6,9% decrease (from 1 371.4 per 100 000 to 1 277.2 per 100 000) was achieved - actually meaning that the bottom line of the target was achieved. It is particularly the complexity of the social contact crimes which prevented achievement of a larger reduction in contact crime. A larger reduction will only be achieved if all relevant Government departments, NGOs and the community work hand-in-glove to change people’s lifestyle.
2.2 Contact-related Crime
Contact-related crimes cover the crimes of arson and malicious damage to property, which accounted for 6,4% of all serious crime reported during 2010/2011. Such crimes can flow from either individual behaviour (someone in bad faith causing damage to another person’s property for whatever reason) or from collective behaviour (a group of people going on the rampage as a result of industrial action; out of frustration with e.g. trains running late or a lack of service delivery; or from being swept along by a frenzy of e.g. xenophobic fury). In this regard it has to be kept in mind that if a train is set alight, a charge of malicious damage to property will be registered, as arson usually only occurs when immovable property is set alight. This may partly explain the large difference in the reported figures of the two crimes under discussion. According to tables 1 and 10, the incidence of arson decreased by -3,7%, while malicious damage to property decreased by -6,4% since the previous financial year. Compared to figures for 2003/2004, arson has decreased by -31,1% over the past seven financial years and malicious damage to property by -26,5%.

SAPS TOGETHER SQUEEZING CRIME to ZEROSAPS Members, My Family - Together Pushing Back The Frontiers Of Evil
ANNUAL REPORT 2010/2011SOUTH AFRICAN POLICE SERVICE
21
Table 10: A comparison of the decreases in the ratios of recorded contact-related crimes between 2009/2010 and 2010/2011
Crime Category Financial year 2009/2010 Financial year 2010/2011
Arson -3,5% -3,7%
Malicious damage to property -2,9% -6,4%
The seriousness of the crimes under discussion is often overlooked. Deliberate destruction of or damage to sophisticated – and even not that sophisticated – equipment can cause disruption and losses running into millions to both the private and the public sector in material terms alone. It may e.g. ruin some concerns, with an attendant loss of employment opportunities and concomitant effects on the rest of society.
In a similar vein, deliberate (or even negligently started) veld or forest fires (whether resulting from pure maliciousness, intended as an act of intimidation, meant as revenge or originating from whatever purpose the criminals involved could devise) can have unforeseen consequences. The ensuing costs not only result from the direct damage incurred, but possible loss of life and also the efforts spent on preventing and combating such fires. The damage itself could be far-reaching and such fires might rage over literally hundreds of kilometres, engulfing and sometimes completely destroying heritage sites; productive farmland (often leaving both small-scale and commercial farmers totally devastated); invaluable natural resources (including sensitive elements of biodiversity); and other irreplaceable assets. The direct and indirect suffering to human beings and animals caused by such wanton destruction is literally incalculable.
2.3 Property-related Crimes
This category of crime includes burglary at residential and non-residential premises, theft of motor vehicles and motorcycles, theft out of or from motor vehicles and stock-theft. These crimes (except in some cases of theft out of or from vehicles and burglary) mainly occur in the absence of the victims (or the latter being unaware of the occurrence) and therefore involve no violence other than damage to property in some cases. The figures contained in table 1 indicate that property-related crime accounted for 25,8% of all reported serious crime during 2010/2011. The percentage decreases/increases of the crime ratios between 2009/2010 and 2010/2011 are ordered from the most significant decrease to the least in table 11. The figures are also compared to the corresponding decreases/increases recorded between 2008/2009 and 2009/2010. From the table it is evident that four of the five trends of property-related crime reflected noteworthy decreases (ranging from a remarkable -11,3% in the case of theft of motor vehicles to a still significant -4,8% in that of burglary at residential premises). Three of these trends, namely burglaries at both residential and non-residential premises and stock-theft, had still increased during 2009/2010. Although theft of motor vehicles and motorcycles had already decreased during the latter period, the decrease almost doubled during 2010/2011. Only theft out of or from motor vehicle increased marginally during the current reporting period, after also increasing by a significant 8,9% during 2009/2010.
The improved economic situation during 2010/2011, following upon two years of recession and the high levels of police visibility referred to earlier, probably go a long way to explain the significant decreases in property-related crime.

SAPS TOGETHER SQUEEZING CRIME to ZEROSAPS Members, My Family - Together Pushing Back The Frontiers Of Evil
ANNUAL REPORT 2010/2011SOUTH AFRICAN POLICE SERVICE
22
Table 11: A comparison of the decreases and increases in the ratios of recorded property-related crime between 2009/2010 and 2010/2011
Crime category Financial year 2009/2010 Financial year 2010/2011
Theft of motor vehicle and motorcycle -6,7% -11,3%
Stock-theft 6,5% -8,2%
Burglary at non-residential premises 1,2% -5,0%
Burglary at residential premises 2,7% -4,8%
Theft out of or from motor vehicle 8,9% 0,4%
The -5,0% decrease in the ratio of burglary at non-residential premises (mainly businesses and specifically small to medium-sized businesses) during 2010/2011 was a first decrease in five years. This crime increased by 6,3%, 6,8%, 9,2% and 1,2% during 2006/2007, 2007/2008, 2008/2009 and 2009/2010 respectively. Previous analysis indicated that burglary at business (non-residential) premises is more likely to be of an organized nature (e.g. to systematically steal computer equipment) than a crime of need. The same applies to theft of motor vehicles, which decreased systematically by an overall figure of -26,8% since 2003/2004 (from 88 144 cases in 2003/2004 to 64 504 cases in 2010/2011).
Research done by Business Against Crime (BAC) as well as international studies indicated that the more motor vehicles are stolen, the more the targets are hardened by installing additional and increasingly sophisticated security or anti-theft devices and systems. At first only associated with the more expensive and luxurious models, the technology has since also become a feature of the less expensive models. Short-term insurance companies also played a role in this development by constantly increasing the security requirements pertaining to less expensive models. (Tracking devices were e.g. a few years ago only compulsory in vehicles costing R300 000-00 or more. Within two-three years this amount was lowered to R200 000-00). The result is that the latest vehicles cannot easily be stolen anymore and now have to be hijacked by criminals. Not surprisingly, this contributed to a decrease in motor vehicle theft and an increase in hijackings.
The single largest decrease among the four property-related crimes during 2010/2011 was that in the occurrence of stock-theft. In effect, stock-theft decreased from a 6,5% increase during 2009/2010 to a -8,2% decrease in 2010/2011, which effectively translates into a -14,7% decrease. Furthermore, neither the high police visibility during the Confederation Cup and the World Cup nor the sustained visibility since the World Cup will have had much influence on stock-theft - which mainly occurs on farms (50,0%) and communal land (17,5%) and much less frequently in residential areas (11,6% in formal residential and 9,7% in informal residential areas).
Analysis by Crime Research and Statistics at Crime Intelligence indicates that stock-theft occurs under many different circumstances and with divergent motives. It seems as if so-called “pot slaughtering”, involving the theft of a single (usually smaller) animal such as a sheep or goat for consumption by the perpetrators and/or their kin, with the skin and entrails left at the scene of crime, still accounts for the single largest proportion of stock-theft (at least a third of cases). This is in all probability the proportion of stock-theft also accounting for the largest increases during the economically difficult years of 2008/2009 and 2009/2010 and the subsequent decrease during 2010/2011.
Although the research indicates that in less than 1,0% of the dockets analysed the thefts had occurred from land bordering on a foreign country and/or involved animals recovered from a foreign country, the redeployment of the SANDF along the international borders may also contribute to the reduction of stock-theft.
Since 2009/2010 stock-theft has again become a priority of the SAPS, particularly because of the importance of stock-farming to the maintainance of food security and its prominent role among the emerging black farmers. In traditional communal areas, stock (particularly cattle) are not only important

SAPS TOGETHER SQUEEZING CRIME to ZEROSAPS Members, My Family - Together Pushing Back The Frontiers Of Evil
ANNUAL REPORT 2010/2011SOUTH AFRICAN POLICE SERVICE
23
in a commercial sense. Theft of cattle could not only destroy the livelihood of the farmers or owners, but deeply affect their traditions and culture (particularly with regard to the customs associated with important events such as death and marriage).
2.4 Other Serious Crime
Other serious crime, which accounted for 25,8% of South Africa’s total serious crime during the reporting period, includes all theft not mentioned elsewhere, commercial crime and shoplifting.
All theft not mentioned elsewhere (also called “other theft”) basically refers to all theft excluding theft of motor vehicles and motorcycles, theft out of or from motor vehicles, housebreaking at both residential and non-residential premises and stock-theft (i.e. the felonies classified as property-related crime). With 368 095 registered cases during 2010/2011, this is the single largest category of crime, accounting for 17,8% of the combined figure for the 20 categories of serious crime featuring in table 1.
Although marginally decreasing by -1,2% during the current reporting period (2010/2011 financial year), this has to be considered against the background of quite significant decreases in other theft over the preceding years (2007/2008, 2008/2009 and 2009/2010). It seems as if theft of particularly computers or laptop computers, cellular telephones and non-ferrous metals accounts for considerable upward pressure as far as this category of crime is concerned. The items stolen during other thefts include anything not covered by the definitions of property-related crimes, but the crime mainly involves stealing of smaller items ranging from an engagement ring to a nearly worthless piece of hosepipe. Such items in most cases are easy to carry, can sometimes be used by the thieves themselves and are easy to hide or sell. If other theft is not committed in an organized fashion, the proceeds thus generated provide some people with the little money or few commodities they need to survive from day-to-day 4. This nothwithstanding, the impact of other theft (of even seemingly insignificant items) on individuals and society is sometimes severe. This is all the more the case if infrastructure is damaged in the process. In such cases other theft may assume the proportions of sabotage and result in other crimes of a most extreme nature.
Table 12: A comparison of the decreases and increases in the ratios of recorded other serious crime between 2009/2010 and 2010/2011
Crime category Financial year 2009/2010 Financial year 2010/2011
Shoplifting 8,3% -12,7%
All theft not mentioned elsewhere -8,0% -1,2%
Commercial crime 8,1% 2,8%
The significant decrease of -12,7% in shoplifting during 2010/2011, following upon alarming increases of 18,5% in 2008/2009 and 8,3% in 2009/2010, is a clear indication that South Africa has made progress in surmounting the recession period. However, commercial crime, with a 2,8% increase, is continuing to experience a steady (and significant) upward trend noted since 2005/2006. This is illustrated below:
Table 13: The steady increase in commercial crime
2006/2007 2007/2008 2008/2009 2009/2010 2010/2011
12,6% 4,8% 16,6% 8,1% 2,8%
The above table reflects an overall increase of 52,9% in commercial crime over a period of five years. This constant increase can in all probability be ascribed to a combination of the following factors:
4 A more comprehensive and detailed discussion of the items stolen during other thefts appeared in the SAPS Annual Report for 2007/2008.

SAPS TOGETHER SQUEEZING CRIME to ZEROSAPS Members, My Family - Together Pushing Back The Frontiers Of Evil
ANNUAL REPORT 2010/2011SOUTH AFRICAN POLICE SERVICE
24
The increasing role of computerization and electronic communication in commercial activity; the globalization of commercial crime; the influx of foreign visitors to South Africa (particularly during 2008/2009 and 2009/2010); and the fact that conventional policing (for example police visibility) will not have an influence on so-called cybercrime.
2.5 Crime Detected as a Result of Police Action
The crimes fitting this category are the following:
➤ Illegal possession of firearms.
➤ Drug-related crimes (these cover both the use, possession of and dealing in drugs).
➤ Driving under the influence of alcohol or drugs.
The above crimes are usually not reported to the police by members of the public. These crimes come to attention primarily as a result of police activities such as roadblocks, searches and intelligence collection. An increase in these crimes may actually indicate that the police are more active, whereas a decrease may indicate reduced police activity. Other explanations may also exist for decreases and increases observed in relation to these crimes. Decreases may e.g. result from a change in strategy among gunrunners and drug peddlers (e.g. to avoid roadblocks), a real decrease in these phenomena, or the impact of previous actions such as “arrive alive” campaigns on people’s drinking and driving behaviour. Crimes heavily dependent on police action for detection are also indicators of the availability or presence of some of the generators of crime (particularly socially-motivated contact crimes). However, an increase in illegal possession of firearms and drug-related crime cases might not necessarily indicate an increase in the volumes of illegal firearms or drugs available in society. Similarly, a decrease does not necessarily indicate shrinking quantities of such firearms and drugs.
Table 14: A comparison of the decreases and increases in the recorded ratios of crime detected as a result of police action between 2009/2010 and 2010/2011
Crime category Financial year 2009/2010 Financial year 2010/2011
Illegal possession of firearms and ammunition 2,4% -2,0%
Driving under the influence of alcohol or drugs 10,6% 4,5%
Drug-related crime 13,6% 10,2%
In the case of crimes detected as a result of police action, an increase is considered as positive. The increases of 10,2% and 4,5% in drug-related crime and driving under the influence of alcohol or drugs respectively should therefore be seen as a welcome development. Since 2003/2004 drug-related crime increased by 123,0% and driving under the influence by 148,4%. A serious question arising from the increase in drug-related crime is whether this should mainly be attributed to increasingly effective intelligence-led policing or also points to a major increase in the availability of drugs in South Africa.
3. The Provincial Crime SituationThe provincial serious crime ratios for the 20 serious crimes under consideration during the 2009/2010 and 2010/2011 financial years, as well as the percentage decreases and increases calculated on the basis of these ratios, are reflected in table 15. This table and the crime figures in tables 16 - 24 as well as on the South African Police Service website (www.saps.gov.za) are self-explanatory. Only a few comments are therefore made in this section on increases and decreases in the provincial incidence of crime. The focus is on the most serious contact crimes and some subtrends of aggravated robbery.
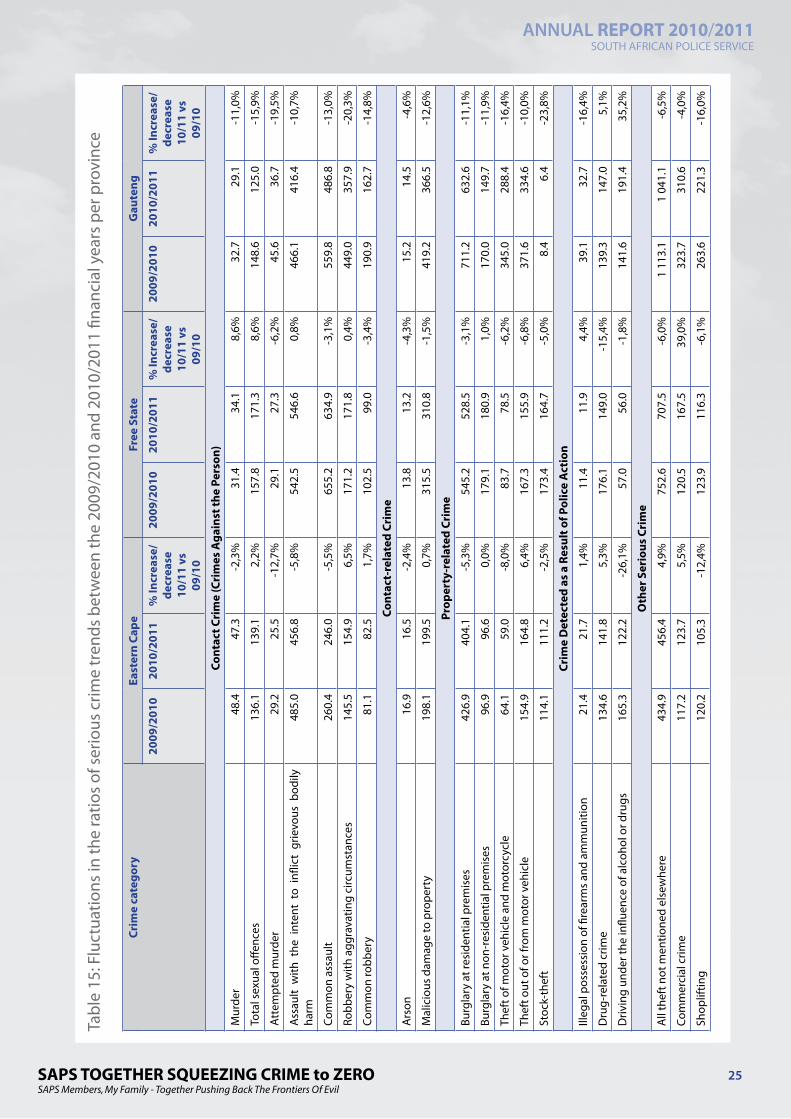
SAPS TOGETHER SQUEEZING CRIME to ZEROSAPS Members, My Family - Together Pushing Back The Frontiers Of Evil
ANNUAL REPORT 2010/2011SOUTH AFRICAN POLICE SERVICE
25
Tabl
e 15
: Flu
ctua
tions
in th
e ra
tios
of s
erio
us c
rime
tren
ds b
etw
een
the
2009
/201
0 an
d 20
10/2
011
finan
cial
yea
rs p
er p
rovi
nce
Crim
e ca
tego
ryEa
ster
n Ca
peFr
ee S
tate
Gau
teng
2009
/201
020
10/2
011
% In
crea
se/
decr
ease
10
/11
vs
09/1
0
2009
/201
020
10/2
011
% In
crea
se/
decr
ease
10
/11
vs
09/1
0
2009
/201
020
10/2
011
% In
crea
se/
decr
ease
10
/11
vs
09/1
0
Cont
act C
rim
e (C
rim
es A
gain
st th
e Pe
rson
)
Mur
der
48.4
47.3
-2,3
%31
.434
.18,
6%32
.729
.1-1
1,0%
Tota
l sex
ual o
ffenc
es13
6.1
139.
12,
2%15
7.8
171.
38,
6%14
8.6
125.
0-1
5,9%
Att
empt
ed m
urde
r29
.225
.5-1
2,7%
29.1
27.3
-6,2
%45
.636
.7-1
9,5%
Ass
ault
with
the
int
ent
to i
nflic
t gr
ievo
us b
odily
ha
rm48
5.0
456.
8-5
,8%
542.
554
6.6
0,8%
466.
141
6.4
-10,
7%
Com
mon
ass
ault
260.
424
6.0
-5,5
%65
5.2
634.
9-3
,1%
559.
848
6.8
-13,
0%
Robb
ery
with
agg
rava
ting
circ
umst
ance
s14
5.5
154.
96,
5%17
1.2
171.
80,
4%44
9.0
357.
9-2
0,3%
Com
mon
robb
ery
81.1
82.5
1,7%
102.
599
.0-3
,4%
190.
916
2.7
-14,
8%
Cont
act-
rela
ted
Crim
e
Ars
on
16.9
16.5
-2,4
%13
.813
.2-4
,3%
15.2
14.5
-4,6
%
Mal
icio
us d
amag
e to
pro
pert
y19
8.1
199.
50,
7%31
5.5
310.
8-1
,5%
419.
236
6.5
-12,
6%
Prop
erty
-rel
ated
Cri
me
Burg
lary
at r
esid
entia
l pre
mis
es42
6.9
404.
1-5
,3%
545.
252
8.5
-3,1
%71
1.2
632.
6-1
1,1%
Burg
lary
at n
on-r
esid
entia
l pre
mis
es96
.996
.60,
0%17
9.1
180.
91,
0%17
0.0
149.
7-1
1,9%
Thef
t of m
otor
veh
icle
and
mot
orcy
cle
64.1
59.0
-8,0
%83
.778
.5-6
,2%
345.
028
8.4
-16,
4%
Thef
t out
of o
r fro
m m
otor
veh
icle
154.
916
4.8
6,4%
167.
315
5.9
-6,8
%37
1.6
334.
6-1
0,0%
Stoc
k-th
eft
114.
111
1.2
-2,5
%17
3.4
164.
7-5
,0%
8.4
6.4
-23,
8%
Crim
e D
etec
ted
as a
Res
ult o
f Pol
ice
Act
ion
Illeg
al p
osse
ssio
n of
fire
arm
s an
d am
mun
ition
21.4
21.7
1,4%
11.4
11.9
4,4%
39.1
32.7
-16,
4%
Dru
g-re
late
d cr
ime
134.
614
1.8
5,3%
176.
114
9.0
-15,
4%13
9.3
147.
05,
1%
Driv
ing
unde
r the
influ
ence
of a
lcoh
ol o
r dru
gs16
5.3
122.
2-2
6,1%
57.0
56.0
-1,8
%14
1.6
191.
435
,2%
Oth
er S
erio
us C
rim
e
All
thef
t not
men
tione
d el
sew
here
434.
945
6.4
4,9%
752.
670
7.5
-6,0
%1
113.
11
041.
1-6
,5%
Com
mer
cial
crim
e11
7.2
123.
75,
5%12
0.5
167.
539
,0%
323.
731
0.6
-4,0
%
Shop
liftin
g12
0.2
105.
3-1
2,4%
123.
911
6.3
-6,1
%26
3.6
221.
3-1
6,0%

SAPS TOGETHER SQUEEZING CRIME to ZEROSAPS Members, My Family - Together Pushing Back The Frontiers Of Evil
ANNUAL REPORT 2010/2011SOUTH AFRICAN POLICE SERVICE
26
Crim
e ca
tego
ryKw
aZul
u-N
atal
Lim
popo
Mpu
mal
anga
2009
/201
020
10/2
011
% In
crea
se/
decr
ease
10
/11
vs
09/1
0
2009
/201
020
10/2
011
% In
crea
se/
decr
ease
10
/11
vs
09/1
0
2009
/201
020
10/2
011
% In
crea
se/
decr
ease
10
/11
vs
09/1
0
Cont
act C
rim
e (C
rim
es A
gain
st th
e Pe
rson
)
Mur
der
40.4
35.2
-12,
9%14
.612
.2-1
6,4%
24.3
20.0
-17,
7%
Tota
l sex
ual o
ffenc
es12
7.0
120.
2-5
,4%
93.8
89.8
-4,3
%12
7.6
122.
8-3
,8%
Att
empt
ed m
urde
r44
.236
.8-1
6,7%
13.9
12.0
-13,
7%34
.022
.7-3
3,2%
Ass
ault
with
the
inte
nt to
infli
ct g
rievo
us b
odily
ha
rm29
5.6
287.
3-2
,8%
254.
823
7.8
-6,7
%43
9.8
399.
0-9
,3%
Com
mon
ass
ault
315.
630
3.1
-4,0
%17
1.0
149.
3-1
2,7%
310.
628
5.8
-8,0
%
Robb
ery
with
agg
rava
ting
circ
umst
ance
s22
2.4
183.
9-1
7,3%
56.8
50.8
-10,
6%18
3.3
153.
4-1
6,3%
Com
mon
robb
ery
76.4
68.8
-9,9
%62
.957
.5-8
,6%
110.
098
.0-1
0,9%
Cont
act-
rela
ted
Crim
e
Ars
on
11.5
10.7
-7,0
%11
.810
.4-1
1,9%
15.9
11.2
-29,
6%
Mal
icio
us d
amag
e to
pro
pert
y16
0.7
155.
7-3
,1%
116.
410
6.2
-8,8
%22
7.6
199.
2-1
2,5%
Prop
erty
-rel
ated
Cri
me
Burg
lary
at r
esid
entia
l pre
mis
es38
6.6
371.
5-3
,9%
267.
424
6.7
-7,7
%53
6.5
500.
7-6
,7%
Burg
lary
at n
on-r
esid
entia
l pre
mis
es10
8.3
103.
2-4
,7%
119.
610
8.0
-9,7
%15
3.6
144.
7-5
,8%
Thef
t of m
otor
veh
icle
and
mot
orcy
cle
109.
699
.5-9
,2%
20.9
16.4
-21,
5%90
.176
.1-1
5,5%
Thef
t out
of o
r fro
m m
otor
veh
icle
136.
114
9.8
10,1
%66
.463
.8-3
,9%
178.
218
5.2
3,9%
Stoc
k-th
eft
76.2
69.5
-8,8
%29
.730
.63,
0%92
.380
.4-1
2,9%
Crim
e D
etec
ted
as a
Res
ult o
f Pol
ice
Act
ion
Illeg
al p
osse
ssio
n of
fire
arm
s an
d am
mun
ition
47.5
47.6
0,2%
8.8
7.4
-15,
9%17
.215
.0-1
2,8%
Dru
g-re
late
d cr
ime
274.
630
4.9
11,0
%92
.585
.2-7
,9%
56.6
87.8
55,1
%
Driv
ing
unde
r the
influ
ence
of a
lcoh
ol o
r dru
gs11
4.2
95.0
-16,
8%42
.550
.218
,1%
58.8
74.6
26,9
%
Oth
er S
erio
us C
rim
e
All
thef
t not
men
tione
d el
sew
here
448.
747
2.3
5,3%
307.
229
7.5
-3,2
%64
7.9
654.
21,
0%
Com
mer
cial
crim
e13
1.8
143.
58,
9%57
.558
.11,
0%12
9.8
127.
4-1
,8%
Shop
liftin
g14
7.4
120.
4-1
8,3%
85.5
71.9
-15,
9%10
9.4
100.
1-8
,5%

SAPS TOGETHER SQUEEZING CRIME to ZEROSAPS Members, My Family - Together Pushing Back The Frontiers Of Evil
ANNUAL REPORT 2010/2011SOUTH AFRICAN POLICE SERVICE
27
Crim
e ca
tego
ryN
orth
Wes
tN
orth
ern
Cape
Wes
tern
Cap
e
2009
/201
020
10/2
011
% In
crea
se/
decr
ease
10
/11
vs
09/1
0
2009
/201
020
10/2
011
% In
crea
se/
decr
ease
10
/11
vs
09/1
0
2009
/201
020
10/2
011
% In
crea
se/
decr
ease
10
/11
vs
09/1
0
Cont
act C
rim
e (C
rim
es A
gain
st th
e Pe
rson
)
Mur
der
21.5
23.2
7,
9%33
.231
.0-6
,6%
42.4
44.2
4,2%
Tota
l sex
ual o
ffenc
es13
7.9
147.
06,
6%16
0.8
169.
25,
2%18
0.7
178.
0-1
,5%
Att
empt
ed m
urde
r24
.322
.0-9
,5%
62.0
58.8
-5,2
%31
.941
.429
,8%
Ass
ault
with
the
inte
nt to
infli
ct g
rievo
us b
odily
ha
rm42
1.9
439.
94,
3%83
0.7
815.
5-1
,8%
449.
247
3.3
5,4%
Com
mon
ass
ault
257.
724
3.2
-5,6
%48
5.7
461.
9-4
,9%
642.
363
7.0
-0,8
%
Robb
ery
with
agg
rava
ting
circ
umst
ance
s15
7.1
158.
71,
0%90
.480
.7-1
0,7%
234.
123
4.5
0,2%
Com
mon
robb
ery
87.2
85.6
-1,8
%11
7.2
106.
5-9
,1%
176.
819
9.1
12,6
%
Cont
act-
rela
ted
Crim
e
Ars
on
12.2
15.7
28,7
%14
.616
.110
,3%
11.2
12.1
8,0%
Mal
icio
us d
amag
e to
pro
pert
y20
4.2
199.
8-2
,2%
270.
625
3.2
-6,4
%45
6.1
446.
7-2
,1%
Prop
erty
-rel
ated
Cri
me
Burg
lary
at r
esid
entia
l pre
mis
es43
1.6
461.
77,
0%48
3.6
452.
5-6
,4%
808.
383
8.5
3,7%
Burg
lary
at n
on-r
esid
entia
l pre
mis
es15
5.4
155.
80,
3%19
4.9
184.
4-5
,4%
215.
522
1.7
2,9%
Thef
t of m
otor
veh
icle
and
mot
orcy
cle
77.5
76.8
-0,9
%21
.122
.35,
7%18
7.4
174.
2-7
,0%
Thef
t out
of o
r fro
m m
otor
veh
icle
151.
217
0.3
12,6
%16
2.7
191.
217
,5%
660.
269
7.8
5,7%
Stoc
k-th
eft
91.2
85.2
-6,6
%15
4.1
143.
9-6
,6%
20.7
19.0
-8,2
%
Crim
e D
etec
ted
as a
Res
ult o
f Pol
ice
Act
ion
Illeg
al p
osse
ssio
n of
fire
arm
s an
d am
mun
ition
11.3
11.7
3,5%
4.4
5.5
25,0
%40
.748
.819
,9%
Dru
g-re
late
d cr
ime
223.
322
3.9
0,3%
206.
621
9.0
6,0%
1 12
7.7
1 35
1.3
19,8
%
Driv
ing
unde
r the
influ
ence
of a
lcoh
ol o
r dru
gs63
.150
.6-1
9,8%
112.
095
.4-1
4,8%
292.
033
0.1
13,0
%
Oth
er S
erio
us C
rim
e
All
thef
t not
men
tione
d el
sew
here
554.
660
2.9
8,7%
647.
858
0.1
-10,
5%1
616.
31
626.
90,
7%
Com
mer
cial
crim
e14
9.2
140.
0-6
,2%
99.7
103.
43,
7%21
8.4
227.
64,
2%
Shop
liftin
g80
.077
.5-3
,1%
192.
114
8.6
-22,
6%38
2.7
359.
2-6
,1%

SAPS TOGETHER SQUEEZING CRIME to ZEROSAPS Members, My Family - Together Pushing Back The Frontiers Of Evil
ANNUAL REPORT 2010/2011SOUTH AFRICAN POLICE SERVICE
28
3.1 Social Contact Crime
Table 16: Murder ratios sorted from highest decreases to highest increases between 1 April 2010 and 31 March 2011
Province 2009/2010 2010/2011 Increase/Decrease
RSA 34.1 31.9 -6,5%
Mpumalanga 24.3 20.0 -17,7%
Limpopo 14.6 12.2 -16,4%
KwaZulu-Natal 40.4 35.2 -12,9%
Gauteng 32.7 29.1 -11,0%
Northern Cape 33.2 31.0 -6,6%
Eastern Cape 48.4 47.3 -2,3%
Western Cape 42.4 44.2 4,2%
North West 21.5 23.2 7,9%
Free State 31.4 34.1 8,6%
From table 16 it is evident that the highest ratio of reported murder during 2010/2011 was recorded in the Eastern Cape, followed by the Western Cape, KwaZulu-Natal and the Free State. Mpumalanga, Limpopo, KwaZulu-Natal and Gauteng exceeded the -8,5% reduction target. The Northern Cape (with a -6,6% reduction) and the Eastern Cape (with a -2,3% reduction) did not achieve the -8,5% reduction target, while the Western Cape, North West and Free State experienced increases in murder of 4,2%; 7,9% and 8,6% respectively.
Table 17: Ratios of all sexual offences5 from highest decreases to highest increases between 1 April 2010 and 31 March 2011
Province 2009/2010 2010/2011 Increase/Decrease
RSA 138.5 132.4 -4,4%
Gauteng 148.6 125.0 -15,9%
KwaZulu-Natal 127.0 120.2 -5,4%
Limpopo 93.8 89.8 -4,3%
Mpumalanga 127.6 122.8 -3,8%
Western Cape 180.7 178.0 -1,5%
Eastern Cape 136.1 139.1 2,2%
Northern Cape 160.8 169.2 5,2%
North West 137.9 147.0 6,6%
Free State 157.8 171.3 8,6%
The highest incidence of all reported sexual offences was recorded in the Western Cape, followed by the Free State and Northern Cape, while Limpopo featured at the bottom of the list. Five of the nine provinces recorded decreases in sexual offences, while four experienced increases. Only one of the five provinces which experienced decreases, namely Gauteng, also met the reduction target with a significant decrease of -15,9%. The increases in sexual offences of 8,6% in the Free State, 6,6% in North West and 5,2% in the Northern Cape are cause for concern.
5 See elucidation in section 2.1.1.3.

SAPS TOGETHER SQUEEZING CRIME to ZEROSAPS Members, My Family - Together Pushing Back The Frontiers Of Evil
ANNUAL REPORT 2010/2011SOUTH AFRICAN POLICE SERVICE
29
Table 18: Attempted murder ratios sorted from highest decreases to highest increase between 1 April 2010 and 31 March 2011
Province 2009/2010 2010/2011 % Increase/Decrease
RSA 35.3 31.0 -12,2%
Mpumalanga 34.0 22.7 -33,2%
Gauteng 45.6 36.7 -19,5%
KwaZulu-Natal 44.2 36.8 -16,7%
Limpopo 13.9 12.0 -13,7%
Eastern Cape 29.2 25.5 -12,7%
North West 24.3 22.0 -9,5%
Free State 29.1 27.3 -6,2%
Northern Cape 62.0 58.8 -5,2%
Western Cape 31.9 41.4 29,8%
The highest incidence of attempted murder during 2010/2011 was recorded in the Northern Cape, followed by the Western Cape, KwaZulu-Natal and Gauteng. According to the figures in table 18, all the provinces except the Western Cape recorded decreasing trends in the incidence of attempted murder during 2010/2011. Most met the -8,5% reduction target as well. The reductions in the Northern Cape and Free State did not meet the target, while the 29,8% increase in the Western Cape (the only increase recorded) is of grave concern.
The highest ratio of assault with the intent to inflict grievous bodily harm (twice the national ratio) was recorded in the Northern Cape. With the exception of Limpopo and KwaZulu-Natal, where the recorded ratios were less than 300, the levels of assault GBH in the other provinces except the Free State did not deviate that much from the national average. While six of the provinces experienced decreases in the incidence of assault GBH, only the substantial decreases of -10,7% in Gauteng and -9,3% in Mpumalanga met the contact crime reduction target of -8,5%.
Table 19: Assault with the intent to inflict grievous bodily harm ratios sorted from highest decreases to highest increases between 1 April 2010 and 31 March 2011
Province 2009/2010 2010/2011 % Increase/Decrease
RSA 416.2 397.3 -4,5%
Gauteng 466.1 416.4 -10,7%
Mpumalanga 439.8 399.0 -9,3%
Limpopo 254.8 237.8 -6,7%
Eastern Cape 485.0 456.8 -5,8%
KwaZulu-Natal 295.6 287.3 -2,8%
Northern Cape 830.7 815.5 -1,8%
Free State 542.5 546.6 0,8%
North West 421.9 439.9 4,3%
Western Cape 449.2 473.3 5,4%

SAPS TOGETHER SQUEEZING CRIME to ZEROSAPS Members, My Family - Together Pushing Back The Frontiers Of Evil
ANNUAL REPORT 2010/2011SOUTH AFRICAN POLICE SERVICE
30
Table 20: Common assault ratios sorted from highest to lowest decreases between 1 April 2010 and 31 March 2011
Province 2009/2010 2010/2011 % Increase/Decrease
RSA 400.0 371.8 -7,1%
Gauteng 559.8 486.8 -13,0%
Limpopo 171.0 149.3 -12,7%
Mpumalanga 310.6 285.8 -8,0%
North West 257.7 243.2 -5,6%
Eastern Cape 260.4 246.0 -5,5%
Northern Cape 485.7 461.9 -4,9%
KwaZulu-Natal 315.6 303.1 -4,0%
Free State 655.2 634.9 -3,1%
Western Cape 642.3 637.0 -0,8%
The highest incidence of common assault was recorded in the Western Cape, followed by the Free State and Gauteng. The lowest level of common assault was recorded in Limpopo, as was the case with regard to the other categories of social contact crime (see table 15). All of the provinces recorded decreases in the incidence of common assault. Only Gauteng and Limpopo met the contact crime reduction target of -8,5%.
3.2 Aggravated Robbery and its Subtrends
Table 21: Robbery with aggravating circumstances ratios sorted from highest decreases to highest increases between 1 April 2010 and 31 March 2011
Province 2009/2010 2010/2011 % Increase/Decrease
RSA 230.6 203.0 -12,0%
Gauteng 449.0 357.9 -20,3%
KwaZulu-Natal 222.4 183.9 -17,3%
Mpumalanga 183.3 153.4 -16,3%
Northern Cape 90.4 80.7 -10,7%
Limpopo 56.8 50.8 -10,6%
Western Cape 234.1 234.5 0,2%
Free State 171.2 171.8 0,4%
North West 157.1 158.7 1,0%
Eastern Cape 145.5 154.9 6,5%
From table 21 it is evident that the highest incidence of aggravated robbery (at a ratio nearly twice the national average) was recorded in Gauteng, the economical and financial hub of South Africa. The Western Cape and KwaZulu-Natal recorded the second and third-highest ratios, but did not deviate that much from the national average. Five of the provinces recorded decreases in aggravated robbery. The Western Cape, Free State and North West recorded marginal increases and the Eastern Cape a 6,5% increase. Gauteng, KwaZulu-Natal and Mpumalanga with decreases of -20,3%, -17,3% and -16,3% respectively exceeded the reduction target by far. The Northern Cape and Limpopo also exceeded the target, but by smaller margins. Since most aggravated robberies occur in Gauteng and KwaZulu-Natal, the significant reductions recorded there are a most positive development.

SAPS TOGETHER SQUEEZING CRIME to ZEROSAPS Members, My Family - Together Pushing Back The Frontiers Of Evil
ANNUAL REPORT 2010/2011SOUTH AFRICAN POLICE SERVICE
31
The figures in table 22 indicate that 80,5% of all reported carjackings occurred in Gauteng and KwaZulu-Natal, with 55,9% and 24,6% of the reported cases respectively. All the provinces (except the Northern Cape with a single case more) experienced decreases in carjacking. The decreases fluctated between -39,8% in Mpumalanga and -13,0% in the Eastern Cape.
Table 22: Carjacking sorted from highest to lowest decreases between 1 April 2010 and 31 March 2011*
Province 2009/2010 2010/2011 Case difference % Increase or decrease
RSA 13 902 10 627 -3 275 -23,6%
Mpumalanga 709 427 -282 -39,8%
KwaZulu-Natal 3 715 2 619 -1 096 -29,5%
Limpopo 251 177 -74 -29,5%
Free State 316 234 -82 -25,9%
Western Cape 575 457 -118 -20,5%
Gauteng 7 444 5 936 -1 508 -20,3%
North West 273 236 -37 -13,6%
Eastern Cape 606 527 -79 -13,0%
Northern Cape 13 14 1 - **
* Raw figures** The low numerical values involved in the Northern Cape make this calculation meaningless.
Table 23: Robbery at residential premises sorted from the highest decreases to the highest increases between 1 April 2010 and 31 March 2011*
Province 2009/2010 2010/2011 Case difference % Increase or decrease
RSA 18 786 16 889 -1 897 -10,1%
Mpumalanga 1 300 1 045 -255 -19,6%
KwaZulu-Natal 4 580 3 998 -582 -12,7%
Gauteng 8 051 7 039 -1 012 -12,6%
Limpopo 584 530 -54 -9,2%
North West 899 828 -71 -7,9%
Eastern Cape 1 606 1 556 -50 -3,1%
Western Cape 1 167 1 215 48 4,1%
Free State 535 637 102 19,1%
Northern Cape 64 41 -23 -**
* Raw figures** The low numerical values involved in the Northern Cape make this calculation meaningless.
Most of the robberies at residential premises recorded during 2009/2010 were reported in Gauteng (41,7%) and KwaZulu-Natal (23,7%). A further 9,2% and 7,2% of cases were reported in the Eastern Cape and the Western Cape respectively. Most of the provinces experienced decreases, except the Free State with a 19,1% increase and the Western Cape with a 4,1% increase.
The trends pertaining to robbery at non-residential premises (mostly businesses) are very similar to those observed with regard to robbery at residential premises. Most of the cases were reported in

SAPS TOGETHER SQUEEZING CRIME to ZEROSAPS Members, My Family - Together Pushing Back The Frontiers Of Evil
ANNUAL REPORT 2010/2011SOUTH AFRICAN POLICE SERVICE
32
Gauteng (37,9%) and KwaZulu-Natal (13,2%). A further 11,3% and 8,9% were reported in the Eastern Cape and the Western Cape respectively. Only Gauteng and KwaZulu-Natal experienced decreases in robbery at non-residential premises of -12,9% and -6,0% respectively. All the other provinces experienced increases. The Eastern Cape with a 30,2%, Western Cape with a 23,7% and Limpopo with a 20,0% increase are a particular cause for concern.
Table 24: Robbery at non-residential premises ranked from the highest decreases to the highest increases between 1 April 2010 and 31 March 2011*
Province 2009/2010 2010/2011 Case difference % Increase or decrease
RSA 14 534 14 667 133 0,9%
Gauteng 6 379 5 553 -826 -12,9%
KwaZulu-Natal 2 066 1 943 -123 -6,0%
North West 1 130 1 162 32 2,8%
Northern Cape 147 157 10 6,8%
Mpumalanga 978 1 105 127 13,0%
Free State 873 1 024 151 17,3%
Limpopo 630 756 126 20,0%
Western Cape 1 058 1 309 251 23,7%
Eastern Cape 1 273 1 658 385 30,2%
* Raw figures