annual report 2010 - chiyoda corp
TRANSCRIPT
12-1, Tsurumichuo 2-chome, Tsurumi-ku, Yokohama 230-8601, JapanTel: (81) 45-521-1231Fax: (81) 45-503-0200http:// www.chiyoda-corp.com
Annual Report 2010For the year ended March 31,2010

Profile
Since its establishment in 1948, Chiyoda Corporation has engaged in engineer-
ing and construction work and services at innumerable industrial plants both in
Japan and overseas in the fields of oil, natural gas and other energy sources; pet-
rochemicals and chemicals; pharmaceuticals; and general industrial machinery.
Thirty-eight years ago in 1972, Chiyoda’s founder was already emphasizing in a
booklet entitled Legacy for the Twenty-first Century that sustainable social devel-
opment should progress by harmonizing nature and industrial development.
We were one of the first companies to state our intention to contribute to sus-
tainable social development through our engineering and technology by providing
appropriate solutions to the various energy and environmental issues we currently
face, and have been putting those words into action ever since. This booklet is
available on our website.
With over 60 years of technological experience, Chiyoda is working to build on
its position as the “Reliability No. 1” project company with a high level of customer
and investor trust, not only in terms of technology but also in terms of our people
and management. At the same time, we will continue to improve our financial
strength and to raise our corporate value.
Corporate Philosophy
Enhance our business in aiming for harmony between energy and the environment, and contribute to the sustainable development of a society as an integrated engineering company through the use of our collective wisdom and painstakingly developed technology.
Forward-Looking Statements:This annual report contains forward-looking statements about Chiyoda Corporation’s outlooks, plans, forecasts, results and other items that may take place in the future. Such statements are based on data available as of June 24, 2010. Unknown risks and other uncertainties that happen in the future may cause our actual results to be different from the forward-looking state-ments contained in this report. The risks and uncertainties include business and economic conditions, competitive pressure, changes in laws and regulations, addition or elimination of products, and exchange rate fluctuation, among others.

Contents
Profile
Financial Highlights
To Our Stakeholders2
4
13
17
54
56
TopicsWon Order for Papua New Guinea LNG Project
Focus on Metallurgical Smelting and Refining
Start of Naoetsu LNG Receiving Terminal Construction Project
Subsidiary in Brazil Open for Business
Corporate GovernanceManagement Structures
Internal Control Structure
Compliance
Board of Directors, Corporate Auditors and Executive Officers
Management’s Discussion and Analysis
Consolidated Financial Statements
Global Network
Corporate Information
8
8
9
9
10
10
10
12
*1,*2: Courtesy of Qatargas Operating Company Limited *3: Courtesy of Sakhalin Energy Investment *4: CCR System Construction Project for Seibu Oil’s Yamaguchi Refinery,
UOP CCR PlatformingTM unit /UOP PolybedTM PSA unit
*1
*2
*3
*4
� CHIYODA CORPORATION ANNUAL REPORT 2010
Financial Highlights
Millions of yen Thousands of U.S. dollars
2010 2009 2008 2007 2006 2010
For the Year
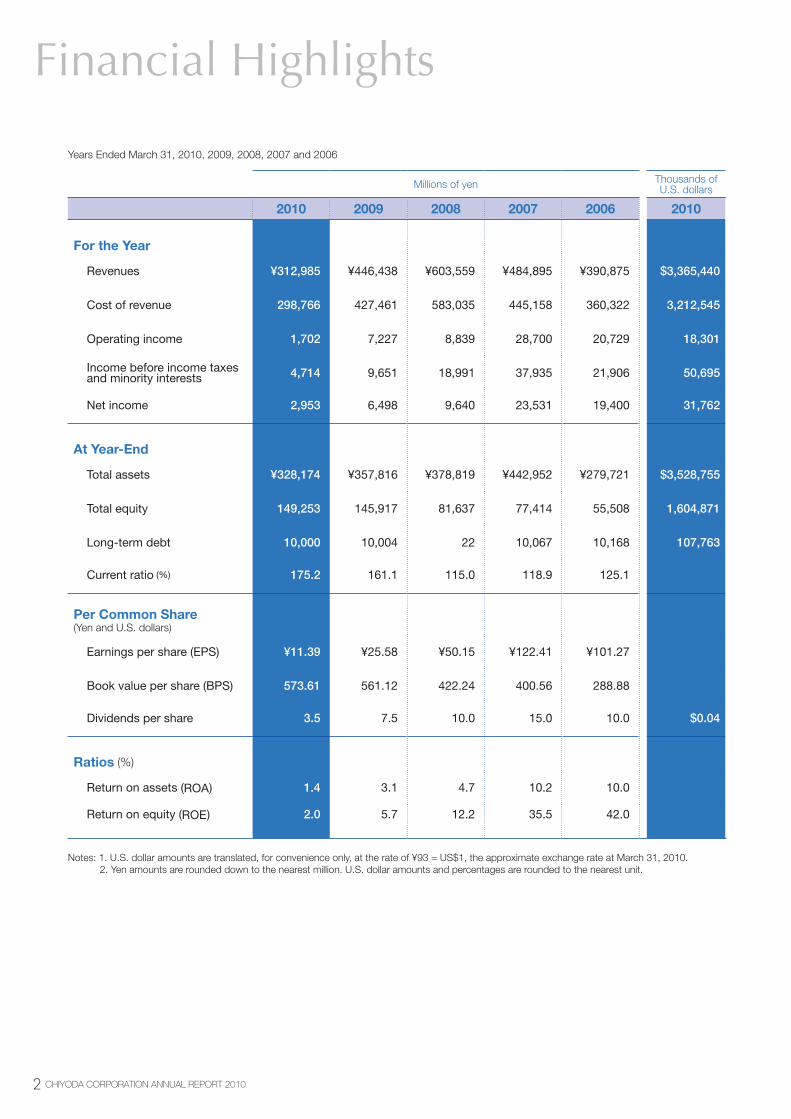
Revenues ¥312,985 ¥446,438 ¥603,559 ¥484,895 ¥390,875 $3,365,440
Cost of revenue 298,766 427,461 583,035 445,158 360,322 3,212,545
Operating income 1,702 7,227 8,839 28,700 20,729 18,301
Income before income taxes and minority interests 4,714 9,651 18,991 37,935 21,906 50,695
Net income 2,953 6,498 9,640 23,531 19,400 31,762
At Year-End
Total assets ¥328,174 ¥357,816 ¥378,819 ¥442,952 ¥279,721 $3,528,755
Total equity 149,253 145,917 81,637 77,414 55,508 1,604,871
Long-term debt 10,000 10,004 22 10,067 10,168 107,763
Current ratio (%) 175.2 161.1 115.0 118.9 125.1
Per Common Share(Yen and U.S. dollars)
Earnings per share (EPS) ¥11.39 ¥25.58 ¥50.15 ¥122.41 ¥101.27
Book value per share (BPS) 573.61 561.12 422.24 400.56 288.88
Dividends per share 3.5 7.5 10.0 15.0 10.0 $0.04
Ratios (%)
Return on assets (ROA) 1.4 3.1 4.7 10.2 10.0
Return on equity (ROE) 2.0 5.7 12.2 35.5 42.0
Notes: 1. U.S. dollar amounts are translated, for convenience only, at the rate of ¥93 = US$1, the approximate exchange rate at March 31, 2010. 2. Yen amounts are rounded down to the nearest million. U.S. dollar amounts and percentages are rounded to the nearest unit.
Years Ended March 31, 2010, 2009, 2008, 2007 and 2006
�CHIYODA CORPORATION ANNUAL REPORT 2010
Revenues
0
100
200
300
400
500
600
700
800
1
2
3
4
5
6Billions of yen
Revenues
Revenues
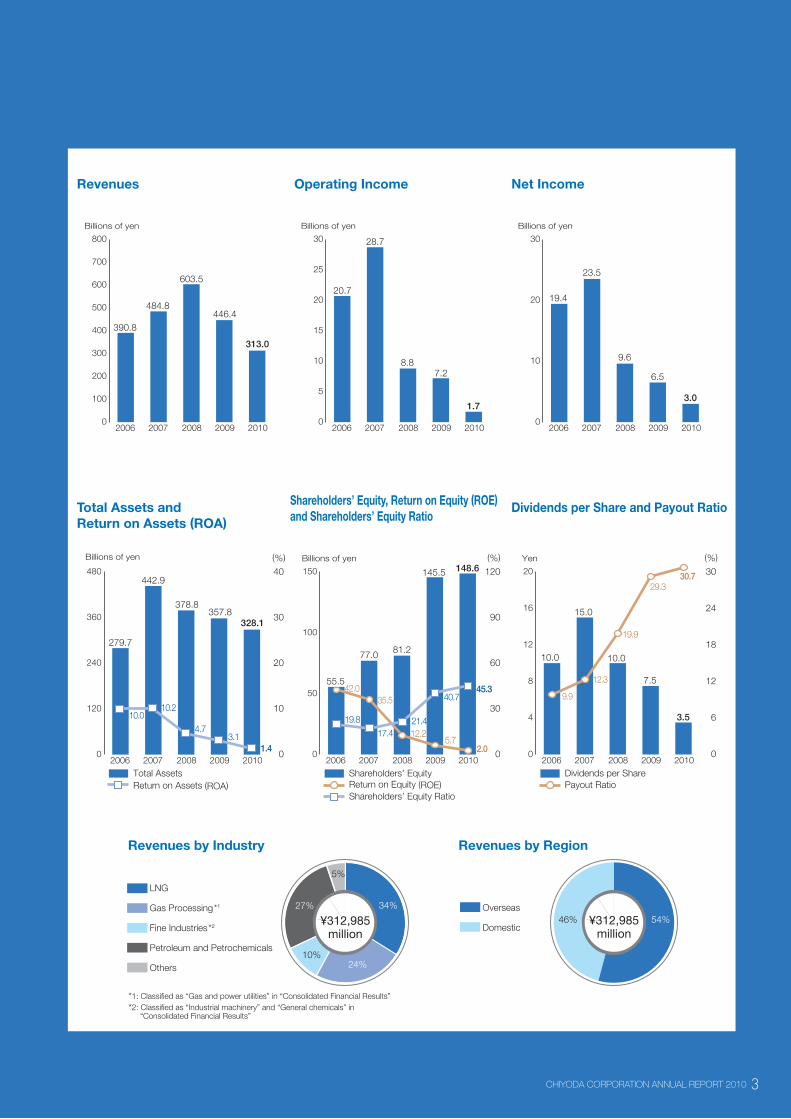
390.8
484.8
603.5
446.4
313.0
2006 2007 2008 2009 2010
34%
24%10%
27%
5%
¥312,985million
LNG
Gas Processing*1
Fine Industries*2
Petroleum and Petrochemicals
Others
*1: Classified as “Gas and power utilities” in “Consolidated Financial Results”*2: Classified as “Industrial machinery” and “General chemicals” in
“Consolidated Financial Results”
Operating Income Net Income
46% 54%Overseas
Domestic¥312,985
million
Revenues by Industry Revenues by Region
Total Assets and Return on Assets (ROA)
Shareholders’ Equity, Return on Equity (ROE) and Shareholders’ Equity Ratio
Dividends per Share and Payout Ratio
0
10
20
30
1
2
3
4
5
6Billions of yen
Revenues
Revenues
19.4
23.5
9.6
6.5
3.0
2006 2007 2008 2009 20100
5
10
15
20
25
30
1
2
3
4
5
6Billions of yen
Revenues
Revenues
20.7
28.7
8.87.2
1.7
2006 2007 2008 2009 2010
0
120
240
360
480
0
10
20
30
40
Billions of yen (%)
Total AssetsReturn on Assets (ROA)
279.7
10.0
442.9
10.2
378.8357.8
4.73.1
328.1
1.42006 2007 2008 2009 2010
0
4
8
12
16
20
0
6
12
18
24
30
Dividends per SharePayout Ratio
10.0
9.9
15.0
12.3
10.0
7.5
19.9
29.3
3.5
30.7
2006 2007 2008 2009 2010
Yen (%)
0
50
100
150
0
30
60
90
120Billions of yen
Shareholders’ EquityReturn on Equity (ROE)
19.8
17.421.4
40.745.3
55.542.0
77.0
35.5
81.2
145.5
12.25.7
148.6
2.02006 2007 2008 2009 2010
Shareholders’ Equity Ratio
(%)
� CHIYODA CORPORATION ANNUAL REPORT 2010
To Our Stakeholders
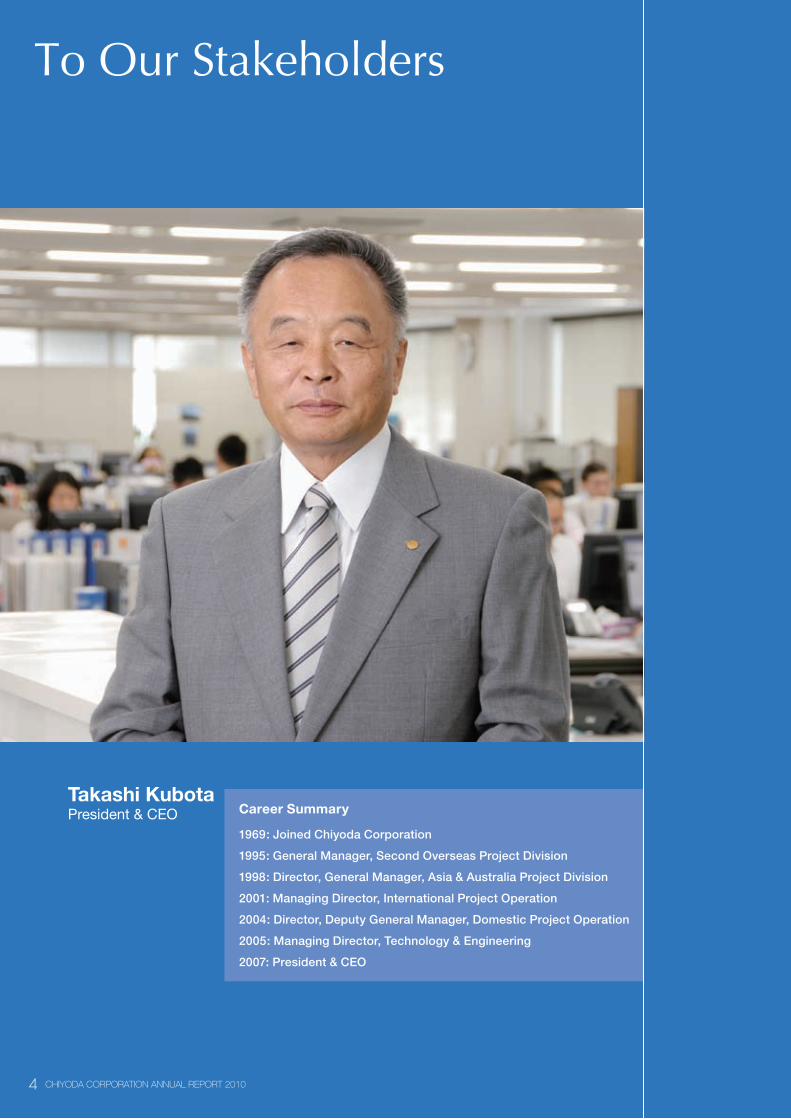
Takashi Kubota President & CEO Career Summary
1969: Joined Chiyoda Corporation
1995: General Manager, Second Overseas Project Division
1998: Director, General Manager, Asia & Australia Project Division
2001: Managing Director, International Project Operation
2004: Director, Deputy General Manager, Domestic Project Operation
2005: Managing Director, Technology & Engineering
2007: President & CEO
� CHIYODA CORPORATION ANNUAL REPORT 2010
�CHIYODA CORPORATION ANNUAL REPORT 2010
Fiscal 2009 Results
From a global perspective, the economic con-
ditions in fiscal 2009—the consolidated period
ended March 31, 2010—were mixed. In some
parts of the world, such as Asia, particularly
in China and India, the accelerated pace of
recovery was obvious. However, the rally in
Europe was lukewarm at best and certainly
not hot enough to burn off the recessionary
fog that obscured predictions over the direc-
tion that the regional economy would take.
At home, signs of improvement were evident
but lacked the dynamics to support a self-
sustained recovery. Consequently, domestic
economic conditions remained difficult.
Given this backdrop, the operating environ-
ment for the Chiyoda Group presented oppor-
tunities as well as challenges. On the opportu-
nity front, we welcomed the prospect of new
contracts, as large-scale investment plans
began to crystallize everywhere amid growing
future demand for oil and gas. On the challenge
front, we faced increasingly fierce competition
from South Korean contractors whose growth
has been rapid and who maintained a remark-
ably competitive position.
Capitalizing on the positives and skirting
the negatives, the Chiyoda Group successfully
picked up contracts for engineering, procure-
ment and construction (EPC) services at home
and abroad, including a liquefied natural gas
(LNG) plant in Papua New Guinea, as well as
several contracts for engineering design. The
Group also pushed ahead steadily on exist-
ing contracts and completed three more trains
at super-large LNG plants under construc-
tion in Qatar. We have now finished four of
the six trains in Ras Laffan, Qatar, including
the train completed in f iscal 2008, with
each tra in having an annual production
capacity of 7.8 million tonnes.
However, in order to meet the delivery
schedule for LNG plant Train 6 and Train 7 for
Qatargas (3) and (4), the Group was unfortu-
nately required to adopt measures, including
the hiring of more workers, which significantly
eroded the project’s profitability. In light of
the disappointing results on this project, the
Group will direct its concerted efforts toward
offsetting lost income by being more thorough
in risk management, by raising profitability on
existing projects and working steadily to ease
the backlog of new projects.
Despite the challenges encountered in fiscal
2009, the value of new contracts rebounded
dramatically, soaring 105.0% over fiscal 2008,
to ¥429,393 million, on a consolidated basis.
The backlog of contracts amounted to ¥536,150
million, up 26.1%. However, revenues fell 29.9%,
to ¥312,985 million, operating income tumbled
76.4%, to ¥1,702 million, and net income
dropped 54.5%, to ¥2,953 million.
Fiscal 2009 Developments
Natural Gas and Electric PowerIn addition to the aforementioned EPC services
for the LNG plant in Papua New Guinea, other
notable overseas contracts included EPC ser-
vices for a gas processing plant in Qatar and
engineering design services for a floating LNG
plant in Brazil.
On the project execution front, the Group
pushed forward with the construction of large
LNG plants and undertook several engineer-
ing design/feasibility studies.
Also worth noting, a subsidiary in Qatar
began long-term EPC management services for an
LNG/gas-processing plant. Long-term services
� CHIYODA CORPORATION ANNUAL REPORT 2010
support efforts to expand the plant lifecycle engi-
neering business that the Group has promoted for
many years already.
In Japan, major orders included engineering
design services associated with the construc-
tion of an LNG receiving terminal, and the Group
continued to work on existing domestic orders,
including construction of three LNG receiving
terminals in Niigata and Okayama prefectures.
Petroleum, Petrochemicals and Gas ChemicalsThe Group pooled its resources and expertise
to win overseas contracts related to planned
investment in petroleum refineries by clients
in the Middle East and Southeast Asia. These
joint efforts were successful, securing contracts
for EPC services on a heavy oil cracking unit
in Saudi Arabia and engineering design ser-
vices on a desulfurization plant in Singapore.
Through the provision of these services, Group
companies will broaden the scope of respective
capabilities and raise Chiyoda’s reputation as a
global operator.
Demand narrowed in Japan, reflecting plans
by the petroleum sector to realign and idle facili-
ties and assume a tougher stance on investment
priorities. Nevertheless, the Chiyoda Group was
awarded contracts for services associated with
industrial complexes and for feasibility studies on
projects to enhance competitiveness and make
facilities more energy-efficient.
Work proceeded smoothly on projects in
progress, including the on-schedule comple-
tion of a continuous catalyst regeneration-type
catalytic reforming unit.
General Chemicals, Industrial Machinery, the Environment and Other SectorsThe Group has achieved a measure of success in
the general chemicals and industrial machinery
sectors through its emphasis on renewable energy,
particularly solar batteries and solar heat energy.
The Group also concentrated on the development
of eco-related components for vehicles, such as
lithium battery parts and advanced material com-
ponents for on-board use, and is also involved in
the refining of non-ferrous metals.
In the pharmaceuticals sector, the Group has
expanded its presence and successfully secured its
involvement in planned investment projects to build
facilities for antibody drugs and high-activation
drugs typical of anti-cancer agents.
Management Priorities
Although the path toward economic recovery
varies region by region, a common trend has
emerged in the placement of orders. We are
seeing an increase in contracts for large plants,
especially from corporations able to take an
aggressive approach on investments for future
growth. In this business environment, the Group
will make every effort to achieve the profit tar-
gets stated in the medium-term management
plan “Engineering Excellence, Value Creation
2012,” promote growth strategies and reinforce
its business fundamentals.
Toward this end, we will address the follow-
ing four issues in fiscal 2010.
1. Win contracts for new projectsWe will strive to diversify our overseas pool of
contracts, not only with new projects in the
LNG and gas sector but also in other sectors,
particularly oil and petrochemicals. To underpin
this effort, we will strengthen our technology
development capabilities, sharpen our cost
competitiveness, and apply newly formulated
strategies to attract the right type of new people

�CHIYODA CORPORATION ANNUAL REPORT 2010
and keep essential existing personnel and
hone their skills.
In Japan, we will look beyond the existing
fields of pursuit, by seeking to utilize overseas
offices and expand our scope of activities so
that we will be in a prime position to be able
to participate in the construction of a broader
range of industrial facilities and be selected for
projects undertaken by domestic clients who
seek to establish a wider presence abroad.
2. Complete work on existing projectsThe profitability of some ongoing LNG plant
construction projects in Qatar has been
squeezed significantly by new challenges,
notably a shortage of labor, which pushed
costs beyond initial estimates. To compen-
sate, we will pursue meticulous project man-
agement, not only for profit-pinched LNG
projects in Qatar but also for more recently
acquired large-scale projects under con-
struction in other countries.
In addition, we will take positive steps to
adopt an even stronger stance on safety and
ensure that we maintain steady progress on
construction work to buttress the trust that
our clients have in us.
3. Cultivate new businessWe will focus more on environmental activi-
ties, where we already boast superior techno-
logical capabilities, and for which we utilize a
dedicated internal business execution struc-
ture to reinforce our presence in non-EPC
businesses.
4. Grow the overseas networkWe will source adequate personnel to ex-
ecute projects and run operations at local
subsidiaries throughout the Group network,
which will help forge a business and execu-
tion framework that is more finely tuned to
the situation in each region. We will initiate
measures to expand the role of overseas
offices, particularly design subsidiaries, and
will also promote international work demar-
cation to improve cost-competitiveness.
Return to Shareholders
Targeting a payout ratio of 30%, based on con-
solidated net income, management subscribes
to a dividend policy that emphasizes return to
shareholders while retaining sufficient internal
reserves to fund future business development.
It is with regret, therefore, that the Group’s
performance in fiscal 2009 precipitated a drop
in dividends, to ¥3.5 per share. Management
anticipates a year-end dividend of ¥5 per share
for fiscal 2010.
I rely on our stakeholders to understand the
challenges we still face and realize that we are
committed to overcoming these obstacles. On
behalf of the Board of Directors, I respectfully
ask for your continued support of Chiyoda and
the Group it leads.
Takashi KubotaPresident & CEO
August 2010

� CHIYODA CORPORATION ANNUAL REPORT 2010
In the last few years, worldwide investment in metallurgical smelting and refining has picked up at an aggressive pace. Companies are particularly interested in the extremely
sophisticated technologies needed for refin-ing low-grade ore—a process that poses a challenge under existing methods—as well as high-level techniques for extracting specific materials from such ore.
With experience in plant construction in countries all over the world, Chiyoda is vigor-ously pursuing and undertaking projects at home and abroad. We have established a solid track record, exemplified by the completion in April 2010 of a titanium refinery in Kyushu, where we were responsible for the construc-tion of key sections of the facility.
Topics
Won Order for Papua New Guinea LNG Project
A signing ceremony took place in December 2009 in Brisbane, Australia, for a pivotal project.
The project—to build an LNG plant com-prising two trains each with a capacity of 3.3 million tonnes—is the first in Papua New Guinea and calls for construction of facilities for inlet processing, treating, liquefaction, storage and loading of LNG.
Chiyoda formed a joint venture with JGC Corporation to provide a strong and efficient organization for the execution of EPC activi-ties and set the direction that the joint venture would take in this project.
The lead investor, Exxon Mobil Corporation, stated at the signing ceremony that the project will be a catalyst for change in Papua New Guinea. It will be exceedingly worthwhile from a local perspective, creating an economic ripple effect that could potentially double the island country’s gross domestic product and establish a solid foundation for industrial growth.
Expectations are therefore high, not only for the plant in operation but also for what the joint venture will contribute during the construction process.
Titanium Refinery in Kyushu
Focus on Metallurgical Smelting and Refining
Signing Ceremony in Brisbane, Australia
Australia
Papua New GuineaPapua New Guinea
IndonesiaIndonesia
SingaporeSingapore
�CHIYODA CORPORATION ANNUAL REPORT 2010
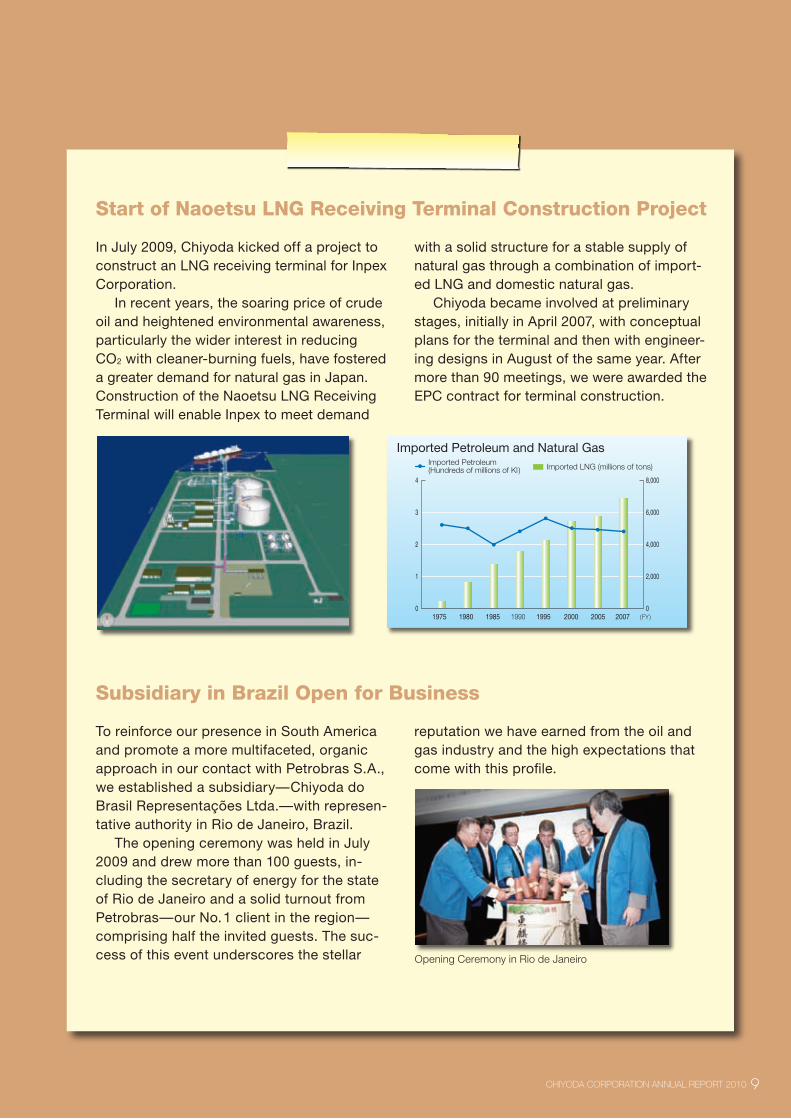
Start of Naoetsu LNG Receiving Terminal Construction Project
In July 2009, Chiyoda kicked off a project to construct an LNG receiving terminal for Inpex Corporation.
In recent years, the soaring price of crude oil and heightened environmental awareness, particularly the wider interest in reducing CO2 with cleaner-burning fuels, have fostered a greater demand for natural gas in Japan. Construction of the Naoetsu LNG Receiving Terminal will enable Inpex to meet demand
with a solid structure for a stable supply of natural gas through a combination of import-ed LNG and domestic natural gas.
Chiyoda became involved at preliminary stages, initially in April 2007, with conceptual plans for the terminal and then with engineer-ing designs in August of the same year. After more than 90 meetings, we were awarded the EPC contract for terminal construction.
Subsidiary in Brazil Open for Business
To reinforce our presence in South America and promote a more multifaceted, organic approach in our contact with Petrobras S.A., we established a subsidiary—Chiyoda do Brasil Representações Ltda.—with represen-tative authority in Rio de Janeiro, Brazil.
The opening ceremony was held in July 2009 and drew more than 100 guests, in-cluding the secretary of energy for the state of Rio de Janeiro and a solid turnout from Petrobras—our No.1 client in the region—comprising half the invited guests. The suc-cess of this event underscores the stellar
reputation we have earned from the oil and gas industry and the high expectations that come with this profile.
0
2,000
4,000
6,000
8,000
0
1
2
3
4
1975 1980 1985 1990 (FY)1995 2000 2005 2007
Imported Petroleum and Natural GasImported Petroleum(Hundreds of millions of Kl ) Imported LNG (millions of tons)
Opening Ceremony in Rio de Janeiro
10 CHIYODA CORPORATION ANNUAL REPORT 2010
Corporate Governance
Management Structures
Overview of Corporate Governance System
and Reasons for Its Adoption
Chiyoda has created its corporate governance system
that utilizes an internal auditing system in addition to the
Board of Directors, corporate auditors, the Corporate
Auditors Committee and independent auditors. The
Company has also adopted the executive officer sys-
tem in which executive officers and directors assume
separate functions, with the former shouldering re-
sponsibility for day-to-day operations, thus leaving the
latter to focus on decision-making and management
supervision. Executive officers provide regular reports
on the status of operations at the monthly meeting of
the Executive Committee, at which directors are also
present.
The Board of Directors, comprising nine directors
including four representative directors, meets once a
month. This management group monitors the activi-
ties of executive officers and ensures that decisions
pertaining to key management issues are made ratio-
nally and efficiently. To accelerate the decision-making
process and fine-tune decisions according to rapidly
changing social and economic conditions, the Board
of Directors delegates some decision-making authority
to the Executive Committee.
The Executive Committee, which in principle meets
weekly, consists of four representative directors, and
it makes decisions within its authority regarding the
execution of operations. The committee also engages in
the preliminary discussion of issues that will be brought
before the Board of Directors for final approval. In prin-
ciple, the Executive Committee meets weekly.
Chiyoda has four corporate auditors, three of
whom are full-time auditors and three of whom are ex-
ternal auditors. The corporate auditors provide over-
sight concerning the general execution of duties by
directors. Two of the corporate auditors are independent
executives, and one corporate auditor has considerable
expertise in finance and accounting.
Internal Control Structure
Chiyoda seeks to maintain an effective and efficient
operation, ensure reliable financial reporting, comply
with prevailing laws and regulations, and protect its
assets. To this end, the Company has created the follow-
ing internal control structure, based on the features that
define its business activities.
Compliance
Chiyoda believes that the trust and affinity it has with
society and customers underpin the foundation of the
Group’s corporate activities. To ensure that the Group’s
business pursuits conform to social standards, man-
agement seeks unconditional respect from all mem-
bers of the Group for domestic and international laws
and regulations, global agreements and internal rules.
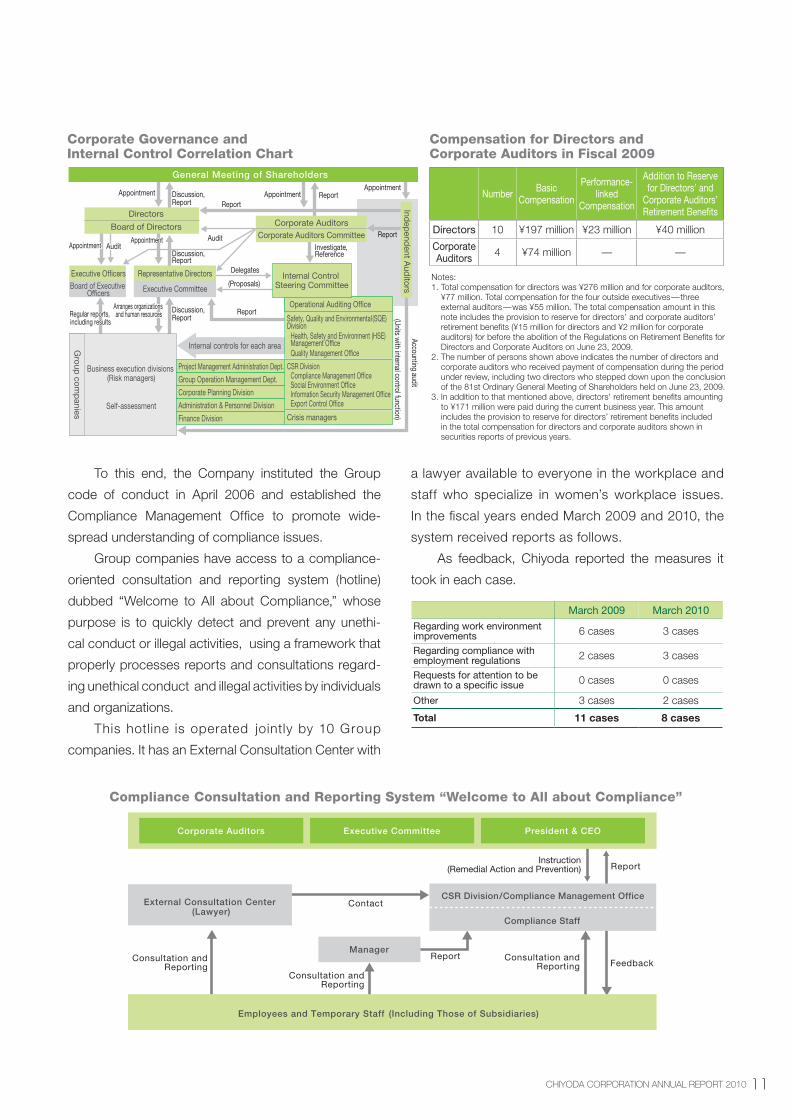
The basic premise behind corporate governance within the Chiyoda Group is that the man-
agement practices that underpin operations must emphasize corporate social responsibility
(CSR) and earn the trust and support of all stakeholders, including shareholders, customers
and employees. We are continuously striving to reinforce our business platform, ensure sound
management practices and enhance management transparency in order to sustain quality
growth over the medium to long term. The continuous improvement of corporate governance
and further fortification of our internal control structure are regarded as priority issues, and
we are striving to carry these out. The state of corporate governance within the Company is
described below.
11CHIYODA CORPORATION ANNUAL REPORT 2010
To this end, the Company instituted the Group
code of conduct in April 2006 and established the
Compliance Management Office to promote wide-
spread understanding of compliance issues.
Group companies have access to a compliance-
oriented consultation and reporting system (hotline)
dubbed “Welcome to All about Compliance,” whose
purpose is to quickly detect and prevent any unethi-
cal conduct or illegal activities, using a framework that
properly processes reports and consultations regard-
ing unethical conduct and illegal activities by individuals
and organizations.
This hotline is operated jointly by 10 Group
companies. It has an External Consultation Center with
a lawyer available to everyone in the workplace and
staff who specialize in women’s workplace issues.
In the fiscal years ended March 2009 and 2010, the
system received reports as follows.
As feedback, Chiyoda reported the measures it
took in each case.
Arranges organizations and human resources
General Meeting of Shareholders
Directors
Internal Control Steering Committee
Executive OfficersBoard of Executive
Officers
Representative Directors
Internal controls for each area
Business execution divisions (Risk managers)
Self-assessment
Operational Auditing Office
Safety, Quality and Environmental (SQE) Division
Health, Safety and Environment (HSE) Management OfficeQuality Management Office
CSR DivisionCompliance Management OfficeSocial Environment OfficeInformation Security Management OfficeExport Control Office
Crisis managers
Project Management Administration Dept.
Group Operation Management Dept.
Corporate Planning Division
Administration & Personnel Division
Finance Division
(Units with internal control function)
Accounting audit
Executive Committee
Appointment
AppointmentAppointment
Regular reports, including resultsRegular reports, including results
Arranges organizations and human resources
AppointmentAppointment
Discussion,Report
Discussion,Report
Discussion,Report
Report
Report
Audit Audit Audit Investigate,
Reference
Report
AppointmentAppointment
Report
Board of Directors Corporate AuditorsCorporate Auditors Committee
Indep
endent A
uditors
Group
comp
anies
Delegates
(Proposals)
Arranges organizations and human resources
Ordinary General Meeting of Shareholders
Directors
Internal Control Steering Committee
Executive OfficersBoard of Executive
Officers
Representative Directors
Internal controls for each area
Business execution divisions (Risk managers)
Self-assessment
Operational Auditing Office
Safety, Quality and Environmental (SQE) DivisionHealth, Safety and Environment (HSE) Management OfficeQuality Management Office
CSR DivisionCompliance Management OfficeSocial Environmental OfficeInformation Security Management OfficeExport Control Office
Crisis managers
Project Management Administration Department
Group Company Management Division
Corporate Planning Division
Administration & Personnel Division
Finance Division
(Units with internal control function)
Accounting audit
Executive Committee
Appointment
AppointmentAppointment
Regular reports, including resultsRegular reports, including results
Arranges organizations and human resources
AppointmentAppointment
Discussion,Report
Discussion,Report
Discussion,Report
Report
Report
Audit Audit Audit Investigate,
Reference
Report
AppointmentAppointment
Report
Board of Directors Corporate AuditorsCorporate Auditors Committee
Indep
endent A
uditors
Group
comp
anies
Delegates
(Proposals)
Number BasicCompensation
Performance-linked
Compensation
Addition to Reserve for Directors’ and
Corporate Auditors’ Retirement Benefits
Directors 10 ¥197 million ¥23 million ¥40 million
Corporate Auditors 4 ¥74 million — —
Notes:1. Total compensation for directors was ¥276 million and for corporate auditors,
¥77 million. Total compensation for the four outside executives—three external auditors—was ¥55 million. The total compensation amount in this note includes the provision to reserve for directors’ and corporate auditors’ retirement benefits (¥15 million for directors and ¥2 million for corporate auditors) for before the abolition of the Regulations on Retirement Benefits for Directors and Corporate Auditors on June 23, 2009.
2. The number of persons shown above indicates the number of directors and corporate auditors who received payment of compensation during the period under review, including two directors who stepped down upon the conclusion of the 81st Ordinary General Meeting of Shareholders held on June 23, 2009.
3. In addition to that mentioned above, directors' retirement benefits amounting to ¥171 million were paid during the current business year. This amount includes the provision to reserve for directors’ retirement benefits included in the total compensation for directors and corporate auditors shown in securities reports of previous years.
Corporate Governance and Internal Control Correlation Chart
Compensation for Directors and Corporate Auditors in Fiscal 2009
Corporate Auditors
External Consultation Center (Lawyer)
Manager
Employees and Temporary Staff (Including Those of Subsidiaries)
Contact
Consultation andReporting
Consultation andReporting Feedback
Report
Consultation andReporting
ReportInstruction
(Remedial Action and Prevention)
CSR Division/Compliance Management Office
Compliance Staff
Executive Committee President & CEO
Corporate Auditors
External Consultation Center (Lawyer)
Manager
Exployees and Temporary Staff (Including Those of Subsidiaries)
Contact
Consultation andReporting
Consultation andReporting Feedback
Report
Consultation andReporting
ReportInstruction(Remedial Action and Prevention)
CSR Division/Compliance Management Office
Compliance Staff
Executive Committee Executive VP in Charge of CSR
Compliance Consultation and Reporting System “Welcome to All about Compliance”
March 2009 March 2010
Regarding work environment improvements 6 cases 3 cases
Regarding compliance with employment regulations 2 cases 3 cases
Requests for attention to be drawn to a specific issue 0 cases 0 cases
Other 3 cases 2 cases
Total 11 cases 8 cases

1� CHIYODA CORPORATION ANNUAL REPORT 2010
Board of Directors, Corporate Auditors and Executive Officers
President & CEO Takashi Kubota *1
Executive Vice President Yoichi Kanno *1
Corporate Planning, Management & Finance
Executive Vice President Hiroshi Shibata *1
CFO
Senior Managing Executive Officer Hiroshi Ogawa *1, 2
Project Operations
Managing Executive Officer Sumio NakashimaProject Operations
Managing Executive Officer Satoru YokoiBusiness Development Operation
Managing Executive Officer Kazuo ObokataCSR Division, Operational Auditing Office
Managing Executive OfficerHiromi Koshizuka *2
Technology Development Business Operation
Director Kazushi Okawa *2
Board of Directors
Hiroshi Ida *3
Wataru Shimono
Masanori Ito *3
Yukihiro Imadegawa *3
Corporate Auditors
*1: Representative Director/Member of Executive Committee*2: New Appointment*3: Outside Corporate Auditor
Managing Executive Officer
Manabu MitaniProjects Logistics & Construction
Managing Executive Officer
Katsutoshi Kimura *2
Corporate Planning, Management & FinanceGeneral ManagerFinance Division
Managing Executive Officer
Kenjiroh Miura *2
Project OperationsGeneral ManagerProject Planning & Administration
Managing Executive Officer
Shougo Shibuya *2
Technology & Engineering
Managing Executive Officer
Masahiko Kojima *2
Corporate Planning, Management & FinanceGeneral ManagerCorporate Planning Division
Executive Officer Toshiyuki OhnumaOffice of President
Executive OfficerTsuyoshi KakizakiGeneral ManagerProject Management Administration Division
Executive Officer
Eisaku YamashitaBusiness Development OperationGeneral ManagerBusiness Development Division 1
Executive Officers
Executive Officer
Koichi ShirakawaProject Operations General ManagerInternational Project Division 2
Executive Officer
Takao KamijiTechnology Development Business OperationBusiness Development OperationGeneral ManagerStrategic Business Development Division
Executive Officer
Ryosuke ShimizuProject OperationsGeneral ManagerGroup Operation Division
Executive Officer
Kenji Hotta *2
Corporate Planning, Management & FinanceGeneral ManagerCorporate Services & HRM Division
Executive Officer
Katsuo Nagasaka *2
Business Development OperationGeneral ManagerBusiness Development Division 2
Executive Officer Seiichiro Ikeda *2
Technology & Engineering
Executive Officer
Noriyuki Kasuya *2
Corporate Planning, Management & FinanceGeneral ManagerCorporate Communication Division
(As of July 1, 2010)
1�CHIYODA CORPORATION ANNUAL REPORT 2010
Business Results
The global economy during the fiscal year ended
March 31, 2010 showed some clear signs of recovery,
which were especially strong in the Asian countries led
by China and India. On the other hand, sluggish recov-
ery in European countries continues to exert a negative
influence on the economic outlook. Although Japan’s
economy has been improving steadily, there are still no
signs of a full-fledged recovery in the foreseeable future.
The business environment surrounding the Chiyoda
Group was characterized by rising expectations of win-
ning new contracts as more plans for large-scale invest-
ments began to take shape in various regions of the
world to meet the future demand for oil and gas. On the
other hand, the Group is increasingly more exposed to
intense competition from Korean contractors who have
shown remarkable growth in recent times.
Under these circumstances, the Chiyoda Group
received orders for both domestic and overseas
EPC contracts, including a contract to construct an
LNG plant in Papua New Guinea and multiple basic
design works. At the same time, the Group diligently
continued with the execution of its existing projects
and completed three out of the six trains (each train
designed to produce 7.8 million tonnes per annum) for
ultra large-scale LNG plants in Qatar, the first train of
which the Group had already completed in the previous
period. However, the projects’ profitability deteriorated
to a large extent due to some leveraging measures im-
plemented, which included increasing the number of
construction workers in an effort to complete work on
the sixth and seventh trains for the Qatargas LNG plant
within the time stipulated in the contract. In response
to these business issues, it endeavored to recover its
performance by practicing thorough risk management,
and by improving the profitability of existing contracts
as well as solidly executing the new contracts. Con-
sequently, new contracts awarded to the Chiyoda
Group during this fiscal year increased by 105.0%, to
¥429,393 million, compared with the previous fiscal
year, and the contract backlog increased by 26.1%,
to ¥536,150 million. Revenues decreased by 29.9%,
to ¥312,985 million. Operating income decreased by
76.4%, to ¥1,702 million, and ordinary income de-
creased by 57.7%, to ¥4,837 million. Net income for
the period was ¥2,953 million, a 54.5% decrease from
the previous fiscal year.
Results by Business Segment
Natural Gas and Electric Power
The main overseas contracts newly awarded to the
Chiyoda Group included an EPC contract for an LNG
plant in Papua New Guinea, an EPC contract for a gas
processing plant in Qatar and the basic design work
for a floating LNG plant in Brazil. Meanwhile, work con-
tinued on the construction of a large-scale LNG plant
and multiple basic design/investment planning ser-
vices. Furthermore, our Qatar subsidiary commenced
the work under a long-term EPCm service contract for
LNG/gas processing plants, awarded during the previ-
ous fiscal year. With these long-term service contracts,
the Chiyoda Group plans to actively promote the plant
life-cycle engineering (PLE) business which the Chiyoda
Group has been pursuing for some time.
On the domestic front, the Chiyoda Group was
awarded new contracts including the basic design
work for an LNG receiving terminal, while it contin-
ued to execute three EPC contracts for LNG receiving
terminals in Niigata and Okayama prefectures and for
other existing projects.
Petroleum, Petrochemicals and Gas Chemicals
The Chiyoda Group’s concerted efforts to win oil
refinery investment projects in the Middle East and
Southeast Asia resulted in receiving orders for an EPC
contract in Saudi Arabia for a heavy oil cracking unit
and a basic engineering contract for a desulfurization
plant in Singapore. Our aim is to strengthen our Group
companies and promote our global operations through
the execution of these projects.
Management’s Discussion and Analysis

1� CHIYODA CORPORATION ANNUAL REPORT 2010
Domestically, in a market stagnated by shrinking
investment plans and the trend of realignment and dis-
use of facilities in the oil industry, we received engineer-
ing study contracts for connecting chemical complexes,
competitiveness improvement and energy conservation.
As for project execution, we completed the construction
of a CCR (continuous catalytic regeneration) unit.
General Chemicals, Industrial Machinery,
the Environment and Other Sectors
We achieved some tangible results in the general
chemicals and industrial machinery sectors through
our concerted efforts in facilities for photovoltaic and
solar-powered generation and other renewable energies,
lithium ion batteries, parts and components fabricated
with advanced materials for eco-friendly vehicles, and
non-ferrous metal smelting.
In the pharmaceuticals sector, our efforts were
directed towards highly active pharmaceuticals such as
antibodies and cancer drugs, which resulted in several
orders being received.
Major contracts included in the consolidated results for the period
Overseas
• LNG plant Trains 6 & 7 for Ras Laffan Liquefied Natural Gas Co., Ltd. (3) in Qatar (*)
• LNG plant Trains 6 & 7 for Qatar Liquefied Gas Co., Ltd. (3) and (4) in Qatar
• Al Khaleej Gas Phase 2 project for ExxonMobil Middle East Gas Marketing Ltd. in Qatar (*)
• LNG plant Trains 4 & 5 for Qatar Liquefied Gas Co., Ltd. (2) in Qatar (*)
• Pearl GTL project feed gas preparation works for Qatar Shell GTL Ltd. in Qatar
Domestic
• Construction of RFCC complex for Taiyo Oil Co., Ltd.
• Expansion of Mizushima LNG receiving terminal for Mizushima LNG Co., Ltd.
(*) Projects completed during the period
Cash Flow Analysis
Assets, Liabilities and Net Assets
• Assets
Total assets decreased by ¥29,642 million from the
previous fiscal year. Although cash savings increased
by ¥4,255 million due to an improved operating cash
flow, current assets decreased by ¥30,128 million
due to a ¥3,058 million decrease in jointly controlled
assets of joint ventures through the progress of large-
scale joint venture projects in Qatar.
• Liabilities
Although there was an increase of ¥15,372 million
in accounts payable for construction, the balance of
advances received on uncompleted projects decreased
by ¥43,493 million. This resulted in a decrease in
total liabilities of ¥32,977 million compared with the
previous fiscal year.
• Net assets
Net assets were ¥149,253 million as the result of a
¥1,029 million year-on-year increase in retained earn-
ings due to booking net income. The equity ratio in-
creased 4.6 points year on year, to 45.3%.
Cash Flows
• Cash flow from operating activities
Net cash from operating activities was ¥8,613 million
despite a ¥21,398 million decrease in working capital
(total in notes and accounts receivable–trade, costs
on uncompleted construction contracts, notes and ac-
counts payable–trade, and advances received on un-
completed construction contracts). This was due to the
jointly controlled assets of a joint venture decreasing by
¥3,058 million according to the progress of large-scale
JV projects in Qatar, in addition to booking income
before income taxes and minority interests of ¥4,714
million for the fiscal year.
Jointly controlled assets of the joint venture are
shown on the JV balance sheet as the assets controlled
by Chiyoda. In real terms, it is equivalent to the portion

1�CHIYODA CORPORATION ANNUAL REPORT 2010
of the current deposit balance under the JV name that
is allocated to Chiyoda.
• Cash flow from investment activities
Net cash from investment activities was ¥2,722 million
in the negative due to ¥1,864 million paid for software,
etc.
• Cash flow from financing activities
Net cash from financing activities was ¥2,079 million
in the negative due to ¥1,940 million paid in dividends
and other factors.
As the result of the factors described above, the
account balance for the fiscal year for cash and cash
equivalents was ¥139,790 million, which was a year-
on-year increase of ¥4,254 million.
Issues Requiring the Group’s Attention
It is clear that clients with a vision to the future with
regard to growth and development are the key to the
Group’s success in securing big projects, irrespec-
tive of the speed or degree of economic recovery in
various regions.
The profit, targets and strengthening of our operat-
ing base growth strategies laid out in the new medium-
term management plan—Engineering Excellence,
Value Creation 2012—were formulated with the chal-
lenges of the current business environment in mind.
To achieve stated targets and successfully execute
the strategic blueprint, the Group will emphasize the
following issues during fiscal 2010, the second year of
Engineering Excellence, Value Creation 2012.
Secure Orders for New Projects
Group companies will focus their efforts on winning new
orders not only in the areas of LNG- and gas-related
projects but in other industry sectors such as oil and
petrochemicals. Toward this end, measures will be drawn
up to reinforce R&D capabilities and cost-competitiveness,
and to retain and train essential personnel.
In Japan, the objective will be to look beyond
existing fields of pursuit to maximize the Group’s
overseas presence and develop business activities
that will lead to orders for various industrial facilities
and for projects by domestic clients expanding their
operations abroad.
Complete Existing Orders
The profitability of some LNG projects under construc-
tion in Qatar is being squeezed, due mainly to factors
such as a shortage of workers causing costs to exceed
initial estimates. The Group must therefore carefully
manage the progress of big projects, not only in Qatar
but also in other areas, and reinforce its reputation for
reliability among clients by taking an even stronger
stance on safety and ensuring the steady execution of
construction work.
Cultivate New Business
Efforts will be directed into areas in the environment
sector where the Company boasts a superior tech-
nological capability, and the Company will implement
an internal business execution structure for non-EPC
businesses to underpin new business development.
Strengthen Group Operations
Management plans to attract essential personnel to
execute projects and run operations at local subsid-
iaries throughout the Group network. This will create
a business and execution structure that is fine-tuned
to each region. The Group will utilize its international
specialized capabilities to underpin its cost-competi-
tiveness, along with measures to reinforce and extend
the function of its overseas design subsidiaries.
Business Risks
The primary issues that could affect investor deci-
sions regarding investment risk, such as material
issues related to the Chiyoda Group’s financial position,
performance and cash flow, and the Chiyoda Group’s
1� CHIYODA CORPORATION ANNUAL REPORT 2010
response to such issues, include but are not limited
to, the issues outlined below. The Chiyoda Group rec-
ognizes the potential occurrence of these risks and
works to avoid them to the maximum extent possible.
The Chiyoda Group also moves to respond as quickly
as possible to minimize the impact of issues if and
when they occur.
Chiyoda Group management acknowledges that
the issues outlined below may present risks in the
future and has made them the focus of risk manage-
ment.
Changes in Exchange Rates
In overseas construction projects, payments made to
Chiyoda for construction are often in currencies differ-
ent to those made by Chiyoda to subcontractors and/
or vendors for equipment and materials. Foreign cur-
rency exchange rates may therefore affect the financial
results of the projects. The Chiyoda Group works to
avoid and minimize such foreign currency fluctuation
risks by using forward foreign exchange contracts and
matching planned outlays in multiple currencies with
construction payments and receivables.
Rapid Changes in Economic Trends
Cancellation, delays or revisions of the investment
plans of customers, or other factors resulting from
changes in worldwide economic trends, could impact
the Chiyoda Group’s performance. In addition, con-
struction execution plans and budgets and collection
of receivables may be affected by worsening business
conditions of business partners involved in plant con-
struction, including subcontractors and suppliers of
equipment and materials.
The Group will work to avoid or minimize risk by
scrupulously analyzing the credit standing of business
partners, while monitoring economic trends to confirm
whether or not to transact business or under what con-
ditions business should be transacted.
Terrorism, Conflicts and Other Force
Majeure Events
Force majeure events such as terrorism, conflicts,
and natural disasters, etc., may cause direct losses,
delays in procuring or delivering materials and equip-
ment, threats to the safety of workers, cessation of
construction work or other problems at construction
sites in Japan and overseas.
Whilst a top priority is placed on the avoidance
of human injury, the Chiyoda Group has structured
a threat management system that includes coopera-
tion with customers and other related parties to sup-
port rapid initial response should such events occur.
In addition, the Chiyoda Group will take other steps
to avoid or minimize these risks, including negotiat-
ing contractual provisions that rationally allocate ad-
ditional costs to customers.
Plant Accidents
The possibility exists that a serious incident such as an
explosion or fire may occur at plants that the Chiyoda
Group is constructing or has completed. The Chiyoda
Group could be adjudged responsible for such acci-
dents, including being held liable for damages, which
could impact the Chiyoda Group’s performance.
The Chiyoda Group works to avoid or minimize
this risk in ways such as taking all possible measures
to preclude the occurrence of such incidents, includ-
ing quality control and safety management. Other
countermeasures include maintaining the appropriate
insurance coverage and negotiating contracts that
rationally allocate customer responsibility for damages.
1�CHIYODA CORPORATION ANNUAL REPORT 2010
Consolidated Financial Statements for the Years Ended March 31, 2010 and 2009, and Independent Auditors' Report
Chiyoda Corporation and Consolidated Subsidiaries

1� CHIYODA CORPORATION ANNUAL REPORT 2010
To the Board of Directors of Chiyoda Corporation:
We have audited the accompanying consolidated balance sheets of Chiyoda Corporation (the "Company") and
consolidated subsidiaries as of March 31, 2010 and 2009, and the related consolidated statements of income,
changes in equity, and cash flows for the years then ended, all expressed in Japanese yen. These consolidated
financial statements are the responsibility of the Company's management. Our responsibility is to express an
opinion on these consolidated financial statements based on our audits.
We conducted our audits in accordance with auditing standards generally accepted in Japan. Those standards
require that we plan and perform the audit to obtain reasonable assurance about whether the financial state-
ments are free of material misstatement. An audit includes examining, on a test basis, evidence supporting the
amounts and disclosures in the financial statements. An audit also includes assessing the accounting principles
used and significant estimates made by management, as well as evaluating the overall financial statement pre-
sentation. We believe that our audits provide a reasonable basis for our opinion.
In our opinion, the consolidated financial statements referred to above present fairly, in all material respects, the
consolidated financial position of Chiyoda Corporation and consolidated subsidiaries as of March 31, 2010 and
2009, and the consolidated results of their operations and their cash flows for the years then ended in confor-
mity with accounting principles generally accepted in Japan.
Our audits also comprehended the translation of Japanese yen amounts into U.S. dollar amounts and, in our
opinion, such translation has been made in conformity with the basis stated in Note 1. Such U.S. dollar amounts
are presented solely for the convenience of readers outside Japan.
June 11, 2010
Chiyoda Corporation and Consolidated Subsidiaries
INDEPENDENT AUDITORS' REPORT
1�CHIYODA CORPORATION ANNUAL REPORT 2010
Chiyoda Corporation and Consolidated Subsidiaries
Consolidated Balance SheetsMarch 31, 2010 and 2009
- 2 -
Chiyoda Corporation and Consolidated Subsidiaries
Consolidated Balance Sheets March 31, 2010 and 2009
Millions of Yen
Thousands of
U.S. Dollars
(Note 1)
ASSETS 2010 2009 2010
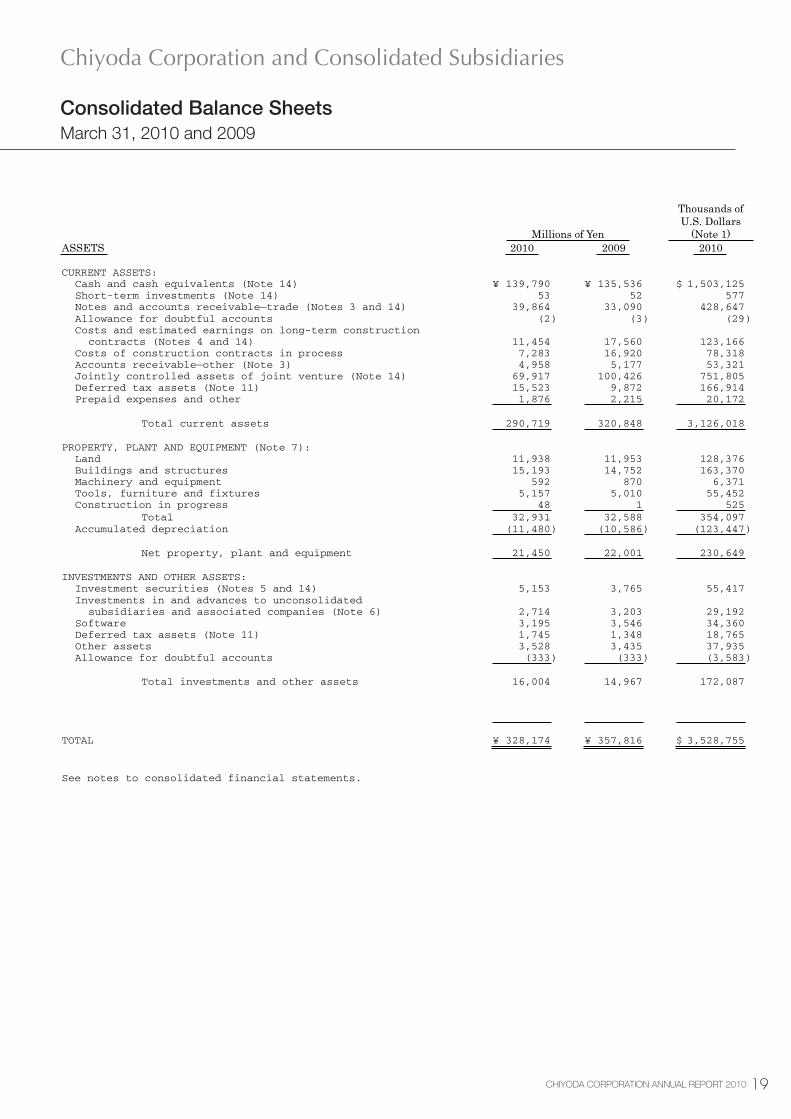
CURRENT ASSETS: Cash and cash equivalents (Note 14) ¥ 139,790 ¥ 135,536 $ 1,503,125 Short-term investments (Note 14) 53 52 577 Notes and accounts receivable—trade (Notes 3 and 14) 39,864 33,090 428,647 Allowance for doubtful accounts (2 ) (3 ) (29 ) Costs and estimated earnings on long-term construction contracts (Notes 4 and 14) 11,454 17,560 123,166 Costs of construction contracts in process 7,283 16,920 78,318 Accounts receivable—other (Note 3) 4,958 5,177 53,321 Jointly controlled assets of joint venture (Note 14) 69,917 100,426 751,805 Deferred tax assets (Note 11) 15,523 9,872 166,914 Prepaid expenses and other 1,876 2,215 20,172
Total current assets 290,719 320,848 3,126,018
PROPERTY, PLANT AND EQUIPMENT (Note 7): Land 11,938 11,953 128,376 Buildings and structures 15,193 14,752 163,370 Machinery and equipment 592 870 6,371 Tools, furniture and fixtures 5,157 5,010 55,452 Construction in progress 48 1 525 Total 32,931 32,588 354,097 Accumulated depreciation (11,480 ) (10,586 ) (123,447 )
Net property, plant and equipment 21,450 22,001 230,649
INVESTMENTS AND OTHER ASSETS: Investment securities (Notes 5 and 14) 5,153 3,765 55,417 Investments in and advances to unconsolidated subsidiaries and associated companies (Note 6) 2,714 3,203 29,192 Software 3,195 3,546 34,360 Deferred tax assets (Note 11) 1,745 1,348 18,765 Other assets 3,528 3,435 37,935 Allowance for doubtful accounts (333 ) (333 ) (3,583 )
Total investments and other assets 16,004 14,967 172,087
TOTAL ¥ 328,174 ¥ 357,816 $ 3,528,755
See notes to consolidated financial statements.
Millions of Yen
Thousands of U.S. Dollars
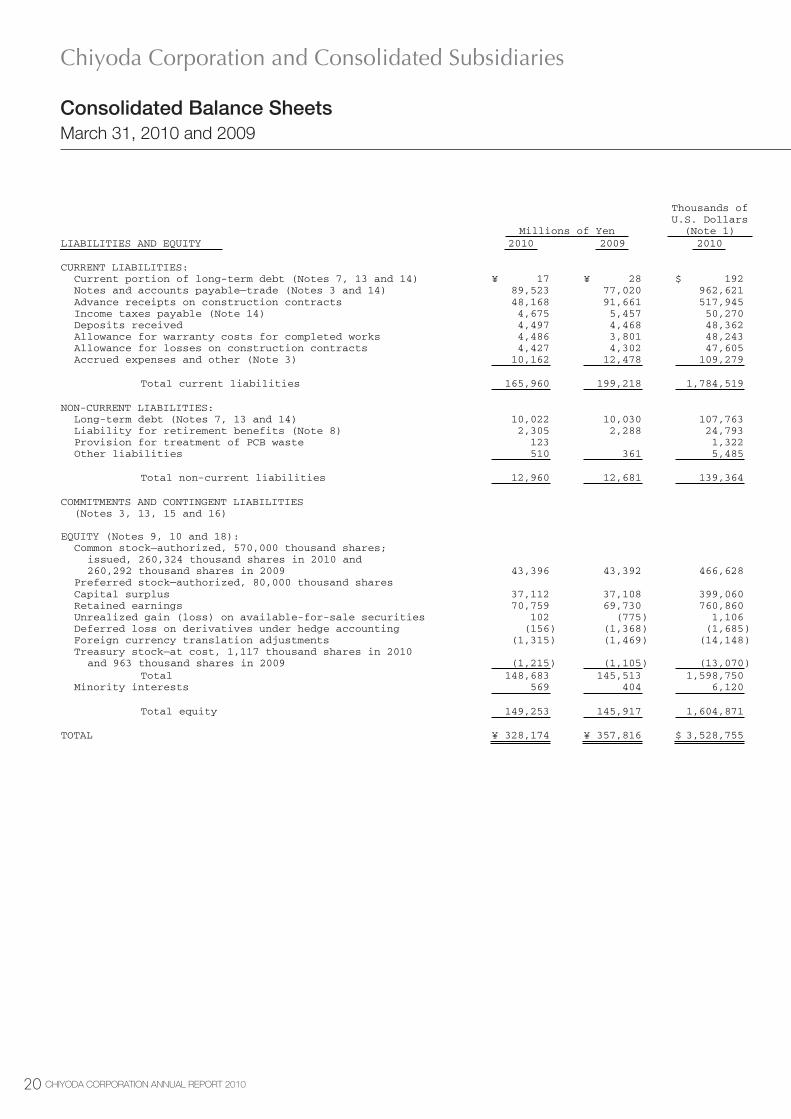
(Note 1) LIABILITIES AND EQUITY 2010 2009 2010
CURRENT LIABILITIES: Current portion of long-term debt (Notes 7, 13 and 14) ¥ 17 ¥ 28 $ 192 Notes and accounts payable—trade (Notes 3 and 14) 89,523 77,020 962,621 Advance receipts on construction contracts 48,168 91,661 517,945 Income taxes payable (Note 14) 4,675 5,457 50,270 Deposits received 4,497 4,468 48,362 Allowance for warranty costs for completed works 4,486 3,801 48,243 Allowance for losses on construction contracts 4,427 4,302 47,605 Accrued expenses and other (Note 3) 10,162 12,478 109,279
Total current liabilities 165,960 199,218 1,784,519
NON-CURRENT LIABILITIES: Long-term debt (Notes 7, 13 and 14) 10,022 10,030 107,763 Liability for retirement benefits (Note 8) 2,305 2,288 24,793 Provision for treatment of PCB waste 123 1,322 Other liabilities 510 361 5,485
Total non-current liabilities 12,960 12,681 139,364
COMMITMENTS AND CONTINGENT LIABILITIES (Notes 3, 13, 15 and 16)
EQUITY (Notes 9, 10 and 18): Common stock—authorized, 570,000 thousand shares; issued, 260,324 thousand shares in 2010 and 260,292 thousand shares in 2009 43,396 43,392 466,628 Preferred stock—authorized, 80,000 thousand shares Capital surplus 37,112 37,108 399,060 Retained earnings 70,759 69,730 760,860 Unrealized gain (loss) on available-for-sale securities 102 (775 ) 1,106 Deferred loss on derivatives under hedge accounting (156 ) (1,368 ) (1,685 ) Foreign currency translation adjustments (1,315 ) (1,469 ) (14,148 ) Treasury stock—at cost, 1,117 thousand shares in 2010 and 963 thousand shares in 2009 (1,215 ) (1,105 ) (13,070 ) Total 148,683 145,513 1,598,750 Minority interests 569 404 6,120
Total equity 149,253 145,917 1,604,871
TOTAL ¥ 328,174 ¥ 357,816 $ 3,528,755
�0 CHIYODA CORPORATION ANNUAL REPORT 2010
- 2 -
Chiyoda Corporation and Consolidated Subsidiaries
Consolidated Balance Sheets March 31, 2010 and 2009
Millions of Yen
Thousands of
U.S. Dollars
(Note 1)
ASSETS 2010 2009 2010
CURRENT ASSETS: Cash and cash equivalents (Note 14) ¥ 139,790 ¥ 135,536 $ 1,503,125 Short-term investments (Note 14) 53 52 577 Notes and accounts receivable—trade (Notes 3 and 14) 39,864 33,090 428,647 Allowance for doubtful accounts (2 ) (3 ) (29 ) Costs and estimated earnings on long-term construction contracts (Notes 4 and 14) 11,454 17,560 123,166 Costs of construction contracts in process 7,283 16,920 78,318 Accounts receivable—other (Note 3) 4,958 5,177 53,321 Jointly controlled assets of joint venture (Note 14) 69,917 100,426 751,805 Deferred tax assets (Note 11) 15,523 9,872 166,914 Prepaid expenses and other 1,876 2,215 20,172
Total current assets 290,719 320,848 3,126,018
PROPERTY, PLANT AND EQUIPMENT (Note 7): Land 11,938 11,953 128,376 Buildings and structures 15,193 14,752 163,370 Machinery and equipment 592 870 6,371 Tools, furniture and fixtures 5,157 5,010 55,452 Construction in progress 48 1 525 Total 32,931 32,588 354,097 Accumulated depreciation (11,480 ) (10,586 ) (123,447 )
Net property, plant and equipment 21,450 22,001 230,649
INVESTMENTS AND OTHER ASSETS: Investment securities (Notes 5 and 14) 5,153 3,765 55,417 Investments in and advances to unconsolidated subsidiaries and associated companies (Note 6) 2,714 3,203 29,192 Software 3,195 3,546 34,360 Deferred tax assets (Note 11) 1,745 1,348 18,765 Other assets 3,528 3,435 37,935 Allowance for doubtful accounts (333 ) (333 ) (3,583 )
Total investments and other assets 16,004 14,967 172,087
TOTAL ¥ 328,174 ¥ 357,816 $ 3,528,755
See notes to consolidated financial statements.
Millions of Yen
Thousands of U.S. Dollars
(Note 1) LIABILITIES AND EQUITY 2010 2009 2010
CURRENT LIABILITIES: Current portion of long-term debt (Notes 7, 13 and 14) ¥ 17 ¥ 28 $ 192 Notes and accounts payable—trade (Notes 3 and 14) 89,523 77,020 962,621 Advance receipts on construction contracts 48,168 91,661 517,945 Income taxes payable (Note 14) 4,675 5,457 50,270 Deposits received 4,497 4,468 48,362 Allowance for warranty costs for completed works 4,486 3,801 48,243 Allowance for losses on construction contracts 4,427 4,302 47,605 Accrued expenses and other (Note 3) 10,162 12,478 109,279
Total current liabilities 165,960 199,218 1,784,519
NON-CURRENT LIABILITIES: Long-term debt (Notes 7, 13 and 14) 10,022 10,030 107,763 Liability for retirement benefits (Note 8) 2,305 2,288 24,793 Provision for treatment of PCB waste 123 1,322 Other liabilities 510 361 5,485
Total non-current liabilities 12,960 12,681 139,364
COMMITMENTS AND CONTINGENT LIABILITIES (Notes 3, 13, 15 and 16)
EQUITY (Notes 9, 10 and 18): Common stock—authorized, 570,000 thousand shares; issued, 260,324 thousand shares in 2010 and 260,292 thousand shares in 2009 43,396 43,392 466,628 Preferred stock—authorized, 80,000 thousand shares Capital surplus 37,112 37,108 399,060 Retained earnings 70,759 69,730 760,860 Unrealized gain (loss) on available-for-sale securities 102 (775 ) 1,106 Deferred loss on derivatives under hedge accounting (156 ) (1,368 ) (1,685 ) Foreign currency translation adjustments (1,315 ) (1,469 ) (14,148 ) Treasury stock—at cost, 1,117 thousand shares in 2010 and 963 thousand shares in 2009 (1,215 ) (1,105 ) (13,070 ) Total 148,683 145,513 1,598,750 Minority interests 569 404 6,120
Total equity 149,253 145,917 1,604,871
TOTAL ¥ 328,174 ¥ 357,816 $ 3,528,755
Consolidated Balance SheetsMarch 31, 2010 and 2009
Chiyoda Corporation and Consolidated Subsidiaries
�1CHIYODA CORPORATION ANNUAL REPORT 2010
- 2 -
Chiyoda Corporation and Consolidated Subsidiaries
Consolidated Balance Sheets March 31, 2010 and 2009
Millions of Yen
Thousands of
U.S. Dollars
(Note 1)
ASSETS 2010 2009 2010
CURRENT ASSETS: Cash and cash equivalents (Note 14) ¥ 139,790 ¥ 135,536 $ 1,503,125 Short-term investments (Note 14) 53 52 577 Notes and accounts receivable—trade (Notes 3 and 14) 39,864 33,090 428,647 Allowance for doubtful accounts (2 ) (3 ) (29 ) Costs and estimated earnings on long-term construction contracts (Notes 4 and 14) 11,454 17,560 123,166 Costs of construction contracts in process 7,283 16,920 78,318 Accounts receivable—other (Note 3) 4,958 5,177 53,321 Jointly controlled assets of joint venture (Note 14) 69,917 100,426 751,805 Deferred tax assets (Note 11) 15,523 9,872 166,914 Prepaid expenses and other 1,876 2,215 20,172
Total current assets 290,719 320,848 3,126,018
PROPERTY, PLANT AND EQUIPMENT (Note 7): Land 11,938 11,953 128,376 Buildings and structures 15,193 14,752 163,370 Machinery and equipment 592 870 6,371 Tools, furniture and fixtures 5,157 5,010 55,452 Construction in progress 48 1 525 Total 32,931 32,588 354,097 Accumulated depreciation (11,480 ) (10,586 ) (123,447 )
Net property, plant and equipment 21,450 22,001 230,649
INVESTMENTS AND OTHER ASSETS: Investment securities (Notes 5 and 14) 5,153 3,765 55,417 Investments in and advances to unconsolidated subsidiaries and associated companies (Note 6) 2,714 3,203 29,192 Software 3,195 3,546 34,360 Deferred tax assets (Note 11) 1,745 1,348 18,765 Other assets 3,528 3,435 37,935 Allowance for doubtful accounts (333 ) (333 ) (3,583 )
Total investments and other assets 16,004 14,967 172,087
TOTAL ¥ 328,174 ¥ 357,816 $ 3,528,755
See notes to consolidated financial statements.
Millions of Yen
Thousands of U.S. Dollars
(Note 1) LIABILITIES AND EQUITY 2010 2009 2010
CURRENT LIABILITIES: Current portion of long-term debt (Notes 7, 13 and 14) ¥ 17 ¥ 28 $ 192 Notes and accounts payable—trade (Notes 3 and 14) 89,523 77,020 962,621 Advance receipts on construction contracts 48,168 91,661 517,945 Income taxes payable (Note 14) 4,675 5,457 50,270 Deposits received 4,497 4,468 48,362 Allowance for warranty costs for completed works 4,486 3,801 48,243 Allowance for losses on construction contracts 4,427 4,302 47,605 Accrued expenses and other (Note 3) 10,162 12,478 109,279
Total current liabilities 165,960 199,218 1,784,519
NON-CURRENT LIABILITIES: Long-term debt (Notes 7, 13 and 14) 10,022 10,030 107,763 Liability for retirement benefits (Note 8) 2,305 2,288 24,793 Provision for treatment of PCB waste 123 1,322 Other liabilities 510 361 5,485
Total non-current liabilities 12,960 12,681 139,364
COMMITMENTS AND CONTINGENT LIABILITIES (Notes 3, 13, 15 and 16)
EQUITY (Notes 9, 10 and 18): Common stock—authorized, 570,000 thousand shares; issued, 260,324 thousand shares in 2010 and 260,292 thousand shares in 2009 43,396 43,392 466,628 Preferred stock—authorized, 80,000 thousand shares Capital surplus 37,112 37,108 399,060 Retained earnings 70,759 69,730 760,860 Unrealized gain (loss) on available-for-sale securities 102 (775 ) 1,106 Deferred loss on derivatives under hedge accounting (156 ) (1,368 ) (1,685 ) Foreign currency translation adjustments (1,315 ) (1,469 ) (14,148 ) Treasury stock—at cost, 1,117 thousand shares in 2010 and 963 thousand shares in 2009 (1,215 ) (1,105 ) (13,070 ) Total 148,683 145,513 1,598,750 Minority interests 569 404 6,120
Total equity 149,253 145,917 1,604,871
TOTAL ¥ 328,174 ¥ 357,816 $ 3,528,755
- 3 - (Continued)
Chiyoda Corporation and Consolidated Subsidiaries
Consolidated Statements of Income Years Ended March 31, 2010 and 2009
Millions of Yen
Thousands of U.S. Dollars
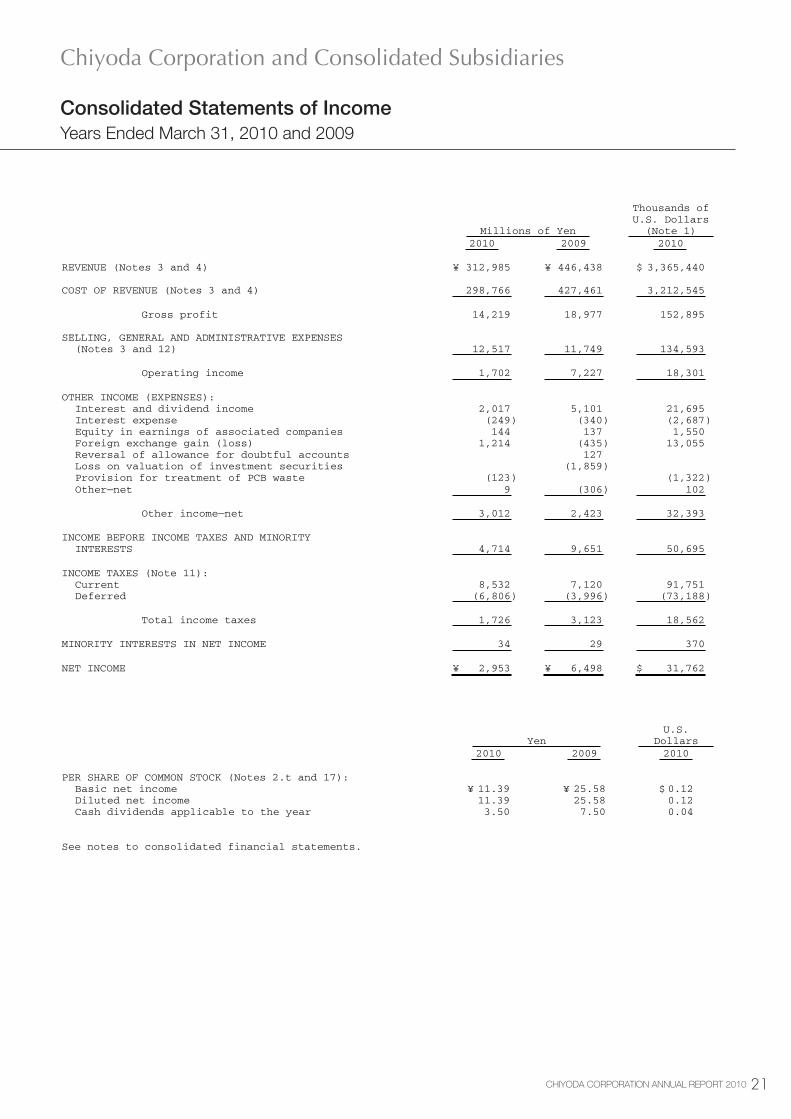
(Note 1) 2010 2009 2010 REVENUE (Notes 3 and 4) ¥ 312,985 ¥ 446,438 $ 3,365,440 COST OF REVENUE (Notes 3 and 4) 298,766 427,461 3,212,545 Gross profit 14,219 18,977 152,895 SELLING, GENERAL AND ADMINISTRATIVE EXPENSES (Notes 3 and 12) 12,517 11,749 134,593 Operating income 1,702 7,227 18,301 OTHER INCOME (EXPENSES): Interest and dividend income 2,017 5,101 21,695 Interest expense (249 ) (340 ) (2,687 ) Equity in earnings of associated companies 144 137 1,550 Foreign exchange gain (loss) 1,214 (435 ) 13,055 Reversal of allowance for doubtful accounts 127 Loss on valuation of investment securities (1,859 ) Provision for treatment of PCB waste (123 ) (1,322 ) Other—net 9 (306 ) 102 Other income—net 3,012 2,423 32,393 INCOME BEFORE INCOME TAXES AND MINORITY INTERESTS 4,714 9,651 50,695 INCOME TAXES (Note 11): Current 8,532 7,120 91,751 Deferred (6,806 ) (3,996 ) (73,188 ) Total income taxes 1,726 3,123 18,562 MINORITY INTERESTS IN NET INCOME 34 29 370 NET INCOME ¥ 2,953 ¥ 6,498 $ 31,762
Consolidated Statements of IncomeYears Ended March 31, 2010 and 2009
- 4 - (Concluded)
Chiyoda Corporation and Consolidated Subsidiaries
Consolidated Statements of Income Years Ended March 31, 2010 and 2009
Yen U.S.
Dollars 2010 2009 2010 PER SHARE OF COMMON STOCK (Notes 2.t and 17): Basic net income ¥ 11.39 ¥ 25.58 $ 0.12 Diluted net income 11.39 25.58 0.12 Cash dividends applicable to the year 3.50 7.50 0.04 See notes to consolidated financial statements.
Chiyoda Corporation and Consolidated Subsidiaries
�� CHIYODA CORPORATION ANNUAL REPORT 2010
Consolidated Statements of Changes in EquityYears Ended March 31, 2010 and 2009
- 5 -
Chiyoda Corporation and Consolidated Subsidiaries
Consolidated Statements of Changes in Equity Years Ended March 31, 2010 and 2009
Thousands Millions of Yen
OutstandingNumber ofShares ofCommonStock
CommonStock
CapitalSurplus
RetainedEarnings
UnrealizedGain (Loss)
onAvailable-for-Sale
Securities
DeferredLoss on
Derivativesunder Hedge Accounting
ForeignCurrency
TranslationAdjustments
TreasuryStock Total
MinorityInterests
TotalEquity
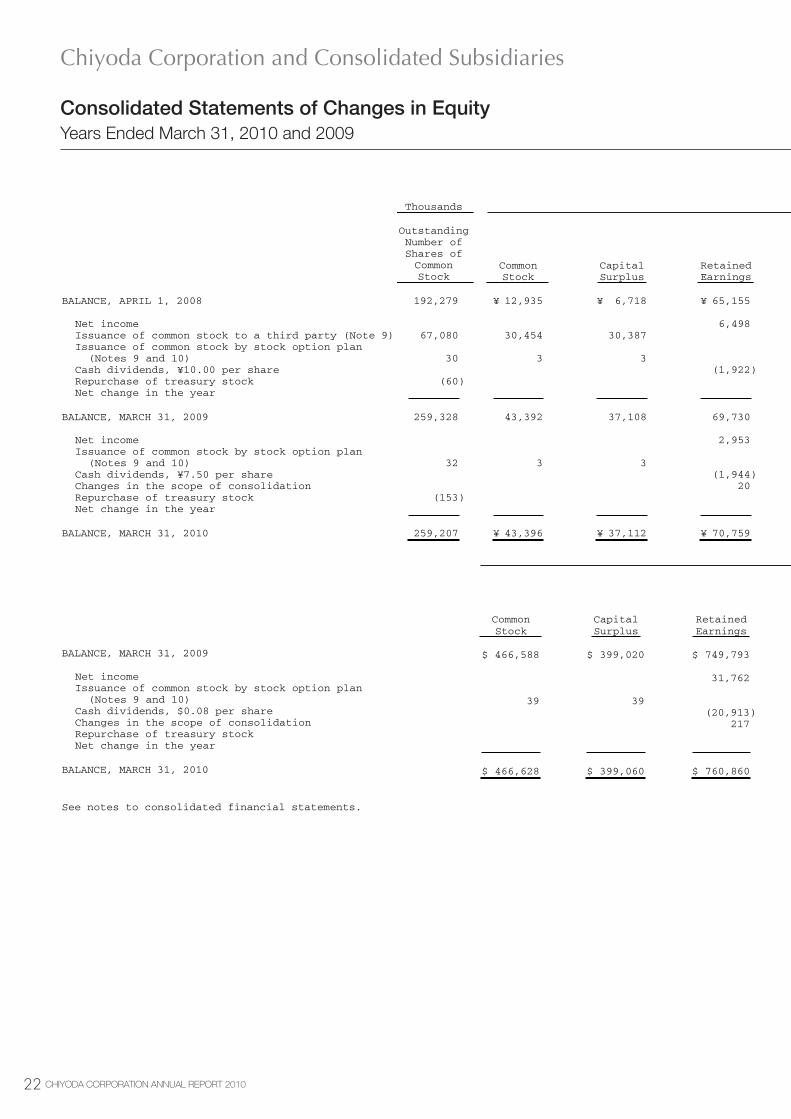
BALANCE, APRIL 1, 2008 192,279 ¥ 12,935 ¥ 6,718 ¥ 65,155 ¥ (847 ) ¥ (1,668) ¥ (6 ) ¥ (1,059) ¥ 81,228 ¥ 410 ¥ 81,638
Net income 6,498 6,498 6,498 Issuance of common stock to a third party (Note 9) 67,080 30,454 30,387 60,841 60,841 Issuance of common stock by stock option plan (Notes 9 and 10) 30 3 3 6 6 Cash dividends, ¥10.00 per share (1,922 ) (1,922 ) (1,922 ) Repurchase of treasury stock (60 ) (46 ) (46 ) (46 ) Net change in the year 71 299 (1,462 ) (1,091 ) (6 ) (1,097 )
BALANCE, MARCH 31, 2009 259,328 43,392 37,108 69,730 (775 ) (1,368 ) (1,469 ) (1,105 ) 145,513 404 145,917
Net income 2,953 2,953 2,953 Issuance of common stock by stock option plan (Notes 9 and 10) 32 3 3 7 7 Cash dividends, ¥7.50 per share (1,944 ) (1,944 ) (1,944 ) Changes in the scope of consolidation 20 20 20 Repurchase of treasury stock (153 ) (109 ) (109 ) (109 ) Net change in the year 878 1,211 153 2,243 164 2,408
BALANCE, MARCH 31, 2010 259,207 ¥ 43,396 ¥ 37,112 ¥ 70,759 ¥ 102 ¥ (156 ) ¥ (1,315) ¥ (1,215) ¥ 148,683 ¥ 569 ¥ 149,253
Thousands of U.S. Dollars (Note 1)
CommonStock
CapitalSurplus
RetainedEarnings
UnrealizedGain (Loss)
onAvailable-for-Sale
Securities
DeferredLoss on
Derivativesunder Hedge Accounting
ForeignCurrency
TranslationAdjustments
TreasuryStock Total
MinorityInterests
TotalEquity
BALANCE, MARCH 31, 2009 $ 466,588 $ 399,020 $ 749,793 $ (8,338) $ (14,712 ) $ (15,799 ) $ (11,892 ) $ 1,564,660 $ 4,346 $ 1,569,008
Net income 31,762 31,762 31,762 Issuance of common stock by stock option plan (Notes 9 and 10) 39 39 79 79 Cash dividends, $0.08 per share (20,913 ) (20,913 ) (20,913 ) Changes in the scope of consolidation 217 217 217 Repurchase of treasury stock (1,178 ) (1,178 ) (1,178 ) Net change in the year 9,444 13,026 1,650 24,122 1,773 25,896
BALANCE, MARCH 31, 2010 $ 466,628 $ 399,060 $ 760,860 $ 1,106 $ (1,685 ) $ (14,148 ) $ (13,070 ) $ 1,598,750 $ 6,120 $ 1,604,871
See notes to consolidated financial statements.
Chiyoda Corporation and Consolidated Subsidiaries
- 5 -
Chiyoda Corporation and Consolidated Subsidiaries
Consolidated Statements of Changes in Equity Years Ended March 31, 2010 and 2009
Thousands Millions of Yen
OutstandingNumber ofShares ofCommonStock
CommonStock
CapitalSurplus
RetainedEarnings
UnrealizedGain (Loss)
onAvailable-for-Sale
Securities
DeferredLoss on
Derivativesunder Hedge Accounting
ForeignCurrency
TranslationAdjustments
TreasuryStock Total
MinorityInterests
TotalEquity
BALANCE, APRIL 1, 2008 192,279 ¥ 12,935 ¥ 6,718 ¥ 65,155 ¥ (847 ) ¥ (1,668) ¥ (6 ) ¥ (1,059) ¥ 81,228 ¥ 410 ¥ 81,638
Net income 6,498 6,498 6,498 Issuance of common stock to a third party (Note 9) 67,080 30,454 30,387 60,841 60,841 Issuance of common stock by stock option plan (Notes 9 and 10) 30 3 3 6 6 Cash dividends, ¥10.00 per share (1,922 ) (1,922 ) (1,922 ) Repurchase of treasury stock (60 ) (46 ) (46 ) (46 ) Net change in the year 71 299 (1,462 ) (1,091 ) (6 ) (1,097 )
BALANCE, MARCH 31, 2009 259,328 43,392 37,108 69,730 (775 ) (1,368 ) (1,469 ) (1,105 ) 145,513 404 145,917
Net income 2,953 2,953 2,953 Issuance of common stock by stock option plan (Notes 9 and 10) 32 3 3 7 7 Cash dividends, ¥7.50 per share (1,944 ) (1,944 ) (1,944 ) Changes in the scope of consolidation 20 20 20 Repurchase of treasury stock (153 ) (109 ) (109 ) (109 ) Net change in the year 878 1,211 153 2,243 164 2,408
BALANCE, MARCH 31, 2010 259,207 ¥ 43,396 ¥ 37,112 ¥ 70,759 ¥ 102 ¥ (156 ) ¥ (1,315) ¥ (1,215) ¥ 148,683 ¥ 569 ¥ 149,253
Thousands of U.S. Dollars (Note 1)
CommonStock
CapitalSurplus
RetainedEarnings
UnrealizedGain (Loss)
onAvailable-for-Sale
Securities
DeferredLoss on
Derivativesunder Hedge Accounting
ForeignCurrency
TranslationAdjustments
TreasuryStock Total
MinorityInterests
TotalEquity
BALANCE, MARCH 31, 2009 $ 466,588 $ 399,020 $ 749,793 $ (8,338) $ (14,712 ) $ (15,799 ) $ (11,892 ) $ 1,564,660 $ 4,346 $ 1,569,008
Net income 31,762 31,762 31,762 Issuance of common stock by stock option plan (Notes 9 and 10) 39 39 79 79 Cash dividends, $0.08 per share (20,913 ) (20,913 ) (20,913 ) Changes in the scope of consolidation 217 217 217 Repurchase of treasury stock (1,178 ) (1,178 ) (1,178 ) Net change in the year 9,444 13,026 1,650 24,122 1,773 25,896
BALANCE, MARCH 31, 2010 $ 466,628 $ 399,060 $ 760,860 $ 1,106 $ (1,685 ) $ (14,148 ) $ (13,070 ) $ 1,598,750 $ 6,120 $ 1,604,871
See notes to consolidated financial statements.

��CHIYODA CORPORATION ANNUAL REPORT 2010
- 5 -
Chiyoda Corporation and Consolidated Subsidiaries
Consolidated Statements of Changes in Equity Years Ended March 31, 2010 and 2009
Thousands Millions of Yen
OutstandingNumber ofShares ofCommonStock
CommonStock
CapitalSurplus
RetainedEarnings
UnrealizedGain (Loss)
onAvailable-for-Sale
Securities
DeferredLoss on
Derivativesunder Hedge Accounting
ForeignCurrency
TranslationAdjustments
TreasuryStock Total
MinorityInterests
TotalEquity
BALANCE, APRIL 1, 2008 192,279 ¥ 12,935 ¥ 6,718 ¥ 65,155 ¥ (847 ) ¥ (1,668) ¥ (6 ) ¥ (1,059) ¥ 81,228 ¥ 410 ¥ 81,638
Net income 6,498 6,498 6,498 Issuance of common stock to a third party (Note 9) 67,080 30,454 30,387 60,841 60,841 Issuance of common stock by stock option plan (Notes 9 and 10) 30 3 3 6 6 Cash dividends, ¥10.00 per share (1,922 ) (1,922 ) (1,922 ) Repurchase of treasury stock (60 ) (46 ) (46 ) (46 ) Net change in the year 71 299 (1,462 ) (1,091 ) (6 ) (1,097 )
BALANCE, MARCH 31, 2009 259,328 43,392 37,108 69,730 (775 ) (1,368 ) (1,469 ) (1,105 ) 145,513 404 145,917
Net income 2,953 2,953 2,953 Issuance of common stock by stock option plan (Notes 9 and 10) 32 3 3 7 7 Cash dividends, ¥7.50 per share (1,944 ) (1,944 ) (1,944 ) Changes in the scope of consolidation 20 20 20 Repurchase of treasury stock (153 ) (109 ) (109 ) (109 ) Net change in the year 878 1,211 153 2,243 164 2,408
BALANCE, MARCH 31, 2010 259,207 ¥ 43,396 ¥ 37,112 ¥ 70,759 ¥ 102 ¥ (156 ) ¥ (1,315) ¥ (1,215) ¥ 148,683 ¥ 569 ¥ 149,253
Thousands of U.S. Dollars (Note 1)
CommonStock
CapitalSurplus
RetainedEarnings
UnrealizedGain (Loss)
onAvailable-for-Sale
Securities
DeferredLoss on
Derivativesunder Hedge Accounting
ForeignCurrency
TranslationAdjustments
TreasuryStock Total
MinorityInterests
TotalEquity
BALANCE, MARCH 31, 2009 $ 466,588 $ 399,020 $ 749,793 $ (8,338) $ (14,712 ) $ (15,799 ) $ (11,892 ) $ 1,564,660 $ 4,346 $ 1,569,008
Net income 31,762 31,762 31,762 Issuance of common stock by stock option plan (Notes 9 and 10) 39 39 79 79 Cash dividends, $0.08 per share (20,913 ) (20,913 ) (20,913 ) Changes in the scope of consolidation 217 217 217 Repurchase of treasury stock (1,178 ) (1,178 ) (1,178 ) Net change in the year 9,444 13,026 1,650 24,122 1,773 25,896
BALANCE, MARCH 31, 2010 $ 466,628 $ 399,060 $ 760,860 $ 1,106 $ (1,685 ) $ (14,148 ) $ (13,070 ) $ 1,598,750 $ 6,120 $ 1,604,871
See notes to consolidated financial statements.

�� CHIYODA CORPORATION ANNUAL REPORT 2010
- 6 - (Continued)
Chiyoda Corporation and Consolidated Subsidiaries Consolidated Statements of Cash Flows Years Ended March 31, 2010 and 2009
Millions of Yen
Thousands of U.S. Dollars
(Note 1) 2010 2009 2010
OPERATING ACTIVITIES: Income before income taxes and minority interests ¥ 4,714 ¥ 9,651 $ 50,695 Adjustments for: Income taxes paid (7,531 ) (72 ) (80,979 ) Depreciation and amortization 2,059 1,957 22,143 Reversal of allowance for doubtful accounts—net (6 ) (158 ) (67 ) Provision for warranty costs for completed works 678 1,754 7,297 Provision for loss on construction contracts 125 43 1,344 Provision for (reversal of) retirement benefits—net 374 (56 ) 4,024 Loss on valuation of investment securities 1,859 Foreign exchange loss (gain)—net 78 (26 ) 842 Equity in earnings of associated companies (144 ) (137 ) (1,550 ) Changes in operating assets and liabilities: Decrease (increase) in trade notes and accounts receivable, and costs and estimated earnings on long-term construction contracts 469 (13,859 ) 5,051 Decrease in costs of construction contracts in process 9,692 171 104,216 Decrease in jointly controlled assets of joint venture 30,508 92,256 328,053 Increase in interest and dividend receivable (694 ) (3,753 ) (7,465 ) Increase in trade notes and accounts payable 12,031 2,772 129,367 Decrease in advance receipts on construction contracts (43,592 ) (93,209 ) (468,731 ) Increase (decrease) in deposits received 1 (511 ) 19 Decrease in accounts receivable—other 656 2,654 7,061 Decrease in accrued liability of a defined contribution pension plan (800 ) (811 ) (8,604 ) Other—net (9 ) 8,446 (102 ) Total adjustments 3,898 (679 ) 41,921 Net cash provided by operating activities 8,613 8,971 92,616 INVESTING ACTIVITIES: Payments for time deposits (539 ) (5,804 ) Proceeds from withdrawal of time deposits 539 888 5,804 Payments for purchases of investment securities (535 ) (65 ) (5,761 ) Purchases of property, plant and equipment (922 ) (563 ) (9,914 ) Purchases of intangible assets (942 ) (1,156 ) (10,135 ) Proceeds from collections of long-term loans 51 551 Payments for acquisition of shares (ARROW HUMAN RESOURCES Co., Ltd. for 2010 and IT Engineering Ltd. for 2009) affecting scope of consolidation, net of cash acquired (388 ) (215 ) (4,176 ) Other—net 14 40 159 Net cash used in investing activities (2,722 ) (1,072 ) (29,276 ) FORWARD ¥ 5,890 ¥ 7,898 $ 63,340
Consolidated Statements of Cash FlowsYears Ended March 31, 2010 and 2009
Chiyoda Corporation and Consolidated Subsidiaries
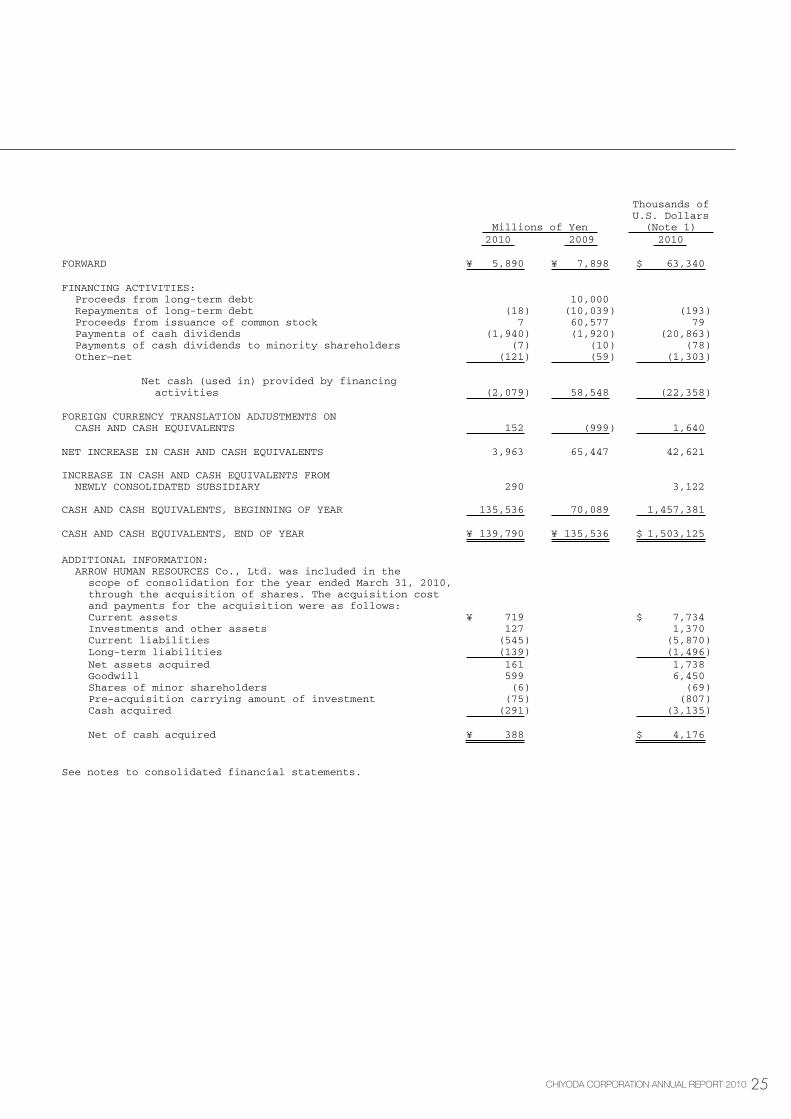
��CHIYODA CORPORATION ANNUAL REPORT 2010
- 7 - (Concluded)
Chiyoda Corporation and Consolidated Subsidiaries Consolidated Statements of Cash Flows Years Ended March 31, 2010 and 2009
Millions of Yen
Thousands of U.S. Dollars
(Note 1) 2010 2009 2010 FORWARD ¥ 5,890 ¥ 7,898 $ 63,340 FINANCING ACTIVITIES: Proceeds from long-term debt 10,000 Repayments of long-term debt (18 ) (10,039 ) (193 ) Proceeds from issuance of common stock 7 60,577 79 Payments of cash dividends (1,940 ) (1,920 ) (20,863 ) Payments of cash dividends to minority shareholders (7 ) (10 ) (78 ) Other—net (121 ) (59 ) (1,303 ) Net cash (used in) provided by financing activities (2,079 ) 58,548 (22,358 ) FOREIGN CURRENCY TRANSLATION ADJUSTMENTS ON CASH AND CASH EQUIVALENTS 152 (999 ) 1,640 NET INCREASE IN CASH AND CASH EQUIVALENTS 3,963 65,447 42,621 INCREASE IN CASH AND CASH EQUIVALENTS FROM NEWLY CONSOLIDATED SUBSIDIARY 290 3,122 CASH AND CASH EQUIVALENTS, BEGINNING OF YEAR 135,536 70,089 1,457,381 CASH AND CASH EQUIVALENTS, END OF YEAR ¥ 139,790 ¥ 135,536 $ 1,503,125
ADDITIONAL INFORMATION: ARROW HUMAN RESOURCES Co., Ltd. was included in the scope of consolidation for the year ended March 31, 2010, through the acquisition of shares. The acquisition cost and payments for the acquisition were as follows: Current assets ¥ 719 $ 7,734 Investments and other assets 127 1,370 Current liabilities (545 ) (5,870 ) Long-term liabilities (139 ) (1,496 ) Net assets acquired 161 1,738 Goodwill 599 6,450 Shares of minor shareholders (6 ) (69 ) Pre-acquisition carrying amount of investment (75 ) (807 ) Cash acquired (291 ) (3,135 ) Net of cash acquired ¥ 388 $ 4,176
See notes to consolidated financial statements.
�� CHIYODA CORPORATION ANNUAL REPORT 2010
- 8 -
Chiyoda Corporation and Consolidated Subsidiaries Notes to Consolidated Financial Statements Years Ended March 31, 2010 and 2009 1. BASIS OF PRESENTING CONSOLIDATED FINANCIAL STATEMENTS
The accompanying consolidated financial statements have been prepared in accordance with the provisions set forth in the Japanese Financial Instruments and Exchange Act and its related accounting regulations and in conformity with accounting principles generally accepted in Japan ("Japanese GAAP"), which are different in certain respects as to application and disclosure requirements of International Financial Reporting Standards. In preparing these consolidated financial statements, certain reclassifications and rearrangements have been made to the consolidated financial statements issued domestically in order to present them in a form which is more familiar to readers outside Japan. In addition, certain reclassifications and rearrangements have been made in the 2009 financial statements in order for them to conform to classifications and presentations used in 2010. The consolidated financial statements are stated in Japanese yen, the currency of the country in which Chiyoda Corporation (the "Company") is incorporated and principally operates. The translations of Japanese yen amounts into U.S. dollar amounts are included solely for the convenience of readers outside Japan and have been made at the rate of ¥93 to $1, the approximate rate of exchange at March 31, 2010. Such translations should not be construed as representations that the Japanese yen amounts could be converted into U.S. dollars at that or any other rate. Japanese yen figures less than a million yen are rounded down to the nearest million yen, except for per share data. U.S. dollar figures less than a thousand U.S. dollars are rounded down to the nearest thousand U.S. dollars, except for per share data.
2. SUMMARY OF SIGNIFICANT ACCOUNTING POLICIES
a. Consolidation—The consolidated financial statements for the year ended March 31, 2010 include the accounts of the Company and its 19 significant (17 in 2009) subsidiaries (together, the "Group"). Under the control or influence concept, those companies in which the Company, directly or indirectly, is able to exercise control over operations are fully consolidated, and those companies over which the Group has the ability to exercise significant influence are accounted for by the equity method. Investments in two (three in 2009) associated companies are accounted for by the equity method. Investments in the remaining unconsolidated subsidiaries and associated companies are stated at cost. If the equity method of accounting had been applied to the investments in these companies, the effect on the accompanying consolidated financial statements would not be material. The excess of the cost of the Company's investments in consolidated subsidiaries and associated companies over the fair value of the net assets of the acquired subsidiary at the date of acquisition is being amortized over a period of 20 years.
Notes to Consolidated Financial StatementsYears Ended March 31, 2010 and 2009
- 9 -
All significant intercompany balances and transactions have been eliminated in consolidation. All material unrealized profit included in assets resulting from transactions within the Group is eliminated.
b. Construction Contracts—For the year ended March 31, 2009, revenues on construction contracts
greater than ¥100 million and having a construction duration exceeding one year are recognized on the percentage-of-completion method based on the ratio of costs incurred to total estimated costs. Under this method, related costs and estimated earnings in excess of progress billings are presented as a current asset. In December 2007, the Accounting Standards Board of Japan (the "ASBJ") issued ASBJ Statement No. 15 "Accounting Standard for Construction Contracts" and ASBJ Guidance No. 18 "Guidance on Accounting Standard for Construction Contracts." Under the previous Japanese GAAP, either the completed-contract method or the percentage-of-completion method was permitted to account for construction contracts. Under this new accounting standard, the construction revenue and construction costs should be recognized by the percentage-of-completion method, if the outcome of a construction contract can be estimated reliably. When total construction revenue, total construction costs and the stage of completion of the contract at the balance sheet date can be reliably measured, the outcome of a construction contract can be estimated reliably. If the outcome of a construction contract cannot be reliably estimated, the completed-contract method should be applied. When it is probable that the total construction costs will exceed total construction revenue, an estimated loss on the contract should be immediately recognized by providing for a loss on construction contracts. This standard is applicable to construction contracts and software development contracts and effective for fiscal years beginning on or after April 1, 2009. The Group applied the new accounting standard effective April 1, 2009. The effect of this change was not material. Concerning the construction contracts, the Group applies the accounting methods below:
Unbilled costs on the other contracts, which are accounted for by the completed-contract
method, are stated as costs of construction contracts in process. Payments received in excess of costs and estimated earnings on the contracts, which are accounted for by the percentage-of-completion method, and payments received on the other contracts are presented as current liabilities. Costs of preparation work for unsuccessful proposals and other projects which are not realized are charged to income and are included in costs of revenue.
c. Cash Equivalents—Cash equivalents are short-term investments that are readily convertible
into cash and that are exposed to insignificant risk of changes in value. Cash equivalents include time deposits and certificate of deposits both of which mature or become due within three months of the date of acquisition.
d. Short-Term Investments—Short-term investments are time deposits which will mature after
three months of the date of acquisition. Short-term investments are exposed to insignificant risk of changes in value.
Chiyoda Corporation and Consolidated Subsidiaries

��CHIYODA CORPORATION ANNUAL REPORT 2010
- 9 -
All significant intercompany balances and transactions have been eliminated in consolidation. All material unrealized profit included in assets resulting from transactions within the Group is eliminated.
b. Construction Contracts—For the year ended March 31, 2009, revenues on construction contracts
greater than ¥100 million and having a construction duration exceeding one year are recognized on the percentage-of-completion method based on the ratio of costs incurred to total estimated costs. Under this method, related costs and estimated earnings in excess of progress billings are presented as a current asset. In December 2007, the Accounting Standards Board of Japan (the "ASBJ") issued ASBJ Statement No. 15 "Accounting Standard for Construction Contracts" and ASBJ Guidance No. 18 "Guidance on Accounting Standard for Construction Contracts." Under the previous Japanese GAAP, either the completed-contract method or the percentage-of-completion method was permitted to account for construction contracts. Under this new accounting standard, the construction revenue and construction costs should be recognized by the percentage-of-completion method, if the outcome of a construction contract can be estimated reliably. When total construction revenue, total construction costs and the stage of completion of the contract at the balance sheet date can be reliably measured, the outcome of a construction contract can be estimated reliably. If the outcome of a construction contract cannot be reliably estimated, the completed-contract method should be applied. When it is probable that the total construction costs will exceed total construction revenue, an estimated loss on the contract should be immediately recognized by providing for a loss on construction contracts. This standard is applicable to construction contracts and software development contracts and effective for fiscal years beginning on or after April 1, 2009. The Group applied the new accounting standard effective April 1, 2009. The effect of this change was not material. Concerning the construction contracts, the Group applies the accounting methods below:
Unbilled costs on the other contracts, which are accounted for by the completed-contract
method, are stated as costs of construction contracts in process. Payments received in excess of costs and estimated earnings on the contracts, which are accounted for by the percentage-of-completion method, and payments received on the other contracts are presented as current liabilities. Costs of preparation work for unsuccessful proposals and other projects which are not realized are charged to income and are included in costs of revenue.
c. Cash Equivalents—Cash equivalents are short-term investments that are readily convertible
into cash and that are exposed to insignificant risk of changes in value. Cash equivalents include time deposits and certificate of deposits both of which mature or become due within three months of the date of acquisition.
d. Short-Term Investments—Short-term investments are time deposits which will mature after
three months of the date of acquisition. Short-term investments are exposed to insignificant risk of changes in value.
�� CHIYODA CORPORATION ANNUAL REPORT 2010
- 10 -
e. Investment Securities—All marketable securities are classified as available-for-sale securities and are reported at fair value, with unrealized gains and losses, net of applicable taxes, reported in a separate component of equity. The cost of securities sold is determined based on the moving-average method. Non-marketable available-for-sale securities are stated at cost determined by the moving-average method. For other than temporary declines in fair value, non-marketable securities are reduced to net realizable value by a charge to income.
f. Allowance for Doubtful Accounts—The allowance for doubtful accounts is stated in amounts
considered to be appropriate based on the Group's past credit loss experience and an evaluation of potential losses in the receivables outstanding.
g. Property, Plant and Equipment—Property, plant and equipment are stated at cost. Depreciation
is computed by the declining-balance method, except for buildings owned by the Company which are depreciated using the straight-line method, at rates based on the estimated useful lives of the assets. The range of useful lives is from 11 to 57 years for buildings and structures, from 4 to 17 years for machinery and equipment, and from 2 to 15 years for tools, furniture and fixtures. Equipment held for lease is depreciated by the straight-line method over the respective lease periods.
h. Long-Lived Assets—The Group reviews its long-lived assets for impairment whenever events or
changes in circumstances indicate the carrying amount of an asset or asset group may not be recoverable. An impairment loss would be recognized if the carrying amount of an asset or asset group exceeds the sum of the undiscounted future cash flows expected to result from the continued use and eventual disposition of the asset or asset group. The impairment loss would be measured as the amount by which the carrying amount of the asset exceeds its recoverable amount, which is the higher of the discounted cash flows from the continued use and eventual disposition of the asset or the net selling price at disposition.
i. Other Assets—Intangible assets are carried at cost less accumulated amortization, which is
calculated by the straight-line method over their estimated useful lives. Software for internal use is amortized on a straight-line basis over its estimated useful life (five years at the maximum).
j. Allowance for Warranty Costs for Completed Work—The allowance for warranty costs for
completed work is provided based on past rate experience. k. Allowance for Losses on Construction Contracts—The allowance for losses on construction
contracts is provided for an estimated amount of probable losses to be incurred in future years in respect of construction projects in progress. When there are losses on completed-contract method applied contract, the allowance for losses on construction contracts on the balance sheet is the net amount of costs of construction contracts in process on the same contract.
l. Provision for Treatment of PCB Waste—Provision for treatment of PCB (Poly Chlorinated
Biphenyl) waste is provided based on estimated costs of the treatment for PCB products and equipment as well as their collection and transportation fees.
m. Retirement Benefits—Employees of the Company are, under most circumstances, entitled to
payments from the defined contribution pension plan and the defined benefit corporate pension plan. Employees of certain of the Company's consolidated subsidiaries are, under most circumstances, entitled to certain lump-sum severance payments and pension payments.
- 11 -
Effective April 1, 2000, the Company and its domestic consolidated subsidiaries adopted a new accounting standard for employees' retirement benefits and accounted for the liability for retirement benefits based on the projected benefit obligations and plan assets at the balance sheet date. The transitional obligation of ¥5,696 million ($61,251 thousand) is being amortized and charged to income over 15 years using the straight-line amortization method and presented as an operating expense in the consolidated statements of income for the years ended March 31, 2010 and 2009. Retirement benefits to directors, officers and corporate auditors of the Company are provided at the amount which would be required if all directors, officers and corporate auditors terminated at March 31, 2009. Effective June 23, 2009, the Company terminated its unfunded retirement benefit allowance for all directors, officers and corporate auditors under the resolution of shareholders meeting and board meeting. The outstanding balance of retirement benefit allowance for directors, officers and corporate auditors of the Company was reclassified to non-current liabilities—other liabilities in the year ended March 31, 2010. Retirement benefits to directors, officers and corporate auditors of the Company's certain consolidated subsidiaries are provided at the amount which would be required if all directors, officers and corporate auditors terminated at March 31, 2010 and 2009.
n. Research and Development Costs—Research and development costs are charged to income when
incurred. o. Leases—In March 2007, the ASBJ issued ASBJ Statement No. 13, "Accounting Standard for Lease
Transactions," which revised the previous accounting standard for lease transactions issued in June 1993. The revised accounting standard for lease transactions is effective for fiscal years beginning on or after April 1, 2008 with early adoption permitted for fiscal years beginning on or after April 1, 2007. Under the previous accounting standard, finance leases that deem to transfer ownership of the leased property to the lessee were to be capitalized. However, other finance leases were permitted to be accounted for as operating lease transactions if certain "as if capitalized" information is disclosed in the note to the lessee's financial statements. The revised accounting standard requires that all finance lease transactions should be capitalized to recognize lease assets and lease obligations in the balance sheet. In addition, the revised accounting standard permits leases which existed at the transition date and do not transfer ownership of the leased property to the lessee to be accounted for as operating lease transactions with certain "as if capitalized information" disclosed in the notes to the lessee's financial statements. The Group applied the revised accounting standard effective April 1, 2008. In addition, the Group accounted for leases which existed at the transition date and do not transfer ownership of the leased property to the lessee as operating lease transactions. All other leases are accounted for as operating leases.
p. Income Taxes—The provision for income taxes is computed based on the pretax income included
in the consolidated statements of income. The asset and liability approach is used to recognize deferred tax assets and liabilities for the expected future tax consequences of temporary differences between the carrying amounts and the tax bases of assets and liabilities. Deferred taxes are measured by applying currently enacted tax laws to the temporary differences.
Chiyoda Corporation and Consolidated Subsidiaries
Notes to Consolidated Financial StatementsYears Ended March 31, 2010 and 2009
��CHIYODA CORPORATION ANNUAL REPORT 2010
- 11 -
Effective April 1, 2000, the Company and its domestic consolidated subsidiaries adopted a new accounting standard for employees' retirement benefits and accounted for the liability for retirement benefits based on the projected benefit obligations and plan assets at the balance sheet date. The transitional obligation of ¥5,696 million ($61,251 thousand) is being amortized and charged to income over 15 years using the straight-line amortization method and presented as an operating expense in the consolidated statements of income for the years ended March 31, 2010 and 2009. Retirement benefits to directors, officers and corporate auditors of the Company are provided at the amount which would be required if all directors, officers and corporate auditors terminated at March 31, 2009. Effective June 23, 2009, the Company terminated its unfunded retirement benefit allowance for all directors, officers and corporate auditors under the resolution of shareholders meeting and board meeting. The outstanding balance of retirement benefit allowance for directors, officers and corporate auditors of the Company was reclassified to non-current liabilities—other liabilities in the year ended March 31, 2010. Retirement benefits to directors, officers and corporate auditors of the Company's certain consolidated subsidiaries are provided at the amount which would be required if all directors, officers and corporate auditors terminated at March 31, 2010 and 2009.
n. Research and Development Costs—Research and development costs are charged to income when
incurred. o. Leases—In March 2007, the ASBJ issued ASBJ Statement No. 13, "Accounting Standard for Lease
Transactions," which revised the previous accounting standard for lease transactions issued in June 1993. The revised accounting standard for lease transactions is effective for fiscal years beginning on or after April 1, 2008 with early adoption permitted for fiscal years beginning on or after April 1, 2007. Under the previous accounting standard, finance leases that deem to transfer ownership of the leased property to the lessee were to be capitalized. However, other finance leases were permitted to be accounted for as operating lease transactions if certain "as if capitalized" information is disclosed in the note to the lessee's financial statements. The revised accounting standard requires that all finance lease transactions should be capitalized to recognize lease assets and lease obligations in the balance sheet. In addition, the revised accounting standard permits leases which existed at the transition date and do not transfer ownership of the leased property to the lessee to be accounted for as operating lease transactions with certain "as if capitalized information" disclosed in the notes to the lessee's financial statements. The Group applied the revised accounting standard effective April 1, 2008. In addition, the Group accounted for leases which existed at the transition date and do not transfer ownership of the leased property to the lessee as operating lease transactions. All other leases are accounted for as operating leases.
p. Income Taxes—The provision for income taxes is computed based on the pretax income included
in the consolidated statements of income. The asset and liability approach is used to recognize deferred tax assets and liabilities for the expected future tax consequences of temporary differences between the carrying amounts and the tax bases of assets and liabilities. Deferred taxes are measured by applying currently enacted tax laws to the temporary differences.
- 12 -
The Company files a tax return under the consolidated corporate-tax system which allows companies to base tax payments on the combined profits or losses of the parent company and its wholly owned domestic subsidiaries.
q. Foreign Currency Transactions—All short-term and long-term monetary receivables and payables
denominated in foreign currencies are translated into Japanese yen at the exchange rates at the balance sheet date. The foreign exchange gains and losses from translation are recognized in the income statement to the extent that they are not hedged by foreign currency forward contracts.
r. Foreign Currency Financial Statements—The balance sheet accounts of the consolidated foreign
subsidiaries are translated into Japanese yen at the current exchange rate as of the balance sheet date except for equity, which is translated at the historical rate. Differences arising from such translation were shown as "Foreign currency translation adjustments" in a separate component of equity. Revenue and expense accounts of consolidated foreign subsidiaries are translated into Japanese yen at the current exchange rate as of the balance sheet date.
s. Derivatives and Hedging Activities—The Company uses a variety of derivative financial
instruments, including foreign currency forward contracts as a means of hedging exposure to foreign currency risks. The Company does not enter into derivatives for trading or speculative purposes. Derivative financial instruments and foreign currency transactions are classified and accounted for as follows: (a) all derivatives are recognized as either assets or liabilities and measured at fair value, with gains or losses recognized in the income statement and (b) for derivatives used for hedging purposes, if derivatives qualify for hedge accounting, because of high correlation and effectiveness between the hedging instruments and the hedged items, gains or losses on derivatives are deferred until maturity of the hedged transactions. The foreign currency forward contracts are utilized to hedge foreign exchange risks. Certain assets and liabilities on construction contracts denominated in foreign currencies are translated at the contracted rates if the forward contracts qualify for hedge accounting.
t. Per Share Information—Basic net income per share is computed by dividing net income
available to common shareholders by the weighted-average number of common shares outstanding for the period, retroactively adjusted for stock splits. Diluted net income per share reflects the potential dilution that could occur if securities were exercised or converted into common stock. Diluted net income per share of common stock assumes full conversion of the outstanding convertible notes and bonds at the beginning of the year (or at the time of issuance) with an applicable adjustment for related interest expense, net of tax, and full exercise of outstanding warrants. Cash dividends per share presented in the accompanying consolidated statements of income are dividends applicable to the respective years including dividends to be paid after the end of the year.

�0 CHIYODA CORPORATION ANNUAL REPORT 2010
- 12 -
The Company files a tax return under the consolidated corporate-tax system which allows companies to base tax payments on the combined profits or losses of the parent company and its wholly owned domestic subsidiaries.
q. Foreign Currency Transactions—All short-term and long-term monetary receivables and payables
denominated in foreign currencies are translated into Japanese yen at the exchange rates at the balance sheet date. The foreign exchange gains and losses from translation are recognized in the income statement to the extent that they are not hedged by foreign currency forward contracts.
r. Foreign Currency Financial Statements—The balance sheet accounts of the consolidated foreign
subsidiaries are translated into Japanese yen at the current exchange rate as of the balance sheet date except for equity, which is translated at the historical rate. Differences arising from such translation were shown as "Foreign currency translation adjustments" in a separate component of equity. Revenue and expense accounts of consolidated foreign subsidiaries are translated into Japanese yen at the current exchange rate as of the balance sheet date.
s. Derivatives and Hedging Activities—The Company uses a variety of derivative financial
instruments, including foreign currency forward contracts as a means of hedging exposure to foreign currency risks. The Company does not enter into derivatives for trading or speculative purposes. Derivative financial instruments and foreign currency transactions are classified and accounted for as follows: (a) all derivatives are recognized as either assets or liabilities and measured at fair value, with gains or losses recognized in the income statement and (b) for derivatives used for hedging purposes, if derivatives qualify for hedge accounting, because of high correlation and effectiveness between the hedging instruments and the hedged items, gains or losses on derivatives are deferred until maturity of the hedged transactions. The foreign currency forward contracts are utilized to hedge foreign exchange risks. Certain assets and liabilities on construction contracts denominated in foreign currencies are translated at the contracted rates if the forward contracts qualify for hedge accounting.
t. Per Share Information—Basic net income per share is computed by dividing net income
available to common shareholders by the weighted-average number of common shares outstanding for the period, retroactively adjusted for stock splits. Diluted net income per share reflects the potential dilution that could occur if securities were exercised or converted into common stock. Diluted net income per share of common stock assumes full conversion of the outstanding convertible notes and bonds at the beginning of the year (or at the time of issuance) with an applicable adjustment for related interest expense, net of tax, and full exercise of outstanding warrants. Cash dividends per share presented in the accompanying consolidated statements of income are dividends applicable to the respective years including dividends to be paid after the end of the year.
- 13 -
u. New Accounting Pronouncements Business Combinations—In December 2008, the ASBJ issued a revised accounting standard for business combinations, ASBJ Statement No. 21, "Accounting Standard for Business Combinations." Major accounting changes under the revised accounting standard are as follows:
(1) The current accounting standard for business combinations allows companies to apply the
pooling of interests method of accounting when certain specific criteria are met such that the business combination is essentially regarded as a uniting-of-interests. The revised standard requires to account for such business combination by the purchase method and the pooling of interests method of accounting is no longer allowed.
(2) The current accounting standard accounts for the research and development costs to be
charged to income as incurred. Under the revised standard, an in-process research and development (IPR&D) acquired by the business combination is capitalized as an intangible asset.
(3) The current accounting standard accounts for a bargain purchase gain (negative goodwill)
to be systematically amortized within 20 years. Under the revised standard, the acquirer recognizes a bargain purchase gain in profit or loss on the acquisition date after reassessing whether it has correctly identified all of the assets acquired and all of the liabilities assumed with a review of such procedures used.
This standard is applicable to business combinations undertaken on or after April 1, 2010
with early adoption permitted for fiscal years beginning on or after April 1, 2009. Unification of Accounting Policies Applied to Foreign Associated Companies for the Equity Method—The current accounting standard requires to unify accounting policies within the consolidation group. However, the current guidance allows to apply the equity method for the financial statements of its foreign associated company which have been prepared in accordance with generally accepted accounting principles in their respective jurisdictions without unification of accounting policies. In March 2008, the ASBJ issued ASBJ Statement No. 16, "Accounting Standard for Equity Method of Accounting for Investments." The new standard requires adjustments to be made to conform the associate's accounting policies for similar transactions and events under similar circumstances to those of the parent company when the associate's financial statements are used in applying the equity method unless it is impracticable to determine adjustments. In addition, financial statements prepared by foreign associated companies in accordance with either International Financial Reporting Standards or the generally accepted accounting principles in the United States of America tentatively may be used in applying the equity method if the following items are adjusted so that net income is accounted for in accordance with Japanese GAAP unless they are not material: (1) amortization of goodwill; (2) scheduled amortization of actuarial gain or loss of pensions that has been directly recorded in the equity; (3) expensing capitalized development costs of R&D; (4) cancellation of the fair value model accounting for property, plant and equipment and investment properties and incorporation of the cost model accounting; (5) recording the prior years' effects of changes in accounting policies in the income statement where retrospective adjustments to the financial statements have been incorporated; and (6) exclusion of minority interests from net income, if contained.
Chiyoda Corporation and Consolidated Subsidiaries
Notes to Consolidated Financial StatementsYears Ended March 31, 2010 and 2009

�1CHIYODA CORPORATION ANNUAL REPORT 2010
- 14 -
This standard is applicable to equity method of accounting for fiscal years beginning on or after April 1, 2010 with early adoption permitted for fiscal years beginning on or after April 1, 2009. Asset Retirement Obligations—In March 2008, the ASBJ published a new accounting standard for asset retirement obligations, ASBJ Statement No. 18 "Accounting Standard for Asset Retirement Obligations" and ASBJ Guidance No. 21 "Guidance on Accounting Standard for Asset Retirement Obligations." Under this accounting standard, an asset retirement obligation is defined as a legal obligation imposed either by law or contract that results from the acquisition, construction, development and the normal operation of a tangible fixed asset and is associated with the retirement of such tangible fixed asset. The asset retirement obligation is recognized as the sum of the discounted cash flows required for the future asset retirement and is recorded in the period in which the obligation is incurred if a reasonable estimate can be made. If a reasonable estimate of the asset retirement obligation cannot be made in the period the asset retirement obligation is incurred, the liability should be recognized when a reasonable estimate of asset retirement obligation can be made. Upon initial recognition of a liability for an asset retirement obligation, an asset retirement cost is capitalized by increasing the carrying amount of the related fixed asset by the amount of the liability. The asset retirement cost is subsequently allocated to expense through depreciation over the remaining useful life of the asset. Over time, the liability is accreted to its present value each period. Any subsequent revisions to the timing or the amount of the original estimate of undiscounted cash flows are reflected as an increase or a decrease in the carrying amount of the liability and the capitalized amount of the related asset retirement cost. This standard is effective for fiscal years beginning on or after April 1, 2010 with early adoption permitted for fiscal years beginning on or before March 31, 2010. Accounting Changes and Error Corrections—In December 2009, ASBJ issued ASBJ Statement No. 24 "Accounting Standard for Accounting Changes and Error Corrections" and ASBJ Guidance No. 24 "Guidance on Accounting Standard for Accounting Changes and Error Corrections." Accounting treatments under this standard and guidance are as follows:
(1) Changes in accounting policies
When a new accounting policy is applied with revision of accounting standards, a new policy is applied retrospectively unless the revised accounting standards include specific transitional provisions. When the revised accounting standards include specific transitional provisions, an entity shall comply with the specific transitional provisions.
(2) Changes in presentations
When the presentation of financial statements is changed, prior period financial statements are reclassified in accordance with the new presentation.
(3) Changes in accounting estimates
A change in an accounting estimate is accounted for in the period of the change if the change affects that period only, and is accounted for prospectively if the change affects both the period of the change and future periods.
(4) Corrections of prior period errors
When an error in prior period financial statements is discovered, those statements are restated.
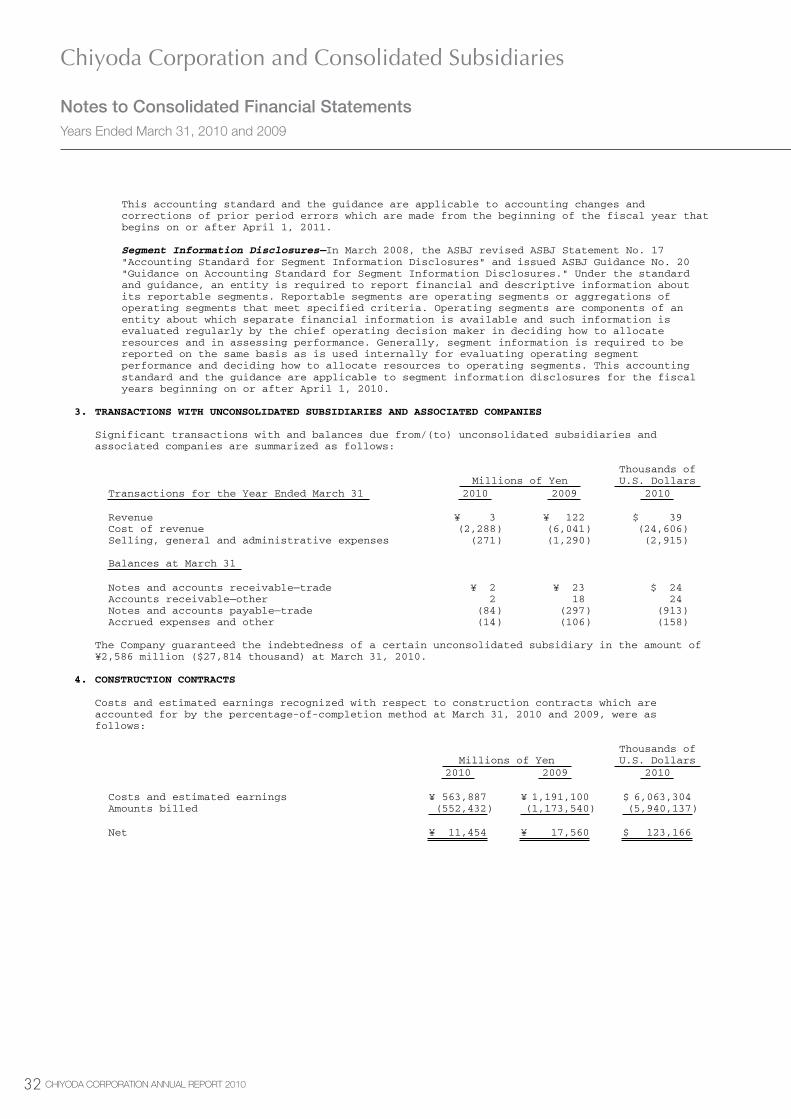
�� CHIYODA CORPORATION ANNUAL REPORT 2010
- 15 -
This accounting standard and the guidance are applicable to accounting changes and corrections of prior period errors which are made from the beginning of the fiscal year that begins on or after April 1, 2011. Segment Information Disclosures—In March 2008, the ASBJ revised ASBJ Statement No. 17 "Accounting Standard for Segment Information Disclosures" and issued ASBJ Guidance No. 20 "Guidance on Accounting Standard for Segment Information Disclosures." Under the standard and guidance, an entity is required to report financial and descriptive information about its reportable segments. Reportable segments are operating segments or aggregations of operating segments that meet specified criteria. Operating segments are components of an entity about which separate financial information is available and such information is evaluated regularly by the chief operating decision maker in deciding how to allocate resources and in assessing performance. Generally, segment information is required to be reported on the same basis as is used internally for evaluating operating segment performance and deciding how to allocate resources to operating segments. This accounting standard and the guidance are applicable to segment information disclosures for the fiscal years beginning on or after April 1, 2010.
3. TRANSACTIONS WITH UNCONSOLIDATED SUBSIDIARIES AND ASSOCIATED COMPANIES
Significant transactions with and balances due from/(to) unconsolidated subsidiaries and associated companies are summarized as follows:
Millions of Yen Thousands of U.S. Dollars
Transactions for the Year Ended March 31 2010 2009 2010
Revenue ¥ 3 ¥ 122 $ 39 Cost of revenue (2,288 ) (6,041 ) (24,606 ) Selling, general and administrative expenses (271 ) (1,290 ) (2,915 )
Balances at March 31
Notes and accounts receivable—trade ¥ 2 ¥ 23 $ 24 Accounts receivable—other 2 18 24 Notes and accounts payable—trade (84 ) (297 ) (913 ) Accrued expenses and other (14 ) (106 ) (158 )
The Company guaranteed the indebtedness of a certain unconsolidated subsidiary in the amount of
¥2,586 million ($27,814 thousand) at March 31, 2010. 4. CONSTRUCTION CONTRACTS
Costs and estimated earnings recognized with respect to construction contracts which are accounted for by the percentage-of-completion method at March 31, 2010 and 2009, were as follows:
Millions of Yen Thousands of U.S. Dollars
2010 2009 2010
Costs and estimated earnings ¥ 563,887 ¥ 1,191,100 $ 6,063,304 Amounts billed (552,432 ) (1,173,540 ) (5,940,137 ) Net ¥ 11,454 ¥ 17,560 $ 123,166
Chiyoda Corporation and Consolidated Subsidiaries
Notes to Consolidated Financial StatementsYears Ended March 31, 2010 and 2009

��CHIYODA CORPORATION ANNUAL REPORT 2010
- 16 -
5. INVESTMENT SECURITIES Investment securities at March 31, 2010 and 2009, consisted of the following:
Millions of Yen Thousands of U.S. Dollars
2010 2009 2010
Non-current—Equity securities ¥ 5,153 ¥ 3,765 $ 55,417 The costs and aggregate fair values of investment securities at March 31, 2010 and 2009, were as
follows:
Millions of Yen
March 31, 2010 Cost Unrealized
Gains Unrealized
Losses Fair Value
Securities classified as available-for-sale—Equity securities ¥ 3,377 ¥ 507 ¥ 375 ¥ 3,508
March 31, 2009
Securities classified as available-for-sale—Equity securities ¥ 3,400 ¥ 193 ¥ 966 ¥ 2,626
Thousands of U.S. Dollars
March 31, 2010 Cost Unrealized
Gains Unrealized
Losses Fair Value
Securities classified as available-for-sale—Equity securities $ 36,316 $ 5,456 $ 4,041 $ 37,730
Available-for-sale securities whose fair value was not readily determinable at March 31, 2009,
were as follows. The similar information for 2010 is disclosed in Note 14.
Carrying Amount March 31, 2009 Millions of Yen
Available-for-sale—Equity securities ¥ 1,138
The information of the available-for-sale securities which were sold during the year ended March
31, 2010 was as follows:
Millions of Yen
March 31, 2010 Proceeds Realized Gains
Realized Losses
Available-for-sale—Equity securities ¥ 13 ¥ 4 ¥ 12
Thousands of U.S. Dollars
March 31, 2010 Proceeds Realized Gains
Realized Losses
Available-for-sale—Equity securities $ 143 $ 44 $ 134
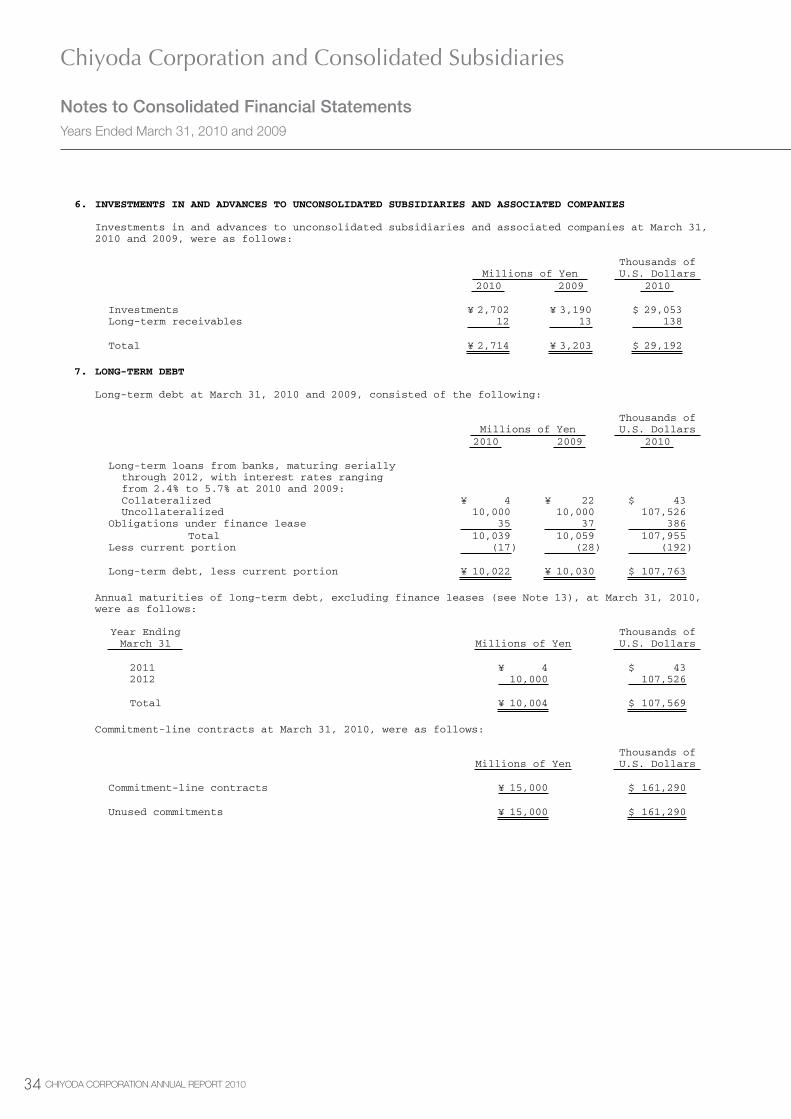
�� CHIYODA CORPORATION ANNUAL REPORT 2010
- 17 -
6. INVESTMENTS IN AND ADVANCES TO UNCONSOLIDATED SUBSIDIARIES AND ASSOCIATED COMPANIES Investments in and advances to unconsolidated subsidiaries and associated companies at March 31, 2010 and 2009, were as follows:
Millions of Yen Thousands of U.S. Dollars
2010 2009 2010
Investments ¥ 2,702 ¥ 3,190 $ 29,053 Long-term receivables 12 13 138 Total ¥ 2,714 ¥ 3,203 $ 29,192
7. LONG-TERM DEBT
Long-term debt at March 31, 2010 and 2009, consisted of the following:
Millions of Yen Thousands of U.S. Dollars
2010 2009 2010
Long-term loans from banks, maturing serially through 2012, with interest rates ranging from 2.4% to 5.7% at 2010 and 2009: Collateralized ¥ 4 ¥ 22 $ 43 Uncollateralized 10,000 10,000 107,526 Obligations under finance lease 35 37 386 Total 10,039 10,059 107,955 Less current portion (17 ) (28 ) (192 ) Long-term debt, less current portion ¥ 10,022 ¥ 10,030 $ 107,763
Annual maturities of long-term debt, excluding finance leases (see Note 13), at March 31, 2010,
were as follows:
Year Ending March 31 Millions of Yen
Thousands of U.S. Dollars
2011 ¥ 4 $ 43 2012 10,000 107,526 Total ¥ 10,004 $ 107,569
Commitment-line contracts at March 31, 2010, were as follows:
Millions of Yen Thousands of U.S. Dollars
Commitment-line contracts ¥ 15,000 $ 161,290 Unused commitments ¥ 15,000 $ 161,290
Chiyoda Corporation and Consolidated Subsidiaries
Notes to Consolidated Financial StatementsYears Ended March 31, 2010 and 2009
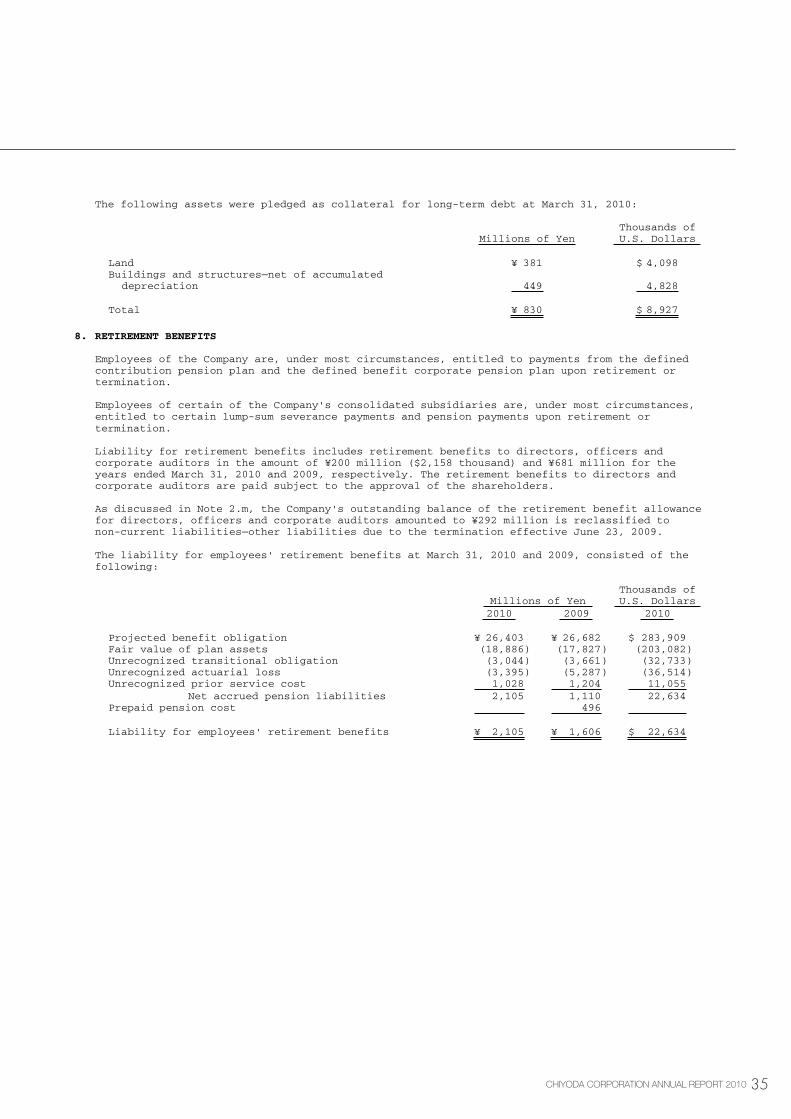
��CHIYODA CORPORATION ANNUAL REPORT 2010
- 18 -
The following assets were pledged as collateral for long-term debt at March 31, 2010:
Millions of Yen Thousands of U.S. Dollars
Land ¥ 381 $ 4,098 Buildings and structures—net of accumulated depreciation 449 4,828 Total ¥ 830 $ 8,927
8. RETIREMENT BENEFITS
Employees of the Company are, under most circumstances, entitled to payments from the defined contribution pension plan and the defined benefit corporate pension plan upon retirement or termination. Employees of certain of the Company's consolidated subsidiaries are, under most circumstances, entitled to certain lump-sum severance payments and pension payments upon retirement or termination. Liability for retirement benefits includes retirement benefits to directors, officers and corporate auditors in the amount of ¥200 million ($2,158 thousand) and ¥681 million for the years ended March 31, 2010 and 2009, respectively. The retirement benefits to directors and corporate auditors are paid subject to the approval of the shareholders. As discussed in Note 2.m, the Company's outstanding balance of the retirement benefit allowance for directors, officers and corporate auditors amounted to ¥292 million is reclassified to non-current liabilities—other liabilities due to the termination effective June 23, 2009. The liability for employees' retirement benefits at March 31, 2010 and 2009, consisted of the following:
Millions of Yen Thousands of U.S. Dollars
2010 2009 2010
Projected benefit obligation ¥ 26,403 ¥ 26,682 $ 283,909 Fair value of plan assets (18,886 ) (17,827 ) (203,082 ) Unrecognized transitional obligation (3,044 ) (3,661 ) (32,733 ) Unrecognized actuarial loss (3,395 ) (5,287 ) (36,514 ) Unrecognized prior service cost 1,028 1,204 11,055 Net accrued pension liabilities 2,105 1,110 22,634 Prepaid pension cost 496 Liability for employees' retirement benefits ¥ 2,105 ¥ 1,606 $ 22,634
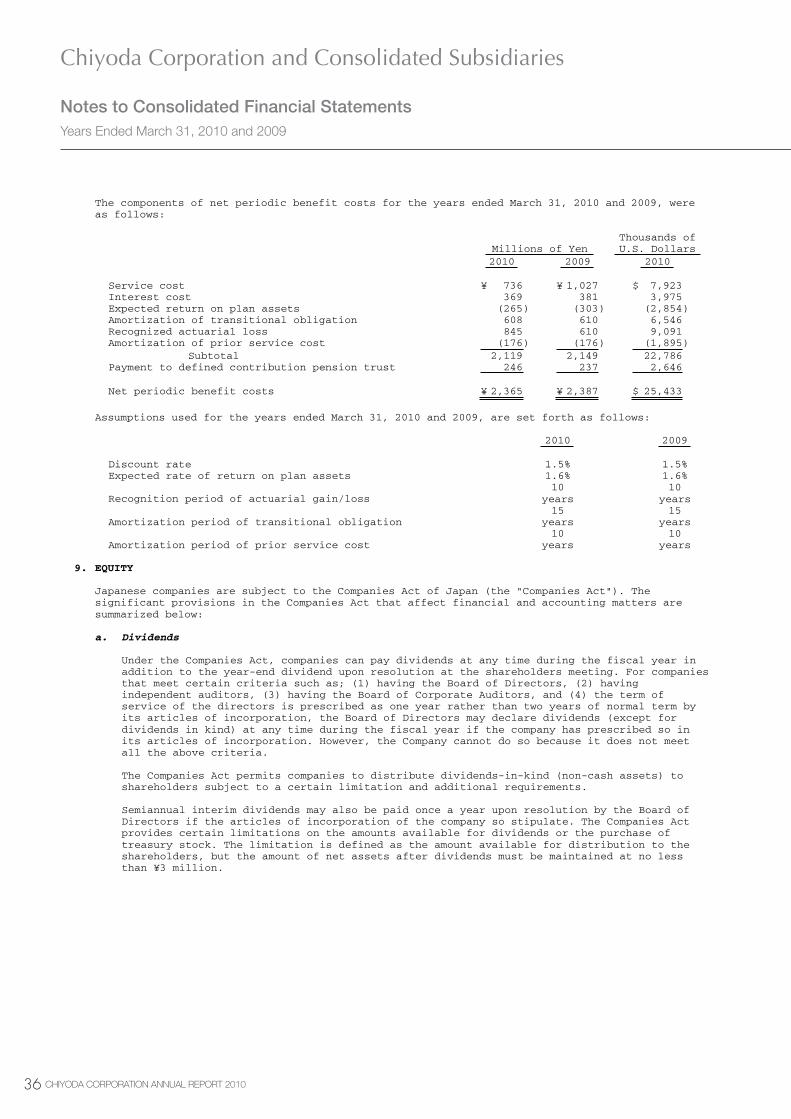
�� CHIYODA CORPORATION ANNUAL REPORT 2010
- 19 -
The components of net periodic benefit costs for the years ended March 31, 2010 and 2009, were as follows:
Millions of Yen Thousands of U.S. Dollars
2010 2009 2010
Service cost ¥ 736 ¥ 1,027 $ 7,923 Interest cost 369 381 3,975 Expected return on plan assets (265 ) (303 ) (2,854 ) Amortization of transitional obligation 608 610 6,546 Recognized actuarial loss 845 610 9,091 Amortization of prior service cost (176 ) (176 ) (1,895 ) Subtotal 2,119 2,149 22,786 Payment to defined contribution pension trust 246 237 2,646 Net periodic benefit costs ¥ 2,365 ¥ 2,387 $ 25,433
Assumptions used for the years ended March 31, 2010 and 2009, are set forth as follows:
2010 2009
Discount rate 1.5% 1.5% Expected rate of return on plan assets 1.6% 1.6%
Recognition period of actuarial gain/loss 10
years 10
years
Amortization period of transitional obligation 15
years 15
years
Amortization period of prior service cost 10
years 10
years 9. EQUITY
Japanese companies are subject to the Companies Act of Japan (the "Companies Act"). The significant provisions in the Companies Act that affect financial and accounting matters are summarized below:
a. Dividends
Under the Companies Act, companies can pay dividends at any time during the fiscal year in addition to the year-end dividend upon resolution at the shareholders meeting. For companies that meet certain criteria such as; (1) having the Board of Directors, (2) having independent auditors, (3) having the Board of Corporate Auditors, and (4) the term of service of the directors is prescribed as one year rather than two years of normal term by its articles of incorporation, the Board of Directors may declare dividends (except for dividends in kind) at any time during the fiscal year if the company has prescribed so in its articles of incorporation. However, the Company cannot do so because it does not meet all the above criteria. The Companies Act permits companies to distribute dividends-in-kind (non-cash assets) to shareholders subject to a certain limitation and additional requirements. Semiannual interim dividends may also be paid once a year upon resolution by the Board of Directors if the articles of incorporation of the company so stipulate. The Companies Act provides certain limitations on the amounts available for dividends or the purchase of treasury stock. The limitation is defined as the amount available for distribution to the shareholders, but the amount of net assets after dividends must be maintained at no less than ¥3 million.
Chiyoda Corporation and Consolidated Subsidiaries
Notes to Consolidated Financial StatementsYears Ended March 31, 2010 and 2009

��CHIYODA CORPORATION ANNUAL REPORT 2010
- 20 -
b. Increases/Decreases and Transfer of Common Stock, Reserve and Surplus The Companies Act requires that an amount equal to 10% of dividends must be appropriated as a legal reserve (a component of retained earnings) or as additional paid-in capital (a component of capital surplus) depending on the equity account charged upon the payment of such dividends until the total of aggregate amount of legal reserve and additional paid-in capital equals 25% of the common stock. Under the Companies Act, the total amount of additional paid-in capital and legal reserve may be reversed without limitation. The Companies Act also provides that common stock, legal reserve, additional paid-in capital, other capital surplus and retained earnings can be transferred among the accounts under certain conditions upon resolution of the shareholders.
c. Treasury Stock and Treasury Stock Acquisition Rights
The Companies Act also provides for companies to purchase treasury stock and dispose of such treasury stock by resolution of the Board of Directors. The amount of treasury stock purchased cannot exceed the amount available for distribution to the shareholders which is determined by specific formula. Under the Companies Act, stock acquisition rights are presented as a separate component of equity. The Companies Act also provides that companies can purchase both treasury stock acquisition rights and treasury stock. Such treasury stock acquisition rights are presented as a separate component of equity or deducted directly from stock acquisition rights.
d. Issuance of New Ordinary Shares to a Third Party
On April 30, 2008, the Company issued new ordinary shares to a third party based on the resolution of the Board of Directors meeting held on March 31, 2008. Details are as follows: (1) Allocated third party: Mitsubishi Corporation (2) Number of shares issued: Ordinary shares, 67,080 thousand shares (3) Issue price: ¥907 per share (4) Aggregate issue amount: ¥60,841 million The Company's common stock and capital surplus were increased by ¥30,454 million and ¥30,387 million, respectively.
10. STOCK OPTIONS
The stock options outstanding as of March 31, 2010 were as follows:
Stock Option
Persons Granted
Number of Options Granted
Date of Grant
Exercise Price
Exercise Period
2002 Stock Option
8 directors 8 officers 623 employees
7,896,000 shares July 12, 2002
(
¥232 $2.49
)
From July 1, 2004 to June 30, 2009
�� CHIYODA CORPORATION ANNUAL REPORT 2010
- 21 -
The stock option activity was as follows: 2002 Stock Option (Shares)
Year Ended March 31, 2009
Vested March 31, 2008—Outstanding 66,000 Exercised (30,000) March 31, 2009—Outstanding 36,000
Year Ended March 31, 2010
Vested March 31, 2009—Outstanding 36,000 Exercised (32,000) Lapse (4,000) March 31, 2010—Outstanding Exercise price ¥232 Average stock price at exercise ¥768 Fair value price at grant date
11. INCOME TAXES
The Company and its domestic subsidiaries are subject to Japanese national and local income taxes which, in the aggregate, resulted in a normal effective statutory tax rate of approximately 41% for the years ended March 31, 2010 and 2009. The tax effects of significant temporary differences and tax loss carryforwards which resulted in deferred tax assets and liabilities at March 31, 2010 and 2009, are as follows:
Millions of Yen Thousands of U.S. Dollars
2010 2009 2010 Deferred tax assets: Cost of revenue ¥ 13,528 ¥ 5,600 $ 145,469 Allowance for employees' bonus 1,246 1,367 13,399 Allowance for warranty costs for completed works 1,715 1,422 18,449 Allowance for losses on construction contracts 1,780 1,661 19,149 Deferred loss on derivatives under hedge accounting 1,033 Retirement benefits 836 8,993 Other 2,966 4,714 31,893 Less valuation allowance (874 ) (1,278 ) (9,404 ) Total 21,199 14,521 227,948 Deferred tax liabilities: Profit/loss in joint venture 3,785 2,992 40,704 Other 145 316 1,565 Total 3,931 3,309 42,269 Net deferred tax assets ¥ 17,268 ¥ 11,212 $ 185,679
Chiyoda Corporation and Consolidated Subsidiaries
Notes to Consolidated Financial StatementsYears Ended March 31, 2010 and 2009
��CHIYODA CORPORATION ANNUAL REPORT 2010
- 22 -
Net deferred tax assets as of March 31, 2010 and 2009 were recorded in the accompanying consolidated balance sheets as follows:
Millions of Yen Thousands of U.S. Dollars
2010 2009 2010
Deferred tax assets—current assets ¥ 15,523 ¥ 9,872 $ 166,914 Deferred tax assets—investments and other assets 1,745 1,348 18,765
A reconciliation between the normal effective statutory tax rate and the actual effective tax
rate reflected in the accompanying consolidated statements of income for the years ended March 31, 2010 and 2009, is as follows:
2010 2009
Normal effective statutory tax rate 41 % 41 % Expenses not deductible for income tax purposes 4 2 Non-taxable dividend income (8) (1) Inhabitant taxes per capita levy 1 Tax credit 13 (2) Temporary difference on change in tax act (5) Increase in valuation allowance for deferred tax assets 3 Equity in earnings of associated companies (1) (1) Lower income tax rates applicable to subsidiaries (6) (4) Lower tax basis of enterprise tax (7) (1) Actual effective tax rate 37 % 32 %
12. RESEARCH AND DEVELOPMENT COSTS
Research and development costs charged to income were ¥1,741 million ($18,726 thousand) and ¥1,797 million for the years ended March 31, 2010 and 2009, respectively.
13. LEASES
The Group leases certain machinery, computer equipment and other assets. Obligations under finance leases and future minimum payments under noncancelable operating leases were as follows:
Millions of Yen Thousands of U.S. Dollars 2010 2010 Finance Leases Finance Leases
On
Balance Off
Balance Operating Leases
On Balance
Off Balance
Operating Leases
Due within one year ¥ 13 ¥ 90 ¥ 132 $ 149 $ 973 $ 1,424 Due after one year 22 117 1,424 236 1,260 15,286 Total ¥ 35 ¥ 207 ¥ 1,554 $ 386 $ 2,233 $ 16,711

�0 CHIYODA CORPORATION ANNUAL REPORT 2010
- 23 -
Pro forma Information of Leased Property Whose Lease Inception Was before March 31, 2008 ASBJ Statement No. 13, "Accounting Standard for Lease Transactions" requires that all finance lease transactions should be capitalized to recognize lease assets and lease obligations in the balance sheet. However, the ASBJ Statement No. 13 permits leases without ownership transfer of the leased property to the lessee whose lease inception was before March 31, 2008 to be accounted for as operating lease transactions if certain "as if capitalized" information is disclosed in the note to the financial statements. The Company applied the ASBJ Statement No. 13 effective April 1, 2008 and accounted for such leases as operating lease transactions. Pro forma information of leased property whose lease inception was before March 31, 2008 such as acquisition cost, accumulated depreciation, obligations under finance leases, depreciation expense, interest expense and other information of finance leases that do not transfer ownership of the leased property to the lessee on an "as if capitalized" basis was as follows:
Year Ended March 31, 2010
Millions of Yen
Buildings and
Structures
Tools, Furniture
and Fixtures Other Total
Acquisition cost ¥ 67 ¥ 388 ¥ 77 ¥ 533 Accumulated depreciation 19 254 51 325 Net leased property ¥ 48 ¥ 134 ¥ 25 ¥ 207
Thousands of U.S. Dollars
Buildings and
Structures
Tools, Furniture
and Fixtures Other Total
Acquisition cost $ 726 $ 4,182 $ 828 $ 5,736 Accumulated depreciation 205 2,741 555 3,503 Net leased property $ 520 $ 1,440 $ 272 $ 2,233
Obligations under finance leases:
Millions of Yen Thousands of U.S. Dollars
Due within one year ¥ 90 $ 973 Due after one year 117 1,260 Total ¥ 207 $ 2,233
Chiyoda Corporation and Consolidated Subsidiaries
Notes to Consolidated Financial StatementsYears Ended March 31, 2010 and 2009
�1CHIYODA CORPORATION ANNUAL REPORT 2010
- 24 -
Year Ended March 31, 2009
Millions of Yen
Buildings and
Structures
Tools, Furniture
and Fixtures Other Total
Acquisition cost ¥ 67 ¥ 475 ¥ 77 ¥ 619 Accumulated depreciation 12 244 43 299 Net leased property ¥ 55 ¥ 230 ¥ 33 ¥ 319
Obligations under finance leases:
Millions of Yen
Due within one year ¥ 110 Due after one year 209 Total ¥ 319
Depreciation expense as lessee, which is not reflected in the accompanying consolidated
statements of income, computed by the straight-line method was ¥111 million ($1,193 thousand) and ¥138 million for the years ended March 31, 2010 and 2009, respectively. The amounts of obligations, acquisition cost and depreciation under finance leases include the imputed interest income portion and interest expense portion, respectively. The minimum rental commitments under noncancelable operating leases at March 31, 2009 were as follows:
Year Ended March 31, 2009
Millions of Yen
Due within one year ¥ 144 Due after one year 1,545 Total ¥ 1,690
14. FINANCIAL INSTRUMENTS AND RELATED DISCLOSURES
On March 10, 2008, the ASBJ revised ASBJ Statement No. 10 "Accounting Standard for Financial Instruments" and issued ASBJ Guidance No. 19 "Guidance on Accounting Standard for Financial Instruments and Related Disclosures." This accounting standard and the guidance are applicable to financial instruments and related disclosures at the end of the fiscal years ending on or after March 31, 2010 with early adoption permitted from the beginning of the fiscal years ending before March 31, 2010. The Group applied the revised accounting standard and the new guidance effective March 31, 2010.
�� CHIYODA CORPORATION ANNUAL REPORT 2010
- 25 -
(1) Group Policy for Financial Instruments The Group uses financial instruments for cash surpluses, if any, invested in low risk financial assets such as certificate of deposits and deposits at call. For operating capital, the Group uses bank loans. Derivatives are used, not for speculative purposes, but to manage exposure to the market risk of fluctuation in foreign currency exchange rates.
(2) Nature and Extent of Risks Arising from Financial Instruments
Receivables such as trade notes and trade accounts are exposed to customer credit risk. Although receivables in foreign currencies are exposed to the market risk of fluctuation in foreign currency exchange rates, the position, net of payables in foreign currencies, is hedged by using foreign currency forward contracts. Cash equivalents include certificate of deposits which mature shortly and are used for cash surpluses. Short-term investments include deposits at call which will mature after three month of the date of acquisition. Both certificate of deposits and deposits at call are exposed to default risk of its issuing financial institution. Investment securities are equity securities related to the business which the Group operates. Marketable securities are exposed to the risk of fluctuations in stock prices. Payment terms of payables, such as trade notes and trade accounts, are mostly less than one year. Although payables in foreign currencies are exposed to the market risk of fluctuation in foreign currency exchange rates, those risks are netted against the balance of receivables denominated in the same foreign currency as noted above. Bank loans are used for operating capital, and are exposed to the market risks from changes in interest rates. Derivatives are foreign currency forward contracts, which are entered to manage exposure to market risks from changes in foreign currency exchange rates of receivables and payables. Please see Notes 2.s and 15 for more detail about derivatives.
(3) Risk Management for Financial Instruments
Credit risk management Credit risk is the risk of economic loss arising from a counterparty's failure to repay or service debt according to the contractual terms. The Group manages its credit risk from receivables on the basis of internal guidelines, which include monitoring of payment term and balances of major customers to identify the default risk of customers in early stage. Certificate of deposits and deposits at call are exposed to insignificant default risk because transactions are limited to major financial institutions. With respect to foreign currency forward contract, the Group limits the counterparty to those derivatives to major financial institutions for losses arising from credit risk.
Chiyoda Corporation and Consolidated Subsidiaries
Notes to Consolidated Financial StatementsYears Ended March 31, 2010 and 2009
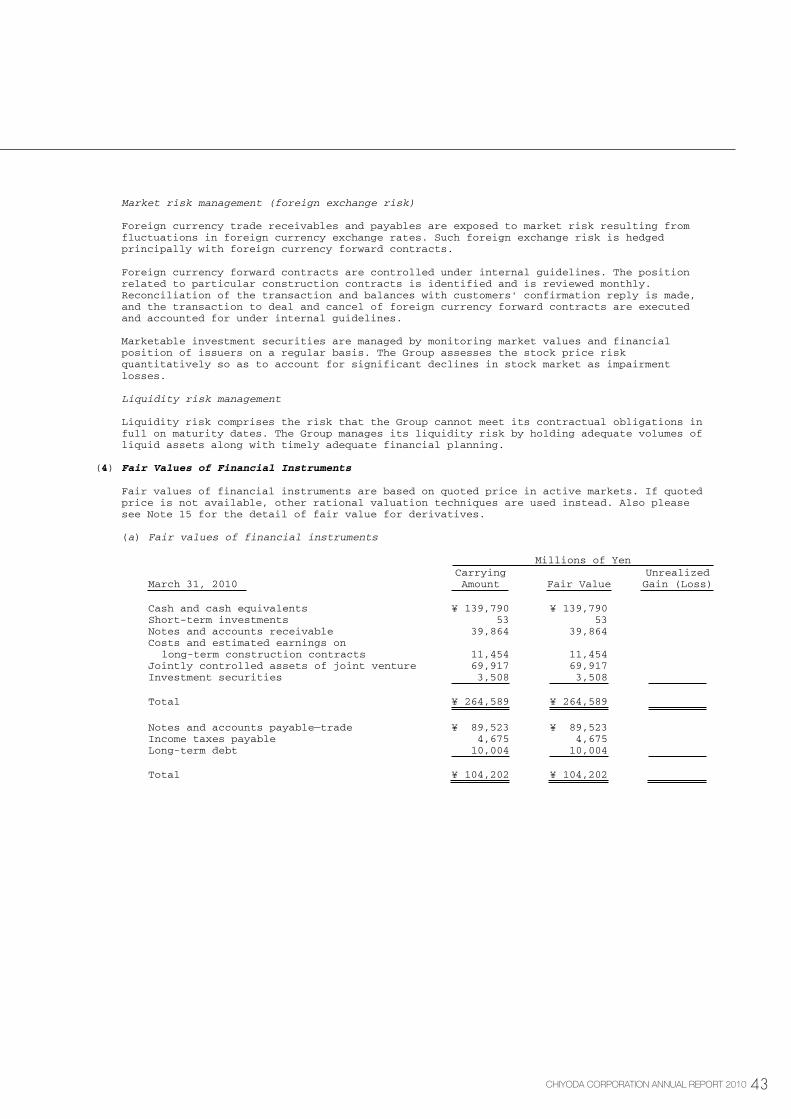
��CHIYODA CORPORATION ANNUAL REPORT 2010
- 26 -
Market risk management (foreign exchange risk) Foreign currency trade receivables and payables are exposed to market risk resulting from fluctuations in foreign currency exchange rates. Such foreign exchange risk is hedged principally with foreign currency forward contracts. Foreign currency forward contracts are controlled under internal guidelines. The position related to particular construction contracts is identified and is reviewed monthly. Reconciliation of the transaction and balances with customers' confirmation reply is made, and the transaction to deal and cancel of foreign currency forward contracts are executed and accounted for under internal guidelines. Marketable investment securities are managed by monitoring market values and financial position of issuers on a regular basis. The Group assesses the stock price risk quantitatively so as to account for significant declines in stock market as impairment losses. Liquidity risk management Liquidity risk comprises the risk that the Group cannot meet its contractual obligations in full on maturity dates. The Group manages its liquidity risk by holding adequate volumes of liquid assets along with timely adequate financial planning.
(4) Fair Values of Financial Instruments
Fair values of financial instruments are based on quoted price in active markets. If quoted price is not available, other rational valuation techniques are used instead. Also please see Note 15 for the detail of fair value for derivatives.
(a) Fair values of financial instruments
Millions of Yen
March 31, 2010 Carrying Amount Fair Value
Unrealized Gain (Loss)
Cash and cash equivalents ¥ 139,790 ¥ 139,790 Short-term investments 53 53 Notes and accounts receivable 39,864 39,864 Costs and estimated earnings on long-term construction contracts 11,454 11,454 Jointly controlled assets of joint venture 69,917 69,917 Investment securities 3,508 3,508 Total ¥ 264,589 ¥ 264,589
Notes and accounts payable—trade ¥ 89,523 ¥ 89,523 Income taxes payable 4,675 4,675 Long-term debt 10,004 10,004 Total ¥ 104,202 ¥ 104,202

�� CHIYODA CORPORATION ANNUAL REPORT 2010
- 27 -
Thousands of U.S. Dollars
March 31, 2010 Carrying Amount Fair Value
Unrealized Gain (Loss)
Cash and cash equivalents $ 1,503,125 $ 1,503,125 Short-term investments 577 577 Notes and accounts receivable 428,647 428,647 Costs and estimated earnings on long-term construction contracts 123,166 123,166 Jointly controlled assets of joint venture 751,805 751,805 Investment securities 37,730 37,730 Total $ 2,845,053 $ 2,845,053
Notes and accounts payable—trade $ 962,621 $ 962,621 Income taxes payable 50,270 50,270 Long-term debt 107,569 107,569 Total $ 1,120,461 $ 1,120,461
Cash and Cash Equivalents, Short-Term Investments, Notes and Accounts Receivable, and
Costs and Estimated Earnings on Long-Term Construction Contracts The carrying values of accounts mentioned above approximate fair value because of their short maturities. Jointly Controlled Assets of Joint Venture The jointly controlled assets of joint venture are jointly controlled cash recognized based on the Company's share on the venture. The carrying values of jointly controlled assets of joint venture are approximate fair value because of their short maturities. Investment Securities The fair values of investment securities are measured at the quoted market price of the stock exchange for the equity instruments. The information of the fair value for investment securities by classification is included in Note 5. Above schedules do not include investment securities whose fair value cannot be reliably determined. Notes and Accounts Payable—Trade and Income Taxes Payable The carrying values of accounts mentioned above approximate fair value because of their short maturities. Long-Term Debt (Bank Loans) The carrying amounts of long-term bank loans approximate fair value, because terms are based on floating rate and the Group's credit standing is deemed not to be changed since it has borrowed. Above schedules include current portion of long-term bank loans, excluding obligations under finance lease.
Chiyoda Corporation and Consolidated Subsidiaries
Notes to Consolidated Financial StatementsYears Ended March 31, 2010 and 2009
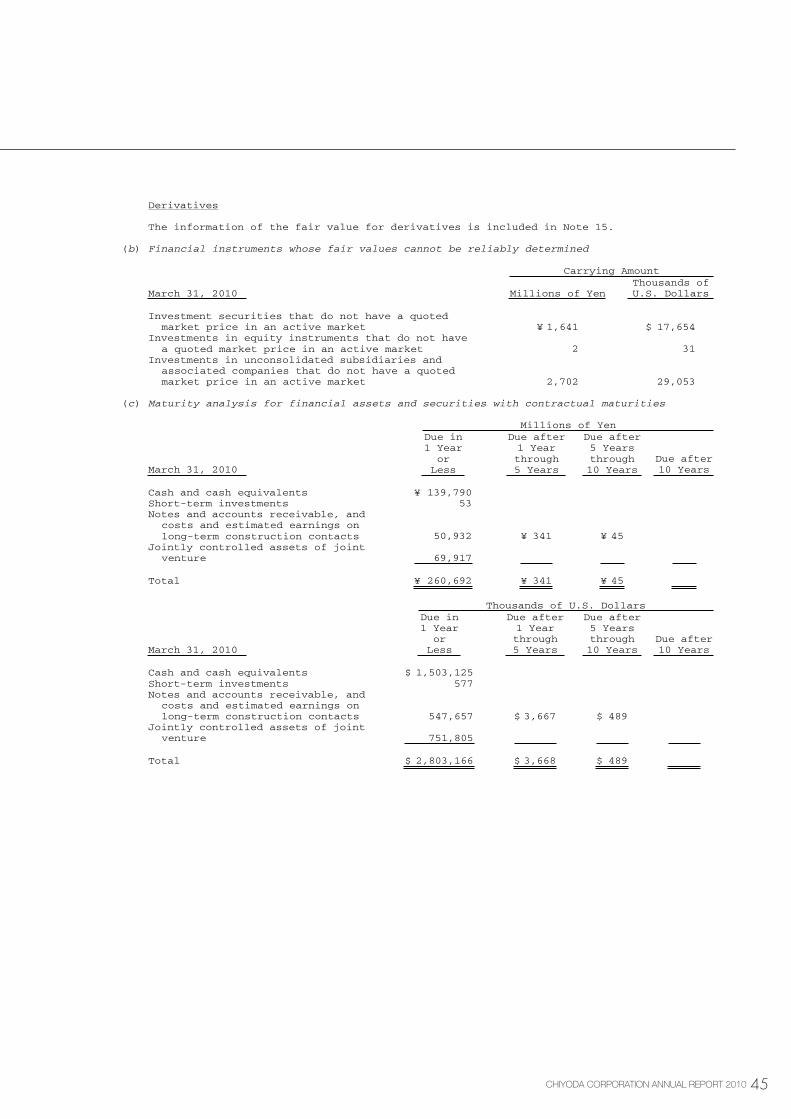
��CHIYODA CORPORATION ANNUAL REPORT 2010
- 28 -
Derivatives The information of the fair value for derivatives is included in Note 15.
(b) Financial instruments whose fair values cannot be reliably determined
Carrying Amount
March 31, 2010 Millions of Yen Thousands of U.S. Dollars
Investment securities that do not have a quoted market price in an active market ¥ 1,641 $ 17,654 Investments in equity instruments that do not have a quoted market price in an active market 2 31 Investments in unconsolidated subsidiaries and associated companies that do not have a quoted market price in an active market 2,702 29,053
(c) Maturity analysis for financial assets and securities with contractual maturities
Millions of Yen
March 31, 2010
Due in 1 Year
or Less
Due after 1 Year through 5 Years
Due after 5 Years through 10 Years
Due after 10 Years
Cash and cash equivalents ¥ 139,790 Short-term investments 53 Notes and accounts receivable, and costs and estimated earnings on long-term construction contacts 50,932 ¥ 341 ¥ 45 Jointly controlled assets of joint venture 69,917 Total ¥ 260,692 ¥ 341 ¥ 45
Thousands of U.S. Dollars
March 31, 2010
Due in 1 Year
or Less
Due after 1 Year through 5 Years
Due after 5 Years through 10 Years
Due after 10 Years
Cash and cash equivalents $ 1,503,125 Short-term investments 577 Notes and accounts receivable, and costs and estimated earnings on long-term construction contacts 547,657 $ 3,667 $ 489 Jointly controlled assets of joint venture 751,805 Total $ 2,803,166 $ 3,668 $ 489
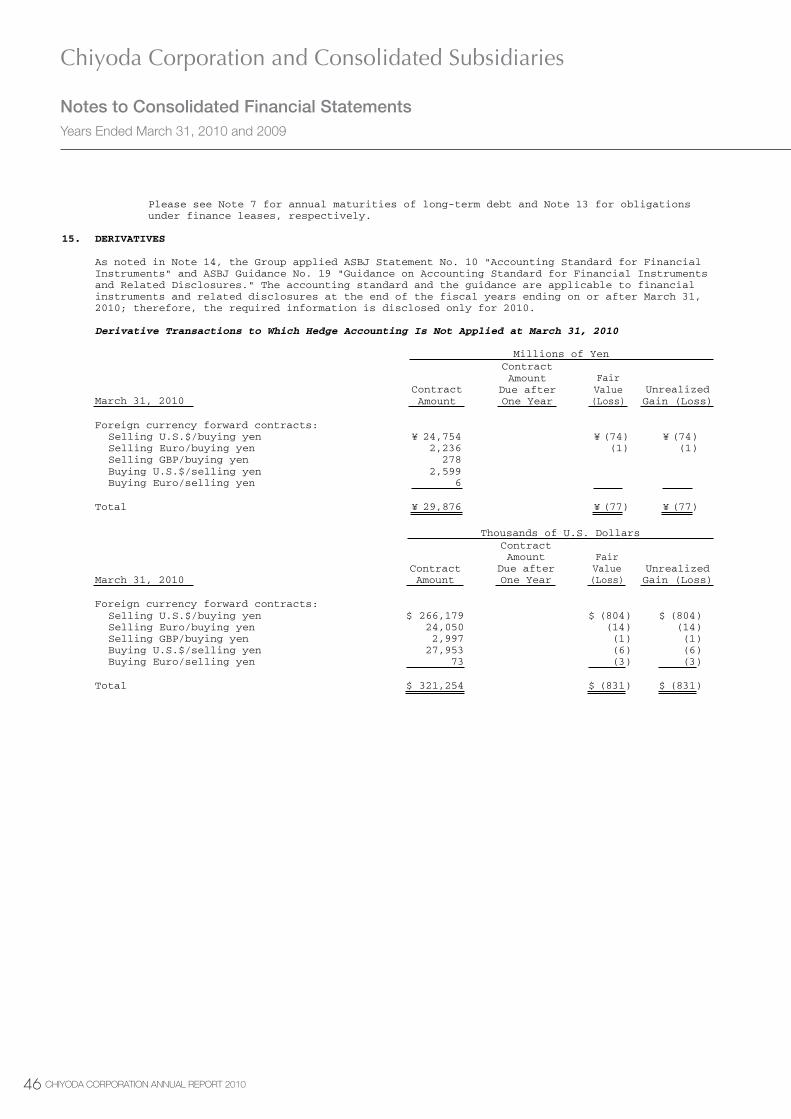
�� CHIYODA CORPORATION ANNUAL REPORT 2010
- 29 -
Please see Note 7 for annual maturities of long-term debt and Note 13 for obligations under finance leases, respectively.
15. DERIVATIVES
As noted in Note 14, the Group applied ASBJ Statement No. 10 "Accounting Standard for Financial Instruments" and ASBJ Guidance No. 19 "Guidance on Accounting Standard for Financial Instruments and Related Disclosures." The accounting standard and the guidance are applicable to financial instruments and related disclosures at the end of the fiscal years ending on or after March 31, 2010; therefore, the required information is disclosed only for 2010. Derivative Transactions to Which Hedge Accounting Is Not Applied at March 31, 2010
Millions of Yen
March 31, 2010 Contract Amount
Contract Amount
Due after One Year
Fair Value (Loss)
Unrealized Gain (Loss)
Foreign currency forward contracts: Selling U.S.$/buying yen ¥ 24,754 ¥ (74 ) ¥ (74 ) Selling Euro/buying yen 2,236 (1 ) (1 ) Selling GBP/buying yen 278 Buying U.S.$/selling yen 2,599 Buying Euro/selling yen 6 Total ¥ 29,876 ¥ (77 ) ¥ (77 )
Thousands of U.S. Dollars
March 31, 2010 Contract Amount
Contract Amount
Due after One Year
Fair Value (Loss)
Unrealized Gain (Loss)
Foreign currency forward contracts: Selling U.S.$/buying yen $ 266,179 $ (804 ) $ (804 ) Selling Euro/buying yen 24,050 (14 ) (14 ) Selling GBP/buying yen 2,997 (1 ) (1 ) Buying U.S.$/selling yen 27,953 (6 ) (6 ) Buying Euro/selling yen 73 (3 ) (3 ) Total $ 321,254 $ (831 ) $ (831 )
Chiyoda Corporation and Consolidated Subsidiaries
Notes to Consolidated Financial StatementsYears Ended March 31, 2010 and 2009

��CHIYODA CORPORATION ANNUAL REPORT 2010
- 30 -
Derivative Transactions to Which Hedge Accounting Is Applied at March 31, 2010
Millions of Yen
March 31, 2010 Hedged Item Contract Amount
Contract Amount
Due after One Year
Fair Value (Loss)
Foreign currency forward contracts—Accounted for under deferred hedge accounting method: Selling U.S.$/buying yen Foreign ¥ 11,833 ¥ 3,361 ¥ (216 ) Selling Euro/buying yen currency 1,016 29 Buying U.S.$/selling yen forecasted 4,540 150 Buying Euro/selling yen transaction 1,553 240 (61 ) Buying GBP/selling yen 114 (8 ) Buying Euro/selling U.S.$ 2,934 2,292 (161 ) Total ¥ 21,993 ¥ 5,893 ¥ (268 )
Other*: Selling U.S.$/buying yen Receivables ¥ 76 Buying U.S.$/selling yen 440 Buying Euro/selling yen Payables 424 Buying GBP/selling yen 4 Total ¥ 945
Thousands of U.S. Dollars
March 31, 2010 Hedged Item Contract Amount
Contract Amount
Due after One Year
Fair Value (Loss)
Foreign currency forward contracts—Accounted for under deferred hedge accounting method: Selling U.S.$/buying yen Foreign $ 127,246 $ 36,141 $ (2,325 ) Selling Euro/buying yen currency 10,928 317 Buying U.S.$/selling yen forecasted 48,825 1,615 Buying Euro/selling yen transaction 16,703 2,581 (665 ) Buying GBP/selling yen 1,229 (92 ) Buying Euro/selling U.S.$ 31,555 24,645 (1,740 ) Total $ 236,487 $ 63,369 $ (2,890 )
Other*: Selling U.S.$/buying yen Receivables $ 819 Buying U.S.$/selling yen 4,740 Buying Euro/selling yen Payables 4,563 Buying GBP/selling yen 46 Total $ 10,170
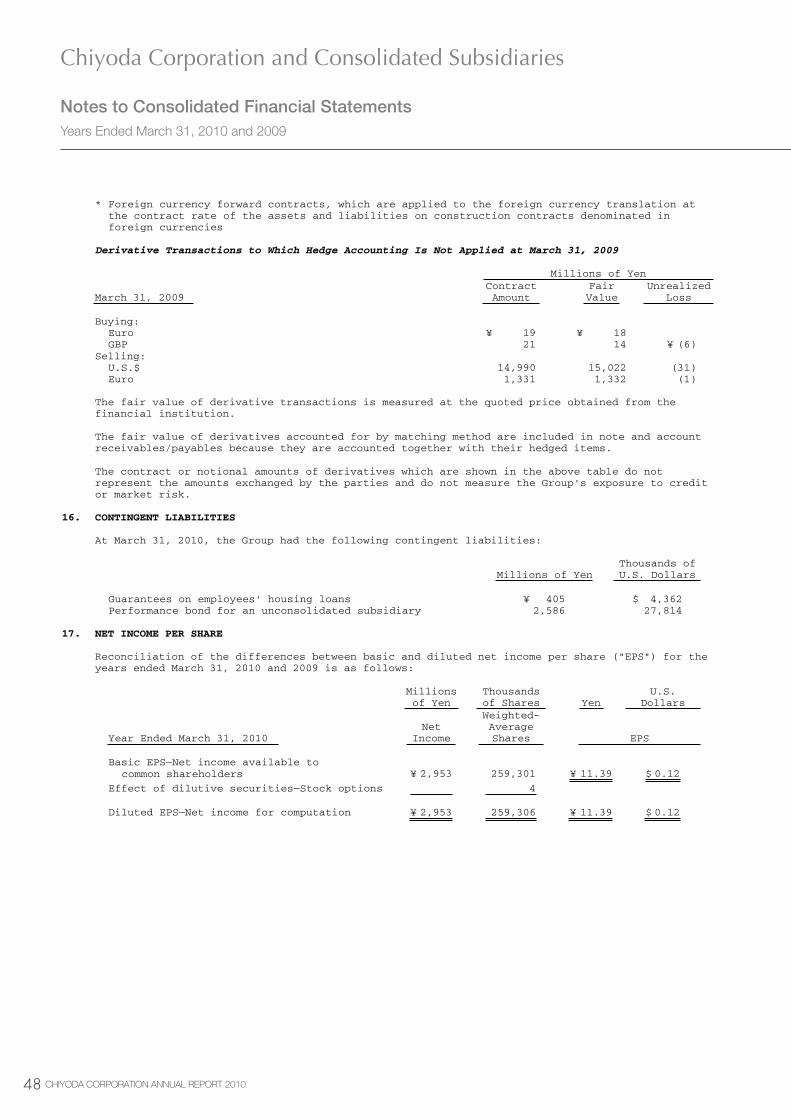
�� CHIYODA CORPORATION ANNUAL REPORT 2010
- 31 -
* Foreign currency forward contracts, which are applied to the foreign currency translation at the contract rate of the assets and liabilities on construction contracts denominated in foreign currencies
Derivative Transactions to Which Hedge Accounting Is Not Applied at March 31, 2009
Millions of Yen
March 31, 2009 Contract Amount
Fair Value
Unrealized Loss
Buying: Euro ¥ 19 ¥ 18 GBP 21 14 ¥ (6 ) Selling: U.S.$ 14,990 15,022 (31 ) Euro 1,331 1,332 (1 )
The fair value of derivative transactions is measured at the quoted price obtained from the
financial institution. The fair value of derivatives accounted for by matching method are included in note and account receivables/payables because they are accounted together with their hedged items. The contract or notional amounts of derivatives which are shown in the above table do not represent the amounts exchanged by the parties and do not measure the Group's exposure to credit or market risk.
16. CONTINGENT LIABILITIES
At March 31, 2010, the Group had the following contingent liabilities:
Millions of Yen Thousands of U.S. Dollars
Guarantees on employees' housing loans ¥ 405 $ 4,362 Performance bond for an unconsolidated subsidiary 2,586 27,814
17. NET INCOME PER SHARE
Reconciliation of the differences between basic and diluted net income per share ("EPS") for the years ended March 31, 2010 and 2009 is as follows:
Millions of Yen
Thousands of Shares Yen
U.S. Dollars
Year Ended March 31, 2010 Net
Income
Weighted- Average Shares EPS
Basic EPS—Net income available to common shareholders ¥ 2,953 259,301 ¥ 11.39 $ 0.12
Effect of dilutive securities—Stock options 4 Diluted EPS—Net income for computation ¥ 2,953 259,306 ¥ 11.39 $ 0.12
Chiyoda Corporation and Consolidated Subsidiaries
Notes to Consolidated Financial StatementsYears Ended March 31, 2010 and 2009

��CHIYODA CORPORATION ANNUAL REPORT 2010
- 32 -
Millions of Yen
Thousands of Shares Yen
Year Ended March 31, 2009 Net Income Weighted-Average
Shares EPS
Basic EPS—Net income available to common shareholders ¥ 6,498 254,000 ¥ 25.58
Effect of dilutive securities—Stock options 42 Diluted EPS—Net income for computation ¥ 6,498 254,043 ¥ 25.58
18. SUBSEQUENT EVENT
The following appropriation of retained earnings at March 31, 2010, is scheduled for approval at the Company's shareholders meeting on June 24, 2010:
Millions of Yen Thousands of U.S. Dollars
Year-end cash dividends, ¥3.50 ($0.04) per share ¥ 907 $ 9,755
19. SEGMENT INFORMATION
Information about geographical segments and sales to foreign customers of the Company and consolidated subsidiaries for the years ended March 31, 2010 and 2009, was as follows:
(1) Geographical Segments
Millions of Yen
Year Ended March 31, 2010 Japan Asia Other Subtotal Eliminations (Corporate) Consolidated
Revenue: Sales to customers ¥ 303,372 ¥ 8,586 ¥ 1,026 ¥ 312,985 ¥ 312,985 Interarea transfer 922 2,998 35 3,956 ¥ (3,956 ) Total sales 304,295 11,585 1,061 316,942 (3,956 ) 312,985 Operating expenses 303,560 10,620 1,059 315,240 (3,956 ) 311,283 Operating income ¥ 734 ¥ 965 ¥ 2 ¥ 1,702 ¥ 1,702
Total assets ¥ 319,561 ¥ 9,413 ¥ 1,772 ¥ 330,747 ¥ (2,572 ) ¥ 328,174
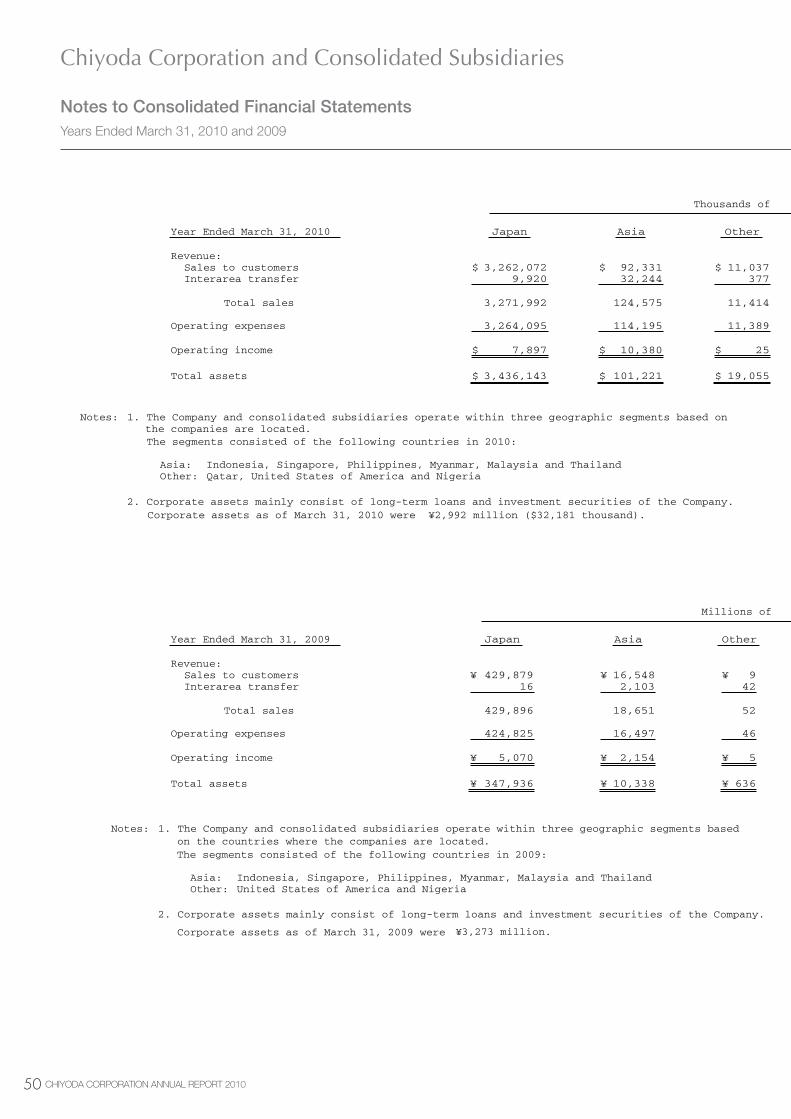
�0 CHIYODA CORPORATION ANNUAL REPORT 2010
- 33 -
Thousands of U.S. Dollars
Year Ended March 31, 2010 Japan Asia Other Subtotal Eliminations (Corporate) Consolidated
Revenue: Sales to customers $ 3,262,072 $ 92,331 $ 11,037 $ 3,365,440 $ 3,365,440 Interarea transfer 9,920 32,244 377 42,542 $ (42,542 ) Total sales 3,271,992 124,575 11,414 3,407,983 (42,542 ) 3,365,440 Operating expenses 3,264,095 114,195 11,389 3,389,680 (42,541 ) 3,347,139 Operating income $ 7,897 $ 10,380 $ 25 $ 18,302 $ 18,301
Total assets $ 3,436,143 $ 101,221 $ 19,055 $ 3,556,420 $ (27,665 ) $ 3,528,755
Notes: 1. The Company and consolidated subsidiaries operate within three geographic segments based on the countries where the companies are located.
The segments consisted of the following countries in 2010:
Asia: Indonesia, Singapore, Philippines, Myanmar, Malaysia and Thailand Other: Qatar, United States of America and Nigeria
2. Corporate assets mainly consist of long-term loans and investment securities of the Company. Corporate assets as of March 31, 2010 were ¥2,992 million ($32,181 thousand).
Millions of Yen
Year Ended March 31, 2009 Japan Asia Other Subtotal Eliminations (Corporate) Consolidated
Revenue: Sales to customers ¥ 429,879 ¥ 16,548 ¥ 9 ¥ 446,438 ¥ 446,438 Interarea transfer 16 2,103 42 2,161 ¥ (2,161 ) Total sales 429,896 18,651 52 448,600 (2,161 ) 446,438 Operating expenses 424,825 16,497 46 441,369 (2,157 ) 439,211 Operating income ¥ 5,070 ¥ 2,154 ¥ 5 ¥ 7,230 ¥ (3 ) ¥ 7,227
Total assets ¥ 347,936 ¥ 10,338 ¥ 636 ¥ 358,912 ¥ (1,095 ) ¥ 357,816
Notes: 1. The Company and consolidated subsidiaries operate within three geographic segments based on the countries where the companies are located.
The segments consisted of the following countries in 2009:
Asia: Indonesia, Singapore, Philippines, Myanmar, Malaysia and Thailand Other: United States of America and Nigeria
2. Corporate assets mainly consist of long-term loans and investment securities of the Company. Corporate assets as of March 31, 2009 were ¥3,273 million.
Chiyoda Corporation and Consolidated Subsidiaries
Notes to Consolidated Financial StatementsYears Ended March 31, 2010 and 2009
- 33 -
Thousands of U.S. Dollars
Year Ended March 31, 2010 Japan Asia Other Subtotal Eliminations (Corporate) Consolidated
Revenue: Sales to customers $ 3,262,072 $ 92,331 $ 11,037 $ 3,365,440 $ 3,365,440 Interarea transfer 9,920 32,244 377 42,542 $ (42,542 ) Total sales 3,271,992 124,575 11,414 3,407,983 (42,542 ) 3,365,440 Operating expenses 3,264,095 114,195 11,389 3,389,680 (42,541 ) 3,347,139 Operating income $ 7,897 $ 10,380 $ 25 $ 18,302 $ 18,301
Total assets $ 3,436,143 $ 101,221 $ 19,055 $ 3,556,420 $ (27,665 ) $ 3,528,755
Notes: 1. The Company and consolidated subsidiaries operate within three geographic segments based on the countries where the companies are located.
The segments consisted of the following countries in 2010:
Asia: Indonesia, Singapore, Philippines, Myanmar, Malaysia and Thailand Other: Qatar, United States of America and Nigeria
2. Corporate assets mainly consist of long-term loans and investment securities of the Company. Corporate assets as of March 31, 2010 were ¥2,992 million ($32,181 thousand).
Millions of Yen
Year Ended March 31, 2009 Japan Asia Other Subtotal Eliminations (Corporate) Consolidated
Revenue: Sales to customers ¥ 429,879 ¥ 16,548 ¥ 9 ¥ 446,438 ¥ 446,438 Interarea transfer 16 2,103 42 2,161 ¥ (2,161 ) Total sales 429,896 18,651 52 448,600 (2,161 ) 446,438 Operating expenses 424,825 16,497 46 441,369 (2,157 ) 439,211 Operating income ¥ 5,070 ¥ 2,154 ¥ 5 ¥ 7,230 ¥ (3 ) ¥ 7,227
Total assets ¥ 347,936 ¥ 10,338 ¥ 636 ¥ 358,912 ¥ (1,095 ) ¥ 357,816
Notes: 1. The Company and consolidated subsidiaries operate within three geographic segments based on the countries where the companies are located.
The segments consisted of the following countries in 2009:
Asia: Indonesia, Singapore, Philippines, Myanmar, Malaysia and Thailand Other: United States of America and Nigeria
2. Corporate assets mainly consist of long-term loans and investment securities of the Company. Corporate assets as of March 31, 2009 were ¥3,273 million.

�1CHIYODA CORPORATION ANNUAL REPORT 2010
- 33 -
Thousands of U.S. Dollars
Year Ended March 31, 2010 Japan Asia Other Subtotal Eliminations (Corporate) Consolidated
Revenue: Sales to customers $ 3,262,072 $ 92,331 $ 11,037 $ 3,365,440 $ 3,365,440 Interarea transfer 9,920 32,244 377 42,542 $ (42,542 ) Total sales 3,271,992 124,575 11,414 3,407,983 (42,542 ) 3,365,440 Operating expenses 3,264,095 114,195 11,389 3,389,680 (42,541 ) 3,347,139 Operating income $ 7,897 $ 10,380 $ 25 $ 18,302 $ 18,301
Total assets $ 3,436,143 $ 101,221 $ 19,055 $ 3,556,420 $ (27,665 ) $ 3,528,755
Notes: 1. The Company and consolidated subsidiaries operate within three geographic segments based on the countries where the companies are located.
The segments consisted of the following countries in 2010:
Asia: Indonesia, Singapore, Philippines, Myanmar, Malaysia and Thailand Other: Qatar, United States of America and Nigeria
2. Corporate assets mainly consist of long-term loans and investment securities of the Company. Corporate assets as of March 31, 2010 were ¥2,992 million ($32,181 thousand).
Millions of Yen
Year Ended March 31, 2009 Japan Asia Other Subtotal Eliminations (Corporate) Consolidated
Revenue: Sales to customers ¥ 429,879 ¥ 16,548 ¥ 9 ¥ 446,438 ¥ 446,438 Interarea transfer 16 2,103 42 2,161 ¥ (2,161 ) Total sales 429,896 18,651 52 448,600 (2,161 ) 446,438 Operating expenses 424,825 16,497 46 441,369 (2,157 ) 439,211 Operating income ¥ 5,070 ¥ 2,154 ¥ 5 ¥ 7,230 ¥ (3 ) ¥ 7,227
Total assets ¥ 347,936 ¥ 10,338 ¥ 636 ¥ 358,912 ¥ (1,095 ) ¥ 357,816
Notes: 1. The Company and consolidated subsidiaries operate within three geographic segments based on the countries where the companies are located.
The segments consisted of the following countries in 2009:
Asia: Indonesia, Singapore, Philippines, Myanmar, Malaysia and Thailand Other: United States of America and Nigeria
2. Corporate assets mainly consist of long-term loans and investment securities of the Company. Corporate assets as of March 31, 2009 were ¥3,273 million.

�� CHIYODA CORPORATION ANNUAL REPORT 2010
Chiyoda Corporation and Consolidated Subsidiaries
Notes to Consolidated Financial StatementsYears Ended March 31, 2010 and 2009
- 34 -
(2) Sales to Foreign Customers
Millions of Yen
Year Ended March 31, 2010 Asia The Middle
and Near East Oceania Other Total
Overseas sales (A) ¥ 12,709 ¥ 147,336 ¥ 6,730 ¥ 2,330 ¥ 169,107 Consolidated sales (B) 312,985 (A)/(B) 4.06% 47.07% 2.15% 0.75% 54.03%
Thousands of U.S. Dollars
Year Ended March 31, 2010 Asia The Middle
and Near East Oceania Other Total
Overseas sales (A) $ 136,665 $ 1,584,260 $ 72,376 $ 25,059 $ 1,818,361 Consolidated sales (B) 3,365,440 (A)/(B) 4.06% 47.07% 2.15% 0.75% 54.03% Note: The Company and consolidated subsidiaries are summarized into four segments by
geographic area based on the countries where the companies are located. The segments consisted of the following countries in 2010:
Asia: Singapore, Indonesia, Malaysia, Thailand and others The Middle and Near East: Qatar, UAE and others Oceania: Papua New Guinea and Australia Other: Algeria and Brazil
Millions of Yen
Year Ended March 31, 2009 Asia
The Middle and
Near East Russia and
Central Asia Other Total
Overseas sales (A) ¥ 20,380 ¥ 277,627 ¥ 23,308 ¥ 1,966 ¥ 323,282 Consolidated sales (B) 446,438 (A)/(B) 4.56% 62.19% 5.22% 0.44% 72.41%
Note: The Company and consolidated subsidiaries are summarized into four segments by
geographic area based on the countries where the companies are located. The segments consisted of the following countries in 2009:
Asia: Singapore, Indonesia, Malaysia, Thailand and others The Middle and Near East: Qatar, UAE and others Russia and Central Asia: Russia Other: Australia, Algeria and others
The Company and its consolidated subsidiaries operate predominantly in the engineering business,
while certain subsidiaries operate in leasing and software producing businesses which are minor in relation to the total business. The proportion of engineering business is over 90% in the total sales of the Group. Accordingly, the presentation of industry segment information is not required under Japanese accounting standards.
* * * * * *

��CHIYODA CORPORATION ANNUAL REPORT 2010
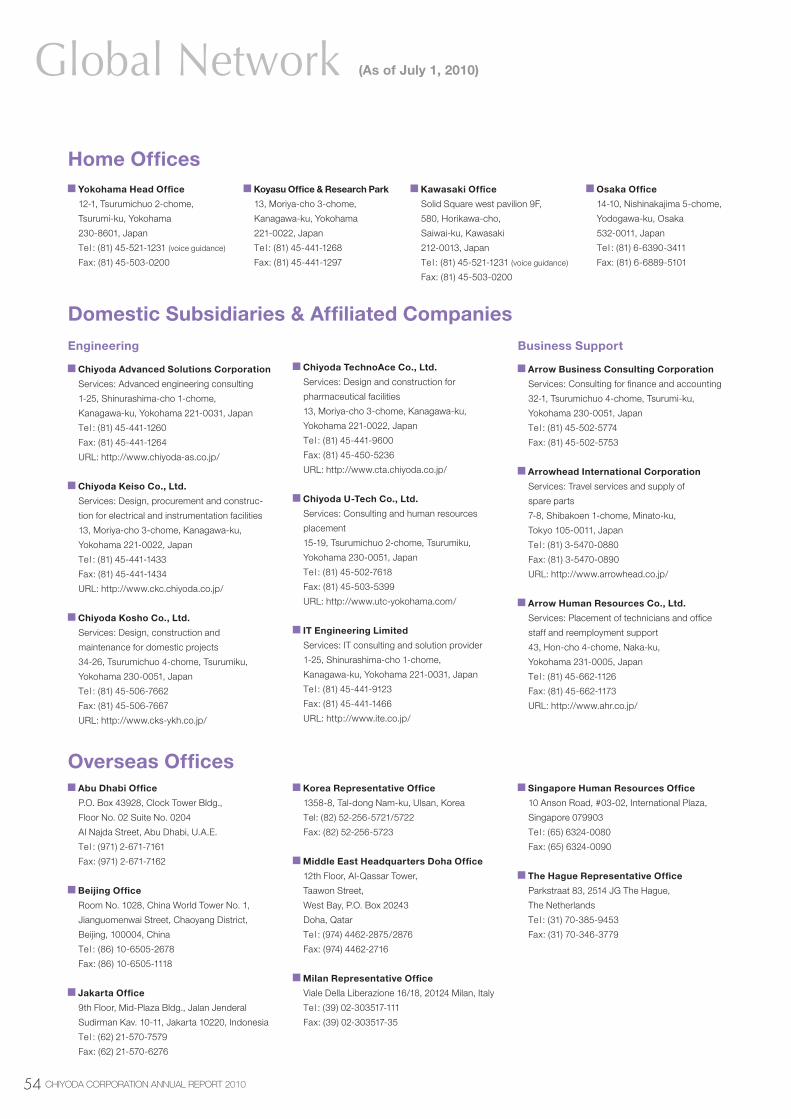
�� CHIYODA CORPORATION ANNUAL REPORT 2010
Global Network (As of July 1, 2010)
Yokohama Head Office
12-1, Tsurumichuo 2-chome,
Tsurumi-ku, Yokohama
230-8601, Japan
Te l : (81) 45-521-1231 (voice guidance)
Fax: (81) 45-503-0200
Home Offices Koyasu Office & Research Park
13, Moriya-cho 3-chome,
Kanagawa-ku, Yokohama
221-0022, Japan
Te l : (81) 45-441-1268
Fax: (81) 45-441-1297
Kawasaki Office
Solid Square west pavilion 9F,
580, Horikawa-cho,
Saiwai-ku, Kawasaki
212-0013, Japan
Te l : (81) 45-521-1231 (voice guidance)
Fax: (81) 45-503-0200
Osaka Office
14-10, Nishinakajima 5-chome,
Yodogawa-ku, Osaka
532-0011, Japan
Te l : (81) 6-6390-3411
Fax: (81) 6-6889-5101
Domestic Subsidiaries & Affiliated CompaniesEngineering
Chiyoda Advanced Solutions Corporation
Services: Advanced engineering consulting
1-25, Shinurashima-cho 1-chome,
Kanagawa-ku, Yokohama 221-0031, Japan
Te l : (81) 45-441-1260
Fax: (81) 45-441-1264
URL: http://www.chiyoda-as.co.jp/
Chiyoda Keiso Co., Ltd.
Services: Design, procurement and construc-
tion for electrical and instrumentation facilities
13, Moriya-cho 3-chome, Kanagawa-ku,
Yokohama 221-0022, Japan
Te l : (81) 45-441-1433
Fax: (81) 45-441-1434
URL: http://www.ckc.chiyoda.co.jp/
Chiyoda Kosho Co., Ltd.
Services: Design, construction and
maintenance for domestic projects
34-26, Tsurumichuo 4-chome, Tsurumiku,
Yokohama 230-0051, Japan
Te l : (81) 45-506-7662
Fax: (81) 45-506-7667
URL: http://www.cks-ykh.co.jp/
Chiyoda TechnoAce Co., Ltd.
Services: Design and construction for
pharmaceutical facilities
13, Moriya-cho 3-chome, Kanagawa-ku,
Yokohama 221-0022, Japan
Te l : (81) 45-441-9600
Fax: (81) 45-450-5236
URL: http://www.cta.chiyoda.co.jp/
Chiyoda U-Tech Co., Ltd.
Services: Consulting and human resources
placement
15-19, Tsurumichuo 2-chome, Tsurumiku,
Yokohama 230-0051, Japan
Te l : (81) 45-502-7618
Fax: (81) 45-503-5399
URL: http://www.utc-yokohama.com/
IT Engineering Limited
Services: IT consulting and solution provider
1-25, Shinurashima-cho 1-chome,
Kanagawa-ku, Yokohama 221-0031, Japan
Te l : (81) 45-441-9123
Fax: (81) 45-441-1466
URL: http://www.ite.co.jp/
Business Support
Arrow Business Consulting Corporation
Services: Consulting for finance and accounting
32-1, Tsurumichuo 4-chome, Tsurumi-ku,
Yokohama 230-0051, Japan
Te l : (81) 45-502-5774
Fax: (81) 45-502-5753
Arrowhead International Corporation
Services: Travel services and supply of
spare parts
7-8, Shibakoen 1-chome, Minato-ku,
Tokyo 105-0011, Japan
Te l : (81) 3-5470-0880
Fax: (81) 3-5470-0890
URL: http://www.arrowhead.co.jp/
Arrow Human Resources Co., Ltd.
Services: Placement of technicians and office
staff and reemployment support
43, Hon-cho 4-chome, Naka-ku,
Yokohama 231-0005, Japan
Te l : (81) 45-662-1126
Fax: (81) 45-662-1173
URL: http://www.ahr.co.jp/
Overseas Offices Abu Dhabi Office
P.O. Box 43928, Clock Tower Bldg.,
Floor No. 02 Suite No. 0204
AI Najda Street, Abu Dhabi, U.A.E.
Te l : (971) 2-671-7161
Fax: (971) 2-671-7162
Beijing Office
Room No. 1028, China World Tower No. 1,
Jianguomenwai Street, Chaoyang District,
Beijing, 100004, China
Te l : (86) 10-6505-2678
Fax: (86) 10-6505-1118
Jakarta Office
9th Floor, Mid-Plaza Bldg., Jalan Jenderal
Sudirman Kav. 10-11, Jakarta 10220, Indonesia
Te l : (62) 21-570-7579
Fax: (62) 21-570-6276
Korea Representative Office
1358-8, Tal-dong Nam-ku, Ulsan, Korea
Tel: (82) 52-256-5721/5722
Fax: (82) 52-256-5723
Middle East Headquarters Doha Office
12th Floor, Al-Qassar Tower,
Taawon Street,
West Bay, P.O. Box 20243
Doha, Qatar
Te l : (974) 4462-2875/2876
Fax: (974) 4462-2716
Milan Representative Office
Viale Della Liberazione 16/18, 20124 Milan, Italy
Te l : (39) 02-303517-111
Fax: (39) 02-303517-35
Singapore Human Resources Office
10 Anson Road, #03-02, International Plaza,
Singapore 079903
Te l : (65) 6324-0080
Fax: (65) 6324-0090
The Hague Representative Office
Parkstraat 83, 2514 JG The Hague,
The Netherlands
Te l : (31) 70-385-9453
Fax: (31) 70-346-3779
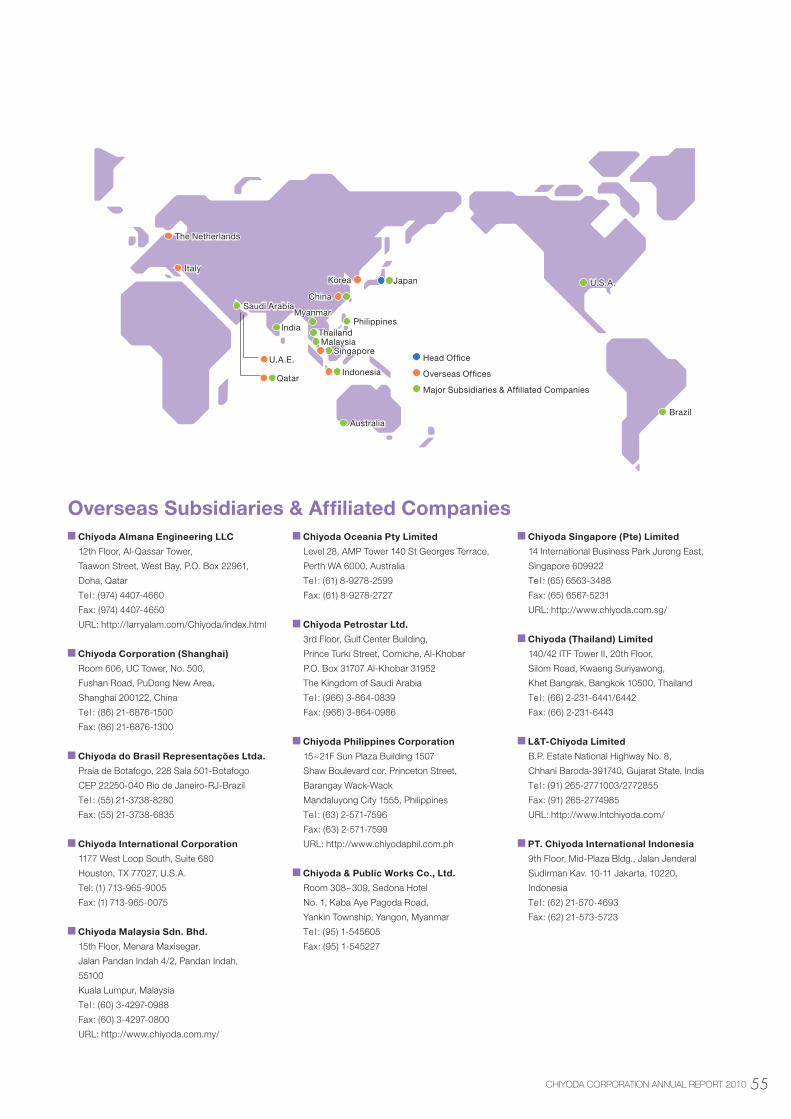
��CHIYODA CORPORATION ANNUAL REPORT 2010
Head Office
Overseas Offices
Major Subsidiaries & Affiliated Companies
Japan
Australia
Indonesia
SingaporeMalaysia
Myanmar
Saudi Arabia
U.A.E.
Qatar
Italy
The Netherlands
Korea
China
Brazil
U.S.A.
PhilippinesThailand
India
Overseas Subsidiaries & Affiliated Companies Chiyoda Almana Engineering LLC
12th Floor, Al-Qassar Tower,
Taawon Street, West Bay, P.O. Box 22961,
Doha, Qatar
Te l : (974) 4407-4660
Fax: (974) 4407-4650
URL: http:// larryalam.com/Chiyoda/index.html
Chiyoda Corporation (Shanghai)
Room 606, UC Tower, No. 500,
Fushan Road, PuDong New Area,
Shanghai 200122, China
Te l : (86) 21-6876-1500
Fax: (86) 21-6876-1300
Chiyoda do Brasil Representações Ltda.
Praia de Botafogo, 228 Sala 501-Botafogo
CEP 22250-040 Rio de Janeiro-RJ-Brazil
Te l : (55) 21-3738-8280
Fax: (55) 21-3738-6835
Chiyoda International Corporation
1177 West Loop South, Suite 680
Houston, TX 77027, U.S.A.
Tel: (1) 713-965-9005
Fax: (1) 713-965-0075
Chiyoda Malaysia Sdn. Bhd.
15th Floor, Menara Maxisegar,
Jalan Pandan Indah 4/2, Pandan Indah,
55100
Kuala Lumpur, Malaysia
Te l : (60) 3-4297-0988
Fax: (60) 3-4297-0800
URL: http://www.chiyoda.com.my/
Chiyoda Oceania Pty Limited
Level 28, AMP Tower 140 St Georges Terrace,
Perth WA 6000, Australia
Te l : (61) 8-9278-2599
Fax: (61) 8-9278-2727
Chiyoda Petrostar Ltd.
3rd Floor, Gulf Center Building,
Prince Turki Street, Corniche, Al-Khobar
P.O. Box 31707 Al-Khobar 31952
The Kingdom of Saudi Arabia
Te l : (966) 3-864-0839
Fax: (966) 3-864-0986
Chiyoda Philippines Corporation
15~21F Sun Plaza Building 1507
Shaw Boulevard cor. Princeton Street,
Barangay Wack-Wack
Mandaluyong City 1555, Philippines
Te l : (63) 2-571-7596
Fax: (63) 2-571-7599
URL: http://www.chiyodaphil.com.ph
Chiyoda & Public Works Co., Ltd.
Room 308~309, Sedona Hotel
No. 1, Kaba Aye Pagoda Road,
Yankin Township, Yangon, Myanmar
Te l : (95) 1-545605
Fax: (95) 1-545227
Chiyoda Singapore (Pte) Limited
14 International Business Park Jurong East,
Singapore 609922
Te l : (65) 6563-3488
Fax: (65) 6567-5231
URL: http://www.chiyoda.com.sg/
Chiyoda (Thailand) Limited
140/42 ITF Tower II, 20th Floor,
Silom Road, Kwaeng Suriyawong,
Khet Bangrak, Bangkok 10500, Thailand
Te l : (66) 2-231-6441/6442
Fax: (66) 2-231-6443
L&T-Chiyoda Limited
B.P. Estate National Highway No. 8,
Chhani Baroda-391740, Gujarat State, India
Te l : (91) 265-2771003/2772855
Fax: (91) 265-2774985
URL: http://www.lntchiyoda.com/
PT. Chiyoda International Indonesia
9th Floor, Mid-Plaza Bldg., Jalan Jenderal
Sudirman Kav. 10-11 Jakarta, 10220,
Indonesia
Te l : (62) 21-570-4693
Fax: (62) 21-573-5723

�� CHIYODA CORPORATION ANNUAL REPORT 2010
Chiyoda Corporation
Head Office
12-1, Tsurumichuo 2-chome, Tsurumi-ku,
Yokohama 230-8601, Japan
Tel: (81) 45-521-1231
Fax: (81) 45-503-0200
Established
January 20, 1948
Paid-in Capital
¥43,396 million
Number of Employees
1,281 (Non-Consolidated)
3,670 (Consolidated)
Annual Fiscal Close
March 31
Shareholders’ Meeting
June
Number of Shares per Unit
1,000
Stock Code
ISIN: JP3528600004
SEDOL 1:6191704 JP
TSE: 6366
Transfer Agent of Common Stock
Mitsubishi UFJ Trust and Banking
Corporation
1-4-5 Marunouchi, Chiyoda-ku, Tokyo
Authorized Shares
650,000,000
Capital Stock Issued
260,324,529
Number of Shareholders
14,069
URL
http://www.chiyoda-corp.com/en/
Shareholders’ Meeting
Board of Directors
Executive Committee
Corporate Auditors Committee
CSR Division
Corporate Planning,Management & Finance
Corporate Planning Division
Corporate Communication Division
Corporate Services & HRM Division
Finance Division
Project Management Administration Division
Process Engineering Division/Refinery, Petrochemical & New Energy
Engineering Operation Division
Process Engineering Division/Gas & LNG
Business Development Division 1
Business Development Division 2
Business Development Management Division
International Project Division 1
International Project Division 2
International Project Division 3
International Project Division 4
Domestic Project Division 1
Domestic Project Division 2
Project Management Service Division
Group Operation Division
Mechanical Engineering Division
Electrical and Control System Engineering Division
Strategic Business DevelopmentDivision
Technology Development Division
Green Technology Project Division
Pharmaceutical & EnvironmentalProject Division
Piping and Civil Engineering Division
Procurement Division
Construction Division
Project Operations Business Development Operation
Technology & Engineering
Research Institute of Technology Innovation & Strategy
PC Planning & Administration Office
Technology Planning &Administration Office
Projects Logistics & Construction
Technology Development Business Planning & Administration Office
Project Plannning & Administration Office
Business Managers Office
Technology Development Business Operation
SQE Division
Operational Auditing Office
Corporate Information
(As of July 1, 2010)
Organization Chart
(As of March 31, 2010)
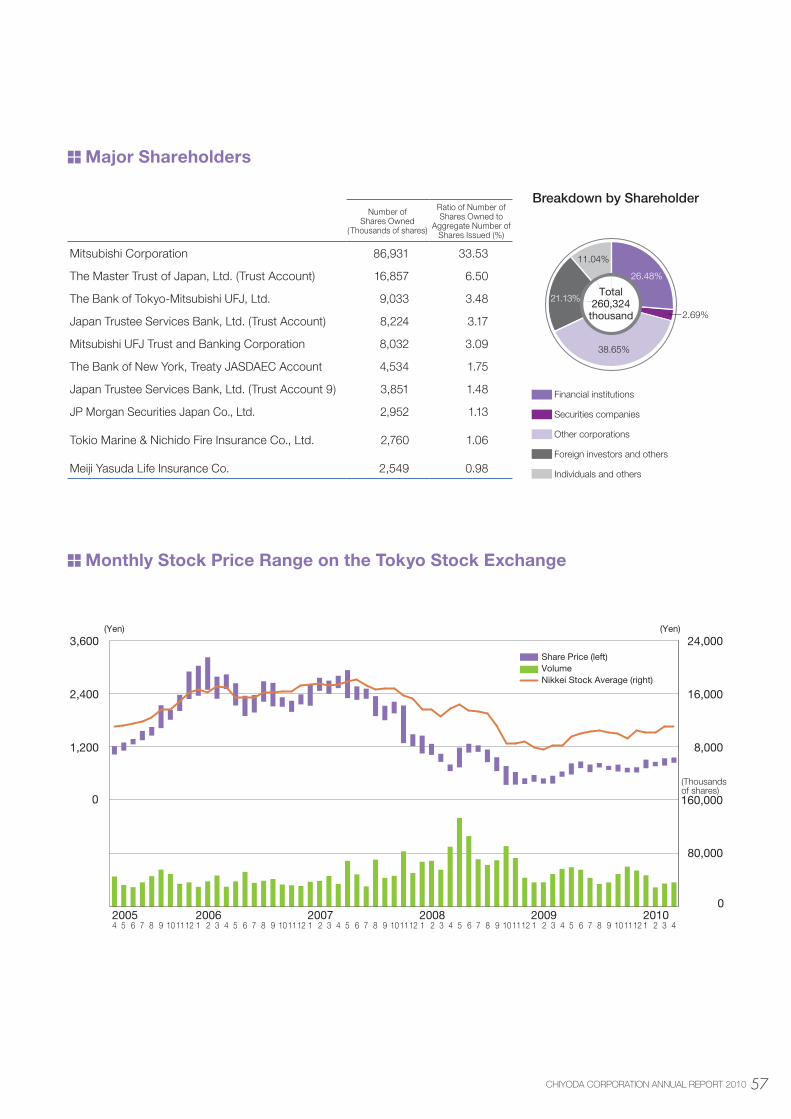
��CHIYODA CORPORATION ANNUAL REPORT 2010
Number of Shares Owned
(Thousands of shares)
Ratio of Number ofShares Owned to
Aggregate Number of Shares Issued (%)
Mitsubishi Corporation 86,931 33.53
The Master Trust of Japan, Ltd. (Trust Account) 16,857 6.50
The Bank of Tokyo-Mitsubishi UFJ, Ltd. 9,033 3.48
Japan Trustee Services Bank, Ltd. (Trust Account) 8,224 3.17
Mitsubishi UFJ Trust and Banking Corporation 8,032 3.09
The Bank of New York, Treaty JASDAEC Account 4,534 1.75
Japan Trustee Services Bank, Ltd. (Trust Account 9) 3,851 1.48
JP Morgan Securities Japan Co., Ltd. 2,952 1.13
Tokio Marine & Nichido Fire Insurance Co., Ltd. 2,760 1.06
Meiji Yasuda Life Insurance Co. 2,549 0.98
26.48%
21.13%
38.65%
11.04%
2.69%
77%
14%
9%
Financial institutions
Securities companies
Other corporations
Foreign investors and others
Individuals and others
Total260,324
thousand
23.38%
22.90%
38.93%
12.94%
1.85%Total
260,292thousand
Breakdown by Shareholder
Major Shareholders
Monthly Stock Price Range on the Tokyo Stock Exchange
(Yen) (Yen)
Share Price (left)VolumeNikkei Stock Average (right)
(Thousandsof shares)
20051 2 34 5 6 7 8 9 101112 4 5 6 7 8 9 1011121 2 3 4 5 6 7 8 9 1011121 2 3 5 6 7 8 9 10111241 2 3 41 2 34 5 6 7 8 9 1011122006 2007 2008 2009 2010
0
3,600
2,400
1,200
160,000
80,000
0
24,000
16,000
8,000

12-1, Tsurumichuo 2-chome, Tsurumi-ku, Yokohama 230-8601, JapanTel: (81) 45-521-1231Fax: (81) 45-503-0200http:// www.chiyoda-corp.com
Annual Report 2010For the year ended March 31,2010