annual report 2011 - orascomdh.com consolidated statement of comprehensive income f-3 8.2...
TRANSCRIPT

ANNUAL REPORT
2011
Value Creation

Contents1. Facts & Figures 2
2. Board & Management Statements 6 2.1 Message from the Chairman 6 2.2 Interview with the CEO 8 2.3 CFO statement 10 2.4 Focus for 2012 12
3. Business Segments 14 3.1 Hotels 14 3.2 Real Estate and Construction 16 3.3 Town Management 18 3.4 Other Segments 19
4. Countries 20 4.1 Egypt 22 4.2 UAE 32 4.3 Jordan 34 4.4 Oman 36 4.5 Switzerland 42 4.6 Morocco 44 4.7 Montenegro 46 4.8 United Kingdom 48 4.9 Romania 49
5. Sustainability 50 5.1 Social sustainability 52 5.2 Environmental sustainability 54 5.3 Economic sustainability 55 5.4 Examples of sustainability in our towns 56 5.5 Interview with the Head of Group Design & Destination Planning 60
6. Corporate Governance 62 6.1 Group Structure and Significant Shareholders 62 6.2 Capital structure 64 6.3 Board of Directors 66 6.4 Executive Management 72 6.5 Compensation, shareholdings and loans 75 6.6 Shareholders’ participation 76 6.7 Changes of control and defense measures 76 6.8 External auditors 77 6.9 Information policy 77
7. Investor Information 78
8. Consolidated Financial Statements 2011 Orascom Development Holding AG F-2 8.1 Consolidated statement of comprehensive income F-3 8.2 Consolidated statement of financial position F-4 8.3 Consolidated statement of changes in equity F-6 8.4 Consolidated statement of cash flows F-7 8.5 Notes to the consolidated financial statements F-9
9. Financial Statements 2011 Orascom Development Holding AG 9.1 Income statement F-85 9.2 Statutory balance sheet F-86 9.3 Statement of changes in equity F-87 9.4 Cash flow statement F-87 9.5 Notes to the financial statements F-88
10. Glossary of Terms 176
2 | Orascom DevelopmentAnnual Report 2011 | 3
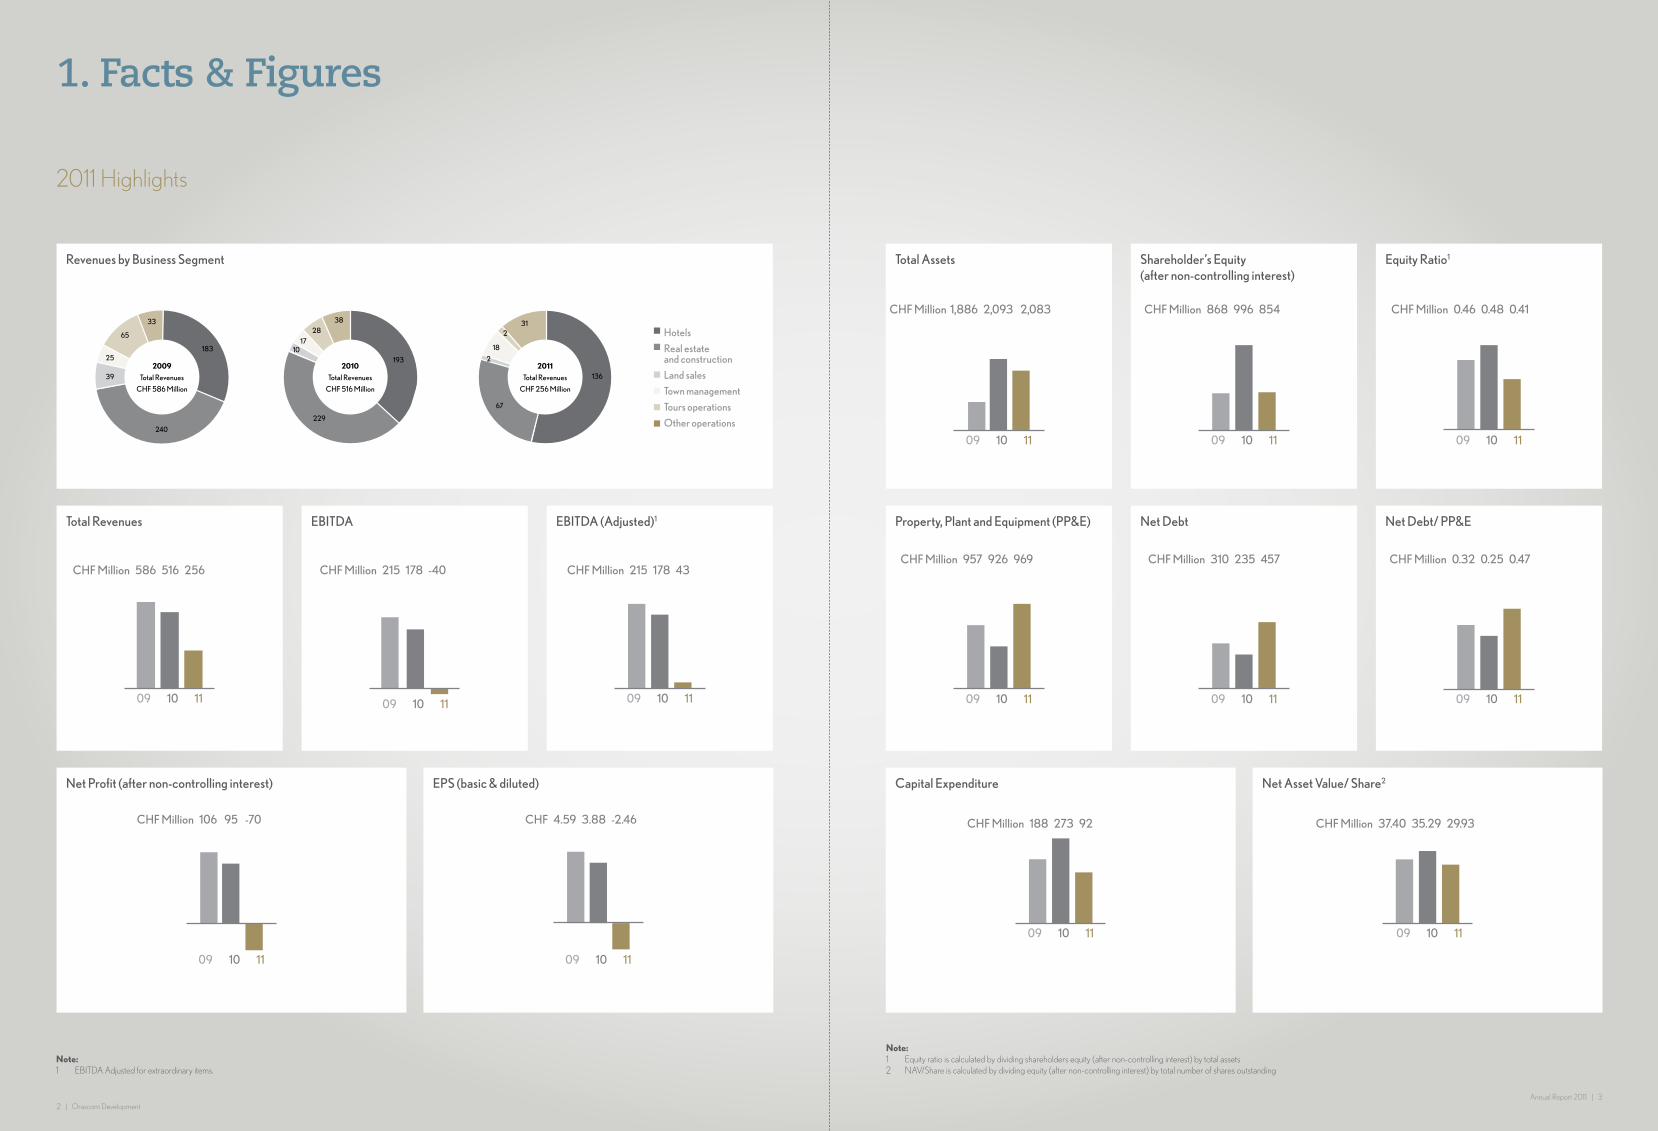
2011 Highlights
Revenues by Business Segment
Net Profit (after non-controlling interest)
CHF Million 106 95 -70
EPS (basic & diluted)
CHF 4.59 3.88 -2.46
Shareholder’s Equity(after non-controlling interest)
CHF Million 868 996 854 CHF Million 0.46 0.48 0.41
Total Assets
CHF Million 1,886 2,093 2,083
Property, Plant and Equipment (PP&E)
CHF Million 957 926 969
Net Debt/ PP&E
CHF Million 0.32 0.25 0.47
Net Asset Value/ Share2
CHF Million 37.40 35.29 29.93
Capital Expenditure
CHF Million 188 273 92
Net Debt
CHF Million 310 235 457
1. Facts & Figures
183
240
39
25
65
33
2009
Total Revenues
Chf 586 Million
193
229
1017
28
38
2010
Total Revenues
Chf 516 Million
136
67
2
2
18
31
2011
Total Revenues
Chf 256 Million
Hotels
Real estate and construction
Land sales
Town management
Tours operations
Other operations
EBITDA
CHF Million 215 178 -40
EBITDA (Adjusted)1
CHF Million 215 178 43CHF Million 586 516 256
09 10 11
09 10 11 09 10 11
09 10 1109 10 11
Total Revenues
Note:1 EBITDA Adjusted for extraordinary items.
Note:1 Equity ratio is calculated by dividing shareholders equity (after non-controlling interest) by total assets2 NAV/Share is calculated by dividing equity (after non-controlling interest) by total number of shares outstanding
Equity Ratio1
09 10 11 09 10 11
09 10 11
09 10 11
09 10 11
09 10 11
09 10 11
09 10 11
4 | Orascom DevelopmentAnnual Report 2011 | 5
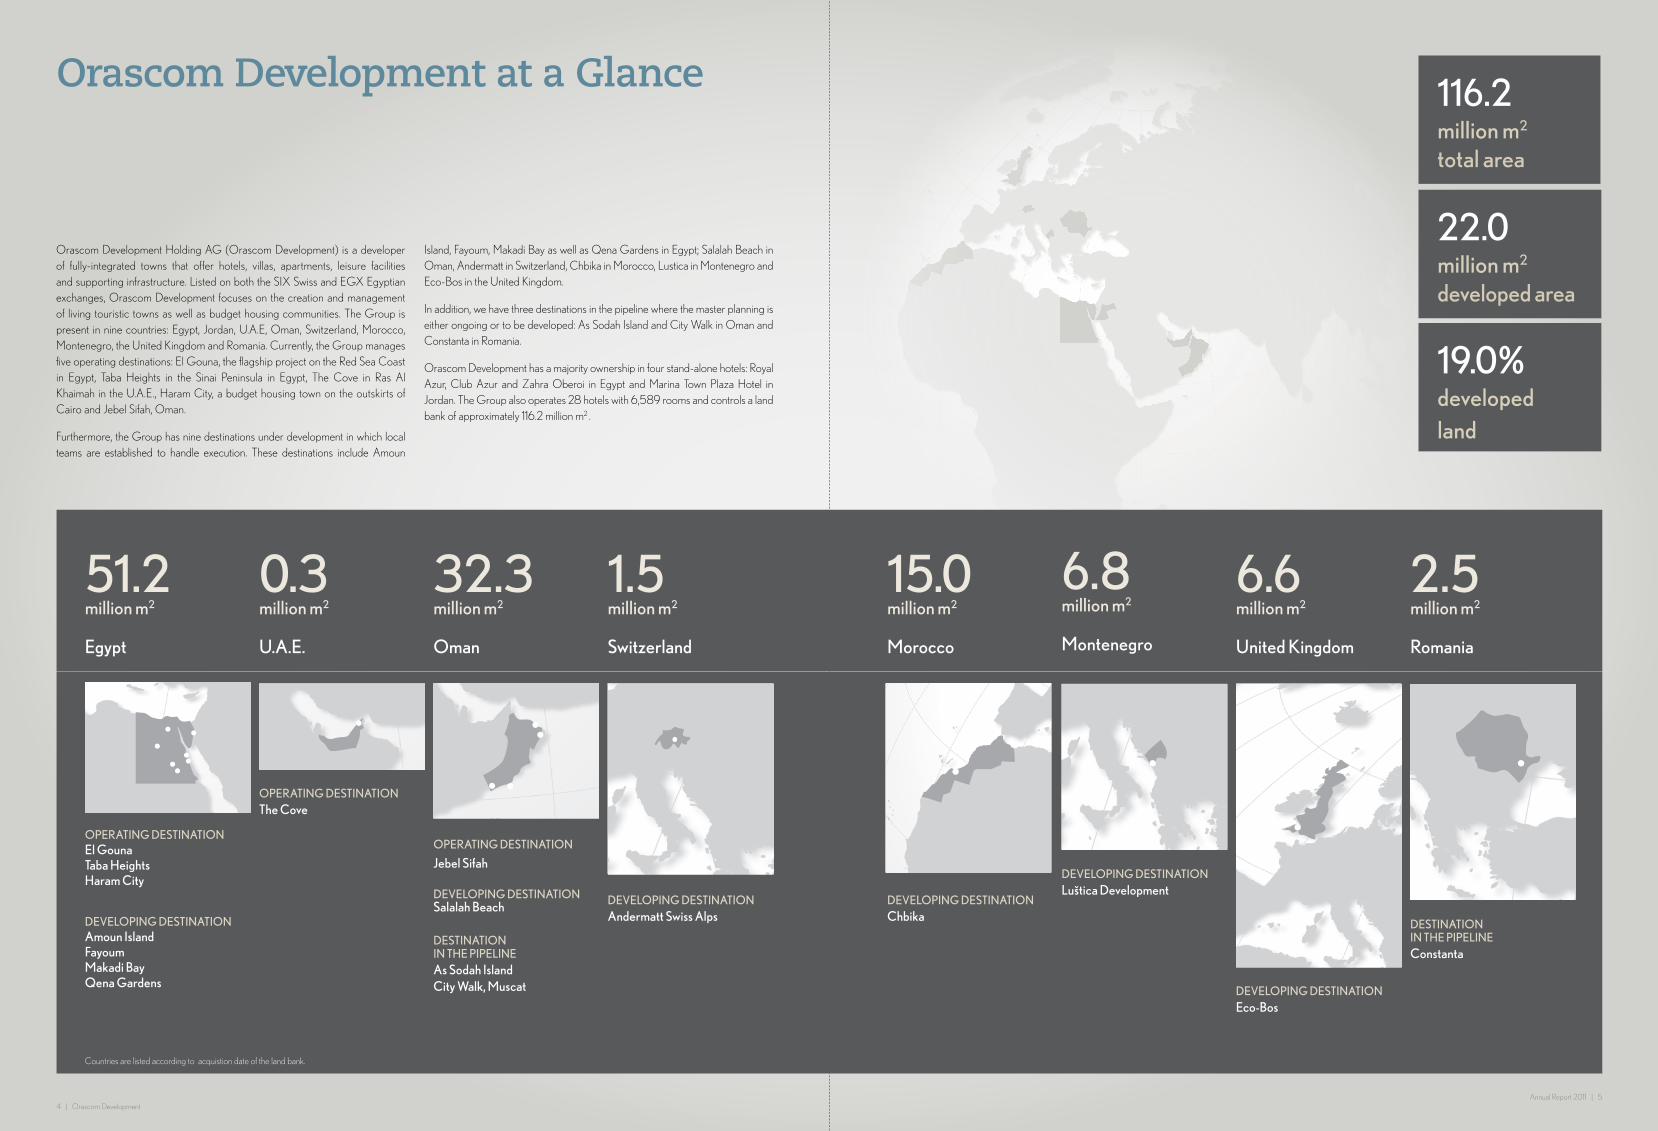
116.2 million m2
total area
22.0million m2
developed area
19.0%developedland
Orascom Development Holding AG (Orascom Development) is a developer of fully-integrated towns that offer hotels, villas, apartments, leisure facilities and supporting infrastructure. Listed on both the SIX Swiss and EGX Egyptian exchanges, Orascom Development focuses on the creation and management of living touristic towns as well as budget housing communities. The Group is present in nine countries: Egypt, Jordan, U.A.E, Oman, Switzerland, Morocco, Montenegro, the United Kingdom and Romania. Currently, the Group manages five operating destinations: El Gouna, the flagship project on the Red Sea Coast in Egypt, Taba Heights in the Sinai Peninsula in Egypt, The Cove in Ras Al Khaimah in the U.A.E., Haram City, a budget housing town on the outskirts of Cairo and Jebel Sifah, Oman.
Furthermore, the Group has nine destinations under development in which local teams are established to handle execution. These destinations include Amoun
Island, Fayoum, Makadi Bay as well as Qena Gardens in Egypt; Salalah Beach in Oman, Andermatt in Switzerland, Chbika in Morocco, Lustica in Montenegro and Eco-Bos in the United Kingdom.
In addition, we have three destinations in the pipeline where the master planning is either ongoing or to be developed: As Sodah Island and City Walk in Oman and Constanta in Romania.
Orascom Development has a majority ownership in four stand-alone hotels: Royal Azur, Club Azur and Zahra Oberoi in Egypt and Marina Town Plaza Hotel in Jordan. The Group also operates 28 hotels with 6,589 rooms and controls a land bank of approximately 116.2 million m2 .
Orascom Development at a Glance
2.5million m2
Romania
DESTINATION IN THE PIPELINEConstanta
6.8million m2
Montenegro
DEVELOPING DESTINATIONLuštica Development
6.6million m2
United Kingdom
DEVELOPING DESTINATIONEco-Bos
15.0million m2
Morocco
DEVELOPING DESTINATIONChbika
1.5million m2
Switzerland
DEVELOPING DESTINATIONAndermatt Swiss Alps
32.3million m2
Oman
OPERATING DESTINATION
Jebel Sifah
DEVELOPING DESTINATION Salalah Beach DESTINATION IN THE PIPELINEAs Sodah IslandCity Walk, Muscat
0.3million m2
U.A.E.
OPERATING DESTINATIONThe Cove
51.2million m2
Egypt
OPERATING DESTINATIONEl Gouna Taba Heights Haram City
DEVELOPING DESTINATIONAmoun IslandFayoumMakadi BayQena Gardens
Countries are listed according to acquistion date of the land bank.

6 | Orascom DevelopmentAnnual Report 2011 | 7
2.1 Message from the Chairman
In order to reflect the broader presence of the Group and to separate the activities of the Executive Management and the Board of Directors, I decided to hand-over my duties as CEO of Orascom Development to Dr. Gerhard Niesslein as of the 1st of November. Dr. Niesslein is a well experienced, broadly networked real estate expert who has served as a leader of various companies in Canada and Germany and previously acted as the CEO of IVG Immobilien AG, Bonn, a listed German real estate company. In his new position, he will lead the day-to-day business of the Group and its subsidiaries. I will keep my position as Chairman of the Board of Directors and focus on developing the long-term strategic goals of the Group.
Finally, I would like to thank Amr Sheta, Vice Chairman and Co-CEO, on his substantial contribution to the growth of the Group, without his active role, the Group could never have developed so vigorously.
OutlookThe beginning of 2012 turned out to be challenging and I expect it to continue being so for the rest of the year. Nevertheless, I strongly believe in the company’s performance and I am confident that we will be able to weather the storm and emerge stronger. I remain committed to the company through my capacity as the Chairman of the Board and worked to secure CHF 125 million in credit agreements earlier this year that will enable us, together with the existing cash reserves and credit lines, to finance all of our activities for the current year. Furthermore, I am also willing to secure additional funding to cover the 2013 investment program if required.
The Group has a unique business model with a proven track record, which I believe can be applied in other parts of the world. In light of the current circumstances, we have adapted the business model to create the best long-term value possible for our shareholders and
increase performance by identifying credible equity investors willing to partner with the Group on potential investments.
Faced with challenges ahead and influenced by the need to change while adapting to new realities, we have to better manage our costs, become more efficient in what we do and become more effective in how we do it. If we are to remain leaders, we need to implement changes swiftly and effectively.
On behalf of the Board of Directors and Executive Management, we would like to thank all our employees for their commitment and the huge efforts they put forward during this time of uncertainty. We also like to thank our clients and business partners for their confidence in our business model. Lastly, we wish to thank you, our shareholders, for the trust you have always placed in the Group, and we are prepared to deliver on that trust.
Dear Shareholders,
2011 has been a truly challenging year for Egypt, the Middle East and the world as a whole. We have witnessed a number of unexpected changes on the political and economic fronts, all of which have had a profound impact on global business. The events in the MENA Region (Middle East and North Africa), which started early in the year, significantly impacted our operations. In Egypt and Oman, tourism demand dropped which affected economic growth. Nevertheless, our hotels managed to pick up the pace with higher room occupancies towards year end. In our real estate market, construction work in Egypt came to a near halt for almost 50 days during the first half of the year resulting in comparatively lower revenues and profits. Beyond the region, high volatility in international currency markets, a deepening of the European debt crisis and slower global economic growth in the second half of the year created additional challenges for the Group.
Despite these harsh market conditions, we managed to achieve several milestones in our destinations. At our Swiss destination Andermatt, considerable construction and investment progress was achieved. We completed the shell of the Chedi hotel in November, one-third of the initial construction of the car-free village Podium and finalized the earthworks for the 18-hole golf course. Even with a robust Swiss Franc and a debate surrounding the development of the ski area, we were able to reach reasonable levels of sales and reservation contracts in Andermatt. We also launched our first hotel in Jebel Sifah; Oman, the Sifawy boutique hotel with 55 rooms and suites in September and are planning to launch the pre-sales of “Lustica Bay,” our new destination in Montenegro, by the second quarter of 2012. These developments continue to support our financial positioning and diversification strategy in the coming years.
Samih Sawiris
Chairman
2. Board & Management Statements

8 | Orascom DevelopmentAnnual Report 2011 | 9
Why did you join Orascom Development Holding AG? For me, Orascom Development is a unique organization with a proven business model, an experienced management team and a land bank of about 116.2 million m2 that is still largely undeveloped. But, the destination portfolio today already consists of five fully-fledged towns and further destinations under development in nine countries. The Group also operates a total of 6,589 hotel rooms.
What is your current role at Orascom ?As CEO, I will lead the day-to-day business of the Group and its subsidiaries.
What are your first impressions about Egypt?Egypt is a fascinating country with a rich history and a long tradition. I have met a lot of enthusiastic and interesting people here and I am optimistic that also the business environment will return to growth once the current situation subsides.
Which areas are you planning to focus on over the next 6-18 months?Our main focus is to become more efficient and effective in what we do and to increase transparency. We are currently reviewing our process landscape, strengthening our Group-wide business practices and more clearly aligning roles and procedures. Another area would be securing further funding requirements for our destinations.
Can you give some examples of what exactly you are planning to do?Yes, of course. In light of the current circumstances, we intend to focus more on the monetization of our land bank, to identify equity partners to convert our equivalent of land into a hotel ownership or joint venture and to more closely work with sub-developers.
We are in the process of setting-up a matrix structure for the Group, with clear profit and support centers. We also simplified processes for staff members with more role specialization and defined responsibilities.
Given the recent changes on the global economical and political side, we decided to assess not only our existing operations, but also our developments from a legal and a financial point of view. This should enable us to come up with several solutions under various scenarios for each destination. Additionally, we successfully prolonged the maturity of our debt facilities.
What is your outlook for budget housing?We believe that the Group is well-positioned to explore new opportunities in the budget housing segment as the political environment in the MENA-region improves. We have an experienced team that has the expertise to build budget housing that can combine business profitability with a consideration of the economic welfare and development of societies.
Any new expansion plans or joint ventures in the pipeline?Today, we have about 94 million m2 of undeveloped land. This should be enough residual land to keep the Group growing organically for at least a decade. Therefore, we do not intend to add any new major developments in the near future.
2.2 Interview with the CEO
Gerhard Niesslein
Chief Executive Officer

10 | Orascom DevelopmentAnnual Report 2011 | 11
Balance sheet
Total assets on the balance sheet remained broadly unchanged at CHF 2,083.2 million compared to CHF 2,093.4 million in 2010. Cash and cash equivalents decreased from CHF 276.5 million to CHF 79.4 million in 2011 in connection with the construction work of real estate units (construction work in progress) that are either contracted or sold or that are ready to be sold. As a result, the inventory balance increased from CHF 260.2 million in 2010 to CHF 478.2 million by the end of 2011. Of the total inventory CHF 346.3 million relates to construction work in progress.
On the liability and equity side, the drop of shareholders`equity (after non-controlling interests) of CHF 141.2 million resulted from three main components: the losses from the continued operations of CHF 69.7 million (net loss), exchange rate differences of CHF 17.6 million and revaluation of assets available for sale of CHF 34.7 million.
Financing
As of 31 December 2011, the net debt position of Orascom Development stood at CHF 456.8 million, almost doubled when compared to 2010 (CHF 235.3 million). While in 2010, the Group successfully concluded rights issue with the proceeds of CHF 185.2 million, that reduced the net debt position considerably, in 2011 the increase of it indebtedness mainly stems from higher real estate inventory (plus CHF 218.0 millon). The high inventory will generate a part of our future cash inflow, once the real estate units are sold.
The Group is working on several financing facilities to fund expansions of hotels in Oman, Switzerland and Egypt. During 2011, Orascom Development succeeded to prolong its debt repayments. Additionally, we are currently working on restructuring our debt to further optimize the cash positions of the Group.
In order to serve the long-term vision of the company, we will increasingly focus in our daily business on the functions of reporting, budgeting and controlling. Furthermore, we intend to improve our finance-related IT tools.
The political changes in the MENA-region, the slowdown of the world economy and the strengthening of the Swiss Franc all affected the performance of the Group during 2011; in particular as 70% of the financial statements are contributed from the Egyptian entities.
Consolidated revenues accordingly declined by 50% to CHF 256.1 million from CHF 516.1 million in 2010. Next to the impact from the political and economical events, the strengthening of the Swiss Franc resulted in a 13.8% decrease in revenues.
The operating results of the Group (EBITDA) stood at a loss of CHF 40.1 million as several extraordinary items, derived from the above mentioned events, occurred. These items in total amounted to CHF 82.8 million and include provisions (CHF 57.1 million), revaluations of investment properties (CHF 8.7 million), legal fees (CHF 5.0 million) as well as currency revaluations from the appreciation of the Swiss Franc (CHF 12.0 million). It is worth noting that more than 90% of these items are non-cash items. When adjusting for these extraordinary items, Group EBITDA was CHF 42.7 million, corresponding to an EBITDA-margin of 16.7% (2010: 34.5%).
Reported net loss (after non-controlling interests) amounted to CHF 69.7 million (2010: profit of CHF 94.9 million).
Mahmoud Zuaiter
Group Chief Financial Officer
Note:1 Group net debt divided by P,P&E
2.3 CFO Statement
MCHF
50
-40.1
57.1
42.7
8.7
5.012.0
-50
-40
-30
-20
-10
40
30
20
10
0
EBITDAReported
Provisions Investmentproperties
Currencyrevaluations
Legal Fees EBITDAAdjusted*

12 | Orascom DevelopmentAnnual Report 2011 | 13
2.4 Focus for 2012
What has changed in your development approach?Orascom Development`s land bank remains the main value driver. Today, we have 94 millon m2 available for development.
In 2012, Orascom is at a crossroad from a strategic standpoint. Over the last years, our land bank has significantly increased due to our new destinations in Morocco, Montenegro, the UK and Romania, which together added some 30 million m2.
As a consequence of this increase, we had to assess first of all the option of shifting towards a more “Capital Light Strategy”; which basically means a higher share of sub-developers in our destinations. Secondly, we are in the process of internally analyzing various options to better monetize our land bank.
What type of investment opportunities could you offer?Orascom as a destination and a community developer provides all activities and components associated with those life centres. Our destinations, which have a strong tourism profile include hotels, leisure infrastructures, residential real estate and necessary amenities to support our residents day to day life (such as schools, shops, restaurants and/or hospitals). All of these could create investment opportunities for third-parties.
What type of investors do you want to attract?First and foremost investors who are interested to invest in undeveloped locations that are also supportive of sustainable solutions respectful of the environment. Second, the capital needs to be mid to long term as we are in the ground up business which takes time to plan, build and mature. Third, investors that like to invest in residential real estate itself, hotels, land or real estate
associated with infrastructure. Finally, capital that can actively participate in our effort by contributing its ideas and past experiences with a strong penchant for low density construction.
What do investors get at this stage?Beyond deploying capital, they get access to scarce land resources and they can benefit from the know-how, brand and experience of Orascom. For example, if an investor is interested to fund or co-fund a hotel, we can provide them with access to our portfolio of international hotel management companies. Co-investors as well also particpiate in the appreciation of the land value, next to an attractive return, once the project is successfully developed. A further benefit is that the investor usually can be provided with an existing high-end infrastructure such as a marina, golf course or a hospital.
Where are your Destinations that are attractive for investors?We are actively developing in five countries: Switzerland and Montenegro in Europe as well as Oman, Egypt and Morocco.
Julien Renaudperret
Chief Development Officer
Our proven business model is based on the acquistions of untapped land and the development and management of fully integrated towns. At the heart of our operations, and thus a key long term value driver of our business model, is our land bank which we acquired in several jurisdictions.
While we in essence remain committed to our business model the global environment has materially changed during the last couple of years. Among the most popular events, we faced the headwinds derived from the global financial crisis since 2008, the deepening of the debt crisis in Europe, the strengthening of the Swiss Franc and the unexpected changes on the political fronts in the MENA-region during 2010-2012. We still feel the effects of these events, having witnessed a reduced demand for real estate and tourism among our destinations which has lead to lower profit and cash generation.
Therefore, we created different initiatives to tackle the current challenges derived from the changed environment. The overall goal of these initiatives is to become more efficient and effective and to increase internal and external transparency.
The key initiative is the comprehensive reengineering of the whole Group. In the framework of this reengineering, we establish a more common understanding of the business we are in. We reviewed our process landscape and optimized the related business, management and support processes. We focus on the group wide standardization of all our processes, organizational structures and
tools. In addition we aligned the roles, objectives and responsibilities across the Group and improved our management principles. The implementation of the results of all these efforts in the daily business is a key factor of success for the reengineering. Hence the respective training of our staff as well as a process based management system which is accessible via our Intranet are important elements of the initiative.
Corporate Initiatives
Raymond Cron
SVP European Destinations & Responsible for Corporate Development
14 | Orascom DevelopmentAnnual Report 2011 | 15
The political events in the MENA region had a prolonged impact on our hotel operations. While the year 2011 started with a record high revenue for the month of January, operations started to slow-down following the political changes that began on the 25th of January 2011. Cancellations of room reservations and a rerouting of flights resulted due to the issuance of security warnings and travel bans by many of the Group’s feeder markets.
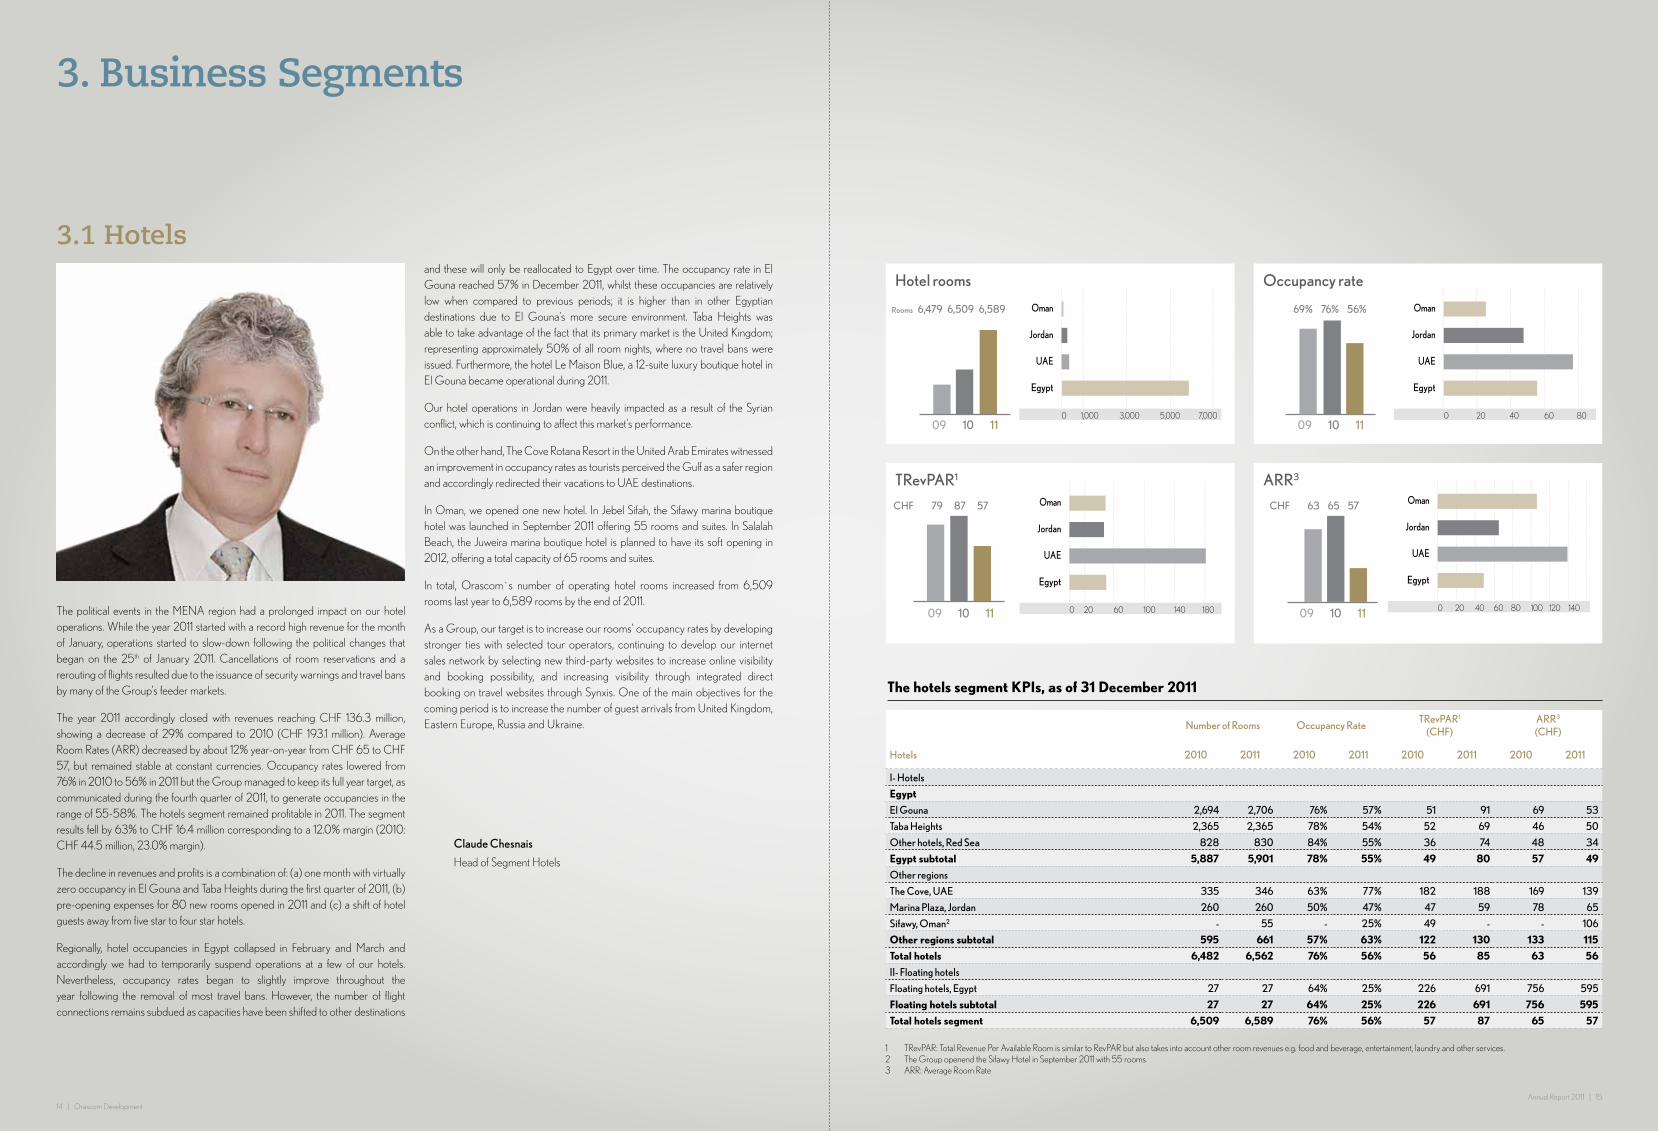
The year 2011 accordingly closed with revenues reaching CHF 136.3 million, showing a decrease of 29% compared to 2010 (CHF 193.1 million). Average Room Rates (ARR) decreased by about 12% year-on-year from CHF 65 to CHF 57, but remained stable at constant currencies. Occupancy rates lowered from 76% in 2010 to 56% in 2011 but the Group managed to keep its full year target, as communicated during the fourth quarter of 2011, to generate occupancies in the range of 55-58%. The hotels segment remained profitable in 2011. The segment results fell by 63% to CHF 16.4 million corresponding to a 12.0% margin (2010: CHF 44.5 million, 23.0% margin).
The decline in revenues and profits is a combination of: (a) one month with virtually zero occupancy in El Gouna and Taba Heights during the first quarter of 2011, (b) pre-opening expenses for 80 new rooms opened in 2011 and (c) a shift of hotel guests away from five star to four star hotels.
Regionally, hotel occupancies in Egypt collapsed in February and March and accordingly we had to temporarily suspend operations at a few of our hotels. Nevertheless, occupancy rates began to slightly improve throughout the year following the removal of most travel bans. However, the number of flight connections remains subdued as capacities have been shifted to other destinations
and these will only be reallocated to Egypt over time. The occupancy rate in El Gouna reached 57% in December 2011, whilst these occupancies are relatively low when compared to previous periods; it is higher than in other Egyptian destinations due to El Gouna’s more secure environment. Taba Heights was able to take advantage of the fact that its primary market is the United Kingdom; representing approximately 50% of all room nights, where no travel bans were issued. Furthermore, the hotel Le Maison Blue, a 12-suite luxury boutique hotel in El Gouna became operational during 2011.
Our hotel operations in Jordan were heavily impacted as a result of the Syrian conflict, which is continuing to affect this market’s performance.
On the other hand, The Cove Rotana Resort in the United Arab Emirates witnessed an improvement in occupancy rates as tourists perceived the Gulf as a safer region and accordingly redirected their vacations to UAE destinations.
In Oman, we opened one new hotel. In Jebel Sifah, the Sifawy marina boutique hotel was launched in September 2011 offering 55 rooms and suites. In Salalah Beach, the Juweira marina boutique hotel is planned to have its soft opening in 2012, offering a total capacity of 65 rooms and suites.
In total, Orascom`s number of operating hotel rooms increased from 6,509 rooms last year to 6,589 rooms by the end of 2011.
As a Group, our target is to increase our rooms’ occupancy rates by developing stronger ties with selected tour operators, continuing to develop our internet sales network by selecting new third-party websites to increase online visibility and booking possibility, and increasing visibility through integrated direct booking on travel websites through Synxis. One of the main objectives for the coming period is to increase the number of guest arrivals from United Kingdom, Eastern Europe, Russia and Ukraine.
3. Business Segments
3.1 Hotels
TRevPAR1 ARR3
CHF 79 87 57
Hotel rooms Occupancy rate
69% 76% 56%
CHF 63 65 57
Rooms 6,479 6,509 6,589
Egypt
UAE
Oman
Jordan
0 20 40 60 80
Egypt
UAE
Oman
Jordan
0 20 60 100 140 180
Egypt
UAE
Oman
Jordan
0 20 40 60 80 100 120 140
Egypt
UAE
Oman
Jordan
0 1,000 3,000 5,000 7,000
Claude Chesnais
Head of Segment Hotels
The hotels segment KPIs, as of 31 December 2011
Number of Rooms Occupancy RateTRevPAR1
(CHF)ARR3
(CHF)
Hotels 2010 2011 2010 2011 2010 2011 2010 2011
I- Hotels
Egypt
El Gouna 2,694 2,706 76% 57% 51 91 69 53
Taba Heights 2,365 2,365 78% 54% 52 69 46 50
Other hotels, Red Sea 828 830 84% 55% 36 74 48 34
Egypt subtotal 5,887 5,901 78% 55% 49 80 57 49
Other regions
The Cove, UAE 335 346 63% 77% 182 188 169 139
Marina Plaza, Jordan 260 260 50% 47% 47 59 78 65
Sifawy, Oman2 - 55 - 25% 49 - - 106
Other regions subtotal 595 661 57% 63% 122 130 133 115
Total hotels 6,482 6,562 76% 56% 56 85 63 56
II- Floating hotels
Floating hotels, Egypt 27 27 64% 25% 226 691 756 595
Floating hotels subtotal 27 27 64% 25% 226 691 756 595
Total hotels segment 6,509 6,589 76% 56% 57 87 65 57
1 TRevPAR: Total Revenue Per Available Room is similar to RevPAR but also takes into account other room revenues e.g. food and beverage, entertainment, laundry and other services.2 The Group openend the Sifawy Hotel in September 2011 with 55 rooms.3 ARR: Average Room Rate
09 10 11
09 10 11
09 10 11
09 10 11
16 | Orascom DevelopmentAnnual Report 2011 | 17
REAL ESTATE – OPERATING REVIEW
The effects of the MENA-region on business operations were inevitable and took their toll on the real estate segment’s business performance during 2011. For our real estate and construction segment in total, which next to the tourism real estate includes our Budget Housing activities, the year 2011 accordingly closed with revenues reaching CHF 67.0 million, showing a decrease of 71% compared to last year (CHF 229.0 million). The main reason for the reduction in revenues was that construction works came to a near halt for about 50 days during the first half of the year in Egypt and Oman. Hence lower revenues were achieved, as the company can only realize real estate revenues when the actual construction work is carried out. The segments result fell 95% from CHF 112.4 million (49.1% margin) to CHF 5.1 million (7.7% margin).
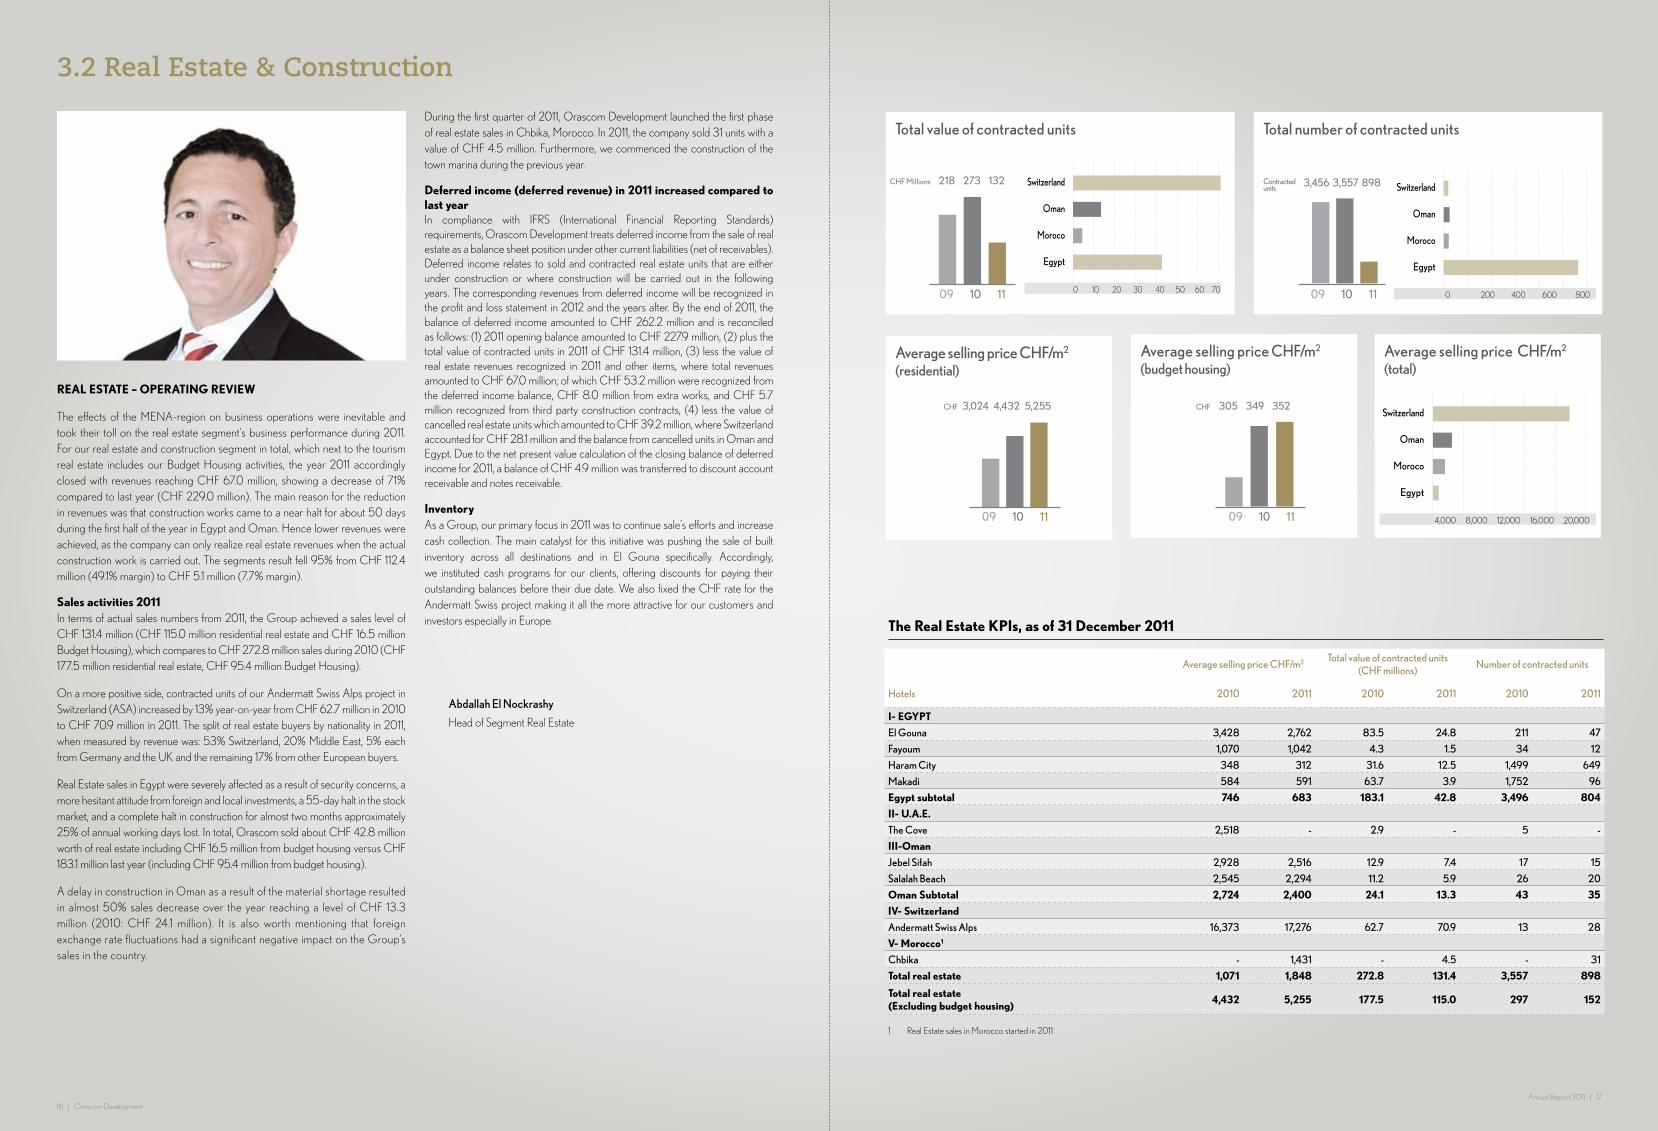
Sales activities 2011 In terms of actual sales numbers from 2011, the Group achieved a sales level of CHF 131.4 million (CHF 115.0 million residential real estate and CHF 16.5 million Budget Housing), which compares to CHF 272.8 million sales during 2010 (CHF 177.5 million residential real estate, CHF 95.4 million Budget Housing).
On a more positive side, contracted units of our Andermatt Swiss Alps project in Switzerland (ASA) increased by 13% year-on-year from CHF 62.7 million in 2010 to CHF 70.9 million in 2011. The split of real estate buyers by nationality in 2011, when measured by revenue was: 53% Switzerland, 20% Middle East, 5% each from Germany and the UK and the remaining 17% from other European buyers.
Real Estate sales in Egypt were severely affected as a result of security concerns, a more hesitant attitude from foreign and local investments, a 55-day halt in the stock market, and a complete halt in construction for almost two months approximately 25% of annual working days lost. In total, Orascom sold about CHF 42.8 million worth of real estate including CHF 16.5 million from budget housing versus CHF 183.1 million last year (including CHF 95.4 million from budget housing).
A delay in construction in Oman as a result of the material shortage resulted in almost 50% sales decrease over the year reaching a level of CHF 13.3 million (2010: CHF 24.1 million). It is also worth mentioning that foreign exchange rate fluctuations had a significant negative impact on the Group’s sales in the country.
During the first quarter of 2011, Orascom Development launched the first phase of real estate sales in Chbika, Morocco. In 2011, the company sold 31 units with a value of CHF 4.5 million. Furthermore, we commenced the construction of the town marina during the previous year.
Deferred income (deferred revenue) in 2011 increased compared to last yearIn compliance with IFRS (International Financial Reporting Standards) requirements, Orascom Development treats deferred income from the sale of real estate as a balance sheet position under other current liabilities (net of receivables). Deferred income relates to sold and contracted real estate units that are either under construction or where construction will be carried out in the following years. The corresponding revenues from deferred income will be recognized in the profit and loss statement in 2012 and the years after. By the end of 2011, the balance of deferred income amounted to CHF 262.2 million and is reconciled as follows: (1) 2011 opening balance amounted to CHF 227.9 million, (2) plus the total value of contracted units in 2011 of CHF 131.4 million, (3) less the value of real estate revenues recognized in 2011 and other items, where total revenues amounted to CHF 67.0 million; of which CHF 53.2 million were recognized from the deferred income balance, CHF 8.0 million from extra works, and CHF 5.7 million recognized from third party construction contracts, (4) less the value of cancelled real estate units which amounted to CHF 39.2 million, where Switzerland accounted for CHF 28.1 million and the balance from cancelled units in Oman and Egypt. Due to the net present value calculation of the closing balance of deferred income for 2011, a balance of CHF 4.9 million was transferred to discount account receivable and notes receivable.
Inventory As a Group, our primary focus in 2011 was to continue sale’s efforts and increase cash collection. The main catalyst for this initiative was pushing the sale of built inventory across all destinations and in El Gouna specifically. Accordingly, we instituted cash programs for our clients, offering discounts for paying their outstanding balances before their due date. We also fixed the CHF rate for the Andermatt Swiss project making it all the more attractive for our customers and investors especially in Europe.
Abdallah El Nockrashy
Head of Segment Real Estate
3.2 Real Estate & Construction
Total value of contracted units Total number of contracted units
CHF Millions 218 273 132
Average selling price CHF/m2
(residential)
CHF 3,024 4,432 5,255
Average selling price CHF/m2
(budget housing)
CHF 305 349 352
Average selling price CHF/m2
(total)
3,456 3,557 898Contracted units
Egypt
Moroco
Switzerland
Oman
4,000 8,000 12,000 16,000 20,000
Egypt
Moroco
Switzerland
Oman
0 10 20 30 40 50 60 70
Egypt
Moroco
Switzerland
Oman
0 200 400 600 800
The Real Estate KPIs, as of 31 December 2011
Average selling price CHF/m2 Total value of contracted units (CHF millions)
Number of contracted units
Hotels 2010 2011 2010 2011 2010 2011
I- EGyPT
El Gouna 3,428 2,762 83.5 24.8 211 47
Fayoum 1,070 1,042 4.3 1.5 34 12
Haram City 348 312 31.6 12.5 1,499 649
Makadi 584 591 63.7 3.9 1,752 96
Egypt subtotal 746 683 183.1 42.8 3,496 804
II- U.A.E.
The Cove 2,518 - 2.9 - 5 -
III-Oman
Jebel Sifah 2,928 2,516 12.9 7.4 17 15
Salalah Beach 2,545 2,294 11.2 5.9 26 20
Oman Subtotal 2,724 2,400 24.1 13.3 43 35
IV- Switzerland
Andermatt Swiss Alps 16,373 17,276 62.7 70.9 13 28
V- Morocco1
Chbika - 1,431 - 4.5 - 31
Total real estate 1,071 1,848 272.8 131.4 3,557 898
Total real estate(Excluding budget housing)
4,432 5,255 177.5 115.0 297 152
1 Real Estate sales in Morocco started in 2011
09 10 11 09 10 11
09 10 1109 10 11
18 | Orascom DevelopmentAnnual Report 2011 | 19
Within Town Management, we are responsible not only for providing and maintaining top-quality hotels and residences, but for the day-to-day maintenance and upkeep of the town’s power grid, desalination plants and sewage plants. We are also in charge for the town’s security and other services. As a rule, the town facilities and infrastructure such as hospitals and water desalination facilities, are owned and operated by one of our majority-owned subsidiaries. The term Town Management refers to all revenues generated from municipal facilities. It primarily includes revenues from utilities (such as electricity, irrigation, and telephone lines), as well as community services (such as: airport, museum, sporting club, and bakeries), urban services (such as: garbage collection, security, and fire brigade), and commercial services (such as: fish and fowl farm).
Developments and performance in 2011
We were able to increase the segment revenues in comparison to 2010 by 1% to CHF 17.7 million. However, the segment result decreased to CHF 6.6 million losses versus a CHF 2.5 million profit last year. The main reasons for the decrease of the segment result were as following. First of all, a new destination usually needs two to four years until it becomes operationally break-even. During 2011, the segment Town Management for the first time included the destinations Jebel Sifah and Salalah Beach which hardly provided any revenues, but a substantial amount of costs. In addition in our destination The Cove, U.A.E we paid a low single digit million amount for an increased use of electricity.
We were challenged with the maintenance costs needed to retain the quality of offerings within our destinations as opposed by limited cash collections. A new Electricity grid with 100% power from the Government was introduced in El Gouna, Egypt. Accordingly we disconnected the diesel generators that were previously used and installed the new electricity grid through which we should receive cleaner electricity. The prior connection had a cost of CHF 10 million designed for 100 MV amperes of which 50 are already connected and therefore,
with the newly introduced grid, we expect to reduce the associated running costs during future financial periods. Another milestone was realized during 2011 by signing an agreement with the renowned Troon Golf; the leader in upscale golf course management, development and marketing, to manage two of our golf courses in El Gouna and Taba Heights in Egypt.
Our most recent project was a joint cooperation with the German Technical University Berlin, which is setting up a satellite campus as an external research department. In January 2012, we officially launched our TU Berlin Campus in El Gouna, which should be ready for use as of April 2012 with master courses commencing in October 2012.
During 2012, we intend to focus on improving the service quality to our clients whether it’s a hotel guest, real estate buyer or a member of staff.
Hamza Selim
SVP Destinations Management
3.3 Town Management
Total revenues
2011: CHF 17.7 million
2010: CHF 17.5 million
Segment result
2011: CHF 6.6 million losses
2010: CHF 2.5 million
3.4 Other Segments
Occasionally, the Group sells land where there is no additional development commitments. Revenues from such sales are included in our land sales segment. Land sales segment accounted for only 1% from our total revenues during 2011 (2010: 1.9%).
Total Revenues
2011: CHF 2.3 million2010: CHF 10.2 million
Segment Result
2011:CHF 0.3 million losses2010: CHF 2.2 million
Land Sales
Type of service (CHF Millions) 2010 2011 % Change
Mortgage (real estate financing) 6.7 6.3 (5%)
Sport (golf) 6.7 3.3 (50%)
Rentals 17.1 13.1 (23%)
Hospital services 4.8 3.6 (25%)
Educational services 2.3 2.2 (1%)
Marina 2.2 1.8 (21%)
Limousine 1.6 1.2 (29%)
Laundry services 2.7 1.8 (34%)
Leasing 3.8 4.8 26%
Others 36.7 6.9 (81%)
Total segment revenues 84.5 44.9 (47%)
Intersegment revenues (eliminations) (46.7) (14.4) (69%)
Total revenue from external customers 37.8 30.5 (19%)
Total Revenue
2011: CHF 30.5 million2010: CHF 37.8 million
Segment Result
2011: CHF 0.3 million2010: CHF 23.4 million
The segment result in 2011 was CHF 0.3 million compared to CHF 23.4 million in 2010. The positive contribution in 2010 from the revaluation of the investment properties in Mauritius and the units rented in El Gouna (total CHF 14.1 million) did not take place in 2011. The value of the project in Mauritius in 2011 remained the same as in 2010, while the properties in El Gouna (rented restaurants, shops and apartments) reduced by CHF 4.7 million. As of the end of 2011, the total value of all investment properties owned by Orascom Development was CHF 76.4 million, compared to CHF 78.4 million in 2010.
Other Operations
Tours Operations
Total Revenues
2011: CHF 2.3 million2010: CHF 28.5 million
Segment Result
2011: CHF 0.1 million losses2010: CHF 3.0 million
Until June 30, 2010, the Group held a controlling stake in the Garranah tours operations companies. Following the sale of companies in June 2010, we no longer hold a controlling stake in these entities. As a result, starting July 1, 2010, our consolidated financial statements no longer show revenues generated by the tours operations business of the Garranah tours operations companies as part of our tours operations segment. Rather, the corresponding net income is recognized as income from investment in associates. Our tours operations segment accounted for 0.9% of our total revenues in the financial period ending 31 December 2011 (2010: 5.5%).

20 | Orascom DevelopmentAnnual Report 2011 | 21
4. Countries
Destinations Portfolio
Notes:1 Year in which the master plan is deemed final by the Group (E= estimates).
Orascom Development’s strategy is based on the creation of value in its land bank for the medium to long term. To that end, we accumulate large tracts of land with enough space to develop self-sufficient communities and towns. To date the Group has secured, subject to certain conditions, land banks of approximately 116 million m2 in several jurisdictions. Orascom Development holds its undeveloped land banks primarily by way of contractual rights or usufructs with the option to acquire legal titles. On these land banks, we develop fully-integrated towns, generally retaining or obtaining ownership in hotels, commercial real estate, facilities and staff housing towns while selling the residential units. The revenues generated in our towns primarily originate from the sale of residential units (villas and apartments), hotel operations, the rental of commercial properties, and the management of infrastructure and other facilities.
Orascom Development retains reputable and well-established third party hotel operators including Accor’s Sofitel, Cheval Blanc, Chedi, ClubMed, Four Seasons, Hyatt Regency, InterContinental, Marriott, Mövenpick, Radisson Blu, Rotana, Starwood’s Sheraton, and Steigenberger as well as local chains in Egypt such as The Three Corners (TTC), Azur, and Optima to manage hotels in developed destinations and retain management of only niche hotels. We have established a separate legal entity for each self-managed hotel and while we might invite other reputable partners to participate in those hotel ownership companies, we generally retain a controlling stake.
As a rule, any given town’s facilities and infrastructure (including hospitals and water desalination facilities) are owned and operated by majority-owned subsidiaries of the Group or rented out (such as schools).
Destinations
The Group has developed five fully-integrated destinations which are currently operational: the tourist destinations of El Gouna (Red Sea coast, Egypt), Taba Heights (Sinai Peninsula, Egypt) and The Cove (Ras Al Khaimah, UAE) as well as the budget housing community of Haram City (Greater Cairo area, Egypt). Each of these destinations has the complete infrastructure of a self-sufficient town. Recently, Jebel Sifah commenced operations adding a new operating destination.
In addition, nine destinations including tourist towns and budget housing communities are currently in various stages of development and planning in Egypt, Oman, Morocco, Switzerland, Montenegro, and the United Kingdom, and also three destinations in the pipeline in Oman and Romania. Furthermore, we have participations in other hotels in development in Jordan and Egypt.
The following table provides an overview of our portfolio of destinations, in operation and under development, and in the pipeline as of December 31, 2011.
Destination NameDestination Status/ Type
Development start1 (year)
Total area (million m2)
Developed (million m2)
Undeveloped (million m2)
Developed (%)
EGyPT
El Gouna Operating 1990 36.8 14.7 22.1 40%
Taba Heights Operating 1996 4.3 2.8 1.5 65%
Amoun Island Developing 2007 0.02 - 0.02 0%
Fayoum Developing 2007/08 1.3 0.5 0.8 38%
Makadi Developing 2009 3.8 0.4 3.3 11%
Haram City Operating 2007 4.2 1.9 2.3 45%
Qena Gardens Developing 2011 0.8 0.1 0.7 8%
Royal Azur Other Hotel
Club Azur Other Hotel
Oberoi Zahra Other Hotel
UNITED ARAB EMIRATES
The Cove Operating 2005 0.3 0.28 0.01 94%
JORDAN
Tala Bay Other Hotel 2002
OMAN
Jebel Sifah Operating 2007 6.2 0.6 5.6 10%
Salalah Beach Developing 2007 25.1 0.7 24.4 3%
As Sodah In the pipeline 2009 1.0 0.02 1.0 2%
City Walk In the pipeline 2011 0.05 0.0 0.05 0%
SWITZERLAND
Andermatt Developing 2008 1.5 0.0 1.5 0%
MOROCCO
Chbika Developing 2010 15.0 0.0 15.0 0%
MONTENEGRO
Lustica Developing 2012E 6.8 0.0 6.8 0%
UNITED KINGDOM
Eco-Bos Developing 2013E 6.6 0.0 6.6 0%
ROMANIA
Constanta In the pipeline 2011 2.5 0.0 2.5 0%
Total 116.2 22.0 94.2 19%
Introduction

22 | Orascom DevelopmentAnnual Report 2011 | 23
El Gouna, Egypt
El Gouna’s first phase in 1990 consisted of 15 houses sold exclusively to Egyptian nationals. Real estate value has increased substantially, from an average selling price of approximately CHF 1,071/m2 in the financial year 2000 up to CHF 2,762/m2 by the end of 2011. Buyers come from all over the world, with foreign nationals representing approximately 56 percent of homeowners.
El Gouna has eighteen1 operating hotels with a total capacity of 2,897 rooms. Of these, seventeen hotels are controlled by the Group with a total capacity of 2,731 rooms. Hotels accommodate holiday guests from all over the world, primarily from Europe. The following chart highlights the nationalities of hotel guests for all 12 months ending 31 December 2011.
The primary requirements of a modern town are fresh water, electricity, communications, and roads. The Group has invested in all these forms of infrastructure to make El Gouna more attractive to residents and visitors. All the infrastructure is owned and operated by the Group. This currently includes a water desalination facility, sewage plants with a capacity to treat approximately 15,000 m3/day from El Gouna and Hurghada, an electrical power generator to provide part of the town’s electrical needs in the event of a supply failure, and approximately 5,000 telephone lines and Wi-Fi network coverage for all hotels.
36.8million m2
total land area
14.7m2
developed area
2,897rooms
22,000 - 24,000permanent residents
18operatinghotels
419outlets
The town started as a small collection of villas sold only to Egyptian citizens.
1990 2011
Today, El Gouna is the premier tourism destination on the Red Sea coast.
Operating Destination
Our flagship development is a self-sufficient town built on 10 km of Red Sea coastline. The destination has a total land area of 36.8 million m2 of which only 14.7 million m2 has been developed, providing a large land bank for future development. El Gouna is home to a population of 22,000 – 24,000 permanent residents and visitors from all over the world. The town offers international-standard facilities including a landing strip, a hospital and nursing institute, 18-hole championship golf course, three marinas, four schools, child daycare facilities, a library linked to the Bibliotheca Alexandrina, a branch of the American University in Cairo, and TU Berlin University that should be operational in October 2012, 419 outlets including restaurants, bars, shops, various services, and a vibrant town center. The Group has a 100 percent stake in El Gouna.
29%
16%
10%9%
8%
6%
4%
3%
3%
14%
Nationality of hotel guests during 2011
Egypt
Germany
Belgium
United Kingdom
Netherlands
France
Switzerland
Sweden
Russia
1 As at 31 December 2011, El Gouna’s 18 hotels offered a total capacity of 2,897 operating rooms, of which 17 hotels are controlled by the Group, offering a total capacity of 2,731 rooms. This excludes “El Khan”, 25 rooms, one star hotel, which is 100% owned by the Group and is leased to third party.

24 | Orascom DevelopmentAnnual Report 2011 | 25
2011
Natural beauty and access to regional tourism destinations sets Taba Heights apart.
The Group’s second integrated development on the shores of the Sinai Peninsula.
1996
The town is home to approximately 4,000 permanent residents including facility staff and offers a range of facilities such as a medical center, child daycare services, school, and a vibrant town center. Furthermore, the destination features 102 outlets including restaurants, cafés, bars, and retail, 16 hotel swimming pools, an 18-hole championship golf course, various spas and Egypt’s first Salt Cave. The marina’s 40,000 m2 basin has a berthing capacity of 50 yachts and is host to the Red Sea’s largest water activity center.
The Egyptian Government continues to prohibit the sale of real estate in the Taba area to non-Egyptian nationals, thus Taba Heights is managed exclusively as a holiday
destination. There are six operating hotels with a current capacity of 2,365 rooms. To accommodate holiday guests from all over the world.
Taba Heights has the necessary infrastructure of a modern town, all owned and operated by Orascom Development. It includes a water desalination facility and two town sewage treatment plants. The town is self-sufficient in terms of power supply with an installed capacity of 16 MVA of electrical power generation. Communication infrastructure includes approximately 1,000 telephone lines and a Wi-Fi network covering the whole development including hotels.
Taba Heights, Egypt
4.3 million m2
total land area
2.8million m2
developed area
2,365rooms
4,000Permanentresidents
6operatinghotel
102outlets
Taba Heights is the Group’s second fully self-sufficient resort town, developed after the successful model of El Gouna. The destination comprises a total land area of approximately 4.3 million m2 with around 2.8 million m2 already developed. The destination is situated along the Red Sea coast on the northern end of the Gulf of Aqaba, approximately 200 km north of Sharm El Sheikh and around 20 km south of the Israeli town of Eilat. Taba International Airport is only 25 km away from Taba Heights. The Group has a 99 percent stake in Taba Heights.
27%
18%
12%10%
7%
5%
4%
4%
2%
14%
United Kingdom
France
Israel
Egypt
Belgium
Russia
Poland
Ukraine
Jordon
Operating Destination
Nationality of hotel guests during 2011
26 | Orascom DevelopmentAnnual Report 2011 | 27
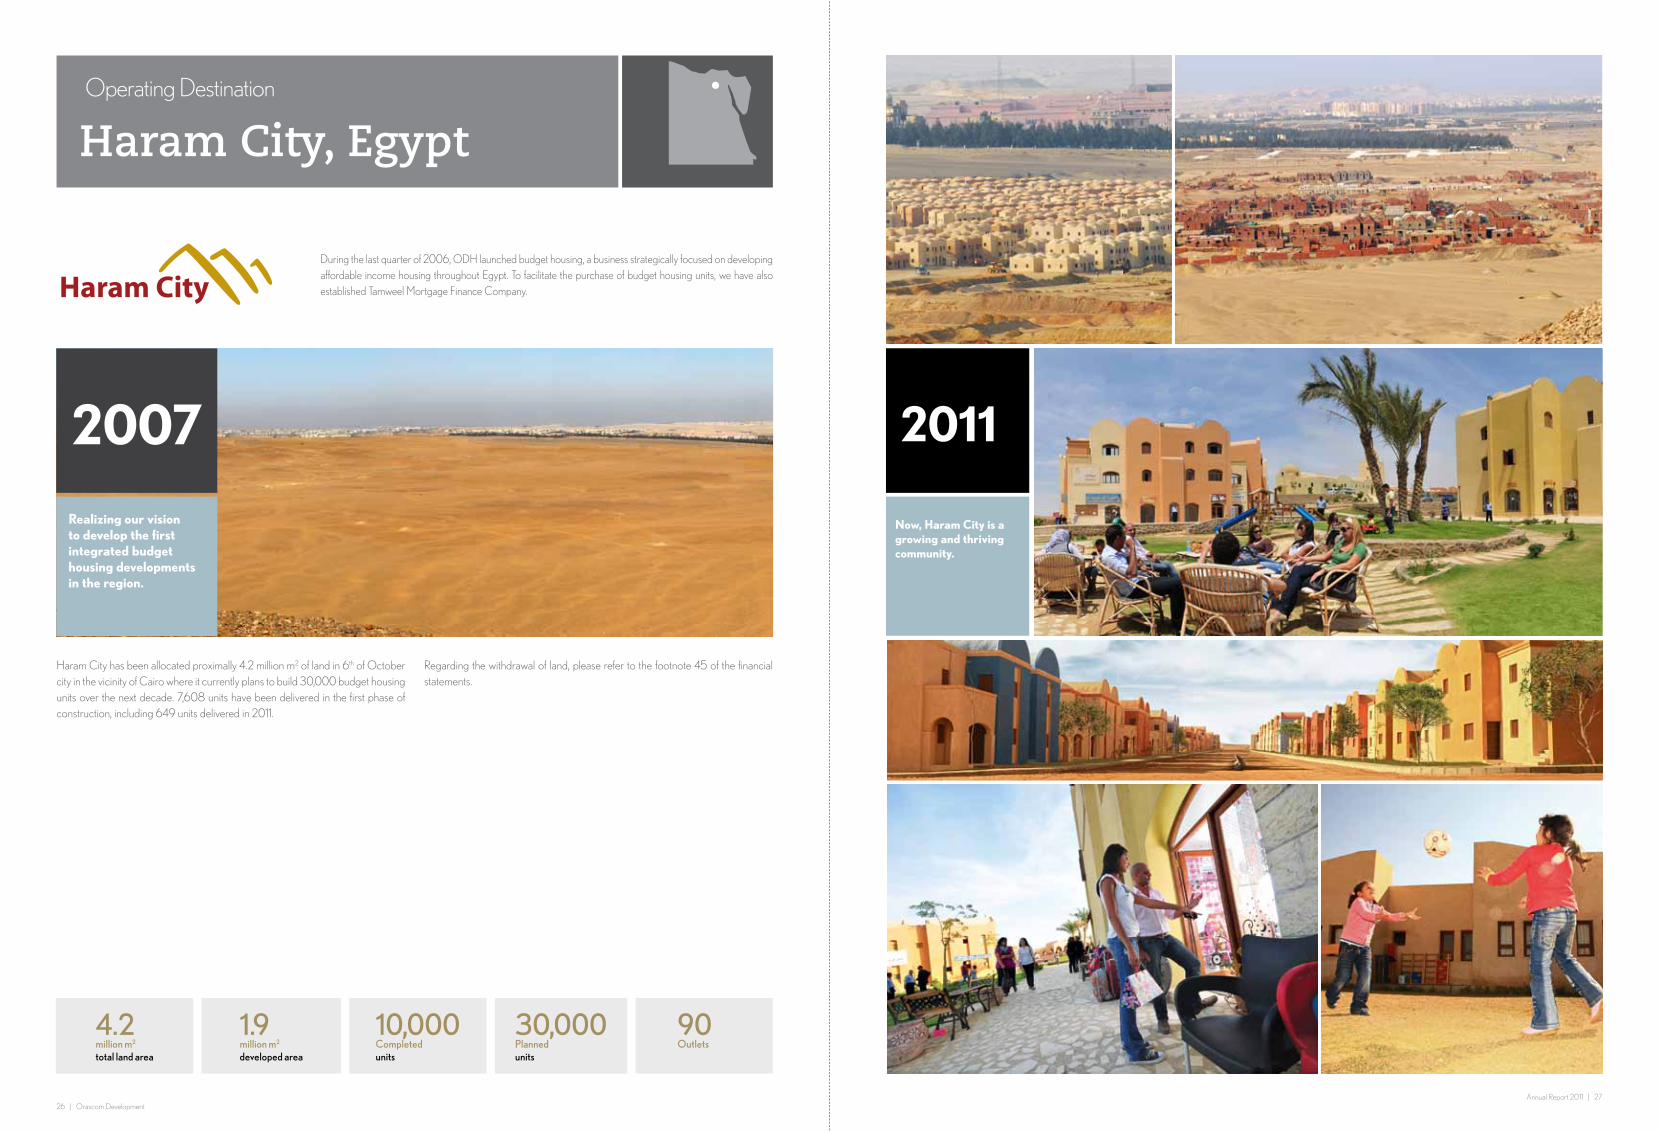
Haram City has been allocated proximally 4.2 million m2 of land in 6th of October city in the vicinity of Cairo where it currently plans to build 30,000 budget housing units over the next decade. 7,608 units have been delivered in the first phase of construction, including 649 units delivered in 2011.
Regarding the withdrawal of land, please refer to the footnote 45 of the financial statements.
Haram City, Egypt
4.2million m2
total land area
1.9million m2
developed area
30,000Plannedunits
10,000Completedunits
90Outlets
Haram City
Realizing our vision to develop the first integrated budget housing developments in the region.
2007
During the last quarter of 2006, ODH launched budget housing, a business strategically focused on developing affordable income housing throughout Egypt. To facilitate the purchase of budget housing units, we have also established Tamweel Mortgage Finance Company.
Operating Destination
2011
Now, Haram City is a growing and thriving community.
28 | Orascom DevelopmentAnnual Report 2011 | 29
38luxurious suites planned
22,000 m2
total land area
Group LVMHhotel partner
62Guest rooms planned
301Residential rooms planned
1.3 m2
total land area
0.6m2
Developed land area
In 1998 Orascom Development was awarded land acquisition rights by the Government of Egypt for a residential real estate destination in El Fayoum Oasis. El Fayoum is located approximately 100 km southwest of Cairo. Total land parcels secured cover approximately 1.3 million m2. The Al Roboua project in Fayoum offers 36 standalone villas in traditional Nubian style with all supporting amenities, covering a total area of 0.07 million m2.
During the third quarter of 2008, the Group launched Byoum, a second real estate project in El Fayoum Oasis. The destination is planned to offer 138 apartments, 127 villas with full access to an attached marina and 4-star 62-room hotel. Site development commenced during the third quarter of 2008 and residential components and the hotel are expected to be operational by mid-2012.
Regarding the withdrawal of land, please refer to the footnote 45 of the financial statements.
Fayoum, Egypt
Qena Gardens, Egypt
In 2010, OHC was allocated 0.8 million m2 of land in the Qena governorate. The destination is planned to offer an additional 8,000 basic affordable housing units. The destination will be developed as a fully-integrated town complete with school, clinics, shopping areas, and entertainment venues. In 2011, there have been 366 completed units with a contractual delivery date in 2012.
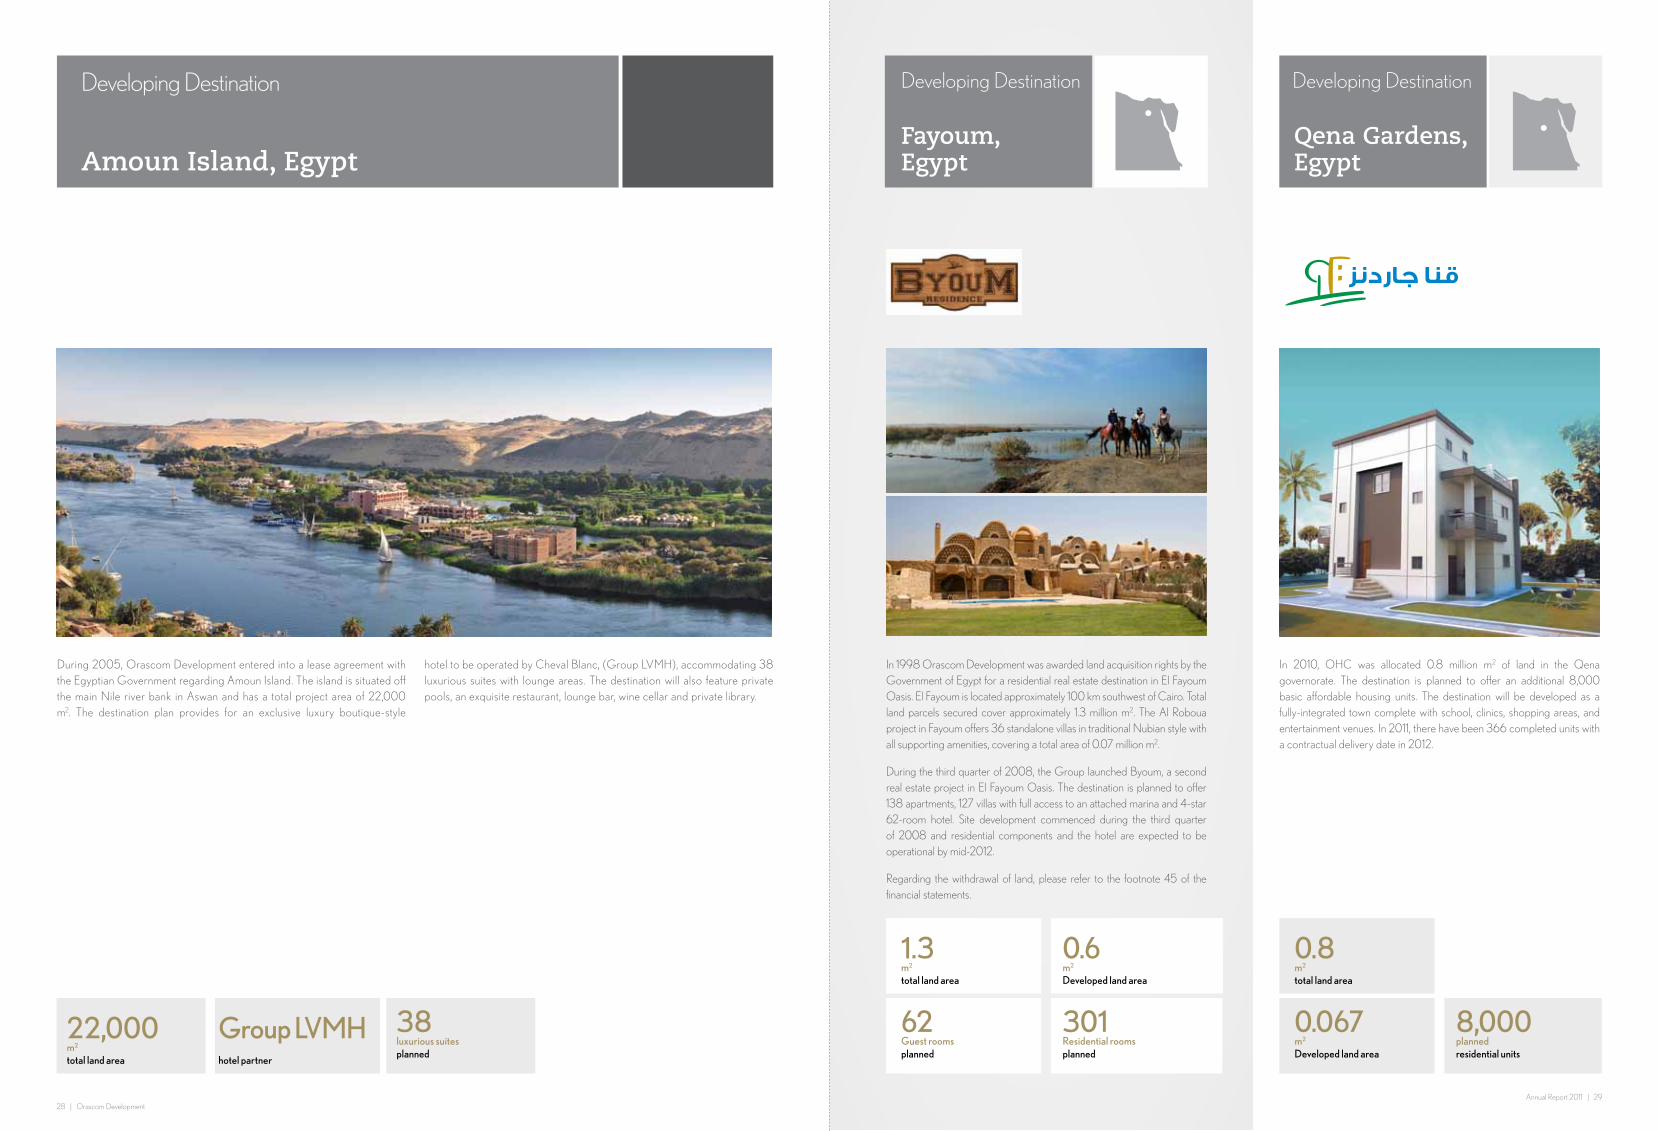
Amoun Island, Egypt
Developing Destination Developing Destination Developing Destination
During 2005, Orascom Development entered into a lease agreement with the Egyptian Government regarding Amoun Island. The island is situated off the main Nile river bank in Aswan and has a total project area of 22,000 m2. The destination plan provides for an exclusive luxury boutique-style
hotel to be operated by Cheval Blanc, (Group LVMH), accommodating 38 luxurious suites with lounge areas. The destination will also feature private pools, an exquisite restaurant, lounge bar, wine cellar and private library.
0.067m2
Developed land area
8,000planned residential units
0.8 m2
total land area
30 | Orascom DevelopmentAnnual Report 2011 | 31
As part of the acquisition of Garranah, the Group has acquired interest in two operational hotel properties located in Makadi Bay, south of Hurghada, Egypt. These two hotels offer a total of 830 guest rooms. Royal Azur, a 4-star hotel, offers 491 rooms, while Club Azur, a four star hotel, offers 339 rooms.
Royal Azur & Club Azur, Egypt
Zahra Oberoi, Egypt
The Oberoi Zahra offers the highest standards of hospitality and is amongst the most spacious accommodations on the Nile, with 27 cabins. The Oberoi Zahra is the only boat on the Nile with a full-service spa. Oberoi Zahra was ranked the best Nile cruiser on the river Nile by the Egyptian Ministry of Tourism during 2009.
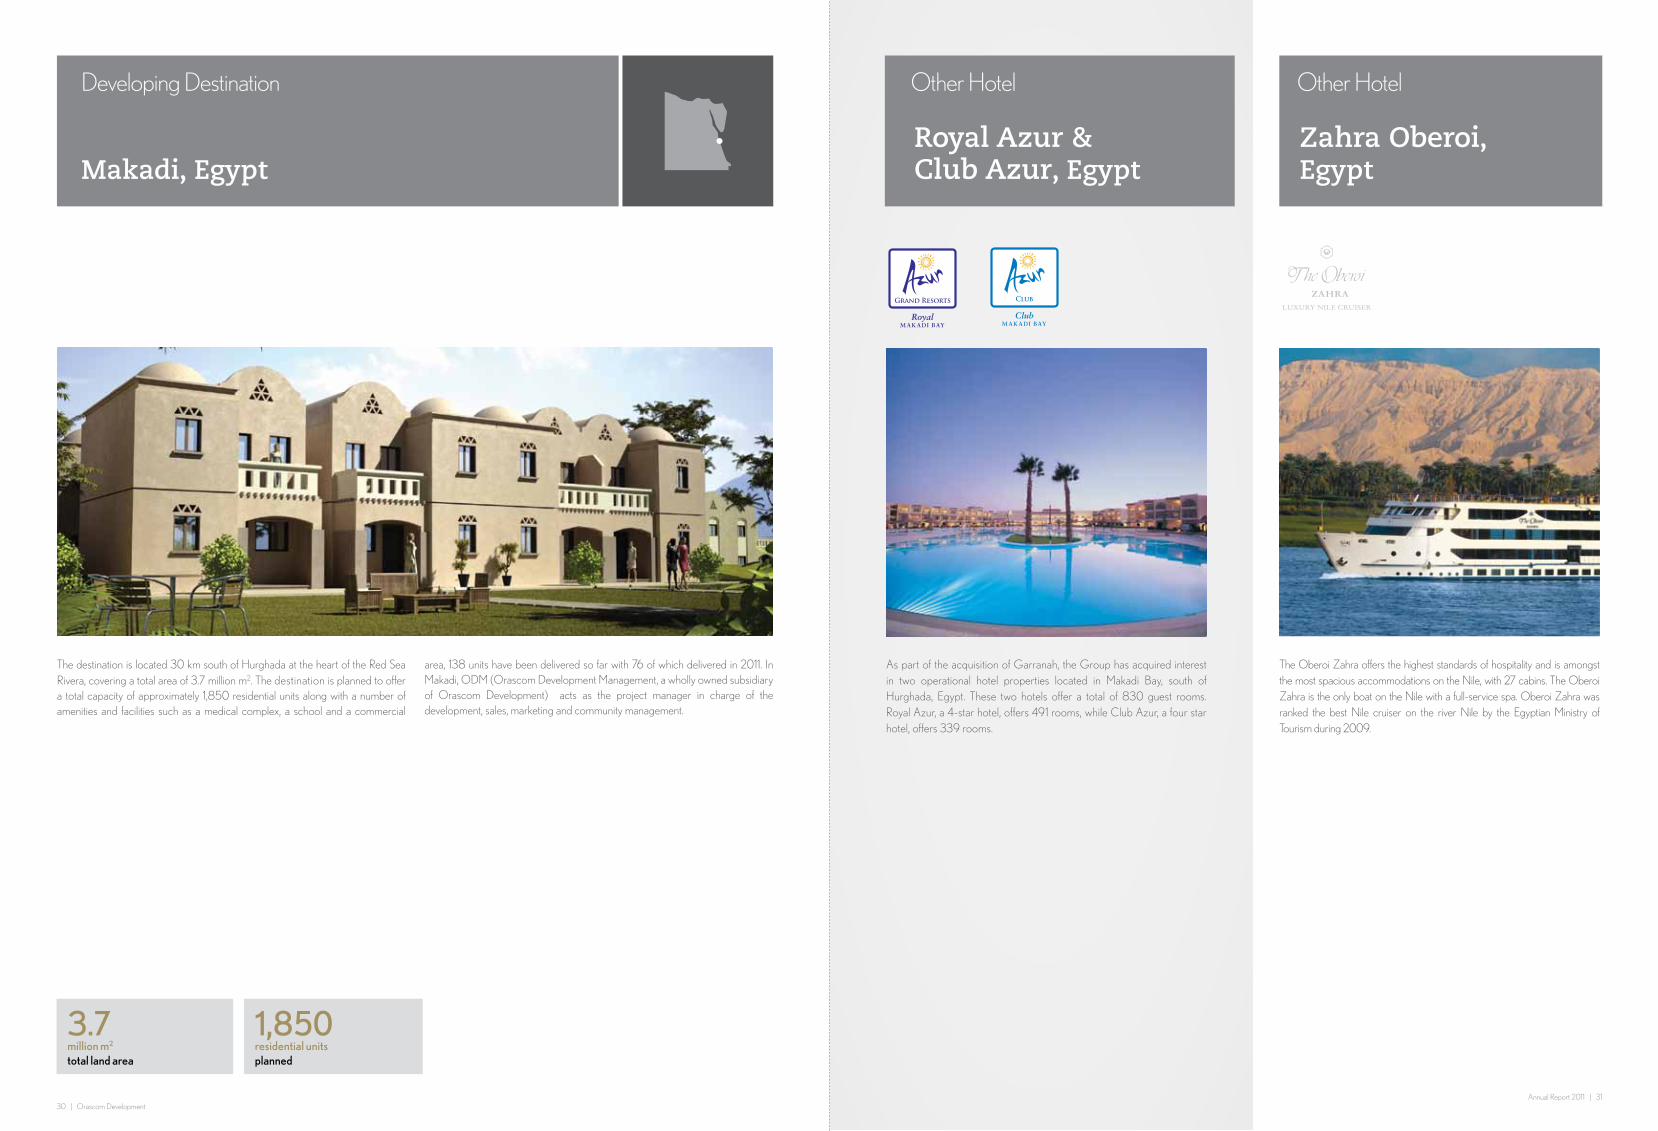
Makadi, Egypt
The destination is located 30 km south of Hurghada at the heart of the Red Sea Rivera, covering a total area of 3.7 million m2. The destination is planned to offer a total capacity of approximately 1,850 residential units along with a number of amenities and facilities such as a medical complex, a school and a commercial
area, 138 units have been delivered so far with 76 of which delivered in 2011. In Makadi, ODM (Orascom Development Management, a wholly owned subsidiary of Orascom Development) acts as the project manager in charge of the development, sales, marketing and community management.
RoyalM A K A DI BAY
Grand Resorts
ClubM A K A DI BAY
Club
3.7million m2
total land area
1,850residential unitsplanned
Developing Destination Other Hotel Other Hotel

32 | Orascom DevelopmentAnnual Report 2011 | 33
62%18%
3%
2%2%
13%
In the U.A.E., the Cove represents the Group’s first development in the Gulf.
2005
Our operational destination of The Cove is located close to Ras Al Khaimah International Airport and approximately 100 km north of Dubai. The development comprises a total area of around 300,000 m2, of which approximately 282,000 m2 have been developed. The destination is fully complete, offering 190 residential units with easy access to leisure and town facilities,
including shopping malls, international schools and hospitals within Ras Al Khaimah.
The 5-star Rotana Resort & Spa soft opening took place in early 2009 with 346 rooms. The second phase was completed during the fourth quarter of 2009 with the delivery of 78 residential apartments.
The Cove, U.A.E.Operating Destination
2011
Homes, businesses, and a resort mark the successful application of the Group’s business model.
0.3million m2
total land area
268totalresidential units
0.28million m2
developed area
United Arab Emirates
Germany
Russia
Switzerland
Austria
Others
Nationality of hotel guests during 2011

34 | Orascom DevelopmentAnnual Report 2011 | 35
Tala Bay was the Group’s first regional roll-out of its model outside of Egypt.
Tala Bay is situated on the Gulf of Aqaba in the northern Red Sea, which is Jordan’s only sea gateway. The destination is built on a man-made lagoon and is one of the largest tourism
destinations in the country, covering a land area of approximately 2.7 million m2. The project is located on the outskirts of Aqaba, approximately 10 km from the Aqaba International Airport.
The destination’s masterplan includes residential villas and apartments, a marina, championship golf
course, and commercial facilities. Tala Bay is planned to include four hotels with a total capacity of 1,300 rooms. One of these hotels, the Marina Town Plaza, is wholly owned by the Group and commenced operations in April 2008 with 260 rooms.
Tala Bay, Jordan
Other Hotels
260Rooms
Laying the foundation for the Group’s first experience in the region outside Egypt.
2002 2011
Tala Bay becomes the exciting, exquisite gateway to the Northern Red Sea.

36 | Orascom DevelopmentAnnual Report 2011 | 37
2011
Premier dining, first-class hotels and a stunning marina allow Jebel Sifah to redefine luxury in Oman.
Breathtaking scenery creates the backdrop for hotels, residences, and a fully-integrated community.
2007
Situated some 30 km from downtown Muscat, Jebel Sifah appeals to affluent residents of the country’s capital with its combination of hotels, restaurants, golf course, marina, and retail facilities. The destination comprises a total land area of approximately 6.2 million m2. The initial plan includes five hotels with a total of 804 rooms, of which one hotel will be integrated with a golf course, approximately 950 residential units, a marina, and marina town along with other town features. In the long term, we expect to add to the hotel capacity to reach a target of 800 rooms. World-renowned hotel operators will manage the town’s hotels, such as Rezidor’s Hotel Missoni (250 rooms) and Four Seasons (200 rooms).
During 2011, we launched the Sifawy Boutique hotel offering 55 hotel rooms; we also completed the construction of 18 apartment blocks and we developed out of which 92 apartments and 12 villas. The development of the marina was also completed with a berthing capacity to hold 84 boats in water and 120 on land. The destination is now operating with several restaurants, shops, pharmacies and mini markets are now open serving our clientele’s needs.
Jebel Sifah, OmanOperating Destination
6.2million m2
total land area
0.6million m2
developed area
950residential unitsplanned
800plannedhotel rooms

38 | Orascom DevelopmentAnnual Report 2011 | 39
Set amongst a collection of man-made lagoons with hotels and homes.
Situated in the southern part of Oman approximately 1,000 km from Muscat and 15 km from the Salalah Airport, the destination comprises a total land area of 25.1 million m2. The destination is planned to include five hotels with capacity of approximately 1,300 rooms total, three of which will be under the management of international the hotel operators Mövenpick (391 rooms), Rotana (399 rooms), and ClubMed (398 rooms). Scheduled real estate includes 1,150 units as well as other town features.
In 2011, the construction of the Juweira boutique hotel offering 65 rooms was completed and is planned to have its soft opening during May 2012. The marina apartment blocks construction is nearing completion and is expected to be finished in 2012. As of December 2011, we have developed 9 villas and 43 apartments. We also started the construction of the marina completing 10 berths out of its planned capacity of holding 174 boats in water and 120 on land. The marina is expected to be operational in 2012. Moreover, the Rotana Hotel; is currently under construction were about 40% of the construction work is completed.
Salalah Beach, OmanDeveloping Destination
25.1million m2
total land area
0.7million m2
developed area
1,150residential unitsplanned
1,300plannedhotel rooms
2007
The natural setting for Salalah is one of the region’s most beautiful locations.
2011

40 | Orascom DevelopmentAnnual Report 2011 | 41
As Sodah is an island with a surface of around 11 million m2, of which a total 1 million m2 will be developed to offer a niche luxury boutique hotel. Located off the southern coast of Oman opposite Salalah Beach, As Sodah Island will comprise a
luxury hotel with 32 rooms consisting of 20 guest-one bedroom pavilions, 10 two-bedroom villas and two five-bedroom villas. Each exclusive property has its own swimming pool and access to a private beach. The hotel project will also include a main lodge and
a spa building. During 2009, the Group signed a management agreement with Cheval Blanc (Group LVMH) to operate this luxurious property.
The Group is planning to develop a downtown Leisure City complex with a total built up area of 153,000 m2,
a tower with 19,400 m2 of office space, and a mall with a built-up area of 42,000 m2. Furthermore, the project
plan includes a 5 star hotel with a capacity of 270 rooms scheduled to be managed by Grand Hyatt.
As Sodah Island, Oman City Walk, Muscat, OmanDestination in the Pipeline Destination in the Pipeline

42 | Orascom DevelopmentAnnual Report 2011 | 43
Located in the heart of the Swiss Alps, Andermatt is the Group›s first destination in Europe.
2008
In Andermatt, a Swiss mountain village, the Group plans to develop a comprehensive and self-sustainable Alpine resort village as a year-round destination. Andermatt is situated at about 1,440 meters above sea level and lies approximately 120 km south of Zurich and 180 km north of Milan. The total land bank of the project amounts to approximately 1.5 million m2.
The destination is planned to offer 490 apartments and 20-30 private villas. In addition, six hotels classified as 4 and 5-star properties with a capacity of 844 rooms are planned. World-renowned operators will manage the village’s hotels, such as General Hotel Management Ltd (The Chedi Andermatt) and The Carlson Rezidor Hotel Group (Radisson Blu Andermatt). Aside from the existing 13 ski lifts, the destination will feature various leisure facilities including a professional 18-hole golf course, sports center with all-season leisure pool, and a commercial space.
We plan to use a carbon-free energy supply system for the entire resort by using renewable energy sources. In addition, the planned underground parking lot in the podium will offer a capacity for a maximum of 1,970 cars, reducing air pollution and noise in the town. Subject to certain construction obligations, the Group has been granted an exemption from the Lex Koller legislation, which restricts the acquisition of real estate by non-Swiss residents. Pursuant to this exemption, non-Swiss residents will be able to acquire and transfer residential property without authorization until the end of 2030.
Site development started in the fourth quarter of 2008 with the site-specific master plan approvals. Construction began with the launch of the first phase in September 2009. In this phase, the Chedi Andermatt hotel, basic and flood protection infrastructure, the podium, villas and the 18-hole championship golf course started construction. Considerable progress was also achieved in 2011, both in terms of construction
and investment, with sales and reservation contracts totaling CHF 102 million. (sales: CHF 71 million, reservation: CHF 31 million).
2012 will be another important year for the development of the Andermatt Swiss Alps tourist resort with work across its various construction sites continuing. We will see construction begin on the first apartment building on the 46,000 m2 Podium site as well as the first chalet, both of which will be completed by the end of 2013. At the luxury hotel The Chedi Andermatt, finishing touches will be made to both interior renderings as well as the external façade ahead of its official opening in December 2013. At the 18-hole on-site golf course, landscaping work and construction of the Golf Clubhouse will also take place. The course will be finished in the second half of 2012 and transferred to the operator, Andermatt Swiss Alps, where it will be used for test rounds in 2013 before officially opening to the public in 2014. The projected expenditures for 2012 is CHF 115 million.
Andermatt, SwitzerlandDeveloping Destination
1.5million m2
Project area
490units in 42 buildingsApartments
64- and 5-starHotels
20-30totalVillas
18-hole championshipGolf Course
35,000m2
Commercial space
2011
With its Alpine beauty and modern amenities, Andermatt continues to grow into an luxurious mountain retreat.

44 | Orascom DevelopmentAnnual Report 2011 | 45
In 2007, Orascom Development entered into an agreement with the Government of Morocco to develop Chbika as an integrated self-sufficient tourist destination in the south of Morocco. Located approximately 400 km south of Agadir directly in front of the Canary Island of Fuerteventura on the Atlantic Ocean, the destination’s total land bank amounts to 15 million m2.
Among the planned components are eight hotels with a capacity of 2,500 guest rooms, 1,166 apartments, 685 villas, golf courses, a marina, and city center facilities. The inauguration of the first phase took place in June 2009, marking the start of construction and the Group’s mobilization in Morocco. This phase will encompass 5 hotels, a marina, an 18-hole golf course and approximately 1,100 real estate units. In
2011, we finally received all related land acquisition permits, completed the set up of the construction site; with the Marina basin (back-fill of cover dams) nearly completed and Marina quay walls reached 50% completion. We also commenced the construction of the first mansion walls. The first phase is expected to be operational during the fourth quarter of 2013.
Chbika, MoroccoDeveloping Destination
15.0million m2
total land area
2,500Hotel rooms planned
1,851Residential units planned
A new project is born on the picturesque shores of Morocco.
Activity in Chbika is centered around a vibrant marina town.
20112010
46 | Orascom DevelopmentAnnual Report 2011 | 47
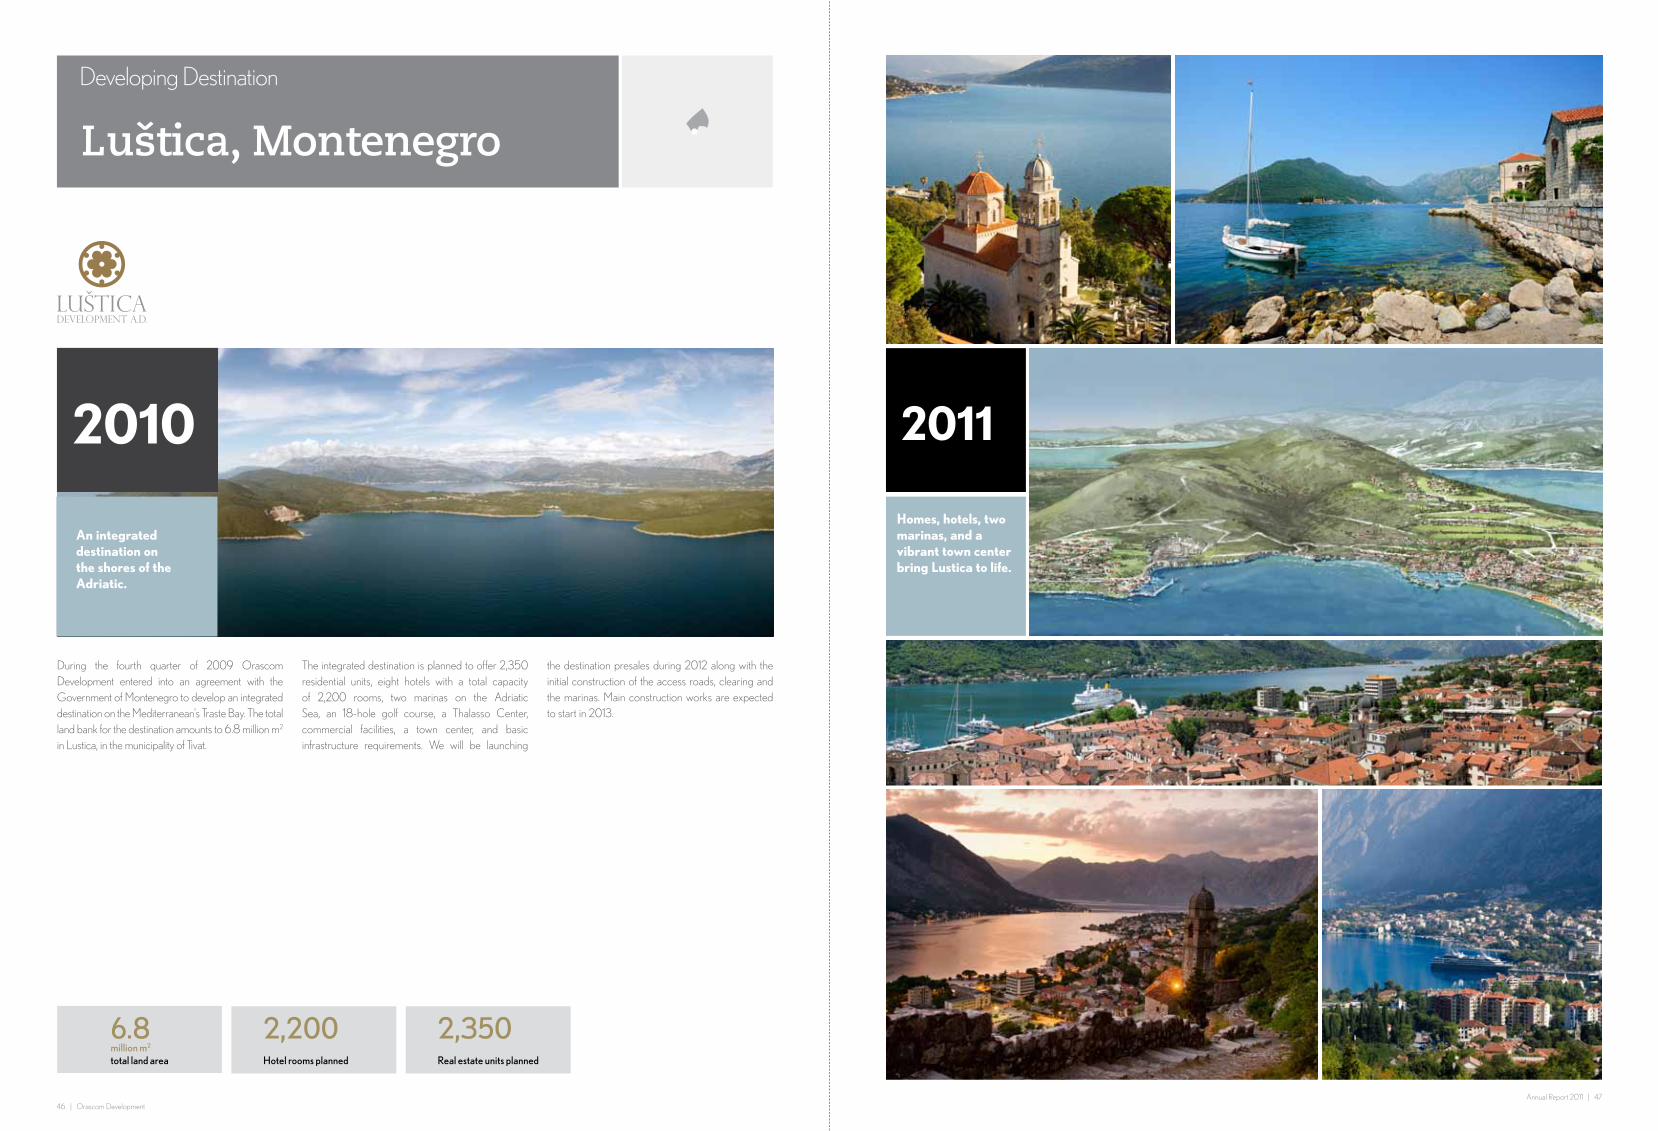
Luštica, Montenegro
During the fourth quarter of 2009 Orascom Development entered into an agreement with the Government of Montenegro to develop an integrated destination on the Mediterranean’s Traste Bay. The total land bank for the destination amounts to 6.8 million m2 in Lustica, in the municipality of Tivat.
The integrated destination is planned to offer 2,350 residential units, eight hotels with a total capacity of 2,200 rooms, two marinas on the Adriatic Sea, an 18-hole golf course, a Thalasso Center, commercial facilities, a town center, and basic infrastructure requirements. We will be launching
the destination presales during 2012 along with the initial construction of the access roads, clearing and the marinas. Main construction works are expected to start in 2013.
6.8million m2
total land area
2,200Hotel rooms planned
2,350Real estate units planned
Developing Destination
An integrated destination on the shores of the Adriatic.
2010
Homes, hotels, two marinas, and a vibrant town center bring Lustica to life.
2011
48 | Orascom Development
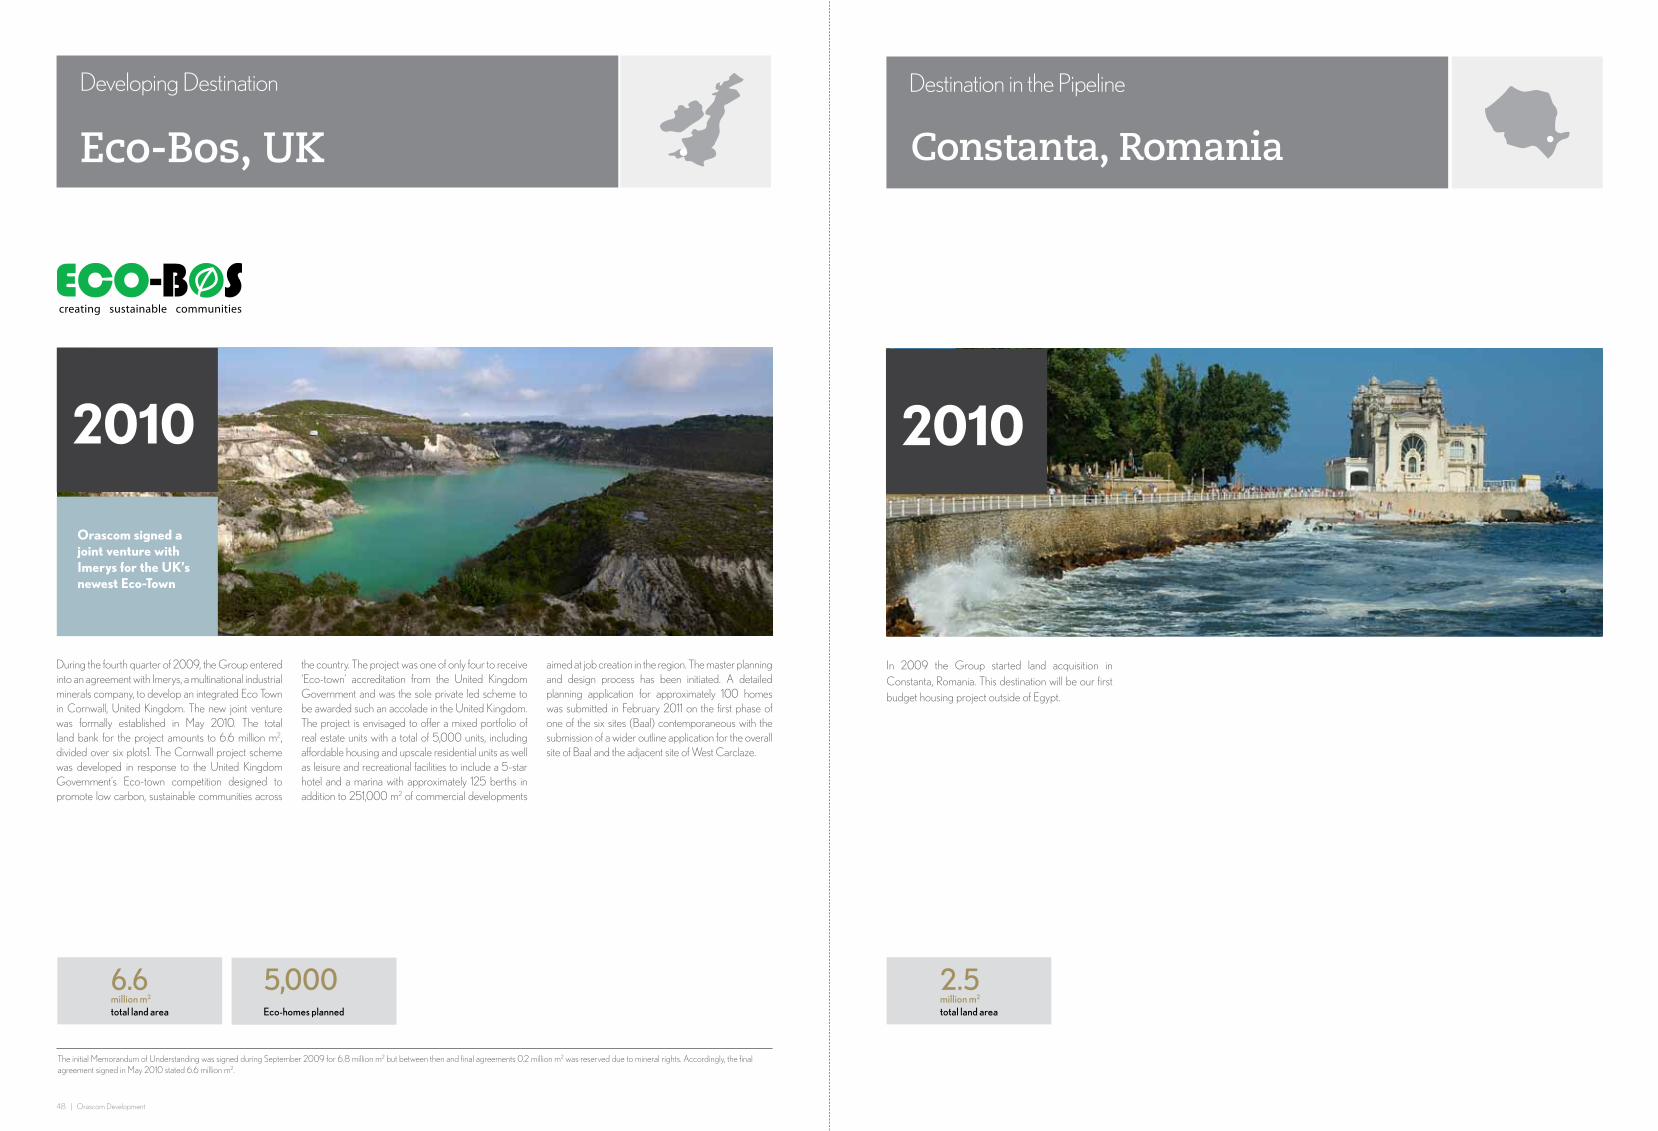
Eco-Bos, UK
Developing Destination
During the fourth quarter of 2009, the Group entered into an agreement with Imerys, a multinational industrial minerals company, to develop an integrated Eco Town in Cornwall, United Kingdom. The new joint venture was formally established in May 2010. The total land bank for the project amounts to 6.6 million m2, divided over six plots1. The Cornwall project scheme was developed in response to the United Kingdom Government’s Eco-town competition designed to promote low carbon, sustainable communities across
the country. The project was one of only four to receive ‘Eco-town’ accreditation from the United Kingdom Government and was the sole private led scheme to be awarded such an accolade in the United Kingdom. The project is envisaged to offer a mixed portfolio of real estate units with a total of 5,000 units, including affordable housing and upscale residential units as well as leisure and recreational facilities to include a 5-star hotel and a marina with approximately 125 berths in addition to 251,000 m2 of commercial developments
aimed at job creation in the region. The master planning and design process has been initiated. A detailed planning application for approximately 100 homes was submitted in February 2011 on the first phase of one of the six sites (Baal) contemporaneous with the submission of a wider outline application for the overall site of Baal and the adjacent site of West Carclaze.
6.6million m2
total land area
5,000Eco-homes planned
Orascom signed a joint venture with Imerys for the UK’s newest Eco-Town
2010
The initial Memorandum of Understanding was signed during September 2009 for 6.8 million m2 but between then and final agreements 0.2 million m2 was reserved due to mineral rights. Accordingly, the final agreement signed in May 2010 stated 6.6 million m2.
In 2009 the Group started land acquisition in Constanta, Romania. This destination will be our first budget housing project outside of Egypt.
2.5million m2
total land area
Constanta, Romania
Destination in the Pipeline
2010

50 | Orascom DevelopmentAnnual Report 2011 | 51
5. Sustainability
“Protecting the environment, respecting the social habits of the countries we operate in and safeguarding the sustainability of our developments is deeply rooted in our corporate culture.” Gerhard Niesslein, CEO
Sustainability at Orascom Development
Orascom Development is dedicated to sustainability. As a major town developer with projects in several countries around the globe, the Group recognizes the significant impact on the areas where it operates. These projects are designed to work over the long-term, growing over time and slowly becoming prosperous communities. Therefore, as part of overall strategic planning as well as daily decision-making, the Group implements a range of sustainable practices in all fields to ensure that projects are protected for the future and conserve the pristine natural environment in which the Group operates.
In all Group projects and developments actions are taken based on the assessment of three main areas of sustainability:
• Social
• Environmental
• Economic
The following explanations show how the principles of sustainability are implemented in our daily business.
EnviromentalProtection
SocialConsiderations
EconomicAspects
Sustainable Communities
Social
EconomicEnvironmental
EquitableBearable
Via
ble
52 | Orascom DevelopmentAnnual Report 2011 | 53
5.1 Social Sustainability
Social visionThe Group’s social vision is to integrate local communities, customers and employees, engaging them in the numerous activities and development opportunities available and creating lively communities in which welfare, intercultural understanding and a quality lifestyle become standard. The Group therefore focuses on a holistic development approach. Projects do not simply include homes, but also are completed with the infrastructure to serve the basic needs of the residents as well as the surrounding community. After the construction process is finished, the Group continues to be involved by conducting routine maintenance of town services, implementing certification schemes that provide checklists to ensure that the level of quality provided is never compromised.
Beyond basic services, developments also provide homeowners with a wide array of premium quality services and amenities including international schools, hospitals, and research centres to state of the art marinas and hotels.
The aim of these efforts is to ultimately develop sustainable communities. This requires that everyone, from corporate employees to the local population, gets involved in our projects as responsible contributing members. Through creating jobs, engaging in social causes, educational initiatives, cultural activities and social welfare, the Group ensures that every sector in the community benefits.
Unified code of conductThe Group has a unified code of conduct that all employees must adhere to, part of a handbook prepared according to international standards. The Group is also guided by the principles of sustainability in the selection, development, training and management of employees.
Employee TurnoverThe turnover rate was reduced in 2011 as a result of the outcome of exit interview surveys, loyalty programs, and improving staff recognition.
Work OpportunitiesThe group offers attractive career opportunities to locals in each destination, aimed at improving the standard of living and reduce unemployment.
New Talent Management ProgramThe newly-established Talent Management Program is a systematic planning tool for the development and placement of nominated employees to fill future vacant managerial positions in the company. This program, which already includes eighty-five employees, prepares them for the development process and promotion through talent management training plans, competency development and job rotation methods. The Human Resources department then uses the program to fill key vacant positions with highly-qualified, competent and motivated employees.
Behind the management of our talent are the educational institutions offered across the project portfolio. The quality of universities, schools and other training facilities selected for towns are nothing short of the best in their field, to ensure the ideal lifestyle residents desire. The Group then works to employ graduates of those institutions in various positions in the company.
Training and Education The education department is especially devoted to human development with a focus on the young generations, the key factor in building for the future. Therefore, the department’s main vision is to implement internationally recognised educational standards by integrating different partners in joint projects with local institutions in different educational fields.
End Human Trafficking Now initiativeDeveloped in partnership with the United Nations Global Initiative to Fight Human Trafficking, the Group acts as a main media sponsor for the End Human Trafficking Now Initiative to encourage world leaders and businesses to fight against human trafficking through abiding by ethical business standards.
Learning about Egypt`s heritageSpearheaded by the Egyptian Museum, the Children’s Museum was created in partnership with Lego to develop a place for children to learn more about Egypt’s Pharaonic history by interacting with pieces of history. Replicated monuments are available for children to explore and an added play area lets children build on their own.
Sponsorship of cultural centre in EgyptThe Group also supports many cultural and educational projects, including the Egyptian Center for Culture and Art. Sponsored by El Gouna, the center encourages the diversity of Egypt’s cultural scene, promotes intercultural understanding and presents Egyptian oral and traditional arts.
2008
2009
2011
2010
0% 5% 10% 15%
8.9%
8%
8%
6.5%
Technical University Berlin in El Gouna The Technical University of Berlin (TU Berlin) has recently setup a satellite campus and external research department in El Gouna. Three Masters programs are currently under development, all targeted to the sustainable development of modern urban communities: Energy Engineering, Urban Development and Water Engineering. The first group of students is expected to start courses in September 2012.
American University of Cairo in El Gouna Together with the American University in Cairo, the Group has created a campus in El Gouna for students of the university. This campus serves as an on-site research centre where students can pursue their topics in different academic fields. The branch also offers a number of continuing education and language courses for residents and guests.
Elementary SchoolsAs part of providing comprehensive education, El Gouna is home to an elementary school that offers two programs, national and international. The international program, which currently has 210 students, teaches a British curriculum and is delivered by British-trained instructors. The program is accredited by the Council of International Schools (CIS) and the British Schools of the Middle East (BSME), and is also inspected by the British system to conform with British Schools Overseas standards.
The national section is a higher English language school which delivers the Egyptian National Curriculum in English. Class sizes range from 30 children in some of the primary classes to 15 in the secondary classes.
All children learn Arabic and also have the opportunity to choose a second foreign language, currently French or German, from Primary Level 3. The school has produced students at the top of their level from the Red Sea Governate in the past five years.
El Gouna Hotel SchoolThe Group strongly supports those working in the tourism sector by offering education opportunities for those in the hotel business. According to German training regulations, students complete their education and are rewarded with a certificate from the Chamber of Commerce in Leipzig (Germany). With an average of seventy students graduating each year, the El Gouna Hotel School has proven to be a great success and presents a unique opportunity for students from around Egypt. The goals for the future include expanding the project to other craft-based industries, especially in the construction sector.
Following the successful model of the El Gouna Hotel School, the Group plans to build an international hotel school in Jebel Sifah, Oman. The school will enable future generations of Omani hoteliers to benefit from a high standard of education and grant them the necessary skills and professionalism to enhance their careers.
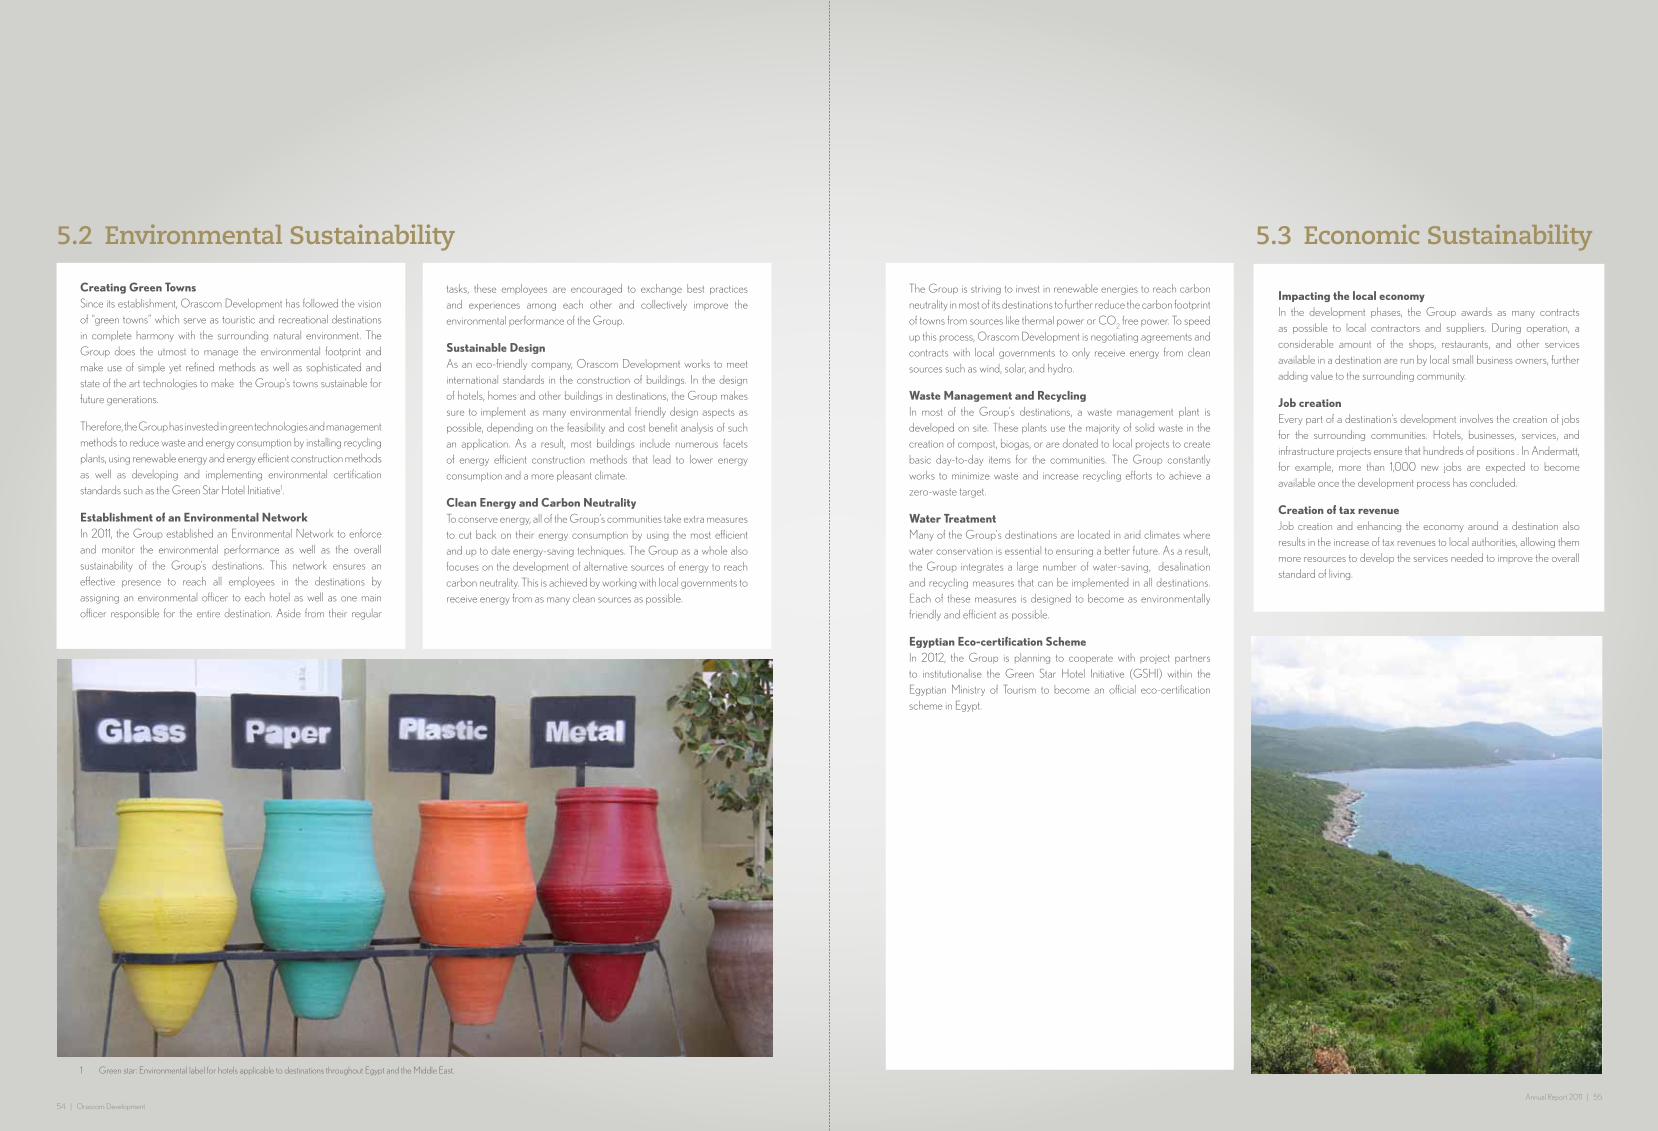
54 | Orascom DevelopmentAnnual Report 2011 | 55
5.2 Environmental Sustainability
tasks, these employees are encouraged to exchange best practices and experiences among each other and collectively improve the environmental performance of the Group.
Sustainable DesignAs an eco-friendly company, Orascom Development works to meet international standards in the construction of buildings. In the design of hotels, homes and other buildings in destinations, the Group makes sure to implement as many environmental friendly design aspects as possible, depending on the feasibility and cost benefit analysis of such an application. As a result, most buildings include numerous facets of energy efficient construction methods that lead to lower energy consumption and a more pleasant climate.
Clean Energy and Carbon NeutralityTo conserve energy, all of the Group’s communities take extra measures to cut back on their energy consumption by using the most efficient and up to date energy-saving techniques. The Group as a whole also focuses on the development of alternative sources of energy to reach carbon neutrality. This is achieved by working with local governments to receive energy from as many clean sources as possible.
The Group is striving to invest in renewable energies to reach carbon neutrality in most of its destinations to further reduce the carbon footprint of towns from sources like thermal power or CO
2 free power. To speed
up this process, Orascom Development is negotiating agreements and contracts with local governments to only receive energy from clean sources such as wind, solar, and hydro.
Waste Management and RecyclingIn most of the Group’s destinations, a waste management plant is developed on site. These plants use the majority of solid waste in the creation of compost, biogas, or are donated to local projects to create basic day-to-day items for the communities. The Group constantly works to minimize waste and increase recycling efforts to achieve a zero-waste target.
Water TreatmentMany of the Group’s destinations are located in arid climates where water conservation is essential to ensuring a better future. As a result, the Group integrates a large number of water-saving, desalination and recycling measures that can be implemented in all destinations. Each of these measures is designed to become as environmentally friendly and efficient as possible.
Egyptian Eco-certification Scheme In 2012, the Group is planning to cooperate with project partners to institutionalise the Green Star Hotel Initiative (GSHI) within the Egyptian Ministry of Tourism to become an official eco-certification scheme in Egypt.
Creating Green Towns Since its establishment, Orascom Development has followed the vision of “green towns” which serve as touristic and recreational destinations in complete harmony with the surrounding natural environment. The Group does the utmost to manage the environmental footprint and make use of simple yet refined methods as well as sophisticated and state of the art technologies to make the Group’s towns sustainable for future generations.
Therefore, the Group has invested in green technologies and management methods to reduce waste and energy consumption by installing recycling plants, using renewable energy and energy efficient construction methods as well as developing and implementing environmental certification standards such as the Green Star Hotel Initiative1.
Establishment of an Environmental NetworkIn 2011, the Group established an Environmental Network to enforce and monitor the environmental performance as well as the overall sustainability of the Group’s destinations. This network ensures an effective presence to reach all employees in the destinations by assigning an environmental officer to each hotel as well as one main officer responsible for the entire destination. Aside from their regular
5.3 Economic Sustainability
Impacting the local economyIn the development phases, the Group awards as many contracts as possible to local contractors and suppliers. During operation, a considerable amount of the shops, restaurants, and other services available in a destination are run by local small business owners, further adding value to the surrounding community.
Job creationEvery part of a destination’s development involves the creation of jobs for the surrounding communities. Hotels, businesses, services, and infrastructure projects ensure that hundreds of positions . In Andermatt, for example, more than 1,000 new jobs are expected to become available once the development process has concluded.
Creation of tax revenueJob creation and enhancing the economy around a destination also results in the increase of tax revenues to local authorities, allowing them more resources to develop the services needed to improve the overall standard of living.
1 Green star: Environmental label for hotels applicable to destinations throughout Egypt and the Middle East.
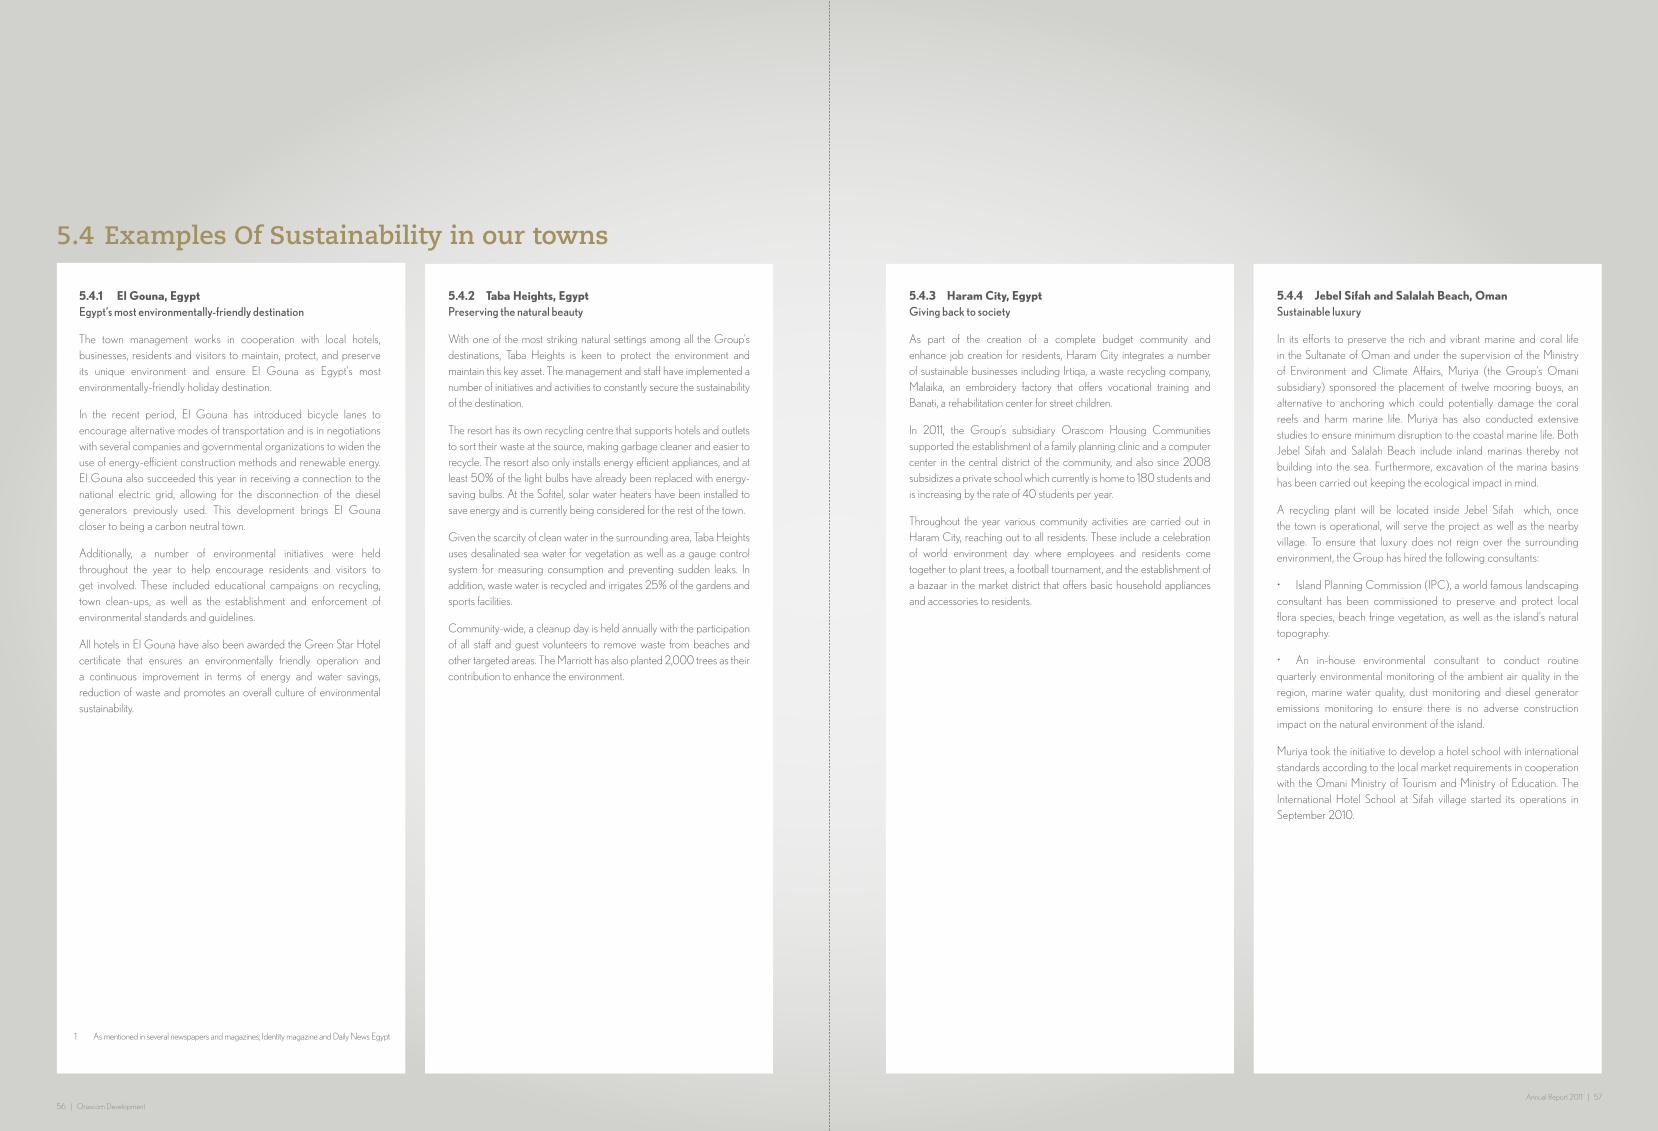
56 | Orascom DevelopmentAnnual Report 2011 | 57
5.4 Examples Of Sustainability in our towns
5.4.1 El Gouna, EgyptEgypt’s most environmentally-friendly destination
The town management works in cooperation with local hotels, businesses, residents and visitors to maintain, protect, and preserve its unique environment and ensure El Gouna as Egypt’s most environmentally-friendly holiday destination.
In the recent period, El Gouna has introduced bicycle lanes to encourage alternative modes of transportation and is in negotiations with several companies and governmental organizations to widen the use of energy-efficient construction methods and renewable energy. El Gouna also succeeded this year in receiving a connection to the national electric grid, allowing for the disconnection of the diesel generators previously used. This development brings El Gouna closer to being a carbon neutral town.
Additionally, a number of environmental initiatives were held throughout the year to help encourage residents and visitors to get involved. These included educational campaigns on recycling, town clean-ups, as well as the establishment and enforcement of environmental standards and guidelines.
All hotels in El Gouna have also been awarded the Green Star Hotel certificate that ensures an environmentally friendly operation and a continuous improvement in terms of energy and water savings, reduction of waste and promotes an overall culture of environmental sustainability.
5.4.2 Taba Heights, EgyptPreserving the natural beauty
With one of the most striking natural settings among all the Group’s destinations, Taba Heights is keen to protect the environment and maintain this key asset. The management and staff have implemented a number of initiatives and activities to constantly secure the sustainability of the destination.
The resort has its own recycling centre that supports hotels and outlets to sort their waste at the source, making garbage cleaner and easier to recycle. The resort also only installs energy efficient appliances, and at least 50% of the light bulbs have already been replaced with energy-saving bulbs. At the Sofitel, solar water heaters have been installed to save energy and is currently being considered for the rest of the town.
Given the scarcity of clean water in the surrounding area, Taba Heights uses desalinated sea water for vegetation as well as a gauge control system for measuring consumption and preventing sudden leaks. In addition, waste water is recycled and irrigates 25% of the gardens and sports facilities.
Community-wide, a cleanup day is held annually with the participation of all staff and guest volunteers to remove waste from beaches and other targeted areas. The Marriott has also planted 2,000 trees as their contribution to enhance the environment.
5.4.3 Haram City, EgyptGiving back to society
As part of the creation of a complete budget community and enhance job creation for residents, Haram City integrates a number of sustainable businesses including Irtiqa, a waste recycling company, Malaika, an embroidery factory that offers vocational training and Banati, a rehabilitation center for street children.
In 2011, the Group’s subsidiary Orascom Housing Communities supported the establishment of a family planning clinic and a computer center in the central district of the community, and also since 2008 subsidizes a private school which currently is home to 180 students and is increasing by the rate of 40 students per year.
Throughout the year various community activities are carried out in Haram City, reaching out to all residents. These include a celebration of world environment day where employees and residents come together to plant trees, a football tournament, and the establishment of a bazaar in the market district that offers basic household appliances and accessories to residents.
5.4.4 Jebel Sifah and Salalah Beach, OmanSustainable luxury
In its efforts to preserve the rich and vibrant marine and coral life in the Sultanate of Oman and under the supervision of the Ministry of Environment and Climate Affairs, Muriya (the Group’s Omani subsidiary) sponsored the placement of twelve mooring buoys, an alternative to anchoring which could potentially damage the coral reefs and harm marine life. Muriya has also conducted extensive studies to ensure minimum disruption to the coastal marine life. Both Jebel Sifah and Salalah Beach include inland marinas thereby not building into the sea. Furthermore, excavation of the marina basins has been carried out keeping the ecological impact in mind.
A recycling plant will be located inside Jebel Sifah which, once the town is operational, will serve the project as well as the nearby village. To ensure that luxury does not reign over the surrounding environment, the Group has hired the following consultants:
• Island Planning Commission (IPC), a world famous landscaping consultant has been commissioned to preserve and protect local flora species, beach fringe vegetation, as well as the island’s natural topography.
• An in-house environmental consultant to conduct routine quarterly environmental monitoring of the ambient air quality in the region, marine water quality, dust monitoring and diesel generator emissions monitoring to ensure there is no adverse construction impact on the natural environment of the island.
Muriya took the initiative to develop a hotel school with international standards according to the local market requirements in cooperation with the Omani Ministry of Tourism and Ministry of Education. The International Hotel School at Sifah village started its operations in September 2010.
1 As mentioned in several newspapers and magazines; Identity magazine and Daily News Egypt
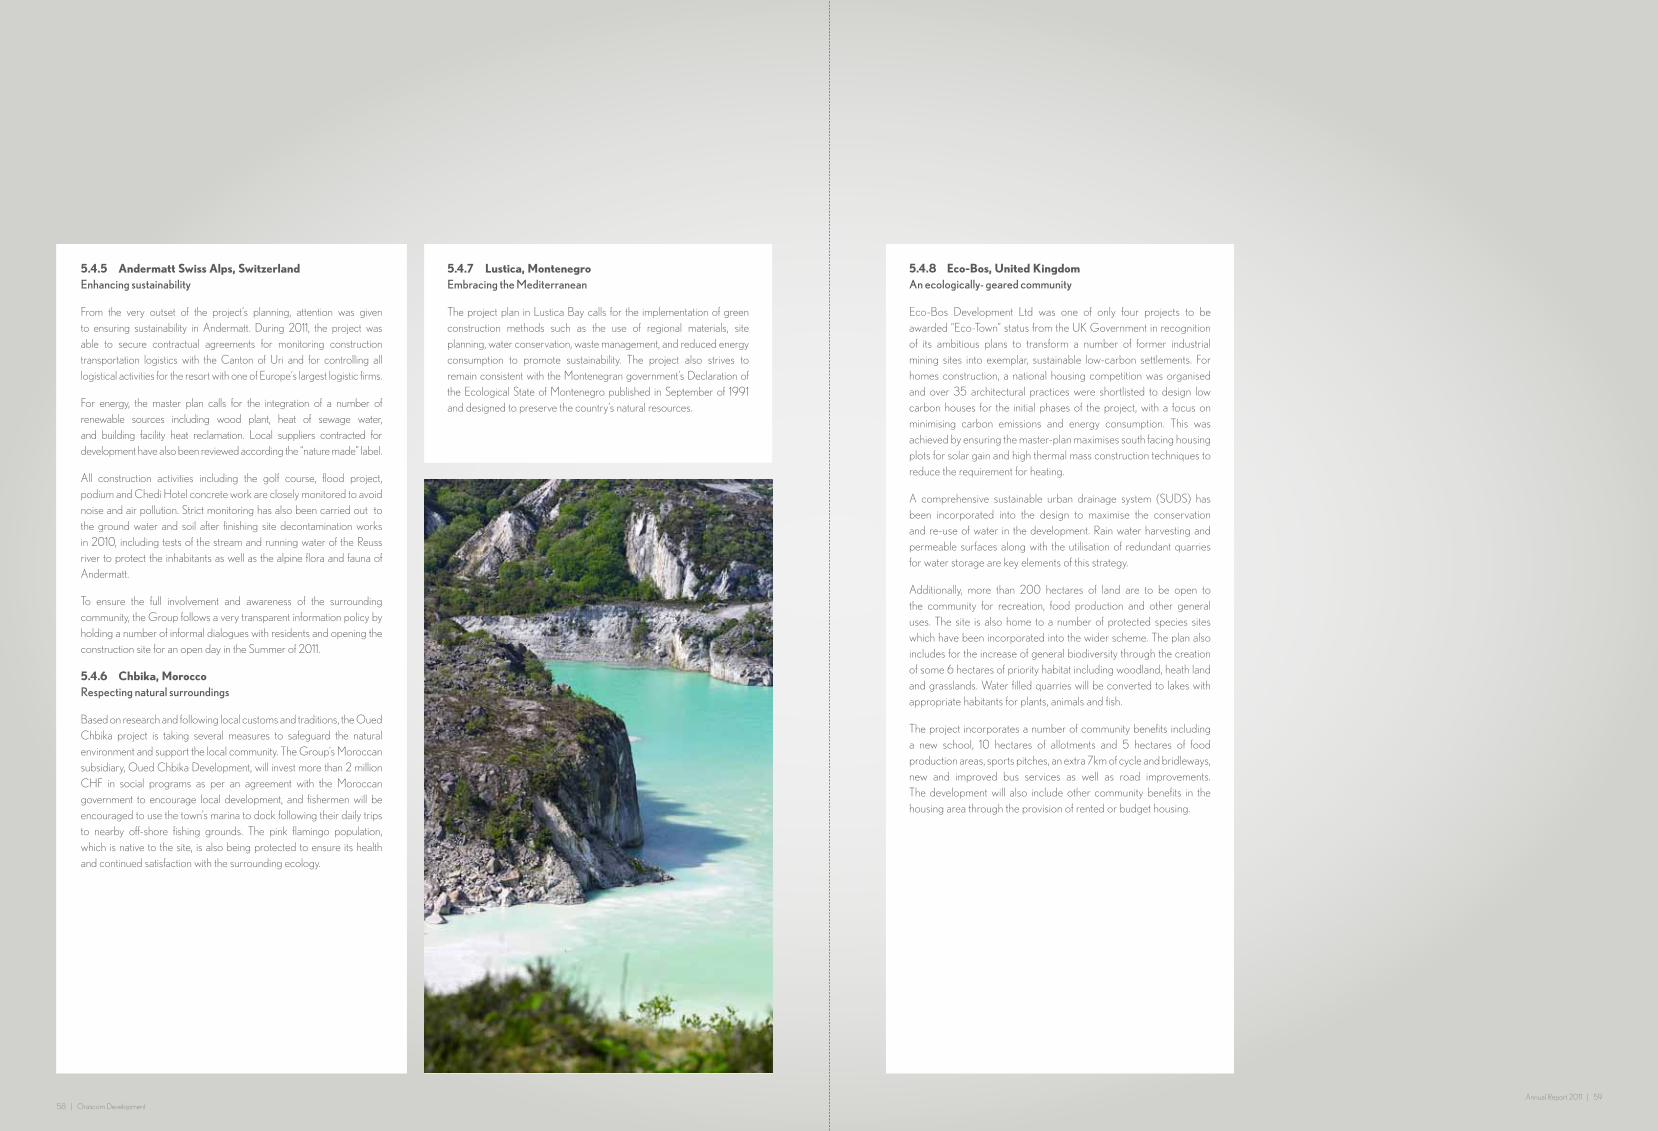
58 | Orascom DevelopmentAnnual Report 2011 | 59
5.4.5 Andermatt Swiss Alps, SwitzerlandEnhancing sustainability
From the very outset of the project’s planning, attention was given to ensuring sustainability in Andermatt. During 2011, the project was able to secure contractual agreements for monitoring construction transportation logistics with the Canton of Uri and for controlling all logistical activities for the resort with one of Europe‘s largest logistic firms.
For energy, the master plan calls for the integration of a number of renewable sources including wood plant, heat of sewage water, and building facility heat reclamation. Local suppliers contracted for development have also been reviewed according the “nature made” label.
All construction activities including the golf course, flood project, podium and Chedi Hotel concrete work are closely monitored to avoid noise and air pollution. Strict monitoring has also been carried out to the ground water and soil after finishing site decontamination works in 2010, including tests of the stream and running water of the Reuss river to protect the inhabitants as well as the alpine flora and fauna of Andermatt.
To ensure the full involvement and awareness of the surrounding community, the Group follows a very transparent information policy by holding a number of informal dialogues with residents and opening the construction site for an open day in the Summer of 2011.
5.4.6 Chbika, MoroccoRespecting natural surroundings
Based on research and following local customs and traditions, the Oued Chbika project is taking several measures to safeguard the natural environment and support the local community. The Group’s Moroccan subsidiary, Oued Chbika Development, will invest more than 2 million CHF in social programs as per an agreement with the Moroccan government to encourage local development, and fishermen will be encouraged to use the town’s marina to dock following their daily trips to nearby off-shore fishing grounds. The pink flamingo population, which is native to the site, is also being protected to ensure its health and continued satisfaction with the surrounding ecology.
5.4.8 Eco-Bos, United KingdomAn ecologically- geared community
Eco-Bos Development Ltd was one of only four projects to be awarded “Eco-Town” status from the UK Government in recognition of its ambitious plans to transform a number of former industrial mining sites into exemplar, sustainable low-carbon settlements. For homes construction, a national housing competition was organised and over 35 architectural practices were shortlisted to design low carbon houses for the initial phases of the project, with a focus on minimising carbon emissions and energy consumption. This was achieved by ensuring the master-plan maximises south facing housing plots for solar gain and high thermal mass construction techniques to reduce the requirement for heating.
A comprehensive sustainable urban drainage system (SUDS) has been incorporated into the design to maximise the conservation and re-use of water in the development. Rain water harvesting and permeable surfaces along with the utilisation of redundant quarries for water storage are key elements of this strategy.
Additionally, more than 200 hectares of land are to be open to the community for recreation, food production and other general uses. The site is also home to a number of protected species sites which have been incorporated into the wider scheme. The plan also includes for the increase of general biodiversity through the creation of some 6 hectares of priority habitat including woodland, heath land and grasslands. Water filled quarries will be converted to lakes with appropriate habitants for plants, animals and fish.
The project incorporates a number of community benefits including a new school, 10 hectares of allotments and 5 hectares of food production areas, sports pitches, an extra 7km of cycle and bridleways, new and improved bus services as well as road improvements. The development will also include other community benefits in the housing area through the provision of rented or budget housing.
5.4.7 Lustica, MontenegroEmbracing the Mediterranean
The project plan in Lustica Bay calls for the implementation of green construction methods such as the use of regional materials, site planning, water conservation, waste management, and reduced energy consumption to promote sustainability. The project also strives to remain consistent with the Montenegran government’s Declaration of the Ecological State of Montenegro published in September of 1991 and designed to preserve the country’s natural resources.
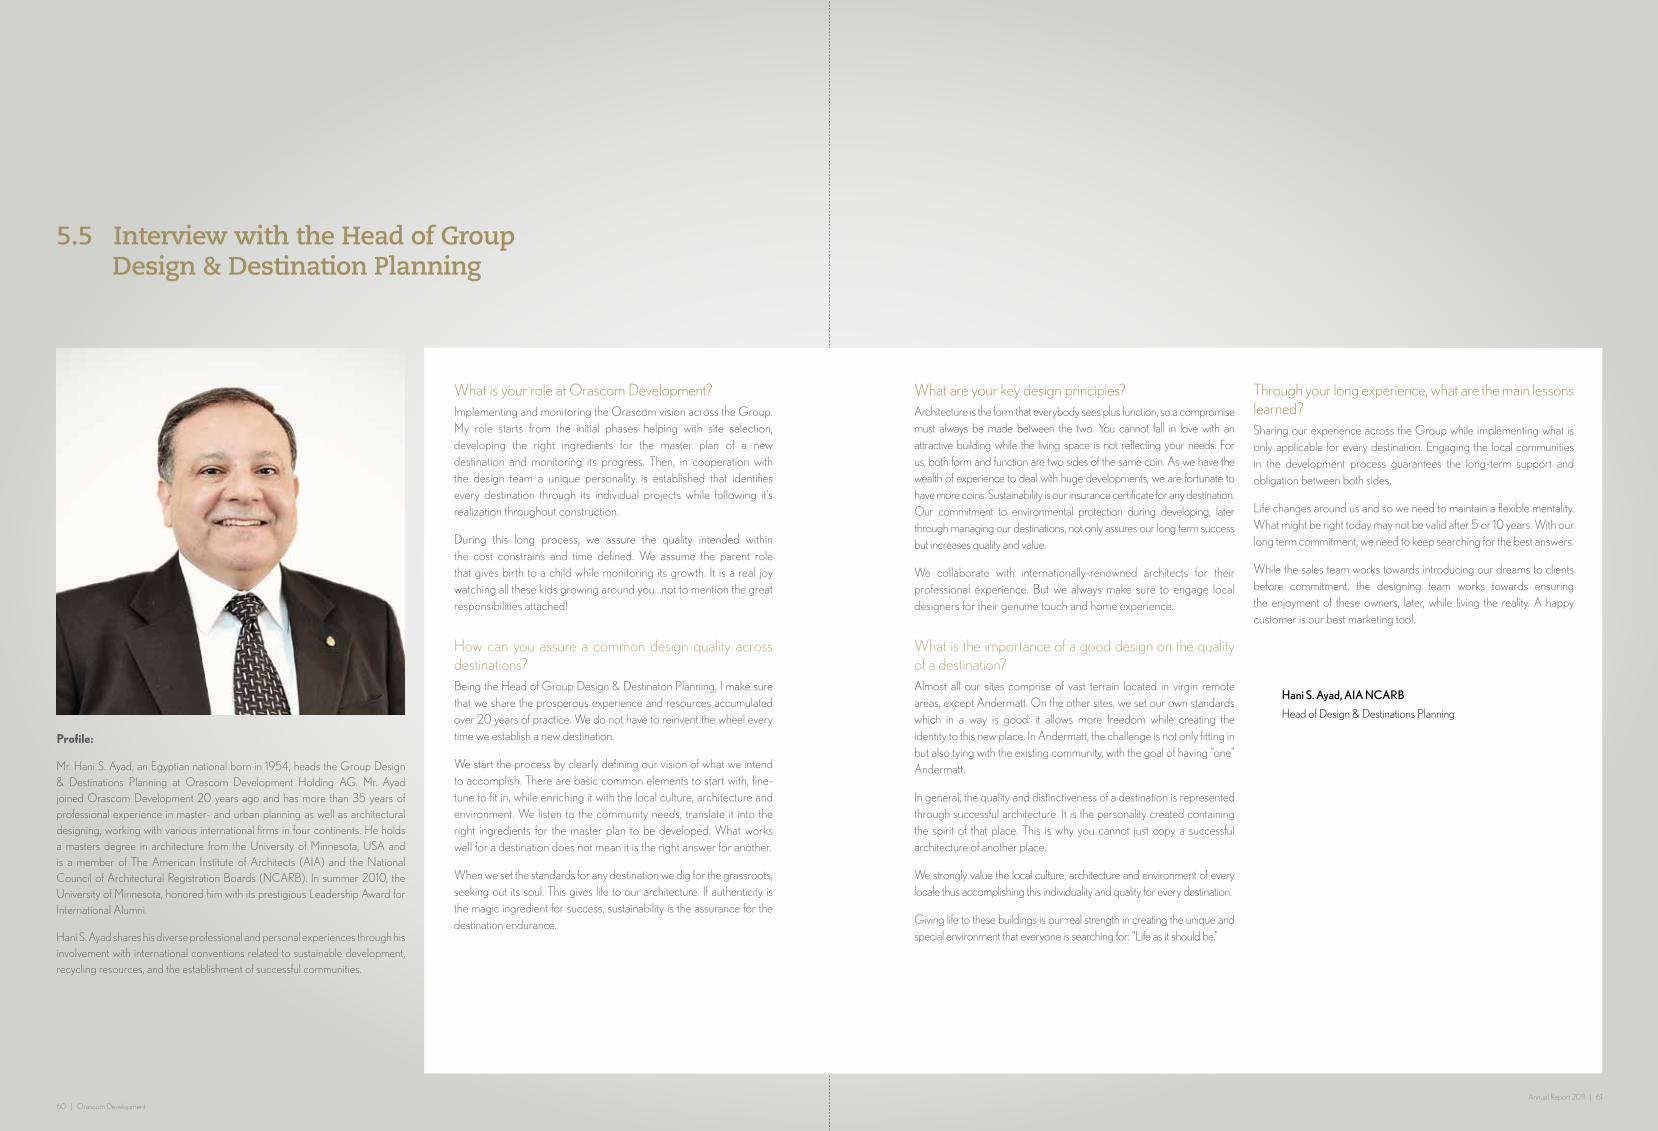
60 | Orascom DevelopmentAnnual Report 2011 | 61
5.5 Interview with the Head of Group Design & Destination Planning
What are your key design principles?Architecture is the form that everybody sees plus function, so a compromise must always be made between the two. You cannot fall in love with an attractive building while the living space is not reflecting your needs. For us, both form and function are two sides of the same coin. As we have the wealth of experience to deal with huge developments, we are fortunate to have more coins. Sustainability is our insurance certificate for any destination. Our commitment to environmental protection during developing, later through managing our destinations, not only assures our long term success but increases quality and value.
We collaborate with internationally-renowned architects for their professional experience. But we always make sure to engage local designers for their genuine touch and home experience.
What is the importance of a good design on the quality of a destination?Almost all our sites comprise of vast terrain located in virgin remote areas, except Andermatt. On the other sites, we set our own standards which in a way is good: it allows more freedom while creating the identity to this new place. In Andermatt, the challenge is not only fitting in but also tying with the existing community, with the goal of having “one” Andermatt.
In general, the quality and distinctiveness of a destination is represented through successful architecture. It is the personality created containing the spirit of that place. This is why you cannot just copy a successful architecture of another place.
We strongly value the local culture, architecture and environment of every locale thus accomplishing this individuality and quality for every destination.
Giving life to these buildings is our real strength in creating the unique and special environment that everyone is searching for: “Life as it should be.”
Through your long experience, what are the main lessons learned? Sharing our experience across the Group while implementing what is only applicable for every destination. Engaging the local communities in the development process guarantees the long-term support and obligation between both sides.
Life changes around us and so we need to maintain a flexible mentality. What might be right today may not be valid after 5 or 10 years. With our long term commitment, we need to keep searching for the best answers.
While the sales team works towards introducing our dreams to clients before commitment, the designing team works towards ensuring the enjoyment of these owners, later, while living the reality. A happy customer is our best marketing tool.
What is your role at Orascom Development? Implementing and monitoring the Orascom vision across the Group. My role starts from the initial phases helping with site selection, developing the right ingredients for the master plan of a new destination and monitoring its progress. Then, in cooperation with the design team a unique personality is established that identifies every destination through its individual projects while following it’s realization throughout construction.
During this long process, we assure the quality intended within the cost constrains and time defined. We assume the parent role that gives birth to a child while monitoring its growth. It is a real joy watching all these kids growing around you...not to mention the great responsibilities attached!
How can you assure a common design quality across destinations? Being the Head of Group Design & Destinaton Planning, I make sure that we share the prosperous experience and resources accumulated over 20 years of practice. We do not have to reinvent the wheel every time we establish a new destination.
We start the process by clearly defining our vision of what we intend to accomplish. There are basic common elements to start with, fine-tune to fit in, while enriching it with the local culture, architecture and environment. We listen to the community needs; translate it into the right ingredients for the master plan to be developed. What works well for a destination does not mean it is the right answer for another.
When we set the standards for any destination we dig for the grassroots, seeking out its soul. This gives life to our architecture. If authenticity is the magic ingredient for success, sustainability is the assurance for the destination endurance.
Hani S. Ayad, AIA NCARB
Head of Design & Destinations Planning
Profile:
Mr. Hani S. Ayad, an Egyptian national born in 1954, heads the Group Design & Destinations Planning at Orascom Development Holding AG. Mr. Ayad joined Orascom Development 20 years ago and has more than 35 years of professional experience in master- and urban planning as well as architectural designing, working with various international firms in four continents. He holds a masters degree in architecture from the University of Minnesota, USA and is a member of The American Institute of Architects (AIA) and the National Council of Architectural Registration Boards (NCARB). In summer 2010, the University of Minnesota, honored him with its prestigious Leadership Award for International Alumni.
Hani S. Ayad shares his diverse professional and personal experiences through his involvement with international conventions related to sustainable development, recycling resources, and the establishment of successful communities.

62 | Orascom DevelopmentAnnual Report 2011 | 63
6. Corporate Governance
6.1. Group Structure and Significant Shareholders
The operating business of the group headed by Orascom Development Holding AG (the “Orascom Development Group”) is organized into the following segments: Hotels, Real Estate and Construction, Land Sales, Town Management, Tours Operations, and Other Operations.
An application to de-list Orascom Hotels & Development S.A.E. from the EGX has not yet been submitted. Pursuant to a tender offer completed in January 2011, Orascom Development increased its holding in this Egyptian subsidiary to 99.68%.
For information on the non-listed companies comprised by the Orascom Development Group’s scope of consolidation, please refer to Note 18 (Subsidiaries) to the consolidated financial statements.
Significant shareholders
Since the initial public offering of the Company’s shares in May 2008 through the end of the 2011 financial year, the following shareholders have disclosed participation in the Company of 3 percent or more in voting rights (in accordance with art. 20 SESDA1):2
Orascom Development Holding AG
Corporate Functions
Real Estateand Construction
Hotels Land SalesTown
ManagementOther OperationsTours Operations
Company
Orascom Development Holding AG(Altdorf, Switzerland)
SIX RegistrationExchange SIX Swiss ExchangeMarket capitalization CHF 409,594,159.45
Symbol ODHNSecurity number 003828567ISIN CH0038285679
EGX Registration (Egyptian Depositary Receipts)
Exchange EGX Egyptian ExchangeMarket capitalization EGP 2,272,034,501.20 Symbol ODNHISIN EGG676K1D011
Orascom Hotels & Development S.A.E. (Cairo, Egypt) EGX RegistrationExchange EGX Egyptian ExchangeMarket capitalization EGP 4,312,727,955Symbol ORHDISIN EGS70321C012
Orascom Hotels & Development S.A.E. is 99.68% owned by the Orascom Development Group
As of the end of the 2011 financial year, the following listed companies were part of the Orascom Development Group scope of consolidation:
Name of Shareholder Date of latest disclosure3 Number of sharesPercentage of ownership of the total
equity capital and voting rights4
Samih O. Sawiris
13 May 2008
13,534,714 60.82%
whereof held directly 7,172,655 32.23%
whereof held through Thursday Holding Ltd.5 5,848,741 26,28%
whereof held through SOS Holding Ltd.6 513,318 2.31%
Janus Capital Management LLC7 25 Aug 2008 1,156,323 5.08%
Orascom Development8 15 Dec 2010 1,286,353 4.56%
1 Swiss Federal Act on Stock Exchanges and Securities Dealing.
2 The table, in accordance with the SIX Swiss Exchange’s guidelines, shows significant shareholders’ participations as last disclosed pursuant to art. 20 SESDA. The numbers of shares and percentages shown conform to the situation at the time of the respective last disclosure. They do not necessarily conform to the situation as per 31 December 2011, given that a shareholder may have purchased or sold shares subsequent to the last disclosure but not thereby crossed a disclosure threshold. See also fn. 4 in respect of the percentages shown. For information on the participations of shareholders exceeding 3 percent of voting rights as reflected in the Company’s share register as at 31 December 2011, refer to Note 26.5 to the Company’s non-consolidated financial statements.
3 The date indicated is (a) as from 2010, the date of publication on the SIX Swiss Exchange’s online database; (b) prior to 2010, the date of the issue of the Swiss Commercial Gazette in which the disclosure was published or, in those cases where the latest disclosure was made in or in conjunction with the Offering Circular published by the Company in the course of the initial public offering of its shares, the date of the Offering Circular (13 May 2008).
4 The percentages shown relate to the Company’s registered share capital as at the date of the respective disclosure. For information on changes in capital since the founding of the Company, refer to Section 6.2. In those cases where the latest disclosure was made in or in conjunction with the Offering Circular published by the Company in the course of the initial public offering of its shares, the percentages shown are those disclosed as “Expected holding upon completion of the Offering (assuming full exercise of Over-Allotment Option)”.
5 Thursday Holding Ltd. (formerly TNT Holding Ltd.), c/o M&C Corporate Services Limited, PO Box 309GT Ugland House, South Church Street, George Town, Grand Cayman, Cayman Islands. Wednesday (Cayman Island) Trust (formerly TNT (Cayman Island) Trust) owns Thursday Holding Ltd. Samih O. Sawiris has the ability to exercise the voting rights of Thursday Holding Ltd.
6 SOS Holding Ltd., c/o M&C Corporate Services Limited, PO Box 309GT Ugland House, South Church Street, George Town, Grand Cayman, Cayman Islands. SOS (Jersey) Trust owns SOS Holdings Ltd. Samih O. Sawiris has the ability to exercise the voting rights of SOS Holding Ltd.
7 Janus Capital Management LLC, with its principal office at 151 Detroit Street, Denver, CO. 80206, is the investment adviser of (a) Janus Overseas Fund, with its principal office at 151 Detroit Street, Denver, CO. 80206, (b) Janus Adviser International Growth Fund, with its principal office at 151 Detroit Street, Denver, CO. 80206, and (c) Janus Aspen Series International Growth Portfolio, with its principal office at 151 Detroit Street, Denver, CO. 80206.
8 Orascom Development and Samih O. Sawiris entered into a Securities Lending Agreement under which the Company is entitled to borrow from Samih O. Sawiris up to the indicated number of shares. On 2 December 2010 the indicated number of shares was transferred to the Company.
9 Blue Ridge Capital Holdings LLC, with its principal office at 660 Madison Avenue, New York, New York 10065, is the general partner of Blue Ridge Limited Partnership, with its principal office at 660 Madison Avenue, New York, New York 10065. Blue Ridge Capital Offshore Holdings LLC, with its principal office at 660 Madison Avenue, New York, New Yord 10065, is the general partner of Blue Ridge Offshore Master Limited Partnership, with its principal office at P.O. Box 309, Grand Cayman KY1-1104, Cayman Islands.
On 21 September 2011, Blue Ridge Capital Holdings LLC and Blue Ridge Capital Offshore Holdings LLC9 disclosed that their participation in the company had fallen below 3 percent in voting rights.
Aside from the above, the Company is not aware of a shareholder holding a participation of 3 percent or more of voting rights.
Cross-Shareholdings
There are no cross-shareholdings between the Company and any other entity that would exceed 5 percent of capital or voting rights on both sides.
Group Structure (Reporting Structure)

64 | Orascom DevelopmentAnnual Report 2011 | 65
6.2. Capital Structure
Capital
As at 31 December 2011, the Company’s issued share capital amounted to CHF 662,201,010.40 and was divided into 28,543,147 registered shares with a nominal value of CHF 23.20 each, fully paid in. The authorized capital amounted to CHF 108,343,327.20 while the conditional capital amounted to CHF 130,489,699.20.
Authorized and conditional capital
Authorized capitalArt. 4a of the Company’s articles of incorporation (“Articles of Incorporation”), relating to its authorized capital, reads as follows:
“The board of directors is authorized to increase the share capital of the Company by a maximum of CHF 108,343,327.20 by issuing of up to 4,669,971 fully paid-up registered shares with a par value of CHF 23.20 each until May 23, 2013. A partial increase is permitted. The board of directors determines the date of issue, the issue price, the type of contribution, the date of dividend entitlement as well as the allocation of non exercised pre-emptive rights.
The board of directors can withdraw or limit the pre-emptive rights of the shareholders in case of (i) the use of shares in connection with mergers, acquisitions, financing and/or refinancing of mergers, acquisitions and other investment projects, (ii) national and international offerings of shares for the purpose of increasing the free float or to meet applicable listing requirements, (iii) an over-allotment option (greenshoe) being granted to one or more financial institutions in connection with an offering of shares and (iv) conversion of loans, securities or equity securities (including shares of subsidiaries) into shares.”
Conditional capitalArt. 4b of the Articles of Incorporation, relating to the Company’s conditional capital, reads as follows:
“The share capital may be increased by a maximum amount of CHF 130,489,699.20 through the issuance of up to 5,624,556 fully paid registered shares with a nominal value of CHF 23.20 each, (a) up to the amount of CHF 14,489,699.20 corresponding to 624,556 fully paid registered shares through the exercise of option rights granted to the members of the board and the management, further employees and/or advisors of the company or its subsidiaries, (b) up to the amount of CHF 116,000,000 corresponding to 5,000,000 fully paid registered shares through the exercise of conversion rights and/or warrants granted in connection with the issuance of newly or already issued bonds or other financial instruments by the Company or one of
its group companies. The subscription rights of the shareholders shall be excluded.
The board of directors may restrict or withdraw the right for advance subscription (Vorwegzeichnungsrecht) of the shareholders in connection with (i) the financing (refinancing inclusively) of acquisitions of enterprises or parts thereof, participations or other investment projects of the company and/or its subsidiaries or (ii) the placement of convertible bonds or financial instruments with conversion or option rights on the national or international capital market. In case the right of advance subscription (Vorwegzeichnungsrecht) will be withdrawn, (x) the bonds or financial instruments have to be placed at market conditions, (y) the period of time for exercising the conversion rights or the option rights may not exceed 10 years and (z) the exercise or conversion price of the new registered shares has to be fixed at the conditions of the market. The terms and conditions of the convertible bonds or financial instruments with option or conversion rights, the issue price of the new shares, the dividend entitlement as well as the type of contribution shall be determined by the board of directors.”
At 31 December 2011, no option rights, conversion rights, or warrants had been granted on the basis of Art. 4b.
Changes in capital in the past three years
2009At the ordinary general meeting of shareholders on 4 May 2009 it was resolved to reduce the share capital by CHF 11,609,829 from CHF 580,491,450 to CHF 568,881,621 by reducing the nominal value of each of the 23,219,658 registered shares from CHF 25 to CHF 24.50. The amount of the reduction of CHF 0.50 per registered share was remitted to shareholders.
2010At the ordinary general meeting of shareholders on 11 May 2010 it was resolved to reduce the share capital by CHF 15,092,777.70 from CHF 568,881,621 to 553,788,843.30 by reducing the nominal value of each of the 23,219,658 registered shares from CHF 24.50 to CHF 23.85. The amount of the reduction of CHF 0.65 per registered share was remitted to shareholders.
On 29 September 2010 the Board of Directors resolved, based on the authorization included in Art. 4a of the Articles of Incorporation to increase the share capital by CHF 119,094,021 through the issuance of 4,993,460 new registered shares to CHF 672,882,864.30 divided into 28,213,118 registered shares with a nominal value of CHF 23.85 each.
2011At the ordinary general meeting of shareholders on 23 May 2011 it was resolved to reduce the share capital by CHF 18,338,526.70 from CHF 672,882,864.30 to CHF 654,544,337.60 by reducing the nominal value of each of the 28,213,118 registered shares from CHF 23.85 to CHF 23.20 and to remit the amount of reduction of CHF 0.65 per registered share to the shareholders. At the same meeting it was resolved that the nominal value of any shares created from authorized or conditional capital in accordance with Art. 4a and Art. 4b of the Articles of Incorporation (cf. next paragraph) until completion of the capital reduction equally reduced by CHF 0.65 and the amount of the reduction remitted to the respective shareholders.
At its meetings of July 14, 2011 and July 28, 2011 (i.e. before the share capital reduction described in the preceding paragraph had become effective), the Board of Directors resolved, based on the authorization included in Art. 4a of the Articles of Incorporation, to increase the share capital by CHF 7,871,191.65 through the issuance of 330’029 new registered shares, from CHF 672,882,864.30 to CHF 680,754,055.95, divided into 28,543,147 registered shares with a nominal value of CHF 23.85 each.
The share capital reduction resolved by the shareholders on 23 May 2011 (see above) became effective on 8 August 2011. The payment for the reduction of CH 0.65 per registered share amounted to a total of CHF 18,553,045.55. The registered share capital after the reduction amounts to CHF 662,201,010.40 and is divided into 28,543,147 registered shares with a par value of CHF 23.20 each.
Shares and participation certificates
The 28,543,147 registered shares with a nominal value of CHF 23.20 are fully paid in. They are in the form of dematerialized securities (Wertrechte, within the meaning of the Swiss Code of Obligations) and intermediated securities (Bucheffekten, within the meaning of the Swiss Federal Intermediated Securities Act). Each registered share carries an equal right to dividend payments. Voting rights are described in Section 6.6. The voting rights of registered shares held by the Company or any of its subsidiaries are suspended. No preferential or similar rights have been granted. As at 31 December 2011, no participation certificates (Partizipationsscheine) have been issued.
Profit sharing certificates
The Company has not issued any profit sharing certificates (Genussscheine).
Limitation on transferability and nominee registrations
Limitations on transferability for each share category; indication of statutory group clauses and rules for granting exceptionsPursuant to Art. 5 of the Articles of Incorporation, the Company maintains a share register in which the full name, address, and nationality (in case of legal entities, the company name and registered office) of the holders and usufructuaries of registered shares are recorded. Upon application to the Company, acquirers of registered shares will be recorded in the share register as shareholders with the right to vote, provided that they explicitly declare to have acquired the shares in their own name and for their own account. Acquirers who do not make this declaration will be recorded in the share register as shareholders without the right to vote (for an exception to permit nominee registrations, see below).
Exemptions in the year under reviewNo exemptions from the limitations on transferability of shares have been granted in the year under review.
Permissibility of nominee registrations; indication of any percent clauses and registration conditionsPursuant to the Company’s Regulations on the Registration of Nominees, the Company may register a nominee in its share register as a shareholder with the right to vote if either such nominee’s shareholdings do not exceed 5 percent of the issued share capital as set forth in the Commercial Register, or, if such nominee’s shareholdings exceed that threshold, the respective nominee discloses to the Company the names, addresses, locations or registered offices, nationalities and the number of shares held on behalf of all beneficial owners whose beneficial shareholdings exceed 0.5 percent of the issued share capital.
Procedure and conditions for cancelling statutory privileges and limitations on transferabilityThe Articles of Incorporation do not provide for any privileges. The limitations on transferability of the Company’s shares, as described above, may be cancelled by a resolution (amending the Articles of Incorporation) of an ordinary general meeting of shareholders reuniting the absolute majority of votes represented at the meeting, or by a resolution of an extraordinary general meeting of shareholders reuniting a majority of two thirds of votes represented (see Section 6.6 below).
Convertible bonds and warrants/options
The Company has not issued any convertible bonds, warrants or options.
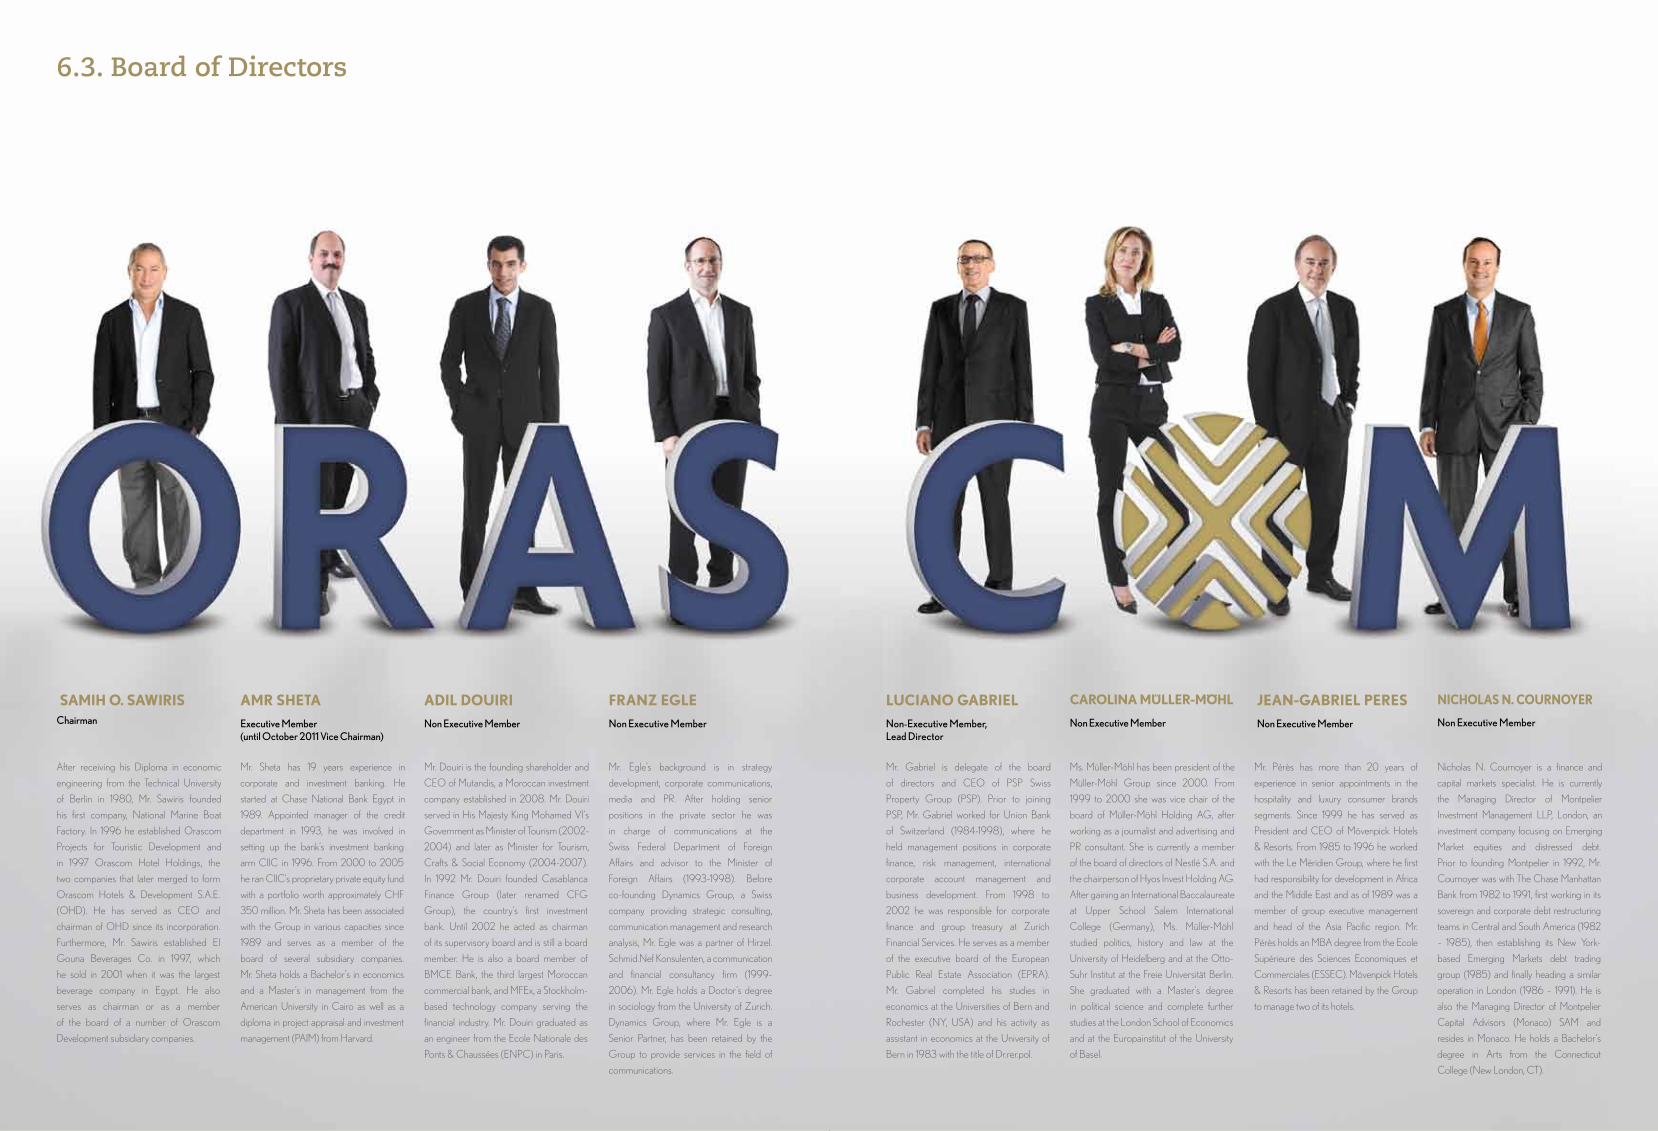
66 | Orascom DevelopmentAnnual Report 2011 | 67
After receiving his Diploma in economic
engineering from the Technical University
of Berlin in 1980, Mr. Sawiris founded
his first company, National Marine Boat
Factory. In 1996 he established Orascom
Projects for Touristic Development and
in 1997 Orascom Hotel Holdings, the
two companies that later merged to form
Orascom Hotels & Development S.A.E.
(OHD). He has served as CEO and
chairman of OHD since its incorporation.
Furthermore, Mr. Sawiris established El
Gouna Beverages Co. in 1997, which
he sold in 2001 when it was the largest
beverage company in Egypt. He also
serves as chairman or as a member
of the board of a number of Orascom
Development subsidiary companies.
SAMIH O. SAWIRIS Chairman
Mr. Sheta has 19 years experience in
corporate and investment banking. He
started at Chase National Bank Egypt in
1989. Appointed manager of the credit
department in 1993, he was involved in
setting up the bank’s investment banking
arm CIIC in 1996. From 2000 to 2005
he ran CIIC’s proprietary private equity fund
with a portfolio worth approximately CHF
350 million. Mr. Sheta has been associated
with the Group in various capacities since
1989 and serves as a member of the
board of several subsidiary companies.
Mr. Sheta holds a Bachelor’s in economics
and a Master’s in management from the
American University in Cairo as well as a
diploma in project appraisal and investment
management (PAIM) from Harvard.
AMR SHETA
Executive Member (until October 2011 Vice Chairman)
Mr. Douiri is the founding shareholder and
CEO of Mutandis, a Moroccan investment
company established in 2008. Mr. Douiri
served in His Majesty King Mohamed VI’s
Government as Minister of Tourism (2002-
2004) and later as Minister for Tourism,
Crafts & Social Economy (2004-2007).
In 1992 Mr. Douiri founded Casablanca
Finance Group (later renamed CFG
Group), the country’s first investment
bank. Until 2002 he acted as chairman
of its supervisory board and is still a board
member. He is also a board member of
BMCE Bank, the third largest Moroccan
commercial bank, and MFEx, a Stockholm-
based technology company serving the
financial industry. Mr. Douiri graduated as
an engineer from the Ecole Nationale des
Ponts & Chaussées (ENPC) in Paris.
ADIL DOUIRI
Non Executive Member
Mr. Egle’s background is in strategy
development, corporate communications,
media and PR. After holding senior
positions in the private sector he was
in charge of communications at the
Swiss Federal Department of Foreign
Affairs and advisor to the Minister of
Foreign Affairs (1993-1998). Before
co-founding Dynamics Group, a Swiss
company providing strategic consulting,
communication management and research
analysis, Mr. Egle was a partner of Hirzel.
Schmid.Nef Konsulenten, a communication
and financial consultancy firm (1999-
2006). Mr. Egle holds a Doctor’s degree
in sociology from the University of Zurich.
Dynamics Group, where Mr. Egle is a
Senior Partner, has been retained by the
Group to provide services in the field of
communications.
Nicholas N. Cournoyer is a finance and
capital markets specialist. He is currently
the Managing Director of Montpelier
Investment Management LLP, London, an
investment company focusing on Emerging
Market equities and distressed debt.
Prior to founding Montpelier in 1992, Mr.
Cournoyer was with The Chase Manhattan
Bank from 1982 to 1991, first working in its
sovereign and corporate debt restructuring
teams in Central and South America (1982
– 1985), then establishing its New York-
based Emerging Markets debt trading
group (1985) and finally heading a similar
operation in London (1986 – 1991). He is
also the Managing Director of Montpelier
Capital Advisors (Monaco) SAM and
resides in Monaco. He holds a Bachelor’s
degree in Arts from the Connecticut
College (New London, CT).
FRANZ EGLE
Non Executive Member
NICHOLAS N. COURNOyER
Non Executive Member
Mr. Gabriel is delegate of the board
of directors and CEO of PSP Swiss
Property Group (PSP). Prior to joining
PSP, Mr. Gabriel worked for Union Bank
of Switzerland (1984-1998), where he
held management positions in corporate
finance, risk management, international
corporate account management and
business development. From 1998 to
2002 he was responsible for corporate
finance and group treasury at Zurich
Financial Services. He serves as a member
of the executive board of the European
Public Real Estate Association (EPRA).
Mr. Gabriel completed his studies in
economics at the Universities of Bern and
Rochester (NY, USA) and his activity as
assistant in economics at the University of
Bern in 1983 with the title of Dr.rer.pol.
LUCIANO GABRIEL
Non-Executive Member, Lead Director
Ms. Müller-Möhl has been president of the
Müller-Möhl Group since 2000. From
1999 to 2000 she was vice chair of the
board of Müller-Möhl Holding AG, after
working as a journalist and advertising and
PR consultant. She is currently a member
of the board of directors of Nestlé S.A. and
the chairperson of Hyos Invest Holding AG.
After gaining an International Baccalaureate
at Upper School Salem International
College (Germany), Ms. Müller-Möhl
studied politics, history and law at the
University of Heidelberg and at the Otto-
Suhr Institut at the Freie Universität Berlin.
She graduated with a Master’s degree
in political science and complete further
studies at the London School of Economics
and at the Europainstitut of the University
of Basel.
CAROLINA MüLLER-MöHL
Non Executive Member
Mr. Pérès has more than 20 years of
experience in senior appointments in the
hospitality and luxury consumer brands
segments. Since 1999 he has served as
President and CEO of Mövenpick Hotels
& Resorts. From 1985 to 1996 he worked
with the Le Méridien Group, where he first
had responsibility for development in Africa
and the Middle East and as of 1989 was a
member of group executive management
and head of the Asia Pacific region. Mr.
Pérès holds an MBA degree from the Ecole
Supérieure des Sciences Economiques et
Commerciales (ESSEC). Mövenpick Hotels
& Resorts has been retained by the Group
to manage two of its hotels.
JEAN-GABRIEL PERES
Non Executive Member
6.3. Board of Directors
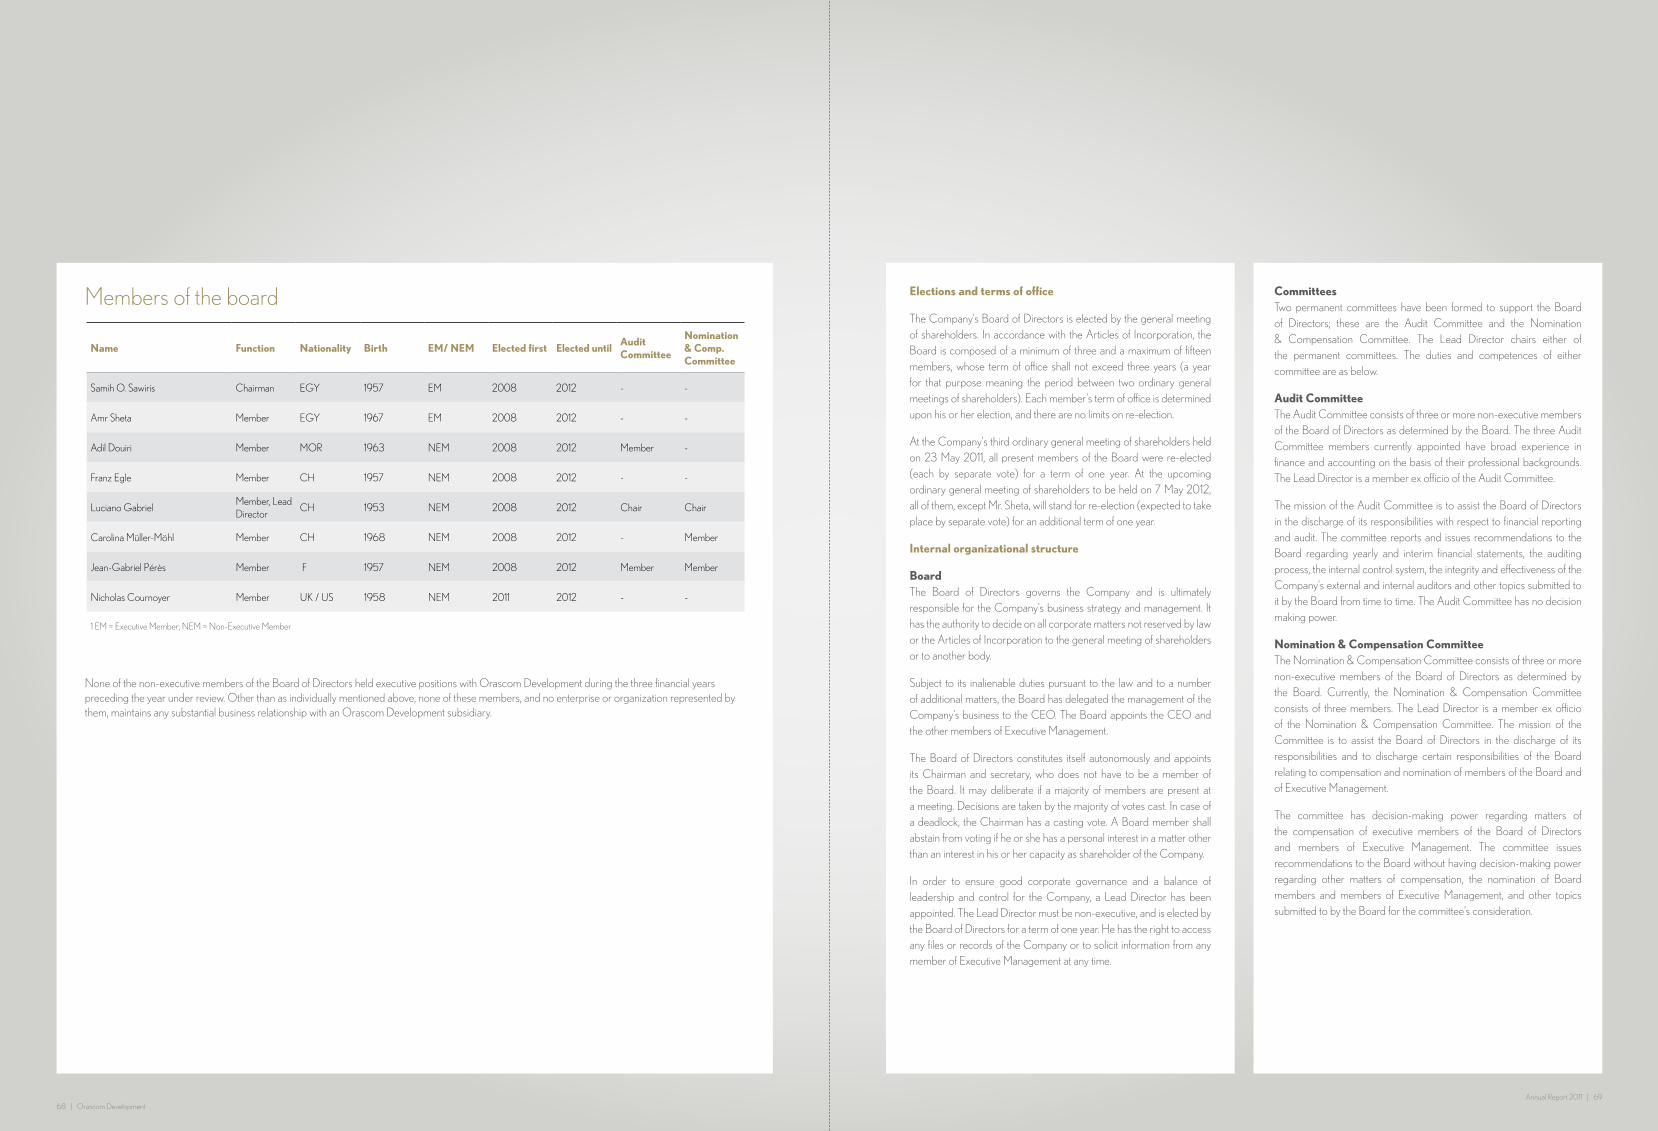
68 | Orascom DevelopmentAnnual Report 2011 | 69
Elections and terms of office
The Company’s Board of Directors is elected by the general meeting of shareholders. In accordance with the Articles of Incorporation, the Board is composed of a minimum of three and a maximum of fifteen members, whose term of office shall not exceed three years (a year for that purpose meaning the period between two ordinary general meetings of shareholders). Each member’s term of office is determined upon his or her election, and there are no limits on re-election.
At the Company’s third ordinary general meeting of shareholders held on 23 May 2011, all present members of the Board were re-elected (each by separate vote) for a term of one year. At the upcoming ordinary general meeting of shareholders to be held on 7 May 2012, all of them, except Mr. Sheta, will stand for re-election (expected to take place by separate vote) for an additional term of one year.
Internal organizational structure
BoardThe Board of Directors governs the Company and is ultimately responsible for the Company’s business strategy and management. It has the authority to decide on all corporate matters not reserved by law or the Articles of Incorporation to the general meeting of shareholders or to another body.
Subject to its inalienable duties pursuant to the law and to a number of additional matters, the Board has delegated the management of the Company’s business to the CEO. The Board appoints the CEO and the other members of Executive Management.
The Board of Directors constitutes itself autonomously and appoints its Chairman and secretary, who does not have to be a member of the Board. It may deliberate if a majority of members are present at a meeting. Decisions are taken by the majority of votes cast. In case of a deadlock, the Chairman has a casting vote. A Board member shall abstain from voting if he or she has a personal interest in a matter other than an interest in his or her capacity as shareholder of the Company.
In order to ensure good corporate governance and a balance of leadership and control for the Company, a Lead Director has been appointed. The Lead Director must be non-executive, and is elected by the Board of Directors for a term of one year. He has the right to access any files or records of the Company or to solicit information from any member of Executive Management at any time.
None of the non-executive members of the Board of Directors held executive positions with Orascom Development during the three financial years preceding the year under review. Other than as individually mentioned above, none of these members, and no enterprise or organization represented by them, maintains any substantial business relationship with an Orascom Development subsidiary.
Name Function Nationality Birth EM/ NEM Elected first Elected untilAudit Committee
Nomination & Comp. Committee
Samih O. Sawiris Chairman EGY 1957 EM 2008 2012 - -
Amr Sheta Member EGY 1967 EM 2008 2012 - -
Adil Douiri Member MOR 1963 NEM 2008 2012 Member -
Franz Egle Member CH 1957 NEM 2008 2012 - -
Luciano GabrielMember, Lead Director
CH 1953 NEM 2008 2012 Chair Chair
Carolina Müller-Möhl Member CH 1968 NEM 2008 2012 - Member
Jean-Gabriel Pérès Member F 1957 NEM 2008 2012 Member Member
Nicholas Cournoyer Member UK / US 1958 NEM 2011 2012 - -
Members of the board
1 EM = Executive Member; NEM = Non-Executive Member
CommitteesTwo permanent committees have been formed to support the Board of Directors; these are the Audit Committee and the Nomination & Compensation Committee. The Lead Director chairs either of the permanent committees. The duties and competences of either committee are as below.
Audit CommitteeThe Audit Committee consists of three or more non-executive members of the Board of Directors as determined by the Board. The three Audit Committee members currently appointed have broad experience in finance and accounting on the basis of their professional backgrounds. The Lead Director is a member ex officio of the Audit Committee.
The mission of the Audit Committee is to assist the Board of Directors in the discharge of its responsibilities with respect to financial reporting and audit. The committee reports and issues recommendations to the Board regarding yearly and interim financial statements, the auditing process, the internal control system, the integrity and effectiveness of the Company’s external and internal auditors and other topics submitted to it by the Board from time to time. The Audit Committee has no decision making power.
Nomination & Compensation CommitteeThe Nomination & Compensation Committee consists of three or more non-executive members of the Board of Directors as determined by the Board. Currently, the Nomination & Compensation Committee consists of three members. The Lead Director is a member ex officio of the Nomination & Compensation Committee. The mission of the Committee is to assist the Board of Directors in the discharge of its responsibilities and to discharge certain responsibilities of the Board relating to compensation and nomination of members of the Board and of Executive Management.
The committee has decision-making power regarding matters of the compensation of executive members of the Board of Directors and members of Executive Management. The committee issues recommendations to the Board without having decision-making power regarding other matters of compensation, the nomination of Board members and members of Executive Management, and other topics submitted to by the Board for the committee’s consideration.
70 | Orascom DevelopmentAnnual Report 2011 | 71
Work methods of the Board of Directors and its committeesInvitations to attend meetings of the Board of Directors are extended by the Chairman or the secretary. Any member of the Board may request the Chairman to convene a meeting. The members of the Board and the committees are provided with all necessary supporting material before a meeting is held, enabling them to prepare for discussion of the relevant agenda items.
Pursuant to their respective Charters, the committees of the Board of Directors convene at least once (in the case of the Nomination & Compensation Committee) or twice a year (in the case of the Audit Committee), but can be summoned by their respective chairman as often as the business requires.
Meetings of the Audit Committee may, upon invitation by its chairman and in an advisory function, be attended by members of Executive Management. The Company’s auditors are in regular contact with the chairman of the Audit Committee and have the right to have items added to its agenda.
In the 2011 financial year, the Board of Directors convened for 11 meetings, and passed 1 circular resolution. Of the 11 meetings, there were four physical meetings, and seven were meetings held by telephone conference. The Audit Committee convened for two physical meetings. The Nomination & Compensation Committee convened for three meetings, one was a physical meeting, and two were meetings held by telephone conference. Certain members of the Executive Management, in particular the CEO and the CFO, participated in several meetings of the Board and the committees. Physical meetings of the Board as well as the Audit Committee and the Nomination & Compensation Committee typically lasted approximately from three to five hours, while telephone conferences typically lasted from thirty minutes to one hour.
Definition of areas of responsibilityBased on the provision of Art. 15 of the Articles of Incorporation governing the delegation of duties, the Board of Directors has entrusted the preparation and the execution of certain of its decisions, the supervision of certain tasks, as well as certain decision-making powers to the permanent committees. The Board has delegated the management of the Company’s business to the CEO, who may further delegate any of his duties and competencies to Executive Management and other members of the Company’s management although the CEO remains fully responsible for all duties and competencies delegated to him by the Board.
Excluded from such delegation to the CEO are the inalienable duties of the Board as defined by law (art. 716a para. 1 of the Swiss Code of Obligations), the duties of the Board’s permanent committees (as described above), and decisions on the following matters which remain reserved to the Board:
1. The approval of the issuance of securities or other capital market transactions, and the entering into loan agreements in excess of CHF 80 million;
2. The approval of investments and acquisitions (including land acquisitions, whether by way of contract or by rights in rem, or acquisitions of companies and participations in companies) as well as divestments, dispositions and asset disposals in excess of CHF 20 million;
3. The entering into agreements with a value in excess of CHF 20 million (subject to 1. above);
4. The provision of guarantees, suretyships, liens and pledges and other security in excess of CHF 20 million;
5. The approval of inter-company agreements of a value exceeding CHF 20 million.
Information and control instruments vis-a-vis senior managementTo ensure comprehensive information of the Board of Directors on the performance of the functions delegated by it, members of Executive Management and other senior managers are regularly invited by the Chairman or the Lead Director to attend meetings of the Board, or to participate when individual agenda items are discussed. For example, during the year under review, the CEO and the CFO were present at all physical meetings of the Board of Directors. Also during the year under review, individual Board members supported Executive Management in various projects. Furthermore, Board members cultivate a regular informal exchange of ideas with Company management and regularly visit the Company’s locations. In May 2011, for instance, the Board visited the project in Andermatt, Switzerland.
An internal audit and controlling function is maintained at group level, which during the year under review performed several group-wide audits and controls throughout the various legal entities and at the different locations where the group is active. In each case a report of major findings was presented to and discussed with the management on the entity level, and corrective action was agreed. The agreed-upon
action was followed up on and documented. In order to ensure the information of the governing bodies, a summarized report in respect to each audit was sent to Executive Management and executive members of the Board, including the most material points to be addressed in the short term. The internal audit and controlling function and the Company’s statutory auditors regularly liaise throughout the year to coordinate their activities.
The company employs a Management Information System (MIS) which provides Company management (including the Executive Management and executive members of the Board) with monthly, quarterly, semi-annual and annual reports for the different entities and segments within the Group. Other members of the Board receive reports on a quarterly basis or upon request. These results are then consolidated per division and at group level. Subsequently, the results are compared to the previous financial year and budgets and projections are updated on a quarterly basis. Key performance indicator reports are also produced for the various segments on a monthly, quarterly and annual basis and submitted to management for necessary comparison to the budgeted figures and previous results. Based on those reports the Board is informed in subsequent meeting of substantial deviations. Justifications are requested and corrective action is taken where necessary.
A system to automatically generate all MIS reports from the existing financial system became fully operational during 2011.
In respect of the Company’s system of risk assessment and management, please also refer to Note 37 (Risk Assessment Disclosure Required by Swiss Law) to the consolidated financial statements (page F-69) and Note 13 (Risk Assessment) to the stand-alone financial statements (p. F-92).
Executive Management meetings, chaired by the CEO, are held on a (at least) monthly basis in which performance of operating projects is reviewed alongside the budget and previous financial year. Key performance indicators are reviewed as described in the preceding paragraph. Updates on new projects, whether off-plan or under construction, are shared and future steps agreed.
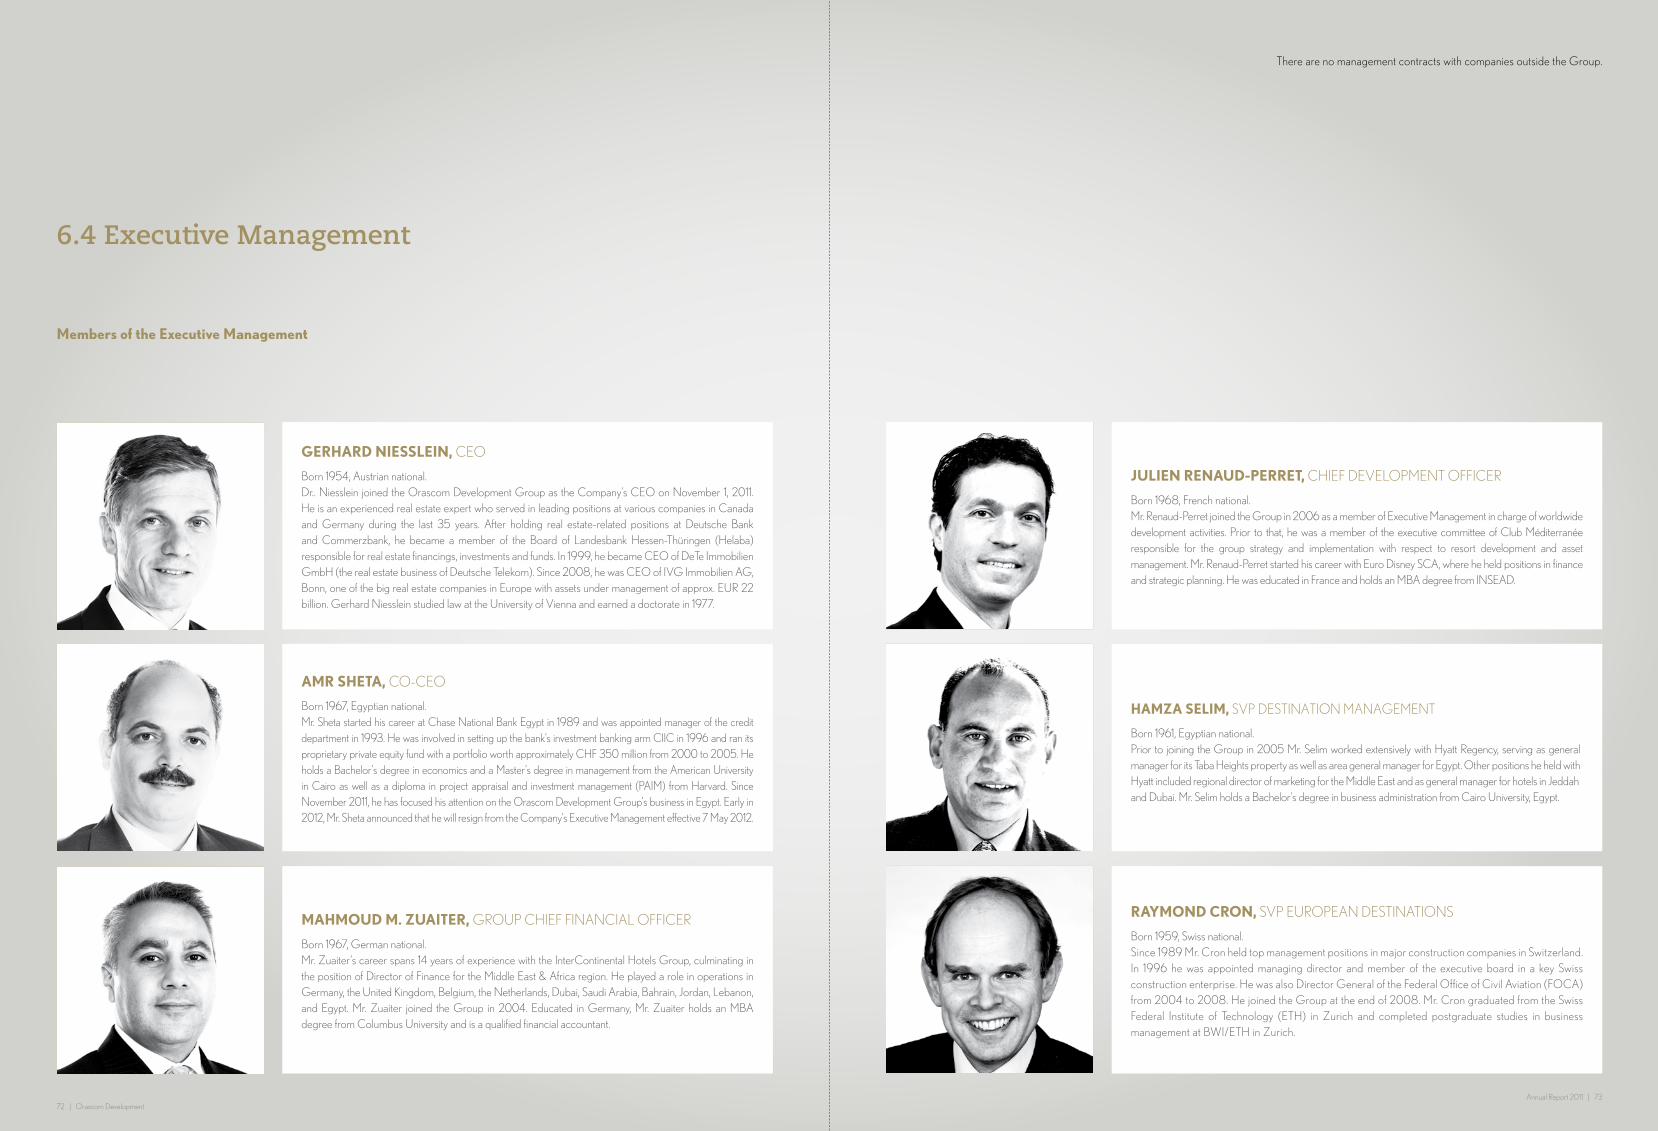
72 | Orascom DevelopmentAnnual Report 2011 | 73
GERHARD NIESSLEIN, CEO
Born 1954, Austrian national. Dr.. Niesslein joined the Orascom Development Group as the Company’s CEO on November 1, 2011. He is an experienced real estate expert who served in leading positions at various companies in Canada and Germany during the last 35 years. After holding real estate-related positions at Deutsche Bank and Commerzbank, he became a member of the Board of Landesbank Hessen-Thüringen (Helaba) responsible for real estate financings, investments and funds. In 1999, he became CEO of DeTe Immobilien GmbH (the real estate business of Deutsche Telekom). Since 2008, he was CEO of IVG Immobilien AG, Bonn, one of the big real estate companies in Europe with assets under management of approx. EUR 22 billion. Gerhard Niesslein studied law at the University of Vienna and earned a doctorate in 1977.
JULIEN RENAUD-PERRET, CHIEF DEVELOPMENT OFFICER
Born 1968, French national.Mr. Renaud-Perret joined the Group in 2006 as a member of Executive Management in charge of worldwide development activities. Prior to that, he was a member of the executive committee of Club Méditerranée responsible for the group strategy and implementation with respect to resort development and asset management. Mr. Renaud-Perret started his career with Euro Disney SCA, where he held positions in finance and strategic planning. He was educated in France and holds an MBA degree from INSEAD.
AMR SHETA, CO-CEO
Born 1967, Egyptian national.Mr. Sheta started his career at Chase National Bank Egypt in 1989 and was appointed manager of the credit department in 1993. He was involved in setting up the bank’s investment banking arm CIIC in 1996 and ran its proprietary private equity fund with a portfolio worth approximately CHF 350 million from 2000 to 2005. He holds a Bachelor’s degree in economics and a Master’s degree in management from the American University in Cairo as well as a diploma in project appraisal and investment management (PAIM) from Harvard. Since November 2011, he has focused his attention on the Orascom Development Group’s business in Egypt. Early in 2012, Mr. Sheta announced that he will resign from the Company’s Executive Management effective 7 May 2012.
HAMZA SELIM, SVP DESTINATION MANAGEMENT
Born 1961, Egyptian national.Prior to joining the Group in 2005 Mr. Selim worked extensively with Hyatt Regency, serving as general manager for its Taba Heights property as well as area general manager for Egypt. Other positions he held with Hyatt included regional director of marketing for the Middle East and as general manager for hotels in Jeddah and Dubai. Mr. Selim holds a Bachelor’s degree in business administration from Cairo University, Egypt.
6.4 Executive Management
Members of the Executive Management
MAHMOUD M. ZUAITER, GROUP CHIEF FINANCIAL OFFICER
Born 1967, German national.Mr. Zuaiter’s career spans 14 years of experience with the InterContinental Hotels Group, culminating in the position of Director of Finance for the Middle East & Africa region. He played a role in operations in Germany, the United Kingdom, Belgium, the Netherlands, Dubai, Saudi Arabia, Bahrain, Jordan, Lebanon, and Egypt. Mr. Zuaiter joined the Group in 2004. Educated in Germany, Mr. Zuaiter holds an MBA degree from Columbus University and is a qualified financial accountant.
RAyMOND CRON, SVP EUROPEAN DESTINATIONS
Born 1959, Swiss national.Since 1989 Mr. Cron held top management positions in major construction companies in Switzerland. In 1996 he was appointed managing director and member of the executive board in a key Swiss construction enterprise. He was also Director General of the Federal Office of Civil Aviation (FOCA) from 2004 to 2008. He joined the Group at the end of 2008. Mr. Cron graduated from the Swiss Federal Institute of Technology (ETH) in Zurich and completed postgraduate studies in business management at BWI/ETH in Zurich.
There are no management contracts with companies outside the Group.

74 | Orascom DevelopmentAnnual Report 2011 | 75
6.5 Compensation, shareholdings and loans
ABDALLA ELNOCKRASHy, HEAD OF SEGMENT REAL ESTATE
Born 1960, American national.Prior to joining the Orascom Development Group in 2006, Mr. ElNockrashy served as executive vice president with Power Group INT (PGI) in the United States for three years. From 1997 to 2004, he held the position of regional director of sales and marketing with Polaris Industries, a U.S. producer of power sports vehicles. Earlier in his career, Mr. ElNockrashy spent thirteen years with Goodyear Tires and Rubber Company. He holds an MBA degree from the University of Phoenix and a BA degree in business administration from the American University in Cairo.
CLAUDE CHESNAIS, HEAD OF SEGMENT HOTELS
Born 1951, French national.Mr. Chesnais is responsible for the Orascom Development Group’s hospitality and hotel operations. Prior to joining Orascom, Mr. Chesnais for the major part of his career worked with Hilton International, where he held various managerial responsibilities for over 25 years, finally as vice president operations for the Gulf and Arabian Peninsula based in Dubai. Thereafter, he held the position of executive vice president for the Middle East with Helnan International Hotels, and lately, from 2003 to 2006, he was the managing director at Iberotel Egypt, a TUI company.
Other members of senior management attending the executive managment meeting
For detailed information on compensation paid to members of the Board of Directors and of Executive Management for the financial year 2011, and on shares and options held by and loans granted to these persons as at 31 December 2011, please refer to Note 12.1 (Board and Executive Compensation Disclosures as Required by Swiss Law) to the consolidated financial statements.
The compensation of the members of the Board of Directors and of Executive Management is determined as specified below. The Company does not have any formal stock ownership or option plans for members of the Board of Directors or Executive Management. It does not employ external advisors or systematically use external benchmarks for fixing compensation.
Board of Directors: In respect of the compensation of Board members for their service on the Board of Directors and on its committees, the Board decided in 2008, in its discretion, on the amount of the annual remuneration per member (CHF 160’000 for all Board members, except for the Lead Director in whose case the amount is CHF 185’000), and on the form in which that remuneration is discharged (i.e. half in cash and half in the form of shares of the Company). This decision of the Board, in which all Board members participated at the time, remained in effect for the 2011 financial year. The shares of the Company allocated to the members of the Board as compensation are, for that purpose, purchased by the Company in the market, and their valuation (for purposes of the calculation of the number of shares allocated to each member) is based on the average purchase price paid by the Company.
Executive Management: Compensation of the members of Executive Management (including the executive members of the Board of Directors), for their service in Executive Management, consists of a base salary which is annually reviewed, and a bonus payment which is annually determined, as further described below. The initial base salaries of the members of Executive Management were either (in case of members who have served in that capacity since the Company was formed in 2008) carried over from their previous employment with Orascom Hotels & Development S.A.E., or (in case of members appointed at a later time) they were determined in a discretionary decision of the CEO and Co-CEO approved by the Nomination & Compensation Committee.
In respect of the annual salary review and bonus determination, proposals by the executive members of the Board are presented to the Nomination & Compensation Committee which discusses such proposals, approves them if deemed fit, and subsequently informs the Board on its decisions. Members of Executive Management do not have a right to attend meetings of the Nomination & Compensation Committee at which decisions are taken in respect of their compensation, or otherwise to participate in the decision process (except for the executive members of the Board who make proposals to the Committee for their own compensation).
Salary Review: The annual proposals and decisions concerning the development of the base salaries of members of Executive
Management are based on an evaluation of the individual performance of each member, as well as of the performance of the business area for which he is responsible (in case of the executive members of the Board and the CEO, the performance of the Orascom Development Group as a whole). The executive members of the Board form the respective proposals in their discretion, based on their judgment of the relevant individuals’ and business areas’ achievements.
Bonus: In late 2010, the Board of Directors approved a formal bonus policy (“Policy”) for the group, which has applied as from the 2011 financial year (see, however, below in respect of a waiver of bonuses for 2011) and covers the members of Executive Management as well as lower levels of management.
For members of Executive Management, the Policy provides that their target bonus may be in the range of 0-75% of their base salary, and that it may be paid in cash or (for 50% of the bonus at most) in the form of unrestricted shares of the Company. Details in respect of compensation paid in the form of shares, if any, remain to be defined separately.
The amount of the bonus paid to members of Executive Management for a particular year (percentage of the target bonus) is determined, pursuant to the Policy, based on two categories of targets:
• Firstly, a target figure for the group’s EBTDA (Earnings Before Tax, Depreciation and Amortization, excluding revaluations) is annually defined, the achievement of which determines the bonus entitlement of the members of Executive Management in respect of three fourths of the target bonus. The entitlement for this part of the bonus rises, in defined steps, from 0% (in case of achievement of less than 95% of the EBTDA target) to 100% (in case of achievement of 99-101% of the target) and further to a maximum of 150% (in case of achievement of more than 110% of the target).
• Secondly, several individual bonus targets are set for members of Executive Management in the beginning of each year, which in the aggregate determine the member’s entitlement in respect of one fourth of the target bonus (e.g. where five individual targets are set, each target will determine the entitlement to 5% of the target bonus). Such individual targets comprise both quantitative and qualitative targets. While individual quantitative targets can only be achieved or not achieved, the qualitative targets admit of partial achievement in steps of 33, 50, 67 and 100%, leading to respective percentages of entitlement.
Example: If, in a particular year, the Orascom Development Group has achieved 98% of its target for EBTDA, and an individual member of Executive Management has, out of five individually set bonus targets, achieved three, failed to achieve one, and achieved one (qualitative) target to 50%, then his bonus entitlement will be as follows: (80% of 75%) + (70% of 25%) = 60% + 17.5% = 77.5% of his target bonus.
Due to the exceptionally difficult economic environment during the year under review, all members of the Executive Management have waived the entitlement to any bonus for 2011.
The following members of the Company’s senior management, although not members of Executive Management, are regularly invited to participate in Executive Management meetings as guests:
76 | Orascom DevelopmentAnnual Report 2011 | 77
Voting rights and representation restrictionsWith the exception of restrictions on the transferability of shares (see Section 6.2 above), there are no limitations on voting rights. At a general meeting of shareholders, each share entitles its owner to one vote. By means of a written proxy, each shareholder may be represented by a third person who need not himself be a shareholder.
Statutory quoraAccording to Art. 10 of the Articles of Incorporation, the holders of at least 25 percent of issued shares must be present or represented at an ordinary general meeting of shareholders for the meeting to be validly constituted. Similarly, holders of at least 50 percent of issued shares must be present or represented at an extraordinary general meeting of shareholders for the meeting to be validly constituted.
Resolutions are generally passed, in the case of an ordinary general meeting of shareholders (except for matters subject to a higher majority requirement by law), with the absolute majority of the shares represented. In the case of an extraordinary general meeting of shareholders, resolutions are generally passed with a majority of two thirds of the shares represented.
Resolutions relating to the following matters, however, require a majority of 75 percent of shares represented at the meeting: (a) capital increases pursuant to art. 650 CO and reductions of the share capital pursuant to art. 732 CO; (b) dissolving the Company before its termination date or changing its duration (which pursuant to the Articles of Incorporation is 99 years from its formation); (c) changing the Company’s purpose; and (d) any merger with another company.
Convocation of the general meeting of shareholdersAn ordinary general meeting of shareholders is to be held annually following the close of the financial year. It is called by the Board of Directors or, if necessary, by the auditors. Extraordinary general meetings may be called by the Board of Directors, the auditors, the liquidators, or by the general meeting of shareholders itself.
One or more shareholders representing at least 10 percent of the share capital may request in writing that the Board of Directors call an extraordinary general meeting of shareholders. The request must state the purpose of the meeting and the agenda to be submitted. General meetings of shareholders are held at the statutory seat of the Company or at such other place as determined by the Board of Directors.
Notice of a general meeting of shareholders is given by means of a single publication in the Swiss Commercial Gazette (Schweizerisches Handelsamtblatt) or by registered letter to the shareholders of record. There must be a time period of not less than 20 days between the day of the publication or the mailing of the notice and the scheduled date of the meeting. The notice of the general meeting of shareholders must indicate the agenda and the motions by the Board of Directors.
6.6 Shareholders’ participation 6.8 External Auditors 6.9 Information Policy
6.7 Changes of control and defense measures
AgendaShareholders who represent shares with a par value of at least CHF 1,000,000 may request that an item be placed on the agenda. The request must be communicated to the Board of Directors in writing, stating the item to be placed on the agenda and the shareholder’s corresponding motion, at least 45 days prior to the general meeting of shareholders.
Record date for entry into the share registerIn order to be entitled to participate at the 2012 ordinary general meeting of shareholders, a holder of registered shares need be inscribed in the share register as a shareholder with voting rights by 25 April 2012.
In CHF 2011 2010
Audit Services 2,401,507 2,522,155
Tax Services - 55,000
Public offering - 329,344
Other services 12,000 -
Total non-audit services 12,000 384,344
Total fees 2,413,507 2,906,499
Duty to make an offerThe Articles of Incorporation do not provide for any “opting out” or “opting up” arrangements within the meaning of Art. 22 and Art. 32 SESDA.
Clauses of change of controlNo change of control clauses have been agreed upon.
Duration of the mandate and term of office of the lead auditorSince the foundation of the Company on 17 January 2008, Deloitte AG, Zurich, have been the statutory auditors with responsibility for the audit of the Company’s non-consolidated and consolidated financial statements. The Company’s subsidiary OHD is audited by Deloitte Saleh, Barsoum & Abdel Aziz, Cairo. The auditor in charge for the Company at Deloitte AG, Hans-Peter Wyss, took up office as of the 2008 financial year. A rotation cycle of 7 years is foreseen for the position of the auditor in charge. The Board of Directors will propose to the ordinary general meeting of shareholders on 7 May 2012 to re-elect Deloitte AG, Zurich as the statutory auditors for the 2012 financial year.
Auditing feesDeloitte received the following fees for their services as the statutory auditors of the Company and the majority of Orascom Development Group companies on the one hand, and for non-audit services on the other hand:
The Chairman, the CEO (as of November 2011), the CFO, and the Investor Relations department took care of the communication with investors during 2011. The company intends to update the financial community through personal contacts, discussions, and presentations held throughout various road shows and investor conferences.
The financial reporting system comprises of quarterly, interim (semi-annual) and annual reports. Consolidated financial statements are prepared in accordance with International Financial Reporting Standards (IFRS) in compliance with Swiss law and the rules of the SIX Swiss Exchange.
In addition, the Company utilizes electronic news releases to report the latest changes and developments to ensure equal treatment for all capital market participants.
Corporate Calendar
Annual general meeting of shareholders: 7 May 2012
First quarter 2012 results: 30 May 2012
Second quarter 2012 results: 29 Aug 2012
Third quarter 2012 results: 29 Nov 2012
Further information and contact
Investors and other interested stakeholders can find further information on the Orascom Development Group online at www.orascomdh.com.
Direct links to the pages where news releases of the Company (including news releases issued pursuant to ad-hoc publicity rules) are available at www.orascomdh.com/en/media-center/news.html.
Stakeholders may subscribe to the Company’s e-mail alert service to receive news releases at www.orascomdh.com/en/media-center/news-alert.html.
Investors may also contact the Investor Relations department as follows:
Till Leisner+41 41 874 88 07
as well as
Mamdouh Abdel Wahab+41 798 465 560
Informational instruments pertaining to the external auditThe Board of Directors’ Audit Committee has the task of ensuring the effective and regular supervision of the statutory auditors’ reporting with the aim of ensuring its integrity, transparency and quality.
In advance of each financial year, the proposed auditing schedule is presented to and discussed with the Audit Committee. After each audit important observations by the statutory auditors, together with appropriate recommendations, are presented to the Audit Committee (after discussions with the CFO) during its relevant meeting. Subsequently, members of the Audit Committee receive the statutory auditors’ management letter in final form. During the year, the statutory auditors are in regular contact with the chairman of the Audit Committee to discuss matters arising in the performance of their task, e.g. during the 2011 financial year, they convened for four meetings with the Committee chairman, physically or in some of the cases by telephone conference.
Based on these communications the Audit Committee discusses its impression of the integrity and effectiveness of the statutory auditors’ work, and issues a recommendation to the Board concerning the proposal to the general meeting of shareholders whether to re-elect the statutory auditors for the following year. In its assessment, the Audit Committee places particular value on demonstrated independence and willingness to identify and challenge assumptions underlying the financial reporting, and the timely completion of audits permitting the Company to comply with its reporting obligations and its corporate communications calendar.
In the year under review, representatives of the statutory auditors participated in one meeting of the Board of Directors as well as in both Audit Committee meetings (in which the Company’s internal auditor also participated).
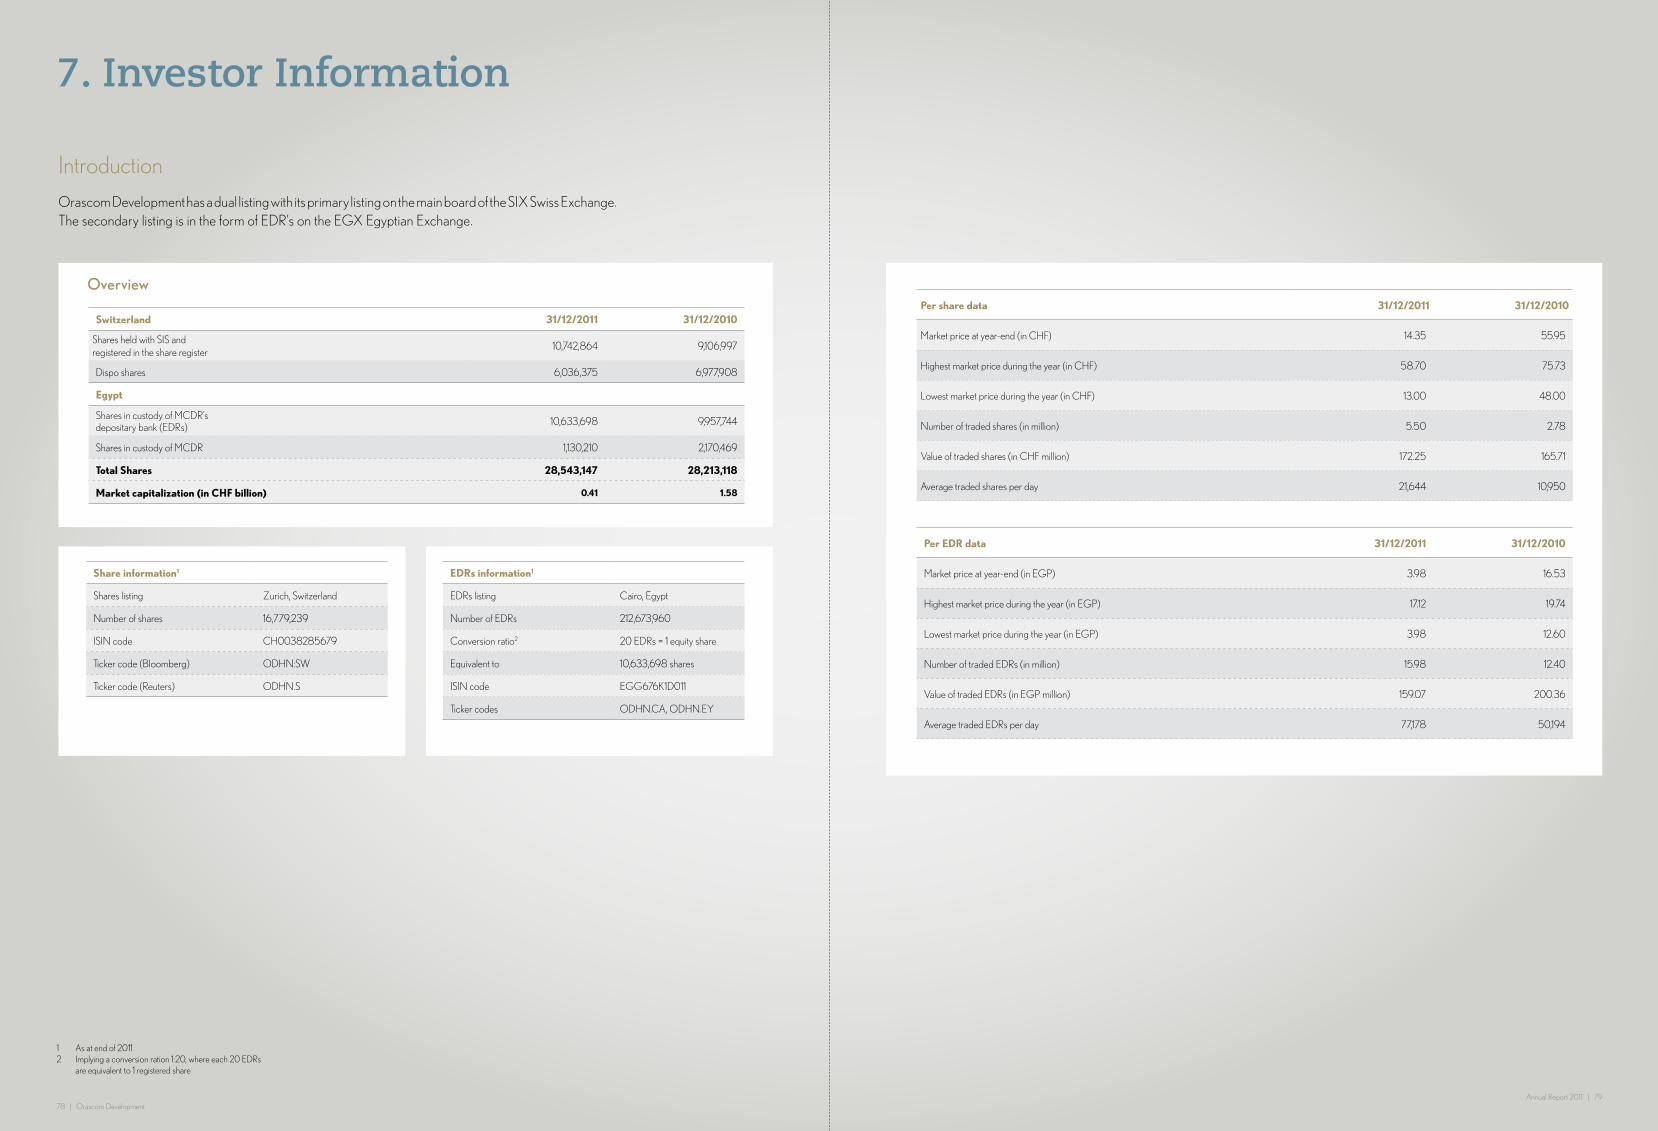
78 | Orascom DevelopmentAnnual Report 2011 | 79
7. Investor Information
Introduction
Orascom Development has a dual listing with its primary listing on the main board of the SIX Swiss Exchange. The secondary listing is in the form of EDR’s on the EGX Egyptian Exchange.
Overview
Switzerland 31/12/2011 31/12/2010
Shares held with SIS and registered in the share register
10,742,864 9,106,997
Dispo shares 6,036,375 6,977,908
Egypt
Shares in custody of MCDR’s depositary bank (EDRs) 10,633,698 9,957,744
Shares in custody of MCDR 1,130,210 2,170,469
Total Shares 28,543,147 28,213,118
Market capitalization (in CHF billion) 0.41 1.58
Share information1
Shares listing Zurich, Switzerland
Number of shares 16,779,239
ISIN code CH0038285679
Ticker code (Bloomberg) ODHN:SW
Ticker code (Reuters) ODHN.S
EDRs information1
EDRs listing Cairo, Egypt
Number of EDRs 212,673,960
Conversion ratio2 20 EDRs = 1 equity share
Equivalent to 10,633,698 shares
ISIN code EGG676K1D011
Ticker codes ODHN.CA, ODHN.EY
Per EDR data 31/12/2011 31/12/2010
Market price at year-end (in EGP) 3.98 16.53
Highest market price during the year (in EGP) 17.12 19.74
Lowest market price during the year (in EGP) 3.98 12.60
Number of traded EDRs (in million) 15.98 12.40
Value of traded EDRs (in EGP million) 159.07 200.36
Average traded EDRs per day 77,178 50,194
Per share data 31/12/2011 31/12/2010
Market price at year-end (in CHF) 14.35 55.95
Highest market price during the year (in CHF) 58.70 75.73
Lowest market price during the year (in CHF) 13.00 48.00
Number of traded shares (in million) 5.50 2.78
Value of traded shares (in CHF million) 172.25 165.71
Average traded shares per day 21,644 10,950
1 As at end of 20112 Implying a conversion ration 1:20, where each 20 EDRs are equivalent to 1 registered share

80 | Orascom DevelopmentAnnual Report 2011 | 81
Shareholding StructureA) Shares
Distribution of shareholdings1
Number of shareholders
Number of shares
1 10 383 2,666
11 100 1,349 73,569
101 1,000 1,711 601,483
1,001 10,000 238 596,358
10,001 100,000 33 844,223
100,001 1,000,000 8 3,139,617
1,000,001 999,999,999 1 5,484,948
Total 3,723 10,742,864
Distribution of EDRs Holdings1
Number of shareholders
Number of shares
1 10 43 201
11 100 85 4,762
101 1,000 633 322,836
1,001 10,000 695 2,693,672
10,001 100,000 179 5,549,012
100,001 1,000,000 36 9,140,923
1,000,001 999,999,999 8 194,962,554
Total 1,679 212,673,960
Shareholders by country
CountryNumber of
shareholdersNumber of
shares
Egypt 6 6,009,244
Switzerland 3,667 2,187,959
United Kingdom 7 1,909,161
United States of America 4 387,697
Virgin Islands (British) 1 124,441
United Arab of Emirates 2 59,946
Belgium 1 23,644
Germany 13 9,982
Ireland 3 7,566
Netherlands 1 6,314
Austria 4 5,060
Singapore 2 3,300
Luxembourg 1 2,400
Liechtenstein 3 1,510
Malta 1 1,500
Thailand 1 810
Brazil 2 800
Denmark 1 700
Bahamas 1 500
Spain 1 200
France 1 130
Total 3,723 10,742,864
EDRs holders by country
CountryNumber of
shareholdersNumber of
shares
Egypt 1,614 177,632,959
United Kingdom 11 22,672,498
Saudi Arabia 16 11,117,520
Cayman Islands 1 400,841
Germany 3 265,520
France 2 240,000
Canada 3 122,660
Netherlands 2 75,100
Lebanon 3 29,016
Jordan 5 26,235
Bahrain 1 22,948
United States of America 5 22,331
Syria 1 13,839
Malaysia 1 9,100
Oman 1 8,240
Italy 1 6,250
Palestine 5 6,170
India 1 1,650
Thailand 1 1,060
United Arab of Emirates 1 19
Switzerland 1 4
Total 1,679 212,673,960
Name of major shareholders 2011 2010
Number of shares issued
Percentage of ownership (%)
Number of shares issued
Percentage of ownership (%)
Samih Sawiris 9,364,872 32.81 8,717,995 30.90
Thursday Holding Ltd. (controlled by Mr. Samih Sawiris' family) 7,142,941 25.03 7,142,941 25.32
SOS Holding Ltd. (controlled by Mr. Samih Sawiris' family) 1,126,508 3.95 1,126,508 3.99
Janus Capital Management LLC 1,533,538 5.37 1,524,707 5.40
Blue Ridge Capital Holdings LLC and Blue Ridge Capital Offshore Holdings LLC - - 1,059,174 3.75
Others 9,375,288 32.85 8,641,793 30.63
Total 28,543,147 100.00 28,213,118 100.00
Shareholders by type
CategoriesNumber of
shareholdersNumber of
shares
Legal entities 86 6,957,017
Banks 28 2,070,711
Individuals 3,554 1,201,570
Funds 28 390,980
Pension funds 18 106,423
Other foundations 9 16,163
Total 3,723 10,742,864
EDRs holders by type
CategoriesNumber of
EDRs HoldersNumber of
EDRs
Individuals 1,623 177,603,633
Legal entities 29 29,458,204
Funds 12 2,000,597
Other foundations 9 1,693,901
Banks 4 1,677,625
Pension funds 2 240,000
Total 1,679 212,673,960
B) EDRs
Research coverage
Bank Sarasin Patrick Hasenböhler [email protected] T: +41 44 213 94 81
EFG-Hermes Jan Pawel Hasmann [email protected] T: + 20 23 332 11 39
Goldman Sachs Eshan Toorabally [email protected] T: +97 14 42 823 84
HSBC Patrick Gaffney [email protected] T: +97 14 423 69 30
HC Nemat Choucri [email protected] T: +20 23 535 73 52
Nermeen Abdel Gawad [email protected] T: +20 23 749 60 08
UBS Jean-Francois Meymandi [email protected] T: +41 44 239 79 21
Zürcher Kantonalbank Marco Strittmatter [email protected] T: +41 44 292 35 64
Investor Contacts
Till Leisner Head of Group Controlling & Investor Relations T: +41 41 874 88 07
Mamdouh Abdel Wahab Director Investor Relations M: +41 79 846 55 60
M: +20 12 231 53 200
[email protected] For publications and further information visit http://www.orascomdh.com/en/investor-relations
Significant Shareholders
1 Overview of significant shareholders as at 31 December 2011
1 Distribution of registered shares as of 31 December 2011
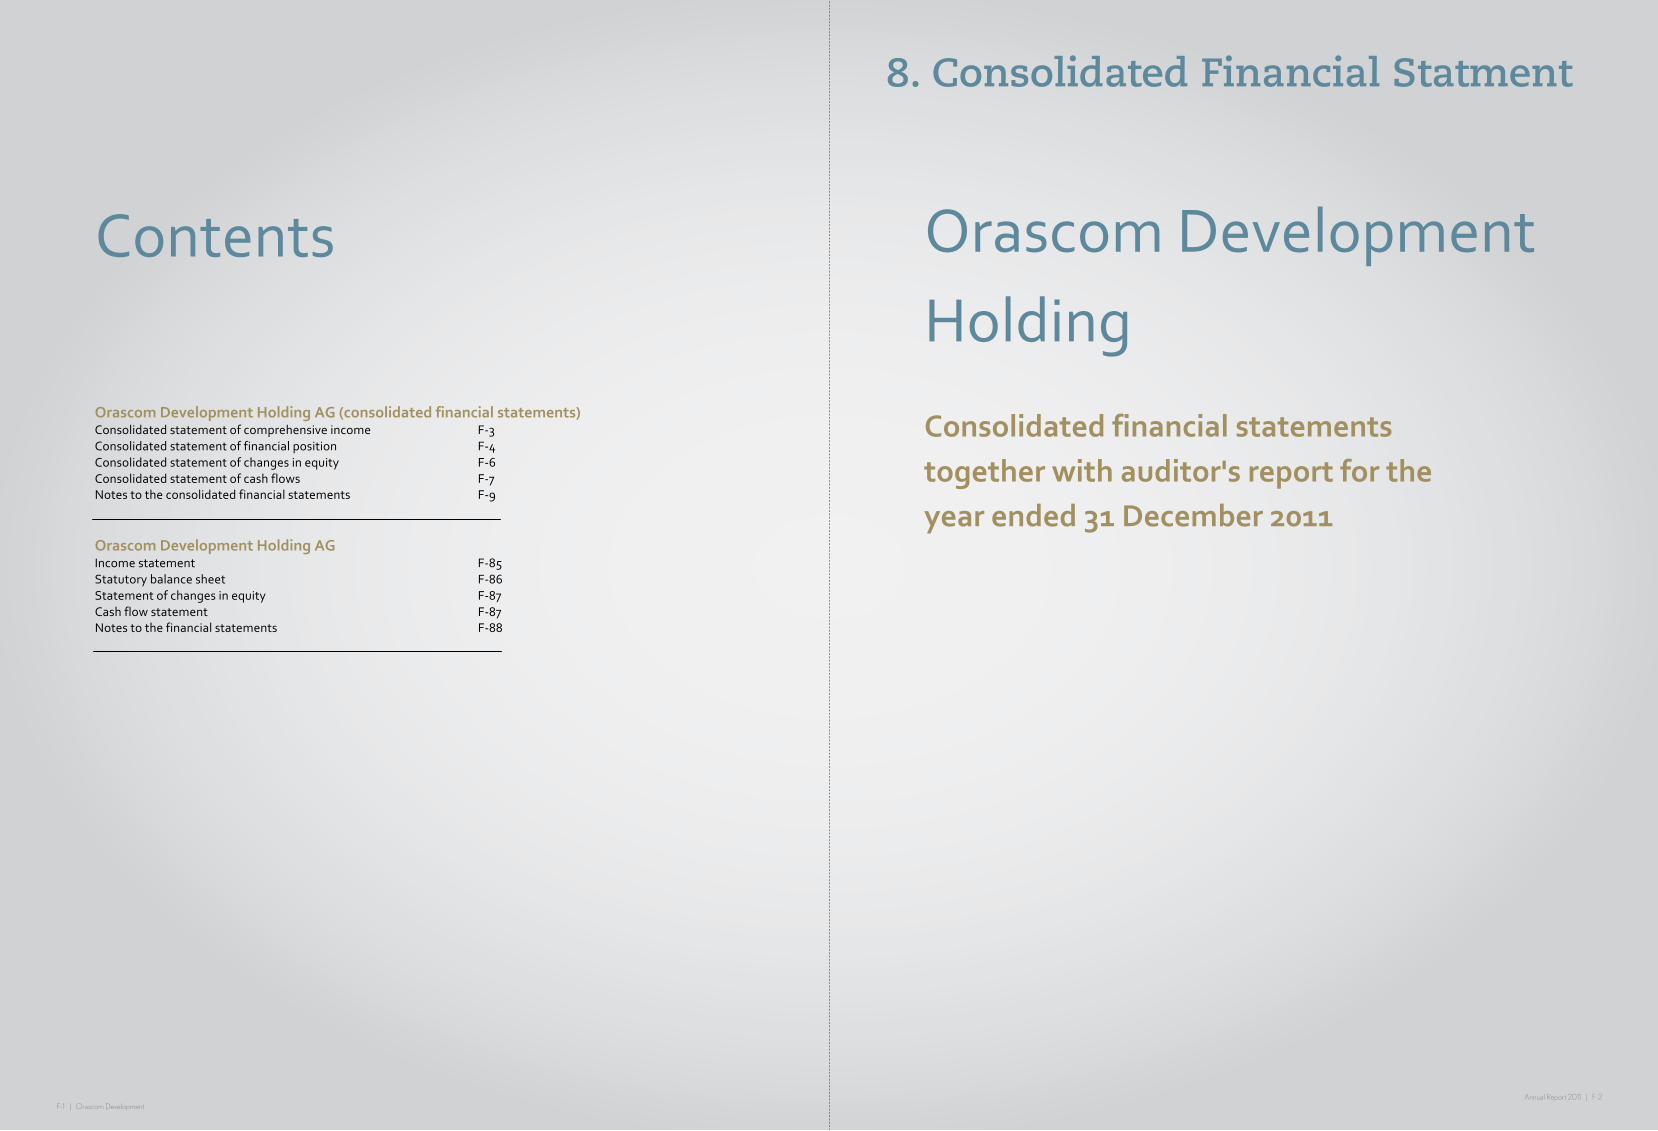
F-1 | Orascom DevelopmentAnnual Report 2011 | F-2
8. Consolidated Financial Statment
F-‐1
Contents
Orascom Development Holding AG (consolidated financial statements) Consolidated statement of comprehensive income F-‐3 Consolidated statement of financial position F-‐4 Consolidated statement of changes in equity F-‐6 Consolidated statement of cash flows F-‐7 Notes to the consolidated financial statements F-‐9 Orascom Development Holding AG Income statement F-‐85 Statutory balance sheet F-‐86 Statement of changes in equity F-‐87 Cash flow statement F-‐87 Notes to the financial statements F-‐88 Filename/Version: ODH -‐ 2011 Financial Statements v18(03.04.2012) D
Date/Time: 04/04/2012 02:00
F-‐2
Orascom Development Holding
Consolidated financial statements together with auditor's report for the year ended 31 December 2011
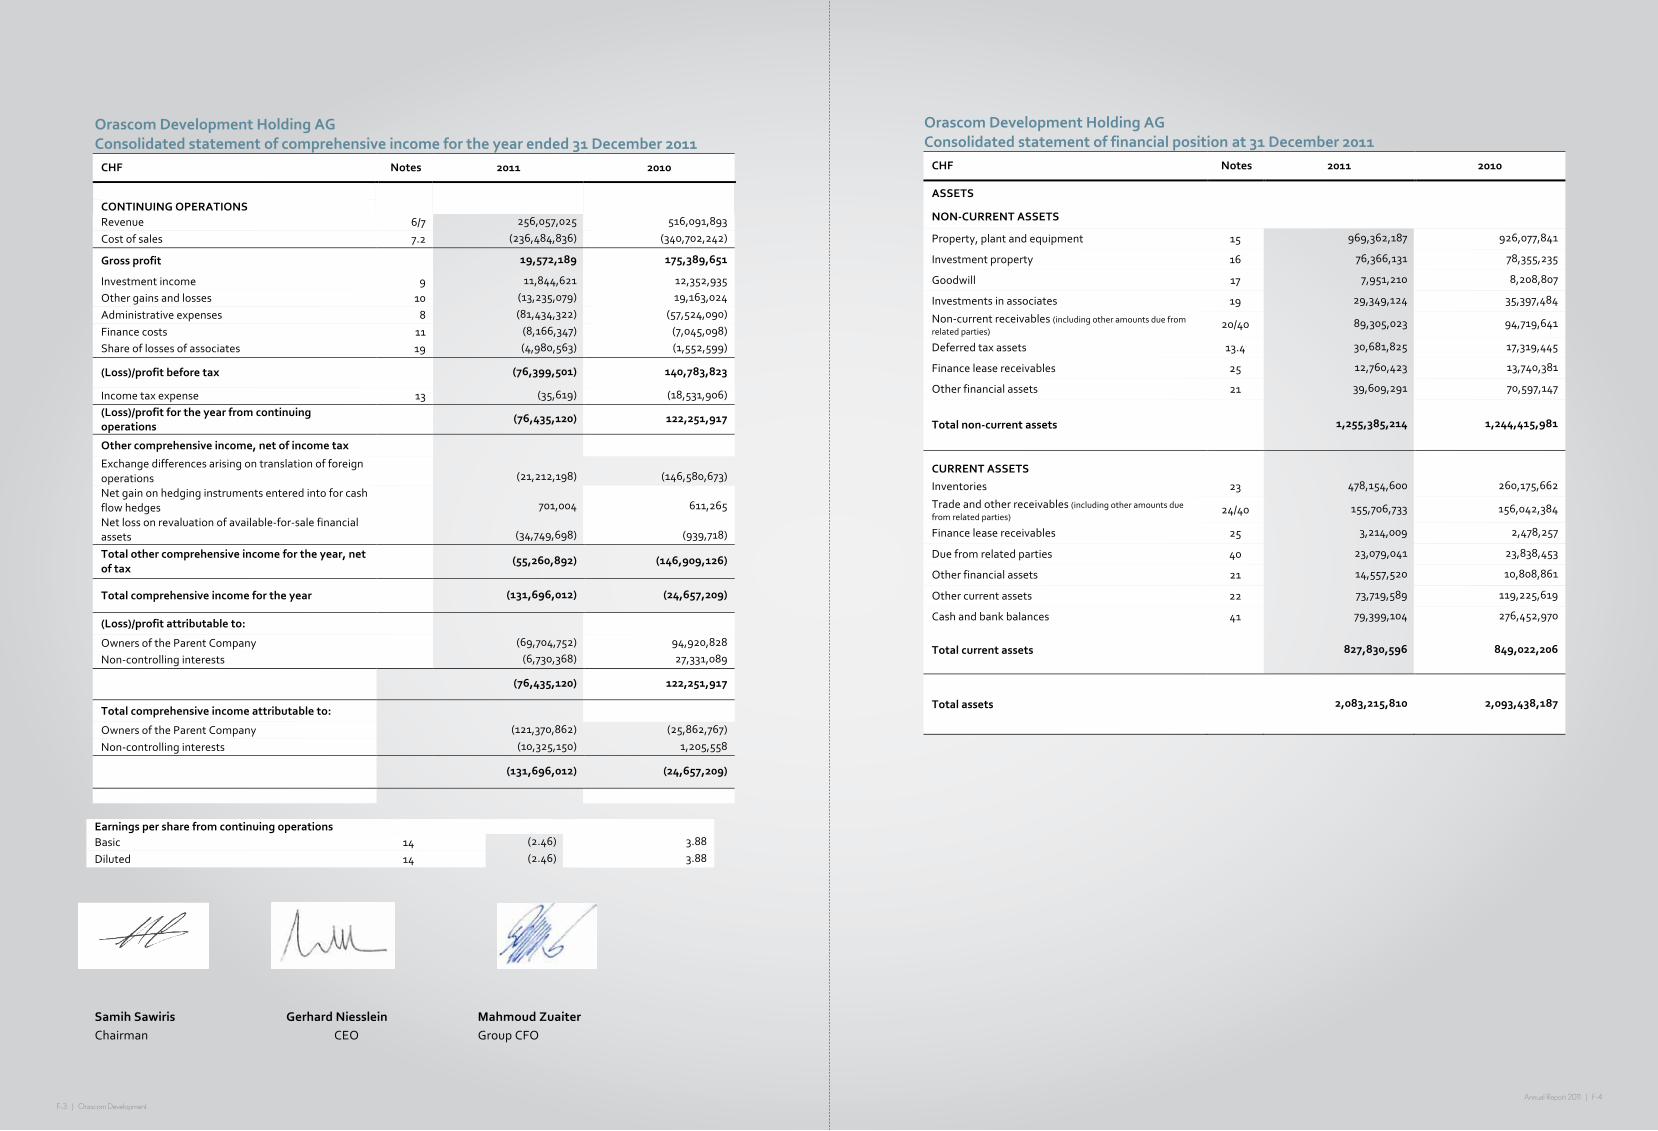
F-3 | Orascom DevelopmentAnnual Report 2011 | F-4
F-‐3
Orascom Development Holding AG Consolidated statement of comprehensive income for the year ended 31 December 2011
CHF Notes 2011 2010
CONTINUING OPERATIONS
Revenue 6/7 256,057,025 516,091,893
Cost of sales 7.2 (236,484,836) (340,702,242)
Gross profit 19,572,189 175,389,651
Investment income 9 11,844,621 12,352,935
Other gains and losses 10 (13,235,079) 19,163,024
Administrative expenses 8 (81,434,322) (57,524,090)
Finance costs 11 (8,166,347) (7,045,098)
Share of losses of associates 19 (4,980,563) (1,552,599)
(Loss)/profit before tax (76,399,501) 140,783,823
Income tax expense 13 (35,619) (18,531,906)
(Loss)/profit for the year from continuing operations
(76,435,120) 122,251,917
Other comprehensive income, net of income tax
Exchange differences arising on translation of foreign operations
(21,212,198) (146,580,673) Net gain on hedging instruments entered into for cash flow hedges
701,004 611,265 Net loss on revaluation of available-‐for-‐sale financial assets
(34,749,698) (939,718)
Total other comprehensive income for the year, net of tax
(55,260,892) (146,909,126)
Total comprehensive income for the year (131,696,012) (24,657,209)
(Loss)/profit attributable to:
Owners of the Parent Company (69,704,752) 94,920,828
Non-‐controlling interests (6,730,368) 27,331,089
(76,435,120) 122,251,917
Total comprehensive income attributable to:
Owners of the Parent Company (121,370,862) (25,862,767)
Non-‐controlling interests (10,325,150) 1,205,558
(131,696,012) (24,657,209)
Samih Sawiris Gerhard Niesslein Mahmoud Zuaiter Chairman CEO Group CFO
Earnings per share from continuing operations Basic 14 (2.46) 3.88
Diluted 14 (2.46) 3.88
F-‐4
Orascom Development Holding AG Consolidated statement of financial position at 31 December 2011
CHF Notes 2011 2010
ASSETS
NON-‐CURRENT ASSETS
Property, plant and equipment 15 969,362,187 926,077,841
Investment property 16 76,366,131 78,355,235
Goodwill 17 7,951,210 8,208,807
Investments in associates 19 29,349,124 35,397,484
Non-‐current receivables (including other amounts due from related parties) 20/40 89,305,023 94,719,641
Deferred tax assets 13.4 30,681,825 17,319,445
Finance lease receivables 25 12,760,423 13,740,381
Other financial assets 21 39,609,291 70,597,147
Total non-‐current assets 1,255,385,214 1,244,415,981
CURRENT ASSETS
Inventories 23 478,154,600 260,175,662
Trade and other receivables (including other amounts due from related parties) 24/40 155,706,733 156,042,384
Finance lease receivables 25 3,214,009 2,478,257
Due from related parties 40 23,079,041 23,838,453
Other financial assets 21 14,557,520 10,808,861
Other current assets 22 73,719,589 119,225,619
Cash and bank balances 41 79,399,104 276,452,970
Total current assets 827,830,596 849,022,206
Total assets 2,083,215,810 2,093,438,187
F-‐5
CHF Notes 2011 2010
EQUITY AND LIABILITIES
CAPITAL AND RESERVES
Issued capital 26 662,201,010 672,882,864
Reserves 27 (134,983,659) (74,209,306)
Retained earnings 28 327,175,626 396,880,378
Equity attributable to owners of the Parent Company
854,392,977 995,553,936
Non-‐controlling interests 29 240,823,907 197,589,888
Total equity 1,095,216,884 1,193,143,824
NON-‐CURRENT LIABILITIES
Borrowings 30 254,353,148 270,832,587
Trade payables 33 31,717,802 35,921,963
Retirement benefit obligation 36 416,295 199,646
Notes payable 5,797,662 10,193,018
Deferred tax liabilities 13.4 36,396,168 27,993,241
Other financial liabilities 35 14,018,690 15,448,607
Total non-‐current liabilities 342,699,765 360,589,062
CURRENT LIABILITIES
Trade and other payables 33 57,631,059 57,120,751
Borrowings 30 281,857,673 240,936,367
Due to related parties 40 5,760,784 2,614,098
Current tax liabilities 13.3 6,133,481 15,975,901
Provisions 31 90,144,020 56,779,789
Other current liabilities 32 203,772,144 166,278,395
Total current liabilities 645,299,161 539,705,301
Total liabilities 987,998,926 900,294,363
Total equity and liabilities 2,083,215,810 2,093,438,187
Samih Sawiris Gerhard Niesslein Mahmoud Zuaiter Chairman CEO Group CFO
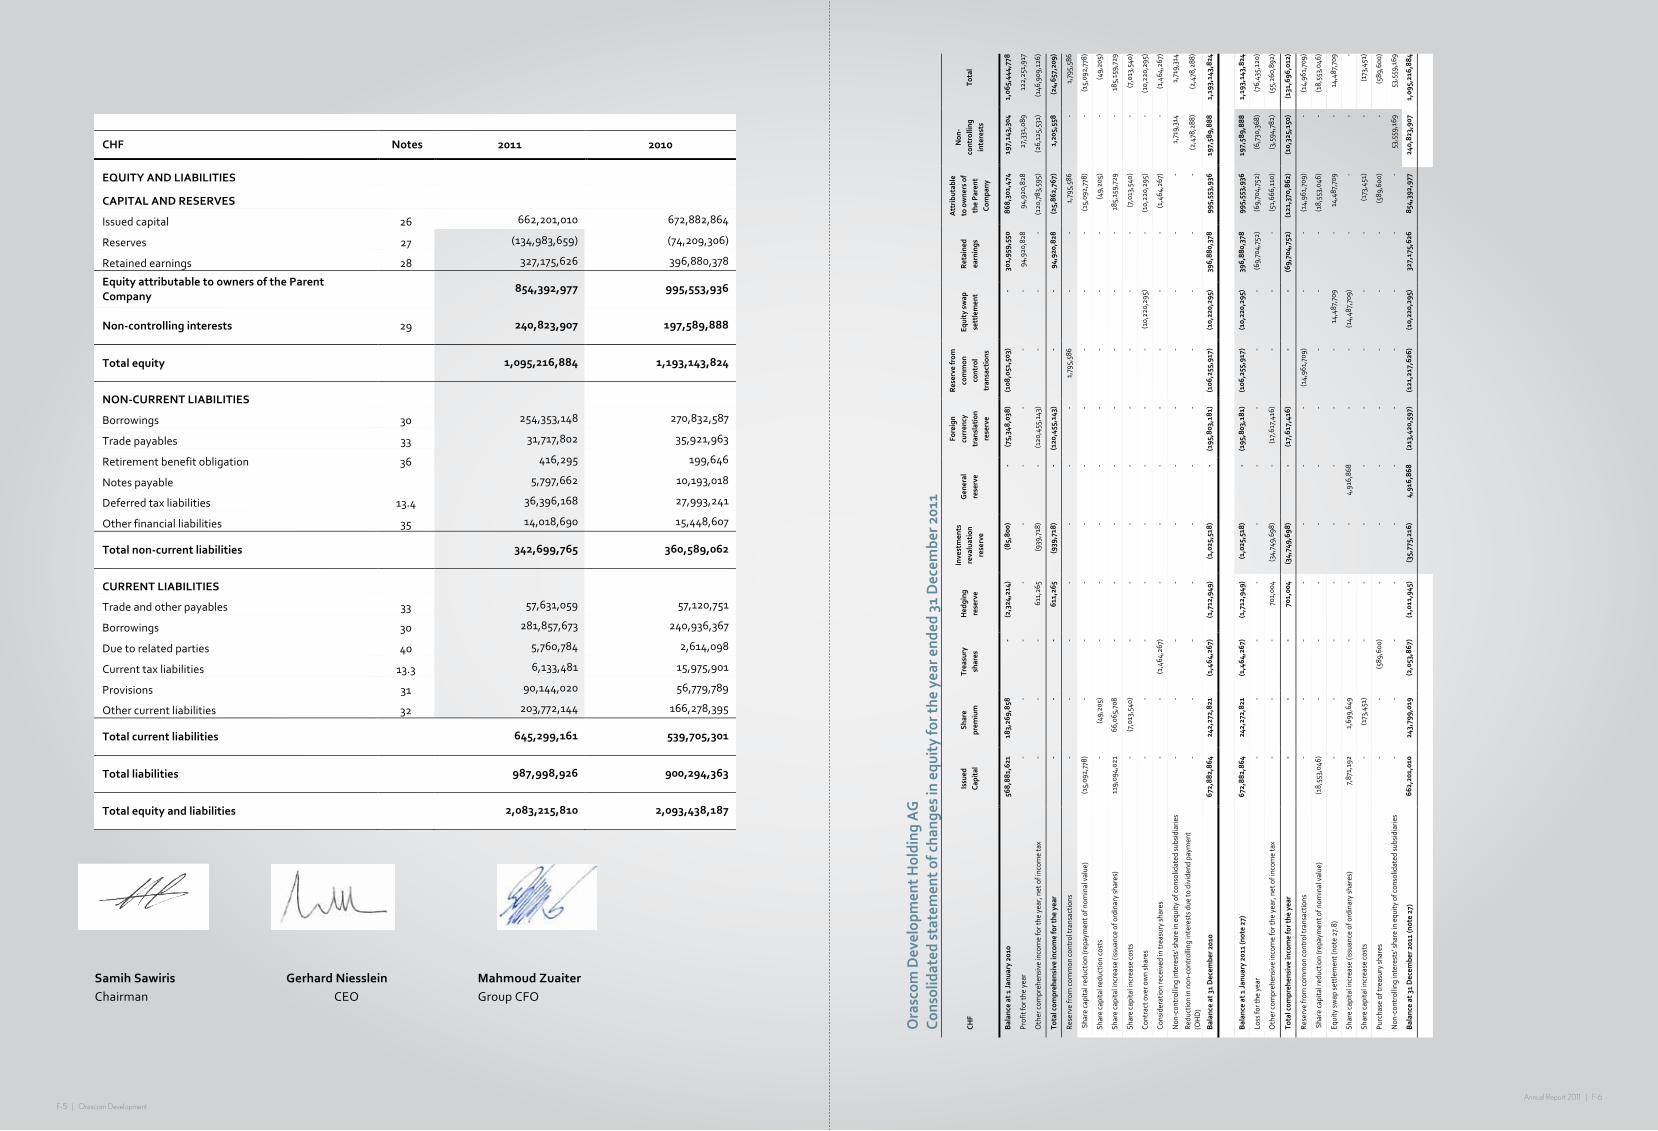
F-5 | Orascom DevelopmentAnnual Report 2011 | F-6
F-‐6
Orascom
Develop
ment H
olding
AG
Consolidated statement o
f chang
es in equity for the year end
ed 31 Decem
ber 2011
CHF
Issued
Capital
Share
prem
ium
Treasury
shares
Hedging
reserve
Investments
revaluation
reserve
General
reserve
Foreign
currency
translation
reserve
Reserve from
common
control
transactions
Equity swap
settlement
Retained
earnings
Attrib
utable
to owners of
the Pa
rent
Company
Non
-‐controlling
interests
Total
Balance at 1 Ja
nuary 2010
568,88
1,621
183,269,858
-‐ (2,324,214)
(85,800)
-‐ (75,348,038)
(108,051,503)
-‐ 301,959,550
868,301,474
197,143,304
1,065,444,778
Profit for the year
-‐ -‐
-‐ -‐
-‐ -‐
-‐ -‐
-‐ 94,920,828
94,920,828
27,331,089
122,251,917
Other comprehensive income for the year, net of income tax
-‐ -‐
-‐ 611,265
(939,718)
-‐ (120,455,143)
-‐ -‐
-‐ (120,783,595)
(26,125,531)
(146,909,126)
Total com
prehensive income for the year
-‐ -‐
-‐ 611,265
(939,718)
-‐ (120,455,143)
-‐ -‐
94,920,828
(25,86
2,767)
1,205,558
(24,657,209)
Reserve from common control transactions
-‐ -‐
-‐ -‐
-‐ -‐
-‐ 1,795,586
-‐ -‐
1,795,586
-‐ 1,795,586
Share capital reduction (repayment of nominal value)
(15,092,778)
-‐ -‐
-‐ -‐
-‐ -‐
-‐ -‐
-‐ (15,092,778)
-‐ (15,092,778)
Share capital reduction costs
-‐ (49,205)
-‐ -‐
-‐ -‐
-‐ -‐
-‐ -‐
(49,205)
-‐ (49,205)
Share capital increase (issuance of ordinary shares)
119,094,021
66,065,708
-‐ -‐
-‐ -‐
-‐ -‐
-‐ -‐
185,159,729
-‐ 185,159,729
Share capital increase costs
-‐ (7,013,540)
-‐ -‐
-‐ -‐
-‐ -‐
-‐ -‐
(7,013,540)
-‐ (7,013,540)
Contract over own shares
-‐ -‐
-‐ -‐
-‐ -‐
-‐ -‐
(10,220,295)
-‐ (10,220,295)
-‐ (10,220,295)
Consideration received in treasury shares
-‐ -‐
(1,464,267)
-‐ -‐
-‐ -‐
-‐ -‐
-‐ (1,464,267)
-‐ (1,464,267)
Non-‐controlling interests’ share in equity of consolidated subsidiaries
-‐ -‐
-‐ -‐
-‐ -‐
-‐ -‐
-‐ -‐
-‐ 1,719,314
1,719,314
Reduction in non-‐controlling interests due to dividend payment
(OHD)
-‐ -‐
-‐ -‐
-‐ -‐
-‐ -‐
-‐ -‐
-‐ (2,478,288)
(2,478,288)
Balance at 31 Decem
ber 2010
672,88
2,86
4 242,272,821
(1,464,267)
(1,712,949)
(1,025,518)
-‐ (195,803,181)
(106,255,917)
(10,220,295)
396,88
0,378
995,553,936
197,589,88
8 1,193,143,824
Balance at 1 Ja
nuary 2011 (note 27)
672,88
2,86
4 242,272,821
(1,464,267)
(1,712,949)
(1,025,518)
-‐ (195,803,181)
(106,255,917)
(10,220,295)
396,88
0,378
995,553,936
197,589,88
8 1,193,143,824
Loss for the year
-‐ -‐
-‐ -‐
-‐ -‐
-‐ -‐
-‐ (69,704,752)
(69,704,752)
(6,730,368)
(76,435,120)
Other comprehensive income for the year, net of income tax
-‐ -‐
-‐ 701,004
(34,749,698)
-‐ (17,617,416)
-‐ -‐
-‐ (51,666,110)
(3,594,782)
(55,260,892)
Total com
prehensive income for the year
-‐ -‐
-‐ 701,004
(34,749,69
8)
-‐ (17,617,416)
-‐ -‐
(69,704,752)
(121,370,862)
(10,325,150)
(131,696
,012)
Reserve from common control transactions
-‐ -‐
-‐ -‐
-‐ -‐
-‐ (14,961,709)
-‐ -‐
(14,961,709)
-‐ (14,961,709)
Share capital reduction (repayment of nominal value)
(18,553,046)
-‐ -‐
-‐ -‐
-‐ -‐
-‐ -‐
-‐ (18,553,046)
-‐ (18,553,046)
Equity swap settlement (note 27.8)
-‐ -‐
-‐ -‐
-‐ -‐
-‐ -‐
14,487,709
-‐ 14,487,709
-‐ 14,487,709
Share capital increase (issuance of ordinary shares)
7,871,192
1,699,649
-‐ -‐
-‐ 4,916,868
-‐ -‐
(14,487,709)
-‐ -‐
-‐ -‐
Share capital increase costs
-‐ (173,451)
-‐ -‐
-‐ -‐
-‐ -‐
-‐ -‐
(173,451)
-‐ (173,451)
Purchase of treasury shares
-‐ -‐
(589,600)
-‐ -‐
-‐ -‐
-‐ -‐
-‐ (589,600)
-‐ (589,600)
Non-‐controlling interests’ share in equity of consolidated subsidiaries
-‐ -‐
-‐ -‐
-‐ -‐
-‐ -‐
-‐ -‐
-‐ 53,559,169
53,559,169
Balance at 31 Decem
ber 2011 (note 27)
662,201,010
243,799,019
(2,053,867)
(1,011,945)
(35,775,216)
4,916,86
8 (213,420,597)
(121,217,626)
(10,220,295)
327,175,626
854,392,977
240,823,907
1,095,216,88
4
F-‐5
CHF Notes 2011 2010
EQUITY AND LIABILITIES
CAPITAL AND RESERVES
Issued capital 26 662,201,010 672,882,864
Reserves 27 (134,983,659) (74,209,306)
Retained earnings 28 327,175,626 396,880,378
Equity attributable to owners of the Parent Company
854,392,977 995,553,936
Non-‐controlling interests 29 240,823,907 197,589,888
Total equity 1,095,216,884 1,193,143,824
NON-‐CURRENT LIABILITIES
Borrowings 30 254,353,148 270,832,587
Trade payables 33 31,717,802 35,921,963
Retirement benefit obligation 36 416,295 199,646
Notes payable 5,797,662 10,193,018
Deferred tax liabilities 13.4 36,396,168 27,993,241
Other financial liabilities 35 14,018,690 15,448,607
Total non-‐current liabilities 342,699,765 360,589,062
CURRENT LIABILITIES
Trade and other payables 33 57,631,059 57,120,751
Borrowings 30 281,857,673 240,936,367
Due to related parties 40 5,760,784 2,614,098
Current tax liabilities 13.3 6,133,481 15,975,901
Provisions 31 90,144,020 56,779,789
Other current liabilities 32 203,772,144 166,278,395
Total current liabilities 645,299,161 539,705,301
Total liabilities 987,998,926 900,294,363
Total equity and liabilities 2,083,215,810 2,093,438,187
Samih Sawiris Gerhard Niesslein Mahmoud Zuaiter Chairman CEO Group CFO

F-7 | Orascom DevelopmentAnnual Report 2011 | F-8
F-‐7
Orascom Development Holding AG Consolidated cash flow statement for the year ended 31 December 2011
CHF Notes 2011 2010
CASH FLOWS FROM OPERATING ACTIVITIES (Loss)/Profit for the year (76,435,120) 122,251,917 Adjustments for: Income tax expense recognized in profit or loss 13.1 35,619 18,531,906
Share of losses of associates 19 4,980,563 1,552,599
Finance costs recognized in profit or loss 11 8,166,347 7,045,098
Investment revenue recognized in profit or loss 9 (11,844,621) (12,352,935) Impairment loss recognized on trade receivables and other current assets
38.11 29,843,491 19,655,459
Reversal of Impairment loss on trade receivables 24 (684,615) (3,389,300) Gain on sale or disposal of property, plant and equipment 10 (413,555) (305,021) Loss/(gain) on revaluation of investment properties 16 4,745,050 (14,120,934) Gain on disposal of subsidiaries 34 -‐ (7,824,706) Gain arising on financial assets carried at FVTPL (127,724) -‐ Depreciation and amortization of non-‐current assets 15 33,499,525 41,608,430 Net foreign exchange (gains)/losses 10 11,332,336 6,575,798 MOVEMENTS IN WORKING CAPITAL (Increase) in trade and other receivables (21,295,585) (49,072,176) (Increase) in finance lease receivables (264,741) (8,006,356) (Increase) in inventories (205,465,076) (84,261,660) Decrease in other assets 26,474,236 31,948,246 (Decrease)/Increase in trade and other payables (5,859,094) 13,249,443 Increase in provision 33,437,215 18,077,465 Increase in other liabilities 33,235,182 62,784,780 Cash (used in)/generated from operations (136,640,567) 163,948,053
Interest paid (30,550,953) (26,987,170)
Income tax paid (14,107,925) (10,873,384)
Net cash (used in)/generated by operating activities (181,299,445) 126,087,499
CASH FLOWS FROM INVESTING ACTIVITIES Payments for property, plant and equipment 15/42 (92,158,715) (273,121,088) Proceeds from disposal of property, plant and equipment 5,320,782 1,460,285 Proceeds on sale of financial assets 10,936,585 -‐ Payments to acquire financial assets (15,653,211) (31,933,533) Dividends received 9 1,157,774 8,158 Interest received 10,686,847 12,345,149 Net cash outflow on deconsolidated subsidiaries 34.4 -‐ (2,868,053) Net cash used in investing activities (79,709,938) (294,109,082) CASH FLOWS FROM FINANCING ACTIVITIES Proceeds from issues of equity instruments -‐ 185,159,729 Transaction costs resulted from capital increase (173,451) (7,013,540) Transaction cost resulted from capital reduction -‐ (49,205) Issued capital reduction paid to shareholders 42 (13,580,644) (15,092,778) Payment for buy-‐back of shares (589,600) -‐ Dividends paid -‐ (2,478,289) Non controlling interests shares in changes of equity for consolidated subsidiaries
60,733,748 16,617,433
Repayment of borrowings (9,259,658) (11,804,867) Proceeds from borrowings 42,786,749 211,688,812 Net cash generated by financing activities 79,917,144 377,027,295
Net (decrease)/increase in cash and cash equivalents (181,092,239) 209,005,712
Cash and cash equivalents at the beginning of the year 276,452,970 77,899,218 Effects of exchange rate changes on the balance of cash held in foreign currencies
(15,961,627) (10,451,960)
Cash and cash equivalents at the end of the year 41 79,399,104 276,452,970
F-‐8
Index to the notes to the consolidated financial statements Page 1 General information 9
2 Application of new and revised International Financial Reporting Standards (“IFRSs”) 9
3 Significant accounting policies 12
4 Critical accounting judgments and key sources of estimation uncertainty 27
5 The group and major changes in group entities 31
6 Revenue 31
7 Segment information 32
8 Employee benefits expense 35
9 Investment revenue 36
10 Other gains and losses 36
11 Finance costs 37
12 Compensation of key management personnel 37
13 Income taxes relating to continuing operations 40
14 Earnings per share 43
15 Property, plant and equipment 43
16 Investment property 45
17 Goodwill 45
18 Subsidiaries 47
19 Investments in associates 49
20 Non-‐current receivables 50
21 Other financial assets 51
22 Other current assets 52
23 Inventories 53
24 Trade and other receivables 53
25 Finance lease receivables 54
26 Capital 55
27 Reserves (net of income tax) 56
28 Retained earnings 59
29 Non-‐controlling interests 60
30 Borrowings 60
31 Provisions 61
32 Other current liabilities 62
33 Trade and other payables 62
34 Disposal of subsidiaries 63
35 Other financial liabilities 65
36 Retirement benefit plans 66
37 Risk assessment disclosure required by Swiss law 69
38 Financial instruments 69
39 Share-‐based payments 77
40 Related party transactions 77
41 Cash and cash equivalents 79
42 Non-‐cash transactions 79
43 Operating lease arrangements 80
44 Commitments for expenditure 81
45 Other significant events that occurred during the reporting period 81
46 Subsequent events 82
47 Litigation 82
48 Approval of financial statements 82
F-9 | Orascom DevelopmentAnnual Report 2011 | F-10
F-‐9
Notes to the consolidated financial statements for the year ended 31 December 2011 1 GENERAL INFORMATION
Orascom Development Holding AG (“ODH” or “the Parent Company”), a limited company incorporated in Altdorf, Switzerland, is a public company whose shares are traded on the SIX Swiss Exchange. In addition, Egyptian Depository Receipts (“EDRs”) of the Parent Company are traded at the EGX Egyptian Exchange. One EDR represents 1/20 of an ODH share.
The Company and its subsidiaries (the “Group”) is a leading developer of fully integrated towns that include hotels, private villas and apartments, leisure facilities such as golf courses, marinas and supporting infrastructure. The Group’s diversified portfolio of projects is spread over nine jurisdictions, with primary focus on touristic towns and recently affordable housing. The Group currently operates in Egypt, Jordan, UAE, Oman, Switzerland, Morocco, United Kingdom, Montenegro and Romania and is continuously seeking development opportunities in untapped yet attractive locations all over the world. The Group has four existing projects: El Gouna, the flagship project, a fully-‐fledged town on the Red Sea coast (Egypt); Taba Heights, on the Sinai Peninsula (Egypt), the Group’s second tourism destination following El Gouna’s business model; the Cove (Ras Al Khaimah, UAE), the Group’s first development experience outside Egypt; and Haram City, an integrated town dedicated to affordable housing in Egypt, catering for the mass population.
The addresses of its registered office and principal place of business are disclosed in the introduction to the annual report.
2 APPLICATION OF NEW AND REVISED INTERNATIONAL FINANCIAL REPORTING STANDARDS (“IFRSs”)
2.1 New and revised IFRSs affecting amounts reported in the current year and prior years
The following new and revised Standards and Interpretations have been applied in the current period and have affected these financial statements. Details of other new and revised IFRSs applied in these financial statements that have had no material effect on the financial statements are set out in note 2.2:
2.1.1 New and revised IFRSs affecting presentation and disclosure only
Amendments to IAS 1 Presentation of Financial Statements (as part of Improvements to IFRSs issued in 2010)
The amendments to IAS 1 clarify that an entity may choose to disclose an analysis of other comprehensive income by item in the statement of changes in equity or in the notes to the financial statements. The Group has chosen to continue to present such an analysis by item in the statement of changes in equity.
2.2 New and revised IFRSs applied with no material effect on the consolidated financial statements
Amendments to IFRS 3 Business Combinations
As part of Improvements to IFRSs issued in 2010, IFRS 3 was amended to clarify that the measurement choice regarding non-‐controlling interests at the date of acquisition is only available in respect of non-‐controlling interests that are present ownership interests and that entitle their holders to a proportionate share of the entity's net assets in the event of liquidation. All other types of non-‐controlling interests are measured at their acquisition-‐date fair value, unless another measurement basis is required by other Standards. In addition, IFRS 3 was amended to provide more guidance regarding the accounting for share-‐based payment awards held by the acquiree's employees. Specifically, the amendments specify that share-‐based payment transactions of the acquiree that are not replaced should be measured in accordance with IFRS 2 Share-‐based Payment at the acquisition date (‘market-‐based measure’).
So far this amendment has not had an impact on the consolidated financial statements of the Group as there was no business combination in the current year.
IAS 24 Related Party Disclosures (as revised in 2009)
IAS 24 (as revised in 2009) has been revised on the following two aspects: (a) IAS 24 (as revised in 2009) has changed the definition of a related party and (b) IAS 24 (as revised in 2009) introduces a partial exemption from the disclosure requirements for government-‐related entities.
F-‐10
The Company and its subsidiaries are not government-‐related entities. The application of the revised definition of related party set out in IAS 24 (as revised in 2009) in the current year has not resulted in the identification of related parties that were not identified as related parties under the previous Standard.
Amendments to IAS 32 Classification of Rights Issues
The amendments address the classification of certain rights issues denominated in a foreign currency as either equity instruments or as financial liabilities. Under the amendments, rights, options or warrants issued by an entity for the holders to acquire a fixed number of the entity's equity instruments for a fixed amount of any currency are classified as equity instruments in the financial statements of the entity provided that the offer is made pro rata to all of its existing owners of the same class of its non-‐derivative equity instruments. Before the amendments to IAS 32, rights, options or warrants to acquire a fixed number of an entity's equity instruments for a fixed amount in foreign currency were classified as derivatives. The amendments require retrospective application.
The application of the amendments has had no effect on the amounts reported in the current and prior years because the Group has not issued instruments of this nature.
Amendments to IFRIC 14 Prepayments of a Minimum Funding Requirement
IFRIC 14 addresses when refunds or reductions in future contributions should be regarded as available in accordance with paragraph 58 of IAS 19; how minimum funding requirements might affect the availability of reductions in future contributions; and when minimum funding requirements might give rise to a liability. The amendments now allow recognition of an asset in the form of prepaid minimum funding contributions.
The application of the amendments has not had any effect on the Group's consolidated financial statements.
IFRIC 19 Extinguishing Financial Liabilities with Equity Instruments
The Interpretation provides guidance on the accounting for the extinguishment of a financial liability by the issue of equity instruments. Specifically, under IFRIC 19, equity instruments issued under such arrangement will be measured at their fair value, and any difference between the carrying amount of the financial liability extinguished and the consideration paid will be recognised in profit or loss.
The application of IFRIC 19 has had no effect on the amounts reported in the current and prior years because the Group has not entered into any transactions of this nature.
Improvements to IFRSs issued in 2010
The application of Improvements to IFRSs issued in 2010 has not had any material effect on amounts reported in the consolidated financial statements.
2.3Standards and Interpretations in issue but not yet effective
At the date of authorisation of these financial statements, the Group has not adopted the following Standards and Interpretations that have been issued but are not yet effective. They will be effective on or after the dates described below.
(i) New, amended and revised Standards effective from IFRS 7 The amendments to IFRS 7 increase the disclosure requirements for transactions
involving transfers of financial assets. These amendments are intended to provide greater transparency around risk exposures when a financial asset is transferred but the transferor retains some level of continuing exposure in the asset. The amendments also require disclosures where transfers of financial assets are not evenly distributed throughout the period.
Annual periods beginning on or after 1 July 2011
IFRS 9 Financial Instruments: Recognition and Measurement was issued in 2009 and amended in 2010 to cover classification and measurement of financial assets and financial liabilities, as the first part of its project to replace IAS 39.
Annual periods beginning on or after 1 January 2015
IFRS 10 IFRS 10 replaces the parts of IAS 27 Consolidated and Separate Financial Statements that deal with consolidated financial statements. SIC-‐12 Consolidation – Special Purpose Entities has been withdrawn upon the issuance of IFRS 10. Under IFRS 10, there is only one basis for consolidation; that is control. In addition, IFRS 10 includes a new definition of control that contains three elements which should all be possessed by an entity to conclude it controls an investee, these are: (a) power over an investee, (b) exposure, or rights, to variable returns from its involvement with the investee, and (c) the ability to use its power over the investee to affect the amount of the investor's returns.
Annual periods beginning on or after 1 January 2013

F-11 | Orascom DevelopmentAnnual Report 2011 | F-12
F-‐11
IFRS 11 IFRS 11 replaces IAS 31 Interests in Joint Ventures. IFRS 11 deals with how a joint arrangement of which two or more parties have joint control should be classified. SIC-‐13 Jointly Controlled Entities – Non-‐monetary Contributions by Venturers has been withdrawn upon the issuance of IFRS 11. Under IFRS 11, joint arrangements are classified as joint operations or joint ventures, depending on the rights and obligations of the parties to the arrangements. In contrast, under IAS 31, there are three types of joint arrangements: jointly controlled entities, jointly controlled assets and jointly controlled operations.
In addition, joint ventures under IFRS 11 are required to be accounted for using the equity method of accounting, whereas jointly controlled entities under IAS 31 can be accounted for using the equity method of accounting or proportionate consolidation accounting.
Annual periods beginning on or after 1 January 2013
IFRS 12 IFRS 12 is a disclosure standard and is applicable to entities that have interests in subsidiaries, joint arrangements, associates and/or unconsolidated structured entities. In general, the disclosure requirements in IFRS 12 are more extensive than those in the current standards.
Annual periods beginning on or after 1 January 2013
IFRS 13 IFRS 13, which shall be applicable on a prospective basis, establishes a single source of guidance for fair value measurements and disclosures about fair value measurements. The Standard defines fair value, establishes a framework for measuring fair value, and requires disclosures about fair value measurements. The scope of IFRS 13 is broad; it applies to both financial instrument items and non-‐financial instrument items for which other IFRSs require or permit fair value measurements and disclosures about fair value measurements, except in specified circumstances. In general, the disclosure requirements in IFRS 13 are more extensive than those required in the current standards. For example, quantitative and qualitative disclosures based on the three-‐level fair value hierarchy currently required for financial instruments only under IFRS 7 Financial Instruments: Disclosures will be extended by IFRS 13 to cover all assets and liabilities within its scope.
Annual periods beginning on or after 1 January 2013
IAS 1 The new amendments to IAS 1,that have to be adopted retrospectively, retain the option to present profit or loss and other comprehensive income in either a single statement or in two separate but consecutive statements. However, the amendments to IAS 1 require additional disclosures to be made in the other comprehensive income section such that items of other comprehensive income are grouped into two categories: (a) items that will not be reclassified subsequently to profit or loss; and (b) items that will be reclassified subsequently to profit or loss when specific conditions are met. Income tax on items of other comprehensive income is required to be allocated on the same basis.
Annual periods beginning on or after 1 July 2012
IAS 12 The amendments to IAS 12 provide an exception to the general principles in IAS 12 that the measurement of deferred tax assets and deferred tax liabilities should reflect the tax consequences that would follow from the manner in which the entity expects to recover the carrying amount of an asset. Specifically, under the amendments, investment properties that are measured using the fair value model in accordance with IAS 40 Investment Property are presumed to be recovered through sale for the purposes of measuring deferred taxes, unless the presumption is rebutted in certain circumstances.
Annual periods beginning on or after 1 January 2012
IAS 19 The amendments to IAS 19 change the accounting for defined benefit plans and termination benefits. The most significant change relates to the accounting for changes in defined benefit obligations and plan assets. The amendments require the recognition of changes in defined benefit obligations and in fair value of plan assets when they occur, and hence eliminate the 'corridor approach' permitted under the previous version of IAS 19 and accelerate the recognition of past service costs. The amendments require all actuarial gains and losses to be recognised immediately through other comprehensive income in order for the net pension asset or liability recognised in the consolidated statement of financial position to reflect the full value of the plan deficit or surplus.Except for two exceptions this amendment needs to be applied retrospectively.
Annual periods beginning on or after 1 January 2013
IAS 27 IAS 27 Separate Financial Statements (revised 2011), has been amended for the issuance of IFRS 10 but retains the current guidance for separate financial statements.
Annual periods beginning on or after 1 January 2013
IAS 28 IAS 28 Investments in Associates and Joint Ventures (revised 2011), has been Annual periods beginning on or
F-‐12
amended for conforming changes based on the issuance of IFRS 10 and IFRS 11. after 1 January 2013
IFRIC 20 IFRIC 20 clarifies the requirements for accounting for stripping costs associated with waste removal in surface mining, including when production stripping costs should be recognised as an asset, how the asset is initially recognised, and subsequent measurement. As the Group’s activities do not extend to that industry this IFRIC will not be applicable.
Annual periods beginning on or after 1 January 2013
Due to the changes to IAS 19 the Group will have to change its accounting policy for the recognition of actuarial gains/losses as they are currently using the corridor approach. For all other changes, the Group is assessing whether these changes will impact the consolidated financial statements in the period of initial application.
3 SIGNIFICANT ACCOUNTING POLICIES
3.1 Statement of compliance
The consolidated financial statements have been prepared in accordance with International Financial Reporting Standards (IFRS) issued by the International Accounting Standards Board (IASB).
3.2 Basis of preparation
The consolidated financial statements have been prepared on the historical cost basis except for financial instruments that are measured at fair value or amortized cost, as appropriate and investment properties that are measured at fair value as explained in the accounting policies below. Historical cost is generally based on the fair value of the consideration given in exchange for assets.
The principal accounting policies are set out below
3.3Basis of consolidation
The consolidated financial statements of the Group incorporate the financial statements of the Parent Company and entities (including special purpose entities)controlled by the Parent Company (its subsidiaries). Control is achieved where the Parent Company has the power to govern the financial and operating policies of an entity so as to obtain benefits from its activities.
The Parent Company considers the existence and effect of potential voting rights that are currently exercisable or convertible, including potential voting rights held by another entity such as a call and put option, when assessing whether it has the power to govern the financial and operating policies of its subsidiary. Potential voting rights are not currently exercisable or convertible if they cannot be exercised or converted until a future date or until the occurrence of a future event.
Income and expenses of subsidiaries acquired or disposed of during the year are included in the consolidated statement of comprehensive income from the effective date of acquisition or up to the effective date of disposal, as appropriate. Total comprehensive income of subsidiaries is attributed to the owners of the Parent Company and to the non-‐controlling interests even if this results in the non-‐controlling interests having a deficit balance, except where such total comprehensive income relates to subsidiaries for which the deficit balance was incurred prior to 1 January 2010 (in which case the Group continue to apply the old policy in the attribution of total comprehensive income to owners of the Parent Company and to the non-‐controlling interests and does not restate any such attribution for reporting periods preceding that date as set out below in the same note).
Where necessary, adjustments are made to the financial statements of subsidiaries to bring their accounting policies in line with those used by other members of the Group.
All intra-‐group transactions, balances, income and expenses are eliminated in full on consolidation.
Non-‐controlling interests in subsidiaries are identified separately from the Group’s equity therein.
Where the non-‐controlling interests have arisen from business combinations for which the acquisition date is prior to 1 January 2010, the non-‐controlling shareholders are initially measured at the non-‐controlling interests’ proportionate share of the fair value of the acquiree’s identifiable net assets, at the date of the original business combination. Subsequent to acquisition, the carrying amount of non-‐controlling interests is the amount of those interests at initial recognition plus the non-‐controlling interests’ share of subsequent changes in equity. Total comprehensive income is attributed to non-‐controlling interests to the extent of the carrying amount of those non-‐controlling interests. Losses applicable to the non-‐controlling shareholders in excess of their interests in a subsidiary’s equity are allocated against the interests of the Group except to the extent that the non-‐controlling shareholders have a binding obligation and are able to make an additional investment to cover the losses.

F-13 | Orascom DevelopmentAnnual Report 2011 | F-14
F-‐13
Changes in the Group's ownership interests in existing subsidiaries
Changes in the Group's ownership interests in subsidiaries that do not result in the Group losing control over the subsidiaries are accounted for as equity transactions. The carrying amounts of the Group's interests and the non-‐controlling interests are adjusted to reflect the changes in their relative interests in the subsidiaries. Any difference between the amount by which the non-‐controlling interests are adjusted and the fair value of the consideration paid or received is recognised directly in equity and attributed to owners of the Parent Company.
When the Group loses control of a subsidiary, the profit or loss on disposal is calculated as the difference between (i) the aggregate of the fair value of the consideration received and the fair value of any retained interest and (ii) the previous carrying amount of the assets (including goodwill), and liabilities of the subsidiary and any non-‐controlling interests. When assets of the subsidiary are carried at re-‐valued amounts or fair values and the related cumulative gain or loss has been recognised in other comprehensive income and accumulated in equity, the amounts previously recognised in other comprehensive income and accumulated in equity are accounted for as if the Parent Company had directly disposed of the relevant assets (i.e. reclassified to profit or loss or transferred directly to retained earnings as specified by applicable IFRSs). The fair value of any investment retained in the former subsidiary at the date when control is lost is regarded as the fair value on initial recognition for subsequent accounting under IAS 39 Financial Instruments: Recognition and Measurement or, when applicable, the cost on initial recognition of an investment in an associate or a jointly controlled entity.
3.4Business combinations
Acquisitions of businesses are accounted for using the acquisition method. The consideration transferred in a business combination is measured at fair value, which is calculated as the sum of the acquisition-‐date fair values of the assets transferred by the Group, liabilities incurred by the Group to the former owners of the acquiree and the equity interests issued by the Group in exchange for control of the acquiree. Acquisition-‐related costs are generally recognised in profit or loss as incurred.
At the acquisition date, the identifiable assets acquired and the liabilities assumed are recognised at their fair value at the acquisition date, except that:
– deferred tax assets or liabilities and liabilities or assets related to employee benefit arrangements are recognised and measured in accordance with IAS 12 Income Taxes and IAS 19 Employee Benefits respectively;
– liabilities or equity instruments related to share-‐based payment arrangements of the acquiree or share-‐based payment arrangements of the Group entered into to replace share-‐based payment arrangements of the acquiree are measured in accordance with IFRS 2 Share-‐based Payment at the acquisition date; and
– assets (or disposal groups) that are classified as held for sale in accordance with IFRS 5 Non-‐current Assets Held for Sale and Discontinued Operations are measured in accordance with that Standard.
Goodwill is measured as the excess of the sum of the consideration transferred, the amount of any non-‐controlling interests in the acquiree, and the fair value of the acquirer's previously held equity interest in the acquiree (if any) over the net of the acquisition-‐date amounts of the identifiable assets acquired and the liabilities assumed. If, after reassessment, the net of the acquisition-‐date amounts of the identifiable assets acquired and liabilities assumed exceeds the sum of the consideration transferred, the amount of any non-‐controlling interests in the acquiree and the fair value of the acquirer's previously held interest in the acquiree (if any), the excess is recognised immediately in profit or loss as a bargain purchase gain.
Non-‐controlling interests that are present ownership interests and entitle their holders to a proportionate share of the entity's net assets in the event of liquidation may be initially measured either at fair value or at the non-‐controlling interests' proportionate share of the recognised amounts of the acquiree's identifiable net assets. The choice of measurement basis is made on a transaction-‐by-‐transaction basis. Other types of non-‐controlling interests are measured at fair value or, when applicable, on the basis specified in another IFRS.
When the consideration transferred by the Group in a business combination includes assets or liabilities resulting from a contingent consideration arrangement, the contingent consideration is measured at its acquisition-‐date fair value and included as part of the consideration transferred in a business combination. Changes in the fair value of the contingent consideration that qualify as measurement period adjustments are adjusted retrospectively, with corresponding adjustments against goodwill. Measurement period adjustments are adjustments that arise from additional information obtained during the ‘measurement period’ (which cannot exceed one year from the acquisition date) about facts and circumstances that existed at the acquisition date.
The subsequent accounting for changes in the fair value of the contingent consideration that do not qualify as measurement period adjustments depends on how the contingent consideration is classified. Contingent consideration that is classified as equity is not re-‐measured at subsequent reporting dates and its subsequent settlement is accounted for within equity. Contingent consideration that is classified as an asset or a liability is re-‐measured at subsequent reporting dates in accordance with IAS 39, or IAS 37 Provisions, Contingent Liabilities and Contingent Assets, as appropriate, with the corresponding gain or loss being recognised in profit or loss.
When a business combination is achieved in stages, the Group's previously held equity interest in the acquiree is re-‐measured to fair value at the acquisition date (i.e. the date when the Group obtains control) and the resulting gain or loss, if any, is recognised
F-‐14
in profit or loss. Amounts arising from interests in the acquiree prior to the acquisition date that have previously been recognised in other comprehensive income are reclassified to profit or loss where such treatment would be appropriate if that interest were disposed of.
If the initial accounting for a business combination is incomplete by the end of the reporting period in which the combination occurs, the Group reports provisional amounts for the items for which the accounting is incomplete. Those provisional amounts are adjusted during the measurement period (see above), or additional assets or liabilities are recognised, to reflect new information obtained about facts and circumstances that existed at the acquisition date that, if known, would have affected the amounts recognised at that date.
Business combinations that took place prior to 1 January 2010 were accounted for in accordance with the previous version of IFRS 3.The policy described above is applied to all business combinations that took place on or after January 2010.
For common control transactions in which all of the combining entities or businesses ultimately are controlled by the same party or parties both before and after the combination, and that control is not transitory, the Group recognises the difference between purchase consideration and carrying amount of net assets of acquired entities or businesses as an adjustment to equity. This accounting treatment is also applied to later acquisitions of some or all shares of the non-‐controlling interests in a subsidiary.
3.5Investment in associates
An associate is an entity over which the Group has significant influence and that is neither a subsidiary nor an interest in a joint venture. Significant influence is the power to participate in the financial and operating policy decisions of the investee but is not control or joint control over those policies.
The results, assets and liabilities of associates are incorporated in these consolidated financial statements using the equity method of accounting, except when the investment is classified as held for sale, in which case it is accounted for in accordance with IFRS 5 Non-‐current Assets Held for Sale and Discontinued Operations.
Under the equity method, an investment in an associate is initially recognised in the consolidated statement of financial position at cost and adjusted thereafter to recognise the Group's share of the profit or loss and other comprehensive income of the associate. When the Group's share of losses of an associate exceeds the Group's interest in that associate (which includes any long-‐term interests that, in substance, form part of the Group's net investment in the associate), the Group discontinues recognising its share of further losses. Additional losses are recognised only to the extent that the Group has incurred legal or constructive obligations or made payments on behalf of the associate.
Any excess of the cost of acquisition over the Group’s share of the net fair value of the identifiable assets, liabilities and contingent liabilities of an associate recognised at the date of acquisition is recognised as goodwill, which is included within the carrying amount of the investment. Any excess of the Group’s share of the net fair value of the identifiable assets, liabilities and contingent liabilities over the cost of acquisition, after reassessment, is recognised immediately in profit or loss.
The requirements of IAS 39 are applied to determine whether it is necessary to recognise any impairment loss with respect to the Group’s investment in an associate. When necessary, the entire carrying amount of the investment (including goodwill) is tested for impairment in accordance with IAS 36 Impairment of Assets as a single asset by comparing its recoverable amount (higher of value in use and fair value less costs to sell) with its carrying amount. Any impairment loss recognised forms part of the carrying amount of the investment. Any reversal of that impairment loss is recognised in accordance with IAS 36 to the extent that the recoverable amount of the investment subsequently increases.
Upon disposal of an associate that results in the Group losing significant influence over that associate, any retained investment is measured at fair value at that date and the fair value is regarded as its fair value on initial recognition as a financial asset in accordance with IAS 39.The difference between the previous carrying amount of the associate attributable to the retained interest and its fair value is included in the determination of the gain or loss on disposal of the associate. In addition, the Group accounts for all amounts previously recognised in other comprehensive income in relation to that associate on the same basis as would be required if that associate had directly disposed of the related assets or liabilities. Therefore, if a gain or loss previously recognised in other comprehensive income by that associate would be reclassified to profit or loss on the disposal of the related assets or liabilities, the Group reclassifies the gain or loss from equity to profit or loss (as a reclassification adjustment) when it loses significant influence over that associate.
When a Group entity transacts with associates of the Group, profits and losses resulting from the transactions with the associate are recognised in the Group’s consolidated financial statements only to the extent of interests in the associate that are not related to the Group.
3.6Goodwill
Goodwill arising on an acquisition of a business is carried at cost as established at the date of acquisition of the business (see note 3.4) less accumulated impairment losses, if any.
For the purposes of impairment testing, goodwill acquired in a business combination is allocated, starting from the acquisition date, to each of the Group’s cash-‐generating units (or groups of cash-‐generating units) that is expected to benefit from the
F-15 | Orascom DevelopmentAnnual Report 2011 | F-16
F-‐15
synergies of the combination. When assessing each unit or group of units to which the goodwill is so allocated, the Group’s objective is to test goodwill for impairment at a level that reflects the way the Group manages its operations and with which the goodwill would naturally be associated under the reporting system in place.
A cash-‐generating unit to which goodwill has been allocated is tested for impairment annually, or more frequently when there is indication that the unit may be impaired. If the recoverable amount of the cash-‐generating unit is less than its carrying amount, the impairment loss is allocated first to reduce the carrying amount of any goodwill allocated to the unit and then to the other assets of the unit pro-‐rata based on the carrying amount of each asset in the unit. Any impairment loss for goodwill is recognised directly in profit or loss in the consolidated statement of comprehensive income. An impairment loss recognised for goodwill is not reversed in subsequent periods.
On disposal of the relevant cash-‐generating unit, the attributable amount of goodwill is included in the determination of the profit or loss on disposal.
The Group’s policy for goodwill arising on the acquisition of an associate is described in note 3.5.
3.7Revenue recognition
Revenue is measured at the fair value of the consideration received or receivable. Revenue is reduced for estimated customer returns, rebates and other similar allowances.
Different policies for revenue recognition apply across the Group's business segments. The following table shows the link between the accounting policies for revenue recognition and segment information.
Accounting policies Segments classified by type of activity
3.7.1 Revenue on sale of land Sale of land
3.7.2 Revenue from agreements for construction of real estate Real estate and construction
3.7.3 Construction revenue Real estate and construction
Hotels
Town management
Tours operations 3.7.4 Revenue from the rendering of services
Other operations
3.7.5 Dividend and interest income Other operations
3.7.6 Rental income Other operations
3.7.1 Revenue on sale of land
Revenue from sale of land, sale of land right and associated cost are recognised when land is delivered and the significant risks, rewards of ownership and control have been transferred to the buyer, the amount of revenue can be measured reliably, it is probable that the economic benefits associated with the transaction will flow to the Group and the costs incurred or to be incurred in respect of the transaction can be measured reliably. Management uses its judgment and considers the opinion obtained from the legal advisors in assessing whether the Group’s contractual and legal rights and obligations in the agreements are satisfied and the above criteria are met.
3.7.2 Revenue from agreements for construction of real estate
Management uses its judgment to analyze the Group's agreements for the construction of real estate and any related agreements to conclude whether or not the contractual terms of such agreements indicate that they are, in substance, for the provision of construction services or for the delivery of goods that are not complete at the time of entering into the agreement. Such conclusion depends on the terms of the agreement and all the surrounding facts and circumstances and on whether such an agreement meets the definition of a construction contract, as described in 3.7.3 below.
In accordance with IFRIC 15, an agreement for the construction of real estate will meet the definition of a construction contract when the buyer is able to specify the major structural elements of the design of the real estate before construction begins and / or specify major structural changes once construction is in progress, whether it exercises that ability or not. Where such conditions are met, revenue and costs associated with such contracts are accounted for in accordance with IAS 11 Construction Contracts (see 3.7.3).
Where an agreement for the construction of real estate does not meet the definition of a construction contract and is not for the rendering of services, then it is accounted for as a sale of goods under the scope of IAS 18 Revenue. Management concluded that all contracts entered into for the construction of real estate meet the revenue recognition criteria for the sale of goods.
F-‐16
Accordingly, revenue from the sale of real estate is recognised when all the following conditions are satisfied: the Group has transferred to the buyer the significant risks and rewards of ownership of the real estate, the Group retains neither continuing managerial involvement to the degree usually associated with ownership nor effective control over the real estate sold, the amount of revenue and the costs incurred or to be incurred in respect of the transaction can be measured reliably and it is probable that the economic benefits associated with the transaction will flow to the entity.
3.7.3 Construction revenue
A construction contract is a contract specifically negotiated for the construction of an asset or a combination of assets that are closely interrelated or interdependent in term of their design, technology and function or their ultimate purpose or use.
Where the outcome of a construction contract can be estimated reliably, revenue and costs are recognised by reference to the stage of completion of the contract activity at the end of the reporting period measured based on the completion of a physical proportion of the contract work. Variations in contract work, claims and incentive payments are included to the extent that they have been agreed with the customer, their amount can be measured reliably and its receipt is considered probable.
Where the outcome of a construction contract cannot be estimated reliably, contract revenue is recognised to the extent of contract costs incurred that is probable to be recovered. Contract costs are recognised as expenses in the period in which they are incurred. When it is probable that total contract costs will exceed total contract revenue, the expected loss is recognised as an expense immediately.
When contract costs incurred to date plus recognized profits less recognized losses exceed progress billings, the surplus is shown as amounts due from customers for contract work. For contracts where progress billings exceed contract costs incurred to date plus recognized profits less recognized losses, the surplus is shown as amounts due to customers for contract work. Amounts received before the related work is performed are included in the consolidated statement of financial position, as a liability, as advances received. Amounts billed for work performed but not yet paid by the customer are included in the consolidated statement of financial position under trade and other receivables.
Construction contract revenue comprises revenue arising from finishing of sold units, extra works requested by customers and any construction agreement with third parties.
3.7.4 Revenue from the rendering of services
Revenue from services is recognised in the accounting periods in which the services are rendered.
3.7.5 Dividend and interest income
Dividend income from investments other than in associates is recognised when the shareholder’s right to receive payment has been established, provided that it is probable that the economic benefits will flow to the Group and the amount of income can be measured reliably.
Interest income from a financial asset is recognized when it is probable that the economic benefits will flow to the Group and the amount of income can be measured reliably. Interest income is accrued on a time basis, by reference to the principal outstanding and at the effective interest rate applicable, which is the rate that exactly discounts estimated future cash receipts through the expected life of the financial asset to that asset’s net carrying amount on original recognition.
3.7.6 Rental income
The Group’s policy for recognition of revenue from operating leases is described in 3.8.1.
3.7.7 Cost of sales
Cost of sales comprises costs related directly to the sale of goods or rendering of services. These costs include also administration expenses of revenue generating entities in the Group. Under administration expenses are costs allocated for corporate and head quarter functions as well as non revenue generating entities, such as corporate companies, holding companies and start up companies. Companies providing these services are marked as HQ in the subsidiaries' list in note 18.
3.8Leasing
Leases are classified as finance leases whenever the terms of the lease substantially transfer all the risks and rewards of ownership to the lessee. All other leases are classified as operating leases.
3.8.1 The Group as lessor
Amounts due from lessees under finance leases are recognised as receivables at the amount of the Group's net investment in the leases. Finance lease income is allocated to accounting periods so as to reflect a constant periodic rate of return on the Group's net investment outstanding in respect of the leases.

F-17 | Orascom DevelopmentAnnual Report 2011 | F-18
F-‐17
Rental income from operating leases is recognized on a straight-‐line basis over the term of the relevant lease. Initial direct costs incurred in negotiating and arranging an operating lease are added to the carrying amount of the leased asset and recognized on a straight-‐line basis over the lease term.
3.8.2 The Group as lessee
Assets held under finance leases are initially recognised as assets of the Group at their fair value at the inception of the lease or, if lower, at the present value of the minimum lease payments. The corresponding liability to the lessor is included in the statement of financial position as a finance lease obligation.
Lease payments are apportioned between finance expenses and reduction of the lease obligation so as to achieve a constant rate of interest on the remaining balance of the liability. Finance expenses are recognised immediately in profit or loss, unless they are directly attributable to qualifying assets, in which case they are capitalised in accordance with the Group’s general policy on borrowing costs (see 3.10below). Contingent rentals are recognised as expenses in the periods in which they are incurred.
Operating lease payments are recognised as an expense on a straight-‐line basis over the lease term, except when another systematic basis is more representative of the time pattern in which economic benefits from the leased asset are consumed. Contingent rentals arising under operating leases are recognised as an expense in the period in which they are incurred.
In the event that lease incentives are received to enter into operating leases, such incentives are recognised as a liability. The aggregate benefit of incentives is recognised as a reduction of rental expense on a straight-‐line basis, except when another systematic basis is more representative of the time pattern in which economic benefits from the leased asset are consumed.
3.9Foreign currencies
The individual financial statements of each subsidiary are presented in the currency of the primary economic environment in which the entity operates (its functional currency). For the preparation of the Group’s consolidated financial statements, the results and financial position of each subsidiary are translated into Swiss Franc (CHF), which is the Group’s presentation currency.
In preparing the financial statements of each individual group entity, transactions in currencies other than the entity’s functional currency (foreign currencies) are recognised at the rates of exchange prevailing at the dates of the transactions. At the end of each reporting period, monetary items denominated in foreign currencies are retranslated at the rates prevailing at that date. Non-‐monetary items carried at fair value that are denominated in foreign currencies are retranslated at the rates prevailing at the date when the fair value was determined. Non-‐monetary items that are measured in terms of historical cost in a foreign currency are not retranslated.
Exchange differences on monetary items are recognised in profit or loss in the period in which they arise except for:
– Exchange differences on foreign currency borrowings relating to assets under construction for future productive use, which are included in the cost of those assets when they are regarded as an adjustment to interest costs on those foreign currency borrowings;
– Exchange differences on transactions entered into to hedge certain foreign currency risks (see 3.22below for hedging accounting policies); and
– Exchange differences on monetary items receivable from or payable to a foreign operation for which settlement is neither planned nor likely to occur (therefore forming part of the net investment in the foreign operation), which are recognised initially in other comprehensive income and reclassified from equity to profit or loss on repayment of the monetary items.
For the purpose of presenting consolidated financial statements, the assets and liabilities of the Group’s foreign operations are translated into Swiss Francs (CHF) using exchange rates prevailing at the end of each reporting period. Income and expense items are translated at the average exchange rates for the period, unless exchange rates fluctuate significantly during that period, in which case the exchange rates at the dates of the transactions are used. Exchange differences arising, if any, are recognised in other comprehensive income and accumulated in the Group’s foreign currency reserve, a separate component in equity (attributed to non-‐controlling interests as appropriate).
On the disposal of a foreign operation (i.e. disposal of the Group’s entire interest in a foreign operation, or a disposal involving loss of control over a subsidiary that includes a foreign operation, or a disposal involving loss of significant influence over an associate that includes a foreign operation), all of the exchange differences accumulated in other comprehensive income in respect of that operation attributable to the owners of the Parent are reclassified to profit or loss.
In the case of a partial disposal of a subsidiary that does not result in the Group losing control over the subsidiary, the proportionate share of accumulated exchange differences are re-‐attributed to non-‐controlling interests and are not recognized in profit or loss. For all other partial disposals (i.e. reductions in the Group's ownership interest in associates that do not result in the Group losing significant influence), the proportionate share of the accumulated exchange differences is reclassified to profit or loss.
Goodwill and fair value adjustments on identifiable assets and liabilities acquired arising on the acquisition of a foreign operation are treated as assets and liabilities of the foreign operation and translated at the exchange rate prevailing at the end of each reporting period. Exchange differences arising are recognised in equity.
F-‐18
The exchange rates relevant to the annual financial statements were:
2011 2010 Currency table
Average Year end Average Year end
1 EGP Egyptian Pound 0.1491 0.1556 0.1848 0.1606
1 USD US Dollar 0.8866 0.9384 1.0424 0.9323
1 EUR Euro 1.2329 1.2171 1.3810 1.2490
1 OMR Oman Rial 2.3027 2.4372 2.7076 2.4209
1 AED United Arab Emirates Dirham 0.2414 0.2555 0.2838 0.2538
1 MAD Moroccan Dirham 0.1094 0.1095 0.1238 0.1116
1 JOD Jordanian Dinar 1.2508 1.3244 1.4711 1.3173
3.10Borrowing costs
Borrowing costs directly attributable to the acquisition, construction or production of qualifying assets, which are assets that necessary take a substantial period of time to get ready for their intended use or sale, are added to the cost of those assets until such time, as the assets are substantially ready for their intended use or sale.
The following principles apply when borrowing costs are partly or fully capitalized by the Group as part of a qualifying asset:
– Where hedge accounting is not applied to minimize the interest rate risk on borrowings used to fund that asset and, therefore derivatives are classified as at fair value through profit or loss, all gains / losses on non-‐hedging derivatives are immediately recognized in profit or loss.
– Where variable rate borrowings are used to finance a qualifying asset and a derivative is designated to cash flow hedge the variability in interest rates on such borrowings, any gain or loss on the hedging derivative that is effective and, therefore previously recognized in other comprehensive income, is reclassified from equity to profit or loss when the hedged risk impacts profit or loss. The hedged interest component of the qualifying asset (hedged risk) impacts profit or loss when the qualifying asset is amortized, impaired or sold.
– Where fixed rate borrowings are used to finance a qualifying asset and a derivative is designated to hedge the fair value exposure to changes in interest rates of such borrowings, the synthetic floating interest rate that is achieved as a result of a highly effective hedge is capitalized, so that borrowing costs always reflect the hedged interest rate. The amount of borrowing costs capitalized in such a case comprises the actual fixed rate on the borrowings plus the effect of swapping this fixed rate into floating rates.
Investment income earned on the temporary investment of specific borrowings pending their expenditure on qualifying assets is deducted from the borrowing costs eligible for capitalisation.
All other borrowing costs are recognised in profit or loss in the period in which they are incurred.
As the financing activity is co-‐ordinated centrally and generally by the parent and some of the main subsidiaries, the group determines the amount of borrowing costs eligible for capitalisation by applying a capitalisation rate to the expenditures on that asset.The group includes all borrowings of the parent and its subsidiaries when computing the weighted average of the borrowing costs applicable to the borrowings that are outstanding during the period other than borrowings made specifically for the purpose of obtaining a qualifying asset.
The amount of borrowing costs that an entity capitalises during the period shall not exceed the amount of borrowing costs it incurred during that period, provided that the carrying amount of the qualifying asset on which eligible borrowing costs have been capitalized does not exceed its recoverable amount (being the higher of fair value less costs to sell or amount in use for that asset).
3.11Government grants
Government grants are not recognised until there is reasonable assurance that the Group will comply with the conditions attached to them and that the grants will be received.
Government grants are recognised in profit or loss on a systematic basis over the periods in which the Group recognises as expenses the related costs for which the grants are received.
Government grants whose primary condition is that the Group should purchase, construct or otherwise acquire non-‐current assets are recognised as deferred revenue in the consolidated statement of financial position and transferred to profit or loss on a systematic and rational basis over the useful lives of the related assets.
F-19 | Orascom DevelopmentAnnual Report 2011 | F-20
F-‐19
Government grants that are receivable as compensation for expenses or losses already incurred or for the purpose of giving immediate financial support to the Group with no future related costs are recognised in profit or loss in the period in which they become receivable.
The benefit of a government loan granted at below-‐market interest rates of interest is treated as a government grant and measured as the difference between proceeds received and the fair value of the loan based on prevailing market interest rates.
3.12Retirement benefit costs
Employee pension and retirement benefits are based on the regulations and prevailing circumstances of those countries in which the Group is represented. In Switzerland, ordinary pension and retirement benefit plans qualify as defined-‐benefit plans and are accounted for in conformity with IAS 19 Employee Benefits.
For defined benefit retirement benefit plans, the cost of providing benefits is determined using the Projected Unit Credit Method, with actuarial valuations being carried out at the end of each reporting period. Actuarial gains and losses that exceed 10 percent of the greater of (i) the present value of the Group’s defined benefit obligation and (ii) the fair value of plan assets as at the end of the prior year are amortised over the excepted average remaining working lives of the participating employees.
Past service-‐costs are recognised immediately in profit or loss to the extent that the benefits are already vested, and otherwise are amortized on a straight-‐line basis over the average period until the benefits become vested.
The retirement benefit obligation recognised in the consolidated statement of financial position represents the present value of the defined benefit obligation as adjusted for unrecognised actuarial gains and losses and unrecognised past service cost, and as reduced by the fair value of plan assets. Any asset resulting from this calculation is limited to unrecognised actuarial losses and past service cost, plus the present value of available refunds and reductions in future contributions to the plan.
Payments to defined contribution retirement benefit plans are recognised as an expense when employees have rendered service entitling them to the contribution.
3.13Taxation
Income tax expense represents the sum of the tax currently payable and deferred tax.
3.13.1 Current tax
The tax currently payable is based on taxable profit for the year. Taxable profit differs from profit as reported in the consolidated statement of comprehensive income because of items of income or expense that are taxable or deductible in other years and items that are never taxable or deductible. The Group’s liability for current tax is calculated using tax rates that have been enacted or substantively enacted by the end of the reporting period.
3.13.2 Deferred tax
Deferred tax is recognised on temporary differences between the carrying amounts of assets and liabilities in the consolidated financial statements and the corresponding tax bases used in the computation of taxable profit, and are accounted for using the Balance Sheet Liability Method.
Deferred tax liabilities are generally recognised for all taxable temporary differences. Deferred tax assets are generally recognised for all deductible temporary differences to the extent that it is probable that taxable profits will be available against which those deductible temporary differences can be utilized.
Such deferred tax liabilities are not recognised if the temporary difference arises from goodwill and no deferred tax assets or liabilities are recognised for temporary differences resulting from the initial recognition (other than in a business combination) of other assets and liabilities in a transaction that affects neither the taxable profit nor the accounting profit.
Deferred tax liabilities are recognised for taxable temporary differences associated with investments in subsidiaries and associates, and interests in joint ventures, except where the Group is able to control the reversal of the temporary difference and it is probable that the temporary difference will not reverse in the foreseeable future.
Deferred tax assets arising from deductible temporary differences associated with such investments and interests are only recognised to the extent that it is probable that there will be sufficient taxable profits against which to utilize the benefits of the temporary differences and they are expected to reverse in the foreseeable future.
The carrying amount of deferred tax assets is reviewed at the end of each reporting period and reduced to the extent that it is no longer probable that sufficient taxable profits will be available to allow all or part of the asset to be recovered.
Deferred tax assets and liabilities are measured at the tax rates that are expected to apply in the period in which the liability is settled or the asset realised, based on tax rates (and tax laws) that have been enacted or substantively enacted by the end of the reporting period. The measurement of deferred tax liabilities and assets reflects the tax consequences that would follow from the
F-‐20
manner in which the Group expects, at the end of the reporting period, to recover or settle the carrying amount of its assets and liabilities.
Deferred tax assets and liabilities are offset when there is a legally enforceable right to set off current tax assets against current tax liabilities and when they relate to income taxes levied by the same taxation authority and the Group intends to settle its current tax assets and liabilities on a net basis.
3.13.3 Current and deferred tax for the year
Current and deferred tax are recognised as an expense or income in profit or loss, except when they relate to items that are recognised in other comprehensive income or directly in equity, in which case, the current and deferred tax are also recognised in other comprehensive income or directly in equity respectively. Where current tax or deferred tax arises from the initial accounting for a business combination, the tax effect is included in the accounting for the business combination.
3.14Property, plant and equipment
Buildings, plant and equipment, furniture and fixtures held for use in the production, supply of goods or services or for administrative purposes are stated in the consolidated statement of financial position at cost less any accumulated depreciation and accumulated impairment losses.
Properties in the course of construction for production, administrative purposes or for a currently undetermined future use are carried at cost less any recognised impairment loss. Cost includes professional fees and, for qualifying assets, borrowing costs capitalized in accordance with the Group’s accounting policy as described in 3.10. Such properties are classified to the appropriate categories of property, plant and equipment when completed and ready for intended use. Depreciation of these assets, on the same basis as other property assets, commences when the assets are ready for their intended use.
Depreciation of buildings, plant and equipment as well as furniture and fixtures commences when the assets are ready for their intended use.
Freehold land is not depreciated.
Depreciation is recognized so as to write off the cost of assets (other than freehold land and properties under construction) less their residual values over their estimated useful lives, using the straight-‐line method. The estimated useful lives, residual values and depreciation method are reviewed at the end of each reporting period, with the effect of any changes in estimate accounted for on a prospective basis.
Assets held under finance leases are depreciated over their expected useful lives on the same basis as owned assets.However, when there is no reasonable certainty that ownership of the leased asset will be obtained by the end of the lease term, assets are depreciated over the shorter of the lease term and their useful lives.
An item of property, plant and equipment is derecognised upon disposal or when no future economic benefits are expected to arise from the continued use of the asset. Any gain or loss arising on the disposal or retirement of an item of property, plant and equipment is determined as the difference between the net sales proceeds and the carrying amount of the asset and is recognised in profit or loss.
The following estimated useful lives are used in the calculation of depreciation:
Buildings 20 – 50 years
Plant and equipment 4 – 25 years
Furniture and fixtures 3 – 20 years
3.15Investment property
Investment properties are properties (land or a building – or part of a building – or both) held by the Group entities to earn rentals and / or for capital appreciation (including property under construction for such purposes). Investment properties are measured initially at cost, including transaction costs. Subsequent to initial recognition, investment properties are measured at fair value at the end of each reporting period. Gains and losses arising from changes in the fair value of investment properties are recognised in profit or loss including an adjustment to the related deferred tax position in the period in which they arise.
Fair value is the amount for which an asset could be exchanged between knowledgeable and willing parties in an arm’s length transaction. The fair value of investment properties reflects market conditions at the end of each reporting period and is determined without any deduction for transaction costs which the Group may incur on sale or other disposal. The fair value of investment properties is determined based on evaluations performed by independent valuators.
An investment property is derecognised upon disposal or when the investment property is permanently withdrawn from use and no future economic benefits are expected from the disposal. Any gain or loss arising on de-‐recognition of the property (calculated
F-21 | Orascom DevelopmentAnnual Report 2011 | F-22
F-‐21
as the difference between the net disposal proceeds and the carrying amount of the asset) is included in profit or loss in the period in which the property is derecognised.
3.16Impairment of tangible assets
At the end of each reporting period, the Group reviews the carrying amounts of its tangible assets to determine whether there is any indication that those assets have suffered an impairment loss. If any such indication exists, the recoverable amount of the asset is estimated in order to determine the extent of the impairment loss (if any).
Where it is not possible to estimate the recoverable amount of an individual asset, the Group estimates the recoverable amount of the cash-‐generating unit to which the asset belongs. Where a reasonable and consistent basis of allocation can be identified, corporate assets are also allocated to individual cash-‐generating units, or otherwise they are allocated to the smallest group of cash-‐generating units for which a reasonable and consistent allocation basis can be identified.
Recoverable amount is the higher of fair value less costs to sell and value in use. In assessing value in use, the estimated future cash flows are discounted to their present value using a pre-‐tax discount rate that reflects current market assessments of the time value of money and the risks specific to the asset for which the estimates of future cash flows have not been adjusted.
If the recoverable amount of an asset (or cash-‐generating unit) is estimated to be less than its carrying amount, the carrying amount of the asset (or cash-‐generating unit) is reduced to its recoverable amount. An impairment loss is recognised immediately in profit or loss.
Where an impairment loss subsequently reverses, the carrying amount of the asset (or cash-‐generating unit) is increased to the revised estimate of its recoverable amount, but so that the increased carrying amount does not exceed the carrying amount that would have been determined had no impairment loss been recognised for the asset (or cash-‐generating unit) in prior years. A reversal of an impairment loss is recognized immediately in profit or loss..
3.17Inventories
Inventories are stated at the lower of cost and net realizable value.
Costs, including an appropriate portion of fixed and variable production overheads as well as other costs incurred in bringing the inventories to their present location and condition, are assigned to inventories by the method most appropriate to the particular class of inventory, with the majority being valued on a weighted average basis. For items acquired on credit and where payment terms of the transaction are extended beyond normal credit terms, the cost of that item is its cash price equivalent at the recognition date with any difference from that price being treated as an interest expense on an effective-‐yield basis (see note 11).
Net realizable value represents the estimated selling price for inventories less all estimated costs of completion and costs necessary to make the sale.
Estimates of net realisable value are generally made on an item-‐by-‐item basis, except in circumstances, where it is more appropriate to group items of similar or related inventories.
The net realizable value of an item of inventory may fall below its cost for many reasons including, damage, obsolescence, slow moving items, a decline in selling prices, or an increase in the estimate of costs to complete and costs necessary to make the sale. In such cases, the cost of that item is written-‐down to its net realizable value and the difference is recognized immediately in profit or loss.
Properties intended for sale in the ordinary course of business or in the process of construction or development for such a sale are included in inventories. These are stated at the lower of cost and net realizable value. The cost of development properties includes the cost of land and other related expenditure attributable to the construction or development during the period in which activities are in progress that are necessary to get the properties ready for its intended sale.
3.18Provisions
Provisions are recognised when the Group has a present obligation (legal or constructive) as a result of a past event, it is probable that the Group will be required to settle the obligation, and a reliable estimate can be made of the amount of the obligation.
The amount recognised as a provision is the best estimate of the consideration required to settle the present obligation at the end of the reporting period, taking into account the risks and uncertainties surrounding the obligation. When a provision is measured using the cash flows estimated to settle the present obligation, its carrying amount is the present value of those cash flows (where the effect of the time value of money is material).
When some or all of the economic benefits required to settle a provision are expected to be recovered from a third party, a receivable is recognised as an asset, if it is virtually certain that reimbursement will be received and the amount of the receivable can be measured reliably.
F-‐22
3.19Financial instruments
Financial assets and financial liabilities are recognised when a Group entity becomes a party to the contractual provisions of the instrument.
Financial assets and financial liabilities are initially measured at fair value. Transaction costs that are directly attributable to the acquisition or issue of financial assets and financial liabilities (other than financial assets and financial liabilities at fair value through profit or loss) are added to or deducted from the fair value of the financial assets or financial liabilities, as appropriate, on initial recognition. Transaction costs directly attributable to the acquisition of financial assets or financial liabilities at fair value through profit or loss are recognised immediately in profit or loss.
3.20Financial assets
All regular way purchases or sales of financial assets are recognised and derecognised on a trade date basis. Regular way purchases or sales are purchases or sales of financial assets that require delivery of assets within the timeframe established by regulation or convention in the market place.
Financial assets are classified into the following specified categories: financial assets ‘at fair value through profit or loss’ (FVTPL), ‘available-‐for-‐sale’ (AFS) financial assets, held-‐to–maturity investments and ‘loans and receivables’. The classification depends on the nature and purpose of the financial assets and is determined at the time of initial recognition.
3.20.1 Effective interest method
The effective interest method is a method of calculating the amortised cost of a debt instrument and of allocating interest income over the relevant period. The effective interest rate is the rate that exactly discounts estimated future cash receipts (including all fees or points paid or received that form an integral part of the effective interest rate, transaction costs and other premiums or discounts) through the expected life of the debt instrument, or, where appropriate, a shorter period, to the net carrying amount on initial recognition.
Income is recognised on an effective interest basis for debt instruments other than those financial assets classified as at FVTPL.
3.20.2 Financial assets at fair value through profit or loss (FVTPL)
Financial assets are classified as at FVTPL where the financial asset is either held for trading or it is designated as at FVTPL.
A financial asset is classified as held for trading, if:
– it has been acquired principally for the purpose of selling it in the near term; or
– on initial recognition it is a part of a portfolio of identified financial instruments that the Group manages together and has a recent actual pattern of short-‐term profit-‐taking; or
– it is a derivative that is not designated and effective as a hedging instrument.
A financial asset other than a financial asset held for trading may be designated as at FVTPL upon initial recognition, if:
– such designation eliminates or significantly reduces a measurement or recognition inconsistency that would otherwise arise; or
– the financial asset forms part of a group of financial assets or financial liabilities or both, which is managed and its performance is evaluated on a fair value basis in accordance with the Group's documented risk management or investment strategy and information about the grouping is provided internally on that basis; or
– it forms part of a contract containing one or more embedded derivatives, and IAS 39 Financial Instruments: Recognition and Measurement permits the entire combined contract (asset or liability) to be designated as at FVTPL.
All financial assets at FVTPL are stated at fair value with any gains or losses arising on re-‐measurement recognised in profit or loss. The net gain or loss recognised in profit or loss incorporates any dividend or interest earned on the financial asset and is included in the ‘other gains and losses’ line item in the consolidated statement of comprehensive income. Fair value is determined in the manner described in note 38.
3.20.3 Held-‐to-‐maturity investments
Held-‐to-‐maturity investments are non-‐derivative financial assets with fixed or determinable payments and fixed maturity dates that the Group has the positive intent and ability to hold to maturity. Subsequent to initial recognition, held-‐to-‐maturity investments are measured at amortised cost using the effective interest method less any impairment.

F-23 | Orascom DevelopmentAnnual Report 2011 | F-24
F-‐23
3.20.4 Available for sale financial assets (AFS)
AFS financial assets are non-‐derivatives that are either designated as AFS or are not classified as loans and receivable, held-‐to–maturity investment or financial assets at fair value through profit or loss.
Listed shares and listed redeemable notes held by the Group that are traded in an active market are classified as AFS and are stated at fair value at the end of each reporting period. Fair value is determined in the manner described in note 38.
Changes in the carrying amount of AFS monetary financial assets relating to changes in foreign currency rates (see below), interest income calculated using the effective interest method and dividends on AFS equity investments are recognised in profit or loss. Other changes in the carrying amount of available-‐for-‐sale financial assets are recognised in other comprehensive income and accumulated under the heading of investments revaluation reserve. Where the investment is disposed of or is determined to be impaired, the cumulative gain or loss previously accumulated in the investments revaluation reserve is reclassified to profit or loss.
Dividends on AFS equity instruments are recognised in profit or loss when the Group's right to receive the dividends is established.
The fair value of AFS monetary assets denominated in a foreign currency is determined in that foreign currency and translated at the spot rate prevailing at the end of the reporting period. The foreign exchange gains and losses that are recognised in profit or loss are determined based on the amortised cost of the monetary asset. Other foreign exchange gains and losses are recognised in other comprehensive income.
AFS equity Investments that do not have a quoted market price in an active market and whose fair value cannot be reliably measured, and derivatives that are linked to and must be settled by delivery of such unquoted equity investments, are measured at cost less any identified impairment losses at the end of each reporting period.
3.20.5 Loans and receivables
Loans and receivables are non-‐derivative financial assets with fixed or determinable payments that are not quoted in an active market other than those the Group intends to sell immediately or in the short-‐term, or those that the Group on initial recognition designates as either at FVTPL or available-‐for-‐sale. Loans and receivables (including trade and other receivables) are measured at amortised cost using the effective interest method, less any impairment. Impairment for loans and receivables is discussed in 4.2.6 below.
Interest income is recognised by applying the effective interest rate, except for short-‐term receivables when the recognition of interest would be immaterial.
3.20.6 Impairment of financial assets
Financial assets, other than those at FVTPL, are assessed for indicators of impairment at the end of each reporting period. Financial assets are considered to be impaired where there is objective evidence that, as a result of one or more events that occurred after the initial recognition of the financial asset, the estimated future cash flows of the investment have been affected.
For listed and unlisted AFS equity investments, a significant or prolonged decline in the fair value of the security below its cost is considered to be objective evidence of impairment. Management records an impairment charge if the fair value decline exceeds 20 percent or persists over a period of 180 days. The applied criteria to determine a significant or prolonged decline, i.e. impairment, are different for equity instruments listed at the Egyptian stock exchange due to the exceptional situation in Egypt. See note 4.1.5 for further details.
For all other financial assets, objective evidence of impairment could include:
– significant financial difficulty of the issuer or counterparty;
– breach of contract, such as a default or delinquency in interest or principal payments;
– it becoming probable that the borrower will enter bankruptcy or financial re-‐organisation; or
– the disappearance of an active market for that financial asset because of financial difficulties.
For certain categories of financial assets, such as loans, trade and notes receivable, assets that are assessed not to be impaired individually are, in addition, assessed for impairment on a collective basis. Objective evidence of impairment for a portfolio of receivables could include the Group's past experience of collecting payments, an increase in the number of delayed payments in the portfolio past the average credit period for the Group, as well as observable changes in national or local economic conditions that correlate with default on loans and receivables.
If collective assessment has indicated that a group of financial assets (loans and receivables) has suffered an impairment loss, it is recognized in profit or loss.
For financial assets carried at amortised cost, the amount of the impairment loss recognized is the difference between the asset’s carrying amount and the present value of estimated future cash flows, discounted at the financial asset’s original effective interest rate.
F-‐24
For financial assets carried at cost, the amount of the impairment loss is measured as the difference between the asset's carrying amount and the present value of the estimated future cash flows discounted at the current market rate of return for a similar financial asset. Such impairment loss will not be reversed in subsequent periods.
The carrying amount of the financial asset is reduced by the impairment loss directly for all financial assets with the exception of trade receivables, where the carrying amount is reduced through the use of an allowance account. When a trade receivable is considered uncollectible, it is written off against the allowance account. Subsequent recoveries of amounts previously written off are credited against the allowance account. Changes in the carrying amount of the allowance account are recognised in profit or loss.
When an AFS financial asset is considered to be impaired, cumulative gains or losses previously recognised in other comprehensive income are reclassified to profit or loss in the period.
For financial assets measured at amortised cost, if, in a subsequent period, the amount of the impairment loss decreases and the decrease can be related objectively to an event occurring after the impairment was recognised, the previously recognised impairment loss is reversed through profit or loss to the extent that the carrying amount of the investment at the date the impairment is reversed does not exceed what the amortised cost would have been had the impairment not been recognised.
In respect of AFS equity securities, impairment losses previously recognised in profit or loss are not reversed through profit or loss. Any increase in fair value subsequent to an impairment loss is recognised directly in other comprehensive income and accumulated under the heading of investments revaluation reserve. In respect of AFS debt securities, impairment losses are subsequently reversed through profit or loss, if an increase in the fair value of the investment can be objectively related to an event occurring after the recognition of the impairment loss.
3.20.7 De-‐recognition of financial assets
The Group derecognises a financial asset only when the contractual rights to the cash flows from the asset expire, or if it transfers the financial asset and substantially all the risks and rewards of ownership of the asset to another entity.
If the Group neither transfers nor retains substantially all the risks and rewards of ownership and continues to control the transferred asset, the Group recognises its retained interest in the asset and an associated liability for amounts it may have to pay. If the Group retains substantially all the risks and rewards of ownership of a transferred financial asset, the Group continues to recognise the financial asset and also recognises a collateralised borrowing for the proceeds received.
On de-‐recognition of a financial asset in its entirety, the difference between the asset's carrying amount and the sum of the consideration received and receivable and the cumulative gain or loss that had been recognised in other comprehensive income and accumulated in equity is recognised in profit or loss.
On de-‐recognition of a financial asset other than in its entirety (e.g. when the Group retains an option to repurchase part of a transferred asset or retains a residual interest that does not result in the retention of substantially all the risks and rewards of ownership and the Group retains control), the Group allocates the previous carrying amount of the financial asset between the part it continues to recognise under continuing involvement, and the part it no longer recognises on the basis of the relative fair values of those parts on the date of the transfer.
The difference between the carrying amount allocated to the part that is no longer recognised and the sum of the consideration received for the part no longer recognised and any cumulative gain or loss allocated to it that had been recognised in other comprehensive income is recognised in profit or loss. A cumulative gain or loss that had been recognised in other comprehensive income is allocated between the part that continues to be recognised and the part that is no longer recognised on the basis of the relative fair values of those parts.
3.21Financial liabilities and equity instruments
3.21.1 Classification as debt or equity
Debt and equity instruments issued by a Group entity are classified as either financial liabilities or as equity in accordance with the substance of the contractual arrangements and the definitions of a financial liability and an equity instrument.
3.21.2 Equity instruments
An equity instrument is any contract that evidences a residual interest in the assets of an entity after deducting all of its liabilities.
The instrument is an equity instrument if, and only if, both conditions (a) and (b) below are met:
a) The instrument includes no contractual obligation: i. to deliver cash or another financial asset to another entity; or ii. to exchange financial assets or financial liabilities with another entity under conditions that are potentially unfavourable
to the issuer. b) If the instrument will or may be settled in the issuer’s own equity instruments, it is:
F-25 | Orascom DevelopmentAnnual Report 2011 | F-26
F-‐25
i. a non-‐derivative that includes no contractual obligation for the issuer to deliver a variable number of its own equity instruments; or
ii. a derivative that will be settled only by the issuer exchanging a fixed amount of cash or another financial asset for a fixed number of its own equity instruments.
A contract that will be settled by the Group entity receiving or delivering a fixed number of its own equity instruments in exchange for a fixed amount of cash or another financial asset is an equity instrument.
Equity instruments issued by the Group are recognised at the proceeds received, net of direct issue costs.
Repurchases of the Parent Company’s own equity instruments is recognised and deducted directly in equity. No gain or loss is recognised in profit of loss on the purchase, sale, issue or cancellation of the Parent Company’s own equity instruments.
3.21.3 Financial liabilities
Financial liabilities are classified as ‘other financial liabilities’. Other financial liabilities including borrowings are subsequently measured at amortised cost using the effective interest method, with interest expense recognised on an effective yield basis.
Liabilities arising on written put option agreements are classified as miscellaneous financial liabilities "obligation to buy". These are initially measured at fair value, which is the present value of the future amount to be paid to the other shareholders, if they were to exercise the option on the last day of the option period. Put option liabilities are subsequently measured at amortized cost using the effective interest method with the difference between the present value on initial recognition and the settlement value of the liability recognized as interest expense on an effective yield basis (see note 35).
Short-‐term trade and notes payable are non-‐interest bearing liabilities, whose settlement dates do not extend beyond 12 months from the end of the reporting period. These are classified as other financial liabilities and are stated at their nominal value, where the effect of discounting is immaterial.
Other long-‐term payables arising on acquisition of an item of property, plant and equipment or inventory are classified as other financial liabilities. These are initially measured at the fair value, which is the cash price equivalent for that item. They are subsequently measured at amortized cost using the effective interest method. As such, when payment for an item of property, plant and equipment or inventory is deferred beyond normal credit terms, the difference between the cash price equivalent and the total payments is recognized in profit or loss as an interest expense over the period of the credit using the effective interest rate method, unless it is capitalized on qualifying assets in accordance with the Group's policy. The interest expense recognized as such is reported as part of the finance costs.
The effective interest method is a method of calculating the amortised cost of a financial liability and of allocating interest expense over the relevant period. The effective interest rate is the rate that exactly discounts estimated future cash payments (including all fees and points paid or received that form an integral part of the effective interest rate, transaction costs and other premiums or discounts) through the expected life of the financial liability, or (where appropriate) a shorter period, to the net carrying amount on initial recognition.
A financial guarantee contract is a contract that requires the issuer to make specified payments to reimburse the holder for a loss it incurs because a specified debtor fails to make payments when due in accordance with the terms of a debt instrument. It is not the Group's policy to guarantee third party debtors, but it usually issues such contracts to guarantee debts of the group subsidiaries.
3.21.4 De-‐recognition of financial liabilities
The Group de-‐recognises financial liabilities when, and only when, the Group’s obligations are discharged, cancelled or they expire. The difference between the carrying amount of the financial liability derecognised and the consideration paid and payable is recognised in profit or loss.
3.22Derivative financial instruments
The Group enters into a variety of derivative financial instruments mainly to manage its exposure to interest rate and foreign exchange rate risk, including foreign exchange forward contracts and interest rate swaps. Further details of derivative financial instruments are disclosed in notes 21 and 38.
Derivatives are initially recognised at fair value at the date the derivative contracts are entered into and are subsequently re-‐measured to their fair value at the end of each reporting period. The resulting gain or loss is recognised in profit or loss immediately unless the derivative is designated and effective as a hedging instrument, in which event the timing of the recognition in profit or loss depends on the nature of the hedge relationship.
A derivative with a positive fair value is recognized as a financial asset; a derivative with a negative fair value is recognized as a financial liability.
F-‐26
A derivative that has a remaining maturity of less than twelve months from the end of the reporting period or has a remaining maturity greater than twelve months but is expected to be settled within twelve months is presented as current asset or liability.
A derivative that is designated and effective in a hedging relationship with a non-‐current hedged item is presented as a non-‐current asset or liability in accordance with the presentation of the hedged item.
A derivative that has a maturity of more than twelve months from the end of the reporting period and is not intended to be settled within twelve months is presented as a non-‐current asset or liability, even if that derivative is not part of a designated and effective hedge accounting.
3.22.1 Hedge accounting
The Group generally designates certain derivatives as hedging instruments in respect of foreign currency risk, interest rate risk or hedges of net investments in foreign operations. Hedges of foreign currency risk on firm commitments, hedges of net investments in foreign operations as well as hedges of the variability risk of interest rates are all accounted for by the Group as cash flow hedges.
At the inception of the hedge relationship, the entity documents the relationship between the hedging instrument and the hedged item, along with its risk management objectives and its strategy for undertaking various hedge transactions. Furthermore, at the inception of the hedge and on an ongoing basis, the Group documents whether the hedging instrument, in a hedging relationship, is highly effective in offsetting changes in cash flows of the hedged item attributable to the hedged risk.
3.22.2 Cash flow hedges
The effective portion of changes in the fair value of derivatives that are designated and qualify as cash flow hedges is recognised in other comprehensive income and accumulated under the heading of cash flow hedging reserve. The gain or loss relating to the ineffective portion is recognised immediately in profit or loss, and is included in the ‘other gains and losses’ line item.
Amounts previously recognised in other comprehensive income and accumulated in equity are reclassified to profit or loss in the periods when the hedged item is recognised in profit or loss, in the same line of the consolidated statement of comprehensive income as the recognised hedged item. However, when the hedged forecast transaction results in the recognition of a non-‐financial asset or a non-‐financial liability, the gains and losses previously recognized in other comprehensive income and accumulated in equity are transferred from equity and included in the initial measurement of the cost of the non-‐financial asset or non-‐financial liability.
Hedge accounting is discontinued when the Group revokes the hedging relationship, the hedging instrument expires or is sold, terminated, or exercised, or when it no longer qualifies for hedge accounting. Any gain or loss recognised in other comprehensive income and accumulated in equity at that time remains in equity and is recognised when the forecast transaction is ultimately recognised in profit or loss. When a forecast transaction is no longer expected to occur, the gain or loss accumulated in equity is recognised immediately in profit or loss.
3.22.3 Hedges of net investments in foreign operations
Hedges of net investments in foreign operations are accounted for similarly to cash flow hedges. Any gain or loss on the hedging instrument relating to the effective portion of the hedge is recognized in other comprehensive income and accumulated under the heading of foreign currency translation reserve. The gain or loss relating to the ineffective portion is recognized immediately in profit or loss, and is included in the ’other gains and losses’ line item.
Gains and losses on the hedging instrument relating to the effective portion of the hedge accumulated in the foreign currency translation reserve are reclassified to profit or loss on the disposal of the foreign operation in the same way as exchange differences relating to foreign operation as described at 3.9above.

F-27 | Orascom DevelopmentAnnual Report 2011 | F-28
F-‐27
4 CRITICAL ACCOUNTING JUDGMENTS AND KEY SOURCES OF ESTIMATION UNCERTAINTY
In the application of the Group’s accounting policies, which are described in note 3, the directors are required to make judgments, estimates and assumptions about the carrying amounts of assets and liabilities that are not readily apparent from other sources. The estimates and associated assumptions are based on historical experience and other factors that are considered to be relevant. Actual results may differ from these estimates.
The estimates and underlying assumptions are reviewed on an ongoing basis. Revisions to accounting estimates are recognised in the period in which the estimate is revised if the revision affects only that period or in the period of the revision and future periods if the revision affects both current and future periods.
4.1 Critical judgments in applying accounting policies
The following are the critical judgments, apart from those involving estimations (see note 4.2 below), that management have made in the process of applying the Group’s accounting policies and that have the most significant effect on the amounts recognised in the consolidated financial statements.
4.1.1 Revenue recognition – Real estate sales
The operating cycle of residential construction projects predominantly starts when the Group enters into agreements to sell the real estate units off-‐plan. The Group treats the sale of real estate units as sale of goods in accordance with IAS 18 Revenue and IFRIC 15 Agreements for the Construction of Real Estates. Management takes the view that the critical event of revenue recognition hinges on the transfer of significant risks and rewards of ownership and control to the buyer. When management makes this assessment it ensures that the detailed criteria for revenue recognition from the sale of goods as set out in IAS 18 and IFRIC 15 -‐ including the transfer of significant risks and rewards of ownership and control to the buyer -‐ are satisfied and that recognition of revenue from the sale of real estate is appropriate in the current reporting period.
Given the structure of the real estate sale contracts and the application of IAS 18 and IFRIC 15 as described above, revenue recognition from residential construction projects occurs in independent stages and consists of the sale of land, constructed, but unfinished units and finished units. The transfer of significant risks and rewards of ownership and control of each stage is documented in an official delivery protocol and signed by representatives of the Group as well as the buyer.
4.1.2 Government grants
Acquisition by the Group entities of part of the land used in the construction of their real estate projects from governments of the local jurisdictions in which they carry out their activities has not brought these transactions under the scope of IAS 20 Accounting for Government Grants and Disclosure of Government Assistance and, therefore, has not resulted in the recognition of government grants in the current or in prior periods.
In these cases the government is the only possible seller in the market and the Group purchases the land at market prices available to all interested parties and does not obtain finance facilities from the government which would require accounting for government grants.
4.1.3 Employee benefits expense
Employee benefits expense which are directly related to the sale of goods or rendering of services form part of the operation’s cost of sales. Where employee benefit expense is incurred to perform head quarter functions or relate to non-‐revenue generating entities, such as corporate companies, holding companies and start up companies, they are allocated to administration expenses.
4.1.4 Sale of six percent stake in former Garranah subsidiaries
On 18 May 2010, the Group signed a share sale and purchase agreement to sell to the Garranah family a six percent stake in six subsidiaries whereof four are operating floating hotels (International Stock Company for Floating Hotels & Touristic Establishments, Mirotel for Floating Hotels Company, Tarot Garranah & Merotil for Floating Hotels, El Tarek for Nile Cruises & Floating Hotels), one is active as a tour operator (Tarot Tours Company (Garranah) SAE) and one provides tour transportation services (Tarot Garranah for Touristic Transportation).
Pursuant to this agreement, the Group’s interest in these entities decreased from 51 to 45 percent and the Group ceased control over these subsidiaries, but retained significant influence at 31 December 2010. As of the date of this change of ownership interest, the Group did not consolidate these operations but accounted for them as investments in associates.
F-‐28
The sale is not disclosed as a discontinued operation in accordance with IFRS 5 in these consolidated financial statements, as management is of the opinion that the disposed subsidiaries did not represent a separate major line of business or a geographical area of operations and were not acquired exclusively with a view to resale.
Furthermore, management has the intention to acquire significant shareholdings of companies providing services in the above mentioned activities if they match the Group’s strategy.
4.1.5 Impairment of available-‐for-‐sale financial assets
At the end of each reporting period, the Group reviews the carrying amounts of its available for sale financial assets to determine whether there is any objective evidence that an AFS financial asset or group of AFS financial assets is impaired. An AFS financial asset is impaired, and an impairment loss recognized, if and only if, such evidence exists. Objective evidence of impairment may result from one or more events that occurred after the initial recognition of the asset (a ‘loss event’) which the Group considers. These events are disclosed in note 3.20.
When considering what is a ‘significant or prolonged decline in fair value’ of an available-‐for-‐sale listed equity investment below cost, the Group entity which holds the instrument compares the original cost at the date of acquisition and fair value of the equity security on the re-‐measurement date. This assessment is made in the functional currency of the entity holding the instrument. Therefore, when the foreign currency, in which the listed equity investment is denominated, depreciates significantly and causes decline in fair value below cost, an impairment loss is recognized.
If there is objective evidence that an AFS unquoted equity investment (measured at cost) is impaired, the Group measures the amount of the impairment loss as the difference between carrying amount and the present value of estimated future cash flows discounted at the current rate of return for a similar financial asset.
If there is objective evidence that an AFS debt instrument is impaired, the Group measures the amount of the impairment loss at the cumulative fair value loss that has been recognized in other comprehensive income and reclassifies the whole amount from equity to profit or loss. The impairment loss on an AFS debt instrument includes a market participant’s view of recoverable cash flows discounted at the rate that reflects current market interest rates, adjusted for liquidity and other factors a market participant would include in determining fair value.
The carrying value of the Group’s available-‐for-‐sale financial assets at the end of the current reporting period is CHF 39,609,291 (31 December 2010: CHF 70,597,147).
Management has performed a detailed review of the carrying amounts of its available for sale financial assets to determine whether there is any objective evidence that an AFS financial asset or group of AFS financial assets is impaired. The significant assumptions are disclosed in note 3.20.
The fair value of available-‐for-‐sale financial assets in Egypt (ERC and MNHD) has decreased significantly since the turmoil in Egypt started. However the decrease was mainly driven by the overall downtrend in the market as a consequence of the political situation and the related volatility of the share market has been witnessed around year end. Supported by the fact that the share price of both financial assets has increased significantly in the first three months of 2012, management, based on the detailed review, which they have performed at year end, believes that the decline is not prolonged but only temporary during the phase of political instability and therefore has not recorded any impairment for available-‐for-‐sale financial assets. This treatment is in line with the generally accepted treatment in Egypt for accounting of such financial assets in this extraordinary situation.
Changes to the assumptions may result in an impairment loss in subsequent years.
4.2 Key sources of estimation uncertainty The following are the key assumptions concerning the future and other key sources of estimation uncertainty at the end of the reporting period, that have a significant risk of causing a material adjustment to the carrying amounts of assets and liabilities within the next financial year.
4.2.1 Impairment of tangible assets and investments in associates
At the end of each reporting period, the Group reviews the carrying amounts of its tangible assets and investments in associates to determine whether there is any indication that those assets have suffered an impairment loss.
If any such indication exists, the recoverable amount of the asset is estimated in order to determine the extent of the impairment loss (if any). Where it is not possible to estimate the recoverable amount of an individual asset, the Group estimates the recoverable amount of the cash-‐generating unit to which the asset belongs. Where a reasonable and consistent basis of allocation can be identified, corporate assets are also allocated to individual cash-‐generating units, or otherwise, they are allocated to the smallest Group of cash-‐generating units for which a reasonable and consistent allocation basis can be identified.
In light of the political development in Egypt, management reconsidered the recoverability of the Group's significant items of property, plant and equipment and its investments in associates, which are included in the consolidated statement of financial position at 31 December 2011 at CHF 969,362,187 and CHF 29,349,124 respectively (31 December 2010: CHF 926,077,841 and CHF 35,397,484).
F-29 | Orascom DevelopmentAnnual Report 2011 | F-30
F-‐29
Management is aware that the slow-‐down in processes and logistics still impacts the business operations considerably. However, occupancy rates have started to improve in the last few months and management expects that the slowdown in construction activities mainly leads to a shift of those revenues to other financial periods. These facts have reconfirmed management's previous estimates of anticipated revenues from the projects. Management periodically reconsider their assumptions in light of the macroeconomic developments regarding future anticipated margins on their products. Detailed sensitivity analysis has been carried out and the directors are confident that the carrying amount of these assets will be recovered in full, even if returns are reduced. This situation will be closely monitored, and adjustments made in future periods if future market activity indicates that such adjustments are appropriate.
4.2.2 Valuation of available-‐for-‐sale financial assets
Basically the fair value of available-‐for-‐sale financial assets is based on stock quotes. However, due to extraordinary situations, as for example the political situation in Egypt in 2011, such market prices might not reflect the real value at all times.
4.2.3 Useful lives of property, plant and equipment
The carrying value of the Group's property, plant and equipment at the end of the current reporting period is CHF 969,362,187(31 December 2010: CHF 926,077,841). Management’s assessment of the useful life of property, plant and equipment is based on the expected use of the assets, the expected physical wear and tear on the assets, technological developments as well as past experience with comparable assets. A change in the useful life of any asset may have an effect on the amount of depreciation that is to be recognized in profit or loss for future periods.
4.2.4 Impairment of goodwill
Determining whether goodwill is impaired requires an estimation of the value in use of the cash-‐generating units to which goodwill has been allocated. The value in use calculation requires management to estimate the future cash flows expected to arise from the cash-‐generating unit and a suitable discount rate in order to calculate present value.
The carrying amount of goodwill at the end of the current reporting period is CHF 7,951,210 (31 December 2010: 8,208,807). The recoverability of goodwill is tested for impairment annually during the fourth quarter, or earlier, if an indication of impairment exists. The value of goodwill is primarily dependent upon projected cash flows, discount rates (WACC) and long-‐term growth rates. The significant assumptions are disclosed in note 17. Changes to the assumptions may result in an impairment loss in subsequent periods.
4.2.5 Provisions
The carrying amount of provisions at the end of the current reporting period is CHF 90,144,020 (31 December 2010: CHF 56,779,789). This amount is based on estimates of future costs for infrastructure completion, legal cases, government fees, employee benefits and other charges including taxes in connection with the Group’s operations (see note 31). As the provisions cannot be determined exactly, the amount could change based on future developments. Changes in the amount of provisions due to change in management estimates are accounted for on a prospective basis and recognized in the period in which the change in estimates arises.
4.2.6 Impairment of trade and other receivables as well as other current assets
An allowance for doubtful receivables is recognized in order to record foreseeable losses arising from events such as a customer’s
insolvency. The carrying amount of the allowance for trade and other receivables at the end of the current reporting period is
CHF 23,127,659(31 December 2010: CHF 10,729,483) (see note 24). In determining the amount of the allowance, several factors are
considered. These include the aging of accounts receivables balances, the current solvency of the customer and the historical
write-‐off experience.
A similar assessment is being done in relation to the recoverability of other current assets amounted to CHF 73,719,589 (2010:
CHF 119,225,619) which includes outstanding proceeds from the sale of the six percent stake in the former Garranah subsidiaries
and the entire interests in the Joud Funds 1, 2, 3 and 4 (see note 22). To determine the need for the recognition of any impairment
charge, management considered several factors, such as the contractual repayment date, current solvency of the counterparty
and historical write-‐off experience. At 31 December 2011, an impairment charge of CHF 18 million was recorded in addition to the
CHF 15 million charged in 2010 to cover any shortfall that might occur.
The actual write-‐offs and / or impairment charges might be higher than expected if the actual financial situation of the customers
and other counterparties is worse than originally expected.
4.2.7 Deferred income taxes
F-‐30
The measurement of deferred income tax assets and liabilities is based on the judgment of management. Deferred income tax
assets are only capitalized if it is probable that they can be used. Whether or not they can be used depends on whether the
deductable tax temporary difference can be offset against future taxable gains. In order to assess the probability of their future
use, estimates must be made of various factors including future taxable profits. At 31 December 2011 deferred income tax assets
amounted to CHF 30,681,825 (31 December 2010: CHF 17,319,445) that have mainly resulted from increases in provisions (see note
31 and note 13.4) as well as the tax impact of carry forward tax losses (see note 13.4). Such deferred tax assets are only recorded
when the development phase of the project has been started and it becomes evident that future taxable profits are probable. If
the actual values differ from the estimates, this can lead to a change in the assessment of recoverability of the deferred tax assets.
4.2.8 Retirement benefit obligations
The retirement benefit obligation is calculated on the basis of various financial and actuarial assumptions. The key assumptions
for assessing these obligations are the discount rate, future salary and pension increases and the probability of the employee
reaching retirement. The obligation was calculated using a discount rate of 2.40% (31 December 2010: 2.60%). Pension costs were
calculated on the basis of an expected return on investment on plan assets of 3.00% (31 December 2010: 3.50%). The calculations
were done by an external expert and the principal assumptions used are summarised in note 36. At 31 December 2011, the
underfunding amounted to CHF 2,352,983 (31 December 2010: CHF 1,673,574), whereby only CHF 416,295 (31 December 2010: CHF 199,646) were recorded as an obligation in the consolidated statement of financial position because the corridor approach is
used. Using other basis for the calculations could have led to different results.
4.2.9 Classification and valuation of investment property
Generally real estate units are constructed either for the Group’s own use or for the sale to third parties and carried at cost.
However, when a unit may not be sold, as soon as a long term rent contract over more than 1 year is agreed with a third party at
market conditions, the unit is classified as an investment property and measured at the fair value obtained from independent, third party valuation experts. The fair value of investment properties at 31 December 2011 is CHF 76,366,131 (2010: CHF
78,355,235).
The fair value of each of these properties has been arrived at on the basis of valuations carried out, at the dates specified above, by
Messrs Alan Tinkler, Ramlackhan & Co and Fincorp, independent valuation specialists not related to the Group. Note 16 provides
detailed information about the valuation techniques applied and the key assumptions used in the determination of the fair value
of each investment property.
4.2.10 Net realisable value of inventory
Inventory mainly includes real estate construction work under progress which is recognised at cost or net realisable value. The majority of real estate under construction (approximately three quarters) is already sold at market prices which are significantly
higher than construction cost. Therefore the estimation uncertainty only relates to the unsold real estate under construction. In
general the profit margins on these real estate projects are high and management currently does not expect any of these projects
to be sold below cost.
4.2.11Infrastructure cost
The Group has an obligation under the terms of its sale and purchase agreements to develop the infrastructure of the sold land. Infrastructure cost is deemed to form part of the cost of revenue and is based on management estimate of the future budgeted
costs to be incurred in relation to the project including, but are not limited to, future subcontractor costs, estimated labor costs,
and planned other material costs. The provision for infrastructure costs requires the Group’s management to revise its estimate of
such costs on a regular basis in light of current market prices for inclusion as part of the cost of revenue.

F-31 | Orascom DevelopmentAnnual Report 2011 | F-32
F-‐31
5 THE GROUP AND MAJOR CHANGES IN GROUP ENTITIES The Group is comprised of the Parent Company and its subsidiaries operating in different countries.
There have been no major changes in the group structure during the period except for the sale of the Group’s six percent stake in the former Garranah subsidiaries and the full interest in Joud Fund 4 in the comparative financial period as outlined in note 19 and
34.
Orascom Hotels & Development SAE (“OHD”) remains the principal operating subsidiary and is located in Egypt.
On 22 December 2010 the Parent Company launched a tender offer to the remaining minority shareholders to acquire the
outstanding OHD shares. The tender offer was completed on 18 January 2011 and the outcome is described in note 26.2.
The group controls its subsidiaries directly and indirectly.
6 REVENUE An analysis of the Group’s revenue for the year is as follows:
CHF 2011 2010
Revenue from the rendering of services and rental income 186,833,145 276,858,997
Revenue from agreements for construction of Real Estate and construction revenue 66,969,813 228,990,911
Revenue on sale of land 2,254,067 10,241,985
256,057,025 516,091,893
F-‐32
7 SEGMENT INFORMATION
7.1 Products and services from which reportable segments derive their revenues
The Group has five reportable segments, as described below, which are the Group’s strategic divisions. The strategic divisions offer different products and services and are managed separately because they require different skills or have different customers. For each of the strategic divisions, the Country CEOs and the Head of Segments review the internal management reports at least on a quarterly basis. The following summary describes the operation in each of the Group’s reportable segments:
– Hotels – Include provision of hospitality services in two to five star hotels owned by the Group which are managed by international or local hotel chains or by the Group itself.
– Real estate and construction – Include acquisition of land in undeveloped areas and addition of substantial value by building residential real estate and other facilities in stages.
– Land sales – Include sale of land and land rights to third parties on which the Group have developed or will develop certain infrastructure facilities and where the Group does not have further development commitments.
– Town management – Include provision of facility and infrastructure services at operational resorts and towns.
– Tours operations – Include provision of tour packages for tourist groups as well as tour transportation services.
Tours operations does not meet the quantitative threshold to be shown as a separate reportable segment. However, management believes that information about this segment is useful to the users of the financial statements and therefore it is presented as a separate reportable segment.
Other operations include the provision of services from businesses not allocated to any of the segments listed above comprising rentals from investment properties, mortgages, sports, hospital services, educational services, marina, limousine rentals, laundry services and other services. None of these segments meets any of the quantitative thresholds for determining a reportable segment in 2011 or 2010.
The following is an analysis of the Group's revenue from continuing operations by its major products and services.
Revenue from external customers Segment Product
2011 2010
Hotels Hotels managed by international chains 102,012,697 133,680,020
Hotels managed by local chains 24,282,196 43,823,042
Hotels managed by the Group 10,045,297 14,888,379
Floating hotels -‐ 736,891
Segment total 136,340,190 193,128,332
Real estate and construction Tourism Real estate 48,963,392 192,353,128
Budget Housing 12,413,287 32,030,193
Construction work 5,593,134 4,607,590
Segment total 66,969,813 228,990,911
Land sales Sales of land and land rights 2,254,067 10,241,985
Town management Utilities (e.g. water, electricity) 17,680,163 17,497,444
Tours operations Tours operations 2,295,402 26,127,653
(see note 34) Tour transportation -‐ 2,336,277
Segment total 2,295,402 28,463,930
Other operations Mortgage (Real estate financing) 5,132,459 6,083,527
Sport (Golf) 3,299,447 6,630,288
Rentals (i) 8,043,705 9,933,269
Hospital services 3,304,702 4,396,913
Educational services 2,244,077 2,263,338
Marina 1,759,677 2,232,953
Limousine 568,145 910,445
Laundry services 135,284 361,938
Others 6,029,894 4,956,620
Segment total 30,517,390 37,769,291
Total 256,057,025 516,091,893
(i) Rentals include income from investment property of CHF 5,943,966 (2010: CHF 7,161,744) and from other short term rent contracts in hotels, marinas and golf courses of CHF 2,099,739 (2010: CHF 2,772,125).
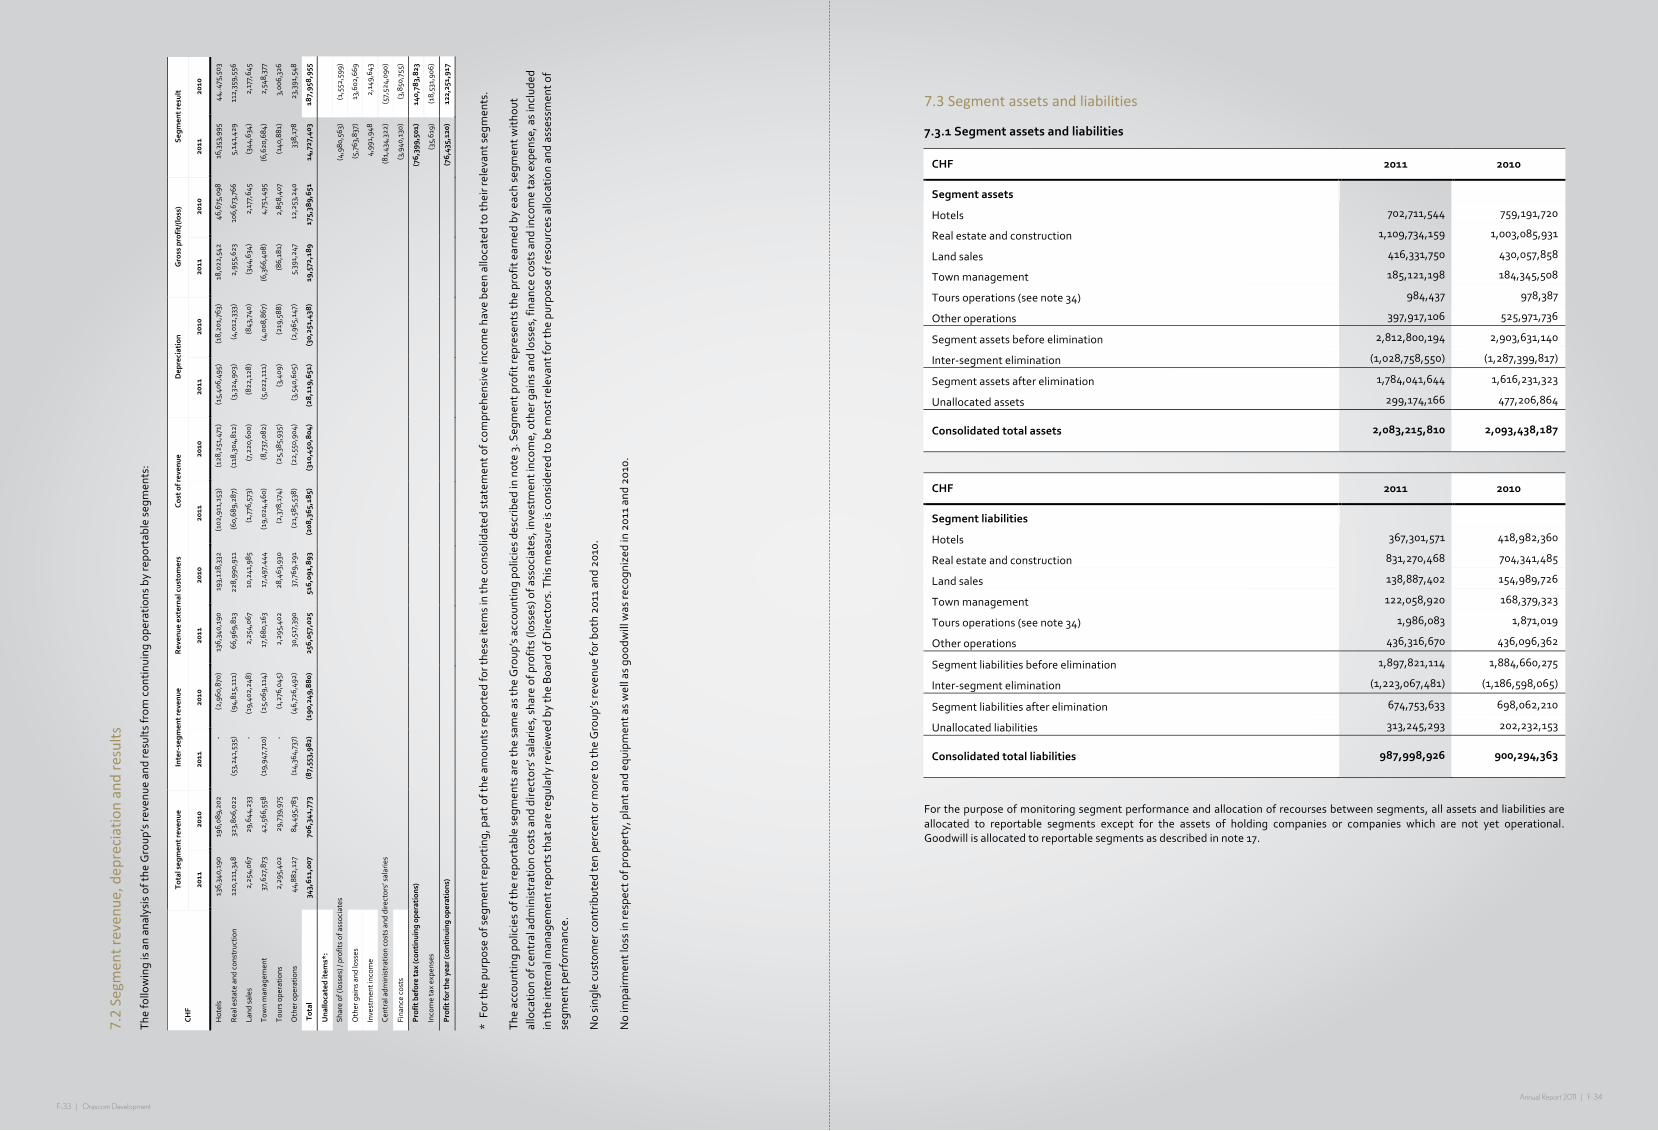
F-33 | Orascom DevelopmentAnnual Report 2011 | F-34
F-‐33
7.2 Segm
ent reven
ue, dep
reciation and results
The
follo
win
g is a
n an
alys
is o
f the
Gro
up’s re
venu
e an
d re
sults
from
con
tinui
ng o
pera
tions
by re
portab
le seg
men
ts:
Total seg
men
t reven
ue
Inter-‐segm
ent reven
ue
Reven
ue externa
l customers
Cost of reven
ue
Dep
reciation
Gross profit/(loss)
Segm
ent result
CHF
2011
2010
2011
2010
2011
2010
2011
2010
2011
2010
2011
2010
2011
2010
Hot
els
136,
340,
190
196,
089,
202
-‐ (2
,960
,870
) 13
6,34
0,19
0 19
3,12
8,33
2 (1
02,9
11,1
53)
(128
,251
,471
) (1
5,40
6,49
5)
(18,
201,
763)
18
,022
,542
46
,675
,098
16
,353
,995
44
,.475
,503
Real
est
ate
and
cons
truc
tion
120,
211,
348
323,
806,
022
(53,
241,
535)
(9
4,81
5,11
1)
66,9
69,8
13
228,
990,
911
(60,
689,
287)
(1
18,3
04,8
12)
(3,3
24,9
03)
(4,0
12,3
33)
2,95
5,62
3 10
6,67
3,76
6 5,
141,
429
112,
359,
556
Land
sal
es
2,25
4,06
7 29
,644
,233
-‐
(19,
402,
248)
2,
254,
067
10,2
41,9
85
(1,776
,573
) (7
,220
,600
) (8
22,1
28)
(843
,740
) (3
44,6
34)
2,17
7,64
5 (3
44,6
34)
2,17
7,64
5
Tow
n m
anag
emen
t 37
,627
,873
42
,566
,558
(1
9,94
7,71
0)
(25,
069,
114)
17
,680
,163
17
,497
,444
(1
9,02
4,46
0)
(8,737
,082
) (5
,022
,111
) (4
,008
,867
) (6
,366
,408
) 4,
751,
495
(6,6
20,6
84)
2,54
8,37
7
Tour
s op
erat
ions
2,
295,
402
29,739
,975
-‐
(1,2
76,0
45)
2,29
5,40
2 28
,463
,930
(2
,378
,174
) (2
5,38
5,93
5)
(3,4
09)
(219
,588
) (8
6,18
1)
2,85
8,40
7 (1
40,8
81)
3,00
6,32
6
Oth
er o
pera
tions
44
,882
,127
84
,495
,783
(1
4,36
4,73
7)
(46,
726,
492)
30
,517
,390
37
,769
,291
(2
1,58
5,53
8)
(22,
550,
904)
(3
,540
,605
) (2
,965
,147
) 5,
391,
247
12,2
53,2
40
338,
178
23,3
91,5
48
Total
343,61
1,007
706,341,773
(87,553,98
2)
(190
,249
,880
) 256,057,025
516,09
1,89
3 (208
,365,185
) (310,450,804)
(28,119,651)
(30,251,438)
19,572,189
175,38
9,651
14,727,403
187,958,955
Una
llocated item
s*:
Shar
e of
(los
ses)
/ pr
ofits
of a
ssoc
iate
s
(4
,980
,563
) (1
,552
,599
)
Oth
er g
ains
and
loss
es
(5,763
,837
) 13
,602
,669
Inve
stm
ent i
ncom
e
4,
991,
948
2,14
9,64
3
Cent
ral a
dmin
istrat
ion
cost
s an
d di
rect
ors’ sal
arie
s
(8
1,43
4,32
2)
(57,52
4,09
0)
Fina
nce
cost
s
(3
,940
,130
) (3
,850
,755
)
Profit before tax (con
tinu
ing op
erations)
(76,399,501)
140,78
3,82
3
Inco
me
tax ex
pens
es
(35,
619)
(1
8,53
1,90
6)
Profit fo
r the
year (continuing
ope
ration
s)
(76,435,120)
122,251,91
7
* Fo
r the
pur
pose
of s
egm
ent r
epor
ting,
par
t of t
he a
mou
nts re
ported
for t
hese
item
s in
the
cons
olid
ated
sta
tem
ent o
f com
preh
ensive
inco
me
have
bee
n al
loca
ted
to th
eir r
elev
ant s
egm
ents
.
The
acco
untin
g po
licie
s of
the
repo
rtab
le seg
men
ts a
re th
e sa
me
as th
e Gro
up’s a
ccou
ntin
g po
licie
s de
scrib
ed in
not
e 3.
Seg
men
t pro
fit re
pres
ents
the
prof
it ea
rned
by ea
ch seg
men
t with
out
allo
catio
n of
cen
tral
adm
inistrat
ion
cost
s an
d di
rect
ors’ sal
arie
s, sha
re o
f pro
fits (lo
sses
) of a
ssoc
iate
s, in
vest
men
t inc
ome,
oth
er g
ains
and
loss
es, f
inan
ce cos
ts a
nd in
com
e ta
x ex
pens
e, a
s in
clud
ed
in th
e in
tern
al m
anag
emen
t rep
orts
that
are
regu
larly
revi
ewed
by th
e Boa
rd o
f Dire
ctor
s. T
his m
easu
re is
con
side
red
to b
e m
ost r
elev
ant f
or th
e pu
rpos
e of
reso
urce
s al
loca
tion
and
asse
ssm
ent o
f se
gmen
t per
form
ance
.
No
sing
le cus
tom
er con
trib
uted
ten
perc
ent o
r mor
e to
the
Gro
up’s re
venu
e fo
r bot
h 20
11 a
nd 2
010.
No
impa
irmen
t los
s in
resp
ect o
f pro
perty,
pla
nt a
nd e
quip
men
t as w
ell a
s go
odw
ill w
as re
cogn
ized
in 2
011 an
d 20
10.
F-‐34
7.3 Segment assets and liabilities
7.3.1 Segment assets and liabilities
CHF 2011 2010
Segment assets
Hotels 702,711,544 759,191,720
Real estate and construction 1,109,734,159 1,003,085,931
Land sales 416,331,750 430,057,858
Town management 185,121,198 184,345,508
Tours operations (see note 34) 984,437 978,387
Other operations 397,917,106 525,971,736
Segment assets before elimination 2,812,800,194 2,903,631,140
Inter-‐segment elimination (1,028,758,550) (1,287,399,817)
Segment assets after elimination 1,784,041,644 1,616,231,323
Unallocated assets 299,174,166 477,206,864
Consolidated total assets 2,083,215,810 2,093,438,187
CHF 2011 2010
Segment liabilities
Hotels 367,301,571 418,982,360
Real estate and construction 831,270,468 704,341,485
Land sales 138,887,402 154,989,726
Town management 122,058,920 168,379,323
Tours operations (see note 34) 1,986,083 1,871,019
Other operations 436,316,670 436,096,362
Segment liabilities before elimination 1,897,821,114 1,884,660,275
Inter-‐segment elimination (1,223,067,481) (1,186,598,065)
Segment liabilities after elimination 674,753,633 698,062,210
Unallocated liabilities 313,245,293 202,232,153
Consolidated total liabilities 987,998,926 900,294,363
For the purpose of monitoring segment performance and allocation of recourses between segments, all assets and liabilities are allocated to reportable segments except for the assets of holding companies or companies which are not yet operational. Goodwill is allocated to reportable segments as described in note 17.

F-35 | Orascom DevelopmentAnnual Report 2011 | F-36
F-‐35
7.3.2 Additions to non-‐current assets
CHF 2011 2010
Hotels 21,360,865 124,468,596
Real estate and construction 20,210,653 59,446,848
Land sales -‐ -‐
Town management 355,308 15,887,126
Tours operations 1,634 6,485
Other operations 12,468,607 17,459,141
Unallocated 53,446,643 55,852,892
Total 107,843,710 273,121,088
7.4 Geographical information
The Group currently operates in nine principal geographical areas – Egypt, Oman, United Arab Emirates, Jordan, Switzerland, UK, Montenegro, Romania and Morocco. The Group's revenue from continuing operations from external customers by location of operations and information about its non-‐current assets by location of assets are detailed below:
Revenue Non-‐current assets
CHF 2011 2010 2011 2010
Egypt 208,001,567 382,965,917 608,582,843 628,914,232
Oman 6,052,255 84,483,771 128,371,343 119,061,675
United Arab Emirates 26,590,213 28,827,783 53,214,387 54,423,257
Jordan 4,424,362 5,701,367 17,429,087 17,845,843
Switzerland 356,343 5,954,417 145,630,120 103,571,760
UK -‐ -‐ 16,737,816 9,715,064
Montenegro -‐ -‐ 9,763,197 3,917,739
Romania -‐ -‐ 5,932,251 4,253,049
Morocco 1,469 -‐ 5,612,679 1,101,628
Others 10,630,816 8,158,638 62,405,805 69,837,636
Total 256,057,025 516,091,893 1,053,679,528 1,012,641,883
Non-‐current assets exclude investments in associates, financial instruments and deferred tax assets.
8 EMPLOYEE BENEFITS EXPENSE
CHF 2011 2010
Employee benefits expense 96,459,389 109,736,136
Thereof included in cost of sales 80,661,485 96,029,396
Thereof included in administration expenses 15,797,904 13,706,740
F-‐36
9 INVESTMENT INCOME
CHF 2011 2010
Interest income:
-‐ Bank deposits 3,244,728 3,439,148
-‐ Other loans and receivables 7,442,119 8,905,629
Dividends received from equity investments 1,157,774 8,158
Total 11,844,621 12,352,935
Investment income earned on financial assets by category of assets is CHF 10,686,847 (2010: CHF 12,344,777) for loans and receivables including cash and bank balances and CHF 1,157,774 (2010: CHF 8,158) for dividend income earned on AFS financial assets.
Gain or (loss) relating to financial assets classified as at fair value through profit or loss is included in “Other gains and losses” in note 10.
10 OTHER GAINS AND LOSSES
CHF 2011 2010
Gain on disposal of property, plant and equipment 413,555 305,021
Gain on disposal of subsidiaries and associates (i) -‐ 7,824,706
Net foreign exchange losses (11,332,336) (6,575,798)
(Loss)/Gain from change in fair value of investment property (ii) (4,745,050) 14,120,934
Other gains 2,428,752 3,488,161
(13,235,079) 19,163,024
(i) The gain in 2010 mainly relates to the sale of the six percent stake in the former Garranah subsidiaries which resulted in a loss
of control (see note 34). In 2011 no subsidiaries or associates were sold.
(ii) This net gain/loss represents the effect from the revaluation of the investment properties. The gain in 2010 was further due to the subsequent change in use of several premises in El Gouna (Egypt) after the retrospective implementation of the new accounting policy.

F-37 | Orascom DevelopmentAnnual Report 2011 | F-38
F-‐37
11 FINANCE COSTS
CHF 2011 2010
Interest on bank overdrafts and loans (34,893,108) (27,969,905)
Interest on obligations under finance leases -‐ (402,129)
Interest on call and put option arrangements (977,090) (1,019,238)
Total interest expense for financial liabilities not classified as at fair value through profit or loss (35,870,198) (29,391,272)
Less: amounts included in the cost of qualifying assets (i) 27,703,851 22,346,174
(8,166,347) (7,045,098)
(i) The amount of capitalization cost of qualifying assets (project under construction and work in progress) has increased compared to prior year. This is mainly due to the large size of the current hotel projects and real estate projects, which are eligible for the capitalization of interest expense and the increase in the weighted average capitalization rate. They include 6 hotels (2010: 9), 3 marinas (2010: 2), 2 golf courses (2010: 3) and 4 infrastructure projects in Oman, Switzerland, Montenegro and Morocco (2010: 3).
The weighted average capitalization rate on funds borrowed generally is 7.45% per annum (2010: 6.7% per annum). This is the rate that the Group used to determine the amount of borrowing costs eligible for capitalization.
12COMPENSATION OF KEY MANAGEMENT PERSONNEL
CHF 2011 2010
Salaries 4,328,504 4,330,880
Other short-‐term employee benefits 1,014,604 2,027,584
Post employment benefits 211,154 247,500
Total compensation of key management personnel 5,554,262 6,605,964
There is a compensation plan in place for the Board of Directors which consists of a fixed compensation subject to an annual review. As to the compensation of the members of Executive Management, the base salary is either (in case of members who have served in that capacity since the Company was formed in 2008) carried over from their previous employment with Orascom Hotels & Development SAE, or (in case of members appointed at a later time) determined in a discretionary decision of the CEO and Co-‐CEO approved by the Nomination & Compensation Committee. In respect of the bonus part of the compensation, proposals by the CEO and the Co-‐CEO are presented to the Nomination & Compensation Committee which discusses such proposals and approves them if deemed fit.
The annual proposals and decisions concerning the compensation of the members of Executive Management are based on an evaluation of the individual performance of each member, as well as of the performance of the business area for which each member is responsible (in case of the executive members of the Board, the performance of the Orascom Development Group as a whole). The CEO and Co-‐CEO form the respective proposals in their discretion, based on their judgment of the relevant individuals' and business areas' achievements.
Total compensation of directors and Executive Management is part of the employees benefit expense allocated between cost of sales and administrative expenses (see note 8).
F-‐38
12.1 Board and Executive Compensation Disclosures as Required by Swiss Law
Compensation in 2011
CHF
Gross value of salaries and fees
Gross value of cash bonuses
Unrest-‐ricted shares
Other benefits (car,
insurances)
Pension contri-‐butions
Total remune-‐ration
Board of Directors
Samih Sawiris Chairman 85,000 -‐ 85,0003 -‐ -‐ 170,000
Amr Sheta Vice-‐Chairman 83,000 -‐ 83,0003 -‐ -‐ 166,000
Franz Egle Member 85,000 -‐ 85,0003 -‐ -‐ 170,000
Adil Douiri Member 83,000 -‐ 83,0003 -‐ -‐ 166,000
Luciano Gabriel 1 Member 98,000 -‐ 98,0003 -‐ -‐ 196,000
Carolina Müller-‐Möhl Member 85,000 -‐ 85,0003 -‐ -‐ 170,000
Jean-‐Gabriel Pérès Member 85,000 -‐ 85,0003 -‐ -‐ 170,000
Nicolas Cournoyer5 Member 85,000 -‐ 85,000 3 -‐ -‐ 170,000
Total Board of Directors 689,000 -‐ 689,000 -‐ -‐ 1,378,000
Executive Management
Samih Sawiris 2,6 741,709 -‐ -‐ 741,709
Gerhard Niesslein7 206,668 -‐ -‐ 8,000 28,807 243,475
Total other members of Executive Management 2,691,127 -‐ -‐ 317,604 182,347 3,191,078
Total Executive Management 3,639,504 325,604 211,154 4,176,262
Total compensation of key management
4,328,504 -‐ 689,000 325,604 211,154 5,554,262
1 acting as Lead Director 2 highest-‐compensated member of the Executive Management 3 will be paid out in 2012 in shares at market prices 4 has been paid out in 2011 5 since June 2011 6 January – October 2011 7 November/December 2011
Compensation in 2010
CHF
Gross value of salaries and fees
Gross value of cash bonuses
Unrest-‐ricted shares
Other benefits (car,
insurances)
Pension contri-‐butions
Total remune-‐ration
Board of Directors
Samih Sawiris Chairman 85,000 -‐ 85,000 4 -‐ -‐ 170,000
Amr Sheta Vice-‐Chairman 85,000 -‐ 85,000 4 -‐ -‐ 170,000
Franz Egle Member 85,000 -‐ 85,000 4 -‐ -‐ 170,000
Adil Douiri Member 85,000 -‐ 85,000 4 -‐ -‐ 170,000
Luciano Gabriel Member 98,000 -‐ 98,000 4 -‐ -‐ 196,000
Carolina Müller-‐Möhl Member 85,000 -‐ 85,000 4 -‐ -‐ 170,000
Jean-‐Gabriel Pérès Member 85,000 -‐ 85,000 4 -‐ -‐ 170,000
Total Board of Directors 608,000 -‐ 608,000 -‐ -‐ 1,216,000
Executive Management
Samih Sawiris 985,068 547,260 -‐ -‐ -‐ 1,532,328
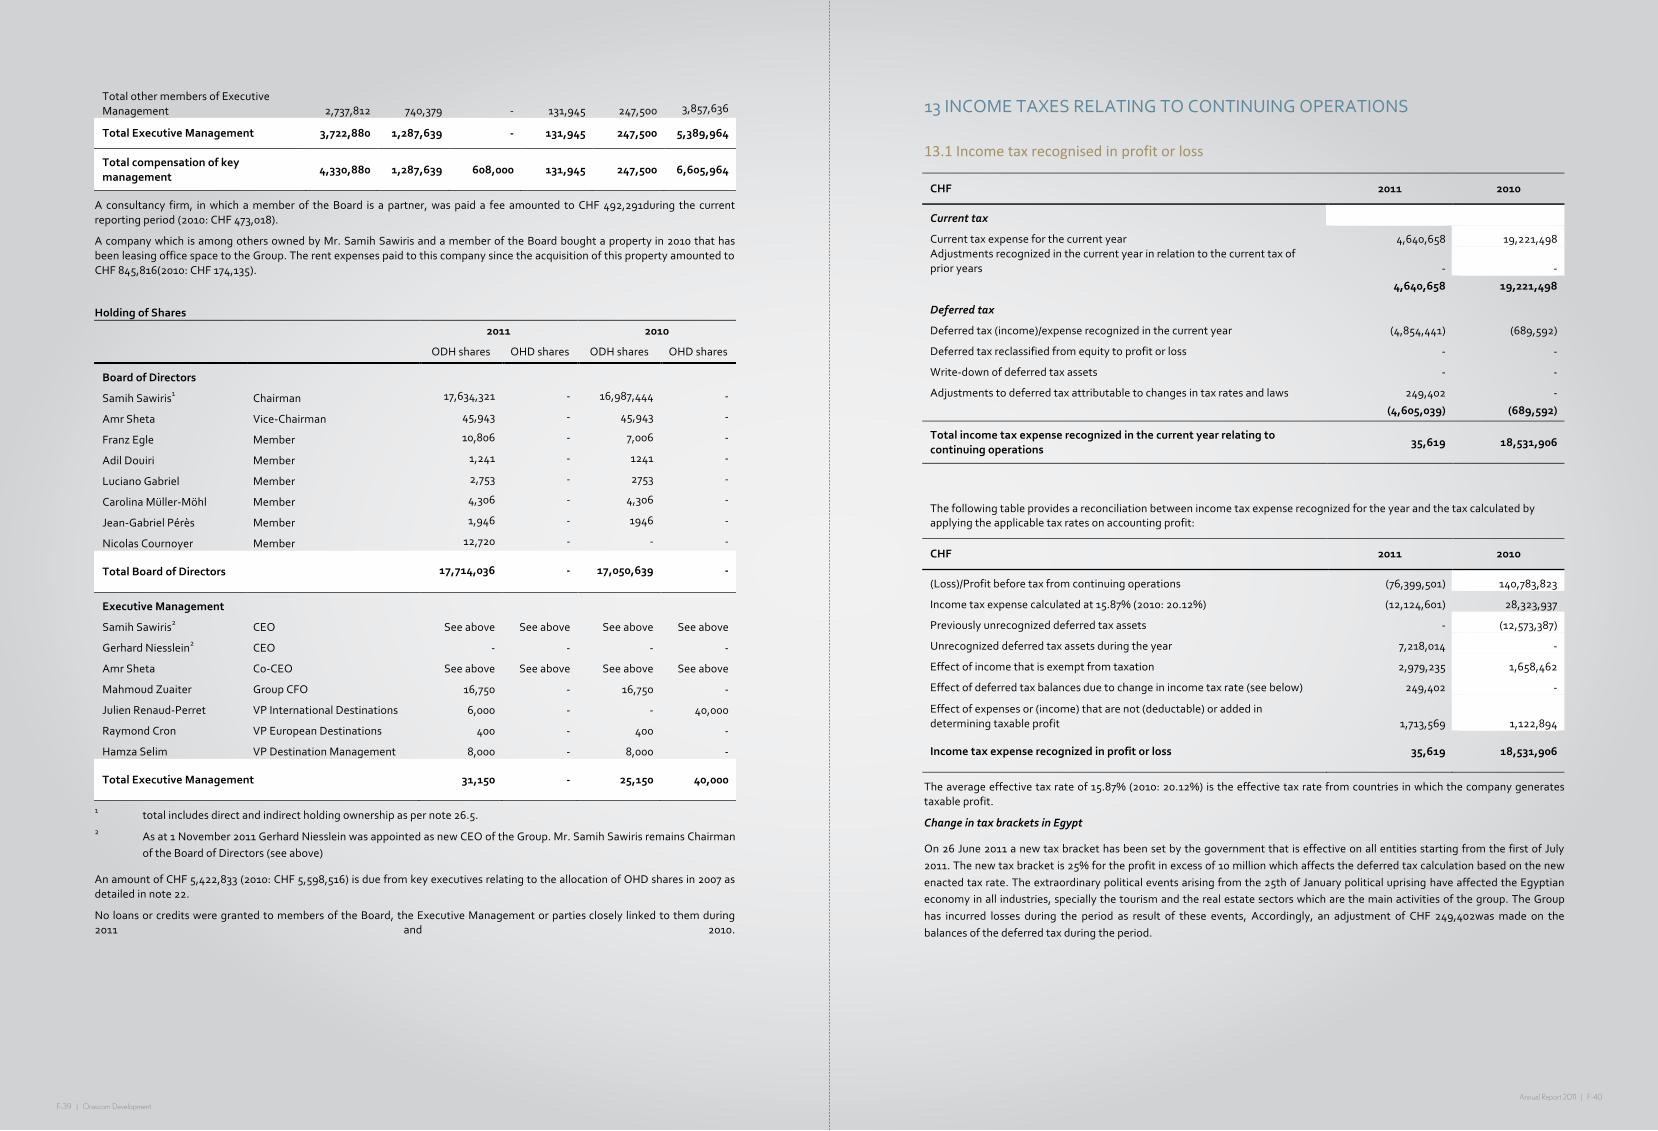
F-39 | Orascom DevelopmentAnnual Report 2011 | F-40
F-‐39
Total other members of Executive Management 2,737,812 740,379 -‐ 131,945 247,500 3,857,636
Total Executive Management 3,722,880 1,287,639 -‐ 131,945 247,500 5,389,964
Total compensation of key management
4,330,880 1,287,639 608,000 131,945 247,500 6,605,964
A consultancy firm, in which a member of the Board is a partner, was paid a fee amounted to CHF 492,291during the current reporting period (2010: CHF 473,018).
A company which is among others owned by Mr. Samih Sawiris and a member of the Board bought a property in 2010 that has been leasing office space to the Group. The rent expenses paid to this company since the acquisition of this property amounted to CHF 845,816(2010: CHF 174,135).
Holding of Shares
2011 2010
ODH shares OHD shares ODH shares OHD shares
Board of Directors
Samih Sawiris1 Chairman 17,634,321 -‐ 16,987,444 -‐
Amr Sheta Vice-‐Chairman 45,943 -‐ 45,943 -‐
Franz Egle Member 10,806 -‐ 7,006 -‐
Adil Douiri Member 1,241 -‐ 1241 -‐
Luciano Gabriel Member 2,753 -‐ 2753 -‐
Carolina Müller-‐Möhl Member 4,306 -‐ 4,306 -‐
Jean-‐Gabriel Pérès Member 1,946 -‐ 1946 -‐
Nicolas Cournoyer Member 12,720 -‐ -‐ -‐
Total Board of Directors 17,714,036 -‐ 17,050,639 -‐
Executive Management
Samih Sawiris2 CEO See above See above See above See above
Gerhard Niesslein2 CEO -‐ -‐ -‐ -‐
Amr Sheta Co-‐CEO See above See above See above See above
Mahmoud Zuaiter Group CFO 16,750 -‐ 16,750 -‐
Julien Renaud-‐Perret VP International Destinations 6,000 -‐ -‐ 40,000
Raymond Cron VP European Destinations 400 -‐ 400 -‐
Hamza Selim VP Destination Management 8,000 -‐ 8,000 -‐
Total Executive Management 31,150 -‐ 25,150 40,000
1 total includes direct and indirect holding ownership as per note 26.5. 2 As at 1 November 2011 Gerhard Niesslein was appointed as new CEO of the Group. Mr. Samih Sawiris remains Chairman
of the Board of Directors (see above)
An amount of CHF 5,422,833 (2010: CHF 5,598,516) is due from key executives relating to the allocation of OHD shares in 2007 as detailed in note 22.
No loans or credits were granted to members of the Board, the Executive Management or parties closely linked to them during 2011 and 2010.
F-‐40
13 INCOME TAXES RELATING TO CONTINUING OPERATIONS
13.1 Income tax recognised in profit or loss
CHF 2011 2010
Current tax
Current tax expense for the current year 4,640,658 19,221,498 Adjustments recognized in the current year in relation to the current tax of prior years -‐ -‐
4,640,658 19,221,498
Deferred tax
Deferred tax (income)/expense recognized in the current year (4,854,441) (689,592)
Deferred tax reclassified from equity to profit or loss -‐ -‐
Write-‐down of deferred tax assets -‐ -‐
Adjustments to deferred tax attributable to changes in tax rates and laws 249,402 -‐
(4,605,039) (689,592)
Total income tax expense recognized in the current year relating to continuing operations
35,619 18,531,906
The following table provides a reconciliation between income tax expense recognized for the year and the tax calculated by applying the applicable tax rates on accounting profit:
CHF 2011 2010
(Loss)/Profit before tax from continuing operations (76,399,501) 140,783,823
Income tax expense calculated at 15.87% (2010: 20.12%) (12,124,601) 28,323,937
Previously unrecognized deferred tax assets -‐ (12,573,387)
Unrecognized deferred tax assets during the year 7,218,014 -‐
Effect of income that is exempt from taxation 2,979,235 1,658,462
Effect of deferred tax balances due to change in income tax rate (see below) 249,402 -‐
Effect of expenses or (income) that are not (deductable) or added in determining taxable profit 1,713,569 1,122,894
Income tax expense recognized in profit or loss 35,619 18,531,906
The average effective tax rate of 15.87% (2010: 20.12%) is the effective tax rate from countries in which the company generates taxable profit.
Change in tax brackets in Egypt
On 26 June 2011 a new tax bracket has been set by the government that is effective on all entities starting from the first of July 2011. The new tax bracket is 25% for the profit in excess of 10 million which affects the deferred tax calculation based on the new enacted tax rate. The extraordinary political events arising from the 25th of January political uprising have affected the Egyptian economy in all industries, specially the tourism and the real estate sectors which are the main activities of the group. The Group has incurred losses during the period as result of these events, Accordingly, an adjustment of CHF 249,402was made on the balances of the deferred tax during the period.
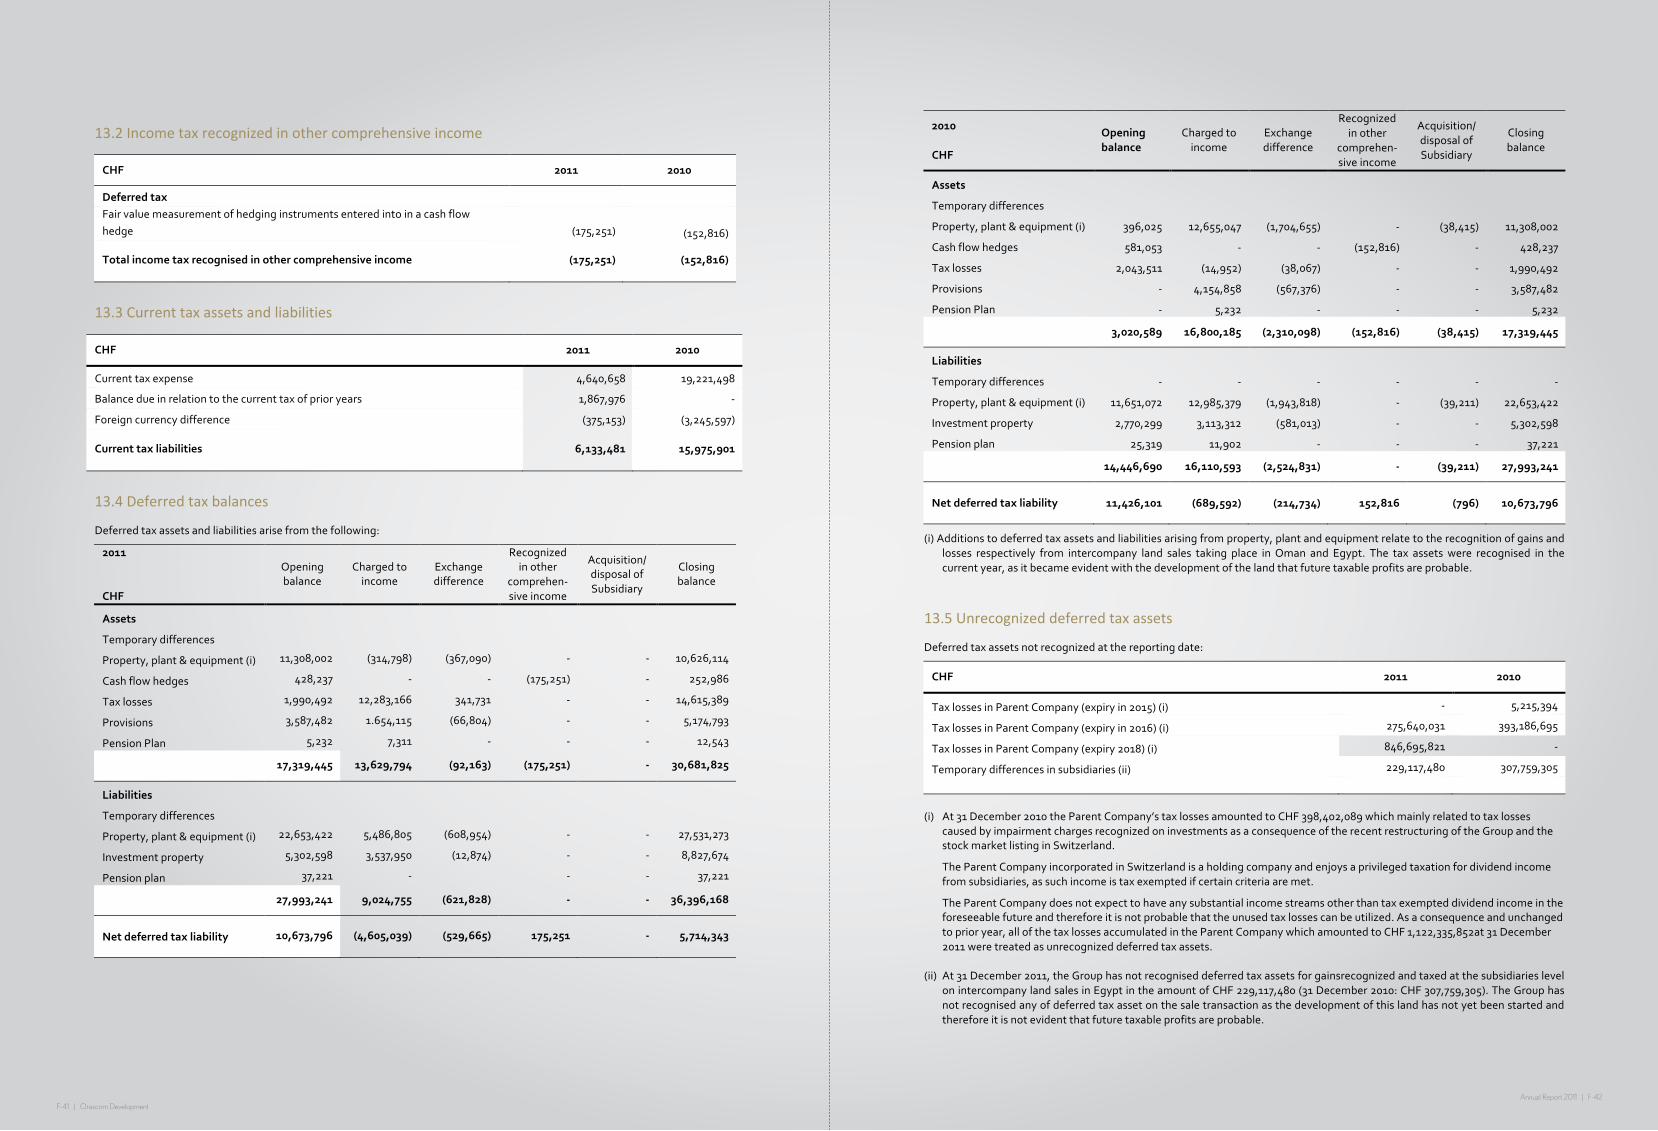
F-41 | Orascom DevelopmentAnnual Report 2011 | F-42
F-‐41
13.2 Income tax recognized in other comprehensive income
CHF 2011 2010
Deferred tax Fair value measurement of hedging instruments entered into in a cash flow hedge (175,251) (152,816)
Total income tax recognised in other comprehensive income (175,251) (152,816)
13.3 Current tax assets and liabilities
CHF 2011 2010
Current tax expense 4,640,658 19,221,498
Balance due in relation to the current tax of prior years 1,867,976 -‐
Foreign currency difference (375,153) (3,245,597)
Current tax liabilities 6,133,481 15,975,901
13.4 Deferred tax balances
Deferred tax assets and liabilities arise from the following:
2011 CHF
Opening balance
Charged to income
Exchange difference
Recognized in other
comprehen-‐sive income
Acquisition/ disposal of Subsidiary
Closing balance
Assets
Temporary differences
Property, plant & equipment (i) 11,308,002 (314,798) (367,090) -‐ -‐ 10,626,114
Cash flow hedges 428,237 -‐ -‐ (175,251) -‐ 252,986
Tax losses 1,990,492 12,283,166 341,731 -‐ -‐ 14,615,389
Provisions 3,587,482 1.654,115 (66,804) -‐ -‐ 5,174,793
Pension Plan 5,232 7,311 -‐ -‐ -‐ 12,543
17,319,445 13,629,794 (92,163) (175,251) -‐ 30,681,825
Liabilities
Temporary differences
Property, plant & equipment (i) 22,653,422 5,486,805 (608,954) -‐ -‐ 27,531,273
Investment property 5,302,598 3,537,950 (12,874) -‐ -‐ 8,827,674
Pension plan 37,221 -‐ -‐ -‐ 37,221
27,993,241 9,024,755 (621,828) -‐ -‐ 36,396,168
Net deferred tax liability 10,673,796 (4,605,039) (529,665) 175,251 -‐ 5,714,343
F-‐42
2010 CHF
Opening balance
Charged to income
Exchange difference
Recognized in other
comprehen-‐sive income
Acquisition/ disposal of Subsidiary
Closing balance
Assets
Temporary differences
Property, plant & equipment (i) 396,025 12,655,047 (1,704,655) -‐ (38,415) 11,308,002
Cash flow hedges 581,053 -‐ -‐ (152,816) -‐ 428,237
Tax losses 2,043,511 (14,952) (38,067) -‐ -‐ 1,990,492
Provisions -‐ 4,154,858 (567,376) -‐ -‐ 3,587,482
Pension Plan -‐ 5,232 -‐ -‐ -‐ 5,232
3,020,589 16,800,185 (2,310,098) (152,816) (38,415) 17,319,445
Liabilities
Temporary differences -‐ -‐ -‐ -‐ -‐ -‐
Property, plant & equipment (i) 11,651,072 12,985,379 (1,943,818) -‐ (39,211) 22,653,422
Investment property 2,770,299 3,113,312 (581,013) -‐ -‐ 5,302,598
Pension plan 25,319 11,902 -‐ -‐ -‐ 37,221
14,446,690 16,110,593 (2,524,831) -‐ (39,211) 27,993,241
Net deferred tax liability 11,426,101 (689,592) (214,734) 152,816 (796) 10,673,796
(i) Additions to deferred tax assets and liabilities arising from property, plant and equipment relate to the recognition of gains and losses respectively from intercompany land sales taking place in Oman and Egypt. The tax assets were recognised in the current year, as it became evident with the development of the land that future taxable profits are probable.
13.5 Unrecognized deferred tax assets
Deferred tax assets not recognized at the reporting date:
CHF 2011 2010
Tax losses in Parent Company (expiry in 2015) (i) -‐ 5,215,394
Tax losses in Parent Company (expiry in 2016) (i) 275,640,031 393,186,695
Tax losses in Parent Company (expiry 2018) (i) 846,695,821 -‐
Temporary differences in subsidiaries (ii) 229,117,480 307,759,305
(i) At 31 December 2010 the Parent Company’s tax losses amounted to CHF 398,402,089 which mainly related to tax losses
caused by impairment charges recognized on investments as a consequence of the recent restructuring of the Group and the stock market listing in Switzerland.
The Parent Company incorporated in Switzerland is a holding company and enjoys a privileged taxation for dividend income from subsidiaries, as such income is tax exempted if certain criteria are met.
The Parent Company does not expect to have any substantial income streams other than tax exempted dividend income in the foreseeable future and therefore it is not probable that the unused tax losses can be utilized. As a consequence and unchanged to prior year, all of the tax losses accumulated in the Parent Company which amounted to CHF 1,122,335,852at 31 December 2011 were treated as unrecognized deferred tax assets.
(ii) At 31 December 2011, the Group has not recognised deferred tax assets for gainsrecognized and taxed at the subsidiaries level
on intercompany land sales in Egypt in the amount of CHF 229,117,480 (31 December 2010: CHF 307,759,305). The Group has not recognised any of deferred tax asset on the sale transaction as the development of this land has not yet been started and therefore it is not evident that future taxable profits are probable.
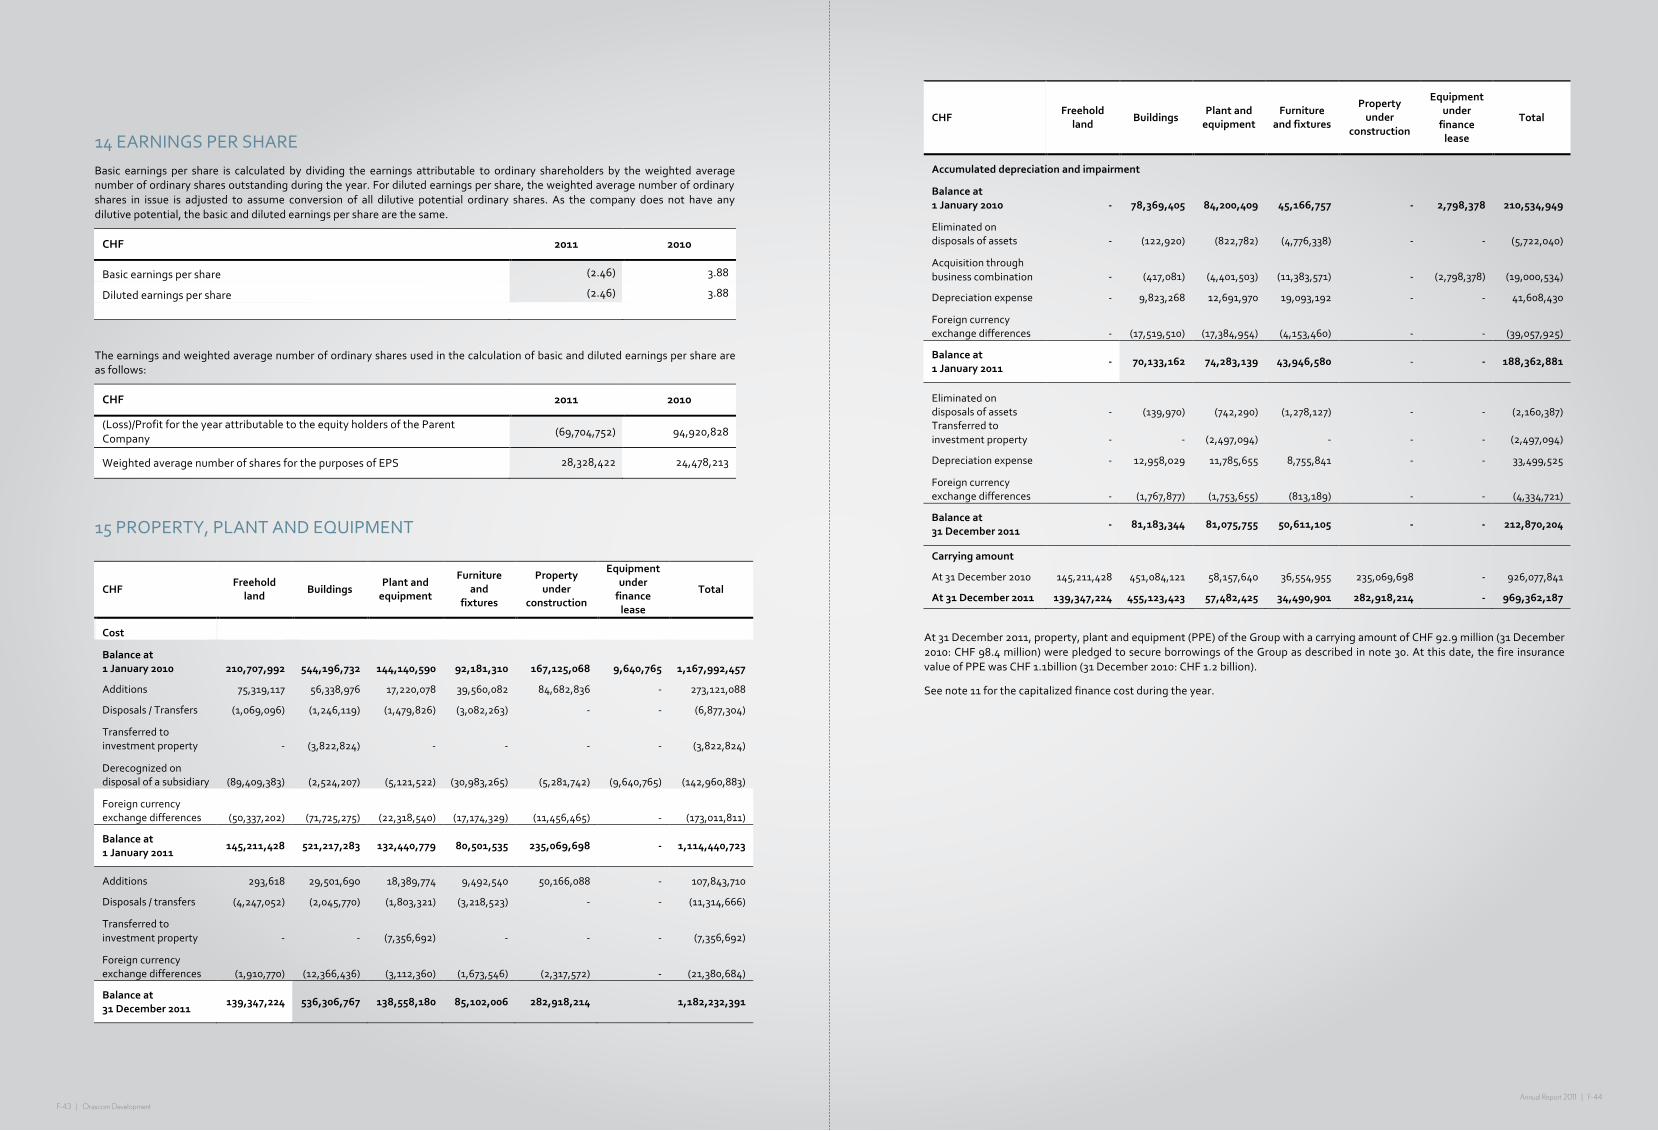
F-43 | Orascom DevelopmentAnnual Report 2011 | F-44
F-‐43
14 EARNINGS PER SHARE Basic earnings per share is calculated by dividing the earnings attributable to ordinary shareholders by the weighted average number of ordinary shares outstanding during the year. For diluted earnings per share, the weighted average number of ordinary shares in issue is adjusted to assume conversion of all dilutive potential ordinary shares. As the company does not have any dilutive potential, the basic and diluted earnings per share are the same.
CHF 2011 2010
Basic earnings per share (2.46) 3.88
Diluted earnings per share (2.46) 3.88
The earnings and weighted average number of ordinary shares used in the calculation of basic and diluted earnings per share are as follows:
CHF 2011 2010
(Loss)/Profit for the year attributable to the equity holders of the Parent Company
(69,704,752) 94,920,828
Weighted average number of shares for the purposes of EPS 28,328,422 24,478,213
15 PROPERTY, PLANT AND EQUIPMENT
CHF Freehold
land Buildings
Plant and equipment
Furniture and
fixtures
Property under
construction
Equipment under finance lease
Total
Cost
Balance at 1 January 2010 210,707,992 544,196,732 144,140,590 92,181,310 167,125,068 9,640,765 1,167,992,457
Additions 75,319,117 56,338,976 17,220,078 39,560,082 84,682,836 -‐ 273,121,088
Disposals / Transfers (1,069,096) (1,246,119) (1,479,826) (3,082,263) -‐ -‐ (6,877,304)
Transferred to investment property -‐ (3,822,824) -‐ -‐ -‐ -‐ (3,822,824)
Derecognized on disposal of a subsidiary (89,409,383) (2,524,207) (5,121,522) (30,983,265) (5,281,742) (9,640,765) (142,960,883)
Foreign currency exchange differences (50,337,202) (71,725,275) (22,318,540) (17,174,329) (11,456,465) -‐ (173,011,811)
Balance at 1 January 2011
145,211,428 521,217,283 132,440,779 80,501,535 235,069,698 -‐ 1,114,440,723
Additions 293,618 29,501,690 18,389,774 9,492,540 50,166,088 -‐ 107,843,710
Disposals / transfers (4,247,052) (2,045,770) (1,803,321) (3,218,523) -‐ -‐ (11,314,666)
Transferred to investment property -‐ -‐ (7,356,692) -‐ -‐ -‐ (7,356,692)
Foreign currency exchange differences (1,910,770) (12,366,436) (3,112,360) (1,673,546) (2,317,572) -‐ (21,380,684)
Balance at 31 December 2011
139,347,224 536,306,767 138,558,180 85,102,006 282,918,214 1,182,232,391
F-‐44
CHF Freehold
land Buildings
Plant and equipment
Furniture and fixtures
Property under
construction
Equipment under finance lease
Total
Accumulated depreciation and impairment
Balance at 1 January 2010 -‐ 78,369,405 84,200,409 45,166,757 -‐ 2,798,378 210,534,949
Eliminated on disposals of assets -‐ (122,920) (822,782) (4,776,338) -‐ -‐ (5,722,040)
Acquisition through business combination -‐ (417,081) (4,401,503) (11,383,571) -‐ (2,798,378) (19,000,534)
Depreciation expense -‐ 9,823,268 12,691,970 19,093,192 -‐ -‐ 41,608,430
Foreign currency exchange differences -‐ (17,519,510) (17,384,954) (4,153,460) -‐ -‐ (39,057,925)
Balance at 1 January 2011
-‐ 70,133,162 74,283,139 43,946,580 -‐ -‐ 188,362,881
Eliminated on disposals of assets -‐ (139,970) (742,290) (1,278,127) -‐ -‐ (2,160,387) Transferred to investment property -‐ -‐ (2,497,094) -‐ -‐ -‐ (2,497,094)
Depreciation expense -‐ 12,958,029 11,785,655 8,755,841 -‐ -‐ 33,499,525
Foreign currency exchange differences -‐ (1,767,877) (1,753,655) (813,189) -‐ -‐ (4,334,721)
Balance at 31 December 2011
-‐ 81,183,344 81,075,755 50,611,105 -‐ -‐ 212,870,204
Carrying amount
At 31 December 2010 145,211,428 451,084,121 58,157,640 36,554,955 235,069,698 -‐ 926,077,841
At 31 December 2011 139,347,224 455,123,423 57,482,425 34,490,901 282,918,214 -‐ 969,362,187
At 31 December 2011, property, plant and equipment (PPE) of the Group with a carrying amount of CHF 92.9 million (31 December 2010: CHF 98.4 million) were pledged to secure borrowings of the Group as described in note 30. At this date, the fire insurance value of PPE was CHF 1.1billion (31 December 2010: CHF 1.2 billion).
See note 11 for the capitalized finance cost during the year.
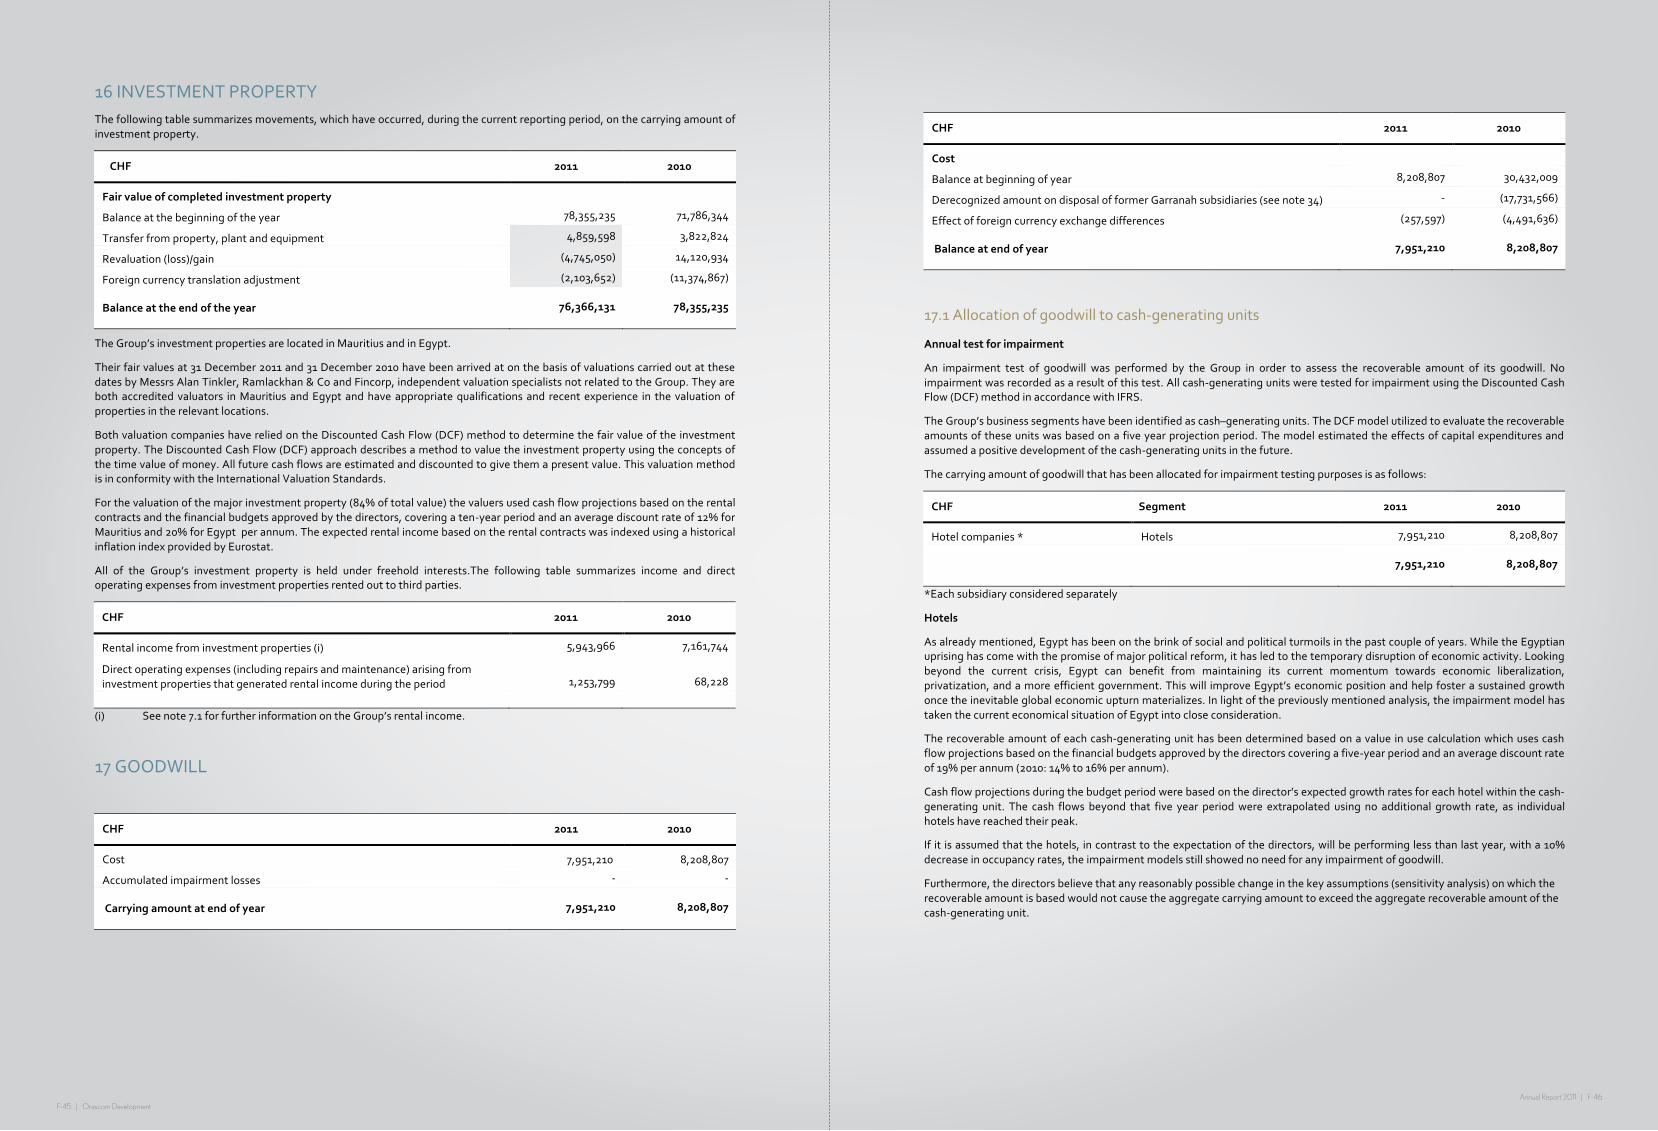
F-45 | Orascom DevelopmentAnnual Report 2011 | F-46
F-‐45
16 INVESTMENT PROPERTY
The following table summarizes movements, which have occurred, during the current reporting period, on the carrying amount of investment property.
CHF 2011 2010
Fair value of completed investment property
Balance at the beginning of the year 78,355,235 71,786,344
Transfer from property, plant and equipment 4,859,598 3,822,824
Revaluation (loss)/gain (4,745,050) 14,120,934
Foreign currency translation adjustment (2,103,652) (11,374,867)
Balance at the end of the year 76,366,131 78,355,235
The Group’s investment properties are located in Mauritius and in Egypt.
Their fair values at 31 December 2011 and 31 December 2010 have been arrived at on the basis of valuations carried out at these dates by Messrs Alan Tinkler, Ramlackhan & Co and Fincorp, independent valuation specialists not related to the Group. They are both accredited valuators in Mauritius and Egypt and have appropriate qualifications and recent experience in the valuation of properties in the relevant locations.
Both valuation companies have relied on the Discounted Cash Flow (DCF) method to determine the fair value of the investment property. The Discounted Cash Flow (DCF) approach describes a method to value the investment property using the concepts of the time value of money. All future cash flows are estimated and discounted to give them a present value. This valuation method is in conformity with the International Valuation Standards.
For the valuation of the major investment property (84% of total value) the valuers used cash flow projections based on the rental contracts and the financial budgets approved by the directors, covering a ten-‐year period and an average discount rate of 12% for Mauritius and 20% for Egypt per annum. The expected rental income based on the rental contracts was indexed using a historical inflation index provided by Eurostat.
All of the Group’s investment property is held under freehold interests.The following table summarizes income and direct operating expenses from investment properties rented out to third parties.
CHF 2011 2010
Rental income from investment properties (i) 5,943,966 7,161,744
Direct operating expenses (including repairs and maintenance) arising from investment properties that generated rental income during the period 1,253,799 68,228
(i) See note 7.1 for further information on the Group’s rental income.
17 GOODWILL
CHF 2011 2010
Cost 7,951,210 8,208,807
Accumulated impairment losses -‐ -‐
Carrying amount at end of year 7,951,210 8,208,807
F-‐46
CHF 2011 2010
Cost
Balance at beginning of year 8,208,807 30,432,009
Derecognized amount on disposal of former Garranah subsidiaries (see note Q34) -‐ (17,731,566)
Effect of foreign currency exchange differences (257,597) (4,491,636)
Balance at end of year 7,951,210 8,208,807
17.1 Allocation of goodwill to cash-‐generating units
Annual test for impairment
An impairment test of goodwill was performed by the Group in order to assess the recoverable amount of its goodwill. No impairment was recorded as a result of this test. All cash-‐generating units were tested for impairment using the Discounted Cash Flow (DCF) method in accordance with IFRS.
The Group’s business segments have been identified as cash–generating units. The DCF model utilized to evaluate the recoverable amounts of these units was based on a five year projection period. The model estimated the effects of capital expenditures and assumed a positive development of the cash-‐generating units in the future.
The carrying amount of goodwill that has been allocated for impairment testing purposes is as follows:
CHF Segment 2011 2010
Hotel companies * Hotels 7,951,210 8,208,807
7,951,210 8,208,807
*Each subsidiary considered separately
Hotels
As already mentioned, Egypt has been on the brink of social and political turmoils in the past couple of years. While the Egyptian uprising has come with the promise of major political reform, it has led to the temporary disruption of economic activity. Looking beyond the current crisis, Egypt can benefit from maintaining its current momentum towards economic liberalization, privatization, and a more efficient government. This will improve Egypt’s economic position and help foster a sustained growth once the inevitable global economic upturn materializes. In light of the previously mentioned analysis, the impairment model has taken the current economical situation of Egypt into close consideration.
The recoverable amount of each cash-‐generating unit has been determined based on a value in use calculation which uses cash flow projections based on the financial budgets approved by the directors covering a five-‐year period and an average discount rate of 19% per annum (2010: 14% to 16% per annum).
Cash flow projections during the budget period were based on the director’s expected growth rates for each hotel within the cash-‐generating unit. The cash flows beyond that five year period were extrapolated using no additional growth rate, as individual hotels have reached their peak.
If it is assumed that the hotels, in contrast to the expectation of the directors, will be performing less than last year, with a 10% decrease in occupancy rates, the impairment models still showed no need for any impairment of goodwill.
Furthermore, the directors believe that any reasonably possible change in the key assumptions (sensitivity analysis) on which the recoverable amount is based would not cause the aggregate carrying amount to exceed the aggregate recoverable amount of the cash-‐generating unit.

F-47 | Orascom DevelopmentAnnual Report 2011 | F-48
F-‐47
18 SUBSIDIARIES
The Group has control over all the subsidiaries below either directly or indirectly through subsidiaries controlled by the Parent Company. Details of the Group’s significant subsidiaries at the end of the reporting period are as follows:
Country -‐ Company name Domicile FC Segment
Share/paid-‐in capital
Proportion of
ownership interest
and voting power held
by the Group
HO *
R&C LS TM TO Other HQ
Egypt
Abu Tig for Hotels Company Red Sea EGP 637,500 98.58% 2
Accasia for Hotels Company Cairo EGP 25,000,000 99.16% 5
Arena for Hotels Company S.A.E Cairo EGP 20,000,000 100.00% 4
Azur for Floating Hotels Company S.A.E (ii)
Cairo EGP 3,000,000 50.84% 5
Captain for Hotels Company Red Sea EGP 768,750 59.69% 3
El Dawar for Hotels Company Cairo EGP 9,560,000 99.16% 3
El Golf for Hotels Company & Touristic Establishments
Cairo EGP 19,000,000 99.16% 5
El Gouna for Hotels Company S.A.E Cairo EGP 79,560,000 70.12% 5
El Gouna Hospital Company Red Sea EGP 19,000,000 75.23%
El Gouna Services Company Red Sea EGP 250,000 99.68%
El Mounira for Hotels Company S.A.E Red Sea EGP 13,000,000 64.46% 4
El Tebah for Hotels & Touristic Establishments Company
Cairo EGP 52,000,000 70.12% 5
El Wekala for Hotels Company Cairo EGP 39,000,000 74.58% 4
International Company for Taba Touristic Projects (Taba Resorts)
Cairo EGP 96,000,000 64.47% 5
International Hotel Holding (previously: Orascom Hotels Holding S.A.E)
Cairo EGP 452,367,300 99.16%
Marina 2 for Hotels &Touristic Establishments Company
Cairo EGP 19,250,000 59.50% 4
Marina 3 for Hotels &Touristic Establishments Company
Cairo EGP 18,500,000 99.16% 4
Med Taba for Hotels Company S.A.E Cairo EGP 51,000,000 66.57% 4
Misr El Fayoum for Touristic Development Company S.A.E
Cairo EGP 28,000,000 67.06%
Mokbela for Hotels Company S.A.E Cairo EGP 85,000,000 81.87% 5
Orascom Hotels & Development S.A.E
Cairo EGP 1,109,811,630 99.68%
Orascom Housing Communities (OHC)
Cairo EGP 185,000,000 69.34%
Orascom Housing Company Cairo EGP 22,000,000 99.68%
Paradisio for Hotels & Touristic Establishments Company S.A.E
Red Sea EGP 18,500,000 99.16% 4
Rihana for Hotels Company S.A.E Red Sea EGP 13,000,000 59.50% 4
Roaya for Tourist & Real Estate Development SAE (i)
Red Sea EGP 50,000,000 74.26%
Royal for Investment & Touristic Development S.A.E (i)
Cairo EGP 50,000,000 50.84% 4
Taba First Hotel Company S.A.E Cairo EGP 105,000,000 59.57% 5
Taba Heights Company S.A.E South Sinai EGP 157,510,000 98.65%
Tamweel Leasing Finance Co. ILC Cairo EGP 28,860,734 79.70%
Tamweel Mortgage Finance Company S.A.E
Cairo EGP 100,000,000 87.66%
Tawila for Hotel Company S.A.E Cairo EGP 68,000,000 99.16% 5
F-‐48
Country -‐ Company name Domicile FC Segment
Share/paid-‐in capital
Proportion of
ownership interest
and voting power held
by the Group
HO *
LS TM TO Other HQ
Jordan
Golden Beach for Hotels Company Aqaba JOD 8,200,000 100.00% 4
Mauritius
Club Méditerranée Albion Resorts Ltd (ii)
Port-‐Louis EUR 20,000,000 12.40%
Montenegro
Lustica Development Ad Podgorica Podgorica EUR 25,000 90.00%
Morocco
Oued Chibika Development (SA) Casablanca MAD 286,117,692 64.99%
Oman
Madrakah Hotels Management Company LLC
Muscat OMR 4,350,000 70.00%
Muriya Tourism Development Company (S.A.O.C)
Muscat OMR 7,500,000 70.00%
Salalah Beach Tourism Development Company (S.A.O.C)
Muscat OMR 16.600.000 70.00%
Sifah Tourism Development Company (S.A.O.C)
Muscat OMR 17,700,000 70.00%
Wateera Property Management Company LLC
Muscat OMR 270,000 70.00%
Switzerland
Andermatt Swiss Alps AG (previously AADC AG)
Altdorf CHF 37,000,000 100.00%
Andermatt Hotels Holding AG Andermatt CHF 100,000 100.00%
Bellevue Hotels and Apartment Development AG.
Altdorf CHF 4,360,000 73.48% UC
United Arab Emirates
RAK Tourism Investment FZC Ras al Kaimah
AED 7,300,000 73.00% 5
United Kingdom
Eco-‐Bos Development Limited Cornwall GBP 10,000,000 75.00%
(i) The Group has control over these subsidiaries as it has the power to appoint and remove the majority of the Board of Directors and hence has control over the financial and operating policies of these subsidiaries.
(ii) The Group has control over the Club Méditerranée Albion Resorts Ltd through a call and put option as described in note 35.
Abbreviations:
HO Hotels R&C Real estate and construction LS Land sales TM Town management HQ Headquarter or not yet operational TO Tours operations Other Other operations * Number of stars the hotel holds UC Hotel under construction

F-49 | Orascom DevelopmentAnnual Report 2011 | F-50
F-‐49
19 INVESTMENTS IN ASSOCIATES
Details of the Group’s associates at the end of the reporting period are as follows:
Name of associate Place of incorporation
Proportion of ownership interest and voting
power held by the Group
Carrying value (CHF )
2011 2011 2010
Jordan Company for Projects and Touristic Development (i) Jordon 15.64% 6,850,240 6,804,656
Orascom for Housing and Establishments (ii) Cairo 39.90% 1,208,091 1,633,303
International Stock Company for Floating Hotels & Touristic Establishments (iii) Cairo 45.00% 358,523 370,333
Mirotel for Floating Hotels Company (iii) Cairo 45.00% 732,039 1,496,440
Tarot Garranah & Merotil for Floating Hotels (iii) Cairo 45.00% 1,055,735 1,084,682
Tarot Tours Company (Garanah) S.A.E (iii) Cairo 45.00% 13,564,911 17,581,334
Tarot Garranah for Touristic Transportation (iii) Cairo 45.00% 5,579,585 6,426,736
Total 29,349,124 35,397,484
Summarised financial information in respect of the Group’s associates is set out below.
CHF 2011 2010
Total assets 200,527,845 202,022,366
Total liabilities (144,337,166) (131,149,512)
Net assets 56,190,679 70,872,854
Group’s share of net assets of associates 13,084,459 18,859,503
Total revenue 37,391,756 45,783,670
Total loss for the year (11,167,476) (4,614,435)
Group’s share of lossof associates (4,980,563) (1,552,599)
(i) Jordan Company for Projects and Touristic Development (JPTD)
JPTD is investing in property, town management and development in Aqaba in Jordon. Since 2008 the Group exercised significant influence with their two active board members out of eleven leading to changes in the JPTD’s Executive Management and provision of essential technical information. The proportion of ownership interest held by the Group at 31 December 2011 is unchanged to prior year.
(ii) Orascom for Housing and Establishment
The company develops real estate and housing projects located in Egypt for the low cost sector. OHD increased its investment in Orascom for Housing and Establishment during 2010resulting in an ownership interest of 39.90%. The proportion of ownership interest held by the Group at 31 December 2011 is unchanged to prior year.
F-‐50
(iii) Garranah Group subsidiaries
On 18 May 2010, the Group signed a share sale and purchase agreement to sell to the Garranah family a six percent stake in six subsidiaries (International Stock Company for Floating Hotels & Touristic Establishments, Mirotel for Floating Hotels Company, Tarot Garranah & Merotil for Floating Hotels, El Tarek for Nile Cruises & Floating Hotels, Tarot Tours Company (Garranah) SAE and Tarot Garranah for Touristic Transportation). Pursuant to this agreement, the Group’s interest in these entities decreased from 51 to 45 percent and the Group ceased control over these subsidiaries, but retained significant influence at 31 December 2010 and 31 December 2011. Since the date of this change of ownership interest, the Group has deconsolidated these operations and has rather accounted for them as investments in associates.
The Group has accounted in 2010 for the partial disposal of the six percent it previously held in Garranah subsidiaries in accordance with IAS 27 (as amended in 2008). The Group derecognized all assets, liabilities and non-‐controlling interests of the entities at their carrying amount. The retained interest in the former subsidiaries was recognized at its fair value at the date when control was lost and the resulting gain amounting to CHF 8,530,587 was recorded in the statement of comprehensive income as other gains and losses (see notes 10 and 34).
The members of the Garranah family who were party to the transaction as sellers in 2008 and buyers in 2010 of the six percent stake in the former Garranah subsidiaries are related to the ex minister who is also a member of the Garranah family and currently is under trial before the court in Egypt in his capacity as a public officer. The assets of the Garranah family are frozen; however, this should not impact the recovery of the remaining sales proceedsas this measure is only precautionary and not permanent.
On 28 December 2010 the Group signed the legal documents to register the transfer of title regarding the six percent stake of the Garranah entities according to the broker’s invoices by the par value of the shares to the Garranah family except for the legal title of Tarot Tours Company (Garanah) S.A.Ewhichwas approval by the regulator in 2011.
20 NON-‐CURRENT RECEIVABLES
CHF 2011 2010
Trade receivables 53,508,055 56,264,407
Notes receivable 35,796,968 38,455,234
89,305,023 94,719,641
Non-‐current receivables include long term receivables for real estate contracts, which will be collected over an average collecting period of 5.5 years (2010: 5.5 years) and accounts receivables from the mortgage company (Tamweel Mortgage Finance Company S.A.E.), one of OHD subsidiaries, with an average collecting period of 10 years (2010: 10 years).
Tamweel Mortgage Finance Company S.A.E. has pledged trade receivable with carrying amount of CHF 15.6 million (2010: CHF 19.3 million) to secure borrowings (note 30).

F-51 | Orascom DevelopmentAnnual Report 2011 | F-52
F-‐51
21 OTHER FINANCIAL ASSETS
Details of the Group’s other financial assets are as follows:
Current Non-‐current CHF
2011 2010 2011 2010
Financial assets carried at fair value through profit or loss (FVTPL)
Held for trading non-‐derivative financial assets -‐ certificates of mutual funds (i) 7,294,817 1,380,948 -‐ -‐
AFS equity investments carried at fair value Nasr City company for Housing & Development (N.C.H.R.) (ii) -‐ -‐ 12,601,741 36,126,607
Egyptian Resort Company (iii) -‐ -‐ 6,174,190 15,175,383
Green Power Uri AG -‐ -‐ 30,000 30,000
Sedrun Bergbahnen AG -‐ -‐ 228,800 286,000
Andermatt Gotthard Sportbahnen AG -‐ -‐ 481,208 105,138 Andermatt-‐Urserntal Tourismus GmbH Investments 5,000 -‐
Reclaim Limited 1,099,709 -‐
AFS equity investments carried at cost
Falcon for Hotels SAE (iv) -‐ -‐ 18,767,007 18,645,202
Egyptian Mortgage Refinance Company -‐ -‐ 155,570 160,610
Camps and Lodges Company -‐ -‐ 38,892 40,153
Palestine for Tourism Investment Company -‐ -‐ 26,645 27,508
El Koseir Company -‐ -‐ 529 546
Held-‐to-‐maturity investments carried at amortised cost
Bonds issued by the Hellenic Republic (2 3/8%, 2004 – 18 March 2011) -‐ 9,427,913 -‐ -‐ Bonds issued by the Egyptian Government (14.5%, 11 December 2012) 7,262,703 -‐
14,557,520 10,808,861 39,609,291 70,597,147
(i) Certificates – mutual fund
The Group holds certificates in Mutual Funds and these certificates are recorded at their redemption price at year end. (ii) Nasr City Company for Housing & Development (N.C.H.R.)
The investment in N.C.H.R. remains unchanged to prior year at 7.07%. In 2009, a development management agreement was signed between Orascom Development & Management (ODM) and N.C.H.R., an Egyptian listed real estate development company with a total land bank of 10.13 million square meters. As the necessary licenses are outstanding, the development has not been started at 31 December 2011.
(iii) Egyptian Resort Company The investment in Egyptian Resort Company (“ERC”) was increased during lastyear. The company is acting as the developer of the hotel and real estate project in Sahel Hashish (Egypt). Since March 2011, ERC is involved in a dispute with the General Authority for Tourism and Development (“GATD”) whichis further disclosed in note 21.1.
(iv) Falcon for hotels The financial statements of Falcon Company for Hotels (“Falcon”) were incorporated into ODH’s consolidated financial statements at 31 December 2008 in accordance with the International Financial Reporting Standards, as a result of the business combination previously effected through one of ODH’s subsidiaries whereby control had existed over Falcon at that time. Subsequent to the first time consolidation, but prior to the completion of the transfer of the legal title on the
F-‐52
Egyptian Stock Exchange (EGX), a dispute over the Falcon securities purchase agreement had arisen. At the beginning of October 2009, the Group ceased consolidating Falcon due to changes in Falcon’s management resulting in a loss of control for the Group which was one of the reasons of the dispute.
21.1 Possible impairment of certain other financial assets
Nasr City Company for Housing & Development (N.C.H.R.) Due to the political events in Egypt and the related losses on the stock market, the fair value of the available-‐for-‐sale investment in Nasr City Company for Housing & Development was decreased by CHF 23.2 million in 2011, which is also recognised in net loss on available-‐for-‐sale financial assets within other comprehensive income.
Management does not believe that there is a prolonged decline in fair value and therefore has not recognised any of the decrease in fair value as impairment loss in profit and loss due to the following reasons:
• As per a study made by a third party the share value is considered to be more than double the market value as at year end which indicates that market conditions at year end were not transparent
• The price of the shares has increased by average 35% since the beginning of 2012.
Egyptian Resort Company The share price of the Egyptian Resorts Company (“ERC”), one of the Group’s available-‐for-‐sale equity investments carried at fair value, has significantly dropped in 2011 following an announcement made by ERC on the EGX that the authorities in Egypt have withdrawn a previously allocated plot of land. This decline in the carrying value of ERC shares held by the Group amounts to CHF 7.4 million and is recorded in net (loss) on available-‐for-‐sale financial assets within other comprehensive income.
A study by a independent third party shows that the share value mainly decreased due to this decision. Based on information received from ERC management is convinced that this withdrawal is only temporary and the land will be returned in due time. Further, management is convinced that market conditions at year end were not transparent. This view is supported by the fact that the price of the shares has increased byaverage 35% since the beginning of 2012.
Due to the above, management is convinced that there is no prolonged decline in fair value and therefore has not recognised any of the decrease in fair value as impairment loss in profit and loss.
22 OTHER CURRENT ASSETS
CHF 2011 2010
Advance to suppliers (i) 9,741,155 20,460,324
Other debit balances (ii) 19,228,883 48,690,280
Amounts due from employees and the management team (iii) 12,995,352 13,024,339
Down payments for investments (iv) 186,217 7,283,114
Prepaid expenses 7,568,536 7,894,771
Deposit with others 4,040,411 3,118,512
Prepaid sales commissions related to uncompleted units 7,376,268 3,300,768
Withholding tax 3,268,261 7,591,835
Urban development authority 1,073,860 1,108,650
Letters of guarantee – cash margin 6,413,957 4,702,026
Cash imprest 298,172 356,465
Accrued revenue 1,528,517 1,694,535
73,719,589 119,225,619
(i) The decrease in advance to suppliers mainly relates to the general slow-‐down of construction work in 2011 due to the political crisis in Egypt and Oman.

F-53 | Orascom DevelopmentAnnual Report 2011 | F-54
F-‐53
(ii) Other debit balances, reported in other current assets, include deferred proceeds of net CHF nil(2010: CHF 24.7 million) from the sale of all interests in Joud Fund 1, 2, 3 and 4 net of the impairment charge of CHF 33million of which CHF 15 million was recorded against other debit balances at 31 December 2010 to cover any shortfall that might occur as a result of the recent political developments in the Middle East region. In 2011 an additional impairment charge of CHF 18million was recorded.
(iii) Include an amount of CHF 12,787,116 (2010: CHF 12,042,632) which is due from employees and management team including executive board members as a result of receiving two million OHD shares for full consideration being the market price as of the day of allocation (being 17 January 2007). These shares were previously issued based on a general assembly resolution in OHD dated 13 February 2006 authorizing the company to issue 2 million shares at par to be used to allocate to employees and management team (see note 40). Of this amount CHF 5,422,833 (2010: CHF 5,598,516) are due from the chairman and executive board members. All of these shares were swapped at a rate of 1:10 for ODH shares in 2008. In 2011 the board of Orascom Hotels & Development extended the repayment period for another year.
(iv) Investments in the amount of CHF 6.6 million were not realised and the amounts were received back. The decrease in down payments for investments is further due to the acquisition of Reclaim which was finalised in the financial period (refer to note 21 for further details.
23 INVENTORIES
CHF 2011 2010
Construction work in progress (i) 350,744,293 145,035,953
Land held for development under purchase agreements (ii) 66,831,436 58,361,107
Other inventories (iii) 60,578,871 56,778,602
478,154,600 260,175,662
(i) This amount includes real estate construction work under progress. The real estate units are sold off plan. The growth is mainly due to the commencement of the construction and preparation work in Switzerland, Morocco and Oman. For further details on the net realisable value of construction work in progress refer to note 4.2.10.
(ii) In 2008, the finance leases between OHD and General Authority for Touristic and Development (“GATD”) for development of land were terminated and replaced with purchase agreements with GATD. On May 2008, OHD signed a new purchase agreement with GATD to purchase a plot of land and paid a down payment of 27% and the remaining balance is payable in equal annual instalment commencing upon the expiry of the grace period of three years.
(iii) This amount includes construction work materials and hotels inventory
In addition, OHD is required to pay an annual interest at the rate of 5% after the grace period with each instalment.
The value of land shown above is for those plots of land assigned for development and not yet sold by OHD.
There were no material write-‐downs or reversal of write-‐downs of inventory in 2011 and 2010.
24 TRADE AND OTHER RECEIVABLES
CHF 2011 2010
Trade receivables (i) 129,335,939 134,409,628
Notes receivable 49,498,453 32,362,239
Allowance for doubtful debts (see below) (23,127,659) (10,729,483)
155,706,733 156,042,384
(i) The average credit period on sales of real-‐estate is 5.5years. No contractual interest is charged on trade receivables arising from the sale of real estate units. Interest is only charged in case of customers default. The Group has recognised an allowance for doubtful debts of 18% (2010: 8%) based on individual bad debts and allowances due to past due amounts which significantly increased in 2011 compared to 2010.Allowances for doubtful debts are recognised against
F-‐54
trade receivables based on estimated irrecoverable amounts determined by reference to past default experience of the counterparty and an analysis of the counterparty's current financial position.
Movement in the allowance for doubtful debt:
CHF 2011 2010
Balance at beginning of year (10,729,483) (13,054,738)
Impairment losses recognised on receivables (11,849,852) (4,655,459)
Impairment losses reversed (allowance no longer used) 684,615 3,389,300
Foreign exchange translation gains and losses (1,232,939) 3,591,414
Balance at end of year (23,127,659) (10,729,483)
Included in the Group’s trade and other receivable balance are debtors with a carrying amount of CHF 40,926,952(2010: CHF 32,530,404) which are past due but not impaired at the reporting date. The Group has not built an allowance for impairment lossfor the past due amounts reported below as there has not been a significant change in credit quality and the amounts are still considered recoverable (see note 38).
Aging of receivables that are past due but not impaired:
CHF 2011 2010
Less than 30 days 19,533,160 15,046,685
Between 30 to 60 days 6,123,969 2,209,917
Between 60 to 90 days 959,867 1,966,265
Between 90 to 120 days 1,526,522 2,311,888
More than 120 days 12,783,434 10,995,649
Total 40,926,952 32,530,404
25 FINANCE LEASE RECEIVABLES
CHF 2011 2010
Current finance lease receivables 3,214,009 2,478,257
Non-‐current finance lease receivables 12,760,423 13,740,381
15,974,432 16,218,638
25.1 Leasing arrangements
Tamweel Leasing Finance Co., a subsidiary of the Group entered into finance lease arrangements for buildings, cars, equipments, computer hardware and software as a lessor. All leases are denominated in EGP. The average term of finance leases entered into is ten years.
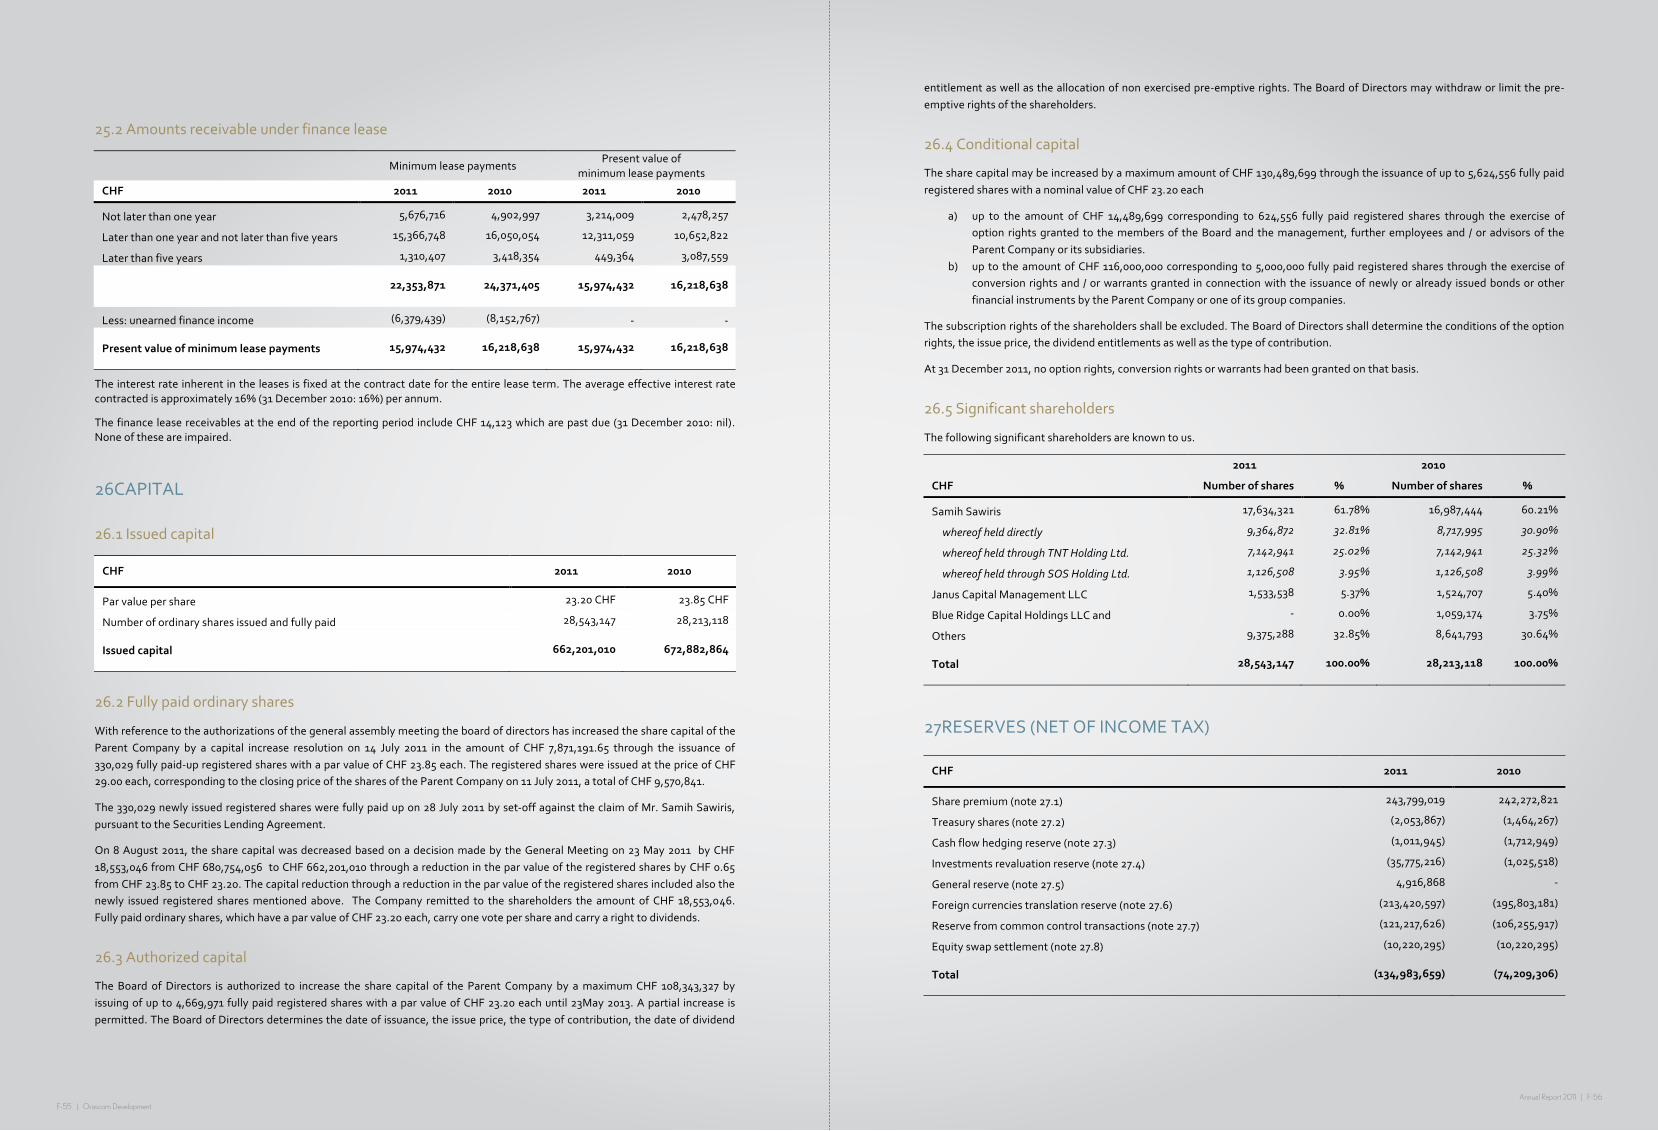
F-55 | Orascom DevelopmentAnnual Report 2011 | F-56
F-‐55
25.2 Amounts receivable under finance lease
Minimum lease payments Present value of
minimum lease payments
CHF 2011 2010 2011 2010
Not later than one year 5,676,716 4,902,997 3,214,009 2,478,257
Later than one year and not later than five years 15,366,748 16,050,054 12,311,059 10,652,822
Later than five years 1,310,407 3,418,354 449,364 3,087,559
22,353,871 24,371,405 15,974,432 16,218,638
Less: unearned finance income (6,379,439) (8,152,767) -‐ -‐
Present value of minimum lease payments 15,974,432 16,218,638 15,974,432 16,218,638
The interest rate inherent in the leases is fixed at the contract date for the entire lease term. The average effective interest rate contracted is approximately 16% (31 December 2010: 16%) per annum.
The finance lease receivables at the end of the reporting period include CHF 14,123 which are past due (31 December 2010: nil). None of these are impaired.
26CAPITAL
26.1 Issued capital
CHF 2011 2010
Par value per share 23.20 CHF 23.85 CHF
Number of ordinary shares issued and fully paid 28,543,147 28,213,118
Issued capital 662,201,010 672,882,864
26.2 Fully paid ordinary shares
With reference to the authorizations of the general assembly meeting the board of directors has increased the share capital of the Parent Company by a capital increase resolution on 14 July 2011 in the amount of CHF 7,871,191.65 through the issuance of 330,029 fully paid-‐up registered shares with a par value of CHF 23.85 each. The registered shares were issued at the price of CHF 29.00 each, corresponding to the closing price of the shares of the Parent Company on 11 July 2011, a total of CHF 9,570,841.
The 330,029 newly issued registered shares were fully paid up on 28 July 2011 by set-‐off against the claim of Mr. Samih Sawiris, pursuant to the Securities Lending Agreement.
On 8 August 2011, the share capital was decreased based on a decision made by the General Meeting on 23 May 2011 by CHF 18,553,046 from CHF 680,754,056 to CHF 662,201,010 through a reduction in the par value of the registered shares by CHF 0.65 from CHF 23.85 to CHF 23.20. The capital reduction through a reduction in the par value of the registered shares included also the newly issued registered shares mentioned above. The Company remitted to the shareholders the amount of CHF 18,553,046. Fully paid ordinary shares, which have a par value of CHF 23.20 each, carry one vote per share and carry a right to dividends.
26.3 Authorized capital
The Board of Directors is authorized to increase the share capital of the Parent Company by a maximum CHF 108,343,327 by issuing of up to 4,669,971 fully paid registered shares with a par value of CHF 23.20 each until 23May 2013. A partial increase is permitted. The Board of Directors determines the date of issuance, the issue price, the type of contribution, the date of dividend
F-‐56
entitlement as well as the allocation of non exercised pre-‐emptive rights. The Board of Directors may withdraw or limit the pre-‐emptive rights of the shareholders.
26.4 Conditional capital
The share capital may be increased by a maximum amount of CHF 130,489,699 through the issuance of up to 5,624,556 fully paid registered shares with a nominal value of CHF 23.20 each
a) up to the amount of CHF 14,489,699 corresponding to 624,556 fully paid registered shares through the exercise of option rights granted to the members of the Board and the management, further employees and / or advisors of the Parent Company or its subsidiaries.
b) up to the amount of CHF 116,000,000 corresponding to 5,000,000 fully paid registered shares through the exercise of conversion rights and / or warrants granted in connection with the issuance of newly or already issued bonds or other financial instruments by the Parent Company or one of its group companies.
The subscription rights of the shareholders shall be excluded. The Board of Directors shall determine the conditions of the option rights, the issue price, the dividend entitlements as well as the type of contribution.
At 31 December 2011, no option rights, conversion rights or warrants had been granted on that basis.
26.5 Significant shareholders
The following significant shareholders are known to us.
2011 2010
CHF Number of shares % Number of shares %
Samih Sawiris 17,634,321 61.78% 16,987,444 60.21%
whereof held directly 9,364,872 32.81% 8,717,995 30.90%
whereof held through TNT Holding Ltd. 7,142,941 25.02% 7,142,941 25.32%
whereof held through SOS Holding Ltd. 1,126,508 3.95% 1,126,508 3.99%
Janus Capital Management LLC 1,533,538 5.37% 1,524,707 5.40%
Blue Ridge Capital Holdings LLC and -‐ 0.00% 1,059,174 3.75%
Others 9,375,288 32.85% 8,641,793 30.64%
Total 28,543,147 100.00% 28,213,118 100.00%
27RESERVES (NET OF INCOME TAX)
CHF 2011 2010
Share premium (note Q27.1) 243,799,019 242,272,821
Treasury shares (note 27.2) (2,053,867) (1,464,267)
Cash flow hedging reserve (note Q27.3) (1,011,945) (1,712,949)
Investments revaluation reserve (note 27.4) (35,775,216) (1,025,518)
General reserve (note 27.5) 4,916,868 -‐
Foreign currencies translation reserve (note Q27.6) (213,420,597) (195,803,181)
Reserve from common control transactions (note 27.7) (121,217,626) (106,255,917)
Equity swap settlement (note 27.8) (10,220,295) (10,220,295)
Total (134,983,659) (74,209,306)

F-57 | Orascom DevelopmentAnnual Report 2011 | F-58
F-‐57
27.1 Share premium
CHF 2011 2010
Balance at beginning of year 242,272,821 183,269,858
Share capital reduction costs (repayment of nominal value) -‐ (49,205)
Share capital increase (issuance of ordinary shares) 1,699,649 66,065,708
Share capital increase costs (173,451) (7,013,540)
Balance at end of year 243,799,019 242,272,821
27.2 Treasury shares
CHF 2011 2010
Balance at beginning of year (1,464,267) -‐
Purchase of treasury shares (i) (589,600) -‐
Consideration received in treasury shares (i) -‐ (1,464,267)
Balance at end of year (2,053,867) (1,464,267)
(i) As of 31 December 2011, the Company owned 70,171 own shares (31 December 2010: 26,171). 26,171 own shares were received on 30 December 2010 as part of the compensation for the sale of the six percent stake in the former Garranah subsidiaries. On 28 December 2011, the Company bought 44,000 own shares as a part of the board member remuneration for 2011. Most of these shares have been forwarded to the board members during the first quarter 2012.
On 3 December 2010, the Parent Company borrowed 1 286 353 ODH shares from Mr. Samih Sawiris free of charge under a securities lending agreement. These shares were intended to be used for the tender offer regarding the buy-‐out of the remaining shareholders of Orascom Hotels & Development SAE (OHD), a company listed at the EGX. The borrowed ODH shares were not accounted for as treasury shares by the Group, as Mr. Samih Sawiris retained the significant rights, such as dividend and voting rights, during the borrowing period as per contractual provisions. Under the above mentioned securities lending agreement the Parent Company has returned 330 029 of the borrowed ODH shares to Mr. Samih Sawiris on 28 July 2011 by way of capital increase, which is further explained in note 40. The remaining 956 324 shares, which were not used during the above mentioned tender offer, are to be returned to Mr. Samih Sawiris by EGX. The difference between the balance, which was reported in equity as “equity swap settlement”, measured at the fair value of the share at the end of the tender offer, and the amount of the capital increase was recognised in ”General reserve” (note 27.5).
27.3 Cash flow hedging reserve
CHF 2011 2010
Balance at beginning of year (1,712,949) (2,324,214) Gain (loss) arising on changes in fair value of hedging instruments entered into for cash flow hedges
Interest rate swaps 876,255 764,081
Income tax related to gains/losses recognised in other comprehensive income (175,251) (152,816)
Balance at end of year (1,011,945) (1,712,949)
The cash flow hedging reserve represents the cumulative effective portion of gains or losses arising on changes in fair value of hedging instruments entered into for cash flow hedges. The cumulative gain or loss arising on changes in fair value of the hedging instruments that are recognised and accumulated under the heading of cash flow hedging reserve will be reclassified to profit or loss only when the hedged transaction affects the profit or loss, or included as a basis adjustment to the non-‐financial hedged item, consistent with the relevant accounting policy. As the cash flow hedge is 100% effective at 31 December 2011 the cumulative hedging gain up to that date is recognised in other comprehensive income(note 38.7).
F-‐58
27.4 Investments revaluation reserve
CHF 2011 2010
Balance at beginning of year (1,025,518) (85,800)
Net loss arising on revaluation of available-‐for-‐sale financial assets (34,749,698) (939,718)
Balance at end of year (35,775,216) (1,025,518)
The investments revaluation reserve represents the cumulative gains and (losses) arising on the revaluation of available-‐for-‐sale financial assets that have been recognised in other comprehensive income, net of amounts reclassified to profit or loss when those assets have been disposed of or are determined to be impaired.
27.5 General reserve
CHF 2011 2010
Balance at beginning of year -‐ -‐
Share capital increase (issuance of ordinary shares) 4,916,868 -‐
Balance at end of year 4,916,868 -‐
The balance at 31 December 2011 is due to the securities lending agreement between the Parent Company and Mr. Samih Sawiris. For further details refer to note 27.8.
27.6 Foreign currencies translation reserve
CHF 2011 2010
Balance at beginning of year (195,803,181) (75,348,038)
Exchange differences arising on translating the foreign operations (17,617,416) (120,455,143)
Balance at end of year (213,420,597) (195,803,181)
Exchange differences relating to the translation of the results and net assets of the Group's foreign operations from their functional currencies to the Group's presentation currency (CHF) are recognized directly in other comprehensive income and accumulated in the foreign currency translation reserve. Exchange differences previously accumulated in the foreign currency translation reserve in respect of translating the results and net assets of foreign operations are reclassified to profit or loss on the disposal of the foreign operation.
27.7 Reserve from common control transactions
CHF 2011 2010
Balance at beginning of year (106,255,917) (108,051,503)
Reserve from common control transactions (14,961,709) 1,795,586
Balance at end of year (121,217,626) (106,255,917)
The reserve from common control transactions relates to the restructuring of the group and the set up of a new holding company during May 2008. This new structure became effective by way of a share exchange between the shareholders of the initial holding company (OHD) and the new holding company (ODH). Following this acquisition through exchange of equity instruments, ODH became the parent of OHD with an ownership stake of 98.05%, later increased to 98.16% at 31 December 2008.
Current year decrease is mainly due to the increase in ownership of OHD to 99.68%.

F-59 | Orascom DevelopmentAnnual Report 2011 | F-60
F-‐59
Whereas the new holding company (ODH) is ultimately owned and controlled by the same major shareholders, management decided that this Group reorganisation was for the purpose of capital restructuring and it has been accounted for as a continuation of the financial statements of the initial holding Group (OHD) in the 2008 consolidated financial statements
Management concluded that the above Group restructure is classified as a transaction under common control since the combining entities are ultimately controlled by the same parties both before and after the combination and that control is not transitory.
However, since IFRS 3 Business Combinations excludes from its scope business combinations involving entities or businesses under common control (common control transactions), IAS 8 requires management to develop and apply an accounting policy that results in information that is relevant and reliable.
Management used its judgment in developing and applying an accounting policy for common control transactions arising from the Group’s capital restructuring as follows:
− Recognition of the assets acquired and liabilities assumed of the initial holding Group (OHD) at their previous carrying amounts;
− Recognition of the difference between purchase consideration and the previous carrying amount of net assets acquired as an adjustment to equity;
− Transaction costs, which were incurred in relation to the issuance of ODH shares, have been recognised as a reduction to the reserve from common control transaction. Amount included in the consolidated statement of changes in equity.
27.8 Equity swap settlement
CHF 2011 2010
Balance at beginning of year (10,220,295) -‐
Contract over own shares -‐ (10,220,295)
Equity swap settlement 14,487,709 -‐
Share capital increase (issuance of ordinary shares) (14,487,709) -‐
Balance at end of year (10,220,295) (10,220,295)
The consolidated statement of changes in equity includes a balance of CHF -‐10.2 million outstanding at 31 December 2011 which is the Group’s sale of the six percent stake in Garranah companies to the Garranah family during 2010. The unsettled consideration at 31 December 2011 amounts to CHF 10.6 million of which CHF 10.2 million is reported as a negative component. The remaining balance arising from such sale of CHF 0.4 million is classified as trade and other receivables.
During 2011 shares were borrowed from Mr. Samih Sawiris which has resulted in the recognition of an amount owed to Mr. Samih Sawiris of CHF 14.5 million reported as a positive component as further explained in note 40.
Under the above mentioned securities lending agreement the Parent Company has returned 330,029 of the borrowed ODH shares to Mr. Samih Sawiris on 28 July 2011 by way of capital increase, which is further explained in note 26.2. The difference between the balance, which was reported in equity as “equity swap settlement”, measured at the fair value of the shares at the end of the tender offer, and the amount of the capital increase was recognised in “General reserve” (note 27.5).
28RETAINED EARNINGS AND DIVIDENDS ON EQUITY INSTRUMENTS
CHF 2011 2010
Balance at beginning of year 396,880,378 301,959,550
(loss) /Profitattributable to owners of the Parent Company (69,704,752) 94,920,828
Balance at end of year 327,175,626 396,880,378
During 2010 and 2011 no dividends had been paid, but a capital reduction with payment to the shareholders took place in each year as explained in note 26. In respect of the current year, the Board of Directors does not propose a dividend or a capital reduction to the shareholders at the Annual General Meeting.
F-‐60
29 NON-‐CONTROLLING INTERESTS
CHF 2011 2010
Balance at beginning of year 197,589,888 197,143,304
Share of (loss)/profit for the year (6,730,368) 27,331,089
Exchange differences arising on translation of foreign operations (3,594,782) (26,125,531)
Non-‐controlling interest share in equity of consolidated subsidiaries (i) 53,559,169 1,719,314
Reduction in non-‐controlling interests due to dividend payment (OHD) -‐ (2,478,288)
Balance at end of year 240,823,907 197,589,888
(i) For 2011 this figure represents NCI share in capital increases mainly due to share contribution to Salalah,Sifah,Soda (Oman), Med Taba ( Egypt ) and Qued Chibika Development (Morocco). In 2010 it was as well related to Oman but also to Eco-‐Bos Development (UK) and Qued Chibika Development (Morocco). Further it included the effect on the NCI arising from the Group’s sale of the six percent stake in the former Garranah subsidiaries and the disposal of its full interest in Joud Fund 4 (see note 34).
30 BORROWINGS
Current Non-‐current
CHF 2011 2010 2011 2010
Secured-‐ at amortized cost
Credit facilities (i) 213,986,311 188,657,790 -‐ -‐
Bank loans (ii) 67,871,362 52,278,577 254,353,148 270,832,587
281,857,673 240,936,367 254,353,148 270,832,587
30.1 Summary of borrowing arrangements
The weighted average contractual effective interest rate for all credit facilities and loans are 6.69% (2010: 6.11%). It is calculated by dividing the forecasted contractual interest expense due next year by the total outstanding credit facilities and bank loans at the end of the current reporting period. For a breakdown of debts bearing variable and fixed interest see note 38.10.1.
(i) Credit facilities used by the group are revolving facilities used to finance working capital requirements and they are available in multiple currencies. The average interest rate for the credit facilities for year 2011 is 7.96% (2010: 6.97%).
(ii) Bank loans are current and non-‐current loans and have in general variable interest rates including a mark up. Property, plant and equipment with a carrying amount of CHF 92.9 million (2010: CHF 98.4 million) and non-‐current receivable with a carrying amount of CHF 15.6 million (2010: CHF 19.3 million) have been pledged to secure borrowings (see notes 15 and 20).
30.2 Breach of loan agreement
In light of the political turmoil that Egypt had been experiencing in the last year due to January 25th revolution, the Egyptian economy has been at a virtual standstill throughout 2011 up to now with the tourism sector, the main pillar industry, suffering the biggest blow. The instability in various aspects such as political, economical and security aspects all led to a sharp decrease in the number of incoming tourists evidenced by sharp decline in occupancy rates to 56% in company’s hotels in Egypt down from 78% in 2010 accompanied by minimal purchasing power of the tourists. All of these factors affected the profitability and cash flow of the group since Egypt is the main pillar of the group.

F-61 | Orascom DevelopmentAnnual Report 2011 | F-62
F-‐61
Due to these factors and the low cash flow level that cannot meet financial obligations, the company exerted severe efforts with its banks to reschedule 2011 due instalments and their accompanied interest expense for hotels and real estate segments in Egypt. As at year end 2010, the current portion of long term debts (CPLTD) was CHF 44.5 million (hotels & real estate segments countered for CHF 39.6 million) while the related interest expense was CHF 14.2 million (hotels & real estate segments countered for CHF 10.5 million). Due to the long track record the Company has with its banks and due to the current economic conditions, the Company succeeded to reschedule instalments in the amount of CHF 38.7 million and interest expense in the amount of CHF 5.7 million which made a relief on financial obligations burden. The instalments were mainly rescheduled by pushing back (extending) the final maturity of existing loans by 6-‐12 months past the original maturity date while interest expense were pushed back by 6 months past their original due dates.
Furthermore, the said rescheduling as well as the waiving of the covenants by the banksenabled the group to be in compliance with the financial covenants of the loans and no breach incurred.
31PROVISIONS
CHF 2011 2010
Current 90,144,020 56,779,789
Non-‐Current -‐ -‐
Total provisions 90,144,020 56,779,789
CHF Provision for infrastructure completion
Provision for legal cases
Provision for governmental
fees
Provision for employee benefits
Other provisions
Total
(i) (ii) (iii) (iv) (v)
Balance at 1 January 2011 20,028,756 6,525,820 4,067,955 1,071,027 25,086,231 56,779,789
Additional provisions recognized 7,088,041 13,123,602 1,042,297 3,360,347 17,188,429 41,802,716
Reductions arising from payments (2,368,442) -‐ (453,088) (61,559) (5,482,412) (8,365,501)
Exchange differences arising on translation of foreign operations 132,137 (20,073) (127,979) 93,525 (150,594) (72,984)
Balance at 31 December 2011
24,880,492 19,629,349 4,529,185 4,463,340 36,641,654 90,144,020
(i) Provision for infrastructure completion relates to committed cash outflows for the development of the necessary infrastructure to make the project area that is usually located in remote regions, habitable and attractive. Such provisions are recorded for land and real estate sales on the date on which all the criteria for revenue recognition are met, in case that the cash outflows for related infrastructure costs have not yet been incurred and take place with the upcoming twelve months.
(ii) Provision for legal cases consists of expected cash outflows for the settlement of pending litigations and relates amongst others to the Falcon case which is described in note 47.
(iii) Provision for government fees relates to cash outflows for fees due on the sale of land and / or any profit thereon which were recorded during the current year. Such provision is calculated and recorded using the locally enacted fee structures. Management expects the related cash outflow to take place within the upcoming twelve months.
(iv) Provision for employee benefits relates to compulsory termination payments to foreign employees in Oman. The provision is based on their actual salaries. As the work permits for these employees are reconsidered by the Government on annual basis, the related cash outflows are likely to take place within the upcoming twelve months.
F-‐62
(v) This provision mainly includes charges, services and consultancy fees for the Group's current year's operations which have not yet been finally negotiated. The increase in the current year is mainly related to expected cost in relation to employee’s end of service. In addition it covers the Group’s exposures to tax risks amounting to CHF 7.7 million at 31 December 2011 (31 December 2010: CHF 7.0 million). Management expects the related cash outflows to take place within the upcoming twelve months.
Management annually reviews and adjusts these provisions based on the latest developments, discussions and agreements with the involved parties.
32 OTHER CURRENT LIABILITIES
CHF 2011 2010
Advances from customers (i) 114,379,708 74,670,548
Other credit balances 17,012,088 17,764,827
Accrued expenses (ii) 30,772,641 23,042,430
Deposits from others 8,483,834 11,847,541
Taxes payable (other than income taxes) 7,598,048 8,564,823
Amounts due to shareholders (iii) 22,871,079 28,378,122
Due to management companies 2,654,746 2,010,104
203,772,144 166,278,395
(i) Advances from customers include amounts received (progress payments) from buyers of real estate units between the time of the initial agreement and contractual completion. The increaseis mainly related to the construction of real estate in Switzerland and Oman.
(ii) Accrued expenses mainly include operating costs for the hotel and town management activities.
(iii) Amounts due to shareholders include amounts owed to non controlling shareholders for planned capital increases in several subsidiaries in Egypt in the total of CHF 6.6million (2010: CHF 26 million) as well as amounts owed to Mr. Samih Sawiris in the total of 14,9million (2010: nil).
33 TRADE AND OTHER PAYABLES
CHF 2011 2010
Non-‐current trade payables 31,717,802 35,921,963
Current trade and other payables 57,631,059 57,120,751
Despite the economic slowdown, trade and other payables decreased only by CHF 3.7 million in 2011 due to construction work in Oman and Switzerland.
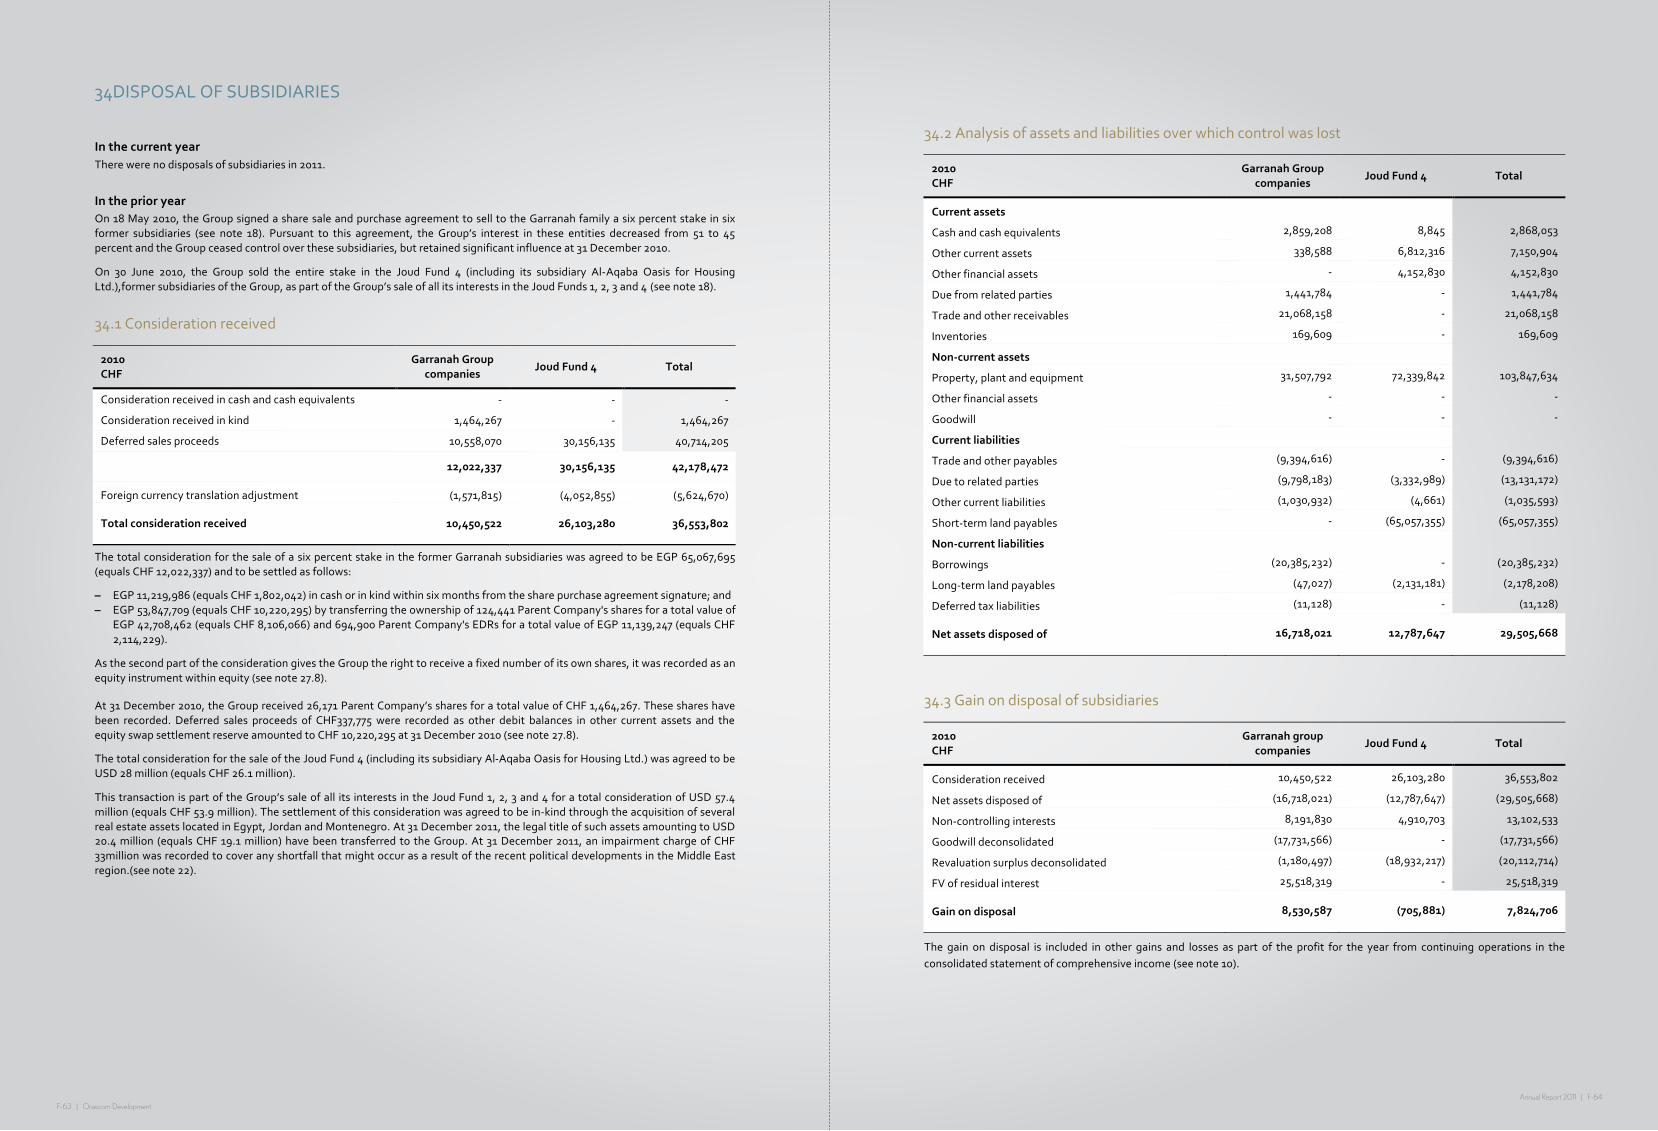
F-63 | Orascom DevelopmentAnnual Report 2011 | F-64
F-‐63
34DISPOSAL OF SUBSIDIARIES
In the current year There were no disposals of subsidiaries in 2011.
In the prior year On 18 May 2010, the Group signed a share sale and purchase agreement to sell to the Garranah family a six percent stake in six former subsidiaries (see note 18). Pursuant to this agreement, the Group’s interest in these entities decreased from 51 to 45 percent and the Group ceased control over these subsidiaries, but retained significant influence at 31 December 2010.
On 30 June 2010, the Group sold the entire stake in the Joud Fund 4 (including its subsidiary Al-‐Aqaba Oasis for Housing Ltd.),former subsidiaries of the Group, as part of the Group’s sale of all its interests in the Joud Funds 1, 2, 3 and 4 (see note 18).
34.1 Consideration received
2010 CHF
Garranah Group companies
Joud Fund 4 Total
Consideration received in cash and cash equivalents -‐ -‐ -‐
Consideration received in kind 1,464,267 -‐ 1,464,267
Deferred sales proceeds 10,558,070 30,156,135 40,714,205
12,022,337 30,156,135 42,178,472
Foreign currency translation adjustment (1,571,815) (4,052,855) (5,624,670)
Total consideration received 10,450,522 26,103,280 36,553,802
The total consideration for the sale of a six percent stake in the former Garranah subsidiaries was agreed to be EGP 65,067,695 (equals CHF 12,022,337) and to be settled as follows:
– EGP 11,219,986 (equals CHF 1,802,042) in cash or in kind within six months from the share purchase agreement signature; and – EGP 53,847,709 (equals CHF 10,220,295) by transferring the ownership of 124,441 Parent Company's shares for a total value of
EGP 42,708,462 (equals CHF 8,106,066) and 694,900 Parent Company's EDRs for a total value of EGP 11,139,247 (equals CHF 2,114,229).
As the second part of the consideration gives the Group the right to receive a fixed number of its own shares, it was recorded as an equity instrument within equity (see note 27.8).
At 31 December 2010, the Group received 26,171 Parent Company’s shares for a total value of CHF 1,464,267. These shares have been recorded. Deferred sales proceeds of CHF337,775 were recorded as other debit balances in other current assets and the equity swap settlement reserve amounted to CHF 10,220,295 at 31 December 2010 (see note 27.8).
The total consideration for the sale of the Joud Fund 4 (including its subsidiary Al-‐Aqaba Oasis for Housing Ltd.) was agreed to be USD 28 million (equals CHF 26.1 million).
This transaction is part of the Group’s sale of all its interests in the Joud Fund 1, 2, 3 and 4 for a total consideration of USD 57.4 million (equals CHF 53.9 million). The settlement of this consideration was agreed to be in-‐kind through the acquisition of several real estate assets located in Egypt, Jordan and Montenegro. At 31 December 2011, the legal title of such assets amounting to USD 20.4 million (equals CHF 19.1 million) have been transferred to the Group. At 31 December 2011, an impairment charge of CHF 33million was recorded to cover any shortfall that might occur as a result of the recent political developments in the Middle East region.(see note 22).
F-‐64
34.2 Analysis of assets and liabilities over which control was lost
2010 CHF
Garranah Group companies
Joud Fund 4 Total
Current assets
Cash and cash equivalents 2,859,208 8,845 2,868,053
Other current assets 338,588 6,812,316 7,150,904
Other financial assets -‐ 4,152,830 4,152,830
Due from related parties 1,441,784 -‐ 1,441,784
Trade and other receivables 21,068,158 -‐ 21,068,158
Inventories 169,609 -‐ 169,609
Non-‐current assets
Property, plant and equipment 31,507,792 72,339,842 103,847,634
Other financial assets -‐ -‐ -‐
Goodwill -‐ -‐ -‐
Current liabilities
Trade and other payables (9,394,616) -‐ (9,394,616)
Due to related parties (9,798,183) (3,332,989) (13,131,172)
Other current liabilities (1,030,932) (4,661) (1,035,593)
Short-‐term land payables -‐ (65,057,355) (65,057,355)
Non-‐current liabilities
Borrowings (20,385,232) -‐ (20,385,232)
Long-‐term land payables (47,027) (2,131,181) (2,178,208)
Deferred tax liabilities (11,128) -‐ (11,128)
Net assets disposed of 16,718,021 12,787,647 29,505,668
34.3 Gain on disposal of subsidiaries
2010 CHF
Garranah group companies
Joud Fund 4 Total
Consideration received 10,450,522 26,103,280 36,553,802
Net assets disposed of (16,718,021) (12,787,647) (29,505,668)
Non-‐controlling interests 8,191,830 4,910,703 13,102,533
Goodwill deconsolidated (17,731,566) -‐ (17,731,566)
Revaluation surplus deconsolidated (1,180,497) (18,932,217) (20,112,714)
FV of residual interest 25,518,319 -‐ 25,518,319
Gain on disposal 8,530,587 (705,881) 7,824,706
The gain on disposal is included in other gains and losses as part of the profit for the year from continuing operations in the consolidated statement of comprehensive income (see note 10).
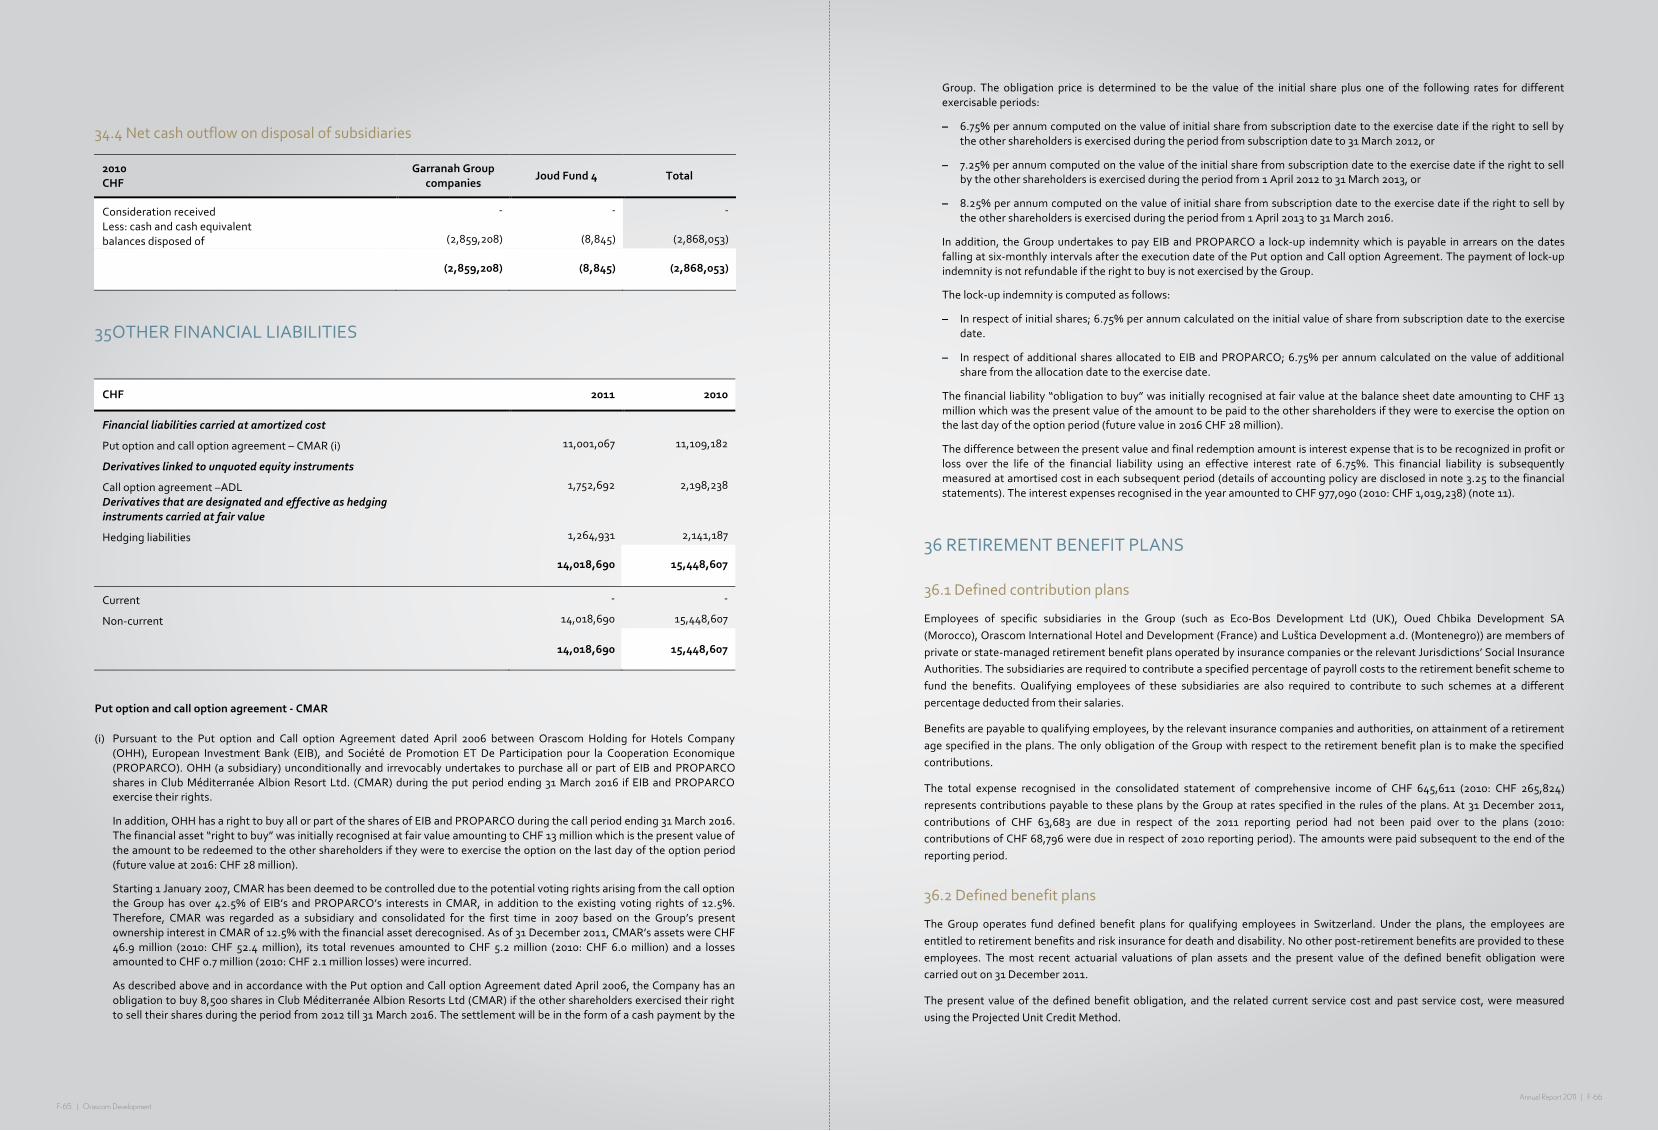
F-65 | Orascom DevelopmentAnnual Report 2011 | F-66
F-‐65
34.4 Net cash outflow on disposal of subsidiaries
2010 CHF
Garranah Group companies
Joud Fund 4 Total
Consideration received -‐ -‐ -‐ Less: cash and cash equivalent balances disposed of (2,859,208) (8,845) (2,868,053)
(2,859,208) (8,845) (2,868,053)
35OTHER FINANCIAL LIABILITIES
CHF 2011 2010
Financial liabilities carried at amortized cost
Put option and call option agreement – CMAR (i) 11,001,067 11,109,182
Derivatives linked to unquoted equity instruments
Call option agreement –ADL 1,752,692 2,198,238 Derivatives that are designated and effective as hedging instruments carried at fair value
Hedging liabilities 1,264,931 2,141,187
14,018,690 15,448,607
Current -‐ -‐
Non-‐current 14,018,690 15,448,607
14,018,690 15,448,607
Put option and call option agreement -‐ CMAR
(i) Pursuant to the Put option and Call option Agreement dated April 2006 between Orascom Holding for Hotels Company (OHH), European Investment Bank (EIB), and Société de Promotion ET De Participation pour la Cooperation Economique (PROPARCO). OHH (a subsidiary) unconditionally and irrevocably undertakes to purchase all or part of EIB and PROPARCO shares in Club Méditerranée Albion Resort Ltd. (CMAR) during the put period ending 31 March 2016 if EIB and PROPARCO exercise their rights.
In addition, OHH has a right to buy all or part of the shares of EIB and PROPARCO during the call period ending 31 March 2016. The financial asset “right to buy” was initially recognised at fair value amounting to CHF 13 million which is the present value of the amount to be redeemed to the other shareholders if they were to exercise the option on the last day of the option period (future value at 2016: CHF 28 million).
Starting 1 January 2007, CMAR has been deemed to be controlled due to the potential voting rights arising from the call option the Group has over 42.5% of EIB’s and PROPARCO’s interests in CMAR, in addition to the existing voting rights of 12.5%. Therefore, CMAR was regarded as a subsidiary and consolidated for the first time in 2007 based on the Group’s present ownership interest in CMAR of 12.5% with the financial asset derecognised. As of 31 December 2011, CMAR’s assets were CHF 46.9 million (2010: CHF 52.4 million), its total revenues amounted to CHF 5.2 million (2010: CHF 6.0 million) and a losses amounted to CHF 0.7 million (2010: CHF 2.1 million losses) were incurred.
As described above and in accordance with the Put option and Call option Agreement dated April 2006, the Company has an obligation to buy 8,500 shares in Club Méditerranée Albion Resorts Ltd (CMAR) if the other shareholders exercised their right to sell their shares during the period from 2012 till 31 March 2016. The settlement will be in the form of a cash payment by the
F-‐66
Group. The obligation price is determined to be the value of the initial share plus one of the following rates for different exercisable periods:
– 6.75% per annum computed on the value of initial share from subscription date to the exercise date if the right to sell by the other shareholders is exercised during the period from subscription date to 31 March 2012, or
– 7.25% per annum computed on the value of the initial share from subscription date to the exercise date if the right to sell by the other shareholders is exercised during the period from 1 April 2012 to 31 March 2013, or
– 8.25% per annum computed on the value of initial share from subscription date to the exercise date if the right to sell by the other shareholders is exercised during the period from 1 April 2013 to 31 March 2016.
In addition, the Group undertakes to pay EIB and PROPARCO a lock-‐up indemnity which is payable in arrears on the dates falling at six-‐monthly intervals after the execution date of the Put option and Call option Agreement. The payment of lock-‐up indemnity is not refundable if the right to buy is not exercised by the Group.
The lock-‐up indemnity is computed as follows:
– In respect of initial shares; 6.75% per annum calculated on the initial value of share from subscription date to the exercise date.
– In respect of additional shares allocated to EIB and PROPARCO; 6.75% per annum calculated on the value of additional share from the allocation date to the exercise date.
The financial liability “obligation to buy” was initially recognised at fair value at the balance sheet date amounting to CHF 13 million which was the present value of the amount to be paid to the other shareholders if they were to exercise the option on the last day of the option period (future value in 2016 CHF 28 million).
The difference between the present value and final redemption amount is interest expense that is to be recognized in profit or loss over the life of the financial liability using an effective interest rate of 6.75%. This financial liability is subsequently measured at amortised cost in each subsequent period (details of accounting policy are disclosed in note 3.25 to the financial statements). The interest expenses recognised in the year amounted to CHF 977,090 (2010: CHF 1,019,238) (note 11).
36 RETIREMENT BENEFIT PLANS
36.1 Defined contribution plans
Employees of specific subsidiaries in the Group (such as Eco-‐Bos Development Ltd (UK), Oued Chbika Development SA (Morocco), Orascom International Hotel and Development (France) and Luštica Development a.d. (Montenegro)) are members of private or state-‐managed retirement benefit plans operated by insurance companies or the relevant Jurisdictions’ Social Insurance Authorities. The subsidiaries are required to contribute a specified percentage of payroll costs to the retirement benefit scheme to fund the benefits. Qualifying employees of these subsidiaries are also required to contribute to such schemes at a different percentage deducted from their salaries.
Benefits are payable to qualifying employees, by the relevant insurance companies and authorities, on attainment of a retirement age specified in the plans. The only obligation of the Group with respect to the retirement benefit plan is to make the specified contributions.
The total expense recognised in the consolidated statement of comprehensive income of CHF 645,611 (2010: CHF 265,824) represents contributions payable to these plans by the Group at rates specified in the rules of the plans. At 31 December 2011, contributions of CHF 63,683 are due in respect of the 2011 reporting period had not been paid over to the plans (2010: contributions of CHF 68,796 were due in respect of 2010 reporting period). The amounts were paid subsequent to the end of the reporting period.
36.2 Defined benefit plans
The Group operates fund defined benefit plans for qualifying employees in Switzerland. Under the plans, the employees are entitled to retirement benefits and risk insurance for death and disability. No other post-‐retirement benefits are provided to these employees. The most recent actuarial valuations of plan assets and the present value of the defined benefit obligation were carried out on 31 December 2011.
The present value of the defined benefit obligation, and the related current service cost and past service cost, were measured using the Projected Unit Credit Method.
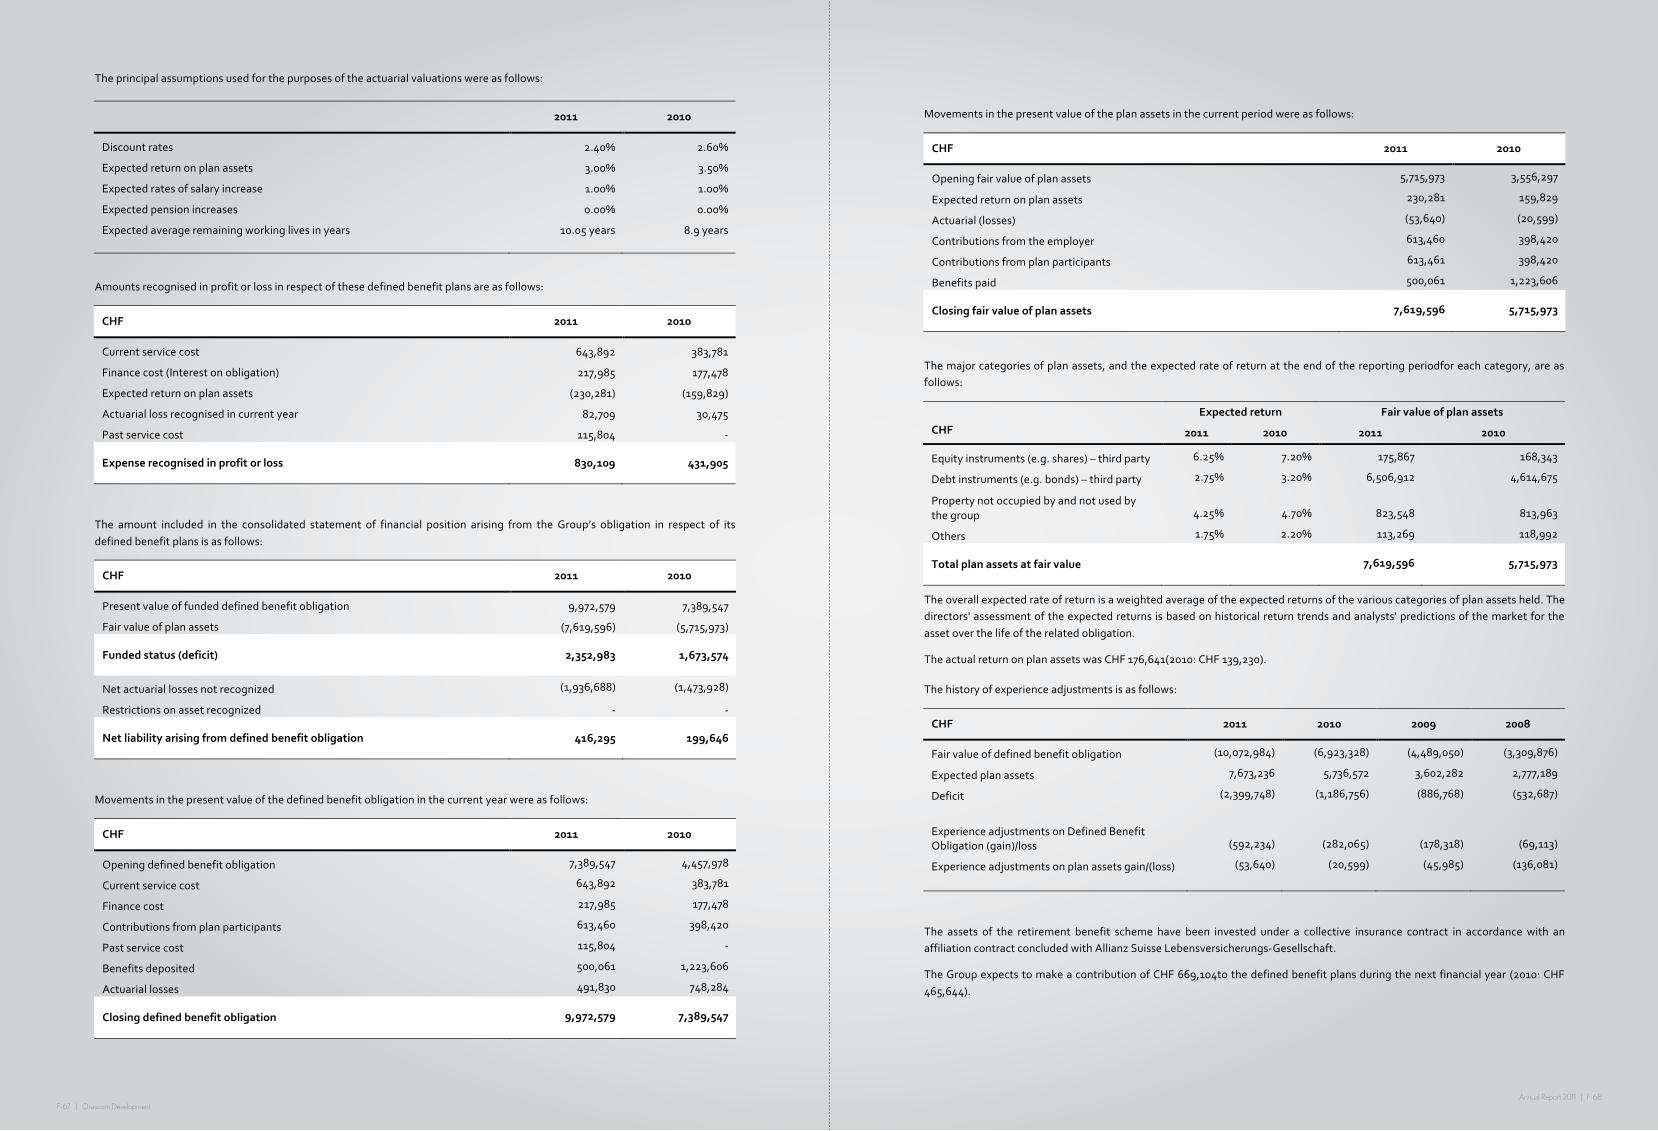
F-67 | Orascom DevelopmentAnnual Report 2011 | F-68
F-‐67
The principal assumptions used for the purposes of the actuarial valuations were as follows:
2011 2010
Discount rates 2.40% 2.60%
Expected return on plan assets 3.00% 3.50%
Expected rates of salary increase 1.00% 1.00%
Expected pension increases 0.00% 0.00%
Expected average remaining working lives in years 10.05 years 8.9 years
Amounts recognised in profit or loss in respect of these defined benefit plans are as follows:
CHF 2011 2010
Current service cost 643,892 383,781
Finance cost (Interest on obligation) 217,985 177,478
Expected return on plan assets (230,281) (159,829)
Actuarial loss recognised in current year 82,709 30,475
Past service cost 115,804 -‐
Expense recognised in profit or loss 830,109 431,905
The amount included in the consolidated statement of financial position arising from the Group’s obligation in respect of its defined benefit plans is as follows:
CHF 2011 2010
Present value of funded defined benefit obligation 9,972,579 7,389,547
Fair value of plan assets (7,619,596) (5,715,973)
Funded status (deficit) 2,352,983 1,673,574
Net actuarial losses not recognized (1,936,688) (1,473,928)
Restrictions on asset recognized -‐ -‐
Net liability arising from defined benefit obligation 416,295 199,646
Movements in the present value of the defined benefit obligation in the current year were as follows:
CHF 2011 2010
Opening defined benefit obligation 7,389,547 4,457,978
Current service cost 643,892 383,781
Finance cost 217,985 177,478
Contributions from plan participants 613,460 398,420
Past service cost 115,804 -‐
Benefits deposited 500,061 1,223,606
Actuarial losses 491,830 748,284
Closing defined benefit obligation 9,972,579 7,389,547
F-‐68
Movements in the present value of the plan assets in the current period were as follows:
CHF 2011 2010
Opening fair value of plan assets 5,715,973 3,556,297
Expected return on plan assets 230,281 159,829
Actuarial (losses) (53,640) (20,599)
Contributions from the employer 613,460 398,420
Contributions from plan participants 613,461 398,420
Benefits paid 500,061 1,223,606
Closing fair value of plan assets 7,619,596 5,715,973
The major categories of plan assets, and the expected rate of return at the end of the reporting periodfor each category, are as follows:
Expected return Fair value of plan assets
CHF 2011 2010 2011 2010
Equity instruments (e.g. shares) – third party 6.25% 7.20% 175,867 168,343
Debt instruments (e.g. bonds) – third party 2.75% 3.20% 6,506,912 4,614,675
Property not occupied by and not used by the group 4.25% 4.70% 823,548 813,963
Others 1.75% 2.20% 113,269 118,992
Total plan assets at fair value 7,619,596 5,715,973
The overall expected rate of return is a weighted average of the expected returns of the various categories of plan assets held. The directors' assessment of the expected returns is based on historical return trends and analysts' predictions of the market for the asset over the life of the related obligation.
The actual return on plan assets was CHF 176,641(2010: CHF 139,230).
The history of experience adjustments is as follows:
CHF 2011 2010 2009 2008
Fair value of defined benefit obligation (10,072,984) (6,923,328) (4,489,050) (3,309,876)
Expected plan assets 7,673,236 5,736,572 3,602,282 2,777,189
Deficit (2,399,748) (1,186,756) (886,768) (532,687)
Experience adjustments on Defined Benefit Obligation (gain)/loss (592,234) (282,065) (178,318) (69,113)
Experience adjustments on plan assets gain/(loss) (53,640) (20,599) (45,985) (136,081)
The assets of the retirement benefit scheme have been invested under a collective insurance contract in accordance with an affiliation contract concluded with Allianz Suisse Lebensversicherungs-‐Gesellschaft.
The Group expects to make a contribution of CHF 669,104to the defined benefit plans during the next financial year (2010: CHF 465,644).
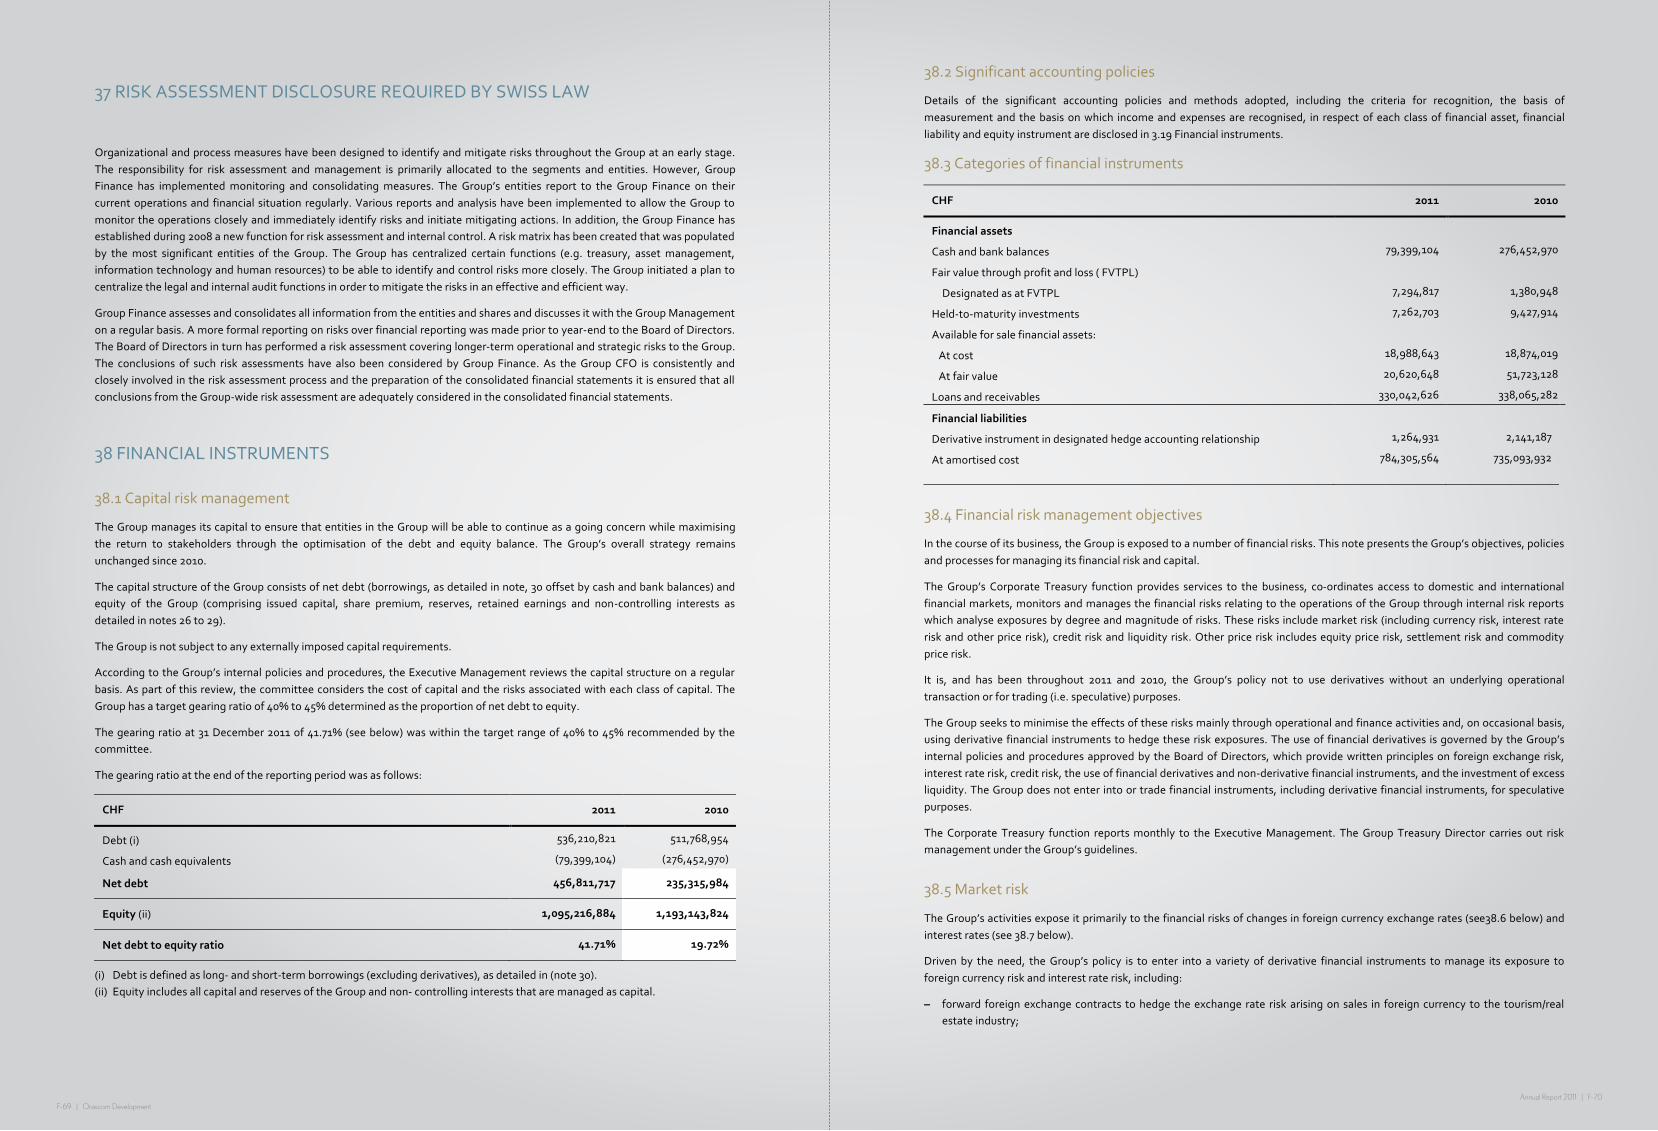
F-69 | Orascom DevelopmentAnnual Report 2011 | F-70
F-‐69
37 RISK ASSESSMENT DISCLOSURE REQUIRED BY SWISS LAW
Organizational and process measures have been designed to identify and mitigate risks throughout the Group at an early stage. The responsibility for risk assessment and management is primarily allocated to the segments and entities. However, Group Finance has implemented monitoring and consolidating measures. The Group’s entities report to the Group Finance on their current operations and financial situation regularly. Various reports and analysis have been implemented to allow the Group to monitor the operations closely and immediately identify risks and initiate mitigating actions. In addition, the Group Finance has established during 2008 a new function for risk assessment and internal control. A risk matrix has been created that was populated by the most significant entities of the Group. The Group has centralized certain functions (e.g. treasury, asset management, information technology and human resources) to be able to identify and control risks more closely. The Group initiated a plan to centralize the legal and internal audit functions in order to mitigate the risks in an effective and efficient way.
Group Finance assesses and consolidates all information from the entities and shares and discusses it with the Group Management on a regular basis. A more formal reporting on risks over financial reporting was made prior to year-‐end to the Board of Directors. The Board of Directors in turn has performed a risk assessment covering longer-‐term operational and strategic risks to the Group. The conclusions of such risk assessments have also been considered by Group Finance. As the Group CFO is consistently and closely involved in the risk assessment process and the preparation of the consolidated financial statements it is ensured that all conclusions from the Group-‐wide risk assessment are adequately considered in the consolidated financial statements.
38 FINANCIAL INSTRUMENTS
38.1 Capital risk management
The Group manages its capital to ensure that entities in the Group will be able to continue as a going concern while maximising the return to stakeholders through the optimisation of the debt and equity balance. The Group’s overall strategy remains unchanged since 2010.
The capital structure of the Group consists of net debt (borrowings, as detailed in note, 30 offset by cash and bank balances) and equity of the Group (comprising issued capital, share premium, reserves, retained earnings and non-‐controlling interests as detailed in notes 26 to 29).
The Group is not subject to any externally imposed capital requirements.
According to the Group’s internal policies and procedures, the Executive Management reviews the capital structure on a regular basis. As part of this review, the committee considers the cost of capital and the risks associated with each class of capital. The Group has a target gearing ratio of 40% to 45% determined as the proportion of net debt to equity.
The gearing ratio at 31 December 2011 of 41.71% (see below) was within the target range of 40% to 45% recommended by the committee.
The gearing ratio at the end of the reporting period was as follows:
CHF 2011 2010
Debt (i) 536,210,821 511,768,954
Cash and cash equivalents (79,399,104) (276,452,970)
Net debt 456,811,717 235,315,984
Equity (ii) 1,095,216,884 1,193,143,824
Net debt to equity ratio 41.71% 19.72%
(i) Debt is defined as long-‐ and short-‐term borrowings (excluding derivatives), as detailed in (note 30). (ii) Equity includes all capital and reserves of the Group and non-‐ controlling interests that are managed as capital.
F-‐70
38.2 Significant accounting policies
Details of the significant accounting policies and methods adopted, including the criteria for recognition, the basis of measurement and the basis on which income and expenses are recognised, in respect of each class of financial asset, financial liability and equity instrument are disclosed in 3.19 Financial instruments.
38.3 Categories of financial instruments
CHF 2011 2010
Financial assets
Cash and bank balances 79,399,104 276,452,970
Fair value through profit and loss ( FVTPL)
Designated as at FVTPL 7,294,817 1,380,948
Held-‐to-‐maturity investments 7,262,703 9,427,914
Available for sale financial assets:
At cost 18,988,643 18,874,019
At fair value 20,620,648 51,723,128
Loans and receivables 330,042,626 338,065,282
Financial liabilities
Derivative instrument in designated hedge accounting relationship 1,264,931 2,141,187
At amortised cost 784,305,564 735,093,932
38.4 Financial risk management objectives
In the course of its business, the Group is exposed to a number of financial risks. This note presents the Group’s objectives, policies and processes for managing its financial risk and capital.
The Group’s Corporate Treasury function provides services to the business, co-‐ordinates access to domestic and international financial markets, monitors and manages the financial risks relating to the operations of the Group through internal risk reports which analyse exposures by degree and magnitude of risks. These risks include market risk (including currency risk, interest rate risk and other price risk), credit risk and liquidity risk. Other price risk includes equity price risk, settlement risk and commodity price risk.
It is, and has been throughout 2011 and 2010, the Group’s policy not to use derivatives without an underlying operational transaction or for trading (i.e. speculative) purposes.
The Group seeks to minimise the effects of these risks mainly through operational and finance activities and, on occasional basis, using derivative financial instruments to hedge these risk exposures. The use of financial derivatives is governed by the Group’s internal policies and procedures approved by the Board of Directors, which provide written principles on foreign exchange risk, interest rate risk, credit risk, the use of financial derivatives and non-‐derivative financial instruments, and the investment of excess liquidity. The Group does not enter into or trade financial instruments, including derivative financial instruments, for speculative purposes.
The Corporate Treasury function reports monthly to the Executive Management. The Group Treasury Director carries out risk management under the Group’s guidelines.
38.5 Market risk
The Group’s activities expose it primarily to the financial risks of changes in foreign currency exchange rates (see38.6 below) and interest rates (see 38.7 below).
Driven by the need, the Group’s policy is to enter into a variety of derivative financial instruments to manage its exposure to foreign currency risk and interest rate risk, including:
– forward foreign exchange contracts to hedge the exchange rate risk arising on sales in foreign currency to the tourism/real estate industry;

F-71 | Orascom DevelopmentAnnual Report 2011 | F-72
F-‐71
– interest rate swaps to mitigate the risk of rising interest rates; and – forward foreign exchange contracts to hedge the exchange rate risk arising on translation of the Group's significant
investment in foreign operations.
38.6 Foreign currency risk management
The Group undertakes certain transactions denominated in foreign currencies. Hence, exposures to exchange rate fluctuations arise. The currencies, in which these transactions primarily are denominated, are US Dollar (USD), Euro (EUR) and Egyptian Pound (EGP). Exchange rate exposures are managed within approved policy parameters utilising forward foreign exchange contracts.
The Group’s main foreign exchange risk arises from sales in foreign currency to the tourism/real estate industry, which generates a net foreign currency surplus for the Group. The Group has strong inflows in foreign currency, mainly US Dollar, Euro, Oman Rial and Egyptian Pound.
Out of the total receivables on hand at the end of the reporting period, receivables in USD have accounted for 40% (2010: 53%), in EUR for 6% (2010: 7%),in EGP for 41% (2010: 34%) and in CHF for 11% (2010: 5%) respectively.
To mitigate the above risk exposures, where possible, the Group borrows in matching currencies to create a natural hedge. The following table shows the carrying amounts of borrowings, at the end of the reporting period, in the major currencies in which they are issued.
Borrowing
CHF 2011 2010
USD 243,970,612 46% 237,018,341 46%
EGP 194,250,742 36% 164,867,415 32%
EUR 77,275,959 14% 83,502,902 16%
AED 11,406,301 2% 16,994,248 4%
CHF 9,307,207 2% 9,386,048 2%
Total 536,210,821 100% 511,768,954 100%
At the end of the reporting period, the carrying amounts of the Group’s major foreign currency denominated monetary assets (mainly receivables and finance lease receivables) and monetary liabilities (mainly borrowings), at which the Group is exposed to currency rate risk, are as follows.
CHF Liabilities Assets
2011 2010 2011 2010
Currency-‐USD 243,970,612 237,018,341 105,229,240 133,814,499
Currency-‐EUR 77,275,959 83,502,902 15,755,310 18,530,113
Currency-‐EGP 194,250,742 164,867,415 109,624,884 85,811,304
Residual foreign exchange exposure is managed by hedging through entering into foreign currency forward contracts.
Currency risk has also recently developed due to the Group’s investments in different markets such as those in Egypt, UAE, Oman, Jordan, Morocco, Switzerland, Romania-‐Montengro and the UK. Again, the Group borrows in the local currency of the investment and uses the above mentioned strategies to mitigate residual currency risk.
38.6.1 Foreign currency sensitivity analysis
As discussed above, the Group is mainly exposed to the US Dollar (USD), Euro (EUR) and Egyptian Pound (EGP) arising from sales in these currencies to the tourism / real estate industry.
The following table details the Group’s sensitivity to a 5% increase and decrease in CHF against the relevant foreign currencies. The (5%) is the sensitivity rate used when reporting foreign currency risk internally to key management and represents
F-‐72
management’s assessment of the reasonably possible change in foreign exchange rates. The sensitivity analysis includes only outstanding foreign currency denominated monetary items and adjusts their translation at the period end for a 5% change in foreign currency rates.
The sensitivity analysis includes outstanding borrowings, impact of the changes in the fair value of derivative instruments designated as cash flow hedges and receivables in foreign currencies and, where appropriate, loans to foreign operations within the Group where the denomination of the loan is in a currency other than the functional currency of the lender or the borrower.
A positive number below indicates an increase in profit or equity where the CHF strengths 5% against the relevant currency. For a 5% weakening of the CHF against the relevant currency, there would be a comparable impact on the profit or equity, and the balances below would be negative.
CHF Currency USD Impact Currency EUR Impact Currency EGP Impact
2011 2010 2011 2010 2011 2010
Profit or loss 6,937,068 5,159,285 3,075,846 3,246,542 4,253,738 3,928,944
Equity 52,135 56,166 -‐ -‐ -‐ -‐
The Group's sensitivity to foreign currency has changed in accordance with the changes inEGP, USD and AED borrowings.
Forward foreign exchange contracts
It is the policy of the Group to enter into forward foreign exchange contracts to cover specific foreign currency receipts within 25% to 30% of the exposure generated. At 31 December 2011, the Group has no outstanding forward foreign currency exchange contracts. However, the Group entered during the current year into several forward foreign currency exchange contracts to hedge part of the Group’s receivables denominated in EUR and USD resulting in a net gain of CHF 560,000.
At 31 December 2011, no ineffectiveness has been recognised in profit or loss arising from the Group’s hedging activities.
38.7 Interest rate risk management
The Group is exposed to interest rate risk because entities in the Group borrow funds at both fixed and floating interest rates. The risk is managed by the Group by maintaining an appropriate mix between fixed and floating rate borrowings, and by the use of interest rate swap contracts. Hedging activities are evaluated regularly to align with interest rate views and defined risk appetite, ensuring the most cost-‐effective hedging strategies are applied. The Group's exposures to interest rates on financial assets and financial liabilities are detailed in the liquidity risk management section of this note.
At 31 December 2011, the Group held one interest rate swap contract (IRS) under which the Group agrees to exchange the difference between fixed and floating rate interest amounts calculated on the agreed notional principal amount. The notional amount of the IRS contract is based on the outstanding amount of one of the long-‐term borrowings. The group was engaged in this contract on September 2008 and it will expire on June 2014.
As the interest rate swap exchanges floating rate interest amounts for fixed rate interest amounts it is designated as a cash flow hedge in order to reduce the Group’s cash flow exposure resulting from variable interest rates on borrowings. The interest rate swap and the interest payments on the borrowing occur simultaneously and the amount accumulated in equity is reclassified in profit or loss over the period that the floating rate interest payments on debt affect profit or loss.
The Group receives the fair value of the swap from the counterparty bank at the end of each reporting period and is disclosed below. The average interest rate is based on the outstanding balances at the end of the reporting period.
Management has assessed that the cash flow hedge is 100% effective and therefore the entire change in fair value of the interest rate swap is recognised in other comprehensive income and accumulated in equity(note 27.3).
The following table details the notional principal amount and remaining terms of the interest rate swap contract outstanding at the end of the reporting period.
Last instalment date
Average contracted Notional principal amount Fair value assets (liabilities)
Fixed interest rate CHF CHF
2011 2010 2011 2010 2011 2010
30-‐Jun-‐14 3.50% 3.50% 35,827,969 35,595,410 (1,264,931) (2,141,187)

F-73 | Orascom DevelopmentAnnual Report 2011 | F-74
F-‐73
The interest rate swap settles on a half-‐yearly basis. The floating rate on the interest rate swaps is based on LIBOR for 6 months. The Group settles the difference between the fixed and floating interest rate on a net basis.
38.7.1 Interest rate sensitivity analysis
The sensitivity analyses below have been determined based on the exposure to interest rates for both derivatives and non-‐derivative instruments at the end of the reporting period. For floating rate liabilities, the analysis is prepared assuming the amount of liability outstanding at the end of reporting period was outstanding for the whole year. A ‘100 basis point’ (1%) increase or decrease is used when reporting interest rate risk internally to key management personnel and represents management’s assessment of the reasonably possible change in interest rates.
If interest rates had been 100 basis points higher / lower and all other variables were held constant, the Group’s profit for the year ended 31 December 2011 would decrease / increase by CHF 2.6million (2010: decrease / increase by CHF 2.9 million). This is mainly attributable to the Group’s exposure to interest rates on its variable rate borrowings.
38.8 Other price risks
The Group is exposed to equity price risks arising from equity investments. Equity investments are held for strategic rather than trading purposes. The Group does not actively trade these investments.
38.9 Credit risk management
Credit risk refers to the risk that a counterparty will default on its contractual obligations resulting in financial loss to the Group. The Group credit risk arises from transactions with counterparties, mainly individual customers and corporations. The Group has adopted a policy of only dealing with creditworthy counterparties and obtaining sufficient collateral, where appropriate, as a means of mitigating the risk of financial loss from defaults.
The Group’s exposure to credit risk is, to a great extent, influenced by the individual characteristics of each customer. Risk control assesses the credit quality of the customer, taking into account its financial position, past experience, other publicly available financial information, its own trading records and other factors, where appropriate, as a means of mitigating the risk of financial loss from defaults. The Group’s exposure is continuously monitored and the aggregate value of transactions concluded is spread amongst approved counterparties.
Trade receivables consist of a large number of customers, spread across various industries and geographical areas. The Group does not have any significant credit risk exposure to any single counterparty or any Group of counterparties having similar characteristics. The Group defines counterparties as having similar characteristics if they are related entities. The credit risk on sales of real estateis limited because the Group controls this risk through the property itself by registering the unit in the name of the customer only after receiving the entire amount due from the customer.
Counterparty risk is also minimized by ensuring that 80% of derivative financial instruments, money market investments and current account deposits are placed with financial institutions whose credit standings are above Aa1 and 20% above BB+.
The carrying amount of financial assets recorded in the financial statements, which is net of impairment losses, represents the Group’s maximum exposure to credit risk without taking account of the value of any collateral obtained.
38.10 Liquidity risk management
Ultimate responsibility for liquidity risk management rests with the Board of Directors, which has established an appropriate liquidity risk management framework for the management of the Group’s short-‐, medium-‐ and long-‐term funding and liquidity management requirements. The Group manages liquidity risk by maintaining adequate reserves, banking facilities and reserve borrowing facilities, by continuously monitoring forecast and actual cash flows and matching the maturity profiles of financial assets and liabilities.
As of 31 December 2011, total un-‐drawn facilities, that the Group has at its disposal in order to further reduce liquidity risk, are CHF 6 million (31 December 2010: CHF 28 million).
F-‐74
38.10.1 Liquidity and interest risk tables
The following tables detail the Group's remaining contractual maturity for its non-‐derivative financial liabilities with agreed repayment periods. The tables have been drawn up based on the undiscounted cash flows of financial liabilities based on the earliest date on which the Group can be required to pay. The tables include both interest and principal cash flows. To the extent that interest cash flows are floating rate, the undiscounted amount is derived from interest rate curves at the end of the reporting period. The contractual maturity is based on the earliest date on which the Group may be required to pay.
Maturities of non-‐derivative financial liabilities
2011
CHF
Weighted average effective interest
rate
Less than 6 month
6 months to one year
1 – 5 years 5 + years Total
Non-‐interest bearing -‐ 150,433,926 -‐ 5,986,046 -‐ 156,419,972 Variable interest rate instruments 5.57% 35,101,835 189,012,669 188,952,426 40,222,376 453,289,306
Fixed interest rate instruments 10.05% 14,173,492 78,085,279 50,707,845 18,534,713 161,501,329
199,709,253 267,097,948 245,646,317 58,757,089 771,210,607
2010
CHF
Weighted average effective interest
Rate
Less than 6 month
6 months to one year
1 – 5 years 5 + years Total
Non-‐interest bearing -‐ 155,471,057 -‐ -‐ 5,986,046 161,457,103 Variable interest rate instruments 4.90% 27,443,907 173,018,390 195,987,161 50,110,531 446,559,989
Fixed interest rate instruments 10.09% 11,884,929 59,067,650 52,605,636 25,369,398 148,927,613
194,799,893 232,086,040 248,592,797 81,465,975 756,944,705
In January 2012, ODH has finalized credit agreements in the total amount of CHF 125 million which enable the Group -‐ together with existing cash reserves and existing credit lines -‐ to finance all its activities in 2012. The terms and conditions of these credit agreements, which materialized due to commitments of the majority shareholder Samih Sawiris, will reduce the average cost of debt of the Group. If necessary, Samih Sawiris would also secure the funding of the 2013 investment program with additional contributions.
The Group has access to financing facilities as explained above. The Group expects to meet its other obligations from operating cash flows and proceeds of maturing financial assets. The Group target is not to exceed a debt to equity ratio of 40% to 45% and the group is maintaining this level as at year end.
CHF 2011 2010
Counterparty Rating Credit limit Carrying amount
Credit limit Carrying amount
Bank 1 B+ 31,321,277 31,431,569 28,471,736 27,054,574 *
Bank 2 AA-‐ 15,557,000 15,179,094 16,061,000 11,170,905
Bank 3 A-‐3 36,217,682 38,003,417 36,908,178 34,636,198
Bank 4 A-‐1 23,458,789 23,456,674 23,306,519 23,301,235 *
Bank 5 B 13,272,766 12,790,742 13,337,857 12,859,693
* Outstanding amount includes interest charged
The average interest rate for credit facilities is 7.96% (2010: 6.97%).

F-75 | Orascom DevelopmentAnnual Report 2011 | F-76
F-‐75
The amounts included above for variable interest rate instruments for liabilities is subject to change if changes in variable interest rates differ to those estimates of interest rates determined at the end of the reporting period.
38.11 Impairment losses on financial assets
CHF 2011 2010
Impairment loss on trade receivables 11,849,852 4,655,459
Impairment loss on other current assets carried at amortized cost 17,993,639 15,000,000
29,843,491 19,655,459
38.12 Fair value of financial instruments
38.12.1 Fair value of financial instruments carried at amortised cost
Except as detailed in the following table, the directors consider that the carrying amounts of financial assets and financial liabilities recognised in the consolidated financial statements approximate their fair values.
31 December 2011 31 December 2010
CHF Carrying amount Fair value Carrying amount Fair value
Financial liabilities
Borrowings/bank loans 536,210,821 619,354,040 511,768,954 600,051,008
38.12.2 Valuation techniques and assumptions applied for the purposes of measuring fair value
The fair values of financial assets and financial liabilities are determined as follows:
– The fair values of financial assets with standard terms and conditions and traded on active liquid markets are determined with reference to quoted market prices (includes listed equity investments classified as at FVTPL and AFS).
– The Group receives the fair values of foreign currency forward contracts and interest rate swaps from the counterparty banks. Foreign currency forward contracts are usually measured using quoted forward exchange rates and yield curves derived from quoted interest rates matching maturities of the contracts. Interest rate swaps are usually measured at the present value of future cash flows estimated and discounted based on the applicable yield curves derived from quoted interest rates.
– The fair values of other financial assets and financial liabilities (excluding those described above) are determined in accordance with generally accepted pricing models based on discounted cash flow analysis. Specifically, significant assumptions used in determining the fair value of the following financial assets and liabilities are set out below.
Finance lease receivables
The fair value of finance lease receivables is estimated to be CHF 15.9million (31 December 2010: CHF 16.2 million) using a 16% discount rate (31 December 2010: 16%) based on an average six year tenor and adding a credit margin that reflects the secured nature of the receivables.
Unlisted shares
The consolidated financial statements include holdings in unlisted available-‐for-‐sale shares which are carried at cost (note 21). Equity investments are held for strategic rather than trading purposes. The Group does not actively trade these investments. These AFS equity unlisted instruments have a carrying amount of CHF 19.0 million at the end of the reporting period. The fair value has not been disclosed for these instruments because their fair value cannot be reliably measured. Measurement of the fair value of these instruments cannot be made without using subjective management judgments and assumptions based on specific-‐entity inputs and significant adjustments to observable market prices or rates.
F-‐76
38.12.3 Fair value measurements recognised in the consolidated statement of financial position
The following table provides an analysis of financial instruments that are measured subsequent to initial recognition at fair value, grouped into Levels 1 to 3 based on the degree to which the fair value is observable.
– Level 1: fair value measurements are those derived from quoted prices (unadjusted) in active markets for identical assets or liabilities.
– Level 2: fair value measurements are those derived from inputs, other than quoted prices included within Level 1, that are observable for the asset or liability, either directly (i.e. as prices) or indirectly (i.e. derived from prices).
– Level 3:fair value measurements are those derived from valuation techniques that include inputs for the asset or liability that are not based on observable market data (unobservable inputs).
2011
CHF Level 1 Level 2 Level 3 Total
Financial assets at FVTPL
Non-‐derivative financial assets held for trading 7,294,817 -‐ -‐ 7,294,817
7,294,817 -‐ -‐ 7,294,817
Available-‐for-‐sale financial assets
Listed and unlisted shares measured at FV 18,775,931 -‐ 1,844,717 20,620,648
18,775,931 -‐ 1,844,717 20,620,648
Derivative financial liabilities designated in a effective hedge relationship -‐ 1,264,931 -‐ 1,264,931
-‐ 1,264,931 -‐ 1,264,931
2010
CHF Level 1 Level 2 Level 3 Total
Financial assets at FVTPL
Non-‐derivative financial assets held for trading 1,380,948 -‐ -‐ 1,380,948
1,380,948 -‐ -‐ 1,380,948
Available-‐for-‐sale financial assets
Listed and unlisted shares measured at FV 51,301,991 -‐ 421,137 51,723,128
51,301,991 -‐ 421,137 51,723,128 Derivative financial liabilities designated in a effective hedge relationship -‐ 2,141,187 -‐ 2,141,187
-‐ 2,141,187 -‐ 2,141,187 There were no transfers between Level 1 and 2 in the period. The Available-‐for-‐sale financial assets were measured at fair value based on a method that combined the earning and net equity book values of the companies.
Reconciliation of Level 3 fair value measurements of financial assets
Unquoted equity securities
CHF 2011 2010
Opening balance 421,137 287,400
Total gains or( losses) recognized in other comprehensive income 318,870 28,600
Purchases 1,104,710 105,137
Closing balance 1,844,717 421,137
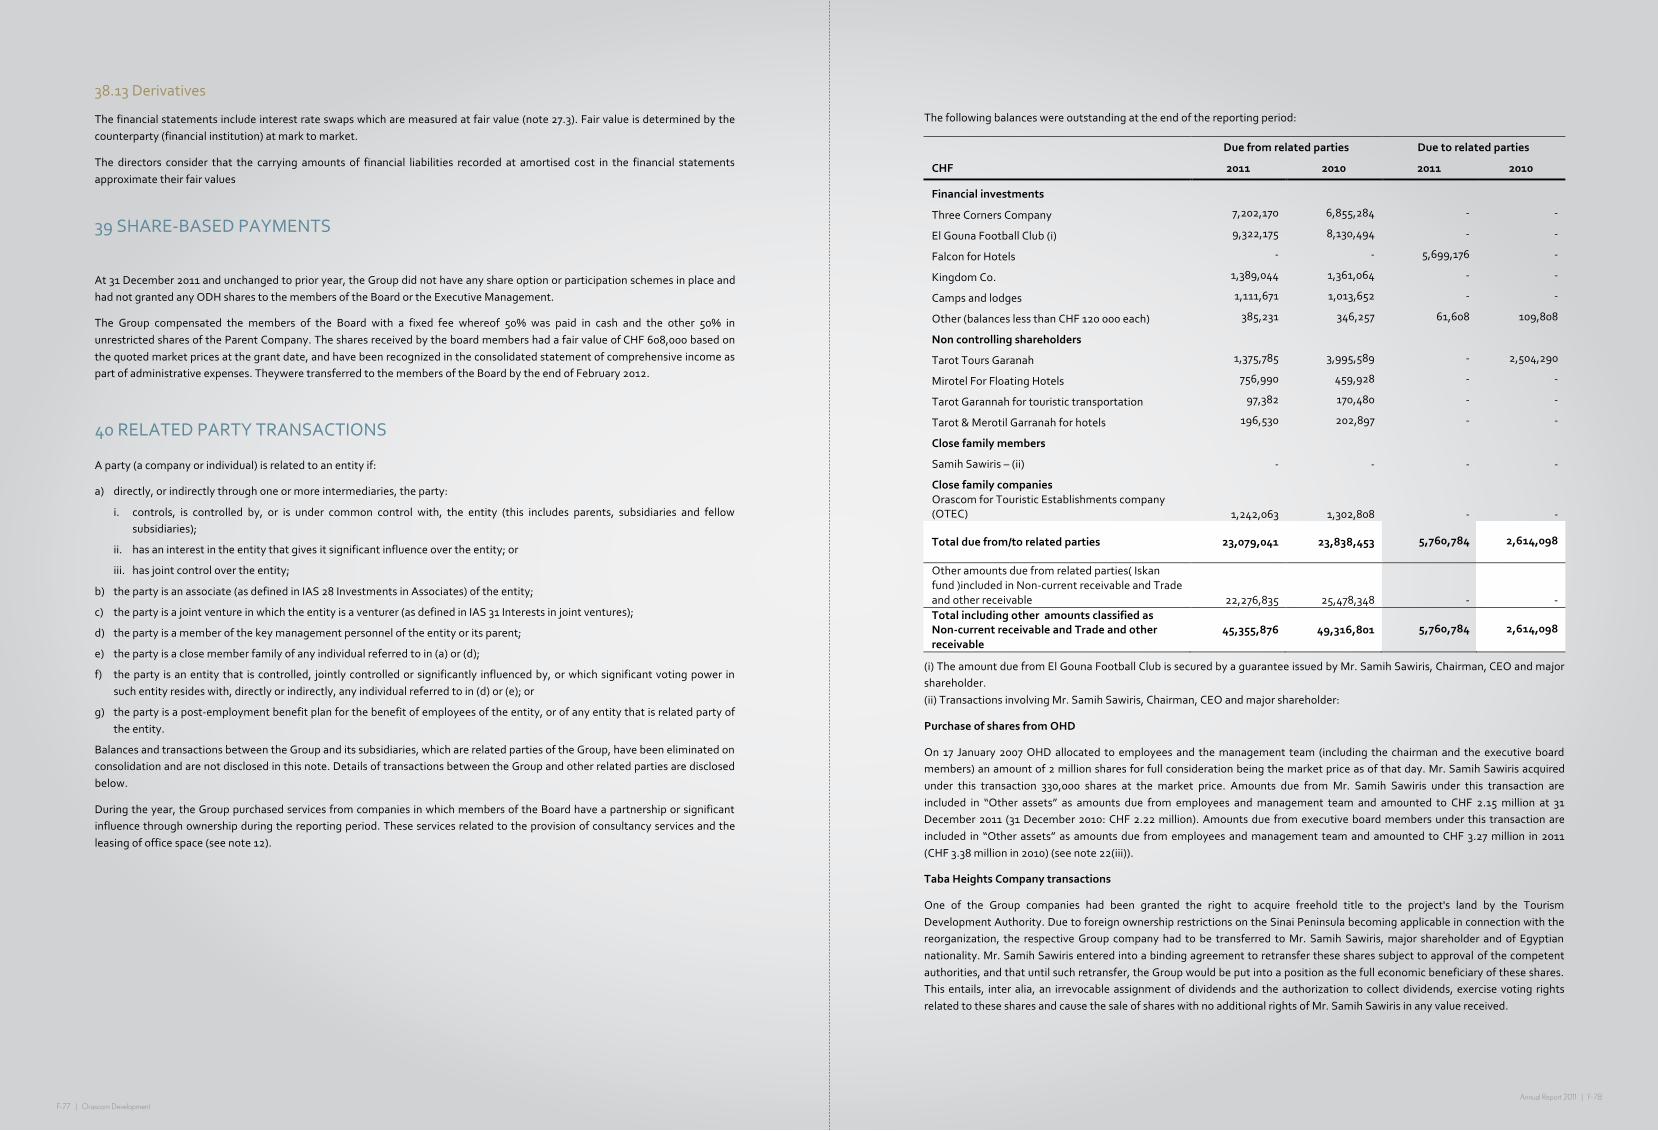
F-77 | Orascom DevelopmentAnnual Report 2011 | F-78
F-‐77
38.13 Derivatives
The financial statements include interest rate swaps which are measured at fair value (note 27.3). Fair value is determined by the counterparty (financial institution) at mark to market.
The directors consider that the carrying amounts of financial liabilities recorded at amortised cost in the financial statements approximate their fair values
39 SHARE-‐BASED PAYMENTS
At 31 December 2011 and unchanged to prior year, the Group did not have any share option or participation schemes in place and had not granted any ODH shares to the members of the Board or the Executive Management.
The Group compensated the members of the Board with a fixed fee whereof 50% was paid in cash and the other 50% in unrestricted shares of the Parent Company. The shares received by the board members had a fair value of CHF 608,000 based on the quoted market prices at the grant date, and have been recognized in the consolidated statement of comprehensive income as part of administrative expenses. Theywere transferred to the members of the Board by the end of February 2012.
40 RELATED PARTY TRANSACTIONS
A party (a company or individual) is related to an entity if:
a) directly, or indirectly through one or more intermediaries, the party:
i. controls, is controlled by, or is under common control with, the entity (this includes parents, subsidiaries and fellow subsidiaries);
ii. has an interest in the entity that gives it significant influence over the entity; or
iii. has joint control over the entity;
b) the party is an associate (as defined in IAS 28 Investments in Associates) of the entity;
c) the party is a joint venture in which the entity is a venturer (as defined in IAS 31 Interests in joint ventures);
d) the party is a member of the key management personnel of the entity or its parent;
e) the party is a close member family of any individual referred to in (a) or (d);
f) the party is an entity that is controlled, jointly controlled or significantly influenced by, or which significant voting power in such entity resides with, directly or indirectly, any individual referred to in (d) or (e); or
g) the party is a post-‐employment benefit plan for the benefit of employees of the entity, or of any entity that is related party of the entity.
Balances and transactions between the Group and its subsidiaries, which are related parties of the Group, have been eliminated on consolidation and are not disclosed in this note. Details of transactions between the Group and other related parties are disclosed below.
During the year, the Group purchased services from companies in which members of the Board have a partnership or significant influence through ownership during the reporting period. These services related to the provision of consultancy services and the leasing of office space (see note 12).
F-‐78
The following balances were outstanding at the end of the reporting period:
Due from related parties Due to related parties
CHF 2011 2010 2011 2010
Financial investments
Three Corners Company 7,202,170 6,855,284 -‐ -‐
El Gouna Football Club (i) 9,322,175 8,130,494 -‐ -‐
Falcon for Hotels -‐ -‐ 5,699,176 -‐
Kingdom Co. 1,389,044 1,361,064 -‐ -‐
Camps and lodges 1,111,671 1,013,652 -‐ -‐
Other (balances less than CHF 120 000 each) 385,231 346,257 61,608 109,808
Non controlling shareholders
Tarot Tours Garanah 1,375,785 3,995,589 -‐ 2,504,290
Mirotel For Floating Hotels 756,990 459,928 -‐ -‐
Tarot Garannah for touristic transportation 97,382 170,480 -‐ -‐
Tarot & Merotil Garranah for hotels 196,530 202,897 -‐ -‐
Close family members
Samih Sawiris – (ii) -‐ -‐ -‐ -‐
Close family companies Orascom for Touristic Establishments company (OTEC) 1,242,063 1,302,808 -‐ -‐
Total due from/to related parties 23,079,041 23,838,453 5,760,784 2,614,098
Other amounts due from related parties( Iskan fund )included in Non-‐current receivable and Trade and other receivable 22,276,835 25,478,348 -‐ -‐ Total including other amounts classified as Non-‐current receivable and Trade and other receivable
45,355,876 49,316,801 5,760,784 2,614,098
(i) The amount due from El Gouna Football Club is secured by a guarantee issued by Mr. Samih Sawiris, Chairman, CEO and major shareholder. (ii) Transactions involving Mr. Samih Sawiris, Chairman, CEO and major shareholder:
Purchase of shares from OHD
On 17 January 2007 OHD allocated to employees and the management team (including the chairman and the executive board members) an amount of 2 million shares for full consideration being the market price as of that day. Mr. Samih Sawiris acquired under this transaction 330,000 shares at the market price. Amounts due from Mr. Samih Sawiris under this transaction are included in “Other assets” as amounts due from employees and management team and amounted to CHF 2.15 million at 31 December 2011 (31 December 2010: CHF 2.22 million). Amounts due from executive board members under this transaction are included in “Other assets” as amounts due from employees and management team and amounted to CHF 3.27 million in 2011 (CHF 3.38 million in 2010) (see note 22(iii)).
Taba Heights Company transactions
One of the Group companies had been granted the right to acquire freehold title to the project's land by the Tourism Development Authority. Due to foreign ownership restrictions on the Sinai Peninsula becoming applicable in connection with the reorganization, the respective Group company had to be transferred to Mr. Samih Sawiris, major shareholder and of Egyptian nationality. Mr. Samih Sawiris entered into a binding agreement to retransfer these shares subject to approval of the competent authorities, and that until such retransfer, the Group would be put into a position as the full economic beneficiary of these shares. This entails, inter alia, an irrevocable assignment of dividends and the authorization to collect dividends, exercise voting rights related to these shares and cause the sale of shares with no additional rights of Mr. Samih Sawiris in any value received.

F-79 | Orascom DevelopmentAnnual Report 2011 | F-80
F-‐79
Iskan International Project W.L.L. Inc. Transaction
Iskan International Project W.L.L. Inc. (Iskan) entered into a purchase agreements with Sifah Tourism Development Company (S.A.O.C) and Salalah Beach Tourism Development Company (S.A.O.C) to acquire 139 real estate properties. Mr. Samih Sawiris is a major shareholder in Iskan. The contracts have a value of USD 53,977,880 (equals CHF 50,650,164) and are based on normal commercial terms and conditions.
Iskan transferred the amount of USD12,000,000 (equals CHF 11,260,205) as a down-‐payment. Trade and other receivables balances in the Group’s consolidated financial statements at 31 December 2011 include outstanding receivables in connection with this transaction in the amount of USD 23,740,423 equals CHF 22,276,835 (2010: USD 24,900,239 equals CHF 25,478,348) see note 20 and 24 ; thereof USD 12,821,931 (equals CHF 12,031,464)are overdue but not impaired. The related revenue recognized during the period amounts to USD 35,744,600 (equals CHF 33,540,959).
Securities lending agreement
On 3 December 2010, the Parent Company borrowed 1,286,353 ODH shares from Mr. Samih Sawiris free of charge under a securities lending agreement. These shares were intended to be used for the tender offer regarding the buy-‐out of the remaining shareholders of Orascom Hotels & Development SAE (OHD), a company listed at the EGX. For information on the outcome of this tender offer which was completed on 18 January 2011 (see note 26).
The borrowed ODH shares were not accounted for as treasury shares by the Group, as Mr. Samih Sawiris retained the significant rights, such as dividend and voting rights, during the borrowing period as per contractual provisions.
Under the above mentioned securities lending agreement the Parent Company has returned 330 029 shares of the borrowed ODH shares to Mr. Samih Sawiris on 28 July 2011 by way of capital increase, which is further explained in note 26.2. The remaining 956,324 shares, which were not used during the above mentioned tender offer, are to be returned to Mr. Samih Sawiris by EGX. The difference between the balance, which was reported in equity as “equity swap settlement”, measured at the fair value of the share at the end of the tender offer, and the amount of the capital increase was recognised in ”General reserve” (note 27.5).
Rental contract for office building in Cairo
Orascom Hotel and Development, a wholly owned subsidiary of Orascom Development Holding A.G., has a five year rental contract for 1,701 square meters office space in Nile City office building-‐ Cairo where its owned headquarters are currently situated, the contract was transferred in 2010 among other similar contracts totalling 11,274 square meters to a Joint Stock company which is majority owned by the Chairman and the Co-‐CEO amongst others. The basic annual rental value under this contract is USD 903,420 payable in advance on quarterly basis which is in line with the other contracts transferred (there are other standard parking, deposit and maintenance clauses in the contract that are the same for all other units in the same building).
41 CASH AND CASH EQUIVALENTS
For the purposes of the consolidated cash flow statement, cash and cash equivalents include cash on hand, demand deposits and balances at banks. Cash equivalents are short-‐term, highly liquid investments of maturities of three months or less from the acquisition date, that are readily convertible to known amounts of cash and which are subject to an insignificant risk of changes in value.
CHF 2011 2010
Cash and cash equivalents 79,399,104 276,452,970
42 NON-‐CASH TRANSACTIONS
During the current year, the Group entered into the following non-‐cash investing and financing activities which are not reflected in the consolidated statement of cash flow:
– The Group entered into a securities lending agreement with Mr. Samih Sawiris in course of the buy-‐out of the minority shareholders of OHD as described in note 27.2 and 40.
– Capitalization of interest of CHF 11.4 million over projects under constructions (see note 11). – Unpaid amounts due to the shareholder from capital decrease in the amount of CHF 4.9 milliion
F-‐80
43 OPERATING LEASE ARRANGEMENTS
43.1 The Group as lessee
43.1.1 Leasing arrangements
Operating leases relates to car lease with lease terms of between 2 to 4 years and office facilities with lease terms of 25 years. The Group (as a lessee) does not have an option to purchase these leased assets at the expiry of the lease periods.
43.1.2 Payments recognised as an expense in the period
CHF 2011 2010
Minimum lease payments 1,692,922 1,361,120
1,692,922 1,361,120
43.1.3 Non-‐cancellable operating lease commitments
Total of future minimum lease payments
CHF 2011 2010
Not longer than 1 year 236,612 238,976
Longer than 1 year and not longer than 5 years 842,400 868,412
Longer than 5 years 3,580,200 3,790,800
4,659,212 4,898,188
In respect of non-‐cancellable operating leases, no liabilities have been recognised.
43.2 The Group as lessor
43.2.1 Leasing arrangements
Operating leases relate to the investment property owned by the Group with lease terms of between 1 and 4 years for premises in El Gouna (Egypt) and 25 years for the resort in Mauritius. These lease contracts do not include a lease extension option and are subject to renegotiation at the end of the lease term. The lessee does not have an option to purchase the property at the expiry of the lease period.
Rental income earned by the Group from its investment properties and direct operating expenses arising on the investment properties for the year are set out in note 16.
43.2.2 Non-‐cancellable operating lease receivables
CHF 2011 2010
Not later than 1 year 6,248,417 6,125,899
Later than 1 year and not longer than 5 years 26,268,597 25,753,527
Later than 5 years 51,287,319 58,050,807
83,804,333 89,930,233

F-81 | Orascom DevelopmentAnnual Report 2011 | F-82
F-‐81
44 COMMITMENTS FOR EXPENDITURE
The following commitments for expenditure have been made for the future development of the respective projects:
CHF 2011
Salalah Beach Tourism Development Company (S.A.O.C) 1,822,409
Sifah Tourism Development Company (S.A.O.C) 4,534,944
Andermatt Swiss Alps AG (i) 33,347,000
Luštica Development A.D. 2,434,200
Eco-‐Bos Development Limited (ii) 5,110,032
(i) The Swiss subsidiary Andermatt Swiss Alps AG (ASA) has obligations towards the canton of Uri and the municipality of Andermatt. ASA is responsible for the construction of certain parts of the tourism resort Andermatt. Within certain periods of time or should the construction work be stopped for whatever reason, ASA has the obligation to rebuild the relevant plots of land to the original state. At 31 December 2011, 32,347 ASA shares with a nominal value of CHF 1,000 each, amounting to a total book value of CHF 32,347,000, have been pledged as a security to the canton and municipality.Additionally, land with a value of CHF 1,000,000 is pledged under this transaction and the security towards the canton of Uri amounts to CHF 33,347,000.
(ii) The UK subsidiary Eco-‐Bos Development Ltd. is committed to purchase three plots of land from Imerys, a multinational industrial minerals company, to develop an integrated Eco Town in Cornwall, UK.
45 OTHER SIGNIFICANT EVENTS THAT OCCURRED DURING THE REPORTING PERIOD
Political situation in Egypt
As already mentioned in the annual financial statements for the year ended 31 December 2010 some substantial political events took place in Egypt since January 2011 that impacted generally its economic sectors, which led and will probably continue to lead to a decline in the economic activities in future periods. As described in note 7, the turmoils in Egypt had a significant impact on the Group’s operations in the current period. Management expects that the situation in Egypt, which is still insecure, may have a further impact on the Group’s operations in future financial periods.
The slowdown in the Group’s performance during the period is attributable to a number of reasons, including:
– The extraordinary events that took place in Egypt and other countries in the Middle East have had a significant impact on the general business environment in these countries. The slow-‐down in processes and logistics does still impact the business operations considerably.
– The circumstances in Egypt had a noticeable impact on the tourism sector’s performance during the period under review, following the issuance of security warnings and travel ban from almost all feeder markets. Nevertheless, occupancy rates started to improve during the second quarter and improved considerably in the third quarter following the removal of most travel bans on Egypt.
– The events led to a slowdown in construction activities in the Group’s Egyptian operations for almost 50 days during the first quarter of 2011, meaning that no real estate and construction revenues were recognized from real estate units under construction. Moreover, some events in the Middle East, including Oman, affected the pace of development in the Group’s other operations within the region. Accordingly, real estate and construction revenues will be shifted to other financial periods. Contrary to expectations of the Group earlier this year, revenue is expected to be shifted to 2012 rather than to the second half of 2011 due to the above mentioned slow-‐down in processes and logistics.
Withdrawals of land by the government
Land withdrawal of 6th of October
2000 Acres
With reference to the purchased land in Sixth of October city (2000 acres), the Urban Communities Authority related to the Ministry of Housing issued its decision on 11 December 2011 to grant one of the subsidiaries of ODH an area of 1,000 acres rather than 2,000 acres on the condition of completing the construction works on this area not later than 30 September 2013.
F-‐82
Since it is difficult for the subsidiary to complete the construction work during that period of time and as it is contrary to the terms of the contract with the Authority, the Group’s entity raised a litigation for redress of that resolution. No judgement or decision has been issued as of the date of this report.
200 Acres
On 5 May 2008 one of the subsidiaries of ODH signed a contract with the Ministry of Housing for receiving 50 acres and a promise of sale for another 150 acres to construct a project for low and middle income housing.
On 15 March 2010 the subsidiary received the declaration from the Ministry of Housing which allows the subsidiary to issue the necessary construction licenses; on 13 July 2010 the subsidiary received a letter from the Ministry of Housing to cancel the project and to withdraw the land. The company has taken all the legal actions to protect its rights of the land and the trial has not been finalized yet.
Land withdrawal at Al Fayoum Project:
In addition, Fayoum Governance issued its decision on 11 June 2011 to terminate the contract signed 9 June 2007 for the purchase of a piece of land in Fayoum Governance taking into consideration that there are constructions on that land worth EGP 11 million (equals CHF 1.7 million). Accordingly the subsidiary of ODH has remedied this resolution. As a result, the Conciliation Commission related to the Ministry of Justice issued its decision on 3 October 2011 that the subsidiary is entitled to cancel the decision of the province. On the basis of this decision, the subsidiary has raised a law suit to the Egyptian judiciary to cancel that decision.No judgement or decision has been issued as of the date of this report.
46 SUBSEQUENT EVENTS
Delisting OHD from EGX
The Parent Company plans to start the process of completely delisting OHD from the EGX, as per article 35 of the EGX listing rules, without having to call for an OHD Extraordinary General Assembly Meeting.
Hotel 4b Development Ltd.
Andermatt Swiss Alps Ltd. (ASA), a 100% subsidiary of Orascom Development Holding AG and Besix Group SA (Besix), a Belgium based leading international construction company, which is a related party to ODH, have founded Hotel 4b Development Ltd. On 14 February 2012. The initial share capital is CHF 100,000 of which ASA owns 51% and Besix 49%. The purpose of Hotel 4b Development Ltd. is to plan, design, construct and operate a Hotel and sell the apartments and the related facilities.
Financing agreement with majority shareholder for 2012 and 2013
In January 2012 the Group has finalized credit agreements in the total amount of CHF 125 million which enable the Group -‐ together with existing cash reserves and existing credit lines -‐ to finance all its activities in 2012. The terms and conditions of these credit agreements, which materialized due to commitments of the majority shareholder Samih Sawiris, will reduce the average cost of debt of the Group. If necessary, Samih Sawiris would also secure the funding of the 2013 investment program with additional contributions.
47 LITIGATION
The financial statements of Falcon Company for Hotels (“Falcon”) were incorporated into ODH’s consolidated financial statements at 31 December 2008 in accordance with the International Financial Reporting Standards, as a result of the business combination previously effected through one of ODH’s subsidiaries whereby control had existed over Falcon at that time.
Subsequent to the first time consolidation, but prior to the completion of the transfer of the legal title on the Egyptian Stock Exchange (EGX), a dispute over the Falcon securities purchase agreement had arisen. At the beginning of October 2009, the Group ceased consolidating Falcon due to changes in Falcon’s management resulting in a loss of control for the Group which was one of the reasons of the dispute (see note 21).
48 APPROVAL OF FINANCIAL STATEMENTS
The financial statements were approved by the directors and authorized for issue on 29 March 2012.
F-83 | Orascom DevelopmentAnnual Report 2011 | F-84
9. Financial Statement 2011
F-‐84
Orascom Development Holding AG Statutory financial statements together with auditor's report for the year ended 31 December 2011
F-‐83
REPORT OF THE STATUTORY AUDITOR
To the General meeting of Orascom Development Holding AG, Altdorf
Report on the consolidated financial statements
As statutory auditor, we have audited the accompanying consolidated financial statements of Orascom Development Holding AG, Altdorf, which comprise the statement of comprehensive income, statement of financial position, cash flow statement, statement of changes in equity and notes (pages F-‐3to F-‐82) for the year ended 31 December 2011.
Board of Directors’ Responsibility
The Board of Directors is responsible for the preparation of the consolidated financial statements in accordance with International Financial Reporting Standardsand the requirements of Swiss law. This responsibility includes designing, implementing and maintaining an internal control system relevant to the preparation and fair presentation of consolidated financial statements that are free from material misstatement, whether due to fraud or error. The Board of Directors is further responsible for selecting and applying appropriate accounting policies and making accounting estimates that are reasonable in the circumstances.
Auditor’s Responsibility
Our responsibility is to express an opinion on these consolidated financial statements based on our audit. We conducted our audit in accordance with Swiss law and Swiss Auditing Standards and the International Standards on Auditing. Those standards require that we plan and perform the audit to obtain reasonable assurance whether the consolidated financial statements are free from material misstatement.
An audit involves performing procedures to obtain audit evidence about the amounts and disclosures in the consolidated financial statements. The procedures selected depend on the auditor’s judgment, including the assessment of the risks of material misstatement of the consolidated financial statements, whether due to fraud or error. In making those risk assessments, the auditor considers the internal control system relevant to the entity’s preparation and fair presentation of the consolidated financial statements in order to design audit procedures that are appropriate in the circumstances, but not for the purpose of expressing an opinion on the effectiveness of the entity’s internal control system. An audit also includes evaluating the appropriateness of the accounting policies used and the reasonableness of accounting estimates made, as well as evaluating the overall presentation of the consolidated financial statements. We believe that the audit evidence we have obtained is sufficient and appropriate to provide a basis for our audit opinion.
Opinion
In our opinion, the consolidated financial statements for the year ended 31 December 2011give a true and fair view of the financial position, the results of operations and the cash flows in accordance with International Financial Reporting Standards and comply with Swiss law.
Report on Other Legal Requirements
We confirm that we meet the legal requirements on licensing according to the Auditor Oversight Act (AOA) and independence (article 728 CO and article 11 AOA) and that there are no circumstances incompatible with our independence.
In accordance with article 728a paragraph 1 item 3 CO and Swiss Auditing Standard 890, we confirm that an internal control system exists, which has been designed for the preparation of the consolidated financial statements according to the instructions of the Board of Directors.
We recommend that the consolidated financial statements submitted to you be approved.
Deloitte AG
Hans-‐Peter Wyss Thomas Schmid Licensed audit expert Licensed audit expert Auditor in charge Zurich, 3April 2012
Deloitte AG General Guisan-Quai 38
Postfach 2232 CH-8022 Zürich
Tel: +41 (0)44 421 60 00 Fax: +41 (0)44 421 66 00
www.deloitte.ch
F-‐83
REPORT OF THE STATUTORY AUDITOR
To the General meeting of Orascom Development Holding AG, Altdorf
Report on the consolidated financial statements
As statutory auditor, we have audited the accompanying consolidated financial statements of Orascom Development Holding AG, Altdorf, which comprise the statement of comprehensive income, statement of financial position, cash flow statement, statement of changes in equity and notes (pages F-‐3to F-‐82) for the year ended 31 December 2011.
Board of Directors’ Responsibility
The Board of Directors is responsible for the preparation of the consolidated financial statements in accordance with International Financial Reporting Standardsand the requirements of Swiss law. This responsibility includes designing, implementing and maintaining an internal control system relevant to the preparation and fair presentation of consolidated financial statements that are free from material misstatement, whether due to fraud or error. The Board of Directors is further responsible for selecting and applying appropriate accounting policies and making accounting estimates that are reasonable in the circumstances.
Auditor’s Responsibility
Our responsibility is to express an opinion on these consolidated financial statements based on our audit. We conducted our audit in accordance with Swiss law and Swiss Auditing Standards and the International Standards on Auditing. Those standards require that we plan and perform the audit to obtain reasonable assurance whether the consolidated financial statements are free from material misstatement.
An audit involves performing procedures to obtain audit evidence about the amounts and disclosures in the consolidated financial statements. The procedures selected depend on the auditor’s judgment, including the assessment of the risks of material misstatement of the consolidated financial statements, whether due to fraud or error. In making those risk assessments, the auditor considers the internal control system relevant to the entity’s preparation and fair presentation of the consolidated financial statements in order to design audit procedures that are appropriate in the circumstances, but not for the purpose of expressing an opinion on the effectiveness of the entity’s internal control system. An audit also includes evaluating the appropriateness of the accounting policies used and the reasonableness of accounting estimates made, as well as evaluating the overall presentation of the consolidated financial statements. We believe that the audit evidence we have obtained is sufficient and appropriate to provide a basis for our audit opinion.
Opinion
In our opinion, the consolidated financial statements for the year ended 31 December 2011give a true and fair view of the financial position, the results of operations and the cash flows in accordance with International Financial Reporting Standards and comply with Swiss law.
Report on Other Legal Requirements
We confirm that we meet the legal requirements on licensing according to the Auditor Oversight Act (AOA) and independence (article 728 CO and article 11 AOA) and that there are no circumstances incompatible with our independence.
In accordance with article 728a paragraph 1 item 3 CO and Swiss Auditing Standard 890, we confirm that an internal control system exists, which has been designed for the preparation of the consolidated financial statements according to the instructions of the Board of Directors.
We recommend that the consolidated financial statements submitted to you be approved.
Deloitte AG
Hans-‐Peter Wyss Thomas Schmid Licensed audit expert Licensed audit expert Auditor in charge Zurich, 3April 2012
Deloitte AG General Guisan-Quai 38
Postfach 2232 CH-8022 Zürich
Tel: +41 (0)44 421 60 00
Fax: +41 (0)44 421 66 00 www.deloitte.ch

F-85 | Orascom DevelopmentAnnual Report 2011 | F-86
F-‐85
Orascom Development Holding AG Income statement CHF Notes 2011 2010
Revenue Interest income 6,916,679 2,914,146 Management fee 423,800 230,400 Dividend income -‐ 141,454,343 Other revenues 200,372 1,600
Total revenues 7,540,851 144,600,489
Operating expenses Personnel expenses (6,784,871) (4,704,254) Marketing expenses -‐ -‐ Depreciation of fixed assets (129,664) (221,418) Impairment of receivables 12 32,993,640 Other operating expenses (5,407,251) (4,923,962)
Total operating expenses (45,315,426) (9,849,634)
Other income/expenses Amortization of incorporation and organization costs 4 (6,211,020) (5,118,917) Impairment on investments (795,148,339) -‐ Finance expense -‐ (5,000,000) Interest expense (1,831,901) (2,456,995) Exchange rate differences (5,729,984) 587,115
Total other expenses (808,921,244) (11,988,797)
Net (loss)/profit for the period (846,695,821) 122,762,058
F-‐86
Orascom Development Holding AG Statutory balance sheet
CHF Notes 31 December 2011 31 December 2010
Assets
Current assets Cash at bank 6,847,093 155,790,727 Other receivables -‐ Affiliated companies 303,276,209 175,886,773 -‐ Related party 12 9,306,925 9,306,925 -‐ Third parties 178,087 6,494,794 Own shares 11 2,053,867 1,464,267 Other financial assets -‐ 9,427,914
Total current assets 321,662,181 358,371,400
Non-‐current assets Fixed assets 5 43,996 150,859 Incorporation and organization costs 4 12,298,757 18,226,912 Investments 8 2,327,369,382 3,090,259,432
Total non-‐current assets 2,339,712,135 3,108,637,203
Total assets 2,661,374,316 3,467,008,603
Liabilities and shareholders’ equity
Short-‐term liability Bank overdraft 10,833,284 -‐ Other payables -‐ Shareholder 7 15,257,372 177,377 -‐ Affiliated companies 78,822,091 61,700,226 -‐ Third parties 557,007 876,833 Accrued expenses 2,373,785 1,112,232 Provisions 1,150,000 -‐
Total short-‐term liabilities 108,993,539 63,866,668
Shareholders’ equity Share capital 9 662,201,010 672,882,864 Additional paid-‐in capital (agio) 9 -‐ 2,505,326,807 Reserve for own shares 11 589,600 1,464,267 Capital contribution reserve (privileged) 10 -‐ Additional paid-‐in capital (agio) 2,507,026,456 -‐ -‐ Reserve for own shares 1,464,267 -‐ -‐ Other reserve 491,481,458 -‐ Other reserve 9 11,953,838 499,108,028 Accumulated losses (275,640,031) -‐398,402,089 Net (loss)/profitof the period (846,695,821) 122,762,058
Total shareholders' equity 2,552,380,777 3,403,141,935
Total liability and shareholders‘ equity 2,661,374,316 3,467,008,603
Samih Sawiris Gerhard Niesslein Mahmoud Zuaiter Chairman CEO Group CFO

F-87 | Orascom DevelopmentAnnual Report 2011 | F-88
F-‐87
Orascom Development Holding AG Statement of changes in equity
CHF Share capital Additional
paid-‐in capital (agio)
Reserve for own shares
Other reserves
Retained earnings
Total
Balance at 1 January 2010 568,881,621 2,439,261,100 -‐ 500,572,295 (398,402,089) 3,110,312,927 Share capital decrease (15,092,778) -‐ -‐ -‐ -‐ (15,092,778) Share capital increase 119,094,021 66,065,707 -‐ -‐ -‐ 185,159,728 Acquisition of own shares -‐ -‐ 1,464,267 (1,464,267) -‐ -‐ Profit for the period -‐ -‐ -‐ -‐ 122,762,058 122,762,058 Balance at 31 December 2010
672,882,864 2,505,326,807 1,464,267 499,108,028 (275,640,031) 3,403,141,935
Balance at 1 January 2011 672,882,864 2,505,326,807 1,464,267 499,108,028 (275,640,031) 3,403,141,935 Share capital decrease (18,553,046) -‐ -‐ (18,553,046) Share capital increase 7,871,192 1,699,649 4,916,868 -‐ 14,487,709 Acquisition of own shares -‐ -‐ 589,600 (589,600) -‐ -‐ Loss for the period -‐ -‐ -‐ -‐ (846,695,821) (846,695,821) Balance at 31 December 2011
662,201,010 2,507,026,456 2,053,867 503,435,296 (1,122,335,852) 2,552,380,777
Orascom Development Holding AG Cash flow statement CHF 2011 2010
Cash flows from operating activities
Profit/(loss) for the period (846,695,821) 122,762,058 Depreciation of fixed assets 129,664 221,418 Amortization of incorporation and organization cost 6,211,020 5,118,917 Impairment on investments 795,148,339 -‐
Movements in working capital Decrease/(increase) in trade and other receivables 15,744,621 (15,383,258) Increase in other financial assets -‐ (9,427,914) Increase in due from affiliated parties (127,389,437) (116,984,224) Decreasein due from related parties -‐ 8,146,190 (Decrease)/Increase in trade and other payables (319,826) 574,583 Increase/ (decrease) in due to affiliated parties 17,121,867 (3,014,404) Increase in other liabilities 28,324,831 490,177
Cash used from operations (111,724,742) (7,496,457)
Cash flows from investing activities
Payments for fixed assets (22,801) (25,969) Increase in investmentsof subsidiaries (17,770,579) -‐
Net cash used in investing activities (17,793,380) (25,969)
Cash flows from financing activities
Incorporation and organization cost (282,866) (7,062,744) Capital increase -‐ 185,159,728 Capital reduction (18,553,046) (15,092,778) Acquisition of own shares (589,600) (1,464,267)
Net cash (used)/generated by financing activities (19,425,512) 161,539,939
Net(decrease)/ increase in cash and cash equivalents (148,943,634) 154,017,513
Cash and cash equivalents as at beginning of the financial year 155,790,727 1,773,214
Cash and cash equivalents as at end of the financial year 6,847,093 155,790,727
F-‐88
Notes to the financial statements 1. General
The purpose of the Company is the direct or indirect acquisition, durable management and disposal of participations in domestic or foreign enterprises, in particular in the field of real estate, tourism, hotels, construction, resort management, financing of real estate and related industries as well as the provision of related services.
2. Pledged assets to secure own obligations
The Swiss subsidiary Andermatt Swiss Alps AG (ASA) has obligations towards the canton of Uri and the municipality of Andermatt. ASA is responsible for the construction of certain parts of the tourism resort Andermatt. Within certain periods of time or should the construction work be stopped for whatever reason, ASA has the obligation to rebuild the relevant plots of land to the original state. As at 31 December 2011, 32,347 ASA shares with a nominal value of CHF 1,000 each, amounting to a total book value of CHF 32,347,000, have been pledged as a security to the canton and municipality. Additionally, land with a value of CHF 1,000,000 has been pledged.
3. Off-‐balance-‐sheet leasing commitments
CHF 31 December 2011 31 December 2010
Cars 26,012 54,388
Office rent 4,633,200 4,843,800
4. Incorporation costs
Incorporation costs relate to costs incurred in relation to the incorporation of the Company, the related capital increase and exchange offer, as well as the listing of the shares at the SIX Swiss Exchange and the EGX Egyptian Exchange in 2008 and the public offering in September 2010. Incorporation costs are capitalised and amortised over a period of five years.
5. Fire insurance value of fixed assets
The fire insurance value of fixed assets at 31 December 2011 amounts to CHF 731,000 (31 December 2010: CHF 731,000).
6. Liabilities towards staff pension schemes
Current liabilities at 31 December 2011 amount to CHF 63,683 (31 December 2010: CHF 4,378).
7. Other payables -‐ Shareholder
The position of “other payables – shareholder” at 31 December 2011 includes CHF 4,925,982 due to the Egyptian counterparty “Mirsr for Central Clearing, Depository and Registry” (MCDR), which will pay out the amount of CHF 0.65 per share to the shareholders with shares which are registered and traded on the Egyptian Stock Exchange (EGX).
The amount of CHF 10,331,389 due to Mr. Samih Sawiris (31 December 2010: CHF 177,377) is also included within this position.
8. Investments
Investments are valued at acquisition cost less adjustments for impairment, if any. The Company performs annually an impairment assessment of its investments based on a DCF valuation model for operations, of shareholders’ equity for entities not yet operating and on separate valuations for land banks. Based on the last valuation, impairment on the investments was necessary, because the political turmoil in Egypt and the Arab World have negatively impacted the Group’s operations during 2011.

F-89 | Orascom DevelopmentAnnual Report 2011 | F-90
F-‐89
At 31 December 2011, the Company directly holds the following investments:
Company, domicile, purpose Ownership % Share capital
31 December 2011 31 December 2010
Orascom Hotels & Development S.A.E. 99.68% 98.16% EGP 1,109,811,630 (previously: EL Gouna Development & Hotels S.A.E.), Egypt Real estate development, hotel management
Arena for Hotels Company S.A.E., Egypt 99.85% 99.85% EGP 20,000,000 Hotel operation
Orascom Development Holding International Ltd, British Virgin Islands (BVI) 100.00% 100.00% USD 1 International holding company
Orascom Development & Management Limited, Cyprus 100.00% 100.00% EUR 1,000 Management company
ORH Investment Holding Ltd, BVI 100.00% 100.00% USD 125,000,000 International holding company
ONSA Holding Ltd, BVI 100.00% 100.00% USD 1 International holding company
Lustica Development AD, Montenegro 51.00% 51.00% EUR 25,000 Real estate development, hotel management
Andermatt Swiss Alps AG, Switzerland 100.00% 100.00% CHF 37,000,000 Real estate development
Orascom Development International AG, Switzerland 100.00% 100.00% CHF 100,000 Real estate development
Orascom Hotels & Development S.A.E. (OHD) (previously: EL Gouna Development & Hotels S.A.E.)
On 22 December 2010 the Company launched a tender offer to the remaining minority shareholders to acquire the outstanding OHD shares. The registration process for approximately 2% of these shares was not completed at the time of launching the tender offer and therefore this portion was also included in the tender offer. The Company had control over the voting rights and borne all the risks and rewards of these shares including dividend rights.
The tender offer to buy-‐out the minority shareholders of OHD ended on 18 January 2011. The Company acquired a total of 8,117,758 OHD shares and thereby increased its share of OHD to 99.66%. 330,029 borrowed ODH shares were used to acquire 6,997,392 OHD shares. Furthermore 1,120,366 OHD shares were acquired by cash-‐payments.
During the second and the third quarter 2011, the Company acquired 3,752 additional shares for an amount of CHF 21,592 and increased its share in OHD to 99.68%.
ORH Investment Holding Limited (ORH)
On 12 April 2010, ODH bought all outstanding shares from group companies and has increased its ownership to 100.00%.
Andermatt Swiss Alps AG
On 16 December 2010, the Company issued a waiver for an intercompany loan amounting to CHF 5,000,000 granted to ASA and recorded the respective costs as finance expenses in the income statement. On 15 December 2011, the capital was increased again in the amount of CHF 10,000,000 by paying off a credit balance due to the Company.
F-‐90
9. Shareholders’ equity
As at 31 December 2011 the Company's share capital of CHF 662,201,010 was divided into 28,543,147 registered shares with a par value of CHF 23.20 each. The share capital is fully paid-‐in. The registered shares of the Company are listed on the Swiss Exchange (SIX). The Company has also issued Egyptian Depository Rights (EDRs) which are traded on the Egyptian Stock Exchange (EGX).
Par Value CHF Shares # CHF
Share capital 23.20 28,543,147 662,201,010
Authorized capital 23.20 4,669,971 108,343,327
Conditional capital 23.20 5,624,556 130,489,699
The table below shows the development of issued capital and additional paid-‐in capital (agio):
Shares Issued capital Additional paid-‐in capital
(agio)
Par Value
# CHF CHF Date Transaction CHF Change Total Change Total Change Total 01/01/2010 Opening balance 24.50 -‐ 23,219,658 568,881,621 -‐ 2,439,261,100
a) 24/08/2010 Capital reduction 23.85 -‐ 23,219,658 (15,092,778) 553,788,843 -‐ 2,439,261,100 b) 30/09/2010 Capital increase 23.85 4,993,460 28,213,118 119,094,021 672,882,864 66,065,707 2,505,326,807 c) 28/07/2011 Capital increase 23.85 330,029 28,543,147 7,871,192 680,754,056 1,699,650 2,507,026,457 d) 08/08/2011 Capital reduction 23.20 -‐ 28,543,147 (18,553,046) 662,201,010 -‐ 2,507,026,457
a) As per resolution of the general shareholder meeting held on 11 May 2010, the share capital was reduced by CHF 15,092,778 by decreasing the nominal value per share from CHF 24.50 to CHF 23.85. The amount of CHF 0.65 per share was distributed to the shareholders on 24 August 2010.
b) As per resolution of the Board of Directors’ meeting held on 17/18 September 2010, the share capital was increased by the amount of CHF 119,094,021 through the issuance of CHF 4,993,460 fully paid-‐up registered shares with a par value of CHF 23.85 each.
4,965,220 shares were issued for an amount of CHF 37.00 each, resulting in an additional paid-‐in capital of CHF 65,292,643. The offer price of CHF 37.00 was derived from the closing price of the trading session on 17 September 2010, discounted at a discount rate negotiated with the banks.
In addition, 28,240 shares were issued for an average amount of CHF 51.22 resulting in an additional paid-‐in capital of CHF 773,064.The total additional paid-‐in capital from this capital increase amounted to CHF 66,065,707.
According to the resolution of the general shareholder meeting held on 23 May 2011, the board of directors has approved on 14 July 2011 a capital increase in the amount of CHF 7,871,192 (made up of 330,029 shares with a par value of CHF 23.85) at a total issue price of CHF 9,570,841. The capital increase has been completed on 28 July 2011. Therefore, the additional paid-‐in capital increased by CHF 1,699,650 to CHF 2,507,026,457 in total.
c) On 3 December 2010, the Company borrowed 1,286,353 ODH shares from Mr. Samih Sawiris free of charge under a securities
lending agreement. These shares were intended to be used for the tender offer regarding the buy-‐out of the remaining shareholders of Orascom Hotels & Development SAE, a company listed at the EGX. During this offer 330,029 shares have been swapped against ODH shares. At the time when Mr. Sawiris lent the shares, the market value for the shares swapped was CHF 14,487,709. The difference between this amount and the issue price of CHF 9,570,841 amounting to CHF 4,916,868 was recorded within general reserves
d) As per resolution of the general shareholder meeting held on 23 May 2011, the share capital was reduced by decreasing the nominal value per share from CHF 23.85 to CHF 23.20. The amount of CHF 0.65 per share was distributed to the shareholders on 15 September 2011.
10. Privileged capital contribution reserves As of 1 January 2011, Swiss tax authorities introduced a new regulation concerning capital contribution reserves. The new regulation foresees the exemption of distributions from the capital contribution reserves, which were received after 31 December 1996 from Swiss income and withholding tax. In order to reflect this new regulation, capital contribution reserves have been classified separately in the balance sheet. The tax authorities have approved capital contribution reserves in the amount of CHF 2,999,972,182.

F-91 | Orascom DevelopmentAnnual Report 2011 | F-92
F-‐91
11. Own shares As of 31 December 2011, the Company owned 70,171 own shares (31 December 2010: 26,171). 26,171 own shares were received on 30 December 2010 as part of the compensation for the sale of the six percent stake in the former Garranah subsidiaries.
On 28 December 2011, the Company bought 44,000 own shares as a part of the board member remuneration for 2011. Most of these shares have been forwarded to the board members during the first quarter 2012.
12. Accounts receivables from affiliated companies
Accounts receivables are included after a deduction for bad debtors in the amount of CHF 33 million (31 December 2010: CHF 15 million).
13. Risk assessment
Orascom Development Holding AG, as the Parent Company of the Group, is fully integrated into the Group-‐wide internal risk assessment process. Such assessment is performed bottom-‐up and top-‐down with final conclusions consolidated in the Group Finance Function.
The Group’s entities report periodically to the Group Finance on their current operations and financial situation. Various reports and analysis have been implemented to allow the Group to monitor the operations closely and immediately identify risks. In managing the Companies vital activities and controlling the risks within those activities the Company pursuits a policy of centralization at the corporate level in which the bank accounts, the fixed assets, the collection of receivables and material transactions are controlled at the corporate level with certain approvals required to exercise or execute any of the above.
Management is efficiently and effectively assisted into taking decisions based on the short term operating level and long term strategic level through the various reports that are provided through the system. In addition to that there is a monthly as well as quarterly reporting package and a set of key performance indicators on the entity and segment level that enable the management to monitor the business, take decisions and undergo corrective action whenever necessary.
In addition, the Group Finance has a function for risk assessment and internal control. A risk matrix is regularly updated for the most significant entities of the Group. All information from the entities is reviewed and consolidated by Group Finance and is shared and discussed with the Executive Management on a regular base. A more formal reporting on risks over financial reporting was made prior to year-‐end to the Board of Directors.
The Board of Directors in turn has performed a risk assessment covering more long-‐term operational and strategic risks to the Group. The conclusions of such risk assessment are also considered by Group Finance.
The risk mitigating actions are performed on the segment and entity level. The Group has centralized certain functions to be able to identify and control risks more closely. This risk assessment also covers the specific risks related to unconsolidated financial statements of Orascom Development Holding AG.
14. Significant shareholders
31 December 2011 31 December 2010
Name of holder Number of
shares
Percentage ownership of total equity capital and
voting rights
Number of shares
Percentage ownership of total equity capital and
voting rights
Samih Sawiris 9,364,872 32.81% 8,717,995 30.91%
Thursday Holding Ltd. (controlled by Mr. Samih Sawiris’ family) 7,142,941 25.02% 7,142,941 25.32%
SOS Holding Ltd. (controlled by Mr. Samih Sawiris’ family) 1,126,508 3.95% 1,126,508 3.99%
Janus Capital Management LLC 1,533,538 5.37% 1,524,707 5.40%
Blue Ridge Capital Holdings LLC and Blue Ridge Capital Offshore Holdings LLC -‐ 0.00% 1,059,174 3.75%
Others 9,375,288 32.85% 8,641,793 30.63%
Total 28,543,147 100.00% 28,213,118 100.00%
F-‐92
15. Remuneration of the Board of Directors and Executive Management
A detailed overview of the remuneration of the Board of Directors and Executive Management is provided in the consolidated financial statements.
16. Political events in Egypt Some substantial political events have taken place in Egypt since January 2011 that have impacted various sectors of the economy and which may well lead to a decline in the economic activities in the future. These events may have a consequential impact on the Group’s operations in future financial periods.
17. Joint liability in favour of third party Orascom Group acts as Group company against confederate value-‐added tax authorities. This leads to a joint liability from Group taxation for value added tax purposes.
18. Subsequent events On 17 January 2012, the Chairman (lender) and the Company (borrower) signed and entered into a loan agreement pursuant to which the lender lends to the borrower a total loan amount of CHF 75,000,000.

F-93 | Orascom DevelopmentAnnual Report 2011 | F-94
F-‐93
REPORT OF THE STATUTORY AUDITOR
To the General meeting of Orascom Development Holding AG, Altdorf
Report on the financial statements
As statutory auditor, we have audited the accompanying financial statements of Orascom Development Holding AG, Altdorf, which comprise the income statement, statutory balance sheet, statement of changes in equity,cash flow statement and notes (pages F-‐84 to F-‐92) for the year ended 31 December 2011.
Board of Directors’ Responsibility
The Board of Directors is responsible for the preparation of the financial statements in accordance with the requirements of Swiss law and the company’s articles of incorporation. This responsibility includes designing, implementing and maintaining an internal control system relevant to the preparation of financial statements that are free from material misstatement, whether due to fraud or error. The Board of Directors is further responsible for selecting and applying appropriate accounting policies and making accounting estimates that are reasonable in the circumstances.
Auditor’s Responsibility
Our responsibility is to express an opinion on these financial statements based on our audit. We conducted our audit in accordance with Swiss law and Swiss Auditing Standards. Those standards require that we plan and perform the audit to obtain reasonable assurance whether the financial statements are free from material misstatement.
An audit involves performing procedures to obtain audit evidence about the amounts and disclosures in the financial statements.Theprocedures selected depend on the auditor’s judgment, including the assessment of the risks of material misstatement of the financial statements, whether due to fraud or error. In making those risk assessments, the auditor considers the internal control system relevant to the entity’s preparation of the financial statements in order to design audit procedures that are appropriate in the circumstances, but not for the purpose of expressing an opinion on the effectiveness of the entity’s internal control system. An audit also includes evaluating the appropriateness of the accounting policies used and the reasonableness of accounting estimates made, as well as evaluating the overall presentation of the financial statements. We believe that the audit evidence we have obtained is sufficient and appropriate to provide a basis for our audit opinion.
Opinion
In our opinion, the financial statements for the period ended 31 December 2011comply with Swiss law and the company’s articles of incorporation.
Report on Other Legal Requirements
We confirm that we meet the legal requirements on licensing according to the Auditor Oversight Act (AOA) and independence (article 728 CO and article 11 AOA) and that there are no circumstances incompatible with our independence.
In accordance with article 728a paragraph 1 item 3 CO and Swiss Auditing Standard 890, we confirm that an internal control system exists, which has been designed for the preparation of financial statements according to the instructions of the Board of Directors.
We recommend that the financial statements submitted to you be approved.
Deloitte AG
Hans-‐Peter Wyss Thomas Schmid Licensed audit expert Licensed audit expert Auditor in charge Zurich, 3April 2012
Deloitte AG General Guisan-Quai 38
Postfach 2232 CH-8022 Zürich
Tel: +41 (0)44 421 60 00 Fax: +41 (0)44 421 66 00
www.deloitte.ch
F-‐93
REPORT OF THE STATUTORY AUDITOR
To the General meeting of Orascom Development Holding AG, Altdorf
Report on the financial statements
As statutory auditor, we have audited the accompanying financial statements of Orascom Development Holding AG, Altdorf, which comprise the income statement, statutory balance sheet, statement of changes in equity,cash flow statement and notes (pages F-‐84 to F-‐92) for the year ended 31 December 2011.
Board of Directors’ Responsibility
The Board of Directors is responsible for the preparation of the financial statements in accordance with the requirements of Swiss law and the company’s articles of incorporation. This responsibility includes designing, implementing and maintaining an internal control system relevant to the preparation of financial statements that are free from material misstatement, whether due to fraud or error. The Board of Directors is further responsible for selecting and applying appropriate accounting policies and making accounting estimates that are reasonable in the circumstances.
Auditor’s Responsibility
Our responsibility is to express an opinion on these financial statements based on our audit. We conducted our audit in accordance with Swiss law and Swiss Auditing Standards. Those standards require that we plan and perform the audit to obtain reasonable assurance whether the financial statements are free from material misstatement.
An audit involves performing procedures to obtain audit evidence about the amounts and disclosures in the financial statements.Theprocedures selected depend on the auditor’s judgment, including the assessment of the risks of material misstatement of the financial statements, whether due to fraud or error. In making those risk assessments, the auditor considers the internal control system relevant to the entity’s preparation of the financial statements in order to design audit procedures that are appropriate in the circumstances, but not for the purpose of expressing an opinion on the effectiveness of the entity’s internal control system. An audit also includes evaluating the appropriateness of the accounting policies used and the reasonableness of accounting estimates made, as well as evaluating the overall presentation of the financial statements. We believe that the audit evidence we have obtained is sufficient and appropriate to provide a basis for our audit opinion.
Opinion
In our opinion, the financial statements for the period ended 31 December 2011comply with Swiss law and the company’s articles of incorporation.
Report on Other Legal Requirements
We confirm that we meet the legal requirements on licensing according to the Auditor Oversight Act (AOA) and independence (article 728 CO and article 11 AOA) and that there are no circumstances incompatible with our independence.
In accordance with article 728a paragraph 1 item 3 CO and Swiss Auditing Standard 890, we confirm that an internal control system exists, which has been designed for the preparation of financial statements according to the instructions of the Board of Directors.
We recommend that the financial statements submitted to you be approved.
Deloitte AG
Hans-‐Peter Wyss Thomas Schmid Licensed audit expert Licensed audit expert Auditor in charge Zurich, 3April 2012
Deloitte AG General Guisan-Quai 38
Postfach 2232 CH-8022 Zürich
Tel: +41 (0)44 421 60 00
Fax: +41 (0)44 421 66 00 www.deloitte.ch
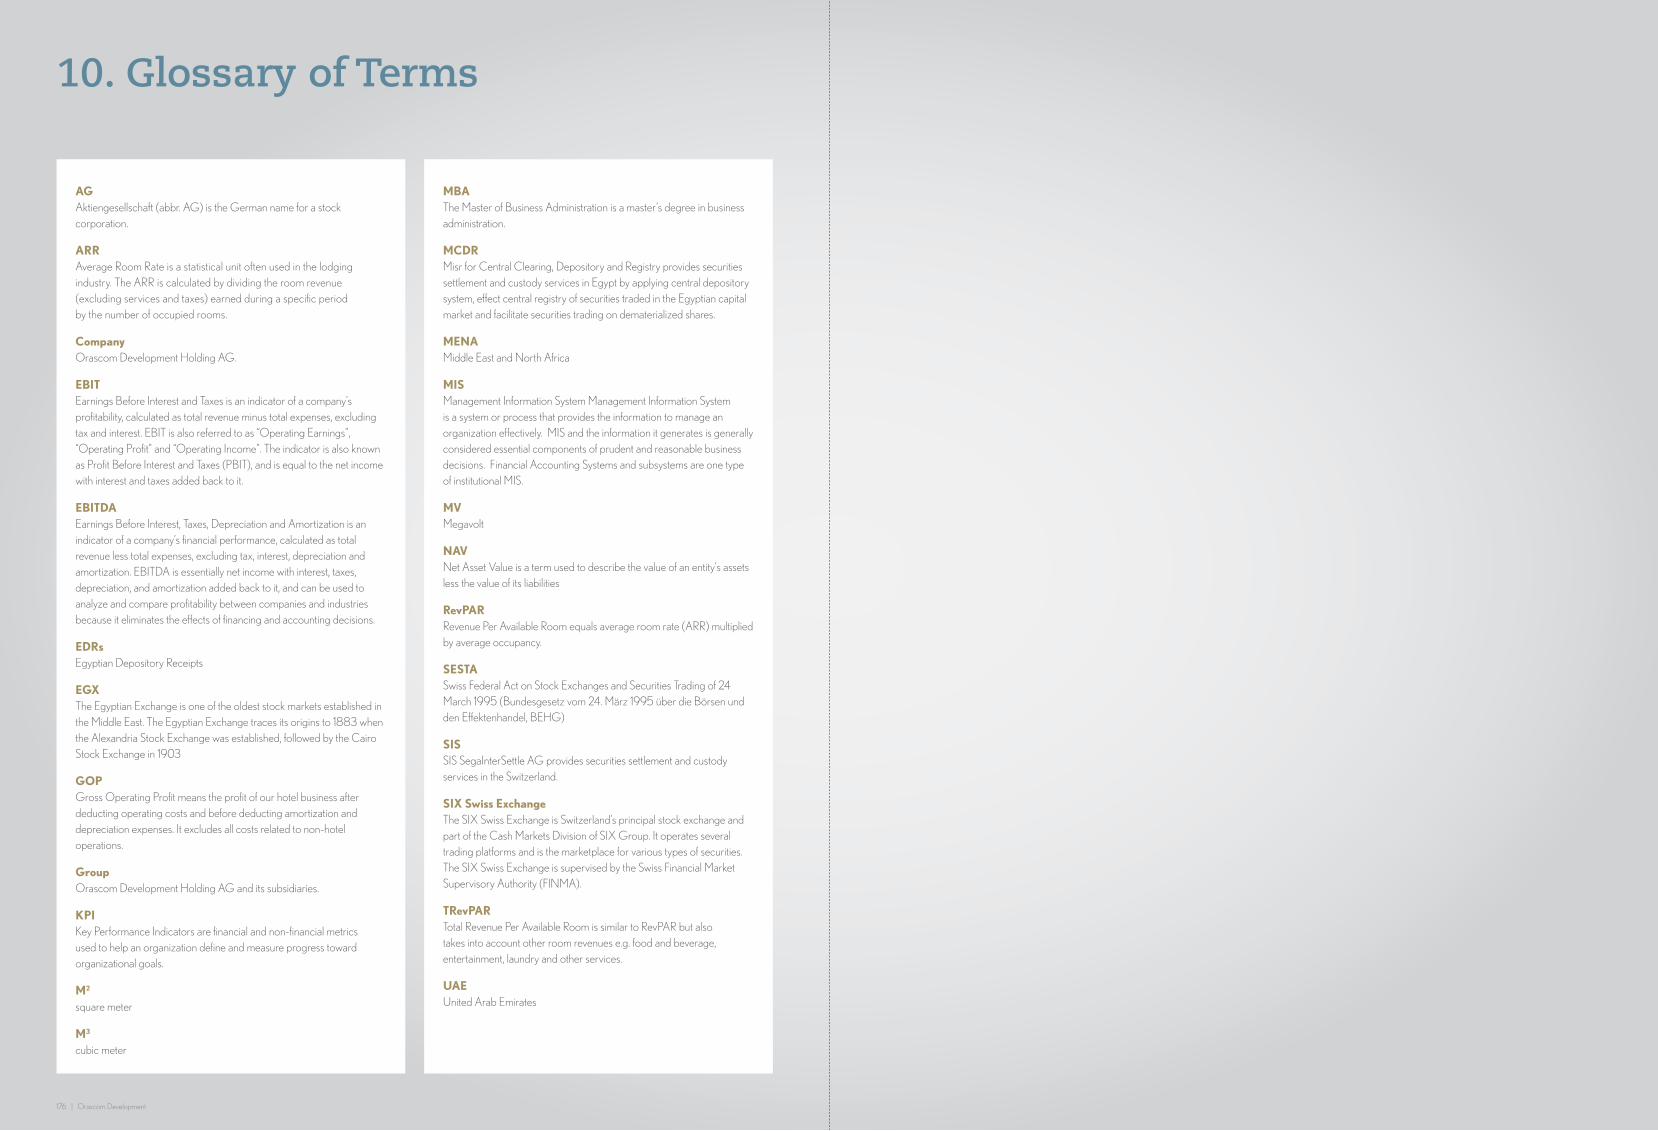
10. Glossary of Terms
AG Aktiengesellschaft (abbr. AG) is the German name for a stock corporation.
ARR Average Room Rate is a statistical unit often used in the lodging industry. The ARR is calculated by dividing the room revenue (excluding services and taxes) earned during a specific period by the number of occupied rooms.
Company Orascom Development Holding AG.
EBIT Earnings Before Interest and Taxes is an indicator of a company’s profitability, calculated as total revenue minus total expenses, excluding tax and interest. EBIT is also referred to as “Operating Earnings”, “Operating Profit” and “Operating Income”. The indicator is also known as Profit Before Interest and Taxes (PBIT), and is equal to the net income with interest and taxes added back to it.
EBITDA Earnings Before Interest, Taxes, Depreciation and Amortization is an indicator of a company’s financial performance, calculated as total revenue less total expenses, excluding tax, interest, depreciation and amortization. EBITDA is essentially net income with interest, taxes, depreciation, and amortization added back to it, and can be used to analyze and compare profitability between companies and industries because it eliminates the effects of financing and accounting decisions.
EDRs Egyptian Depository Receipts
EGX The Egyptian Exchange is one of the oldest stock markets established in the Middle East. The Egyptian Exchange traces its origins to 1883 when the Alexandria Stock Exchange was established, followed by the Cairo Stock Exchange in 1903
GOP Gross Operating Profit means the profit of our hotel business after deducting operating costs and before deducting amortization and depreciation expenses. It excludes all costs related to non-hotel operations.
Group Orascom Development Holding AG and its subsidiaries.
KPI Key Performance Indicators are financial and non-financial metrics used to help an organization define and measure progress toward organizational goals.
M2 square meter
M3 cubic meter
MBA The Master of Business Administration is a master’s degree in business administration.
MCDR Misr for Central Clearing, Depository and Registry provides securities settlement and custody services in Egypt by applying central depository system, effect central registry of securities traded in the Egyptian capital market and facilitate securities trading on dematerialized shares.
MENA Middle East and North Africa
MIS Management Information System Management Information System is a system or process that provides the information to manage an organization effectively. MIS and the information it generates is generally considered essential components of prudent and reasonable business decisions. Financial Accounting Systems and subsystems are one type of institutional MIS.
MV Megavolt
NAV Net Asset Value is a term used to describe the value of an entity’s assets less the value of its liabilities
RevPAR Revenue Per Available Room equals average room rate (ARR) multiplied by average occupancy.
SESTA Swiss Federal Act on Stock Exchanges and Securities Trading of 24 March 1995 (Bundesgesetz vom 24. März 1995 über die Börsen und den Effektenhandel, BEHG)
SIS SIS SegaInterSettle AG provides securities settlement and custody services in the Switzerland.
SIX Swiss Exchange The SIX Swiss Exchange is Switzerland’s principal stock exchange and part of the Cash Markets Division of SIX Group. It operates several trading platforms and is the marketplace for various types of securities. The SIX Swiss Exchange is supervised by the Swiss Financial Market Supervisory Authority (FINMA).
TRevPAR Total Revenue Per Available Room is similar to RevPAR but also takes into account other room revenues e.g. food and beverage, entertainment, laundry and other services.
UAE United Arab Emirates
176 | Orascom Development

www.orascomdh.com