annual report 2011 - subaru
TRANSCRIPT

2011Annual ReportFor the year ended March 31, 2011
We Are Pursuing ....
subaru2011e_0928.indd a3subaru2011e_0928.indd a3 11/09/28 17:2211/09/28 17:22

ANNUAL REPORT 2011FUJI HEAVY INDUSTRIES LTD.
Confi dence in MotionConfi dence in Motion is a unifi ed global brand statement that
encapsulates the aim of the Subaru brand. Confi dence refl ects our approach towards
reliable automobile manufacturing dating back to the Subaru 360 and the relationship of trust that
we have built with customers by providing enjoyment and peace of mind. In Motion expresses
Subaru’s resolve to enhance customer trust by proactively staying abreast of changing trends.
Through Confi dence in Motion, Subaru aims to meet customer expectations for the freedom
and fulfi llment enabled by Subaru’s uniquely satisfying driving experience.
subaru2011e_0928.indd a4subaru2011e_0928.indd a4 11/09/28 17:2211/09/28 17:22

1
Disclaimer Regarding Forward-Looking Statements
Statements herein concerning plans and strategies, expectations or projections about the future, FHI’s efforts with regard to various management issues, and other statements, except for historical facts, are forward-looking statements. These forward-looking statements are subject to uncertainties that could cause actual results to differ materially from those anticipated. These uncertainties include, but are not limited to, general economic conditions, demand for and prices of FHI’s prod-ucts, FHI’s ability to continue to develop and market advanced products, raw material prices, and currency exchange rates. FHI disclaims any obligation to update any forward-looking statements, whether as a result of new information, future events, or otherwise.
Contents
2 _ A Message to Our Stakeholders
4 _ Message from the CEO
10 _ Message from the COO
14 _ Special Feature: Subaru’s Production Structure
17 _ Special Feature: Subaru’s Safety Concept
20 _ Corporate Social Responsibility (CSR)
23 _ Management
24 _ Consolidated Ten-Year Financial Summary
25 _ Management’s Discussion and Analysis of Results of
Operations and Financial Position
34 _ Consolidated Subsidiaries and Affi liates
35 _ Investor Information
subaru2011e_0928.indd 1subaru2011e_0928.indd 1 11/09/28 17:2211/09/28 17:22
2 ANNUAL REPORT 2011FUJI HEAVY INDUSTRIES LTD.
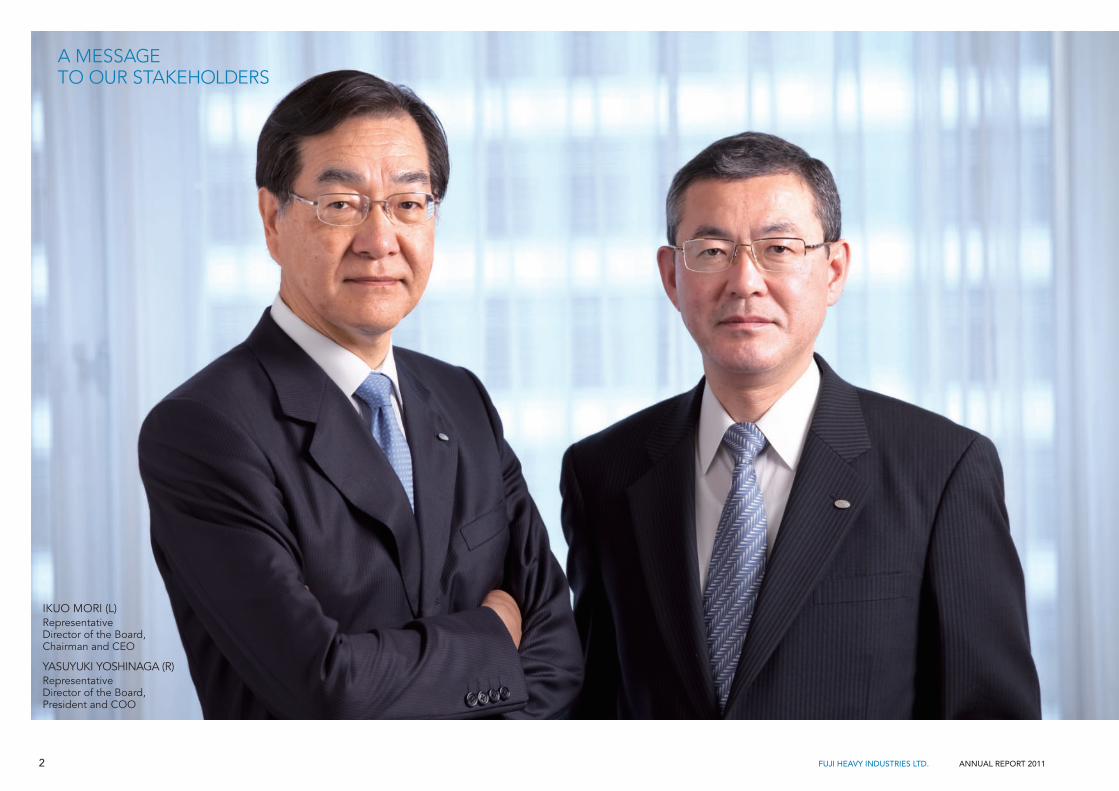
A MESSAGE TO OUR STAKEHOLDERS
IKUO MORI (L)Representative Director of the Board,Chairman and CEO
YASUYUKI YOSHINAGA (R)Representative Director of the Board,President and COO
subaru2011e_0928.indd 2subaru2011e_0928.indd 2 11/09/28 17:2211/09/28 17:22

3
Subaru successfully concluded its four-year, mid-term management plan that commenced in 2007. We achieved record-breaking consolidated unit sales, net sales and net income in fi scal 2011, ended March 31, 2011. We were able to surpass the fi nal-year targets of consolidated operating income of ¥80.0 billion, an operating margin of 5% and ROA of 7%. During the course of the plan, the value of the yen exceeded every forecast and the global economy slumped in the wake of the Lehman Shock. Consequently, we were faced with a crisis, recording losses in fi scal 2009 for the fi rst time in 15 years, which led to the decision not to pay dividends. Despite these extraordinary events, performance was driven by higher sales in the United States, China and other overseas markets fol-lowing the development of globally oriented model designs for Subaru’s mainstay Impreza, Forester and Legacy from 2007 onward. During the fi nal stage of the plan, the environment in which Subaru operates changed dramati-cally following the Great East Japan Earthquake. Yet, the direction outlined by the previous mid-term management plan was ultimately affi rmed. FHI has decided that now is the right time to promote a new president. Simultaneously, FHI will introduce a new mid-term management plan, which starts from fi scal 2012, in line with the new Subaru and the guiding principle, Confi dence in Motion.
Pursuing Greater
Integrationsubaru2011e_0928.indd 3subaru2011e_0928.indd 3 11/09/28 17:2211/09/28 17:22

4 ANNUAL REPORT 2011FUJI HEAVY INDUSTRIES LTD.
We met the fi nal targets set in the previous mid-term management plan, with operating income exceeding ¥80.0 billion and an operating margin of 5.3%.
Achieving Our Targets in the Final Year of the Mid-Term Management Plan
In fiscal 2011, sales volume stood at 657 thousand units, net sales were ¥1,580.6 billion, operating income amounted to ¥84.1 billion and net income totaled ¥50.3 billion. Although the Great East Japan Earthquake caused us to fall one step short of full-year forecasts made during the third quarter financial account settle-
ment, we recorded the highest ever unit sales, net sales and net income. At the same time, we met the final tar-gets set in the previous mid-term management plan, with operating income exceeding ¥80.0 billion and an operating margin of 5.3%. Subaru automobile sales fell year on year due to the major impact of the discontinua-tion of the eco-car subsidy system and the disaster. However, overseas sales of Subaru’s mainstay Legacy, Forester and Impreza remained favorable, leading to an increase in performance in all overseas markets com-pared with the previous fiscal year. For the first time ever, overseas net sales exceeded 70%. The just-concluded mid-term management plan out-lined five key initiatives. In spite of harsh operating con-ditions characterized by a major falloff in demand due to the strong yen and the Lehman Shock, these initiatives helped prove that the direction we took was ultimately correct. As a result of the Great East Japan Earthquake, FHI recorded an extraordinary loss of ¥7.4 billion. This amount includes roughly ¥5.0 billion for fixed costs relat-ed to suspended operations. Approximately ¥2.5 billion was applied to the loss of inventories as well as the loss and the restoration of fixed assets. Reduced operations following the disaster had a major impact on operating income in fiscal 2011.
Increased Sales in the United States, Subaru’s Most Important Market, Spurs Performance
Sales in the United States are the key reason we achieved the targets of the mid-term management plan. Sale volume in the United States increased from 217 thousand units in 2009 to 264 thousand units in 2010, reaching a market share of 2.2%. Surmounting 200 thousand units and achieving a market share of 2% were targets established when I became chief general
MESSAGE FROM THE CEO
IKUO MORI Representative
Director of the Board,Chairman and CEO
subaru2011e_0928.indd 4subaru2011e_0928.indd 4 11/09/28 17:2211/09/28 17:22

5
manager of the Overseas Sales & Marketing Division in 2005. I could not, however, have predicted that unit sales would rise to this extent. Looking back, our intention to increase overseas sales by focusing on the United States, our most important market, was outlined in the just concluded mid-term management plan. In 2007 and 2008, Subaru introduced the Impreza and Forester to the U.S. market with the aim of expanding global sales. Both became successive hits. Consequently, Subaru actually experienced increased sales despite the U.S. financial crisis that occurred half-
for clunkers” incentive program, which encouraged the purchase of new automobiles. In contrast, trade-ins of Subaru vehicles under this program stood at only 173 units. This underscores my belief that the Subaru brand is increasing in popularity. There are approximately 620 Subaru dealerships in the United States. During the course of the mid-term management plan, we increased quality in this area by upgrading systems that allow for more precise follow up with dealers while replacing nearly 40% of all dealers. Consequently, we have significantly bolstered dealer
way through the plan. This garnered much interest and stood in contrast to the major year-on-year drops in sales suffered by many competitors. Taking advantage of this forward momentum, we decided to release the Legacy in 2009, sparking a dra-matic leap in showroom traffic. Subaru took steps to adjust its automobile sizes to global standards while improving fuel economy. At the same time, the switch by customers from large-sized SUVs to Subaru automobiles led to an upswing in sales. In fiscal 2009, Subaru sold 17 thousand units following the introduction of the “cash
Performance OverviewBillions of yen
FY2006 FY2007 FY2008 FY2009 FY2010 FY2011(Forecast)FY2012
Automobiles Sales Volume (thousand units) 571 578 597 555 563 657 632
Net Sales 1,476.4 1,494.8 1,572.3 1,445.8 1,428.7 1,580.6 1,480.0
Operating Income (Loss) 58.3 47.9 45.7 (5.8) 27.4 84.1 30.0
Ordinary Income (Loss) 46.8 42.2 45.4 (4.6) 22.4 82.2 25.0
Net Income (Loss) 15.6 31.9 18.5 (69.9) (16.5) 50.3 35.0
Capital Expenditures 56.2 59.6 56.3 58.0 56.1 43.1 60.0
Depreciation Expenses 57.5 58.9 65.5 65.1 57.1 49.8 55.0
R&D Expenses 46.9 50.7 52.0 42.8 37.2 42.9 48.0
Interest-Bearing Debt 374.1 343.9 304.5 381.7 367.6 330.6 370.0
Exchange Rate (¥/$, non-consolidated) 112 117 116 102 93 86 81
ROE 3.3 6.6 3.7 — — 12.7 —
ROA* 4.6 3.9 3.9 — 2.4 7.1 —
Total Assets 1,348.4 1,316.0 1,296.4 1,165.4 1,231.4 1,188.3 —
Net Assets** 467.8 495.7 494.4 394.7 381.9 414.0 —
* ROA was calculated as “(operating income + interest and dividend income)/(average of assets at the beginning and end of the term)”** Net Assets for the year ended March 2006 was the fi gure of total shareholders’ equity.
subaru2011e_0928.indd 5subaru2011e_0928.indd 5 11/10/03 13:1511/10/03 13:15
6 ANNUAL REPORT 2011FUJI HEAVY INDUSTRIES LTD.
morale and their management foundation. Amid a recovery in overall demand in the United States, if Subaru is able to maintain its current market share of 2%, it will attain its forecasted sales volume of 300 thou-sand units. At present, we face another crisis caused by a lack of inventory following the disaster in Japan. This crisis is fundamentally different from what we confronted following the Lehman collapse, but it is still unfortunate that we are unable to meet the current level of demand as a result of this event. For the foreseeable future, we aim to achieve sales of 300 thousand units and prevent our market share from falling. This is our number one goal.
Subaru’s Survival Hinges on Rejuvenating Operations in Japan
At the start of the mid-term management plan four years ago, the domestic market was forecast to become increasingly severe. To achieve the plan, we clearly need-ed to focus on overseas sales. As a result, we decided to undertake global product planning. However, we could not forget about domestic profitability. To survive and thrive amid harsh conditions character-ized by shrinking domestic demand, Subaru promoted the direct control of wholly owned distributors in Japan.
We aim to achieve sales of 300 thousand units in the United States and prevent our market share from falling. This is our number one goal.
REVIEW OF THE PREVIOUS MID-TERM MANAGEMENT PLAN (FISCAL 2008—2011)
Retail Sales in U.S.
Achievements Sharing the mind of “Customers come fi rst” within group Globalization of products World’s leading safety performance Expanding the sales in U.S., as most important market Reform of profi t structure by leaning cost
Targets VS Actual Results
Actual ResultsFY2007
Targets ofFY2011
Actual ResultsFY2011
Units of Sales (non-consolidated) 584 thousand 683 thousand 657 thousand
Operating Income ¥47.9 billion ¥80.0 billion ¥84.1 billion
Operating Income Margin 3.2% 5% or more 5.3%
¥/$ rate 117 110 86
2010200920082007
300,000
(Unit)
200,000
100,000
(%)
3.0
2.0
1.0
0 0
Retail Sales Market Share
CY
subaru2011e_0928.indd 6subaru2011e_0928.indd 6 11/09/28 17:2211/09/28 17:22

7
In addition, Subaru decided to withdraw from the devel-opment and production of minicars. This was an emo-tional decision since these operations had always been at the core of the Company. Withdrawing from minicars has been the catalyst to reduce fixed costs, shift towards passenger cars and improve overall sales and services at our dealerships. All of these have improved profitability. Half a year ahead of schedule, we established core distributors by consolidating the 46 dealerships nation-wide into 23. A virtuous circle emerged as visible increases in income led to higher morale, which, in turn, translated to further improvements. In short, the domes-tic sales system has been completely overhauled, reduc-ing the break-even-point from 300 thousand units to approximately 165 thousand units.
Progress Continues through FHI’s Alliance with the Toyota Group
The alliance that we commenced with the Toyota Group in 2005 has made steady progress based on a policy of pursuing a win-win relationship for long-term competi-tive growth. During the mid-term management plan, this partnership specifically led to Subaru of Indiana Automotive, Inc. (SIA) commencing production of the Toyota Camry in 2007. SIA’s manufacturing of 100 thou-sand units per year not only contributes to increased profits through the reduction of fixed costs but also has major benefits in terms of the exchange of production technology. Beyond this, the supply of new compact cars and minicars on an OEM basis is going almost according to plan. In addition, we are steadily complet-ing joint development of front-engine, rear-wheel drive compact sports car with Toyota, which we aim to release in spring 2012.
Looking ahead, Subaru will maintain its distinctiveness while continuing the win-win relationship with Toyota.
Strengthening Production Capacity Is an Urgent Issue
During the implementation of the mid-term manage-ment plan, insufficient production capacity became an issue. Even during the 2008 financial crisis, sales regular-ly outpaced production. We were making investments to upgrade the production capacity of our existing facilities to keep pace with sales when the Great East Japan Earthquake struck. In light of damage sustained to cer-tain production and R&D facilities, we were forced to immediately suspend operations. As a result of exhaus-tive efforts, it only took three days to restore production lines. However, we were unable to surpass record-break-ing unit sales because of the significant impact that los-ing two thirds of our production had during March, a period when domestic demand is at its peak. For me, this was a regrettable first. In my 41 years working at Subaru I had never experienced a situation in which we were unable to sell vehicles because of diminished man-ufacturing capacity.
CLOSE UPMARKETING THAT SUPPORTS ROBUST PERFORMANCE
The One Show award showcases excellence in adver-tising and ranks as one of the world’s top three ad-vertising awards along with the Cannes Lions Interna-tional Advertising Festival and the Clio Awards. Each year a variety of work is judged by an international jury of advertising producers, making this a much sought-after prize worldwide.
Referred to as the Academy Awards of the Internet, the Webby Awards is the leading international award honoring excellence on the Internet. Awards are de-termined based on votes cast by both web special-ists and regular members of the online community.
The International Automotive Advertising Awards was established in 1995 to showcase excellence in automotive advertising and marketing.
In May 2011, the One Show advertising awards announced in New York that the Subaru brand movie The Car Parts won the silver medals in the Broadcast Design category in recognition of its design excellence. In addition, the Mediocrity advertising campaign produced by Subaru of America, Inc. (SOA) was awarded a Webby Award in the automobile cat-egory and a gold medal at the International Auto-motive Advertising Awards. These distinctions call attention to outstand-ing marketing efforts that are increasing the value and recognition of the Subaru brand.
Subaru’s award-winning movie The Car Parts
The One Show “Pencil” trophy
subaru2011e_0928.indd 7subaru2011e_0928.indd 7 11/09/28 17:2211/09/28 17:22

8 ANNUAL REPORT 2011FUJI HEAVY INDUSTRIES LTD.
Despite our desire to restore full operations as soon as possible, we expect production in Japan to remain at 60% until the second quarter while SIA’s operations are expected to be capped at 80%. We aim to return to full operations in October. Despite issues related to stable power supply, if component supplies are restored to normal levels, major automakers with high production capacity will be able to rapidly regain their losses. Being accustomed to operating at full capacity, Subaru must now deal with the critical challenge of catching up after operations are restored. To address this problem, we are currently directing business resources to bolster produc-tion capacity. In light of increasing sales volume in the United States and emerging markets, expanding local produc-tion overseas is an urgent issue. In particular, we are accelerating initiatives in response to the Chinese mar-ket. Amid demand topping 18 million vehicles in China, Subaru sold 62 thousand units in the previous year. We believe China is a suitable market for Subaru automo-biles, and we are investigating local production given the unmistakable sales opportunities the country offers. We aim to capture a 1% share of the Chinese market in the medium term with sales of 180 thousand units. Following China, the ASEAN region is another very attractive market. We are examining methods to under-take local production in careful consideration of numer-ous factors. In addition, the shift to local production will enable us to efficiently channel domestic production capacity towards the development of other emerging markets.
Unique Technology is the Essence of Subaru’s Distinctive Driving Experience
We are not mass marketers. Through the provision of distinctive Subaru technology, customers recognize the value of our vehicles. Based on this, we are employing a strategy of offering products with relatively higher price points. Our focus on safety is one aspect of manufacturing distinctively Subaru automobiles. Subaru is increasing “Active Safety” features by refining driving stability through our all-wheel drive and horizontally-opposed engines. Moreover, the superior features of Subaru’s “Passive Safety” have been recognized globally, thanks to its excellent safety performance during collisions. We have taken safety to a higher level through “collision-free cars (pre-crash safety)” enabled by the use of Subaru’s “EyeSight” Active Driving Assist System (ver-sion 2). At present, the installation rate of EyeSight (which is being optionally installed only in the domestic Legacy & Outback models) has reached 80%, far exceeding the initial projected rate of 30%. Customers who experience the collision avoidance and driver bur-den reduction functions of EyeSight, even just one time, view them as absolutely indispensable. EyeSight is grad-ually evolving as a unique technology that is playing a major role in defining the Subaru brand. Regarding the all new Impreza, we are tirelessly pursu-ing the development of an automobile that customers will easily recognize in terms of value, attractiveness and safety.
CLOSE UP
The “EyeSight” MechanismThe EyeSight is equipped with two stereo cam-eras to maintain constant awareness of road conditions in front of the vehicle. This system functions in the same manner as the human eye. Images received by the stereo cameras are processed at ultrahigh speed by the specialized 3D-image processing engine to determine the distance, location and speed of objects. When a potential collision hazard is detected based on data sent mainly from sensors installed in the engine and Vehicle Dynamics Control (VDC), an alarm sounds to warn the driver and the brakes are activated. These functions help to avoid colli-sions as well as reduce collision damage.
External Recognition Received a prize at the Technology of the Year Awards (Sponsor: Automotive Researchers’ & Jour-nalists’ Conference of Japan (RJC))
Received a prize at the Japan Automotive Hall of Fame Association’s (JAHFA) Car Technology of the Year Awards (Sponsor: JAHFA)
HIGHER-THAN-EXPECTED INSTALLATION RATES OF SUBARU’S “EyeSight” IN THE DOMESTIC LEGACY
Image of “EyeSight”
3030%Expected Installation Rates
80%Actual Installation Rates
subaru2011e_0928.indd 8subaru2011e_0928.indd 8 11/09/28 17:2211/09/28 17:22

9
In Conclusion
In light of the series of achievements brought about by our efforts to implement the mid-term management plan as well as the commencement of the new mid-term management plan, we have reached a critical stage. I consider this to be the best time to change president in order to further the major innovations being implement-ed under Subaru’s new management system. As such, the entire organization must undergo constant innova-tion. To date, Subaru has repeatedly experienced both improvements and downturns in operations. Although the direction Subaru must take has not changed, it is the duty of management to develop a growth trajectory through new ideas and strategies that focus on taking advantage of favorable opportunities while refreshing top management. FHI’s new president, Yasuyuki Yoshinaga, possesses a broad strategic viewpoint and most decidedly has the ability to realize the Company’s goals. I have every confidence that he is the most suit-able person to lead Subaru to further growth in the future.
During my five-year term as president of FHI, I carried out my duties with the goal of obtaining results. Although there is much left to accomplish, the direction we have taken has translated into tangible success. Looking ahead, President Yoshinaga will be in charge of the execution of all automobile operations as COO. In my capacity as CEO, I will oversee disaster countermea-sures, develop guidelines for the internal Companies (excluding the Aerospace Company) and manage proj-ects related to China. I feel that Subaru is currently undergoing gradual change. It is our aim to work toward future break-throughs by improving Subaru’s dynamism under the guiding principle, Confidence in Motion. In the years ahead, please stay tuned for even greater achievements from Subaru. I consider this to be
the best time to change presidents in order to further the major innovations being implemented under Subaru’s new management system. Ikuo Mori
Representative Director of the Board,Chairman and CEO
subaru2011e_0928.indd 9subaru2011e_0928.indd 9 11/09/28 17:2211/09/28 17:22
10 ANNUAL REPORT 2011FUJI HEAVY INDUSTRIES LTD.
Subaru will increase its corporate value and realize further growth through “Motion-V.”
Building on the Success of the Previous Mid-Term Management Plan to Achieve Sustainable Progress
Subaru’s previous mid-term management plan began in fiscal 2008. Centered on the philosophy, customers come first, two of the initiatives outlined in the plan were: (1) provide a distinctive Subaru experience for drivers and passengers, and (2) increase sales globally. As a result, unit sales rose significantly in North America,
China and other markets. At the same time, we were able to noticeably improve our profit structure by pro-moting the direct control of wholly owned distributors in Japan. These successes enabled Subaru to exceed its target with operating income of ¥84.1 billion despite a foreign currency exchange rate of ¥86 to the U.S. dollar, which greatly surpassed the ¥110 forecasted during the plan’s formulation. In spite of major sales growth in the United States and China, various issues remain. These include unit sales that are still low compared with other automakers and the ongoing ineffectiveness of Subaru’s initiatives in emerging markets. We recognize that the direction established in the previous mid-term manage-ment plan proved to be correct. With the launching of the new mid-term management plan “Motion-V,” we will continue the initiatives promoted in the previous plan while pursuing sustainable progress in the years ahead. To this end, we must focus our energy on tackling out-standing issues with a healthy sense of urgency. As we consolidate our market foothold over the five-year period established by the new mid-term manage-ment plan, we aim to achieve annual unit sales of one million units within the next 10 years. To this end, we established the new action guideline, Confidence in Motion. Since the release of the Subaru 360 in 1958, the Company has been building a relationship of trust with its customers by providing unique products that make use of its original technologies, including the horizontally-opposed engine and Symmetrical All Wheel Drive (AWD). The new plan forces us to once again reexamine this core aspect of Subaru in order to achieve greater growth in the future. The reason all employees perform their duties with a constant focus on providing products and services trusted by customers is due to the Subaru philosophy of customers come first. There is however a flipside: Taking on new challenges has never been one of Subaru’s strengths. Amid constantly changing market
MESSAGE FROM THE COO
YASUYUKI YOSHINAGA Representative
Director of the Board,President and COO
subaru2011e_0928.indd 10subaru2011e_0928.indd 10 11/09/28 17:2211/09/28 17:22

11
conditions, we must accept new challenges to further strengthen the customer relationship, inspiring confi-dence through our commitment to “Engineering excel-lence.” Based on the Confidence in Motion action guideline, Subaru will increase its corporate value and realize fur-ther growth through the following three initiatives out-lined in “Motion-V.”
1. Provide a Distinctive Subaru Experience
The aim of “Motion-V” is to achieve Subaru’s manage-ment vision of being “a compelling company with a strong market presence.” Understanding the true mean-ing of this vision is more important now than when it was formulated 15 years ago. As a niche manufacturer that possesses a 1% share of the global automobile market, the word “presence” is very important for Subaru. In spite of low unit sales,
Subaru has remained in business for the past 60 years by maintaining a constant market presence. We continue to display our presence through a variety of initiatives that I will discuss below. In order to create a unique market presence, we pro-vide a distinctive Subaru experience for drivers and passengers by offering original value focusing on “Enjoyment and peace of mind.” Subaru strives for driv-ability that incorporates not only sporty handling but also safety. To this end, we are pursuing superior driving performance and danger avoidance through our hori-zontally-opposed engine and Symmetrical AWD; main-taining top-level collision safety capabilities; gradually expanding the “EyeSight” Driving Assist System to overseas markets; and thoroughly improving all-around safety. Regarding our environmental responsiveness, we will gradually install the new horizontally-opposed engine and Lineartronic-CVT (Continuously Variable Transmission) with the goal of improving the fuel economy
of all Subaru vehicles by approximately 30%. In 2013, Subaru is scheduled to launch its first hybrid vehicle, which will be equipped with a horizontally opposed engine. This release has been greatly anticipated by the market. Starting with the U.S. market, Subaru will introduce the new model Impreza in 2011 as part of an effort to expand its product portfolio. This release is in line with our aim to provide a distinctive Subaru experience for drivers and passengers. During the period of the new mid-term management plan, one Subaru automobile brand per year will undergo a full model change. At the same time, we will proactively release new Subaru mod-els. In 2011, Subaru will introduce the Subaru XV to the crossover segment, an area in which the Company excels. In 2012, we plan to launch the Subaru BRZ, a new front-engine, rear-wheel drive sports car jointly devel-oped with Toyota as well as a new model in 2014. As part of our efforts to provide a distinctive Subaru
Pursuing Specifi c Goalssubaru2011e_0928.indd 11subaru2011e_0928.indd 11 11/09/28 17:2211/09/28 17:22

12 ANNUAL REPORT 2011FUJI HEAVY INDUSTRIES LTD.
experience for drivers and passengers, we will imple-ment the market strategies and sales growth measures, discussed below, to prevail over the competition. We will also take steps to develop an appropriate level of production. Through these measures, we aim to surpass sales of one million units within a decade.
2. Accelerate Sales Expansion
It must be recognized that today’s global automobile industry is growing. According to surveys conducted by various market research firms, the total sales volume of the automobile industry is expected to increase
between 90 million and 100 million units in 2015. The ongoing need to display our presence in the growing global automobile market is vital to retaining our 1% share of the global market. As such, achieving the goal of one million units sold is not simply a matter of increasing sales volume but is also central to the promo-tion of sustainable progress, which reflects increases in overall demand. The United States and China are the key markets for realizing this growth. For Subaru, it is critical to fully retain its share of the key U.S. market and avoid delays in its expansion into such emerging markets as China, which is growing rapidly. In fiscal 2016, the final year of the mid-term management plan, we aim to increase
sales by 70 thousand to 380 thousand units in North America compared with fiscal 2011 and by 120 thousand to 180 thousand units in China. Combined with unit sales of 270 thousand in Japan, Europe and Australia as well as 70 thousand in other regions, Subaru anticipates sales volume to grow by 230 thousand to 900 thousand. We intend to maintain a 2% share in the key U.S. mar-ket. Taking advantage of Subaru’s strengths in the cross-over segment (which it had a pioneering role in developing), we plan to increase unit sales of sedans, a high volume sales area. Consequently, much is expected of the new model Impreza. Subaru’s sales in China have grown remarkably. However, major obstacles remain regarding Subaru’s
Provide distinctive Subaru experience
Brand, Technology and Products
Improvement in managementHuman resources, Corporate governance etc.
Accelerate sales expansion
Sales and Production
Solidify operational foundation
Quality, Cost and Alliance
Guiding principle for all activities:Confidence in Motion1. Guiding principle for all activities “Confi dence in Motion”
2. With the basic philosophy of “customers come fi rst,” “Provide distinctive Subaru experience”
3. Strengthen sales force and the availability of automotive supply, “Accelerate sales expansion”
4. Overhaul of cost structure and promoting alliance with Toyota, “Solidify operational foundation”
5. Back up concrete approaches for business, “Improvement in Management”
Strategic Direction for Growth
FIVE CHALLENGES OF MID-TERM MANAGEMENT PLAN “MOTION-V”
subaru2011e_0928.indd 12subaru2011e_0928.indd 12 11/09/28 17:2211/09/28 17:22
13
efforts to penetrate the world’s largest consumer market due to its low sales volume compared with total demand. To avoid getting submerged in the Chinese market, we aim to build a network of 250 dealerships by 2015, approximately twice the current number, and increase sales to 180 thousand units, triple the present amount. We are currently exploring the possibility of joint production in China, which is essential for realizing the aforementioned goals. By promoting local produc-tion in China, Subaru plans on increasing its overseas production ratio from 26% to about 40%.
3. Solidify Our Operational Foundation
The key to solidifying Subaru’s operational foundation lies in product quality and cost improvement. Subaru addressed past difficulties related to its high cost struc-ture in the previous mid-term management plan. “Motion-V” aims to reduce costs related to the new development of existing models by 20% and overall development investment by 30%. I believe that our efforts to thoroughly improve product quality and decrease costs will strengthen Subaru’s operational capacity. In addition, Subaru will pursue greater mutual competitiveness over the long term through its business alliance with Toyota. Examples of our successes to date enabled by this alliance include Subaru of Indiana Automotive, Inc.’s (SIA) contracted manufacturing of the Toyota Camry and the supply of new compact cars and minicars from the Toyota Group on an OEM basis. Subaru is scheduled to release a new front-engine, rear-wheel drive sports car jointly developed with Toyota in 2012. Through these initiatives, Subaru is pursuing a win-win relationship with Toyota that will foster the future development of both companies.
The Outlook for Fiscal 2012
For fiscal 2012, Subaru projects decreases in net sales, operating income and net income of ¥1,480 billion, ¥30 billion and ¥35 billion, respectively. Despite efforts to recover lost production volume in the second half of fis-cal 2012, the annual sales volume is expected to decline 25 thousand units year on year to 632 thousand units. This is attributable to the major impact of disaster-relat-ed production shortages in the first half that lowered sales volume by 79 thousand units compared with the previous fiscal year. To encourage future growth, we plan to invest in the production of new engines and CVTs as well as increase experiment- and research-relat-ed spending on new products. In addition, Subaru will concentrate its efforts on maintaining operating income of ¥30 billion in fiscal 2012 while steadily implementing the various initiatives established by “Motion-V.” Aiming to be “a compelling company with a strong market presence,” all Subaru employees will work together to implement the initiatives outlined in the new plan. I look forward to your continued understanding and support in the years ahead.
Yasuyuki YoshinagaRepresentative Director of the Board,President and COO
According to sustainable progress, which refl ects increases in overall demand, we aim to surpass sales of one million units within a decade.
subaru2011e_0928.indd 13subaru2011e_0928.indd 13 11/09/28 17:2211/09/28 17:22

We will restore production volume to pre-disaster levels and develop a stable production system by augmenting production capacity. Such actions will ensure the supply of high-quality Subaru vehicles to customers worldwide.
14 ANNUAL REPORT 2011FUJI HEAVY INDUSTRIES LTD.
Masahiro KasaiCorporate Senior Vice PresidentChief General ManagerSubaru Manufacturing Div.
SPECIAL FEATURE: SUBARU’S PRODUCTION STRUCTURE order is automatically broadcast in the event that an earth-quake exceeds magnitude four. Following predetermined procedures, all of the Gunma Plant’s approximately 9,000 employees safely evacuated in around 30 minutes. I was deeply relieved that the emergency evacuation drills we conduct on a daily basis proved to be effective. Given the uncertainty of the situation, however, we were fully focused on pressing issues, including the safety of employee families as well as the extent of damage to plant facilities and the supply chain. Immediately follow-ing the earthquake, we established an emergency response headquarters, cancelled the evacuation order after trained employees verified the safety of the plant, and made a concerted effort to determine the level of damage sustained. In an effort to gain control of the situation, we decided to resume operations on March 14 and took steps to determine each department’s responsibilities. To this end, we prepared a disaster response report. Fortunately, we were able to confirm that no one was seriously injured. By the end of the day, we verified the damage to the minicar production plant, the Oizumi Plant (which manufactures engine and transmissions), and other Subaru facilities. The status of the Yajima Plant, which produces passenger cars, was confirmed the following day. This delay was caused by a power outage that made it impossible to determine the safety of the painting station, which has no access to outside light. At the same time, the purchasing division contacted each of Subaru’s business partners to assess the status of
Achieving the Early Restoration of Operations Following the Disaster
Striking on March 11, 2011 at 2:46 p.m., the Great East Japan Earthquake began with a shudder and vertical shaking. Registering at a lower six on the seven-point Japanese seismic intensity scale, the earthquake then vio-lently rocked sideways to such a degree that people were unable to stand. At the Gunma Plant, an evacuation
March 14Decided to suspend operations, despite repairs enabling plant test runs, based on the status of our suppliers and electric power supply
March 11Issued evacuation order immediately after the Great East Japan Earthquake and confi rmed zero employee injuries
March 12Verifi ed the safety of each plant and the extent of damage as well as undertook repairs Fallen piping (Oizumi Plant)A car body shaken loose from
an overhead clamp (Yajima Plant)
subaru2011e_0928.indd 14subaru2011e_0928.indd 14 11/10/05 14:1011/10/05 14:10

15
First, any power disruption would be disastrous for the Oizumi Plant’s heat treatment furnace, a production pro-cess that operates 20-hours per day without interrup-tion. Second, power outages of just two to three hours require extra time to shut down and restart the plant’s computers, greatly reducing production time. In response, the Yajima and Oizumi plants began using in-house power generation systems to supply electricity for the heat treatment process. In addition, these plants maintain electric generators to provide power to com-puter systems. Such measures have made it possible to avoid being affected by planned blackouts. We also shifted the operation of press and other energy-inten-sive processes to the evening. Despite restoring operations faster than initially estimated, we were forced to subsequently suspend
production and deliveries in response to problems aris-ing from planned blackouts and delays in parts supply. Owing to tireless efforts to determine the status of partner business operations and secure parts, we commenced production of minicars on March 31 and passenger cars on April 6. However, the number of Subaru automobiles (including minicars) produced domestically in March plunged from 40,729 units in the previous month to 16,530 units, one third of that record-ed for March 2010. U.S.-based Subaru of Indiana Automotive, Inc. (SIA) had been maintaining full production capacity on the back of strong sales of the Legacy and Outback. In light of the disaster, however, our ability to supply SIA with CKD* components became very uncertain. In order to avoid a suspension of production in the United States,
employee injuries, along with damage to facilities and sup-ply systems. In addition, we quickly secured the external resources needed for repairs and to restore operations. All stations in the plant were visually checked by the evening of March 12. Thanks to the exhaustive efforts of 1,500 employees over March 12 and 13, we conducted test runs on March 14 and resumed operations on March 15, only a day later than planned.
New Challenges Posed by Scheduled Blackouts and Parts Supply Difficulties
The issue we faced immediately following the disaster was how to respond to planned blackouts implemented from March 13 by the Tokyo Electric Power Company. There were two major problems caused by these blackouts.
March 23Resumed production of parts for U.S.-based Subaru of Indiana Automotive, Inc. (SIA) in stages after securing supply
March 24Resumed spare parts production in stages after securing supply
March 31Resumed production of minicars in stages after securing supply
April 6Resumed production of passenger cars in stages after securing supply
Pursuing Stable Supply
subaru2011e_0928.indd 15subaru2011e_0928.indd 15 11/09/28 17:2211/09/28 17:22

16 ANNUAL REPORT 2011FUJI HEAVY INDUSTRIES LTD.
we placed the highest priority on supplying components that had become difficult to procure. On March 23, the Oizumi Plant resumed production of engine compo-nents and transmissions to be sent to SIA. Amid these circumstances, SIA had two choices. The first was to maintain production at the current level, which requires a two-shift work system. The second was to decrease production volume in order to prolong operations. However, if SIA chose to reduce production volume too drastically, it would be unable to return to normal levels, even after component supplies resumed. Given Subaru’s limited production capacity, sharp drops in production volume are unsustainable. Consequently, SIA limited production to 70% by suspending all over-time and holiday work until supply lines in Japan were fully restored. In response to parts supply issues within Subaru’s supply chain, we have increased the number of supply routes, secured replacement parts and changed product designs. Thanks to these efforts, along with the help we provided suppliers to rapidly restore their operations, we have completely solved our supply chain problems. *Completely knocked down or unassembled components
Developing Systems to Regain Lost Production Volume in the Second Half of Fiscal 2012
The mainstay Yajima Plant has a maximum production capacity of 400 thousand vehicles per year. By operating at full capacity, we were able to fill orders for 657 thou-sand finished units in fiscal 2011, the first time consolidat-ed sales volume has ever exceeded 600 thousand units. Following the Lehman collapse, however, we experi-enced difficulties caused by overstaffing. To avoid repeating this situation, we maintain staffing levels between upper and lower requirements based on Subaru’s sales forecasts. As in the case of the previous
fiscal year, when we experienced an increase in orders, we can maintain full production through overtime and holiday work. The staff at Subaru’s plants consists of reg-ular employees, temporary workers and personnel from other departments that assist in production when need-ed. We have made an effort to optimize human resourc-es to address the rapidly changing circumstances currently confronting us by transferring personnel back to their original departments when necessary. We were able to increase the production capacity of the Yajima Plant by approximately 5% to 420 thousand units per year. This was due to undertaking the emer-gency measures mentioned above, using the holiday periods in May and August to upgrade facilities and improving production speed. To comply with new regulations for reducing power usage by 15% from July onward, we commenced week-end operations and implemented various electricity con-servation measures. Moreover, we introduced additional in-house power generators in August. In combination with existing power generation equipment, we have been able to produce approximately 60% of the plant’s power usage internally. As a result of these initiatives, we expect the number of automobiles produced in the second half of fiscal 2012 to increase 34.6% to 288 thousand units. This pro-jected rise in production will more than offset a forecast-ed year-on-year decrease of 28.6% to 175 thousand units in the first half and is a 0.9% rise compared with the pre-vious full fiscal year. Continuing to enjoy the momentum created by favorable sales, SIA plans to boost produc-tion 1.5% year on year to 167 thousand units by produc-ing 99 thousand units in the second half.
Delivering High-Quality Subaru Automobiles as Quickly as Possible
Issues still remain regarding our plans to rapidly shift to full production after power conservation directives are discontinued in late September. We are urgently secur-ing the personnel needed to increase production. Since the end of June, we have accelerated efforts to recruit temporary workers, with plans to increase the staff from 1,100 to 1,500 employees. In retrospect, I believe that our ability to rapidly bounce back from the damage to factories caused by the disaster underscores the success of the “multiple capabilities” concept promoted by Subaru. For a small automobile manufacturer like Subaru, being competitive globally depends on the versatility of each employee. For example, production line staff being able to repair equipment or maintenance staff who can make quality-related judgments. Through programs intended to pass along skills from experienced employees to new ones, it is a tradition at Subaru to cultivate personnel who pos-sess a wide range of abilities. Owing to these initiatives, we were able to restore operations at all Subaru plants faster than expected. Quickly adapting to changing cir-cumstances was a challenging but valuable experience. Our inability to meet the Company’s supply obligations was the most difficult ordeal of all. This meant that we could not fill orders, forcing customers to wait before receiving their purchases. Overcoming this situation and restoring Subaru’s impressive production capability with-out a doubt increases employee motivation. Supplying high-quality Subaru vehicles as soon as possible to car lovers worldwide is my greatest aspiration.
subaru2011e_0928.indd 16subaru2011e_0928.indd 16 11/09/28 17:2211/09/28 17:22

17
SPECIAL FEATURE: SUBARU’S SAFETY CONCEPT
The Development of Superior Products Underpins Subaru
Automobiles and airplanes are unique products because people physically get inside and operate them. This fea-ture differentiates them from most products, which are operated from the outside, including cameras and televi-sions. Responding accurately to the will of the driver, an attractive feature of automobiles is their ability to magnify individual desires and abilities. Improperly used or in the event of an unexpected collision, automobiles can also be dangerous. Our customers select Subaru over dozens of automobile brands worldwide. We are committed to
meeting customer demand through superior technolo-gies, encompassing product planning, design and devel-opment. Where we encounter shortcomings, we will aggressively develop new technologies and incorporate them into our products. We are confident that such dili-gence is appreciated by our customers. In our chosen technological field, “good enough” is never enough. The final product, namely automobiles, will change greatly depending on which features are enhanced. Our planning, design and development divi-sions share the development philosophy of offering cus-tomers reliability and driving pleasure by integrating our superior technologies. Subsequently, the manufacturing division undertakes operations with the determination to “realize whatever is necessary to bring enjoyment to customers.” We work to achieve a distinctive Subaru experience by leveraging our organizational strengths. This involves open dialog and cooperation among the planning, design, development, manufacturing and sales divisions.
What Safety Means to Subaru
The essential function of automobiles is to safely, inex-pensively and quickly transport people and objects. In addition to fulfilling this basic function, Subaru produces vehicles that are attractive because they conform to driver sensibilities and provide ideal handling. We believe the level of safety required for automobiles not only involves collision protection, but is also achieved by tailoring vehicle maneuverability to human senses. Maintaining comfortable driving conditions helps to realize optimal automobile safety. When a vehicle responds exactly as expected, this leads to greater driv-er safety and comfort as well as an enjoyable ride for passengers from start to finish. This is Subaru’s concept of safety.
Taking on the challenge of producing enjoyable and safe automobiles is the source of Subaru’s superior safety performance.
Yoshio HirakawaCorporate Vice PresidentSenior General ManagerSubaru Engineering Div.
subaru2011e_0928.indd 17subaru2011e_0928.indd 17 11/09/28 17:2211/09/28 17:22
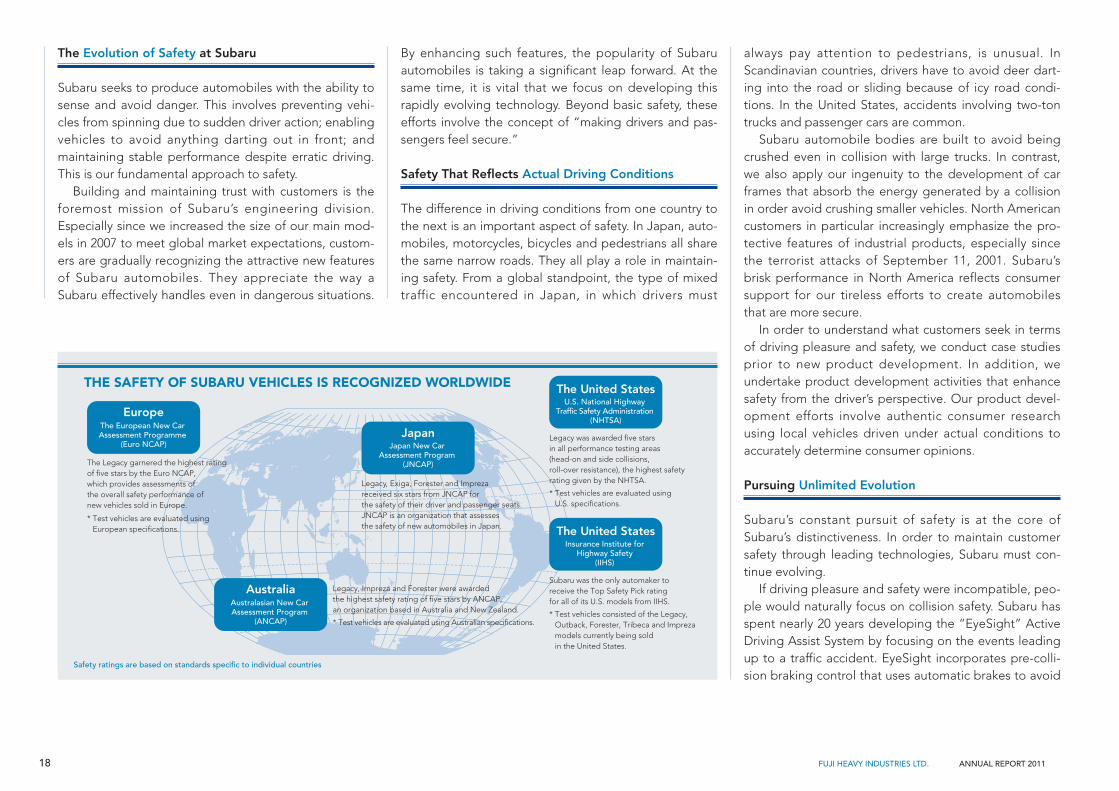
Safety ratings are based on standards specific to individual countries
The Legacy garnered the highest rating of five stars by the Euro NCAP, which provides assessments of the overall safety performance of new vehicles sold in Europe.
* Test vehicles are evaluated using European specifications.
Legacy was awarded five stars in all performance testing areas (head-on and side collisions, roll-over resistance), the highest safety rating given by the NHTSA.
* Test vehicles are evaluated using U.S. specifications.
The United StatesU.S. National Highway
Traffic Safety Administration (NHTSA)
Legacy, Exiga, Forester and Impreza received six stars from JNCAP for the safety of their driver and passenger seats. JNCAP is an organization that assesses the safety of new automobiles in Japan.
JapanJapan New Car
Assessment Program (JNCAP)
Subaru was the only automaker to receive the Top Safety Pick rating for all of its U.S. models from IIHS.
* Test vehicles consisted of the Legacy, Outback, Forester, Tribeca and Impreza models currently being sold in the United States.
The United StatesInsurance Institute for
Highway Safety (IIHS)
Legacy, Impreza and Forester were awarded the highest safety rating of five stars by ANCAP, an organization based in Australia and New Zealand.
* Test vehicles are evaluated using Australian specifications.
AustraliaAustralasian New Car Assessment Program
(ANCAP)
EuropeThe European New Car Assessment Programme
(Euro NCAP)
18 ANNUAL REPORT 2011FUJI HEAVY INDUSTRIES LTD.
THE SAFETY OF SUBARU VEHICLES IS RECOGNIZED WORLDWIDE
The Evolution of Safety at Subaru
Subaru seeks to produce automobiles with the ability to sense and avoid danger. This involves preventing vehi-cles from spinning due to sudden driver action; enabling vehicles to avoid anything darting out in front; and maintaining stable performance despite erratic driving. This is our fundamental approach to safety. Building and maintaining trust with customers is the foremost mission of Subaru’s engineering division. Especially since we increased the size of our main mod-els in 2007 to meet global market expectations, custom-ers are gradually recognizing the attractive new features of Subaru automobiles. They appreciate the way a Subaru effectively handles even in dangerous situations.
By enhancing such features, the popularity of Subaru automobiles is taking a significant leap forward. At the same time, it is vital that we focus on developing this rapidly evolving technology. Beyond basic safety, these efforts involve the concept of “making drivers and pas-sengers feel secure.”
Safety That Reflects Actual Driving Conditions
The difference in driving conditions from one country to the next is an important aspect of safety. In Japan, auto-mobiles, motorcycles, bicycles and pedestrians all share the same narrow roads. They all play a role in maintain-ing safety. From a global standpoint, the type of mixed traffic encountered in Japan, in which drivers must
always pay attention to pedestrians, is unusual. In Scandinavian countries, drivers have to avoid deer dart-ing into the road or sliding because of icy road condi-tions. In the United States, accidents involving two-ton trucks and passenger cars are common. Subaru automobile bodies are built to avoid being crushed even in collision with large trucks. In contrast, we also apply our ingenuity to the development of car frames that absorb the energy generated by a collision in order avoid crushing smaller vehicles. North American customers in particular increasingly emphasize the pro-tective features of industrial products, especially since the terrorist attacks of September 11, 2001. Subaru’s brisk performance in North America reflects consumer support for our tireless efforts to create automobiles that are more secure. In order to understand what customers seek in terms of driving pleasure and safety, we conduct case studies prior to new product development. In addition, we undertake product development activities that enhance safety from the driver’s perspective. Our product devel-opment efforts involve authentic consumer research using local vehicles driven under actual conditions to accurately determine consumer opinions.
Pursuing Unlimited Evolution
Subaru’s constant pursuit of safety is at the core of Subaru’s distinctiveness. In order to maintain customer safety through leading technologies, Subaru must con-tinue evolving. If driving pleasure and safety were incompatible, peo-ple would naturally focus on collision safety. Subaru has spent nearly 20 years developing the “EyeSight” Active Driving Assist System by focusing on the events leading up to a traffic accident. EyeSight incorporates pre-colli-sion braking control that uses automatic brakes to avoid
subaru2011e_0928.indd 18subaru2011e_0928.indd 18 11/09/28 17:2211/09/28 17:22

THE DIRECTION OF SUBARU’S SAFETY SYSTEM EVOLUTION (P CONSTRUCTION)
19
Comfortable driving
Preventive safety
Avoidance safety
Danger
Crash
Collision safety
Damage minimization
Occupant protection
From reducing collision damage to automatic avoidance and autonomous driving
Future focus: Potential Danger Recognition
Danger
Crash
PreCrash
Collision safety
Damage minimizationPedestrian protection
Automatic avoidance
Autonomous/automatic driving
Damage reduction
Comfortable driving
Preventive safety
Avoidance safety
Avoidance
customer awareness of everyday safety. Subaru is inves-tigating to what extent the EyeSight system meets the most pressing needs of customers. Subaru ceaselessly works to perfect its safety technol-ogy. During the next development cycle, nearly 40% of conventional technology can be upgraded using com-puter-aided design. This minimizes the amount of investment as well as the number of employees and engineers required for such tasks. In turn, the savings can be invested to further the development of EyeSight and create new concepts for safe and secure products. We will strive to develop EyeSight danger avoidance functions that are tailored to each customer. We will also enhance system intelligence through new input sensors that have the potential of surpassing the driver’s five senses. We strongly believe that the number of loyal Subaru owners will increase with our efforts to further hone the secure features of Subaru vehicles while increasing comfort and pleasure for both drivers and passengers.
collisions; adaptive cruise control with all-speed range tracking functions to help maintain safe distance between vehicles; and a creep suspension and control system to guard against sudden acceleration due to driver error. Subaru’s development of the EyeSight system for mass-produced automobiles drew the attention of auto-motive organizations worldwide. Subaru began provid-ing a diverse array of information to relevant overseas organizations over a decade ago, back when enhancing collision safety was one of its main goals. Through the EyeSight system, we will make every possible effort to communicate our thoughts on how to improve automo-bile safety. As part of such initiatives, we are providing vehicles for use in research conducted by the Insurance Institute for Highway Safety (IIHS) in the United States and the Thatcham Motor Insurance Repair Research Centre in the United Kingdom. In the year since the launch of EyeSight, we have gained a great deal of insight regarding the changes in
Pursuing
Secure Automobiles
subaru2011e_0928.indd 19subaru2011e_0928.indd 19 11/09/28 17:2211/09/28 17:22

20 ANNUAL REPORT 2011FUJI HEAVY INDUSTRIES LTD.
CSR Management
One aspect of our long-term vision is the aim to be: “A compelling company with a strong market presence.” As such, the new mid-term management plan establish-es the CSR-related themes: “Being a company that con-tributes to the resolution of social issues through the provision of products and services” and “Being a com-pany that values its relationship with various stakehold-ers.” FHI aims to retain the trust of stakeholders and to improve FHI’s corporate value.
CSR Activities
Eight themes underpin FHI’s CSR activities: customers and products, employees, the environment, compliance, information disclosure, social contributions, procure-ment and corporate governance. Based on these themes, we undertake initiatives to help solve a variety of social issues.
ALL-AROUND SAFETY
As well as naturally striving to ensure that the driver and passengers in a Subaru vehicle enjoy a safe and com-fortable ride from a variety of driving scenarios, Subaru aims to improve the overall safety of today’s mobility society from such perspectives as the surrounding envi-ronments and people’s safety.
Active Safety: Safe Driving CapabilitiesSubaru is improving the drive, turn and stop functions fundamental to automobiles, which in turn leads to the avoidance of hazards. Featuring superior weight balance by lowering the center of gravity of Subaru automobiles, Symmetrical AWD is the Company’s core technology that increases pleasurable drivability while enabling safe
CSR Policy
As a corporate entity that carries out monozukuri (“man-ufacturing products”) to bring enjoyment to its custom-ers, the FHI Group has revised its CSR policy. The purpose of the revision to the CSR Policy in 2009, which has received the approval of the CSR-related commit-tees, was to clarify the requirements for approaches at the corporate organizational level: (1) CSR centered on upholding the Corporate Code of Conduct and respect of critical items, and (2) aggressive CSR centered on contributing to social issues through business activities as a good corporate citizen.
1. Based on FHI’s Corporate Code of Conduct, we shall respect the law, human rights, international codes of conduct and stakeholder rights as well as uphold standards of moral behavior.
2. As a good corporate citizen, the FHI Group shall work toward rectifying the global social problems facing modern society.
In addition to focusing on relationships with various stakeholders, our CSR activities emphasize the FHI Group’s mission, which is to contribute to society’s ongoing development through our global business activities.
operation. Owing to the optimal handling it provides in various circumstances, Symmetrical AWD creates leeway that allows drivers to make composed decisions just in time. Such capabilities allow the driver to avoid hazards.
Passive Safety: Collision Safety CapabilitiesIn the event of a collision, Subaru is continuing to pursue next-generation collision safety performance that will reduce injuries not only to drivers and passengers in Subaru automobiles, but to those in other vehicles and pedestrians as well. Consequently, Subaru automobiles have achieved the world’s highest ratings in collision safe-ty performance. (For more details, please refer to p. 18).
Pre-Crash Safety: Working to Realize a Society with-out Automobile AccidentsThe “EyeSight” Active Driving Assist System was devel-oped with the aim of providing the ultimate level of safety, referred to as “collision-free cars.” Subaru’s EyeSight (version 2) has been achieving high installation rates in Japan since release on the Legacy in May 2010. EyeSight (version 2) features such functions as
CORPORATE SOCIAL RESPONSIBILITY (CSR)
subaru2011e_0928.indd 20subaru2011e_0928.indd 20 11/09/28 17:2211/09/28 17:22

21
automobiles require limited global resources as materi-als and fuels. Consequently, they emit carbon dioxide (CO2), which causes global warming, as well as other air pollutants. Profoundly aware of these two aspects of the automobile, Subaru is dedicated to developing next-generation environmental technologies to realize a ben-eficial coexistence between the global environment and automobiles that enable comfort, reliance and fun through Subaru’s Distinctive Driving Experience. Such actions will contribute to the realization of an abundant automobile-based society.
Product Development ActivitiesSubaru aims to achieve compatibility between an automo-bile-based society and an abundant global environment. Subaru released Legacy, Outback, Impreza and
Forester equipped with the world’s first Boxer Diesel Engine in Europe beginning in 2008. Approximately half of Subaru automobiles sold in Europe now fea-ture diesel engines. Subaru has been installing the new horizontally-
opposed engine (which improves fuel economy by approximately 10%) in the Forester since 2010 and will gradually introduce this technology to other models.
Eco Technologies Company is developing wind-pow-er generation that makes full use of this renewable natural energy source.
Corporate Governance
Basic Approach to Corporate GovernanceIn line with its Corporate Philosophy, FHI views the strengthening of corporate governance as one of man-agement’s highest priorities, so that it can measure up to the trust and confidence placed in the Company by all of its shareholders, customers and other stakehold-ers. In the pursuit of more efficient management, FHI is working to clarify management and execution functions to enhance decision-making speed. To this end, the Executive Management Board was established to under-take deliberations regarding Companywide strategies and matters important to business execution. The results of these deliberations are reported to the Board of Directors. In addition to adopting the executive offi-cer system, the Company has positioned the Automobile division as its core business and has intro-duced an internal company system—composed of the Aerospace, Industrial Products and Eco Technology divi-sions—to clarify management responsibilities and accel-erate business execution.
Directors and Corporate AuditorsFHI’s Board of Directors and Board of Corporate Auditors make decisions, monitor and conduct audits regarding matters that are important to business execu-tion. The Board of Directors is comprised of seven direc-tors. This includes an independent outside director who has been appointed to further augment the Company’s corporate governance. The Board of Corporate Auditors is comprised of four corporate audi-tors, including two outside corporate auditors, who par-ticipate in Board of Directors’ and Board of Corporate Auditors’ meetings as well as attend other important company meetings. At the same time, corporate
pre-collision braking control that uses automatic brakes to avoid collisions; adaptive cruise control with all-speed-range tracking functions that helps to maintain a safe distance between vehicles; and a creep suspension and control system that guards against sudden accelera-tion due to driver error.
The Environment
Environmental InitiativesFHI regards global environmental matters as one of its most pressing management issues. On that basis, FHI established in 1998 its “Environmental Policy” and for-mulated the “Operating Criteria for Environmental Conservation” as specific action guidelines. FHI is pro-moting activities in this area based on a detailed revision of the “Environmental Policy” in 2010.
Environmental PolicyIn recognition of the close relationship between the global environment and business activities, we will deliv-er “Green Products” from “Clean Plants and Offices” through “Green Logistics” and “Clean Dealers” to cus-tomers for the sustainable development of society. Also, to say nothing of strictly observing laws and regulations, local agreements and industries’ codes, we will get our-selves committed to contribution to the society and local communities, voluntary ongoing improvements and prevention of pollution.
Corporate Activities and Environmental ImpactsSubaru is a transportation manufacturer focusing on automobiles. Automobiles, which are a convenient and comfortable form of transportation, are now indispens-able for living in a modern society. On the other hand,
subaru2011e_0928.indd 21subaru2011e_0928.indd 21 11/09/28 17:2211/09/28 17:22

22 ANNUAL REPORT 2011FUJI HEAVY INDUSTRIES LTD.
auditors provide appropriate advice and direction from a wide-ranging perspective. The Company has appointed the outside director, Toshio Arima, who possesses considerable experience as an executive and has a high degree of expertise in the area of CSR. The Company has appointed the outside corporate auditor, Giichi Miyakawa, who is fully qualified for this position owing to his management experience and wealth of knowledge as an executive in the manufac-turing industry, and his credentials and abilities to under-take audits in an objective manner. In light of their backgrounds and with no possibility of a conflict of inter-est arising with regular shareholders, Mr. Arima and Mr. Miyakawa have been appointed as independent directors under the Tokyo Stock Exchange (TSE) guidelines.
Overview of Compensation for Directors and Corporate Auditors Regarding executive compensation, the total amount of compensation paid to directors and corporate auditors in one year is limited to ¥600 million and ¥100 million, respectively. These amounts were approved at the Ordinary General Meeting of Shareholders in June 2006. Approved by the Board of Directors, this compensation, which is the basic amount paid to directors, is divided into a fixed amount (the specific amount is decided upon in consideration of the business environment and other factors based on position) and a performance-based amount (the specific amount decided upon in consideration of the business environment and other factors based on consolidated ordinary income for the fiscal year under review). In fiscal 2011, compensation for directors and corpo-rate auditors was as follows:
Risk ManagementFHI takes steps to maintain business operations during emergencies by fully comprehending and taking optimal measures to deal with risk. Based on its compliance sys-tems, FHI strengthens its risk management through the coordination of each division and company. Many types of risk can seriously affect FHI’s manage-ment. In addition, such risks may lead to emergency sit-uations that cannot be addressed through regular decision-making channels. Such risks are categorized into natural disasters, accidents, internal and external human factors, social factors, and compliance. The Company has prepared a manual for responding these types of emergencies. FHI works to address risks through measures that include establishing optimal communication channels to provide information after risks are detected as well as an emergency response headquarters.
Fundamental Emergency Response Policies (1) Life and physical safety are of the utmost importance(2) Minimize losses related to stakeholders and corpo-
rate value(3) Consistently take actions that are honest, fair and
transparent, especially during emergencies
ReportBoard of Corporate
Auditors Meeting (4 corporate auditors,
including 2 outside corporate auditors)
Corporate Governance System
Corporate Operations at HQ, Automotive BU, Each Company and Affiliate of the Group
Appoint/Dismiss
Appoint/Dismiss
Appoint/Dismiss
Audit
Report
Report
Report
Cooperate
Audit
Make proposal for and report on plans
Approval of policy presentations and plans
Appoint/Dismiss
Assign/Supervise
Implement
Internal Audit Department
Executive Management Board Meeting
Corporate Vice Presidents
(20)
CSR Committee
Environmental Committee
Recall Committee
Export Control Committee
Compliance Committee
Committees
Appoint/Dismiss/Supervise
President/Representative
Director
General Meeting of Shareholders
Board of Directors Meeting
(7 directors)
Report
Deliberate and report on important matters
Accounting Auditors
Millions of yen
Classifi cation Number
Basic compensation
TotalFixed
amount
Performance-based
amount
Directors 8 244 101 345
Corporate auditors 5 81 — 81
Outside corporate auditors (Included above)
2 32 — 32
Total 13 325 101 426
Note: This chart includes directors and corporate auditors who retired at the conclusion of the Ordinary General Meeting of Shareholders, held in June 2010.
subaru2011e_0928.indd 22subaru2011e_0928.indd 22 11/09/29 15:3511/09/29 15:35

23
MANAGEMENT (As of June 24, 2011)
Representative Director of the Board,Chairman and CEO
1. IKUO MORI
Representative Director of the Board,President and COO
2. YASUYUKI YOSHINAGA
Representative Director of the Board,Deputy President
3. JUN KONDO
Directors of the Board,Executive Vice Presidents
4. AKIRA MABUCHI
5. NAOTO MUTO
6. TOMOHIKO IKEDA
Outside Director of the Board
7. TOSHIO ARIMA 1
Executive Vice Presidents
MITSURU TAKAHASHI (CFO)
SHUZO HAIMOTO
MITSURU TAKADA
Senior Vice Presidents
TAMAKI KAMOGAWA
HISASHI NAGANO
MOTOHISA MIYAWAKI
TAKESHI TACHIMORI
MASAHIRO KASAI
Vice Presidents
MOTOKIYO NOMURA
YASUO UENO
HIDETOSHI KOBAYASHI
YOSHIO HIRAKAWA
RYOICHI SHIMOKAWA
TATSUHIKO MUKAWA
YASUO KOSAKAI
TSUYOSHI NAKAI
YASUNOBU NOGAI
MASASHI TAKAHASHI
MASAMI IIDA
TOMOMI NAKAMURA
Standing Corporate Auditors
SHUNSUKE TAKAGI
HIROYUKI OIKAWA
NOBUSHIGE IMAI 2
Corporate Auditor
GIICHI MIYAKAWA 3
1. Toshio Arima has been appointed as an outside director in accor-dance with Japanese Corporate Law (the “Law”) and an indepen-dent director under Tokyo Stock Exchange (TSE) regulations.
2. Nobushige Imai has been appointed as an outside corporate auditor in accordance with the Law
3. Giichi Miyakawa has been appointed as an outside corporate auditor in accordance with the Law and an independent director under TSE regulations.
65
74
1
23
subaru2011e_0928.indd 23subaru2011e_0928.indd 23 11/09/28 17:5911/09/28 17:59

24 ANNUAL REPORT 2011FUJI HEAVY INDUSTRIES LTD.
Millions of yenThousands of
U.S. dollars*2002 2003 2004 2005 2006 2007 2008 2009 2010 2011 2011
For the Year: Net sales ¥1,362,493 ¥1,372,337 ¥1,439,451 ¥1,446,491 ¥1,476,368 ¥1,494,817 ¥1,572,346 ¥1,445,790 ¥1,428,690 ¥1,580,563 $19,008,575 Cost of sales 992,950 1,011,582 1,085,716 1,107,718 1,125,293 1,142,674 1,217,662 1,164,564 1,152,763 1,241,427 14,929,970 Gross profit 369,543 360,755 353,735 338,773 351,075 352,143 354,684 281,226 275,927 339,136 4,078,605 Selling, general and administrative expenses 281,063 293,234 303,411 296,756 292,736 304,237 309,004 287,029 248,577 255,001 3,066,759 Operating income (loss) 88,480 67,521 50,324 42,017 58,339 47,906 45,680 (5,803) 27,350 84,135 1,011,846 Income (loss) before income taxes and minority interests
56,136
46,970
56,266
21,066
28,674
45,589
31,906
(21,517)
(443)
63,214
760,241
Net income (loss) 30,283 33,484 38,649 18,238 15,611 31,899 18,481 (69,933) (16,450) 50,326 605,244 Comprehensive income — — — — — — — — (13,416) 34,900 419,723
At Year-End: Net assets** ¥0,399,598 ¥0,414,614 ¥0,457,027 ¥0,474,616 ¥0,467,786 ¥0,495,703 ¥0,494,423 ¥0,394,719 ¥0,381,893 ¥ 413,963 $ 4,978,509 Shareholders’ equity 396,112 411,252 453,708 471,149 465,522 494,004 493,397 393,946 380,587 412,661 4,962,850 Total assets 1,269,558 1,344,072 1,349,727 1,357,459 1,348,400 1,316,041 1,296,388 1,165,431 1,231,367 1,188,324 14,291,329 Ratio of shareholder’s equity to total assets (%) 31.2% 30.6% 33.6% 34.7% 34.5% 37.5% 38.1% 33.8% 30.9% 34.7%
Per Share (in yen and U.S. dollars): Net income or net loss: Basic ¥40.74 ¥44.84 ¥50.62 ¥23.27 ¥20.66 ¥44.46 ¥25.73 ¥(91.97) ¥(21.11) ¥64.56 $0.78 Diluted 38.83 42.91 49.66 23.27 20.66 44.44 25.73 — — — — Net assets 532.88 553.90 582.60 604.51 649.41 687.81 687.02 505.59 488.58 528.88 6.36
Other Information: Automobile inventory (thousand units): Japan 33.5 22.9 28.4 24.5 18.5 16.5 12.4 13.5 10.5 6.4 United States 41.2 44.7 48.1 51.2 55.6 46.3 49.5 54.2 41.8 47.1 Depreciation/amortization expenses ¥00,63,964 ¥00,67,896 ¥00,71,112 ¥00,71,010 ¥00,80,073 ¥00,81,454 ¥00,87,164 ¥00,74,036 ¥0,065,785 ¥ 56,062 $ 674,227 Capital expenditures (addition to fixed assets)
118,376
119,423
128,026
147,759
119,289
126,329
118,869
95,153
89,077
67,378
810,319
R&D expenses 54,903 60,110 57,541 52,962 46,893 50,709 52,020 42,831 37,175 42,907 516,019 Number of shares issued (thousands of shares)***
746,506
746,521
782,865
782,865
782,865
782,865
782,865
782,865
782,865
782,865
Number of shareholders*** 33,094 35,584 34,704 34,558 46,367 42,920 44,484 40,839 39,223 34,240 Number of employees***: Parent only 13,374 13,064 12,928 12,703 11,998 11,752 11,909 12,137 12,483 12,429 Consolidated 26,483 27,478 27,296 26,989 26,115 25,598 26,404 27,659 27,586 27,296*** U.S. dollar figures have been translated from yen, for convenience only, at the rate of ¥83.15 to US$1.00, the approximate rate of exchange at March 31, 2011.*** Prior year amounts have been reclassified to conform to the current year presentation.*** As of March 31
FUJI HEAVY INDUSTRIES LTD. AND CONSOLIDATED SUBSIDIARIES, Years ended March 31
CONSOLIDATED TEN-YEAR FINANCIAL SUMMARY

25
The Fuji Heavy Industries Ltd. Group
The Fuji Heavy Industries Ltd. (“FHI”) Group is engaged in production and sales activities across a wide range of business sectors. These activities are conducted under four business divisions: Automobiles (the Group’s core operating domain, which accounts for over 90% of consolidated net sales), Aerospace, Industrial Products and Other. On a consolidated settlement of accounts basis, FHI and 71 subsidiaries (no change year on year) as well as 9 equity-method affiliated companies (no change year-on-year) were included in the scope of the FHI Group’s consolida-tion as of March 31, 2011, the end of fiscal 2011 (“the fiscal year under review”).
Overview
Business EnvironmentDuring fiscal 2011, ended March 31, 2011, the global econo-my began to gradually recover primarily owing to increased exports on the back of improved economic conditions in the North America and economic growth in China. This was also due to the impact of a series of economic coun-termeasures implemented by individual countries. Under these circumstances, the FHI Group took steps to achieve the targets established in its four-year, medium-term management plan, which concluded in fiscal 2011. To this end, the Group aggressively increased domestic and overseas sales activities focusing on auto-mobiles as it promoted struc tural improvements. However, the environment in which the Group operates experienced a major setback as a result of the Great East Japan Earthquake, which occurred on March 11, 2011. The damage incurred to Group production and other facilities during the disaster was relatively minor. Despite this, production and sales for March were severely impact-ed by the halting of component supplies from affected business partners and power shortages caused mainly by the accident at the Fukushima Daiichi Nuclear Power Plant.
Performance ReviewThe above factors reflect the unforeseen changes that took place during the final month of the fiscal year under review. Nevertheless, the Group successfully achieved operating income of ¥80.0 billion, an operating income ratio of 5% and ROA of 7%, all of which were targets set for the final year of FHI’s mid-term management plan. In addition, consolidated automobile unit sales, net sales and net income reached record high levels. Enabled by our focus on sales from a global perspective and our pursuit of a “Distinct Subaru Experience”—which is centered on the concept of “customers come first”—these results reaffirm that we have been moving in the right direction. Consolidated performance during the fiscal year under review was as follows. Sales increased in the Automobiles division, which recorded strong sales focusing on the North American and Chinese markets, and the Industrial Products division, which experienced a rise in sales of engines thanks to a recovery in demand. As a result, net sales in fiscal 2011 were ¥1,580.6 billion, up ¥151.9 billion, or 10.6%, compared with in the fiscal year ended March 31, 2010. This result occurred despite the negative impact of yen appreciation on foreign currency exchange rates. On a geographic basis, net sales in Japan decreased 10.3% to ¥467.3 billion compared with the previous fiscal year because of such factors as a fall in automobile sales following the conclu-sion of eco-car subsidies as well as the recent disaster. Overseas sales, however, rose 22.6% to ¥1,113.2 billion year on year owing to increased unit sales in every market, most notably North America and China. For the first time, overseas sales accounted for 70% of net sales. From a profit perspective, the FHI Group reported an operating income of ¥84.1 billion, representing a gain of ¥56.8 billion, or 207.6%, compared with the previous fiscal year. Despite the impact of strong yen and a rise in R&D expenses, the increase was the result of favorable overseas sales and efforts to reduce costs, including SG&A and other expenses. Net income totaled ¥50.3 billion, a positive turnaround of ¥66.8 billion from a net loss of ¥16.5 billion in
Operating Income (Loss) & Net Income (Loss)(Billions of yen)
90
60
30
0
-30
-60
-90
� Operating Income (Loss) � Net Income (Loss)
2007FY 2008 2009 2010 2011
1,600
1,200
800
400
0
Net Sales(Billions of yen)
2007FY 2008 2009 2010 2011
MANAGEMENT’S DISCUSSION AND ANALYSIS OF RESULTS OF OPERATIONS AND FINANCIAL POSITION

26 ANNUAL REPORT 2011FUJI HEAVY INDUSTRIES LTD.
Consolidated Automobile Sales Number of units
2007 2008 2009 2010 2011
Domestic Units:
Legacy 43,951 31,079 20,415 28,862 22,673
Impreza 24,135 29,678 19,733 21,721 20,184
Forester 11,807 16,863 16,424 11,879 12,685
Exiga — — 11,126 10,789 7,859
OEM — — 2,034 1,523 4,430
Others 1,308 435 363 323 303
Subtotal 81,201 78,055 70,095 75,097 68,134
Minicars 145,610 130,635 108,694 96,175 89,971
Domestic Total 226,811 208,690 178,789 171,272 158,105
Overseas Units by Region:
United States 190,276 192,760 188,240 227,028 278,959
Canada 16,247 17,587 18,873 22,828 28,059
Europe 58,475 63,373 56,764 37,340 48,244
Russia 12,929 22,622 20,711 1,563 11,320
Australia 38,136 40,210 36,716 34,992 41,150
China 7,454 12,621 26,184 48,938 62,412
Others 27,610 38,802 29,056 18,876 28,715
Subtotal 351,127 387,975 376,544 391,565 498,859
Overseas Units by Model:
Legacy 133,720 137,829 102,106 146,099 225,388
Impreza 90,927 113,777 97,472 74,998 87,066
Forester 102,969 96,839 153,289 156,288 176,453
Tribeca 18,268 27,327 17,658 7,564 5,643
OEM 4,848 11,624 5,580 5,994 3,865
Others 395 579 439 622 444
Subtotal 351,127 387,975 376,544 391,565 498,859
Total 577,938 596,665 555,333 562,837 656,964
800,000
600,000
400,000
200,000
0
� Japan � United States � Canada � Europe � Russia � Australia � China � Others
2007FY 2008 2009 2010 2011
Consolidated Automobile Sales by Region(Number of units)
Consolidated Automobile Sales by Model
� Legacy � Impreza � Forester � Tribeca � Exiga � OEM � Others � Minicars
2007FY 2008 2009 2010 2011
800,000
600,000
200,000
400,000
0
(Number of units)

27
(Number of units)
300,000
200,000
100,000
0
Non-Consolidated Domestic Automobile Sales by Model
� Legacy � Impreza � Forester � Exiga � OEM � Minicars
2007FY 2008 2009 2010 2011
400,000
300,000
200,000
100,000
0 2007FY 2008 2009 2010 2011
Non-Consolidated Automobile Export Units by Model
� Legacy � Impreza � Forester � Others CKD Overseas
(Number of units)
Non-Consolidated Automobile Sales Number of units
2007 2008 2009 2010 2011
Domestic Units:
Legacy 47,176 34,634 22,059 30,927 23,212
Impreza 26,159 32,873 21,935 23,316 20,859
Forester 12,946 18,740 16,954 12,542 13,160
Exiga — — 12,787 11,893 8,150
OEM — — 2,651 1,575 5,313
Others — — — — —
Subtotal 86,281 86,247 76,386 80,253 70,694
Minicars 157,453 132,872 110,043 97,230 92,752
Domestic Total 243,734 219,119 186,429 177,483 163,446
Export Units:
Legacy 46,410 48,568 28,787 43,937 67,926
Impreza 92,782 119,000 99,688 69,386 83,921
Forester 99,637 98,602 164,960 159,463 174,541
Others 894 7,533 6,978 6,934 4,309
Export total 239,723 273,703 300,413 279,720 330,697
U.S. Retail Sales*:
Legacy 84,442 78,428 66,878 86,330 131,873
Impreza 41,148 46,329 49,098 46,611 44,395
Forester 51,258 44,534 60,748 77,781 85,080
Baja 5,241 1,127 — — —
Tribeca 18,614 16,790 10,975 5,930 2,472
Total 200,703 187,208 187,699 216,652 263,820
CKD** Overseas 100,972 110,363 77,871 113,605 163,469
(SIA Portion) 100,972 110,363 77,871 113,605 163,469
SIA Production Units***
Legacy 89,351 84,960 73,473 100,149 159,215
Tribeca 21,022 24,218 18,108 4,197 5,558
* U.S. Retail Sales are the aggregate figures for the calendar year from January through December.** CKD: Completely Knocked Down*** SIA Production Units are the aggregate figures for the calendar year from January through December until 2009.

28 ANNUAL REPORT 2011FUJI HEAVY INDUSTRIES LTD.
the fiscal year ended March 31, 2010. This improvement occurred in spite of an extraordinary loss of ¥7.4 billion due to the disaster. (Please refer to “Cost of Sales, Expenses and Operating Income” [next page] for more details.)
Segment Information
Automobiles DivisionIn the fiscal year under review, sales volume for completed automobiles stood at the record high level of 657 thousand units, up 94 thousand units, or 16.7%, year on year in spite of the conclusion of eco-car subsidies in Japan and the impact of the Great East Japan Earthquake during the second half of fiscal 2011. This increase was attributable to ongoing strong sales of the Legacy, mainly in North America and China. In Japan, sales volume during the first half of fiscal 2011 was favorable, exceeding that of the previous fiscal year. Factors contributing to this result include strengthening product capabilities by releasing Legacy models equipped with “EyeSight” Active Driving Assist System (version 2) and the minicar models Lucra and Pleo, as well as the posi-tive contribution made by eco-car subsidies. During the second half, however, circumstances turned severe. Sales volume fell year on year despite ongoing efforts to improve products that included the release of Forester models equipped with the New-Generation Subaru Boxer Engine and the new compact car Trezia. This negative result was caused by the cessation of eco-car subsidies and the impact of the Great East Japan Earthquake. As a result, the full-year sales volume of Subaru passen-ger cars in Japan fell 7 thousand units, or 9.3%, year on year to 68 thousand units, while the sales volume of mini-cars declined 6 units, or 6.5%, to 90 thousand units. Accordingly, domestic sales volume decreased 13 thou-sand units, or 7.7%, to 158 thousand units compared with the previous fiscal year. Overseas, sales volume in the first half increased signifi-cantly compared with the corresponding period of the previous fiscal year owing to shipment adjustments
1,600
1,200
800
400
0
Net Sales by Division (Excluding intersegment sales)
� Automobiles � Aerospace � Industrial Products � Other
2007FY 2008 2009 2010 2011
(Billions of yen)
Net Sales by Division (Excluding intersegment sales) Billions of yen
2007 2008 2009 2010 2011
Automobiles ¥1,339.3 ¥1,421.2 ¥1,316.3 ¥1,294.5 ¥1,452.2
Aerospace 94.0 99.7 80.9 93.2 82.8
Industrial Products 49.7 40.7 34.9 23.9 30.1
Other 11.8 10.8 13.7 17.1 15.5
Total ¥1,494.8 ¥1,572.3 ¥1,445.8 ¥1,428.7 ¥1,580.6
undertaken within the market and favorable sales of such models as the Legacy and Forester in all regions, begin-ning with North America and China. Despite the impact of the disaster, the year-on-year rise in sales volume during the second half was spurred on by ongoing sales of the Legacy, particularly in North America. As a result, overseas sales volume jumped 107 thousand units, or 27.4%, to 499 thousand units compared with the previous fiscal year, reflecting record sales in the United States, Canada, China and Australia. By region, units sold in the United States were up 52 thousand units, or 22.9%, to 279 thousand units, while unit sales in Canada increased 5 thousand units, or 22.9%, to 28 thousand units, thanks to continual robust sales of the Legacy and Forester. In China, sales volume grew 13 thou-sand units, or 27.5%, to 62 thousand units year on year owing to favorable sales of the Legacy. In Europe and Russia, sales volume improved 21 thousand units, or 53.1%, year on year to 60 thousand units. Year-on-year unit sales in Australia increased 6 thousand units, or 17.6%, to 41 thousand units, while sales volume in other regions were up 10 thousand units, or 52.1%, to 29 thousand units. Consequently, net sales in the Automobile division rose ¥157.8 billion, or 12.2%, to ¥1,452.2 billion compared with the previous fiscal year despite the impact of the yen’s appreciation in foreign currency exchange markets. This result was driven by strong sales in the overseas market. Segment income in the fiscal year ended March 31, 2011 jumped ¥58.7 billion, or 270.2%, year on year to ¥80.4 billion. This rise was primarily attributable to improved overseas unit sales as well as efforts to reduce costs, including SG&A and other expenses.
Aerospace DivisionNet sales fell year on year due to decreased sales of such products as unmanned aircraft research systems produced for Japan’s Ministry of Defense. In the commercial sector, however, net sales rose compared with the previous fiscal year thanks to an improvement in sales of the Boeing 787. The rise in commercial sales occurred in spite of
decreased sales of the Boeing 777, caused by the impact of the strong yen on foreign currency exchange rates. Based on these factors, net sales in the Aerospace divi-sion decreased ¥10.4 billion, or 11.2%, compared with the previous fiscal year, to ¥82.8 billion. Segment income declined ¥2.6 billion, or 53.1%, to ¥2.3 billion.
Industrial Products DivisionIn Japan, sales of engines primarily used in construction and electrical equipment increased thanks to an ongoing

29
100
80
60
40
20
0
-20
Segment Income (Loss) by Division
� Automobiles � Aerospace � Industrial Products � Other � Corporate and Elimination
2007 2008 2009 2010 2011FY
(Billions of yen)
Segment Income (Loss) by Division Billions of yen
2007 2008 2009 2010 2011
Automobiles ¥37.8 ¥37.1 ¥(9.2) ¥21.7 ¥80.4
Aerospace 5.7 4.4 1.6 4.8 2.3
Industrial Products 1.5 0.7 (1.6) (2.4) (0.1)
Other 2.3 2.5 3.1 2.6 1.5
Corporate and Elimination 0.6 0.9 0.3 0.7 0.1
Total ¥47.9 ¥45.7 ¥(5.8) ¥27.4 ¥84.1
(5.8)
26.0
23.2
8.75.7
(30.4)
27.4
27.4
83.18.9
6.1
(35.6)(5.7)
84.1
Analysis of Increases and Decreases in Operating Income (Consolidated, Three-Year YoY Comparison)
� O
pera
ting
loss
FYE
Marc
h 200
9�
Red
uctio
n in c
ost
� D
ecre
ase o
f SG&A
expe
nses
and
othe
rs�
Impr
ovem
ent o
f
sales
volum
e &
mixt
ure a
nd o
ther
s
� Lo
ss o
n for
eign
exch
ange
� D
ecre
ase o
f
R&D ex
pens
es
� O
pera
ting
incom
e
FYE
Marc
h 201
0
� O
pera
ting
incom
e
FYE
Marc
h 201
0
� R
educ
tion i
n cos
t�
Dec
reas
e of S
G&A
expe
nses
and
othe
rs
� Im
prov
emen
t of
sales
volum
e &
mixt
ure a
nd o
ther
s
� Lo
ss o
n for
eign
exch
ange
� In
creas
e of
R&D ex
pens
es�
Ope
ratin
g inc
ome
FYE
Marc
h 201
1
84.1 3.7
(22.0)
(18.8)
(11.9)(5.1)
30.0
� O
pera
ting
incom
e
FYE
Marc
h 201
1
� Lo
ss o
n for
eign
exch
ange
s�
Det
erior
ation
of
sales
volum
e &
mixt
ure a
nd o
ther
s
� D
ecre
ase o
f SG&A
expe
nses
and
othe
rs
� R
educ
tion i
n cos
t�
Incre
ase o
f
R&D ex
pens
es�
Ope
ratin
g inc
ome
FYE
Marc
h 201
2 (pl
an)
(Billions of yen)
recovery in demand starting in the beginning of 2011 as well as a bottoming out of market inventories. Overseas, engine sales volume grew considerably in all markets, par-ticularly in North America, Europe (which includes Russia) and Middle Eastern countries. As a result, net sales in the Industrial Products division increased ¥6.1 billion, or 25.7%, compared with the previous fiscal year, to ¥30.1 billion. Despite a ¥2.4 billion year-on-year improvement in segment income, the division reported an
segment loss of ¥0.1 billion due to the impact of foreign currency exchange rates.
Other DivisionThe number of large-scale wind turbine generator system deliveries fell primarily due to a slump in overall demand. At the same time, unit sales of sanitation trucks decreased. As a result of these and other factors, net sales in the Other division dropped ¥1.6 billion, or 9.5%, compared with the previous fiscal year, to ¥15.5 billion, and segment income decreased ¥1.1 billion, or 42.9%, year on year, to ¥1.5 billion.
Cost of Sales, Expenses and Operating Income
Operating IncomeOperating income, as mentioned previously, rose ¥56.8 billion year on year to ¥84.1 billion, despite decreases in income of ¥35.6 billion and ¥5.7 billion caused, respectively, by the appreciation of the yen in foreign currency exchange markets and R&D expenses for new model development and environment-friendly applications. This increase was primarily attributable to improved sales volume and mix contributing ¥83.1 billion, on the back of increased unit sales in all overseas markets, including the United States and China; a reduction in costs of ¥8.9 billion that offset an increase in raw material prices; and a ¥6.1 billion decline in SG&A and other expenses thanks to a fall in fixed manu-facturing costs and expenses used to address customer complaints. Consequently, the operating margin increased 1.9% year on year to 5.3%.
Income before Income Taxes and Minority Interests, and Net IncomeNon-operating and extraordinary expenses totaled ¥20.9 billion, a ¥6.9 billion decrease, year on year. This was mainly attributable to the FHI Group’s financial revenue and expenditure (interest earned and dividends minus interest paid) and an increase in equity in earnings of affiliates. This result occurred despite the recording of such losses
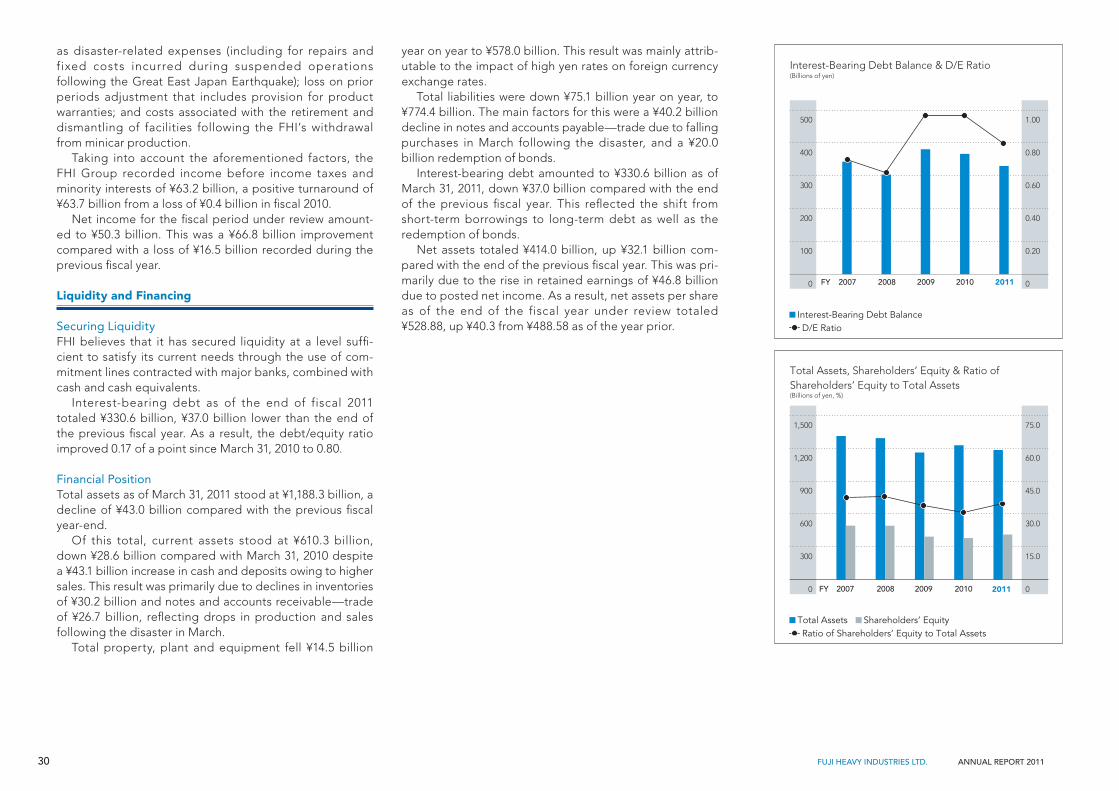
30 ANNUAL REPORT 2011FUJI HEAVY INDUSTRIES LTD.
1.00
0.80
0.60
0.40
0.20
0
Interest-Bearing Debt Balance & D/E Ratio(Billions of yen)
� Interest-Bearing Debt Balance D/E Ratio
2007FY 2008 2009 2010 2011
500
400
300
200
100
0
1,500 75.0
1,200 60.0
900 45.0
600 30.0
300 15.0
0 0
Total Assets, Shareholders’ Equity & Ratio of Shareholders’ Equity to Total Assets(Billions of yen, %)
� Total Assets � Shareholders’ Equity Ratio of Shareholders’ Equity to Total Assets
2007FY 2008 2009 2010 2011
year on year to ¥578.0 billion. This result was mainly attrib-utable to the impact of high yen rates on foreign currency exchange rates. Total liabilities were down ¥75.1 billion year on year, to ¥774.4 billion. The main factors for this were a ¥40.2 billion decline in notes and accounts payable—trade due to falling purchases in March following the disaster, and a ¥20.0 billion redemption of bonds. Interest-bearing debt amounted to ¥330.6 billion as of March 31, 2011, down ¥37.0 billion compared with the end of the previous fiscal year. This reflected the shift from short-term borrowings to long-term debt as well as the redemption of bonds. Net assets totaled ¥414.0 billion, up ¥32.1 billion com-pared with the end of the previous fiscal year. This was pri-marily due to the rise in retained earnings of ¥46.8 billion due to posted net income. As a result, net assets per share as of the end of the fiscal year under review totaled ¥528.88, up ¥40.3 from ¥488.58 as of the year prior.
as disaster-related expenses (including for repairs and fixed costs incurred during suspended operations following the Great East Japan Earthquake); loss on prior periods adjustment that includes provision for product warranties; and costs associated with the retirement and dismantling of facilities following the FHI’s withdrawal from minicar production. Taking into account the aforementioned factors, the FHI Group recorded income before income taxes and minority interests of ¥63.2 billion, a positive turnaround of ¥63.7 billion from a loss of ¥0.4 billion in fiscal 2010. Net income for the fiscal period under review amount-ed to ¥50.3 billion. This was a ¥66.8 billion improvement compared with a loss of ¥16.5 billion recorded during the previous fiscal year.
Liquidity and Financing
Securing LiquidityFHI believes that it has secured liquidity at a level suffi-cient to satisfy its current needs through the use of com-mitment lines contracted with major banks, combined with cash and cash equivalents. Interest-bearing debt as of the end of fiscal 2011 totaled ¥330.6 billion, ¥37.0 billion lower than the end of the previous fiscal year. As a result, the debt/equity ratio improved 0.17 of a point since March 31, 2010 to 0.80.
Financial PositionTotal assets as of March 31, 2011 stood at ¥1,188.3 billion, a decline of ¥43.0 billion compared with the previous fiscal year-end. Of this total, current assets stood at ¥610.3 billion, down ¥28.6 billion compared with March 31, 2010 despite a ¥43.1 billion increase in cash and deposits owing to higher sales. This result was primarily due to declines in inventories of ¥30.2 billion and notes and accounts receivable—trade of ¥26.7 billion, reflecting drops in production and sales following the disaster in March. Total property, plant and equipment fell ¥14.5 billion

31
Research and Development Expenses
FHI invested in the development of the new Impreza and environment-friendly applications as temporary lull in new model development occurred in the previous fiscal year. Mainly as a result of these factors, R&D expenses increased ¥5.7 billion, or 15.4%, year on year, to ¥42.9 billion.
Capital Expenditures and Depreciation
Capital expenditures declined ¥13.1 billion, or 23.3%, com-pared with the previous fiscal year, to ¥43.1 billion despite such factors as an increase in production capacity at the Oizumi Plant in response to the introduction of new engine models. This decrease was primarily due to delays in certain areas in the aftermath of the disaster. Depreciation fell ¥7.3 billion, or 12.7%, year on year, to ¥49.8 billion.
Cash FlowsIn the fiscal year under review, net cash provided by oper-ating activities was ¥138.2 billion compared with ¥176.7 billion provided during the previous fiscal year. This mainly reflects decreases in depreciation and working capital that offset the rise in income before income taxes and minority interests. Net cash used in investing activities was ¥51.1 billion in fiscal 2011 compared with ¥62.7 billion used in the previous fiscal year. This decline was primarily due to reductions in cash outflows related to the acquisition of property, plant and equipment and increased income from the sale of investment securities. As a result, free cash flow amounted to ¥87.1 billion, a decrease of ¥27.0 billion from ¥114.1 billion provided in the previous fiscal year. Net cash used in financing activities totaled ¥39.4 billion in the fiscal year ended March 31, 2011 compared with net cash used in financing activities of ¥18.6 billion in fiscal 2010. This result was largely attributable to cash outflows related to the redemption of bonds. Accounting for the aforementioned activities and the effect of translation adjustments, cash and cash equivalents as of the end of the fiscal year under review stood at ¥227.7 billion, up ¥36.2 billion year on year.
200
150
100
50
0
-50
-100
Cash Flows from Operating Activities & Cash Flows from Investing Activities
� Cash Flows from Operating Activities � Cash Flows from Investing Activities
2007FY 2008 2009 2010 2011
(Billions of yen)
120
80
40
0
-40
-80
-120
Free Cash Flow
2007FY 2008 2009 2010 2011
(Billions of yen)
Billions of yen
2007 2008 2009 2010 2011
R&D Expenses
¥ 50.7
¥ 52.0
¥ 42.8
¥ 37.2
¥ 42.9
Capital Expenditures
59.6
56.3
58.0
56.1
43.1
Depreciation Expenses
58.9
65.5
65.1
57.1
49.8

32 ANNUAL REPORT 2011FUJI HEAVY INDUSTRIES LTD.
global unit sales are expected to fall 3.8% to 632 thousand units. Despite efforts to accelerate operations in the second half, we do not expected to offset these forecasted drops in production and sales, the cause of which is a decline in the number of automobiles produced following the disaster. Earnings are forecast to feel the impact of yen appreciation, higher raw materials prices and increases in future investment that includes capital expenditures and R&D expenses. These forecasts are based on average annual exchange rates of ¥81 to U.S. $1.00 and ¥115 to A1.
Note: Performance forecasts and mid- to long-term management strate-gies are based on information available to management as of the date of this report. Accordingly, actual results may differ materially due to a variety of factors.
Mid- to Long-Term Management Strategies
FHI is undertaking its new mid-term management plan “Motion-V” between April 1, 2011 and March 31, 2016. The plan positions these five years to solidify the foundation of FHI’s core Subaru automobile business in order to ensure further growth by achieving an annual sales volume of one million vehicles within the next ten years. Continuing on from our previous management plan, we have established the brand statement Confidence in Motion as a guiding principle based on our basic philosophy that customers come first. Following this guiding principle, we will realize the growth of the Subaru brand through the following three themes: 1. Provide distinctive Subaru experience; 2. Accelerate sales expansion; and 3. Solidify our opera-tional foundation.
Basic Policy Regarding the Distribution of Profits
FHI views the return of profits to shareholders as a key management priority, while taking into account yearly performance, investment plans, and operating conditions. FHI links profit distribution to performance, with a basic policy of maintaining ongoing distribution payments in conjunction with improvements in ROE. In order to ensure continual growth, we actively channel cash flow towards such essential areas as the development of products and environmentally friendly technologies, production capacity expansion and overseas business creation. At the same time, FHI works to achieve balanced financial strategies that prioritize investment efficiency and financial soundness. In line with initial projections, interim and fiscal year-end dividends were each ¥4.50 per share, providing a total annual dividend of ¥9.00. In fiscal 2012, interim and fiscal year-end dividends are each scheduled to continue at ¥4.50 per share, for an annual dividend of ¥9.00.
Outlook
Despite indications of a recovery owing to expanding automobile demand in such emerging markets as China, economic conditions are forecast to remain uncertain due primarily to exchange rate fluctuations and high raw materials prices. In addition, power and component supply shortages, resulting from the Great East Japan Earthquake, are expected to affect FHI’s production into early autumn. Against this backdrop, the FHI Group is forecasting (as of July 2011) net sales of ¥1,480.0 billion in the fiscal year ending March 31, 2012. This represents a year-on-year decrease of 6.4%. On the earnings front, the Group’s consolidated operating income is projected to drop 64.3%, compared with the fiscal year under review, to ¥30.0 billion. Net income is expected to decrease 30.4% to ¥35.0 billion. Based on forecasts for the next fiscal year, automobile production in the first half of fiscal 2012 is projected to decrease by over 25% year on year, while
80
60
40
20
0
� Capital Expenditure � Depreciation Expenses
Capital Expenditure & Depreciation Expenses
2007FY 2008 2009 2010 2011
(Billions of yen)
60
45
30
15
0
Research & Development Expenses
2007FY 2008 2009 2010 2011
(Billions of yen)

33
1. Provide distinctive Subaru experienceWe aim to expand our base of Subaru fans by offering increased brand value. This will be achieved through distinct automobile manufacturing methods that are defined by the concepts of “Enjoyment and peace of mind.” In particular, we are promoting product and tech-nological development focusing on increased safety and environmental friendliness. We will:
• Pursuedrivabilityandtheavoidanceofhazards
• Keepthehighestratingsincollisionsafetyperformance
• Introduce the “EyeSight” Active Driving Assist Systemto all models in global markets
• Developanewandlightplatformwithhighversatility
• IntroducehybridcarstotheJapanesemarketin2013
• Introduceaturbochargeddirect injectionboxerenginecompatible with high performance and environmental friendliness
2. Accelerate sales expansionWe intend to increase unit sales approximately 40% over a 5-year period by focusing on the key U.S. and Chinese markets. In addition, we will build a flexible production structure to accommodate unit sales and protect against currency exchange fluctuations. We will:
• Focus management resources on the U.S and Chinamarkets as key markets and substantially expand sales
• BeginproductioninChinainordertoexpandproductioncapacity and mitigate the sensitivity of foreign currencies
• RefurbishtheGunmaMainPlant toproducepassengercars instead of minicars
• Expand the Oizumi Plant’s production of the new- generation boxer engines that excel in environmental friendliness
• BeginassemblyofKDunitsinMalaysia,therebymakinginroads to the growing markets within the ASEAN Free Trade Area
3. Solidify our operational foundationWe will strive to overcome various risks and environmental changes in such areas as investment in environmental technological development, rising costs and currency rate fluctuations by integrating the effects of our cost reduction efforts and business alliances. We will:
• Achieve20%costreductioninnewmodels,andcontinue30 % reduction in development cost
• Promoteprocurement reformmainlybyexpandingLCCpurchase
• Pursue a win-win relationship to boost the long-termcompetitiveness and development of FHI and Toyota, for example:
– Sporty, compact RWD (front engine, rear-wheel drive) cars, jointly developed with Toyota, are scheduled for launch in spring 2012
– All Subaru minicar lineups will be supplied by Daihatsu under an OEM agreement by spring 2012
– Subaru of Indiana Automotive, Inc. will continue production of the Toyota Camry
Through the above initiatives, FHI aims to achieve by fiscal 2016, the final year of “Motion-V,” consolidated operating income of ¥120.0 billion and a consolidated operating income ratio of 6% or more. The entire staff of FHI will work together to achieve the targets set by “Motion-V” and, in turn, realize further growth.
Principal RisksBusiness risks faced by FHI with the potential to have significant impact on investor decisions are listed on FHI’s website at http://www.fhi.co.jp/english/ir/
Forecast for Global Automobile Sales Thousand units2011
(Results) 2012 Change
Japan:
Passenger cars 68.1 70.7 2.5
Minicars 90.0 93.2 3.2
Subtotal 158.1 163.8 5.7
Overseas:
United States 279.0 274.3 (4.6)
Canada 28.1 27.2 (0.9)
Europe 48.2 37.8 (10.5)
Russia 11.3 13.6 2.2
Australia 41.2 36.4 (4.7)
China 62.4 54.9 (7.5)
Other 28.7 23.8 (4.9)
Subtotal 498.9 468.0 (30.8)
Total 657.0 631.8 (25.1)
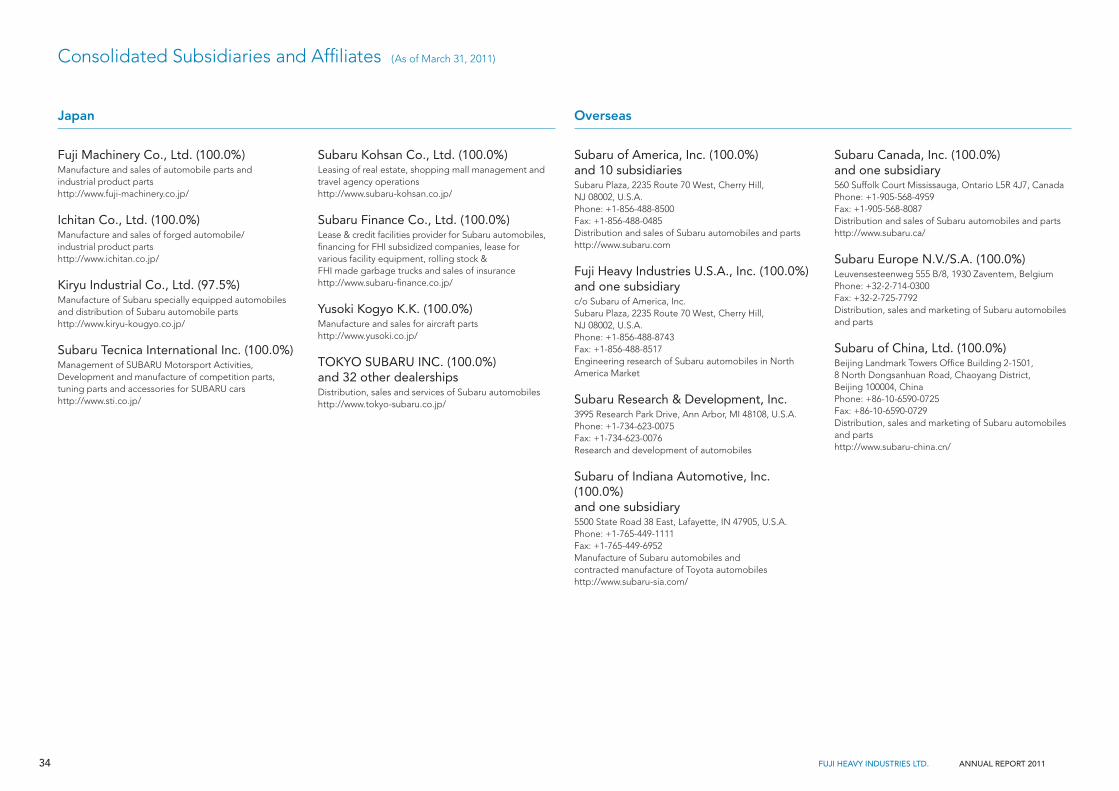
34 ANNUAL REPORT 2011FUJI HEAVY INDUSTRIES LTD.
Consolidated Subsidiaries and Affi liates (As of March 31, 2011)
Fuji Machinery Co., Ltd. (100.0%)Manufacture and sales of automobile parts and industrial product partshttp://www.fuji-machinery.co.jp/
Ichitan Co., Ltd. (100.0%)Manufacture and sales of forged automobile/industrial product partshttp://www.ichitan.co.jp/
Kiryu Industrial Co., Ltd. (97.5%)Manufacture of Subaru specially equipped automobiles and distribution of Subaru automobile partshttp://www.kiryu-kougyo.co.jp/
Subaru Tecnica International Inc. (100.0%)Management of SUBARU Motorsport Activities, Development and manufacture of competition parts, tuning parts and accessories for SUBARU carshttp://www.sti.co.jp/
Subaru Kohsan Co., Ltd. (100.0%)Leasing of real estate, shopping mall management and travel agency operationshttp://www.subaru-kohsan.co.jp/
Subaru Finance Co., Ltd. (100.0%)Lease & credit facilities provider for Subaru automobiles, fi nancing for FHI subsidized companies, lease for various facility equipment, rolling stock & FHI made garbage trucks and sales of insurancehttp://www.subaru-fi nance.co.jp/
Yusoki Kogyo K.K. (100.0%)Manufacture and sales for aircraft partshttp://www.yusoki.co.jp/
TOKYO SUBARU INC. (100.0%)and 32 other dealershipsDistribution, sales and services of Subaru automobileshttp://www.tokyo-subaru.co.jp/
Subaru of America, Inc. (100.0%)and 10 subsidiariesSubaru Plaza, 2235 Route 70 West, Cherry Hill, NJ 08002, U.S.A.Phone: +1-856-488-8500Fax: +1-856-488-0485Distribution and sales of Subaru automobiles and partshttp://www.subaru.com
Fuji Heavy Industries U.S.A., Inc. (100.0%)and one subsidiaryc/o Subaru of America, Inc.Subaru Plaza, 2235 Route 70 West, Cherry Hill, NJ 08002, U.S.A.Phone: +1-856-488-8743Fax: +1-856-488-8517Engineering research of Subaru automobiles in North America Market
Subaru Research & Development, Inc.3995 Research Park Drive, Ann Arbor, MI 48108, U.S.A.Phone: +1-734-623-0075Fax: +1-734-623-0076Research and development of automobiles
Subaru of Indiana Automotive, Inc. (100.0%)and one subsidiary5500 State Road 38 East, Lafayette, IN 47905, U.S.A.Phone: +1-765-449-1111Fax: +1-765-449-6952Manufacture of Subaru automobiles andcontracted manufacture of Toyota automobileshttp://www.subaru-sia.com/
Subaru Canada, Inc. (100.0%)and one subsidiary 560 Suffolk Court Mississauga, Ontario L5R 4J7, CanadaPhone: +1-905-568-4959Fax: +1-905-568-8087Distribution and sales of Subaru automobiles and partshttp://www.subaru.ca/
Subaru Europe N.V./S.A. (100.0%)Leuvensesteenweg 555 B/8, 1930 Zaventem, BelgiumPhone: +32-2-714-0300Fax: +32-2-725-7792Distribution, sales and marketing of Subaru automobiles and parts
Subaru of China, Ltd. (100.0%)Beijing Landmark Towers Offi ce Building 2-1501, 8 North Dongsanhuan Road, Chaoyang District, Beijing 100004, ChinaPhone: +86-10-6590-0725Fax: +86-10-6590-0729Distribution, sales and marketing of Subaru automobiles and partshttp://www.subaru-china.cn/
Japan Overseas
subaru2011e_0928.indd 34subaru2011e_0928.indd 34 11/09/28 17:2211/09/28 17:22

35
Head Offi ceSubaru Building, 7-2, Nishi-Shinjuku 1-chome, Shinjuku-ku, Tokyo 160-8316, JapanPhone:+81-3-3347-2111Fax:+81-3-3347-2338
Investor Relations Offi ceSubaru Building, 7-2, Nishi-Shinjuku 1-chome, Shinjuku-ku, Tokyo 160-8316, JapanPhone:+81-3-3347-2655Fax:+81-3-3347-2295
EstablishedJuly 15, 1953
Paid-in Capital¥153,795 million
Number of Shareholders43,968
Number of Common Stock Issued782,865,873
Domestic Manufacturing DivisionsGunma Manufacturing Division (Automobiles Division)Utsunomiya Manufacturing Division (Aerospace Division and Eco Technologies Division)Saitama Manufacturing Division (Industrial Products Division)
Major Shareholders 1. Toyota Motor Corporation 2. The Master Trust Bank of Japan, Ltd. (Trust account) 3. Japan Trustee Services Bank, Ltd. (Trust account) 4. Suzuki Motor Corporation 5. FHI’s Client Stock Ownership 6. Mizuho Corporate Bank, Ltd. 7. Mizuho Bank, Ltd. 8. Sompo Japan Insurance Inc. 9. Nippon Life Insurance Company 10. Tokio Marine & Nichido Fire Insurance Co., Ltd.
Stock Exchange ListingTokyo Stock Exchange
Transfer AgentMizuho Trust & Banking Co., Ltd.2-1, Yaesu 1-chome, Chuo-ku, Tokyo 103-8670, Japan
Website Addresshttp://www.fhi.co.jp/english/ir/
800
600
400
200
0
Quarterly Common Stock Price Range (Tokyo Stock Exchange)
(Yen)
FY2007
747577
HighLow
1Q 2Q 3Q 4Q
FY2008
641376
1Q 2Q 3Q 4Q
FY2009
635223
1Q 2Q 3Q 4Q
FY2010
487317
1Q 2Q 3Q 4Q
FY2011
758435
1Q 2Q 3Q 4Q
Developed under the concept of “Redefi ning Value, Redefi ning Class,” the new Impreza pursues a uniquely agile and
enjoyable driving experience. At the same time, the new Impreza features a more spacious and comfortable interior
without increasing overall size. Subaru has also improved the environmental performance of the new Impreza through
such innovations as the installation of the third generation Boxer engine and the new Lineartronic-CVT (Continuously
Variable Transmission). As a result, the new Impreza has achieved leading fuel effi ciency among AWD vehicles in the
United States. Subaru plans to release the new Impreza in the United States in autumn 2011.
IMPREZA
INVESTOR INFORMATION (As of March 31, 2011)
For the entire Annual Report including the fi nancial statements, please visit FHI’s website: http://www.fhi.co.jp/english/ir/report/ar.html
subaru2011e_0928.indd 35subaru2011e_0928.indd 35 11/09/28 17:2211/09/28 17:22

Fuji Heavy Industries Ltd.Subaru Building, 7-2, Nishi-Shinjuku 1-chome, Shinjuku-ku, Tokyo 160-8316, JapanPhone:+81-3-3347-2111Fax:+81-3-3347-2338http://www.fhi.co.jp/english/ir/
subaru2011e_0928.indd a2subaru2011e_0928.indd a2 11/09/28 15:4511/09/28 15:45

Consolidated Balance Sheets 83.15FUJI HEAVY INDUSTRIES LTD. AND CONSOLIDATED SUBSIDIARIESAs of March 31, 2011 and 2010
Thousands of Millions of yen U.S. dollars
(Note 1)2011 2010 2011
Current assets: ¥211,700 ¥168,643 $2,546,001
76,810 103,521 $923,752Lease investment assets (Note 4 and 23) 23,050 27,788 $277,210
21,063 12,458 $253,313Merchandise and finished goods 72,871 101,351 $876,380Work in process 56,567 59,596 $680,301Raw materials and supplies 36,974 35,672 $444,666
13,754 15,549 $165,41259,986 75,780 $721,41939,396 40,216 $473,795(1,851) (1,686) ($22,261)
610,320 638,888 7,339,988
1,230,215 1,241,606 14,795,129Accumulated depreciation (765,211) (759,073) (9,202,778)Accumulated impairment loss (34,162) (33,006) (410,848)
430,842 449,527 5,181,503
12,040 11,999 144,79962,595 61,616 752,79612,894 6,167 155,069
1,812 5,742 21,79261,832 62,577 743,620(4,011) (5,149) (48,238)
147,162 142,952 1,769,838¥1,188,324 ¥1,231,367 $14,291,329
Thousands of Millions of yen U.S. dollars
(Note 1)2011 2010 2011
¥176,895 ¥217,051 $2,127,42099,072 142,121 1,191,48540,912 33,922 492,02660,876 56,244 732,123
Provision for bonuses 16,322 15,348 196,296Provision for product warranties 27,172 19,999 326,783
2,089 2,873 25,12357,365 67,503 689,898
480,703 555,061 5,781,154
190,642 191,569 2,292,74833,707 34,867 405,37614,002 13,541 168,39455,307 54,436 665,148
293,658 294,413 3,531,666
Authorized— 1,500,000,000 sharesIssued — 782,865,873 shares 153,795 153,795 1,849,609
160,071 160,071 1,925,087156,948 110,172 1,887,529
(1,381) (2,173) (16,609)2011— 2,605,141 shares 2010— 3,901,219 shares
469,433 421,865 5,645,616
11,567 10,309 139,110(68,339) (51,587) (821,876)(56,772) (41,278) (682,766)
1,302 1,306 15,659
413,963 381,893 4,978,509
¥1,188,324 ¥1,231,367 $14,291,329The accompanying notes are an integral part of these balance sheets.Total liabilities and net assets
LIABILITIES AND NET ASSETS
Valuation difference on available-for-sale securitiesForeign currency translation adjustmentTotal accumulated other comprehensive income
Less-treasury stock, at cost,
Total shareholders’ equity
Deferred tax liabilities (Note 11)
Capital surplusRetained earnings
Minority interests
Total net assets
Long-term debts (Note 4 and 6) Long-term liabilities:
Accrued pension and severance liability (Note 10)
Accumulated other comprehensive income: *
Other long-term liabilities (Note 6)Total long-term liabilities
Contingent liabilities (Note 25)Net assets: (Note 1 and 12)
Allowance for doubtful accounts
Shareholders' equity:Capital stock
Accrued expenses (Note 4)
Accrued income taxes (Note 4 and 11)Other current liabilities (Note 4, 6 and 11)Total current liabilities
Current portion of long-term debts (Note 4 and 6)
Notes and accounts payable-trade (Note 4)
Total assetsTotal investments and other assets
Short-term loans payable (Note 4 and 6)
Current liabilities:
Cash and deposits (Note 3 and 4)
Intangible assetsInvestments and other assets:
Short-term investment securities (Notes 3, 4 and 5)
Deferred tax assets (Note 11) Other assets (Note 32)
Investment securities (Note 4 and 5)Investments in non-consolidated subsidiaries and affiliated companies
*From the fiscal 2011, the Company has adopted "Accounting Standard for Presentation of Comprehensive Income" (ASBJ Statement No.25,June 30, 2010). The amounts of "Accumulated other comprehensive income" and "Total accumulated other comprehensive income" of theprevious fiscal year states in the amounts of "Valuation and translation adjustments" and "Total valuation and translation adjustments".
ASSETS
Total assets
Total property, plant and equipment
Property, plant and equipment (Notes 6, 8 and 15)
Short-term loans receivable (Note 3 and 4)Deferred tax assets (Note 11)
Other current assets
Notes and accounts receivable-trade (Note 4 and 6)
Allowance for doubtful accounts
1
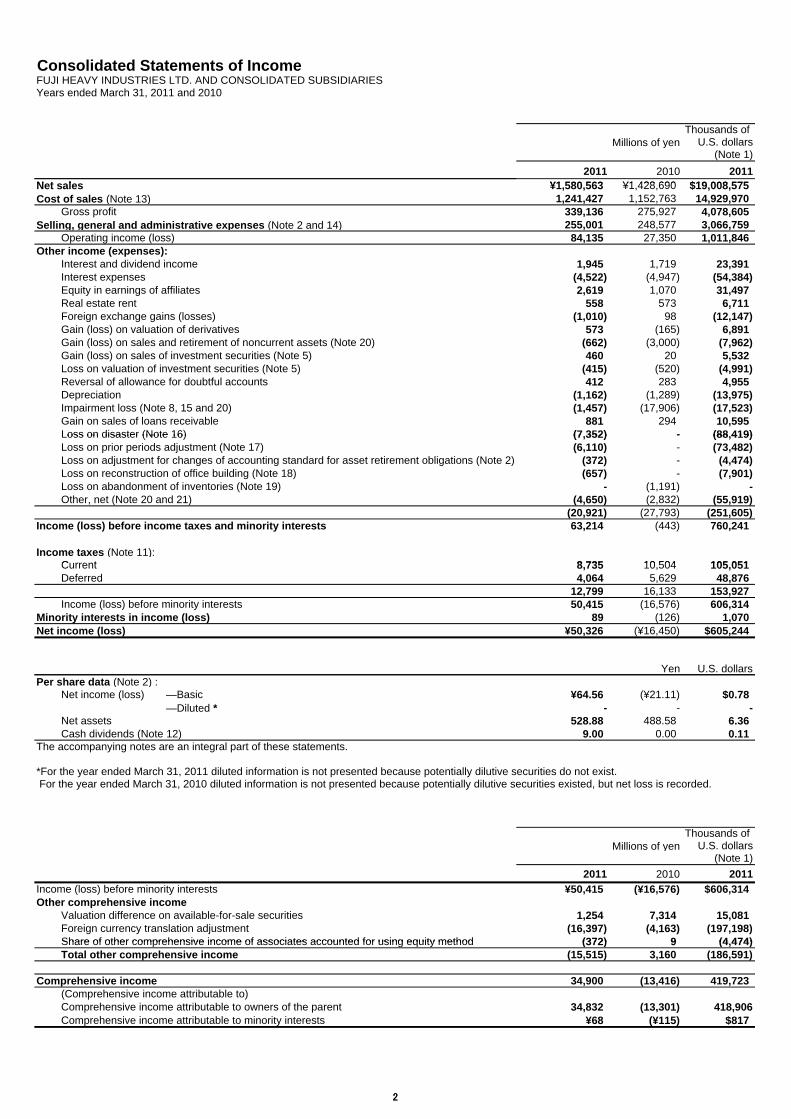
Consolidated Statements of Income 83.15FUJI HEAVY INDUSTRIES LTD. AND CONSOLIDATED SUBSIDIARIESYears ended March 31, 2011 and 2010
Thousands of Millions of yen U.S. dollars
(Note 1)2011 2010 2011
N t l ¥1 580 563 ¥1 428 690 $19 008 575
2
Net sales ¥1,580,563 ¥1,428,690 $19,008,575Cost of sales (Note 13) 1,241,427 1,152,763 14,929,970
Gross profit 339,136 275,927 4,078,605Selling, general and administrative expenses (Note 2 and 14) 255,001 248,577 3,066,759
Operating income (loss) 84,135 27,350 1,011,846Other income (expenses):
Interest and dividend income 1,945 1,719 23,391Interest expenses (4,522) (4,947) (54,384)Equity in earnings of affiliates 2,619 1,070 31,497Real estate rent 558 573 6,711,Foreign exchange gains (losses) (1,010) 98 (12,147)Gain (loss) on valuation of derivatives 573 (165) 6,891Gain (loss) on sales and retirement of noncurrent assets (Note 20) (662) (3,000) (7,962)Gain (loss) on sales of investment securities (Note 5) 460 20 5,532Loss on valuation of investment securities (Note 5) (415) (520) (4,991)Reversal of allowance for doubtful accounts 412 283 4,955Depreciation (1,162) (1,289) (13,975)Impairment loss (Note 8, 15 and 20) (1,457) (17,906) (17,523)Gain on sales of loans receivable 881 294 10,595Loss on disaster (Note 16) (7 352) - (88 419)Loss on disaster (Note 16) (7,352) - (88,419)Loss on prior periods adjustment (Note 17) (6,110) - (73,482)Loss on adjustment for changes of accounting standard for asset retirement obligations (Note 2) (372) - (4,474)Loss on reconstruction of office building (Note 18) (657) - (7,901)Loss on abandonment of inventories (Note 19) - (1,191) -Other, net (Note 20 and 21) (4,650) (2,832) (55,919)
(20,921) (27,793) (251,605)Income (loss) before income taxes and minority interests 63,214 (443) 760,241
Income taxes (Note 11):C rrent 8 735 10 504 105 051Current 8,735 10,504 105,051Deferred 4,064 5,629 48,876
12,799 16,133 153,927Income (loss) before minority interests 50,415 (16,576) 606,314
Minority interests in income (loss) 89 (126) 1,070Net income (loss) ¥50,326 (¥16,450) $605,244
Yen U.S. dollarsPer share data (Note 2) :
Net income (loss) —Basic ¥64.56 (¥21.11) $0.78—Diluted * - - -
Net assets 528.88 488.58 6.36Cash dividends (Note 12) 9.00 0.00 0.11
The accompanying notes are an integral part of these statements.
*For the year ended March 31, 2011 diluted information is not presented because potentially dilutive securities do not exist. For the year ended March 31, 2010 diluted information is not presented because potentially dilutive securities existed, but net loss is recorded.
Thousands of Millions of yen U.S. dollars
(Note 1)2011 2010 2011
Income (loss) before minority interests ¥50,415 (¥16,576) $606,314Other comprehensive income
Valuation difference on available-for-sale securities 1,254 7,314 15,081Foreign currency translation adjustment (16,397) (4,163) (197,198)Share of other comprehensive income of associates accounted for using equity method (372) 9 (4 474)Share of other comprehensive income of associates accounted for using equity method (372) 9 (4,474)Total other comprehensive income (15,515) 3,160 (186,591)
Comprehensive income 34,900 (13,416) 419,723(Comprehensive income attributable to)Comprehensive income attributable to owners of the parent 34,832 (13,301) 418,906Comprehensive income attributable to minority interests ¥68 (¥115) $817
2

83.15FUJI HEAVY INDUSTRIES LTD. AND CONSOLIDATED SUBSIDIARIESYears ended March 31, 2011 and 2010
Thousands of Millions of yen U.S. dollars
(Note 1)2011 2010 2011
Shareholders' equity Capital stock Balance at the end of previous period 153,795 153,795 1,849,609 Balance at the end of current period 153,795 153,795 1,849,609 Capital surplus Balance at the end of previous period 160,071 160,071 1,925,087 Balance at the end of current period 160,071 160,071 1,925,087 Retained earnings Balance at the end of previous period 110,172 126,593 1,324,979 Changes of items during the period Dividends from surplus (3,510) - (42,213) Net income (loss) 50,326 (16,450) 605,244 Disposal of treasury stock (109) (3) (1,311) Other 69 32 830 Total changes of items during the period 46,776 (16,421) 562,550 Balance at the end of current period 156,948 110,172 1,887,529 Treasury stock Balance at the end of previous period (2,173) (2,086) (26,134) Changes of items during the period Purchase of treasury stock (30) (93) (361) Disposal of treasury stock 822 6 9,886 Total changes of items during the period 792 (87) 9,525 Balance at the end of current period (1,381) (2,173) (16,609) Total shareholders' equity Balance at the end of previous period 421,865 438,373 5,073,541 Changes of items during the period Dividends from surplus (3,510) - (42,213) Net income (loss) 50,326 (16,450) 605,244 Purchase of treasury stock (30) (93) (361) Disposal of treasury stock 713 3 8,575 Other 69 32 830 Total changes of items during the period 47,568 (16,508) 572,075 Balance at the end of current period 469,433 421,865 5,645,616
Consolidated Statements of Changes in Net Assets
3

Consolidated Statements of Changes in Net AssetsFUJI HEAVY INDUSTRIES LTD. AND CONSOLIDATED SUBSIDIARIESYears ended March 31, 2011 and 2010
Thousands of Millions of yen U.S. dollars
(Note 1)2011 2010 2011
Accumulated other comprehensive income * Valuation difference on available-for-sale securities Balance at the end of previous period 10,309 3,002 123,981 Changes of items during the period Net changes of items other than shareholders' equity 1,258 7,307 15,129 Total changes of items during the period 1,258 7,307 15,129 Balance at the end of current period 11,567 10,309 139,110 Foreign currency translation adjustment Balance at the end of previous period (51,587) (47,429) (620,409) Changes of items during the period Net changes of items other than shareholders' equity (16,752) (4,158) (201,467) Total changes of items during the period (16,752) (4,158) (201,467) Balance at the end of current period (68,339) (51,587) (821,876) Total accumulated other comprehensive income * Balance at the end of previous period (41,278) (44,427) (496,428) Changes of items during the period Net changes of items other than shareholders' equity (15,494) 3,149 (186,338) Total changes of items during the period (15,494) 3,149 (186,338) Balance at the end of current period (56,772) (41,278) (682,766)Minority interests Balance at the end of previous period 1,306 773 15,707 Changes of items during the period Net changes of items other than shareholders' equity (4) 533 (48) Total changes of items during the period (4) 533 (48) Balance at the end of current period 1,302 1,306 15,659Total net assets Balance at the end of previous period 381,893 394,719 4,592,820 Changes of items during the period Dividends from surplus (3,510) - (42,213) Net income (loss) 50,326 (16,450) 605,244 Purchase of treasury stock (30) (93) (361) Disposal of treasury stock 713 3 8,575 Other 69 32 830 Net changes of items other than shareholders' equity (15,498) 3,682 (186,386) Total changes of items during the period 32,070 (12,826) 385,689 Balance at the end of current period 413,963 381,893 4,978,509The accompanying notes are an integral part of these statements.
*From the fiscal 2011, the Company has adopted "Accounting Standard for Presentation of Comprehensive Income" (ASBJ StatementNo.25, June 30, 2010). The amounts of "Aaccumulated other comprehensive income" and "Total accumulated other comprehensiveincome" of the previous fiscal year states in the amounts of "Valuation and translation adjustments" and "Total valuation and translationadjustments".
4

Consolidated Statements of Cash Flows 83.15FUJI HEAVY INDUSTRIES LTD. AND CONSOLIDATED SUBSIDIARIESYears ended March 31, 2011 and 2010
Thousands of Millions of yen U.S. dollars
(Note 1)2011 2010 2011
Net cash provided by (used in) operating activities Income (loss) before income taxes and minority interests ¥63,214 (¥443) $760,241 Depreciation and amortization 56,062 65,785 674,227 Impairment loss 1,457 17,906 17,523 Increase (decrease) in allowance for doubtful accounts (972) (630) (11,690) Increase (decrease) in provision for bonuses 974 1,168 11,714 Increase (decrease) in provision for product warranties 8,618 1,708 103,644 Increase (decrease) in provision for loss on construction contracts 3,282 639 39,471 Increase (decrease) in provision for retirement benefits (1,284) (2,292) (15,442) Interest and dividends income (1,945) (1,719) (23,391) Interest expenses 4,522 4,947 54,384 Loss (gain) on valuation of derivatives (573) 165 (6,891) Equity in (earnings) losses of affiliates (2,619) (1,070) (31,497) Loss (gain) on sales and retirement of noncurrent assets 662 3,000 7,962 Loss (gain) on sales and valuation of investment securities (45) 500 (541) Decrease (increase) in notes and accounts receivable-trade 25,208 (18,305) 303,163 Decrease (increase) in inventories 18,677 56,491 224,618 Increase (decrease) in notes and accounts payable-trade (37,633) 67,557 (452,592) Decrease (increase) in lease investment assets 4,447 (575) 53,482 Decrease (increase) in operating loans receivable 1,465 (12,154) 17,619 Decrease (increase) in vehicles and equipment on operating leases 2,750 (2,867) 33,073 Increase (decrease) in deposits received (7,906) 3,293 (95,081) Other 12,544 3,155 150,857
Sub total 150,905 186,259 1,814,853
Interest and dividends income received 1,967 1,722 23,656 Interest expenses paid (4,592) (5,203) (55,225) Income taxes paid (10,072) (6,044) (121,131)
Net cash provided by (used in) operating activities 138,208 176,734 1,662,153
Net cash provided by (used in) investing activities Purchase of short-term investment securities (4,237) (703) (50,956) Proceeds from sales of short-term investment securities 4,460 1,055 53,638 Purchase of property, plant and equipment (44,729) (53,087) (537,931) Proceeds from sales of property, plant and equipment 1,880 2,390 22,610 Purchase of intangible assets (3,078) (2,894) (37,017) Purchase of investment securities (20,719) (15,050) (249,176) Proceeds from sales of investment securities 16,722 6,386 201,106 Payments of loans receivable (84,517) (59,057) (1,016,440) Collection of loans receivable 84,848 58,721 1,020,421 Other, net (1,739) (417) (20,915)
Net cash provided by (used in) investing activities (51,109) (62,656) (614,660)
Net cash provided by (used in) financing activities Net increase (decrease) in short-term loans payable (43,034) (81,922) (517,547) Increase (decrease) in commercial papers - (24,000) - Proceeds from long-term loans payable 68,828 110,472 827,757 Repayment of long-term loans payable (40,721) (26,118) (489,729) Proceeds from issuance of bonds - 4,100 - Redemption of bonds (20,010) - (240,649) Proceeds from sales of treasury stock (3,498) - (42,069) Repayment of lease obligations (1,302) (960) (15,658) Other,net 329 (132) 3,956
Net cash provided by (used in) financing activities (39,408) (18,560) (473,939)Effect of exchange rate change on cash and cash equivalents (11,453) (816) (137,739)Net increase (decrease) in cash and cash equivalents 36,238 94,702 435,815
Cash and cash equivalents at beginning of period 191,466 96,515 2,302,658 Increase (decrease) in cash and cash equivalents resulting from change of scope of consolidation - 249 -Cash and cash equivalents at end of period (Note 3) ¥227,704 ¥191,466 $2,738,473The accompanying notes are an integral part of these statements.
5

6
Notes to Consolidated Financial Statements FUJI HEAVY INDUSTRIES LTD. AND CONSOLIDATED SUBSIDIARIES 1. Basis of Presentation of the Financial Statements The accompanying consolidated financial statements of Fuji Heavy Industries Ltd. (the “Company”) have been prepared in accordance with the provisions set forth in the Financial Instruments and Exchange Law and its related accounting regulations, and in conformity with accounting principles generally accepted in Japan (“Japanese GAAP”), which are different in certain respects as to application and disclosure requirements of International Financial Reporting Standards.
The accounts of the Company’s overseas subsidiaries are based on their accounting records maintained in conformity with generally accepted accounting principles prevailing in the respective countries of their domicile. The accompanying consolidated financial statements have been restructured and translated into English from the consolidated financial statements of the Company prepared in accordance with Japanese GAAP and filed with the appropriate Local Finance Bureau of the Ministry of Finance, as required by the Financial Instruments and Exchange Law. Certain supplementary information included in the statutory Japanese-language consolidated financial statements, but not considered necessary for fair presentation, is not presented in the accompanying consolidated financial statements. The translation of the Japanese yen amounts into U.S. dollars is included solely for the convenience of readers outside Japan, using the prevailing exchange rate at March 31, 2011, which was ¥83.15 to U.S.$1. The convenience translation should not be construed as a representation that the Japanese yen amounts have been, could have been, or could in the future be converted into U.S. dollars at this or any other rate of exchange. 2. Summary of Significant Accounting Policies [1] The Scope of Consolidation and Application of the Equity Method The accompanying consolidated financial statements include the accounts of the Company and its significant subsidiaries. All significant intercompany transactions and balances have been eliminated in consolidation. The fiscal year-end of consolidated domestic subsidiaries and main foreign subsidiaries is the same as that of the parent company, while the fiscal year-end of the nine consolidated foreign subsidiaries is December 31.The operating results of those subsidiaries that have fiscal year-ends different from that of the parent company are consolidated by using the financial statements as of each subsidiary’s respective fiscal year-end, the necessary adjustments being made in consolidation if there are any significant transactions between January 1 and March 31. The consolidated financial statements include the accounts of the Company and 71 subsidiaries in fiscal 2011 (71 subsidiaries in fiscal 2010).
In addition, 8 non-consolidated subsidiaries and one affiliated companies were accounted for by the equity method in fiscal 2011 and 2010.
Investments in insignificant non-consolidated subsidiaries and affiliated companies not accounted for by the equity method are carried at cost. The difference between the cost and the underlying net equity of investments in subsidiaries and affiliated companies is allocated to identifiable assets based on their fair value at the date of acquisition. The unallocated residual value of the excess of the cost over the fair value of the underlying net assets is recognized as goodwill and amortized over a period of five years on a straight-line basis.
All assets and liabilities of subsidiaries, which include not only the Company’s interest in the subsidiaries but also the minority interest portion, are valued based on their fair value at the time the Company first consolidates the subsidiary in question.

7
[2] Short-Term Investment Securities and Investment Securities Under the Japanese accounting standards for financial instruments, available-for-sale securities for which fair value is available are stated at their fair value as of the balance sheet dates with unrealized holding gains and losses included as a separate component of net assets until realized, while securities for which fair value is not readily available are stated at cost, as determined by the moving-average method, after taking into consideration devaluation, if any, for permanent impairment. Held-to-maturity debt securities are stated using the amortized cost method. [3] Inventories Inventories for regular sales are stated at cost, determined mainly by the moving-average cost method. (Book value on the consolidated balance sheet is measured based on the lower of cost or market value.)
[4] Property, Plant and Equipment (Excluding Leased Assets) Property, plant and equipment are stated at cost. Significant renewals and additions are capitalized; ordinary maintenance, ordinary repairs, minor renewals and minor improvements are charged to the consolidated statements of income as incurred.
Depreciation of the property, plant and equipment of the Company and its consolidated domestic subsidiaries is principally computed by the declining-balance method, except for those buildings (excluding building improvements) acquired on or after April 1, 1998, for which the straight-line method is applied. Depreciation of the property, plant and equipment of consolidated foreign subsidiaries is computed by the straight-line method at rates based on the estimated useful lives of the assets according to their general class, type of construction, and use.
Estimated useful lives for depreciable assets are as follows: (Fiscal 2011 and 2010) Buildings and structures: 6–50 years Machinery, equipment and vehicles: 2–15 years
[5] Intangible Assets (Excluding Leased Assets) Computer software used internally by the Company and its consolidated subsidiaries is amortized by the straight-line method over the relevant economic useful lives of three or five years. [6] Leased Assets For leased assets under finance lease transactions in which the ownership is transferred to the lessee:The leased assets are depreciated by the same method as used for other property, plant and equipment. For leased assets under finance lease transactions in which the ownership is not transferred to the lessee: The leased assets are depreciated by the straight-line method over the leased period and the residual value is zero. In addition, finance lease transactions in which the ownership is not transferred to the lessee on or before March 31, 2008 are recorded as regular rental transactions. [7] Allowance for Doubtful Accounts Allowance for doubtful accounts is provided based on the amount calculated from the historical ratio of bad debt for ordinary receivables, and an estimated amount of uncollectible accounts for specific overdue receivables. [8] Provision for Bonuses Employee's bonus is recognized as expenses for the period in which it is incurred.

8
[9] Provision for Product Warranties The Company and its consolidated subsidiaries provide for accrued warranty claims on products sold based on their past experience of warranty services and estimated future warranty costs, which are included in “Accrued expenses” in the accompanying consolidated balance sheets. [10] Provision for Loss on Construction Contracts The provision for losses on uncompleted construction of contracts in the Aerospace segment is made when substantial losses on the contracts are anticipated at the fiscal year-end for the next fiscal year and beyond and such losses can be reasonably estimated.
[11] Accrued Pension and Severance Liability Upon termination of employment, employees of the Company and its consolidated subsidiaries in Japan are entitled, under most circumstances, to lump-sum indemnities or pensions as described below, based on current rates of pay, length of service, and conditions under which the termination occurs. The minimum payment is an amount based on voluntary retirement. In addition to the minimum payment based on voluntary retirement, employees receive additional benefits for retirement due to age limit, death or other defined reasons.
Certain consolidated subsidiaries in Japan have contributory funded defined benefit employees’ welfare pension funds, which are pursuant to the Japanese Welfare Pension Insurance Law. The contributory pension funds consist of a portion of the governmental welfare pension program, under which the contributions are made by the companies and their employees, and an additional portion representing the corporate noncontributory pension plans.
Under the Japanese accounting standards for pension and severance benefits, accrued pension and severance liability for employees is provided based on the estimated amounts of projected pension and severance obligation and the fair value of plan assets at the end of the fiscal year. Prior service cost is being amortized by the straight-line method over a period (11-18 years) that is shorter than the average remaining service period of the eligible employees. Actuarial gains and losses are amortized from the following fiscal year by the straight-line method over a period (primarily 16 years for fiscal years 2011 and 2010) that is shorter than the average remaining service period of the eligible employees.
Accrued pension contribution for defined benefit pension plans is included in accrued pension and severance liability.
Directors and statutory auditors of the Company and its consolidated domestic subsidiaries are entitled to receive a lump-sum payment at the time of severance or retirement, subject to shareholder approval. The liabilities for such benefits, which are determined based on the Company’s and its consolidated subsidiaries’ internal rules, are included in “Other long-term liabilities” in the accompanying consolidated balance sheets.
(Change in accounting policy) (Fiscal 2010) The Company has applied Partial Amendments to Accounting Standard for Retirement Benefits (Part3) (ASBJ Statement No.19, July 31, 2008) since the beginning of fiscal 2010.
Since accumulated actuarial loss is amortized from next fiscal year, this change resulted in no effect on operating income and loss before income taxes and minority interests.
Also, the amount of retirement benefit obligation which is accrued with this change is ¥1,447 million. [12] Translation of Foreign Currency-Denominated Accounts Under the Japanese accounting standards for foreign currency translation, monetary assets and liabilities denominated in foreign currencies are translated into Japanese yen at the exchange rates prevailing at each balance sheet date with the resulting gain or loss included currently in the statement of income.

9
The assets and liabilities of foreign subsidiaries and affiliated companies are translated into Japanese yen at the exchange rates in effect at the balance sheet dates of the foreign subsidiaries and affiliated companies, except for common stock and capital surplus, which are translated at historical rates. Revenue and expense accounts are translated at the average exchange rates during the respective years. The resulting foreign currency translation adjustments are included in “Foreign currency translation adjustments” and “Minority interest” in the net assets section of the accompanying consolidated balance sheets. [13] Revenue Recognition The percentage-of-completion method of revenue from Aerospace division production has been applied to construction contracts for which certain elements were determinable with certainty at the end of fiscal year. (The percentage of completion is estimated with the proportion-of-cost method). The completed-contract method was applied to other works.
(Change in accounting policy) (Fiscal 2010) The Company previously used the percentage-of-completion method for accounting revenues associated with construction contracts with a contract amount of ¥5,000 million or more and a construction period of over one year, and other construction work was accounted for using the completed-contract method. Since the beginning of fiscal year 2010, in conjunction with adoption of the Accounting Standard for Construction Contracts (ASBJ Statement No.15, December 27, 2007) and its accompanying Guidance on Accounting Standard for Construction Contracts (ASBJ Guidance No.18, December 27, 2007), the percentage-of-completion method has been applied to construction contracts that were started during the fiscal year 2010, for which certain elements were determinable with certainty at the end of fiscal year 2010. (The percentage of completion is estimated with the proportion-of-cost method). The completed-contract method was applied to other works.
This change resulted in an increase in net sales of ¥2,361 million, an increase in operating income of ¥215 million and a decrease in loss before income taxes and minority interests of ¥215 million in the year ended March 31, 2010.
[14] Accounting for Lease Transactions A part of domestic consolidated subsidiaries recognizes revenue for financial lease transactions on the effective date of each lease contract.
[15] Derivative Financial Instruments and Hedge Accounting The Japanese accounting standards for financial instruments require that the Company and its consolidated domestic subsidiaries state derivative financial instruments at their fair value and recognize changes in the fair value as a gain or loss, unless such derivative financial instruments are used for hedging purposes.
For interest rate swap contracts used as a hedge that meet certain hedging criteria, the net amount to be paid or received under the interest rate swap contract is added to or deducted from the interest on the assets or liabilities for which the swap contract is executed.
Derivative financial instruments qualifying as a hedge, along with the underlying transactions, assets and liabilities are as follows:
Financial Instrument Transactions, assets and liabilities Interest swaps Borrowings
The risk exposures to movements in interest rates are hedged according to the Company’s and
consolidated subsidiaries’ risk management policy. An evaluation of hedge effectiveness is not considered necessary as the terms and notional amounts of these hedging instruments are the same as those of the

10
underlying transactions, assets and liabilities, and therefore they are presumed to be highly effective in offsetting the effect of movements in interest rates at their inception as well as during their terms. [16] Goodwill and Negative Goodwill Goodwill and negative goodwill are principally amortized by the straight-line method over five years in accordance with accounting principles generally accepted in the countries where such goodwill is recorded. [17] Cash and Cash Equivalents Cash and cash equivalents include all highly liquid investments—generally with original maturities of three months or less—that are readily convertible to known amounts of cash and have negligible risk of changes in value due to their short maturities. [18] Income Taxes The provision for income taxes is computed based on the pretax income for financial reporting purposes. Deferred tax assets and liabilities are recognized for expected future tax consequences of temporary differences between the financial statement carrying amounts and the tax bases of assets and liabilities. A valuation allowance is recorded to reduce deferred tax assets when it is more likely than not that a tax benefit will not be realized. [19] Research and Development Expenses Research and development costs are expensed as incurred and amounted to ¥42,907 million (US$ 516,019 thousand) and ¥37,175 million for fiscal years 2011 and 2010, respectively. [20] Net Income per Share Basic net income per share (EPS) is computed based on the average number of shares of common stock outstanding during each year. Diluted EPS assumes the potential dilution that could occur if all the convertible securities were converted or other contracts to issue common stock were exercised to the extent that they are not anti-dilutive. [21] Reclassification and Restatement Financial statements in fiscal 2010 have been reclassified to conform to the current year presentation. These reclassifications had no impact on previously reported results of operations or retained earnings. [22] Other Changes in Accounting Policy (Fiscal 2011) Application of Accounting Standard for Asset Retirement Obligations From the fiscal year 2011, the Company has adopted Accounting Standard for Asset Retirement Obligations (ASBJ Statement No.18, March 31, 2008) and Guidance on Accounting Standard for Asset Retirement Obligations (ASBJ Guidance No.21, March 31, 2008). This impact of this adoption on profit and loss was insignificant.
Application of Accounting Standard for Business Combinations and others From the fiscal year 2011, the Company has adopted Accounting Standard for Business Combinations (ASBJ Statement No.21, December 26, 2008), Accounting Standard for Consolidated Financial Statements (ASBJ Statement No.22, December 26, 2008), Partial amendments to Accounting Standard for Research and Development Costs (ASBJ Statement No.23, December 26, 2008), the Revised Accounting Standard for Business Divestitures (ASBJ Statement No.7, December 26, 2008), the Revised Accounting Standard for Equity Method of Accounting for Investments (ASBJ Statement No.16, December 26, 2008), and the Revised Guidance on Accounting Standard for Business

11
Combinations and Accounting Standard for Business Divestitures (ASBJ Guidance No.10, December 26, 2008). 3. Additional Cash Flow Information Cash and cash equivalents as of March 31, 2011 and 2010, consisted of the following: Millions of yen Thousands of U.S. dollars
2011 2010 2011Cash and deposits ¥211,700 ¥168,643 $2,546,001Short-term investment securities 21,063 12,458 253,313Short-term loans receivable 59,986 75,780 721,419 292,749 256,881 3,520,733Less maturity over three months (65,045) (65,415) (782,260)Cash and cash equivalents ¥227,704 ¥191,466 $2,738,473
(Fiscal 2011) Non Cash transaction The Company carried out a share exchange (the "Share Exchange") on August 1, 2010, and Ichitan Co., Ltd. becomes a wholly owned subsidiary of the Company. This share exchange resulted in recognition of "Goodwill" of ¥280 million (US$ 3,367 thousand), and a decrease in "treasury stock" of ¥450 million (US$ 5,412 thousand). 4. Financial Instruments The Company has applied "Accounting Standard for Financial Instruments and its Implementation Guidance (ASBJ Statement No.10, March 10, 2008)" and "Guidance on Disclosures about Fair Value of Financial Instruments (ASBJ Guidance No.19, March 10, 2008)" since the beginning of fiscal 2010. (1) Summary of Financial Instruments Status [1] Action Policy with Regard to Financial Instruments With regard to planned capital expenditure to support Fuji Heavy Industries Ltd., its consolidated subsidiaries and affiliated companies (the “FHI Group”) in their main operations of automobile manufacturing and sales, the Company finances mainly from bank loans and the issue of corporate bonds. Temporary surpluses are invested in highly secure financial assets, and bank loans and liquidation of accounts receivable provide short-term working capital. It is the Company's policy to use derivatives as a way to avoid the below-stated risks and to not conduct speculative transactions. [2] Details of Financial Instruments and Respective Risks Operating receivables such as notes and accounts receivable-trade and lease investment assets are subject to customer credit risks. Moreover, because the Company works to expand its business globally, operating receivables denominated in foreign currencies are subject to the risk of changes in foreign exchange rates. As a general rule, however, forward foreign exchange contracts are used to hedge the foreign exchange rate risk, considering the net amount of operating receivables denominated in foreign currencies that exceed foreign currency denominated operating liabilities. Available-for-sale securities and investment securities are mainly stocks associated with business and capital alliances with principal business partners, and are subject to risk of market price fluctuation.
Notes and accounts payable-trade that are included in operating liabilities usually have a payment date of within one year. Furthermore, a certain portion of such liabilities involves foreign currency denominated transactions associated with the import of raw materials and is thus subject to exchange rate fluctuation risk,

12
although it is consistently less than accounts receivable balance of the same foreign currency. The FHI Group’s liabilities associated with debt and bonds are set specifically for the acquisition of essential funds, mainly for capital expenditure, whose redemption dates come within 13 years after March 31, 2011 at the latest. A certain portion of said liabilities may have adjustable rates and are therefore subject to the risk of changes in interest rates, although in such cases derivative transactions (interest rate swap transactions) are used. Derivative transactions are foreign exchange forward contracts to hedge against exchange rate fluctuations associated with accounts receivables and liabilities denominated in foreign currencies, and interest rate swap contracts with the objective of hedging against the risk of change in interest rates to be paid on loans. With regard to hedging instruments and hedged items, hedge policy, the method of evaluation of hedge effectiveness and other related items, please refer to “2-[15] Derivative Financial Instruments and Hedge Accounting”. [3] Risk Management System with Regard to Financial Instruments
(a) Management of Credit Risk (Risk Associated with Business Partner’s Breach of Contract) Credit control departments at each FHI division and its consolidated subsidiaries regularly monitor the financial status of key customers with regard to accounts receivables and lease investment assets. Together with keeping an eye on deadlines and balances of each customer, these departments identify and mitigate the risk of potential problem in collection due to deterioration in financial status or other factors.
(b) Management of Market Risk (Risk Associated with Fluctuations in Exchange or Interest Rates) With regard to operating assets and liabilities denominated in foreign currencies, as a general rule, the Company uses foreign exchange forward contracts to hedge against risks of exchange rate fluctuation on a monthly basis by each currency. Depending on the status of exchange rates, foreign exchange forward contracts, that is no longer than six months, are used to hedge against the risk of exchange rate fluctuation to which net position of accounts receivable and accounts payable dominated in foreign currency is exposed. Moreover, the Company and certain consolidated subsidiaries use interest rate swap transactions to limit exposure to the risk of fluctuation in interest rates payable on loans or corporate bonds. The Company also regularly check the market values of securities and investment securities as well as the financial conditions of issuers (business partner companies), and constantly reviews its investment position taking into consideration its relationships with respective business partner companies. Basic policies with regard to derivative transactions are approved by the Executive Management Board. Derivative transactions are handled in line with regulations and are conducted by the Finance & Accounting Department. The results of these transactions are without exception reported to officers concerned.
(c) Management of Liquidity Risk (Risk of Becoming Unable to Make Payments by the Due Date) Associated with Funds Procurement The Company secures liquidity at a level sufficient to satisfy its current needs through the use of commitment lines contracted with major banks in combination with cash and cash equivalents.
[4] Supplemental Explanation of Items with Regard to Fair Value of Financial Instruments Fair value includes the fair market value of financial instruments and, in the event market-based prices are not available, prices that are calculated on a rational basis. Because the factors incorporated into the calculation of these prices are subject to change, differing assumptions may result in differing fair values. In addition, the values of contracts with regard to derivative transactions as stated in “(2) Items with Regard to Fair Value of Financial Instruments” do not by themselves indicate the market risk associated with the respective derivative transaction.
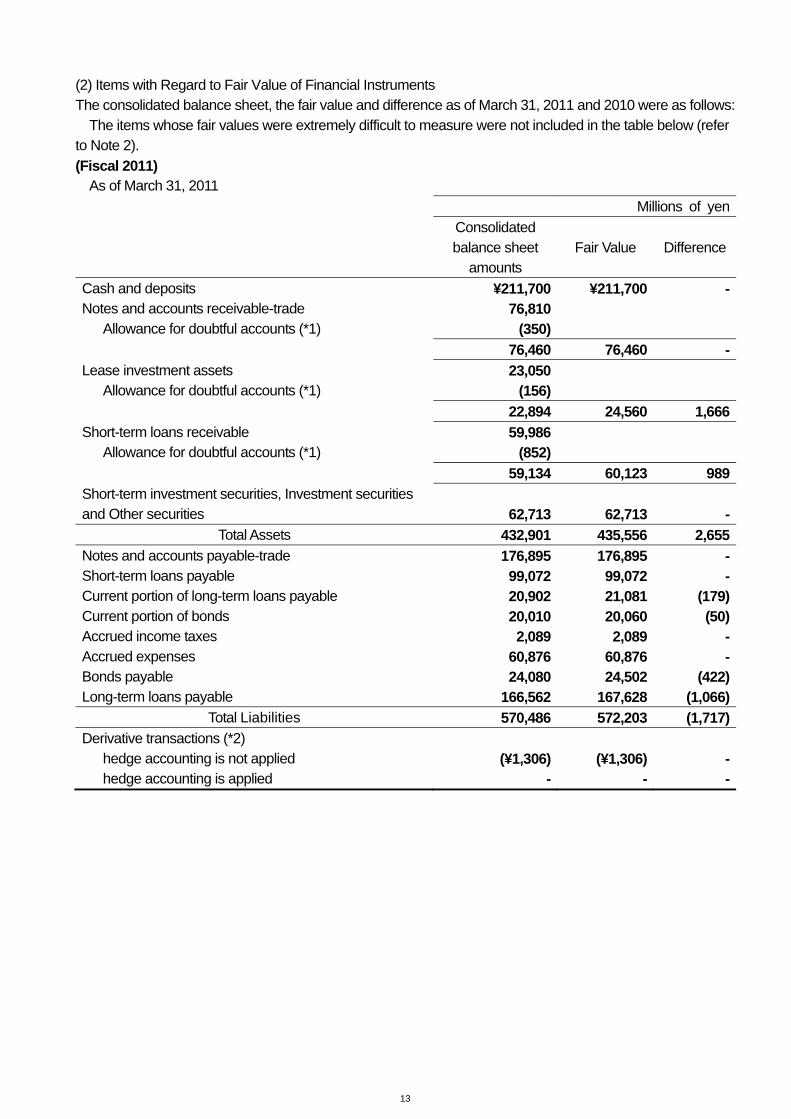
13
(2) Items with Regard to Fair Value of Financial Instruments The consolidated balance sheet, the fair value and difference as of March 31, 2011 and 2010 were as follows:
The items whose fair values were extremely difficult to measure were not included in the table below (refer to Note 2). (Fiscal 2011)
As of March 31, 2011 Millions of yen Consolidated
balance sheet amounts
Fair Value
Difference
Cash and deposits ¥211,700 ¥211,700 -Notes and accounts receivable-trade 76,810
Allowance for doubtful accounts (*1) (350) 76,460 76,460 -Lease investment assets 23,050
Allowance for doubtful accounts (*1) (156) 22,894 24,560 1,666Short-term loans receivable 59,986
Allowance for doubtful accounts (*1) (852) 59,134 60,123 989Short-term investment securities, Investment securities and Other securities 62,713
62,713 -
Total Assets 432,901 435,556 2,655Notes and accounts payable-trade 176,895 176,895 -Short-term loans payable 99,072 99,072 -Current portion of long-term loans payable 20,902 21,081 (179)Current portion of bonds 20,010 20,060 (50)Accrued income taxes 2,089 2,089 -Accrued expenses 60,876 60,876 -Bonds payable 24,080 24,502 (422)Long-term loans payable 166,562 167,628 (1,066)
Total Liabilities 570,486 572,203 (1,717)Derivative transactions (*2)
hedge accounting is not applied (¥1,306) (¥1,306) -hedge accounting is applied - - -

14
As of March 31, 2011 Thousands of U.S. dollars Consolidated
balance sheet amounts
Fair Value
Difference
Cash and deposits $2,546,001 $2,546,001 -Notes and accounts receivable-trade 923,752
Allowance for doubtful accounts (*1) (4,209) 919,543 919,543 -Lease investment assets 277,210
Allowance for doubtful accounts (*1) (1,876) 275,334 295,370 20,036Short-term loans receivable 721,419
Allowance for doubtful accounts (*1) (10,246) 711,173 723,067 11,894Short-term investment securities, Investment securities and Other securities 754,215
754,215 -
Total Assets 5,206,266 5,238,196 31,930Notes and accounts payable-trade 2,127,420 2,127,420 -Short-term loans payable 1,191,485 1,191,485 -Current portion of long-term loans payable 251,377 253,530 (2,153)Current portion of bonds 240,649 241,251 (602)Accrued income taxes 25,123 25,123 -Accrued expenses 732,123 732,123 -Bonds payable 289,597 294,672 (5,075)Long-term loans payable 2,003,151 2,015,971 (12,820)
Total Liabilities 6,860,925 6,881,575 (20,650)Derivative transactions (*2)
hedge accounting is not applied ($15,707) ($15,707) -hedge accounting is applied - - -
*1. Allowance for doubtful accounts corresponding to Notes and accounts receivable-trade, Lease investment assets and Short-term loans receivable is deducted. *2. Indicated are the net amounts of assets and liabilities results from derivative transactions, with the total net liabilities indicated in ( ). [1] The calculation methods of financial instrument fair value together with securities and derivative transactions Assets Cash and deposits and Notes and accounts receivable-trade
Because these are settled in the short-term, the fair value is mostly the same as the book value and as such the book value is deemed as fair value.
Lease investment assets and Short-term loans receivable Fair value is the present value calculated by discounting relevant cash flows by each category of the assets and timing of cash flow, where discount rates were adopted taking into consideration the period until maturity and credit risks. In addition, the estimated residual value is included in the balance of Lease investment assets.

15
Short-term investment securities and investment securities
Fair value is determined by the stock exchange price, while bonds are determined by the stock exchange price or by quotations received from financial institutions. Please refer to the note entitled "5.Short-term investment securities and investment securities" regarding to respective objectives for holding securities.
Liabilities Notes and accounts payable-trade, Short-term loans payable, Accrued income taxes and Accrued expenses
Because these are settled in the short-term, the fair value is mostly the same as the book value and as such the book value is deemed as fair value.
Current portion of long-term loans payable and Long-term loans payable
Fair value is measured based on the present value that is calculated as discounted cash flow of the total amount of principal and interest, where the interest would be set, if the Company concluded a brand new loan agreement with the same condition at the date of measurement.
Current portion of bonds and Bonds payable
The fair value of bonds issued by the Company is based on market prices if available. For bonds with no available market price, fair value is calculated using the present value that is calculated as discounted cash flow of the total amount of principal and interest by, where discount rates are adopted taking into consideration the remaining redemption period and credit risks.
Derivative transactions Fair value of interest rate swap that meets certain hedging criteria is included in the fair value of long-term debt as a hedged item, because they are treated as a unit. [2] Financial instruments which fair value is extremely difficult to measure Consolidated balance sheet amount as of March 31, 2011:
Other securities (available-for-sale securities) Millions of yen Thousands of
U.S. dollarsMoney management fund ¥17,802 $214,095Unlisted stocks (excluding over-the-counter stocks) ¥3,143 $37,799
These have no available market price and are expected to entail excessive costs in the estimation of future cash flows. Consequently, estimating their fair value is recognized as extremely difficult and they are not included in "Short-term investment securities, Investment securities and Other securities".

16
[3] Scheduled redemption of monetary assets and securities with maturity As of March 31, 2011:
Millions of yenWithin 1 1 to 5 5 to 10 Over 10
Year Years Years yearsCash and deposits ¥211,700 - - -Notes and accounts receivable-trade 74,059 2,751 - -Lease investment assets 9,911 13,075 64 -Short-term investment securities, Investment securities and Other securities
Government and municipal bonds 1,152 2,854 1,106 2,069Corporate bonds 2,109 6,365 1,269 430Other - 6 217 2,687
Short-term loans receivable ¥22,814 ¥36,245 ¥927 -
Thousands of U.S. dollarsWithin 1 1 to 5 5 to 10 Over 10
Year Years Years yearsCash and deposits $2,546,001 - - -Notes and accounts receivable-trade 890,667 33,085 - -Lease investment assets 119,194 157,246 770 -Short-term investment securities, Investment securities and Other securities
Government and municipal bonds 13,854 34,324 13,301 24,883Corporate bonds 25,364 76,548 15,262 5,171Other - 72 2,610 32,315
Short-term loans receivable $274,372 $435,899 $11,148 - 4] Amount of repayment for long-term debt and other interest-bearing debt As of March 31, 2011:
Millions of yenWithin 1 1 to 5 5 to 10 Over 10
Year Years Years yearsBonds payable ¥20,010 ¥24,080 - -Long-term loans payable 20,902 145,574 20,137 851
Thousands of U.S. dollars
Within 1 1 to 5 5 to 10 Over 10Year Years Years years
Bonds payable $240,649 $289,597 - -Long-term loans payable 251,377 1,750,740 242,177 10,234

17
(Fiscal 2010) As of March 31, 2010 Millions of yen Consolidated
balance sheet amounts (*1)
Fair Value
(*1)
Difference
Cash and deposits ¥168,643 ¥168,643 -Notes and accounts receivable-trade 103,521 103,521 -Lease investment assets 27,788 26,040 (1,748)Short-term loans receivable 75,780 75,844 64Short-term investment securities, Investment securities and Other securities 58,132
58,132 -
Notes and accounts payable-trade (217,051) (217,051) -Short-term loans payable (142,121) (142,121) -Current portion of long-term loans payable (13,912) (13,912) -Current portion of bonds (20,010) (20,010) -Accrued income taxes (2,873) (2,873) -Accrued expenses (56,244) (56,244) -Bonds payable (44,090) (44,447) (357)Long-term loans payable (147,479) (146,994) 485Derivative transactions (*2) hedge accounting is not applied (¥1,879) (¥1,879) -hedge accounting is applied - - -
*1. Liabilities are indicated in ( ). *2. Indicated are the net amounts of assets and liabilities results from derivative transactions, with the total net liabilities indicated in ( ). [1] The calculation methods of financial instrument fair value together with securities and derivative transactions Assets Cash and deposits and Notes and accounts receivable-trade
Because these are settled in the short-term, the fair value is mostly the same as the book value and as such the book value is deemed as fair value.
Lease investment assets and Short-term loans receivable Fair value is the present value calculated by discounting relevant cash flows by each category of the assets and timing of cash flow, where discount rates were adopted taking into consideration the period until maturity and credit risks. In addition, the estimated residual value is included in the balance of Lease investment assets.
Short-term investment securities and investment securities Fair value is determined by the stock exchange price, while bonds are determined by the stock exchange price or by quotations received from financial institutions. Please refer to the note entitled "5.Short-term investment securities and investment securities" regarding to respective objectives for holding securities.
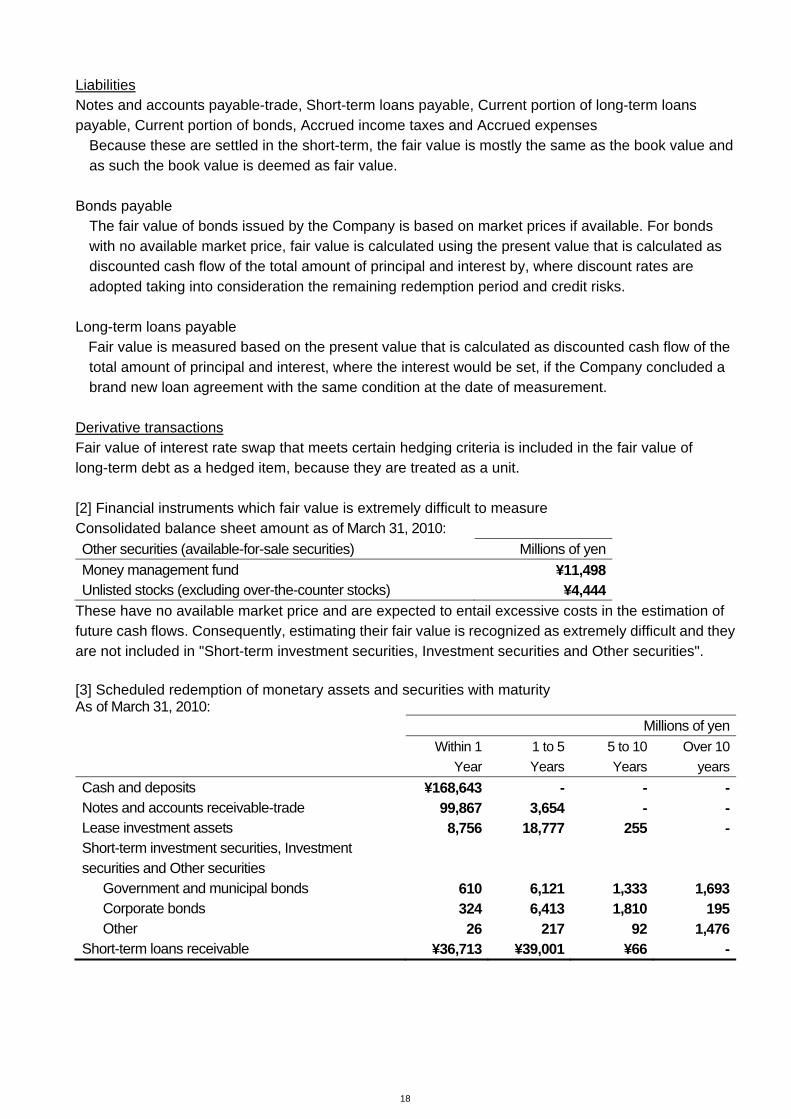
18
Liabilities Notes and accounts payable-trade, Short-term loans payable, Current portion of long-term loans payable, Current portion of bonds, Accrued income taxes and Accrued expenses
Because these are settled in the short-term, the fair value is mostly the same as the book value and as such the book value is deemed as fair value.
Bonds payable
The fair value of bonds issued by the Company is based on market prices if available. For bonds with no available market price, fair value is calculated using the present value that is calculated as discounted cash flow of the total amount of principal and interest by, where discount rates are adopted taking into consideration the remaining redemption period and credit risks.
Long-term loans payable
Fair value is measured based on the present value that is calculated as discounted cash flow of the total amount of principal and interest, where the interest would be set, if the Company concluded a brand new loan agreement with the same condition at the date of measurement.
Derivative transactions Fair value of interest rate swap that meets certain hedging criteria is included in the fair value of long-term debt as a hedged item, because they are treated as a unit. [2] Financial instruments which fair value is extremely difficult to measure Consolidated balance sheet amount as of March 31, 2010: Other securities (available-for-sale securities) Millions of yen Money management fund ¥11,498 Unlisted stocks (excluding over-the-counter stocks) ¥4,444
These have no available market price and are expected to entail excessive costs in the estimation of future cash flows. Consequently, estimating their fair value is recognized as extremely difficult and they are not included in "Short-term investment securities, Investment securities and Other securities". [3] Scheduled redemption of monetary assets and securities with maturity As of March 31, 2010:
Millions of yenWithin 1 1 to 5 5 to 10 Over 10
Year Years Years yearsCash and deposits ¥168,643 - - -Notes and accounts receivable-trade 99,867 3,654 - -Lease investment assets 8,756 18,777 255 -Short-term investment securities, Investment securities and Other securities
Government and municipal bonds 610 6,121 1,333 1,693Corporate bonds 324 6,413 1,810 195Other 26 217 92 1,476
Short-term loans receivable ¥36,713 ¥39,001 ¥66 -

19
[4] Amount of repayment for long-term debt and other interest-bearing debt As of March 31, 2010:
Millions of yenWithin 1 1 to 5 5 to 10 Over 10
Year Years Years yearsBonds payable ¥20,010 ¥44,090 - -Long-term loans payable 13,912 136,349 10,265 865
5. Short-Term Investment Securities and Investment Securities Information on the value of short-term investment securities and investment securities as of March 31, 2011 and 2010 was as follows: (Fiscal 2011) (1) Other securities (available-for-sale securities): As of March 31, 2011: Millions of yen Book value Acquisition cost Difference Book value exceeding acquisition cost:
Equity securities ¥38,865 ¥19,191 ¥19,674Debt securities
Government and municipal bonds 4,654 4,553 101Corporate bonds 8,846 8,580 266
Other 2,041 2,000 41Sub-total 54,406 34,324 20,082
Book value not exceeding acquisition cost: Equity securities 3,583 4,233 (650)Debt securities
Government and municipal bonds 2,526 2,575 (49)Corporate bonds 1,326 1,334 (8)
Other 872 888 (16)Sub-total 8,307 9,030 (723)Total ¥62,713 ¥43,354 ¥19,359
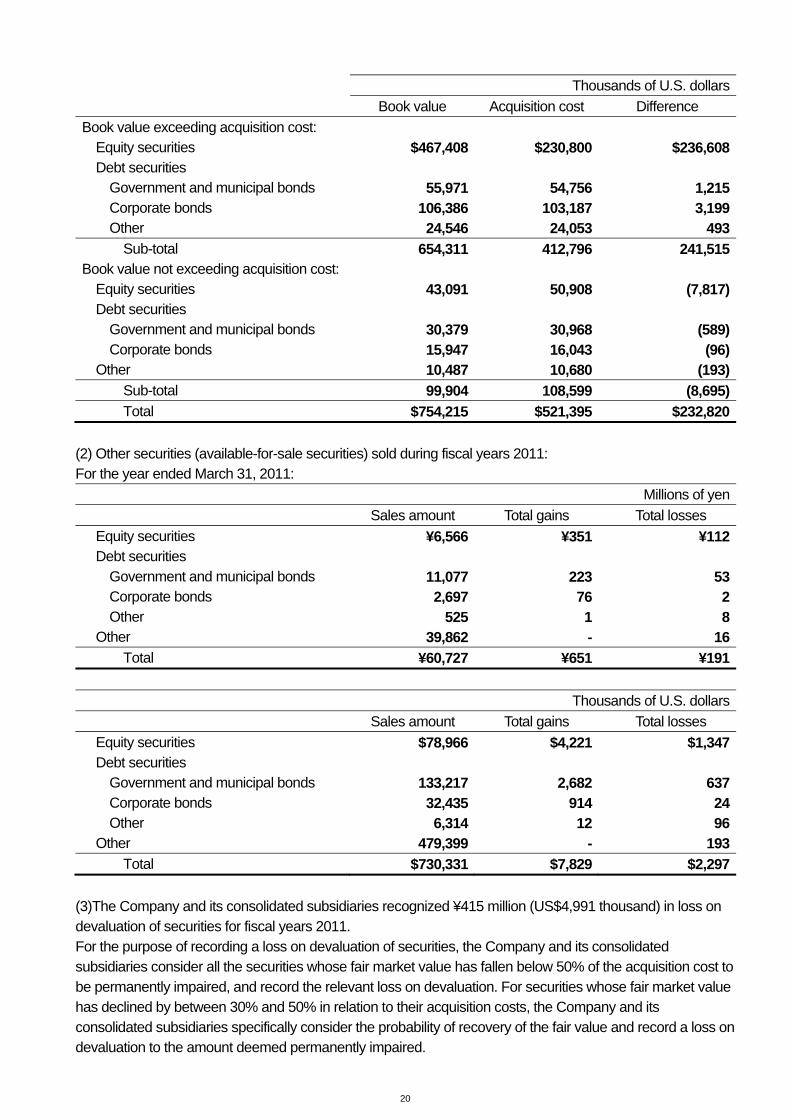
20
Thousands of U.S. dollars Book value Acquisition cost Difference Book value exceeding acquisition cost:
Equity securities $467,408 $230,800 $236,608Debt securities
Government and municipal bonds 55,971 54,756 1,215Corporate bonds 106,386 103,187 3,199Other 24,546 24,053 493
Sub-total 654,311 412,796 241,515Book value not exceeding acquisition cost:
Equity securities 43,091 50,908 (7,817)Debt securities
Government and municipal bonds 30,379 30,968 (589)Corporate bonds 15,947 16,043 (96)
Other 10,487 10,680 (193)Sub-total 99,904 108,599 (8,695)Total $754,215 $521,395 $232,820
(2) Other securities (available-for-sale securities) sold during fiscal years 2011: For the year ended March 31, 2011: Millions of yen Sales amount Total gains Total losses
Equity securities ¥6,566 ¥351 ¥112Debt securities
Government and municipal bonds 11,077 223 53Corporate bonds 2,697 76 2Other 525 1 8
Other 39,862 - 16Total ¥60,727 ¥651 ¥191
Thousands of U.S. dollars Sales amount Total gains Total losses
Equity securities $78,966 $4,221 $1,347Debt securities
Government and municipal bonds 133,217 2,682 637Corporate bonds 32,435 914 24Other 6,314 12 96
Other 479,399 - 193Total $730,331 $7,829 $2,297
(3)The Company and its consolidated subsidiaries recognized ¥415 million (US$4,991 thousand) in loss on devaluation of securities for fiscal years 2011. For the purpose of recording a loss on devaluation of securities, the Company and its consolidated subsidiaries consider all the securities whose fair market value has fallen below 50% of the acquisition cost to be permanently impaired, and record the relevant loss on devaluation. For securities whose fair market value has declined by between 30% and 50% in relation to their acquisition costs, the Company and its consolidated subsidiaries specifically consider the probability of recovery of the fair value and record a loss on devaluation to the amount deemed permanently impaired.

21
(Fiscal 2010) (1) Other securities (available-for-sale securities): As of March 31, 2010: Millions of yen Book value Acquisition cost Difference Book value exceeding acquisition cost:
Equity securities ¥35,028 ¥17,936 ¥17,092Debt securities
Government and municipal bonds 6,350 6,223 127Corporate bonds 7,960 7,618 342
Other 1,115 1,082 33Sub-total 50,453 32,859 17,594
Book value not exceeding acquisition cost: Equity securities 2,791 3,087 (296)Debt securities
Government and municipal bonds 3,407 3,437 (30)Corporate bonds 782 785 (3)
Other 699 710 (11)Sub-total 7,679 8,019 (340)Total ¥58,132 ¥40,878 ¥17,254
(2) Other securities (available-for-sale securities) sold during fiscal years 2010: For the year ended March 31, 2010: Millions of yen Sales amount Total gains Total losses
Equity securities ¥1,320 ¥106 ¥106Debt securities
Government and municipal bonds 4,144 50 43Corporate bonds 1,699 41 -Other 195 5 6
Other 63,287 - 27Total ¥70,645 ¥202 ¥182
(3)The Company and its consolidated subsidiaries recognized ¥520 million in loss on devaluation of securities for fiscal years 2010. For the purpose of recording a loss on devaluation of securities, the Company and its consolidated subsidiaries consider all the securities whose fair market value has fallen below 50% of the acquisition cost to be permanently impaired, and record the relevant loss on devaluation. For securities whose fair market value has declined by between 30% and 50% in relation to their acquisition costs, the Company and its consolidated subsidiaries specifically consider the probability of recovery of the fair value and record a loss on devaluation to the amount deemed permanently impaired.

22
6. Short-Term Borrowings and Long-Term Debts Short-term borrowings as of March 31, 2011 and 2010, consisted of the following: Thousands of Millions of yen U.S. dollars 2011 2010 2011Bank loans with average interest rate of 0.66 % and 0.97%
per annum as of March 31, 2011 and 2010, respectively ¥99,072
¥142,121 $1,191,485 Long-term debts as of March 31, 2011 and 2010 consisted of the following: Thousands of Millions of yen U.S. dollars 2011 2010 2011Loans principally from banks and insurance companies due
through 2024 with average interest rate of 1.39% and 1.44% per annum as of March 31, 2011 and 2010, respectively
¥187,464
¥161,391 $2,254,528
Unsecured 0.68% bonds due June 18, 2010 - 20,000 -Unsecured 0.93% bonds due March 31, 2011 - 10 -Unsecured 1.31% bonds due April 28, 2011 20,000 20,000 240,529Unsecured 0.93% bonds due March 30, 2012 10 10 120Unsecured 2.01% bonds due May 31, 2012 20,000 20,000 240,529Unsecured 0.93% bonds due March 29, 2013 10 10 120Unsecured 0.93% bonds due March 31, 2014 10 10 120Unsecured 1.62 % bonds due July 10, 2014 4,000 4,000 48,106Unsecured 0.93% bonds due March 31, 2015 60 60 722
Subtotal 231,554 225,491 2,784,774Less-Portion due within one year (40,912) (33,922) (492,026)
Total ¥190,642 ¥191,569 $2,292,748 Annual maturities of long-term loans payable and bonds payable as of March 31, 2011 were as follows: Thousands of Millions of yen U.S. dollars2012 ¥40,912 $492,0262013 41,450 498,4972014 45,144 542,9222015 41,683 501,2992016 41,377 497,6192017and thereafter 20,988 252,411
Total ¥231,554 $2,784,774

23
Lease obligations as of March 31, 2011 and 2010 consisted of the following: Thousands of Millions of yen U.S. dollars 2011 2010 2011Lease obligations due within one year as of March 31,
2011and 2010 ¥674 ¥1,123 $8,106
Lease obligations due after one year as of March 31, 2011and 2010
1,184 720 14,239
Total ¥1,858 ¥1,843 $22,345 Annual maturities of lease obligations as of March 31, 2011 were as follows: Thousands of Millions of yen U.S. dollars2012 ¥674 $8,1062013 580 6,9752014 316 3,8002015 199 2,3932016 73 8782017and thereafter 16 193
Total ¥1,858 $22,345 The following assets as of March 31, 2011 and 2010 were pledged as collateral for certain loans: Thousands of Millions of yen U.S. dollars 2011 2010 2011Notes and accounts receivable-trade ¥110 ¥69 $1,323Property, plant and equipment 64,339 65,584 773,770
Total ¥64,449 ¥65,653 $775,093 For efficient procurement of operating fund, the group concludes the commitment-line contracts as follows: Thousands of Millions of yen U.S. dollars 2011 2010 2011Total commitments ¥105,273 ¥74,956 $1,266,061Unused balance - - -
7. Derivative transactions In the normal course of business, the Company and its consolidated subsidiaries employ derivative financial instruments, including foreign exchange forward contracts, foreign currency options and interest rate swaps, to manage their exposures to fluctuations in foreign currency exchange rates and interest rates. The Company and its consolidated subsidiaries do not use derivatives for speculative or trading purposes.
The fair value information of derivative financial instruments as of March 31, 2011and 2010 was as follows:

24
Derivative transactions to which hedge accounting is not applied (1) Foreign currency contracts: As of March 31, 2011 Millions of yen Thousands of U.S. dollars Notional Valuation Notional Valuation Amount Fair value gain (loss) Amount Fair value gain (loss)Foreign exchange forward contracts:
Sell- U.S. dollar ¥83,265 (¥625) (¥625) $1,001,383 ($7,517) ($7,517)
Euro 8,913 (359) (359) 107,192 (4,317) (4,317) Canadian dollar 11,921 (322) (322) 143,367 (3,873) (3,873)
Note: The method to determine the fair value is based on quotations obtained from financial institutions. As of March 31, 2010 Millions of yen Notional Valuation Amount Fair value gain (loss)Foreign exchange forward contracts:
Sell- U.S. dollar ¥61,590 (¥1,361) (¥1,361)
Euro 8,899 58 58 Canadian dollar 13,184 (576) (576) Australian dollar ¥25 0 0
Note: The method to determine the fair value is based on quotations obtained from financial institutions. Derivative transactions to which hedge accounting is applied (1) Interest rate contracts: As of March 31, 2011 Accounting treatment: Exception processing of interest rate swap Hedge item: Long-term loans payable Millions of yen Thousands of U.S. dollars Notional Over Notional Over Amount 1 year Fair value Amount 1 year Fair valueInterest rate swap contracts:
Receive floating rate pay fixed rate
¥36,060 ¥34,735 (*)
$433,674
$417,739 (*)
Note *Fair value of interest rate swap that meets certain hedging criteria is included in the fair value of long-term debt as a hedged item, because they are treated as a unit.

25
As of March 31, 2010 Accounting treatment: Exception processing of interest rate swap Hedge item: Long-term loans payable Millions of yen Notional Over Amount 1 year Fair valueInterest rate swap contracts: Receive floating rate pay fixed rate
¥36,945
¥36,115 (*)Note *Fair value of interest rate swap that meets certain hedging criteria is included in the fair value of long-term debt as a hedged item, because they are treated as a unit. 8. Property, Plant and Equipment Property, plant and equipment as of March 31, 2011and 2010 are summarized as follows: Thousands of Millions of yen U.S. dollars 2011 2010 2011Buildings and structures ¥317,448 ¥318,236 $3,817,775Machinery, equipment and vehicles 454,663 452,122 5,467,986Vehicles and equipment on operating leases, net 18,783 27,207 225,893Other 226,816 239,985 2,727,793 Subtotal 1,017,710 1,037,550 12,239,447Accumulated depreciation (765,211) (759,073) (9,202,778)Accumulated impairment loss (34,162) (33,006) (410,848)Land 191,111 191,384 2,298,388Construction in progress 21,394 12,672 257,294
Total ¥430,842 ¥449,527 $5,181,503
9. Unexecuted Balance of Overdraft Facilities and Lending Commitments The unexecuted balance of overdraft facilities and lending commitments at a consolidated subsidiary (Subaru Finance Co., Ltd.) as of March 31, 2011 and 2010 was as follows: Thousands of Millions of yen U.S. dollars 2011 2010 2011Total overdraft facilities and lending commitments ¥4,800 ¥5,010 $57,727Less amounts currently executed 666 808 8,010Unexecuted balance ¥4,134 ¥4,202 $49,717
A portion of the overdraft facilities and lending commitments above is subject to credit considerations as documented in the customer contracts. Therefore, the total balance above is not always available.
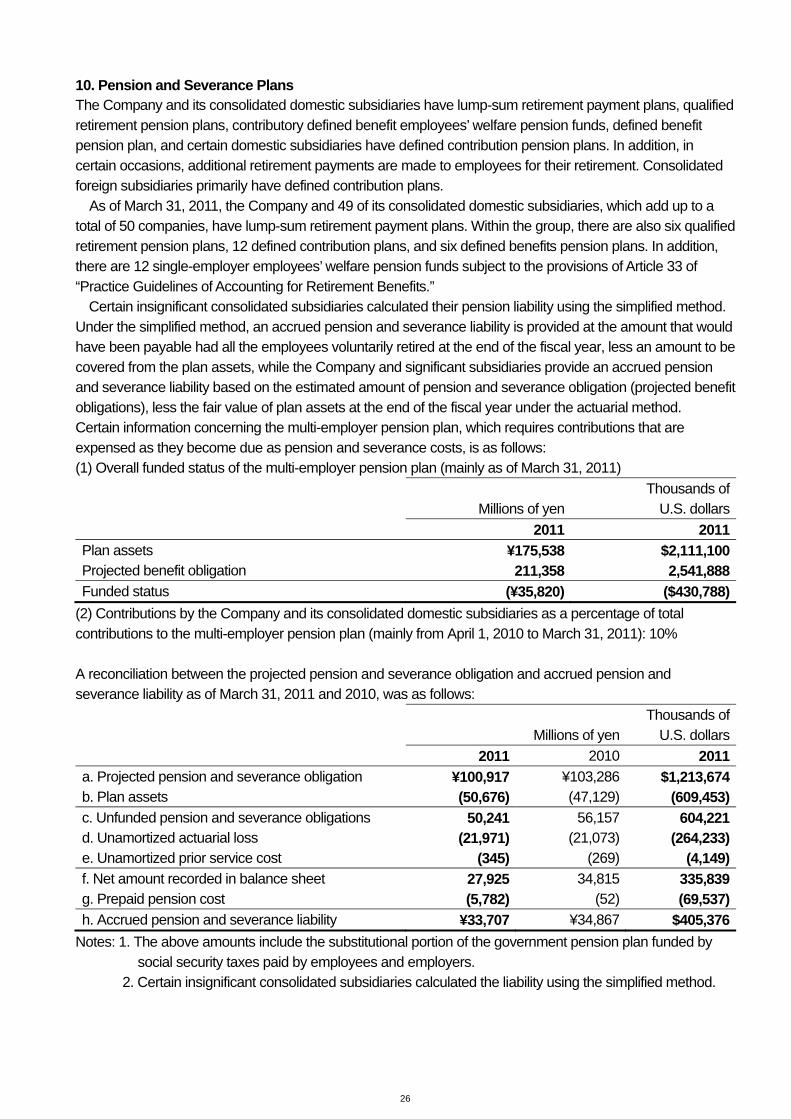
26
10. Pension and Severance Plans The Company and its consolidated domestic subsidiaries have lump-sum retirement payment plans, qualified retirement pension plans, contributory defined benefit employees’ welfare pension funds, defined benefit pension plan, and certain domestic subsidiaries have defined contribution pension plans. In addition, in certain occasions, additional retirement payments are made to employees for their retirement. Consolidated foreign subsidiaries primarily have defined contribution plans.
As of March 31, 2011, the Company and 49 of its consolidated domestic subsidiaries, which add up to a total of 50 companies, have lump-sum retirement payment plans. Within the group, there are also six qualified retirement pension plans, 12 defined contribution plans, and six defined benefits pension plans. In addition, there are 12 single-employer employees’ welfare pension funds subject to the provisions of Article 33 of “Practice Guidelines of Accounting for Retirement Benefits.”
Certain insignificant consolidated subsidiaries calculated their pension liability using the simplified method. Under the simplified method, an accrued pension and severance liability is provided at the amount that would have been payable had all the employees voluntarily retired at the end of the fiscal year, less an amount to be covered from the plan assets, while the Company and significant subsidiaries provide an accrued pension and severance liability based on the estimated amount of pension and severance obligation (projected benefit obligations), less the fair value of plan assets at the end of the fiscal year under the actuarial method. Certain information concerning the multi-employer pension plan, which requires contributions that are expensed as they become due as pension and severance costs, is as follows: (1) Overall funded status of the multi-employer pension plan (mainly as of March 31, 2011) Thousands of Millions of yen U.S. dollars 2011 2011Plan assets ¥175,538 $2,111,100Projected benefit obligation 211,358 2,541,888Funded status (¥35,820) ($430,788)
(2) Contributions by the Company and its consolidated domestic subsidiaries as a percentage of total contributions to the multi-employer pension plan (mainly from April 1, 2010 to March 31, 2011): 10% A reconciliation between the projected pension and severance obligation and accrued pension and severance liability as of March 31, 2011 and 2010, was as follows: Thousands of Millions of yen U.S. dollars 2011 2010 2011a. Projected pension and severance obligation ¥100,917 ¥103,286 $1,213,674b. Plan assets (50,676) (47,129) (609,453)c. Unfunded pension and severance obligations 50,241 56,157 604,221d. Unamortized actuarial loss (21,971) (21,073) (264,233)e. Unamortized prior service cost (345) (269) (4,149)f. Net amount recorded in balance sheet 27,925 34,815 335,839g. Prepaid pension cost (5,782) (52) (69,537)h. Accrued pension and severance liability ¥33,707 ¥34,867 $405,376
Notes: 1. The above amounts include the substitutional portion of the government pension plan funded by social security taxes paid by employees and employers.
2. Certain insignificant consolidated subsidiaries calculated the liability using the simplified method.

27
Periodic pension and severance costs for the fiscal years 2011, and 2010, consisted of the following: Thousands of Millions of yen U.S. dollars 2011 2010 2011a. Service cost ¥8,599 ¥8,541 $103,416b. Interest cost 1,791 1,920 21,539c. Expected return on plan assets (1,609) (1,440) (19,351)d. Amortization of actuarial gain/loss 1,941 1,976 23,343e. Amortization of prior service cost 51 35 614f. Pension and severance cost 10,773 11,032 129,561g. Gain on transfer of the substitutional portion of the
employee’s pension fund (236)
- (2,838)h. Total ¥10,537 ¥11,032 $126,723
Notes:1. The above amounts do not include the social security taxes paid by employees. 2. The service cost of consolidated subsidiaries using the simplified method is included in the service
cost above. 3. The service cost above includes required funding for the multi-employer pension plan amounting to
¥628 million (US$7,553 thousand) and ¥726 million for fiscal years 2011 and 2010, respectively, for which plan assets could not be allocated to each participating employer.
4. The service cost above includes contributions for the defined contribution plans of the Company and certain consolidated subsidiaries amounting to ¥2,473 million (US$29,741 thousand) and ¥2,184 million for fiscal years 2011 and 2010, respectively.
5. In addition to the pension and severance cost above, additional retirement payments amounting to ¥220 million (US$2,646 thousand) and ¥174 million were made for fiscal years 2011 and 2010, respectively. For fiscal years 2011 and 2010, the entire ¥220 million (US$2,646 thousand) of additional retirement payments and ¥174 million of additional retirement payments is included in cost of sales and selling, general and administrative expenses, respectively.
Actuarial assumptions used in computation of pension and severance liability were as follows: 2011 2010 a. Attribution of expected benefit obligation The straight-line method The straight-line method b. Discount rate 1.4%–2.0% 1.4%–2.0% c. Expected rate of return on plan assets 1.4%–3.5% 1.4%–4.0% d. Amortization of actuarial gain/loss Primarily 16 years (amortized
by the straight-line method starting from the following fiscal year, over a period shorter than the average remaining service periods of the eligible employees)
Primarily 16 years (amortized by the straight-line method starting from the following fiscal year, over a period shorter than the average remaining service periods of the eligible employees)
e. Amortization of prior service cost 11 to 18 years 11 to 18 years

28
11. Income Taxes The Company and its consolidated subsidiaries were subject to a number of taxes based on income, which in the aggregate resulted in a normal statutory income tax rate of approximately 40.5% for fiscal years 2011 and 2010.
A reconciliation of the statutory income tax rates in Japan to the Company’s effective income tax rates for the fiscal years 2011 is as follows: 2011 Statutory income tax rate in Japan 40.5%Increase (reduction) in taxes resulting from: Changes in valuation allowance and tax benefits realized from loss carry forwards (17.1)Adjustment to past corporate income taxes payable and corporate income taxes refundable (0.2)Equity in earnings of affiliates (1.7)Difference of applicable tax rate in subsidiaries (1.5)Other 0.2Effective income tax rate 20.2%
For fiscal 2010, such reconciliation is not presented herein because the consolidated financial results recorded a net loss.
Significant components of the deferred tax assets and liabilities as of March 31, 2011 and 2010, were as
follows: Thousands of Millions of yen U.S. dollars 2011 2010 2011Deferred tax assets:
Depreciation and amortization expenses ¥13,568 ¥13,191 $163,175Accrued expenses 11,687 8,836 140,553Accrued pension and severance liabilities 11,028 13,847 132,628Accrued warranty claims 10,129 7,324 121,816Loss on devaluation of inventories 9,148 8,340 110,018Accrued bonus 6,561 6,255 78,906Long-term accounts payable, other 4,472 4,681 53,782Allowance for doubtful accounts 2,349 2,882 28,250Net operating loss carryforwards 33,663 53,878 404,847Other 10,024 11,818 120,553
Total deferred tax assets 112,629 131,052 1,354,528Valuation allowance (89,542) (101,750) (1,076,873)
Total deferred tax assets, net of valuation allowance 23,087 29,302 277,655Deferred tax liabilities:
Net unrealized holding gains on investment securities (7,437) (6,648) (89,441)Depreciation and amortization expenses (7,266) (7,780) (87,384)Advanced depreciation reserve (510) (510) (6,133)Other (6,436) (6,614) (77,403)
Total deferred tax liabilities (21,649) (21,552) (260,361)Net deferred tax assets ¥1,438 ¥7,750 $17,294
The net deferred tax assets are included in the following line items in the accompanying consolidated balance

29
sheets. Thousands of Millions of yen U.S. dollars 2011 2010 2011Current assets—Deferred tax assets ¥13,754 ¥15,549 $165,412Investments and other assets—Deferred tax assets 1,812 5,742 21,792Current liabilities—Deferred tax liabilities (Other current liabilities) (126)
(-) (1,516)
Long-term liabilities—Deferred tax liabilities (14,002) (13,541) (168,394)Total net deferred tax assets ¥1,438 ¥7,750 $17,294
12. Net Assets The Japanese Corporate Law (the “Law”) became effective on May 1, 2006, replacing the Japanese Commercial Code (the “Code”). The Law is generally applicable to events and transactions occurring after April 30, 2006, and for fiscal years ending after that date.
Under Japanese laws and regulations, the entire amount paid for new shares is required to be designated as common stock. However, a company may, by a resolution of its Board of Directors, designate an amount not exceeding one half of the price of the new shares as additional paid-in capital, which is included in capital surplus.
Under the Law, in cases where a dividend distribution of surplus is made, the smaller of an amount equal to 10% of the dividend or the excess, if any, of 25% of common stock over the total of additional paid-in capital and legal earnings reserve must be set aside as additional paid-in capital or legal earnings reserve. Legal earnings reserve is included in retained earnings in the accompanying consolidated balance sheets.
Under the Code, companies were required to set aside an amount equal to at least 10% of the aggregate amount of cash dividends and other cash appropriations as legal earnings reserve until the total of legal earnings reserve and additional paid-in capital equaled 25% of common stock.
Under the Code, legal earnings reserve and additional paid-in capital could be used to eliminate or reduce a deficit by a resolution of the shareholders’ meeting or could be capitalized by a resolution of the Board of Directors. Under the Law, both of these appropriations generally require a resolution of the shareholders’ meeting.
Additional paid-in capital and legal earnings reserve may not be distributed as dividends. Under the Code, however, on condition that the total amount of legal earnings reserve and additional paid-in capital remained equal to or exceeded 25% of common stock, they were available for distribution by resolution of the shareholders’ meeting. Under the Law, all additional paid-in capital and all legal earnings reserve may be transferred to other capital surplus and retained earnings, respectively, which are potentially available for dividends.
The maximum amount that the Company can distribute as dividends is calculated based on the non-consolidated financial statements of the Company in accordance with Japanese laws and regulations.
At the annual shareholders’ meeting held on June 24, 2011, the shareholders approved cash dividends amounting to ¥3,513 million (US$42,249 thousand). Such appropriations have not been accrued in the consolidated financial statements as of March 31, 2011. Such appropriations are recognized in the period in which they are approved by the shareholders.
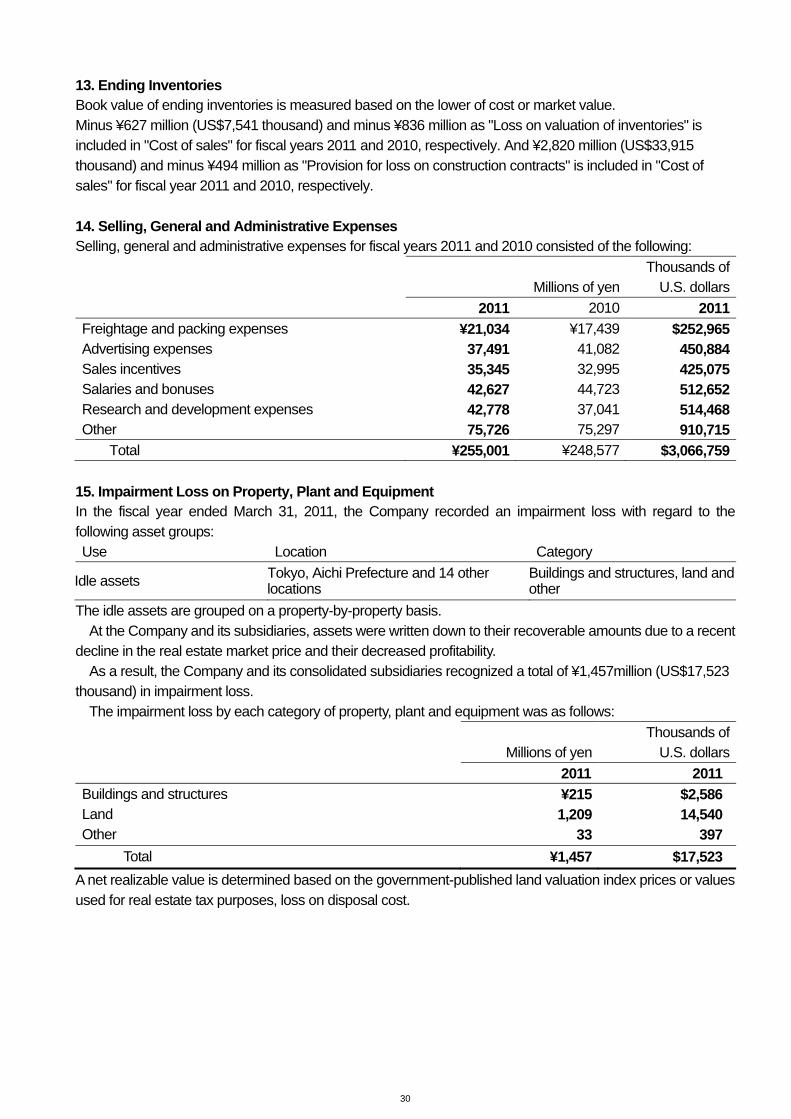
30
13. Ending Inventories Book value of ending inventories is measured based on the lower of cost or market value. Minus ¥627 million (US$7,541 thousand) and minus ¥836 million as "Loss on valuation of inventories" is included in "Cost of sales" for fiscal years 2011 and 2010, respectively. And ¥2,820 million (US$33,915 thousand) and minus ¥494 million as "Provision for loss on construction contracts" is included in "Cost of sales" for fiscal year 2011 and 2010, respectively. 14. Selling, General and Administrative Expenses Selling, general and administrative expenses for fiscal years 2011 and 2010 consisted of the following: Thousands of Millions of yen U.S. dollars 2011 2010 2011Freightage and packing expenses ¥21,034 ¥17,439 $252,965Advertising expenses 37,491 41,082 450,884Sales incentives 35,345 32,995 425,075Salaries and bonuses 42,627 44,723 512,652Research and development expenses 42,778 37,041 514,468Other 75,726 75,297 910,715
Total ¥255,001 ¥248,577 $3,066,759 15. Impairment Loss on Property, Plant and Equipment In the fiscal year ended March 31, 2011, the Company recorded an impairment loss with regard to the following asset groups: Use Location Category
Idle assets Tokyo, Aichi Prefecture and 14 other locations
Buildings and structures, land and other
The idle assets are grouped on a property-by-property basis. At the Company and its subsidiaries, assets were written down to their recoverable amounts due to a recent
decline in the real estate market price and their decreased profitability. As a result, the Company and its consolidated subsidiaries recognized a total of ¥1,457million (US$17,523
thousand) in impairment loss. The impairment loss by each category of property, plant and equipment was as follows:
Thousands of Millions of yen U.S. dollars 2011 2011 Buildings and structures ¥215 $2,586 Land 1,209 14,540 Other 33 397
Total ¥1,457 $17,523 A net realizable value is determined based on the government-published land valuation index prices or values used for real estate tax purposes, loss on disposal cost.

31
In the fiscal year ended March 31, 2010, the Company recorded an impairment loss with regard to the following asset groups: Use Location Category
Production facility Saitama Prefecture and Gunma Prefecture
Buildings and structures, Machinery, equipment and vehicles, land and other
Assets for dealership business Tokyo, Gifu Prefecture and 7 other locations
Buildings and structures, land and other
Idle assets Osaka Prefecture, Chiba Prefecture and 11 other locations
Buildings and structures, land and other
The assets on which impairment loss was recognized are grouped as follows: The production facilities are grouped by each business line ,the assets for dealership business are grouped by each dealership, and the idle assets are grouped on a property-by-property basis.
In automobiles businesses, the supply business of CVT (gearless transmission) unit for minicar significantly dropped after July, 2010,and the change that remarkably decreases recoverable amounts that can be collected is expected to take place. As a result, at the Company and its subsidiaries, production facilities were written down to their recoverable amounts.
Because industrial products company has continuously experienced profit loss on operating activities and it is predicted that future cash flow falls below book value of related facilities, the book value of those assets was written down to the their recoverable amounts.
A recoverable amount is determined by a value in use. A value in use is calculated based on future cash flows discounted principally at 7.58%.
As a part of the rationalization, the company is performing restructuring of dealership network in Japan gradually. At the Company and its subsidiaries, assets for dealership business were written down to their recoverable amounts.
As a result, the Company and its consolidated subsidiaries recognized a total of ¥17,906 million in impairment loss.
The impairment loss by each category of property, plant and equipment was as follows: Millions of yen 2010 Buildings and structures ¥4,700 Machinery, equipment and vehicles 3,694 Land 9,435 Other 77
Total $17,906 A recoverable amount is the higher of net realizable value or value in use. A net realizable value is determined based on the government-published land valuation index prices or values used for real estate tax purposes, less cost of disposal. A value in use is calculated based on future cash flows discounted principally at 7.58%.

32
16. Loss on disaster The loss was caused by Great East Japan Earthquake. The main contents were as follows; Thousands of Millions of yen U.S. dollars 2011 2011 Fixed costs by temporary suspension of production, etc ¥4,669 $56,152 Cost to restore damaged facilities 966 11,618 Loss on the damage on inventory and fixed assets 883 10,619 Loss on doubtful accounts for suppliers, etc. 313 3,764 Other 521 6,266
Total ¥7,352 $88,419 17. Loss on prior periods adjustment The main contents were as follows. The adjustment of provision for product warranties in prior years was recognised as a result of review of product warranty cost. Thousands of Millions of yen U.S. dollars 2011 2011 The adjustment of provision for product warranties in prior years ¥4,763 $57,282 The adjustment of cost of sales in prior years 1,347 16,200
Total ¥6,110 $73,482 18. Loss on reconstruction of office building In relation to the reconstruction of Ebisu Subaru Building, the following losses were recognized. Thousands of Millions of yen U.S. dollars 2011 2011 Estimation of demolition costs ¥334 $4,017 Non-recurring depreciation 323 3,884
Total ¥657 $7,901 19. Loss on Abandonment of Inventories (Fiscal 2010) The Company conducted a business field review in the industrial products segment in fiscal 2010. As a result, the Company abandoned obsolete inventories and recorded a loss of ¥1,191 million in fiscal 2010.

33
20. Loss on Sales and Retirement of Noncurrent Assets and Other (Fiscal 2010) After assessing the severe business environment for domestic distributors, such as the sluggish automobile market caused by a business slowdown, and the response to sophisticated and diversified customer needs, the Company has determined that it was necessary to quickly implement regional business activities while simultaneously establishing a rational management system. Therefore, the transition from Subaru distributors to the integrated system was performed sequentially from October, 2008. As a part of the rationalization,the Company is performing a gradual restructuring of the dealership network in Japan.
Furthermore, regarding dealerships that the Company had closed (or, had decided to close) by the end of fiscal 2010, it recorded loss in the fiscal year under review as follows: Millions of yen 2010Loss on sales and retirement of noncurrent assets ¥902Impairment loss 3,639Other 815
Total ¥5,356 21.Other Loss The Company is going to terminate the production of minicar in FY2012. Other loss includes ¥2,422 million (US$29,128 thousand), the cost of retirement and demolition, etc of facilities related to the termination. 22. Stock Option Plans (Fiscal 2011) 1. Descriptions, volume, and movement of stock options (1) Descriptions of stock option plans Fiscal 2004
Stock option planPosition and number of grantees
Directors, Executive Officers, Corporate Auditors and employees:
320Class and number of stock (shares) Common Stock 1,917,000Date of grant September 6, 2004
Vesting conditions Directors, Executive Officers, Corporate Auditors and employees who are enrolled at the date the subscription rights are granted. Should an employee under 50 years of age retire by voluntary termination, the employee’s right to exercise his/her claim will expire.
Required service period From September 6, 2004, to July 31, 2006
Exercise period From August 1, 2006, to July 31, 2011
Note: The number of stock options is converted to the equivalent number of common stock. (2) Volume and movement of stock options

34
The stock options outstanding in the fiscal year 2011 are summarized as follows: [1] The number of stock options (shown as the equivalent number of common stock) Fiscal 2004
Stock option plan Nonexercisable stock options (shares):
At the end of the fiscal year 2010 - Stock options granted - Forfeitures - Conversion to exercisable stock options -
Stock options outstanding - Exercisable stock options (shares): At the end of the fiscal year 2010 1,863,000 Conversion from nonexercisable stock options -
Stock options exercised 609,000
Forfeitures - Stock options outstanding 1,254,000
[2] Price information of stock options Fiscal 2004
Stock option Exercise price (Yen) ¥594,000 Average market price of the stock at the time of exercise (Yen) 675
Fair value (date of grant) (Yen) -

35
(Fiscal 2010) 1. Descriptions, volume, and movement of stock options (1) Descriptions of stock option plans Fiscal 2002
Stock option planFiscal 2004
Stock option planPosition and number of grantees
Directors, Executive Officers, Corporate Auditors and employees:
303
Directors, Executive Officers, Corporate Auditors and employees:
320Class and number of stock (shares) Common Stock 1,029,000 Common Stock 1,917,000Date of grant September 9, 2002 September 6, 2004
Vesting conditions Directors, Executive Officers, Corporate Auditors and employees who are enrolled at the date the subscription rights are granted. Should an employee under 50 years of age retire by voluntary termination, the employee’s right to exercise his/her claim will expire.
Directors, Executive Officers, Corporate Auditors and employees who are enrolled at the date the subscription rights are granted. Should an employee under 50 years of age retire by voluntary termination, the employee’s right to exercise his/her claim will expire.
Required service period From September 9, 2002, to July 31, 2004
From September 6, 2004, to July 31, 2006
Exercise period From August 1, 2004, to July 31, 2009
From August 1, 2006, to July 31, 2011
Note: The number of stock options is converted to the equivalent number of common stock. (2) Volume and movement of stock options The stock options outstanding in the fiscal year 2010 are summarized as follows: [1] The number of stock options (shown as the equivalent number of common stock) Fiscal 2002
Stock option plan Fiscal 2004
Stock option planNonexercisable stock options (shares):
At the end of the fiscal year 2009 - -Stock options granted - -Forfeitures - -Conversion to exercisable stock options - -
Stock options outstanding - -Exercisable stock options (shares): At the end of the fiscal year 2009 734,000 1,863,000Conversion from nonexercisable stock options - -
Stock options exercised - -
Forfeitures 734,000 -Stock options outstanding - 1,863,000

36
[2] Price information of stock options Fiscal 2002
Stock option Fiscal 2004
Stock optionExercise price (Yen) ¥498,000 ¥594,000Average market price of the stock at the time of exercise (Yen) - -
Fair value (date of grant) (Yen) - -
23. Finance Leases As allowed under the Japanese accounting standards, the Company and its consolidated subsidiaries in Japan account for finance leases. Information as Lessee (1) Transfer of title through finance lease transaction [1] Leased assets Mainly implements of production in the automotive business [2] Depreciation method for leased assets Leased assets are depreciated by the same method as used for other property, plant and equipment. (2) Finance leases which do not transfer ownership title [1] Leased assets Mainly network equipment and terminal units (Other tangible assets) in the automotive business [2] Depreciation method for leased assets Leased assets are depreciated by the straight-line method over the leased period and the residual value is zero. (3) Those finance lease transactions that had not had their ownership transferred on or before March 31, 2008, are recorded based on the same method as used for regular rental transactions. [1] Pro forma information of such leases as of March 31, 2011 and 2010, was as follows: Thousands of Millions of yen U.S. dollars 2011 2010 2011Machinery, equipment and vehicles ¥284 ¥334 $3,416Other tangible assets 760 1,426 9,139Intangible assets 31 141 373
Total 1,075 1,901 12,928Accumulated depreciation/amortization (810) (1,261) (9,741)
Net ¥265 ¥640 $3,187
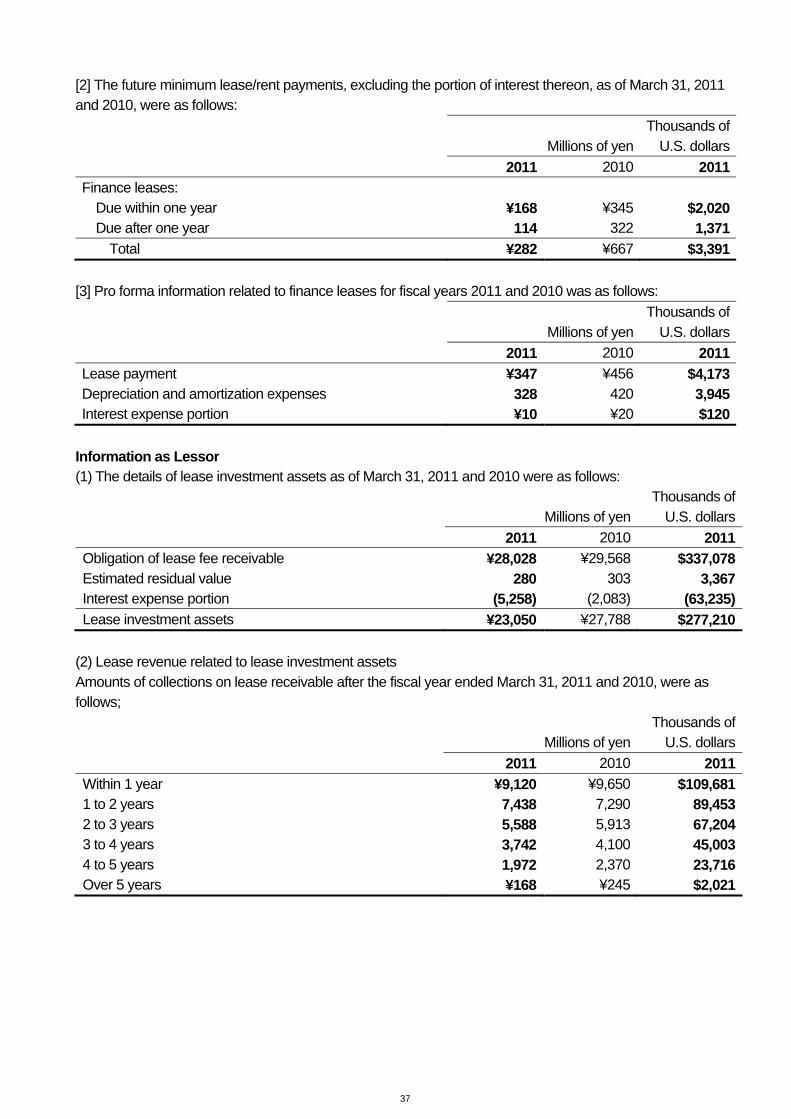
37
[2] The future minimum lease/rent payments, excluding the portion of interest thereon, as of March 31, 2011 and 2010, were as follows: Thousands of Millions of yen U.S. dollars 2011 2010 2011Finance leases:
Due within one year ¥168 ¥345 $2,020Due after one year 114 322 1,371
Total ¥282 ¥667 $3,391 [3] Pro forma information related to finance leases for fiscal years 2011 and 2010 was as follows: Thousands of Millions of yen U.S. dollars 2011 2010 2011Lease payment ¥347 ¥456 $4,173Depreciation and amortization expenses 328 420 3,945Interest expense portion ¥10 ¥20 $120
Information as Lessor (1) The details of lease investment assets as of March 31, 2011 and 2010 were as follows: Thousands of Millions of yen U.S. dollars 2011 2010 2011Obligation of lease fee receivable ¥28,028 ¥29,568 $337,078Estimated residual value 280 303 3,367Interest expense portion (5,258) (2,083) (63,235)Lease investment assets ¥23,050 ¥27,788 $277,210
(2) Lease revenue related to lease investment assets Amounts of collections on lease receivable after the fiscal year ended March 31, 2011 and 2010, were as follows; Thousands of Millions of yen U.S. dollars 2011 2010 2011Within 1 year ¥9,120 ¥9,650 $109,6811 to 2 years 7,438 7,290 89,4532 to 3 years 5,588 5,913 67,2043 to 4 years 3,742 4,100 45,0034 to 5 years 1,972 2,370 23,716Over 5 years ¥168 ¥245 $2,021

38
24. Operating Lease Information as Lessee The future minimum lease/rent payments, excluding the portion of interest thereon, as of March 31, 2011 and 2010, were as follows: Thousands of Millions of yen U.S. dollars 2011 2010 2011Operating leases:
Due within one year ¥1,135 ¥1,233 $13,650Due after one year 5,346 4,839 64,293
Total ¥6,481 ¥6,072 $77,943 Information as Lessor The future minimum lease/rent payments receivable, excluding the portion of interest thereon, as of March 31, 2011 and 2010, were as follows: Thousands of Millions of yen U.S. dollars 2011 2010 2011Operating leases:
Due within one year ¥1,122 ¥1,682 $13,494Due after one year 300 276 3,608
Total ¥1,422 ¥1,958 $17,102 25. Contingent Liabilities Contingent liabilities as of March 31, 2011 and 2010, were as follows: Thousands of Millions of yen U.S. dollars 2011 2010 2011As guarantor of third-party indebtedness from financial
institutions ¥31,943
¥32,330 $384,161 26. The Amount of Discount of Export Bill The amount of discount of export bill as of March 31, 2011 and 2010, were as follows: Thousands of Millions of yen U.S. dollars 2011 2010 2011The amount of discount of export bill
¥9,102
¥19,637 $109,465 27. Property for Transfer Balance to Special Purpose Company Property for transfer balance to special purpose company as of March 31, 2011 and 2010, were as follows: Thousands of Millions of yen U.S. dollars 2011 2010 2011Property for transfer balance to special purpose company (loan claims of Automobiles and account receivable-trade
of Aerospace) ¥51,512
¥43,788 $619,507
39
28. Segment Information (Additional Information) From the fiscal 2011, the Company has adopted "Revised Accounting Standard for Disclosures about Segments of an Enterprise and Related Information" (ASBJ Statement No.17, March 27, 2009) and Implementation Guidance on Accounting Standard for Disclosures about Segments of an Enterprise and Related Information" (ASBJ Guidance No.20, March 21, 2008). (1)General information about reportable segments The reportable segments the Company reports are the business units for which the Company is able to obtain respective financial information separately in order for the Board of Directors to conduct periodic investigation to determine distribution of management resources and evaluate their business result.
The Company has placed Automobile at the center of the whole businesses, and has implemented internal company system into Aerospace, Industrial Products and Eco technology divisions. This framework makes clearer the responsibility of each division and accelerates business execution. The Company manages the subsidiaries on the basis of this classification. Therefore the reportable segments consist of Automobile, Aerospace, Industrial products, Eco technology, and Other which does not belong to any division.
As for Eco technology division, the Company includes it into "Other" because it does not satisfy the quantitative criteria for the reportable segments. As a result, reportable segments are Automobile, Aerospace, and Industrial products.
Automobile segment manufactures and sells vehicles and related products. Aerospace segment manufactures aircrafts, parts of space-related devices. Industrial products segment manufactures and sells Robin engines and related products. (2)Calculation method of sales, profit or loss, assets, liabilities and other items by reportable segments Accounting method for reportable segments is almost the same as "2. Summary of Significant Accounting Policies".
The segment profit or loss are calculated based on operating income or loss. Net sales - Inter-segment are calculated based on current market prices.

40
(3)Information on sales, profit or loss, assets and other items by reportable segments for the fiscal years ended March 31, 2011 and 2010 was summarized as follows Thousands of Millions of yen U.S. dollarsNet Sales: 2011 2010 2011Automobiles
Outside customers ¥1,452,207 ¥1,294,451 $17,464,907Inter-segment 2,520 2,304 30,307
Sub-total 1,454,727 1,296,755 17,495,214Aerospace
Outside customers 82,817 93,216 995,995Inter-segment - - -
Sub-total 82,817 93,216 995,995Industrial products
Outside customers 30,061 23,913 361,527Inter-segment 39 63 469
Sub-total 30,100 23,976 361,996Other (*1)
Outside customers 15,478 17,110 186,146Inter-segment 13,207 12,678 158,833
Sub-total 28,685 29,788 344,979Total 1,596,329 1,443,735 19,198,184
Adjustment (*2) (15,766) (15,045) (189,609)Consolidated total (*3) ¥1,580,563 ¥1,428,690 $19,008,575
Thousands of Millions of yen U.S. dollarsSegment profit or Loss: 2011 2010 2011
Automobiles ¥80,387 ¥21,716 $966,771Aerospace 2,256 4,812 27,132Industrial products (52) (2,437) (625)Other (*1) 1,463 2,560 17,595
Total 84,054 26,651 1,010,873Adjustment (*2) 81 699 973Consolidated total (*3) ¥84,135 ¥27,350 $1,011,846
Thousands of Millions of yen U.S. dollarsSegment assets: 2011 2010 2011
Automobiles ¥944,046 ¥989,462 $11,353,530Aerospace 162,704 166,492 1,956,753Industrial products 41,515 31,591 499,278Other (*1) 71,562 77,895 860,637
Total 1,219,827 1,265,440 14,670,198Adjustment (*2) (31,503) (34,073) (378,869)Consolidated total (*3) ¥1,188,324 ¥1,231,367 $14,291,329

41
Thousands of Millions of yen U.S. dollarsOther Items: 2011 2010 2011Depreciation and amortization:
Automobiles ¥51,004 ¥59,155 $613,397Aerospace 2,380 3,709 28,623Industrial products 660 1,228 7,937Other (*1) 2,018 1,693 24,270
Total 56,062 65,785 674,227Adjustment (*2) - - -Consolidated total (*3) ¥56,062 ¥65,785 $674,227Investment to equity-method affiliates:
Automobiles ¥4,849 ¥2,641 $58,316Aerospace 230 231 2,766Industrial products 890 875 10,704Other (*1) 394 388 4,738
Total 6,363 4,135 76,524Adjustment (*2) - - -Consolidated total (*3) ¥6,363 ¥4,135 $76,524Increase of property, plant and equipment and intangible fixed assets:
Automobiles ¥64,591 ¥84,085 $776,801Aerospace 1,918 1,347 23,067Industrial products 215 433 2,586Other (*1) 654 3,212 7,865
Total 67,378 89,077 810,319Adjustment (*2) - - -Consolidated total (*3) ¥67,378 ¥89,077 $810,319
Note: *1. "Other" means the category which is not included into any reportable segments. It consists of garbage collection vehicles, specialized vehicles, real estate lease, etc.
*2. Adjustment of segment profit of loss refers to elimination of intersegment transaction. *3 Segment profit or loss is adjusted on operating income on the consolidated statements of income.

42
Related Information (1)Products and services information Products and services information is not shown since the same information is in the segment information. (2)Information about geographic areas [1]Sales for the fiscal years ended March 31, 2011 and 2010 was summarized as follows: Thousands of Millions of yen U.S. dollars 2011 2010 2011Sales: (*1)
Japan ¥467,323 ¥520,836 $5,620,241North America 725,775 622,126 8,728,503
[United States] (*2) [654,402] [565,545] [7,870,138]Europe 126,321 84,474 1,519,194Asia 138,854 101,470 1,669,922Other 122,290 99,784 1,470,715
Consolidated total ¥1,580,563 ¥1,428,690 $19,008,575Note: *1 Sales is categorized by country or area which is based on customer location.
*2 Sales of the United States is included in North America area. [2]Property, plant and equipment for the fiscal years ended March 31, 2011 and 2010 was summarized as follows: Thousands of Millions of yen U.S. dollars 2011 2010 2011Property, plant and equipment: (*1)
Japan ¥379,717 ¥381,987 $4,566,651North America 50,990 67,414 613,229
[United States] (*2) [50,234] [66,553] [604,137]Europe 135 126 1,623Asia - - -Other - - -
Consolidated total ¥430,842 ¥449,527 $5,181,503Note: *1 Property, plant and equipment is categorized by country or area according to geographic adjacent
level. *2 Property, plant and equipment of the United States is included in North America area.
[3]Major customers Information Information about major customers is not shown because outside sales for major customers accounted for less 10% of operating revenue on the consolidated statements of income for the fiscal years ended March 31, 2011 and 2010.
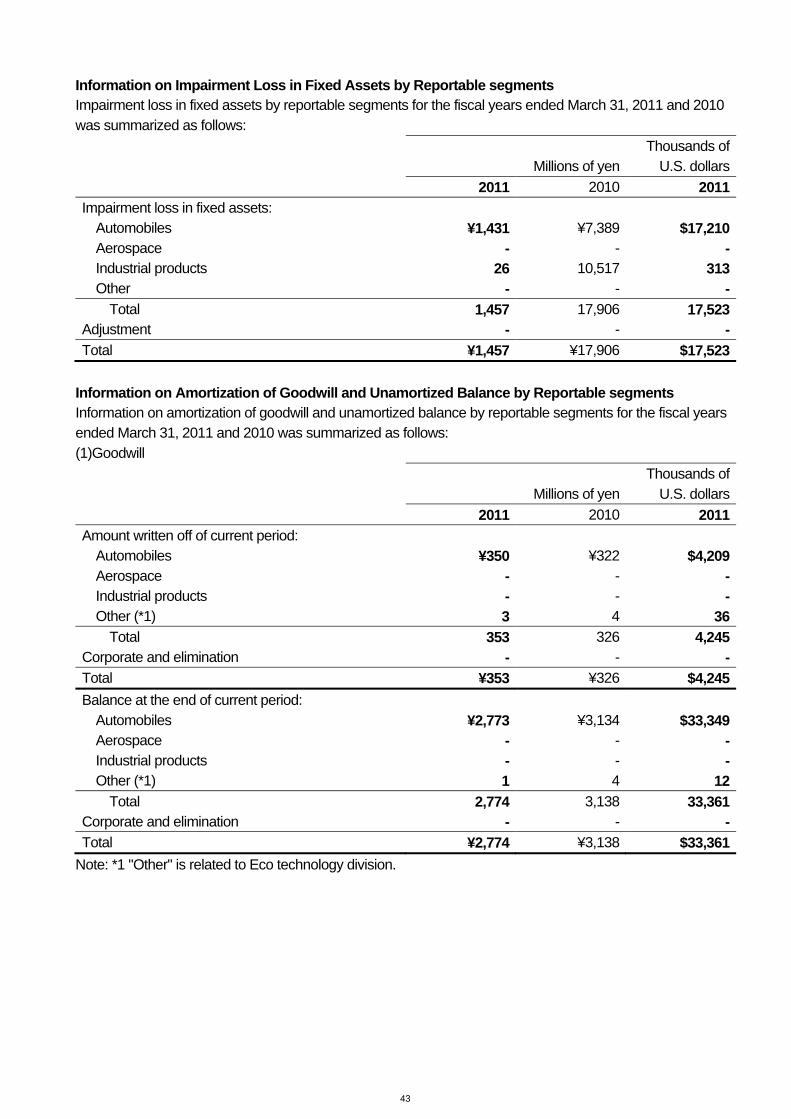
43
Information on Impairment Loss in Fixed Assets by Reportable segments Impairment loss in fixed assets by reportable segments for the fiscal years ended March 31, 2011 and 2010 was summarized as follows: Thousands of Millions of yen U.S. dollars 2011 2010 2011Impairment loss in fixed assets:
Automobiles ¥1,431 ¥7,389 $17,210Aerospace - - -Industrial products 26 10,517 313Other - - -
Total 1,457 17,906 17,523Adjustment - - -Total ¥1,457 ¥17,906 $17,523
Information on Amortization of Goodwill and Unamortized Balance by Reportable segments Information on amortization of goodwill and unamortized balance by reportable segments for the fiscal years ended March 31, 2011 and 2010 was summarized as follows: (1)Goodwill Thousands of Millions of yen U.S. dollars 2011 2010 2011Amount written off of current period:
Automobiles ¥350 ¥322 $4,209Aerospace - - -Industrial products - - -Other (*1) 3 4 36
Total 353 326 4,245Corporate and elimination - - -Total ¥353 ¥326 $4,245Balance at the end of current period:
Automobiles ¥2,773 ¥3,134 $33,349Aerospace - - -Industrial products - - -Other (*1) 1 4 12
Total 2,774 3,138 33,361Corporate and elimination - - -Total ¥2,774 ¥3,138 $33,361
Note: *1 "Other" is related to Eco technology division.
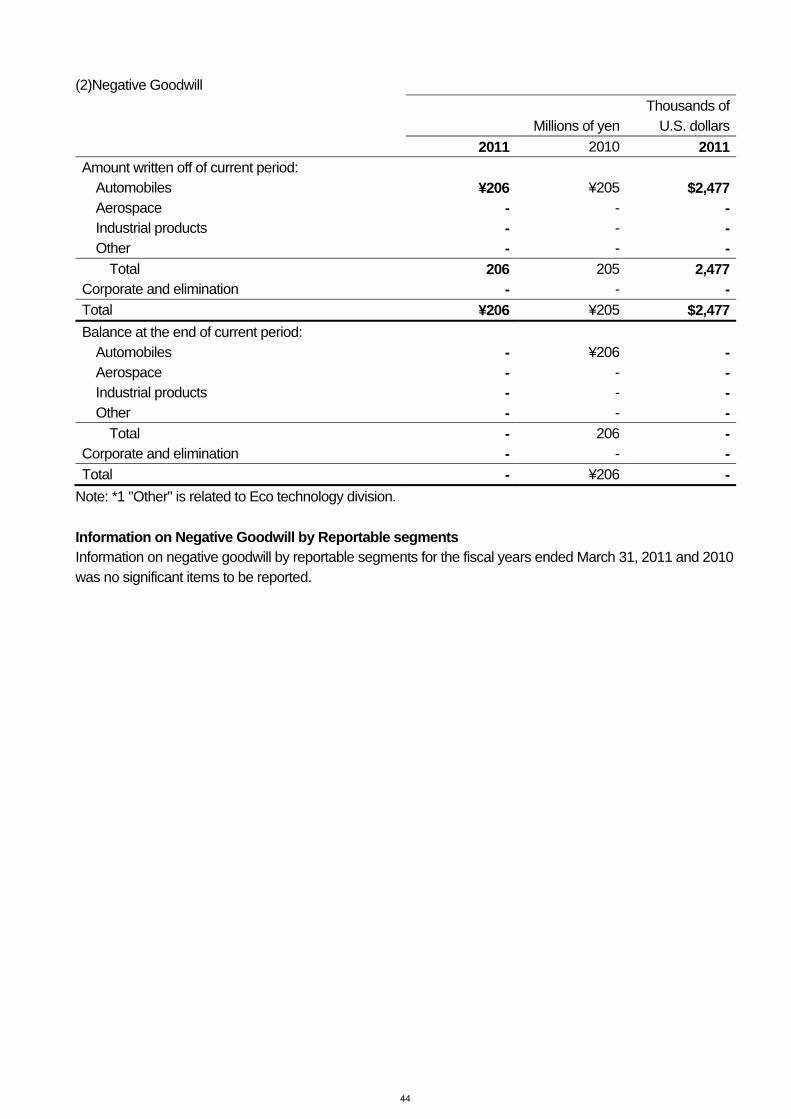
44
(2)Negative Goodwill Thousands of Millions of yen U.S. dollars 2011 2010 2011Amount written off of current period:
Automobiles ¥206 ¥205 $2,477Aerospace - - -Industrial products - - -Other - - -
Total 206 205 2,477Corporate and elimination - - -Total ¥206 ¥205 $2,477Balance at the end of current period:
Automobiles - ¥206 -Aerospace - - -Industrial products - - -Other - - -
Total - 206 -Corporate and elimination - - -Total - ¥206 -
Note: *1 "Other" is related to Eco technology division. Information on Negative Goodwill by Reportable segments Information on negative goodwill by reportable segments for the fiscal years ended March 31, 2011 and 2010 was no significant items to be reported.

45
(Fiscal 2010) Information by business segment The Company and its consolidated subsidiaries operate principally in four business segments: automobiles, aerospace, industrial products and other business fields (including eco-related equipment).
A summary of net sales, operating income, assets, depreciation and amortization expenses and capital expenditures by business segment for fiscal years 2010 was shown below: Millions of yenNet Sales: 2010Automobiles
Outside customers ¥1,294,451Inter-segment 2,304
Sub-total 1,296,755Aerospace
Outside customers 93,216Inter-segment -
Sub-total 93,216Industrial products
Outside customers 23,913Inter-segment 63
Sub-total 23,976Other
Outside customers 17,110Inter-segment 12,678
Sub-total 29,788Total 1,443,735
Corporate and elimination (15,045)Consolidated total ¥1,428,690
Millions of yen Operating Income or Loss: 2010Operating income:
Automobiles ¥21,716Aerospace 4,812Industrial products (2,437)Other 2,560
Total 26,651Corporate and elimination 699Consolidated total ¥27,350

46
Millions of yenAssets: 2010Total assets:
Automobiles ¥989,462Aerospace 166,492Industrial products 31,591Other 77,895
Total 1,265,440Corporate and elimination (34,073)Consolidated total ¥1,231,367
Millions of yenOther Significant Items: 2010Depreciation and amortization expenses:
Automobiles ¥59,155Aerospace 3,709Industrial products 1,228Other 1,693
Total 65,785Corporate and elimination -Consolidated total ¥65,785Impairment loss on property, plant and equipment:
Automobiles ¥7,389Aerospace -Industrial products 10,517Other -
Total 17,906Corporate and elimination -Consolidated total ¥17,906Capital expenditures for segment assets:
Automobiles ¥84,085Aerospace 1,347Industrial products 433Other 3,212
Total 89,077Corporate and elimination -Consolidated total ¥89,077
Notes:1. Definition of business segments Business segments are defined based on their product line and market.
2. Main products by each business segment Business segments’ main products: Automobiles: Legacy, Impreza, Forester, Exiga,Tribeca, Stella, R1, R2, Pleo, Samber Industrial products; Robin engines, power generators, pumps Aerospace: Aircraft, parts of space-related devices Other: Garbage collection vehicles, specialized vehicles, real estate lease
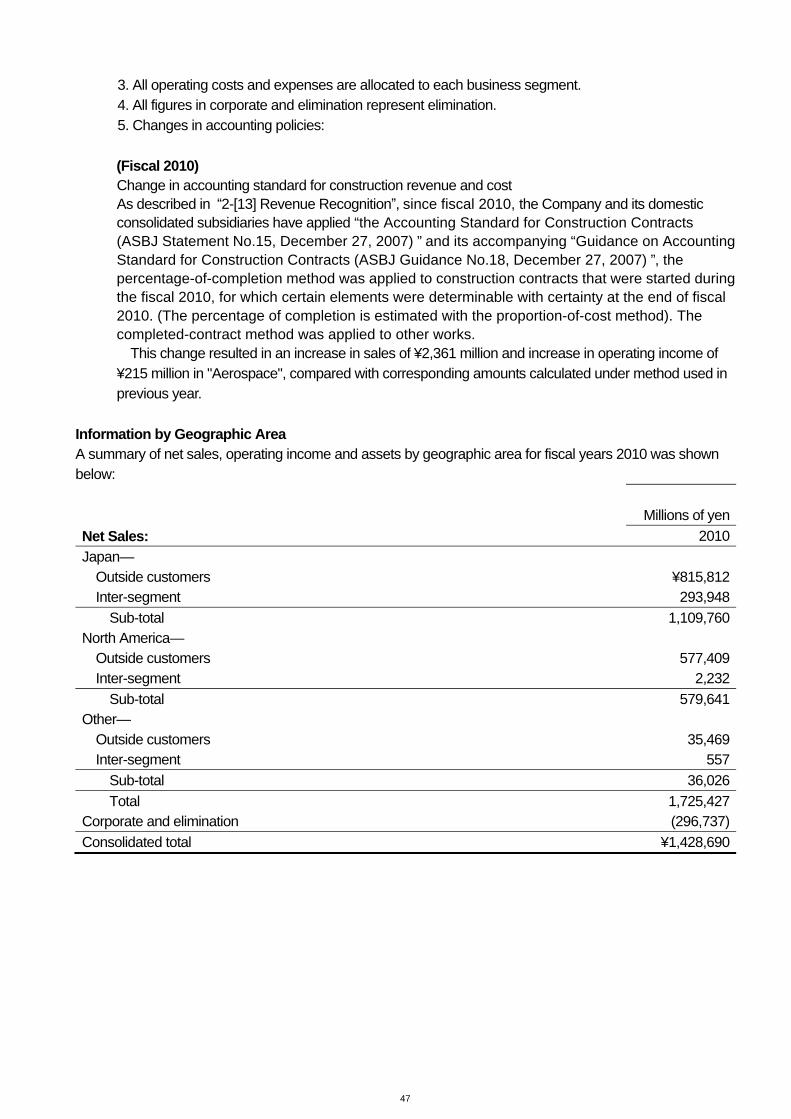
47
3. All operating costs and expenses are allocated to each business segment. 4. All figures in corporate and elimination represent elimination. 5. Changes in accounting policies:
(Fiscal 2010) Change in accounting standard for construction revenue and cost As described in “2-[13] Revenue Recognition”, since fiscal 2010, the Company and its domestic consolidated subsidiaries have applied “the Accounting Standard for Construction Contracts (ASBJ Statement No.15, December 27, 2007) ” and its accompanying “Guidance on Accounting Standard for Construction Contracts (ASBJ Guidance No.18, December 27, 2007) ”, the percentage-of-completion method was applied to construction contracts that were started during the fiscal 2010, for which certain elements were determinable with certainty at the end of fiscal 2010. (The percentage of completion is estimated with the proportion-of-cost method). The completed-contract method was applied to other works.
This change resulted in an increase in sales of ¥2,361 million and increase in operating income of ¥215 million in "Aerospace", compared with corresponding amounts calculated under method used in previous year.
Information by Geographic Area A summary of net sales, operating income and assets by geographic area for fiscal years 2010 was shown below: Millions of yenNet Sales: 2010Japan—
Outside customers ¥815,812Inter-segment 293,948
Sub-total 1,109,760North America—
Outside customers 577,409Inter-segment 2,232
Sub-total 579,641Other—
Outside customers 35,469Inter-segment 557
Sub-total 36,026Total 1,725,427
Corporate and elimination (296,737)Consolidated total ¥1,428,690

48
Millions of yenOperating Income or Loss: 2010Operating income:
Japan ¥1,844North America 32,057Other 95
Total 33,996Corporate and elimination (6,646)Consolidated total 27,350
Millions of yenAssets: 2010Assets:
Japan ¥910,841North America 338,721Other 18,518
Total 1,268,080Corporate and elimination (36,713)Consolidated total ¥1,231,367
Notes:1. Geographic areas are based on geographical proximity. 2. Principal countries or districts in each geographic area:
North America: United States and Canada Other: Europe
3. All operating costs and expenses are allocated to each segment. 4. All figures in corporate and elimination represent elimination. 5. Changes in accounting policies: (Fiscal 2010) Change in accounting standard for construction revenue and cost As described in “2-[13] Revenue Recognition”, since fiscal 2010, the Company and its domestic consolidated subsidiaries have applied the “Accounting Standard for Construction Contracts (ASBJ Statement No.15, December 27, 2007)” and its accompanying “Guidance on Accounting Standard for Construction Contracts (ASBJ Guidance No.18, December 27, 2007)” therefore, the percentage-of-completion method was applied to construction contracts that were started during the fiscal 2010, for which certain elements were determinable with certainty at the end of fiscal 2010. (The percentage of completion is estimated with the proportion-of-cost method). The completed-contract method was applied to other work.
This change resulted in an increase in sales of ¥2,361 million and increase in operating income of ¥215 million in "Japan", compared with corresponding amounts calculated under method used in previous year.
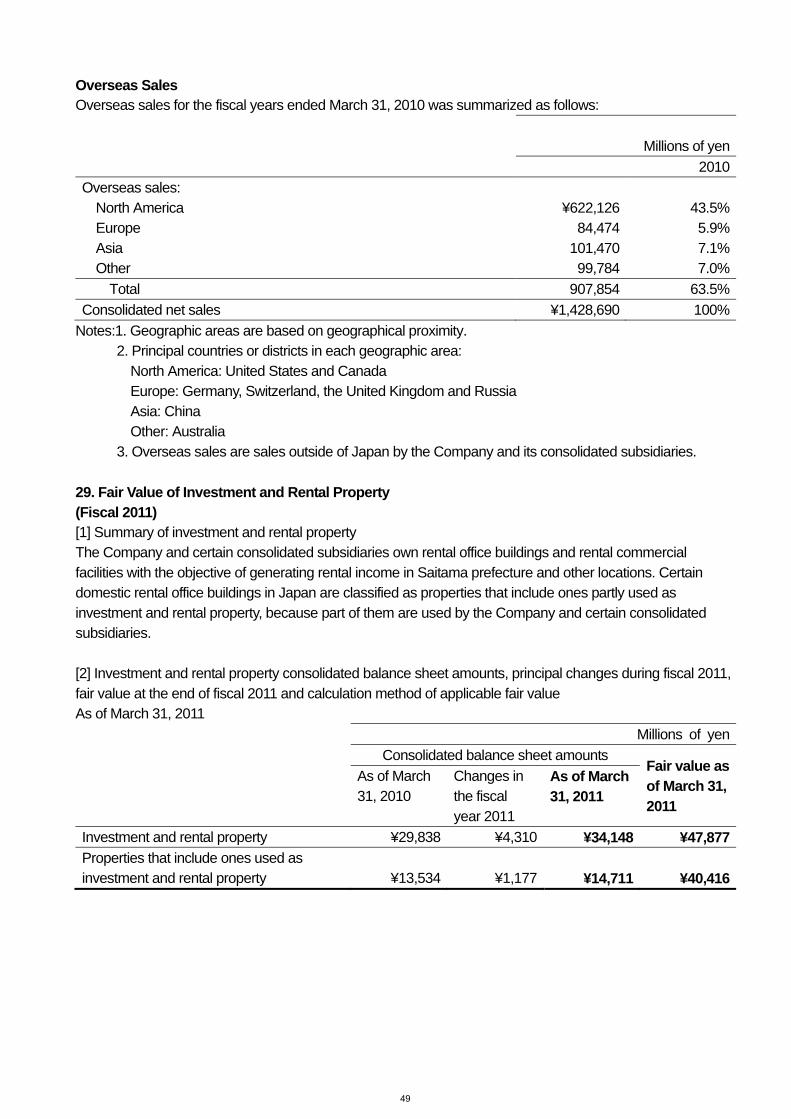
49
Overseas Sales Overseas sales for the fiscal years ended March 31, 2010 was summarized as follows: Millions of yen 2010Overseas sales:
North America ¥622,126 43.5%Europe 84,474 5.9%Asia 101,470 7.1%Other 99,784 7.0%
Total 907,854 63.5%Consolidated net sales ¥1,428,690 100%
Notes:1. Geographic areas are based on geographical proximity. 2. Principal countries or districts in each geographic area:
North America: United States and Canada Europe: Germany, Switzerland, the United Kingdom and Russia Asia: China Other: Australia
3. Overseas sales are sales outside of Japan by the Company and its consolidated subsidiaries. 29. Fair Value of Investment and Rental Property (Fiscal 2011) [1] Summary of investment and rental property The Company and certain consolidated subsidiaries own rental office buildings and rental commercial facilities with the objective of generating rental income in Saitama prefecture and other locations. Certain domestic rental office buildings in Japan are classified as properties that include ones partly used as investment and rental property, because part of them are used by the Company and certain consolidated subsidiaries.
[2] Investment and rental property consolidated balance sheet amounts, principal changes during fiscal 2011, fair value at the end of fiscal 2011 and calculation method of applicable fair value As of March 31, 2011 Millions of yen Consolidated balance sheet amounts
Fair value as of March 31, 2011
As of March 31, 2010
Changes in the fiscal year 2011
As of March 31, 2011
Investment and rental property ¥29,838 ¥4,310 ¥34,148 ¥47,877Properties that include ones used as investment and rental property ¥13,534 ¥1,177
¥14,711 ¥40,416

50
As of March 31, 2011 Thousands of U.S. dollars Consolidated balance sheet amounts
Fair value as of March 31, 2011
As of March 31, 2010
Changes in the fiscal year 2011
As of March 31, 2011
Investment and rental property $358,845 $51,834 $410,679 $575,791Properties that include ones used as investment and rental property $162,766 $14,155
$176,921 $486,061
Note 1. The amounts of consolidated balance sheet excludes accumulated depreciation and accumulated impairment loss from acquisition costs.
2. Among changes in the amount of investment, rental property and properties that includes ones partly used as investment and rental property during the fiscal 2011, principal increases were properties acquisitions etc, which amounted to ¥9,113 million (US$109,597 thousand), and principal decreases were depreciation and impairment loss, which amounted to ¥1,321 million (US$15,887 thousand) and ¥846 million (US$10,174 thousand), respectively. 3. Fair value at the end of the fiscal year of Shinjuku Subaru building is the amount estimated by based sale value. Fair value of a part of main investment and rental property is the amount estimated by based value of real-estate appraiser, and fair value of a part of other investment and rental property is the amount estimated by the Company based principally on land assessment value.
[3] Profit and loss concerning investment and rental property Profit and loss in fiscal 2011 concerning investment and rental property and properties that include ones used as investment and rental property were as follows:
As of March 31, 2011 Millions of yen Rental
income Rental expenses
Change Other profit and loss
Investment and rental property ¥3,055 ¥2,199 ¥856 (¥338)Properties that include ones used as investment and rental property ¥1,790 ¥1,099
¥691 (¥669)
As of March 31, 2011 Thousands of U.S. dollars Rental
income Rental expenses
Change Other profit and loss
Investment and rental property $36,741 $26,446 $10,295 ($4,065)Properties that include ones properties used as investment and rental property $21,527 $13,217
$8,310 ($8,046)
Note:1. Rental income (from the properties that include ones partly used as investment and rental property) does not include the portion that the Company or certain subsidiaries use as the provision of services and business administration purposes. Rental expenses, however, include all portions of the expenses (costs related to depreciation, repairs, insurance and taxes).
2. Other profit and loss include in gain on sale and impairment loss.

51
(Fiscal 2010) (Additional Information) From fiscal 2010, the Company has applied “Accounting Standard for Disclosures about Fair Value of Investment and Rental Property” (The Accounting Standards Board of Japan (ASBJ) No. 20, November 28, 2008) and “Guidance on Accounting Standard for Disclosures about Fair Value of Investment and Rental Property” (The Accounting Standards Board of Japan (ASBJ Guidance) No. 23, November 28, 2008). [1] Summary of investment and rental property The Company and certain consolidated subsidiaries own rental office buildings and rental commercial facilities with the objective of generating rental income in Saitama prefecture and other locations. Certain domestic rental office buildings in Japan are classified as properties that include ones partly used as investment and rental property, because part of them are used by the Company and certain consolidated subsidiaries.
[2] Investment and rental property consolidated balance sheet amounts, principal changes during fiscal 2010, fair value at the end of fiscal 2010 and calculation method of applicable fair value As of March 31, 2010 Millions of yen Consolidated balance sheet amounts
Fair value as of March 31, 2010
As of March 31, 2009
Changes in the fiscal year 2010
As of March 31, 2010
Investment and rental property ¥30,982 (¥1,144) ¥29,838 ¥30,834Properties that include ones used as investment and rental property ¥13,707 (¥173)
¥13,534 ¥33,561
Note 1. The amounts of consolidated balance sheet excludes accumulated depreciation and accumulated impairment loss from acquisition costs.
2. Among changes in the amount of investment, rental property and properties that includes ones partly used as investment and rental property during the fiscal 2010, principal increases were properties acquisitions, which amounted to ¥653 million, and principal decreases were depreciation and impairment loss, which amounted to ¥966 million and ¥526 million, respectively.
3. Fair value at the end of the fiscal year is the amount estimated by the Company based principally on land assessment value.
[3] Profit and loss concerning investment and rental property Profit and loss in fiscal 2010 concerning investment and rental property and properties that include ones used as investment and rental property were as follows:
As of March 31, 2010 Millions of yen Rental
income Rental expenses
Change Other profit and loss
Investment and rental property ¥3,297 ¥2,275 ¥1,022 (¥474)Properties that include ones used as investment and rental property ¥1,685 ¥978
¥707 ¥0
Note:1. Rental income (from the properties that include ones partly used as investment and rental property) does not include the portion that the Company or certain subsidiaries use as the provision of services and business administration purposes. Rental expenses, however, include all portions of the expenses (costs related to depreciation, repairs, insurance and taxes).
2. Other profit and loss include in impairment loss.

52
30. Additional information (Fiscal 2010) Notification with Respect to the Execution of an Agreement Regarding a Share Exchange through which Ichitan Co., Ltd. will become a Wholly Owned Subsidiary of the Company The Company and Ichitan Co., Ltd. (“Ichitan”) resolved, at their respective meetings of the Board of Directors held on March 31, 2010, to conduct a share exchange (the “Share Exchange”) through which Ichitan will become a wholly owned subsidiary of the Company and entered into an agreement concerning the Share Exchange (the “Share Exchange Agreement”).
The effective date of the Share Exchange(the “Effective Date”) was August 1, 2010, after Ichitan obtains approval for the Share Exchange Agreement at the ordinary general meeting of its shareholders scheduled to be held on June 29, 2010. The Company implemented the Share Exchange without obtaining approval for the Share Exchange Agreement at a general meeting of its shareholders in accordance with “simplified share exchange” (kan-i kabushiki kokan) procedures pursuant to Article 796, Paragraph 3 of the Companies Act of Japan. In addition, prior to August 1, 2010, the scheduled Effective Date of the Share Exchange, the shares of common stock of Ichitan were delisted from Osaka Securities Exchange Co., Ltd. on July 28, 2010 (the final day on which the shares of common stock of Ichitan were traded on Osaka Securities Exchange Co., Ltd. was July. 31.Subsequent Event (fiscal 2011) Sellout of noncurrent asset The Company resolved, at the Board of Directors held on August 30, 2010, to sell Shinjuku Subaru Building(building and land) co-owned by the Company and Subaru Kosan Co., Ltd., wholly owned subsidiary of the Company, to Odakyu Electric Railway Co., Ltd. and entered into the sales agreement for the purposes of reorganizing and enhancing its function of headquarter and utilizing its assets effectively.
The transfer of ownership of Shinjuku Subaru Building was completed on April 28, 2011. The Company will recognise ¥25,000 million (US$300,661 thousand) of gain on sales of noncurrent assets
as other income in FY2012. 32.Other On January 15, 2010, the Company filed a lawsuit with the Tokyo District Court against the Government of Japan for the payment [totaling ¥35,124 million (US$ 422,417 thousand)] of uncollected initial investment fees (amount paid for customization to the Japanese specifications) for the manufacture of the AH-64D combat helicopters for the Japan Ministry of Defense. The payment [totaling ¥23,954 million (US$ 288,082 thousand)] of uncollected initial investment fees the Company paid was included in “Other assets” of “Inventments and other assets”. In addition, the amount of lawsuit includes the uncollected initial investment fees, consumption tax and other paid by subcontractors.

Independent Anditors' Report
To the Board ofDirectors ofFUJI HEAVY INDUSTRIES LTD.:
We have audited the accompanying consolidated balance sheets ofFun HEAVY INDUSTRIES LTD. and consolidated subsidiaries as ofMarch 31, 2011 and 2010, and the related consolidated statements of income, comprehensive income, changes in net assets and cash flows for the years then ended expressed in J apanese yen目 Theseconsolidated tinancial statements are the responsibility ofthe Company's management. Our responsibility is to independently express an
opinion on these consolidated tinancial statements based on our audits.
We conducted our audits in accordance with auditing standards generally accepted in Japan Those standards require that we plan and perform the audit to obtain reasonable assurance about whether the tinancial statements are free of material misstatement. An audit includes examining, on a test basis, evidence supporting the amounts and disclosures in the tinancial statements. An audit also includes assessing the accounting principles used and signiticant estimates made by management, as well as evaluating the overall tinancial statement presentation. We believe that
our audits provide a reasonable basis for our opinion.
In our opinion, the consolidated tinancial statements refe町edto above present fairly, in all material問 spects,the tinancial position ofFun HEAVY nぜDUSTRIESLTD.and subsidiaries as of March 31, 2011 and 2010, and the resuIts of their operations and their cash flows for the years then ended, in conformity with accounting principles generally accepted in Japan
The U.S. dollar amounts in the accompanying consolidated tinancial statements with respect to the year ended March 31, 2011. are presented solely for convenience. Our audit also included the translation of yen amounts into U .S. dollar amounts and, in our opinion, such translation has been made on the basis described in Note 1 to也econsolidated tinancial statements
~.pM4 升g5A しし乙
Tokyo, Japan June 27, 2011