annual report 2012 - masan group
TRANSCRIPT

AnnuAl RepoRt

200%
0%
Nov 09 Feb 10 May 10 Aug 10 Nov 10 Feb 11 May 11 Aug 11 Nov 11 Feb 12 May 12 Aug 12 Nov 12 Feb 13
100%
MSN VN Index Source: Bloomberg
We are one of Vietnam’s largest private sector companies with a focus on the consumption and resources sectors. We have a track record of actively building, acquiring and managing large-scale operating platforms that capitalize on Vietnam’s structural consumption and resources stories. We believe that substantial value can be created for our shareholders through professional management, global partners and a commitment to serving Vietnam’s emerging middle class.
Cash and cash equivalent (VND billion)Net income – Proforma (VND billion)* ROE
3,090
201120102009
2,783
2012 2009
1,900
2010
3,885
2011
10,796
2012
7,559
1,149
1,860
19.5% 20.0%
24.1%
17.5%
*Calculation excludes goodwill and is normalized by applying our current economic interest percentages on Techcombank since 2009.
Note: Cash and cash equivalents include short-term investments, which are primarily term deposits with lower than 3 month maturities. 2012 does not include cash raised from KKR, who invested in early 2013.
Pro forma Earnings and roE Cash and Cash EquiValEnts from 2009
MASAN GROUP
sharE PriCE sinCE listing

Annual Report 2012 3
CONteNtSChairman’s letter masan group our Businesses masan Consumer masan resources our associates management report financial report general Corporate information
unloCking ValuE By sErVing ViEtnam’s ConsumErs
418252636556175
163

4 Masan Group
ChAiRMAN’S letteR
dEar sharEholdErs,
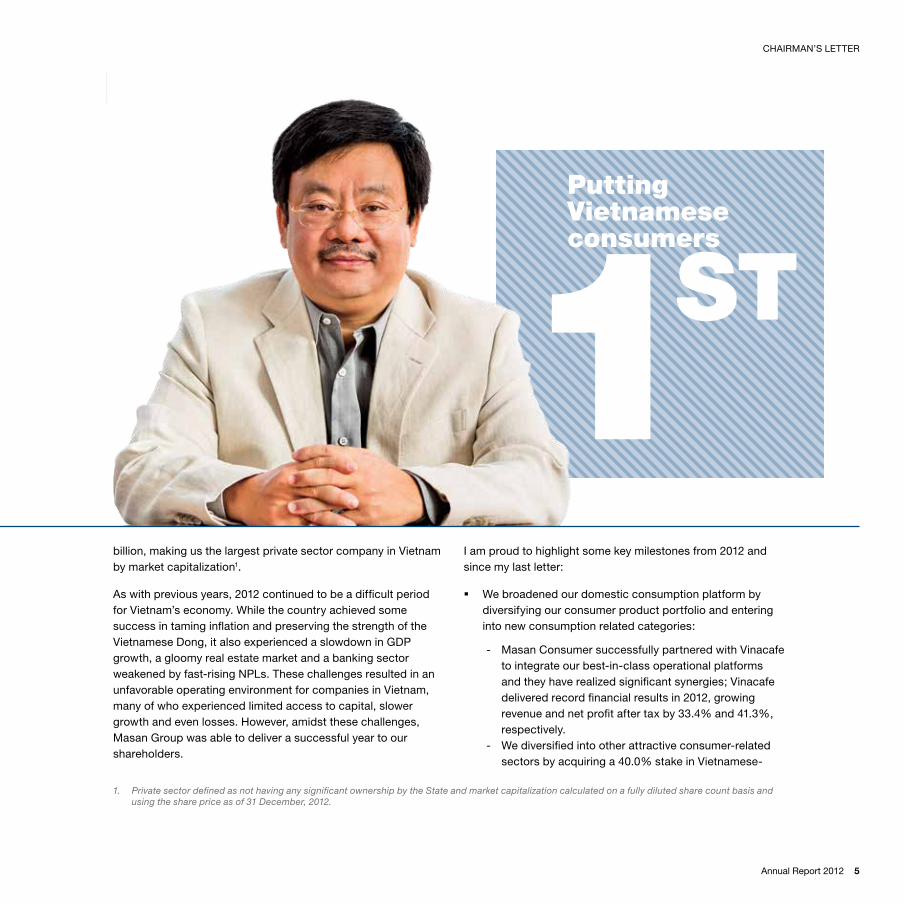
over the past few years, our company has transformed from being primarily a food manufacturer into one of Vietnam’s largest private sector business groups. Masan Group’s success derives from having a strong commitment to improving the Vietnamese people’s spiritual and material lives each and every day, applying best practices to build scale and developing leading businesses that can compete and win in a more globalized marketplace. We strive to become the pride of Vietnam by demonstrating to the world that a local company can succeed by putting the Vietnamese consumers first, focusing on a few objectives and executing with professionalism.
In 2012, Masan Group continued our disciplined approach to business building with a renewed focus on the consumption-related sectors and accelerating the development of the nui phao project, Vietnam’s largest private sector mining development. As a result, we have been able to achieve record revenues and earnings at Masan Consumer and are on track to witness the nui phao mine’s commissioning ahead of schedule.
our performance and business prospects have also been recognized by the financial markets. Since our listing on the Ho Chi Minh Stock exchange in 2009, our share price has increased by 136.1% as compared to a 25.5% decrease of the benchmark index over the same period. today, our market capitalization is VnD79,351 billion, or approximately uS$3.8
Annual Report 2012 5
Putting Vietnamese consumers
1st
CHAIRMAn’S letteR
billion, making us the largest private sector company in Vietnam by market capitalization1.
As with previous years, 2012 continued to be a difficult period for Vietnam’s economy. While the country achieved some success in taming inflation and preserving the strength of the Vietnamese Dong, it also experienced a slowdown in GDp growth, a gloomy real estate market and a banking sector weakened by fast-rising npls. these challenges resulted in an unfavorable operating environment for companies in Vietnam, many of who experienced limited access to capital, slower growth and even losses. However, amidst these challenges, Masan Group was able to deliver a successful year to our shareholders.
I am proud to highlight some key milestones from 2012 and since my last letter:
� We broadened our domestic consumption platform by diversifying our consumer product portfolio and entering into new consumption related categories:
- Masan Consumer successfully partnered with Vinacafe to integrate our best-in-class operational platforms and they have realized significant synergies; Vinacafe delivered record financial results in 2012, growing revenue and net profit after tax by 33.4% and 41.3%, respectively.
- We diversified into other attractive consumer-related sectors by acquiring a 40.0% stake in Vietnamese-
1. Private sector defined as not having any significant ownership by the State and market capitalization calculated on a fully diluted share count basis and using the share price as of 31 December, 2012.
6 Masan Group
French Cattle Feed JSC, the number two animal feed producer in Vietnam, which will allow us to benefit from Vietnam’s growing protein-based diet.
- In February 2013, Masan Consumer acquired a 24.9% stake in Vinh Hao Mineral Water Corporation, one of Vietnam’s most recognized and trusted brands in the bottled beverage sector. on the back of the transaction, Masan Consumer launched a cash tender offer process on similar commercial terms to increase its stake.
� Masan Resources made significant progress in the development of the nui phao project:
- Masan Resources spent approximately uS$220 million over the course of the year to significantly advance construction.
- the processing plant is expected to be in operation early in the second quarter of 2013, which is expected to make us the largest operating tungsten producer outside of China.
- nui phao received the 2013 “Corporate Social Responsibility excellence Award” from the Ministry of planning and Investment for the mine’s track record of supporting local communities in the thai nguyen province and adhering to world-class standards for environmental, safety and social practices.
� We enhanced our management teams at the group and subsidiary levels with new hires coming from prominent multinational corporations and with proven track records in emerging markets:
- At Masan Consumer, we hired a Chief operating officer and Chief Marketing officer.
- At Masan Group, we strengthened our compliance, risk management and corporate communication platform by hiring seasoned executives.
� Some of the world’s most reputable investors continue to validate our approach to building leading businesses by investing in us:
- KKR, a leading global private equity firm, invested
uS$200 million in Masan Consumer, in addition to uS$159 million invested in April 2011. the uS$359 million total investment is the largest ever private equity investment in Vietnam. KKR’s deepening partnership with Masan demonstrates its strong conviction in Vietnam’s structural consumption growth story and is a validation that Masan is the partner of choice to access Vietnam’s consumer potential.
- Masan Resources secured an uS$80 million loan from Standard Chartered to develop the nui phao project, Vietnam’s first international loan facility for a private sector mining project. this was a validation of the progress of the mine’s development and its financial feasibility.
- We issued approximately uS$130 million in convertible instruments to our existing investors, the Richard Chandler Corporation and Mount Kellett, which demonstrates their continued confidence in Masan Group.
Financially, our core business delivered record results, while our consolidated earnings declined due to lower contribution from techcombank. Driven by increased market share in our key categories and the successful integration of Vinacafe, our net sales grew from VnD7,057 billion in 2011 to VnD10,389 billion in 2012, representing a 47.2% increase. normalized to remove the impact of goodwill amortization from our businesses and associates, our pro forma net profit declined slightly from VnD3,090 billion in 2011 to VnD2,783 billion in 2012, representing a 9.9% decrease. the decrease in our pro forma net profit after tax is primarily attributable to techcombank, which experienced a 75.7% drop in earnings from VnD3,154 billion in 2011 to VnD766 billion in 2012 due to lower interest rates, a trying lending environment for the industry as a whole, and conservative loan loss provisioning. Despite techcombank’s weaker than expected results, the slight decline in our overall pro forma net profit after tax is a testimony to the strength of our core business. Masan Consumer’s net profit grew by 26.4% to VnD2,850 billion in 2012.

Annual Report 2012 7
With regards to our balance sheet, at the end of 2012 we held approximately VnD7,559 billion in cash and cash equivalents1. this figure does not include the equity capital raised from KKR, which occurred in January 2013. our cash position strengthens our balance sheet in a volatile macro environment and gives us greater resources to deepen our consumption platform organically and through M&A. While we have highlighted our ability to raise capital in the past, 2012 was special as many of our existing partners doubled up on their investment in Masan, which is one of the strongest forms of validation.
operationally, 2012 was a strong year for our company as we continued to strengthen and invest in our business platforms. We successfully integrated the operations of Masan Consumer and Vinacafe, resulting in records sales and earnings for our coffee business. our businesses also continued expanding their reach to better service our customers. Masan Consumer increased its already market-leading consumer distribution network from 164,000 points of sale in 2011 to 176,000 points of sale in 2012. We increased our production capacity and introduced new brands to the market such as Chin-su nam ngu, Wake up and Kachi, which helped drive our organic growth. We also significantly ramped up construction activities for the nui phao project and increased the number of on-site workers to approximately 3,300. With the aim of increasing our regional presence in Southeast Asia, we also opened up a representative office in Singapore. Most importantly, we have invested in talent across our company, particularly at Masan Group, Masan Consumer and techcombank, where we have hired senior executives to help take us to the next level.
looking forward, we have many reasons to be optimistic in 2013, with our mine starting commercial production, our bigger push into the beverage market, and other investments in the consumption-related sectors. In addition, techcombank has made concerted efforts to reduce its interbank exposure, reduce its loan book and adopt more prudent lending policies.
these efforts signal an aggressive effort to clean up its balance sheet and better position itself for sustainable growth in the years going forward. Given these supportive reasons, Masan Group expects to grow our earnings by 30% to 70% in 2013, getting us closer to our goal of achieving uS$1 billion in consolidated eBItDA within two to three years.
I would like to express my gratitude to our valued customers, employees, partners and other stakeholders for their tremendous support over the past year. I am very proud that Masan continued to grow and generate significant returns for our shareholders in 2012 and that our outlook for 2013 is bright. I am even prouder that we have proven to the world that a local company can succeed in a challenging environment with a professional team that thinks and executes like entrepreneurs while having an unrelenting focus on servicing Vietnamese consumers.
Yours sincerely,
nguyen Dang QuangChairman of the Board
8 April, 2013
CHAIRMAn’S letteR
1 Cash and cash equivalents include short-term investments.

8 Masan Group
income statement for 2012 Audited Pro forma1
net sales (VnD billion) 10,389 10,389
net sales growth rate 47.2% 47.2%
net profit (VnD billion) 1,963 2,783
net profit growth rate -21.4% -9.9%
Balance sheet as of 31 December, 2012 Audited
Cash and cash equivalents (VnD billion)2 7,559
total debt (VnD billion)3 11,585
Book value of equity (VnD billion) 13,884
total assets (VnD billion) 38,699
2012 sElECtEd finanCial information
1. Pro forma are our unaudited financial numbers based on our audited results with adjustments made to reflect normalized earnings. These adjustments include (a) adding back the amortization of goodwill from the transfer of ownership in Techcombank for the years ended 31 December, 2012 and 2011, assuming Masan Group held a 30.4% interest in Techcombank from 1 January, 2011; (b) adding back the amortization of goodwill, tangible assets and intangible assets from the acquisition of Vinacafe Bien Hoa JSC for the years ended 31 December, 2012 and 2011; (c) adding back the amortization of goodwill from the acquisition of Vietnamese French Cattle Feed JSC for the year ended 31 December, 2012.
2. Cash and cash equivalents include short-term investments, which are primarily term deposits with maturity lower than 3 month. 2012 does not include cash raised from KKR, who invested in early 2013.
3. Total debt equals short-term and long-term financial borrowings excluding promissory notes. The promissory notes of VND2,856 billion will be extinguished in the event the options to purchase primary shares in Masan Group are exercised with payments in the form of said promissory notes in lieu of cash. The options were given as part of the Nui Phao acquisition and were “in the money” as of 31 December, 2012. Masan Group had the right to force convert the said options as of 31 December, 2012.

Annual Report 2012 9
CHAIRMAn’S letteR
OUR BUSiNeSSeS ARe
PlAtfORMS iN VietNAM’S CONSUMPtiON AND ReSOURCeS SeCtORS
market-leading

10 Masan Group
hOUSehOlD CONSUMPtiON eXPeNDitURe RePReSeNtS MORe thAN
Of VietNAM’S GDP
63%
Source: World Bank.

Annual Report 2012 11

12 Masan Group
Annual Report 2012 13
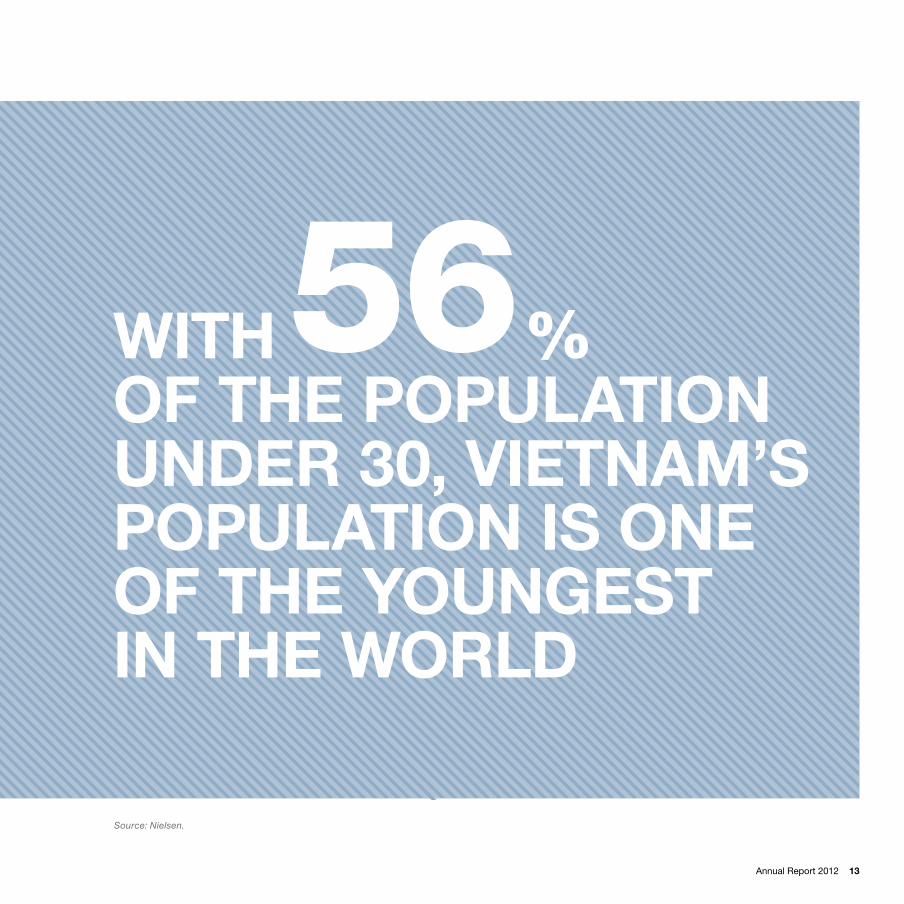
56With % Of the POPUlAtiON UNDeR 30, VietNAM’S POPUlAtiON iS ONe Of the yOUNGeSt iN the WORlD
Source: Nielsen.

14 Masan Group
VietNAM hAS the
lARGeSt POPUlAtiON iN the WORlD
13tH
Source: World Bank.

Annual Report 2012 15

16 Masan Group

Annual Report 2012 17
tOtAl CONSUMeR SPeNDiNG iS PROjeCteD tO DOUBle tO APPROXiMAtely
By 2020173 BilliOn US$
Source: Euromonitor, Global Insight, Bain Analysis.

18 Masan Group
MASAN GROUP
Who WE arE
Masan Group is one of Vietnam’s largest private sector companies. our businesses include our subsidiaries, Masan Consumer and Masan Resources – large-scale operating platforms focused on the consumer products and resources sectors, respectively. We are committed to becoming the country’s leading private sector player in terms of scale, profitability and shareholder return, and becoming the growth partner and employer of choice. to achieve these objectives, we operate in sectors where a local private sector company can be a market leader and where we can develop scale through focus and consolidation.
Our focused approach to business building
In a dynamic market with many opportunities, we believe in being disciplined and have recognized several important components of a successful and sustainable business in Vietnam. these include:
Cash flow generating businessesMasan believes sustainable growth in a developing market like Vietnam requires building cash flow generating businesses. We do not engage in asset trading, such as purchasing land banks or participating in short-term speculation. We compete only in sectors with strong growth fundamentals, a proven private sector regional business model and the potential to build a business of scale. therefore, we have chosen to focus on the consumption and resources sectors.
We are committed to focus and discipline to build leading businesses.

Annual Report 2012 19
MASAn GRoup
Best-in-class operating platformsSustainable growth can be achieved only through building best-in-class systems and operating platforms. When we enter into a sector, we develop a bespoke strategy and repeatable models to drive market leadership in each business line. this enables us to invest continually in best-in-class operating platforms. over the past several years, we have invested in new products, brands, production facilities, distribution networks, information systems and most importantly, talent. today, our operating platforms are leaders in their respective sectors.
Building scaleBeing a market leader of size allows us to compete successfully in an economy with a fragmented local private sector and where competition from multinational companies and state-owned enterprises is intense. As one of Vietnam’s largest private sector companies, Masan has greater access to capital and professional talent, and the scale to invest in operating platforms. We build scale through focus and consolidation, growing our existing businesses organically and accelerating growth with acquisitions that fit within our sector focus.
sharE PriCE inCrEasE sinCE listing in 20091
1. Based on price as at 31 December, 2012.
20 Masan Group
Stringent capital allocation and capital structureover the last few years, we have raised over uS$1.2 billion in long-term capital, which allows for more strategic business building and investing in Vietnam. We have demonstrated stringent capital allocation by using most of the proceeds only to increase our ownership and invest in our existing businesses. We acquired the nui phao project on a primarily cashless basis and we have deployed less than 20% of that capital to acquire new businesses – namely, Vinacafe Bien Hoa, proconco and Vinh Hao Mineral Water Corporation. We believe these companies and their iconic brands provide us avenues to go deeper into other consumption-related categories.
World-class MNC management and reputable partnersWe have professional management at all levels of our organization and incentivize our team by making them shareholders and rewarding those who produce results. We have selectively partnered with globally reputable firms who can provide a sounding board and validation on strategy, information on opportunities and access to long-term capital.
ViEtnam’s groWth story
Masan Group’s strategy is driven by our view of Vietnam’s opportunities as one of Southeast Asia’s fastest growing economies. Real GDp has grown at a compound annual growth rate of 7.8% between 2005 and 2012. Vietnam’s growth has been supported by low labor costs and productivity gains as a result of the Doi Moi (“renovation”) reforms, which opened up the markets, but we believe Vietnam’s true value lies in its domestic consumption potential and untapped natural resources.
Domestic consumption potentialVietnam’s demographics and rising income levels support strong continued growth in domestic consumption. the country has just entered an anticipated 30-year era of “demographic dividend” with nearly 70% of its 90 million residents in the working age population and 56% of its residents under 30 years old. over the next 10 years, the working age population is expected to grow at least one million per year.
Vietnam’s expanding workforce is expected to drive consumer spending. the country had the highest growth rate in the consumer goods sector in Asia in 2012, up by 23% compared to India (18%) and China (13%). Domestic consumer demand is expected to continue to benefit from the combined effects of favorable demographics, greater urbanization and a rise in disposable incomes and consumer leverage.
Underdeveloped resources potentialMineral resources, agribusiness and energy together constitute a significant percentage of Vietnam’s GDp. Further growth is anticipated in all three areas. As a mineral rich country, Vietnam’s potential remains largely untapped as many areas remain unexplored. Agriculture, forestry and fisheries, which constituted over 24% of Vietnam’s 2012 GDp, will benefit from rising domestic consumption, new export markets and institutional support from government and trade groups. Finally, Vietnam ranks third in Southeast Asia for petroleum resources. It holds 4.4 billion barrels of proven oil reserves and nearly 25 trillion cubic feet of proven natural gas reserves. Meanwhile, oil consumption in Vietnam is set to increase by 69% between 2011 and 2020, with annual growth of 5% to 7%. All three areas are also expected to grow as downstream sectors and related infrastructure are developed.
Vietnam’s constraints drive our business modelVietnam has recently experienced macroeconomic challenges, including high non-performing loans and the scaling back of credit activities, which hampered GDp growth in 2012. Additionally, the private sector, while growing strongly, remains fragmented as demonstrated by turnover rates and market share. private sector companies are further challenged by constrained availability of long-term capital, lack of professional expertise and competition from larger multinationals. Masan Group manages these risks and addresses Vietnam’s private sector constraints by building scale and creating leading operating platforms to weather financial cycles, and by consolidating and growing market share.

Annual Report 2012 21
MASAn GRoup
MASAN GROUP1
MASAN GROUPStraight Debt: uS$27 millionequity-linked Debt: uS$134 millionequity: uS$661 million
MASAN ReSOURCeS
MASAN ReSOURCeSStraight Debt: uS$191 millionpromissory notes: uS$136 million6
equity: uS$406 million
teChCOMBANknot applicable as tCB is an associate and is not consolidated
1. Does not include our intermediary holding companies.2. On a fully diluted basis and includes Masan Group’s right, but not obligation, to buy the 15% ownership of Tiberon Minerals Private Limited, a company
owned by the funds managed by Dragon Capital Group.3. Includes Masan Group’s partial ownership in Techcombank’s VND3,000 billion convertible bond offering issued in December 2010.4. Masan Consumer has launched a cash tender offer to increase its stake.5. Debt on a consolidated basis, except for Masan Group, which is standalone. US$/VND = 21,000. 6. The promissory notes were issued by Masan Resources’ direct parent company. The promissory notes will be extinguished in the event certain options
to purchase primary shares in Masan Group are exercised with payments in the form of such promissory notes in lieu of cash. The options were given as part of the Nui Phao acquisition and are “in the money” as at 31 December, 2012. We have the right to force convert such options as at 31 December, 2012 based on the terms of the options.
7. As of 31 December, 2012 and including short-term investments and proceeds from KKR’s investment at MSC (agreements signed in December 2012 and closed in January 2013).
8. Excludes equity-linked instruments.
grouP CorPoratE struCturE as of march 2013
CaPital struCturE as of 31 december, 20125
MASAN CONSUMeR53.2% Vinacafe Bien Hoa24.9%4 Vinh Hao Mineral Water40.0% proconco
MASAN CONSUMeRStraight Debt: uS$200 millionequity: uS$505 million
2012 eBItDA (uS$ million) 119
Cash and Cash equivalents (uS$ million) 4697
total Straight Debt (uS$ million) 418
net Straight Debt8 -51
Share Count (Basic) 687,280,123
Share Count (Fully Diluted) 777,954,658
77.7% 77.7%2
teChCOMBANk
30.4%3

22 Masan Group
ProfEssional managEmEnt tEam
the best person for each job – the Masan WayWe operate according to the “Masan Way”, a unique partnership model where different stakeholders within Masan Group collaborate as equals and play to their strengths to execute on scalable business building. our various stakeholders contribute the following expertise:
� Risk management and capital allocation – A private equity platform with an appreciation for focus, risk management and optimized capital allocation;
� local access and execution – Capabilities that allow us to source and execute on opportunities while effectively managing local risks; and
� professional management – Seasoned local and expatriate professionals who are best-in-class operators, augmented with reputable strategic partners.
We have invested heavily to ensure that we have strong professional management at all levels of our organization. We believe in hiring professionals who have multinational experience and a track record of business execution in local markets. At Masan Group, our team members bring breadth and depth of experience garnered from companies such as J.p. Morgan, Deutsche Bank, Morgan Stanley, KpMG, ernst & Young, pricewaterhouseCoopers, White & Case, linklaters and YKVn. At our operating companies, our professionals come from leading multinational companies such as unilever, nestle, p&G, oZ Minerals, placer Dome and MMG.
Most importantly, we believe in hiring professionals who demonstrate our entrepreneurial values and are project managers of transformative initiatives within a fast-growing organization. our team is comprised of young, global, proven and flexible professionals who can execute on diverse projects
to create the most shareholder value.
together, we have created a unique execution platform and have established a continual record of success in a frontier market. our management team has been instrumental in transforming Masan Group from a closely held private office with a wide portfolio of businesses and investments into one of Vietnam’s largest private sector companies focusing on the consumption and resources sectors.
fPO
Annual Report 2012 23
MASAn GRoup
PartnErs and inVEstors
our partners are reputable global firms whom we value as a key part of our business model. they provide us with strategic advice, access to opportunities and long-term capital for growth.
Bankinvestthe BankInvest Group was founded in Denmark in 1969 and is one of the largest asset managers in Scandinavia with uS$30 billion under management, of which uS$6 billion has been invested in emerging markets.
In 2006, BankInvest launched the private equity new Markets (penM) fund and currently has two funds with capital of approximately uS$240 million. through penM, BankInvest provides capital and business know-how and focuses on medium-sized companies with high growth opportunities.
Dragon CapitalDragon Capital Group is an investment group with exclusive focus on Vietnam. established in 1994, Dragon Capital manages assets of over uS$1.3 billion on behalf of private and public institutions from around the globe.
international finance CorporationInternational Finance Corporation (IFC), a member of the World Bank Group, is the largest global development institution focused on the private sector in developing countries. IFC provides financing to help businesses employ more people and supply essential services by mobilizing capital from others, and by delivering advisory services to ensure sustainable development. In a time of global economic uncertainty, IFC’s new investments climbed to a record uS$18 billion in fiscal year 2010.
tPG GrowthtpG Growth is the middle market and growth equity investment platform of tpG, a global private investment firm. With more than uS$2.5 billion under management, tpG Growth targets investments in a broad range of industries and geographies, utilizing leveraged buyout, growth equity and private investment in public equity structures. the firm is backed by the resources of tpG, which has more than uS$48 billion of assets under management. tpG Growth has offices in the u.S., China and India.
Since 2009, Masan Group, on a consolidated basis, has raised over uS$1.2 billion in cash capital. our stakeholders include BankInvest, tpG, Goldman Sachs, IFC and Richard Chandler Corporation. As for our underlying companies, KKR, J.p. Morgan and House Foods are partners of Masan Consumer; HSBC is a strategic partner of techcombank; and Mount Kellett and Standard Chartered have provided funding to Masan Resources.
1.2 billionUs$ raised from world-class investors and partners

24 Masan Group
Annual Report 2012 25
OUR BUSiNeSSeS
26 Masan Group
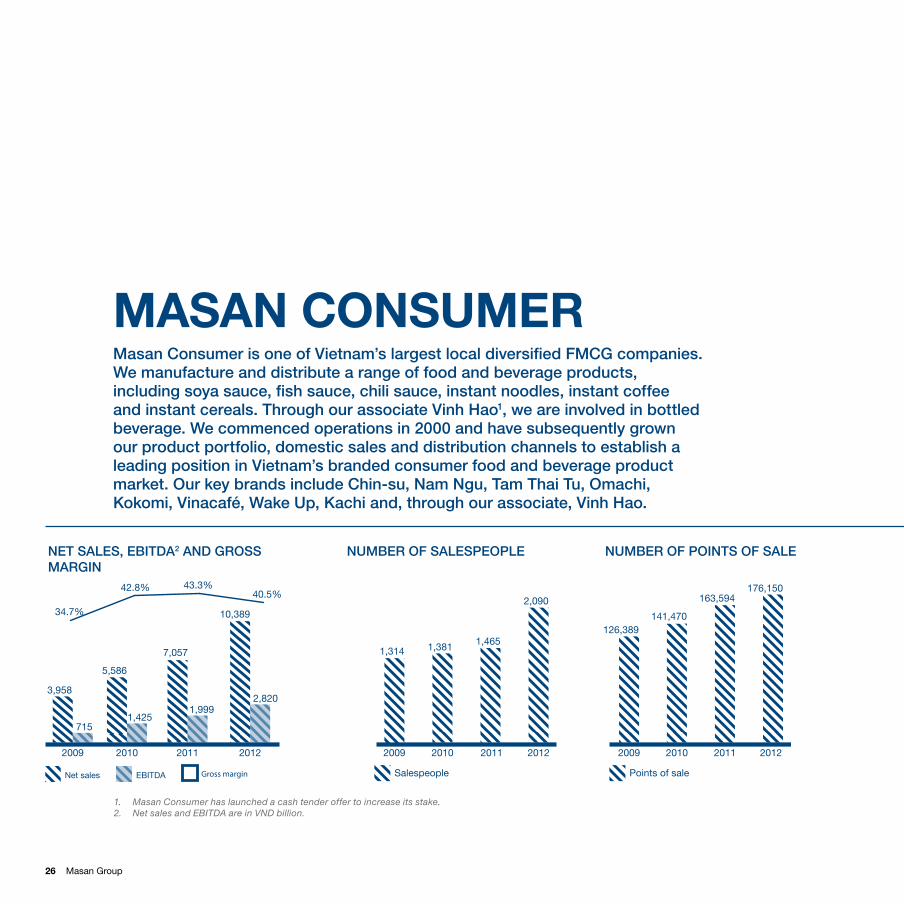
nEt salEs, EBitda2 and gross margin
numBEr of salEsPEoPlE numBEr of Points of salE
40.5%
2,820
Gross margin Salespeople
2009 2010 2011 2012
1,314 1,381 1,465
2,090
Points of sale
2009 2010 2011 2012
126,389141,470
163,594176,150
10,389
43.3%42.8%
34.7%
Net sales EBITDA
3,958
715
2009
5,586
1,425
2010
7,057
1,999
2011 2012
1. Masan Consumer has launched a cash tender offer to increase its stake.2. Net sales and EBITDA are in VND billion.
MASAN CONSUMeRmasan Consumer is one of Vietnam’s largest local diversified fmCg companies. We manufacture and distribute a range of food and beverage products, including soya sauce, fish sauce, chili sauce, instant noodles, instant coffee and instant cereals. through our associate Vinh hao1, we are involved in bottled beverage. We commenced operations in 2000 and have subsequently grown our product portfolio, domestic sales and distribution channels to establish a leading position in Vietnam’s branded consumer food and beverage product market. our key brands include Chin-su, nam ngu, tam thai tu, omachi, kokomi, Vinacafé, Wake up, kachi and, through our associate, Vinh hao.

Annual Report 2012 27
markEt sharE
SOyA SAUCe2
78%
fiSh SAUCe2
76%
SUPeR PReMiUM
iNStANt NOODleS3
48%
iNStANt COffee4
44%
1. Kantar 2012.2. Nielsen 2011, 36 cities.3. Nielsen 2012, 36 cities.4. Euromonitor 2011.
of ViEtnamEsE PEoPlE haVE a masan ProduCt in thEir homE1
MASAn ConSuMeR
28 Masan Group
aBout masan ConsumEr
Masan Consumer is one of Vietnam’s largest diversified consumer product companies with leading market share positions in the condiment, convenience food and instant coffee categories. We have continuously transformed our operating platform since 2000 by diversifying our product portfolio, and deepening our domestic sales and distribution footprint. We are now a leader in Vietnam’s branded consumer food and beverage market in both the premium and mass-market segments. our market leading brands include Chin-su (soya, fish and chili sauces), tam thai tu (soya sauce), nam ngu (fish sauce), omachi, Kokomi, Yoshi (instant noodles), Vinacafé, Wake up (coffee) and Kachi (instant cereal). With a reputation for quality and a global-standard operating platform, we are well placed to expand our presence in other high-growth food and beverage categories.
Masan Consumer has been one of the fastest growing FMCG companies in Asia-pacific over the past several years, with particular success in the condiments and convenience food segments and our growing presence in the beverage sector. Revenue and net profit have grown from VnD571 billion and VnD29 billion in 2006 to VnD10,389 billion and VnD2,850 billion in 2012, respectively, representing respective compounded annual growth rates of 62.2% and 115.0%.
At Masan Consumer, our vision is:
� to be Vietnam’s leading consumer company by sales, profitability and brand recognition;
� to meet the daily needs of Vietnam’s 90 million evolving consumers;
� to be the destination for top talent and recognized as the best workplace in Vietnam; and
� to be a symbol for quality and a source of pride among Vietnamese.
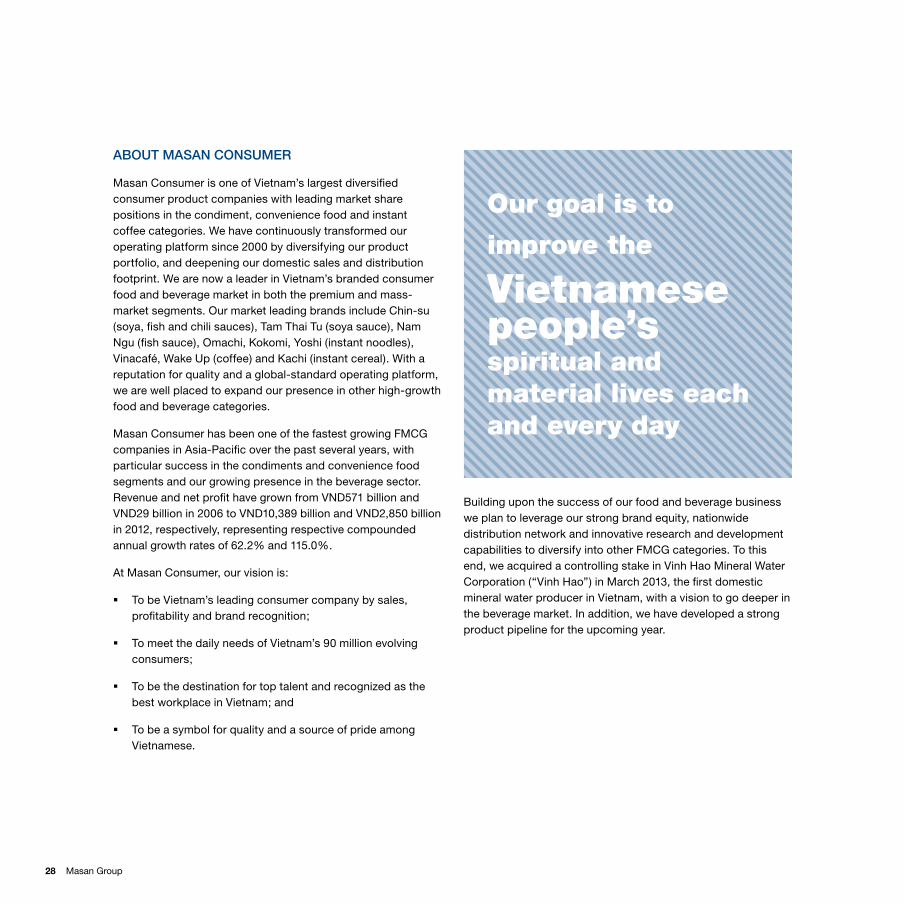
Building upon the success of our food and beverage business we plan to leverage our strong brand equity, nationwide distribution network and innovative research and development capabilities to diversify into other FMCG categories. to this end, we acquired a controlling stake in Vinh Hao Mineral Water Corporation (“Vinh Hao”) in March 2013, the first domestic mineral water producer in Vietnam, witha vision to go deeper in the beverage market. In addition, we have developed a strong product pipeline for the upcoming year.
Our goal is to
improve the
Vietnamese people’s spiritual and material lives each and every day

Annual Report 2012 29
MASAn ConSuMeR
A deep understanding of Vietnamese consumer behaviorWe have currently identified the condiments, instant noodles, instant coffee and bottle beverage segments as the foundation for our food and beverage business. Masan Consumer is the number one player in Vietnam’s condiment segment, with leading product lines in the fish sauce, soya sauce and chili sauce categories and the instant coffee segment. We are also the number two player in the instant noodles segment. A deep understanding of consumer behavior has helped drive our success, and in each of our segments, we have identified several trends that we expect to help us continue to grow.
fish saucethe Vietnamese fish sauce market contains many small, unbranded local producers whose products are typically sold at low price points in traditional open food markets found all over the country. As the population’s disposable income continues to increase, the market is expected to shift towards branded fish sauce consumption, especially in urbanized areas. We believe that the market offers room for further penetration, as Vietnam’s consumption per capita is lower than that of other Southeast Asian fish sauce consuming nations. We also see demand for quality products increasing after a series of recent food safety scandals. Moreover, Vietnamese consumers are using fish sauce in new ways and are looking for new product offerings such as ready-mixed fish sauce.
Soya sauceDue to the popularity of fish sauce, soya sauce is still a relatively small market in Vietnam, but it is undergoing rapid expansion and market penetration is expected to grow. the market is shifting from unknown brands towards well-known and premium brands, in part due to improved buying power and concerns about product safety. In 2007, the market was hit by the discovery of cancer-causing 3-MCpD in many low- and mid-tier products. Masan’s Chin-su and tam thai tu were two of only three major soya sauce brands that met the government’s safety requirements and were able to capitalize on the opportunity to gain significant market share. Growth of retail channels such as hypermarkets, supermarkets, convenience stores and independent small
grocers in rural areas is expected to improve the distribution of soya sauce and increase customer reach.
Chili sauceuntil recently, chili sauce was primarily utilized as a dipping agent in Vietnam, but it is increasingly becoming a cooking aid, which is expected to drive growth. the market has also seen a shift in consumer behavior from the use of fresh chili to branded chili sauce due to widespread availability, stronger demand for convenience and increased concerns about food safety. the introduction of chili sauce in quick service restaurants such as KFC, lotteria and pizza Hut has influenced consumer tastes, driving chili sauce consumption, as have aggressive advertising and innovative packaging. the entry of fortified chili sauce and new flavors is expected to continue to stimulate consumer interest in branded chili sauce.

30 Masan Group
instant noodleson a per capita basis, Vietnam’s instant noodles consumption is estimated to be the third highest in the Asia-pacific region, trailing only South Korea and Indonesia. the popularity of instant noodles in the cup/bowl format is likely to increase as young Vietnamese professionals demand ease of preparation. Consumers will increasingly shift to premium products whose higher price points will boost the overall market size. to combat the traditional perception that instant noodles are junk food, producers will continue to increase product variety and flavors and introduce healthier non-flour-based noodles.
CoffeeWhile Vietnam is one of the world’s largest exporters of coffee, the country’s per capita consumption is much lower than other coffee growing nations and lower than other countries in the region. However, Vietnam is experiencing a rapid increase in coffee consumption, particularly instant coffee. Designed specifically to offer convenience to Vietnam’s increasingly busy consumers, the instant coffee market is growing faster than the fresh coffee market and has been gaining market share over fresh coffee over the past 10 years. Instant coffee saw the most dynamic retail volume and value sales growth among all coffee sub-categories in 2010. As the instant coffee market develops and competition increases, companies are focusing more on marketing, innovation and improving product quality. As a result, new products with a stronger taste are flourishing and have increased consumer interest.
the Vietnamese coffee market is expected to continue to grow thanks to increasing market penetration, modernization of distribution channels, product innovation and shifts in consumer behavior towards coffee due to aggressive advertising and innovative packaging.
Bottled beveragethe bottled beverage is expected to experience strong growth, supported by an increase in brand awareness through advertising, greater focus on health issues, demand for convenience due to busy modern lifestyle and the higher availability in distribution channels. More and more consumers will shift from boiled water to bottled water and from unbranded beverages to branded bottled beverages. Branding capabilities and the ability to offer beverage products tailored to the local taste will be critical factors for companies to gain market share in this expanding market.
According to euromonitor, the bottled water and bottled soft drinks1 market is expected to grow at 20% per annum from 2011 to 2015.
With its recognizable brand and product portfolio, Vinh Hao is a strong addition that will allow Masan Consumer to further penetrate the bottled beverage market.
1. Soft drinks include carbonates, juices and RTD Tea.
Annual Report 2012 31
MASAn ConSuMeR
What is our focus?We focus on food and beverage categories that are large and have market size potential of at least uS$500 million. In particular, we aim to compete in sectors where local taste and/or branding is a differentiator. this allows us to leverage our operating platform to consolidate market share and generate above average gross margins similar to what we have been able to achieve in the condiments and convenience food segments.
Secondly, our management team is focused on continually changing the market dynamics of Vietnam’s FMCG sector. this effort includes shifting consumers toward premium brands and changing consumer behavior to increase per capita consumption in key FMCG categories. At our core we are dedicated to serving the 90 million Vietnamese consumers by offering safe, healthy and innovative products.
ViEtnam’s food and BEVEragE sECtor
Improving per capita income has fuelled Vietnam’s domestic consumption, which has been a solid growth driver despite external economic turbulences over recent years. AC nielsen ranks Vietnam as having the highest growth rate in the consumer goods sector in Asia in 2012, up by 23% compared to India’s increase of 18% and China’s rise of 13%. Domestic consumer demand is expected to continue to benefit from the combined effects of favorable demographics, greater urbanization, a rise in disposable incomes and consumer leverage.
Vietnam has the third largest population in Southeast Asia, with nearly 70% belonging to the working age group (15-60). Vietnam’s demographic presents an excellent opportunity for the rise in domestic consumer demand and is expected to persist through the next 30 years. there are other trends allied to these demographic realities that could result in structural changes in the consumer market, including: greater demand for convenience foods, greater focus on quality and health aspects of products, consolidation and greater preference for branded products, and demand for new products and variants.
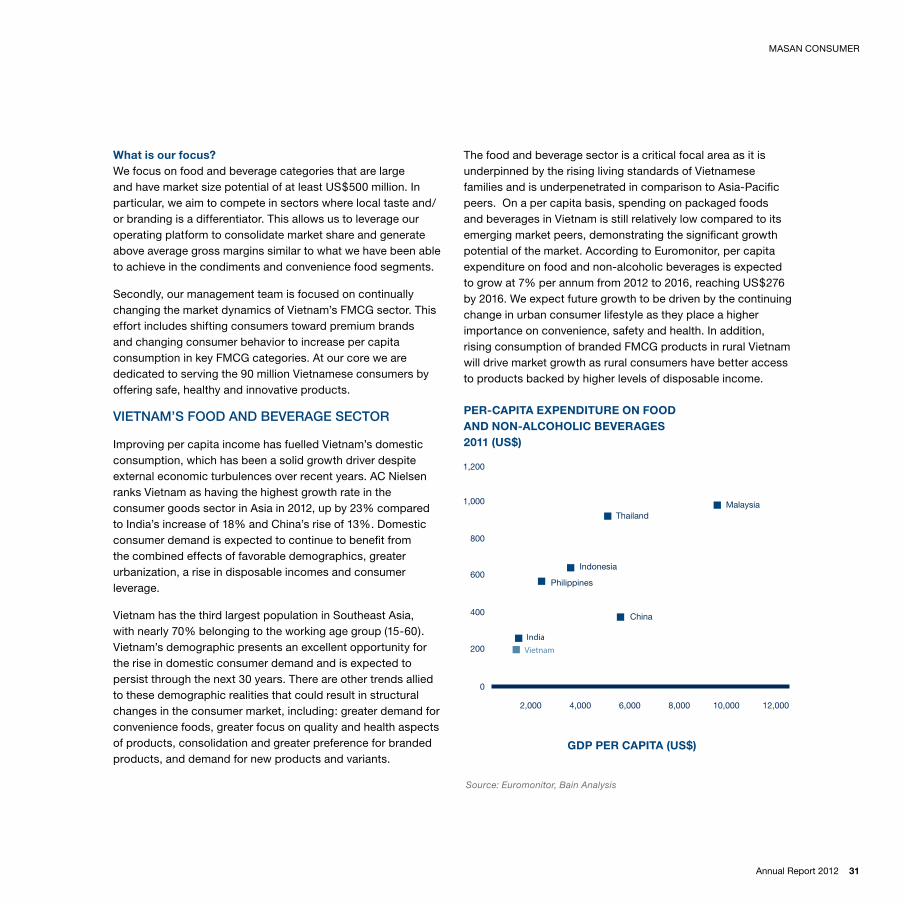
the food and beverage sector is a critical focal area as it is underpinned by the rising living standards of Vietnamese families and is underpenetrated in comparison to Asia-pacific peers. on a per capita basis, spending on packaged foods and beverages in Vietnam is still relatively low compared to its emerging market peers, demonstrating the significant growth potential of the market. According to euromonitor, per capita expenditure on food and non-alcoholic beverages is expected to grow at 7% per annum from 2012 to 2016, reaching uS$276 by 2016. We expect future growth to be driven by the continuing change in urban consumer lifestyle as they place a higher importance on convenience, safety and health. In addition, rising consumption of branded FMCG products in rural Vietnam will drive market growth as rural consumers have better access to products backed by higher levels of disposable income.
0
400
600
800
1,000
1,200
200India
Vietnam
China
Philippines
Indonesia
ThailandMalaysia
2,000 4,000 6,000 8,000 10,000 12,000
PeR-CAPitA eXPeNDitURe ON fOOD AND NON-AlCOhOliC BeVeRAGeS 2011 (US$)
GDP PeR CAPitA (US$)
Source: Euromonitor, Bain Analysis

32 Masan Group
2012 tRACk ReCORD
CorporateIn 2012, we continued to execute our transformation from a market-leading food platform into a broader consumer FMCG platform with the integration of Vinacafe. Specifically, we partnered with Vinacafe to launch two co-branded products, Wake up and Kachi through Masan Consumer’s distribution network. As a result, Vinacafe’s network increased from 32 distributors and 93 sales agents to 180 distributors and access to 176,000 points of sale. With a stronger distribution network, Vinacafe delivered record 2012 year-end results marked by revenue and net profit after tax increasing to VnD2,115 billion and VnD298 billion, respectively. to further penetrate the beverage market we acquired a 24.9% stake for VnD 171 billion in Vinh Hao Mineral Water Corporation, a bottled beverage manufacturer famous for its mineral water brand. We plan to partner with Vinh Hao to create significant operational value in order to achieve its vision of becoming a leading diversified bottled beverage player.
We also strengthened our partnership with KKR, who acquired an additional 8.7% of Masan Consumer through a combination of secondary and primary shares for uS$200 million. the additional investment is a validation of Masan Consumer’s ability to diversify its platform to serve the evolving needs of Vietnamese consumers and Masan Group as a partner of choice in Vietnam.
Vinh hao Mineral Water CorporationFounded over 80 years ago, Vietnam’s oldest mineral water brand Vinh Hao is one of the most trusted and recognizable brands in Vietnam. In 1928, French scientists discovered the Vinh Hao mineral springs in the Binh thuan province and compared the quality to that of the famous mineral water from Vichy.
today, Vinh Hao has a portfolio of different beverages that includes carbonated drinks, non-carbonated mineral water, purified water and mineral water-based soft drinks. Vinh Hao currently sells its products through over 40 distributors and reaches approximately 25,000 points of sale, primarily catering to Southern and Central Vietnam. With Masan Consumer’s
extensive distribution network, Vinh Hao’s brand and reputation is expected to grow strongly.
Product and branding initiativesIn 2012, we successfully developed several new variants and launched new brands to further consolidate our market share in our existing categories. leveraging on the success of omachi, which has a market share of 48% in the super premium segment, we launched Kokomi, a mass market instant noodle brand, which has captured 19% retail market share in its price segment.
We also successfully implemented our brand consolidation strategy with the launch of Chin-su nam ngu fish sauce with the aim of up-trading nam ngu users to our more premium Chin-su brand.
At Vinacafe, Masan cooperated to launch co-branded products for instant coffee and instant cereal, Wake up and Kachi, respectively. We introduced two variants of Wake up, “Wake up Saigon” and “Wake up with Weasel Flavor”, to cater to different regional tastes. Kachi has helped solidify our leading position in the instant cereal segment. With Masan Consumer’s

Annual Report 2012 33
MASAn ConSuMeR
R&D department, we have enhanced the Vinacafe heritage brand to maintain its super premium branding by changing the formula and packaging to improve the overall product quality.
Distribution network We continued to deepen our distribution platform in 2012. We have developed a pan-national distribution network with over approximately 176,000 points of sale covering all of Vietnam’s 64 provinces. our network includes all major modern trade channels, including hypermarkets, supermarkets and convenience stores, as well as traditional, primarily independent local operators. As at 31 December, 2012, we had established exclusive relationships with 200 distributors and over 2,000 dedicated salesmen throughout Vietnam. to support our distributors, we give them geographical exclusivity and work closely with them to ensure the effectiveness of their sales force.
We operate five distribution centers, strategically located in Binh Duong, tan Binh, Da nang, Hung Yen and Hai Duong provinces to provide our distributors with products within 24 hours of an order being placed. these distribution centers collectively handled more than 800,000 pallets in 2012.
ProductionIncluding Vinacafe’s facilities, we currently operate six production facilities at Binh Duong, tan Binh, phu Quoc, Hai Duong, Bien Hoa and long thanh. these world-class facilities allow us to manufacture products with consistently high health and safety standards, and consistent quality of flavor to better serve Vietnamese consumers.
In 2012, we completed the first stage of the Binh Duong facility upgrade and expansion. notably, we have installed three fully automated fish sauce lines with a combined capacity of 25 million liters per month, making it the first automated fish sauce facility in the world. In addition, the facility conforms to GMp and HACCp standards.
For 2013, we plan to complete the renovation process for our instant noodles facility, which will increase production capacity by 60 million packets per month. At the same time, Vinacafe’s new state of the art facility in long thanh is expected to
commence operations in the second quarter of 2013. once in full operation, the fully automated processing lines at the new facility will increase Vinacafe’s instant coffee production capacity by 2.5 times.
New hiresto strengthen our management team, Masan Consumer hired a Chief operating officer who brings over 30 years of integrated supply chain and operations experience to Masan Consumer, and a Chief Marketing officer who has over 17 years of brand management experience across multiple brands and categories for multinational consumer companies. In order to support our beverage strategy, we have also hired a R&D and supply chain director solely dedicated to our beverage division.
please see the Management team section for their experience and backgrounds.
AwardsIn 2012, Masan Consumer received the “Golden Brand” and “Impressive logo and Slogan” awards from the Ministry of Industry and trade. omachi Instant noodles also won the latter award as a brand separately. Chin-su nam ngu fish sauce was awarded “Favorite and trusted Brand” by Intellectual property Magazine.
Masan Consumer’s subsidiary, Vinacafe, was voted in the “top 50 Most effective Companies on Vietnam’s Stock Market in 2012” by nhip Cau Dau tu Magazine and thien Viet Securities, and the “top 10 Strong Brand in 2012” by economic times Magazine.
34 Masan Group
MANAGeMeNt teAM
our senior management team has extensive experience in the consumer products industry and comprehensive understanding of local market tastes, conditions and practices. Masan Consumer achieves this unique balance of local knowledge and industry expertise by recruiting top local talent with backgrounds from leading multinational consumer products organizations.
truong Cong thang President, Chief Executive Officerthang has over 16 years of experience in the fast moving consumer goods industry, including six years at procter & Gamble Vietnam as Marketing Director, where he successfully launched some of the company’s global brands in the Vietnamese market. He graduated from Hanoi national economics university, Vietnam.
jeremy R. ClarkeChief Operating OfficerJeremy has over 30 years of integrated supply chain and operations experience. prior to joining Masan Consumer, he held various senior positions at procter & Gamble (Canada, Malaysia, Singapore and philippines), John Hardy International (Indonesia) and Cadbury/ Kraft Foods (Singapore, thailand). He graduated from the university of Waterloo, Canada.
Deepak GulatiChief Marketing OfficerDeepak has over 17 years of brand management experience across multiple brands and categories. prior to joining Masan Consumer, he held various senior roles at procter & Gamble, nokia and phillip Morris International, across many different countries including India, Japan, Singapore, nigeria, Hong Kong and Indonesia. He graduated from the Indian Institute of Management (IIM), Bangalore, India.
Pham hong SonSenior Vice President, Business DevelopmentSon has over 10 years of production and manufacturing experience at Masan Consumer. He was formerly a lecturer at Hanoi university of technology. He has a doctorate in engineering from Kansai university, Japan.
Pham Dinh toaiVice President, Chief Financial Officertoai had over 20 years of experience in finance before joining Masan Consumer. He was formerly the Finance and Accounting operations Director for unilever Vietnam. He graduated from university of Accounting and Finance and university of technical education, Ho Chi Minh City, Vietnam.
Nguyen tuan VietMarketing Director Viet has 10 years of experience with unilever. He graduated from university of economics, Ho Chi Minh City, Vietnam.
Ngo Van PhuocNational Sales Directorphuoc has over 17 years of experience in retail sales with multinationals like unilever, nestle and Kimberly Clark. He graduated from university of economics, Ho Chi Minh City, Vietnam.
Phan Quang khangNational General Trade DirectorKhang has over 15 years of experience in retail sales with multinational corporations including nestle and unilever. He graduated from Can tho university.
le thi Nga Vice President, R&D Director (Foods)nga has over 20 years of experience in food sciences. She graduated from Moscow technological Institute of Food Industry, Russia.
Annual Report 2012 35
MASAn ConSuMeR
Naveen kumarR&D Director (Beverage)naveen has over 14 years of experience in R&D in food and beverage. prior to joining Masan, he held various senior positions at pepsico and Dabur in India, and Group Danone in Saudi Arabia. He graduated from university of G.B.p.u.A&t, pantnagar and S.G.I.D.t., patna, India.
Vu Quoc tuanIntegrated Supply Chain Director (Foods)tuan has 15 years of experience in production and supply chain management at unilever Vietnam and Malaysia, and Kimberly Clark South Asia. He graduated from polytechnic university in Bratislava, Slovakia and Asia Institute of technology, thailand.
Peter R. BoothIntegrated Supply Chain Director (Beverage)peter has 22 year of experience in supply chain management, including 17 years at Kraft Foods in Canada and the u.S. and five years of experience in Vietnam in the food and beverage industry. He graduated from university of British Columbia, Vancouver, Canada and northwestern university, Chicago, u.S.
Nguyen thi thu haPlanning & Logistics DirectorHa has 14 years of experience in supply chain management at unilever, effem Foods, novatis pharma and procter & Gamble. She graduated from university of economics, Ho Chi Minh City, Vietnam.
PARtNeR
kkRestablished in 1976, Kohlberg Kravis Roberts & Co. (KKR) is a leading global alternative asset manager. KKR sponsors and manages funds that make investments in private equity, fixed income and other assets in north America, europe, Asia and the Middle east. throughout its history, it has brought a long-term investment approach, working in partnership with the management teams of its portfolio companies and investing for future competitiveness and growth. KKR has offices in new York, Menlo park, San Francisco, Houston, Washington D.C, london, paris, Hong Kong, Beijing, tokyo, Seoul, Sydney, Mumbai and Dubai.
house foodsFounded in 1913 and listed on the tokyo and osaka stock exchanges since 1971, House Foods’ products includes curry, seasonings, spices, packaged foods, pre-cooked foods, drinks, snacks and other products. It has offices, manufacturing facilities and research and development centers across Japan, China and taiwan, as well as centers in the u.K. and the u.S.
36 Masan Group
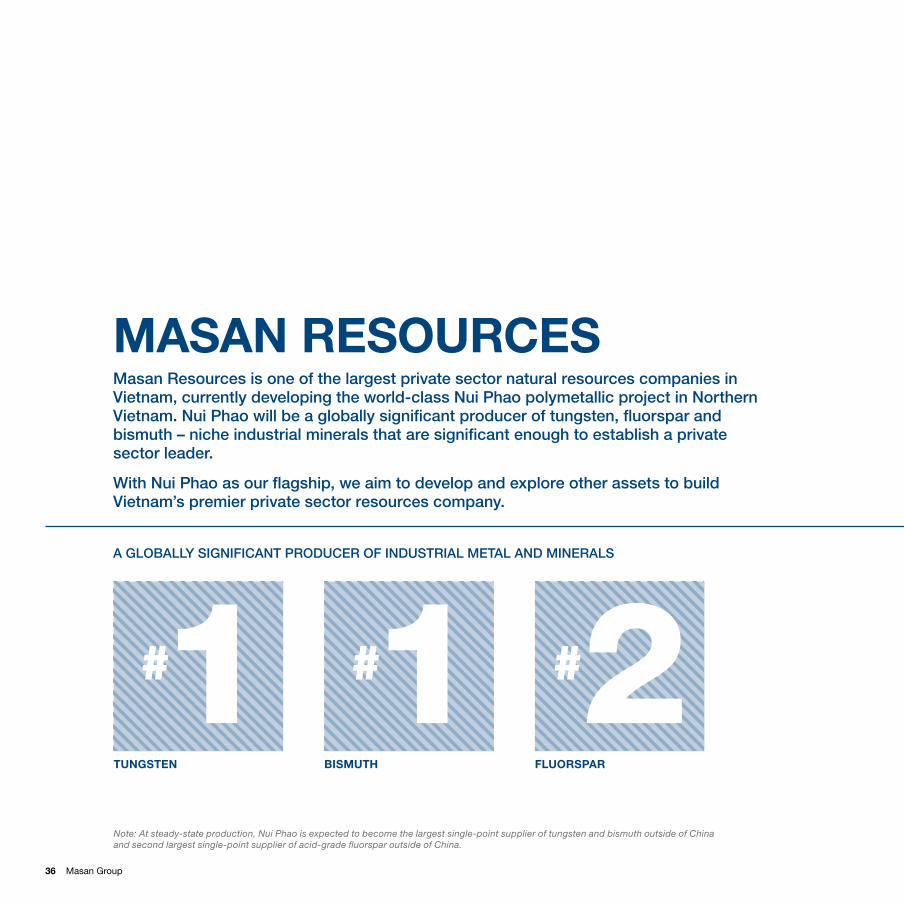
masan resources is one of the largest private sector natural resources companies in Vietnam, currently developing the world-class nui Phao polymetallic project in northern Vietnam. nui Phao will be a globally significant producer of tungsten, fluorspar and bismuth – niche industrial minerals that are significant enough to establish a private sector leader.
With nui Phao as our flagship, we aim to develop and explore other assets to build Vietnam’s premier private sector resources company.
MASAN ReSOURCeS
a gloBally signifiCant ProduCEr of industrial mEtal and minErals
tUNGSteN
11 ## 2#BiSMUth flUORSPAR
Note: At steady-state production, Nui Phao is expected to become the largest single-point supplier of tungsten and bismuth outside of China and second largest single-point supplier of acid-grade fluorspar outside of China.

Annual Report 2012 37
MASAn ReSouRCeS
3rd Party finanCing arrangEd2 status of on-sitEland transfEr ComPlEtion3
numBEr of PEoPlEWorking on thEProjECt1
Jul-10
2%
98%
Dec-12MountKellett
Localfinancing
StandardChartered
Others Total
100
203
80 25 408
Sep-10
200
3,300
Dec-12
1. We have created almost 800 jobs for the people of Thai Nguyen. 2. Financing arranged is in US$ million.3. Land discussed excludes Sector 6, the buffer zone not required until 5 years into the project.
Corporate socialResponsibility ExcellenceAward
ConfErrEd By thE ministry of Planning and inVEstmEnt

38 Masan Group
aBout masan rEsourCEs
Masan Resources is looking to become Vietnam’s private sector resources champion by exploring and developing large-scale resource assets. Vietnam is endowed with significant resources across a variety of metals and minerals. these resources are largely undeveloped and, outside of state ownership, their market is highly fragmented. We believe that with our experienced management team, local access, strong execution capabilities, international partners and capital raising abilities, we have developed the right platform to develop these assets and build Masan Resources into the leading mineral mining company in Vietnam.
our flagship project, nui phao, is on schedule to begin production in the first half of 2013. our current focus is to begin production and sales of our products from the plant and achieve steady state production. once in steady state production, nui phao will be among the world’s largest producers of tungsten, fluorspar and bismuth, providing cash flows for the development of Masan Resources.
STRATEGY
our execution strategy for building our business is focused on three key areas: having local knowledge and understanding to facilitate project execution, using our access to capital and cash flows to acquire and develop quality assets, and de-risking projects through the Masan platform.
We believe that a strong local understanding of community concerns and local sensitivities is critical to developing projects successfully. By proactively working with the local community, Masan has been able to create a favorable business environment to develop the nui phao mine and achieve strong buy-in from various stakeholders, allowing for swift execution onsite.
We aim to put our access to capital and cash flows to use in acquiring and developing assets with high potential. We believe in injecting the required capital not only to complete development of brownfield assets, but also to scale up operations, which helps to optimize productivity over the long term.
We minimize macroeconomic risk by naturally hedging against commodity price fluctuations with Masan Resources’ diversified basket of metals and minerals. our financial risk is low because of our access to Masan Group’s stable capital flows and investor network, while our operational risk is mitigated by our access to Masan Group’s trading partners, customers and professional management expertise.
Achieving global standardsMasan Resources is committed to achieving global standards as we develop and expand our business. We have assembled a team of world-class professionals with extensive international and regional experience who are passionate about building Masan Resources into Vietnam’s resources champion. our partners, including Jacobs engineering Group, Cube Consulting and Golder Associates, are assisting us in achieving this vision.
We care deeply about the impact of our projects on the environment and local communities. thus, our environmental and social action plans are built in accordance with equator principles, the gold standard for social and environmental sustainability for mining projects, to minimize any adverse impacts from our projects and to add value to the communities surrounding our projects. As a result of our efforts and engagement with the local community, we received the 2013 “Corporate Social Responsibility excellence Award” from the Ministry of planning and Investment.
As at the end of 2012, the nui phao project had invested over uS$60 million into the local community affected by the project, towards not only compensation and resettlement, but also various economic restoration activities for the community. to date, we have provided economic restoration to over 3,000 people from the project-affected area, through means such as alternate skills training, employment with nui phao and partnerships with international investors to provide employment opportunities for the people.

Annual Report 2012 39
MASAn ReSouRCeS
40 Masan Group
ViEtnam’s rEsourCEs sECtor
We believe the resources sector is one of the core areas that represent Vietnam’s value. It is an underdeveloped and fragmented sector where a local private sector company can achieve scale and develop market leadership. Vietnam is endowed with significant deposits of a variety of bulk and niche minerals, including bauxite, rare earths, tungsten, titanium, phosphate, coal and iron ore. However, with the exception of coal, the majority of the current mining projects in the country are small in scope, representing an untapped opportunity for development on a larger scale.
the nui phao project fits Masan’s business selection criteria, as it will be a globally significant producer of tungsten, fluorspar and bismuth – niche industrial minerals that are significant enough to establish a private sector leader that can generate cash flows to develop the sector.
foCus arEas driVing our outPErformanCE
Nui Phao’s strategic advantagenui phao represents the ideal platform to build Masan Resources into Vietnam’s leading private-sector resources company.
Unique large-scale assetnui phao is a unique mine with one of the world’s largest deposits of tungsten, fluorspar and bismuth, as well as deposits of copper.
the right commoditiesA distributed revenue base lends the project stability in a volatile environment for commodities. In addition, given the concentration of supply for tungsten, fluorspar and bismuth, and the prospects for copper linked to emerging markets growth, the outlook for prices in these commodities is favorable.
low cost of operationsAs an open-pit mine with a low strip ratio, nui phao will be one of the world’s lowest cost producers of tungsten. the project will produce refined tungsten products, acid-grade fluorspar, bismuth cement and copper concentrate. the products will be separated from the ore using a combination of conventional froth flotation and gravity separation processes.
infrastructure availability the project is spread over an area of 9.21 km2 in the Dai tu District of the thai nguyen province, only 80 km from Hanoi and about 180 km and 240 km from the Hai phong and Quang ninh ports, respectively. Basic infrastructure including roads, rail lines and access to power and water are in place, allowing for a shorter project development timeline.
Mineral reserves and resourcesWorld-class depositnui phao is one of the world’s largest identified tungsten deposits outside China, with 52.5 million tons of ore reserves with average Wo3 (tungsten trioxide) grade of 0.21%. once in production, nui phao will be the largest producer of tungsten outside China and among the largest producers of acid-grade fluorspar and bismuth in the world. the region has additional exploration potential to extend the mining life past the current plan of 16 years.

Annual Report 2012 41
Classification tonnes WO3 % Caf2 % Bi % Cu % Au g/t
Measured 25,450,000 0.27 8.70 0.12 0.26 0.28
Indicated 39,560,000 0.16 8.30 0.06 0.14 0.15
total Measured + indicated 65,010,000 0.20 8.40 0.09 0.19 0.20
Inferred 32,400,000 0.15 6.40 0.07 0.17 0.14
Classification tonnes WO3 % Caf2 % Bi % Cu % Au g/t
proven 25,200,000 0.26 8.31 0.12 0.25 0.27
probable 27,350,000 0.17 7.71 0.08 0.17 0.18
total Proven + Probable 52,540,000 0.21 8.00 0.10 0.21 0.22
NUi PhAO ReSOURCeS1
NUi PhAO ReSeRVeS2
Source: The ore reserves estimate stated above have been compiled under the direction of Cube Consulting Pty Ltd’s Quinton de Klerk, who is qualified for such reporting as defined in the 2004 Edition of the ‘Australasian Code for Reporting of Exploration Results, Mineral Resources and Ore Reserves’ (JORC Code). This ore reserves estimate has been compiled in accordance with the JORC Code.
Source: The mineral resource estimate stated above have been compiled under the direction of Cube Consulting Pty Ltd’s Chris Black, who is qualified for such reporting as defined in the 2004 Edition of the ‘Australasian Code for Reporting of Exploration Results, Mineral Resources and Ore Reserves’ (JORC Code). This mineral resources estimate has been compiled in accordance with the JORC Code.
1. As of September 2011, 0.1% WO3 equivalent cut-off.2. As of November 2011, 0.1% WO3 equivalent cut-off.
MASAn ReSouRCeS
42 Masan Group
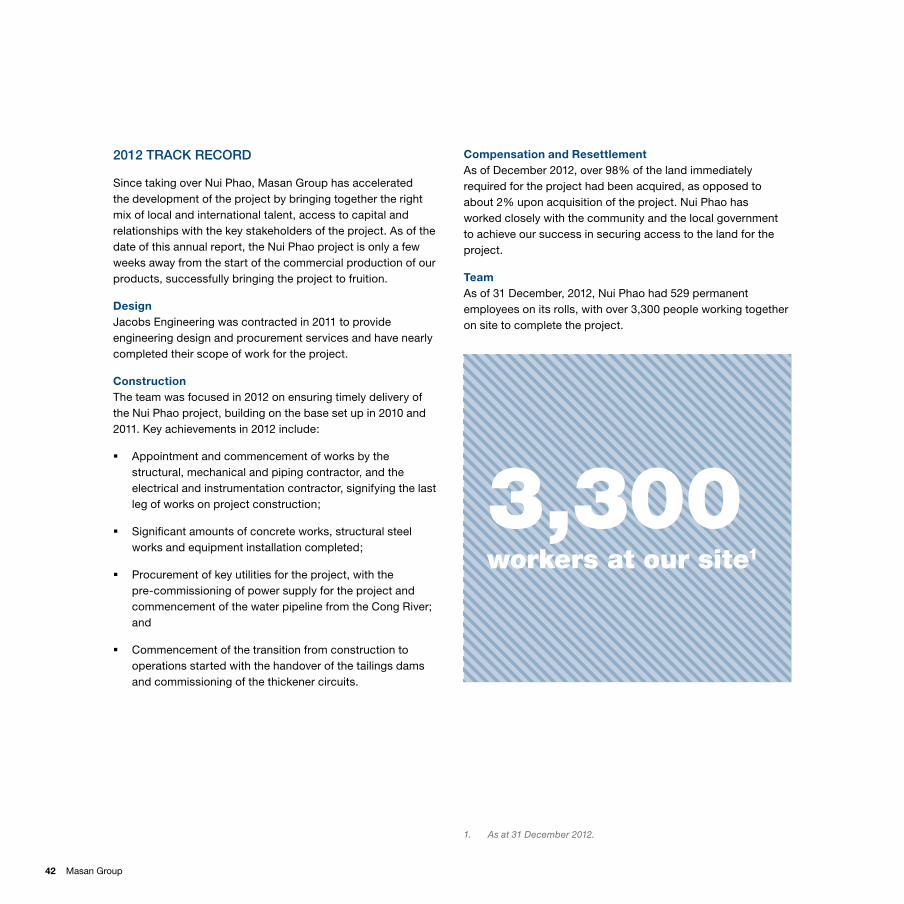
3,300workers at our site1
2012 traCk rECord
Since taking over nui phao, Masan Group has accelerated the development of the project by bringing together the right mix of local and international talent, access to capital and relationships with the key stakeholders of the project. As of the date of this annual report, the nui phao project is only a few weeks away from the start of the commercial production of our products, successfully bringing the project to fruition.
DesignJacobs engineering was contracted in 2011 to provide engineering design and procurement services and have nearly completed their scope of work for the project.
Constructionthe team was focused in 2012 on ensuring timely delivery of the nui phao project, building on the base set up in 2010 and 2011. Key achievements in 2012 include:
� Appointment and commencement of works by the structural, mechanical and piping contractor, and the electrical and instrumentation contractor, signifying the last leg of works on project construction;
� Significant amounts of concrete works, structural steel works and equipment installation completed;
� procurement of key utilities for the project, with the pre-commissioning of power supply for the project and commencement of the water pipeline from the Cong River; and
� Commencement of the transition from construction to operations started with the handover of the tailings dams and commissioning of the thickener circuits.
Compensation and Resettlement As of December 2012, over 98% of the land immediately required for the project had been acquired, as opposed to about 2% upon acquisition of the project. nui phao has worked closely with the community and the local government to achieve our success in securing access to the land for the project.
teamAs of 31 December, 2012, nui phao had 529 permanent employees on its rolls, with over 3,300 people working together on site to complete the project.
1. As at 31 December 2012.

Annual Report 2012 43
financingSoon after the acquisition, Masan Group forged ahead with conversations with potential partners for the nui phao project. Masan Group signed a deal with Mount Kellett, a global private equity firm, for an equity investment of uS$100 million into Masan Resources. Subsequently, Masan Group secured debt financing for the project for approximately uS$200 million.
In addition, in February 2012, we signed an agreement for a two-year, uS$80 million loan from Standard Chartered Bank.
ChallengesMasan Group has been able to achieve success in building the nui phao project with the imminent start of production, but not without overcoming significant challenges along the way.
Given the volatile nature of the financial markets in Vietnam and the region, Masan Group has had to pledge significant amount of its assets outside of the project assets themselves to raise financing for nui phao. this is apart from the guarantees for capital raising and other financial support provided by Masan Group to nui phao to ensure that the project development did not stall at any point. At the same time, project development cost increased significantly from the initial estimate, requiring more capital, even as the prices of the metals and minerals that nui phao will produce went down in 2012.
engineering and building a plant of the complexity and scale and to the standards being implemented by nui phao in Vietnam has itself been challenging. However, the stellar team at nui phao has worked with our local and international contractors and consultants to ensure that the project comes to fruition.
the regulatory landscape has also provided uncertainty. Increases in tax rates, and changes in laws and regulations presented additional challenges which made it more difficult to de-risk the project.
Despite these challenges, Masan Group has forged ahead with the construction of the nui phao project. We believe that this project will be seen as a benchmark for mining projects in Vietnam and will create shareholder value for Masan Group over the long term.
MASAn ReSouRCeS
1. As at 31 December 2012.
44 Masan Group
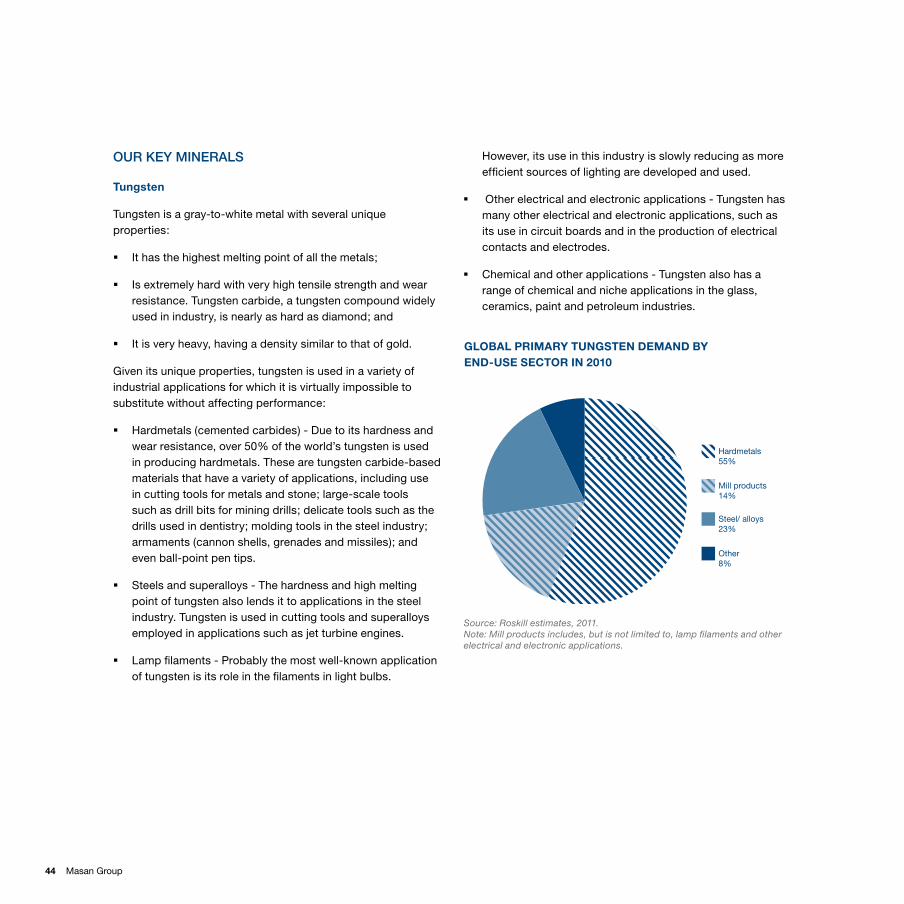
Hardmetals55%
Mill products14%
Steel/ alloys23%
Other8%
Source: Roskill estimates, 2011.Note: Mill products includes, but is not limited to, lamp filaments and other electrical and electronic applications.
GlOBAl PRiMARy tUNGSteN DeMAND By eND-USe SeCtOR iN 2010
our kEy minErals
tungsten
tungsten is a gray-to-white metal with several unique properties:
� It has the highest melting point of all the metals;
� Is extremely hard with very high tensile strength and wear resistance. tungsten carbide, a tungsten compound widely used in industry, is nearly as hard as diamond; and
� It is very heavy, having a density similar to that of gold.
Given its unique properties, tungsten is used in a variety of industrial applications for which it is virtually impossible to substitute without affecting performance:
� Hardmetals (cemented carbides) - Due to its hardness and wear resistance, over 50% of the world’s tungsten is used in producing hardmetals. these are tungsten carbide-based materials that have a variety of applications, including use in cutting tools for metals and stone; large-scale tools such as drill bits for mining drills; delicate tools such as the drills used in dentistry; molding tools in the steel industry; armaments (cannon shells, grenades and missiles); and even ball-point pen tips.
� Steels and superalloys - the hardness and high melting point of tungsten also lends it to applications in the steel industry. tungsten is used in cutting tools and superalloys employed in applications such as jet turbine engines.
� lamp filaments - probably the most well-known application of tungsten is its role in the filaments in light bulbs.
However, its use in this industry is slowly reducing as more efficient sources of lighting are developed and used.
� other electrical and electronic applications - tungsten has many other electrical and electronic applications, such as its use in circuit boards and in the production of electrical contacts and electrodes.
� Chemical and other applications - tungsten also has a range of chemical and niche applications in the glass, ceramics, paint and petroleum industries.
Annual Report 2012 45
MASAn ReSouRCeS
WORlD PRODUCtiON AND ReSeRVeS Of PRiMARy tUNGSteN (iN MetRiC tONS Of tUNGSteN)
100
200
400
300
500
Sep 10 May 11 May 12Jan 12 Sep 12Sep 11 Jan 13Jan 11
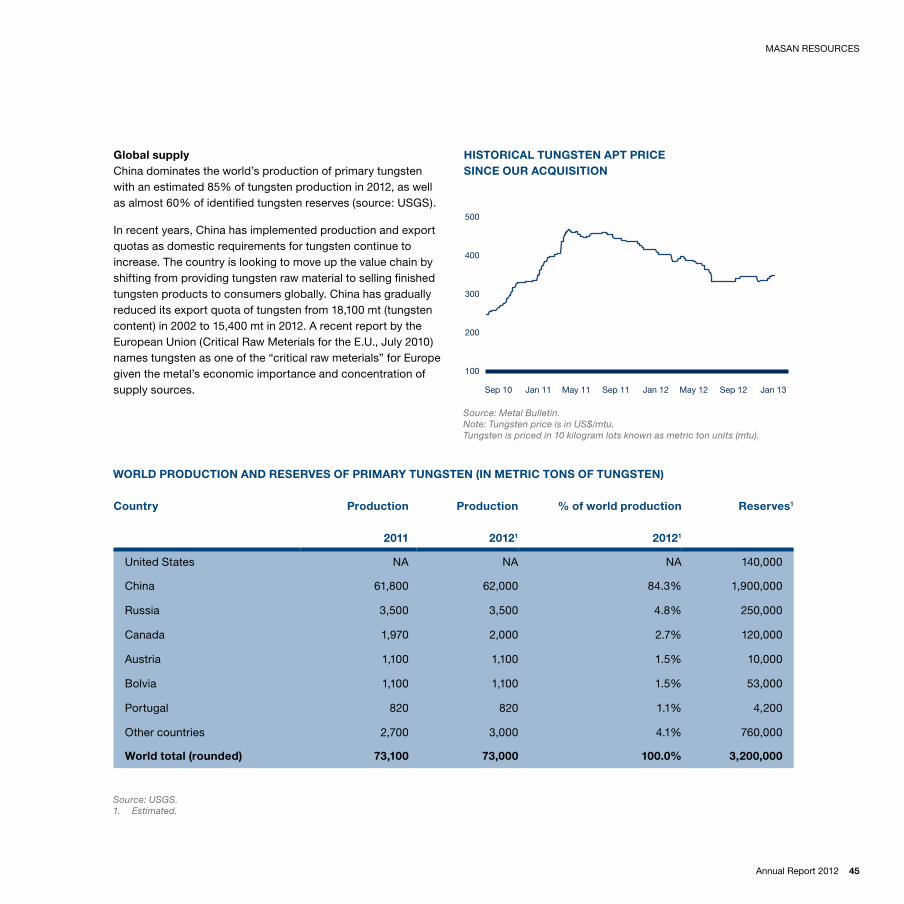
hiStORiCAl tUNGSteN APt PRiCe SiNCe OUR ACQUiSitiON
Global supplyChina dominates the world’s production of primary tungsten with an estimated 85% of tungsten production in 2012, as well as almost 60% of identified tungsten reserves (source: uSGS).
In recent years, China has implemented production and export quotas as domestic requirements for tungsten continue to increase. the country is looking to move up the value chain by shifting from providing tungsten raw material to selling finished tungsten products to consumers globally. China has gradually reduced its export quota of tungsten from 18,100 mt (tungsten content) in 2002 to 15,400 mt in 2012. A recent report by the european union (Critical Raw Meterials for the e.u., July 2010) names tungsten as one of the “critical raw meterials” for europe given the metal’s economic importance and concentration of supply sources.
Country Production Production % of world production Reserves1
2011 20121 20121
united States nA nA nA 140,000
China 61,800 62,000 84.3% 1,900,000
Russia 3,500 3,500 4.8% 250,000
Canada 1,970 2,000 2.7% 120,000
Austria 1,100 1,100 1.5% 10,000
Bolvia 1,100 1,100 1.5% 53,000
portugal 820 820 1.1% 4,200
other countries 2,700 3,000 4.1% 760,000
World total (rounded) 73,100 73,000 100.0% 3,200,000
Source: USGS.1. Estimated.
Source: Metal Bulletin.Note: Tungsten price is in US$/mtu.Tungsten is priced in 10 kilogram lots known as metric ton units (mtu).
46 Masan Group
Global supplyAs per uSGS estimates, China and Mexico together account for over 79% of world fluorspar production in 2012 (expected). Approximately 70-75% of the fluorspar produced around the world is acid grade, with the rest being metallurgical grade. Both China and Mexico produce both grades. World resources of fluorspar are reasonably widely spread, with South Africa and Mongolia also having sizeable reserves.
A recent report by the european union (Critical Raw Materials for the e.u., July 2010) names fluorspar as one of the four “critical raw materials” for europe given the mineral’s economic importance and concentration of supply sources.
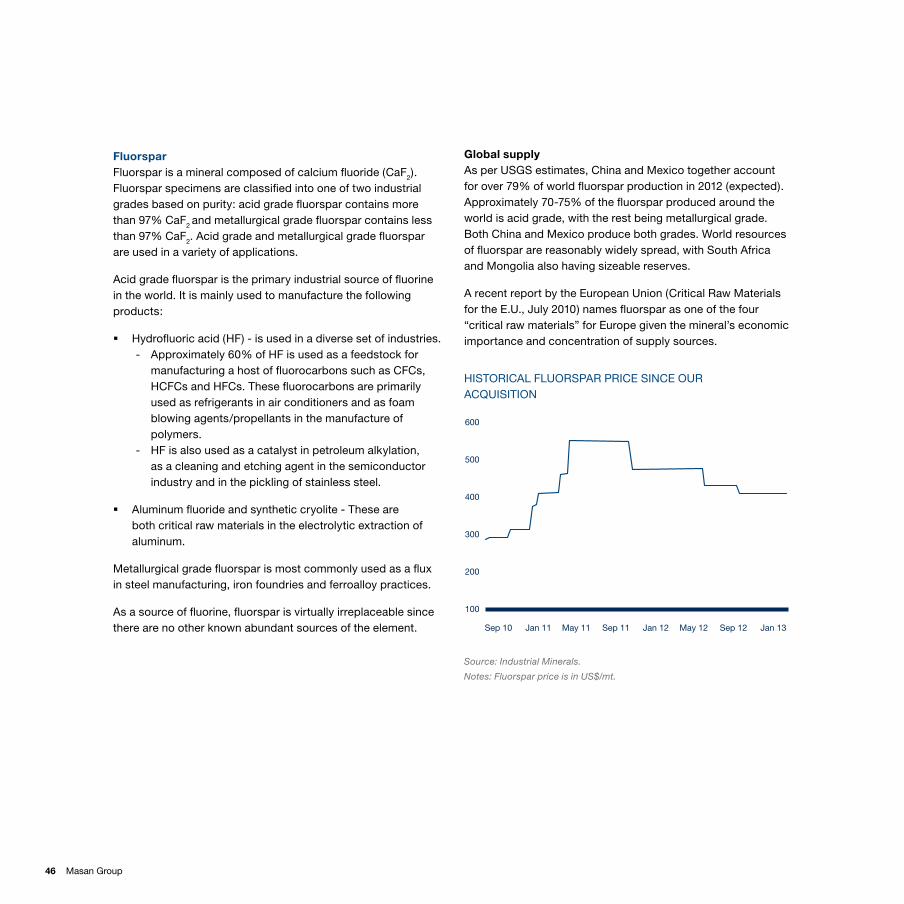
fluorsparFluorspar is a mineral composed of calcium fluoride (CaF2). Fluorspar specimens are classified into one of two industrial grades based on purity: acid grade fluorspar contains more than 97% CaF2
and metallurgical grade fluorspar contains less than 97% CaF2. Acid grade and metallurgical grade fluorspar are used in a variety of applications.
Acid grade fluorspar is the primary industrial source of fluorine in the world. It is mainly used to manufacture the following products:
� Hydrofluoric acid (HF) - is used in a diverse set of industries. - Approximately 60% of HF is used as a feedstock for
manufacturing a host of fluorocarbons such as CFCs, HCFCs and HFCs. these fluorocarbons are primarily used as refrigerants in air conditioners and as foam blowing agents/propellants in the manufacture of polymers.
- HF is also used as a catalyst in petroleum alkylation, as a cleaning and etching agent in the semiconductor industry and in the pickling of stainless steel.
� Aluminum fluoride and synthetic cryolite - these are both critical raw materials in the electrolytic extraction of aluminum.
Metallurgical grade fluorspar is most commonly used as a flux in steel manufacturing, iron foundries and ferroalloy practices.
As a source of fluorine, fluorspar is virtually irreplaceable since there are no other known abundant sources of the element.
Source: Industrial Minerals.
Notes: Fluorspar price is in US$/mt.
100
200
400
300
500
600
Sep 10 May 11 May 12Jan 12 Sep 12Sep 11 Jan 13Jan 11
historical fluorspar price since our acquisition
Annual Report 2012 47
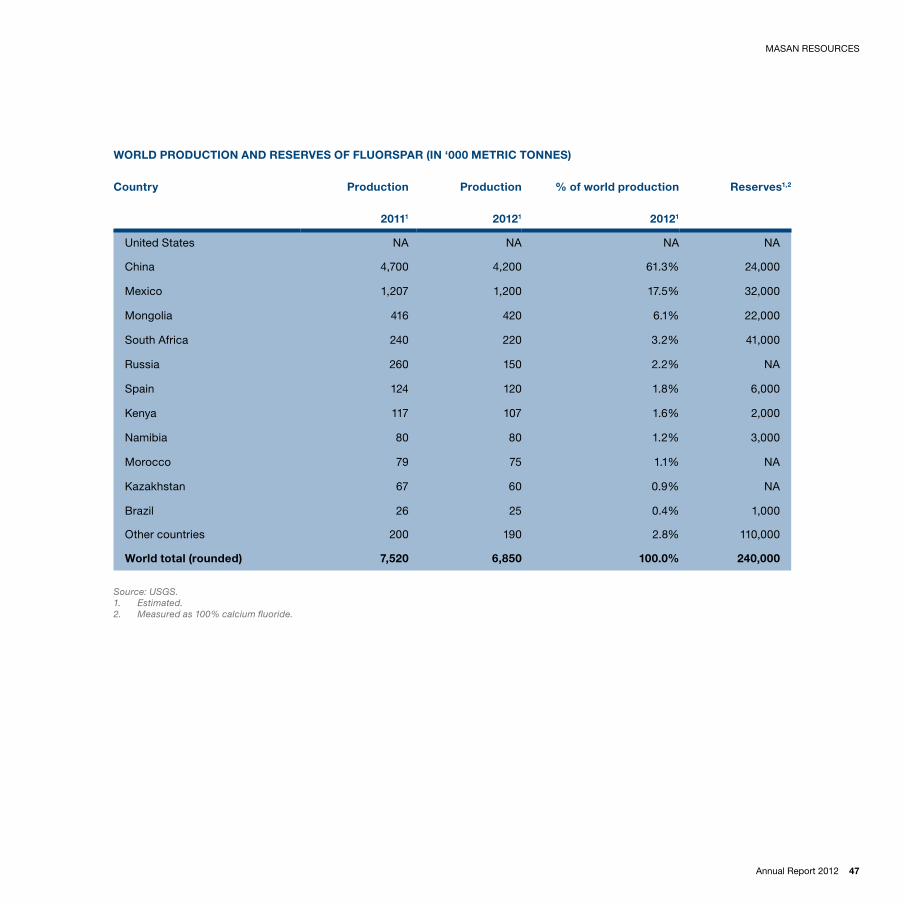
WORlD PRODUCtiON AND ReSeRVeS Of flUORSPAR (iN ‘000 MetRiC tONNeS)
MASAn ReSouRCeS
Country Production Production % of world production Reserves1,2
20111 20121 20121
united States nA nA nA nA
China 4,700 4,200 61.3% 24,000
Mexico 1,207 1,200 17.5% 32,000
Mongolia 416 420 6.1% 22,000
South Africa 240 220 3.2% 41,000
Russia 260 150 2.2% nA
Spain 124 120 1.8% 6,000
Kenya 117 107 1.6% 2,000
namibia 80 80 1.2% 3,000
Morocco 79 75 1.1% nA
Kazakhstan 67 60 0.9% nA
Brazil 26 25 0.4% 1,000
Other countries 200 190 2.8% 110,000
World total (rounded) 7,520 6,850 100.0% 240,000
Source: USGS.1. Estimated.2. Measured as 100% calcium fluoride.
48 Masan Group
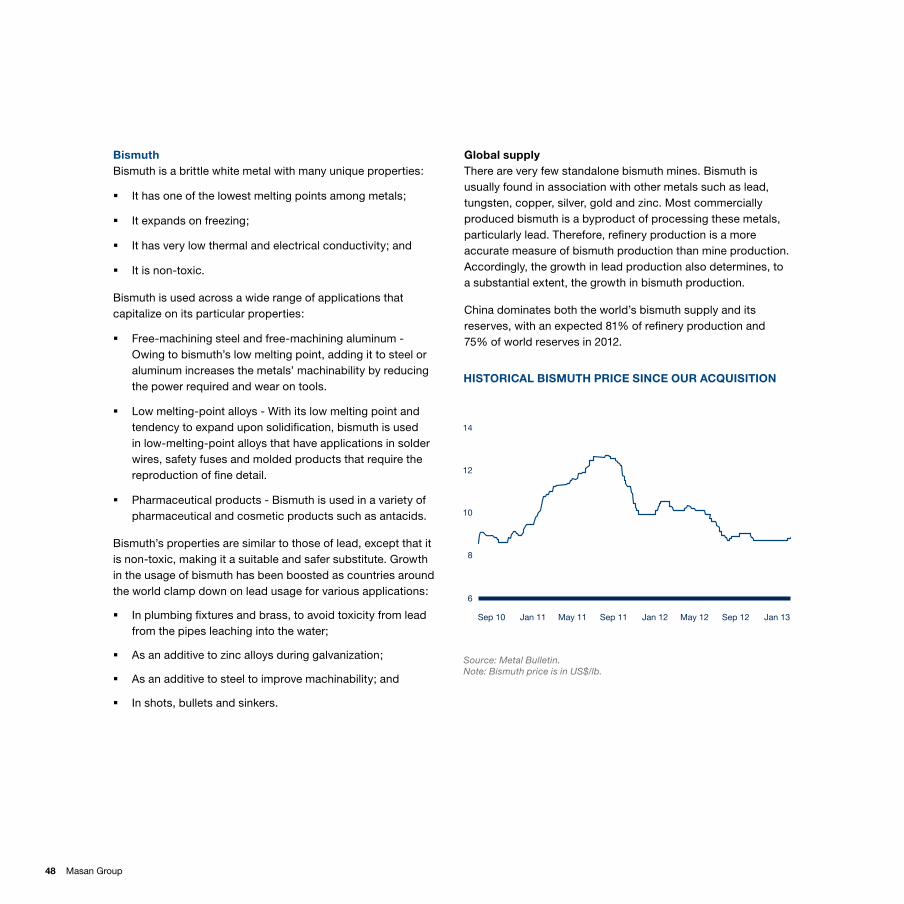
Global supplythere are very few standalone bismuth mines. Bismuth is usually found in association with other metals such as lead, tungsten, copper, silver, gold and zinc. Most commercially produced bismuth is a byproduct of processing these metals, particularly lead. therefore, refinery production is a more accurate measure of bismuth production than mine production. Accordingly, the growth in lead production also determines, to a substantial extent, the growth in bismuth production.
China dominates both the world’s bismuth supply and its reserves, with an expected 81% of refinery production and 75% of world reserves in 2012.
BismuthBismuth is a brittle white metal with many unique properties:
� It has one of the lowest melting points among metals;
� It expands on freezing;
� It has very low thermal and electrical conductivity; and
� It is non-toxic.
Bismuth is used across a wide range of applications that capitalize on its particular properties:
� Free-machining steel and free-machining aluminum - owing to bismuth’s low melting point, adding it to steel or aluminum increases the metals’ machinability by reducing the power required and wear on tools.
� low melting-point alloys - With its low melting point and tendency to expand upon solidification, bismuth is used in low-melting-point alloys that have applications in solder wires, safety fuses and molded products that require the reproduction of fine detail.
� pharmaceutical products - Bismuth is used in a variety of pharmaceutical and cosmetic products such as antacids.
Bismuth’s properties are similar to those of lead, except that it is non-toxic, making it a suitable and safer substitute. Growth in the usage of bismuth has been boosted as countries around the world clamp down on lead usage for various applications:
� In plumbing fixtures and brass, to avoid toxicity from lead from the pipes leaching into the water;
� As an additive to zinc alloys during galvanization;
� As an additive to steel to improve machinability; and
� In shots, bullets and sinkers.
Source: Metal Bulletin.Note: Bismuth price is in US$/lb.
6
10
8
14
12
Sep 10 May 11 May 12Jan 12 Sep 12Sep 11 Jan 13Jan 11
hiStORiCAl BiSMUth PRiCe SiNCe OUR ACQUiSitiON

Annual Report 2012 49
MASAn ReSouRCeS
WORlD RefiNeRy PRODUCtiON AND ReSeRVeS Of BiSMUth (iN MetRiC tONS)
Source: USGS.1. Estimated.
Country Production Production % of world production Reserves1
2011 20121 20121
China 7,000 6,000 81.1% 240,000
Mexico 980 1,000 13.5% 10,000
Bolvia 100 100 1.4% 10,000
Canada 92 100 1.4% 5,000
other countries 130 200 2.7% 50,000
World total (rounded) 8,300 7,400 100.0% 320,000
50 Masan Group
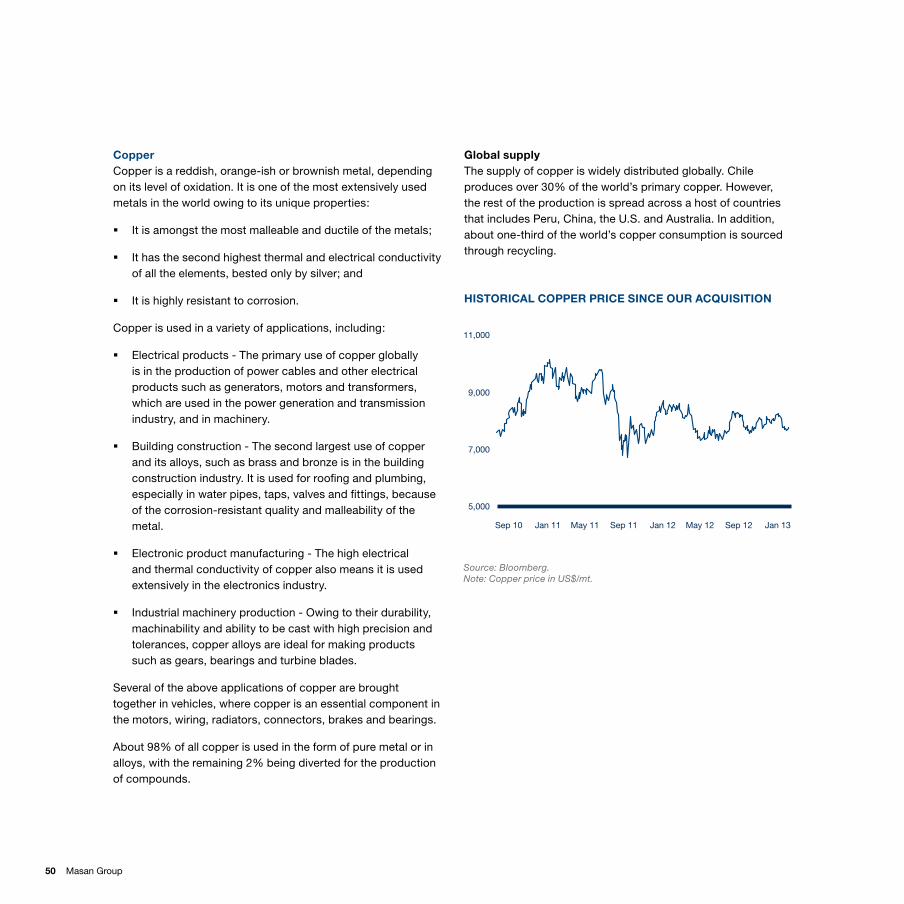
Global supplythe supply of copper is widely distributed globally. Chile produces over 30% of the world’s primary copper. However, the rest of the production is spread across a host of countries that includes peru, China, the u.S. and Australia. In addition, about one-third of the world’s copper consumption is sourced through recycling.
CopperCopper is a reddish, orange-ish or brownish metal, depending on its level of oxidation. It is one of the most extensively used metals in the world owing to its unique properties:
� It is amongst the most malleable and ductile of the metals;
� It has the second highest thermal and electrical conductivity of all the elements, bested only by silver; and
� It is highly resistant to corrosion.
Copper is used in a variety of applications, including:
� electrical products - the primary use of copper globally is in the production of power cables and other electrical products such as generators, motors and transformers, which are used in the power generation and transmission industry, and in machinery.
� Building construction - the second largest use of copper and its alloys, such as brass and bronze is in the building construction industry. It is used for roofing and plumbing, especially in water pipes, taps, valves and fittings, because of the corrosion-resistant quality and malleability of the metal.
� electronic product manufacturing - the high electrical and thermal conductivity of copper also means it is used extensively in the electronics industry.
� Industrial machinery production - owing to their durability, machinability and ability to be cast with high precision and tolerances, copper alloys are ideal for making products such as gears, bearings and turbine blades.
Several of the above applications of copper are brought together in vehicles, where copper is an essential component in the motors, wiring, radiators, connectors, brakes and bearings.
About 98% of all copper is used in the form of pure metal or in alloys, with the remaining 2% being diverted for the production of compounds.
Source: Bloomberg.Note: Copper price in US$/mt.
11,000
9,000
7,000
5,000
Sep 10 May 11 May 12Jan 12 Sep 12Sep 11 Jan 13Jan 11
hiStORiCAl COPPeR PRiCe SiNCe OUR ACQUiSitiON

Annual Report 2012 51
MASAn ReSouRCeS
WORlD MiNe PRODUCtiON AND ReSeRVeS Of COPPeR (iN ‘000 MetRiC tONNeS)
Country Production Production % of world production Reserves1
2011 20121 20121
Chile 5,260 5,370 32.3% 190,000
China 1,310 1,500 9.0% 30,000
peru 1,240 1,240 7.5% 76,000
united States 1,100 1,150 6.9% 39,000
Australia 958 970 5.8% 86,000
Russia 713 720 4.3% 30,000
Zambia 668 675 4.1% 20,000
Congo 520 580 3.5% 20,000
Canada 566 530 3.2% 10,000
Mexico 443 500 3.0% 38,000
Indonesia 543 430 2.6% 28,000
poland 27 430 2.6% 26,000
Kazakhstan 417 420 2.5% 7,000
Other countries 1,970 2,100 12.6% 80,000
World total (rounded) 16,100 17,000 100.0% 680,000
Source: USGS.1. Estimated.

52 Masan Group
managEmEnt tEam
Masan Resources has assembled a world-class team of international mining industry professionals who have extensive experience building and operating projects in the region with international best practices. We have the right team to successfully develop and operate the nui phao project and to develop Masan Resources into Vietnam’s premier private sector resources company.
Dominic heatonChief Executive OfficerDominic Heaton is responsible for developing nui phao, leading exploration activities and building Masan Resources into a large-scale multi-asset resource company.
Since joining Masan Resources, Dominic has assembled a world-class management team to build Masan Resources into Vietnam’s resources champion and has been instrumental in advancing the development of the nui phao mine.
He has over 25 years of mining experience in Southeast Asia at placer pacific, Aurora Gold, oxiana, oZ Minerals and MMG. He has been General Manager of the Sepon mine in laos and General Manager of operations of the Martabe mine in Indonesia.
Dominic graduated from James Cook university and la trobe university in Australia.
Vu hongFirst Deputy General Director/Director of External RelationsHong has over 30 years of experience and has worked with the World Bank, mainly in Southeast Asia on infrastructure and development products. He graduated from Hanoi Water Resources university and the university of Roorkee, India.
Dale SmithConstruction DirectorDale has over 23 years of experience in the mining industry with over 10 years of experience in project development. He was formerly project Director at the Sepon mine in laos. He graduated from university of Queensland, Australia.
Craig BradshawOperations DirectorCraig has close to 20 years of experience in the commercial and administrative verticals of mining. He was formerly Senior Commercial Manager for Sepon mine in laos. He graduated from the university of Southern Queensland, Australia.
Russell GriffinDirector of Sales and MarketingRussell has considerable experience developing markets for new mines and expansions in Australia and Southeast Asia with companies including oZ Minerals. He graduated from the university of South Australia.
Paritosh GuptaChief Financial Officerparitosh has been seconded from Masan Group as CFo for Masan Resources. He was instrumental in the acquisition of nui phao and capital raising from international and local investors for the project. He has also worked closely with the management team on strategic initiatives for the company.
paritosh was formerly with lehman Brothers. He graduated from Indian Institute of Management, Bangalore and Indian Institute of technology, Bombay.
Saurabh Mathur Deputy Chief Financial OfficerSaurabh has over 18 years of finance and accounting experience and was formerly with Schlumberger in India. He graduated from the Institute of Chartered Accountants of India.
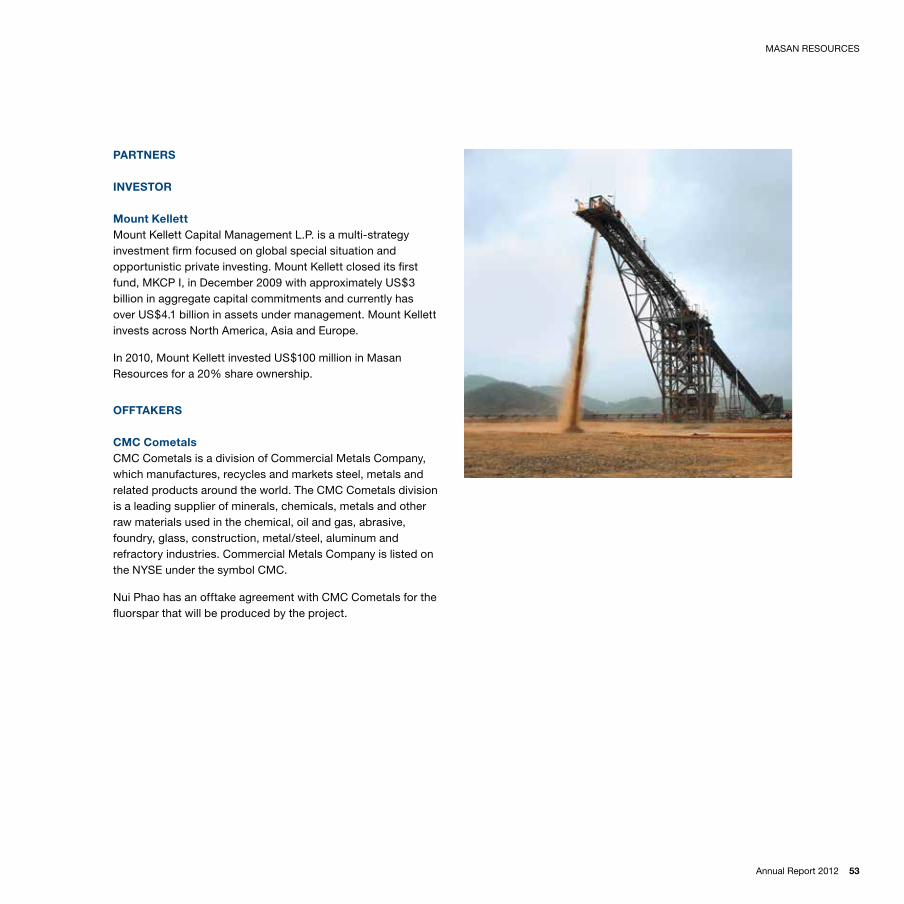
Annual Report 2012 53
PARtNeRS
iNVeStOR
Mount kellettMount Kellett Capital Management l.p. is a multi-strategy investment firm focused on global special situation and opportunistic private investing. Mount Kellett closed its first fund, MKCp I, in December 2009 with approximately uS$3 billion in aggregate capital commitments and currently has over uS$4.1 billion in assets under management. Mount Kellett invests across north America, Asia and europe.
In 2010, Mount Kellett invested uS$100 million in Masan Resources for a 20% share ownership.
OfftAkeRS
CMC Cometals CMC Cometals is a division of Commercial Metals Company, which manufactures, recycles and markets steel, metals and related products around the world. the CMC Cometals division is a leading supplier of minerals, chemicals, metals and other raw materials used in the chemical, oil and gas, abrasive, foundry, glass, construction, metal/steel, aluminum and refractory industries. Commercial Metals Company is listed on the nYSe under the symbol CMC.
nui phao has an offtake agreement with CMC Cometals for the fluorspar that will be produced by the project.
MASAn ReSouRCeS

54 Masan Group

Annual Report 2012 55
OUR ASSOCiAteS
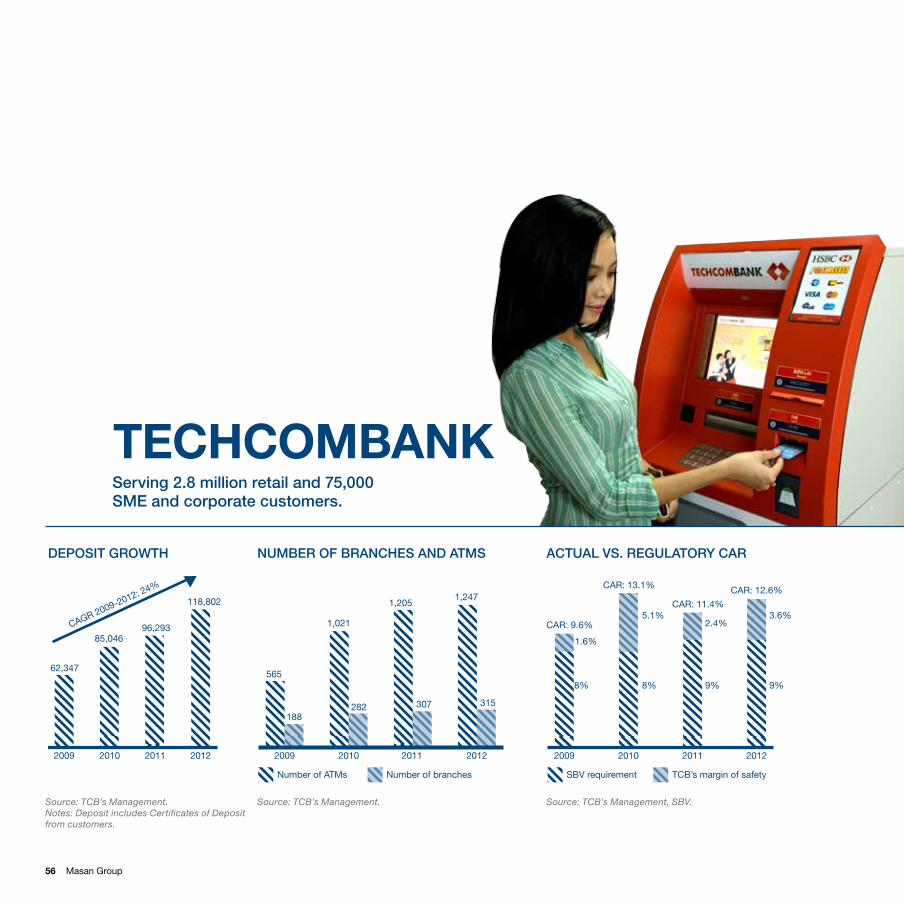
56 Masan Group
serving 2.8 million retail and 75,000 smE and corporate customers.
teChCOMBANk
dEPosit groWth numBEr of BranChEs and atms aCtual Vs. rEgulatory Car
Number of ATMs
2009 2010 2011 2012
565
188
1,021
282
1,205
307
1,247
315
Number of branches SBV requirement
2009 2010 2011 2012
8%
1.6%
8%
5.1%
9%
2.4%
9%
3.6%CAR: 9.6%
CAR: 13.1%
CAR: 11.4%
CAR: 12.6%
TCB’s margin of safety
62,347
85,04696,293
118,802
2009 2010 2011 2012
CAGR 2009-2012: 24%
Source: TCB’s Management.Notes: Deposit includes Certificates of Deposit from customers.
Source: TCB’s Management. Source: TCB’s Management, SBV.
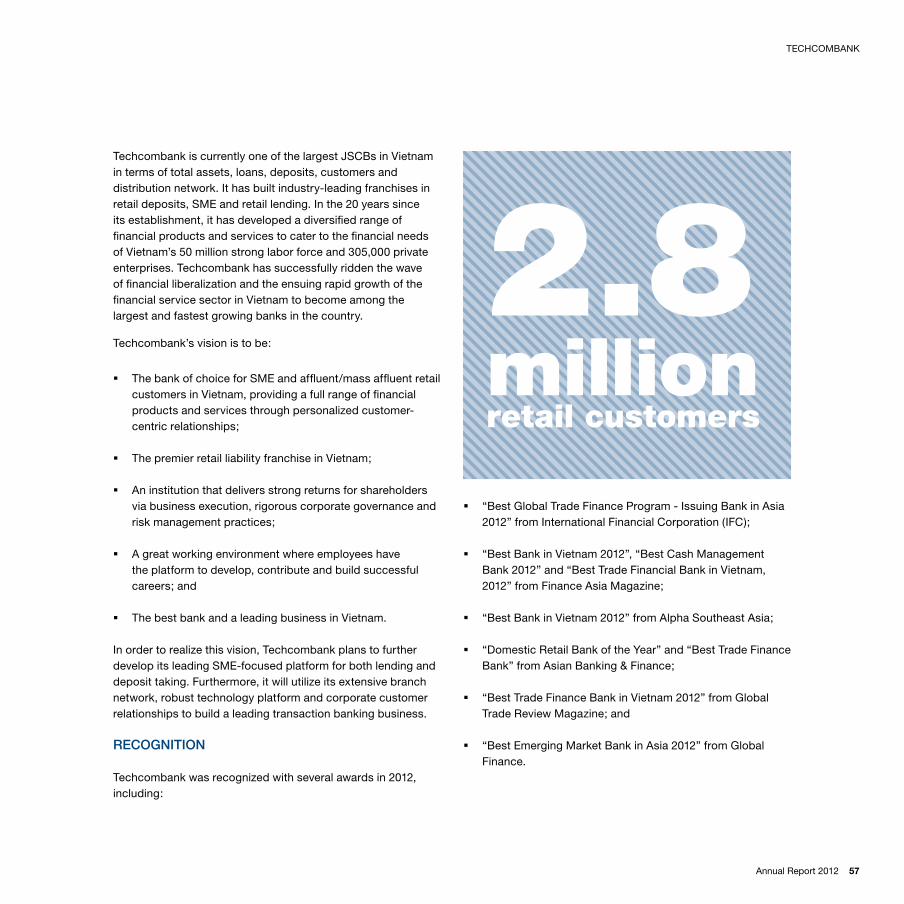
Annual Report 2012 57
techcombank is currently one of the largest JSCBs in Vietnam in terms of total assets, loans, deposits, customers and distribution network. It has built industry-leading franchises in retail deposits, SMe and retail lending. In the 20 years since its establishment, it has developed a diversified range of financial products and services to cater to the financial needs of Vietnam’s 50 million strong labor force and 305,000 private enterprises. techcombank has successfully ridden the wave of financial liberalization and the ensuing rapid growth of the financial service sector in Vietnam to become among the largest and fastest growing banks in the country.
techcombank’s vision is to be:
� the bank of choice for SMe and affluent/mass affluent retail customers in Vietnam, providing a full range of financial products and services through personalized customer-centric relationships;
� the premier retail liability franchise in Vietnam;
� An institution that delivers strong returns for shareholders via business execution, rigorous corporate governance and risk management practices;
� A great working environment where employees have the platform to develop, contribute and build successful careers; and
� the best bank and a leading business in Vietnam.
In order to realize this vision, techcombank plans to further develop its leading SMe-focused platform for both lending and deposit taking. Furthermore, it will utilize its extensive branch network, robust technology platform and corporate customer relationships to build a leading transaction banking business.
rECognition
techcombank was recognized with several awards in 2012, including:
� “Best Global trade Finance program - Issuing Bank in Asia 2012” from International Financial Corporation (IFC);
� “Best Bank in Vietnam 2012”, “Best Cash Management Bank 2012” and “Best trade Financial Bank in Vietnam, 2012” from Finance Asia Magazine;
� “Best Bank in Vietnam 2012” from Alpha Southeast Asia;
� “Domestic Retail Bank of the Year” and “Best trade Finance Bank” from Asian Banking & Finance;
� “Best trade Finance Bank in Vietnam 2012” from Global trade Review Magazine; and
� “Best emerging Market Bank in Asia 2012” from Global Finance.
teCHCoMBAnK
2.8 millionretail customers
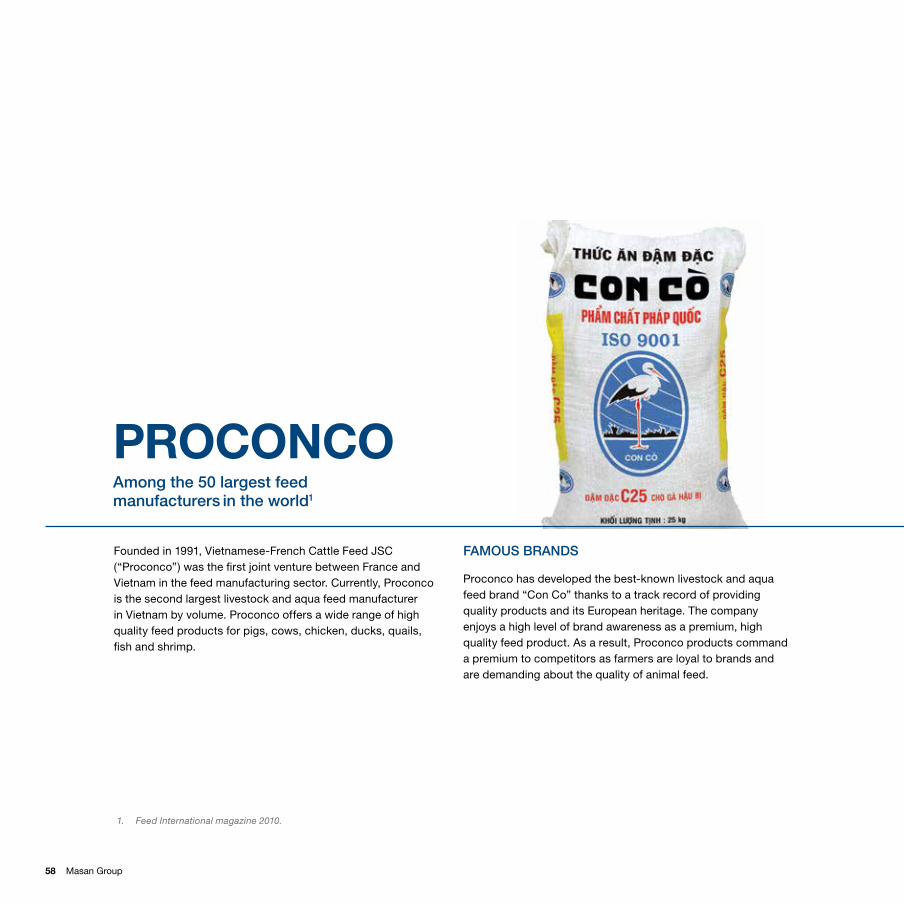
58 Masan Group
among the 50 largest feedmanufacturers in the world1
Founded in 1991, Vietnamese-French Cattle Feed JSC (“proconco”) was the first joint venture between France and Vietnam in the feed manufacturing sector. Currently, proconco is the second largest livestock and aqua feed manufacturer in Vietnam by volume. proconco offers a wide range of high quality feed products for pigs, cows, chicken, ducks, quails, fish and shrimp.
famous Brands
proconco has developed the best-known livestock and aqua feed brand “Con Co” thanks to a track record of providing quality products and its european heritage. the company enjoys a high level of brand awareness as a premium, high quality feed product. As a result, proconco products command a premium to competitors as farmers are loyal to brands and are demanding about the quality of animal feed.
PROCONCO
1. Feed International magazine 2010.

Annual Report 2012 59
pRoConCo
2009
9.8
2007
7.8
2006
6.6
2008
8.9
2010
11.9
2011
13.0
strong distriBution nEtWork and ProduCtion CaPaCity
proconco has built one of the strongest distribution networks in the industry covering all 63 provinces and municipalities with more than 500 distributors and over 50% of them exclusively distributing proconco’s feed. It also has the third highest production capacity producing 1.2 million metric tons of feed per year through six production facilities strategically located across Vietnam.
ConsumPtion story
Masan is currently the largest shareholder in proconco with a 40% stake. the investment is part of our strategy of broadening our consumption-related platform. As consumers in Vietnam become wealthier, they will have a higher protein diet, supporting the domestic animal feed market. It also provides Masan the opportunity to forward integrate and enter the processed meat market and reach the end consumers.
industry groWth
the Vietnam commercial feed market has witnessed a strong growth during the period 2006 to 2011 - a CAGR of approximately 15% on the back of strong meat consumption growth in Vietnam. the current market size is about 13 million metric tons of feed in 2011 and is forecasted to grow at 7 to 9% in volume terms during the period 2012 to 2016, according to Ministry of Agriculture and Rural Development.
CAGR = 15%
#2 feed producer in Vietnam
Source: Bain.

60 Masan Group
Annual Report 2012 61
MANAGeMeNt RePORt

62 Masan Group
oVErViEW
2012 was again a challenging year for Vietnam. While inflation has been brought under control and the trade deficit has narrowed, the country’s economy is still facing headwinds, caused partly by the stabilization measures implemented in 2012 and the need for structural reforms. With the financial sector suffering from illiquidity and rising npls, and the real estate sector stagnating, the overall macro picture has been cloudy. GDp fell to 5.0% in 2012 from 5.9% in 2011.
Within this challenging environment, Masan Group’s belief in the domestic consumption story only grew stronger and we successfully executed further business transformation. In 2012, we continued the build-out of our operational platforms; achieved solid financial results in light of the difficulties confronting the banking sector; raised long-term capital; and successfully executed M&A transactions to increase our stakes in our businesses and broaden our consumption platform.
operationally, we have successfully integrated the operations of Vinacafe, one of Vietnam’s leading instant coffee makers which we acquired a majority stake of in 2011. Masan Consumer grew its distribution network, launched new brands across our different categories and increased production capacity to meet rising demand. Masan Group further delivered on business execution in building out the nui phao mine, where we spent approximately uS$220 million over the course of the year to significantly advance construction and began the last leg of construction works. As a result, we are on track for the commissioning of the project in the first half 2013. Most importantly, we have made key senior hires at Masan Group, Masan Consumer and techcombank, building upon professional management teams that combine MnC pedigree with successful track records in emerging markets.
Financially, our core business delivered record results, while our consolidated earnings declined due to lower contribution from our affiliate company techcombank, in which we have a non-controlling economic interest of 30.4%. Driven by increased market share in our key categories and the successful integration of Vinacafe, our net sales grew from VnD7,057 billion in 2011 to VnD10,389 billion in 2012, representing a 47.2% increase. normalized to remove the impact of goodwill amortization from of our businesses and associates, our pro forma net profit declined slightly from VnD3,090 billion in 2011 to VnD2,783 billion in 2012, representing a 9.9% decrease. the decrease in our pro forma net profit after tax is primarily attributable to techcombank, which experienced a 75.7% drop in earnings from VnD3,154 billion in 2011 to VnD766 billion in 2012 due to lower interest rates, a trying lending environment for the industry as a whole and conservative loan loss provisioning. Despite techcombank’s weaker than expected results, the slight decline in our overall pro forma net profit after tax is a testimony to the strength of our core business. Masan Consumer’s net profit grew by 26.4% to VnD2,850 billion in 2012.
However, techcombank did deliver on some positive results and took aggressive action to build a stronger foundation for its future. Deposits from customers grew strongly by 25.7% in 2012, driven by techcombank’s strong franchise, while loans to customers grew 7.3% in 2012, underpinned by prudent lending policies. techcombank has also taken significant steps to de-risk its balance sheet, improve efficiencies and control costs. the bank continues to maintain strong liquidity and robust capital adequacy, with its loan-to-deposit ratio at 60.2% as at 31 December, 2012 compared to 70.6% as at 31 December, 2011, and CAR at 12.6% as at 31 December, 2012, well in excess of the regulatory requirement of 9.0%. the banking

Annual Report 2012 63
MAnAGeMent RepoRt
sector is going through a consolidation phase and we expect techcombank, with its strong risk management systems and focus on liquidity and balance sheet strength, to outperform over the medium term.
With regards to our balance sheet, we took several steps to begin simplifying our capital structure by either converting or repurchasing many of the equity-linked instruments that were previously issued. this includes converting or repurchasing instruments that were issued to tpG, IFC and mandatory convertible loans issued as consideration for the increasing of our stakes in our existing businesses in the past. the exercise helped offset our financial debt and outstanding share count on a fully diluted basis. We will continue to focus on simplifying our capital structure going forward, including our group structure, to allow our shareholders to more easily understand us.
2012 and the first quarter of 2013 was also a successful period for raising capital, when we raised nearly half a billion dollars from reputable investors and partners, including Mount Kellett, Richard Chandler Corporation and Standard Chartered. Most notably, in January, 2013, KKR, a leading global investment firm with more than uS$66 billion in assets under management, invested uS$200 million in Masan Consumer through a combination of primary and secondary shares. this is in addition to the uS$159 million invested in April 2011. this is the largest ever private equity transaction in Vietnam. With this investment, KKR has doubled its investment in less than two years, demonstrating a strong conviction to Vietnam’s consumption story, Masan Group as its partner of choice in Vietnam and Masan Consumer as a leading Vietnamese consumption platform. the partnership with KKR will enable Masan to broaden and deepen the group’s consumption platform to capture opportunities provided by the structural consumption growth and rising middle class potential of Vietnam.
our M&A activities in 2012 were primarily focused on increasing stakes in our businesses and broadening our consumption platform. We increased our economic interest in Masan Consumer to 80.8% from 76.5% and increased Masan Consumer’s stake of Vinacafe to 53.2% from 50.3% . We also acquired a 40.0% stake in proconco, the second largest animal feed producer in Vietnam by volume, in order to build yet another world-class consumption-related platform. In February 2013, Masan Consumer acquired a 24.9% stake in Vinh Hao, one of Vietnam’s most recognized and trusted brands in the bottled beverage sector. We have subsequently launched a tender offer to further increase our stake in Vinh Hao.
For 2013, we will continue to focus on consumption and consumption-related sectors, while ramping up our production at the nui phao mine. With our leading platforms in the consumer and resources business, we feel confident in consolidating our position as Vietnam’s premier private sector group, applying best practices for build leading businesses, and providing the best products and services to Vietnamese consumers.
Business environmentour operations are focused on Vietnam and our performance and the quality of our assets depend substantially on the Vietnamese economy. the economic environment in Vietnam may be significantly impacted by a variety of external factors, including economic developments throughout Asia.
Macroeconomic factors that may have an impact on performance include personal expenditure and consumption, demand for products and services, inflation levels, interest rates, commodity price levels, debt service burden of consumers or businesses and general availability of credit, as well as factors such as the spread of disease, large-scale acts of war, terrorism or any other adverse social, geographic or political incidents.

64 Masan Group
In 2013, Vietnam’s economy is expected to continue expanding, despite concerns regarding inflation and the banking sector’s npls.
Internationally, there is a risk that the global economic recovery will be weaker than is currently expected. not only would this damage exports, but it would also have a follow-on effect on consumer and business spending in Vietnam, inhibiting economic growth. Vietnam will continue to be vulnerable to movements in international commodity prices. Global fuel prices are expected to remain at a relatively high level throughout the forecast period. Strong demand-side pressure and any depreciation of the Vietnamese Dong against the u.S. Dollar are expected to make it more expensive to import goods, pushing up overall prices for goods and services.
factors affecting our business and results of operationsWe are a holding company whose material assets are the shares of the companies that we hold, primarily Masan Consumer, Masan Resources and our associatecompanies, including proconco and techcombank. thus, risks that affect the businesses of these companies could also affect our business, financial condition, results of operations and prospects.
We have an 80.8% economic interest in Masan Consumer as at 31 December, 2012 and consolidate the company as a subsidiary on our financial statement. events that affect Masan Consumer’s business, financial condition, results of operations and prospects will directly affect our business, financial condition, results of operations and prospects.
We have an 80.0% economic interest in Masan Resources as at 31 December, 2012. of this economic interest, 65.0% is held through shares and we consolidate this percentage
of the company as a subsidiary on our financial statement. the remaining economic interest is held in the form of a call option to purchase 15% of Masan Resources from a minority shareholder and is not recorded on our balance sheet in accordance with Vietnam Accounting Standards (VAS). events that affect Masan Resources’ business, financial condition, results of operations and prospects will directly affect our business, financial condition, results of operations and prospects.
We have a 30.4% of economic interest in techcombank, which includes convertible bonds that are mandatorily convertible and 32.3% of equity interest in proconco as at 31 December, 2012. As we do not own a controlling stake in techcombank and proconco, we account for our investment using the equity accounting method. events that affect techcombank and proconco’s business and financial condition will in turn affect our net profit, impacting our business and financial condition.
Risk factors that may affect our businesses and financial results include regulatory, business, competition and operational risks as well as other factors that may be beyond our control.
Masan Group’s subsidiaries and associates operate in industries that face significant competition and our market-leading positions may be challenged if our competitors make significant strides to capture market share. Masan Consumer competes mainly on the basis of brand image, pricing, distribution network and product mix. the entrance of established foreign brands and companies has heightened the competitiveness of the basic foods market in Vietnam. Competition may cause competitors to significantly increase their advertising expenditures and promotional
Annual Report 2012 65
MAnAGeMent RepoRt
activities or to engage in irrational or predatory pricing behavior. Masan Consumer may be required to make substantially greater investments in research and development, as well as promotions and marketing. Such expenditures may lower our profit margins and thereby adversely affect our results of operations.
It is expected that when Masan Resources commences operations of nui phao project, a substantial portion of our revenues will be derived from exports. the company will compete with global producers of tungsten, fluorspar, bismuth and copper, including producers from China, in the world mineral markets, primarily on the basis of quality, price, transportation cost and reliability of supply. there can be no assurance that nui phao’s competitors will not seek to sell higher-grade minerals, significantly reduce their prices to gain market share, discover more readily accessible mine sites or have a more reliable supply.
techcombank may face tougher competition from both local and foreign financial institutions as a result of Vietnam joining the World trade organization in 2007. the State Bank of Vietnam also allows foreign banks to operate in Vietnam through local branches. As the State Bank of Vietnam continues liberalizing the banking sector, techcombank may also face greater competition from other local banks, which may result in a material adverse effect on our business, financial condition, results of operations and prospects.
We cannot assure you that proconco’s current or potential competitors will not offer products comparable or superior to those we provide or adapt more quickly than we do to evolving industry trends or changing market requirements. our competitors may have greater financial resources, better purchasing economics, or lower cost bases than we do, which could provide a competitive advantage to them. there can
be no assurance that we will be able to compete effectively against current or potential competitors. If we are unable to compete effectively, our business, financial condition, results of operations and prospects could be adversely affected.
Masan Group is dependent on a continued ability to recruit or retain appropriately skilled personnel for its key management positionsAlthough Masan Group is not dependent on any one member of our respective Boards of Directors, Supervisory Boards, Management Boards or senior management teams, our success depends to a significant extent on their skills, capabilities and efforts, as well as our ability to recruit and retain them and other appropriately skilled personnel. Due to intense competition in Vietnam, we face a continuing challenge in recruiting and retaining a sufficient number of skilled professionals. A loss of key personnel may have a material adverse effect on its business, financial condition, results of operations and prospects.
Masan Group’s business outlook is directly tied to the economic prospects of Vietnamour business outlook is directly tied to the economic prospects of Vietnam. thus, if Vietnam should experience an economic recession, this will materially impact us.
the financial results of Masan Resources will be influenced by commodity price movementsonce the nui phao project is operational, it will sell concentrate or value-added products of tungsten, fluorspar, bismuth and copper. the price at which it will sell its output will be dependent on global demand-supply and pricing for these products.

66 Masan Group
CONSOliDAteD iNCOMe StAteMeNt
2012 2011 2012 2011
figures in VND million Audited Audited Pro forma Pro forma
total Revenue 10,575,249 7,239,003 10,575,249 7,239,003
less Sales Deductions (185,835) (182,154) (185,835) (182,154)
Net sales 10,389,414 7,056,849 10,389,414 7,056,849
Cost of Goods Sold (6,178,926) (3,997,834) (6,178,926) (3,997,834)
Gross profit 4,210,488 3,059,015 4,210,488 3,059,015
Selling, General & Administrative expenses (2,052,650) (1,416,523) (1,884,811) (1,388,550)
Financial Income 809,824 1,185,206 809,824 1,185,206
Financial expenses (309,385) (347,725) (309,385) (347,725)
Net Operating Profit 2,658,277 2,479,973 2,826,116 2,507,946
other profit / (expense) 168,043 (4,134) 168,043 (4,134)
Share of profit in an Associate (337,798) 392,733 325,709 960,006
Profit Before tax 2,488,522 2,868,572 3,319,868 3,463,818
Tax (525,930) (372,564) (536,427) (374,314)
Net Profit* 1,962,592 2,496,008 2,783,441 3,089,504
(*) Net profit is before removing minority interest.
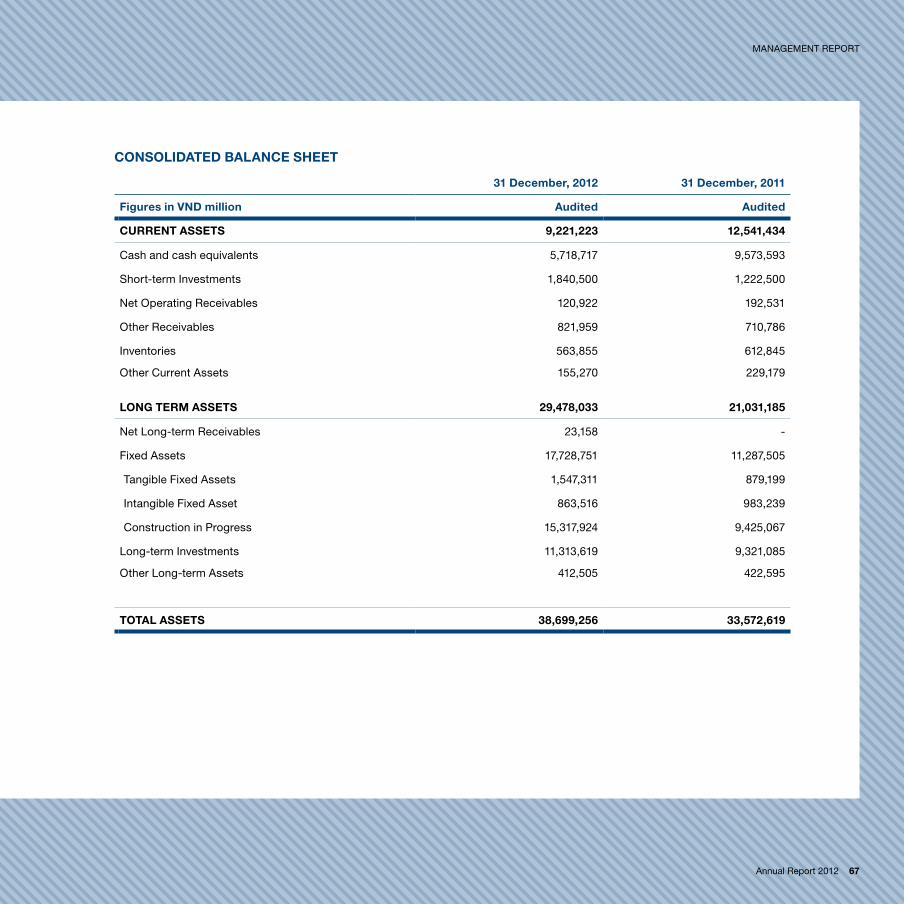
Annual Report 2012 67
MAnAGeMent RepoRt
CONSOliDAteD BAlANCe Sheet
31 December, 2012 31 December, 2011
figures in VND million Audited Audited
CURReNt ASSetS 9,221,223 12,541,434
Cash and cash equivalents 5,718,717 9,573,593
Short-term Investments 1,840,500 1,222,500
net operating Receivables 120,922 192,531
other Receivables 821,959 710,786
Inventories 563,855 612,845
other Current Assets 155,270 229,179
lONG teRM ASSetS 29,478,033 21,031,185
net long-term Receivables 23,158 -
Fixed Assets 17,728,751 11,287,505
tangible Fixed Assets 1,547,311 879,199
Intangible Fixed Asset 863,516 983,239
Construction in progress 15,317,924 9,425,067
long-term Investments 11,313,619 9,321,085
other long-term Assets 412,505 422,595
tOtAl ASSetS 38,699,256 33,572,619

68 Masan Group
31 December, 2012 31 December, 2011
figures in VND million Audited Audited
CURReNt liABilitieS 4,748,364 3,625,783
Short-term Debt 1,793,384 2,032,397
Current Account payables 973,856 422,772
Advance from Customers 14,490 7,994
tax payables 608,893 291,359
payroll payables 12,480 12,618
Accrued expense 1,300,931 824,384
other payables 44,330 34,259
lONG teRM liABilitieS 14,246,507 8,391,804
long-term Debt 12,647,177 7,409,781
other long-term liabilities 1,599,330 982,023
tOtAl liABilitieS 18,994,871 12,017,587
eQUity 13,883,837 15,875,652
Chartered Capital 6,872,801 5,152,723
Capital Surplus 7,999,167 2,166,136
other Capital 1,721,824 10,462,804
Differences in Forex Revaluation (16,128) (16,066)
other Reserves (8,619,479) (6,569,981)
Retained earnings 5,925,652 4,680,036
MiNORity iNteReSt 5,820,548 5,679,380
tOtAl ReSOURCeS 38,699,256 33,572,619
CONSOliDAteD BAlANCe Sheet (Continued)
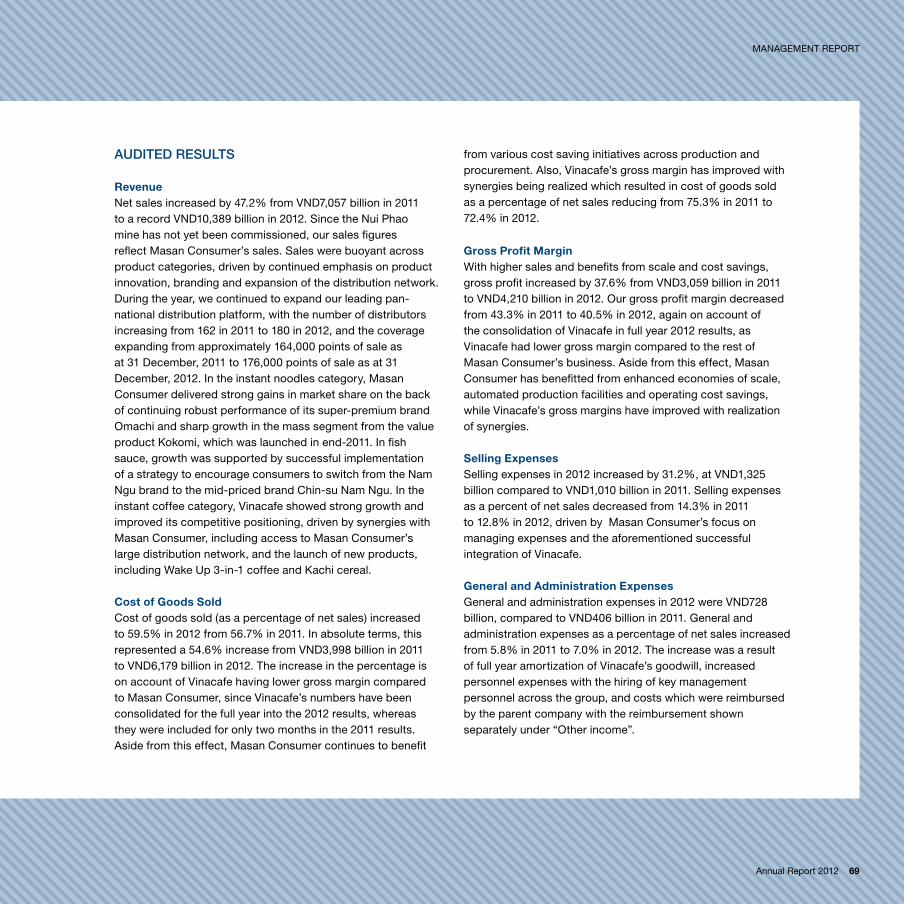
Annual Report 2012 69
MAnAGeMent RepoRt
auditEd rEsults
Revenuenet sales increased by 47.2% from VnD7,057 billion in 2011 to a record VnD10,389 billion in 2012. Since the nui phao mine has not yet been commissioned, our sales figures reflect Masan Consumer’s sales. Sales were buoyant across product categories, driven by continued emphasis on product innovation, branding and expansion of the distribution network. During the year, we continued to expand our leading pan-national distribution platform, with the number of distributors increasing from 162 in 2011 to 180 in 2012, and the coverage expanding from approximately 164,000 points of sale as at 31 December, 2011 to 176,000 points of sale as at 31 December, 2012. In the instant noodles category, Masan Consumer delivered strong gains in market share on the back of continuing robust performance of its super-premium brand omachi and sharp growth in the mass segment from the value product Kokomi, which was launched in end-2011. In fish sauce, growth was supported by successful implementation of a strategy to encourage consumers to switch from the nam ngu brand to the mid-priced brand Chin-su nam ngu. In the instant coffee category, Vinacafe showed strong growth and improved its competitive positioning, driven by synergies with Masan Consumer, including access to Masan Consumer’s large distribution network, and the launch of new products, including Wake up 3-in-1 coffee and Kachi cereal.
Cost of Goods SoldCost of goods sold (as a percentage of net sales) increased to 59.5% in 2012 from 56.7% in 2011. In absolute terms, this represented a 54.6% increase from VnD3,998 billion in 2011 to VnD6,179 billion in 2012. the increase in the percentage is on account of Vinacafe having lower gross margin compared to Masan Consumer, since Vinacafe’s numbers have been consolidated for the full year into the 2012 results, whereas they were included for only two months in the 2011 results. Aside from this effect, Masan Consumer continues to benefit
from various cost saving initiatives across production and procurement. Also, Vinacafe’s gross margin has improved with synergies being realized which resulted in cost of goods sold as a percentage of net sales reducing from 75.3% in 2011 to 72.4% in 2012.
Gross Profit MarginWith higher sales and benefits from scale and cost savings, gross profit increased by 37.6% from VnD3,059 billion in 2011 to VnD4,210 billion in 2012. our gross profit margin decreased from 43.3% in 2011 to 40.5% in 2012, again on account of the consolidation of Vinacafe in full year 2012 results, as Vinacafe had lower gross margin compared to the rest of Masan Consumer’s business. Aside from this effect, Masan Consumer has benefitted from enhanced economies of scale, automated production facilities and operating cost savings, while Vinacafe’s gross margins have improved with realization of synergies.
Selling expensesSelling expenses in 2012 increased by 31.2%, at VnD1,325 billion compared to VnD1,010 billion in 2011. Selling expenses as a percent of net sales decreased from 14.3% in 2011 to 12.8% in 2012, driven by Masan Consumer’s focus on managing expenses and the aforementioned successful integration of Vinacafe.
General and Administration expensesGeneral and administration expenses in 2012 were VnD728 billion, compared to VnD406 billion in 2011. General and administration expenses as a percentage of net sales increased from 5.8% in 2011 to 7.0% in 2012. the increase was a result of full year amortization of Vinacafe’s goodwill, increased personnel expenses with the hiring of key management personnel across the group, and costs which were reimbursed by the parent company with the reimbursement shown separately under “other income”.
70 Masan Group
pro forma G&A which is adjusted for Vinacafe goodwill amortization remained stable at 5.4% of sales (for details, please see the section on “Discussion on Audited vs pro Forma Results” below).
financial incomeFinancial income decreased by 31.7% to VnD810 billion in 2012 from VnD1,185 billion in 2011. the decrease was primarily due to the decrease in net interest income due to lower interest rates and our lower cash balance. the lower cash balance was on account of funds outflow for business-building initiatives, as detailed in the section on “Cash and Cash equivalents” below.
financial expensesFinancial expenses decreased by 11.0% to VnD309 billion in 2012 from VnD348 billion in 2011, driven mainly by a decrease in interest paid to bondholders.
Other incomeother income increased to VnD215 billion in 2012 from VnD22 billion in 2011. the increase was primarily due to income from reimbursement of the parent company for shared costs such as office rent and other administrative expenses.
Share of Profit in AssociatesShare of profit in associates includes Masan Group’s share of techcombank and proconco’s profit proportionate to its equity interest. Share of profit in associates amounted to negative VnD338 billion in 2012 versus a positive VnD393 billion in 2011. the decrease was primarily due to the increasing amortization of goodwill due to acquisition of an effective 40.0% interest by Masan Consumer in our new associate proconco, and the amortization of goodwill of techcombank which together amounted to VnD664 billion in 2012 and lower profits from techcombank, which delivered a 75.7% decrease in net income to VnD766 billion in 2012 on account of the difficult operating environment and conservative loan loss provisioning.
Net Profit After taxIn 2012, our core business performed well, as reflected by resulting in our eBIt growth of 31.4% to VnD2,158 billion from VnD1,642 billion in 2011. on account of lower net profit of our associate techcombank, our net profit after tax was VnD1,963 billion in 2012, a decrease of 21.4% from VnD2,496 billion in 2011. normalized to remove the impact of goodwill amortization of our businesses and associates, our pro forma net profit declined slightly from VnD3,090 billion in 2011 to VnD2,783 billion in 2012, a 9.9% decrease. For details on our normalized, pro forma results, please see the “Discussion on audited vs. pro forma results” section further below.
Cash and Cash equivalentsMasan Group had a strong consolidated cash position (include short-term investments) of VnD7,559 billion as at 31 December, 2012, compared to VnD10,796 billion as at 31 December, 2011, a decrease of 30.0%. the cash position also does not reflect the additional cash raised from KKR at Masan Consumer, which occurred in January 2013. the decrease is a result of funds outflow for business-building initiatives, including the acquisition of a 40.0% stake in proconco for a total of VnD1,967 billion, increasing our stake in Masan Consumer for VnD1,933 billion, and capital expenditures at our subsidiaries, especially for development and construction of the nui phao project at Masan Resources.
During 2012, Masan Group raised approximately uS$130 million from R.F. Chandler and Mount Kellett and VnD2,200 million in bonds, while Masan Resources raised uS$80 million through a loan arranged by Standard Chartered. Masan Group believes in having adequate liquidity in a capital constrained market. our strong cash position provides greater flexibility, can be used to fund capital expenditure requirements, is a buffer for unforeseen events, and allows us to invest to support growth.
Annual Report 2012 71
fixed AssetsAs at 31 December, 2012, fixed assets amounted to VnD17,729 billion, increasing by 57.1% from VnD11,288 billion as at 31 December, 2011. the increase was mainly due to capital expenditure for the nui phao project, as well as investments in the expansion of Masan Consumer’s automated fish sauce facility, a new office building for Masan Consumer and a new facility for Vinacafe.
investments in Subsidiaries and Associatesinvestments in SubsidiariesIn December 2012, Masan Group increased its stake in Masan Consumer for a total consideration of VnD1,933 billion, corresponding to a 80.8% stake. Subsequently, KKR invested in Masan Consumer in January 2013, which diluted our ownership in Masan Consumer to 77.7%.
investments in AssociatesInvestments in associates represent 30.4% effective economic interest in techcombank and 32.3% effective economic interest in proconco as at 31 December, 2012.
In october 2012, a wholly owned subsidiary of Masan Consumer acquired a 40.0% stake in proconco for a total cash consideration of approximately VnD1,967 billion. Such acquisition resulted in Masan Group having 32.3% effective economic interest in proconco.
total Assetstotal assets increased by 15.3% from VnD33,573 billion as at 31 December, 2011 to VnD38,699 billion as at 31 December, 2012, on account of capital expenditure (especially on the nui phao project and on Masan Consumer’s expanded facilities) and increased investments in subsidiary and associates (with the acquisition of the stake in proconco).
BorrowingsAs at 31 December, 2012, short-term and long-term borrowings increased by 52.9% to VnD14,441 billion, representing 37.3% of total resources. Much of the increase in borrowings came from long-term borrowings, including VnD2,200 billion from bonds issued at Masan Group and long-term borrowings at our subsidiaries, including Masan Consumer and Masan Resources which raised uS$80 million through Standard Chartered. As mentioned earlier, Masan Group believes in having adequate liquidity in a capital constrained market. our strong cash position provides greater flexibility, can be used to fund capital expenditure requirements, is a buffer for unforeseen events, and allows us to invest to support growth. therefore, the Group had cash and cash equivalents of VnD7,559 billion as at December 31, 2012, not including the cash raised from KKR in January 2013.
excluding promissory notes, our short-term and long-term borrowings amounted to VnD11,585 billion. the promissory notes of VnD2,856 billion were issued to the vendor at the time of acquisition of the stake in the nui phao project, and will be extinguished in the event the options to purchase primary shares in Masan Group are exercised with payment in the form of said promissory notes in lieu of cash. the options were given as part of the nui phao acquisition and were “in the money” as at 31 December, 2012. We had the right to force convert the said options as at 31 December, 2012 based on the terms of the options.
Owners’ equityowners’ equity as at 31 December, 2012 was VnD13,884 billion, as compared to VnD15,876 billion as at 31 December, 2011, representing a decrease of 12.5% year over year. the decrease in owner’s equity was mainly derived from (i) decrease in other capital on account of the repurchase of equity instruments and (ii) the acquisition of an additional 4.6% economic interest in Masan Consumer during the year (with the difference between cost of acquisition and net assets acquired being recorded as a reduction in other reserves).
MAnAGeMent RepoRt

72 Masan Group
disCussion on auditEd Vs. Pro formarEsults
pro forma numbers are unaudited numbers that are derived from our audited results with adjustments made to reflect normalized earnings. these adjustments include (a) adding back the amortization of goodwill from the transfer of ownership in techcombank for the year ended 31 December 2012 and 2011, assuming Masan Group held a 30.4% interest in techcombank from 1 January, 2011; (b) adding back the amortization of goodwill, tangible assets and intangible assets from the acquisition of Vinacafe Bien Hoa JSC for the year ended 31 December, 2012 and 2011; and (c) adding back the amortization of goodwill from the acquisition of proconco for the year ended 31 December, 2012.
Pro forma finanCial rEsults
General and Administration expenses (G&A)pro forma general and administration expenses have been computed after adding back the amortization of goodwill, tangible assets and intangible assets from the acquisition of Vinacafe. pro forma G&A in 2012 was VnD560 billion compared to VnD378 billion in 2011. pro forma G&A as a percentage of net sales remained stable at 5.4% in 2012.
Share of Profit in Associatespro forma share of profit in associates have been computed after adding back the amortization of goodwill from the transfer of ownership in techcombank, assuming Masan Group held a 30.4% interest in techcombank from 1 January 2011, and adding back the amortization of goodwill from the acquisition of proconco for the year ended 2012. pro forma share of associate’s results decreased by 66.1% to VnD326 billion in 2012, on account of lower profits from techcombank in 2012.
Net Profit After taxpro forma net profit after tax was VnD2,783 billion in 2012, representing a 9.9% decrease from VnD3,090 billion in 2011. However, our core consumer business showed strong performance and represented a 26.4% growth in net profit. this decrease was mainly on account of techcombank’s lower net profit in 2012.
Annual Report 2012 73
MAnAGeMent RepoRt

74 Masan Group

Annual Report 2012 75
fiNANCiAl RePORt

76 Masan Group
the Financial Report was reviewed by our auditor, KpMG. In this section, “Board of Management” refers to our Board of Directors.this section was prepared in British english, while other sections were prepared using American english.

Annual Report 2012 77
FINANCIAL reportCORPORAte iNfORMAtiON
Business Registration Certificate No 0303576603 20 July 2012
The Company’s Business Registration Certificate has been amended several times, the most recent of which is dated 20 July 2012. The Certificate and its amendments were issued by the Department of Planning and Investment of Ho Chi Minh City. The initial Business Registration Certificate No. 4103002877 was dated 18 November 2004.
Board of Management Dr Nguyen Dang Quang ChairmanMr Ho Hung Anh Vice chairmanMr Madhur Maini Member Ms Nguyen Hoang Yen Member Mr Nguyen Thieu Nam Member Mr Lars Kjaer Member
Registered Office Suite 802, Central Plaza 17 Le Duan StreetBen Nghe Ward, District 1Ho Chi Minh CityVietnam
Auditors KPMG LimitedVietnam

78 Masan Group
StAteMeNt Of the BOARD Of MANAGeMeNt’S ReSPONSiBility iN ReSPeCt Of the fiNANCiAl StAteMeNtS
the Board of Management is responsible for preparing the financial statements of Ma San Group Corporation (“the Company”) and its subsidiaries (collectively “the Group”) as at and for the year ended 31 December 2012 in accordance with Vietnamese Accounting Standards, the Vietnamese Accounting System and the relevant statutory requirements. In preparing those financial statements, the Board of Management is required to:
� select suitable accounting policies and then apply them consistently;
� make judgments and estimates that are reasonable and prudent;
� state whether applicable accounting standards have been followed, subject to any material departures disclosed and explained in the financial statements; and
� prepare the financial statements on the going concern basis unless it is inappropriate to presume that the Company or the Group will continue in business.
the Board of Management is also responsible for ensuring that proper accounting records are kept which disclose, with reasonable accuracy at any time, the financial position of the Company and the Group to ensure that the accounting records comply with the requirements of Vietnamese Accounting Standards, the Vietnamese Accounting System and the relevant statutory requirements. It is also responsible for safeguarding the assets of the Company and the Group and hence for taking reasonable steps for the prevention and detection of fraud and other irregularities.
the Board of Management confirm that they have complied with the above requirements in preparing these financial statements.
APPROVAl Of the fiNANCiAl StAteMeNtS
I, Nguyen Dang Quang, being the Chairman of the Board of Management and on behalf of the Board of Management, do hereby approve the accompanying financial statements of the Company and the Group as of and for the year ended 31 December 2012 prepared in accordance with Vietnamese Accounting Standards, the Vietnamese Accounting System and the relevant statutory requirements.On behalf of the Board of Management
Nguyen Dang Quang
ChairmanHo Chi Minh City, Vietnam
29 March 2013

Annual Report 2012 79
FINANCIAL report
tO the ShARehOlDeRSMA SAN GROUP CORPORAtiON ScopeWe have audited the accompanying financial statements of Ma San Group Corporation (“the Company”) and its subsidiaries (collectively “the Group”) which comprise the separate and consolidated balance sheets as of 31 December 2012 and the related separate and consolidated statements of income and cash flows for the year then ended and the explanatory notes thereto which were authorised for issue by the Company’s management on 29 March 2013, as set out on pages 4 to 82. these financial statements are the responsibility of the Company’s management. our responsibility is to express an opinion on these financial statements based on our audit.
We conducted our audit in accordance with Vietnamese Standards on Auditing. those standards require that we plan and perform the audit to obtain reasonable assurance that the financial statements are free of material misstatement. An audit includes examining, on a test basis, evidence supporting the amounts and disclosures in the financial statements. An audit also includes assessing the accounting principles used and significant estimates made by management, as well as evaluating the overall financial statement presentation. We believe that our audit provides a reasonable basis for our opinion.
Audit opinionIn our opinion, the separate and consolidated financial statements give a true and fair view of the financial positions of the Company and the Group, respectively, as of 31 December 2012 and the results of their operations and their cash flows for the year then ended in accordance with Vietnamese Accounting Standards, the Vietnamese Accounting System and the relevant statutory requirements.
kPMG limitedVietnamInvestment Certificate No: 011043000345Audit Report No: 12-01-809
__________________________________ ________________________________Chang Hung Chun Tran Dinh VinhCPA No. N.0863/KTV CPA No. 0339/KTVDeputy General Director
Ho Chi Minh City, 29 March 2013
iNDePeNDeNt AUDitORS’ RePORt

80 Masan Group
Code Note Group Company
31/12/2012 31/12/2011 31/12/2012 31/12/2011
VND million VND million VND million VND million
ASSetS
Current assets(100 = 110 + 120 + 130 + 140 + 150) 100 9,221,223 12,541,434 2,643,573 2,291,494
Cash and cash equivalents 110 6 5,718,717 9,573,593 2,160,026 1,510,736
Cash 111 151,205 175,717 9,484 23,284
Cash equivalents 112 5,567,512 9,397,876 2,150,542 1,487,452
Short-term investments 120 12 1,840,500 1,222,500 68,000 373,000
Accounts receivable 130 7 942,881 903,317 376,179 387,496
Accounts receivable - trade 131 121,300 193,615 - -
Prepayments to suppliers 132 475,436 363,633 117,773 57,977
Other receivables 135 346,523 347,153 258,406 329,519
Allowance for doubtful debts 139 (378) (1,084) - -
inventories 140 8 563,855 612,845 - -
Inventories 141 575,846 625,746 - -
Allowance for inventories 149 (11,991) (12,901) - -
Other current assets 150 155,270 229,179 39,368 20,262
Short-term prepayments 151 27,492 129,695 496 1,391
Deductible value added tax 152 105,858 55,418 30,243 17,739
Taxes and other receivables from State Treasury
154 - 103 - -
Other current assets 158 21,920 43,963 8,629 1,132
BAlANCe SheetS
At 31 December 2012 Form B 01 - Dn
The accompanying notes are an integral part of these financial statements
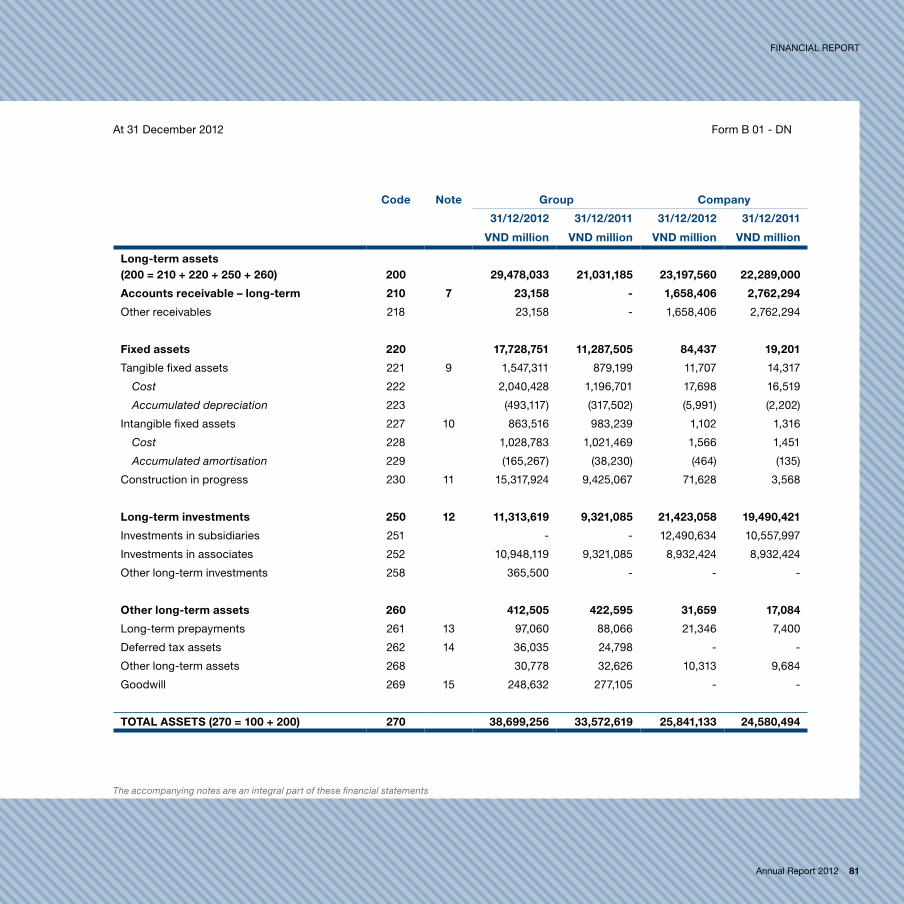
Annual Report 2012 81
FINANCIAL report
At 31 December 2012 Form B 01 - Dn
Code Note Group Company
31/12/2012 31/12/2011 31/12/2012 31/12/2011
VND million VND million VND million VND million
long-term assets(200 = 210 + 220 + 250 + 260) 200 29,478,033 21,031,185 23,197,560 22,289,000
Accounts receivable – long-term 210 7 23,158 - 1,658,406 2,762,294
Other receivables 218 23,158 - 1,658,406 2,762,294
fixed assets 220 17,728,751 11,287,505 84,437 19,201
Tangible fixed assets 221 9 1,547,311 879,199 11,707 14,317
Cost 222 2,040,428 1,196,701 17,698 16,519
Accumulated depreciation 223 (493,117) (317,502) (5,991) (2,202)
Intangible fixed assets 227 10 863,516 983,239 1,102 1,316
Cost 228 1,028,783 1,021,469 1,566 1,451
Accumulated amortisation 229 (165,267) (38,230) (464) (135)
Construction in progress 230 11 15,317,924 9,425,067 71,628 3,568
long-term investments 250 12 11,313,619 9,321,085 21,423,058 19,490,421
Investments in subsidiaries 251 - - 12,490,634 10,557,997
Investments in associates 252 10,948,119 9,321,085 8,932,424 8,932,424
Other long-term investments 258 365,500 - - -
Other long-term assets 260 412,505 422,595 31,659 17,084
Long-term prepayments 261 13 97,060 88,066 21,346 7,400
Deferred tax assets 262 14 36,035 24,798 - -
Other long-term assets 268 30,778 32,626 10,313 9,684
Goodwill 269 15 248,632 277,105 - -
tOtAl ASSetS (270 = 100 + 200) 270 38,699,256 33,572,619 25,841,133 24,580,494
The accompanying notes are an integral part of these financial statements

82 Masan Group
Code Note Group Company
31/12/2012 31/12/2011 31/12/2012 31/12/2011
VND million VND million VND million VND million
ReSOURCeS
liABilitieS (300 = 310 + 330) 300 18,994,871 12,017,587 10,020,279 6,821,280
Current liabilities 310 4,748,364 3,625,783 473,329 3,237,125
Short-term borrowings and liabilities 311 16 1,793,384 2,032,397 - 2,630,000
Accounts payable – trade 312 973,856 422,772 1,854 523
Advances from customers 313 14,490 7,994 - -
Taxes payable to State Treasury 314 17 608,893 291,359 - 5,193
Payables to employees 315 12,480 12,618 - -
Accrued expenses 316 18 1,300,931 824,384 471,475 339,697
Other payables 319 19 44,330 34,259 - 261,712
long-term borrowings and liabilities 330 14,246,507 8,391,804 9,546,950 3,584,155
Other long-term liabilities 333 19 737,832 - 2,170,428 256,195
Long-term borrowings and liabilities 334 20 12,647,177 7,409,781 7,376,522 3,327,960
Deferred tax liabilities 335 14 860,117 973,459 - -
Provision for severance allowance 336 21 1,381 8,564 - -
eQUity (400 = 410) 400 13,883,837 15,875,652 15,820,854 17,759,214
Owners’ equity 410 13,883,837 15,875,652 15,820,854 17,759,214
Share capital 411 23 6,872,801 5,152,723 6,872,801 5,152,723
Capital surplus 412 23 7,999,167 2,166,136 7,999,167 2,166,136
Other capital 413 24 1,721,824 10,462,804 1,721,824 10,462,804
Foreign exchange differences 416 (16,128) (16,066) - -
Other reserves 418 12 (8,619,479) (6,569,981) (530,235) -
Retained profits 420 5,925,652 4,680,036 (242,703) (22,449)
MiNORity iNteReStS 439 5,820,548 5,679,380 - -
tOtAl ReSOURCeS(440 = 300 + 400 + 439)
440 38,699,256 33,572,619 25,841,133 24,580,494
The accompanying notes are an integral part of these financial statements
At 31 December 2012 (Continued)
BAlANCe SheetS
Form B 01 - Dn

Annual Report 2012 83
FINANCIAL report
Off BAlANCe Sheet iteMS
Included in the cash and cash equivalents as at 31 December 2012 and 31 December 2011 are amounts denominated in currencies other than VND of:
Group Company
31/12/2012 31/12/2011 31/12/2012 31/12/2011
Foreign currencies:
USD 168,860,335 110,370,528 66,367,554 9,590,493
EUR 4,947 1,284,391 - -
29 March 2013
Prepared by: Approved by:
Doan Thi My Duyen Nguyen Dang Quang Chief Accountant Chairman
The accompanying notes are an integral part of these financial statements
At 31 December 2012 Form B 01 - Dn

84 Masan Group
Code Note Group Company
2012 2011 2012 2011
VND million VND million VND million VND million
total revenue 01 25 10,575,249 7,239,003 - -
less sales deductions 02 25 185,835 182,154 - -
Net sales (10 = 01 - 02) 10 25 10,389,414 7,056,849 - -
Cost of sales 11 26 6,178,926 3,997,834 - -
Gross profit (20 = 10 - 11) 20 4,210,488 3,059,015 - -
Financial income 21 27 809,824 1,185,206 1,221,639 645,584
Financial expenses 22 28 309,385 347,725 1,325,744 717,657
In which: Interest expenses 23 279,176 316,251 955,620 579,291
Selling expenses 24 1,325,121 1,010,149 - -
General and administration expenses 25 727,529 406,374 258,602 150,487
Net operating profit/(loss){30 = 20 + (21 - 22) - (24 + 25)}
30 2,658,277 2,479,973 (362,707) (222,560)
Other income 31 29 214,517 22,169 142,453 -
Other expenses 32 30 46,474 26,303 - 73
Results of other activities(40 = 31 - 32)
40 168,043 (4,134) 142,453 (73)
Share of (loss)/profit in associates 41 31 (337,798) 392,733 - -
Profit/(loss) before tax(50 = 30 + 40 + 41)
50 2,488,522 2,868,572 (220,254) (222,633)
income tax expense – current 51 32 650,509 247,114 - -
income tax (benefit)/expense – deferred 52 32 (124,579) 125,450 - -
Net profit/(loss) (carried forward to next page) (60 = 50 - 51 - 52)
60 1,962,592 2,496,008 (220,254) (222,633)
For the year ended 31 December 2012
StAteMeNtS Of iNCOMe
The accompanying notes are an integral part of these financial statements
Form B 02 - Dn

Annual Report 2012 85
FINANCIAL report
Code Note Group Company
2012 2011 2012 2011
VND million VND million VND million VND million
Net profit/(loss) (brought forward from previous page) 1,962,592 2,496,008 (220,254)
(222,633)
Attributable to:
Minority interests 61 702,074 522,859 - -
Equity holders of the Company 62 1,260,518 1,973,149 - -
earnings per share
Basic earnings per share in VND 70 5 1,776 2,909 - -
Diluted earnings per share in VND 70 5 1,634 2,523 - -
29 March 2013
Prepared by: Approved by:
Doan Thi My Duyen Nguyen Dang Quang Chief Accountant Chairman
For the year ended 31 December 2012
The accompanying notes are an integral part of these financial statements
Form B 02 - Dn

86 Masan Group
Code Note Group Company
2012 2011 2012 2011
VND million VND million VND million VND million
CASh flOWS fROM OPeRAtiNG ACtiVitieS
Profit/(loss) before tax 01 2,488,522 2,868,572 (220,254) (222,633)
Adjustments for
Depreciation and amortisation 02 349,906 142,120 10,797 5,112
Allowances and provisions 03 34,492 86,870 - -
Net unrealised foreign exchange differences 04 (204) (16,689) - (18,184)
Loss on disposal of fixed assets and other long-term assets
05 4,911 5,210 - -
Interest and facility fee income 05 (789,189) (1,124,958) (1,221,572) (602,109)
Interest and facility fee expenses 06 279,176 316,251 1,302,041 701,046
Share of loss/(profit) in associates 07 337,798 (392,733) - -
Operating profit/(loss) before changes in working capital
08 2,705,412 1,884,643 (128,988) (136,768)
Change in receivables and other assets 09 169,869 (35,172) 228,653 (136,272)
Change in inventories 10 8,195 (173,878) - -
Change in payables and other liabilities 11 219,840 74,423 (482,637) 23,508
3,103,316 1,750,016 (382,972) (249,532)
Interest paid 13 (745,684) (149,650) (243,736) (59,020)
Corporate income tax paid 14 (317,354) (148,616) - -
Other payments for operating activities 16 (9,245) (11,304) - -
Net cash flows from operating activities 20 2,031,033 1,440,446 (626,708) (308,552)
For the year ended 31 December 2012 (Indirect method)
StAteMeNtS Of CASh flOWS
The accompanying notes are an integral part of these financial statements
Form B 03 - Dn
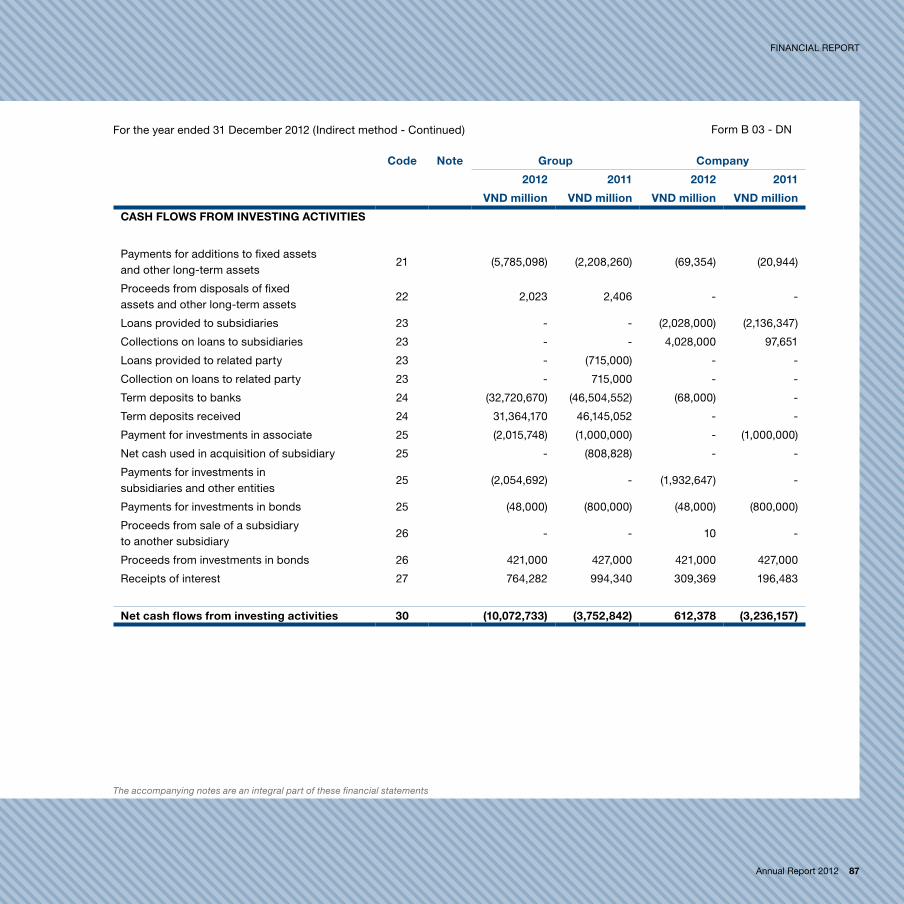
Annual Report 2012 87
FINANCIAL report
Code Note Group Company
2012 2011 2012 2011
VND million VND million VND million VND million
CASh flOWS fROM iNVeStiNG ACtiVitieS
Payments for additions to fixed assets and other long-term assets
21 (5,785,098) (2,208,260) (69,354) (20,944)
Proceeds from disposals of fixed assets and other long-term assets
22 2,023 2,406 - -
Loans provided to subsidiaries 23 - - (2,028,000) (2,136,347)
Collections on loans to subsidiaries 23 - - 4,028,000 97,651
Loans provided to related party 23 - (715,000) - -
Collection on loans to related party 23 - 715,000 - -
Term deposits to banks 24 (32,720,670) (46,504,552) (68,000) -
Term deposits received 24 31,364,170 46,145,052 - -
Payment for investments in associate 25 (2,015,748) (1,000,000) - (1,000,000)
Net cash used in acquisition of subsidiary 25 - (808,828) - -
Payments for investments in subsidiaries and other entities
25 (2,054,692) - (1,932,647) -
Payments for investments in bonds 25 (48,000) (800,000) (48,000) (800,000)
Proceeds from sale of a subsidiary to another subsidiary
26 - - 10 -
Proceeds from investments in bonds 26 421,000 427,000 421,000 427,000
Receipts of interest 27 764,282 994,340 309,369 196,483
Net cash flows from investing activities 30 (10,072,733) (3,752,842) 612,378 (3,236,157)
For the year ended 31 December 2012 (Indirect method - Continued)
The accompanying notes are an integral part of these financial statements
Form B 03 - Dn

88 Masan Group
Code Note Group Company
2012 2011 2012 2011
VND million VND million VND million VND million
CASh flOWS fROM fiNANCiNG ACtiVitieS
Proceeds from issuance of new shares 31 411,000 - 411,000 -
Proceeds from minority interest capital contribution to subsidiaries
31 12,500 5,329,180 - -
Proceeds from issuance of equity instruments 31 2,707,640 - 2,707,640 -
Payments for repurchases of equity instruments 32 (4,634,395) - (4,634,395) -
Proceeds from short-term and long-term borrowings
33 8,749,029 5,215,862 2,200,000 4,000,000
Payments to settle debts 34 (3,009,517) (2,092,857) - -
Payments of borrowing fees 36 (20,625) - (20,625) -
Payments of dividends to minority interest of a subsidiary
36 (25,988) - - -
Net cash flows from financing activities 40 4,189,644 8,452,185 663,620 4,000,000
Net cash flows during the year(50 = 20 + 30 + 40)
50 (3,852,056) 6,139,789 649,290 455,291
Cash and cash equivalents at the beginning of the year
60 9,573,593 3,394,575 1,510,736 1,037,261
effect of exchange rate fluctuation on cash and cash equivalents
61 (2,820) 39,229 - 18,184
Cash and cash equivalents at the end of the year (70 = 50 + 60 + 61)
70 6 5,718,717 9,573,593 2,160,026 1,510,736
For the year ended 31 December 2012 (indirect method - continued)
StAteMeNtS Of CASh flOWS
The accompanying notes are an integral part of these financial statements
Form B 03 - Dn
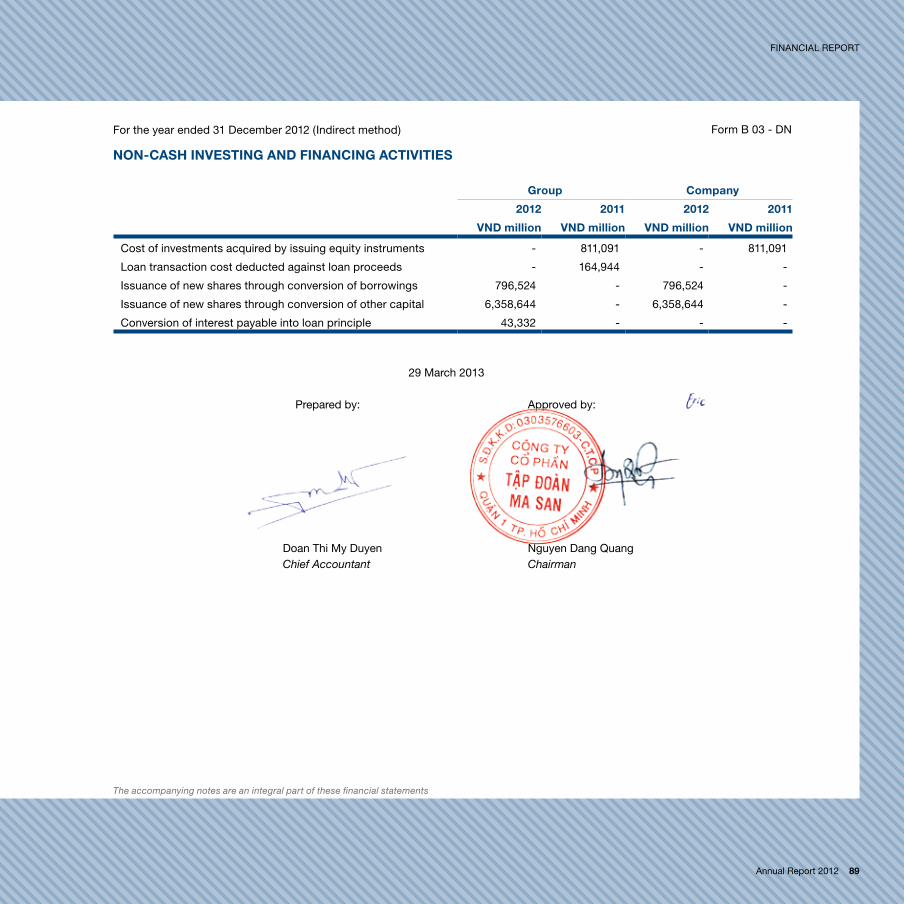
Annual Report 2012 89
FINANCIAL report
NON-CASh iNVeStiNG AND fiNANCiNG ACtiVitieS
Group Company
2012 2011 2012 2011
VND million VND million VND million VND million
Cost of investments acquired by issuing equity instruments - 811,091 - 811,091
Loan transaction cost deducted against loan proceeds - 164,944 - -
Issuance of new shares through conversion of borrowings 796,524 - 796,524 -
Issuance of new shares through conversion of other capital 6,358,644 - 6,358,644 -
Conversion of interest payable into loan principle 43,332 - - -
29 March 2013
Prepared by: Approved by:
Doan Thi My Duyen Nguyen Dang Quang Chief Accountant Chairman
For the year ended 31 December 2012 (Indirect method)
The accompanying notes are an integral part of these financial statements
Form B 03 - Dn
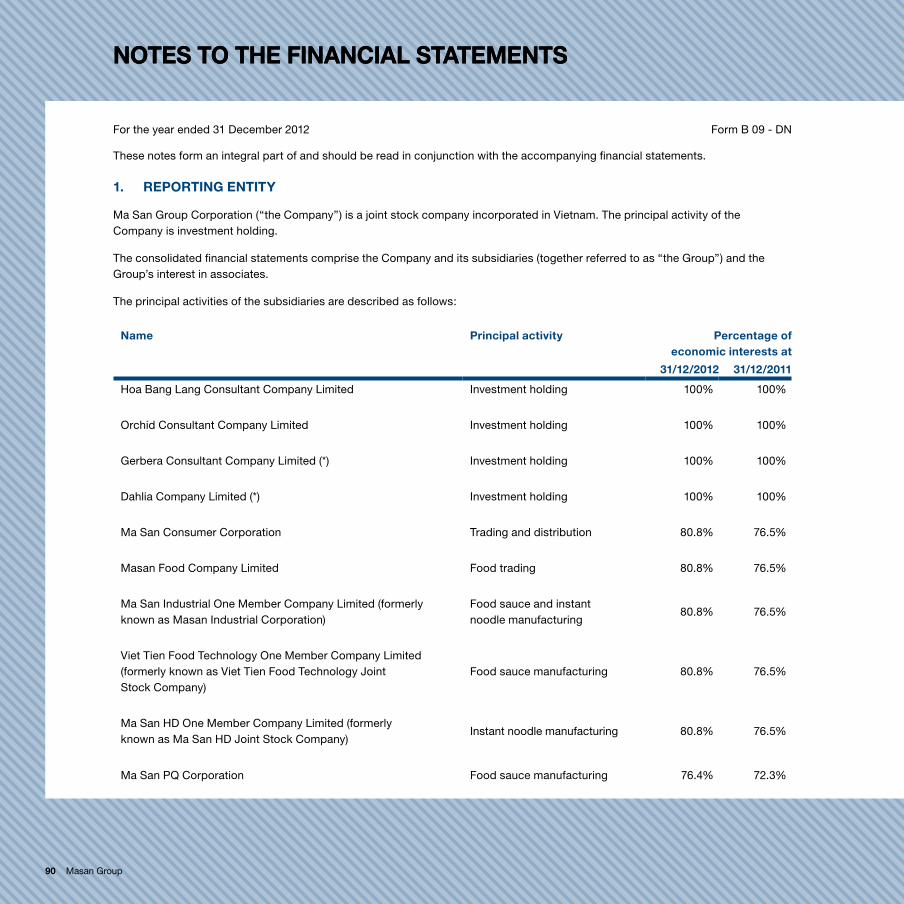
90 Masan Group
Notes to the fiNaNcial statemeNts
These notes form an integral part of and should be read in conjunction with the accompanying financial statements.
1. RePORtiNG eNtity
Ma San Group Corporation (“the Company”) is a joint stock company incorporated in Vietnam. the principal activity of the Company is investment holding.
the consolidated financial statements comprise the Company and its subsidiaries (together referred to as “the Group”) and the Group’s interest in associates.
the principal activities of the subsidiaries are described as follows:
Name Principal activity Percentage of economic interests at
31/12/2012 31/12/2011
Hoa Bang Lang Consultant Company Limited Investment holding 100% 100%
Orchid Consultant Company Limited Investment holding 100% 100%
Gerbera Consultant Company Limited (*) Investment holding 100% 100%
Dahlia Company Limited (*) Investment holding 100% 100%
Ma San Consumer Corporation Trading and distribution 80.8% 76.5%
Masan Food Company Limited Food trading 80.8% 76.5%
Ma San Industrial One Member Company Limited (formerly known as Masan Industrial Corporation)
Food sauce and instant noodle manufacturing
80.8% 76.5%
Viet Tien Food Technology One Member Company Limited (formerly known as Viet Tien Food Technology Joint Stock Company)
Food sauce manufacturing 80.8% 76.5%
Ma San HD One Member Company Limited (formerly known as Ma San HD Joint Stock Company)
Instant noodle manufacturing 80.8% 76.5%
Ma San PQ Corporation Food sauce manufacturing 76.4% 72.3%
NOteS tO the fiNANCiAl StAteMeNtS
For the year ended 31 December 2012 Form B 09 - Dn

Annual Report 2012 91
FINANCIAL report
Name Principal activity Percentage of economic interests at
31/12/2012 31/12/2011
Minh Viet Packaging One Member Company Limited (formerly known as Minh Viet Packaging Joint Stock Company)
Packaging 80.8% 76.5%
Hoa Muoi Gio Company Limited (**) Investment holdings 80.8% -
Vinacafe Bien Hoa Joint Stock Company Beverage manufacturing 43% 38.4%
Ma San Horizon Corporation Investment holding 100% 100%
Ma San Resources Corporation Investment holding 65% 65%
Ma San Thai Nguyen Resources Company Limited Investment holding 65% 65%
Thai Nguyen Trading and Investment Company Limited Investment holding 65% 65%
Nui Phao Mining Company Limited Exploring and processing mineral 65% 65%
(*) Gerbera Consultant Company Limited and Dahlia Company Limited are not owned by the Company but the Company has been assigned 100% of the voting rights and all economic benefits relating to the ownership in these companies. As such, the Company has control of these companies.
(**) During the year, the Company acquired Hoa Muoi Gio Company Limited (“HMG”) to be used as an investment holding vehicle to acquire 40% of Vietnamese French Cattle Feed Joint Stock Company (“Proconco”) earlier held by two funds named Prudential Vietnam Assurance Private Limited and PCA International Funds SPC. The total transaction value was VND2,028,010 million, of which VND10 million was for the equity in HMG and VND2,028,000 million was in the form of a loan from the Company to HMG to acquire Proconco. Subsequently, the equity of HMG and the loan to HMG were transferred to Ma San Consumer Corporation, a subsidiary, at cost by the Company. As a result, HMG, now a wholly owned subsidiary of Ma San Consumer Corporation, owed a loan to Ma San Consumer Corporation (see Note 12(a)).
All the subsidiaries are incorporated in Vietnam.
The percentage of economic interests represents the effective percentage of economic interests of the Group both directly and indirectly in the subsidiaries.
As at 31 December 2012, the Company had 41 employees (31/12/2011: 41 employees) and the Group had 5,832 employees (31/12/2011: 5,555 employees).
For the year ended 31 December 2012 Form B 09 - Dn

92 Masan Group
Notes to the fiNaNcial statemeNts
For the year ended 31 December 2012 (continued) Form B 09 - DN
2. BASiS Of PRePARAtiON
(a) Statement of compliance
The financial statements have been prepared in accordance with Vietnamese Accounting Standards, the Vietnamese Accounting System and the relevant statutory requirements.
(b) Basis of measurement
The financial statements, except for the statement of cash flows, are prepared on the accrual basis using the historical cost concept. The statement of cash flows is prepared using the indirect method.
(c) Annual accounting period
The annual accounting period of the Company is from 1 January to 31 December.
(d) Accounting currency
The financial statements are prepared and presented in millions of Vietnam Dong (“VND million”).
3. BASiS Of PRePARAtiON
The following significant accounting policies have been adopted by the Group and the Company in the preparation of these financial statements.
(a) Basis of consolidation
(i) Common-control business combination
Business combination where the same group of shareholders (“the Controlling Shareholders”) control the combining companies before and after the business combination meets the definition of business combination under common control because there is a continuation of the risks and benefits to the Controlling Shareholders. Such common control business combination is specifically excluded from the scope of Vietnamese Accounting Standard 11 Business Combination and in selecting its accounting policy with respect to such transaction, the Group has considered Vietnamese Accounting Standard 01 Framework and Vietnamese Accounting Standard 21 Presentation of Financial Statements. Based on these standards, the Group has adopted the merger (“carry-over”) basis of accounting. The assets and liabilities of the combining companies are consolidated using the existing book values from the Controlling Shareholders’ perspective. Any difference between the cost of acquisition and net assets acquired is treated as a deemed distribution to or contribution from shareholders and recorded directly in equity.
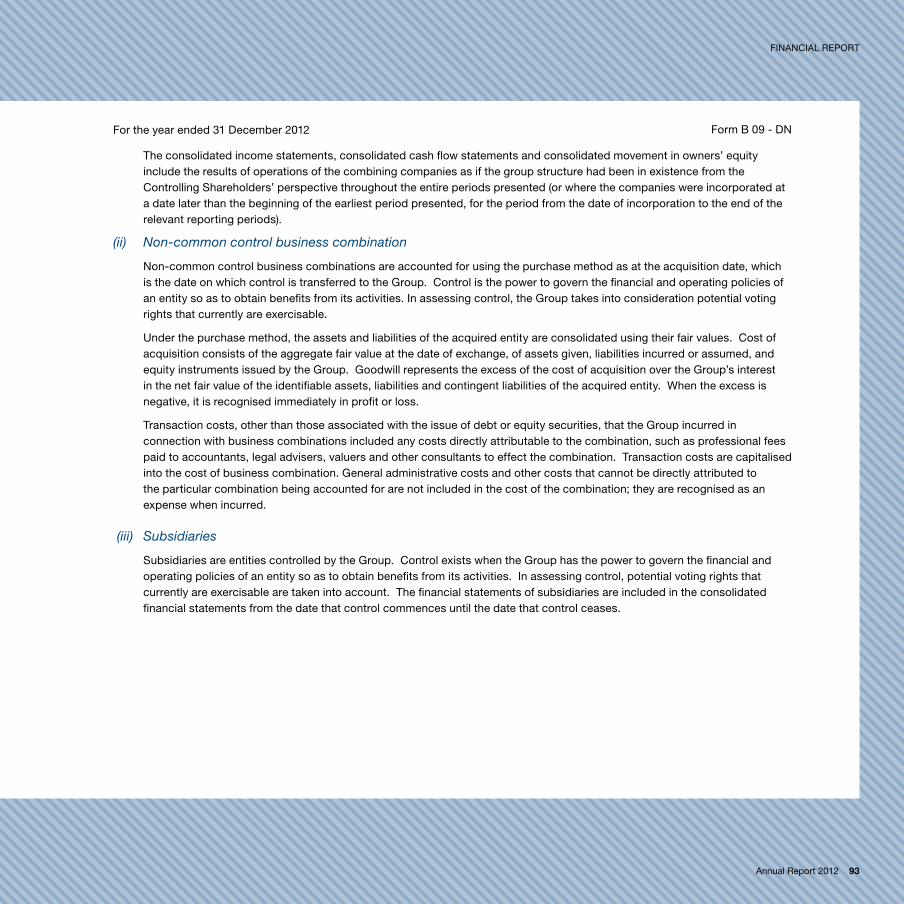
Annual Report 2012 93
FINANCIAL report
For the year ended 31 December 2012 Form B 09 - DN
The consolidated income statements, consolidated cash flow statements and consolidated movement in owners’ equity include the results of operations of the combining companies as if the group structure had been in existence from the Controlling Shareholders’ perspective throughout the entire periods presented (or where the companies were incorporated at a date later than the beginning of the earliest period presented, for the period from the date of incorporation to the end of the relevant reporting periods).
(ii) Non-common control business combination
Non-common control business combinations are accounted for using the purchase method as at the acquisition date, which is the date on which control is transferred to the Group. Control is the power to govern the financial and operating policies of an entity so as to obtain benefits from its activities. In assessing control, the Group takes into consideration potential voting rights that currently are exercisable.
Under the purchase method, the assets and liabilities of the acquired entity are consolidated using their fair values. Cost of acquisition consists of the aggregate fair value at the date of exchange, of assets given, liabilities incurred or assumed, and equity instruments issued by the Group. Goodwill represents the excess of the cost of acquisition over the Group’s interest in the net fair value of the identifiable assets, liabilities and contingent liabilities of the acquired entity. When the excess is negative, it is recognised immediately in profit or loss.
Transaction costs, other than those associated with the issue of debt or equity securities, that the Group incurred in connection with business combinations included any costs directly attributable to the combination, such as professional fees paid to accountants, legal advisers, valuers and other consultants to effect the combination. Transaction costs are capitalised into the cost of business combination. General administrative costs and other costs that cannot be directly attributed to the particular combination being accounted for are not included in the cost of the combination; they are recognised as an expense when incurred.
(iii) Subsidiaries
Subsidiaries are entities controlled by the Group. Control exists when the Group has the power to govern the financial and operating policies of an entity so as to obtain benefits from its activities. In assessing control, potential voting rights that currently are exercisable are taken into account. The financial statements of subsidiaries are included in the consolidated financial statements from the date that control commences until the date that control ceases.
94 Masan Group
Notes to the fiNaNcial statemeNts
For the year ended 31 December 2012 (continued) Form B 09 - DN
(iv) Associates (equity accounted investees)
Associates are those entities in which the Group has significant influence, but not control, over the financial and operating policies. Significant influence is presumed to exist when the Group holds between 20 and 50 percent of the voting power of another entity. Associates are accounted for in the consolidated financial statements using the equity method (equity accounted investees) and are initially recognised at cost. The Group’s investment in associates includes goodwill identified on acquisition, net of any accumulated amortisation on the goodwill. The consolidated financial statements include the Group’s share of the income and expenses of equity accounted investees, after adjustments to align the accounting policies with those of the Group, from the date that significant influence commences until the date that significant influence ceases. When the Group’s share of losses exceeds its interest in an equity accounted investee, the carrying amount of that interest (including any long-term investments) is reduced to nil and the recognition of further losses is discontinued except to the extent that the Group has an obligation or has made payments on behalf of the investee.
(v) Minority interests
For changes in the Group’s ownership interest in a subsidiary that do not result in change in control, the difference between the cost of acquisition or proceeds on disposal of the interest and the proportionate carrying amount of net assets acquired or disposed at the date of exchange is recorded directly in equity.
(vi) Transactions eliminated on consolidation
Intra-group balances, and any unrealised income and expenses arising from intra-group transactions, are eliminated in preparing the consolidated financial statements. Unrealised gains and losses arising from transactions with equity accounted investees are eliminated against the investment to the extent of the Group’s interest in the investee.
(b) Foreign currency transactions
Monetary assets and liabilities denominated in currencies other than VND are translated into VND at rates of exchange ruling at the balance sheet date. Transactions in currencies other than VND during the year have been translated into VND at rates approximating those ruling at the transaction dates.
All foreign exchange differences are recorded in the statement of income, except when they relate to the construction of tangible fixed assets or the translation of foreign currency monetary items during pre-operating stage, in which case they are recorded in the Foreign Exchange Difference Account in equity until the entity commences operations and the tangible fixed assets are put into use. Once the entity commences operations and the tangible fixed assets are put into use, the related realised foreign exchange differences are transferred to the statement of income, unrealised foreign exchange gains are transferred to the Unearned Revenue Account and unrealised foreign exchange losses are transferred to the Long-term Prepayment Account. The gains and losses are then amortised on a straight line basis over five years.
Annual Report 2012 95
FINANCIAL report
For the year ended 31 December 2012 Form B 09 - DN
(c) Cash and cash equivalents
Cash comprises cash balances and call deposits. Cash equivalents are short-term highly liquid investments that are readily convertible to known amount of cash, are subject to an insignificant risk of changes in value, and are held for the purpose of meeting short-term cash commitments rather than for investment or other purposes.
(d) Investments
Investments in term deposits and debt instruments, investments in equity instruments of entities over which the Group has no control or significant influence in the consolidated financial statements, and investments in all equity instruments in the separate financial statements are stated at cost. Allowance is made for reductions in investment values which in the opinion of the management are not temporary. The allowance is reversed if the subsequent increase in recoverable amount can be related objectively to an event occurring after the allowance was recognised. An allowance is reversed only to the extent that the investment’s carrying amount does not exceed the carrying amount that has been determined if no allowance had been recognised.
(e) Accounts receivable
Trade and other receivables are stated at cost less allowance for doubtful debts.
(f) Inventories
Inventories are stated at the lower of cost and net realisable value. Cost is determined on a weighted average basis and includes all costs incurred in bringing the inventories to their present location and condition. Cost in the case of finished goods and work in progress includes raw materials, direct labour and attributable manufacturing overheads. Net realisable value is the estimated selling price of inventory items, less the estimated costs of completion and selling expenses.
The Group apply the perpetual method of accounting for inventory.
(g) Tangible fixed assets
(i) Cost
Tangible fixed assets are stated at cost less accumulated depreciation. The initial cost of a tangible fixed asset comprises its purchase price, including import duties, non-refundable purchase taxes and any directly attributable costs of bringing the asset to its working condition and location for its intended use. Expenditure incurred after tangible fixed assets have been put into operation, such as repairs and maintenance and overhaul costs, are normally charged to income in the year in which the costs are incurred. In situations where it can be clearly demonstrated that the expenditure have resulted in an increase in the future economic benefits expected to be obtained from the use of tangible fixed assets beyond their originally assessed standard of performance, the expenditure are capitalised as an additional cost of tangible fixed assets.

96 Masan Group
Notes to the fiNaNcial statemeNts
For the year ended 31 December 2012 (continued) Form B 09 - DN
(ii) Depreciation
Depreciation is computed on a straight-line basis over the estimated useful lives of tangible fixed assets. The estimated useful lives are as follows:
� buildings and structures 5 - 25 years
� leasehold improvements 3 - 5 years
� office equipment 3 - 6 years
� machinery and equipment 3 - 12 years
� motor vehicles 3 - 6 years
(h) Intangible fixed assets
(i) Land use rights
Land use rights are stated at cost less accumulated amortisation. The initial cost of a land use right comprises its purchase price and any directly attributable costs incurred in conjunction with securing the land use right. Amortisation is computed on a straight-line basis over their useful lives ranging from 40 to 47 years.
(ii) Software
Cost of acquisition of new software, which is not an integral part of the related hardware, is capitalised and treated as an intangible asset. Software is amortised on a straight-line basis over four and five years.
(iii) Brand name
Cost of acquisition of brand name is capitalised and treated as an intangible asset. Brand name is amortised on a straight-line basis over five years.
The fair value of brand name acquired in a business combination is based on the discounted estimated royalty payments that have been avoided as a result of the brand name being owned. The fair value of brand name acquired in a business combination is recognised as an intangible asset and is amortised on a straight-line basis over ten years.
(iv) Customer relationships
Customer relationships that are acquired by the Group on the acquisition of subsidiary is capitalised and presented as an intangible asset. The fair value of customer relationships acquired in a business combination is determined using the multi-period excess earnings method, whereby the subject assets are valued after deducting a fair return on all other assets that are part of creating the related cash flows. The fair value of customer relationship is amortised on a straight line basis over five years.

Annual Report 2012 97
FINANCIAL report
For the year ended 31 December 2012 Form B 09 - DN
(i) Construction in progress
Construction in progress represents the cost of construction and machinery which have not been fully completed or installed and mineral assets under development. No depreciation is provided for construction in progress during the period of construction and installation.
Mineral assets under development comprise mineral reserve and related development costs acquired in a business combination and subsequent development expenditure. These assets qualify for capitalisation when the mineral reserve to which they relate is proven to be commercially and technically viable. They are initially recognised at their fair values as part of business combination accounting and subsequent development expenditures are capitalised net of proceeds from the sale of ore extracted during the development phase. On completion of development, defined as the time when saleable materials begin to be extracted from the mine, all assets are reclassified to tangible fixed assets.
(j) Long-term prepayments
(i) Pre-operating expenses
Pre-operating expenses are recorded in the statement of income, except for establishment costs and expenditures on training, advertising and promotional activities incurred from the incorporation date to the commercial operation date. These expenses are recognised as long-term prepayments, initially stated at cost, and are amortised on a straight line basis over three years staring from the date of commercial operation.
(ii) Prepaid land costs
Prepaid land costs comprise prepaid land lease rentals and other costs incurred in conjunction with securing the use of leased land. These costs are recognised in the statement of income on a straight-line basis over the term of the lease from 47 to 50 years.
(iii) Tools and supplies and printing axles
Tools and supplies and printing axles are stated at cost and amortised over their useful lives ranging from six months to two years.
(iv) Borrowing fees
Loan origination costs are incurred in conjunction with the arrangement of long-term borrowings and are amortised on a straight-line basic over the tenure of the borrowings.

98 Masan Group
Notes to the fiNaNcial statemeNts
For the year ended 31 December 2012 (continued) Form B 09 - DN
(v) Insurance fees
Insurance fees are stated at cost and amortised over their useful lives of two years.
(vi) Website fees
Website fees are stated at cost and amortised over their useful lives of three years.
(k) Goodwill
Goodwill arises on acquisition of subsidiaries and associate in non-common control acquisition.
Goodwill is measured at cost less accumulated amortisation. Cost of goodwill represents the excess of the cost of the acquisition over the Group’s interest in the net fair value of the identifiable assets, liabilities and contingent liabilities of the acquiree. Goodwill is amortised on a straight-line basis over ten years. In respect of equity accounted investees, the carrying amount of goodwill is included in the carrying value of the investment.
(l) Trade and other payables
Trade and other payables are stated at their cost.
(m) Provisions
A provision is recognised if, as a result of a past event, the Group has a present legal or constructive obligation that can be estimated reliably, and it is probable that an outflow of economic benefits will be required to settle the obligation. Provisions are determined by discounting the expected future cash flows at a pre-tax rate that reflects current market assessments of the time value of money and the risks specific to the liability.
Severance allowance
Under the Vietnamese Labour Code, when employees who have worked for 12 months or more (“eligible employees”) voluntarily terminates their labour contracts, the employer is required to pay the eligible employees severance allowance calculated based on years of service and employees’ compensation at termination. Provision for severance allowance has been provided based on employees’ years of service and their current salary level.
Pursuant to Law on Social Insurance, effective from 1 January 2009, the Group and its employees are required to contribute to an unemployment insurance fund managed by the Vietnam Social Insurance Agency. The contribution to be paid by each party is calculated at 1% of the lower of the employees’ basic salary and 20 times the general minimum salary level as specified by the Government from time to time. With the implementation of the unemployment insurance scheme, the Group is no longer required to provide severance allowance for the service period after 1 January 2009. However, severance allowance to be paid to existing eligible employees as of 31 December 2008 will be determined based on the eligible employees’ years of service as of 31 December 2008 and their average salary for the six-month period prior to the termination date.
(n) Classification of financial instruments
Solely for the purpose of providing disclosures about the significance of financial instruments to the Group and the Company’s consolidated and separate financial positions and results of operations and the nature and extent of risk arising from financial instruments, the Group and the Company classify their financial instruments as follows:
Annual Report 2012 99
FINANCIAL report
For the year ended 31 December 2012 Form B 09 - DN
(i) Financial assets
Financial assets at fair value through profit or loss
A financial asset at fair value through profit or loss is a financial asset that meets either of the following conditions:
� It is considered by management as held for trading. A financial asset is considered as held for trading if: - it is acquired principally for the purpose of selling it in the near term; - there is evidence of a recent pattern of short-term profit-taking; or - a derivative (except for a derivative that is financial guarantee contract or a designated and effective hedging
instrument).
� upon initial recognition, it is designated by the Group and the Company as at fair value through profit or loss.
Held-to-maturity investments
Held-to-maturity investments are non-derivative financial assets with fixed or determinable payments and a fixed maturity that the Group and the Company has the positive intention and ability to hold to maturity, other than:
� those that the Group and the Company upon initial recognition designates as at fair value through profit or loss;
� those that the Group and the Company designates as available-for-sale; and
� those that meet the definition of loans and receivables.
Loans and receivables
Loans and receivables are non-derivative financial assets with fixed or determinable payments that are not quoted in an active market, other than those:
� that the Group and the Company intends to sell immediately or in the near term, which are classified as held for trading, and those that the entity on initial recognition designates as at fair value through profit or loss;
� that the Group and the Company upon initial recognition designates as available-for-sale; or
� for which the Group and the Company may not recover substantially all of its initial investment, other than because of credit deterioration, which are classified as available-for-sale.
Available-for-sale financial assets
Available-for-sale financial assets are non-derivative financial assets that are designated as available for sale or that are not classified as:
� financial assets at fair value through profit or loss;
� held-to-maturity investments; or
� loans and receivables.

100 Masan Group
Notes to the fiNaNcial statemeNts
For the year ended 31 December 2012 (continued) Form B 09 - DN
(ii) Financial liabilities
Financial liabilities at fair value through profit or loss
A financial liability at fair value through profit or loss is a financial liability that meets either of the following conditions:
� It is considered by management as held for trading. A financial liability is considered as held for trading if: - it is incurred principally for the purpose of repurchasing it in the near term; - there is evidence of a recent pattern of short-term profit-taking; or - a derivative (except for a derivative that is financial guarantee contract or a designated and effective hedging instrument).
� upon initial recognition, it is designated by the Group and the Company as at fair value through profit or loss.
Financial liabilities carried at amortised cost
Financial liabilities which are not classified as financial liabilities at fair value through profit or loss are classified as financial liabilities carried at amortised cost.
The above described classification of financial instruments is solely for presentation and disclosure purpose and is not intended to be a description of how the instruments are measured. Accounting policies for measurement of financial instruments are disclosed in other relevant notes.
(o) Taxation
Income tax on the profit or loss for the year comprises current and deferred tax. Income tax is recognised in the statement of income except to the extent that it relates to items recognised directly to equity, in which case it is recognised in equity.
Current tax is the expected tax payable on the taxable income for the year, using tax rates enacted or substantially enacted at the balance sheet date, and any adjustment to tax payable in respect of previous years.
Deferred tax is provided using the balance sheet method, providing for temporary differences between the carrying amounts of assets and liabilities for financial reporting purposes and the amounts used for taxation purposes. The amount of deferred tax provided is based on the expected manner of realisation or settlement of the carrying amount of assets and liabilities using tax rates enacted or substantively enacted at the balance sheet date.
A deferred tax asset is recognised only to the extent that it is probable that future taxable profits will be available against which the asset can be utilised. Deferred tax assets are reduced to the extent that it is no longer probable that the related tax benefit will be realised.
(p) Equity
(i) Share capital and capital surplus
Ordinary share capital is classified as equity. The excess of proceeds contributed over the par value of shares issued is recorded as capital surplus. Incremental costs directly attributable to the issue of ordinary shares are recognised as a deduction from capital surplus.

Annual Report 2012 101
FINANCIAL report
For the year ended 31 December 2012 Form B 09 - DN
(ii) Other capital
Agreements to issue a fixed number of shares in the future are recognised based on their fair values at the dates of the agreements under other capital if there are no other settlement alternatives.
(iii) Other reserves
Equity movements resulting from common-control business combination and acquisition of/disposal to minority interests are recorded in “Other Reserves” in equity.
(q) Revenue
Revenue from the sale of goods is recognised in the statement of income when the significant risks and rewards of ownership have been transferred to the buyer. No revenue is recognised if there are significant uncertainties regarding recovery of the consideration due or the possible return of goods.
(r) Dividend income
Dividend income is recognised when the right to receive dividend is established.
(s) Financial income and financial expenses
(i) Financial income
Financial income comprises interest income from deposits and loans, and net foreign exchange gains. Interest income is recognised as it accrues in the statement of income.
(ii) Financial expenses
Financial expenses comprise interest expenses on borrowings and net foreign exchange losses. Borrowing costs are recognised as an expense in the year in which they are incurred, except where the borrowing costs relate to borrowings in respect of the construction of tangible fixed assets, in which case the borrowing costs incurred during the period of construction are capitalised as part of the cost of the fixed assets concerned.
(t) Operating lease payments
Payments made under operating leases are recognised in the statement of income on a straight-line basis over the term of the lease. Lease incentives received are recognised in the statement of income as an integral part of the total lease expense.

102 Masan Group
Notes to the fiNaNcial statemeNts
For the year ended 31 December 2012 (continued) Form B 09 - DN
(u) Earnings per share
The Group presents basic and diluted earnings per share (EPS) data for its ordinary shares. Basic EPS is calculated by dividing the profit or loss attributable to ordinary shareholders of the Company by the weighted average number of ordinary shares outstanding during the year. Diluted EPS is determined by adjusting the profit or loss attributable to ordinary shareholders of the Company and the weighted average number of ordinary shares outstanding for the effects of all dilutive potential ordinary shares.
(v) Segment reporting
A segment is a distinguishable component of the Group that is engaged either in providing related products or services (business segment), or in providing products or services within a particular economic environment (geographical segment), which is subject to risks and rewards that are different from those of other segments. The Group’s primary format for segment reporting is based on business segments.
(w) Related parties
Parties are considered to be related if one party has the ability, directly or indirectly, to control the other party or exercise significant influence over the other party in making financial and operating decisions. Parties are also considered to be related if they are subject to common control or common significant influence.
(x) Share-based payments
Shares issued to employees are recorded at their par value. Redemption of such shares performed by related companies outside the Group is not recorded by the Group.
4. SeGMeNt RePORtiNG
The Group has four (4) reportable segments, as described below, which are the Group’s strategic businesses. The strategic businesses offer different products and services, and are managed separately because they require different technology and marketing strategies. For each of the strategic businesses, the Group’s Board of Management reviews internal management reports on a periodic basis.
The Group holds the following business segments through separate subsidiary groups:
� Food and beverage
� Mining
The Group also invested in and has significant influence in a joint stock bank and the Group’s Board of Management considers Financial Services as a separate business segment. During the year the Group also invested in and has significant influence in a group that operates feed mills and supply animal nutrition products. The Group considers Animal Nutrition as a separate business segment.

Annual Report 2012 103
FINANCIAL report
For the year ended 31 December 2012 Form B 09 - DN
Business segments
food and beverage Animal nutrition Mining financial services total
VND million 2012 2011 2012 2011 2012 2011 2012 2011 2012 2011
Segment revenue 10,389,414 7,056,849 - - - - - - 10,389,414 7,056,849
Segment gross margin 4,210,488 3,059,015 - - - - - - 4,210,488 3,059,015
Segment results 2,733,282 2,158,106 2,555 - 113,099 262,477 (340,353) 392,733 2,508,583 2,813,316
Unallocated expenses (258,446) (150,487)
Financial income 232,753 388,892
Financial expenses (162,411) (179,015)
Net operating profit (include share of profit in associate)
2,320,479 2,872,706
Other income 214,517 22,169
Other expenses (46,474) (26,303)
Income tax expense (525,930) (372,564)
Net profit 1,962,592 2,496,008
The accounting profit for the Animal nutrition segment at the Group level includes adjustments due to price purchase allocations and goodwill amortisation. Results would be VND89,775 million if these were added back.

104 Masan Group
Notes to the fiNaNcial statemeNts
For the year ended 31 December 2012 (continued) Form B 09 - DN
food and beverage Animal nutrition Mining financial services total
VND million 31/12/2012 31/12/2011 31/12/2012 31/12/2011 31/12/2012 31/12/2011 31/12/2012 31/12/2011 31/12/2012 31/12/2011
Segment assets 9,816,942 9,387,054 1,967,387 - 15,220,632 12,570,448 8,980,732 9,321,085 35,985,693 31,278,587
Unallocated assets 2,713,563 2,294,032
total assets 38,699,256 33,572,619
Segment liabilities 5,734,363 4,967,970 - - 4,954,500 918,720 - - 10,688,863 5,886,690
Unallocated
liabilities 8,306,008 6,130,897
total liabilities 18,994,871 12,017,587
VND million 2012 2011 2012 2011 2012 2011 2012 2011 2012 2011
Capital expenditures 861,222 558,495 - - 4,854,522 1,628,630 - - 5,715,744 2,187,125
Depreciation 175,994 102,000 - - 10,376 1,829 - - 186,370 103,829
Amortisation of
intangible fixed
assets and goodwill
153,068 29,267 - - 2,113 576 - - 155,181 29,843
Segment assets and liabilities exclude deferred tax assets and liabilities, respectively.
Geographical segments
The Group operates in one geographical segment which is in Vietnam.
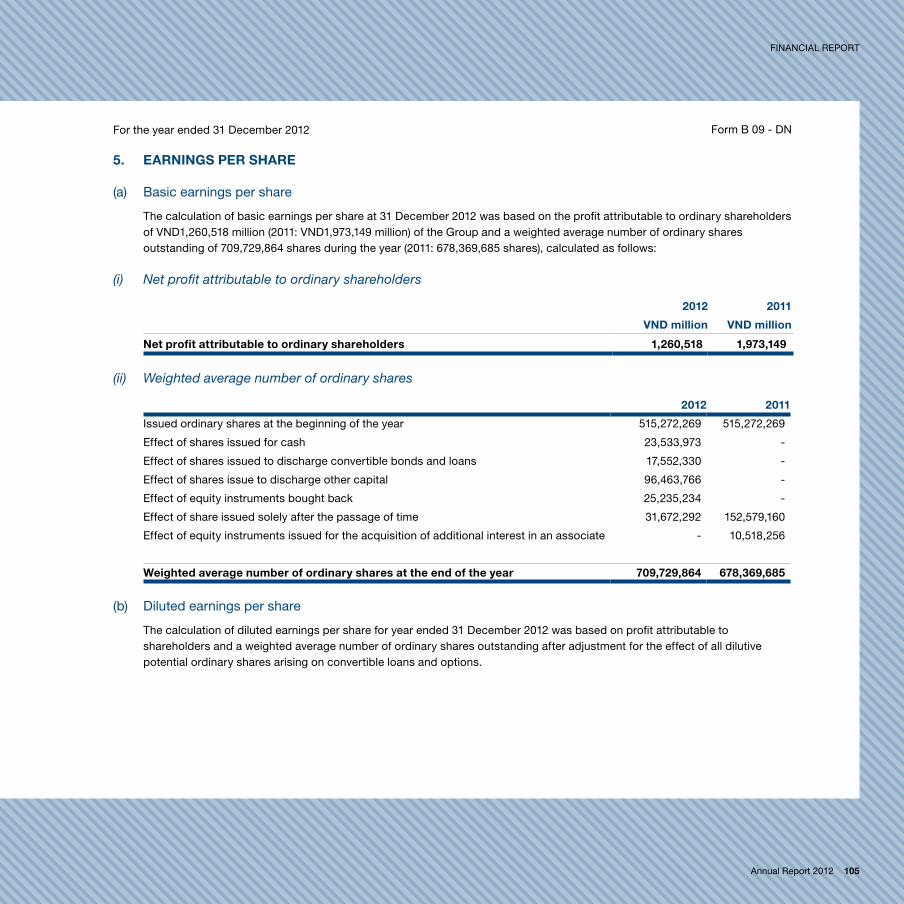
Annual Report 2012 105
FINANCIAL report
For the year ended 31 December 2012 Form B 09 - DN
5. eARNiNGS PeR ShARe
(a) Basic earnings per share
The calculation of basic earnings per share at 31 December 2012 was based on the profit attributable to ordinary shareholders of VND1,260,518 million (2011: VND1,973,149 million) of the Group and a weighted average number of ordinary shares outstanding of 709,729,864 shares during the year (2011: 678,369,685 shares), calculated as follows:
(i) Net profit attributable to ordinary shareholders
2012 2011
VND million VND million
Net profit attributable to ordinary shareholders 1,260,518 1,973,149
(ii) Weighted average number of ordinary shares
2012 2011
Issued ordinary shares at the beginning of the year 515,272,269 515,272,269
Effect of shares issued for cash 23,533,973 -
Effect of shares issued to discharge convertible bonds and loans 17,552,330 -
Effect of shares issue to discharge other capital 96,463,766 -
Effect of equity instruments bought back 25,235,234 -
Effect of share issued solely after the passage of time 31,672,292 152,579,160
Effect of equity instruments issued for the acquisition of additional interest in an associate - 10,518,256
Weighted average number of ordinary shares at the end of the year 709,729,864 678,369,685
(b) Diluted earnings per share
The calculation of diluted earnings per share for year ended 31 December 2012 was based on profit attributable to shareholders and a weighted average number of ordinary shares outstanding after adjustment for the effect of all dilutive potential ordinary shares arising on convertible loans and options.
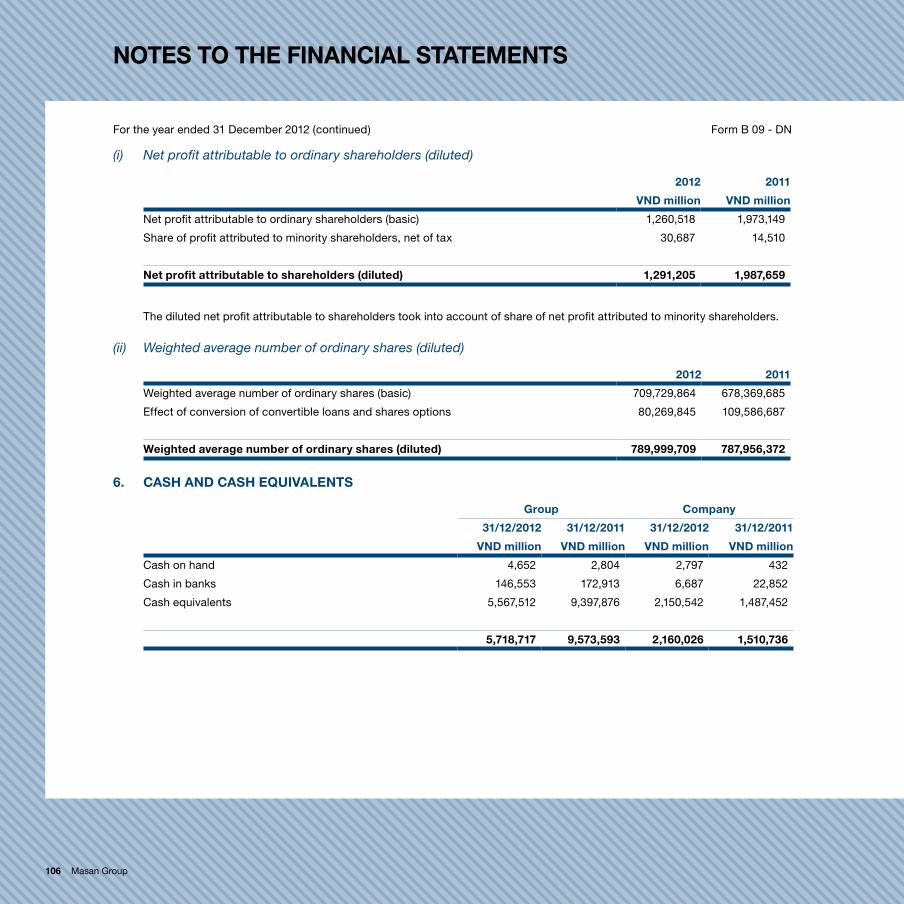
106 Masan Group
Notes to the fiNaNcial statemeNts
For the year ended 31 December 2012 (continued) Form B 09 - DN
(i) Net profit attributable to ordinary shareholders (diluted)
2012 2011
VND million VND million
Net profit attributable to ordinary shareholders (basic) 1,260,518 1,973,149
Share of profit attributed to minority shareholders, net of tax 30,687 14,510
Net profit attributable to shareholders (diluted) 1,291,205 1,987,659
The diluted net profit attributable to shareholders took into account of share of net profit attributed to minority shareholders.
(ii) Weighted average number of ordinary shares (diluted)
2012 2011
Weighted average number of ordinary shares (basic) 709,729,864 678,369,685
Effect of conversion of convertible loans and shares options 80,269,845 109,586,687
Weighted average number of ordinary shares (diluted) 789,999,709 787,956,372
6. CASh AND CASh eQUiVAleNtS
Group Company
31/12/2012 31/12/2011 31/12/2012 31/12/2011
VND million VND million VND million VND million
Cash on hand 4,652 2,804 2,797 432
Cash in banks 146,553 172,913 6,687 22,852
Cash equivalents 5,567,512 9,397,876 2,150,542 1,487,452
5,718,717 9,573,593 2,160,026 1,510,736
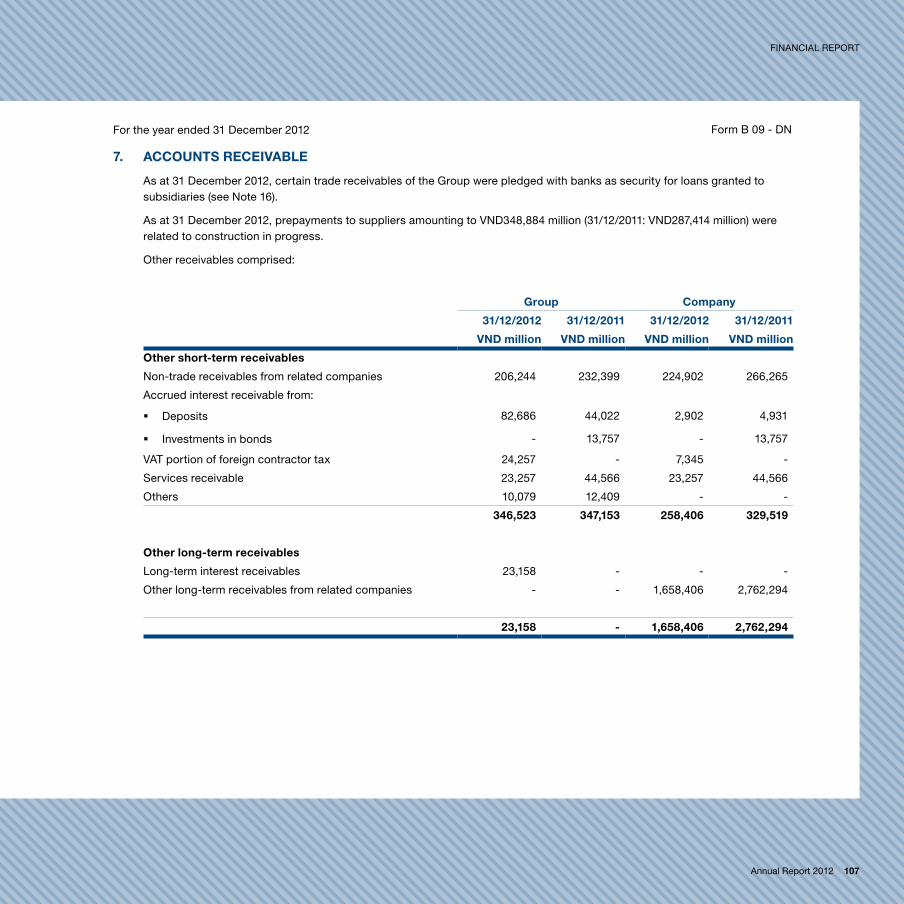
Annual Report 2012 107
FINANCIAL report
For the year ended 31 December 2012 Form B 09 - DN
7. ACCOUNtS ReCeiVABle
As at 31 December 2012, certain trade receivables of the Group were pledged with banks as security for loans granted to subsidiaries (see Note 16).
As at 31 December 2012, prepayments to suppliers amounting to VND348,884 million (31/12/2011: VND287,414 million) were related to construction in progress.
Other receivables comprised:
Group Company
31/12/2012 31/12/2011 31/12/2012 31/12/2011
VND million VND million VND million VND million
Other short-term receivables
Non-trade receivables from related companies 206,244 232,399 224,902 266,265
Accrued interest receivable from:
� Deposits 82,686 44,022 2,902 4,931
� Investments in bonds - 13,757 - 13,757
VAT portion of foreign contractor tax 24,257 - 7,345 -
Services receivable 23,257 44,566 23,257 44,566
Others 10,079 12,409 - -
346,523 347,153 258,406 329,519
Other long-term receivables
Long-term interest receivables 23,158 - - -
Other long-term receivables from related companies - - 1,658,406 2,762,294
23,158 - 1,658,406 2,762,294
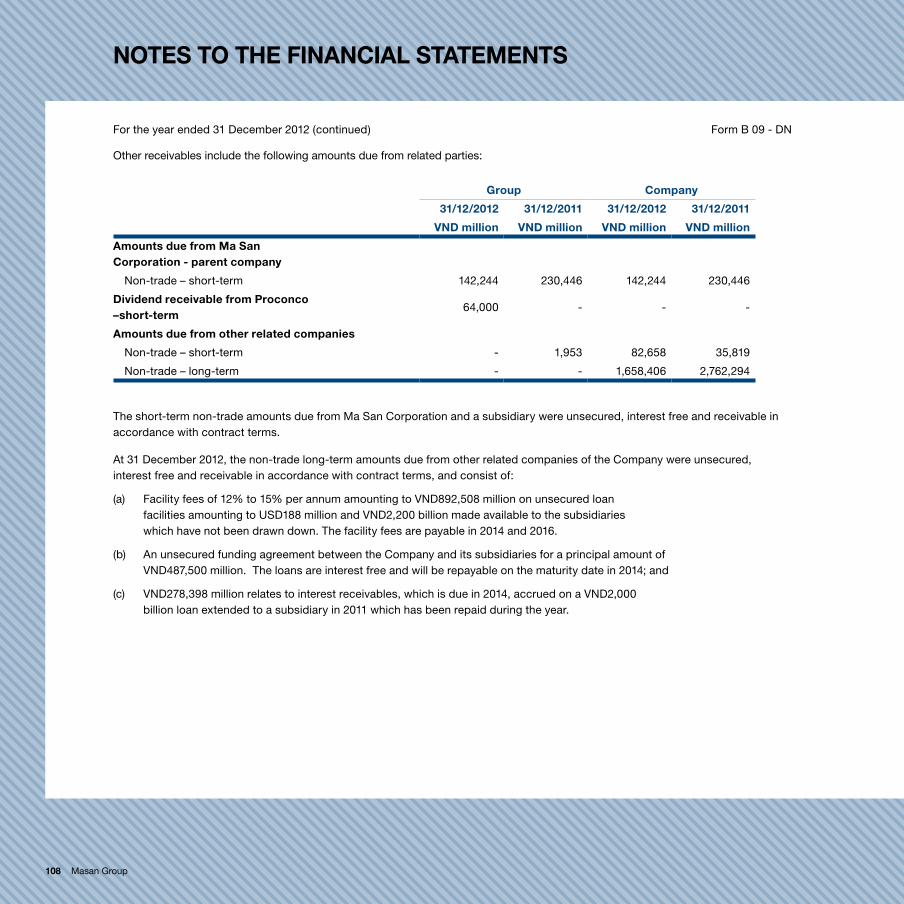
108 Masan Group
Notes to the fiNaNcial statemeNts
For the year ended 31 December 2012 (continued) Form B 09 - DN
Other receivables include the following amounts due from related parties:
Group Company
31/12/2012 31/12/2011 31/12/2012 31/12/2011
VND million VND million VND million VND million
Amounts due from Ma San Corporation - parent company
Non-trade – short-term 142,244 230,446 142,244 230,446
Dividend receivable from Proconco –short-term
64,000 - - -
Amounts due from other related companies
Non-trade – short-term - 1,953 82,658 35,819
Non-trade – long-term - - 1,658,406 2,762,294
the short-term non-trade amounts due from Ma San Corporation and a subsidiary were unsecured, interest free and receivable in accordance with contract terms.
At 31 December 2012, the non-trade long-term amounts due from other related companies of the Company were unsecured, interest free and receivable in accordance with contract terms, and consist of:
(a) Facility fees of 12% to 15% per annum amounting to VND892,508 million on unsecured loan facilities amounting to USD188 million and VND2,200 billion made available to the subsidiaries which have not been drawn down. The facility fees are payable in 2014 and 2016.
(b) An unsecured funding agreement between the Company and its subsidiaries for a principal amount of VND487,500 million. The loans are interest free and will be repayable on the maturity date in 2014; and
(c) VND278,398 million relates to interest receivables, which is due in 2014, accrued on a VND2,000 billion loan extended to a subsidiary in 2011 which has been repaid during the year.

Annual Report 2012 109
FINANCIAL report
For the year ended 31 December 2012 Form B 09 - DN
8. iNVeNtORieS
Group
31/12/2012 31/12/2011
VND million VND million
Goods in transit 15,349 31,028
Raw materials 396,321 409,748
Tools and supplies 26,794 1,152
Work in progress 88,448 64,939
Finished goods 48,934 118,879
575,846 625,746
Allowance for inventories (11,991) (12,901)
563,855 612,845
Movements in the allowance for inventories during the year were as follows:
Group
2012 2011
VND million VND million
Opening balance 12,901 6,347
Increase in allowance during the year 46,618 86,491
Allowance utilised during the year (41,705) (79,937)
Written back (5,823) -
Closing balance 11,991 12,901
As at 31 December 2012, certain inventories of the Group were pledged with banks as security for loans granted to a subsidiary (see Note 16).
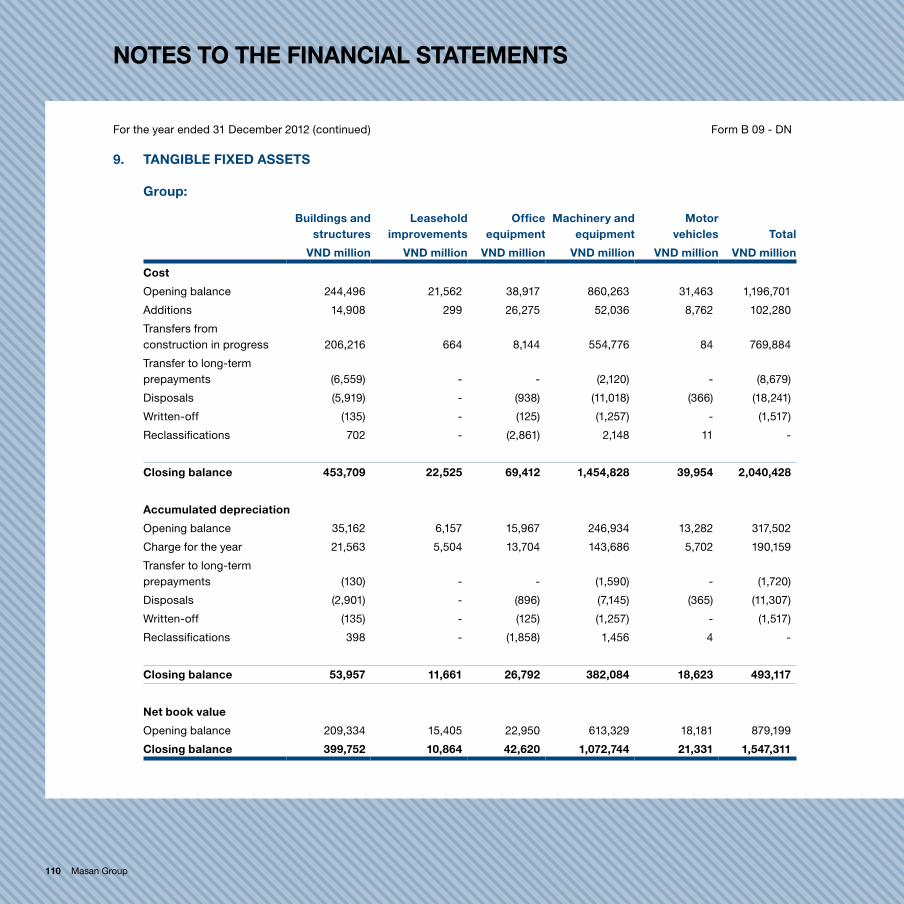
110 Masan Group
Notes to the fiNaNcial statemeNts
For the year ended 31 December 2012 (continued) Form B 09 - DN
9. tANGiBle fiXeD ASSetS
Group:
Buildings and structures
leasehold improvements
Office equipment
Machinery and equipment
Motor vehicles total
VND million VND million VND million VND million VND million VND million
Cost
Opening balance 244,496 21,562 38,917 860,263 31,463 1,196,701
Additions 14,908 299 26,275 52,036 8,762 102,280
Transfers from construction in progress 206,216 664 8,144 554,776 84 769,884
Transfer to long-term prepayments (6,559) - - (2,120) - (8,679)
Disposals (5,919) - (938) (11,018) (366) (18,241)
Written-off (135) - (125) (1,257) - (1,517)
Reclassifications 702 - (2,861) 2,148 11 -
Closing balance 453,709 22,525 69,412 1,454,828 39,954 2,040,428
Accumulated depreciation
Opening balance 35,162 6,157 15,967 246,934 13,282 317,502
Charge for the year 21,563 5,504 13,704 143,686 5,702 190,159
Transfer to long-term prepayments (130) - - (1,590) - (1,720)
Disposals (2,901) - (896) (7,145) (365) (11,307)
Written-off (135) - (125) (1,257) - (1,517)
Reclassifications 398 - (1,858) 1,456 4 -
Closing balance 53,957 11,661 26,792 382,084 18,623 493,117
Net book value
Opening balance 209,334 15,405 22,950 613,329 18,181 879,199
Closing balance 399,752 10,864 42,620 1,072,744 21,331 1,547,311

Annual Report 2012 111
FINANCIAL report
For the year ended 31 December 2012 Form B 09 - DN
Included in the cost of tangible fixed assets were assets costing VND71,270 million which were fully depreciated as of 31 December 2012 (31/12/2011: VND39,221 million), but which are still in active use.
The carrying amount of tangible fixed assets retired from active use and held for disposal amounted to VND24,138 million as of 31 December 2012 (31/12/2011: VND23,946 million).
The carrying amount of temporarily idle equipment in tangible fixed assets amounted to VND35,556 million as of 31 December 2012 (31/12/2011: VND7,914 million).
As at 31 December 2012, tangible fixed assets with a carrying value of VND613,304 million (31/12/2011: VND312,378 million) were pledged with banks as security for loans granted to the subsidiaries.
Company:
leasehold improvements
Office equipment total
VND million VND million VND million
Cost
Opening balance 14,896 1,623 16,519
Additions 187 992 1,179
Closing balance 15,083 2,615 17,698
Accumulated depreciation
Opening balance 1,830 372 2,202
Depreciation for the year 3,158 631 3,789
Closing balance 4,988 1,003 5,991
Net book value
Opening balance 13,066 1,251 14,317
Closing balance 10,095 1,612 11,707
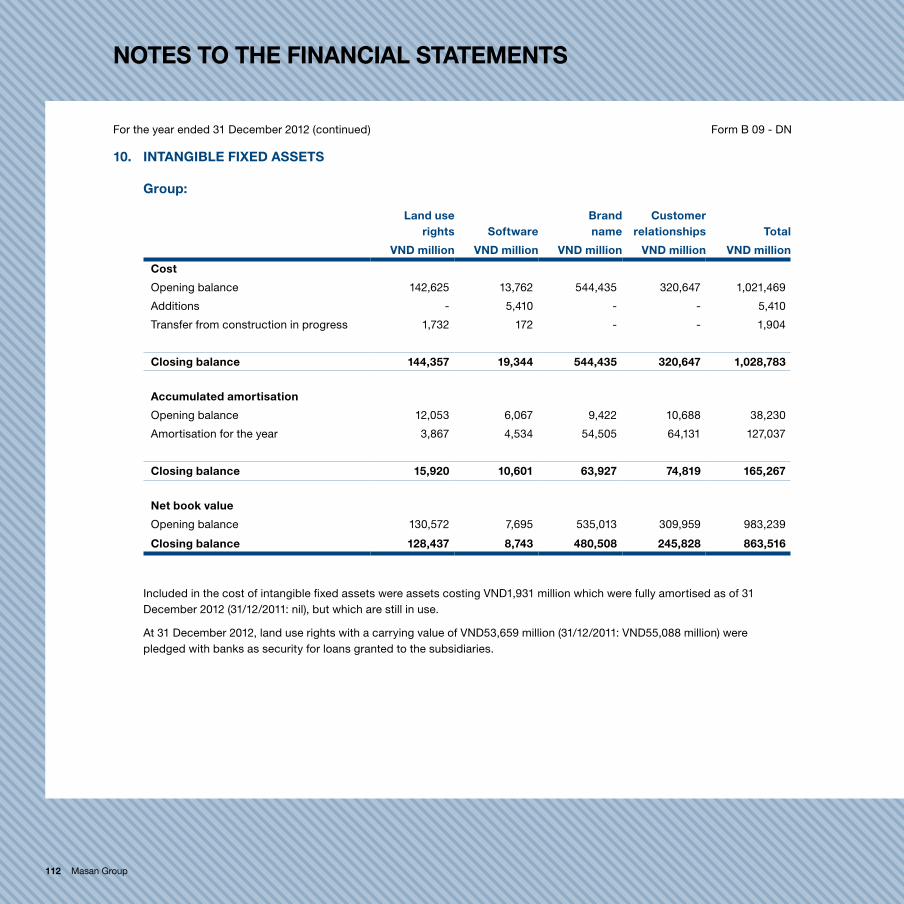
112 Masan Group
Notes to the fiNaNcial statemeNts
For the year ended 31 December 2012 (continued) Form B 09 - DN
10. iNtANGiBle fiXeD ASSetS
Group:
land use rights Software
Brandname
Customer relationships total
VND million VND million VND million VND million VND million
Cost
Opening balance 142,625 13,762 544,435 320,647 1,021,469
Additions - 5,410 - - 5,410
Transfer from construction in progress 1,732 172 - - 1,904
Closing balance 144,357 19,344 544,435 320,647 1,028,783
Accumulated amortisation
Opening balance 12,053 6,067 9,422 10,688 38,230
Amortisation for the year 3,867 4,534 54,505 64,131 127,037
Closing balance 15,920 10,601 63,927 74,819 165,267
Net book value
Opening balance 130,572 7,695 535,013 309,959 983,239
Closing balance 128,437 8,743 480,508 245,828 863,516
Included in the cost of intangible fixed assets were assets costing VND1,931 million which were fully amortised as of 31 December 2012 (31/12/2011: nil), but which are still in use.
At 31 December 2012, land use rights with a carrying value of VND53,659 million (31/12/2011: VND55,088 million) were pledged with banks as security for loans granted to the subsidiaries.
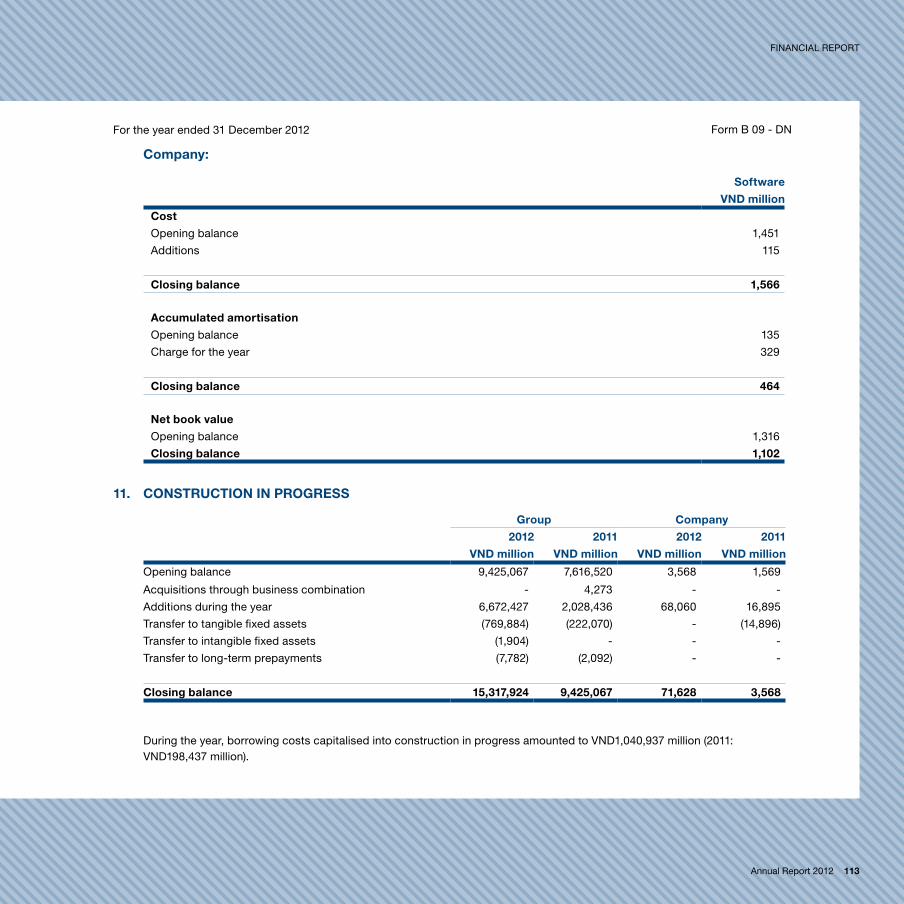
Annual Report 2012 113
FINANCIAL report
For the year ended 31 December 2012 Form B 09 - DN
Company:
Software
VND million
Cost
Opening balance 1,451
Additions 115
Closing balance 1,566
Accumulated amortisation
Opening balance 135
Charge for the year 329
Closing balance 464
Net book value
Opening balance 1,316
Closing balance 1,102
11. CONStRUCtiON iN PROGReSS
Group Company
2012 2011 2012 2011
VND million VND million VND million VND million
Opening balance 9,425,067 7,616,520 3,568 1,569
Acquisitions through business combination - 4,273 - -
Additions during the year 6,672,427 2,028,436 68,060 16,895
Transfer to tangible fixed assets (769,884) (222,070) - (14,896)
Transfer to intangible fixed assets (1,904) - - -
Transfer to long-term prepayments (7,782) (2,092) - -
Closing balance 15,317,924 9,425,067 71,628 3,568
During the year, borrowing costs capitalised into construction in progress amounted to VND1,040,937 million (2011: VND198,437 million).

114 Masan Group
Notes to the fiNaNcial statemeNts
For the year ended 31 December 2012 (continued) Form B 09 - DN
12. iNVeStMeNtS
Group Company
31/12/2012 31/12/2011 31/12/2012 31/12/2011
VND million VND million VND million VND million
long-term investments
Investments in subsidiaries - - 12,490,634 10,557,997
Investment in associates (a) 10,948,119 9,321,085 8,932,424 8,932,424
Other long-term investments (b) 365,500 - - -
11,313,619 9,321,085 21,423,058 19,490,421
Short-term investments
Short-term investments in bonds (c) - 373,000 - 373,000
Term deposits to banks (c) 1,840,500 849,500 68,000 -
1,840,500 1,222,500 68,000 373,000
Details of the Company’s investments in subsidiaries are as follows:
31/12/2012 31/12/2011
VND million VND million
Ma San Consumer Corporation 10,333,461 8,400,824
Hoa Bang Lang Consultant Company Limited 516,600 516,600
Orchid Consultant Company Limited 441,200 441,200
Ma San Horizon Corporation 1,199,373 1,199,373
12,490,634 10,557,997
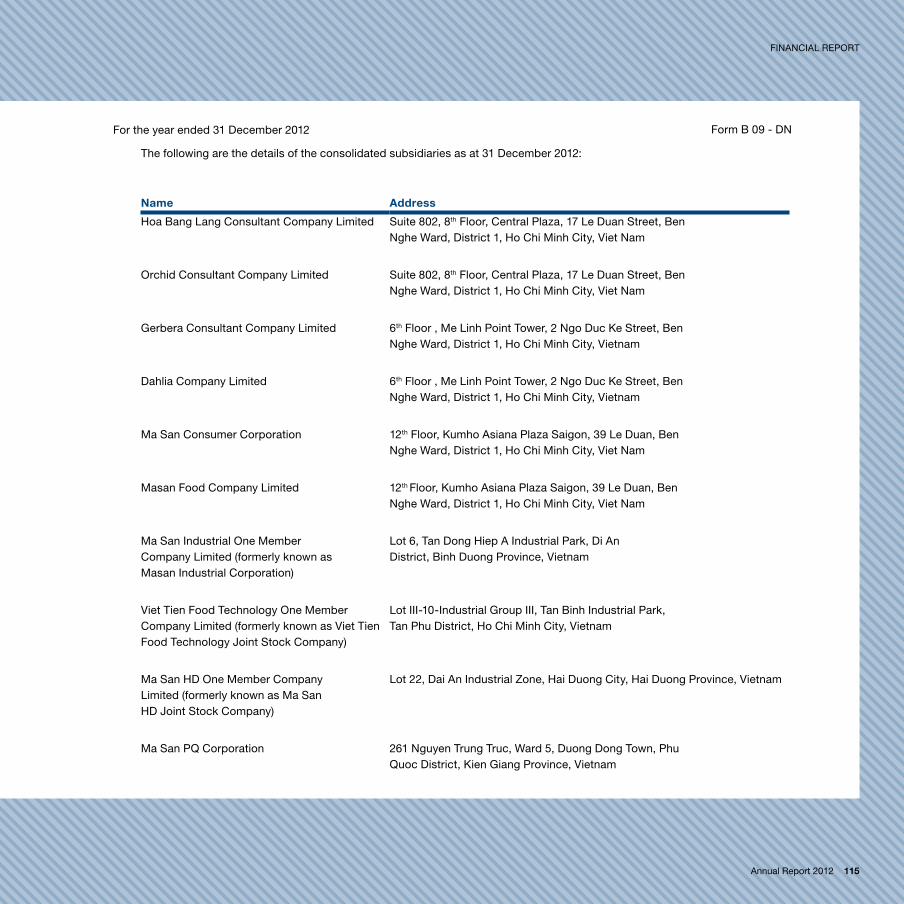
Annual Report 2012 115
FINANCIAL report
For the year ended 31 December 2012 Form B 09 - DN
The following are the details of the consolidated subsidiaries as at 31 December 2012:
Name Address
Hoa Bang Lang Consultant Company Limited Suite 802, 8th Floor, Central Plaza, 17 Le Duan Street, Ben Nghe Ward, District 1, Ho Chi Minh City, Viet Nam
Orchid Consultant Company Limited Suite 802, 8th Floor, Central Plaza, 17 Le Duan Street, Ben Nghe Ward, District 1, Ho Chi Minh City, Viet Nam
Gerbera Consultant Company Limited 6th Floor , Me Linh Point Tower, 2 Ngo Duc Ke Street, Ben Nghe Ward, District 1, Ho Chi Minh City, Vietnam
Dahlia Company Limited 6th Floor , Me Linh Point Tower, 2 Ngo Duc Ke Street, Ben Nghe Ward, District 1, Ho Chi Minh City, Vietnam
Ma San Consumer Corporation 12th Floor, Kumho Asiana Plaza Saigon, 39 Le Duan, Ben Nghe Ward, District 1, Ho Chi Minh City, Viet Nam
Masan Food Company Limited 12th Floor, Kumho Asiana Plaza Saigon, 39 Le Duan, Ben Nghe Ward, District 1, Ho Chi Minh City, Viet Nam
Ma San Industrial One Member Company Limited (formerly known as Masan Industrial Corporation)
Lot 6, Tan Dong Hiep A Industrial Park, Di An District, Binh Duong Province, Vietnam
Viet Tien Food Technology One Member Company Limited (formerly known as Viet Tien Food Technology Joint Stock Company)
Lot III-10-Industrial Group III, Tan Binh Industrial Park, Tan Phu District, Ho Chi Minh City, Vietnam
Ma San HD One Member Company Limited (formerly known as Ma San HD Joint Stock Company)
Lot 22, Dai An Industrial Zone, Hai Duong City, Hai Duong Province, Vietnam
Ma San PQ Corporation 261 Nguyen Trung Truc, Ward 5, Duong Dong Town, Phu Quoc District, Kien Giang Province, Vietnam
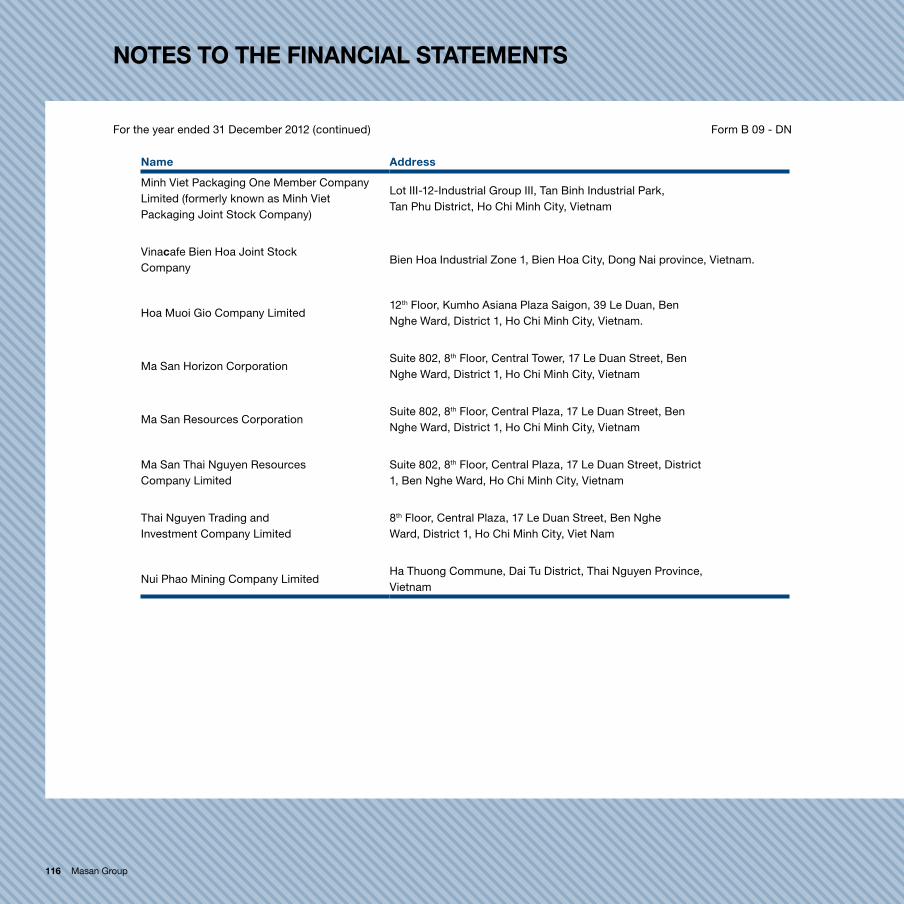
116 Masan Group
Notes to the fiNaNcial statemeNts
For the year ended 31 December 2012 (continued) Form B 09 - DN
Name Address
Minh Viet Packaging One Member Company Limited (formerly known as Minh Viet Packaging Joint Stock Company)
Lot III-12-Industrial Group III, Tan Binh Industrial Park, Tan Phu District, Ho Chi Minh City, Vietnam
Vinacafe Bien Hoa Joint Stock Company
Bien Hoa Industrial Zone 1, Bien Hoa City, Dong Nai province, Vietnam.
Hoa Muoi Gio Company Limited12th Floor, Kumho Asiana Plaza Saigon, 39 Le Duan, Ben Nghe Ward, District 1, Ho Chi Minh City, Vietnam.
Ma San Horizon CorporationSuite 802, 8th Floor, Central Tower, 17 Le Duan Street, Ben Nghe Ward, District 1, Ho Chi Minh City, Vietnam
Ma San Resources CorporationSuite 802, 8th Floor, Central Plaza, 17 Le Duan Street, Ben Nghe Ward, District 1, Ho Chi Minh City, Vietnam
Ma San Thai Nguyen Resources Company Limited
Suite 802, 8th Floor, Central Plaza, 17 Le Duan Street, District 1, Ben Nghe Ward, Ho Chi Minh City, Vietnam
Thai Nguyen Trading and Investment Company Limited
8th Floor, Central Plaza, 17 Le Duan Street, Ben Nghe Ward, District 1, Ho Chi Minh City, Viet Nam
Nui Phao Mining Company LimitedHa Thuong Commune, Dai Tu District, Thai Nguyen Province,Vietnam

Annual Report 2012 117
FINANCIAL report
For the year ended 31 December 2012 Form B 09 - DN
(a) Investment in associates
Details of the investments in associates are as follows:
Group Company
31/12/2012 31/12/2011 31/12/2012 31/12/2011
VND million VND million VND million VND million
Vietnam Technological and Commercial Joint Stock Bank (“Techcombank”) (*)
8,980,732 9,321,085 8,932,424 8,932,424
Vietnamese French Cattle Feed Joint Stock Company (“Proconco”) (**)
1,967,387 - - -
10,948,119 9,321,085 8,932,424 8,932,424
(*) On 4 September 2012, the Group’s effective economic interest in Techcombank was diluted from 30.61% to 30.44% (31/12/2011: 30.61%) as a result of the issuance of additional shares by Techcombank. The Group’s effective economic interest includes 15.68% through direct equity interest and 14.76% through 10 year convertible bonds issued by Techcombank which the Company has agreed to irrevocably and mandatorily convert during the conversion period of the convertible bonds, subject to regulatory and other customary approvals.
(**) During the year, Hoa Muoi Gio Company Limited (“HMG”), a wholly owned subsidiary of Ma San Consumer Corporation, acquired 40% of the equity interests in Proconco from two funds named Prudential Vietnam Assurance Private Limited and PCA International Funds SPC. The Group holds 32.32% of the effective equity interest in Proconco as of 31 December 2012.
(b) Other long-term investments
Other long-term investments represent deposits with original terms to maturity of more than twelve months from their transaction dates. The term deposits are denominated in Vietnam Dong and earned interest ranging from 11% to 14% per annum during the year (31/12/2011: N/A).
(c) Short-term investments
Term deposits to banks represent deposits with original terms to maturity of more than three months from their transaction dates. The term deposits are denominated in Vietnam Dong and earned interest from 8% to 12% per annum during the year (2011: 14%).

118 Masan Group
Notes to the fiNaNcial statemeNts
For the year ended 31 December 2012 (continued) Form B 09 - DN
(d) Transactions in subsidiaries in 2012 – transactions with non - controlling interests
(i) Issuance of shares to certain employees
On 15 May 2012, Ma San Consumer Corporation (“MSC”), a subsidiary, issued shares to certain employees, resulting in the following effects:
VND million
Shares issued at par not subscribed by the Group 12,500
Net assets diluted (34,947)
Difference recorded in other reserves (22,447)
(ii) Acquisition of minority interests in a subsidiary
On 26 December 2012, the Company acquired additional 4.64% economic interest in MSC for VND1,932,637 million in cash consideration, resulting in the following effects:
VND million
Cost of acquisition (1,932,637)
Net assets acquired 491,929
Difference recorded in other reserves (1,440,708)

Annual Report 2012 119
FINANCIAL report
For the year ended 31 December 2012 Form B 09 - DN
(iii) Acquisition of minority interests in Vinacafe Bien Hoa Joint Stock Company
During the year, the Group’s effective interest in Vinacafe Bien Hoa Joint Stock Company (“Vinacafe”) increased from 38.4%
to 43% as a result of further acquisitions of equity interest for a total consideration of VND 122,044 million:
All acquisitions were done through a subsidiary, Ma San Consumer Corporation, and all purchase considerations were paid in cash.
Such acquisitions resulted in the following effects:
VND million
Cost of acquisition (122,044)
Net assets acquired 48,380
(73,664)
Difference attributable to minority interests 17,556
Difference recorded in other reserves (56,108)
Other reserves movements were as follows:
VND million
Balance at 1 january 2012 (6,569,981)
Decrease in minority interests in MSC (1,463,155)
Decrease in minority interests in a subsidiary of MSC (56,108)
Equity instruments repurchased (Note 24(c)) (530,235)
Balance at 31 December 2012 (8,619,479)
120 Masan Group
Notes to the fiNaNcial statemeNts
For the year ended 31 December 2012 (continued) Form B 09 - DN
(e) Transactions in subsidiaries in 2011
(i) Transactions with non-controlling interests in Ma San Consumer Corporation
On 7 April 2011, Kohlberg Kravis Roberts & Co. L.P. (“KKR”) through its company named MC Holdings II (Cayman) Limited subscribed for new shares issued by Ma San Consumer Corporation (“MSC”) equivalent to 10% of its outstanding shares on that date for VND3,327,552 million.
In connection with this issuance, the Company entered into an agreement with the investor wherein if the equity valuation of MSC based on a multiple of 16 times 2011 earnings does not meet the agreed initial entry valuation of MSC, the Company will transfer a certain number of its MSC shares to the investor to achieve an effective entry valuation of 16 times 2011 earnings. In addition, if the 2011-2013 growth rate of MSC’s earnings is below the agreed internal return rate at 20% in VND or 15% in USD at the Company’s discretion, the Company will also transfer a certain number of its MSC shares to the investor. The Earning Adjustments and IRR Adjustments are contingent consideration.
Within 6 years from the closing date, if MSC has not completed a qualified initial public offering, as defined in the agreement, the investor has the option to put its MSC shares for the Company’s shares within a certain period. If the investor does not exercise its put option during the put option period, the Company can call the MSC shares from the investor for a period of one year after the end of the put option period for cash or the Company’s shares or 50% of each at a pre-agreed valuation to the investor.
(ii) Transactions with non-controlling interests in Ma San Resources Corporation
On 16 March 2011, Mount Kellett Capital Management LP through its company named MRC Limited subscribed for new Ma San Resources Corporation (“MR”) shares for a cash consideration of USD100 million, equivalent to VND2,059,120 million. The investor obtained 20% interest in MR. As part of this transaction, the Group invested VND487,500 million in MR for new ordinary shares, overall resulting in the dilution of the Group’s interest in MR from 80% to 65%. The Company also granted the investor an option to put its 20% ownership in MR to the Company for the Company’s shares in the event MR is not listed within 4.5 years after the closing of the transaction. The amount of shares to be issued in the event the put option is exercised will be based on the trading price of the Company’s shares and an amount of shares that would allow the investor to generate a 15% annual internal rate of return, based on the USD invested amount.
(f) Swap agreements entered into in 2010
MSC swap agreement – As part of acquiring additional 16% economic interest in MSC in 2010, the Company entered into a swap agreement with the seller. The swap agreement allows the Company to receive from zero up to VND2,609,503 million in cash in 3.5 years based on the performance of MSC from year 2011 to 2013. The amount receivable in the swap varies according to MSC’s profit. The amount receivable in the swap varies according to MSC’s earnings and earnings growth, kept within a range of VND1,538 billion to VND2,000 billion. The amount receivable under this swap is a contingent asset and no value has been recorded as it is not virtually certain of receipt. In the event that the Company unwind the swap agreement before maturity, the swap shall have nil value.

Annual Report 2012 121
FINANCIAL report
For the year ended 31 December 2012 Form B 09 - DN
13. lONG-teRM PRePAyMeNtS
Group:
VND million
Pre-operating expenses
Prepaid land
costsPrinting
axlestools and
suppliesBorrowing
feesinsurance
feesWebsite
fees total
Opening balance 56,796 2,346 610 3,419 6,720 17,495 680 88,066
Additions - - 3,377 5,634 20,625 28,123 - 57,759
Transfer from construction in progress - - - 7,782 - - - 7,782
Transfer from tangible fixed assets - - - 6,959 - - - 6,959
Transfer to short-term prepayments - - - (1,453) - (6,002) - (7,455)
Amortisation for the year - (60) (3,232) (6,464) (6,135) (39,616) (544) (56,051)
Closing balance 56,796 2,286 755 15,877 21,210 - 136 97,060
Company:
VND millionBorrowing
feesWebsite
fees total
Opening balance 6,720 680 7,400
Additions 20,625 - 20,625
Amortisation for the year (6,135) (544) (6,679)
Closing balance 21,210 136 21,346
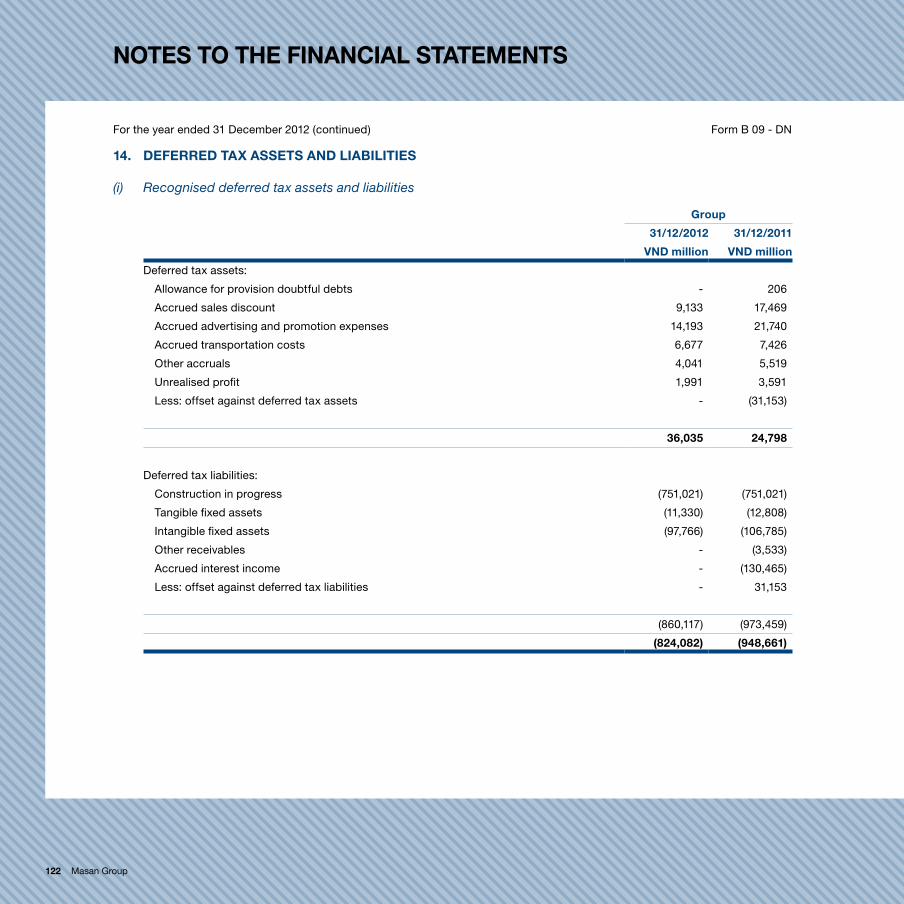
122 Masan Group
Notes to the fiNaNcial statemeNts
For the year ended 31 December 2012 (continued) Form B 09 - DN
14. DefeRReD tAX ASSetS AND liABilitieS
(i) Recognised deferred tax assets and liabilities
Group
31/12/2012 31/12/2011
VND million VND million
Deferred tax assets:
Allowance for provision doubtful debts - 206
Accrued sales discount 9,133 17,469
Accrued advertising and promotion expenses 14,193 21,740
Accrued transportation costs 6,677 7,426
Other accruals 4,041 5,519
Unrealised profit 1,991 3,591
Less: offset against deferred tax assets - (31,153)
36,035 24,798
Deferred tax liabilities:
Construction in progress (751,021) (751,021)
Tangible fixed assets (11,330) (12,808)
Intangible fixed assets (97,766) (106,785)
Other receivables - (3,533)
Accrued interest income - (130,465)
Less: offset against deferred tax liabilities - 31,153
(860,117) (973,459)
(824,082) (948,661)

Annual Report 2012 123
FINANCIAL report
For the year ended 31 December 2012 Form B 09 - DN
(ii) Movement in temporary difference during the year
31/12/2011Recognised
in income 31/12/2012
VND million VND million VND million
Allowance for provision doubtful debts 206 (206) -
Accrued sales discount 17,469 (8,336) 9,133
Accrued advertising and promotion expenses 21,740 (7,547) 14,193
Accrued transportation costs 7,426 (749) 6,677
Other accruals 5,519 (1,478) 4,041
Unrealised profit 3,591 (1,600) 1,991
Construction in progress (751,021) - (751,021)
Tangible fixed assets (12,808) 1,478 (11,330)
Intangible fixed assets (106,785) 9,019 (97,766)
Other receivables (3,533) 3,533 -
Accrued interest income (130,465) 130,465 -
(948,661) 124,579 (824,082)
(iii) Unrecognised deferred tax assets
Deferred tax assets have not been recognised in respect of the following items:
Group Company
31/12/2012 31/12/2011 31/12/2012 31/12/2011
VND million VND million VND million VND million
Other accruals 27,768 - 27,768 -
Tax losses 102,185 58,760 79,982 53,630
129,953 58,760 107,750 53,630
The deductible temporary differences do not expire under current tax legislation. Tax losses expire in five years from the year of occurrence. Deferred tax assets have not been recognised in respect of these items because it is not probable that future taxable profit will be available against which the Group and the Company can utilise the benefits therefrom.
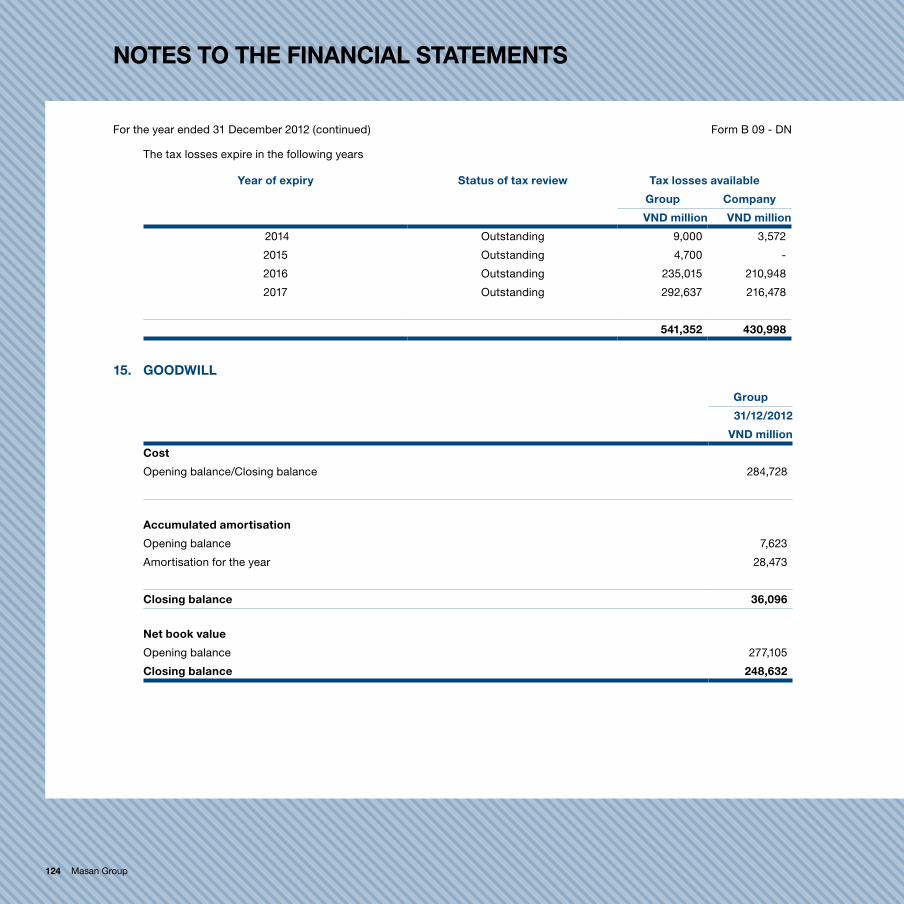
124 Masan Group
Notes to the fiNaNcial statemeNts
For the year ended 31 December 2012 (continued) Form B 09 - DN
The tax losses expire in the following years
year of expiry Status of tax review tax losses available
Group Company
VND million VND million
2014 Outstanding 9,000 3,572
2015 Outstanding 4,700 -
2016 Outstanding 235,015 210,948
2017 Outstanding 292,637 216,478
541,352 430,998
15. GOODWill
Group
31/12/2012
VND million
Cost
Opening balance/Closing balance 284,728
Accumulated amortisation
Opening balance 7,623
Amortisation for the year 28,473
Closing balance 36,096
Net book value
Opening balance 277,105
Closing balance 248,632

Annual Report 2012 125
FINANCIAL report
For the year ended 31 December 2012 Form B 09 - DN
16. ShORt-teRM BORROWiNGS AND liABilitieS
Group Company
31/12/2012VND million
31/12/2011VND million
31/12/2012VND million
31/12/2011VND million
Short-term borrowings 1,540,393 1,298,728 - 2,000,000
Current portion of long-term borrowings (see Note 20) 252,991 733,669 - 630,000
1,793,384 2,032,397 - 2,630,000
Terms and conditions of outstanding short-term borrowings were as follows:
Group Company
Annual 31/12/2012 31/12/2011 31/12/2012 31/12/2011
Currency interest rate VND million VND million VND million VND million
Short-term borrowings
Secured bank loans VND 8.2%-13% 1,540,393 815,822 - -
Secured bank loans USD 6.5% - 1,536 - -
Unsecured bank loans VND 15.7%-18% - 481,370 - -
Unsecured loan from a subsidiary VND 15% - 18%
- - - 2,000,000
1,540,393 1,298,728 - 2,000,000
As at 31 December 2012, the bank loans were secured by the following assets of the Group:
(i) Inventories and trade receivables with a carrying amount of USD26.25 million, equivalent to VND546,000 million (31/12/2011: USD5 million, equivalent to VND104,140 million).
(ii) Fixed assets with a carrying value of VND666,963 million (31/12/2011: VND367,466 million). Part of these fixed assets with carrying value of VND632,006 million (31/12/2011: VND310,560 million) was also used as security for long term borrowings and accordingly, included in the amount of security disclosed in Note 20.
During the year, the Company entered into an agreement with a subsidiary to extend the maturity of the VND2,000 billion loan from that subsidiary from twelve months to four years, and accordingly, has reclassified the amount to a long-term loan.
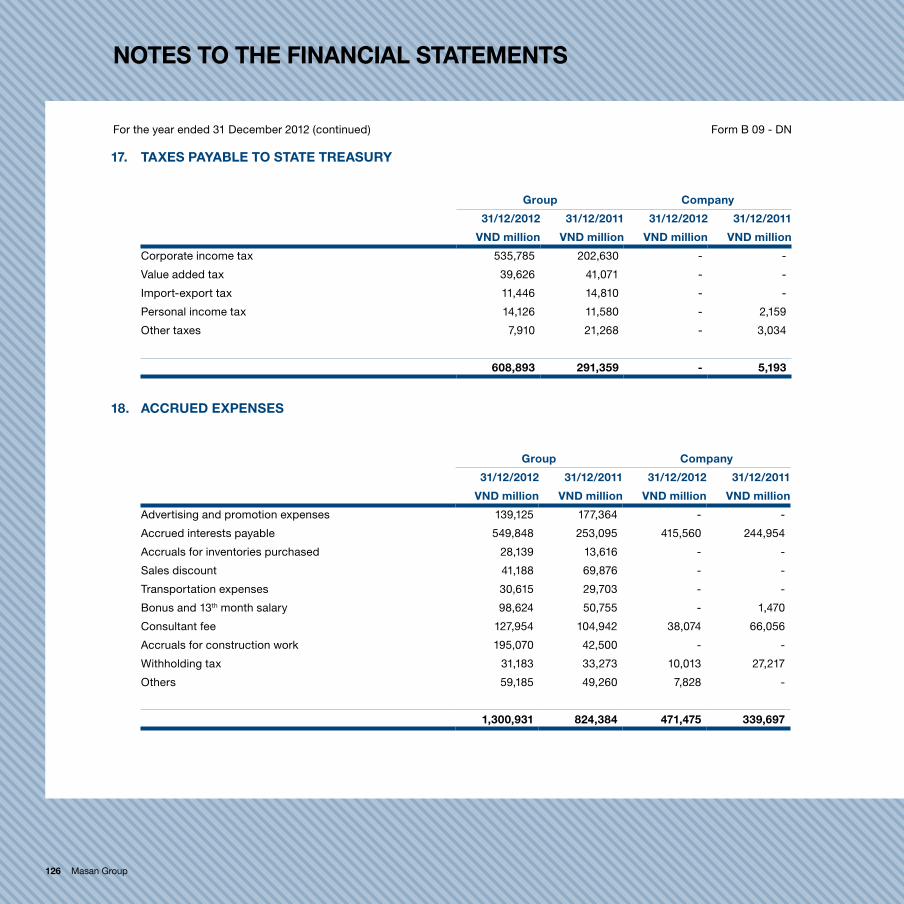
126 Masan Group
Notes to the fiNaNcial statemeNts
For the year ended 31 December 2012 (continued) Form B 09 - DN
17. tAXeS PAyABle tO StAte tReASURy
Group Company
31/12/2012 31/12/2011 31/12/2012 31/12/2011
VND million VND million VND million VND million
Corporate income tax 535,785 202,630 - -
Value added tax 39,626 41,071 - -
Import-export tax 11,446 14,810 - -
Personal income tax 14,126 11,580 - 2,159
Other taxes 7,910 21,268 - 3,034
608,893 291,359 - 5,193
18. ACCRUeD eXPeNSeS
Group Company
31/12/2012 31/12/2011 31/12/2012 31/12/2011
VND million VND million VND million VND million
Advertising and promotion expenses 139,125 177,364 - -
Accrued interests payable 549,848 253,095 415,560 244,954
Accruals for inventories purchased 28,139 13,616 - -
Sales discount 41,188 69,876 - -
Transportation expenses 30,615 29,703 - -
Bonus and 13th month salary 98,624 50,755 - 1,470
Consultant fee 127,954 104,942 38,074 66,056
Accruals for construction work 195,070 42,500 - -
Withholding tax 31,183 33,273 10,013 27,217
Others 59,185 49,260 7,828 -
1,300,931 824,384 471,475 339,697

Annual Report 2012 127
FINANCIAL report
For the year ended 31 December 2012 Form B 09 - DN
19. OtheR PAyABleS
Group Company
31/12/2012 31/12/2011 31/12/2012 31/12/2011
VND million VND million VND million VND million
Other short-term payables
Social and health insurance 226 1,002 - 12
Short-term deposits from customers 480 19,705 - -
Interest expenses payable to a subsidiary - - - 261,698
Others 43,624 13,552 - 2
44,330 34,259 - 261,712
Other long-term payables
Long-term payables 381,563 - 381,563 -
Other long-term payables to a subsidiary - - 1,432,596 256,195
Obligation to issue shares (Note 24(a)) 356,269 - 356,269 -
737,832 - 2,170,428 256,195
The long-term payables comprise the gross amount of interest relating to certain instruments described in Note 24(a), and were unsecured and payable every six months and every twelve months from the disbursement date of the instruments.
Other long-term payables of the Company to a subsidiary amounting to VND1,432,596 million (31/12/2011: VND256,195 million) comprise of interest expenses and facility fees related to the VND denominated long-term borrowings amounting to VND4,000,000 million and USD denominated long-term borrowing equivalent to VND2,246,400 million, respectively. The amounts are unsecured and payable on maturity of the principal amounts.
Obligation to issue shares represents the liability to issue an additional variable number of shares as noted in Note 24(a).

128 Masan Group
Notes to the fiNaNcial statemeNts
For the year ended 31 December 2012 (continued) Form B 09 - DN
20. lONG-teRM BORROWiNGS AND liABilitieS
Group Company
31/12/2012VND million
31/12/2011VND million
31/12/2012VND million
31/12/2011VND million
Long-term borrowings (a) 6,667,882 3,329,726 4,000,000 2,000,000
Promissory notes (b) 2,855,764 2,855,764 - -
Convertible bonds and loans (c) 1,176,522 1,957,960 1,176,522 1,957,960
Secured convertible bonds (d) 2,200,000 - 2,200,000 -
12,900,168 8,143,450 7,376,522 3,957,960
Repayable within twelve months (Note 16) (252,991) (733,669) - (630,000)
Repayable after twelve months 12,647,177 7,409,781 7,376,522 3,327,960
Terms and conditions of outstanding long-term borrowings and liabilities are as follows:
Group Company
Annual year of 31/12/2012 31/12/2011 31/12/2012 31/12/2011
Currency interest rate maturity VND millionVND millionVND millionVND million
a. long-term borrowings
Secured bank loans VND 9.6%-20% 2014-2020 2,397,355 1,080,302 - -
Secured bank loans USD 3.82%-10.15% 2014-2020 4,270,527 2,249,424 - -
Unsecured loan from a subsidiary
VND 13% 2016 - - 4,000,000 2,000,000

Annual Report 2012 129
FINANCIAL report
For the year ended 31 December 2012 Form B 09 - DN
Group Company
Annual year of 31/12/2012 31/12/2011 31/12/2012 31/12/2011
Currency interest rate maturity VND millionVND millionVND millionVND million
6,667,882 3,329,726 4,000,000 2,000,000
b. Promissory notes (b) VND 2016-2017 2,855,764 2,855,764 - -
c. Convertible bonds and loans issued to:
TPG (c.1) VND 15% 2012 - 630,000 - 630,000
International Finance Corporation
(c.2) VND 8.0%-20.4% 2014-2016 608,562 760,000 608,562 760,000
Jade Dragon (Mauritius) Limited
(c.3) USD 2%-6% 2015 567,960 567,960 567,960 567,960
1,176,522 1,957,960 1,176,522 1,957,960
d. Secured convertible bonds
VND 11.25%-15% 2016 2,200,000 - 2,200,000 -
(a) As at 31 December 2012, long-term borrowings comprised of:
(i) VND denominated loans amounting to VND418,597 million were secured over fixed assets with a carrying amount of VND632,006 million (31/12/2011: VND310,560 million).
(ii) VND denominated loan amounting to VND879,500 million was secured over proportionately existing and future assets and exploitation rights relating to Nui Phao mine. In addition, the Company has pledged 68,521,729 shares of Techcombank to further secure the loan.
(iii) VND denominated loan amounting to VND1,099,258 million and USD denominated loan amounting to VND360,127
130 Masan Group
Notes to the fiNaNcial statemeNts
For the year ended 31 December 2012 (continued) Form B 09 - DN
million were secured over proportionately existing and future assets and exploitation rights relating to Nui Phao mine. In addition, the Company has pledged 69,321,837 shares of Techcombank to further secure the loan.
(iv) USD denominated loan from Standard Chartered Bank (Viet Nam) Limited amounting to VND1,664,000 million was secured over 275,748,141 shares held by Ma San Horizon in Ma San Resources Corporation and VND5,087,836 million charter capital held by Ma San Resources Corporation in Ma San Thai Nguyen Resources Company Limited. The facility is also guaranteed by the Company.
(v) USD denominated loan from J.P. Morgan amounting to VND2,246,400 million bear interest at LIBOR plus 3.5% per annum during the first year, LIBOR plus 7% per annum during the second year and LIBOR plus 10% per annum during the third year after draw down. The outstanding balance at 31 December 2012 is repayable in one instalment on the termination date.
The Group has the option to extend the loan after twelve, eighteen, twenty four and thirty months upon payment of an extension fee amounting to VND56,797 million for each extension. The facility is available for thirty-six months.
At 31 December 2012, Ma San Consumer Company’s investments in subsidiaries with carrying value of VND879,023 million (31/12/2011: VND679,023 million) and in associate were pledged as security for this loan.
As at 31 December 2012, long-term borrowings of the Company comprised two unsecured VND loans from a subsidiary amounting to VND4,000,000 million which were unsecured and bore interest at 13% per annum. The loans mature in 4 and 5 years from the drawdown dates, respectively. The principals and interest are payable on the dates of maturity.
(b) Promissory notes are payable on 23 September 2016 and 23 September 2017 for VND237,980 million and VND2,617,784 million, respectively, in relation to the acquisition of Nui Phao Mining Company Limited (“NPM”) from the funds and companies managed and/or owned by Dragon Capital Group Limited (collectively, “Dragon Capital”) in 2010. These promissory notes were issued as consideration for the acquisition of NPM.
In addition to the promissory notes above, the Group has issued several instruments as part of the cost of acquisition. Below are the financial details and key commercial terms of the instruments issued. These instruments have not been recognised in the financial statements.
(i) Company primary share option - the Company granted Dragon Capital an option to purchase VND1,962,320 million worth of the Company shares at a price of VND65,915 per share, equalling 29,770,465 shares of the Company. The option can be exercised in cash or by extinguishing the promissory notes, at the discretion of the Dragon Capital. Dragon Capital shall have the right to exercise the option for the period commencing on the third anniversary following 23 September 2010 until the fifth anniversary. The Company is able to require conversion anytime after the Company’s share price reaches VND65,915 for 15 consecutive days, upon which the Company can either pay the promissory notes issued to Dragon Capital or require Dragon Capital to exercise the option.
(ii) MR ownership adjustment - the Group has entered into an agreement with Dragon Capital in which the Group will give Dragon Capital up to 12% (31/12/2011: 12%) of its interest in MR if the prices of tungsten-related products or commodities increase above the agreed set of ranges. In return, Dragon Capital will give the Group up to 4% (31/12/2011: 4%) of its interest in MR if the prices of tungsten-related products or commodities decrease below the agreed set of ranges. The option can be exercised at no cost during the 15 days following the availability of NPM’s audited financial statements for the year after the year that NPM produces more than 300,000 metric ton units of contained tungsten trioxide. Any potential adjustment in the shareholding of MR will be included in the call option and put options as described below, without any adjustments to the cost of the exercise prices of such options.
Annual Report 2012 131
FINANCIAL report
For the year ended 31 December 2012 Form B 09 - DN
(iii) MR call and put options – Dragon Capital has granted the Group a call option to purchase 100% of its shares in MR in cash within three years of the option date, which will increase its economic interest in MR from 65% to 80%. The exercise prices are defined on a quarterly basis over the three year period and ranged from VND1,164,320 million to VND1,710,000 million. In return, the Company has granted Dragon Capital put option to put 100% of its shares in MR for the primary shares of the Company based on a valuation of VND1,710,000 million during the period of one month after the lapse of the above three year period at VND65,915 per share.
(c.1) The long-term bonds issued to TPG consist of (i) three convertible bonds, with a principal of VND180,000 million each, entered into with TPG Star Masan, Limited, TPG Star Masan II, Limited and TPG Star Masan III, Limited (collectively “TPG”); and (ii) a convertible bond with a principal of VND90,000 million entered into with TPG Star Masan, Limited.
Interest was charged at 15% per annum, compounded annually and payable on redemption of the bond. Interest is not payable if the conversion option is exercised. In June 2012, the bonds were fully converted into 30,922,285 shares issued by the Company.
(c.2) This loan represents a convertible loan, with a principal of VND608,562 million (31/12/2011: VND760,000 million), entered into with International Finance Corporation (“IFC”), wherein VND38,562 million (31/12/2011: VND190,000 million) is convertible to the Company’s shares.
Among others the agreement provides for the following:
(i) Interest is charged at 8% per annum from disbursement date to 15 April 2012 and at 20.4% per annum from 15 April 2012 to the maturity date for the convertible portion. Interest is charged at 20.4% per annum for the non-convertible portion from 15 April 2012 to 15 April 2016. The loan matures on 15 April 2016. The Group has accrued interest based on the nominal interest rates.
(ii) IFC can exercise the option to convert VND190,000 million, at the maximum, of the principal amount and require the Company to list those converted shares. There are two available period for conversion: the first option period is the period commencing the date falling 12 months after 11 May 2010 and ending on the date falling 36 months after 31 May 2010, the second option period is the period commencing from the date falling thirty six months after 11 May 2010 and ending on 15 April 2016. Interest shall continue to accrue and payment premium remains payable on the convertible loan if IFC does not exercise its conversion option during the first option period. IFC exercised the option to convert VND151,438 million into 3,521,803 shares issued by the Company in June 2012. At 31 December 2012, VND38,562 million remains available for conversion by IFC into 896,802 shares up to 15 April 2016.
(iii) Ma San Consumer Corporation guarantees this loan. The loan is secured by the Company’s 2,800,000 shares in Ma San Consumer Corporation.
(c.3) This loan from Goldman Sachs Group, Inc. through its company named Jade Dragon (Mauritius) Limited represents a USD-denominated convertible loan, with a principal amount of USD30 million.
132 Masan Group
Notes to the fiNaNcial statemeNts
For the year ended 31 December 2012 (continued) Form B 09 - DN
Among others, the agreement provides the following:
(i) The interest rate of this loan has two portions: nominal interest rate and deferred interest rate. Deferred interest is not payable if the loan is converted. During the period from 15 December 2010 to 14 December 2012 the nominal interest rate and deferred interest rate are 2% per annum and 6% per annum respectively. During the period from 15 December 2012 to 14 December 2013 the nominal interest rate and deferred interest rate are 4% per annum and 4% per annum respectively. During the period from 15 December 2013 to 14 December 2015 the nominal interest rate and deferred interest rate are 6% per annum and 2% per annum respectively. The loan matures on 14 December 2015. The nominal interest rate is compounded daily and the deferred interest rate is compounded annually.
(ii) The loan may be converted into shares by the lender at any time after two years from 15 December 2010 to the loan’s maturity date.
(iii) The conversion price was determined at VND65,000 per share.
(iv) The Group also separately entered into an arrangement with Ma San Corporation which undertakes the risks and obligations to subscribe to and pay a cash consideration of USD30 million plus the deferred interest for 9,000,000 shares under the convertible loan in the event that the lender does not exercise the conversion option.
(d) The VND2,200 billion bonds were secured against 22.3 million convertible bonds issued by Techcombank. VND1,500 billion of the bonds bear coupon of 15% per annum and VND700 billion of the bonds bear coupon of 15% per annum for the first 6 months. Thereafter, those bonds bear a coupon rate of 1% per annum plus the amalgated average 12 month deposit rates of selected major banks. The coupons are payable every six months from the disbursement date. The Company also issued options allowing the holder to convert the bonds or to subscribe for primary shares of the Company based on an initial strike price of VND 100,000 or VND 120,000 per share and subject to ratchet adjustments and other terms of the definitive agreements. However, the maximum number of shares to be issued will be 33.8 million.
During the year, the Company and the Group complied with the loan covenants on the above borrowings.
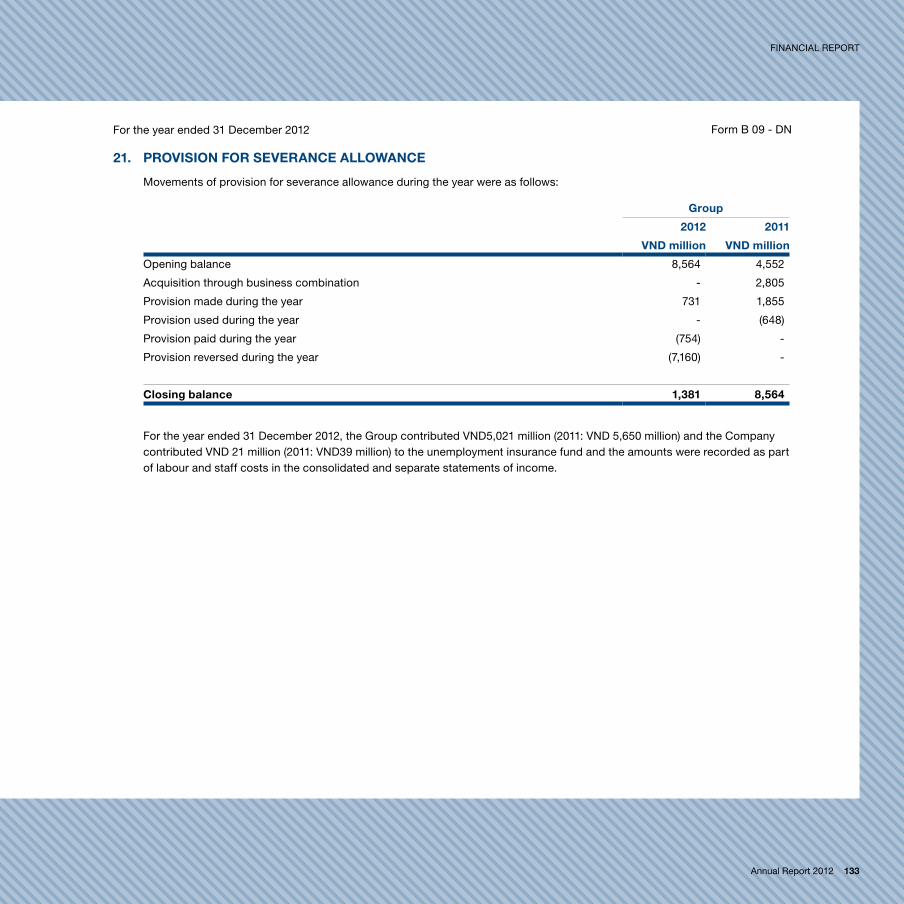
Annual Report 2012 133
FINANCIAL report
For the year ended 31 December 2012 Form B 09 - DN
21. PROViSiON fOR SeVeRANCe AllOWANCe
Movements of provision for severance allowance during the year were as follows:
Group
2012 2011
VND million VND million
Opening balance 8,564 4,552
Acquisition through business combination - 2,805
Provision made during the year 731 1,855
Provision used during the year - (648)
Provision paid during the year (754) -
Provision reversed during the year (7,160) -
Closing balance 1,381 8,564
For the year ended 31 December 2012, the Group contributed VND5,021 million (2011: VND 5,650 million) and the Company contributed VND 21 million (2011: VND39 million) to the unemployment insurance fund and the amounts were recorded as part of labour and staff costs in the consolidated and separate statements of income.

134 Masan Group
Notes to the fiNaNcial statemeNts
For the year ended 31 December 2012 (continued) Form B 09 - DN
22. ChANGe iN OWNeRS’ eQUity
Group:
Share
capital
Capital
surplus
Other
capital
foreign
exchange
differences
Other
reserves
Retained
profits
equity
attributable
to equity
holders of
Company
Minority
interests total
VND
million
VND
million
VND
million
VND
million
VND
million
VND
million
VND
million
VND
million
VND
million
Balance at 1 january 2011
5,152,723 2,166,136 9,651,713 3,189 (9,062,082) 2,712,006 10,623,685 1,524,803 12,148,488
Issuance of equity instruments
- - 811,091 - - - 811,091 - 811,091
Increase in minority interests from acquiring Vinacafe Bien Hoa Joint Stock Company
- - - - - - - 800,370 800,370
Increase in minority interests from share capital issued by subsidiaries
- - - - 2,492,101 - 2,492,101 2,837,079 5,329,180
Foreign exchange differences in a subsidiary
- - - (19,255) - - (19,255) (4,155) (23,410)
Net profit for the year - - - - - 1,973,149 1,973,149 522,859 2,496,008
Appropriation to bonus and welfare funds
- - - - - (5,119) (5,119) (1,576) (6,695)
Balance at 31 December 2011
5,152,723 2,166,136 10,462,804 (16,066) (6,569,981) 4,680,036 15,875,652 5,679,380 21,555,032
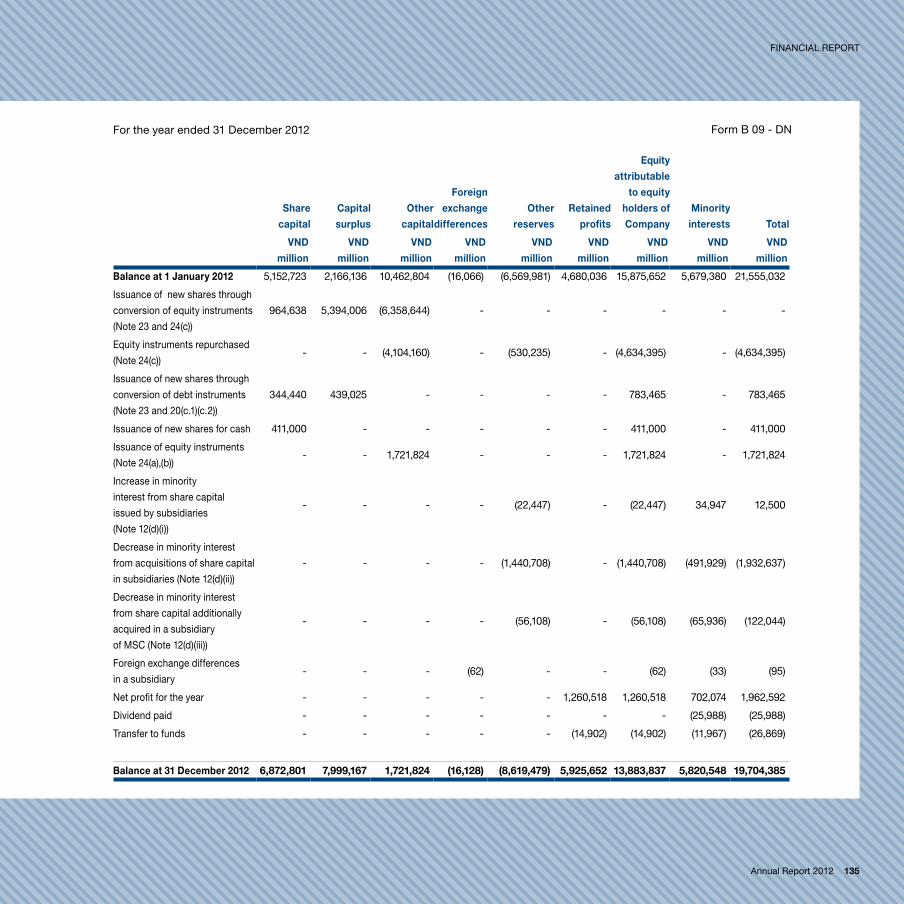
Annual Report 2012 135
FINANCIAL report
For the year ended 31 December 2012 Form B 09 - DN
Share
capital
Capital
surplus
Other
capital
foreign
exchange
differences
Other
reserves
Retained
profits
equity
attributable
to equity
holders of
Company
Minority
interests total
VND
million
VND
million
VND
million
VND
million
VND
million
VND
million
VND
million
VND
million
VND
million
Balance at 1 january 2012 5,152,723 2,166,136 10,462,804 (16,066) (6,569,981) 4,680,036 15,875,652 5,679,380 21,555,032
Issuance of new shares through
conversion of equity instruments
(Note 23 and 24(c))
964,638 5,394,006 (6,358,644) - - - - - -
Equity instruments repurchased
(Note 24(c))- - (4,104,160) - (530,235) - (4,634,395) - (4,634,395)
Issuance of new shares through
conversion of debt instruments
(Note 23 and 20(c.1)(c.2))
344,440 439,025 - - - - 783,465 - 783,465
Issuance of new shares for cash 411,000 - - - - - 411,000 - 411,000
Issuance of equity instruments
(Note 24(a),(b))- - 1,721,824 - - - 1,721,824 - 1,721,824
Increase in minority
interest from share capital
issued by subsidiaries
(Note 12(d)(i))
- - - - (22,447) - (22,447) 34,947 12,500
Decrease in minority interest
from acquisitions of share capital
in subsidiaries (Note 12(d)(ii))
- - - - (1,440,708) - (1,440,708) (491,929) (1,932,637)
Decrease in minority interest
from share capital additionally
acquired in a subsidiary
of MSC (Note 12(d)(iii))
- - - - (56,108) - (56,108) (65,936) (122,044)
Foreign exchange differences
in a subsidiary- - - (62) - - (62) (33) (95)
Net profit for the year - - - - - 1,260,518 1,260,518 702,074 1,962,592
Dividend paid - - - - - - - (25,988) (25,988)
Transfer to funds - - - - - (14,902) (14,902) (11,967) (26,869)
Balance at 31 December 2012 6,872,801 7,999,167 1,721,824 (16,128) (8,619,479) 5,925,652 13,883,837 5,820,548 19,704,385
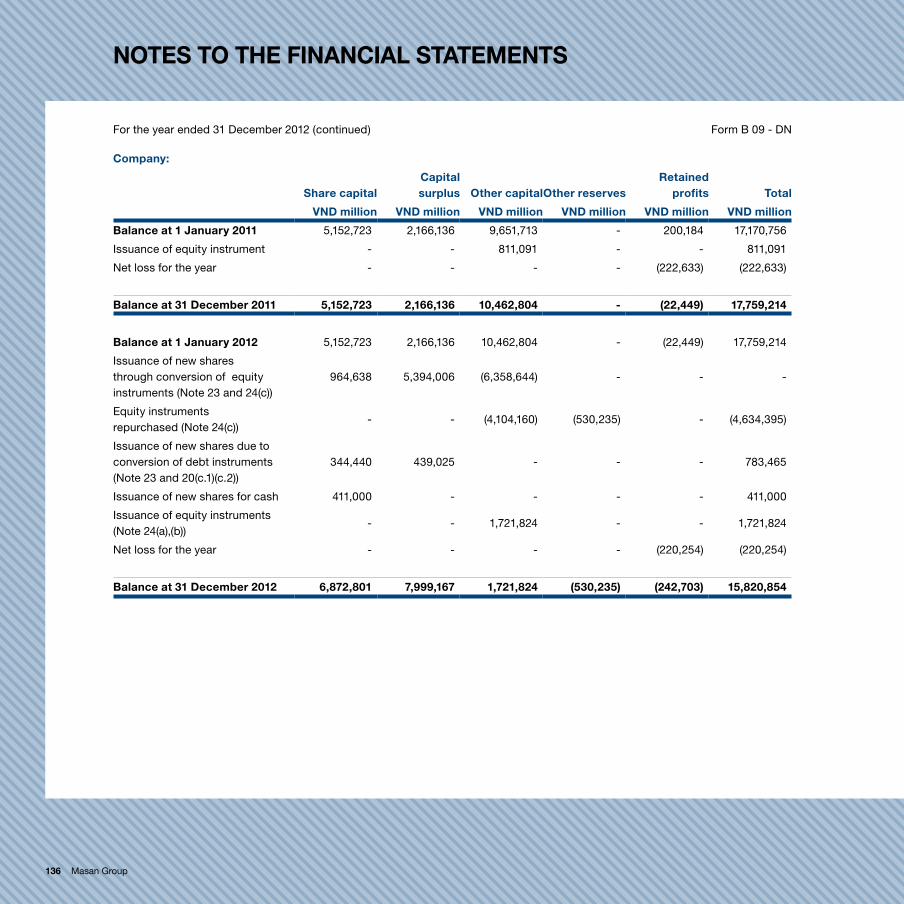
136 Masan Group
Notes to the fiNaNcial statemeNts
For the year ended 31 December 2012 (continued) Form B 09 - DN
Company:
Share capitalCapital surplus Other capitalOther reserves
Retained profits total
VND million VND million VND million VND million VND million VND million
Balance at 1 january 2011 5,152,723 2,166,136 9,651,713 - 200,184 17,170,756
Issuance of equity instrument - - 811,091 - - 811,091
Net loss for the year - - - - (222,633) (222,633)
Balance at 31 December 2011 5,152,723 2,166,136 10,462,804 - (22,449) 17,759,214
Balance at 1 january 2012 5,152,723 2,166,136 10,462,804 - (22,449) 17,759,214
Issuance of new shares through conversion of equity instruments (Note 23 and 24(c))
964,638 5,394,006 (6,358,644) - - -
Equity instruments repurchased (Note 24(c))
- - (4,104,160) (530,235) - (4,634,395)
Issuance of new shares due to conversion of debt instruments (Note 23 and 20(c.1)(c.2))
344,440 439,025 - - - 783,465
Issuance of new shares for cash 411,000 - - - - 411,000
Issuance of equity instruments (Note 24(a),(b))
- - 1,721,824 - - 1,721,824
Net loss for the year - - - - (220,254) (220,254)
Balance at 31 December 2012 6,872,801 7,999,167 1,721,824 (530,235) (242,703) 15,820,854

Annual Report 2012 137
FINANCIAL report
For the year ended 31 December 2012 Form B 09 - DN
23. ShARe CAPitAl AND CAPitAl SURPlUS
The Company’s authorised and issued share capital comprise:
31/12/2012 31/12/2011
Number of shares VND million
Number of shares VND million
Authorised share capital 687,280,123 6,872,801 515,272,269 5,152,723
issued share capital
Ordinary shares 687,280,123 6,872,801 515,272,269 5,152,723
Capital surplus - 7,999,167 - 2,166,136
All ordinary shares have a par value of VND10,000. Each share is entitled to one vote at meetings of the Company. Shareholders are entitled to receive dividends as declared from time to time. All ordinary shares are ranked equally with regard to the Company’s residual assets. In respect of shares bought back by the Company, all rights are suspended until those shares are reissued.
Capital surplus represents the excess of the proceeds on issuance of shares over the par value.
Movements in issued share capital during the year were as follows:
2012 2011
Number of shares
VND million
Number of shares
VND million
Balance at beginning of the year 515,272,269 5,152,723 515,272,269 5,152,723
Issuance of new shares through conversion of equity instruments
96,463,766 964,638 - -
Issuance of new shares through conversion of debt instruments
34,444,088 344,440 - -
Issuance of new shares for cash 41,100,000 411,000 - -
Balance at the end of the year 687,280,123 6,872,801 515,272,269 5,152,723

138 Masan Group
Notes to the fiNaNcial statemeNts
For the year ended 31 December 2012 (continued) Form B 09 - DN
24. OtheR CAPitAl
Other capital represents the fair value of the Company’s fixed number of shares to be issued at a future date.
Movements of other capital during the year were as follows:
2012 2011
Number of shares to be issued
VND million
Number of shares to be issued
VND million
Balance at beginning of the year 154,393,705 10,462,804 143,579,160 9,651,713
Issuance of equity instruments for acquisition of shares in Techcombank
- - 10,814,545 811,091
Issuance of equity instruments for cash:
� parent company credit support (a) 19,602,824 909,846 - -
� Mandatory convertible loan (b) 11,571,111 811,978 - -
Equity instruments repurchased (c) (57,929,939) (4,104,160) - -
Issuance of ordinary shares through conversion of equity instruments
(96,463,766) (6,358,644) - -
Balance at the end of the year 31,173,935 1,721,824 154,393,705 10,462,804
(a) Parent company credit support
During the year, the Company entered into convertible loan agreements for USD50 million (equivalent to VND1,041,400 million) with Richard Chandler Corporation through its company named Kairos Capital Limited and USD30 million (equivalent to VND624,840 million) with Mount Kellett Capital Management LP through its company named MRG Limited for a term of four years.
To enhance the creditworthiness of the Company and facilitate the financing transaction, the parent company also entered into arrangements with the Company and the lenders in which the parent company undertakes the risks and obligations to subscribe to the Conversion Shares and directly pay the principals and deferred interests to the lenders in the event that the lenders do not exercise the conversion option. The parent company did not receive any consideration or other benefits in return for such undertakings on behalf of the Company.

Annual Report 2012 139
FINANCIAL report
For the year ended 31 December 2012 Form B 09 - DN
Among others, the agreements provide the following:
(i) The convertible loans bear semi-annual coupons of 5% per annum in year one, 6% per annum in years two and three, and 7% per annum for the remaining term of the convertible loans. A deferred interest which would achieve an effective rate of return of 10% is payable if the conversion option is not exercised; and
(ii) The shares to be issued on conversion (“Conversion Shares”) shall be determined based on an initial conversion price of VND85,000 per share subject to other terms of the definitive agreements. However, the maximum number of Conversion Shares will be 25.6 million. The mandatorily issuable minimum number of Conversion Shares is 19.6 million, which is treated as an equity instrument.
(b) Mandatory convertible loan
During the year, the Company entered into mandatory convertible loan agreements with Richard Chandler Corporation through its company named Kairos Capital Limited for USD50 million (equivalent to VND1,041,400 million) with a term of two years. On the maturity date, all outstanding principal amount of the loan shall be mandatorily converted into shares.
Among others, the agreements provide the following:
(i) The convertible loans bear annual coupons of 11% per annum. All payments of interest shall be in USD by converting the interest amount in VND by using interbank average rate published by the State Bank of Vietnam as at on the due date or other immediate funds; and
(ii) The shares to be issued on conversion (“Conversion Shares”) shall be determined based on conversion price of VND90,000 per share. As the loan is mandatorily convertible to a fixed number of shares at the end of the two year term, the fair value of the issuable shares has been treated as an equity instrument.
(c) Equity instruments repurchased
In the second half of 2010 and first half of 2011, the Company issued equity instruments as partial consideration for its acquisitions during the same period, which resulted in its increased economic interest in its subsidiaries and associate. In the second quarter of 2012, the Company had excess cash and saw an opportunity to reduce its fully diluted share count in weak equity markets. In June 2012, the Company bought back the equity instruments which would have required the Company to issue 57,929,939 ordinary shares by paying purchase consideration of VND4,634,395 million, equalling VND80,000 per share. On such date the closing market price of the Group was VND100,000 per share. The remaining equity instruments were converted into 96,463,766 shares according to the conversion terms.

140 Masan Group
Notes to the fiNaNcial statemeNts
For the year ended 31 December 2012 (continued) Form B 09 - DN
25. tOtAl ReVeNUe
Total revenue represents the gross invoiced value of goods sold and services rendered exclusive of value added tax.
Net sales comprised:
Group Company
2012 2011 2012 2011
VND million VND million VND million VND million
Total revenue
� Sales of finished goods 10,575,021 7,238,994 - -
� Services and other sales 228 9 - -
Less sales deductions
� Sales discounts (150,243) (119,856) - -
� Sales returns and allowances (35,592) (62,298) - -
Net sales 10,389,414 7,056,849 - -
26. COSt Of SAleS
Group Company
2012 2011 2012 2011
VND million VND million VND million VND million
Total cost of sales
� Finished goods sold 6,138,131 3,911,343 - -
� Allowance for inventories 40,795 86,491 - -
6,178,926 3,997,834 - -

Annual Report 2012 141
FINANCIAL report
For the year ended 31 December 2012 Form B 09 - DN
27. fiNANCiAl iNCOMe
Group Company
2012 2011 2012 2011
VND million VND million VND million VND million
Interest income from:
� Deposits 760,585 917,948 204,082 138,407
� Investment in bonds 28,604 75,265 28,604 75,265
� loan to subsidiaries - - 60,898 134,937
� Recharge to parent company - 110,997 - 110,997
� loan to parent company - 20,748 - 20,748
Facility income from subsidiaries - - 927,988 121,755
Foreign exchange gains 17,687 54,598 67 43,475
Others 2,948 5,650 - -
809,824 1,185,206 1,221,639 645,584
28. fiNANCiAl eXPeNSeS
Group Company
2012 2011 2012 2011
VND million VND million VND million VND million
Interest expense on loans from:
� Banks 140,468 153,847 - -
� Bondholders 138,708 162,404 387,339 162,404
� Subsidiary - - 568,281 416,887
Facility fee expenses to subsidiaries - - 346,421 121,755
Foreign exchange losses 9,913 19,273 3,399 8,646
Other financial expenses 20,296 12,201 20,304 7,965
309,385 347,725 1,325,744 717,657

142 Masan Group
Notes to the fiNaNcial statemeNts
For the year ended 31 December 2012 (continued) Form B 09 - DN
29. OtheR iNCOMe
Group Company
2012 2011 2012 2011
VND million VND million VND million VND million
Income from scrap sales 20,630 12,499 - -
Proceeds on disposal of fixed assets 2,023 2,406 - -
Reimbursement of cost from parent company 142,244 - 142,244 -
Import tax refund 18,977 - - -
Write-back of provisions 7,160 - - -
Others 23,483 7,264 209 -
214,517 22,169 142,453 -
30. OtheR eXPeNSeS
Group Company
2012 2011 2012 2011
VND million VND million VND million VND million
Cost of scrap sales 15,759 12,174 - -
Net book value of disposed fixed assets 6,934 7,616 - -
Tax penalties 2,080 3,315 - -
Others 21,701 3,198 - 73
46,474 26,303 - 73
31. ShARe Of (lOSS)/PROfit iN ASSOCiAteS
Group
2012 2011
VND million VND million
Share of profit in associates 325,709 969,019
Adjustment arising from purchase price allocation and goodwill amortisation
(663,507) (576,286)
(337,798) 392,733

Annual Report 2012 143
FINANCIAL report
For the year ended 31 December 2012 Form B 09 - DN
32. iNCOMe tAX
(a) Recognised in the statement of income
Group Company
2012 2011 2012 2011
VND million VND million VND million VND million
Current tax expense
Current year 649,931 242,683 - -
Under provision in prior years 578 4,431 - -
650,509 247,114 - -
Deferred tax (income)/expenses
Origination and reversal of temporary differences (124,579) 125,450 - -
income tax expense 525,930 372,564 - -
(b) Reconciliation of effective tax rate
Group:
2012 2011
% VND million % VND million
Profit before tax 2,488,522 2,868,572
Tax at the Company’s income tax rate 25.00% 622,131 25.00% 717,143
Effect of different tax rates in subsidiaries (11.48%) (285,724) (11.8%) (338,558)
Non-deductible expenses 1.34% 33,302 1.37% 39,313
Effect of share of associate results net of tax 3.39% 84,450 (3.42%) (98,183)
Deferred tax assets not recognised 2.86% 71,193 1.84% 52,739
Under provision in prior years 0.02% 578 0.15% 4,431
Benefit of previously unrecognised tax losses - - (0.15%) (4,321)
21.13% 525,930 12.99% 372,564

144 Masan Group
Notes to the fiNaNcial statemeNts
For the year ended 31 December 2012 (continued) Form B 09 - DN
Company:
2012 2011
% VND million % VND million
Loss before tax (220,254) (222,633)
Tax at the Company’s income tax rate (25.00%) (55,064) (25.00%) (55,658)
Non-deductible expenses 0.42% 944 1.31% 2,921
Deferred tax assets not recognised 24.57% 54,120 23.69% 52,737
- - - -
(c) Applicable tax rates
The Company has an obligation to pay the government corporate income tax at the rate of 25% of taxable profits.
The Company’s subsidiaries enjoy various tax incentives which provide some subsidiaries with further tax exemptions and reductions.
(d) Tax contingencies
The taxation laws and their application in Vietnam are subject to interpretation and change over time as well as from one tax office to another. The final tax position may be subject to review and investigation by a number of authorities, who are enabled by law to impose severe fines, penalties and interest charges. These facts may create tax risks in Vietnam that are substantially more significant than in other countries. Management believes that it has adequately provided for tax liabilities based on its interpretation of tax legislation, including on transfer pricing requirements and computation of corporate income tax. However, the relevant authorities may have differing interpretations and the effects could be significant.

Annual Report 2012 145
FINANCIAL report
For the year ended 31 December 2012 Form B 09 - DN
33. SiGNifiCANt tRANSACtiONS With RelAteD PARtieS
In addition to related party balances and transactions disclosed in other notes to these financial statements, the Group and the Company have the following transactions with related parties during the year:
Group:
Related Party Nature of transaction 2012 2011
VND million VND million
Parent Company
Ma San Corporation Interest expense and withholding tax shared by parent company
- 123,974
Miscellaneous expenses shared by parent company 142,244 1,801
Loan provided to parent company - 715,000
Interest income from loan to parent company - 20,748
Other related parties
Masan Global Services Maintenance fee 12,990 10,717
Corporation Purchase of fixed assets 12 2,505
Masan Property Service charge expense 13,459 12,797
Corporation Sales of fixed assets 32 -
Rental income - 91
Vietnamese French Cattle Feed Joint Stock Company
Dividend receivable 64,000 -
key management personnel Remuneration to key management personnel (*) 33,972 48,286
(*) No board fees were paid to Board of Management members in 2012 and 2011.

146 Masan Group
Notes to the fiNaNcial statemeNts
For the year ended 31 December 2012 (continued) Form B 09 - DN
Company:
Related Party Nature of transaction 2012 2011
VND million VND million
Parent Company
Ma San Corporation Interest expense and withholding tax shared by parent company
- 123,974
Miscellaneous expenses shared by parent company 142,244 1,801
Loan to parent company - 715,000
Interest income from loan to parent company - 20,748
Other related parties
Ma San Consumer Loan provided to a subsidiary 2,028,000 -
Corporation Loans received from a subsidiary - 4,715,000
Interest income on short-term loan 60,898 -
Interest expenses on short-term loan - 282,447
Interest expenses on long-term loan 568,281 134,440
Facility fee expense 346,421 121,755
Sale of a subsidiary to a subsidiary 10 -
Ma San Horizon Corporation Loans provided to a subsidiary - 2,136,347
Ma San Resources Corporation
Interest income from loans provided to a subsidiary 157,236 134,937
Facility fee income 346,421 121,755
Nui Phao Mining Company Limited
Facility fee income 424,332 -
key management personnel Remuneration to key management personnel (*) 6,306 4,985
(*) No board fees were paid to Board of Management members in 2012 and 2011.

Annual Report 2012 147
FINANCIAL report
For the year ended 31 December 2012 Form B 09 - DN
34. COMMitMeNtS
(a) Capital expenditure
As at the reporting date, the following outstanding capital commitments have been approved but not provided for in the balance sheet:
Group Company
31/12/2012 31/12/2011 31/12/2012 31/12/2011
VND million VND million VND million VND million
Approved and contracted 2,137,305 1,577,637 1,011 -
Approved but not contracted 558,796 235,345 - -
2,696,101 1,812,982 1,011 -
(b) Leases
As at the reporting date, the future minimum lease payments under non-cancellable operating leases were:
Group Company
31/12/2012 31/12/2011 31/12/2012 31/12/2011
VND million VND million VND million VND million
Within one year 100,172 62,198 26,638 23,619
Within two to five years 79,466 103,647 16,211 35,738
More than five years 961 34,450 - -
180,599 200,295 42,849 59,357

148 Masan Group
Notes to the fiNaNcial statemeNts
For the year ended 31 December 2012 (continued) Form B 09 - DN
35. ShARe-BASeD PAyMeNt PlAN
The number of the subsidiary’s shares issued and to be issued to certain employees for services rendered were as follows:
2012 2011
Employees 1,149,594 683,466
Members of the Board of Directors of the subsidiary (excluded from employees numbers) 131,521 268,334
At 31 December 2012, the subsidiary of the Company also has a commitment to issue 565,590 shares (2011: 324,268 shares) to employees for services rendered from May to December 2012, which has been included in above total shares.
Prior to listing, the Company entered into option agreements with management which allow for conversion based on a percentage of shares on a fully diluted basis. The options were granted to management prior to listing for work performed on the successful restructuring and initial public offering of the Company. These option agreements were approved by the shareholders of the Company on 9 October 2009 and the issuance of the shares under the option agreement was further approved by shareholders of the Company on 25 April 2012. The options were fully exercised and 5% shares on fully diluted basis were issued in June 2012.
36. fiNANCiAl RiSk MANAGeMeNt
The Board of Management has overall responsibility for establishing, developing and monitoring the Group’s risk management policies.
(a) Credit risk
Credit risk is the potential financial loss resulting from the failure of a customer or a counterparty to settle its financial and contractual obligations to the Group and Company, as and when they fall due.
The Group and the Company’s exposure to credit risk in relation to receivables is influenced mainly by the individual characteristics of each customer or counter party. In response to the risk, the Group generally transact with customers on cash on delivery terms. For instances where customers are granted credit terms, management has established a credit policy under which each customer is analysed individually for creditworthiness before credit terms are offered. Cash and cash equivalents are placed with financial institutions which are regulated. Investments and transactions involving derivative financial instruments are allowed only with counterparties after assessment by management. Management does not foresee any significant credit risks from these deposits nor expect these financial institutions to default.
The carrying amount of the trade and other receivables represents the maximum credit exposure.
The Group and the Company establishes allowance for doubtful debt that represents its estimate of incurred losses in respect of trade and other receivables.

Annual Report 2012 149
FINANCIAL report
For the year ended 31 December 2012 Form B 09 - DN
Movements of allowance for doubtful debts were as follows:
Group Company
2012VND million
2011VND million
2012VND million
2011VND million
Opening balance 1,084 705 - -
Increase in allowance during the year 143 379 - -
Allowance utilised during the year (832) - - -
Written back (17) - - -
Closing balance 378 1,084 - -
The Group and the Company believe that, apart from the amount provided for above, no further allowance for doubtful debts is necessary in respect of the outstanding trade and other receivables (short and long-term) as of 31 December 2012. The ageing analysis of the trade and other receivables prior to allowance is as follows:
Group Company
31/12/2012 31/12/2011 31/12/2012 31/12/2011
VND million VND million VND million VND million VND million VND million VND million VND million
Grossimpairment
losses Grossimpairment
losses Grossimpairment
losses Grossimpairment
losses
Not past due 463,983 - 480,085 - 1,916,812 - 3,091,813 -
Past due 0 – 30 days 18,763 - 47,526 - - - - -
Past due 31 – 180 days 3,434 - 11,247 - - - - -
Past due over 180 days 4,801 (378) 1,910 (1,084) - - - -
490,981 (378) 540,768 (1,084) 1,916,812 - 3,091,813 -
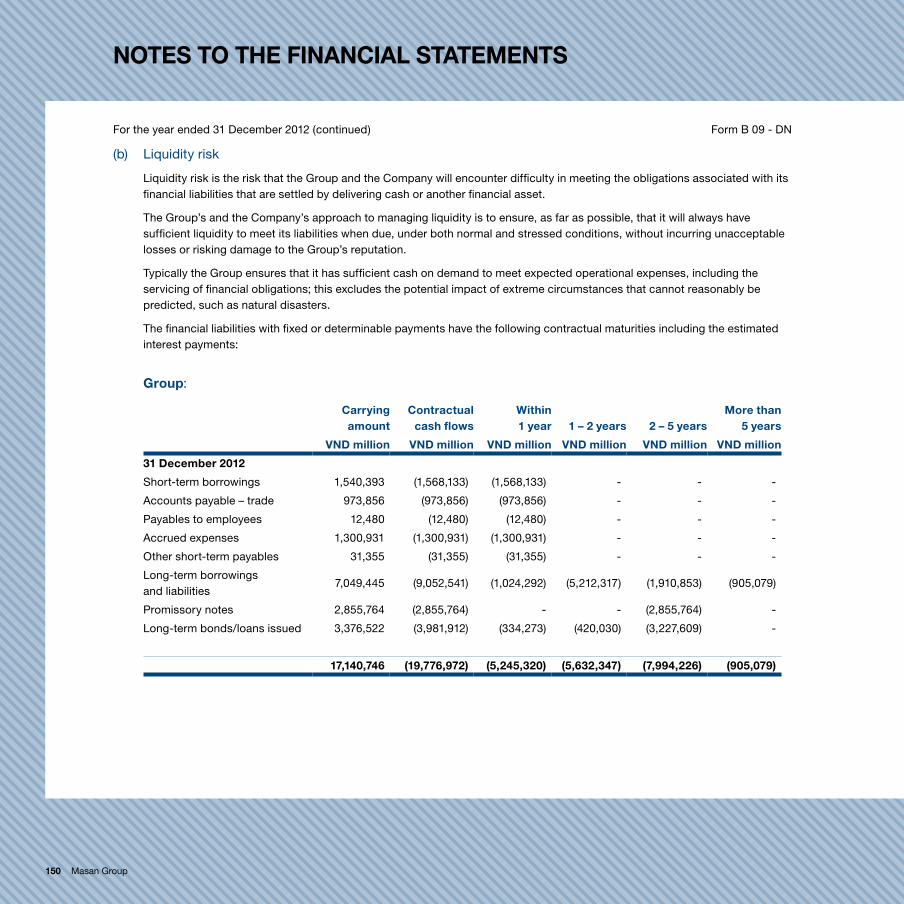
150 Masan Group
Notes to the fiNaNcial statemeNts
For the year ended 31 December 2012 (continued) Form B 09 - DN
(b) Liquidity risk
Liquidity risk is the risk that the Group and the Company will encounter difficulty in meeting the obligations associated with its financial liabilities that are settled by delivering cash or another financial asset.
The Group’s and the Company’s approach to managing liquidity is to ensure, as far as possible, that it will always have sufficient liquidity to meet its liabilities when due, under both normal and stressed conditions, without incurring unacceptable losses or risking damage to the Group’s reputation.
Typically the Group ensures that it has sufficient cash on demand to meet expected operational expenses, including the servicing of financial obligations; this excludes the potential impact of extreme circumstances that cannot reasonably be predicted, such as natural disasters.
The financial liabilities with fixed or determinable payments have the following contractual maturities including the estimated interest payments:
Group:
Carrying amount
Contractual cash flows
Within 1 year 1 – 2 years 2 – 5 years
More than 5 years
VND million VND million VND million VND million VND million VND million
31 December 2012
Short-term borrowings 1,540,393 (1,568,133) (1,568,133) - - -
Accounts payable – trade 973,856 (973,856) (973,856) - - -
Payables to employees 12,480 (12,480) (12,480) - - -
Accrued expenses 1,300,931 (1,300,931) (1,300,931) - - -
Other short-term payables 31,355 (31,355) (31,355) - - -
Long-term borrowings and liabilities
7,049,445 (9,052,541) (1,024,292) (5,212,317) (1,910,853) (905,079)
Promissory notes 2,855,764 (2,855,764) - - (2,855,764) -
Long-term bonds/loans issued 3,376,522 (3,981,912) (334,273) (420,030) (3,227,609) -
17,140,746 (19,776,972) (5,245,320) (5,632,347) (7,994,226) (905,079)
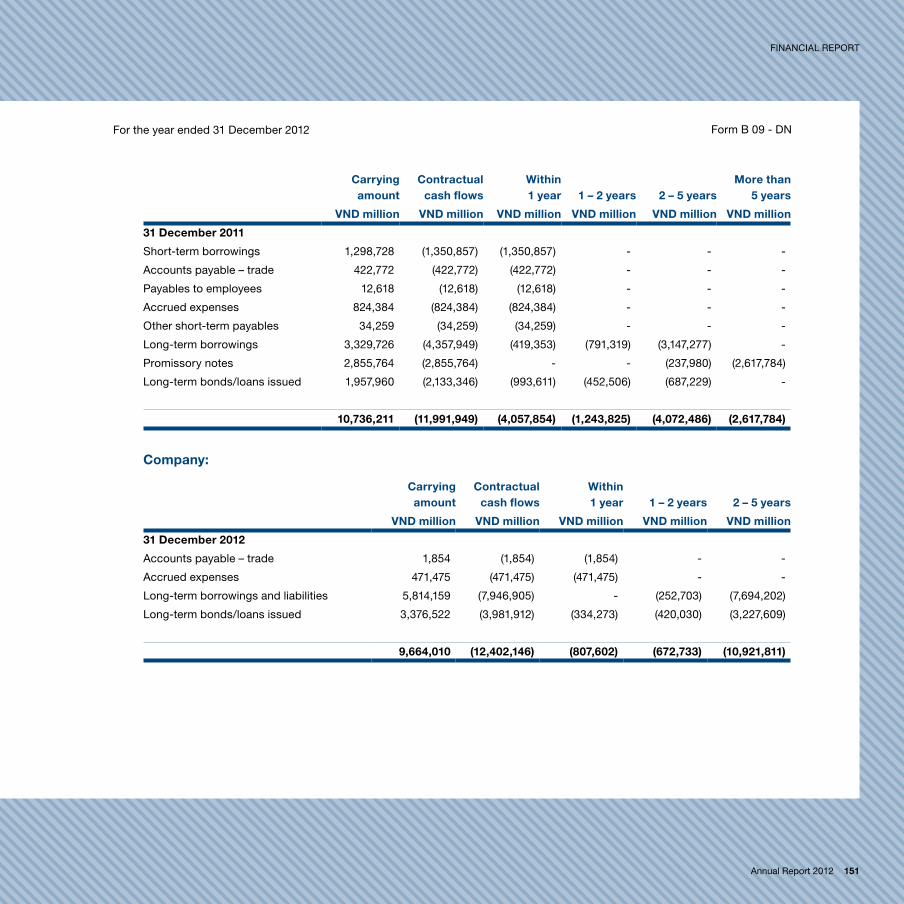
Annual Report 2012 151
FINANCIAL report
For the year ended 31 December 2012 Form B 09 - DN
Carrying amount
Contractual cash flows
Within 1 year 1 – 2 years 2 – 5 years
More than 5 years
VND million VND million VND million VND million VND million VND million
31 December 2011
Short-term borrowings 1,298,728 (1,350,857) (1,350,857) - - -
Accounts payable – trade 422,772 (422,772) (422,772) - - -
Payables to employees 12,618 (12,618) (12,618) - - -
Accrued expenses 824,384 (824,384) (824,384) - - -
Other short-term payables 34,259 (34,259) (34,259) - - -
Long-term borrowings 3,329,726 (4,357,949) (419,353) (791,319) (3,147,277) -
Promissory notes 2,855,764 (2,855,764) - - (237,980) (2,617,784)
Long-term bonds/loans issued 1,957,960 (2,133,346) (993,611) (452,506) (687,229) -
10,736,211 (11,991,949) (4,057,854) (1,243,825) (4,072,486) (2,617,784)
Company:
Carrying amount
Contractual cash flows
Within 1 year 1 – 2 years 2 – 5 years
VND million VND million VND million VND million VND million
31 December 2012
Accounts payable – trade 1,854 (1,854) (1,854) - -
Accrued expenses 471,475 (471,475) (471,475) - -
Long-term borrowings and liabilities 5,814,159 (7,946,905) - (252,703) (7,694,202)
Long-term bonds/loans issued 3,376,522 (3,981,912) (334,273) (420,030) (3,227,609)
9,664,010 (12,402,146) (807,602) (672,733) (10,921,811)

152 Masan Group
Notes to the fiNaNcial statemeNts
For the year ended 31 December 2012 (continued) Form B 09 - DN
Carrying amount
Contractual cash flows
Within 1 year 1 – 2 years 2 – 5 years
VND million VND million VND million VND million VND million
31 December 2011
Short-term borrowings and liabilities 2,000,000 (2,344,942) (2,344,942) - -
Accounts payable – trade 523 (523) (523) - -
Accrued expenses 339,697 (339,697) (339,697) - -
Other short-term payables 261,712 (261,712) (261,712) - -
Long-term borrowings and liabilities 2,256,195 (4,697,271) - - (4,697,271)
Long-term bonds/loans issued 1,957,960 (2,133,346) (993,611) (452,506) (687,229)
6,816,087 (9,777,491) (3,940,485) (452,506) (5,384,500)
It is not expected that the cash flows included in the Group and the Company’s maturity analysis could occur significantly earlier, or at significantly different amounts.
(c) Market risk
Market risk is the risk that changes in market prices, such as foreign exchange rates and interest rates will affect the Group and the Company ‘s results of operations or the value of its holdings of financial instruments. The objective of market risk management is to manage and control market risk exposures within acceptable parameters, while optimising the return.
Currency risk
The Group and the Company is exposed to currency risk on sales, purchases and borrowings that are denominated in a currency other than the respective functional currencies of Group entities. The currencies in which these transactions are primarily denominated are the United States dollar (USD), Australian dollar (AUD), Euro (EUR) and Thai Baht (THB).
In 2011, the Group entered into a forward exchange contract to manage its foreign exchange risk. The notional principal was for USD10.46 million and matured in 2012. As at 31 December 2012, the Group did not have any outstanding forward exchange contracts.
In respect of other monetary assets and liabilities denominated in foreign currencies, the Group’s policy is to ensure that its net exposure is kept to an acceptable level by buying or selling foreign currencies at spot rates when necessary to address short-term imbalances.

Annual Report 2012 153
FINANCIAL report
For the year ended 31 December 2012 Form B 09 - DN
The Group and the Company had the following net exposed asset/(liability) positions:
Group Company
USD AUD eUR thB USD
31 December 2012
Cash and cash equivalents 168,860,335 - 4,947 - 66,367,554
Trade and other receivables (*) 1,029,798 - - - -
Other long-term receivables - - - - 31,635,370
Trade and other payables (**) (19,271,699) (2,579,577) (568,090) (53,186,433) (11,464,445)
Long-term borrowings and liabilities (***) (223,626,890) - - - (41,512,356)
(73,008,456) (2,579,577) (563,143) (53,186,433) 45,026,123
Group Company
USD AUD eUR USD
31 December 2011
Cash and cash equivalents 110,370,528 - 1,284,391 9,590,493
Trade and other receivables (*) 780,537 - 1,392,000 -
Other long-term receivables - - - 6,036,164
Trade and other payables (**) (6,469,551) (856,620) (1,093,544) (2,565,697)
Short-term borrowings (73,755) - - -
Long-term borrowings and liabilities (***) (108,000,000) - - (6,036,164)
(3,392,241) (856,620) 1,582,847 7,024,796
(*) Trade and other receivables comprise of accounts receivable – trade and other receivables – short-term.(**) Trade and other payables comprise of accounts payable – trade and accrued expenses.(***) Long-term borrowings and liabilities comprise of long-term borrowings and other long-term liabilities.

154 Masan Group
Notes to the fiNaNcial statemeNts
For the year ended 31 December 2012 (continued) Form B 09 - DN
The followings were the significant exchange rates applied by the Group and Company:
Group Company
exchange rate as at
31/12/2012
exchange rate as at
31/12/2011
exchange rate as at
31/12/2012
exchange rate as at
31/12/2011
VND VND VND VND
USD1 20,800 20,828 20,811 20,828
AUD1 21,520 21,772 - -
EUR1 27,398 27,700 - -
THB1 663 - - -
Below is an analysis of the possible impact on the profit before tax of the Group and loss before tax of the Company by a strengthening of the following currencies after taking into account the current level of exchange rates and the historical volatility as well as market expectations . This analysis assumes that all other variables, in particular interest rates, remain constant.
Group Company
increase/(decrease) in profit before tax
as at
Decrease in loss before tax
as at
31/12/2012 31/12/2012
VND million VND million
USD (1%) (15,186) 9,370
AUD (1%) (555) -
EUR ( 1%) (154) -
THB (1%) (353) -
(16,248) 9,370

Annual Report 2012 155
FINANCIAL report
For the year ended 31 December 2012 Form B 09 - DN
Group Company
increase/(decrease) in profit before tax as at
Decrease inloss before tax
as at
31/12/2011 31/12/2011
VND million VND million
USD (10%) 9,597 14,631
AUD (3%) (560) -
EUR ( 1%) 438 -
9,475 14,631
The opposite movement of the currencies would have the equal but opposite effect to the profit/(loss) before tax of the Group and the Company as at 31 December 2012, respectively.
Interest rate risk
The Group and the Company’s exposure to changes in interest rates relates primarily to floating rate interest-bearing financial assets and financial liabilities. Interest rate risk is managed by the Group and the Company on an on-going basis with the primary objective of limiting the extent to which interest expense could be affected by an adverse movement in interest rates.
The Group and the Company does not hedge its exposure to changes in interest rates on interest-bearing borrowings.
At the reporting date the interest rate profile of the Group and the Company’s interest-bearing financial instruments was as follows:
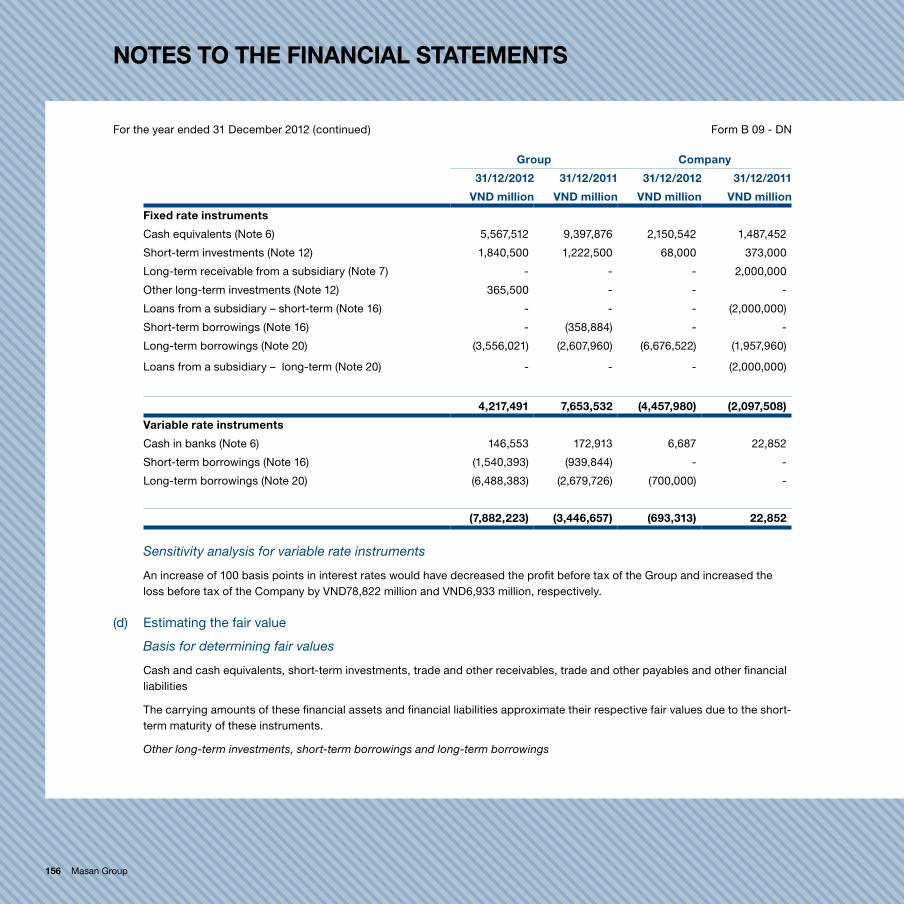
156 Masan Group
Notes to the fiNaNcial statemeNts
For the year ended 31 December 2012 (continued) Form B 09 - DN
Group Company
31/12/2012 31/12/2011 31/12/2012 31/12/2011
VND million VND million VND million VND million
fixed rate instruments
Cash equivalents (Note 6) 5,567,512 9,397,876 2,150,542 1,487,452
Short-term investments (Note 12) 1,840,500 1,222,500 68,000 373,000
Long-term receivable from a subsidiary (Note 7) - - - 2,000,000
Other long-term investments (Note 12) 365,500 - - -
Loans from a subsidiary – short-term (Note 16) - - - (2,000,000)
Short-term borrowings (Note 16) - (358,884) - -
Long-term borrowings (Note 20) (3,556,021) (2,607,960) (6,676,522) (1,957,960)
Loans from a subsidiary – long-term (Note 20) - - - (2,000,000)
4,217,491 7,653,532 (4,457,980) (2,097,508)
Variable rate instruments
Cash in banks (Note 6) 146,553 172,913 6,687 22,852
Short-term borrowings (Note 16) (1,540,393) (939,844) - -
Long-term borrowings (Note 20) (6,488,383) (2,679,726) (700,000) -
(7,882,223) (3,446,657) (693,313) 22,852
Sensitivity analysis for variable rate instruments
An increase of 100 basis points in interest rates would have decreased the profit before tax of the Group and increased the loss before tax of the Company by VND78,822 million and VND6,933 million, respectively.
(d) Estimating the fair value
Basis for determining fair values
Cash and cash equivalents, short-term investments, trade and other receivables, trade and other payables and other financial liabilities
The carrying amounts of these financial assets and financial liabilities approximate their respective fair values due to the short-term maturity of these instruments.
Other long-term investments, short-term borrowings and long-term borrowings

Annual Report 2012 157
FINANCIAL report
For the year ended 31 December 2012 Form B 09 - DN
The Group and the Company has not determined fair values of other long-term investments, short-term borrowings and long-term borrowings for disclosure in accordance with Article 28 of Circular No. 210/2009/TT-BTC dated 6 November 2009 of the Ministry of Finance because (i) quoted prices in active market is not available for these financial instruments; and (ii) Vietnamese Accounting Standards and the Vietnamese Accounting System and the relevant statutory requirements do not provide guidance on measurement of fair values in the case where quoted prices in active market is not available. Fair value of these financial instruments may be different from their carrying value.
(e) Carrying amount of financial assets and liabilities
The following tables summarise the carrying value of financial assets and liabilities together with carrying amounts shown on the balance sheet by Circular 210 categories:
Group:
Noteheld to
maturity
fair value through
profit or lossloans and
receivables
Other financial liabilities
total carrying amount
VND million VND million VND million VND million VND million
31 December 2012
Short-term investments 12 1,840,500 - - - 1,840,500
Other long-term investments 12 365,500 - - - 365,500
Trade and other receivables (*) - - 467,445 - 467,445
Other long-term receivables 7 - - 23,158 - 23,158
Cash and cash equivalents 6 - - 5,714,065 - 5,714,065
2,206,000 - 6,204,668 - 8,410,668
Short-term borrowings 16 - - - (1,540,393) (1,540,393)
Long-term borrowings and liabilities (***)
19, 20 - (356,269) - (7,049,445) (7,405,714)
Promissory notes 20 - - - (2,855,764) (2,855,764)
Convertible bonds/loans 20 - - - (3,376,522) (3,376,522)
Trade and other payables (**) - - - (2,318,622) (2,318,622)
- (356,269) - (17,140,746) (17,497,015)
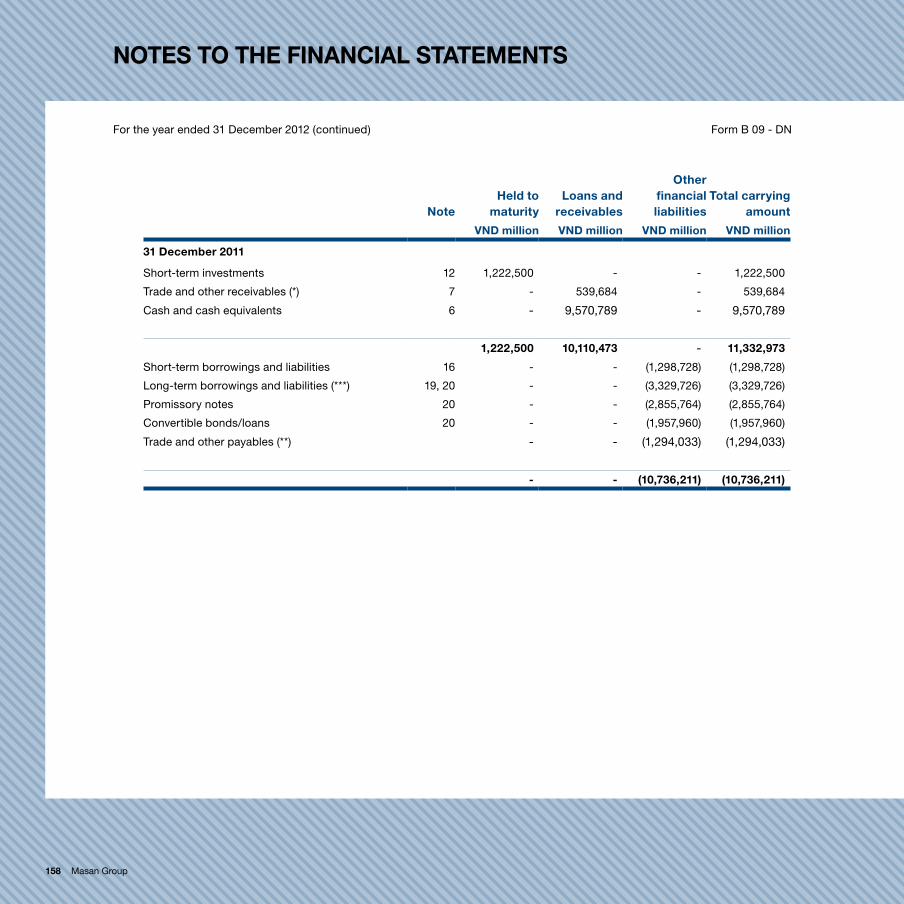
158 Masan Group
Notes to the fiNaNcial statemeNts
For the year ended 31 December 2012 (continued) Form B 09 - DN
Noteheld to
maturityloans and
receivables
Other financial liabilities
total carrying amount
VND million VND million VND million VND million
31 December 2011
Short-term investments 12 1,222,500 - - 1,222,500
Trade and other receivables (*) 7 - 539,684 - 539,684
Cash and cash equivalents 6 - 9,570,789 - 9,570,789
1,222,500 10,110,473 - 11,332,973
Short-term borrowings and liabilities 16 - - (1,298,728) (1,298,728)
Long-term borrowings and liabilities (***) 19, 20 - - (3,329,726) (3,329,726)
Promissory notes 20 - - (2,855,764) (2,855,764)
Convertible bonds/loans 20 - - (1,957,960) (1,957,960)
Trade and other payables (**) - - (1,294,033) (1,294,033)
- - (10,736,211) (10,736,211)
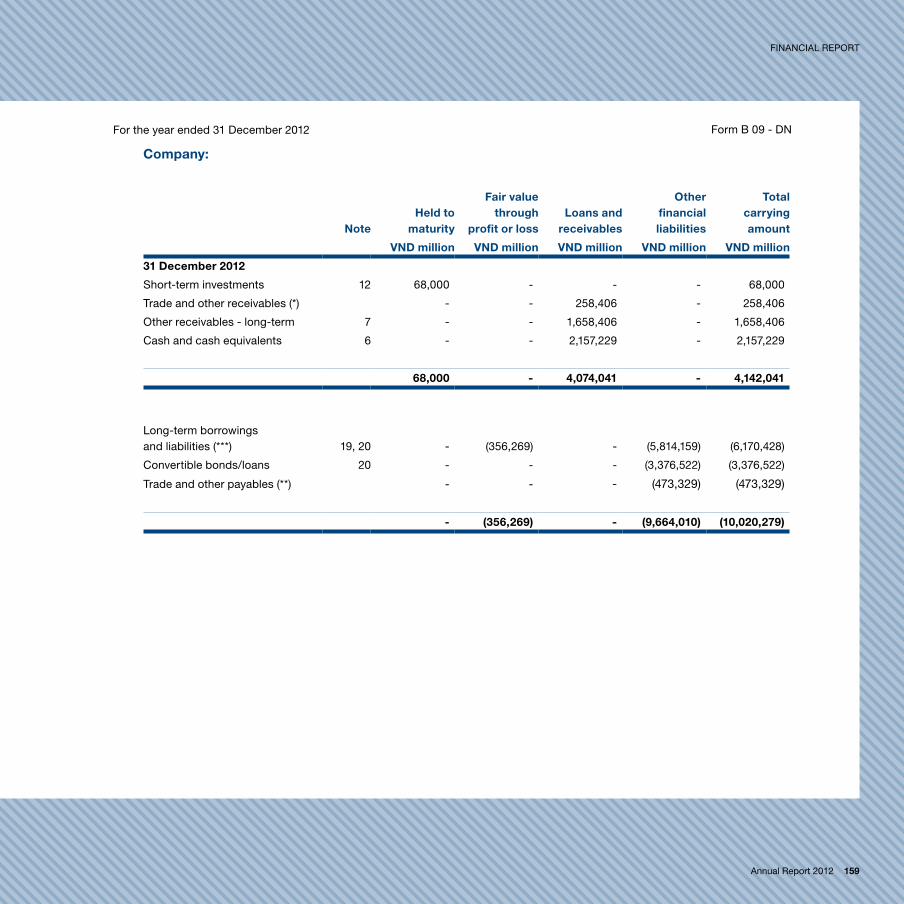
Annual Report 2012 159
FINANCIAL report
For the year ended 31 December 2012 Form B 09 - DN
Company:
Noteheld to
maturity
fair value through
profit or lossloans and
receivables
Other financial liabilities
total carrying amount
VND million VND million VND million VND million VND million
31 December 2012
Short-term investments 12 68,000 - - - 68,000
Trade and other receivables (*) - - 258,406 - 258,406
Other receivables - long-term 7 - - 1,658,406 - 1,658,406
Cash and cash equivalents 6 - - 2,157,229 - 2,157,229
68,000 - 4,074,041 - 4,142,041
Long-term borrowings and liabilities (***) 19, 20 - (356,269) - (5,814,159) (6,170,428)
Convertible bonds/loans 20 - - - (3,376,522) (3,376,522)
Trade and other payables (**) - - - (473,329) (473,329)
- (356,269) - (9,664,010) (10,020,279)

160 Masan Group
Notes to the fiNaNcial statemeNts
For the year ended 31 December 2012 (continued) Form B 09 - DN
Noteheld to
maturityloans and
receivables
Other financial liabilities
total carrying amount
VND million VND million VND million VND million
31 December 2011
Short-term investments 12 373,000 - - 373,000
Trade and other receivables (*) 7 - 329,519 - 329,519
Other receivables – long-term 7 - 2,762,294 - 2,762,294
Cash and cash equivalents 6 - 1,510,304 - 1,510,304
373,000 4,602,117 - 4,975,117
Short-term borrowings and liabilities 16 - - (2,000,000) (2,000,000)
Long-term borrowings and liabilities (***) 19,20 - - (2,256,195) (2,256,195)
Convertible bonds/loans 20 - - (1,957,960) (1,957,960)
Trade and other payables (**) - - (601,932) (601,932)
- - (6,816,087) (6,816,087)
(*) Trade and other receivables comprise of accounts receivable – trade and other receivables – short-term.(**) Trade and other payables comprise of accounts payable – trade, payables to employees, accrued expenses and other short-term payables.(***) Long-term borrowings and liabilities comprise of long-term borrowings and other long-term liabilities.

Annual Report 2012 161
FINANCIAL report
For the year ended 31 December 2012 Form B 09 - DN
37. SUBSeQUeNt eVeNtS
(i) Issuance of new shares by a subsidiary
On 25 January 2013, Kohlberg Kravis Roberts through its company named KKR Ma San Aggregator L.P. subscribed for new shares issued by Ma San Consumer Corporation, a subsidiary, equivalent to 4.348% of its outstanding shares after such issuance for USD109 million, subject to the terms and conditions of the agreement.
(ii) Acquisition of new entities
On 1 February 2013, Ma San Consumer Corporation announced that it has entered into an agreement to purchase 24.9% of the bottled beverage company, Vinh Hao Mineral Joint Stock Company (“Vinh Hao”) from an existing shareholder of Vinh Hao for cash of VND85,000 per share. Subsequently, Ma San Consumer Corporation’s effective interest in Vinh Hao increased from 24.9% to 63.51% as a result of a further acquisition of 38.61% of Vinh Hao from other shareholders at a price of VND85,000 per share.
Subsequent to 31 December 2012, the Company through its subsidiaries extended VND252 billion to fund the acquisition of a brewery company.
(iii) Transaction with non-controlling interests in Ma San Resources Corporation
On 25 January 2013, BI Private Equity New Markets II K/S, an investment entity managed by BankInvest, subscribed for VND521 billion of mandatory convertible preference shares of Ma San Resources Corporation, a subsidiary of the Company. The subscription price was VND32,744 per share. The mandatory convertible preference shares shall be paid a dividend ranging from 3% to 10% per annum on the investment amount and be mandatorily convertible into ordinary shares within 4 years.
29 March 2013
Prepared by: Approved by:
Doan Thi My Duyen Nguyen Dang Quang Chief Accountant Chairman

162 Masan Group

Annual Report 2012 163
GeNeRAl CORPORAte iNfORMAtiON

164 Masan Group
CorPoratE oVErViEW
our company’s legal name is Ma San Group Corporation and it was incorporated in november 2004 under the name Ma San Shipping Corporation. We officially changed our name to Ma San Group Corporation in August 2009 and successfully listed on the Ho Chi Minh Stock exchange on 5 november, 2009. While the listed entity was formally incorporated in 2004, Masan, through our majority shareholder and our underlying operating businesses and their predecessor companies, has been in existence as a business group for over 15 years.
We are a holding company, with controlling stakes in Masan Consumer and Masan Resources representing an economic interest of 77.7% and 77.7%1, respectively, as of March 2013. We have an economic interest, through shares and mandatory convertible subordinated debt, in techcombank of 30.4%2 as of March 2013.
CorPoratE goVErnanCE
Governance structure
Approval Annual General Meeting
Validation Board of Directors Supervisory Board
Strategic management Management Board � Chief executive officer � Deputy Chief executive officer � Chief Financial officer3
� Chief Accountant
Implementation Business Development Finance and Accounting, legal and Administration
Board of Directorsthe Board of Directors (the “Board”) is elected by shareholders to oversee the activities of the Company. Members of the Board of Directors meet regularly to discuss strategic decisions raised by the Management Board. Details on the responsibilities of the Board are presented in the Board of Directors section.
Supervisory Boardthe Supervisory Board oversees the activities of the Board of Directors and the Management Board.
Management Boardthe Management Board’s prime responsibilities include strategic management, resource allocation at the senior management level, financial accounting and controls, capital management, governance, and internal control.
1. On a fully diluted and includes Masan Group’s right (but not obligation) to buy 15% ownership of Tiberon Minerals Private Limited, a company owned by the funds managed by Dragon Capital Group.
2. Includes Masan Group’s partial ownership in Techcombank’s VND3,000 billion convertible bond offering issued in December 2010.3. Official appointment as Chief Financial Officer pending upcoming resolution by the Board of Directors
Annual Report 2012 165
Business developmentthe Business Development team is responsible for transaction execution, business analytics and subsidiary management.
finance & accounting, legal and administrationFinance & Accounting, legal and administration are departments responsible for financial reporting, legal and regulatory compliance, and managing the administrative functions of the Company. Senior professionals from the finance & accounting and legal departments play pivotal roles in transaction execution and post-deal follow up.
Board of Directors Board responsibility and delegation of authority the Board of Directors has two executive members and four non-executive members. the Board of Directors is chaired by the Chairman, a non-executive member. the roles of the Chairman and Chief executive officer are separate. During the year, there were no changes in the structure of the Board of Directors.
Members of the Board of Directors include:
� Dr. nguyen Dang Quang, Chairman;
� Mr. Ho Hung Anh, Vice Chairman;
� Mr. Madhur Maini, member;
� Mr. nguyen thieu nam, member;
� Ms. nguyen Hoang Yen, member; and
� Mr. lars Kjaer, member.
the Chairman plays an important leadership role and is involved in:
� Chairing meetings of the Board and providing effective leadership to it;
� Maintaining dialogue with the Chief executive office and providing appropriate strategic input;
� Monitoring the performance of the Board; and
� Being a respected ambassador for the Group, including chairing meetings of shareholders, managing community issues and interacting with key stakeholders.
GeneRAl CoRpoRAte InFoRMAtIon
166 Masan Group
the Board is responsible for charting the direction, strategies and financial objectives of the Group and monitoring the progress in relation to such matters. It does not form committees under itself.
non-executive members regularly communicate with the management of the Group to understand the progress and performance of the operations.
As of 31 December of 2012, Dr. nguyen Dang Quang, Mr. Ho Hung Anh, Mr. Madhur Maini, Mr. nguyen thieu nam, Ms. nguyen Hoang Yen and Mr. lars Kjaer held directorship members in four, three, one, five, three and five other companies, respectively.
Board meetingsthe Board regularly meets to discuss the direction, strategy and progress of the business. typically, the topics at the Board meetings include:
� Reports on major projects and current business issues;
� Reports on financial performance;
� Specific business proposals; and
� Minutes from the previous meeting and outstanding issues.
Activities of the BoardIn 2012 the Board’s activities mainly included discussion and approval of the following items:
� Raising capital;
� Implementing other transactions of Masan Group and subsidiaries; and
� Deciding business development plan and annual budget.
there were no separate meetings of non-executive Board members. Activities of the Board involved all members.
Management Board the Management Board is responsible for implementing the Company’s business development plan and business performance reporting. the Chief executive officer chairs the Management Board.
Currently, the Management Board is comprised of the two most senior executives at Masan Group, the Chief executive officer and the Deputy Chief executive officer, and the two most senior members of the Finance & Accounting team. Members of the Management Board include:
� Mr. Madhur Maini - Chief executive officer. Mr. Maini is the Chief executive officer of Masan Group and a member of the Board of Directors of Masan Group, Masan Consumer and Deputy Chairman of the Member’s Council of nui phao. Madhur has a dual degree in Applied Science and Finance from the university of pennsylvania, u.S.
� Mr. nguyen thieu nam - Deputy Chief executive officer. Mr. nguyen was formerly with Da My JSC. He graduated from Vietnam university of Commerce, Hanoi Vietnam.

Annual Report 2012 167
� Mr. Chan Hong Wai - Chief Financial officer1 . Mr. Chan was formerly with pricewaterhouseCoopers and ernst & Young. He graduated from Sunway university College, Malaysia.
� Ms. Doan thi My Duyen - Chief Accountant. Ms. Doan was formerly with KpMG, Vietnam. She graduated from university of economics, Ho Chi Minh City, Vietnam.
As of 31 December 2012, the ownership of the Company shares of the Management Board members is as follows:
Management Board Position Number of shares Percent (%)
Madhur Maini Ceo 597,800 0.087
nguyen thieu nam Deputy Ceo 110,400 0.016
Chan Hong Wai Chief Financial officer1 0 0
Doan thi My Duyen Chief Accountant 0 0
total outstanding shares 687,280,123 100,000
Changes of members of the Management Board: on 12 July 2012, the Board of Directors approved the removal of Ms. ta thi thuy trang from the position as the Chief Accountant and the appointment of Ms. Doan thi My Duyen as the new Chief Accountant of the Company.
Supervisory BoardMembers of the Supervisory Board were appointed at the General Meeting of Shareholders.
the Supervisory Board is composed of the following members:
� Mr. nguyen Quynh lam – Head of the Supervisory Board. Mr. nguyen has more than 20 years of experience in managerial and accounting positions. He was formerly with Da My JSC and la Giang Commerce JSC. He graduated from university of Mining and Geology, Hanoi, Vietnam.
� Ms. nguyen thu Hien2 – Member. Ms. nguyen has more than 20 years of experience in the banking and finance industry. She was formerly with Incombank and Masan Consumer. She graduated from university of economics, Baku City, union of Soviet Socialist Republics.
� Mr. Dang ngoc Ca – Member. Mr. Dang was formerly with Allens Arthur Robinson and luat Viet. He graduated from Ho Chi Minh City university of law, Vietnam.
1. Official appointment as Chief Financial Officer pending upcoming resolution by the Board of Directors2. Ms. Nguyen Thu Hien resigned from the member of the Supervisory Board from 2 January 2013. The Annual General Meeting of Shareholders of 2013 shall
approve such resignation and appoint a new member of the Supervisory Board.
GeneRAl CoRpoRAte InFoRMAtIon
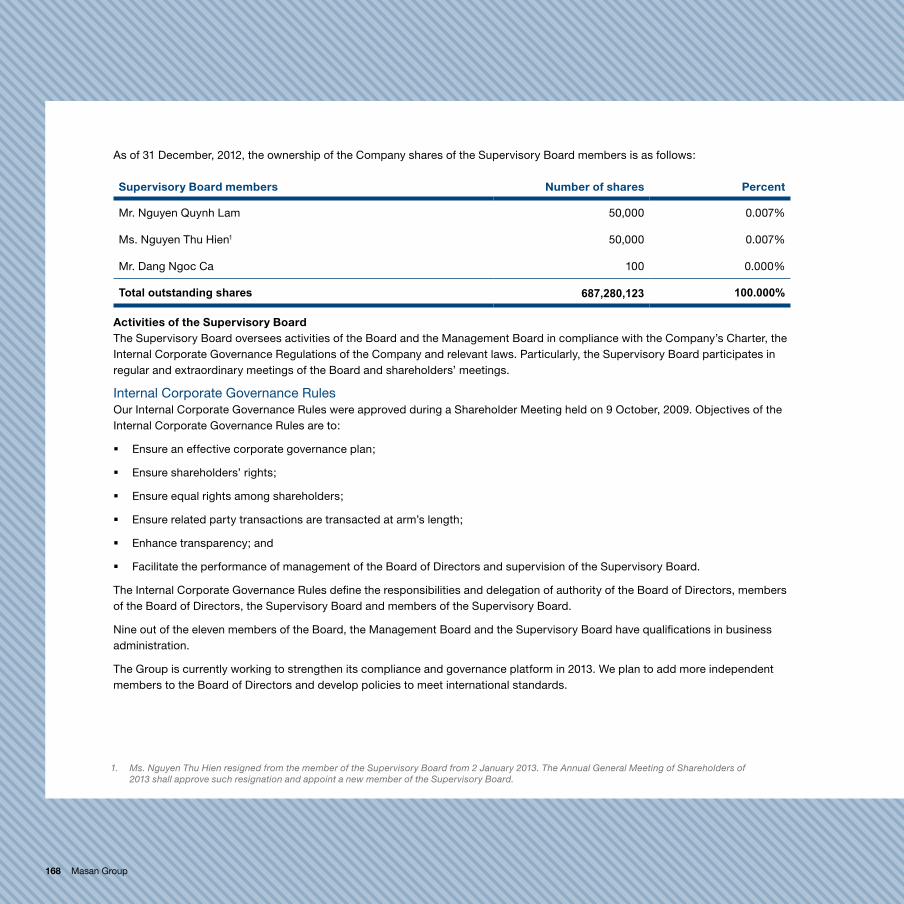
168 Masan Group
As of 31 December, 2012, the ownership of the Company shares of the Supervisory Board members is as follows:
Supervisory Board members Number of shares Percent
Mr. nguyen Quynh lam 50,000 0.007%
Ms. nguyen thu Hien1 50,000 0.007%
Mr. Dang ngoc Ca 100 0.000%
Total outstanding shares 687,280,123 100.000%
Activities of the Supervisory Boardthe Supervisory Board oversees activities of the Board and the Management Board in compliance with the Company’s Charter, the Internal Corporate Governance Regulations of the Company and relevant laws. particularly, the Supervisory Board participates in regular and extraordinary meetings of the Board and shareholders’ meetings.
Internal Corporate Governance Rulesour Internal Corporate Governance Rules were approved during a Shareholder Meeting held on 9 october, 2009. objectives of the Internal Corporate Governance Rules are to:
� ensure an effective corporate governance plan;
� ensure shareholders’ rights;
� ensure equal rights among shareholders;
� ensure related party transactions are transacted at arm’s length;
� enhance transparency; and
� Facilitate the performance of management of the Board of Directors and supervision of the Supervisory Board.
the Internal Corporate Governance Rules define the responsibilities and delegation of authority of the Board of Directors, members of the Board of Directors, the Supervisory Board and members of the Supervisory Board.
nine out of the eleven members of the Board, the Management Board and the Supervisory Board have qualifications in business administration.
the Group is currently working to strengthen its compliance and governance platform in 2013. We plan to add more independent members to the Board of Directors and develop policies to meet international standards.
1. Ms. Nguyen Thu Hien resigned from the member of the Supervisory Board from 2 January 2013. The Annual General Meeting of Shareholders of 2013 shall approve such resignation and appoint a new member of the Supervisory Board.
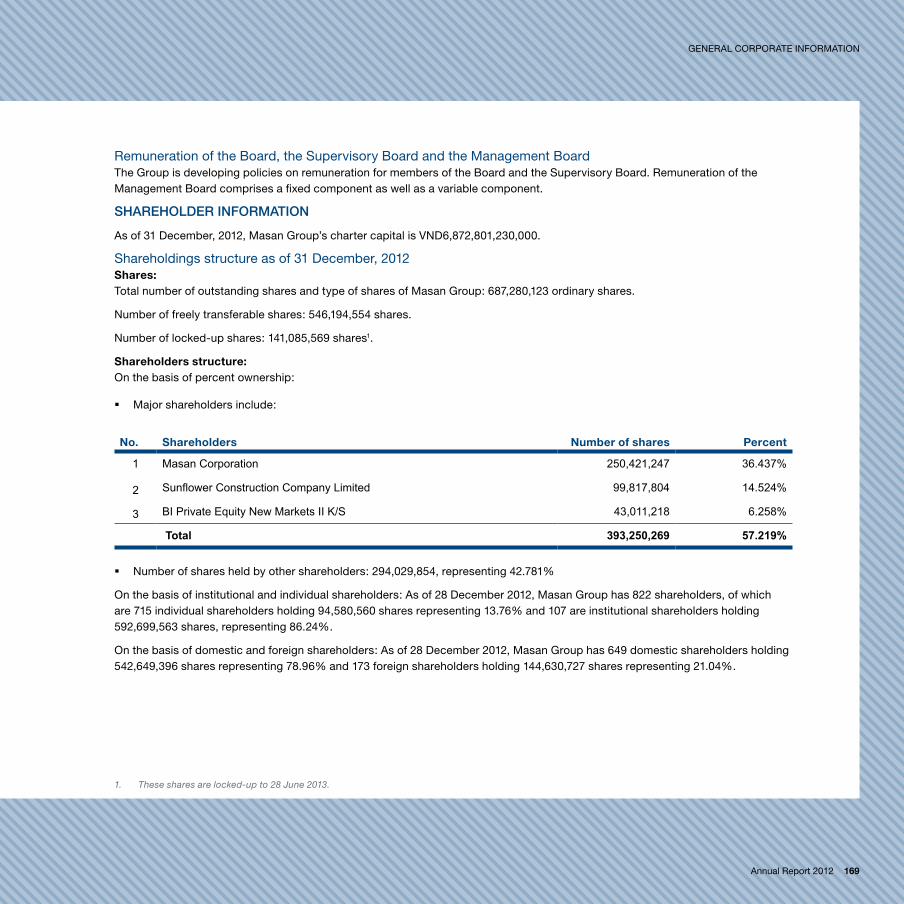
Annual Report 2012 169
Remuneration of the Board, the Supervisory Board and the Management Boardthe Group is developing policies on remuneration for members of the Board and the Supervisory Board. Remuneration of the Management Board comprises a fixed component as well as a variable component.
sharEholdEr information
As of 31 December, 2012, Masan Group’s charter capital is VnD6,872,801,230,000.
Shareholdings structure as of 31 December, 2012Shares: total number of outstanding shares and type of shares of Masan Group: 687,280,123 ordinary shares.
number of freely transferable shares: 546,194,554 shares.
number of locked-up shares: 141,085,569 shares1.
Shareholders structure: on the basis of percent ownership:
� Major shareholders include:
No. Shareholders Number of shares Percent
1 Masan Corporation 250,421,247 36.437%
2 Sunflower Construction Company Limited 99,817,804 14.524%
3 BI Private Equity New Markets II K/S 43,011,218 6.258%
Total 393,250,269 57.219%
� number of shares held by other shareholders: 294,029,854, representing 42.781%
on the basis of institutional and individual shareholders: As of 28 December 2012, Masan Group has 822 shareholders, of which are 715 individual shareholders holding 94,580,560 shares representing 13.76% and 107 are institutional shareholders holding 592,699,563 shares, representing 86.24%.
on the basis of domestic and foreign shareholders: As of 28 December 2012, Masan Group has 649 domestic shareholders holding 542,649,396 shares representing 78.96% and 173 foreign shareholders holding 144,630,727 shares representing 21.04%.
1. These shares are locked-up to 28 June 2013.
GeneRAl CoRpoRAte InFoRMAtIon
170 Masan Group
Change of the charter capital In 2012: the Company increased its charter capital from VnD5,152,722,690,000 to VnD6,872,801,230,000. of which 172,007,854 new shares issued in 2012, 141,085,569 new shares were issued under the form of private placement and 30,922,285 new shares were issued from the conversion of the convertible bonds issued in 2009.
Masan Group has no treasury shares.
Masan CorporationMasan Corporation was incorporated on 13 September, 2000. Its registered activities cover market research and commercial promotion, investment, management and technology transfer consulting, establishment and management of investment projects, office leasing and real estate business.
Sunflower Construction Company Limited Sunflower Construction Company limited was incorporated on 10 August, 2009. Its registered activities cover civil construction work, construction and mining materials, equipment and machinery trading, goods consignee agent, market research, commercial promotion, management and investment consulting (excluding financial and accounting consulting).
BI Private Equity New Markets II K/S (BankInvest)Further information on BankInvest is provided in Masan Group’s partners section.
Founding shareholdersnguyen Dang Quang was Chairman of Masan Group and Ho Hung Anh was Vice Chairman of Masan Group as of 31 December, 2012. As of the date of this report, they are still in their positions.
Significant foreign shareholdersMasan Group’s only significant foreign institutional shareholder was BankInvest. Further information on BankInvest is provided in Masan Group’s partners section.
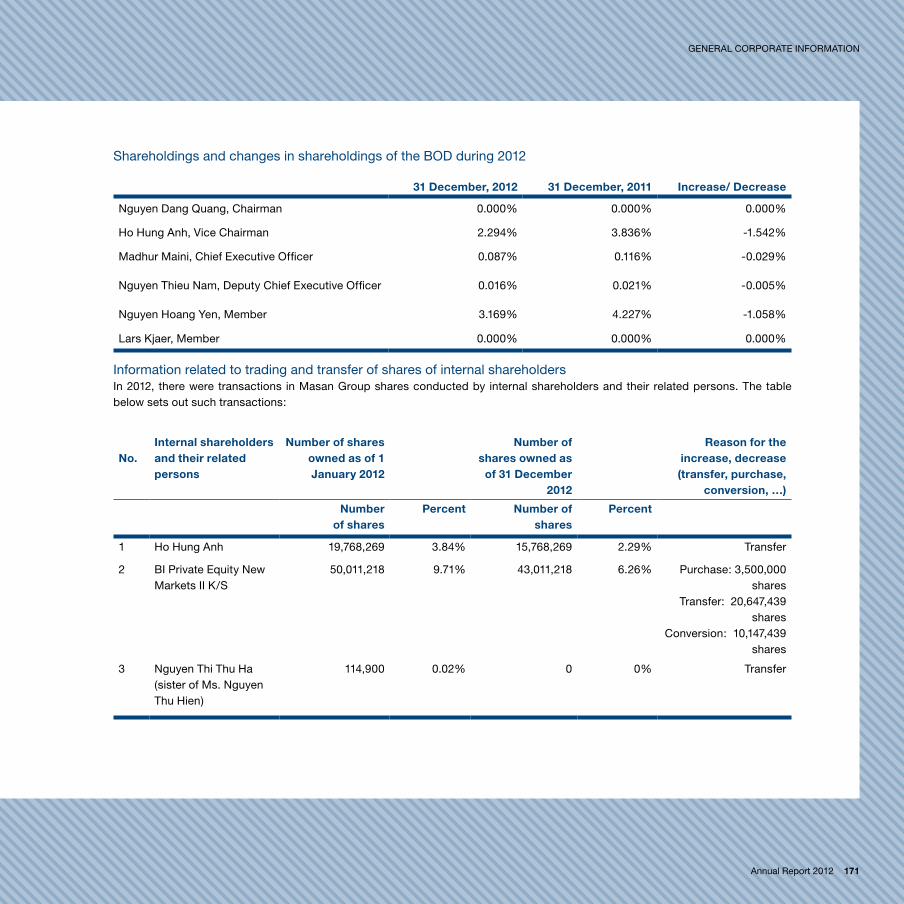
Annual Report 2012 171
Shareholdings and changes in shareholdings of the BoD during 2012
31 December, 2012 31 December, 2011 increase/ Decrease
nguyen Dang Quang, Chairman 0.000% 0.000% 0.000%
Ho Hung Anh, Vice Chairman 2.294% 3.836% -1.542%
Madhur Maini, Chief executive officer 0.087% 0.116% -0.029%
nguyen thieu nam, Deputy Chief executive officer 0.016% 0.021% -0.005%
nguyen Hoang Yen, Member 3.169% 4.227% -1.058%
lars Kjaer, Member 0.000% 0.000% 0.000%
Information related to trading and transfer of shares of internal shareholders In 2012, there were transactions in Masan Group shares conducted by internal shareholders and their related persons. the table below sets out such transactions:
No.internal shareholders and their related persons
Number of shares owned as of 1 january 2012
Number of shares owned as
of 31 December 2012
Reason for the increase, decrease (transfer, purchase,
conversion, …)
Number
of sharesPercent Number of
sharesPercent
1 Ho Hung Anh 19,768,269 3.84% 15,768,269 2.29% transfer
2 BI private equity new Markets II K/S
50,011,218 9.71% 43,011,218 6.26% purchase: 3,500,000 shares
transfer: 20,647,439 shares
Conversion: 10,147,439 shares
3 nguyen thi thu Ha (sister of Ms. nguyen thu Hien)
114,900 0.02% 0 0% transfer
GeneRAl CoRpoRAte InFoRMAtIon

172 Masan Group
Equity information
As of 31 December, 2012
Charter capital (VnD billion) 6,873
Share price 102,000
52-week high share price (VnD) 124,000
52-week low share price (VnD) 83,500
number of shares issued (share) 687,280
number of ordinary shares (share) 687,280
number of preference shares (share) 0
number of treasury shares (share) 0
Dividend yield (%) 0

Annual Report 2012 173
GeneRAl CoRpoRAte InFoRMAtIon
Cautionary notE rEgarding forWard-looking statEmEnts
All statements contained in this report that are not statements of historical fact constitute “forward-looking statements”. Some of these statements can be identified by forward-looking terms, such as “anticipate”, “believe”, “can”, “could”, “estimate”, “anticipate”, “project”, “expect”, “intend”, “may”, “plan”, “aim”, “will” and “would” or similar words. However, these words are not the exclusive means of identifying forward-looking statements. All statements regarding our expected financial condition and results of operations, business, plans and prospects are forward-looking statements. these forward-looking statements include statements as to our business strategy, revenue and profitability (including, without limitation, any financial or operating projections or forecasts), planned projects and other matters discussed in this document regarding matters that are not historical fact. these forward-looking statements and any other projections contained in this report involve known and unknown risks, uncertainties and other factors that may cause our actual financial results, performance or achievements to be materially different from any future financial results, performance or achievements expressed or implied by such forward-looking statements or other projections.
Forward-looking statements are based on our beliefs and assumptions, which in turn are based on currently available information. We are in the business of acquiring, actively building, managing and investing in market-leading businesses in several of the fastest growing areas of the Vietnamese economy. our outlook is predominantly based on our interpretation of what we consider to be the key economic factors affecting our business, the Vietnamese economy and the sectors we operate in. Although we believe the assumptions upon which these forward-looking statements are based are reasonable, any of these assumptions could prove to be inaccurate, and the forward-looking statements based on these assumptions could be incorrect. Actual results may differ materially from information contained in the forward-looking statements as a result of a number of factors, many of which are beyond our control. Accordingly, investors are cautioned not to place undue reliance on the forward-looking statements in this report. these statements speak only as of the date of this report or the respective dates indicated in this report, and we undertake no obligation to update or revise any of them, whether as a result of new information, future events or otherwise.

174 Masan Group
glossary of tErms
AtM Automatic teller MachineBankInvest BankInvest Groupthe Board the Board of DirectorsCAR Capital Adequacy RatioC&R Compensation and ResettlementCSR Corporate Social ResponsibilityDragon Capital Dragon Capital Group and the funds and entities it manageseSop employee Share ownership planFMCG Fast-moving Consumer GoodsHouse Foods House Foods Corporation Inc.HSBC the Hong Kong and Shanghai Banking CorporationIFC International Finance CorporationM&A Mergers and AcquisitionsMasan A term referring to Masan Group, inclusive of Masan Consumer, Masan Resources, techcombank and their subsidiariesMasan Consumer Ma San Consumer Corporation, renamed from Masan FoodMasan Food Ma San Food CorporationMasan Group or the Group Ma San Group CorporationMasan Horizon Ma San Horizon CorporationMasan Resources Ma San Resources CorporationMasan thai nguyen Resources Ma San thai nguyen Resources Company limited
Annual Report 2012 175
GeneRAl CoRpoRAte InFoRMAtIon
MnC Multinational CompanyMount Kellett Mount Kellett Capital Management l.p.nui phao nui phao Mining limited Company, restructured from nui phao Mining Join Venture Company ltd as the result of the nui phao acquisitionnpl non-performing loanp&l profit and lossproconco Vietnamese-French Cattle Feed JSC.R.F. Chandler R.F. Chandler CorporationRoA Return on AssetsRoe Return on equitySBV State Bank of VietnamSG&A Selling, General and Administration expensesSMe Small and Medium Sized enterprisesSoe State-owned enterprisetechcombank, or the Bank Vietnamese technological and Commercial Joint Stock Bankthe Board the Board of DirectorstpG texas pacific GroupuS$ u.S. DollaruSGS u.S. Geological SurveyVinacafe Vinacafé Bien Hoa Joint Stock CompanyVinacafé Coffee brand owned by Vinacafé Bien Hoa Joint Stock CompanyVinh Hao Vinh Hao Mineral Water CorporationVnD Vietnamese Dong
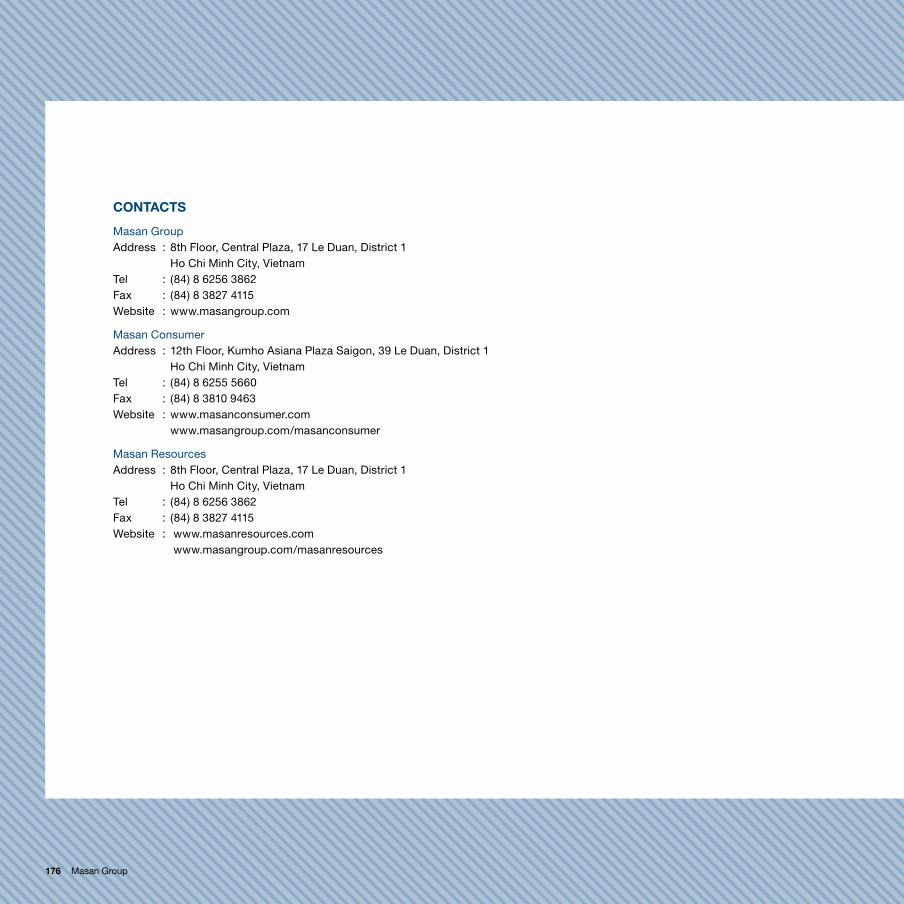
176 Masan Group
CONtACtS
Masan Group Address : 8th Floor, Central plaza, 17 le Duan, District 1 Ho Chi Minh City, Vietnamtel : (84) 8 6256 3862Fax : (84) 8 3827 4115Website : www.masangroup.com
Masan consumer Address : 12th Floor, Kumho Asiana plaza Saigon, 39 le Duan, District 1 Ho Chi Minh City, Vietnamtel : (84) 8 6255 5660Fax : (84) 8 3810 9463Website : www.masanconsumer.com www.masangroup.com/masanconsumer
Masan resourcesAddress : 8th Floor, Central plaza, 17 le Duan, District 1 Ho Chi Minh City, Vietnamtel : (84) 8 6256 3862Fax : (84) 8 3827 4115Website : www.masanresources.com www.masangroup.com/masanresources

Annual Report 2012 177