annual report 2012 - sakari resources limited
TRANSCRIPT

SAKARI RESOURCES LIMITED391B Orchard Road #17-01 Ngee Ann City Tower B Singapore 238874
Tel: +65 6499 4100www.sakariresources.com
ANNUAL REPORT 2012
SA
KA
RI R
ES
OU
RC
ES
LIM
ITE
D
A
nn
ua
l Re
po
rt 20
12
SAKARI RESOURCES LIMITED391B Orchard Road #17-01 Ngee Ann City Tower B Singapore 238874
Tel: +65 6499 4100www.sakariresources.com
ANNUAL REPORT 2012
SA
KA
RI R
ES
OU
RC
ES
LIM
ITE
D
A
nn
ua
l Re
po
rt 20
12

CONTENTS1 Corporate Directory2 Five Year Financial Summary3 Chairman’s Statement 5 Board Of Directors8 Key Executives11 Chief Executive Officer’s Review16 Financial Review17 Operations’ Review22 Marketing And Sales Review24 Coal Resource Statement24 Coal Reserves Statement27 Sustainability29 Directors’ Report34 Statement By Directors35 Independent Auditor’s Report36 Financial Statements And Notes To The Financial Statements99 Glossary100 Notice of Annual General Meeting103 Proxy FormIBC The Sakari Charter
CONTENTS1 Corporate Directory2 Five Year Financial Summary3 Chairman’s Statement 5 Board Of Directors8 Key Executives11 Chief Executive Officer’s Review16 Financial Review17 Operations’ Review22 Marketing And Sales Review24 Coal Resource Statement24 Coal Reserves Statement27 Sustainability29 Directors’ Report34 Statement By Directors35 Independent Auditor’s Report36 Financial Statements And Notes To The Financial Statements99 Glossary100 Notice of Annual General Meeting103 Proxy FormIBC The Sakari Charter

CORPORATE DIRECTORY
DirectorsDr Chitrapongse Kwangsukstith ChairmanMr Martin David Purvis Chief Executive OfficerMr Chatchawal EimsiriMr Peerachat PinprayongMr Supattanapong PunmeechaowMr Surong BulakulMr Apisit RujikeatkamjornDr Chua Yong HaiMs Julie Therese HallMr Han Eng Juan
Audit, Risk & Compliance CommitteeMr Han Eng Juan ChairmanDr Chua Yong Hai Mr Apisit Rujikeatkamjorn
Remuneration CommitteeMs Julie T Hall ChairwomanMr Han Eng JuanMr Apisit Rujikeatkamjorn
Nomination CommitteeMr Apisit Rujikeatkamjorn ChairmanMs Julie T HallMr Han Eng Juan
Corporate Governance CommitteeDr Chua Yong Hai ChairmanMs Julie T HallMr Han Eng JuanMr Apisit Rujikeatkamjorn
Company Secretaries Graeme Bruce TiveyYip Ming Fai
Registered & Head Office 391B Orchard RoadNgee Ann City Tower B 17-01Singapore238874Tel (65) 6499 4100Fax (65) 6327 4222
Website www.sakariresources.com
Share Register Boardroom Corporate & Advisory Services Pte. Ltd. 50 Raffles Place #32-01Singapore Land Tower, Singapore 048623
Independent Auditors PricewaterhouseCoopers8 Cross StreetPWC BuildingSingapore 0484245
Audit Partner: Graham LeeYear of appointment: 2008
SAK
AR
I R
ESO
UR
CES
LIM
ITED
Ann
ual R
epor
t 20
121

02 S
AKA
RI R
ESO
URC
ES L
IMIT
ED A
nnua
l Rep
ort 2
012
SAKARI RESOURCES LIMITED
SAK
AR
I R
ESO
UR
CES
LIM
ITED
Ann
ual R
epor
t 20
122
FIVE YEAR SUMMARYY/E 31 Dec ($M) 2008 2009 2010 2011 2012Coal sales volume (Mt) 8.6 8.5 10.7 10.7 10.8Coal revenue 620.3 775.3 779.4 1,010.4 924.0Other revenue 14.4 15.5 2.6 3.1 3.2COGS (407.2) (490.5) (598.5) (696.7) (732.2)Gross profit 227.5 300.3 183.5 316.8 195.0Other operating income/(expense) 6.3 (1.0) (7.7) 13.1 6.2Administrative, Corp & Technical (37.8) (57.5) (36.5) (57.2) (58.7)Operating profit 196.0 241.8 139.3 272.8 142.5Financial expenses (14.8) (22.9) (13.6) (13.4) (13.5)PBT 181.2 218.9 125.7 259.4 129.0Tax (56.8) (85.4) (37.5) (69.1) (20.5)Net profit 124.4 133.5 88.2 190.3 108.5Dividend (74.7) (80.1) (52.9) (114.2) (65.1) Dividend Payout % 60% 60% 60% 60% 60%EBITDA 236.6 281.3 178.0 321.2 230.4 Balance Sheet Total Current assets 242.9 212.8 259.1 317.6 318.3
Total long-term assets 631.1 790.2 838.9 869.7 902.3
Total current liabilities 230.1 378.7 167.9 178.6 290.4
Total long-term liabilities 268.1 152.2 406.3 377.7 274.3
Total equity 375.7 472.1 523.8 631.0 656.0
Net Debt 116.9 174.7 232.5 128.6 157.6

SAK
AR
I R
ESO
UR
CES
LIM
ITED
Ann
ual R
epor
t 20
123
2012 proved to be a significant year in Sakari’s corporate history with the key event being PTT’s offer to consolidate its control of the Company. This offer led to PTT increasing its total shareholding in Sakari to over 94%. The additional investment resulting from this offer reached close to $1.2 billion and reflects the strong appreciation PTT has for the inherent value within Sakari’s portfolio of assets and its positive outlook on the long-term coal business in Asia.
Against this background and the prevailing weakness in the global economy, management has again delivered a robust set of results.
Sakari’s Performance in 2012
Group revenue of $927.3m, the second highest amount in the Group’s history, was only 9% down from 2011 ($1,103.6m) in a market where coal prices measured on the Newcastle Index, the Group’s main pricing benchmark, fell by 21%. This is a very satisfactory outcome and one that was achieved by swift reaction to changing market circumstances, perceptive planning and close teamwork at all levels.
The Group net profit was $108.5m (2011: $190.3m) and, given Sakari’s strong balance sheet and cash flow, your Directors are recommending a total
dividend payout of 60% of net profit for 2012, in line with Sakari’s dividend policy.
Shareholder Developments
After completion of the PTT offer in October 2012, the free float of Sakari’s shares on the SGX fell just below the required minimum of 10%. PTT indicated that it had no intention to divest any shares and therefore, after considering all the circumstances, the Board decided to apply to delist Sakari from the SGX, which happened on 15 February 2013. This means that Sakari is now a public, unlisted company.
Notwithstanding this change and at this point in time, we still have over 700 registered shareholders in the company. We are mindful that many of those shareholders who did not accept PTT’s offer and who opted to keep their investment, share your Directors’ belief in the long-term prospects for Sakari. We are also aware that all our shareholders will be looking for an opportunity to realise the value of their investment in due course. With the original offer now formally closed and the time restrictions of Singapore’s Takeover Code on any new offer or arrangement approaching (22 April 2013), it is entirely up to PTT to consider and decide how, if or when, another liquidity event might occur.
CHAIRMAN’S STATEMENT

SAK
AR
I R
ESO
UR
CES
LIM
ITED
Ann
ual R
epor
t 20
124
Directorate
Following the offer, Mr Surong Bulakul, the Chief Financial Officer of PTT Public Company Limited, was nominated to be a Director of Sakari and he was formally appointed to the Board in February this year. Mr Surong has a wealth of commercial and financial experience within the energy and resource industry and is an important addition to the Board.
Outlook and Conclusion
The near-term outlook for coal markets remains subdued as the major global economies struggle to balance monetary policy between inflationary fears and sustainable growth. That said the supply-demand fundamentals of the business are more stable than they were at this time last year, with clear evidence of producers tailoring production and expansion plans to meet constrained
demand growth. As long as these conditions persist, Sakari’s pursuit of continuous improvement in all aspects of its business has put our Group in a very strong position, to enjoy the benefits and margins inherent within an inevitable recovery of market conditions.
In closing I take this opportunity to acknowledge the commitment and loyalty that Sakari’s management and staff have shown through the events of 2012 and into 2013. My thanks also go to the many public officers and communities that we deal with in Indonesia and elsewhere for their diligent approach to the issues that arise in the course of Sakari’s daily business. Finally, I would also like to offer my appreciation to my fellow Directors for their continued support.
Dr Chitrapongse Kwangsukstith Chairman
Chairman’s Statement (continued)

SAK
AR
I R
ESO
UR
CES
LIM
ITED
Ann
ual R
epor
t 20
125
Dr Chitrapongse KwangsukstithChairman
Dr Chitrapongse holds an MSc degree and a Doctorate in Industrial Engineering from the Lamar University, Texas, USA. His career in the natural resources industry began with positions in several major international companies in Thailand and the USA. He has worked with the Petroleum Authority of Thailand, subsequently renamed to PTT Public Company Limited, where he held the position of Deputy Governor Corporate Strategy until 1999. In 2000, Dr Chitrapongse was assigned by PTT to assume the position as Chief Executive Officer of PTT Exploration and Production Public Company Limited and retired in 2010 as the Chief Operating Officer of the Upstream Petroleum and Gas Business Group of PTT Public Company Limited. Dr Chitrapongse holds Directorships in several subsidiary companies of PTT, including PTTAPM and is also President of the Thailand Association for Natural Gas.
Martin David Purvis GAICDChief Executive Officer
Mr Purvis obtained his honours degree in Mining Engineering from Leeds University in the UK and originally joined the Sakari Group in 1997 to develop the Sebuku coal mine in Indonesia. He has over 30 years’ experience in the resources industry working in a wide range of senior management and operating roles in major mining companies in South Africa, Indonesia, Singapore and Australia. For a large part of this time his focus has been on the evaluation, development and commercialisation of coal opportunities and projects and through these roles he has gained extensive knowledge and contacts within the international coal industry. Mr Purvis is a Graduate Member of the Australian Institute of Company Directors and joined the Board of Sakari in 2006, prior to its IPO. He was appointed Chief Executive Officer of the company in March 2010.
Chatchawal Eimsiri
Mr Chatchawal holds an MSc in Operations Research from the London School of Economics and Political Science and a BSc in Mathematics from the University of London. He has held various executive positions in PTT Group during his career and is now an Executive Vice President of PTT Public Company Limited.
BOARD OF DIRECTORS

SAK
AR
I R
ESO
UR
CES
LIM
ITED
Ann
ual R
epor
t 20
126
Peerachat Pinprayong
Mr Peerachat holds a BSc degree in Geology and a Master of Management qualification from Chulalongkorn University. He has worked with PTT Group since 1997 specialising in business development and planning positions in various subsidiary companies. He is now the Executive Vice President of PTT International Company Limited’s Coal & Mining Business. Mr Peerachat has been a Director of Sakari since April 2011.
Supattanapong Punmeechaow
Mr Supattanapong has over 25 years’ experience in commercial and investment banking and has developed an extensive network with corporates and government in Thailand. In a career that has spanned banking and the industrial sector, Mr Supattanapong has developed particular expertise in project finance and M & A in the petrochemical, energy and infrastructure industries. He joined PTT Group in 2009 as Executive Vice President in charge of enterprise risk management and international business development.
Surong Bulakul
Mr Surong is the Chief Financial Officer of PTT Public Company Limited. He holds a BSc in Industrial Engineering and Operations Research, an ME in Operations Research and an MBA from Cornell University, USA. He joined PTT Group in 2005 and has held various senior management positions in PTT Group prior to his appointment as CFO in 2012. He was appointed to the Board of Sakari in February 2013. Mr Surong holds Directorships in other PTT Group companies including Thai Lube Base Public Company Limited and Thai Oil Solvent Company Limited.
Apisit Rujikeatkamjorn
Mr Apisit holds a BSc degree in Civil Engineering from Khonkaen University, Thailand and a Master in Engineering from Lamar University, Texas, USA. He has had a long and distinguished career in the oil and gas industry, including appointments as Department Director and Senior Vice President for the Petroleum Authority of Thailand and Senior Assistant Governor at companies including Star Petroleum Refining Limited and Petro Asia (Thailand). Mr Apisit worked for PTT Group from 2000 to 2006 when he retired as Senior Executive Vice President of the Oil Business Group of PTT Public Company Limited. In addition to his Directorship of Sakari, Mr Apisit serves as a Non-Executive Director on the boards of several other companies in the ASEAN region.
Board of Directors (continued)

SAK
AR
I R
ESO
UR
CES
LIM
ITED
Ann
ual R
epor
t 20
127
Dr Chua Yong Hai
Dr Chua holds postgraduate qualifications in Chemical Engineering and Business Administration. He has served on the boards of several listed companies in Singapore and Australia, is chairman of 2 other public companies and a director of several private companies. In the public sector, he was a Deputy Secretary in the Singapore Government Administrative Service where his last held positions were Director of Investments in the Ministry of Finance and General Manager of Temasek Holdings Private Limited. In the private sector, Dr Chua was Chief Executive and Managing Director of United Engineers Limited and the Group General Manager of Suntec City Development Private Limited. He is Singapore’s non-resident High Commissioner to the Maldives and has been awarded a Public Service Medal and a Public Service Star by the President of Singapore for social and community work.
Han Eng Juan
Mr Han is a qualified accountant. He is a Director of the Singapore Deposit Insurance Corporation Limited, a member of the Citizenship Committee of Inquiry and Treasurer of the Singapore Red Cross Society. Mr Han has been awarded the Public Administration Medal (Silver) for service in the public sector and the Public Service Medal for community work. In the public sector, Mr Han has held senior positions in the Board of Commissioners of Currency Singapore and the Monetary Authority of Singapore. His last position in the private sector was as Senior Managing Director and Singapore Country Head of Dexia Banque Internationale à Luxembourg.
Julie Therese Hall
Ms Hall is a qualified geologist and also holds several diplomas in corporate directorship and financial planning. She is a Senior Fellow of the Corporate Directors Association, a member of the Australian Institute of Directors and a Senior Fellow of the Financial Securities Institute. Ms Hall has almost 30 years’ experience in mining projects in Australia and Asia, including 13 years at BHP Ltd. She is an Executive Director of Far East Energy Corporate Pty Limited and its subsidiaries, and a Director of Pegnel Resources Pty Limited, a private resources consultancy company.
Board of Directors (continued)

SAK
AR
I R
ESO
UR
CES
LIM
ITED
Ann
ual R
epor
t 20
128
KEY EXECUTIVES
Martin PurvisChief Executive Officer
Mr Purvis was appointed CEO of Sakari Group on 1 March 2010 and has been a Director of Sakari since 2006.
David Lim Chief Operating Officer
Mr Lim was appointed as Chief Operating Officer in March 2010. He is responsible for managing all operational aspects of Sakari’s coal mining activities, including exploration, mining, processing, environmental rehabilitation, safety, and contractor management. Mr Lim is an experienced mining executive with a career that spans 29 years in South East Asia, of which 27 have been spent working in Indonesia in civil engineering, marine engineering, coal and gold mining. He joined the Sakari Group in 2003 and spent 4 years working at Sebuku mine as the Resident Manager.
Shaun Day Chief Financial Officer
Mr Day obtained his Bachelor of Commerce from University of Western Australia, is an Associate of the Institute of Chartered Accountants, a Fellow of the Financial Services Institute of Australasia, a Certified Finance & Treasury Professional and a Chartered Company Secretary. He originally joined the Sakari Group in 2006 and has over 15 years professional experience in a range of multinational business and investment banking roles, with particular focus on the mining sector. He has performed Chief Financial Officer and Treasury roles in ASX listed mining and telecommunications infrastructure companies, with in-depth exposure to a number of debt and equity market transactions. He was appointed Chief Financial Officer of Sakari in 2010.
Ir Ginarsa Tandinegara President Director, Indonesia
Pak Ginarsa was appointed President Director Indonesia in 1993, holding responsibility for key government relationships, operating licences, tax and legal compliance in Indonesia. He has a degree in Civil Engineering and 40 years working experience in Indonesia, of which over one-half has been based in Jakarta and Balikpapan. Pak Ginarsa was a key member of the original project team that developed the Sebuku coal mine in 1997.

SAK
AR
I R
ESO
UR
CES
LIM
ITED
Ann
ual R
epor
t 20
129
Dany Aswin Director, Indonesia
Pak Dany is a Geologist with qualifications in Economic Geology from universities in Indonesia and Australia and almost 30 years of experience working with the Government of Indonesia. He joined the Group in 1996 as a Geologist and acquired senior responsibilities for managing government relations and community development programmes before being appointed to his current role. Pak Dany was a member of the team that assessed the potential in the Jembayan mine prior to its acquisition in December 2007 and oversaw the subsequent exploration and drill out to JORC standards.
Nicholas Stephens Managing Director, Marketing
Mr Stephens graduated in 1992 as a Bachelor of Business (Hons) majoring in Marketing and Finance. His career includes over 20 years sales and marketing experience in the mining industry working in a range of senior commercial roles in Australia and the UK with Rio Tinto and Straits Resources. Mr Stephens has been directly involved in the marketing and freight logistics of a broad range of commodities including iron ore, coal, copper, zinc, lead and industrial minerals.
Graeme TiveyExecutive General Manager, Business Systems & Company Secretary
Mr Tivey holds a Bachelor of Economics from Monash University and an MBA from Deakin University. He is a Chartered Accountant and a Chartered Company Secretary with 30 years’ experience in a diverse range of industries, multi-national companies and high profile organizations in Australia and in Indonesia. He has lived and worked in Asia for over 15 years and joined Sakari in 2008 as General Manager Finance. Mr Tivey is member of the Singapore Institute of Directors and a Fellow of the Australian Institute of Company Directors.
Key Executives (continued)
SAK
AR
I R
ESO
UR
CES
LIM
ITED
Ann
ual R
epor
t 20
1210
Lon TaranakiExecutive General Manager, Business Development
Mr Taranaki is tasked with the generation and targeting of business development and growth opportunities as well as the risk management and sustainability portfolios for the Group. He has over 18 years’ experience in the mining industry of which 14 years have been in the coal industry, working for BHP Coal, Sedgman’s and as a Resident Manager of Sakari’s Sebuku coal mine for over 4 years.
Jeremy Figgins General Manager, Corporate Relations and Corporate Development
Mr Figgins was a key member of the professional team that was assembled for the 2006 IPO of Sakari Resources and he went on to join the Group in 2007. In a career covering finance, commerce and industry he has held positions up to and including Managing Director for major international banking and finance organizations. Mr Figgins has also held Directorships and Senior Management positions in the commercial and industrial field and has been an advisor to the owners of some of South-East Asia’s largest companies. He is a Solicitor and has lived and worked in Asia for over 28 years.
Tim Glare General Manager, Human Resources
Mr Glare holds a Bachelor of Business Studies majoring in Personnel and Industrial Relations obtained from the Royal Melbourne Institute of Technology. His career has spanned over 24 years working in the manufacturing and mining industries in a variety of human resources and people development roles. He has spent the last 19 years working in companies involved in coal and base metals production. He has developed and implemented HR systems at the site level in both contractor and owner operated mines. He joined the Sakari Group in 2008.
Key Executives (continued)

SAK
AR
I R
ESO
UR
CES
LIM
ITED
Ann
ual R
epor
t 20
1211
Dear Shareholders
The past year will largely be remembered for PTT’s decision to further consolidate its control over Sakari Resources. That move, I believe, underscores the confidence that shareholders should have in the long-term opportunity that lies within our Group. Our assets have robust upside potential and Sakari continues to display significant internal strength from the strong foundations that the management team has laid in the past 3 years. The successful combination of these factors will provide the key to further momentum and growth for Sakari in the coming years.
Despite the distraction that inevitably arises from involvement in a take-over offer, management has remained focused on its performance targets and, in 2012, has once again steered the Group to a successful outcome within turbulent market conditions.
Operations
Some fundamental and structural changes occurred in the coal markets in 2012. For the first time in several years, suppliers were faced with much weaker than expected demand growth across the emerging markets in Asia. This in turn applied significant pressure back on the ever-increasing amounts of coal from new mines and brownfield expansions, which had been surging onto the seaborne market in recent times. The
CHIEF EXECUTIVE OFFICER’s REVIEW
resultant fall in prices meant that coal producers quickly had to change their mind-set away from volume growth and begin a careful focus on efficiency, costs and margins.
The management team at Sakari was one of the first to identify this evolving trend and was also one of the first to make the strategic decision to moderate expansion growth in exchange for margin delivery – the net result of which enabled the Group to generate profits, conserve capital and ensure on-going returns to shareholders.
At Jembayan this approach manifested in the reduction of production targets from over 9Mt for the year to 8Mt with a corresponding reduction in the budgeted stripping ratio from close to 13:1 to just over 12:1. The portion of production trimmed from the original target through this process represented the 10% of uncommitted production that the mine maintains each year to adjust for market conditions and holds back for the development of new customers. Not having this spot tonnage to sell in a highly competitive, depressed market enabled Sakari to maintain its pricing profile and achieve better selling prices. In addition to the beneficial impact on stripping ratio from the revised mine plan, the mine was also able to identify and achieve greater efficiencies in logistics management leading to lower dumping distances and better barge operating

SAK
AR
I R
ESO
UR
CES
LIM
ITED
Ann
ual R
epor
t 20
1212
cycles. Both these measures helped to reduce Jembayan’s operating costs for 2012. Achieving these objectives was even more satisfying given the horrendous start to the year with record rainfall leading to extensive pit flooding and the need to open up new pits much earlier than expected at a stripping ratio of over 20:1 at the beginning of the year.
By the third quarter of 2012, Jembayan had managed to eradicate the effects of the poor start to the year on operational performance, with cash costs trending below $55/t and on-going stripping ratios falling under 12:1. This was further achieved against a background of mine sector inflation running well above the published national figure of 4% and cost pressures from all sides as local businesses attempted to make up for margin erosion caused by the global economic slow-down. Looking ahead there is no doubt that the prompt measures implemented at the beginning of the year and the continuous efforts to improve performance have re-set the platform for Jembayan for the year ahead and increased the competitiveness of the mine in the context of the current operating conditions.
On the other side of the equation, Sebuku was in a fortuitous position to be able to pursue a different market strategy. Sebuku’s low cash-cost base and unique quality of coal, allowed Sebuku to push ahead with its development of
the Northern Leases towards maximum sustainable capacity – which is essentially limited by pit operating room within the confines of a narrow operating lease area. The mine’s margins warrant that even in the most depressed market conditions production cutbacks are not readily considered. Indeed the high demand for this type of product in first class power utilities in Asia, means that the focus is on increasing supply at all times irrespective of overall supply and demand fundamentals. For this reason the focus in 2012 remained on growth and efficiency.
As a result Sebuku increased production by more than 50% year on year to 2.7Mt and, like Jembayan, kept its cash costs at roughly the same level as those achieved in 2011.
Both mines’ production and management teams deserve well-earned praise for their hard work, initiatives and determination to forge greater efficiency in operating the mines in 2012.
Exploration
The pressure on the exploration team eased in 2012 now that the major resource drill-outs of both Sebuku’s and Jembayan’s leases have been effectively completed. We now have an extensive data base of high quality geological information to help with detailed mine planning, as was demonstrated by the
Chief Executive Officer’s Review (continued)

SAK
AR
I R
ESO
UR
CES
LIM
ITED
Ann
ual R
epor
t 20
1213
exploration team’s ability to help with the cost and margin solutions related to the revised mine plan fashioned for Jembayan in 2012. Our reserves increased in 2012 to 170.1Mt (2011: 146.5Mt), which supports our belief that shareholders can expect both mines to be well positioned for further sustainable expansion once the market resumes its latent growth in demand as the global economy recovers.
Exploration also started at a number of early stage projects that our Business Development team has been progressing within the region, with the most notable of these projects being in Cambodia and in an area about 30km North of the Jembayan mine site. Both projects have shown promise from the work completed so far.
Business Development
In August 2012 Sakari announced that it had created a JV with the Royal Group of Cambodia to explore for potential occurrences of economic coal in that country. The Business Development team also signed a binding Heads of Agreement in relation to exploring, and possibly buying into, 6 IUP’s in an area about 30Km North of Jembayan. Both are exciting new ventures and exploration drilling has begun, but it is too early to say what will be the results of our exploration work although initial results are encouraging.
These two ventures are just the tip of the massive amount of opportunities that the Group’s Business Development team has studied over the last 3 years. In the process we have assembled a large data base of information on coal basins and companies around Asia. In addition Sakari now has a significant level of background research to help with our long-term goal of consolidating the regional potential of the Separi coal basin, of which Jembayan forms a substantial part.
Following from this exercise, Sakari took the step in 2012 of acquiring a local company called PT Tri Tunggal Lestari Bersama - a small, special purpose vehicle that holds a unique licence that allows the holder to build a bridge and associated infrastructure over major gas pipelines that stretch along the Samarinda coastline, that would otherwise bar the creation of a coal hauling corridor from Jembayan to the East coast of Kalimantan. The creation of that corridor, which can now become a reality through the building of the bridge, would give rise to very substantial cost savings in Jembayan’s coal transportation from the mine to the Ocean going vessel. If these cost savings can be achieved, then this seemingly small acquisition can effectively open the door on increasing the recovery of in-situ coal from Jembayan’s huge resource base with a consequent rise in production capacity and investment returns.
Chief Executive Officer’s Review (continued)

SAK
AR
I R
ESO
UR
CES
LIM
ITED
Ann
ual R
epor
t 20
1214
In 2012 we also worked hard to continue to advance our plans for developing the Western Leases, the extension of Sebuku’s CCOW that we were granted in 2007. Whilst we have made considerable progress in accordance with the process required to allow us to unlock this highly prospective area, there have been a number of changes to the regulations that apply to this process and that in turn has introduced a number of delays along the way. That said, there are signs that there are efforts to stabilise the regulatory environment to encourage greater investment in large scale projects of this nature that could have a significant beneficial impact on the local and national economy and, if this is the case, it is possible that there will be a clear schedule established for the Western Leases’ development before the end of 2013.
Sustainability
Since our first production of coal back in 1997, Sakari has always been committed to sustainable practices. Sakari’s Sustainability Report which is available for download from our website or in hardcopy on request, shows the programmes and plans that we have in place.
Of particular note in 2012, was Sakari’s adoption of ISO26000 as the basis for our Sustainability Programme. We anticipate that this is the first stage in a programme that will eventually lead to the adoption of the Global Reporting Initiative (GRI) standard.
Chief Executive Officer’s Review (continued)
Marketing
Tiger Energy’s contribution to Sakari in 2012 is also worth mentioning. As the Newcastle Index dropped by 21% in 2012 compared to 2011, Sakari’s ASP tracked lower by only 7% year on year. On an energy-adjusted basis, this outcome means that the Group exceeded the performance of all our major peers in terms of the ASP achieved for our coal. This achievement also reflects the benefits of the strategic, synchronised response between operations and sales towards the global economic conditions encountered throughout 2012.
The newly created derivatives desk, whose mandate is restricted to protecting margin on physical coal sales and the proportionate fuel costs associated with generating this tonnage, added about $14m to our Group’s pre-tax profit. Tiger Energy also successfully traded 363kt of third party coal in 2012.
Outlook
With the significant decline in international coal prices over the past year, we witnessed a number of smaller miners closing and larger miners re-evaluating their capital expansion plans. This, coupled with a realisation that rapid and continuous demand growth for energy from emerging markets in Asia is not guaranteed, has introduced a far more cautious element into the current pricing and supply discussions

SAK
AR
I R
ESO
UR
CES
LIM
ITED
Ann
ual R
epor
t 20
1215
Chief Executive Officer’s Review (continued)
between producers and consumers. With the “shale shocks” in the USA now stabilising to a large extent, the volume of coal being forced out of that market into Asian consumers is now starting to moderate and is unlikely to have the same influence on pricing that it did in 2012. That said, it does now appear that the market is through the worst of the cycle and that any further downside on prices is clearly limited by cost constraints. This means that mines that can run profitably and efficiently under the prevailing conditions will be well placed to consolidate their operations and customer relationships and start to prepare more aggressive production strategies for the inevitable return to demand driven fundamentals in the next phase in the cycle. Since the start of this millennium there have been 3 previous periods where coal prices have fallen below the 90th cost percentile as a result of an imbalance in market conditions – in 2003, 2006 and 2008 – and in each case there was a strong price recovery after that point in the cycle.
In summary, in the near term we expect to continue to see market pricing “tread water” while the supply side response starts to reduce high levels of stocks and inventory in the pipeline. As this trend progresses prices will start to firm as long as there are no further, unforeseen shocks that add to overall supply.
Given this situation and my comments earlier about the depth and quality of information on our mines, our sustainable development plans, the agility of our asset base to respond to market changes, Tiger Energy’s robust marketing platform and the seasoned experience within our overall management team, I am confident that Sakari is well positioned to maintain its competitive advantages in 2013. The year has begun positively.
In closing I would like to thank the entire staff and management team of Sakari who have once again proved their resolve and commitment to respond to challenging external conditions with an innovative and tenacious attitude to achieve success.
Martin PurvisChief Executive Officer
SAK
AR
I R
ESO
UR
CES
LIM
ITED
Ann
ual R
epor
t 20
1216
FINANCIAL REVIEW
I am pleased to report that for 2012 Sakari Resources Limited again delivered a solid financial outcome for its stakeholders, notwithstanding the continued high levels of volatility and uncertainty within the world’s economy.
Across the coal price cycle of the past three years, Sakari has achieved coal revenue growth of around 19%, which has driven a three-year compound average growth rate in net profit after tax of 11%. This result has been driven by our commitment to continuous improvement across our business.
This commitment to improvement is reflected in a number of key achievements over the course of 2012. Among these has been the integration of sales, marketing and distribution into our SAP enterprise resource planning system, the conclusion and successful settlement of the 2009 Indonesian insurance claim and the completion of the first full year of our new treasury risk management policy and its associated hedging activity.
The SAP system has enabled more efficient data collection and, perhaps more importantly, delivery of data to management in shorter timeframes. This delivery, coupled with careful analysis of the data meant that the finance team was an important contributor to operational management’s review on how to improve financial margins in
2012. This was particularly important to the decisions that were made over Jembayan’s mine plan for 2012 that are referred to elsewhere in this Annual Report.
For CY12 Sakari produced free cash flow of over US$71 million, demonstrating the cash generation and productivity of the underlying operations, even within a more challenging economic environment. The quality of Sakari’s performance for 2012 highlights the strength of the business and distinguishes itself from its peer group.
Management of the balance sheet and confidence in the Group’s future is once again shown by your Board’s decision to recommend a final dividend of 3.72 cents per share for 2012. In the last 3 years we have paid $213m in total dividends to shareholders.
It is the people of Sakari and its strong management team that are responsible for delivering such consistently strong outcomes for all stakeholders. As part of this team approach, I would like to take this opportunity to recognise the contribution of all staff towards another successful year for the Company.
Shaun DayChief Financial Officer

SAK
AR
I R
ESO
UR
CES
LIM
ITED
Ann
ual R
epor
t 20
1217
OPERATIONS’ REVIEW
Production and Sales Volumes
Kt Full Year Ended 31 December Sebuku 2012 2011Coal mined 3,324 2,050Product coal 2,715 1,772Sales 2,610 1,825JembayanCoal mined 8,083 8,514Product coal 8,040 8,892Sales 8,225 8,901TotalCoal mined 11,407 10,564Product coal 10,755 10,664Sales 10,835 10,726
Sebuku Mine
Nearly all mining production is currently concentrated within the Northern Leases area. This area comprises two IUPs: Karbon Mahakam (KM) to the South, which is immediately next to the old Tanah Putih pit; and Metalindo Bumi Raya (MBR), which adjoins KM and stretches some 6 kilometres northwards. The Tanah Putih pit is now completely mined-out with the exception of a small amount of residual coal along the boundary with KM, which will eventually be mined as we progress in KM. Almost the whole of Sebuku’s 2012 production came from the KM area in the Northern Leases.
As a result of the extensive infrastructure created as part of the development activities for the Northern Leases as well as the innovative technical approaches in overcoming challenges associated with mud handling, we were able to
accelerate mining at KM in 2012 and get ahead of the 2012 Budget Plan. Coal production increased by 53% over 2011’s level as KM reached its optimum production level.
Whilst we undertook a significant amount of preparatory work at MBR in the past year and did manage to extract some coal from the area at the end of 2012, the commercial opening of the pit was only finally achieved in March 2013. It is important to note that future mining costs at MBR will be higher than KM due to a higher stripping ratio, thicker mud layers and longer hauling distances. In addition, opening of MBR, as with all new pit developments, requires a significant initial cost outlay for pre-stripping. MBR is now operating at a sustainable steady state of production and will increasingly be relied upon for the majority of production and sales from Sebuku over the next 2 to 3 years.

SAK
AR
I R
ESO
UR
CES
LIM
ITED
Ann
ual R
epor
t 20
1218
Sebuku’s operating pits ended 2012 in good shape, with robust inventory and positive expansion momentum. All the mine’s key operational targets were achieved. Notwithstanding the additional complexities and challenges associated with the development of a new mining area, Sebuku was able to maintain its cash costs at close to the same levels as those achieved in 2011.
Developing KM and MBR’s pits involved advancing and overcoming numerous technical and non-technical issues. The main technical issue revolved around the development of new techniques and operating practices related to the handling and containment of thick mud cover of up to 15 meters. This posed serious challenges in terms of being able to mine the mud efficiently and safely. A large amount of work and resources were channelled to this area over the year, including intensive geotechnical studies, design of mud mining methodology, design of mud containment cells followed by implementation and development of agreed plans. The relatively unstable and unpredictable nature of the mud warranted the introduction of a broad range of checks and geo-technical controls over all areas where mud was being worked or stored.
The biggest non-technical challenge was delivering on our commitment to protect the environment and the community surrounding our mine. Significant investments were made on environmental activities to ensure we discharge clean water continue to preserve and protect forest areas and
Operations’ Review (continued)
animals. For the community, our focus was to ensure better and safer facilities for those who might be affected by our operations. During the year, a major task that faced us was the undertaking of an approved community programme to relocate a village in close proximity to the mine, containing approximately 100 families. The programme was carefully planned and socialised to all stakeholders over several years and our challenge was to ensure timely delivery of their new homes and support infrastructure. We built the new village in an area that allowed for the construction of more spacious and improved facilities allowing improved access by road and river. In completing this project, we built a school, a mosque, public recreational facilities, local village and government offices, access roads, bigger and deeper rivers with jetties, electricity and clean water. Now that the relocation plan has been completed, the project has been given excellent recognition and testaments by the local government as an example of commitment to the community by a private organization.
Jembayan Mine
The Jembayan mine is located at the heart of East Kalimantan’s coal industry within the Separi Basin. The mine occupies over 12,000ha and operates multiple pits in areas that include forestry and transmigration land. 2012 proved to be an extremely challenging year for all coal mining companies in East Kalimantan, especially with softening coal prices and community claims over land.

SAK
AR
I R
ESO
UR
CES
LIM
ITED
Ann
ual R
epor
t 20
1219
Jembayan was no exception to these challenges and overcoming them required flexibility in our approach, excellent planning and delivery through teamwork. Jembayan’s outcome for 2012 was satisfactory in the face of these challenges, in as much that the mine produced its best ever safety performance, a reduction of year on year cash costs of 3.5% and an increase in manpower productivity of over 6.5%.
The Jembayan mine started the year with a major setback as the heavy downpours that began in December 2011 continued into January 2012 and resulted in numerous disruptions to our mining activities. This was compounded by excess water being channelled into rivers from upstream operations, which overflowed into our mining areas and a number of villages in our concessions. Despite the setback, Jembayan’s management worked through the challenges and overcame them with a set of appropriate counter-measures. With all the hard work, production was back to normal by Q2 2012. While opportunities existed to push the production levels even higher for the rest of the year, a decision was taken to moderate the rate of increase to align with weaker market conditions and limit the production of additional quantities of spot, or uncommitted coal. For this reason the final production from Jembayan was held to roughly 10% below the original budget target for the year.
As far back as early 2011, the coal mining industry, especially in East Kalimantan has been facing strong cost
Operations’ Review (continued)
inflation effects from the general industry boom, which has seen all coal miners expanding their operations to satisfy very strong demand and historically attractive prices. Coal mining companies resorted to paying premiums to secure goods and services to keep their operations performing at their maximum capacity. During 2011, Jembayan experienced a strong rise in its cash costs as a result of this “boom-time” situation.
As the outlook for prices changed in late 2011 and gathered momentum in 2012, the whole industry came under margin pressures for the first time for many years and a change of mindset was needed. Our site management team focused on cost reduction through improved productivity. Numerous cost improvement initiatives were introduced, ranging from a review of the mine plan to improved control over the strip ratio, developing alternatives for dumping to reduce truck movements, identifying the cost drivers of activities in each of the mine’s pits and improving the allocation of resources, especially manpower. This process delivered dividends as site cash costs dropped for the first time in several years, by 3.5% against a rising cost trend for the industry and Jembayan’s manpower productivity improved by 6.5%.
The biggest ongoing challenge for Jembayan at this time relates to land acquisition. Price compensation demands by land owners continue to increase out of hand with speculative middle men fuelling the expectations well beyond reasonable market levels. Jembayan’s operations were disrupted by organised

SAK
AR
I R
ESO
UR
CES
LIM
ITED
Ann
ual R
epor
t 20
1220
Operations’ Review (continued)
protests on several occasions in the past year with numerous groups pressing for exorbitant offers and unsupported claims that past compensation had not been paid to the right owners. We have been very proactive in trying to reach the core of the problem but the issues are complex with conflicting claims over historical land titles that go beyond registered titles. This problem has still to be remedied effectively and will continue until a solution is found that involves all the stakeholders, including several branches of local government as well as the key community representatives.
Considering all the problems that Jembayan had to overcome in 2012, the result is satisfactory. The speed of the turnaround from the substantial setback in Q1 is testament to the dedication and focus of the entire production team on the site. The final outcome for Jembayan was that production reached 8.1Mt - the 3rd highest level in the mine’s history - and cash costs dropped from the high $60’s at the start of 2012 to an average of $57.5/t for the year.
Exploration
Sebuku
An intensive exploration programme that began at Sebuku’s Northern Leases in H1 2011 was completed by mid-2012. We applied significant resources
1 Mineral classification nomenclature specified by the Joint Ore Reserves Committee (JORC). The JORC is composed of members from The Minerals Council of Australia, The Australasian Institute of Mining and Metallurgy and the Australian Institute of Geoscientists), as well as delegates from the Australian Securities Exchange and the Financial Services Institute of Australasia. More information on JORC can be found at http://www.jorc.org/
to a rapid deployment programme to delineate the coal seams and finished the work in less than 14 months. 7 drilling rigs completed 800 holes for 29,000m to define a Measured1 and Indicated1 coal resource of 54Mt. A robust mine plan has been developed and the extraction of reserves from the Northern Leases is now proceeding under that plan.
Exploration work to further define the vast coal resources within Sebuku’s Western Leases continues. A significant upgrade of coal resource confidence from the predominantly ‘Inferred’1 classification to the ‘Indicated’1 classification is expected in 2013 as a result of the fieldwork that we completed in 2012, which included an extensive 3D seismic survey over the area.
Jembayan
Throughout 2012 further exploration and reserve drilling was conducted at Jembayan. With over 90% of the concession now explored, our field activities are primarily focused on finalising reserves on the fringes of the operation and clearing land for overburden storage and other infrastructure requirements. The reserves depleted during the year by mining activities were, once again, substantially replaced through additional fieldwork, keeping reserves at a level that continues to generate robust mine plans.

SAK
AR
I R
ESO
UR
CES
LIM
ITED
Ann
ual R
epor
t 20
1221
Cambodia
The Royal Group of Cambodia, our Cambodian joint venture partner, gave a significant boost to the JV by securing extensive areas of coal concessions containing known coal occurrences and previous mining activity. The new areas have already been subject to extensive high level assessment and prioritisation work, which we began last year and which remains on-going. Other activities that we carried out in Cambodia for the JV involved extensive fieldwork, including detailed seismic surveying,
Operations’ Review (continued)
large scale geological mapping, detailed trenching and drilling. At present several prospective areas are under assessment and we are in discussion with our partner about the possibility of acquiring further areas for the JV. We estimate that it will take 1-2 years of fieldwork in order to gain a good understanding of the broader structural complex hosting the coal measures in this country and the potential opportunities that may exist.
David Lim Chief Operating Officer

SAK
AR
I R
ESO
UR
CES
LIM
ITED
Ann
ual R
epor
t 20
1222
Tiger Energy Trading put in another strong performance in 2012. The team focused on delivering strong ASP numbers relative to our peers as well as achieving positive outcomes and price risk management from our activities in derivatives trading, third-party coal trading, ocean freight services and quality management activities
Our continuous improvement initiatives focused on reducing costs and counterparty risk and improving efficiency in the logistics supply chain. We implemented SAP and Mincom ERP systems to better manage and control sales and logistics operations. This work means Tiger Energy is now capable of delivering a full suite of supply chain services to our customers and will provide a strong foundation on which Sakari can grow its future coal business.
2012 Coal Markets
2012 began with a degree of optimism in most people’s minds after very strong coal prices were recorded throughout 2011. Our customers had, however, been signalling to us for some months that they were having no trouble in securing supplies for the first time for several years and that their own demand was unlikely to increase much in the first half of 2012. This was the first signal that market fundamentals were changing and that demand growth expectations were clearly softening. We therefore took a cautious approach to the market and used our paper desk to remove some of the pricing uncertainty for a significant portion of our index-priced shipments.
MARKETING AND SALES REVIEW
As 2012 progressed, coal prices began a continuous decline due to a combination of factors affecting the seaborne coal market. First, meaningful quantities of US thermal coal were aggressively bid into the Asian market on the back of historically low freight rates. The rapid emergence of cheap shale gas across much of North America forced power companies to switch from coal to gas for electricity generation, which meant that large volumes of thermal coal production had to be closed or redirected to the only part of the world where coal demand was increasing – initially to Europe, but when that became saturated, Asia, which is Sakari’s traditional market.
We then witnessed South African supplies that would normally be bound for Europe, themselves being displaced by US exports and thence being re-targeted into Asia. Other, relatively new entrants into the Asia Pacific market, most notably Colombia, also added to the over-supply from non-traditional sources that was facilitated by record low freight rates.
Against this background Indonesian suppliers continued with the pace of supply expansion that has seen this country become the world’s foremost thermal coal exporter, without the security of preparing an established customer base for the new production. Under pressure to reduce the holding cost of rapidly growing stockpiles, most of these companies took to heavily discounting the market in order to place their coal. This in turn encouraged buyers to press for lower and lower prices in the confident knowledge that there was sufficient availability to ensure reliable supply.

SAK
AR
I R
ESO
UR
CES
LIM
ITED
Ann
ual R
epor
t 20
1223
Eventually, dislocated supply from the USA abated and as spot prices fell below the cash cost of production, many Indonesian producers, and particularly smaller ones, cut production and even closed their mines. Prices stabilised from their downward trend as a result of this supply response and the pick-up in seasonal demand. 2012 closed on a better note with a mildly positive outlook on the pricing curve.
In actual numbers, coal prices started 2012 around $117/t in January before falling sharply to average just $83/t in October (based on the global Coal Newcastle index). Prices partially recovered on the strength of the above trends to average $93/t in December.
Tiger Energy’s Performance
Tiger Energy’s 2012 pricing performance was achieved through a combination of good strategy and strong teamwork. The shift to index-linked pricing combined with the use of coal derivatives allowed us to avoid contract defaults and price re-negotiations, which were a feature of the market for many other participants last year, whilst realising higher than market prices for our coal.
We also took advantage of the weak negotiating power of some producers by trading 363kt of third party coal and earning in excess of $2m as a result of these activities (equivalent to $5.52/t) during 2012.
Even as coal prices declined and oversupply pressures prevailed throughout the year, Tiger Energy helped Sakari to a CV adjusted ASP for 2012 of
Marketing and Sales Review (continued)
$86.84/t. This was a drop of only 7% from 2011’s ASP of $92.93/t. Over the same period the global Coal Newcastle Index dropped by 21% year-on-year from an average of $121/t in 2011 to $96/t in 2012. It’s encouraging to note that Tiger Energy is one of the few coal companies to have achieved its original ASP guidance target for 2012.
Tiger Energy’s shipping and logistics team continued to successfully manage the impact of the Tenggarong Bridge collapse in the early part of the year as well as the follow-on limitations for barge traffic on the Mahakam River. A detailed feasibility study was completed on the Group’s logistics supply chain with sophisticated computer modelling identifying potential efficiency improvements. A number of these initiatives have been implemented, reducing the number and cost of the required tug and barge fleet. A further initiative to reduce costs and improve efficiency saw Tiger Energy move the operation of the Straits Phoenix floating terminal from a third-party contractor to an owner/operator model. Further enhancements to the logistics chain are planned for 2013.
The strong contribution from the team at Tiger Energy is evident in the Group’s 2012 results. We have given Sakari a strong sales and marketing position as we strive to enhance our reputation as one of the best coal companies in Asia.
Nicholas StephensManaging Director, Tiger Energy Trading Pte Ltd

SAK
AR
I R
ESO
UR
CES
LIM
ITED
Ann
ual R
epor
t 20
1224
COAL RESOURCES STATEMENT AS AT 31 DECEMBER 2012
SEBUKU
In situ resources (Mt) Measured Indicated Measured + Indicated
Inferred Total
Karbon Mahakam 1.5 8 10 - 10
Metalindo Bumi Raya 8.0 43 51 - 51
CCoW - BCS - Onshore - 36 36 - 36
CCoW - BCS - Offshore - 420 420 380 800
TOTAL SEBUKU 9.5 507 517 380 897
JEMBAYAN
In situ resources (Mt) Measured Indicated Measured + Indicated
Inferred Total
Jembayan (All) 251.3 328 579 110 689
SAKARI GROUP
In situ resources (Mt) Measured IndicatedMeasured + Indicated
Inferred Total
GRAND TOTAL 260.8 835 1,096 490 1,586
General
1. The information on coal resources as at 31 December 2012 was prepared by or under the supervision of Competent Persons as defined in the JORC Code.
2. The JORC Code requires the use of reasonable economic assumptions. These include long-range commodity price forecasts which are prepared by in-house specialists. The coal resource estimates are dynamic and are influenced by changing economic conditions, technical issues, environmental regulations and relevant new information and therefore can vary from year to year.
3. Coal resources are inclusive of coal reserves
4. Rounding of figures may cause computational discrepancies.
Coal Resource Statement
1. The information in this statement that relates to coal resources is based on information compiled by Mr Chris Ramsay, who is a Member of The Australasian Institute of Mining and Metallurgy (MAusIMM) and the Australian Institute of Geoscientists (MAIG).

SAK
AR
I R
ESO
UR
CES
LIM
ITED
Ann
ual R
epor
t 20
1225
2. Mr Ramsay is a full-time employee of Sakari Resources Limited.
3. Mr Ramsay has sufficient experience which is relevant to the type of mineralisation and style of deposit under consideration and to the activity which he is undertaking, to qualify as the Competent Person as defined in the 2004 edition of the ‘Australasian Code for Reporting of Exploration Results, Mineral Resources and Ore Reserves’. Mr Ramsay consents to the inclusion in this report of the matters based on his information in the form and context in which they appear.
Summary of changes
Changes to reported resources represent minor adjustments to classification and adjustments in relation to mining depletion. Additionally, an increase of approximately 90Mt to the Jembayan Coal Resource is a result of exploration activities which improved the resource confidence and JORC classification.
Coal Resources Statement (continued)
SAK
AR
I R
ESO
UR
CES
LIM
ITED
Ann
ual R
epor
t 20
1226
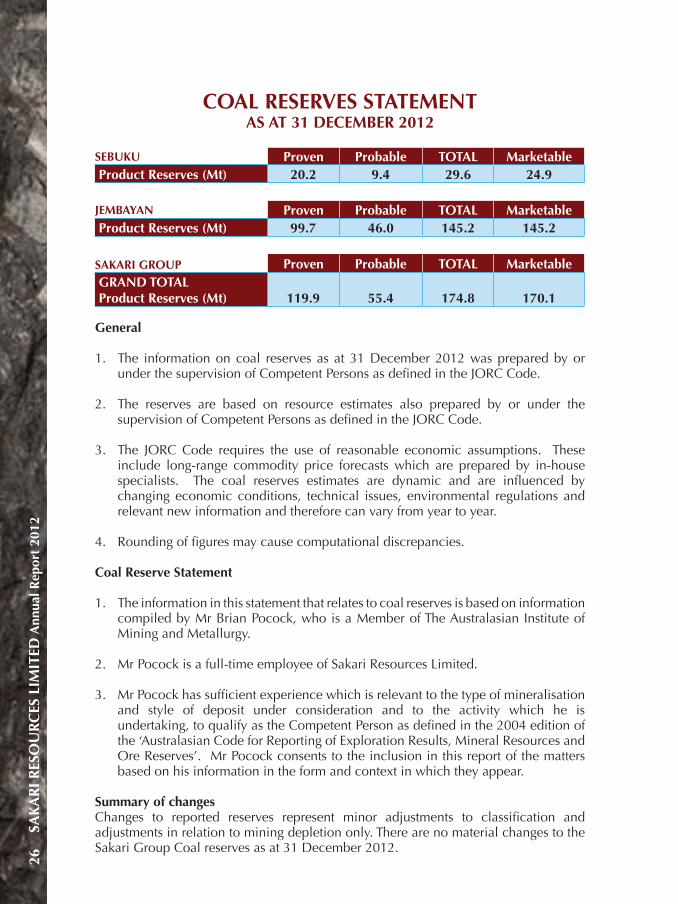
SEBUKU Proven Probable TOTAL MarketableProduct Reserves (Mt) 20.2 9.4 29.6 24.9
JEMBAYAN Proven Probable TOTAL MarketableProduct Reserves (Mt) 99.7 46.0 145.2 145.2
SAKARI GROUP Proven Probable TOTAL MarketableGRAND TOTAL Product Reserves (Mt) 119.9 55.4 174.8 170.1
General
1. The information on coal reserves as at 31 December 2012 was prepared by or under the supervision of Competent Persons as defined in the JORC Code.
2. The reserves are based on resource estimates also prepared by or under the supervision of Competent Persons as defined in the JORC Code.
3. The JORC Code requires the use of reasonable economic assumptions. These include long-range commodity price forecasts which are prepared by in-house specialists. The coal reserves estimates are dynamic and are influenced by changing economic conditions, technical issues, environmental regulations and relevant new information and therefore can vary from year to year.
4. Rounding of figures may cause computational discrepancies.
Coal Reserve Statement
1. The information in this statement that relates to coal reserves is based on information compiled by Mr Brian Pocock, who is a Member of The Australasian Institute of Mining and Metallurgy.
2. Mr Pocock is a full-time employee of Sakari Resources Limited.
3. Mr Pocock has sufficient experience which is relevant to the type of mineralisation and style of deposit under consideration and to the activity which he is undertaking, to qualify as the Competent Person as defined in the 2004 edition of the ‘Australasian Code for Reporting of Exploration Results, Mineral Resources and Ore Reserves’. Mr Pocock consents to the inclusion in this report of the matters based on his information in the form and context in which they appear.
Summary of changesChanges to reported reserves represent minor adjustments to classification and adjustments in relation to mining depletion only. There are no material changes to the Sakari Group Coal reserves as at 31 December 2012.
COAL RESERVES STATEMENT AS AT 31 DECEMBER 2012

SAK
AR
I R
ESO
UR
CES
LIM
ITED
Ann
ual R
epor
t 20
1227
SUSTAINABILITY
Sakari’s Sustainability Report is available for download from our website http://www.sakariresources.com or a hard copy can be obtained on request to our Company Secretary at [email protected]

FINANCIAL STATEMENTS29 Directors’ Report34 Statement by Directors35 Independent Auditor’s Report36 Consolidated Income Statement37 Consolidated Statement of Comprehensive
Income38 Balance Sheets40 Consolidated Statement of Changes in Equity41 Consolidated Statement of Cash Flows42 Notes to the Financial Statements99 Glossary100 Notice of Annual General Meeting103 Proxy Form
SAK
AR
I R
ESO
UR
CES
LIM
ITED
Ann
ual R
epor
t 20
1228

SAK
AR
I R
ESO
UR
CES
LIM
ITED
Ann
ual R
epor
t 20
1229
The directors present their report to the members together with the consolidated audited financial statements of Sakari Resources Limited and its subsidiaries (the “Group”) for the financial year ended 31 December 2012 and the balance sheet of Sakari Resources Limited (the “Company”) as at 31 December 2012.
Directors
The directors of the Company in office at the date of this report are as follows:
Dr Chitrapongse Kwangsukstith Non-Executive Chairman
Mr Martin David Purvis Executive Director and Chief Executive Officer
Mr Chatchawal Eimsiri Non-Executive Director
Mr Supattanapong Punmeechaow Non-Executive Director
Mr Surong Bulakul Non-Executive Director (appointed 21 February 2012)
Mr Peerachat Pinprayong Non-Executive Director
Mr Han Eng Juan Independent Director
Dr Chua Yong Hai Independent Director
Mr Apisit Rujikeatkamjorn Independent Director
Ms Julie Therese Hall Independent Director
Arrangements to enable directors to acquire shares or debentures
Neither at the end of nor at any time during the financial year was the Company a party to any arrangement whose object was to enable the directors of the Company to acquire benefits by means of the acquisition of shares in, or debentures of, the Company or any other body corporate, other than as disclosed under “Options issued to directors” on page 32 of this report.
DIRECTORS’ REPORTFor the financial year ended 31 December 2012

SAK
AR
I R
ESO
UR
CES
LIM
ITED
Ann
ual R
epor
t 20
1230
Directors’ interests in shares or debentures
(a) According to the register of directors’ shareholdings, none of the directors holding office at the end of the financial year had any interest in the shares or debentures of the Company or its related corporations, except as follows:
Holdings registered in name of director or nominee
Holdings in which a director is deemed to have
an interest
At 31.12.2012
At 1.1.2012 or date of
appointment, if later
At 31.12.2012
At 1.1.2012 or date of
appointment, if later
Company
(No. of ordinary shares)
Dr Chitrapongse Kwangsukstith - 35,000 - -
Mr Martin David Purvis 3,338,297 1,868,814 - -
Mr Apisit Rujikeatkamjorn 500,000 500,000 - -
Dr Chua Yong Hai - - - 100,000
PTT Public Company Limited
Ultimate holding corporation(No. of ordinary shares)
Dr Chitrapongse Kwangsukstith 218,090 218,090 40,600 40,600
Mr Chatchawal Eimsiri - 10,000 - -
Mr Apisit Rujikeatkamjorn - 9,000 386,018 227,018
Holdings registered in nameof director or nominee
Holdings in which a director is deemed to have
an interest
At 31.12.2012
At 1.1.2012 or date of
appointment, if later
At 31.12.2012
At 1.1.2012 or date of
appointment, if later
PTT Exploration and Production Public Company Limited
Related corporation(No. of ordinary shares)
Dr Chitrapongse Kwangsukstith 245,463 222,000 187,302 165,000
Mr Peerachat Pinprayong - - - -
Mr Apisit Rujikeatkamjorn 200,000 115,000 - -
PTT Global Chemical Plc
Related corporation(No. of ordinary shares)
Mr Apisit Rujikeatkamjorn - - 402,301 402,301
Directors’ Report (continued)

SAK
AR
I R
ESO
UR
CES
LIM
ITED
Ann
ual R
epor
t 20
1231
Directors’ interests in shares or debentures (continued)
(b) According to the register of directors’ shareholdings, certain directors holding office at the end of the financial year had interests in options to subscribe for ordinary shares of the Company granted pursuant to the Sakari Resources Limited option plan as set out under “Options issued to directors” on page 32 of this report.
No. of unissued ordinary shares under option
At 31.12.2012
At 1.1.2012 or date
of appointment, if later
Dr Chitrapongse Kwangsukstith
2011 Options 77,236 77,236
2012 Options 73,077 -
Mr Supattanapong Punmeechaow
2012 Options 28,846 -
Mr Chatchawal Eimsiri
2012 Options 28,846 -
Mr Peerachat Pinprayong
2011 Options 30,488 30,488
2012 Options 28,846
Mr Han Eng Juan
2008 Options 100,000 100,000
2011 Options 50,813 50,813
2012 Options 51,923 -
Dr Chua Yong Hai
2008 Options 150,000 150,000
2011 Options 67,073 67,073
2012 Options 42,308 -
Mr Apisit Rujikeatkamjorn
2011 Options 48,780 48,780
2012 Options 50,000 -
Ms Julie Hall
2012 Options 42,308 -
Directors’ Report (continued)

SAK
AR
I R
ESO
UR
CES
LIM
ITED
Ann
ual R
epor
t 20
1232
Directors’ contractual benefits
Since the end of the previous financial year, no director has received or become entitled to receive a benefit by reason of a contract made by the Company or a related corporation with the director or with a firm of which he is a member, or with a company in which he has a substantial financial interest, except as disclosed in the accompanying financial statements and in this report, and except that Dr Chitrapongse Kwangsukstith has a directorship with a related corporation of PTT Public Company Limited and has received remuneration in that capacity; Mr Apisit Rujikeatkamjorn has a directorship with a related corporation of PTT Public Company Limited and has received remuneration in that capacity; Mr Supattanapong Punmeechaow has an executive position with a related corporation of PTT Public Company Limited and has received remuneration in that capacity; Mr Peerachat Pinprayong has an executive position with a related corporation of PTT Public Company Limited and has received remuneration in that capacity; and Mr Chatchawal Eimsiri has an executive position with a related corporation of PTT Public Company Limited and has received remuneration in that capacity.
Share options
(a) Employee Share option Plans
Information regarding the Company’s Employee Share Option Plan (“ESOP”) and Executive Share Acquisition Plan (“ExSAP”) was disclosed in the Company’s 2012 Financial Statements. There have been no changes to these plans during 2012 or up to the date of this report.
On 31 January 2012, the Company granted options to key management to subscribe for 502,226 ordinary shares in the Company at an exercise price of S$2.23 per share. 40% of these options are exercisable from 31 January 2013; a further 30% are exercisable from 31 January 2014, with the remaining 30% exercisable from 31 January 2015. These options expire on 31 January 2017. The total fair value of these options granted was estimated to be US$380,000.
(b) Options issued to directors
Details of the options to subscribe for ordinary shares in the Company granted to Directors in previous years have been disclosed in the Company’s 2011 Financial Statements.
On 27 April 2012, the Company granted options to Non-Executive Directors of the Company to subscribe for 346,154 ordinary shares of the Company at an exercise price of S$1.99 per share. 40% of these options are exercisable from 27 April 2013; a further 30% are exercisable from 27 April 2014, with the remaining 30% exercisable from 27 April 2015. These options expire on 27 April 2017. The total fair value of these options granted was estimated to be US$229,000 using the Binomial Option Pricing Model.
Details of the options granted to directors of the Company are as follows:
No. of unissued ordinary shares of the Company under option
Granted in financial year
ended
Aggregate granted since
commencement of schemes to
Aggregate exercised since
commencement of schemes to
Aggregate outstanding
as at
Name of director 31.12.2012 31.12.2012 31.12.2012 31.12.2012
Dr Chitrapongse Kwangsukstith 73,077 150,313 - 150,313
Mr Chatchawal Eimsiri 28,846 28,846 - 28,846
Mr Peerachat Pinprayong 28,846 59,334 - 59,334
Mr Supattanapong Punmeechaow 28,846 28,846 - 28,846
Mr Han Eng Juan 51,923 202,736 - 202,736
Dr Chua Yong Hai 42,308 259,381 - 259,381
Mr Apisit Rujikeatkamjorn 50,000 98,780 - 98,780
Ms Julie Hall 42,308 42,308 - 42,308
Directors’ Report (continued)

SAK
AR
I R
ESO
UR
CES
LIM
ITED
Ann
ual R
epor
t 20
1233
Share options (continued)
(c) Share options outstanding
The number of unissued ordinary shares of the Company under option in relation to the Sakari Resources Limited Employee Share Option Plan outstanding at the end of the financial year was as follows:
No. of unissued ordinary shares under
option at31.12.2012 Exercise price Exercise period
2008 Options 310,000 S$3.14 24.03.2009 - 24.03.2013
2008 Options 250,000 S$3.67 30.04.2009 - 30.04.2013
2010 Options 383,750 S$2.27 23.06.2011 - 23.06.2015
2011 Options 449,006 S$2.30 23.02.2012 - 23.02.2016
2011 Options 274,390 S$2.66 21.04.2012 - 21.04.2016
2012 Options 502,226 S$2.23 31.01.2013 - 31.01.2017
2012 Options 346,154 S$1.99 27.04.2013 - 27.04.2017
2,515,526
On behalf of the directors
Dr Chitrapongse Kwangsukstith Mr Martin PurvisDirector Director
21 February 2013
Directors’ Report (continued)
SAK
AR
I R
ESO
UR
CES
LIM
ITED
Ann
ual R
epor
t 20
1234
In the opinion of the directors,
(a) the balance sheet of the Company and the consolidated financial statements of the Group as set out on pages 36 to 98 are drawn up so as to give a true and fair view of the state of affairs of the Company and of the Group as at 31 December 2012 and of the results of the business, changes in equity and cash flows of the Group for the financial year then ended; and
(b) at the date of this statement there are reasonable grounds to believe that the Company will be able to pay its debts as and when they fall due.
On behalf of the directors
Dr Chitrapongse Kwangsukstith Mr Martin PurvisDirector Director
21 February 2013
STATEMENT BY DIRECTORS31 December 2012

SAK
AR
I R
ESO
UR
CES
LIM
ITED
Ann
ual R
epor
t 20
1235
Independent Auditor’s Report to the Members of Sakari Resources Limited
Report on the Financial Statements
We have audited the accompanying financial statements of Sakari Resources Limited (the “Company”) and its subsidiaries (the “Group”) set out on pages 36 to 98 which comprise the consolidated balance sheet of the Group and the balance sheet of the Company as at 31 December 2012, the consolidated income statement, the consolidated statement of comprehensive income, the consolidated statement of changes in equity and the consolidated statement of cash flows of the Group for the financial year then ended, and a summary of significant accounting policies and other explanatory information.
Management’s Responsibility for the Financial Statements
Management is responsible for the preparation of financial statements that give a true and fair view in accordance with the provisions of the Singapore Companies Act (the “Act”) and Singapore Financial Reporting Standards, and for devising and maintaining a system of internal accounting controls sufficient to provide a reasonable assurance that assets are safeguarded against loss from unauthorised use or disposition; and transactions are properly authorised and that they are recorded as necessary to permit the preparation of true and fair profit and loss accounts and balance sheets and to maintain accountability of assets.
Auditor’s Responsibility
Our responsibility is to express an opinion on these financial statements based on our audit. We conducted our audit in accordance with Singapore Standards on Auditing. Those standards require that we comply with ethical requirements and plan and perform the audit to obtain reasonable assurance about whether the financial statements are free from material misstatement.
An audit involves performing procedures to obtain audit evidence about the amounts and disclosures in the financial statements. The procedures selected depend on the auditor’s judgement, including the assessment of the risks of material misstatement of the financial statements, whether due to fraud or error. In making those risk assessments, the auditor considers internal control relevant to the entity’s preparation of financial statements that give a true and fair view in order to design audit procedures that are appropriate in the circumstances, but not for the purpose of expressing an opinion on the effectiveness of the entity’s internal control. An audit also includes evaluating the appropriateness of accounting policies used and the reasonableness of accounting estimates made by management, as well as evaluating the overall presentation of the financial statements.
We believe that the audit evidence we have obtained is sufficient and appropriate to provide a basis for our audit opinion.
Opinion
In our opinion, the consolidated financial statements of the Group and the balance sheet of the Company are properly drawn up in accordance with the provisions of the Act and Singapore Financial Reporting Standards so as to give a true and fair view of the state of affairs of the Group and of the Company as at 31 December 2012, and of the results, changes in equity and cash flows of the Group for the financial year ended on that date.
Report on other Legal and Regulatory Requirements
In our opinion, the accounting and other records required by the Act to be kept by the Company and by those subsidiaries incorporated in Singapore, of which we are the auditors, have been properly kept in accordance with the provisions of the Act.
PricewaterhouseCoopers LLP,Public Accountants and Certified Public Accountants,Singapore, 21 February 2013
INDEPENDENT AUDITOR’S REPORT31 December 2012

SAK
AR
I R
ESO
UR
CES
LIM
ITED
Ann
ual R
epor
t 20
1236
Group
2012 2011
Note US$'000 US$'000
Revenue 4 927,268 1,013,574
Cost of sales 7 (732,242) (696,749)
Gross profit 195,026 316,825
Other income 5 1,043 646
Other gains - net 6 5,147 12,485
Expenses Finance 9 (13,533) (13,385)
Corporate and technical support 7 (58,692) (57,183)
Profit before income tax 128,991 259,388
Income tax expense 10 (20,524) (69,113)
Net profit after tax 108,467 190,275
Earnings per share attributable to the equity holders of the Company (US$ per share):
- Basic 11(a) 0.10 0.17
- Diluted 11(b) 0.10 0.17
The accompanying notes form an integral part of these financial statements.
CONSOLIDATED INCOME STATEMENTFor the financial year ended 31 December 2012

SAK
AR
I R
ESO
UR
CES
LIM
ITED
Ann
ual R
epor
t 20
1237
Group
2012 2011
Note US$'000 US$'000
Profit for the year 108,467 190,275
Other comprehensive loss:
Available-for-sale financial assets
- Fair value loss 17 (24) (5,626)
Other comprehensive loss, net of tax (24) (5,626)
Total comprehensive income 108,443 184,649
The accompanying notes form an integral part of these financial statements.
CONSOLIDATED STATEMENT OF COMPREHENSIVE INCOME
For the financial year ended 31 December 2012

SAK
AR
I R
ESO
UR
CES
LIM
ITED
Ann
ual R
epor
t 20
1238
Group Company
2012 2011 2012 2011
Note US$'000 US$'000 US$'000 US$'000
ASSETS
Current assets
Cash and cash equivalents 12 121,721 155,188 9,585 23,394
Trade and other receivables 13 86,284 100,289 571,202 566,553
Inventories 14 39,148 18,287 - -
Current tax receivables 15 64,703 33,276 - -
Derivative financial instruments 24 6,459 10,551 - -
318,315 317,591 580,787 589,947
Non-current assets
Restricted cash - 800 - -
Other receivables 16 7,151 2,310 - -
Available-for-sale financial assets 17 2,045 8,580 - -
Investments in subsidiaries - - 42,208 42,208
Property, plant and equipment 18 795,604 769,874 993 1,661
Exploration and evaluation 19 10,912 8,143 - -
Intangible assets 20 78,540 76,367 - -
Deferred income tax assets 21 8,074 3,589 - 1,431
902,326 869,663 43,201 45,300
Total assets 1,220,641 1,187,254 623,988 635,247
LIABILITIES
Current liabilities
Trade and other payables 22 166,976 155,263 7,920 7,016
Current income tax liabilities 23 23,710 12,645 2,200 1,646
Derivative financial instruments 24 6,615 80 - -
Borrowings 27 87,500 - 80,000
Provisions 25 5,606 10,647 2,370 8,043
290,407 178,635 92,490 16,705
BALANCE SHEETSAs at 31 December 2012

SAK
AR
I R
ESO
UR
CES
LIM
ITED
Ann
ual R
epor
t 20
1239
Group Company
2012 2011 2012 2011
Note US$'000 US$'000 US$'000 US$'000
Non-current liabilities
Borrowings 27 191,848 283,779 184,348 283,779
Deferred income tax liabilities 28 74,996 87,106 1,797 -
Provisions 26 7,409 6,766 - -
274,253 377,651 186,145 283,779
Total liabilities 564,660 556,286 278,635 300,484
Net assets 655,981 630,968 345,353 334,763
EQUITY
Capital and reserves attributable to equity holders of the Company
Share capital 29 327,509 326,832 327,509 326,832
Other reserves 30 (11,733) (16,631) 9,216 4,294
Retained profits 31 340,205 320,767 8,628 3,637
Total equity 655,981 630,968 345,353 334,763
The accompanying notes form an integral part of these financial statements.
Balance Sheets (continued)

SAK
AR
I R
ESO
UR
CES
LIM
ITED
Ann
ual R
epor
t 20
1240
Attributable to equity holders of the Company
Sharecapital
Otherreserves
Retained profits Total
Note US$'000 US$'000 US$'000 US$'000
2012
Beginning of financial year 326,832 (16,631) 320,767 630,968
Total comprehensive (loss)/income for the financial year - (24) 108,467 108,443
Total recognised (loss)/income for the financial year - (24) 108,467 108,443
Transferred from/(to) share capital 29 591 (591) - -
Shares issued on exercise of options 29 86 - - 86
Share based payments expense 30 - 4,622 - 4,622
Share plan loan repayment 30 - 891 - 891
Dividends paid 32 - - (89,029) (89,029)
End of financial year 327,509 (11,733) 340,205 655,981
2011
Beginning of financial year 325,758 (12,874) 210,898 523,782
Total comprehensive income for the financial year - (5,626) 190,275 184,649
Total recognised income for the financial year - (5,626) 190,275 184,649
Transferred from/(to) share capital 29 850 (850) - -
Shares issued on exercise of options 29 224 - - 224
Share based payments expense 30 - 2,039 - 2,039
Share plan loan repayment 30 - 680 - 680
Dividends paid 32 - - (80,406) (80,406)
End of financial year 326,832 (16,631) 320,767 630,968
The accompanying notes form an integral part of these financial statements.
CONSOLIDATED STATEMENT OF CHANGES IN EQUITYFor the financial year ended 31 December 2012

SAK
AR
I R
ESO
UR
CES
LIM
ITED
Ann
ual R
epor
t 20
1241
Group
2012 2011
Note US$'000 US$'000
Cash flows from operating activities
Receipts from customers 935,734 1,015,137
Payments to suppliers and employees (773,381) (688,231)
162,353 326,906
Interest received 1,053 637
Income taxes paid (60,526) (48,477)
Net cash provided by operating activities 40 102,880 279,066
Cash flows from investing activities
Acquisition of subsidiary, net of cash acquired (2,178) -
Payments for property, plant and equipment (52,584) (82,439)
Proceeds from sale of property, plant and equipment 1 33
Payments for exploration and evaluation (2,769) (1,549)
Payments for available-for-sale financial assets - (807)
Proceeds from derivative financial instruments 25,934 2,189
Net cash used in investing activities (31,596) (82,573)
Cash flows from financing activities
Proceeds from issues of shares and other equity securities 977 904
Proceeds from borrowings 60,000 -
Repayment of borrowings (65,000) (30,000)
Interest paid (11,780) (12,297)
Dividends paid to equity holders of the Company 32 (89,029) (80,406)
Net cash used in financing activities (104,832) (121,799)
Net (decrease)/increase in cash and cash equivalents (33,548) 74,694
Cash and cash equivalents at beginning of the financial year 155,188 80,743
Effect of exchange rate movements on cash and cash equivalents 81 (249)
Cash and cash equivalents at end of the financial year 12 121,721 155,188
The accompanying notes form an integral part of the financial statements.
CONSOLIDATED STATEMENT OF CASH FLOWSFor the financial year ended 31 December 2012

SAK
AR
I R
ESO
UR
CES
LIM
ITED
Ann
ual R
epor
t 20
1242
1 General Information
On 15 February 2013, Sakari Resources Limited (the “Company”) delisted from the Main Board of the Singapore Exchange Securities Trading Limited. The company is incorporated and domiciled in Singapore. The address of its registered office is 391B Orchard Road, Ngee Ann City, Tower B #17-01, Singapore 238874. Sakari Resources Limited and its subsidiaries together are referred to in these financial statements as the Group.
The principal activity of the Company is that of investment holding. The Group is principally engaged in the exploration for and mining and marketing of coal.
The Company’s immediate parent company is PTT Mining Ltd, a company incorporated in Hong Kong.
The Company’s ultimate parent company is PTT Public Company Limited, a company incorporated in Thailand. The address of PTT Public Company Limited is 555 Vibhavadi Rangsit Road, Chatuchak, Thailand.
2 Summary of significant accounting policies
(a) Basis of preparation
These financial statements have been prepared in accordance with Singapore Financial Reporting Standards (“FRS”). The financial statements have been prepared under the historical cost convention, except as disclosed in the accounting policies below.
The preparation of financial statements in conformity with FRS requires management to exercise its judgement in the process of applying the Group’s accounting policies. It also requires the use of certain critical accounting estimates and assumptions. The areas involving a higher degree of judgment or complexity, or areas where assumptions and estimates are significant to the financial statements are disclosed in Note 3.
Interpretations and amendments to published standards effective in 2012
On 1 January 2012, the Group adopted the new or amended FRS and Interpretations to FRS (“INT FRS”) that are mandatory for application from that date. Changes to the Group’s accounting policies have been made as required, in accordance with the transitional provisions in the respective FRS and INT FRS.
The adoption of these new or amended FRS and INT FRS did not result in substantial changes to the Group’s and Company’s accounting policies and had no material effect on the amounts reported for the current or prior financial years.
(b) Principles of consolidation
i. Subsidiaries
Subsidiaries are entities (including special purpose entities) over which the Group has the power to govern the financial and operating policies so as to obtain benefits from its activities, generally accompanied by a shareholding giving rise to the majority of the voting rights. The existence and effect of potential voting rights that are currently exercisable or convertible are considered when assessing whether the Group controls another entity. Subsidiaries are consolidated from the date on which control is transferred to the Group. They are de-consolidated from the date on which control ceases.
NOTES TO THE FINANCIAL STATEMENTSFor the financial year ended 31 December 2012

SAK
AR
I R
ESO
UR
CES
LIM
ITED
Ann
ual R
epor
t 20
1243
2 Summary of significant accounting policies (continued)
(b) Principles of consolidation (continued)
i. Subsidiaries (continued) The acquisition method of accounting is used to account for business combinations
by the Group (refer to note 2h).
In preparing the consolidated financial statements, transactions, balances and unrealised gains on transactions between group entities are eliminated. Unrealised losses are also eliminated but are considered an impairment indicator of the asset transferred. Accounting policies of subsidiaries have been changed where necessary to ensure consistency with the policies adopted by the Group.
Non-controlling interests in the results and equity of subsidiaries are shown separately in the consolidated income statement, statement of comprehensive income, statement of changes in equity and balance sheet respectively.
Investments in subsidiaries are carried at cost less accumulated impairment losses in the Company’s balance sheet. On disposal of investments in subsidiaries, the difference between disposal proceeds and the carrying amount of the investments are recognised in profit or loss.
ii. Changes in ownership interests The group treats transactions with non-controlling interests that do not result in a loss
of control as transactions with equity owners of the Group. A change in ownership interest results in an adjustment between the carrying amounts of the controlling and non-controlling interests to reflect their relative interests in the subsidiary. Any difference between the amount of the adjustment to non-controlling interests and any consideration paid or received is recognised in a separate reserve within equity attributable to owners of the Company.
When the Group ceases to have control, joint control or significant influence, any retained interest in the entity is remeasured to its fair value with the change in carrying amount recognised in profit or loss. The fair value is the initial carrying amount for the purposes of subsequently accounting for the retained interest as an associate, jointly controlled entity or financial asset. In addition, any amounts previously recognised in other comprehensive income in respect of that entity are accounted for as if the Group had directly disposed of the related assets or liabilities. This may mean that amounts previously recognised in other comprehensive income are reclassified to profit or loss.
If the ownership interest in a jointly-controlled entity or an associate is reduced but joint control or significant influence is retained, only a proportionate share of the amounts previously recognised in other comprehensive income are reclassified to profit or loss where appropriate.
(c) Segment reporting
Operating segments are reported in a manner consistent with the internal reporting provided to members of management and the executive committee whose members are responsible for allocating resources and assessing performance of the operating segments.
Notes to the Financial Statements (continued)

Notes to the Financial Statements (continued)
SAK
AR
I R
ESO
UR
CES
LIM
ITED
Ann
ual R
epor
t 20
1244
2 Summary of significant accounting policies (continued)
(d) Foreign currency translation
i. Functional and presentation currency Items included in the financial statements of each entity in the Group are measured
using the currency of the primary economic environment in which the entity operates (“functional currency”). The financial statements are presented in United States Dollars, which is the functional currency of the Company.
ii. Transactions and balances Transactions in a currency other than the functional currency (“foreign currency”) are
translated into the functional currency using the exchange rates at the dates of the transactions. Currency translation differences resulting from the settlement of such transactions and from the translation of monetary assets and liabilities denominated in foreign currencies at the closing rates at the balance date are recognised in profit or loss.
Foreign exchange gains and losses impacting profit or loss are presented in the income statement within other gains/(losses) – net.
Non-monetary items that are measured at fair value in a foreign currency are translated using the exchange rates at the date when the fair value was determined. Translation differences on assets and liabilities carried at fair value are reported as part of the fair value gain or loss. For example, translation differences on non-monetary assets and liabilities such as equities held at fair value through profit or loss are recognised in profit or loss as part of the fair value gain or loss and translation differences on non-monetary assets such as equities classified as available-for-sale financial assets are recognised in other comprehensive income.
(e) Revenue recognition
Revenue is measured at the fair value of the consideration received or receivable. Amounts disclosed as revenue are net of value added tax, rebates, discounts and penalties.
The Group recognises revenue when the amount of revenue and related cost can be reliably measured, it is probable that the collectability of the related receivables is reasonably assured and when the specific criteria for each of the Group’s activities are met as follows:
i. Sale of goods - Coal Revenue from these sales are recognised when a Group entity has delivered the products
to locations specified by its customers and the customers have accepted the products in accordance with the sales contract and the collectability of the related receivable is reasonably assured.
ii. Provisional pricing Revenue from the sale of coal where the coal is provisionally priced pending a renegotiation
of the sales contract is initially recognised at the invoiced provisional price. Subsequently, a best estimate based on the final benchmark price adjustment using an appropriate benchmark calculation is made. The difference between the carrying amount of the revenue recognised for the sale and the estimated price adjustment is recognised in revenue. This adjustment will continue until the contract price is negotiated.

Notes to the Financial Statements (continued)
SAK
AR
I R
ESO
UR
CES
LIM
ITED
Ann
ual R
epor
t 20
1245
2 Summary of significant accounting policies (continued)
(e) Revenue recognition (continued)
iii. Rendering of services Revenue from management and agency services is recognised over the period
in which the services are rendered, by reference to completion of the specific transaction assessed on the basis of the actual service provided as a proportion of the total services to be performed.
iv. Interest income Interest income is recognised using the effective interest method.
v. Dividend Income Dividends are recognised as revenue when the right to receive payment is
established. This applies even if they are paid out of pre-acquisition profits. However, the investment may need to be tested for impairment as a consequence.
(f) Income taxes
Current income tax for current and prior periods is recognised at the amount expected to be paid to or recovered from the tax authorities, using the tax rates and tax laws that have been enacted or substantively enacted by the balance sheet date.
Deferred income tax is recognised for all temporary differences arising between the tax bases of assets and liabilities and their carrying amounts in the financial statements except when the deferred income tax arises from the initial recognition of goodwill or an asset or liability in a transaction that is not a business combination and affects neither accounting nor taxable profit or loss at the time of the transaction.
A deferred income tax liability is recognised on temporary differences arising on investments in subsidiaries, except where the Group is able to control the timing of the reversal of the temporary difference and it is probable that the temporary difference will not reverse in the foreseeable future.
A deferred income tax asset is recognised to the extent that it is probable that future taxable profit will be available against which the deductible temporary differences and tax losses can be utilised.
Deferred income tax is measured:
i. at the tax rates that are expected to apply when the related deferred income tax asset is realised or the deferred income tax liability is settled, based on tax rates and tax laws that have been enacted or substantively enacted by the balance sheet date; and
ii. based on the tax consequence that will follow from the manner in which the Group expects, at the balance sheet date, to recover or settle the carrying amounts of its assets and liabilities.
Current and deferred income taxes are recognised as income or expenses in the income statement, except to the extent that the tax arises from a business combination or a transaction which is recognised directly in equity. Deferred tax arising from a business combination is adjusted against goodwill on acquisition.

Notes to the Financial Statements (continued)
SAK
AR
I R
ESO
UR
CES
LIM
ITED
Ann
ual R
epor
t 20
1246
2 Summary of significant accounting policies (continued)
(g) Leases
The Group leases office space, residential properties and office equipment under operating leases from non-related parties. Leases of office space, residential properties and office equipment where substantially all the risks and rewards incidental to ownership are retained by the lessors are classified as operating leases. Payments made under operating leases (net of any incentives received from the lessors) are recognised in profit or loss on a straight line basis over the period of the lease.
(h) Business combinations
The acquisition method of accounting is used to account for all business combinations. The consideration transferred for the acquisition of a subsidiary comprises the fair values of the assets transferred, the liabilities incurred and the equity interests issued by the Group. The consideration transferred also includes the fair value of any asset or liability resulting from a contingent consideration arrangement and the fair value of any pre-existing equity interest in the subsidiary. Acquisition-related costs are expensed as incurred. Identifiable assets acquired and liabilities and contingent liabilities assumed in a business combination are, with limited exceptions, measured initially at their fair values at the acquisition date. On an acquisition-by-acquisition basis, the Group recognises any non-controlling interest in the acquiree either at fair value or at the non-controlling interest’s proportionate share of the acquiree’s net identifiable assets.
The excess of the consideration transferred, the amount of any non-controlling interest in the acquiree and the acquisition-date fair value of any previous equity interest in the acquiree over the fair value of the net identifiable assets acquired is recorded as goodwill. If those amounts are less than the fair value of the net identifiable assets of the subsidiary acquired and the measurement of all amounts has been reviewed, the difference is recognised directly in profit or loss as a bargain purchase.
Where settlement of any part of cash consideration is deferred, the amounts payable in the future are discounted to their present value as at the date of exchange. The discount rate used is the entity’s incremental borrowing rate, being the rate at which a similar borrowing could be obtained from an independent financier under comparable terms and conditions. Contingent consideration is classified either as equity or a financial liability. Amounts classified as a financial liability are subsequently remeasured to fair value with changes in fair value recognised in profit or loss.
(i) Impairment of assets
Goodwill and intangible assets that have an indefinite useful life are not subject to amortisation and are tested annually for impairment or more frequently if events or changes in circumstances indicate that they might be impaired. Other assets are tested for impairment whenever events or changes in circumstances indicate that the carrying amount may not be recoverable. An impairment loss is recognised for the amount by which the asset’s carrying amount exceeds its recoverable amount. The recoverable amount is the higher of the fair value less cost to sell and the value-in-use. For the purpose of assessing impairment, assets are grouped at the lowest levels for which there are separately identifiable cash inflows which are largely independent of the cash inflows from other assets or groups of assets (cash-generating units). Non-financial assets other than goodwill that suffered impairment losses are reviewed for possible reversal of the impairment loss at the end of each reporting period.

Notes to the Financial Statements (continued)
SAK
AR
I R
ESO
UR
CES
LIM
ITED
Ann
ual R
epor
t 20
1247
2 Summary of significant accounting policies (continued)
(i) Impairment of assets (continued)
An impairment loss recognised in prior periods for an asset other than goodwill is reversed if, and only if, there has been a change in the estimates used to determine the asset’s recoverable amount since the last impairment loss was recognised. The carrying amount of this asset is increased to its revised recoverable amount, provided that this amount does not exceed the carrying amount that would have been determined (net of any accumulated amortisation or depreciation) had no impairment loss been recognised for the asset in prior years. An impairment loss recognised for goodwill is recognised as an expense and is not reversed in a subsequent period.
(j) Cash and cash equivalents
For the purpose of presentation in the consolidated statement of cash flows, cash and cash equivalents includes cash on hand, deposits held at call with financial institutions which are subject to an insignificant risk of change in value, and bank overdrafts. Bank overdrafts are presented as current borrowings on the balance sheet.
Cash and cash equivalents which are restricted as to usage are excluded from the amounts reported in the statement of cash flows.
(k) Trade receivables
Trade receivables are recognised initially at fair value and subsequently measured at amortised cost using the effective interest method, less provision for impairment. Trade receivables are generally due for settlement within 14 days. They are presented as current assets unless collection is not expected for more than 12 months after the reporting date.
Collectability of trade receivables is reviewed on an ongoing basis. Debts which are known to be uncollectible are written off by reducing the carrying amount directly. An allowance account (provision for impairment of trade receivables) is used when there is objective evidence that the group will not be able to collect all amounts due according to the original terms of the receivables. Significant financial difficulties of the debtor, probability that the debtor will enter bankruptcy or financial reorganisation, and default or delinquency in payments are considered indicators that the trade receivable is impaired. The amount of the impairment allowance is the difference between the asset’s carrying amount and the present value of estimated future cash flows, discounted at the original effective interest rate. Cash flows relating to short-term receivables are not discounted if the effect of discounting is immaterial.
The amount of the impairment loss is recognised in profit or loss within other gains/(losses) - net. When a trade receivable for which an impairment allowance had been recognised becomes uncollectible in a subsequent period, it is written off against the allowance account. Subsequent recoveries of amounts previously written off are credited against other gains/(losses) - net in profit or loss.

Notes to the Financial Statements (continued)
SAK
AR
I R
ESO
UR
CES
LIM
ITED
Ann
ual R
epor
t 20
1248
2 Summary of significant accounting policies (continued)
(l) Inventories
Run of mine coal and finished product coal is valued at the lower of cost and net realisable value. The cost of coal inventories is determined using the weighted average cost method. Costs includes direct material, overburden removal, mining, processing, labour incurred in the extraction process and an appropriate proportion of variable and fixed overhead costs directly related to mining activities. Net realisable value is the estimated selling price in the ordinary course of business, less the estimated costs of completion and applicable variable selling expenses.
Inventories are classified as follows:
i. Run of mine: This is material extracted through the mining process.
ii. Finished product coal: These are products that have passed through all stages of the production process.
iii. Consumables: These are goods or supplies to be either directly or indirectly consumed in the production process.
(m) Financial assets
Classification
The Group classifies its financial assets in the following categories: financial assets at fair value through profit or loss (including derivative financial instruments), loans and receivables and available for sale financial assets. The classification depends on the nature of the asset and the purpose for which the assets were acquired. Management determines the classification of its financial assets at initial recognition.
i. Financial assets at fair value though profit or loss Financial assets at fair value through profit or loss are financial assets held for trading.
A financial asset is classified in this category if acquired principally for the purpose of selling in the short term. Derivatives are classified as held for trading unless they are designated as hedges. Assets in this category are classified as current assets if they are expected to be settled within 12 months; otherwise they are classified as non-current.
ii. Loans and receivables Loans and receivables are non-derivative financial assets with fixed or determinable
payments that are not quoted in an active market. They are included in current assets, except for those with maturities greater than 12 months after the reporting period which are classified as non-current assets. Loans and receivables are included in trade and other receivables (note 13) and other receivables (note 16) in the balance sheet.
iii. Available-for-sale financial assets Available-for-sale financial assets, comprising principally marketable equity securities,
are non-derivatives that are either designated in this category or not classified in any of the other categories. They are included in non-current assets unless the investment matures or management intends to dispose of the investment within 12 months of the end of the reporting period.

Notes to the Financial Statements (continued)
SAK
AR
I R
ESO
UR
CES
LIM
ITED
Ann
ual R
epor
t 20
1249
2 Summary of significant accounting policies (continued)
(m) Financial assets (continued)
Financial assets – reclassification
Financial assets other than loans and receivables are permitted to be reclassified out of the held for trading category only in rare circumstances arising from a single event that is unusual and highly unlikely to recur in the near term. In addition, the Group may choose to reclassify financial assets that would meet the definition of loans and receivables out of the held for trading or available-for-sale categories if the group has the intention and ability to hold these financial assets for the foreseeable future or until maturity at the date of reclassification
Reclassifications are made at fair value as of the reclassification date. Fair value becomes the new cost or amortised cost as applicable, and no reversals of fair value gains or losses recorded before reclassification date are subsequently made. Effective interest rates for financial assets reclassified to loans and receivables and held-to-maturity categories are determined at the reclassification date. Further increases in estimates of cash flows adjust effective interest rates prospectively.
Recognition and de-recognition
Regular way purchases and sales of financial assets are recognised on the trade date - the date on which the Group commits to purchase or sell the asset. Financial assets are derecognised when the rights to receive cash flows from the financial assets have expired or have been transferred and the Group has transferred substantially all risks and rewards of ownership. On disposal of a financial asset, the difference between the carrying amount and the sale proceeds is recognised in profit or loss. Any amount in other comprehensive income relating to that asset is reclassified to profit or loss.
Initial measurement
At initial recognition, the Group measures a financial asset at its fair value plus, in the case of a financial asset not at fair value through profit or loss, transaction costs that are directly attributable to the acquisition of the financial asset. Transaction costs of financial assets carried at fair value through profit or loss are expensed in profit or loss.
Subsequent measurement
Loans and receivables are subsequently carried at amortised cost using the effective interest method.
Available-for-sale financial assets and financial assets at fair value through profit or loss are subsequently carried at fair value. Gains or losses arising from changes in the fair value of the financial assets at fair value through profit or loss category are presented in profit or loss within other gains/(losses) - net in the period in which they arise. Dividend income from financial assets at fair value through profit or loss is recognised in profit or loss as part of other income when the Group’s right to receive payments is established. Interest income from these financial assets is included in other income.
Changes in the fair value of monetary securities denominated in a foreign currency and classified as available-for-sale are analysed between translation differences resulting from changes in amortised cost of the security and other changes in the carrying amount of the security. The translation differences related to changes in the amortised cost are recognised in profit or loss, and other changes in carrying amount are recognised in other comprehensive income. Changes in the fair value of other monetary and non-monetary securities classified as available-for-sale are recognised in other comprehensive income.

Notes to the Financial Statements (continued)
SAK
AR
I R
ESO
UR
CES
LIM
ITED
Ann
ual R
epor
t 20
1250
2 Summary of significant accounting policies (continued)
(m) Financial assets (continued)
Impairment
The Group assesses at the end of each reporting period whether there is objective evidence that a financial asset or group of financial assets is impaired. A financial asset or a group of financial assets is impaired and impairment losses are incurred only if there is objective evidence of impairment as a result of one or more events that occurred after the initial recognition of the asset (a ‘loss event’) and that loss event (or events) has an impact on the estimated future cash flows of the financial asset or group of financial assets that can be reliably estimated. In the case of equity investments classified as available-for-sale, a significant or prolonged decline in the fair value of the security below its cost is considered an indicator that the assets are impaired.
i. Assets carried at amortised cost For loans and receivables, the amount of the loss is measured as the difference
between the asset’s carrying amount and the present value of estimated future cash flows (excluding future credit losses that have not been incurred) discounted at the financial asset’s original effective interest rate. The carrying amount of the asset is reduced and the amount of the loss is recognised in the consolidated income statement. If a loan or held-to-maturity investment has a variable interest rate, the discount rate for measuring any impairment loss is the current effective interest rate determined under the contract. As a practical expedient, the Group may measure impairment on the basis of an instrument’s fair value using an observable market price.
If, in a subsequent period, the amount of the impairment loss decreases and the decrease can be related objectively to an event occurring after the impairment was recognised (such as an improvement in the debtor’s credit rating), the reversal of the previously recognised impairment loss is recognised in the consolidated income statement.
ii. Assets classified as available-for-sale If there is objective evidence of impairment for available-for-sale financial assets,
the cumulative loss – measured as the difference between the acquisition cost and the current fair value, less any impairment loss on that financial asset previously recognised in profit or loss – is removed from equity and recognised in profit or loss.
Impairment losses on equity instruments that were recognised in profit or loss are not reversed through profit or loss in a subsequent period.
If the fair value of a debt instrument classified as available-for-sale increases in a subsequent period and the increase can be objectively related to an event occurring after the impairment loss was recognised in profit or loss, the impairment loss is reversed through profit or loss.

Notes to the Financial Statements (continued)
SAK
AR
I R
ESO
UR
CES
LIM
ITED
Ann
ual R
epor
t 20
1251
2 Summary of significant accounting policies (continued)
(n) Derivatives and hedging activities
Derivatives are initially recognised at fair value on the date the derivative contracts are entered into and are subsequently remeasured to their fair value at the end of each reporting period. The accounting for subsequent changes in fair value depends on whether the derivative is designated as a hedging instrument, and if so, the nature of the item being hedged. The group designates certain derivatives as either:
- hedges of the fair value of recognised assets or liabilities or a firm commitment (fair value hedges)
- hedges of a particular risk associated with the cash flows of recognised assets and liabilities and highly probable forecast transactions (cash flow hedges), or
- hedges of a net investment in a foreign operation (net investment hedges).
Fair value changes on derivatives that are not designated or do not qualify for hedge accounting are recognised in the profit or loss when the changes in fair value arise.
The carrying amount of a derivative designated as a hedge is presented as a non-current asset or liability if the remaining expected life of the hedged item is more than 12 months and as a current asset or liability if the remaining expected life of the hedged item is less than 12 months. The fair value of the trading derivative is presented as a current asset or liability.
(o) Property, plant and equipment
i. Measurement All items of property, plant and equipment are initially recognised at cost and
subsequently carried at cost less accumulated depreciation and accumulated impairment losses.
ii. Components of cost The cost of an item of property, plant and equipment initially recognised includes
its purchase price (including import duties and non-refundable purchase taxes), any cost that is directly attributable to bringing the asset to the location and condition necessary for it to be capable of operating in the manner intended by management and the estimated future costs of dismantling and removing the asset. Cost also includes borrowing costs that are directly attributable to the acquisition, construction or production of a qualifying asset.
iii. Mining properties Mining properties are classified as an asset under property, plant and equipment.
Once a mining project has been established as commercially viable, expenditure other than that on buildings, plant and equipment or land rights is capitalised under mining properties together with any amount transferred from exploration and evaluation.
Mining properties comprise: • Capitalised exploration and evaluation assets for properties now in
production • Development expenditure (including pre-production stripping) • Acquisition costs and mineral rights acquired • Production stripping (as described below in “overburden removal costs”)

Notes to the Financial Statements (continued)
SAK
AR
I R
ESO
UR
CES
LIM
ITED
Ann
ual R
epor
t 20
1252
2 Summary of significant accounting policies (continued)
(o) Property, plant and equipment (continued)
iii. Mining properties (continued)
Development expenditure Development activities commence after project sanctioning by the appropriate level
of management. Judgement is applied by management in determining when a project is economically viable. Development expenditure is capitalised and classified as mining properties. Costs associated with commissioning new assets, in the period before they are capable of operating in the manner intended by management are capitalised. Development costs incurred after the commencement of production are capitalised to the extent they are expected to give rise to a future economic benefit. Interest on borrowings related to construction or development projects is capitalised until the point when substantially all the activities that are necessary to make the asset ready for its intended use are complete.
Overburden removal costs Overburden and other mine waste materials are often removed during the initial
development of a mine site in order to access the mineral deposit. This activity is referred to as development stripping. The directly attributable costs are capitalised under mining properties. Capitalisation of development stripping costs ceases at the time that saleable material begins to be extracted from the mine.
Production stripping commences at the time that saleable materials begin to be extracted from the mine and normally continues throughout the life of a mine. The costs of production stripping are charged to the income statement as operating costs when the ratio of waste material to ore extracted is expected to be reasonably constant throughout its estimated life.
Stripping costs are deferred during the production stage for those operations where this is the most appropriate basis for matching the costs against the related economic benefits and where the effect is material. This is generally the case where there are expected to be fluctuations in stripping costs over the life of the mine. The amount of stripping costs deferred is based on the ratio (“Ratio”) obtained by dividing the tonnage of waste mined either by the quantity of ore mined or by the quantity of minerals contained in the ore. Stripping costs incurred in the period are deferred, as a component of mining properties, to the extent that the current period Ratio exceeds the life of mine Ratio. Such deferred costs are then charged to the income statement as operating costs when the current period Ratio is less than the life of mine Ratio on a units-of-production basis.
The life of mine Ratio is based on estimated proved and probable reserves of the mine. The life of mine waste-to-ore ratio is a function of the pit design and therefore changes to that design will generally result in changes to the Ratio. Changes in other technical or economic parameters that have an impact on reserves will also have an impact on the life of mine Ratio even if they do not affect the pit design. Changes to the life of mine Ratio are accounted for prospectively.
Where proved and probable reserves have not been finalised, the best estimate of the coal inventory obtained through drilling programs and technical understanding of the ore body is used to develop a production model with which a mine waste to ore ratio is determined. When the categorisation and classification of reserves is finalised the ratio is updated and accounted for prospectively.

Notes to the Financial Statements (continued)
SAK
AR
I R
ESO
UR
CES
LIM
ITED
Ann
ual R
epor
t 20
1253
2 Summary of significant accounting policies (continued)
(o) Property, plant and equipment (continued)
iv. Depreciation of plant, property and equipment The depreciable amount of items of property, plant and equipment are depreciated
over their useful lives, or over the remaining life of the mine if shorter. Depreciation commences when an asset is available for use. The major categories of property, plant and equipment are depreciated either on a units-of-production and/or straight-line basis as follows:
Units of production basis For mining properties and land rights and certain mining equipment, the economic
benefits from the asset are consumed in a pattern which is linked to the production level. Except as noted below, such assets are depreciated on a units-of-production basis.
Straight line basis Assets which have a physical life shorter than the related mine or whose usage is
not directly related to production levels, are depreciated on a straight line basis as follows:
• Buildings 3 – 10 years
• Plant and equipment 3 – 15 years
• Capital work in progress Not depreciated
Residual values and useful lives are reviewed, and adjusted if appropriate, at each balance sheet date. Changes to the estimated residual values or useful lives are accounted for prospectively. In applying the units of production method, depreciation/amortisation is normally calculated using the quantity of material extracted from the mine in the period as a percentage of the total quantity of material to be extracted in current and future periods based on proved and probable reserves. Non-reserve material may be included in depreciation/amortisation calculations where there is a high degree of confidence in its economic extraction. Reserves/resources and life of mine estimates are reviewed on an annual basis and depreciation calculations are adjusted accordingly where necessary.
v. Subsequent expenditure Subsequent expenditure relating to property, plant and equipment that has already
been recognised is added to the carrying amount of the asset only when it is probable that future economic benefits associated with the item will flow to the Group and the cost of the item can be measured reliably. All other repair and maintenance expenses are recognised in the income statement when incurred.
vi. Disposal On disposal of an item of property, plant and equipment, the difference between the
disposal proceeds and its carrying amount is recognised in profit or loss.

Notes to the Financial Statements (continued)
SAK
AR
I R
ESO
UR
CES
LIM
ITED
Ann
ual R
epor
t 20
1254
2 Summary of significant accounting policies (continued)
(p) Exploration and evaluation expenditure
Exploration and evaluation activity involves the search for mineral resources, the determination of technical feasibility and the assessment of the commercial viability of an identified resource. Costs incurred before the Group has obtained the legal rights to explore an area are recognised in the income statement. Exploration and evaluation expenditure are capitalised in respect of each area of interest for which the rights to tenure are current and where:
i. The exploration and evaluation expenditures are expected to be recouped through successful development and exploitation of the area of interest; or alternatively, by its sale; or
ii. Exploration and evaluation activities in the area of interest have not reached a stage which permits a reasonable assessment of the existence or otherwise of economically recoverable reserves, and active and significant operations in, or in relation to, the areas of interest are continuing.
Exploration and evaluation expenditure comprises costs that are directly attributable to: researching and analysing existing exploration data, gathering exploration data through topographical, geochemical and geophysical studies, exploratory drilling, trenching and sampling, determining and examining the volume and grade of the resource, examining and testing extraction and treatment methods, surveying transportation and infrastructure requirements, compiling pre-feasibility and feasibility studies and/or gaining access to areas of interest including occupancy and relocation compensation.
General and administration costs are allocated to, and included in, the cost of an exploration and evaluation asset only to the extent that those costs can be related directly to operational activities in the area of interest to which the exploration and evaluation asset relates. In all other cases, these costs are expensed as incurred.
Exploration and evaluation assets are transferred to mining properties, a component of property, plant and equipment, when the technical feasibility and commercial viability of extracting the mineral resource are demonstrable and sanctioned by the Board.
Exploration and evaluation assets are assessed for impairment when facts and circumstances suggest that the carrying amount of an exploration and evaluation asset may exceed its recoverable amount. Where a potential impairment is indicated, assessment is performed for each area of interest in conjunction with the group of operating assets (representing a cash generating unit) to which the exploration and evaluation asset is attributable. To the extent that capitalised exploration and evaluation expenditure is not expected to be recovered it is charged to the income statement.
Cash flows associated with exploration and evaluation expenditure are classified as investing activities in the consolidated statement of cash flows.

Notes to the Financial Statements (continued)
SAK
AR
I R
ESO
UR
CES
LIM
ITED
Ann
ual R
epor
t 20
1255
2 Summary of significant accounting policies (continued)
(q) Intangible assets
Goodwill on acquisitions of subsidiaries and businesses on or after 1 January 2010 represents the excess of (i) the consideration transferred, the amount of any non-controlling interest in the acquiree and the acquisition-date fair value of any previous equity interest in the acquiree over (ii) the fair value of the identifiable net assets acquired.
Goodwill on acquisition of subsidiaries and businesses prior to 1 January 2010 represents the excess of the cost of acquisition over the fair value of the Group’s share of the identifiable net assets and contingent liabilities of the acquired subsidiaries at the date of acquisition.
Goodwill on subsidiaries is recognised separately as an intangible asset and carried at cost less accumulated impairment losses.
(r) Trade and other payables
Trade payables are initially recognised at fair value, and subsequently carried at amortised cost using the effective interest method. These amounts represent liabilities for goods and services provided to the Group prior to the end of the financial year, which are unpaid.
(s) Borrowings
Borrowings are initially recognised at fair value (net of transaction costs) and subsequently carried at amortised cost. Any difference between the proceeds (net of transaction costs) and the redemption value is recognised in profit or loss over the period of the borrowings using the effective interest method.
Borrowings are presented as current liabilities unless the Group has an unconditional right to defer settlement for at least 12 months after the balance sheet date in which case they are presented as non-current liabilities.
(u) Borrowing costs
Borrowing costs are recognised in profit or loss using the effective interest method except for those costs that are directly attributable to borrowings acquired specifically for the construction or development of property, plant and equipment. This includes those costs on borrowings acquired specifically for the construction or development of property, plant and equipment, as well as those in relation to general borrowings used to finance construction or development of property, plant and equipment.
(u) Provisions
Provisions are recognised when the Group has a present legal or constructive obligation as a result of past events, it is probable that an outflow of resources will be required to settle the obligation and the amount has been reliably estimated. Provisions are not recognised for future operating losses.
Provision for rehabilitation and dismantling The Group has obligations to dismantle, remove, restore and rehabilitate certain items of
property, plant and equipment. The Group recognises the estimated costs of dismantlement, removal or restoration of items of property, plant and equipment arising from the acquisition or use of assets. The provisions are estimated based on the best estimate of the expenditure required to settle or transfer the obligation, taking into consideration the time value of money.

Notes to the Financial Statements (continued)
SAK
AR
I R
ESO
UR
CES
LIM
ITED
Ann
ual R
epor
t 20
1256
2 Summary of significant accounting policies (continued)
(u) Provisions (continued)
Provision for rehabilitation and dismantling (continued)
The estimated costs are measured at the present value of the expenditure expected to be required to settle the obligation using the pre-tax discount rate that reflects the current market assessment of the time value of money and the risks specific to the obligation. The increase in the provision due to the passage of time is recognised in the income statement under finance expenses. Changes in the estimated timing or amount of the expenditure or discount rate are recognised in profit or loss when the changes arise.
(v) Employee compensation
Employee benefits are recognised as an expense, unless the cost qualifies to be capitalised as an asset.
i. Wages and salaries, annual leave and sick leave Liabilities for wages and salaries, including non-monetary benefits, annual leave and
accumulating sick leave expected to be settled within 12 months of the reporting date are recognised under Trade and other payables in respect of employees’ services up to the reporting date and are measured at the amounts expected to be paid when the liabilities are settled. Liabilities for non-accumulating sick leave are recognised when the leave is taken and measured at the rates paid or payable.
ii. Other long-term employee benefit obligations The liability for long service leave and annual leave which is not expected to be
settled within 12 months after the end of the period in which the employees render the related service is recognised in the provision for employee benefits and measured as the present value of expected future payments to be made in respect of services provided by employees up to the end of the reporting period using the projected unit credit method. Consideration is given to expected future wage and salary levels, experience of employee departures and periods of service. Expected future payments are discounted using market yields at the end of the reporting period on national government bonds with terms to maturity and currency that match, as closely as possible, the estimated future cash outflows.
iii. Termination benefits Termination benefits are those benefits which are payable when employment is
terminated before the normal retirement date, or whenever an employee accepts voluntary redundancy in exchange for these benefits. The Group recognises termination benefits when it is demonstrably committed to either: terminating the employment of current employees according to a detailed formal plan without possibility of withdrawal; or providing termination benefits as a result of an offer made to encourage voluntary redundancy. Benefits falling due more than 12 months after balance sheet date are discounted to present value.
iv. Defined contribution plans Defined contribution plans are post-employment benefit plans under which the
Group pays fixed contributions into separate entities such as the Central Provident Fund of Singapore on a mandatory, contractual or voluntary basis. The Group has no further payment obligations once the contributions have been paid.

Notes to the Financial Statements (continued)
SAK
AR
I R
ESO
UR
CES
LIM
ITED
Ann
ual R
epor
t 20
1257
2 Summary of significant accounting policies (continued)
(v) Employee compensation (continued)
iv. Defined benefit plans Defined benefit plans are post-employment benefit plans other than defined
contribution plans, which the Group pays to an employee on termination of employment, whether the termination is voluntary or not. These benefits are mandatory under certain jurisdictions the Group operates within. Defined benefit plans define the amount of benefit that an employee will receive on or after termination, resignation or retirement, and where the benefit is dependent on one or more factors such as years of service and compensation. The liability recognised in the consolidated balance sheet in respect of defined benefit pension plans is the present value of the defined benefit obligation at the balance sheet date less the value of plan assets, together with adjustment for unrecognised actuarial gains or losses and past service costs. The defined benefit obligation is calculated annually by an independent actuary using the projected unit credit method. Actuarial gains and losses are recognised in the income statement when they arise.
v. Share-based compensation The Group operates equity settled share-based compensation plans. Share-based
payment benefits are provided to employees via the Executive Share Acquisition Plan (“ExSAP”) and Employee Share Option Plan (“ESOP”).
The fair value of the employee services received in exchange for the grant of options under the ESOP is recognised as an expense with a corresponding increase in the share-based payment reserve over the vesting period. The total amount to be recognised over the vesting period is determined by reference to the fair value of the options granted on the date of the grant. Non-market vesting conditions are included in the estimation of the number of shares under options that are expected to become exercisable on the vesting date. At each balance sheet date, the Group revises its estimates of the number of shares under option that are expected to become exercisable on the vesting date and recognises the impact of the revision of the estimates in profit or loss, with a corresponding adjustment to the share-based payment reserve over the remaining vesting period.
Upon the exercise of options, the proceeds received (net of transaction costs) and the balance previously recognised in the share-based payment reserve relating to those options are transferred to the share capital account.
Share based compensation benefits are also provided to employees via the ExSAP by allowing participants to purchase shares in the Company at a price approved by the Board by way of a Company provided interest free loan. The subscription price of an award under ExSAP is the last traded share price of the Company on the Singapore Exchange before the date of grant of the award, rounded to nearest whole cent. A holding lock is placed over the shares in the Company until the loan is repaid in full. The fair value of the employee services received in exchange for the grant of shares under the ExSAP is recognised as an expense with a corresponding increase in the share-based payment reserve. When the loan under the ExSAP is fully repaid, the proceeds received (net of transaction costs) and the related balance previously recognised in the share-based payment reserve are credited to the share capital account when the ordinary shares are paid up.

Notes to the Financial Statements (continued)
SAK
AR
I R
ESO
UR
CES
LIM
ITED
Ann
ual R
epor
t 20
1258
2 Summary of significant accounting policies (continued)
(v) Employee compensation (continued)
vii. Profit-sharing and bonus plans The Group recognises a liability and an expense for bonuses and profit-sharing based
on a formula that takes into consideration the profit attributable to the company’s shareholders after certain adjustments. The group recognises a provision where contractually obliged or where there is a past practice that has created a constructive obligation.
(w) Share Capital
Ordinary shares are classified as equity. Incremental costs directly attributable to the issuance of new ordinary shares are deducted against the share capital account.
(x) Dividends
Provision is made for the amount of any dividend declared, being appropriately authorised and no longer at the discretion of the entity, on or before the end of the reporting period but not distributed at the end of the reporting period.
(y) Earnings per share
i. Basic earnings per share Basic earnings per share is calculated by dividing the net profit after income tax
attributable to equity holders of the Company, excluding any costs of servicing equity other than ordinary shares, by the weighted average number of ordinary shares outstanding during the financial year, adjusted for bonus elements in ordinary shares issued during the financial year.
ii. Diluted earnings per share For the purpose of calculating diluted earnings per share, profit attributable to
equity holders of the Company and the weighted average number of ordinary shares outstanding are adjusted for the effects of dilutive potential ordinary shares.
(z) Rounding of amounts
The Board has determined that the financial reports of the Group are more clearly presented when rounded to the nearest thousand dollars. Amounts reported in the financial statements have been rounded on this basis.

Notes to the Financial Statements (continued)
SAK
AR
I R
ESO
UR
CES
LIM
ITED
Ann
ual R
epor
t 20
1259
3 Critical accounting estimates, assumptions and judgements
Estimates, assumptions and judgments are continually evaluated and are based on historical experience and other factors, including expectation of future events that are believed to be reasonable under the circumstances.
i. Estimation for the provision for rehabilitation and dismantling
Provision for rehabilitation and dismantling of related property, plant and equipment is estimated taking into consideration facts and circumstances of the Group’s mining properties available at the balance sheet date. These estimates are based on the expenditure required to transfer or settle the obligation for rehabilitation and dismantling, taking into consideration the time value of money.
ii. Estimatedimpairmentofnon‑financialassets
Goodwill is tested for impairment annually and whenever there is an indication that goodwill may be impaired. Property, plant and equipment, exploration and evaluation and investment in subsidiaries, are tested for impairment whenever there is any objective evidence or indication that these assets may be impaired. The recoverable amounts of assets and where applicable, cash generating units, are determined based on value in use calculations which require the use of estimates.
iii. Uncertain tax positions
The Group is subject to income taxes in Singapore, Indonesia and Australia. The Group operates in jurisdictions where legislative applications can give rise to uncertain tax positions. Management believe that the current tax positions taken by the Group are appropriate and supportable by expert advice where relevant. In determining the income tax liabilities, management is required to estimate the amount of capital allowances and the deductibility of certain expenses (“uncertain tax positions”) at each jurisdiction. Where the final tax outcome of these matters is different from the amounts that were initially recognised, such differences will impact the income tax and deferred tax provisions in the year in which such determination is made.
iv. Determination of coal reserves
Judgement is required in determining the Group’s coal reserves taking into account various assumptions regarding mining costs and the sale price of the particular resource concerned. The Group’s economically recoverable coal reserves are sensitive to the cost and revenue assumptions used due to the geological structure of the deposits, which means that, all other factors remaining the same, if the cost assumption is higher or the price assumption is lower, the Group estimates lower reserves, and if the cost assumption is lower or the price assumption is higher, the Group estimates more reserves. The Group bases all assumptions on geological reports and uses only measured reserves.
Additional geological data is gathered during the course of mining operations and this, in conjunction with the various assumptions used could result in a change in estimated coal reserves from period to period. Changes in estimated coal reserves could affect the Group’s financial results in a numbers of ways, including the rate of depreciation and amortisation of plant, property and equipment as well as the carrying value of certain mine assets due to change in estimates of mine life and future discounted cash flows.

Notes to the Financial Statements (continued)
SAK
AR
I R
ESO
UR
CES
LIM
ITED
Ann
ual R
epor
t 20
1260
3 Critical accounting estimates, assumptions and judgements (continued)
v. Overburden removal costs
Certain mining costs, principally those that relate to the stripping of waste and which relate to future economically recoverable coal to be mined, are capitalised and included in mining properties, which is classified in the balance sheet under property, plant and equipment. These costs are deferred and subsequently taken to the cost of production through the amortisation of mining properties. The waste to ore ratio and the remaining life of the mine are regularly assessed by the Board and senior management to ensure the carrying value and rate of deferral is appropriate taking into consideration the available facts and circumstances from time to time.
vi. Capitalisation and impairment of exploration and evaluation assets
Exploration and evaluation expenditures are capitalised on the balance sheet, in respect of areas of interest for which the rights of tenure are current and where such costs are expected to be recouped or exploration and/or evaluation activities in the area have not yet reached a stage which permits a reasonable assessment of the existence of economically recoverable reserves. The carrying value of assets within each area of interest are reviewed regularly taking into consideration the available facts and circumstances, and to the extent to which the capitalised value exceeds its recoverable value, the excess is provided for or written off in the year in which this is determined.
4 Revenue
Group
2012 2011
US$'000 US$'000
Coal sales 924,047 1,010,502
Management fees 447 585
Logistics service revenue 2,774 2,487
927,268 1,013,574
5 Other income
Group
2012 2011
US$'000 US$'000
Interest income 1,043 646

Notes to the Financial Statements (continued)
SAK
AR
I R
ESO
UR
CES
LIM
ITED
Ann
ual R
epor
t 20
1261
6 Other gains - net
Group
2012 2011
US$'000 US$'000
Fair value gains on financial assets at fair value through profit or loss 14,026 13,559
Foreign exchange losses - net (2,145) (931)
Impairment of available-for-sale financial asset (6,511) -
Gain/(losses) on sale of property, plant and equipment 1 (143)
Write off of property, plant and equipment (224) -
5,147 12,485
7 Expenses by nature
Group
2012 2011
US$'000 US$'000
Third party commodity purchases 22,546 3,471
Depreciation and amortisation (note 18) 88,714 47,311
Impairment of intangible asset (note 20) - 1,725
Total amortisation, depreciation and impairment 88,714 49,036
Mining 386,678 379,592
Processing 35,084 28,701
Changes in inventories (19,771) 4,338
Barging and shipping 73,046 76,699
Agency fees and royalties 63,878 81,501
Direct site support 8,046 9,473
Value added tax 59,344 52,565
Employee compensation (note 8) 38,301 40,917
Corporate, consulting and technical services fees 8,991 7,677
Operating leases rentals 1,411 1,987
Other expenses 24,666 17,975
Total cost of sales and corporate and technical support expenses 790,934 753,932

Notes to the Financial Statements (continued)
SAK
AR
I R
ESO
UR
CES
LIM
ITED
Ann
ual R
epor
t 20
1262
8 Employee compensation
Group
2012 2011
US$'000 US$'000
Wages and salaries 28,485 33,659
Share-based payments expense 4,622 2,039
Termination benefits - 212
Employer’s contributions to defined contribution plans 1,185 1,013
Other staff benefits 4,009 3,994
38,301 40,917
9 Finance expenses
Group
2012 2011
US$'000 US$'000
Interest expense 12,725 12,578
Bank charges 628 807
Finance charges 180 -
13,533 13,385
10 Income taxes
Group
2012 2011
US$'000 US$'000
Income tax expense
Tax expense attributable to profit is made up of:
Current income tax 26,369 62,417
Deferred income tax benefit (16,893) (354)
Withholding tax 5,564 6,228
15,040 68,291

Notes to the Financial Statements (continued)
SAK
AR
I R
ESO
UR
CES
LIM
ITED
Ann
ual R
epor
t 20
1263
Group
2012 2011
US$'000 US$'000
Under provision in prior financial year:
Current income tax 5,181 822
Deferred income tax 303 -
Total income tax expense 20,524 69,113
Deferred income tax included in income tax expense comprises:
Increase in deferred tax assets (note 21) (685) (5,917)
(Decrease)/increase in deferred tax liabilities (note 28) (15,905) 5,563
(16,590) (354)
The tax expense on profit differs from the amount that would arise using the Singapore standard rate of income tax as explained below:
Group
2012 2011
US$'000 US$'000
Profit before income tax 128,991 259,388
Tax calculated at tax rate of 17% (2011: 17%) 21,928 44,096
Effects of:
Expenses not deductible for tax purposes 9,154 2,430
Income subject to tax incentive (1,326) (4,109)
Different tax rates in other countries 11,085 17,663
Movement in deferred withholding tax on foreign retained profits (29) 2,000
Withholding tax paid 5,564 6,228
Release of previously recognised deferred tax liability relating to mining properties (a) (31,336) -
Under provision in prior years 5,484 822
Sundry items - (17)
Income tax expense 20,524 69,113
(a) The depreciation charge of certain mining properties relating to a coal off-take agreement became tax deductible in 2012 as a result of amendments made to the agreement. Accordingly, the previously recognised deferred tax liability of US$31.3 million arising from these mining properties was released to the income statement for the year ended 31 December 2012.
10 Income taxes (cont’d)

Notes to the Financial Statements (continued)
SAK
AR
I R
ESO
UR
CES
LIM
ITED
Ann
ual R
epor
t 20
1264
11 Earnings per share
Group
2012 2011
(a) Basic earnings per share
Net profit attributable to equity holders of the Company (US$'000) 108,467 190,275
Weighted average number of ordinary shares outstanding for basic earnings per share 1,136,782,145 1,133,623,771
Basic earnings per share (US dollars) 0.10 0.17
Basic earnings per share is calculated by dividing the net profit attributable to equity holders of the Company by the weighted average number of ordinary shares outstanding during the financial year.
Group
2012 2011
(b) Diluted earnings per share
Net profit attributable to equity holders of the company (US$'000) 108,467 190,275
Weighted average number of ordinary outstanding for basic earnings per share 1,136,782,145 1,133,623,771
Adjustments for:
Share options - 84,500
Weighted average number of ordinary shares and potential ordinary shares used as the denominator in calculating diluted earnings per share 1,136,782,145 1,133,708,271
Diluted earnings per share (US dollars) 0.10 0.17
For the purpose of calculating diluted earnings per share, profit attributable to equity holders of the Company and the weighted average number of ordinary shares outstanding are adjusted for the effects of all dilutive potential ordinary shares. The Company has one category of dilutive potential ordinary shares: share options.
For share options, the weighted average number of shares on issue has been adjusted as if all dilutive share options were exercised. The number of shares that could have been issued upon the exercise of all dilutive share options less the number of shares that could have been issued at fair value (determined as the Company’s average share price for the financial year) for the same total proceeds is added to the denominator as the number of shares issued for no consideration. No adjustment is made to net profit.

Notes to the Financial Statements (continued)
SAK
AR
I R
ESO
UR
CES
LIM
ITED
Ann
ual R
epor
t 20
1265
12 Cash and cash equivalents
Group Company
2012 2011 2012 2011
US$'000 US$'000 US$'000 US$'000
Cash at bank and on hand 85,620 105,188 9,585 23,394
Short term bank deposits 36,101 50,000 - -
121,721 155,188 9,585 23,394
There is a floating pledge on the cash balance of several of the Group’s bank accounts (note 27).
13 Trade and other receivables
Group Company
2012 2011 2012 2011
US$'000 US$'000 US$'000 US$'000
Trade receivables
Non-related parties 49,780 73,329 - -
Other receivables
- Immediate holding corporation 4 94 - 90
- Subsidiaries - - 574,502 564,865
- Non-related parties 13,621 17,632 965 1,380
13,625 17,726 575,467 566,335
Less: Provision for impairment (1,455) (1,455) (4,543) -
Other receivables - net 12,170 16,271 570,924 566,335
Accrued Income 19,809 6,849 - -
Prepayments 4,525 3,840 278 218
24,334 10,689 278 218
86,284 100,289 571,202 566,553
Other receivables include loans to subsidiaries from the Company which are unsecured, interest-bearing at the London Interbank Offered Rate (“LIBOR”) plus 4.50%-5.83% (2011: LIBOR plus 4.50%-5.83%) and are repayable at call.
Other receivables from the immediate holding corporation are unsecured, non-interest bearing and repayable at call.

Notes to the Financial Statements (continued)
SAK
AR
I R
ESO
UR
CES
LIM
ITED
Ann
ual R
epor
t 20
1266
14 Inventories
Group
2012 2011
US$'000 US$'000
Run of mine stockpiles 10,277 4,317
Finished product coal 24,733 11,135
Consumables 4,138 2,835
39,148 18,287
15 Current tax receivables
Current tax receivables represent advance tax payments made by the Group which can be credited against the Group’s future corporate income tax payable.
Group
2012 2011
US$'000 US$'000
Beginning of financial year 33,276 42,361
Income tax and withholding tax prepaid during the year 39,806 34,892
Provision for current year (1,665) (48,173)
Foreign exchange difference (2,844) 4,196
Over provision in respect to prior year (3,870) -
64,703 33,276
16 Other receivables
Group
2012 2011
US$'000 US$'000
Third party 1,950 2,310
Security deposits 5,201 -
7,151 2,310
These receivables include; long term security bonds and deposits placed with various agencies, which will be settled on completion of certain governmental or legal requirements; and a receivable due from a third party in regard to the construction of property, plant and equipment. The receivable for property, plant and equipment is unsecured, and payments are received via instalments that earn interest at 9% (2011: 9%) per annum.

Notes to the Financial Statements (continued)
SAK
AR
I R
ESO
UR
CES
LIM
ITED
Ann
ual R
epor
t 20
1267
17 Available‑for‑sale financial assets
Available-for-sale financial assets are analysed as follows:
Group
2012 2011
US$'000 US$'000
Beginning of financial year 8,580 12,182
Additions - 807
Transfer from financial assets at fair value through profit and loss - 1,217
Impairment loss (6,511) -
Fair value loss recognised in other comprehensive income (24) (5,626)
End of financial year 2,045 8,580
Group
2012 2011
US$'000 US$'000
Listed securities
Equity securities – Australia 2,045 8,580
18 Property, plant and equipment
Group
Capital work in progress
Mining properties Buildings
Plant and equipment Land rights Total
US$'000 US$'000 US$'000 US$'000 US$'000 US$'000
2012
Beginning of financial year 19,472 626,963 981 86,592 35,866 769,874
Additions 34,977 83,325 - 4,133 2,586 125,021
Transfers (to)/from other classes (19,065) 5,993 - 635 12,437 -
Depreciation/amortisation charge - (74,648) (187) (10,769) (3,110) (88,714)
Disposal/write off (65) (10,426) - (86) - (10,577)
End of financial year 35,319 631,207 794 80,505 47,779 795,604
At 31 December 2012
Cost or fair value 35,319 834,953 3,636 136,996 61,973 1,072,877
Accumulated depreciation/amortisation - (203,746) (2,842) (56,491) (14,194) (277,273)
Net book amount 35,319 631,207 794 80,505 47,779 795,604

Notes to the Financial Statements (continued)
SAK
AR
I R
ESO
UR
CES
LIM
ITED
Ann
ual R
epor
t 20
1268
18 Property, plant and equipment (continued)
Group
Capital work in progress
Mining properties Buildings
Plant and equipment Land rights Total
US$'000 US$'000 US$'000 US$'000 US$'000 US$'000
2011
Beginning of financial year 36,184 596,428 1,169 67,443 33,479 734,703
Additions 21,063 45,874 - 12,743 4,958 84,638
Transfers (to)/from other classes (37,686) 19,358 - 18,361 - 33
Depreciation/amortisation charge - (32,786) (188) (11,766) (2,571) (47,311)
Disposal/write off (89) (1,911) - (189) - (2,189)
End of financial year 19,472 626,963 981 86,592 35,866 769,874
At 31 December 2011
Cost or fair value 19,472 756,057 3,636 132,564 46,950 958,679
Accumulated depreciation/amortisation - (129,094) (2,655) (45,972) (11,084) (188,805)
Net book amount 19,472 626,963 981 86,592 35,866 769,874
Included within additions for mining properties in the consolidated financial statements are deferred stripping costs amounting to US$71 million (2011: US$20 million).
CompanyPlant and equipment
Capital work in progress Total
US$'000 US$'000 US$'000
2012
Beginning of financial year 632 1,029 1,661
Additions 214 196 410
Transfer (to)/from other classes 259 (259) -
Depreciation charge (389) - (389)
Disposal - (689) (689)
End of financial year 716 277 993
At 31 December 2012
Cost or fair value 2,809 277 3,086
Accumulated depreciation (2,093) - (2,093)
Net book amount 716 277 993

Notes to the Financial Statements (continued)
SAK
AR
I R
ESO
UR
CES
LIM
ITED
Ann
ual R
epor
t 20
1269
18 Property, plant and equipment (continued)
CompanyPlant and equipment
Capital work in progress Total
US$'000 US$'000 US$'000
2011
Beginning of financial year 346 30 376
Additions 717 1,024 1,741
Depreciation charge (425) - (425)
Disposal (6) (25) (31)
End of financial year 632 1,029 1,661
At 31 December 2011
Cost or fair value 2,351 1,029 3,380
Accumulated depreciation (1,719) - (1,719)
Net book amount 632 1,029 1,661
Mining properties are amortised on a units-of-production basis. The units-of-production calculation is based on estimated coal resources and reserves. In the current financial period, the Group revised the estimated coal resources and reserves based on latest published coal reserves. The change in this estimate had a prospective impact on amortisation expense of the mining properties recorded from 1 January 2012 onwards.
The revision resulted in an increase in the amortisation expense of US$11 million recognised in the current financial period.
19 Exploration and evaluation
Group
2012 2011
US$'000 US$'000
Beginning of financial year 8,143 6,627
Expenditure incurred 2,769 1,549
Transfers from/(to) other classes - (33)
End of financial year 10,912 8,143

Notes to the Financial Statements (continued)
SAK
AR
I R
ESO
UR
CES
LIM
ITED
Ann
ual R
epor
t 20
1270
20 Intangible assets
Group Goodwill
US$'000
2012
Beginning of financial year 76,367
Acquisition of subsidiary 2,173
End of financial year 78,540
At 31 December 2012
Cost 98,103
Accumulated impairment losses (19,563)
Net book amount 78,540
2011
Beginning of financial year 78,092
Impairment (1,725)
End of financial year 76,367
At 31 December 2011
Cost 95,930
Accumulated impairment losses (19,563)
Net book amount 76,367
As at 31 December 2012, goodwill is allocated to the Group’s cash-generation units (“CGUs”) as follows:
2012 2011
US$'000 US$'000
Mining operations
Jembayan 48,074 45,901
Sebuku 30,466 30,466
Total 78,540 76,367

Notes to the Financial Statements (continued)
SAK
AR
I R
ESO
UR
CES
LIM
ITED
Ann
ual R
epor
t 20
1271
20 Intangible assets (continued)
The recoverable amount of the CGUs were determined based on value-in-use, using discounted cash flows over the period of Life of Mine (“LOM”) of each mining operation, in line with the policy in note 2(i). The value-in-use computations was determined by estimating cash flows until the end of the life of each mine operation based on long-term production plans, including closure restoration and environmental clean-up costs. Thermal coal benefits from a global marketplace with substantial barriers to entry. In addition, continued global industrialisation is expected to support demand for thermal coal in the long term. The key assumptions used in the value-in-use calculations are the thermal coal price, strip ratio, the Indonesian Rupiah exchange rate against the US dollar, operating costs, and discount rates. These assumptions have been estimated in line with the policy in note 2(i). Key assumptions: Thermal coal prices are based on the Newcastle forward price curve obtained from market observable prices. Strip Ratios and production profiles of both operations are derived from developed LOM plans. Foreign exchange rate assumptions are sourced from forward curves observed from Bloomberg. Operating costs are based on developed LOM plans and follow current contractual terms and pricing with an inflationary element included thereafter over the remaining LOM. A pre-tax discount rate of 10.2 per cent has been applied.
21 Deferred income tax assets
Group Company
2012 2011 2012 2011
US$'000 US$'000 US$'000 US$'000
Deferred tax asset to be recovered after one year 10,737 10,047 2,071 1,431
Set-off of deferred tax assets pursuant to set-off provisions (2,663) (6,458) (2,071) -
Deferred tax asset to be recovered after one year 8,074 3,589 - 1,431
Deferred income tax assets are recognised for tax losses and capital allowances carried forward to the extent that realisation of the related tax benefits through future taxable profits is probable.

Notes to the Financial Statements (continued)
SAK
AR
I R
ESO
UR
CES
LIM
ITED
Ann
ual R
epor
t 20
1272
21 Deferred income tax assets (continued)
Movement in deferred tax asset account is as follows:
GroupTax
losses
Depreciation and
amortisationInterestpayable Provisions Total
US$'000 US$'000 US$’000 US$'000 US$'000
2012
Beginning of financial year 1,401 1,672 - 6,974 10,047
Tax credited/(charged) to the income statement 944 (1,218) 1,910 (1,495) 141
Acquisition of subsidiary 5 - - - 5
Under/(over) provision in respect of prior year 880 907 - (1,243) 544
End of financial year 3,230 1,361 1,910 4,236 10,737
2011
Beginning of financial year 786 1,874
-1,207 3,867
Tax credited/(charged) to the income statement 618 (73)
-5,372 5,917
Others (3) (129) - 395 263
End of financial year 1,401 1,672 - 6,974 10,047
CompanyTax
losses
Depreciation and
amortisationInterestpayable Provisions Total
US$'000 US$'000 US$’000 US$'000 US$'000
2012
Beginning of financial year - (54) - 1,485 1,431
Tax (charged)/credited to the income statement - (54) 1,910 14 1,870
Under/(over) provision in respect of prior year - - - (1,230) (1,230)
End of financial year - (108) 1,910 269 2,071
2011
Beginning of financial year - - - - -
Tax (charged)/credited to the income statement - (54)
-1,485 1,431
End of financial year - (54) - 1,485 1,431

Notes to the Financial Statements (continued)
SAK
AR
I R
ESO
UR
CES
LIM
ITED
Ann
ual R
epor
t 20
1273
22 Trade and other payables
Group Company
2012 2011 2012 2011
US$'000 US$'000 US$'000 US$'000
Trade payables 54,682 52,195 - 1
Other payables
- Ultimate holding corporation - 261 - 204
- Subsidiaries - - 2,766 1,988
- Non-related parties 19,674 9,397 5,135 4,736
Accrued expenses 92,620 93,410 19 87
166,976 155,263 7,920 7,016
Other payables to the ultimate holding corporation and subsidiaries are unsecured, non-interest bearing and repayable at call.
23 Current income tax liabilities
Group Company
2012 2011 2012 2011
US$'000 US$'000 US$'000 US$'000
Beginning of financial year 12,645 4,984 1,646 1,133
Income tax paid (20,720) (13,585) (6,121) (6,752)
Provision for current year 30,268 20,472 7,800 7,897
Others - (60) - -
Foreign exchange differences 206 12 88 -
Under/(over) provision in respect to prior years 1,311 822 (1,213) (632)
End of financial year 23,710 12,645 2,200 1,646
24 Derivative financial instruments
The derivatives used by the Group are over-the-counter commodity derivatives in the form of coal and gas-oil swaps which are measured at fair value and which will settle within 12 months of balance sheet date. The Group did not apply hedge accounting in 2011 and 2012.

Notes to the Financial Statements (continued)
SAK
AR
I R
ESO
UR
CES
LIM
ITED
Ann
ual R
epor
t 20
1274
25 Provisions – current
Group Company
2012 2011 2012 2011
US$'000 US$'000 US$'000 US$'000
Employee benefits 5,606 10,647 2,370 8,043
Movements in provisions
Movements in each class of provision are as follows:
Group Employee benefits
US$'000
2012
Beginning of financial year 10,647
Provisions made 2,619
Provisions utilised during the year (7,660)
End of financial year 5,606
Movements in each class of provision are as follows:
Group Employee benefits
US$'000
2011
Beginning of financial year 2,894
Provisions made 10,113
Provisions utilised during the year (2,360)
End of financial year 10,647
Company
2012
Beginning of financial year 8,043
Provisions written back (574)
Provision utilised during the year (5,099)
End of financial year 2,370
2011
Beginning of financial year 1,154
Provisions made 8,902
Provision utilised during the year (2,013)
End of financial year 8,043

Notes to the Financial Statements (continued)
SAK
AR
I R
ESO
UR
CES
LIM
ITED
Ann
ual R
epor
t 20
1275
26 Provisions – non–current
Group
2012 2011
US$'000 US$'000
Employee benefits (a) 4,209 3,465
Rehabilitation and dismantling (b) 3,200 3,301
7,409 6,766
(a) Employee benefits
Provision for employee benefits represents the amounts provided for in respect of long service leave and termination benefits required by certain jurisdictions the Group operates in. The Group is required to pay these benefits on termination of employment, whether the termination was voluntary or not. These amounts are disclosed as non-current as they are not expected to be paid within 12 months from the balance sheet date. However, there may be some voluntary departure of personnel in the next financial year which will require utilisation of the provision.
(b) Rehabilitation and dismantling
Provision for rehabilitation and dismantling represents the expected cost to dismantle and remove or restore and rehabilitate properties which the Group utilises. This provision represents the best estimate of the present value of the expenditure required to settle the obligation at the balance sheet date. This amount represents provisions that are expected to be settled more than 12 months from the balance sheet date.
(c) Movements in provisions
Movements in each class of provision are as follows:
GroupEmployee benefits
Rehabilitation and dismantling Total
US$'000 US$'000 US$'000
2012
Beginning of financial year 3,465 3,301 6,766
Provision made/(reversed) 1,005 (101) 904
Provision utilised during the year (261) - (261)
End of financial year 4,209 3,200 7,409
2011
Beginning of financial year 2,929 2,313 5,242
Provision made 1,803 988 2,791
Provision utilised during the year (1,267) - (1,267)
End of financial year 3,465 3,301 6,766

Notes to the Financial Statements (continued)
SAK
AR
I R
ESO
UR
CES
LIM
ITED
Ann
ual R
epor
t 20
1276
27 Borrowings
Group Company
2012 2011 2012 2011
US$'000 US$'000 US$'000 US$'000
Current
Secured bank borrowings 87,500 - 80,000 -
Non-current
Secured bank borrowings 191,848 283,779 184,348 283,779
Total borrowings 279,348 283,779 264,348 283,779
The exposure of the borrowings of the Group and of the Company to interest rate changes and the contractual repricing dates at the balance sheet dates are as follows:
Group Company
2012 2011 2012 2011
US$'000 US$'000 US$'000 US$'000
6 months or less 280,000 285,000 265,000 285,000
Less: Capitalised borrowing costs (652) (1,221) (652) (1,221)
279,348 283,779 264,348 283,779
The bank borrowings are principally secured by:
• A charge over certain bank accounts of the Company and certain subsidiaries (note 12); • Share charges and pledges by certain subsidiaries within the Group; • Main sales contracts assignments, and • Guarantees from certain subsidiaries.
The Group entered into a US$25 million facility equipment lease agreement with ANZ Bank on 7 August 2012. This facility has a tenor of 3 years. As at 31 December 2012, US$15 million was drawn down under this facility.
The carrying amount of assets pledged as security for the bank borrowings are:
Group Company
2012 2011 2012 2011
US$'000 US$'000 US$'000 US$'000
Cash and cash equivalents 73,912 99,861 9,576 23,379
Investment in subsidiaries - - 42,208 42,208
Total assets pledged as security 73,912 99,861 51,784 65,587
As the shares in the subsidiaries of the Company are pledged as security, the net tangible assets of the subsidiaries are considered pledged as security at Group level.

Notes to the Financial Statements (continued)
SAK
AR
I R
ESO
UR
CES
LIM
ITED
Ann
ual R
epor
t 20
1277
27 Borrowings (continued)
Fair value of borrowings
Group Company
2012 2011 2012 2011
US$'000 US$'000 US$'000 US$'000
Bank borrowings 280,000 285,000 265,000 285,000
28 Deferred income tax liabilities
Group Company
2012 2011 2012 2011
US$'000 US$'000 US$'000 US$'000
To be settled after one year 77,659 93,564 3,868 -
Set off of deferred tax liabilities pursuant to set-off provisions (note 21) (2,663) (6,458) (2,071) -
Net deferred income tax liabilities 74,996 87,106 1,797 -
Movement in deferred income tax liabilities account is as follows:
Group Miningproperties Other Total
US$'000 US$'000 US$'000
2012
Beginning of financial year 82,496 11,068 93,564
Tax (credited)/charged to the income statement (33,944) 17,192 (16,752)
Under/(over) provision in respect of prior years 808 39 847
End of financial year 49,360 28,299 77,659
2011
Beginning of financial year 86,107 1,747 87,854
Tax (credited)/charged to the income statement (3,611) 9,174 5,563
Other - 147 147
End of financial year 82,496 11,068 93,564

Notes to the Financial Statements (continued)
SAK
AR
I R
ESO
UR
CES
LIM
ITED
Ann
ual R
epor
t 20
1278
28 Deferred income tax liabilities (continued)
Movement in deferred income tax liabilities account is as follows:
Company Other Total
US$'000 US$'000
2012
Beginning of financial year - -
Tax charged to the income statement 3,868 3,868
End of financial year 3,868 3,868
2011
Beginning of financial year 50 50
Tax charged to the income statement (50) (50)
End of financial year - -
29 Share capital
Issued share capital No. of shares
Share Capital US$'000
2012
Beginning of financial year 1,134,136,930 326,832
Shares issued under ExSAP (b) 2,825,102 -
Shares issued on exercise of options (a) 90,188 86
Transfer from share-based payment reserve (note 30) - 591
End of financial year 1,137,052,220 327,509
2011
Beginning of financial year 1,131,469,308 325,758
Shares issued under ExSAP (b) 2,473,372 -
Shares issued on exercise of options (a) 194,250 224
Transfer from share-based payment reserve (note 30) - 850
End of financial year 1,134,136,930 326,832
All issued ordinary shares are fully paid except for 7,797,884 shares issued under the ExSAP. There is no par value for ordinary shares.

Notes to the Financial Statements (continued)
SAK
AR
I R
ESO
UR
CES
LIM
ITED
Ann
ual R
epor
t 20
1279
29 Share capital (continued)
Fully paid ordinary shares including those issued under the ExSAP carry one vote per share and carry a right to dividends as and when declared by the Company.
(a) Share options
During the financial year ended 31 December 2012, share options were granted to key management and employees under the Employee Share Option Plan (“ESOP”) which was approved by shareholders of the Company at an Extraordinary General Meeting on 19 November 2010, and also to directors of the Company which was approved by shareholders of the Company at the Annual General Meeting on 26 April 2012.
The exercise price of the options is the last traded share price of the Company’s ordinary shares on the Singapore Exchange before the date of offer rounded to the nearest whole cent. 40% of the options vest one year from the grant date, a further 30% of the options vest two years from the grant date and the remaining 30% of the options vest three years from the grant date. Once the options are vested, they are exercisable for a period up to five years from the grant date.
Movement in the number of unissued ordinary shares under option and their exercise prices are as follows:
Beginning of
financial year
Granted during
financial year
Exercised during
financial year
Forfeited/lapsedduring
financial year
End of financial
yearExercise
priceExerciseperiod
2012
2012 Options - 346,154 - - 346,154 S$1.99 27.04.2013 - 27.04.2017
2012 Options - 502,226 - - 502,226 S$2.23 31.01.2013 - 31.01.2017
2011 Options 274,390 - - - 274,390 S$2.66 21.04.2012 - 21.04.2016
2011 Options 454,694 - (5,688) - 449,006 S$2.30 23.02.2012 - 23.02.2016
2010 Options 433,750 - - (50,000) 383,750 S$2.27 23.06.2011 - 23.06.2015
2009 Options 84,500 - (84,500) - - S$1.22 23.04.2010 - 23.04.2014
2008 Options 360,000 - - (50,000) 310,000 S$3.14 24.03.2009 - 24.03.2013
2008 Options 250,000 - - - 250,000 S$3.67 30.04.2009 - 30.04.2013
1,857,334 848,380 (90,188) (100,000) 2,515,526
2011
2011 Options - 274,390 - - 274,390 S$2.66 21.04.2012 - 21.04.2016
2011 Options - 464,387 - (9,693) 454,694 S$2.30 23.02.2012 - 23.02.2016
2010 Options 475,000 - (41,250) - 433,750 S$2.27 23.06.2011 - 23.06.2015
2009 Options 295,000 - (153,000) (57,500) 84,500 S$1.22 23.04.2010 - 23.04.2014
2008 Options 450,000 - - (90,000) 360,000 S$3.14 24.03.2009 - 24.03.2013
2008 Options 250,000 - - - 250,000 S$3.67 30.04.2009 - 30.04.2013
1,470,000 738,777 (194,250) (157,193) 1,857,334

Notes to the Financial Statements (continued)
SAK
AR
I R
ESO
UR
CES
LIM
ITED
Ann
ual R
epor
t 20
1280
29 Share capital (continued)
(a) Share options (continued)
On 31 January 2012, the Company granted options to key management to subscribe for 502,226 ordinary shares in the Company at an exercise price of S$2.23 per share. 40% of these options are exercisable from 31 January 2013; a further 30% are exercisable from 31 January 2014, with the remaining 30% exercisable from 31 January 2015. These options expire on 31 January 2017. The total fair value of these options granted was estimated to be US$380,000.
On 27 April 2012, the Company granted options to Directors of the Company to subscribe for 346,154 ordinary shares in the Company at an exercise price of S$1.99 per share. 40% of these options are exercisable from 27 April 2013; a further 30% are exercisable from 27 April 2014, with the remaining 30% exercisable from 27 April 2015. These options expire on 27 April 2017. The total fair value of these options granted was estimated to be US$229,000.
The fair value at grant date is independently determined using a Binomial Option Pricing Model that takes into account the exercise price, the term of the option, the vesting and performance criteria, the impact of dilution, the non-tradable nature of the option, the share price at grant date and expected price volatility of the underlying share, the expected dividend yield and the risk free interest rate for the term of the option.
The significant inputs into the option model for the two tranches of share options issued under ESOP during the financial year ended 31 December 2012 (2011: two tranches) were the share price of S$2.23 and S$1.99 (2011: S$2.30 and S$2.66) one day prior the grant date, the exercise price of S$2.23 and S$1.99 (2011: S$2.30 and S$2.66), a standard deviation of expected share price return of 65% (2011: 65% and 60%), the option life of 5 years (2011: 5 years) and the annual risk-free interest rate of 0.49% and 0.56% respectively (2011: 1.20% and 1.13% respectively). The volatility measured as the standard deviation of expected share price returns was estimated using Hoadley’s volatility calculator using data extracted from Bloomberg.
Out of the unexercised options for 2,515,526 (2011: 1,857,334) shares in the Company, options for 1,283,108 (2011: 911,375) shares are exercisable at the balance sheet date.
(b) Share issue
On 31 January 2012, 2,825,102 (2011: 2,473,372) ordinary shares in the Company were granted to key management under the Executive Share Acquisition Plan (“ExSAP”) at a price of S$2.23 per share (2011: S$2.30) with a total fair value at grant date of US$1,965,000 (2011: US$2,210,000) based on the closing market share price at grant date. The shares vest over four years, with 25% vesting after the first anniversary, a further 25% after the second anniversary, a further 25% after the third anniversary and the final 25% after the fourth anniversary.
Pursuant to the mandatory unconditional cash offer for all the ordinary shares of the Company by PTT Mining Limited on 24 September 2012, the unvested shares granted under ExSAP became immediately available.

Notes to the Financial Statements (continued)
SAK
AR
I R
ESO
UR
CES
LIM
ITED
Ann
ual R
epor
t 20
1281
30 Other reserves
Group Company
2012 2011 2012 2011
US$'000 US$'000 US$'000 US$'000
Share-based payments reserve (a) 9,216 4,294 9,216 4,294
Capital reserve (b) (13,526) (13,526) - -
General reserve (c) 329 329 - -
Merger reserve (d) (7,752) (7,752) - -
Available for sale reserve (e) - 24 - -
(11,733) (16,631) 9,216 4,294
Other reserves are non-distributable.
(a) Share-based payments reserve
Group Company
2012 2011 2012 2011
US$'000 US$'000 US$'000 US$'000
Beginning of financial year 4,294 2,425 4,294 2,425
Transferred to share capital (note 29) (591) (850) (591) (850)
Share-based payment expense (note 8) 4,622 2,039 4,622 2,039
Share plan loan repayment 891 680 891 680
End of financial year 9,216 4,294 9,216 4,294
(b) Capital reserve
In January 2005, the Group acquired the remaining 20% equity interest of PT Bahari Cakrawala Sebuku (“PT BCS”) for a consideration of US$15,821,000. The acquisition consideration was satisfied by the allotment and issuance of 6,145,537 shares of S$1 each at a premium of S$3.18 per share. This reserve of US$13,526,000 represents the difference between the value of the consideration paid for the acquisition of the 20% minority interest in PT BCS prior to 2006 and the amount that these minority interests were recognised in the financial statements.
(c) General reserve
Group
2012 2011
US$'000 US$'000
Beginning balance and end of financial year 329 329
The revised Indonesian Limited Company Law No. 40/2007 dated 16 August 2007 requires Indonesian companies to set up a general reserve amounting to 20% of the company’s issued and paid up share capital.

Notes to the Financial Statements (continued)
SAK
AR
I R
ESO
UR
CES
LIM
ITED
Ann
ual R
epor
t 20
1282
30 Other reserves (continued)
(d) Merger reserve
Merger reserve arising from a restructuring exercise representing the excess of cash consideration paid over the subsidiaries capital acquired and accounted for using the pooling of interest method.
(e) Available for sale reserve
Group
2012 2011
US$'000 US$'000
Beginning balance 24 5,650
Fair value loss on available-for-sale financial asset (note 17) (24) (5,626)
End of financial year - 24
The available-for-sale reserve represents the mark to market over the cost of the investment (note 17).
31 Retained profits
Group Company
2012 2011 2012 2011
US$'000 US$'000 US$'000 US$'000
Beginning of financial year 320,767 210,898 3,637 4,223
Net profit after tax 108,467 190,275 94,020 79,820
Dividends paid (note 32) (89,029) (80,406) (89,029) (80,406)
End of financial year 340,205 320,767 8,628 3,637
Retained profits of the Group and Company are distributable.
32 Dividends
2012 2011
US$'000 US$'000
Final dividend paid in respect of the previous financial year of 5.83 cents (2010: 2.85 cents) per share 66,288 32,320
Interim dividend paid in respect of the current financial year of 2.00 cents (2011: 4.24 cents) per share 22,741 48,086
89,029 80,406
At the Board meeting on 21 February 2013, a final dividend of 3.72 cents per share amounting to a total of US$42.3 million has been recommended for approval at the Company’s Annual General Meeting. These financial statements do not reflect this dividend, which will be accounted for in shareholders’ equity as an appropriation of retained profits in the financial year ending 31 December 2013.

Notes to the Financial Statements (continued)
SAK
AR
I R
ESO
UR
CES
LIM
ITED
Ann
ual R
epor
t 20
1283
33 Capital commitments
Capital expenditures contracted for at the balance sheet date but not recognised in the financial statements, are as follows:
Group Company
2012 2011 2012 2011
US$'000 US$'000 US$'000 US$'000
Property, plant and equipment 1,058 1,335 142 100
34 Operating lease commitments
The Group leases office space, residential properties and certain office equipment from non-related parties under non-cancellable operating lease agreements. The leases have varying terms, escalation clauses and renewal rights.
The future minimum lease payables under non-cancellable operating leases contracted for at the balance sheet date but not recognised as liabilities, are as follows:
Group Company
2012 2011 2012 2011
US$'000 US$'000 US$'000 US$'000
Not later than one year 2,681 2,282 1,077 826
Between one and five years 1,799 2,042 503 761
4,480 4,324 1,580 1,587
35 Financial risk management
Financial risk factors
The Group’s operations are exposed to market risk (including currency risk, price risk and interest rate risk), credit risk and liquidity risk. The Group’s overall risk management strategy seeks to minimise any adverse effects from the unpredictability of financial and commodity markets on the Group’s financial performance. The Group uses financial instruments such as over-the-counter commodity swaps to hedge certain market risk exposures.
The Board is responsible for setting the objectives and underlying principles of financial risk management for the Group. The Treasury Committee then establishes the detailed policies such as authority levels, oversight responsibilities, risk identification and measurement, exposure limits and hedging strategies, in accordance with the objectives and principles set by the Board.
Financial risk management is carried out by a central treasury department, trading department and reporting department and these teams evaluate and hedge financial risks in co-operation with the Group’s operating units. Regular reports are also submitted to management and the Board.

Notes to the Financial Statements (continued)
SAK
AR
I R
ESO
UR
CES
LIM
ITED
Ann
ual R
epor
t 20
1284
35 Financial risk management (continued)
Financial risk factors (continued)
(a) Market risk
i. Currency risk
The Group operates in Singapore, Australia and Indonesia. Entities in the Group regularly transact in their respective functional currency, which is the United States dollar (“USD”). Currency risk arises when transactions are denominated in foreign currencies such as the Singapore dollar (“SGD”), Australian dollar (“AUD”) and Indonesia rupiah (“IDR”).
The Group’s exposure to foreign currencies is not significant. The Group does not
use any financial instruments such as forward exchange contracts to mitigate the currency risks which is consistent with the Group’s Treasury Risk Management policy.
The Group’s foreign currency exposure based on the information provided to key management is as follows:
SGD IDR AUD Total
US$’000 US$’000 US$’000 US$’000
At 31 December 2012
Financial assets
Cash and cash equivalents 1,140 2,526 517 4,183
Trade and other receivables 452 6,788 287 7,527
Available-for-sale financial assets - - 2,045 2,045
1,592 9,314 2,849 13,755
Financial liabilities
Trade and other payables 606 3,861 2,152 6,619
606 3,861 2,152 6,619
At 31 December 2011
Financial assets
Cash and cash equivalents 768 1,454 476 2,698
Trade and other receivables 884 3,124 91 4,099
Available-for-sale financial assets - - 8,580 8,580
1,652 4,578 9,147 15,377
Financial liabilities
Trade and other payables 705 4,063 1,017 5,785
705 4,063 1,017 5,785

Notes to the Financial Statements (continued)
SAK
AR
I R
ESO
UR
CES
LIM
ITED
Ann
ual R
epor
t 20
1285
35 Financial risk management (continued)
Financial risk factors (continued)
(a) Market risk
i. Currency risk
The Company’s foreign currency exposure based on the information provided to key management is as follows:
2012 2011 SGD AUD Total SGD AUD Total
USD$’000 USD$’000 USD$’000 USD$’000 USD$’000 USD$’000
Financial assetsCash and cash equivalents 767 13 780 138 - 138Trade and other receivables 311 - 311 736 91 827
1,078 13 1,091 874 91 965
Financial liabilitiesTrade and other payables 531 791 1,322 566 661 1,227
531 791 1,322 566 661 1,227
If the Singapore dollar, Australian dollar and Indonesian rupiah change against the United States dollar by 2% (2011: 5%), 2% (2011: 8%) and 3% (2011: 2%) respectively with all other variables including tax rate being held constant, the effects arising from the net financial liability/asset position will be as follows:
Increase/(Decrease) 2012 2011
Profitafter tax
Other comprehensive
incomeProfit
after tax
Other comprehensive
incomeUS$’000 US$’000 US$’000 US$’000
GroupSGD against USD -strengthened 17 - 34 - -weakened (17) - (34) -IDR against USD -strengthened 137 - 7 - -weakened (137) - (7) -AUD against USD -strengthened (18) - (25) 686 -weakened (23) 41 25 (686)
CompanySGD against USD -strengthened 9 - 14 - -weakened (9) - (14) -AUD against USD -strengthened 13 - (42) - -weakened (13) - 42 -

Notes to the Financial Statements (continued)
SAK
AR
I R
ESO
UR
CES
LIM
ITED
Ann
ual R
epor
t 20
1286
35 Financial risk management (continued)
Financial risk factors (continued)
(a) Market risk (continued)
ii. Price risk
The Group is exposed to thermal coal price risk generated by its mining activities. The Group sells coal either on a contracted or spot basis, with prices either fixed or index linked. Coal price risk is managed through contractual arrangements negotiated directly with customers, usually for a period of 12 months and through the use of derivative financial instruments.
Fuel is a major component of the Group’s operating costs. The Group’s exposure to changes in fuel prices is ultimately based on reference to a USD Mean of Platts Singapore (“MOPS”) Gas Oil assessment price. This benchmark reference is used to determine diesel fuel prices in Indonesia, which are primarily passed through to the Group by mine contractors through rise and fall adjustment clauses. Historically, as sources of energy generation, there is a positive correlation between coal and oil prices, and this has served as a natural hedge to the Group’s exposure to changing fuel prices.
The Group uses derivative financial instruments in the form of coal and gas-oil swaps to hedge adverse movements in coal prices received by customers and gas-oil prices paid as part of the Group’s mining costs. These instruments are over-the-counter derivative contracts referenced to indices and therefore underlying commodity prices of coal and gas-oil. If the referenced price increased/(decreased) by 10% (2011: 10%) with all other variables including tax rate being held constant, the effects on profit after tax would have been an (decrease)/increase of US$22,155,000 respectively (2011: (decrease)/increase of US$22,089,000 and US$23,843,000 respectively).
The Group has one equity investment on the balance sheet that is exposed to equity securities price risk. If the price of the equity security listed on the Australia Securities Exchange changed by 10% (2011: 10%) with all other variables including tax rate being held constant, the effects on profit after tax would have been an increase/(decrease) of US$205,000 (2011: US$858,000).
iii. Cash flow and fair value interest rate risks
Cash flow interest rate risk is the risk that the future cash flows of a financial instrument will fluctuate because of changes in market interest rates. Fair value interest rate risk is the risk that the fair value of a financial instrument will fluctuate due to changes in market interest rates. As the Group has no significant interest bearing assets, the Group’s income is substantially independent of changes in market interest rates.
The Group’s main interest rate risk arises from borrowings. Borrowings issued at variable rates expose the Group to cash flow interest rate risk.
The Group’s borrowings are at variable rates and are denominated in USD. If the USD interest rates had increased/decreased by 0.50% (2011: 0.50%) with all other variables including tax rate being held constant, the profit after tax will be lower/higher by US$1,148,000 (2011: US$1,279,000) as a result of higher/lower interest expense on these borrowings.

Notes to the Financial Statements (continued)
SAK
AR
I R
ESO
UR
CES
LIM
ITED
Ann
ual R
epor
t 20
1287
35 Financial risk management (continued)
Financial risk factors (continued)
(b) Credit risk
Credit risk refers to the risk that counterparty will default on its contractual obligations resulting in financial loss to the Group. Credit risk is managed on a group basis. Credit risk arises from cash and cash equivalents, and deposits with banks and financial institutions and derivative financial instruments, as well as credit exposures to trade customers, including outstanding receivables and contracted sales. The Group only deals with banks and financial institutions of good repute and standing. For trade customers, the corporate team assess and monitor the credit quality of each trade customer, taking into account their financial position, past experience and other relevant factors.
Credit exposure to an individual counterparty is restricted by the corporate team management based on ongoing credit evaluation. Counterparty’s payment profiles are monitored by management. Generally, the Group only enters into contracts with large counterparties (such as power utilities). Counterparty and payment risk is also managed through the use of letters of credit or telegraphic transfers payable within 7-21 days from a vessel’s bill of lading date.
The Group has a broad customer base with many sales secured by letters of credit. The majority of the Group’s customers belong to the power generation sector across various countries which represent some concentration of risk within this market.
The maximum exposure to credit risk for each class of financial instrument is the carrying amount of that class of financial assets presented on the balance sheet.
The credit risk for trade receivables, net of letters of credit, based on the information provided to key management is as follows:
Group
2012 2011
US$'000 US$'000
By geographical areas:
Indonesia 30,805 23,644
Singapore 18,975 49,685
Less: Letters of credit - (6,078)
49,780 67,251

Notes to the Financial Statements (continued)
SAK
AR
I R
ESO
UR
CES
LIM
ITED
Ann
ual R
epor
t 20
1288
35 Financial risk management (continued)
(b) Credit risk (continued)
i. Financial assets that neither past due nor impaired
Bank deposits that are neither past due nor impaired are mainly deposits with banks with high credit ratings assigned with international credit rating agencies. Trade receivables that are neither past due nor impaired are substantially with companies with a good collection track record with the Group.
ii. Financial assets that are past due and/or impaired
Where financial assets are past due but not impaired, the Group has assessed that the credit quality of these amounts has not changed and the amounts are still considered recoverable.
The age analysis of trade receivables past due but not impaired is as follows:
Group Company
2012 2011 2012 2011
US$'000 US$'000 US$'000 US$'000
Past due < 3 months 24,273 7,204 - -
Past due 3 to 6 months 463 33 - -
Past due > 6 months 53 121 - -
24,789 7,358 - -
There were no trade receivables individually determined to be impaired as at 31 December 2012 and 31 December 2011.
(c) Liquidity risk
Prudent liquidity risk management implies maintaining at all times sufficient cash and marketable securities and the availability of funding through an adequate amount of committed credit facilities so as to enable the Group to meet its obligations as and when they fall due. At the balance sheet date, assets held by the Group and Company for managing liquidity risk included cash and short-term deposits as disclosed in note 12.
Liquidity risk management covers daily, short term, and long term needs. The appropriate levels of liquidity are determined by both the nature of the Group’s business and its risk profile. The Group monitors its liquidity position on a daily basis and prepares short term weekly cash flows of up to three months, on a monthly basis. In addition to this, the Group looks at cash flows on a medium term (< 12 months) and long term (> 12 months) basis through regular forecasts, annual budgets and long term business plans.
The table below analyses the maturity profile of the Group’s and Company’s financial liabilities, including derivative financial instruments into relevant maturity groupings based on the remaining period from the balance sheet date to the contractual maturity date. The amounts disclosed in the table are the contractual undiscounted cash flows.

Notes to the Financial Statements (continued)
SAK
AR
I R
ESO
UR
CES
LIM
ITED
Ann
ual R
epor
t 20
1289
35 Financial risk management (continued)
(c) Liquidity risk (continued)
Less than 1 year
Between 1 and 2 years
Between 2 and 5 years Over 5 years
US$’000 US$’000 US$’000 US$’000
2012
Group
Trade and other payables (166,976) - - -
Derivative financial instruments (6,615) - - -
Borrowings (95,311) (89,231) (107,668) -
(268,902) (89,231) (107,668) -
Company
Trade and other payables (7,920) - - -
Borrowings (87,395) (84,527) (104,626) -
(95,315) (84,527) (104,626) -
Less than 1 year
Between 1 and 2 years
Between 2 and 5 years
Over 5 years
US$’000 US$’000 US$’000 US$’000
2011
Group
Trade and other payables (155,263) - - -
Derivative financial instruments (80) - - -
Borrowings (9,738) (47,829) (249,160) -
(165,081) (47,829) (249,160) -
Company
Trade and other payables (7,016) - - -
Borrowings (9,738) (47,829) (249,160) -
(16,754) (47,829) (249,160) -
The Group’s borrowings have a carrying value of US$279,348,000 (2011: US$283,779,000) and are due to mature between 2013 and 2015 (note 27).

Notes to the Financial Statements (continued)
SAK
AR
I R
ESO
UR
CES
LIM
ITED
Ann
ual R
epor
t 20
1290
35 Financial risk management (continued)
(d) Capital risk (continued)
The Group’s objectives when managing capital are to maintain an optimal capital structure so as to maximise shareholder value and to safeguard the Group’s ability to continue as a going concern. The capital structure of the Group consists of debt, which includes borrowings, cash and cash equivalents and equity attributable to equity holders of the Company, comprising issued capital, reserves and retained profits.
In order to maintain or achieve an optimal capital structure, the Group may adjust the amount of dividend payment, return capital to shareholders, issue new shares, buy back issued shares, obtain new borrowings or sell assets to reduce borrowings.
The gearing ratio is calculated as net debt divided by the total book value of capital. Net debt is calculated as borrowings plus trade and other payables less cash and cash equivalents. Total capital is calculated as equity plus net debt.
The Group also evaluates its debt levels by measuring the level of interest expense relative to the Group’s net earnings. The level of gearing is also restricted in bank covenants as part of the Group’s borrowings. These covenants include minimum ratios such as interest coverage and leverage ratios.
The Group and the Company are in compliance with all externally imposed capital requirements for the financial years ended 31 December 2011 and 2012.
Group Company
2012 2011 2012 2011
US$'000 US$'000 US$'000 US$'000
Net debt 324,603 283,854 262,683 267,401
Total equity 655,981 630,968 343,896 334,763
Total capital 980,584 914,822 606,579 602,164
Gearing ratio 33% 31% 43% 44%
(e) Fair value measurement
The following table presents assets measured at fair value and classified by level of the following fair value measurement hierarchy:
i. Quoted prices (unadjusted) in active markets for identical assets (Level 1); ii. Inputs other than quoted prices included within Level 1 that are observable for the
asset, either directly (i.e. as prices) or indirectly (i.e. derived from prices) (Level 2); and
iii. Inputs for the asset that are not based on observable market data (unobservable inputs) (Level 3).

Notes to the Financial Statements (continued)
SAK
AR
I R
ESO
UR
CES
LIM
ITED
Ann
ual R
epor
t 20
1291
35 Financial risk management (continued)
(e) Fair value measurement (continued)
Level 1 Level 2 Level 3 Total
US$'000 US$'000 US$'000 US$'000
Group
2012Assets
Derivative financial instruments - 6,459 - 6,459
Available-for-sale financial assets 2,045 - - 2,045
Total assets 2,045 6,459 - 8,504
Liabilities
Derivative financial instruments - 6,615 - 6,615
Level 1 Level 2 Level 3 Total
US$'000 US$'000 US$'000 US$'000
Group
2011Assets
Derivative financial instruments - 10,551 - 10,551
Available-for-sale financial assets 8,580 - - 8,580
Total assets 8,580 10,551 - 19,131
Liabilities
Derivative financial instruments - 80 - 80
The fair value of financial instruments traded in active markets (such as trading and available-for-sale securities) is based on the quoted market prices at the balance sheet date. The quoted market prices used for financial assets held by the Group is the current bid price. These instruments are included in Level 1.
The fair value of financial instruments that are not traded in an active market (e.g. over-the-counter derivatives) is determined by using valuation techniques. The Group uses a variety of methods and makes assumptions that are based on market conditions existing at balance sheet date. Quoted market prices and index-linked prices for similar instruments are used to estimate fair value. These investments are classified as Level 2.
(f) Financial Instruments by category
The carrying amount of the different categories of financial instruments is as disclosed on the face of the balance sheets.

Notes to the Financial Statements (continued)
SAK
AR
I R
ESO
UR
CES
LIM
ITED
Ann
ual R
epor
t 20
1292
36 Segment information
Management has determined the operating segments based on the reports that are used to make strategic decisions. The principal business of the Group is the exploration for and mining and marketing of coal.
Other operations of the Group mainly comprise management services and investment holding, none of which constitutes a separately reportable segment.
Segment assets consist primarily of property, plant and equipment, exploration and evaluation assets, inventories, receivables and cash and cash equivalents. Segment liabilities comprise payables, accruals, provisions and borrowings. Capital expenditure comprises additions to property, plant and equipment and exploration and evaluation assets.
The Group’s business operates principally in the geographical region of Asia. The pricing of the Group’s products is governed principally by reference to international market pricing and is benchmarked to the Newcastle Export Index (NEX) and adjusted for transport charges and relative calorific value. Hence, the Group is not materially subject to risk and return arising in differing economic environments in Asia.
The segment information for the reportable segment for the year ended 31 December 2012 is as follows:
CoalAll other segments Total
US$’000 US$’000 US$’000
2012
Group
SalesTotal segment sales 927,268 - 927,268
Segment profit after tax 114,651 (6,184) 108,467
Depreciation and amortisation 88,714 - 88,714
Interest expense 12,725 - 12,725
Interest income (815) (228) (1,043)
Income tax expense 20,501 23 20,524
Segment assets 1,208,817 11,824 1,220,641
Segment assets includes:
Financial assets at fair value through profit and loss 6,459 - 6,459
Financials assets, available-for-sale - 2,045 2,045
Additions to:
- property, plant and equipment 125,021 - 125,021
- exploration and evaluation 2,769 - 2,769
- intangibles 2,173 - 2,173Segment liabilities (542,677) (21,983) (564,660)

Notes to the Financial Statements (continued)
SAK
AR
I R
ESO
UR
CES
LIM
ITED
Ann
ual R
epor
t 20
1293
36 Segment information (continued)
The segment information for the reportable segment for the year ended 31 December 2011 is as follows:
Coal All other segments
Total
US$’000 US$’000 US$’0002011GroupSalesTotal segment sales 1,013,484 90 1,013,574
Segment profit after tax 187,774 2,501 190,275
Depreciation and amortisation 47,311 - 47,311Goodwill impairment 1,725 - 1,725Interest expense 12,578 - 12,578Interest income (386) (260) (646)Income tax expense 69,113 - 69,113
Segment assets 1,168,671 18,583 1,187,254
Segment assets includes:Financial assets at fair value through profit and loss 10,551 - 10,551Financials assets, available-for-sale - 8,580 8,580Additions to: - property, plant and equipment 84,638 - 84,638 - exploration and evaluation 1,549 - 1,549
Segment liabilities (533,753) (22,533) (556,286)
The Group operates in 2 main geographical areas:
• Singapore – the Company is headquartered and has operations in Singapore. The operations in this area are principally the marketing of coal and investment holding;
• Indonesia – the operations in this area are principally exploration and mining of coal.
Revenues from external customers: Sales
2012 2011
US$’000 US$’000
Singapore 645,058 727,267
Indonesia 282,210 286,307
927,268 1,013,574
Revenues of approximately US$667,719,000 (2011: US$711,979,000) are derived from four external customers in 2012 (2011: 4 customers). These revenues are attributable to the Coal segment.
Non-current assets are located in Indonesia.

Notes to the Financial Statements (continued)
SAK
AR
I R
ESO
UR
CES
LIM
ITED
Ann
ual R
epor
t 20
1294
37 Related party transactions
(a) Key management personnel compensation
Group
2012 2011
US$'000 US$'000
Salaries and other short-term employee benefits 7,120 7,916
Termination benefits - 212
Share based expenses 3,170 1,688
10,290 9,816 Included in the total above is compensation provided to directors of the Company amounting to US$3,418,000 (2011: US$2,950,000).
Share based expenses represent the fair value of instruments issued under ExSAP and ESOP plans which have vested during the financial year ended 31 December 2012 as accounted for under FRS 102 Share-based payment, and not cash payments made to awardees. The subscription prices of the instruments which vested during the financial year were S$2.64, S$2.30 and S$2.23, being the last traded share price before the grant dates. The closing price of the Company’s security as traded on the last day before suspension on 23 October 2012 was S$1.85.
In addition to the information disclosed elsewhere in the financial statements, the following transactions took place between the Group and related parties at terms agreed between the parties, which are considered arm’s length.
(b) Sales and purchases of goods and services
Group
2012 2011
US$'000 US$'000
Management fees paid to immediate holding corporation 642 391
Management fees received from immediate holding corporation 392 585
Management fees received from related corporation 55 -
Related corporation comprise mainly companies which are controlled or significantly influenced by the Group’s ultimate holding company that are not part of the Group or companies which are controlled or significantly influenced by key management personnel and their close family members.

Notes to the Financial Statements (continued)
SAK
AR
I R
ESO
UR
CES
LIM
ITED
Ann
ual R
epor
t 20
1295
38 Business combination
On 24 May 2012, the Group acquired a 100% interest in PT Tri Tunggal Lestari Bersama (“TTLB”). The principal activity of TTLB is that of infrastructure development. Details of the consideration paid, the assets acquired and liabilities assumed are as follows:
2012
US$’000
Purchase consideration
Cash paid 2,178
Identifiable net assets acquired:
Deferred tax assets 5
Add: Goodwill 2,173
Consideration transferred for the business 2,178
The acquisition of TTLB will enable the Group to explore the possibility of opening an overland route for transporting coal from the Jembayan operations and the Separi region to the coast. Pre-feasibility studies indicate that a direct transport route provided by TTLB would result in a substantial reduction in haulage costs for the Jembayan operations.
39 Subsidiaries
The consolidated financial statements incorporate the assets, liabilities and results of the following subsidiaries in accordance with the accounting policy described in note 2(b):
Name of entityCountry of incorporation Principal activity Equity holding
2012 2011
% %
Tiger Energy Trading Pte Ltd (a) Singapore Trading 100 100
Sakari Energy Trading Pte Ltd (a) Singapore Investment holding 100 100
Sakari Asia Energy Pte Ltd (a) Singapore Dormant 100 100
Reyka Wahana Digdjaya Pte Ltd (b) Singapore Dormant 100 100
PT Bahari Cakrawala Sebuku (c) Indonesia Coal mining 100 100
PT Straits Consultancy Services (c) * Indonesia Management services 100 100
PT Reyka Wahana Digdjaya (b) Indonesia Investment holding 100 100
Sakari Marine Infrastructure Pte Ltd (a) Singapore Marine Engineering 100 100
Sakari Australia Pty Ltd Australia Management services 100 100
- Formerly SAR Resources (Australia) Pty Ltd (b)
PT Bumiborneo Pertiwi Nusantara (c) Indonesia Investment holding 100 100
PT Borneo Citrapertiwi Nusantara (c) Indonesia Investment holding 100 100
PT Separi Energy (c) Indonesia Investment holding 100 100
PT Jembayan Muarabara (c) Indonesia Coal mining 100 100

Notes to the Financial Statements (continued)
SAK
AR
I R
ESO
UR
CES
LIM
ITED
Ann
ual R
epor
t 20
1296
Name of entityCountry of incorporation Principal activity Equity holding
2012 2011
% %
PT Kemilau Rindang Abadi (c) Indonesia Coal mining 100 100
PT Arzara Baraindo Energitama (c) Indonesia Coal mining 100 100
PT Karbon Mahakam (c) Indonesia Coal mining 100 100
PT Metalindo Bumi Raya (c) Indonesia Coal mining 100 100
PT Citra Pertiwi Nusantara (b) Indonesia Asset holding 100 100
PT Kuda Perdana Pertiwi (b) Indonesia Dormant 100 100
PT Bahari Perdana Persada (b) Indonesia Dormant 100 100
PT Bahari Putra Perdana (b) Indonesia Dormant 100 100
PT Bumi Borneo Metalindo (b) Indonesia Dormant 100 100
PT Sakti Utama Luas (b) Indonesia Dormant 100 100
PT Makassar Prima Coal Indonesia Dormant 70 70
PT Cakrawala Abadi Jaya (b) Indonesia Dormant 100 100
PT Tri Tunggal Lestari Bersama (b) Indonesia Dormant 100 -
(a) Audited by PricewaterhouseCoopers LLP, Singapore. (b) Not required to be audited under the law of the country of incorporation. (c) Audited by KAP Tanudiredja, Wibisana & Rekan - a member firm of the PricewaterhouseCoopers
global network. * Includes 1% indirect interest
40 Reconciliation of profit after income tax to net cash provided by operating activities
Group
2012 2011
US$'000 US$'000
Net profit after tax 108,467 190,275
Depreciation and amortisation 88,714 47,311
Foreign exchange (gain)/losses (183) 224
(Gain)/losses on sale of property, plant and equipment (1) 143
Impairment of intangible asset (note 20) - 1,725
Impairment of available-for-sale financial asset 6,511 -
Write off property, plant and equipment 224 -
Fair value gains on financial assets at fair value through profit and loss (14,026) (13,559)
Interest expense 12,725 12,578
Share-based payments expense 4,622 2,039
39 Subsidiaries (continued)

Notes to the Financial Statements (continued)
SAK
AR
I R
ESO
UR
CES
LIM
ITED
Ann
ual R
epor
t 20
1297
Group
2012 2011
US$'000 US$'000
Changes in operating assets and liabilities
Decrease in trade and other receivables 9,650 15,004
(Increase)/decrease in current tax receivables (31,428) 9,085
(Increase)/decrease in inventories (20,861) 3,028
(Increase)/decrease in deferred income tax assets (4,480) 278
Increase in other operating assets (70,460) (20,302)
Increase in current income tax liabilities 11,065 7,662
Increase in trade and other payables and provisions 14,451 24,323
Decrease in deferred income tax liabilities (12,110) (748)
Net cash provided by operating activities 102,880 279,066
41 New or revised accounting standards and interpretations
Certain new standards, amendments and interpretations to existing standards have been published and are mandatory for the Group’s accounting periods beginning on or after 1 January 2013 or later periods and which the Group has not early adopted. The Group’s assessment of the impact of adopting those standards, amendments and interpretations is not expected to have a material effect on the results of the Group.
(a) Amendments to FRS 19 Employee Benefits (effective for annual periods beginning on or after 1 January 2013)
(b) Amendments to FRS 113 Fair value management (effective for annual periods beginning on or after 1 January 2013)
(c) Amendments to FRS 107 Disclosures – Offsetting Financial Assets and Financial Liabilities (effective for annual periods beginning on or after 1 January 2013)
(d) INT FRS 120 Stripping Costs in the Production Phase of a Surface Mine (effective for annual periods commencing on or after 1 January 2013)
(e) FRS 27 (revised 2011) Separate Financial Statements (effective for annual periods commencing on or after 1 January 2014)
(f) FRS 28 (revised 2011) Investments in Associates and Joint Ventures (effective for annual periods commencing on or after 1 January 2014)
(g) FRS 110 Consolidated Financial Statements (effective for annual periods commencing on or after 1 January 2014)
(h) FRS 111 Joint Arrangements (effective for annual periods commencing on or after 1 January 2014)
(i) FRS 112 Disclosure of Interests in Other Entities (effective for annual periods commencing on or after 1 January 2014)
40 Reconciliation of profit after income tax to net cash provided by operating activities (continued)

Notes to the Financial Statements (continued)
SAK
AR
I R
ESO
UR
CES
LIM
ITED
Ann
ual R
epor
t 20
1298
41 New or revised accounting standards and interpretations (continued)
(j) Amendments to FRS 32 Offsetting Financial Assets and Liabilities (effective for annual periods commencing on or after 1 January 2014)
(k) Amendments to FRS 1 Presentation of Items of Comprehensive Income (effective for annual periods beginning on or after 1 July 2012).
42 Authorisation of financial statements
These financial statements were authorised for issue in accordance with a resolution of the Board of Directors of Sakari Resources Limited on 21 February 2013.

SAK
AR
I R
ESO
UR
CES
LIM
ITED
Ann
ual R
epor
t 20
1299
GLOSSARY
The following definitions apply throughout this Annual Report;
“ASP” Average selling price“Board” The Board of Directors of Sakari“CEO” Chief Executive Officer“Sakari”, “Company” Sakari Resources Limited“Group” Sakari and its subsidiaries“JV” Joint venture“NL” Northern Leases “ha” Hectares“Mt” Millions of metric tonnes“pa” per year“PTT” PTT Public Company Limited“PTTAPM” PTT Asia Pacific Mining Pty Ltd, Sakari’s
immediate holding company “t” One metric tonne“Kt” Thousands of metric tonnes“$”, “US$” United States dollars“CY” Calendar year“Q1” First quarter“Q2” Second quarter“Q3” Third quarter“Q4” Fourth quarter“H1” First half of the year“H2” Second half of the year

SAK
AR
I R
ESO
UR
CES
LIM
ITED
Ann
ual R
epor
t 20
1210
0
NOTICE OF ANNUAL GENERAL MEETING
NOTICE IS HEREBY GIVEN that the Annual General Meeting of SAKARI RESOURCES LIMITED (“the Company”) will be held at the STI AUDITORIUM, Capital Tower Level 9, 168 Robinson Road, Singapore 068912 on Friday, 3 May 2013 at 10.00 a.m. for the following purposes:
AS ORDINARY BUSINESS
To consider and, if thought fit, to pass the following resolutions as Ordinary Resolutions, with or without any modifications:
1. To receive and adopt the Directors’ Report and the Audited Accounts of the Company for the year ended 31 December 2012 together with the Auditors’ Report thereon. (Resolution 1)
2. To declare a final dividend of 3.72 US cents per share (equivalent to approximately Singapore 4.60 cents per share), tax exempt for the year ended 31 December 2012 (2011: US 5.83 cents).
[See Explanatory Note (i)] (Resolution 2)
3. To re-elect the following Directors retiring pursuant to Articles 94 and 100 of the Company’s Articles of Association and section 153 of the Singapore Companies Act:
Mr Peerachat Pinprayong [Retiring under Article 94] (Resolution 3) Mr Martin Purvis [Retiring under Article 94] (Resolution 4) Ms Julie Therese Hall [Retiring under Article 94] (Resolution 5) Mr Surong Bulakul [Retiring under Article 100] (Resolution 6) Mr Han Eng Juan [Retiring under S.153] (Resolution 7)
Ms Julie Therese Hall will, upon re-election as a Director of the Company, remain as chairwoman of the Remuneration Committee, a member of the Nomination Committee, a member of the Corporate Governance Committee and be appointed to a member of the Audit, Risk and Compliance Committee.
Mr Han Eng Juan will, upon re-election as a Director of the Company, remain as a member of the, the Remuneration Committee, the Nomination Committee and the Corporate Governance Committee and as chairman of the Audit, Risk and Compliance Committee.
4. To approve the payment of directors’ fees of up to S$750,000 payable by the Company for the year ending 31 December 2013. (Resolution 8)
5. To re-appoint Messrs PricewaterhouseCoopers LLP as the Company’s Auditors to hold office until the conclusion of the next Annual General Meeting and to authorise the Directors to fix their remuneration. (Resolution 9)
6. To transact any other ordinary business which may properly be transacted at an Annual General Meeting.

SAK
AR
I R
ESO
UR
CES
LIM
ITED
Ann
ual R
epor
t 20
1210
1
AS SPECIAL BUSINESS
To consider and, if thought fit, to pass the following resolution, which will be proposed as an Ordinary Resolution, with or without any modifications:
7. Authority to issue shares
As an Ordinary Resolution:
That pursuant to Section 161 of the Companies Act, Cap. 50 (“CA”) the Directors of the Company be authorised and empowered to:
(a) (i) issue shares in the Company (“shares”) whether by way of rights, bonus or otherwise; and/or
(ii) make or grant offers, agreements or options (collectively, “Instruments”) that might
or would require shares to be issued, including but not limited to the creation and issue of (as well as adjustments to) options, warrants, debentures or other instruments convertible into shares,
at any time and upon such terms and conditions and for such purposes and to such persons as the Directors of the Company may in their absolute discretion deem fit; and
(b) (notwithstanding the authority conferred by this Resolution may have ceased to be in force) issue shares in pursuance of any Instruments made or granted by the Directors of the Company while this Resolution was in force,
provided that:
1) in exercising the authority conferred by this Resolution, the Company shall comply with the provisions of the Articles of Association of the Company; and
2) unless revoked or varied by the Company in a general meeting, such authority shall continue in force until the conclusion of the next Annual General Meeting of the Company or the date by which the next Annual General Meeting of the Company is required by law to be held, whichever is the earlier.
[See Explanatory Note (ii)] (Resolution 10)
By Order of the Board
Graeme TiveySecretarySingapore15 April 2013
Notice of Annual General Meeting (continued)

SAK
AR
I R
ESO
UR
CES
LIM
ITED
Ann
ual R
epor
t 20
1210
2
Notice of Annual General Meeting (continued)
Explanatory Note:
i) Subject to approval of Resolution 2 by shareholders, NOTICE IS HEREBY GIVEN that the Share Transfer Books and Register of Members of Sakari Resources Limited will be closed on 7 May 2013 for the preparation of dividend warrants. Duly completed registerable transfers received by the Company’s Share Registrar, Boardroom Corporate & Advisory Services Pte Ltd., 50 Raffles Place, #32-01 Singapore Land Tower, Singapore 048623 up to 5.00 p.m. on 6 May 2013 will be registered to determine shareholders’ entitlements to the said final dividend of 3.72 US cents per share to be paid on 17 May 2013.
ii) The Ordinary Resolution 10 in item 7 above, if passed, will empower the Directors of the Company, effective until the conclusion of the next Annual General Meeting of the Company, or the date by which the next Annual General Meeting of the Company is required by law to be held or such authority is varied or revoked by the Company in a general meeting, whichever is the earlier, to issue shares.
Notes:
1. A Member entitled to attend and vote at the Annual General Meeting (the “Meeting”) is entitled to appoint one (1) or two (2) proxies to attend and vote in his/her stead. A proxy need not be a Member of the Company.
2. The instrument appointing a proxy must be deposited at the Registered Office of the Company at 391B Orchard Road, Ngee Ann City Tower B #17-01, Singapore 238874 not less than 48 hours before the time appointed for holding the Meeting.

SAKARI RESOURCES LIMITED Company Registration No. 199504024R (Incorporated In The Republic of Singapore) PROXY FORM(Please see notes overleaf before completing this Form)
I/We,
of
being a member/members of Sakari Resources Limited (the “Company”), hereby appoint:
Name NRIC/Passport No. Proportion of Shareholdings
No. of Shares %
Address
and/or (delete as appropriate)
Name NRIC/Passport No. Proportion of Shareholdings
No. of Shares %
Address
or failing the person, or either or both of the persons, referred to above, the Chairman of the Meeting as my/our proxy/proxies to vote for me/us on my/our behalf at the Annual General Meeting (the “Meeting”) of the Company to be held at the STI AUDITORIUM, Capital Tower Level 9, 168 Robinson Road, Singapore 068912 on Friday 3 May 2013 at 10.00 a.m. and at any adjournment thereof. I/We direct my/our proxy/proxies to vote for or against the Resolutions proposed at the Meeting as indicated hereunder. If no specific direction as to voting is given or in the event of any other matter arising at the Meeting and at any adjournment thereof, the proxy/proxies will vote or abstain from voting at his/her discretion. The authority herein includes the right to demand or to join in demanding a poll and to vote on a poll.
(Please indicate your vote “For” or “Against” with a tick [] within the box provided.)
No. Resolutions relating to: For Against
1 Directors’ Report and Audited Accounts for the year ended 31 December 2012
2 Payment of proposed final dividend
3 Re-election of Mr Peerachat Pinprayong a Director
4 Re-election of Mr Martin Purvis as a Director
5 Re-election of Ms Julie Therese Hall as a Director
6 Re-election of Mr Surong Bulakul as a Director
7 Re-election of Mr Han Eng Juan as a Director
8 Approval of Directors’ fees amounting to S$750,000
9 Re-appointment of Messrs PricewaterhouseCoopers LLP as Auditors
10 Authority to issue shares
Dated this ______________ day of _______________ 2013
________________________________________Signature of Shareholder(s)Or, Common Seal of Corporate Shareholder
Total number of Shares in: No. of Shares
Register of Members

Notes:
1. Please insert the total number of Shares registered in your name in the Register of Members. If no number is inserted, the instrument appointing a proxy or proxies shall be deemed to relate to all the Shares held by you.
2. A member of the Company entitled to attend and vote at a meeting of the Company is entitled to appoint one or two proxies to attend and vote in his/her stead. A proxy need not be a member of the Company.
3. Where a member appoints two proxies, the appointments shall be invalid unless he/she specifies the proportion of his/her shareholding (expressed as a percentage of the whole) to be represented by each proxy.
4. Completion and return of this instrument appointing a proxy shall not preclude a member from attending and voting at the Meeting. Any appointment of a proxy or proxies shall be deemed to be revoked if a member attends the meeting in person, and in such event, the Company reserves the right to refuse to admit any person or persons appointed under the instrument of proxy to the Meeting.
5. The instrument appointing a proxy or proxies must be deposited at the registered office of the Company at 391B Orchard Road, Ngee Ann City, Tower B #17-01, Singapore 238874 not less than 48 hours before the time appointed for the Meeting.
6. The instrument appointing a proxy or proxies must be under the hand of the appointor or of his attorney duly authorised in writing. Where the instrument appointing a proxy or proxies is executed by a corporation, it must be executed either under its seal or under the hand of an officer or attorney duly authorised. Where the instrument appointing a proxy or proxies is executed by an attorney on behalf of the appointor, the letter or power of attorney or a duly certified copy thereof must be lodged with the instrument.
7. A corporation which is a member may authorise by resolution of its directors or other governing body such person as it thinks fit to act as its representative at the Meeting, in accordance with Section 179 of the Companies Act, Chapter 50 of Singapore.
General:
The Company shall be entitled to reject the instrument appointing a proxy or proxies if it is incomplete, improperly completed or illegible, or where the true intentions of the appointor are not ascertainable from the instructions of the appointor specified in the instrument appointing a proxy or proxies.

CONTENTS1 Corporate Directory2 Five Year Financial Summary3 Chairman’s Statement 5 Board Of Directors8 Key Executives11 Chief Executive Officer’s Review16 Financial Review17 Operations’ Review22 Marketing And Sales Review24 Coal Resource Statement24 Coal Reserves Statement27 Sustainability29 Directors’ Report34 Statement By Directors35 Independent Auditor’s Report36 Financial Statements And Notes To The Financial Statements99 Glossary100 Notice of Annual General Meeting103 Proxy FormIBC The Sakari Charter
CONTENTS1 Corporate Directory2 Five Year Financial Summary3 Chairman’s Statement 5 Board Of Directors8 Key Executives11 Chief Executive Officer’s Review16 Financial Review17 Operations’ Review22 Marketing And Sales Review24 Coal Resource Statement24 Coal Reserves Statement27 Sustainability29 Directors’ Report34 Statement By Directors35 Independent Auditor’s Report36 Financial Statements And Notes To The Financial Statements99 Glossary100 Notice of Annual General Meeting103 Proxy FormIBC The Sakari Charter

SAKARI RESOURCES LIMITED391B Orchard Road #17-01 Ngee Ann City Tower B Singapore 238874
Tel: +65 6499 4100www.sakariresources.com
ANNUAL REPORT 2012
SA
KA
RI R
ES
OU
RC
ES
LIM
ITE
D
A
nn
ua
l Re
po
rt 20
12
SAKARI RESOURCES LIMITED391B Orchard Road #17-01 Ngee Ann City Tower B Singapore 238874
Tel: +65 6499 4100www.sakariresources.com
ANNUAL REPORT 2012
SA
KA
RI R
ES
OU
RC
ES
LIM
ITE
D
A
nn
ua
l Re
po
rt 20
12