annual report 2013 - bipl sec · askari bank limited ank al-h b il m ted deutsche bank ag faysal...
TRANSCRIPT
Annual Report 2013
Vision, Mission and Values
Company InformationCode of Conduct
Profile of DirectorsDirectors' Report to the Members
Financial HighlightsNotice of Annual General Meeting
Review Report to the Members on Statement of ComplianceStatement of Compliance with the Code of Corporate Governance
STANDALONE FINANCIAL STATEMENTSAuditors' Report to the MembersBalance Sheet
Profit and Loss AccountCash Flow Statement
Statement of Changes in EquityNotes to the Financial Statements
CONSOLIDATED FINANCIAL STATEMENTSDirectors' Report on Consolidated Financial Statements
Auditors' Report to the MembersConsolidated Balance Sheet
Consolidated Profit and Loss AccountConsolidated Cash Flow Statement
Consolidated Statement of Changes in EquityNotes to the Consolidated Financial Statements
Pattern of Shareholding
Form of Proxy
CONTENTS
Page No.02
0304
0507
1213
1516
1920
2122
2324
48
4950
5152
5354
77
Annual Report 2013 1

Annual Report 20132
Vision
Mission
VisionAttitudeLeadershipUprightExcellenceSynergy
Customer Oriented, Innovative
Proactive, Based on Commitment & Respect
Based on Integrity, Trust & Teamwork
Credible & Reliable
In Customer Services with Quality
In Team Results
To invest in Quality Human Resource ensuring sustained growth enablingprovision of par excellence financial services fuelled with innovation.
Building a team of professionals, managing relationships with all stakeholderstheir families and businesses on the principles of integrity and accountabilitywith a tradition of trust.
Annual Report 2013 3
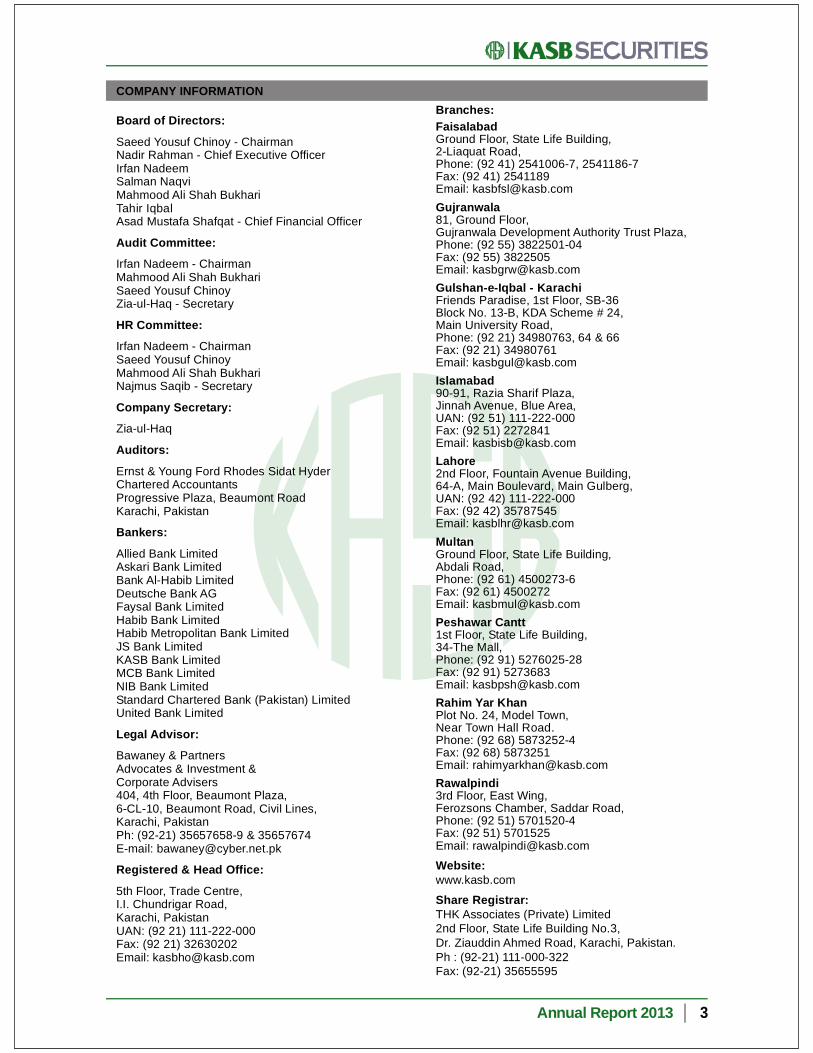
FaisalabadGround Floor, State Life Building,2-Liaquat Road,Phone: (92 41) 2541006-7, 2541186-7Fax: (92 41) 2541189Email: [email protected], Ground Floor,Gujranwala Development Authority Trust Plaza,Phone: (92 55) 3822501-04Fax: (92 55) 3822505Email: [email protected] - KarachiFriends Paradise, 1st Floor, SB-36Block No. 13-B, KDA Scheme # 24,Main University Road,Phone: (92 21) 34980763, 64 & 66Fax: (92 21) 34980761Email: [email protected], Razia Sharif Plaza,Jinnah Avenue, Blue Area,UAN: (92 51) 111-222-000Fax: (92 51) 2272841Email: [email protected] Floor, Fountain Avenue Building,64-A, Main Boulevard, Main Gulberg,UAN: (92 42) 111-222-000Fax: (92 42) 35787545Email: [email protected] Floor, State Life Building,Abdali Road,Phone: (92 61) 4500273-6Fax: (92 61) 4500272Email: [email protected] Cantt1st Floor, State Life Building,34-The Mall,Phone: (92 91) 5276025-28Fax: (92 91) 5273683Email: [email protected] Yar KhanPlot No. 24, Model Town,Near Town Hall Road.Phone: (92 68) 5873252-4Fax: (92 68) 5873251Email: [email protected] Floor, East Wing,Ferozsons Chamber, Saddar Road,Phone: (92 51) 5701520-4Fax: (92 51) 5701525Email: [email protected]
Website:www.kasb.com
Share Registrar:THK Associates (Private) Limited2nd Floor, State Life Building No.3,Dr. Ziauddin Ahmed Road, Karachi, Pakistan.Ph : (92-21) 111-000-322Fax: (92-21) 35655595
Board of Directors:
Saeed Yousuf Chinoy - ChairmanNadir Rahman - Chief Executive OfficerIrfan NadeemSalman NaqviMahmood Ali Shah BukhariTahir IqbalAsad Mustafa Shafqat - Chief Financial Officer
Audit Committee:
Irfan Nadeem - ChairmanMahmood Ali Shah BukhariSaeed Yousuf ChinoyZia-ul-Haq - Secretary
HR Committee:
Irfan Nadeem - ChairmanSaeed Yousuf ChinoyMahmood Ali Shah BukhariNajmus Saqib - Secretary
Company Secretary:
Zia-ul-Haq
Auditors:
Ernst & Young Ford Rhodes Sidat HyderChartered AccountantsProgressive Plaza, Beaumont RoadKarachi, Pakistan
Bankers:
Allied Bank LimitedAskari Bank LimitedBank Al-Habib LimitedDeutsche Bank AGFaysal Bank LimitedHabib Bank LimitedHabib Metropolitan Bank LimitedJS Bank LimitedKASB Bank LimitedMCB Bank LimitedNIB Bank LimitedStandard Chartered Bank (Pakistan) LimitedUnited Bank Limited
Legal Advisor:
Bawaney & PartnersAdvocates & Investment &Corporate Advisers404, 4th Floor, Beaumont Plaza,6-CL-10, Beaumont Road, Civil Lines,Karachi, PakistanPh: (92-21) 35657658-9 & 35657674E-mail: [email protected]
Registered & Head Office:
5th Floor, Trade Centre,I.I. Chundrigar Road,Karachi, PakistanUAN: (92 21) 111-222-000Fax: (92 21) 32630202Email: [email protected]
COMPANY INFORMATIONBranches:

CODE OF CONDUCT
Conflict of Interest
Employees must act at all times in the Company’s best interests and are expected to avoid situations in which theirfinancial or other personal interests or dealings are in conflict with the interests of the Company. Matters involvingconflict of interest are prohibited as a matter of policy and any conflict that arises in a specific situation or transactionmust be disclosed and resolved.
Gifts or entertainment
Offering or acceptance of money, gifts, entertainment, loans or any other benefit or preferential treatment is notacceptable from any existing or potential customer, supplier or business associate of the Company, other thanoccasional gifts of a modest value and entertainment on a modest scale as part of customary business practice.
Bribery
The making or receiving of facilitation payments or inducements such as bribes and similar acts in cash or kindare prohibited and the resources of the Company are not utilized for any such purpose.
Accounting Standards
Compliance with applicable accounting standards and procedures is always necessary. The information suppliedto the external auditors, shareholders and other third parties must be complete and not misleading.
Human Resources
Human Resource policies are consistent, transparent and fair and staff members are encouraged to make suggestionsor raise business concerns. Selection for employment and promotion is based on objective assessment of ability,qualification and experience, free from discrimination on any grounds. Discrimination on the basis of caste, culture,religion, disability or sex is intolerable.
Compliance with Regulatory Requirements
KASB Securities transacts its business in accordance with the applicable laws, rules and regulations and cooperatesfully with the government and regulatory bodies.
Confidentiality
Employees are bound to protect the confidentiality of information and are obliged to keep delicate informationconfidential. Use of Company information for personal gain is strictly prohibited. Confidential information must ONLYbe used for the intended purpose.
Community Responsibility
KASB aims to operate as a responsible corporate citizen, supporting the communities locally and globally andrecognizes its responsibilities towards these communities.
Environmental Responsibility
KASB is concerned with the conservation of the environment in its broadest sense, recognizing its role in thisrespect by maintaining responsibility for the building and land which it occupies and it aims to limit its use of allfinite resources.
KASB Securities is a strong supporter of corporate decorum and ensures that its employees endeavor to maintainhighest ethical standards during the discharge of their duties. The Company has adopted a Code of Ethics andBusiness Practices applicable to all its employees which is regularly circulated within the Company. A summaryof the Code is as follows:
Annual Report 20134

PROFILE OF DIRECTORSSaeed Yousuf Chinoy – Chairman
Mr. Saeed Yousuf Chinoy is a business and management consultant with over forty years global experiencein corporate consultancy and project development. He is appointed to the Board of Directors of KASB SecuritiesLimited as an independent non-executive Director and is currently the President of the Oxford & CambridgeSociety, an educational charity raising money to fund university education of the financially disadvantaged.He has also served on the Boards of various other companies in Pakistan including Singer Pakistan Limited,Premier Sugar and Distillery Company Limited, Phipson & Co. Limited, Pakistan Agencies Limited, andContinental Furnishing Co. Limited, as well as companies in Saudi Arabia and Dubai. He remains engagedin international financial services and equity markets and holds investments in Pakistan Real Estate and CapitalMarkets. He holds a Bachelors as well as a Masters degree from Cambridge University, United Kingdom.
Nadir Rahman – Chief Executive Officer
Mr. Nadir Rahman has 24 years of experience in corporate and investment banking, sales and trading, directinvestments, and real estate. He has done business in over 25 countries, focused on capital markets andfinancing.
Mr. Rahman has held senior management positions (including board memberships) with various global andlocal firms, including Pakistan’s Fauji Foundation.
Mr. Rahman holds degrees from the Wharton School and the College of Arts and Sciences of the Universityof Pennsylvania.
Irfan Nadeem – Director
Mr. Irfan Nadeem is a senior retired civil servant and during his service with the Government of Pakistan,Mr. Nadeem served as (a) Federal Secretary-Ministry of Science and Technology, (b) Director General, PakistanStandards and Quality Control Authority, (c) Deputy/Acting Chairman-National Accountability Bureau (d)Additional Director General, Economic Crimes Wing-Federal Investigation Agency and (e) Member InlandRevenue FBR apart from various field positions in Income Tax. Mr. Nadeem also served as a member of thegoverning body of the Higher Education Commission, COMSATS, NUST apart from being the Chairman Boardof Governors of Commecs Institute for nearly 14 years.
Mr. Nadeem holds a bachelor’s degree in Law and Commerce from the University of Karachi. While servingthe Government of Pakistan, he attended specialized training programs such as the Executive LeadershipDevelopment Program in Honors category from the JFK School of Government, Harvard University, Cambridge,USA, Advance Management for Senior Tax Officials at Lincoln, England, International Taxation in Tokyo, Japan,apart from many other short and long courses. He has lead Pakistani delegations in many National andInternational conferences and is recipient of many Awards.
Salman Naqvi – Director
Mr. Salman Naqvi has over 32 years of experience from banking and different industries. He is currently workingwith KASB Bank as Group Head of Branch Banking and is responsible for looking after a portfolio of branchesaround Pakistan. Prior to joining KASB Bank, he was Retail and Distribution Banking Head at NIB Bank Ltd.He has also worked with ABN Amro bank as Head of country assets, liability, consumer branch & non stopbanking center. He has also served as Director production / sales and General Manager positions of Europe& Srilankan regions.
Annual Report 2013 5

Annual Report 20136
Mahmood Ali Shah Bukhari – Director
Mr. Mahmood Ali Shah Bukhari is a Director in KASB Finance Limited and an Economic Consultant with KASBModaraba where his primary focus is on devising feasibilities of new ventures with group companies.
As a KASB Foundation Ambassador, Mr. Bukhari also plays an active role in fulfilling social responsibilitiesby volunteering for human relief efforts, and special children projects. In addition, he has also participated invarious national and international conferences organized by outfits, such as Young Presidents Organization(YPO) and United Nations.
Mr. Bukhari has a BSc in Liberal Studies from University of Waterloo, Waterloo-Canada. Furthermore, he hasreceived professional training in various aspects of Asset Management, Investment Analysis, Core Bankingand Brokerage at leading companies such as Citi Group, Tikehau Capital and Stanhope Capital.
Tahir Iqbal - Director
Mr. Tahir Iqbal joined KASB Securities Limited in February 1994. Mr. Iqbal has over a decade long associationwith KASB Securities Limited where he has been engaged with settlements, custody and general operationsof the company and has been a key resource in designing and automating its business and back office systems.Prior to joining KASB Securities he was Associated as a Cost Accountant with Associated Industries Pakistan(Pvt) Ltd., one of the most prominent export houses in Pakistan. Mr. Iqbal has an MBA (Finance & Accounts)degree from Preston University, USA and has completed various courses from the Institute of Cost andManagement Accountants of Pakistan.
Asad Mustafa Shafqat – Director
Mr. Asad Mustafa Shafqat possesses more than 15 years of experience in Investment Banking, Capital Marketsand Private Equity. During his career, Mr. Shafqat has lead-managed large ticket domestic and internationaltransactions, including M&A, debt and equity raising, project finance, corporate restructurings & reorganizations,portfolio and investment management, asset valuation and loan resolution/workouts.
Previously, Mr. Shafqat has held senior level positions at renowned organizations including Faysal Bank,Foundation Securities, Fauji Foundation, Actis Capital and Ernst & Young Pakistan.
Mr. Shafqat received his Bachelors in Finance & Accounting from The University of Hull UK in 1998 and is aCFA Charter holder.
Annual Report 2013 7
On behalf of the Board of Directors of KASB Securities Limited, I am pleased to present the audited financialstatements of the Company, and commentary for the year ended December 31, 2013.
Economic Review
Pakistan’s macroeconomic situation improved in 2013, led by a successful democratic transition of power in theMay-2013 elections. Two major positives emerged, 1) the first time in Pakistan's sixty-five year history a democraticallyelected government completed its term and handed over power to another and 2) the PML -N government won asimple majority in the National Assembly, which is beneficial to the reform process.
Broadly, macro indicators are moving in the right direction. CPI inflation fell to an avg. of 7.7% in CY13, from 9.7%in CY12. Pakistan entered a new IMF program in Sep-2013, which was critical for macro-economic stability, andto steady the balance of payments position. Under the new government, private sector credit has improvedconsiderably; fiscal deficit has been contained, whilst GDP growth and LSM growth have rebounded significantly.The energy sector resolution in June 2013 helped alleviate the circular debt crisis, and improved electricity availabilityin the country.
In 2014, the government’s ambitious privatization program, along with impending issuance of Eurobonds and a 3Gauction would be important milestones for the economy. Shoring up FX reserves and stabilizing the balance ofpayments would be the crucial challenge for the year. Working within the IMF program, energy and fiscal reformshold the key to unlock a high growth trajectory.
Equity Market Review
2013 was the second consecutive year in which the KSE-100 posted a return of 49%. The smooth transition ofpower in May 2013 elections drove re-rating at the KSE (forward P/E rose to 7.9x by Dec-13 from 6.7x in Dec-12),and helped achieve a 49% return in 2013. In terms of activity, volumes jumped 29% in 2013 to 223 million sharesa day, whilst value traded was up a more significant 50% YoY to US$ 75 million / day, a four year high. Pakistan’sequity market handsomely out-performed Asian peers in 2013, whose average return was 9%, compared to 49%for the KSE-100. Politics was the dominant investment theme for Pakistan's equity market in 2013, with the smoothtransition of power in the May-13 elections exciting domestic and foreign investors alike. Foreign portfolio investmentwas US$ 402 million, representing a 3-year high.
Debt and Currency Market Review
There was significant volatility in debt markets in 2013. Firstly, there was a reduction in the discount rate (DR) from9.5% to 9.0% in June 2013, which was subsequently followed by two DR hikes of 50bp each in Sep-13 and Nov-13. Meanwhile, the SBP also reduced in interest rate corridor (difference between the repo and reserve repo rates)by 50bp to 2.5%.
In line with the government’s growing reliance on banks to finance its deficit, the SBP conducted fortnightly T-billauctions worth PKR 6.1 trillion, ten PIB auctions worth PKR 347 billion and only one Ijarah Sukuk auction worthPKR 43 billion during the year.
The inter-bank currency market saw the PKR depreciating by 8.6% against the greenback in 2013, as falling FXreserves (SBP reserves fell below 1 month of import cover) weakened the currency. However, in the first few monthsof 2014, this trend has revered, and we have witnessed a sharp appreciation in the PKR.
DIRECTORS’ REPORT TO THE MEMBERS

Annual Report 20138
Operating and Financial Performance
Profit after tax for CY13 amounted to PKR 81.5 million as compared to a profit after tax of PKR 131.4 million forCY12. Monetary impact of key P&L items on the Company’s bottom-line are highlighted as under:
• Operating revenue increased 53.3% from PKR 313.9 million in CY12 to PKR 481.1 million in CY13, reflectingthe increase in brokerage fees / income due to increased market activity during the year;
• Reversal of provisions (net) were of PKR 9.7 million in CY 13 as against PKR 33.5 million in CY12;
• Operating and administrative costs increased by 23.8% from PKR 323.6 million in CY12 to PKR 400.7 millionin CY13;
• The Company generated an operating profit of PKR 126.8 million in CY13 , as against an operating profit ofPKR 95.7 million in CY12 , an increase of 32.5%;
• The Company posted profit before tax of PKR 125.1 million in CY13 as against PKR 86.0 million in CY12;
• After due taxation adjustments, the Company’s profit after tax was PKR 81.5 million (EPS of 0.81) in CY13as compared to PKR 131.4 million (EPS of 1.31) in CY12;
• In light of the performance for the year, the board has proposed to issue a dividend of PKR 0.50 per share forCY 2013.
Corporate Governance
The directors confirm compliance with the Corporate & Financial Reporting Framework of the Securities andExchange Commission of Pakistan (SECP’s) Code of Corporate Governance for the following:
• Proper books of account of the Company have been maintained;
• The financial statements prepared by the management of the Company, present fairly its state of affairs, theresult of its operations, cash flows and the changes in equity;
• Appropriate accounting policies, as more fully explained in notes 4.2 to 4.16 of the financial statements havebeen consistently applied in the preparation of the financial statements and accounting estimates are basedon reasonable and prudent judgment;
• Approved Accounting Standards, as applicable in Pakistan, Companies Ordinance, 1984 and the directivesissued by the Commission as also stated in note 4.1 to the financial statements, have been followed in thepreparation of the financial statements;
• The system of internal control, which is sound in design has been effectively implemented and is beingcontinuously reviewed and monitored;
• The Company is financially sound and is a going concern and that there are no doubts about its ability tocontinue as a going concern;
• There has not been any material departure from the best practices of Corporate Governance, as detailed inthe listing regulations;
• The Company maintains a balance of executive and non-executive directors in the Board of Directors, withthree directors meeting the criteria for independent directors as laid out in the listing regulations. ExecutiveDirectors do not number more than one third of the elected directors. Details of the composition of the Boardof Directors appear on page 5.

Annual Report 2013 9
• The Board of Directors has ensured that all regulations concerning responsibilities, powers and functions ofthe Directors have been carefully considered and acted upon. In addition, Company Secretary, CFO and Headof Internal Audit who meet the requirements laid out in the Code have been appointed;
• The Board is well aware of the training requirements of the directors under the code. One director from theBoard got certified under the Board Development Series organized by Pakistan Institute of Corporate Governance;
• Key operating and financial data of the preceding years is appearing on page 12;
• There are no statutory payments on account of taxes, duties, levies and charges which are outstanding as onDecember 31, 2013 except for those disclosed in the financial statements;
• Related-party transactions have been placed before the Audit Committee and their recommendations placed;
• The Company operates an approved contributory provident fund for its eligible employees. The value ofinvestments as per the un-audited financial statements for the year ended December 31, 2013 amounts toapproximately PKR 60 million;
• No material changes and commitments affecting the financial position of your Company have occurred betweenthe balance sheet date and the date of the Directors Report.
Corporate Social Responsibility
Responsibility towards the Community: KASB continues to be a good corporate citizen, supporting the communitiesfrom which it derives its business and recognizing its responsibilities towards all such communities. KASB will besupportive of community initiatives across the organization, targeting those most appropriate for each individualcommunity.
Responsibility towards the Environment: KASB is concerned with conservation of the environment in its broadestsense, recognizing its role in this respect by maintaining responsibility for the building and land which it occupiesand aims to limit its use of all finite resources, with specific focus on its waste management practices and usageof energy.
KASB has integrated Corporate Social Responsibility (CSR) into its ethics and business practices. In this context,community and stakeholder needs are carefully assessed and support is extended in line with the company’s policies,code of ethics and business objectives.
Summary of CSR activities during 2013 are as follows:
• Adherence to regulatory requirements: The Company and its employees contributed an amount of PKR 68.9million to the national exchequer in the form of taxes.
• People / Human Resources: The Company follows a policy of contributing to employees’ professional developmentand promoting physical, mental and emotional health. To this end:- Employees were awarded study scholarships for pursuing in higher education- Various in-house and external training programs have been conducted and arranged to improve HR quality
• Philanthropic contributions are made via KASB Foundation. This year a total contribution of PKR 2.0 millionwas made to the Foundation.
The Board
The Board comprised of three independent directors, two non-executive directors and two executive directors. Thepositions of the Chairman and the Chief Executive Officer are kept separate in line with the best governance practicesand the Chairman has been elected from among the Non-Executive Directors. The Board has established a separateAudit Committee and an HR & Remuneration Committee to assist the Board in the performance of its functions.Further, none of the Directors is elected or nominated in more than seven listed companies, including unlistedsubsidiaries of listed companies.
Annual Report 201310
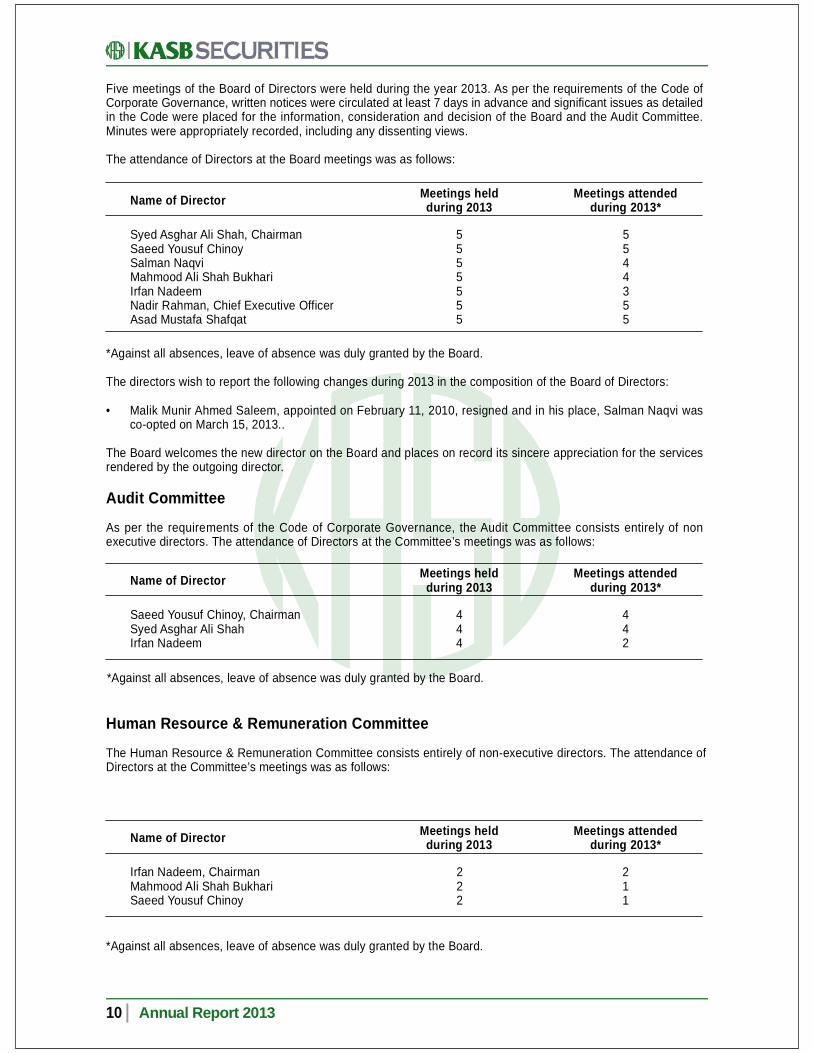
Five meetings of the Board of Directors were held during the year 2013. As per the requirements of the Code ofCorporate Governance, written notices were circulated at least 7 days in advance and significant issues as detailedin the Code were placed for the information, consideration and decision of the Board and the Audit Committee.Minutes were appropriately recorded, including any dissenting views.
The attendance of Directors at the Board meetings was as follows:
*Against all absences, leave of absence was duly granted by the Board.
Human Resource & Remuneration Committee
The Human Resource & Remuneration Committee consists entirely of non-executive directors. The attendance ofDirectors at the Committee’s meetings was as follows:
*Against all absences, leave of absence was duly granted by the Board.
The directors wish to report the following changes during 2013 in the composition of the Board of Directors:
• Malik Munir Ahmed Saleem, appointed on February 11, 2010, resigned and in his place, Salman Naqvi wasco-opted on March 15, 2013..
The Board welcomes the new director on the Board and places on record its sincere appreciation for the servicesrendered by the outgoing director.
Audit Committee
As per the requirements of the Code of Corporate Governance, the Audit Committee consists entirely of nonexecutive directors. The attendance of Directors at the Committee’s meetings was as follows:
Saeed Yousuf Chinoy, ChairmanSyed Asghar Ali ShahIrfan Nadeem
Name of Director
444
Meetings heldduring 2013
442
Meetings attendedduring 2013*
Irfan Nadeem, ChairmanMahmood Ali Shah BukhariSaeed Yousuf Chinoy
Name of Director
222
Meetings heldduring 2013
211
Meetings attendedduring 2013*
*Against all absences, leave of absence was duly granted by the Board.
Syed Asghar Ali Shah, ChairmanSaeed Yousuf ChinoySalman NaqviMahmood Ali Shah BukhariIrfan NadeemNadir Rahman, Chief Executive OfficerAsad Mustafa Shafqat
Name of Director
5555555
Meetings heldduring 2013
Meetings attendedduring 2013*
5544355

Annual Report 2013 11
Financial Responsibility
The management of the Company is responsible for the preparation of financial statements and the related notescontained therein. These financial statements are reviewed by the Audit Committee before being approved by theBoard of Directors.
The Audit Committee assists the Board in monitoring and managing risks associated with the business and theinternal controls put in place to mitigate these risks. The Committee operates in accordance with the requirementslaid down in the Code of Corporate Governance and the terms of reference approved by the Board. The Committeecomprises of three Non-Executive Directors and held four meetings during the year.
Appointment of External Auditors
The external auditors Messrs. Ernst & Young Ford Rhodes Sidat Hyder, Chartered Accountants stand retired followingexpiry of their tenor. As per the recommendations of the Audit Committee, the Board endorses the re-appointmentof Messrs. Ernst & Young Ford Rhodes Sidat Hyder, Chartered Accountants as the external auditors for the financialyear ending 2014. Approval to this effect will be sought from the members at the forthcoming annual general meeting.
Shareholding
The pattern of shareholding as on December 31, 2013 appears on page 77. Transactions in the shares of theCompany as reported by the Directors, Chief Executive Officer, Chief Financial Officer and Company Secretary ofthe Company on their own account and on account of their spouses and minor children are also reported therein.
Dividends
Keeping in view the success the Company has achieved this year, the board has proposed to issue a dividendpayment of PKR 0.50 per share.
Future Outlook
YTD 2014 KSE-100 index has shown strong performance of 7.5%, hitting new highs of 27,300 this year. Pak Rupeeat the same time has also appreciated by 6.7% Jan-Mar 2014 on back of increased foreign inflows and commitments.Going forward, privatization and secondary offerings of key government owned entities, materialization of expectedforeign inflows and portfolio investment, leading to strengthening Pak Rupee, decline in inflation and thus monetaryeasing would be the key trigger for the equity markets. Increase in Pakistan’s weight in MSCI Frontier Market Indexscheduled in May-2014 from exclusion of UAE and Qatar would also be a key trigger to watch out for this year.
Acknowledgement
The Directors wish to record their gratitude to the Company’s valued clients, shareholders, business partners andother stakeholders for their continued trust that they have reposed in the Company. The Board would also like torecord their appreciation to the employees of the Company for their commitment and dedication.
On behalf of the Board of Directors
Saeed Yousuf ChinoyChairman
Karachi: March 20, 2014

Operating Performance(Rupees in '000)RevenueOperating and administrative expensesReversal of provision / (provision) / impairmentFinance costOther incomeProfit / (loss) before taxationProfit / (loss) after taxation
FINANCIAL HIGHLIGHTS
Per Ordinary Share(Rupees)Earnings / (loss) per shareBreak-up value per share
Dividends(Percentage)Final dividend
Financial Position(Rupees in '000)Assets and LiabilitiesTotal assetsCurrent assetsCurrent liabilities
EquityShareholders’ equityShare capitalReservesNo. of Shares outstanding(Number in '000)
Return on capital employed - (%)Return on total assets - (%)Current ratio-timesInterest cover ratio-times
2012 2011 2010 2009 2008
Annual Report 201312
2013
488,679(194,988(156,961(106,575
15,04545,2004,690
0.0511.98
-
2,255,3432,143,693
556,308
1,198,3561,000,000
198,356
100,000
3.776.733.851.42
)))
511,732(242,964(450,858
(85,32014,117
(253,293(298,270
(2.9810.18
-
2,305,0271,876,991
785,478
1,018,2021,000,000
18,202
100,000
(24.88(7.292.39
(1.97
)
)
)
)
)))
)
)
335,171(301,574102,324(72,60011,71075,03168,872
0.6910.63
-
2,034,7431,151,957
804,791
1,063,3861,000,000
63,386
100,000
7.067.261.432.03
)
)
267,937(281,319(61,521(69,77410,813
(133,864(146,226
(1.469.90
-
1,665,708747,216675,444
990,2641,000,000
(9,736
100,000
(13.52(3.851.11
(0.92
)
))
))
)
))
)
)
385,856(323,617
33,454(18,439
8,77086,024
131,396
1.3111.74
5%
2,007,0121,002,555
833,460
1,173,5521,000,000
173,552
100,000
7.335.201.205.67
)
)
517,717(400,656
9,695(8,9427,263
125,07781,454
0.8112.18
5%
2,257,8471,272,453
939,432
1,218,4151,000,000
218,415
100,000
10.275.941.35
14.99
)
)
Year En d ed D ece m b er 3 1 ,

NOTICE OF ANNUAL GENERAL MEETING
Annual Report 2013 13
Annual Report 201314
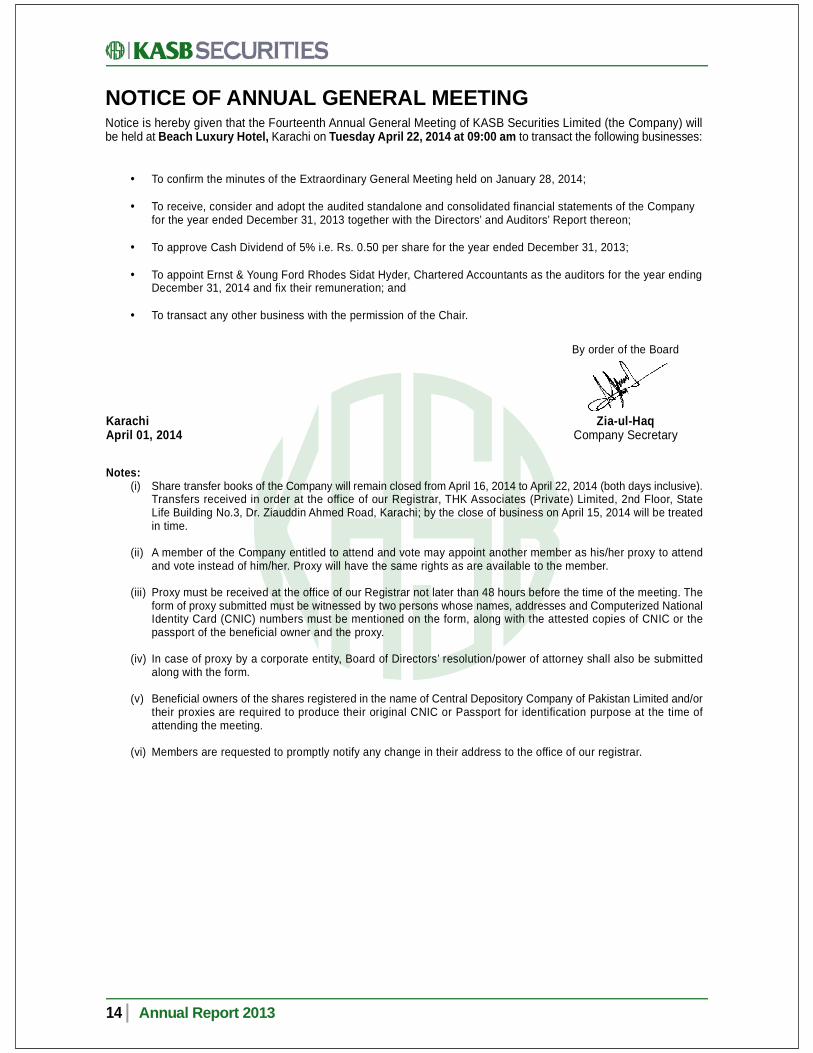
NOTICE OF ANNUAL GENERAL MEETINGNotice is hereby given that the Fourteenth Annual General Meeting of KASB Securities Limited (the Company) willbe held at Beach Luxury Hotel, Karachi on Tuesday April 22, 2014 at 09:00 am to transact the following businesses:
• To confirm the minutes of the Extraordinary General Meeting held on January 28, 2014;
• To receive, consider and adopt the audited standalone and consolidated financial statements of the Companyfor the year ended December 31, 2013 together with the Directors’ and Auditors’ Report thereon;
• To approve Cash Dividend of 5% i.e. Rs. 0.50 per share for the year ended December 31, 2013;
• To appoint Ernst & Young Ford Rhodes Sidat Hyder, Chartered Accountants as the auditors for the year endingDecember 31, 2014 and fix their remuneration; and
• To transact any other business with the permission of the Chair.
By order of the Board
KarachiApril 01, 2014
Zia-ul-HaqCompany Secretary
Notes:(i) Share transfer books of the Company will remain closed from April 16, 2014 to April 22, 2014 (both days inclusive).
Transfers received in order at the office of our Registrar, THK Associates (Private) Limited, 2nd Floor, StateLife Building No.3, Dr. Ziauddin Ahmed Road, Karachi; by the close of business on April 15, 2014 will be treatedin time.
(ii) A member of the Company entitled to attend and vote may appoint another member as his/her proxy to attendand vote instead of him/her. Proxy will have the same rights as are available to the member.
(iii) Proxy must be received at the office of our Registrar not later than 48 hours before the time of the meeting. Theform of proxy submitted must be witnessed by two persons whose names, addresses and Computerized NationalIdentity Card (CNIC) numbers must be mentioned on the form, along with the attested copies of CNIC or thepassport of the beneficial owner and the proxy.
(iv) In case of proxy by a corporate entity, Board of Directors’ resolution/power of attorney shall also be submittedalong with the form.
(v) Beneficial owners of the shares registered in the name of Central Depository Company of Pakistan Limited and/ortheir proxies are required to produce their original CNIC or Passport for identification purpose at the time ofattending the meeting.
(vi) Members are requested to promptly notify any change in their address to the office of our registrar.
Annual Report 2013 15

Annual Report 201316
STATEMENT OF COMPLIANCE WITH THE CODE OFCORPORATE GOVERNANCEThis statement is being presented to comply with the Code of Corporate Governance (CCG) contained in RegulationNo. 35 of listing regulations of Karachi Stock Exchange for the purpose of establishing a framework of goodgovernance, whereby a listed Company is managed in compliance with the best practices of corporate governance.The Company has applied the principles contained in the CCG in the following manner:
1. The Company encourages representation of independent non-executive directors on its Board. The Boardincludes:
2. The directors have confirmed that none of them is serving as a director on more than seven listed companies,including this Company (excluding the listed subsidiaries of listed holding companies where applicable).
3. All the resident directors of the Company are registered as taxpayers and none of them has defaulted in paymentof any loan to a banking Company, a DFI or an NBFI or, being a member of a stock exchange, has been declaredas a defaulter by that stock exchange.
4. A casual vacancy occurring on the board on February 14, 2013 was filled up by a new director within 90 days.
5. The Company has prepared a ‘’Code of Conduct’’ and has ensured that appropriate steps have been taken todisseminate it throughout the Company along with its supporting policies and procedures.
6. The Board has developed a vision / mission statement, overall corporate strategy and significant policies of theCompany. A complete record of particulars of significant policies along with the dates on which they wereapproved or amended has been maintained.
7. All the powers of the board have been duly exercised and decisions on material transactions, including appointmentand determination of remuneration and terms & conditions of employment of the CEO, other executive and non-executive directors, have been taken by the Board.
8. The meetings of the board were presided over by the Chairman and the board met at least once in every quarter.Written notices of the board meetings, along with agenda and working papers, were circulated at least sevendays before the meeting. The minutes of the meetings were appropriately recorded and circulated.
9. The Board is well aware of the training requirements of the directors under the code. One director from theBoard got certified under the Board Development Series organized by Pakistan Institute of Corporate Governance.
10. The Chief Financial Officer and the Company Secretary were appointed by the Board. The remuneration andterms & conditions of appointment were approved by Board of the Company.
11. The directors’ report for this year has been prepared in compliance with the requirements of the CCG and fullydescribes the salient matters required to be disclosed.
12. The financial statements of the Company were duly endorsed by the CEO and CFO before approval of theboard.
13. The directors, CEO and executives do not hold any interest in the shares of the Company other than thatdisclosed in the pattern of shareholding.
14. The Company has complied with all the corporate and financial reporting requirements of the CCG.
Independent Directors
Category Names
Saeed Yousuf ChinoySyed Asghar Ali Shah*Irfan Nadeem
•••
Executive Directors
Non-Executive Directors Salman NaqviMahmood Ali Shah Bukhari
Nadir RahmanAsad Mustafa Shafqat
••
••
*Syed Asghar Ali Shah completed his tenure in January 2014 and has not offered himself for re-appointmentas a Director of the Company.
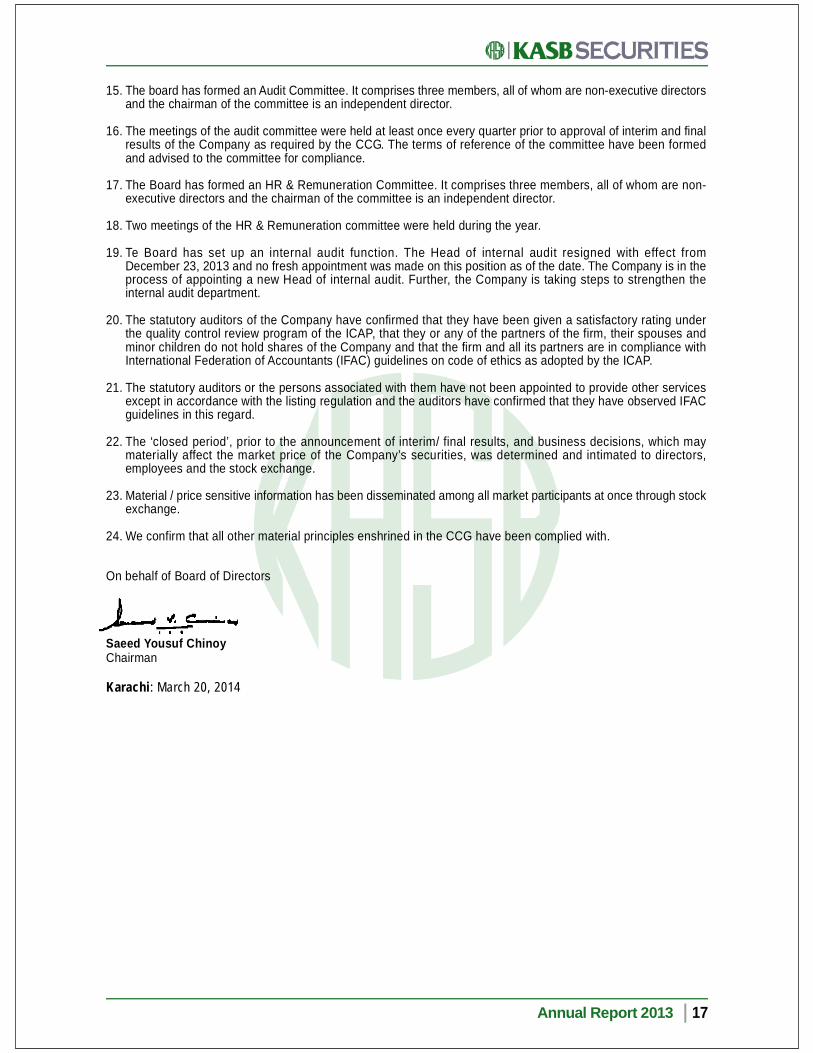
15. The board has formed an Audit Committee. It comprises three members, all of whom are non-executive directorsand the chairman of the committee is an independent director.
16. The meetings of the audit committee were held at least once every quarter prior to approval of interim and finalresults of the Company as required by the CCG. The terms of reference of the committee have been formedand advised to the committee for compliance.
17. The Board has formed an HR & Remuneration Committee. It comprises three members, all of whom are non-executive directors and the chairman of the committee is an independent director.
18. Two meetings of the HR & Remuneration committee were held during the year.
19. Te Board has set up an internal audit function. The Head of internal audit resigned with effect fromDecember 23, 2013 and no fresh appointment was made on this position as of the date. The Company is in theprocess of appointing a new Head of internal audit. Further, the Company is taking steps to strengthen theinternal audit department.
20. The statutory auditors of the Company have confirmed that they have been given a satisfactory rating underthe quality control review program of the ICAP, that they or any of the partners of the firm, their spouses andminor children do not hold shares of the Company and that the firm and all its partners are in compliance withInternational Federation of Accountants (IFAC) guidelines on code of ethics as adopted by the ICAP.
21. The statutory auditors or the persons associated with them have not been appointed to provide other servicesexcept in accordance with the listing regulation and the auditors have confirmed that they have observed IFACguidelines in this regard.
22. The ‘closed period’, prior to the announcement of interim/ final results, and business decisions, which maymaterially affect the market price of the Company’s securities, was determined and intimated to directors,employees and the stock exchange.
23. Material / price sensitive information has been disseminated among all market participants at once through stockexchange.
24. We confirm that all other material principles enshrined in the CCG have been complied with.
Annual Report 2013 17
Saeed Yousuf ChinoyChairman
Karachi: March 20, 2014
On behalf of Board of Directors
Annual Report 201318
STANDALONE FINANCIAL STATEMENTS
Annual Report 2013 19
A member firm of Ernst & Young Global Limited

BALANCE SHEETAS AT DECEMBER 31, 2013
Non-current assetsProperty and equipmentIntangible assetsInvestment propertiesLong-term InvestmentsLong-term loans and advancesLong-term deposits and prepaymentsLong-term receivableDeferred tax asset - net
Current assetsShort-term investmentsTrade debtsAdvances, deposits, prepayments and other receivablesTaxation - netCash and bank balances
TOTAL ASSETS
EQUITY AND LIABILITIES
Share capital and reservesIssued, subscribed and paid-up capitalGeneral reserveUnrealized gain on re-measurement of 'available-for-sale' investments to fair value - netUnappropriated profit
Non-current liabilities
Long-term loan
Current liabilitiesTrade and other payablesShort-term borrowingAccrued mark-up
TOTAL EQUITY AND LIABILITIES
CONTINGENCIES AND COMMITMENTS
Note
The annexed notes from 1 to 41 form an integral part of these financial statements.
ASSETS
789
1011121314
151617
18
19
Annual Report 201320
2013 2012
35,83812,7367,429
866,3721,4483,616
23,48053,538
1,004,457
175,978298,133147,07818,278
363,0881,002,5552,007,012
1,000,00018,752
140,12114,679
1,173,552
-
580,748250,000
2,712833,460
2,007,012
46,8378,854-
883,376498
6,429218
39,182985,394
267,630382,704257,97026,752
337,3971,272,4532,257,847
1,000,00018,752
153,53046,133
1,218,415
100,000
939,399-
33939,432
2,257,847
Nadir RahmanChief Executive Officer
Saeed Yousuf ChinoyChairman
Asad Mustafa ShafqatChief Financial Officer
(Rupees in ‘000)
212224
25
20
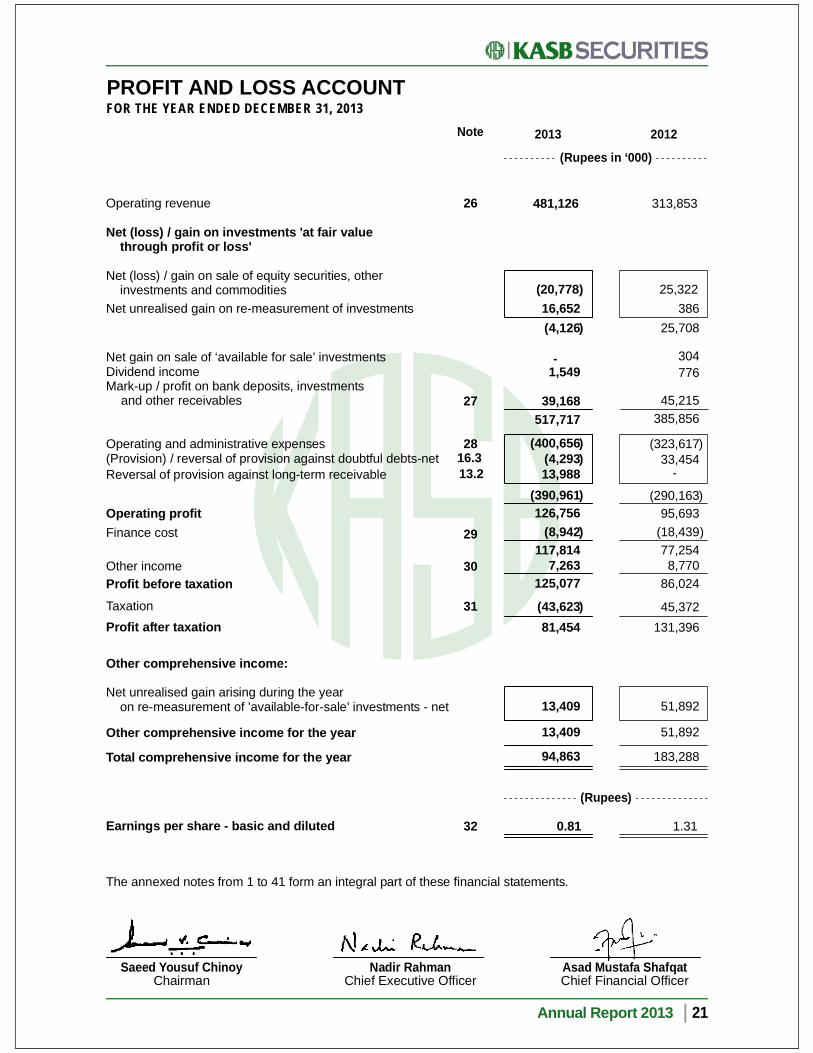
PROFIT AND LOSS ACCOUNTFOR THE YEAR ENDED DECEMBER 31, 2013
Annual Report 2013 21
Nadir RahmanChief Executive Officer
Saeed Yousuf ChinoyChairman
Asad Mustafa ShafqatChief Financial Officer
Note 2013 2012
(Rupees in ‘000)
1.31
The annexed notes from 1 to 41 form an integral part of these financial statements.
26
27
28
13.2
29
30
31
32 0.81
481,126
38625,708
304776
45,215385,856
(323,61733,454
-
(290,16395,693
(18,43977,2548,770
86,024
45,372131,396
51,892
51,892
183,288
)
313,853
Net unrealised gain on re-measurement of investments
Net gain on sale of ‘available for sale’ investmentsDividend incomeMark-up / profit on bank deposits, investments and other receivables
Operating and administrative expenses(Provision) / reversal of provision against doubtful debts-netReversal of provision against long-term receivable
Operating profitFinance cost
Other incomeProfit before taxationTaxationProfit after taxation
Other comprehensive income:
Net unrealised gain arising during the year on re-measurement of 'available-for-sale' investments - net
Other comprehensive income for the year
Total comprehensive income for the year
Earnings per share - basic and diluted
(Rupees)
)
)
16.3
)
)
))
)
)
16,652(4,126
-1,549
39,168517,717
(400,656(4,29313,988
(390,961126,756
(8,942117,814
7,263125,077
(43,62381,454
13,409
13,409
94,863
Operating revenue
Net (loss) / gain on investments 'at fair value through profit or loss'
Net (loss) / gain on sale of equity securities, other investments and commodities (20,778 25,322
)
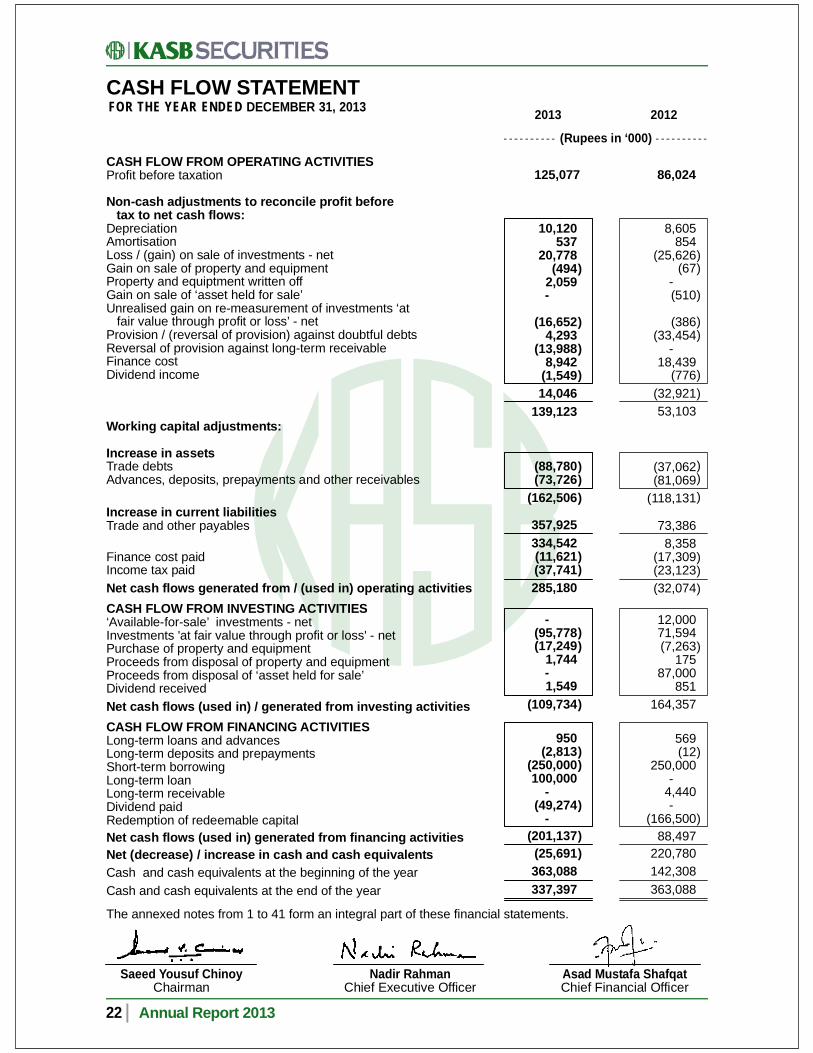
CASH FLOW STATEMENTFOR THE YEAR ENDED DECEMBER 31, 2013
Annual Report 201322
Nadir RahmanChief Executive Officer
Saeed Yousuf ChinoyChairman
Asad Mustafa ShafqatChief Financial Officer
The annexed notes from 1 to 41 form an integral part of these financial statements.
CASH FLOW FROM OPERATING ACTIVITIESProfit before taxation
Non-cash adjustments to reconcile profit before tax to net cash flows:DepreciationAmortisationLoss / (gain) on sale of investments - netGain on sale of property and equipmentProperty and equiptment written offGain on sale of ‘asset held for sale’Unrealised gain on re-measurement of investments ‘at fair value through profit or loss’ - netProvision / (reversal of provision) against doubtful debtsReversal of provision against long-term receivableFinance costDividend income
Working capital adjustments:
Increase in assetsTrade debtsAdvances, deposits, prepayments and other receivables
Increase in current liabilitiesTrade and other payables
Finance cost paidIncome tax paidNet cash flows generated from / (used in) operating activitiesCASH FLOW FROM INVESTING ACTIVITIES‘Available-for-sale’ investments - netInvestments 'at fair value through profit or loss' - netPurchase of property and equipmentProceeds from disposal of property and equipmentProceeds from disposal of ‘asset held for sale’Dividend receivedNet cash flows (used in) / generated from investing activitiesCASH FLOW FROM FINANCING ACTIVITIESLong-term loans and advancesLong-term deposits and prepaymentsShort-term borrowingLong-term loanLong-term receivableDividend paidRedemption of redeemable capitalNet cash flows (used in) generated from financing activitiesNet (decrease) / increase in cash and cash equivalentsCash and cash equivalents at the beginning of the yearCash and cash equivalents at the end of the year
125,077
10,120537
20,778(494
2,059-
(16,6524,293
(13,9888,942
(1,54914,046
139,123
(88,780(73,726
(162,506
357,925334,542(11,621(37,741285,180
-(95,778(17,249
1,744-1,549
(109,734
950(2,813
(250,000100,000
-(49,274
-(201,137(25,691363,088337,397
86,024
8,605854
(25,626(67
-(510
(386(33,454
-18,439
(776(32,92153,103
(37,062(81,069
(118,131
73,3868,358
(17,309(23,123(32,074
12,00071,594(7,263
17587,000
851164,357
569(12
250,000-
4,440-
(166,50088,497
220,780142,308363,088
))
)
))
)
)
)
)
)
)
)
)
))
)
))
)
))
)
))
)
)
)
))
))
)
)
2013 2012
(Rupees in ‘000)
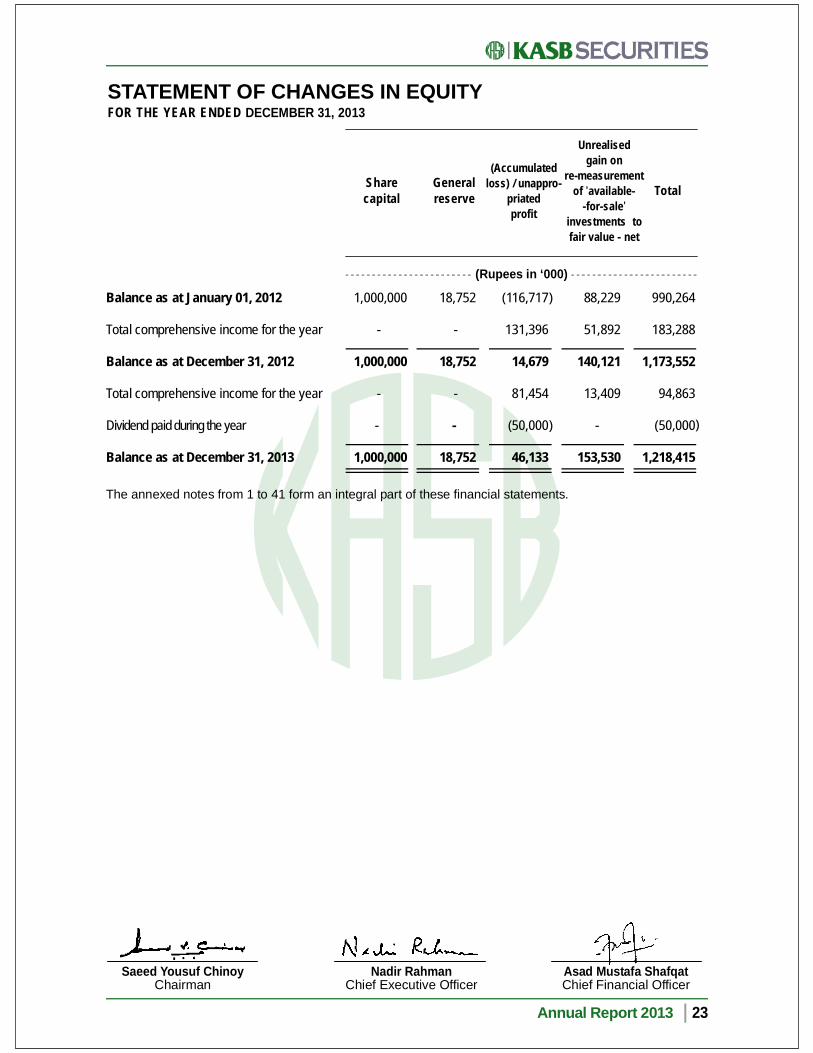
STATEMENT OF CHANGES IN EQUITYFOR THE YEAR ENDED DECEMBER 31, 2013
Balance as at January 01, 2012
Total comprehensive income for the year
Balance as at December 31, 2012
Total comprehensive income for the year
Dividend paid during the year
Balance as at December 31, 2013
The annexed notes from 1 to 41 form an integral part of these financial statements.
990,264
183,288
1,173,552
94,863
(50,000
1,218,415
1,000,000
-
1,000,000
-
-
1,000,000
18,752
-
18,752
-
-
18,752
(116,717
131,396
14,679
81,454
(50,000
46,133
88,229
51,892
140,121
13,409
-
153,530
Unrealisedgain on
re-measurementof 'available-
-for-sale'investments tofair value - net
(Accumulatedloss) / unappro-
priatedprofit
Generalreserve
Sharecapital Total
Annual Report 2013 23
Nadir RahmanChief Executive Officer
Saeed Yousuf ChinoyChairman
Asad Mustafa ShafqatChief Financial Officer
(Rupees in ‘000)
)
) )

NOTES TO THE FINANCIAL STATEMENTS FOR THE YEAR ENDED DECEMBER 31, 2013
1. STATUS AND NATURE OF BUSINESS
1.1 KASB Securities Limited (the Company) was incorporated in Pakistan on October 24, 2000 under the CompaniesOrdinance, 1984 and commenced its operations effective January 01, 2003, on the transfer of assets and liabilitiesof the securities segment of the then Khadim Ali Shah Bukhari and Company Limited under a scheme of arrangementapproved by the High Court of Sindh. The shares of the Company are listed on the Karachi Stock Exchange Limited.The registered office of the Company is situated at 5th Floor, Trade Centre, I.I. Chundrigar Road, Karachi.
The Company is a subsidiary of KASB Bank Limited (the Parent Company) which holds 77.12% of the shares ofthe Company. The ultimate parent of the Company is KASB Corporation Limited [Formerly: KASB Finance (Private)Limited.]
The Company has corporate membership of the Karachi Stock Exchange Limited (KSE) and Pakistan MercantileExchange Limited (PMEL) and is principally engaged in the business of stocks, money market, foreign exchangeand commodity broking. Other activities include investment in a mix of listed and unlisted equity and debt securities,economic research and advisory services.
1.2 These are separate financial statements of the Company in which investment in subsidiary is reported on the basisof direct equity interest and is not consolidated.
2. BASIS OF PREPARATION
These financial statements have been prepared under the historical cost convention except for investments whichare carried at fair value as referred to in note 4.6 below.
3. STATEMENT OF COMPLIANCE
These financial statements have been prepared in accordance with approved accounting standards as applicablein Pakistan. Approved accounting standards comprise of such International Financial Reporting Standards (IFRS)issued by the International Accounting Standards Board (IASB) as are notified under the Companies Ordinance,1984, provisions of and directives issued under the Companies Ordinance, 1984. In case requirements differ, theprovisions or directives of the Companies Ordinance, 1984 shall prevail.
4. SUMMARY OF SIGNIFICANT ACCOUNTING POLICIES
4.1 The accounting policies adopted in the preparation of these financial statements are consistent with those of theprevious financial year except as describe below:
The Company has adopted the following amendments to IFRSs which became effective for the current year:
IFRS 7 – Financial Instruments: Disclosures - (Amendment)
Improvements to Accounting Standards Issued by the IASB:
IAS 1 – Presentation of Financial Statements - Clarification of the requirements for comparative information.IAS 16 – Property, Plant and Equipment – Clarification of Servicing Equipment.IAS 32 – Financial Instruments: Presentation – Tax Effects of Distribution to Holders of Equity Instruments.IAS 34 – Interim Financial Reporting – Interim Financial Reporting and Segment Information for Total Assets and Liabilities.
The adoption of the above amendments did not have any effect on the financial statements.
4.2 Property and equipment
These are stated at cost less accumulated depreciation and impairment, if any. Such costs include the cost ofreplacing parts of fixed assets when that cost is incurred. Maintenance and normal repairs are charged to incomeas and when incurred. Depreciation is charged to income over the useful life of the asset on a systematic basisapplying the straight line method at the rates specified in note 7 to the financial statements.
Property and equipment are assessed for impairment whenever there is an indication that the same are impaired.Depreciation is charged from the day of purchase and no depreciation is charged on the day of disposal.
An item of fixed asset is derecognised upon disposal or when no future economic benefits are expected from itsuse or disposal.
The assets' residual values, useful lives and methods are reviewed and adjusted, if appropriate at each financialyear end.
Gains and losses on disposals, if any, of assets are included in income currently.
Annual Report 201324
4.3 Assets subject to finance lease
Assets subject to finance lease are stated at fair value of the leased assets at inception of the lease or, if lower atthe present value of minimum lease payments. Depreciation is charged at the rates specified in note 7.
The outstanding obligations under finance lease less finance charges allocated to future periods are shown asliability. The finance charges are calculated at the rate implicit in the leases and are charged to profit andloss account.
4.4 Intangible assets
These are stated at cost less accumulated amortisation and impairment, if any. Amortisation is charged over theuseful life of the asset on a systematic basis to income applying the straight line method at the rate specified innote 8 to the financial statements.
Intangible assets with indefinite useful lives are not amortised. These are annually tested for impairment to assesswhether these are in excess of their recoverable amounts, and where the carrying amounts exceeds the estimatedrecoverable amounts, the carrying amounts are written down to the estimated recoverable amounts.
Intangible assets are assessed for impairment whenever there is an indication that the same are impaired. Costsassociated with maintaining assets are recognized as an expense in the period in which these are incurred. Gainsand losses on disposals, if any, of assets are included in income currently.
4.5 Investment properties
Investment properties are carried at cost less accumulated depreciation and accumulated impairment losses, if any.Depreciation is charged at the rate specified in note 9. Subsequent expenditures, depreciation and gains or losseson disposals are accounted for in the same manner as property and equipment.
4.6 Financial assets
4.6.1 Investments
Investment in subsidary company is stated at cost less provision for impairment, if any. Other, Investments areclassified as either 'investments at fair value through profit or loss', 'held-to-maturity' investments or 'available-forsale' investments, as appropriate.
When investments are recognised initially, these are measured at fair value plus, in the case of investments notat fair value through profit or loss, directly attributable transaction costs.
All regular way purchases / sales of investments are recognised on the trade date, i.e. the date on which commitmentto purchase / sale is made by the Company. Regular way purchases or sales of financial assets are those, thecontract for which requires delivery of securities within the time frame generally established by regulation orconvention in the market place.
Investments at fair value through profit or loss
Investments classified as 'investments at fair value through profit or loss' are carried at fair value. Gain / loss onremeasurement of such investments to fair value is recognised in the profit and loss account.
Available-for-sale
Investments classified as 'available-for-sale' are measured at fair value. Gains or losses on ‘available-for-sale’investments are recognised directly in equity until the investment is sold, derecognised or is determined to beimpaired, at which time the cumulative gain or loss previously reported in statement of comprehensive income isincluded in income. Upon impairment, gain / loss which had been previously recognised directly in the statementof comprehensive income, is included in the profit and loss account for the year.
The fair value of those investments representing listed equity and other securities i.e. debt instruments, are determinedon the basis of year-end prices obtained from stock exchange quotations.
4.6.2 Loans and receivables
Loans and receivables are non-derivative financial assets with fixed or determinable payments that are not quotedin an active market.These are carried at amortised cost using effective yield method, less impairment losses,if any.
Annual Report 2013 25

4.7 Financial instruments
All the financial assets and financial liabilities are recognised at the time when the company becomes a party tothe contractual provisions of the instrument. Financial assets are derecognised when the Company loses controlof the contractual rights that comprise the financial assets. Financial liabilities are derecognised when these areextinguished, that is, when the obligation specified in the contract is discharged, cancelled or expired. Any gainor loss on derecognition of the financial assets and financial liabilities is taken to income currently.
4.8 Off-setting of financial assets and financial liabilities
Financial assets and financial liabilities are off-set and the net amount is reported in the balance sheet if the Companyhas a legally enforceable right to set-off the transaction and also intends either to settle on a net basis or to realisethe asset and settle the liability simultaneously. Income and expenses arising from such assets and liabilities arealso accordingly off-set.
4.9 Revenue recognition
- Brokerage income is recognised as and when such services are rendered.- Financial advisory fees and other income are recognised on an accrual basis.- Underwriting commission is recognised on accrual basis in accordance with the terms of the agreement.- Capital gains and losses on sale of securities are recognised when realised.- Mark-up income, return on bank deposits and balances are recognized on accrual basis.- Dividend income is recorded when the right to receive the dividend is established.
4.10 Taxation
Current
Provision for current taxation is based on taxable income at the current rates of taxation after taking into accounttax credits, rebates and tax exemptions available, if any. The charge for the current tax also includes adjustmentswhere necessary, relating to prior years which arise from assessment framed / finalised during the year.
Deferred
Deferred tax is recognised using the balance sheet liability method on all temporary differences arising betweentax bases of assets and liabilities and their carrying amounts appearing in the financial statements. A deferred taxasset is recognised only to the extent that it is probable that future taxable profits will be available against whichthe asset can be utilized. Deferred tax assets are reduced to the extent that it is no longer probable that the relatedtax benefits will be realized.
Deferred tax is calculated at the rates that are expected to apply to the year when the differences reverse, basedon tax rates that have been enacted or substantively enacted by the balance sheet date. Deferred tax is chargedor credited to the profit and loss account.
Deferred tax, if any, on revaluation of investments is recognised as an adjustment to surplus / deficit arising onrevaluation.
4.11 Dividend distributions and appropriations
Dividend distributions and appropriations are recorded in the period in which the distributions and appropriationsare approved.
4.12 Employees' benefits
Defined contribution plan
The Company operates a contributory provident fund for all its permanent employees, and contributions are mademonthly in accordance with the fund rules.
Employee compensated absences
The Company allows its management and non-management employees' to avail 30 days annual earned leave. Theunutilized portion of the earned leave is neither accumulating nor encashable.
4.13 Cash and cash equivalents
Cash in hand and at banks is carried at cost. For the purposes of cash flow statement, cash and cash equivalentsconsist of cash in hand and bank balances. For the purposes of statement of cash flows, cash and cash equivalentsare presented net of short term borrowings which are repayable on demand or in the short term and form an integralpart of the Company's cash management.
Annual Report 201326

4.14 Foreign currency transactions
Functional and presentation currency
These financial statements are presented in Pak Rupees, which is the Company’s functional and presentationcurrency.
Foreign currency translation
Foreign currency transactions are recorded at the exchange rates prevailing on the date of the transaction. Monetaryassets and liabilities in foreign currencies are translated at the rates of exchange prevailing on the balance sheetdate. Gains and losses on translation are taken into income currently. Non monetary-items that are measured interms of historical cost in a foreign currency are translated using the exchange rates as at the dates of the initialtransactions. Non-monetary items measured at fair value in a foreign currency are translated using the exchangerates at the date when the fair value was determined.
4.15 Provisions
Provisions are recognized when the Company has the legal or constructive obligation as a result of past events,and it is probable that an outflow of resources will be required to settle the obligation and a reliable estimate of theamount can be made.
4.16 Trade and other payables
Trade and other payables are recognized initially at fair value plus directly attributable costs, if any, and subsequentlymeasured at amortized cost.
5. ACCOUNTING ESTIMATES AND JUDGEMENTS
The preparation of financial statements requires management to make judgments, estimates and assumptions thateffect the application of policies and reported amounts of assets and liabilities, income and expenses. The estimatesand associated assumptions are based on historical experience and various other factors that are believed to bereasonable under the circumstances, the result of which form the basis of making judgments about carrying valuesof assets and liabilities. The estimates and underlying assumptions are reviewed on an ongoing basis.
The estimates, judgments and assumptions that have significant effect on the financial statements are as follows:
Annual Report 2013 27
NoteUseful lives of assets and methods of depreciation and impairment
Classification of investments
Provision for doubtful debts
Deferred taxation and taxation
4.2 to 4.5,7, 8 & 9
4.6.1,10 & 15
4.15 & 16
4.10,14 & 31
6. STANDARDS AND IFRIC INTERPRETATIONS THAT ARE NOT YET EFFECTIVE
The following revised standards, amendments and interpretations with respect to the approved accounting standardsas applicable in Pakistan would be effective from the dates mentioned below against the respective standard orinterpretation:
Effective date (accounting periods beginning
on or after)Standard, Interpretation or amendment
IAS 39 – Novation of Derivatives and Continuation of Hedge Accounting
IAS 36 – Recoverable Amount for Non-Financial Assets – (Amendment)
IFRIC 21 – Levies
IAS 32 – Off-setting Financial Assets and Financial liabilities – (Amendment)
IFAS 3 – Profit and Loss Sharing on Deposits
January 01, 2014
January 01, 2014
January 01, 2014
January 01, 2014
June 12, 2013

Annual Report 201328
The Company expects that the adoption of the above revision, amendments and interpretation of the standards willnot affect the Company's financial statements in the period of initial application.
Improvements to IFRS
In addition to the above amendments, improvements to various accounting standards have also been issued bythe IASB. Such improvements are generally effective for accounting periods beginning on or after January 01, 2013.The Company expects that such improvements to the standards will not have any material impact on the Company'sfinancial statements in the period of initial application.
Further, following new standards have been issued by IASB which are yet to be notified by the SECP for the purposeof applicability in Pakistan.
IFRS 9 – Financial Instruments: Classification and MeasurementIFRS 10 – Consolidated Financial StatementsIFRS 11 – Joint ArrangementsIFRS 12 – Disclosure of Interests in Other EntitiesIFRS 13 – Fair Value Measurement
Effective date(annual periods
beginning on or after)
January 01, 2015January 01, 2013January 01, 2013January 01, 2013January 01, 2013
Standard

Annual Report 2013 29
Depreciation rate (% per annum) 2033.335 10
7. PROPERTY AND EQUIPMENT2013
20
3,890 (2,372
1,518
4,080
(1,328 1,062
(266
---
(543
---
3,2714,789
6,642(1,8534,789
33.33
124,855(116,719
8,136
11,364
(3,671 3,503
(168
(63,82463,782
(42
(5,592
---5,562
13,698
68,724(55,02613,698
5
21,197 (6,173 15,024
-
---
(2,149 418
(1,731
(1,217
20,732(13,822
6,9103,962
18,986
39,780(20,79418,986
10
25,859(14,69911,160
1,555
(1,9231,107(816
(2,0011,715(286
(2,249
---
(1,7969,364
23,490(14,126
9,364
Cost
Computersand officeequipment
Furnitureand
fixtures
Officepremises- lease hold
Total
Accumulated depreciationNet book value at the beginning of the year
Changes during the yearAdditions during the year
Disposals during the year- Cost- Depreciation
Analysis of Net Book Value
CostAccumulated depreciationNet book value as at December 31, 2013
Net book value at the end of the year
175,801 (139,963
35,838
16,999
(6,922 5,672(1,250
(67,97465,915(2,059
(9,601
20,732(13,822
6,91010,99946,837
138,636(91,79946,837
Motorvehicles
(Rupees in ‘000)
) ) ) ) )
)
) ) ) )
Depreciation rate (% per annum)
2012
3,890 (1,938
1,952
-
- --
(434(434
1,518
3,890 (2,372 1,518
)
)
))
121,338 (115,524
5,814
6,596
(3,079 2,971
(108 (4,166
2,322 8,136
124,855 (116,719
8,136
)
)
)
)
)
21,197 (5,112
16,085
-
- - -
(1,061(1,061
15,024
21,197 (6,173 15,024
))
25,192 (12,455
12,737
667
- - -
(2,244(1,577
11,160
25,859 (14,699 11,160
)
)
))
Cost
Computersand officeequipment
Furnitureand
fixtures
Officepremises- lease hold
Total
Accumulated depreciationNet book value at the beginning of the year
Changes during the yearAdditions during the year
Disposals during the year- Cost- Depreciation
Depreciation charge for the year
Analysis of Net Book ValueCostAccumulated depreciationNet book value as at December 31, 2012
Net book value at the end of the year
171,617 (135,029
36,588
7,263
(3,079 2,971 (108
(7,905(750
35,838
175,801 (139,963
35,838
)
)
)
Motorvehicles
(Rupees in ‘000)
))
)))
Written off during the year (note 7.1)- Cost- Depreciation
Transfer from investment propertiesduring the year (note 9)- Cost- Depreciation
)
) ) ) )
) ) )
) ) ))
)
) ) ) )
)
Depreciation charge for the year
) ) ) ) )
)

Annual Report 201330
7.2 Disposal of property and equipment
Particulars of property and equipment disposed off during the year having book value of more than Rs. 50,000 areas follows:
7.1 During the year, a comprehensive exercise for physical verification of fixed assets was performed by a firm ofChartered Accountants, whose report dated October 10, 2013 suggests that cost of fixed assets amounting toRs. 65.69 million requires to be written off. Accordingly, the Company has written off fixed assets having cost ofRs. 65.69 million (written down value of Rs. 0.33 million) during the year.
In addition, the Company has also written off certain other fixed assets during the year which were not in usablecondition amounting to Rs. 2.28 million (written down value of Rs. 1.73 million).
CostAccum-ulateddepre-ciation
Writtendownvalue
Saleproce-
edsGain /(loss) Mode of disposalParticular of Buyers
(Rupees in ‘000)
Furniture & FixturesOffice FurnitureOffice Furniture
VehiclesToyota Corolla
661823
1,328
359453
1,062
302370
266
175574
750
(127204
484
Negotiation
The aggregate amountof property and equip-ment disposed offduring the year havingbook value less thanRs. 50,000:
) KASB Funds Limited-related partyKASB Bank Limited-the Parent Company
Younus Khan
Negotiation
Negotiation
Furniture and fixturesComputer and
office equipment
439
3,671
295
3,503
144
168
58
187
(86
19
)
December 31, 2013December 31, 2012
6,9223,079
5,6722,971
1,250108
1,744175
49467

8. INTANGIBLE ASSETS
Annual Report 2013 31
8.1 Currently, rooms at KSE are used by KASB Bank Limited (the Parent Company) under rental arrangements.
8.2 Pursuant to the promulgation of the Stock Exchanges (Corporatisation, Demutualization and Integration) Act, 2012(The Act), the ownership in a stock exchange has been segregated from right to trade on the exchange. Accordingly,the Company has received equity shares of KSE and a Trading Right Entitlement (TRECs) in lieu of its membershipcard of KSE. The Company's entitlement in respect of KSE's shares is determined on the basis of valuation ofassets and liabilities of KSE as approved by the SECP and the Company has been allotted 4,007,383 shares ofthe face value of Rs 10/- each, out of which 2,404,430 shares are kept in the blocked account and the divestmentof the same will be made in accordance with the requirements of the Act within two years from the date ofDemutualization.
The cost / book value of the KSE membership card amounts to Rs. 4.95 million as at December 31, 2013. Inabsense of an active market of the shares of KSE and TREC, the allocation of the carrying value of the membershipcard between the shares (financial asset) and TREC (an intangible asset) has been made by the Company on thebasis of the face value of ordinary shares and the TREC value assigned by the KSE for minimum capital requirmentpurpose applicable to the stock exchange brokers currently.
2013
Computersoftware Total
Membershipof PMEL
Rooms atKSE
(Note 8.1)
Boothsat KSE
CostAccumulated amortisationNet book value at the beginning of the year
Adjustment during the yearAmortisation for the yearNet book value at the end of the year
Analysis of Net Book ValueCostAccumulated amortisationNet book value as at December 31, 2013
Amortisation rate (% per annum)
Membershipof KSE
(Note 8.2)
8,575(8,038
537-
(537-
8,575(8,575
-
33.33
(Rupees in ‘000)
2012
Computersoftware TotalMembership
of PMELRoomsat KSE
Boothsat KSE
CostAccumulated amortisationNet book value at the beginning of the year
Amortisation for the yearNet book value at the end of the year
Analysis of Net Book ValueCostAccumulated amortisationNet book value as at December 31, 2012
Amortisation rate (% per annum)
Membershipof KSE
20,774(7,18413,590
(85412,736
20,774(8,03812,736
)
)
)
4,945 -
4,945
-4,945
4,945 -
4,945
-
950 -
950
-950
950 -
950
-
5,804-
5,804
-5,804
5,804-
5,804
-
500-
500
-500
500-
500
-
8,575(7,1841,391
(854537
8,575(8,038
537
33.33
)
)
)
(Rupees in ‘000)
500-
500250-
750
750-
750
-
5,804-
5,804--
5,804
5,804-
5,804
-
950-
950--
950
950-
950
-
4,945-
4,945(3,595
-1,350
1,350-
1,350
-
20,774(8,03812,736(3,345
(5378,854
17,429(8,5758,854
-
)
)
)
)
)
)
) )

9.1 During the year, the Company has transferred the investment properties (comprising 6th and 10th floor office spaces)to its own use. Previously, these office spaces were given on rent to KASB Bank Limited (the Parent Company)and KASB Funds Limited (a related party), however, during the year, the rental contracts with these group companieswere not renewed and the Company is now using these offices for its own operations.
9. INVESTMENT PROPERTIES
CostAccumulated depreciationNet book value at the beginning of the yearDepreciation charge for the year Transfers during the year
- Cost- Depreciation
Net book value at the end of the yearAnalysis of net book value
CostAccumulated Depreciation
Net book value at the end of the year
Depreciation rate (% per annum)
Annual Report 201332
20,732 (13,303
7,429(519
(20,732 13,822(6,910
-
- --
5
2013 2012Note(Rupees in ‘000)
)
)
)
20,732 (12,603
8,129(700
---
7,429
20,732 (13,303
7,429
5
)
)
)
9.1 )
10.1 Structured Venture (Private) Limited is subsidiary of the Company. The total amount of investment approved by theshareholders of the Company in the extra-ordinary general meeting held on June 22, 2010 is Rs. 625 million. Asof the balance sheet date, the Company has invested a total sum of Rs. 488.58 million.
The book value of each ordinary share is Rs. 9.79 (2012: Rs. 9.80) based on the audited financial statements ofthe subsidiary for the year ended December 31, 2013.
10.2.1 These shares have been blocked by the Central Depository Company of Pakistan Limited (CDC) in compliance withBPRD Circular No. 4 dated May 22, 2008 issued by the State Bank of Pakistan. No activity (including pledge andwithdrawal) in these shares is allowed without prior written permission of the State Bank of Pakistan.
10.2.2 The Company's investment in unquoted shares of Al Jomaih Power Limited is valued at its fair value as at the yearend based on the net assets value of the investee Company as at December 31, 2012.
10.2 Description of ‘available-for-sale’ investments
(*) adjusted for impairment charge
Number of shares Name of the Investee Company Cost* Carryingvalue Cost*
2013Carrying
value
2012
(Rupees in ‘000)
2013 2012
Quoted shares
19,858,649 KASB Bank Limited (Parent Company) 10.2.1Unquoted shares
19,858,649 38,12921,844 48,25621,844
Note
394,795241,265 377,791237,670
2,915,925 Karachi Stock Exchange Limited 8.2- 3,595 --3,595
3,370 Al Jomaih Power Limited 10.2.2New Horizon Exploration and Production Limited (related party)
14,760,000 Class ‘A’ ordinary shares
3,370 321,442184,197
31,629
297,906
31,629
184,197
31,62931,62914,760,000
488,581 394,795 883,376
Subsidiary company (48,858,120 shares of Rs.10 each)‘Available-for-sale’ investments
10. LONG-TERM INVESTMENTS
10.110.2
488,581 377,791 866,372
Annual Report 2013 33
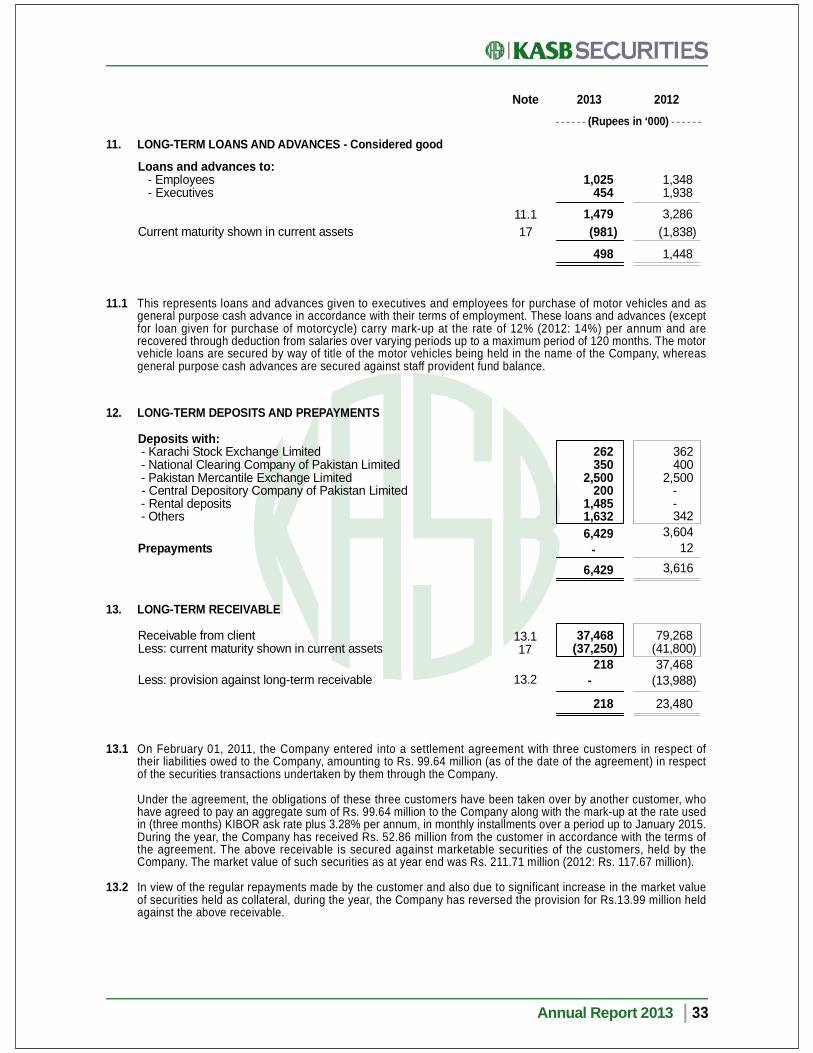
11.1 This represents loans and advances given to executives and employees for purchase of motor vehicles and asgeneral purpose cash advance in accordance with their terms of employment. These loans and advances (exceptfor loan given for purchase of motorcycle) carry mark-up at the rate of 12% (2012: 14%) per annum and arerecovered through deduction from salaries over varying periods up to a maximum period of 120 months. The motorvehicle loans are secured by way of title of the motor vehicles being held in the name of the Company, whereasgeneral purpose cash advances are secured against staff provident fund balance.
11. LONG-TERM LOANS AND ADVANCES - Considered good
Loans and advances to: - Employees - Executives
Current maturity shown in current assets
1,025 454
1,479(981498
1,348 1,938
3,286(1,838
1,448
11.117 )
2013 2012Note(Rupees in ‘000)
)
13.1 On February 01, 2011, the Company entered into a settlement agreement with three customers in respect oftheir liabilities owed to the Company, amounting to Rs. 99.64 million (as of the date of the agreement) in respectof the securities transactions undertaken by them through the Company.
Under the agreement, the obligations of these three customers have been taken over by another customer, whohave agreed to pay an aggregate sum of Rs. 99.64 million to the Company along with the mark-up at the rate usedin (three months) KIBOR ask rate plus 3.28% per annum, in monthly installments over a period up to January 2015.During the year, the Company has received Rs. 52.86 million from the customer in accordance with the terms ofthe agreement. The above receivable is secured against marketable securities of the customers, held by theCompany. The market value of such securities as at year end was Rs. 211.71 million (2012: Rs. 117.67 million).
13.2 In view of the regular repayments made by the customer and also due to significant increase in the market valueof securities held as collateral, during the year, the Company has reversed the provision for Rs.13.99 million heldagainst the above receivable.
Deposits with: - Karachi Stock Exchange Limited - National Clearing Company of Pakistan Limited - Pakistan Mercantile Exchange Limited - Central Depository Company of Pakistan Limited - Rental deposits - Others
Prepayments
12. LONG-TERM DEPOSITS AND PREPAYMENTS
262 350
2,500 200
1,4851,632
6,429 -
6,429
362 400
2,500--342
3,60412
3,616
Receivable from clientLess: current maturity shown in current assets
13. LONG-TERM RECEIVABLE
37,468 (37,250
218-
218
13.117 )
)Less: provision against long-term receivable
79,268 (41,800 37,468(13,988
23,480
)
)
)
13.2
Annual Report 201334
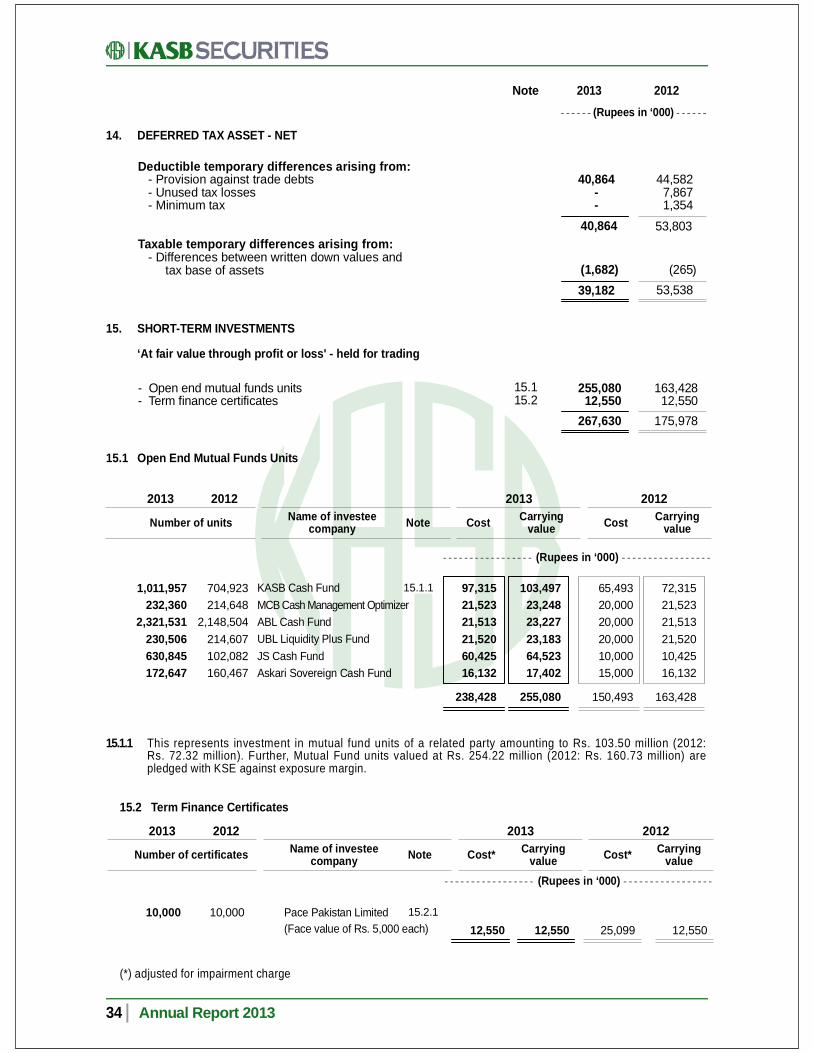
15. SHORT-TERM INVESTMENTS
‘At fair value through profit or loss' - held for trading
- Open end mutual funds units- Term finance certificates
255,08012,550
267,630
163,42812,550
175,978
15.115.2
15.1.1 This represents investment in mutual fund units of a related party amounting to Rs. 103.50 million (2012: Rs. 72.32 million). Further, Mutual Fund units valued at Rs. 254.22 million (2012: Rs. 160.73 million) are pledged with KSE against exposure margin.
Pace Pakistan Limited(Face value of Rs. 5,000 each)
10,000 10,000
15.2 Term Finance Certificates
(*) adjusted for impairment charge
2013 2012
Number of certificates Name of investeecompany
2013 2012
(Rupees in ‘000)
Cost* CarryingvalueCost* Carrying
valueNote
12,550 12,550 25,099 12,55015.2.1
15.1 Open End Mutual Funds Units
KASB Cash FundMCB Cash Management OptimizerABL Cash FundUBL Liquidity Plus FundJS Cash FundAskari Sovereign Cash Fund
1,011,957232,360
2,321,531230,506630,845172,647
704,923214,648
2,148,504214,607102,082160,467
97,31521,52321,51321,52060,42516,132
238,428
103,49723,24823,22723,18364,52317,402
255,080
65,49320,00020,00020,00010,00015,000
150,493
72,31521,52321,51321,52010,42516,132
163,428
15.1.1
2013 2012
Number of units Name of investeecompany
2013 2012
(Rupees in ‘000)
Cost CarryingvalueCost Carrying
valueNote
14. DEFERRED TAX ASSET - NET
Deductible temporary differences arising from: - Provision against trade debts - Unused tax losses - Minimum tax
Taxable temporary differences arising from: - Differences between written down values and tax base of assets
40,864--
(1,68239,182
44,5827,8671,354
(26553,538
2013 2012(Rupees in ‘000)
)
40,864 53,803
Note
)

Annual Report 2013 35
15.2.1 The above TFCs are secured and carry mark-up at the rate of 6 month KIBOR + 2% and will mature inFebruary 15, 2017. These TFCs are currently rated as 'non-performing' by the Mutual Funds Association ofPakistan and accordingly, the Company is maintaining a provision for decline in the value of investment to theextent of Rs. 32.82 million as at December 31, 2013.
16.2 This includes receivables from related parties amounting to Rs. 0.20 million (2012 : Rs. 1.42 million)
16.3.1 Provisions against doubtful debts have been made after considering the market value of listed shares amountingto Rs. 39.46 million (2012: Rs. 56.89 million) held in custody by the Company against respective customers accounts.
16. TRADE DEBTS
Receivable against purchase of marketable securities - net of provisionsInter-bank brokerageFees
16.1 Considered goodSecuredUnsecured
Considered doubtfulProvision for doubtful debts
378,880 2,707 1,117
382,704
338,928 491
339,419159,649
(120,188
378,880
16.1 & 16.2 293,527 2,124 2,482
298,133
236,446 187
236,633172,789(115,895
293,527
)
2013 2012(Rupees in ‘000)
Note
)16.3
16.3 Reconciliation of provisions against trade debtsOpening balanceProvision for the yearReversal of provision during the year
115,89513,104(8,8114,293
)
120,188
149,349-
(33,454(33,454
)
115,895)

Annual Report 201336
2013 2012Note(Rupees in ‘000)
18.1 These carry profit at rates ranging from 1.25% to 9.25% (2012: 1% to 11.25%) per annum.
18.2 This includes Rs. 303.75 million (2012:Rs. 339.98 million) with KASB Bank Limited (the Parent Company).
17.1 Receivable from related parties comprises of:
- KASB Funds Limited - New Horizon Exploration and Production Limited - Director of KASB Corporation Limited [formerly KASB Finance (Private) Limited]
(the ultimate Parent of the Company)
152-
-152
45326
12,41012,889
18. CASH AND BANK BALANCES
Cash at bank in: - Current accounts - Saving accounts
Cash in handStamps in hand
68,661268,697337,358
363
337,397
18.118.1 & 18.2
19,928343,159363,087
-1
363,088
17. ADVANCES, DEPOSITS, PREPAYMENTS AND OTHER RECEIVABLESAdvances to: - Suppliers - Current portion of long-term loans and advances to employees and executives
Deposits: - Exposure deposits with KSE - Exposure deposit with PMEL - Others
Prepayments: - Rent - Insurance - Software development and maintenance - Others
Other receivables: - Profit on bank deposits - Profit on exposure deposit with KSE - Profit on long-term receivables - Current portion of long-term receivable - Receivable from related parties - Others
4,476
981
207,0081,190 -
208,198
1,925350969
2,5955,839
145821
-37,250
152108
38,476
888
1,838
73,0003,784
3,313 80,097
1,570673
3,1791,9187,340
121285
1,46441,80012,889
35656,915
147,078
11
1317.1
5,457 2,726
257,970
19. SHARE CAPITAL
19.1 Authorised Capital
Ordinary shares of Rs. 10 each 2,000,000 2,000,000
(Number of shares)
200,000,000 200,000,000
2013 2012 2013 2012(Rupees in ‘000)
Note

Annual Report 2013 37
19.2 Issued, subscribed and paid-up share capital
89,867,900
10,132,100100,000,000
89,867,900
10,132,100
100,000,000
Ordinary shares of Rs 10 each fully paid-up in cashOrdinary shares of Rs 10 each fully paid-up as part of the scheme of arrangement
898,679
101,321 1,000,000
898,679
101,321
1,000,000
19.3 The following shares were held by related parties of the Company:
KASB Bank LimitedKASB Bank Limited - Employees Provident Fund TrustKASB Securities Limited - Employees Provident Fund TrustKASB Funds PS Limited -Employees Provident Fund TrustKASB Corporation Limited [formerly KASB Finance (Private) Limited]Key Management Personnel
Shares held
77,117,500400,000
32,0003,000
700,000945
78,253,445
Percentage
77.118%0.400%0.032%0.003%0.700%0.001%
78.254%
Shares held
77,117,500400,00032,000
3,000700,000
82578,253,325
Percentage
77.118%0.400%0.032%0.003%0.700%0.001%
78.254%
2013 2012
2013 2012Note(Rupees in ‘000)
20. LONG-TERM LOAN
Long-term loan from KASB Bank Limited(the Parent Company) 20.1 100,000 -
20.1 During the year, the Company has obtained a long-term loan of Rs.100 million from the Parent Company. Theloan carries mark-up at the rate of 3 months KIBOR + 2.5% per annum and payable on quarterly basis startingfrom September 2013 to January 2015. The principal amount will be paid as a bullet payment in January 2015.The loan is secured by first ranking charge over all present and future current assets of the Company.
21. TRADE AND OTHER PAYABLES
Trade creditorsAccrued expensesWithholding taxUnclaimed dividendsDividend payableOthers
21.121.2
896,86219,69911,795
609726
9,708939,399
525,86050,459
2,668609
-1,152
580,748
22.1 Short-term borrowing from the Parent Company which carried mark-up at the rate of 11% per annum was repaidduring the year.
21.1 This includes payable to KSE and NCCPL amounting to Rs. 2.61 million (2012: Rs. 17.47 million) and Rs. 66.09million (2012: Rs. Nil) respectively in respect of trading in securities, settled subsequent to the year end.
21.2 This includes accrued expenses relating to various services provided by related parties amounting to Rs. 3.44million (2012: 7.41 million)
22. SHORT-TERM BORROWING
Short-term borrowing from KASB Bank Limited ( the Parent Company ) 22.1 - 250,000

Annual Report 201338
23. SHORT-TERM RUNNING FINANCES UNDER MARK-UP ARRANGEMENTS - Secured
23.1 Running finance facility of Rs. 199 million (2012: Rs. 299 million) is available to the Company from the ParentCompany. The facility is subject to mark-up at rates ranging from 11.58% to 12.03% (2012: 12.70% to 14.49%)per annum during the year and is required to be secured by first ranking charge over all present and future currentassets of the Company.
23.2 Further, the facilities for short-term running finances available from various banks amounted to Rs. 750 million(2012: Rs. 850 million) which remained unutilised as at the year end. These facilities are subject to mark-up at ratesranging from 11.51% to 13.15% (2012: 12.38% to 15.14%) per annum and are required to be secured by pledgeof securities for the purposes of utilisation of finance.
26.1 During the year, the Company was engaged by a foreign bank as a sub-contractor to provide financial advisoryservices and act as a purchase agent in connection with the de-listing of securities of a multinational company fromall stock exchanges in Pakistan. As per the terms of the subject agreement, the Company has received a cash feeof USD 200,000 at the successful de-listing of the securities of all stock exchanges in Pakistan. Further, an additionalfee of USD 100,000 based on the satisfactory provision of services was also payable at the sole discretion of themultinational company, out of which, the Company has received USD 50,000 as at the year end and the remainingUSD 50,000 will be paid at the discretion of the multinational company and hence the Company has not accruedthe same as its income in these financial statements. In respect of the above transactions, the Company hasrecorded income of Rs 26.53 million which is included in the account head of 'financial advisory fee' above.
27.1 This represents mark-up on long-term receivables as fully explained in note 13.1.
27. MARK-UP / PROFIT ON BANK DEPOSITS, INVESTMENTS AND OTHER RECEIVABLES
Profit on bank depositsProfit on term finance certificatesProfit on long-term receivableMark-up on receivable from related party
28,328591
9,595654
39,168
28,1093,055
13,641410
45,215
27.1
2013 2012Note(Rupees in ‘000)
25. CONTINGENCIES AND COMMITMENTSThere were no contingencies and commitments outstanding as at the year end.
24. ACCRUED MARK-UP
Mark-up accrued on: - Long-term borrowing - KASB Bank Limited (the Parent Company) - Short-term borrowing - KASB Bank Limited (the Parent Company)
33-
33
-2,712
2,712
26. OPERATING REVENUE
BrokerageSubscription research incomeFinancial advisory feeCustody servicesProfit on margin trading system
447,0812,069
28,5631,1882,225
481,126
306,8553,2012,580
963254
313,853
26.1

Annual Report 2013 39
Note 2013 2012
28. OPERATING AND ADMINISTRATIVE EXPENSES
Salaries, allowances and other benefitsStaff training and developmentRent, rates and taxesInsurance chargesDepreciationAmortisationRepairs and maintenancePower and utilitiesCommunicationTrading costsInformation technology related costsFees and subscriptionPrinting and stationeryPapers and periodicalsAdvertisement and business promotionSales and marketingTravelling and conveyanceEntertainmentBrokerage expenseLegal and professional chargesAuditor's remunerationStamp chargesDonationsWorkers’ Welfare FundProperty and equipment written offOthers
28.1
28.28
28.3
28.4
7
244,840212
16,404333
10,120537
12,35211,85417,74221,19315,170
6,2344,131
177910
3,7395,9512,573
15,7992,427
98048
2,1052,5532,059
213400,656
201,428382
9,075286
8,605854
6,16210,13714,413
9,99117,55210,274
2,972147911
2,4204,5292,167
14,1022,251
88289
2,0601,756
-172
323,617
28.1 Salaries, allowances and benefits include Company's contribution to provident fund amount to Rs. 6.22 million (2012:Rs. 5.92 million).
(Rupees in ‘000)
28.3 Auditors' remuneration
Statutory audit feeHalf yearly review fee and other certificationsOut of pocket expenses
536 347
97 980
480 310
92
882
28.2 Depreciation
Property and equipmentInvestment properties
9,601519
10,120
7,905700
8,605
79
28.4 Donation were not made to any donee fund in which any director of the Company or his spouse had any interest.
29. FINANCE COST
Mark-up on:- Short-term borrowing (the Parent Company)- Short-term running finance facilities (the Parent Company)- Long-term loan (the Parent Company)- Redeemable capital- Repurchase transactionBank charges
452519
6,021--
1,9508,942
2,712280-
11,2552,3071,885
18,43930. OTHER INCOME
Gain on disposal of property and equipmentGain on disposal of ‘assets held for sale’Rental incomeOthers
494-
6,002767
7,263
67510
7,603590
8,770
7.2
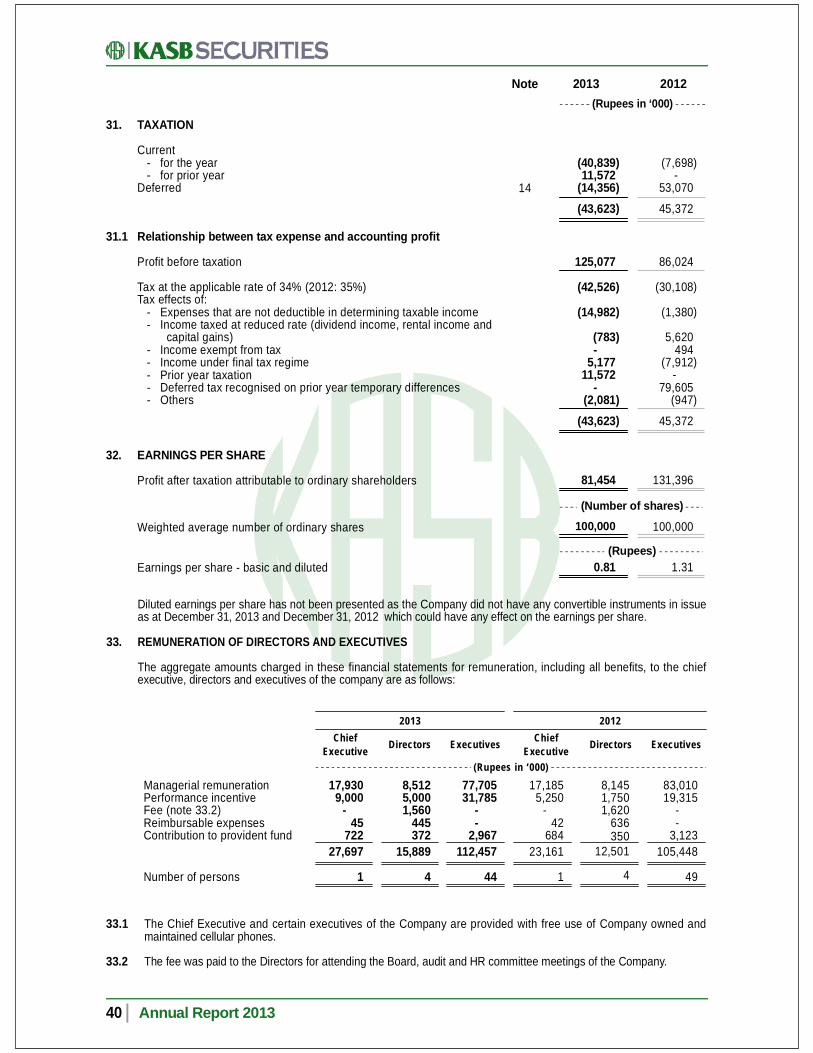
Annual Report 201340
33.1 The Chief Executive and certain executives of the Company are provided with free use of Company owned andmaintained cellular phones.
33.2 The fee was paid to the Directors for attending the Board, audit and HR committee meetings of the Company.
Diluted earnings per share has not been presented as the Company did not have any convertible instruments in issueas at December 31, 2013 and December 31, 2012 which could have any effect on the earnings per share.
33. REMUNERATION OF DIRECTORS AND EXECUTIVES
The aggregate amounts charged in these financial statements for remuneration, including all benefits, to the chiefexecutive, directors and executives of the company are as follows:
31. TAXATION
Current - for the year - for prior yearDeferred
(40,83911,572
(14,356(43,623
(7,698-
53,070
45,372
Note 2013 2012
)
31.1 Relationship between tax expense and accounting profit
Profit before taxation
Tax at the applicable rate of 34% (2012: 35%)Tax effects of: - Expenses that are not deductible in determining taxable income - Income taxed at reduced rate (dividend income, rental income and
capital gains) - Income exempt from tax - Income under final tax regime - Prior year taxation - Deferred tax recognised on prior year temporary differences - Others
125,077
(42,526
(14,982
(783-
5,17711,572
-(2,081
(43,623
86,024
(30,108
(1,380
5,620494
(7,912-
79,605(947
45,372
)
14
(Rupees in ‘000)
)
)
)
))
)
)
))
)
)
32. EARNINGS PER SHARE
Profit after taxation attributable to ordinary shareholders
100,000 100,000
(Number of shares)
Weighted average number of ordinary shares
Earnings per share - basic and diluted(Rupees)
81,454 131,396
0.81 1.31
Managerial remunerationPerformance incentiveFee (note 33.2)Reimbursable expensesContribution to provident fund
8,5125,0001,560
445372
15,889
4
77,70531,785
--
2,967112,457
44Number of persons
(Rupees in ‘000)
ChiefExecutive Directors Executives
17,9309,000
-45
72227,697
1
2013 2012Chief
Executive Directors Executives
83,01019,315
--
3,123105,448
49
8,1451,7501,620
636350
12,501
4
17,1855,250
-42
68423,161
1

Annual Report 2013 41
34. RELATED PARTY TRANSACTIONS
The related parties of the Company comprise of KASB Bank Limited (the Parent company), associated undertakings(including companies under common directorship), employee benefit plans and its key management personnel.The balances with related parties as at December 31, 2013 and December 31, 2012 and transactions with relatedparties during the year ended December 31, 2013 and December 31, 2012 are as follows:-
BALANCES
Long-term depositsTrade debtsProfit receivable on bank depositReceivable against expensesBank balancesTrade payablesLong-term loanPayable against expensesAccrued mark-up
(Rupees in ‘000)
2013
TotalOthersKey
managementpersonnel
Subsidiary/ associates
ParentCompany
-18
144-
303,753-
100,0003,012
33
-50
-3
-1,546
-180-
-118-------
142199144155
303,7531,547
100,0003,424
33
14213-
152-
1-
232-
BALANCES
Long-term depositsTrade debtsOther receivablesPrepaid rentProfit receivable on bank depositReceivable against expensesBank balancesTrade payablesShort-term borrowingPayable against expensesAccrued mark-upRent payable
OFF BALANCE SHEET ITEM
Bank guarantee
(Rupees in ‘000)
2012
TotalOthersKey
managementpersonnel
Subsidiary/ associates
ParentCompany
-115
-332
1,059-
339,980-
250,0004,4352,712
631
51,000
14231
---480-
2-
2,663--
-
-1,052
396----
4,029-312--
-
-221
12,410---------
-
1421,419
12,806332
1,059480
339,9804,031
250,0007,4102,712
631
51,000

Annual Report 201342
Particulars relating to remuneration of Chief Executive Officer, Directors and Executives who are key managementpersonnel are disclosed in note 33.
2013
ParentCompany
Subsidiary/ associates
Keymanagement
personnelOthers Total
(Rupees in ‘000)
IncomeBrokerage income earnedCustody servicesProfit on bank depositsRent incomeOthers
ExpensesBank chargesCharge in respect of contributory planCommunication expensesDonationLocker rentMark-up expenseReimbursement of expensesRent expense
Other transactionsLoans disbursedLoans repaymentMutual Funds bonus units issuedMutual Funds units purchased
1,1896
22,1614,811
-
1,635---
46,992
555889
----
-178-
1,191-
--
11,484---
3,781-
----
1,71638
--654
------211-
8,0178,642
--
421----
-6,224
-2,040
--
48-
--
6,39525,000
3,326222
22,1616,002
654
1,6356,224
11,4842,040
46,9924,595
889
8,0178,6426,395
25,000
TRANSACTIONS
ParentCompany
Subsidiary/ associates
2012Key
managementpersonnel
Others Total
(Rupees in ‘000)
IncomeBrokerage income earnedCustody servicesProfit on bank depositsRent incomeOthers
ExpensesBank chargesCharge in respect of contributory planCommunication expensesDonationLocker rentMark-up expenseReimbursement of expensesRent expenseSalary expense reimbursed
Other transactionsLoans disbursedLoans repaymentMutual Fund bonus units issuedMutual Fund units redeemedProperty and equipment disposed offSale of 'available-for-sale' investmentsSale of ‘assets held for sale’
5717
22,5825,005
-
1,526---
42,992
15,335585-
-------
1,766161-
2,598-
--
8,838---
6,235-
48
-------
2,74648
---
---------
3,2574,835
-----
5285
--410
-5,918
-2,040
--
13--
--
9,36910,000
81412,00087,000
5,611221
22,5827,603
410
1,5265,9188,8382,040
42,992
21,583585
48
3,2574,8359,369
10,000814
12,00087,000
TRANSACTIONS
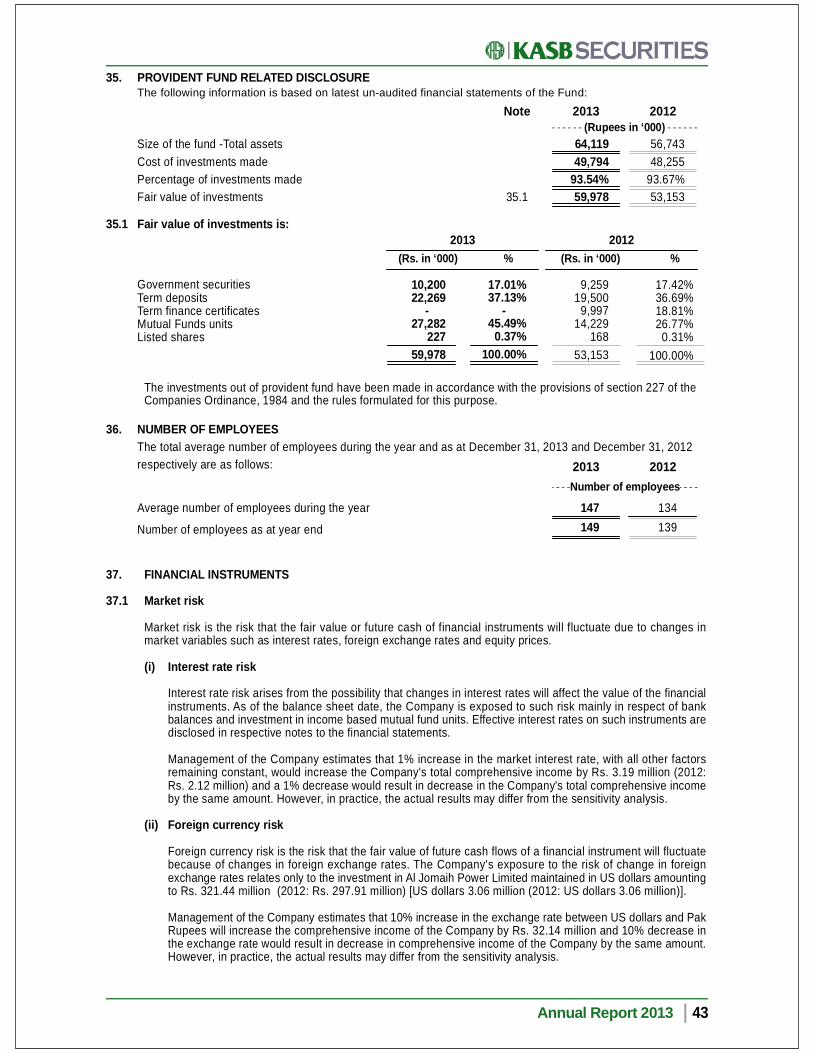
37. FINANCIAL INSTRUMENTS
37.1 Market risk
Market risk is the risk that the fair value or future cash of financial instruments will fluctuate due to changes inmarket variables such as interest rates, foreign exchange rates and equity prices.
(i) Interest rate risk
Interest rate risk arises from the possibility that changes in interest rates will affect the value of the financialinstruments. As of the balance sheet date, the Company is exposed to such risk mainly in respect of bankbalances and investment in income based mutual fund units. Effective interest rates on such instruments aredisclosed in respective notes to the financial statements.
Management of the Company estimates that 1% increase in the market interest rate, with all other factorsremaining constant, would increase the Company's total comprehensive income by Rs. 3.19 million (2012:Rs. 2.12 million) and a 1% decrease would result in decrease in the Company's total comprehensive incomeby the same amount. However, in practice, the actual results may differ from the sensitivity analysis.
(ii) Foreign currency risk
Foreign currency risk is the risk that the fair value of future cash flows of a financial instrument will fluctuatebecause of changes in foreign exchange rates. The Company's exposure to the risk of change in foreignexchange rates relates only to the investment in Al Jomaih Power Limited maintained in US dollars amountingto Rs. 321.44 million (2012: Rs. 297.91 million) [US dollars 3.06 million (2012: US dollars 3.06 million)].
Management of the Company estimates that 10% increase in the exchange rate between US dollars and PakRupees will increase the comprehensive income of the Company by Rs. 32.14 million and 10% decrease inthe exchange rate would result in decrease in comprehensive income of the Company by the same amount.However, in practice, the actual results may differ from the sensitivity analysis.
Annual Report 2013 43
Size of the fund -Total assetsCost of investments madePercentage of investments madeFair value of investments
35. PROVIDENT FUND RELATED DISCLOSUREThe following information is based on latest un-audited financial statements of the Fund:
The investments out of provident fund have been made in accordance with the provisions of section 227 of theCompanies Ordinance, 1984 and the rules formulated for this purpose.
Government securitiesTerm depositsTerm finance certificatesMutual Funds unitsListed shares
9,25919,500
9,99714,229
16853,153
17.42%36.69%18.81%26.77%
0.31%100.00%
10,20022,269
-27,282
22759,978
17.01%37.13%
-45.49%
0.37%100.00%
2013 2012(Rs. in ‘000) % (Rs. in ‘000) %
36. NUMBER OF EMPLOYEESThe total average number of employees during the year and as at December 31, 2013 and December 31, 2012respectively are as follows:
Average number of employees during the year
Number of employees as at year end
147149
134139
2013 2012Number of employees
64,11949,794
93.54%59,978
56,74348,255
93.67%53,15335.1
Note 2013 2012(Rupees in ‘000)
35.1 Fair value of investments is:
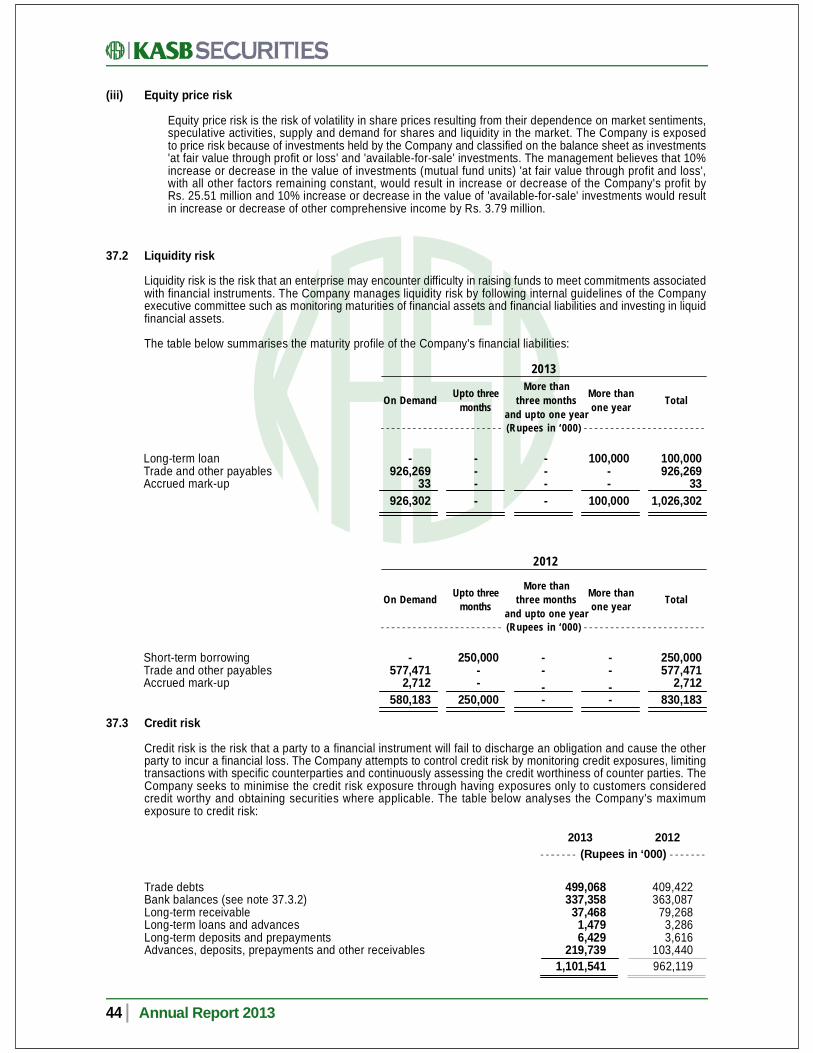
Annual Report 201344
37.2 Liquidity risk
Liquidity risk is the risk that an enterprise may encounter difficulty in raising funds to meet commitments associatedwith financial instruments. The Company manages liquidity risk by following internal guidelines of the Companyexecutive committee such as monitoring maturities of financial assets and financial liabilities and investing in liquidfinancial assets.
The table below summarises the maturity profile of the Company's financial liabilities:
2013
2012
Long-term loanTrade and other payablesAccrued mark-up
-926,269
33926,302
On Demand Upto threemonths
More thanthree months
and upto one year
More thanone year Total
(Rupees in ‘000)
Short-term borrowingTrade and other payablesAccrued mark-up
250,000577,471
2,712830,183
-577,471
2,712580,183
250,000--
250,000
On Demand Upto threemonths
More thanthree months
and upto one year
More thanone year Total
----
----
(Rupees in ‘000)
37.3 Credit risk
Credit risk is the risk that a party to a financial instrument will fail to discharge an obligation and cause the otherparty to incur a financial loss. The Company attempts to control credit risk by monitoring credit exposures, limitingtransactions with specific counterparties and continuously assessing the credit worthiness of counter parties. TheCompany seeks to minimise the credit risk exposure through having exposures only to customers consideredcredit worthy and obtaining securities where applicable. The table below analyses the Company's maximumexposure to credit risk:
(iii) Equity price risk
Equity price risk is the risk of volatility in share prices resulting from their dependence on market sentiments,speculative activities, supply and demand for shares and liquidity in the market. The Company is exposedto price risk because of investments held by the Company and classified on the balance sheet as investments'at fair value through profit or loss' and 'available-for-sale' investments. The management believes that 10%increase or decrease in the value of investments (mutual fund units) 'at fair value through profit and loss',with all other factors remaining constant, would result in increase or decrease of the Company's profit byRs. 25.51 million and 10% increase or decrease in the value of 'available-for-sale' investments would resultin increase or decrease of other comprehensive income by Rs. 3.79 million.
Trade debtsBank balances (see note 37.3.2)Long-term receivableLong-term loans and advancesLong-term deposits and prepaymentsAdvances, deposits, prepayments and other receivables
499,068337,358
37,4681,4796,429
219,7391,101,541
409,422363,087
79,2683,2863,616
103,440962,119
100,000926,269
331,026,302
100,000--
100,000
----
----
(Rupees in ‘000)2013 2012
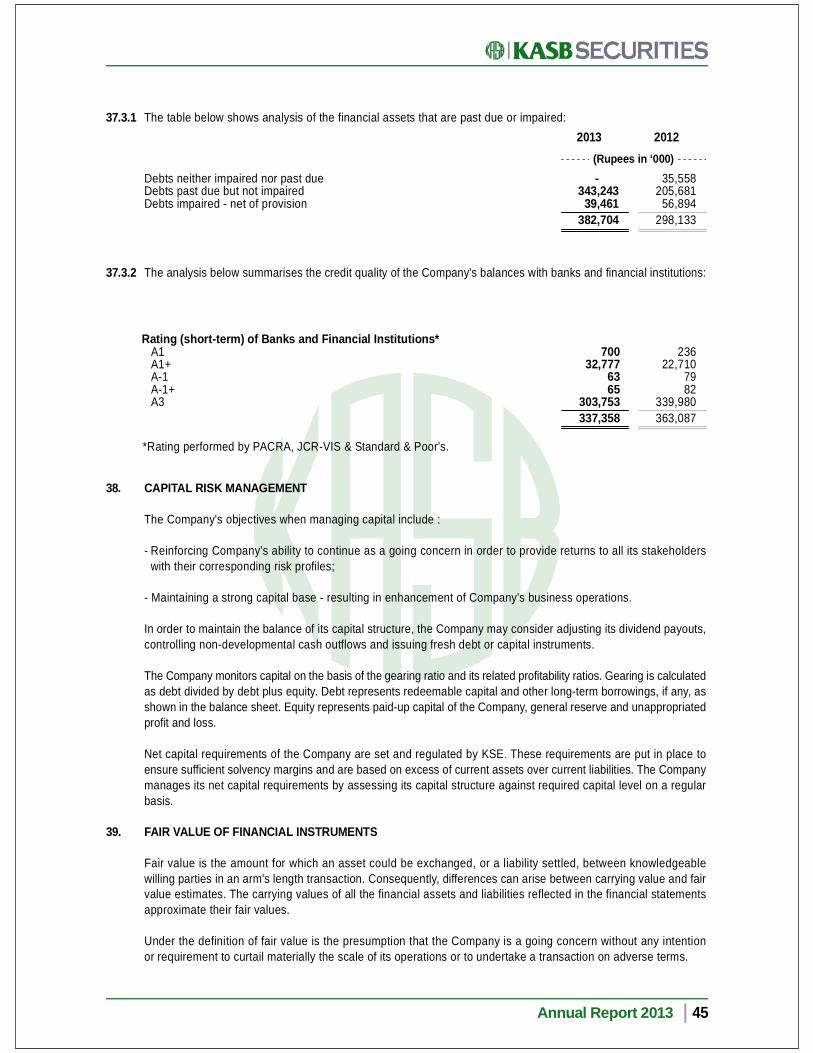
38. CAPITAL RISK MANAGEMENT
The Company's objectives when managing capital include :
- Reinforcing Company’s ability to continue as a going concern in order to provide returns to all its stakeholders with their corresponding risk profiles;
- Maintaining a strong capital base - resulting in enhancement of Company's business operations.
In order to maintain the balance of its capital structure, the Company may consider adjusting its dividend payouts,controlling non-developmental cash outflows and issuing fresh debt or capital instruments.
The Company monitors capital on the basis of the gearing ratio and its related profitability ratios. Gearing is calculatedas debt divided by debt plus equity. Debt represents redeemable capital and other long-term borrowings, if any, asshown in the balance sheet. Equity represents paid-up capital of the Company, general reserve and unappropriatedprofit and loss.
Net capital requirements of the Company are set and regulated by KSE. These requirements are put in place toensure sufficient solvency margins and are based on excess of current assets over current liabilities. The Companymanages its net capital requirements by assessing its capital structure against required capital level on a regularbasis.
39. FAIR VALUE OF FINANCIAL INSTRUMENTS
Fair value is the amount for which an asset could be exchanged, or a liability settled, between knowledgeablewilling parties in an arm's length transaction. Consequently, differences can arise between carrying value and fairvalue estimates. The carrying values of all the financial assets and liabilities reflected in the financial statementsapproximate their fair values.
Under the definition of fair value is the presumption that the Company is a going concern without any intentionor requirement to curtail materially the scale of its operations or to undertake a transaction on adverse terms.
Annual Report 2013 45
37.3.2 The analysis below summarises the credit quality of the Company's balances with banks and financial institutions:
*Rating performed by PACRA, JCR-VIS & Standard & Poor's.
Rating (short-term) of Banks and Financial Institutions* A1 A1+ A-1 A-1+ A3
70032,777
6365
303,753 337,358
23622,710
7982
339,980 363,087
37.3.1 The table below shows analysis of the financial assets that are past due or impaired:
Debts neither impaired nor past dueDebts past due but not impairedDebts impaired - net of provision
35,558205,681
56,894298,133
-343,243
39,461382,704
(Rupees in ‘000)
2013 2012

Annual Report 201346
2013
‘Available-for-sale’ investmentsInvestment ‘at fair value through profit and loss’ - held for trading
359,571267,630
627,201
Total Level 1
- -
-
Level 2 Level 3(note 39.1.1)
38,129255,080
293,209
321,44212,550
333,992
40. DATE OF AUTHORISATION
These financial statements have been authorised for issue by the Board of Directors of the Company onMarch 20, 2014.
41. GENERAL
41.1 Corresponding figures have been rearranged and re-classified, wherever necessary, for the purpose of comparison.However, there are no material reclassifications to report.
41.2 The Board of Directors of the Company has proposed a cash dividend of Rs. 0.50 per share (2012: Rs. 0.50 pershare) amounting to Rs. 50 million (2012: Rs. 50 million) at its meeting held on March 20, 2014 for the approvalof members at the Annual General Meeting to be held on April 22, 2014. These financial statements do not reflectthis appropriation as explained in note 4.11.
41.3 Figures have been rounded off to the nearest thousand.
2012
‘Available-for-sale’ investmentsInvestment ‘at fair value through profit and loss’ - held for trading
346,162175,978
522,140
Total
48,256163,428
211,684
Level 1
- --
Level 2 Level 3(note 39.1.1)
297,90612,550
310,456
39.1.1 The reconciliation from the beginning to ending balances for assets measured at fair value using level 3 valuationtechnique is given below:
(Rupees in ‘000)2013 2012
Opening balanceAdditions during the yearProvision for impairmentInvestment disposed during the year
Closing balance
310,45623,536
--
333,992
309,22125,480
(12,549(11,696
310,456
))
(Rupees in ‘000)
(Rupees in ‘000)
))
As at December 31, 2013 the Company held the following financial instruments measured at fair value:
39.1 Financial Assets Fair Value Hierarchy
All financial instruments carried at fair value are categorised in three categories defined as follows:
Level 1 - quoted prices in active markets for identical assets.
Level 2 - other techniques for which all inputs which have a significant effect on the recorded fair value areobservable, either directly or indirectly.
Level 3 - techniques which use inputs which have a significant effect on the recorded fair value that are not basedon observable market data.
Nadir RahmanChief Executive Officer
Saeed Yousuf ChinoyChairman
Asad Mustafa ShafqatChief Financial Officer
CONSOLIDATED FINANCIAL STATEMENTS
Annual Report 2013 47
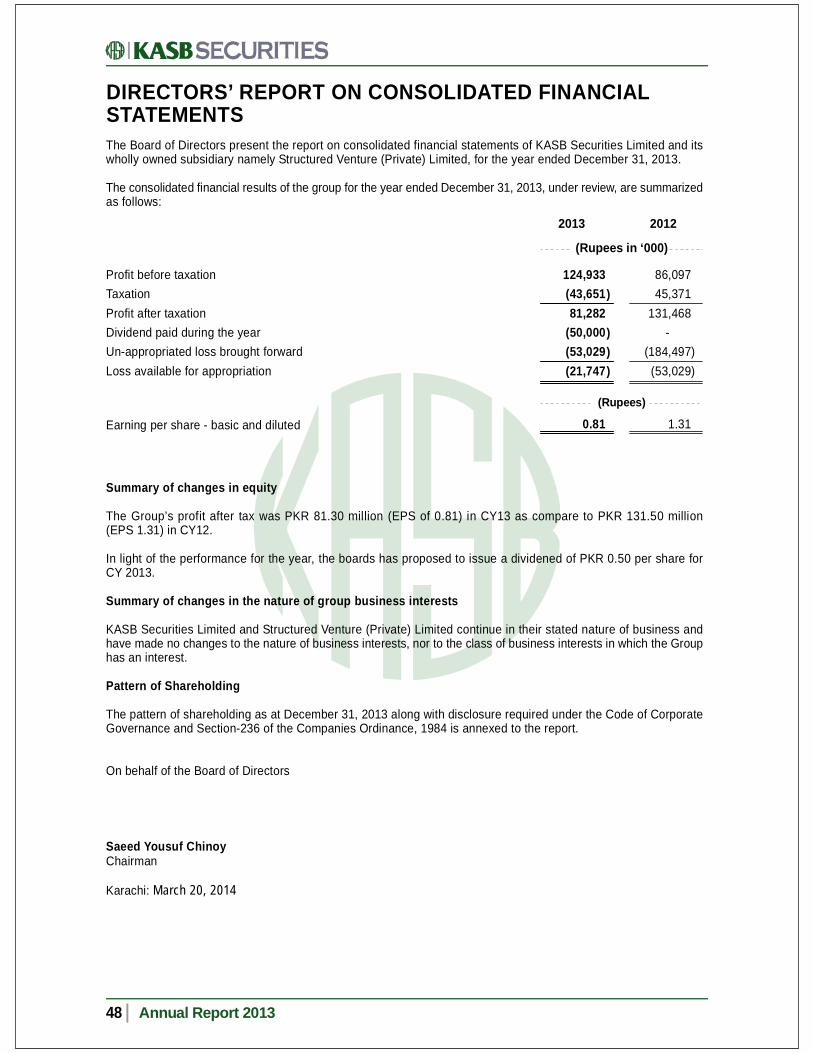
The Board of Directors present the report on consolidated financial statements of KASB Securities Limited and itswholly owned subsidiary namely Structured Venture (Private) Limited, for the year ended December 31, 2013.
The consolidated financial results of the group for the year ended December 31, 2013, under review, are summarizedas follows:
DIRECTORS’ REPORT ON CONSOLIDATED FINANCIALSTATEMENTS
2013 2012
(Rupees in ‘000)
Summary of changes in equity
The Group’s profit after tax was PKR 81.30 million (EPS of 0.81) in CY13 as compare to PKR 131.50 million(EPS 1.31) in CY12.
In light of the performance for the year, the boards has proposed to issue a dividened of PKR 0.50 per share forCY 2013.
Summary of changes in the nature of group business interests
KASB Securities Limited and Structured Venture (Private) Limited continue in their stated nature of business andhave made no changes to the nature of business interests, nor to the class of business interests in which the Grouphas an interest.
Pattern of Shareholding
The pattern of shareholding as at December 31, 2013 along with disclosure required under the Code of CorporateGovernance and Section-236 of the Companies Ordinance, 1984 is annexed to the report.
On behalf of the Board of Directors
Annual Report 201348
124,933(43,65181,282
(50,000(53,029(21,747
86,09745,371
131,468-
(184,497(53,029
))
(Rupees)
Saeed Yousuf ChinoyChairman
Karachi: March 20, 2014
0.81 1.31
)
)
)Profit before taxationTaxationProfit after taxationDividend paid during the yearUn-appropriated loss brought forwardLoss available for appropriation
Earning per share - basic and diluted
)

Annual Report 2013 49
A member firm of Ernst & Young Global Limited
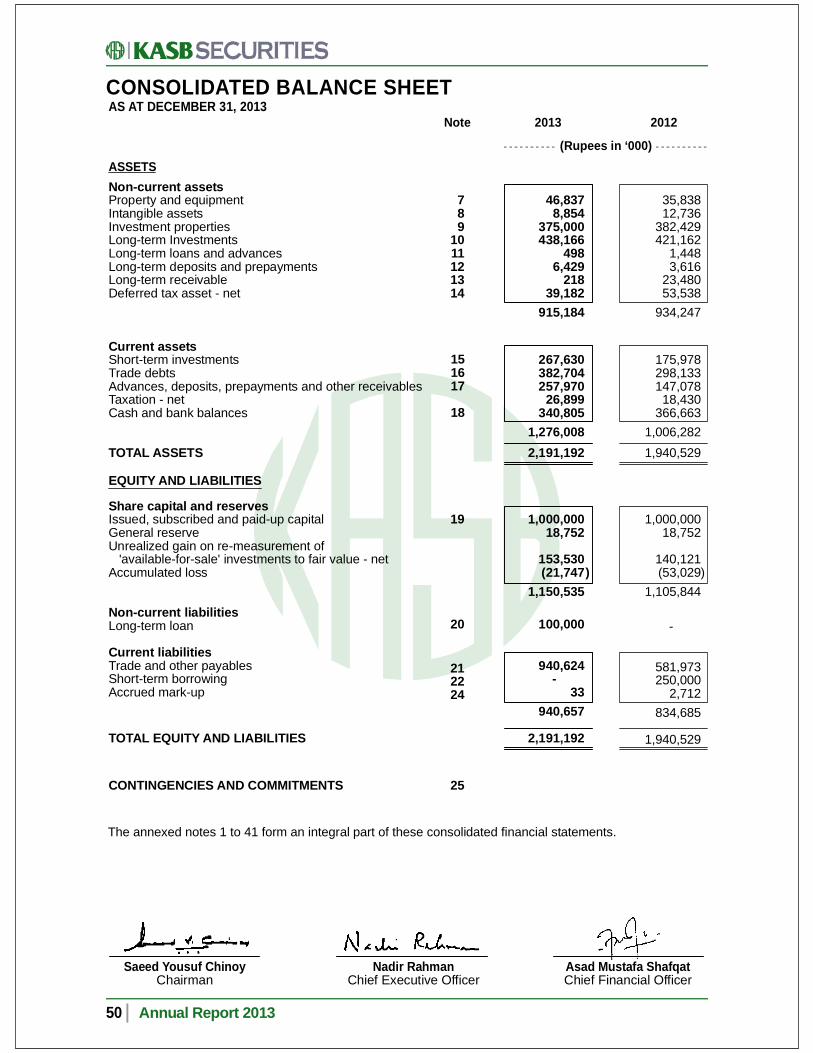
CONSOLIDATED BALANCE SHEETAS AT DECEMBER 31, 2013
Non-current assetsProperty and equipmentIntangible assetsInvestment propertiesLong-term InvestmentsLong-term loans and advancesLong-term deposits and prepaymentsLong-term receivableDeferred tax asset - net
Current assetsShort-term investmentsTrade debtsAdvances, deposits, prepayments and other receivablesTaxation - netCash and bank balances
TOTAL ASSETS
Share capital and reservesIssued, subscribed and paid-up capitalGeneral reserveUnrealized gain on re-measurement of 'available-for-sale' investments to fair value - netAccumulated loss
Non-current liabilitiesLong-term loan
Current liabilitiesTrade and other payablesShort-term borrowingAccrued mark-up
TOTAL EQUITY AND LIABILITIES
CONTINGENCIES AND COMMITMENTS
Note
The annexed notes 1 to 41 form an integral part of these consolidated financial statements.
ASSETS
789
1011121314
151617
18
19
212224
25
Annual Report 201350
EQUITY AND LIABILITIES
2013 2012
35,83812,736
382,429421,162
1,4483,616
23,48053,538
934,247
175,978298,133147,07818,430
366,6631,006,2821,940,529
1,000,00018,752
140,121(53,029
1,105,844
-
581,973250,000
2,712834,685
1,940,529
)
46,8378,854
375,000438,166
4986,429
21839,182
915,184
267,630382,704257,970
26,899340,805
1,276,0082,191,192
1,000,00018,752
153,530(21,747
1,150,535
100,000
940,624-
33940,657
2,191,192
)
Nadir RahmanChief Executive Officer
Saeed Yousuf ChinoyChairman
Asad Mustafa ShafqatChief Financial Officer
(Rupees in ‘000)
20
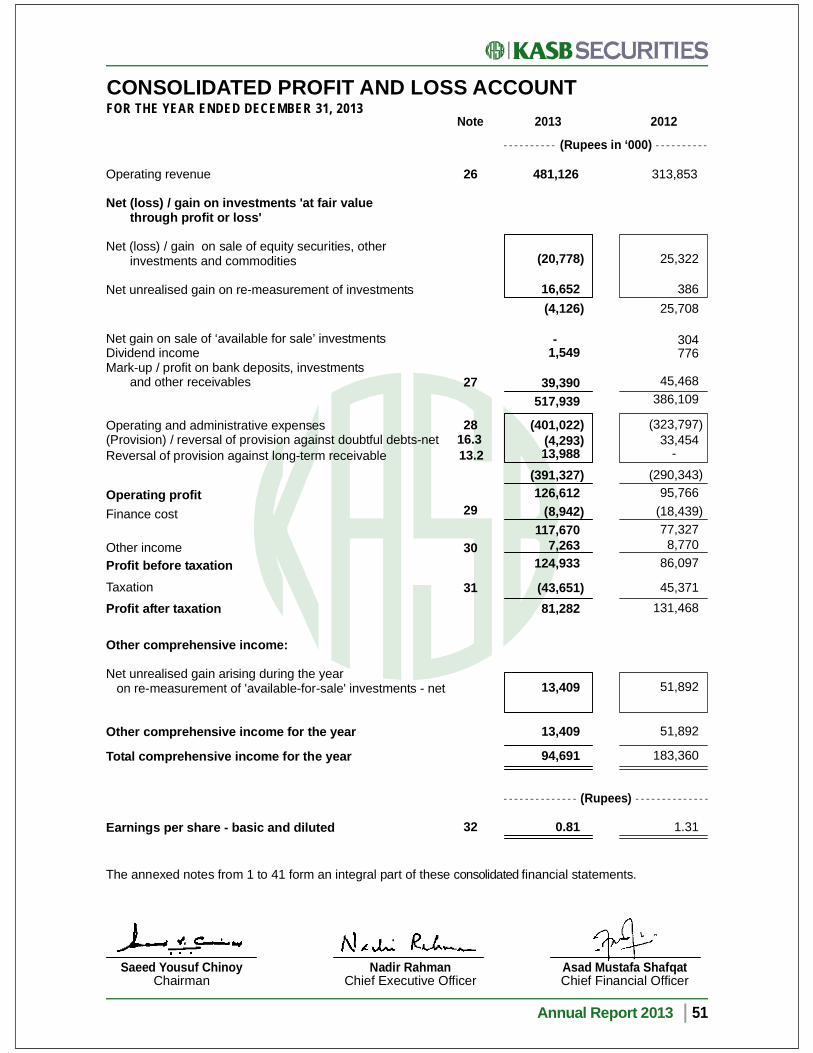
CONSOLIDATED PROFIT AND LOSS ACCOUNTFOR THE YEAR ENDED DECEMBER 31, 2013
Annual Report 2013 51
Nadir RahmanChief Executive Officer
Saeed Yousuf ChinoyChairman
Asad Mustafa ShafqatChief Financial Officer
Note 2013 2012
(Rupees in ‘000)
1.31
The annexed notes from 1 to 41 form an integral part of these consolidated financial statements.
26
27
28
13.2
29
30
31
32 0.81
481,126
25,322
38625,708
304776
45,468386,109
(323,79733,454
-
(290,34395,766
(18,43977,3278,770
86,097
45,371131,468
51,892
51,892
183,360
)
313,853Operating revenue
Net (loss) / gain on investments 'at fair valuethrough profit or loss'
Net (loss) / gain on sale of equity securities, otherinvestments and commodities
Net unrealised gain on re-measurement of investments
Net gain on sale of ‘available for sale’ investmentsDividend incomeMark-up / profit on bank deposits, investments
and other receivables
Operating and administrative expenses(Provision) / reversal of provision against doubtful debts-netReversal of provision against long-term receivable
Operating profitFinance cost
Other incomeProfit before taxationTaxation
Profit after taxation
Other comprehensive income:
Net unrealised gain arising during the year on re-measurement of 'available-for-sale' investments - net
Other comprehensive income for the year
Total comprehensive income for the year
Earnings per share - basic and diluted
(Rupees)
)
)
16.3
)
)
))
)
)
(20,778
16,652(4,126
-1,549
39,390517,939
(401,022(4,29313,988
(391,327126,612
(8,942117,670
7,263124,933
(43,65181,282
13,409
13,409
94,691
)
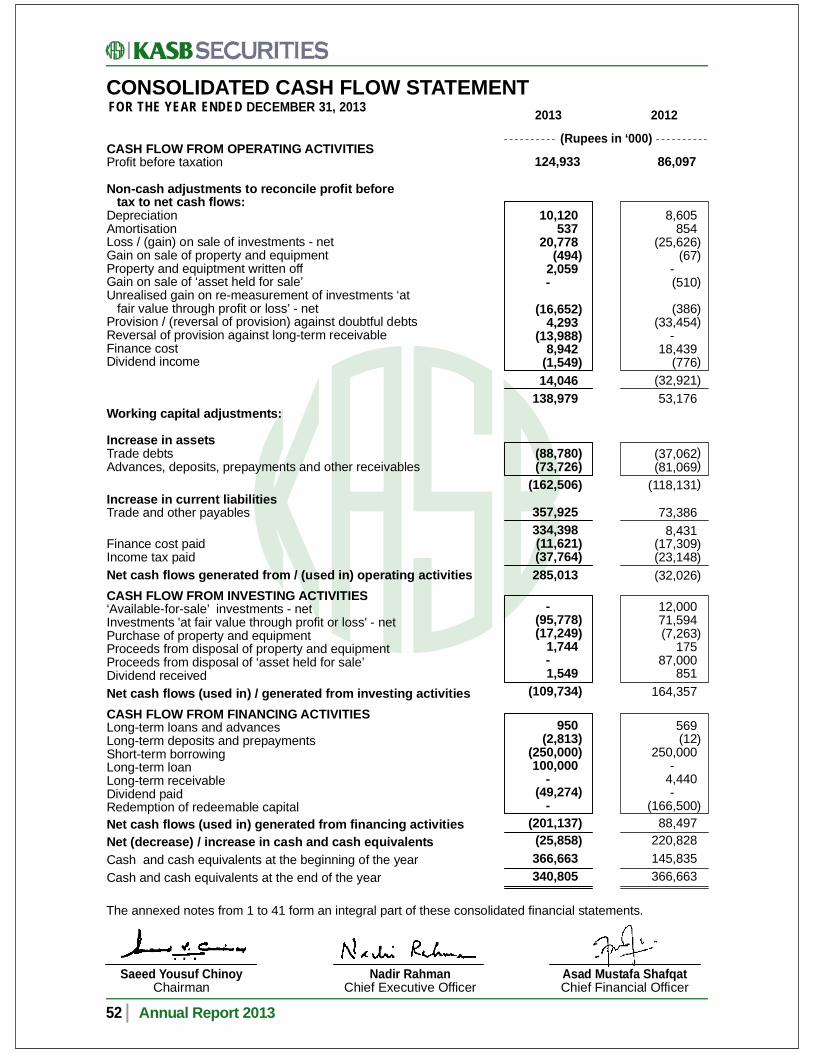
CONSOLIDATED CASH FLOW STATEMENTFOR THE YEAR ENDED DECEMBER 31, 2013
Annual Report 201352
Nadir RahmanChief Executive Officer
Saeed Yousuf ChinoyChairman
Asad Mustafa ShafqatChief Financial Officer
The annexed notes from 1 to 41 form an integral part of these consolidated financial statements.
CASH FLOW FROM OPERATING ACTIVITIESProfit before taxation
Non-cash adjustments to reconcile profit before tax to net cash flows:DepreciationAmortisationLoss / (gain) on sale of investments - netGain on sale of property and equipmentProperty and equiptment written offGain on sale of ‘asset held for sale’Unrealised gain on re-measurement of investments ‘at fair value through profit or loss’ - netProvision / (reversal of provision) against doubtful debtsReversal of provision against long-term receivableFinance costDividend income
Working capital adjustments:
Increase in assetsTrade debtsAdvances, deposits, prepayments and other receivables
Increase in current liabilitiesTrade and other payables
Finance cost paidIncome tax paidNet cash flows generated from / (used in) operating activitiesCASH FLOW FROM INVESTING ACTIVITIES‘Available-for-sale’ investments - netInvestments 'at fair value through profit or loss' - netPurchase of property and equipmentProceeds from disposal of property and equipmentProceeds from disposal of ‘asset held for sale’Dividend receivedNet cash flows (used in) / generated from investing activitiesCASH FLOW FROM FINANCING ACTIVITIESLong-term loans and advancesLong-term deposits and prepaymentsShort-term borrowingLong-term loanLong-term receivableDividend paidRedemption of redeemable capitalNet cash flows (used in) generated from financing activitiesNet (decrease) / increase in cash and cash equivalentsCash and cash equivalents at the beginning of the yearCash and cash equivalents at the end of the year
2013 2012
124,933
10,120537
20,778(494
2,059-
(16,6524,293
(13,9888,942
(1,54914,046
138,979
(88,780(73,726
(162,506
357,925334,398(11,621(37,764285,013
-(95,778(17,249
1,744-1,549
(109,734
950(2,813
(250,000100,000
-(49,274
-(201,137(25,858366,663340,805
86,097
8,605854
(25,626(67
-(510
(386(33,454
-18,439
(776(32,92153,176
(37,062(81,069
(118,131
73,3868,431
(17,309(23,148(32,026
12,00071,594(7,263
17587,000
851164,357
569(12
250,000-
4,440-
(166,50088,497
220,828145,835366,663
))
)
))
)
)
)
(Rupees in ‘000)
)
)
)
)
)
))
)
))
)
))
)
))
)
)
)
))
))
)
)
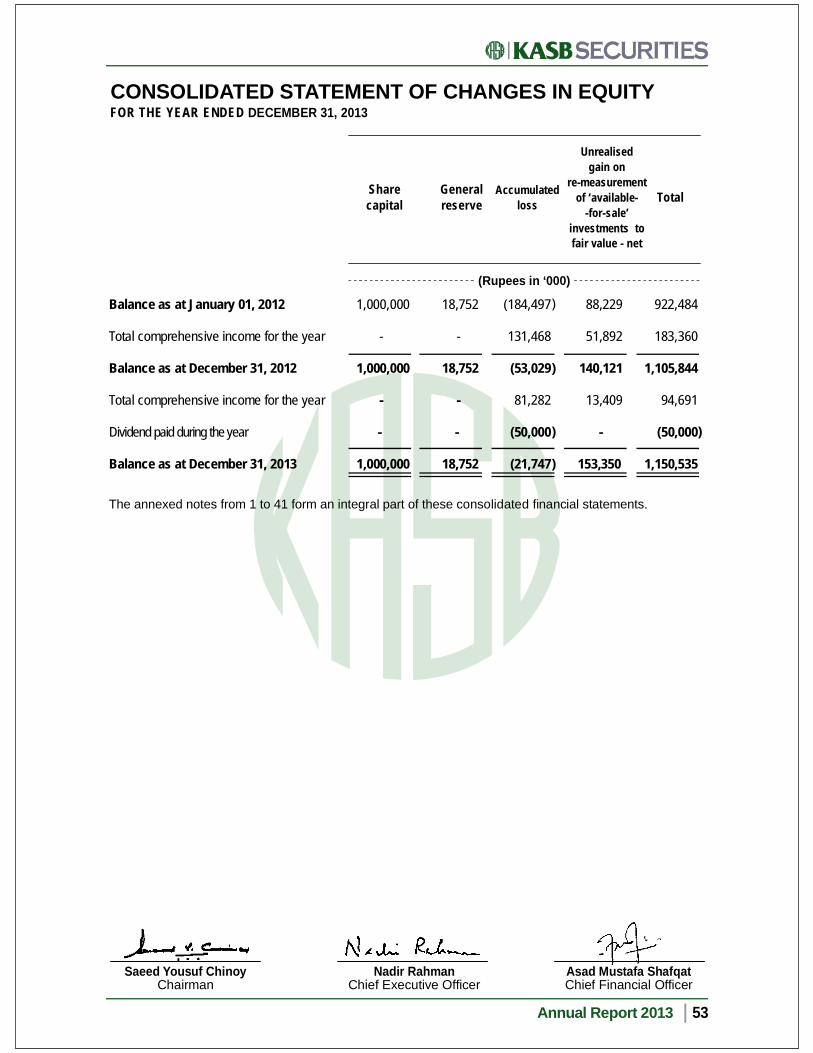
CONSOLIDATED STATEMENT OF CHANGES IN EQUITYFOR THE YEAR ENDED DECEMBER 31, 2013
(Rupees in ‘000)
Balance as at January 01, 2012
Total comprehensive income for the year
Balance as at December 31, 2012
Total comprehensive income for the year
Dividend paid during the year
Balance as at December 31, 2013
922,484
183,360
1,105,844
94,691
(50,000
1,150,535
1,000,000
-
1,000,000
-
-
1,000,000
18,752
-
18,752
-
-
18,752
(184,497
131,468
(53,029
81,282
(50,000
(21,747
88,229
51,892
140,121
13,409
-
153,350
Unrealisedgain on
re-measurementof ‘available-
-for-sale’investments tofair value - net
Accumulatedloss
Generalreserve
Sharecapital Total
)
)
The annexed notes from 1 to 41 form an integral part of these consolidated financial statements.
Annual Report 2013 53
Nadir RahmanChief Executive Officer
Saeed Yousuf ChinoyChairman
Asad Mustafa ShafqatChief Financial Officer
)
)
)
NOTES TO THE CONSOLIDATED FINANCIAL STATEMENTSFOR THE YEAR ENDED DECEMBER 31, 2013
1. STATUS AND NATURE OF BUSINESS
The Group comprises of:
Holding company- KASB Securities Limited
Subsidiary company- Structured Venture (Private) Limited
KASB Securities Limited (the Company) was incorporated in Pakistan on October 24, 2000 under the CompaniesOrdinance, 1984 and commenced its operations effective January 01, 2003, on the transfer of assets and liabilitiesof the securities segment of the then Khadim Ali Shah Bukhari and Company Limited under a scheme of arrangementapproved by the High Court of Sindh. The shares of the Group are listed on the Karachi Stock Exchange Limited.The registered office of the Group is situated at 5th Floor, Trade Centre, I.I. Chundrigar Road, Karachi.
The Group is a subsidiary of KASB Bank Limited (the Parent Company) which holds 77.12% of the shares of theGroup. The ultimate parent of the Group is KASB Corporation Limited [formerly: KASB Finance (Private) Limited].
The Company has corporate membership of the Karachi Stock Exchange Limited (KSE) and Pakistan MercantileExchange Limited (PMEL) and is principally engaged in the business of stocks, money market, foreign exchangeand commodity broking. Other activities include investment in a mix of listed and unlisted equity and debt securities,economic research and advisory services.
Structured Venture (Private) Limited (the Subsidiary) was incorporated in Pakistan on 25 June 2010 under theCompanies Ordinance, 1984. The registered office of the Company is situated at 5th Floor, Trade Centre, I.I.Chundrigar Road, Karachi.
The subsidiary is wholly owned by KASB Securities Limited.
The subsidiary's core objective is to capitalize on opportunities across different asset classes, including but notlimited to, commodities, structured products, real estate etc. In addition, the subsidiary can, subject to regulatoryapprovals, invest / participate in selected local and foreign business ventures.
2. BASIS OF PREPARATION
These consolidated financial statements have been prepared under the historical cost convention except forinvestments which are carried at fair value as referred to in note 4.7 below.
3. STATEMENT OF COMPLIANCE
These consolidated financial statements have been prepared in accordance with approved accounting standardsas applicable in Pakistan. Approved accounting standards comprise of such International Financial ReportingStandards (IFRS) issued by the International Accounting Standards Board (IASB) as are notified under the CompaniesOrdinance, 1984, provisions of and directives issued under the Companies Ordinance, 1984. In case requirementsdiffer, the provisions or directives of the Companies Ordinance, 1984 shall prevail.
4. SUMMARY OF SIGNIFICANT ACCOUNTING POLICIES
4.1 The accounting policies adopted in the preparation of these consolidated financial statements are consistent withthose of the previous financial year except as described below:
Annual Report 201354
IFRS 7 – Financial Instruments : Disclosures – (Amendments)
The Group has adopted the following amendments to IFRSs which became effective for the current year:

4.2 Basis of consolidation
The financial statements of the subsidiary are included in the consolidated financial statements from the date thecontrol commences until the date control ceases. In preparing consolidated financial statements, the financialstatements of the Holding Company and the subsidiary are consolidated on a line by line basis by adding togetherthe like items of assets, liabilities, income and expenses. Significant intercompany transactions have been eliminated.
4.3 Property and equipment
These are stated at cost less accumulated depreciation and impairment, if any. Such costs include the cost ofreplacing parts of fixed assets when that cost is incurred. Maintenance and normal repairs are charged to incomeas and when incurred. Depreciation is charged to income over the useful life of the asset on a systematic basisapplying the straight line method at the rates specified in note 7 to the consolidated financial statements.
Property and equipment are assessed for impairment whenever there is an indication that the same are impaired.Depreciation is charged from the day of purchase and no depreciation is charged on the day of disposal.
An item of fixed asset is derecognised upon disposal or when no future economic benefits are expected from itsuse or disposal.
The assets' residual values, useful lives and methods are reviewed and adjusted, if appropriate at each financialyear end.
Gains and losses on disposals, if any, of assets are included in income currently.
4.4 Assets subject to finance lease
Assets subject to finance lease are stated at fair value of the leased assets at the inception of the lease or, if lowerat the present value of minimum lease payments. Depreciation is charged at the rates specified in note 7.
The outstanding obligations under finance lease less finance charges allocated to future periods are shown asliability. The finance charges are calculated at the rate implicit in the leases and are charged to profit and lossaccount.
4.5 Intangible assets
These are stated at cost less accumulated amortisation and impairment, if any. Amortisation is charged over theuseful life of the asset on a systematic basis to income applying the straight line method at the rate specified innote 8 to the consolidated financial statements.
Intangible assets with indefinite useful lives are not amortised. These are annually tested for impairment to assesswhether these are in excess of their recoverable amounts, and where the carrying amounts exceeds the estimatedrecoverable amounts, the carrying amounts are written down to the estimated recoverable amounts.
Intangible assets are assessed for impairment whenever there is an indication that the same are impaired. Costsassociated with maintaining assets are recognized as an expense in the period in which these are incurred. Gainsand losses on disposals, if any, of assets are included in income currently.
Annual Report 2013 55
IAS 1 – Presentation of Financial Statements - Clarification of the requirements for comparative information.
IAS 16 – Property, Plant and Equipment – Clarification of Servicing Equipment.
IAS 32 – Financial Instruments: Presentation – Tax Effects of Distribution to Holders of Equity Instruments.
IAS 34 – Interim Financial Reporting – Interim Financial Reporting and Segment Information for Total Assets and Liabilities.
The adoption of the above amendments did not have any effect on the financial statements.
Improvements to Accounting Standards Issued by the IASB:
Investments at fair value through profit or loss
Investments classified as 'investments at fair value through profit or loss' are carried at fair value. Gain / loss onremeasurement of such investments to fair value is recognised in the profit and loss account.
Available-for-sale
Investments classified as 'available-for-sale' are measured at fair value. Gains or losses on 'available-for-sale'investments are recognised directly in equity until the investment is sold, derecognised or is determined to beimpaired, at which time the cumulative gain or loss previously reported in statement of comprehensive income isincluded in income. Upon impairment, gain / loss which had been previously recognised directly in the statementof comprehensive income, is included in the profit and loss account for the year.
The fair value of those investments representing listed equity and other securities i.e. debt instruments, are determinedon the basis of year-end prices obtained from stock exchange quotations.
4.7.2 Loans and receivables
Loans and receivables are non-derivative financial assets with fixed or determinable payments that are not quotedin an active market.These are carried at amortised cost using effective yield method, less impairment losses, ifany.
4.8 Financial instruments
All the financial assets and financial liabilities are recognised at the time when the Group becomes a party to thecontractual provisions of the instrument. Financial assets are derecognised when the Group loses control of thecontractual rights that comprise the financial assets. Financial liabilities are derecognised when they are extinguished,
that is, when the obligation specified in the contract is discharged, cancelled, or expired. Any gain or loss onderecognition of the financial assets and financial liabilities is taken to income currently.
4.9 Off-setting of financial assets and financial liabilities
Financial assets and financial liabilities are off-set and the net amount is reported in the balance sheet if the Grouphas a legally enforceable right to set-off the transactions and also intends either to settle on a net basis or to realisethe asset and settle the liability simultaneously. Income and expenses arising from such assets and liabilities arealso accordingly off-set.
4.10 Revenue recognition
- Brokerage income is recognised as and when such services are rendered.- Financial advisory fees and other income are recognised on an accrual basis.- Underwriting commission is recognised on accrual basis in accordance with the terms of the agreement.- Capital gains and losses on sale of securities are recognised as and when realised.- Mark-up income, return on bank deposits and balances are recognized on accrual basis.- Dividend income is recorded when the right to receive the dividend is established.
4.11 Taxation
Current
Provision for current taxation is based on taxable income at the current rates of taxation after taking into accounttax credits, rebates and tax exemptions available, if any. The charge for current tax also includes adjustments wherenecessary, relating to prior years which arise from assessment framed / finalised during the year.
Annual Report 201356
4.6 Investment properties
Investment properties are carried at cost less accumulated depreciation and accumulated impairment losses, if any.Depreciation is charged at the rate specified in note 9. Subsequent expenditures, depreciation and gains or losseson disposals are accounted for in the same manner as property and equipment.
4.7 Financial assets
4.7.1 Investments
Investment in subsidary company is stated at cost less provision for impairment, if any. Other investments areclassified as either 'investments at fair value through profit or loss', 'held-to-maturity' investments or 'available-forsale' investments, as appropriate.
When investments are recognised initially, these are measured at fair value plus, in the case of investments not atfair value through profit or loss, directly attributable transaction costs.
All regular way purchases / sales of investments are recognised on the trade date, i.e. the date on which commitmentto purchase / sale is made by the Group. Regular way purchases or sales of financial assets are those, the contractfor which requires delivery of securities within the time frame generally established by regulation or convention inthe market place.

4.12 Dividend distributions and appropriations
Dividend distributions and appropriations are recorded in the period in which the distributions and appropriationsare approved.
4.13 Employees’ benefits
Defined contribution plan
The Group operates a contributory provident fund for all its permanent employees, and contributions are mademonthly in accordance with the fund rules.
Employee compensated absences
The Group allows it's management and non-management employees' to avail 30 days annual earned leave. Theunutilized portion of the earned leave is neither accumulated nor encashable.
4.14 Cash and cash equivalents
Cash in hand and at banks is carried at cost. For the purposes of cash flow statement, cash and cash equivalentsconsist of cash in hand and bank balances. For the purpose of statement of cash flows, cash and cash equivalentsare presented net of short-term borrowings which are repayable on demand or in the short-term and form an integralpart of the Group's cash management.
4.15 Foreign currency transactions
Functional and presentation currency
These consolidated financial statements are presented in Pak Rupees, which is the Group's functional and presentationcurrency.
Foreign currency translation
Foreign currency transactions recorded at the exchange rate prevailing on the date of the transaction. Monetaryassets and liabilities in foreign currencies are translated at the rates of exchange prevailing on the balance sheetdate. Gains and losses on translation are taken into income currently. Non monetary-items that are measured interms of historical cost in a foreign currency are translated using the exchange rate as at the date of the initialtransaction. Non-monetary items measured at fair value in a foreign currency are translated using the exchangerate at the date when the fair value was determined.
4.16 Provisions
Provisions are recognized when the Group has the legal or constructive obligation as a result of past events, andit is probable that an outflow of resources will be required to settle the obligation and a reliable estimate of theamount can be made.
4.17 Trade and other payables
Trade and other payables are recognized initially at fair value plus directly attributable costs, if any, and subsequentlymeasured at amortised cost.
Annual Report 2013 57
Deferred
Deferred tax is recognized using the balance sheet liability method on all temporary differences arising betweentax bases of assets and liabilities and their carrying amounts appearing in the financial statements. A deferred taxasset is recognised only to the extent that it is probable that future taxable profits will be available against whichthe asset can be utilized. Deferred tax assets are reduced to the extent that it is no longer probable that the relatedtax benefits will be realized.
Deferred tax is calculated at the rates that are expected to apply to the year when the differences reverse, basedon tax rates that have been enacted or substantively enacted by the balance sheet date. Deferred tax is chargedor credited to the profit and loss account.
Deferred tax, if any, on revaluation of investments is recognised as an adjustment to surplus / deficit arising onrevaluation.

Annual Report 201358
The Group expects that the adoption of the above revision, amendments and interpretation of the standards willnot affect the Group's financial statements in the period of initial application.
Improvements to IFRS
In addition to the above amendments, improvements to various accounting standards have also been issued bythe IASB. Such improvements are generally effective for accounting periods beginning on or after January 01, 2013.The Group expects that such improvements to the standards will not have any material impact on the Group'sfinancial statements in the period of initial application.
Further, following new standards have been issued by IASB which are yet to be notified by the SECP for the purposeof applicability in Pakistan.
NoteUseful lives of assets and methods of depreciation and impairment
Classification of investments
Provision for doubtful debts
Deferred taxation and taxation
4.3 to 4.6,7, 8 & 9
4.7.1, 10 & 15
4.16 & 16
4.11,14 & 31
6. STANDARDS AND IFRIC INTERPRETATIONS THAT ARE NOT YET EFFECTIVE
The following revised standards, amendments and interpretations with respect to the approved accounting standardsas applicable in Pakistan would be effective from the dates mentioned below against the respective standard orinterpretation:
Effective date (accounting periods beginning
on or after)Standard, Interpretation or amendment
IAS 39 – Novation of Derivatives and Continuation of Hedge Accounting
IAS 36 – Recoverable Amount for Non-Financial Assets – (Amendment)
IFRIC 21 – Levies
IAS 32 – Off-setting Financial Assets and Financial liabilities – (Amendment)
IFAS 3 – Profit and Loss Sharing on Deposits
January 01, 2014
January 01, 2014
January 01, 2014
January 01, 2014
June 12, 2013
5. ACCOUNTING ESTIMATES AND JUDGEMENTS
The preparation of consolidated financial statements requires management to make judgments, estimates andassumptions that effect the application of policies and reported amounts of assets and liabilities, income andexpenses. The estimates and associated assumptions are based on historical experience and various other factorsthat are believed to be reasonable under the circumstances, the result of which form the basis of making judgmentsabout carrying values of assets and liabilities. The estimates and underlying assumptions are reviewed on anongoing basis.
The estimates, judgments and assumptions that have significant effect on the consolidated financial statementsare as follows:
IFRS 9 – Financial Instruments: Classification and MeasurementIFRS 10 – Consolidated Financial StatementsIFRS 11 – Joint ArrangementsIFRS 12 – Disclosure of Interests in Other EntitiesIFRS 13 – Fair Value Measurement
Effective date(annual periods
beginning on or after)
January 01, 2015January 01, 2013January 01, 2013January 01, 2013January 01, 2013
Standard
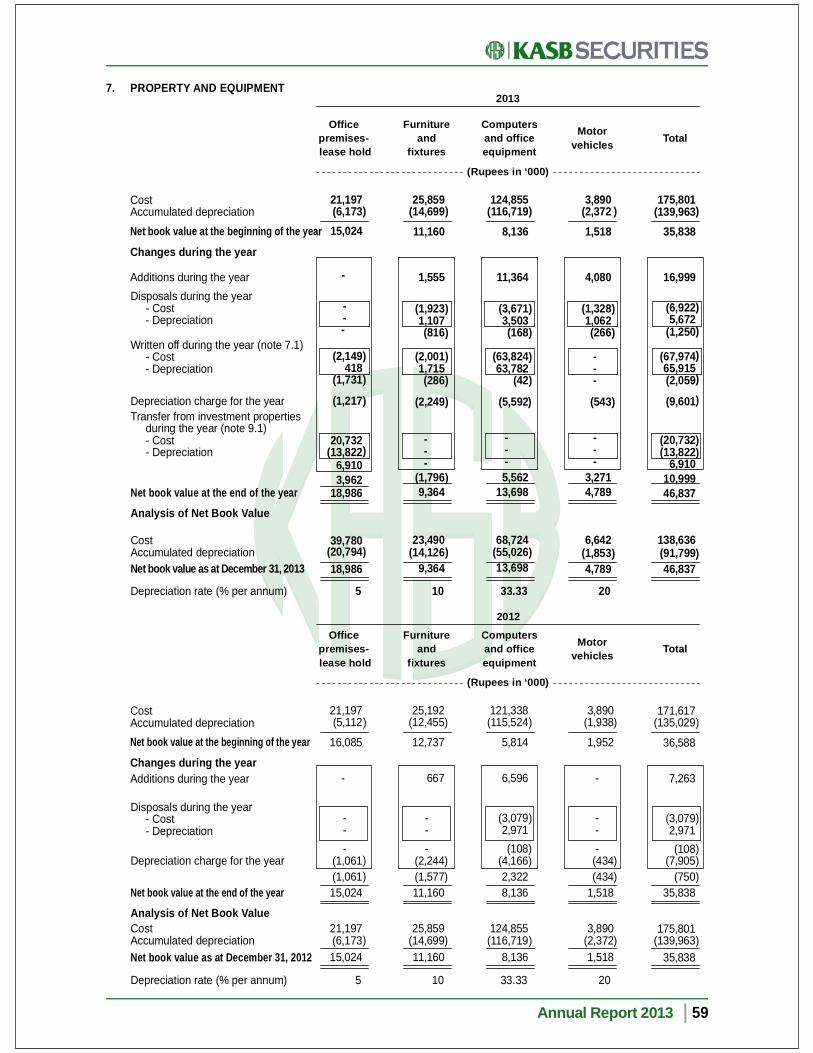
Annual Report 2013 59
Depreciation rate (% per annum) 2033.335 10
7. PROPERTY AND EQUIPMENT2013
20
3,890 (2,372
1,518
(1,328 1,062
(266
---
(543
---
3,2714,789
6,642(1,8534,789
33.33
124,855(116,719
8,136
(3,671 3,503
(168
(63,82463,782
(42
(5,592
---5,562
13,698
68,724(55,02613,698
5
21,197 (6,173 15,024
- --
(2,149 418
(1,731
(1,217
20,732(13,822
6,9103,962
18,986
39,780(20,79418,986
10
25,859(14,69911,160
(1,9231,107(816
(2,0011,715(286
(2,249
---
(1,7969,364
23,490(14,126
9,364
Cost
Computersand officeequipment
Furnitureand
fixtures
Officepremises- lease hold
Total
Accumulated depreciationNet book value at the beginning of the year
Changes during the year
Disposals during the year- Cost- Depreciation
Analysis of Net Book Value
CostAccumulated depreciationNet book value as at December 31, 2013
Net book value at the end of the year
175,801 (139,963
35,838
(6,922 5,672(1,250
(67,97465,915(2,059
(9,601
(20,732(13,822
6,91010,99946,837
138,636(91,79946,837
Motorvehicles
(Rupees in ‘000)
) ) ) ) )
)
) ) ) )
Depreciation rate (% per annum)
2012
3,890 (1,938
1,952
-
---
(434(434
1,518
3,890 (2,372 1,518
)
)
))
121,338 (115,524
5,814
6,596
(3,079 2,971
(108 (4,166
2,322 8,136
124,855 (116,719
8,136
)
)
)
)
)
21,197 (5,112
16,085
-
- - -
(1,061(1,061
15,024
21,197 (6,173 15,024
))
25,192 (12,455
12,737
667
- - -
(2,244(1,577
11,160
25,859 (14,699 11,160
)
)
))
Cost
Computersand officeequipment
Furnitureand
fixtures
Officepremises- lease hold
Total
Accumulated depreciationNet book value at the beginning of the year
Changes during the yearAdditions during the year
Disposals during the year- Cost- Depreciation
Depreciation charge for the year
Analysis of Net Book ValueCostAccumulated depreciationNet book value as at December 31, 2012
Net book value at the end of the year
171,617 (135,029
36,588
7,263
(3,079 2,971 (108
(7,905(750
35,838
175,801 (139,963
35,838
)
)
)
Motorvehicles
(Rupees in ‘000)
))
)))
Written off during the year (note 7.1)- Cost- Depreciation
Transfer from investment propertiesduring the year (note 9.1)- Cost- Depreciation
)
) ) ) )
) ) )
) ) )
)
))
) ) ) )
)
)
Depreciation charge for the year
) ) ) ) )
Additions during the year 1,555 11,364 4,080 16,999-

Annual Report 201360
7.2 Disposal of property and equipment
Particulars of property and equipment disposed off during the year having book value of more than Rs. 50,000 areas follows:
CostAccum-ulateddepre-ciation
Writtendownvalue
Saleproce-
edsGain /(loss) Mode of disposalParticular of Buyers
(Rupees in ‘000)
Furniture & FixturesOffice FurnituresOffice Furniture
VehiclesToyota Corolla
661823
1,328
359453
1,062
302370
266
175574
750
(127204
484
Negotiation
The aggregate amountof property and equip-ment disposed offduring the year havingbook value less thanRs. 50,000:
) KASB Funds Limited-related partyKASB Bank Limited-the Parent Company
Younus Khan
Negotiation
Negotiation
Furniture and fixturesComputer and
office equipment
439
3,671
295
3,503
144
168
58
187
(86
19
)
December 31, 2013December 31, 2012
6,9223,079
5,6722,971
1,250108
1,744175
49467
7.1 During the year, a comprehensive exercise for physical verification of fixed assets was performed by a firm ofChartered Accountants, whose report dated October 10, 2013 suggests that cost of fixed assets amounting toRs. 65.69 million requires to be written off. Accordingly, the Group has written off fixed assets having cost ofRs. 65.69 million (written down value of Rs. 0.33 million) during the year.
In addition, the Group has also written off certain other fixed assets during the year which were not in usablecondition amounting to Rs. 2.28 million (written down value of Rs. 1.73 million).
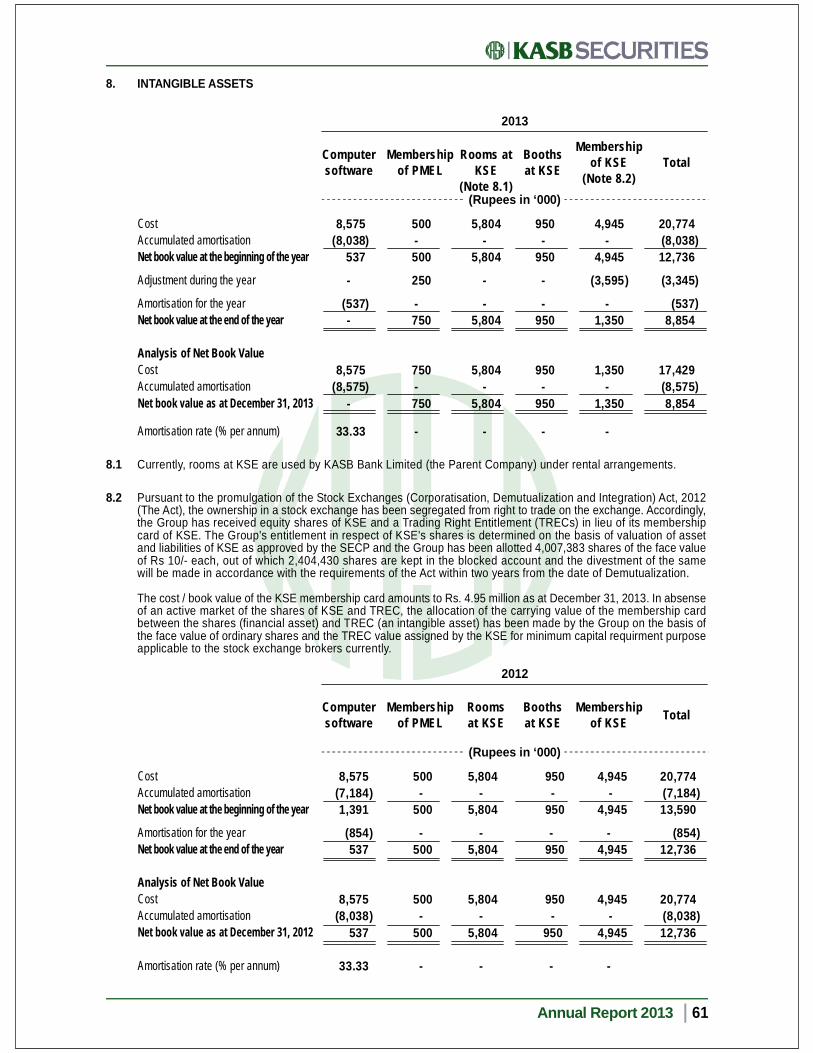
Annual Report 2013 61
8. INTANGIBLE ASSETS
2013
Computersoftware TotalMembership
of PMELRooms at
KSE(Note 8.1)
Boothsat KSE
Membershipof KSE
(Note 8.2)
)
)
500-500
250
-750
750-750
-
8,575(8,038
537
-
(537-
8,575(8,575
-
33.33
)
)
)
(Rupees in ‘000)
CostAccumulated amortisationNet book value at the beginning of the year
Adjustment during the year
Amortisation for the yearNet book value at the end of the year
Analysis of Net Book ValueCostAccumulated amortisationNet book value as at December 31, 2013
Amortisation rate (% per annum)
5,804-
5,804
-
-5,804
5,804-
5,804
-
950-
950
-
-950
950-
950
-
4,945-
4,945
(3,595
-1,350
1,350-
1,350
-
20,774(8,03812,736
(3,345
(5378,854
17,429(8,5758,854
)
)
)
8.2 Pursuant to the promulgation of the Stock Exchanges (Corporatisation, Demutualization and Integration) Act, 2012(The Act), the ownership in a stock exchange has been segregated from right to trade on the exchange. Accordingly,the Group has received equity shares of KSE and a Trading Right Entitlement (TRECs) in lieu of its membershipcard of KSE. The Group's entitlement in respect of KSE's shares is determined on the basis of valuation of assetand liabilities of KSE as approved by the SECP and the Group has been allotted 4,007,383 shares of the face valueof Rs 10/- each, out of which 2,404,430 shares are kept in the blocked account and the divestment of the samewill be made in accordance with the requirements of the Act within two years from the date of Demutualization.
The cost / book value of the KSE membership card amounts to Rs. 4.95 million as at December 31, 2013. In absenseof an active market of the shares of KSE and TREC, the allocation of the carrying value of the membership cardbetween the shares (financial asset) and TREC (an intangible asset) has been made by the Group on the basis ofthe face value of ordinary shares and the TREC value assigned by the KSE for minimum capital requirment purposeapplicable to the stock exchange brokers currently.
2012
Computersoftware TotalMembership
of PMELRoomsat KSE
Boothsat KSE
CostAccumulated amortisationNet book value at the beginning of the year
Amortisation for the yearNet book value at the end of the year
Analysis of Net Book ValueCostAccumulated amortisationNet book value as at December 31, 2012
Amortisation rate (% per annum)
Membershipof KSE
20,774(7,18413,590
(85412,736
20,774(8,03812,736
)
)
)
4,945 -
4,945
-4,945
4,945 -
4,945
-
950 -
950
-950
950 -
950
-
5,804-
5,804
-5,804
5,804-
5,804
-
500-
500
-500
500-
500
-
8,575(7,1841,391
(854537
8,575(8,038
537
33.33
)
)
)
(Rupees in ‘000)
8.1 Currently, rooms at KSE are used by KASB Bank Limited (the Parent Company) under rental arrangements.

9. INVESTMENT PROPERTIES
Investment propertiesAdvance paid for purchase of land
- in Korangi Housing Scheme
-
375,000375,000
7,429
375,000382,429
9.1
9.2
9.1.1 During the year, the Group has transferred the investment properties (comprising 6th and 10th floor office spaces)to its own use. Previously, these office spaces were given on rent to KASB Bank Limited (the Parent Company)and KASB Funds Limited (a related party), however, during the year, the rental contracts with these group companieswere not renewed and the Group is now using these offices for its own operations.
9.2 During the year 2010, the Group had acquired housing scheme land of 375 residential plots for an aggregatepurchase consideration of Rs. 300 million. Under the agreement, the Group has also paid a sum of Rs. 75 millionas development charges to the developers for completion of all development work on the aforementioned land.The Group is in the process of completing the legal formalities for the transfer of ownership title of these propertiesin the name of the Group. These residential plots are held mainly for capital appreciation and sale in due courseof business and accordingly have been classified as investment properties.The fair market value of these residential plots as determined by the independent valuer amounted to Rs. 465 millionas of December 28, 2013 ( 2012: Rs.450 million).
9.1
Annual Report 201362
CostAccumulated depreciationNet book value at the beginning of the yearDepreciation charge for the year
- Cost- Depriciation
Net book value at the end of the year
CostAccumulated depreciationNet book value at the end of the year
Depreciation rate (% per annum)
)
)
20,732 (12,603
8,129(700
---
7,429
20,732 (13,303
7,429
5
)
)
9.1.1
2013 2012Note(Rupees in ‘000)
)
20,732 (13,303
7,429(519
(20,73213,822(6,910
-
---
5
)
)
421,162438,16610. LONG-TERM INVESTMENTS
‘Available-for-sale’ investments 10.1
2013 2012Note(Rupees in ‘000)
10.1 Description of ‘available-for-sale’ investments
Number of shares Name of the Investee Company Cost Carryingvalue Cost
2013Carrying
value
2012
(Rupees in ‘000)
2013 2012
Quoted shares19,858,649 KASB Bank Limited (Parent Company) 10.1.1
Unquoted shares19,858,649 38,12921,844 48,25621,844
Note
2,915,925 Karachi Stock Exchange Limited 8.2- 3,595 --3,595
3,370 Al Jomaih Power Limited 10.1.2New Horizon Exploration and Production Limited (related party)
25,000,000 Class ‘A’ ordinary shares
3,370 321,442184,197
25,000
297,906
25,000
184,197
25,00025,00025,000,00010,000,000 Class ‘B’ ordinary shares10,000,000 50,000 50,00050,00050,000
438,166284,636 421,162281,04175,000 75,00075,00075,000
Transfers during the year
Analysis of Net Book Value

Annual Report 2013 63
10.1.1 These shares have been blocked by the Central Depository Company of Pakistan Limited (CDC) in compliance withBPRD Circular No. 4 dated May 22, 2008 issued by the State Bank of Pakistan. No activity (including pledge andwithdrawal) in these shares is allowed without prior written permission of the State Bank of Pakistan.
10.1.2 The Group's investment in unquoted shares of Al Jomaih Power Limited are valued at its fair value as at year endbased on the net assets value of the investee Company as at December 31, 2012.
11. LONG-TERM LOANS AND ADVANCES - Considered good
Loans and advances to: - Employees - Executives
Current maturity shown in current assets
1,025 454
1,479981498
1,348 1,938
3,286(1,8381,448
11.117 )
11.1 This represents loans and advances given to executives and employees for purchase of motor vehicles and asgeneral purpose cash advance in accordance with their terms of employment. These loans and advances (exceptfor loan given for purchase of motorcycle) carry mark-up at the rate of 12% (2012: 14%) per annum and arerecovered through deduction from salaries over varying periods up to a maximum period of 120 months. The motorvehicle loans are secured by way of title of the motor vehicles being held in the name of the Group, whereas generalpurpose cash advances are secured against staff provident fund balance.
Deposits with: - Karachi Stock Exchange Limited - National Clearing Company of Pakistan Limited - Pakistan Mercantile Exchange Limited - Central Depository Company of Pakistan Limited - Rental deposits - Others
Prepayments
12. LONG-TERM DEPOSITS AND PREPAYMENTS
262 350
2,500 200
1,485 1,6326,429 -
6,429
Receivable from clientLess: current maturity shown in current assets
13. LONG-TERM RECEIVABLE
37,468 (37,250
218-218
13.117 )
Less: provision against long-term receivable
362 400
2,500-- 342
3,60412
3,616
79,268 (41,800 37,468(13,98823,480
)
)
13.1 On February 01, 2011, the Group entered into a settlement agreement with three customers in respect of theirliabilities owed to the Group, amounting to Rs. 99.64 million (as of the date of the agreement) in respect of thesecurities transactions undertaken by them through the Group.
Under the agreement, the obligations of these three customers have been taken over by another customer, whohave agreed to pay an aggregate sum of Rs. 99.64 million to the Group along with the mark-up at the rate used in(three months) KIBOR ask rate plus 3.28% per annum, in monthly installments over a period up to January 2015.During the year, the Group has received Rs. 52.86 million from the customer in accordance with the terms of theagreement. The above receivable is secured against marketable securities of the customers, held by the Group.The market value of such securities as at year end was Rs. 211.71 million (2012: Rs. 117.67 million).
2013 2012Note
2013 2012Note
(Rupees in ‘000)
(Rupees in ‘000)
13.2

Annual Report 201364
13.2 In view of the regular repayments made by the customer and also due to significant increase in the market valueof securities held as collateral, during the year, the Group has reversed the provision for Rs.13.99 million heldagainst the above receivable.
15.1.1 This represents investment in mutual fund units of a related party amounting to Rs. 103.50 million (2012:Rs. 72.32 million). Further, Mutual Fund units valued at Rs. 254.22 million (2012: Rs. 160.73) are pledged withKSE against exposure margin.
2013 2012
Number of certificates Name of investeecompany
2013 2012
(Rupees in ‘000)
Cost* Carryingvalue Cost* Carrying
value
15.2 Term Finance Certificates
Note
(*) adjusted for impairment charge
Pace Pakistan Limited(Face value of Rs. 5,000 each)
10,000 10,000 12,550 25,099 12,55015.2.1 12,550
2013 2012Note(Rupees in ‘000)14. DEFERRED TAX ASSET - NET
Deductible temporary differences arising from: - Provision against trade debts - Unused tax losses - Minimum tax
Taxable temporary differences arising from: - Differences between written down values
and tax base of assets
40,864--
40,864
(1,68239,182
44,5827,8671,354
53,803
(26553,538
))
15. SHORT-TERM INVESTMENTS
- Open end mutual funds units- Term finance certificates
255,08012,550
267,630
163,42812,550
175,978
‘At fair value through profit or loss’ - held for trading
15.115.2
15.1 Open End Mutual Funds Units
2013 2012
Number of units Name of investeecompany
2013 2012
(Rupees in ‘000)
Cost CarryingvalueCost Carrying
value
KASB Cash FundMCB Cash Management OptimizerABL Cash FundUBL Liquidity Plus FundJS Cash FundAskari Sovereign Cash Fund
1,011,957232,360
2,321,531230,506630,845172,647
704,923214,648
2,148,504214,607102,082160,467
97,31521,52321,51321,52060,42516,132
238,428
103,49723,24823,22723,18364,52317,402
255,080
65,49320,00020,00020,00010,00015,000
150,493
72,31521,52321,51321,52010,42516,132
163,428
Note
15.1.1
15.2.1 The above TFCs are secured and carry mark-up at the rate of 6 month KIBOR + 2% and will mature inFebruary 15, 2017. These TFCs are currently rated as 'non-performing' by the Mutual Funds Association of Pakistanand accordingly, the Group is maintaining a provision for decline in the value of investment to the extent ofRs. 32.82 million as at December 31, 2013.

Annual Report 2013 65
16. TRADE DEBTS
Receivable against purchase of marketable securities - net of provisionsInter-bank brokerageFees
16.1 Considered goodSecuredUnsecured
Considered doubtfulProvision for doubtful debts
378,880 2,707 1,117
382,704
338,928 491
339,419159,649
(120,188 378,880
16.1 & 16.2 293,527 2,124 2,482
298,133
236,446 187
236,633172,789
(115,895 293,527
16.2 This includes receivables from related parties amounting to Rs. 0.2 million (2012 : Rs. 1.42 million)
) )16.3
2013 2012Note(Rupees in ‘000)
16.3.1 Provisions against doubtful debts have been made after considering the market value of listed shares amountingto Rs. 39.46 million (2012: Rs. 56.89 million) held in custody by the Group against respective customers accounts.
16.3 Reconciliation of provisions against trade debtsOpening balanceProvision for the yearReversal of provision during the year
115,89513,104(8,8114,293
)
120,188
149,349-
(33,454(33,454
)
115,895)
17. ADVANCES, DEPOSITS, PREPAYMENTS AND OTHER RECEIVABLESAdvances to: - Suppliers - Current portion of long-term loans and advances to employees and executives
Deposits: - Exposure deposits with KSE - Exposure deposit with PMEL - Others
Prepayments: - Rent - Insurance - Software development and maintenance - Others
Other receivables: - Profit on bank deposits - Profit on exposure deposit with KSE - Profit on long-term receivables - Current portion of long-term receivable - Receivable from related parties - Others
4,476
9815,457
207,0081,190 -
208,198
1,925350969
2,5955,839
145821
-37,250
152108
38,476257,970
888
1,8382,726
73,0003,784 3,313
80,097
1,570673
3,1791,9187,340
121285
1,46441,80012,889
35656,915
147,078
11
1317.1

Annual Report 201366
2013 2012Note(Rupees in ‘000)
17.1 Receivable from related parties comprises of:
- KASB Funds Limited - New Horizon Exploration and Production Limited - Director of KASB Corporation Limited [formerly
KASB Finance (Private) Limited] (the ultimate Parent of the Company)
152-
-152
45326
12,41012,889
18. CASH AND BANK BALANCES
Cash at bank in: - Current accounts - Savings accounts Cash in handStamps in hand
68,661272,105340,766
363
340,805
19,928346,734366,662
-1
366,663
18.1 These carry profit at rates ranging from 1.25% to 9.25% (2012: 1% to 11.25%) per annum.
18.2 This includes Rs. 307.16 million (2012: Rs. 343.56 million) with KASB Bank Limited (the Parent Company).
18.118.1 & 18.2
19.3 The following shares were held by related parties of the Group:
KASB Bank LimitedKASB Bank Limited - Employees Provident Fund TrustKASB Securities Limited - Employees Provident Fund TrustKASB Funds PS Limited - Employees Provident Fund TrustKASB Corporation Limited [formerly KASB Finance (Private) Limited]Key Management Personnel
Shares held
77,117,500400,000
32,0003,000
700,000945
78,253,445
Percentage
77.118%0.400%0.032%0.003%0.700%0.001%
78.254%
Shares held
77,117,500400,000
32,0003,000
700,000825
78,253,325
Percentage
77.118%0.400%0.032%0.003%0.700%0.001%
78.254%
2013 2012
19. SHARE CAPITAL
19.1 Authorised Capital
Ordinary shares of Rs. 10 each 2,000,000 2,000,000200,000,000 200,000,000
19.2 Issued, subscribed and paid-up share capital
89,867,900
10,132,100100,000,000
89,867,900
10,132,100100,000,000
Ordinary shares of Rs 10 each fully paid-up in cashOrdinary shares of Rs 10 each fully paid-up as part of the scheme of arrangement
898,679
101,321 1,000,000
898,679
101,321 1,000,000
(Number of shares)
2013 2012
20. LONG-TERM LOAN
Long-term loan from KASB Bank Limited (the Parent Company) 20.1 100,000 -
2013 2012(Rupees in ‘000)

Annual Report 2013 67
20.1 During the year, the Group has obtained a long-term loan of Rs.100 million from the Parent Company. The loancarries mark-up at the rate of 3 months KIBOR + 2.5% per annum and payable on quarterly basis starting fromSeptember 2013 to January 2015. The principal amount will be paid as a bullet payment in January 2015. The loanis secured by first ranking charge over all present and future current assets of the Group.
2013 2012Note(Rupees in ‘000)
21. TRADE AND OTHER PAYABLES
Trade creditorsAccrued expensesWithholding taxUnclaimed dividendsDividend PayableOthers
21.121.2
896,86220,92411,795
609726
9,708940,624
525,86051,684
2,668609
-1,152
581,973
21.1 This includes payable to KSE and NCCPL amounting to Rs. 2.61 million (2012: Rs. 17.47 million) and Rs. 66.09million (2012: Rs. Nil) respectively in respect of trading in securities settled subsequent to the year end.
21.2 This includes accrued expenses relating to various services provided by related parties amounting to Rs. 3.44million (2012: Rs. 7.41 million)
22. SHORT-TERM BORROWING
Short-term borrowing from KASB Bank Limited (the Parent Company) 22.1 - 250,000
22.1 Short-term borrowing from the Parent Company which carried mark-up at the rate of 11% per annum was repaidduring the year.
23. SHORT-TERM RUNNING FINANCES UNDER MARK-UP ARRANGEMENTS - Secured
23.1 Running finance facility of Rs. 199 million (2012: Rs. 299 million) is available to the Group from the Parent Company.The facility is subject to mark-up at rates ranging from 11.58% to 12.03% (2012: 12.70% to 14.49%) per annumduring the year and is required to be secured by first ranking charge over all present and future current assets ofthe Group.
23.2 Further, the facilities for short-term running finances available from various banks amounted to Rs. 750 million(2012: Rs. 850 million) which remained unutilised as at the year end. These facilities are subject to mark-up at ratesranging from 11.51% to 13.15% (2012: 12.38% to 15.14%) per annum and are required to be secured by pledgeof securities for the purposes of utilisation of finance.
25. CONTINGENCIES AND COMMITMENTSThere were no contingencies and commitments outstanding as at the year end.
26. OPERATING REVENUE
BrokerageSubscription research incomeFinancial advisory feeCustody servicesProfit on margin trading system
447,0812,069
28,5631,1882,225
481,126
306,8553,2012,580
963254
313,853
26.1
24. ACCRUED MARK-UP
Mark-up accrued on: - Long-term borrowing - KASB Bank Limited (the Parent Company) - Short-term borrowing - KASB Bank Limited (the Parent Company)
33-33
-2,7122,712
2013 2012
(Rupees in ‘000)

Annual Report 201368
27. MARK-UP / PROFIT ON BANK DEPOSITS, INVESTMENTS AND OTHER RECEIVABLES
Profit on bank depositsProfit on term finance certificatesProfit on long-term receivableMark-up on receivable from related party
28,550591
9,595654
39,390
28,3623,055
13,641410
45,468
27.1
27.1 This represents mark-up on long-term receivables as fully explained in note 13.1.
26.1 During the year, the Group was engaged by a foreign bank as a sub-contractor to provide financial advisory servicesand act as a purchase agent in connection with the de-listing of securities of a multinational company from all stockexchanges in Pakistan. As per the terms of the subject agreement, the Group has received a cash fee of USD200,000 at the successful de-listing of the securities of all stock exchanges in Pakistan. Further an additional feeof USD 100,000 based on the satisfactory provision of services was also payable at the sole discretion of themultinational company, out of which, the Group has received USD 50,000 as at the year end and the remainingUSD 50,000 will be paid at the discretion of the multinational company and hence the Group has not accrued thesame as its income in these financial statements. In respect of the above transactions, the Group has recordedincome of Rs. 26.53 million which is included in the account head of 'financial advisory fee' above.
2013 2012Note(Rupees in ‘000)
28. OPERATING AND ADMINISTRATIVE EXPENSES
Salaries, allowances and other benefitsStaff training and developmentRent, rates and taxesInsurance chargesDepreciationAmortisationRepairs and maintenancePower and utilitiesCommunicationTrading costsInformation technology related costsFees and subscriptionPrinting and stationeryPapers and periodicalsAdvertisement and business promotionSales and marketingTravelling and conveyanceEntertainmentBrokerage expenseLegal and professional chargesAuditor's remunerationStamp chargesDonationsWorkers’ Welfare fundProperty and equipment written offOthers
28.1
28.28
28.3
28.4
7
244,840212
16,404333
10,120537
12,35211,85417,74221,19315,170
6,2414,131
177910
3,7395,9512,573
15,7992,6191,123
482,1052,5532,059
237401,022
201,428382
9,075286
8,605854
6,16210,13714,413
9,99117,55210,294
2,972147911
2,4204,5292,167
14,1022,2511,033
892,0601,756-181
323,797
28.1 Salaries, allowances and benefits include Group's contribution to provident fund amounting to Rs. 6.22 million (2012: Rs. 5.92 million).
28.2 Depreciation
Property and equipmentInvestment properties
9,601519
10,120
7,905700
8,605
79

Annual Report 2013 69
30. OTHER INCOME
Gain on disposal of property and equipmentGain on disposal of ‘assets held for sale’Rental incomeOthers
494-
6,002767
7,263
67510
7,603590
8,770
28.3 Auditors’ remuneration
Statutory audit feeHalf-yearly review fee and other certificationsOut of pocket expenses
661 347115
1,123
631 310
92 1,033
28.4 Donation were not made to any donee fund in which any director of the Group or his spouse had any interest.
29. FINANCE COST
Mark-up on: - Short-term borrowing (the Parent Company) - Short-term running finances facilities (the Parent Company) - Long-term loan (the Parent Company) - Redeemable capital - Repurchase transactionBank charges
452519
6,021--
1,9508,942
2,712280-
11,2552,3071,885
18,439
7.2
2013 2012Note(Rupees in ‘000)
31. TAXATION
Current - for the year - for prior yearDeferred
(40,84111,546
(14,356(43,651
(7,699-
53,07045,371
) )
14 ))
32. EARNINGS PER SHARE
Profit after taxation attributable to ordinary shareholders
100,000 100,000
(Number of shares)
Weighted average number of ordinary shares
Earnings per share - basic and diluted(Rupees)
81,282 131,468
0.81 1.31
Diluted earnings per share has not been presented as the Group did not have any convertible instruments in issue asat December 31, 2013 and December 31, 2012 which could have any effect on the earnings per share.
31.1 Relationship between tax expense and accounting profit
Profit before taxation
Tax at the applicable rate of 34% (2012: 35%)Tax effects of: - Expenses that are not deductible in determining taxable income - Income taxed at reduced rate (dividend income, rental income
and capital gains) - Income exempt from tax - Income under final tax regime - Deferred tax recognised on prior year temporary differences - Prior year taxation - Others
124,933
(42,477
(15,107
(730-
5,177-
11,546(2,060
(43,651
)
)
)
86,097
(30,134
(1,380
5,620494
(7,91279,605
-(922
45,371
)
)
)
)
) )

Annual Report 201370
33. REMUNERATION OF DIRECTORS AND EXECUTIVES
The aggregate amounts charged in these financial statements for remuneration, including all benefits, to the chiefexecutive, directors and executives of the Group are as follows:
33.1 The Chief Executive and certain executives of the Group are provided with free use of Group owned and maintainedcellular phones.
33.2 The fee was paid to the Directors for attending the Board, audit and HR committee meetings of the Group.
Managerial remunerationPerformance incentiveFee (note 33.2)Reimbursable expensesContribution to provident fund
8,5125,0001,560
445372
15,889
4
77,70531,785
--
2,967
112,457
44Number of persons
(Rupees in ‘000)
ChiefExecutive Directors Executives
17,9309,000
-45
722
27,697
1
2013 2012Chief
Executive Directors Executives
83,01019,315
--
3,123
105,448
49
8,1451,7501,620
636350
12,501
4
17,1855,250
-42
684
23,161
1

Annual Report 2013 71
34. RELATED PARTY TRANSACTIONS
The related parties of the Group comprise of KASB Bank Limited (the Parent Company), associated undertakings(including companies under common directorship), employee benefit plans and its key management personnel.The balances with related parties as at December 31, 2013 and December 31, 2012 and transactions with relatedparties during the year ended December 31, 2013 and December 31, 2012 are as follows:
BALANCES
Long-term depositsTrade debtsProfit receivable on bank depositReceivable against expensesBank balancesTrade payablesLong-term loanPayable against expensesAccrued mark-up
(Rupees in ‘000)
2013
TotalOthersKey
managementpersonnel
AssociatesParentCompany
-18
144-
307,161-
100,0003,012
33
14213-
152-
1-
232-
-50
-3
-1,546
-180-
-118-------
142199144155
307,1611,547
100,0003,424
33
BALANCES
Long-term depositsTrade debtsOther receivablesPrepaid rentProfit receivable on bank depositReceivable against expensesBank balancesTrade payablesShort-term borrowingPayable against expensesAccrued mark-upRent payable
OFF BALANCE SHEET ITEM
Bank guarantee
(Rupees in ‘000)
2012
TotalOthersKey
managementpersonnel
AssociatesParentCompany
-115
-332
1,059-
343,555-
250,0004,4352,712
631
51,000
14231
---480-
2-
2,663--
-
-1,052
396----
4,029-312--
-
-221
12,410---------
-
1421,419
12,806332
1,059480
343,5554,031
250,0007,4102,712
631
51,000

Annual Report 201372
2013
Particulars relating to remuneration of Chief Executive Officer, Directors and Executives who are key managementpersonnel are disclosed in note 33.
ParentCompany Associates
Keymanagement
personnelOthers Total
(Rupees in ‘000)
IncomeBrokerage income earnedCustody servicesProfit on bank depositsRent incomeOthers
ExpensesBank chargesCharge in respect of contributory planCommunication expensesDonationLocker rentMark-up expenseReimbursement of expensesRent expense
Other transactionsLoans disbursedLoans repaymentMutual Fund bonus units issuedMutual Fund units purchased
1,1896
22,3834,811
-
1,635---
46,992
555889
----
-178-
1,191-
--
11,484---
3,781-
----
1,71638
--654
------211-
8,0178,642
--
421----
-6,224
-2,040
--
48-
--
6,39525,000
3,326222
22,3836,002
654
1,6356,224
11,4842,040
46,9924,595
889
8,0178,6426,395
25,000
TRANSACTIONS
ParentCompany Associates
2012Key
managementpersonnel
Others Total
(Rupees in ‘000)
IncomeBrokerage income earnedCustody servicesProfit on bank depositsRent incomeOthers
ExpensesBank chargesCharge in respect of contributory planCommunication expensesDonationLocker rentMark-up expenseReimbursement of expensesRent expenseSalary expense reimbursed
Other transactionsLoans disbursedLoans repaymentMutual Fund bonus units issuedMutual Fund units redeemedProperty and equipment disposed offSale of 'available-for-sale' investmentsSale of ‘assets held for sale’
5717
22,8355,005
-
1,526---
42,992
15,335585-
-------
1,766161-
2,598-
--
8,838---
6,235-
48
-------
2,74648
---
---------
3,2574,835
-----
5285
--410
-5,918
-2,040
--
13--
--
9,36910,000
81412,00087,000
5,611221
22,8357,603
410
1,5265,9188,8382,040
42,992
21,583585
48
3,2574,8359,369
10,000814
12,00087,000
TRANSACTIONS

Annual Report 2013 73
35. PROVIDENT FUND RELATED DISCLOSURE
The following information is based on latest un-audited financial statements of the Fund:
Size of the fund -Total assetsCost of investments madePercentage of investments madeFair value of investments
64,11949,794
93.54%59,978
56,74348,255
93.67%53,153
2013 2012(Rupees in ‘000)
35.1
37. FINANCIAL INSTRUMENTS37.1 Market risk
Market risk is the risk that the fair value or future cash flows of financial instruments will fluctuate due to changesin market variables such as interest rates, foreign exchange rates and equity prices.
(i) Interest rate riskInterest rate risk arises from the possibility that changes in interest rates will affect the value of the financialinstruments. As of the balance sheet date, the Group is exposed to such risk mainly in respect of bank balancesand investment in income based mutual fund units. Effective interest rates on such instruments are disclosedin respective notes to the financial statements.
Management of the Group estimates that 1% increase in the market interest rate, with all other factorsremaining constant, would increase the Group's total comprehensive income by Rs. 3.22 million (2012:Rs. 2.12 million) and a 1% decrease would result in decrease in the Group's total comprehensive income bythe same amount. However, in practice, the actual results may differ from the sensitivity analysis.
(ii) Foreign currency riskForeign currency risk is the risk that the fair value of future cash flows of a financial instrument will fluctuatebecause of changes in foreign exchange rates. The Group's exposure to the risk of change in foreign exchangerates relates only to the investment in Al Jomaih Power Limited maintained in US dollars amounting toRs. 321.44 million (2012: Rs. 297.91 million) [US dollars 3.06 million (2012: US dollars 3.06 million)].
Management of the Group estimates that 10% increase in the exchange rate between US dollars and PakRupees will increase the comprehensive income of the Group by Rs. 32.14 million and 10% decrease in theexchange rate would result in decrease in comprehensive income of the Group by the same amount. However,in practice, the actual results may differ from the sensitivity analysis.
(iii) Equity price riskEquity price risk is the risk of volatility in share prices resulting from their dependence on market sentiments,speculative activities, supply and demand for shares and liquidity in the market. The Group is exposed toprice risk because of investments held by the Group and classified on the balance sheet as investments 'atfair value through profit or loss' and 'available-for-sale' investments. The management believes that 10%increase or decrease in the value of investments (mutual fund units) 'at fair value through profit and loss',with all other factors remaining constant, would result in increase or decrease of the Group's profit byRs. 25.51 million and 10% increase or decrease in the value of 'available-for-sale' investments would resultin increase or decrease of other comprehensive income by Rs. 3.79 million.
35.1 Fair value of investments is:
Government securitiesTerm depositsTerm finance certificateMutual Funds unitsListed shares
9,25919,500
9,99714,229
16853,153
17.42%36.69%18.81%26.77%
0.31%100.00%
10,20022,269
-27,282
22759,978
17.01%37.13%
-45.49%
0.37%100.00%
2013 2012(Rs. in ‘000) % (Rs. in ‘000) %
The investments out of provident fund have been made in accordance with the provisions of section 227 of theCompanies Ordinance, 1984 and the rules formulated for this purpose.
36. NUMBER OF EMPLOYEES
The total average number of employees during the year and as at December 31, 2013 and December 31, 2012respectively are as follows:
Average number of employees during the yearNumber of employees as at year end
147149
134139
Number of employees
Note

Annual Report 201374
37.2 Liquidity risk
Liquidity risk is the risk that an enterprise may encounter difficulty in raising funds to meet commitments associatedwith financial instruments. The Group manages liquidity risk by following internal guidelines of the Group executivecommittee such as monitoring maturities of financial assets and financial liabilities and investing in liquid financialassets.
The table below summarises the maturity profile of the Group's financial liabilities:
2013
Long-term loanTrade and other payablesAccrued mark-up
100,000927,494
33
-927,494
33
---
On Demand Upto threemonths
More thanthree months
and upto one year
More thanone year Total
---
100,000--
(Rupees in ‘000)
Short-term borrowingTrade and other payablesAccrued mark-up
250,000578,696
2,712
-578,696
2,712
250,000--
On Demand Upto threemonths
More thanthree months
and upto one year
More thanone year Total
---
---
(Rupees in ‘000)
2012
927,527 - - 100,000 1,027,527
37.3 Credit risk
Credit risk is the risk that a party to a financial instrument will fail to discharge an obligation and cause the otherparty to incur a financial loss. The Group attempts to control credit risk by monitoring credit exposures, limitingtransactions with specific counterparties and continuously assessing the credit worthiness of counter parties. TheGroup seeks to minimise the credit risk exposure through having exposures only to customers considered creditworthy and obtaining securities where applicable. The table below analyses the Group's maximum exposure tocredit risk:
37.3.1 The table below shows analysis of the financial assets that are past due or impaired:
(Rupees in ‘000)2013 2012
Trade debtsBank balances (see note 37.3.2)Long-term receivableLong-term loans and advancesLong-term deposits and prepaymentsAdvances, deposits, prepayments and other receivables
499,068340,766
37,4681,4796,429
219,7391,104,949
409,422366,662
79,2683,2863,616
103,440965,694
581,408 250,000 - - 831,408
Debts neither impaired nor past dueDebts past due but not impairedDebts impaired - net of provision
35,558205,681
56,894298,133
-343,243
39,461382,704

Annual Report 2013 75
37.3.2 The analysis below summarises the credit quality of the Group's balances with banks and financial institutions:
*Ratings performed by PACRA, JCR-VS & Standard & Poor’s.
Rating (short-term) of Banks and Financial Institutions* A1 A1+ A-1 A-1+ A3
70032,777
6365
307,161 340,766
23622,710
7982
343,555 366,662
(Rupees in ‘000)
2013 2012
38. CAPITAL RISK MANAGEMENT
The Group's objectives when managing capital include :
- Reinforcing Group’s ability to continue as a going concern in order to provide returns to all its stakeholders with their corresponding risk profiles;
- Maintaining a strong capital base - resulting in enhancement of Group's business operations.
In order to maintain the balance of its capital structure, the Group may consider adjusting its dividend payouts,controlling non-developmental cash outflows and issuing fresh debt or capital instruments.
The Group monitors capital on the basis of the gearing ratio and its related profitability ratios. Gearing is calculatedas debt divided by debt plus equity. Debt represents redeemable capital and other long-term borrowings, if any,as shown in the balance sheet. Equity represents paid-up capital of the Group, general reserve and unappropriatedprofit and loss.
Net capital requirements of the Group are set and regulated by KSE. These requirements are put in place to ensuresufficient solvency margins and are based on excess of current assets over current liabilities. The Group managesits net capital requirements by assessing its capital structure against required capital level on a regular basis.
39. FAIR VALUE OF FINANCIAL INSTRUMENTS
Fair value is the amount for which an asset could be exchanged, or a liability settled, between knowledgeablewilling parties in an arm's length transaction. Consequently, differences can arise between carrying value and fairvalue estimates. The carrying values of all the financial assets and liabilities reflected in the financial statementsapproximate their fair values.
Under the definition of fair value is the presumption that the Group is a going concern without any intention orrequirement to curtail materially the scale of its operations or to undertake a transaction on adverse terms.
39.1 Financial Assets Fair Value Hierarchy
All financial instruments carried at fair value are categorised in three categories defined as follows:
Level 1 - quoted prices in active markets for identical assets.
Level 2 - other techniques for which all inputs which have a significant effect on the recorded fair value areobservable, either directly or indirectly.
Level 3 - techniques which use inputs which have a significant effect on the recorded fair value that are not basedon observable market data.
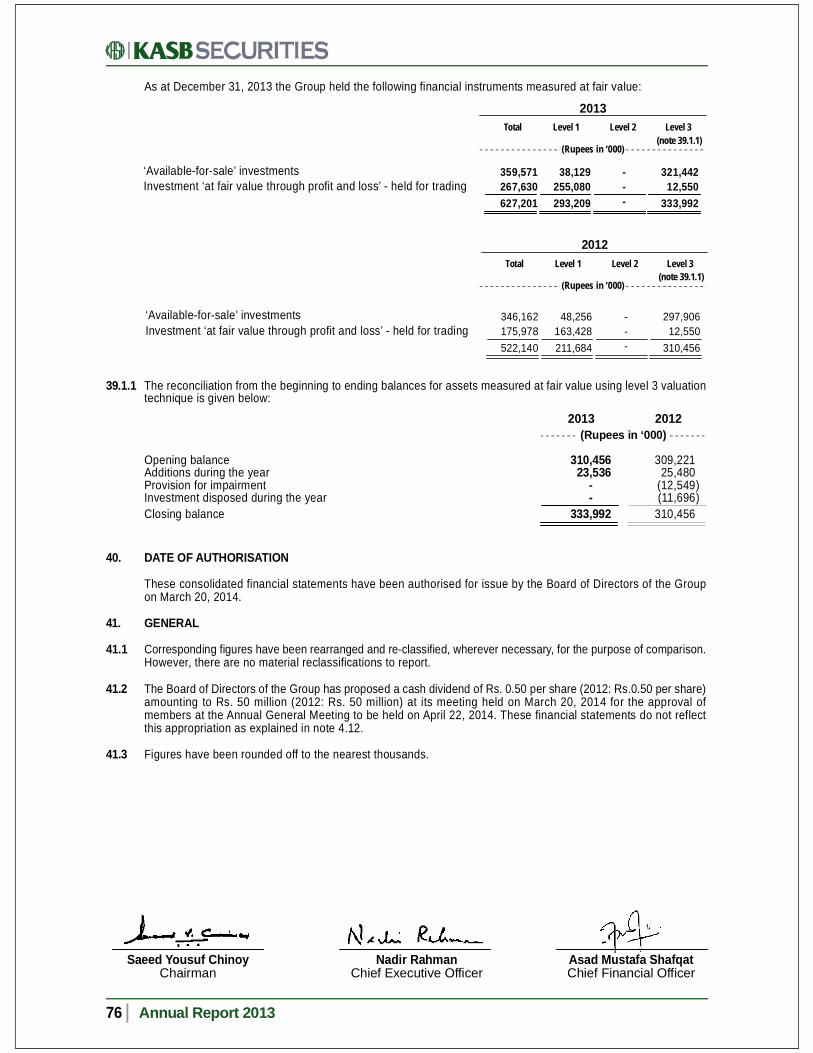
Nadir RahmanChief Executive Officer
Saeed Yousuf ChinoyChairman
Asad Mustafa ShafqatChief Financial Officer
Annual Report 201376
2013
‘Available-for-sale’ investmentsInvestment ‘at fair value through profit and loss’ - held for trading
359,571267,630627,201
Total Level 1
- --
Level 2 Level 3 (note 39.1.1)
38,129255,080293,209
321,44212,550
333,992
40. DATE OF AUTHORISATION
These consolidated financial statements have been authorised for issue by the Board of Directors of the Groupon March 20, 2014.
41. GENERAL
41.1 Corresponding figures have been rearranged and re-classified, wherever necessary, for the purpose of comparison.However, there are no material reclassifications to report.
41.2 The Board of Directors of the Group has proposed a cash dividend of Rs. 0.50 per share (2012: Rs.0.50 per share)amounting to Rs. 50 million (2012: Rs. 50 million) at its meeting held on March 20, 2014 for the approval ofmembers at the Annual General Meeting to be held on April 22, 2014. These financial statements do not reflectthis appropriation as explained in note 4.12.
41.3 Figures have been rounded off to the nearest thousands.
2012
‘Available-for-sale’ investmentsInvestment ‘at fair value through profit and loss’ - held for trading
346,162175,978522,140
Total
48,256163,428211,684
Level 1
- --
Level 2 Level 3 (note 39.1.1)
297,90612,550
310,456
39.1.1 The reconciliation from the beginning to ending balances for assets measured at fair value using level 3 valuationtechnique is given below:
(Rupees in ‘000)2013 2012
Opening balanceAdditions during the yearProvision for impairmentInvestment disposed during the yearClosing balance
310,45623,536
--
333,992
309,22125,480
(12,549(11,696
310,456
))
(Rupees in ‘000)
(Rupees in ‘000)
))
As at December 31, 2013 the Group held the following financial instruments measured at fair value:
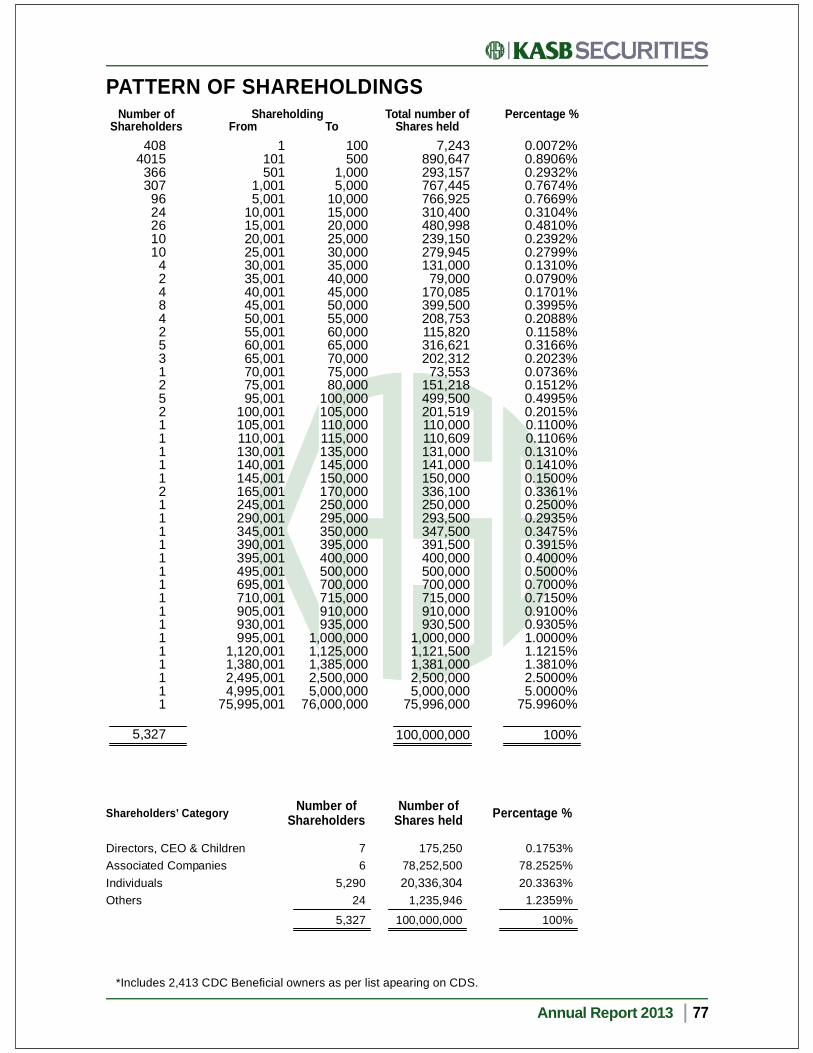
Annual Report 2013 77
PATTERN OF SHAREHOLDINGSNumber of
ShareholdersShareholding Total number of
Shares heldFrom ToPercentage %
40840153663079624261010
4248425312521111121111111111111111
7,243890,647293,157767,445766,925310,400480,998239,150279,945131,00079,000
170,085399,500208,753115,820316,621202,31273,553
151,218499,500201,519110,000110,609131,000141,000150,000336,100250,000293,500347,500391,500400,000500,000700,000715,000910,000930,500
1,000,0001,121,5001,381,0002,500,0005,000,000
75,996,000
0.0072%0.8906%0.2932%0.7674%0.7669%0.3104%0.4810%0.2392%0.2799%0.1310%0.0790%0.1701%0.3995%0.2088%0.1158%0.3166%0.2023%0.0736%0.1512%0.4995%0.2015%0.1100%0.1106%0.1310%0.1410%0.1500%0.3361%0.2500%0.2935%0.3475%0.3915%0.4000%0.5000%0.7000%0.7150%0.9100%0.9305%1.0000%1.1215%1.3810%2.5000%5.0000%
75.9960%
100500
1,0005,000
10,00015,00020,00025,00030,00035,00040,00045,00050,00055,00060,00065,00070,00075,00080,000
100,000105,000110,000115,000135,000145,000150,000170,000250,000295,000350,000395,000400,000500,000700,000715,000910,000935,000
1,000,0001,125,0001,385,0002,500,0005,000,000
76,000,000
1101501
1,0015,001
10,00115,00120,00125,00130,00135,00140,00145,00150,00155,00160,00165,00170,00175,00195,001
100,001105,001110,001130,001140,001145,001165,001245,001290,001345,001390,001395,001495,001695,001710,001905,001930,001995,001
1,120,0011,380,0012,495,0014,995,001
75,995,001
100,000,000 100%5,327
Shareholders’ Category Number ofShareholders
Number ofShares held Percentage %
76
5,29024
5,327
175,25078,252,50020,336,304
1,235,946
100,000,000
0.1753%78.2525%20.3363%
1.2359%
100%
Directors, CEO & ChildrenAssociated CompaniesIndividualsOthers
*Includes 2,413 CDC Beneficial owners as per list apearing on CDS.

Annual Report 201378
Pattern of Shareholding Additional InformationSerial No Description No of
Shareholders
1
2
Associated Companies and Related Parties
KASB Bank LimitedKASB Bank Limited - Employees Provident Fund TrustKASB Securities Limited - Employees Provident Fund TrustKASB Funds PS Limited -Employees Provident Fund TrustKASB Corporation Limited [formerly KASB Finance (Private) Limited]
Directors:
Saeed Yousuf ChinoyMahmood Ali Shah BukhariNadir RahmanIrfan NadeemSalman NaqviTahir IqbalAsad Mustafa Shafqat
Individuals
Others
211116
No ofShares held
77,117,500 400,000
32,000 3,000
700,000 78,252,500
11111117
1,1251,125
170,0001,0001,000
500500
175,250
5,290
24
20,336,304
1,235,946

FORM OF PROXYFOURTEENTH ANNUAL GENERAL MEETING
The Company SecretaryKASB Securities Limited5th Floor, Trade Centre,I.I. Chundrigar Road, Karachi,Pakistan.
I/We
of
being member(s) of KASB Securities Limited holding
ordinary shares hereby appoint
of or failing him/her
of who is/are also member(s) of KASB Securities Limited as my/our proxy in my/our
absence to attend and vote for me/us and on my / our behalf at the Fourteenth Annual General Meeting of the Company to be held
at Beach Luxury Hotel, Karachi on Tuesday, April 22, 2014 at 09:00 am and / or any adjournment thereof.
As witness my / our hand / seal this day of 2014.
Signature onFive Rupees
Revenue Stamp
The Signature shouldagree with the
specimen registeredwith the Company’s
Registrar
Witnesses
1.
2.
Shareholder Folio No.or
CDC Participant I.D. No.&
Sub Account No.
NOTES:
1. The Member is requested:(a) to affix Revenue Stamp of Rs. 5 at the place indicated above;(b) to sign accross the Revenue Stamp in the same Style of Signature as is registered with the Company’s Registrar; and(c) to write down his folio number.
3. No person shall act as a proxy unless he / she himself / herself is a member of the Company, except that a Corporate bodymay appoint a person who is not a member.
4. CDC shareholders or their proxies should bring their original Computerised National Identity Card or Passport along with theParticipant’s ID Number and their Account number to facilitate their identification.
2. This proxy form, duly completed and signed, must be received at the office of our Registrar not later than 48 hours before thetime of the meeting.
Annual Report 2013 79

AFFIXCORRECTPOSTAGE
The Company SecretaryKASB Securities Limited5th Floor, Trade Centre,I.I. Chundrigar Road, Karachi, PakistanPh: (92-21) 111-222-000 & 32635501-10Fax: (92-21) 32630202

Dear Shareholder,
Subject: DIVIDEND MANDATE FORM
It is to inform you that under Section-250 of the Companies Ordinance, 1984 a shareholder may, if so desire, directsthe company to pay dividend through his / her its bank account.
In pursuance of the directions given by the Securities and Exchange Commission of Pakistan (SECP) videCircular Number 18 of 2012 dated June 05, 2012, we hereby give the opportunity to authorize the Company todirectly credit cash dividend in your bank account, if any, declared by the Company in future.
{PLEASE NOTE THAT DIVIDEND MANDATE IS OPTIONAL AND NOT COMPULSORY. IN CASE YOU DO NOTWISH YOUR DIVIDEND TO BE DIRECTLY CREDITED INTO YOUR BANK ACCOUNT, THEN THE SAME SHALLBE PAID TO YOU THROUGH THE DIVIDEND WARRANT.}
Do you wish the cash dividend declared by the company, if any, is directly credited in your bank account, insteadof issue of dividend warrant please “tick” any of the following boxes:
YES NO
If yes than please provide the following information:
Folio No.Name of the ShareholderName of the listed companyCNIC No.Title of Bank AccountBank Account NumberBank’s NameBranch Name and AddressCell number of ShareholderLandline Number of shareholder, if any
Shareholder’s Bank Detail
NOTE: Physical Shareholders are requested to please submit the Dividend Mandate Form duly completed to THKAssociates (Private) Limited. In case of CDC account holder, please submit the Mandate Form to their participants.
It is stated that the above-mentioned information is correct, that I will intimate the changes in the above mentionedinformation to the Company and the concerned Share Registrar as soon as these occur.
Signature of the member/shareholder
*please attach attested copy
*
