annual report 2013 - bwsc and... · companies, including capital investments • long-term...
TRANSCRIPT

128
BWSC Lebanon Construction SARLc/o Moghaizel Law OfficesAshrafieh 5585 Bldg. Pierre Gemayel AvenueP.O. Box 16 6742 AshrafiehBeirut 2066 71 13LebanonTelephone: +45 48 14 00 22E-mail: [email protected]
BWSC Lanka (Private) Ltd.103/8 Galle RoadColombo 3, Sri LankaTelephone: +94 114 721 900Telefax: +94 114 721 905E-mail: [email protected]
BWSC Mauritius Ltd.c/o KPMG31, CybercityEbene, MauritiusTelephone: +230 211 32 98Telefax: +230 212 51 95E-mail: [email protected]
BWSC Panama S.A. Representative OfficeP.O. Box 832 - 0147World Trade Center, 6th Floor, Office 602Calle 53 este, Urb. MarbellaPanama City, Rep. of PanamaTelephone: +507 264 2886Telefax: +507 264 2884E-mail: [email protected]
Burmeister & Wain Scandinavian Contractor A/S
Your Global Energy Partner
Burmeister & Wain Scandinavian Contractor A/S
A N N U A L R E P O R T 2 0 1 3
32
For more than 30 years, BWSC has held a position as a leading supplier in the world market for turn-key power plants based on fossil fuels and biomass. In 2013, the company celebrated its highest order intake ever.
Management’s Report Group Financial Highlights 4
Management’s Report 5
Management’s Statement & Auditors’
Report
Management’s Statement 11
Independent Auditors’ Report 12
Financial Statements Income Statement 14
Cash Flow Statement 15
Balance Sheet 16
Statement of Changes in Equity 18
Notes 19
Company Information Company Information 39
Board of Directors 42
Management Group 43
Page
2
Front page: Engine overhaul, Bemland, Suriname, Straw harvest, the UK

32
M A N A G E M E N T ’ S R E P O R T
SurinameArrival of the first engine to the 63 MW power station in Paramaribo, Suriname.
The power station was taken over by the client in January 2014.
3

54
G R O U P F I N A N C I A L H I G H L I G H T S
Key Figures2009
DKK
2010
DKK
2011
DKK
2012
DKK
2013
DKK
2013
*EUR
Income Statement (in millions):
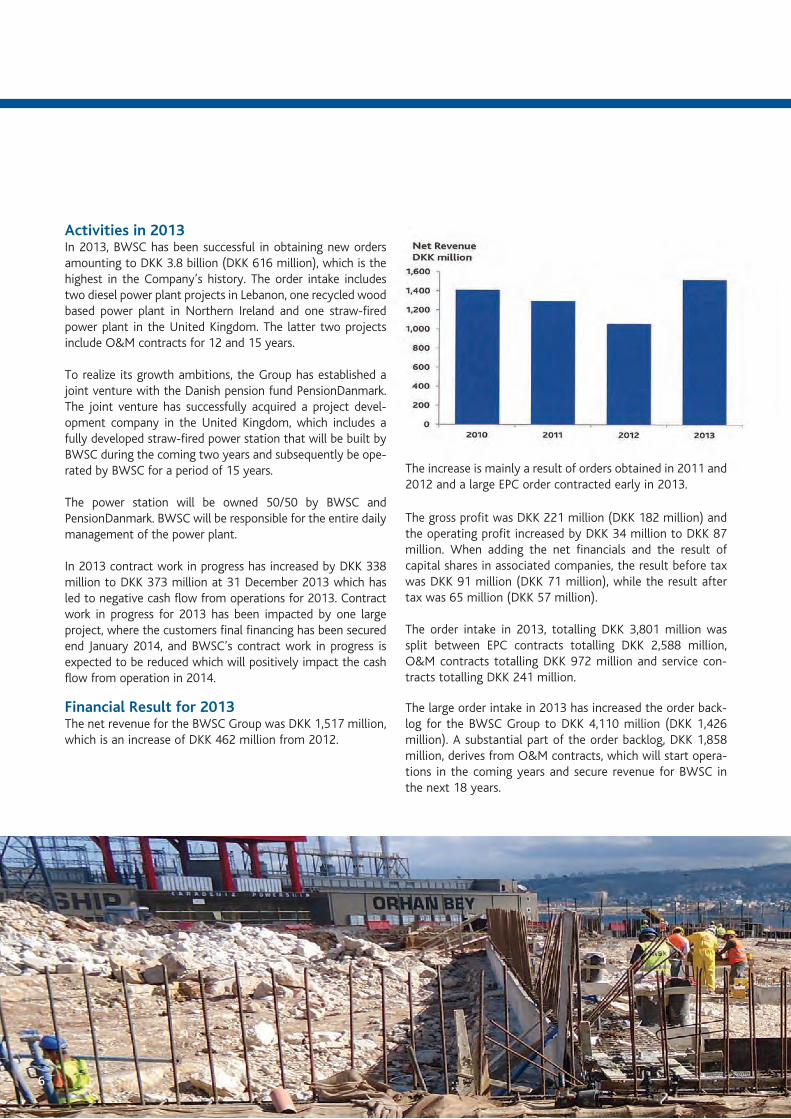
Net revenue 1,603 1,403 1,293 1,055 1,517 203
Gross profit 320 241 173 182 221 30
Operating profit/loss 199 123 51 53 87 12
Net financials 17 13 8 -2 -6 -1
Profit before tax 230 149 75 71 91 12
Profit for the year 174 113 57 57 65 9
Balance Sheet (in millions):
Total assets 922 1,062 1,080 1,195 1,288 173
Cash, cash equivalents and securities 380 738 713 827 538 72
Equity 556 588 574 603 623 84
Interest-bearing debts 43 40 37 34 31 4
Investments in assets per year -10 -14 -11 -5 -8 -1
Cash Flows (in millions):
From operating activities 28 453 40 131 -196 -26
From investing activities -5 -10 -2 12 -57 -8
From financing activities -37 -83 -58 -29 -30 -4
Financial Ratio (in %):
Gross margin 20 17 13 17 15
Profit margin 14 11 6 7 6
Return on investments 24 13 5 4 6
Solidity 60 55 53 50 48
Return on equity 36 20 10 10 11
Employees
Average number of full-time employees 519 462 428 415 450
Of which employed by the Parent Company 285 282 254 251 296
Except for the profit margin, which according to the custom of the sector has been calculated as the result before tax propor-tional to the turnover, the ratios have been prepared in accordance with the “Recommendations and Financial Ratios 2010” issued by the Danish Society of Financial Analysts.
* The key figures are translated at the year-end EUR exchange rate of 7.4603.

54
Focus on GrowthDuring execution of BWSC’s large and small projects, the Group maintains focus on constantly increasing efficiency and securing maximum integration between the Group’s divisions from sales to contracting to service.
The Company is operating according to a defined strategy plan that aims at securing sustainable growth of results and increased financial strength. The plan includes:
• Delivery of turnkey power plants based on diesel, gas, woodchip, straw and biogas
• Development of new IPP (Independent Power Producer) companies, including capital investments
• Long-term operation and maintenance contracts for power plants, technical service agreements and sale of spare parts and other services
BWSC is now a shareholder in five IPP companies, of which two have been acquired during 2013. Further investments are anticipated in the coming years.
To support the anticipated growth, while increasing efficiency, BWSC continues to streamline internal processes and continu-ously optimise usage of the IT system platform, which include engineering systems as well as administrative systems.
Group ProfileFor more than 30 years, BWSC has been building up its posi-tion as a leading supplier in the world markets for delivery of turnkey power plants up to 300 MW, based on fossil fuels and biomass fuels.
Initially, BWSC was a contractor focused exclusively on deliv-ering turnkey power plants, but now the company covers the full life cycle of a power plant, from project development to turnkey delivery to full operation and maintenance. The product range includes medium and large diesel engine and gas-based power systems as well as power plants based on renewable fuels. In recent years, the company has begun to engage in development of companies and capital investments.
M A N A G E M E N T ’ S R E P O R T
Sleaford Biomass Plant under construction, the UK
5
76
Activities in 2013In 2013, BWSC has been successful in obtaining new orders amounting to DKK 3.8 billion (DKK 616 million), which is the highest in the Company’s history. The order intake includes two diesel power plant projects in Lebanon, one recycled wood based power plant in Northern Ireland and one straw-fired power plant in the United Kingdom. The latter two projects include O&M contracts for 12 and 15 years.
To realize its growth ambitions, the Group has established a joint venture with the Danish pension fund PensionDanmark. The joint venture has successfully acquired a project devel-opment company in the United Kingdom, which includes a fully developed straw-fired power station that will be built by BWSC during the coming two years and subsequently be ope-rated by BWSC for a period of 15 years.
The power station will be owned 50/50 by BWSC and PensionDanmark. BWSC will be responsible for the entire daily management of the power plant.
In 2013 contract work in progress has increased by DKK 338 million to DKK 373 million at 31 December 2013 which has led to negative cash flow from operations for 2013. Contract work in progress for 2013 has been impacted by one large project, where the customers final financing has been secured end January 2014, and BWSC’s contract work in progress is expected to be reduced which will positively impact the cash flow from operation in 2014.
Financial Result for 2013The net revenue for the BWSC Group was DKK 1,517 million, which is an increase of DKK 462 million from 2012.
The increase is mainly a result of orders obtained in 2011 and 2012 and a large EPC order contracted early in 2013.
The gross profit was DKK 221 million (DKK 182 million) and the operating profit increased by DKK 34 million to DKK 87 million. When adding the net financials and the result of capital shares in associated companies, the result before tax was DKK 91 million (DKK 71 million), while the result after tax was 65 million (DKK 57 million).
The order intake in 2013, totalling DKK 3,801 million was split between EPC contracts totalling DKK 2,588 million, O&M contracts totalling DKK 972 million and service con-tracts totalling DKK 241 million.
The large order intake in 2013 has increased the order back-log for the BWSC Group to DKK 4,110 million (DKK 1,426 million). A substantial part of the order backlog, DKK 1,858 million, derives from O&M contracts, which will start opera-tions in the coming years and secure revenue for BWSC in the next 18 years.
6

76
Site workers, Lebanon
7
The profit ratio was 6% (7%), while the average return on equity yielded 11% (10%).
Capital structureThe share capital at 31 December 2013 was DKK 150 million. The equity amounts to DKK 623 million (DKK 603 million), corresponding to a solidity ratio of 48% (50%).
BWSC’s Japanese parent company Mitsui Engineering & Shipbuilding Co., Ltd. (MES) owns the total share capital through its Danish subsidiary MESCO Denmark A/S.
Capital resourcesThe Group’s cash funds by the end of 2013 were DKK 538 million (DKK 827 million). The receivables of the Group were DKK 521 million (DKK 196 million).
The major part of the Company’s cash funds is placed in short-term deposits. The cash position of the Company is considered sound.
Quality, Health, Safety and EnvironmentA new BWSC QHSE policy with increased focus on com-mitment, leadership and responsibility was implemented in 2013. The policy is supported by a revised QHSE Management System Description, which promotes the implementation of and compliance to the QHSE Policy.
BWSC attaches great importance to the working environ-ment, and that all employees, suppliers and contractors adhere to the strict procedures for a safe workplace.
The focus on reduction of work accidents has resulted in a declining Lost Time Injury Frequency during the last three years.
As part of the corporate strategy to obtain the ISO 9001 quality certificate before the end of 2014, work is ongoing to ensure that required procedures are fully up-to-date and implemented. When considering new projects, BWSC strives to offer the solution to the client, which will have the lowest possible environmental impact. Focus is on reductions in particle
98
emissions and NOx- (nitrogen oxides) and SOx- (sulphur oxides). Focus is also on continuing improvement of plant efficiencies, which will lead to lower CO2 emissions. Diesel engines installed by BWSC can be adapted to use a large vari-ety of alternative fuels, such as natural gas and vegetable oils.
BWSC constantly focuses on developing exhaust gas cleaning facilities, which remove dangerous and malicious particles from the power plant exhaust gas. BWSC is working with construction of power plants based on renewable energy sources, such as woodchips and straw. Furthermore, BWSC has continued the construction of one straw-fired power plant and commenced the construction of another straw-fired power plant i the UK in 2013.
Risk managementBWSC’s business platform includes large construction pro-jects in various jurisdictions and related contracts with sub suppliers and consortium partners, which exposes the Company to a number of risks.
BWSC holds comprehensive experience within engineering, construction and servicing, which has been accumulated dur-ing construction of more than 160 power plants in 50 diffe-rent countries. The experience contributes to reduce poten-tial risks, when projects are planned and executed.
Risks will, however, always be a significant factor in large construction projects, and each project is carefully evaluated and an appropriate contingency is allocated.
BWSC continuously assess risks in the Group’s projects, including possible consequences and mitigating actions. BWSC has ambitions to further systematise and strengthen its risk assessment procedures in 2014.
BWSC is operating worldwide and will therefore from time to time enter projects, whose profitability may be influenced
by the local economic and political climate, fluctuations in currencies, etc.
Currency HedgingThe Parent Company manages the currency hedging as well as the Group cash management. For each project and/or IPP (Independent Power Producer), investment cash flow and net positions of currencies other than EUR and DKK will be hedged initially upon contract signing and during the project execution, if changes in currency net positions occur. Subsequently, investments in subsidiaries, joint ventures and associated companies in foreign currency are not hedged.
Technical development activitiesBWSC has matured from an engineering company delivering turnkey power plants to a company, which can assume the role as developer of and investor in IPP projects. BWSC continuously strives to develop energy efficient and environ-mentally friendly power solutions to customers. These devel-opment activities include sophisticated exhaust gas cleaning solutions and advanced concept for power plants based on diesel, gas, wood chips, straw and biogas.
In addition, BWSC maintains constant focus on developing technical and conceptual solutions, which can improve all operations and business areas for the Group. Such activi-ties include further development of engineering and design systems.
In order to increase efficiency, enhancement of the adminis-trative and IT systems within the Company headquarters and in the subsidiaries is constantly carried out.
EmployeesBWSC is a knowledge-based Company with highly skilled employees. The dedicated efforts from the employees are creating the Group’s results and support the Company’s growth ambitions. A continued emphasis is therefore main-
98
tained on developing present and new employees through educational programs and internal rotations.
The average age of the employees is 46 years (45.7 years). In 2013, the average number of full-time employees in BWSC was 450, which is an increase of 35 employees compared to year-end 2012. 296 persons were employed by the Parent Company compared to 251 in 2012, while 154 persons were employed by subsidiaries compared to 164 in 2012.
Absence due to sickness was 1.7% (2.2%) of the standard time (excluding long-term illness), which is considered sat-isfactory.
GovernanceBWSC adheres to a set of strong values and policies, which are communicated internally in the Group and externally when entering contracts with customers and suppliers.
Statutory report on corporate social responsibility, in accordance with the Danish Financial Statements Act §99aBWSC constantly strives to proactively integrate the Group’s policies for social responsibilities when projects are imple-mented, and operations are performed in all countries and regions.
The corporate social responsibility efforts include, but are not limited to:
• Anti-corruption• Environmental impact• Quality, Health and Safety• Human rights
Code of ConductBWSC has established a comprehensive Code of Conduct, which is reflecting the Group’s zero-tolerance towards cor-ruption and bribery. Continuous efforts are being carried out to ensure that all employees, suppliers, clients, consortium partners, etc. are adhering to the Code of Conduct. Periodical audits are performed by external independent parties and reported to the Group’s executive management and the Board of Directors. No breaches of the Code of Conduct have been identified during 2013.
Whistleblower facilityIn June 2013, BWSC implemented a Whistleblower facility via an external provider, which will allow any employee of BWSC to make anonymous reporting of misconduct, fraud and other criminal activities.
Human RightsBWSC does not have a policy in respect of human rights. However, BWSC observes human rights in any aspect of the Company’s business activities and will not tolerate any viola-tion of human rights.
Gender compositionAccording to BWSC’s policy for gender composition, a tar-get of 17%, corresponding to one member of the Board of Directors elected by the General Assembly shall be a woman by 2017. Currently, none of the members of the Board of Directors elected by the General Assembly are women. In order to ensure compliance with the policy, the Company is actively searching for women with competences within the contracting industry; however, it is challenging because few women have top level management experience in this field.
The BWSC organisation includes 41 employees, who are working on a managerial level. Five managers are women, which corresponds to 12% of the total number of employ-ees in BWSC. The number is considered reasonable when comparing to the gender composition in the contracting industry in general as well as the gender distribution within the Company.
Events after balance sheet dateNo significant events subsequent to 31 December 2013, which could impact the Group’s financial position, have occurred.
Outlook for 2014 and beyondThe turnkey contracting market for diesel power stations is expected to be highly competitive, while the market for power stations based on renewable fuels will offer several opportunities, which will be explored by BWSC.
BWSC experienced an extraordinary high order intake in 2013. For 2014, it is anticipated that order intake will be lower and closer to the level experienced in previous years.
Implementation of existing and new orders will utilise many resources from the organisation, which has been prepared for through employment of qualified employees.
Although the activity level and net revenue will be high in 2014 due to the large order intake in 2013, it is expected that the profit for 2014 will be at the same level as in 2013.

1110
M A N A G E M E N T ’ S S T A T E M E N T & A U D I T O R S ’ R E P O R T
LebanonSite workers preparing for the largest diesel-fired power station in Lebanon.
The 194 MW power station will be in commercial operation in 2014.
10

1110
Executive Management
Board of Directors
Torkil Bentzen Hiroyuki Komine Katsuhisa Ohno (Chairman) (Deputy Chairman)
Yuji Kozai Michael Hedegaard Lyng Iain Miller
Birgit Svensson*) Lars Ellegaard*) Willy S. Henriksen*)
The Annual Report is adopted at the Annual General Meeting of Shareholders on 24 February 2014.
Chairman *) Elected by employees
M A N A G E M E N T ’ S S T A T E M E N T
Today, the Executive Management and Board of Directors have discussed and adopted the Annual Report for 2013 of Burmeister & Wain Scandinavian Contractor A/S.
The Annual Report has been prepared in accordance with the Danish Financial Statements Act.
In our opinion, the Financial Statements give a true and fair view of the Group’s assets, liabilities and financial position at 31 December 2013, as well as of the results of the Group’s and the Company’s operations and the Group’s consolidated cash flows for the financial year ended 31 December 2013.
In addition, it is our opinion, that the Management Report gives a true and fair view of the development in the Group’s and the Company’s operations and economic conditions, the year’s result and of the Group’s and the Company’s financial position.
It is recommended that the Annual Report be approved at the Annual General Meeting.
Allerød, 24 February 2014
Anders Heine JensenChief Executive Officer

1312
I N D E P E N D E N T A U D I T O R S ’ R E P O R T
To the Shareholders of Burmeister & Wain Scandinavian Contractor A/S
Independent auditors’ report on the consolidated financial statements and the parent company financial statementsWe have audited the consolidated financial statements and the parent company financial statements of Burmeister & Wain Scandinavian Contractor A/S for the financial year 1 January – 31 December 2013. The consolidated finan-cial statements and the parent company financial state-ments comprise accounting policies, income statement, balance sheet, statement of changes in equity and notes for the Group as well as for the parent company and consolidated cash flow statement. The consolidated financial statements and the parent company financial state-ments are prepared in accordance with the Danish Financial Statements Act.
Management’s responsibility for the consolidated finan-cial statements and the parent company financial state-mentsManagement is responsible for the preparation of consolidated financial statements and parent company financial statements that give a true and fair view in accordance with the Danish Financial Statements Act and for such internal control that Management determines is necessary to enable the preparation of consolidated finan-cial statements and parent company financial statements that are free from material misstatement, whether due to fraud or error.
Auditors’ responsibilityOur responsibility is to express an opinion on the con- solidated financial statements and the parent company financial statements based on our audit. We conducted our audit in accordance with International Standards on Auditing and additional requirements under Danish audit regulation. This requires that we comply with ethical requirements and plan and perform the audit to obtain reasonable assurance as to whether the consolidated financial statements and the parent company financial state-ments are free from material misstatement.
An audit involves performing procedures to obtain audit evidence about the amounts and disclosures in the consolidated financial statements and the parent company financial statements. The procedures selected depend on the auditors’ judgment, including the assessment of the risks of material misstatement of the consolidated financial state-ments and the parent company financial statements, whether due to fraud or error. In making those risk assessments, the
auditors consider internal control relevant to the Company’s preparation of consolidated financial statements and parent company financial statements that give a true and fair view in order to design audit procedures that are appropriate in the circumstances, but not for the purpose of expressing an opinion on the effectiveness of the Company’s internal con-trol. An audit also includes evaluating the appropriateness of accounting policies used and the reasonableness of accounting estimates made by Management, as well as evaluating the overall presentation of the consolidated financial statements and the parent company financial statements.
We believe that the audit evidence we have obtained is sufficient and appropriate to provide a basis for our opinion.
Our audit has not resulted in any qualification.
OpinionIn our opinion, the consolidated financial statements and the parent company financial statements give a true and fair view of the Group’s and the parent company’s finan-cial position at 31 December 2013 and of the results of the Group’s and the parent company’s operations and consolidated cash flows for the financial year 1 January – 31 December 2013 in accordance with the Danish Financial Statements Act.
Statement on the Management’s ReportPursuant to the Danish Financial Statements Act, we have read the Management’s Report. We have not performed any further procedures in addition to the audit of the consoli-dated financial statements and the parent company financial statements. On this basis, it is our opinion that the informa-tion provided in the Management’s Report is consistent with the consolidated financial statements and the parent com-pany financial statements.
Copenhagen, 24 February 2014
KPMGStatsautoriseret Revisionspartnerselskab
Lars Rhod Søndergaard State Authorised Public Accountant

1312
F I N A N C I A L S T A T E M E N T S
The UKConstruction of one of the world’s largest straw-fired power stations, the 38.5 MW Sleaford Biomass Plant in Sleaford, Lincolnshire.
13

1514
I N C O M E S T A T E M E N T I N D K K T H O U S A N D S
Parent Company The Group
2012 2013 Notes 2013 2012
842,887 1,297,079 3 Net revenue 1,517,260 1,054,501
-701,169 -1,108,892 Costs of production -1,295,905 -872,209
141,718 188,187 Gross profit 221,355 182,292
-39,535 -37,393 Sales costs -37,365 -39,499
-78,801 -86,744 Administrative costs -97,422 -89,460
0 401 Other operating income 401 0
23,382 64,451 Operating profit/loss 86,969 53,333
18,430 9,143 9 Profit on investments in subsidiaries 0 0
2,983 -3,075 9 Profit on investments in joint ventures -3,075 2,983
15,840 13,409 9 Profit on investments in associated companies 13,409 15,840
60,635 83,928 Profit before non-operating items 97,303 72,156
7,422 4,557 Financial income 5,410 9,277
-7,229 -10,626 Financial costs -11,491 -10,831
60,828 77,859 Profit before tax 91,222 70,602
-7,215 -18,442 4 Tax on profit for the year -26,267 -13,564
53,613 59,417 Profit for the year 64,955 57,038
Minority interests -5,538 -3,425
The Parent Company’s share of profit for the year 59,417 53,613
It is recommended that the profit for the year, DKK 59,417 thousands, is appropriated as follows:
Parent Company
2013 2012
Proposed dividend 29,500 26,500
Transferred to net revaluation reserves -19,143 37,919
Retained profit 49,060 -10,806
59,417 53,613

1514
C A S H F L O W S T A T E M E N T I N D K K T H O U S A N D S
The Group
Notes 2013 2012
Operating profit 86,969 53,333
Cash flow adjustments 16 -72,529 92,489
Changes in working capital 17 -184,333 3,681
Cash flows from operating activities before net financials -169,893 149,503
Financial income 5,410 9,277
Financial costs -11,628 -10,689
Cash flows from ordinary activities -176,111 148,091
Taxes paid -19,572 -16,684
Cash flows from operating activities -195,683 131,407
Additions of tangible assets -5,173 -2,394
Additions of intangible assets -3,121 -2,098
Dividends received from associated companies 12,191 3,627
Investments in associated companies -12,954 0
Investments in joint ventures -64,327 0
Disposals of investments in associated companies 16,747 13,200
Cash flows from investing companies -56,637 12,335
Repayment of mortgage debt -3,041 -2,933
Dividends distributed -26,500 -26,500
Cash flows from financing activities -29,541 -29,433
Cash and cash equivalents at beginning of year 826,770 719,146
Exchange rate adjustments -7,154 -6,685
Changes in cash and cash equivalents -281,861 114,309
Cash and cash equivalents at year-end 537,755 826,770
The cash flow statement cannot be derived directly from the Income Statement and Balance Sheets.
2013 2012
Bonds 0 73,125
Cash and cash equivalents 537,755 753,645
Cash and cash equivalents at year-end 537,755 826,770
Cash and equivalents at year-end can be specified as follows:

1716
B A L A N C E S H E E T A S S E T S
I N D K K T H O U S A N D S
Parent Company The Group
2012 2013 Notes 2013 2012
24,190 21,571 Software 21,571 24,190
24,190 21,571 7 Intangible fixed assets 21,571 24,190
72,908 71,549 Land and buildings 71,549 72,908
3,917 4,256 Fixtures and fittings, tools and equipment 5,717 4,403
76,825 75,805 8 Tangible fixed assets 77,266 77,311
46,227 27,345 Investments in subsidiaries - -
3,280 61,849 Investments in joint ventures 61,849 3,280
61,830 62,293 Investments in associated companies 62,293 61,830
1,499 1,499 Other securities 1,499 1,499
112,836 152,986 9 Financial fixed assets 125,641 66,609
213,851 250,362 Total fixed assets 224,478 168,110
3,934 3,934 Raw materials and consumables 4,458 4,526
3,934 3,934 Inventories 4,458 4,526
94,306 27,931 Trade debtors 45,167 109,379
33,169 258,971 10 Contract work in progress 372,830 34,835
9,337 69,889 Amounts owed by related companies 2,255 2,298
3,012 15,349 Amounts owed by associated companies 19,901 7,059
430 12,616 Receivable corporate taxes 13,700 1,068
34,852 55,460 11 Other debtors 63,035 39,314
1,390 3,738 Prepayments 4,443 1,690
176,496 443,954 Debtors 521,331 195,643
73,125 0 Bonds 0 73,125
73,125 0 Securities 0 73,125
726,812 499,104 Cash and cash equivalents 537,755 753,645
980,367 946,992 Total current assets 1,063,544 1,026,939
1,194,218 1,197,354 TOTAL ASSETS 1,288,022 1,195,049

1716
Parent Company The Group
2012 2013 Notes 2013 2012
150,000 150,000 Share capital 150,000 150,000
52,114 31,630 Net revauation reserve acc. to the equity method 8,955 10,457
-5,287 -16,718 Reserves for financial instruments -16,718 -5,287
377,843 426,903 Retained earnings 449,578 419,500
26,500 29,500 Proposed dividend 29,500 26,500
601,170 621,315 Equity owned by shareholders of BWSC A/S 621,315 601,170
Minority interests 1,708 1,831
Equity 623,023 603,001
26,495 38,014 12 Deferred tax 39,124 26,117
34,365 23,482 Warranty provisions 23,482 34,365
78,391 15,477 13 Other provisions 17,762 89,055
139,251 76,973 Provisions 80,368 149,537
31,288 28,231 14 Mortgage debt 28,231 31,288
31,288 28,231 Long-term liabilities 28,231 31,288
3,042 3,058 Mortgage debt, short-term 3,058 3,042
277,584 265,390 10 Prepayments received from customers 264,999 279,354
70,259 136,401 Trade creditors 220,055 72,494
24,656 10,243 Payables to related companies 5,386 3,924
428 110 Payables to associated companies 110 428
350 2,237 Corporate tax 4,489 1,979
46,190 53,396 15 Other creditors 58,303 50,002
422,509 470,835 Current liabilities 556,400 411,223
453,797 499,066 Total long-term and current liabilities 584,631 442,511
1,194,218 1,197,354 TOTAL EQUITY AND LIABILITIES 1,288,022 1,195,049
B A L A N C E S H E E T E Q U I T Y A N D L I A B I L I T I E S I N D K K T H O U S A N D S
1918
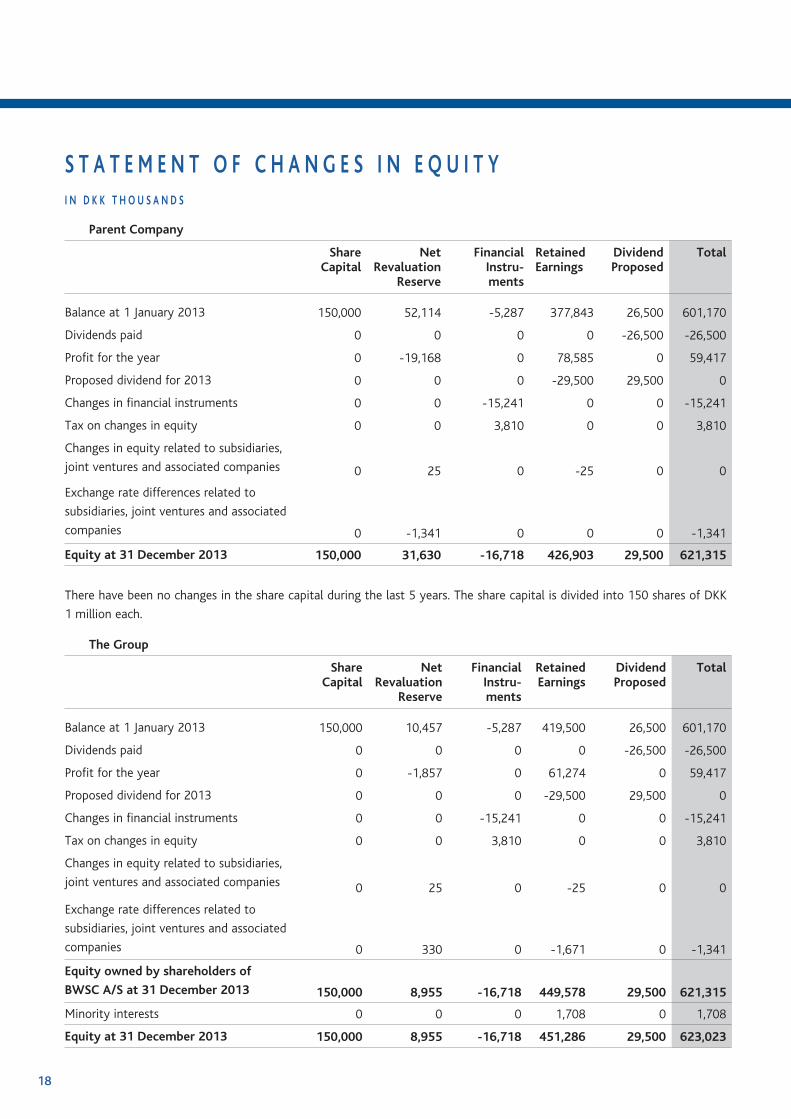
S T A T E M E N T O F C H A N G E S I N E Q U I T Y I N D K K T H O U S A N D S
Parent Company
Share Capital
Net Revaluation
Reserve
Financial Instru-ments
Retained Earnings
Dividend Proposed
Total
Balance at 1 January 2013 150,000 52,114 -5,287 377,843 26,500 601,170
Dividends paid 0 0 0 0 -26,500 -26,500
Profit for the year 0 -19,168 0 78,585 0 59,417
Proposed dividend for 2013 0 0 0 -29,500 29,500 0
Changes in financial instruments 0 0 -15,241 0 0 -15,241
Tax on changes in equity 0 0 3,810 0 0 3,810
Changes in equity related to subsidiaries,
joint ventures and associated companies 0 25 0 -25 0 0
Exchange rate differences related to
subsidiaries, joint ventures and associated
companies 0 -1,341 0 0 0 -1,341
Equity at 31 December 2013 150,000 31,630 -16,718 426,903 29,500 621,315
There have been no changes in the share capital during the last 5 years. The share capital is divided into 150 shares of DKK
1 million each.
The Group
Share Capital
Net Revaluation
Reserve
Financial Instru-ments
Retained Earnings
Dividend Proposed
Total
Balance at 1 January 2013 150,000 10,457 -5,287 419,500 26,500 601,170
Dividends paid 0 0 0 0 -26,500 -26,500
Profit for the year 0 -1,857 0 61,274 0 59,417
Proposed dividend for 2013 0 0 0 -29,500 29,500 0
Changes in financial instruments 0 0 -15,241 0 0 -15,241
Tax on changes in equity 0 0 3,810 0 0 3,810
Changes in equity related to subsidiaries,
joint ventures and associated companies 0 25 0 -25 0 0
Exchange rate differences related to
subsidiaries, joint ventures and associated
companies 0 330 0 -1,671 0 -1,341
Equity owned by shareholders of
BWSC A/S at 31 December 2013 150,000 8,955 -16,718 449,578 29,500 621,315
Minority interests 0 0 0 1,708 0 1,708
Equity at 31 December 2013 150,000 8,955 -16,718 451,286 29,500 623,023

1918
N O T E S
WalesLogs are placed on trucks and brought to a 14 MW wood chip-fired power plant in Port Talbot, Wales.
19
2120
N O T E S
Notes Page
Accounting Policies 1 Accounting Policies 21
2 Estimates by Management 25
Income Statement 3 Net Revenue 26
4 Tax 27
5 Audit Fees 27
6 Staff Costs, etc. 28
Balance Sheet 7 Intangible Fixed Assets 29
8 Tangible Fixed Assets 30
9 Financial Fixed Assets 32
10 Contract Work in Progress 33
11 Other Debtors 34
12 Deferred Tax 34
13 Other Provisions 35
14 Mortgage Debt 35
15 Other Creditors 35
Cash Flow Statement 16 Cash Flow Adjustments 35
17 Changes in Working Capital 36
Other 18 Derivative Financial Instruments 36
19 Transactions between Related Parties 37
20 Contingency Liabilities, Security for Loans, etc. 37
21 Subsidiaries, Joint Ventures and Associated Companies 38
2120
GeneralThe Annual Report of Burmeister & Wain Scandinavian Contractor A/S has been presented in accordance with the provisions of the Danish Financial Statements Act for large reporting Class C companies.
Change in Accounting PoliciesIn line with international practice, investments in joint ven-tures are from 2013 measured and presented in one line at the Parent Company’s proportionate share of the net assets of the joint ventures (the equity method). Previously, joint ventures were consolidated line-by-line on a pro-rata basis.
Comparative figures for 2012 have been restated. Accordingly, turnover has been reduced by DKK 11 million and total assets have been reduced by DKK 2 million. Similarly, comparative figures for 2009-2011 in the financial highlights have been restated. The change has no effect on net profit or equity.
The accounting policies are besides the above unchanged from last year.
Recognition and measurement in generalAssets are recognised at the balance sheet, when it is prob-able that future economic benefits associated with the assets will flow to the Group, and the cost of the assets can be measured reliably.
Liabilities are recognised at the Balance Sheet, when it is probable that future economic benefits associated with the liabilities will flow from the Group, and the cost of the liabili-ties can be measured reliably.
At initial recognition assets and liabilities are measured at cost. Assets and liabilities are afterwards measured as described below for each balance sheet item.
ConsolidationThe consolidated financial statements are prepared on the basis of audited financial statements of the Parent Company and each subsidiary by aggregating items of a similar nature and by eliminating intra-group transactions.
The project financial statements of international contracting activities are translated into Danish kroner as follows: The items in the Income Statement and the Balance Sheet are translated according to weighted project rates, corresponding to the exchange rates according to forward exchange contracts entered into. As the exchange rates applied are the same dur-
ing the entire project period, generally no exchange rate dif-ferences arise on large projects.
The financial statements of foreign subsidiaries that operate as independent entities are translated into Danish kroner as follows: The items in the Income Statement are translated at average rates that do not differ materially from the exchange rates ruling at the date of transaction. Balance sheet items are translated into closing exchange rates. Exchange rate dif-ferences are recognised directly in equity.
The financial statements of international subsidiaries that operate as integrated entities are translated into Danish kroner as follows: The items in the Income Statement are translated at average rates that do not differ materially from the exchange rates ruling at the date of transaction. Current assets and liabilities are translated at closing exchange rates, whereas fixed assets and long-term liabilities are translated at histori-cal rates. Exchange rate differences are recognised in the Income Statement.
The items from the subsidiaries are consolidated into the Group’s Financial Statements 100% line by line. The minor-ity interest’s proportional share of the net result and equity of the subsidiaries is included as separate items under the consolidated net profit and equity.
Companies in which the Group holds between 20% and 50% of the voting rights or in some other way holds significant influence, but not control, are regarded as associated com-panies as described under the item “Financial Fixed Assets”.
Investments in joint ventures are treated in the same way as investments in associated companies.
Foreign Currency TranslationTransactions in foreign currency are translated at the ex-change rate at the transaction date. Exchange rate differ-ences arising between the exchange rate at the transaction date and the payment date are recognised in the Income Statement.
Receivables, payables and other monetary items in foreign currency, which are not paid at the balance sheet date, are translated at the exchange rate at the balance sheet date. The difference between the exchange rate at the balance sheet date and the exchange rate at the time when the receivable or payable is incurred is recognised in the Income Statement.
Note 1. Accounting Policies
N O T E S
2322
Derivative Financial InstrumentsDerivative financial instruments are initially recognised in theBalance Sheet at cost and subsequently measured according to fair value. The fair value of derivative financial instruments is included in other debtors (positive fair value) or other creditors (negative fair value) as the case may be.
Changes in the fair value of derivative financial instruments that hedge the fair value of already recognised assets or liabilities are recognised in the Income Statement under financial income or financial costs together with changes in the value of the assets and liabilities hedged.
Derivative financial instruments used to hedge expected future transactions regarding specific projects or interest payments are measured at fair value on the balance sheet date, and value adjustments are recognised directly in the equity until the hedged item is realised. When the hedged item is realised, the changes in value are recognised in the same accounting entry as the hedged item, as stated above by transferring the changes in value from the equity to the Income Statement.
Derivative financial instruments which are not held for hedg-ing purposes regarding specific projects or interest payments are recognised in the Balance Sheet at fair value on the bal-ance sheet date. Value adjustments are recognised in the Income Statement under financial income and financial costs.
INCOME STATEMENTNet RevenueThe Group’s net revenue is derived from contract activities, service contracts, etc.
Contract work and operational contracts are recognized according to the percentage-of-completion method. Profits on contracts are recognised by reference to actual stage of completion, based on an estimate allowing for both known and expected additional costs. In connection with consorti-ums, only the Group’s share is taken into account.
Stage of completion is determined on the basis of an assess-ment of the work carried out, evaluated on the basis of 6 indicators for the stage of completion, including among oth-ers hours incurred in relation to the total budgeted hours, costs incurred on the projects compared to the total esti-mated costs and final delivery of the project.
Realised profits on completed contracts are recognised net of provisions for warranties.
Income from spare part contracts is recognised when invoiced.
Costs of ProductionCosts of production comprise expenses, including wages and salaries and depreciation made for purposes of generating the year’s net revenue, including direct and indirect costs related to raw materials and consumables, wages and sala-ries, rent and leases and depreciation.
Research costs, development costs that do not qualify for capitalisation and depreciation of capitalised development costs, are recognised as costs of production.
Write-downs in connection with expected losses on contractactivities are recognised as costs of production.
Sales CostsCosts related to offers and orders, including expenses related to sales personnel, marketing, including costs for Independent Power Producer (IPP) project development, and internal development projects, are recognised as sales costs.
Administrative CostsCosts related to management and group administration, including costs related to administrative officers, manage-ment, office premises, office expenses, depreciation etc., are recognised as administrative costs.
The administrative costs that are included in production overheads are transferred to production overheads.
Net FinancialsFinancial income and costs include interest income and costs, realised and unrealised capital gains and losses, paya-bles and transactions in foreign currency, amortisation of financial assets and liabilities and surcharges and allowances under the advance-payment-of-tax scheme, etc. financial income and costs are recognised at the amounts relating to the reporting period.
TaxThe estimated tax charge for the year is recognised in the Income Statement and is recorded as a current liability in the Balance Sheet. Non-refunded dividend tax concerning dividends from foreign subsidiaries is expensed in the year in which the dividend is declared.
The Group and its Parent Company are jointly taxed. The tax of the joint taxation income is fully allocated by payment of joint taxation contributions.
N O T E S

2322
Deferred tax resulting from timing differences between income and expenses in the financial statements and the statement of taxable income and from tax loss carry-for-wards is provided for in the Balance Sheet. Changes in the deferred tax charge for the year are taken to the Income Statements. Actual and deferred tax related to equity move-ments is recognised directly in equity.
BALANCE SHEETIntangible and Tangible Fixed AssetsIntangible fixed assets and property, plant and equipment are measured at cost plus subsequent additions and revalu-ation and less accumulated amortisation/depreciation and write-downs.
Amortisation/depreciation in the year is provided on a straight-line basis over the estimated useful lives of the indi-vidual assets, using the following periods:
Financial Fixed AssetsInvestments in subsidiaries, joint ventures and associated companies are recognised at the Parent Company’s propor-tionate share of the net assets of the companies, calculated by reference to the accounting polices applied by the Parent Company, adjusted for unrealised intra-group profits and losses (the equity method).
Subsidiaries, joint ventures and associated companies whose net asset value is negative are recognised at DKK 0, and any receivables from these companies are written down by the Parent Company’s share of the negative net asset value. If the net asset value exceeds the receivables, the residual amount is recognized under provisions provided that the Parent Company has a legal or actual obligation to cover the subsidiaries’ deficits.
Net revaluation of investments in subsidiaries, joint ventures and associated companies is taken to equity as a net revalu-ation reserve according to the equity method to the extent
that the carrying amount exceeds the cost.
Newly acquired or newly established companies are recog-nized in the financial statements from the time of acquisi-tion. Companies sold or otherwise disposed of are recognized until the time of sale.
Profits or losses on the sale of subsidiaries, joint ventures and associated companies are stated as the difference between the selling price and the carrying amount of the net assets at the time of sale and expected costs related to the sale and/or disposal and recognised in the Income Statements under net financials.
The takeover method is applied to newly acquired subsidia-ries, joint ventures and associated companies. Thus, the assets and liabilities of such companies are measured at fair value at the time of acquisition.
InventoriesInventories, including prepayments for goods, are measuredat cost according to the FIFO principle. However, inventoriesare written down to the lower of cost or net realisable value.
ReceivablesReceivables, etc. are measured at amortised cost, which usu-ally equals the nominal value.
Write-downs for bad debts are based on individual assess-ments if there is an objective indication that a receivable is impaired.
SecuritiesSecurities under Current Assets comprise listed bonds and shares stated at the market price at the balance sheet date.
Contract Work in ProgressContract work in progress is measured by reference to the stage of completion, reference is made to the section Net Revenue.
The sales value is based on the stage of completion at the balance sheet date and the total expected income on the individual work in progress.
The individual work in progress is recognised in the BalanceSheet under receivables or liabilities other than provisions, dependent on the net value of the selling price less pay-ments on account and prepayments. Costs related to sales work and contracts are recognised in the Income Statement as incurred.
N O T E S
Office building 100 years
Warehouse 25 years
Installations 10 years
Cars 5 years
Plant and equipment 5 years
Fixtures and fittings 3-10 years
IT software 3-7 years
IT hardware 3 years

2524
PrepaymentsPayments, made or received concerning costs or income in subsequent years are recognised under prepayments.
ProvisionsProvisions comprise expected remaining costs relating to delivered contracts expected costs to performance guaran-tees.
Performance guarantees comprise commitments to repair work within the guarantee period. Provisions are measured and recognised based on previous experience with guarantee work.
When it is probable that the total costs will exceed the total income on contract work in progress, a provision is made forthe total loss expected to be incurred on the work. The provi-sion is recognised as costs under production costs.
Proposed Dividend for the YearProposed dividend for the year is included in the equity.
Financial LiabilitiesFinancial liabilities are recognised from the raising of the loan at the proceeds received net of transaction costs incurred.
The financial liability is subsequently measured at amortisedcost, equalling the capitalised value, using the effective interest rate method. The difference between the proceeds and the nominal value is thus recognised in the Income Statement over the loan term.
Other financial liabilities, which comprise trade payables, payables to subsidiaries and associated companies and other payables, are measured at amortised cost, which usually cor-responds to the nominal value.
CASH FLOW STATEMENTThe cash flow statement shows the Group’s net cash flows for the year, broken down by operating, investing and financ-ing activities, changes in cash and cash equivalents and the Group’s cash and cash equivalents at the beginning and at the end of the year.
Cash flow statement for the Parent Company has not been prepared in accordance with §86,4 of the Danish Financial Statements Act.
Cash and cash equivalents comprise cash and near money securities which immediately can be converted into cash.
Cash Flows from Operating ActivitiesCash flows from operating activities are made up as the net profit or loss for the year, adjusted for non-cash operating items, changes in working capital and paid income taxes.
Cash Flows from Investing ActivitiesCash flows from investing activities comprise payments related to additions and disposals of companies and activi-ties and additions and disposals of intangible assets, property, plant and equipment and investments.
Cash Flows from Financing ActivitiesCash flows from financing activities comprise changes in the size or composition of share capital and related costs, raising of loans and repayments of interest-bearing debt and divi-dends distributed to shareholders.
Key FiguresExcept from the Profit margin, which according to the cus-tom of the sector has been calculated as the result before tax proportional to the revenue, the ratios have been prepared in accordance with the “Recommendations and Financial Ratios 2010” issued by the Danish Society of Financial Analysts.
Analysis of the ratios included in the below financial high-lights:
N O T E S
Gross margin Gross profit x 100 Net revenue
Profit margin Profit before tax x 100 Net revenue
Return on Operating p/l incl. net financials x 100investments Assets at year-end
Solidity ratio Equity at year-end x 100 Total equity and liabilities at year-end
Return on equity Profit after tax x 100 Average equity

2524
N O T E S
Note 2. Estimates by Management
Significant management estimates and assumptionsIn preparing the consolidated financial statements for the BWSC Group, Management has made a number of estimates and assumptions which affect the recognised assets and liabilities and Income Statement. The most significant man-agement estimates and assumptions relate to:
• Calculation of the expected contribution margin relating to contract work in progress, including estimates of the potential financial impact of project risks, disputes, war-ranty costs, etc.
• Statement of percentage of completion for contract work in progress
• Warranty provisions and completion and settlement of completed contracts, including profit or loss on any outstanding claims from or against customers, partners and subcontractors
As part of the assessment of ongoing and completed con-tracts, a number of project-related risks are taken into account, including performance, quality, claims raised and delay of projects in respect of which assessments and provi-sions have been made based on Management’s estimates.
Management bases its estimates on historical experience, legal opinions and other assumptions as deemed appropriate at the given time. Actual results may differ from this over time, and deviations may be material.
2726
N O T E S
Parent Company The Group
2012 2013 2013 2012
1,970,745 403,250 Final invoicing 488,447 2,479,672
-1,127,858 893,829 Changes in contract work in progress 1,028,813 -1,425,171
842,887 1,297,079 1,517,260 1,054,501
Net Revenue for the year is divided into the following geographical segments:
2012 2013 2013 2012
351,874 402,490 Europe 417,124 402,477
210,035 443,517 Africa and the Middle East 620,521 299,578
228,605 409,522 South and Central America 429,770 291,181
52,373 41,550 Southeast Asia 49,845 61,265
842,887 1,297,079 1,517,260 1,054,501
Note 3. Net RevenueIn DKK thousands
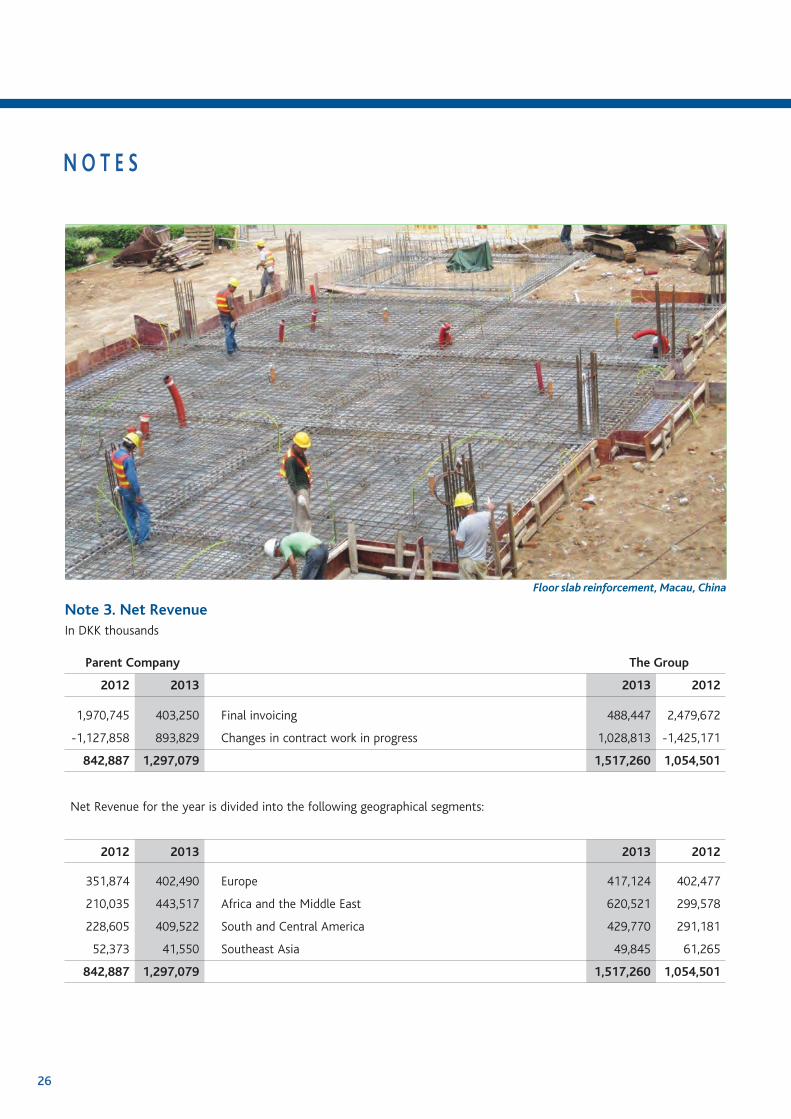
Floor slab reinforcement, Macau, China
2726
Note 4. Tax In DKK thousands
Note 5. Audit FeesIn DKK thousands
Parent Company The Group
2012 2013 2013 2012
18,302 2,206 Income tax payable 8,499 24,610
-9,041 11,519 Change in deferred tax 13,133 -8,861
-2,539 3,810 Tax on changes in equity 3,810 -2,539
-28 -547 Adjustment of tax concerning previous years -629 -167
521 1,454 Paid dividend tax abroad 1,454 521
7,215 18,442 26,267 13,564
Specification of effective tax rate:
2012 2013 2013 2012
25.0% 25.0% Company tax rate in Denmark 25.0% 25.0%
-13.0% -0.7% Tax on profit in subsidiaries, joint ventures and associated
companies
1.9% -4.7%
0.0% 0.0% Adjustment of calculated tax in foreign companies compared to 25%
1.5% -3.2%
0.0% 0.1% Non-deductible costs 0.8% 2.3%
-0.1% -0.7% Other adjustments -0.4% -0.4%
11.9% 23.7% Effective tax rate 28.8% 19.0%
Parent Company The Group
2012 2013 2013 2012
510 510 Audit fee 793 830
150 152 Other declaration assignments 153 150
370 569 Tax advisory fee 716 626
478 683 Other fees 730 731
1,508 1,914 2,392 2,337
N O T E S
2928
Parent Company The Group
2012 2013 2013 2012
167,118 201,525 Wages and salaries 228,471 213,108
1,692 1,885 Social security costs 2,450 1,889
168,810 203,410 230,921 214,997
Including remuneration for:
2012 2013 2013 2012
2,612 2,812 Executive Management of Parent Company 2,812 2,612
1,173 1,253 Board of Directors of Parent Company 1,253 1,173
3,785 4,065 4,065 3,785
251 296 Average number of employees 450 415
A bonus scheme for the Executive Management and Management Group is established in the Parent Company. The bonus
scheme is based on individual goals and the Company’s overall result.
N O T E S
Floot slab reinforcement, Mauca, China
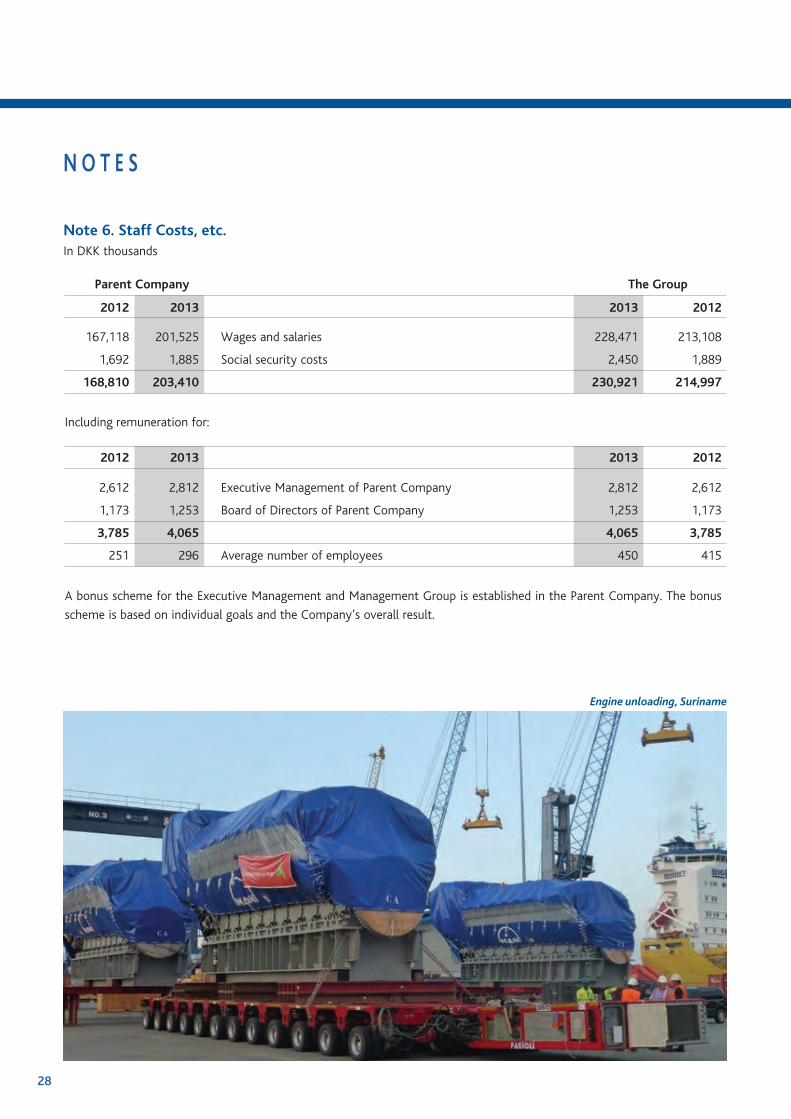
Engine unloading, Suriname
Note 6. Staff Costs, etc.In DKK thousands
2928
Parent Company Software Total
Cost at 1 January 2013 35,367 35,367
Additions in the year 3,121 3,121
Cost at 31 December 2013 38,488 38,488
Deprecation at 1 January 2013 11,177 11,177
Deprecation for the year 5,740 5,740
Deprecation at 31 December 2013 16,917 16,917
Book value at 31 December 2013 21,571 21,571
Book value at 31 December 2012 24,190 24,190
The Group Software Total
Cost at 1 January 2013 35,367 35,367
Additions in the year 3,121 3,121
Cost at 31 December 2013 38,488 38,488
Deprecation at 1 January 2013 11,177 11,177
Deprecation for the year 5,740 5,740
Deprecation at 31 December 2013 16,917 16,917
Book value at 31 December 2013 21,571 21,571
Book value at 31 December 2012 24,190 24,190
Deprecation for the year is included in:
Parent Company The Group
2012 2013 2013 2012
5,100 5,740 Administrative costs 5,740 5,100
5,100 5,740 5,740 5,100
N O T E S
Note 7. Intangible Fixed AssetsIn DKK thousands

3130
N O T E S
Parent Company
Fixtures and Fittings, Tools and Equipment
Land and Buildings
Total
Cost at 1 January 2013 14,009 114,744 128,753
Additions in the year 2,582 931 3,513
Disposals in the year -495 0 -495
Cost at 31 December 2013 16,096 115,675 131,771
Deprecation at 1 January 2013 10,092 41,836 51,928
Deprecation for the year 2,228 2,290 4,518
Deprecation of disposals -480 0 -480
Deprecation at 31 December 2013 11,840 44,126 55,966
Book value at 31 December 2013 4,256 71,549 75,805
Book value at 31 December 2012 3,917 72,908 76,825
Note 8. Tangible Fixed Assets In DKK thousands
Sleaford site by night, the UK

3130
N O T E S
Parent Company The Group
2012 2013 2013 2012
787 789 Production costs 1,005 1,108
58 70 Sales costs 80 96
3,610 3,659 Administrative costs 3,915 4,020
4,455 4,518 5,000 5,224
The Group
Fixtures and Fittings, Tools and Equipment
Land and Buildings
Total
Cost at 1 January 2013 17,959 114,744 132,703
Currency adjustments at 1 January 2013 -111 0 -111
Additions in the year 4,244 931 5,175
Disposals in the year -1,709 0 -1,709
Cost at 31 December 2013 20,383 115,675 136,058
Deprecation at 1 January 2013 13,556 41,836 55,392
Currency adjustments at 1 January 2013 -109 0 -109
Deprecation for the year 2,710 2,290 5,000
Deprecation of disposals -1,491 0 -1,491
Deprecation at 31 December 2013 14,666 44,126 58,792
Book value at 31 December 2013 5,717 71,549 77,266
Book value at 31 December 2012 4,403 72,908 77,311
Deprecation for the year is included in:
Note 8. Tangible Fixed Assets (continued) In DKK thousands
3332
N O T E S
Parent Company
Subsidiaries Joint Ventures
AssociatedCompanies
OtherSecurities
Total
Cost at 1 January 2013 4,570 207 54,446 1,514 60,737
Additions in the year 2013 100 64,327 12,954 0 77,381
Disposals in the year 0 0 -16,747 0 -16,747
Cost at 31 December 2013 4,670 64,534 50,653 1,514 121,371
Revaluations/write-downs at 1 January 2013 41,657 3,072 7,385 -15 52,099
Profit share in 2013 9,143 -3,075 13,409 0 19,477
Exchange rate differences -1,671 894 -564 0 -1,341
Distribution of dividend to Parent Company -26,454 -2,176 -10,015 0 -38,645
Elimination intercompany profit 0 -1,400 1,425 0 25
Revaluations/write-downs at 31 December 2013 22,675 -2,685 11,640 -15 31,615
Book value at 31 December 2013 27,345 61,849 62,293 1,499 152,986
Book value at 31 December 2012 46,227 3,280 61,830 1,499 112,836
Note 9. Financial Fixed Assets In DKK thousands
3332
Parent Company The Group
2012 2013 2013 2012
532,566 1,426,395 Sales value of production in progress 1,575,662 546,849
-776,981 -1,432,814 Invoiced on account -1,467,831 -791,368
-244,415 -6,419 Contract work in progress, net 107,831 -244,519
Classified as follows:
2012 2013 2013 2012
33,169 258,971 Contract work in progress (receivables) 372,830 34,835
-277,584 -265,390 Prepayments received from customers -264,999 -279,354
-244,415 -6,419 107,831 -244,519
N O T E S
The Group
Joint Ventures
AssociatedCompanies
OtherSecurities
Total
Cost at 1 January 2013 207 54,446 1,514 56,167
Additions in the year 2013 64,327 12,954 0 77,281
Disposals in the year 0 -16,747 0 -16,747
Cost at 31 December 2013 64,534 50,653 1,514 116,701
Revaluations/write-downs at 1 January 2013 3,072 7,385 -15 10,442
Profit share in 2013 -3,075 13,409 0 10,334
Exchange rate differences 894 -564 0 330
Distribution of dividend to Parent Company -2,176 -10,015 0 -12,191
Elimination intercompany profit -1,400 1,425 0 25
Revaluations/write-downs at 31 December 2013 -2,685 11,640 -15 8,940
Book value at 31 December 2013 61,849 62,293 1,499 125,641
Book value at 31 December 2012 3,280 61,830 1,499 66,609
As per 31 December 2013, elimination of the proportionate share of the intercompany profit of DKK 24.2 million before tax has been deducted from the investments in joint ventures and associated companies.
Note 9. Financial Fixed Assets (continued) In DKK thousands
Note 10. Contract Work in ProgressIn DKK thousands

3534
N O T E S
Parent Company The Group
2012 2013 2013 2012
1,686 39,226 VAT receivable, duties and other taxes 46,217 4,857
0 0 Deposits 490 556
28,548 0 Project related claims 0 28,548
1,101 1,675 Financial instruments 1,675 1,101
0 12,727 Other project related income 12,727 0
3,517 1,832 Other accrued income 1,926 4,252
34,852 55,460 63,035 39,314
Note 11. Other Debtors In DKK thousands
Parent Company The Group
2012 2013 2013 2012
35,563 26,495 Deferred tax at 1 January 2013 26,117 35,156
-27 0 Adjustment concerning previous years -126 -178
-9,041 11,519 Changes in deferred tax 13,133 -8,861
26,495 38,014 39,124 26,117
Deferred tax can be specified as follows:
2012 2013 2013 2012
15,520 14,019 Tangible fixed assets 13,984 15,422
-6,055 -6,049 Financial fixed assets -6,043 -6,035
19,824 35,277 Contract work in progress a.o. 36,851 19,824
-2,070 -333 Current assets -512 -2,070
-599 0 Provisions -133 -899
-125 -125 Liabilities other than provisions -125 -125
0 -4,775 Tax loss carried forward -4,898 0
26,495 38,014 39,124 26,117
Note 12. Deferred Tax
In DKK thousands
3534
Note 13. Other Provisions
Provisions cover estimated remaining liabilities in connection with finalised contracts, other than warranty provi sions.
Note 14. Mortgage Debt
Long-term debt maturing after 5 years from the end of the fiscal year amounts to DKK 15.9 million.
Parent Company The Group
2012 2013 2013 2012
24,763 27,991 Payable payroll related costs 31,849 26,677
7,901 22,608 Financial instruments 22,607 7,901
10,211 0 VAT payable 505 10,561
3,315 2,797 Other accrued costs 3,342 4,863
46,190 53,396 58,303 50,002
N O T E S
Note 15. Other Creditors
In DKK thousands
The Group
2013 2012
Amortisation/depreciation 10,740 10,334
Changes in provisions -82,176 86,296
Profit/loss on the sale of fixed assets 15 30
Derivative financial instruments -1,108 -4,171
-72,259 92,489
Note 16. Cash Flow Adjustments In DKK thousands
3736
N O T E S
It is company policy to account for a net cash flow hedge per currency of individual projects, primarily through forward con-
tracting. The net cash flow per currency is made up as the difference between the total foreign exchange earnings and the
foreign exchange losses during the life of a project.
Open foreign exchange transactions and options as of 31 December 2013:
Principal amount USD GBP
Sold 12,645 668,641
Bought 0 26,759
Net market value 1,357 -17,318
Maturity 2 months 24 months
The Company has made interest swaps to hedge payment of interest on a mortgage loan with variable interest. The
principal of the loan at 31 December 2013 is DKK 31.3 million with a maturity of 10 years. The market value of the interest
swaps as per 31 December 2013, amounted to DKK -5.0 million which has been accounted for in the equity.
Note 18. Derivative Financial Instruments In DKK thousands
The Group
2013 2012
Changes in inventories 68 -3,922
Changes in contract work in progress -352,069 148,716
Changes in trade debtors 64,349 -33,618
Changes in receivables from group companies and associated companies -12,799 15,246
Changes in other debtors -23,147 -16,886
Changes in prepayments -2,753 1,185
Changes in trade creditors 147,280 -102,111
Changes in payables to group companies and associated companies 1,144 4,352
Changes in other creditors -6,405 -9,281
-184,333 3,681
Note 17. Changes in Working Capital In DKK thousands

3736
Guarantees totalling DKK 832 million (DKK 552 million) have been provided for ongoing and completed projects, including
DKK 115 million (DKK 125 million) by way of prepayment guarantees. In addition, guarantees totalling DKK 495 million (DKK
507 million) are issued by the Parent Company in Japan.
No other warranty commitments exist apart from service and guarantee commitments customary in the industry.
The Group is party to disputes and litigation from time to time which is normal for the Group’s business. It is not estimated
that the outcome of such disputes or litigation will have a material impact on the Group’s financial position.
The Parent Company is jointly taxed with the other Danish entities in the Mesco Denmark Group. As a wholly-owned sub-
sidiary, the Parent Company is jointly and severally liable, together with the other jointly taxed entities, for Danish income
taxes and withholding taxes on dividends, interest and royalties within the Group of jointly taxes entities. Any subsequent
adjustments of the joint taxable income or withholding taxes may result in an increase of the Parent Company’s liability.
Note 20. Contingency Liabilities, Security for Loans, etc.
Note 19. Transactions between Related Parties
Purchase of diesel engines, spare parts, guarantees etc. from Mitsui Engineering & Shipbuilding Co., Ltd., Japan and
purchase of diesel engines and spare parts etc. from MAN Diesel & Turbo SE in Germany and Denmark have taken place at
market conditions.
The sale of goods to associated companies has also taken place at market conditions.
Apart from intercompany transactions which have been eliminated in the Group accounts, plus usual management fee, no
transactions have been made with the Board of Directors, Management Group, subsidiaries and associated companies or other
related parties during the year.
Group relationships
BWSC’s ultimate Parent Company is Mitsui Engineering & Shipbuilding Co., Ltd., which prepares the accounts for the group
in which BWSC is included.
Group accounts for the Parent Company can be obtained from:
Mitsui Engineering & Shipbuilding Co., Ltd., 6-4, Tsukiji 5-chome, Chuo-ku, Tokyo 104-8439, Japan.
N O T E S

3938
N O T E S
Note 21. Subsidiaries, Joint Ventures and Associated Companies
Regions & Companies Incorporated in Country
Ownership in % Currency Nominal Value
Europe
Burmeister & Wain Scandinavian Contractor A/S* Denmark 100% DKK 150,000,000
BWSC Generation ApS Denmark 100% DKK 125,000
BWSC Foreign Investments ApS Denmark 100% DKK 80,000
BWSC Cyprus Ltd. Cyprus 100% EUR 10,000
BWSC Malta Ltd. Malta 100% EUR 1,200
BWSC Generation Services UK Ltd. United Kingdom 100% GBP 100
Western Biomass Operating Company Ltd. United Kingdom 50% GBP 25,000
APOM Ltd. United Kingdom 50% USD 35,000
BWSC Power Corporation Ltd. United Kingdom 50% GBP 14,664,978
Rabai Power Holding Ltd.
ERE Development Ltd.
United Kingdom
United Kingdom
25.5%
17.2%
EUR
GBP
11,516,000
5,800,000
Africa & Middle East
BWSC Kenya Ltd.
Rabai Operation & Maintenance Ltd.
Kenya
Kenya
100%
51%
KSH
EUR
200
1,818
BWSC Mauritius Ltd. Mauritius 100% MUR 100,000
BWSC Lebanon Construction SARL Lebanon 100% LBP 5,000,000
South and Central America
BWSC Panama S.A. Panama 100% USD 1,000
BWSC Regional Services S.A. Panama 100% USD 10,000
Pedregal Power Company S.D.E.R.L
BWCC Ltd.
Panama
The Bahamas
7.6%
100%
USD
BSD
100,000
5,000
Southeast Asia
BWSC Lanka (Private) Ltd.
Asia Power (Private) Ltd.
Sri Lanka
Sri Lanka
100%
6.8%
LKR
USD
3,635,000
22,510,003
BWSC Mindanao Inc. The Philippines 100% PHP 13,739,000
* The Company has branches in the United Kingdom, Greece and Suriname.

3938
C O M P A N Y I N F O R M A T I O N
TrainingBWSC has developed and implemented a long-term capacity building concept aimed at new and existing power plant organisations. The concept is made up by a combination of theoretical classroom training sessions and structured on-the-job training.
39
4140
C O M P A N Y I N F O R M A T I O N
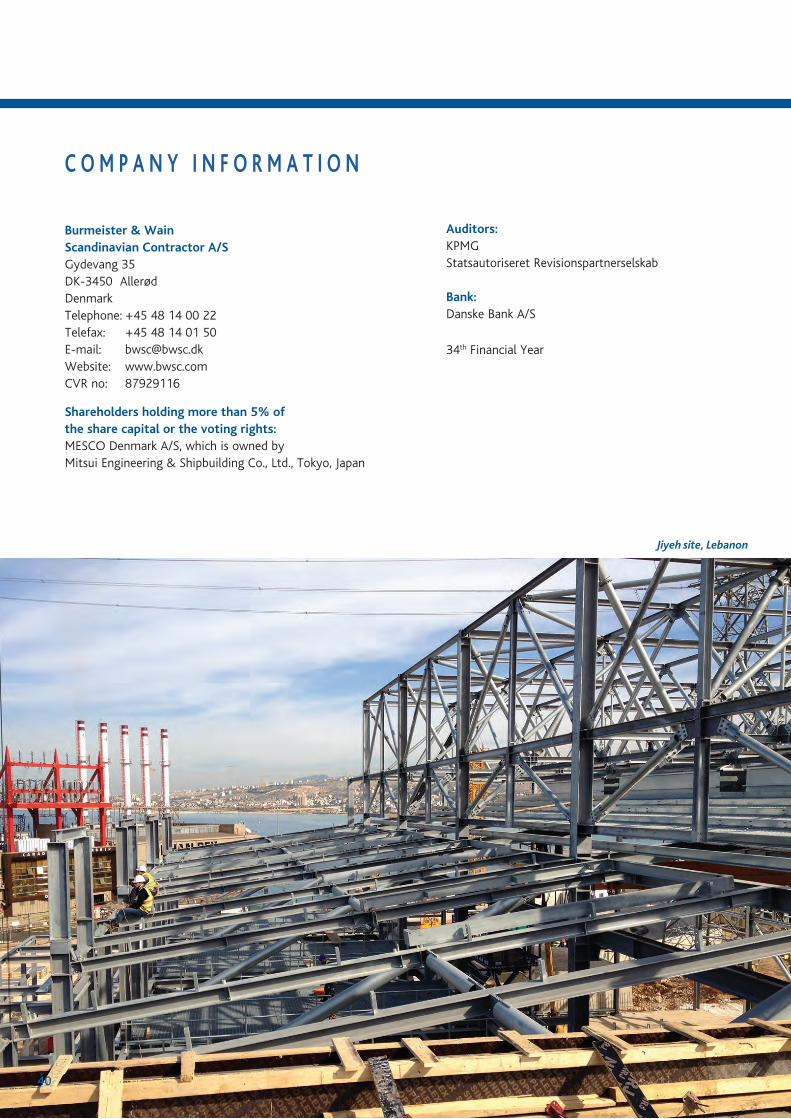
Jiyeh site, Lebanon
Burmeister & WainScandinavian Contractor A/SGydevang 35DK-3450 AllerødDenmarkTelephone: +45 48 14 00 22Telefax: +45 48 14 01 50E-mail: [email protected]: www.bwsc.comCVR no: 87929116
Shareholders holding more than 5% ofthe share capital or the voting rights:MESCO Denmark A/S, which is owned by Mitsui Engineering & Shipbuilding Co., Ltd., Tokyo, Japan
Auditors:KPMG Statsautoriseret Revisionspartnerselskab
Bank:Danske Bank A/S
34th Financial Year
40

4140 41
Bemland 63 MW Power Station, in the centre of Suriname’s capital Paramaribo, delivered to the client Energie Bedrijven
Suriname. BWSC installed the Balance of Plant for 3 client delivered DE units, each 21 MW and prepared the plant for future
installation of a 4th unit.
The client took over the plant on 3 January 2014, i.e. 13 months after the commencement date.

4342
B O A R D O F D I R E C T O R S
Yuji Kozai
Board Member
Birgit Svensson
Elected by employees
Torkil Bentzen
Chairman
Katsuhisa Ohno
Board Member
Michael Hedegaard Lyng
Board Member
Lars Ellegaard
Elected by employees
Hiroyuki Komine
Deputy Chairman
Iain Miller
Board Member
Willy S. Henriksen
Elected by employees
4342
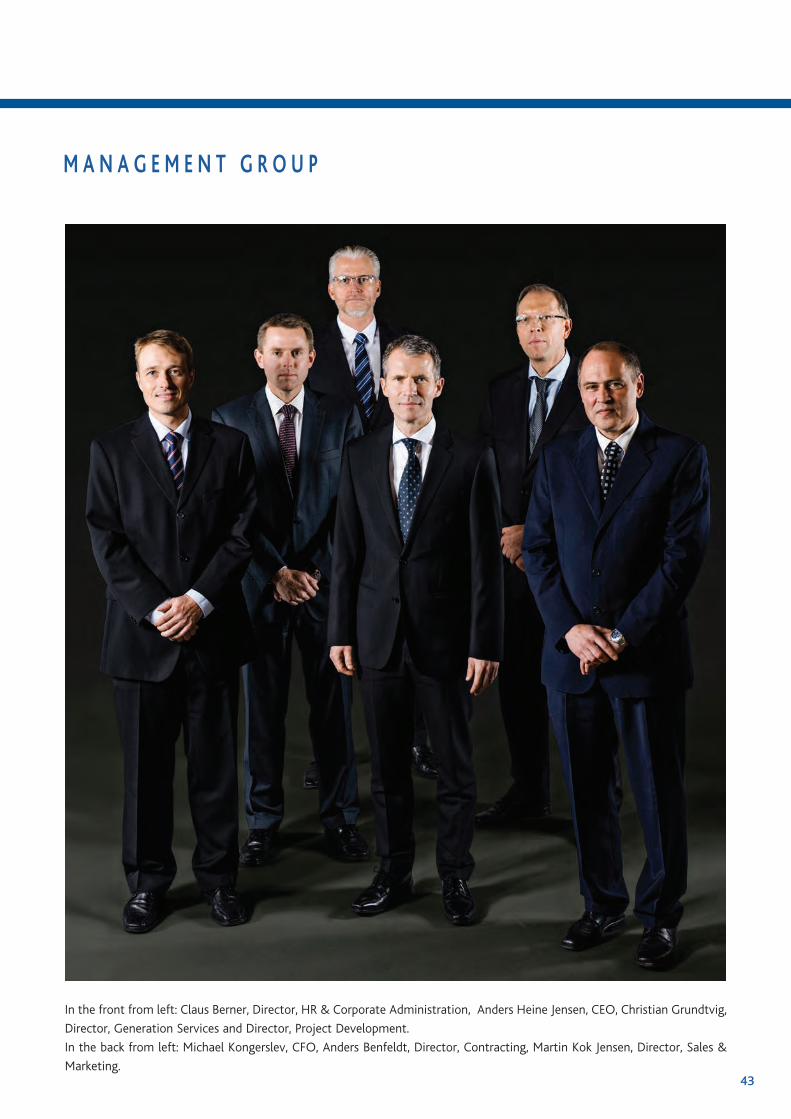
M A N A G E M E N T G R O U P
In the front from left: Claus Berner, Director, HR & Corporate Administration, Anders Heine Jensen, CEO, Christian Grundtvig,
Director, Generation Services and Director, Project Development.
In the back from left: Michael Kongerslev, CFO, Anders Benfeldt, Director, Contracting, Martin Kok Jensen, Director, Sales &
Marketing.

128
Burmeister & Wain Scandinavian Contractor A/S Gydevang 35, P.O. Box 235DK-3450 Allerød, DenmarkTelephone: +45 48 14 00 22Telefax: +45 48 14 01 50E-mail: [email protected]: www.bwsc.com
BWCC Ltd.P.O. Box CB - 13013Hibiscus Beach Apt. 13, Cable BeachNassau, the BahamasTelephone: +1 242 327 6288Telefax: +1 242 327 6288E-mail: [email protected]
BWSC Kenya Ltd. c/o Scribe Services 20th Floor, Lonrho House Standard Street P.O. Box 3085 - 00100 Nairobi, Kenya Telephone: +45 48 14 00 22Telefax: +45 48 14 01 50E-mail: [email protected]
Rabai Operation and Maintenance Ltd.c/o Scribe Services 20th Floor, Lonrho House Standard Street P.O. Box 3085 - 00100Nairobi, KenyaTelephone: +254 412 013 806/7/8E-mail: [email protected]
BWSC Generation Services UK Ltd.Boston Road, SleafordLincolnshire, NG34 9GHUnited KingdomTelephone: +45 48 14 00 22E-mail: [email protected]
BWSC Lebanon Construction SARLc/o Moghaizel Law OfficesAshrafieh 5585 Bldg. Pierre Gemayel AvenueP.O. Box 16 6742 AshrafiehBeirut 2066 71 13LebanonTelephone: +45 48 14 00 22E-mail: [email protected]
BWSC Lanka (Private) Ltd.103/8 Galle RoadColombo 3, Sri LankaTelephone: +94 114 721 900Telefax: +94 114 721 905E-mail: [email protected]
BWSC Mauritius Ltd.c/o KPMG31, CybercityEbene, MauritiusTelephone: +230 211 32 98Telefax: +230 212 51 95E-mail: [email protected]
BWSC Panama S.A. Representative OfficeP.O. Box 832 - 0147World Trade Center, 6th Floor, Office 602Calle 53 este, Urb. MarbellaPanama City, Rep. of PanamaTelephone: +507 264 2886Telefax: +507 264 2884E-mail: [email protected]
B W S C O F F I C E L O C A T I O N S
Burmeister & Wain Scandinavian Contractor A/S