annual report 2013 - i&m bank kenya€¦ · karen office park langata road p.o box 30238 ......
TRANSCRIPT

For decades, the community at large has been crying out for the Healing Touch.
The Healing Touch for the ailing...through medical care.
The Healing Touch for those in need of education...so the community can prosper as a whole. The Healing Touch for a scarred and ravaged environment...through a green and clean movement.
We at I&M Bank strongly support The Healing Touch with our many social responsibility activities based on the three pillars of health, education and environment.
Table of ConTenTs
• Board of Directors 02• Senior Management 04 • Directors, Officials and Administration 06 • Branches 07 • I&M News 08 • Chairman’s Statement 15 • Report of the Directors 20 • Statement of Corporate Governance 21 • Statement of Directors’ Responsibilities 27 • Report of the Independent Auditor to the members of I&M Bank Limited 28
• Consolidated Statement of Comprehensive Income 29 • Company Statement of Comprehensive Income 31 • Consolidated Statement of Financial Position 32 • Company Statement of Financial Position 33• Cosolidated Statement of Cash Flow 34• Company Statement of Cash Flow 35 • Consolidated Statement of Changes In Equity 36 • Company Statement of Changes In Equity 38 • Notes to the Consolidated Financial Statements 40 • I&M CSR 106

I&M Bank Limited Report and Consolidated Financial Statements 2013 I&M Bank Limited Report and Consolidated Financial Statements 20132 3
BOARD OF DIRECTORS
seated (left To Right): SBR Shah (Chairman), Sarit S Raja Shah (Executive Director) and Arun S Mathur (CEO). standing (left To Right): MJ Karanja, Sachit Shah, PCM Kibati, NP Kothari (Company Secretary), EM Kimani and M Soundararajan.

I&M Bank Limited Report and Consolidated Financial Statements 2013 I&M Bank Limited Report and Consolidated Financial Statements 20134 5
SEnIOR MAnAgEMEnT TEAM SEnIOR MAnAgEMEnT TEAM (COnTInUED)
lucy Thegeya, Head of Business Support.
Henry Kirimania,Head of Treasury.
srinivasan Parthasarthy, Head of Commercial Banking.
Ravi Ramamoorthy,Head of Corporate Banking.
Rohit Gupta, Head of Information andCommunication Technology.
Chhanda C Mishra, Head of Projects.
l a sivaramakrishnan, Head of Business Development
Ruma shah, Head of Internal Audit.
Joseph njomo, Head of Operations.
Gauri Gupta, Head of Corporate and Strategic Planning.
suprio sen Gupta, Head of Marketing and Product Development.
a V Chavda, Senior General Manager.
DIReCToRs
SBR Shah, MBS (Chairman)Sarit S Raja Shah (Executive Director)
MJ KaranjaSachit S Raja ShahEM Kimani, MBS
PCM KibatiM Soundararajan*
A S Mathur (Appointed 21st March 2013)Christina Gabener** (Ceased 27th June 2013) - Alternate: E Kaleja (Ceased 27th June 2013)**
Guedi MM Ainache*** (Ceased 27th June 2013)
* Indian ** German *** French
seCReTaRY
NP Kothari – FCPS (Kenya)
aUDIToRs
KPMG Kenya8th Floor, ABC Towers
Wayaki WayP.O Box 40612
00100 Nairobi GPO
ReGIsTeReD offICe
I&M Bank House2nd Ngong Avenue
P.O Box 3023800100 Nairobi GPO
CoRResPonDenT banKs
ABSA Bank Bank One Ltd
Bank of Tokyo MitsubishiBarclays Bank
BHF BankCitibank NA
Commerzbank AGCommonwealth Bank Australia
Deutsche Bank AGFirst Bank
HDFC BankI&M Bank (Rwanda) Limited
I&M Bank (T) LimitedICICI Bank
JP Morgan Chase BankNational Australia Bank
Mashreq BankStandard Bank of South AfricaStandard Chartered Bank NY
UBS AG
I&M banK ToWeR
Kenyatta AvenueP.O Box 302380100 Nairobi GPO
I&M banK HoUse
2nd Ngong AvenueP.O Box 3023800100 Nairobi GPO
saRIT CenTRe
WestlandsP.O Box 3023800100 Nairobi GPO
ansH PlaZa
Biashara StreetP.O Box 3023800100 Nairobi GPO
CHanGaMWe RoaD
Industrial AreaP.O Box 3023800100 Nairobi
KaRen offICe PaRK
Langata RoadP.O Box 3023800100 Nairobi GPO
PanaRI sKY CenTRe
Mombasa RoadP.O Box 3023800100 Nairobi GPO
CenTRe PoInT
Parklands RoadP.O Box 3023800100 Nairobi GPO
PeWIn HoUse
Wilson AirportP.O Box 3023800100 Nairobi GPO
onGaTa RonGaI
Maasai MallP.O Box 3023800100 Nairobi GPO
soUTH C sHoPPInG CenTRe
P.O Box 3023800100 Nairobi GPO
lanGaTa lInK
Langata South RoadP.O Box 3023800100 Nairobi GPO
GITanGa RoaDLavingtonP.O Box 3023800100 Nairobi GPO
14 RIVeRsIDe DRIVe
Riverside DriveP.O Box 3023800100 Nairobi GPO
bIasHaRa banK bUIlDInG
Nyerere AvenueP.O Box 8635780100 Mombasa
nYalI CIneMaX
Main Nyali RoadP.O Box 8635780100 Mombasa
CHanGaMWe
Refinary RoadP.O Box 863578 0100Mombasa
bon aCCoRD HoUse
Odinga Oginga RoadP.O Box 42440100 Kisumu
ZIon Mall
Uganda RoadP.O Box 936230100 Eldoret
Polo CenTRe
Kenyatta AvenueP.O Box 1844520100 Nakuru
DIRECTORS, OFFICIAlS AnD ADMInISTRATIOn BRAnChES
I&M Bank Limited Report and Consolidated Financial Statements 20136
I&M Bank Limited Report and Consolidated Financial Statements 20137
RoYal ToWeR
Hospital RoadP.O Box 447440200 Kisii
I&M banK (T) lIMITeD
Maktaba SquareMaktaba StreetP.O Box 1509Dar es salaamTanzania
I&M banK (RWanDa) lIMITeD
11, Boulevard de la RevolutionP.O Box 354KigaliRwanda
banK one lIMITeD
16 Sir William Newton StreetPort LouisMauritius

I&M Bank Limited Report and Consolidated Financial Statements 2013 I&M Bank Limited Report and Consolidated Financial Statements 20138 9
I&M nEWS I&M nEWS (COnTInUED)
Internet banking- Corporate
The year 2013 started on good note following the launch of Corporate I-Click, the Bank’s internet banking platform for corporates. Corporate I-Click has changed the way the Banks’ customers do business with us. Bank transactions and requests are now just a click away; viewing account and transaction details, local or international transfers, KRA payments, viewing cheque images, Trade services, making bank requests delivered in a secure and user friendly platform.
branch opening
2013 saw the Bank open its 21st branch at Changamwe in Mombasa. This new branch is located along Refinery Road right next to Kenya Oil Refinery in a complex named Refinery Place, 1st floor and is the Banks 3rd branch in Mombasa. This is a full service branch with a 24 hour ATM.
awards
I&M Bank was ranked Third place in the Best Bank Tier 2 category at the Banking Awards 2013.
I&M bank Diaspora banking
I&M Bank connected with the Kenyan Diaspora community with the launch of Diaspora Services. The aim of the service is to propagate and expand Diaspora Business with the bank’s eyes set on increasing its presence in the Diaspora through provision of such services as Mortgages, Insurance, Fund management and Forex services. Our expansive agency network is well grounded in major cities across the world.
I&M bank sponsors cricket team at the east africa Premier league
The bank sponsored the I&M Nyatis cricket team at the 2013 East Africa Premier league, signalling its entry into sports sponsorship.
Multicurrency Prepaid Card
2013 was another year of firsts for I&M Bank, where the Bank launched the Pre-Paid Platinum Multicurrency card, the first of its kind in East Africa. For any traveller this card allows holding of funds in 3 virtual wallets in USD, EUR and GBP and spending directly from any wallet. The card can be used at any MasterCard ATM, for online transactions including shopping worldwide.
I&M KenYa neWs
I&M goes public
I&M Holdings has officially listed its new shares at the Nairobi Securities Exchange after a successful conclusion of the merger deal between I&M Bank with investment company, City Trust through a share swap.The merger resulted in set up of a holding company, I&M Holdings Limited, in a transaction that enabled I&M Bank’s shareholders to exchange their shares for those of City Trust in a reverse takeover. This transaction which has enabled the shareholders of the Bank to list on the NSE thus providing liquidity for the institutional, corporate and individual shareholders. The listing also provides the Bank with the platform to raise additional capital in the future to facilitate the achievement of the Bank’s long term growth and expansion strategy and to improve on its capacities to successfully manage the growth achieved in the last few years.
I&M launches Medium Term note Program
On 25th November 2013, I&M Bank launched the first tranche of its Medium-Term Note Programme. The Bank received the approval of the Capital Markets Authority and the Nairobi Securities Exchange for the issue of the Notes, comprising in the aggregate up to KShs 10 billion, to be issued in up to three tranches over a 3-year period to provide long term funding for I&M’s future strategic growth and expansion as well as enhance to I&M’s capital adequacy ratios by way of Tier 2 Capital through the Note Programme. The first tranche of Ksh 3 billion was oversubscribed and a total of Ksh 655 million was retained under the Green Shoe Option.
BRING HOMEYOUR SUCCESSLive Chat: www.imbank.com/diaspora
Email: [email protected]
I&M BANK LIMITEDINFORMATIONMEMORANDUM
banK one MaURITIUs neWs
branch opening
Bank One operates with sixteen branches throughout Mauritius and has a well distributed network of ATMs. Its endeavour is to bring a sharper focus to the requirements of customers and to leverage cutting-edge technology to provide the highest levels of service. In this regard Bank One in early 2013 saw the official opening of the La Croisette Branch to continuously meet customer’s needs. I&M TanZanIa neWs
I&M bank Multicurrency Prepaid Mastercard International Travel Card
I&M Bank Multicurrency Prepaid Master International Travel Card was launched for the Tanzanian customers. The product is available at all branches of I&M Bank (T) Limited.
The Young savers account
I&M Bank (T) Limited launched an exclusive product for children ( Under 18 years of age). The product has attractive features for children and discounts by various merchants.

I&M Bank Limited Report and Consolidated Financial Statements 2013 I&M Bank Limited Report and Consolidated Financial Statements 201310 11
I&M nEWS (COnTInUED)
I&M RWanDa neWs
Rebrand to I&M bank (Rwanda) ltd.
In July of 2012 Banque Commerciale du Rwanda Ltd (BCR) joined the I&M Bank Group, and in August 2013 following statutory approvals, had a rebrand and change of name from Banque Commerciale du Rwanda Ltd to I&M Bank (Rwanda) Ltd.
As a result of the acquisition in 2012, the effective shareholding of BCR changed with 55% being held by I&M Bank Ltd, 12.5% each by PROPARCO and DEG, two leading European Development Finance Institutions, 19.8% by the Government of Rwanda and 0.2% by private shareholders.
While maintaining the management structure and operations of the bank, the rebrand has brought fresh vigour to the Bank’s operations as a regional entity with network presence in four countries.
awards and Recognition
2013 was a good year for I&M Rwanda for awards and recognition as they managed to scoop many industry awards including:
• “The Banker Award” for Best Bank in Rwanda in 2013, after a gap of five years.
• The “Global Finance award” for the Best Bank in Rwanda, for the fifth year running
• The Rwanda Country Award for “CIO 100” as most technologically innovative company in Rwanda.
• The Rwanda Revenue Authority award for “Exemplary Tax Compliance”.

Nurturing the soul.Environment, the soul of the community is of critical concern for I&M Bank. The denuded Karura Forest has a green cover once again...thanks to a 25 acres reforestation programme by I&M Bank.
Also, in what has now become an annual event, 10 acres of land are being planted with indigenous trees to replace ravages by unfortunate forest fires.
Most importantly, the awareness and initiatives by the various people who lend us a hand in this drive is creating a healthy concern that is spreading like an invisible protective membrane for our forests.
I&M Bank Kenya staff members participated in the Annual Tree Planting staff and family fun day dubbed “Let’s create millions of branches together”. This took place at the Karura Forest where the bank nurtures a 25 acre I&M Bank forest.
I&M Bank (Rwanda) staff participated in Umuganda (monthly community cleaning). This exercise involved creating drainage to prevent soil erosion in Jali sector in Gasabo District.
InnoVaTIon In eXeCUTIon
Successful innovation is based on both an idea and execution. Innovation without a vision, without execution and without leadership is just an idea waiting to happen. At I&M Bank we take pride in having successfully executed several ideas. It takes a team working strongly together, guided by strong managers, ethics and motivation to make an idea a realized innovation. It was this philosophy that kept us inspired in 2013 as we worked steadfastly towards meeting our strategic goals and objectives.
At I&M, it is our constant endeavour to deliver new technology and services in order to continuously improve the banking experience for our customers. The use of new channels such as mobile devices, internet and social media to deliver banking services not only offers convenience to our customers with a whole new meaning but assists them to manage their money more efficiently and seamlessly as well.
Following the peaceful political transition in 2013, the Kenyan Banking Sector recorded continued growth. The total banking sector balance sheet grew by 16% compared to December 2012. The total banking sector loans and advances to consumers grew by 17.65% and deposits grew by 12.5% over the same period. Unaudited pre-tax profits increased by 16.89% from KShs 107.68 billion as at 31st
December 2012 compared to KShs 124.57 billion as at 31st December 2013. The growth in demand for credit was attributed to an increase in lending to Transport and Communication, Trade, Manufacturing and Agriculture sectors. The fairly stable macro-economic environment had a positive impact on the demand for credit.
THe banK
Seen against what was certainly a very challenging year on account of the General Elections in the first quarter of the year and liquidity constraints, the year 2013 ended on a very positive note. Total Assets increased by 18.5%to close at KES 141.36 billion up from KES 119.28 billion as at 31st December 2012. This was largely attributed to the significant growth noted in Loans and Advances which increased to KES 91.8 billion an increase of 29.3% from KES 71 billion as at December 2012. Likewise Customer Deposits increased by 10.6% from KES 87.8 billion as at December 2012 to close at KES 97.1 billion as at 31st December 2013. With continued focus on operational efficiency, and increase in net interest income as a result of the significant growth in Loans and Advances, the Bank reported a Profit after Tax of KES 7.26 billion up from KES 5.7 billion the previous year reflecting an increase of 27.3%
It gives me great pleasure to inform you that during 2013 your Bank made significant progress in growing its various business segments and reaching out in centers across the country. We further expanded into the Coast region by opening branches in Changamwe and Malindi; and in the Central region through our newly opened branch in Nyeri. With this the Bank’s branch network has increased to 23 and is expected to further improve by the end of this year as we continue to broad base our presence in Kenya. In addition to an ATM at each of these newly opened branches, we installed offsite ATMs at Gertrude’s Children’s Hospital in Nairobi, Thika Road Mall and in Eldoret at Sugarland Plaza. We also introduced Western Union money transfer services at several of our branches during the year.
During the year the Bank set up a separate unit for Asset Financing and which is now fully functional. Increased focus on cross border lending continues through the Offshore Banking Unit set up within the Corporate Department. Furthermore 2013 saw the Bank introduce the Diaspora Banking service through which it offers a wide range of versatile services to Kenyans who are living and working abroad. The Diaspora Mortgage facility offers attractive mortgage options and various professional services to facilitate acquiring properties in Kenya.
I am pleased to highlight that the Bank launched a new MasterCard Multicurrency Prepaid Card, an ultimate luxury available to frequent travelers. This card has a facility to hold funds in three virtual wallets in USD, EURO and GBP.
Following the introduction of Excise duty by the Kenya Revenue Authority (KRA), I&M had successfully and after significant efforts implemented the levy of Excise duty on all banking charges, fees and commissions in its Core Banking system. I am also proud to share that your Bank successfully implemented the I-Tax solution - an initiative launched by KRA to automate the tax collection system including the payment and filing of returns aimed at improving efficiency of the system and more importantly to minimize the possibilities of tax avoidance and leakage.
In pursuit of new growth opportunities and to support the expanding small and medium enterprises - SME sector in Kenya, the Bank successfully achieved a number of milestones which would aid in realization of this goal in the medium term. First, the Bank negotiated and received from International Finance Corporation (IFC) a credit line of USD 50 million (KES 4.35 billion) for onward lending to SMEs. This is expected to drive the Bank’s business growth across the country and will also help the Bank better manage its foreign exchange maturity mismatches.
Second, PROPARCO approved and signed a loan agreement for an amount of approximately USD 40M long-term with a seven year maturity with I&M Bank Limited, Kenya. This long term foreign currency loan to be drawn in the 1st quarter of 2014 will allow I&M to sustain its growth plans as well as meet the growing demand for long-term foreign currency loans while benefitting the SMEs that are involved in International trade.
Third, I&M Bank launched the first tranche of its Medium-Term Note (MTN) Programme of KShs 10 billion debt facility which is expected to boost capital adequacy in line with international BASEL II requirements and CBK’s revised Prudential Guidelines. Proceeds from this issue are a key source of long-term funding and provide the required support for the bank’s future strategic growth and expansion
I&M Bank Limited Report and Consolidated Financial Statements 201315
ChAIRMAn’S STATEMEnT

while improving the maturity profile of the liability portfolio. The 1st tranche issued for an amount of KES 3 billion was oversubscribed by 21.8% and under the Green shoe Option of up to KES 1 billion the Bank accepted all the successful applications aggregating KES 3.655 billion. Notes issued under the 1st tranche were listed on the Nairobi Securities Exchange and commenced trading from the 7th
January 2014.
One of the most significant achievements of 2013 was the achievement of “listing” on the Nairobi Securities Exchange (“NSE”). For a long time now, it had been the Bank’s intention to have its shares listed on the NSE and after more than three years of persistent hard work and efforts, this long awaited vision was fulfilled on 25th June 2013 when I&M Bank concluded its reverse take-over of City Trust Limited (“CTL”), an entity listed on the NSE. CTL was simultaneously renamed to I&M Holdings Limited (“IMHL”). This transaction effected by way of a share swap wherein the shareholders of the Bank exchanged their shares in the Bank for shares in the listed entity – IMHL enabled the Bank’s shareholders to list and freely trade in their shares on the NSE.
Simultaneously, this structure facilitated the set-up of the Bank’s non-operational holding company which is in turn expected to enable I&M Bank Group to (i) further improve upon its risk management framework, and (ii) undertake other activities that would enable it to become a “one stop shop” to meets its customers’ financial needs.
Subsequently in continuation of this Corporate Restructuring exercise which commenced with the listing, the Bank, following receipt of all required regulatory approvals, successfully transferred its shares held in I&M Bank (Rwanda) Limited and Bank One Limited, Mauritius to IMHL in January and March 2014 respectively.
Effective development of the Bank’s human resources remains a key strategic objective for the Bank. Towards this objective and to support its growing workforce, the Bank undertook several training and development programmes primarily focused on capacity building across the business based on identified training gaps.
You will be pleased to note that your Bank is committed to improving the quality of life for all Kenyans and in this regard, the Bank has been supporting needy deserving projects, institutions and individuals around the country through its Corporate Social Responsibility programme and in turn creating long term relationships. The Bank’s CSR projects encompass many diverse causes, ranging from education, health care, children welfare and environment. As part of its CSR activity in 2013, the Bank in conjunction with the Bhagwanji Raja Charitable Foundation donated KShs 50 million under its CSR initiative to Gertrude’s Children’s Hospital. The funds donated will go towards equipping the ultra-modern Pediatric Critical Care Unit (PCCU) and Radiology departments of the newly constructed hospital wing. This donation will enable the doctors to better respond to the needs of the young patients and give them a chance of survival. The donation is in line with the Bank’s corporate philosophy to support institutions of excellence which serve our children in the region and society at large.
banK one lIMITeD – MaURITIUs
Bank One Limited closed 2013 with a profit after tax of USD 1.79 million which was below budget due to two exceptional charges on account of a loss in treasury operations in first quarter 2013 and a specific impairment provision made on a potential non-performing asset. This year we expect the bank to perform better with the improvement in global economic conditions.
Total deposits declined by 12%; there was a conscious move to trim down some high cost term deposits on maturity due to limited redeployment opportunities as well as to improve the cost of funds. The bank achieved net Interest Income growth of 23% and net fee and commission income grew by 11% from 2012, due to the launch of the e commerce business in late 2012. The Retail Banking business advances grew by 16% and there was an increase in the retail client base by 15% in 2013.
The shareholders strong support to the Bank continued with the infusion of Mauritian Rupees 180m (USD 6Mn) as additional capital during 2013. The capital adequacy ratio stood at 12.97%; compared to 11.18% at end of 2012, well above the statutory minimum of 10%.
I&M banK (T) lIMITeD – TanZanIa
The Bank recorded a profit before tax of TZS 5,987 million (KShs 321.55 million), representing an increase of just under 13%. The increase is attributed to increase in interest income showing a growth of 22%. Loan portfolio increased by 21.8% from the previous year. Deposits grew by 16% in the same period as a result of focused and consistent marketing efforts.
The Bank launched AsyBank, an electronic tax payment solution for customers and linked to the Tanzania Revenue Authority (TRA), which was well appreciated for its user friendliness.
Tanzania presents huge growth opportunities with its vast resources. The Bank is in the process of putting in place various initiatives to harness these emerging opportunities. We are already seeing the importance of the Bank in Tanzania as a platform for exploiting regional opportunities through BRISK (our regional remittance solution), expanding customer base and regional trade.
I&M Bank (T) Limited relentlessly continued its CSR activities during the year. These include donations to charitable organizations and active participation in community activities and development programmes throughout the country. Areas being given priority by the Bank are health, education and support to orphaned children, victims of natural disasters, disabled persons, security and sports.
I&M Bank Limited Report and Consolidated Financial Statements 201316
ChAIRMAn’S STATEMEnT (COnTInUED)
I&M banK (RWanDa) lTD - RWanDa
2013 was a significant year for I&M Bank (Rwanda), as it celebrated its 50th anniversary in July with a series of CSR and developmental activities such as “Adopt a School” , remodeling and development of a BCR Public Garden, donations to an orphanage village, launch of a SME capacity building program and data collection for a museum. The celebrations also included several programs and events for staff and customer appreciation and culminated with a celebration party on 23rd July with the Prime Minister of Rwanda, The Rt. Honourable Dr Pierre Damien Habumuremyi gracing the occasion as guest of honour.
In September 2013, following the receipt of regulatory approvals, the Bank rebranded from Banque Commerciale du Rwanda or BCR, as it was more commonly known, to identify with the I&M Bank brand.
This Bank reported a profit before tax of Rwf.6.76 Billion (KES 878.8 million in 2013 representing a growth of 13.5% against the 2012 profit before tax of Rwf.5.95 Billion (KES 773.5 million). Loans and Advances increased by 25% in 2013, from Rwf.52.47 Bn (KES 6.82 billion) to Rwf.65.64 Bn (KES 8.53 billion); while deposits increased by 10%, to Rwf.94.06 Bn (KES 1.22 billion) during the same period.I&M Bank (Rwanda) successfully negotiated a Euro 8 million credit facility from the European Investment Bank to support small-and-medium enterprises (SMEs) in continuation of its strategy to be a leading player in the SME market.
oUTlooK
We have challenges in every economic climate, but I believe we have the right initiatives and strategies in place, a strong momentum and an exceptional team to make I&M Bank the first choice for its customers, where the best people want to work and where shareholders are happy with their investments. In the coming year, we continue to look back at our core values and work towards continuously improving and adapting to the interests of our customers.
2014 is a year of promise as we continue to seek opportunities for expansion and most importantly the pursuit for excellence in service delivery. We shall strive harder to deliver innovative technologies and foster closer relationships with our customer. In a bid to develop cohesive relationships, and generate long-term and meaningful relationships with our customers the Bank recently launched its Social Media programme with simultaneous presence on Facebook, Twitter and YouTube. Through this programme, we hope to reach a wider audience and keep our customers informed about all our products and services offered.
I am indebted and very grateful to have the support of a highly competent Board of Directors and I thank my fellow Directors for their contribution and commitment and most importantly for ensuring that your Bank is resiliently founded. The Board composition changed in 2013 as a result of the set-up of the Bank’s holding company - IMHL. PROPARCO and DEG, our valued DFI partners and key shareholders choose to be represented on the Board of IMHL and their representatives – Ms Christina Gabener of DEG and Mr Guédi Ainache of PROPARCO resigned from the Bank’s Board with effect from 27th June 2013 and simultaneously joined the Board of IMHL. It also gives me a lot of pleasure to welcome our Chief Executive Officer – Mr A S Mathur who joined the Board as a Director with effect from 21st March 2013.
On behalf of the Board, I thank the management and staff for their dedication and outstanding contributions that has enabled the Bank to contribute towards Kenya’s economic and financial wellbeing; thank you all for keeping the momentum going!
On behalf of the Board and management of the Bank, I would like to express our sincere gratitude to all our customers for giving us the opportunity to serve them and look forward to providing them with the best possible service. Last but definitely not the least, I would like to say “Asante Sana” to all our shareholders, partners, consultants, professional service providers without whose support the Bank could not have managed to achieve what it did.
God bless you all!
s.b.R sHaHCHaIRMan
I&M Bank Limited Report and Consolidated Financial Statements 201317
ChAIRMAn’S STATEMEnT (COnTInUED)

Healing the body.Community Health forms a healthy community body. To support this, I&M Bank has sponsored a total of KShs 32 million in health activities in 2013.
The Bank conducted a blood drive that contributed over 260 pints to the National Blood Bank.
Of the many other medical initiatives, perhaps the most significant one is a donation of KShs 25 million to the pediatric critical care unit at Gertrude’s Children’s Hospital.
MEAK (Medical and Education Aid to Kenya) is a group of doctors who travel around the world performing congenital paedriatic heart surgery. I&M Kenya contributed towards 15 paedriatic heart surgeries.
Staff member donating blood at the Annual Blood Drive held at I&M Towers.

I&M Bank Limited Report and Consolidated Financial Statements 2013 I&M Bank Limited Report and Consolidated Financial Statements 201320 21
The directors have pleasure in submitting their report together with the audited financial statements for the year ended 31st December 2013, which disclose the state of affairs of the company and the group. The group comprises I&M Bank LIMITED, Kenya, Bank One Limited, Mauritius, I&M Bank (T) Limited, Tanzania and I&M Bank (Rwanda) Limited, Rwanda.
1. aCTIVITIes
The Bank provides an extensive range of banking, financial and related services permitted under the Banking Act (Cap.488).
2. CoRPoRaTe ResTRUCTURInG
(a) On 14th June 2013, the Bank set up a non-operational holding company – I&M Holdings Limited (IMHL), (formerly City Trust Limited (CTL)), by way of a reverse acquisition of CTL through a share swap. CTL was an existing shareholder of the Bank and was already listed on the Nairobi Securities Exchange. This transaction culminated in the shareholders of the Bank becoming shareholders of I&M Holdings Limited and in the Bank becoming a wholly owned subsidiary of IMHL.
(b) On 31st December 2013, the shareholders of Biashara Securities Limited who had submitted all the required documentation had their shares converted into shares of I&M Holdings Limited.
(c) On 1st January 2014, the shares held by the Bank in I&M Bank (Rwanda) Limited were transferred to I&M Holdings Limited.
3. DebT CaPITal
The Bank’s First Tranche of the Medium Term Note Programme was launched on 25th November 2013 for an amount of KShs 3 billion. The issue was oversubscribed by 21.8% and the Bank chose to accept all the successful applications in exercise of the green shoe option of up to KShs 1 billion. The Bank having raised an aggregate amount of KShs 3.655 billion, issued notes which were listed on the Nairobi Securities Exchange on 7th January 2014.
4. ResUlTs
The consolidated results for the year are as follows: 2013 Kshs
Profit before taxation 7,262,666,022Taxation (2,281,305,100)Profit after taxation 4,981,360,922
5. DIVIDenD
The directors recommend the payment of a final dividend of KShs 1,008,085,855 (2012 – KShs 748,863,778).
6. DIReCToRs
The directors of the company who served during the year and up to the date of this report are set out on page 6.
7. aUDIToRs
The auditors of the company, KPMG Kenya, continue in office in accordance with Section 159(2) of the Kenyan Companies Act (Cap.486) and subject to Section 24(1) of the Banking Act (Cap.488).
8. aPPRoVal of fInanCIal sTaTeMenTs
The financial statements were approved at a meeting of the directors held on 21st March 2014.
bY oRDeR of THe boaRD
n.P KotharisecretaryDate: 21st March 2014
REPORT OF ThE DIRECTORS FOR ThE YEAR EnDED 31 DECEMBER 2013
The hallmark of I&M Bank Group’s Corporate Governance Framework is a Group-wide commitment to ensuring that the highest standards of corporate governance are implemented and upheld in all its entities. This in turn ensures that the Group maintains and promotes high standards of integrity, transparency and accountability across all levels. The Corporate Governance Framework, established by the Board of Directors of I&M Bank Ltd. (‘I&M Bank’ or ‘I&M’ or ‘the Bank’), includes a robust management structure built on a platform of stringent internal control and pre-approved policies, practice and procedures to deliver sustainable value to its shareholders, whilst also remaining focused on the Group’s wider role and responsibility to society at large.
The Bank has in place a Code of Conduct and Code of Ethics that bind all its Directors and employees to ensure that the Bank’s business is carried out in an ethical, fair and transparent manner, in keeping with the local regulations and international best practices.
For the Group’s operations outside Kenya in Mauritius, Tanzania and Rwanda, the Bank has ensured set up of a sound governance framework which not only meets its own high standards of corporate governance but is also in accordance with the guidelines and directives issued by their respective regulators.
The recent restructuring of I&M Bank Group resulted in the creation of the Bank’s holding company – I&M Holdings Limited (“IMHL”). IMHL is listed on the Nairobi Securities Exchange and regulated by Capital Markets Authority, and the Central Bank of Kenya. Set up of the holding company structure is expected to aid in enhancing the levels of accountability and governance within the Group as it continues to grow and expand in other countries within the Pan-African region.
RIsK ManaGeMenT fRaMeWoRK
I&M Bank has over the years maintained a keen focus on risk management, both in its business processes and products, and which have supported the Bank’s steady and sustainable growth.
The Risk Management Framework at the Bank ensures that risks are identified and effectively managed on an on-going basis.
Given that risk taking is core to the Bank’s innovation capacity and ultimately its entrepreneurial success, I&M’s approach to Risk Management is characterized by a strong risk oversight at the Board level and a strong risk management culture at all levels across the Bank. This approach supports and facilitates I&M’s decision making process which not only ensures that the risk reward trade-off is optimized but also that risks assumed are within the overall Risk Appetite and Risk Tolerance levels as laid down by the Board of Directors.
I&M’s Risk Management Process is guided by the following principles:
• Its Risk Appetite and Risk Tolerance Levels• An Independent Audit, Compliance and Quality Assurance Department• Zero Tolerance for Violations• A Policy of “No Surprises”• Protection of Reputation• Enhanced Stakeholder Satisfaction
The Bank endeavours to be compliant with Best Practices in its Risk Management and uses the Committee of Sponsoring Organisations of the Treadway Commission “COSO” framework as a reference and adopts compatible processes and terminology. THe boaRD of DIReCToRs
Constitution, appointment and Composition
The Bank’s Board, led by the Chairman, Mr SBR Shah, consists of four independent non-executive Directors, two non-executive Directors, one Executive Director and the Chief Executive Officer. Of the six non-executive Directors, more than 50% are independent. The Directors, collectively have vast experience stemming out of their varied backgrounds in different disciplines, which include, inter alia Banking, General Management, Law, Accounting and Investment Analysis, apart from hands on experience in various industries. The unique collective experience of our Board members provides a superior mix of skills as required by the Board, in not only discharging its responsibilities and providing a strategic vision and direction for the Bank, but more importantly also adds value to, and brings in the element of independent judgment and risk assessment to bear on the decision making process.
I&M Bank recognizes and appreciates that all Directors make valuable contributions to the Board and to the Bank by virtue of their experience and judgment.
Roles and Responsibilities
Entrusted with the overall responsibility of the Bank, the Board’s key role is to provide effective, responsible leadership characterized by the ethical values of responsibility, accountability, fairness and transparency.
STATEMEnT On CORPORATE gOVERnAnCE
I&M Bank Limited Report and Consolidated Financial Statements 2013 I&M Bank Limited Report and Consolidated Financial Statements 201322 23
THe boaRD of DIReCToRs (ConTInUeD)
The Board ensures that appropriate steps are taken to protect and enhance the value of the assets of the Bank in the best interests of its shareholders and other stakeholders. This entails the approval and oversight of the implementation of the Bank’s strategic objectives, risk strategy, corporate governance and corporate values, as well as the oversight of Senior Management. Further, the Board ensures that at the heart of the organisation, there is a culture of honesty, integrity and excellent performance.
board Meetings
The Board meets at least quarterly each year for scheduled meetings and on other occasions when required to deal with specific matters between scheduled meetings. During the year, four scheduled Board meetings were held. All members attended at least 75% of the meetings held during the year.
Board members receive board papers well in advance of their meetings, thereby facilitating meaningful deliberations therein. They also have full and unlimited access to the Bank’s records and consult with employees and independent professional advisors, as the Board or its Committees deem appropriate.
board evaluation
The Bank has an established an effective process of evaluating the Board’s Chairman’s and individual Director’s performance, on an annual basis. This performance evaluation process is reviewed periodically to incorporate global best practice and any amendments issued by the Central Bank of Kenya, the Regulator, from time to time.
Governance Principles
The Board ensures that accountability among staff is enhanced through a system of objective goal setting and periodic performance appraisals. Additionally, the Board has delegated financial and other powers with clearly defined accountabilities for each.
In order to ensure that high levels of efficiency and effectiveness are maintained, the Bank has a good pool of well-trained staff with appropriate skills required to perform their duties. Further, the Bank ensures that all staff undergo regular training to improve and develop their skills.
The Code of Ethics that all staff are expected to adhere to, encompasses, inter alia, matters touching upon safety and health, environment, compliance with laws and regulations, confidentiality of customer information, financial integrity and relationships with external parties. This Code of Ethics is reviewed periodically and amendments incorporated if necessary.
The Board has set up seven Board Committees and several top level Management Committees to assist in discharging its responsibilities. These include:
boaRD CoMMITTees
board audit Committee (baC)
An independent non-executive Director chairs this Committee consisting of four Directors. BAC, which meets at least once every quarter, assists the Board in fulfilling its responsibilities by reviewing the financial condition of the Bank, its internal controls, performance and findings of the Internal Audit functions. Further, in compliance with the revised Prudential Guidelines issued by the Central Bank of Kenya with effect from 1st January 2013, two BAC meetings are held in each year independent of management giving the internal and external auditors an opportunity to raise matters directly with members of the BAC. board Risk Management Committee (bRC)
The BRC, comprising six members, is chaired by an independent non-executive Director, and meets at least once every quarter. Through the Bank’s risk management function, BRC is responsible for translating the Risk Management Framework established by the Board of Directors into specific policies, processes and procedures that can be implemented and verified within the different business units, so that risks faced by the Bank are adequately considered and mitigated.
board Credit Committee (bCC)
The BCC, which consists of five Directors is chaired by an independent non-executive Director and is responsible for the review of the Bank’s overall lending policy, conducting independent loan reviews, delegation and review of lending limits, ensure statutory compliance and be overall responsible for the overall management of credit risk. The Credit Risk Management Committee (CRMC) assists the BCC in its role.
STATEMEnT On CORPORATE gOVERnAnCE (COnTInUED)
boaRD CoMMITTees (ConTInUeD)
board Procurement Committee (bPC)
This Board Committee comprising five members, excluding the Secretary, is chaired by an independent non-executive Director, and meets at least half-yearly and on other occasions to deal with specific matters. The BPC is responsible for reviewing and approving significant procurement proposals as well as proposed consultancy assignments and unbudgeted capital expenditure. In addition, the BPC also vets any agreements with and procurements from related parties. board Capital structure strategy Committee (bCssC)
This Committee comprising six members, excluding the Secretary, is chaired by an independent non-executive director, and meets at least once a year. It assists the Board in fulfilling its responsibilities by considering matters pertaining to the raising of equity and debt capital of the Bank from time to time.
board share Transfers Committee (bsTC)
The BSTC, comprising three members excluding the Secretary, is chaired by a non-executive director, and meets at least once every quarter. It assists the Board in fulfilling its responsibilities by considering matters pertaining to the transfers of ordinary shares of the Bank from time to time, to ensure that the Bank is also compliant with the guidelines issued by the Central Bank as regards shareholding of the Bank.
board nomination and Remuneration Committee (bnRC)
The Board has delegated responsibility to the BNRC to undertake structured assessment of candidates for membership of the Board and Executive Management, and establishment of an appropriate framework for remuneration of the Board and Executive Management members, in line with clearly defined remuneration principles.
ManaGeMenT CoMMITTees
business strategy and Coordination Committee
This Committee provides the link between the Board and the Management in terms of formulating, implementing and monitoring of the Bank’s Strategic direction, intent and objectives.
executive Committee (eXCo)
This provides the link between the Board, Top Management and Department Heads. It is responsible for reviewing and benchmarking the Bank’s financial and business performance, review of progress of special projects and identification of risks or opportunities in addition to providing a platform for review of new products, initiatives and ideas and developments in the banking industry and impact of changes in regulations / legislation.
assets and liabilities Committee (alCo)
The Bank’s Assets and Liabilities Committee’s primary functions include measurement, management and monitoring of liquidity, interest rate, foreign exchange and equity risks of the Bank in order to protect the Bank’s net worth from adverse movements of market.
Credit Risk Management Committee (CRMC)
This Committee is the link between the Board and Management in terms of establishing and implementing the credit and lending policies of the Bank. It is responsible for the sanction of credit proposals in line with the Bank’s Credit Policy, effective management and follow-up of all credit-related matters and review of Non-Performing Accounts. The Non Performing Accounts Committee and the Card Centre Credit Appraisal Committee assist the CRMC in its role.
Human Resources Committee (HRC)
This Committee assists the Board in fulfilling its Human Resource Management responsibilities with due recognition to this key resource. HRC oversees implementation of all major HR initiatives, rendering support and guidance as appropriate. It also facilitates periodic review of the Bank’s HR policies and practices to ensure the Bank remains competitive and able to attract and retain competent Talent for its business.
STATEMEnT On CORPORATE gOVERnAnCE (COnTInUED)

I&M Bank Limited Report and Consolidated Financial Statements 2013 I&M Bank Limited Report and Consolidated Financial Statements 201324 25
ManaGeMenT CoMMITTees (ConTInUeD)
IT steering Committee (ITsC)
This Committee has been set up to enhance ICT governance in a growing ICT enabled banking environment with emphasis on assessment and management of ICT risks, ensuring optimum use of ICT resources, determining prioritization of ICT investments in line with the Bank’s strategy, monitoring service levels and adopting best practices.
CoRPoRaTe soCIal ResPonsIbIlITY (CsR)
I&M Bank is very conscious of its responsibility towards the Community and those around it. It is in this endeavour that the Bank has put in place guidelines that support the discharge of its Corporate Social Responsibility mandate, which is well integrated within the Bank. The Bank has continued to deepen its relationship with various stakeholders while providing opportunities to its employees to participate in various CSR activities. Of note is the technical assistance the Bank received from DEG to implement its Environmental and Social Management System (ESMS) in 2013, which allows it to analyze and improve its environmental and social impact in carrying out its activities.
I&M Bank considers ‘the community’ as a key stakeholder in its business initiatives, and during 2013, the Bank’s CSR activities were aimed at making sustainable difference under four key social pillars: Education, Health, Environment and Community Support. The Bank developed its resources towards supporting various projects that included:
• Scholarships for bright but needy students in various educational institutions;• Environmental care, with a tree planting activity carried out by staff of the Bank, in which trees were planted in 10 acres of Nairobi’s
Karura Forest;• Active participation in various health-care initiatives of the Bank, key amongst them being a blood donation drive in which over 260
pints were contributed to the National Blood Bank, and the construction and equipping of a new radiology and paediatric critical care department at Gertrude’s Children’s Hospital;
• Various community service initiatives, in which staff members are instrumental in supporting the initiatives of the Bank to enhance the lives of those around us. In 2013, staff members participated in the monthly school feeding programme at Kibagare in which over 1,000 children are fed, and also dedicated a day to visit various children’s homes supported by the Bank.
The Bank strongly believes in the importance of giving back to the society at large and sharing its success with the communities in which it operates. It is this underlying philosophy that guides the Bank’s CSR programmes and which are designed to achieve maximum impact to enhance the lives of the communities around us, and Kenya as a whole.
STATEMEnT On CORPORATE gOVERnAnCE (COnTInUED)
bo
aR
D C
oM
MIT
Te
es
Tabu
late
d be
low
are
Boa
rd C
omm
ittee
s, th
eir c
ompo
sitio
n an
d m
embe
rshi
p, fu
nctio
ns a
nd th
e fre
quen
cy o
f mee
tings
:
bo
ard
aud
it
Co
mm
itte
eb
oar
d R
isk
Co
mm
itte
eb
oar
d C
red
it
Co
mm
itte
eb
oar
d P
rocu
rem
ent
Co
mm
itte
e
bo
ard
Cap
ital
s
truc
ture
str
ateg
y C
om
mit
tee
bo
ard
sha
re T
rans
fers
C
om
mit
tee
bo
ard
no
min
atio
n an
d R
emun
erat
ion
Co
mm
itte
e
Cha
irm
an
Ind
epen
den
t N
on-E
xecu
tive
Dire
ctor
Ind
epen
den
t N
on-E
xecu
tive
Dire
ctor
In
dep
end
ent
Non
-Exe
cutiv
e D
irect
or
Ind
epen
den
t N
on-E
xecu
tive
Dire
ctor
Ind
epen
den
t N
on-E
xecu
tive
Dire
ctor
N
on-E
xecu
tive
Dire
ctor
In
dep
end
ent
Non
-Exe
cutiv
e D
irect
or
Mem
ber
s(In
clud
ing
C
hair
man
)
• 3
Non
-Exe
cutiv
e In
dep
end
ent
Dire
ctor
s;•
1 N
on-E
xecu
tive
Dire
ctor
• H
ead
of I
nter
nal A
udit
(Sec
reta
ry)
• G
roup
Hea
d o
f In
tern
al A
udit
(Alte
rnat
e S
ecre
tary
)
Invi
tees
:•
Exe
cutiv
e D
irect
or•
CE
O•
Hea
d o
f Bus
ines
s S
upp
ort
• H
ead
of B
usin
ess
Dev
elop
men
t
• 3
Ind
epen
den
t N
on-
E
xecu
tive
Dire
ctor
s•
1 N
on-E
xecu
tive
Dire
ctor
• 1
Exe
cutiv
e D
irect
or•
Hea
d o
f Ris
k an
d C
omp
lianc
e (S
ecre
tary
)
Invi
tees
:•
CE
O•
Gro
up H
ead
of
Inte
rnal
Aud
it
• 3
Ind
epen
den
t N
on-
Exe
cutiv
e D
irect
ors
• 1
non–
Exe
cutiv
e D
irect
or•
1 E
xecu
tive
Dire
ctor
• C
hief
Exe
cutiv
e O
ffice
r (C
EO
)•
Hea
d o
f Cre
dit
(Sec
reta
ry)
Invi
tees
:•
Hea
d o
f Bus
ines
s D
evel
opm
ent
• H
ead
of R
isk
• 2
Ind
epen
den
t N
on-
Exe
cutiv
e D
irect
ors
• 1
Exe
cutiv
e D
irect
or•
CE
O•
Hea
d o
f Bus
ines
s S
upp
ort
• H
ead
of F
inan
ce
(Sec
reta
ry)
• 2
Ind
epen
den
t N
on-
Exe
cutiv
e D
irect
ors
• 1
Exe
cutiv
e D
irect
or•
CE
O•
1 E
xter
nal A
dvi
sor
• H
ead
– C
orp
orat
e an
d
Str
ateg
ic P
lann
ing
(CS
P)
• C
hief
Man
ager
-CS
P
(Sec
reta
ry)
• 2
Non
-Exe
cutiv
e D
irect
ors
• 1
Exe
cutiv
e D
irect
or•
Com
pan
y S
ecre
tary
(S
ecre
tary
)
• 2
Ind
epen
den
t N
on-E
xecu
tive
Dire
ctor
s•
1 E
xecu
tive
Dire
ctor
• H
ead
of H
R (S
ecre
tary
)
Invi
tees
:•
CE
O•
Hea
d o
f Bus
ines
s S
upp
ort
freq
uenc
y o
f M
eeti
ngs
Qua
rter
lyQ
uart
erly
Q
uart
erly
H
alf-
year
lyQ
uart
erly
Q
uart
erly
Ann
ually
Mai
n fu
ncti
ons
• E
nsur
e es
tab
lishm
ent
of a
n ad
equa
te,
effic
ient
and
effe
ctiv
e in
tern
al a
udit
func
tion
• R
evie
w s
truc
ture
and
ad
equa
cy o
f int
erna
l C
ontr
ols
• R
evie
w a
nd c
o-or
din
ate
bet
wee
n E
xter
nal A
udito
rs
and
Inte
rnal
Aud
it D
epar
tmen
t•
Rev
iew
and
rec
eive
C
BK
Insp
ectio
n R
epor
t, a
nd e
nsur
e im
ple
men
tatio
n of
re
com
men
dat
ions
th
erei
n.
• E
nsur
e th
at t
he
Ris
k m
anag
emen
t
fram
ewor
k an
d
the
pro
cess
es
as a
pp
rove
d a
re
imp
lem
ente
d•
Rev
iew
, mon
itor
and
del
iber
ate
on
the
app
rop
riate
ris
k m
itiga
tion
app
roac
h•
Ens
ure
BC
P is
fo
rmul
ated
, tes
ted
an
d r
evie
wed
p
erio
dic
ally
•
Rev
iew
of p
olic
ies,
p
roce
dur
es a
nd
exp
osur
e lim
its
• R
evie
w o
f pro
pos
ed
stra
tegi
c in
itiat
ives
•
Cre
atin
g aw
aren
ess
abou
t R
isk
Man
agem
ent
Pro
cess
in
the
Ban
k.
• R
evie
w le
ndin
g p
olic
y•
Con
sid
er lo
an
app
licat
ions
bey
ond
d
iscr
etio
nary
lim
its
gran
ted
to
CR
MC
• R
evie
w le
ndin
g b
y C
RM
C•
Dire
ct, m
onito
r, re
view
al
l asp
ects
tha
t w
ill
imp
act
upon
pre
sent
an
d fu
ture
Cre
dit
risk
man
agem
ent
at t
he
Ban
k •
Ens
ure
com
plia
nce
with
Ban
king
Act
and
P
rud
entia
l Gui
del
ines
•
Con
duc
t in
dep
end
ent
loan
rev
iew
s as
and
w
hen
app
rop
riate
.
• R
evie
w a
nd a
pp
rove
th
e P
rocu
rem
ent
Pol
icy
• R
evie
w a
nd
cons
ider
sig
nific
ant
pro
cure
men
t p
rop
osal
s /
cons
ulta
ncy
assi
gnm
ents
ab
ove
the
del
egat
ed
auth
ority
lim
it of
the
E
xecu
tive
Dire
ctor
’s
Del
egat
ed•
Vet
agre
emen
ts/
Pro
cure
men
t p
rop
osal
s fr
om
rela
ted
par
ties
• R
evie
w a
nd r
atify
un
bud
gete
d c
apita
l ex
pen
ditu
re a
bov
e E
xecu
tive
Dire
ctor
’s
del
egat
ed a
utho
rity
limits
• R
evie
w a
nd
app
rove
Str
ateg
y an
d o
bje
ctiv
es o
n ad
diti
onal
cap
ital
need
s•
Ens
ure
optim
al
cap
ital s
truc
ture
w
ith a
pp
rop
riate
mix
of
deb
t an
d e
qui
ty
to s
upp
ort
Ban
k’s
Str
ateg
y•
Ris
k as
sess
men
t an
d a
pp
rova
l of
cap
ital r
aisi
ng
aven
ues
pro
pos
ed b
y m
anag
emen
t•
Reg
ular
ly r
evie
w
stru
ctur
e an
d t
erm
s of
d
ebt
cap
ital.
• E
nsur
e th
at a
ny n
ew
shar
ehol
der
s m
eet
the
Boa
rd’s
crit
eria
of
good
sta
ndin
g•
Ap
pro
ve /
rej
ect
app
licat
ions
for
the
tran
sfer
of s
hare
s an
d
app
rove
reg
istr
atio
n of
suc
h tr
ansf
ers
• G
ive
guid
ance
and
ap
pro
ve a
ny s
hare
al
lotm
ent
aris
ing
out
of a
bon
us /
rig
hts
issu
e•
Sig
n th
e S
hare
C
ertifi
cate
s, u
nder
C
omp
any
Sea
l, to
b
e is
sued
to
any
shar
ehol
der
.
• A
sses
smen
t of
Boa
rd r
equi
rem
ents
fo
r no
n-ex
ecut
ive
dire
ctor
s•
Suc
cess
ion
pla
nnin
g fo
r B
oard
and
ke
y M
anag
emen
t m
emb
ers
• In
duc
tion
pro
gram
s fo
r ne
w
mem
ber
s an
d d
evel
opm
ent
pro
gram
s to
bui
ld in
div
idua
l ski
lls
and
imp
rove
Boa
rd e
ffect
iven
ess
• B
oard
and
Sen
ior
Man
agem
ent
succ
essi
on p
lann
ing
• P
erfo
rman
ce e
valu
atio
n of
the
Boa
rd
of In
div
idua
l Dire
ctor
s an
d o
f the
ED
an
d C
EO
• S
et r
emun
erat
ion
pol
icie
s an
d
stra
tegi
c ob
ject
ives
of B
oard
, ED
an
d C
EO
• S
et p
olic
ies
for
ES
OP
Sch
eme
and
pro
vid
e re
qui
site
gui
dan
ce t
o S
chem
e Tr
uste
e.
STAT
EMEn
T O
n C
OR
POR
ATE
gO
VER
nA
nC
E (C
On
TIn
UED
)
I&M Bank Limited Report and Consolidated Financial Statements 2013 I&M Bank Limited Report and Consolidated Financial Statements 201326 27
Tabu
late
d be
low
are
Man
agem
ent C
omm
ittee
s, th
eir c
ompo
sitio
n an
d m
embe
rshi
p, fu
nctio
ns a
nd th
e fre
quen
cy o
f mee
tings
:
bus
ines
s s
trat
egy
Co
mm
itte
ee
xecu
tive
Co
mm
itte
ea
sset
s an
d l
iab
iliti
es
Co
mm
itte
eC
red
it R
isk
Man
agem
ent
Co
mm
itte
eH
uman
Res
our
ces
Co
mm
itte
eIT
ste
erin
g C
om
mit
tee
Cha
irm
an
Exe
cutiv
e D
irect
or (E
D)
Exe
cutiv
e D
irect
or
Exe
cutiv
e D
irect
or
Exe
cutiv
e D
irect
orE
xecu
tive
Dire
ctor
Chi
ef E
xecu
tive
Offi
cer
(CE
O)
Mem
ber
sE
D, C
EO
, S
enio
r G
ener
al M
anag
er
Hea
ds
of:
• B
usin
ess
Dev
elop
men
t•
Bus
ines
s S
upp
ort
• C
orp
orat
e an
d S
trat
egic
P
lann
ing.
(Sec
reta
ry)
ED
, CE
O, S
enio
r G
ener
al
Man
ager
,
Hea
ds
of:
• B
usin
ess
Dev
elop
men
t•
Bus
ines
s S
upp
ort
• R
isk
• Tr
easu
ry•
Cor
por
ate
and
Str
ateg
ic
Pla
nnin
g.•
Chi
ef M
anag
er –
CE
O’s
O
ffice
(Sec
reta
ry)
Invi
tees
:•
Hea
d –
Inte
rnal
Aud
it
ED
, CE
O,
Sen
ior
Gen
eral
Man
ager
Hea
ds
of:
•
Bus
ines
s D
evel
opm
ent
• B
usin
ess
Sup
por
t•
Cor
por
ate
and
Str
ateg
ic
Pla
nnin
g•
Fina
nce
• Tr
easu
ry
• R
isk
(Sec
reta
ry)
ED
, CE
O,
Sen
ior
Gen
eral
Man
ager
Hea
ds
of:
• B
usin
ess
Dev
elop
men
t•
Ris
k•
Cre
dit
(Sec
reta
ry)
ED
, CE
O,
Sen
ior
Gen
eral
Man
ager
Hea
ds
of:
• B
usin
ess
Dev
elop
men
t•
Bus
ines
s S
upp
ort
• H
R (S
ecre
tary
)
CE
O,
Hea
ds
of:
•
Bus
ines
s D
evel
opm
ent
• B
usin
ess
Sup
por
t•
Cen
tral
Mar
ketin
g•
Chi
ef M
anag
er –
CE
O’s
O
ffice
• IC
T (S
ecre
tary
)•
Pro
ject
s
freq
uenc
y o
f m
eeti
ngs
Qua
rter
ly O
nce
ever
y 2
mon
ths
Mon
thly
Fo
rtni
ghtly
Mon
thly
Q
uart
erly
Mai
n fu
ncti
ons
• Le
ad a
nd d
irect
Str
ateg
ic
Pla
nnin
g P
roce
ss,
incl
udin
g fo
rmul
atio
n,
imp
lem
enta
tion
and
ev
alua
tion
of S
trat
egy
• R
evie
w a
nd r
ecom
men
d
mid
-str
eam
cor
rect
ions
in
Str
ateg
ic D
irect
ion
• E
nsur
e b
ank-
wid
e st
rate
gic
focu
s b
y se
ttin
g m
ediu
m/
shor
t te
rm o
bje
ctiv
es•
Eva
luat
e p
rogr
ess
on
Str
ateg
ic a
nd C
orp
orat
e O
bje
ctiv
es•
Per
iod
ical
ly e
valu
ate
per
form
ance
tar
gets
.
• R
evie
w a
nd b
ench
mar
k B
ank’
s fin
anci
al a
nd
bus
ines
s p
erfo
rman
ce•
Rev
iew
issu
es t
hat
war
rant
p
olic
y ch
ange
s fo
r ot
her
man
agem
ent
Com
mitt
ees
• R
evie
w p
rogr
ess
of
spec
ial p
roje
cts
and
im
ple
men
tatio
n st
atus
of
pol
icy
initi
ativ
es•
Rev
iew
and
form
ulat
e m
arke
ting
stra
tegi
es•
Pla
tfor
m fo
r d
iscu
ssin
g an
d r
evie
w o
f inn
ovat
ions
to
enh
ance
effi
cien
cy a
nd
per
form
ance
• Id
entif
y an
d m
anag
e ke
y ris
ks•
Rev
iew
dis
aste
r p
rep
ared
ness
and
b
usin
ess
cont
inui
ty.
• Li
qui
dity
man
agem
ent
• In
tere
st R
ate
Ris
k m
anag
emen
t •
Mat
urity
Gap
man
agem
ent
• C
urre
ncy
Ris
k m
anag
emen
t•
Cap
ital R
isk
man
agem
ent
• D
eter
min
ing
inve
stm
ent
stra
tegi
es o
f the
Ban
k fo
r m
axim
izat
ion
of r
isk
adju
sted
ret
urns
ove
r th
e lo
ng t
erm
• C
ount
er P
arty
and
S
ettle
men
ts R
isk
man
agem
ent.
• S
et C
red
it P
olic
y an
d
Cre
dit
Ris
k M
anag
emen
t P
olic
y•
San
ctio
n C
red
it P
rop
osal
s in
line
with
Pol
icy
and
CB
K
Gui
del
ines
• R
evie
w N
PAs
• C
onsi
der
and
ap
pro
ve n
ew
asse
t-b
ased
pro
duc
ts•
Con
trol
and
follo
w-u
p o
n cr
edit-
rela
ted
mat
ters
• R
egul
arly
rep
ort
to B
oard
C
red
it C
omm
ittee
.
• R
evie
w a
nd m
onito
r im
ple
men
tatio
n of
var
ious
st
aff d
evel
opm
ent
and
w
elfa
re in
itiat
ives
to
ensu
re
mai
nten
ance
of p
rod
uctiv
e an
d h
ealth
y st
aff r
elat
ions
• R
evie
w o
f Ban
k’s
Man
pow
er P
lan
• R
evie
w a
nd t
ake
dec
isio
ns
on d
isci
plin
ary
issu
es•
Rev
iew
sta
ff re
mun
erat
ion
vis-
à-vi
s ov
eral
l Ban
k’s
per
form
ance
and
ind
ustr
y to
ens
ure
the
Ban
k re
mai
ns
com
pet
itive
in a
ttra
ctin
g an
d r
etai
ning
tal
ent
• U
pd
ate
Boa
rd o
n H
R
mat
ters
.
• D
raw
up
the
Str
ateg
ic IC
T P
lan
• G
uid
e d
evel
opm
ent
of t
he
info
rmat
ion
arch
itect
ure
and
det
erm
ine
the
tech
nolo
gica
l dire
ctio
n•
Defi
ne IC
T p
roce
sses
, or
gani
satio
n an
d
rela
tions
hip
s•
Iden
tify,
ass
ess
and
m
anag
e IT
ris
ks•
Defi
ne a
nd m
anag
e IC
T an
d IC
T-d
epen
den
t p
roje
cts
• E
nsur
e op
timum
use
of I
T re
sour
ces
and
man
age
ICT
inve
stm
ents
.
STAT
EMEn
T O
n C
OR
POR
ATE
gO
VER
nA
nC
E (C
On
TIn
UED
)
The Directors are responsible for the preparation and fair presentation of the consolidated and company financial statements of I&M Bank LIMITED set out on pages 29 to 102 which comprise the consolidated and company statement of financial position as at 31 December 2013, consolidated and company statement of profit or loss and other comprehensive income, statement of changes in equity and statement of cash flows for the year then ended, and a summary of significant accounting policies and other explanatory information, in conformity with International Financial Reporting Standards and in the manner required by the Kenyan Companies Act. The Directors are of the opinion that the financial statements give a true and fair view of the state of the financial affairs and the operating results of the group and the company.
The Directors’ responsibilities include: determining that the basis of accounting described in Note 3 is an acceptable basis for preparing and presenting the financial statements in the circumstances, preparation and presentation of financial statements in accordance with International Financial Reporting Standards and in the manner required by the Kenyan Companies Act and for such internal control as the directors determine is necessary to enable the preparation of financial statements that are free from material misstatements, whether due to fraud or error.
Under the Kenyan Companies Act the Directors are required to prepare financial statements for each financial year which give a true and fair view of the state of affairs of the group and the company as at the end of the financial year and of the operating results of the group and the company for that year. It also requires the Directors to ensure the group and the company keeps proper accounting records which disclose with reasonable accuracy the financial position of the group and the company.
The Directors accept responsibility for the maintenance of accounting records which may be relied upon in the preparation of financial statements, as well as adequate systems of internal financial control.
The Directors have made an assessment of the company, its subsidiaries and Joint Venture’s ability to continue as a going concern and have no reason to believe the company, its subsidiaries and Joint Venture will not be a going concern for at least the next twelve months from the date of this statement.
aPPRoVal of THe fInanCIal sTaTeMenTs
The group and company financial statements, as indicated above, were approved by the Board of Directors on 21st March 2014 and were signed on its behalf by:
sbR shah sarit s Raja shah eM KimaniDirector Director Director
STATEMEnT OF DIRECTORS’ RESPOnSIBIlITIES

I&M Bank Limited Report and Consolidated Financial Statements 2013 I&M Bank Limited Report and Consolidated Financial Statements 201328 29
We have audited the financial statements of I&M Bank LIMITED set out on pages 29 to 102 which comprise the consolidated and company statement of financial position as at 31st December 2013, and the consolidated and company statement of Profit or loss and other comprehensive income, consolidated and company statement of changes in equity and consolidated and company statement of cash flows for the year then ended, and a summary of significant accounting policies and other explanatory information.
Directors’ responsibility for the financial statements
As stated on page 27, the directors are responsible for the preparation and fair presentation of these financial statements in accordance with International Financial Reporting Standards and in the manner required by the Companies Act of Kenya, and for such internal control as the directors determine is necessary to enable the preparation of financial statements that are free from material misstatement, whether due to fraud or error.
auditor’s responsibility
Our responsibility is to express an opinion on these financial statements based on our audit. We conducted our audit in accordance with International Standards on Auditing. Those standards require that we comply with relevant ethical requirements and plan and perform the audit to obtain reasonable assurance whether the financial statements are free from material misstatement.
An audit involves performing procedures to obtain audit evidence about the amounts and disclosures in the financial statements. The procedures selected depend on our judgement, including the assessment of the risks of material misstatement of the financial statements, whether due to fraud or error. In making those risk assessments, we consider internal control relevant to the entity’s preparation and fair presentation of the financial statements in order to design audit procedures that are appropriate in the circumstances, but not for the purpose of expressing an opinion on the effectiveness of the entity’s internal control. An audit also includes evaluating the appropriateness of accounting policies used and the reasonableness of accounting estimates made by management, as well as evaluating the overall presentation of the financial statements.
We believe that the audit evidence we have obtained is sufficient and appropriate to provide a basis for our opinion.
opinion
In our opinion, these financial statements give a true and fair view of the consolidated and separate financial position of I&M Bank LIMITED at 31st December 2013, and the consolidated and separate financial performance and consolidated and separate cash flows for the year then ended in accordance with International Financial Reporting Standards and in a manner required by the Kenyan Companies Act. Report on other legal requirements
As required by the Kenyan Companies Act we report to you, based on our audit, that:
• We have obtained all the information and explanations, which to the best of our knowledge and belief were necessary for the purpose of our audit;
• In our opinion, proper books of account have been kept by the company, in so far as appears from our examination of those books; and,
• The statement of financial position and statement of Profit or loss and other comprehensive income of the company are in agreement with the books of account.
The Engagement Partner responsible for the audit resulting in this independent auditors’ report is CPA Eric Etale Aholi – P/1471.
KPMG KenyaCertified Public accountants (Kenya)nairobi, Kenya21st March 2014
COnSOlIDATED STATEMEnT OF PROFIT OR lOSS AnD OThER COMPREhEnSIVE InCOMEFOR ThE YEAR EnDED 31 DECEMBER 2013
2013 2012 Restated note Kshs Kshs
Interest income 7 14,479,684,766 12,718,823,448Interest expense 8 ( 5,595,543,870) ( 6,723,817,005)
net interest income 8,884,140,896 5,995,006,443
Fee and commission income 9 (a) 1,959,791,919 1,578,557,044Fee and commission expense 9 (a) ( 64,037,893) ( 66,993,228)
net fee and commission income 9 (a) 1,895,754,026 1,511,563,816
Revenue 10,779,894,922 7,506,570,259
Other operating income 10 1,542,236,694 1,477,392,640
operating income 12,322,131,616 8,983,962,899
Staff costs 11 ( 2,436,801,300) ( 1,815,085,253)Premises and equipment costs 11 ( 389,265,969) ( 303,546,907)General administrative expenses 11 ( 1,392,670,958) ( 1,070,985,229)Depreciation and amortisation 11 ( 444,970,577) ( 386,924,056)
operating expenses ( 4,663,708,804) ( 3,576,541,445)
operating profit before impairment losses and taxation 7,658,422,812 5,407,421,454
Net impairment (loss)/recovery on loans and advances 18 (c) ( 472,088,972) 4,891,097
7,186,333,840 5,412,312,551
Share of profit of equity-accounted Joint Venture 20 (a) 76,332,182 289,991,785
Profit before income tax 12 7,262,666,022 5,702,304,336
Income tax expense 13 (a) ( 2,281,305,100) ( 1,582,746,875)
net profit for the year after tax 4,981,360,922 4,119,557,461
The notes set out on pages 40 to 102 form an integral part of these financial statements.
KPMG KenyaCertififed Public AccountantsABC Towers, 8th floorWaiyaki wayP.O. Box 40612 00100 GPONairobi Kenya
Tel: +254 20 2806000Fax: +254 20 2215695Email: [email protected]/eastafrica
RePoRT of THe InDePenDenT aUDIToR To THe MeMbeRs of I&M banK lIMITeD
KPMG Kenya is a Kenyan partnership and a member firm of the KPMG network of Independent member firms affiliated with KPMG International Cooperative (“KPMG International”), a Swiss entity.
Partners: EE Ahol PC Mwema PC Appleton* JL Mwaura BC D’Souza RB Ndung’u JM Gathecha AW Pringle*(*British)

I&M Bank Limited Report and Consolidated Financial Statements 2013 I&M Bank Limited Report and Consolidated Financial Statements 201330 31
COnSOlIDATED STATEMEnT OF PROFIT OR lOSS AnD OThER COMPREhEnSIVE InCOMEFOR ThE YEAR EnDED 31 DECEMBER 2013 (COnTInUED)
2013 2012 Restated note Kshs Kshs
other comprehensive income
Items that will never be reclassified to Profit or loss
Actuarial (losses)/gains on re-measurement of employeesbenefit scheme 37 ( 22,036,978) 383,577Revaluation on Property and equipment 488,952,808 -
466,915,830 383,577
Items that are or may be classified to Profit or loss
Net change in fair value of available for sale financial assets ( 36,739,626) 134,279,931Foreign currency translation differences (pg 24) ( 182,715,004) ( 16,288,378)Related tax – current year 24 (a) 13,706,971 -Related tax – prior year under provision 24 (a) 58,942,021 - ( 146,805,638) 117,991,553
Total other comprehensive income for the year 320,110,192 118,375,130
Total comprehensive income for the year 5,301,471,114 4,237,932,591
Profit attributable to:
Equity holders of the company 4,617,470,815 3,860,460,435Non controlling interest 363,890,107 259,097,026
4,981,360,922 4,119,557,461
Total comprehensive income attributable to:
Equity holders of the company 5,034,950,571 3,969,386,354Non controlling interest 266,520,543 268,546,237
5,301,471,114 4,237,932,591
basic and diluted earnings per share - (Kshs) 14 160.32 134.03
Dividend per share - (Kshs)
- Final 15 35.00 26.00
The notes set out on pages 40 to 102 form an integral part of these financial statements.
COMPAnY STATEMEnT OF PROFIT OR lOSS AnD OThER COMPREhEnSIVE InCOMEFOR ThE YEAR EnDED 31 DECEMBER 2013
2013 2012 note Kshs Kshs
Interest income 7 11,577,079,411 10,966,387,228Interest expense 8 ( 4,534,934,544) ( 6,035,221,563)
net interest income 7,042,144,867 4,931,165,665
Fee and commission income 9 (b) 1,496,689,082 1,266,269,206Fee and commission expense 9 (b) ( 46,008,926) ( 31,199,336)
net fee and commission income 9 (b) 1,450,680,156 1,235,069,870
Revenue 8,492,825,023 6,166,235,535
Other operating income 10 749,003,909 882,696,635Dividend income 10 97,285,812 103,578,700
846,289,721 986,275,335
operating income 9,339,114,744 7,152,510,870
Staff costs 11 ( 1,431,291,396) ( 1,209,223,691)Premises and equipment costs 11 ( 226,451,177) ( 211,832,793)General administrative expenses 11 ( 854,968,607) ( 706,328,291)Depreciation and amortisation 11 ( 298,711,308) ( 289,418,162)
operating expenses ( 2,811,422,488) ( 2,416,802,937)
operating profit before impairment losses and taxation 6,527,692,256 4,735,707,933
Net impairment (loss)/ recovery on loans and advances 18 (c) ( 467,874,581) ( 14,167,545)
Profit before income tax 12 6,059,817,675 4,721,540,388
Income tax expense 13 (b) ( 1,865,382,349) ( 1,358,647,847)
net profit for the year after tax 4,194,435,326 3,362,892,541
other comprehensive income
Items that will never be reclassified to Profit or loss
Revaluation of property and equipment 491,506,129 -
Items that are or may be reclassified to Profit or loss
Net change in fair value of available for sale financial assets ( 45,689,903) 119,115,809 Related tax - current year 13,706,971 Related tax - prior years under provisions 58,942,021 -
26,959,089 119,115,809
Total other comprehensive income for the year 518,465,218 119,115,809
Total comprehensive income for the year 4,712,900,544 3,482,008,350
basic and diluted earnings per share - (Kshs) 14 145.63 116.76
Dividend per share - (Kshs) 15- Final 35.00 26.00
The notes set out on pages 40 to 102 form an integral part of these financial statements.

I&M Bank Limited Report and Consolidated Financial Statements 2013 I&M Bank Limited Report and Consolidated Financial Statements 201332 33
31.12.2012 01.01.2012 31.12.2013 Restated Restated note Kshs Kshs Kshs
assets
Cash and balances with Central Banks 16 8,909,224,001 6,744,132,656 5,204,366,824 Loans and advances to banks 17 6,050,626,986 6,774,013,121 5,871,679,940 Loans and advances to customers 18 (a) 91,882,663,906 71,012,960,123 53,244,093,199 Investment securities 19 26,197,402,129 27,322,216,105 17,066,358,327 Investment in Joint Venture 20 (a) 2,411,972,727 2,066,667,578 1,840,951,353Property and equipment 21 2,608,195,742 2,129,369,021 1,453,280,139Intangible assets - Goodwill 22 (a) 1,173,406,016 1,173,406,016 619,699,547 Intangible assets - Software 22 (b) 175,007,742 242,911,959 55,862,884 Prepaid operating lease rentals 23 241,325,331 246,104,186 250,883,040 Tax recoverable 13 (b)(i) - 2,909,947 - Deferred tax asset 24 (a) 575,988,859 337,756,198 270,749,496 Other assets 25 1,138,402,284 1,223,597,412 917,194,829
Total assets 141,364,215,723 119,276,044,322 86,795,119,578
liabilities and shareholders’ equity
liabilities
Deposits from banks 26 6,411,628,429 5,877,198,410 2,546,060,409 Deposits from customers 27 97,145,568,401 87,774,148,570 64,828,118,553Deferred tax liability 24 (b) 26,288,067 17,235,682 -Tax payable 13 (b)(i) 569,712,733 110,005,188 313,210,128 Other liabilities 28 1,782,178,314 1,640,646,774 978,035,030 Long term borrowings 29 11,572,650,440 4,446,419,567 2,969,262,405 117,508,026,384 99,865,654,191 71,634,686,525shareholders’ equity (Pages 36 and 37)
Share capital 30 (a) 2,880,245,300 2,880,245,300 2,880,245,300 Share premium 30 (c) 3,773,237,119 3,773,237,119 3,773,237,119 Retained earnings 13,722,034,818 10,241,780,381 7,179,016,452 Revaluation reserve 30 (d) 631,857,844 141,842,012 142,330,963 Statutory loan loss reserve 30 (e) 218,047,667 141,176,203 91,470,947 Translation reserve 30 (f) 16,468,490 98,934,894 124,672,483 Available-for-sale reserve 30 (g) ( 161,584,903) ( 193,552,209) ( 327,832,140)Proposed dividends 1,008,085,855 748,863,778 747,424,874
22,088,392,190 17,832,527,478 14,610,565,998equity attributable to owners of the company
Non controlling interest 1,767,797,149 1,577,862,653 549,867,055
Total shareholders’ equity 23,856,189,339 19,410,390,131 15,160,433,053
Total liabilities and shareholders’ equity 141,364,215,723 119,276,044,322 86,795,119,578
The financial statements set out on pages 29 to 102 were approved by the Board of Directors on 21st March 2014 and were signed on its behalf by:Director: sbR shah Director: sarit s Raja shah Director: eM Kimani secretary: nP Kothari
The notes set out on pages 40 to 102 form an integral part of these financial statements.
COnSOlIDATED STATEMEnT OF FInAnCIAl POSITIOn AS AT 31 DECEMBER 2013
2013 2012 note Kshs Kshs
assets
Cash and balances with Central Bank of Kenya 16 6,151,961,252 4,247,943,202Loans and advances to banks 17 1,695,669,062 1,492,544,276Loans and advances to customers 18 (a) 73,369,587,567 55,374,812,294Investment securities 19 20,975,157,099 23,317,885,968Investment in Joint Venture 20 (a) 1,498,814,479 1,245,537,610Investment in subsidiary 20 (b) 2,752,188,620 2,752,188,620Property and equipment 21 1,948,404,145 1,387,467,275Intangible asset - Goodwill 22 (a) 10,746,998 10,746,998Intangible assets - Software 22 (b) 102,766,346 164,620,750Prepaid operating lease rentals 23 241,325,331 246,104,186Deferred tax asset 24 (a) 558,049,635 328,140,174Tax recoverable 13 (b)(ii) - 2,909,947Other assets 25 1,011,011,959 948,721,629 Total assets 110,315,682,493 91,519,622,929
liabilities and shareholders’ equity
liabilities
Deposits from banks 26 2,895,022,029 4,730,413,541Deposits from customers 27 74,494,274,534 65,640,244,868Tax payable 13 (b)(ii) 412,050,416 -Other liabilities 28 1,080,723,572 886,571,435Long term borrowings 29 10,908,977,608 3,671,573,436
89,791,048,159 74,928,803,280shareholders’ equity (Page 38 and 39)
Share capital 30 (a) 2,880,245,300 2,880,245,300Share premium 30 (c) 3,773,237,119 3,773,237,119Retained earnings 12,308,162,034 9,217,455,769Revaluation reserve 30 (d) 629,739,248 138,233,119Statutory loan loss reserve 30 (e) 94,679,096 29,257,971Available-for-sale reserve 30 (g) ( 169,514,318) ( 196,473,407)Proposed dividends 1,008,085,855 748,863,778
20,524,634,334 16,590,819,649
Total liabilities and shareholders’ equity 110,315,682,493 91,519,622,929
The financial statements set out on pages 29 to 102 were approved by the Board of Directors on 21st March 2014 and were signed on its behalf by:
Director: sbR shah Director: sarit s Raja shah Director: eM Kimani secretary: nP Kothari
The notes set out on pages 40 to 102 form an integral part of these financial statements.
COMPAnY STATEMEnT OF FInAnCIAl POSITIOn AS AT 31 DECEMBER 2013

I&M Bank Limited Report and Consolidated Financial Statements 2013 I&M Bank Limited Report and Consolidated Financial Statements 201334 35
COnSOlIDATED STATEMEnT OF CASh FlOWS FOR ThE YEAR EnDED 31 DECEMBER 2013
2013 2012 Restated note Kshs Kshs
net cash flows used in operating activities 31 (a) (25,726,064,512) (9,297,899,485)
Cash flows from investing activities
Purchase of property and equipment 21 (a) ( 331,889,383) ( 336,025,894)Purchase of intangible assets 22 (b) ( 75,945,492) ( 298,289,771)Proceeds from disposal of property and equipment 11,784,902 29,373,312Proceeds from disposal of investment securities 20,300,355,483 4,282,214,532Dividend from Joint Venture - 42,300,000Investment in subsidiary 2,267,085,797Additional investment in Joint Venture 20 (a) ( 253,276,869) -
net cash from investing activities 19,651,028,641 5,986,657,976
Cash flows from financing activities
Reverse takeover costs ( 30,222,081) -Receipt of long term borrowings 7,126,230,873 1,101,331,676Dividend paid to shareholders of the company ( 748,863,778) ( 747,424,874)Dividend paid to non controlling interests ( 76,586,047) ( 32,973,132)net cash from financing activities 6,270,558,967 320,933,670
net increase/(decrease) in cash and cash equivalents 31 (b) 195,523,096 (2,990,307,839)
The notes set out on pages 40 to 102 form an integral part of these financial statements.
COMPAnY STATEMEnT OF CASh FlOWS FOR ThE YEAR EnDED 31 DECEMBER 2013
2013 2012 Restated note Kshs Kshs
net cash flows used in operating activities 31 (c) (22,849,091,687) (9,140,128,494)
Cash flows from investing activities
Purchase of property and equipment 21 (b) ( 249,591,174) ( 250,545,409)Purchase of intangible assets 22 (b) ( 52,459,550) ( 233,080,859)Proceeds from disposal of property and equipment 641,000 2,241,475Dividends received 10 (b) 97,285,812 103,578,700Investments in Joint Venture ( 253,276,869) -Investments in subsidiary - (1,629,277,260)Proceeds on investment securities 20,253,059,678 4,282,214,532
net cash from investing activities 19,795,658,897 2,275,131,179
Cash flows from financing activities
Reverse takeover costs ( 30,222,081) -Net proceeds of long term borrowings 7,237,404,172 702,311,031Dividend paid ( 748,863,778) ( 747,424,874)
net cash from/(used in) financing activities 6,458,318,313 ( 45,113,843)
net increase/(decrease) in cash and cash equivalents 31 (d) 3,404,885,523 (6,910,111,158)
The notes set out on pages 40 to 102 form an integral part of these financial statements.

I&M Bank Limited Report and Consolidated Financial Statements 2013 I&M Bank Limited Report and Consolidated Financial Statements 201336 37
CO
nSO
lID
ATED
STA
TEM
EnT
OF
Ch
An
gES
In
EQ
UIT
Y F
OR
Th
E Y
EAR
En
DED
31
DEC
EMB
ER 2
013
2012
:s
hare
cap
ital
Ks
hs
sha
re
prem
ium
Ks
hs
Ret
aine
dea
rnin
gsK
shs
sta
tuto
rycr
edit
risk
rese
rve
Ks
hs
Rev
alua
tion
rese
rve
Ks
hs
ava
ilabl
e-fo
r sa
le-r
eser
veK
shs
Tran
slat
ion
rese
rve
Ks
hs
Pro
pose
d
divi
dend
sK
shs
To
tal
Ks
hs
non
co
ntro
lling
inte
rest
Ks
hs
Tota
lK
shs
At 1
Jan
uary
201
2:
- As p
revio
usly
repo
rted
2,88
0,24
5,30
0 3,
773,
237,
119
7,18
5,25
4,00
3 91
,470
,947
14
2,33
0,96
3 (3
27,8
32,1
40)
124,
672,
483
747,
424,
874
14,6
16,8
03,5
49
549,
867,
055
15,1
66,6
70,6
04
Actu
arial
(loss
es)/g
ains
to
empl
oyee
ben
efits
sche
me
--
(
6,23
7,55
1)-
--
--
(
6,2
37,5
51)
-(
6
,237
,551
)a
t 1 J
anua
ry 2
012
– a
s re
stat
ed2,
880,
245,
300
3,77
3,23
7,11
9 7,
179,
016,
452
91,4
70,9
47
142,
330,
963
(327
,832
,140
)12
4,67
2,48
3 74
7,42
4,87
4 14
,610
,565
,998
54
9,86
7,05
5 15
,160
,433
,053
Tota
l com
preh
ensi
ve
inco
me
for t
he y
ear
Net p
rofit
afte
r tax
atio
n -
-3,
860,
460,
435
--
--
-3,
860,
460,
435
259,
097,
026
4,11
9,55
7,46
1 o
ther
com
preh
ensi
ve
inco
me
Tran
slatio
n re
serv
e -
--
--
-( 2
5,73
7,58
9)-
(
25,
737,
589)
9,44
9,21
1 (
1
6,28
8,37
8)
Reva
luatio
n re
serv
e -
-48
8,95
1 -
(
488
,951
)-
--
- -
Actu
arial
(loss
es)/g
ains
to
empl
oyee
ben
efits
sche
me
--
383,
577
--
--
-38
3,57
7 -
383,
577
Avail
able-
for-s
ale re
serv
e -
--
--
134,
279,
931
--
134,
279,
931
-13
4,27
9,93
1
Stat
utor
y loa
n lo
ss re
serv
e -
- (
49,
705,
256)
49,7
05,2
56
--
--
--
-To
tal o
ther
co
mpr
ehen
sive
inco
me
--
(
48,
832,
728)
49,7
05,2
56
(
48
8,95
1)13
4,27
9,93
1 (
25,7
37,5
89)
-10
8,92
5,91
9 9,
449,
211
118,
375,
130
Tota
l co
mpr
ehen
sive
inco
me
--
3,81
1,62
7,70
749
,705
,256
(
488,
951)
134,
279,
931
( 25
,737
,589
)-
3,96
9,38
6,35
4 26
8,54
6,23
7 4,
237,
932,
591
Tran
sact
ions
with
ow
ners
, re
cord
ed d
irect
ly in
equ
ity
Divid
end
paid
- 20
11 F
inal
--
--
--
-(7
47,4
24,8
74)
( 7
47,4
24,8
74)
( 32
,973
,132
)(
780
,398
,006
)
Divid
end
prop
osed
- 20
12
Fina
l -
- (
748
,863
,778
)-
--
-74
8,86
3,77
8 -
--
Tota
l tra
nsac
tions
w
ith o
wne
rs fo
r the
yea
r -
- (
748
,863
,778
)-
--
-1,
438,
904
(
747,
424,
874)
( 3
2,97
3,13
2) (
78
0,39
8,00
6)
Cha
nges
in o
wne
rshi
p
inte
rest
s in
sub
sidi
ary:
Non
cont
rollin
g int
eres
t on
shar
e ca
pita
l at a
cquis
ition
of su
bsid
iary
--
--
--
--
-79
2,42
2,49
379
2,42
2,49
3To
tal c
hang
es in
ow
ners
hip
in
tere
sts
in s
ubsi
diar
y -
- -
- -
- -
- -
79
2,42
2,49
3
792,
422,
493
bal
ance
as
at
31 D
ecem
ber 2
012
2,88
0,24
5,30
0 3,
773,
237,
119
10,2
41,7
80,3
81
141,
176,
203
141,
842,
012
(193
,552
,209
)98
,934
,894
74
8,86
3,77
8 17
,832
,527
,478
1,
577,
862,
653
19,4
10,3
90,1
31
The
note
s se
t ou
t on
pag
es 4
0 to
102
form
an
inte
gral
par
t of
the
se fi
nanc
ial s
tate
men
ts.
CO
nSO
lID
ATED
STA
TEM
EnT
OF
Ch
An
gES
In
EQ
UIT
Y F
OR
Th
E Y
EAR
En
DED
31
DEC
EMB
ER 2
013
(CO
nTI
nU
ED)
2013
:
sha
re
capi
tal
Ks
hs
sha
re
prem
ium
Ks
hs
Ret
aine
dea
rnin
gsK
shs
sta
tuto
rycr
edit
risk
rese
rve
Ks
hs
Rev
alua
tion
rese
rve
Ks
hs
ava
ilabl
e-fo
r sa
le-r
eser
veK
shs
Tran
slat
ion
rese
rve
Ks
hs
Pro
pose
d
divi
dend
sK
shs
Tota
lK
shs
non
co
ntro
lling
inte
rest
Ks
hsTo
tal
Ks
hs
At 1
Jan
uary
201
3
- As p
revio
usly
repo
rted
2,88
0,24
5,30
0 3,
773,
237,
119
10,2
47,6
34,3
55
141,
176,
203
141,
842,
012
(193
,552
,209
)98
,779
,888
74
8,86
3,77
8 17
,838
,226
,446
1,
577,
862,
653
19,4
16,0
89,0
99
Actu
arial
(loss
es)/g
ains
to
empl
oyee
ben
efits
sche
me
--
(
5,8
53,9
74)
--
-15
5,00
6 -
(
5,6
98,9
68)
-(
5
,698
,968
)a
t 1 J
anua
ry 2
013
-
as
rest
ated
2,88
0,24
5,30
0 3,
773,
237,
119
10,2
41,7
80,3
8114
1,17
6,20
3 14
1,84
2,01
2 (1
93,5
52,2
09)
98,9
34,8
9474
8,86
3,77
8 17
,832
,527
,478
1,57
7,86
2,65
3 19
,410
,390
,131
Tota
l com
preh
ensi
vein
com
e fo
r the
yea
r
Net P
rofit
afte
r tax
atio
n -
-4,
617,
470,
815
--
--
-4,
617,
470,
815
363,
890,
107
4,98
1,36
0,92
2o
ther
com
preh
ensi
ve
inco
me
Tran
slatio
n re
serv
e -
--
--
-(8
2,46
6,40
4)-
(
82,4
66,4
04)
( 10
0,24
8,60
0)(
182
,715
,004
)
Reva
luatio
n re
serv
e -
--
-49
0,01
5,83
2 -
--
490,
015,
832
(
1,0
63,0
24)
488,
952,
808
Fair v
alue
chan
ges o
n em
ploy
ee b
enefi
ts-
- (
2
2,03
6,97
8)-
--
--
( 2
2,03
6,97
8)-
(
22,
036,
978)
Avail
able
for s
ale re
serv
e -
--
--
31,
967,
306
--
31,
967,
306
3,94
2,06
0 3
5,90
9,36
6
Stat
utor
y loa
n lo
ss re
serv
e -
-(
76
,871
,464
)76
,871
,464
-
--
--
--
Tota
l oth
erco
mpr
ehen
sive
inco
me
--
(
9
8,90
8,44
2)76
,871
,464
490,
015,
832
31,
967,
306
(82,
466,
404)
-41
7,47
9,75
6 (
9
7,36
9,56
4)32
0,11
0,19
2
Tota
l com
preh
ensi
ve in
com
e -
-4,
518,
562,
373
76,8
71,4
64
490,
015,
832
31,9
67,3
06(8
2,46
6,40
4)-
5,03
4,95
0,57
126
6,52
0,54
3 5,
301,
471,
114
Tran
sact
ions
with
ow
ners
, re
cord
ed d
irect
ly in
equ
ity
Reve
rse
take
ove
r exp
ense
s -
- (
3
0,22
2,08
1)-
--
--
(
30,2
22,0
81)
- (
3
0,22
2,08
1)
Divid
end
paid
- 20
12 F
inal
--
--
--
-( 7
48,8
63,7
78)
( 7
48,8
63,7
78)
( 7
6,58
6,04
7) (
825
,449
,825
)
Divid
end
prop
osed
-20
13 F
inal
--
( 1,0
08,0
85,8
55)
--
--
1,00
8,08
5,85
5-
--
Tota
l tra
nsac
tions
with
ow
ners
for t
he y
ear
--
( 1,
038,
307,
936)
--
--
259,
222,
077
( 7
79,0
85,8
59)
(
76,5
86,0
47)
(
855,
671,
906)
bal
ance
as
at
31 D
ecem
ber 2
013
2,88
0,24
5,30
0 3,
773,
237,
119
13,7
22,0
34,8
1821
8,04
7,66
7 63
1,85
7,84
4 (1
61,5
84,9
03)
16,4
68,4
901,
008,
085,
855
22,0
88,3
92,1
90
1,76
7,79
7,14
9 23
,856
,189
,339
The
note
s se
t out
on
page
s 40
to 1
02 fo
rm a
n in
tegr
al p
art o
f the
se fi
nanc
ial s
tate
men
ts.

I&M Bank Limited Report and Consolidated Financial Statements 2013 I&M Bank Limited Report and Consolidated Financial Statements 201338 39
CO
MPA
nY
STA
TEM
EnT
OF
Ch
An
gES
In
EQ
UIT
Y F
OR
Th
E Y
EAR
En
DED
31
DEC
EMB
ER 2
013
2012
:
sta
tuto
ry
sha
re c
apit
alK
shs
sha
re p
rem
ium
Ks
hs
Ret
aine
d
earn
ing
sK
shs
cred
it r
isk
rese
rve
Ks
hs
ava
ilab
le-
for-
sale
res
erve
Ks
hs
Rev
alua
tio
n re
serv
eK
shs
Pro
po
sed
d
ivid
end
sK
shs
T
ota
lK
shs
At 1
Jan
uary
201
22,
880,
245,
300
3,77
3,23
7,11
96,
609,
634,
053
23,0
50,9
24(3
15,5
89,2
16)
138,
233,
119
747,
424,
874
13,8
56,2
36,1
73To
tal c
om
pre
hens
ive
inco
me
for
the
year
Net
pro
fit a
fter t
axat
ion
-
-3,
362,
892,
541
--
--
3,36
2,89
2,54
1o
ther
co
mp
rehe
nsiv
e in
com
e
Avai
labl
e-fo
r-sal
e re
serv
e
--
--
119,
115,
809
--
119,
115,
809
Stat
utor
y lo
an lo
ss re
serv
e
--
(
6,2
07,0
47)
6,20
7,04
7-
--
-To
tal o
ther
co
mp
rehe
nsiv
e in
com
e
--
(
6,2
07,0
47)
6,20
7,04
711
9,11
5,80
9-
-11
9,11
5,80
9
Tota
l co
mp
rehe
nsiv
e in
com
e
--
3,35
6,68
5,49
46,
207,
047
119,
115,
809
--
3,48
2,00
8,35
0
Tran
sact
ions
wit
h o
wne
rs r
eco
rded
dir
ectl
y in
eq
uity
Divi
dend
pai
d - 2
011
final
--
--
--
(747
,424
,874
)(
747
,424
,874
)
Divi
dend
pro
pose
d - 2
012
final
-
-(
748,
863,
778)
--
-74
8,86
3,77
8-
Tota
l tra
nsac
tio
ns w
ith
ow
ners
for
the
year
--
( 74
8,86
3,77
8)-
--
1,43
8,90
4(
747
,424
,874
)
bal
ance
as
at 3
1 D
ecem
ber
201
22,
880,
245,
300
3,77
3,23
7,11
99,
217,
455,
769
29,2
57,9
71(1
96,4
73,4
07)
138,
233,
119
748,
863,
778
16,5
90,8
19,6
49
CO
MPA
nY
STA
TEM
EnT
OF
Ch
An
gES
In
EQ
UIT
Y F
OR
Th
E Y
EAR
En
DED
31
DEC
EMB
ER 2
013
(CO
nTI
nU
ED)
2013
:s
tatu
tory
s
hare
cap
ital
Ks
hss
hare
pre
miu
mK
shs
Ret
aine
d
earn
ing
sK
shs
cred
it r
isk
rese
rve
Ks
hs
ava
ilab
le-
for-
sale
res
erve
Ks
hs
Rev
alua
tio
n re
serv
eK
shs
Pro
po
sed
d
ivid
end
sK
shs
To
tal
Ks
hs
At
1 Ja
nuar
y 20
132,
880,
245,
300
3,77
3,23
7,11
99,
217,
455,
769
29,2
57,9
71(1
96,4
73,4
07)
138,
233,
119
748,
863,
778
16,5
90,8
19,6
49To
tal c
om
pre
hens
ive
inco
me
for
the
year
Net
pro
fit a
fter t
axat
ion
-
-4,
194,
435,
326
--
--
4,19
4,43
5,32
6o
ther
co
mp
rehe
nsiv
e in
com
e
Reva
luat
ion
rese
rve
--
--
-49
1,50
6,12
9-
491,
506,
129
Avai
labl
e-fo
r-sal
e re
serv
e
-
--
-26
,959
,089
--
26,9
59,0
89
Stat
utor
y lo
an lo
ss re
serv
e
--
(
65,4
21,1
25)
65,4
21,1
25-
--
-To
tal o
ther
co
mp
rehe
nsiv
e in
com
e
--
(
65,4
21,1
25)
65,4
21,1
2526
,959
,089
491,
506,
129
-51
8,46
5,21
8
Tota
l co
mp
rehe
nsiv
e in
com
e
--
4,12
9,01
4,20
165
,421
,125
26,9
59,0
8949
1,50
6,12
9-
4,71
2,90
0,54
4
Tran
sact
ions
wit
h o
wne
rs r
eco
rded
dir
ectl
y in
eq
uity
Divi
dend
pai
d - 2
012
final
--
--
--
( 7
48,8
63,7
78)
( 7
48,8
63,7
78)
Divi
dend
pro
pose
d - 2
013
final
--
(1,0
08,0
85,8
55)
--
-1,
008,
085,
855
-
Reve
rse
take
over
cos
ts
--
(
30,2
22,0
81)
--
--
(
30,
222,
081)
Tota
l tra
nsac
tio
ns w
ith
ow
ners
for
the
year
--
(1,0
38,3
07,9
36)
--
-25
9,22
2,07
7(
779
,085
,859
)
bal
ance
as
at 3
1 D
ecem
ber
201
32,
880,
245,
300
12,3
08,1
62,0
34
94,6
79,0
96(1
69,5
14,3
18)
629,
739,
248
1,00
8,08
5,85
520
,524
,634
,334
3,77
3,23
7,11
9
The
note
s se
t out
on
page
s 40
to 1
02 fo
rm a
n in
tegr
al p
art o
f the
se fi
nanc
ial s
tate
men
ts.
The
note
s se
t out
on
page
s 40
to 1
02 fo
rm a
n in
tegr
al p
art o
f the
se fi
nanc
ial s
tate
men
ts.

I&M Bank Limited Report and Consolidated Financial Statements 2013 I&M Bank Limited Report and Consolidated Financial Statements 201340 41
nOTES TO ThE COnSOlIDATED AnD SEPARATE FInAnCIAl STATEMEnTSFOR ThE YEAR EnDED 31 DECEMBER 2013
1. RePoRTInG enTITY
I&M Bank LIMITED (the “Bank”), a financial institution licensed under the Kenyan Banking Act (Chapter 488), provides corporate and retail banking services in various parts of the country. The Bank is incorporated in Kenya under the Kenyan Companies Act and has subsidiaries in Tanzania and Rwanda as well as a Joint Venture in Mauritius. The consolidated financial statements of the Bank as at and for the year ended 31st December 2013 comprise the Bank and its subsidiaries and the Joint Venture (together referred to as the “Group”). The address of its registered office is as follows:
I&M Bank House2nd Ngong AvenueP.O Box 3023800100 Nairobi GPO
The Bank has 50% (2012 - 50%) interest in Bank One Limited, a Joint Venture in a bank licensed in Mauritius, 55.03% (2012 - 55.03%) shareholding in I&M Bank (T) Limited and effective interest of 54.99% (2012 – 54.99%) in I&M Bank (Rwanda) Limited through a 68.742% holding in BCR Investment Company Limited (Mauritius) which owns 80% shareholding in I&M Bank (Rwanda) Limited.
Where reference is made to “Group” in the accounting policies, it should be interpreted as referring to the Bank where the context requires, unless otherwise stated.
For Kenyan Companies Act reporting purposes, the balance sheet is represented by the Statement of Financial Position and the Profit and loss account by the Statement of Profit or loss and other comprehensive income, in these financial statements.
2. basIs of PRePaRaTIon
(a) statement of compliance
These consolidated and separate financial statements have been prepared in accordance with International Financial Reporting Standards (IFRSs).
(b) basis of measurement
These consolidated financial statements have been prepared under the historical cost basis of accounting except for the following:
• Available-for-sale financial assets are measured at fair value• Buildings are measured at fair value
(c) functional and presentation currency
These consolidated financial statements are presented in Kenya Shillings (KShs), which also is the Bank’s functional currency. All financial information presented in KShs has been rounded to the nearest Shilling.
(d) Use of estimates and judgments
In preparing these consolidated financial statements, management has made judgements, estimated and assumptions that affect the application of the Group’s accounting policies and the reported amounts of assets, liabilities, income and expenses. Actual results may differ from these estimates.
Estimates and underlying assumptions are reviewed on an ongoing basis. Revisions to estimates are recognised prospectively.
In particular information about significant areas of estimation uncertainty and critical judgements in applying accounting policies that have the most significant effect on the amount recognised in the financial statements are described in Note 5.
(e) Changes in accounting policy
The Group has adopted the following new standards and amendments to standards, including any consequential amendments to other standards, with a date of initial application of 1st January 2013.
• amendments to Ias 1 - ‘Presentation of Items of Other Comprehensive Income’ (effective 1st July 2012). The amendments require that an entity present separately the items of other comprehensive income that would be reclassified to profit or loss in the future if certain conditions are met from those that would never be reclassified to profit or loss. It however does not change the existing option to present profit or loss and other comprehensive income in two statements but changes the title of the statement of comprehensive income to the statement of profit or loss and other comprehensive income. However, an entity is still allowed to use other titles. The Group has adopted this standard and comparative information has been re-presented on the same basis.
nOTES TO ThE COnSOlIDATED AnD SEPARATE FInAnCIAl STATEMEnTSFOR ThE YEAR EnDED 31 DECEMBER 2013 (COnTInUED)
2. basIs of PRePaRaTIon (ConTInUeD)
(e) Changes in accounting policy (continued)
• Ias 19 - ‘Employee Benefits’ (effective 1st January 2013). The amended IAS 19 requires that actuarial gains and losses are recognised immediately in other comprehensive income. This change removed the corridor method and eliminated the ability for entities to recognise all changes in the defined benefit obligation and in plan assets in profit or loss, which was previously allowed under IAS 19. It also requires that expected return on plan assets recognised in profit or loss is calculated based on the rate used to discount the defined benefit obligation. The Group has adopted this standard through the Joint Venture that has an employee benefit scheme.
• IfRs 10 - ‘Consolidated Financial Statements’ (effective 1st January 2013). This standard replaces the requirements and guidance in IAS 27 relating to consolidated financial statements. The objective of this standard is to improve the usefulness of consolidated financial statements by developing a single basis for consolidation and robust guidance for applying that basis to situations where it has proved difficult to assess control in practice and divergence has evolved. The basis for consolidation is control and it is applied irrespective of the nature of the investee. The Group has adopted this standard and reassessed its control conclusions of its subsidiaries and Joint Venture as of 1st January 2013. The quantitative impact of the change is set out below.
• IfRs 11 - ‘Joint arrangements’ (effective 1st January 2013). IFRS 11 supersedes IAS 31 and SIC-13 relating to Jointly Controlled Entities. The objective of this IFRS is to establish principles for financial reporting by entities that have an interest in arrangements that are controlled jointly. It focuses on the rights and obligations of joint arrangements, rather than the legal form (as is currently the case). It further distinguishes joint arrangements between joint operations and Joint Ventures; and requires the equity method for jointly controlled entities that are now called Joint Ventures. As a result, the Joint Venture has been accounted for using equity method. Previously this was accounted for using proportionate method. The opening statement of financial position of the earliest comparative period presented (1st January 2012) has been restated to reflect the change in accounting for the Group’s investment in the Joint Venture. The quantitative impact of the change is set out below.
• IfRs 12 - ‘Disclosure of interests in other entities’ (effective 1st January 2013). The objective of this IFRS is to require an entity to disclose information that enables users of its financial statements to evaluate: the nature of, and risks associated with, its interests in other entities; and the effects of those interests on its financial position, financial performance and cash flows. The group has adopted this standard.
• IfRs 13 - ‘Fair value measurement’ (effective 1st January 2013). IFRS 13 replaces the fair value measurement guidance contained in individual IFRSs with a single source of fair value measurement guidance. It defines fair value, establishes a framework for measuring fair value and sets out disclosure requirements for fair value measurements. It explains how to measure fair value when it is required or permitted by other IFRSs. It does not introduce new requirements to measure assets or liabilities at fair value, nor does it eliminate the practicability exceptions to fair value measurements that currently exist in certain standards. The Group has applied the new fair value measurement guidance. The change had no significant impact on the measurements of the Group’s assets and liabilities.

I&M Bank Limited Report and Consolidated Financial Statements 2013 I&M Bank Limited Report and Consolidated Financial Statements 201342 43
2. basIs of PRePaRaTIon (ConTInUeD)
(e) Changes in accounting policy (continued)
• Summary of quantitative impacts:
Consolidated statement of financial position
Impact of changes in accounting policies
as previously Joint Venture net asset reported hive-off share as restated31 December 2012 Kshs Kshs Kshs Kshs
assets Cash and cash equivalents 20,537,953,606 7,019,807,829 - 13,518,145,777 Loans and advances to customers 87,835,117,691 16,822,157,568 - 71,012,960,123 Investment securities 29,528,700,092 2,206,483,987 - 27,322,216,105 Intangible assets - Goodwill 1,670,138,590 496,732,574 - 1,173,406,016 Investment in Joint Venture - ( 1,245,537,610) 821,129,968 2,066,667,578 Property and equipment 2,592,471,835 463,102,814 - 2,129,369,021 Intangible assets - Software 299,547,209 56,635,250 - 242,911,959 Other assets 2,261,143,142 450,775,399 - 1,810,367,743
Total assets 144,725,072,165 26,270,157,811 821,129,968 119,276,044,322
equity and liabilities Total deposits 117,586,496,697 23,935,149,717 - 93,651,346,980 Long term borrowings 5,429,651,683 983,232,116 - 4,446,419,567 Other liabilities 2,292,834,686 524,947,042 - 1,767,887,644 Total liabilities 125,308,983,066 25,443,328,875 - 99,865,654,191
equity Equity attributable to owners of the Company 17,838,226,446 826,828,936 821,129,968 17,832,527,478 Non controlling interest 1,577,862,653 - - 1,577,862,653
Total equity and liablilities 144,725,072,165 26,270,157,811 821,129,968 119,276,044,322
nOTES TO ThE COnSOlIDATED AnD SEPARATE FInAnCIAl STATEMEnTSFOR ThE YEAR EnDED 31 DECEMBER 2013 (COnTInUED)
2. basIs of PRePaRaTIon (ConTInUeD)
(e) Changes in accounting policy (continued)
Consolidated statement of financial position
Impact of changes in accounting policies
as previously Joint Venture net asset reported hive-off share as restated1 January 2012 Kshs Kshs Kshs Kshs
assets Cash and cash equivalents 16,907,146,048 5,831,099,284 - 11,076,046,764 Loans and advances to customers 66,365,869,990 13,121,776,791 - 53,244,093,199Investment securities 19,685,791,796 2,619,433,469 - 17,066,358,327 Intangible assets - Goodwill 1,116,975,611 497,276,064 - 619,699,547 Investment in Joint Venture - ( 1,245,537,610) 595,413,743 1,840,951,353 Property and equipment 1,915,489,873 462,209,734 - 1,453,280,139 Intangible assets - Software 108,047,505 52,184,621 - 55,862,884 Other assets 1,964,391,556 525,564,191 - 1,438,827,365
Total assets 108,063,712,379 21,864,006,544 595,413,743 86,795,119,578
equity and liabilities Total deposits 87,758,964,237 20,384,785,275 - 67,374,178,962 Long term borrowings 3,435,773,450 466,511,045 - 2,969,262,405 Other liabilities 1,702,304,088 411,058,930 - 1,291,245,158
Total liabilities 92,897,041,775 21,262,355,250 - 71,634,686,525
equity Equity attributable to owners of the Company 14,616,803,549 601,651,294 595,413,743 14,610,565,998Non controlling interest 549,867,055 - - 549,867,055
Total equity and liabilities 108,063,712,379 21,864,006,544 595,413,743 86,795,119,578
nOTES TO ThE COnSOlIDATED AnD SEPARATE FInAnCIAl STATEMEnTSFOR ThE YEAR EnDED 31 DECEMBER 2013 (COnTInUED)

I&M Bank Limited Report and Consolidated Financial Statements 2013 I&M Bank Limited Report and Consolidated Financial Statements 201344 45
2. basIs of PRePaRaTIon (ConTInUeD)
(e) Changes in accounting policy (continued)
Consolidated statement of profit or loss and SOCI
Impact of changes in accounting policies share of Joint as previously Joint Venture Venture for the year ended reported hive-off profit as restated31 December 2012 Kshs Kshs Kshs Kshs
Net Interest income 6,560,598,650 565,592,207 - 5,995,006,443 Net Fees and commission income 1,664,220,219 152,656,403 - 1,511,563,816 net trading income 8,224,818,869 718,248,610 - 7,506,570,259
Other operating income 1,688,618,114 211,225,474 - 1,477,392,640
Total operating income 9,913,436,983 929,474,084 - 8,983,962,899
Staff costs ( 2,147,204,517) (332,119,264) - ( 1,815,085,253)Premises and equipment costs ( 348,771,917) ( 45,225,010) - ( 303,546,907)General administrative expenses ( 1,186,290,773) ( 115,305,544) - ( 1,070,985,229)Depreciation and amortisation ( 437,755,328) ( 50,831,272) - ( 386,924,056)
operating expenses (4,120,022,535) (543,481,090) - (3,576,541,445)
operating profit before impairment losses and taxation 5,793,414,448 385,992,994 - 5,407,421,454
Net impairment losses on loans and advances ( 60,737,654) ( 65,628,751) - 4,891,097
Profit before share of Joint Venture profit and income tax 5,732,676,794 320,364,243 - 5,412,312,551
Share of Joint Venture profit - - 289,991,785 289,991,785
Profit before income tax 5,732,676,794 320,364,243 289,991,785 5,702,304,336
Income tax expense ( 1,613,119,333) ( 30,372,458) - ( 1,582,746,875)
net profit for the year 4,119,557,461 289,991,785 289,991,785 4,119,557,461
Other comprehensive income 117,836,547 ( 22,514,153) ( 21,975,570) 118,375,130
Total comprehensive income for the year 4,237,394,008 267,477,632 268,016,215 4,237,932,591
nOTES TO ThE COnSOlIDATED AnD SEPARATE FInAnCIAl STATEMEnTSFOR ThE YEAR EnDED 31 DECEMBER 2013 (COnTInUED)
3. sIGnIfICanT aCCoUnTInG PolICIes
The principal accounting policies adopted in the preparation of these consolidated financial statements are set out below:
(a) basis of consolidation
(i) Subsidiaries
Subsidiaries are investees controlled by the Group. The Group controls an investee when it is exposed to, or has rights to, variable returns from its involvement in the investee and has the ability to affect those returns through its power over the investee. The financial statements of subsidiaries are included in the consolidated financial statements from the date that control commences until the date that control ceases. The financial statements have been prepared using uniform accounting policies for like transactions and other events in similar circumstances. All intercompany transactions are eliminated during consolidation.
(ii) Joint Venture
As a result of IFRS 11, the Group has changed its accounting policy for interest in joint arrangements. The investment continues to be recognised as a Joint Venture, by applying the equity method of accounting in consolidated financial statements. The consolidated statement of financial position includes the initial recognition of the investment in the Joint Venture at cost, and the carrying amount is increased or decreased to recognise the investor’s share of the Profit or loss of the Joint Venture after the date of the acquisition. The Joint Venture is accounted for at cost in the separate financial statements.
(b) foreign currencies
Foreign currency transactions are translated into the functional currency of Group entities using the exchange rates prevailing at the dates of the transactions. Foreign exchange gains and losses resulting from the settlement of such transactions and from the translation at year-end exchange rates of monetary assets and liabilities denominated in foreign currencies are recognised in the profit or loss in the year in which they arise.
Translation differences on non-monetary items, such as equities held at fair value through profit or loss, are reported as part of the fair value gain or loss. Translation differences on non-monetary items, such as equities classified as available-for-sale financial assets, are included in the available-for-sale reserve in equity.
(c) foreign operations
The results and financial position of the Joint Venture and subsidiaries have been translated into the presentation currency as follows:
i assets and liabilities at each reporting period are translated at the closing rate at the reporting date;ii. income and expenses for each statement of comprehensive income are translated at average exchange rates (unless this average is
not a reasonable approximation of the cumulative effect of the rates prevailing on the transaction dates, in which case income and expenses are translated at the dates of the transactions); and
iii. all resulting exchange differences are recognised in other comprehensive income. On consolidation, exchange differences arising from the translation of the net investment in foreign entities, and of borrowings and other currency instruments designated as hedges of such investments, are recognised in other comprehensive income. When a foreign operation is sold, such exchange differences are recognised in profit or loss as part of the gain or loss on sale.
Goodwill and fair value adjustments arising on the acquisition of a foreign entity are treated as assets and liabilities of the foreign entity and translated at the closing rate.
(d) Income recognition
Income is derived substantially, from banking business and related activities and comprises net interest income and fee and commission income.
Gains and losses arising from changes in the fair value of financial assets and liabilities at fair value through profit or loss, as well as any interest receivable or payable, are included in profit or loss in the period in which they arise.
Gains and losses arising from changes in the fair value of available-for-sale financial assets, other than foreign exchange gains or losses from monetary items, are recognised directly in other comprehensive income, until the financial asset is derecognised or impaired at which time the cumulative gain or loss previously recognised in other comprehensive income is recognised in profit or loss.
nOTES TO ThE COnSOlIDATED AnD SEPARATE FInAnCIAl STATEMEnTSFOR ThE YEAR EnDED 31 DECEMBER 2013 (COnTInUED)

I&M Bank Limited Report and Consolidated Financial Statements 2013 I&M Bank Limited Report and Consolidated Financial Statements 201346 47
3. sIGnIfICanT aCCoUnTInG PolICIes (ConTInUeD)
(d) Income recognition (continued)
(i) Net interest income
Interest income and expense on available-for-sale assets and financial assets or liabilities held at amortised cost is recognised in profit or loss using the effective interest method.
When calculating the effective interest rate, the Bank estimates the cash flows considering all contractual terms of the financial instrument but does not consider future credit losses. The calculation includes all fees and points paid or received, between the parties to the contract that are an integral part of the effective interest rate, transaction costs and all other discounts and premiums. Transaction costs are incremental costs that are directly attributable to the acquisition, issue or disposal of a financial asset or liability.
Once a financial asset or a group of similar financial assets has been written down as a result of an impairment loss, interest income is recognised using the rate of interest used to discount the future cash flows for the purpose of measuring the impairment loss.
Interest income and expense on all trading assets and liabilities are considered to be incidental to the Group’s trading operations and are presented together with all other changes in the fair value of trading assets and liabilities in net trading income.
(ii) Fee and commission income
Fee and commission income and expenses that are integral to the effective interest rate of a financial asset or liability are included in the measurement of the effective interest rate.
Other fee and commission expenses relate mainly to transaction and service fees, which are expensed as the services are received. (iii) Other operating income
Other operating income comprises gains less losses related to trading assets and liabilities and includes all realised and unrealised fair value changes, interest and foreign exchange differences. It also includes rental income and gain on disposal of property and equipment.
(iv) Rental income – other operating income
Rental income is recognised in the profit or loss on a straight-line basis over the term of the lease.
(v) Dividend income Dividend income is recognised when the right to receive income is established. Dividends are reflected as a component of operating income.
(e) Income tax expense
Income tax expense comprises current tax and change in deferred tax. Income tax expense is recognised in profit or loss except to the extent that it relates to items recognised directly in equity or other comprehensive income, in which case it is recognised in equity or in other comprehensive income.
Current tax is the expected tax payable or receivable on the taxable income for the year using tax rates enacted or substantively enacted at the reporting date, and any adjustment to tax payable in respect of previous years.
Deferred tax is recognised on all temporary differences between the carrying amounts of assets and liabilities for financial reporting purposes and the amounts used for taxation purposes, except for:
• Temporary differences relating to the initial recognition of assets or liabilities in a transaction that is not a business combination and which affects neither accounting nor taxable profit;
• Temporary differences related to investments in subsidiaries to the extent that it is probable that they will not reverse in the foreseeable future; and
• Taxable temporary differences arising on the initial recognition of goodwill.
Deferred tax is measured at the tax rates that are expected to be applied to the temporary differences when they reverse, based on the laws that have been enacted or substantively enacted by the reporting date. A deferred tax asset is recognised only to the extent that it is probable that future taxable profits will be available against which the asset can be utilised.
A deferred tax asset is recognised for unused tax losses, tax credits and deductible temporary differences to the extent that it is probable that future taxable profits will be available against which they can be utilised. Deferred tax assets are reviewed at each reporting date and are reduced to the extent that it is no longer probable that the related tax benefit will be realized.
nOTES TO ThE COnSOlIDATED AnD SEPARATE FInAnCIAl STATEMEnTSFOR ThE YEAR EnDED 31 DECEMBER 2013 (COnTInUED)
3. sIGnIfICanT aCCoUnTInG PolICIes (ConTInUeD)
(e) Income tax expense (continued)
Deferred tax assets and liabilities are offset if there is a legally enforceable right to offset current tax liabilities against current tax assets and they relate to income taxes levied by the same tax authority on the same taxable entity or on different tax entities, but they intend to settle current tax assets and liabilities on a net basis or their tax assets and liabilities will be realized simultaneously. (f) financial assets and financial liabilities
(i) Recognition
The Group initially recognises loans and advances, deposits and debt securities on the date at which they are originated. All other financial assets and liabilities (including assets designated at fair value through profit or loss) are initially recognised on the trade date at which the Group becomes a party to the contractual provision of the instrument.
A financial asset or liability is initially measured at fair value plus (for an item not subsequently measured at fair value through profit or loss) transaction costs that are directly attributable to its acquisition or issue. Subsequent to initial recognition, financial liabilities (deposits and debt securities) are measured at their amortized cost using the effective interest method.
(ii) Classification
The Group classifies its financial assets in the following categories: financial assets at fair value through profit or loss; loans and receivables; held-to-maturity investments; and available-for-sale financial assets. Management determines the classification of its investments at initial recognition.
i) Financial assets at fair value through profit or loss
This category has two sub-categories: financial assets held for trading, and those designated at fair value through profit or loss at inception. A financial asset is classified in this category if acquired principally for the purpose of selling in the short term or if so designated by management.
Investments held for trading are those which were either acquired for generating a profit from short-term fluctuations in price or dealer’s margin, or are securities included in a portfolio in which a pattern of short-term profit-taking exists. Investments held for trading are subsequently re-measured at fair value based on quoted bid prices or dealer price quotations, without any deduction for transaction costs. All related realized and unrealized gains and losses are included in profit or loss. Interest earned whilst holding held for trading investments is reported as interest income.
Foreign exchange forward and spot contracts are classified as held for trading. They are marked to market and are carried at their fair value. Fair values are obtained from discounted cash flow models which are used in the determination of the foreign exchange forward and spot contract rates. Gains and losses on foreign exchange forward and spot contracts are included in foreign exchange income as they arise.
ii) Loans and receivables
Loans and receivables are non-derivative financial assets with fixed or determinable payments that are not quoted in an active market. They arise when the Group provides money directly to a debtor with no intention of trading the receivable. Loans and advances are initially measured at fair value plus incremental direct transaction costs, and subsequently measured at amortized cost using the effective interest method. Loans and receivables compose of loans and advances and cash and cash equivalents. iii) Held to maturity
Held-to-maturity investments are non-derivative financial assets with fixed or determinable payments and fixed maturities that the Group’s management has the positive intention and ability to hold to maturity. A sale or reclassification of more than an insignificant amount of held to maturity investments would result in the reclassification of the entire category as available for sale and would prevent the Group from classifying investment securities as held to maturity for the current and the following two financial years. Held to maturity investments includes treasury bills and bonds. They are subsequently measured at amortized cost using the effective interest rate method.
iv) Available-for-sale
Available-for-sale financial investments are those non derivative financial assets that are designated as available-for-sale or are not classified as any other category of financial assets. Available-for-sale financial assets are recognized initially at fair value plus any directly attributable transaction costs. Subsequent to initial recognition, they are measured at fair value and changes therein are recognized in other comprehensive income and presented in the available-for-sale fair value reserve in equity. When an investment is derecognized, the gain or loss accumulated in equity is re-classified to profit or loss.
nOTES TO ThE COnSOlIDATED AnD SEPARATE FInAnCIAl STATEMEnTSFOR ThE YEAR EnDED 31 DECEMBER 2013 (COnTInUED)
I&M Bank Limited Report and Consolidated Financial Statements 2013 I&M Bank Limited Report and Consolidated Financial Statements 201348 49
3. sIGnIfICanT aCCoUnTInG PolICIes (ConTInUeD)
(f) financial assets and financial liabilities (continued)
(iii) Identification and measurement of impairment of financial assets
At each reporting date the Group assesses whether there is objective evidence that financial assets not carried at fair value through profit or loss are impaired. Financial assets are impaired when objective evidence demonstrates that a loss event has occurred after the initial recognition of the asset, and that the loss event has an impact on the future cash flows on the asset than can be estimated reliably.The Group considers evidence of impairment at both a specific asset and collective level. All individually significant financial assets are assessed for specific impairment. Significant assets found not to be specifically impaired are then collectively assessed for any impairment that may have been incurred but not yet identified. Assets that are not individually significant are collectively assessed for impairment by grouping together financial assets with similar risk characteristics.
Objective evidence that financial assets (including equity securities) are impaired can include default or delinquency by a borrower, restructuring of a loan or advance by the Group on terms that the Group would otherwise not consider, indications that a borrower or issuer will enter bankruptcy, the disappearance of an active market for a security, or other observable data relating to a group of assets such as adverse changes in the payment status of borrowers or issuers in the group, or economic conditions that correlate with defaults in the group.
In assessing collective impairment the Group uses historical trends of the probability of default, timing of recoveries and the amount of loss incurred, adjusted for management’s judgment as to whether current economic and credit conditions are such that the actual losses are likely to be greater or less than suggested by historical trends. Default rate, loss rates and the expected timing of future recoveries are regularly benchmarked against actual outcomes to ensure that they remain appropriate. Impairment losses on assets carried at amortized cost are measured as the difference between the carrying amount of the financial assets and the present value of estimated cash flows discounted at the assets’ original effective interest rate. Losses are recognised in profit or loss and reflected in an allowance account against loans and receivables or held-to-maturity investment securities. Interest on the impaired asset continues to be recognised through the unwinding of the discount.
Impairment losses on available-for-sale securities are recognised by reclassifying the losses accumulated in the fair value reserve in equity to profit or loss. The cumulative loss that is reclassified from equity to profit or loss is the difference between the acquisition cost, net of any principal repayment and amortisation, and the current fair value, less any impairment loss recognised previously in profit or loss.
When a subsequent event causes the amount of impairment loss to decrease, the impairment loss is reversed through the income statement.
(iv) De-recognition
The Group derecognizes a financial asset when the contractual rights to the cash flows from the financial asset expire, or when it transfers the rights to receive the contractual cash flows on the financial asset in a transaction in which substantially all the risks and rewards of ownership of the financial asset are transferred. Any interest in transferred financial assets that is created or retained by the Group is recognized as a separate asset or liability.
The Group derecognizes a financial liability when its contractual obligations are discharged or cancelled or expire.
On derecognition of a financial asset, the difference between the carrying amount of the asset and the sum of (i) the consideration received and (ii) any cumulative gain or loss that had been recognised in other comprehensive income is recognised in profit or loss.
The Group enters into transactions whereby it transfers assets recognized on its statement of financial position, but retains either all or substantially all of the risks and rewards of the transferred assets or a portion of them. If all or substantially all risks and rewards are retained, then the transferred assets are not derecognized from the statement of financial position. Transfers of assets with retention of all or substantially all risks and rewards include repurchase transactions.
(v) Offsetting of financial assets and financial liabilities
Financial assets and financial liabilities are offset and the net amount reported on the statement of financial position when there is a legally enforceable right to offset the recognized amounts and there is an intention to settle on a net basis, or to realize the asset and settle the liability simultaneously.
Income and expenses are presented on a net basis only when permitted under IFRSs, or for gains and losses arising from a group of similar transactions such as in the Group’s trading activity.
nOTES TO ThE COnSOlIDATED AnD SEPARATE FInAnCIAl STATEMEnTSFOR ThE YEAR EnDED 31 DECEMBER 2013 (COnTInUED)
3. sIGnIfICanT aCCoUnTInG PolICIes (ConTInUeD)
(f) financial assets and liabilities (continued)
(vi) Fair value of financial assets and financial liabilities
Fair value is the price that would be received to sell an asset or paid to transfer a liability in an orderly transaction between market participants at the measurement date, in the principal, or in its absence, the most advantageous market to which the group has access at that date.
(vii) Amortized cost measurement
The amortized cost of a financial asset or liability is the amount at which the financial asset or liability is measured at initial recognition, minus principal repayments, plus or minus the cumulative amortization using the effective interest method of any difference between the initial amount recognized and the maturity amount, minus any reduction for impairment.
(g) fair value measurement
Fair value is the price that would be received to sell an asset or paid to transfer a liability in an orderly transaction between market participants at the measurement date in the principal or, in its absence, the most advantageous market to which the Group has access at that date. The fair value of a liability reflects its non-performance risk.
If there is no quoted price in an active market, then the Group uses valuation techniques that maximise the use of relevant observable inputs and minimise the use of unobservable inputs. The chosen valuation technique incorporates all of the factors that market participants would take into account in pricing a transaction.
The best evidence of the fair value of a financial instrument at initial recognition is normally the transaction price – i.e. the fair value of the consideration given or received. If the Group determines that the fair value at initial recognition differs from the transaction price and the fair value is evidenced neither by a quoted price in an active market for an identical asset or liability nor based on a valuation technique that uses only data from observable markets, then the financial instrument is initially measured at fair value, adjusted to defer the difference between the fair value at initial recognition and the transaction price. Subsequently, that difference is recognised in profit or loss on an appropriate basis over the life of the instrument but no later than when the valuation is wholly supported by observable market data or the transaction is closed out.
If an asset or liability measure at fair value has a bid price and an ask price, then the Group measures assets and long positions at a bid price and liabilities and short positions at an ask price.
Portfolio of financial assets and financial liabilities that are exposed to market risk and credit risk that are managed by the Group on the basis of net exposure to either market or credit risk are measure on the basis of a price that would be received to sell a net long position (or paid to transfer a net short position) for a particular risk exposure. Those portfolio-level adjustments are allocated to the individual assets and liabilities on the basis of the relative risk adjustment of each of the individual instruments in the portfolio.
The fair value of a demand deposit is not less than the amount payable on demand, discounted from the first date on which the amount could be required to be paid. The Group measure fair values using the following fair value hierarchy, which reflects the significance of the inputs used in making the measurements:
• Level 1: inputs that are quoted market prices (unadjusted) in active markets for identical instruments.• Level 2: inputs other than quoted prices included in level 1 that are observable either directly (i.e. as prices) or indirectly (i.e. derived
from prices). This category includes instruments valued using: quoted market prices in active markets for similar instruments; quoted prices for identical or similar instruments in markets that are considered less than active; or other valuation techniques in which all significant inputs are directly or indirectly observable from market data.
• Level 3: inputs that are unobservable. This category includes all instruments for which the valuation technique includes inputs not based on observable data and the unobservable inputs have a significant effect on the instrument’s valuation. This category includes instruments that are valued based on quoted prices for similar instruments for which significant unobservable adjustments or assumptions are required to reflect differences between the instruments.
(h) Cash and cash equivalents
For the purpose of presentation in the statement of cash flows in the financial statements, the cash and cash equivalents include cash and balances with the Central Bank of Kenya which are available to finance the Bank’s day to day operations and net balances from banking institutions.
nOTES TO ThE COnSOlIDATED AnD SEPARATE FInAnCIAl STATEMEnTSFOR ThE YEAR EnDED 31 DECEMBER 2013 (COnTInUED)

I&M Bank Limited Report and Consolidated Financial Statements 2013 I&M Bank Limited Report and Consolidated Financial Statements 201350 51
3. sIGnIfICanT aCCoUnTInG PolICIes (ConTInUeD)
(i) Property and equipment
Items of property and equipment are measured at cost or valuation less accumulated depreciation and accumulated impairment losses. Cost includes expenditure that is directly attributable to the asset.
Subsequent expenditure is capitalised only when it is probable that future economic benefits of the expenditure will flow to the Group. Ongoing repairs and maintenance are expensed as incurred.
Depreciation is charged on a straight line basis to allocate the cost of each asset, to its residual value over its estimated useful life as follows:
• Leasehold buildings 2%• Leasehold improvements 10-12½% or over the period of lease if shorter than 8 years• Computer equipment and computer software 20-33⅓%• Furniture, fittings and fixtures 10- 12½% • Motor vehicles 20 -25%
Depreciation is recognised in profit or loss. The assets’ residual values and useful lives are reviewed and adjusted as appropriate, at each reporting date.
Any gains or losses on disposal of property and equipment (calculated as the difference between the net proceeds from disposal and the carrying amount of the item) is recognised in other income in profit or loss. (j) Intangible assets
(i) Computer software
The costs incurred to acquire and bring to use specific computer software licences are capitalised. Software is measure at cost less accumulated amortisation and accumulated impairment. The costs are amortised on a straight line basis over the expected useful lives, from the date it is available for use, not exceeding three years. Costs associated with maintaining software are recognised as an expense as incurred.
Amortisation methods, residual values and useful lives are reviewed and adjusted as appropriate, at each reporting date.
(ii) Goodwill
Goodwill represents the excess of the cost of an acquisition over the Group’s interest in the net fair value of the acquired company’s identifiable assets, liabilities and contingent liabilities as at the date of acquisition. Goodwill is stated at cost less accumulated impairment losses. At the reporting date, the Group assesses the goodwill carried in the books for impairment.
(k) operating leases
(i) Operating leases
Leases where a significant portion of the risks and rewards of ownership are retained by the lessor, are classified as operating leases. Payments made under operating leases arrangements (whether prepaid or post paid) are charged to the profit or loss on a straight-line basis over the period of the lease.
(ii) Finance lease receivables
Minimum lease receipts are apportioned between the interest income and the reduction of outstanding asset. The interest income is allocated to each period during the lease term so as to produce a constant period of rate of interest on the remaining balance of the liability.
(l) Impairment of non-financial assets
The carrying amounts of the Group’s non-financial assets, other than deferred tax assets, are reviewed at each reporting date to determine whether there is any indication of impairment. If any such indication exists then the asset’s recoverable amount is estimated.
An impairment loss is recognised if the carrying amount of an asset or its cash-generating unit exceeds its recoverable amount. A cash-generating unit is the smallest identifiable asset group that generates cash flows that largely are independent from other assets and group. Impairment losses are recognised in the profit or loss. Impairment losses recognised in respect of cash-generating units are allocated first to reduce the carrying amount of any goodwill allocated to the units and then to reduce the carrying amount of the other assets in the unit (group of units) on a pro-rata basis.
nOTES TO ThE COnSOlIDATED AnD SEPARATE FInAnCIAl STATEMEnTSFOR ThE YEAR EnDED 31 DECEMBER 2013 (COnTInUED)
3. sIGnIfICanT aCCoUnTInG PolICIes (ConTInUeD)
(l) Impairment of non-financial assets (continued)
The recoverable amount of an asset or cash-generating unit is the greater of its value in use and its fair value less costs to sell. In assessing value in use, the estimated future cash flows are discounted to their present value using a pre-tax discount rate that reflects current market assessments of the time value of money and the risks specific to the asset.
(m) Derivative financial instruments
The Bank uses financial instruments to hedge its exposure to foreign exchange and interest rate risks arising from operational, financing and investment activities.
Derivative financial instruments are recognised initially at fair value on the date the derivative contract is entered into. Subsequent to initial recognition, derivative financial instruments are stated at fair value.
The fair value of forward exchange contracts is the amount of the mark to market adjustment at the reporting date.
(n) employee benefits
(i) Defined contribution plan
The majority of the Bank’s employees are eligible for retirement benefits under a defined contribution plan.
The assets of the defined contribution scheme are held in a separate trustee administered guaranteed scheme managed by an insurance company. Retirement plans are funded by contributions from the employees and the Bank. The Bank’s contributions are recognised in profit or loss in the year to which they relate.
The employees of the Bank also contribute to the National Social Security Fund. Contributions are determined by local statute and the Bank’s contributions are charged to the income statement in the year to which they relate. The group also contributes to various national social security funds in the countries it operates.
(ii) Defined benefit plan
The Joint Venture, Bank One Limited, Mauritius, contributes to a defined benefit plan that provides for employees upon retirement and is wholly funded. In line with IAS 19 (Revised), the actuarial gains and losses are fully recognised in other comprehensive income and all expenses related to defined benefits plans in employee benefit expense in profit or loss.
(iii) Leave accrual
The monetary value of the unutilised leave by staff as at year end is recognised within accruals and the movement in the year is debited/credited to the profit or loss.
(o) share capital and share issue costs
Ordinary shares are classified as equity. Incremental costs directly attributable to the issue of an equity instrument are deducted from initial measurement of the equity instruments.
(p) earnings per share
Earnings per share are calculated based on the profit attributable to shareholders divided by the number of ordinary shares. Diluted earnings per share are computed using the weighted average number of equity shares and dilutive potential ordinary shares outstanding during the year. During the year there were no outstanding shares with dilutive potential.
(q) Dividends
Dividends on ordinary shares are recognised as a liability in the period in which they are declared and proposed dividends are disclosed as a separate component of equity.
nOTES TO ThE COnSOlIDATED AnD SEPARATE FInAnCIAl STATEMEnTSFOR ThE YEAR EnDED 31 DECEMBER 2013 (COnTInUED)

I&M Bank Limited Report and Consolidated Financial Statements 2013 I&M Bank Limited Report and Consolidated Financial Statements 201352 53
3. sIGnIfICanT aCCoUnTInG PolICIes (ConTInUeD)
(r) Contingent liabilities
Letters of credit, acceptances, guarantees and performance bonds are not recognised and are disclosed as contingent liabilities. Estimates of the outcome and the financial effect of contingent liabilities is made by Management based on the information available up to the date the financial statements are approved for issue by the directors. Any expected loss is charged to profit or loss.
(s) fiduciary activities
The group commonly acts as Trustees and in other fiduciary capacities that result in the holding or placing of assets on behalf of individuals, trusts, retirement benefits plans and institutions. These assets and income arising thereon are excluded from these financial statements, as they are not assets of the Bank.
(t) Comparative information
Where necessary, comparative figures have been restated to conform with changes in presentation in the current year. (u) new standards and interpretations not yet adopted
A number of new standards, amendments to standards and interpretations are not yet effective for the year ended 31st December 2013, and have not been applied in preparing these consolidated financial statements as follows:
effective for annual periods new standard or amendments beginning on or after
• IFRS 9 Financial Instruments (2010) 1st January 2018• Amendments to IAS 32-Offsetting Financial Assets and Financial Liabilities (2011) 1st January 2014• Amendments to IFRS 10, IFRS 12, and IAS 27 (2012) 1st January 2014• Amendments to IAS 36-Recoverable Amount 1st January 2014• Disclosures for Non-Financial Assets (2013) • IFRIC 21 Levies (2013)
(i) IFRS 9: Financial Instruments (2010)
It replaces parts of IAS 39 - Financial Instruments, Recognition and Measurement that relates classification, measurement and recognition of financial assets and financial liabilities. IFRS 9 requires financial assets to be classified, at initial recognition as either measured at fair value or at amortised cost. The classification depends on the entity’s business model for managing its financial instruments and the characteristics of the contractual cash flows of the instrument. For financial liabilities, the standard retains most of the requirements of IAS 39. The main change is that, in cases where the fair value option is applied for financial liabilities, the part of a fair value change arising from a change in an entity’s own credit risk is recorded in other comprehensive income rather than the profit or loss, unless this creates an accounting mismatch.
(ii) Amendments to IAS 32: Offsetting Financial Assets and Financial Liabilities
The amendments address inconsistencies in current practice when applying the offsetting criteria in IAS 32, mainly by clarifying the meaning of “currently has a legally enforceable right of set-off” and that some gross settlement systems may be considered equivalent to net settlement. These amendments are effective for annual periods beginning on or after 1st January 2014, with retrospective application.
(iii) Amendments to IFRS 10, IFRS 12 and IAS 27: Investment Entities (2012)
The amendments define “investment entities” and provide them an exemption from the consolidation of subsidiaries; instead, an investment entity is required to measure the investment in each eligible subsidiary at fair value through profit or loss in accordance with IFRS 9 / IAS 39 (the exception does not apply to subsidiaries that provide services relating to the investment entity’s investment activities). An investment entity is required to account for its investment in a relevant subsidiary in the same way in its consolidated and separate financial statements, and additional disclosures are introduced. The amendments are effective for annual periods beginning on or after 1st January 2014.
nOTES TO ThE COnSOlIDATED AnD SEPARATE FInAnCIAl STATEMEnTSFOR ThE YEAR EnDED 31 DECEMBER 2013 (COnTInUED)
nOTES TO ThE COnSOlIDATED AnD SEPARATE FInAnCIAl STATEMEnTSFOR ThE YEAR EnDED 31 DECEMBER 2013 (COnTInUED)
3. sIGnIfICanT aCCoUnTInG PolICIes (ConTInUeD)
(u) new standards and interpretations not yet adopted (continued)
(iv) Amendments to IAS 36L: Recoverable Amount Disclosures for Non-Financial Assets (2013)
The amendments reduce the circumstances in which the recoverable amount of assets or cash-generating units is required to be disclosed, clarify the disclosures required, and introduce an explicit requirement to disclose the discount rate used in determining impairment (or reversals) where recoverable amount (based on fair value less costs of disposal) is determined using a present value technique. They are effective for annual periods beginning on or after 1st January 2014. Amendments to IAS 39 titled Novation of Derivatives and Continuation of Hedge Accounting (issued in June 2013) – The amendments permit the continuation of hedge accounting in a situation where the counterparty to a derivative designated as a hedging instrument is replaced by a new central counterparty (known as ‘novation of derivatives’), as a consequence of laws or regulations, if specific conditions are met.
(v) Amendments to IAS 39 titled Novation of Derivatives and Continuation of Hedge Accounting (June 2013)
The amendments permit the continuation of hedge accounting in a situation where a counterparty to a derivative designated as a hedging instrument is replaced by a new central counterparty (known as ‘novation of derivatives’ ), as a consequence of laws or regulations, if specific conditions are met.
(vi) IFRIC 21: Levies (2013)
The interpretation provides guidance on when to recognise a liability for a levy imposed by a government. The obligating event for the recognition of a liability is the activity that triggers the payment of the levy in accordance with the relevant legislation. It also provides guidance on recognition of a liability to pay levies: the liability is recognised either progressively if the obligating event occurs over a period of time, or when the minimum threshold is reached if an obligation is triggered on reaching that minimum threshold. The interpretation is effective for annual periods beginning on or after 1st January 2014.
The Group did not early adopt new or amended Standards in 2013 and is in the process of assessing their impact.
4. RIsK ManaGeMenT
This section provides details of the Bank’s exposure to risk and describes the methods used by management to control risk. The most important types of risk to which the Bank is exposed are liquidity risk, credit risk, market risk and operational risk. Market risk includes currency risk and interest rate risk.
(a) Credit risk
Credit risk is the risk of financial loss to the Bank if a customer or counterparty to a financial instrument fails to meet its contractual obligations, and arises principally from the Bank’s loans and advances to customers and other banks and investment securities. For risk management reporting purposes, the Bank considers and consolidates all elements of credit risk exposure.
The Board of Directors has delegated responsibility of the management of credit risk to its Board Credit Committee. A separate Bank Credit Risk Management Committee reporting to the Board Credit Committee is responsible for oversight of the Bank credit risk.
The Bank’s credit exposure at the reporting date from financial instruments held or issued for trading purposes is represented by the fair value of instruments with a positive fair value at that date, as recorded on the statement of financial position.
The risk that the counter-parties to trading instruments might default on their obligation is monitored on an ongoing basis. In monitoring credit risk exposure, consideration is given to trading instruments with a positive fair value and to the volatility of the fair value of trading instruments over their remaining life.
To manage the level of credit risk, the Bank deals with counter parties of good credit standing wherever possible and when appropriate, obtains collateral.
An assessment of the extent to which fair values of collaterals cover existing credit risk exposure on loans and advances to customers is highlighted below.
The Bank also monitors concentrations of credit risk that arise by industry and type of customer in relation to Bank loans and advances to customers by carrying a balanced portfolio. The Bank has no significant exposure to any individual customer or counter-party.
To determine impairment of loans and advances, the Bank assesses whether it is probable that it will be unable to collect all principal and interest according to the contractual terms of the loans and advances.

I&M Bank Limited Report and Consolidated Financial Statements 2013 I&M Bank Limited Report and Consolidated Financial Statements 201354 55
4. RIsK ManaGeMenT (ConTInUeD)
(a) Credit risk (continued)
exposure to credit risk
Company:
2013 2012loans and advances to customers Kshs Kshs
Individually impaired:
Grade 3: Substandard 340,831,882 36,780,491Grade 4: Doubtful 465,020,204 584,310,547Grade 5: Loss 254,401,985 136,112,314
1,060,254,071 757,203,352Allowance for impairment ( 637,073,149) ( 611,766,979)
Carrying amounts 423,180,922 145,436,373
Collectively impaired:
Grade 1: Normal 66,352,511,940 51,799,883,776Grade 2: Watch 7,670,472,681 4,062,332,632
74,022,984,621 55,862,216,408Portfolio impairment provision ( 1,076,577,976) ( 632,840,487)
Carrying amounts 72,946,406,645 55,229,375,921
Total carrying amounts 73,369,587,567 55,374,812,294
Impaired loans and securities
Impaired loans and securities are loans for which the Bank determines that it is probable that it will be unable to collect all principal and interest due according to the contractual terms of the loan agreement(s). These loans are graded 3 (substandard) to 5 (loss) in the Bank’s internal credit risk and grading system.
Past due but not impaired loans
These are loans where contractual interest or principal payments are past due but the Bank believes that impairment is not appropriate on the basis of the level of security/collateral available and/or the stage of collection of amounts owed to the Bank.
Loans with renegotiated terms
Loans with renegotiated terms are loans that have been restructured due to the deterioration in the borrower’s financial position and where the Bank has made concession that it would not otherwise consider. Once the loan is restructured it remains in this category independent of satisfactory performance after restructuring.
Allowances for impairment
The Bank establishes an allowance for impairment losses that represents its estimate of incurred losses in its loan portfolio. The main components of this allowance are a specific loss component that relates to individually significant exposures, and a collective loan loss allowance established for homogeneous assets in respect of losses that have been incurred but have not been identified on loans subject to individual assessment for impairment.
nOTES TO ThE COnSOlIDATED AnD SEPARATE FInAnCIAl STATEMEnTSFOR ThE YEAR EnDED 31 DECEMBER 2013 (COnTInUED)
4. RIsK ManaGeMenT (ConTInUeD)
(a) Credit risk (continued)
Write off policy
The Bank writes off a loan balance (and any related allowances for impairment losses) when Credit Committee determines that the loans are uncollectible. This determination is reached after considering information such as the occurrence of significant changes in the borrower/issuer’s financial position such that the borrower/issuer can no longer pay the obligation, or that proceeds from collateral will not be sufficient to pay back the entire exposure.
Set out below is an analysis of the gross and net (of allowances for impairment) amounts of individually impaired assets by risk grade.
Gross netloans and advances - Company Kshs Kshs
Individually impaired:
31 December 2013
Grade 3: Substandard 340,831,882 43,329,782Grade 4: Doubtful 465,020,204 379,851,140Grade 5: Loss 254,401,985 -
1,060,254,071 423,180,922
31 December 2012
Grade 3: Substandard 36,780,491 32,623,937Grade 4: Doubtful 584,310,547 112,812,436Grade 5: Loss 136,112,314 -
757,203,352 145,436,373
Collectively impaired: 31 December 2013
Grade 1: Normal 66,352,511,940 65,705,307,303Grade 2: Watch 7,670,472,681 7,241,099,342
74,022,984,621 72,946,406,645
31 December 2012
Grade 1: Normal 51,799,883,776 51,322,012,683Grade 2: Watch 4,062,332,632 3,907,363,238
55,862,216,408 55,229,375,921
The Bank holds collaterals against loans and advances to customers in the form of mortgage interests over property, other registered securities over assets, and guarantees. Estimate of fair value are based on the value of collateral assessed at the time of borrowing, and generally are not updated except when a loan is individually assessed as impaired. Collateral generally is not held over loans and advances to banks, except when securities are held as part of reverse repurchase and securities borrowings activity. Collateral usually is not held against investment securities, and no such collateral was held at 31 December 2013 or 2012.
An estimate of the fair value of collateral and other security enhancements held against financial assets is shown below:
2013 2012loans and advances to Customers Kshs Kshs
Company
Fair value of collateral held - Against impaired loans 344,669,867 248,384,978
nOTES TO ThE COnSOlIDATED AnD SEPARATE FInAnCIAl STATEMEnTSFOR ThE YEAR EnDED 31 DECEMBER 2013 (COnTInUED)

I&M Bank Limited Report and Consolidated Financial Statements 2013 I&M Bank Limited Report and Consolidated Financial Statements 201356 57
4. RIsK ManaGeMenT (ConTInUeD)
(b) liquidity risk
Liquidity risk includes the risk of being unable to meet the Bank’s financial obligations as they fall due because of inability to liquidate assets at a reasonable price and in an appropriate timeframe.
The Bank continually assesses liquidity risk by identifying and monitoring changes in funding required to meet business goals and targets set in terms of the overall Bank strategy. In addition, the Bank holds a portfolio of liquid assets as part of its liquidity risk management strategy.
The liquidity ratios at the reporting date and during the reporting period (based on month end ratios) were as follows:
2013 2012
At 31 December 34.02% 35.46%Average for the period 30.60% 37.94%Highest for the period 34.02% 43.00%Lowest for the period 27.13% 35.31%
The table below analyses financial liabilities into relevant maturity groupings based on the remaining period at 31 December 2013 to the contractual maturity date:
Company31 December 2013:
Due on demand
Kshs’000
Due within 3 monthsKshs’000
Due between
3-12 months
Kshs’000
Due between
1-5 yearsKshs’000
Due after 5 years
Kshs’000 Total
Kshs’000
liabilitiesDeposits from banksDeposits from customersOther liabilitiesLong-term borrowingsat 31 December 2013
389,63224,914,845
462,324-
2,503,11744,953,846
618,400341,915
2,2734,555,512
-642,309
-70,072
-5,092,804
---
4,831,950
2,895,02274,494,275
1,080,72410,908,978
25,766,801 48,417,278 5,200,094 5,162,876 4,831,950 89,378,999
Company31 December 2012:
Due on demand
Kshs’000
Due within 3 monthsKshs’000
Due between
3-12 months
Kshs’000
Due between
1-5 yearsKshs’000
Due after 5 years
Kshs’000 Total
Kshs’000
liabilitiesDeposits from banksDeposits from customersOther liabilitiesLong-term borrowings
at 31 December 2012
680,89720,180,008
421,623-
2,596,76535,850,976
464,948205,559
1,452,7529,587,061
-571,918
-22,200
-2,894,096
----
4,730,41465,640,245
886,5713,671,573
21,282,528 39,118,248 11,611,731 2,916,296 - 74,928,803
Deposits from customers represent business transaction, personal transaction, savings, call and fixed deposit balances, which past experience has shown to be stable.
(c) Market risk
Market risk is the risk that changes in market prices, such as interest rate, equity prices, foreign exchange rates and credit spread (not relating to changes in the obligator’s/issuer’s credit standing) will affect the Bank’s income or the value of its holdings of financial instruments.
All trading instruments are subject to market risk, the risk that the future changes in market conditions may make an instrument less valuable or more onerous. The Bank manages its use of trading instruments in response to changing market conditions.
nOTES TO ThE COnSOlIDATED AnD SEPARATE FInAnCIAl STATEMEnTSFOR ThE YEAR EnDED 31 DECEMBER 2013 (COnTInUED)
4. RIsK ManaGeMenT (ConTInUeD)
(c) Market risk (continued)
The Board of Directors has delegated responsibility for management of Market Risk to the Board Risk Committee. Exposure to market risk is formally managed within Risk Limits and Policy Guidelines issued by the Board, on recommendation of the Board Risk Committee. ALCO, a Management Committee is charged with the responsibility of ensuring implementation and monitoring of the Risk Management framework in line with Policy Guidelines. The Bank is primarily exposed to Interest Rate and Foreign Exchange Risk. The policy guidelines and procedures in place are adequate to effectively manage these risks.
Exposure to interest rate risk
This is the risk of loss from fluctuations in the future cash flows of fair values of financial instruments because of a change in market interest rates. Interest rate risk is managed principally through monitoring interest rate gaps. A summary of the Bank’s interest rate gap position reflecting assets and liabilities at carrying amounts, categorised by the earlier of contractual re-pricing or maturity dates is shown below:
31 December 2013:
Due on demand
Kshs’000
Due within 3 months
Kshs’000
Due between
3-12 months
Kshs’000
Due between
1-5 yearsKshs’000
Due after 5 years
Kshs’000
non-interest bearing
Kshs’000Total
Kshs’000
assetsCash and balances with Central Bank of KenyaLoans and advances to banksLoans and advances to customersInvestment securitiesOther assetsat 31 December 2013
-
1,659,731
70,242,741--
-
35,938
376,67768,427
-
-
-
840,6848,408,760
-
-
-
1,710,6687,255,376
-
-
-
198,8175,242,594
-
6,151,961
-
--
1,011,012
6,151,961
1,695,669
73,369,58720,975,157
1,011,012
71,902,472 481,042 9,249,444 8,966,044 5,441,411 7,162,973 103,203,386
liabilitiesDeposits from banksDeposits from customersOther liabilitiesLong-term borrowingsat 31 December 2013
2,895,022
42,058,839--
-
27,257,110-
160,621
-
4,984,990-
823,603
-
193,336-
5,092,804
-
--
4,831,950
-
-1,080,724
-
2,895,022
74,494,2751,080,724
10,908,978
44,953,861 27,417,731 5,808,593 5,286,140 4,831,950 1,080,724 89,378,999
nOTES TO ThE COnSOlIDATED AnD SEPARATE FInAnCIAl STATEMEnTSFOR ThE YEAR EnDED 31 DECEMBER 2013 (COnTInUED)

I&M Bank Limited Report and Consolidated Financial Statements 2013 I&M Bank Limited Report and Consolidated Financial Statements 201358 59
nOTES TO ThE COnSOlIDATED AnD SEPARATE FInAnCIAl STATEMEnTSFOR ThE YEAR EnDED 31 DECEMBER 2013 (COnTInUED)
4. RIsK ManaGeMenT (ConTInUeD)
(c) Market risk (continued)
Exposure to interest rate risk (continued)
31 December 2012:
Due on demand
Kshs’000
Due within 3 months
Kshs’000
Due between
3-12 months
Kshs’000
Due between
1-5 yearsKshs’000
Due after 5 years
Kshs’000
non-interest bearing
Kshs’000Total
Kshs’000
assetsCash and balances with Central Bank of KenyaLoans and advances to banksLoans and advances to customersInvestment securitiesOther assetsat 31 December 2012
-
544,380
52,787,054--
-
948,164
303,0065,754,304
-
-
-
750,7074,193,267
-
-
-
1,400,3065,080,371
-
-
-
133,7398,289,944
-
4,247,943
-
--
948,722
4,247,943
1,492,544
55,374,81223,317,886
948,722
53,331,434 7,005,474 4,943,974 6,480,677 8,423,683 5,196,665 85,381,907
liabilitiesDeposits from banksDeposits from customersOther liabilitiesLong-term borrowings
at 31 December 2012
680,897
20,180,008--
2,596,765
35,850,976-
205,559
1,452,752
9,587,061-
571,918
-
22,200-
2,894,096
-
---
-
-886,571
-
4,730,414
65,640,245886,571
3,671,573
20,860,905 38,653,300 11,611,731 2,916,296 - 886,571 74,928,803
Customer deposits up to three months represent current, savings and call deposit account balances, which past experience has shown to be stable and of a long term nature.
The Bank’s operations are subject to the risk of interest rate fluctuations to the extent that the interest earning assets (including investments) and interest bearing liabilities mature or re-price at different times or in differing amounts. Risk management activities are aimed at optimising net interest income, given market interest rate levels consistent with the Bank’s business strategies.
Sensitivity Analysis
A change of 100 basis points in interest rates at the reporting date would have increased/decreased equity and profit or loss by the amounts shown below. The analysis assumes that all other variables in particular foreign currency exchange rates remain constant.
31 December 2013:100 basis points
Profit or lossIncrease/decrease in basis points
(‘000)
equity net of taxIncrease/decrease in basis points
(‘000)
AssetsLiabilities
955,588 668,912
net position 79,401 55,581
31 December 2012:100 basis points
Profit or lossIncrease/decrease in basis points
(‘000)
equity net of taxIncrease/decrease in basis points
(‘000)
AssetsLiabilities
797,347 558,143
net position 69,451 48,616
( 876,187) ( 613,331)
( 727,896) ( 509,527)
nOTES TO ThE COnSOlIDATED AnD SEPARATE FInAnCIAl STATEMEnTSFOR ThE YEAR EnDED 31 DECEMBER 2013 (COnTInUED)
4. RIsK ManaGeMenT (ConTInUeD)
(c) Market risk (continued)
Currency rate risk
The Bank is exposed to currency risk through transactions in foreign currencies. The Bank’s transactional exposure gives rise to foreign currency gains and losses that are recognised in the profit or loss. In respect of monetary assets and liabilities in foreign currencies, the Bank ensures that its net exposure is kept to an acceptable level by buying and selling foreign currencies at spot rates when considered appropriate. The table below analyses the currencies which the Bank is exposed to as at 31st December 2013 and 31st December 2012.
31 December 2013:UsD
Kshs’000GbP
Kshs’000euro
Kshs’000other
Kshs’000Total
Kshs’000
assetsCash and balances with Central Bank of KenyaLoans and advances to banksLoans and advances to customersOther assetsat 31 December 2013
212,5171,326,824
22,454,31980,315
29,027148,950
1,378,7337,223
49,75497,117
1,756,15611,009
9117,450
21-
291,3071,690,341
25,589,22998,547
24,073,975 1,563,933 1,914,036 117,480 27,669,424
liabilitiesDeposits from banksDeposits from customersOther liabilitiesLong-term borrowings at 31 December 2013
900,09414,014,559
124,7026,634,740
13,9081,491,526
7,376-
29,771780,676
5,800-
8,57589,48012,863
-
952,34816,376,241
150,7416,634,740
21,674,095 1,512,810 816,247 110,918 24,114,070
net on statement of financial position 2,399,880 51,123 1,097,789 6,562 3,555,354
net notional off balance sheet position 1,324,855 653,594 106,705 59,533 2,144,687
overall net position – 2013 3,724,735 704,717 1,204,494 66,095 5,700,041
31 December 2012:UsD
Kshs’000GbP
Kshs’000euro
Kshs’000other
Kshs’000Total
Kshs’000
assetsCash and balances with Central Bank of KenyaLoans and advances to banksLoans and advances to customersOther assetsat 31 December 2012
192,223916,603
19,439,31169,314
28,65185,512
627,4601,917
59,401160,383
2,148,3558,221
-66,717
--
280,2751,229,215
22,215,12679,452
20,617,451 743,540 2,376,360 66,717 23,804,068
liabilitiesDeposits from banksDeposits from customersOther liabilitiesLong-term borrowings at 31 December 2012
4,192,9559,189,111
153,8323,048,509
27,0281,439,466
7,109-
13,4182,168,478
7,55622,715
1,60929,111
4,927-
4,235,01012,826,166
173,4243,071,224
16,584,407 1,473,603 2,212,167 35,647 20,305,824
net on statement of financial position 4,033,044 164,193 31,070 3,498,244
net notional off balance sheet position 737,495
overall net position – 2012 7,432 13,161 4,039
( 730,063)
( 4,380,347)
(347,303) ( 322,671)
( 151,032) ( 27,031) ( 3,820,915)
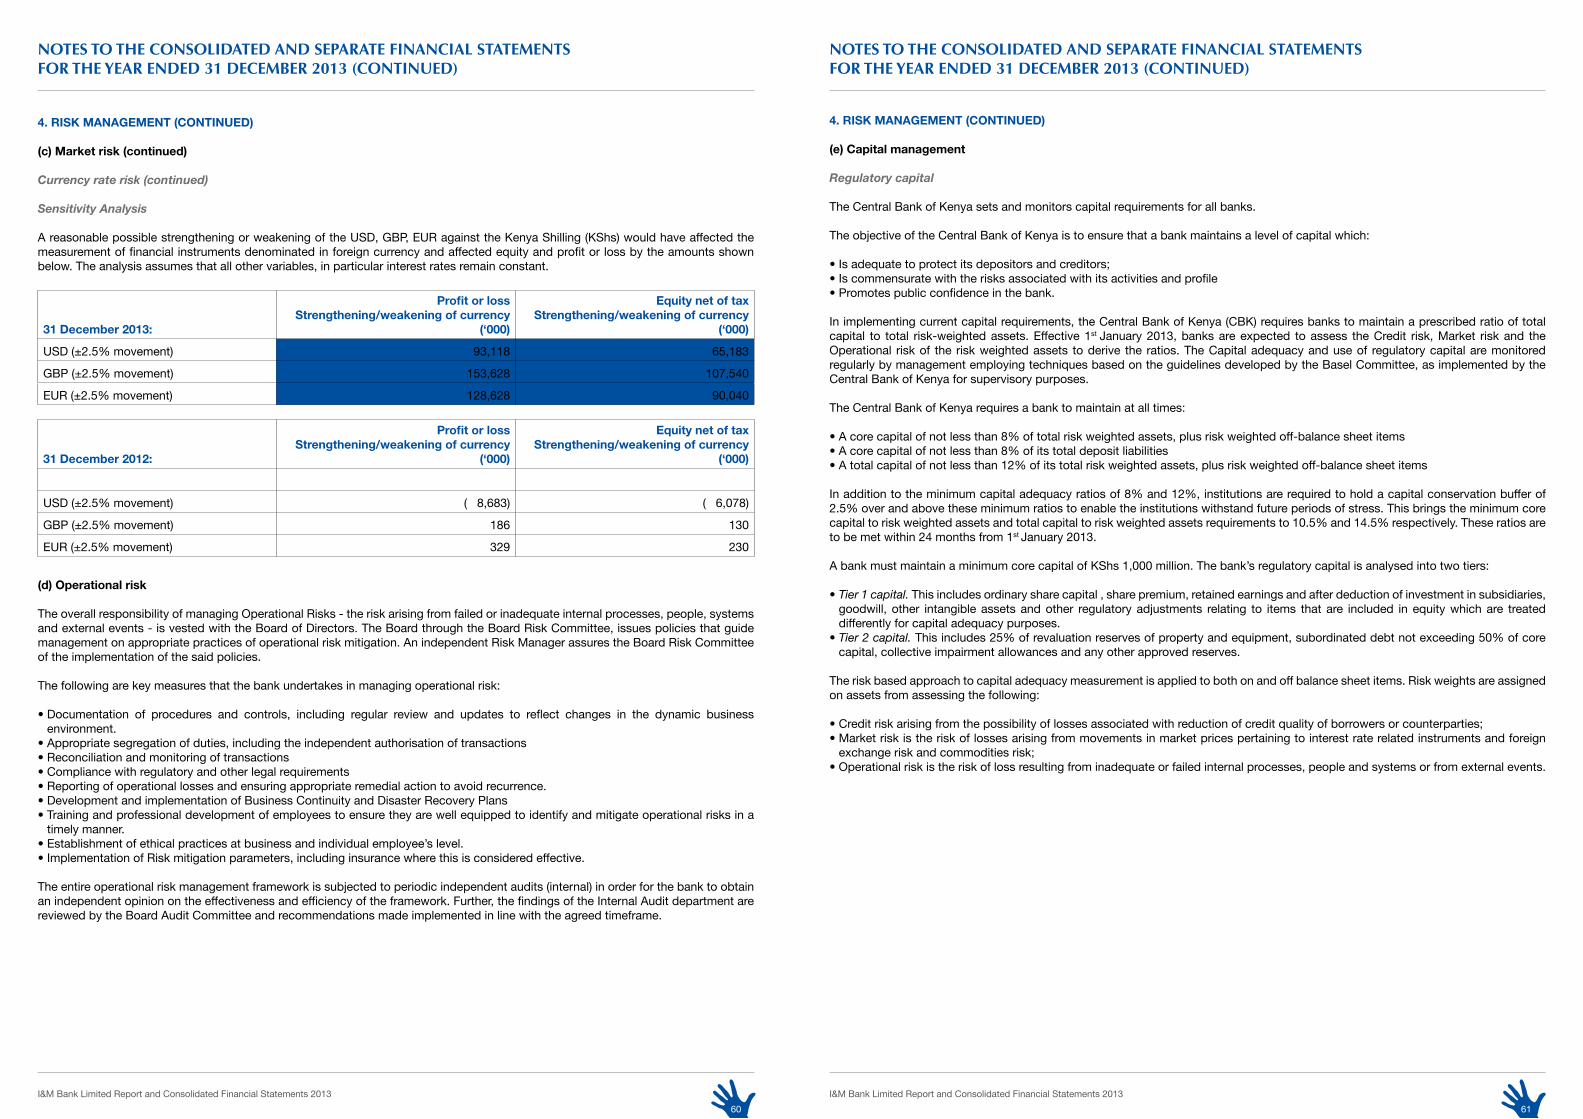
I&M Bank Limited Report and Consolidated Financial Statements 2013 I&M Bank Limited Report and Consolidated Financial Statements 201360 61
4. RIsK ManaGeMenT (ConTInUeD)
(c) Market risk (continued)
Currency rate risk (continued)
Sensitivity Analysis
A reasonable possible strengthening or weakening of the USD, GBP, EUR against the Kenya Shilling (KShs) would have affected the measurement of financial instruments denominated in foreign currency and affected equity and profit or loss by the amounts shown below. The analysis assumes that all other variables, in particular interest rates remain constant.
31 December 2013:
Profit or lossstrengthening/weakening of currency
(‘000)
equity net of taxstrengthening/weakening of currency
(‘000)
USD (±2.5% movement) 93,118 65,183
GBP (±2.5% movement) 153,628 107,540
EUR (±2.5% movement) 128,628 90,040
31 December 2012:
Profit or lossstrengthening/weakening of currency
(‘000)
equity net of taxstrengthening/weakening of currency
(‘000)
USD (±2.5% movement) ( 8,683) ( 6,078)
GBP (±2.5% movement) 186 130
EUR (±2.5% movement) 329 230
(d) operational risk
The overall responsibility of managing Operational Risks - the risk arising from failed or inadequate internal processes, people, systems and external events - is vested with the Board of Directors. The Board through the Board Risk Committee, issues policies that guide management on appropriate practices of operational risk mitigation. An independent Risk Manager assures the Board Risk Committee of the implementation of the said policies.
The following are key measures that the bank undertakes in managing operational risk:
• Documentation of procedures and controls, including regular review and updates to reflect changes in the dynamic business environment.
• Appropriate segregation of duties, including the independent authorisation of transactions • Reconciliation and monitoring of transactions • Compliance with regulatory and other legal requirements• Reporting of operational losses and ensuring appropriate remedial action to avoid recurrence. • Development and implementation of Business Continuity and Disaster Recovery Plans • Training and professional development of employees to ensure they are well equipped to identify and mitigate operational risks in a
timely manner.• Establishment of ethical practices at business and individual employee’s level. • Implementation of Risk mitigation parameters, including insurance where this is considered effective.
The entire operational risk management framework is subjected to periodic independent audits (internal) in order for the bank to obtain an independent opinion on the effectiveness and efficiency of the framework. Further, the findings of the Internal Audit department are reviewed by the Board Audit Committee and recommendations made implemented in line with the agreed timeframe.
nOTES TO ThE COnSOlIDATED AnD SEPARATE FInAnCIAl STATEMEnTSFOR ThE YEAR EnDED 31 DECEMBER 2013 (COnTInUED)
4. RIsK ManaGeMenT (ConTInUeD)
(e) Capital management
Regulatory capital
The Central Bank of Kenya sets and monitors capital requirements for all banks.
The objective of the Central Bank of Kenya is to ensure that a bank maintains a level of capital which:
• Is adequate to protect its depositors and creditors; • Is commensurate with the risks associated with its activities and profile • Promotes public confidence in the bank.
In implementing current capital requirements, the Central Bank of Kenya (CBK) requires banks to maintain a prescribed ratio of total capital to total risk-weighted assets. Effective 1st January 2013, banks are expected to assess the Credit risk, Market risk and the Operational risk of the risk weighted assets to derive the ratios. The Capital adequacy and use of regulatory capital are monitored regularly by management employing techniques based on the guidelines developed by the Basel Committee, as implemented by the Central Bank of Kenya for supervisory purposes.
The Central Bank of Kenya requires a bank to maintain at all times:
• A core capital of not less than 8% of total risk weighted assets, plus risk weighted off-balance sheet items• A core capital of not less than 8% of its total deposit liabilities• A total capital of not less than 12% of its total risk weighted assets, plus risk weighted off-balance sheet items In addition to the minimum capital adequacy ratios of 8% and 12%, institutions are required to hold a capital conservation buffer of 2.5% over and above these minimum ratios to enable the institutions withstand future periods of stress. This brings the minimum core capital to risk weighted assets and total capital to risk weighted assets requirements to 10.5% and 14.5% respectively. These ratios are to be met within 24 months from 1st January 2013.
A bank must maintain a minimum core capital of KShs 1,000 million. The bank’s regulatory capital is analysed into two tiers:
• Tier 1 capital. This includes ordinary share capital , share premium, retained earnings and after deduction of investment in subsidiaries, goodwill, other intangible assets and other regulatory adjustments relating to items that are included in equity which are treated differently for capital adequacy purposes.
• Tier 2 capital. This includes 25% of revaluation reserves of property and equipment, subordinated debt not exceeding 50% of core capital, collective impairment allowances and any other approved reserves.
The risk based approach to capital adequacy measurement is applied to both on and off balance sheet items. Risk weights are assigned on assets from assessing the following:
• Credit risk arising from the possibility of losses associated with reduction of credit quality of borrowers or counterparties;• Market risk is the risk of losses arising from movements in market prices pertaining to interest rate related instruments and foreign
exchange risk and commodities risk;• Operational risk is the risk of loss resulting from inadequate or failed internal processes, people and systems or from external events.
nOTES TO ThE COnSOlIDATED AnD SEPARATE FInAnCIAl STATEMEnTSFOR ThE YEAR EnDED 31 DECEMBER 2013 (COnTInUED)
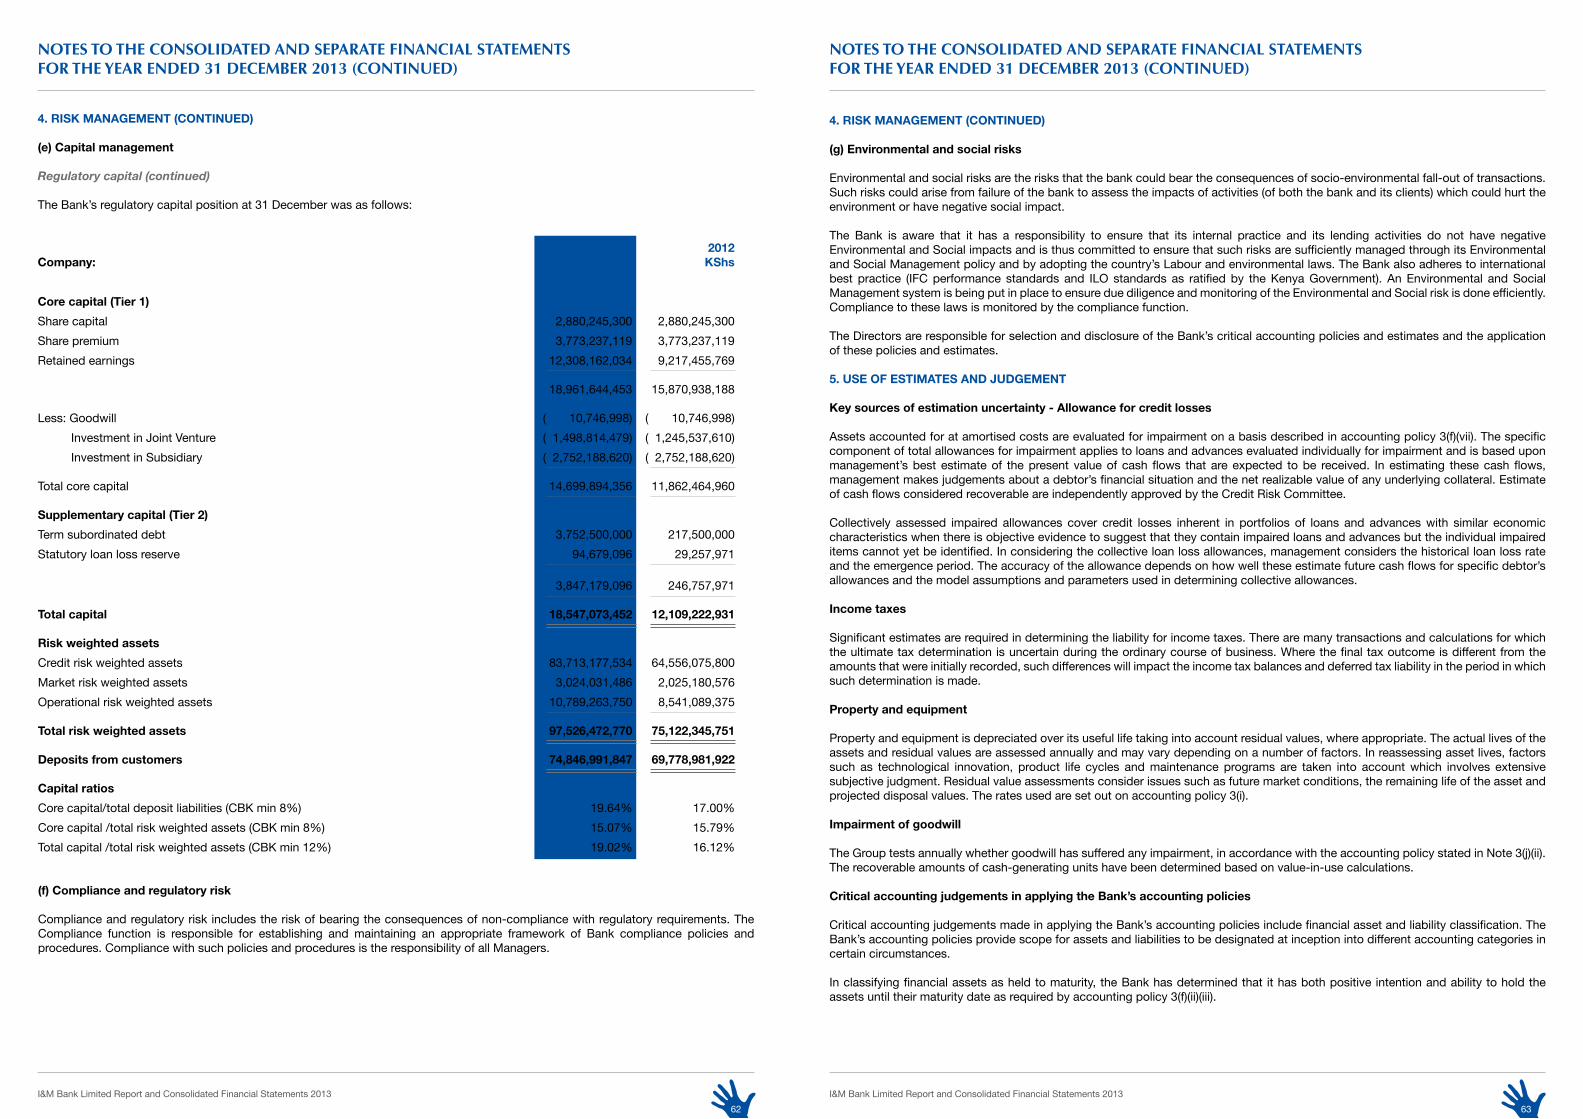
I&M Bank Limited Report and Consolidated Financial Statements 2013 I&M Bank Limited Report and Consolidated Financial Statements 201362 63
4. RIsK ManaGeMenT (ConTInUeD)
(e) Capital management
Regulatory capital (continued)
The Bank’s regulatory capital position at 31 December was as follows:
2013 2012Company: Kshs Kshs
Core capital (Tier 1)
Share capital 2,880,245,300 2,880,245,300Share premium 3,773,237,119 3,773,237,119Retained earnings 12,308,162,034 9,217,455,769
18,961,644,453 15,870,938,188
Less: Goodwill ( 10,746,998) ( 10,746,998) Investment in Joint Venture ( 1,498,814,479) ( 1,245,537,610) Investment in Subsidiary ( 2,752,188,620) ( 2,752,188,620)
Total core capital 14,699,894,356 11,862,464,960
supplementary capital (Tier 2)
Term subordinated debt 3,752,500,000 217,500,000Statutory loan loss reserve 94,679,096 29,257,971
3,847,179,096 246,757,971
Total capital 18,547,073,452 12,109,222,931
Risk weighted assets
Credit risk weighted assets 83,713,177,534 64,556,075,800Market risk weighted assets 3,024,031,486 2,025,180,576Operational risk weighted assets 10,789,263,750 8,541,089,375
Total risk weighted assets 97,526,472,770 75,122,345,751
Deposits from customers 74,846,991,847 69,778,981,922
Capital ratios
Core capital/total deposit liabilities (CBK min 8%) 19.64% 17.00%Core capital /total risk weighted assets (CBK min 8%) 15.07% 15.79%Total capital /total risk weighted assets (CBK min 12%) 19.02% 16.12%
(f) Compliance and regulatory risk
Compliance and regulatory risk includes the risk of bearing the consequences of non-compliance with regulatory requirements. The Compliance function is responsible for establishing and maintaining an appropriate framework of Bank compliance policies and procedures. Compliance with such policies and procedures is the responsibility of all Managers.
nOTES TO ThE COnSOlIDATED AnD SEPARATE FInAnCIAl STATEMEnTSFOR ThE YEAR EnDED 31 DECEMBER 2013 (COnTInUED)
4. RIsK ManaGeMenT (ConTInUeD)
(g) environmental and social risks
Environmental and social risks are the risks that the bank could bear the consequences of socio-environmental fall-out of transactions. Such risks could arise from failure of the bank to assess the impacts of activities (of both the bank and its clients) which could hurt the environment or have negative social impact.
The Bank is aware that it has a responsibility to ensure that its internal practice and its lending activities do not have negative Environmental and Social impacts and is thus committed to ensure that such risks are sufficiently managed through its Environmental and Social Management policy and by adopting the country’s Labour and environmental laws. The Bank also adheres to international best practice (IFC performance standards and ILO standards as ratified by the Kenya Government). An Environmental and Social Management system is being put in place to ensure due diligence and monitoring of the Environmental and Social risk is done efficiently. Compliance to these laws is monitored by the compliance function.
The Directors are responsible for selection and disclosure of the Bank’s critical accounting policies and estimates and the application of these policies and estimates.
5. Use of esTIMaTes anD JUDGeMenT
Key sources of estimation uncertainty - allowance for credit losses
Assets accounted for at amortised costs are evaluated for impairment on a basis described in accounting policy 3(f)(vii). The specific component of total allowances for impairment applies to loans and advances evaluated individually for impairment and is based upon management’s best estimate of the present value of cash flows that are expected to be received. In estimating these cash flows, management makes judgements about a debtor’s financial situation and the net realizable value of any underlying collateral. Estimate of cash flows considered recoverable are independently approved by the Credit Risk Committee. Collectively assessed impaired allowances cover credit losses inherent in portfolios of loans and advances with similar economic characteristics when there is objective evidence to suggest that they contain impaired loans and advances but the individual impaired items cannot yet be identified. In considering the collective loan loss allowances, management considers the historical loan loss rate and the emergence period. The accuracy of the allowance depends on how well these estimate future cash flows for specific debtor’s allowances and the model assumptions and parameters used in determining collective allowances.
Income taxes
Significant estimates are required in determining the liability for income taxes. There are many transactions and calculations for which the ultimate tax determination is uncertain during the ordinary course of business. Where the final tax outcome is different from the amounts that were initially recorded, such differences will impact the income tax balances and deferred tax liability in the period in which such determination is made.
Property and equipment
Property and equipment is depreciated over its useful life taking into account residual values, where appropriate. The actual lives of the assets and residual values are assessed annually and may vary depending on a number of factors. In reassessing asset lives, factors such as technological innovation, product life cycles and maintenance programs are taken into account which involves extensive subjective judgment. Residual value assessments consider issues such as future market conditions, the remaining life of the asset and projected disposal values. The rates used are set out on accounting policy 3(i).
Impairment of goodwill
The Group tests annually whether goodwill has suffered any impairment, in accordance with the accounting policy stated in Note 3(j)(ii). The recoverable amounts of cash-generating units have been determined based on value-in-use calculations.
Critical accounting judgements in applying the bank’s accounting policies
Critical accounting judgements made in applying the Bank’s accounting policies include financial asset and liability classification. The Bank’s accounting policies provide scope for assets and liabilities to be designated at inception into different accounting categories in certain circumstances.
In classifying financial assets as held to maturity, the Bank has determined that it has both positive intention and ability to hold the assets until their maturity date as required by accounting policy 3(f)(ii)(iii).
nOTES TO ThE COnSOlIDATED AnD SEPARATE FInAnCIAl STATEMEnTSFOR ThE YEAR EnDED 31 DECEMBER 2013 (COnTInUED)
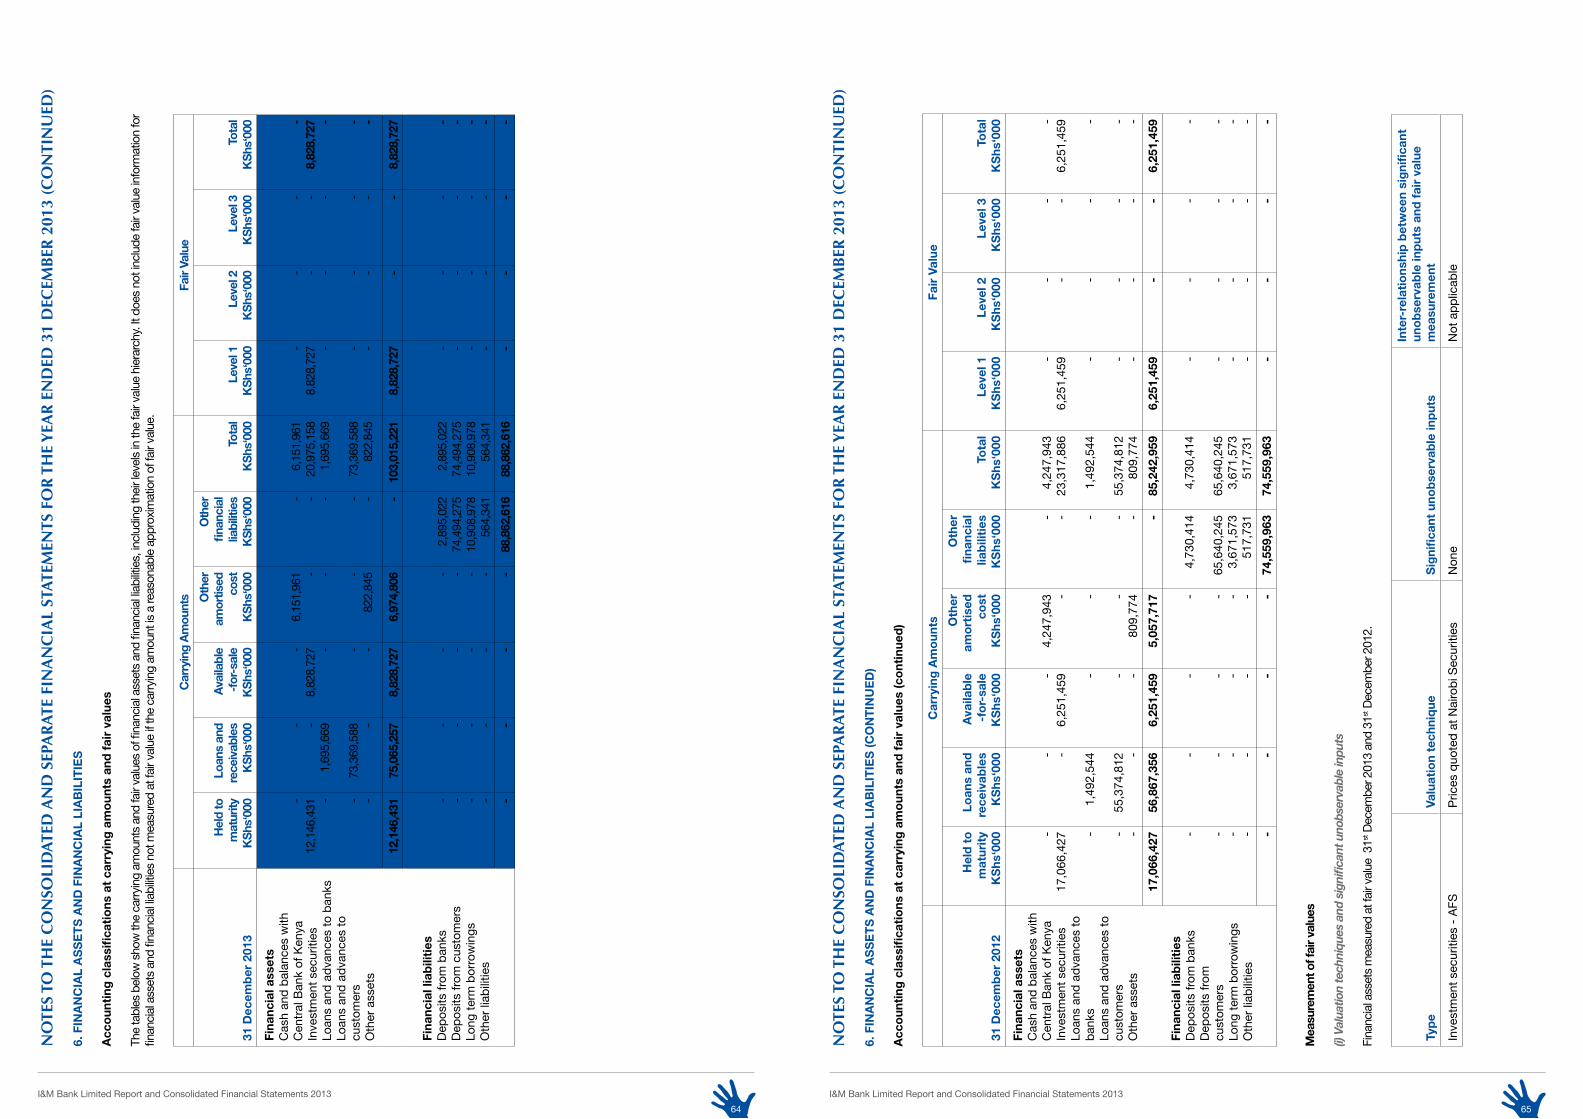
I&M Bank Limited Report and Consolidated Financial Statements 2013 I&M Bank Limited Report and Consolidated Financial Statements 201364 65
nO
TES
TO T
hE
CO
nSO
lID
ATED
An
D S
EPA
RAT
E FI
nA
nC
IAl
STAT
EMEn
TS F
OR
Th
E Y
EAR
En
DED
31
DEC
EMB
ER 2
013
(CO
nTI
nU
ED)
6. f
Ina
nC
Ial
as
se
Ts
an
D f
Ina
nC
Ial
lIa
bIl
ITIe
s
acc
oun
ting
cla
ssifi
cati
ons
at
carr
ying
am
oun
ts a
nd f
air
valu
es
The
tabl
es b
elow
sho
w th
e ca
rryi
ng a
mou
nts
and
fair
valu
es o
f fina
ncia
l ass
ets
and
finan
cial
liab
ilitie
s, in
clud
ing
thei
r lev
els
in th
e fa
ir va
lue
hier
arch
y. It
doe
s no
t inc
lude
fair
valu
e in
form
atio
n fo
r fin
anci
al a
sset
s an
d fin
anci
al li
abilit
ies
not m
easu
red
at fa
ir va
lue
if th
e ca
rryi
ng a
mou
nt is
a re
ason
able
app
roxi
mat
ion
of fa
ir va
lue.
Car
ryin
g a
mou
nts
fair
Valu
e
31 D
ecem
ber
201
3
Hel
d to
m
atur
ityK
shs
‘000
loan
s an
d
rece
ivab
les
Ks
hs‘0
00
ava
ilabl
e-f
or-s
ale
Ks
hs‘0
00
oth
er
amor
tised
cost
Ks
hs‘0
00
oth
er
finan
cial
liabi
litie
sK
shs
‘000
To
tal
Ks
hs‘0
00
le
vel 1
Ks
hs‘0
00
le
vel 2
Ks
hs‘0
00
le
vel 3
Ks
hs‘0
00
To
tal
Ks
hs‘0
00
fina
ncia
l ass
ets
Cas
h an
d ba
lanc
es w
ith
Cen
tral B
ank
of K
enya
Inve
stm
ent s
ecur
ities
Loan
s an
d ad
vanc
es to
ban
ksLo
ans
and
adva
nces
to
cust
omer
sO
ther
ass
ets
fina
ncia
l lia
bili
ties
Depo
sits
from
ban
ksDe
posi
ts fr
om c
usto
mer
sLo
ng te
rm b
orro
win
gsO
ther
liab
ilitie
s
-12
,146
,431
- - -
- - 1
,695
,669
73
,369
,588
-
-8,
828,
727 - - -
6
,151
,961
- - - 8
22,8
45
- - - - -
6,
151,
961
20,9
75,1
581,
695,
669
73,3
69,5
88
822
,845
-8,
828,
727 - - -
- - - - -
- - - - -
-8,
828,
727 - - -
12,1
46,4
31
75,
065,
257
8,82
8,72
7 6,
974,
806
-10
3,01
5,22
1 8,
828,
727
--
8,82
8,72
7
- - - -
- - - -
- - - -
- - - -
2,
895,
022
74,4
94,2
75
10,9
08,9
78
564,
341
2,
895,
022
74,4
94,2
75
10,9
08,9
78
564,
341
- - - -
- - - -
- - - -
- - - -
--
--
88,8
62,6
16
88,8
62,6
16
--
--
6. f
Ina
nC
Ial
as
se
Ts
an
D f
Ina
nC
Ial
lIa
bIl
ITIe
s (C
on
TIn
Ue
D)
acc
oun
ting
cla
ssifi
cati
ons
at
carr
ying
am
oun
ts a
nd f
air
valu
es (c
ont
inue
d)
Car
ryin
g a
mo
unts
fair
Val
ue
31 D
ecem
ber
201
2
Hel
d t
o
mat
urit
yK
shs
‘000
loan
s an
d
rece
ivab
les
Ks
hs‘0
00
ava
ilab
le-f
or-
sale
Ks
hs‘0
00
oth
er
amo
rtis
edco
stK
shs
‘000
oth
er
fina
ncia
llia
bili
ties
Ks
hs‘0
00
Tota
lK
shs
‘000
leve
l 1K
shs
‘000
leve
l 2K
shs
‘000
leve
l 3K
shs
‘000
Tota
lK
shs
‘000
fina
ncia
l ass
ets
Cas
h an
d ba
lanc
es w
ith
Cen
tral B
ank
of K
enya
Inve
stm
ent s
ecur
ities
Loan
s an
d ad
vanc
es to
ba
nks
Loan
s an
d ad
vanc
es to
cu
stom
ers
Oth
er a
sset
s
fina
ncia
l lia
bili
ties
Depo
sits
from
ban
ksDe
posi
ts fr
om
cust
omer
sLo
ng te
rm b
orro
win
gsO
ther
liab
ilitie
s
-17
,066
,427
- - -
- -
1,49
2,54
4
55,3
74,8
12 -
-6,
251,
459 - - -
4
,247
,943
- - -80
9,77
4
- - - - -
4,
247,
943
23,3
17,8
86
1,49
2,54
4
55,3
74,8
12
809,
774
-6,
251,
459 - - -
- - - - -
- - - - -
-6,
251,
459 - - -
17,0
66,4
27
56,8
67,3
56
6,25
1,45
9 5,
057,
717
-85
,242
,959
6,
251,
459
--
6,25
1,45
9
- - - -
- - - -
- - - -
- - - -
4,
730,
414
65,6
40,2
45
3,67
1,57
3 51
7,73
1
4,
730,
414
65,6
40,2
45
3,67
1,57
3 51
7,73
1
- - - -
- - - -
- - - -
- - - --
--
-74
,559
,963
74
,559
,963
-
--
-
Mea
sure
men
t of f
air v
alue
s
(i) V
alua
tion
tech
niqu
es a
nd s
igni
fican
t uno
bser
vabl
e in
puts
Fina
ncial
ass
ets m
easu
red
at fa
ir valu
e 3
1st D
ecem
ber 2
013
and
31st D
ecem
ber 2
012.
Typ
eVa
luat
ion
tech
niq
ues
igni
fica
nt u
nob
serv
able
inp
uts
Inte
r-re
lati
ons
hip
bet
wee
n si
gni
fica
nt
uno
bse
rvab
le in
put
s an
d f
air
valu
e m
easu
rem
ent
Inve
stm
ent s
ecur
ities
- AF
SPr
ices
quo
ted
at N
airo
bi S
ecur
ities
Non
eN
ot a
pplic
able
nO
TES
TO T
hE
CO
nSO
lID
ATED
An
D S
EPA
RAT
E FI
nA
nC
IAl
STAT
EMEn
TS F
OR
Th
E Y
EAR
En
DED
31
DEC
EMB
ER 2
013
(CO
nTI
nU
ED)

I&M Bank Limited Report and Consolidated Financial Statements 2013 I&M Bank Limited Report and Consolidated Financial Statements 201366 67
nOTES TO ThE COnSOlIDATED AnD SEPARATE FInAnCIAl STATEMEnTSFOR ThE YEAR EnDED 31 DECEMBER 2013 (COnTInUED)
7. InTeResT InCoMe
2013 2012 Kshs Kshs
(a) Group
Loans and advances to customers 11,698,335,975 10,127,213,929Loans and advances to banks 174,423,300 539,270,529
Investment securities: - Held-to-maturity 1,847,981,307 1,395,203,905 - Available-for-sale 758,944,184 657,135,085
14,479,684,766 12,718,823,448
(b) Company
Loans and advances to customers 9,412,952,981 8,756,660,611Loans and advances to banks 67,044,986 456,726,623
Investment securities: - Held-to-maturity 1,349,947,091 1,098,271,613 - Available-for-sale 747,134,353 654,728,381
11,577,079,411 10,966,387,228
8. InTeResT eXPense
2013 2012 Kshs Kshs
(a) Group
Deposits from customers 5,077,342,507 6,341,372,565Deposits from banks 197,357,001 162,922,963Borrowings 320,844,362 219,521,477
5,595,543,870 6,723,817,005
(b) Company
Deposits from customers 4,086,041,161 5,706,987,639Deposits from banks 172,990,890 114,054,763Borrowings 275,902,493 214,179,161
4,534,934,544 6,035,221,563
nOTES TO ThE COnSOlIDATED AnD SEPARATE FInAnCIAl STATEMEnTSFOR ThE YEAR EnDED 31 DECEMBER 2013 (COnTInUED)
9. neT fee anD CoMMIssIon InCoMe
2013 2012 Kshs Kshs
(a) Group
fee and commission income
Commissions 1,298,403,639 1,043,061,574Service fees 661,388,280 535,495,470
1,959,791,919 1,578,557,044
fee and commission expense
Inter bank transaction fees ( 28,771,660) ( 29,844,444)Other ( 35,266,233) ( 37,148,784)
( 64,037,893) ( 66,993,228)
net fee and commission income 1,895,754,026 1,511,563,816
2013 2012 Kshs Kshs
(b) Company
fee and commission income
Commissions 947,304,347 826,364,910Service fees 549,384,735 439,904,296
1,496,689,082 1,266,269,206
fee and commission expense
Inter bank transaction fees ( 19,753,557) ( 26,776,416)Other ( 26,255,369) ( 4,422,920)
( 46,008,926) ( 31,199,336)
net fee and commission income 1,450,680,156 1,235,069,870
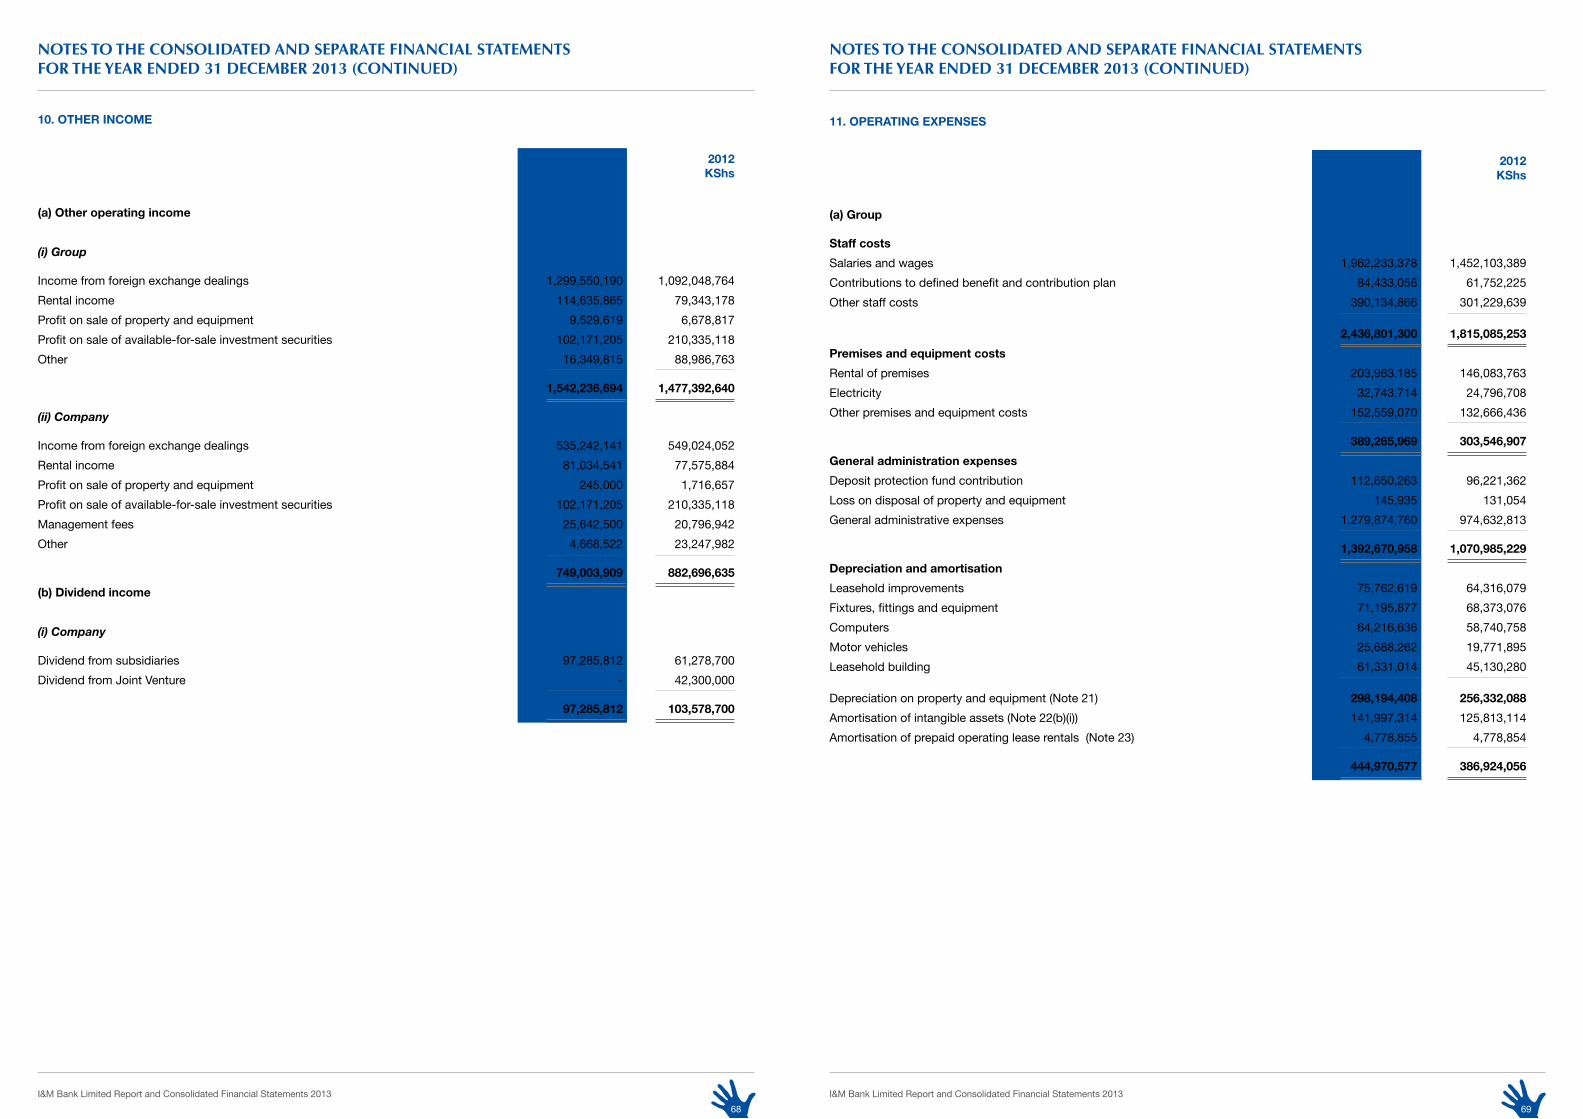
I&M Bank Limited Report and Consolidated Financial Statements 2013 I&M Bank Limited Report and Consolidated Financial Statements 201368 69
10. oTHeR InCoMe
2013 2012 Kshs Kshs
(a) other operating income
(i) Group
Income from foreign exchange dealings 1,299,550,190 1,092,048,764Rental income 114,635,865 79,343,178Profit on sale of property and equipment 9,529,619 6,678,817Profit on sale of available-for-sale investment securities 102,171,205 210,335,118Other 16,349,815 88,986,763
1,542,236,694 1,477,392,640
(ii) Company
Income from foreign exchange dealings 535,242,141 549,024,052Rental income 81,034,541 77,575,884Profit on sale of property and equipment 245,000 1,716,657Profit on sale of available-for-sale investment securities 102,171,205 210,335,118Management fees 25,642,500 20,796,942Other 4,668,522 23,247,982
749,003,909 882,696,635
(b) Dividend income
(i) Company
Dividend from subsidiaries 97,285,812 61,278,700Dividend from Joint Venture - 42,300,000
97,285,812 103,578,700
nOTES TO ThE COnSOlIDATED AnD SEPARATE FInAnCIAl STATEMEnTSFOR ThE YEAR EnDED 31 DECEMBER 2013 (COnTInUED)
nOTES TO ThE COnSOlIDATED AnD SEPARATE FInAnCIAl STATEMEnTSFOR ThE YEAR EnDED 31 DECEMBER 2013 (COnTInUED)
11. oPeRaTInG eXPenses
2013 2012 Kshs Kshs
(a) Group
staff costs
Salaries and wages 1,962,233,378 1,452,103,389Contributions to defined benefit and contribution plan 84,433,056 61,752,225Other staff costs 390,134,866 301,229,639
2,436,801,300 1,815,085,253
Premises and equipment costs
Rental of premises 203,963,185 146,083,763Electricity 32,743,714 24,796,708Other premises and equipment costs 152,559,070 132,666,436
389,265,969 303,546,907
General administration expenses
Deposit protection fund contribution 112,650,263 96,221,362Loss on disposal of property and equipment 145,935 131,054General administrative expenses 1,279,874,760 974,632,813
1,392,670,958 1,070,985,229
Depreciation and amortisation
Leasehold improvements 75,762,619 64,316,079Fixtures, fittings and equipment 71,195,877 68,373,076Computers 64,216,636 58,740,758Motor vehicles 25,688,262 19,771,895Leasehold building 61,331,014 45,130,280
Depreciation on property and equipment (Note 21) 298,194,408 256,332,088
Amortisation of intangible assets (Note 22(b)(i)) 141,997,314 125,813,114Amortisation of prepaid operating lease rentals (Note 23) 4,778,855 4,778,854
444,970,577 386,924,056

I&M Bank Limited Report and Consolidated Financial Statements 2013 I&M Bank Limited Report and Consolidated Financial Statements 201370 71
11. oPeRaTInG eXPenses (ConTInUeD)
2013 2012 Kshs Kshs
(b) Company
staff costs
Salaries and wages 1,126,292,381 953,616,965Contributions to defined contribution plan 41,522,908 36,296,563Other staff costs 263,476,107 219,310,163
1,431,291,396 1,209,223,691
Premises and equipment costs
Rental of premises 116,245,255 93,697,778Electricity 13,847,713 13,311,866Other premises and equipment costs 96,358,209 104,823,149
226,451,177 211,832,793
General administration expenses
Deposit protection fund contribution 97,950,000 79,455,956Loss on disposal of property and equipment 145,935 131,054General administrative expenses 756,872,672 626,741,281
854,968,607 706,328,291
Depreciation and amortisation
Leasehold improvements 67,120,444 64,316,079Fixtures, fittings and equipment 37,673,426 36,104,654Computers 48,789,589 49,400,503Motor vehicles 4,165,004 4,626,750Leasehold building 21,870,036 19,964,974
Depreciation on property and equipment (Note 21) 179,618,499 174,412,960
Amortisation of intangible assets (Note 22(b)(ii)) 114,313,954 110,226,348Amortisation of prepaid operating lease rentals (Note 23) 4,778,855 4,778,854
298,711,308 289,418,162
nOTES TO ThE COnSOlIDATED AnD SEPARATE FInAnCIAl STATEMEnTSFOR ThE YEAR EnDED 31 DECEMBER 2013 (COnTInUED)
12. PRofIT befoRe InCoMe TaX
2013 2012 Kshs Kshs
Group
Profit before income tax is arrived at after charging/(crediting):Depreciation 298,194,408 256,332,088Amortisation of intangible assets 141,997,314 125,813,114Directors’ emoluments: - Fees 27,980,267 17,297,194 - Other 23,222,667 19,544,493Auditors’ remuneration 13,844,512 8,635,659Amortisation of prepaid operating lease rentals 4,778,855 4,778,854Net profit on sale of property and equipment 9,383,684 ( 6,547,763)
Company
Profit before income tax is arrived at after charging/(crediting):Depreciation 179,618,499 174,412,961Amortisation of intangible assets 114,313,956 110,226,348Directors’ emoluments: - Fees 10,000,000 8,410,000 - Other 21,630,000 18,000,000Auditors’ remuneration 3,811,000 3,700,000Amortisation of prepaid operating lease rentals 4,778,855 4,778,854Net profit on sale of property and equipment 99,065 ( 1,585,603)
nOTES TO ThE COnSOlIDATED AnD SEPARATE FInAnCIAl STATEMEnTSFOR ThE YEAR EnDED 31 DECEMBER 2013 (COnTInUED)

I&M Bank Limited Report and Consolidated Financial Statements 2013 I&M Bank Limited Report and Consolidated Financial Statements 201372 73
13. InCoMe TaX eXPense anD TaX PaYable
(a) Income tax expense
2013 2012 Kshs Kshs
(i) Group
Current year’s tax 2,438,381,470 1,698,186,437Under provision in prior year - Current tax 1,832,759 ( 41,564,338)Over provision in prior year - Deferred tax 58,123,892 -
2,498,338,121 1,656,622,099
Deferred tax credit (Note 24) ( 217,033,021) ( 73,875,224)
Income tax expense 2,281,305,100 1,582,746,875
The tax on the group’s profit differs from the theoretical amount using the basic tax rate as follows:
2013 2012 Kshs Kshs
Accounting profit before taxation 7,262,666,022 5,702,304,336
Computed tax using the applicable corporation tax rate 2,183,963,838 1,662,162,838Under provision in the prior year 1,832,759 ( 40,120,734)Effect on non-deductible costs 57,242,090 ( 14,025,431)Under provision in prior year – Deferred tax 58,123,892 ( 25,269,798)Prior period tax recoverable ( 4,522,390) -Tax discount in accordance with Rwandan tax laws ( 15,335,089) -
2,281,305,100 1,582,746,875
nOTES TO ThE COnSOlIDATED AnD SEPARATE FInAnCIAl STATEMEnTSFOR ThE YEAR EnDED 31 DECEMBER 2013 (COnTInUED)
13. InCoMe TaX eXPense anD TaX PaYable (ConTInUeD)
(a) Income tax expense (continued)
2013 2012 Kshs Kshs
(ii) Company
Current year’s tax at 30% 2,023,926,996 1,466,626,525Under provision in prior year - Current tax ( 1,284,180) ( 41,564,338)Over provision in prior year - Deferred tax 48,218,735 -
2,070,861,551 1,425,062,187
Deferred tax credit (Note 24) ( 205,479,202) ( 66,414,340)
Income tax expense 1,865,382,349 1,358,647,847
The tax on the Bank’s profit differs from the theoretical amount using the basic tax rate as follows:
2013 2012 Kshs Kshs
accounting profit before taxation 6,059,817,675 4,721,540,388
Computed tax using the applicable corporation tax rate at 30% 1,817,945,303 1,416,462,116Under provision in the prior year ( 1,284,180) ( 41,564,338)Effect on non-deductible costs 502,491 ( 16,249,931)Over provision in prior year - Deferred tax 48,218,735 -
1,865,382,349 1,358,647,847
(b) Tax payable/ recoverable
2013 2012 Kshs Kshs
(i) Group
At 1 January 107,095,241 313,210,128Income tax expense (Note 13(a)(i)) 2,440,214,228 1,656,622,099Effect of tax in foreign jurisdiction ( 2,377,845) 51,603,180Tax paid (Note 31(a)) ( 1,975,218,891) ( 1,914,340,166)
at 31 December 569,712,733 107,095,241
(ii) Company
At 1 January ( 2,909,947) 311,262,090Income tax expense (Note 13(a)(i)) 2,022,642,816 1,425,062,187Tax paid (Note 31(c)) ( 1,607,682,453) ( 1,739,234,224)
at 31 December 412,050,416 ( 2,909,947)
nOTES TO ThE COnSOlIDATED AnD SEPARATE FInAnCIAl STATEMEnTSFOR ThE YEAR EnDED 31 DECEMBER 2013 (COnTInUED)

I&M Bank Limited Report and Consolidated Financial Statements 2013 I&M Bank Limited Report and Consolidated Financial Statements 201374 75
nOTES TO ThE COnSOlIDATED AnD SEPARATE FInAnCIAl STATEMEnTSFOR ThE YEAR EnDED 31 DECEMBER 2013 (COnTInUED)
14. eaRnInGs PeR sHaRe
2013 2012 2013 2012
Net profit after tax for the year (KShs) 4,617,470,815 3,860,460,435 4,194,435,326 3,362,892,541
Weighted average number ofordinary shares in issue during the year 28,802,453 28,802,453 28,802,453 28,802,453
Earnings per share (KShs) 160.32 134.03 145.63 116.76
There were no potentially dilutive shares outstanding at 31st December 2013 (2012 – Nil).
15. DIVIDenD PeR sHaRe
2013 2012 Kshs Kshs
The calculation of dividend per share is based on:
Final dividend proposed during the year (KShs) 1,008,085,855 748,863,778
Weighted average number of ordinary shares in issue during the year 28,802,453 28,802,453
Final dividend per share (KShs) 35.00 26.00
16. CasH anD balanCes WITH CenTRal banKs
2013 2012 Kshs Kshs
(a) Group
Cash on hand 1,498,209,444 1,272,793,707Balances with Central Banks: - Restricted balances (Cash Reserve Ratio) 5,752,974,264 5,041,222,170 - Unrestricted balances 1,658,040,293 430,116,779 8,909,224,001 6,744,132,656
(b) Company
Cash on hand 787,041,796 584,557,853Balances with Central Bank of Kenya: - Restricted balances (Cash Reserve Ratio) 3,868,580,835 3,330,932,010 - Unrestricted balances 1,496,338,621 332,453,339
6,151,961,252 4,247,943,202
The payment of dividends is subject to withholding tax at the rate of 10% for all non-residents, 5% for Kenyan residents and nil for resident Kenyan companies with shareholding of 12.5% or more.
The Bank’s Cash Reserve Ratio is non-interest earning and is based on the value of deposits as adjusted for the Central Bank of Kenya requirements. As at 31st December 2013, the Cash Reserve Ratio requirement was 5.25% of all customer deposits (2012 – 5.25%).
nOTES TO ThE COnSOlIDATED AnD SEPARATE FInAnCIAl STATEMEnTSFOR ThE YEAR EnDED 31 DECEMBER 2013 (COnTInUED)
17. loans anD aDVanCes To banKs
2013 2012 Kshs Kshs
(a) Group
Due within 90 days 6,050,626,986 6,774,013,121Due after 90 days - -
6,050,626,986 6,774,013,121
(b) Company
Due within 90 days 1,695,669,062 1,492,544,276Due after 90 days - -
1,695,669,062 1,492,544,276
The company’s weighted average effective interest rate on loans and advances to banks at 31st December 2013 was 7.70% (2012 – 4.30 %).
Consolidated Company

I&M Bank Limited Report and Consolidated Financial Statements 2013 I&M Bank Limited Report and Consolidated Financial Statements 201376 77
18. loans anD aDVanCes To CUsToMeRs
(a) Classification
2013 2012 Kshs Kshs
(i) Group
Overdrafts 32,136,433,855 26,478,682,882Loans 59,589,235,288 43,925,723,218Bills discounted 286,902,412 662,384,822Hire purchase 1,870,055,737 1,437,555,240
Gross loans and advances 93,882,627,292 72,504,346,162
Less: Impairment losses on loans and advances (Note 18(b)(i)) ( 1,999,963,386) ( 1,491,386,039)
net loans and advances 91,882,663,906 71,012,960,123
Repayable on demand 24,569,977,509 23,987,583,948Less than 3 months 8,056,859,134 5,074,611,4063 months to 1 year 11,566,385,550 7,521,553,5561 to 5 years 29,829,778,985 22,413,048,1355 to 10 years 16,161,237,804 12,083,802,915Over 10 years 3,698,388,310 1,423,746,202
Gross loans and advances 93,882,627,292 72,504,346,162
(ii) Company
Overdrafts 25,785,433,603 20,794,791,885Loans 47,177,380,625 33,724,687,813Bills discounted 250,368,727 662,384,822Hire purchase 1,870,055,737 1,437,555,240
Gross loans and advances 75,083,238,692 56,619,419,760
Less: Impairment losses on loans and advances (Note 18(b)(ii)) ( 1,713,651,125) ( 1,244,607,466)
net loans and advances 73,369,587,567 55,374,812,294
Repayable on demand 22,066,532,700 22,299,948,866Less than 3 months 6,677,944,501 3,792,079,8853 months to 1 year 7,125,646,874 2,590,274,8951 to 5 years 20,571,463,186 15,570,643,9525 to 10 years 15,684,375,909 10,942,725,959Over 10 years 2,957,275,522 1,423,746,203
Gross loans and advances 75,083,238,692 56,619,419,760
nOTES TO ThE COnSOlIDATED AnD SEPARATE FInAnCIAl STATEMEnTSFOR ThE YEAR EnDED 31 DECEMBER 2013 (COnTInUED)
18. loans anD aDVanCes To CUsToMeRs (ConTInUeD)
(b) Impairment losses reserve
specific Portfolio impairment impairment losses provision Total Kshs Kshs Kshs
(i) Group
2013:
At 1 January 2013 777,224,163 714,161,876 1,491,386,039 Impairment made in the year 96,251,622 509,855,408 606,107,030Recoveries and impairment no longer required ( 56,968,395) - ( 56,968,395)Net recoveries, write offs during the year ( 4,113,792) - ( 4,113,792)Amounts written off during the year ( 20,875,432) - ( 20,875,432)Translation difference ( 9,272,026) ( 6,300,038) ( 15,572,064)
at 31 December 2013 782,246,140 1,217,717,246 1,999,963,386
2012: At 1 January 2012 834,273,135 595,817,682 1,430,090,817Acquisition of subsidiary 140,919,837 57,416,864 198,336,701 Impairment made in the year 102,206,416 60,939,911 163,146,327 Recoveries and impairment no longer required ( 125,450,427) - ( 125,450,427)Net recoveries, write offs during the year ( 51,283,930) - ( 51,283,930)Amounts written off during the year ( 124,138,171) - ( 124,138,171)Translation difference 697,303 ( 12,581) 684,722
at 31 December 2012 777,224,163 714,161,876 1,491,386,039
(ii) Company
At 1 January 2013 611,766,979 632,840,487 1,244,607,466Impairment made in the year 62,531,201 443,737,489 506,268,690Recoveries and impairment no longer required ( 37,225,031) - ( 37,225,031) Net recoveries, write offs during the year - - -Amounts written off during the year - - -
at 31 December 2013 637,073,149 1,076,577,976 1,713,651,125
2012:
At 1 January 2012 795,650,105 594,098,458 1,389,748,563 Impairment made in the year 76,143,955 38,742,029 114,885,984 Recoveries and impairment no longer required ( 100,754,240) - ( 100,754,240)Net recoveries, write offs during the year ( 53,996,373) - ( 53,996,373)Amounts written off during the year ( 105,276,468) - ( 105,276,468)
at 31 December 2012 611,766,979 632,840,487 1,244,607,466
nOTES TO ThE COnSOlIDATED AnD SEPARATE FInAnCIAl STATEMEnTSFOR ThE YEAR EnDED 31 DECEMBER 2013 (COnTInUED)

I&M Bank Limited Report and Consolidated Financial Statements 2013 I&M Bank Limited Report and Consolidated Financial Statements 201378 79
18. loans anD aDVanCes To CUsToMeRs (ConTInUeD)
(c) Impairment losses on loans and advances
2013 2012 Kshs Kshs
(i) Group
Impairment made in the year 606,107,030 163,146,327 Recoveries and impairment no longer required ( 56,968,395) (125,450,427)Recoveries of loans and advances previously written off ( 78,149,752) ( 46,565,797)Amounts directly written off during the year 1,100,089 3,978,800
472,088,972 (4,891,097)
(ii) Company
Impairment made in the year 506,268,690 114,885,984 Recoveries and impairment no longer required ( 37,225,031) (100,754,240)Recoveries of loans and advances written off in prior years ( 1,303,123) -Amounts directly written off during the year 134,045 35,801
Company 467,874,581 14,167,545
(d) non-performing loans and advances - Company
The company’s loans and advances include an amount of KShs 423,180,922 (2012 – KShs 145,436,373) net of impairment losses which are non-performing. The estimated realisable value of securities held against this balance is KShs 344,669,867 (2012 – KShs 248,384,978).
2013 2012 Kshs Kshs
Interest on impaired loans and advances which has not yet been received in cash 355,354,486 266,442,983
The company’s weighted average effective interest rate on loans and advances to customers at 31 December 2013 was 13.93% (2012 – 16.63%).
nOTES TO ThE COnSOlIDATED AnD SEPARATE FInAnCIAl STATEMEnTSFOR ThE YEAR EnDED 31 DECEMBER 2013 (COnTInUED)
18. loans anD aDVanCes To CUsToMeRs (ConTInUeD)
(e) loans and advances concentration by sector - Company
2013 2012 Kshs % Kshs %
Manufacturing 18,260,894,362 24.32 14,809,540,634 26.16Wholesale and retail trade 2,614,292,354 3.48 5,810,773,015 10.26Building and construction 6,681,418,716 8.90 5,266,524,225 9.30Agriculture 4,050,740,654 5.39 3,060,657,990 5.41Real estate 12,857,373,778 17.12 10,325,352,350 18.24 Transport and communication 3,671,664,254 4.89 3,143,923,638 5.55Business services 16,259,204,707 21.65 11,297,283,397 19.95Electricity and water 110,845,697 0.15 97,358,068 0.17Finance and insurance 852,966,217 1.15 119,024,995 0.21Mining and quarrying 1,397,792,429 1.86 230,556,868 0.41Others 8,326,045,524 11.09 2,458,424,580 4.34
75,083,238,692 100.00 56,619,419,760 100.00
(f) finance leases - Company
Loans and advances to customers include finance leases receivable as follows:
2013 2012 Kshs Kshs
Receivable no later than 1 year 197,566,619 208,276,529Receivable later than 1 year and no later than 5 years 1,672,489,118 1,229,278,711
1,870,055,737 1,437,555,240
nOTES TO ThE COnSOlIDATED AnD SEPARATE FInAnCIAl STATEMEnTSFOR ThE YEAR EnDED 31 DECEMBER 2013 (COnTInUED)

I&M Bank Limited Report and Consolidated Financial Statements 2013 I&M Bank Limited Report and Consolidated Financial Statements 201380 81
19. InVesTMenT seCURITIes
2013 2012 Kshs Kshs
(a) Group
available-for-sale
Corporate bonds - available-for-sale 677,463,026 864,613,516Treasury bonds - available-for-sale 7,153,679,008 5,575,247,268Treasury bills - available-for-sale 1,133,447,000 -
Total available-for-sale 8,964,589,034 6,439,860,784
Held-to-maturity
Treasury bonds 10,163,169,598 10,457,572,701Treasury bills 7,069,643,497 10,302,353,990Other investment securities - 122,428,630
Total held to maturity 17,232,813,095 20,882,355,321
Total investment securities 26,197,402,129 27,322,216,105
(b) Company
available-for-sale
Medium term notes - -Corporate bonds - available-for-sale 677,463,026 864,613,516Treasury bonds - available-for-sale 7,017,816,498 5,386,845,201Treasury bills - available-for-sale 1,133,447,000 - Total available-for-sale 8,828,726,524 6,251,458,717
Held-to-maturity
Treasury bonds 8,917,420,771 8,949,705,918Treasury bills 3,229,009,804 8,116,721,333
Total held to maturity 12,146,430,575 17,066,427,251
Total investment securities 20,975,157,099 23,317,885,968
nOTES TO ThE COnSOlIDATED AnD SEPARATE FInAnCIAl STATEMEnTSFOR ThE YEAR EnDED 31 DECEMBER 2013 (COnTInUED)
nOTES TO ThE COnSOlIDATED AnD SEPARATE FInAnCIAl STATEMEnTSFOR ThE YEAR EnDED 31 DECEMBER 2013 (COnTInUED)
19. InVesTMenT seCURITIes (ConTInUeD)
The change in the carrying amount of investment securities held by the company is as shown below:
Treasurybonds
and billsKshs
CorporatebondKshs
Medium term floating
notes Kshs
TotalKshs
31 December 2013:At 1 January 2013AdditionsDisposals and maturitiesChanges in fair valueAmortisation of discounts and premiumsUnearned interestInterest receivable
22,453,272,45220,841,000,000
29,633,187
14,365,342
864,613,516-
27,288,513--
-------
23,317,885,968 20,841,000,000
29,633,187
10,267,685
at 31 December 2013 20,297,694,073 677,463,026 - 20,975,157,099
Treasurybonds
and billsKshs
CorporatebondKshs
Medium term floating
notes Kshs
TotalKshs
31 December 2012:At 1 January 2012AdditionsDisposals and maturitiesChanges in fair valueAmortisation of discounts and premiumsUnearned interestInterest receivable
14,576,698,17311,750,000,000
134,564,618
45,556,085
993,517,330-
--
68,176,680-
---
15,638,392,183 11,750,000,000
119,115,809
at 31 December 2012 22,453,272,452 864,613,516 - 23,317,885,968
The weighted average effective interest rate on Government securities at 31st December 2013 was 9.90% (2012 – 9.40%).
The weighted average effective interest rate on corporate bonds at 31st December 2013 was 12.20% (2012 – 11.67%).
At 31st December 2013, unamortized premiums on investment securities amounted to KShs 255,114,032 (2012 – KShs 329,138,430) and unamortized discounts amounted to KShs 245,568,274 (2012 – KShs 439,883,297).
( 22,873,850,000) ( 72,978,417)
( 93,748,491)
( 8,948,151)
( 3,899,000,000) (110,887,500)( 15,448,809)
(67,500,000)
( 676,680)
( 4,077,387,500)
( 8,948,151) ( 145,598,273)
( 2,567,505) ( 145,598,273)
( 210,341,346)
( 4,097,657)
(23,084,191,346) ( 45,689,904)
( 93,748,491)
42,311,900

I&M Bank Limited Report and Consolidated Financial Statements 2013 I&M Bank Limited Report and Consolidated Financial Statements 201382 83
nOTES TO ThE COnSOlIDATED AnD SEPARATE FInAnCIAl STATEMEnTSFOR ThE YEAR EnDED 31 DECEMBER 2013 (COnTInUED)
20. InVesTMenT In sUbsIDIaRIes anD JoInT VenTURes
(a) Investment in Joint Venture
The Bank has 50% (2012 - 50%) control over Bank One Limited (formerly First City Bank Limited – Mauritius) with the other Joint Venturer, CIEL Investments Limited.
beneficial ownership 2013 2012 activity % Kshs Kshs
Group
bank one limited Commercial Banking 50 2,411,972,727 2,066,667,578 Percentage ownership 2013 2012
Interest 50% 50%
Non-current assets 1,071,093,326 1,082,129,972 Current assets (including cash and cash equivalents) 49,760,914,103 53,558,220,077 Non-current liabilities ( 2,611,214,530) ( 1,966,464,232)Current liabilities (44,347,658,748) (49,491,361,963)Net assets (100%) 3,873,134,151 3,182,523,854 Group’s share of net assets (50%) 1,936,567,076 1,591,261,927 Goodwill 475,405,651 475,405,651
Carrying amount of interest in Joint Venture 2,411,972,727 2,066,667,578
Interest income 2,764,616,837 2,577,652,056 Interest expense ( 1,382,362,457) ( 1,446,467,641)Other income 143,787,935 715,281,101 Operating expenses ( 1,296,885,935) ( 1,205,737,029)Income tax expense ( 76,492,016) ( 60,744,916)Profit and total comprehensive income (100%) 152,664,364 579,983,571
Profit and total comprehensive income (50%) 76,332,182 289,991,785 Group’s share of profit and total comprehensive income 76,332,182 289,991,785 Dividends received by the Group - 42,300,000
beneficial ownership 2013 2012 activity % Kshs Kshs
Company Bank One Limited Commercial Banking 50 1,245,537,610 1,245,537,610
Additional Investment through rights issue 253,276,869 - 1,498,814,479 1,245,537,610
(b) Investment in subsidiaries
I&M Bank (T) Limited Commercial banking 55.03 1,122,911,360 1,122,911,360I&M Bank (Rwanda) Limited Commercial banking 54.99 1,629,277,260 1,629,277,260
2,752,188,620 2,752,188,620 nO
TES
TO T
hE
CO
nSO
lID
ATED
An
D S
EPA
RAT
E FI
nA
nC
IAl
STAT
EMEn
TS F
OR
Th
E Y
EAR
En
DED
31
DEC
EMB
ER 2
013
(CO
nTI
nU
ED)
21. P
Ro
Pe
RTY
an
D e
QU
IPM
en
T- G
Ro
UP
an
D C
oM
Pan
Y
fu
rnitu
re,
fit
tings
,
fixtu
res
le
aseh
old
leas
ehol
d an
d of
fice,
Mot
or
Cap
ital w
ork
bu
ildin
gs
impr
ovem
ents
eq
uipm
ent
Com
pute
rs
vehi
cles
in
pro
gres
s To
tal
2013
: K
shs
K
shs
K
shs
K
shs
K
shs
K
shs
K
shs
(a) G
roup
Cos
t/va
luat
ion
At 1
Jan
uary
201
3 1,
424,
112,
060
565,
338,
128
886,
533,
681
493,
261,
133
219,
916,
990
22,8
50,9
77
3,61
2,01
2,96
9Ac
quisi
tion
of S
ubsid
iary
- -
- -
- -
-Ad
ditio
ns
37,4
14,7
70
42,2
87,9
53
43,8
33,5
27
36,8
78,8
68
9,12
0,67
8 16
2,35
3,58
7 33
1,88
9,38
3Re
class
ificat
ions
(
2
,361
,944
) -
(
183
,144
) (
1
52,6
92)
27,8
21
- (
2
,669
,959
)Tr
ansf
ers
- 80
,757
,712
( 8
8,38
7,38
1)
9,49
3,69
4 -
( 1
,864
,025
) -
Disp
osals
/writ
e off
(
7
,592
,079
) -
( 7
,652
,942
) (
17,8
52,7
56)
(
682
,027
) -
(
33,7
79,8
04)
Surp
lus o
n re
valua
tion
400,
000,
000
- -
- -
- 40
0,00
0,00
0Tr
ansla
tion
diffe
renc
e (
34
,141
,604
) -
( 20,
232,
204)
(
11,2
00,3
23)
( 11,
153,
674)
(
1,0
92,9
87)
(
77,8
20,7
92)
At 3
1 De
cem
ber 2
013
1,81
7,43
1,20
3 68
8,38
3,79
3
813,
911,
537
510,
427,
924
21
7,22
9,78
8
182,
247,
552
4,
229,
631,
797
Dep
reci
atio
n
At 1
Jan
uary
201
3 1
68,0
71,9
46
312,
158,
200
483,
025,
183
360,
809,
673
158,
578,
946
- 1,
482,
643,
948
Acqu
isitio
n of
Sub
sidiar
y -
- -
- -
- -
Recla
ssific
atio
ns
- 12
,434
,046
( 1
4,63
5,69
9)
1,86
5,81
6 27
,821
-
(
3
08,0
16)
Char
ge fo
r the
year
61
,331
,014
75
,762
,619
71
,195
,877
64
,216
,636
25
,688
,262
-
298,
194,
408
On
disp
osals
(
6
,307
,085
) -
( 6
,721
,607
) (
17,8
52,7
56)
(
497
,138
) -
(
31,3
78,5
86)
Reve
rsal
on re
valua
tion
( 9
1,50
6,12
9)
- -
- -
- (
91
,506
,129
)Tr
ansla
tion
diffe
renc
e
(
7,7
52,3
65)
(
45,
458)
( 1
0,63
4,81
6)
( 9
,827
,723
) (
7,9
49,2
08)
- (
36
,209
,570
)
At 3
1 De
cem
ber 2
013
123
,837
,381
40
0,30
9,40
7 52
2,22
8,93
8
399,
211,
646
17
5,84
8,68
3
- 1,
621,
436,
055
net
boo
k va
lue
at 3
1 D
ecem
ber 2
013
1,69
3,59
3,82
2 28
8,07
4,38
6
291,
682,
599
11
1,21
6,27
8 41
,381
,105
18
2,24
7,55
2 2,
608,
195,
742
In 2
013,
the
lease
hold
buil
ding
was
reva
lued
afte
r 4 ye
ars b
y an
indep
ende
nt va
luer, K
iragu
and
Mw
angi
Lim
ited.
The
valua
tion
is lev
el 3
unde
r the
Fair
value
hier
arch
y.

I&M Bank Limited Report and Consolidated Financial Statements 2013 I&M Bank Limited Report and Consolidated Financial Statements 201384 85
nO
TES
TO T
hE
CO
nSO
lID
ATED
An
D S
EPA
RAT
E FI
nA
nC
IAl
STAT
EMEn
TS F
OR
Th
E Y
EAR
En
DED
31
DEC
EMB
ER 2
013
(CO
nTI
nU
ED)
21. P
Ro
Pe
RTY
an
D e
QU
IPM
en
T- G
Ro
UP
an
D C
oM
Pan
Y (C
on
TIn
Ue
D)
fu
rnitu
re,
fit
tings
,
fixtu
res
le
aseh
old
leas
ehol
d an
d of
fice,
Mot
or
Cap
ital w
ork
bu
ildin
gs
impr
ovem
ents
eq
uipm
ent
Com
pute
rs
vehi
cles
in
pro
gres
s To
tal
2012
: K
shs
K
shs
K
shs
K
shs
K
shs
K
shs
K
shs
(a) G
roup
(con
tinue
d)
Cos
t/va
luat
ion
At 1
Jan
uary
201
2 95
0,00
0,00
0 53
4,08
2,07
6
413,
921,
292
184,
973,
857
43
,886
,083
50
,635
,507
2,
177,
498,
815
Acqu
isitio
n of
Sub
sidiar
y 45
9,64
0,67
9 -
312,
314,
929
174,
279,
591
156,
058,
557
37,0
50,3
45
1,13
9,34
4,10
1Ad
ditio
ns
1,08
0,97
6 83
,609
,601
61
,747
,131
13
8,71
4,42
4 23
,706
,541
27
,165
,961
33
6,02
4,63
4Re
class
ificat
ions
-
( 53
,459
,155
) 85
,206
,526
5,
509,
629
- (3
7,25
7,00
0)
-Tr
ansf
ers
36,
160,
328
- 19
,588
,120
-
- (5
5,74
8,44
8)
-Di
spos
als/w
rite
off
( 2
2,12
9,98
1)
- (
6,5
70,9
06)
( 10
,459
,351
) (
3,6
38,6
24)
- (
42
,798
,862
)Tr
ansla
tion
diffe
renc
e (
639,
942)
1,
105,
606
326,
589
242
,983
(
95,
567)
1,
004,
612
1,94
4,28
1
At 3
1 De
cem
ber 2
012
1,42
4,11
2,06
0 56
5,33
8,12
8 88
6,53
3,68
1 49
3,26
1,13
3 21
9,91
6,99
0 22
,850
,977
3,
612,
012,
969
Dep
reci
atio
n
At 1
Jan
uary
201
2 5
4,90
3,67
9 25
2,60
6,68
2
233,
387,
171
150,
854,
515
32
,466
,629
-
724,
218,
676
Acqu
isitio
n of
Sub
sidiar
y 68
,150
,401
-
184,
139,
890
160,
018,
191
109,
761,
570
- 52
2,07
0,05
2Re
class
ificat
ions
-
( 4
,863
,944
) 3,
251,
054
1,61
2,89
0 -
- -
Char
ge fo
r the
year
45
,130
,280
64
,316
,079
68
,373
,076
58
,740
,758
19
,771
,895
-
256,
332,
088
On
disp
osals
-
- (
6,2
03,4
25)
( 10
,445
,838
) (
3,3
22,5
00)
- (
19
,971
,763
)Tr
ansla
tion
diffe
renc
e (
112,
414)
99
,383
77
,417
29
,157
(
98,
648)
-
(
5
,105
)
At 3
1 De
cem
ber 2
012
168
,071
,946
31
2,15
8,20
0 48
3,02
5,18
3 36
0,80
9,67
3 15
8,57
8,94
6 -
1,48
2,64
3,94
8
net
boo
k va
lue
at 3
1 D
ecem
ber 2
012
1,25
6,04
0,11
4 25
3,17
9,92
8 40
3,50
8,49
8 13
2,45
1,46
0 61
,338
,044
22
,850
,977
2,
129,
369,
021
21. P
Ro
Pe
RTY
an
D e
QU
IPM
en
T- G
Ro
UP
an
D C
oM
Pan
Y (C
on
TIn
Ue
D)
fu
rnitu
re,
fit
tings
,
fixtu
res
le
aseh
old
leas
ehol
d an
d of
fice,
Mot
or
Cap
ital w
ork
bu
ildin
gs
impr
ovem
ents
eq
uipm
ent
Com
pute
rs
vehi
cles
in
pro
gres
s To
tal
2013
: K
shs
K
shs
K
shs
K
shs
K
shs
K
shs
K
shs
(b) C
ompa
ny
Cos
t/va
luat
ion
At 1
Jan
uary
201
3 9
50,0
00,0
00
565,
338,
128
418,
076,
248
270,
286,
126
34,4
53,7
10
- 2,
238,
154,
212
Addi
tions
-
39,2
37,3
92
32,5
33,9
27
25,0
12,0
63
7,59
0,00
0 14
5,21
7,79
2 24
9,59
1,17
4Re
class
ificat
ion
- -
- -
- -
-Tr
ansf
ers
- -
- -
- -
-Di
spos
als
- -
( 2
,898
,969
) -
- -
(
2,8
98,9
69)
Surp
lus o
n re
valua
tion
4
00,0
00,0
00
-
- -
- -
40
0,00
0,00
0
At 3
1 De
cem
ber 2
013
1,
350,
000,
000
604,
575,
520
447,
711,
206
295,
298,
189
42,0
43,7
10
145,
217,
792
2,88
4,84
6,41
7
Dep
reci
atio
n
At 1
Jan
uary
201
3 74
,868
,651
31
2,15
8,20
0 25
3,27
5,34
7 17
9,18
1,02
9 31
,203
,710
-
850,
686,
937
Re
class
ificat
ion
-
- -
- -
- -
Char
ge fo
r the
year
21
,870
,036
67
,120
,444
37
,673
,426
48
,789
,589
4,
165,
004
- 17
9,61
8,49
9O
n di
spos
als
- -
( 2
,357
,035
) -
- -
(
2,3
57,0
35)
Reve
rsal
on re
valua
tion
(
91,
506,
129)
-
-
- -
- (
9
1,50
6,12
9)
At 3
1 De
cem
ber 2
013
5
,232
,558
37
9,27
8,64
4
288,
591,
738
22
7,97
0,61
8 35
,368
,714
- 93
6,44
2,27
2
net
boo
k va
lue
at 3
1 D
ecem
ber 2
013
1,34
4,76
7,44
2
225,
296,
876
15
9,11
9,46
8
67,3
27,5
71
6,67
4,99
6
145,
217,
792
1,94
8,40
4,14
5
In 2
013,
the
leas
ehol
d bu
ildin
g w
as re
valu
ed a
fter 4
yea
rs b
y an
inde
pend
ent v
alue
r, Ki
ragu
and
Mw
angi
Lim
ited.
The
val
uatio
n is
leve
l 3 u
nder
the
Fair
valu
e hi
erar
chy.
Incl
uded
in
the
prop
erty
and
equ
ipm
ent a
re a
sset
s w
ith a
gro
ss v
alue
of K
Shs
506,
223,
876
(201
2 –
KShs
423
,653
,667
) whi
ch a
re fu
lly d
epre
ciat
ed b
ut s
till in
use
. If d
epre
ciat
ion
had
been
ch
arge
d du
ring
the
year
on
the
cost
of t
hese
ass
ets
at a
nom
inal
rate
, it w
ould
hav
e am
ount
ed to
KSh
s 10
2,46
2,27
7 (2
012
– KS
hs 8
6,58
3,77
8).
nO
TES
TO T
hE
CO
nSO
lID
ATED
An
D S
EPA
RAT
E FI
nA
nC
IAl
STAT
EMEn
TS F
OR
Th
E Y
EAR
En
DED
31
DEC
EMB
ER 2
013
(CO
nTI
nU
ED)
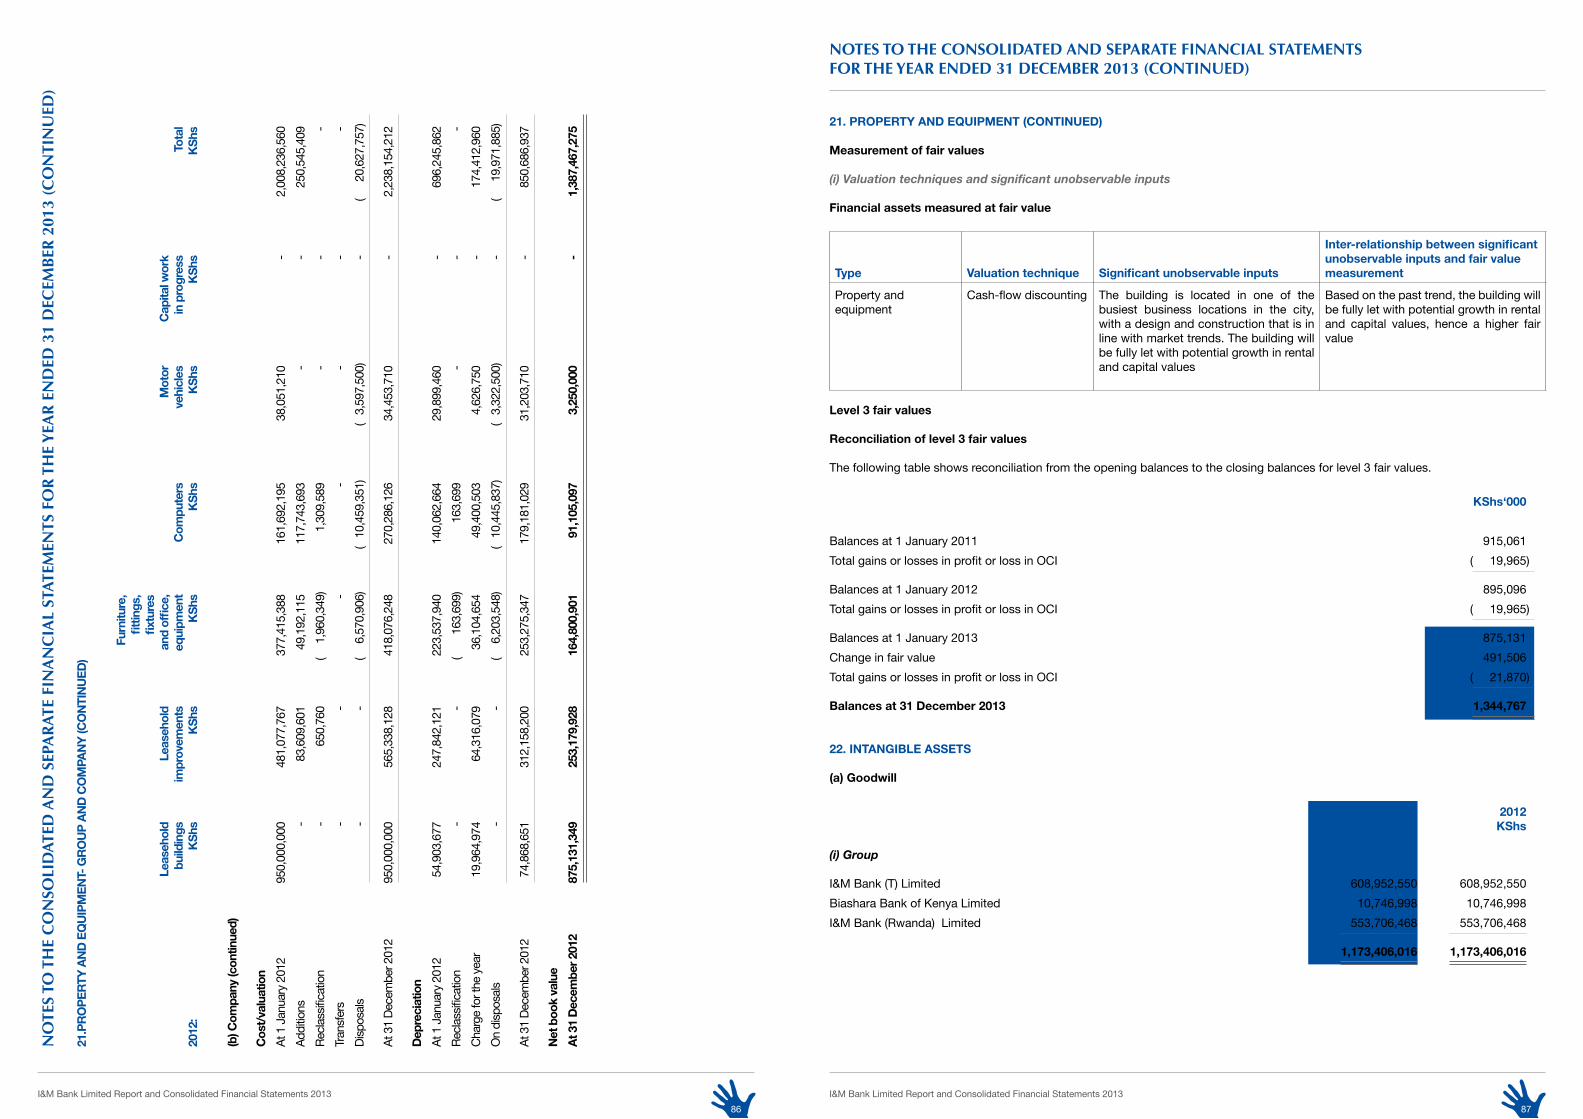
I&M Bank Limited Report and Consolidated Financial Statements 2013 I&M Bank Limited Report and Consolidated Financial Statements 201386 87
21. P
Ro
Pe
RTY
an
D e
QU
IPM
en
T- G
Ro
UP
an
D C
oM
Pan
Y (C
on
TIn
Ue
D)
fu
rnitu
re,
fit
tings
,
fixtu
res
le
aseh
old
leas
ehol
d an
d of
fice,
Mot
or
Cap
ital w
ork
bu
ildin
gs
impr
ovem
ents
eq
uipm
ent
Com
pute
rs
vehi
cles
in
pro
gres
s To
tal
2012
: K
shs
K
shs
K
shs
K
shs
K
shs
K
shs
K
shs
(b) C
ompa
ny (c
ontin
ued)
Cos
t/va
luat
ion
At 1
Jan
uary
201
2
950
,000
,000
48
1,07
7,76
7 37
7,41
5,38
8 16
1,69
2,19
5 38
,051
,210
-
2,00
8,23
6,56
0Ad
ditio
ns
- 83
,609
,601
49
,192
,115
11
7,74
3,69
3 -
- 25
0,54
5,40
9Re
class
ificat
ion
- 65
0,76
0 (
1,9
60,3
49)
1,30
9,58
9 -
- -
Tran
sfer
s -
- -
- -
- -
Disp
osals
-
- (
6,5
70,9
06)
( 10
,459
,351
) (
3,59
7,50
0)
- (
20
,627
,757
)
At 3
1 De
cem
ber 2
012
950
,000
,000
56
5,33
8,12
8 41
8,07
6,24
8 27
0,28
6,12
6 34
,453
,710
-
2,23
8,15
4,21
2
Dep
reci
atio
n
At 1
Jan
uary
201
2
54,
903,
677
247,
842,
121
223,
537,
940
140,
062,
664
29,8
99,4
60
- 69
6,24
5,86
2Re
class
ificat
ion
-
- (
1
63,6
99)
163,
699
- -
-Ch
arge
for t
he ye
ar
19,9
64,9
74
64,3
16,0
79
36,1
04,6
54
49,4
00,5
03
4,62
6,75
0 -
174,
412,
960
On
disp
osals
-
- (
6,2
03,5
48)
( 10
,445
,837
) (
3,32
2,50
0)
- (
19
,971
,885
) At
31
Dece
mbe
r 201
2
74,
868,
651
312,
158,
200
253,
275,
347
179,
181,
029
31,2
03,7
10
- 85
0,68
6,93
7
net
boo
k va
lue
at 3
1 D
ecem
ber 2
012
87
5,13
1,34
9 25
3,17
9,92
8 16
4,80
0,90
1 91
,105
,097
3,
250,
000
- 1,
387,
467,
275
nO
TES
TO T
hE
CO
nSO
lID
ATED
An
D S
EPA
RAT
E FI
nA
nC
IAl
STAT
EMEn
TS F
OR
Th
E Y
EAR
En
DED
31
DEC
EMB
ER 2
013
(CO
nTI
nU
ED)
nOTES TO ThE COnSOlIDATED AnD SEPARATE FInAnCIAl STATEMEnTSFOR ThE YEAR EnDED 31 DECEMBER 2013 (COnTInUED)
21. PRoPeRTY anD eQUIPMenT (ConTInUeD)
Measurement of fair values
(i) Valuation techniques and significant unobservable inputs
financial assets measured at fair value
Type Valuation technique significant unobservable inputs
Inter-relationship between significant unobservable inputs and fair value measurement
Property and equipment
Cash-flow discounting The building is located in one of the busiest business locations in the city, with a design and construction that is in line with market trends. The building will be fully let with potential growth in rental and capital values
Based on the past trend, the building will be fully let with potential growth in rental and capital values, hence a higher fair value
level 3 fair values
Reconciliation of level 3 fair values
The following table shows reconciliation from the opening balances to the closing balances for level 3 fair values.
Kshs‘000
Balances at 1 January 2011 915,061Total gains or losses in profit or loss in OCI ( 19,965)
Balances at 1 January 2012 895,096Total gains or losses in profit or loss in OCI ( 19,965)
Balances at 1 January 2013 875,131Change in fair value 491,506Total gains or losses in profit or loss in OCI ( 21,870)
balances at 31 December 2013 1,344,767
22. InTanGIble asseTs
(a) Goodwill
2013 2012 Kshs Kshs
(i) Group
I&M Bank (T) Limited 608,952,550 608,952,550 Biashara Bank of Kenya Limited 10,746,998 10,746,998 I&M Bank (Rwanda) Limited 553,706,468 553,706,468
1,173,406,016 1,173,406,016

I&M Bank Limited Report and Consolidated Financial Statements 2013 I&M Bank Limited Report and Consolidated Financial Statements 201388 89
nOTES TO ThE COnSOlIDATED AnD SEPARATE FInAnCIAl STATEMEnTSFOR ThE YEAR EnDED 31 DECEMBER 2013 (COnTInUED)
22. InTanGIble asseTs (ConTInUeD)
(a) Goodwill (continued)
The recoverable amounts for I&M Bank (T) Limited and I&M Bank (Rwanda) Limited have been calculated based on their value in use, determined by discounting the future cash flows expected to be generated from the continuing use of the Cash Generating Unit (CGU). The present value of the recoverable amounts on I&M Kenya’s share were Kshs 3.46 billion and Kshs 2.35 billion for I&M Bank (T) Limited and I&M Bank (Rwanda) Ltd respectively. No impairment losses were recognised during 2013, because the recoverable amounts of these CGUs were determined to be higher than their carrying amounts. The key assumptions used in the calculation of value in use were as follows:
I&M (T) ltd I&M Rwanda ltd
(i) Group (continued)
5 year risk free rate 9.18% 11.25%Risk premium 13.00% 14.00%Terminal growth rate 3.00% 2.50%Exchange rate Kshs 1 = Tzs 18.52 Kshs 1 = Rwf 7.80
The discount rate utilised was the risk free rate on the rate of 5 year government bonds issued by the government in the respective markets and in the same currency as the cash flows.
These cash flows have been projected for 4 years for I&M (T) Limited and 5 years for I&M Rwanda Limited, based on the approved Business plans of the respective units. For I&M (T) Limited and I&M Rwanda Limited, the terminal growth rates estimated were 3.00% and 2.50% respectively.
(ii) Company
Goodwill on assets purchased from Biashara Bank of Kenya Limited 10,746,998 10,746,998
In the opinion of the directors, there was no impairment of goodwill during the year.
(b) Computer software
software Capital work in progress Total2013: Kshs Kshs Kshs
(i) Group
Cost
At 1 January as previously stated 689,704,668 78,965,067 768,669,735Acquistion of subsidiary - - -Additions 75,945,492 - 75,945,492Transfers 78,965,067 ( 78,965,067) -Exchange differences ( 13,848,252) - ( 13,848,252)
At 31 December 830,766,975 - 830,766,975
amortisation
At 1 January as previously stated 525,757,776 - 525,757,776Acqusition of subsidiary - - -Amortisation for the year 141,997,314 - 141,997,314Exchange differences ( 11,995,857) - ( 11,995,857)
655,759,233 - 655,759,233At 31 Decembernet carrying amount at 31 December 2013 175,007,742 - 175,007,742
nOTES TO ThE COnSOlIDATED AnD SEPARATE FInAnCIAl STATEMEnTSFOR ThE YEAR EnDED 31 DECEMBER 2013 (COnTInUED)
22. InTanGIble asseTs (ConTInUeD)
(b) Computer software (continued)
software Capital work in progress Total2012: Kshs Kshs Kshs
(i) Group (continued)
Cost
At 1 January as previously stated 314,478,426 - 314,478,426Acquisition of subsidiary 155,686,058 - 155,686,058Additions 219,324,704 78,965,067 298,289,771Transfers - - -Exchange differences 215,480 - 215,480
At 31 December 689,704,668 78,965,067 768,669,735
amortisation
At 1 January as previously stated 258,615,541 - 258,615,541Acquisition of subsidiary 141,362,384 - 141,362,384Amortisation for the year 125,813,114 - 125,813,114Exchange differences ( 33,263) - ( 33,263)
At 31 December 525,757,776 - 525,757,776
net carrying amount at 31 December 2012 163,946,892 78,965,067 242,911,959
software Capital work in progress Total2013: Kshs Kshs Kshs
(ii) Company
Cost
At 1 January as previously stated 447,872,273 78,965,067 526,837,340Additions 52,459,550 - 52,459,550Transfers 78,965,067 ( 78,965,067) -
At 31 December 579,296,890 - 579,296,890
amortisation
At 1 January as previously stated 362,216,590 - 362,216,590Amortisation for the year 114,313,954 - 114,313,954
At 31 December 476,530,544 - 476,530,544
net carrying amount at 31 December 2013 102,766,346 - 102,766,346
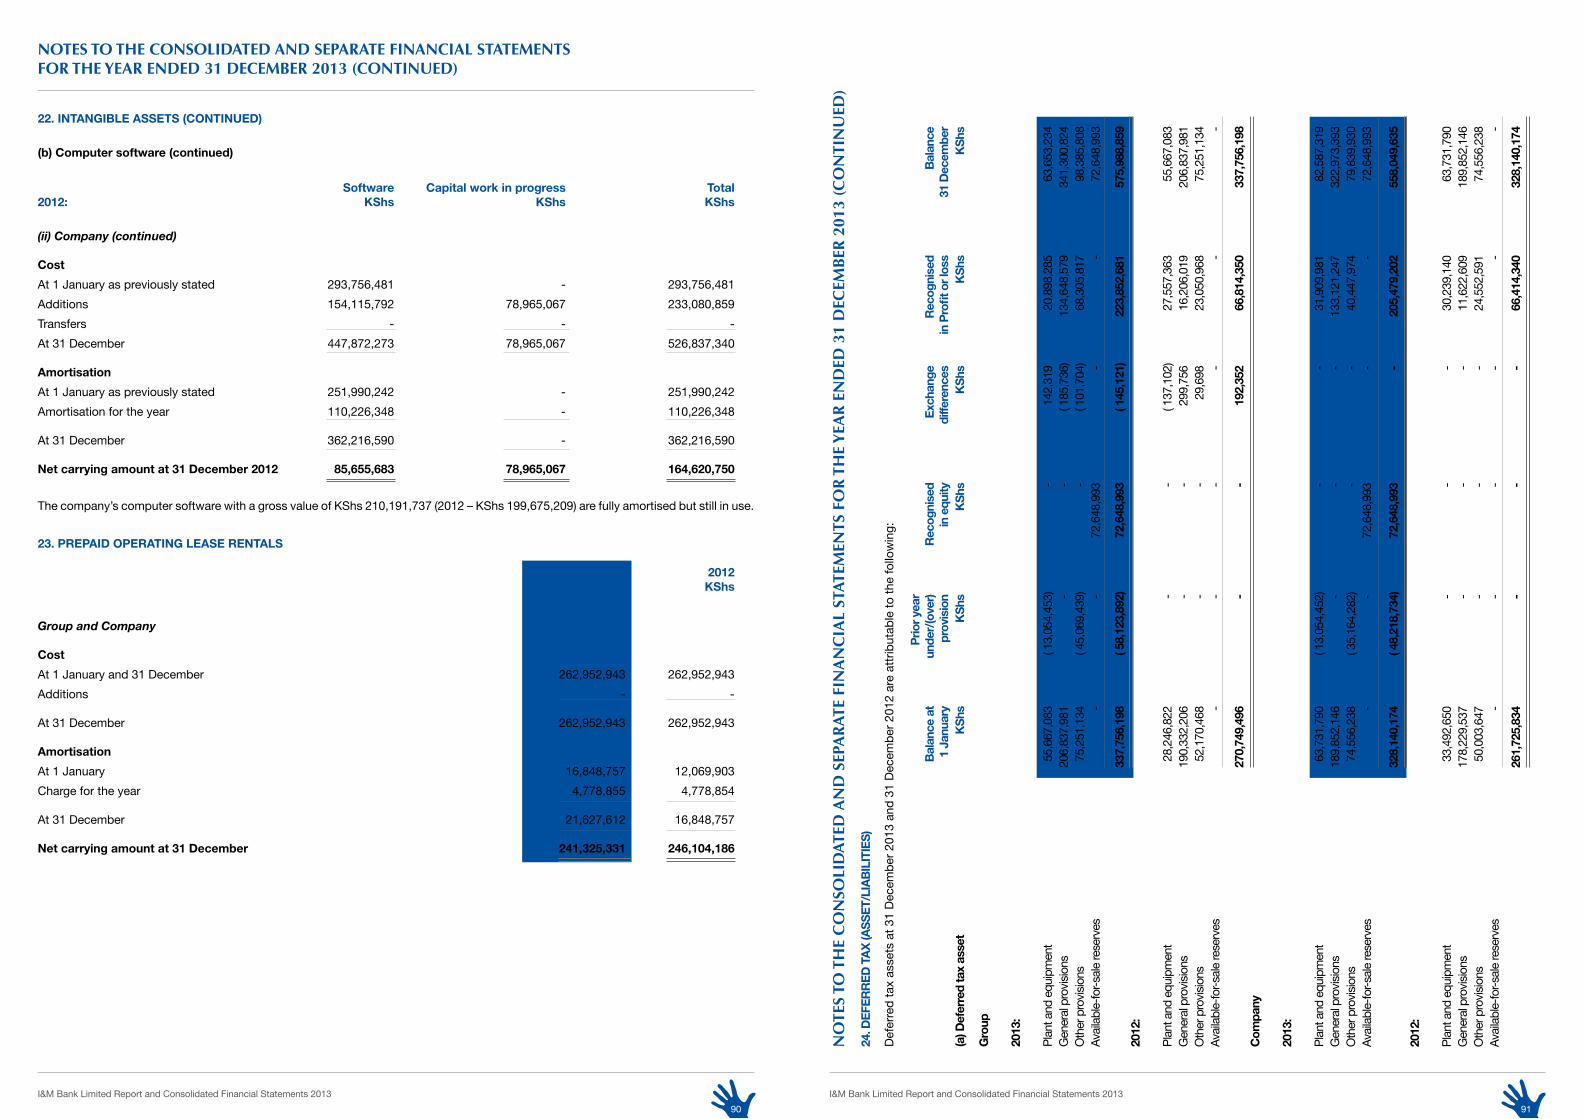
I&M Bank Limited Report and Consolidated Financial Statements 2013 I&M Bank Limited Report and Consolidated Financial Statements 201390 91
nOTES TO ThE COnSOlIDATED AnD SEPARATE FInAnCIAl STATEMEnTSFOR ThE YEAR EnDED 31 DECEMBER 2013 (COnTInUED)
22. InTanGIble asseTs (ConTInUeD)
(b) Computer software (continued)
software Capital work in progress Total2012: Kshs Kshs Kshs
(ii) Company (continued)
Cost
At 1 January as previously stated 293,756,481 - 293,756,481Additions 154,115,792 78,965,067 233,080,859Transfers - - -At 31 December 447,872,273 78,965,067 526,837,340
amortisation
At 1 January as previously stated 251,990,242 - 251,990,242Amortisation for the year 110,226,348 - 110,226,348
At 31 December 362,216,590 - 362,216,590
net carrying amount at 31 December 2012 85,655,683 78,965,067 164,620,750
The company’s computer software with a gross value of KShs 210,191,737 (2012 – KShs 199,675,209) are fully amortised but still in use.
23. PRePaID oPeRaTInG lease RenTals
2013 2012 Kshs Kshs
Group and Company
Cost
At 1 January and 31 December 262,952,943 262,952,943Additions - -
At 31 December 262,952,943 262,952,943
amortisation
At 1 January 16,848,757 12,069,903Charge for the year 4,778,855 4,778,854
At 31 December 21,627,612 16,848,757
net carrying amount at 31 December 241,325,331 246,104,186n
OTE
S TO
Th
E C
On
SOlI
DAT
ED A
nD
SEP
AR
ATE
FIn
An
CIA
l ST
ATEM
EnTS
FO
R T
hE
YEA
R E
nD
ED 3
1 D
ECEM
BER
201
3 (C
On
TIn
UED
)
24. D
efe
RR
eD
Ta
X (a
ss
eT/
lIa
bIl
ITIe
s)
Defe
rred
tax
asse
ts a
t 31
Dece
mbe
r 201
3 an
d 31
Dec
embe
r 201
2 ar
e at
tribu
tabl
e to
the
follo
win
g:
Prio
r yea
r
b
alan
ce a
t un
der/
(ove
r)
Rec
ogni
sed
exc
hang
e R
ecog
nise
d b
alan
ce
1 Ja
nuar
y pr
ovis
ion
in e
quity
di
ffere
nces
in
Pro
fit o
r los
s 31
Dec
embe
r(a
) Def
erre
d ta
x as
set
Ks
hs
Ks
hs
Ks
hs
Ks
hs
Ks
hs
Ks
hs
Gro
up
2013
:
Pl
ant a
nd e
quip
men
t 55
,667
,083
( 1
3,05
4,45
3)
- 14
2,31
9
20,8
98,2
85
63,6
53,2
34
Gen
eral
prov
ision
s 20
6,83
7,98
1
- -
( 185
,736
) 13
4,64
8,57
9
341,
300,
824
Oth
er p
rovis
ions
75
,251
,134
( 4
5,06
9,43
9)
- ( 1
01,7
04)
68,3
05,8
17
98,3
85,8
08
Avail
able-
for-s
ale re
serv
es
- -
72,6
48,9
93
- -
72,6
48,9
93
33
7,75
6,19
8
( 58,
123,
892)
7
2,64
8,99
3 ( 1
45,1
21)
223,
852,
681
57
5,98
8,85
9 20
12:
Plan
t and
equ
ipm
ent
28,2
46,8
22
-
-
( 137
,102
) 27
,557
,363
55
,667
,083
G
ener
al pr
ovisi
ons
190,
332,
206
-
-
29
9,75
6
16,2
06,0
19
206,
837,
981
Oth
er p
rovis
ions
52
,170
,468
-
-
29
,698
23
,050
,968
75
,251
,134
Av
ailab
le-fo
r-sale
rese
rves
-
-
-
-
-
-
27
0,74
9,49
6
-
-
192,
352
66
,814
,350
33
7,75
6,19
8C
ompa
ny
2013
:
Pl
ant a
nd e
quip
men
t 63
,731
,790
( 1
3,05
4,45
2)
-
-
31,9
09,9
81
82,5
87,3
19
Gen
eral
prov
ision
s 18
9,85
2,14
6
- -
-
13
3,12
1,24
7
322,
973,
393
Oth
er p
rovis
ions
74
,556
,238
( 3
5,16
4,28
2)
-
-
40,4
47,9
74
79,8
39,9
30
Avail
able-
for-s
ale re
serv
es
-
-
72
,648
,993
-
-
72
,648
,993
32
8,14
0,17
4
( 48,
218,
734)
72
,648
,993
-
20
5,47
9,20
2
558,
049,
635
2012
:
Plan
t and
equ
ipm
ent
33,4
92,6
50
-
-
-
30,2
39,1
40
63,7
31,7
90
Gen
eral
prov
ision
s 17
8,22
9,53
7
-
-
-
11,6
22,6
09
189,
852,
146
Oth
er p
rovis
ions
50
,003
,647
-
-
-
24
,552
,591
74
,556
,238
Av
ailab
le-fo
r-sale
rese
rves
-
-
-
-
-
-
261,
725,
834
-
-
-
66
,414
,340
3
28,1
40,1
74
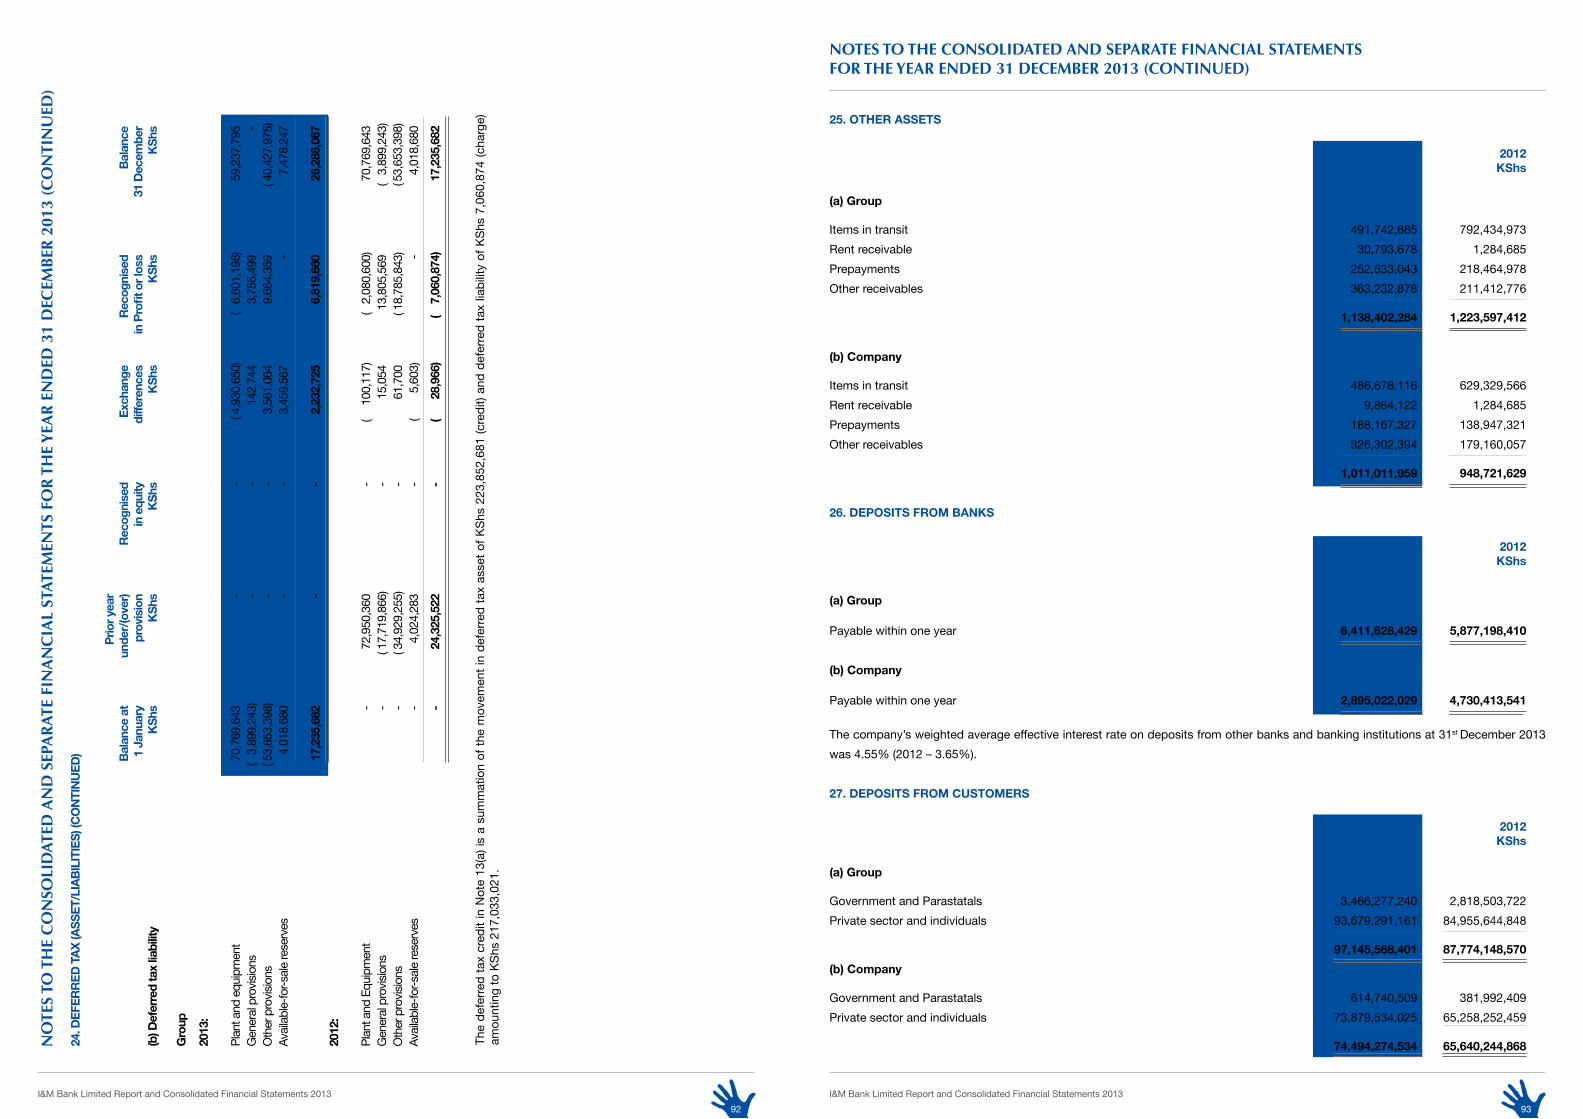
I&M Bank Limited Report and Consolidated Financial Statements 2013 I&M Bank Limited Report and Consolidated Financial Statements 201392 93
25. oTHeR asseTs
2013 2012 Kshs Kshs
(a) Group
Items in transit 491,742,685 792,434,973Rent receivable 30,793,678 1,284,685Prepayments 252,633,043 218,464,978Other receivables 363,232,878 211,412,776
1,138,402,284 1,223,597,412
(b) Company
Items in transit 486,678,116 629,329,566Rent receivable 9,864,122 1,284,685Prepayments 188,167,327 138,947,321Other receivables 326,302,394 179,160,057
1,011,011,959 948,721,629
26. DePosITs fRoM banKs
2013 2012 Kshs Kshs
(a) Group
Payable within one year 6,411,628,429 5,877,198,410
(b) Company
Payable within one year 2,895,022,029 4,730,413,541
The company’s weighted average effective interest rate on deposits from other banks and banking institutions at 31st December 2013 was 4.55% (2012 – 3.65%).
27. DePosITs fRoM CUsToMeRs
2013 2012 Kshs Kshs
(a) Group
Government and Parastatals 3,466,277,240 2,818,503,722Private sector and individuals 93,679,291,161 84,955,644,848
97,145,568,401 87,774,148,570
(b) Company
Government and Parastatals 614,740,509 381,992,409Private sector and individuals 73,879,534,025 65,258,252,459
74,494,274,534 65,640,244,868
nOTES TO ThE COnSOlIDATED AnD SEPARATE FInAnCIAl STATEMEnTSFOR ThE YEAR EnDED 31 DECEMBER 2013 (COnTInUED)
nO
TES
TO T
hE
CO
nSO
lID
ATED
An
D S
EPA
RAT
E FI
nA
nC
IAl
STAT
EMEn
TS F
OR
Th
E Y
EAR
En
DED
31
DEC
EMB
ER 2
013
(CO
nTI
nU
ED)
24. D
efe
RR
eD
Ta
X (a
ss
eT/
lIa
bIl
ITIe
s) (
Co
nTI
nU
eD
)
Prio
r yea
r
b
alan
ce a
t un
der/
(ove
r)
Rec
ogni
sed
exc
hang
e R
ecog
nise
d b
alan
ce
1 Ja
nuar
y pr
ovis
ion
in e
quity
di
ffere
nces
in
Pro
fit o
r los
s 31
Dec
embe
r(b
) Def
erre
d ta
x lia
bilit
y K
shs
K
shs
K
shs
K
shs
K
shs
K
shs
Gro
up
2013
:
Plan
t and
equ
ipm
ent
70,7
69,6
43
-
-
( 4,9
30,6
50)
( 6,
601,
198)
59
,237
,795
G
ener
al pr
ovisi
ons
( 3,
899,
243)
-
-
14
2,74
4
3,75
6,49
9
-
Oth
er p
rovis
ions
( 5
3,65
3,39
8)
-
-
3,56
1,06
4
9,66
4,35
9
( 40,
427,
975)
Avail
able-
for-s
ale re
serv
es
4,01
8,68
0
-
-
3,45
9,56
7
-
7,47
8,24
7
17
,235
,682
-
-
2,
232,
725
6,
819,
660
26
,288
,067
2012
:
Plan
t and
Equ
ipm
ent
- 72
,950
,360
-
( 1
00,1
17)
( 2,
080,
600)
70
,769
,643
G
ener
al pr
ovisi
ons
- ( 1
7,71
9,86
6)
-
15,
054
13
,805
,569
(
3,89
9,24
3)O
ther
pro
visio
ns
- ( 3
4,92
9,25
5)
-
61,7
00
( 18,
785,
843)
Av
ailab
le-fo
r-sale
rese
rves
-
4,02
4,28
3
-
(
5,60
3)
-
4,01
8,68
0
-
24,3
25,5
22
-
(
28,
966)
(
7,0
60,8
74)
17,2
35,6
82
The
defe
rred
tax
cred
it in
Not
e 13
(a) i
s a
sum
mat
ion
of th
e m
ovem
ent i
n de
ferre
d ta
x as
set o
f KSh
s 22
3,85
2,68
1 (c
redi
t) an
d de
ferre
d ta
x lia
bilit
y of
KSh
s 7,
060,
874
(cha
rge)
am
ount
ing
to K
Shs
217,
033,
021.
( 53,
653,
398)
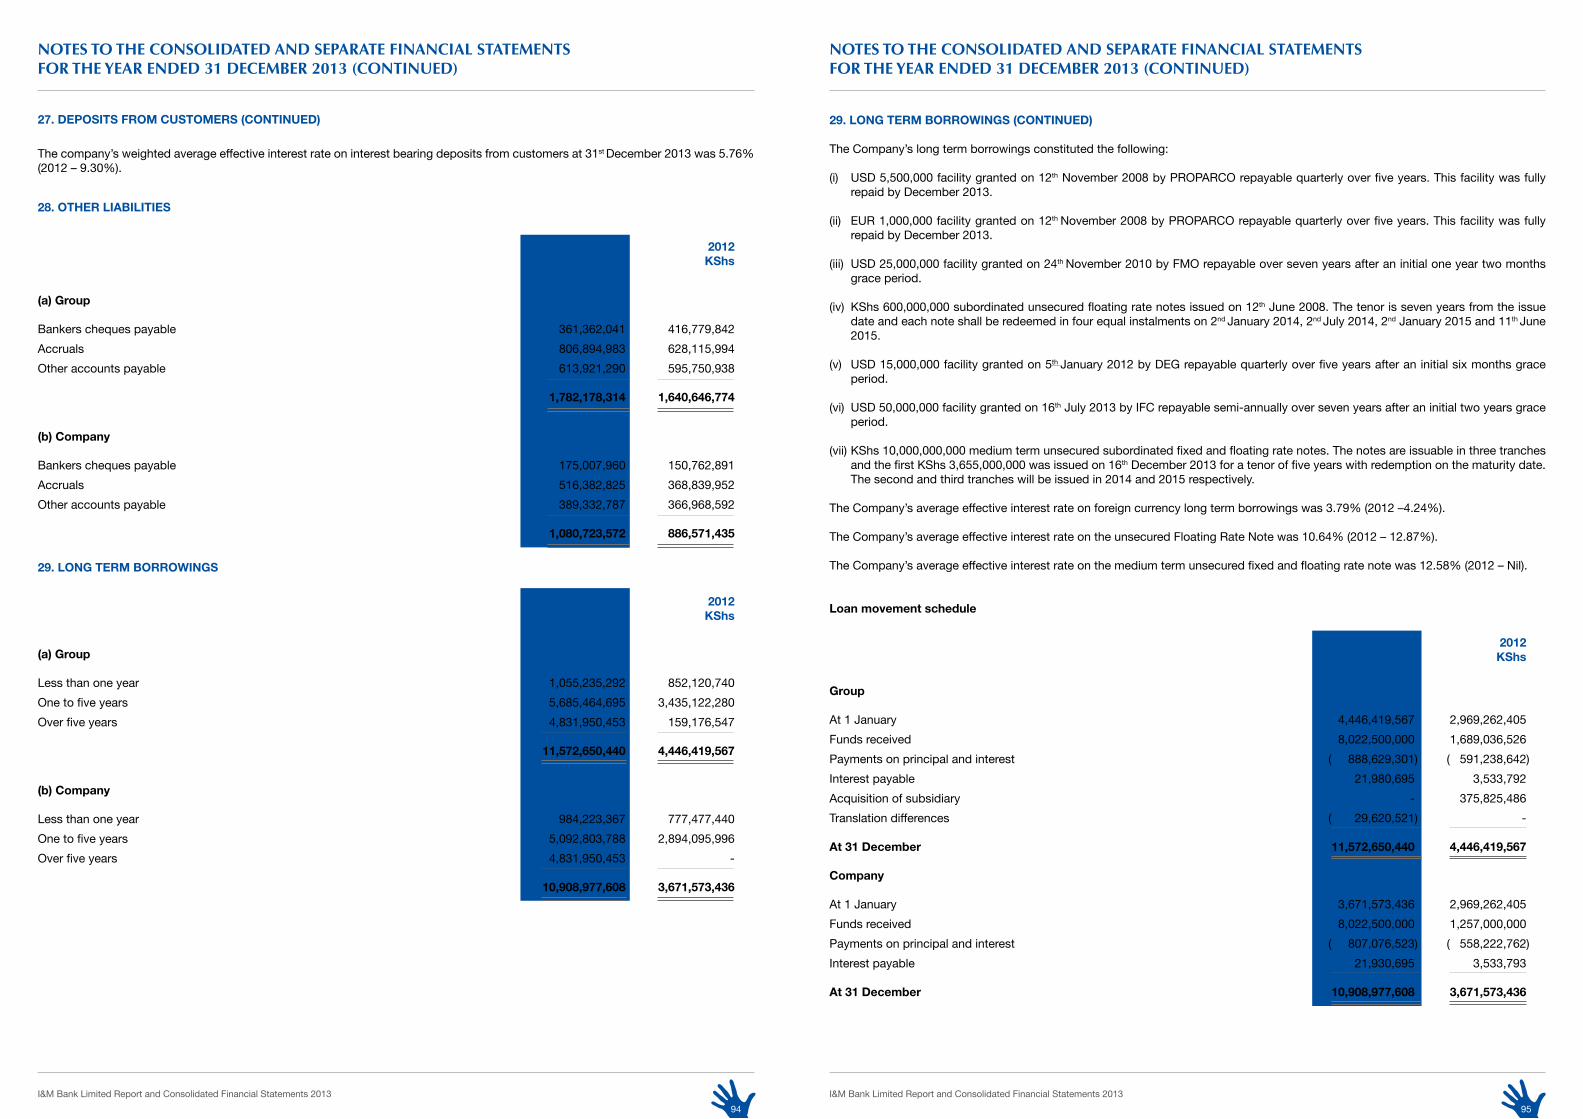
I&M Bank Limited Report and Consolidated Financial Statements 2013 I&M Bank Limited Report and Consolidated Financial Statements 201394 95
nOTES TO ThE COnSOlIDATED AnD SEPARATE FInAnCIAl STATEMEnTSFOR ThE YEAR EnDED 31 DECEMBER 2013 (COnTInUED)
27. DePosITs fRoM CUsToMeRs (ConTInUeD)
The company’s weighted average effective interest rate on interest bearing deposits from customers at 31st December 2013 was 5.76% (2012 – 9.30%).
28. oTHeR lIabIlITIes
2013 2012 Kshs Kshs
(a) Group
Bankers cheques payable 361,362,041 416,779,842Accruals 806,894,983 628,115,994Other accounts payable 613,921,290 595,750,938
1,782,178,314 1,640,646,774
(b) Company
Bankers cheques payable 175,007,960 150,762,891Accruals 516,382,825 368,839,952Other accounts payable 389,332,787 366,968,592
1,080,723,572 886,571,435
29. lonG TeRM boRRoWInGs
2013 2012 Kshs Kshs
(a) Group
Less than one year 1,055,235,292 852,120,740One to five years 5,685,464,695 3,435,122,280Over five years 4,831,950,453 159,176,547
11,572,650,440 4,446,419,567
(b) Company
Less than one year 984,223,367 777,477,440One to five years 5,092,803,788 2,894,095,996Over five years 4,831,950,453 -
10,908,977,608 3,671,573,436
29. lonG TeRM boRRoWInGs (ConTInUeD)
The Company’s long term borrowings constituted the following:
(i) USD 5,500,000 facility granted on 12th November 2008 by PROPARCO repayable quarterly over five years. This facility was fully repaid by December 2013.
(ii) EUR 1,000,000 facility granted on 12th November 2008 by PROPARCO repayable quarterly over five years. This facility was fully repaid by December 2013.
(iii) USD 25,000,000 facility granted on 24th November 2010 by FMO repayable over seven years after an initial one year two months grace period.
(iv) KShs 600,000,000 subordinated unsecured floating rate notes issued on 12th June 2008. The tenor is seven years from the issue date and each note shall be redeemed in four equal instalments on 2nd January 2014, 2nd July 2014, 2nd January 2015 and 11th June 2015.
(v) USD 15,000,000 facility granted on 5th January 2012 by DEG repayable quarterly over five years after an initial six months grace period.
(vi) USD 50,000,000 facility granted on 16th July 2013 by IFC repayable semi-annually over seven years after an initial two years grace period.
(vii) KShs 10,000,000,000 medium term unsecured subordinated fixed and floating rate notes. The notes are issuable in three tranches and the first KShs 3,655,000,000 was issued on 16th December 2013 for a tenor of five years with redemption on the maturity date. The second and third tranches will be issued in 2014 and 2015 respectively.
The Company’s average effective interest rate on foreign currency long term borrowings was 3.79% (2012 –4.24%).
The Company’s average effective interest rate on the unsecured Floating Rate Note was 10.64% (2012 – 12.87%).
The Company’s average effective interest rate on the medium term unsecured fixed and floating rate note was 12.58% (2012 – Nil).
loan movement schedule
2013 2012 Kshs Kshs
Group At 1 January 4,446,419,567 2,969,262,405Funds received 8,022,500,000 1,689,036,526Payments on principal and interest ( 888,629,301) ( 591,238,642)Interest payable 21,980,695 3,533,792Acquisition of subsidiary - 375,825,486Translation differences ( 29,620,521) -
at 31 December 11,572,650,440 4,446,419,567
Company At 1 January 3,671,573,436 2,969,262,405Funds received 8,022,500,000 1,257,000,000Payments on principal and interest ( 807,076,523) ( 558,222,762)Interest payable 21,930,695 3,533,793
at 31 December 10,908,977,608 3,671,573,436
nOTES TO ThE COnSOlIDATED AnD SEPARATE FInAnCIAl STATEMEnTSFOR ThE YEAR EnDED 31 DECEMBER 2013 (COnTInUED)

I&M Bank Limited Report and Consolidated Financial Statements 2013 I&M Bank Limited Report and Consolidated Financial Statements 201396 97
30. sHaRe CaPITal anD ReseRVes
(a) share capital
2013 2012 Kshs Kshs
authorised
30,000,000 Ordinary shares of KShs 100 each 3,000,000,000 3,000,000,000 Issued and fully paid
28,802,453 Ordinary shares of KShs 100 each 2,880,245,300 2,880,245,300
(b) Major shareholders
The major shareholders at 31st December 2013 and 2012 were as follows:
number of shares %
2013:
I&M Holdings Limited 28,802,453 100%
number of shares %
2012:
1. Minard Holdings Limited 4,475,759 15.54%2. Biashara Securities Ltd 4,008,740 13.92%3. Ziyungi Limited 4,000,000 13.89%4. Tecoma Limited 4,000,000 13.89%5. DEG 3,100,000 10.76%6. Proparco 2,575,000 8.94%7. City Trust Limited 2,097,458 7.28%8. Others 4,545,496 15.78%
28,802,453 100.00%
The distribution of shareholders as at 31st December 2013 and 2012 was as follows:
2013 2012
share number of number ofrange shareholders shares held % shareholders shares held %
Less than 1m shares - - - 105 4,545,496 15.78>1m <2m - - - - - ->2m <3m - - - 2 4,672,458 16.22>3m 1 28,802,453 100.00 5 19,584,499 68.00 Total 1 28,802,453 100.00 112 28,802,453 100.00
nOTES TO ThE COnSOlIDATED AnD SEPARATE FInAnCIAl STATEMEnTSFOR ThE YEAR EnDED 31 DECEMBER 2013 (COnTInUED)
sHaRe CaPITal anD ReseRVes (ConTInUeD)
(c) share premium
2013 2012 Kshs Kshs
At 1 January and 31 December 3,773,237,119 3,773,237,119
(d) Revaluation reserve
The revaluation reserve relates to the revaluation of Leasehold buildings.
(e) statutory loan loss reserve
Where impairment losses required by legislation or regulations exceed those computed under International Financial Reporting Standards (IFRSs), the excess is recognised as a statutory reserve and accounted for as an appropriation of retained profits and the reverse for reductions. These reserves are not distributable.
(f) Translation reserve
The translation reserve comprises foreign exchange differences arising from the translation of the financial statements of foreign operations (namely the Joint Venture in Bank One Limited – Mauritius, I&M Bank (T) Limited - Tanzania and I&M Bank (Rwanda) Limited - Rwanda into the functional currency of the Parent company.
(g) available-for-sale reserve
The available-for-sale reserve includes the cumulative net change in the fair value of available-for-sale investment, excluding impairment losses, until the investment is derecognised.
nOTES TO ThE COnSOlIDATED AnD SEPARATE FInAnCIAl STATEMEnTSFOR ThE YEAR EnDED 31 DECEMBER 2013 (COnTInUED)
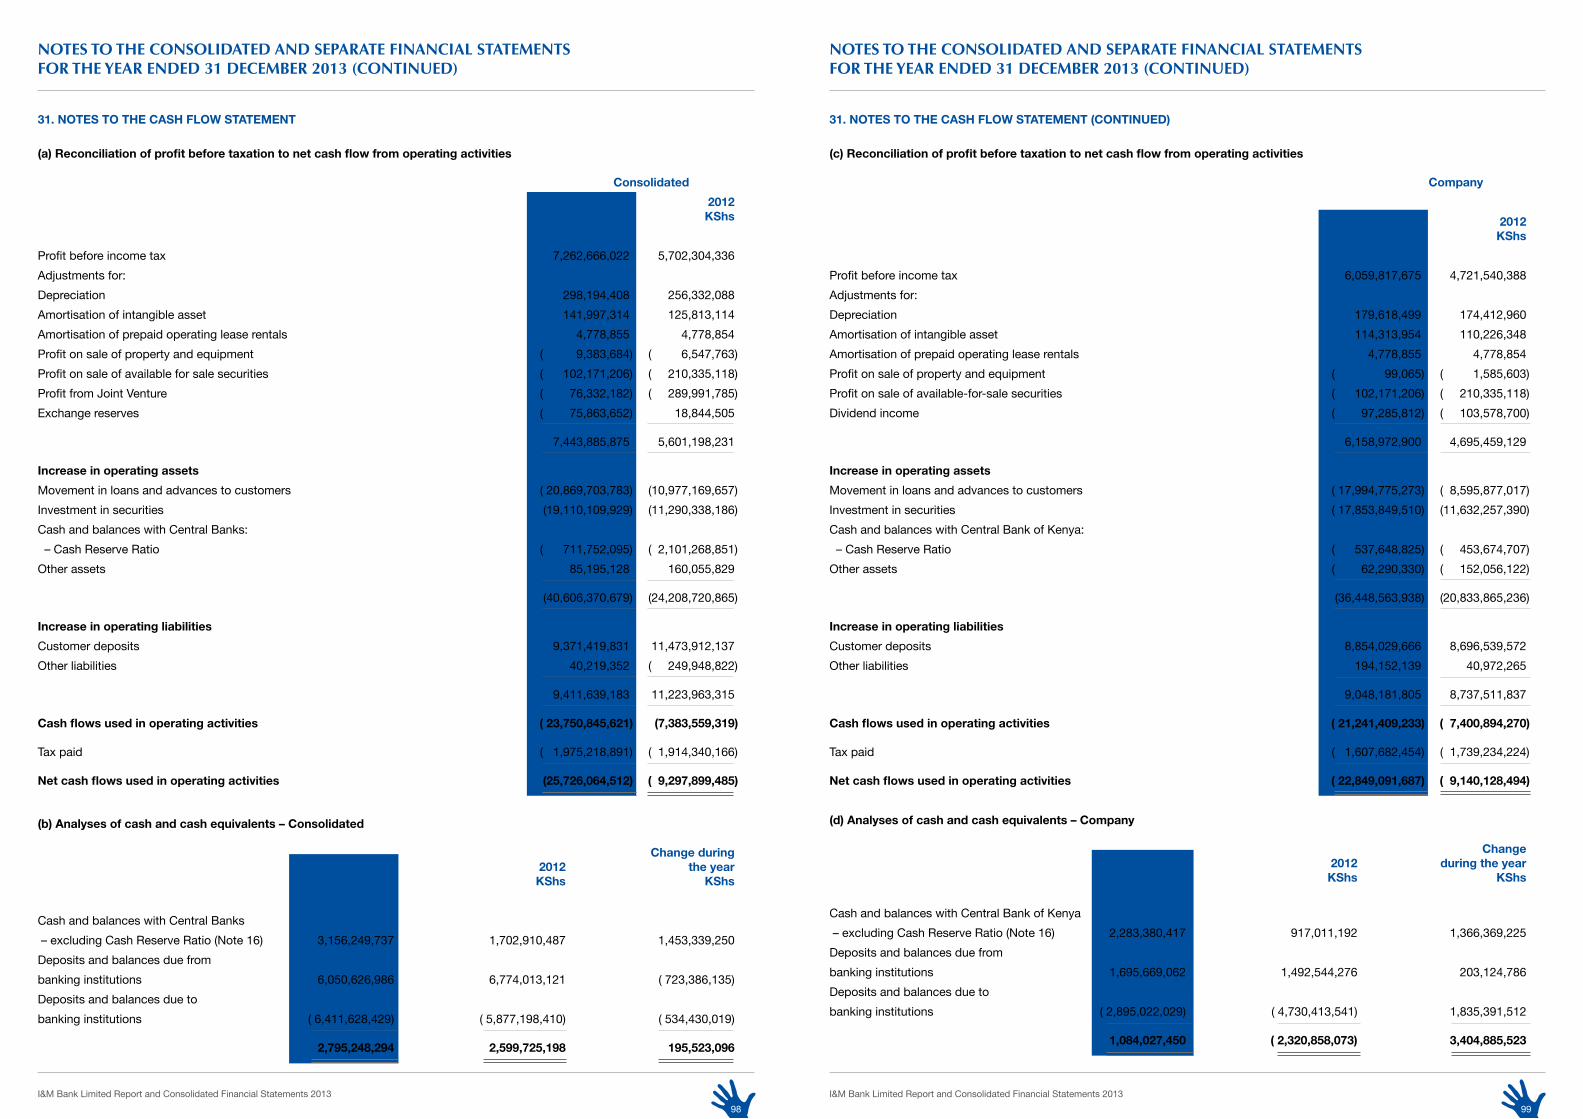
I&M Bank Limited Report and Consolidated Financial Statements 2013 I&M Bank Limited Report and Consolidated Financial Statements 201398 99
31. noTes To THe CasH floW sTaTeMenT
(a) Reconciliation of profit before taxation to net cash flow from operating activities
2013 2012 Kshs Kshs
Profit before income tax 7,262,666,022 5,702,304,336Adjustments for: Depreciation 298,194,408 256,332,088Amortisation of intangible asset 141,997,314 125,813,114Amortisation of prepaid operating lease rentals 4,778,855 4,778,854Profit on sale of property and equipment ( 9,383,684) ( 6,547,763)Profit on sale of available for sale securities ( 102,171,206) ( 210,335,118)Profit from Joint Venture ( 76,332,182) ( 289,991,785)Exchange reserves ( 75,863,652) 18,844,505
7,443,885,875 5,601,198,231
Increase in operating assets
Movement in loans and advances to customers ( 20,869,703,783) (10,977,169,657)Investment in securities (19,110,109,929) (11,290,338,186)Cash and balances with Central Banks: – Cash Reserve Ratio ( 711,752,095) ( 2,101,268,851)Other assets 85,195,128 160,055,829
(40,606,370,679) (24,208,720,865)
Increase in operating liabilities
Customer deposits 9,371,419,831 11,473,912,137Other liabilities 40,219,352 ( 249,948,822)
9,411,639,183 11,223,963,315
Cash flows used in operating activities ( 23,750,845,621) (7,383,559,319)
Tax paid ( 1,975,218,891) ( 1,914,340,166)
net cash flows used in operating activities (25,726,064,512) ( 9,297,899,485)
(b) analyses of cash and cash equivalents – Consolidated
Change during 2013 2012 the year Kshs Kshs Kshs
Cash and balances with Central Banks – excluding Cash Reserve Ratio (Note 16) 3,156,249,737 1,702,910,487 1,453,339,250Deposits and balances due from banking institutions 6,050,626,986 6,774,013,121 ( 723,386,135)Deposits and balances due tobanking institutions ( 6,411,628,429) ( 5,877,198,410) ( 534,430,019)
2,795,248,294 2,599,725,198 195,523,096
nOTES TO ThE COnSOlIDATED AnD SEPARATE FInAnCIAl STATEMEnTSFOR ThE YEAR EnDED 31 DECEMBER 2013 (COnTInUED)
31. noTes To THe CasH floW sTaTeMenT (ConTInUeD)
(c) Reconciliation of profit before taxation to net cash flow from operating activities
Company
2013 2012 Kshs Kshs
Profit before income tax 6,059,817,675 4,721,540,388Adjustments for: Depreciation 179,618,499 174,412,960Amortisation of intangible asset 114,313,954 110,226,348Amortisation of prepaid operating lease rentals 4,778,855 4,778,854Profit on sale of property and equipment ( 99,065) ( 1,585,603)Profit on sale of available-for-sale securities ( 102,171,206) ( 210,335,118)Dividend income ( 97,285,812) ( 103,578,700)
6,158,972,900 4,695,459,129
Increase in operating assets
Movement in loans and advances to customers ( 17,994,775,273) ( 8,595,877,017)Investment in securities ( 17,853,849,510) (11,632,257,390)Cash and balances with Central Bank of Kenya: – Cash Reserve Ratio ( 537,648,825) ( 453,674,707)Other assets ( 62,290,330) ( 152,056,122)
(36,448,563,938) (20,833,865,236)
Increase in operating liabilities
Customer deposits 8,854,029,666 8,696,539,572Other liabilities 194,152,139 40,972,265
9,048,181,805 8,737,511,837
Cash flows used in operating activities ( 21,241,409,233) ( 7,400,894,270)
Tax paid ( 1,607,682,454) ( 1,739,234,224)
net cash flows used in operating activities ( 22,849,091,687) ( 9,140,128,494)
(d) analyses of cash and cash equivalents – Company Change 2013 2012 during the year Kshs Kshs Kshs
Cash and balances with Central Bank of Kenya – excluding Cash Reserve Ratio (Note 16) 2,283,380,417 917,011,192 1,366,369,225Deposits and balances due frombanking institutions 1,695,669,062 1,492,544,276 203,124,786Deposits and balances due to banking institutions ( 2,895,022,029) ( 4,730,413,541) 1,835,391,512
1,084,027,450 ( 2,320,858,073) 3,404,885,523
nOTES TO ThE COnSOlIDATED AnD SEPARATE FInAnCIAl STATEMEnTSFOR ThE YEAR EnDED 31 DECEMBER 2013 (COnTInUED)
Consolidated
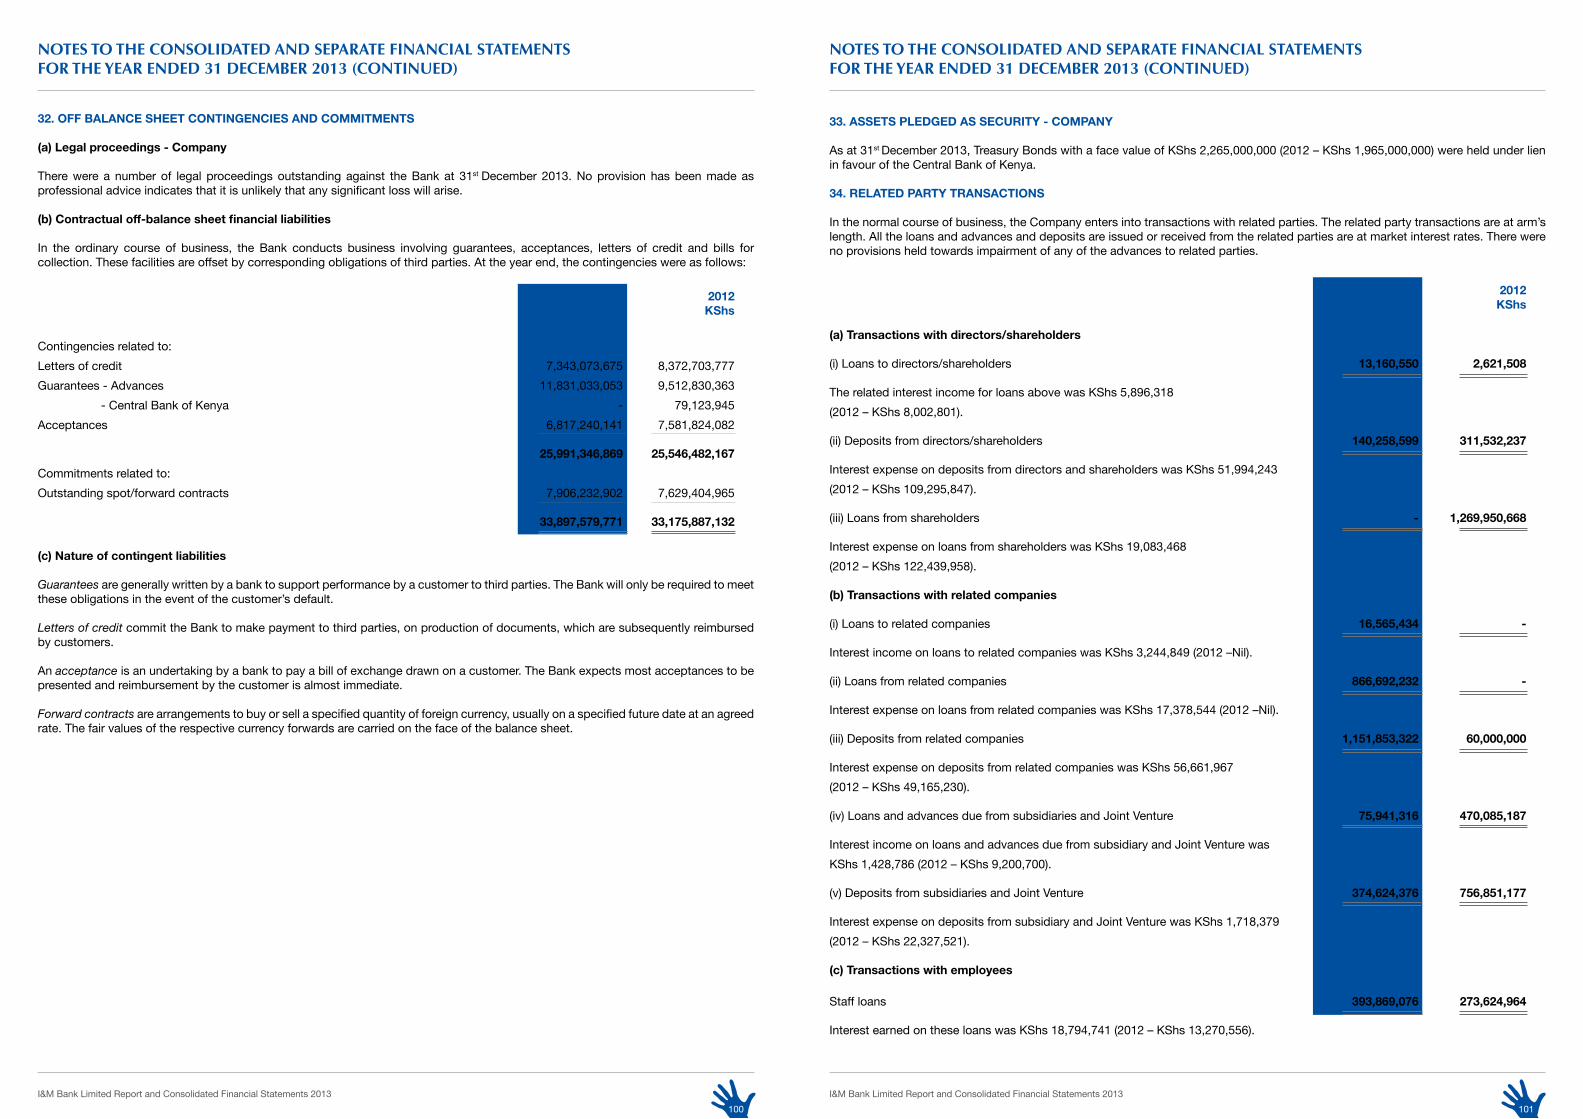
I&M Bank Limited Report and Consolidated Financial Statements 2013 I&M Bank Limited Report and Consolidated Financial Statements 2013100 101
32. off balanCe sHeeT ConTInGenCIes anD CoMMITMenTs
(a) legal proceedings - Company
There were a number of legal proceedings outstanding against the Bank at 31st December 2013. No provision has been made as professional advice indicates that it is unlikely that any significant loss will arise. (b) Contractual off-balance sheet financial liabilities
In the ordinary course of business, the Bank conducts business involving guarantees, acceptances, letters of credit and bills for collection. These facilities are offset by corresponding obligations of third parties. At the year end, the contingencies were as follows:
2013 2012 Kshs Kshs
Contingencies related to:Letters of credit 7,343,073,675 8,372,703,777Guarantees - Advances 11,831,033,053 9,512,830,363 - Central Bank of Kenya - 79,123,945Acceptances 6,817,240,141 7,581,824,082 25,991,346,869 25,546,482,167
Commitments related to:Outstanding spot/forward contracts 7,906,232,902 7,629,404,965
33,897,579,771 33,175,887,132
(c) nature of contingent liabilities
Guarantees are generally written by a bank to support performance by a customer to third parties. The Bank will only be required to meet these obligations in the event of the customer’s default.
Letters of credit commit the Bank to make payment to third parties, on production of documents, which are subsequently reimbursed by customers.
An acceptance is an undertaking by a bank to pay a bill of exchange drawn on a customer. The Bank expects most acceptances to be presented and reimbursement by the customer is almost immediate.
Forward contracts are arrangements to buy or sell a specified quantity of foreign currency, usually on a specified future date at an agreed rate. The fair values of the respective currency forwards are carried on the face of the balance sheet.
nOTES TO ThE COnSOlIDATED AnD SEPARATE FInAnCIAl STATEMEnTSFOR ThE YEAR EnDED 31 DECEMBER 2013 (COnTInUED)
33. asseTs PleDGeD as seCURITY - CoMPanY
As at 31st December 2013, Treasury Bonds with a face value of KShs 2,265,000,000 (2012 – KShs 1,965,000,000) were held under lien in favour of the Central Bank of Kenya.
34. RelaTeD PaRTY TRansaCTIons
In the normal course of business, the Company enters into transactions with related parties. The related party transactions are at arm’s length. All the loans and advances and deposits are issued or received from the related parties are at market interest rates. There were no provisions held towards impairment of any of the advances to related parties.
2013 2012 Kshs Kshs
(a) Transactions with directors/shareholders
(i) Loans to directors/shareholders 13,160,550 2,621,508
The related interest income for loans above was KShs 5,896,318 (2012 – KShs 8,002,801).
(ii) Deposits from directors/shareholders 140,258,599 311,532,237
Interest expense on deposits from directors and shareholders was KShs 51,994,243 (2012 – KShs 109,295,847).
(iii) Loans from shareholders - 1,269,950,668
Interest expense on loans from shareholders was KShs 19,083,468 (2012 – KShs 122,439,958).
(b) Transactions with related companies
(i) Loans to related companies 16,565,434 -
Interest income on loans to related companies was KShs 3,244,849 (2012 –Nil).
(ii) Loans from related companies 866,692,232 -
Interest expense on loans from related companies was KShs 17,378,544 (2012 –Nil).
(iii) Deposits from related companies 1,151,853,322 60,000,000
Interest expense on deposits from related companies was KShs 56,661,967 (2012 – KShs 49,165,230).
(iv) Loans and advances due from subsidiaries and Joint Venture 75,941,316 470,085,187
Interest income on loans and advances due from subsidiary and Joint Venture was KShs 1,428,786 (2012 – KShs 9,200,700).
(v) Deposits from subsidiaries and Joint Venture 374,624,376 756,851,177
Interest expense on deposits from subsidiary and Joint Venture was KShs 1,718,379 (2012 – KShs 22,327,521).
(c) Transactions with employees
Staff loans 393,869,076 273,624,964
Interest earned on these loans was KShs 18,794,741 (2012 – KShs 13,270,556).
nOTES TO ThE COnSOlIDATED AnD SEPARATE FInAnCIAl STATEMEnTSFOR ThE YEAR EnDED 31 DECEMBER 2013 (COnTInUED)

I&M Bank Limited Report and Consolidated Financial Statements 2013 I&M Bank Limited Report and Consolidated Financial Statements 2013102 103
35. CaPITal CoMMITMenTs
2013 2012 Kshs Kshs
Consolidated 777,816,460 36,687,344
36. fUTURe RenTal CoMMITMenTs UnDeR oPeRaTInG leases – CoMPanY
(a) lessee
The Bank leases twenty bank premises under operating leases. The leases typically run for an initial period of six years with an option to renew the lease after that date. None of the leases include contingent rentals. During the year, KShs 116,245,255 (2012 – KShs 93,697,778) was charged to the Profit or loss statement in respect of operating leases. Future minimum lease payments under these operating leases are as follows:
2013 2012 Kshs Kshs
Less than one year 131,674,109 84,735,638One to five years 467,207,073 246,730,016Over five years 133,802,242 52,198,722
732,683,424 383,664,376
(b) lessor
The company leases out its building under operating leases. Non-cancellable operating lease rentals are receivable as follows:
2013 2012 Kshs Kshs
Less than one year 84,484,423 73,944,110One to five years 379,181,704 304,861,372Over five years - -
463,666,127 378,805,482
During the year, KShs 81,034,541 (2012 – KShs 77,575,884) was recognized as rental income in the income statement in respect of operating leases. In addition, KShs 40,069,169 (2012 – KShs 54,178,076) in respect of management expenses was recognized as an expense in the income statement in respect of the building.
37. eMPloYee benefITs sCHeMe In THe JoInT VenTURe
The Joint venture in Bank One Limited has an employee benefit scheme. The actuarial losses of KShs 22,036,978 (2012 actuarial gains – KShs 383,577) have been recognised in other comprehensive income.
nOTES TO ThE COnSOlIDATED AnD SEPARATE FInAnCIAl STATEMEnTSFOR ThE YEAR EnDED 31 DECEMBER 2013 (COnTInUED)
NOBLEACCOUNT
FOR NON-PROFIT ORGANISATIONS
CONTACT (020)3221000 or visit: www.imbank.com

Nourishing the mind.Education is one of the main aspects of community development that we at I&M Bank have been reaching out to since 2007. Our monetary contributions towards this cause have been in excess of KShs 9million and have so far extended to needy or impaired students in 4 institutions.
Next year, we are preparing to employ some of our sponsored graduating students...which for us is cause for huge pride. Minds that we have helped enrich will in turn enrich us!
As a final word, Mr Henry Konga, Project Coordinator of the Ongata Rongai Training Center said, ‘It is small things done with compassion and love by people like you that change the world and make a difference...at our center.’
Teule students send I&M Bank (Kenya) a thank you card showing their appreciation for support in tuition and mentoring of students.
Members of the I&M Bank (Kenya) CSR Team hold a mentoring session with the I&M Bank scholarship recipients at the Strathmore University

I&M Bank Limited Report and Consolidated Financial Statements 2013 I&M Bank Limited Report and Consolidated Financial Statements 2013106 107
I&M CSR
As a responsible corporate citizen I&M Bank has a social responsibility to share its success with the communities where it operates. The bank has continued to deepen its relationship with various support groups while providing opportunities to our employees to participate in various CSR activities. I&M Bank perceives the ‘community’ as a key stakeholder in its business initiatives and various activities were undertaken under 4 key social pillars; Education, Health, Environment and Community Support.
eDUCaTIon
I&M Bank (K) Ltd contributed approximately KShs 9 million in scholarship programs for the following:
Palmhouse foundation
The Palmhouse Foundation provides scholarships for secondary education to bright and talented children from financially challenged families. Palmhouse Foundation also mentors these children through life to help them transform their own lives and in turn that of their families. I&M Bank has been supporting this foundation since 2007 and, made a donation of KShs 4 million in 2013 for the education and mentoring of forty deserving students.
strathmore University scholarship Programme
Every year I&M Bank provides scholarships to 10 needy students pursuing various Finance related degree programmes for a total contribution per year of KShs 1.75 million per year. This year we are proud to announce that our first group of students will be graduating in May. We will also be preparing for intake of the 2nd set of students.
Tabitha Olang’ one of the graduating students had this to say “I joined the I&M Bank family in 2010 when they granted me a full scholarship to study BBS Actuarial Science in Strathmore University. I am grateful that they gave me a chance to pursue my love for mathematics albeit my poor background. I say I&M Bank family because, even after giving us scholarships, they also took care of us, keeping constant communication, advising us, mentoring us, priding in our achievements and also encouraging
us in our failures, they even gave four of us internship opportunities in I&M Bank during our industrial attachment at the end of our third year. This was more than a scholarship, they embraced and took us in as their own children. Their support and belief in us has been my motivation to do my best in my studies and not let them down and to achieve the very best as they expected of me. Thank you I&M Bank, you were an answer to my prayers. I will forever be grateful to you.”
st anne’s Gichocho
St. Anne’s Gichocho Girls Secondary School is a Catholic girl’s secondary school located in Gichocho approximately 4km from Ndumberi in Kiambu. Every year I&M Bank makes a contribution of KShs 375,000 for tuition for 5 students.
oshwal academy
I&M Bank sponsors talented students at Oshwal Academy with a contribution of approximately KShs 1.3 million.
Tuele Kenya
Teule Kenya is a non-governmental organization, registered in March 1996 under the NGO Act located in Oloitoktok. Teule works with children from the streets who are orphaned, abandoned and vulnerable with the aim of educating and rehabilitating them. They also provide basic needs for the children like food, shelter, clothing and education. The bank paid KShs 700,000/- towards payment of tuition fees to selected students in various secondary schools.
I&M CSR (COnTInUED)
Gertrude’s Children’s Hospital
I&M Bank donated KShs 25 million to Getrude’s Children’s Hospital for the construction of the new ultra-modern Radiology and Paedriatic critical care departments of the newly constructed hospital wing.
enVIRonMenT
I&M Bank have undertaken to develop 25 acres at the Karura Forest as a commitment to preserving the environment. Last year, we developed and planted different species of indigenous trees on 10 acres of the land to restore areas that had burnt down in an unfortunate forest fire.
Roho Kwa Roho foundation
I&M Bank sponsors school fees for 10 children under Roho Kwa Roho Foundation who attend Ongata Rongai Special Home Care and Training Centre School. The Bank contributed KShs 540,000 for the student’s school fees in 2013. Henry Konga, Project Coordinator of the Ongata Rongai Special Home Care and Training Centre said “It is the small things done with compassion and love by people like you, that change the world and make a difference for mentally impaired children at our centre”.
HealTH
I&M Bank sponsored a total of approximately KShs 32 million in health activities.
We conducted a successful blood drive that contributed over 260 pints to the National Blood Bank. Other initiatives supported included:
Mamujee brothers foundation
The Mamujee Brothers Foundation in conjunction with MEAK runs this programme. MEAK (Medical and Education Aid to Kenya) is a group of mobile doctors who travel around the world performing congenital paedriatic heart surgery. I&M donated KShs 1.8 million which was used for 15 paedriatic heart surgeries.
shree Jalaram lab and Diagnostics Centre
I&M Bank made a donation of KShs 3.2 million for a GE Ultra Sound machine for Shree Jalaram Lab and Diagnostics Centre.
Mathare Hospital
The Bank also donated through Phillips Healthcare Services Ltd a total of KShs 2 million for drug delivery to Mathare Hospital.

I&M Bank Limited Report and Consolidated Financial Statements 2013108
I&M CSR (COnTInUED)
new life Home Trust
New Life Home Trust was founded by Clive and Mary Beckenham in response to the high numbers of abandoned and orphaned babies particularly those with HIV and Aids. I&M Bank donated KShs 3.7 million for a double twin cab Isuzu pickup for use as a rescue vehicle in Central province and the surrounding areas under their Nyeri Home. Abandoned children rescued from this region are driven to nearby hospitals and the Nairobi centre for special medical care.
George Kibuku, the County Director of Children’s Services at the Ministry of Labour, Social Security and Services said “Your generous, worthy and rare gift shall be remembered in the Children’s Sector for a very long time to come”.
Africa Heart Association
I&M Bank through the Africa Health Education Africa Resource Team participated in the Freedom for Girls girl child campaign which supplied sanitary towels for school girls in Kisii worth KShs 1 million.
CoMMUnITY seRVICe
We sponsored a total of approximately KShs 16 million towards various initiatives.
The bank dedicated one day for staff to visit various children’s homes that we support. The event which saw about 250 staff members visiting 4 homes was very successful. Among the community projects that we have supported are:
Nest Children’s Home
This is a rescue centre that caters for abandoned babies and those whose mothers have been imprisoned and have no relatives to care for them. The bank made an annual donation of KShs 1 million towards purchasing baby formula milk and food for the severely malnourished babies aged 0 – 7years.
Asirit
One of the main reasons for road accidents is lack of proper road safety measures. Kasarani Primary School has suffered a great blow from ongoing traffic from the main road at the school entrance. I&M Bank Ltd made a donation of KShs 200,000 towards the purchase of reflective road safety sashes for pupils of Kasarani Primary School.
St Martin’s Kibagare – Annual Feeding Program
The Assumption Sisters of Nairobi run Kibagare Centre as a settlement for the hungry children. I&M Bank through their commitment to helping the poor orphaned children of Kibagare participate in a monthly feeding programme that sees over 1500 children from nearby slums enjoy a hearty meal served by the Bank’s staff.