annual report 2013–2014 - calcpa
TRANSCRIPT
16 2 0 1 4 c a l c p a a n n u a l r e p o r t www.calcpa.org
Access the Annual Report online at www.calcpa.org
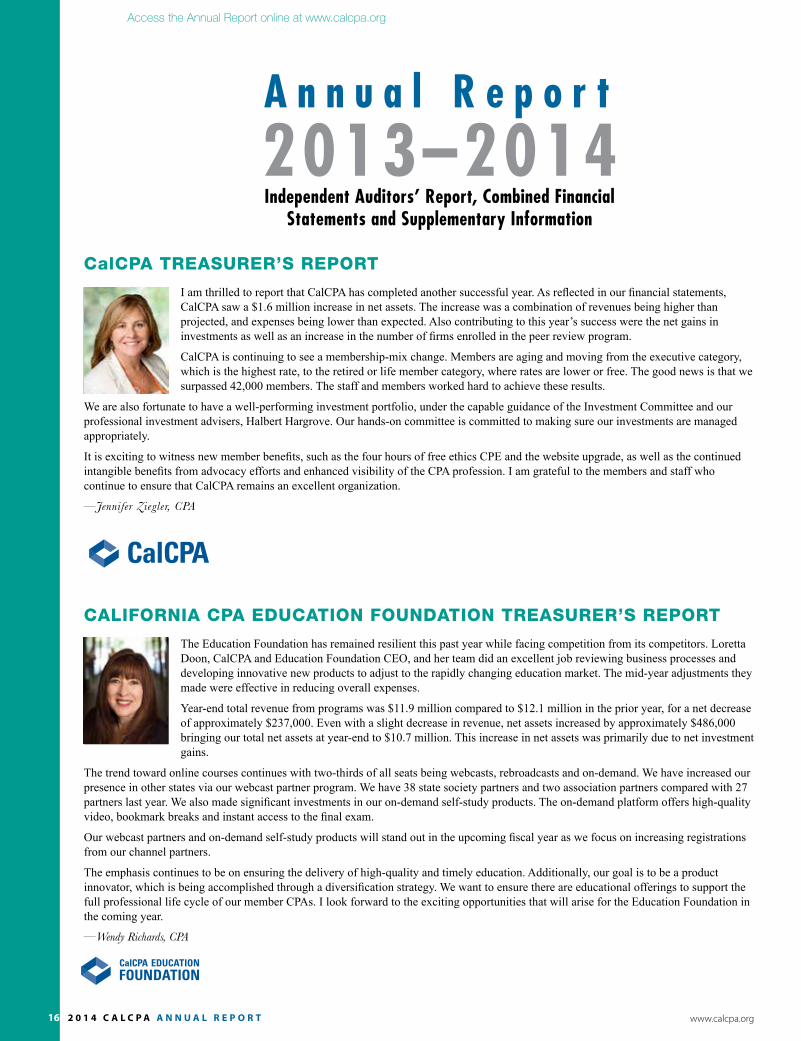
CalCPA TREASURER’S REPORT
I am thrilled to report that CalCPA has completed another successful year. As reflected in our financial statements, CalCPA saw a $1.6 million increase in net assets. The increase was a combination of revenues being higher than projected, and expenses being lower than expected. Also contributing to this year’s success were the net gains in investments as well as an increase in the number of firms enrolled in the peer review program.
CalCPA is continuing to see a membership-mix change. Members are aging and moving from the executive category, which is the highest rate, to the retired or life member category, where rates are lower or free. The good news is that we surpassed 42,000 members. The staff and members worked hard to achieve these results.
We are also fortunate to have a well-performing investment portfolio, under the capable guidance of the Investment Committee and our professional investment advisers, Halbert Hargrove. Our hands-on committee is committed to making sure our investments are managed appropriately.
It is exciting to witness new member benefits, such as the four hours of free ethics CPE and the website upgrade, as well as the continued intangible benefits from advocacy efforts and enhanced visibility of the CPA profession. I am grateful to the members and staff who continue to ensure that CalCPA remains an excellent organization.
—Jennifer Ziegler, CPA
CAlifORniA CPA EdUCATiOn fOUndATiOn TREASURER’S REPORT
The Education Foundation has remained resilient this past year while facing competition from its competitors. Loretta Doon, CalCPA and Education Foundation CEO, and her team did an excellent job reviewing business processes and developing innovative new products to adjust to the rapidly changing education market. The mid-year adjustments they made were effective in reducing overall expenses.
Year-end total revenue from programs was $11.9 million compared to $12.1 million in the prior year, for a net decrease of approximately $237,000. Even with a slight decrease in revenue, net assets increased by approximately $486,000 bringing our total net assets at year-end to $10.7 million. This increase in net assets was primarily due to net investment gains.
The trend toward online courses continues with two-thirds of all seats being webcasts, rebroadcasts and on-demand. We have increased our presence in other states via our webcast partner program. We have 38 state society partners and two association partners compared with 27 partners last year. We also made significant investments in our on-demand self-study products. The on-demand platform offers high-quality video, bookmark breaks and instant access to the final exam.
Our webcast partners and on-demand self-study products will stand out in the upcoming fiscal year as we focus on increasing registrations from our channel partners.
The emphasis continues to be on ensuring the delivery of high-quality and timely education. Additionally, our goal is to be a product innovator, which is being accomplished through a diversification strategy. We want to ensure there are educational offerings to support the full professional life cycle of our member CPAs. I look forward to the exciting opportunities that will arise for the Education Foundation in the coming year.
—Wendy Richards, CPA
A n n u a l R e p o r t
Independent Auditors’ Report, Combined Financial Statements and Supplementary Information
2013–2014
2 0 1 4 c a l c p a a n n u a l r e p o r t 17www.calcpa.org
Access the Annual Report online at www.calcpa.org
AnnUAl REPORT TAblE Of COnTEnTS
Independent Auditors’ Report .................................................... 18
Combined Financial Statements: Combined Statements of Financial Position ....................... 20 Combined Statements of Activities ..................................... 21 Combined Statements of Functional Expenses ................. 22 Combined Statements of Cash Flows ................................. 23 Notes to the Combined Financial Statements ..................... 24
Supplementary Information: Combining Statements of Financial Position....................... 29 Combining Statements of Activities .................................... 31 Combining Statements of Functional Expenses ................ 33 Combining Statements of Cash Flows ................................ 34

18 2 0 1 4 c a l c p a a n n u a l r e p o r t www.calcpa.org
Access the Annual Report online at www.calcpa.org
1
Independent Auditors’ Report
COUNCIL OF THE CALIFORNIA SOCIETY
OF CERTIFIED PUBLIC ACCOUNTANTS
and
BOARD OF TRUSTEES OF THE CALIFORNIA
CERTIFIED PUBLIC ACCOUNTANTS
EDUCATION FOUNDATION
San Mateo, California
Report on the Combined Financial Statements
We have audited the accompanying combined financial statements of California Society of
Certified Public Accountants (Society) and California Certified Public Accountants
Education Foundation (Foundation), which comprise the combined statements of financial
position as of April 30, 2014 and 2013, and the related combined statements of activities,
functional expenses, and cash flows for the years then ended, and the related notes to the
financial statements.
Management’s Responsibility for the Combined Financial Statements
Management is responsible for the preparation and fair presentation of these combined
financial statements in accordance with accounting principles generally accepted in the
United States of America; this includes the design, implementation, and maintenance of
internal control relevant to the preparation and fair presentation of combined financial
statements that are free from material misstatement, whether due to fraud or error.
Auditors’ Responsibility
Our responsibility is to express an opinion on these combined financial statements based on
our audits. We conducted our audits in accordance with auditing standards generally
accepted in the United States of America. Those standards require that we plan and perform
the audit to obtain reasonable assurance about whether the combined financial statements are
free of material misstatement.
Consultants and
Business Advisors
100 First Street
14th Floor
San Francisco
CA 94105
415.781.0793
fax 415.421.2976
60 South Market Street
Suite 200
San Jose
CA 95113
408.998.8400
fax 408.998.8485
2 0 1 4 c a l c p a a n n u a l r e p o r t 19www.calcpa.org
Access the Annual Report online at www.calcpa.org
2
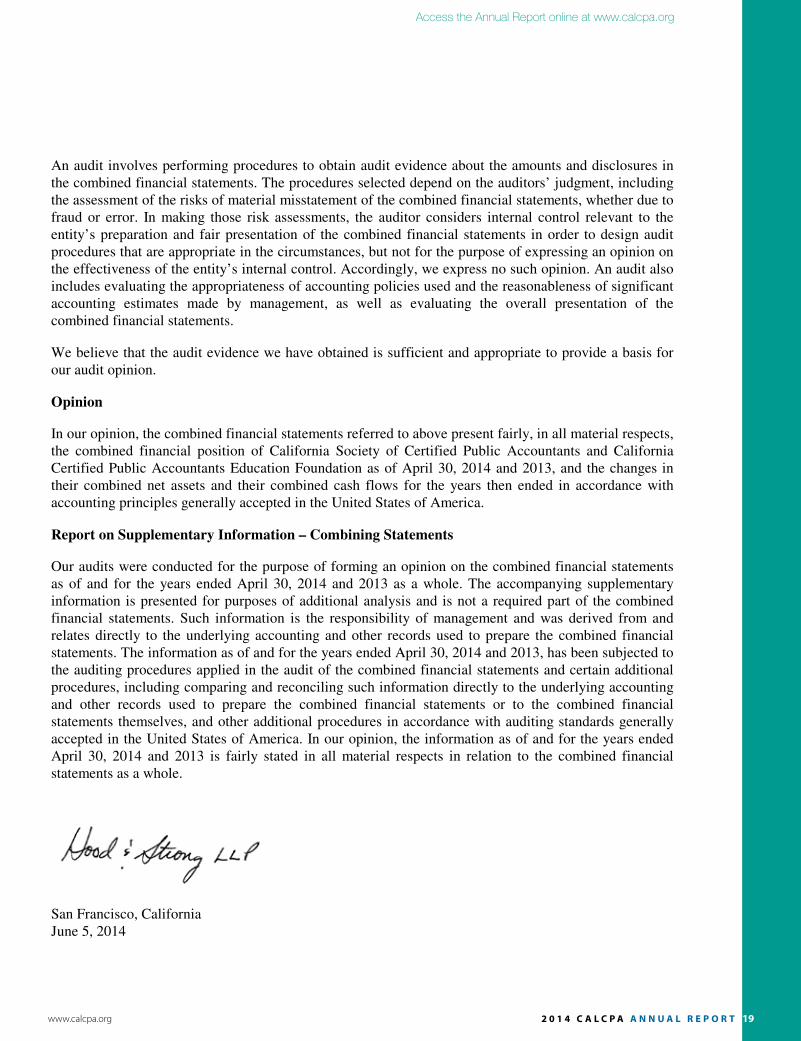
An audit involves performing procedures to obtain audit evidence about the amounts and disclosures in
the combined financial statements. The procedures selected depend on the auditors’ judgment, including
the assessment of the risks of material misstatement of the combined financial statements, whether due to
fraud or error. In making those risk assessments, the auditor considers internal control relevant to the
entity’s preparation and fair presentation of the combined financial statements in order to design audit
procedures that are appropriate in the circumstances, but not for the purpose of expressing an opinion on
the effectiveness of the entity’s internal control. Accordingly, we express no such opinion. An audit also
includes evaluating the appropriateness of accounting policies used and the reasonableness of significant
accounting estimates made by management, as well as evaluating the overall presentation of the
combined financial statements.
We believe that the audit evidence we have obtained is sufficient and appropriate to provide a basis for
our audit opinion.
Opinion
In our opinion, the combined financial statements referred to above present fairly, in all material respects,
the combined financial position of California Society of Certified Public Accountants and California
Certified Public Accountants Education Foundation as of April 30, 2014 and 2013, and the changes in
their combined net assets and their combined cash flows for the years then ended in accordance with
accounting principles generally accepted in the United States of America.
Report on Supplementary Information – Combining Statements
Our audits were conducted for the purpose of forming an opinion on the combined financial statements
as of and for the years ended April 30, 2014 and 2013 as a whole. The accompanying supplementary
information is presented for purposes of additional analysis and is not a required part of the combined
financial statements. Such information is the responsibility of management and was derived from and
relates directly to the underlying accounting and other records used to prepare the combined financial
statements. The information as of and for the years ended April 30, 2014 and 2013, has been subjected to
the auditing procedures applied in the audit of the combined financial statements and certain additional
procedures, including comparing and reconciling such information directly to the underlying accounting
and other records used to prepare the combined financial statements or to the combined financial
statements themselves, and other additional procedures in accordance with auditing standards generally
accepted in the United States of America. In our opinion, the information as of and for the years ended
April 30, 2014 and 2013 is fairly stated in all material respects in relation to the combined financial
statements as a whole.
San Francisco, California
June 5, 2014
20 2 0 1 4 c a l c p a a n n u a l r e p o r t www.calcpa.org
Access the Annual Report online at www.calcpa.org
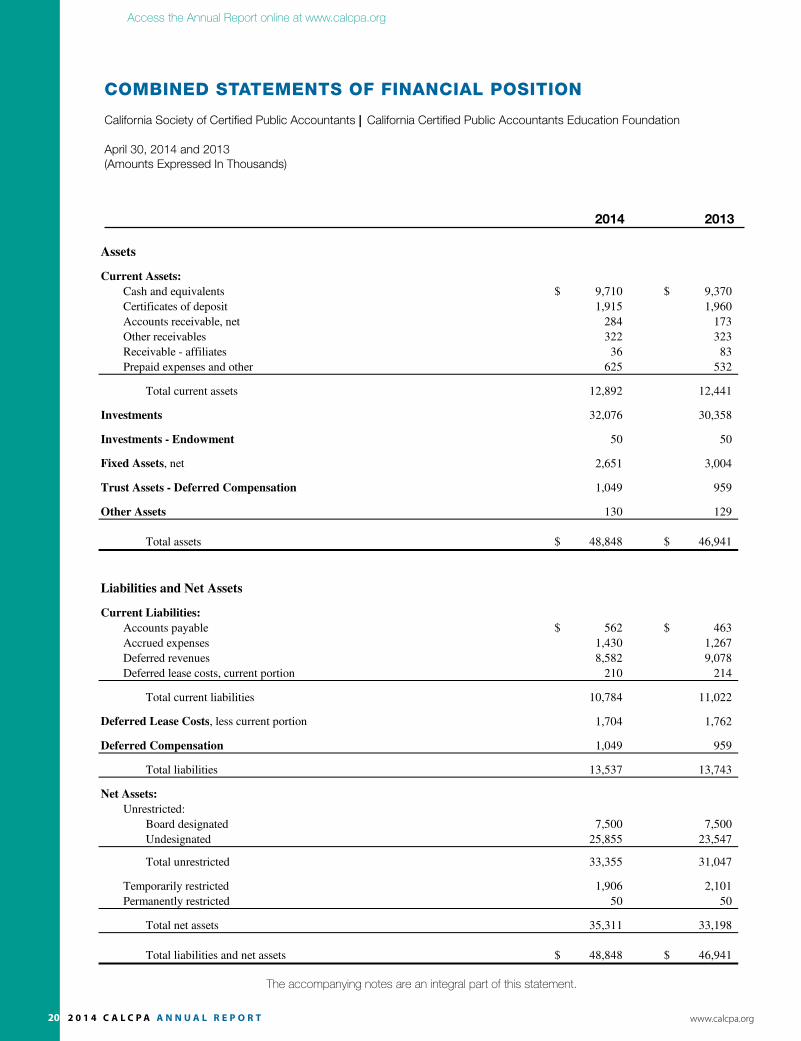
COMbinEd STATEMEnTS Of finAnCiAl POSiTiOn
California Society of Certified Public Accountants | California Certified Public Accountants Education Foundation
April 30, 2014 and 2013(Amounts Expressed In Thousands)
The accompanying notes are an integral part of this statement.
2014 2013
California Society of Certified Public Accountants
California Certified Public Accountants Education Foundation
Combined Statements of Financial Position
(In Thousands)
April 30,
Assets
Current Assets:
Cash and equivalents $ 9,710 $ 9,370
Certificates of deposit 1,915 1,960
Accounts receivable, net 284 173
Other receivables 322 323
Receivable - affiliates 36 83
Prepaid expenses and other 625 532
Total current assets 12,892 12,441
Investments 32,076 30,358
Investments - Endowment 50 50
Fixed Assets, net 2,651 3,004
Trust Assets - Deferred Compensation 1,049 959
Other Assets 130 129
Total assets $ 48,848 $ 46,941
Liabilities and Net Assets
Current Liabilities:
Accounts payable $ 562 $ 463
Accrued expenses 1,430 1,267
Deferred revenues 8,582 9,078
Deferred lease costs, current portion 210 214
Total current liabilities 10,784 11,022
Deferred Lease Costs, less current portion 1,704 1,762
Deferred Compensation 1,049 959
Total liabilities 13,537 13,743
Net Assets:
Unrestricted:
Board designated 7,500 7,500
Undesignated 25,855 23,547
Total unrestricted 33,355 31,047
Temporarily restricted 1,906 2,101
Permanently restricted 50 50
Total net assets 35,311 33,198
Total liabilities and net assets $ 48,848 $ 46,941
2014 2013
The accompanying notes are an integral part of this statement.
3

2 0 1 4 c a l c p a a n n u a l r e p o r t 21www.calcpa.org
Access the Annual Report online at www.calcpa.org
COMbinEd STATEMEnTS Of ACTiviTiES
California Society of Certified Public Accountants | California Certified Public Accountants Education Foundation
Years Ended April 30, 2014 and 2013(Amounts Expressed In Thousands)
2014 2013
The accompanying notes are an integral part of this statement.
California Society of Certified Public Accountants
California Certified Public Accountants Education Foundation
Combined Statements of Activities
(In Thousands)
Years Ended April 30,
Unrestricted Net Assets:
Unrestricted revenues:
Dues $ 9,403 $ 9,520
Professional education programs 11,844 12,082
Peer review fees 1,325 1,407
Member meetings and events 831 827
Advertising 620 672
Affiliation fees 557 576
Royalties and affinity programs 183 152
Investment income, net 1,602 2,298
Other income 247 198
Total unrestricted revenues 26,612 27,732
Net assets released from restrictions 775 576
Total revenues 27,387 28,308
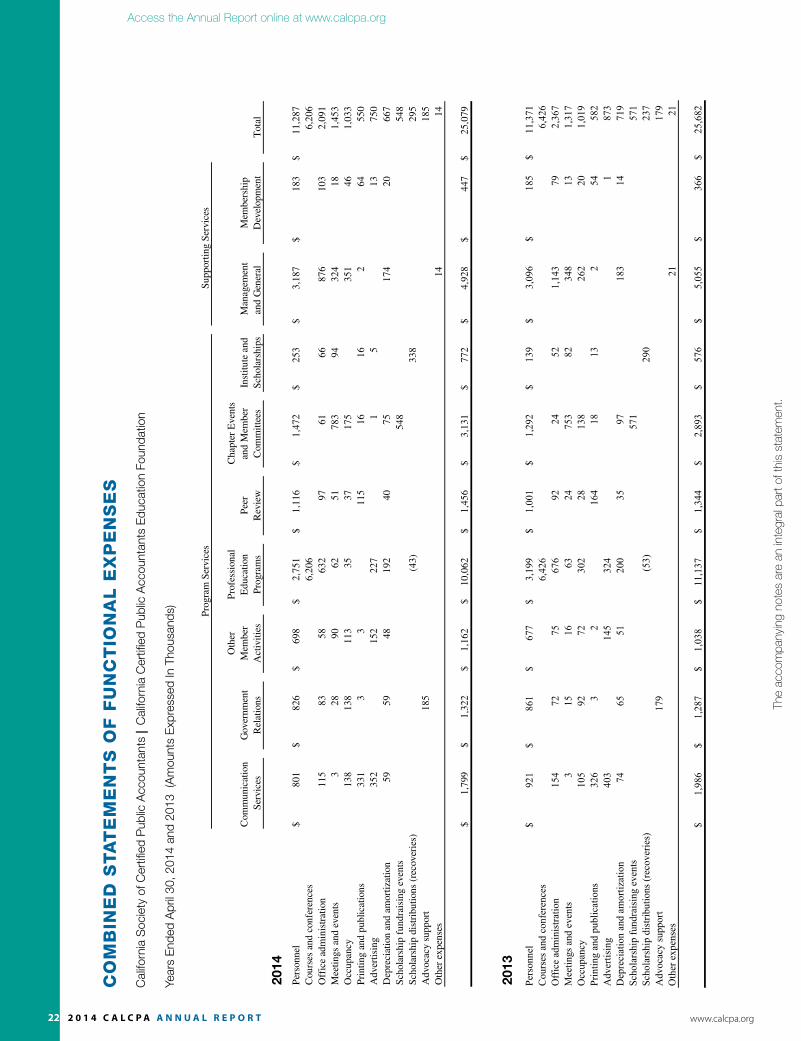
Expenses:
Program services:
Communication services 1,799 1,986
Government relations 1,322 1,287
Other member activities 1,162 1,038
Professional education programs 10,062 11,137
Peer review 1,456 1,344
Chapter events and member committees 3,131 2,893
Institute and scholarships 772 576
Supporting services:
Management and general 4,928 5,055
Membership development 447 366
Total expenses 25,079 25,682
Change in unrestricted net assets 2,308 2,626
Temporarily Restricted Net Assets:
Net proceeds from scholarship events held by the Society 281 271
Scholarship contributions 34 36
Financial literacy and other program contributions 140 260
Investment income, net 125 190
Net assets released from restrictions (775) (576)
Change in temporarily restricted net assets (195) 181
Change in Net Assets 2,113 2,807
Net Assets, beginning of year 33,198 30,391
Net Assets, end of year $ 35,311 $ 33,198
2014 2013
The accompanying notes are an integral part of this statement.
4
22 2 0 1 4 c a l c p a a n n u a l r e p o r t www.calcpa.org
Access the Annual Report online at www.calcpa.org
CO
Mb
inE
d S
TA
TE
ME
nT
S O
f f
Un
CT
iOn
Al
Ex
PE
nS
ES
Cal
iforn
ia S
ocie
ty o
f Cer
tified
Pub
lic A
ccou
ntan
ts |
Cal
iforn
ia C
ertifi
ed P
ublic
Acc
ount
ants
Edu
catio
n Fo
unda
tion
Year
s E
nded
Apr
il 30
, 201
4 an
d 20
13 (
Am
ount
s E
xpre
ssed
In T
hous
ands
)
The
acco
mpa
nyin
g no
tes
are
an in
tegr
al p
art o
f thi
s st
atem
ent.
Yea
r E
nd
ed A
pri
l 3
0,
20
14
Ch
apte
r E
ven
ts
Com
mu
nic
atio
nIn
stit
ute
an
d
Sch
ola
rsh
ips
Tota
l
Per
son
nel
$8
01
$8
26
$6
98
$2
,75
1$
1,1
16
$1
,47
2$
25
3$
3,1
87
$1
83
$1
1,2
87
Cou
rses
an
d c
on
fere
nce
s6
,20
66
,20
6
Off
ice
adm
inis
trat
ion
11
58
35
86
32
97
61
66
87
61
03
2,0
91
Mee
tin
gs
and
even
ts3
28
90
62
51
78
39
43
24
18
1,4
53
Occ
up
ancy
13
81
38
11
33
53
71
75
35
14
61
,03
3
Pri
nti
ng a
nd
pu
bli
cati
on
s3
31
33
11
51
61
62
64
55
0
Ad
ver
tisi
ng
35
21
52
22
71
51
37
50
Dep
reci
atio
n a
nd
am
ort
izat
ion
59
59
48
19
24
07
51
74
20
66
7
Sch
ola
rsh
ip f
un
dra
isin
g e
ven
ts5
48
54
8
Sch
ola
rsh
ip d
istr
ibu
tion
s (r
ecover
ies)
(43
)3
38
29
5
Ad
voca
cy s
up
port
18
51
85
Oth
er e
xp
ense
s1
41
4
$1
,79
9$
1,3
22
$1
,16
2$
10
,06
2$
1,4
56
$3
,13
1$
77
2$
4,9
28
$4
47
$2
5,0
79
and
Gen
eral
Man
agem
ent
Dev
elop
men
t
Mem
ber
ship
Oth
er
Pro
gra
ms
Ed
uca
tion
Pro
fess
ion
al
Rev
iew
Pee
r
Su
pp
ort
ing S
ervic
es
Ca
lifo
rnia
So
ciet
y o
f C
erti
fied
Pu
bli
c A
cco
un
tan
ts
Ca
lifo
rnia
Cer
tifi
ed P
ub
lic
Acc
ou
nta
nts
Ed
uca
tio
n F
ou
nd
ati
on
Co
mb
ined
Sta
tem
ent
of
Fu
nct
ion
al
Ex
pen
ses
(In
Th
ou
san
ds)
and
Mem
ber
Com
mit
tees
Pro
gra
m S
ervic
es
Ser
vic
esR
elat
ion
s
Gover
nm
ent
Act
ivit
ies
Mem
ber
Th
e ac
com
pan
yin
g n
ote
s ar
e an
in
tegra
l p
art
of
this
sta
tem
ent.
5
2014
2013
Year
End
ed A
pril
30, 2
013
Cha
pter
Eve
nts
Com
mun
icat
ion
Inst
itute
and
Scho
lars
hips
Tota
l
Pers
onne
l$
921
$86
1$
677
$3,
199
$1,
001
$1,
292
$13
9$
3,09
6$
185
$11
,371
Cou
rses
and
con
fere
nces
6,42
66,
426
Off
ice
adm
inis
tratio
n15
472
7567
692
2452
1,14
379
2,36
7M
eetin
gs a
nd e
vent
s3
1516
6324
753
8234
813
1,31
7O
ccup
ancy
105
9272
302
2813
826
220
1,01
9Pr
intin
g an
d pu
blic
atio
ns32
63
216
418
132
5458
2A
dver
tisin
g 40
314
532
41
873
Dep
reci
atio
n an
d am
ortiz
atio
n74
6551
200
3597
183
1471
9Sc
hola
rshi
p fu
ndra
isin
g ev
ents
571
571
Scho
lars
hip
dist
ribut
ions
(rec
over
ies)
(53)
290
237
Adv
ocac
y su
ppor
t17
917
9O
ther
exp
ense
s21
21
$1,
986
$1,
287
$1,
038
$11
,137
$1,
344
$2,
893
$57
6$
5,05
5$
366
$25
,682
Dev
elop
men
tan
d M
embe
rM
anag
emen
tM
embe
rshi
pSe
rvic
esR
elat
ions
Act
iviti
esPr
ogra
ms
Rev
iew
Com
mitt
ees
and
Gen
eral
Oth
erPr
ofes
sion
alG
over
nmen
tM
embe
rEd
ucat
ion
Peer
Cal
iforn
ia S
ocie
ty o
f Cer
tifie
d Pu
blic
Acc
ount
ants
Cal
iforn
ia C
ertif
ied
Publ
ic A
ccou
ntan
ts E
duca
tion
Foun
datio
n
Com
bine
d St
atem
ent o
f Fun
ctio
nal E
xpen
ses
(In
Tho
usan
ds)
Prog
ram
Ser
vice
sSu
ppor
ting
Serv
ices
The
acco
mpa
nyin
g no
tes a
re a
n in
tegr
al p
art o
f thi
s sta
tem
ent.
5

2 0 1 4 c a l c p a a n n u a l r e p o r t 23www.calcpa.org
Access the Annual Report online at www.calcpa.org
The
acco
mpa
nyin
g no
tes
are
an in
tegr
al p
art o
f thi
s st
atem
ent.
COMbinEd STATEMEnTS Of CASh flOwS
California Society of Certified Public Accountants | California Certified Public Accountants Education Foundation
Years Ended April 30, 2014 and 2013(Amounts Expressed In Thousands)
The accompanying notes are an integral part of this statement.
2014 2013
The accompanying notes are an integral part of this statement.
7
California Society of Certified Public AccountantsCalifornia Certified Public Accountants Education Foundation
Combined Statements of Cash Flows(In Thousands)
Years Ended April 30, 2014 2013
Operating Activities:Change in net assets $ 2,113 $ 2,807Reconciliation of change in net assets to cash provided by operating activities:
Net realized and unrealized gain on investments (905) (1,681)Depreciation and amortization 667 719Loss on disposal of fixed assets 11 1Changes in operating assets and liabilities:
Accounts receivable, net (111) 5Other receivables 1 (105)Receivable - affiliates 47 (15)Prepaid expenses and other (99) 12Other assets (8) (34)Accounts payable 99 (171)Accrued expenses 163 (277)Deferred revenues (496) 375Deferred lease costs (49) (75)
Net cash provided by operating activities 1,433 1,561
Investing Activities:Purchases of investments (18,506) (24,745)Proceeds from sales of investments 17,738 24,041Purchases of fixed assets (331) (291)Proceeds from sales of fixed assets 6
Net cash used by investing activities (1,093) (995)
Net Increase in Cash and Equivalents 340 566
Cash and Equivalents, beginning of year 9,370 8,804
Cash and Equivalents, end of year $ 9,710 $ 9,370
Supplemental DisclosureNo payments for interest were made during 2014 and 2013.Payments of $11 were made in 2014 for 2014 taxes and $55 were made in 2013 for 2013 and 2012 taxes; a refund of $2 was received in 2014 for 2012 taxes.
24 2 0 1 4 c a l c p a a n n u a l r e p o r t www.calcpa.org
Access the Annual Report online at www.calcpa.org
1. ORGANIZATION The California Society of Certified Public Accountants (Society) is a nonprofit incorporated membership organization whose purpose is to advance the profession of accountancy in the State of California. The Society provides its members with general and technical resources through its chapters and committees and administers the Peer Review Program on behalf of the American Institute of Certified Public Accountants in California, Arizona and Alaska. The California Certified Public Accountants Education Foundation (Foundation) is a nonprofit public benefit corporation organized to provide continuing professional education to Certified Public Accountants (CPAs) and other interested parties. The Society is governed by the CalCPA Council (Council), which is elected by the membership of the Society. The Foundation is governed by a Board of Trustees. Revenues for the Society and the Foundation are derived primarily from CPAs in California. The Society and the Foundation share administrative functions. Such costs are allocated between the entities based on their estimated share. The California CPA Institute (CalCPA Institute), a public charity nonprofit organization, was formed in October 2004 to administer scholarship activities, financial literacy and other programs. The activities of the CalCPA Institute are consolidated with the activities of the Society.
2. SUMMARY OF SIGNIFICANT ACCOUNTING POLICIESPrInCIPLES OF COMbInATIOn—The Board of Trustees of the Foundation consists of members of the Society who are elected by the governing Council of the Society. Because of common control by the Council, the accompanying financial statements reflect the combined statements of the Society and the Foundation. All inter-organization transactions have been eliminated in combination.
PrInCIPLES OF COnSOLIDATIOn—All inter-organization transactions have been eliminated in consolidation.
bASIS OF PrESEnTATIOn—The combined financial statements of the Society and the Foundation have been prepared on the accrual basis of accounting in accordance with accounting principles generally accepted in the United States of America (U.S. GAAP). net assets are classified based on the existence or absence of donor-imposed restrictions. Accordingly, the Society and the Foundation classify their net assets and changes in net assets as follows:
Unrestricted Net Assets – Net assets that are not subject to donor-imposed restrictions or the donor-imposed restrictions have expired. As reflected in the accompanying financial statements and discussed in the notes, the Council has designated a portion of the unrestricted net assets for specific purposes.Temporarily Restricted Net Assets – Net assets that are subject to donor-imposed restrictions that may or will be met either by actions of the Society or the Foundation and/or the passage of time.Permanently Restricted Net Assets – Net assets that are to be held in perpetuity as directed by donors. The income from these net assets is available to support activities as designated by the donors.
Revenues are reported as increases in unrestricted net assets unless use of the related assets is limited by donor-imposed restrictions. Expenses are reported as decreases in unrestricted net assets. Gains and losses on assets and liabilities are reported as increases or decreases in unrestricted net assets unless their use is restricted by explicit donor restriction or by law. Generally, the donors of assets allow the Society and the Foundation to use all or part of the income earned on the related investments for unrestricted or specific (temporarily restricted) purposes.
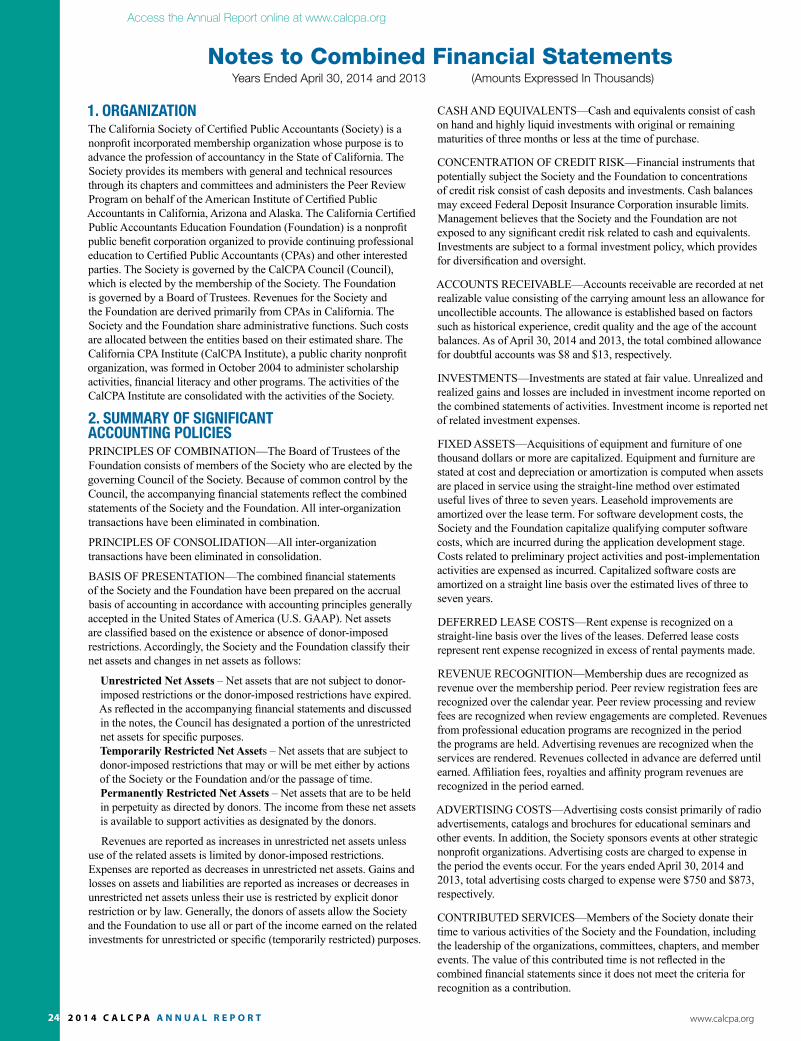
CASH AnD EqUIvALEnTS—Cash and equivalents consist of cash on hand and highly liquid investments with original or remaining maturities of three months or less at the time of purchase.
COnCEnTrATIOn OF CrEDIT rISk—Financial instruments that potentially subject the Society and the Foundation to concentrations of credit risk consist of cash deposits and investments. Cash balances may exceed Federal Deposit Insurance Corporation insurable limits. Management believes that the Society and the Foundation are not exposed to any significant credit risk related to cash and equivalents. Investments are subject to a formal investment policy, which provides for diversification and oversight.
ACCOUnTS rECEIvAbLE—Accounts receivable are recorded at net realizable value consisting of the carrying amount less an allowance for uncollectible accounts. The allowance is established based on factors such as historical experience, credit quality and the age of the account balances. As of April 30, 2014 and 2013, the total combined allowance for doubtful accounts was $8 and $13, respectively.
InvESTMEnTS—Investments are stated at fair value. Unrealized and realized gains and losses are included in investment income reported on the combined statements of activities. Investment income is reported net of related investment expenses.
FIxED ASSETS—Acquisitions of equipment and furniture of one thousand dollars or more are capitalized. Equipment and furniture are stated at cost and depreciation or amortization is computed when assets are placed in service using the straight-line method over estimated useful lives of three to seven years. Leasehold improvements are amortized over the lease term. For software development costs, the Society and the Foundation capitalize qualifying computer software costs, which are incurred during the application development stage. Costs related to preliminary project activities and post-implementation activities are expensed as incurred. Capitalized software costs are amortized on a straight line basis over the estimated lives of three to seven years.
DEFErrED LEASE COSTS—rent expense is recognized on a straight-line basis over the lives of the leases. Deferred lease costs represent rent expense recognized in excess of rental payments made.
rEvEnUE rECOGnITIOn—Membership dues are recognized as revenue over the membership period. Peer review registration fees are recognized over the calendar year. Peer review processing and review fees are recognized when review engagements are completed. revenues from professional education programs are recognized in the period the programs are held. Advertising revenues are recognized when the services are rendered. Revenues collected in advance are deferred until earned. Affiliation fees, royalties and affinity program revenues are recognized in the period earned.
ADvErTISInG COSTS—Advertising costs consist primarily of radio advertisements, catalogs and brochures for educational seminars and other events. In addition, the Society sponsors events at other strategic nonprofit organizations. Advertising costs are charged to expense in the period the events occur. For the years ended April 30, 2014 and 2013, total advertising costs charged to expense were $750 and $873, respectively.
COnTrIbUTED SErvICES—Members of the Society donate their time to various activities of the Society and the Foundation, including the leadership of the organizations, committees, chapters, and member events. The value of this contributed time is not reflected in the combined financial statements since it does not meet the criteria for recognition as a contribution.
notes to Combined financial StatementsYears Ended April 30, 2014 and 2013 (Amounts Expressed In Thousands)
notes to Combined financial Statements

2 0 1 4 c a l c p a a n n u a l r e p o r t 25www.calcpa.org
Access the Annual Report online at www.calcpa.org
notes to Combined financial Statements
2. SUMMARY OF SIGNIFICANT ACCOUNTING POLICIES (CONT’d)InCOME TAxES—The Society is exempt from income taxes under Internal revenue Code (IrC) Section 501(c)(6) and related California code sections. The CalCPA Institute and the Foundation are both exempt from income taxes under IrC Section 501(c)(3) and related Californiacode sections. However, the organizations are subject to income taxes from activities unrelated to their tax-exempt purposes. The Foundation and the Institute are considered publicly supported organizations. Management of the Society and the Foundation has evaluated their tax positions and related income tax contingencies. Management does not believe that any material uncertain tax positions exist. With few exceptions, the Society and Foundation are no longer subject to income tax examinations by federal authorities for years ending April 30, 2010 and before and by state authorities for years ending April 30, 2009 and before.
FUnCTIOnAL ExPEnSES—The costs of providing program services and supporting services have been summarized on a functional basis in the combined statements of activities and functional expenses. Accordingly, certain costs are for services shared between the Society and the Foundation. Indirect costs are allocated among programs and supporting services based on personnel, space and other factors.
USE OF ESTIMATES—In preparing financial statements in conformity with U.S. GAAP, management is required to make estimates and assumptions that affect certain reported amounts and disclosures. Actual results could differ from those estimates under different assumptions or conditions.
rECLASSIFICATIOnS—Certain prior year amounts have been reclassified to conform with the current year financial statement and supplementary information presentation.
3. RELATEd PARTYGroup Insurance Trust of the California Society of Certified Public Accountants Group Insurance Trust of the California Society of Certified Public Accountants (GIT) is a multiple-employer welfare arrangement, sponsored by the Society, to provide health and welfare insurance plans to Society members at favorable group rates. The Society receives anaffiliation fee from GIT, which is based on GIT’s total participant contributions less administrative expenses. receivables from GIT to the Society at April 30, 2014 and 2013, were $19 and $30, respectively, and are included in receivable - affiliates on the combined statements of financial position. The Society earned an affiliation fee for the years ended April 30, 2014 and 2013, of $328 and $343, respectively, from GIT, which is included in the combined statements of activities. For the years ended April 30, 2014 and 2013, the Society paid certain costs on behalf of GIT totaling $117 and $103, respectively. Such costs were reimbursed by GIT. Total costs charged to GIT for its share of facilities costs and certain administrative costs were $57 and $58 for the years ended April 30, 2014 and 2013, respectively.
4. ASSOCIATEd ENTITYCAMICO Mutual Insurance Company CAMICO Mutual Insurance Company (CAMICO) provides professional liability insurance for Society members and is endorsed by the Society. Since CAMICO is not under common control with the Society and the Foundation, the combined financial statements do not reflect consolidation of CAMICO accounts. The Society receives an affiliation fee from CAMICO, which is based on CAMICO’s total
annual earned premiums. CAMICO shares certain administrative and facility functions and costs with the Society and the Foundation. At April 30, 2014 and 2013, receivables of $17 and $53, respectively, were included in receivable - affiliates on the combined statements of financial position. For the years ended April 30, 2014 and 2013, affiliation fees earned by the Society were $229 and $233,respectively, and are included in the combined statements of activities. For the years ended April 30, 2014 and 2013, total costs charged to the Society by CAMICO were $49 and $44, respectively, and are included in the combined statements of activities. In addition, during the years ended April 30, 2014 and 2013, the Society paid certain expenses on behalf of CAMICO totaling $3 and $4, respectively. Such costs were reimbursed by CAMICO. Total costs charged to the Foundation by CAMICO were $25 for the years ended April 30, 2014 and 2013, respectively, and are reported in the combined statements of functional expenses.
5. INVESTMENTS ANd INVESTMENT INCOME (LOSS)
Investments are comprised of the following at April 30:
2014 Society Foundation Total
Mutual FundsCorporate BondsCommon StocksGovernment bonds
$ 16,8986,528
$ 4,320716
3,165499
$ 21,2187,2443,165
499
Total $ 23,426 $ 8,700 $ 32,126
2013 Society Foundation Total
Mutual FundsCorporate BondsCommon StocksGovernment bonds
$ 18,7983,551
$ 3,109505
3,825620
$ 21,9074,0563,825
620
Total $ 22,349 $ 8,059 $ 30,408
notes to Combined financial StatementsYears Ended April 30, 2014 and 2013 (Amounts Expressed In Thousands)
26 2 0 1 4 c a l c p a a n n u a l r e p o r t www.calcpa.org
Access the Annual Report online at www.calcpa.org
5. INVESTMENTS ANd INVESTMENT INCOME (LOSS) (CONT’d)Investment income (loss) is comprised of the following for the years ended April 30:
2014 Society Foundation Total
Unrestricted: Interest and Dividends net realized Gain (Loss) net Unrealized Gain (Loss)
$ 647 (4) 383
$ 227 544 (79)
$ 874 540 304
Investment Expense1,026
(54) 692 (62)
1,718(116)
Total Unrestricted 972 630 1,602
Temporarily Restricted: Interest and Dividends net realized Loss net Unrealized Gain
68 (1) 62
68 (1) 62
Investment Expense129
(4)129
(4)
Total Temporarily Restricted 125 125
Total Investment Income, net $ 1,097 $ 630 $ 1,727
2013 Society Foundation Total
Unrestricted: Interest and Dividends net realized Gain net Unrealized Gain
$ 604730311
$ 271203297
$ 875933608
Investment Expense1,645
(55)771(63)
2,416(118)
Total Unrestricted 1,590 708 2,298
Temporarily Restricted: Interest and Dividends net realized Gain net Unrealized Gain
558951
558951
Investment Expense195
(5)195
(5)
Total Temporarily Restricted 190 190
Total Investment Income, net $ 1,780 $ 708 $ 2,488
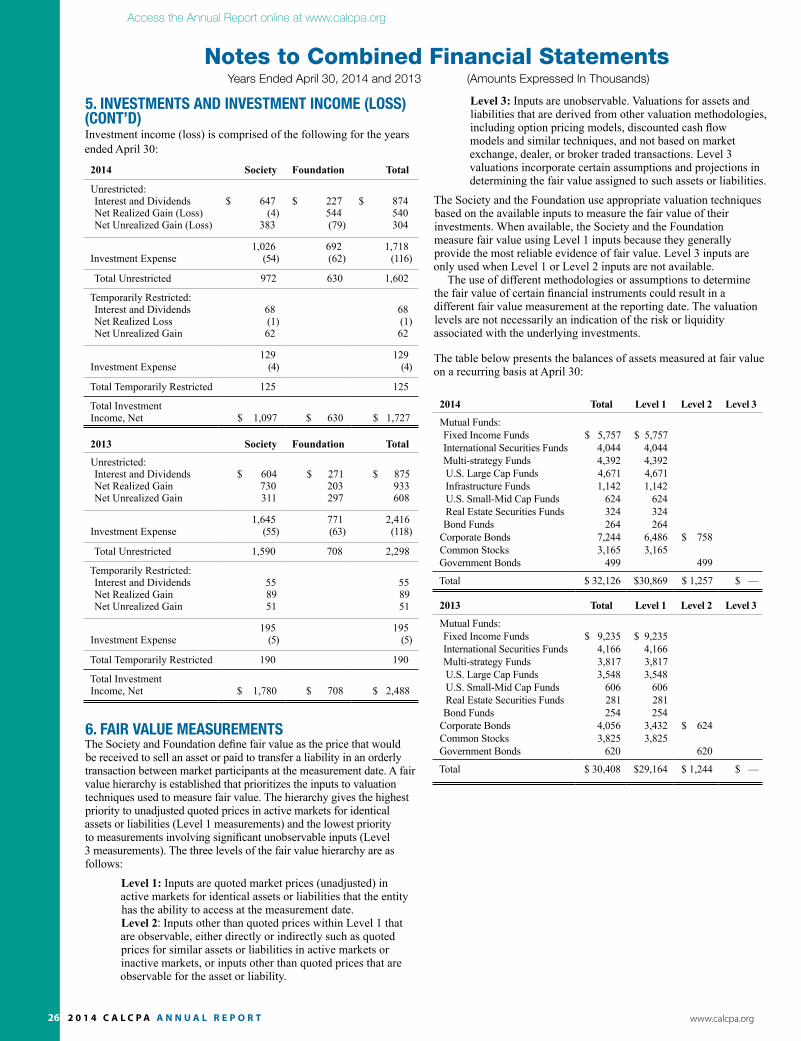
6. FAIR VALUE MEASUREMENTSThe Society and Foundation define fair value as the price that would be received to sell an asset or paid to transfer a liability in an orderly transaction between market participants at the measurement date. A fair value hierarchy is established that prioritizes the inputs to valuation techniques used to measure fair value. The hierarchy gives the highest priority to unadjusted quoted prices in active markets for identical assets or liabilities (Level 1 measurements) and the lowest priority to measurements involving significant unobservable inputs (Level 3 measurements). The three levels of the fair value hierarchy are as follows:
Level 1: Inputs are quoted market prices (unadjusted) in active markets for identical assets or liabilities that the entity has the ability to access at the measurement date. Level 2: Inputs other than quoted prices within Level 1 that are observable, either directly or indirectly such as quoted prices for similar assets or liabilities in active markets or inactive markets, or inputs other than quoted prices that are observable for the asset or liability.
Level 3: Inputs are unobservable. valuations for assets and liabilities that are derived from other valuation methodologies, including option pricing models, discounted cash flow models and similar techniques, and not based on market exchange, dealer, or broker traded transactions. Level 3 valuations incorporate certain assumptions and projections in determining the fair value assigned to such assets or liabilities.
The Society and the Foundation use appropriate valuation techniques based on the available inputs to measure the fair value of their investments. When available, the Society and the Foundation measure fair value using Level 1 inputs because they generally provide the most reliable evidence of fair value. Level 3 inputs are only used when Level 1 or Level 2 inputs are not available. The use of different methodologies or assumptions to determine the fair value of certain financial instruments could result in a different fair value measurement at the reporting date. The valuation levels are not necessarily an indication of the risk or liquidity associated with the underlying investments.
The table below presents the balances of assets measured at fair value on a recurring basis at April 30:
2014 Total Level 1 Level 2 Level 3
Mutual Funds: Fixed Income Funds International Securities Funds Multi-strategy Funds
U.S. Large Cap Funds Infrastructure FundsU.S. Small-Mid Cap Fundsreal Estate Securities Funds
bond FundsCorporate BondsCommon StocksGovernment bonds
$ 5,757 4,044 4,392 4,671 1,142
624 324 264
7,244 3,165
499
$ 5,757 4,044 4,392 4,671 1,142
624 324 264
6,486 3,165
$ 758
499
Total $ 32,126 $30,869 $ 1,257 $ —
2013 Total Level 1 Level 2 Level 3
Mutual Funds: Fixed Income Funds International Securities Funds Multi-strategy Funds
U.S. Large Cap FundsU.S. Small-Mid Cap Fundsreal Estate Securities Funds
bond FundsCorporate BondsCommon StocksGovernment bonds
$ 9,2354,1663,8173,548
606281254
4,0563,825
620
$ 9,2354,1663,8173,548
606281254
3,4323,825
$ 624
620
Total $ 30,408 $29,164 $ 1,244 $ —
notes to Combined financial StatementsYears Ended April 30, 2014 and 2013 (Amounts Expressed In Thousands)
notes to Combined financial Statements

2 0 1 4 c a l c p a a n n u a l r e p o r t 27www.calcpa.org
Access the Annual Report online at www.calcpa.org
notes to Combined financial Statements
7. PREPAId EXPENSES ANd OTHER Prepaid expenses and other consist of the following at April 30:
2014 Society Foundation Total
RentSoftware and Hardware Maintenance CostsMeetings and EventsPostageInsurance and Other
$ 101
44125
41156
$ 34
8920115
$ 135
13314552
161
Total $ 466 $ 159 $ 625
2013 Society Foundation Total
RentSoftware and Hardware Maintenance CostsMeetings and EventsPostageInsurance and Other
$ 105
2811040
105
$ 34
405710
3
$ 139
6816750
108
Total $ 388 $ 144 $ 532
8. FIXEd ASSETSFixed assets consist of the following at April 30:
2014 Society Foundation Total
EquipmentSoftwareFurnitureLeasehold Improvements
$ 1,149950486
2,066
$ 3361,499
162
$ 1,4852,449
6482,066
Accumulated Depreciation and Amortization
4,651
(2,595)
1,997
(1,402)
6,648
(3,997)
Fixed Assets, net $ 2,056 $ 595 $ 2,651
2013 Society Foundation Total
EquipmentSoftwareFurnitureLeasehold Improvements
$ 1,164857427
1,985
$ 3541,434
179
$ 1,518 2,291 606 1,985
Accumulated Depreciation and Amortization
4,433
(2,178)
1,967
(1,218)
6,400
(3,396)
Fixed Assets, net $ 2,255 $ 749 $ 3,004
9. dEFERREd REVENUESDeferred revenues consist of the following at April 30:
2014 Society Foundation Total
DuesProfessional Education ProgramsPeer review Fees Meetings and EventsAdvertising
$ 5,728
744179
95
$ 1,836
$ 5,728
1,836744179
95
Total $ 6,746 $ 1,836 $ 8,582
2013 Society Foundation Total
DuesProfessional Education ProgramsPeer review Fees Meetings and EventsAdvertising
$ 6,005
702170
66
$ 2,135
$ 6,005
2,135702170
66
Total $ 6,943 $ 2,135 $ 9,078
10. RETIREMENT PLANSDefined Contribution PlanThe Society and the Foundation sponsor a defined contribution plan under IrC Section 401(k). All employees at least 21 years of age who have completed one year of service are eligible to participate. Under the 401(k) plan, the Society and the Foundation match 100% of the employee elective deferral up to 2% of salary and 50% of the employee elective deferral between 2% and 6% of salary. In addition, all current employees, regardless of participation, earn a nonelective employer contribution equal to 3% of salary. Employer contributions totaled $471 and $498 for the years ended April 30, 2014 and 2013, respectively. Employer contributions vest starting in year two of service at a rate of 20% per year.
Deferred Compensation PlanThe Society maintains a deferred compensation plan under IRC Section 457. Deferred compensation assets consist of investments reserved for future payment of deferred compensation liabilities. There are no employer contribution expenses associated with this plan because all contributions are made by employees.
11. LINES OF CREdITThe Society and the Foundation maintained revolving credit agreements for borrowings up to $2,000 each through October 2013. In October 2013, the Society and the Foundation renewed their revolving credit agreements for borrowings up to $1,000 each. The line of credit agreements mature on november 1, 2016. Under the agreements, interest is payable monthly on outstanding balances at the reference rate announced by the bank of 3.25% for both April 30, 2014 and 2013. The lines of credit are collateralized by the property of the Society and the Foundation. There were no borrowings during 2014 and 2013.
12. TEMPORARILY RESTRICTEd NET ASSETSTemporarily restricted net assets consist of the following at April 30:
2014 Society Foundation Total
ScholarshipsFinancial Literacy and Other ProgramsForbes Medal Award
$ 1,858
15$ 33
$ 1,858
1533
Total $ 1,873 $ 33 $ 1,906
2013 Society Foundation Total
ScholarshipsFinancial Literacy and Other ProgramsForbes Medal Award
$ 1,764
301$ 36
$ 1,764
30136
Total $ 2,065 $ 36 $ 2,101
Temporarily restricted net assets released from restriction consist of the following for the years ending April 30:
2014 Society Foundation Total
ScholarshipsAdministrative and Program Costs
$ 434
338
$ 3
$ 437
338
Total $ 772 $ 3 $ 775
2013 Society Foundation Total
ScholarshipsAdministrative and Program Costs
$ 289
287
$ 289
287
Total $ 576 $ - $ 576
notes to Combined financial StatementsYears Ended April 30, 2014 and 2013 (Amounts Expressed In Thousands)

28 2 0 1 4 c a l c p a a n n u a l r e p o r t www.calcpa.org
Access the Annual Report online at www.calcpa.org
13. PERMANENTLY RESTRICTEd NET ASSETSPermanently restricted net assets consist of the original endowment for the John F. Forbes Medal Award. The earnings from the endowment are temporarily restricted and should be used to fund the Forbes Medal Award. The Forbes Medal is an award bestowed on the individual receiving the highest grade on the California Uniform Certified Public Accountant Examination.
14. BOARd dESIGNATEd NET ASSETSAs of April 30, 2014 and 2013, the board, an Executive Committee of the Society’s Council, has designated $7,500 of the Society’s unrestricted net assets for a building fund. In May 2014, the Society signed a Letter of Intent to purchase a building in burlingame, California with a proposed purchase price of $7,375. The terms and conditions of the purchase sales agreement, including potential leaseback to the seller, are currently being considered.
15. OPERATING LEASE COMMITMENTSThe Society maintains its headquarters in San Mateo, California, under a non-cancelable lease agreement, which expires in December 2020. In connection with the San Mateo lease agreement, the Society has the option to purchase the building and land at 1800 Gateway, San Mateo, California, subject to certain terms and conditions, at a purchase price equal to the greater of $27,275 or the then fair market value. The option is not expected to be exercised. The Foundation and GIT sublease a portion of the office space in San Mateo for their corporate headquarters under non-cancelable sublease agreements with the Society also expiring in December 2020. The Society also leases office space in Sacramento under a non-cancelable operating lease expiring in April 2018. The Society renewed its Glendale office space lease in September 2013 under a non-cancelable operating lease expiring in February 2019. At April 30, 2014, future minimum lease payments under these agreements were as follows:
Years ended April 30 Society Foundation Total
2015 2016 2017 2018 2019 Thereafter
$ 764 657 814 833 663
1,004
$ 349 268 371 382 393 680
$ 1,113 925 1,185 1,215 1,056 1,684
Sublease Revenues 7,188
(480)
Total $ 6,698
rent expense and sublease revenue for the years ended April 30 is as follows:
2014 Society Foundation Total
rent ExpenseSublease Revenues
$ 578(85)
$ 329 $ 907(85)
Total $ 493 $ 329 $ 822
2013 Society Foundation Total
rent ExpenseSublease Revenues
$ 580(74)
$ 329 $ 909(74)
Total $ 506 $ 329 $ 835
16. SUBSEQUENT EVENTS Management of the Society and the Foundation has reviewed the changes in their net assets and evaluated subsequent events for the period of time from their year end of April 30, 2014 through June 5, 2014, the date the combined financial statements were available to be issued. Except as discussed in note 14, management has determined that no adjustments are necessary to the amounts reported in the accompanying combined financial statements nor have any subsequent events occurred, the nature of which would require disclosure.
notes to Combined financial StatementYears Ended April 30, 2014 and 2013 (Amounts Expressed In Thousands)

2 0 1 4 c a l c p a a n n u a l r e p o r t 29www.calcpa.org
Access the Annual Report online at www.calcpa.org
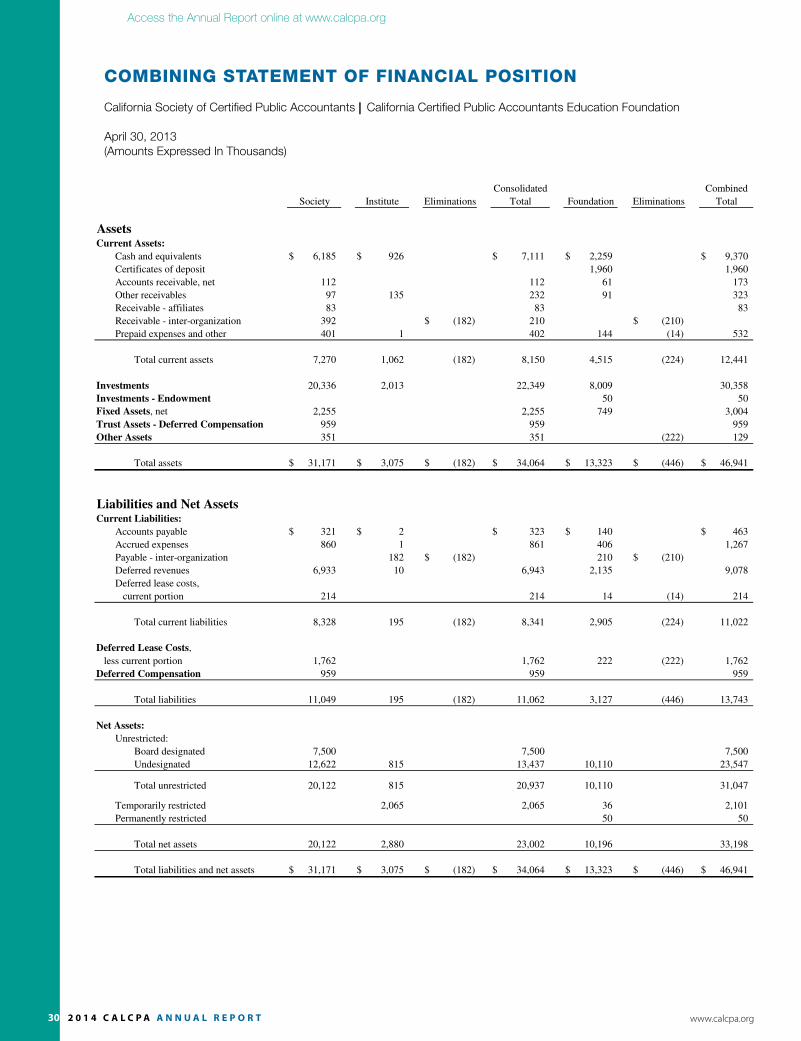
notes to Combined financial StatementCOMbininG STATEMEnT Of finAnCiAl POSiTiOn
California Society of Certified Public Accountants | California Certified Public Accountants Education Foundation
April 30, 2014 (Amounts Expressed In Thousands)April 30, 2014
Consolidated Combined
Institute Total Foundation Eliminations Total
AssetsCurrent Assets:
Cash and equivalents $ 6,449 $ 998 $ 7,447 $ 2,263 $ 9,710
Certificates of deposit 1,915 1,915
Accounts receivable, net 182 182 102 284
Other receivables 178 73 251 71 322
Receivable - affiliates 36 36 36
Receivable - inter-organization 700 $ (241) 459 $ (459)
Prepaid expenses and other 484 2 486 159 (20) 625
Total current assets 8,029 1,073 (241) 8,861 4,510 (479) 12,892
Investments 21,284 2,142 23,426 8,650 32,076
Investments - Endowment 50 50
Fixed Assets, net 2,056 2,056 595 2,651
Trust Assets - Deferred Compensation 1,049 1,049 1,049
Other Assets 359 359 (229) 130
Total assets $ 32,777 $ 3,215 $ (241) $ 35,751 $ 13,805 $ (708) $ 48,848
Liabilities and Net AssetsCurrent Liabilities:
Accounts payable $ 365 $ 48 $ 413 $ 149 $ 562
Accrued expenses 994 6 1,000 430 1,430
Payable - inter-organization 241 $ (241) - 459 $ (459)
Deferred revenues 6,713 33 6,746 1,836 8,582
Deferred lease costs,
current portion 210 210 20 (20) 210
Total current liabilities 8,282 328 (241) 8,369 2,894 (479) 10,784
Deferred Lease Costs,
less current portion 1,704 1,704 229 (229) 1,704
Deferred Compensation 1,049 1,049 1,049
Total liabilities 11,035 328 (241) 11,122 3,123 (708) 13,537
Net Assets:
Unrestricted:
Board designated 7,500 7,500 7,500
Undesignated 14,242 1,014 15,256 10,599 25,855
Total unrestricted 21,742 1,014 22,756 10,599 33,355
Temporarily restricted 1,873 1,873 33 1,906
Permanently restricted 50 50
Total net assets 21,742 2,887 24,629 10,682 35,311
Total liabilities and net assets $ 32,777 $ 3,215 $ (241) $ 35,751 $ 13,805 $ (708) $ 48,848
California Society of Certified Public Accountants
California Certified Public Accountants Education Foundation
Combining Statement of Financial Position
(In Thousands)
See Independent Auditors' Report
EliminationsSociety
21
30 2 0 1 4 c a l c p a a n n u a l r e p o r t www.calcpa.org
Access the Annual Report online at www.calcpa.org
COMbininG STATEMEnT Of finAnCiAl POSiTiOn
California Society of Certified Public Accountants | California Certified Public Accountants Education Foundation
April 30, 2013 (Amounts Expressed In Thousands)
April 30, 2013
Consolidated Combined
Total Foundation Eliminations Total
AssetsCurrent Assets:
Cash and equivalents $ 6,185 $ 926 $ 7,111 $ 2,259 $ 9,370
Certificates of deposit 1,960 1,960
Accounts receivable, net 112 112 61 173
Other receivables 97 135 232 91 323
Receivable - affiliates 83 83 83
Receivable - inter-organization 392 $ (182) 210 $ (210)
Prepaid expenses and other 401 1 402 144 (14) 532
Total current assets 7,270 1,062 (182) 8,150 4,515 (224) 12,441
Investments 20,336 2,013 22,349 8,009 30,358
Investments - Endowment 50 50
Fixed Assets, net 2,255 2,255 749 3,004
Trust Assets - Deferred Compensation 959 959 959
Other Assets 351 351 (222) 129
Total assets $ 31,171 $ 3,075 $ (182) $ 34,064 $ 13,323 $ (446) $ 46,941
Liabilities and Net AssetsCurrent Liabilities:
Accounts payable $ 321 $ 2 $ 323 $ 140 $ 463
Accrued expenses 860 1 861 406 1,267
Payable - inter-organization 182 $ (182) 210 $ (210)
Deferred revenues 6,933 10 6,943 2,135 9,078
Deferred lease costs,
current portion 214 214 14 (14) 214
Total current liabilities 8,328 195 (182) 8,341 2,905 (224) 11,022
Deferred Lease Costs,
less current portion 1,762 1,762 222 (222) 1,762
Deferred Compensation 959 959 959
Total liabilities 11,049 195 (182) 11,062 3,127 (446) 13,743
Net Assets:
Unrestricted:
Board designated 7,500 7,500 7,500
Undesignated 12,622 815 13,437 10,110 23,547
Total unrestricted 20,122 815 20,937 10,110 31,047
Temporarily restricted 2,065 2,065 36 2,101
Permanently restricted 50 50
Total net assets 20,122 2,880 23,002 10,196 33,198
Total liabilities and net assets $ 31,171 $ 3,075 $ (182) $ 34,064 $ 13,323 $ (446) $ 46,941
Eliminations
See Independent Auditors' Report
California Society of Certified Public Accountants
California Certified Public Accountants Education Foundation
(In Thousands)
Combining Statement of Financial Position
Society Institute
22
2 0 1 4 c a l c p a a n n u a l r e p o r t 31www.calcpa.org
Access the Annual Report online at www.calcpa.org
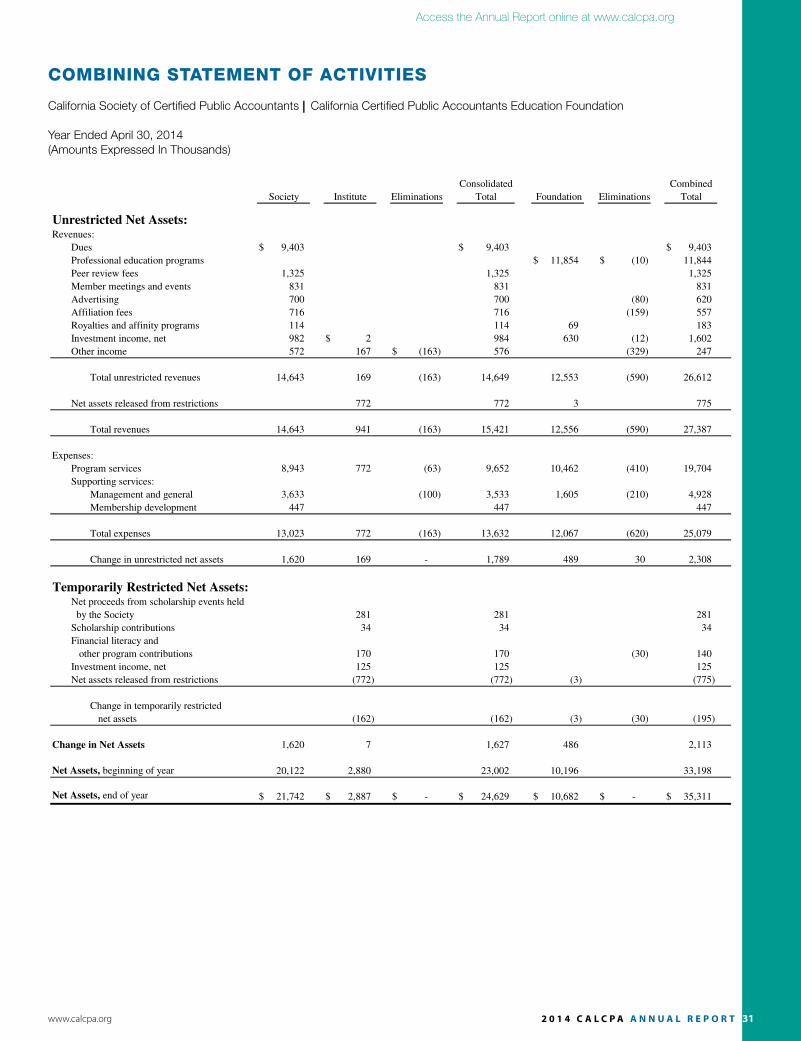
COMbininG STATEMEnT Of ACTiviTiES
California Society of Certified Public Accountants | California Certified Public Accountants Education Foundation
Year Ended April 30, 2014 (Amounts Expressed In Thousands)Year Ended April 30, 2014
Consolidated
Eliminations Foundation Eliminations
Unrestricted Net Assets:Revenues:
Dues $ 9,403 $ 9,403 $ 9,403
Professional education programs $ 11,854 $ (10) 11,844
Peer review fees 1,325 1,325 1,325
Member meetings and events 831 831 831
Advertising 700 700 (80) 620
Affiliation fees 716 716 (159) 557
Royalties and affinity programs 114 114 69 183
Investment income, net 982 $ 2 984 630 (12) 1,602
Other income 572 167 $ (163) 576 (329) 247
Total unrestricted revenues 14,643 169 (163) 14,649 12,553 (590) 26,612
Net assets released from restrictions 772 772 3 775
Total revenues 14,643 941 (163) 15,421 12,556 (590) 27,387
Expenses:
Program services 8,943 772 (63) 9,652 10,462 (410) 19,704
Supporting services:
Management and general 3,633 (100) 3,533 1,605 (210) 4,928
Membership development 447 447 447
Total expenses 13,023 772 (163) 13,632 12,067 (620) 25,079
Change in unrestricted net assets 1,620 169 - 1,789 489 30 2,308
Temporarily Restricted Net Assets:Net proceeds from scholarship events held
by the Society 281 281 281
Scholarship contributions 34 34 34
Financial literacy and
other program contributions 170 170 (30) 140
Investment income, net 125 125 125
Net assets released from restrictions (772) (772) (3) (775)
Change in temporarily restricted
net assets (162) (162) (3) (30) (195)
Change in Net Assets 1,620 7 1,627 486 2,113
Net Assets, beginning of year 20,122 2,880 23,002 10,196 33,198
Net Assets, end of year $ 21,742 $ 2,887 $ - $ 24,629 $ 10,682 $ - $ 35,311
1,620 7 1,627 486 - (35,311)
California Society of Certified Public Accountants
California Certified Public Accountants Education Foundation
Society Institute
Combining Statement of Activities
(In Thousands)
See Independent Auditors' Report
Total Total
Combined
23
32 2 0 1 4 c a l c p a a n n u a l r e p o r t www.calcpa.org
Access the Annual Report online at www.calcpa.org
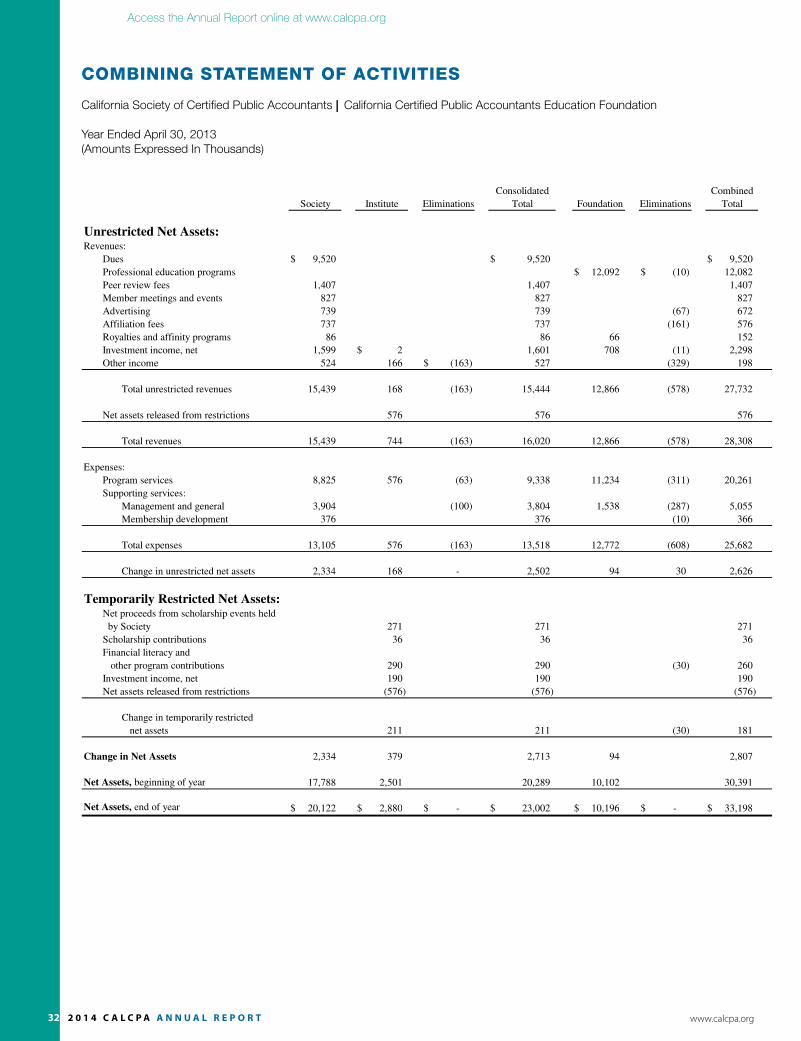
COMbininG STATEMEnT Of ACTiviTiES
California Society of Certified Public Accountants | California Certified Public Accountants Education Foundation
Year Ended April 30, 2013 (Amounts Expressed In Thousands)Year Ended April 30, 2013
Eliminations Foundation Eliminations
Unrestricted Net Assets:Revenues:
Dues $ 9,520 $ 9,520 $ 9,520
Professional education programs $ 12,092 $ (10) 12,082
Peer review fees 1,407 1,407 1,407
Member meetings and events 827 827 827
Advertising 739 739 (67) 672
Affiliation fees 737 737 (161) 576
Royalties and affinity programs 86 86 66 152
Investment income, net 1,599 $ 2 1,601 708 (11) 2,298
Other income 524 166 $ (163) 527 (329) 198
Total unrestricted revenues 15,439 168 (163) 15,444 12,866 (578) 27,732
Net assets released from restrictions 576 576 576
Total revenues 15,439 744 (163) 16,020 12,866 (578) 28,308
Expenses:
Program services 8,825 576 (63) 9,338 11,234 (311) 20,261
Supporting services:
Management and general 3,904 (100) 3,804 1,538 (287) 5,055
Membership development 376 376 (10) 366
Total expenses 13,105 576 (163) 13,518 12,772 (608) 25,682
Change in unrestricted net assets 2,334 168 - 2,502 94 30 2,626
Temporarily Restricted Net Assets:Net proceeds from scholarship events held
by Society 271 271 271
Scholarship contributions 36 36 36
Financial literacy and
other program contributions 290 290 (30) 260
Investment income, net 190 190 190
Net assets released from restrictions (576) (576) (576)
Change in temporarily restricted
net assets 211 211 (30) 181
Change in Net Assets 2,334 379 2,713 94 2,807
Net Assets, beginning of year 17,788 2,501 20,289 10,102 30,391
Net Assets, end of year $ 20,122 $ 2,880 $ - $ 23,002 $ 10,196 $ - $ 33,198
- - - - -
Total
See Independent Auditors' Report
Society Institute
Consolidated
California Society of Certified Public Accountants
California Certified Public Accountants Education Foundation
Combining Statement of Activities
(In Thousands)
Total
Combined
24
2 0 1 4 c a l c p a a n n u a l r e p o r t 33www.calcpa.org
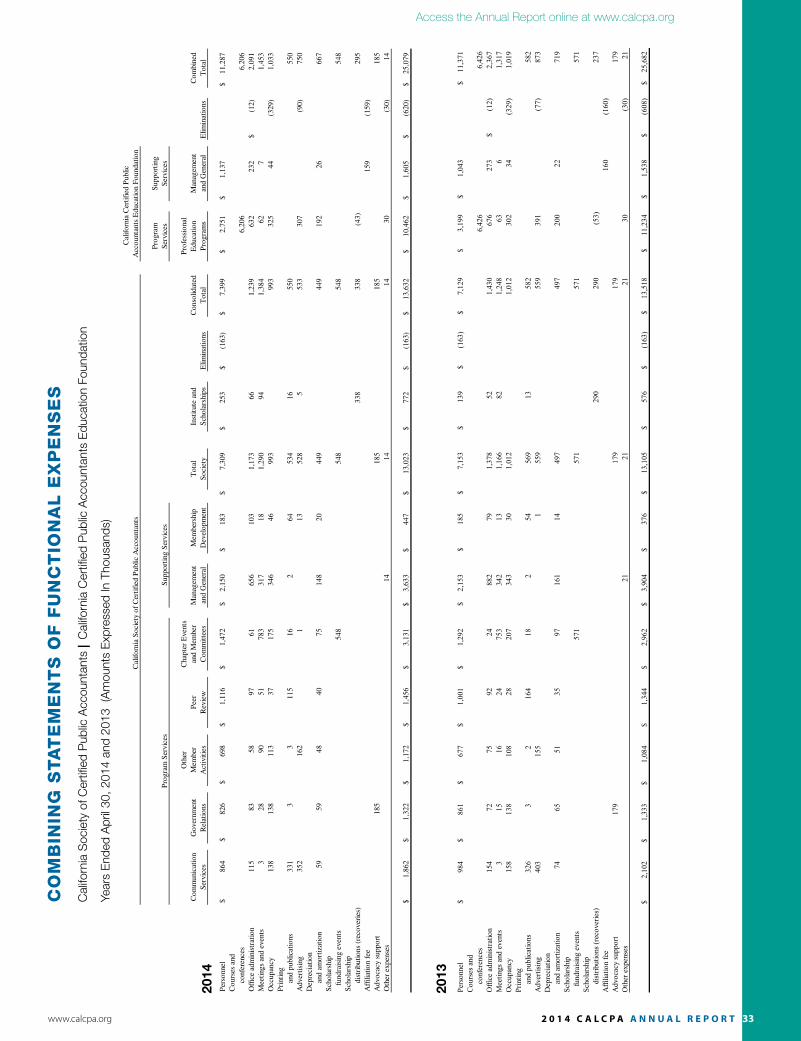
Access the Annual Report online at www.calcpa.org
Cal
iforn
ia S
ocie
ty o
f Cer
tifie
d Pu
blic
Acc
ount
ants
Cal
iforn
ia C
ertif
ied
Publ
ic A
ccou
ntan
ts E
duca
tion
Foun
datio
n
Com
bini
ng S
tate
men
t of F
unct
iona
l Exp
ense
s(I
n Th
ousa
nds)
Year
End
ed A
pril
30, 2
013
Cal
iforn
ia S
ocie
ty o
f Cer
tifie
d Pu
blic
Acc
ount
ants
Supp
ortin
g Se
rvic
es
Tota
lSo
ciet
yEl
imin
atio
ns
Pers
onne
l$
984
$86
1
$
677
$1,
001
$
1,29
2
$2,
153
$
185
$7,
153
$13
9
$
(163
)
$7,
129
$3,
199
$1,
043
$
11,3
71C
ours
es a
ndco
nfer
ence
s6,
426
6,42
6O
ffice
adm
inist
ratio
n15
4
72
75
92
24
882
79
1,
378
52
1,
430
676
27
3
$
(12)
2,
367
Mee
tings
and
eve
nts
3
15
16
24
75
3
34
2
13
1,16
682
1,24
863
6
1,31
7O
ccup
ancy
158
138
108
28
20
7
34
3
30
1,01
21,
012
302
34
(329
)
1,01
9Pr
intin
gan
d pu
blic
atio
ns32
6
3
2
16
4
18
2
54
56
913
582
582
Adv
ertis
ing
403
155
1
559
559
391
(7
7)
873
Dep
reci
atio
n
and
amor
tizat
ion
74
65
51
35
97
16
1
14
497
497
200
22
719
Scho
lars
hip
fund
raisi
ng e
vent
s57
1
57
157
157
1Sc
hola
rshi
p di
strib
utio
ns (r
ecov
erie
s)29
0
29
0(5
3)
23
7A
ffilia
tion
fee
160
(160
)A
dvoc
acy
supp
ort
179
179
179
179
Oth
er e
xpen
ses
21
2121
30
(3
0)
21
$2,
102
$1,
333
$1,
084
$1,
344
$2,
962
$3,
904
$37
6$
13,1
05$
576
$(1
63)
$13
,518
$11
,234
$1,
538
$(6
08)
$25
,682
and
Gen
eral
Tota
lan
d G
ener
alD
evel
opm
ent
Scho
lars
hips
Elim
inat
ions
Tota
lPr
ogra
ms
Inst
itute
and
Con
solid
ated
Educ
atio
nM
anag
emen
tC
ombi
ned
Serv
ices
Rel
atio
nsA
ctiv
ities
Rev
iew
Com
mitt
ees
Oth
erC
hapt
er E
vent
sPr
ofes
siona
lC
omm
unic
atio
nG
over
nmen
tM
embe
rPe
eran
d M
embe
rM
anag
emen
tM
embe
rshi
p
See
Inde
pend
ent A
udito
rs' R
epor
t
Cal
iforn
ia C
ertif
ied
Publ
icA
ccou
ntan
ts E
duca
tion
Foun
datio
n
Prog
ram
Supp
ortin
gPr
ogra
m S
ervi
ces
Serv
ices
Serv
ices
25
Cali
forn
ia S
oci
ety
of
Cer
tifi
ed P
ub
lic
Acc
ou
nta
nts
Cali
forn
ia C
erti
fied
Pu
bli
c A
ccou
nta
nts
Ed
uca
tion
Fou
nd
ati
on
Com
bin
ing S
tate
men
t of
Fu
nct
ion
al
Exp
ense
s
(In
Th
ou
san
ds)
Yea
r E
nded
Apri
l 30,
2014
Cal
ifo
rnia
So
ciet
y o
f C
erti
fied
Public
Acc
ounta
nts
Suppo
rtin
g S
ervic
es
To
tal
So
ciet
yE
lim
inat
ions
Per
sonnel
$864
$826
$
698
$
1,1
16
$1,4
72
$2,1
50
$183
$
7,3
09
$253
$
(163)
$7,3
99
$2,7
51
$
1,1
37
$11,2
87
Co
urs
es a
nd
confe
rence
s6,2
06
6,2
06
Off
ice
adm
inis
trat
ion
115
83
58
97
61
656
103
1,1
73
66
1,2
39
632
232
$
(12)
2,0
91
Mee
tings
and e
ven
ts3
28
90
51
783
317
18
1,2
90
94
1,3
84
62
7
1,4
53
Occ
upan
cy138
138
113
37
175
346
46
993
993
325
44
(329)
1,0
33
Pri
nti
ng
and p
ublica
tio
ns
331
3
3
115
16
2
64
534
16
550
550
Adver
tisi
ng
352
162
1
13
528
5
533
307
(9
0)
750
Dep
reci
atio
n
an
d a
mo
rtiz
atio
n59
59
48
40
75
148
20
449
449
192
26
667
Sch
ola
rship
fundra
isin
g e
ven
ts548
548
548
548
Sch
ola
rship
dis
trib
uti
ons
(rec
over
ies)
338
338
(43)
295
Aff
ilia
tio
n f
ee159
(1
59)
Advo
cacy
suppo
rt185
185
185
185
Oth
er e
xpen
ses
14
14
14
30
(30)
14
$1,8
62
$1,3
22
$1,1
72
$1,4
56
$3,1
31
$3,6
33
$447
$13,0
23
$772
$(1
63)
$13,6
32
$10,4
62
$1,6
05
$(6
20)
$25,0
79
and G
ener
al
Man
agem
ent
Ser
vic
es
Suppo
rtin
g
Dev
elo
pm
ent
Sch
ola
rship
s
Inst
itute
and
Ser
vic
es
Pro
gra
m
Pro
fess
ional
Educa
tio
n
Pro
gra
ms
Oth
er
Rev
iew
Pee
r
Co
mm
itte
es
and M
ember
Chap
ter
Even
ts
Mem
ber
ship
Co
nso
lidat
ed
Rel
atio
ns
Go
ver
nm
ent
Ser
vic
es
Co
mm
unic
atio
n
Act
ivit
ies
Mem
ber
To
tal
Co
mbin
ed
and G
ener
alE
lim
inat
ions
To
tal
See
In
dep
end
ent
Au
dit
ors
' R
eport
Cal
ifo
rnia
Cer
tifi
ed P
ublic
Acc
ounta
nts
Educa
tio
n F
oundat
ion
Pro
gra
m S
ervic
es
Man
agem
ent
25
CO
Mb
inin
G S
TA
TE
ME
nT
S O
f f
Un
CT
iOn
Al
Ex
PE
nS
ES
Cal
iforn
ia S
ocie
ty o
f Cer
tified
Pub
lic A
ccou
ntan
ts |
Cal
iforn
ia C
ertifi
ed P
ublic
Acc
ount
ants
Edu
catio
n Fo
unda
tion
Year
s E
nded
Apr
il 30
, 201
4 an
d 20
13 (
Am
ount
s E
xpre
ssed
In T
hous
ands
)
2014
2013
34 2 0 1 4 c a l c p a a n n u a l r e p o r t www.calcpa.org
Access the Annual Report online at www.calcpa.org
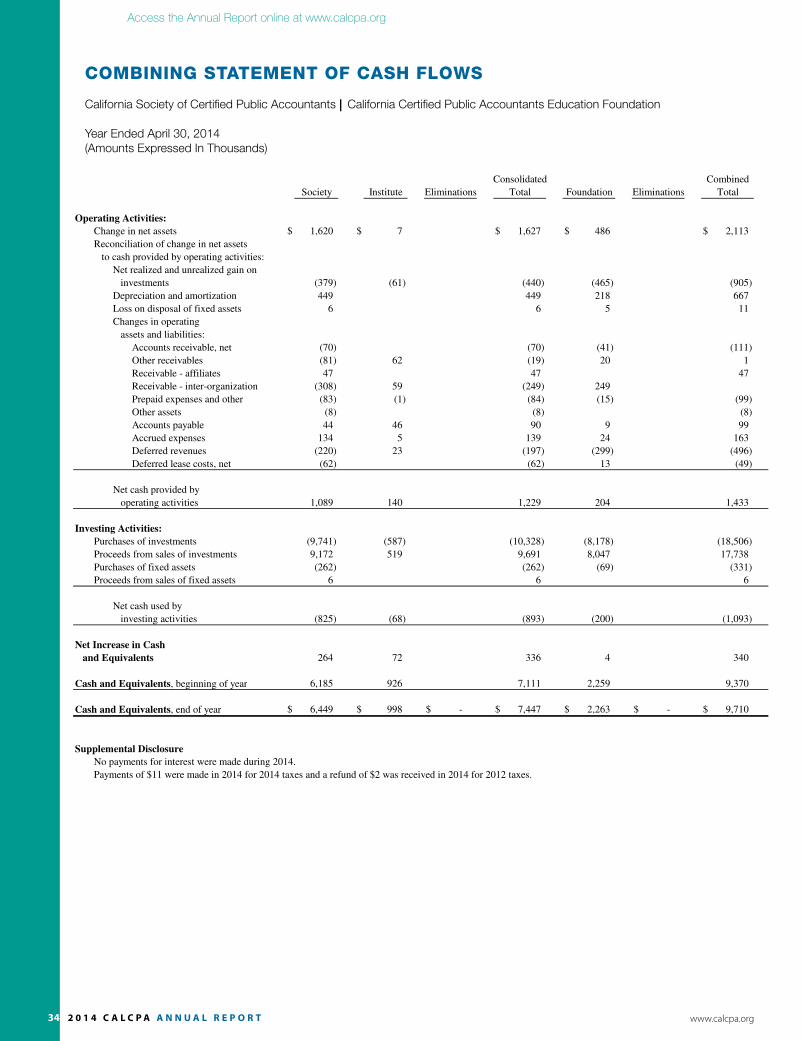
COMbininG STATEMEnT Of CASh flOwS
California Society of Certified Public Accountants | California Certified Public Accountants Education Foundation
Year Ended April 30, 2014(Amounts Expressed In Thousands)Year Ended April 30, 2014
Consolidated Combined
Society Institute Eliminations Total Foundation Eliminations Total
Operating Activities:
Change in net assets $ 1,620 $ 7 $ 1,627 $ 486 $ 2,113
Reconciliation of change in net assets
to cash provided by operating activities:
Net realized and unrealized gain on
investments (379) (61) (440) (465) (905)
Depreciation and amortization 449 449 218 667
Loss on disposal of fixed assets 6 6 5 11
Changes in operating
assets and liabilities:
Accounts receivable, net (70) (70) (41) (111)
Other receivables (81) 62 (19) 20 1
Receivable - affiliates 47 47 47
Receivable - inter-organization (308) 59 (249) 249
Prepaid expenses and other (83) (1) (84) (15) (99)
Other assets (8) (8) (8)
Accounts payable 44 46 90 9 99
Accrued expenses 134 5 139 24 163
Deferred revenues (220) 23 (197) (299) (496)
Deferred lease costs, net (62) (62) 13 (49)
Net cash provided by
operating activities 1,089 140 1,229 204 1,433
Investing Activities:
Purchases of investments (9,741) (587) (10,328) (8,178) (18,506)
Proceeds from sales of investments 9,172 519 9,691 8,047 17,738
Purchases of fixed assets (262) (262) (69) (331)
Proceeds from sales of fixed assets 6 6 6
Net cash used by
investing activities (825) (68) (893) (200) (1,093)
Net Increase in Cash
and Equivalents 264 72 336 4 340
Cash and Equivalents, beginning of year 6,185 926 7,111 2,259 9,370
Cash and Equivalents, end of year $ 6,449 $ 998 $ - $ 7,447 $ 2,263 $ - $ 9,710
Supplemental Disclosure
No payments for interest were made during 2014.
Payments of $11 were made in 2014 for 2014 taxes and a refund of $2 was received in 2014 for 2012 taxes.
California Society of Certified Public Accountants
California Certified Public Accountants Education Foundation
Combining Statement of Cash Flows
(In Thousands)
See Independent Auditors' Report
27

2 0 1 4 c a l c p a a n n u a l r e p o r t 35www.calcpa.org
Access the Annual Report online at www.calcpa.org
COMbininG STATEMEnT Of CASh flOwS
California Society of Certified Public Accountants | California Certified Public Accountants Education Foundation
Year Ended April 30, 2013(Amounts Expressed In Thousands)Year Ended April 30, 2013
Consolidated Combined
Society Institute Eliminations Total Foundation Eliminations Total
Operating Activities:
Change in net assets $ 2,334 $ 379 $ 2,713 $ 94 $ 2,807
Reconciliation of change in net assets to
cash provided (used) by operating activities:
Net realized and unrealized gain on
investments (1,041) (140) (1,181) (500) (1,681)
Depreciation and amortization 497 497 222 719
Loss on disposal of fixed assets 1 1
Changes in operating
assets and liabilities:
Accounts receivable, net 12 12 (7) 5
Other receivables (41) (18) (59) (46) (105)
Receivable - affiliates (15) (15) (15)
Receivable - inter-organization 1 $ (1)
Prepaid expenses and other (37) (1) (38) 50 12
Other assets (34) (34) (34)
Accounts payable (174) (19) (193) 22 (171)
Accrued expenses (314) (2) (316) 39 (277)
Payable - inter-organization (1) 1
Deferred revenues 296 10 306 69 375
Deferred lease costs, net (110) (110) 35 (75)
Net cash provided (used) by
operating activities 1,374 208 1,582 (21) 1,561
Investing Activities:
Purchases of investments (17,044) (981) (18,025) (6,720) (24,745)
Proceeds from sales of investments 16,506 940 17,446 6,595 24,041
Purchases of fixed assets (135) (135) (156) (291)
Net cash used by
investing activities (673) (41) (714) (281) (995)
Net Increase (Decrease) in Cash
and Equivalents 701 167 868 (302) 566
Cash and Equivalents, beginning of year 5,484 759 6,243 2,561 8,804
Cash and Equivalents, end of year $ 6,185 $ 926 $ - $ 7,111 $ 2,259 $ - $ 9,370
Supplemental Disclosure
No payments for interest were made during 2013.
Payments of $55 were made in 2013 for 2013 and 2012 taxes.
See Independent Auditors' Report
California Society of Certified Public Accountants
California Certified Public Accountants Education Foundation
Combining Statement of Cash Flows
(In Thousands)
28