annual report 2014 / 2015 - grupo thyssenkrupp€¦ · c2 thyssenkrupp annual report 2014/2015...
TRANSCRIPT
Annual Report 2014 / 2015
C2 thyssenkrupp annual report 2014/2015 thyssenkrupp in figures
thyssenkrupp in figures
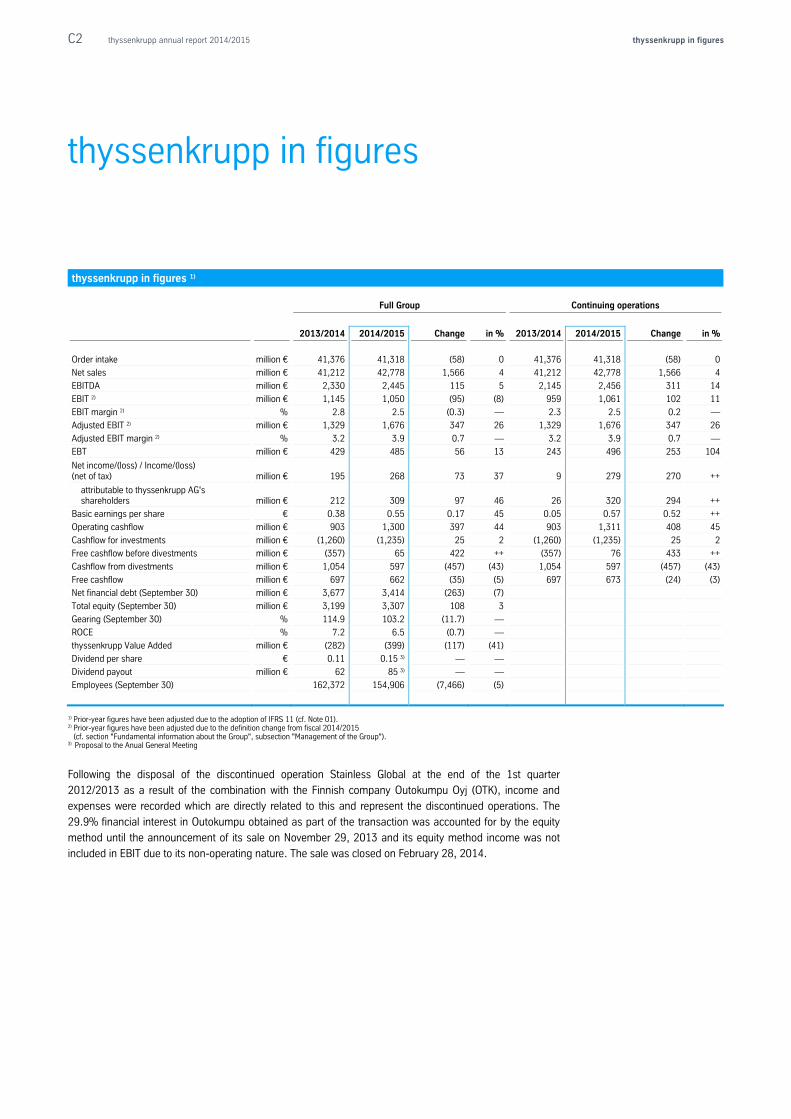
thyssenkrupp in figures 1)
Full Group Continuing operations
2013/2014 2014/2015 Change in % 2013/2014 2014/2015 Change in %
Order intake million € 41,376 41,318 (58) 0 41,376 41,318 (58) 0
Net sales million € 41,212 42,778 1,566 4 41,212 42,778 1,566 4
EBITDA million € 2,330 2,445 115 5 2,145 2,456 311 14
EBIT 2) million € 1,145 1,050 (95) (8) 959 1,061 102 11
EBIT margin 2) % 2.8 2.5 (0.3) — 2.3 2.5 0.2 —
Adjusted EBIT 2) million € 1,329 1,676 347 26 1,329 1,676 347 26
Adjusted EBIT margin 2) % 3.2 3.9 0.7 — 3.2 3.9 0.7 —
EBT million € 429 485 56 13 243 496 253 104
Net income/(loss) / Income/(loss) (net of tax) million € 195 268 73 37 9 279 270 ++
attributable to thyssenkrupp AG's shareholders million € 212 309 97 46 26 320 294 ++
Basic earnings per share € 0.38 0.55 0.17 45 0.05 0.57 0.52 ++
Operating cashflow million € 903 1,300 397 44 903 1,311 408 45
Cashflow for investments million € (1,260) (1,235) 25 2 (1,260) (1,235) 25 2
Free cashflow before divestments million € (357) 65 422 ++ (357) 76 433 ++
Cashflow from divestments million € 1,054 597 (457) (43) 1,054 597 (457) (43)
Free cashflow million € 697 662 (35) (5) 697 673 (24) (3)
Net financial debt (September 30) million € 3,677 3,414 (263) (7)
Total equity (September 30) million € 3,199 3,307 108 3
Gearing (September 30) % 114.9 103.2 (11.7) —
ROCE % 7.2 6.5 (0.7) —
thyssenkrupp Value Added million € (282) (399) (117) (41)
Dividend per share € 0.11 0.15 3) — —
Dividend payout million € 62 85 3) — —
Employees (September 30) 162,372 154,906 (7,466) (5)
1) Prior-year figures have been adjusted due to the adoption of IFRS 11 (cf. Note 01). 2) Prior-year figures have been adjusted due to the definition change from fiscal 2014/2015
(cf. section "Fundamental information about the Group", subsection "Management of the Group"). 3) Proposal to the Anual General Meeting
Following the disposal of the discontinued operation Stainless Global at the end of the 1st quarter
2012/2013 as a result of the combination with the Finnish company Outokumpu Oyj (OTK), income and
expenses were recorded which are directly related to this and represent the discontinued operations. The
29.9% financial interest in Outokumpu obtained as part of the transaction was accounted for by the equity
method until the announcement of its sale on November 29, 2013 and its equity method income was not
included in EBIT due to its non-operating nature. The sale was closed on February 28, 2014.
Contents
C2 thyssenkrupp in figures
02 Letter to shareholders
06 To our shareholders
07 Executive Board 09 Supervisory Board 11 Report by the Supervisory Board 17 Obituary 18 Corporate governance report 31 thyssenkrupp stock
33 Combined management report
34 Preliminary remarks 35 Fundamental information about the Group 44 Report on the economic position 81 Compliance 83 Employees 86 Technology and innovations 90 Environment, climate and energy 92 Purchasing 94 Subsequent events 95 Forecast, opportunity and risk report 116 Legal information
126 Consolidated financial statements
127 Consolidated statement of financial position 128 Consolidated statement of income 129 Consolidated statement of comprehensive income 130 Consolidated statement of changes in equity 131 Consolidated statement of cash flows 132 Notes to the consolidated financial statements
222 Independent Auditors' Report 224 Responsibility statement
225 Additional information
226 Multi-year overview 228 Other directorships held by Executive Board members 229 Other directorships held by Supervisory Board members 231 Glossary 234 Contact and 2016/2017 financial calendar
Our fiscal year begins on October 01 and ends on September 30 of the
following year.

Three words to describe who we are, what we do, and how we do it.
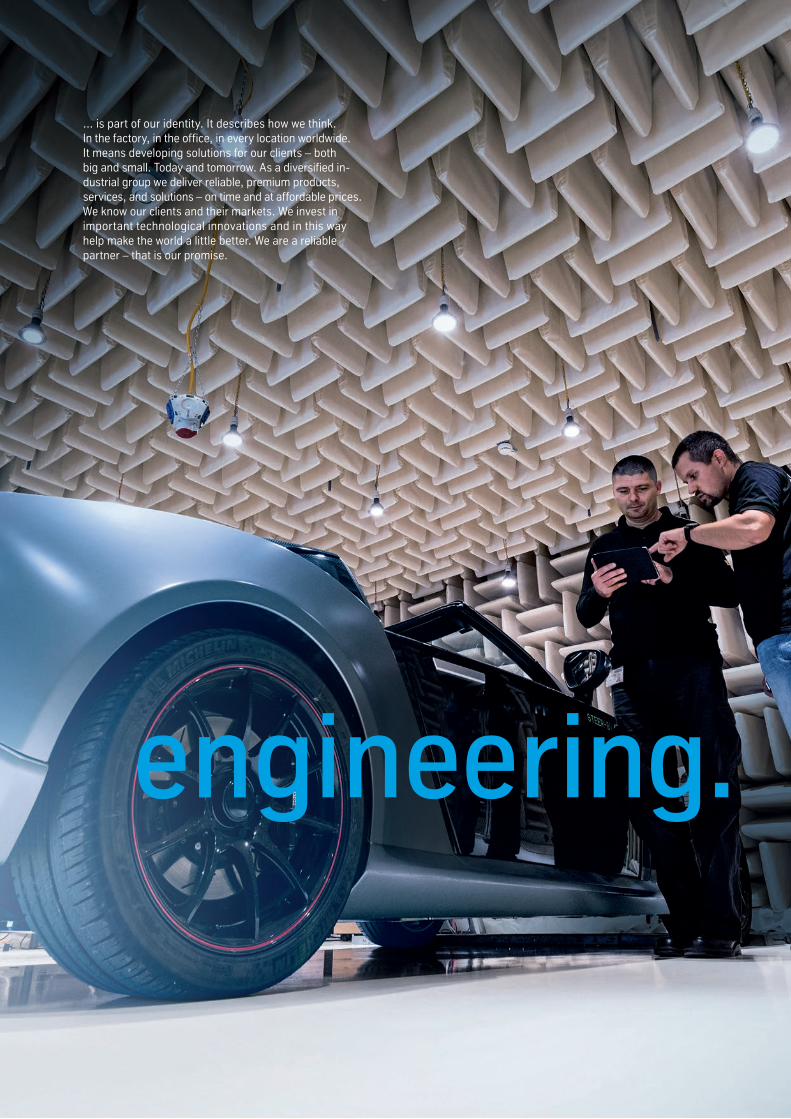
... is part of our identity. It describes how we think. In the factory, in the office, in every location worldwide. It means developing solutions for our clients – both big and small. Today and tomorrow. As a diversified industrial group we deliver reliable, premium products, services, and solutions – on time and at affordable prices. We know our clients and their markets. We invest in important technological innovations and in this way help make the world a little better. We are a reliable partner – that is our promise.
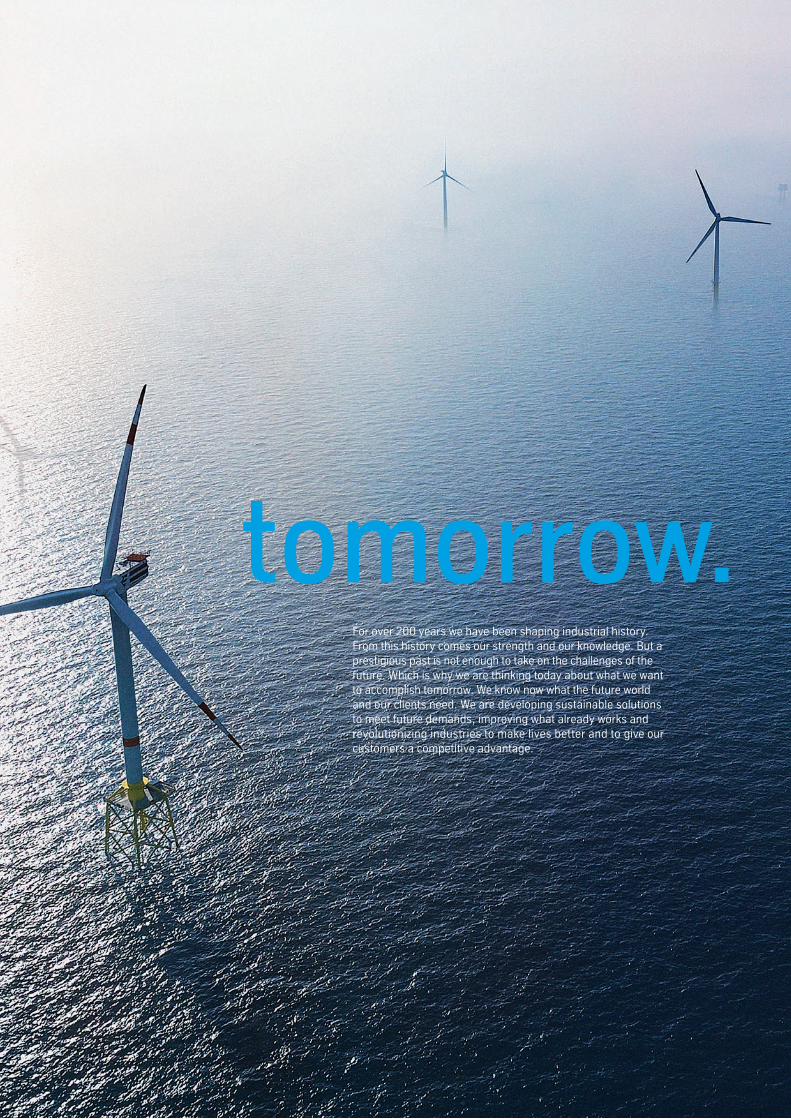
For over 200 years we have been shaping industrial history. From this history comes our strength and our knowledge. But a prestigious past is not enough to take on the challenges of the future. Which is why we are thinking today about what we want to accomplish tomorrow. We know now what the future world and our clients need. We are developing sustainable solutions to meet future demands, improving what already works and revolutionizing industries to make lives better and to give our customers a competitive advantage.
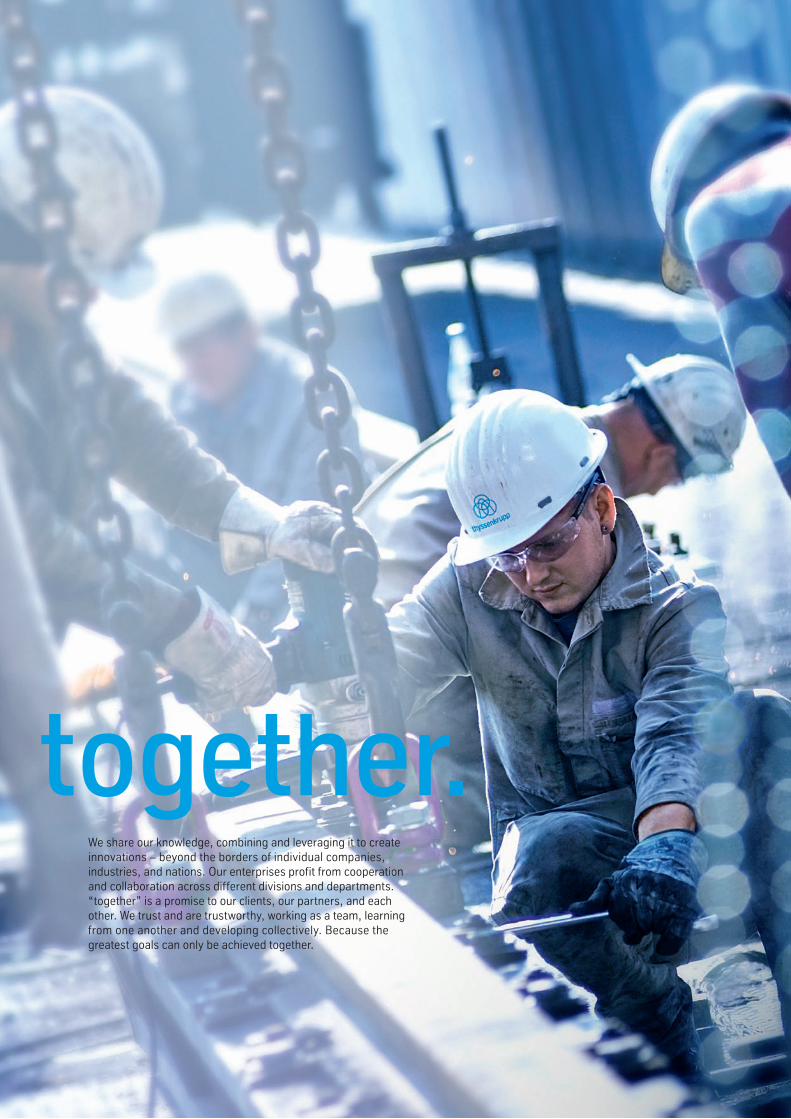
We share our knowledge, combining and leveraging it to create innovations – beyond the borders of individual companies, industries, and nations. Our enterprises profit from cooperation and collabo ration across different divisions and departments. “together” is a promise to our clients, our partners, and each other. We trust and are trustworthy, working as a team, learning from one another and developing collectively. Because the greatest goals can only be achieved together.
02 thyssenkrupp annual report 2014/2015
Letter to shareholders
Dr. Heinrich HiesingerChief Executive Officer
Letter to shareholders
03 thyssenkrupp annual report 2014/2015
From a macroeconomic viewpoint the past fiscal year 2014/2015 was very unsettled. Over the course of the year the business outlook darkened. Uncertainty on the markets increased. Nevertheless we held course:
We had set ourselves the task of continuously improving the efficiency of our businesses, growing in our capital goods businesses, and increasing our overall earning power. We succeeded.
• We significantly improved adjusted EBIT from continuing operations to €1,676 million, up 26% from the
prior year.
• With our efficiency program "impact" we achieved savings of €1.1 billion, clearly exceeding our target of €850 million.
• At €268 million, consolidated net income for the year improved by 37%, with net income attributable to thyssenkrupp AG's shareholders climbing 46% to €309 million.
A further goal was and still is to strengthen our balance sheet. With a slight increase in equity and a reduc-tion in net financial debt, we succeeded. But the most important milestone for us in the past fiscal year was to achieve positive free cash flow before divestments. For the first time since the 2005/2006 fiscal year we earned more money than we spent – €65 million more – even without the cash flows from the sale of invest-ments. We generated €662 million free cash flow. This allowed us to further reduce our net financial debt and gearing. All this progress was only possible through the exceptional performance of our employees, and on behalf of the Executive Board team I would like to thank them for their efforts.
To ensure you as owners participate in our continuous improvement, the Executive Board and Supervisory Board is proposing the payment of a dividend of €0.15 per share to the Annual General Meeting. This cannot be a satisfactory dividend level over the medium term for you as shareholders or for us. But it is a step in the right direction which also takes into account our balance sheet needs.
So over the past fiscal year we have stabilized and strengthened your company. But that is not enough. We are still some way from our minimum requirement and goals. At the same time we see the world around us growing increasingly uncertain. For this reason we will carry on concentrating on the things we can influence ourselves.
€ 0.15 dividend proposal
Letter to shareholders
04 thyssenkrupp annual report 2014/2015
The framework for this is our Strategic Way Forward. Our vision of becoming a diversified industrial group is linked to the ambition to generate strong and stable earnings, cash flow and value added. For us the diversi-fication of thyssenkrupp is not an end in itself. It is a means to seizing growth opportunities while at the same time increasing the stability of our business in a volatile environment.
To significantly improve our earning power over the long term we are applying two levers: Firstly we are in-creasing the efficiency of our businesses. Clear performance targets based on sector benchmarks have been set for each business area. All our business areas are working on detailed programs to achieve these targets.
Secondly we are systematically utilizing the combined strengths of our diversified Group in Groupwide initiatives. Major research and development projects such as InCar®plus for the automotive industry or our mobility solutions ACCEL and MULTI from the elevator business are the result. These are examples of how we combine the different capabilities of our business areas to create new products and market opportunities for thyssenkrupp. Without working together as a group we would not have succeeded.
The efficiency improvements under our corporate program "impact" are also managed on a systematic Group-wide basis. In the past few years we have already achieved €2.7 billion. This progress continues to be the key driver for our earnings improvements. Through "impact" we introduced methods and systems in all compa-nies of the Group which have now become an integral component of our performance culture.
Short-term efficiency and earnings gains are an important part of thyssenkrupp's transformation. But as a board we also have the task of securing our medium- and long-term competitiveness. To this end we have continuously increased our research and development spending over recent years. We are currently setting up an efficient and secure global IT network. At the same time we are automating business processes in our units. It will take some years to complete these programs, but they will provide the basis for further efficiency increases in the medium term. The successful implementation of these corporate programs is also essential for making the digital transformation of industry a success for thyssenkrupp.
For the current fiscal year we expect to make further progress on our Strategic Way Forward. However, in-creasing uncertainty over the economic climate and high import pressure on the materials markets parti-cularly from Asia are giving us cause for concern. Overall therefore we feel we need to take a cautious view of 2015/2016. Nevertheless we forecast a significant increase in net income and economic value added, free cash flow before M&A level with the prior year, and adjusted EBIT of between €1.6 billion and €1.9 billion. An important part in this will once more be played by our efficiency program "impact", with which we are again targeting EBIT effects of €850 million for 2015/2016.
thyssenkrupp has changed in recent years. We are a different company today. We have become more diver-sified and as a result more stable. We run the company in an integrated way, leveraging economies of scope. We have a new corporate culture based on performance and values. Our interactions are based on honesty, respect and mutual appreciation.
However, we are not yet perceived as the high-performance industrial group we are and want to become even more. For this reason we have decided to redevelop the Group's brand, as you will no doubt have already noticed from reading this annual report. The new brand puts a stronger focus on customers and makes our transformation visible. It communicates our mission statement, our positioning as a diversified industrial group, our aspiration to work on an integrated basis, to leverage synergies of scope and create added value for our customers, employees and shareholders.
More than €2.7billion efficiency gain through "impact"
Letter to shareholders
05 thyssenkrupp annual report 2014/2015
The new brand condenses what we stand for – in a new logo, a new slogan, and new colors. But these are only the visible elements of the brand. The core of our brand is our value proposition. It tells us in concrete terms how we want to advance our customers.
The redevelopment of our brand does not mean that we have reached the end of our transformation. The new brand is designed to give a further boost to our change process both within and outside the company. The thyssenkrupp Group will use a common brand in the future. Over 180 different brand identities currently exist side-by-side within the Group. As well as generating complexity, this is an inefficient use of resources. The single brand will create a unified and positive image among our customers and employees.
This is also underlined by the new logo. The Thyssen and Krupp signets are now no longer separate but finally form a single element. Our new slogan "engineering. tomorrow. together." describes in three words who we are, what we do and how we do it. The new brand deliberately represents an evolution. We want to carry our good traditions forward into the future. Our brand is now fresher, more contemporary and modern – and an expression of our transformation. You can read more about the new brand identity on our website at www.thyssenkrupp.com. We will of course be introducing the new brand wisely and in accordance with the Group's financial situation. There will be no lavish advertising campaign.
We have already achieved clearly visible improvements on our Strategic Way Forward. thyssenkrupp today is more stable than at the beginning of our change process. But we are still in the middle of our transformation process. The upside potential from further efficiency gains and our growth opportunities as a diversified industrial group is huge. We will work hard to continue to improve.
Thank you for your trust and your constructive support.
Yours,
Dr. Heinrich HiesingerChief Executive Officer
Essen, November 2015
The new brand puts a stronger
focus on customers and makes our
transformation visible.
Letter to shareholders
06 thyssenkrupp annual report 2014/2015
To our shareholders
07 Executive Board
09 Supervisory Board
11 Report by the Supervisory Board
17 Obituary
18 Corporate governance report
31 thyssenkrupp stock
07 thyssenkrupp annual report 2014/2015 To our shareholders // Executive Board
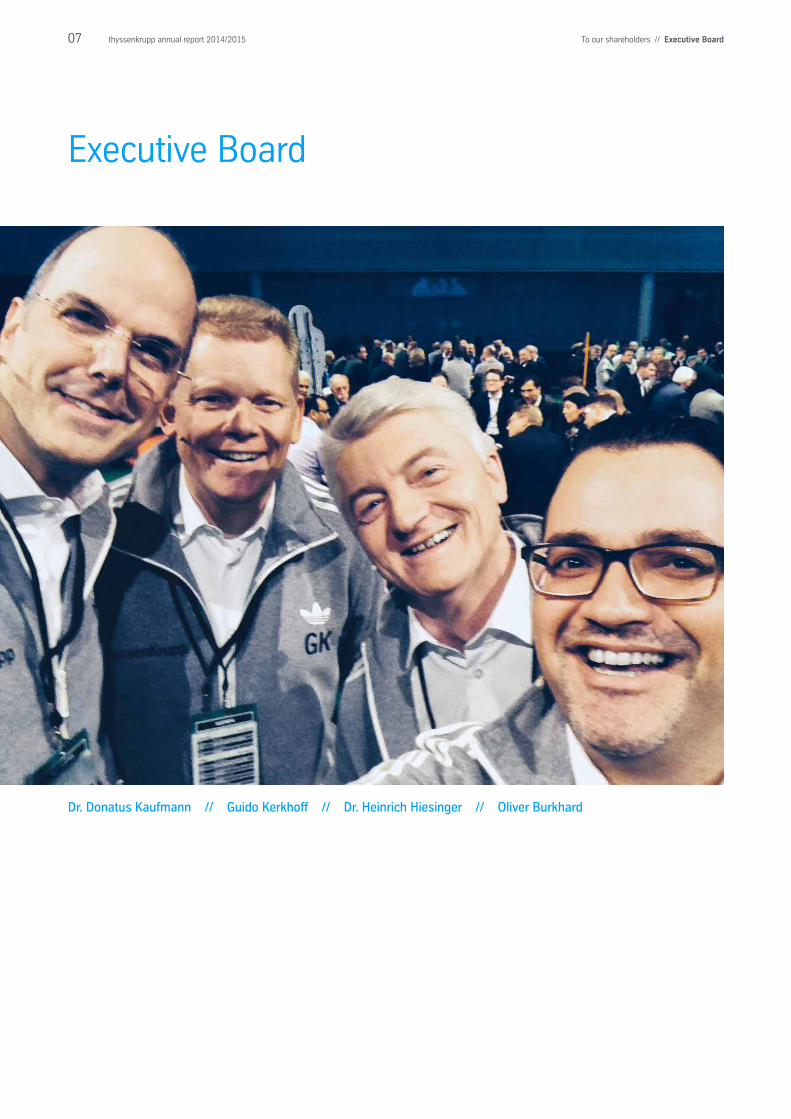
Executive Board
Dr. Donatus Kaufmann // Guido Kerkhoff // Dr. Heinrich Hiesinger // Oliver Burkhard
08 thyssenkrupp annual report 2014/2015 To our shareholders // Executive Board
Dr. Heinrich HiesingerChairman (CEO), born 1960. Member of the Executive Board since October 01, 2010, CEO since Janu-ary 21, 2011. Appointed until September 30, 2020. Responsible for the Corporate Functions Communi-cations; Internal Auditing; Strategy, Markets & Development, and Technology, Innovation & Sustainability. Responsible for the regions Asia-Pacific and China. The CEOs of the business areas report directly to the CEO of thyssenkrupp AG.
Oliver Burkhardborn 1972. Member of the Executive Board since February 01, 2013, CHRO since April 01, 2013. Appointed until January 31, 2021. Responsible for the Corporate Functions Human Resources Strategy; People Develop-ment & Executive Management, plus Regional Services Germany and Corporate Services. Responsible for the regions Germany/Austria/Switzerland/ Liechtenstein, Middle East & Africa, and India. The CHROs of the business areas report directly to the CHRO of thyssenkrupp AG.
Dr. Donatus Kaufmannborn 1962. Member of the Executive Board since February 01, 2014. Appointed until January 31, 2017. Responsible for the Corporate Functions Legal and Compliance. Responsible for the regions North America (NAFTA) and Western Europe. The business area board members responsible for Legal and Compliance report directly to the Executive Board member of thyssenkrupp AG responsible for Legal and Compliance.
Guido Kerkhoffborn 1967. Member of the Executive Board since April 01, 2011. Appointed until March 31, 2021. Responsible for the Corporate Functions Controlling, Accounting & Risk; Corporate Finance; Investor Relations; Group Processes & Information Technology; Mergers & Acquisitions; Procurement & Supply Management; Taxes & Customs, plus Global Shared Services. Responsible for the regions Central/Eastern Europe, Community of Independent States, and South America. The CFOs of the business areas report directly to the CFO of thyssenkrupp AG.
“We combine the different
capabilities of our business areas to
create new products and
market opportunities for thyssenkrupp.”
09 thyssenkrupp annual report 2014/2015 To our shareholders // Supervisory Board
Supervisory Board
Members of the Supervisory Board
Prof. Dr. Ulrich Lehner, Düsseldorf Chairman // Member of the Shareholders’ Committee of
Henkel AG & Co. KGaA
Dr. Sabine Maaßen, Dinslaken Vice Chairwoman // Legal Counsel, IG Metall
Martin Dreher, Heilbronn Retail clerk, Chairman of the Works Council of
thyssenkrupp System Engineering GmbH (Heilbronn) //
Chairman of the Works Council Union
thyssenkrupp Industrial Solutions
Markus Grolms, Frankfurt/Main IG Metall trade union secretary
Dr. Ingrid Hengster, Frankfurt/Main (since January 30, 2015)
Member of the Executive Board of KfW Bankengruppe
Susanne Herberger, Dresden Engineer (FH) – information technology // Vice Chairwoman of the
Group Works Council // Chairwoman of the Works Council Union
thyssenkrupp Elevator Technology
Prof. Dr. Hans-Peter Keitel, Essen Vice President of the Federation of German Industries
(Bundesverband der Deutschen Industrie e.V.)
Ernst-August Kiel, Blumenthal Fitter // Chairman of the Works Council of thyssenkrupp Marine
Systems GmbH (Kiel) // Chairman of the General Works Council of
thyssenkrupp Marine Systems // Vice Chairman of the Works Council
Union thyssenkrupp Industrial Solutions
Dr. Norbert Kluge, Ratingen Diplom-Sozialwirt // Head of Codetermination Support dept. at the
Hans Böckler Foundation
Dr. Ralf Nentwig, Essen Member of the Executive Committee of the Alfried Krupp von Bohlen
und Halbach Foundation
René Obermann, Bonn Partner at Warburg Pincus LLC
Prof. Dr. Bernhard Pellens, Bochum Professor of Business Studies and International Accounting, Ruhr
University Bochum
Klaus Preußler, Essen (until January 31, 2015)
Industrial clerk // Head of Accounting at thyssenkrupp Materials
International GmbH (Essen)
Peter Remmler, Wolfsburg Wholesale and export trader // Chairman of the Works Council of
thyssenkrupp Schulte GmbH (Braunschweig) // Chairman of the Works
Council Union thyssenkrupp Materials Services
Carola Gräfin v. Schmettow, Düsseldorf Chairwoman of the Management Board of HSBC Trinkaus & Burkhardt
AG
Wilhelm Segerath, Duisburg Automotive body maker // Chairman of the Group Works Council of
thyssenkrupp AG
Carsten Spohr, Munich Chairman of the Executive Board of Deutsche Lufthansa AG
Dr. Lothar Steinebach, Leverkusen Former Member of the Management Board of Henkel AG & Co. KGaA
10 thyssenkrupp annual report 2014/2015 To our shareholders // Supervisory Board
Christian Streiff, Paris (until January 30, 2015)
Vice President of SAFRAN S.A.
Jürgen R. Thumann, Düsseldorf (until January 30, 2015)
Chairman of the Advisory Board of Heitkamp & Thumann Group
Jens Tischendorf, Zurich (since January 30, 2015)
Partner and Director of Cevian Capital AG
Fritz Weber, Schöndorf Machine setter // Chairman of the General Works Council of
thyssenkrupp Bilstein GmbH // Chairman of the Works Council Union
thyssenkrupp Components Technology
Isolde Würz, Mülheim a.d.Ruhr (since February 01, 2015)
Attorney // Head of Governance, Corporate Function Legal at
thyssenkrupp AG
Supervisory Board Committees
Executive Committee Prof. Dr. Ulrich Lehner (Chairman)
Prof. Dr. Hans-Peter Keitel
Dr. Sabine Maaßen
Wilhelm Segerath
Mediation Committee under § 27 (3) Codetermination Act Prof. Dr. Ulrich Lehner (Chairman)
Prof. Dr. Hans-Peter Keitel
Dr. Sabine Maaßen
Wilhelm Segerath
Personnel Committee Prof. Dr. Ulrich Lehner (Chairman)
Prof. Dr. Hans-Peter Keitel
Dr. Sabine Maaßen
Wilhelm Segerath
Audit Committee Prof. Dr. Bernhard Pellens (Chairman)
Markus Grolms
Susanne Herberger
Prof. Dr. Ulrich Lehner
Dr. Ralf Nentwig
Wilhelm Segerath
Strategy, Finance and Investment Committee Dr. Lothar Steinebach (Chairman)
Markus Grolms
Susanne Herberger
Prof. Dr. Hans-Peter Keitel
Prof. Dr. Ulrich Lehner
Dr. Sabine Maaßen
Peter Remmler
Jens Tischendorf
Nomination Committee Prof. Dr. Ulrich Lehner (Chairman)
Prof. Dr. Hans-Peter Keitel
Dr. Ralf Nentwig
Prof. Dr. Bernhard Pellens
11 thyssenkrupp annual report 2014/2015 To our shareholders // Report by the Supervisory Board
Report by the Supervisory Board
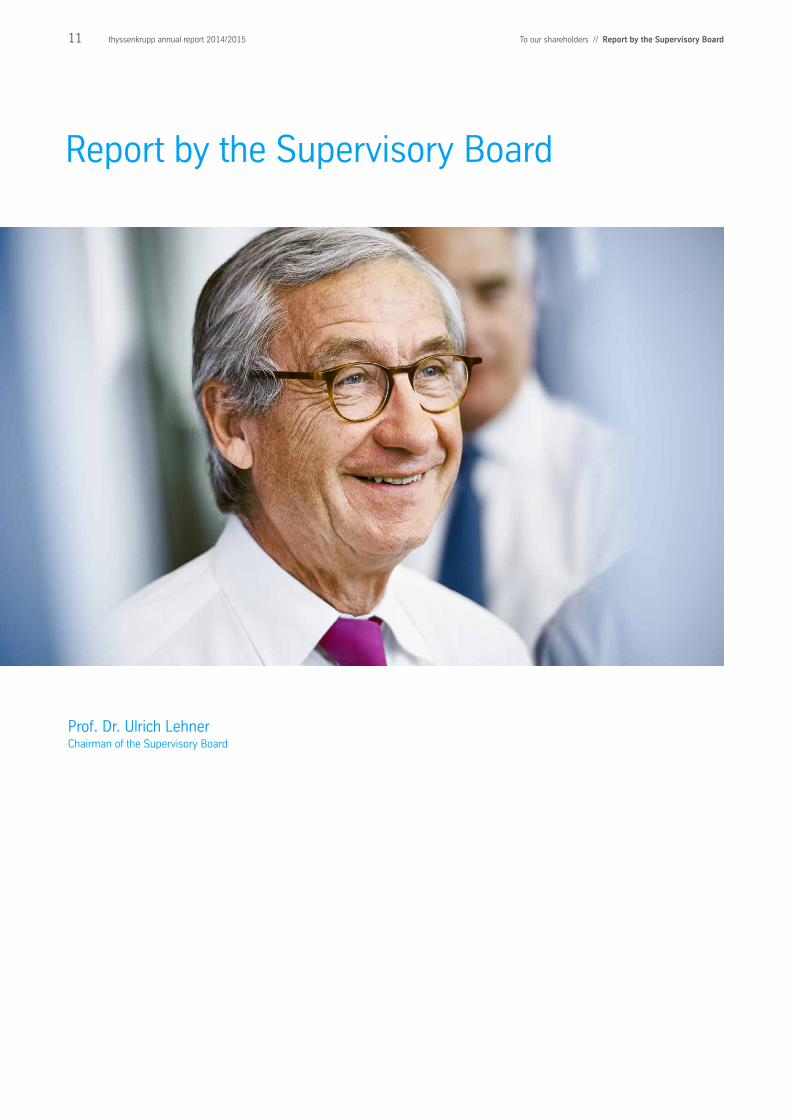
Prof. Dr. Ulrich LehnerChairman of the Supervisory Board
12 thyssenkrupp annual report 2014/2015 To our shareholders // Report by the Supervisory Board
Dear Shareholders,
In the following I would like to inform you about the work of the Supervisory Board in the 2014/2015 fiscal
year:
Cooperation between Supervisory Board and Executive Board In fiscal year 2014/2015 the Supervisory Board again regularly advised the Executive Board on the
management of the Company and continuously supervised its conduct of business. We satisfied ourselves
that the Executive Board’s work complied with all legal and regulatory requirements at all times. The
Executive Board fulfilled its duty to inform and furnished us with regular written and verbal reports containing
up-to-date and comprehensive information on all issues of relevance to the Company and the Group relating
to strategy, planning, business performance, the risk situation and compliance. This also included
information on variances between actual performance and previously reported targets as well as on budget
variances (follow-up reporting). In the committees and in full Supervisory Board meetings, the members of
the Supervisory Board always had ample opportunity to critically examine the reports and resolution
proposals submitted by the Executive Board and contribute suggestions. In particular, we discussed
intensively and examined the plausibility of all transactions of importance to the Company on the basis of
written and verbal reports by the Executive Board. On numerous occasions the Supervisory Board dealt at
length with the risk situation of the Company, the liquidity planning and the equity situation. Thanks to an
analysis of the value potential of the Group's businesses and the opportunities and risks of strategic steps,
critical operating issues were presented to the Supervisory Board in a clear and differentiated way. Where
required by law, the Articles of Association or the rules of procedure for the Executive Board, the Supervisory
Board provided its approval of individual business transactions.
In the periods between meetings, the Supervisory Board Chairman and the Chairmen of the Audit
Committee and the Strategy, Finance and Investment Committee engaged in a close and regular exchange
of views and information with the Executive Board and were informed about major developments. The
Supervisory Board Chairman and Audit Committee and Strategy, Finance and Investment Committee
Chairmen reported on important findings immediately in the following Supervisory Board or Committee
meeting.
Before the Supervisory Board meetings the shareholder and the employee representatives each held
separate meetings to discuss the agenda items. There were no indications of conflicts of interest of
Executive Board and Supervisory Board members, which must be disclosed to the Supervisory Board
immediately and reported to the Annual General Meeting.
Supervisory Board meetings Five Supervisory Board meetings – four regular and one constituent meeting – were held in the reporting
year. The average attendance rate at meetings of the Supervisory Board and its committees was 97.8%. No
Supervisory Board member attended fewer than half the meetings of the Supervisory Board and the relevant
committees. The members of the Executive Board took part in the Supervisory Board meetings unless
otherwise determined by the Supervisory Board Chairman.
In the first meeting in the reporting year on November 19, 2014 we dealt firstly with the business and
earnings situation in fiscal year 2013/2014 and the initial results of the employee survey. A further item on
the agenda dealt with the parent-company and consolidated financial statements for the year ended
September 30, 2014. On the recommendation of the Audit Committee and after discussion with the
auditors, we approved the consolidated and parent-company financial statements for the 2013/2014 fiscal
year. Further, the corporate and investment planning for the 2014/2015 fiscal year was adopted. We also
discussed and adopted the agenda for the Annual General Meeting on January 30, 2015. Other main items
discussed at the meeting included the business activities and strategy of the Components Technology
business area, which we examined on the basis of a detailed report by its CEO, Dr. Karsten Kroos. We also
dealt with acquisitions and disposals as well as questions of compliance and Executive Board matters. In
addition we adapted the rules of procedure for the Supervisory Board concerning age rules to the targets set
for the composition of the Supervisory Board and resolved to submit an unqualified declaration of
The average attendance rate at the five meetings of the Supervisory Board was 97.8%.
13 thyssenkrupp annual report 2014/2015 To our shareholders // Report by the Supervisory Board
conformity. Finally we discussed the results of the Supervisory Board efficiency review, and in particular
what measures could improve the preparation, conduct and follow-up of meetings. These measures were
subsequently implemented. In connection with the efficiency review it was also agreed that the CEOs should
each present their business area and strategy directly to the Supervisory Board and that in the future the
heads of the corporate functions should also present their respective situations to the Supervisory Board of
thyssenkrupp AG.
On the day before the Annual General Meeting on January 29, 2015 the Supervisory Board members
convened for a meeting in which the Executive Board first reported on the situation of the Group and the
results of the employee survey. Other topics were the Annual General Meeting the next day, the development
of a new brand strategy, the compliance report and questions of Executive Board compensation . In addition
the CEO of the Industrial Solutions business area, Dr. Hans Christoph Atzpodien, gave a detailed report on
the business activities and strategy of his business area, which we subsequently discussed.
Directly after the Annual General Meeting on January 30, 2015 a constituent meeting of the Supervisory
Board was held with the newly elected and newly delegated shareholder representatives, in which
Prof. Dr. Ulrich Lehner was reelected as Chairman of the Supervisory Board. The committees were
reconstituted on the shareholder representative side. Prof. Dr. Bernhard Pellens was reelected as chairman
of the Audit Committee and Dr. Lothar Steinebach was reelected as chairman of the Strategy, Finance and
Investment Committee.
In the Supervisory Board meeting on May 13, 2015 we first discussed the Group’s business situation and
Strategic Way Forward on the basis of a comprehensive report by the Executive Board. In this connection we
also dealt with a progress report on the employee survey. A further main topic at this meeting were the
business activities and strategy of the Materials Services business area, which we discussed on the basis of
a detailed report by its CEO, Joachim Limberg. Under transactions requiring approval we dealt in particular
with the sale of the VDM group to Lindsay Goldberg. Other topics were the 2014 EMIR compliance audit
pursuant to § 20 WpHG, the law on the equal participation of women and men in leadership positions and its
implementation in the thyssenkrupp Group as well as compliance questions and Executive Board matters.
In the Supervisory Board meeting on September 9, 2015 the Group’s operating situation and Strategic Way
Forward with particular reference to the strategy in the regions were again a focus of discussion. Other main
topics were the new thyssenkrupp brand strategy, which we noted with assent, and the business activities
and strategy of the Steel Europe and Steel Americas business areas. The CEO of the two business areas,
Andreas Goss, gave a detailed report, which we subsequently discussed. Another topic was the renewal of
the framework agreement with auditors PricewaterhouseCoopers Aktiengesellschaft Wirtschaftsprüfungs-
gesellschaft, Essen (PwC). The implementation of the new law on the equal participation of women and men
in leadership positions was explained by the Executive Board. The Supervisory Board set a target for the
proportion of women in the Executive Board of thyssenkrupp AG and considered the set concrete targets for
the composition of the Supervisory Board and the implementation and updating thereof. As in previous
years, current developments in corporate governance were again a topic in this year’s September meeting.
After reviewing observance of the recommendations and suggestions of the Corporate Governance Code we
resolved to submit an unqualified declaration of conformity. In addition we adapted the rules of procedure for
the Supervisory Board and dealt with compliance issues. Following the meeting Prof. Christian Strenger, a
member of the Government Commission on the German Corporate Governance Code, gave a guest
presentation, as part of Supervisory Board training, on the topic of “Effective supervisory board work”,
which we subsequently discussed.
14 thyssenkrupp annual report 2014/2015 To our shareholders // Report by the Supervisory Board
Report on the work of the committees The primary task of the Supervisory Board's six committees is to prepare decisions and topics for discussion
at the full meetings. The Supervisory Board has delegated decision-making powers to the committees where
this is legally permissible. The powers of the committees and the requirements on committee members are
set out in the rules of procedure for the respective committees, for the Mediation and Nomination
Committees in the rules of procedure for the Supervisory Board. The chairmen of the committees provided
the Supervisory Board with regular detailed reports on the work of the committees. With the exception of the
Audit Committee and the Strategy, Finance and Investment Committee, all committees are chaired by the
Supervisory Board Chairman. The compositions of the six committees are shown in the section “Supervisory
Board”.
The Executive Committee (Praesidium) met five times in the past fiscal year. In addition to preparing the
full Supervisory Board meetings, the main subjects of deliberation were the financial position and earnings
performance of the Group, the strategic development of the individual business areas, and the Groupwide
projects to optimize effectiveness, efficiency and performance. The Executive Committee also prepared the
Supervisory Board efficiency review. As chairman of the committee, I was also in close contact with the
other members of the Executive Committee outside meetings to agree on special projects.
The Personnel Committee held four meetings in the 2014/2015 fiscal year to prepare the personnel
decisions of the Supervisory Board. Where required, resolutions were passed or recommendations for
resolutions were made to the Supervisory Board. The meetings focused in particular on questions regarding
the law on the equal participation of women and men in leadership positions, discussions on the
reappointment of Executive Board members of thyssenkrupp AG and – in fulfilment of our duty of care –
succession planning. In addition, proposals for establishing the performance bonus and additional bonus
and the structuring of pensions for the members of the Executive Board were dealt with. Details of Executive
Board compensation are presented in the compensation report.
The Audit Committee met five times in the 2014/2015 fiscal year. The Chairman of the Audit Committee
was also in regular contact with the auditors between these meetings. Alongside Executive Board members,
the meetings were also attended by representatives of the auditors PricewaterhouseCoopers
Aktiengesellschaft Wirtschaftsprüfungsgesellschaft, Essen, who were elected by the 2015 Annual General
Meeting and subsequently appointed by the Audit Committee. Heads of corporate functions were also
available to provide reports and take questions in committee meetings on individual agenda items. The
auditors declared to the Audit Committee that no circumstances exist which could lead to the assumption of
prejudice on their part. The Audit Committee obtained the required auditors' statement of independence,
reviewed their qualification, concluded the fee agreement, and selected the focus themes for the audit. In
addition, a Groupwide survey of auditing quality was initiated and the results discussed in the Audit
Committee.
In the reporting year the committee’s work focused on examining the 2014/2015 parent-company and
consolidated financial statements along with the combined management report, the proposal for the
appropriation of net income and the auditors’ reports, and preparing the Supervisory Board resolution on
these items. In addition, the interim financial reports (half-year and quarterly reports) were also discussed in
detail and adopted, taking into account the auditors’ review report. The Audit Committee further monitored the
accounting process and discussed the effectiveness of the internal control system, the risk management
system and the internal auditing system. It also dealt with the main legal disputes and compliance in the
Group. Regular reports were given on the progress and execution of the 2020 compliance strategy. The Audit
Committee further prepared the extension of the framework agreement with the auditors PwC. In addition the
committee discussed with the auditors the additional services provided by PwC alongside the audit of the
financial statements, and in the presence of the head of Group internal auditing dealt with the internal audit
results, the audit processes and the audit planning for the 2015/2016 fiscal year. Further main topics were the
management of net working capital, the 2014 EMIR compliance audit in accordance with § 20 WpHG, the
status of the tax inspection, and the management’s initiative to enhance the structure of the internal control
system.
The Supervisory Board has committees. 6
15 thyssenkrupp annual report 2014/2015 To our shareholders // Report by the Supervisory Board
In an additional meeting in September 2015 the committee members dealt in detail with current legal and
accounting developments, an update on contract management and in particular with the status of the
corporate initiatives daproh, unITe and GSS.
The Strategy, Finance and Investment Committee held five meetings in the 2014/2015 fiscal year.
Discussions focused on the strategic development of thyssenkrupp’s business model. The committee also
discussed in detail the reports presented previously to the Supervisory Board on the business activities and
strategy of the individual business areas. The committee members were also introduced in more detail to
individual corporate functions and the current status of the corporate initiatives daproh, unITe and GSS. In
addition the committee made recommendations to the Supervisory Board regarding M&A transactions to be
dealt with by the Supervisory Board. Further, the Group's corporate and investment planning for the reporting
year was discussed, taking into account the Group’s current rating and financial situation, and corresponding
Supervisory Board resolutions were prepared.
The members of the Nomination Committee convened for five meetings in the past fiscal year. Discussions
focused on preparing the election of the shareholder representatives on the Supervisory Board at the Annual
General Meeting on January 30, 2015. In selecting candidates, the Nomination Committee took into account
their qualifications, the recommendations of the German Corporate Governance Code, and the Supervisory
Board’s own goals with regard to its composition. The Nomination Committee also dealt with the effects of
the law on the equal participation of women and men in leadership positions on the Supervisory Board of
thyssenkrupp and the further development of the goals of the Supervisory Board regarding its future
composition.
There was once again no cause to convene the Mediation Committee under § 27 par. 3 Codetermination
Act in the reporting year.
Corporate Governance and Declaration of Conformity The Executive Board and Supervisory Board issued two Declarations of Conformity in accordance with § 161
of the German Stock Corporation Act (AktG) in the reporting year. Firstly on November 19 the Supervisory
Board together with the Executive Board, who had previously resolved this on November 10, 2014, issued a
Declaration of Conformity referring to the June 24, 2014 version of the Code that was valid at the time of the
resolution and was published in the electronic Federal Gazette on September 30, 2014. Subsequently, to
take into account the May 5, 2015 changes to the Code, the Executive Board and Supervisory Board issued
a second Declaration of Conformity which has been permanently available on the Company’s website since
October 1, 2015. In addition the Executive Board – also on behalf of the Supervisory Board – reports on
corporate governance at thyssenkrupp in the corporate governance report and the corporate governance
declaration.
Audit of the parent-company and consolidated financial statements Elected by the Annual General Meeting on January 30, 2015 to audit the financial statements for the
2014/2015 fiscal year, PwC audited the parent-company financial statements for the fiscal year October 1,
2014 to September 30, 2015 prepared by the Executive Board in accordance with HGB (German GAAP)
rules, and the management report on thyssenkrupp AG, which is combined with the management report on
the Group. The auditors issued an unqualified audit opinion. In accordance with § 315a HGB, the
consolidated financial statements of thyssenkrupp AG for the fiscal year from October 1, 2014 to September
30, 2015, and the management report on the Group, which is combined with the management report on the
company, were prepared on the basis of International Financial Reporting Standards (IFRS) as applicable in
the European Union. The consolidated financial statements and the combined management report were also
given an unqualified audit opinion by PwC. The auditors also confirmed that the Executive Board has
installed an appropriate reporting and monitoring system which is suitable in its design and handling to
identify at an early stage developments which could place the continued existence of the Company at risk.
16 thyssenkrupp annual report 2014/2015 To our shareholders // Report by the Supervisory Board
By resolution of the Audit Committee of February 12, 2015 the Supervisory Board tasked the financial
statement auditors for the reporting year with the following focus theme: “Audit of the management of
contractual obligations under long-term construction contracts in the business units Process Technologies
and Resource Technologies”.
The financial-statement documents and audit reports were discussed in detail in the meetings of the Audit
Committee on November 13, 2015 and the Supervisory Board on November 18, 2015. The auditors
reported on the main findings of their audit. They also outlined their findings on the internal control and risk
management systems in relation to the accounting process and were available to answer questions and
provide additional information. The Chairman of the Audit Committee reported in depth at the full
Supervisory Board meeting on the Audit Committee's examination of the parent-company and consolidated
financial statements. Following examination and discussion of the parent-company financial statements, the
consolidated financial statements, and the combined management report by the Supervisory Board no
objections were raised. In line with the recommendation by the Audit Committee, we then approved the
result of the audit by the financial statement auditors. Following completion of our examination we came to
the conclusion that no objections were to be raised and we established the financial statements of
thyssenkrupp AG and approved the consolidated financial statements. Following our own examination and
taking the earnings and financial situation into account, we concurred with the Executive Board’s proposal
for the appropriation of net income. Together with the Executive Board, we propose to the Annual General
Meeting that a dividend of €0.15 per share be paid for the 2014/2015 fiscal year.
Personnel changes on the Supervisory Board and Executive Board There were three changes on the Supervisory Board of thyssenkrupp AG, two on the shareholder
representatives’ side and one on the employee representatives’ side. Following the election of shareholder
representatives by the Annual General Meeting, long-serving members Christian Streiff and Jürgen
Thumann left the Supervisory Board at the close of the Annual General Meeting on January 30, 2015. Their
successors are Dr. Ingrid Hengster and Jens Tischendorf. At the close of January 31, 2015 Klaus Preußler,
the representative of the executive employees, also left the Supervisory Board. His successor is Isolde Würz.
The members of the Supervisory Board thanked Mr. Preußler, Mr. Streiff and Mr. Thumann for their good
work over many years.
In the past fiscal year the Supervisory Board resolved the reappointment of three Executive Board members
for five further years in each case: In its meeting on November 19, 2014 the Supervisory Board appointed
Dr. Heinrich Hiesinger as member and chairman of the Executive Board of thyssenkrupp AG until
September 30, 2020. In its meeting on May 13, 2015 the Supervisory Board appointed Guido Kerkhoff as
member of the Executive Board of thyssenkrupp AG until March 31, 2021 and Oliver Burkhard as member of
the Executive Board and labor director of thyssenkrupp AG until January 31, 2021.
The Supervisory Board thanks the Executive Board members, all employees of the Group worldwide and the
employee representatives of all Group companies for their efforts and achievements in the 2014/2015 fiscal
year.
The Supervisory Board
Prof. Dr. Ulrich Lehner
Chairman
Essen, November 18, 2015
17 thyssenkrupp annual report 2014/2015 To our shareholders // Obituary
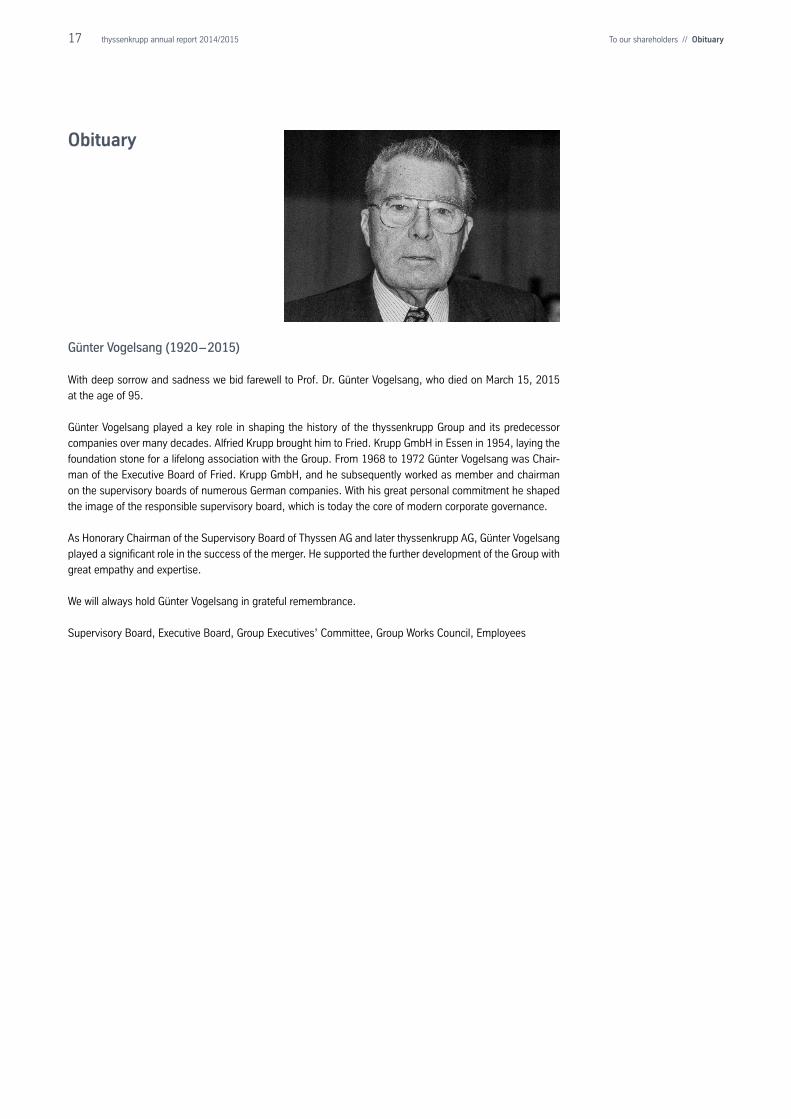
Günter Vogelsang (1920 – 2015)
With deep sorrow and sadness we bid farewell to Prof. Dr. Günter Vogelsang, who died on March 15, 2015 at the age of 95.
Günter Vogelsang played a key role in shaping the history of the thyssenkrupp Group and its predecessor companies over many decades. Alfried Krupp brought him to Fried. Krupp GmbH in Essen in 1954, laying the foundation stone for a lifelong association with the Group. From 1968 to 1972 Günter Vogelsang was Chair-man of the Executive Board of Fried. Krupp GmbH, and he subsequently worked as member and chairman on the supervisory boards of numerous German companies. With his great personal commitment he shaped the image of the responsible supervisory board, which is today the core of modern corporate governance.
As Honorary Chairman of the Supervisory Board of Thyssen AG and later thyssenkrupp AG, Günter Vogelsang played a significant role in the success of the merger. He supported the further development of the Group with great empathy and expertise.
We will always hold Günter Vogelsang in grateful remembrance.
Supervisory Board, Executive Board, Group Executives’ Committee, Group Works Council, Employees
Obituary
18 thyssenkrupp annual report 2014/2015 To our shareholders // Corporate governance report
Corporate governance report
In the following section, the Executive Board and Supervisory Board report on corporate governance at
thyssenkrupp in accordance with section 3.10 of the German Corporate Governance Code. This section also
includes the compensation report for the Executive Board.
Corporate governance overview
Further development of corporate governance in the Group thyssenkrupp is continuing to develop its understanding of good and responsible corporate governance.
Under the project Governance@thyssenkrupp the corporate governance structures throughout the Group are
being harmonized beyond the established understanding of corporate governance defined in the German
Corporate Governance Code and made more transparent. The focus is on strengthening the transparency
and reliability of our binding internal regulations and supporting managers in the use of internal corporate
governance instruments.
Implementation of the German Corporate Governance Code In the reporting year the Executive Board and Supervisory Board of thyssenkrupp AG again dealt intensively
with the requirements of the German Corporate Governance Code, taking into account the amendments and
additions adopted by the Government Commission on the German Corporate Governance Code in May 2015
which entered into effect on publication in the official section of the Federal Gazette ("Bundesanzeiger")
on June 12, 2015. In accordance with § 161 (1) Stock Corporation Act (AktG), the Executive Board
and Supervisory Board issued two joint declarations of conformity in the reporting year, which were
published on November 19, 2014 and October 01, 2015. They are available on the Company's website at
www.thyssenkrupp.com.
In this reporting year thyssenkrupp AG continues to comply with all recommendations of the Government
Commission on the German Corporate Governance Code published by the Federal Ministry of Justice in the
official section of the Federal Gazette, and will continue to comply with these recommendations in the future.
In addition, thyssenkrupp AG complies with all suggestions of the German Corporate Governance Code. The
declarations of conformity issued in the last five years are permanently available on our website.
Our listed subsidiary Eisen- und Hüttenwerke AG also complies with the Code, taking into account the
particularities of its membership of the Group. Individual deviations are presented and explained in the
company’s declaration of conformity of October 01, 2015.
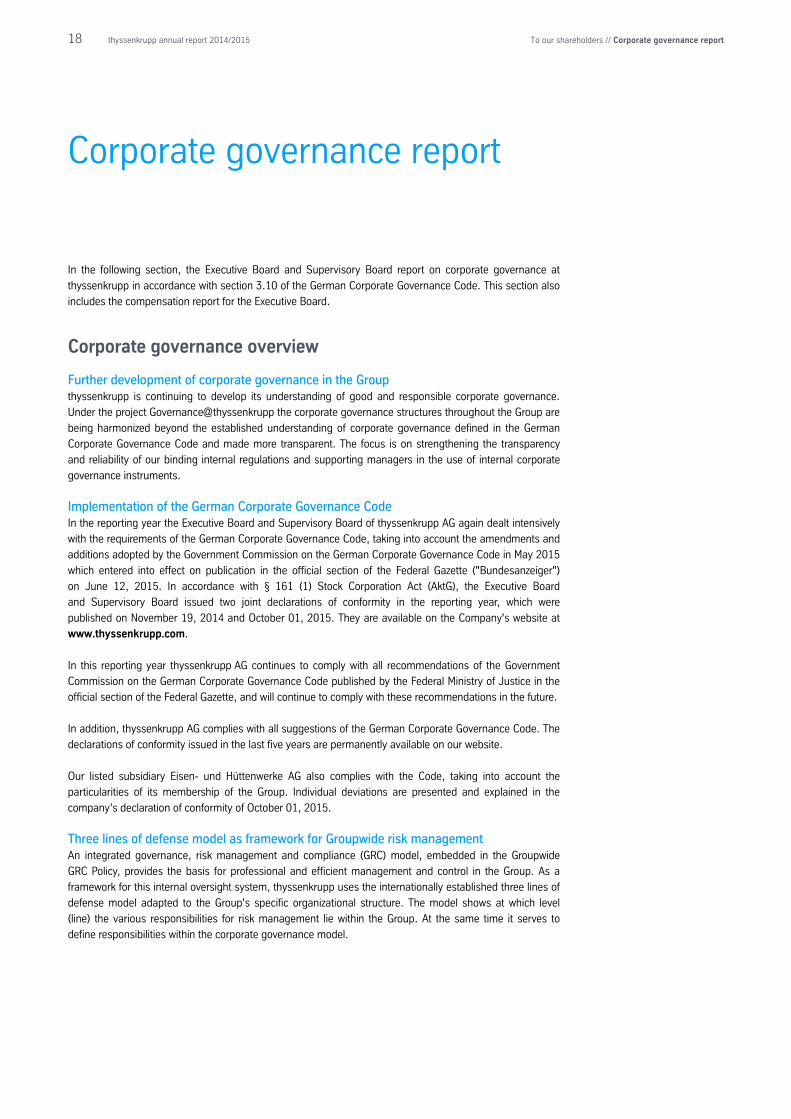
Three lines of defense model as framework for Groupwide risk management An integrated governance, risk management and compliance (GRC) model, embedded in the Groupwide
GRC Policy, provides the basis for professional and efficient management and control in the Group. As a
framework for this internal oversight system, thyssenkrupp uses the internationally established three lines of
defense model adapted to the Group's specific organizational structure. The model shows at which level
(line) the various responsibilities for risk management lie within the Group. At the same time it serves to
define responsibilities within the corporate governance model.
19 thyssenkrupp annual report 2014/2015 To our shareholders // Corporate governance report
The first line of defense involves preventing risks wherever they can occur, and where this is not practicable
identifying and reducing them to an appropriate level. In the reporting period we implemented a project to
improve the internal control system in the Group by strengthening systematic risk management on the first
line of defense with highly automated internal controls in the business processes wherever possible. As
there are cases where this is not fully feasible, further control measures have to be performed by
management to ensure the effectiveness of the control system.
The second line of defense, which includes functions such as Controlling, Accounting & Risk, Compliance,
and Legal, provides the framework for the internal control system, the risk management system, and
compliance, for example via policies, regulations and operating instructions. At the same time these
functions oversee the Group's risk landscape from the viewpoint of the Group as a whole. Close integration
of the internal control system, risk management system and compliance maximizes the efficiency of risk
prevention and management.
The third line of defense is Corporate Function Internal Auditing, which independently reviews the
appropriateness and efficiency of the risk management processes and systems implemented by the first two
lines of defense. The head of Corporate Internal Auditing reports directly to the Executive Board Chairman
and the Supervisory Board and/or Audit Committee in their meetings. Internal Auditing itself is subject to an
external quality audit every five years; the last audit took place in spring 2015.
The model is subject to external supervision by the financial-statement auditors who take into account the
results of the reviews performed by Internal Auditing in their assessment.
Appropriate control and risk management system Corporate governance at thyssenkrupp involves dealing responsibly with risks. The continuous and
systematic management of business opportunities and risks is fundamental to professional governance. It
helps ensure that risks are identified, evaluated and managed at an early stage. The Executive Board reports
regularly to the Supervisory Board and Audit Committee about the status of the main risks in the Group. The
Audit Committee focuses on monitoring the effectiveness of the accounting process and the internal control,
20 thyssenkrupp annual report 2014/2015 To our shareholders // Corporate governance report
risk management and internal auditing system, as well as monitoring the independence of the financial
statement auditors. thyssenkrupp continuously enhances the individual systems and adapts them to
changing conditions. Key features of our control and risk management system are described in the
opportunity and risk report.
Compliance Compliance, in the sense of all Groupwide measures to ensure adherence to statutory requirements and
internal company policies, is a key management and oversight duty at thyssenkrupp.
The Executive Board of thyssenkrupp AG has unequivocally expressed its rejection of antitrust violations and
corruption in the thyssenkrupp Compliance Commitment. thyssenkrupp has made a clear commitment to
compliance with laws and internal policies: Any violations, in particular antitrust or corruption violations, will
be met with zero tolerance. All reports of misconduct will be investigated. To implement the Compliance
Commitment a transparent management culture based on the Group's mission statement is subject
to continuous improvement. Information on the mission statement can be found on our website at
www.thyssenkrupp.com.
The importance attached to compliance at thyssenkrupp is underlined by Dr. Donatus Kaufmann's position
as member of the Executive Board responsible for Compliance and Legal. In this capacity he reports
regularly to the Supervisory Board and Audit Committee. Responsibilities and reporting channels are
structured in such a way that the Chief Compliance Officer reports directly to Dr. Donatus Kaufmann. Below
Executive Board level, the heads of the corporate compliance departments and compliance departments of
the business areas report directly to the Chief Compliance Officer.
The compliance program focusing on anti-corruption policies and antitrust law with its three pillars "inform",
"identify" and "report and act" was rigorously continued in the 2014/2015 fiscal year and extended to
include data protection and combating money laundering. In addition, numerous measures aimed at
developing the program further were resolved and in part already implemented as part of our compliance
strategy for the coming years up to 2020.
More information on compliance at thyssenkrupp can be found in the “Compliance” section of the combined
management report.
Supervisory Board targets for its own composition The Supervisory Board must be composed in such a way that its members have the knowledge, skills and
professional experience needed to perform its tasks properly. The current composition of the Supervisory
Board following the election of shareholder representatives at the Annual General Meeting on January 30,
2015, based on the recommendations of the Nomination Committee, takes into account not only the
requirements of the law, the Articles of Association and the German Corporate Governance Code, but also
the targets the Supervisory Board has set itself for its composition.
In their meetings on September 9, 2015, the Executive Committee, Nomination Committee and Supervisory
Board agreed to update the targets for the composition of the Supervisory Board last resolved in November
2014. The subject of the change was an increase in the target proportion of women on the Supervisory
Board to 30%. This is in line with the new statutory provisions on the minimum representation of women and
men on supervisory boards which have been in effect since May 2015 and must be implemented from
January 2016. The following concrete targets were resolved:
• Supervisory Board to have sufficient members with international experience, in particular in the expansion
markets
• Consideration of special knowledge and experience in the application of accounting principles and internal
control processes, expertise in the areas of accounting and auditing, also consideration of technical
expertise, sector-specific knowledge of the company, and knowledge of financing strategies and financial
instruments
% target proportion 30 of women on the Supervisory Board
21 thyssenkrupp annual report 2014/2015 To our shareholders // Corporate governance report
• Experience in corporate management and the development and formulation of corporate strategies
• Avoidance of significant and non-temporary conflicts of interest (existing conflicts of interest or conflicts of
interest to be expected in the future) and appropriate handling of other conflicts of interest
• Supervisory Board members to serve no more than a maximum three periods of office, and an age limit
of 75 (i.e. Supervisory Board members to stand down from the Supervisory Board at the end of the
Annual General Meeting after they reach 75)
• Increase in the proportion of women to at least 30%
• At least fifteen independent Supervisory Board members (on the assumption that the employee
representatives generally meet the criteria for independence in accordance with the German Corporate
Governance Code), otherwise at least five independent Supervisory Board members representing the
shareholders.
Avoiding conflicts of interest In the reporting year there were no consulting or other service agreements between Supervisory Board
members and the Company. Conflicts of interest of Executive Board or Supervisory Board members, which
must be disclosed immediately to the Supervisory Board, did not occur.
Details of the other directorships held by Executive Board and Supervisory Board members on statutory
supervisory boards or comparable German and non-German control bodies of business enterprises are
provided in the sections of the same name under “Additional information”. Details of related party
transactions are given in Note 23 to the consolidated financial statements.
Directors' dealings According to § 15a Securities Trading Act (WpHG), members of the Executive Board and Supervisory Board
and persons close to them are required by law to disclose the purchase and sale of thyssenkrupp AG shares
or related financial instruments whenever the value of the transactions amounts to €5,000 or more within a
calendar year. No transactions were reported to us in the 2014/2015 fiscal year.
At September 30, 2015 the total volume of thyssenkrupp AG shares held by all Executive Board and
Supervisory Board members amounted to less than 1% of the shares issued by the Company.
Shareholders and Annual General Meeting The shareholders of thyssenkrupp AG exercise their rights at the Company's Annual General Meeting, which
is chaired by the Chairman of the Supervisory Board in accordance with the Articles of Association. The
Annual General Meeting takes place once a year. Each share confers one vote and has an accounting par
value of €2.56.
Shareholders can exercise their voting rights at the Annual General Meeting in person or by proxy, for which
they can authorize a person of their choice or a Company-nominated proxy acting on their instructions.
Proxy voting instructions to Company-nominated proxies can be issued via the internet before and during
the Annual General Meeting up to the end of the general debate. Shareholders can also cast their votes in
writing by postal vote – without authorizing a proxy. The Annual General Meeting can be viewed live and in
full on the Company's website. Also on our website we make all documents and information on the Annual
General Meeting available to shareholders in good time. In addition, questions can be addressed to
members of our Investor Relations department via an infoline or e-mail.
22 thyssenkrupp annual report 2014/2015 To our shareholders // Corporate governance report
Transparency through high-quality information Our dialogue with the capital market is aimed at informing all target groups fully, equally and quickly, and
presenting valuation-relevant facts in the highest quality. For example as part of our investor relations work
we regularly meet up with analysts and institutional investors. The venues and dates of roadshows and
investors' conferences are posted in the Investor Relations section of our website. An intensive dialogue also
takes place at analysts’ and investors’ conferences, at our annual Capital Markets Day, and in conference
calls, which are held to present interim reports and Annual Report and on an ad hoc basis to report on
current developments. The presentations for these events are freely available on the website. Our Investor
Relations department also makes extensive facts and data available on the website to help analysts and
investors better understand and value our business models and their upside potential. We also offer audio
and video recordings of conference calls and major events. We provide information on recurring dates, such
as the date of the Annual General Meeting or the publication dates of interim reports, in a financial calendar
published in the Annual Report, the interim reports and on the Company's website.
Information about the latest developments in the Group is also provided on our website. All press releases
and stock exchange (ad hoc) announcements of thyssenkrupp AG are published there in German and
English, and information and images are made available on important events. The Annual Press Conference
is also streamed live on the internet for everyone who is interested. The Company's Articles of Association
and the rules of procedure for the Executive Board and Supervisory Board can also be viewed on the
website, as can the annual reports, interim reports and information on implementation of the
recommendations and suggestions of the German Corporate Governance Code. All interested parties can
subscribe to an electronic newsletter on the website which reports news from the Group.
Deductible in D&O insurance The Company has taken out directors and officers (D&O) liability insurance for the members of the Executive
Board and Supervisory Board with an appropriate deductible pursuant to § 93 (2) sentence 3 Stock
Corporation Act (AktG) (Executive Board members) and the German Corporate Governance Code
(Supervisory Board members).
Accounting and financial statement auditing by PricewaterhouseCoopers In line with European Union requirements, thyssenkrupp prepares the consolidated financial statements and
interim reports in accordance with the International Financial Reporting Standards (IFRS). However the
statutory parent-company financial statements of thyssenkrupp AG, on which the dividend payment is
based, are drawn up in accordance with German GAAP (HGB).
For the reporting period we once again agreed with the financial-statement auditors, PricewaterhouseCoopers
Aktiengesellschaft Wirtschaftsprüfungsgesellschaft, Essen (PwC) that the Chairman of the Audit Committee
would be informed immediately of any possible grounds for exclusion or bias arising during the audit insofar
as they are not immediately eliminated, and that the auditors would report immediately on any findings or
occurrences during the audit which have a significant bearing on the duties of the Supervisory Board. It was
also agreed that the auditors would inform the Supervisory Board or make a note in the audit report of any
facts ascertained during their examination that conflict with the declaration of conformity issued.
At the proposal of the Supervisory Board, the Annual General Meeting on January 30, 2015 elected PwC to
audit the annual financial statements and review the interim financial reports for fiscal year 2014/2015. In
accordance with the statutory provisions the auditor is elected each year by the Annual General Meeting for
a period of one year. PwC has been auditing the parent-company financial statements and consolidated
financial statements of thyssenkrupp AG since fiscal 2012/2013. The signatory auditors for the parent-
company and consolidated financial statements of thyssenkrupp AG are Prof. Dr. Norbert Winkeljohann and
Mr. Volker Linke (both since fiscal year 2012/2013). The statutory provisions and rotation requirements
under §§ 319 and 319a HGB are fulfilled.
23 thyssenkrupp annual report 2014/2015 To our shareholders // Corporate governance report // Compensation report
Compensation report
The following compensation report is part of the combined management report.
Performance-based compensation system for the Executive Board Since fiscal year 2014/2015 a revised compensation system has been in place for the Executive Board
members of thyssenkrupp AG. It was approved by the Annual General Meeting on January 30, 2015 with a
majority of 98.79% of the capital represented.
Based on this, compensation for the Executive Board members comprises non-performance-related and
performance-related components. The former are the fixed compensation, fringe benefits and pension
plans, while the latter are the performance bonus (Short Term Incentive Plan – STI) and the Long Term
Incentive plan (LTI). These components are described in more detail in the following passages. The
additional bonus granted in previous years based on the ratio funds from operations/total debt and the
conversion of part of the performance bonus into thyssenkrupp AG (stock rights) virtual shares were
discontinued as of fiscal year 2014/2015.
The Supervisory Board – based on preparation by the Personnel Committee – is responsible for determining
individual Executive Board member compensation. Criteria for the appropriateness of the compensation
include the duties of the individual Executive Board members, their personal performance, the business
situation, the success and prospects of the Company and also the prevailing level of compensation at peer
companies and the compensation structure applying in the Company. The performance-related components
are mainly based on performance over several years. They therefore set long-term incentives and focus the
compensation structure on the sustainable development of the Company. In the case of exceptional
performance or achievements, the Supervisory Board can award an additional discretionary bonus.
All Executive Board member contracts provide for a severance payment in the event of early termination
without cause. The severance payment is limited to a maximum of two years’ compensation including fringe
benefits (severance payment cap) and compensates no more than the remaining term of the employment
agreement. Promises of payments in the event of early termination due to a change of control did not exist
for the 2014/2015 fiscal year; however they have been agreed with Dr. Heinrich Hiesinger, Guido Kerkhoff
and Oliver Burkhard in connection with the renewal of their contracts for their second term of office resolved
in this fiscal year. The full content of the change-of-control clause can be found under "Takeover-related
disclosures" in the "Legal information" section of the combined management report.
Fixed compensation and fringe benefits Non-performance-related basic compensation (fixed compensation) is paid in monthly installments as a
salary. Since the last review at October 1, 2014 it has been €700,000 per year for an ordinary Executive
Board member, and €1,340,000 per year for the Executive Board chairman. The Executive Board members
also receive fringe benefits, mainly comprising a company car, security services, and insurance premiums.
The benefits apply in principle to all Executive Board members; the amount varies according to personal
situation.
% 98.79 voted in favor of the revised compensation system
24 thyssenkrupp annual report 2014/2015 To our shareholders // Corporate governance report // Compensation report
Performance bonus The first component of performance-related compensation is the performance bonus. The amount of the
performance bonus is dependent on three of the Group's key performance indicators: Earnings before
interest and taxes (EBIT) and free cash flow (FCF before divestments; from fiscal year 2015/2016 FCF before
M&A) each have a weighting of 40%, ROCE (return on capital employed) accounts for the remaining 20%.
The target figures for these indicators are taken from the corporate planning (budget); in addition threshold
values are defined for each indicator, above or below which a further improvement or deterioration of the
result has no effect on the level of target achievement. The Supervisory Board reviews and if necessary
adjusts the target and threshold amounts annually in order to maintain challenging targets. In addition to the
three weighted performance indicators, a multiplicative correction factor is used in the calculation. This
permits the Supervisory Board to adapt and individually differentiate the overall target achievement level
within a +/−20% range. The correction factor is made up equally of a sustainability multiplier and a
discretionary factor. The sustainability multiplier is based on indirect financial targets from the areas
employees, innovations, environment, and suppliers. The discretionary factor is set by the Supervisory
Board to evaluate overall performance. The payout amount is limited to a maximum of 200% of the target
level; there is no minimum bonus.
Long Term Incentive plan (LTI) The second component of performance-related compensation is the LTI, which has a long-term incentive
effect. Decisive factors here are value generation, measured on the basis of thyssenkrupp Value Added
(tkVA), and the performance of the Company's stock.
For an initial value (in euros) specified in the individual awards, the Executive Board members are granted
so-called stock rights (virtual shares). The number of stock rights issued is calculated from the specified
initial value divided by the average stock price in the 1st quarter of the three-year performance period,
beginning on October 1 of the fiscal year in which the stock rights were granted. The number of stock rights
issued is adjusted at the end of the performance period – depending on the performance of average tkVA in
these three years compared with a target set by the Supervisory Board: The number of stock rights
increases by 1% for every €20 million of average tkVA above the target value and decreases by 1% for every
€10 million below the target. The payout amount is then based on this adjusted number and the average
thyssenkrupp share price in the 1st quarter of the fiscal year immediately after the performance period. If
tkVA and the share price perform positively, the maximum payout amount is 250% of the initial value; in the
event of a very negative performance, the number of stock rights can decrease to zero, in which case no
payout is made.
For the LTI installment granted to the Executive Board members in January 2015, the Supervisory Board set
the tkVA target at zero. This relates to the performance period 2014/2015 up to and including 2016/2017. In
the case of the LTI, too, the Supervisory Board will regularly review and if necessary adjust the target and
threshold values in order to maintain challenging targets.
25 thyssenkrupp annual report 2014/2015 To our shareholders // Corporate governance report // Compensation report
Compensation caps Under the recommendation of the German Corporate Governance Code (section 4.2.3 (2), sentence 6), the
compensation of Executive Board members must be capped both in total and with regard to its variable
components. In addition to the maximum thresholds applying for performance-related compensation
components, thyssenkrupp therefore caps overall compensation at €4 million per fiscal year for an ordinary
Executive Board member, and €8 million per fiscal year for the Executive Board chairman.
Pensions Pensions are paid to former Executive Board members who have either reached pension age or become
permanently incapacitated for work. thyssenkrupp does not pay transitional allowances upon premature
termination or non-renewal of service contracts.
The pension of Executive Board members appointed before September 30, 2012 (Dr. Heinrich Hiesinger and
Guido Kerkhoff) was originally a percentage of the final fixed salary they received before their employment
contract ended. This percentage increased with the duration of the Executive Board member's appointment
and was generally 30% at the start of the first five-year period of appointment, 50% at the start of the
second and 60% at the start of the third; in the case of Dr. Heinrich Hiesinger, a pension entitlement of 50%
of his final fixed salary before his employment contract ended was agreed right at the start of his first
appointment period. When the Supervisory Board resolved to reappoint the two in fiscal year 2014/2015, it
was agreed with them that from the start of the new period of appointment their pension entitlement would
be fixed at 50% of their current fixed salary (salary as of fiscal 2014/2015) – as a result their pension will no
longer be pegged to the term of their appointment and progression of their fixed salary. Current pensions are
adjusted annually in line with the consumer price index.
For Executive Board members appointed after September 30, 2012 (Oliver Burkhard and Dr. Donatus
Kaufmann) the final-salary pension plan was switched to a defined-contribution pension plan, with the
annual pension contribution (“module”) currently amounting to 40% of the annual fixed salary. In connection
with the resolution on the reappointment of Oliver Burkhard in fiscal 2014/2015, with effect from the start of
his new appointment period it was additionally agreed with him to cap his pension entitlement at 50% of his
current fixed salary in fiscal year 2014/2015 and to fix the defined contribution at 40% of his current fixed
salary in 2014/2015. Dr. Donatus Kaufmann’s pension will be paid in principle as a lump sum.
Under the surviving dependants’ benefits plan, a surviving partner receives 60% of the pension and each
dependent child 20%, up to a maximum of 100% of the pension amount. In the case of
Dr. Donatus Kaufmann, surviving dependants will receive the amount of the pension contributions plus
interest at the time the pension becomes payable.
26 thyssenkrupp annual report 2014/2015 To our shareholders // Corporate governance report // Compensation report
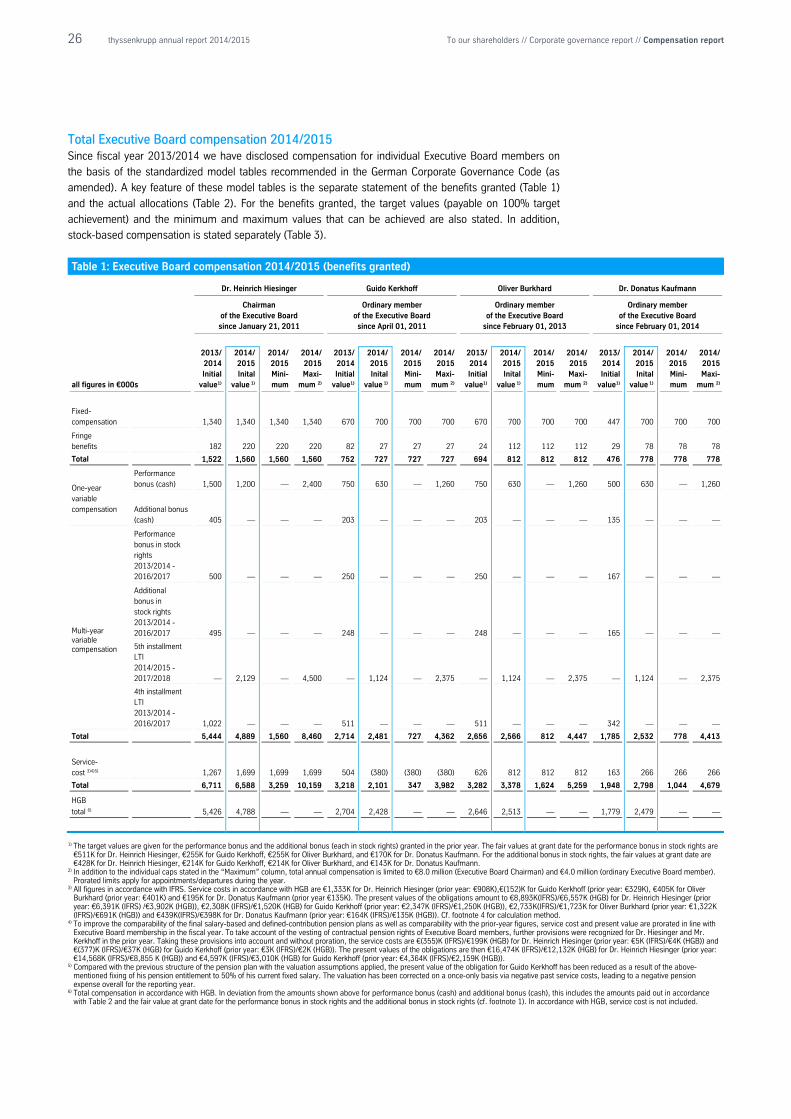
Total Executive Board compensation 2014/2015 Since fiscal year 2013/2014 we have disclosed compensation for individual Executive Board members on
the basis of the standardized model tables recommended in the German Corporate Governance Code (as
amended). A key feature of these model tables is the separate statement of the benefits granted (Table 1)
and the actual allocations (Table 2). For the benefits granted, the target values (payable on 100% target
achievement) and the minimum and maximum values that can be achieved are also stated. In addition,
stock-based compensation is stated separately (Table 3).
Table 1: Executive Board compensation 2014/2015 (benefits granted)
Dr. Heinrich Hiesinger Guido Kerkhoff Oliver Burkhard Dr. Donatus Kaufmann
Chairman of the Executive Board since January 21, 2011
Ordinary member of the Executive Board since April 01, 2011
Ordinary member of the Executive Board
since February 01, 2013
Ordinary member of the Executive Board
since February 01, 2014
all figures in €000s
2013/ 2014 Initial
value1)
2014/ 2015 Inital
value 1)
2014/ 2015 Mini- mum
2014/ 2015 Maxi-
mum 2)
2013/ 2014 Initial
value1)
2014/ 2015 Inital
value 1)
2014/ 2015 Mini- mum
2014/ 2015 Maxi-
mum 2)
2013/ 2014 Initial
value1)
2014/ 2015 Inital
value 1)
2014/ 2015 Mini- mum
2014/ 2015 Maxi-
mum 2)
2013/ 2014 Initial
value1)
2014/ 2015 Inital
value 1)
2014/ 2015 Mini- mum
2014/ 2015 Maxi-
mum 2)
Fixed- compensation 1,340 1,340 1,340 1,340 670 700 700 700 670 700 700 700 447 700 700 700
Fringe benefits 182 220 220 220 82 27 27 27 24 112 112 112 29 78 78 78
Total 1,522 1,560 1,560 1,560 752 727 727 727 694 812 812 812 476 778 778 778
One-year variable compensation
Performance bonus (cash) 1,500 1,200 — 2,400 750 630 — 1,260 750 630 — 1,260 500 630 — 1,260
Additional bonus (cash) 405 — — — 203 — — — 203 — — — 135 — — —
Multi-year variable compensation
Performance bonus in stock rights 2013/2014 - 2016/2017 500 — — — 250 — — — 250 — — — 167 — — —
Additional bonus in stock rights 2013/2014 - 2016/2017 495 — — — 248 — — — 248 — — — 165 — — —
5th installment LTI 2014/2015 - 2017/2018 — 2,129 — 4,500 — 1,124 — 2,375 — 1,124 — 2,375 — 1,124 — 2,375
4th installment LTI 2013/2014 - 2016/2017 1,022 — — — 511 — — — 511 — — — 342 — — —
Total 5,444 4,889 1,560 8,460 2,714 2,481 727 4,362 2,656 2,566 812 4,447 1,785 2,532 778 4,413
Service- cost 3)4)5) 1,267 1,699 1,699 1,699 504 (380) (380) (380) 626 812 812 812 163 266 266 266
Total 6,711 6,588 3,259 10,159 3,218 2,101 347 3,982 3,282 3,378 1,624 5,259 1,948 2,798 1,044 4,679
HGB
total 6) 5,426 4,788 — — 2,704 2,428 — — 2,646 2,513 — — 1,779 2,479 — —
1) The target values are given for the performance bonus and the additional bonus (each in stock rights) granted in the prior year. The fair values at grant date for the performance bonus in stock rights are €511K for Dr. Heinrich Hiesinger, €255K for Guido Kerkhoff, €255K for Oliver Burkhard, and €170K for Dr. Donatus Kaufmann. For the additional bonus in stock rights, the fair values at grant date are €428K for Dr. Heinrich Hiesinger, €214K for Guido Kerkhoff, €214K for Oliver Burkhard, and €143K for Dr. Donatus Kaufmann.
2) In addition to the individual caps stated in the “Maximum” column, total annual compensation is limited to €8.0 million (Executive Board Chairman) and €4.0 million (ordinary Executive Board member). Prorated limits apply for appointments/departures during the year.
3) All figures in accordance with IFRS. Service costs in accordance with HGB are €1,333K for Dr. Heinrich Hiesinger (prior year: €908K),€(152)K for Guido Kerkhoff (prior year: €329K), €405K for Oliver Burkhard (prior year: €401K) and €195K for Dr. Donatus Kaufmann (prior year €135K). The present values of the obligations amount to €8,893K(IFRS)/€6,557K (HGB) for Dr. Heinrich Hiesinger (prior year: €6,391K (IFRS) /€3,902K (HGB)), €2,308K (IFRS)/€1,520K (HGB) for Guido Kerkhoff (prior year: €2,347K (IFRS)/€1,250K (HGB)), €2,733K(IFRS)/€1,723K for Oliver Burkhard (prior year: €1,322K (IFRS)/€691K (HGB)) and €439K(IFRS)/€398K for Dr. Donatus Kaufmann (prior year: €164K (IFRS)/€135K (HGB)). Cf. footnote 4 for calculation method.
4) To improve the comparability of the final salary-based and defined-contribution pension plans as well as comparability with the prior-year figures, service cost and present value are prorated in line with Executive Board membership in the fiscal year. To take account of the vesting of contractual pension rights of Executive Board members, further provisions were recognized for Dr. Hiesinger and Mr. Kerkhoff in the prior year. Taking these provisions into account and without proration, the service costs are €(355)K (IFRS)/€199K (HGB) for Dr. Heinrich Hiesinger (prior year: €5K (IFRS)/€4K (HGB)) and €(377)K (IFRS)/€37K (HGB) for Guido Kerkhoff (prior year: €3K (IFRS)/€2K (HGB)). The present values of the obligations are then €16,474K (IFRS)/€12,132K (HGB) for Dr. Heinrich Hiesinger (prior year: €14,568K (IFRS)/€8,855 K (HGB)) and €4,597K (IFRS)/€3,010K (HGB) for Guido Kerkhoff (prior year: €4,364K (IFRS)/€2,159K (HGB)).
5) Compared with the previous structure of the pension plan with the valuation assumptions applied, the present value of the obligation for Guido Kerkhoff has been reduced as a result of the above-mentioned fixing of his pension entitlement to 50% of his current fixed salary. The valuation has been corrected on a once-only basis via negative past service costs, leading to a negative pension expense overall for the reporting year.
6) Total compensation in accordance with HGB. In deviation from the amounts shown above for performance bonus (cash) and additional bonus (cash), this includes the amounts paid out in accordance with Table 2 and the fair value at grant date for the performance bonus in stock rights and the additional bonus in stock rights (cf. footnote 1). In accordance with HGB, service cost is not included.
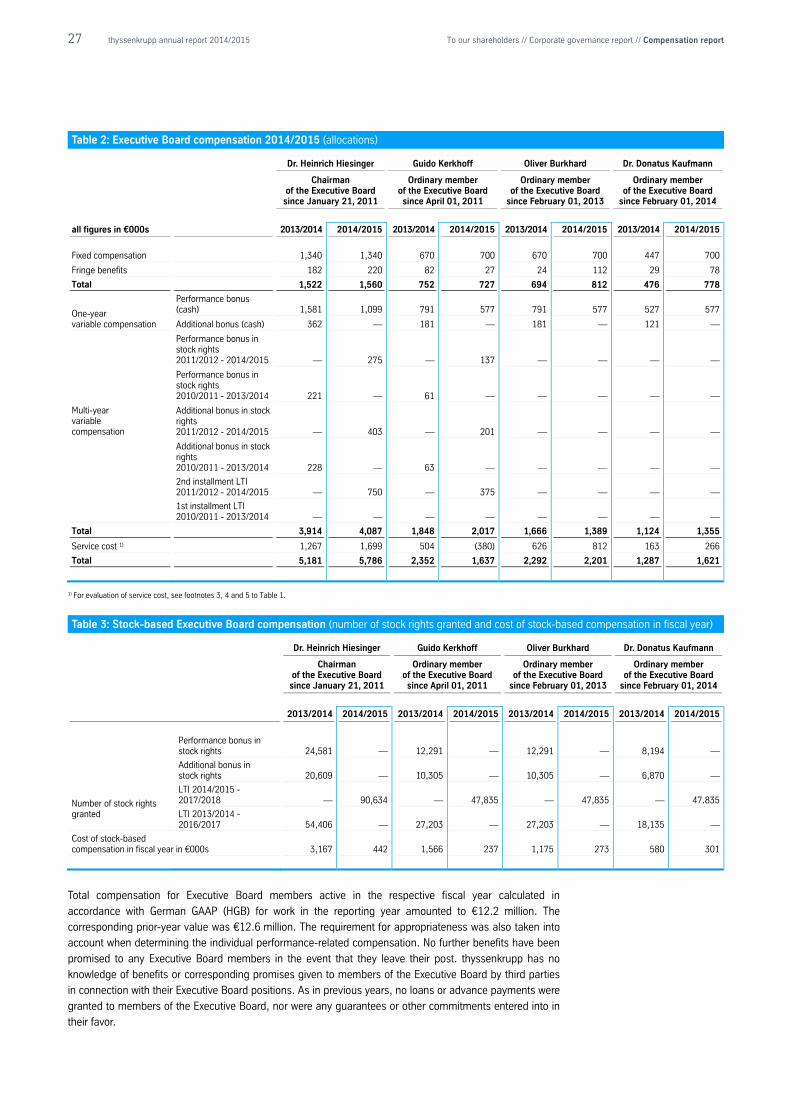
27 thyssenkrupp annual report 2014/2015 To our shareholders // Corporate governance report // Compensation report
Table 2: Executive Board compensation 2014/2015 (allocations)
Dr. Heinrich Hiesinger Guido Kerkhoff Oliver Burkhard Dr. Donatus Kaufmann
Chairman of the Executive Board
since January 21, 2011
Ordinary member of the Executive Board since April 01, 2011
Ordinary member of the Executive Board
since February 01, 2013
Ordinary member of the Executive Board
since February 01, 2014
all figures in €000s 2013/2014 2014/2015 2013/2014 2014/2015 2013/2014 2014/2015 2013/2014 2014/2015
Fixed compensation 1,340 1,340 670 700 670 700 447 700
Fringe benefits 182 220 82 27 24 112 29 78
Total 1,522 1,560 752 727 694 812 476 778
One-year variable compensation
Performance bonus (cash) 1,581 1,099 791 577 791 577 527 577
Additional bonus (cash) 362 — 181 — 181 — 121 —
Multi-year variable compensation
Performance bonus in stock rights 2011/2012 - 2014/2015 — 275 — 137 — — — —
Performance bonus in stock rights 2010/2011 - 2013/2014 221 — 61 — — — — —
Additional bonus in stock rights 2011/2012 - 2014/2015 — 403 — 201 — — — —
Additional bonus in stock rights 2010/2011 - 2013/2014 228 — 63 — — — — —
2nd installment LTI 2011/2012 - 2014/2015 — 750 — 375 — — — —
1st installment LTI 2010/2011 - 2013/2014 — — — — — — — —
Total 3,914 4,087 1,848 2,017 1,666 1,389 1,124 1,355
Service cost 1) 1,267 1,699 504 (380) 626 812 163 266
Total 5,181 5,786 2,352 1,637 2,292 2,201 1,287 1,621
1) For evaluation of service cost, see footnotes 3, 4 and 5 to Table 1.
Table 3: Stock-based Executive Board compensation (number of stock rights granted and cost of stock-based compensation in fiscal year)
Dr. Heinrich Hiesinger Guido Kerkhoff Oliver Burkhard Dr. Donatus Kaufmann
Chairman of the Executive Board
since January 21, 2011
Ordinary member of the Executive Board since April 01, 2011
Ordinary member of the Executive Board
since February 01, 2013
Ordinary member of the Executive Board
since February 01, 2014
2013/2014 2014/2015 2013/2014 2014/2015 2013/2014 2014/2015 2013/2014 2014/2015
Number of stock rights granted
Performance bonus in stock rights 24,581 — 12,291 — 12,291 — 8,194 —
Additional bonus in stock rights 20,609 — 10,305 — 10,305 — 6,870 —
LTI 2014/2015 -2017/2018 — 90,634 — 47,835 — 47,835 — 47.835
LTI 2013/2014 -2016/2017 54,406 — 27,203 — 27,203 — 18,135 —
Cost of stock-based compensation in fiscal year in €000s 3,167 442 1,566 237 1,175 273 580 301
Total compensation for Executive Board members active in the respective fiscal year calculated in
accordance with German GAAP (HGB) for work in the reporting year amounted to €12.2 million. The
corresponding prior-year value was €12.6 million. The requirement for appropriateness was also taken into
account when determining the individual performance-related compensation. No further benefits have been
promised to any Executive Board members in the event that they leave their post. thyssenkrupp has no
knowledge of benefits or corresponding promises given to members of the Executive Board by third parties
in connection with their Executive Board positions. As in previous years, no loans or advance payments were
granted to members of the Executive Board, nor were any guarantees or other commitments entered into in
their favor.
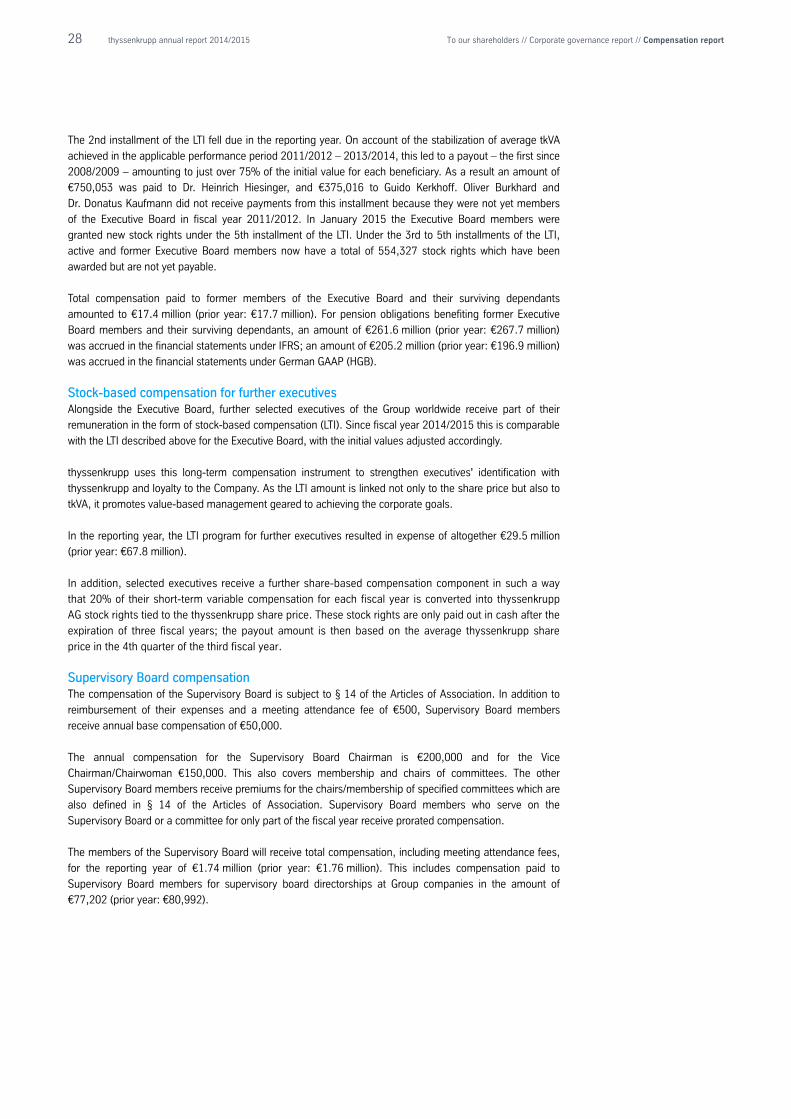
28 thyssenkrupp annual report 2014/2015 To our shareholders // Corporate governance report // Compensation report
The 2nd installment of the LTI fell due in the reporting year. On account of the stabilization of average tkVA
achieved in the applicable performance period 2011/2012 – 2013/2014, this led to a payout – the first since
2008/2009 – amounting to just over 75% of the initial value for each beneficiary. As a result an amount of
€750,053 was paid to Dr. Heinrich Hiesinger, and €375,016 to Guido Kerkhoff. Oliver Burkhard and
Dr. Donatus Kaufmann did not receive payments from this installment because they were not yet members
of the Executive Board in fiscal year 2011/2012. In January 2015 the Executive Board members were
granted new stock rights under the 5th installment of the LTI. Under the 3rd to 5th installments of the LTI,
active and former Executive Board members now have a total of 554,327 stock rights which have been
awarded but are not yet payable.
Total compensation paid to former members of the Executive Board and their surviving dependants
amounted to €17.4 million (prior year: €17.7 million). For pension obligations benefiting former Executive
Board members and their surviving dependants, an amount of €261.6 million (prior year: €267.7 million)
was accrued in the financial statements under IFRS; an amount of €205.2 million (prior year: €196.9 million)
was accrued in the financial statements under German GAAP (HGB).
Stock-based compensation for further executives Alongside the Executive Board, further selected executives of the Group worldwide receive part of their
remuneration in the form of stock-based compensation (LTI). Since fiscal year 2014/2015 this is comparable
with the LTI described above for the Executive Board, with the initial values adjusted accordingly.
thyssenkrupp uses this long-term compensation instrument to strengthen executives' identification with
thyssenkrupp and loyalty to the Company. As the LTI amount is linked not only to the share price but also to
tkVA, it promotes value-based management geared to achieving the corporate goals.
In the reporting year, the LTI program for further executives resulted in expense of altogether €29.5 million
(prior year: €67.8 million).
In addition, selected executives receive a further share-based compensation component in such a way
that 20% of their short-term variable compensation for each fiscal year is converted into thyssenkrupp
AG stock rights tied to the thyssenkrupp share price. These stock rights are only paid out in cash after the
expiration of three fiscal years; the payout amount is then based on the average thyssenkrupp share
price in the 4th quarter of the third fiscal year.
Supervisory Board compensation The compensation of the Supervisory Board is subject to § 14 of the Articles of Association. In addition to
reimbursement of their expenses and a meeting attendance fee of €500, Supervisory Board members
receive annual base compensation of €50,000.
The annual compensation for the Supervisory Board Chairman is €200,000 and for the Vice
Chairman/Chairwoman €150,000. This also covers membership and chairs of committees. The other
Supervisory Board members receive premiums for the chairs/membership of specified committees which are
also defined in § 14 of the Articles of Association. Supervisory Board members who serve on the
Supervisory Board or a committee for only part of the fiscal year receive prorated compensation.
The members of the Supervisory Board will receive total compensation, including meeting attendance fees,
for the reporting year of €1.74 million (prior year: €1.76 million). This includes compensation paid to
Supervisory Board members for supervisory board directorships at Group companies in the amount of
€77,202 (prior year: €80,992).
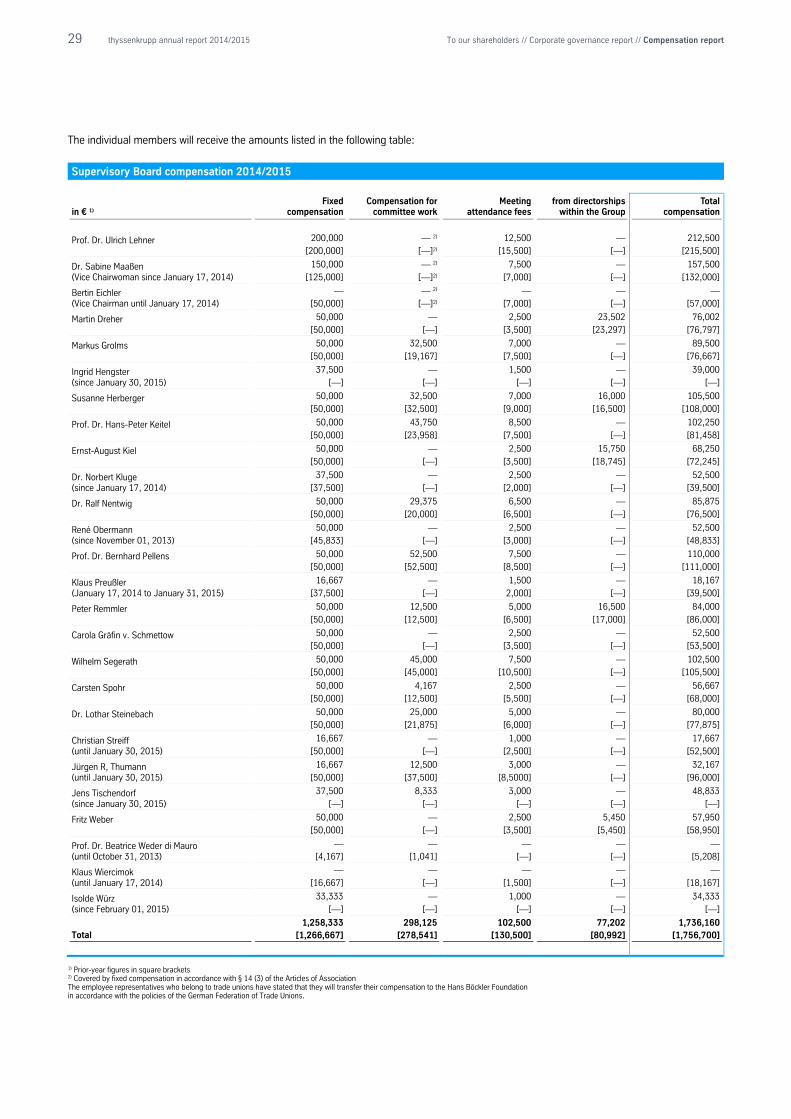
29 thyssenkrupp annual report 2014/2015 To our shareholders // Corporate governance report // Compensation report
The individual members will receive the amounts listed in the following table:
Supervisory Board compensation 2014/2015
in € 1) Fixed
compensation Compensation for
committee work Meeting
attendance fees from directorships
within the Group Total
compensation
Prof. Dr. Ulrich Lehner
200,000 — 2) 12,500 — 212,500
[200,000] [—]2) [15,500] [—] [215,500]
Dr. Sabine Maaßen (Vice Chairwoman since January 17, 2014)
150,000 — 2) 7,500 — 157,500
[125,000] [—]2) [7,000] [—] [132,000]
Bertin Eichler (Vice Chairman until January 17, 2014)
— — 2) — — —
[50,000] [—]2) [7,000] [—] [57,000]
Martin Dreher
50,000 — 2,500 23,502 76,002
[50,000] [—] [3,500] [23,297] [76,797]
Markus Grolms
50,000 32,500 7,000 — 89,500
[50,000] [19,167] [7,500] [—] [76,667]
Ingrid Hengster (since January 30, 2015)
37,500 — 1,500 — 39,000
[—] [—] [—] [—] [—]
Susanne Herberger
50,000 32,500 7,000 16,000 105,500
[50,000] [32,500] [9,000] [16,500] [108,000]
Prof. Dr. Hans-Peter Keitel
50,000 43,750 8,500 — 102,250
[50,000] [23,958] [7,500] [—] [81,458]
Ernst-August Kiel
50,000 — 2,500 15,750 68,250
[50,000] [—] [3,500] [18,745] [72,245]
Dr. Norbert Kluge (since January 17, 2014)
37,500 — 2,500 — 52,500
[37,500] [—] [2,000] [—] [39,500]
Dr. Ralf Nentwig
50,000 29,375 6,500 — 85,875
[50,000] [20,000] [6,500] [—] [76,500]
René Obermann (since November 01, 2013)
50,000 — 2,500 — 52,500
[45,833] [—] [3,000] [—] [48,833]
Prof. Dr. Bernhard Pellens
50,000 52,500 7,500 — 110,000
[50,000] [52,500] [8,500] [—] [111,000]
Klaus Preußler (January 17, 2014 to January 31, 2015)
16,667 — 1,500 — 18,167
[37,500] [—] 2,000] [—] [39,500]
Peter Remmler
50,000 12,500 5,000 16,500 84,000
[50,000] [12,500] [6,500] [17,000] [86,000]
Carola Gräfin v. Schmettow
50,000 — 2,500 — 52,500
[50,000] [—] [3,500] [—] [53,500]
Wilhelm Segerath
50,000 45,000 7,500 — 102,500
[50,000] [45,000] [10,500] [—] [105,500]
Carsten Spohr
50,000 4,167 2,500 — 56,667
[50,000] [12,500] [5,500] [—] [68,000]
Dr. Lothar Steinebach
50,000 25,000 5,000 — 80,000
[50,000] [21,875] [6,000] [—] [77,875]
Christian Streiff (until January 30, 2015)
16,667 — 1,000 — 17,667
[50,000] [—] [2,500] [—] [52,500]
Jürgen R, Thumann (until January 30, 2015)
16,667 12,500 3,000 — 32,167
[50,000] [37,500] [8,5000] [—] [96,000]
Jens Tischendorf (since January 30, 2015)
37,500 8,333 3,000 — 48,833
[—] [—] [—] [—] [—]
Fritz Weber
50,000 — 2,500 5,450 57,950
[50,000] [—] [3,500] [5,450] [58,950]
Prof. Dr. Beatrice Weder di Mauro (until October 31, 2013)
— — — — —
[4,167] [1,041] [—] [—] [5,208]
Klaus Wiercimok (until January 17, 2014)
— — — — —
[16,667] [—] [1,500] [—] [18,167]
Isolde Würz (since February 01, 2015)
33,333 — 1,000 — 34,333
[—] [—] [—] [—] [—]
Total 1,258,333 298,125 102,500 77,202 1,736,160
[1,266,667] [278,541] [130,500] [80,992] [1,756,700]
1) Prior-year figures in square brackets 2) Covered by fixed compensation in accordance with § 14 (3) of the Articles of Association The employee representatives who belong to trade unions have stated that they will transfer their compensation to the Hans Böckler Foundation in accordance with the policies of the German Federation of Trade Unions.

30 thyssenkrupp annual report 2014/2015 To our shareholders // Corporate governance report // Compensation report
In the reporting year Supervisory Board members received no further compensation or benefits for personal
services rendered, in particular advisory and mediatory services. As in previous years, no loans or advance
payments were granted to members of the Supervisory Board, nor were any guarantees or other
commitments entered into in their favor.
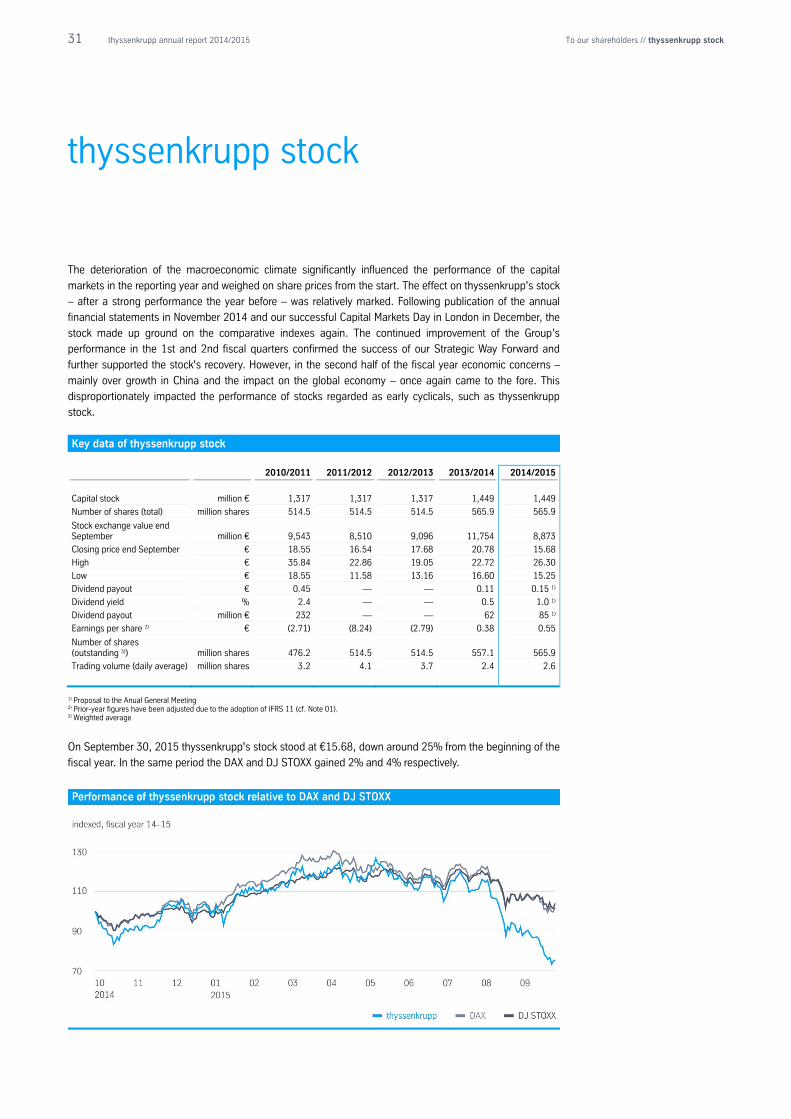
31 thyssenkrupp annual report 2014/2015 To our shareholders // thyssenkrupp stock
thyssenkrupp stock
The deterioration of the macroeconomic climate significantly influenced the performance of the capital
markets in the reporting year and weighed on share prices from the start. The effect on thyssenkrupp's stock
– after a strong performance the year before – was relatively marked. Following publication of the annual
financial statements in November 2014 and our successful Capital Markets Day in London in December, the
stock made up ground on the comparative indexes again. The continued improvement of the Group’s
performance in the 1st and 2nd fiscal quarters confirmed the success of our Strategic Way Forward and
further supported the stock's recovery. However, in the second half of the fiscal year economic concerns –
mainly over growth in China and the impact on the global economy – once again came to the fore. This
disproportionately impacted the performance of stocks regarded as early cyclicals, such as thyssenkrupp
stock.
Key data of thyssenkrupp stock 2010/2011 2011/2012 2012/2013 2013/2014 2014/2015
Capital stock million € 1,317 1,317 1,317 1,449 1,449
Number of shares (total) million shares 514.5 514.5 514.5 565.9 565.9
Stock exchange value end September million € 9,543 8,510 9,096 11,754 8,873
Closing price end September € 18.55 16.54 17.68 20.78 15.68
High € 35.84 22.86 19.05 22.72 26.30
Low € 18.55 11.58 13.16 16.60 15.25
Dividend payout € 0.45 — — 0.11 0.15 1)
Dividend yield % 2.4 — — 0.5 1.0 1)
Dividend payout million € 232 — — 62 85 1)
Earnings per share 2) € (2.71) (8.24) (2.79) 0.38 0.55
Number of shares (outstanding 3)) million shares 476.2 514.5 514.5 557.1 565.9
Trading volume (daily average) million shares 3.2 4.1 3.7 2.4 2.6
1) Proposal to the Anual General Meeting 2) Prior-year figures have been adjusted due to the adoption of IFRS 11 (cf. Note 01). 3) Weighted average
On September 30, 2015 thyssenkrupp's stock stood at €15.68, down around 25% from the beginning of the
fiscal year. In the same period the DAX and DJ STOXX gained 2% and 4% respectively.
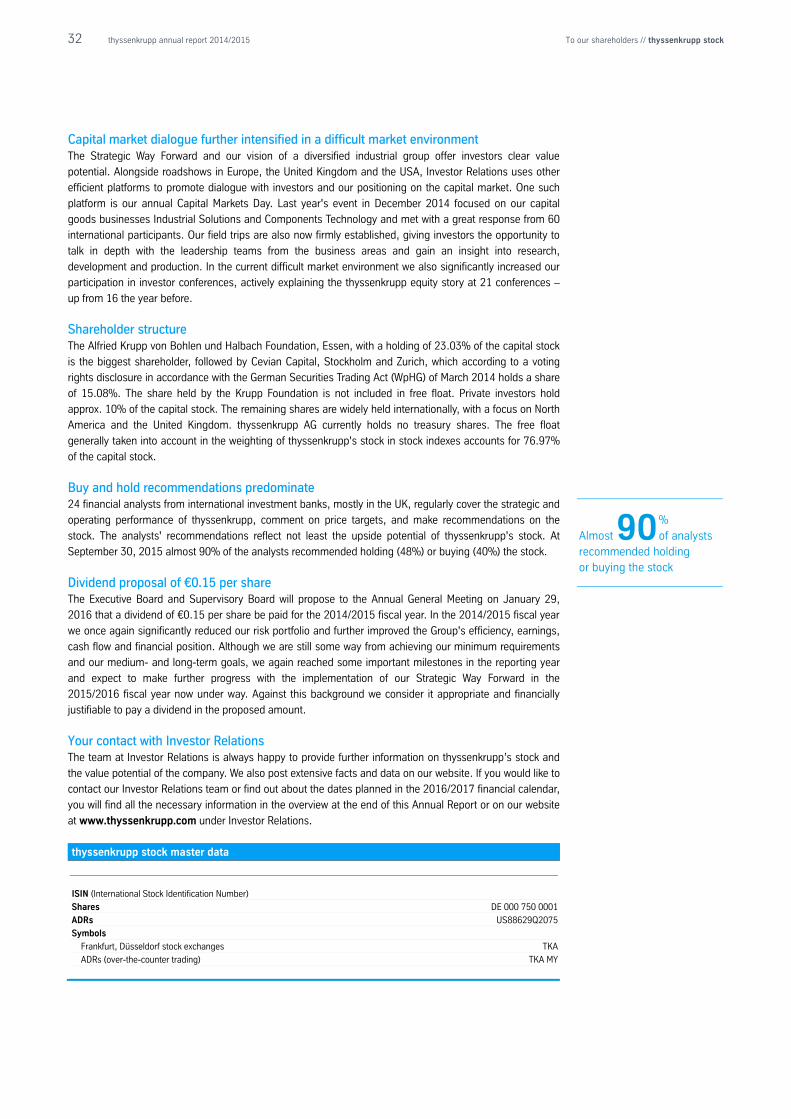
32 thyssenkrupp annual report 2014/2015 To our shareholders // thyssenkrupp stock
Capital market dialogue further intensified in a difficult market environment The Strategic Way Forward and our vision of a diversified industrial group offer investors clear value
potential. Alongside roadshows in Europe, the United Kingdom and the USA, Investor Relations uses other
efficient platforms to promote dialogue with investors and our positioning on the capital market. One such
platform is our annual Capital Markets Day. Last year's event in December 2014 focused on our capital
goods businesses Industrial Solutions and Components Technology and met with a great response from 60
international participants. Our field trips are also now firmly established, giving investors the opportunity to
talk in depth with the leadership teams from the business areas and gain an insight into research,
development and production. In the current difficult market environment we also significantly increased our
participation in investor conferences, actively explaining the thyssenkrupp equity story at 21 conferences –
up from 16 the year before.
Shareholder structure The Alfried Krupp von Bohlen und Halbach Foundation, Essen, with a holding of 23.03% of the capital stock
is the biggest shareholder, followed by Cevian Capital, Stockholm and Zurich, which according to a voting
rights disclosure in accordance with the German Securities Trading Act (WpHG) of March 2014 holds a share
of 15.08%. The share held by the Krupp Foundation is not included in free float. Private investors hold
approx. 10% of the capital stock. The remaining shares are widely held internationally, with a focus on North
America and the United Kingdom. thyssenkrupp AG currently holds no treasury shares. The free float
generally taken into account in the weighting of thyssenkrupp's stock in stock indexes accounts for 76.97%
of the capital stock.
Buy and hold recommendations predominate 24 financial analysts from international investment banks, mostly in the UK, regularly cover the strategic and
operating performance of thyssenkrupp, comment on price targets, and make recommendations on the
stock. The analysts' recommendations reflect not least the upside potential of thyssenkrupp's stock. At
September 30, 2015 almost 90% of the analysts recommended holding (48%) or buying (40%) the stock.
Dividend proposal of €0.15 per share The Executive Board and Supervisory Board will propose to the Annual General Meeting on January 29,
2016 that a dividend of €0.15 per share be paid for the 2014/2015 fiscal year. In the 2014/2015 fiscal year
we once again significantly reduced our risk portfolio and further improved the Group's efficiency, earnings,
cash flow and financial position. Although we are still some way from achieving our minimum requirements
and our medium- and long-term goals, we again reached some important milestones in the reporting year
and expect to make further progress with the implementation of our Strategic Way Forward in the
2015/2016 fiscal year now under way. Against this background we consider it appropriate and financially
justifiable to pay a dividend in the proposed amount.
Your contact with Investor Relations The team at Investor Relations is always happy to provide further information on thyssenkrupp’s stock and
the value potential of the company. We also post extensive facts and data on our website. If you would like to
contact our Investor Relations team or find out about the dates planned in the 2016/2017 financial calendar,
you will find all the necessary information in the overview at the end of this Annual Report or on our website
at www.thyssenkrupp.com under Investor Relations.
thyssenkrupp stock master data
ISIN (International Stock Identification Number) Shares DE 000 750 0001 ADRs US88629Q2075
Symbols Frankfurt, Düsseldorf stock exchanges TKA
ADRs (over-the-counter trading) TKA MY
% Almost 90 of analysts recommended holding or buying the stock
33 thyssenkrupp annual report 2014/2015
Combined management report
34 Preliminary remarks
35 Fundamental information about the Group
35 Profile and organizational structure
37 Strategy
40 Management of the Group
42 Targets
44 Report on the economic position
44 Macro and sector environment
48 Summarized assessment by the Executive Board
50 Forecast-actual comparison
51 Group review
60 Business area review
70 Results of operations and financial position
77 thyssenkrupp AG
81 Compliance
83 Employees
89 Technology and innovations
90 Environment, climate and energy
92 Purchasing
94 Subsequent events
95 Forecast, opportunity and risk report
95 2015/2016 forecast
98 Opportunity and risk report
116 Legal information
34 thyssenkrupp annual report 2014/2015 Combined management report // Preliminary remarks
Preliminary remarks
Combined management report This management report combines the management report on the Group and the management report on
thyssenkrupp AG. This combined management report is published in the thyssenkrupp Group's annual
report in place of the management report on the Group. In it we report on the course of business including
business performance as well as the position and the expected development of the Group and of
thyssenkrupp AG. The information on thyssenkrupp AG is presented in a separate section of the report on
the economic position with disclosures in accordance with HGB. The German Accounting Standard 20
(GAS 20) "Group Management Report" was applied.
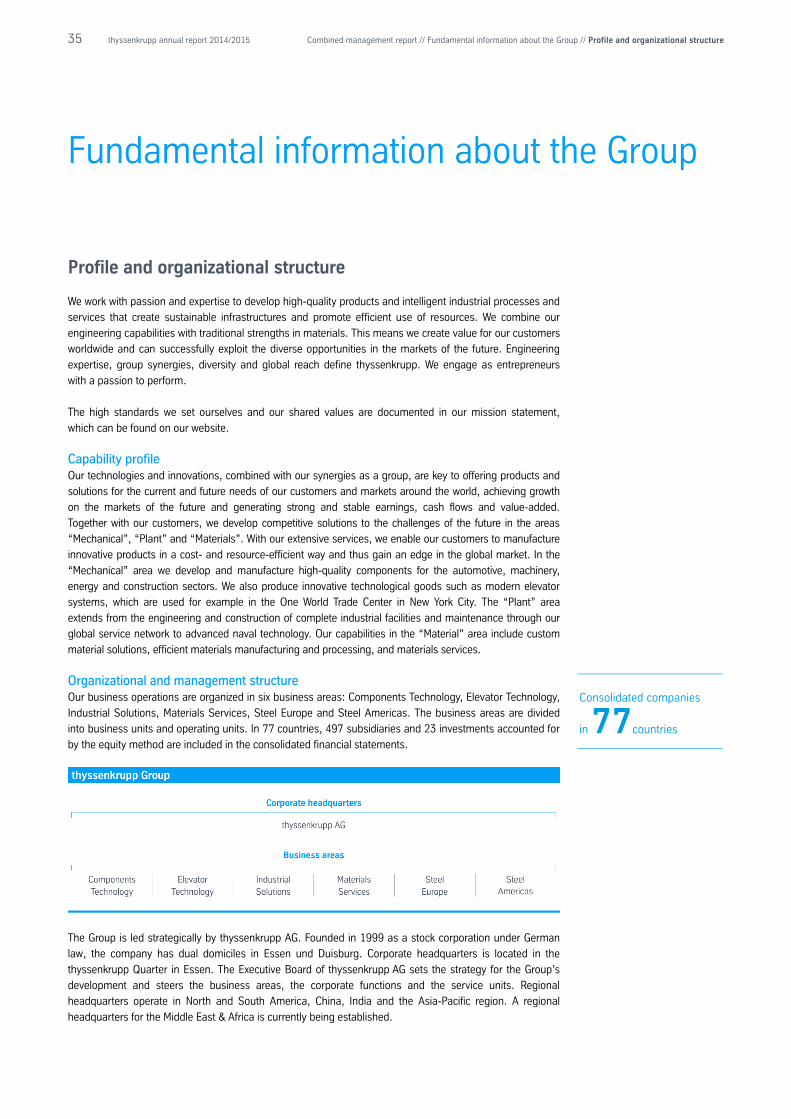
35 thyssenkrupp annual report 2014/2015 Combined management report // Fundamental information about the Group // Profile and organizational structure
Fundamental information about the Group
Profile and organizational structure
We work with passion and expertise to develop high-quality products and intelligent industrial processes and
services that create sustainable infrastructures and promote efficient use of resources. We combine our
engineering capabilities with traditional strengths in materials. This means we create value for our customers
worldwide and can successfully exploit the diverse opportunities in the markets of the future. Engineering
expertise, group synergies, diversity and global reach define thyssenkrupp. We engage as entrepreneurs
with a passion to perform.
The high standards we set ourselves and our shared values are documented in our mission statement,
which can be found on our website.
Capability profile Our technologies and innovations, combined with our synergies as a group, are key to offering products and
solutions for the current and future needs of our customers and markets around the world, achieving growth
on the markets of the future and generating strong and stable earnings, cash flows and value-added.
Together with our customers, we develop competitive solutions to the challenges of the future in the areas
“Mechanical”, “Plant” and “Materials”. With our extensive services, we enable our customers to manufacture
innovative products in a cost- and resource-efficient way and thus gain an edge in the global market. In the
“Mechanical” area we develop and manufacture high-quality components for the automotive, machinery,
energy and construction sectors. We also produce innovative technological goods such as modern elevator
systems, which are used for example in the One World Trade Center in New York City. The “Plant” area
extends from the engineering and construction of complete industrial facilities and maintenance through our
global service network to advanced naval technology. Our capabilities in the “Material” area include custom
material solutions, efficient materials manufacturing and processing, and materials services.
Organizational and management structure Our business operations are organized in six business areas: Components Technology, Elevator Technology,
Industrial Solutions, Materials Services, Steel Europe and Steel Americas. The business areas are divided
into business units and operating units. In 77 countries, 497 subsidiaries and 23 investments accounted for
by the equity method are included in the consolidated financial statements.
The Group is led strategically by thyssenkrupp AG. Founded in 1999 as a stock corporation under German
law, the company has dual domiciles in Essen und Duisburg. Corporate headquarters is located in the
thyssenkrupp Quarter in Essen. The Executive Board of thyssenkrupp AG sets the strategy for the Group’s
development and steers the business areas, the corporate functions and the service units. Regional
headquarters operate in North and South America, China, India and the Asia-Pacific region. A regional
headquarters for the Middle East & Africa is currently being established.
Consolidated companies in 77countries
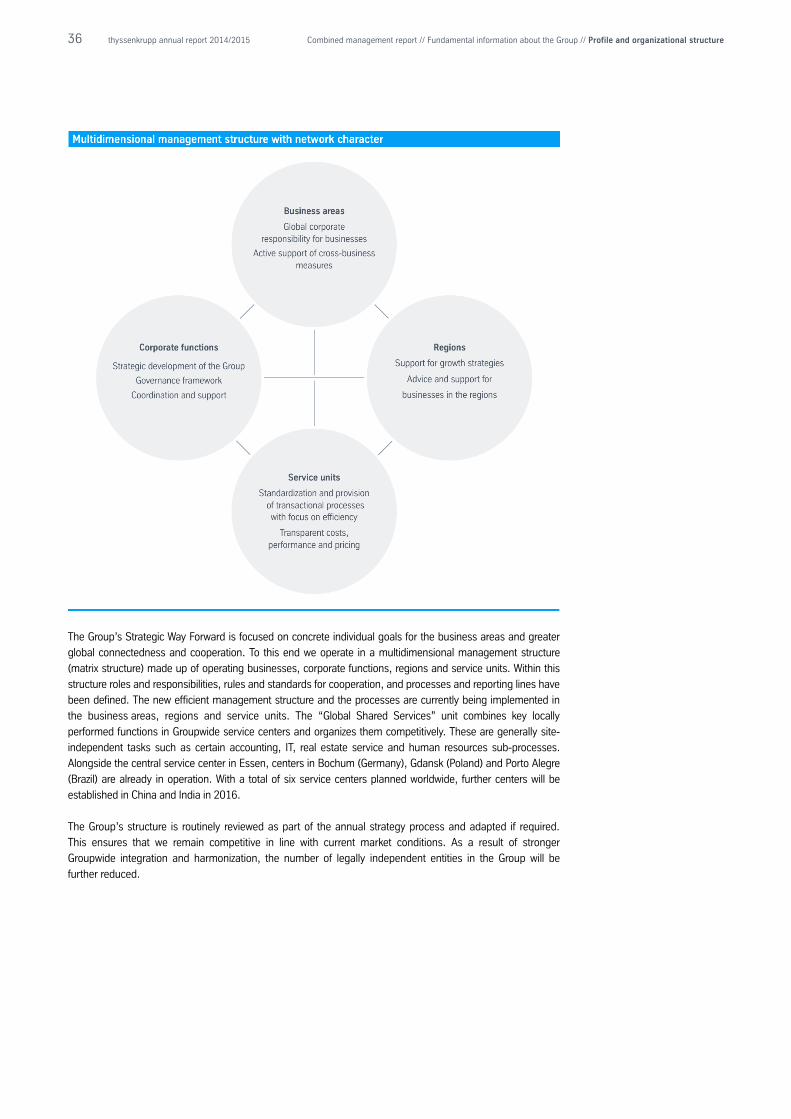
36 thyssenkrupp annual report 2014/2015 Combined management report // Fundamental information about the Group // Profile and organizational structure
The Group’s Strategic Way Forward is focused on concrete individual goals for the business areas and greater
global connectedness and cooperation. To this end we operate in a multidimensional management structure
(matrix structure) made up of operating businesses, corporate functions, regions and service units. Within this
structure roles and responsibilities, rules and standards for cooperation, and processes and reporting lines have
been defined. The new efficient management structure and the processes are currently being implemented in
the business areas, regions and service units. The “Global Shared Services” unit combines key locally
performed functions in Groupwide service centers and organizes them competitively. These are generally site-
independent tasks such as certain accounting, IT, real estate service and human resources sub-processes.
Alongside the central service center in Essen, centers in Bochum (Germany), Gdansk (Poland) and Porto Alegre
(Brazil) are already in operation. With a total of six service centers planned worldwide, further centers will be
established in China and India in 2016.
The Group’s structure is routinely reviewed as part of the annual strategy process and adapted if required.
This ensures that we remain competitive in line with current market conditions. As a result of stronger
Groupwide integration and harmonization, the number of legally independent entities in the Group will be
further reduced.
37 thyssenkrupp annual report 2014/2015 Combined management report //Fundamental information about the Group // Strategy
Strategy
Positioning as a diversified industrial group Our positioning as a diversified industrial group is linked to the ambition to generate strong and stable
earnings, cash flow and value added. We diversify our businesses in several dimensions: with a global
presence, a broad customer base, and different business models for our business areas in different sectors
with different cycles. We do not regard diversification as an end in itself. Rather, it enables us to seize diverse
growth opportunities and at the same time increase the stability of our company in a volatile environment. To
significantly improve our earnings strength we are applying two levers: systematically increasing the earning
power of the business areas to secure their profitable growth while consistently and systematically
leveraging synergies within the Group through targeted, cross-business initiatives.
All businesses in our portfolio have to meet clear minimum requirements or pursue a convincing business
plan to fulfill them: All businesses must sustainably generate positive earnings, positive cash flows and
positive value added (thyssenkrupp Value Added) on average across the cycle and at the same time
maintain or achieve industry-leading positions in terms of profitability.
To leverage synergies in the Group, we connect together and collaborate across functions, businesses and
regions, for example in research and development projects under the InCar®plus program or in the transfer
of manufacturing know-how from our components to our elevator business. Major synergies and process
improvements continue to be generated by our Groupwide initiatives, e.g. professional management and
consolidation under our purchasing and materials cost reduction initiative “synergize+”, a unified IT
infrastructure, data and process harmonization, and the introduction of Global Shared Services.
Our positioning as a diversified industrial group is associated with an increasing strategic focus on profitable
capital goods and service businesses, which have lower volatility and capital intensity than our materials
businesses, and on the worldwide growth regions and sectors. We have greatly reduced the share of more
volatile and capital-intensive businesses in our portfolio; at the end of the reporting year steel producing
businesses accounted for less than 30% of the business areas' sales, and capital goods and services
businesses for over 70%. We are strengthening our focus on the growth regions in Asia, South America, the
USA and the Middle East & Africa through efficient regional structures and a common market identity.
Focus on global megatrends Business opportunities are resulting for thyssenkrupp from global market trends that are causing both
“more” and “better” growth: Demographic change, the rapid growth of mega cities due to increasing
urbanization, the globalization of goods flows and digitization mean that global demand is rising all the time.
People and companies constantly need “more” consumer and capital goods, infrastructure, energy, raw
materials and digital services. However, this growing demand is set against the finite nature of natural
resources. The need to protect the environment and climate and stricter political regulations call for “better”
solutions. We need to use resources more efficiently, reduce the environmental impact of producing
consumer and capital goods, and build more sustainable infrastructure. Moreover, increasing physical and
digital connectedness around the world requires intelligent products and holistic solutions. These aspects
are depicted in the following graphic.
Capital goods and services businesses account for over % of sales 70
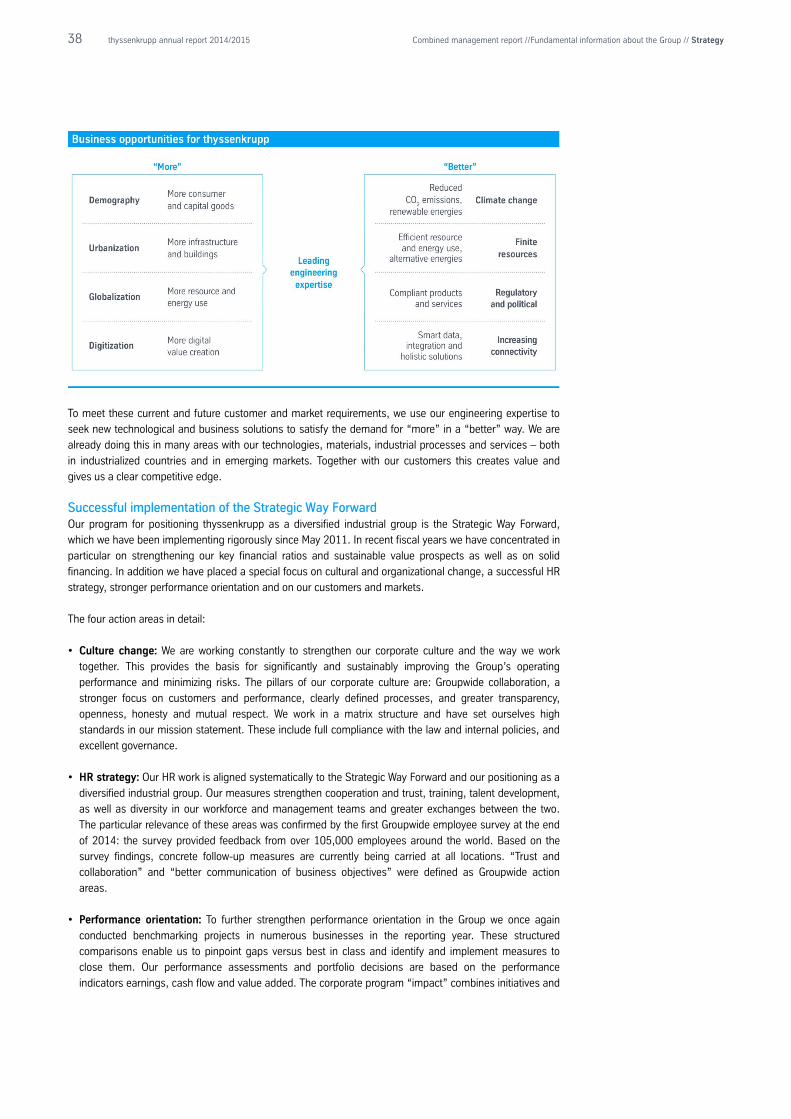
38 thyssenkrupp annual report 2014/2015 Combined management report //Fundamental information about the Group // Strategy
To meet these current and future customer and market requirements, we use our engineering expertise to
seek new technological and business solutions to satisfy the demand for “more” in a “better” way. We are
already doing this in many areas with our technologies, materials, industrial processes and services – both
in industrialized countries and in emerging markets. Together with our customers this creates value and
gives us a clear competitive edge.
Successful implementation of the Strategic Way Forward Our program for positioning thyssenkrupp as a diversified industrial group is the Strategic Way Forward,
which we have been implementing rigorously since May 2011. In recent fiscal years we have concentrated in
particular on strengthening our key financial ratios and sustainable value prospects as well as on solid
financing. In addition we have placed a special focus on cultural and organizational change, a successful HR
strategy, stronger performance orientation and on our customers and markets.
The four action areas in detail:
• Culture change: We are working constantly to strengthen our corporate culture and the way we work
together. This provides the basis for significantly and sustainably improving the Group’s operating
performance and minimizing risks. The pillars of our corporate culture are: Groupwide collaboration, a
stronger focus on customers and performance, clearly defined processes, and greater transparency,
openness, honesty and mutual respect. We work in a matrix structure and have set ourselves high
standards in our mission statement. These include full compliance with the law and internal policies, and
excellent governance.
• HR strategy: Our HR work is aligned systematically to the Strategic Way Forward and our positioning as a
diversified industrial group. Our measures strengthen cooperation and trust, training, talent development,
as well as diversity in our workforce and management teams and greater exchanges between the two.
The particular relevance of these areas was confirmed by the first Groupwide employee survey at the end
of 2014: the survey provided feedback from over 105,000 employees around the world. Based on the
survey findings, concrete follow-up measures are currently being carried at all locations. “Trust and
collaboration” and “better communication of business objectives” were defined as Groupwide action
areas.
• Performance orientation: To further strengthen performance orientation in the Group we once again
conducted benchmarking projects in numerous businesses in the reporting year. These structured
comparisons enable us to pinpoint gaps versus best in class and identify and implement measures to
close them. Our performance assessments and portfolio decisions are based on the performance
indicators earnings, cash flow and value added. The corporate program “impact” combines initiatives and
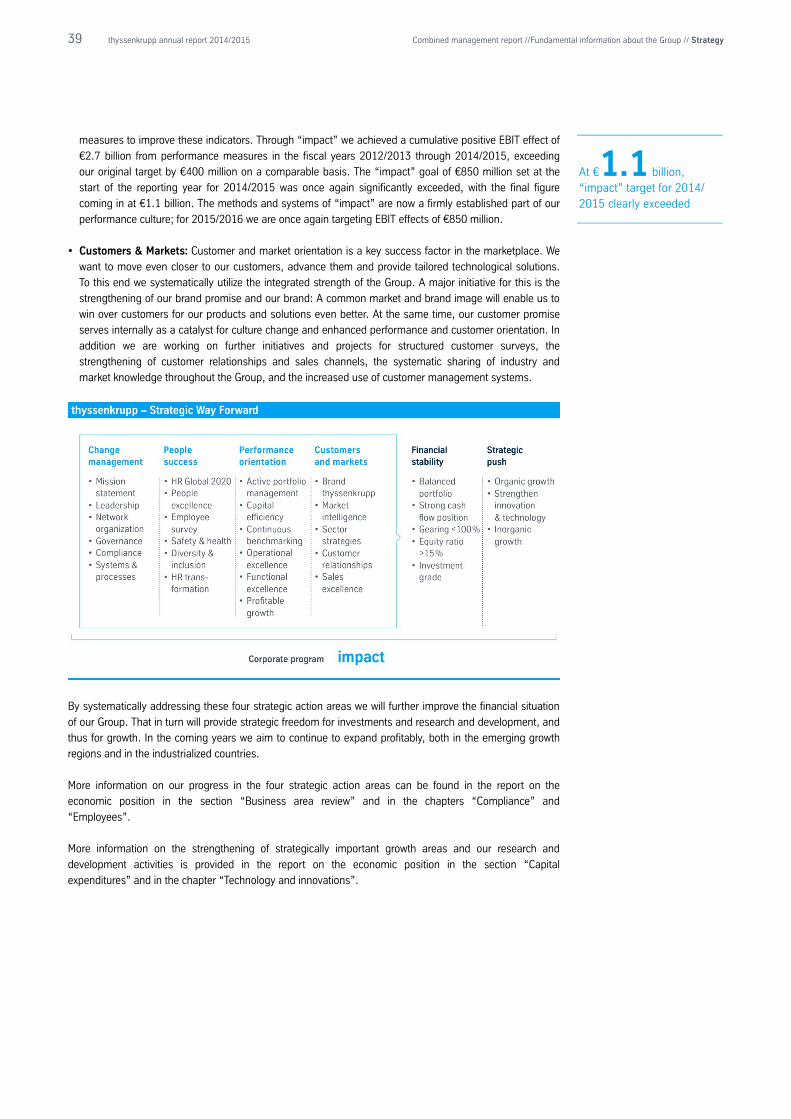
39 thyssenkrupp annual report 2014/2015 Combined management report //Fundamental information about the Group // Strategy
measures to improve these indicators. Through “impact” we achieved a cumulative positive EBIT effect of
€2.7 billion from performance measures in the fiscal years 2012/2013 through 2014/2015, exceeding
our original target by €400 million on a comparable basis. The “impact” goal of €850 million set at the
start of the reporting year for 2014/2015 was once again significantly exceeded, with the final figure
coming in at €1.1 billion. The methods and systems of “impact” are now a firmly established part of our
performance culture; for 2015/2016 we are once again targeting EBIT effects of €850 million.
• Customers & Markets: Customer and market orientation is a key success factor in the marketplace. We
want to move even closer to our customers, advance them and provide tailored technological solutions.
To this end we systematically utilize the integrated strength of the Group. A major initiative for this is the
strengthening of our brand promise and our brand: A common market and brand image will enable us to
win over customers for our products and solutions even better. At the same time, our customer promise
serves internally as a catalyst for culture change and enhanced performance and customer orientation. In
addition we are working on further initiatives and projects for structured customer surveys, the
strengthening of customer relationships and sales channels, the systematic sharing of industry and
market knowledge throughout the Group, and the increased use of customer management systems.
By systematically addressing these four strategic action areas we will further improve the financial situation
of our Group. That in turn will provide strategic freedom for investments and research and development, and
thus for growth. In the coming years we aim to continue to expand profitably, both in the emerging growth
regions and in the industrialized countries.
More information on our progress in the four strategic action areas can be found in the report on the
economic position in the section “Business area review” and in the chapters “Compliance” and
“Employees”.
More information on the strengthening of strategically important growth areas and our research and
development activities is provided in the report on the economic position in the section “Capital
expenditures” and in the chapter “Technology and innovations”.
At €1.1 billion, “impact” target for 2014/ 2015 clearly exceeded
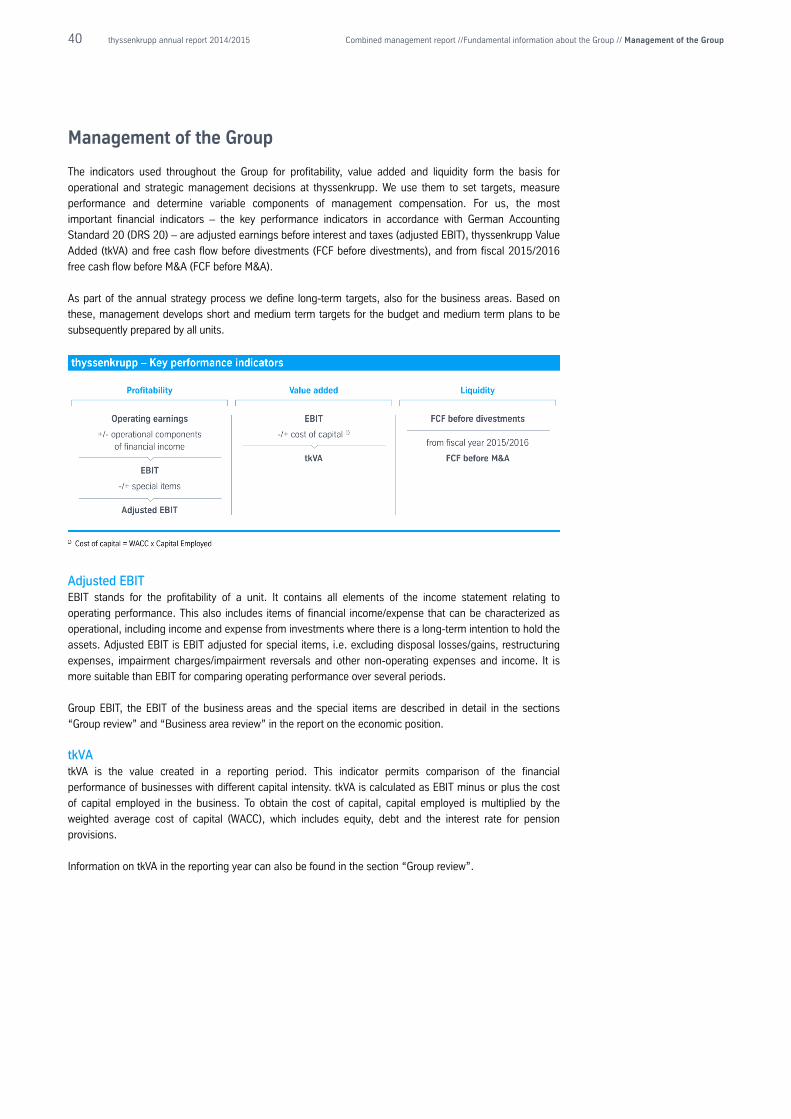
40 thyssenkrupp annual report 2014/2015 Combined management report //Fundamental information about the Group // Management of the Group
Management of the Group
The indicators used throughout the Group for profitability, value added and liquidity form the basis for
operational and strategic management decisions at thyssenkrupp. We use them to set targets, measure
performance and determine variable components of management compensation. For us, the most
important financial indicators – the key performance indicators in accordance with German Accounting
Standard 20 (DRS 20) – are adjusted earnings before interest and taxes (adjusted EBIT), thyssenkrupp Value
Added (tkVA) and free cash flow before divestments (FCF before divestments), and from fiscal 2015/2016
free cash flow before M&A (FCF before M&A).
As part of the annual strategy process we define long-term targets, also for the business areas. Based on
these, management develops short and medium term targets for the budget and medium term plans to be
subsequently prepared by all units.
Adjusted EBIT EBIT stands for the profitability of a unit. It contains all elements of the income statement relating to
operating performance. This also includes items of financial income/expense that can be characterized as
operational, including income and expense from investments where there is a long-term intention to hold the
assets. Adjusted EBIT is EBIT adjusted for special items, i.e. excluding disposal losses/gains, restructuring
expenses, impairment charges/impairment reversals and other non-operating expenses and income. It is
more suitable than EBIT for comparing operating performance over several periods.
Group EBIT, the EBIT of the business areas and the special items are described in detail in the sections
“Group review” and “Business area review” in the report on the economic position.
tkVA tkVA is the value created in a reporting period. This indicator permits comparison of the financial
performance of businesses with different capital intensity. tkVA is calculated as EBIT minus or plus the cost
of capital employed in the business. To obtain the cost of capital, capital employed is multiplied by the
weighted average cost of capital (WACC), which includes equity, debt and the interest rate for pension
provisions.
Information on tkVA in the reporting year can also be found in the section “Group review”.
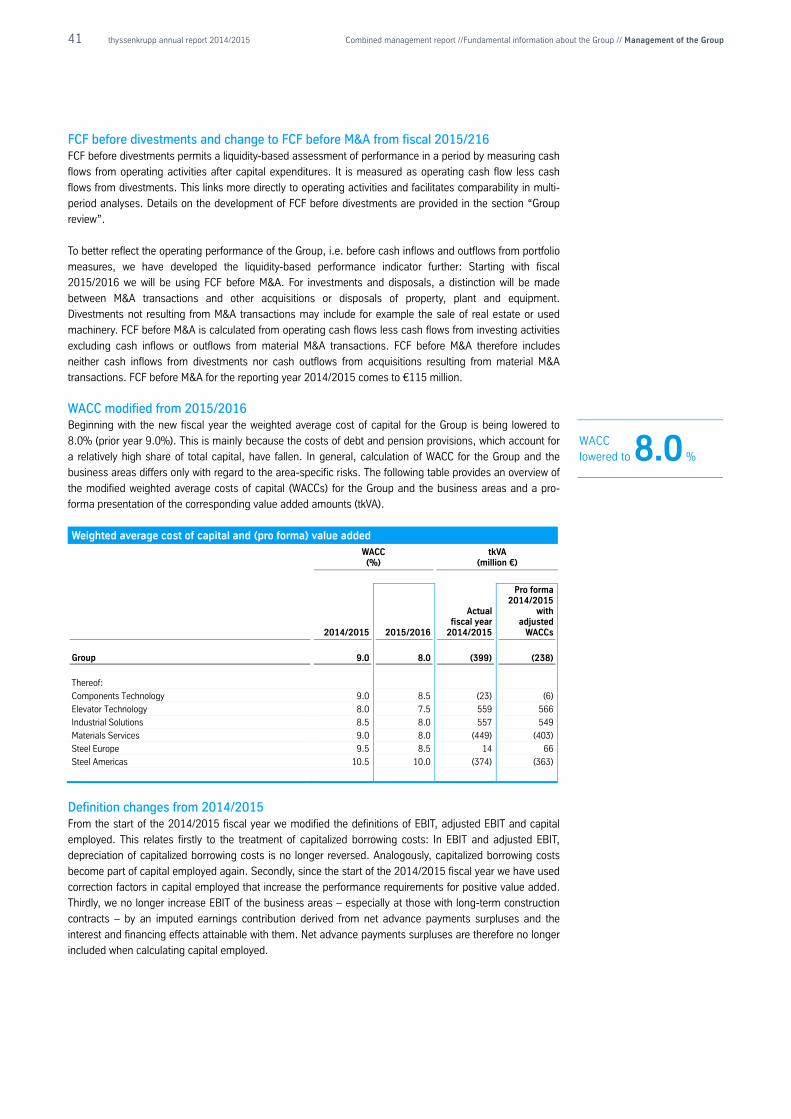
41 thyssenkrupp annual report 2014/2015 Combined management report //Fundamental information about the Group // Management of the Group
FCF before divestments and change to FCF before M&A from fiscal 2015/216 FCF before divestments permits a liquidity-based assessment of performance in a period by measuring cash
flows from operating activities after capital expenditures. It is measured as operating cash flow less cash
flows from divestments. This links more directly to operating activities and facilitates comparability in multi-
period analyses. Details on the development of FCF before divestments are provided in the section “Group
review”.
To better reflect the operating performance of the Group, i.e. before cash inflows and outflows from portfolio
measures, we have developed the liquidity-based performance indicator further: Starting with fiscal
2015/2016 we will be using FCF before M&A. For investments and disposals, a distinction will be made
between M&A transactions and other acquisitions or disposals of property, plant and equipment.
Divestments not resulting from M&A transactions may include for example the sale of real estate or used
machinery. FCF before M&A is calculated from operating cash flows less cash flows from investing activities
excluding cash inflows or outflows from material M&A transactions. FCF before M&A therefore includes
neither cash inflows from divestments nor cash outflows from acquisitions resulting from material M&A
transactions. FCF before M&A for the reporting year 2014/2015 comes to €115 million.
WACC modified from 2015/2016 Beginning with the new fiscal year the weighted average cost of capital for the Group is being lowered to
8.0% (prior year 9.0%). This is mainly because the costs of debt and pension provisions, which account for
a relatively high share of total capital, have fallen. In general, calculation of WACC for the Group and the
business areas differs only with regard to the area-specific risks. The following table provides an overview of
the modified weighted average costs of capital (WACCs) for the Group and the business areas and a pro-
forma presentation of the corresponding value added amounts (tkVA).
Weighted average cost of capital and (pro forma) value added
WACC (%)
tkVA (million €)
2014/2015 2015/2016
Actual fiscal year
2014/2015
Pro forma 2014/2015
with adjusted
WACCs
Group 9.0 8.0 (399) (238)
Thereof:
Components Technology 9.0 8.5 (23) (6)
Elevator Technology 8.0 7.5 559 566
Industrial Solutions 8.5 8.0 557 549
Materials Services 9.0 8.0 (449) (403)
Steel Europe 9.5 8.5 14 66
Steel Americas 10.5 10.0 (374) (363)
Definition changes from 2014/2015 From the start of the 2014/2015 fiscal year we modified the definitions of EBIT, adjusted EBIT and capital
employed. This relates firstly to the treatment of capitalized borrowing costs: In EBIT and adjusted EBIT,
depreciation of capitalized borrowing costs is no longer reversed. Analogously, capitalized borrowing costs
become part of capital employed again. Secondly, since the start of the 2014/2015 fiscal year we have used
correction factors in capital employed that increase the performance requirements for positive value added.
Thirdly, we no longer increase EBIT of the business areas – especially at those with long-term construction
contracts – by an imputed earnings contribution derived from net advance payments surpluses and the
interest and financing effects attainable with them. Net advance payments surpluses are therefore no longer
included when calculating capital employed.
WACC lowered to 8.0 %

42 thyssenkrupp annual report 2014/2015 Combined management report //Fundamental information about the Group // Targets
Targets
The development of our key performance indicators over the past few years shows that the measures under
the Strategic Way Forward are having a clear effect. But although we achieved a further significant
improvement in adjusted EBIT in the past fiscal year, we have not yet achieved our sustainable minimum
requirement. Ambitious targets for our financial indicators and targeted improvements in strategic areas,
including via indirect financial indicators, are therefore important elements of the Strategic Way Forward.
Financial targets We are working hard to generate strong, stable positive free cash flow again in order to provide the funds
needed to expand our growth businesses and pay a solid dividend to our shareholders. For this we need
EBIT of at least €2 billion. We are convinced that we will achieve the earnings growth needed for this
minimum requirement and beyond by strictly following the Strategic Way Forward in all business area. We
have defined clear targets for this: • Components Technology – Profitable growth, medium- to long-term return to EBIT margins of 6% to 8%
through successful ramp-up of new plants and continuation of efficiency and restructuring measures
• Elevator Technology – Profitable growth and efficiency and restructuring measures for continuing
improvements to EBIT margin by 0.5 to 0.7 percentage points per year to 15% long-term and an EBIT
contribution of over €1 billion
• Industrial Solutions – Long-term sales expansion by on average around 5% per year to €8 billion with a
sustainable EBIT margin of 6 to 7% through implementation of the new growth strategy
• Materials Services – Return to higher margin levels with recovery of materials markets and successful
restructuring of AST
• Steel Europe – EBIT improvement through efficiency measures and differentiation initiatives to sustaina-
bly earn more than the cost of capital across the cycle
• Steel Americas – Further operating improvement with positive EBIT contributions
We expect that further progress on our Strategic Way Forward will again be reflected overall in our key
performance indicators in fiscal 2015/2016. However, the economic climate has deteriorated and
uncertainties have increased. Our materials businesses in particular are exposed to considerable foreign
trade risks, because China’s growing production surplus is being diverted massively into exports, resulting in
regional supply overhangs and sharply falling prices worldwide. Despite these challenges and the fact that
visibility for large parts of our materials and components businesses in the current economic climate does
not extend far beyond a quarter, in the current fiscal year we expect a significant improvement in value
added (tkVA), FCF before M&A level with the prior year and adjusted EBIT between €1.6 billion and
€1.9 billion. More information on our key performance indicators can be found in this section under
“Management of the Group”, and details on the forecast for the current fiscal year are provided in the
forecast report.
We require EBIT of at least €2 billion.
43 thyssenkrupp annual report 2014/2015 Combined management report //Fundamental information about the Group // Targets
Indirect financial targets To ensure the positive development of our financial indicators in the short, medium and long term, we must
also systematically improve the performance of important indirect financial parameters. thyssenkrupp has
therefore set itself indirect financial targets (IFTs) in the areas technology and innovations, environment,
climate and energy, purchasing, and people. Our progress towards these targets is measured annually by
thyssenkrupp’s Sustainability Committee, which includes the Group Executive Board, the CEOs of the
business areas and heads of corporate functions. Information on improvements already achieved, the status
of target achievement and the associated management processes is provided in the corresponding sections
and on our website.
Technology and Innovations
• In recent years, research and development (R&D) spending has been increased significantly to an efficient
level. By means of a sustainable R&D intensity of around 2.5% of sales (excluding trading and distribution
businesses) we aim to secure continuing innovativeness and the efficiency of research spending.
Environment, Climate and Energy
• Through systematic identification and leveraging of energy efficiency potential in the operating units, our
aim by fiscal 2019/2020 is to increase energy efficiency sustainably by 3.5 TWh compared with
2012/2013.
• Operational environmental and energy management is also being improved step by step. Our aim is for
ISO 50001 energy management systems and ISO 14001 environmental management systems to be
implemented at all relevant operations by fiscal 2019/2020.
Purchasing
• To avoid reputational and default risks and improve supplier performance we have documented our
sustainability requirements for suppliers in our “thyssenkrupp Supplier Code of Conduct”. Adherence to
this code is to be reviewed by means of 100 supplier audits annually.
People
• To ensure thyssenkrupp’s workforces and management teams continue to display a high level of
motivation, skills and performance, we need greater diversity, in particular in terms of age, gender and
origin. In an initial step we aim to increase the share of women in management positions to 15% by fiscal
2019/2020.
• Health and safety is an ongoing top priority at thyssenkrupp. For this reason we have converted our target
for reducing accident frequency in the reporting year into a continuous target: The number of accidents
per 1 million hours worked is to be reduced by at least 10% each year compared with the prior year.
Sustainable R&D intensity of around 2.5%
44 thyssenkrupp annual report 2014/2015 Combined management report // Report on the economic position // Macro and sector environment
Report on the economic position
Macro and sector environment
Global growth in 2015 slowed by emerging markets – high uncertainties for 2016 After growing at a below-average rate last year, the global economy again looks weak this year. According to
the latest indicators, global growth is set to slow slightly in 2015 to just under 3%. The driving forces are
shifting further from the emerging markets to the industrialized countries; here, continuing highly
expansionary monetary policy will push the average growth rate to around 2%. By contrast, growth in the
emerging markets – most of which currently face very weak and in some cases recessionary conditions –
looks likely to slow substantially to less than 4% in 2015. Overall, the industrialized countries and some
emerging nations are profiting from the low oil price, while in the euro zone the relatively weak euro is also
supporting the economy. For 2016 we expect a mixed global economic picture; following the general
downgrading of forecasts in recent weeks we see at best a moderate increase in the global growth rate to
3.3% but with high uncertainties. A broad-based self-sustaining upturn can hardly be expected, not least
due to numerous growth risks.
Risks for the global economy continue to come from numerous geopolitical uncertainties, for example the
Ukraine crisis and the conflicts in the Middle East, and from the European debt problems and the likely
interest rate hike in the USA. There could also be a noticeable negative impact if China’s economy were to
slow further following the major volatility in the financial sector.
The economy in the euro zone has grown only slightly in 2015 to date. In the longer term consumer
spending should profit from a slowly rising employment rate, slightly higher wage incomes and purchasing
power gains due to lower energy prices. Business spending should also increase gradually as a result of
improved financing conditions and more favorable sales prospects, as well as the relatively low euro-dollar
exchange rate, although growing uncertainties over global economic conditions are diminishing the
propensity to invest. The growth outlook is also overshadowed by the need for numerous structural reforms,
which are being tackled only hesitantly in some cases. Growth of 1.6% is expected in the current year,
followed by a marginally higher rate of 1.7% in 2016.
In Germany the economy has improved slightly since the beginning of 2015, with positive stimulus coming
from consumer and government spending, business spending and also foreign trade. GDP is expected to
grow by 1.7% in 2015. At best a slight rise to 1.9% is expected for 2016 provided the global economy
improves.
After a weak start the US economy has gained pace in the course of 2015. In light of the progress made
with the deleveraging of private households and the continued improvement on the labor market, consumer
spending should continue to rise. Business spending should also accelerate given these conditions. Overall
the US economy is expected to expand by 2.3% in 2015 and 2.8% in 2016.
Of the BRIC countries only the Indian economy is expected to pick up in 2015 and 2016 with growth of 7.5%
and 8% respectively; this is indicated by companies' positive business prospects and further implementation
of ongoing infrastructure projects. Growth in China is expected to slow from 7.3% last year to just under 7%
in 2015. The targeted shift towards greater consumption- and services-led growth is not yet likely to be
enough to offset weaker business spending. In this context a further slowing to an estimated 6.5% is
Global economic growth of % expected around 3 for 2016
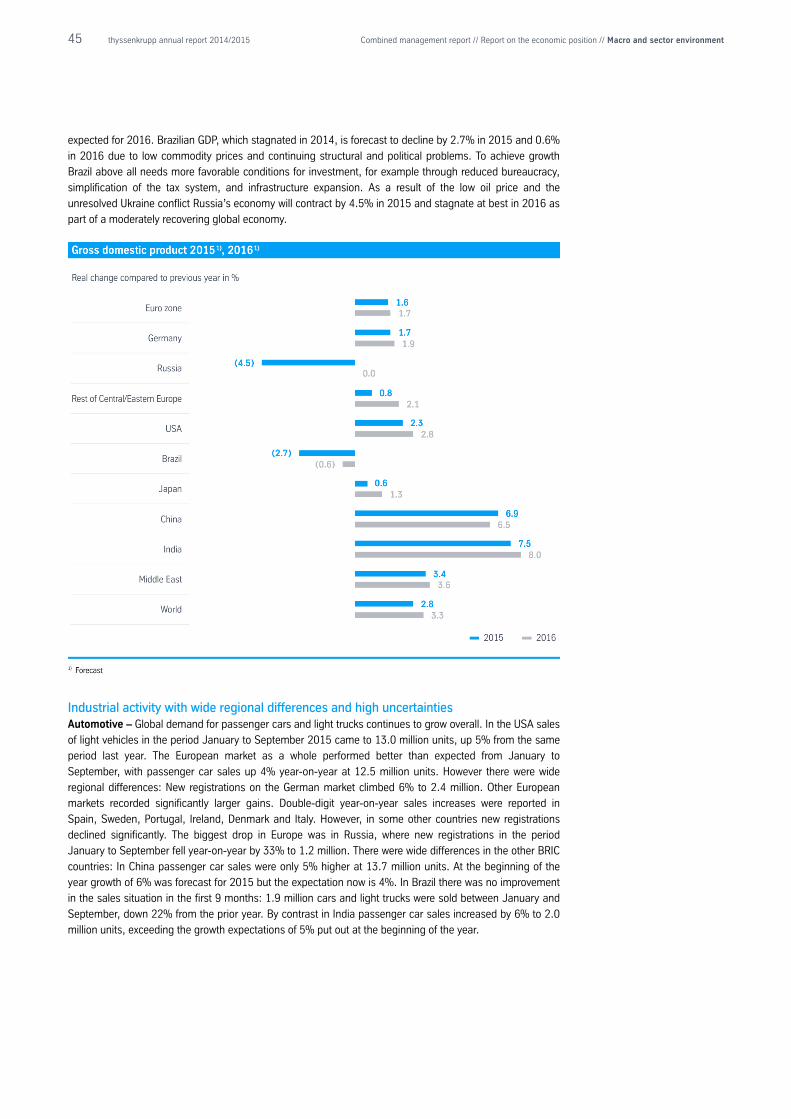
45 thyssenkrupp annual report 2014/2015 Combined management report // Report on the economic position // Macro and sector environment
expected for 2016. Brazilian GDP, which stagnated in 2014, is forecast to decline by 2.7% in 2015 and 0.6%
in 2016 due to low commodity prices and continuing structural and political problems. To achieve growth
Brazil above all needs more favorable conditions for investment, for example through reduced bureaucracy,
simplification of the tax system, and infrastructure expansion. As a result of the low oil price and the
unresolved Ukraine conflict Russia’s economy will contract by 4.5% in 2015 and stagnate at best in 2016 as
part of a moderately recovering global economy.
Industrial activity with wide regional differences and high uncertainties Automotive – Global demand for passenger cars and light trucks continues to grow overall. In the USA sales
of light vehicles in the period January to September 2015 came to 13.0 million units, up 5% from the same
period last year. The European market as a whole performed better than expected from January to
September, with passenger car sales up 4% year-on-year at 12.5 million units. However there were wide
regional differences: New registrations on the German market climbed 6% to 2.4 million. Other European
markets recorded significantly larger gains. Double-digit year-on-year sales increases were reported in
Spain, Sweden, Portugal, Ireland, Denmark and Italy. However, in some other countries new registrations
declined significantly. The biggest drop in Europe was in Russia, where new registrations in the period
January to September fell year-on-year by 33% to 1.2 million. There were wide differences in the other BRIC
countries: In China passenger car sales were only 5% higher at 13.7 million units. At the beginning of the
year growth of 6% was forecast for 2015 but the expectation now is 4%. In Brazil there was no improvement
in the sales situation in the first 9 months: 1.9 million cars and light trucks were sold between January and
September, down 22% from the prior year. By contrast in India passenger car sales increased by 6% to 2.0
million units, exceeding the growth expectations of 5% put out at the beginning of the year.
46 thyssenkrupp annual report 2014/2015 Combined management report // Report on the economic position // Macro and sector environment
We expect global production of passenger cars and light trucks to increase very moderately by 0.4% to 85.3
million units in the current year; for 2016 we currently forecast slightly higher growth of almost 3% to 87.7
million units, but this is subject to major uncertainties. Once again there will be wide regional differences. In
China growth of 4% to 23.8 million units is predicted, but the forecasts are trending downwards.
Opportunities could arise from government incentive programs. In the USA the forecasts are for stable
growth of just under 4%. After another sharp drop of over 20% this year, Brazilian auto production is
expected to show further contraction of almost 5% in the coming year. Germany is expected to record slight
growth in 2015 but at best a sideways movement in 2016 with uncertainty growing. In Western Europe as a
whole production will rise slightly faster than in Germany in 2015 and by almost 3% in 2016.
Important sales markets
2014 20151) 20161)
Vehicle production, million cars and light trucks
World 85.0 85.3 87.7
Western Europe 13.2 14.0 14.4
Germany 5.8 5.9 5.9
USA 11.4 11.8 12.3
Japan 9.2 8.6 8.7
China 22.6 22.8 23.8
Brazil 2.9 2.3 2.2
Machinery production, real, in % versus prior year
Germany 1.3 0.0 0.0
USA 4.7 0.8 1.2
Japan 9.8 3.0 4.5
China 7.2 3.4 4.5
Construction output, real, in % versus prior year
Germany 5.3 1.0 1.5
USA 3.1 5.0 6.7
China 8.9 4.0 3.0
India 4.7 5.8 7.2
Demand for finished steel, million tons
World 1,540 1,513 1,523
Germany 39.4 39.5 40.5
USA 107 104 105
China 711 686 672
1) Forecast
Machinery – Global machinery production will increase at a much slower rate in 2015 than in 2014. In
China machinery output will grow by only around 3.5% this year and only marginally faster at 4.5% in 2016.
The same goes for Japan, where sector growth will slow significantly to only 3% this year and 4.5% next.
Growth in the US machinery market will also be moderate: Last year the growth rate was 7% but will slow to
only around 1% in 2015 and 2016 – mainly due to lower business spending. Among other things the sharp
drop in the oil price is having a negative impact on exploration and fracking projects. The strong US dollar is
taking its toll on export-oriented sectors of industry. In Western Europe, too, most countries will record little
growth in 2015 in view of the slowdown of the global economy. The same applies to 2016.
The export-oriented German machinery sector increased its output in 2014 by only 1.3%. The main reasons
for this were the weak economy in many emerging countries – especially in Russia and Latin America – and
only moderate growth in business spending in Germany and the EU. Demand this year has also been very
moderate: New orders have increased only slightly and output has actually decreased. After the Federal
Statistical Office corrected its production indices for machinery, the forecast for 2015 has been downgraded
to stagnation. For 2016 too, no more than stagnation is expected.
47 thyssenkrupp annual report 2014/2015 Combined management report // Report on the economic position // Macro and sector environment
Construction – Construction activity in the euro zone is expected to grow by around 1% in 2015 and 1.5%
in 2016. German construction output increased by 5.3% in 2014 but has been only marginally higher in
2015 to date. High immigration, a solid labor market – coupled with rising real incomes – and low mortgage
rates should continue to support German housing construction. In general however German construction
activity will slow noticeably with growth rates of 1% in 2015 and 1.5% in 2016. In China too, construction
output growth will be lower than in previous years this year (4%) and next (3%) due to lower overall
economic growth. By contrast the US housing market seems to be continuing its recovery: Both the number
of building permits and the number of housing starts have picked up significantly compared with last year,
while property prices increased by around 5% up to July 2015. US construction output is forecast to grow by
5% in 2015 and over 6.5% in 2016.
Steel – The decline in steel demand in China since 2014 dominated the development of the international
steel industry and the relevant raw material markets in the reporting period. But steel demand has also been
falling in many other emerging and industrialized countries since the beginning of 2015, so there are
currently signs of a global decline. Above all growing Chinese surplus production has been redirected
massively into exports, resulting in regional supply overhangs and strong downward pressure on prices
worldwide.
In the EU demand for flat carbon steel up to and including August 2015 was around 4% higher than a year
earlier. This was due to solid activity in the steel processing sector. In particular, demand from the auto
industry increased significantly. This was reinforced in the first quarter by the need for restocking, although
this factor decreased in importance in the following months with material availability adequate and delivery
times short. However the European flat steel manufacturers profited from the slight market recovery only to a
limited extent – their shipments to the EU increased by only 2%. By contrast, suppliers from third countries
recorded substantial gains – despite the weak euro. The EU’s flat steel imports increased by 19%; imports
from China, which made up 29% of all imports, rose by 37%. Benefiting from currency devaluations the CIS
countries also significantly increased their exports to the EU.
Unlike in North America and Asia, where steel prices declined significantly in the first half, they remained
comparatively stable at first in Europe. However, falling raw material prices, coupled with latent oversupply
due partly to high imports, put spot prices in Europe under pressure again from the middle of the year. This
primarily affected the countries of Southern Europe, who are particularly vulnerable to low-price competition
from imports.
The US steel market, which recorded exceptionally strong growth in 2014 due to high market activity and
restocking, is being slowed this year by destocking and a weak energy sector. Brazil is currently experiencing
its most severe recession in a quarter of a century and demand for steel has dropped significantly.
Global steel demand should stabilize next year. However China will remain a burden, and here we expect
another decline. However, stabilization in other emerging countries and the continued strong expansion of
the Indian steel market should offset the declines in China. Slight volume gains are expected in the
industrialized countries. Provided investment conditions improve, steel demand in the EU could grow by 2%,
faster than this year (1%). However the foreign trade risks for the EU remain; import pressure from Asia and
other regions is likely to remain high.
Construction activity in the euro zone is expected to grow by 1-1.5% in 2015 and 2016
48 thyssenkrupp annual report 2014/2015 Combined management report // Report on the economic position // Summarized assessment by the Executive Board
Summarized assessment by the Executive Board
In a continuing challenging economic climate the overall development of our key performance indicators and
balance sheet ratios in the reporting year once again shows clearly that the measures initiated as part of the
Group’s Strategic Way Forward are continuing to take effect. thyssenkrupp’s performance profile again
improved substantially in the past fiscal year, while its risk portfolio was further reduced. The financial
targets set at the beginning of the reporting year for the Group’s efficiency, earnings, cash flow, and balance
sheet were once again met or exceeded, and year-on-year improvements were achieved in these
performance indicators for the Group. More information on this is contained in the section “Forecast-actual
comparison”.
Milestones again achieved, balance sheet ratios further improved In the reporting year we increased adjusted EBIT year-on-year by 26% and improved net income year-on-
year by 37%. For the third time in succession we achieved clear positive free cash flow and for the first time
since fiscal year 2005/2006 we achieved positive free cash flow before divestments. We also further
increased the book value of equity, further brought down net financial debt and reduced gearing in the
reporting year to 103.2%. With cash, cash equivalents and committed undrawn credit lines totaling
€8.3 billion at September 30, 2015 and a balanced and extended maturity profile, thyssenkrupp is solidly
financed.
Risks further reduced Having already considerably improved the Group’s risk profile in fiscal year 2013/2014 with important
portfolio and financing measures, we again further significantly reduced the risks to the Group in the
reporting year, in particular as a result of the closure of the “auto steel” cartel case against thyssenkrupp for
lack of probable cause. In its press release on the closure of the investigation, the Federal Cartel Office
emphasized thyssenkrupp’s cooperation in the proceedings. In addition, with the sale of the VDM group we
achieved a mid three-digit million euro positive effect on net financial debt and pension obligations while at
the same time further reducing the share of volatile materials businesses in our portfolio.
We will continue the transformation of thyssenkrupp into an efficient, profitable and value-creating diversified
industrial group on a solid financial basis and with a significantly reduced risk portfolio. Details of
opportunities and risks are provided in the Opportunity and risk report.
Adjusted EBIT increased year-on-year by +26%
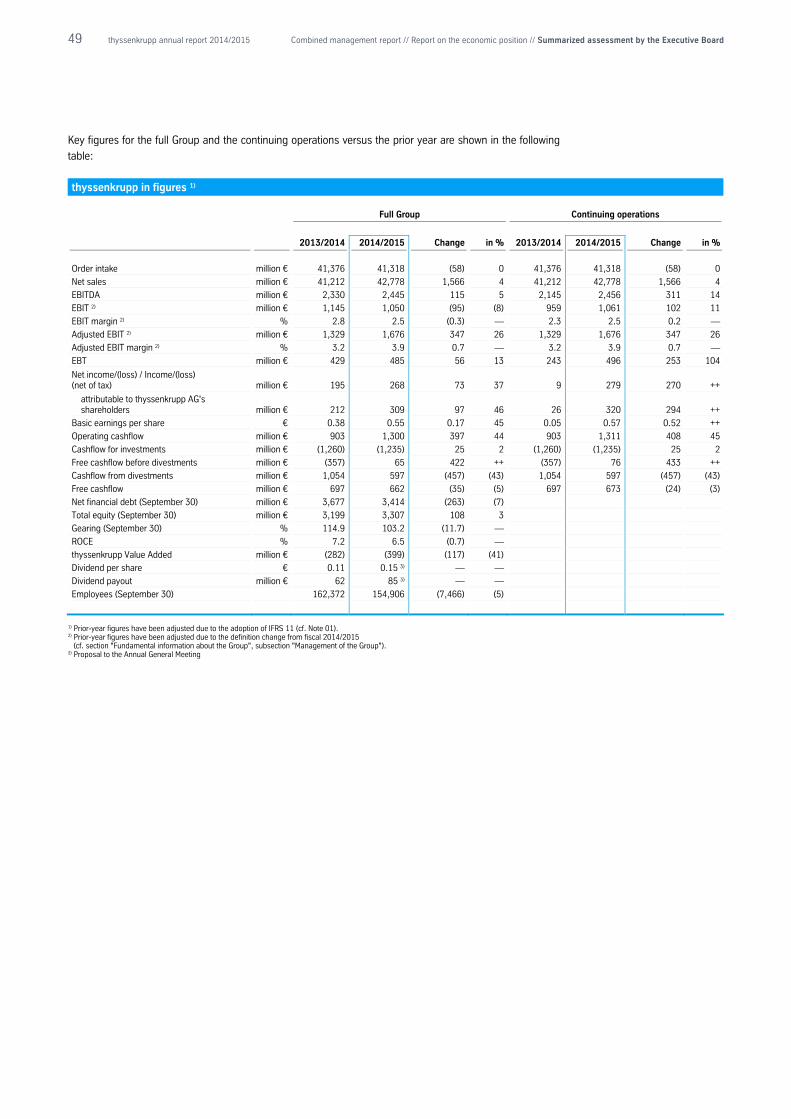
49 thyssenkrupp annual report 2014/2015 Combined management report // Report on the economic position // Summarized assessment by the Executive Board
Key figures for the full Group and the continuing operations versus the prior year are shown in the following
table:
thyssenkrupp in figures 1)
Full Group Continuing operations
2013/2014 2014/2015 Change in % 2013/2014 2014/2015 Change in %
Order intake million € 41,376 41,318 (58) 0 41,376 41,318 (58) 0
Net sales million € 41,212 42,778 1,566 4 41,212 42,778 1,566 4
EBITDA million € 2,330 2,445 115 5 2,145 2,456 311 14
EBIT 2) million € 1,145 1,050 (95) (8) 959 1,061 102 11
EBIT margin 2) % 2.8 2.5 (0.3) — 2.3 2.5 0.2 —
Adjusted EBIT 2) million € 1,329 1,676 347 26 1,329 1,676 347 26
Adjusted EBIT margin 2) % 3.2 3.9 0.7 — 3.2 3.9 0.7 —
EBT million € 429 485 56 13 243 496 253 104
Net income/(loss) / Income/(loss) (net of tax) million € 195 268 73 37 9 279 270 ++
attributable to thyssenkrupp AG's shareholders million € 212 309 97 46 26 320 294 ++
Basic earnings per share € 0.38 0.55 0.17 45 0.05 0.57 0.52 ++
Operating cashflow million € 903 1,300 397 44 903 1,311 408 45
Cashflow for investments million € (1,260) (1,235) 25 2 (1,260) (1,235) 25 2
Free cashflow before divestments million € (357) 65 422 ++ (357) 76 433 ++
Cashflow from divestments million € 1,054 597 (457) (43) 1,054 597 (457) (43)
Free cashflow million € 697 662 (35) (5) 697 673 (24) (3)
Net financial debt (September 30) million € 3,677 3,414 (263) (7)
Total equity (September 30) million € 3,199 3,307 108 3
Gearing (September 30) % 114.9 103.2 (11.7) —
ROCE % 7.2 6.5 (0.7) —
thyssenkrupp Value Added million € (282) (399) (117) (41)
Dividend per share € 0.11 0.15 3) — —
Dividend payout million € 62 85 3) — —
Employees (September 30) 162,372 154,906 (7,466) (5)
1) Prior-year figures have been adjusted due to the adoption of IFRS 11 (cf. Note 01). 2) Prior-year figures have been adjusted due to the definition change from fiscal 2014/2015
(cf. section "Fundamental information about the Group", subsection "Management of the Group"). 3) Proposal to the Annual General Meeting
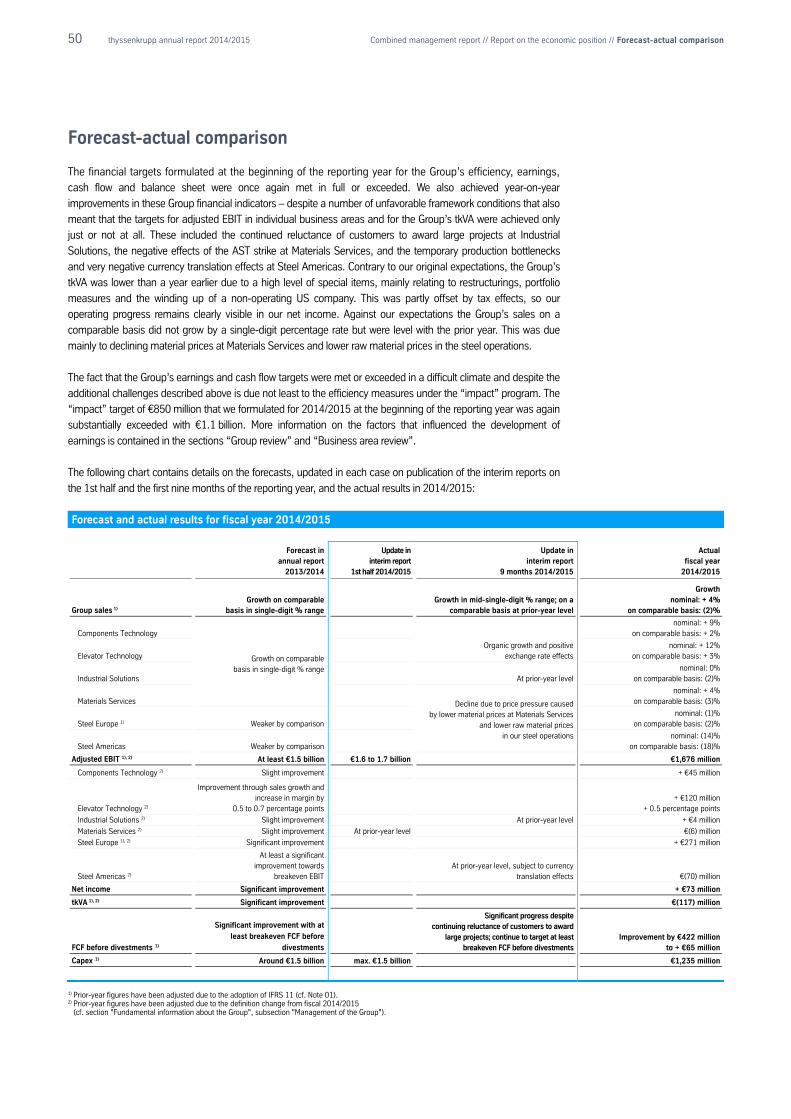
50 thyssenkrupp annual report 2014/2015 Combined management report // Report on the economic position // Forecast-actual comparison
Forecast-actual comparison
The financial targets formulated at the beginning of the reporting year for the Group’s efficiency, earnings,
cash flow and balance sheet were once again met in full or exceeded. We also achieved year-on-year
improvements in these Group financial indicators – despite a number of unfavorable framework conditions that also
meant that the targets for adjusted EBIT in individual business areas and for the Group’s tkVA were achieved only
just or not at all. These included the continued reluctance of customers to award large projects at Industrial
Solutions, the negative effects of the AST strike at Materials Services, and the temporary production bottlenecks
and very negative currency translation effects at Steel Americas. Contrary to our original expectations, the Group’s
tkVA was lower than a year earlier due to a high level of special items, mainly relating to restructurings, portfolio
measures and the winding up of a non-operating US company. This was partly offset by tax effects, so our
operating progress remains clearly visible in our net income. Against our expectations the Group’s sales on a
comparable basis did not grow by a single-digit percentage rate but were level with the prior year. This was due
mainly to declining material prices at Materials Services and lower raw material prices in the steel operations.
The fact that the Group’s earnings and cash flow targets were met or exceeded in a difficult climate and despite the
additional challenges described above is due not least to the efficiency measures under the “impact” program. The
“impact” target of €850 million that we formulated for 2014/2015 at the beginning of the reporting year was again
substantially exceeded with €1.1 billion. More information on the factors that influenced the development of
earnings is contained in the sections “Group review” and “Business area review”.
The following chart contains details on the forecasts, updated in each case on publication of the interim reports on
the 1st half and the first nine months of the reporting year, and the actual results in 2014/2015:
Forecast and actual results for fiscal year 2014/2015
Forecast in annual report
2013/2014
Update in interim report
1st half 2014/2015
Update in interim report
9 months 2014/2015
Actual fiscal year
2014/2015
Group sales 1) Growth on comparable
basis in single-digit % range Growth in mid-single-digit % range; on a
comparable basis at prior-year level
Growth nominal: + 4%
on comparable basis: (2)%
Components Technology
Growth on comparable basis in single-digit % range
Organic growth and positive exchange rate effects
nominal: + 9% on comparable basis: + 2%
Elevator Technology nominal: + 12%
on comparable basis: + 3%
Industrial Solutions At prior-year level nominal: 0%
on comparable basis: (2)%
Materials Services Decline due to price pressure caused by lower material prices at Materials Services
and lower raw material prices in our steel operations
nominal: + 4% on comparable basis: (3)%
Steel Europe 1) Weaker by comparison nominal: (1)%
on comparable basis: (2)%
Steel Americas Weaker by comparison
nominal: (14)% on comparable basis: (18)%
Adjusted EBIT 1), 2) At least €1.5 billion €1.6 to 1.7 billion €1,676 million
Components Technology 2) Slight improvement + €45 million
Elevator Technology 2)
Improvement through sales growth and increase in margin by
0.5 to 0.7 percentage points + €120 million
+ 0.5 percentage points
Industrial Solutions 2) Slight improvement At prior-year level + €4 million
Materials Services 2) Slight improvement At prior-year level €(6) million
Steel Europe 1), 2) Significant improvement + €271 million
Steel Americas 2)
At least a significant improvement towards
breakeven EBIT At prior-year level, subject to currency
translation effects €(70) million
Net income Significant improvement + €73 million
tkVA 1), 2) Significant improvement €(117) million
FCF before divestments 1)
Significant improvement with at
least breakeven FCF before
divestments
Significant progress despite continuing reluctance of customers to award
large projects; continue to target at least breakeven FCF before divestments
Improvement by €422 million to + €65 million
Capex 1) Around €1.5 billion max. €1.5 billion €1,235 million
1) Prior-year figures have been adjusted due to the adoption of IFRS 11 (cf. Note 01). 2) Prior-year figures have been adjusted due to the definition change from fiscal 2014/2015
(cf. section "Fundamental information about the Group", subsection "Management of the Group").
51 thyssenkrupp annual report 2014/2015 Combined management report // Report on the economic position // Group review
Group review
Course of business
Capital goods businesses drive sales growth thyssenkrupp performed well in a continuing challenging economic climate in fiscal year 2014/2015. The
main drivers for the growth in sales were once again the solid market positions and global reach of the
capital goods businesses with corresponding positive exchange rate effects.
Order intake from continuing operations came to €41.3 billion, level with the prior year. On a comparable
basis, i.e. excluding currency and portfolio effects, new orders declined by 5% compared with the prior year,
which profited from a major order at Industrial Solutions.
Of the three capital goods businesses, Components Technology and Elevator Technology significantly
exceeded their prior-year order intake. By contrast, new orders in the Industrial Solutions business area
declined. This was largely due to the above-mentioned major order for Marine Systems in the prior year; in
addition, customers were reluctant to place orders in view of volatile and falling oil and raw material prices.
Nevertheless we won numerous orders in the reporting period: Process Technologies for example profited
from strong demand for electrolysis plants. Besides larger cement plant contracts Resource Technologies
booked several orders for crusher-belt systems, System Engineering recorded keen demand for production
systems for the auto industry and Marine Systems won contracts for two submarines and corvettes. The
Components Technology and Elevator Technology business areas achieved double-digit growth rates in
order intake (11% and 13% respectively) – thanks in part to exchange rate effects. The growth in the
components business was mainly due to the ramp-up of new products and plants, growing demand for axle
module assembly, and clearly positive translation effects. However the momentum slowed in the 2nd half.
Demand in China for car and heavy truck components declined in the 4th quarter. By contrast, business with
wind energy components was pleasing in the reporting year, particularly in China, Brazil and India. Business
with construction equipment components remained weak. Order intake in the Elevator Technology business
area reached a new record level. As well as positive exchange rate effects this was due to higher demand for
new installations particularly in the USA, South Korea and the Middle East. Orders in hand in the elevator
business reached a near-record level of €4.9 billion. Together with the order backlog at Industrial Solutions
orders in hand came to a total of more than €17 billion – a solid basis for the profitable sales growth
targeted for our elevator and project businesses.
Order intake in the materials businesses was only slightly lower year-on-year, profiting from positive
exchange rate effects and net positive portfolio effects: The contributions of VDM and AST, which were
transferred from OTK and belonged to Materials Services from March 1, 2014, are both included until the
sale of VDM at the end of July 2015. On a comparable basis new orders were significantly down in all areas,
mainly due to lower material prices at Materials Services and lower raw material prices at our steel
operations. At Materials Services order intake increased year-on-year by 2%; on a comparable basis it
decreased by 5%. On the one hand, global direct-to-customer business increased particularly in the first two
fiscal quarters and the warehousing and service business in North America performed very well, partly due
to exchange rate effects. On the other hand, however, the warehouse business in Russia and our railway
equipment operations were discontinued and the service operations of the RIP group were sold. Order intake
at Steel Europe was down year-on-year, against continued high price pressure. Order volumes were 3%
lower year-on-year at 11.2 million tons. At Steel Americas order intake was well down from the prior year,
partly due to the sale of thyssenkrupp Steel USA and bottlenecks in production. From the 2nd quarter
growing price pressure also made itself felt. The steel market in Brazil was marked by a further decline in
consumption.
Order intake €41.3billion
52 thyssenkrupp annual report 2014/2015 Combined management report // Report on the economic position // Group review
Order intake by business area
million €
2013/2014 2014/2015 Change
in %
Change on a comparable
basis 1) in %
Components Technology 6,157 6,826 11 4
Elevator Technology 6,819 7,704 13 3
Industrial Solutions 5,732 4,871 (15) (16)
Materials Services 13,682 13,945 2 (5)
Steel Europe 2) 8,912 8,421 (6) (6)
Steel Americas 2,215 1,723 (22) (21)
Corporate 177 196 11 8
Consolidation (2,318) (2,368) — —
Order intake of the continuing operations 2) 41,376 41,318 0 (5)
Stainless Global 0 0 — —
Consolidation 0 0 — —
Order intake of the Group 2) 41,376 41,318 0 (5)
1) Excluding currency and portfolio effects 2) Prior-year figures have been adjusted due to the adoption of IFRS 11 (cf. Note 01).
At €42.8 billion, sales from continuing operations were level or higher year-on-year in almost all business
areas, partly due to exchange rate effects. Elevator Technology achieved a new record level here too. The
only exceptions were the steel businesses: At Steel Europe the slight decline in sales was due to lower net
selling prices, while at Steel Americas the disposal of thyssenkrupp Steel USA made itself felt. On a
comparable basis sales from continuing operations were slightly lower year-on-year, mainly due to a decline
in materials business, particularly as a result of lower material prices at Materials Services and lower raw
material prices at our steel operations. The organic growth in the components and elevator businesses had
a clear stabilizing effect.
Order intake and sales of the full Group were the same as those from continuing operations: As in the prior
year the discontinued operations recorded only expenses and income and contributed neither to order intake
nor to sales.
Net sales by business area
million € 2013/2014 2014/2015 Change
in %
Change on a comparable
basis 1) in %
Components Technology 6,172 6,753 9 2
Elevator Technology 6,416 7,208 12 3
Industrial Solutions 6,271 6,256 0 (2)
Materials Services 13,660 14,254 4 (3)
Steel Europe 2) 8,819 8,697 (1) (2)
Steel Americas 2,060 1,773 (14) (18)
Corporate 177 194 10 7
Consolidation (2,363) (2,357) — — Net sales of the continuing operations 2) 41,212 42,778 4 (2)
Stainless Global 0 0 — —
Consolidation 0 0 — — Net sales of the Group 2) 41,212 42,778 4 (2)
1) Excluding currency and portfolio effects 2) Prior-year figures have been adjusted due to the adoption of IFRS 11 (cf. Note 01).
Germany remained the most important sales market for thyssenkrupp in 2014/2015, although its share of
sales declined further. Sales to customers in North and Central America, Asia/Pacific and Africa gained in
importance. Sales in North America, mainly the USA, and Asia, mainly China, increased in almost all
business areas – in part due to positive exchange rate effects. The increase in Africa is mainly due to higher
sales in the Industrial Solutions business.
Sales € 42.8 billion
53 thyssenkrupp annual report 2014/2015 Combined management report // Report on the economic position // Group review
Sales by region 1)
million € 2013/2014 2014/2015 Change
in %
Germany 12,109 11,611 (4)
Europe (excl. Germany) 11,341 11,606 2
North and Central America 9,041 9,939 10
South America 1,997 1,687 (16)
Asia/Pacific 5,694 6,281 10
Africa 1,030 1,654 61 Worldwide 41,212 42,778 4
1) Prior-year figures have been adjusted due to the adoption of IFRS 11 (cf. Note 01).
With 23% of sales, the automotive industry remained thyssenkrupp’s most important customer group and is
particularly important for our components and steel businesses. It is followed by steel and related
processing and trading, accounting for large shares of overall Group sales and of sales of our materials
businesses. The construction industry accounts for 10% of Group sales and around half the sales of our
elevator business.
Further increase in adjusted EBIT thanks to “impact” In a challenging and highly competitive environment we significantly increased adjusted EBIT from
continuing operations. This primarily reflects our extensive efficiency measures. The “impact” target for
2014/2015 of €850 million formulated at the beginning of the reporting year was again substantially
exceeded with €1.1 billion of savings.
All the capital goods businesses increased their adjusted EBIT and adjusted EBIT margin. Components
Technology continued to profit from the efficiency and restructuring measures, improving its adjusted EBIT
by 17% and margin by 0.3 percentage points. At Elevator Technology the earnings improvement reflected
both a pleasing operating performance and the effects of “impact” efficiency and restructuring measures;
adjusted EBIT increased in the reporting year by 18%, margin by 0.5 percentage points. In the
4th quarter 2014/2015 adjusted EBIT and adjusted EBIT margin were higher year-on-year for the twelfth
time in succession. At Industrial Solutions adjusted EBIT in fiscal year 2014/2015 was a little higher year-
on-year thanks to slightly improved margins.
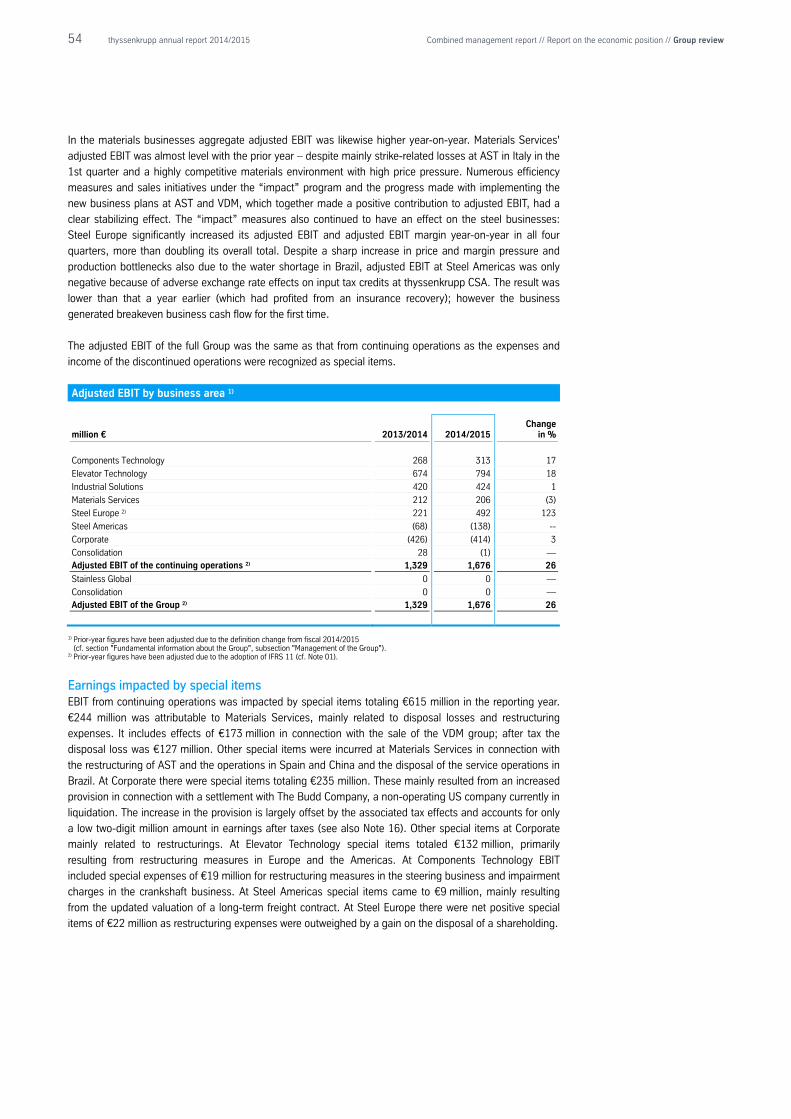
54 thyssenkrupp annual report 2014/2015 Combined management report // Report on the economic position // Group review
In the materials businesses aggregate adjusted EBIT was likewise higher year-on-year. Materials Services'
adjusted EBIT was almost level with the prior year – despite mainly strike-related losses at AST in Italy in the
1st quarter and a highly competitive materials environment with high price pressure. Numerous efficiency
measures and sales initiatives under the “impact” program and the progress made with implementing the
new business plans at AST and VDM, which together made a positive contribution to adjusted EBIT, had a
clear stabilizing effect. The “impact” measures also continued to have an effect on the steel businesses:
Steel Europe significantly increased its adjusted EBIT and adjusted EBIT margin year-on-year in all four
quarters, more than doubling its overall total. Despite a sharp increase in price and margin pressure and
production bottlenecks also due to the water shortage in Brazil, adjusted EBIT at Steel Americas was only
negative because of adverse exchange rate effects on input tax credits at thyssenkrupp CSA. The result was
lower than that a year earlier (which had profited from an insurance recovery); however the business
generated breakeven business cash flow for the first time.
The adjusted EBIT of the full Group was the same as that from continuing operations as the expenses and
income of the discontinued operations were recognized as special items.
Adjusted EBIT by business area 1)
million € 2013/2014 2014/2015 Change
in %
Components Technology 268 313 17
Elevator Technology 674 794 18
Industrial Solutions 420 424 1
Materials Services 212 206 (3)
Steel Europe 2) 221 492 123
Steel Americas (68) (138) --
Corporate (426) (414) 3
Consolidation 28 (1) — Adjusted EBIT of the continuing operations 2) 1,329 1,676 26
Stainless Global 0 0 —
Consolidation 0 0 — Adjusted EBIT of the Group 2) 1,329 1,676 26
1) Prior-year figures have been adjusted due to the definition change from fiscal 2014/2015 (cf. section "Fundamental information about the Group", subsection "Management of the Group").
2) Prior-year figures have been adjusted due to the adoption of IFRS 11 (cf. Note 01).
Earnings impacted by special items EBIT from continuing operations was impacted by special items totaling €615 million in the reporting year.
€244 million was attributable to Materials Services, mainly related to disposal losses and restructuring
expenses. It includes effects of €173 million in connection with the sale of the VDM group; after tax the
disposal loss was €127 million. Other special items were incurred at Materials Services in connection with
the restructuring of AST and the operations in Spain and China and the disposal of the service operations in
Brazil. At Corporate there were special items totaling €235 million. These mainly resulted from an increased
provision in connection with a settlement with The Budd Company, a non-operating US company currently in
liquidation. The increase in the provision is largely offset by the associated tax effects and accounts for only
a low two-digit million amount in earnings after taxes (see also Note 16). Other special items at Corporate
mainly related to restructurings. At Elevator Technology special items totaled €132 million, primarily
resulting from restructuring measures in Europe and the Americas. At Components Technology EBIT
included special expenses of €19 million for restructuring measures in the steering business and impairment
charges in the crankshaft business. At Steel Americas special items came to €9 million, mainly resulting
from the updated valuation of a long-term freight contract. At Steel Europe there were net positive special
items of €22 million as restructuring expenses were outweighed by a gain on the disposal of a shareholding.
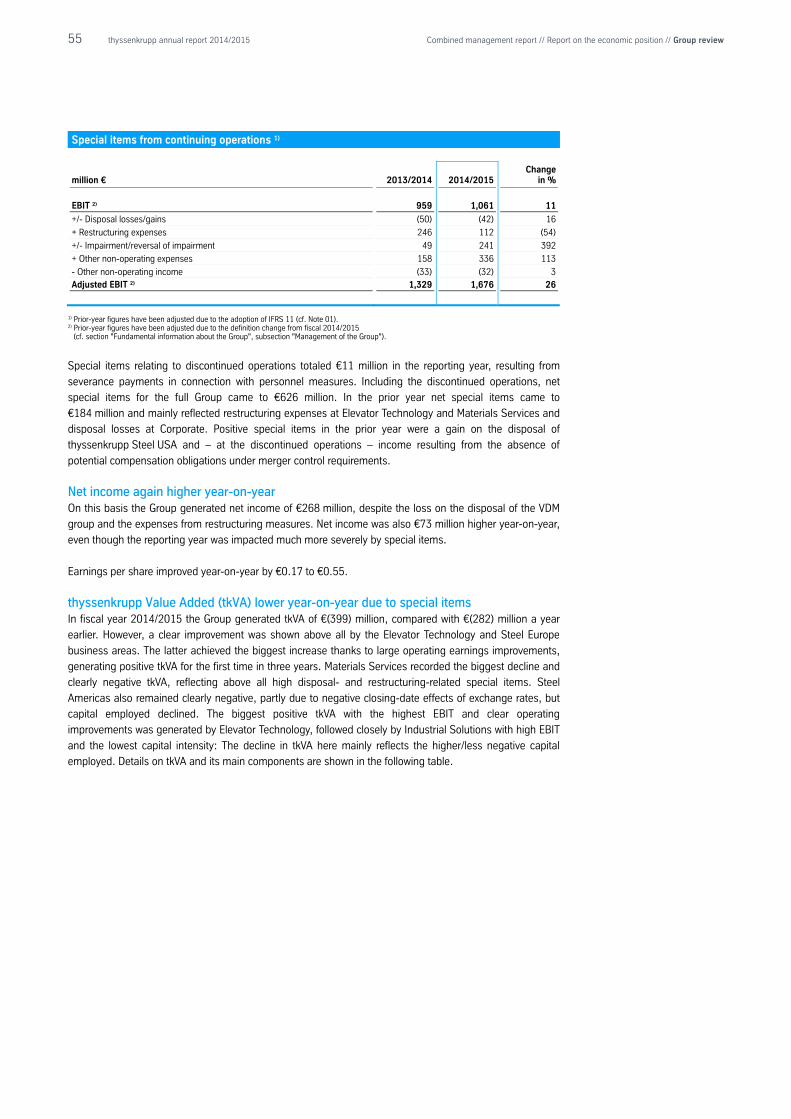
55 thyssenkrupp annual report 2014/2015 Combined management report // Report on the economic position // Group review
Special items from continuing operations 1)
million € 2013/2014 2014/2015 Change
in %
EBIT 2) 959 1,061 11
+/- Disposal losses/gains (50) (42) 16
+ Restructuring expenses 246 112 (54)
+/- Impairment/reversal of impairment 49 241 392
+ Other non-operating expenses 158 336 113
- Other non-operating income (33) (32) 3 Adjusted EBIT 2) 1,329 1,676 26
1) Prior-year figures have been adjusted due to the adoption of IFRS 11 (cf. Note 01). 2) Prior-year figures have been adjusted due to the definition change from fiscal 2014/2015
(cf. section "Fundamental information about the Group", subsection "Management of the Group").
Special items relating to discontinued operations totaled €11 million in the reporting year, resulting from
severance payments in connection with personnel measures. Including the discontinued operations, net
special items for the full Group came to €626 million. In the prior year net special items came to
€184 million and mainly reflected restructuring expenses at Elevator Technology and Materials Services and
disposal losses at Corporate. Positive special items in the prior year were a gain on the disposal of
thyssenkrupp Steel USA and – at the discontinued operations – income resulting from the absence of
potential compensation obligations under merger control requirements.
Net income again higher year-on-year On this basis the Group generated net income of €268 million, despite the loss on the disposal of the VDM
group and the expenses from restructuring measures. Net income was also €73 million higher year-on-year,
even though the reporting year was impacted much more severely by special items.
Earnings per share improved year-on-year by €0.17 to €0.55.
thyssenkrupp Value Added (tkVA) lower year-on-year due to special items In fiscal year 2014/2015 the Group generated tkVA of €(399) million, compared with €(282) million a year
earlier. However, a clear improvement was shown above all by the Elevator Technology and Steel Europe
business areas. The latter achieved the biggest increase thanks to large operating earnings improvements,
generating positive tkVA for the first time in three years. Materials Services recorded the biggest decline and
clearly negative tkVA, reflecting above all high disposal- and restructuring-related special items. Steel
Americas also remained clearly negative, partly due to negative closing-date effects of exchange rates, but
capital employed declined. The biggest positive tkVA with the highest EBIT and clear operating
improvements was generated by Elevator Technology, followed closely by Industrial Solutions with high EBIT
and the lowest capital intensity: The decline in tkVA here mainly reflects the higher/less negative capital
employed. Details on tkVA and its main components are shown in the following table.
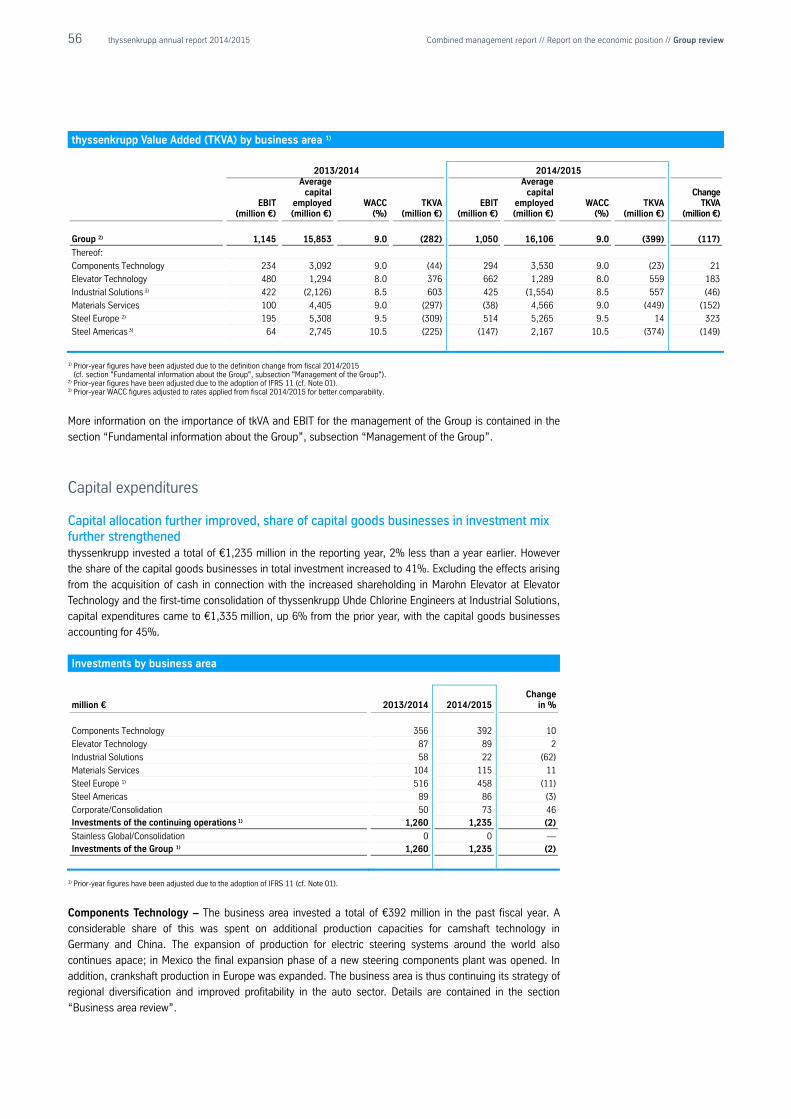
56 thyssenkrupp annual report 2014/2015 Combined management report // Report on the economic position // Group review
thyssenkrupp Value Added (TKVA) by business area 1)
2013/2014 2014/2015
EBIT
(million €)
Average capital
employed (million €)
WACC (%)
TKVA
(million €) EBIT
(million €)
Average capital
employed (million €)
WACC (%)
TKVA
(million €)
Change TKVA
(million €)
Group 2) 1,145 15,853 9.0 (282) 1,050 16,106 9.0 (399) (117)
Thereof:
Components Technology 234 3,092 9.0 (44) 294 3,530 9.0 (23) 21
Elevator Technology 480 1,294 8.0 376 662 1,289 8.0 559 183
Industrial Solutions 3) 422 (2,126) 8.5 603 425 (1,554) 8.5 557 (46)
Materials Services 100 4,405 9.0 (297) (38) 4,566 9.0 (449) (152)
Steel Europe 2) 195 5,308 9.5 (309) 514 5,265 9.5 14 323
Steel Americas 3) 64 2,745 10.5 (225) (147) 2,167 10.5 (374) (149)
1) Prior-year figures have been adjusted due to the definition change from fiscal 2014/2015
(cf. section "Fundamental information about the Group", subsection "Management of the Group"). 2) Prior-year figures have been adjusted due to the adoption of IFRS 11 (cf. Note 01). 3) Prior-year WACC figures adjusted to rates applied from fiscal 2014/2015 for better comparability.
More information on the importance of tkVA and EBIT for the management of the Group is contained in the
section “Fundamental information about the Group”, subsection “Management of the Group”.
Capital expenditures
Capital allocation further improved, share of capital goods businesses in investment mix further strengthened thyssenkrupp invested a total of €1,235 million in the reporting year, 2% less than a year earlier. However
the share of the capital goods businesses in total investment increased to 41%. Excluding the effects arising
from the acquisition of cash in connection with the increased shareholding in Marohn Elevator at Elevator
Technology and the first-time consolidation of thyssenkrupp Uhde Chlorine Engineers at Industrial Solutions,
capital expenditures came to €1,335 million, up 6% from the prior year, with the capital goods businesses
accounting for 45%.
Investments by business area
million € 2013/2014 2014/2015 Change
in %
Components Technology 356 392 10
Elevator Technology 87 89 2
Industrial Solutions 58 22 (62)
Materials Services 104 115 11
Steel Europe 1) 516 458 (11)
Steel Americas 89 86 (3)
Corporate/Consolidation 50 73 46 Investments of the continuing operations 1) 1,260 1,235 (2)
Stainless Global/Consolidation 0 0 — Investments of the Group 1) 1,260 1,235 (2)
1) Prior-year figures have been adjusted due to the adoption of IFRS 11 (cf. Note 01).
Components Technology – The business area invested a total of €392 million in the past fiscal year. A
considerable share of this was spent on additional production capacities for camshaft technology in
Germany and China. The expansion of production for electric steering systems around the world also
continues apace; in Mexico the final expansion phase of a new steering components plant was opened. In
addition, crankshaft production in Europe was expanded. The business area is thus continuing its strategy of
regional diversification and improved profitability in the auto sector. Details are contained in the section
“Business area review”.
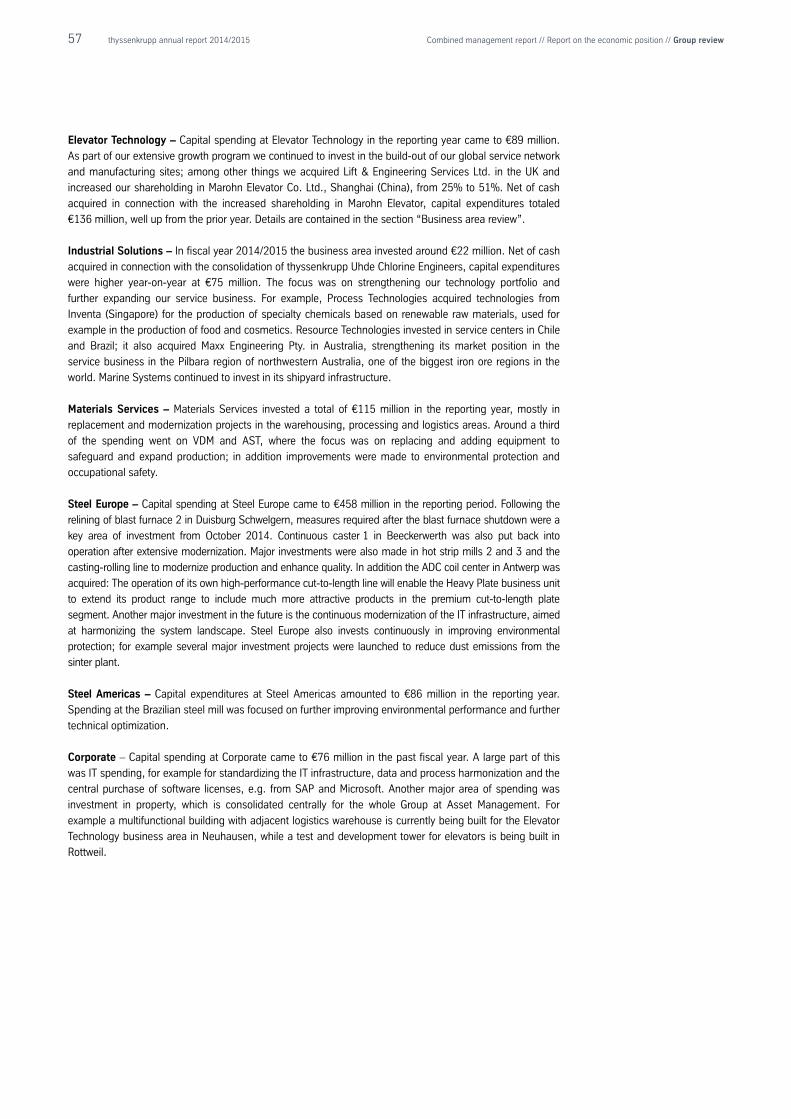
57 thyssenkrupp annual report 2014/2015 Combined management report // Report on the economic position // Group review
Elevator Technology – Capital spending at Elevator Technology in the reporting year came to €89 million.
As part of our extensive growth program we continued to invest in the build-out of our global service network
and manufacturing sites; among other things we acquired Lift & Engineering Services Ltd. in the UK and
increased our shareholding in Marohn Elevator Co. Ltd., Shanghai (China), from 25% to 51%. Net of cash
acquired in connection with the increased shareholding in Marohn Elevator, capital expenditures totaled
€136 million, well up from the prior year. Details are contained in the section “Business area review”.
Industrial Solutions – In fiscal year 2014/2015 the business area invested around €22 million. Net of cash
acquired in connection with the consolidation of thyssenkrupp Uhde Chlorine Engineers, capital expenditures
were higher year-on-year at €75 million. The focus was on strengthening our technology portfolio and
further expanding our service business. For example, Process Technologies acquired technologies from
Inventa (Singapore) for the production of specialty chemicals based on renewable raw materials, used for
example in the production of food and cosmetics. Resource Technologies invested in service centers in Chile
and Brazil; it also acquired Maxx Engineering Pty. in Australia, strengthening its market position in the
service business in the Pilbara region of northwestern Australia, one of the biggest iron ore regions in the
world. Marine Systems continued to invest in its shipyard infrastructure.
Materials Services – Materials Services invested a total of €115 million in the reporting year, mostly in
replacement and modernization projects in the warehousing, processing and logistics areas. Around a third
of the spending went on VDM and AST, where the focus was on replacing and adding equipment to
safeguard and expand production; in addition improvements were made to environmental protection and
occupational safety.
Steel Europe – Capital spending at Steel Europe came to €458 million in the reporting period. Following the
relining of blast furnace 2 in Duisburg Schwelgern, measures required after the blast furnace shutdown were a
key area of investment from October 2014. Continuous caster 1 in Beeckerwerth was also put back into
operation after extensive modernization. Major investments were also made in hot strip mills 2 and 3 and the
casting-rolling line to modernize production and enhance quality. In addition the ADC coil center in Antwerp was
acquired: The operation of its own high-performance cut-to-length line will enable the Heavy Plate business unit
to extend its product range to include much more attractive products in the premium cut-to-length plate
segment. Another major investment in the future is the continuous modernization of the IT infrastructure, aimed
at harmonizing the system landscape. Steel Europe also invests continuously in improving environmental
protection; for example several major investment projects were launched to reduce dust emissions from the
sinter plant.
Steel Americas – Capital expenditures at Steel Americas amounted to €86 million in the reporting year.
Spending at the Brazilian steel mill was focused on further improving environmental performance and further
technical optimization.
Corporate – Capital spending at Corporate came to €76 million in the past fiscal year. A large part of this
was IT spending, for example for standardizing the IT infrastructure, data and process harmonization and the
central purchase of software licenses, e.g. from SAP and Microsoft. Another major area of spending was
investment in property, which is consolidated centrally for the whole Group at Asset Management. For
example a multifunctional building with adjacent logistics warehouse is currently being built for the Elevator
Technology business area in Neuhausen, while a test and development tower for elevators is being built in
Rottweil.
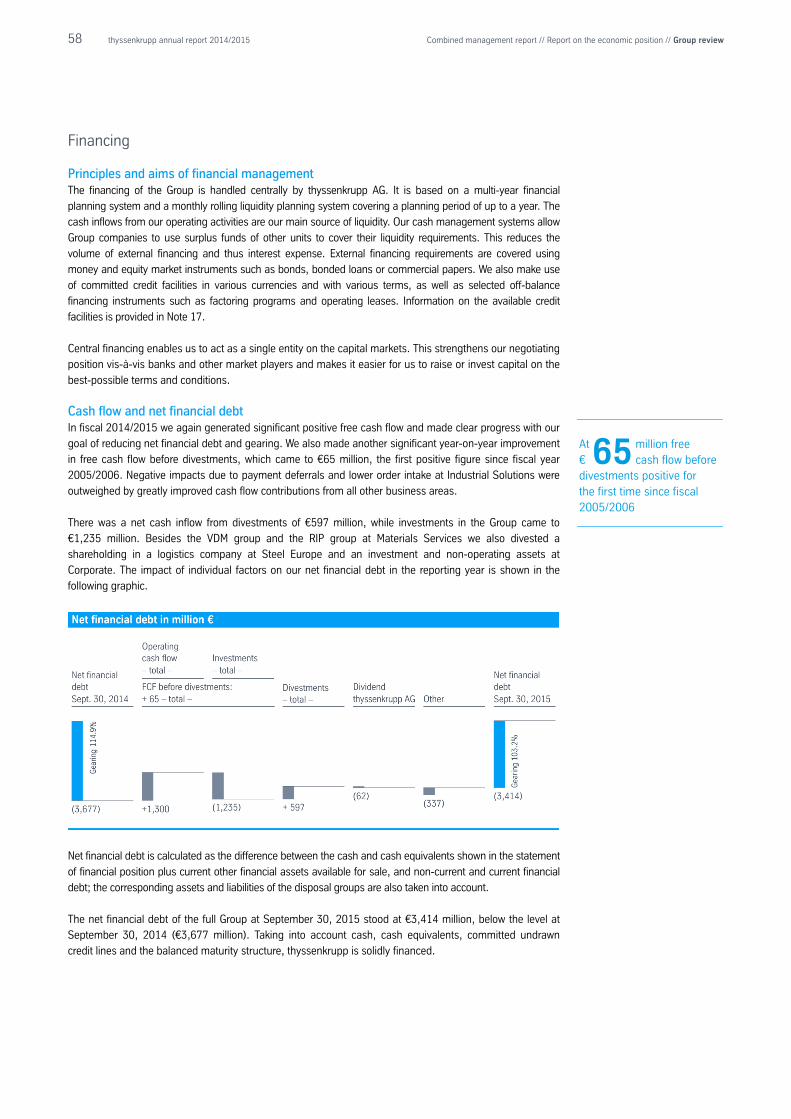
58 thyssenkrupp annual report 2014/2015 Combined management report // Report on the economic position // Group review
Financing
Principles and aims of financial management The financing of the Group is handled centrally by thyssenkrupp AG. It is based on a multi-year financial
planning system and a monthly rolling liquidity planning system covering a planning period of up to a year. The
cash inflows from our operating activities are our main source of liquidity. Our cash management systems allow
Group companies to use surplus funds of other units to cover their liquidity requirements. This reduces the
volume of external financing and thus interest expense. External financing requirements are covered using
money and equity market instruments such as bonds, bonded loans or commercial papers. We also make use
of committed credit facilities in various currencies and with various terms, as well as selected off-balance
financing instruments such as factoring programs and operating leases. Information on the available credit
facilities is provided in Note 17.
Central financing enables us to act as a single entity on the capital markets. This strengthens our negotiating
position vis-à-vis banks and other market players and makes it easier for us to raise or invest capital on the
best-possible terms and conditions.
Cash flow and net financial debt In fiscal 2014/2015 we again generated significant positive free cash flow and made clear progress with our
goal of reducing net financial debt and gearing. We also made another significant year-on-year improvement
in free cash flow before divestments, which came to €65 million, the first positive figure since fiscal year
2005/2006. Negative impacts due to payment deferrals and lower order intake at Industrial Solutions were
outweighed by greatly improved cash flow contributions from all other business areas.
There was a net cash inflow from divestments of €597 million, while investments in the Group came to
€1,235 million. Besides the VDM group and the RIP group at Materials Services we also divested a
shareholding in a logistics company at Steel Europe and an investment and non-operating assets at
Corporate. The impact of individual factors on our net financial debt in the reporting year is shown in the
following graphic.
Net financial debt is calculated as the difference between the cash and cash equivalents shown in the statement
of financial position plus current other financial assets available for sale, and non-current and current financial
debt; the corresponding assets and liabilities of the disposal groups are also taken into account.
The net financial debt of the full Group at September 30, 2015 stood at €3,414 million, below the level at
September 30, 2014 (€3,677 million). Taking into account cash, cash equivalents, committed undrawn
credit lines and the balanced maturity structure, thyssenkrupp is solidly financed.
At million free € 65 cash flow before divestments positive for the first time since fiscal 2005/2006
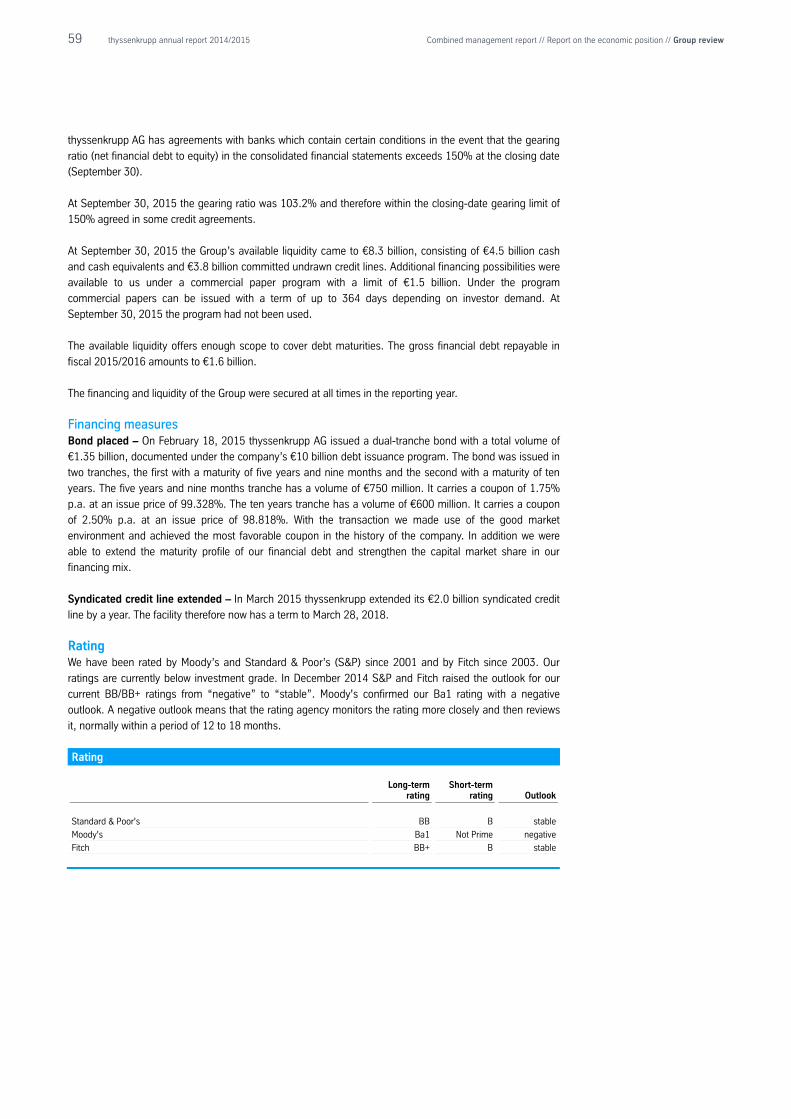
59 thyssenkrupp annual report 2014/2015 Combined management report // Report on the economic position // Group review
thyssenkrupp AG has agreements with banks which contain certain conditions in the event that the gearing
ratio (net financial debt to equity) in the consolidated financial statements exceeds 150% at the closing date
(September 30).
At September 30, 2015 the gearing ratio was 103.2% and therefore within the closing-date gearing limit of
150% agreed in some credit agreements.
At September 30, 2015 the Group’s available liquidity came to €8.3 billion, consisting of €4.5 billion cash
and cash equivalents and €3.8 billion committed undrawn credit lines. Additional financing possibilities were
available to us under a commercial paper program with a limit of €1.5 billion. Under the program
commercial papers can be issued with a term of up to 364 days depending on investor demand. At
September 30, 2015 the program had not been used.
The available liquidity offers enough scope to cover debt maturities. The gross financial debt repayable in
fiscal 2015/2016 amounts to €1.6 billion.
The financing and liquidity of the Group were secured at all times in the reporting year.
Financing measures Bond placed – On February 18, 2015 thyssenkrupp AG issued a dual-tranche bond with a total volume of
€1.35 billion, documented under the company’s €10 billion debt issuance program. The bond was issued in
two tranches, the first with a maturity of five years and nine months and the second with a maturity of ten
years. The five years and nine months tranche has a volume of €750 million. It carries a coupon of 1.75%
p.a. at an issue price of 99.328%. The ten years tranche has a volume of €600 million. It carries a coupon
of 2.50% p.a. at an issue price of 98.818%. With the transaction we made use of the good market
environment and achieved the most favorable coupon in the history of the company. In addition we were
able to extend the maturity profile of our financial debt and strengthen the capital market share in our
financing mix.
Syndicated credit line extended – In March 2015 thyssenkrupp extended its €2.0 billion syndicated credit
line by a year. The facility therefore now has a term to March 28, 2018.
Rating We have been rated by Moody’s and Standard & Poor’s (S&P) since 2001 and by Fitch since 2003. Our
ratings are currently below investment grade. In December 2014 S&P and Fitch raised the outlook for our
current BB/BB+ ratings from “negative” to “stable”. Moody's confirmed our Ba1 rating with a negative
outlook. A negative outlook means that the rating agency monitors the rating more closely and then reviews
it, normally within a period of 12 to 18 months.
Rating
Long-term
rating Short-term
rating Outlook
Standard & Poor's BB B stable
Moody's Ba1 Not Prime negative
Fitch BB+ B stable
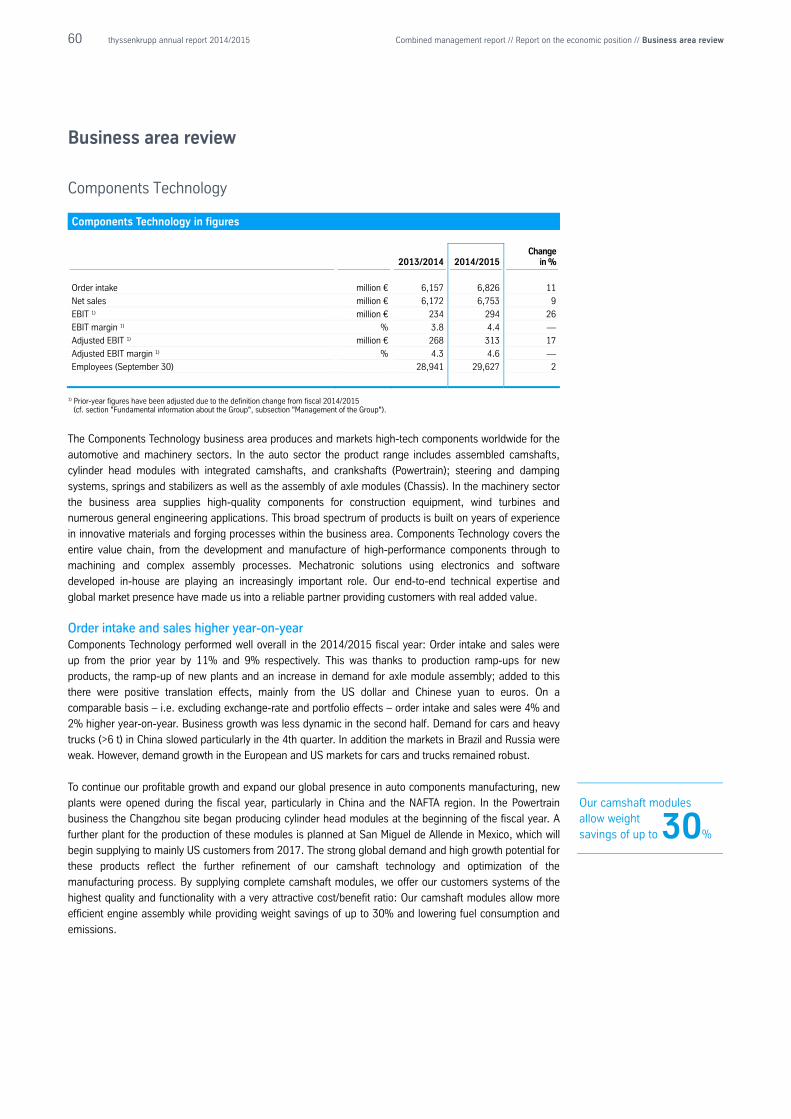
60 thyssenkrupp annual report 2014/2015 Combined management report // Report on the economic position // Business area review
Business area review
Components Technology
Components Technology in figures
2013/2014
2014/2015 Change
in %
Order intake million € 6,157 6,826 11
Net sales million € 6,172 6,753 9
EBIT 1) million € 234 294 26
EBIT margin 1) % 3.8 4.4 —
Adjusted EBIT 1) million € 268 313 17
Adjusted EBIT margin 1) % 4.3 4.6 —
Employees (September 30) 28,941 29,627 2
1) Prior-year figures have been adjusted due to the definition change from fiscal 2014/2015
(cf. section "Fundamental information about the Group", subsection "Management of the Group").
The Components Technology business area produces and markets high-tech components worldwide for the
automotive and machinery sectors. In the auto sector the product range includes assembled camshafts,
cylinder head modules with integrated camshafts, and crankshafts (Powertrain); steering and damping
systems, springs and stabilizers as well as the assembly of axle modules (Chassis). In the machinery sector
the business area supplies high-quality components for construction equipment, wind turbines and
numerous general engineering applications. This broad spectrum of products is built on years of experience
in innovative materials and forging processes within the business area. Components Technology covers the
entire value chain, from the development and manufacture of high-performance components through to
machining and complex assembly processes. Mechatronic solutions using electronics and software
developed in-house are playing an increasingly important role. Our end-to-end technical expertise and
global market presence have made us into a reliable partner providing customers with real added value.
Order intake and sales higher year-on-year Components Technology performed well overall in the 2014/2015 fiscal year: Order intake and sales were
up from the prior year by 11% and 9% respectively. This was thanks to production ramp-ups for new
products, the ramp-up of new plants and an increase in demand for axle module assembly; added to this
there were positive translation effects, mainly from the US dollar and Chinese yuan to euros. On a
comparable basis – i.e. excluding exchange-rate and portfolio effects – order intake and sales were 4% and
2% higher year-on-year. Business growth was less dynamic in the second half. Demand for cars and heavy
trucks (>6 t) in China slowed particularly in the 4th quarter. In addition the markets in Brazil and Russia were
weak. However, demand growth in the European and US markets for cars and trucks remained robust.
To continue our profitable growth and expand our global presence in auto components manufacturing, new
plants were opened during the fiscal year, particularly in China and the NAFTA region. In the Powertrain
business the Changzhou site began producing cylinder head modules at the beginning of the fiscal year. A
further plant for the production of these modules is planned at San Miguel de Allende in Mexico, which will
begin supplying to mainly US customers from 2017. The strong global demand and high growth potential for
these products reflect the further refinement of our camshaft technology and optimization of the
manufacturing process. By supplying complete camshaft modules, we offer our customers systems of the
highest quality and functionality with a very attractive cost/benefit ratio: Our camshaft modules allow more
efficient engine assembly while providing weight savings of up to 30% and lowering fuel consumption and
emissions.
Our camshaft modules allow weight savings of up to 30%
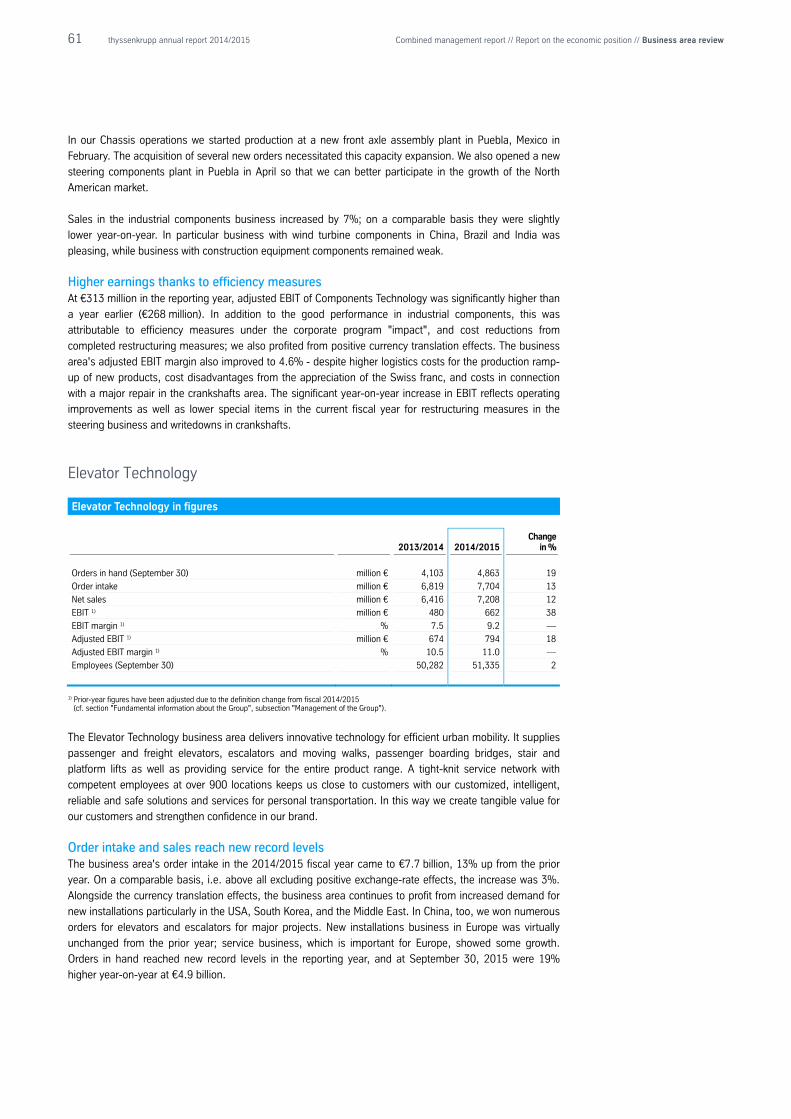
61 thyssenkrupp annual report 2014/2015 Combined management report // Report on the economic position // Business area review
In our Chassis operations we started production at a new front axle assembly plant in Puebla, Mexico in
February. The acquisition of several new orders necessitated this capacity expansion. We also opened a new
steering components plant in Puebla in April so that we can better participate in the growth of the North
American market.
Sales in the industrial components business increased by 7%; on a comparable basis they were slightly
lower year-on-year. In particular business with wind turbine components in China, Brazil and India was
pleasing, while business with construction equipment components remained weak.
Higher earnings thanks to efficiency measures At €313 million in the reporting year, adjusted EBIT of Components Technology was significantly higher than
a year earlier (€268 million). In addition to the good performance in industrial components, this was
attributable to efficiency measures under the corporate program "impact", and cost reductions from
completed restructuring measures; we also profited from positive currency translation effects. The business
area's adjusted EBIT margin also improved to 4.6% - despite higher logistics costs for the production ramp-
up of new products, cost disadvantages from the appreciation of the Swiss franc, and costs in connection
with a major repair in the crankshafts area. The significant year-on-year increase in EBIT reflects operating
improvements as well as lower special items in the current fiscal year for restructuring measures in the
steering business and writedowns in crankshafts.
Elevator Technology
Elevator Technology in figures
2013/2014
2014/2015 Change
in %
Orders in hand (September 30) million € 4,103 4,863 19
Order intake million € 6,819 7,704 13
Net sales million € 6,416 7,208 12
EBIT 1) million € 480 662 38
EBIT margin 1) % 7.5 9.2 —
Adjusted EBIT 1) million € 674 794 18
Adjusted EBIT margin 1) % 10.5 11.0 —
Employees (September 30) 50,282 51,335 2
1) Prior-year figures have been adjusted due to the definition change from fiscal 2014/2015
(cf. section "Fundamental information about the Group", subsection "Management of the Group").
The Elevator Technology business area delivers innovative technology for efficient urban mobility. It supplies
passenger and freight elevators, escalators and moving walks, passenger boarding bridges, stair and
platform lifts as well as providing service for the entire product range. A tight-knit service network with
competent employees at over 900 locations keeps us close to customers with our customized, intelligent,
reliable and safe solutions and services for personal transportation. In this way we create tangible value for
our customers and strengthen confidence in our brand.
Order intake and sales reach new record levels The business area's order intake in the 2014/2015 fiscal year came to €7.7 billion, 13% up from the prior
year. On a comparable basis, i.e. above all excluding positive exchange-rate effects, the increase was 3%.
Alongside the currency translation effects, the business area continues to profit from increased demand for
new installations particularly in the USA, South Korea, and the Middle East. In China, too, we won numerous
orders for elevators and escalators for major projects. New installations business in Europe was virtually
unchanged from the prior year; service business, which is important for Europe, showed some growth.
Orders in hand reached new record levels in the reporting year, and at September 30, 2015 were 19%
higher year-on-year at €4.9 billion.
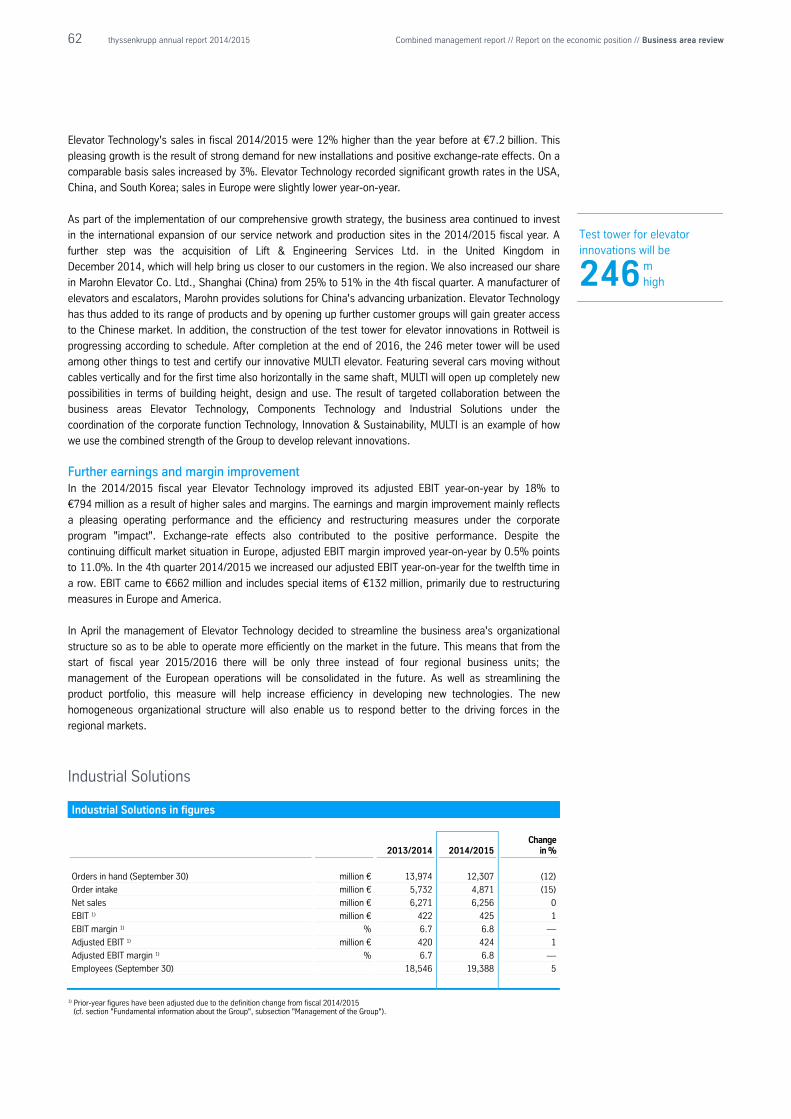
62 thyssenkrupp annual report 2014/2015 Combined management report // Report on the economic position // Business area review
Elevator Technology's sales in fiscal 2014/2015 were 12% higher than the year before at €7.2 billion. This
pleasing growth is the result of strong demand for new installations and positive exchange-rate effects. On a
comparable basis sales increased by 3%. Elevator Technology recorded significant growth rates in the USA,
China, and South Korea; sales in Europe were slightly lower year-on-year.
As part of the implementation of our comprehensive growth strategy, the business area continued to invest
in the international expansion of our service network and production sites in the 2014/2015 fiscal year. A
further step was the acquisition of Lift & Engineering Services Ltd. in the United Kingdom in
December 2014, which will help bring us closer to our customers in the region. We also increased our share
in Marohn Elevator Co. Ltd., Shanghai (China) from 25% to 51% in the 4th fiscal quarter. A manufacturer of
elevators and escalators, Marohn provides solutions for China's advancing urbanization. Elevator Technology
has thus added to its range of products and by opening up further customer groups will gain greater access
to the Chinese market. In addition, the construction of the test tower for elevator innovations in Rottweil is
progressing according to schedule. After completion at the end of 2016, the 246 meter tower will be used
among other things to test and certify our innovative MULTI elevator. Featuring several cars moving without
cables vertically and for the first time also horizontally in the same shaft, MULTI will open up completely new
possibilities in terms of building height, design and use. The result of targeted collaboration between the
business areas Elevator Technology, Components Technology and Industrial Solutions under the
coordination of the corporate function Technology, Innovation & Sustainability, MULTI is an example of how
we use the combined strength of the Group to develop relevant innovations.
Further earnings and margin improvement In the 2014/2015 fiscal year Elevator Technology improved its adjusted EBIT year-on-year by 18% to
€794 million as a result of higher sales and margins. The earnings and margin improvement mainly reflects
a pleasing operating performance and the efficiency and restructuring measures under the corporate
program "impact". Exchange-rate effects also contributed to the positive performance. Despite the
continuing difficult market situation in Europe, adjusted EBIT margin improved year-on-year by 0.5% points
to 11.0%. In the 4th quarter 2014/2015 we increased our adjusted EBIT year-on-year for the twelfth time in
a row. EBIT came to €662 million and includes special items of €132 million, primarily due to restructuring
measures in Europe and America.
In April the management of Elevator Technology decided to streamline the business area's organizational
structure so as to be able to operate more efficiently on the market in the future. This means that from the
start of fiscal year 2015/2016 there will be only three instead of four regional business units; the
management of the European operations will be consolidated in the future. As well as streamlining the
product portfolio, this measure will help increase efficiency in developing new technologies. The new
homogeneous organizational structure will also enable us to respond better to the driving forces in the
regional markets.
Industrial Solutions
Industrial Solutions in figures
2013/2014 2014/2015 Change
in %
Orders in hand (September 30) million € 13,974 12,307 (12)
Order intake million € 5,732 4,871 (15)
Net sales million € 6,271 6,256 0
EBIT 1) million € 422 425 1
EBIT margin 1) % 6.7 6.8 —
Adjusted EBIT 1) million € 420 424 1
Adjusted EBIT margin 1) % 6.7 6.8 —
Employees (September 30) 18,546 19,388 5
1) Prior-year figures have been adjusted due to the definition change from fiscal 2014/2015
(cf. section "Fundamental information about the Group", subsection "Management of the Group").
Test tower for elevator innovations will be m 246 high
63 thyssenkrupp annual report 2014/2015 Combined management report // Report on the economic position // Business area review
The Industrial Solutions business area comprises four business units with a broad spectrum of capabilities in
project business: Process Technologies builds chemical plants and refineries; Resource Technologies
provides innovative solutions for the mining and processing of raw materials and builds equipment for the
mining and cement industries; System Engineering supplies production systems for the automotive industry;
Marine Systems stands for naval shipbuilding.
As part of the Group's Strategic Way Forward, integration and regionalization have created the conditions to
achieve our growth targets and increase efficiency. As a global, integrated engineering and construction
company with strong technological expertise, Industrial Solutions focuses market strategy, collaborates
closely with customers in the regions, and promotes the growth of service business. At the same time we
support the global exchange of knowledge and engineering and project management capabilities across all
our business activities. Leading-edge technologies and secure and reliable project execution form the
foundation for our sustainable engineering solutions.
Order intake down, sales stable As expected, order intake at Industrial Solutions in the 2014/2015 fiscal year at €4.9 billion was lower than a
year earlier, when we profited strongly from major orders at Marine Systems and Resource Technologies.
Against a background of volatile and declining oil and raw material prices, customers were reluctant to place
new orders.
Process Technologies was unable to match its prior-year order intake. However, the project pipeline remains
stable. With gas prices in the USA and Canada generally expected to remain attractive, we see further
opportunities for follow-up orders for fertilizer plants. We also see future growth potential in the Middle East
& Africa region, from which we could benefit thanks to our advanced technologies and closeness to
customers. Under an innovation program we succeeded in significantly increasing the energy efficiency of
our ammonia plants, which will further strengthen our competitive edge. On the back of rising demand for
electrolysis plants, we won orders from France, Cuba and China in the reporting year. In the 3rd fiscal
quarter we completed the establishment of a joint venture with Industrie De Nora, Italy. Combining their
activities in the engineering, procurement and construction of electrolysis plants will enable both partners to
expand their technological platforms, move closer to customers and increase their global presence. We also
entered into a strategic partnership with McPhy Energy in electrochemical hydrogen generation. With this
alliance we further strengthened our position in the growing market for the storage of renewable energies.
Despite a strong 4th quarter, Resource Technologies recorded a decline in orders, which profited in the prior
year from a major order for a cement line in Algeria. In the reporting year we won major cement plant orders
in Canada and Colombia as well as orders for crusher/belt systems from customers in Russia, Peru and
Kazakhstan. As well as our wide offering of engineering, procurement and construction services for turnkey
cement lines, customers in the cement sector value our technological flexibility with regard to the fuels used.
This allows customers to respond to price changes in the energy sector and increase the profitability of their
plants. In the mining business, which continues to suffer from weak investment activity, order intake was
down slightly year-on-year. To put our business on a broader and less cyclical basis, we are strengthening
our worldwide service network. This will help us further strengthen our global presence, develop even closer
links with our customers, and expand our addressable market. In Chile a new service center for the mining
and raw materials industry was opened in the reporting period. The construction of a further service location
is planned in Peru. The high order backlog, a balanced portfolio with an increasing share of repair and
service business, and promising negotiations on planned projects in the cement business point to a
continued stable level of business.
In the 2014/2015 fiscal year System Engineering recorded an increase in order intake, thanks mainly to
lively demand for production systems for the automobile industry. In addition, by successfully completing
various contracts and winning new orders, and through continuous research and development in the area of
innovative energy storage solutions, we further strengthened our position in the growing electromobility
market. Increasingly, the extensive process and technology expertise we have built up over the decades in
the automotive industry is being applied to forward-looking assembly and automation solutions in the
aircraft sector.
Order intake €4.9 billion
64 thyssenkrupp annual report 2014/2015 Combined management report // Report on the economic position // Business area review
Marine Systems received orders for two submarines as well as for corvettes in the reporting year, but overall
orders were down from the prior year, which included a major order. In connection with the focusing of
shipbuilding activities on surface vessels and submarines, Emder Werft und Dockbetriebe was sold as part
of an asset deal.
The continuing high order backlog of the Industrial Solutions business area of €12.3 billion provides long-
term planning certainty for the next two to three years. To achieve the targeted profitable long-term sales
growth, the management team remains focused on expanding the addressable market. This goal is to be
achieved through intensified development and marketing of new technological solutions, increased service
business, expansion of our regional presence and closeness to customers, and cross-business area market
development.
Despite the disposal of the Swedish operations of Marine Systems towards the end of the prior year, sales at
Industrial Solutions remained stable overall at €6.3 billion, partly for currency-related reasons. On a
comparable basis sales were slightly lower year-on-year (down 2%). At Process Technologies lower and in
some cases later than expected orders last fiscal year led to a decline in sales in the reporting year. Sales at
Resource Technologies were level with the prior year. Sales of Marine Systems decreased slightly due to
portfolio effects; however with the launch of the "Nordrhein-Westfalen", the second Class F125 frigate, in
April 2015, a further important milestone in this shipbuilding program for the German Navy was reached.
The highly positive sales trend at System Engineering continued.
Earnings and margin slightly higher year-on-year With a small improvement in margins, adjusted EBIT at €424 million was slightly higher year-on-year.
Adjusted EBIT margin remained within the target range of 6% to 7%, supported by extensive "impact"
measures and in particular through synergies in connection with the integration of the plant engineering
business, the optimization of purchasing processes, and the newly initiated cost reduction program. EBIT
was impacted only slightly by special items in the reporting period.
Materials Services
Materials Services in figures
2013/2014
2014/2015 Change
in %
Order intake million € 13,682 13,945 2
Net sales million € 13,660 14,254 4
EBIT 1) million € 100 (38) --
EBIT margin 1) % 0.7 (0.3) —
Adjusted EBIT 1) million € 212 206 (3)
Adjusted EBIT margin 1) % 1.6 1.4 —
Employees (September 30) 30,289 20,226 (33)
1) Prior-year figures have been adjusted due to the definition change from fiscal 2014/2015
(cf. section "Fundamental information about the Group", subsection "Management of the Group").
The Materials Services business area offers its customers a wide range of materials combined with extensive
services to optimize their value chains. Our services extend from material processing to various logistics
services to innovative supply chain solutions. Materials Services operates as an efficient and reliable
business partner. The cornerstones of our business are our deep understanding of the market, our
international setup with around 480 sites in more than 40 countries and not least our engaged and
motivated employees.
Order backlog €12.3 billion
65 thyssenkrupp annual report 2014/2015 Combined management report // Report on the economic position // Business area review
The companies and businesses of the VDM and AST groups were included in the business area’s figures
from March 1, 2014, mainly in the Special Materials business unit. The VDM group has since been sold,
effective July 31, 2015. This restricts the comparability of the figures for the reporting period with the prior-
year figures.
Sales slightly lower year-on-year on a comparable basis In the 2014/2015 fiscal year order intake came to €13.9 billion and sales to €14.3 billion, year-on-year gains of
2% and 4% respectively. On a comparable basis – in particular excluding the portfolio effects at Special
Materials (VDM and AST) and exchange-rate effects – orders were 5% and sales 3% lower. Positive effects
included the expansion of our global direct-to-customer business particularly in the first half of the fiscal year,
the very good performance of our warehouse and service business in North America – due in part to exchange
rate effects – and finally also the further expansion of our aerospace business. This was partly offset by the
discontinuation of warehouse business in Russia and the closure of our railway equipment operations at the
end of the prior fiscal year. Also, in the 1st quarter of the reporting year the RIP group's service activities in
Brazil were sold. In almost all product segments on the materials side the picture was characterized by
continuously falling price levels. Order intake and sales in the Special Materials area, which was only included
for seven months in the prior-year figures, came to €2.4 billion and €2.6 billion respectively.
In the reporting year the companies of the Materials Services business area sold a total of 12.6 million tons of
materials, 2% less than a year earlier. An additional 900,000 tons was attributable to stainless steel flat
products and high-performance alloys (Special Materials unit). Excluding business in Russia, warehouse
shipments of metals were virtually unchanged at 5.6 million tons. The auto-related service center business in
particular made sales gains. Warehouse shipments were unchanged year-on-year in Eastern Europe excluding
Russia, but lower in Germany and Western Europe. Shipments in the global direct-to-customer and trading
operations were 10% higher year-on-year at 4.0 million tons. We sold 3.5 million tons of raw materials in the
reporting period, 0.2 million tons less than a year earlier. In particular, shipments of coke/coal but also of nickel
ores decreased compared with the very high volumes of the previous year, but shipments of metals and alloys
increased slightly. Our focus on customers and service, close cooperation with our business partners on the
supplier and customer side, our reliability and the dedicated commitment of our employees are key success
factors for our business. For example, following the startup of bases in India and Tunisia our aerospace service
activities are now present on all five continents; this has already brought us numerous new customers and long-
term contracts. In Mexico we expanded our processing capacities for the automotive industry. In our raw
materials business we succeeded in finding new suppliers in South America and Africa. In addition we are
systematically continuing the process of digitizing our business processes: We pursue both a business-
customer and an end-consumer strategy, to accommodate the different needs of our customers. For many
years now we have been successfully establishing online-based customer information and customer service
systems in the USA which we are continuously upgrading. From the start of the new fiscal year we will be rolling
out these web portal and shop solutions stage-by-stage in various European countries.
Adjusted EBIT at prior-year level Materials Services had to contend with intense competition and high price pressure in almost all product areas
in the reporting year, above all in the warehousing business in Germany. In addition, the mainly strike-related
losses in the 1st quarter at AST in Italy and the disposal of the service activities in Brazil also reduced earnings.
Nevertheless adjusted EBIT in the reporting year came to €206 million, almost level with the year before.
Numerous efficiency measures in connection with "impact", particularly under the purchasing and material cost
reduction program "synergize+" had a clear stabilizing effect. We also succeeded in reducing the number of
legal entities by over 20%, mainly by merging business activities in various European countries. In addition the
implementation of the new business plans at AST and VDM was very successful; despite the high strike-related
loss at AST in the 1st quarter, the Special Materials unit made a positive contribution to the business area's
adjusted EBIT.
million 12.6 tons of materials sold
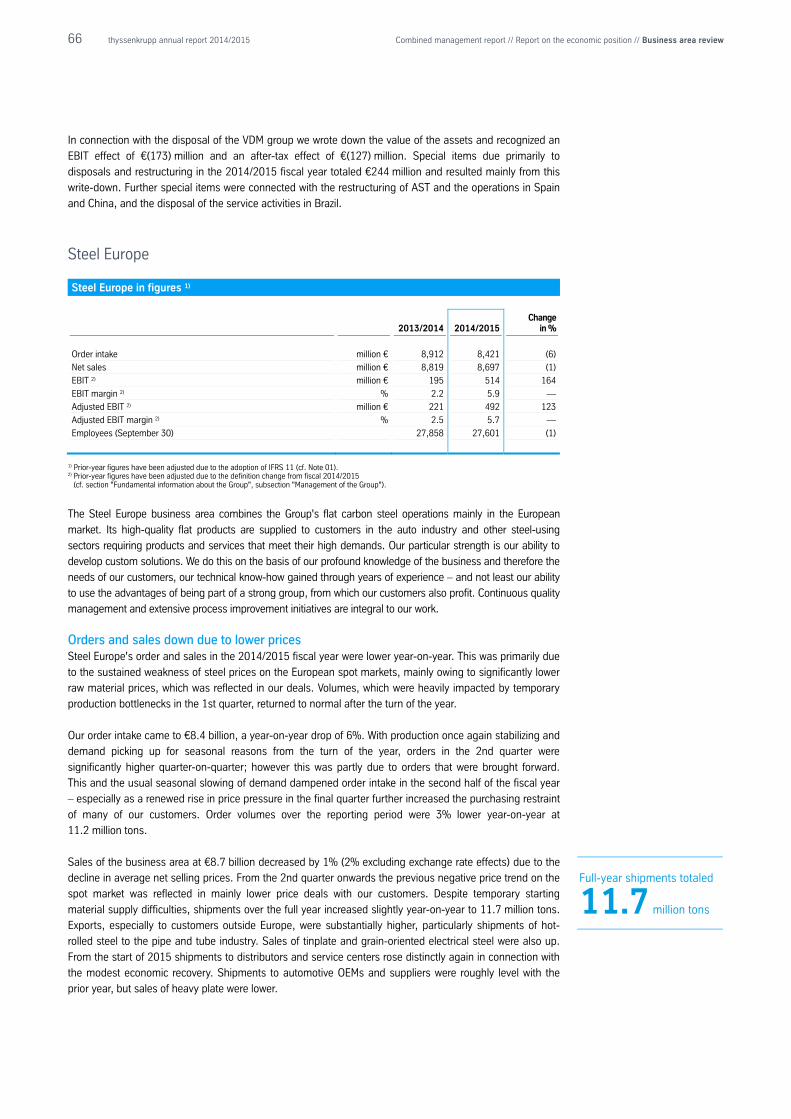
66 thyssenkrupp annual report 2014/2015 Combined management report // Report on the economic position // Business area review
In connection with the disposal of the VDM group we wrote down the value of the assets and recognized an
EBIT effect of €(173) million and an after-tax effect of €(127) million. Special items due primarily to
disposals and restructuring in the 2014/2015 fiscal year totaled €244 million and resulted mainly from this
write-down. Further special items were connected with the restructuring of AST and the operations in Spain
and China, and the disposal of the service activities in Brazil.
Steel Europe
Steel Europe in figures 1)
2013/2014
2014/2015 Change
in %
Order intake million € 8,912 8,421 (6)
Net sales million € 8,819 8,697 (1)
EBIT 2) million € 195 514 164
EBIT margin 2) % 2.2 5.9 —
Adjusted EBIT 2) million € 221 492 123
Adjusted EBIT margin 2) % 2.5 5.7 —
Employees (September 30) 27,858 27,601 (1)
1) Prior-year figures have been adjusted due to the adoption of IFRS 11 (cf. Note 01). 2) Prior-year figures have been adjusted due to the definition change from fiscal 2014/2015
(cf. section "Fundamental information about the Group", subsection "Management of the Group").
The Steel Europe business area combines the Group's flat carbon steel operations mainly in the European
market. Its high-quality flat products are supplied to customers in the auto industry and other steel-using
sectors requiring products and services that meet their high demands. Our particular strength is our ability to
develop custom solutions. We do this on the basis of our profound knowledge of the business and therefore the
needs of our customers, our technical know-how gained through years of experience – and not least our ability
to use the advantages of being part of a strong group, from which our customers also profit. Continuous quality
management and extensive process improvement initiatives are integral to our work.
Orders and sales down due to lower prices Steel Europe's order and sales in the 2014/2015 fiscal year were lower year-on-year. This was primarily due
to the sustained weakness of steel prices on the European spot markets, mainly owing to significantly lower
raw material prices, which was reflected in our deals. Volumes, which were heavily impacted by temporary
production bottlenecks in the 1st quarter, returned to normal after the turn of the year.
Our order intake came to €8.4 billion, a year-on-year drop of 6%. With production once again stabilizing and
demand picking up for seasonal reasons from the turn of the year, orders in the 2nd quarter were
significantly higher quarter-on-quarter; however this was partly due to orders that were brought forward.
This and the usual seasonal slowing of demand dampened order intake in the second half of the fiscal year
– especially as a renewed rise in price pressure in the final quarter further increased the purchasing restraint
of many of our customers. Order volumes over the reporting period were 3% lower year-on-year at
11.2 million tons.
Sales of the business area at €8.7 billion decreased by 1% (2% excluding exchange rate effects) due to the
decline in average net selling prices. From the 2nd quarter onwards the previous negative price trend on the
spot market was reflected in mainly lower price deals with our customers. Despite temporary starting
material supply difficulties, shipments over the full year increased slightly year-on-year to 11.7 million tons.
Exports, especially to customers outside Europe, were substantially higher, particularly shipments of hot-
rolled steel to the pipe and tube industry. Sales of tinplate and grain-oriented electrical steel were also up.
From the start of 2015 shipments to distributors and service centers rose distinctly again in connection with
the modest economic recovery. Shipments to automotive OEMs and suppliers were roughly level with the
prior year, but sales of heavy plate were lower.
Full-year shipments totaled 11.7 million tons
67 thyssenkrupp annual report 2014/2015 Combined management report // Report on the economic position // Business area review
At 12.4 million tons, crude steel production in the past fiscal year including supplies from Hüttenwerke
Krupp Mannesmann (HKM) was 1% higher year-on-year. Temporary production restrictions and backlogs
were in part made up in the course of the fiscal year, partly due to continued supplies from our Brazilian
steel plant thyssenkrupp CSA. Rolled steel production for customers in the reporting period was level with
the prior year at 11.9 million tons.
"Best-in-Class Reloaded" effects continue: EBIT more than doubled The Steel Europe business area recorded adjusted EBIT of €492 million in the year under review, more than
double the prior-year figure of €221 million. Earnings were significantly higher year-on-year in all quarters.
Average adjusted EBIT margin over the full reporting period increased to 5.7%, underlining the effectiveness of
our efficiency measures: While steel price levels continued to drop, the systematic implementation of measures
under the "Best-in-Class Reloaded" program in particular had positive effects on earnings. Alongside cost
reduction measures, this program also includes differentiation initiatives for steel grades and extensive sales
optimization efforts. Thanks to successful restructuring – and additionally aided by a market recovery –
Electrical Steel reached break-even for the first time again after the high losses of previous years, and therefore
made a noticeable contribution to the business area's earnings improvement. Cost reductions for raw materials
also played a part, although these cost advantages were partly eroded by the fall in the euro exchange rate.
EBIT in the 2014/2015 fiscal year came to €514 million, compared with €195 million a year earlier. This
includes net positive special items of €22 million, mainly in the 4th quarter and primarily relating to the sale
of an investment to a logistics enterprise.
The broad-based marketing offensive for the Groupwide development project InCar®plus, unveiled at the end
of the last fiscal year, was continued intensively in conjunction with Components Technology and Industrial
Solutions and has met with a very good response from automotive customers in Europa, the USA and China.
Presentations in South Korea and Japan will follow later in the year. The project is being presented to
customers at their own sites in a global technology roadshow. It demonstrates how we work together with
our customers to develop innovative, market-oriented solutions for automotive efficiency based on detailed
knowledge of our customers' requirements and our extensive engineering expertise.
Steel Americas
Steel Americas in figures
2013/2014
2014/2015 Change
in %
Order intake million € 2,215 1,723 (22)
Net sales million € 2,060 1,773 (14)
EBIT 1) million € 64 (147) --
EBIT margin 1) % 3.1 (8.3) —
Adjusted EBIT 1) million € (68) (138) --
Adjusted EBIT margin 1) % (3.3) (7.8) —
Employees (September 30) 3,466 3,725 7
1) Prior-year figures have been adjusted due to the definition change from fiscal 2014/2015
(cf. section "Fundamental information about the Group", subsection "Management of the Group").
The Steel Americas business area (thyssenkrupp CSA) supplies in particular the US and Brazilian markets
with high-quality slabs from its steel mill in Brazil. In addition to a long-term slab supply contract with a
consortium of ArcelorMittal and Nippon Steel & Sumitomo Metal Corporation (AM/NS), which reliably secures
a minimum 40% capacity utilization for our plant for several years, thyssenkrupp CSA is systematically
addressing the slab markets in South and North America.
Minimum % capacity 40 utilization secured for our plant
68 thyssenkrupp annual report 2014/2015 Combined management report // Report on the economic position // Business area review
Order intake and sales affected by bottlenecks in production In the 2014/2015 fiscal year order intake and sales at Steel Americas came to €1.7 billion and €1.8 billion
respectively, decreasing by 22% and 14% respectively from the prior year. In addition to the sale of
thyssenkrupp Steel USA in the prior year, this reflects bottlenecks in production due to an unscheduled
converter outage in the 1st quarter, temporarily poor raw material quality in the 2nd quarter, scheduled
maintenance shutdowns and the water shortage in Brazil, which led to disruptions in the supply of cooling
water. Added to this there was increasing price pressure from the 2nd quarter. The steel market in Brazil was
characterized overall by a further decline in consumption. On a comparable basis order intake and sales
decreased by 21% and 18% respectively.
The Brazilian steel mill produced 4.0 million tons in the reporting period, almost level with the prior year
despite the above-mentioned bottlenecks thanks to a strongly improved operating performance in the final
quarter. 2.4 million tons of slabs was supplied to the rolling and coating plant of AM/NS in Calvert/Alabama
and 0.6 million tons to Steel Europe.
Adjusted EBIT lower year-on-year in a difficult price environment Adjusted EBIT of the Steel Americas business unit came to €(138) million. Despite sharply increased price
and margin pressure and bottlenecks in production, it only remained negative and below the prior-year
figure (which also included an insurance recovery) on account of extremely negative exchange-rate effects
on input tax credits at thyssenkrupp CSA. However, Steel Americas succeeded for the first time in achieving
break-even business cash flow.
EBIT came to €(147) million in the 2014/2015 fiscal year. This includes net special items of €9 million,
mainly resulting from expense from the updated valuation of a long-term freight agreement in the 1st
quarter. The prior-year figure includes a high positive special item from the sale of the US site in Calvert in
the 2nd quarter 2013/2014.
Corporate at thyssenkrupp AG
The Group is managed centrally by thyssenkrupp AG as corporate headquarters. Corporate comprises the
Group's head office including administration for the regions, asset management for the Group's real estate,
and the global shared services activities. In accordance with the multi-dimensional leadership structure
made up of operating businesses, corporate functions, regions and service units, regional headquarters
have been set up in North and South America, China, India and the Asia/Pacific region. A further regional
headquarters is planned for the Middle East & Africa region.
The global shared services unit combines key functions performed locally at the Group's internal service
centers and organizes them in such a way that they are competitive. This concerns site-independent
activities such as certain processes in accounting, IT, real estate services and HR. Alongside the central
service center in Essen, further centers already operate in Bochum (Germany), Gdansk (Poland) and Porto
Alegre (Brazil). Two more of the six service centers planned in all will be established in China and India in
2016. Sales of services by Corporate companies to Group companies and external customers came to
€194 million in the reporting year, €17 million more than a year earlier.
Adjusted EBIT at Corporate was €(414) million, a year-on-year improvement of €12 million, due mainly to
lower administrative costs and increased efficiency within the shared services activities. Project costs for the
consolidation and modernization of the global IT infrastructure and the introduction of further standardized
data acquisition systems increased. EBIT came to €(649) million and included special items totaling
€235 million. These mainly resulted from an increased provision in connection with a settlement with The
Budd Company, a non-operating US company currently in liquidation. The increase in the provision is largely
offset by the associated tax effects and accounts for only a low two-digit million amount in earnings after
taxes (see also Note 16). Other special items at Corporate mainly related to restructurings. In the prior year
EBIT was €(563) million and also included special items; the loss from the sale of the OTK shareholding was
partly offset by the income from the deconsolidation of The Budd Company last year.

69 thyssenkrupp annual report 2014/2015 Combined management report // Report on the economic position // Business area review
Stainless Global (discontinued operation)
The merger of the Stainless Global business area with the Finnish company OTK was completed on
December 28, 2012. After its exit from the Group, expenses and income continue to be recorded which are
directly associated with the sale of Stainless Global and classified as discontinued operations. The €11
million expense incurred in fiscal 2014/2015 was mainly for settlement payments in connection with
personnel measures. The income and expenses reported in 2013/2014 resulted in net EBIT of €186 million.
It came mainly from the reversal of provisions recognized in connection with the sale of Inoxum to OTK for
the purpose of offsetting any negative financial consequences for OTK under merger control requirements.
70 thyssenkrupp annual report 2014/2015 Combined management report // Report on the economic position // Results of operations and financial position
Results of operations and financial position
The following section mainly contains an analysis of the earnings situation based on the statement of
income, an analysis of liquidity based on the statement of cash flows, and an analysis of the statement of
financial position. Information on financing and capital expenditures is provided in the section “Group
review”.
Analysis of the statement of income
At €42,778 million, net sales from continuing operations in fiscal 2014/2015 were €1,566 million or 4%
higher than a year earlier. This mainly reflects growth in the components and elevator businesses and
exchange rate effects. It also includes twelve months of sales of the AST group and 10 months of sales of
the VDM group up to its sale; in the prior year the sales of these groups were only included from March 1,
2014. Cost of sales from continuing operations increased by €897 million or 3% and thus at a lower rate
than sales. The increase was mainly due to higher material and personnel expense as well as impairment
losses recognized in the 2nd quarter of the reporting year in connection with the sale of the VDM group
concluded in July 2015. Gross profit from continuing operations improved by €669 million to €6,874 million,
while gross profit margin increased to 16%.
Selling expenses from continuing operations increased by €145 million and general and administrative
expenses by €82 million. In both cases this was mainly due to higher personnel and consultancy expenses
as well as the fact that the figures for VDM and AST were only included for seven months of the prior year.
The €136 million increase in other expenses from continuing operations was mainly due to the increase in
the reporting year of a provision in connection with a settlement with the non-operating US company The
Budd Company, which is currently in liquidation. Other losses from continuing operations came to
€223 million overall; in the prior year other gains of €235 million were reported. The main reason for the
€458 million deterioration was the absence of prior-year gains from the deconsolidation of the non-
operating US company The Budd Company and the sale of thyssenkrupp Steel USA; currency translation
losses for refund entitlements in connection with non-income taxes were also higher.
Financing income from continuing operations increased by €418 million. This mainly reflected higher
exchange rate gains in connection with finance transactions. The €18 million rise in financing expense from
continuing operations included significantly higher currency losses in connection with finance transactions.
This was partly offset by the absence of the losses included in the prior year from the sale of the
shareholding in Outokumpu Oyj, declining interest expense for financial debt, and lower net interest expense
for pensions and similar obligations.
The €496 million income before taxes from continuing operations resulted in tax expense from continuing
operations of €217 million in the reporting year, reflecting currency translation losses with no tax effect and
– as in the prior year – valuation allowances for deferred tax assets. This was partly offset by the
aforementioned settlement with the US company The Budd Company. After taking into account income
taxes, income from continuing operations came to €279 million, €270 million higher than a year earlier.
The discontinued operations generated a loss of €11 million in the reporting year, compared with income of
€186 million in the prior year. The €197 million deterioration mainly reflected the reversal in the prior year of
the provision for possible effects from merger control requirements in connection with the sale of
Outokumpu.
Sales up +4 %
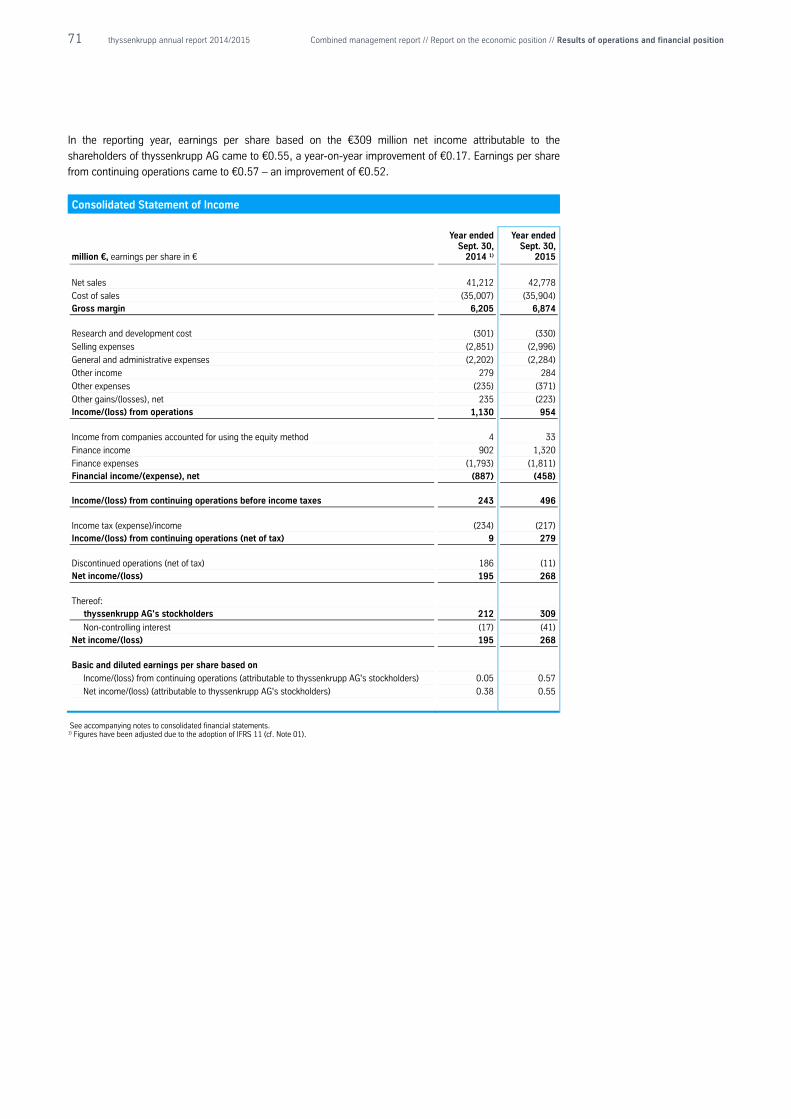
71 thyssenkrupp annual report 2014/2015 Combined management report // Report on the economic position // Results of operations and financial position
In the reporting year, earnings per share based on the €309 million net income attributable to the
shareholders of thyssenkrupp AG came to €0.55, a year-on-year improvement of €0.17. Earnings per share
from continuing operations came to €0.57 – an improvement of €0.52.
Consolidated Statement of Income
million €, earnings per share in €
Year ended Sept. 30,
2014 1)
Year ended Sept. 30,
2015
Net sales 41,212 42,778
Cost of sales (35,007) (35,904) Gross margin 6,205 6,874
Research and development cost (301) (330)
Selling expenses (2,851) (2,996)
General and administrative expenses (2,202) (2,284)
Other income 279 284
Other expenses (235) (371)
Other gains/(losses), net 235 (223) Income/(loss) from operations 1,130 954
Income from companies accounted for using the equity method 4 33
Finance income 902 1,320
Finance expenses (1,793) (1,811) Financial income/(expense), net (887) (458)
Income/(loss) from continuing operations before income taxes 243 496
Income tax (expense)/income (234) (217) Income/(loss) from continuing operations (net of tax) 9 279
Discontinued operations (net of tax) 186 (11) Net income/(loss) 195 268
Thereof: thyssenkrupp AG's stockholders 212 309
Non-controlling interest (17) (41) Net income/(loss) 195 268
Basic and diluted earnings per share based on
Income/(loss) from continuing operations (attributable to thyssenkrupp AG's stockholders) 0.05 0.57
Net income/(loss) (attributable to thyssenkrupp AG's stockholders) 0.38 0.55
See accompanying notes to consolidated financial statements. 1) Figures have been adjusted due to the adoption of IFRS 11 (cf. Note 01).
72 thyssenkrupp annual report 2014/2015 Combined management report // Report on the economic position // Results of operations and financial position
Analysis of the statement of cash flows
The amounts taken into account in the statement of cash flows correspond to the item "Cash and cash
equivalents" as reported in the statement of financial position and also include the cash and cash
equivalents relating to the disposal groups.
In the reporting year there was a net cash inflow from operating activities of €1,300 million. Cash inflows
from continuing operations increased by €408 million to €1,311 million. Significantly improved net income
before impairment losses, deferred taxes and income from the disposal of non-current assets was partly
offset by a net increase in capital employed in operating assets and liabilities.
Investing activities resulted in a net cash outflow of €638 million in the reporting year, related exclusively to
the continuing operations. The €432 million year-on-year increase was mainly the result of lower proceeds
from disposals of consolidated companies. This reflected the absence of proceeds from the disposal of
thyssenkrupp Steel USA recognized in the prior year and lower proceeds in the reporting year, mainly from
the sale of the VDM group. This was partly offset by the absence of the disposal of cash and cash
equivalents recognized in the prior year in connection with the winding-down of the non-operating US
subsidiary The Budd Company in a Chapter 11 case.
In the reporting year we achieved positive free cash flow of €662 million, roughly the same as a year earlier
and almost exclusively attributable to the continuing operations.
Financing activities resulted in a net cash outflow of €78 million, compared with €558 million a year earlier.
The €480 million decrease in cash outflows was mainly due to net proceeds from borrowings of €313 million
in the reporting year, compared with a €1,428 million net repayment of borrowings in the prior year. This
was partly offset by higher dividend payments, the absence of the €878 million proceeds from the capital
increase carried out in December 2013, and higher expenditures, recognized in other financing activities, for
currency and cross-currency swaps in connection with Group financing.
million free €662 cash flow
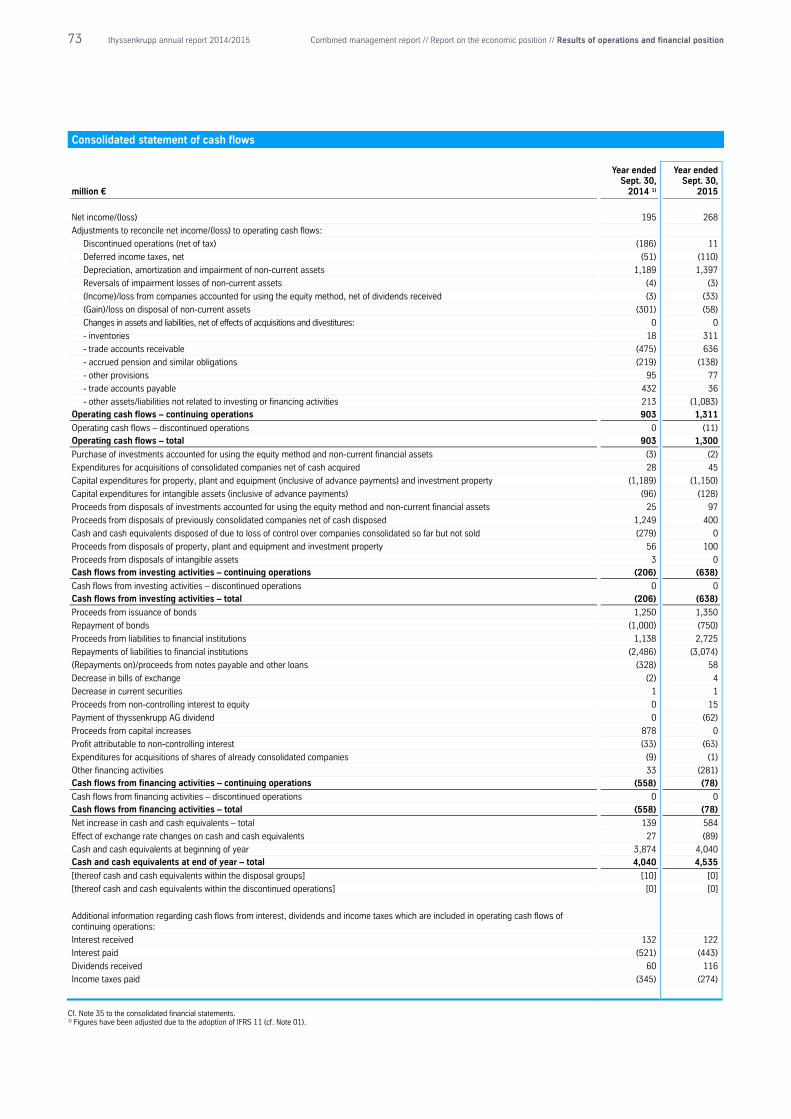
73 thyssenkrupp annual report 2014/2015 Combined management report // Report on the economic position // Results of operations and financial position
Consolidated statement of cash flows
million €
Year ended Sept. 30,
2014 1)
Year ended Sept. 30,
2015
Net income/(loss) 195 268
Adjustments to reconcile net income/(loss) to operating cash flows:
Discontinued operations (net of tax) (186) 11
Deferred income taxes, net (51) (110)
Depreciation, amortization and impairment of non-current assets 1,189 1,397
Reversals of impairment losses of non-current assets (4) (3)
(Income)/loss from companies accounted for using the equity method, net of dividends received (3) (33)
(Gain)/loss on disposal of non-current assets (301) (58)
Changes in assets and liabilities, net of effects of acquisitions and divestitures: 0 0
- inventories 18 311
- trade accounts receivable (475) 636
- accrued pension and similar obligations (219) (138)
- other provisions 95 77
- trade accounts payable 432 36
- other assets/liabilities not related to investing or financing activities 213 (1,083) Operating cash flows – continuing operations 903 1,311
Operating cash flows – discontinued operations 0 (11) Operating cash flows – total 903 1,300
Purchase of investments accounted for using the equity method and non-current financial assets (3) (2)
Expenditures for acquisitions of consolidated companies net of cash acquired 28 45
Capital expenditures for property, plant and equipment (inclusive of advance payments) and investment property (1,189) (1,150)
Capital expenditures for intangible assets (inclusive of advance payments) (96) (128)
Proceeds from disposals of investments accounted for using the equity method and non-current financial assets 25 97
Proceeds from disposals of previously consolidated companies net of cash disposed 1,249 400
Cash and cash equivalents disposed of due to loss of control over companies consolidated so far but not sold (279) 0
Proceeds from disposals of property, plant and equipment and investment property 56 100
Proceeds from disposals of intangible assets 3 0 Cash flows from investing activities – continuing operations (206) (638)
Cash flows from investing activities – discontinued operations 0 0 Cash flows from investing activities – total (206) (638)
Proceeds from issuance of bonds 1,250 1,350
Repayment of bonds (1,000) (750)
Proceeds from liabilities to financial institutions 1,138 2,725
Repayments of liabilities to financial institutions (2,486) (3,074)
(Repayments on)/proceeds from notes payable and other loans (328) 58
Decrease in bills of exchange (2) 4
Decrease in current securities 1 1
Proceeds from non-controlling interest to equity 0 15
Payment of thyssenkrupp AG dividend 0 (62)
Proceeds from capital increases 878 0
Profit attributable to non-controlling interest (33) (63)
Expenditures for acquisitions of shares of already consolidated companies (9) (1)
Other financing activities 33 (281) Cash flows from financing activities – continuing operations (558) (78)
Cash flows from financing activities – discontinued operations 0 0 Cash flows from financing activities – total (558) (78)
Net increase in cash and cash equivalents – total 139 584
Effect of exchange rate changes on cash and cash equivalents 27 (89)
Cash and cash equivalents at beginning of year 3,874 4,040 Cash and cash equivalents at end of year – total 4,040 4,535
[thereof cash and cash equivalents within the disposal groups] [10] [0]
[thereof cash and cash equivalents within the discontinued operations] [0] [0]
Additional information regarding cash flows from interest, dividends and income taxes which are included in operating cash flows of continuing operations:
Interest received 132 122
Interest paid (521) (443)
Dividends received 60 116
Income taxes paid (345) (274)
Cf. Note 35 to the consolidated financial statements. 1) Figures have been adjusted due to the adoption of IFRS 11 (cf. Note 01).
74 thyssenkrupp annual report 2014/2015 Combined management report // Report on the economic position // Results of operations and financial position
Analysis of the statement of financial position
Compared with September 30, 2014, total assets decreased by €736 million to €35,694 million – despite a
currency translation-related increase of €673 million, mainly due to the strong appreciation of the US dollar
against the euro in the reporting year.
Non-current assets were €237 million higher than a year earlier. This included a currency translation-related
increase of €485 million, relating mainly to goodwill included in intangible assets and to property, plant and
equipment. Further increases in intangible assets resulted from company mergers in the Elevator
Technology and Industrial Solutions business areas. There was also an increase in deferred taxes, mainly
due to the increase of a provision in connection with a settlement with the US company The Budd Company.
This was partly offset by an excess of depreciation over additions of property, plant and equipment and
declining refund entitlements in connection with non-income taxes included in other non-financial assets.
Current assets decreased altogether by €973 million. Taking exchange rate-related increases into account,
this was mainly due to sharp decreases in inventories and trade accounts receivable, which also related to
the sale of the VDM group. This was partly offset by a €505 million increase in cash and cash equivalents to
€4,535 million, mainly due to the €662 million free cash flow achieved in the reporting year.
Total equity at September 30, 2015 was up by €108 million year-on-year to €3,307 million. This was mainly
due to the net income of €268 million achieved in the reporting year and the currency translation gains of
€124 million recognized in other comprehensive income. There were further increases in connection with the
first time consolidation of thyssenkrupp Uhde Chlorine Engineers in the Industrial Solutions business area.
This was partly offset by losses of €276 million (after taxes) also recognized in other comprehensive income
from the remeasurement of pension and similar obligations and dividend payments of €125 million. The
equity ratio improved to 9.3%.
Non-current liabilities were level with the prior year at €15,344 million. The €164 million net increase in
provisions for pensions and similar obligations was mainly due to the remeasurement; it was partly offset by
a decrease due to the disposal of the VDM group. The increase in non-current other provisions mainly
related to the aforementioned settlement with the non-operating US company The Budd Company. This was
partly offset by the €266 million net reduction in non-current financial debt. Reclassifications to current
financial debt, mainly relating to a €977 million bond due in February 2016, notes due in the further course
of 2015/2016 totaling €361 million, as well as repayments of liabilities to financial institutions were partly
offset by the issue in February 2015 of a bond with a total volume of €1,350 million.
Current liabilities decreased in total by €869 million. Of this, €1,269 million alone related to current non-
financial liabilities, mainly as a result of significantly lower liabilities in connection with construction contracts
and a reduction in advance payments received. Other current financial liabilities decreased by €104 million,
mainly due to the disposal of the VDM group. In addition, other current provisions were also lower, mainly
due to amounts utilized in connection with restructuring measures. This was partly offset by a €499 million
increase in current financial debt. This related mainly to the aforementioned reclassifications from non-
current financial debt, which were partly offset by the repayment of a bond with a volume of €750 million in
March 2015.
million
€4,535 cash and cash equivalents
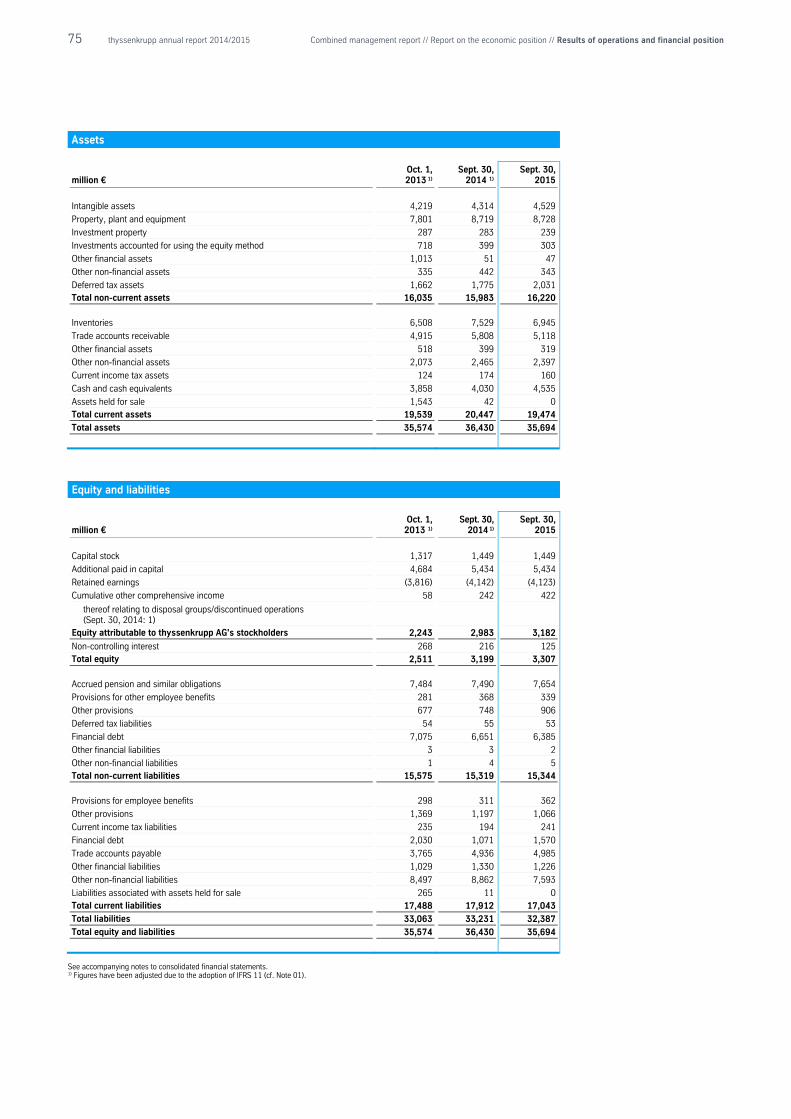
75 thyssenkrupp annual report 2014/2015 Combined management report // Report on the economic position // Results of operations and financial position
Assets
million € Oct. 1, 2013 1)
Sept. 30, 2014 1)
Sept. 30, 2015
Intangible assets 4,219 4,314 4,529
Property, plant and equipment 7,801 8,719 8,728
Investment property 287 283 239
Investments accounted for using the equity method 718 399 303
Other financial assets 1,013 51 47
Other non-financial assets 335 442 343
Deferred tax assets 1,662 1,775 2,031 Total non-current assets 16,035 15,983 16,220
Inventories 6,508 7,529 6,945
Trade accounts receivable 4,915 5,808 5,118
Other financial assets 518 399 319
Other non-financial assets 2,073 2,465 2,397
Current income tax assets 124 174 160
Cash and cash equivalents 3,858 4,030 4,535
Assets held for sale 1,543 42 0 Total current assets 19,539 20,447 19,474
Total assets 35,574 36,430 35,694
Equity and liabilities
million € Oct. 1, 2013 1)
Sept. 30, 2014 1)
Sept. 30, 2015
Capital stock 1,317 1,449 1,449
Additional paid in capital 4,684 5,434 5,434
Retained earnings (3,816) (4,142) (4,123)
Cumulative other comprehensive income 58 242 422
thereof relating to disposal groups/discontinued operations (Sept. 30, 2014: 1) Equity attributable to thyssenkrupp AG's stockholders 2,243 2,983 3,182
Non-controlling interest 268 216 125 Total equity 2,511 3,199 3,307
Accrued pension and similar obligations 7,484 7,490 7,654
Provisions for other employee benefits 281 368 339
Other provisions 677 748 906
Deferred tax liabilities 54 55 53
Financial debt 7,075 6,651 6,385
Other financial liabilities 3 3 2
Other non-financial liabilities 1 4 5 Total non-current liabilities 15,575 15,319 15,344
Provisions for employee benefits 298 311 362
Other provisions 1,369 1,197 1,066
Current income tax liabilities 235 194 241
Financial debt 2,030 1,071 1,570
Trade accounts payable 3,765 4,936 4,985
Other financial liabilities 1,029 1,330 1,226
Other non-financial liabilities 8,497 8,862 7,593
Liabilities associated with assets held for sale 265 11 0 Total current liabilities 17,488 17,912 17,043
Total liabilities 33,063 33,231 32,387
Total equity and liabilities 35,574 36,430 35,694
See accompanying notes to consolidated financial statements. 1) Figures have been adjusted due to the adoption of IFRS 11 (cf. Note 01).
76 thyssenkrupp annual report 2014/2015 Combined management report // Report on the economic position // Results of operations and financial position
Assets not recognized and off-balance financing instruments
In addition to the assets recognized in the balance sheet, the Group also uses non-recognized assets. These
are mainly leased or rented assets (operating leases). More details on this can be found under Note 21. Our
off-balance financing instruments also include factoring programs. More details can be found under Note
10. Should financing instruments of this kind no longer be available in the future, we have adequate
available credit lines. This also applies to the non-recourse factoring of receivables, which the Group sold in
connection with ordinary business activities in the amount of €1.5 billion at the closing date; in the prior year
the amount was €1.4 billion.
77 thyssenkrupp annual report 2014/2015 Combined management report // Report on the economic position // thyssenkrupp AG
thyssenkrupp AG
thyssenkrupp AG is the parent company of the thyssenkrupp Group. The Executive Board of
thyssenkrupp AG is responsible for the management of the Company and the Group. This includes above all
defining corporate strategy and allocating resources as well as executive development and financial
management. The annual financial statements of thyssenkrupp AG were prepared according to the rules of
the German Commercial Code (HGB), the management report is combined with the management report on
the Group; this and the consolidated financial statements were prepared on the basis of International
Financial Reporting Standards (IFRS) pursuant to § 315a HGB. The most important goal in the parent-
company financial statements is to secure sustainable dividend capability by presenting a corresponding
unappropriated profit on the basis of clearly positive HGB net income on average over several years.
Course of business, future development and risk position
Course of business 2014/2015 The business performance and position of thyssenkrupp AG is mainly determined by the business
performance and success of the Group. We report on this in detail in the sections “Group review”, “Business
area review”, and “Results of operations and financial position”.
Expected development 2015/2016 with material opportunities and risks The expected development of thyssenkrupp AG in the 2015/2016 fiscal year also depends mainly on the
development of the Group as a whole and its opportunity and risk position. This is the subject of the
forecast, opportunity and risk report of the Group. To this extent the information provided there on the
expected development and risk position of the Group also applies to the future development and risk
position of thyssenkrupp AG.
As parent company of the Group, thyssenkrupp AG receives income in particular from its equity investments.
Net income from investments comprises profits and losses transferred from domestic subsidiaries and
dividends distributed by foreign subsidiaries. Accordingly, the positive expectations for the Group's business
performance in 2015/2016 should also be reflected in the income of thyssenkrupp AG. Overall we expect an
unappropriated profit at thyssenkrupp AG in 2015/2016 that will allow our shareholders to share
appropriately in the earnings of the Group.
Capital expenditures
thyssenkrupp AG invested €1,717 million in fixed assets in the 2014/2015 fiscal year. Investments in intangible
assets included €15 million for the reorganization of the SAP systems for the data and process harmonization
initiative as well as software licenses. The €24 million additions to property, plant and equipment mainly related
to the thyssenkrupp Quarter in Essen, including €16 million attributable to property, plant and equipment under
construction.
Of the €1,678 million additions to financial assets, €1,665 million related to shares in affiliated companies. This
mainly reflected the capital increases at thyssenkrupp North America, Inc. (€883 million), ThyssenKrupp
Nederland Holding B.V. (€116 million) and ThyssenKrupp Austria GmbH & Co. KG (€16 million). An additional
€647 million was realized through the merger of thyssenkrupp Real Estate GmbH and thyssenkrupp IT Services
GmbH into thyssenkrupp Business Services GmbH. A further €7 million related to loans to affiliated companies
due to a long-term loan granted to ThyssenKrupp France S.A.S.
The €1,478 million net book value of disposals of shares and loans to affiliated companies resulted in the
amount of €647 million from the merger of thyssenkrupp Real Estate GmbH and thyssenkrupp IT Services
GmbH into thyssenkrupp Business Services GmbH, and in the amount of €830 million from the repayment
of internal loans by thyssenkrupp Finance USA, Inc. and thyssenkrupp Electrical Steel GmbH.
78 thyssenkrupp annual report 2014/2015 Combined management report // Report on the economic position // thyssenkrupp AG
Results of operations
thyssenkrupp AG reported a net loss of €122 million in the 2014/2015 fiscal year, compared with net
income of €1,535 million a year earlier.
Net income from investments decreased by €397 million to €(112) million.
Income from profit and loss transfer agreements was down by €294 million to €283 million. In addition,
expenses from loss transfers increased by €342 million to €635 million. This was mainly attributable to
thyssenkrupp Technologies Beteiligungen GmbH, whose prior-year income (€311 million) fell to a loss of
€284 million. There was also an €85 million increase in expenses from loss transfers from thyssenkrupp
Regional Services Germany GmbH to €155 million. This was partly offset by Thyssen Stahl GmbH, whose
income increased by €57 million to €208 million.
In addition, €239 million income from investments resulted from a dividend payment by ThyssenKrupp
China Ltd.
The €1,202 decrease in other operating income was mainly due to the disposal of financial assets in the
prior year. This mainly reflected the transfer of thyssenkrupp Elevator AG to thyssenkrupp Technologies
Beteiligungen GmbH. In fiscal 2014/2015 write-ups on shares in affiliated companies resulted in other
operating income of €739 million. In addition, amounts charged on in accordance with the corporate design,
company naming and trademark policy for the corporate mark, as well as usage fees for Group licenses and
intra-Group service charges resulted in income of €242 million (prior year: €213 million).
In the 2014/2015 fiscal year there were €21 million write-downs on financial assets relating to the shares of
thyssenkrupp Regional Services Germany GmbH (prior year: €0 million).
Compared with a year earlier, general administrative expenses increased by €111 million to €633 million.
This was mainly due to expenses for IT consultancy (€40 million higher) and allocations to pension
provisions (€41 million higher).
Income from ordinary activities came to €(157) million (prior year: €1,529 million).
Income taxes include income from previous years as well as taxes in the reporting period. Under a
recognition option for an excess of deferred tax assets over deferred tax liabilities, deferred taxes are not
included in tax expense.
After income taxes, net loss was €122 million (prior year: net income of €1,535 million).
Financial position
Total assets increased year-on-year by €982 million to €38,768 million. At September 30, 2015, fixed
assets as a percentage of total assets were 1 percentage point higher than a year earlier at 68%.
Fixed assets increased by €897 million to €26,315 million. The significant reduction in loans to affiliated
companies (down by €823 million) was partly offset by an increase in shares in affiliated companies (up by
€1,735 million).
The increase in shares in affiliated companies to €22,787 million is due partly to capital increases at
thyssenkrupp North America, Inc. (€883 million), ThyssenKrupp Nederland Holding B.V. (€116 million) and
partly to write-ups totaling €739 million. The shares of thyssenkrupp North America, Inc. were written up by
€579 million and the shares of ThyssenKrupp UK Plc. by €160 million.
79 thyssenkrupp annual report 2014/2015 Combined management report // Report on the economic position // thyssenkrupp AG
Receivables and liabilities from/to affiliated companies are significant items in the balance sheet of
thyssenkrupp AG. They reflect the central importance of thyssenkrupp AG in the Group's cash management
system. At September 30, 2015 receivables from affiliated companies were down by €272 million from the
prior year to €8,879 million, mainly due to a reduction in other receivables from profit and loss transfer
agreements (€296 million). This was partly offset by a €25 million increase in intercompany account
balances.
thyssenkrupp AG bears liability from the internal transfer of pension obligations. In the past fiscal year, these
obligations under miscellaneous assets decreased by €27 million to €593 million. Correspondingly they
were recognized under pension obligations.
At September 30, 2015 cash in hand and cash at banks was €409 million higher year-on-year at
€2,883 million.
Total equity decreased by €184 million to €5,767 million at September 30, 2015. This reduction resulted
from the €122 million net loss and the dividend payment of €62 million. The equity ratio therefore fell to
15% (prior year: 16%).
The €33 million change in pension provisions includes €78 million additions and accrued interest,
€21 million pension payments, €2 million asset transfers received and the aforementioned internal transfer
of pension obligations.
In February 2015 a dual-tranche bond with a total volume of €1.35 billion was issued under the €10 billion
debt issuance program. The bond was issued in two tranches of €750 million (coupon 1.75%) and €600
million (coupon 2.5%) with maturities of five years and nine months and ten years respectively.
Liabilities to affiliated companies are mainly deposits by subsidiaries in the Group's central financial clearing
system. Liabilities to affiliated companies were €554 million higher year-on-year at €25,208 million. The
increase was due in particular to the €297 million rise in other liabilities to affiliated companies, mainly
reflecting higher liabilities from loss transfers. There was also a €221 million increase in intercompany
liabilities. More information on the financial position of thyssenkrupp AG is contained in the Notes to the
parent-company financial statements.
Unappropriated income and proposal for the appropriation of net income
The legal basis for distribution of a dividend is the unappropriated income of thyssenkrupp AG calculated in
accordance with HGB. The annual financial statements show unappropriated income of €1,351 million. The
Executive Board and Supervisory Board propose to the Annual General Meeting that the unappropriated
income for the 2014/2015 fiscal year in the amount of €1,351 million be used as follows: Distribution of a
dividend of €0.15 per eligible share and the remaining amount to be carried forward.
Unappropriated income of €1,351 million
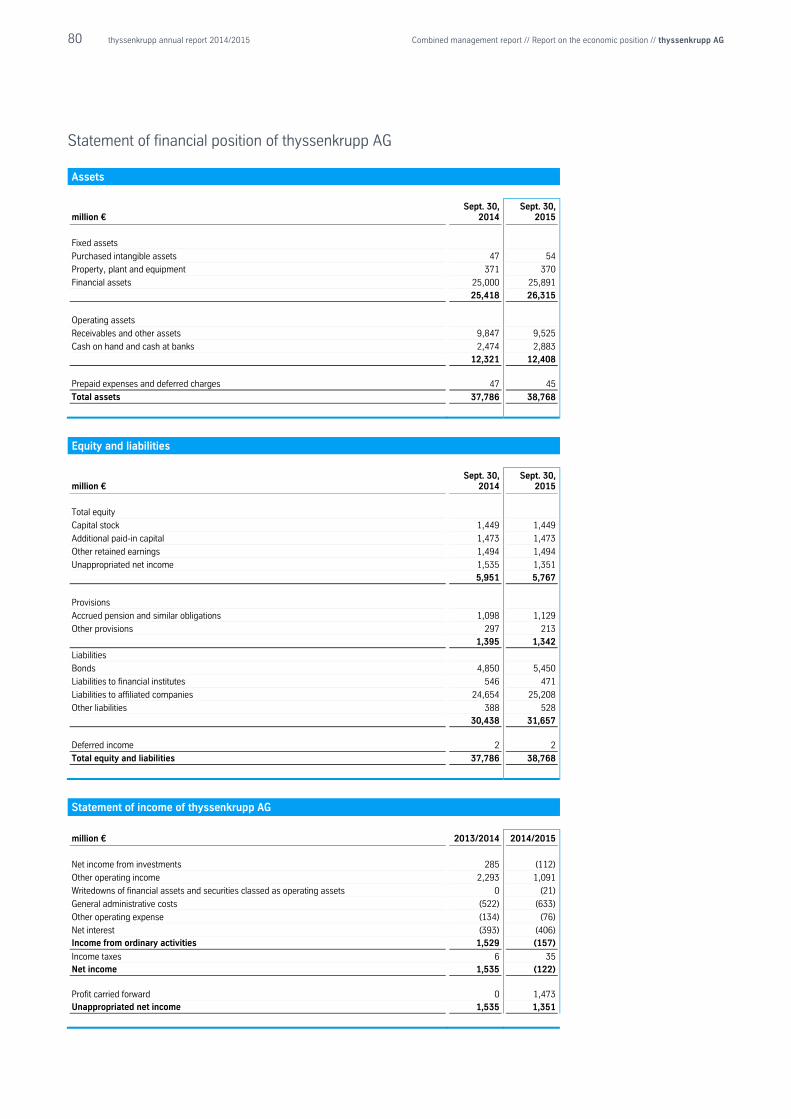
80 thyssenkrupp annual report 2014/2015 Combined management report // Report on the economic position // thyssenkrupp AG
Statement of financial position of thyssenkrupp AG Assets
million € Sept. 30,
2014 Sept. 30,
2015
Fixed assets
Purchased intangible assets 47 54
Property, plant and equipment 371 370
Financial assets 25,000 25,891 25,418 26,315
Operating assets
Receivables and other assets 9,847 9,525
Cash on hand and cash at banks 2,474 2,883
12,321 12,408
Prepaid expenses and deferred charges 47 45
Total assets 37,786 38,768
Equity and liabilities
million € Sept. 30,
2014 Sept. 30,
2015
Total equity
Capital stock 1,449 1,449
Additional paid-in capital 1,473 1,473
Other retained earnings 1,494 1,494
Unappropriated net income 1,535 1,351
5,951 5,767
Provisions
Accrued pension and similar obligations 1,098 1,129
Other provisions 297 213 1,395 1,342
Liabilities
Bonds 4,850 5,450
Liabilities to financial institutes 546 471
Liabilities to affiliated companies 24,654 25,208
Other liabilities 388 528 30,438 31,657
Deferred income 2 2
Total equity and liabilities 37,786 38,768
Statement of income of thyssenkrupp AG
million € 2013/2014 2014/2015
Net income from investments 285 (112)
Other operating income 2,293 1,091
Writedowns of financial assets and securities classed as operating assets 0 (21)
General administrative costs (522) (633)
Other operating expense (134) (76)
Net interest (393) (406) Income from ordinary activities 1,529 (157)
Income taxes 6 35 Net income 1,535 (122)
Profit carried forward 0 1,473 Unappropriated net income 1,535 1,351
81 thyssenkrupp annual report 2014/2015 Combined management report // Compliance
Compliance
thyssenkrupp attaches high priority to values and compliance. In our corporate culture, observance of the
law and internal regulations is a must. Compliance creates the framework for our business actions and
serves to safeguard our long-term business success. In the 2014/2015 fiscal year, compliance work
focused on the detailing and implementation of measures developed under the Compliance 2020 strategy.
The basis: Our corporate culture Our value culture plays a central role in the development of strategic compliance measures: The aim is to
instill the entire thyssenkrupp Group with a value culture in which reliability, honesty, credibility and integrity
are the cornerstones of our actions. This value culture must be jointly supported by all employees and
systematically demonstrated by managers. Compliance is a question of mindset. With this in mind we want
to be role models – for our employees as well as for our suppliers, customers and other stakeholders – to
strengthen awareness that it is important and right to adopt our value culture and strictly observe our
compliance rules. This also involves a clear commitment that thyssenkrupp stands for fair and straight
business. We would rather sacrifice a contract and miss internal targets than break the law.
However, at the same time we want to support entrepreneurial motivation and risk-taking within a clearly
defined framework, i.e. the willingness to take calculable entrepreneurial risks (not compliance risks) in order
to realize business opportunities, allow occasional mistakes to be made as a result, and accept mistakes by
other people. The Compliance function is a strategic partner consulted by the business units at an early
stage in relevant strategic decision processes.
"Compliance 2020" strategy Starting from our holistic understanding of compliance, the "Compliance 2020" strategy was initiated in the
2013/2014 fiscal year: Its aim is to embed compliance more extensively and sustainably throughout the
Group. This is to be achieved with the help of numerous measures – including the further development of
our global training programs, the deeper integration of compliance in our business processes, and targeted
communications.
In the reporting period the integration and establishment of measures relating to anti-money laundering,
data protection, and the Italian compliance law 231/01 was a focus of our compliance activities. In relation
to other topic areas – such as occupational safety and environmental protection – the Compliance function
has taken on the role of advisor, coordinator and consolidator. Responsibility for content in these areas
remains with the competent corporate functions and business areas; the Compliance team provides support
and advice and ensures uniform reporting to the Executive Board.
Compliance program further developed on a risk-oriented basis The compliance officers and regional compliance officers advise, inform, and educate employees around the
world about the relevant laws and internal policies. They have access to a network of over 330 compliance
managers, (generally) managing directors of Group companies, who ensure the compliance program is
implemented at operating level in their areas of responsibility.
Over 330 compliance managers ensure the compliance program is implemented at operating level
82 thyssenkrupp annual report 2014/2015 Combined management report // Compliance
In the 2013/2014 fiscal year we carried out a Groupwide bottom-up risk assessment. Based on a detailed
questionnaire the Compliance team analyzed objective risks, mainly in the areas of antitrust law and
corruption prevention, and the degree of implementation of the compliance program at the Group
companies. In a second step, workshops were held at over 100 Group companies, in which measures were
developed to address the risks identified.
The results of the risk analysis enable compliance activities to be managed in a very targeted and efficient
way, both at Group level and in the regions. The business areas can include the results of the analysis in
their strategies and manage their business activities on a risk-oriented basis. At operating level, the
responsible officers can focus more on risk aspects in day-to-day business and reduce compliance risks.
In the reporting year we provided all analyzed units, business areas and regions with detailed information on
the results of the risk assessment. In addition, the Compliance function continued to support implementation
of the measures developed to minimize risk.
Training and advice at the center of the established compliance activities The already established compliance activities were continued in the reporting period. A key role was played
by antitrust law and corruption prevention training programs, which form part of the "inform" pillar of our
compliance program: In the programs, compliance officers inform employees about compliance
requirements, risks, and possible sanctions. In the reporting year over 9,700 employees worldwide attended
classroom courses. In our compliance e-learning program, almost 47,000 employees successfully
completed anticorruption courses and almost 41,000 employees antitrust courses between August 2012
and the end of the reporting year.
A further key element of our activities is compliance advice: We support important business transactions,
e.g. in connection with major projects and M&A projects or the engagement of intermediaries. For this the
employees can contact their compliance officers in the business areas, regions and at Corporate or call our
central hotline. The compliance officers also advise the operating units on integrating compliance into their
business processes.
The “identify” pillar of the compliance program focuses on regularly reviewing critical business operations
based on a risk-oriented, structured audit process. An additional element in the identification of compliance
risks is our whistleblower system. Alongside the options of directly contacting a supervisor or the
compliance department, this provides employees with a further channel for reporting possible infringements
of laws or policies without revealing their identity.
The third pillar of the compliance program “report and act” signifies intensive compliance reporting in all
three dimensions of our organizational matrix. In the event of proven antitrust law infringements or
corruption, our "zero tolerance" policy applies: Sanctions are systematically imposed on the employees
concerned.
"Auto steel" investigation against thyssenkrupp closed On December 11, 2014 the German Federal Cartel Office closed its anti-trust investigation in the “auto
steel” sector for lack of probable cause. The proceedings were initiated at the end of February 2013 with
searches of three companies in the steel sector, including thyssenkrupp. The authority was investigating the
suspicion of price fixing in the delivery of certain steel products to the German automotive industry in a
period dating back to 1998. In its press release on the closure of the investigation, the Federal Cartel Office
emphasized thyssenkrupp’s cooperation in the proceedings.
Over 9,700 employees attended classroom courses in the past year
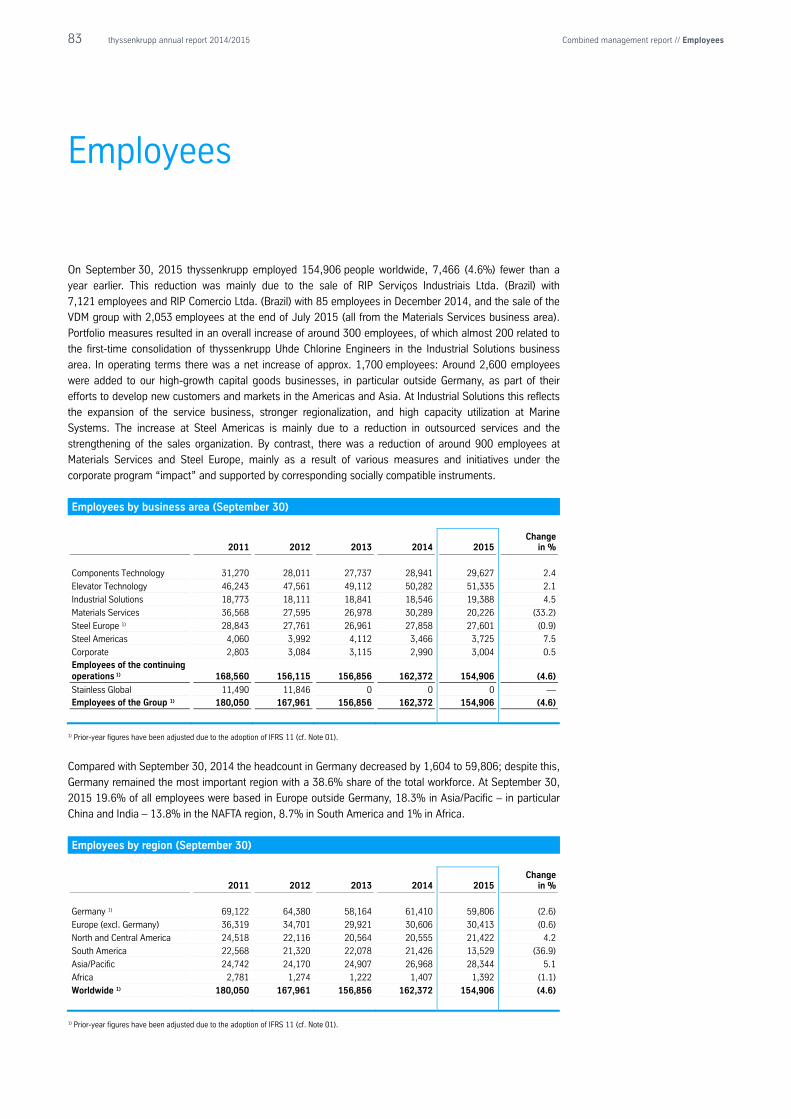
83 thyssenkrupp annual report 2014/2015 Combined management report // Employees
Employees
On September 30, 2015 thyssenkrupp employed 154,906 people worldwide, 7,466 (4.6%) fewer than a
year earlier. This reduction was mainly due to the sale of RIP Serviços Industriais Ltda. (Brazil) with
7,121 employees and RIP Comercio Ltda. (Brazil) with 85 employees in December 2014, and the sale of the
VDM group with 2,053 employees at the end of July 2015 (all from the Materials Services business area).
Portfolio measures resulted in an overall increase of around 300 employees, of which almost 200 related to
the first-time consolidation of thyssenkrupp Uhde Chlorine Engineers in the Industrial Solutions business
area. In operating terms there was a net increase of approx. 1,700 employees: Around 2,600 employees
were added to our high-growth capital goods businesses, in particular outside Germany, as part of their
efforts to develop new customers and markets in the Americas and Asia. At Industrial Solutions this reflects
the expansion of the service business, stronger regionalization, and high capacity utilization at Marine
Systems. The increase at Steel Americas is mainly due to a reduction in outsourced services and the
strengthening of the sales organization. By contrast, there was a reduction of around 900 employees at
Materials Services and Steel Europe, mainly as a result of various measures and initiatives under the
corporate program “impact” and supported by corresponding socially compatible instruments.
Employees by business area (September 30)
2011 2012 2013 2014 2015 Change
in %
Components Technology 31,270 28,011 27,737 28,941 29,627 2.4
Elevator Technology 46,243 47,561 49,112 50,282 51,335 2.1
Industrial Solutions 18,773 18,111 18,841 18,546 19,388 4.5
Materials Services 36,568 27,595 26,978 30,289 20,226 (33.2)
Steel Europe 1) 28,843 27,761 26,961 27,858 27,601 (0.9)
Steel Americas 4,060 3,992 4,112 3,466 3,725 7.5
Corporate 2,803 3,084 3,115 2,990 3,004 0.5
Employees of the continuing operations 1) 168,560 156,115 156,856 162,372 154,906 (4.6)
Stainless Global 11,490 11,846 0 0 0 — Employees of the Group 1) 180,050 167,961 156,856 162,372 154,906 (4.6)
1) Prior-year figures have been adjusted due to the adoption of IFRS 11 (cf. Note 01).
Compared with September 30, 2014 the headcount in Germany decreased by 1,604 to 59,806; despite this,
Germany remained the most important region with a 38.6% share of the total workforce. At September 30,
2015 19.6% of all employees were based in Europe outside Germany, 18.3% in Asia/Pacific – in particular
China and India – 13.8% in the NAFTA region, 8.7% in South America and 1% in Africa.
Employees by region (September 30)
2011 2012 2013 2014 2015 Change
in %
Germany 1) 69,122 64,380 58,164 61,410 59,806 (2.6)
Europe (excl. Germany) 36,319 34,701 29,921 30,606 30,413 (0.6)
North and Central America 24,518 22,116 20,564 20,555 21,422 4.2
South America 22,568 21,320 22,078 21,426 13,529 (36.9)
Asia/Pacific 24,742 24,170 24,907 26,968 28,344 5.1
Africa 2,781 1,274 1,222 1,407 1,392 (1.1)
Worldwide 1) 180,050 167,961 156,856 162,372 154,906 (4.6)
1) Prior-year figures have been adjusted due to the adoption of IFRS 11 (cf. Note 01).
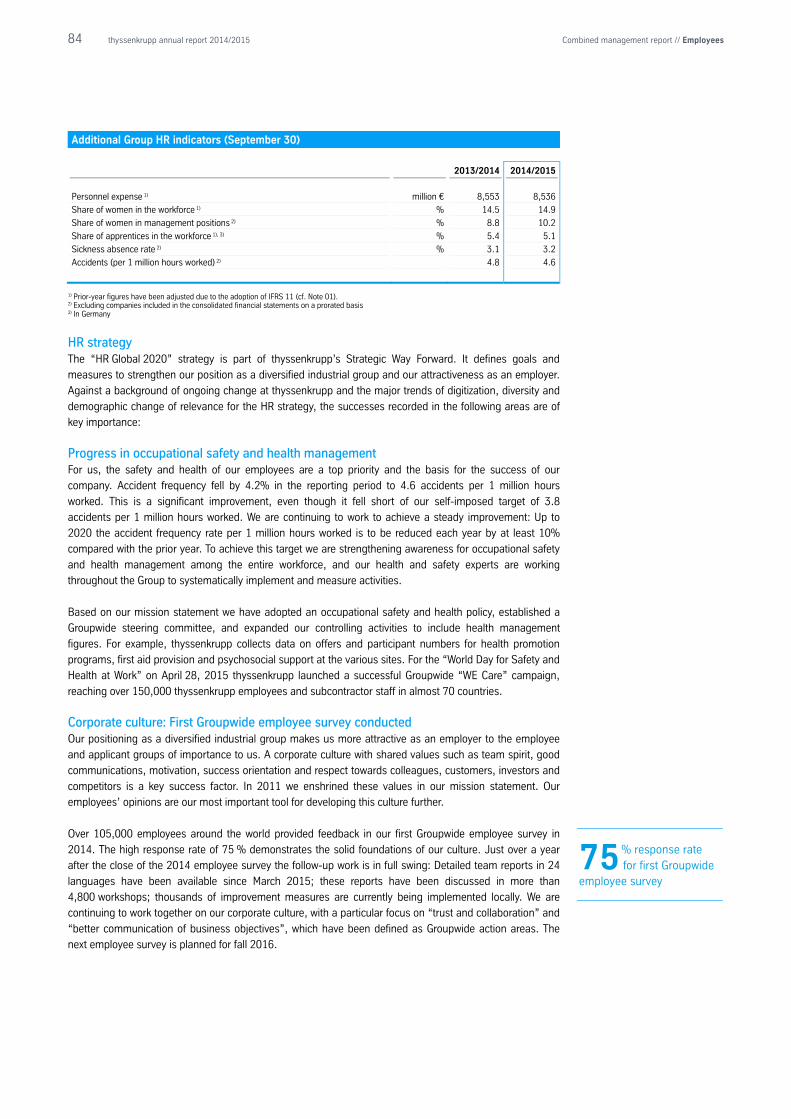
84 thyssenkrupp annual report 2014/2015 Combined management report // Employees
Additional Group HR indicators (September 30)
2013/2014 2014/2015
Personnel expense 1) million € 8,553 8,536
Share of women in the workforce 1) % 14.5 14.9
Share of women in management positions 2) % 8.8 10.2
Share of apprentices in the workforce 1), 3) % 5.4 5.1
Sickness absence rate 2) % 3.1 3.2
Accidents (per 1 million hours worked) 2) 4.8 4.6
1) Prior-year figures have been adjusted due to the adoption of IFRS 11 (cf. Note 01). 2) Excluding companies included in the consolidated financial statements on a prorated basis 3) In Germany
HR strategy The “HR Global 2020” strategy is part of thyssenkrupp’s Strategic Way Forward. It defines goals and
measures to strengthen our position as a diversified industrial group and our attractiveness as an employer.
Against a background of ongoing change at thyssenkrupp and the major trends of digitization, diversity and
demographic change of relevance for the HR strategy, the successes recorded in the following areas are of
key importance:
Progress in occupational safety and health management For us, the safety and health of our employees are a top priority and the basis for the success of our
company. Accident frequency fell by 4.2% in the reporting period to 4.6 accidents per 1 million hours
worked. This is a significant improvement, even though it fell short of our self-imposed target of 3.8
accidents per 1 million hours worked. We are continuing to work to achieve a steady improvement: Up to
2020 the accident frequency rate per 1 million hours worked is to be reduced each year by at least 10%
compared with the prior year. To achieve this target we are strengthening awareness for occupational safety
and health management among the entire workforce, and our health and safety experts are working
throughout the Group to systematically implement and measure activities.
Based on our mission statement we have adopted an occupational safety and health policy, established a
Groupwide steering committee, and expanded our controlling activities to include health management
figures. For example, thyssenkrupp collects data on offers and participant numbers for health promotion
programs, first aid provision and psychosocial support at the various sites. For the “World Day for Safety and
Health at Work” on April 28, 2015 thyssenkrupp launched a successful Groupwide “WE Care” campaign,
reaching over 150,000 thyssenkrupp employees and subcontractor staff in almost 70 countries.
Corporate culture: First Groupwide employee survey conducted Our positioning as a diversified industrial group makes us more attractive as an employer to the employee
and applicant groups of importance to us. A corporate culture with shared values such as team spirit, good
communications, motivation, success orientation and respect towards colleagues, customers, investors and
competitors is a key success factor. In 2011 we enshrined these values in our mission statement. Our
employees’ opinions are our most important tool for developing this culture further.
Over 105,000 employees around the world provided feedback in our first Groupwide employee survey in
2014. The high response rate of 75 % demonstrates the solid foundations of our culture. Just over a year
after the close of the 2014 employee survey the follow-up work is in full swing: Detailed team reports in 24
languages have been available since March 2015; these reports have been discussed in more than
4,800 workshops; thousands of improvement measures are currently being implemented locally. We are
continuing to work together on our corporate culture, with a particular focus on “trust and collaboration” and
“better communication of business objectives”, which have been defined as Groupwide action areas. The
next employee survey is planned for fall 2016.
% response rate 75 for first Groupwide employee survey

85 thyssenkrupp annual report 2014/2015 Combined management report // Employees
Training and talent development improved from a high level Employees with outstanding skills are the basis of our strong solution-providing capabilities. With this in
mind we work on systematically promoting young talents, improving our applicant management system,
providing made-to-measure training programs and developing talents throughout the Group.
Starting from a very high quality level, we continuously develop our training opportunities and make
sustainable investments in this area, for example by establishing new training centers. We have intensified
our cooperation with universities and introduced a global standard applicant management system. To
support the personal and professional development of our employees we are expanding our talent
management system. Regional talent pools provide a broader view of talents at other levels and in other
regions. In addition to developing young management potentials we also offer skill-specific training for our
experts and create transparency into the many and varied job opportunities in the Group. For example, the
thyssenkrupp Academy has created programs for functional experts. They support the reorganization of the
functional areas by imparting new work methods and the latest specialist knowledge. JOBCOMPASS,
introduced in 2014 as the Group’s internal job market, has now become established and offers new job
opportunities to all employees looking to further or change their careers.
Diversity and exchanges strengthened The success of our matrix organization is based among other things on successful cooperation across
business area boundaries. That is why starting in summer 2015 we introduced a job swap scheme under
which employees can change places with a colleague for a specified period. We are also systematically
expanding exchanges between high potentials by offering development programs which give them the
opportunity to discuss strategic challenges in the company and extend their personal networks.
Collaboration in the matrix organization is one way we promote diversity. Another is our Diversity & Inclusion
Management system. One of our goals in this area is to increase the share of women in leadership positions:
We aim to achieve 15% female representation at this level worldwide by fiscal 2019/2020. To this end we
are using completely redefined recruitment processes for top leadership positions. Our measures are taking
effect: In the past fiscal year the share of women in leadership positions rose by 1.4 percentage points to
10.2% (prior year: 8.8%). Further information on the implementation of the law on the equal participation of
women and men in leadership positions in the private and public sector can be found in the corporate
governance declaration.
Management competencies continuously enhanced Building on our established management development and assessment system thyssenkrupp PerspActive,
the thyssenkrupp Academy is helping managers develop the leadership culture in line with common values.
Here again, networks, diversity and exchange are central elements. Around 700 thyssenkrupp managers
engaged in networking activities at the Leadership Academy in the reporting year. The Leadership Academy
also provides support for strategic and cultural change projects, such as the follow-up work for the employee
survey.
Harmonization of compensation systems continued thyssenkrupp has taken a further step towards standardizing its HR processes with its compensation
system: In the reporting year, the standardized compensation system was introduced for the management
levels directly below board level in the business areas. In addition, the Long-Term Incentive plan (LTI) was
adapted for additional selected managers. The new parameters of the plan were matched up with those of
the LTI program for the Executive Board of thyssenkrupp AG. As a result, we now have a uniform system for
all eligible levels.
Share of women in management positions up percentage by +1.4 points
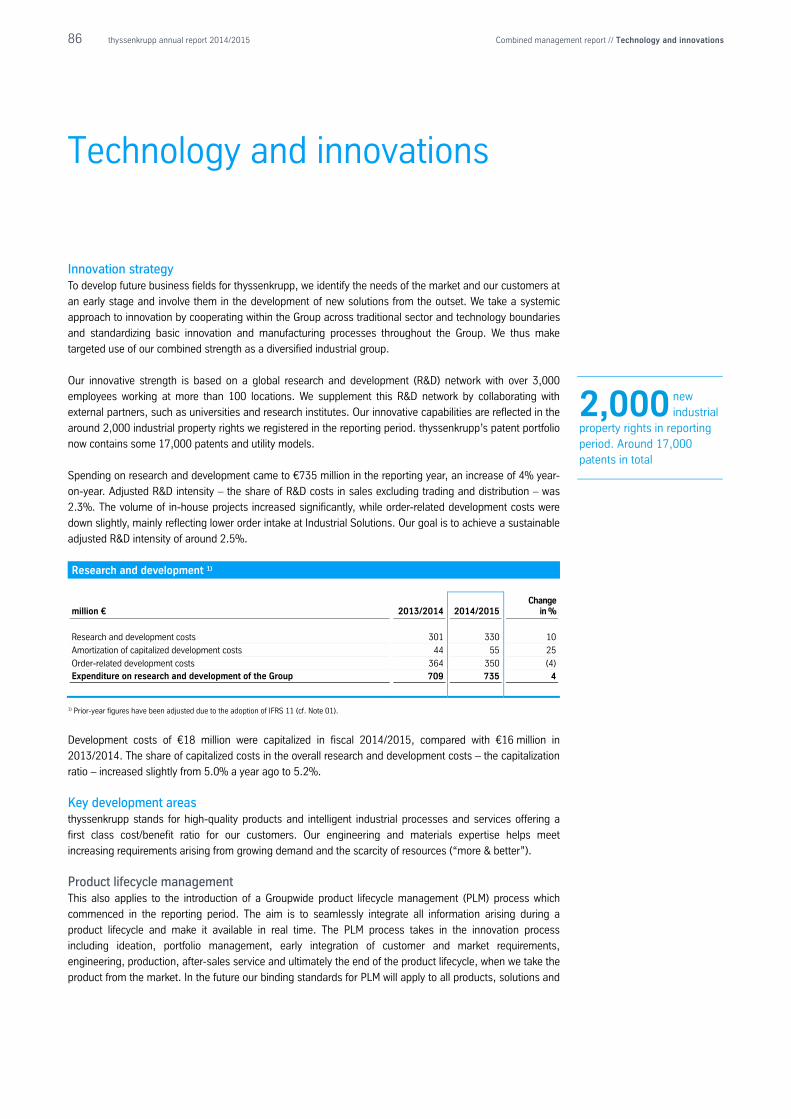
86 thyssenkrupp annual report 2014/2015 Combined management report // Technology and innovations
Technology and innovations
Innovation strategy To develop future business fields for thyssenkrupp, we identify the needs of the market and our customers at
an early stage and involve them in the development of new solutions from the outset. We take a systemic
approach to innovation by cooperating within the Group across traditional sector and technology boundaries
and standardizing basic innovation and manufacturing processes throughout the Group. We thus make
targeted use of our combined strength as a diversified industrial group.
Our innovative strength is based on a global research and development (R&D) network with over 3,000
employees working at more than 100 locations. We supplement this R&D network by collaborating with
external partners, such as universities and research institutes. Our innovative capabilities are reflected in the
around 2,000 industrial property rights we registered in the reporting period. thyssenkrupp’s patent portfolio
now contains some 17,000 patents and utility models.
Spending on research and development came to €735 million in the reporting year, an increase of 4% year-
on-year. Adjusted R&D intensity – the share of R&D costs in sales excluding trading and distribution – was
2.3%. The volume of in-house projects increased significantly, while order-related development costs were
down slightly, mainly reflecting lower order intake at Industrial Solutions. Our goal is to achieve a sustainable
adjusted R&D intensity of around 2.5%.
Research and development 1)
million € 2013/2014
2014/2015 Change
in %
Research and development costs 301 330 10
Amortization of capitalized development costs 44 55 25
Order-related development costs 364 350 (4) Expenditure on research and development of the Group 709 735 4
1) Prior-year figures have been adjusted due to the adoption of IFRS 11 (cf. Note 01).
Development costs of €18 million were capitalized in fiscal 2014/2015, compared with €16 million in
2013/2014. The share of capitalized costs in the overall research and development costs – the capitalization
ratio – increased slightly from 5.0% a year ago to 5.2%.
Key development areas thyssenkrupp stands for high-quality products and intelligent industrial processes and services offering a
first class cost/benefit ratio for our customers. Our engineering and materials expertise helps meet
increasing requirements arising from growing demand and the scarcity of resources (“more & better”).
Product lifecycle management This also applies to the introduction of a Groupwide product lifecycle management (PLM) process which
commenced in the reporting period. The aim is to seamlessly integrate all information arising during a
product lifecycle and make it available in real time. The PLM process takes in the innovation process
including ideation, portfolio management, early integration of customer and market requirements,
engineering, production, after-sales service and ultimately the end of the product lifecycle, when we take the
product from the market. In the future our binding standards for PLM will apply to all products, solutions and
new 2,000 industrial property rights in reporting period. Around 17,000 patents in total
87 thyssenkrupp annual report 2014/2015 Combined management report // Technology and innovations
services throughout the thyssenkrupp Group; the business areas will adapt them to their specific needs. This
provides the framework for a process that will enable us to harmonize and manage the stages of the product
lifecycle. It thus forms the basis for excellence in all phases of product development, engineering,
manufacturing and marketing. As a result our customers will receive products and services tailored exactly
to their requirements.
Digitization PLM is also part of thyssenkrupp’s digital transformation and one of the reference processes in the “daproh”
corporate program to harmonize data and processes throughout the Group. daproh aims to create
automated, efficient and secure business processes based on an integrated, centrally defined system
architecture. This will enable us to focus more strongly on customers, make processes leaner, utilize
knowledge and capabilities more effectively in the company, and make data available at all times worldwide.
The program improves transparency within the Group, reduces complexity, and supports operational
business management.
Industry 4.0 At the same time, PLM – alongside cross-company data sharing and the monitoring of all production data,
which are also part of the “daproh” program – is one of the three main elements of implementing Industry
4.0 at thyssenkrupp. By connecting all areas involved in value creation, all relevant information is available
at all times. thyssenkrupp has already launched numerous Industry 4.0 solutions in its business areas. For
example, the steel supply and distribution logistics department at the Hagen-Hohenlimburg site has a data
network covering all customers, producers and suppliers: This solution gives customers direct access to the
production data and enables them to modify the required product properties until shortly before production
commences. In the camshaft production facility at our Ilsenburg site, machines and workpieces are digitally
connected and can communicate manufacturing information automatically. This boosts production quality
and flexibility and reduces costs. Elevator Technology uses elevator sensors that send their data directly to
the cloud. These data are processed and made available to the service engineers, permitting them to carry
out predictive maintenance and repairs and thus significantly enhancing the business area’s services.
Innovation foresight process In the reporting period thyssenkrupp also initiated an innovation foresight process to identify future customer
and market requirements. This process is to be permanently established in the Group. We aim to use it on a
regular basis to develop scenarios reaching more than 20 years into the future on which we can then base
our long-term research and development strategy. Innovation foresight is a reliable and established method
of studying the future.
Carbon2Chem The long-term aim of our collaborative cross-sector project Carbon2Chem is to use the steel mill gases from
our Duisburg plant to produce chemicals. Alongside carbon monoxide (CO), hydrogen and methane, this
also includes the carbon dioxide (CO2) contained in the steel mill gases. The chemical processes are to be
powered by excess electricity from renewable sources. Partners in the project include the Max Planck
Institute for Chemical Energy Conversion in Mülheim an der Ruhr, other research facilities, and leading
companies from the chemical and energy sectors. The state of North Rhine-Westphalia will also be involved
in this long-term project. The project has the potential to help make the energy transition to renewables a
success and sustainably reduce the cumulative CO2 emissions of the industrial network. Last fiscal year an
area of the thyssenkrupp Steel Europe site was prepared for the construction of a technical center. The aim
is to collect operating experience with real steel mill gases, test the scrubbing of large quantities of steel mill
gases and investigate various catalysts.
Numerous Industry 4.0 solutions launched in the business areas
88 thyssenkrupp annual report 2014/2015 Combined management report // Technology and innovations
Innovations in the business areas Last fiscal year saw the continuation of the global marketing offensive for our collaborative project
InCar®plus, in which the business areas Components Technology, Steel Europe and Industrial Solutions
are involved. InCar®plus is currently the biggest OEM-independent development project by an automotive
supplier and brings together the entire automotive knowledge of the thyssenkrupp Group. Initially the results
and potential of the project were presented to OEMs in Europe as part of a technology roadshow; this was
followed by presentations to auto manufacturers in the USA and China. Customer feedback has been
positive, and the first orders for InCar®plus solutions have already been received.
The Components Technology business area opened one of the world’s most advanced testing and
development centers for slewing ring technology in Lippstadt, Germany. Slewing rings for wind turbines with
an output of up to 10 MW are tested here. This strengthens thyssenkrupp’s slewing ring development
capabilities for customers in the wind industry and the general engineering sector.
In Gijón, Spain, Elevator Technology presented a fully functional 1:3 scale model of the new MULTI
elevator. Based on Transrapid technology we have developed a cable-free elevator system in which cabs
can move not only vertically but also horizontally. Several cabs can operate independently in one shaft,
increasing shaft transportation capacity by up to 50%. The space needed for elevators in the building can be
reduced by the same amount. The ACCEL moving walk is also based on the linear motor technology of the
Transrapid. The system offers high capacity and speed – even over short distances, with no waiting times
for passengers. ACCEL transports up to 30% more people than conventional moving walks and can shorten
transfer times between airport terminals by up to a third. Both projects are examples of the systematic
utilization of synergies in our diversified technology group.
Thanks to an innovation program, Industrial Solutions has significantly improved the energy efficiency of
ammonia plants. These plants are part of a production chain for the manufacture of fertilizers based on
natural gas, a technology in which we lead the way worldwide. The new approach includes using the high
efficiency of a gas turbine to power machines. Moreover, the heat created is used to generate steam. This
enables us to significantly reduce the specific energy requirements for the production of urea, which is used
among other things as a fertilizer.
From early 2017 the pressureless water electrolysis system developed by Industrial Solutions as an energy
storage technology will be ready for market. With renewable energies gaining an ever stronger foothold, the
global market for such solutions is growing rapidly. But the amounts of energy generated from wind and
solar power can fluctuate sharply. Energy storage solutions such as water electrolysis can balance out low-
generation phases. In this technology, electricity is passed through water, breaking the water down into
hydrogen and oxygen. The hydrogen can be stored as a fuel and when required converted back into
electricity and used for fuel cell drives or to produce other chemicals. In developing the pressureless water
electrolysis process, we benefited from our many years of experience with chlor-alkali electrolysis, for which
very similar components are used.
Redox flow batteries are another key development in the area of energy storage systems. In this technology,
electricity is stored as chemical energy in two tanks containing salts dissolved in inorganic acids. The two
tanks are connected to electrochemical cells that convert electricity into chemical energy or chemical energy
into electricity.
Redox flow batteries can respond very flexibly to the supply situation, switching from storage to discharge in
fractions of a second. A further advantage: The amount of electricity stored is scalable. The bigger the
tanks, the more electricity can be stored. The power output of the batteries depends on the size of the active
electrode area. To date, this active area is around 0.4 m2.
Transportation capacity increased by up to 50%
89 thyssenkrupp annual report 2014/2015 Combined management report // Technology and innovations
Industrial Solutions’ aim is to achieve a cell area of more than 2.5 m2. This would allow the construction of
an industrial storage system with an output of 20 MW and a capacity of 200 MWh. At the same time, output-
related costs for energy storage would be reduced to at least a third.
The use of e-commerce is growing steadily. Materials Services is actively involved in this change and offers
its customers mature digital solutions. “Online Metals” is an online shop launched in the USA back in 2007.
The successful concept is now being rolled out to Europe.
Materials Services uses its digital business strategy to supplement its existing distribution structures: The
business area is pursuing a dual approach targeting existing and new customer groups. For example, online
portals are already available to customers for materials in Germany and for plastics. The next step will be the
launch of an online shop for small businesses and end customers in selected European countries.
In this way Materials Services is underlining its role as a pioneer in the sector and adding digital distribution
channels to its existing range and infrastructure. Efficient logistics is essential for this: In-house warehouse
and service centers allow individual customer requirements to be met in full. With its digital services,
Materials Services plans to grow faster than the market.
The composite TriBond®, a groundbreaking innovation from Steel Europe, was developed to production
readiness in the reporting year. The three-layer material has a high-strength steel core enclosed by outer
layers of readily formable steel. This allows different and in part contradictory properties to be realized that
would not be possible in homogeneous materials: high ductility and maximum strength in one product.
TriBond® enhances vehicle safety while at the same time reducing weight, which improves cost efficiency.
thyssenkrupp is the only automotive supplier capable of offering production-ready tailored steel composites
of this kind.
To better utilize wind power, Steel Europe has developed an innovative concept for wind turbine towers with
hub heights of 120 to 200 m under the project name “TetraFlex”. At increasing heights, the wind is both
stronger and more constant, allowing a significant increase in the amount of electricity generated. The
concept is focused on substantially reducing the costs of production, transportation, assembly and
disassembly of the towers. TetraFlex uses spiral welded tubes joined together by means of innovative nodes.
Compared with conventional towers, we achieve significant weight reductions by replacing the closed
structure of the lower tower area with four tube profiles. We are currently investigating possible cooperation
with manufacturers from the wind energy sector.
Achieve a cell area of more than 2.5 m2
90 thyssenkrupp annual report 2014/2015 Combined management report // Environment, climate and energy
Environment, climate and energy
By continuously developing its environmental and energy management systems, thyssenkrupp aims to
improve its energy and resource efficiency and minimize environmental impact. In this we hold ourselves to
the highest standards.
Environmental and climate protection Our sites around the world utilize state-of-the-art environmental protection technologies. We invest regularly
in equipment such as dust filters, wastewater treatment facilities and oil separators, and optimize the
emissions of our vehicle fleets. Ongoing expenditure on air pollution control, waste management, water and
soil protection, noise control and nature conservation came to €486 million in the reporting year.
Our binding target for environmental protection is for all Group companies with environmentally relevant
operations to have implemented an environmental management system in line with the international
standard ISO 14001 by the 2019/2020 fiscal year. This means that environmental protection at our sites is
continuously developed in line with the requirements of this standard. This internal target currently applies to
over 70 companies, more than three quarters of which already comply with the standard. More than 50% of
thyssenkrupp’s total workforce is already covered by ISO 14001.
Regular audits and examinations are also carried out to ensure compliance with other relevant requirements
and regulations. Under the EU Emissions Trading System (ETS), extensive CO2 monitoring systems have
been installed at the sites concerned. In calendar year 2014, CO2 emissions governed by emissions trading
amounted to around 18.9 million tons. For the same period we were allocated emission allowances for 18.7
million tons.
Energy efficiency The efficient use of resources and energy is a key competitive factor for thyssenkrupp. The Groupwide
Energy Efficiency Program (GEEP) is aimed at achieving sustainable efficiency gains of 3.5 TWh by fiscal
2019/2020. Since the launch of the program in 2013/2014 gains of 2.2 TWh have already been achieved
through site-related projects, e.g. improved utilization of waste heat, reduction of standby times, and
replacement of plant components. A major contribution has been made by the Steel Americas and Steel
Europe business areas: The efficiency gains achieved can avoid around 0.8 million tons of CO2 emissions
per year. To support this continuous improvement process regular efficiency and benchmark analyses and
expert workshops are carried out as part of GEEP, for example annual Energy Efficiency Days.
The basis and prerequisite for these efficiency gains is systematic energy management in our production
and service processes. Group companies with relevant energy consumption must therefore additionally align
their energy management with the requirements of the ambitious ISO 50001 standard, again by fiscal
2019/2020. Of the more than 50 companies concerned, a quarter already met these requirements in the
reporting year. Related to annual energy consumption, ISO 50001 is roughly two thirds implemented.
Further information on environment, climate and energy can be found in the opportunity and risk report and
on our website.
2.2 TWh efficiency gains through GEEP
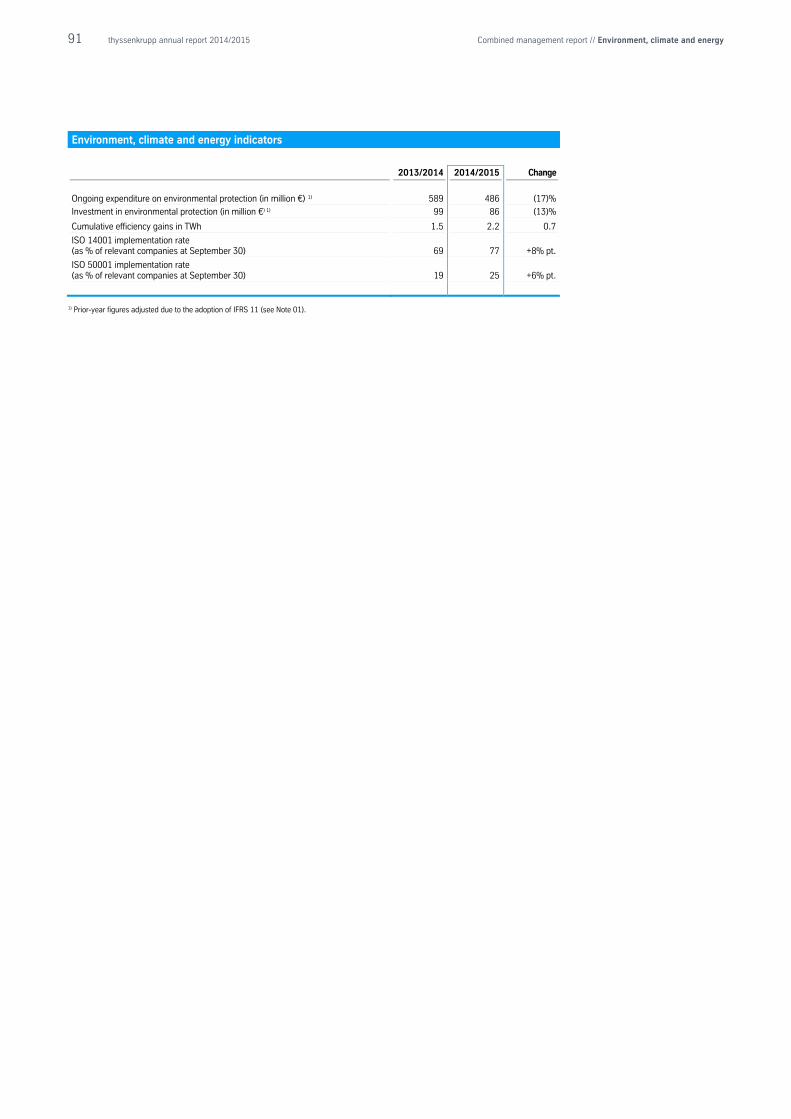
91 thyssenkrupp annual report 2014/2015 Combined management report // Environment, climate and energy
Environment, climate and energy indicators
2013/2014 2014/2015 Change
Ongoing expenditure on environmental protection (in million €) 1) 589 486 (17)%
Investment in environmental protection (in million €) 1) 99 86 (13)%
Cumulative efficiency gains in TWh 1.5 2.2 0.7
ISO 14001 implementation rate (as % of relevant companies at September 30) 69 77 +8% pt.
ISO 50001 implementation rate (as % of relevant companies at September 30) 19 25 +6% pt.
1) Prior-year figures adjusted due to the adoption of IFRS 11 (see Note 01).
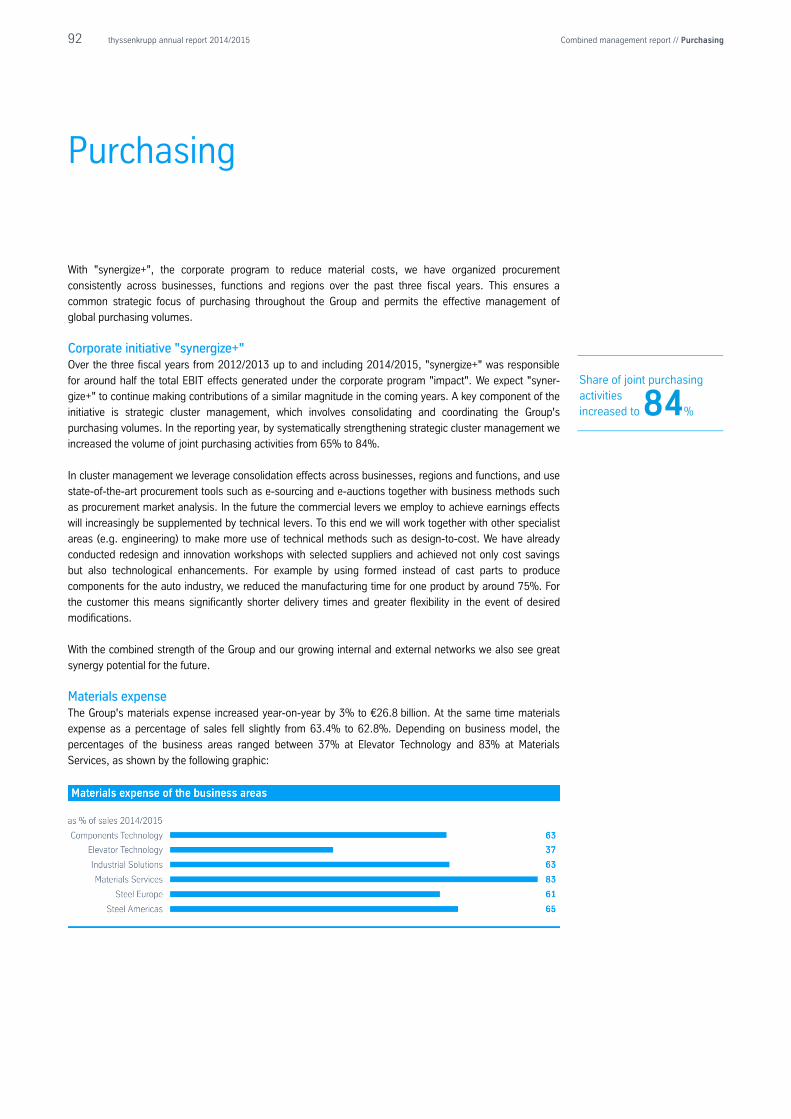
92 thyssenkrupp annual report 2014/2015 Combined management report // Purchasing
Purchasing
With "synergize+", the corporate program to reduce material costs, we have organized procurement
consistently across businesses, functions and regions over the past three fiscal years. This ensures a
common strategic focus of purchasing throughout the Group and permits the effective management of
global purchasing volumes.
Corporate initiative "synergize+" Over the three fiscal years from 2012/2013 up to and including 2014/2015, "synergize+" was responsible
for around half the total EBIT effects generated under the corporate program "impact". We expect "syner-
gize+" to continue making contributions of a similar magnitude in the coming years. A key component of the
initiative is strategic cluster management, which involves consolidating and coordinating the Group's
purchasing volumes. In the reporting year, by systematically strengthening strategic cluster management we
increased the volume of joint purchasing activities from 65% to 84%.
In cluster management we leverage consolidation effects across businesses, regions and functions, and use
state-of-the-art procurement tools such as e-sourcing and e-auctions together with business methods such
as procurement market analysis. In the future the commercial levers we employ to achieve earnings effects
will increasingly be supplemented by technical levers. To this end we will work together with other specialist
areas (e.g. engineering) to make more use of technical methods such as design-to-cost. We have already
conducted redesign and innovation workshops with selected suppliers and achieved not only cost savings
but also technological enhancements. For example by using formed instead of cast parts to produce
components for the auto industry, we reduced the manufacturing time for one product by around 75%. For
the customer this means significantly shorter delivery times and greater flexibility in the event of desired
modifications.
With the combined strength of the Group and our growing internal and external networks we also see great
synergy potential for the future.
Materials expense The Group's materials expense increased year-on-year by 3% to €26.8 billion. At the same time materials
expense as a percentage of sales fell slightly from 63.4% to 62.8%. Depending on business model, the
percentages of the business areas ranged between 37% at Elevator Technology and 83% at Materials
Services, as shown by the following graphic:
Share of joint purchasing activities increased to 84%
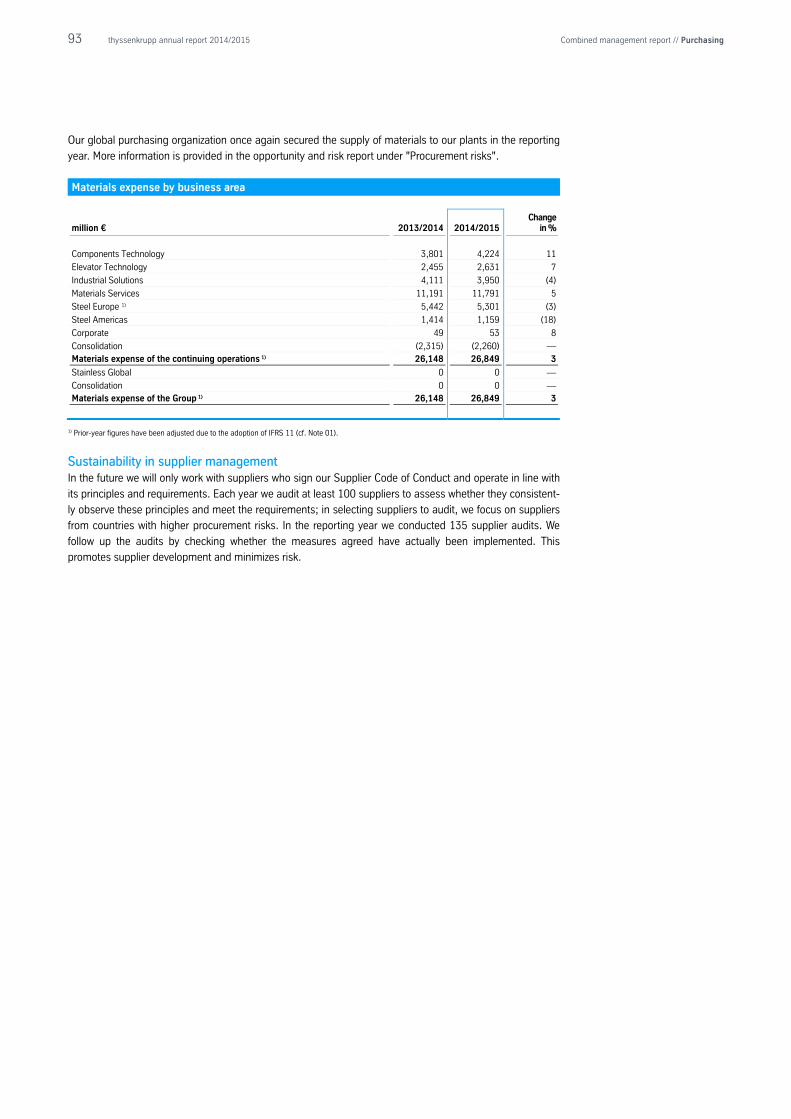
93 thyssenkrupp annual report 2014/2015 Combined management report // Purchasing
Our global purchasing organization once again secured the supply of materials to our plants in the reporting
year. More information is provided in the opportunity and risk report under "Procurement risks".
Materials expense by business area
million € 2013/2014
2014/2015 Change
in %
Components Technology 3,801 4,224 11
Elevator Technology 2,455 2,631 7
Industrial Solutions 4,111 3,950 (4)
Materials Services 11,191 11,791 5
Steel Europe 1) 5,442 5,301 (3)
Steel Americas 1,414 1,159 (18)
Corporate 49 53 8
Consolidation (2,315) (2,260) — Materials expense of the continuing operations 1) 26,148 26,849 3
Stainless Global 0 0 —
Consolidation 0 0 — Materials expense of the Group 1) 26,148 26,849 3
1) Prior-year figures have been adjusted due to the adoption of IFRS 11 (cf. Note 01).
Sustainability in supplier management In the future we will only work with suppliers who sign our Supplier Code of Conduct and operate in line with
its principles and requirements. Each year we audit at least 100 suppliers to assess whether they consistent-
ly observe these principles and meet the requirements; in selecting suppliers to audit, we focus on suppliers
from countries with higher procurement risks. In the reporting year we conducted 135 supplier audits. We
follow up the audits by checking whether the measures agreed have actually been implemented. This
promotes supplier development and minimizes risk.
94 thyssenkrupp annual report 2014/2015 Combined management report // Subsequent events
Subsequent events
No reportable events occurred between the end of the reporting year (September 30, 2015) and the date of
authorization for issuance (November 17, 2015).
95 thyssenkrupp annual report 2014/2015 Combined management report // Forecast, opportunity and risk report // 2015/2016 forecast
Forecast, opportunity and risk report
2015/2016 forecast
Overall assessment by the Executive Board Overall we expect that further progress on our Strategic Way Forward will again be reflected in our key
performance indicators in the 2015/2016 fiscal year. However it must be kept in mind that the economic
climate is marked by great uncertainty and as a result visibility does not extend much beyond a quarter for
large parts of our materials and components businesses. Import pressure on the materials markets
especially from Asia is a particular cause for concern. In view of volatile energy and raw material prices, our
customers in plant engineering continue to be reluctant to award major projects. At present the VW
emissions crisis is not having any negative effects on volumes of orders for automobile components or
materials; however the price pressure is likely to increase as a result of the cost reduction programs already
announced but this cannot yet be quantified precisely. Overall we feel it appropriate to take a cautious view
of developments in the 2015/2016 fiscal year. We expect a significant increase in net income and tkVA, FCF
before M&A level with the prior year, and adjusted EBIT of between €1.6 billion and €1.9 billion. We consider
a forecast corridor appropriate for adjusted EBIT on account of the major uncertainties on the materials
markets with in our view unsustainable import pressure. The efficiency measures under "impact" will again
be key to meeting our targets in the current fiscal year: for 2015/2016 we once more aim to achieve EBIT
effects of €850 million under "impact" which will counter the market effects described above, create the
basis for profitable growth in our elevator business and open up scope for necessary measures to make our
IT infrastructure and process landscape fit for purpose moving forward.
Key assumptions The expected improvement in our key performance indicators is predicated on the assumption that there will
be no further escalation of the geopolitical crises, and the weak economic momentum in the emerging
countries will not lead to any major setbacks or growth slumps which would have a significant negative
impact on the global economy.
For the fiscal year just started we assume a continuation of the current trends: at best moderate growth in
the euro zone, weak growth overall in the emerging economies, and a stable US economy.
We expect global demand for steel to stabilize, with moderate low single-digit percent growth in both Europe
and the USA. Demand is expected to bottom out at a low level in Brazil, and decline further in China. Import
pressure above all from Asia will likely weigh heavily on the European steel market. We assume there will be
no further major dislocations on the raw materials markets and competition will remain intense.
Against a background of high uncertainties, global automotive output should increase further. After only very
moderate growth in 2015 and with the support of government incentives, output in China is expected to pick
up again slightly. Production in the USA and Western Europe as a whole will probably also increase. For
Germany we expect a sideways movement. After a steep decline in 2015, auto production in Brazil is likely to
decrease further in the forecast period – albeit at a slower rate.
We aim to achieve EBIT effects of 850 million under “impact”
96 thyssenkrupp annual report 2014/2015 Combined management report // Forecast, opportunity and risk report // 2015/2016 forecast
We currently do not expect the VW emissions crisis to have any major negative impact on sales of our
automotive components or materials; however price pressure is likely to increase as a result of the cost
reduction programs already announced.
The high order backlog with good earnings quality at Elevator Technology and Industrial Solutions already
secures their sales well into the next fiscal year.
More information on expected future economic developments can be found in the section "Macro and sector
environment" in the report on the economic position.
2015/2016 forecast: Clear increase in net income and tkVA; adjusted EBIT between €1.6 billion and €1.9 billion; FCF before M&A at prior-year level In the following we describe the expected developments for thyssenkrupp in the 2015/2016 fiscal year
based on the above assumptions. The forecast and the pro-forma comparative prior-year figure for tkVA are
based on the updated weighted average cost of capital for the Group. In addition, we now use FCF before
M&A as our liquidity-based key performance indicator. More information on the adjustment to weighted
average cost of capital and the key performance indicators is provided under "Management of the Group" in
the section "Fundamental information about the Group".
On a comparable basis the Group's sales are expected to be level with the prior year (prior year: €42.8 billion).
In the capital goods businesses we predict organic growth at a single-digit percentage rate at Components
Technology and Elevator Technology and a largely sideways movement at Industrial Solutions. In the materials
businesses sales will likely be weaker due to high import pressure.
The Group's adjusted EBIT is expected to be between €1.6 billion and €1.9 billion (prior year:
€1,676 million). We consider a forecast corridor appropriate on account of the major uncertainties on the
materials markets with in our view unsustainable import pressure. €850 million planned EBIT effects from
"impact" will counter the market effects described above, create the basis for profitable growth in the
elevator business, and open up scope for necessary measures to secure the future of the Group.
• Capital goods businesses
- Despite strong price and margin pressure, we expect adjusted EBIT at Components Technology to
come in at least level with the prior year (prior year: €313 million) as a result of further progress with
the ramp-up of the new plants and efficiency programs.
- At Elevator Technology we expect an improvement in adjusted EBIT from sales growth and also an
increase in EBIT margin by 0.5 to 0.7 percentage points from restructuring and efficiency measures
(prior year: €794 million; 11.0%).
- At Industrial Solutions we expect sales, margin and therefore adjusted EBIT to come in at the prior-year
level (prior year: €424 million).
• Materials businesses
- At Materials Services we are striving for adjusted EBIT at the prior-year level (prior year: €206 million).
Earnings impacts from the strike at AST in the prior year, which will not be a factor in the new fiscal
year, and progress with the restructuring and efficiency programs and sales initiatives should counter-
act the margin pressure on the materials markets and offset the loss of income from divested opera-
tions.
- At Steel Europe we are striving for earnings at the prior-year level in a steel market characterized by
high import and margin pressure. The rigorous continuation of efficiency measures and differentiation
initiatives will offset the considerable negative market effects (prior year: €492 million).
Adjusted EBIT between €1.6 billion and €1.9 billion
97 thyssenkrupp annual report 2014/2015 Combined management report // Forecast, opportunity and risk report // 2015/2016 forecast
- In a weak Brazilian steel market and difficult price environment, we are striving for adjusted EBIT at
Steel Americas to be steady with the prior year as a result of operational progress and efficiency pro-
grams, subject to exchange-rate effects at the closing date (prior year: €(138) million).
It remains our goal to strengthen equity with clearly positive net income; for fiscal 2015/2016 we again
expect a significant year-on-year improvement – due in part to a reduced impact from special items (prior
year: €268 million).
The Group's tkVA is therefore also expected to show a clear improvement (prior year: €(238) million).
We are working hard to improve cash generation from operating activities on a sustainable basis; in a
deteriorating climate we aim to achieve FCF before M&A at the prior-year level (prior year: €115 million).
Capital spending in the Group is expected to come to around €1.5 billion in the current fiscal year (prior
year: €1,235 million; net of cash acquired in connection with the increase in Elevator Technology's stake in
Marohn Elevator and the first-time consolidation of thyssenkrupp Uhde Chlorine Engineers at Industrial
Solutions, capital spending amounted to €1,335 million).
We will take into account the development of our key performance indicators and progress with the
implementation of the Strategic Way Forward – also keeping in mind economic justifiability – in our dividend
proposal to the Annual General Meeting.
98 thyssenkrupp annual report 2014/2015 Combined management report // Forecast, opportunity and risk report // Opportunity and risk report
Opportunity and risk report
Opportunities
Overall assessment by the Executive Board: thyssenkrupp with opportunities as a diversified industrial group For thyssenkrupp as a diversified industrial group, considerable opportunities arise from our increasing
focus on high-earning capital goods and service businesses, which compared with our materials businesses
are less volatile and capital-intensive, and on the global growth regions and sectors. Significant
opportunities also arise from the implementation of the "impact" measures and profitable growth in the
business areas. At the same time major opportunities are opening up as a result of targeted Groupwide
initiatives and the consistent and systematic exploitation of the Group's economies of scope.
Definitions thyssenkrupp defines opportunities as events or developments that enhance our ability to exceed the
Group’s targets. Opportunity management encompasses all measures to support the systematic and
transparent management of opportunities. Through integration of the planning and reporting processes in
controlling with the strategy processes, opportunity management is an important element of the strategic
and value-based management of the Group.
Opportunity management process In the Strategic Dialogue, a structured, standardized Groupwide process at thyssenkrupp, strategies
including opportunities and risks arising from relevant market and technology trends are systematically and
comprehensively discussed each year in all business areas. Close integration with the Strategic Dialogue
means that opportunity management too is based on a strategic medium to long term approach in some
cases going far beyond the forecast period.
Following on from the Strategic Dialogue, all business areas record opportunities and risks in operational
plans and monthly reports to facilitate assessment of the current earnings and liquidity situation of the
individual businesses. The graphic “Opportunity and risk reporting at thyssenkrupp” in the risk report shows
how these report elements are integrated in the standard reporting system
In addition, we systematically analyze the regions in which the biggest opportunities exist for thyssenkrupp
in the future. We increase and consolidate our cross-business regional activities in these regions.
The management of our opportunities is a task shared by all the Group’s decision makers – from the
Executive Board of thyssenkrupp AG to the business area management boards and managements of the
Group companies through to regional officers and project leaders with market responsibility. Roles and
responsibilities within the thyssenkrupp matrix organization are clearly defined and demarcated. This
structured involvement of numerous experts in decision-making processes in the Group ensures that
opportunities are reliably identified and systematically exploited.
Strategic opportunities for the Group In addition to internal improvements, the Group’s Strategic Way Forward is based on the factors driving
global growth now and in the future. In a volatile environment we continuously evolve our company in order
to meet the global challenges of the future with competitive solutions. In making our decisions we look at
where the Group can profit from the global trends of demographic change, urbanization, globalization and
digitization, while taking account of constraints such as the finite nature of natural resources.
99 thyssenkrupp annual report 2014/2015 Combined management report // Forecast, opportunity and risk report // Opportunity and risk report
As well as optimizing the performance of each of our six business areas, we as a Group see opportunities
particularly in economies of scope created by the interplay between the business areas, our regions, and the
corporate functions. This applies not only to joint efforts to develop regions and customer sectors, and
efficiency factors such as purchasing, the harmonization of business processes and the standardization of
our IT infrastructure, but also to the integrated management of research and development. Our overriding
goal and also our greatest opportunity lies in developing new products on the basis of a precise
understanding of our customers' needs so as to create real added value with an attractive cost-benefit ratio
for ourselves and our partners.
Advancing digitization means that previously separate value chains are increasingly converging. New
products, services and business models are surfacing which can be developed best within a mix of different
capabilities. thyssenkrupp with its diverse technologies has a structural advantage here. Current joint
innovations such as MULTI, which is setting new standards in elevator technology, or the cross-sector project
Carbon2Chem are only possible in this form thanks to the different capabilities combined within
thyssenkrupp. Details of these and other innovations are contained in the section "Technology and
Innovations".
Our corporate program "impact" continues to form the framework for our Strategic Way Forward and plays a
major role – together with business and theme-specific programs – in increasing the efficiency of the Group
and reducing costs across all business areas and corporate functions.
Details of our corporate strategy including "impact" are contained in the section “Fundamental information
about the Group”, subsection “Strategic Way Forward”.
In our development projects we are also always guided by the Group’s financial scope. Unfavorable
economic conditions may result in delays or compromises in implementing existing opportunities. More on
this and on other risks can be found in the risk report
Operational opportunities of the business areas Components Technology – Growing global demand for personal mobility and freight transportation is the
key factor for the business area's future business performance. For us as a major engineering partner and
component and module supplier to the auto industry, growth opportunities are arising in these sectors
worldwide. This applies particularly to the emerging markets in Asia and the Americas. With new production
sites we have positioned ourselves well in these markets. Our products can support the global trend towards
efficient and environmentally friendly mobility. Challenging political targets worldwide to reduce CO2
emissions in the auto sector add to this need. In the relevant areas of weight reduction and optimization of
internal combustion engines, we offer our customers in the car and truck sector state-of-the-art solutions
and are working to extend our lead.
In the wind industry there is enormous growth potential in both the onshore and offshore sectors. Wind
power is one of the fastest growing renewable energy forms in the world. In Europe this trend is supported
by mandatory renewable energy targets set by the EU. The technological trend towards ever bigger and
more efficient turbines reinforces the need for high-performance components, which we serve with our
global production network.
If the relevant markets and sectors (particularly the automotive markets), our efficiency or growth programs
or the ramp-up of our new plants perform better than expected, the forecasts for our key performance
indicators could be moderately exceeded.
Elevator Technology – The Elevator Technology business area is one of the world’s leading suppliers of
people moving systems. The markets for elevators, escalators, moving walks, passenger boarding bridges
and stair and platform lifts offer attractive growth and profit opportunities in times of increasing globalization
and urbanization. With our broad product range, which includes standard systems, custom solutions as well
as full service and modernization packages, and our local presence with around 50,000 employees at over
900 locations, the business area can open up new market and customer opportunities around the world.
100 thyssenkrupp annual report 2014/2015 Combined management report // Forecast, opportunity and risk report // Opportunity and risk report
Our innovative products meet the highest technological and ecological standards. In addition,
implementation of the measures defined under the "impact" program will continuously improve efficiency
and further increase the competitiveness of Elevator Technology.
If the global economy (particularly the construction sector) or our efficiency or growth programs perform
better than expected, the forecasts for our key performance indicators could be moderately exceeded.
Industrial Solutions – Despite the deterioration of the investment climate due to the current oil price slump,
growing competition and political uncertainties on the relevant markets, we see global growth opportunities
for the Industrial Solutions business area in turnkey engineering and services if we continue to advance our
innovative technologies. To increase competitiveness and exploit global growth opportunities in our markets
even more effectively we are driving forward the regionalization of our business. We are continuously
standardizing and optimizing our project management methods. In the marine sector export projects provide
a continuing bright market outlook for submarines. Our high order backlog gives us a strong workload and
the opportunity to further develop our core products.
If the relevant markets and sectors, the efficiency or growth programs, the investment activity of our
customers or the order situation perform better than expected, the forecasts for our key performance
indicators could be moderately exceeded.
Materials Services – Services are gaining further importance for Materials Services as producers and
processors focus more strongly on their core business. Higher service shares generally offer Materials
Services increased profitability in a volatile materials market. Opportunities for the business area therefore
arise from customer orientation, specific market and sector know-how, global connections and broad
expertise in project management.
Under the "impact" program Materials Services has defined extensive measures to further improve the cost
situation. Operational opportunities will derive from the consistent implementation of the corresponding
sales and service initiatives and the systematic digitization of business processes through to the
establishment and operation of online shops for various target groups. In addition the further
implementation of the restructuring and optimization programs for AST with regard to production,
purchasing, organizational structure, personnel and sales will be of major importance for the business area.
Significant success was already being seen in the reporting year. Additional opportunities will be created by
numerous new initiatives aimed at better exploiting market potential.
If the relevant materials markets, the efficiency and restructuring programs or the sales initiatives perform
better than expected, the forecasts for our key performance indicators could be moderately exceeded.
Steel Europe – The Steel Europe business area is focused on the market for premium flat carbon steel, the
performance of which mainly depends on economic activity in Europe.
The efficiency measures and differentiation initiatives to secure and improve the earnings situation which
have been successfully ongoing for several years are being vigorously continued.
In addition the technological capabilities of the business area are being further strengthened by targeted
investment projects, which will enable us to optimize our product and customer portfolio.
101 thyssenkrupp annual report 2014/2015 Combined management report // Forecast, opportunity and risk report // Opportunity and risk report
Overall, even in a difficult market environment the business area is well placed to participate sustainably in
the major global trends of urbanization, increasing mobility and more efficient use of scarce resources – all
of which require the use of intelligent steel products.
If the efficiency or differentiation initiatives or the relevant steel market environment perform better than
expected and in particular import pressure weakens, the forecasts for our key performance indicators could
be moderately exceeded.
Steel Americas – We are confident that the stabilization of operational processes will continue in the coming
year, further reducing operational risks in the business area. The further optimization of sales activities
should result in deeper penetration of the Brazilian and international slab markets. This will create further
sales opportunities and support the step-by-step ramp-up of production towards nominal capacity.
The corporate performance program "impact" with its many efficiency measures and the Group’s purchasing
program "synergize+" are being vigorously implemented at CSA in Brazil, so the trend towards further
improving operational performance should continue in the coming year. In addition, positive effects are
expected from stronger technical cooperation with the Steel Europe business area.
If the relevant steel market environment (particularly hot strip prices in the USA and global and Brazilian slab
prices), the operational performance improvement or the exchange rates perform better than expected, the
forecasts for our key performance indicators could be moderately exceeded.
Risks
Overall assessment by the Executive Board: Risks at thyssenkrupp further reduced, existence of the Group secured In the reporting year the Group's risk profile continued to improve; a major factor was the closure of the
"auto steel" cartel investigation. Transparent and systematic risk management with structured processes
ensured risks in the Group were efficiently managed.
From the current perspective the Group’s risks are contained and there are no risks that threaten the Group’s
ability to continue as a going concern.
Definitions thyssenkrupp defines risk as events or developments that reduce our ability to achieve the Group’s goals.
Risk management encompasses all measures involved in the systematic and transparent management of
risks. With its integral link to planning and reporting processes in controlling, risk management is an
important element of the value-based management of the Group and goes far beyond the early identification
of risks required by law. Efficient, forward-looking risk management therefore also serves the interests of
capital providers and other stakeholders.
We continuously enhance the Group's risk management system by following the internationally recognized
COSO model and integrating it with the Internal Control System. We promptly implement requirements and
suggestions of the Executive Board and the Supervisory Board Audit Committee.
Standardized risk management processes ensure that the Executive Board and Supervisory Board are
informed promptly and in a structured way about the Group’s current risk situation. However, despite
comprehensive risk analysis, the occurrence of risks cannot be systematically ruled out.
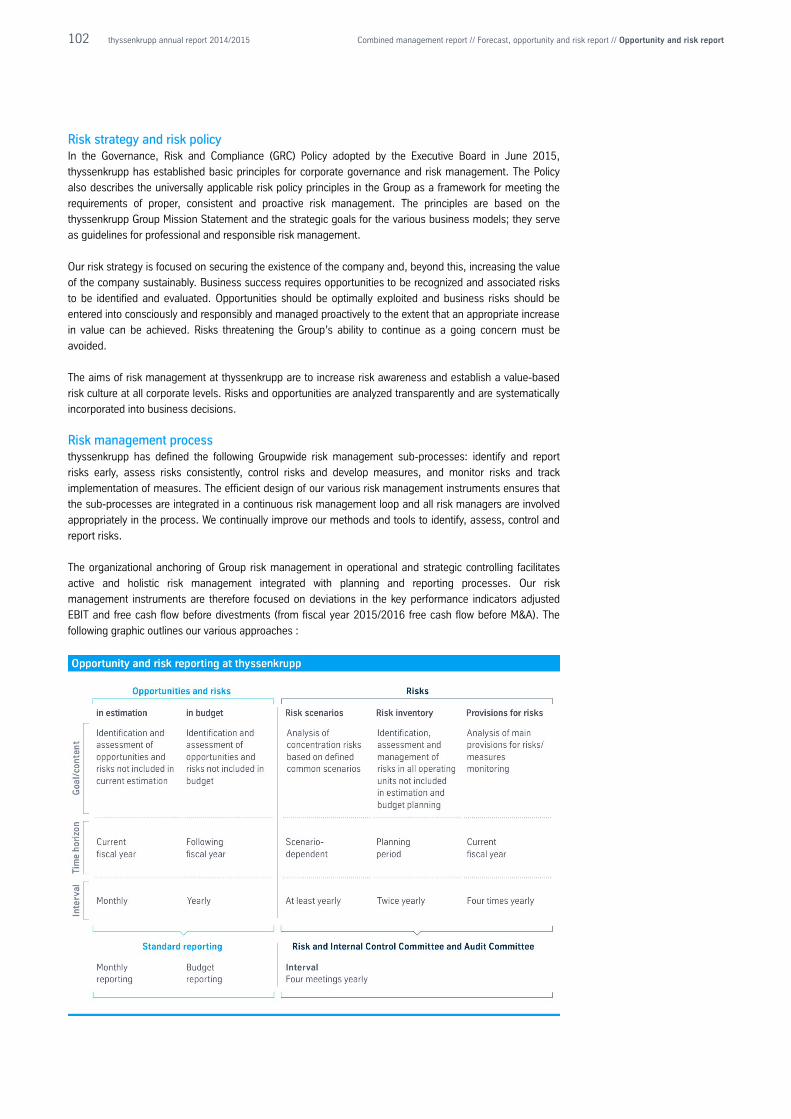
102 thyssenkrupp annual report 2014/2015 Combined management report // Forecast, opportunity and risk report // Opportunity and risk report
Risk strategy and risk policy In the Governance, Risk and Compliance (GRC) Policy adopted by the Executive Board in June 2015,
thyssenkrupp has established basic principles for corporate governance and risk management. The Policy
also describes the universally applicable risk policy principles in the Group as a framework for meeting the
requirements of proper, consistent and proactive risk management. The principles are based on the
thyssenkrupp Group Mission Statement and the strategic goals for the various business models; they serve
as guidelines for professional and responsible risk management.
Our risk strategy is focused on securing the existence of the company and, beyond this, increasing the value
of the company sustainably. Business success requires opportunities to be recognized and associated risks
to be identified and evaluated. Opportunities should be optimally exploited and business risks should be
entered into consciously and responsibly and managed proactively to the extent that an appropriate increase
in value can be achieved. Risks threatening the Group’s ability to continue as a going concern must be
avoided.
The aims of risk management at thyssenkrupp are to increase risk awareness and establish a value-based
risk culture at all corporate levels. Risks and opportunities are analyzed transparently and are systematically
incorporated into business decisions.
Risk management process thyssenkrupp has defined the following Groupwide risk management sub-processes: identify and report
risks early, assess risks consistently, control risks and develop measures, and monitor risks and track
implementation of measures. The efficient design of our various risk management instruments ensures that
the sub-processes are integrated in a continuous risk management loop and all risk managers are involved
appropriately in the process. We continually improve our methods and tools to identify, assess, control and
report risks.
The organizational anchoring of Group risk management in operational and strategic controlling facilitates
active and holistic risk management integrated with planning and reporting processes. Our risk
management instruments are therefore focused on deviations in the key performance indicators adjusted
EBIT and free cash flow before divestments (from fiscal year 2015/2016 free cash flow before M&A). The
following graphic outlines our various approaches :
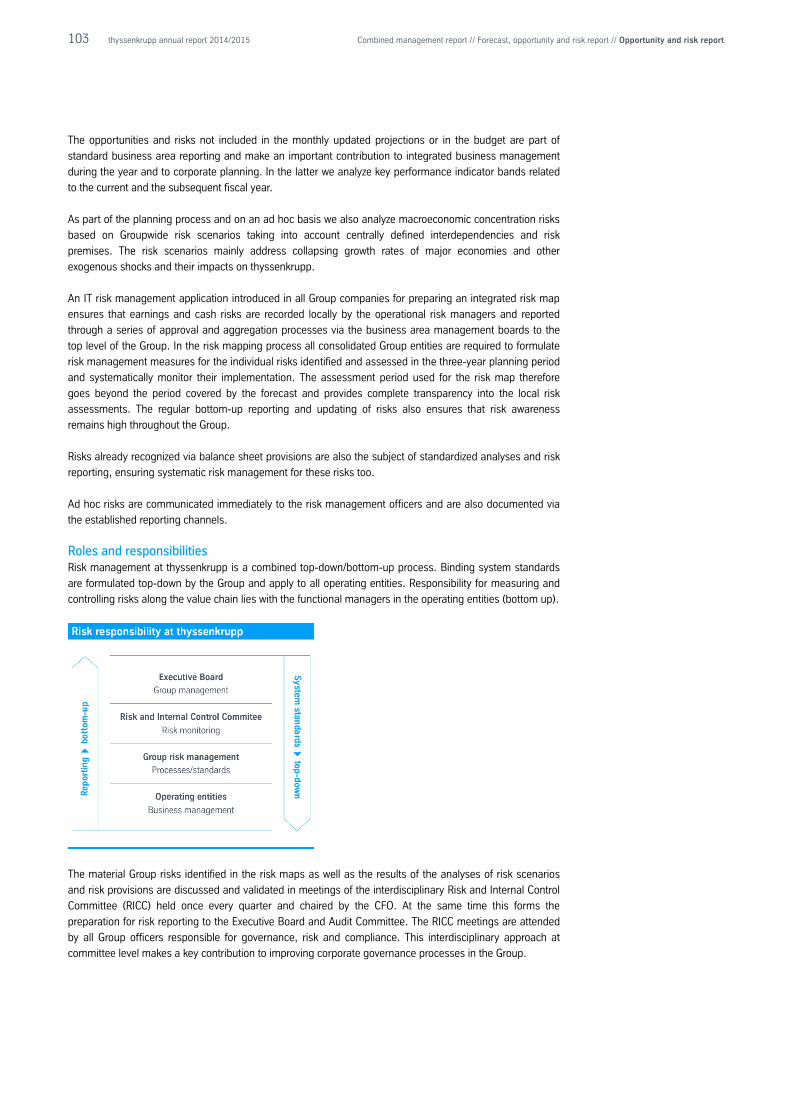
103 thyssenkrupp annual report 2014/2015 Combined management report // Forecast, opportunity and risk report // Opportunity and risk report
The opportunities and risks not included in the monthly updated projections or in the budget are part of
standard business area reporting and make an important contribution to integrated business management
during the year and to corporate planning. In the latter we analyze key performance indicator bands related
to the current and the subsequent fiscal year.
As part of the planning process and on an ad hoc basis we also analyze macroeconomic concentration risks
based on Groupwide risk scenarios taking into account centrally defined interdependencies and risk
premises. The risk scenarios mainly address collapsing growth rates of major economies and other
exogenous shocks and their impacts on thyssenkrupp.
An IT risk management application introduced in all Group companies for preparing an integrated risk map
ensures that earnings and cash risks are recorded locally by the operational risk managers and reported
through a series of approval and aggregation processes via the business area management boards to the
top level of the Group. In the risk mapping process all consolidated Group entities are required to formulate
risk management measures for the individual risks identified and assessed in the three-year planning period
and systematically monitor their implementation. The assessment period used for the risk map therefore
goes beyond the period covered by the forecast and provides complete transparency into the local risk
assessments. The regular bottom-up reporting and updating of risks also ensures that risk awareness
remains high throughout the Group.
Risks already recognized via balance sheet provisions are also the subject of standardized analyses and risk
reporting, ensuring systematic risk management for these risks too.
Ad hoc risks are communicated immediately to the risk management officers and are also documented via
the established reporting channels.
Roles and responsibilities Risk management at thyssenkrupp is a combined top-down/bottom-up process. Binding system standards
are formulated top-down by the Group and apply to all operating entities. Responsibility for measuring and
controlling risks along the value chain lies with the functional managers in the operating entities (bottom up).
The material Group risks identified in the risk maps as well as the results of the analyses of risk scenarios
and risk provisions are discussed and validated in meetings of the interdisciplinary Risk and Internal Control
Committee (RICC) held once every quarter and chaired by the CFO. At the same time this forms the
preparation for risk reporting to the Executive Board and Audit Committee. The RICC meetings are attended
by all Group officers responsible for governance, risk and compliance. This interdisciplinary approach at
committee level makes a key contribution to improving corporate governance processes in the Group.
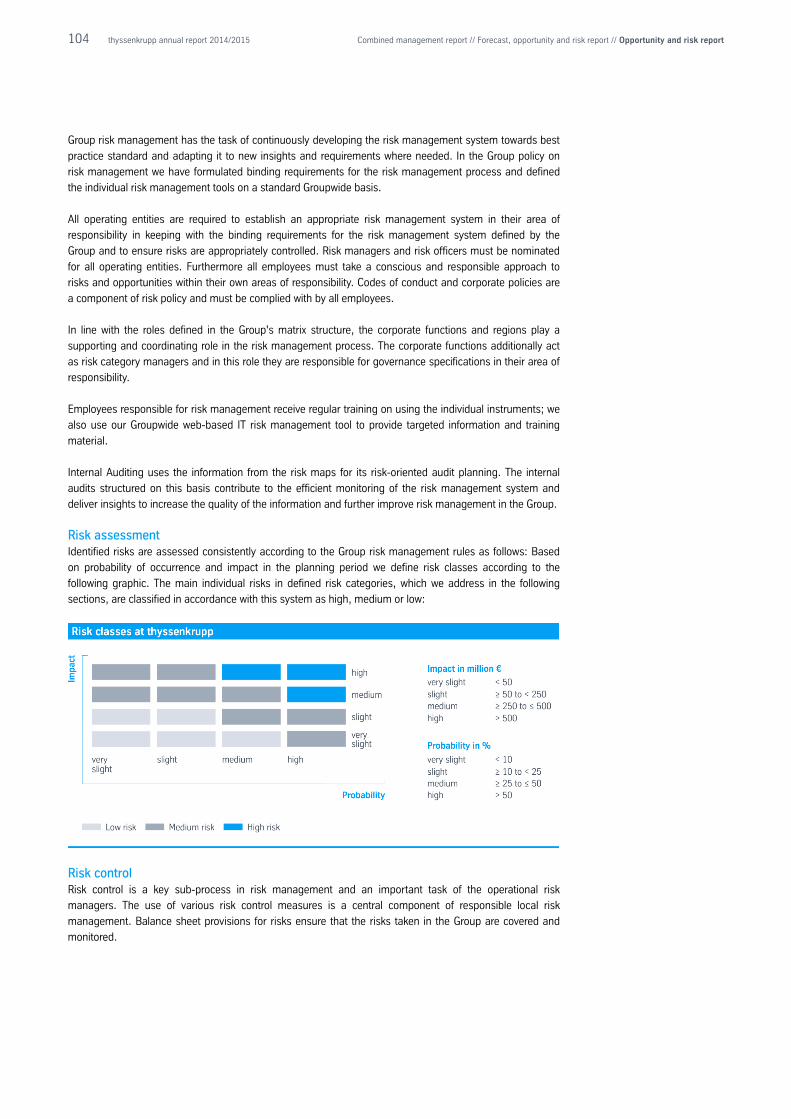
104 thyssenkrupp annual report 2014/2015 Combined management report // Forecast, opportunity and risk report // Opportunity and risk report
Group risk management has the task of continuously developing the risk management system towards best
practice standard and adapting it to new insights and requirements where needed. In the Group policy on
risk management we have formulated binding requirements for the risk management process and defined
the individual risk management tools on a standard Groupwide basis.
All operating entities are required to establish an appropriate risk management system in their area of
responsibility in keeping with the binding requirements for the risk management system defined by the
Group and to ensure risks are appropriately controlled. Risk managers and risk officers must be nominated
for all operating entities. Furthermore all employees must take a conscious and responsible approach to
risks and opportunities within their own areas of responsibility. Codes of conduct and corporate policies are
a component of risk policy and must be complied with by all employees.
In line with the roles defined in the Group's matrix structure, the corporate functions and regions play a
supporting and coordinating role in the risk management process. The corporate functions additionally act
as risk category managers and in this role they are responsible for governance specifications in their area of
responsibility.
Employees responsible for risk management receive regular training on using the individual instruments; we
also use our Groupwide web-based IT risk management tool to provide targeted information and training
material.
Internal Auditing uses the information from the risk maps for its risk-oriented audit planning. The internal
audits structured on this basis contribute to the efficient monitoring of the risk management system and
deliver insights to increase the quality of the information and further improve risk management in the Group.
Risk assessment Identified risks are assessed consistently according to the Group risk management rules as follows: Based
on probability of occurrence and impact in the planning period we define risk classes according to the
following graphic. The main individual risks in defined risk categories, which we address in the following
sections, are classified in accordance with this system as high, medium or low:
Risk control Risk control is a key sub-process in risk management and an important task of the operational risk
managers. The use of various risk control measures is a central component of responsible local risk
management. Balance sheet provisions for risks ensure that the risks taken in the Group are covered and
monitored.
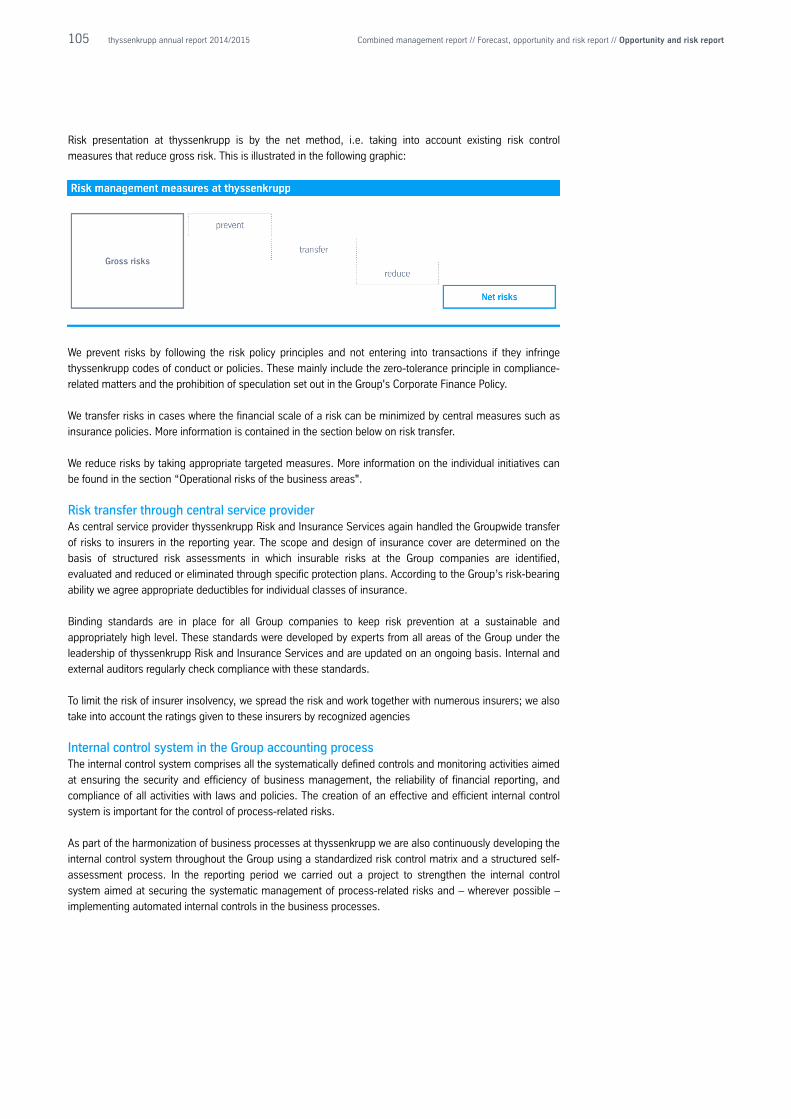
105 thyssenkrupp annual report 2014/2015 Combined management report // Forecast, opportunity and risk report // Opportunity and risk report
Risk presentation at thyssenkrupp is by the net method, i.e. taking into account existing risk control
measures that reduce gross risk. This is illustrated in the following graphic:
We prevent risks by following the risk policy principles and not entering into transactions if they infringe
thyssenkrupp codes of conduct or policies. These mainly include the zero-tolerance principle in compliance-
related matters and the prohibition of speculation set out in the Group's Corporate Finance Policy.
We transfer risks in cases where the financial scale of a risk can be minimized by central measures such as
insurance policies. More information is contained in the section below on risk transfer.
We reduce risks by taking appropriate targeted measures. More information on the individual initiatives can
be found in the section “Operational risks of the business areas".
Risk transfer through central service provider As central service provider thyssenkrupp Risk and Insurance Services again handled the Groupwide transfer
of risks to insurers in the reporting year. The scope and design of insurance cover are determined on the
basis of structured risk assessments in which insurable risks at the Group companies are identified,
evaluated and reduced or eliminated through specific protection plans. According to the Group’s risk-bearing
ability we agree appropriate deductibles for individual classes of insurance.
Binding standards are in place for all Group companies to keep risk prevention at a sustainable and
appropriately high level. These standards were developed by experts from all areas of the Group under the
leadership of thyssenkrupp Risk and Insurance Services and are updated on an ongoing basis. Internal and
external auditors regularly check compliance with these standards.
To limit the risk of insurer insolvency, we spread the risk and work together with numerous insurers; we also
take into account the ratings given to these insurers by recognized agencies
Internal control system in the Group accounting process The internal control system comprises all the systematically defined controls and monitoring activities aimed
at ensuring the security and efficiency of business management, the reliability of financial reporting, and
compliance of all activities with laws and policies. The creation of an effective and efficient internal control
system is important for the control of process-related risks.
As part of the harmonization of business processes at thyssenkrupp we are also continuously developing the
internal control system throughout the Group using a standardized risk control matrix and a structured self-
assessment process. In the reporting period we carried out a project to strengthen the internal control
system aimed at securing the systematic management of process-related risks and – wherever possible –
implementing automated internal controls in the business processes.
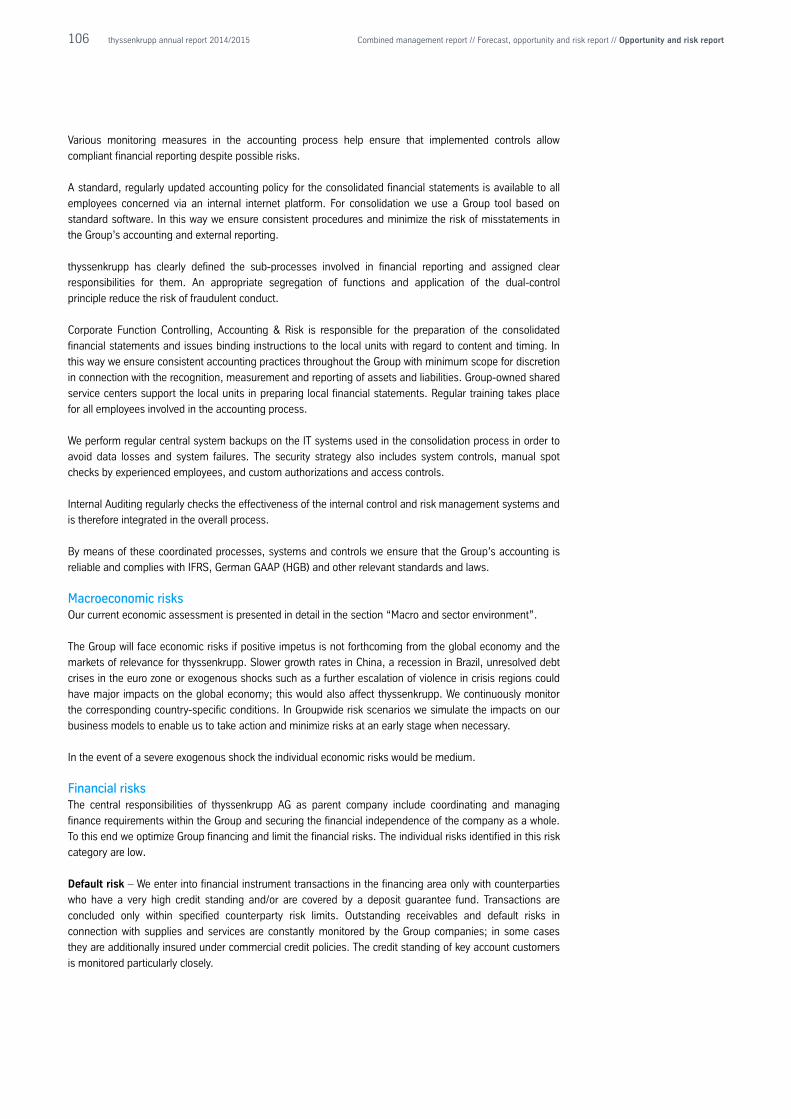
106 thyssenkrupp annual report 2014/2015 Combined management report // Forecast, opportunity and risk report // Opportunity and risk report
Various monitoring measures in the accounting process help ensure that implemented controls allow
compliant financial reporting despite possible risks.
A standard, regularly updated accounting policy for the consolidated financial statements is available to all
employees concerned via an internal internet platform. For consolidation we use a Group tool based on
standard software. In this way we ensure consistent procedures and minimize the risk of misstatements in
the Group’s accounting and external reporting.
thyssenkrupp has clearly defined the sub-processes involved in financial reporting and assigned clear
responsibilities for them. An appropriate segregation of functions and application of the dual-control
principle reduce the risk of fraudulent conduct.
Corporate Function Controlling, Accounting & Risk is responsible for the preparation of the consolidated
financial statements and issues binding instructions to the local units with regard to content and timing. In
this way we ensure consistent accounting practices throughout the Group with minimum scope for discretion
in connection with the recognition, measurement and reporting of assets and liabilities. Group-owned shared
service centers support the local units in preparing local financial statements. Regular training takes place
for all employees involved in the accounting process.
We perform regular central system backups on the IT systems used in the consolidation process in order to
avoid data losses and system failures. The security strategy also includes system controls, manual spot
checks by experienced employees, and custom authorizations and access controls.
Internal Auditing regularly checks the effectiveness of the internal control and risk management systems and
is therefore integrated in the overall process.
By means of these coordinated processes, systems and controls we ensure that the Group’s accounting is
reliable and complies with IFRS, German GAAP (HGB) and other relevant standards and laws.
Macroeconomic risks Our current economic assessment is presented in detail in the section “Macro and sector environment”.
The Group will face economic risks if positive impetus is not forthcoming from the global economy and the
markets of relevance for thyssenkrupp. Slower growth rates in China, a recession in Brazil, unresolved debt
crises in the euro zone or exogenous shocks such as a further escalation of violence in crisis regions could
have major impacts on the global economy; this would also affect thyssenkrupp. We continuously monitor
the corresponding country-specific conditions. In Groupwide risk scenarios we simulate the impacts on our
business models to enable us to take action and minimize risks at an early stage when necessary.
In the event of a severe exogenous shock the individual economic risks would be medium.
Financial risks The central responsibilities of thyssenkrupp AG as parent company include coordinating and managing
finance requirements within the Group and securing the financial independence of the company as a whole.
To this end we optimize Group financing and limit the financial risks. The individual risks identified in this risk
category are low.
Default risk – We enter into financial instrument transactions in the financing area only with counterparties
who have a very high credit standing and/or are covered by a deposit guarantee fund. Transactions are
concluded only within specified counterparty risk limits. Outstanding receivables and default risks in
connection with supplies and services are constantly monitored by the Group companies; in some cases
they are additionally insured under commercial credit policies. The credit standing of key account customers
is monitored particularly closely.
107 thyssenkrupp annual report 2014/2015 Combined management report // Forecast, opportunity and risk report // Opportunity and risk report
Liquidity risk – To secure the solvency and financial flexibility of the Group at all times, we maintain long-
term credit facilities and cash funds on the basis of a multi-year financial planning system and a liquidity
planning system on a rolling monthly basis. The cash pooling system and external financings are
concentrated mainly on thyssenkrupp AG and specific financing companies. We use the cash pooling system
to allocate resources to Group companies internally according to requirements.
thyssenkrupp AG has entered into agreements with banks which require that the ratio of net financial debt to
equity (gearing) in the consolidated financial statements must not exceed 150% at the closing date
(September 30). At September 30, 2015 the gearing ratio was 103.2%, 11.7 percentage points lower than
at September 30, 2014. The main reasons for the improvement in gearing versus September 30, 2014 were
a reduction in net financial debt thanks to our positive free cash flow, and an increase in equity from positive
net income.
At September 30, 2015 the Group's available liquidity amounted to €8.3 billion, consisting of €4.5 billion
cash and cash equivalents and €3.8 billion undrawn committed credit lines. The available liquidity offers
enough scope to cover debt maturities. The gross financial debt repayable in fiscal year 2015/2016 amounts
to €1.6 billion.
Market risk – Various measures are used to mitigate or eliminate the risk of fluctuations in the fair values or
future cash flows from financial instruments due to market changes. These mainly include off-exchange
traded foreign currency forward contracts, interest rate swaps, interest-rate/foreign currency swaps and
commodity forward contracts with banks and commercial partners. To hedge against commodity price risks
we also use exchange-traded futures. The use of derivative financial instruments is extensively monitored,
with checks being carried out on the basis of policies in the framework of regular reporting.
Currency risk – To contain the risks of our numerous payment flows in different currencies – in particular in
US dollars – we have developed Groupwide policies for foreign currency management. All companies of the
Group are required to hedge foreign currency positions at the time of their inception; companies based in the
euro zone hedge via our central clearing office. Translation risks arising from the conversion of foreign
currency positions are generally not hedged.
Interest rate risk – To cover our capital requirements we have procured funds on the international money
and capital markets in different currencies and with various maturities. The resulting financial liabilities and
our financial investments are partially exposed to risks from changing interest rates. To manage these risks,
regular interest rate risk analyses are prepared, the results of which feed into our risk management system.
Risks associated with disposals, acquisitions and restructurings Active portfolio management is one of the key pillars of our Strategic Way Forward. The disposal and
acquisition of businesses as well as restructurings within our existing businesses are associated with risks.
The risks identified in this category, which we classify in each case as low, are monitored continuously and
provisions are recognized where required.
The disposal of the VDM group in the reporting year reduced the share of volatile materials businesses and
therefore supported thyssenkrupp's positioning as a diversified industrial group. With the transaction we also
achieved a mid-three-digit million euro positive effect on our net financial debt and pension obligations.
€ billion available 8.3 liquidity
108 thyssenkrupp annual report 2014/2015 Combined management report // Forecast, opportunity and risk report // Opportunity and risk report
Procurement risks To manufacture our high-quality products, we procure raw materials and other feedstocks as well as energy
and freight capacities. Depending on market situation, procurement prices can vary considerably and impact
on our cost structures. Also, suppliers may be lost, which might in turn jeopardize our production and the
fulfilment of contractual obligations towards our customers. The individual risks identified in this category
are low. We counteract these risks where possible through margin-securing measures and alternative
procurement sources to secure our competitiveness.
To hedge against raw material price swings, we also use derivative financial instruments, mainly commodity
forward transactions. The use of such instruments is subject to strict rules. Details of these risk areas are
provided in Note 22.
Risks related to rising energy prices are countered by structured energy procurement. We operate
sustainably and are working across the Group to save energy and recycle waste.
Further information on procurement risks can be found in the section “Operational risks of the business
areas”.
Production risks In the event of unfavorable constellations and developments, our plants can be exposed to the risk of
business interruptions and property damage. In addition to the cost of repairing damage, there is above all
the risk that a business interruption might result in production losses and thus jeopardize the fulfilment of
our contractual obligations towards our customers. We counter these risks through regular preventive
maintenance and through modernization and investment in our machinery and production facilities. In close
consultation with our central service provider thyssenkrupp Risk and Insurance Services we take out
appropriate insurance and so transfer risks to external service providers. The remaining financial risks in this
category are classified as medium.
In our industrial plants there are process-related risks that can lead to air and water pollution. Furthermore,
some of the Group’s real estate no longer used for operations is subject to risks from past pollution and
mining subsidence. To minimize risks thyssenkrupp invests continuously and sustainably in environmental
protection and scheduled remediation and maintains a close dialogue with authorities, local communities
and political representatives. We recognize adequate provisions for past pollution.
Further details on production risks can be found in the section “Operational risks of the business areas”.
Sales risks The risks described in the section "Macroeconomic risks" may diminish our market prospects and therefore
lead to sales risks. In the event of sustained developments, a market-oriented adjustment or relocation of
capacities is one conceivable measure to control risk.
We counter sales risks resulting from dependence on individual markets and industries by focusing
systematically on the markets of the future. As a diversified industrial group with leading engineering
expertise, thyssenkrupp operates globally, maintains good, long-term customer relationships, and pursues
active strategic market and customer development. Our high degree of diversification with multi-layered
product and customer structures helps ensure that thyssenkrupp remains largely independent of regional
crises on sales markets.
We do not currently expect the VW emissions crisis to have any significant negative impact on sales of our
automotive components or materials; however price pressure is likely to increase as a result of the cost-
reduction programs already announced, and as a result we classify the individual sales risks as medium.
Further details on sales risks and on our professional receivables management system to counter the risk of
bad debt are provided in the section "Operational risks of the business areas".
109 thyssenkrupp annual report 2014/2015 Combined management report // Forecast, opportunity and risk report // Opportunity and risk report
Order risks The management of major contracts involving a high degree of complexity and long project lead times is a
core challenge in the Industrial Solutions business area. Cost overruns and/or delays in individual project
phases cannot be ruled out. Individual identified order risks are currently classified as medium. To minimize
these risks we continuously improve our management instruments so that we are aware of current order
status at all times and able to take necessary measures quickly if required.
Before entering into contracts we check the credit standing of our customers carefully. We deploy
experienced project managers for order execution. Through transparent monitoring of order status we
ensure that payments are made promptly according to order progress and payment defaults are minimized.
Risks from trade restrictions Due to the global nature of its business thyssenkrupp is exposed to possible risks stemming from trade
restrictions such as tariffs, export restrictions, special customs regulations, embargoes, far-reaching
economic sanctions against certain countries, persons, businesses and organizations, as well as other
protectionist or politically motivated restraints. These restrictions can not only impede our business activities
in individual national markets; violations could lead to severe penalties, sanctions, reputational damage and
damage claims. We therefore take strict care to comply with customs and export control regulations and
other trade restrictions. For example, in parallel with the sanctions introduced against Iran in 2010 by the
EU, Germany and the USA, the Executive Board decided to end all business relations with Iran. Since then
no new contracts with Iranian customers or suppliers or with Iran as the country of destination have been
entered into. We are closely monitoring the ongoing negotiations on Iran sanctions relief and if appropriate
will change our position accordingly.
Litigation risks Risks can arise in connection with pending or imminent lawsuits or regulatory or administrative court
proceedings brought against thyssenkrupp (litigation risks). The thyssenkrupp Group uses a software tool
with which litigation risks are systematically identified, categorized, evaluated and reported under the
internal risk management system to the Executive Board and the Audit Committee on a quarterly basis. We
carefully examine claims asserted by third parties for merit. Legal disputes in and out of court are supported
by in-house counsel and where necessary external counsel.
Based on the applicable risk standards, current estimates indicate that there are no litigation risks which
could individually or cumulatively be classified as high. Cumulative litigation risks are combined risks from
lawsuits brought by numerous claimants and from regulatory proceedings against thyssenkrupp which relate
to the same matter and can be classified as a single litigation risk. Information on further litigation risks for
which we have recognized provisions or which are classified as contingent liabilities is provided in the Notes
(Notes 16 and 21).
Compliance risks We operate a strict compliance program focused on reducing the risk of antitrust and corruption violations.
This focus is justified due to the enormous potential for damage with these offenses – both financial and in
terms of reputation. For this reason compliance risks in general are classified as high.
On December 11, 2014 the German Federal Cartel Office closed its anti-trust investigation in the “auto
steel” sector due to a lack of probable cause. The proceedings were initiated at the end of February 2013
with searches of three companies in the steel sector, including thyssenkrupp. The authority was investigating
the suspicion of price fixing in the delivery of certain steel products to the German automotive industry in a
period dating back to 1998. In its press release on the closure of the investigation, the Federal Cartel Office
emphasized thyssenkrupp’s cooperation in the proceedings.
110 thyssenkrupp annual report 2014/2015 Combined management report // Forecast, opportunity and risk report // Opportunity and risk report
In 2013 the public prosecutor’s office in Bremen launched an investigation into (former) employees of Atlas
Elektronik GmbH, among others, on suspicion of bribery of foreign officials and tax evasion in connection
with commission payments to an agent in Greek naval projects. Atlas is a joint company of thyssenkrupp
and Airbus. In this connection, the public prosecutor’s office has now opened administrative proceedings
against Atlas as a legal person which could potentially serve as the basis for a company fine. The Greek
state prosecutors have also started investigations into Atlas Elektronik and natural persons involved in this
case. Under these criminal proceedings, in February 2015 the Greek state filed/announced civil claims for
compensation in the mid two-digit million euro range against Atlas as a company. Atlas is cooperating fully
with the authorities and has initiated an internal investigation to clarify the matter in consultation with the
Bremen public prosecutor’s office. The ongoing official proceedings and the internal investigation are being
closely monitored by the owners.
Regulatory risks New laws and other changes in the legal framework at national and international level could entail risks for
our business activities if they lead to higher costs or other disadvantages for thyssenkrupp compared with
our competitors directly or in respect of our value chain. As an energy-intensive industrial and services
group, we face earnings risks on the global markets if we are not able to pass on the additional costs to our
customers, or only to a limited extent.
thyssenkrupp supports effective climate protection efforts and a sustainable energy transition in which
climate protection, security of supply, and competitiveness are equal priorities. We support the relevant
discussion processes on regulatory efforts through close working contacts with the relevant institutions and
also work through industry associations to reduce possible risks such as further rising energy costs.
Risks could occur for example in Germany as a result of the evaluation of the treatment of in-house
electricity announced for 2017. Regarding the EU emissions trading system there is a significant long-term
risk of higher costs for thyssenkrupp if CO2 allowance costs rise sharply in the fourth trading period (from
2021), as politically desired in part. The EU Commission's current proposal suggests the burdens will
increase significantly, though at present it is not possible to estimate what final form the regulation will take.
At global level, international climate policy and the process to implement at national level the expected
results of the International Climate Conference in December 2015 could give rise to risks for our businesses
in the regions affected. Corresponding activities to minimize risks are coordinated at Group level and
strengthened through global networks and the close involvement of thyssenkrupp's regional headquarters.
Further regulatory risks may ensue from changes to the tax framework over time. For example in Brazil tax
benefits granted at state level, from which thyssenkrupp CSA also profits, are currently being examined by
the constitutional court. Should the court cases result in the benefits being removed and/or reduced, high
risks in the form of substantial back taxes plus additional costs in Brazil cannot be excluded.
Risks associated with information security Our IT-based business processes are exposed to various risks associated with information security, which
we classify as medium. Human error, organizational or technical processes and/or security vulnerabilities in
information processing can create risks that threaten the confidentiality, availability and integrity of
information. For this reason we continually review our processes and technologies. Systems are updated
and processes modified immediately as necessary. The IT-based integration of our business processes is
subject to the condition that the risks involved for our Group companies and business partners are
continuously minimized.
111 thyssenkrupp annual report 2014/2015 Combined management report // Forecast, opportunity and risk report // Opportunity and risk report
In the past fiscal year we again carried out measures to further improve our information security
management and security technologies. A group of IT security experts which is continuously being increased
supports the Group with the early identification of risks.
To secure the sustainability of implemented and planned measures the Group companies are required to
regularly demonstrate the maturity levels of their established information security management systems
(ISMS). Sensitizing our employees to the risks involved in handling business-related information is a very
important issue to us. In this connection we carry out communication campaigns and secure the requisite
technical support. A regular exchange of information and experiences with proactive measures to improve
information security and manage risk takes place at international level.
Furthermore, business processes and data centers at selected Group companies have achieved security
certification, documenting the standards achieved above all to our customers. In addition, vulnerability
analyses are carried out with the support of our IT security team and external experts to verify the security of
the infrastructure and if necessary increase protection.
Together with the Group’s data protection officer, our experts ensure that personal data are processed in
accordance with the rules of the German Data Protection Act. All these measures will allow us to continue to
protect the Group’s business data as well as the privacy of our business partners and employees, and to
respond appropriately to potential new risks.
Personnel risks As a diversified industrial group with leading engineering expertise, thyssenkrupp strives to be successful on
a sustainable basis. For this we need dedicated and highly qualified employees and managers in all
business units. There is a risk of not being able to find key personnel to fill vacancies or losing competent
employees; we classify the individual personnel risks as medium.
thyssenkrupp positions itself as an attractive employer and promotes the long-term retention of employees
in the Group. This involves offering development programs, career prospects and attractive incentive
systems. We provide targeted support for our employees, inform interested young people about career
opportunities and thyssenkrupp from an early stage, and support apprentices as they start work. We
cooperate with key universities and establish contact with students from an early stage to secure the young
talent we need for our workforce.
Risks associated with pension obligations The fund assets used to cover pension liabilities are exposed to capital market risks. To minimize these risks,
the individual investment forms are selected and weighted on the basis of studies by independent experts.
The aim is to align the investments so that the associated pension obligations can be permanently fulfilled in
respect of the current and future income from the investments.
Pension obligations are exposed to risks from increased life expectancies of beneficiaries and from
requirements to adjust pension amounts on a regular basis. In addition, payments to pension funds may
increase substantially in some countries in the future due to stricter statutory requirements. In individual
cases, the premature cancellation of a pension plan may necessitate an additional allocation. Overall we
classify the risks associated with pension obligations as medium.
Operational risks of the business areas Components Technology – The Components Technology business area is a global supplier of automotive
and industrial components and as such is dependent on the international economic situation and exposed to
various general risks in its different areas of business.
112 thyssenkrupp annual report 2014/2015 Combined management report // Forecast, opportunity and risk report // Opportunity and risk report
For the core markets of Components Technology area continued growth is expected in all product segments.
However this is subject to major uncertainty. Low growth rates in the emerging economies, slowing
momentum in China and Brazil, and continuing high budget deficits in Western Europe and the USA could
jeopardize our market prospects.
To lessen the risk of dependency on individual markets the business area is expanding its customer base
and further strengthening its international presence. In addition, extensive early warning indicators have
been put in place to allow a fast response to a possible economic slowdown.
In addition to the economic risks, further risks come from the consolidation process in the auto components
industry and the increasing price pressure, intensified by auto manufacturers' cost reduction programs. On
top of this there are price and structural risks in China.
We do not currently expect the VW emissions crisis to have any significant negative impact on sales of our
automotive components; however price pressure is likely to increase as a result of the cost-reduction
programs already announced. There is a risk of a shift in drive system technology away from diesel systems,
which could impact demand for the moderate number of diesel-specific components in our Powertrain unit
at Components Technology.
Risks in the wind energy industry lie generally in dependence on national funding systems. In Germany
uncertainties remain regarding grid connection and financing of further offshore projects. We are countering
this risk with new technologies and innovations to access new areas of application. At the same time
pressure on selling prices remains high as a result of intense competition. We are countering this price
pressure with optimizations and efficiency enhancements under the corporate program "impact".
On the procurement side there are risks that steeply rising raw material prices cannot be passed on in full to
customers or only with delays. The business area counters these risks by framing contracts with customers
accordingly.
Further general risks for the business area concern the impact of changes in exchange rates on sales and
earnings, both translation and transaction effects. In addition, risks from unplanned impacts on earnings
cannot be ruled out in association with ongoing technological innovations and improvements. On top of this
there are potential risks from unexpected yield and quality problems and the associated warranty
obligations. The business area uses extensive production and quality assurance systems to avoid or limit
such risks as far as possible.
Elevator Technology – The risk structure of Elevator Technology is mainly determined by two factors: the
different areas of business and the different regions in which the business area operates.
The service and modernization business is comparatively independent of the general economic situation. To
prevent possible losses of maintenance units, the business area pursues corresponding customer retention
strategies. In addition we continuously implement efficiency programs to counter rising personnel and
procurement costs.
The new installations business is closely linked with the construction sector and is therefore exposed to
greater fluctuations. However due to the longer project times in this business, downturns can be anticipated
so countermeasures and capacity adjustments can be carried out at an early stage. Risks, particularly in the
execution of complex major projects, are countered by the use of project management measures. Risks from
rising material prices are offset by efficiency improvements in production and optimized procurement
activities.
113 thyssenkrupp annual report 2014/2015 Combined management report // Forecast, opportunity and risk report // Opportunity and risk report
Accident risks cannot be ruled out completely during the installation, maintenance and use of the business
area’s products A safety-oriented corporate culture, employee selection and corresponding training
programs on safe conduct on job sites (Safety First) counter the risk of employee accidents. We carefully
select and train our installation and service employees to ensure maximum safety and quality of the
products we install and service, providing users with best-possible protection. Elevator Technology's goal is
to rule out accidents involving users as far as possible, also in part to avoid loss of reputation.
Potential risks from increasing business activities in the Asian markets, where business is more dependent
on new installations and therefore on construction activity, are largely offset by our successful presence on
the established markets in Europe and the Americas. Possible economic risks in the emerging nations are
countered by expanding the modernization and service business and improving efficiency. Exchange rate
risks resulting from the international nature of our business are reduced by a high level of local value
creation and hedged using financial instruments.
Continuing global economic uncertainty carries further risk potential for Elevator Technology, mainly the risk
of bad debt and project delays. As a secondary effect, competition could intensify on all markets and
increase price pressure. The business area counters these risks with professional project management in
association with extensive checks of customers’ credit standing. Customer retention strategies, high service
quality, efficiency programs and not least innovative and sustainable product solutions help contain the risk
of increasing price pressure.
Industrial Solutions – A major risk factor for the business area is the uncertainty concerning the
performance of the global economy, the stability of growth in the USA, and the future development of other
major economies such as China, India, and Brazil. Further risks include a fall in demand for capital goods
from customers in the oil and gas industries and the mining sector as a result of lower oil and raw material
prices. In addition to the decline in raw material and oil prices, political developments in important sales
regions (for example in the Middle East & Africa region and in Russia/Ukraine) could negatively impact the
project situation in the Industrial Solutions business area, leading to project deferrals or cancellations.
Particular technological risks are associated with "first of its kind" contracts. Specific risks in the execution of
major long-term contracts and technically complex orders are countered by professional and result-oriented
project and claims management, intensive project monitoring, and the increased use of project
management measures.
In the plant construction business increasing price and terms competition, for example from Asian suppliers,
could negatively impact margin quality.
Materials Services – The global materials and service business of Materials Services is subject to cyclical
swings in demand and prices on the procurement and sales sides – in some cases to a greater extent than
other businesses. This has a significant impact on our net working capital. Fast delivery with minimum
capital employed is a key success factor for our business model. We therefore work continually to optimize
our logistics and the entire supply chain, e.g. through the further consolidation and centralized coordination
of our purchasing activities as one of the market leaders in Europe.
Cost-reduction measures under the "impact" program increase efficiency and profitability. Systematic
improvements to net working capital management help us effectively optimize inventories and minimize the
risks of bad debt. At the same time we are intensifying our service activities for materials.
114 thyssenkrupp annual report 2014/2015 Combined management report // Forecast, opportunity and risk report // Opportunity and risk report
In addition we contain cyclical risks by our worldwide presence, broad customer base and high degree of
diversification. This results in a significant spread of risks.
The production sites of our unit AST are exposed to a risk of business interruptions and production losses.
We are countering these risks mainly through preventive maintenance, modernization and investment.
Steel Europe – Risks going forward for the Steel Europe business area include in particular risks on the
sales and procurement markets, earnings and margin risks from high import pressure and global
overcapacities, risks from exchange rate fluctuations and from the emissions trading system and the
Renewable Energies Act. If the economy were to deteriorate, the risk of customer insolvencies would
increase.
To contain the risk of cyclical demand fluctuations the business area optimizes costs in all areas, adjusts
production levels in good time and focuses on less cyclical high-end market segments. The risk of customer
insolvencies is minimized by intensified monitoring, using commercial credit insurance facilities and other
appropriate instruments, and adjusting payment conditions. Constant optimization of supply chains reduces
risks to quality and delivery performance.
We do not currently expect the VW emissions crisis to have any significant negative impact on sales of our
materials; however price pressure is likely to increase as a result of the cost-reduction programs already
announced.
Steel Europe continues to counter intense competition on the market for flat steel products with systematic
strengths in technological expertise and an even stronger focus on customers, allowing differentiation from
the competition. This involves systematic investment in research and development projects aimed at
developing innovative products and customer solutions and bringing them onto the market quickly. In
addition quality management has been reorganized to increase the focus on product quality.
The business area has integrated a business and technical risk controlling system for property insurance
into its risk management process. Additional investment and maintenance budgets are available to further
optimize fire prevention. The risks of other business interruptions are reduced by ongoing preventive
maintenance, modernization and investment. In the event of business interruptions, business continuity
plans are in place specifying measures for remedying damage.
The move towards an energy system dominated by renewables in Germany is also creating major
challenges for energy-intensive industries in general and the steel sector in particular. Possible cuts to the
exemptions applying to producers of in-house electricity in the forthcoming amendment of the Renewable
Energies Act represent a significant threat to the company. Added to this are further cost-driving factors
associated with the integration of renewable energies, such as the necessary expansion of the electricity
grids and the storage of reserve capacities to provide security of supply. Regulatory requirements placed on
the electricity and gas networks of our large production sites and our power plants could result in further
cost impacts. The risk of rising electricity prices is being countered by increasing the supply of in-house
produced electricity. In response to the risk of increasing natural gas prices, the Group is pursuing a centrally
managed price hedging strategy.
115 thyssenkrupp annual report 2014/2015 Combined management report // Forecast, opportunity and risk report // Opportunity and risk report
We could face significant costs for emissions allowances in the third trading period of the EU emissions
trading system from 2013 to 2020. However this risk is countered by the emission allowances we already
hold and through hedging transactions. The models for continuing emissions trading after 2020 currently
being discussed at European level contain significant risks. A potentially steep rise in the need to purchase
allowances could be accompanied by increasing allowance prices, which would weigh heavily on the
European steel industry in the international markets.
The risk of rising raw materials prices is countered by using alternative procurement sources, risk-reducing
procurement strategies, active risk management, and/or margin-securing measures.
Steel Americas – The production-related risks at the steel mill in Brazil, which in the first half of the past
fiscal year led to stoppages mainly in iron production and in the melt shop, were effectively contained
through the reorganization and realignment of our maintenance activities and further process optimizations.
This was reflected in a significantly improved operating performance in the second half of the year.
Risks typical to the industry include future market prices for raw materials on the procurement side
(particularly iron ore and coking coal) and for steel (particularly in Brazil and the USA) on the selling side.
Favorable raw materials prices in the past fiscal year were partly offset by a steep decline in steel prices and
as a result also margins. This situation has now stabilized, albeit at a low level. The establishment of our
own sales organization in Brazil is making good progress. We have already built some promising long-term
customer relationships on the international market. However, on the local market demand remained below
expectations owing to the deteriorating economic situation in Brazil; there are no signs yet of a sustained
recovery.
The steep depreciation of the Brazilian real also lowered the value of input tax credits, which are
denominated in real but accounted for in US dollars, but this also created exchange-rate-related cost
advantages in current operating business. Short- and medium-term risks associated with fluctuations of the
exchange rate of the Brazilian real against the US dollar are minimized by exchange rate hedges in
accordance with the requirements of the thyssenkrupp Corporate Finance Policy.
The risk associated with electricity prices in Brazil has now been significantly reduced as a result of falling
prices and an electricity price cap introduced by the authorities. In addition steam and gas production in the
power plant was optimized, which ultimately stabilized and increased in-house electricity production at the
steel mill and sharply reduced energy procurement costs and dependence on the electricity market.
Further risks typical to Brazil relate to the fast-changing legal situation. Above all, new rules in tax legislation
call for fast and careful action. To counter such fiscal risks at an early stage the steel mill and the tax
department of the regional headquarters in America cooperate closely.
116 thyssenkrupp annual report 2014/2015 Combined management report // Legal information // Corporate Governance Declaration 2014/2015
Legal information
Corporate governance declaration
The corporate governance statement issued in accordance with § 289a HGB is part of the combined
management report. It contains the declaration of conformity in accordance with § 161 AktG, relevant
information on corporate governance practices, a description of how the Executive Board and Supervisory
Board operate as well as the composition and method of operation of their committees and the
commitments to promote the participation of women in leadership positions in accordance with § 76 (4) and
§ 111 (5) AktG.
Declaration of conformity in accordance with § 161 AktG
Under § 161 AktG the executive board and supervisory board of a listed German stock corporation are
required to issue a declaration at least once a year stating whether the German Corporate Governance Code
has been and is being observed and which of the Code's recommendations have not been or are not being
applied and why. The Executive Board and Supervisory Board of thyssenkrupp AG issued the following
declaration in the reporting year, which was published on the Company's website at www.thyssenkrupp.com
on October 01, 2015:
117 thyssenkrupp annual report 2014/2015 Combined management report // Legal information // Corporate Governance Declaration 2014/2015
Relevant information on corporate governance practices
Implementation of the rules of the German Corporate Governance Code thyssenkrupp AG regularly reviews compliance with the recommendations and suggestions of the German
Corporate Governance Code. It also voluntarily follows the Code's suggestions.
Compliance program Compliance, in the sense of all Groupwide measures to ensure adherence to statutory requirements and
internal company policies, is a key management and oversight duty at thyssenkrupp. The Executive Board of
thyssenkrupp AG has unequivocally expressed its rejection of antitrust violations and corruption in the
thyssenkrupp Compliance Commitment. thyssenkrupp has made a clear commitment to compliance with
laws and internal policies: Any violations, in particular antitrust or corruption violations, will be met with zero
tolerance. All reports of misconduct will be investigated. To implement the Compliance Commitment a
transparent management culture based on the Group's mission statement is subject to continuous
improvement. Information on the mission statement can be found on our website.
The compliance program focusing on anti-corruption policies and antitrust law with its three pillars "inform",
"identify" and "report and act" was rigorously continued in the 2014/2015 fiscal year and extended to
include data protection and combating money laundering. In addition, numerous measures aimed at
developing the program further were resolved and in part already implemented as part of our compliance
strategy for the coming years up to 2020.
More information on compliance at thyssenkrupp including information on the compliance program, the
compliance organization, facts and figures can be found on our website.
Group mission statement as a framework for a sustainable corporate culture Our Group mission statement describes how we see ourselves as a Group – "WE are thyssenkrupp". It
strengthens employees' identity with the Company, provides orientation and serves as the basis for
everything we do. It therefore also plays a key role in our Groupwide culture change, which is bringing us
closer to the standards defined in the mission statement. The Group mission statement was developed by
employees from all over the world. Together they defined thyssenkrupp's aims on our path to becoming a
diversified industrial group.
Further key corporate principles While the Group mission statement describes our goals and standards, the concrete principles and ground
rules for our work and our behavior towards business partners and the public are summarized in the
thyssenkrupp Code of Conduct. This provides employees, managers and board members alike with
guidelines on subjects such as compliance, equality and non-discrimination, cooperation with the employee
representatives, occupational health and safety, environmental and climate protection, as well as data
protection and information security. Suppliers are required to follow the thyssenkrupp Supplier Code of
Conduct. In addition thyssenkrupp has signed the United Nations Global Compact, the BME Code of
Conduct, and the Diversity Charter.
All these principles are implemented with the aid of the existing programs and management systems and
indirect financial targets. Details are presented in the sustainability section of our website as well as under
“Profile and organization”, “Strategic way forward” and “Targets” in the section “Fundamental information
about the Group”.
How the Executive Board and Supervisory Board operate and composition and method of operation of their committees
The composition of the Executive Board is described in the section "Executive Board". The Executive Board
has no committees. The work of the Executive Board is governed by the Rules of Procedure for the Executive
Board, available on our website. The distribution of directorates among the individual members of the
3 pillars
118 thyssenkrupp annual report 2014/2015 Combined management report // Legal information // Corporate Governance Declaration 2014/2015
Executive Board is shown in the organization chart, which is part of the Rules of Procedure. The Executive
Board's duties to supply information and report to the Supervisory Board and its committees are set out in
detail in a separate reporting procedure, which likewise forms part of the Rules of Procedure for the
Executive Board.
The composition of the Supervisory Board of thyssenkrupp AG is governed by German law and the detailed
provisions of § 9 of the Articles of Association; the Articles of Association are also available on our website.
In addition the Supervisory Board has adopted targets for its composition which are presented in the
corporate governance report. The current composition of the Supervisory Board is presented in the section
“Supervisory Board”, which also details the current composition of the six Supervisory Board committees.
As an independent member of the Supervisory Board with expertise in accounting and auditing in the
meaning of § 100 (5) AktG, Prof. Dr. Bernhard Pellens is Chairman of the Audit Committee.
The work of the Supervisory Board is governed by Rules of Procedure, which are available on our website.
The composition of the individual committees and their method of operation are described in the Rules of
Procedure for the Supervisory Board and, with the exception of the Mediation Committee and the
Nomination Committee, in the rules of procedure for each of the other committees.
More details on the work of the Executive Board, Supervisory Board and its committees are provided in the
section “Supervisory Board”.
Commitments to promote the participation of women in leadership positions in accordance with § 76 (4) and § 111 (5) AktG
thyssenkrupp has been pursuing a Groupwide strategy to promote diversity since 2013. Among other things
we aim to achieve a 15% proportion of women in leadership positions by 2020. We report on this strategy
and progress in implementing it in the section “Employees”. Under the May 2015 law on the equal
participation of women and men in leadership positions in the private and public sector, certain companies
in Germany are required to set targets for the proportion of women on the supervisory board, executive
board, and the two management levels below, and to specify a deadline for meeting these targets. The
companies concerned must have adopted their targets and implementation deadlines by September 30,
2015. Under the law the first implementation deadline must not go beyond June 30, 2017. When setting the
next implementation deadline the period may be up to five years. The law provides for an exception for the
proportion of women on the supervisory boards of listed and codetermined companies like
thyssenkrupp AG: Here a mandatory minimum proportion of 30% women and 30% men applies to the filling
of vacant supervisory board seats from January 1, 2016.
On September 9, 2015 the Supervisory Board of thyssenkrupp AG set a target of 0% women on the
Executive Board of thyssenkrupp AG, to be implemented by June 30, 2017. This will maintain the current
status.
For the first management level below the Executive Board, the Executive Board of thyssenkrupp AG has
adopted a target of 8%, to be implemented by June 30, 2017. For the second management level below the
Executive Board, the Executive Board of thyssenkrupp AG has adopted a target of 23%, to be met by June
30, 2017. The target for the first management level represents an increase from the current level of 5%. The
target for the second management level maintains the current status. This does not of course rule out an
increase in the proportion of women at this management level. The implementation period adopted is the
maximum period permitted for the first implementation deadline.
For all other affected companies in the thyssenkrupp Group the targets for the proportion of women on
supervisory boards, management boards and the two management levels below as well as the
implementation deadlines were set on time by September 30, 2015.
We aim to achieve a 15% proportion of women in leadership positions by 2020
119 thyssenkrupp annual report 2014/2015 Combined management report // Legal information // Compensation report // Takeover-related disclosures
Compensation report
Contained in the corporate governance report, the compensation report in accordance with § 289 (2) no. 4,
§ 315 (2) no. 4 HGB is part of the combined management report.
Takeover-related disclosures
The following information, valid September 30, 2015, is presented in accordance with § 289 (4), § 315 (4)
HGB. Details under § 289 (4), § 315 (4) HGB which do not apply at thyssenkrupp are not mentioned.
Composition of capital stock The capital stock of thyssenkrupp AG amounts to €1,448,801,144.32 and consists of 565,937,947 no-par
value bearer shares. Each share carries the same rights and grants one vote at the Annual General Meeting.
Direct and indirect shareholdings exceeding 10% of the voting rights At the date of issuance the following shareholdings in the Company exceed 10% of the voting rights:
• Direct shareholding of Alfried Krupp von Bohlen und Halbach Foundation, Essen, in the amount of
23.03% of the voting rights of thyssenkrupp AG;
• Indirect shareholding of Cevian Capital II GP Limited, St. Helier, Jersey, in the amount of 15.08% of the
voting rights. Voting rights are attributed to it by its controlled company Cevian Capital II Master Fund LP,
Cayman Islands, which has a direct shareholding of 12.23% of the voting rights of thyssenkrupp AG.
Appointment and dismissal of Executive Board members, amendments to the Articles of Association The appointment and dismissal of members of the Executive Board of thyssenkrupp AG is subject to § 84
and § 85 AktG and § 31 Codetermination Act (MitbestG) in conjunction with § 6 of the Articles of Association.
Amendments to the Articles of Association are subject to the approval of the Annual General Meeting with a
majority of at least three quarters of the capital stock represented; §§ 179 ff. AktG apply. Under § 11 (9) of
the Articles of Association, the Supervisory Board is authorized to resolve amendments to the Articles of
Association which relate only to their wording. If the authorized capital pursuant to § 5 (5) of the Articles of
Association has not been used or has been only partly used by January 16, 2019, the Supervisory Board
may also amend the wording of § 5.
Authorization of the Executive Board to issue shares and exclude subscription rights Authorized capital – Under § 5 (5) of the Articles of Association, the Executive Board is authorized, with the
approval of the Supervisory Board, to increase the Company’s capital stock on one or more occasions on or
before January 16, 2019 by up to €370 million by issuing up to 144,531,250 new no-par value bearer
shares in exchange for cash and/or contributions in kind (authorized capital).
It may exclude shareholders’ subscription rights with the approval of the Supervisory Board in the following
cases:
• to round off fractional amounts
• to the extent necessary to grant holders, or creditors in the case of registered securities, of option or
conversion rights or conversion obligations issued by thyssenkrupp AG or its Group companies
subscription rights to new shares as would be due to them as shareholders after exercise of the option or
conversion rights or after fulfillment of the conversion obligations
• if the issue price of new shares issued for capital increases in exchange for cash contributions is not
significantly lower than the stock market price of already listed shares at the time the final issue price is
determined, which should be as close as possible to the time the shares are issued, and the shares
issued in total do not exceed 10% of the capital stock either at the time this authorization becomes
120 thyssenkrupp annual report 2014/2015 Combined management report // Legal information // Takeover-related disclosures
effective or at the time it is exercised. There shall be counted towards this limit of 10% of the capital stock
the share of the capital stock attributable to treasury shares which are sold from the time this authorization
becomes effective in direct or analogous application of § 186 (3) sentence 4 AktG, as well as the share of
the capital stock attributable to shares relating to conversion and/or option rights and/or conversion
obligations from bonds issued with exclusion of subscription rights according to § 186 (3) sentence 4 AktG
from the time this authorization becomes effective in accordance with the authorization of the Annual
General Meeting on January 17, 2014
• in the event of capital increases in exchange for contributions in kind
Under the aforesaid authorizations the total shares issued with subscription rights excluded for capital
increases in exchange for cash and/or contributions in kind may not exceed 20% of the capital stock either
at the time the authorization becomes effective or at the time it is exercised. Up to the issue of shares
without subscription rights, there shall be counted towards the aforesaid 20% limit (i) treasury shares sold
with subscription rights excluded, and (ii) shares to be issued to service bonds with conversion and/or option
rights, insofar as the bonds were issued on the basis of the authorization of the Annual General Meeting of
January 17, 2014 with shareholder subscription rights excluded.
The Executive Board is authorized, with the approval of the Supervisory Board, to determine the further
content and conditions of the share issue.
Conditional capital – Under § 5 (6) of the Articles of Association the Company's capital stock is
conditionally increased by up to €250,000,000, divided into up to 97,656,250 no-par bearer shares
(conditional capital). The conditional capital increase will only be implemented to the extent that the holders
or creditors of option or conversion rights or those with an obligation to convert warrant or convertible bonds
issued against cash contribution that are issued or guaranteed by the Company or a subordinate Group
company on or before January 16, 2019 based on the authorization of the Executive Board by resolution by
the Annual General Meeting passed on January 17, 2014 actually use their option or conversion rights or, to
the extent that they are obliged to convert, fulfill their obligation to convert or to the extent that the Company
exercises an option to grant shares of the Company in whole or in part instead of payment of the cash
amount due provided no cash compensation is granted or no treasury shares or shares of another listed
company are used for servicing in each case. New shares are issued at the option or conversion price to be
determined in each case according to the above mentioned authorization resolution. The new shares
participate in profits from the start of the fiscal year in which they are created. To the extent legally
permissible the Executive Board, subject to the approval of the Supervisory Board, may determine the profit
participation of new shares differently than § 60 (2) AktG. The Executive Board is authorized, subject to the
approval of the Supervisory Board, to determine the further details of the conditional capital increase.
Authorization of the Executive Board to repurchase stock By resolution of the Annual General Meeting of January 30, 2015 the Company was authorized until January
29, 2020 to purchase for all legally permissible purposes treasury shares up to a total of 10% of the capital
stock at the time of the resolution of €1,448,801,144.32 or – if lower – at the time the authorization is
exercised. The authorization may be exercised in whole or in installments, once or several times, directly by
the Company or by controlled enterprises or enterprises majority-owned by the Company or by third parties
acting for the Company's account or for the account of controlled enterprises or enterprises majority-owned
by the Company. The purchase may be effected on the open market or by means of a public offer or public
invitation to tender or by issue of tender rights to shareholders or by using equity derivatives (put or call
options or a combination of the two). If the shares are purchased on the open market, the countervalue per
share paid by the Company (excluding incidental costs) may not be more than 5% higher or lower than the
price determined on the day of trading by the opening auction in the Xetra trading system (or a comparable
successor system).
121 thyssenkrupp annual report 2014/2015 Combined management report // Legal information // Takeover-related disclosures
If the shares are purchased by means of a public offer, the purchase price or the limits of the price range per
share (excluding incidental costs) may not be more than 10% higher or lower than the average closing price
in the Xetra trading system (or a comparable successor system) on the three trading days before the date of
the announcement of the offer. If, after announcement of an offer, the relevant price or the limits of the price
range are subject to significant changes, the offer may be modified. In this case the price is based on the
average price over the three days of trading before the announcement of a modification and may not be
more than 10% higher or lower than this amount. The volume of a public offer may be limited. Insofar as the
volume of shares tendered exceeds the volume to be repurchased, tender rights may be partially excluded to
the extent that shares may be purchased in proportion to the number of shares tendered (tender quota)
instead of in proportion to the number of shares held in the company (shareholding quota). In addition
tender rights may be partially excluded to the extent that priority is given to smaller lots of up to 100 shares
per shareholder or the number of shares is rounded to avoid fractions of shares.
If the shares are purchased by means of a public invitation to all shareholders to tender, the Company
specifies a purchase price range per share within which shares may be tendered. The purchase price range
may be modified if the share price changes significantly during the term of the offer from the share price at
the time of publication of the invitation to tender. The purchase price per share to be paid by the Company
(excluding incidental costs), which is calculated by the Company on the basis of the tenders received, may
not be more than 10% higher or lower than the average closing price in the Xetra trading system (or a
comparable successor system) on the three trading days before the cut-off date described below. The cut-
off date is the date on which the Executive Board of the Company finalizes its formal decision to publish or
modify the invitation to tender. The volume of tenders accepted may be limited. If due to the limited volume
not all of several equal tenders can be accepted, tender rights may be partially excluded to the extent that
shares are purchased on the basis of tender quotas instead of shareholding quotas. In addition tender rights
may be partially excluded to the extent that priority is given to smaller lots of up to 100 shares per
shareholder or the number of shares is rounded to avoid fractions of shares.
If the shares are purchased by means of issuing tender rights to shareholders, these may be allocated for
each share of the Company. A fixed number of tender rights based on the ratio of the Company's capital
stock to the volume of shares to be repurchased by the Company will entitle a shareholder to sell one share
of the Company back to the Company. Tender rights may also be allocated in such a way that one tender
right is allocated for a certain number of shares based on the ratio of capital stock to the buy-back volume.
Fractions of tender rights are not allocated; in these cases any partial tender rights are excluded. The price
or the limits of the price range (in each case excluding incidental costs) for which a share of the Company
may be sold when exercising a tender right are subject to the provisions of the above paragraph, with the
relevant cut-off date being the date of publication of the buyback offer with associated tender rights, and in
the event of modifications the relevant cut-off date being the date of publication of the modification. Further
details of the tender rights, in particular their content, term and if appropriate their tradability, are
determined by the Executive Board of the Company.
If the shares are purchased using equity derivatives (put options, call options, combinations of put and call
options, or forward contracts), the equity derivatives must be agreed with one or several bank(s), one or
several enterprises operating in accordance with § 53 (1) sentence 1 or § 53b (1) sentence 1 or (7) of the
German Banking Act or a group or consortium of banks and/or such enterprises. The terms and conditions
must ensure that the equity derivatives are based only on shares acquired in accordance with the principle
of equal treatment for shareholders; this is satisfied by acquiring the shares on the open market. The term of
each individual equity derivative may not exceed 18 months, may end no later than January 29, 2020 and
122 thyssenkrupp annual report 2014/2015 Combined management report // Legal information // Takeover-related disclosures
must be selected in such a way that the purchase of shares to exercise or fulfill the options cannot take place
later than January 29, 2020. The authorization may be exercised in whole or in part, once or in several
different transactions by the Company, and also by an entity dependent on or majority-owned by the
Company or by third parties acting on behalf of the Company or enterprises dependent on or majority-
owned by the Company. Each share purchase by means of equity derivatives is limited to a maximum of 5%
of the capital stock of €1,448,801,144.32 at the time of the resolution or – if lower – at the time the
authorization is exercised. If treasury shares are purchased by means of equity derivatives in accordance
with the authorization provisions, all rights of shareholders to enter into such equity derivatives with the
Company and all shareholder tender rights are excluded.
The Executive Board is authorized to use the repurchased treasury shares for all legally permissible
purposes. In particular it may cancel the shares, sell them by means other than on the open market, by offer
to the shareholders or in exchange for contributions in kind, use them to fulfill option and/or conversion
rights/obligations in respect of warrant and convertible bonds issued by the Company or the Company's
subsidiaries, grant the holders of such warrant and/or convertible bonds a subscription right to the shares as
would be due to them after exercise of the option or conversion rights or after fulfilment of a conversion
obligation, and offer them for sale to employees of the Company and its affiliated companies. With the
exception of cancelation shareholders’ subscription rights are excluded in the cases stated. In addition if
treasury shares are sold by means of a tender offer to all shareholders, the Executive Board may exclude
shareholders' subscription rights for fractional amounts. The Supervisory Board may determine that
measures by the Executive Board under this authorization to purchase and use treasury shares are subject
to its approval.
Authorization of the Executive Board to issue warrant and convertible bonds and to exclude subscription rights By resolution of the Annual General Meeting of January 17, 2014 the Executive Board was authorized, with
the approval of the Supervisory Board, to take the following measures on or before January 16, 2019:
• to issue once or several times bearer or registered warrant and/or convertible bonds (together "bonds") in
the total par value of up to €2 billion with or without limited terms, and to grant to or impose on the
holders or creditors of convertible bonds conversion rights or obligations for no-par bearer shares of the
Company with a total share of the capital stock of up to €250 million in accordance with the conditions of
these bonds. The bonds can also be issued by a subordinate Group company of the Company; in this
event the Executive Board is authorized, with the approval of the Supervisory Board, to guarantee the
bonds for the Company and to grant to or impose on the holders or creditors of these bonds option or
conversion rights or obligations for no-par bearer shares of the Company.
• The bonds are divided into partial bonds. In the event of a warrant bond issue, one or several options are
attached to each partial bond which entitle the holder or creditor to purchase no-par bearer shares of the
Company in accordance with the option conditions determined by the Executive Board. The option
conditions may specify that the option price can also be settled by transfer of partial bonds and if
appropriate a cash surcharge. Where fractional shares occur, the option or bond conditions may specify
that these fractional shares can be added together for the purchase of whole shares, if appropriate
subject to payment of a surcharge.
123 thyssenkrupp annual report 2014/2015 Combined management report // Legal information // Takeover-related disclosures
• In the event of a convertible bond issue, the holders of bearer bonds or creditors of partial bonds obtain
the right to convert their partial bonds into no-par bearer shares of the Company in accordance with the
convertible bond conditions determined by the Executive Board. The conversion ratio is calculated by
dividing the par value or, if lower, the issuing amount of a partial bond by the fixed conversion price for a
no-par bearer share of the Company. The ratio may be rounded up or down; in addition, it may be
specified that a cash surcharge must be paid and that non-convertible fractional amounts must be
grouped together and/or compensated in cash. The bond conditions can specify a variable conversion
ratio (subject to the minimum price specified below) within a pre-defined range depending on the
development of the price of the no-par shares of the Company during the term of the bond.
• The bond conditions may also provide the Company with the right in the event of a conversion or exercise
of an option not to issue new no-par shares, but to pay a cash amount corresponding to the weighted
average closing price of the shares in the electronic trading system of Frankfurt Stock Exchange over a
period specified in the bond conditions in lieu of the shares which would otherwise be issued. The bond
conditions may also specify that, at the Company's discretion, the bond with option rights or conversion
rights or obligations attached is to be converted not into new shares from conditional capital but into
existing shares of the Company or another listed company, or that the option right can be fulfilled by
delivering such shares. The bond conditions may also include a combination of these performance
options.
• The bond conditions may also provide the Company with the right to grant the holders or creditors of a
bond with option rights or conversion rights or obligations which has reached maturity (this also includes
maturity due to termination) non-par shares of the Company or another listed company in lieu of part or
all of the payable cash payment.
• The convertible bond conditions may also include an obligation to convert at the end of the term
(or earlier or at the time of a specified event). The convertible bond conditions may entitle the Company to
fully or partly offset in cash any difference between the par value or lower issuing amount of the
convertible bond and the product of conversion price and conversion ratio.
• With the exception of cases where a right to offer alternative performance or a conversion obligation
applies, the fixed option or conversion price for a no-par share of the Company must be no lower than
80% of the weighted average closing price of the no-par shares of the Company in the electronic trading
system of Frankfurt Stock Exchange over the last 10 trading days before the Executive Board passes the
resolution to issue the bond with option or conversion rights or conversion obligations attached, or – in
the event that a subscription right is granted – no lower than 80% of the weighted average trading price of
the no-par shares of the Company in the electronic trading system of Frankfurt Stock Exchange during the
subscription period with the exception of the days of the subscription period necessary to ensure
the option or conversion price can be announced in due time in accordance with § 186 (2) sentence
2 AktG. § 9 (1) AktG and § 199 AktG remain unaffected.
• In the cases where a right to offer alternative performance or a conversion obligation applies, the option
or conversion price in accordance with the bond conditions must correspond at least to the above
minimum price or the weighted average closing price of the no-par shares of the Company in the
electronic trading system of Frankfurt Stock Exchange over the 10 trading days before the final maturity
date or another specified date, even if this average price is lower than the aforesaid minimum price
(80%). § 9 (1) AktG and § 199 AktG remain unaffected.
124 thyssenkrupp annual report 2014/2015 Combined management report // Legal information // Takeover-related disclosures
• Notwithstanding § 9 (1) AktG, the option or conversion price may be reduced under a dilution protection
clause as defined in the conditions if during the option or conversion period the Company (i) increases the
capital stock through a capital increase from Company funds or (ii) increases the capital stock or sells
treasury stock granting an exclusive subscription right to its shareholders or (iii) issues, grants or
guarantees further bonds with option or conversion rights or obligations granting an exclusive
subscription right to its shareholders, and in cases (ii) and (iii) the owners of existing option or conversion
rights or obligations are not granted subscription rights such as they would have held after exercising the
option or conversion right or after fulfilling the conversion obligation. The reduction of the option or
conversion price may also be effected by a cash payment upon exercise of the option or conversion right
or upon fulfillment of a conversion obligation. In addition, the conditions may require modification of the
option or conversion rights or conversion obligations in the case of a capital reduction or other measures
or events which are associated with an economic dilution of the value of the option rights or conversion
rights or conversion obligations (e.g. dividends, third parties gaining control).
• To the extent that shareholders are not permitted to subscribe to the bonds directly, the statutory
subscription rights will be granted to shareholders in such a way that the bonds are acquired by a bank or
banking syndicate which undertakes to offer them to the shareholders for subscription. If the bonds are
issued by a subordinate Group company, the Company must ensure that statutory subscription rights are
granted to the shareholders of the Company within the meaning of the sentence above.
• However, the Executive Board is authorized, subject to the approval of the Supervisory Board, to exclude
shareholders’ subscription rights in the following cases:
- to eliminate fractional amounts
- to the extent necessary to grant holders, or creditors in the case of registered securities, of option or
conversion rights or obligations previously issued by thyssenkrupp AG or its Group companies
subscription rights to new shares as would be due to them as shareholders after exercise of the option
or conversion rights or after fulfillment of a conversion obligation
- in the case of bonds issued against cash payment, to the extent that the Executive Board, after due
review, reaches the conclusion that the issuing price of the bonds is not significantly lower than their
theoretical fair value, calculated using recognized, in particular financial mathematics methods.
However, this authorization to exclude subscription rights only applies to bonds issued with an option
right or conversion right or obligation, with an option or conversion right or a conversion obligation for
shares with a share of the capital stock that may not exceed 10% of the capital stock in total either on
the date this authorization becomes effective or – if this value is lower – on the date the authorization is
exercised. There shall be counted towards this limit of 10% of the capital stock the share of the capital
stock attributable to shares which during the period between granting of this authorization and the
issue excluding subscription rights in accordance with § 186 (3) sentence 4 AktG utilizing this
authorization of bonds with conversion and/or option rights or conversion obligations excluding
subscription rights are either issued under an authorization of the Executive Board to exclude
subscription rights in direct or analogous application of § 186 (3) sentence 4 AktG or sold as acquired
treasury stock in corresponding application of § 186 (3) sentence 4 AktG
• The total number of bonds issued excluding subscription rights under the above authorizations is limited
to the number of bonds with an option or conversion right or a conversion obligation for shares with a
share of the capital stock that must not exceed 20% of the capital stock in total, either at the time this
authorization enters into force or – if this value is lower – at the time it is exercised. There shall be counted
towards the above 20% limit (i) treasury shares which during the term of this authorization until the issue
125 thyssenkrupp annual report 2014/2015 Combined management report // Legal information // Takeover-related disclosures
excluding subscription rights of the bonds with option and/or conversion rights or obligations are
sold excluding subscription rights, and (ii) shares which during the term of this authorization until the
issue excluding subscription rights of bonds with option and/or conversion rights or obligations are issued
excluding subscription rights from authorized capital.
• The Executive Board is authorized, subject to Supervisory Board approval, to determine the further details
of the issuing of the bonds, in particular interest rate, issuing price, term and denomination, dilution
protection provisions, option or conversion period as well as the conversion and option price within the
above framework, or to fix them in agreement with the boards of the Group company issuing the option or
convertible bond.
Key agreements subject to conditions thyssenkrupp AG is party to the following agreements that contain certain conditions in the event of a
change of control as a result of a takeover bid:
• The Company has concluded an agreement with a banking consortium on a committed credit facility in
the amount of €2.0 billion. Each member of the banking consortium has the right under certain conditions
to cancel its share in the credit facility and its share in outstanding loans and demand their repayment if
one or more shareholders who act in a concerted manner towards thyssenkrupp AG with shareholders
other than the Alfried Krupp von Bohlen und Halbach Foundation, together hold more than 50% of the
voting rights or capital stock of thyssenkrupp AG.
• In the fiscal years 2011/2012, 2012/2013, 2013/2014 and 2014/2015 the Company issued bonds and a
private placement in the total amount of €5.6 billion. It is also guarantor of the further bond issued in
2008/2009 by its subsidiary ThyssenKrupp Finance Nederland B.V. in the total amount of €1 billion.
A change of control, i.e. cases where a third party or third parties acting in a concerted manner towards
thyssenkrupp AG acquire or hold more than 50% of the capital stock or more than 50% of the voting
shares of thyssenkrupp AG, may under certain conditions lead to the early redemption of the bonds
including interest.
• The Company is party to a shareholders' agreement in respect of Atlas Elektronik GmbH (joint venture)
under which the co-shareholder Airbus Defence and Space GmbH has a call option on specific assets and
liabilities of the joint venture at fair value in the event that a competitor of the joint venture or of the
co-shareholder directly or indirectly acquires a controlling interest in the Company. If the call option is
exercised, thyssenkrupp Technologies AG (today operating under the name thyssenkrupp Technologies
Beteiligungen GmbH) is entitled to purchase all the co-shareholder's shares in the joint venture at fair
value plus 5% premium. If the call option is not exercised, the co-shareholder has a put option in respect
of the shares in the joint venture at the specified purchase price conditions.
• In connection with the reappointments of the members of the Executive Board of thyssenkrupp AG –
Dr. Hiesinger, Mr. Kerkhoff and Mr. Burkhard – resolved in this fiscal year, compensation arrangements for
the event of a takeover bid (change of control clause) were agreed in their service contracts with effect
from the second period of appointment. Under these arrangements the Executive Board members
mentioned, in the event of a change of control, have a special right of termination which triggers a
severance payment equal to the sum of two annual fixed salaries and two annual performance bonuses
but not more than the compensation due for the remaining term of their service contract. The installments
of the Long- Term Incentive Plan (LTI) are not forfeited if the special right of termination is exercised. The
same applies if the Executive Board member’s contract is terminated by mutual agreement in connection
with the change of control. A change of control exists when (i) a shareholder has acquired control within
the meaning of the Securities Acquisition and Takeover Act (WpÜG) by holding at least 30% of the voting
shares in the Company, (ii) an enterprise agreement in accordance with § 291 AktG has been entered into
with the Company as a dependent enterprise or (iii) the Company has been merged with another non-
Group legal entity in accordance with § 2 Transformation Act (UmwG), unless the value of the other legal
entity is less than 50% of the value of the Company as evidenced by the agreed exchange ratio.
126 thyssenkrupp annual report 2014/2015
Consolidated financial statements
127 Consolidated statement of financial position
128 Consolidated statement of income
129 Consolidated statement of comprehensive income
130 Consolidated statement of changes in equity
131 Consolidated statement of cash flows
132 Notes to the consolidated financial statements
162 Notes to the consolidated statement of financial position
212 Notes to the consolidated statement of income
218 Notes to the consolidated statement of cash flows
218 Subsequent events
218 Other information
222 Independent Auditors' Report
224 Responsibility statement
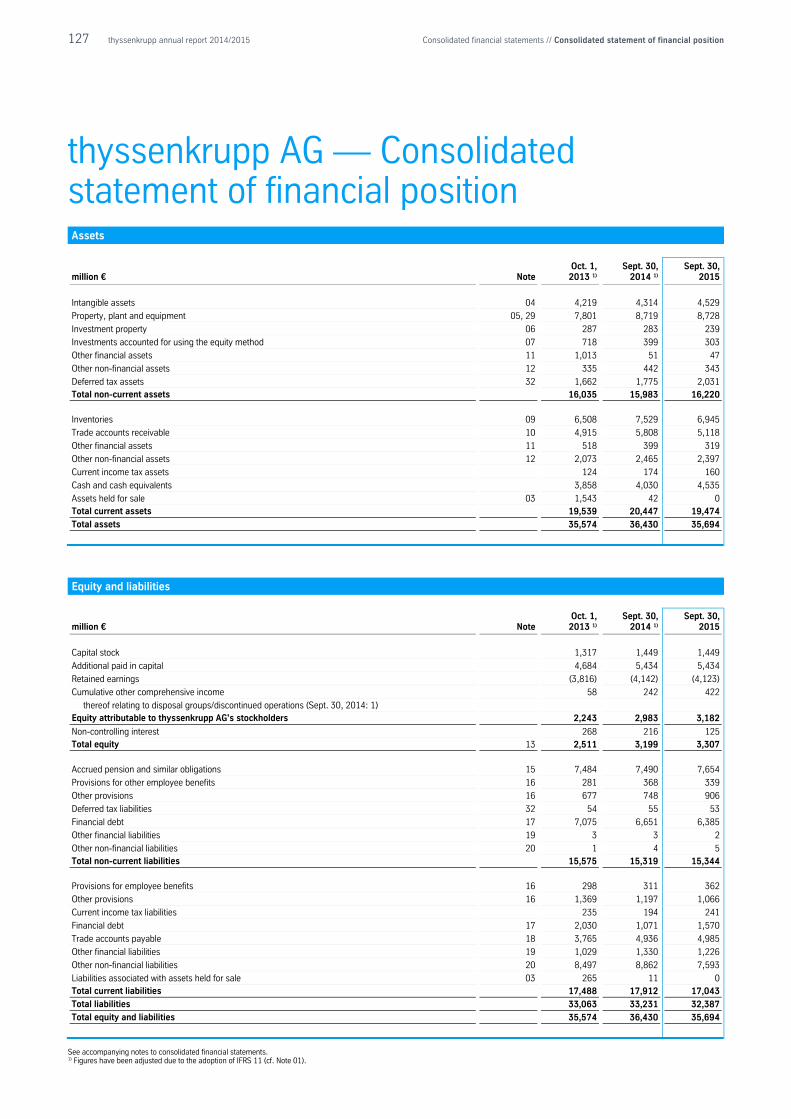
127 thyssenkrupp annual report 2014/2015 Consolidated financial statements // Consolidated statement of financial position
thyssenkrupp AG — Consolidated statement of financial position Assets
million € Note Oct. 1, 2013 1)
Sept. 30, 2014 1)
Sept. 30, 2015
Intangible assets 04 4,219 4,314 4,529
Property, plant and equipment 05, 29 7,801 8,719 8,728
Investment property 06 287 283 239
Investments accounted for using the equity method 07 718 399 303
Other financial assets 11 1,013 51 47
Other non-financial assets 12 335 442 343
Deferred tax assets 32 1,662 1,775 2,031 Total non-current assets 16,035 15,983 16,220
Inventories 09 6,508 7,529 6,945
Trade accounts receivable 10 4,915 5,808 5,118
Other financial assets 11 518 399 319
Other non-financial assets 12 2,073 2,465 2,397
Current income tax assets 124 174 160
Cash and cash equivalents 3,858 4,030 4,535
Assets held for sale 03 1,543 42 0 Total current assets 19,539 20,447 19,474
Total assets 35,574 36,430 35,694
Equity and liabilities
million € Note Oct. 1, 2013 1)
Sept. 30, 2014 1)
Sept. 30, 2015
Capital stock 1,317 1,449 1,449
Additional paid in capital 4,684 5,434 5,434
Retained earnings (3,816) (4,142) (4,123)
Cumulative other comprehensive income 58 242 422
thereof relating to disposal groups/discontinued operations (Sept. 30, 2014: 1) Equity attributable to thyssenkrupp AG's stockholders 2,243 2,983 3,182
Non-controlling interest 268 216 125 Total equity 13 2,511 3,199 3,307
Accrued pension and similar obligations 15 7,484 7,490 7,654
Provisions for other employee benefits 16 281 368 339
Other provisions 16 677 748 906
Deferred tax liabilities 32 54 55 53
Financial debt 17 7,075 6,651 6,385
Other financial liabilities 19 3 3 2
Other non-financial liabilities 20 1 4 5 Total non-current liabilities 15,575 15,319 15,344
Provisions for employee benefits 16 298 311 362
Other provisions 16 1,369 1,197 1,066
Current income tax liabilities 235 194 241
Financial debt 17 2,030 1,071 1,570
Trade accounts payable 18 3,765 4,936 4,985
Other financial liabilities 19 1,029 1,330 1,226
Other non-financial liabilities 20 8,497 8,862 7,593
Liabilities associated with assets held for sale 03 265 11 0 Total current liabilities 17,488 17,912 17,043
Total liabilities 33,063 33,231 32,387
Total equity and liabilities 35,574 36,430 35,694
See accompanying notes to consolidated financial statements. 1) Figures have been adjusted due to the adoption of IFRS 11 (cf. Note 01).
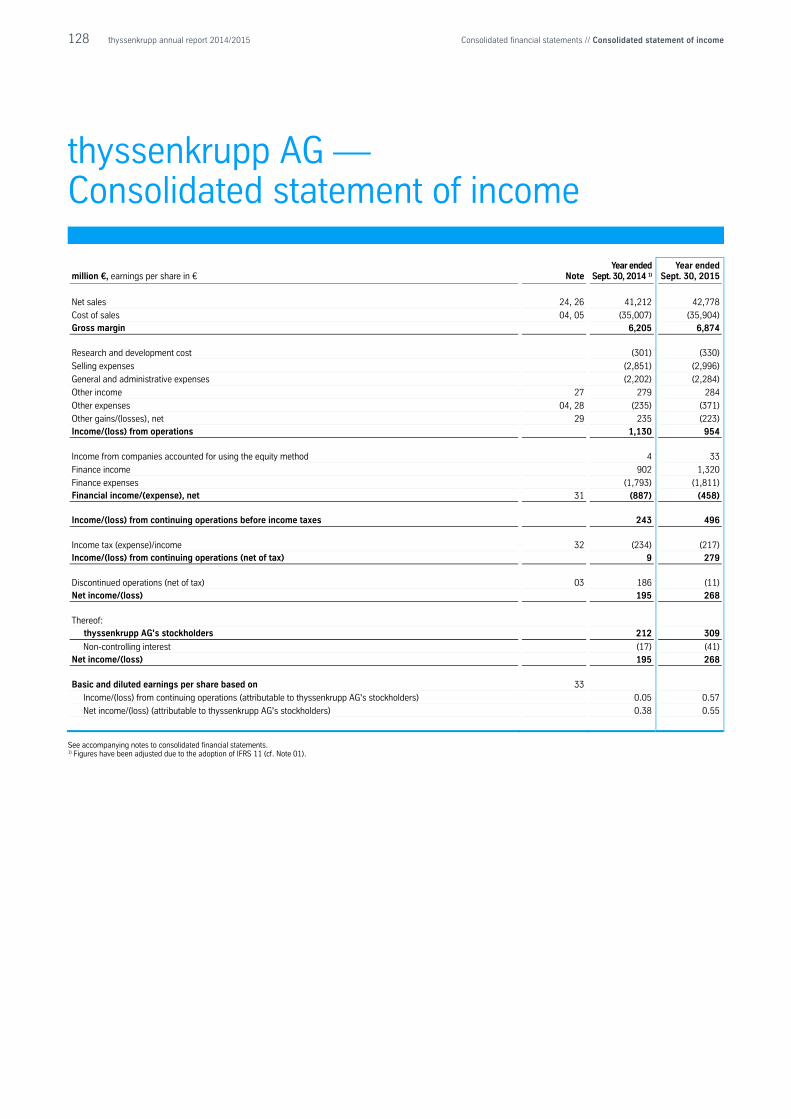
128 thyssenkrupp annual report 2014/2015 Consolidated financial statements // Consolidated statement of income
thyssenkrupp AG — Consolidated statement of income
million €, earnings per share in € Note Year ended
Sept. 30, 2014 1) Year ended
Sept. 30, 2015
Net sales 24, 26 41,212 42,778
Cost of sales 04, 05 (35,007) (35,904) Gross margin 6,205 6,874
Research and development cost (301) (330)
Selling expenses (2,851) (2,996)
General and administrative expenses (2,202) (2,284)
Other income 27 279 284
Other expenses 04, 28 (235) (371)
Other gains/(losses), net 29 235 (223)
Income/(loss) from operations 1,130 954
Income from companies accounted for using the equity method 4 33
Finance income 902 1,320
Finance expenses (1,793) (1,811) Financial income/(expense), net 31 (887) (458)
Income/(loss) from continuing operations before income taxes 243 496
Income tax (expense)/income 32 (234) (217) Income/(loss) from continuing operations (net of tax) 9 279
Discontinued operations (net of tax) 03 186 (11)
Net income/(loss) 195 268
Thereof: thyssenkrupp AG's stockholders 212 309
Non-controlling interest (17) (41) Net income/(loss) 195 268
Basic and diluted earnings per share based on 33
Income/(loss) from continuing operations (attributable to thyssenkrupp AG's stockholders) 0.05 0.57
Net income/(loss) (attributable to thyssenkrupp AG's stockholders) 0.38 0.55
See accompanying notes to consolidated financial statements. 1) Figures have been adjusted due to the adoption of IFRS 11 (cf. Note 01).
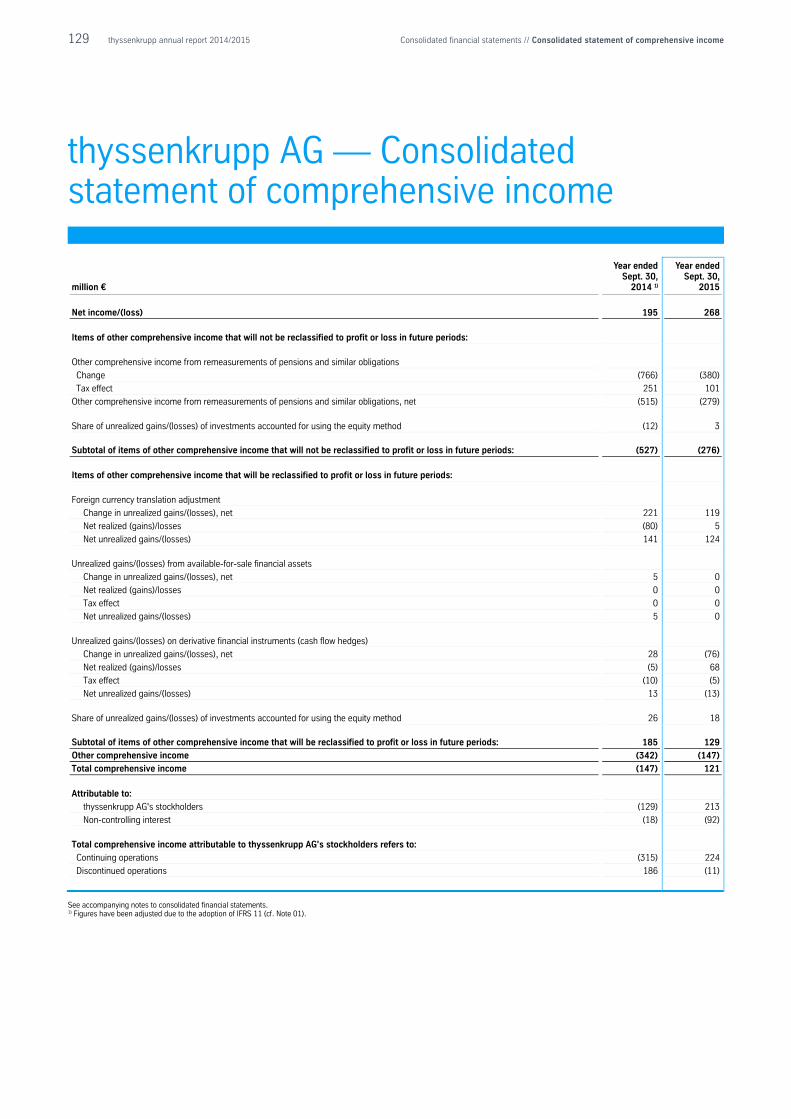
129 thyssenkrupp annual report 2014/2015 Consolidated financial statements // Consolidated statement of comprehensive income
thyssenkrupp AG — Consolidated statement of comprehensive income
million €
Year ended Sept. 30,
2014 1)
Year ended Sept. 30,
2015
Net income/(loss) 195 268
Items of other comprehensive income that will not be reclassified to profit or loss in future periods:
Other comprehensive income from remeasurements of pensions and similar obligations
Change (766) (380)
Tax effect 251 101
Other comprehensive income from remeasurements of pensions and similar obligations, net (515) (279)
Share of unrealized gains/(losses) of investments accounted for using the equity method (12) 3
Subtotal of items of other comprehensive income that will not be reclassified to profit or loss in future periods: (527) (276)
Items of other comprehensive income that will be reclassified to profit or loss in future periods:
Foreign currency translation adjustment
Change in unrealized gains/(losses), net 221 119
Net realized (gains)/losses (80) 5
Net unrealized gains/(losses) 141 124
Unrealized gains/(losses) from available-for-sale financial assets
Change in unrealized gains/(losses), net 5 0
Net realized (gains)/losses 0 0
Tax effect 0 0
Net unrealized gains/(losses) 5 0
Unrealized gains/(losses) on derivative financial instruments (cash flow hedges)
Change in unrealized gains/(losses), net 28 (76)
Net realized (gains)/losses (5) 68
Tax effect (10) (5)
Net unrealized gains/(losses) 13 (13)
Share of unrealized gains/(losses) of investments accounted for using the equity method 26 18
Subtotal of items of other comprehensive income that will be reclassified to profit or loss in future periods: 185 129
Other comprehensive income (342) (147)
Total comprehensive income (147) 121
Attributable to:
thyssenkrupp AG's stockholders (129) 213
Non-controlling interest (18) (92)
Total comprehensive income attributable to thyssenkrupp AG's stockholders refers to:
Continuing operations (315) 224
Discontinued operations 186 (11)
See accompanying notes to consolidated financial statements. 1) Figures have been adjusted due to the adoption of IFRS 11 (cf. Note 01).
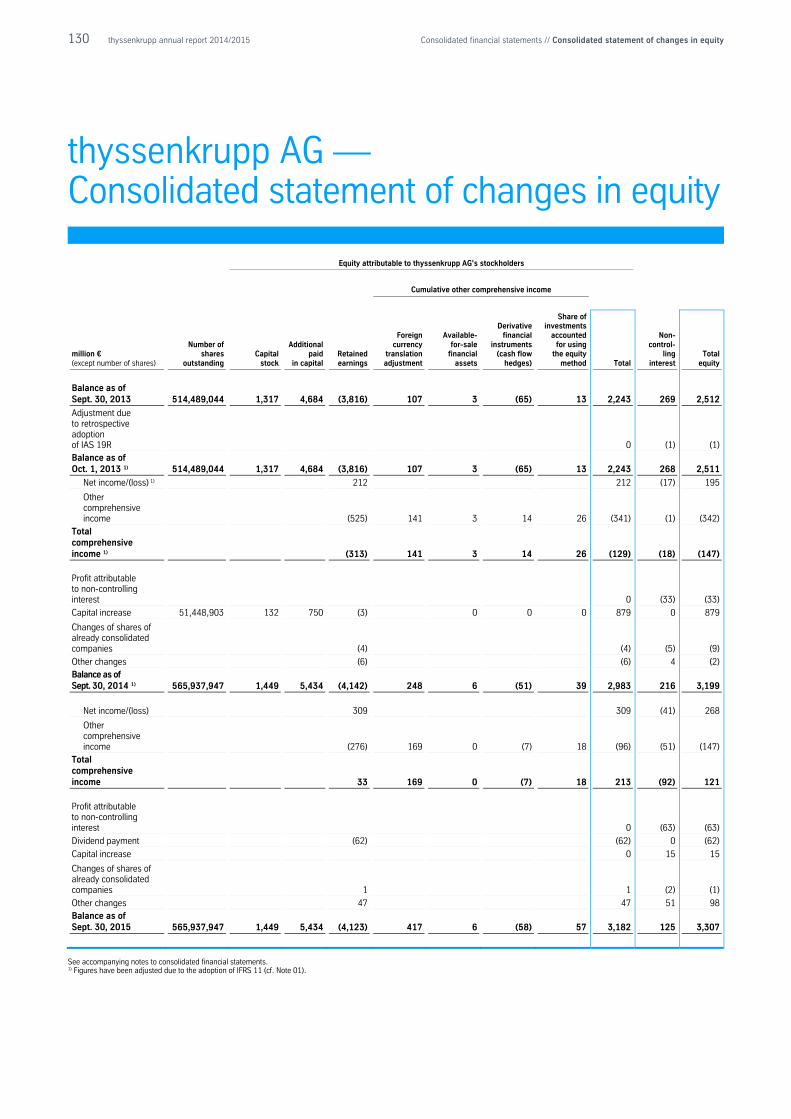
130 thyssenkrupp annual report 2014/2015 Consolidated financial statements // Consolidated statement of changes in equity
thyssenkrupp AG — Consolidated statement of changes in equity
Equity attributable to thyssenkrupp AG's stockholders
Cumulative other comprehensive income
million € (except number of shares)
Number of shares
outstanding Capital
stock
Additional paid
in capital Retained earnings
Foreign currency
translation adjustment
Available- for-sale
financial assets
Derivative financial
instruments (cash flow
hedges)
Share of investments
accounted for using
the equity method Total
Non- control-
ling interest
Total equity
Balance as of Sept. 30, 2013 514,489,044 1,317 4,684 (3,816) 107 3 (65) 13 2,243 269 2,512
Adjustment due to retrospective adoption of IAS 19R 0 (1) (1)
Balance as of Oct. 1, 2013 1) 514,489,044 1,317 4,684 (3,816) 107 3 (65) 13 2,243 268 2,511
Net income/(loss) 1) 212 212 (17) 195
Other comprehensive income (525) 141 3 14 26 (341) (1) (342)
Total comprehensive income 1) (313) 141 3 14 26 (129) (18) (147)
Profit attributable to non-controlling interest 0 (33) (33)
Capital increase 51,448,903 132 750 (3) 0 0 0 879 0 879
Changes of shares of already consolidated companies (4) (4) (5) (9)
Other changes (6) (6) 4 (2)
Balance as of Sept. 30, 2014 1) 565,937,947 1,449 5,434 (4,142) 248 6 (51) 39 2,983 216 3,199
Net income/(loss) 309 309 (41) 268
Other comprehensive income (276) 169 0 (7) 18 (96) (51) (147)
Total comprehensive income 33 169 0 (7) 18 213 (92) 121
Profit attributable to non-controlling interest 0 (63) (63)
Dividend payment (62) (62) 0 (62)
Capital increase 0 15 15
Changes of shares of already consolidated companies 1 1 (2) (1)
Other changes 47 47 51 98
Balance as of Sept. 30, 2015 565,937,947 1,449 5,434 (4,123) 417 6 (58) 57 3,182 125 3,307
See accompanying notes to consolidated financial statements. 1) Figures have been adjusted due to the adoption of IFRS 11 (cf. Note 01).
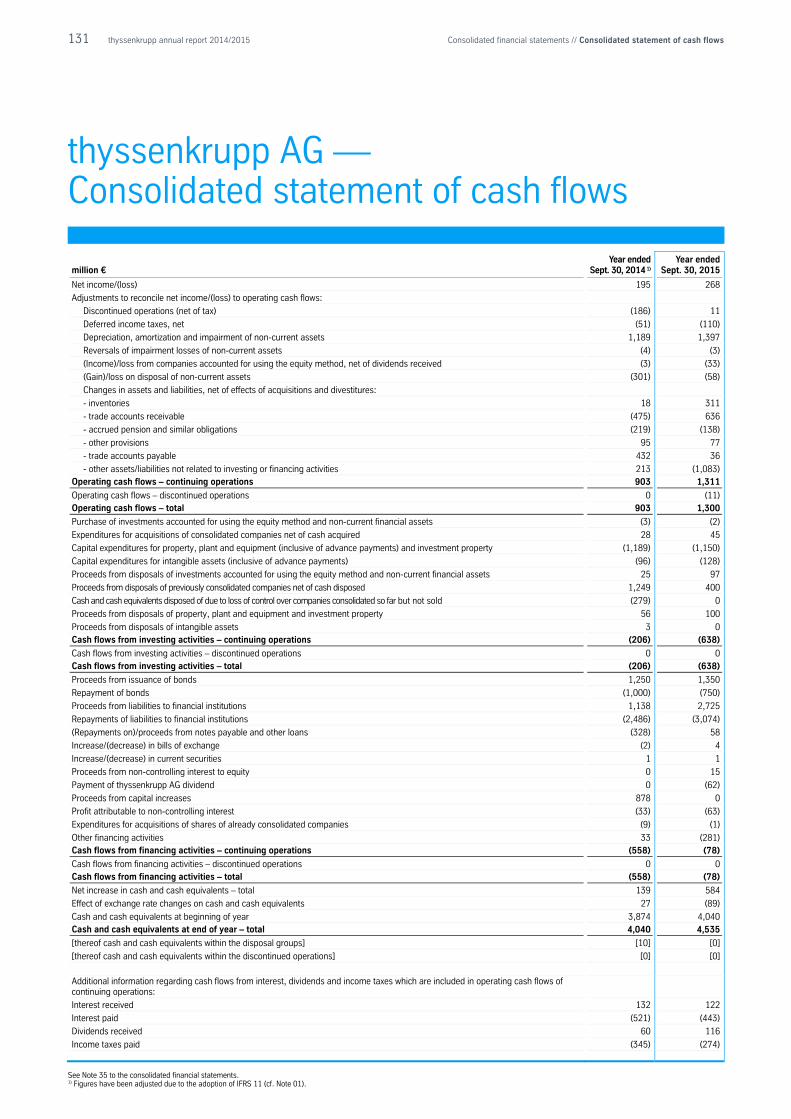
131 thyssenkrupp annual report 2014/2015 Consolidated financial statements // Consolidated statement of cash flows
thyssenkrupp AG — Consolidated statement of cash flows
million € Year ended
Sept. 30, 2014 1) Year ended
Sept. 30, 2015
Net income/(loss) 195 268
Adjustments to reconcile net income/(loss) to operating cash flows:
Discontinued operations (net of tax) (186) 11
Deferred income taxes, net (51) (110)
Depreciation, amortization and impairment of non-current assets 1,189 1,397
Reversals of impairment losses of non-current assets (4) (3)
(Income)/loss from companies accounted for using the equity method, net of dividends received (3) (33)
(Gain)/loss on disposal of non-current assets (301) (58)
Changes in assets and liabilities, net of effects of acquisitions and divestitures:
- inventories 18 311
- trade accounts receivable (475) 636
- accrued pension and similar obligations (219) (138)
- other provisions 95 77
- trade accounts payable 432 36
- other assets/liabilities not related to investing or financing activities 213 (1,083) Operating cash flows – continuing operations 903 1,311
Operating cash flows – discontinued operations 0 (11) Operating cash flows – total 903 1,300
Purchase of investments accounted for using the equity method and non-current financial assets (3) (2)
Expenditures for acquisitions of consolidated companies net of cash acquired 28 45
Capital expenditures for property, plant and equipment (inclusive of advance payments) and investment property (1,189) (1,150)
Capital expenditures for intangible assets (inclusive of advance payments) (96) (128)
Proceeds from disposals of investments accounted for using the equity method and non-current financial assets 25 97
Proceeds from disposals of previously consolidated companies net of cash disposed 1,249 400
Cash and cash equivalents disposed of due to loss of control over companies consolidated so far but not sold (279) 0
Proceeds from disposals of property, plant and equipment and investment property 56 100
Proceeds from disposals of intangible assets 3 0 Cash flows from investing activities – continuing operations (206) (638)
Cash flows from investing activities – discontinued operations 0 0 Cash flows from investing activities – total (206) (638)
Proceeds from issuance of bonds 1,250 1,350
Repayment of bonds (1,000) (750)
Proceeds from liabilities to financial institutions 1,138 2,725
Repayments of liabilities to financial institutions (2,486) (3,074)
(Repayments on)/proceeds from notes payable and other loans (328) 58
Increase/(decrease) in bills of exchange (2) 4
Increase/(decrease) in current securities 1 1
Proceeds from non-controlling interest to equity 0 15
Payment of thyssenkrupp AG dividend 0 (62)
Proceeds from capital increases 878 0
Profit attributable to non-controlling interest (33) (63)
Expenditures for acquisitions of shares of already consolidated companies (9) (1)
Other financing activities 33 (281) Cash flows from financing activities – continuing operations (558) (78)
Cash flows from financing activities – discontinued operations 0 0 Cash flows from financing activities – total (558) (78)
Net increase in cash and cash equivalents – total 139 584
Effect of exchange rate changes on cash and cash equivalents 27 (89)
Cash and cash equivalents at beginning of year 3,874 4,040 Cash and cash equivalents at end of year – total 4,040 4,535
[thereof cash and cash equivalents within the disposal groups] [10] [0]
[thereof cash and cash equivalents within the discontinued operations] [0] [0]
Additional information regarding cash flows from interest, dividends and income taxes which are included in operating cash flows of continuing operations:
Interest received 132 122
Interest paid (521) (443)
Dividends received 60 116
Income taxes paid (345) (274)
See Note 35 to the consolidated financial statements. 1) Figures have been adjusted due to the adoption of IFRS 11 (cf. Note 01).
132 thyssenkrupp annual report 2014/2015 Consolidated financial statements // Notes to the consolidated financial statements
thyssenkrupp AG — Notes to the consolidated financial statements
Corporate Information thyssenkrupp Aktiengesellschaft (“thyssenkrupp AG” or “Company”) is a publicly traded corporation
domiciled in Duisburg and Essen in Germany. The consolidated financial statements of thyssenkrupp AG and
its subsidiaries, collectively the “Group”, for the year ended September 30, 2015, were authorized for
issuance in accordance with a resolution of the Executive Board on November 17, 2015.
Statement of compliance Applying Art. 315a of the German Commercial Code (HGB), the Group’s consolidated financial statements
have been prepared in accordance with International Financial Reporting Standards (IFRS) and its
interpretations of the International Accounting Standards Board (IASB) effective within the EU in accordance
with the Regulation No. 1606/2002 of the European Parliament and the Council concerning the use of
International Accounting Standards.
01 Summary of significant accounting policies The consolidated financial statements are presented in Euros since this is the currency in which the majority
of the Group’s transactions are denominated, with all amounts rounded to the nearest million except when
otherwise indicated; this may result in differences compared to the unrounded figures.
Consolidation The Group’s consolidated financial statements include the accounts of thyssenkrupp AG and all significant
entities which are directly or indirectly controlled by thyssenkrupp AG (subsidiaries). Control is achieved
where thyssenkrupp AG has the power, is exposed to positive or negative variable returns from its
involvement with the investee and has the ability to use its power to affect the amount of its returns. This
typically occurs when thyssenkrupp AG possesses more than half of the voting rights of a company. As far
as structured entities are concerned, the ability to control does not result from a majority of voting rights but
from contractual agreements.
The financial statements of subsidiaries are included in the consolidated financial statements from the date
that control commences until the date that control ceases. Capital consolidation is performed by offsetting
the carrying amounts of subsidiaries against their attributable equity. On acquisition, the identifiable assets,
liabilities and contingent liabilities of a subsidiary are measured at their fair values at the date of acquisition.
The interest of minority shareholders (non-controlling interest) is stated at the minority’s proportion of the
fair values of the identifiable assets, liabilities and contingent liabilities recognized.
All significant intercompany transactions and balances between Group entities are eliminated on
consolidation.
Joint arrangements where two or more parties jointly control an activity either classify as joint operations or
as joint ventures. Joint control exists when decisions about the relevant activities require the unanimous
consent of the parties sharing control. Joint operations are joint arrangements whereby the parties that have
joint control have rights to the assets, and obligations for the liabilities, relating to the arrangement. This
133 thyssenkrupp annual report 2014/2015 Consolidated financial statements // Notes to the consolidated financial statements
results in including the assets and liabilities as well as the related income and expense on a pro rata basis in
the Group’s consolidated financial statements. Joint ventures are joint arrangements whereby the parties
that have joint control have rights to the net assets of the arrangement. Joint ventures are accounted for
using the equity method of accounting. Where the Group transacts with its joint operations or joint ventures,
unrealized profits and losses are eliminated to the extent of the Group’s interest.
Investments in associates are also accounted for using the equity method of accounting. An associate is an
entity over which the Group is in a position to exercise significant influence, but not control or joint control,
through participation in the financial and operating policies. Significant influence is presumed when the
Group holds 20% or more of the voting rights (“Associated Companies”). Where a Group entity transacts
with an associate of the Group, unrealized profits and losses are eliminated to the extent of the Group’s
interest in the relevant associate.
Subsidiaries, joint operations, joint ventures and associates which influence the Group’s net assets, financial
position and results of operations only immaterially. Such entities are measured at fair value or at cost when
the fair value of unlisted equity instruments cannot be reliably measured; they are presented under the
“Other financial assets, non-current” line item.
Goodwill arising on acquisition represents the excess of the cost of acquisition over the Group’s interest in
the fair value of the identifiable assets, liabilities and contingent liabilities of a subsidiary, joint operation,
joint venture or associate at the date of acquisition. Goodwill is recognized as an asset and is tested for
impairment annually, or on such other occasions that events or changes in circumstances indicate that it
might be impaired.
Goodwill arising on the acquisition of a joint venture or an associate is included within the carrying amount of
the joint venture or the associate, respectively. Goodwill arising on the acquisition of subsidiaries or joint
operations is presented separately in the balance sheet.
On disposal of a subsidiary, joint operation, joint venture or associate, the attributable amount of goodwill is
included in the determination of the profit or loss on disposal.
Foreign currency translation The functional and reporting currency of thyssenkrupp AG and its relevant European subsidiaries is the
Euro (€). Transactions denominated in foreign currencies are initially recorded at the rates of exchange
prevailing on the dates of the transactions. Monetary assets and liabilities denominated in such currencies
are retranslated at the rates prevailing on the balance sheet date. Profits and losses arising on exchange are
included in the net profit or loss for the period.
Financial statements of the foreign subsidiaries included in the Group consolidated financial statements
where the functional currency is other than the Euro are translated using their functional currency which is
generally the respective local currency. The translation is performed using the current rate method, in which
balance sheet amounts are translated to the reporting currency using the rates of exchange prevailing on the
balance sheet date, while income statement amounts are translated using the period’s average exchange
rates. Net exchange gains or losses resulting from the translation of foreign financial statements are
accumulated and included in equity. Such translation differences are recognized as income or as expenses
in the period in which the operation is disposed of.
Companies that manage their sales, purchases, and financing substantially not in their local currency use
the currency of their primary economic environment as their functional currency. Using the functional
currency in these cases involves translating non-monetary items such as non-current assets, including
scheduled depreciation, and equity to the functional currency using the average exchange rates of the
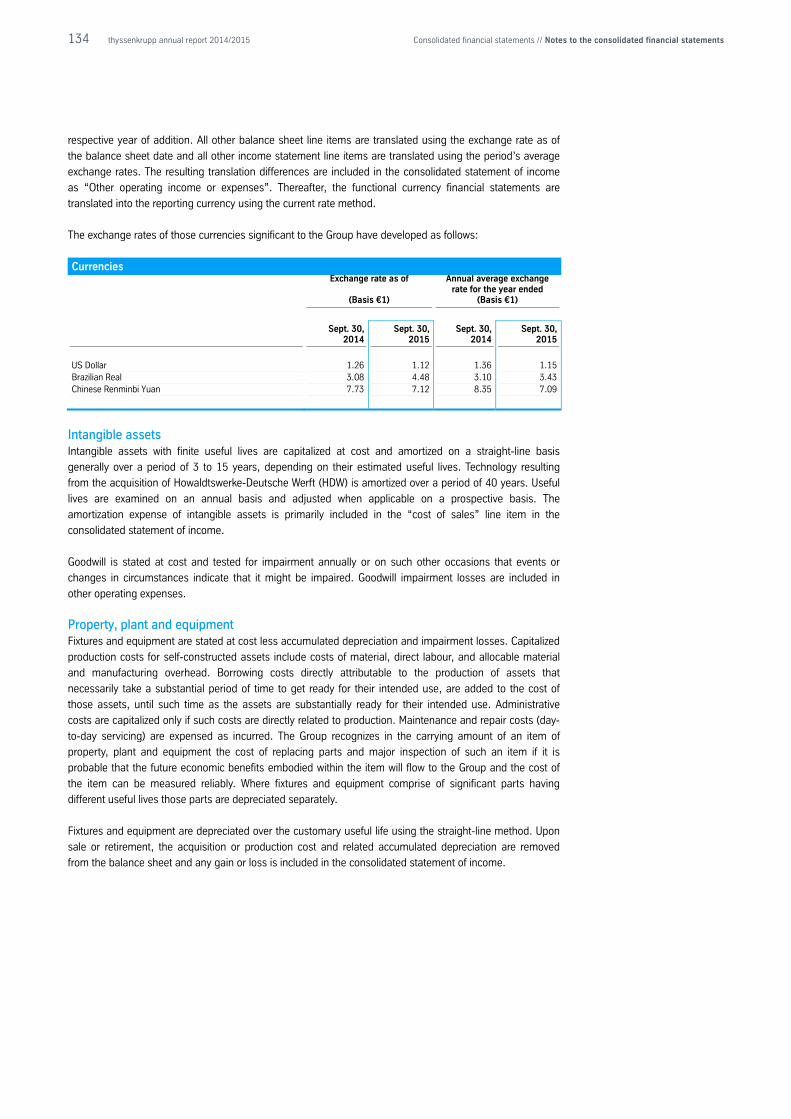
134 thyssenkrupp annual report 2014/2015 Consolidated financial statements // Notes to the consolidated financial statements
respective year of addition. All other balance sheet line items are translated using the exchange rate as of
the balance sheet date and all other income statement line items are translated using the period’s average
exchange rates. The resulting translation differences are included in the consolidated statement of income
as “Other operating income or expenses”. Thereafter, the functional currency financial statements are
translated into the reporting currency using the current rate method.
The exchange rates of those currencies significant to the Group have developed as follows:
Currencies
Exchange rate as of
(Basis €1)
Annual average exchange rate for the year ended
(Basis €1)
Sept. 30,
2014 Sept. 30,
2015 Sept. 30,
2014 Sept. 30,
2015
US Dollar 1.26 1.12 1.36 1.15 Brazilian Real 3.08 4.48 3.10 3.43 Chinese Renminbi Yuan 7.73 7.12 8.35 7.09
Intangible assets Intangible assets with finite useful lives are capitalized at cost and amortized on a straight-line basis
generally over a period of 3 to 15 years, depending on their estimated useful lives. Technology resulting
from the acquisition of Howaldtswerke-Deutsche Werft (HDW) is amortized over a period of 40 years. Useful
lives are examined on an annual basis and adjusted when applicable on a prospective basis. The
amortization expense of intangible assets is primarily included in the “cost of sales” line item in the
consolidated statement of income.
Goodwill is stated at cost and tested for impairment annually or on such other occasions that events or
changes in circumstances indicate that it might be impaired. Goodwill impairment losses are included in
other operating expenses.
Property, plant and equipment Fixtures and equipment are stated at cost less accumulated depreciation and impairment losses. Capitalized
production costs for self-constructed assets include costs of material, direct labour, and allocable material
and manufacturing overhead. Borrowing costs directly attributable to the production of assets that
necessarily take a substantial period of time to get ready for their intended use, are added to the cost of
those assets, until such time as the assets are substantially ready for their intended use. Administrative
costs are capitalized only if such costs are directly related to production. Maintenance and repair costs (day-
to-day servicing) are expensed as incurred. The Group recognizes in the carrying amount of an item of
property, plant and equipment the cost of replacing parts and major inspection of such an item if it is
probable that the future economic benefits embodied within the item will flow to the Group and the cost of
the item can be measured reliably. Where fixtures and equipment comprise of significant parts having
different useful lives those parts are depreciated separately.
Fixtures and equipment are depreciated over the customary useful life using the straight-line method. Upon
sale or retirement, the acquisition or production cost and related accumulated depreciation are removed
from the balance sheet and any gain or loss is included in the consolidated statement of income.
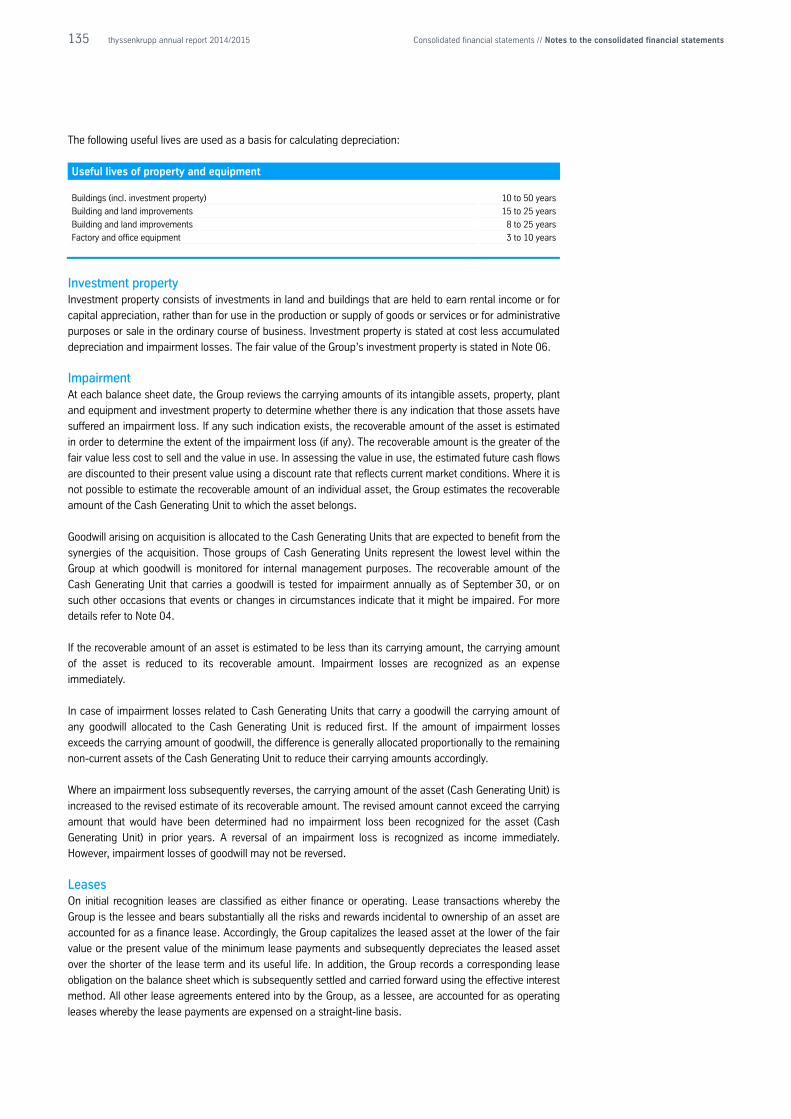
135 thyssenkrupp annual report 2014/2015 Consolidated financial statements // Notes to the consolidated financial statements
The following useful lives are used as a basis for calculating depreciation:
Useful lives of property and equipment
Buildings (incl. investment property) 10 to 50 years
Building and land improvements 15 to 25 years
Building and land improvements 8 to 25 years
Factory and office equipment 3 to 10 years
Investment property Investment property consists of investments in land and buildings that are held to earn rental income or for
capital appreciation, rather than for use in the production or supply of goods or services or for administrative
purposes or sale in the ordinary course of business. Investment property is stated at cost less accumulated
depreciation and impairment losses. The fair value of the Group’s investment property is stated in Note 06.
Impairment At each balance sheet date, the Group reviews the carrying amounts of its intangible assets, property, plant
and equipment and investment property to determine whether there is any indication that those assets have
suffered an impairment loss. If any such indication exists, the recoverable amount of the asset is estimated
in order to determine the extent of the impairment loss (if any). The recoverable amount is the greater of the
fair value less cost to sell and the value in use. In assessing the value in use, the estimated future cash flows
are discounted to their present value using a discount rate that reflects current market conditions. Where it is
not possible to estimate the recoverable amount of an individual asset, the Group estimates the recoverable
amount of the Cash Generating Unit to which the asset belongs.
Goodwill arising on acquisition is allocated to the Cash Generating Units that are expected to benefit from the
synergies of the acquisition. Those groups of Cash Generating Units represent the lowest level within the
Group at which goodwill is monitored for internal management purposes. The recoverable amount of the
Cash Generating Unit that carries a goodwill is tested for impairment annually as of September 30, or on
such other occasions that events or changes in circumstances indicate that it might be impaired. For more
details refer to Note 04.
If the recoverable amount of an asset is estimated to be less than its carrying amount, the carrying amount
of the asset is reduced to its recoverable amount. Impairment losses are recognized as an expense
immediately.
In case of impairment losses related to Cash Generating Units that carry a goodwill the carrying amount of
any goodwill allocated to the Cash Generating Unit is reduced first. If the amount of impairment losses
exceeds the carrying amount of goodwill, the difference is generally allocated proportionally to the remaining
non-current assets of the Cash Generating Unit to reduce their carrying amounts accordingly.
Where an impairment loss subsequently reverses, the carrying amount of the asset (Cash Generating Unit) is
increased to the revised estimate of its recoverable amount. The revised amount cannot exceed the carrying
amount that would have been determined had no impairment loss been recognized for the asset (Cash
Generating Unit) in prior years. A reversal of an impairment loss is recognized as income immediately.
However, impairment losses of goodwill may not be reversed.
Leases On initial recognition leases are classified as either finance or operating. Lease transactions whereby the
Group is the lessee and bears substantially all the risks and rewards incidental to ownership of an asset are
accounted for as a finance lease. Accordingly, the Group capitalizes the leased asset at the lower of the fair
value or the present value of the minimum lease payments and subsequently depreciates the leased asset
over the shorter of the lease term and its useful life. In addition, the Group records a corresponding lease
obligation on the balance sheet which is subsequently settled and carried forward using the effective interest
method. All other lease agreements entered into by the Group, as a lessee, are accounted for as operating
leases whereby the lease payments are expensed on a straight-line basis.
136 thyssenkrupp annual report 2014/2015 Consolidated financial statements // Notes to the consolidated financial statements
Lease transactions whereby the Group is the lessor and transfers substantially all of the benefits and risks
incident to the ownership of property, are accounted for as a sale and financing of the leased asset. The
Group recognizes a receivable at an amount equal to the net investment in the lease and includes interest
income in the consolidated income statement. All other lease agreements entered into by the Group, as a
lessor, are accounted for as operating leases whereby the leased asset remains on the Group’s balance
sheet and is depreciated. Scheduled lease payments are recognized in income on a straight-line basis over
the lease term.
Inventories Inventories are stated at the lower of acquisition/manufacturing cost or net realizable value. Net realizable
value is the estimated selling price in the ordinary course of business less estimated costs of completion and
selling costs. In general, inventories are valued using the average cost method. Manufacturing cost includes
direct material, labor and allocable material and manufacturing overhead based on normal operating
capacity.
Financial instruments A financial instrument is any contract that at the same time gives rise to a financial asset of one entity and a
financial liability or equity instrument of another entity. Financial instruments are recognized as soon as
thyssenkrupp becomes a contracting party to the financial instrument. In cases where trade date and
settlement date do not coincide, for non-derivative financial instruments the settlement date is used for
initial recognition or derecognition, while for derivatives the trade date is used. Financial instruments stated
as financial assets or financial liabilities are generally not offset; they are only offset when a legal right to
set-off exists at that time and settlement on a net basis is intended.
Determining fair value The fair value of financial instruments is generally equal to the amount the Group would receive or pay if it
exchanged or settled the financial instruments on the balance sheet date. If available, quoted market prices
are used for financial instruments, especially for those categorized as available-for-sale financial assets.
Otherwise, fair values are calculated based on the market conditions prevailing on the balance sheet date –
interest rates, exchange rates, commodity prices – using middle rates or prices. In doing so, fair values are
calculated using common methods, such as the option pricing models for currency and interest rate options
or the discounted cash flow method for interest rate swaps. The fair values of some derivatives are based on
external valuations by our financial partners.
Financial assets In particular, financial assets include trade accounts receivable, cash and cash equivalents, derivative
financial assets, as well as equity instruments and bonds held. Financial assets are initially recognized at fair
value. This includes any transaction costs directly attributable to the acquisition of financial assets, which
are not carried at fair value through profit or loss in future periods. The fair values recognized on the balance
sheet usually reflect the market prices of the financial assets.
137 thyssenkrupp annual report 2014/2015 Consolidated financial statements // Notes to the consolidated financial statements
Trade accounts receivable and other current receivables Receivables are accounted for at amortized cost less valuation allowances.
Impairments in the form of individual allowances for doubtful accounts adequately consider default risk.
When there is objective evidence of default, the receivable concerned is derecognized. Receivables that are
immaterial, and receivables of similar default risk, are grouped together and tested collectively for
impairment based on past experience. Partially, impairments are accounted for using separate allowance
accounts. Whether default risk is recognized by means of an allowance account or a direct derecognition of
the receivable depends on the probability of default and the reliability of its estimation.
Receivables that do not bear interest or bear below market interest rates and have an expected term of more
than one year are discounted with the discount subsequently amortized to interest income over the term of
the receivable.
The Group sells undivided interests in certain trade accounts and notes receivable both on an ongoing and
one-time basis to structured entities, which are not required to be consolidated, or to other lending
institutions. Financial assets sold under these arrangements are excluded from accounts receivable in the
Group’s balance sheet at the time of sale if it is assured that the cash flows related to those receivables will
be passed through to the acquirer and substantially all risks and rewards have been transferred. If
substantially all risks and rewards have neither been transferred nor retained, financial assets are excluded
from the books at the time of the sale if it is assured that the cash flows of the receivables will be passed
through to the acquirer and the acquirer has gained control over the receivables. If substantially all risks and
rewards have been retained financial assets remain in the Group’s balance sheet as collateral for
borrowings.
Cash and cash equivalents Cash and cash equivalents include cash on hand and demand deposits as well as financial assets that are
readily convertible to cash and which are only subject to an insignificant risk of change in value, they are
measured at amortized cost.
Financial assets held for trading Derivatives that are not part of an effective hedge accounting in accordance with IAS 39 must be assigned to
this category when the fair value is positive as of measurement date. Gains or losses resulting from changes
in fair value are recognized in profit or loss.
Available-for-sale financial assets Available-for-sale financial assets are those non-derivative financial assets not assigned to any of the above
categories (trade accounts receivable and other current receivables, cash and cash equivalents, and
financial assets held for trading). This category includes primarily equity and debt instruments which are in
general measured at fair value. Gains or losses resulting from the measurement of available-for-sale
financial assets are recognized directly in equity, with the exception of impairment losses and foreign
currency conversion effects. On disposal of these financial assets, a cumulative gain or loss recognized
directly in equity until then is recognized in profit or loss of the respective period. When the fair value of
unlisted equity instruments cannot be reliably measured, they are measured at cost.
Financial assets measured at fair value through profit or loss The Group does not use the option to categorize financial assets at fair value through profit or loss when
initially recognized.
138 thyssenkrupp annual report 2014/2015 Consolidated financial statements // Notes to the consolidated financial statements
Impairment of financial assets At each balance sheet date, an assessment is made of whether there is any objective evidence that the
carrying amounts of financial assets not carried at fair value through profit or loss are impaired. Objective
evidence includes, for example, considerable financial difficulty of the debtor obligor, disappearance of an
active market, and significant changes in the technological, market, economic or legal environment. A
significant or prolonged decline in the fair value of an equity instrument is an objective evidence of
impairment.
The impairment loss on a financial asset carried at amortized cost is measured as the difference between
the asset’s carrying amount and the present value of estimated future cash flows discounted at the financial
asset’s original effective interest rate. An impairment loss is recognized in profit or loss.
If in a subsequent period, the amount of the impairment loss decreases and the decrease can be related
objectively to an event occurring after the impairment was recognized, the previously recognized impairment
loss is reversed through profit or loss.
If the decrease in fair value of an available-for-sale financial asset was previously recognized directly in
equity, such loss is transferred from equity to profit or loss as soon as an objective evidence of an
impairment loss exists. The amount of the impairment represents the difference between historical cost (less
any redemption and amortization) and the current fair value less any impairment loss on that financial asset
previously recognized in profit or loss. Impairment losses on equity instruments classified as available-for-
sale and recognized in the income statement are not reversed through profit or loss, but rather through
equity. The amount of any reversal of any write-down of debt instruments, which objectively occurred after
the impairment was recognized, is recognized in profit or loss.
Financial liabilities Financial liabilities are liabilities that must be settled in cash or other financial assets. These especially
include trade accounts payable, derivative financial liabilities and components of financial debt, mainly
bonds and other securitized liabilities, liabilities to financial institutions and finance lease liabilities. Financial
liabilities are initially carried at fair value. This includes any transaction costs directly attributable to the
acquisition of financial liabilities, which are not carried at fair value through profit or loss in future periods.
Trade accounts payable and other non-derivative financial liabilities Trade accounts payable and other non-derivative financial liabilities are in general measured at amortized
cost using the effective interest method. Finance charges, including premiums payable on redemption or
settlement, are periodically accrued using the effective interest method and increase the liabilities’ carrying
amounts unless they have already been settled in the period in which they were incurred.
Financial liabilities carried at fair value through profit or loss The Group does not use the option to categorize financial liabilities at fair value through profit or loss when
initially recognized.
Financial liabilities held for trading Derivatives that are not part of an effective hedge accounting in accordance with IAS 39 must be classified
as “held for trading” and thus carried at fair value through profit or loss. In the event of negative fair values,
such derivatives are recognized as “financial liabilities held for trading”.
139 thyssenkrupp annual report 2014/2015 Consolidated financial statements // Notes to the consolidated financial statements
Derivative financial instruments The Group generally uses derivative financial instruments to hedge its exposure to foreign currency
exchange rate, interest rate and commodity price risks arising from operational, financing and investment
activities. Derivatives are used generally to hedge existing or anticipated underlying transactions. Such
derivatives and so-called “embedded derivatives”, which are an integral part of a non-derivative host
contract and must be accounted for separately, are measured initially and subsequently at fair value through
profit or loss. Gains or losses due to fluctuations in fair value are recognized immediately in profit or loss.
If derivatives are used to hedge the exposure to variability in cash flows and to hedge balance sheet items,
the hedging relationship qualifies for hedge accounting under IAS 39 if certain conditions are met. This can
reduce volatility in the income statement. There are three types of hedging relationships: fair value hedge,
cash flow hedge and hedge of a net investment in a foreign operation.
In a fair value hedge, which is a hedge of the exposure to changes in fair value of a recognized asset or
liability or an unrecognized firm commitment, the hedging instrument is stated at fair value and any changes
in fair value are immediately recognized in profit or loss. Changes in fair value of a hedged asset, liability or
firm commitment, which are attributable to a particular hedged risk, are also recognized in profit or loss.
Given a perfect hedge, changes in fair value of the underlying and hedging transactions are almost entirely
offset. If the asset or liability is measured at amortized cost according to general accounting guidelines, its
carrying amount must be adjusted for the cumulative changes in fair value resulting from the hedged risk.
However, if the hedged item (e.g. available-for-sale security) is recognized at fair value without influencing
the income statement in accordance with the general accounting guidelines, changes in fair value resulting
from the hedged risk are recognized in profit or loss, contrary to the general guidelines.
A cash flow hedge is a hedge of the exposure to variability in cash flows associated with a recognized asset
or liability, a highly probable forecast transaction, or foreign currency risk of a firm commitment. The
effective portion of the fluctuations in fair value is immediately recognized in equity. The effective portion is
reclassified from equity to profit or loss in the same period during which the hedged underlying transaction
affects profit or loss. If a hedge subsequently results in the recognition of a non-financial asset (e.g.
property, plant and equipment or inventories), then the fluctuations in fair value that were recognized in
equity affect the value of the non-financial asset. When measuring the effectiveness between the underlying
hedged transaction and the hedging instrument the remaining ineffective portion of the hedge and
adjustments due to interest rate changes are immediately recognized in the consolidated statement of
income. In the case of currency risks, the effectiveness of the hedging relationship is established by
including changes in value due to spot rate changes as a hedged risk and excluding the interest component.
When the hedging instrument expires or is sold, terminated or exercised, or the hedging relationship is
discontinued, but the forecast underlying transaction is still expected to occur, the cumulative gain or loss on
the hedging instrument that has been recognized in equity remains separately in equity until the forecast
transaction occurs. It is recognized in profit or loss as detailed above when the transaction affects the
income statement. If the hedged forecast transaction is no longer expected to occur, any related cumulative
unrealized gain or loss recognized in equity is recognized immediately in the consolidated statement of
income.
140 thyssenkrupp annual report 2014/2015 Consolidated financial statements // Notes to the consolidated financial statements
The Group mainly uses cash flow hedges to hedge its exposure to changes in foreign currency rates, interest
rates and commodity prices. In addition, the Group carries out hedging in accordance with the basic
principles of risk management under which existing risks are hedged economically, but the hedges do not
comply with the strict hedge accounting requirements under IAS 39. The Group does not use hedge
accounting for foreign currency derivatives that have been concluded to hedge foreign currency risks arising
from monetary balance sheet items. Thus, the effects from the foreign currency conversion of balance sheet
items recognized in profit or loss are offset against the fluctuations in fair value of derivatives, which are also
recognized in profit or loss.
Currently, the Group does not apply hedging of a net investment in a foreign operation.
More information about financial instruments is provided in Note 22.
Deferred income taxes Deferred tax is accounted for using the balance sheet liability method in respect of temporary differences
between the carrying amount of assets and liabilities in the financial statements and the corresponding tax
basis used in the computation of taxable profit as well as for unused tax losses or credits. In principle,
deferred tax liabilities are recognized for all taxable temporary differences and deferred tax assets are
recognized to the extent that it is probable that taxable profits will be available against which deductible
temporary differences can be utilized. Deferred tax assets and liabilities are also recognized on temporary
differences arising from business combinations except to the extent they arise from goodwill that is not taken
into account for tax purposes.
Deferred taxes are calculated at the enacted or substantially enacted tax rates that are expected to apply
when the asset or liability is settled. Deferred tax is charged or credited to the income statement, except
when it relates to items credited or charged directly to other comprehensive income in equity, in which case
the corresponding deferred tax is also recognized directly in equity.
Cumulative other comprehensive income The equity line item “Cumulative other comprehensive income” includes changes in the equity of the Group
that were not recognized in the consolidated statement of income of the period, except those resulting from
investments by owners and distributions to owners. Cumulative other comprehensive income includes
foreign currency translation adjustments, unrealized holding gains and losses on available-for-sale financial
assets and on derivative financial instruments as well as the share of the other comprehensive income of
associates and joint ventures accounted for using the equity method. Remeasurements of pensions and
similar obligations are reported in retained earnings in the period that they are recognized as other
comprehensive income.
Accrued pension and similar obligations The Group’s net obligation for defined benefit and other postretirement benefit plans have been calculated
for each plan using the projected unit credit method as of the balance sheet date. A quarterly valuation of
pensions and health care obligations is performed on the basis of updated interest rates and fair values of
plan assets.
As far as the fair value of plan assets related to pensions or similar obligations exceeds the corresponding
obligation, the recognition of an asset in respect to such surplus is limited. As far as in connection with plan
assets minimum funding requirements related to past service exist, an additional liability may need to be
recognized in case the economic benefit of a surplus – already taking into account the contributions to be
made in respect of the minimum funding requirements – is limited. The limit is determined by unrecognized
past service costs and the present value of any future refunds from the plan or reductions in future
contributions to the plan (asset ceiling).
141 thyssenkrupp annual report 2014/2015 Consolidated financial statements // Notes to the consolidated financial statements
With the exception of net interest, all income and expenses related to defined benefit plans are recognized in
income from operations. Net interest included in net periodic pension cost is recognized in net financial
income/(expense) in the Group’s consolidated statement of income.
The Group’s obligations for contributions to defined contribution plans are recognized as expense in income
from operations as incurred.
The effects of remeasurements of pensions and similar obligations are recognized in other comprehensive
income in the consolidated statement of comprehensive income. They consist of actuarial gains and losses,
the return on plan assets and changes in the effects of asset ceiling excluding amounts already included in
net interest. Deferred taxes relating to remeasurements are also recognized in other comprehensive income.
The Group also maintains multi-employer plans. In principle, these multi-employer plans contain defined
benefit plans as well as defined contribution plans. With respect to defined benefit multi-employer plans
these are accounted for in the same way as any other defined benefit plan in case the required information
is available. Otherwise these plans are accounted for as defined contribution plans. In particular in the USA,
Sweden and in the Netherlands, there exist multi-employer defined benefit plans that are accounted for as
defined contribution plans due to the fact that the pension obligations and the plan assets cannot be
assigned to the participating employers.
Provisions Provisions are recognized when the Group has a present obligation as a result of a past event which will
result in a probable outflow of economic benefits that can be reasonably estimated. The amount recognized
represents best estimate of the settlement amount of the present obligation as of the balance sheet date.
Expected reimbursements of third parties are not offset but recorded as a separate asset if it is virtually
certain that the reimbursements will be received. Where the effect of the time value of money is material,
provisions are discounted using a market rate.
A provision for warranties is recognized when the underlying products or services are sold. The provision is
based on historical warranty data and a weighting of all possible outcomes against their associated
probabilities.
Provisions for restructuring costs are recognized when the Group has a detailed formal plan for the
restructuring and has notified the affected parties.
A provision for onerous contracts is recognized when the expected benefits to be derived by the Group from
a contract are lower than the unavoidable cost of meeting its obligations under the contract.
Share-based compensation The Group has management incentive plans which grant stock rights to executive and senior employees.
The fair value of these rights is calculated on the date of grant and on each balance sheet date and
recognized as an expense on a straight-line basis over the vesting period with a corresponding increase in
provisions. Furthermore inclusive of fiscal 2013/2014 a portion of the variable compensation was granted as
share appreciation rights to the Executive Board members of thyssenkrupp AG and is still granted to
additional selected executive employees. For both types of compensation, the provision is remeasured at
each balance sheet date and at settlement date. Any changes in the fair value of the provision are
recognized as part of income from operations.
See also information provided in Note 14.
142 thyssenkrupp annual report 2014/2015 Consolidated financial statements // Notes to the consolidated financial statements
Revenue recognition Revenue from the sale of goods is recognized when the significant risks and rewards of ownership have
been transferred to the buyer and the amount of revenue can be measured reliably. Revenue from services
is recognized when services are rendered. No revenue is recognized if there are significant uncertainties
regarding recovery of the consideration due or the possible return of goods. Revenue is recognized net of
applicable provisions for discounts and allowances.
Construction contract revenue and expense are accounted for using the percentage-of-completion method,
which recognizes revenue as performance of the contract progresses. The contract progress is determined
based on the percentage of costs incurred to date to total estimated cost for each contract after giving effect
to the most recent estimates of total cost. If the construction takes a substantial period of time, contract
costs also include borrowing costs that are directly attributable.
Contracts where the Group provides engineering services are also accounted for like construction contracts.
Construction contracts under the percentage-of-completion method are measured at construction cost plus
profits earned based on the percentage of the contract completed.
Revenues net of advance payments received are recognized as trade accounts receivable in the balance
sheet. Variations in contract work and claims are included to the extent that it is probable that they will be
approved by the customer and the amount can be reliably measured. Reliably measurable incentive
payments are recognized if it is probable that the specified performance standards will be met or exceeded.
Where the income of a construction contract cannot be estimated reliably, contract revenue that is probable
to be recovered is recognized to the extent of contract costs incurred. Contract costs are recognized as
expenses in the period in which they are incurred.
Where it is probable that total contract costs will exceed total contract revenue, the expected loss is
recognized as an expense immediately.
Revenues from contracts with multiple element arrangements, such as those including both goods and
services, are recognized as each element is earned based on objective evidence of the relative fair value of
each element.
Interest income is accrued on a time basis by reference to the principal outstanding and at the interest rate
applicable. Dividend income from investments is recognized when the shareholders’ rights to receive
payment have been established.
Government grants Government grants are recognized only if there is reasonable assurance that the associated conditions will
be met and the grants will be received. Grants related to assets are reported as a reduction of cost of the
assets concerned with a corresponding reduction of depreciation and amortization in subsequent periods.
Grants related to income are stated as other operating income in the periods in which the expenses intended
to be compensated by the grant are recognized.
Research and development costs Research costs are expensed as incurred.
Development costs, whereby research findings are applied to a plan or design for the production of new or
substantially improved products and processes, are capitalized if the product or process is technically and
commercially feasible, it is intented to complete the intangible asset, there is a market for the output of the
intangible asset, the attributable expenditure can be measured reliably, and the Group has sufficient
resources to complete development. Other development costs are expensed as incurred.
143 thyssenkrupp annual report 2014/2015 Consolidated financial statements // Notes to the consolidated financial statements
Capitalized development costs of completed projects are stated at cost less accumulated amortization and
impairment losses. Costs include direct costs of material, direct labour, and allocable material and
manufacturing overhead. Borrowing costs directly attributable to a production of assets that necessarily
takes a substantial period of time to get the assets ready for their intended use, are included in the cost of
those assets until the assets are ready for their intended use. Administrative costs are capitalized only if
such costs are directly related to production. Capitalized development costs of projects not yet completed
are reviewed for impairment annually or more frequently when an indicator of impairment arises during the
reporting year.
Earnings per share Basic earnings per share amounts are calculated by dividing net income/(loss) attributable to thyssenkrupp
AG’s shareholders by the weighted average number of shares outstanding. Shares sold during the period
and shares reacquired during the period are weighted for the portion of the period that they were
outstanding.
Segment reporting In accordance with the so-called management approach, segment reporting of the thyssenkrupp Group is
based on the internal organizational and reporting structure. The data used to determine the internal key
figures are derived from the IFRS consolidated financial statements.
Single assets held for sale, disposal groups and discontinued operations A single non-current asset is classified as held for sale if its carrying amount will be recovered principally
through a sale transaction rather than through continuing use. The Group reports assets and liabilities as a
disposal group, that will be disposed of by sale or otherwise in a single transaction, which collectively meet
the held for sale criteria as specified in IFRS 5 “Non-current Assets Held for Sale and Discontinued
Operations”. The Group reports the assets and liabilities of a disposal group separately in the balance sheet
line item “assets held for sale/disposal” and “liabilities associated with assets held for sale/disposal”,
respectively. Unless a disposal group qualifies for discontinued operations reporting, the revenues and
expenses of the disposal group remain within continuing operations until the date of disposal. The Group
reports the results of a disposal group that also qualifies as a component of the Group as discontinued
operations if it represents a separate major line of business or geographical area of operations. The Group
reports the results of discontinued operations in the period in which they occur separately within the
consolidated statement of income as “discontinued operations (net of tax)”. All prior period consolidated
statements of income are adjusted to report the results of the component within discontinued operations. In
the consolidated statement of cash flows the cash flows resulting from discontinued operations are
presented separately from cash flows resulting from continuing operations; prior year presentation has been
adjusted accordingly. In order to present the proportion of income/loss attributable to discontinued
operations, net sales and expenses arising from intercompany transactions are recognized provided that
these transactions will not continue after the disposal of the discontinued operations.
144 thyssenkrupp annual report 2014/2015 Consolidated financial statements // Notes to the consolidated financial statements
On initial classification as held for sale, non-current assets are recognized at the lower of the carrying
amount and fair value less costs to sell and depreciation and amortization ceases. A disposal group is
initially measured in line with the respective IFRS standards to determine the carrying amount of the disposal
group which is then compared to the fair value less costs to sell of the group in order to recognize the group
at the lower of both amounts. Impairment losses on initial classification as held for sale are included in profit
or loss, as are gains and losses on subsequent remeasurement, but not in excess of the cumulative
impairment loss.
If the change to a disposal plan means that the criteria for classification as a discontinued operation are no
longer met, the corresponding disposal group must be presented as a continuing operation again under
IFRS 5. As a result, the consolidated statement of income for the reporting year and also the prior year has
to be adjusted so that the expenses and income of the disposal group are re-included in income from
continuing operations. Analogously in the consolidated statement of cash flows the cash inflows and
outflows of the disposal group are reclassified to continuing operations for both reporting years. However
despite the changed classification, the assets and liabilities of the disposal group continue to be presented
separately in the consolidated statement of financial position for the prior year under "Assets held for sale"
and "Liabilities associated with assets held for sale", and are only re-included in the individual line items of
the consolidated statement of financial position for the reporting year. The disposal group that is no longer
classified as held for sale is measured at the lower of carrying amount and recoverable amount.
Financial statement classification Certain line items on the consolidated balance sheet and in the consolidated statement of income have been
combined. These items are disclosed separately in the Notes to the consolidated financial statements.
Certain reclassifications have been made to the prior year presentation to conform to that of the current
year.
In general the Group classifies assets and liabilities as current when they are expected to be realized or
settled within twelve months after the balance sheet date. Group companies that have operating cycles
longer than twelve months classify assets and liabilities as current if they are expected to be realized within
the company’s normal operating cycle.
Use of estimates The preparation of the Group consolidated financial statements requires Management to make judgements,
estimates and assumptions that affect the application of policies and reported amounts of assets and
liabilities, income and expenses. Actual results may differ from these estimates.
The estimates and underlying assumptions are reviewed on an ongoing basis. Revisions to accounting
estimates are recognized in the period in which the estimate is revised if the revision affects only that period,
or in the period of the revision and future periods if the revision affects both current and future periods.
Accounting estimates and judgements made by Management in the application of IFRS that have a
significant effect on the consolidated financial statements are presented in Note 25.
145 thyssenkrupp annual report 2014/2015 Consolidated financial statements // Notes to the consolidated financial statements
Recently adopted accounting standards In fiscal year 2014/2015, thyssenkrupp adopted the following standards, interpretations and amended
standards:
In May 2011 the IASB issued three new standards dealing with various aspects of interests in entities:
IFRS 10 “Consolidated Financial Statements”, IFRS 11 “Joint Arrangements” and IFRS 12 “Disclosure of
Interests in Other Entities”. At the same time it issued amended versions of IAS 27 “Separate Financial
Statements” (2011) and IAS 28 “Investments in Associates and Joint Ventures” (2011). The new and
amended standards are applicable retrospectively for fiscal years beginning on or after January 1, 2013. In
the context of the endorsement, the IASB deferred the mandatory retrospective effective date for fiscal years
beginning on or after January 1, 2014; the option of an earlier adoption has not been used by
thyssenkrupp.
IFRS 10 introduces a single definition for the concept of control for all entities, thus creating a standard basis
for determining whether a parent-subsidiary relationship exists and should be included in the scope of
consolidation. The standard contains comprehensive guidance for determining whether control exists. It
completely replaces SIC-12 “Consolidation – Special Purpose Entities” and partly replaces IAS 27
“Consolidated and Separate Financial Statements”. The adoption of IFRS 10 has not significantly changed
the scope of consolidation.
IFRS 11 prescribes the accounting for circumstances in which an entity exercises joint control of a joint
venture or joint operation. The new standard replaces IAS 31 “Interests in Joint Ventures” and SIC-13
“Jointly Controlled Entities – Non-Monetary Contributions by Venturers”. The retrospective adoption of
IFRS 11 implied that the joint arrangement Hüttenwerke Krupp Mannesmann GmbH (HKM) previously
accounted for using the equity method of accounting is no longer considered to be a joint venture but a joint
operation. This resulted in including the assets and liabilities as well as the related income and expense on a
pro rata basis in the Group’s consolidated financial statements.
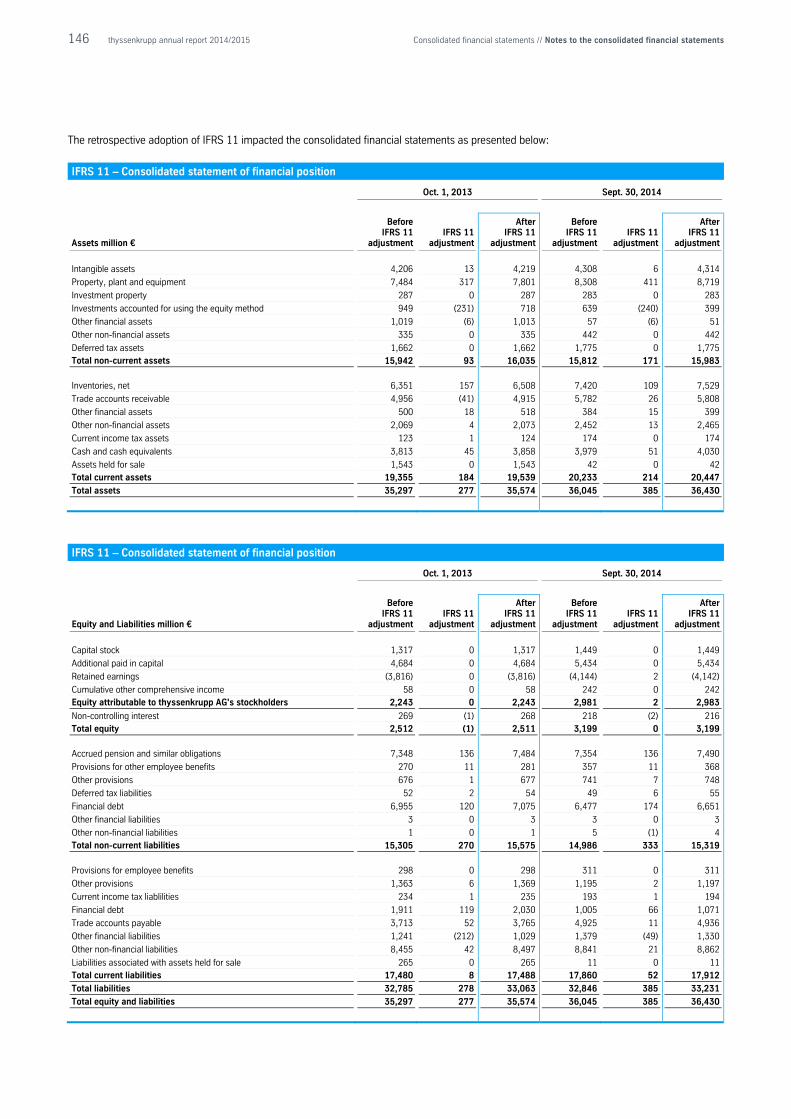
146 thyssenkrupp annual report 2014/2015 Consolidated financial statements // Notes to the consolidated financial statements
The retrospective adoption of IFRS 11 impacted the consolidated financial statements as presented below:
IFRS 11 – Consolidated statement of financial position
Oct. 1, 2013 Sept. 30, 2014
Assets million €
Before IFRS 11
adjustment IFRS 11
adjustment
After IFRS 11
adjustment
Before IFRS 11
adjustment IFRS 11
adjustment
After IFRS 11
adjustment
Intangible assets 4,206 13 4,219 4,308 6 4,314
Property, plant and equipment 7,484 317 7,801 8,308 411 8,719
Investment property 287 0 287 283 0 283
Investments accounted for using the equity method 949 (231) 718 639 (240) 399
Other financial assets 1,019 (6) 1,013 57 (6) 51
Other non-financial assets 335 0 335 442 0 442
Deferred tax assets 1,662 0 1,662 1,775 0 1,775 Total non-current assets 15,942 93 16,035 15,812 171 15,983
Inventories, net 6,351 157 6,508 7,420 109 7,529
Trade accounts receivable 4,956 (41) 4,915 5,782 26 5,808
Other financial assets 500 18 518 384 15 399
Other non-financial assets 2,069 4 2,073 2,452 13 2,465
Current income tax assets 123 1 124 174 0 174
Cash and cash equivalents 3,813 45 3,858 3,979 51 4,030
Assets held for sale 1,543 0 1,543 42 0 42
Total current assets 19,355 184 19,539 20,233 214 20,447
Total assets 35,297 277 35,574 36,045 385 36,430
IFRS 11 – Consolidated statement of financial position
Oct. 1, 2013 Sept. 30, 2014
Equity and Liabilities million €
Before IFRS 11
adjustment IFRS 11
adjustment
After IFRS 11
adjustment
Before IFRS 11
adjustment IFRS 11
adjustment
After IFRS 11
adjustment
Capital stock 1,317 0 1,317 1,449 0 1,449
Additional paid in capital 4,684 0 4,684 5,434 0 5,434
Retained earnings (3,816) 0 (3,816) (4,144) 2 (4,142)
Cumulative other comprehensive income 58 0 58 242 0 242 Equity attributable to thyssenkrupp AG's stockholders 2,243 0 2,243 2,981 2 2,983
Non-controlling interest 269 (1) 268 218 (2) 216 Total equity 2,512 (1) 2,511 3,199 0 3,199
Accrued pension and similar obligations 7,348 136 7,484 7,354 136 7,490
Provisions for other employee benefits 270 11 281 357 11 368
Other provisions 676 1 677 741 7 748
Deferred tax liabilities 52 2 54 49 6 55
Financial debt 6,955 120 7,075 6,477 174 6,651
Other financial liabilities 3 0 3 3 0 3
Other non-financial liabilities 1 0 1 5 (1) 4 Total non-current liabilities 15,305 270 15,575 14,986 333 15,319
Provisions for employee benefits 298 0 298 311 0 311
Other provisions 1,363 6 1,369 1,195 2 1,197
Current income tax liablilities 234 1 235 193 1 194
Financial debt 1,911 119 2,030 1,005 66 1,071
Trade accounts payable 3,713 52 3,765 4,925 11 4,936
Other financial liabilities 1,241 (212) 1,029 1,379 (49) 1,330
Other non-financial liabilities 8,455 42 8,497 8,841 21 8,862
Liabilities associated with assets held for sale 265 0 265 11 0 11 Total current liabilities 17,480 8 17,488 17,860 52 17,912
Total liabilities 32,785 278 33,063 32,846 385 33,231
Total equity and liabilities 35,297 277 35,574 36,045 385 36,430
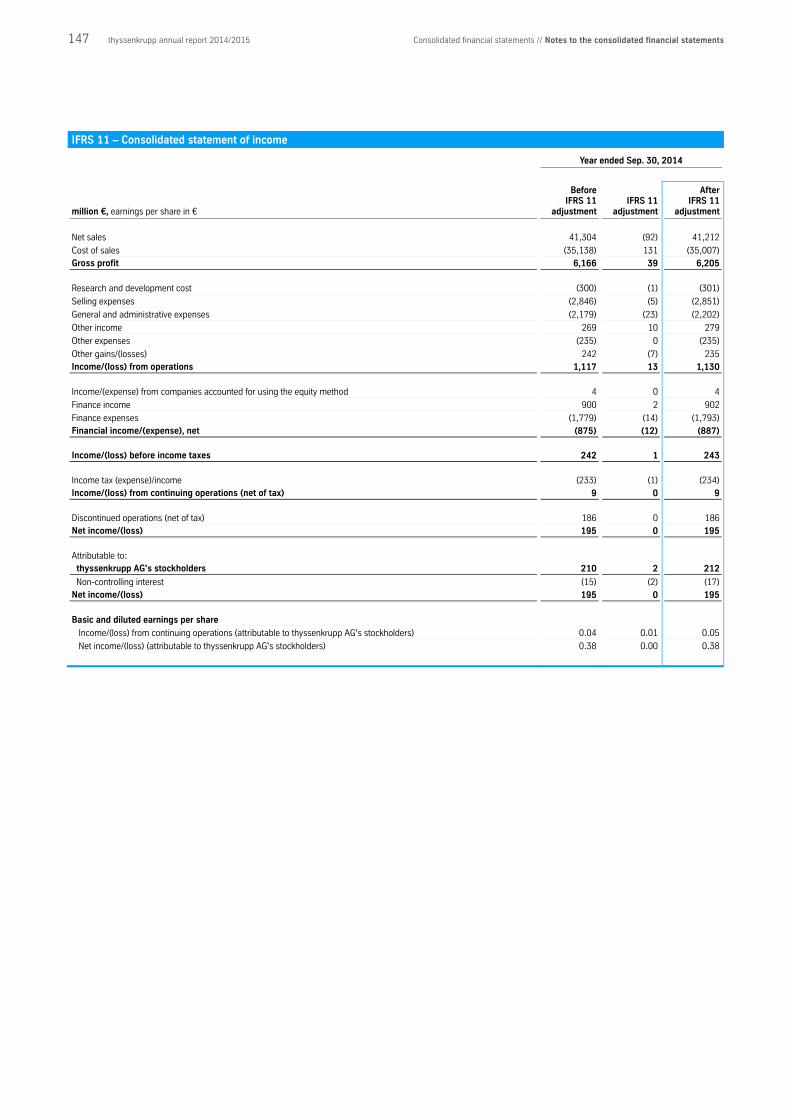
147 thyssenkrupp annual report 2014/2015 Consolidated financial statements // Notes to the consolidated financial statements
IFRS 11 – Consolidated statement of income
Year ended Sep. 30, 2014
million €, earnings per share in €
Before IFRS 11
adjustment IFRS 11
adjustment
After IFRS 11
adjustment
Net sales 41,304 (92) 41,212
Cost of sales (35,138) 131 (35,007) Gross profit 6,166 39 6,205
Research and development cost (300) (1) (301)
Selling expenses (2,846) (5) (2,851)
General and administrative expenses (2,179) (23) (2,202)
Other income 269 10 279
Other expenses (235) 0 (235)
Other gains/(losses) 242 (7) 235 Income/(loss) from operations 1,117 13 1,130
Income/(expense) from companies accounted for using the equity method 4 0 4
Finance income 900 2 902
Finance expenses (1,779) (14) (1,793) Financial income/(expense), net (875) (12) (887)
Income/(loss) before income taxes 242 1 243
Income tax (expense)/income (233) (1) (234) Income/(loss) from continuing operations (net of tax) 9 0 9
Discontinued operations (net of tax) 186 0 186 Net income/(loss) 195 0 195
Attributable to: thyssenkrupp AG's stockholders 210 2 212
Non-controlling interest (15) (2) (17) Net income/(loss) 195 0 195
Basic and diluted earnings per share
Income/(loss) from continuing operations (attributable to thyssenkrupp AG's stockholders) 0.04 0.01 0.05
Net income/(loss) (attributable to thyssenkrupp AG's stockholders) 0.38 0.00 0.38
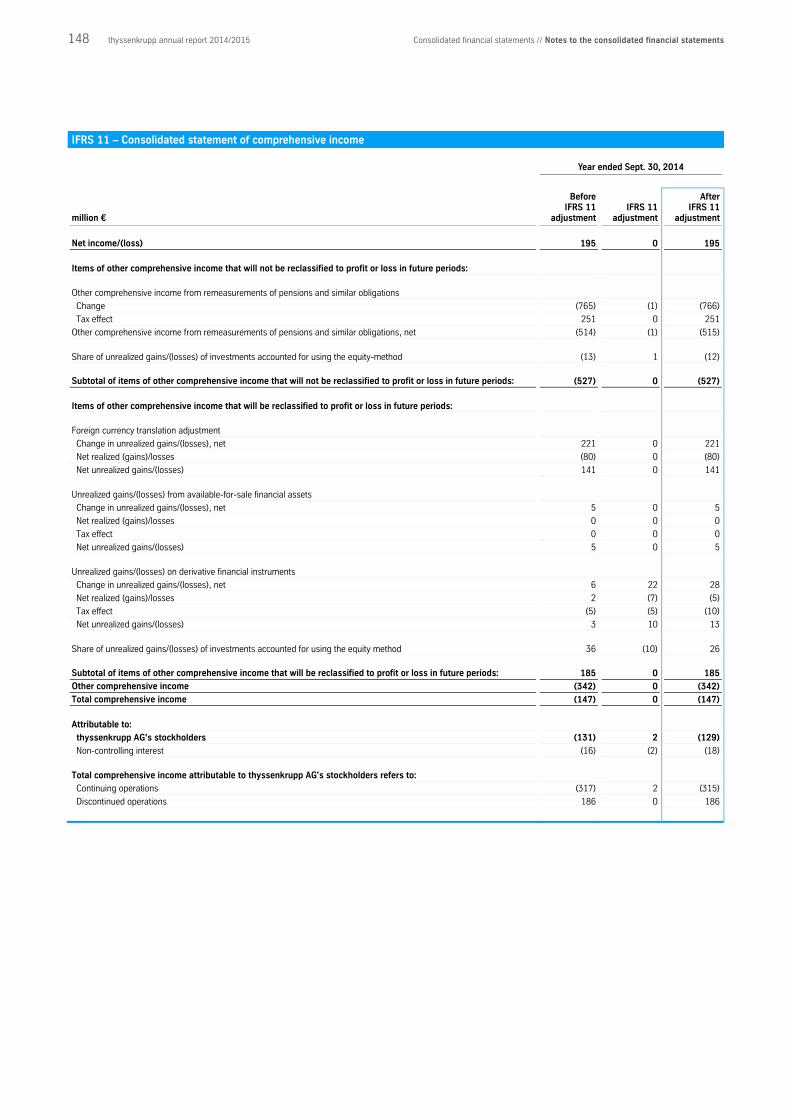
148 thyssenkrupp annual report 2014/2015 Consolidated financial statements // Notes to the consolidated financial statements
IFRS 11 – Consolidated statement of comprehensive income
Year ended Sept. 30, 2014
million €
Before IFRS 11
adjustment IFRS 11
adjustment
After IFRS 11
adjustment
Net income/(loss) 195 0 195
Items of other comprehensive income that will not be reclassified to profit or loss in future periods:
Other comprehensive income from remeasurements of pensions and similar obligations
Change (765) (1) (766)
Tax effect 251 0 251
Other comprehensive income from remeasurements of pensions and similar obligations, net (514) (1) (515)
Share of unrealized gains/(losses) of investments accounted for using the equity-method (13) 1 (12)
Subtotal of items of other comprehensive income that will not be reclassified to profit or loss in future periods: (527) 0 (527)
Items of other comprehensive income that will be reclassified to profit or loss in future periods:
Foreign currency translation adjustment
Change in unrealized gains/(losses), net 221 0 221
Net realized (gains)/losses (80) 0 (80)
Net unrealized gains/(losses) 141 0 141
Unrealized gains/(losses) from available-for-sale financial assets
Change in unrealized gains/(losses), net 5 0 5
Net realized (gains)/losses 0 0 0
Tax effect 0 0 0
Net unrealized gains/(losses) 5 0 5
Unrealized gains/(losses) on derivative financial instruments
Change in unrealized gains/(losses), net 6 22 28
Net realized (gains)/losses 2 (7) (5)
Tax effect (5) (5) (10)
Net unrealized gains/(losses) 3 10 13
Share of unrealized gains/(losses) of investments accounted for using the equity method 36 (10) 26
Subtotal of items of other comprehensive income that will be reclassified to profit or loss in future periods: 185 0 185
Other comprehensive income (342) 0 (342)
Total comprehensive income (147) 0 (147)
Attributable to:
thyssenkrupp AG's stockholders (131) 2 (129)
Non-controlling interest (16) (2) (18)
Total comprehensive income attributable to thyssenkrupp AG's stockholders refers to:
Continuing operations (317) 2 (315)
Discontinued operations 186 0 186
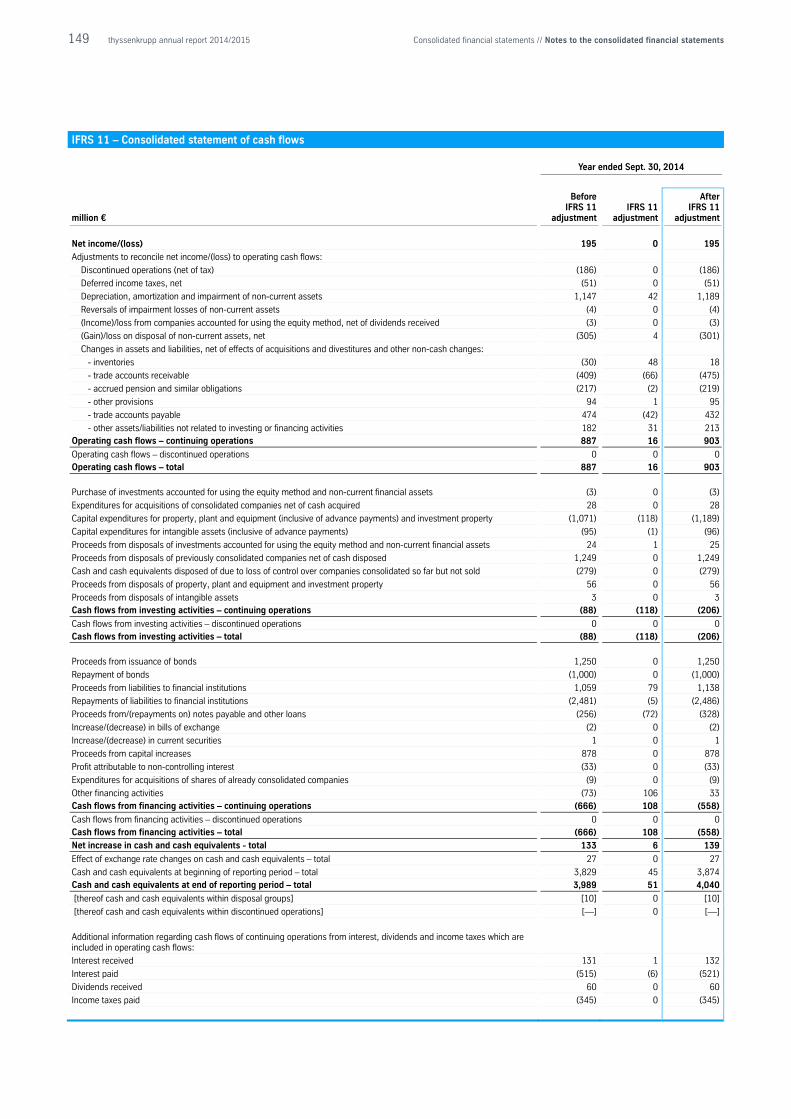
149 thyssenkrupp annual report 2014/2015 Consolidated financial statements // Notes to the consolidated financial statements
IFRS 11 – Consolidated statement of cash flows
Year ended Sept. 30, 2014
million €
Before IFRS 11
adjustment IFRS 11
adjustment
After IFRS 11
adjustment
Net income/(loss) 195 0 195
Adjustments to reconcile net income/(loss) to operating cash flows:
Discontinued operations (net of tax) (186) 0 (186)
Deferred income taxes, net (51) 0 (51)
Depreciation, amortization and impairment of non-current assets 1,147 42 1,189
Reversals of impairment losses of non-current assets (4) 0 (4)
(Income)/loss from companies accounted for using the equity method, net of dividends received (3) 0 (3)
(Gain)/loss on disposal of non-current assets, net (305) 4 (301)
Changes in assets and liabilities, net of effects of acquisitions and divestitures and other non-cash changes:
- inventories (30) 48 18
- trade accounts receivable (409) (66) (475)
- accrued pension and similar obligations (217) (2) (219)
- other provisions 94 1 95
- trade accounts payable 474 (42) 432
- other assets/liabilities not related to investing or financing activities 182 31 213 Operating cash flows – continuing operations 887 16 903
Operating cash flows – discontinued operations 0 0 0 Operating cash flows – total 887 16 903
Purchase of investments accounted for using the equity method and non-current financial assets (3) 0 (3)
Expenditures for acquisitions of consolidated companies net of cash acquired 28 0 28
Capital expenditures for property, plant and equipment (inclusive of advance payments) and investment property (1,071) (118) (1,189)
Capital expenditures for intangible assets (inclusive of advance payments) (95) (1) (96)
Proceeds from disposals of investments accounted for using the equity method and non-current financial assets 24 1 25
Proceeds from disposals of previously consolidated companies net of cash disposed 1,249 0 1,249
Cash and cash equivalents disposed of due to loss of control over companies consolidated so far but not sold (279) 0 (279)
Proceeds from disposals of property, plant and equipment and investment property 56 0 56
Proceeds from disposals of intangible assets 3 0 3 Cash flows from investing activities – continuing operations (88) (118) (206)
Cash flows from investing activities – discontinued operations 0 0 0 Cash flows from investing activities – total (88) (118) (206)
Proceeds from issuance of bonds 1,250 0 1,250
Repayment of bonds (1,000) 0 (1,000)
Proceeds from liabilities to financial institutions 1,059 79 1,138
Repayments of liabilities to financial institutions (2,481) (5) (2,486)
Proceeds from/(repayments on) notes payable and other loans (256) (72) (328)
Increase/(decrease) in bills of exchange (2) 0 (2)
Increase/(decrease) in current securities 1 0 1
Proceeds from capital increases 878 0 878
Profit attributable to non-controlling interest (33) 0 (33)
Expenditures for acquisitions of shares of already consolidated companies (9) 0 (9)
Other financing activities (73) 106 33 Cash flows from financing activities – continuing operations (666) 108 (558)
Cash flows from financing activities – discontinued operations 0 0 0 Cash flows from financing activities – total (666) 108 (558)
Net increase in cash and cash equivalents - total 133 6 139
Effect of exchange rate changes on cash and cash equivalents – total 27 0 27
Cash and cash equivalents at beginning of reporting period – total 3,829 45 3,874 Cash and cash equivalents at end of reporting period – total 3,989 51 4,040
[thereof cash and cash equivalents within disposal groups] [10] 0 [10]
[thereof cash and cash equivalents within discontinued operations] [—] 0 [—]
Additional information regarding cash flows of continuing operations from interest, dividends and income taxes which are included in operating cash flows:
Interest received 131 1 132
Interest paid (515) (6) (521)
Dividends received 60 0 60
Income taxes paid (345) 0 (345)
150 thyssenkrupp annual report 2014/2015 Consolidated financial statements // Notes to the consolidated financial statements
IFRS 12 combines in one standard all disclosure requirements for interests in other entities, including
interests in subsidiaries, associates, joint arrangements and structured entities. The new standard replaces
the previous disclosure requirements in IAS 27 “Consolidated and Separate Financial Statements”, IAS 28
“Investments in Associates”, IAS 31 “Interests in Joint Ventures” and SIC-12 “Consolidation – Special
Purpose Entities”. The adoption of IFRS 12 extends the Group’s fiscal year-end disclosures.
The amended IAS 27 now focuses solely on accounting and disclosure requirements for investments in
subsidiaries, joint ventures and associates when separate financial statements according to IFRS are
presented. This has no impact on the Group’s consolidated financial statements.
The amended IAS 28 prescribes the accounting for investments in associates and sets out the requirements
for the application of the equity method when accounting for investments in associates and joint ventures.
This has no material impact on the Group’s consolidated financial statements.
In December 2011 the IASB issued an amendment to IAS 32 “Financial Instruments: Presentation” which
clarifies the requirements for offsetting financial assets and financial liabilities to eliminate existing
inconsistencies in current practice. The amendment is compulsory for fiscal years beginning on or after
January 1, 2014 and shall be applied retrospectively; the option of an earlier adoption has not been used by
thyssenkrupp. The adoption of the amendment does not have a material impact on the Group’s consolidated
financial statements.
In June 2012 the IASB issued “Consolidated Financial Statements, Joint Arrangements and Disclosure of
Interests in Other Entities: Transition Guidance” Amendments to IFRS 10, IFRS 11 and IFRS 12. The
amendments clarify the transition guidance and provides transition reliefs for the before mentioned
Standards. Such as IFRS 10, IFRS 11 and IFRS 12, the amendments are effective for fiscal years beginning
on or after January 1, 2013. In the context of the endorsement, the IASB deferred the mandatory effective
date to fiscal years beginning on or after January 1, 2014; the option of an earlier adoption has not been
used by thyssenkrupp.
In October 2012 the IASB issued “Investment Entities” as amendments to IFRS 10, IFRS 12 and IAS 27
regarding the accounting of investment entities. The amendments define investment entities and provide an
exception to the general consolidation requirements of subsidiaries in IFRS 10; instead of consolidating
those subsidiaries are measured at fair value through profit or loss. In addition the amendments set out
disclosure requirements for investment entities. The amendments are effective for fiscal years beginning on
or after January 1, 2014, the option of an earlier adoption has not been used by thyssenkrupp. The
amendments do not have any relevance for the Group’s consolidated financial statements.
In May 2013 the IASB issued IFRIC 21 “Levies”, an interpretation of IAS 37 “Provisions, Contingent
Liabilities and Contingent Assets”. The interpretation determines the accounting for levies imposed by
governments, other than income taxes according to IAS 12, and clarifies in particular when an entity should
recognize a liability to pay a levy. The interpretation is effective for fiscal years beginning on or after
January 1, 2014, the option of an earlier adoption has not been used by thyssenkrupp. The interpretation
does not have a material impact on the Group’s consolidated financial statements.
In May 2013 the IASB issued “Recoverable Amount for Disclosures for Non-Financial Assets (Amendments
to IAS 36)” that address changes of the disclosure requirements of IAS 36. The amendments realize the
IASB’s original intention that the scope of the disclosures is limited to the recoverable amount of non-
financial assets for which an impairment loss has been recognized or reversed during the period if that
amount is based on fair value less costs of disposal. In addition the disclosure requirements have been
amended when the recoverable amount is based on fair value less costs of disposal. The amendments are
effective retrospectively for fiscal years beginning on or after January 1, 2014, the option of an earlier
adoption has not been used by thyssenkrupp. The amendments do not have a material impact on the
Group’s consolidated financial statements.
151 thyssenkrupp annual report 2014/2015 Consolidated financial statements // Notes to the consolidated financial statements
In June 2013 the IASB issued “Novation of Derivatives and Continuation of Hedge Accounting (Amendments
to IAS 39)” that amends IAS 39 Financial Instruments. The amendments allow hedge accounting to
continue in a situation where a derivative, which has been designed as a hedging instrument, is novated to
effect clearing with a central counterparty as a result of law or regulation, if specific conditions are met. The
amendments are effective retrospectively for fiscal years beginning on or after January 1, 2014, the option
of an earlier adoption has not been used by thyssenkrupp. The amendments do not have a material impact
on the Group’s consolidated financial statements.
Issued accounting standards that have not been adopted in fiscal year 2014/2015 The following standards, interpretations and amendments have been issued by the IASB. Their adoption has
not been mandatory for 2014/2015 and must be endorsed partially by the EU:
In November 2009 the IASB issued the new standard IFRS 9 “Financial Instruments” on the classification
and measurement of financial assets. This standard is the first part of the three-part project to replace
completely IAS 39 “Financial Instruments: Recognition and Measurement”. In accordance with the approach
of IFRS 9 financial assets are measured at amortized cost or fair value. The classification to one of the two
measurement categories is based on how an entity manages its financial instruments (so called business
model) and the contractual cash flow characteristics of the financial assets. In October 2010 the IASB issued
requirements on the accounting for financial liabilities which amend IFRS 9 “Financial Instruments” and
complete the classification and measurement phase of the IASB’s project to replace IAS 39 “Financial
Instruments: Recognition and Measurement”. With the new requirements, an entity choosing to measure
liability at fair value will recognize the portion of the change in its fair value due to changes in the entity’s
own credit risk in other comprehensive income within equity and not in profit and loss. Issuing amendments
to IFRS 9 “Financial Instruments” and to IFRS 7 “Financial Instruments: Disclosures” in December 2011, the
IASB defers the mandatory effective date of IFRS 9 from January 1, 2013 to January 1, 2015. In addition
the amendment provides relief from the requirement to restate comparative financial statements for the
effect of applying IFRS 9; earlier application is permitted. Instead, additional transition disclosures have
been added to IFRS 7 to help users of the financial statements to understand the effect that the initial
application of IFRS 9 has on the classification and measurement of financial instruments. In November 2013
the IASB issued amendments to IFRS 9 “Financial Instruments“ (Hedge Accounting and Amendments to
IFRS 9; IFRS 7 and IAS 39). The amendments to IFRS 9 establish a new model that represents a substantial
overhaul of hedge accounting that will enable entities to better reflect their risk management activities in
their financial statements. In addition extensive disclosures are required. Moreover recognizing fair value
changes of liabilities due to credit rating within equity will be possible to be earlier adopted without applying
the complete regulations of IFRS 9. Furthermore the IASB decided to abandon the mandatory date of
January 1, 2015; a new date should be decided upon when the entire IFRS 9 project is closer to completion.
In July 2014 the IASB issued the final version of IFRS 9 “Financial Instruments”. The new version includes
revised requirements for the classification and measurement of financial assets and for the first time
regulations on the impairment of financial instruments; with the new “expected loss model” losses are
recognized earlier because both existing and expected losses are recognized. The new regulations must be
applied for fiscal years beginning on or after January 1, 2018. In general they must be applied
retrospectively, but various transition options are allowed; earlier application is permitted. The EU has not yet
endorsed the standard. Currently, Management is not able to finally assess what impact adoption of the
standard will have – if endorsed by the EU in the current version.
152 thyssenkrupp annual report 2014/2015 Consolidated financial statements // Notes to the consolidated financial statements
In November 2013 the IASB issued narrow-scope amendments to IAS 19 “Employee Benefits“ titled
“Defined Benefit Plans: Employee Contributions (Amendments to IAS 19)“. The amendments are applicable
to recognizing contributions of employees or third parties to defined benefit plans. Hereby it will be allowed
to recognize employees’ or third parties’ contributions as a reduction of current service costs in the period in
which the corresponding servicing has been rendered if the contributions are independent of the number of
years of employee service. The amendments to IAS 19 are to be applied for fiscal years beginning on or
after July 1, 2014. In the context of the endorsement, the mandatory effective date was deferred to fiscal
years beginning on or after February 1, 2015; the option of an earlier adoption has not been used by
thyssenkrupp. Currently, Management does not expect the amendments to have a material impact on the
Group’s consolidated financial statements.
In December 2013 the IASB issued the annual improvements for the 2010 to 2012 cycle and for the current
2011 to 2013 cycle as part of its annual improvement process project. In the context of the 2010 to 2012
cycle clarifications and smaller amendments of seven standards were published: IFRS 2 “Share-based
Payment“, IFRS 3 “Business Combinations“, IFRS 8 “Operating Segments“, IFRS 13 “Fair Value
Measurement“, IAS 16 “Property, Plant and Equipment“, IAS 24 “Related Party Disclosures“ and IAS 38
“Intangible Assets“. In the context of the 2011 to 2013 cycle clarifications and smaller amendments of four
standards were published: IFRS 1 “First-time Adoption of IFRS”, IFRS 3 “Business Combinations“, IFRS 13
“Fair Value Measurement“ and IAS 40 “Investment Property“. The amendments are effective for fiscal years
beginning on or after July 1, 2014. In the context of the endorsement, the mandatory effective date was
deferred – namely for the 2010 to 2012 cycle to fiscal years beginning on or after February 1, 2015 and for
the 2011 to 2013 cycle to fiscal years beginning on or after January 1, 2015; earlier application is
permitted. Currently, Management does not expect the amendments to have a material impact on the
Group’s consolidated financial statements.
In May 2014 the IASB issued amendments to IFRS 11 “Joint Arrangements” clarifying that both the initial
and subsequent acquisition of interests in a joint operation that constitutes a business must be accounted
for in line with the principles of IFRS 3 “Business Combinations” except where these principles conflict with
the guidance in IFRS 11. In addition, the disclosure requirements of IFRS 3 must be met. The amendments
are to be applied for fiscal years beginning on or after January 1, 2016; earlier application is permitted. The
EU has not yet endorsed the amendments. Currently, Management does not expect the amendments – if
endorsed by the EU in the current version – to have a material impact on the Group’s consolidated financial
statements.
In May 2014 the IASB issued amendments to IAS 16 “Property, Plant and Equipment” and IAS 38
“Intangible Assets” providing additional guidelines for determining an acceptable method of depreciation or
amortization. The amendments clarify that revenue-based methods are not appropriate for calculating the
depreciation of property, plant and equipment and are only appropriate in limited circumstances for
calculating the amortization of intangible assets. The amendments are to be applied for fiscal years
beginning on or after January 1, 2016; earlier application is permitted. The EU has not yet endorsed the
amendments. Currently, Management does not expect the amendments – if endorsed by the EU in the
current version – to have a material impact on the Group’s consolidated financial statements.
In May 2014 the IASB issued the new standard IFRS 15 “Revenue from Contracts with Customers”. The
purpose of the new standard on revenue recognition is to bring together the large number of existing
guidelines contained in various standards and interpretations. At the same time it establishes uniform core
principles to be applied to all industries and all types of revenue transactions. A 5-step model is used to
determine at which point in time or over which period of time revenues are to be recognized and in what
amount. The standard also includes further detailed guidance and extended disclosure requirements. Due to
the amendment to IFRS 15 issued in September 2015, the mandatory effective date was deferred from
January 1, 2017 to fiscal years beginning on or after January 1, 2018. In general it must be applied
retrospectively, but various transition options are allowed; earlier application is permitted. The EU has not yet
endorsed the standard. Currently, Management is not able to finally assess what impact adoption of the
standard will have – if endorsed by the EU in the current version.
153 thyssenkrupp annual report 2014/2015 Consolidated financial statements // Notes to the consolidated financial statements
In September 2014 the IASB issued amendments to IFRS 10 “Consolidated Financial Statements“ and
IAS 28 “Investments in Associates and Joint Ventures (2011)“. The amendments address a well-known
inconsistency between the two standards regarding the accounting of the sale or contribution of assets
between an investor and its associate or joint venture. When a transaction involves a business in accordance
with IFRS 3, a full gain or loss has to be recognized by the investor, when the transaction involves assets that
do not constitute a business, only a partial gain or loss has to be recognized. The amendments are to be
applied for fiscal years beginning on or after January 1, 2016; earlier application is permitted. The EU has
not yet endorsed the amendments. Currently, Management does not expect the amendments – if endorsed
by the EU in the current version – to have a material impact on the Group’s consolidated financial
statements.
In September 2014 the IASB issued the annual improvements for the 2012 to 2014 cycle. In the context
amendments of four standards were published: IFRS 5 “Non-current Assets held for Sale and Discontinued
Operations”, IFRS 7 “Financial Instruments: Disclosures“, IAS 19 “Employee Benefits“ and IAS 34“ Interim
Financial Reporting“. The amendments are effective for fiscal years beginning on or after January 1, 2016
and has to be applied prospectively or retrospectively depending on the respective amendment; earlier
application is permitted. The EU has not yet endorsed the amendments. Currently, Management does not
expect the amendments – if endorsed by the EU in the current version – to have a material impact on the
Group’s consolidated financial statements.
In December 2014 the IASB issued amendments to IAS 1 “Presentation of Financial Statements”. The
amendments mainly include clarifications regarding the judgment of materiality of disclosures, explanations
how to aggregate and disaggregate line items of the balance sheet and the statement of comprehensive
income, the order of the notes and the disclosure of significant accounting policies. The amendments are to
be applied for fiscal years beginning on or after January 1, 2016; earlier application is permitted. The EU
has not yet endorsed the amendments. Currently, Management expects the amendments – if endorsed by
the EU in the current version – to have an impact on the Group’s presentation of the notes.
In December 2014 the IASB issued amendments to “Investment Entities: Applying the Consolidation
Exception (Amendments to IFRS 10, IFRS 12 and IAS 28)”. The amendments clarify the application of the
consolidation exception of IFRS 10 for investment entities and their subsidiaries that meet the definition of
an investment entity. Amendments were also made to IFRS 12 to clarify that also an investment entity that
measures all its subsidiaries at fair value has to apply IFRS 12. IAS 28 will also be amended by the
application of the equity method by a non-investment entity investor to an investment entity investee. The
amendments are to be applied for fiscal years beginning on or after January 1, 2016; earlier application is
permitted. The EU has not yet endorsed the amendments. Currently, Management does not expect the
amendments – if endorsed by the EU in the current version – to have any relevance for thyssenkrupp.
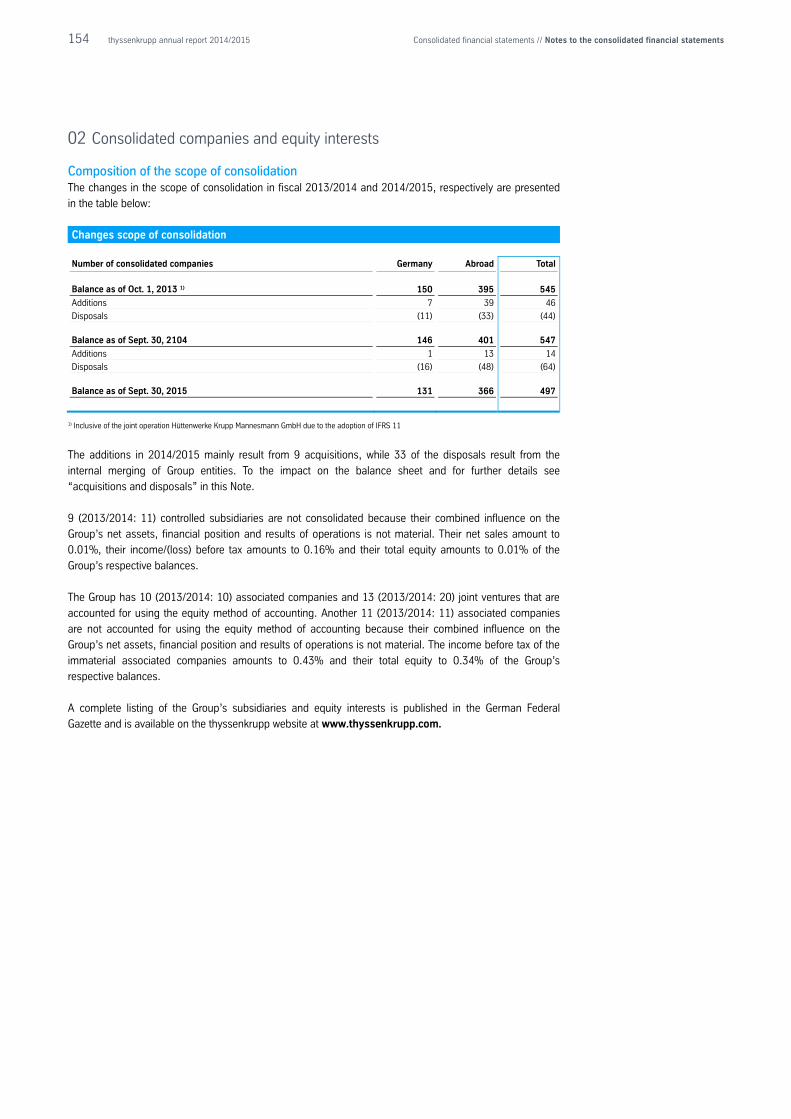
154 thyssenkrupp annual report 2014/2015 Consolidated financial statements // Notes to the consolidated financial statements
02 Consolidated companies and equity interests Composition of the scope of consolidation The changes in the scope of consolidation in fiscal 2013/2014 and 2014/2015, respectively are presented
in the table below:
Changes scope of consolidation
Number of consolidated companies Germany Abroad Total
Balance as of Oct. 1, 2013 1) 150 395 545
Additions 7 39 46
Disposals (11) (33) (44)
Balance as of Sept. 30, 2104 146 401 547
Additions 1 13 14
Disposals (16) (48) (64)
Balance as of Sept. 30, 2015 131 366 497
1) Inclusive of the joint operation Hüttenwerke Krupp Mannesmann GmbH due to the adoption of IFRS 11
The additions in 2014/2015 mainly result from 9 acquisitions, while 33 of the disposals result from the
internal merging of Group entities. To the impact on the balance sheet and for further details see
“acquisitions and disposals” in this Note.
9 (2013/2014: 11) controlled subsidiaries are not consolidated because their combined influence on the
Group’s net assets, financial position and results of operations is not material. Their net sales amount to
0.01%, their income/(loss) before tax amounts to 0.16% and their total equity amounts to 0.01% of the
Group’s respective balances.
The Group has 10 (2013/2014: 10) associated companies and 13 (2013/2014: 20) joint ventures that are
accounted for using the equity method of accounting. Another 11 (2013/2014: 11) associated companies
are not accounted for using the equity method of accounting because their combined influence on the
Group’s net assets, financial position and results of operations is not material. The income before tax of the
immaterial associated companies amounts to 0.43% and their total equity to 0.34% of the Group’s
respective balances.
A complete listing of the Group’s subsidiaries and equity interests is published in the German Federal
Gazette and is available on the thyssenkrupp website at www.thyssenkrupp.com.
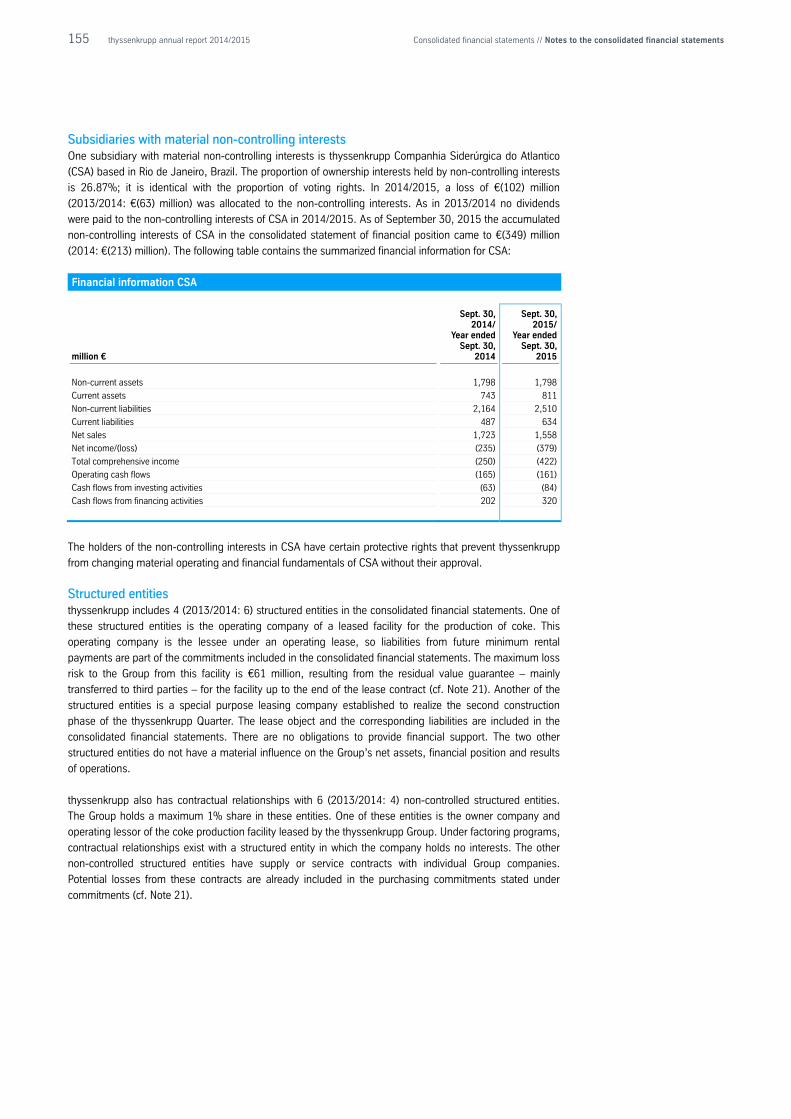
155 thyssenkrupp annual report 2014/2015 Consolidated financial statements // Notes to the consolidated financial statements
Subsidiaries with material non-controlling interests One subsidiary with material non-controlling interests is thyssenkrupp Companhia Siderúrgica do Atlantico
(CSA) based in Rio de Janeiro, Brazil. The proportion of ownership interests held by non-controlling interests
is 26.87%; it is identical with the proportion of voting rights. In 2014/2015, a loss of €(102) million
(2013/2014: €(63) million) was allocated to the non-controlling interests. As in 2013/2014 no dividends
were paid to the non-controlling interests of CSA in 2014/2015. As of September 30, 2015 the accumulated
non-controlling interests of CSA in the consolidated statement of financial position came to €(349) million
(2014: €(213) million). The following table contains the summarized financial information for CSA:
Financial information CSA
million €
Sept. 30, 2014/
Year ended Sept. 30,
2014
Sept. 30, 2015/
Year ended Sept. 30,
2015
Non-current assets 1,798 1,798
Current assets 743 811
Non-current liabilities 2,164 2,510
Current liabilities 487 634
Net sales 1,723 1,558
Net income/(loss) (235) (379)
Total comprehensive income (250) (422)
Operating cash flows (165) (161)
Cash flows from investing activities (63) (84)
Cash flows from financing activities 202 320
The holders of the non-controlling interests in CSA have certain protective rights that prevent thyssenkrupp
from changing material operating and financial fundamentals of CSA without their approval.
Structured entities thyssenkrupp includes 4 (2013/2014: 6) structured entities in the consolidated financial statements. One of
these structured entities is the operating company of a leased facility for the production of coke. This
operating company is the lessee under an operating lease, so liabilities from future minimum rental
payments are part of the commitments included in the consolidated financial statements. The maximum loss
risk to the Group from this facility is €61 million, resulting from the residual value guarantee – mainly
transferred to third parties – for the facility up to the end of the lease contract (cf. Note 21). Another of the
structured entities is a special purpose leasing company established to realize the second construction
phase of the thyssenkrupp Quarter. The lease object and the corresponding liabilities are included in the
consolidated financial statements. There are no obligations to provide financial support. The two other
structured entities do not have a material influence on the Group’s net assets, financial position and results
of operations.
thyssenkrupp also has contractual relationships with 6 (2013/2014: 4) non-controlled structured entities.
The Group holds a maximum 1% share in these entities. One of these entities is the owner company and
operating lessor of the coke production facility leased by the thyssenkrupp Group. Under factoring programs,
contractual relationships exist with a structured entity in which the company holds no interests. The other
non-controlled structured entities have supply or service contracts with individual Group companies.
Potential losses from these contracts are already included in the purchasing commitments stated under
commitments (cf. Note 21).
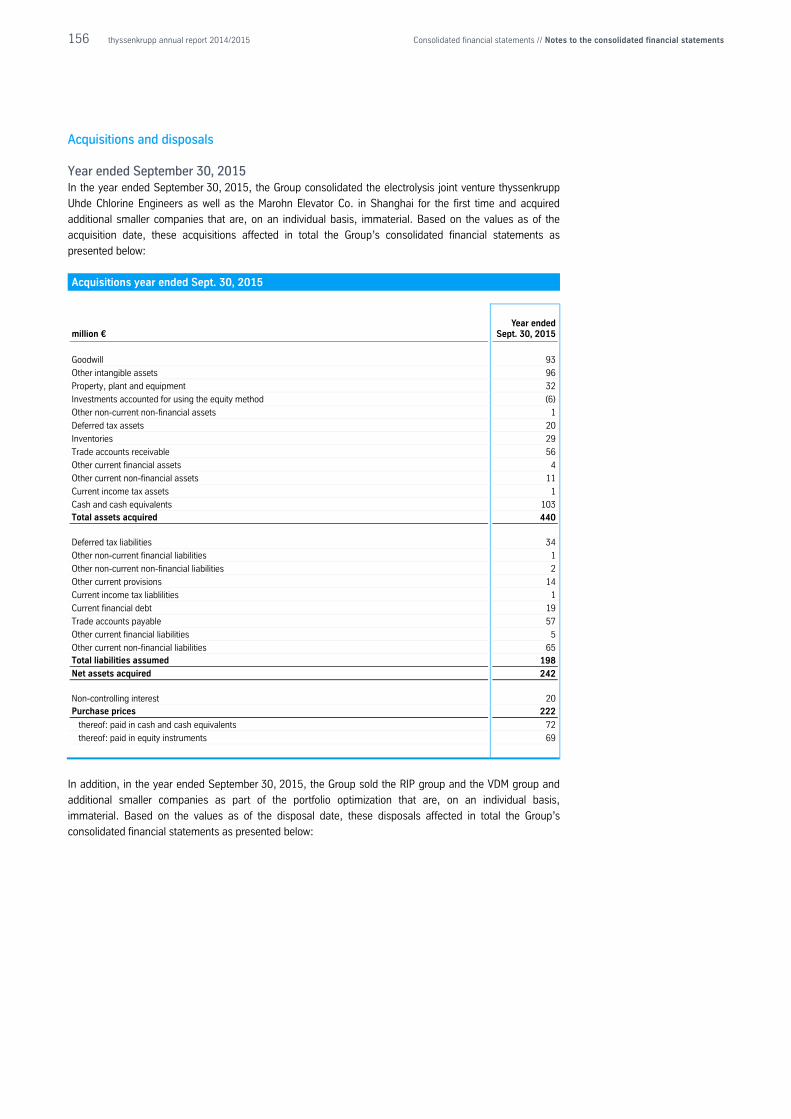
156 thyssenkrupp annual report 2014/2015 Consolidated financial statements // Notes to the consolidated financial statements
Acquisitions and disposals
Year ended September 30, 2015 In the year ended September 30, 2015, the Group consolidated the electrolysis joint venture thyssenkrupp
Uhde Chlorine Engineers as well as the Marohn Elevator Co. in Shanghai for the first time and acquired
additional smaller companies that are, on an individual basis, immaterial. Based on the values as of the
acquisition date, these acquisitions affected in total the Group’s consolidated financial statements as
presented below:
Acquisitions year ended Sept. 30, 2015
million € Year ended
Sept. 30, 2015
Goodwill 93
Other intangible assets 96
Property, plant and equipment 32
Investments accounted for using the equity method (6)
Other non-current non-financial assets 1
Deferred tax assets 20
Inventories 29
Trade accounts receivable 56
Other current financial assets 4
Other current non-financial assets 11
Current income tax assets 1
Cash and cash equivalents 103 Total assets acquired 440
Deferred tax liabilities 34
Other non-current financial liabilities 1
Other non-current non-financial liabilities 2
Other current provisions 14
Current income tax liablilities 1
Current financial debt 19
Trade accounts payable 57
Other current financial liabilities 5
Other current non-financial liabilities 65 Total liabilities assumed 198
Net assets acquired 242
Non-controlling interest 20 Purchase prices 222
thereof: paid in cash and cash equivalents 72
thereof: paid in equity instruments 69
In addition, in the year ended September 30, 2015, the Group sold the RIP group and the VDM group and
additional smaller companies as part of the portfolio optimization that are, on an individual basis,
immaterial. Based on the values as of the disposal date, these disposals affected in total the Group’s
consolidated financial statements as presented below:
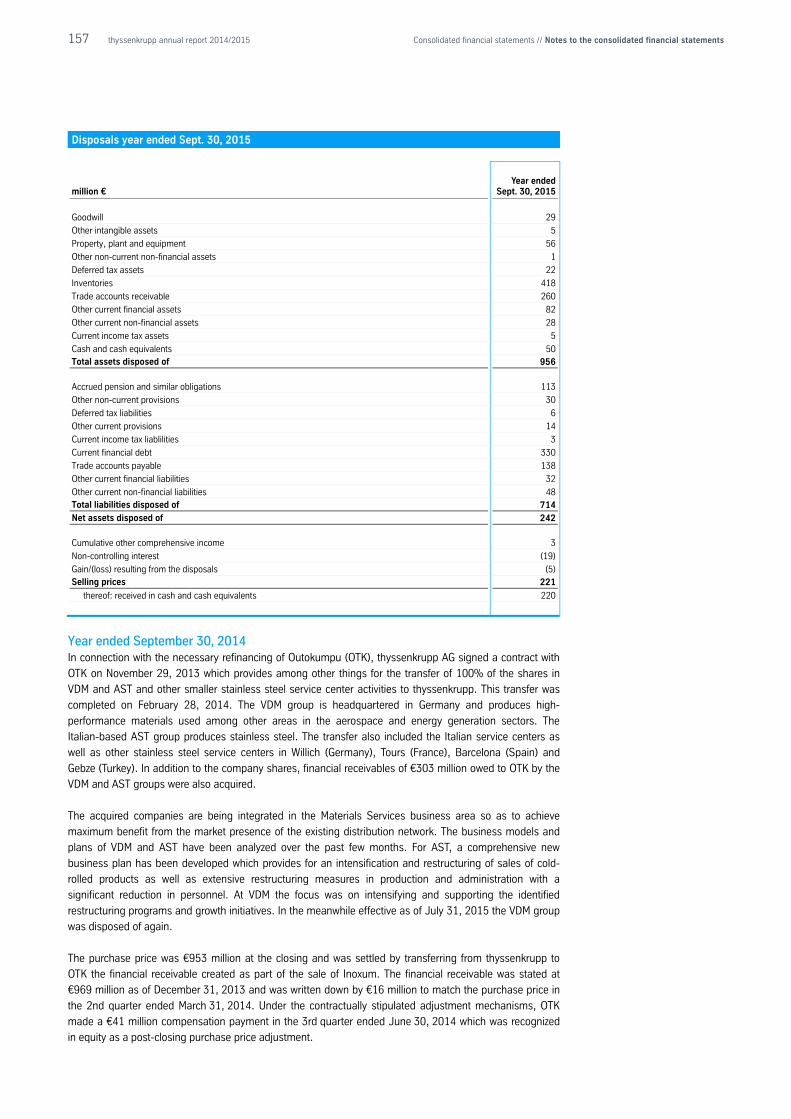
157 thyssenkrupp annual report 2014/2015 Consolidated financial statements // Notes to the consolidated financial statements
Disposals year ended Sept. 30, 2015
million € Year ended
Sept. 30, 2015
Goodwill 29
Other intangible assets 5
Property, plant and equipment 56
Other non-current non-financial assets 1
Deferred tax assets 22
Inventories 418
Trade accounts receivable 260
Other current financial assets 82
Other current non-financial assets 28
Current income tax assets 5
Cash and cash equivalents 50 Total assets disposed of 956
Accrued pension and similar obligations 113
Other non-current provisions 30
Deferred tax liabilities 6
Other current provisions 14
Current income tax liablilities 3
Current financial debt 330
Trade accounts payable 138
Other current financial liabilities 32
Other current non-financial liabilities 48 Total liabilities disposed of 714
Net assets disposed of 242
Cumulative other comprehensive income 3
Non-controlling interest (19)
Gain/(loss) resulting from the disposals (5) Selling prices 221
thereof: received in cash and cash equivalents 220
Year ended September 30, 2014 In connection with the necessary refinancing of Outokumpu (OTK), thyssenkrupp AG signed a contract with
OTK on November 29, 2013 which provides among other things for the transfer of 100% of the shares in
VDM and AST and other smaller stainless steel service center activities to thyssenkrupp. This transfer was
completed on February 28, 2014. The VDM group is headquartered in Germany and produces high-
performance materials used among other areas in the aerospace and energy generation sectors. The
Italian-based AST group produces stainless steel. The transfer also included the Italian service centers as
well as other stainless steel service centers in Willich (Germany), Tours (France), Barcelona (Spain) and
Gebze (Turkey). In addition to the company shares, financial receivables of €303 million owed to OTK by the
VDM and AST groups were also acquired.
The acquired companies are being integrated in the Materials Services business area so as to achieve
maximum benefit from the market presence of the existing distribution network. The business models and
plans of VDM and AST have been analyzed over the past few months. For AST, a comprehensive new
business plan has been developed which provides for an intensification and restructuring of sales of cold-
rolled products as well as extensive restructuring measures in production and administration with a
significant reduction in personnel. At VDM the focus was on intensifying and supporting the identified
restructuring programs and growth initiatives. In the meanwhile effective as of July 31, 2015 the VDM group
was disposed of again.
The purchase price was €953 million at the closing and was settled by transferring from thyssenkrupp to
OTK the financial receivable created as part of the sale of Inoxum. The financial receivable was stated at
€969 million as of December 31, 2013 and was written down by €16 million to match the purchase price in
the 2nd quarter ended March 31, 2014. Under the contractually stipulated adjustment mechanisms, OTK
made a €41 million compensation payment in the 3rd quarter ended June 30, 2014 which was recognized
in equity as a post-closing purchase price adjustment.
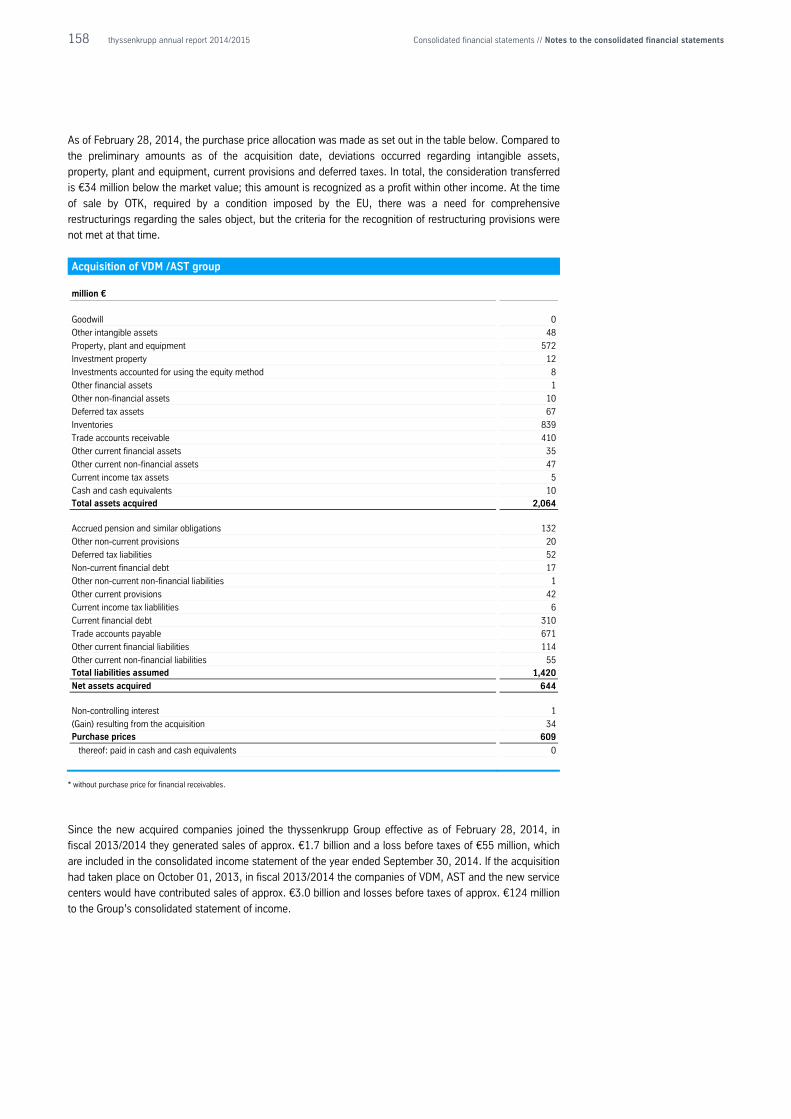
158 thyssenkrupp annual report 2014/2015 Consolidated financial statements // Notes to the consolidated financial statements
As of February 28, 2014, the purchase price allocation was made as set out in the table below. Compared to
the preliminary amounts as of the acquisition date, deviations occurred regarding intangible assets,
property, plant and equipment, current provisions and deferred taxes. In total, the consideration transferred
is €34 million below the market value; this amount is recognized as a profit within other income. At the time
of sale by OTK, required by a condition imposed by the EU, there was a need for comprehensive
restructurings regarding the sales object, but the criteria for the recognition of restructuring provisions were
not met at that time.
Acquisition of VDM /AST group
million €
Goodwill 0
Other intangible assets 48
Property, plant and equipment 572
Investment property 12
Investments accounted for using the equity method 8
Other financial assets 1
Other non-financial assets 10
Deferred tax assets 67
Inventories 839
Trade accounts receivable 410
Other current financial assets 35
Other current non-financial assets 47
Current income tax assets 5
Cash and cash equivalents 10 Total assets acquired 2,064
Accrued pension and similar obligations 132
Other non-current provisions 20
Deferred tax liabilities 52
Non-current financial debt 17
Other non-current non-financial liabilities 1
Other current provisions 42
Current income tax liablilities 6
Current financial debt 310
Trade accounts payable 671
Other current financial liabilities 114
Other current non-financial liabilities 55 Total liabilities assumed 1,420
Net assets acquired 644
Non-controlling interest 1
(Gain) resulting from the acquisition 34 Purchase prices 609
thereof: paid in cash and cash equivalents 0
* without purchase price for financial receivables.
Since the new acquired companies joined the thyssenkrupp Group effective as of February 28, 2014, in
fiscal 2013/2014 they generated sales of approx. €1.7 billion and a loss before taxes of €55 million, which
are included in the consolidated income statement of the year ended September 30, 2014. If the acquisition
had taken place on October 01, 2013, in fiscal 2013/2014 the companies of VDM, AST and the new service
centers would have contributed sales of approx. €3.0 billion and losses before taxes of approx. €124 million
to the Group’s consolidated statement of income.
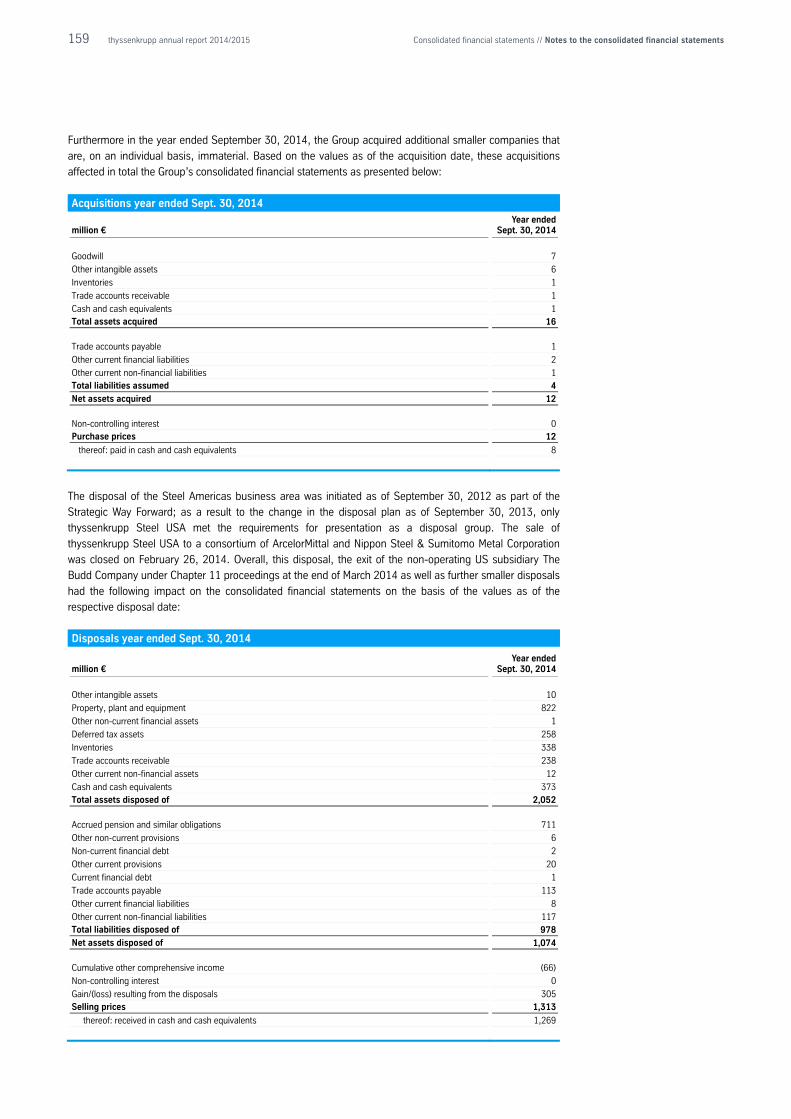
159 thyssenkrupp annual report 2014/2015 Consolidated financial statements // Notes to the consolidated financial statements
Furthermore in the year ended September 30, 2014, the Group acquired additional smaller companies that
are, on an individual basis, immaterial. Based on the values as of the acquisition date, these acquisitions
affected in total the Group’s consolidated financial statements as presented below:
Acquisitions year ended Sept. 30, 2014
million € Year ended
Sept. 30, 2014
Goodwill 7
Other intangible assets 6
Inventories 1
Trade accounts receivable 1
Cash and cash equivalents 1 Total assets acquired 16
Trade accounts payable 1
Other current financial liabilities 2
Other current non-financial liabilities 1
Total liabilities assumed 4
Net assets acquired 12
Non-controlling interest 0 Purchase prices 12
thereof: paid in cash and cash equivalents 8
The disposal of the Steel Americas business area was initiated as of September 30, 2012 as part of the
Strategic Way Forward; as a result to the change in the disposal plan as of September 30, 2013, only
thyssenkrupp Steel USA met the requirements for presentation as a disposal group. The sale of
thyssenkrupp Steel USA to a consortium of ArcelorMittal and Nippon Steel & Sumitomo Metal Corporation
was closed on February 26, 2014. Overall, this disposal, the exit of the non-operating US subsidiary The
Budd Company under Chapter 11 proceedings at the end of March 2014 as well as further smaller disposals
had the following impact on the consolidated financial statements on the basis of the values as of the
respective disposal date:
Disposals year ended Sept. 30, 2014
million € Year ended
Sept. 30, 2014
Other intangible assets 10
Property, plant and equipment 822
Other non-current financial assets 1
Deferred tax assets 258
Inventories 338
Trade accounts receivable 238
Other current non-financial assets 12
Cash and cash equivalents 373
Total assets disposed of 2,052
Accrued pension and similar obligations 711
Other non-current provisions 6
Non-current financial debt 2
Other current provisions 20
Current financial debt 1
Trade accounts payable 113
Other current financial liabilities 8
Other current non-financial liabilities 117 Total liabilities disposed of 978
Net assets disposed of 1,074
Cumulative other comprehensive income (66)
Non-controlling interest 0
Gain/(loss) resulting from the disposals 305
Selling prices 1,313
thereof: received in cash and cash equivalents 1,269
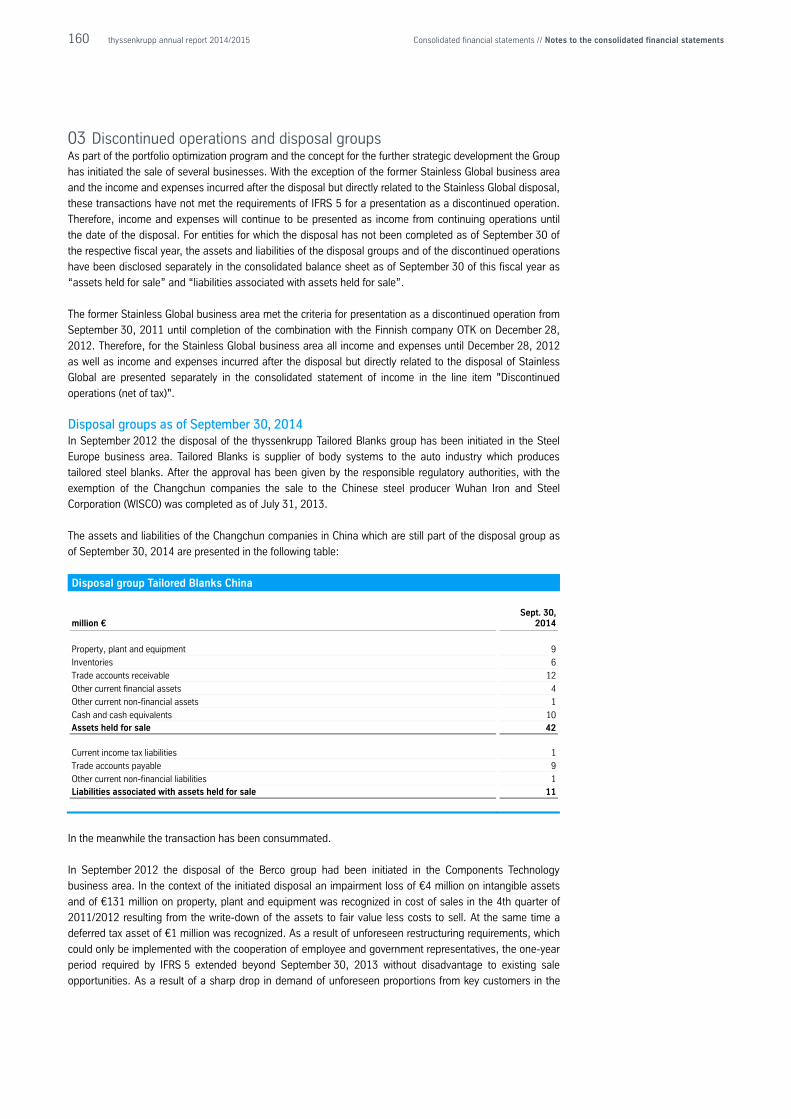
160 thyssenkrupp annual report 2014/2015 Consolidated financial statements // Notes to the consolidated financial statements
03 Discontinued operations and disposal groups As part of the portfolio optimization program and the concept for the further strategic development the Group
has initiated the sale of several businesses. With the exception of the former Stainless Global business area
and the income and expenses incurred after the disposal but directly related to the Stainless Global disposal,
these transactions have not met the requirements of IFRS 5 for a presentation as a discontinued operation.
Therefore, income and expenses will continue to be presented as income from continuing operations until
the date of the disposal. For entities for which the disposal has not been completed as of September 30 of
the respective fiscal year, the assets and liabilities of the disposal groups and of the discontinued operations
have been disclosed separately in the consolidated balance sheet as of September 30 of this fiscal year as
“assets held for sale” and “liabilities associated with assets held for sale”.
The former Stainless Global business area met the criteria for presentation as a discontinued operation from
September 30, 2011 until completion of the combination with the Finnish company OTK on December 28,
2012. Therefore, for the Stainless Global business area all income and expenses until December 28, 2012
as well as income and expenses incurred after the disposal but directly related to the disposal of Stainless
Global are presented separately in the consolidated statement of income in the line item "Discontinued
operations (net of tax)".
Disposal groups as of September 30, 2014 In September 2012 the disposal of the thyssenkrupp Tailored Blanks group has been initiated in the Steel
Europe business area. Tailored Blanks is supplier of body systems to the auto industry which produces
tailored steel blanks. After the approval has been given by the responsible regulatory authorities, with the
exemption of the Changchun companies the sale to the Chinese steel producer Wuhan Iron and Steel
Corporation (WISCO) was completed as of July 31, 2013.
The assets and liabilities of the Changchun companies in China which are still part of the disposal group as
of September 30, 2014 are presented in the following table:
Disposal group Tailored Blanks China
million € Sept. 30,
2014
Property, plant and equipment 9
Inventories 6
Trade accounts receivable 12
Other current financial assets 4
Other current non-financial assets 1
Cash and cash equivalents 10 Assets held for sale 42
Current income tax liabilities 1
Trade accounts payable 9
Other current non-financial liabilities 1
Liabilities associated with assets held for sale 11
In the meanwhile the transaction has been consummated.
In September 2012 the disposal of the Berco group had been initiated in the Components Technology
business area. In the context of the initiated disposal an impairment loss of €4 million on intangible assets
and of €131 million on property, plant and equipment was recognized in cost of sales in the 4th quarter of
2011/2012 resulting from the write-down of the assets to fair value less costs to sell. At the same time a
deferred tax asset of €1 million was recognized. As a result of unforeseen restructuring requirements, which
could only be implemented with the cooperation of employee and government representatives, the one-year
period required by IFRS 5 extended beyond September 30, 2013 without disadvantage to existing sale
opportunities. As a result of a sharp drop in demand of unforeseen proportions from key customers in the
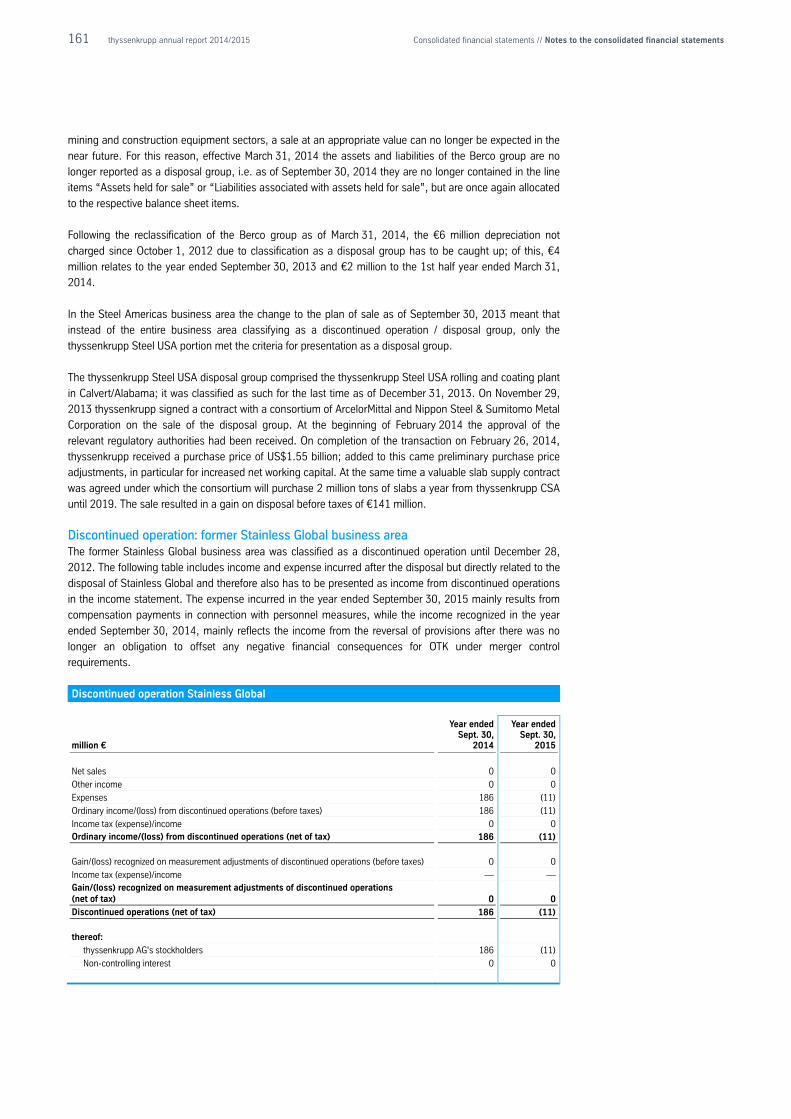
161 thyssenkrupp annual report 2014/2015 Consolidated financial statements // Notes to the consolidated financial statements
mining and construction equipment sectors, a sale at an appropriate value can no longer be expected in the
near future. For this reason, effective March 31, 2014 the assets and liabilities of the Berco group are no
longer reported as a disposal group, i.e. as of September 30, 2014 they are no longer contained in the line
items “Assets held for sale” or “Liabilities associated with assets held for sale”, but are once again allocated
to the respective balance sheet items.
Following the reclassification of the Berco group as of March 31, 2014, the €6 million depreciation not
charged since October 1, 2012 due to classification as a disposal group has to be caught up; of this, €4
million relates to the year ended September 30, 2013 and €2 million to the 1st half year ended March 31,
2014.
In the Steel Americas business area the change to the plan of sale as of September 30, 2013 meant that
instead of the entire business area classifying as a discontinued operation / disposal group, only the
thyssenkrupp Steel USA portion met the criteria for presentation as a disposal group.
The thyssenkrupp Steel USA disposal group comprised the thyssenkrupp Steel USA rolling and coating plant
in Calvert/Alabama; it was classified as such for the last time as of December 31, 2013. On November 29,
2013 thyssenkrupp signed a contract with a consortium of ArcelorMittal and Nippon Steel & Sumitomo Metal
Corporation on the sale of the disposal group. At the beginning of February 2014 the approval of the
relevant regulatory authorities had been received. On completion of the transaction on February 26, 2014,
thyssenkrupp received a purchase price of US$1.55 billion; added to this came preliminary purchase price
adjustments, in particular for increased net working capital. At the same time a valuable slab supply contract
was agreed under which the consortium will purchase 2 million tons of slabs a year from thyssenkrupp CSA
until 2019. The sale resulted in a gain on disposal before taxes of €141 million.
Discontinued operation: former Stainless Global business area The former Stainless Global business area was classified as a discontinued operation until December 28,
2012. The following table includes income and expense incurred after the disposal but directly related to the
disposal of Stainless Global and therefore also has to be presented as income from discontinued operations
in the income statement. The expense incurred in the year ended September 30, 2015 mainly results from
compensation payments in connection with personnel measures, while the income recognized in the year
ended September 30, 2014, mainly reflects the income from the reversal of provisions after there was no
longer an obligation to offset any negative financial consequences for OTK under merger control
requirements.
Discontinued operation Stainless Global
million €
Year ended Sept. 30,
2014
Year ended Sept. 30,
2015
Net sales 0 0
Other income 0 0
Expenses 186 (11)
Ordinary income/(loss) from discontinued operations (before taxes) 186 (11)
Income tax (expense)/income 0 0 Ordinary income/(loss) from discontinued operations (net of tax) 186 (11)
Gain/(loss) recognized on measurement adjustments of discontinued operations (before taxes) 0 0
Income tax (expense)/income — —
Gain/(loss) recognized on measurement adjustments of discontinued operations (net of tax) 0 0
Discontinued operations (net of tax) 186 (11)
thereof:
thyssenkrupp AG's stockholders 186 (11)
Non-controlling interest 0 0
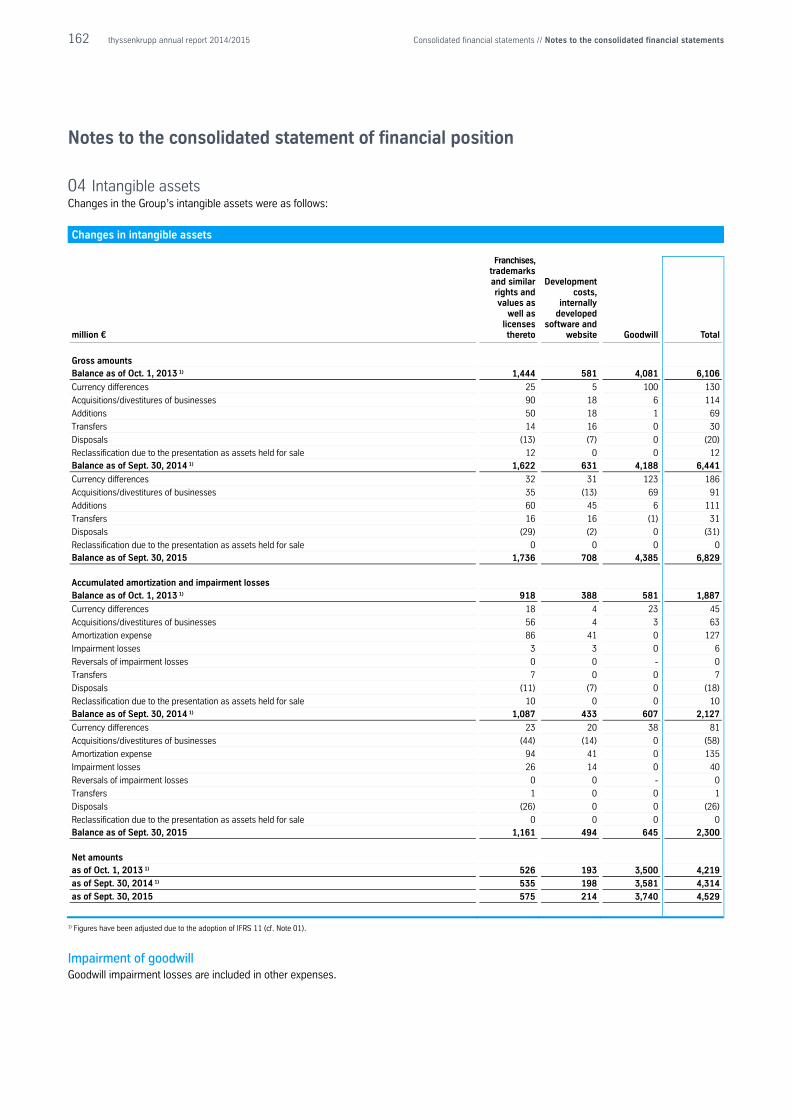
162 thyssenkrupp annual report 2014/2015 Consolidated financial statements // Notes to the consolidated financial statements
Notes to the consolidated statement of financial position
04 Intangible assets Changes in the Group’s intangible assets were as follows:
Changes in intangible assets
million €
Franchises, trademarks and similar rights and values as
well as licenses thereto
Development costs,
internally developed
software and website Goodwill Total
Gross amounts Balance as of Oct. 1, 2013 1) 1,444 581 4,081 6,106
Currency differences 25 5 100 130
Acquisitions/divestitures of businesses 90 18 6 114
Additions 50 18 1 69
Transfers 14 16 0 30
Disposals (13) (7) 0 (20)
Reclassification due to the presentation as assets held for sale 12 0 0 12 Balance as of Sept. 30, 2014 1) 1,622 631 4,188 6,441
Currency differences 32 31 123 186
Acquisitions/divestitures of businesses 35 (13) 69 91
Additions 60 45 6 111
Transfers 16 16 (1) 31
Disposals (29) (2) 0 (31)
Reclassification due to the presentation as assets held for sale 0 0 0 0 Balance as of Sept. 30, 2015 1,736 708 4,385 6,829
Accumulated amortization and impairment losses
Balance as of Oct. 1, 2013 1) 918 388 581 1,887
Currency differences 18 4 23 45
Acquisitions/divestitures of businesses 56 4 3 63
Amortization expense 86 41 0 127
Impairment losses 3 3 0 6
Reversals of impairment losses 0 0 - 0
Transfers 7 0 0 7
Disposals (11) (7) 0 (18)
Reclassification due to the presentation as assets held for sale 10 0 0 10
Balance as of Sept. 30, 2014 1) 1,087 433 607 2,127
Currency differences 23 20 38 81
Acquisitions/divestitures of businesses (44) (14) 0 (58)
Amortization expense 94 41 0 135
Impairment losses 26 14 0 40
Reversals of impairment losses 0 0 - 0
Transfers 1 0 0 1
Disposals (26) 0 0 (26)
Reclassification due to the presentation as assets held for sale 0 0 0 0
Balance as of Sept. 30, 2015 1,161 494 645 2,300
Net amounts as of Oct. 1, 2013 1) 526 193 3,500 4,219
as of Sept. 30, 2014 1) 535 198 3,581 4,314
as of Sept. 30, 2015 575 214 3,740 4,529
1) Figures have been adjusted due to the adoption of IFRS 11 (cf. Note 01).
Impairment of goodwill Goodwill impairment losses are included in other expenses.
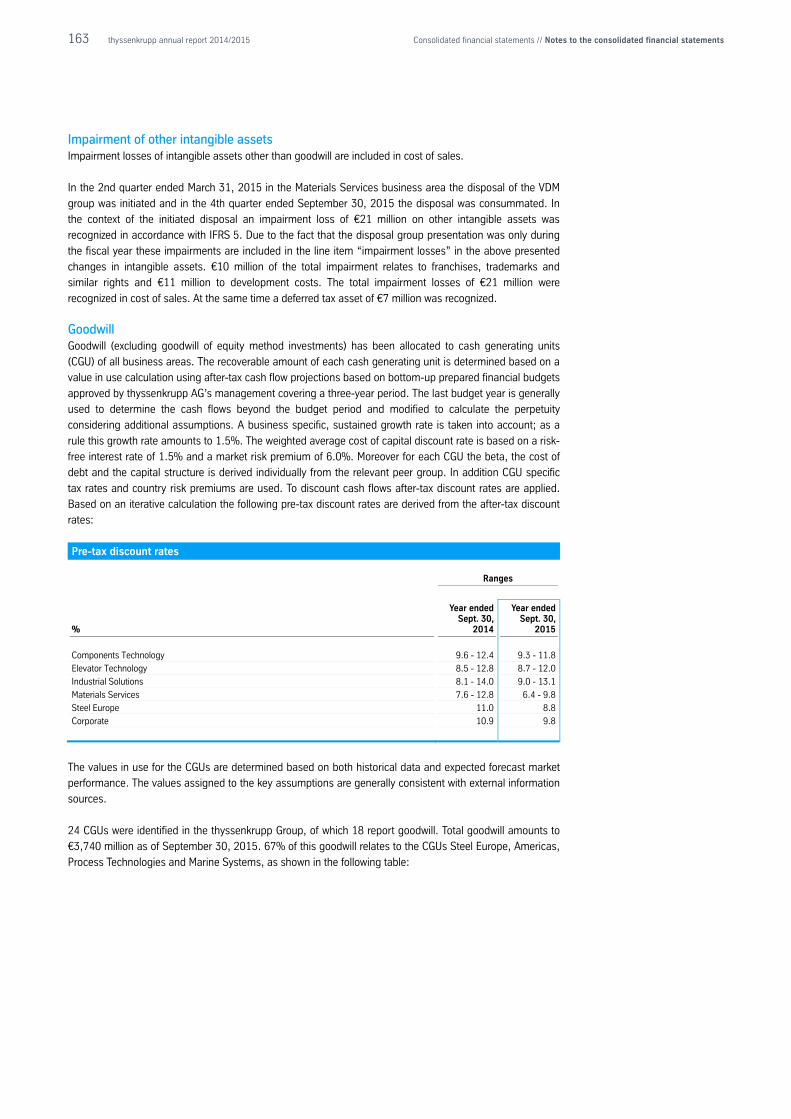
163 thyssenkrupp annual report 2014/2015 Consolidated financial statements // Notes to the consolidated financial statements
Impairment of other intangible assets Impairment losses of intangible assets other than goodwill are included in cost of sales.
In the 2nd quarter ended March 31, 2015 in the Materials Services business area the disposal of the VDM
group was initiated and in the 4th quarter ended September 30, 2015 the disposal was consummated. In
the context of the initiated disposal an impairment loss of €21 million on other intangible assets was
recognized in accordance with IFRS 5. Due to the fact that the disposal group presentation was only during
the fiscal year these impairments are included in the line item “impairment losses” in the above presented
changes in intangible assets. €10 million of the total impairment relates to franchises, trademarks and
similar rights and €11 million to development costs. The total impairment losses of €21 million were
recognized in cost of sales. At the same time a deferred tax asset of €7 million was recognized.
Goodwill Goodwill (excluding goodwill of equity method investments) has been allocated to cash generating units
(CGU) of all business areas. The recoverable amount of each cash generating unit is determined based on a
value in use calculation using after-tax cash flow projections based on bottom-up prepared financial budgets
approved by thyssenkrupp AG’s management covering a three-year period. The last budget year is generally
used to determine the cash flows beyond the budget period and modified to calculate the perpetuity
considering additional assumptions. A business specific, sustained growth rate is taken into account; as a
rule this growth rate amounts to 1.5%. The weighted average cost of capital discount rate is based on a risk-
free interest rate of 1.5% and a market risk premium of 6.0%. Moreover for each CGU the beta, the cost of
debt and the capital structure is derived individually from the relevant peer group. In addition CGU specific
tax rates and country risk premiums are used. To discount cash flows after-tax discount rates are applied.
Based on an iterative calculation the following pre-tax discount rates are derived from the after-tax discount
rates:
Pre-tax discount rates
Ranges
%
Year ended Sept. 30,
2014
Year ended Sept. 30,
2015
Components Technology 9.6 - 12.4 9.3 - 11.8
Elevator Technology 8.5 - 12.8 8.7 - 12.0
Industrial Solutions 8.1 - 14.0 9.0 - 13.1
Materials Services 7.6 - 12.8 6.4 - 9.8
Steel Europe 11.0 8.8
Corporate 10.9 9.8
The values in use for the CGUs are determined based on both historical data and expected forecast market
performance. The values assigned to the key assumptions are generally consistent with external information
sources.
24 CGUs were identified in the thyssenkrupp Group, of which 18 report goodwill. Total goodwill amounts to
€3,740 million as of September 30, 2015. 67% of this goodwill relates to the CGUs Steel Europe, Americas,
Process Technologies and Marine Systems, as shown in the following table:
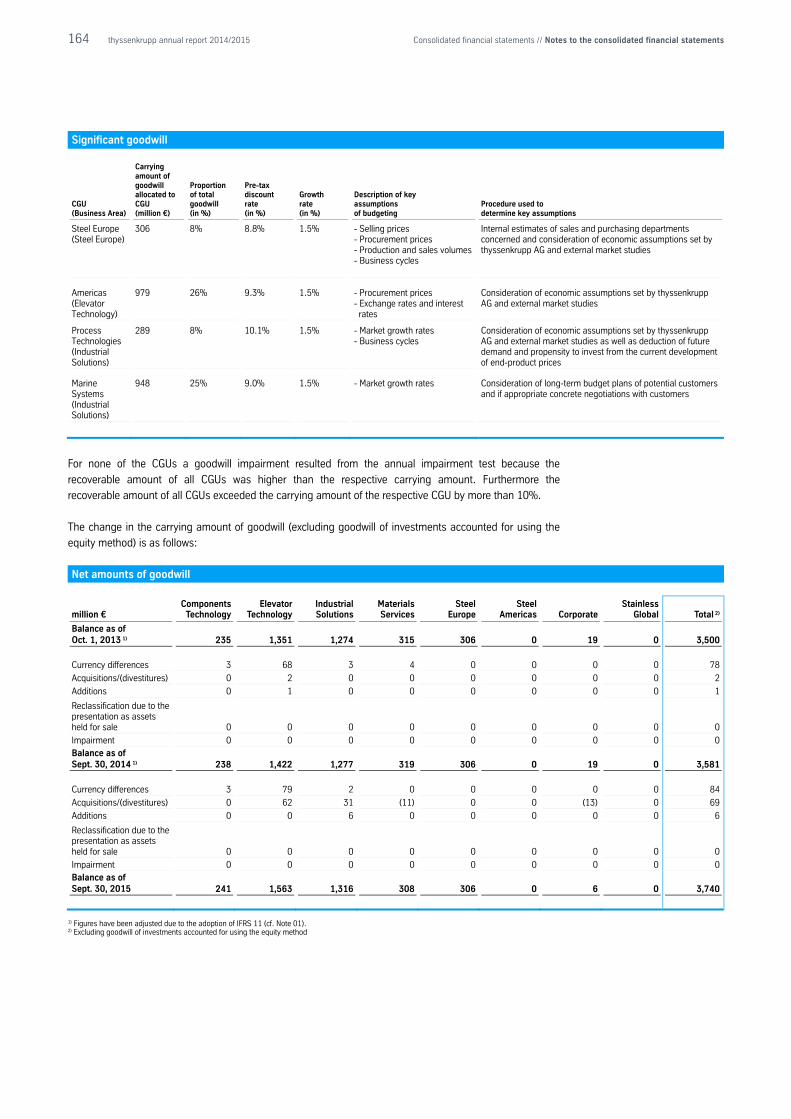
164 thyssenkrupp annual report 2014/2015 Consolidated financial statements // Notes to the consolidated financial statements
Significant goodwill
CGU (Business Area)
Carrying amount of goodwill allocated to CGU (million €)
Proportion of total goodwill (in %)
Pre-tax discount rate (in %)
Growth rate (in %)
Description of key assumptions of budgeting
Procedure used to determine key assumptions
Steel Europe (Steel Europe)
306
8%
8.8%
1.5%
- Selling prices - Procurement prices - Production and sales volumes - Business cycles
Internal estimates of sales and purchasing departments concerned and consideration of economic assumptions set by thyssenkrupp AG and external market studies
Americas (Elevator Technology)
979
26%
9.3%
1.5%
- Procurement prices - Exchange rates and interest rates
Consideration of economic assumptions set by thyssenkrupp AG and external market studies
Process Technologies (Industrial Solutions)
289
8%
10.1%
1.5%
- Market growth rates - Business cycles
Consideration of economic assumptions set by thyssenkrupp AG and external market studies as well as deduction of future demand and propensity to invest from the current development of end-product prices
Marine Systems (Industrial Solutions)
948
25%
9.0%
1.5%
- Market growth rates
Consideration of long-term budget plans of potential customers and if appropriate concrete negotiations with customers
For none of the CGUs a goodwill impairment resulted from the annual impairment test because the
recoverable amount of all CGUs was higher than the respective carrying amount. Furthermore the
recoverable amount of all CGUs exceeded the carrying amount of the respective CGU by more than 10%.
The change in the carrying amount of goodwill (excluding goodwill of investments accounted for using the
equity method) is as follows:
Net amounts of goodwill
million € Components
Technology Elevator
Technology Industrial Solutions
Materials Services
Steel Europe
Steel Americas Corporate
Stainless Global Total 2)
Balance as of Oct. 1, 2013 1) 235 1,351 1,274 315 306 0 19 0 3,500
Currency differences 3 68 3 4 0 0 0 0 78
Acquisitions/(divestitures) 0 2 0 0 0 0 0 0 2
Additions 0 1 0 0 0 0 0 0 1
Reclassification due to the presentation as assets held for sale 0 0 0 0 0 0 0 0 0
Impairment 0 0 0 0 0 0 0 0 0
Balance as of Sept. 30, 2014 1) 238 1,422 1,277 319 306 0 19 0 3,581
Currency differences 3 79 2 0 0 0 0 0 84
Acquisitions/(divestitures) 0 62 31 (11) 0 0 (13) 0 69
Additions 0 0 6 0 0 0 0 0 6
Reclassification due to the presentation as assets held for sale 0 0 0 0 0 0 0 0 0
Impairment 0 0 0 0 0 0 0 0 0
Balance as of Sept. 30, 2015 241 1,563 1,316 308 306 0 6 0 3,740
1) Figures have been adjusted due to the adoption of IFRS 11 (cf. Note 01). 2) Excluding goodwill of investments accounted for using the equity method
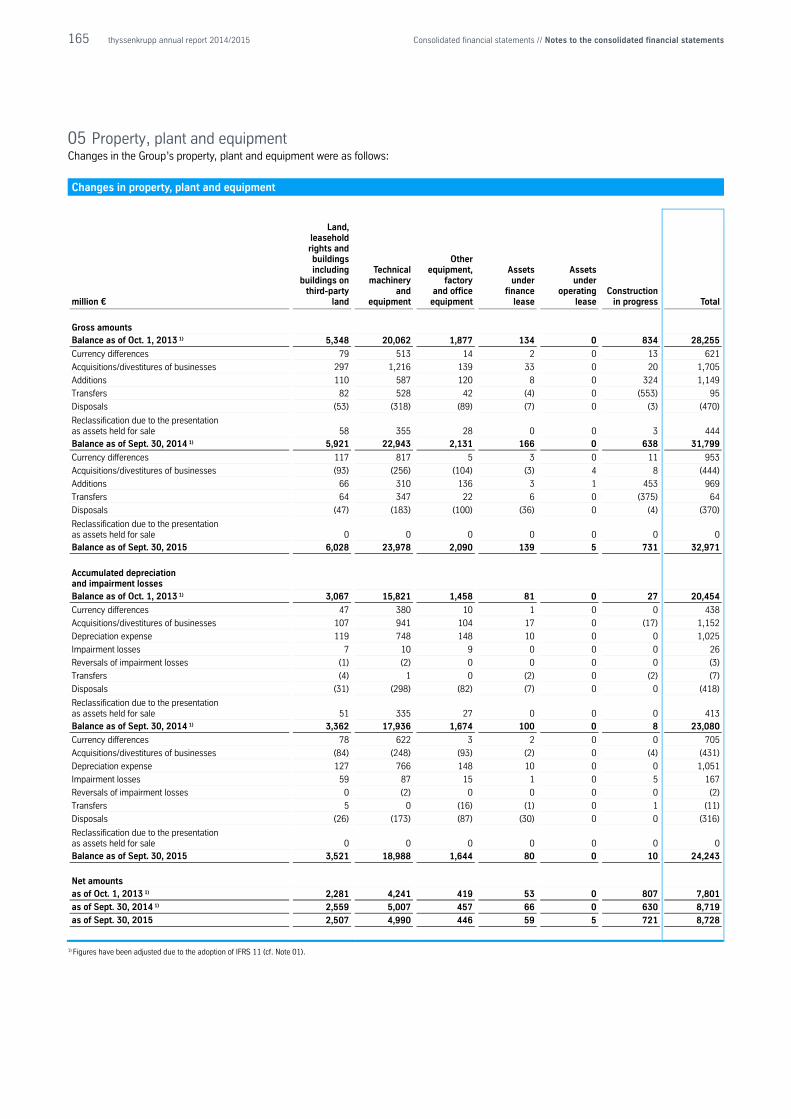
165 thyssenkrupp annual report 2014/2015 Consolidated financial statements // Notes to the consolidated financial statements
05 Property, plant and equipment Changes in the Group’s property, plant and equipment were as follows:
Changes in property, plant and equipment
million €
Land, leasehold rights and buildings including
buildings on third-party
land
Technical machinery
and equipment
Other equipment,
factory and office
equipment
Assets under
finance lease
Assets under
operating lease
Construction in progress Total
Gross amounts Balance as of Oct. 1, 2013 1) 5,348 20,062 1,877 134 0 834 28,255
Currency differences 79 513 14 2 0 13 621
Acquisitions/divestitures of businesses 297 1,216 139 33 0 20 1,705
Additions 110 587 120 8 0 324 1,149
Transfers 82 528 42 (4) 0 (553) 95
Disposals (53) (318) (89) (7) 0 (3) (470)
Reclassification due to the presentation as assets held for sale 58 355 28 0 0 3 444 Balance as of Sept. 30, 2014 1) 5,921 22,943 2,131 166 0 638 31,799
Currency differences 117 817 5 3 0 11 953
Acquisitions/divestitures of businesses (93) (256) (104) (3) 4 8 (444)
Additions 66 310 136 3 1 453 969
Transfers 64 347 22 6 0 (375) 64
Disposals (47) (183) (100) (36) 0 (4) (370)
Reclassification due to the presentation as assets held for sale 0 0 0 0 0 0 0 Balance as of Sept. 30, 2015 6,028 23,978 2,090 139 5 731 32,971
Accumulated depreciation and impairment losses Balance as of Oct. 1, 2013 1) 3,067 15,821 1,458 81 0 27 20,454
Currency differences 47 380 10 1 0 0 438
Acquisitions/divestitures of businesses 107 941 104 17 0 (17) 1,152
Depreciation expense 119 748 148 10 0 0 1,025
Impairment losses 7 10 9 0 0 0 26
Reversals of impairment losses (1) (2) 0 0 0 0 (3)
Transfers (4) 1 0 (2) 0 (2) (7)
Disposals (31) (298) (82) (7) 0 0 (418)
Reclassification due to the presentation as assets held for sale 51 335 27 0 0 0 413 Balance as of Sept. 30, 2014 1) 3,362 17,936 1,674 100 0 8 23,080
Currency differences 78 622 3 2 0 0 705
Acquisitions/divestitures of businesses (84) (248) (93) (2) 0 (4) (431)
Depreciation expense 127 766 148 10 0 0 1,051
Impairment losses 59 87 15 1 0 5 167
Reversals of impairment losses 0 (2) 0 0 0 0 (2)
Transfers 5 0 (16) (1) 0 1 (11)
Disposals (26) (173) (87) (30) 0 0 (316)
Reclassification due to the presentation as assets held for sale 0 0 0 0 0 0 0 Balance as of Sept. 30, 2015 3,521 18,988 1,644 80 0 10 24,243
Net amounts as of Oct. 1, 2013 1) 2,281 4,241 419 53 0 807 7,801
as of Sept. 30, 2014 1) 2,559 5,007 457 66 0 630 8,719
as of Sept. 30, 2015 2,507 4,990 446 59 5 721 8,728
1) Figures have been adjusted due to the adoption of IFRS 11 (cf. Note 01).
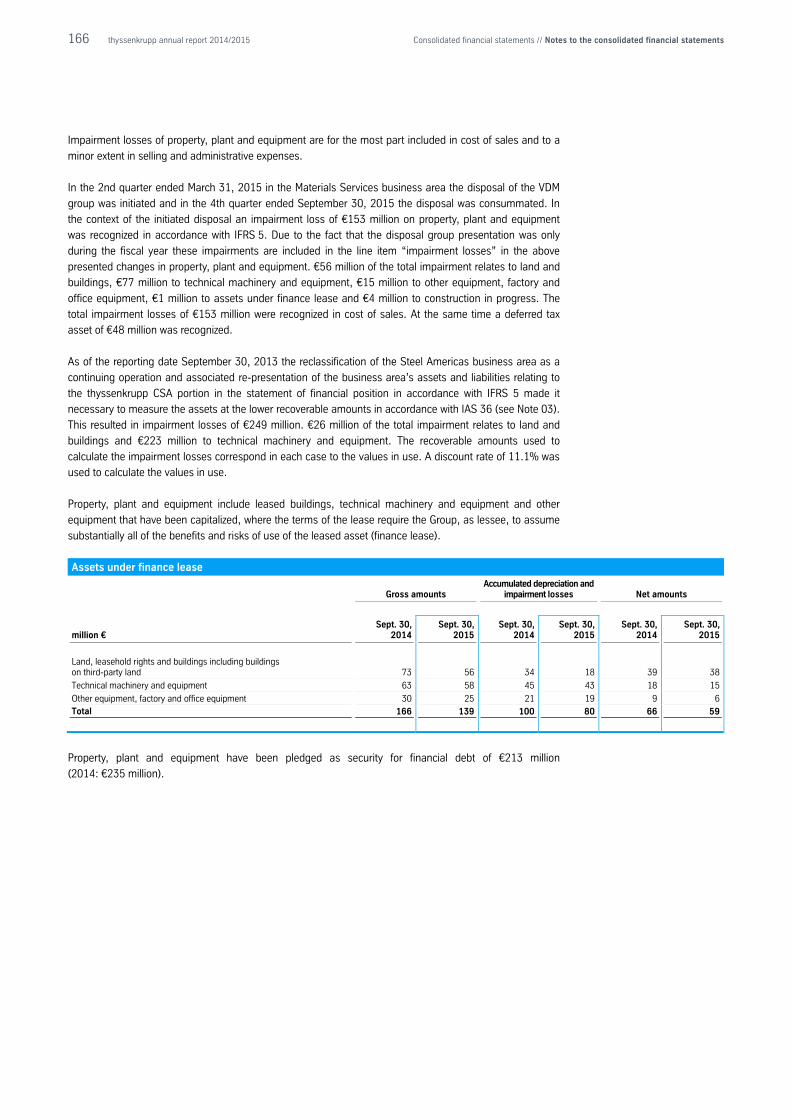
166 thyssenkrupp annual report 2014/2015 Consolidated financial statements // Notes to the consolidated financial statements
Impairment losses of property, plant and equipment are for the most part included in cost of sales and to a
minor extent in selling and administrative expenses.
In the 2nd quarter ended March 31, 2015 in the Materials Services business area the disposal of the VDM
group was initiated and in the 4th quarter ended September 30, 2015 the disposal was consummated. In
the context of the initiated disposal an impairment loss of €153 million on property, plant and equipment
was recognized in accordance with IFRS 5. Due to the fact that the disposal group presentation was only
during the fiscal year these impairments are included in the line item “impairment losses” in the above
presented changes in property, plant and equipment. €56 million of the total impairment relates to land and
buildings, €77 million to technical machinery and equipment, €15 million to other equipment, factory and
office equipment, €1 million to assets under finance lease and €4 million to construction in progress. The
total impairment losses of €153 million were recognized in cost of sales. At the same time a deferred tax
asset of €48 million was recognized.
As of the reporting date September 30, 2013 the reclassification of the Steel Americas business area as a
continuing operation and associated re-presentation of the business area’s assets and liabilities relating to
the thyssenkrupp CSA portion in the statement of financial position in accordance with IFRS 5 made it
necessary to measure the assets at the lower recoverable amounts in accordance with IAS 36 (see Note 03).
This resulted in impairment losses of €249 million. €26 million of the total impairment relates to land and
buildings and €223 million to technical machinery and equipment. The recoverable amounts used to
calculate the impairment losses correspond in each case to the values in use. A discount rate of 11.1% was
used to calculate the values in use.
Property, plant and equipment include leased buildings, technical machinery and equipment and other
equipment that have been capitalized, where the terms of the lease require the Group, as lessee, to assume
substantially all of the benefits and risks of use of the leased asset (finance lease).
Assets under finance lease
Gross amounts Accumulated depreciation and
impairment losses Net amounts
million € Sept. 30,
2014 Sept. 30,
2015 Sept. 30,
2014 Sept. 30,
2015 Sept. 30,
2014 Sept. 30,
2015
Land, leasehold rights and buildings including buildings on third-party land 73 56 34 18 39 38
Technical machinery and equipment 63 58 45 43 18 15
Other equipment, factory and office equipment 30 25 21 19 9 6 Total 166 139 100 80 66 59
Property, plant and equipment have been pledged as security for financial debt of €213 million
(2014: €235 million).
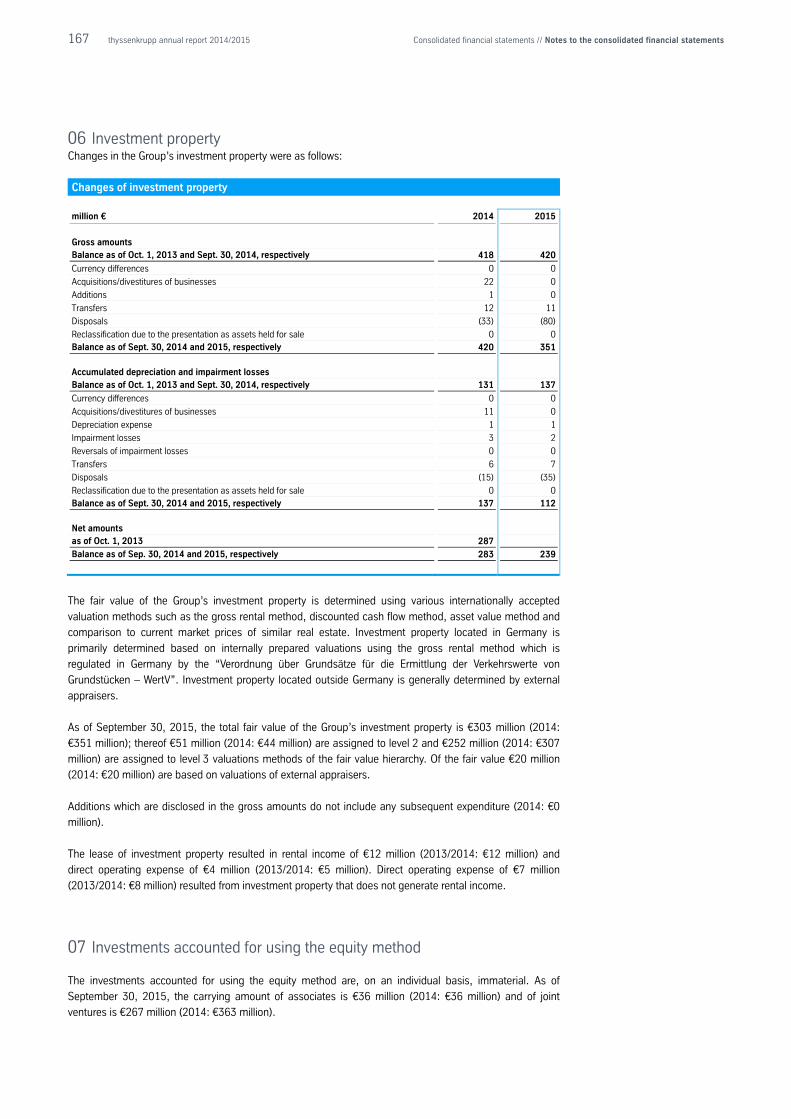
167 thyssenkrupp annual report 2014/2015 Consolidated financial statements // Notes to the consolidated financial statements
06 Investment property Changes in the Group’s investment property were as follows:
Changes of investment property
million € 2014 2015
Gross amounts Balance as of Oct. 1, 2013 and Sept. 30, 2014, respectively 418 420
Currency differences 0 0
Acquisitions/divestitures of businesses 22 0
Additions 1 0
Transfers 12 11
Disposals (33) (80)
Reclassification due to the presentation as assets held for sale 0 0 Balance as of Sept. 30, 2014 and 2015, respectively 420 351
Accumulated depreciation and impairment losses
Balance as of Oct. 1, 2013 and Sept. 30, 2014, respectively 131 137
Currency differences 0 0
Acquisitions/divestitures of businesses 11 0
Depreciation expense 1 1
Impairment losses 3 2
Reversals of impairment losses 0 0
Transfers 6 7
Disposals (15) (35)
Reclassification due to the presentation as assets held for sale 0 0
Balance as of Sept. 30, 2014 and 2015, respectively 137 112
Net amounts as of Oct. 1, 2013 287
Balance as of Sep. 30, 2014 and 2015, respectively 283 239
The fair value of the Group’s investment property is determined using various internationally accepted
valuation methods such as the gross rental method, discounted cash flow method, asset value method and
comparison to current market prices of similar real estate. Investment property located in Germany is
primarily determined based on internally prepared valuations using the gross rental method which is
regulated in Germany by the “Verordnung über Grundsätze für die Ermittlung der Verkehrswerte von
Grundstücken – WertV”. Investment property located outside Germany is generally determined by external
appraisers.
As of September 30, 2015, the total fair value of the Group’s investment property is €303 million (2014:
€351 million); thereof €51 million (2014: €44 million) are assigned to level 2 and €252 million (2014: €307
million) are assigned to level 3 valuations methods of the fair value hierarchy. Of the fair value €20 million
(2014: €20 million) are based on valuations of external appraisers.
Additions which are disclosed in the gross amounts do not include any subsequent expenditure (2014: €0
million).
The lease of investment property resulted in rental income of €12 million (2013/2014: €12 million) and
direct operating expense of €4 million (2013/2014: €5 million). Direct operating expense of €7 million
(2013/2014: €8 million) resulted from investment property that does not generate rental income.
07 Investments accounted for using the equity method
The investments accounted for using the equity method are, on an individual basis, immaterial. As of
September 30, 2015, the carrying amount of associates is €36 million (2014: €36 million) and of joint
ventures is €267 million (2014: €363 million).
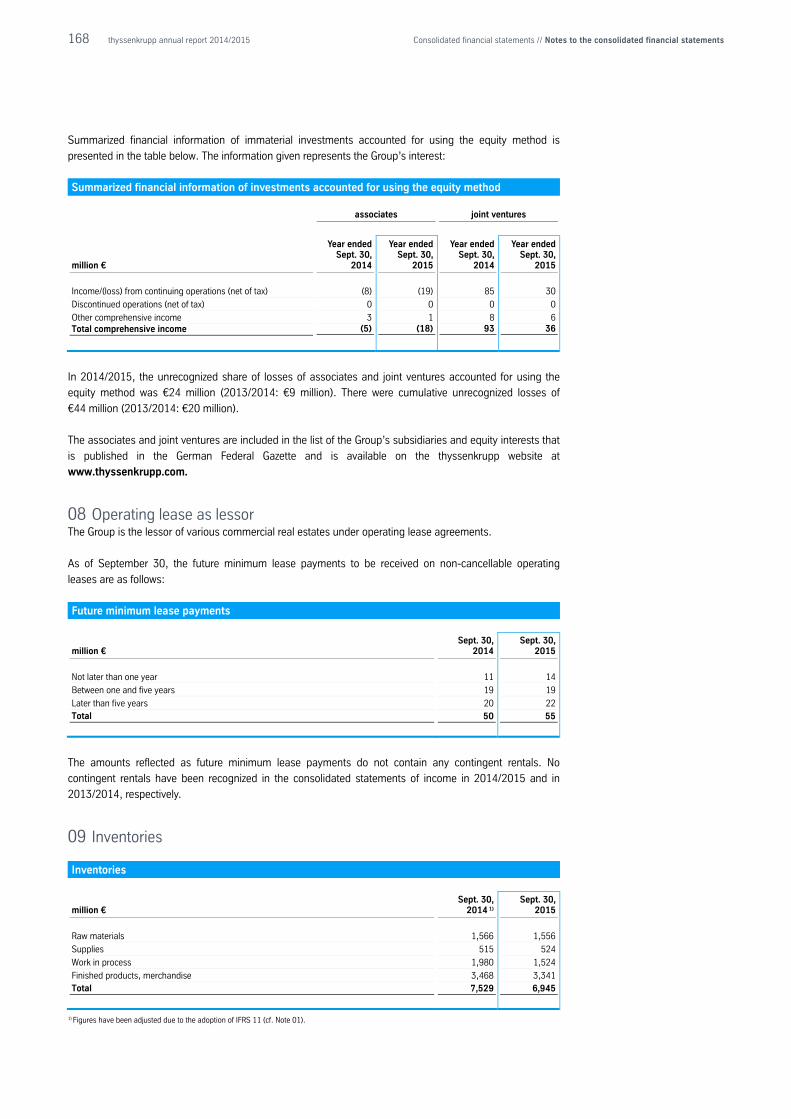
168 thyssenkrupp annual report 2014/2015 Consolidated financial statements // Notes to the consolidated financial statements
Summarized financial information of immaterial investments accounted for using the equity method is
presented in the table below. The information given represents the Group’s interest:
Summarized financial information of investments accounted for using the equity method
associates joint ventures
million €
Year ended Sept. 30,
2014
Year ended Sept. 30,
2015
Year ended Sept. 30,
2014
Year ended Sept. 30,
2015
Income/(loss) from continuing operations (net of tax) (8) (19) 85 30
Discontinued operations (net of tax) 0 0 0 0
Other comprehensive income 3 1 8 6 Total comprehensive income (5) (18) 93 36
In 2014/2015, the unrecognized share of losses of associates and joint ventures accounted for using the
equity method was €24 million (2013/2014: €9 million). There were cumulative unrecognized losses of
€44 million (2013/2014: €20 million).
The associates and joint ventures are included in the list of the Group’s subsidiaries and equity interests that
is published in the German Federal Gazette and is available on the thyssenkrupp website at
www.thyssenkrupp.com.
08 Operating lease as lessor The Group is the lessor of various commercial real estates under operating lease agreements.
As of September 30, the future minimum lease payments to be received on non-cancellable operating
leases are as follows:
Future minimum lease payments
million € Sept. 30,
2014 Sept. 30,
2015
Not later than one year 11 14
Between one and five years 19 19
Later than five years 20 22 Total 50 55
The amounts reflected as future minimum lease payments do not contain any contingent rentals. No
contingent rentals have been recognized in the consolidated statements of income in 2014/2015 and in
2013/2014, respectively.
09 Inventories
Inventories
million € Sept. 30,
2014 1) Sept. 30,
2015
Raw materials 1,566 1,556
Supplies 515 524
Work in process 1,980 1,524
Finished products, merchandise 3,468 3,341 Total 7,529 6,945
1) Figures have been adjusted due to the adoption of IFRS 11 (cf. Note 01).
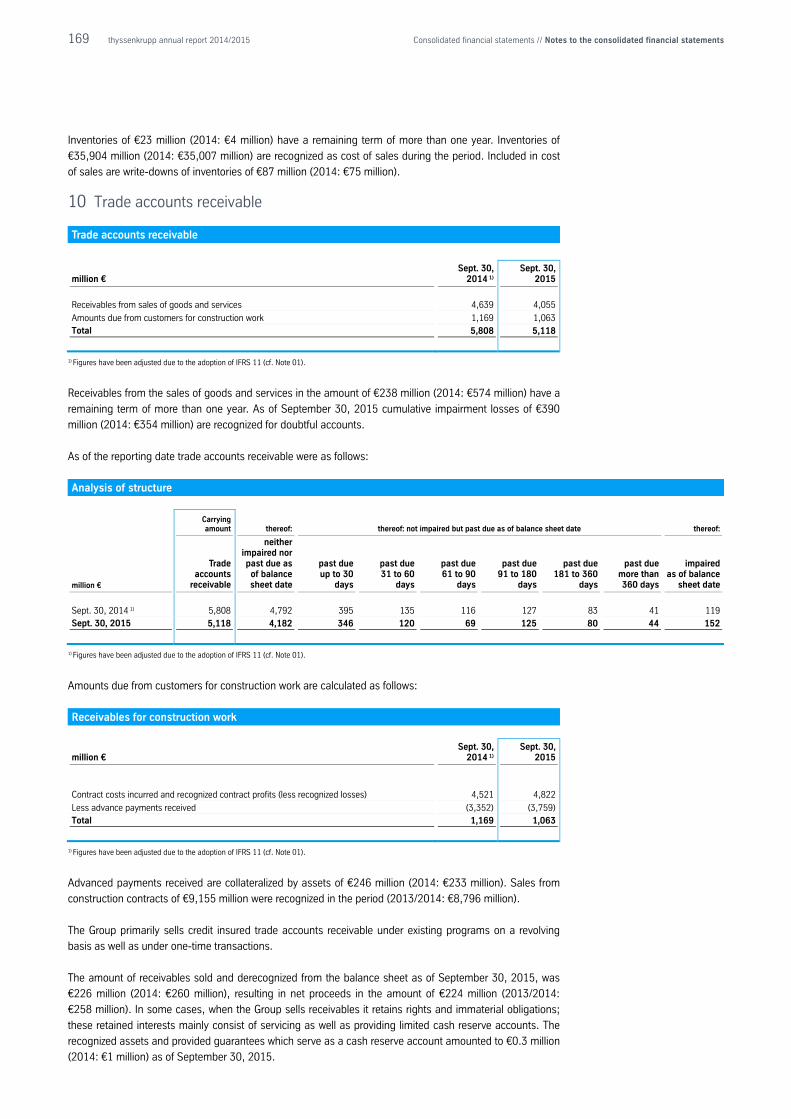
169 thyssenkrupp annual report 2014/2015 Consolidated financial statements // Notes to the consolidated financial statements
Inventories of €23 million (2014: €4 million) have a remaining term of more than one year. Inventories of
€35,904 million (2014: €35,007 million) are recognized as cost of sales during the period. Included in cost
of sales are write-downs of inventories of €87 million (2014: €75 million).
10 Trade accounts receivable Trade accounts receivable
million € Sept. 30,
2014 1) Sept. 30,
2015
Receivables from sales of goods and services 4,639 4,055
Amounts due from customers for construction work 1,169 1,063 Total 5,808 5,118
1) Figures have been adjusted due to the adoption of IFRS 11 (cf. Note 01).
Receivables from the sales of goods and services in the amount of €238 million (2014: €574 million) have a
remaining term of more than one year. As of September 30, 2015 cumulative impairment losses of €390
million (2014: €354 million) are recognized for doubtful accounts.
As of the reporting date trade accounts receivable were as follows:
Analysis of structure
Carrying amount thereof: thereof: not impaired but past due as of balance sheet date thereof:
million €
Trade accounts
receivable
neither impaired nor past due as
of balance sheet date
past due up to 30
days
past due 31 to 60
days
past due 61 to 90
days
past due 91 to 180
days
past due 181 to 360
days
past due more than 360 days
impaired as of balance
sheet date
Sept. 30, 2014 1) 5,808 4,792 395 135 116 127 83 41 119 Sept. 30, 2015 5,118 4,182 346 120 69 125 80 44 152
1) Figures have been adjusted due to the adoption of IFRS 11 (cf. Note 01).
Amounts due from customers for construction work are calculated as follows:
Receivables for construction work
million € Sept. 30,
2014 1) Sept. 30,
2015
Contract costs incurred and recognized contract profits (less recognized losses) 4,521 4,822
Less advance payments received (3,352) (3,759) Total 1,169 1,063
1) Figures have been adjusted due to the adoption of IFRS 11 (cf. Note 01).
Advanced payments received are collateralized by assets of €246 million (2014: €233 million). Sales from
construction contracts of €9,155 million were recognized in the period (2013/2014: €8,796 million).
The Group primarily sells credit insured trade accounts receivable under existing programs on a revolving
basis as well as under one-time transactions.
The amount of receivables sold and derecognized from the balance sheet as of September 30, 2015, was
€226 million (2014: €260 million), resulting in net proceeds in the amount of €224 million (2013/2014:
€258 million). In some cases, when the Group sells receivables it retains rights and immaterial obligations;
these retained interests mainly consist of servicing as well as providing limited cash reserve accounts. The
recognized assets and provided guarantees which serve as a cash reserve account amounted to €0.3 million
(2014: €1 million) as of September 30, 2015.
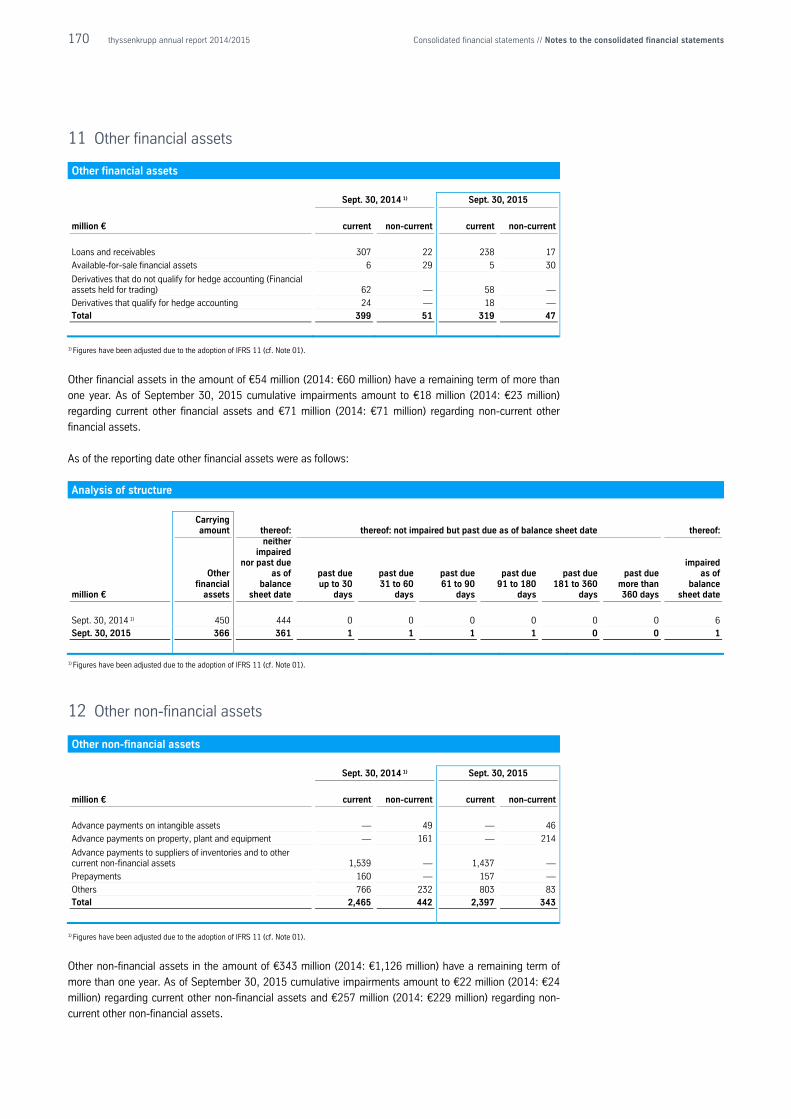
170 thyssenkrupp annual report 2014/2015 Consolidated financial statements // Notes to the consolidated financial statements
11 Other financial assets
Other financial assets
Sept. 30, 2014 1) Sept. 30, 2015
million € current non-current current non-current
Loans and receivables 307 22 238 17
Available-for-sale financial assets 6 29 5 30
Derivatives that do not qualify for hedge accounting (Financial assets held for trading) 62 — 58 —
Derivatives that qualify for hedge accounting 24 — 18 — Total 399 51 319 47
1) Figures have been adjusted due to the adoption of IFRS 11 (cf. Note 01).
Other financial assets in the amount of €54 million (2014: €60 million) have a remaining term of more than
one year. As of September 30, 2015 cumulative impairments amount to €18 million (2014: €23 million)
regarding current other financial assets and €71 million (2014: €71 million) regarding non-current other
financial assets.
As of the reporting date other financial assets were as follows:
Analysis of structure
Carrying amount thereof: thereof: not impaired but past due as of balance sheet date thereof:
million €
Other financial
assets
neither impaired
nor past due as of
balance sheet date
past due up to 30
days
past due 31 to 60
days
past due 61 to 90
days
past due 91 to 180
days
past due 181 to 360
days
past due more than 360 days
impaired as of
balance sheet date
Sept. 30, 2014 1) 450 444 0 0 0 0 0 0 6
Sept. 30, 2015 366 361 1 1 1 1 0 0 1
1) Figures have been adjusted due to the adoption of IFRS 11 (cf. Note 01).
12 Other non-financial assets
Other non-financial assets
Sept. 30, 2014 1) Sept. 30, 2015
million € current non-current current non-current
Advance payments on intangible assets — 49 — 46
Advance payments on property, plant and equipment — 161 — 214
Advance payments to suppliers of inventories and to other current non-financial assets 1,539 — 1,437 —
Prepayments 160 — 157 —
Others 766 232 803 83 Total 2,465 442 2,397 343
1) Figures have been adjusted due to the adoption of IFRS 11 (cf. Note 01).
Other non-financial assets in the amount of €343 million (2014: €1,126 million) have a remaining term of
more than one year. As of September 30, 2015 cumulative impairments amount to €22 million (2014: €24
million) regarding current other non-financial assets and €257 million (2014: €229 million) regarding non-
current other non-financial assets.
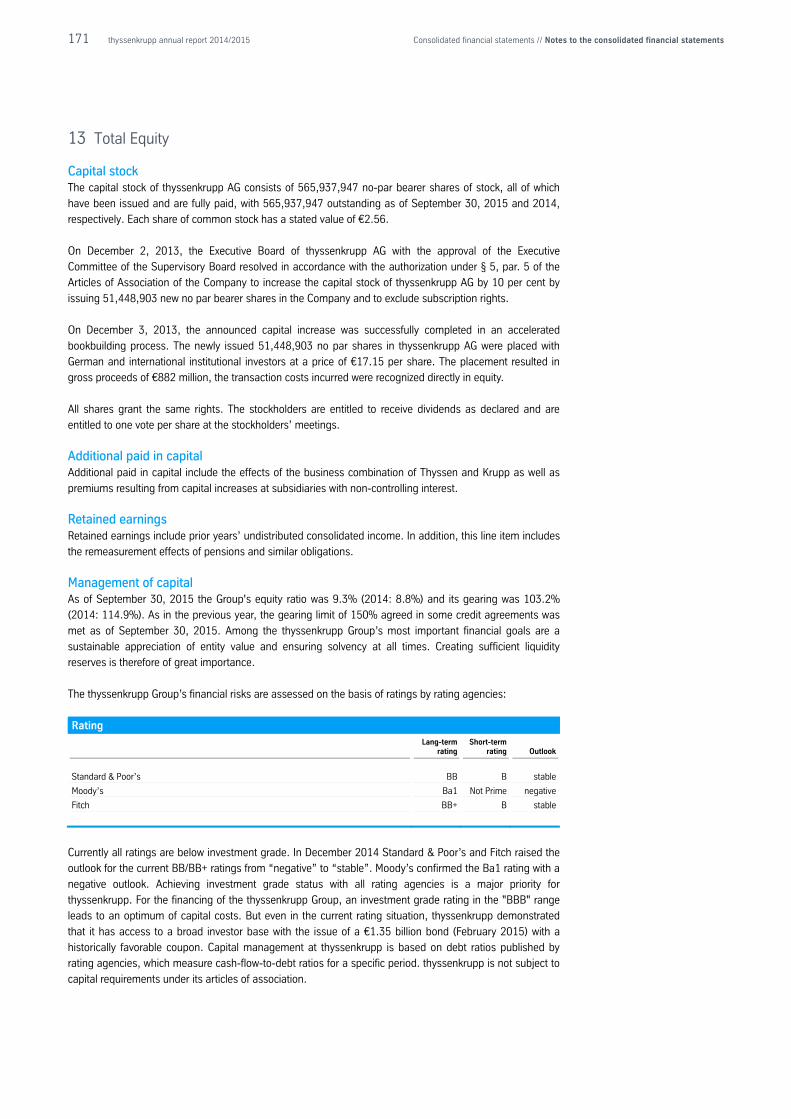
171 thyssenkrupp annual report 2014/2015 Consolidated financial statements // Notes to the consolidated financial statements
13 Total Equity Capital stock The capital stock of thyssenkrupp AG consists of 565,937,947 no-par bearer shares of stock, all of which
have been issued and are fully paid, with 565,937,947 outstanding as of September 30, 2015 and 2014,
respectively. Each share of common stock has a stated value of €2.56.
On December 2, 2013, the Executive Board of thyssenkrupp AG with the approval of the Executive
Committee of the Supervisory Board resolved in accordance with the authorization under § 5, par. 5 of the
Articles of Association of the Company to increase the capital stock of thyssenkrupp AG by 10 per cent by
issuing 51,448,903 new no par bearer shares in the Company and to exclude subscription rights.
On December 3, 2013, the announced capital increase was successfully completed in an accelerated
bookbuilding process. The newly issued 51,448,903 no par shares in thyssenkrupp AG were placed with
German and international institutional investors at a price of €17.15 per share. The placement resulted in
gross proceeds of €882 million, the transaction costs incurred were recognized directly in equity.
All shares grant the same rights. The stockholders are entitled to receive dividends as declared and are
entitled to one vote per share at the stockholders’ meetings.
Additional paid in capital Additional paid in capital include the effects of the business combination of Thyssen and Krupp as well as
premiums resulting from capital increases at subsidiaries with non-controlling interest.
Retained earnings Retained earnings include prior years’ undistributed consolidated income. In addition, this line item includes
the remeasurement effects of pensions and similar obligations.
Management of capital As of September 30, 2015 the Group's equity ratio was 9.3% (2014: 8.8%) and its gearing was 103.2%
(2014: 114.9%). As in the previous year, the gearing limit of 150% agreed in some credit agreements was
met as of September 30, 2015. Among the thyssenkrupp Group’s most important financial goals are a
sustainable appreciation of entity value and ensuring solvency at all times. Creating sufficient liquidity
reserves is therefore of great importance.
The thyssenkrupp Group’s financial risks are assessed on the basis of ratings by rating agencies:
Rating
Lang-term
rating Short-term
rating Outlook
Standard & Poor’s BB B stable
Moody’s Ba1 Not Prime negative
Fitch BB+ B stable
Currently all ratings are below investment grade. In December 2014 Standard & Poor’s and Fitch raised the
outlook for the current BB/BB+ ratings from “negative” to “stable”. Moody’s confirmed the Ba1 rating with a
negative outlook. Achieving investment grade status with all rating agencies is a major priority for
thyssenkrupp. For the financing of the thyssenkrupp Group, an investment grade rating in the "BBB" range
leads to an optimum of capital costs. But even in the current rating situation, thyssenkrupp demonstrated
that it has access to a broad investor base with the issue of a €1.35 billion bond (February 2015) with a
historically favorable coupon. Capital management at thyssenkrupp is based on debt ratios published by
rating agencies, which measure cash-flow-to-debt ratios for a specific period. thyssenkrupp is not subject to
capital requirements under its articles of association.
172 thyssenkrupp annual report 2014/2015 Consolidated financial statements // Notes to the consolidated financial statements
Authorizations Through resolution of the Annual General Meeting of January 30, 2015, the Executive Board of
thyssenkrupp AG is authorized until January 29, 2020 to acquire treasury shares up to a total of 10% of the
capital stock at the time of the resolution or – if lower – at the time the authorization is exercised and use
them for the purposes expressly stated in the authorization resolution and for all legally permissible
purposes. The Executive Board is authorized under certain circumstances to exclude shareholders’ tender
rights when purchasing treasury shares or subscription rights when using treasury shares. The resolution
also includes authorization to use equity derivatives (put or call options or a combination of both) in
connection with the purchase of treasury shares and to exclude tender and subscription rights. The
Supervisory Board of thyssenkrupp AG may determine that measures of the Executive Board under these
shareholder resolutions are subject to its approval.
The following authorizations were issued by resolution of the Annual General Meeting on January 17, 2014:
In revocation of the partly used authorization to increase the capital stock issued by the Annual General
Meeting on January 20, 2012, the Executive Board was authorized, with the approval of the Supervisory
Board, to increase the capital stock on one or more occasions on or before January 16, 2019 by up to €370
million by issuing up to 144,531,250 new no-par bearer shares in exchange for cash and/or contributions in
kind (authorized capital). The shareholders are in principle entitled to subscription rights. However, the
Executive Board is authorized, with the approval of the Supervisory Board, to exclude shareholder
subscription rights in certain cases; the option of excluding subscription rights is limited to 20% of the
capital stock. § 5, par. 5 of the Articles of Association of thyssenkrupp AG has been reworded accordingly.
The Executive Board was authorized, with the approval of the Supervisory Board, to issue once or several
times bearer of registered warrant and/or convertible bonds in the total par value of up to €2 billion with or
without limited terms, and to grant to or impose on the holders or creditors of convertible bonds conversion
rights or obligations for no-par bearer shares of thyssenkrupp AG with a total share of the capital stock up to
€250 million in accordance with the conditions of these bonds. The authorization is valid until January 16,
2019. The Executive Board is authorized, subject to the approval of the Supervisory Board, to exclude
shareholders’ subscription rights in certain cases.
Furthermore, the Executive Board was authorized to conditionally increase the capital stock by up to €250
million by issue of up to 97,626,250 new no-par bearer shares (conditional capital). The conditional capital
increase serves the granting of no-par bearer shares upon exercise of conversion or option rights, upon
fulfilment of corresponding conversion obligations or upon exercise of an option of the thyssenkrupp AG to
grant no-par shares of the thyssenkrupp AG in whole or in part instead of payment of the cash amount due
to the holders or creditors of convertible or warrant bonds that are issued by thyssenkrupp AG or a
subordinate Group company against cash contribution on or before January 16, 2019 as a result of the
authorization resolution passed by the Annual General Meeting on January 17, 2014. New shares are issued
at the option or conversion price to be determined in each case according to the above mentioned
authorization resolution. A new paragraph 6 has been inserted in § 5 of the Articles of Association of
thyssenkrupp AG.
Dividend The Executive Board and Supervisory Board have agreed to propose to the Annual General Meeting a
dividend in the amount of €0.15 per share entitled to dividend to be distributed from unappropriated net
income of the stand-alone entity thyssenkrupp AG for fiscal year 2014/2015 as determined in conformity
with the principles of the German Commercial Code (HGB) and to carry forward the remaining net income.
This would result in a dividend payout of €85 million in total. A dividend of €0.11 was paid for fiscal year
2013/2014 (2012/2013: 0).
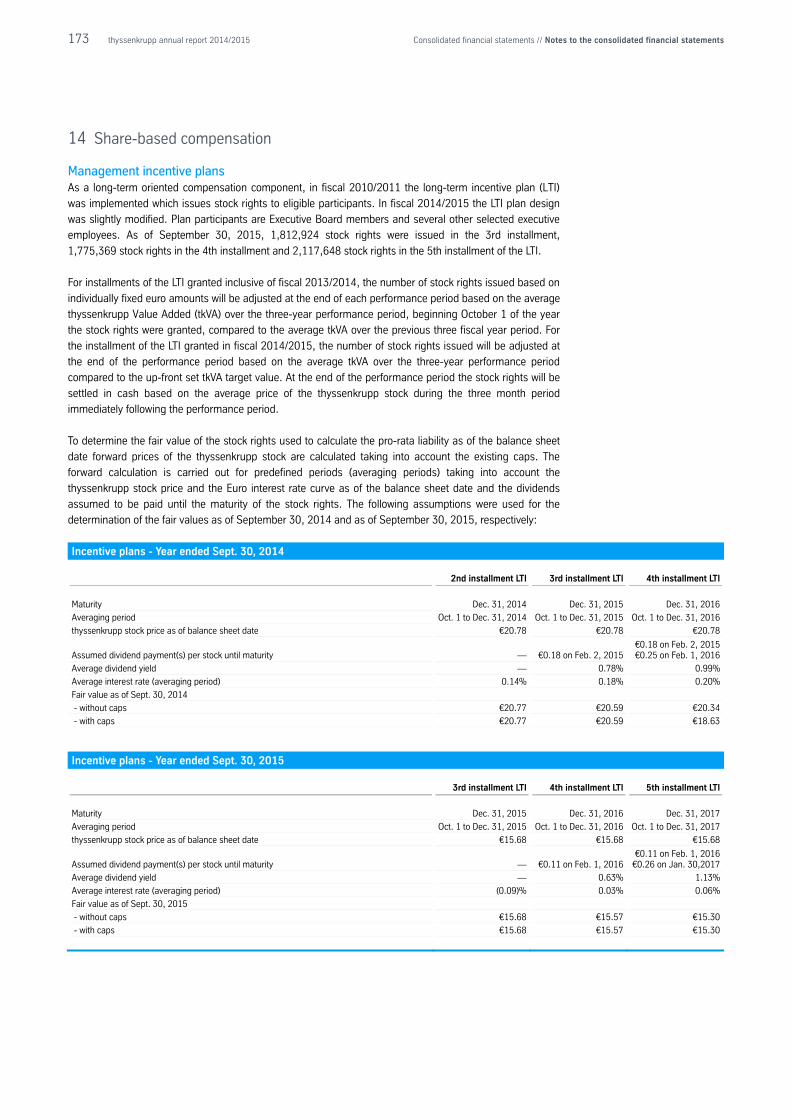
173 thyssenkrupp annual report 2014/2015 Consolidated financial statements // Notes to the consolidated financial statements
14 Share-based compensation
Management incentive plans As a long-term oriented compensation component, in fiscal 2010/2011 the long-term incentive plan (LTI)
was implemented which issues stock rights to eligible participants. In fiscal 2014/2015 the LTI plan design
was slightly modified. Plan participants are Executive Board members and several other selected executive
employees. As of September 30, 2015, 1,812,924 stock rights were issued in the 3rd installment,
1,775,369 stock rights in the 4th installment and 2,117,648 stock rights in the 5th installment of the LTI.
For installments of the LTI granted inclusive of fiscal 2013/2014, the number of stock rights issued based on
individually fixed euro amounts will be adjusted at the end of each performance period based on the average
thyssenkrupp Value Added (tkVA) over the three-year performance period, beginning October 1 of the year
the stock rights were granted, compared to the average tkVA over the previous three fiscal year period. For
the installment of the LTI granted in fiscal 2014/2015, the number of stock rights issued will be adjusted at
the end of the performance period based on the average tkVA over the three-year performance period
compared to the up-front set tkVA target value. At the end of the performance period the stock rights will be
settled in cash based on the average price of the thyssenkrupp stock during the three month period
immediately following the performance period.
To determine the fair value of the stock rights used to calculate the pro-rata liability as of the balance sheet
date forward prices of the thyssenkrupp stock are calculated taking into account the existing caps. The
forward calculation is carried out for predefined periods (averaging periods) taking into account the
thyssenkrupp stock price and the Euro interest rate curve as of the balance sheet date and the dividends
assumed to be paid until the maturity of the stock rights. The following assumptions were used for the
determination of the fair values as of September 30, 2014 and as of September 30, 2015, respectively:
Incentive plans - Year ended Sept. 30, 2014
2nd installment LTI 3rd installment LTI 4th installment LTI
Maturity Dec. 31, 2014 Dec. 31, 2015 Dec. 31, 2016
Averaging period Oct. 1 to Dec. 31, 2014 Oct. 1 to Dec. 31, 2015 Oct. 1 to Dec. 31, 2016
thyssenkrupp stock price as of balance sheet date €20.78 €20.78 €20.78
Assumed dividend payment(s) per stock until maturity — €0.18 on Feb. 2, 2015 €0.18 on Feb. 2, 2015 €0.25 on Feb. 1, 2016
Average dividend yield — 0.78% 0.99%
Average interest rate (averaging period) 0.14% 0.18% 0.20%
Fair value as of Sept. 30, 2014
- without caps €20.77 €20.59 €20.34
- with caps €20.77 €20.59 €18.63
Incentive plans - Year ended Sept. 30, 2015
3rd installment LTI 4th installment LTI 5th installment LTI
Maturity Dec. 31, 2015 Dec. 31, 2016 Dec. 31, 2017
Averaging period Oct. 1 to Dec. 31, 2015 Oct. 1 to Dec. 31, 2016 Oct. 1 to Dec. 31, 2017
thyssenkrupp stock price as of balance sheet date €15.68 €15.68 €15.68
Assumed dividend payment(s) per stock until maturity — €0.11 on Feb. 1, 2016 €0.11 on Feb. 1, 2016
€0.26 on Jan. 30,2017
Average dividend yield — 0.63% 1.13%
Average interest rate (averaging period) (0.09)% 0.03% 0.06%
Fair value as of Sept. 30, 2015
- without caps €15.68 €15.57 €15.30
- with caps €15.68 €15.57 €15.30
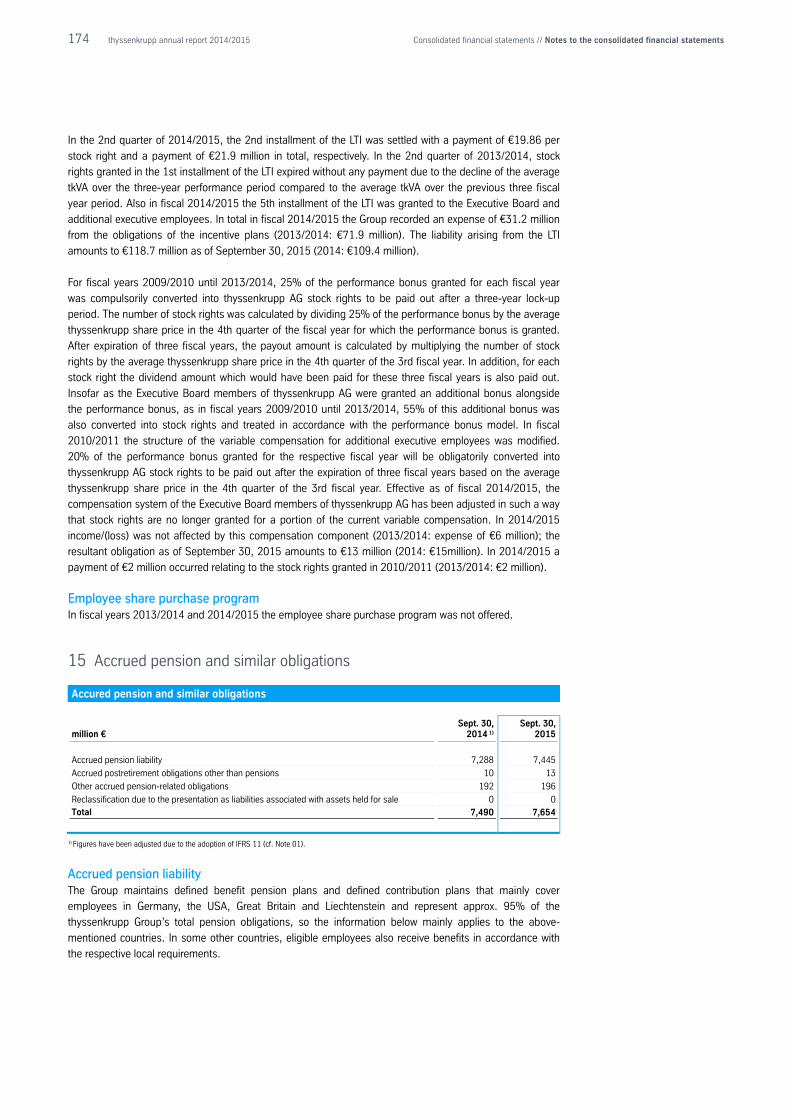
174 thyssenkrupp annual report 2014/2015 Consolidated financial statements // Notes to the consolidated financial statements
In the 2nd quarter of 2014/2015, the 2nd installment of the LTI was settled with a payment of €19.86 per
stock right and a payment of €21.9 million in total, respectively. In the 2nd quarter of 2013/2014, stock
rights granted in the 1st installment of the LTI expired without any payment due to the decline of the average
tkVA over the three-year performance period compared to the average tkVA over the previous three fiscal
year period. Also in fiscal 2014/2015 the 5th installment of the LTI was granted to the Executive Board and
additional executive employees. In total in fiscal 2014/2015 the Group recorded an expense of €31.2 million
from the obligations of the incentive plans (2013/2014: €71.9 million). The liability arising from the LTI
amounts to €118.7 million as of September 30, 2015 (2014: €109.4 million).
For fiscal years 2009/2010 until 2013/2014, 25% of the performance bonus granted for each fiscal year
was compulsorily converted into thyssenkrupp AG stock rights to be paid out after a three-year lock-up
period. The number of stock rights was calculated by dividing 25% of the performance bonus by the average
thyssenkrupp share price in the 4th quarter of the fiscal year for which the performance bonus is granted.
After expiration of three fiscal years, the payout amount is calculated by multiplying the number of stock
rights by the average thyssenkrupp share price in the 4th quarter of the 3rd fiscal year. In addition, for each
stock right the dividend amount which would have been paid for these three fiscal years is also paid out.
Insofar as the Executive Board members of thyssenkrupp AG were granted an additional bonus alongside
the performance bonus, as in fiscal years 2009/2010 until 2013/2014, 55% of this additional bonus was
also converted into stock rights and treated in accordance with the performance bonus model. In fiscal
2010/2011 the structure of the variable compensation for additional executive employees was modified.
20% of the performance bonus granted for the respective fiscal year will be obligatorily converted into
thyssenkrupp AG stock rights to be paid out after the expiration of three fiscal years based on the average
thyssenkrupp share price in the 4th quarter of the 3rd fiscal year. Effective as of fiscal 2014/2015, the
compensation system of the Executive Board members of thyssenkrupp AG has been adjusted in such a way
that stock rights are no longer granted for a portion of the current variable compensation. In 2014/2015
income/(loss) was not affected by this compensation component (2013/2014: expense of €6 million); the
resultant obligation as of September 30, 2015 amounts to €13 million (2014: €15million). In 2014/2015 a
payment of €2 million occurred relating to the stock rights granted in 2010/2011 (2013/2014: €2 million).
Employee share purchase program In fiscal years 2013/2014 and 2014/2015 the employee share purchase program was not offered.
15 Accrued pension and similar obligations
Accured pension and similar obligations
million € Sept. 30,
2014 1) Sept. 30,
2015
Accrued pension liability 7,288 7,445
Accrued postretirement obligations other than pensions 10 13
Other accrued pension-related obligations 192 196
Reclassification due to the presentation as liabilities associated with assets held for sale 0 0 Total 7,490 7,654
1) Figures have been adjusted due to the adoption of IFRS 11 (cf. Note 01).
Accrued pension liability The Group maintains defined benefit pension plans and defined contribution plans that mainly cover
employees in Germany, the USA, Great Britain and Liechtenstein and represent approx. 95% of the
thyssenkrupp Group’s total pension obligations, so the information below mainly applies to the above-
mentioned countries. In some other countries, eligible employees also receive benefits in accordance with
the respective local requirements.
175 thyssenkrupp annual report 2014/2015 Consolidated financial statements // Notes to the consolidated financial statements
For historical reasons a wide variety of voluntary defined benefit pension plans (DB plans) exist in Germany
based on different risk profiles. As a rule they provide benefits in the event of invalidity and/or death or on
reaching a specified age limit, and are based exclusively on individual or collective arrangements. In
Germany there is no legal requirement to provide employer-funded pension benefits.
In the past the mostly employer-funded pension plans in Germany generally provided a life-long pension
based on defined benefits. For the most part benefits were defined according to an employee’s length of
service and final pay or based on career-average earnings or a fixed amount. In addition benefits were
indexed to inflation. Because such pension plans were partly closed many years ago, they mainly cover
terminated employees with vested pension rights and pensioners. For new employees coming into the
Group, these pension plans are no longer available.
In contrast, the pension plans introduced at thyssenkrupp in Germany at the end of the 1990s and start of
the new millennium and currently open to new employees are defined-contribution pension plans with a risk-
optimized payout form. Benefits are paid either as a lump-sum or in installments or in the form of a life-long
pension, though this is subject to a lower-risk fixed cost-of-living adjustment of 1% p.a. In addition, all
employees have the option of participating in defined-contribution deferred-compensation pension plans in
the form of direct insurance or direct pension commitments so that the employee bears a much greater
responsibility for making adequate provision for old age. The deferred compensation currently earns interest
at a rate of 4% or 6%. The risk relating to the amount of interest paid is contained by regular review and
adjustment of the interest rates and partial restriction of the maximum permissible deferred compensation
amounts.
There is no legal or regulatory minimum funding requirement for pension plans in Germany. To this extent
only a small share of the domestic DB plans at thyssenkrupp are covered by offsettable assets held in trust
by way of a Contractual Trust Arrangement (CTA). thyssenkrupp is therefore exposed to only a small
investment risk in this connection, which is accommodated through investment guidelines and a broad mix
and spread of asset categories. The low level of external funding for German pension plan obligations
reflects the objective of the CTA, which is not to fund the benefits in full but to secure only those benefits not
protected by the mutual pension guarantee association (Pensionssicherungsverein auf Gegenseitigkeit
(PSVaG)) in the event of insolvency.
Most of the defined contribution plans (DC plans) in Germany are in the form of employer- or employee-
funded direct insurance plans, but the share of these is immaterial in comparison with the defined benefit
plans.
The majority of Group companies outside Germany also provide pension plans for their employees. These
plans are in some cases based on statutory requirements or collective agreements, but in other cases they
are provided by the Group companies on a voluntary basis.
The range of benefits provided under the plans differs widely depending on local arrangements, extending
from DC plans to final-salary defined-benefit schemes with regular pension payment.
176 thyssenkrupp annual report 2014/2015 Consolidated financial statements // Notes to the consolidated financial statements
In the USA, hourly paid employees receive benefits based on years of service. Salaried employee benefits
are typically based on years of service and salary history. The main DB plans in the USA are frozen related to
future servicing, so the employees (with few exceptions, e.g. some collectively agreed employment
contracts) accrue benefits mainly under DC plans.
In Great Britain, employee benefits are based on years of service and an employee’s final salary before
retirement. In this country on a staffing policy view DB plans play a less important role today because all
current employees have been transitioned to DC plans over the past years. The risk from DB plans therefore
relates exclusively to the vested rights of terminated employees, which will be claimed at a later time, and to
current pension benefit payments.
In Liechtenstein there is in the broadest sense a statutory requirement to offer all employees in the
mandatory social insurance scheme a defined contribution pension plan, which is implemented in the form
of a company pension fund (Pensionskasse).
Partly due to legal minimum funding requirements, the pension plans outside Germany are funded to a
much greater extent by externally separated assets. Minimum funding requirements for employee pension
plans outside Germany are set out inter alia in the "Employee Retirement Income Security Act of 1974" in
conjunction with the "Pension Protection Act of 2006" in the USA, the "Pension Act 1995" in conjunction
with the "Pension Act 2004" in Great Britain, and the employee retirement benefits act "Gesetz über die
betriebliche Personalvorsorge (BPVG)" in Liechtenstein, which require for example full external funding of the
obligations or a financing under a capital funding system. For more information on the breakdown and
investment strategy for plan assets, please refer to the remarks on plan assets.
Material risks associated with the different types of pension plans include above all financial risks as well as
risks in the areas of inflation and biometrics.
Inflation risks which could lead to an increase in benefit obligations exist because some of the plans are
based on (final) salary and in some cases annual pension modules are directly linked to current salaries
(defined contribution plans). To this extent a rise in salaries above the salary/career trends assumed in the
valuation of the obligation would also require a direct increase in the provisions (past service effect in the
case of (final) salary pensions) or the future service cost (defined contribution plans).
In addition, further charges could result from the need for a cost-of-living adjustment in excess of the
assumed pension trend during the pension payment phase, which would lead to an immediate increase in
the provisions. A significant number of the pension plans in Germany are required by law to provide a cost-
of-living adjustment. A cost-of-living adjustment may also be required under (collective bargaining)
agreements or agreed on a voluntary/discretionary basis.
Biometric risks can result either from early benefit claims (risk of sudden changes to the balance sheet after
death or invalidity) or from underestimated life expectancies (longevity risk) and could likewise result in costs
to the company due to unexpected increases in provisions and early cash outflows.
Risks from changes to the discount rate are purely balance sheet-related, i.e. the provisions are adjusted
directly against equity without affecting income. Cash outflows are not affected.
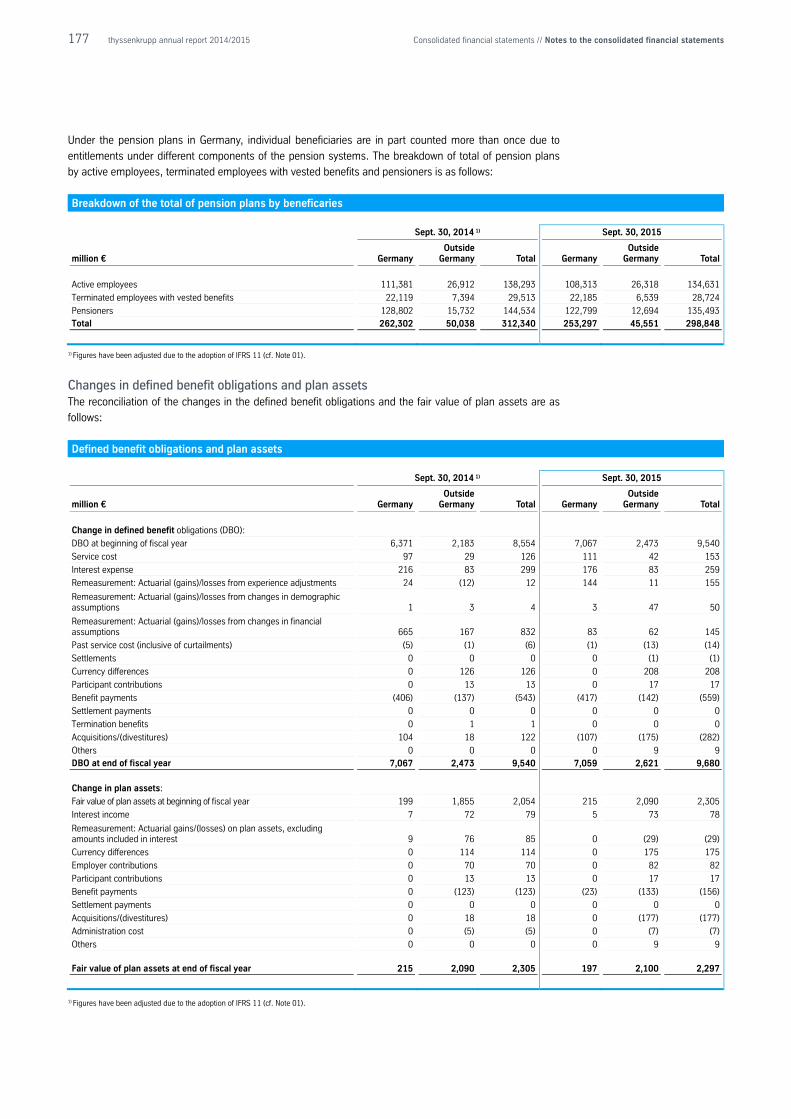
177 thyssenkrupp annual report 2014/2015 Consolidated financial statements // Notes to the consolidated financial statements
Under the pension plans in Germany, individual beneficiaries are in part counted more than once due to
entitlements under different components of the pension systems. The breakdown of total of pension plans
by active employees, terminated employees with vested benefits and pensioners is as follows:
Breakdown of the total of pension plans by beneficaries
Sept. 30, 2014 1) Sept. 30, 2015
million € Germany Outside
Germany Total Germany Outside
Germany Total
Active employees 111,381 26,912 138,293 108,313 26,318 134,631
Terminated employees with vested benefits 22,119 7,394 29,513 22,185 6,539 28,724
Pensioners 128,802 15,732 144,534 122,799 12,694 135,493 Total 262,302 50,038 312,340 253,297 45,551 298,848
1) Figures have been adjusted due to the adoption of IFRS 11 (cf. Note 01).
Changes in defined benefit obligations and plan assets The reconciliation of the changes in the defined benefit obligations and the fair value of plan assets are as
follows:
Defined benefit obligations and plan assets
Sept. 30, 2014 1) Sept. 30, 2015
million € Germany Outside
Germany Total Germany Outside
Germany Total
Change in defined benefit obligations (DBO):
DBO at beginning of fiscal year 6,371 2,183 8,554 7,067 2,473 9,540
Service cost 97 29 126 111 42 153
Interest expense 216 83 299 176 83 259
Remeasurement: Actuarial (gains)/losses from experience adjustments 24 (12) 12 144 11 155
Remeasurement: Actuarial (gains)/losses from changes in demographic assumptions 1 3 4 3 47 50
Remeasurement: Actuarial (gains)/losses from changes in financial assumptions 665 167 832 83 62 145
Past service cost (inclusive of curtailments) (5) (1) (6) (1) (13) (14)
Settlements 0 0 0 0 (1) (1)
Currency differences 0 126 126 0 208 208
Participant contributions 0 13 13 0 17 17
Benefit payments (406) (137) (543) (417) (142) (559)
Settlement payments 0 0 0 0 0 0
Termination benefits 0 1 1 0 0 0
Acquisitions/(divestitures) 104 18 122 (107) (175) (282)
Others 0 0 0 0 9 9 DBO at end of fiscal year 7,067 2,473 9,540 7,059 2,621 9,680
Change in plan assets:
Fair value of plan assets at beginning of fiscal year 199 1,855 2,054 215 2,090 2,305
Interest income 7 72 79 5 73 78
Remeasurement: Actuarial gains/(losses) on plan assets, excluding amounts included in interest 9 76 85 0 (29) (29)
Currency differences 0 114 114 0 175 175
Employer contributions 0 70 70 0 82 82
Participant contributions 0 13 13 0 17 17
Benefit payments 0 (123) (123) (23) (133) (156)
Settlement payments 0 0 0 0 0 0
Acquisitions/(divestitures) 0 18 18 0 (177) (177)
Administration cost 0 (5) (5) 0 (7) (7)
Others 0 0 0 0 9 9
Fair value of plan assets at end of fiscal year 215 2,090 2,305 197 2,100 2,297
1) Figures have been adjusted due to the adoption of IFRS 11 (cf. Note 01).
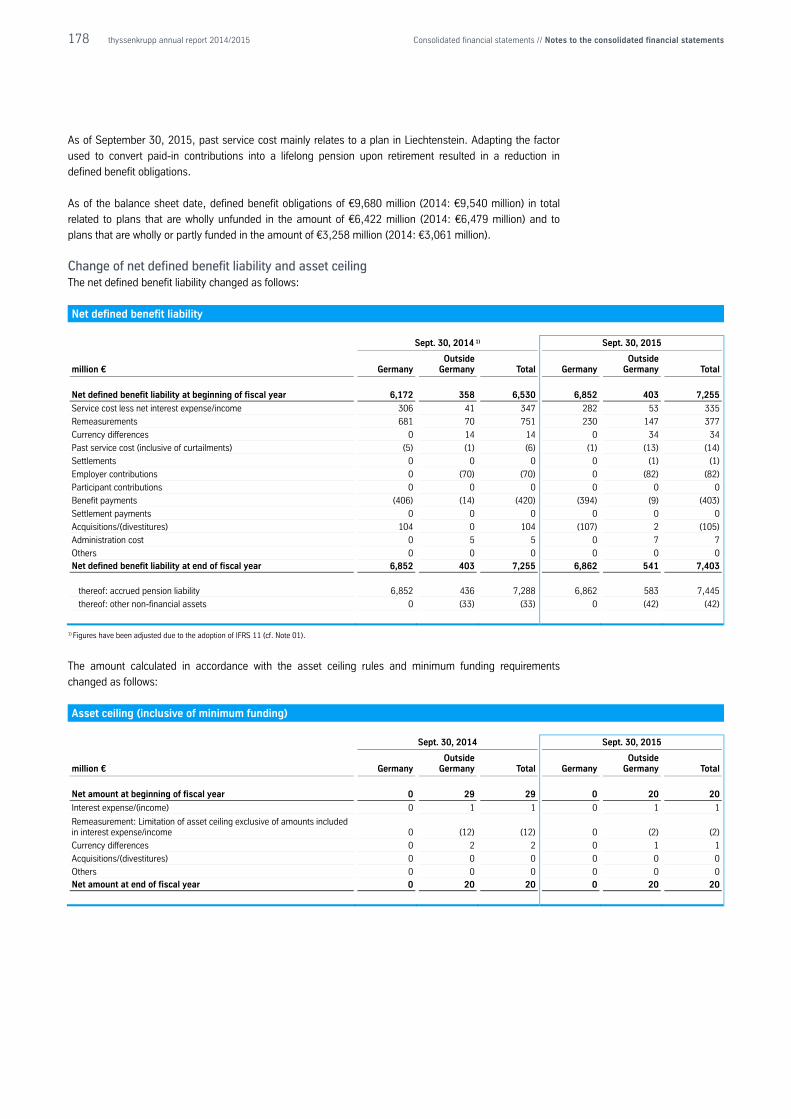
178 thyssenkrupp annual report 2014/2015 Consolidated financial statements // Notes to the consolidated financial statements
As of September 30, 2015, past service cost mainly relates to a plan in Liechtenstein. Adapting the factor
used to convert paid-in contributions into a lifelong pension upon retirement resulted in a reduction in
defined benefit obligations.
As of the balance sheet date, defined benefit obligations of €9,680 million (2014: €9,540 million) in total
related to plans that are wholly unfunded in the amount of €6,422 million (2014: €6,479 million) and to
plans that are wholly or partly funded in the amount of €3,258 million (2014: €3,061 million).
Change of net defined benefit liability and asset ceiling The net defined benefit liability changed as follows:
Net defined benefit liability
Sept. 30, 2014 1) Sept. 30, 2015
million € Germany Outside
Germany Total Germany Outside
Germany Total
Net defined benefit liability at beginning of fiscal year 6,172 358 6,530 6,852 403 7,255
Service cost less net interest expense/income 306 41 347 282 53 335
Remeasurements 681 70 751 230 147 377
Currency differences 0 14 14 0 34 34
Past service cost (inclusive of curtailments) (5) (1) (6) (1) (13) (14)
Settlements 0 0 0 0 (1) (1)
Employer contributions 0 (70) (70) 0 (82) (82)
Participant contributions 0 0 0 0 0 0
Benefit payments (406) (14) (420) (394) (9) (403)
Settlement payments 0 0 0 0 0 0
Acquisitions/(divestitures) 104 0 104 (107) 2 (105)
Administration cost 0 5 5 0 7 7
Others 0 0 0 0 0 0
Net defined benefit liability at end of fiscal year 6,852 403 7,255 6,862 541 7,403
thereof: accrued pension liability 6,852 436 7,288 6,862 583 7,445
thereof: other non-financial assets 0 (33) (33) 0 (42) (42)
1) Figures have been adjusted due to the adoption of IFRS 11 (cf. Note 01).
The amount calculated in accordance with the asset ceiling rules and minimum funding requirements
changed as follows:
Asset ceiling (inclusive of minimum funding)
Sept. 30, 2014 Sept. 30, 2015
million € Germany Outside
Germany Total Germany Outside
Germany Total
Net amount at beginning of fiscal year 0 29 29 0 20 20
Interest expense/(income) 0 1 1 0 1 1
Remeasurement: Limitation of asset ceiling exclusive of amounts included in interest expense/income 0 (12) (12) 0 (2) (2)
Currency differences 0 2 2 0 1 1
Acquisitions/(divestitures) 0 0 0 0 0 0
Others 0 0 0 0 0 0 Net amount at end of fiscal year 0 20 20 0 20 20
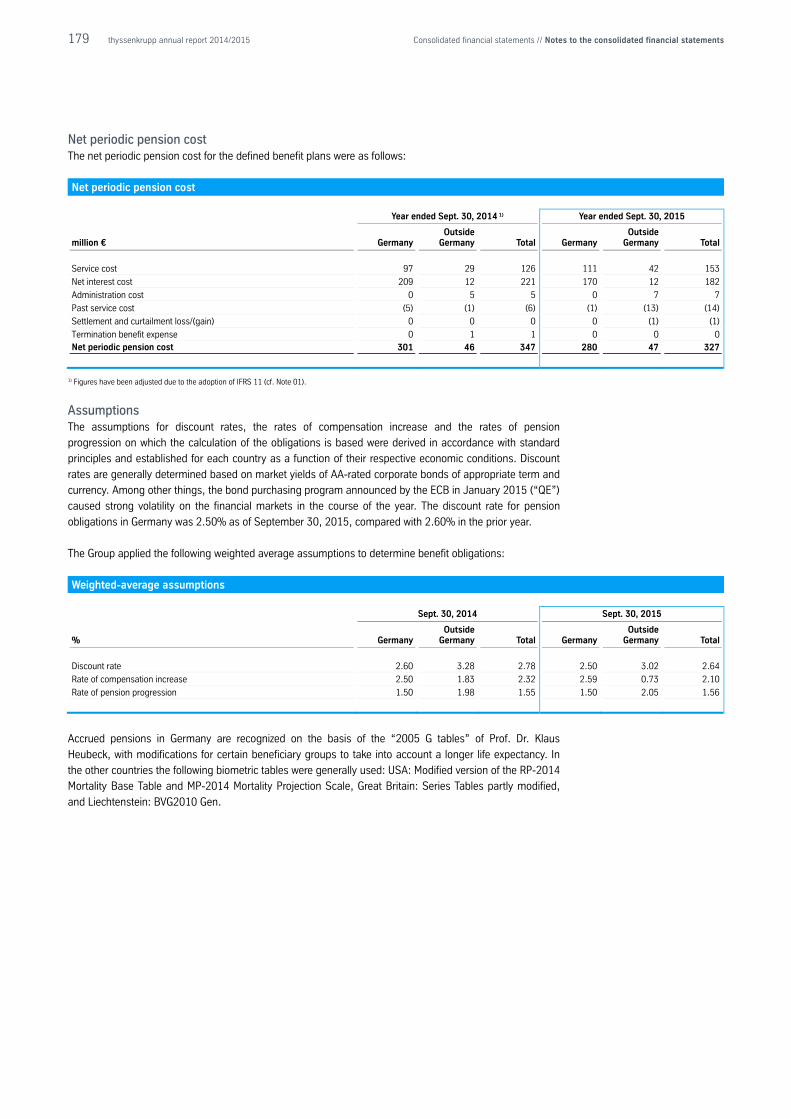
179 thyssenkrupp annual report 2014/2015 Consolidated financial statements // Notes to the consolidated financial statements
Net periodic pension cost The net periodic pension cost for the defined benefit plans were as follows:
Net periodic pension cost
Year ended Sept. 30, 2014 1) Year ended Sept. 30, 2015
million € Germany Outside
Germany Total Germany Outside
Germany Total
Service cost 97 29 126 111 42 153
Net interest cost 209 12 221 170 12 182
Administration cost 0 5 5 0 7 7
Past service cost (5) (1) (6) (1) (13) (14)
Settlement and curtailment loss/(gain) 0 0 0 0 (1) (1)
Termination benefit expense 0 1 1 0 0 0 Net periodic pension cost 301 46 347 280 47 327
1) Figures have been adjusted due to the adoption of IFRS 11 (cf. Note 01).
Assumptions The assumptions for discount rates, the rates of compensation increase and the rates of pension
progression on which the calculation of the obligations is based were derived in accordance with standard
principles and established for each country as a function of their respective economic conditions. Discount
rates are generally determined based on market yields of AA-rated corporate bonds of appropriate term and
currency. Among other things, the bond purchasing program announced by the ECB in January 2015 (“QE”)
caused strong volatility on the financial markets in the course of the year. The discount rate for pension
obligations in Germany was 2.50% as of September 30, 2015, compared with 2.60% in the prior year.
The Group applied the following weighted average assumptions to determine benefit obligations:
Weighted-average assumptions
Sept. 30, 2014 Sept. 30, 2015
% Germany Outside
Germany Total Germany Outside
Germany Total
Discount rate 2.60 3.28 2.78 2.50 3.02 2.64
Rate of compensation increase 2.50 1.83 2.32 2.59 0.73 2.10
Rate of pension progression 1.50 1.98 1.55 1.50 2.05 1.56
Accrued pensions in Germany are recognized on the basis of the “2005 G tables” of Prof. Dr. Klaus
Heubeck, with modifications for certain beneficiary groups to take into account a longer life expectancy. In
the other countries the following biometric tables were generally used: USA: Modified version of the RP-2014
Mortality Base Table and MP-2014 Mortality Projection Scale, Great Britain: Series Tables partly modified,
and Liechtenstein: BVG2010 Gen.
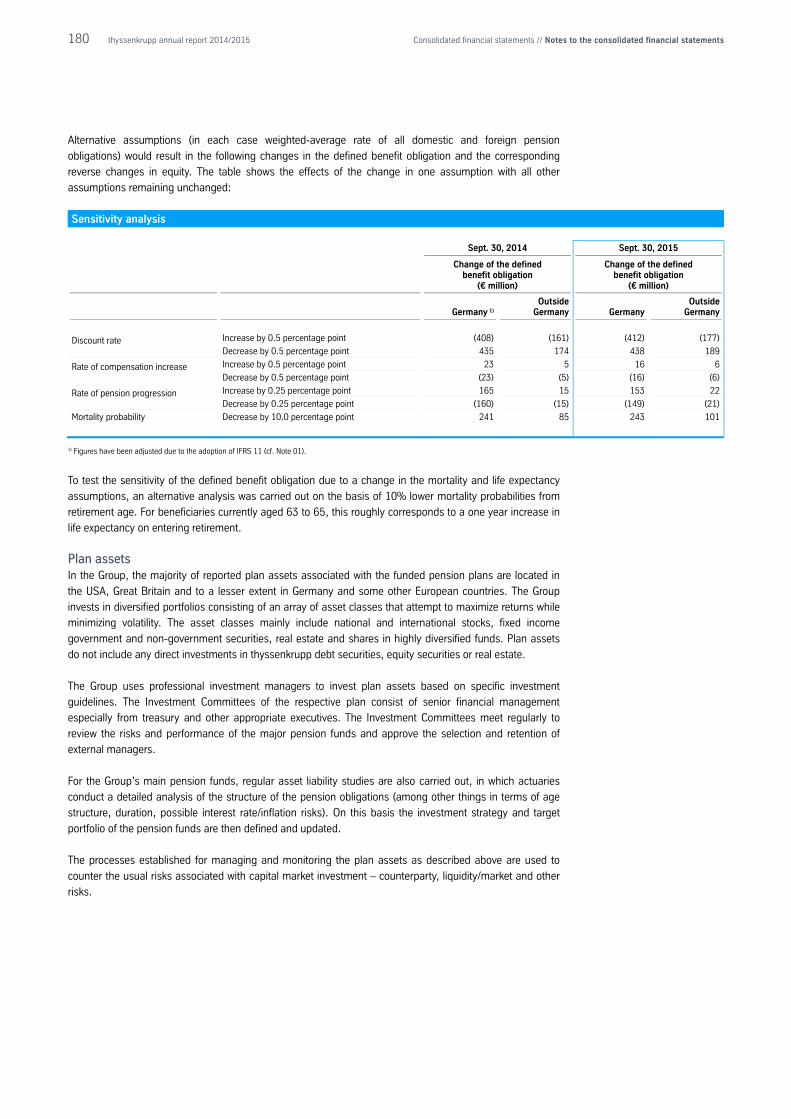
180 thyssenkrupp annual report 2014/2015 Consolidated financial statements // Notes to the consolidated financial statements
Alternative assumptions (in each case weighted-average rate of all domestic and foreign pension
obligations) would result in the following changes in the defined benefit obligation and the corresponding
reverse changes in equity. The table shows the effects of the change in one assumption with all other
assumptions remaining unchanged:
Sensitivity analysis
Sept. 30, 2014 Sept. 30, 2015
Change of the defined benefit obligation
(€ million)
Change of the defined benefit obligation
(€ million)
Germany 1) Outside
Germany Germany Outside
Germany
Discount rate
Increase by 0.5 percentage point (408) (161) (412) (177)
Decrease by 0.5 percentage point 435 174 438 189
Rate of compensation increase
Increase by 0.5 percentage point 23 5 16 6
Decrease by 0.5 percentage point (23) (5) (16) (6)
Rate of pension progression
Increase by 0.25 percentage point 165 15 153 22
Decrease by 0.25 percentage point (160) (15) (149) (21)
Mortality probability Decrease by 10.0 percentage point 241 85 243 101
1) Figures have been adjusted due to the adoption of IFRS 11 (cf. Note 01).
To test the sensitivity of the defined benefit obligation due to a change in the mortality and life expectancy
assumptions, an alternative analysis was carried out on the basis of 10% lower mortality probabilities from
retirement age. For beneficiaries currently aged 63 to 65, this roughly corresponds to a one year increase in
life expectancy on entering retirement.
Plan assets In the Group, the majority of reported plan assets associated with the funded pension plans are located in
the USA, Great Britain and to a lesser extent in Germany and some other European countries. The Group
invests in diversified portfolios consisting of an array of asset classes that attempt to maximize returns while
minimizing volatility. The asset classes mainly include national and international stocks, fixed income
government and non-government securities, real estate and shares in highly diversified funds. Plan assets
do not include any direct investments in thyssenkrupp debt securities, equity securities or real estate.
The Group uses professional investment managers to invest plan assets based on specific investment
guidelines. The Investment Committees of the respective plan consist of senior financial management
especially from treasury and other appropriate executives. The Investment Committees meet regularly to
review the risks and performance of the major pension funds and approve the selection and retention of
external managers.
For the Group’s main pension funds, regular asset liability studies are also carried out, in which actuaries
conduct a detailed analysis of the structure of the pension obligations (among other things in terms of age
structure, duration, possible interest rate/inflation risks). On this basis the investment strategy and target
portfolio of the pension funds are then defined and updated.
The processes established for managing and monitoring the plan assets as described above are used to
counter the usual risks associated with capital market investment – counterparty, liquidity/market and other
risks.
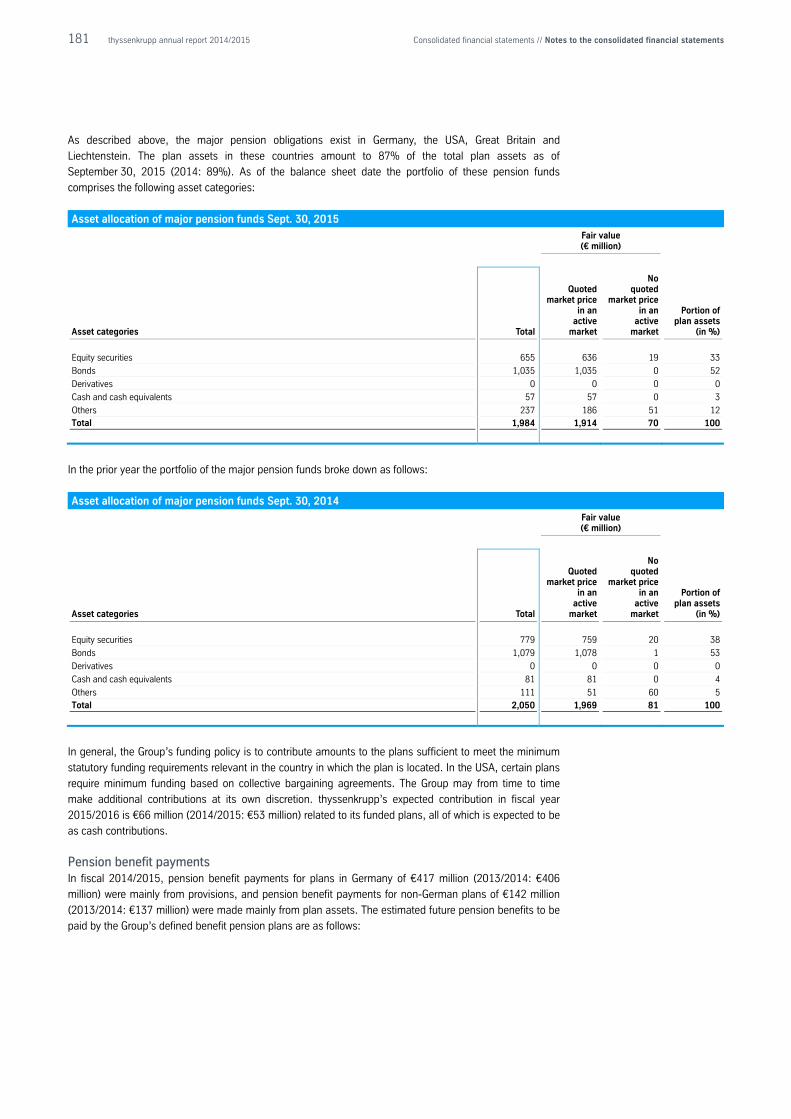
181 thyssenkrupp annual report 2014/2015 Consolidated financial statements // Notes to the consolidated financial statements
As described above, the major pension obligations exist in Germany, the USA, Great Britain and
Liechtenstein. The plan assets in these countries amount to 87% of the total plan assets as of
September 30, 2015 (2014: 89%). As of the balance sheet date the portfolio of these pension funds
comprises the following asset categories:
Asset allocation of major pension funds Sept. 30, 2015
Fair value (€ million)
Asset categories Total
Quoted market price
in an active
market
No quoted
market price in an
active market
Portion of plan assets
(in %)
Equity securities 655 636 19 33
Bonds 1,035 1,035 0 52
Derivatives 0 0 0 0
Cash and cash equivalents 57 57 0 3
Others 237 186 51 12 Total 1,984 1,914 70 100
In the prior year the portfolio of the major pension funds broke down as follows:
Asset allocation of major pension funds Sept. 30, 2014
Fair value (€ million)
Asset categories Total
Quoted market price
in an active
market
No quoted
market price in an
active market
Portion of plan assets
(in %)
Equity securities 779 759 20 38
Bonds 1,079 1,078 1 53
Derivatives 0 0 0 0
Cash and cash equivalents 81 81 0 4
Others 111 51 60 5
Total 2,050 1,969 81 100
In general, the Group’s funding policy is to contribute amounts to the plans sufficient to meet the minimum
statutory funding requirements relevant in the country in which the plan is located. In the USA, certain plans
require minimum funding based on collective bargaining agreements. The Group may from time to time
make additional contributions at its own discretion. thyssenkrupp’s expected contribution in fiscal year
2015/2016 is €66 million (2014/2015: €53 million) related to its funded plans, all of which is expected to be
as cash contributions.
Pension benefit payments In fiscal 2014/2015, pension benefit payments for plans in Germany of €417 million (2013/2014: €406
million) were mainly from provisions, and pension benefit payments for non-German plans of €142 million
(2013/2014: €137 million) were made mainly from plan assets. The estimated future pension benefits to be
paid by the Group’s defined benefit pension plans are as follows:
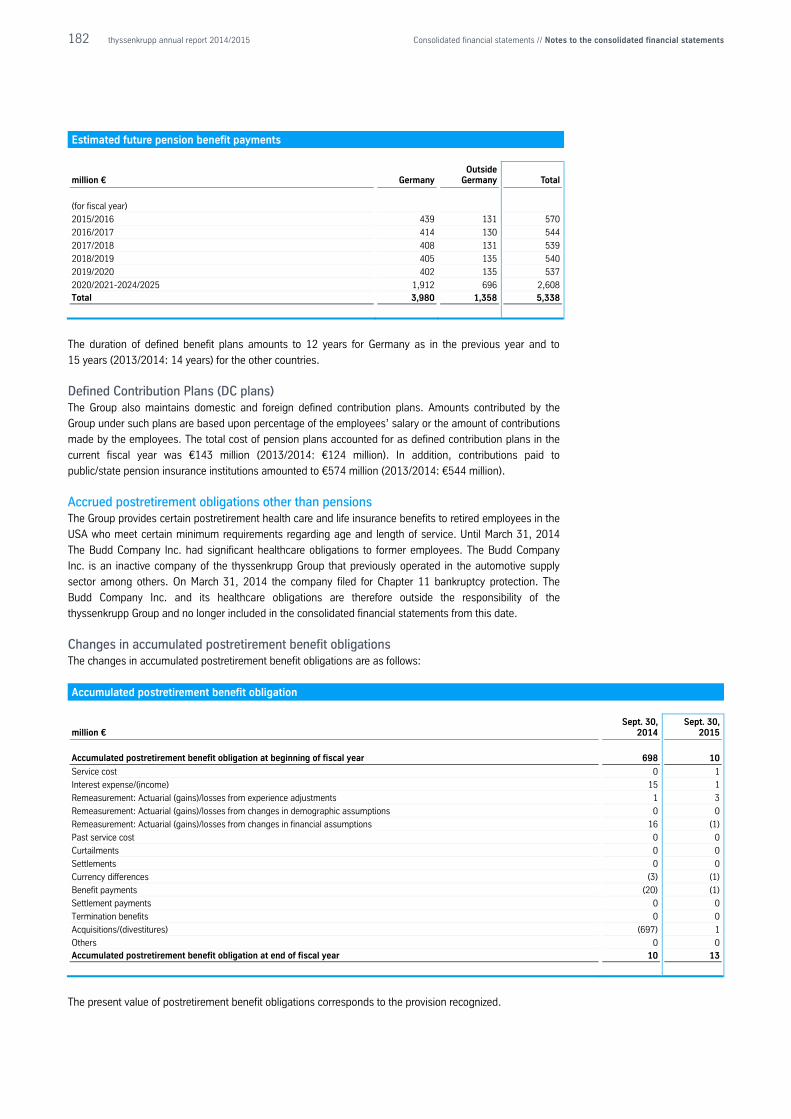
182 thyssenkrupp annual report 2014/2015 Consolidated financial statements // Notes to the consolidated financial statements
Estimated future pension benefit payments
million € Germany Outside
Germany Total
(for fiscal year)
2015/2016 439 131 570
2016/2017 414 130 544
2017/2018 408 131 539
2018/2019 405 135 540
2019/2020 402 135 537
2020/2021-2024/2025 1,912 696 2,608 Total 3,980 1,358 5,338
The duration of defined benefit plans amounts to 12 years for Germany as in the previous year and to
15 years (2013/2014: 14 years) for the other countries.
Defined Contribution Plans (DC plans) The Group also maintains domestic and foreign defined contribution plans. Amounts contributed by the
Group under such plans are based upon percentage of the employees’ salary or the amount of contributions
made by the employees. The total cost of pension plans accounted for as defined contribution plans in the
current fiscal year was €143 million (2013/2014: €124 million). In addition, contributions paid to
public/state pension insurance institutions amounted to €574 million (2013/2014: €544 million).
Accrued postretirement obligations other than pensions The Group provides certain postretirement health care and life insurance benefits to retired employees in the
USA who meet certain minimum requirements regarding age and length of service. Until March 31, 2014
The Budd Company Inc. had significant healthcare obligations to former employees. The Budd Company
Inc. is an inactive company of the thyssenkrupp Group that previously operated in the automotive supply
sector among others. On March 31, 2014 the company filed for Chapter 11 bankruptcy protection. The
Budd Company Inc. and its healthcare obligations are therefore outside the responsibility of the
thyssenkrupp Group and no longer included in the consolidated financial statements from this date.
Changes in accumulated postretirement benefit obligations The changes in accumulated postretirement benefit obligations are as follows:
Accumulated postretirement benefit obligation
million € Sept. 30,
2014 Sept. 30,
2015
Accumulated postretirement benefit obligation at beginning of fiscal year 698 10
Service cost 0 1
Interest expense/(income) 15 1
Remeasurement: Actuarial (gains)/losses from experience adjustments 1 3
Remeasurement: Actuarial (gains)/losses from changes in demographic assumptions 0 0
Remeasurement: Actuarial (gains)/losses from changes in financial assumptions 16 (1)
Past service cost 0 0
Curtailments 0 0
Settlements 0 0
Currency differences (3) (1)
Benefit payments (20) (1)
Settlement payments 0 0
Termination benefits 0 0
Acquisitions/(divestitures) (697) 1
Others 0 0 Accumulated postretirement benefit obligation at end of fiscal year 10 13
The present value of postretirement benefit obligations corresponds to the provision recognized.
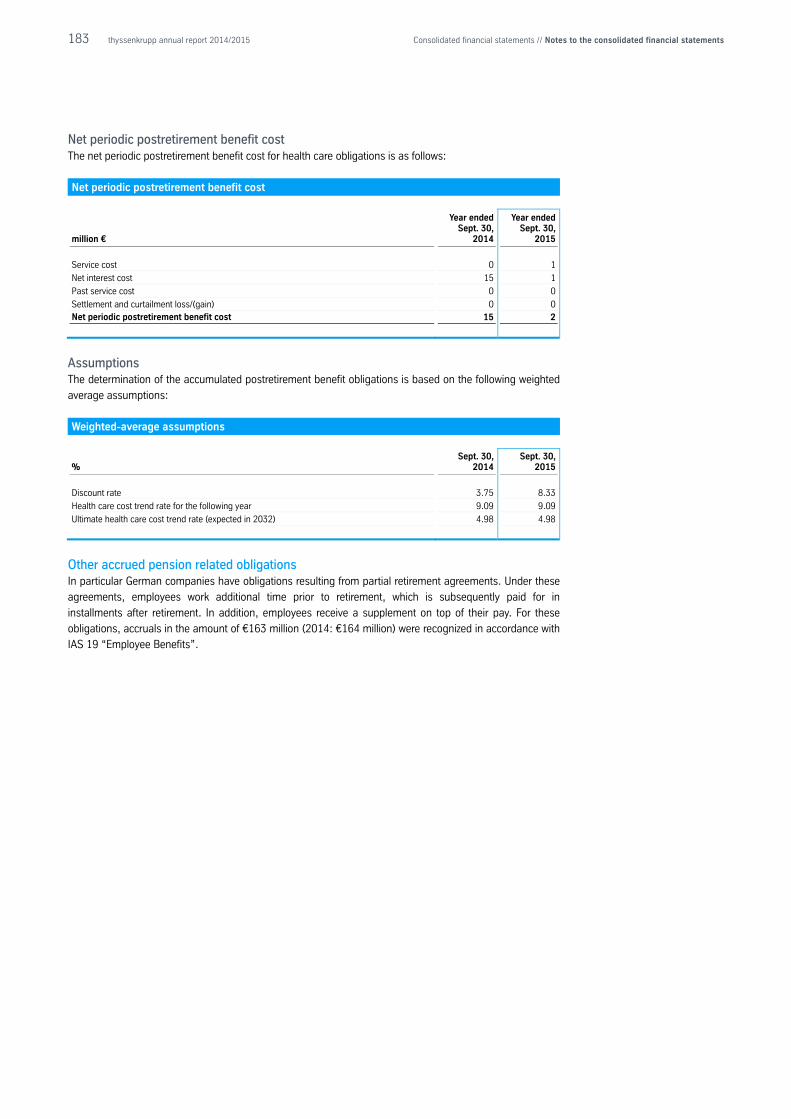
183 thyssenkrupp annual report 2014/2015 Consolidated financial statements // Notes to the consolidated financial statements
Net periodic postretirement benefit cost The net periodic postretirement benefit cost for health care obligations is as follows:
Net periodic postretirement benefit cost
million €
Year ended Sept. 30,
2014
Year ended Sept. 30,
2015
Service cost 0 1
Net interest cost 15 1
Past service cost 0 0
Settlement and curtailment loss/(gain) 0 0 Net periodic postretirement benefit cost 15 2
Assumptions The determination of the accumulated postretirement benefit obligations is based on the following weighted
average assumptions:
Weighted-average assumptions
% Sept. 30,
2014 Sept. 30,
2015
Discount rate 3.75 8.33
Health care cost trend rate for the following year 9.09 9.09
Ultimate health care cost trend rate (expected in 2032) 4.98 4.98
Other accrued pension related obligations In particular German companies have obligations resulting from partial retirement agreements. Under these
agreements, employees work additional time prior to retirement, which is subsequently paid for in
installments after retirement. In addition, employees receive a supplement on top of their pay. For these
obligations, accruals in the amount of €163 million (2014: €164 million) were recognized in accordance with
IAS 19 “Employee Benefits”.
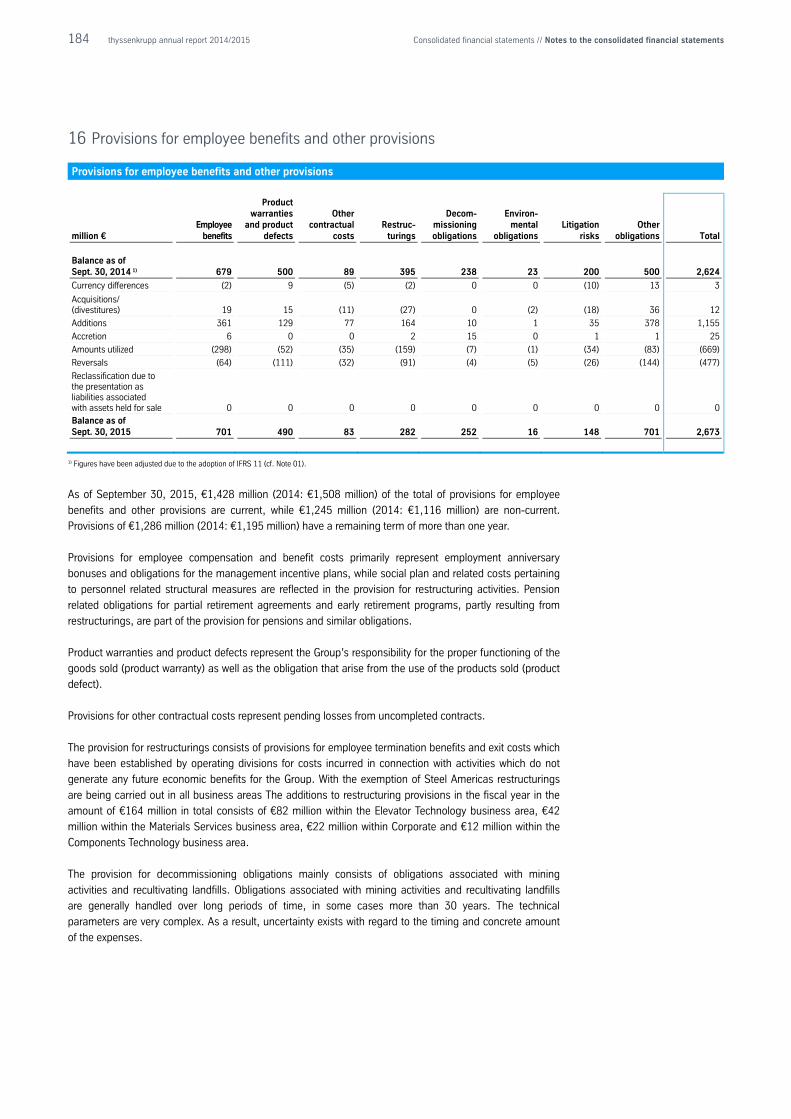
184 thyssenkrupp annual report 2014/2015 Consolidated financial statements // Notes to the consolidated financial statements
16 Provisions for employee benefits and other provisions
Provisions for employee benefits and other provisions
million € Employee
benefits
Product warranties
and product defects
Other contractual
costs Restruc-
turings
Decom- missioning obligations
Environ- mental
obligations Litigation
risks Other
obligations Total
Balance as of Sept. 30, 2014 1) 679 500 89 395 238 23 200 500 2,624
Currency differences (2) 9 (5) (2) 0 0 (10) 13 3
Acquisitions/ (divestitures) 19 15 (11) (27) 0 (2) (18) 36 12
Additions 361 129 77 164 10 1 35 378 1,155
Accretion 6 0 0 2 15 0 1 1 25
Amounts utilized (298) (52) (35) (159) (7) (1) (34) (83) (669)
Reversals (64) (111) (32) (91) (4) (5) (26) (144) (477)
Reclassification due to the presentation as liabilities associated with assets held for sale 0 0 0 0 0 0 0 0 0
Balance as of Sept. 30, 2015 701 490 83 282 252 16 148 701 2,673
1) Figures have been adjusted due to the adoption of IFRS 11 (cf. Note 01).
As of September 30, 2015, €1,428 million (2014: €1,508 million) of the total of provisions for employee
benefits and other provisions are current, while €1,245 million (2014: €1,116 million) are non-current.
Provisions of €1,286 million (2014: €1,195 million) have a remaining term of more than one year.
Provisions for employee compensation and benefit costs primarily represent employment anniversary
bonuses and obligations for the management incentive plans, while social plan and related costs pertaining
to personnel related structural measures are reflected in the provision for restructuring activities. Pension
related obligations for partial retirement agreements and early retirement programs, partly resulting from
restructurings, are part of the provision for pensions and similar obligations.
Product warranties and product defects represent the Group’s responsibility for the proper functioning of the
goods sold (product warranty) as well as the obligation that arise from the use of the products sold (product
defect).
Provisions for other contractual costs represent pending losses from uncompleted contracts.
The provision for restructurings consists of provisions for employee termination benefits and exit costs which
have been established by operating divisions for costs incurred in connection with activities which do not
generate any future economic benefits for the Group. With the exemption of Steel Americas restructurings
are being carried out in all business areas The additions to restructuring provisions in the fiscal year in the
amount of €164 million in total consists of €82 million within the Elevator Technology business area, €42
million within the Materials Services business area, €22 million within Corporate and €12 million within the
Components Technology business area.
The provision for decommissioning obligations mainly consists of obligations associated with mining
activities and recultivating landfills. Obligations associated with mining activities and recultivating landfills
are generally handled over long periods of time, in some cases more than 30 years. The technical
parameters are very complex. As a result, uncertainty exists with regard to the timing and concrete amount
of the expenses.
185 thyssenkrupp annual report 2014/2015 Consolidated financial statements // Notes to the consolidated financial statements
Provisions for environmental obligations refer primarily to rehabilitating contaminated sites, redevelopment
and water protection measures.
The following items are included in provisions for litigation risks and in other risks:
Claims for damages have been filed both in and out of court against thyssenkrupp AG and companies of the
thyssenkrupp Group by potential injured parties in connection with the elevator cartel. A part of the claims
has not yet been quantified. The court proceedings are pending in Germany, Belgium, Austria and the
Netherlands and are at various stages; in part, proceedings have already been settled or otherwise brought
to an end. For the part of the claims thyssenkrupp assesses will probably result in cash outflows,
thyssenkrupp has recognized provisions for risks in the high two-digit million range. Joint and several liability
of thyssenkrupp with the other participants in the cartel was taken into account when calculating the amount
of the provision.
In connection with the rail cartel, which concerned prohibited cartel agreements in the period 2001-2011
with regard to the supply of rails, sleepers and turnouts to private companies, including construction
companies and companies operating private rail operations as well as local transport authorities (the so-
called “private market”), various companies, particularly local transport services, have also asserted or
announced damage claims in or mostly out of court as potential injured parties. thyssenkrupp has
recognized provisions for the damage claims.
In the USA, the non-operating former Group company The Budd Company has asserted various alleged
claims against thyssenkrupp companies in the three-digit million range in connection with the restructuring
and liquidation plan filed by this company in 2014. Agreement has been reached with the company on a
settlement, which is still to be approved by the competent US court as part of the restructuring plan. Under
this settlement, thyssenkrupp is to make prorated payments over several years which will mainly be used to
finance health care plans for former employees of the company. A provision had already been recognized to
cover a small part of this payment obligation. The adjustment to this provision through the settlement will be
largely offset by the resultant tax effects and will impact earnings after taxes by an amount in the low two-
digit millions.
In addition, provisions have been recognized for numerous diverse legal disputes which generally have a low
impact.
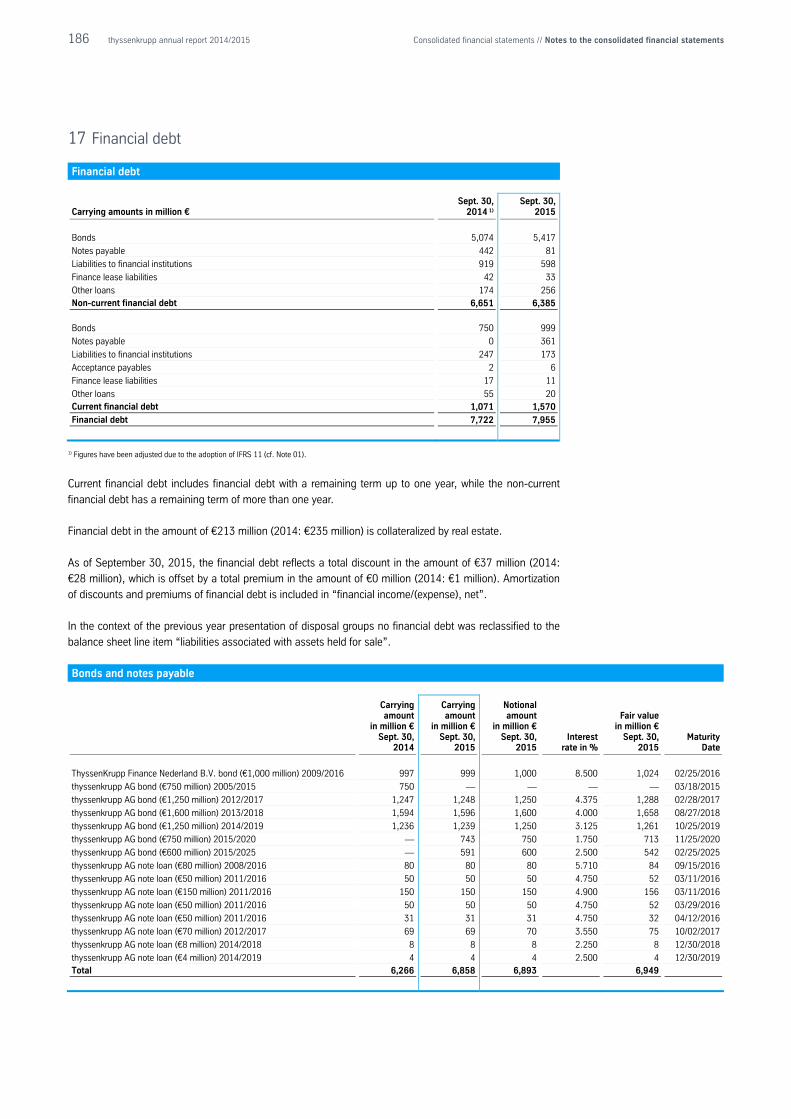
186 thyssenkrupp annual report 2014/2015 Consolidated financial statements // Notes to the consolidated financial statements
17 Financial debt
Financial debt
Carrying amounts in million € Sept. 30,
2014 1) Sept. 30,
2015
Bonds 5,074 5,417
Notes payable 442 81
Liabilities to financial institutions 919 598
Finance lease liabilities 42 33
Other loans 174 256 Non-current financial debt 6,651 6,385
Bonds 750 999
Notes payable 0 361
Liabilities to financial institutions 247 173
Acceptance payables 2 6
Finance lease liabilities 17 11
Other loans 55 20 Current financial debt 1,071 1,570
Financial debt 7,722 7,955
1) Figures have been adjusted due to the adoption of IFRS 11 (cf. Note 01).
Current financial debt includes financial debt with a remaining term up to one year, while the non-current
financial debt has a remaining term of more than one year.
Financial debt in the amount of €213 million (2014: €235 million) is collateralized by real estate.
As of September 30, 2015, the financial debt reflects a total discount in the amount of €37 million (2014:
€28 million), which is offset by a total premium in the amount of €0 million (2014: €1 million). Amortization
of discounts and premiums of financial debt is included in “financial income/(expense), net”.
In the context of the previous year presentation of disposal groups no financial debt was reclassified to the
balance sheet line item “liabilities associated with assets held for sale”.
Bonds and notes payable
Carrying amount
in million € Sept. 30,
2014
Carrying amount
in million € Sept. 30,
2015
Notional amount
in million € Sept. 30,
2015 Interest
rate in %
Fair value in million €
Sept. 30, 2015
Maturity Date
ThyssenKrupp Finance Nederland B.V. bond (€1,000 million) 2009/2016 997 999 1,000 8.500 1,024 02/25/2016
thyssenkrupp AG bond (€750 million) 2005/2015 750 — — — — 03/18/2015
thyssenkrupp AG bond (€1,250 million) 2012/2017 1,247 1,248 1,250 4.375 1,288 02/28/2017
thyssenkrupp AG bond (€1,600 million) 2013/2018 1,594 1,596 1,600 4.000 1,658 08/27/2018
thyssenkrupp AG bond (€1,250 million) 2014/2019 1,236 1,239 1,250 3.125 1,261 10/25/2019
thyssenkrupp AG bond (€750 million) 2015/2020 — 743 750 1.750 713 11/25/2020
thyssenkrupp AG bond (€600 million) 2015/2025 — 591 600 2.500 542 02/25/2025
thyssenkrupp AG note loan (€80 million) 2008/2016 80 80 80 5.710 84 09/15/2016
thyssenkrupp AG note loan (€50 million) 2011/2016 50 50 50 4.750 52 03/11/2016
thyssenkrupp AG note loan (€150 million) 2011/2016 150 150 150 4.900 156 03/11/2016
thyssenkrupp AG note loan (€50 million) 2011/2016 50 50 50 4.750 52 03/29/2016
thyssenkrupp AG note loan (€50 million) 2011/2016 31 31 31 4.750 32 04/12/2016
thyssenkrupp AG note loan (€70 million) 2012/2017 69 69 70 3.550 75 10/02/2017
thyssenkrupp AG note loan (€8 million) 2014/2018 8 8 8 2.250 8 12/30/2018
thyssenkrupp AG note loan (€4 million) 2014/2019 4 4 4 2.500 4 12/30/2019 Total 6,266 6,858 6,893 6,949
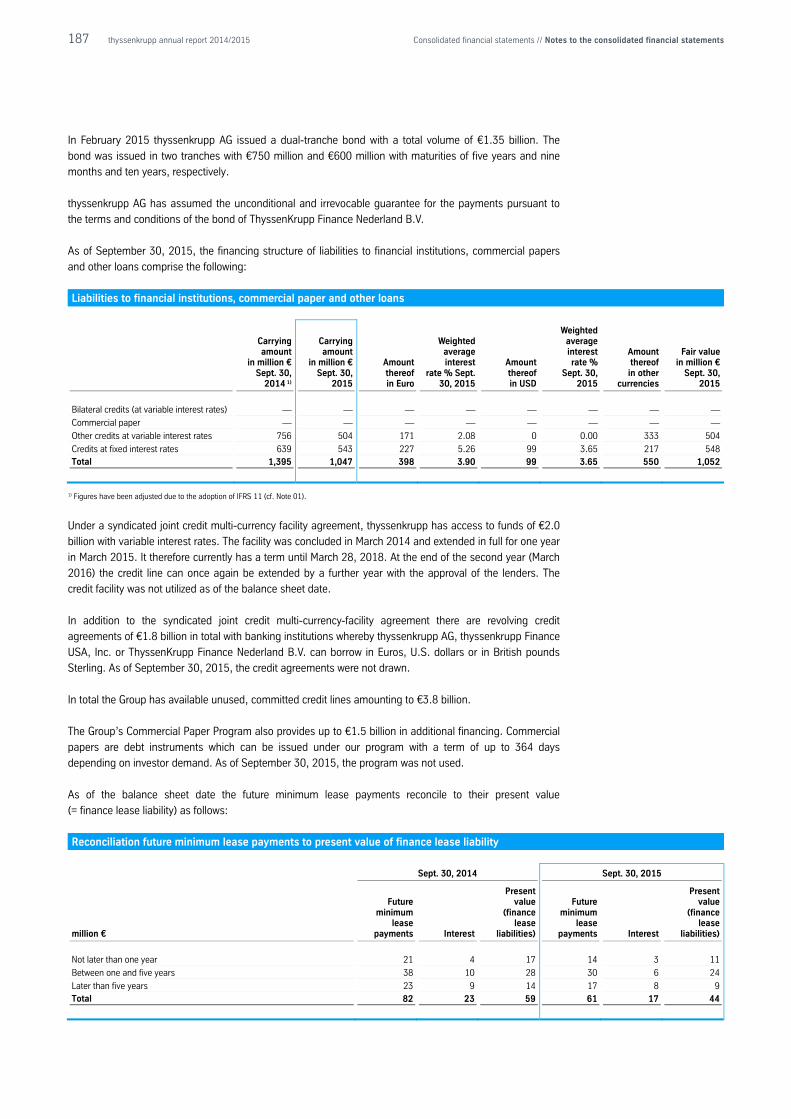
187 thyssenkrupp annual report 2014/2015 Consolidated financial statements // Notes to the consolidated financial statements
In February 2015 thyssenkrupp AG issued a dual-tranche bond with a total volume of €1.35 billion. The
bond was issued in two tranches with €750 million and €600 million with maturities of five years and nine
months and ten years, respectively.
thyssenkrupp AG has assumed the unconditional and irrevocable guarantee for the payments pursuant to
the terms and conditions of the bond of ThyssenKrupp Finance Nederland B.V.
As of September 30, 2015, the financing structure of liabilities to financial institutions, commercial papers
and other loans comprise the following:
Liabilities to financial institutions, commercial paper and other loans
Carrying amount
in million € Sept. 30,
2014 1)
Carrying amount
in million € Sept. 30,
2015
Amount thereof in Euro
Weighted average interest
rate % Sept. 30, 2015
Amount thereof in USD
Weighted average interest rate %
Sept. 30, 2015
Amount thereof in other
currencies
Fair value in million €
Sept. 30, 2015
Bilateral credits (at variable interest rates) — — — — — — — —
Commercial paper — — — — — — — —
Other credits at variable interest rates 756 504 171 2.08 0 0.00 333 504
Credits at fixed interest rates 639 543 227 5.26 99 3.65 217 548 Total 1,395 1,047 398 3.90 99 3.65 550 1,052
1) Figures have been adjusted due to the adoption of IFRS 11 (cf. Note 01).
Under a syndicated joint credit multi-currency facility agreement, thyssenkrupp has access to funds of €2.0
billion with variable interest rates. The facility was concluded in March 2014 and extended in full for one year
in March 2015. It therefore currently has a term until March 28, 2018. At the end of the second year (March
2016) the credit line can once again be extended by a further year with the approval of the lenders. The
credit facility was not utilized as of the balance sheet date.
In addition to the syndicated joint credit multi-currency-facility agreement there are revolving credit
agreements of €1.8 billion in total with banking institutions whereby thyssenkrupp AG, thyssenkrupp Finance
USA, Inc. or ThyssenKrupp Finance Nederland B.V. can borrow in Euros, U.S. dollars or in British pounds
Sterling. As of September 30, 2015, the credit agreements were not drawn.
In total the Group has available unused, committed credit lines amounting to €3.8 billion.
The Group’s Commercial Paper Program also provides up to €1.5 billion in additional financing. Commercial
papers are debt instruments which can be issued under our program with a term of up to 364 days
depending on investor demand. As of September 30, 2015, the program was not used.
As of the balance sheet date the future minimum lease payments reconcile to their present value
(= finance lease liability) as follows:
Reconciliation future minimum lease payments to present value of finance lease liability
Sept. 30, 2014 Sept. 30, 2015
million €
Future minimum
lease payments Interest
Present value
(finance lease
liabilities)
Future minimum
lease payments Interest
Present value
(finance lease
liabilities)
Not later than one year 21 4 17 14 3 11
Between one and five years 38 10 28 30 6 24
Later than five years 23 9 14 17 8 9 Total 82 23 59 61 17 44
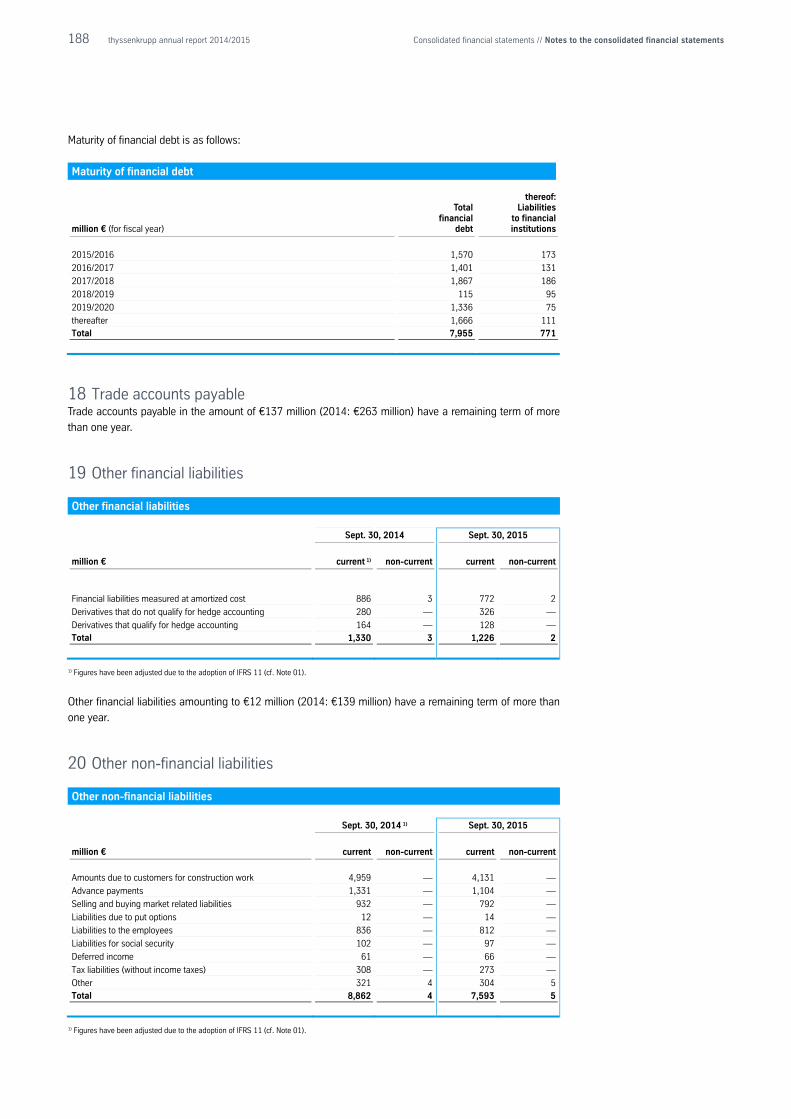
188 thyssenkrupp annual report 2014/2015 Consolidated financial statements // Notes to the consolidated financial statements
Maturity of financial debt is as follows:
Maturity of financial debt
million € (for fiscal year)
Total financial
debt
thereof: Liabilities
to financial institutions
2015/2016 1,570 173
2016/2017 1,401 131
2017/2018 1,867 186
2018/2019 115 95
2019/2020 1,336 75
thereafter 1,666 111 Total 7,955 771
18 Trade accounts payable Trade accounts payable in the amount of €137 million (2014: €263 million) have a remaining term of more
than one year.
19 Other financial liabilities
Other financial liabilities
Sept. 30, 2014 Sept. 30, 2015
million € current 1) non-current current non-current
Financial liabilities measured at amortized cost 886 3 772 2
Derivatives that do not qualify for hedge accounting 280 — 326 —
Derivatives that qualify for hedge accounting 164 — 128 — Total 1,330 3 1,226 2
1) Figures have been adjusted due to the adoption of IFRS 11 (cf. Note 01).
Other financial liabilities amounting to €12 million (2014: €139 million) have a remaining term of more than
one year.
20 Other non-financial liabilities
Other non-financial liabilities
Sept. 30, 2014 1) Sept. 30, 2015
million € current non-current current non-current
Amounts due to customers for construction work 4,959 — 4,131 —
Advance payments 1,331 — 1,104 —
Selling and buying market related liabilities 932 — 792 —
Liabilities due to put options 12 — 14 —
Liabilities to the employees 836 — 812 —
Liabilities for social security 102 — 97 —
Deferred income 61 — 66 —
Tax liabilities (without income taxes) 308 — 273 —
Other 321 4 304 5 Total 8,862 4 7,593 5
1) Figures have been adjusted due to the adoption of IFRS 11 (cf. Note 01).
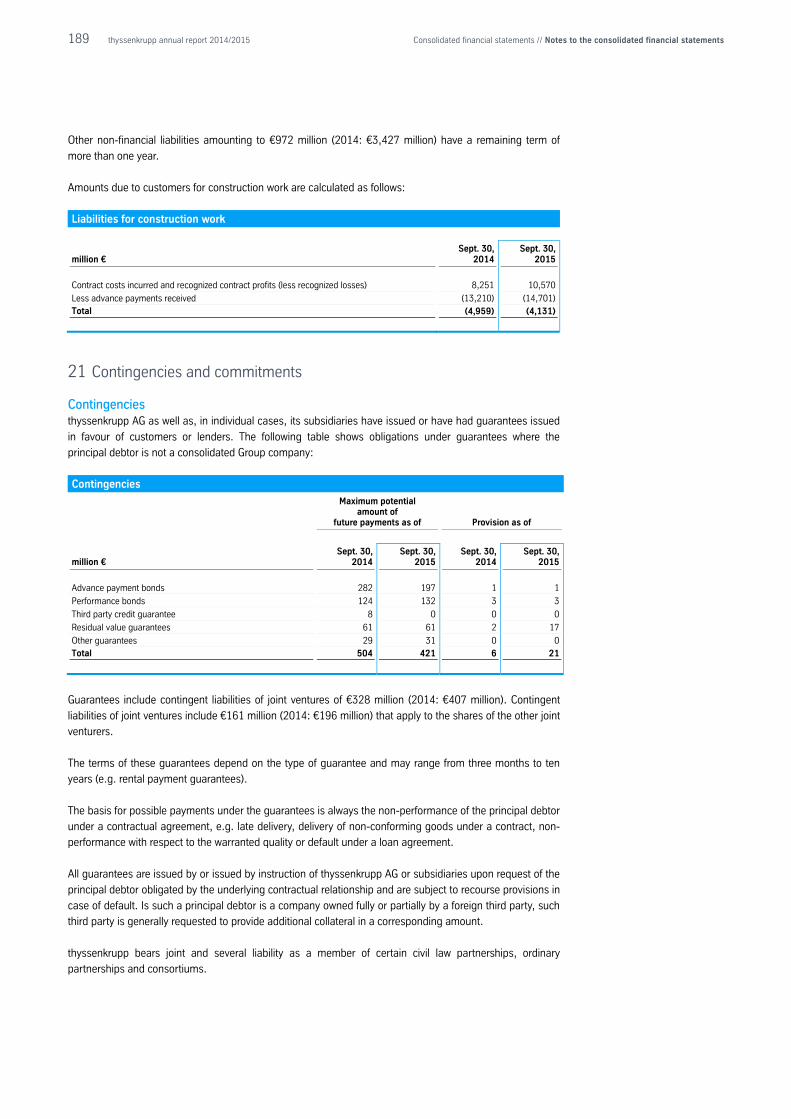
189 thyssenkrupp annual report 2014/2015 Consolidated financial statements // Notes to the consolidated financial statements
Other non-financial liabilities amounting to €972 million (2014: €3,427 million) have a remaining term of
more than one year.
Amounts due to customers for construction work are calculated as follows:
Liabilities for construction work
million € Sept. 30,
2014 Sept. 30,
2015
Contract costs incurred and recognized contract profits (less recognized losses) 8,251 10,570
Less advance payments received (13,210) (14,701) Total (4,959) (4,131)
21 Contingencies and commitments Contingencies thyssenkrupp AG as well as, in individual cases, its subsidiaries have issued or have had guarantees issued
in favour of customers or lenders. The following table shows obligations under guarantees where the
principal debtor is not a consolidated Group company:
Contingencies
million €
Maximum potential amount of
future payments as of Provision as of
Sept. 30,
2014 Sept. 30,
2015 Sept. 30,
2014 Sept. 30,
2015
Advance payment bonds 282 197 1 1
Performance bonds 124 132 3 3
Third party credit guarantee 8 0 0 0
Residual value guarantees 61 61 2 17
Other guarantees 29 31 0 0 Total 504 421 6 21
Guarantees include contingent liabilities of joint ventures of €328 million (2014: €407 million). Contingent
liabilities of joint ventures include €161 million (2014: €196 million) that apply to the shares of the other joint
venturers.
The terms of these guarantees depend on the type of guarantee and may range from three months to ten
years (e.g. rental payment guarantees).
The basis for possible payments under the guarantees is always the non-performance of the principal debtor
under a contractual agreement, e.g. late delivery, delivery of non-conforming goods under a contract, non-
performance with respect to the warranted quality or default under a loan agreement.
All guarantees are issued by or issued by instruction of thyssenkrupp AG or subsidiaries upon request of the
principal debtor obligated by the underlying contractual relationship and are subject to recourse provisions in
case of default. Is such a principal debtor is a company owned fully or partially by a foreign third party, such
third party is generally requested to provide additional collateral in a corresponding amount.
thyssenkrupp bears joint and several liability as a member of certain civil law partnerships, ordinary
partnerships and consortiums.
190 thyssenkrupp annual report 2014/2015 Consolidated financial statements // Notes to the consolidated financial statements
thyssenkrupp has contingencies for the following material legal disputes:
Former shareholders of Thyssen and Krupp petitioned per § 305 UmwG (Reorganization Act, before
amendment) for a judicial review of the share exchange ratios used in the merger of Thyssen AG and Fried.
Krupp AG Hoesch-Krupp to form thyssenkrupp AG. The court of first instance rejected the petitions in August
2015 and found that the exchange ratios had not been too low. Some petitioners have filed an appeal
against this decision. thyssenkrupp continues to assume that the claims are unfounded.
In connection with the majority interest previously held by the Industrial Solutions business area in the Greek
shipyard Hellenic Shipyards (HSY) and the construction of submarines for the Greek Navy, the Greek
government has filed legal and arbitration actions to claim compensation of €2.1 billion and reimbursement
of a €115 million installment payment from thyssenkrupp Industrial Solutions AG and thyssenkrupp Marine
Systems GmbH as well as from HSY and the current majority shareholder of HSY. To date the Greek
government has concretized claims only in a double-digit million euro amount, relating exclusively to its
contact with HSY. The claims asserted against the thyssenkrupp companies appear unfounded. All
contractual obligations of thyssenkrupp Marine Systems and other thyssenkrupp companies vis-à-vis the
Greek government have been fulfilled since 2010.
In addition further legal and arbitration actions and official investigations and proceedings as well as claims
have been filed against thyssenkrupp companies or may be initiated or filed in the future. They include for
example legal, arbitration and out-of-court disputes as well as official investigations in connection with the
construction, tax concessions granted, and operation of the Brazilian steel plant, which could lead to
payment of damages and fines or tax charges. Disputes in connection with the acquisition or disposal of
companies or company units which may lead to partial repayment of the purchase price or to the payment of
damages or to tax charges. Furthermore, damage claims may be payable to contractual partners,
customers, consortium partners and subcontractors under performance contracts. Predicting the progress
and results of lawsuits involves considerable difficulties and uncertainties. This means that lawsuits, official
investigations and proceedings as well as claims not disclosed separately could also individually or together
with other legal disputes, official investigations and proceedings as well as claims have a negative and also
potentially major future impact on the Group’s net assets, financial position and results of operations.
However, at present thyssenkrupp does not expect pending lawsuits, official investigations and proceedings
as well as claims not explained separately in this section to have a major negative impact on the Group’s net
assets, financial position and results of operations.
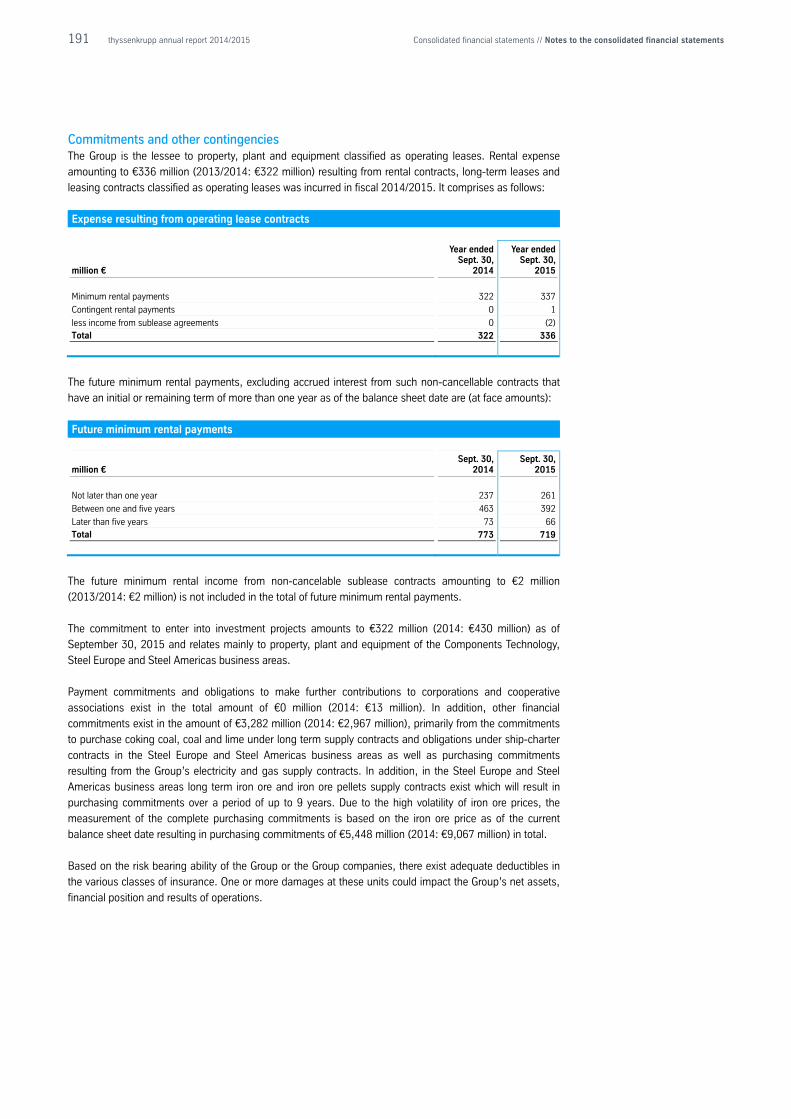
191 thyssenkrupp annual report 2014/2015 Consolidated financial statements // Notes to the consolidated financial statements
Commitments and other contingencies The Group is the lessee to property, plant and equipment classified as operating leases. Rental expense
amounting to €336 million (2013/2014: €322 million) resulting from rental contracts, long-term leases and
leasing contracts classified as operating leases was incurred in fiscal 2014/2015. It comprises as follows:
Expense resulting from operating lease contracts
million €
Year ended Sept. 30,
2014
Year ended Sept. 30,
2015
Minimum rental payments 322 337
Contingent rental payments 0 1
less income from sublease agreements 0 (2) Total 322 336
The future minimum rental payments, excluding accrued interest from such non-cancellable contracts that
have an initial or remaining term of more than one year as of the balance sheet date are (at face amounts):
Future minimum rental payments
million € Sept. 30,
2014 Sept. 30,
2015
Not later than one year 237 261
Between one and five years 463 392
Later than five years 73 66 Total 773 719
The future minimum rental income from non-cancelable sublease contracts amounting to €2 million
(2013/2014: €2 million) is not included in the total of future minimum rental payments.
The commitment to enter into investment projects amounts to €322 million (2014: €430 million) as of
September 30, 2015 and relates mainly to property, plant and equipment of the Components Technology,
Steel Europe and Steel Americas business areas.
Payment commitments and obligations to make further contributions to corporations and cooperative
associations exist in the total amount of €0 million (2014: €13 million). In addition, other financial
commitments exist in the amount of €3,282 million (2014: €2,967 million), primarily from the commitments
to purchase coking coal, coal and lime under long term supply contracts and obligations under ship-charter
contracts in the Steel Europe and Steel Americas business areas as well as purchasing commitments
resulting from the Group’s electricity and gas supply contracts. In addition, in the Steel Europe and Steel
Americas business areas long term iron ore and iron ore pellets supply contracts exist which will result in
purchasing commitments over a period of up to 9 years. Due to the high volatility of iron ore prices, the
measurement of the complete purchasing commitments is based on the iron ore price as of the current
balance sheet date resulting in purchasing commitments of €5,448 million (2014: €9,067 million) in total.
Based on the risk bearing ability of the Group or the Group companies, there exist adequate deductibles in
the various classes of insurance. One or more damages at these units could impact the Group’s net assets,
financial position and results of operations.
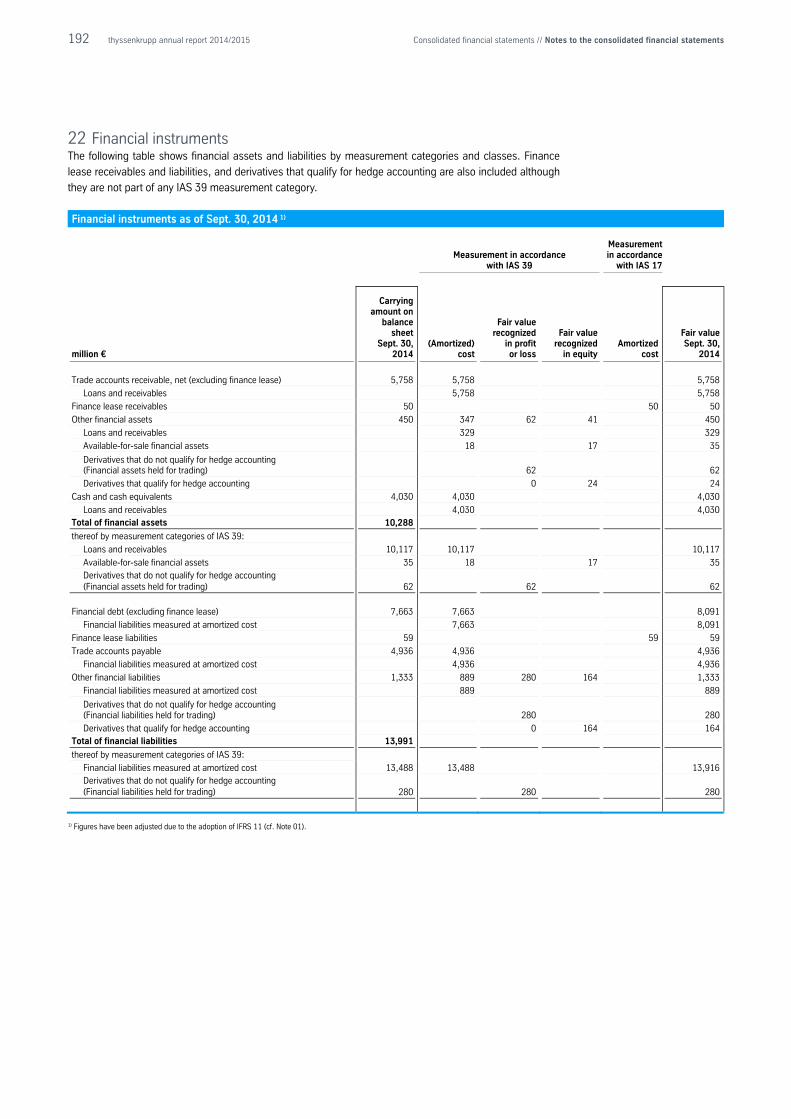
192 thyssenkrupp annual report 2014/2015 Consolidated financial statements // Notes to the consolidated financial statements
22 Financial instruments The following table shows financial assets and liabilities by measurement categories and classes. Finance
lease receivables and liabilities, and derivatives that qualify for hedge accounting are also included although
they are not part of any IAS 39 measurement category.
Financial instruments as of Sept. 30, 2014 1)
Measurement in accordance
with IAS 39
Measurement in accordance
with IAS 17
million €
Carrying amount on
balance sheet
Sept. 30, 2014
(Amortized) cost
Fair value recognized
in profit or loss
Fair value recognized
in equity Amortized
cost
Fair value Sept. 30,
2014
Trade accounts receivable, net (excluding finance lease) 5,758 5,758 5,758
Loans and receivables 5,758 5,758
Finance lease receivables 50 50 50
Other financial assets 450 347 62 41 450
Loans and receivables 329 329
Available-for-sale financial assets 18 17 35
Derivatives that do not qualify for hedge accounting (Financial assets held for trading) 62 62
Derivatives that qualify for hedge accounting 0 24 24
Cash and cash equivalents 4,030 4,030 4,030
Loans and receivables 4,030 4,030 Total of financial assets 10,288
thereof by measurement categories of IAS 39:
Loans and receivables 10,117 10,117 10,117
Available-for-sale financial assets 35 18 17 35
Derivatives that do not qualify for hedge accounting (Financial assets held for trading) 62 62 62
Financial debt (excluding finance lease) 7,663 7,663 8,091
Financial liabilities measured at amortized cost 7,663 8,091
Finance lease liabilities 59 59 59
Trade accounts payable 4,936 4,936 4,936
Financial liabilities measured at amortized cost 4,936 4,936
Other financial liabilities 1,333 889 280 164 1,333
Financial liabilities measured at amortized cost 889 889
Derivatives that do not qualify for hedge accounting (Financial liabilities held for trading) 280 280
Derivatives that qualify for hedge accounting 0 164 164 Total of financial liabilities 13,991
thereof by measurement categories of IAS 39:
Financial liabilities measured at amortized cost 13,488 13,488 13,916
Derivatives that do not qualify for hedge accounting (Financial liabilities held for trading) 280 280 280
1) Figures have been adjusted due to the adoption of IFRS 11 (cf. Note 01).
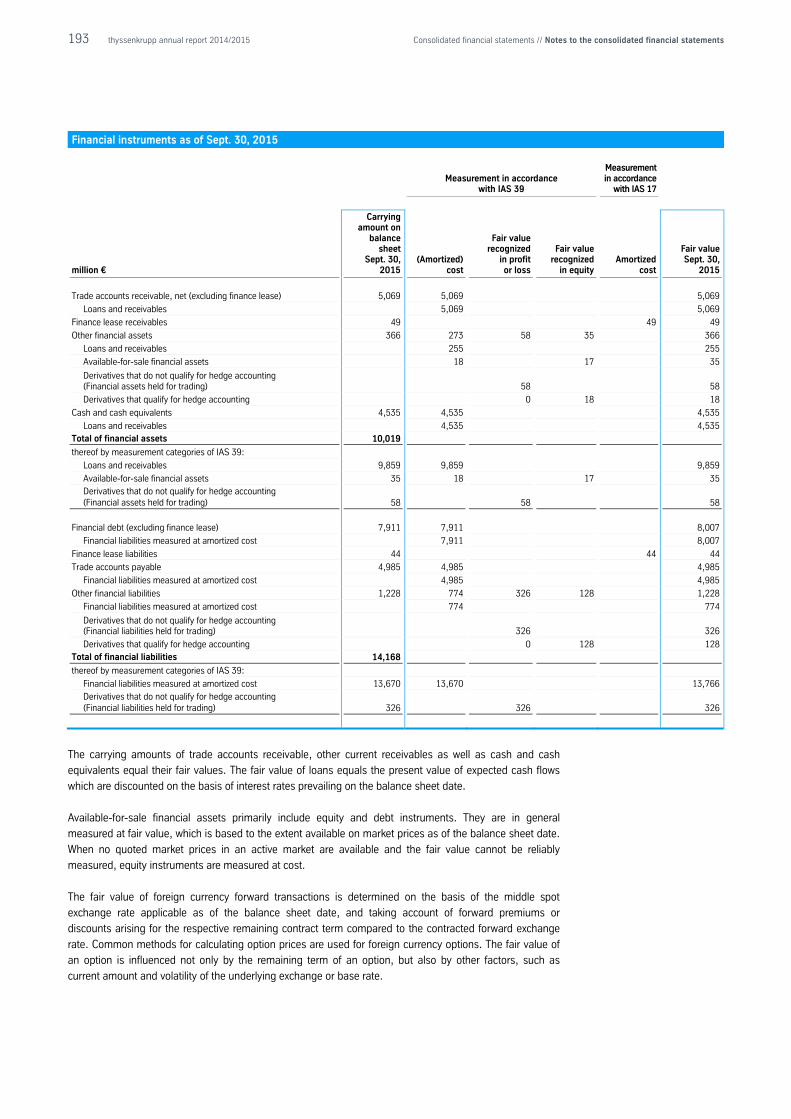
193 thyssenkrupp annual report 2014/2015 Consolidated financial statements // Notes to the consolidated financial statements
Financial instruments as of Sept. 30, 2015
Measurement in accordance
with IAS 39
Measurement in accordance
with IAS 17
million €
Carrying amount on
balance sheet
Sept. 30, 2015
(Amortized) cost
Fair value recognized
in profit or loss
Fair value recognized
in equity Amortized
cost
Fair value Sept. 30,
2015
Trade accounts receivable, net (excluding finance lease) 5,069 5,069 5,069
Loans and receivables 5,069 5,069
Finance lease receivables 49 49 49
Other financial assets 366 273 58 35 366
Loans and receivables 255 255
Available-for-sale financial assets 18 17 35
Derivatives that do not qualify for hedge accounting (Financial assets held for trading) 58 58
Derivatives that qualify for hedge accounting 0 18 18
Cash and cash equivalents 4,535 4,535 4,535
Loans and receivables 4,535 4,535 Total of financial assets 10,019
thereof by measurement categories of IAS 39:
Loans and receivables 9,859 9,859 9,859
Available-for-sale financial assets 35 18 17 35
Derivatives that do not qualify for hedge accounting (Financial assets held for trading) 58 58 58
Financial debt (excluding finance lease) 7,911 7,911 8,007
Financial liabilities measured at amortized cost 7,911 8,007
Finance lease liabilities 44 44 44
Trade accounts payable 4,985 4,985 4,985
Financial liabilities measured at amortized cost 4,985 4,985
Other financial liabilities 1,228 774 326 128 1,228
Financial liabilities measured at amortized cost 774 774
Derivatives that do not qualify for hedge accounting (Financial liabilities held for trading) 326 326
Derivatives that qualify for hedge accounting 0 128 128 Total of financial liabilities 14,168
thereof by measurement categories of IAS 39:
Financial liabilities measured at amortized cost 13,670 13,670 13,766
Derivatives that do not qualify for hedge accounting (Financial liabilities held for trading) 326 326 326
The carrying amounts of trade accounts receivable, other current receivables as well as cash and cash
equivalents equal their fair values. The fair value of loans equals the present value of expected cash flows
which are discounted on the basis of interest rates prevailing on the balance sheet date.
Available-for-sale financial assets primarily include equity and debt instruments. They are in general
measured at fair value, which is based to the extent available on market prices as of the balance sheet date.
When no quoted market prices in an active market are available and the fair value cannot be reliably
measured, equity instruments are measured at cost.
The fair value of foreign currency forward transactions is determined on the basis of the middle spot
exchange rate applicable as of the balance sheet date, and taking account of forward premiums or
discounts arising for the respective remaining contract term compared to the contracted forward exchange
rate. Common methods for calculating option prices are used for foreign currency options. The fair value of
an option is influenced not only by the remaining term of an option, but also by other factors, such as
current amount and volatility of the underlying exchange or base rate.
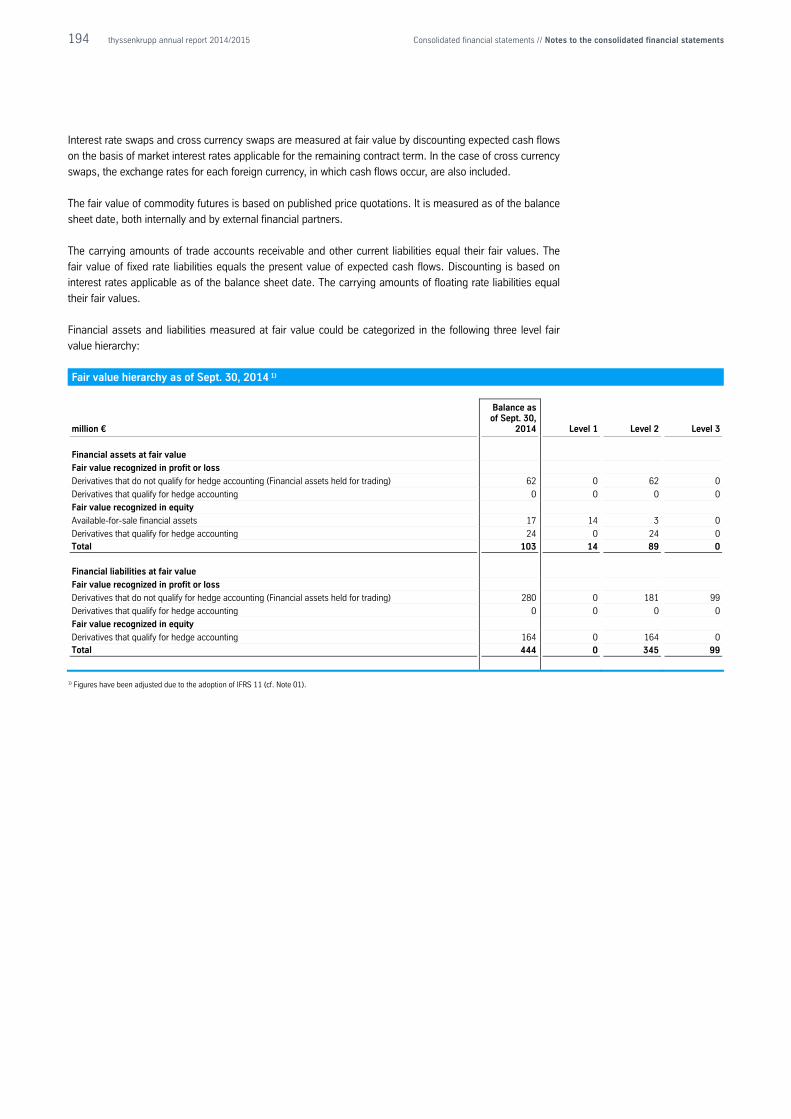
194 thyssenkrupp annual report 2014/2015 Consolidated financial statements // Notes to the consolidated financial statements
Interest rate swaps and cross currency swaps are measured at fair value by discounting expected cash flows
on the basis of market interest rates applicable for the remaining contract term. In the case of cross currency
swaps, the exchange rates for each foreign currency, in which cash flows occur, are also included.
The fair value of commodity futures is based on published price quotations. It is measured as of the balance
sheet date, both internally and by external financial partners.
The carrying amounts of trade accounts receivable and other current liabilities equal their fair values. The
fair value of fixed rate liabilities equals the present value of expected cash flows. Discounting is based on
interest rates applicable as of the balance sheet date. The carrying amounts of floating rate liabilities equal
their fair values.
Financial assets and liabilities measured at fair value could be categorized in the following three level fair
value hierarchy:
Fair value hierarchy as of Sept. 30, 2014 1)
million €
Balance as of Sept. 30,
2014 Level 1 Level 2 Level 3
Financial assets at fair value
Fair value recognized in profit or loss
Derivatives that do not qualify for hedge accounting (Financial assets held for trading) 62 0 62 0
Derivatives that qualify for hedge accounting 0 0 0 0
Fair value recognized in equity
Available-for-sale financial assets 17 14 3 0
Derivatives that qualify for hedge accounting 24 0 24 0 Total 103 14 89 0
Financial liabilities at fair value
Fair value recognized in profit or loss
Derivatives that do not qualify for hedge accounting (Financial assets held for trading) 280 0 181 99
Derivatives that qualify for hedge accounting 0 0 0 0
Fair value recognized in equity
Derivatives that qualify for hedge accounting 164 0 164 0 Total 444 0 345 99
1) Figures have been adjusted due to the adoption of IFRS 11 (cf. Note 01).
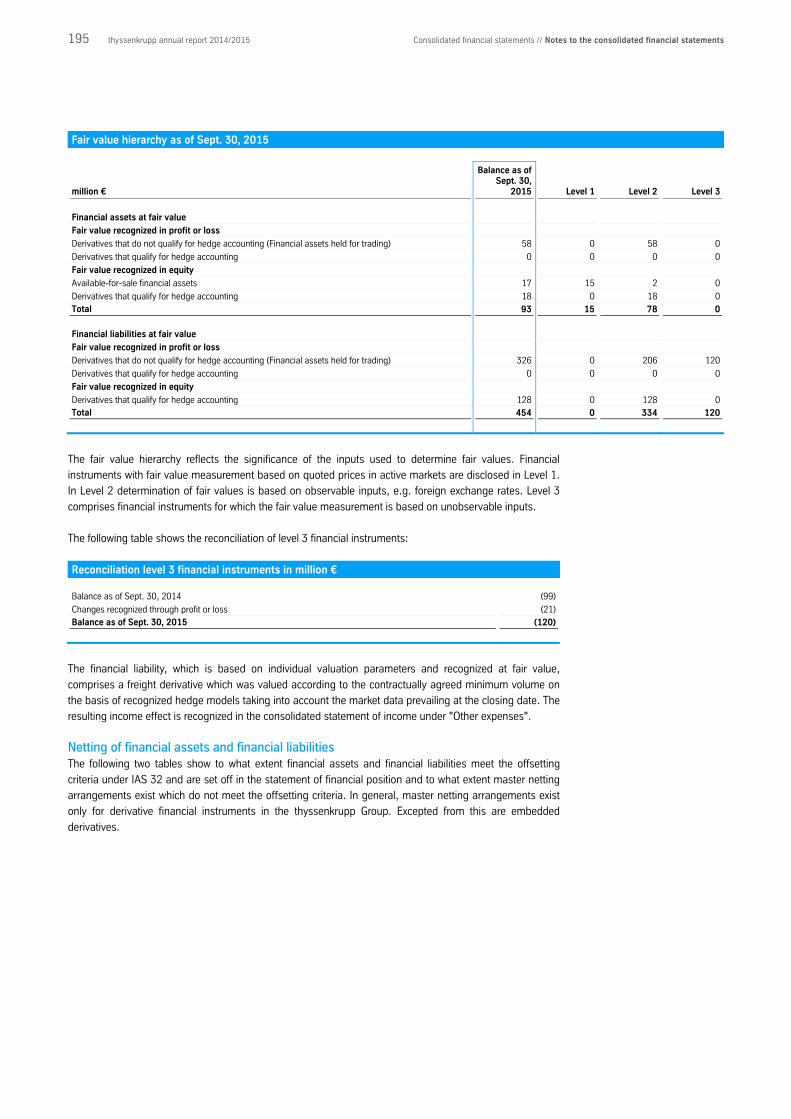
195 thyssenkrupp annual report 2014/2015 Consolidated financial statements // Notes to the consolidated financial statements
Fair value hierarchy as of Sept. 30, 2015
million €
Balance as of Sept. 30,
2015 Level 1 Level 2 Level 3
Financial assets at fair value
Fair value recognized in profit or loss
Derivatives that do not qualify for hedge accounting (Financial assets held for trading) 58 0 58 0
Derivatives that qualify for hedge accounting 0 0 0 0
Fair value recognized in equity
Available-for-sale financial assets 17 15 2 0
Derivatives that qualify for hedge accounting 18 0 18 0 Total 93 15 78 0
Financial liabilities at fair value
Fair value recognized in profit or loss
Derivatives that do not qualify for hedge accounting (Financial assets held for trading) 326 0 206 120
Derivatives that qualify for hedge accounting 0 0 0 0
Fair value recognized in equity
Derivatives that qualify for hedge accounting 128 0 128 0 Total 454 0 334 120
The fair value hierarchy reflects the significance of the inputs used to determine fair values. Financial
instruments with fair value measurement based on quoted prices in active markets are disclosed in Level 1.
In Level 2 determination of fair values is based on observable inputs, e.g. foreign exchange rates. Level 3
comprises financial instruments for which the fair value measurement is based on unobservable inputs.
The following table shows the reconciliation of level 3 financial instruments:
Reconciliation level 3 financial instruments in million €
Balance as of Sept. 30, 2014 (99)
Changes recognized through profit or loss (21)
Balance as of Sept. 30, 2015 (120)
The financial liability, which is based on individual valuation parameters and recognized at fair value,
comprises a freight derivative which was valued according to the contractually agreed minimum volume on
the basis of recognized hedge models taking into account the market data prevailing at the closing date. The
resulting income effect is recognized in the consolidated statement of income under "Other expenses".
Netting of financial assets and financial liabilities The following two tables show to what extent financial assets and financial liabilities meet the offsetting
criteria under IAS 32 and are set off in the statement of financial position and to what extent master netting
arrangements exist which do not meet the offsetting criteria. In general, master netting arrangements exist
only for derivative financial instruments in the thyssenkrupp Group. Excepted from this are embedded
derivatives.
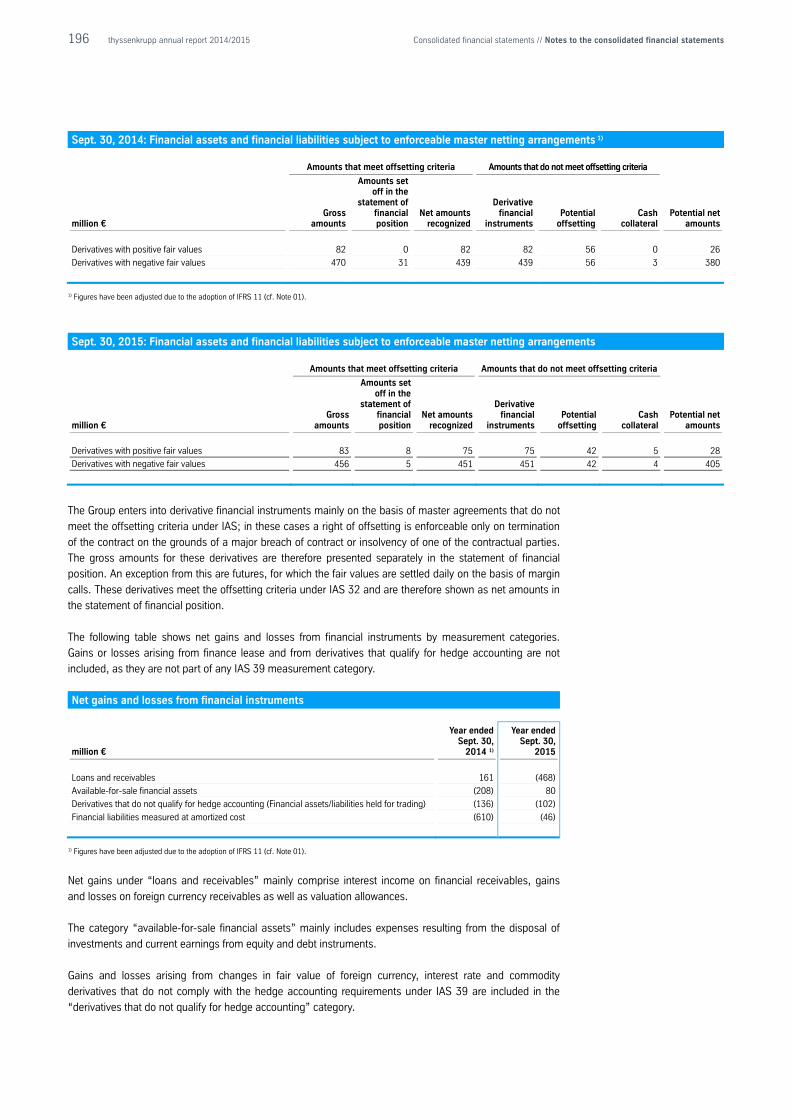
196 thyssenkrupp annual report 2014/2015 Consolidated financial statements // Notes to the consolidated financial statements
Sept. 30, 2014: Financial assets and financial liabilities subject to enforceable master netting arrangements 1)
Amounts that meet offsetting criteria Amounts that do not meet offsetting criteria
million € Gross
amounts
Amounts set off in the
statement of financial position
Net amounts recognized
Derivative financial
instruments Potential
offsetting Cash
collateral Potential net
amounts
Derivatives with positive fair values 82 0 82 82 56 0 26
Derivatives with negative fair values 470 31 439 439 56 3 380
1) Figures have been adjusted due to the adoption of IFRS 11 (cf. Note 01).
Sept. 30, 2015: Financial assets and financial liabilities subject to enforceable master netting arrangements
Amounts that meet offsetting criteria Amounts that do not meet offsetting criteria
million € Gross
amounts
Amounts set off in the
statement of financial position
Net amounts recognized
Derivative financial
instruments Potential
offsetting Cash
collateral Potential net
amounts
Derivatives with positive fair values 83 8 75 75 42 5 28
Derivatives with negative fair values 456 5 451 451 42 4 405
The Group enters into derivative financial instruments mainly on the basis of master agreements that do not
meet the offsetting criteria under IAS; in these cases a right of offsetting is enforceable only on termination
of the contract on the grounds of a major breach of contract or insolvency of one of the contractual parties.
The gross amounts for these derivatives are therefore presented separately in the statement of financial
position. An exception from this are futures, for which the fair values are settled daily on the basis of margin
calls. These derivatives meet the offsetting criteria under IAS 32 and are therefore shown as net amounts in
the statement of financial position.
The following table shows net gains and losses from financial instruments by measurement categories.
Gains or losses arising from finance lease and from derivatives that qualify for hedge accounting are not
included, as they are not part of any IAS 39 measurement category.
Net gains and losses from financial instruments
million €
Year ended Sept. 30,
2014 1)
Year ended Sept. 30,
2015
Loans and receivables 161 (468)
Available-for-sale financial assets (208) 80
Derivatives that do not qualify for hedge accounting (Financial assets/liabilities held for trading) (136) (102)
Financial liabilities measured at amortized cost (610) (46)
1) Figures have been adjusted due to the adoption of IFRS 11 (cf. Note 01).
Net gains under “loans and receivables” mainly comprise interest income on financial receivables, gains
and losses on foreign currency receivables as well as valuation allowances.
The category “available-for-sale financial assets” mainly includes expenses resulting from the disposal of
investments and current earnings from equity and debt instruments.
Gains and losses arising from changes in fair value of foreign currency, interest rate and commodity
derivatives that do not comply with the hedge accounting requirements under IAS 39 are included in the
“derivatives that do not qualify for hedge accounting” category.
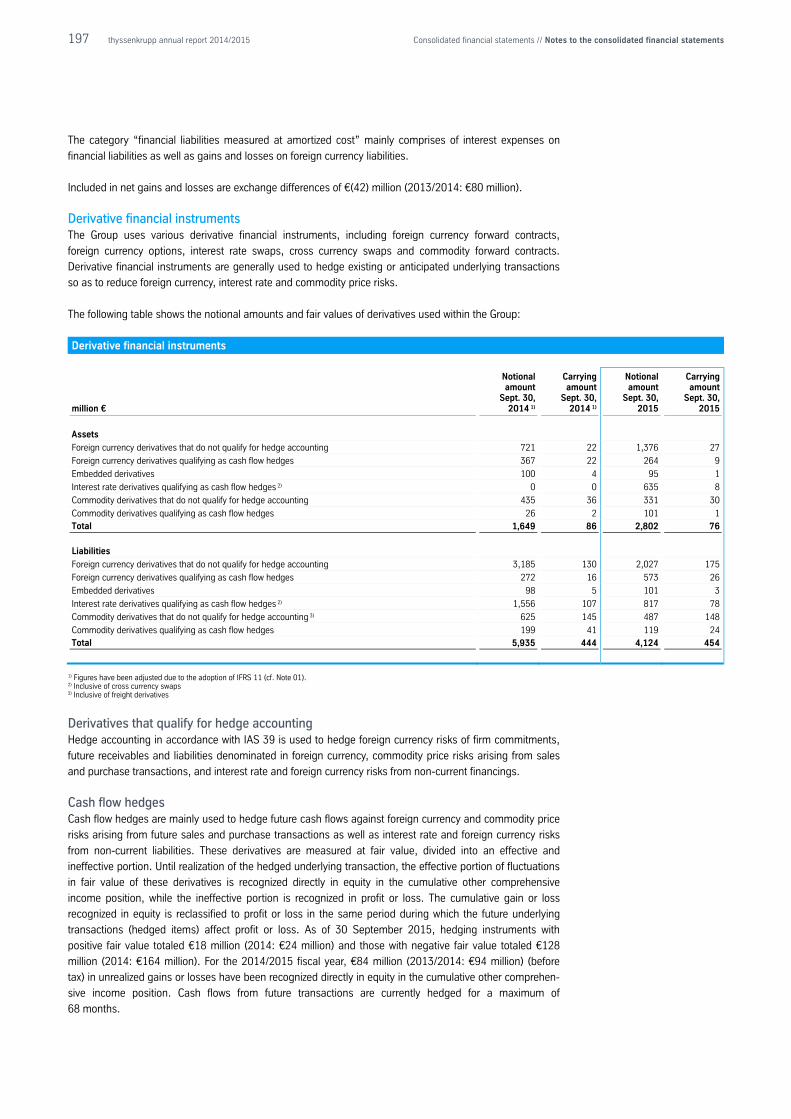
197 thyssenkrupp annual report 2014/2015 Consolidated financial statements // Notes to the consolidated financial statements
The category “financial liabilities measured at amortized cost” mainly comprises of interest expenses on
financial liabilities as well as gains and losses on foreign currency liabilities.
Included in net gains and losses are exchange differences of €(42) million (2013/2014: €80 million).
Derivative financial instruments The Group uses various derivative financial instruments, including foreign currency forward contracts,
foreign currency options, interest rate swaps, cross currency swaps and commodity forward contracts.
Derivative financial instruments are generally used to hedge existing or anticipated underlying transactions
so as to reduce foreign currency, interest rate and commodity price risks.
The following table shows the notional amounts and fair values of derivatives used within the Group:
Derivative financial instruments
million €
Notional amount
Sept. 30, 2014 1)
Carrying amount
Sept. 30, 2014 1)
Notional amount
Sept. 30, 2015
Carrying amount
Sept. 30, 2015
Assets
Foreign currency derivatives that do not qualify for hedge accounting 721 22 1,376 27
Foreign currency derivatives qualifying as cash flow hedges 367 22 264 9
Embedded derivatives 100 4 95 1
Interest rate derivatives qualifying as cash flow hedges 2) 0 0 635 8
Commodity derivatives that do not qualify for hedge accounting 435 36 331 30
Commodity derivatives qualifying as cash flow hedges 26 2 101 1 Total 1,649 86 2,802 76
Liabilities
Foreign currency derivatives that do not qualify for hedge accounting 3,185 130 2,027 175
Foreign currency derivatives qualifying as cash flow hedges 272 16 573 26
Embedded derivatives 98 5 101 3
Interest rate derivatives qualifying as cash flow hedges 2) 1,556 107 817 78
Commodity derivatives that do not qualify for hedge accounting 3) 625 145 487 148
Commodity derivatives qualifying as cash flow hedges 199 41 119 24 Total 5,935 444 4,124 454
1) Figures have been adjusted due to the adoption of IFRS 11 (cf. Note 01). 2) Inclusive of cross currency swaps 3) Inclusive of freight derivatives
Derivatives that qualify for hedge accounting Hedge accounting in accordance with IAS 39 is used to hedge foreign currency risks of firm commitments,
future receivables and liabilities denominated in foreign currency, commodity price risks arising from sales
and purchase transactions, and interest rate and foreign currency risks from non-current financings.
Cash flow hedges Cash flow hedges are mainly used to hedge future cash flows against foreign currency and commodity price
risks arising from future sales and purchase transactions as well as interest rate and foreign currency risks
from non-current liabilities. These derivatives are measured at fair value, divided into an effective and
ineffective portion. Until realization of the hedged underlying transaction, the effective portion of fluctuations
in fair value of these derivatives is recognized directly in equity in the cumulative other comprehensive
income position, while the ineffective portion is recognized in profit or loss. The cumulative gain or loss
recognized in equity is reclassified to profit or loss in the same period during which the future underlying
transactions (hedged items) affect profit or loss. As of 30 September 2015, hedging instruments with
positive fair value totaled €18 million (2014: €24 million) and those with negative fair value totaled €128
million (2014: €164 million). For the 2014/2015 fiscal year, €84 million (2013/2014: €94 million) (before
tax) in unrealized gains or losses have been recognized directly in equity in the cumulative other comprehen-
sive income position. Cash flows from future transactions are currently hedged for a maximum of
68 months.

198 thyssenkrupp annual report 2014/2015 Consolidated financial statements // Notes to the consolidated financial statements
During the current fiscal year, €(27) million (2014: €0 million) of cumulative other comprehensive income
were reclassified to sales in profit or loss as a result of the underlying transactions being realized during the
year. In addition, €36 million (2014: €1 million) of cumulative other comprehensive income were reclassified
to increase cost of inventories, as the hedged commodities were recognized, although the underlying
transaction had not yet been taken to profit or loss. This resulted in increased expenses of €24 million in
2014/2015. Furthermore, €6 million (2014: €0 million) of cumulative other comprehensive income were
reclassified and increased cost of property, plant and equipment. Thereof expenses of €0 million impacted
earnings in 2014/2015. In addition, expenses of €12 million of that reclassified amount is expected to
impact earnings in 2015/2016 and expenses of €6 million in subsequent fiscal years.
As of September 30, 2015, net income from the ineffective portions of derivatives classified as cash flow
hedges totaled €(21) million (2013/2014: €(18) million).
The cancellation of cash flow hedges during the current fiscal year resulted in earnings of €(13) million
(2013/2014: €0 million) due to reclassification from cumulative other comprehensive income. These
fluctuations in fair value of derivatives originally recognized in equity were reclassified to profit or loss when
the hedged underlying transactions in form of currency hedged sales and investments in fixed assets were
no longer probable to occur.
In the subsequent fiscal year fluctuations in fair value of derivatives included in cumulative other compre-
hensive income as of the reporting date is expected to impact earnings by expenses of €31 million. During
the 2016/2017 fiscal, earnings are expected to be impacted by expenses of €31 million, during the
2017/2018 fiscal by expenses of €2 million and during the following fiscal years by expenses of €20 million.
Fair value hedges Fair value hedges are mainly used to hedge the exposure to changes in fair value of a firm commitment and
exposure to inventory price risks as well as to hedge interest rate risks. These commodity and interest rate
derivatives are measured at fair value. The carrying amounts of the corresponding underlying transactions
are adjusted for the change of the fair values of the hedged risks. As of September 30, 2014 and 2015,
respectively, these hedging instruments were not used.
Derivates that do not qualify for hedge accounting If a hedging relationship does not meet the requirements for hedge accounting in accordance with the
conditions under IAS 39 or hedge accounting is economically not reasonable, the derivative financial
instrument is recognized as a derivative that does not qualify for hedge accounting. The resulting impact on
profit or loss is shown in the table on net gains and losses from financial instruments by measurement
categories. This item also includes embedded derivatives. They exist in the thyssenkrupp Group in the way
that regular supply and service transactions with suppliers and customers abroad are not concluded in the
functional currency (local currency) of either contracting parties.
Financial risks The management of thyssenkrupp AG has implemented a risk management system that is monitored by the
Supervisory Board. The general conditions for compliance with the requirements for proper and future-
oriented risk management within the Group are set out in the risk management principles. These principles
aim at encouraging all Group members of staff to responsibly deal with risks as well as supporting a
sustained process to improve risk awareness. The Group guideline on risk management and other Group
guidelines specify risk management processes, compulsory limitations, and the application of financial
instruments. The risk management system aims at identifying, analyzing, managing, controlling and
communicating risks promptly throughout the Group. thyssenkrupp Group’s risk environment is updated at
least twice a year by carrying out a risk inventory in all Group companies. The results of the risk inventory
process are communicated to both thyssenkrupp AG’s Executive Board and the Supervisory Board's audit
committee. Risk management reporting is a continuous process and part of regular Group reporting. Group
guidelines and information systems are checked regularly and adapted to current developments. In addition,
our Corporate Function Internal Auditing regularly checks whether Group companies comply with risk
management system requirements.
199 thyssenkrupp annual report 2014/2015 Consolidated financial statements // Notes to the consolidated financial statements
Being a global Group, thyssenkrupp is exposed to credit, liquidity and market risks (foreign currency, interest
rate and commodity price risks) during the course of ordinary activities. The aim of risk management is to
limit the risks arising from operating activities and associated financing requirements by applying selected
derivate and non-derivative hedging instruments.
Credit risk (counterparty default risk) To the Group, financial instruments bear default risk resulting from one party’s possible failure to meet its
payment obligations, with the maximum default risk being equal to the positive fair value of the respective
financial instrument. During crises, default risks take on greater significance; we are managing them very
carefully by our business policy. In order to minimize default risk, the thyssenkrupp Group only enters into
financial instruments for financing purposes with contracting parties that have a very good credit standing or
are members of a deposit protection fund. For further risk minimizing transactions are concluded in
compliance with specified risk limits. In the operative area, receivables and default risks are monitored by
Group companies on an ongoing basis and partially covered by merchandise credit insurance. Risks arising
from the delivery of goods to major customers are subject to a special credit watch. In addition, letters of
credit and indemnity bonds are used to hedge receivables from major customers. However, receivables from
these contracting parties do not reach levels that would result in extraordinary risk concentrations. Default
risk is taken into account by valuation allowances.
Liquidity risk Liquidity risk is the risk that the Group is unable to meet its existing or future obligations due to insufficient
availability of cash or cash equivalents. Managing liquidity risk, and therefore allocating resources and
hedging the Group’s financial independence, are some of the central tasks of thyssenkrupp AG. In order to
be able to ensure the Group’s solvency and financial flexibility at all times, long-term credit limits and cash
and cash equivalents are reserved on the basis of perennial financial planning and monthly rolling liquidity
planning. Cash pooling and external financing focus primarily on thyssenkrupp AG and specific financing
companies. Our financing is also secured for the next fiscal year.
The gearing limit of 150% agreed in some credit agreements was met as of September 30, 2015. Refer also
to the explanation in Note 13 in chapter “Management of capital”.
Cash pooling and external financing focus primarily on thyssenkrupp AG and specific financing companies.
Funds are provided internally to Group companies according to need.
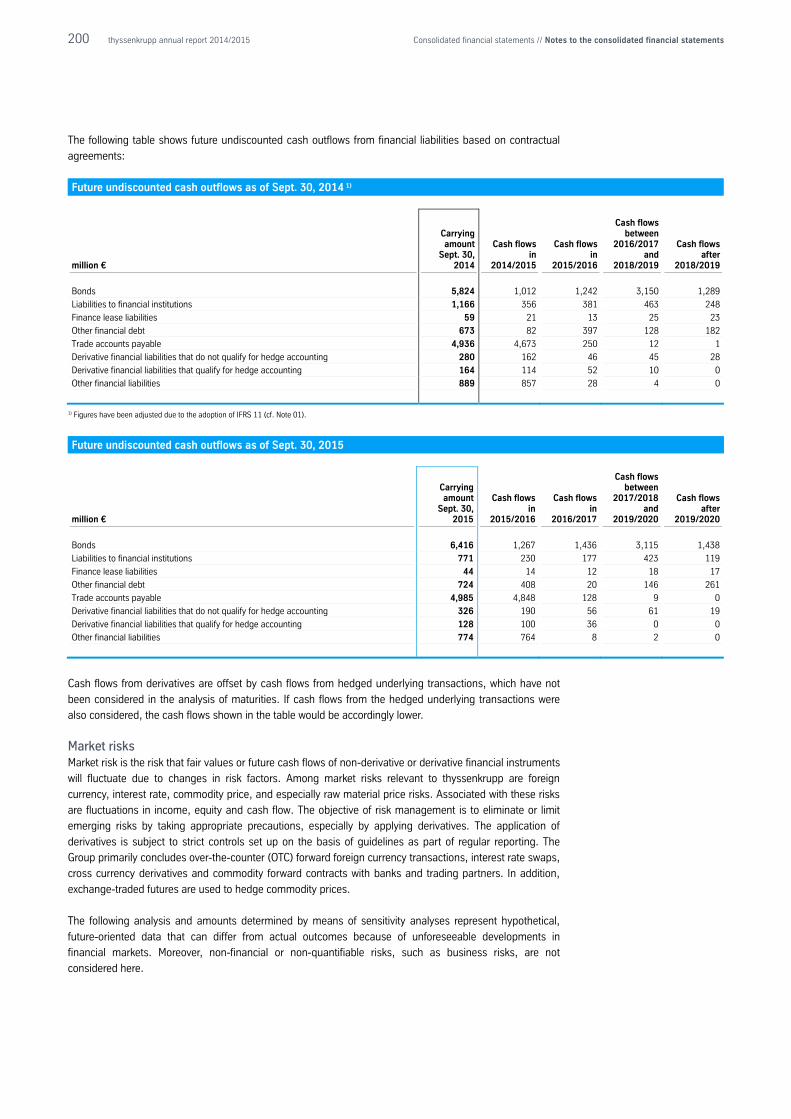
200 thyssenkrupp annual report 2014/2015 Consolidated financial statements // Notes to the consolidated financial statements
The following table shows future undiscounted cash outflows from financial liabilities based on contractual
agreements:
Future undiscounted cash outflows as of Sept. 30, 2014 1)
million €
Carrying amount
Sept. 30, 2014
Cash flows in
2014/2015
Cash flows in
2015/2016
Cash flows between
2016/2017 and
2018/2019
Cash flows after
2018/2019
Bonds 5,824 1,012 1,242 3,150 1,289
Liabilities to financial institutions 1,166 356 381 463 248
Finance lease liabilities 59 21 13 25 23
Other financial debt 673 82 397 128 182
Trade accounts payable 4,936 4,673 250 12 1
Derivative financial liabilities that do not qualify for hedge accounting 280 162 46 45 28
Derivative financial liabilities that qualify for hedge accounting 164 114 52 10 0
Other financial liabilities 889 857 28 4 0
1) Figures have been adjusted due to the adoption of IFRS 11 (cf. Note 01).
Future undiscounted cash outflows as of Sept. 30, 2015
million €
Carrying amount
Sept. 30, 2015
Cash flows in
2015/2016
Cash flows in
2016/2017
Cash flows between
2017/2018 and
2019/2020
Cash flows after
2019/2020
Bonds 6,416 1,267 1,436 3,115 1,438
Liabilities to financial institutions 771 230 177 423 119
Finance lease liabilities 44 14 12 18 17
Other financial debt 724 408 20 146 261
Trade accounts payable 4,985 4,848 128 9 0
Derivative financial liabilities that do not qualify for hedge accounting 326 190 56 61 19
Derivative financial liabilities that qualify for hedge accounting 128 100 36 0 0
Other financial liabilities 774 764 8 2 0
Cash flows from derivatives are offset by cash flows from hedged underlying transactions, which have not
been considered in the analysis of maturities. If cash flows from the hedged underlying transactions were
also considered, the cash flows shown in the table would be accordingly lower.
Market risks Market risk is the risk that fair values or future cash flows of non-derivative or derivative financial instruments
will fluctuate due to changes in risk factors. Among market risks relevant to thyssenkrupp are foreign
currency, interest rate, commodity price, and especially raw material price risks. Associated with these risks
are fluctuations in income, equity and cash flow. The objective of risk management is to eliminate or limit
emerging risks by taking appropriate precautions, especially by applying derivatives. The application of
derivatives is subject to strict controls set up on the basis of guidelines as part of regular reporting. The
Group primarily concludes over-the-counter (OTC) forward foreign currency transactions, interest rate swaps,
cross currency derivatives and commodity forward contracts with banks and trading partners. In addition,
exchange-traded futures are used to hedge commodity prices.
The following analysis and amounts determined by means of sensitivity analyses represent hypothetical,
future-oriented data that can differ from actual outcomes because of unforeseeable developments in
financial markets. Moreover, non-financial or non-quantifiable risks, such as business risks, are not
considered here.
201 thyssenkrupp annual report 2014/2015 Consolidated financial statements // Notes to the consolidated financial statements
Foreign currency risk exposures The international nature of our business activities generates numerous cash flows in different currencies –
especially in US dollars. Hedging the resulting currency risk exposures is an essential part of our risk
management.
Group-wide regulations form the basis for thyssenkrupp Group’s currency management. Principally, all
group companies are obliged to hedge foreign currency positions at the time of inception. Affiliated
companies based in the Euro zone are obliged to submit all unhedged positions from trade activities in major
transaction currencies to a central clearing office. Depending on the derivatives’ hedging purpose and
resulting accounting treatment, the offered positions are either hedged under a portfolio hedge approach or
directly hedged with banks on a back-to-back basis taking into account the respective maturity. Financial
transactions and the transactions undertaken by our subsidiaries outside the Euro zone are hedged in close
cooperation with central Group management. Compliance with the Group’s requirements is regularly
ascertained by our Corporate Function Internal Auditing.
Foreign currency hedging is used to fix prices on the basis of hedging rates as protection against any
unfavorable exchange rate fluctuations in the future. Hedging periods are generally based on the maturities
of underlying transactions. Foreign currency derivative contracts usually have maturities of twelve months or
less, but can also be up to 60 months in single exceptional cases.
The US dollar is the only relevant risk variable for sensitivity analyses under IFRS 7, as the vast majority of
foreign currency cash flows occurs in US dollars. As hedging transactions are generally used to hedge
underlying transactions, opposite effects in underlying and hedging transactions are almost entirely offset
over the total period. Thus, the currency risk exposure described here results from hedging relationships
with off-balance sheet underlying transactions, i.e. hedges of firm commitments and forecasted sales.
Based on our analysis, the US dollar exposure as of September 30, 2015 was as follows:
If the Euro had been 10% stronger against the US dollar as of September 30, 2015, the hedge reserve in
equity and fair value of hedging transactions would have been €11 million (2014: €20 million) lower and
earnings resulting from the measurement as of the balance sheet date €8 million (2013/2014: €64 million)
higher. If the Euro had been 10% weaker against the US dollar as of September 30, 2015, the hedge
reserve in equity and fair value of hedging transactions would have been €13 million (2014: €25 million)
higher and earnings resulting from the measurement as of the balance sheet date €12 million (2013/2014:
€80 million) lower.
Interest rate risk Due to the international focus of thyssenkrupp’s business activities, the Group procures liquidity to cover its
financial needs in international money and capital markets in different currencies and with various
maturities. Some of the resulting financial debt and financial investments are exposed to interest rate risk.
The Group’s central interest rate management manages and optimizes interest rate risk. This includes
regular interest analyses. In some cases, the Group uses derivatives to hedge interest rate risk. These
instruments are contracted with the objective of minimizing interest rate volatilities and finance costs for
underlying transactions.
As of September 30, 2014 and 2015, respectively, all interest derivatives are immediately and directly
allocated to particular financings as cash flow hedges. Consequently, as of the balance sheet dates all
interest derivatives qualify for hedge accounting.
Cross currency swaps have been contracted in connection with the US dollar financing activities.
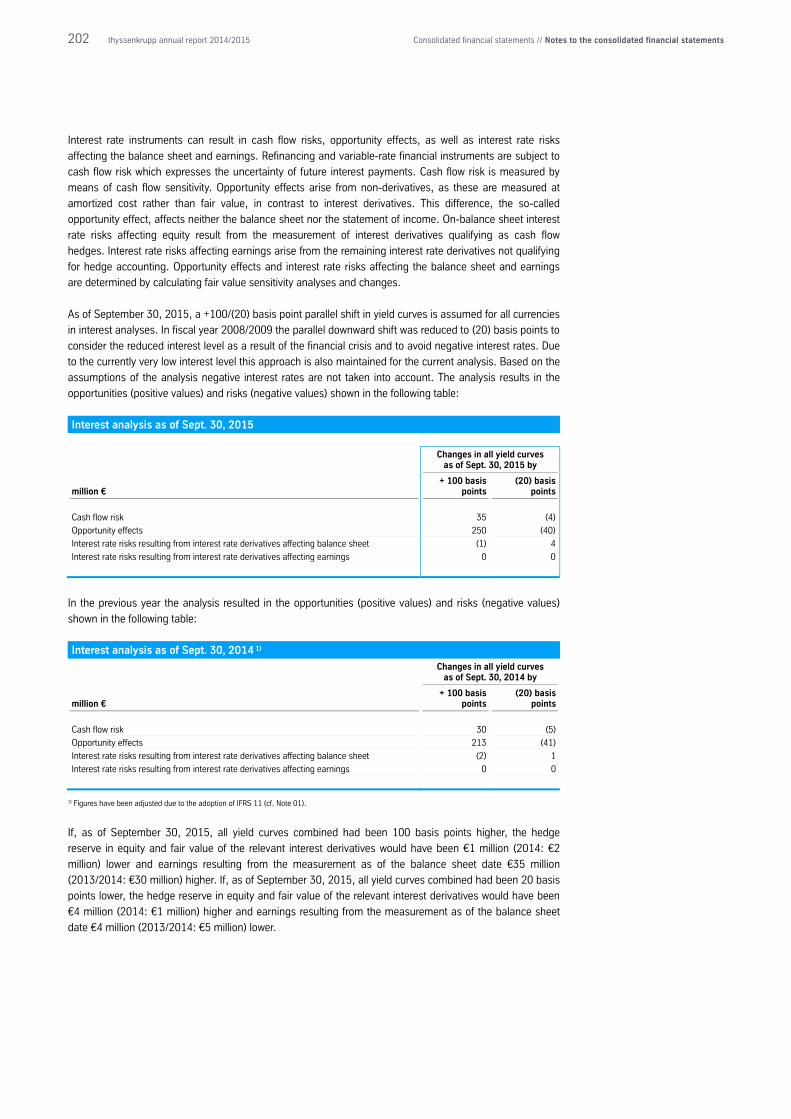
202 thyssenkrupp annual report 2014/2015 Consolidated financial statements // Notes to the consolidated financial statements
Interest rate instruments can result in cash flow risks, opportunity effects, as well as interest rate risks
affecting the balance sheet and earnings. Refinancing and variable-rate financial instruments are subject to
cash flow risk which expresses the uncertainty of future interest payments. Cash flow risk is measured by
means of cash flow sensitivity. Opportunity effects arise from non-derivatives, as these are measured at
amortized cost rather than fair value, in contrast to interest derivatives. This difference, the so-called
opportunity effect, affects neither the balance sheet nor the statement of income. On-balance sheet interest
rate risks affecting equity result from the measurement of interest derivatives qualifying as cash flow
hedges. Interest rate risks affecting earnings arise from the remaining interest rate derivatives not qualifying
for hedge accounting. Opportunity effects and interest rate risks affecting the balance sheet and earnings
are determined by calculating fair value sensitivity analyses and changes.
As of September 30, 2015, a +100/(20) basis point parallel shift in yield curves is assumed for all currencies
in interest analyses. In fiscal year 2008/2009 the parallel downward shift was reduced to (20) basis points to
consider the reduced interest level as a result of the financial crisis and to avoid negative interest rates. Due
to the currently very low interest level this approach is also maintained for the current analysis. Based on the
assumptions of the analysis negative interest rates are not taken into account. The analysis results in the
opportunities (positive values) and risks (negative values) shown in the following table:
Interest analysis as of Sept. 30, 2015
Changes in all yield curves
as of Sept. 30, 2015 by
million € + 100 basis
points (20) basis
points
Cash flow risk 35 (4)
Opportunity effects 250 (40)
Interest rate risks resulting from interest rate derivatives affecting balance sheet (1) 4
Interest rate risks resulting from interest rate derivatives affecting earnings 0 0
In the previous year the analysis resulted in the opportunities (positive values) and risks (negative values)
shown in the following table:
Interest analysis as of Sept. 30, 2014 1)
Changes in all yield curves
as of Sept. 30, 2014 by
million € + 100 basis
points (20) basis
points
Cash flow risk 30 (5)
Opportunity effects 213 (41)
Interest rate risks resulting from interest rate derivatives affecting balance sheet (2) 1
Interest rate risks resulting from interest rate derivatives affecting earnings 0 0
1) Figures have been adjusted due to the adoption of IFRS 11 (cf. Note 01).
If, as of September 30, 2015, all yield curves combined had been 100 basis points higher, the hedge
reserve in equity and fair value of the relevant interest derivatives would have been €1 million (2014: €2
million) lower and earnings resulting from the measurement as of the balance sheet date €35 million
(2013/2014: €30 million) higher. If, as of September 30, 2015, all yield curves combined had been 20 basis
points lower, the hedge reserve in equity and fair value of the relevant interest derivatives would have been
€4 million (2014: €1 million) higher and earnings resulting from the measurement as of the balance sheet
date €4 million (2013/2014: €5 million) lower.
203 thyssenkrupp annual report 2014/2015 Consolidated financial statements // Notes to the consolidated financial statements
Commodity price risks The Group uses various nonferrous metals, especially nickel, as well as commodities such as ore, coal, coke
and energy, for different production processes. Furthermore extensive additional freight capacities are
needed. Purchase prices for commodities, energy and freight capacity can vary significantly depending on
market conditions.
This causes commodity price risks which can affect income, equity and cash flow. We react with adjusted
selling prices and alternative purchasing resources to ensure our competitiveness. To minimize risks arising
from commodity price volatilities, the Group also uses derivatives, especially for copper, nickel, zinc and tin.
The contracting of such financial derivatives is subject to strict guidelines which are checked for compliance
by internal auditing. The nonferrous metals are generally hedged by a central system. Only marketable
instruments are used, as there are mainly commodity forward contracts. Commodity forward contracts are
measured at fair value. Fluctuations in fair value are recognized predominately in profit or loss under sales
revenue or cost of sales. Sometimes cash flow hedge accounting is used when commodity derivatives are
immediately and directly allocated to a particular firm commitment. In some cases, fair value hedges are
used to hedge the exposure to changes in fair value of a firm commitment and exposure to inventory price
risks.
Risks resulting from rising energy prices are limited by structuring procurement on the electricity market and
concluding or extending long-term natural gas contracts. These contracts are subject to the so-called “own
use exemption” and therefore not carried as derivatives.
To minimize the risk of fluctuating freight prices, the Group uses among other things long-term fixed price
contracts, of which one contract is recognized as a commodity forward transaction measured at fair value.
Only hypothetical changes in market prices for derivatives are included in scenario analysis, required for
financial instruments under IFRS 7. Offsetting effects from underlying transactions are not taken into
account and would reduce their effect significantly.
As of September 30, 2015 a +20/(20)% shift in market prices for non-ferrous metals and freight rates is
assumed. If an increase of 20% in market prices for said non-ferrous metals and freight rates is assumed,
the estimated hypothetical impact on profit or loss resulting from the measurement as of the balance sheet
date is €16 million (2013/2014: €2 million), and on equity €9 million (2014: €10 million). If a decrease of
20% in market prices for said non-ferrous metals and freight rates is assumed, the estimated hypothetical
impact on profit or loss resulting from the measurement as of the balance sheet date is €(2) million
(2013/2014: €9 million), and on equity €(22) million (2014: €(19) million).
23 Related parties Based on the notification received in accordance with German Securities Trade Act (WpHG) Art. 21 para. 1
as of December 3, 2013, the Alfried Krupp von Bohlen und Halbach Foundation holds an interest of 23.03%
in thyssenkrupp AG; based on a voluntary notification of the Foundation as of October 13, 2015, the interest
in thyssenkrupp AG as of September 30, 2015 is unchanged. Outside the services and considerations
provided for in the by-laws (Article 21 of the Articles of Association of thyssenkrupp AG), there are no other
significant delivery and service relations.
In 2013/2014 and 2014/2015, the Group has business relations with non-consolidated subsidiaries,
associates and joint ventures. Transactions with these related parties result in general from the delivery and
service relations in the ordinary course of business; the extent of the business relations is presented in the
following table:
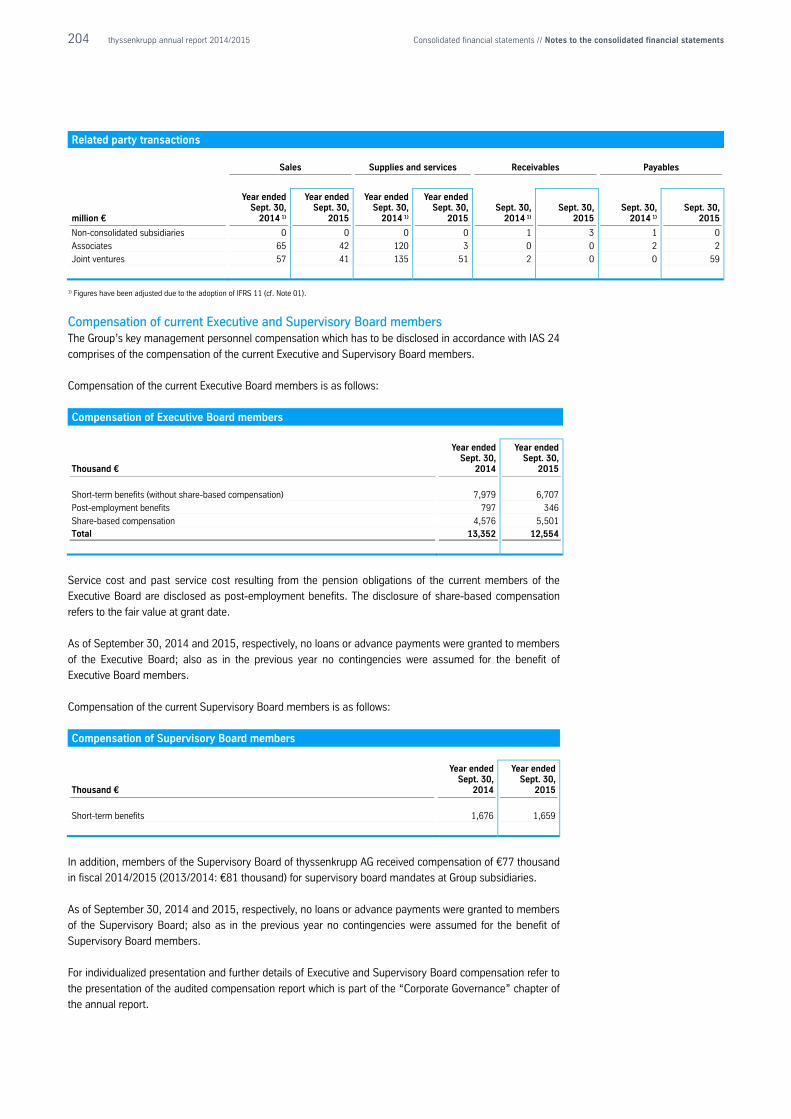
204 thyssenkrupp annual report 2014/2015 Consolidated financial statements // Notes to the consolidated financial statements
Related party transactions
Sales Supplies and services Receivables Payables
million €
Year ended Sept. 30,
2014 1)
Year ended Sept. 30,
2015
Year ended Sept. 30,
2014 1)
Year ended Sept. 30,
2015 Sept. 30,
2014 1) Sept. 30,
2015 Sept. 30,
2014 1) Sept. 30,
2015
Non-consolidated subsidiaries 0 0 0 0 1 3 1 0
Associates 65 42 120 3 0 0 2 2
Joint ventures 57 41 135 51 2 0 0 59
1) Figures have been adjusted due to the adoption of IFRS 11 (cf. Note 01).
Compensation of current Executive and Supervisory Board members The Group’s key management personnel compensation which has to be disclosed in accordance with IAS 24
comprises of the compensation of the current Executive and Supervisory Board members.
Compensation of the current Executive Board members is as follows:
Compensation of Executive Board members
Thousand €
Year ended Sept. 30,
2014
Year ended Sept. 30,
2015
Short-term benefits (without share-based compensation) 7,979 6,707
Post-employment benefits 797 346
Share-based compensation 4,576 5,501 Total 13,352 12,554
Service cost and past service cost resulting from the pension obligations of the current members of the
Executive Board are disclosed as post-employment benefits. The disclosure of share-based compensation
refers to the fair value at grant date.
As of September 30, 2014 and 2015, respectively, no loans or advance payments were granted to members
of the Executive Board; also as in the previous year no contingencies were assumed for the benefit of
Executive Board members.
Compensation of the current Supervisory Board members is as follows:
Compensation of Supervisory Board members
Thousand €
Year ended Sept. 30,
2014
Year ended Sept. 30,
2015
Short-term benefits 1,676 1,659
In addition, members of the Supervisory Board of thyssenkrupp AG received compensation of €77 thousand
in fiscal 2014/2015 (2013/2014: €81 thousand) for supervisory board mandates at Group subsidiaries.
As of September 30, 2014 and 2015, respectively, no loans or advance payments were granted to members
of the Supervisory Board; also as in the previous year no contingencies were assumed for the benefit of
Supervisory Board members.
For individualized presentation and further details of Executive and Supervisory Board compensation refer to
the presentation of the audited compensation report which is part of the “Corporate Governance” chapter of
the annual report.
205 thyssenkrupp annual report 2014/2015 Consolidated financial statements // Notes to the consolidated financial statements
Compensation of former Executive and Supervisory Board members Total compensation paid to former members of the Executive Board and their surviving dependants
amounted to €17.4 million (2013/2014: €17.7 million). Under IFRS an amount of €261.6 million (2014:
€267.7 million) is accrued for pension obligations benefiting former Executive Board members and their
surviving dependants.
24 Segment reporting thyssenkrupp is organized in the following operating business areas that represent the Group’s activities
within capital goods and materials. The business areas are in line with the internal organizational and
reporting structure and represent the segments in accordance with IFRS 8. The Stainless Global business
area is classified as discontinued operation; after the disposal at the end of the 1st quarter ended December
31, 2012, income and expense directly related to the disposal of Stainless Global is reported here.
Components Technology This business area offers efficient and innovative components for the automotive, construction and
engineering sectors as well as for wind turbines.
Elevator Technology This business area is active in the construction, modernization and servicing of elevators, escalators, moving
walks, stair and platform lifts as well as passenger boarding bridges. Alongside a full range of installations
for the volume market, the business area also delivers customized solutions.
Industrial Solutions Industrial Solutions is a leading international supplier in special and large-scale plant construction as well as
naval shipbuilding.
Materials Services The business area is focused on the global distribution of materials and the provision of complex technical
services for the production and manufacturing sectors. In connection with the ending of all financial links
with OTK the full VDM group, the AST group with its plants and the Italian service center as well as further
stainless steel service centers in Germany, France, Spain and Turkey were assigned to the business area
with effect from February 28, 2014; effective as of July 31, 2015 the total VDM group was disposed of
again.
Steel Europe This business area brings together the premium flat carbon steel activities, from intelligent material solutions
to finished parts.
Steel Americas This business area includes the production, processing and marketing of high-quality steel products in North
and South America. It contains mainly the steelmaking and processing plants in Brazil and until sale on
February 26, 2014 in the USA.
Corporate Corporate comprises the Group’s head office and the shared services activities that includes Business
Services (finance and human resources), IT and Real Estate including non-operating real estate. In addition,
part of Corporate are the regional headquarters as well as additional companies that could not be assigned
to the operational business of the individual business areas.
Corporate comprises the Group’s head office including administration for the regions, asset management for
the Group’s real estate, and the global shared services activities. The global shared services unit combines
key locally performed functions at the Group’s internal service centers. These are site-independent activities
such as certain processes in accounting, IT, real estate services and HR. Corporate also includes companies
that cannot be allocated to the operating businesses of the business areas.
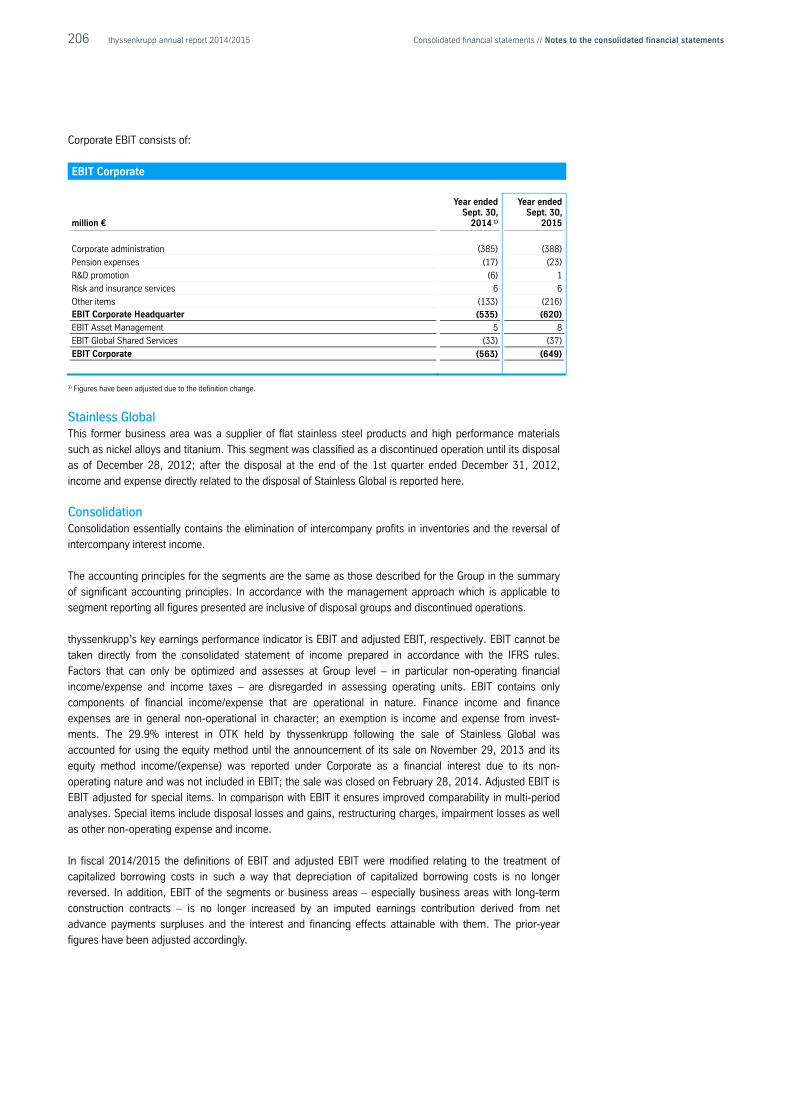
206 thyssenkrupp annual report 2014/2015 Consolidated financial statements // Notes to the consolidated financial statements
Corporate EBIT consists of:
EBIT Corporate
million €
Year ended Sept. 30,
2014 1)
Year ended Sept. 30,
2015
Corporate administration (385) (388)
Pension expenses (17) (23)
R&D promotion (6) 1
Risk and insurance services 6 6
Other items (133) (216) EBIT Corporate Headquarter (535) (620)
EBIT Asset Management 5 8
EBIT Global Shared Services (33) (37)
EBIT Corporate (563) (649)
1) Figures have been adjusted due to the definition change.
Stainless Global This former business area was a supplier of flat stainless steel products and high performance materials
such as nickel alloys and titanium. This segment was classified as a discontinued operation until its disposal
as of December 28, 2012; after the disposal at the end of the 1st quarter ended December 31, 2012,
income and expense directly related to the disposal of Stainless Global is reported here.
Consolidation Consolidation essentially contains the elimination of intercompany profits in inventories and the reversal of
intercompany interest income.
The accounting principles for the segments are the same as those described for the Group in the summary
of significant accounting principles. In accordance with the management approach which is applicable to
segment reporting all figures presented are inclusive of disposal groups and discontinued operations.
thyssenkrupp’s key earnings performance indicator is EBIT and adjusted EBIT, respectively. EBIT cannot be
taken directly from the consolidated statement of income prepared in accordance with the IFRS rules.
Factors that can only be optimized and assesses at Group level – in particular non-operating financial
income/expense and income taxes – are disregarded in assessing operating units. EBIT contains only
components of financial income/expense that are operational in nature. Finance income and finance
expenses are in general non-operational in character; an exemption is income and expense from invest-
ments. The 29.9% interest in OTK held by thyssenkrupp following the sale of Stainless Global was
accounted for using the equity method until the announcement of its sale on November 29, 2013 and its
equity method income/(expense) was reported under Corporate as a financial interest due to its non-
operating nature and was not included in EBIT; the sale was closed on February 28, 2014. Adjusted EBIT is
EBIT adjusted for special items. In comparison with EBIT it ensures improved comparability in multi-period
analyses. Special items include disposal losses and gains, restructuring charges, impairment losses as well
as other non-operating expense and income.
In fiscal 2014/2015 the definitions of EBIT and adjusted EBIT were modified relating to the treatment of
capitalized borrowing costs in such a way that depreciation of capitalized borrowing costs is no longer
reversed. In addition, EBIT of the segments or business areas – especially business areas with long-term
construction contracts – is no longer increased by an imputed earnings contribution derived from net
advance payments surpluses and the interest and financing effects attainable with them. The prior-year
figures have been adjusted accordingly.
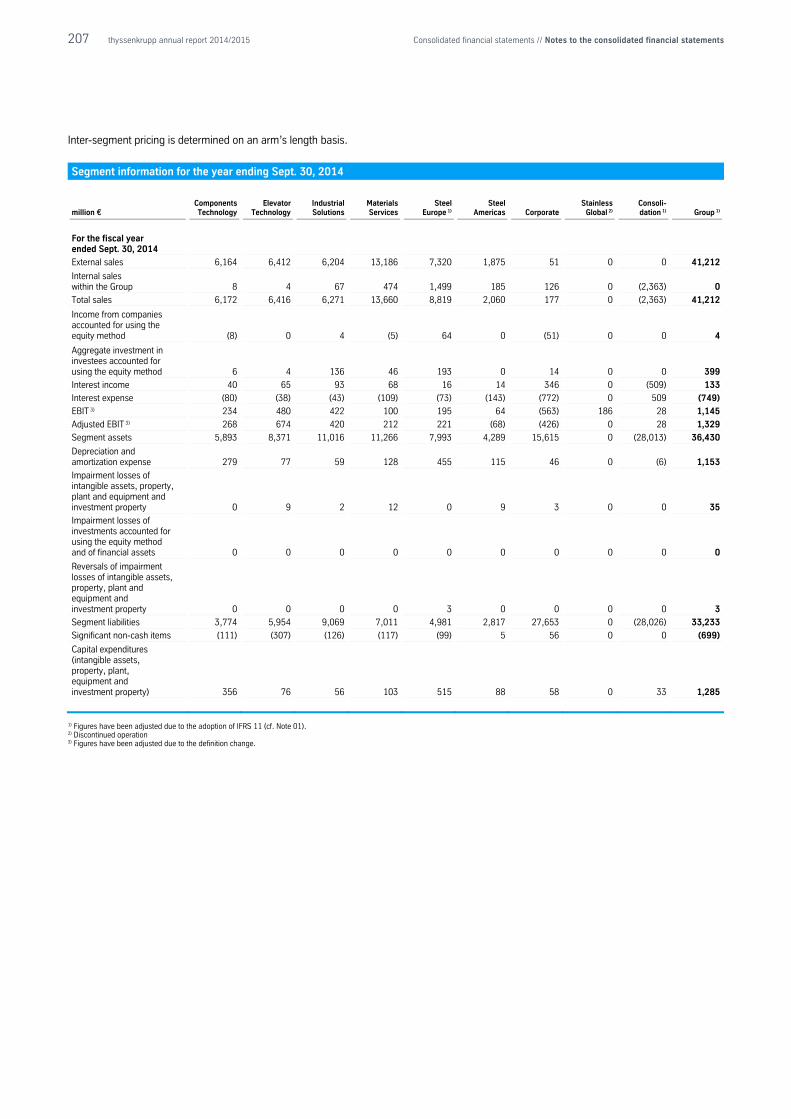
207 thyssenkrupp annual report 2014/2015 Consolidated financial statements // Notes to the consolidated financial statements
Inter-segment pricing is determined on an arm’s length basis.
Segment information for the year ending Sept. 30, 2014
million € Components Technology
Elevator Technology
Industrial Solutions
Materials Services
Steel Europe 1)
Steel Americas Corporate
Stainless Global 2)
Consoli- dation 1) Group 1)
For the fiscal year ended Sept. 30, 2014
External sales 6,164 6,412 6,204 13,186 7,320 1,875 51 0 0 41,212
Internal sales within the Group 8 4 67 474 1,499 185 126 0 (2,363) 0
Total sales 6,172 6,416 6,271 13,660 8,819 2,060 177 0 (2,363) 41,212
Income from companies accounted for using the equity method (8) 0 4 (5) 64 0 (51) 0 0 4
Aggregate investment in investees accounted for using the equity method 6 4 136 46 193 0 14 0 0 399
Interest income 40 65 93 68 16 14 346 0 (509) 133
Interest expense (80) (38) (43) (109) (73) (143) (772) 0 509 (749)
EBIT 3) 234 480 422 100 195 64 (563) 186 28 1,145
Adjusted EBIT 3) 268 674 420 212 221 (68) (426) 0 28 1,329
Segment assets 5,893 8,371 11,016 11,266 7,993 4,289 15,615 0 (28,013) 36,430
Depreciation and amortization expense 279 77 59 128 455 115 46 0 (6) 1,153
Impairment losses of intangible assets, property, plant and equipment and investment property 0 9 2 12 0 9 3 0 0 35
Impairment losses of investments accounted for using the equity method and of financial assets 0 0 0 0 0 0 0 0 0 0
Reversals of impairment losses of intangible assets, property, plant and equipment and investment property 0 0 0 0 3 0 0 0 0 3
Segment liabilities 3,774 5,954 9,069 7,011 4,981 2,817 27,653 0 (28,026) 33,233
Significant non-cash items (111) (307) (126) (117) (99) 5 56 0 0 (699)
Capital expenditures (intangible assets, property, plant, equipment and investment property) 356 76 56 103 515 88 58 0 33 1,285
1) Figures have been adjusted due to the adoption of IFRS 11 (cf. Note 01). 2) Discontinued operation 3) Figures have been adjusted due to the definition change.
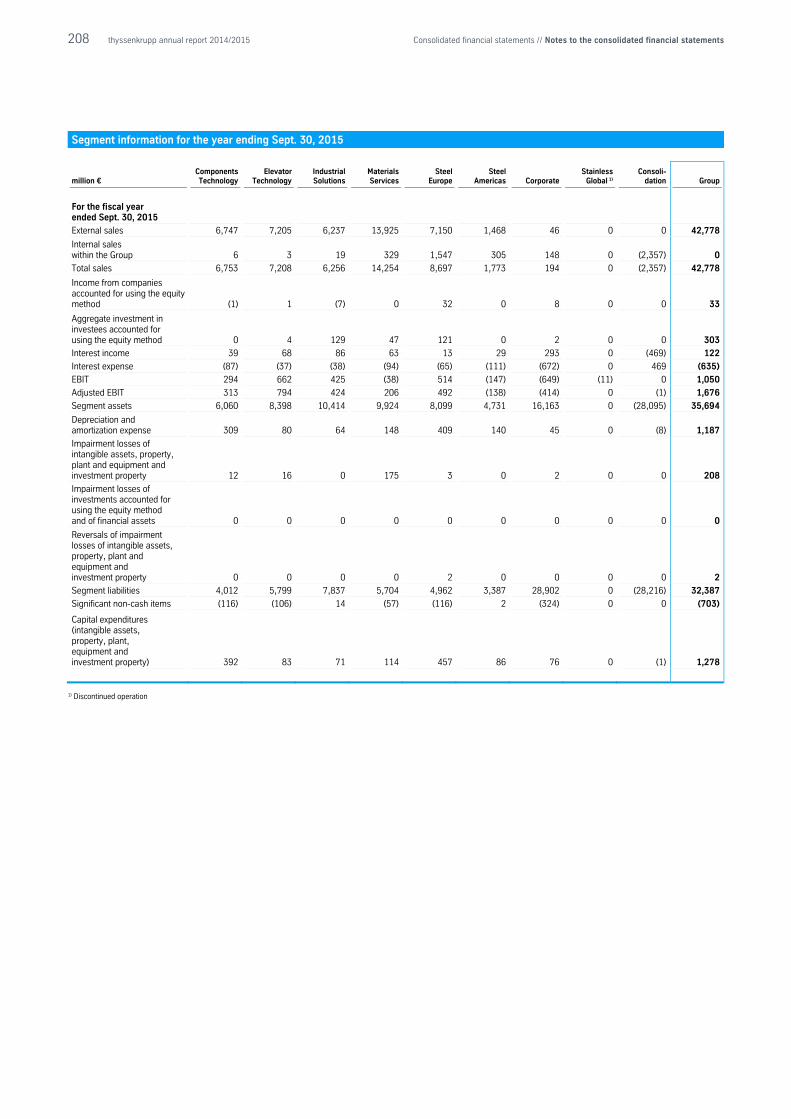
208 thyssenkrupp annual report 2014/2015 Consolidated financial statements // Notes to the consolidated financial statements
Segment information for the year ending Sept. 30, 2015
million € Components Technology
Elevator Technology
Industrial Solutions
Materials Services
Steel Europe
Steel Americas Corporate
Stainless Global 1)
Consoli- dation Group
For the fiscal year ended Sept. 30, 2015
External sales 6,747 7,205 6,237 13,925 7,150 1,468 46 0 0 42,778
Internal sales within the Group 6 3 19 329 1,547 305 148 0 (2,357) 0
Total sales 6,753 7,208 6,256 14,254 8,697 1,773 194 0 (2,357) 42,778
Income from companies accounted for using the equity method (1) 1 (7) 0 32 0 8 0 0 33
Aggregate investment in investees accounted for using the equity method 0 4 129 47 121 0 2 0 0 303
Interest income 39 68 86 63 13 29 293 0 (469) 122
Interest expense (87) (37) (38) (94) (65) (111) (672) 0 469 (635)
EBIT 294 662 425 (38) 514 (147) (649) (11) 0 1,050
Adjusted EBIT 313 794 424 206 492 (138) (414) 0 (1) 1,676
Segment assets 6,060 8,398 10,414 9,924 8,099 4,731 16,163 0 (28,095) 35,694
Depreciation and amortization expense 309 80 64 148 409 140 45 0 (8) 1,187
Impairment losses of intangible assets, property, plant and equipment and investment property 12 16 0 175 3 0 2 0 0 208
Impairment losses of investments accounted for using the equity method and of financial assets 0 0 0 0 0 0 0 0 0 0
Reversals of impairment losses of intangible assets, property, plant and equipment and investment property 0 0 0 0 2 0 0 0 0 2
Segment liabilities 4,012 5,799 7,837 5,704 4,962 3,387 28,902 0 (28,216) 32,387
Significant non-cash items (116) (106) 14 (57) (116) 2 (324) 0 0 (703)
Capital expenditures (intangible assets, property, plant, equipment and investment property) 392 83 71 114 457 86 76 0 (1) 1,278
1) Discontinued operation
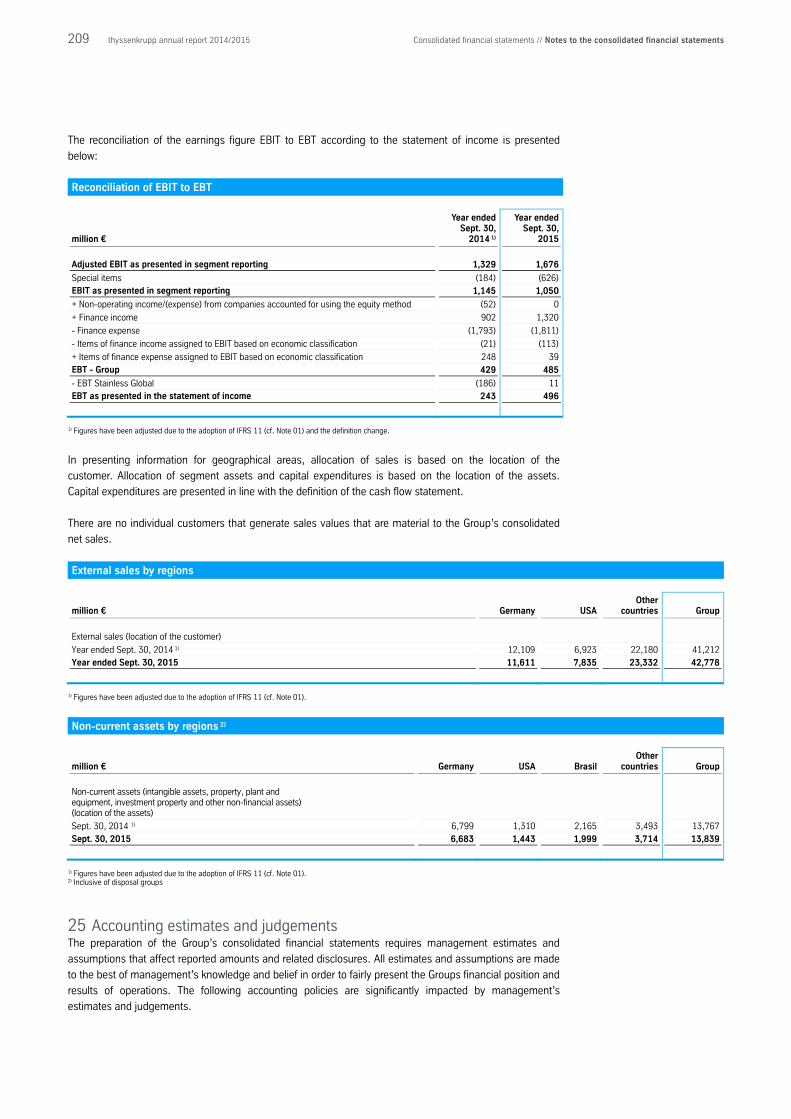
209 thyssenkrupp annual report 2014/2015 Consolidated financial statements // Notes to the consolidated financial statements
The reconciliation of the earnings figure EBIT to EBT according to the statement of income is presented
below:
Reconciliation of EBIT to EBT
million €
Year ended Sept. 30,
2014 1)
Year ended Sept. 30,
2015
Adjusted EBIT as presented in segment reporting 1,329 1,676
Special items (184) (626) EBIT as presented in segment reporting 1,145 1,050
+ Non-operating income/(expense) from companies accounted for using the equity method (52) 0
+ Finance income 902 1,320
- Finance expense (1,793) (1,811)
- Items of finance income assigned to EBIT based on economic classification (21) (113)
+ Items of finance expense assigned to EBIT based on economic classification 248 39 EBT - Group 429 485
- EBT Stainless Global (186) 11 EBT as presented in the statement of income 243 496
1) Figures have been adjusted due to the adoption of IFRS 11 (cf. Note 01) and the definition change.
In presenting information for geographical areas, allocation of sales is based on the location of the
customer. Allocation of segment assets and capital expenditures is based on the location of the assets.
Capital expenditures are presented in line with the definition of the cash flow statement.
There are no individual customers that generate sales values that are material to the Group’s consolidated
net sales.
External sales by regions
million € Germany USA Other
countries Group
External sales (location of the customer)
Year ended Sept. 30, 2014 1) 12,109 6,923 22,180 41,212
Year ended Sept. 30, 2015 11,611 7,835 23,332 42,778
1) Figures have been adjusted due to the adoption of IFRS 11 (cf. Note 01).
Non-current assets by regions 2)
million € Germany USA Brasil Other
countries Group
Non-current assets (intangible assets, property, plant and equipment, investment property and other non-financial assets) (location of the assets)
Sept. 30, 2014 1) 6,799 1,310 2,165 3,493 13,767
Sept. 30, 2015 6,683 1,443 1,999 3,714 13,839
1) Figures have been adjusted due to the adoption of IFRS 11 (cf. Note 01). 2) Inclusive of disposal groups
25 Accounting estimates and judgements The preparation of the Group’s consolidated financial statements requires management estimates and
assumptions that affect reported amounts and related disclosures. All estimates and assumptions are made
to the best of management’s knowledge and belief in order to fairly present the Groups financial position and
results of operations. The following accounting policies are significantly impacted by management’s
estimates and judgements.
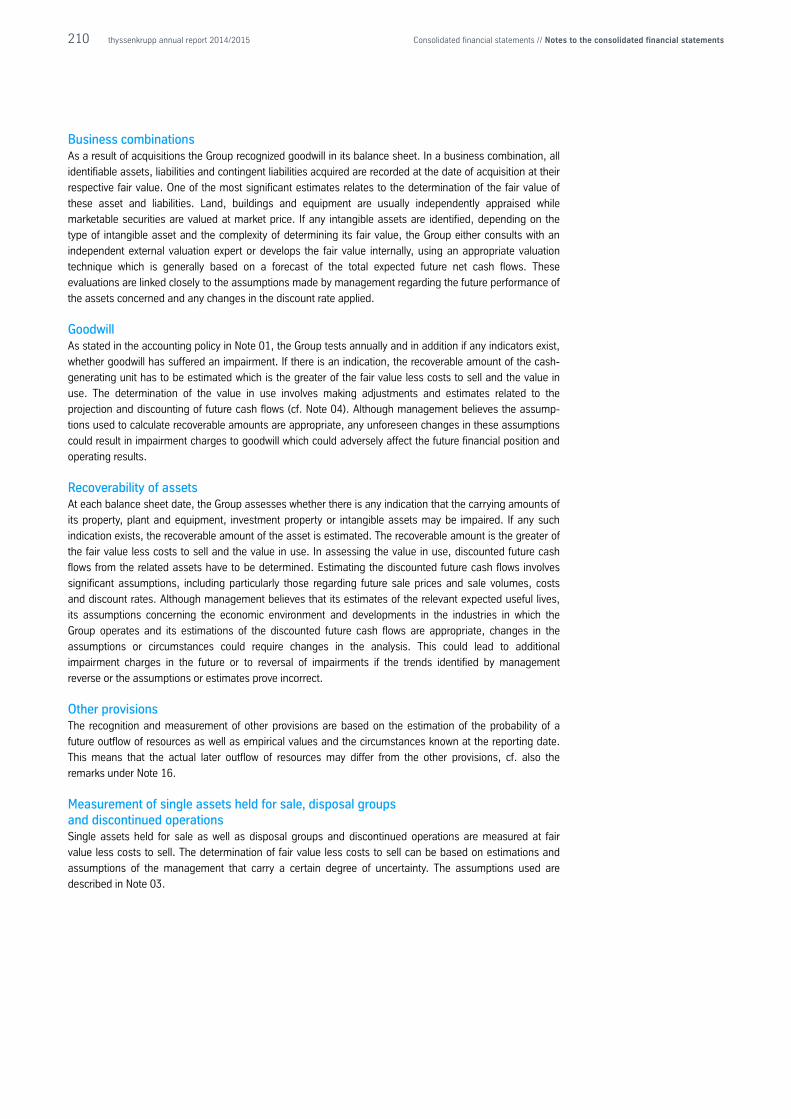
210 thyssenkrupp annual report 2014/2015 Consolidated financial statements // Notes to the consolidated financial statements
Business combinations As a result of acquisitions the Group recognized goodwill in its balance sheet. In a business combination, all
identifiable assets, liabilities and contingent liabilities acquired are recorded at the date of acquisition at their
respective fair value. One of the most significant estimates relates to the determination of the fair value of
these asset and liabilities. Land, buildings and equipment are usually independently appraised while
marketable securities are valued at market price. If any intangible assets are identified, depending on the
type of intangible asset and the complexity of determining its fair value, the Group either consults with an
independent external valuation expert or develops the fair value internally, using an appropriate valuation
technique which is generally based on a forecast of the total expected future net cash flows. These
evaluations are linked closely to the assumptions made by management regarding the future performance of
the assets concerned and any changes in the discount rate applied.
Goodwill As stated in the accounting policy in Note 01, the Group tests annually and in addition if any indicators exist,
whether goodwill has suffered an impairment. If there is an indication, the recoverable amount of the cash-
generating unit has to be estimated which is the greater of the fair value less costs to sell and the value in
use. The determination of the value in use involves making adjustments and estimates related to the
projection and discounting of future cash flows (cf. Note 04). Although management believes the assump-
tions used to calculate recoverable amounts are appropriate, any unforeseen changes in these assumptions
could result in impairment charges to goodwill which could adversely affect the future financial position and
operating results.
Recoverability of assets At each balance sheet date, the Group assesses whether there is any indication that the carrying amounts of
its property, plant and equipment, investment property or intangible assets may be impaired. If any such
indication exists, the recoverable amount of the asset is estimated. The recoverable amount is the greater of
the fair value less costs to sell and the value in use. In assessing the value in use, discounted future cash
flows from the related assets have to be determined. Estimating the discounted future cash flows involves
significant assumptions, including particularly those regarding future sale prices and sale volumes, costs
and discount rates. Although management believes that its estimates of the relevant expected useful lives,
its assumptions concerning the economic environment and developments in the industries in which the
Group operates and its estimations of the discounted future cash flows are appropriate, changes in the
assumptions or circumstances could require changes in the analysis. This could lead to additional
impairment charges in the future or to reversal of impairments if the trends identified by management
reverse or the assumptions or estimates prove incorrect.
Other provisions The recognition and measurement of other provisions are based on the estimation of the probability of a
future outflow of resources as well as empirical values and the circumstances known at the reporting date.
This means that the actual later outflow of resources may differ from the other provisions, cf. also the
remarks under Note 16.
Measurement of single assets held for sale, disposal groups and discontinued operations Single assets held for sale as well as disposal groups and discontinued operations are measured at fair
value less costs to sell. The determination of fair value less costs to sell can be based on estimations and
assumptions of the management that carry a certain degree of uncertainty. The assumptions used are
described in Note 03.
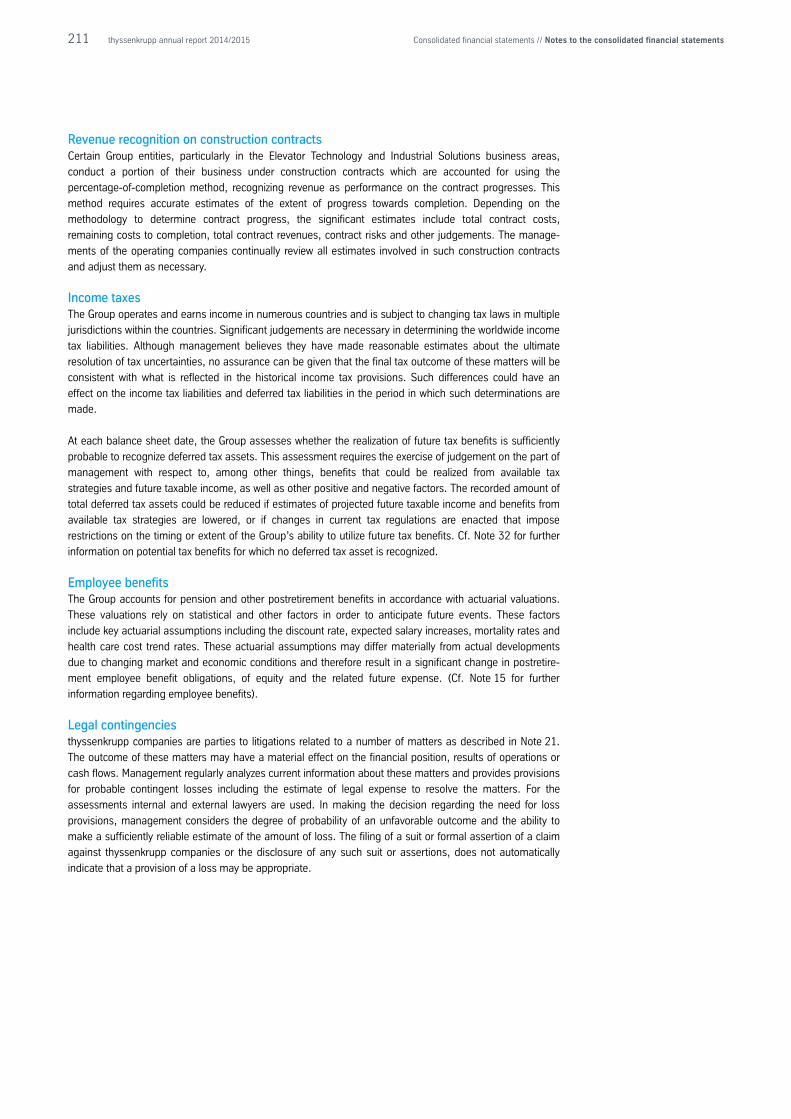
211 thyssenkrupp annual report 2014/2015 Consolidated financial statements // Notes to the consolidated financial statements
Revenue recognition on construction contracts Certain Group entities, particularly in the Elevator Technology and Industrial Solutions business areas,
conduct a portion of their business under construction contracts which are accounted for using the
percentage-of-completion method, recognizing revenue as performance on the contract progresses. This
method requires accurate estimates of the extent of progress towards completion. Depending on the
methodology to determine contract progress, the significant estimates include total contract costs,
remaining costs to completion, total contract revenues, contract risks and other judgements. The manage-
ments of the operating companies continually review all estimates involved in such construction contracts
and adjust them as necessary.
Income taxes The Group operates and earns income in numerous countries and is subject to changing tax laws in multiple
jurisdictions within the countries. Significant judgements are necessary in determining the worldwide income
tax liabilities. Although management believes they have made reasonable estimates about the ultimate
resolution of tax uncertainties, no assurance can be given that the final tax outcome of these matters will be
consistent with what is reflected in the historical income tax provisions. Such differences could have an
effect on the income tax liabilities and deferred tax liabilities in the period in which such determinations are
made.
At each balance sheet date, the Group assesses whether the realization of future tax benefits is sufficiently
probable to recognize deferred tax assets. This assessment requires the exercise of judgement on the part of
management with respect to, among other things, benefits that could be realized from available tax
strategies and future taxable income, as well as other positive and negative factors. The recorded amount of
total deferred tax assets could be reduced if estimates of projected future taxable income and benefits from
available tax strategies are lowered, or if changes in current tax regulations are enacted that impose
restrictions on the timing or extent of the Group’s ability to utilize future tax benefits. Cf. Note 32 for further
information on potential tax benefits for which no deferred tax asset is recognized.
Employee benefits The Group accounts for pension and other postretirement benefits in accordance with actuarial valuations.
These valuations rely on statistical and other factors in order to anticipate future events. These factors
include key actuarial assumptions including the discount rate, expected salary increases, mortality rates and
health care cost trend rates. These actuarial assumptions may differ materially from actual developments
due to changing market and economic conditions and therefore result in a significant change in postretire-
ment employee benefit obligations, of equity and the related future expense. (Cf. Note 15 for further
information regarding employee benefits).
Legal contingencies thyssenkrupp companies are parties to litigations related to a number of matters as described in Note 21.
The outcome of these matters may have a material effect on the financial position, results of operations or
cash flows. Management regularly analyzes current information about these matters and provides provisions
for probable contingent losses including the estimate of legal expense to resolve the matters. For the
assessments internal and external lawyers are used. In making the decision regarding the need for loss
provisions, management considers the degree of probability of an unfavorable outcome and the ability to
make a sufficiently reliable estimate of the amount of loss. The filing of a suit or formal assertion of a claim
against thyssenkrupp companies or the disclosure of any such suit or assertions, does not automatically
indicate that a provision of a loss may be appropriate.
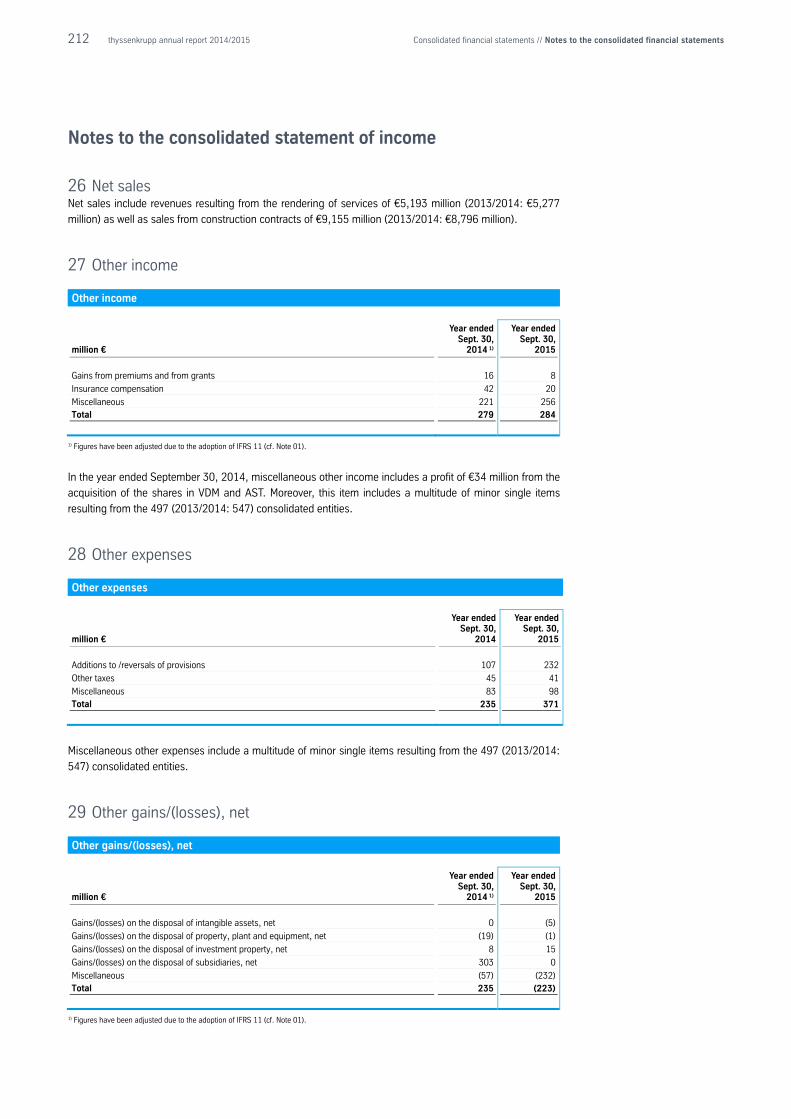
212 thyssenkrupp annual report 2014/2015 Consolidated financial statements // Notes to the consolidated financial statements
Notes to the consolidated statement of income
26 Net sales Net sales include revenues resulting from the rendering of services of €5,193 million (2013/2014: €5,277
million) as well as sales from construction contracts of €9,155 million (2013/2014: €8,796 million).
27 Other income Other income
million €
Year ended Sept. 30,
2014 1)
Year ended Sept. 30,
2015
Gains from premiums and from grants 16 8
Insurance compensation 42 20
Miscellaneous 221 256 Total 279 284
1) Figures have been adjusted due to the adoption of IFRS 11 (cf. Note 01).
In the year ended September 30, 2014, miscellaneous other income includes a profit of €34 million from the
acquisition of the shares in VDM and AST. Moreover, this item includes a multitude of minor single items
resulting from the 497 (2013/2014: 547) consolidated entities.
28 Other expenses Other expenses
million €
Year ended Sept. 30,
2014
Year ended Sept. 30,
2015
Additions to /reversals of provisions 107 232
Other taxes 45 41
Miscellaneous 83 98 Total 235 371
Miscellaneous other expenses include a multitude of minor single items resulting from the 497 (2013/2014:
547) consolidated entities.
29 Other gains/(losses), net Other gains/(losses), net
million €
Year ended Sept. 30,
2014 1)
Year ended Sept. 30,
2015
Gains/(losses) on the disposal of intangible assets, net 0 (5)
Gains/(losses) on the disposal of property, plant and equipment, net (19) (1)
Gains/(losses) on the disposal of investment property, net 8 15
Gains/(losses) on the disposal of subsidiaries, net 303 0
Miscellaneous (57) (232) Total 235 (223)
1) Figures have been adjusted due to the adoption of IFRS 11 (cf. Note 01).
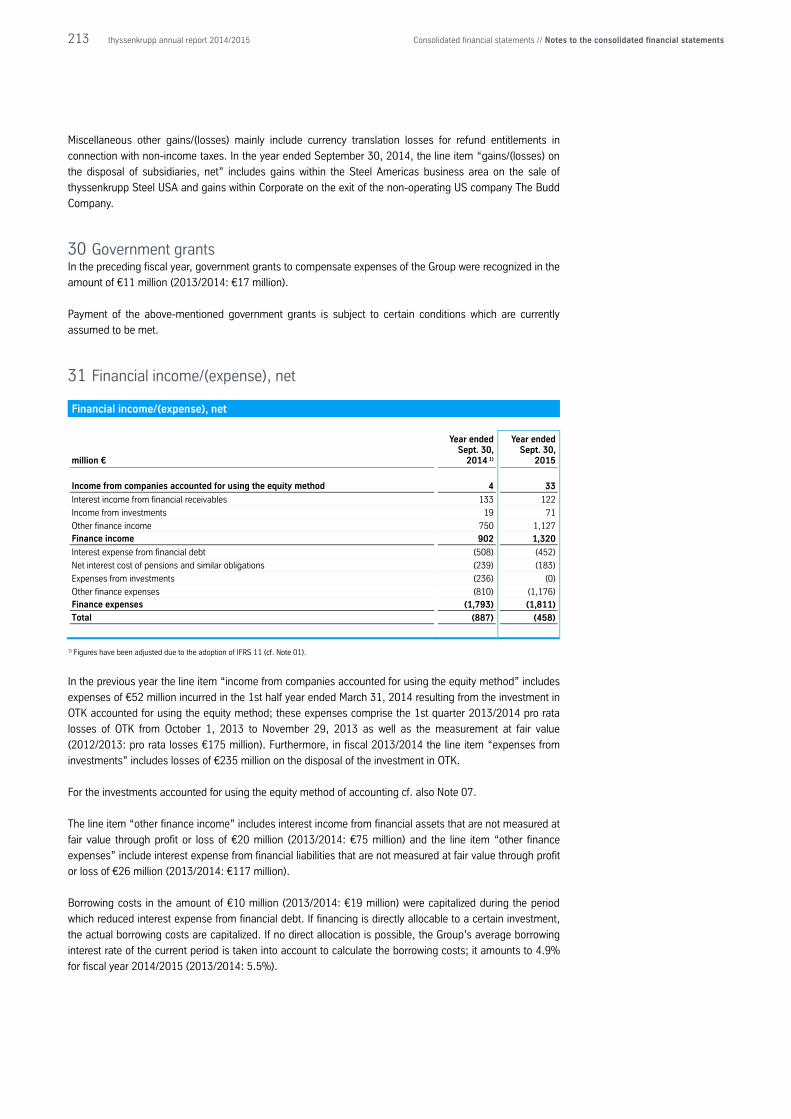
213 thyssenkrupp annual report 2014/2015 Consolidated financial statements // Notes to the consolidated financial statements
Miscellaneous other gains/(losses) mainly include currency translation losses for refund entitlements in
connection with non-income taxes. In the year ended September 30, 2014, the line item “gains/(losses) on
the disposal of subsidiaries, net” includes gains within the Steel Americas business area on the sale of
thyssenkrupp Steel USA and gains within Corporate on the exit of the non-operating US company The Budd
Company.
30 Government grants In the preceding fiscal year, government grants to compensate expenses of the Group were recognized in the
amount of €11 million (2013/2014: €17 million).
Payment of the above-mentioned government grants is subject to certain conditions which are currently
assumed to be met.
31 Financial income/(expense), net Financial income/(expense), net
million €
Year ended Sept. 30,
2014 1)
Year ended Sept. 30,
2015
Income from companies accounted for using the equity method 4 33
Interest income from financial receivables 133 122
Income from investments 19 71
Other finance income 750 1,127 Finance income 902 1,320
Interest expense from financial debt (508) (452)
Net interest cost of pensions and similar obligations (239) (183)
Expenses from investments (236) (0)
Other finance expenses (810) (1,176) Finance expenses (1,793) (1,811)
Total (887) (458)
1) Figures have been adjusted due to the adoption of IFRS 11 (cf. Note 01).
In the previous year the line item “income from companies accounted for using the equity method” includes
expenses of €52 million incurred in the 1st half year ended March 31, 2014 resulting from the investment in
OTK accounted for using the equity method; these expenses comprise the 1st quarter 2013/2014 pro rata
losses of OTK from October 1, 2013 to November 29, 2013 as well as the measurement at fair value
(2012/2013: pro rata losses €175 million). Furthermore, in fiscal 2013/2014 the line item “expenses from
investments” includes losses of €235 million on the disposal of the investment in OTK.
For the investments accounted for using the equity method of accounting cf. also Note 07.
The line item “other finance income” includes interest income from financial assets that are not measured at
fair value through profit or loss of €20 million (2013/2014: €75 million) and the line item “other finance
expenses” include interest expense from financial liabilities that are not measured at fair value through profit
or loss of €26 million (2013/2014: €117 million).
Borrowing costs in the amount of €10 million (2013/2014: €19 million) were capitalized during the period
which reduced interest expense from financial debt. If financing is directly allocable to a certain investment,
the actual borrowing costs are capitalized. If no direct allocation is possible, the Group’s average borrowing
interest rate of the current period is taken into account to calculate the borrowing costs; it amounts to 4.9%
for fiscal year 2014/2015 (2013/2014: 5.5%).
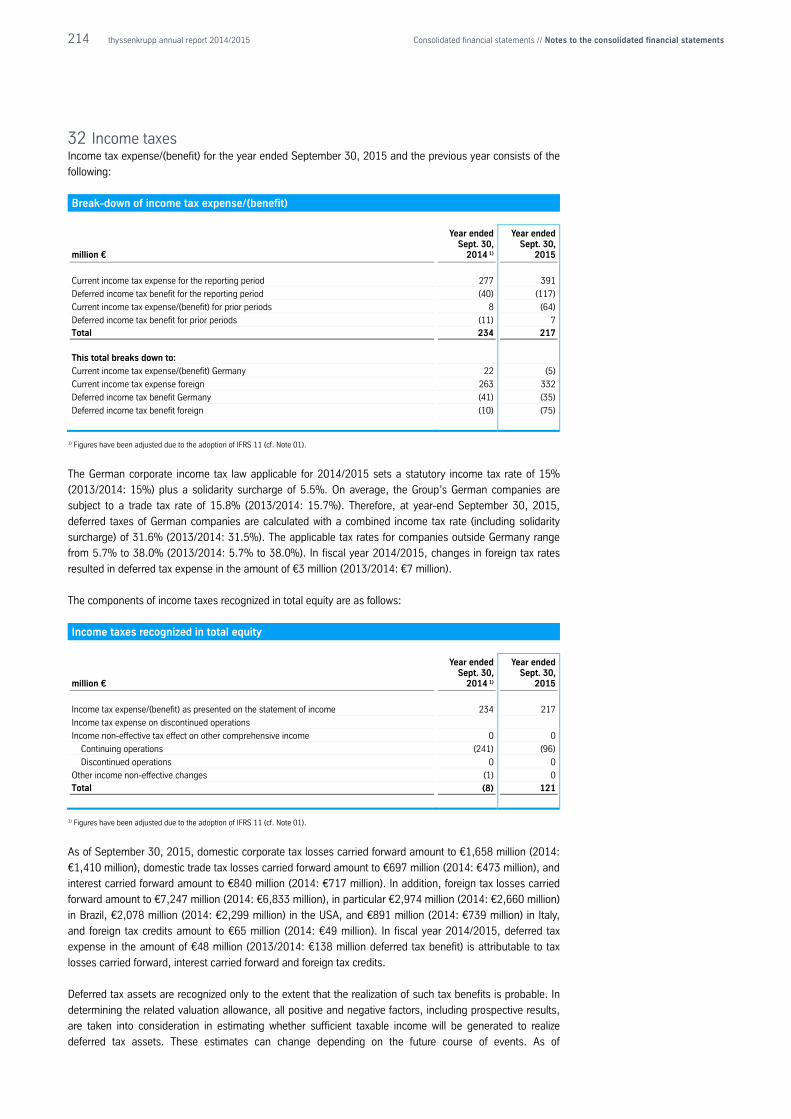
214 thyssenkrupp annual report 2014/2015 Consolidated financial statements // Notes to the consolidated financial statements
32 Income taxes Income tax expense/(benefit) for the year ended September 30, 2015 and the previous year consists of the
following:
Break-down of income tax expense/(benefit)
million €
Year ended Sept. 30,
2014 1)
Year ended Sept. 30,
2015
Current income tax expense for the reporting period 277 391
Deferred income tax benefit for the reporting period (40) (117)
Current income tax expense/(benefit) for prior periods 8 (64)
Deferred income tax benefit for prior periods (11) 7 Total 234 217
This total breaks down to:
Current income tax expense/(benefit) Germany 22 (5)
Current income tax expense foreign 263 332
Deferred income tax benefit Germany (41) (35)
Deferred income tax benefit foreign (10) (75)
1) Figures have been adjusted due to the adoption of IFRS 11 (cf. Note 01).
The German corporate income tax law applicable for 2014/2015 sets a statutory income tax rate of 15%
(2013/2014: 15%) plus a solidarity surcharge of 5.5%. On average, the Group’s German companies are
subject to a trade tax rate of 15.8% (2013/2014: 15.7%). Therefore, at year-end September 30, 2015,
deferred taxes of German companies are calculated with a combined income tax rate (including solidarity
surcharge) of 31.6% (2013/2014: 31.5%). The applicable tax rates for companies outside Germany range
from 5.7% to 38.0% (2013/2014: 5.7% to 38.0%). In fiscal year 2014/2015, changes in foreign tax rates
resulted in deferred tax expense in the amount of €3 million (2013/2014: €7 million).
The components of income taxes recognized in total equity are as follows:
Income taxes recognized in total equity
million €
Year ended Sept. 30,
2014 1)
Year ended Sept. 30,
2015
Income tax expense/(benefit) as presented on the statement of income 234 217
Income tax expense on discontinued operations
Income non-effective tax effect on other comprehensive income 0 0
Continuing operations (241) (96)
Discontinued operations 0 0
Other income non-effective changes (1) 0 Total (8) 121
1) Figures have been adjusted due to the adoption of IFRS 11 (cf. Note 01).
As of September 30, 2015, domestic corporate tax losses carried forward amount to €1,658 million (2014:
€1,410 million), domestic trade tax losses carried forward amount to €697 million (2014: €473 million), and
interest carried forward amount to €840 million (2014: €717 million). In addition, foreign tax losses carried
forward amount to €7,247 million (2014: €6,833 million), in particular €2,974 million (2014: €2,660 million)
in Brazil, €2,078 million (2014: €2,299 million) in the USA, and €891 million (2014: €739 million) in Italy,
and foreign tax credits amount to €65 million (2014: €49 million). In fiscal year 2014/2015, deferred tax
expense in the amount of €48 million (2013/2014: €138 million deferred tax benefit) is attributable to tax
losses carried forward, interest carried forward and foreign tax credits.
Deferred tax assets are recognized only to the extent that the realization of such tax benefits is probable. In
determining the related valuation allowance, all positive and negative factors, including prospective results,
are taken into consideration in estimating whether sufficient taxable income will be generated to realize
deferred tax assets. These estimates can change depending on the future course of events. As of
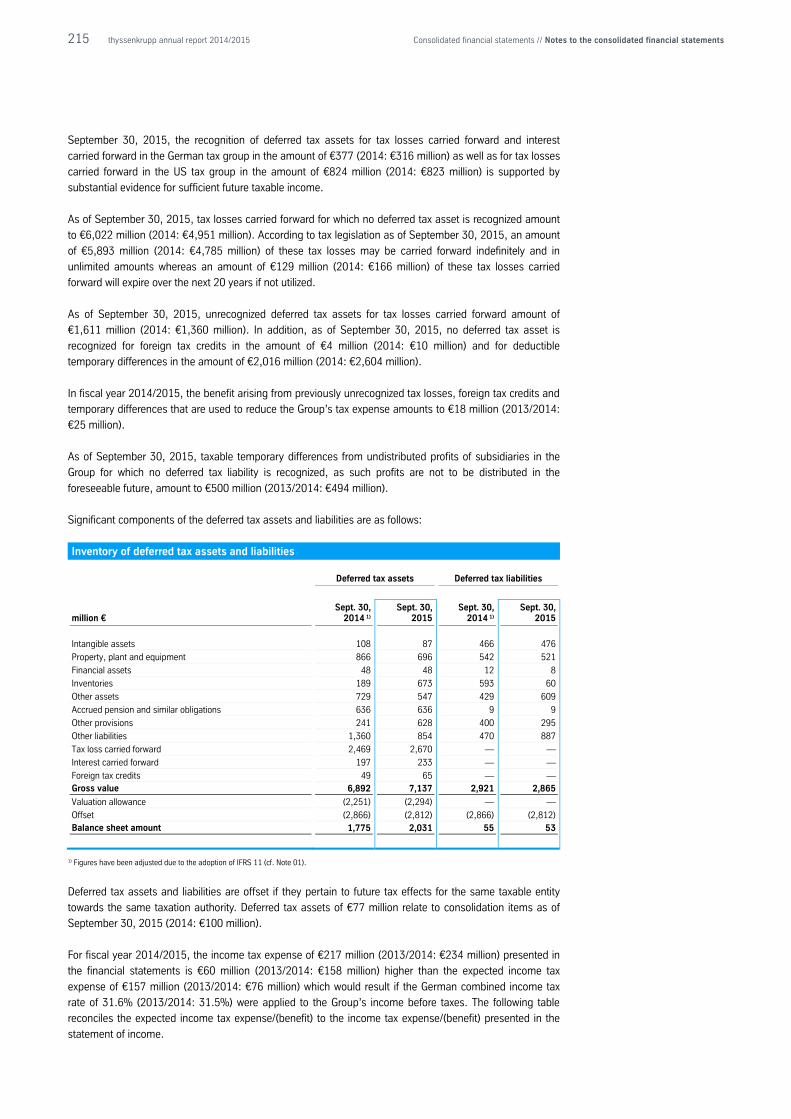
215 thyssenkrupp annual report 2014/2015 Consolidated financial statements // Notes to the consolidated financial statements
September 30, 2015, the recognition of deferred tax assets for tax losses carried forward and interest
carried forward in the German tax group in the amount of €377 (2014: €316 million) as well as for tax losses
carried forward in the US tax group in the amount of €824 million (2014: €823 million) is supported by
substantial evidence for sufficient future taxable income.
As of September 30, 2015, tax losses carried forward for which no deferred tax asset is recognized amount
to €6,022 million (2014: €4,951 million). According to tax legislation as of September 30, 2015, an amount
of €5,893 million (2014: €4,785 million) of these tax losses may be carried forward indefinitely and in
unlimited amounts whereas an amount of €129 million (2014: €166 million) of these tax losses carried
forward will expire over the next 20 years if not utilized.
As of September 30, 2015, unrecognized deferred tax assets for tax losses carried forward amount of
€1,611 million (2014: €1,360 million). In addition, as of September 30, 2015, no deferred tax asset is
recognized for foreign tax credits in the amount of €4 million (2014: €10 million) and for deductible
temporary differences in the amount of €2,016 million (2014: €2,604 million).
In fiscal year 2014/2015, the benefit arising from previously unrecognized tax losses, foreign tax credits and
temporary differences that are used to reduce the Group’s tax expense amounts to €18 million (2013/2014:
€25 million).
As of September 30, 2015, taxable temporary differences from undistributed profits of subsidiaries in the
Group for which no deferred tax liability is recognized, as such profits are not to be distributed in the
foreseeable future, amount to €500 million (2013/2014: €494 million).
Significant components of the deferred tax assets and liabilities are as follows:
Inventory of deferred tax assets and liabilities
Deferred tax assets Deferred tax liabilities
million € Sept. 30,
2014 1) Sept. 30,
2015 Sept. 30,
2014 1) Sept. 30,
2015
Intangible assets 108 87 466 476
Property, plant and equipment 866 696 542 521
Financial assets 48 48 12 8
Inventories 189 673 593 60
Other assets 729 547 429 609
Accrued pension and similar obligations 636 636 9 9
Other provisions 241 628 400 295
Other liabilities 1,360 854 470 887
Tax loss carried forward 2,469 2,670 — —
Interest carried forward 197 233 — —
Foreign tax credits 49 65 — — Gross value 6,892 7,137 2,921 2,865
Valuation allowance (2,251) (2,294) — —
Offset (2,866) (2,812) (2,866) (2,812) Balance sheet amount 1,775 2,031 55 53
1) Figures have been adjusted due to the adoption of IFRS 11 (cf. Note 01).
Deferred tax assets and liabilities are offset if they pertain to future tax effects for the same taxable entity
towards the same taxation authority. Deferred tax assets of €77 million relate to consolidation items as of
September 30, 2015 (2014: €100 million).
For fiscal year 2014/2015, the income tax expense of €217 million (2013/2014: €234 million) presented in
the financial statements is €60 million (2013/2014: €158 million) higher than the expected income tax
expense of €157 million (2013/2014: €76 million) which would result if the German combined income tax
rate of 31.6% (2013/2014: 31.5%) were applied to the Group’s income before taxes. The following table
reconciles the expected income tax expense/(benefit) to the income tax expense/(benefit) presented in the
statement of income.
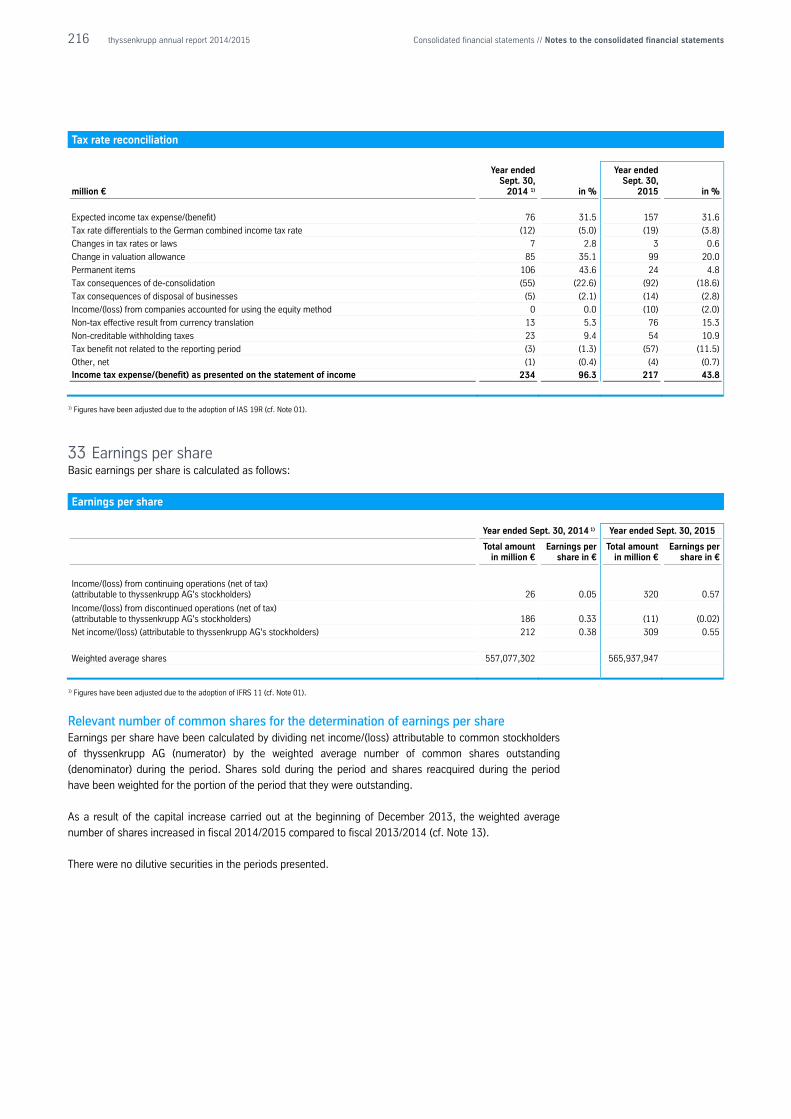
216 thyssenkrupp annual report 2014/2015 Consolidated financial statements // Notes to the consolidated financial statements
Tax rate reconciliation
million €
Year ended Sept. 30,
2014 1) in %
Year ended Sept. 30,
2015 in %
Expected income tax expense/(benefit) 76 31.5 157 31.6
Tax rate differentials to the German combined income tax rate (12) (5.0) (19) (3.8)
Changes in tax rates or laws 7 2.8 3 0.6
Change in valuation allowance 85 35.1 99 20.0
Permanent items 106 43.6 24 4.8
Tax consequences of de-consolidation (55) (22.6) (92) (18.6)
Tax consequences of disposal of businesses (5) (2.1) (14) (2.8)
Income/(loss) from companies accounted for using the equity method 0 0.0 (10) (2.0)
Non-tax effective result from currency translation 13 5.3 76 15.3
Non-creditable withholding taxes 23 9.4 54 10.9
Tax benefit not related to the reporting period (3) (1.3) (57) (11.5)
Other, net (1) (0.4) (4) (0.7) Income tax expense/(benefit) as presented on the statement of income 234 96.3 217 43.8
1) Figures have been adjusted due to the adoption of IAS 19R (cf. Note 01).
33 Earnings per share Basic earnings per share is calculated as follows:
Earnings per share
Year ended Sept. 30, 2014 1) Year ended Sept. 30, 2015
Total amount
in million € Earnings per
share in € Total amount
in million € Earnings per
share in €
Income/(loss) from continuing operations (net of tax) (attributable to thyssenkrupp AG's stockholders) 26 0.05 320 0.57
Income/(loss) from discontinued operations (net of tax) (attributable to thyssenkrupp AG's stockholders) 186 0.33 (11) (0.02)
Net income/(loss) (attributable to thyssenkrupp AG's stockholders) 212 0.38 309 0.55
Weighted average shares 557,077,302 565,937,947
1) Figures have been adjusted due to the adoption of IFRS 11 (cf. Note 01).
Relevant number of common shares for the determination of earnings per share Earnings per share have been calculated by dividing net income/(loss) attributable to common stockholders
of thyssenkrupp AG (numerator) by the weighted average number of common shares outstanding
(denominator) during the period. Shares sold during the period and shares reacquired during the period
have been weighted for the portion of the period that they were outstanding.
As a result of the capital increase carried out at the beginning of December 2013, the weighted average
number of shares increased in fiscal 2014/2015 compared to fiscal 2013/2014 (cf. Note 13).
There were no dilutive securities in the periods presented.
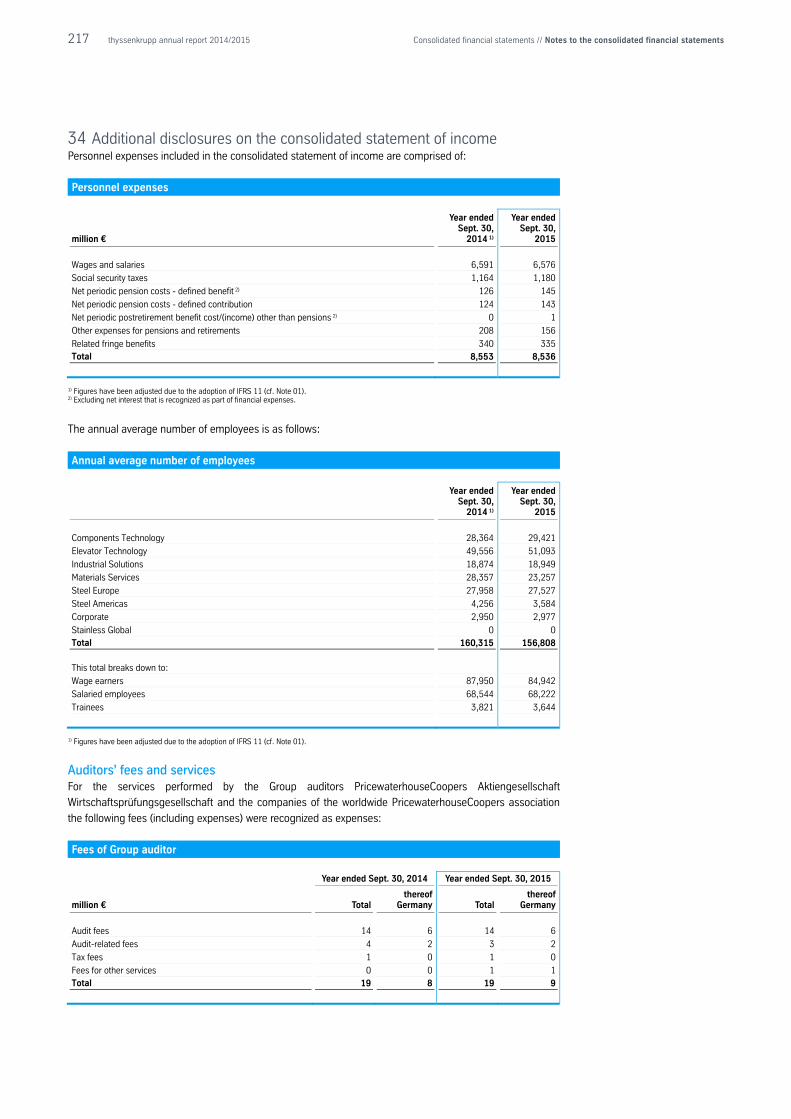
217 thyssenkrupp annual report 2014/2015 Consolidated financial statements // Notes to the consolidated financial statements
34 Additional disclosures on the consolidated statement of income Personnel expenses included in the consolidated statement of income are comprised of:
Personnel expenses
million €
Year ended Sept. 30,
2014 1)
Year ended Sept. 30,
2015
Wages and salaries 6,591 6,576
Social security taxes 1,164 1,180
Net periodic pension costs - defined benefit 2) 126 145
Net periodic pension costs - defined contribution 124 143
Net periodic postretirement benefit cost/(income) other than pensions 2) 0 1
Other expenses for pensions and retirements 208 156
Related fringe benefits 340 335 Total 8,553 8,536
1) Figures have been adjusted due to the adoption of IFRS 11 (cf. Note 01). 2) Excluding net interest that is recognized as part of financial expenses.
The annual average number of employees is as follows:
Annual average number of employees
Year ended Sept. 30,
2014 1)
Year ended Sept. 30,
2015
Components Technology 28,364 29,421
Elevator Technology 49,556 51,093
Industrial Solutions 18,874 18,949
Materials Services 28,357 23,257
Steel Europe 27,958 27,527
Steel Americas 4,256 3,584
Corporate 2,950 2,977
Stainless Global 0 0 Total 160,315 156,808
This total breaks down to:
Wage earners 87,950 84,942
Salaried employees 68,544 68,222
Trainees 3,821 3,644
1) Figures have been adjusted due to the adoption of IFRS 11 (cf. Note 01).
Auditors’ fees and services For the services performed by the Group auditors PricewaterhouseCoopers Aktiengesellschaft
Wirtschaftsprüfungsgesellschaft and the companies of the worldwide PricewaterhouseCoopers association
the following fees (including expenses) were recognized as expenses:
Fees of Group auditor
Year ended Sept. 30, 2014 Year ended Sept. 30, 2015
million € Total thereof
Germany Total thereof
Germany
Audit fees 14 6 14 6
Audit-related fees 4 2 3 2
Tax fees 1 0 1 0
Fees for other services 0 0 1 1 Total 19 8 19 9
218 thyssenkrupp annual report 2014/2015 Consolidated financial statements // Notes to the consolidated financial statements
The audit fees include mainly fees for the year-end audit of the consolidated financial statements, and the
statutory auditing of thyssenkrupp AG and the subsidiaries included in the consolidated financial statements.
The audit-related fees essentially comprise the auditors’ review of the interim consolidated financial
statements and the fees for due diligence services in connection with acquisitions and disposals. The tax
fees include in particular fees for tax consulting services for current and planned transactions, for the
preparation of tax returns, for tax due diligence services, for tax advice in connection with projects and
Group-internal reorganizations as well as tax advice for employees sent to work abroad. The fees for other
services are mainly fees for project-related consulting services.
Notes to the consolidated statement of cash flows
35 Additional information on the consolidated statement of cash flows The liquid funds considered in the consolidated statement of cash flows correspond to the “Cash and cash
equivalents” line item in the consolidated statement of financial position taking into account the cash and
cash equivalents attributable to the disposal groups inclusive of discontinued operations. As of Septem-
ber 30, 2015 cash and cash equivalents of €59 million (2014: €51 million) result from the joint operation
HKM.
Non-cash investing activities In fiscal 2014/2015, the acquisition and first-time consolidation of companies created an increase in non-
current assets of €214 million (2013/2014: €730 million).
The non-cash addition of assets under capital leases in fiscal 2014/2015 amounted to €3 million
(2013/2014: €8 million).
In connection with the second construction stage of the “thyssenkrupp Quarter” located in Essen, there was
a non-cash addition of property, plant and equipment of €44 million in fiscal 2013/2014.
Non-cash financing activities In fiscal 2014/2015, the acquisition and first-time consolidation of companies resulted in an increase in
gross financial debt of €19 million (2013/2014: €313 million).
In connection with the second construction stage of the “thyssenkrupp Quarter” located in Essen, there was
a non-cash increase in financial debt of €44 million in fiscal 2013/2014.
Subsequent events
36 Subsequent events No reportable events occurred.
Other information
37 Declarations of conformity with the German Corporate Governance Code in accordance with Art. 161 of the German Stock Corporation Act (AktG)
The Executive Board and the Supervisory Board of thyssenkrupp AG issued the declaration of conformity in
accordance with Art. 161 of the Stock Corporation Act (AktG) and made it publicly available to the
shareholders on the company’s website on October 1, 2015.
The declaration of conformity of our exchange-listed subsidiary Eisen- und Hüttenwerke AG was issued on
October 1, 2015 and is now publicly available to the shareholders on the company’s website.
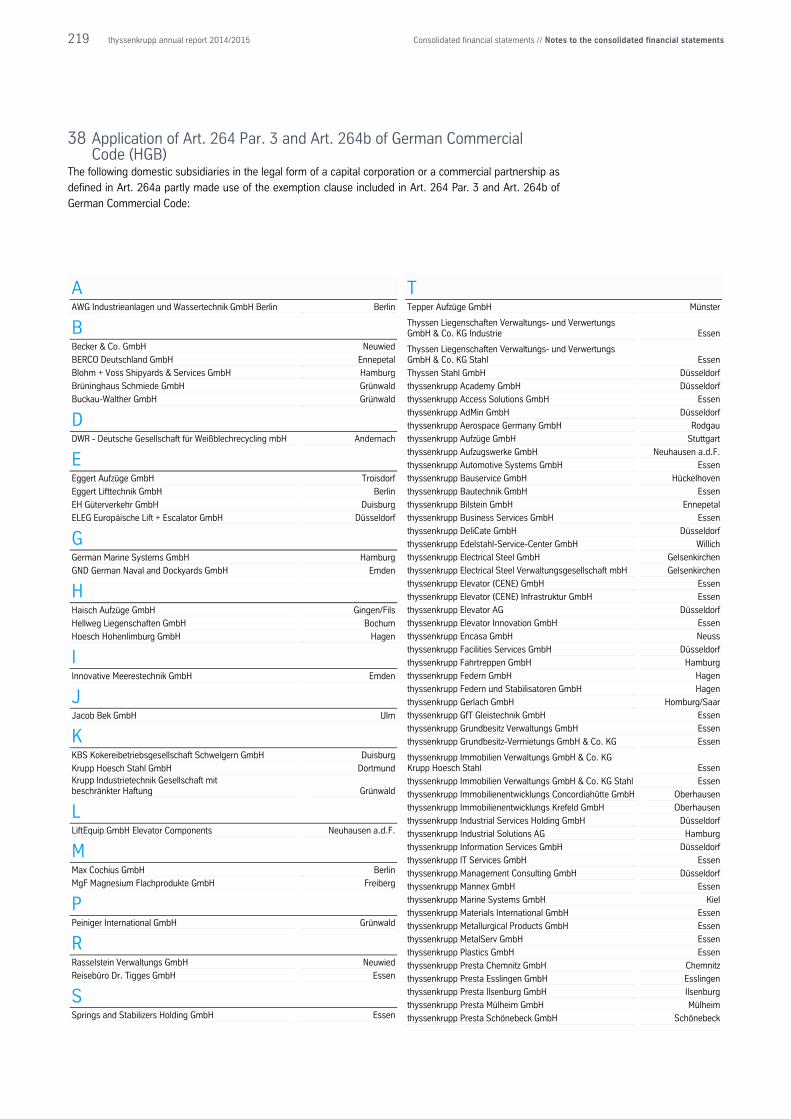
219 thyssenkrupp annual report 2014/2015 Consolidated financial statements // Notes to the consolidated financial statements
38 Application of Art. 264 Par. 3 and Art. 264b of German Commercial Code (HGB)
The following domestic subsidiaries in the legal form of a capital corporation or a commercial partnership as
defined in Art. 264a partly made use of the exemption clause included in Art. 264 Par. 3 and Art. 264b of
German Commercial Code:
A AWG Industrieanlagen und Wassertechnik GmbH Berlin Berlin
B Becker & Co. GmbH Neuwied
BERCO Deutschland GmbH Ennepetal
Blohm + Voss Shipyards & Services GmbH Hamburg
Brüninghaus Schmiede GmbH Grünwald
Buckau-Walther GmbH Grünwald
D DWR - Deutsche Gesellschaft für Weißblechrecycling mbH Andernach
E Eggert Aufzüge GmbH Troisdorf
Eggert Lifttechnik GmbH Berlin
EH Güterverkehr GmbH Duisburg
ELEG Europäische Lift + Escalator GmbH Düsseldorf
G German Marine Systems GmbH Hamburg
GND German Naval and Dockyards GmbH Emden
H Haisch Aufzüge GmbH Gingen/Fils
Hellweg Liegenschaften GmbH Bochum
Hoesch Hohenlimburg GmbH Hagen
I Innovative Meerestechnik GmbH Emden
J Jacob Bek GmbH Ulm
K KBS Kokereibetriebsgesellschaft Schwelgern GmbH Duisburg
Krupp Hoesch Stahl GmbH Dortmund Krupp Industrietechnik Gesellschaft mit beschränkter Haftung Grünwald
L LiftEquip GmbH Elevator Components Neuhausen a.d.F.
M Max Cochius GmbH Berlin
MgF Magnesium Flachprodukte GmbH Freiberg
P Peiniger International GmbH Grünwald
R Rasselstein Verwaltungs GmbH Neuwied
Reisebüro Dr. Tigges GmbH Essen
S Springs and Stabilizers Holding GmbH Essen
T Tepper Aufzüge GmbH Münster
Thyssen Liegenschaften Verwaltungs- und Verwertungs GmbH & Co. KG Industrie Essen
Thyssen Liegenschaften Verwaltungs- und Verwertungs GmbH & Co. KG Stahl Essen
Thyssen Stahl GmbH Düsseldorf
thyssenkrupp Academy GmbH Düsseldorf
thyssenkrupp Access Solutions GmbH Essen
thyssenkrupp AdMin GmbH Düsseldorf
thyssenkrupp Aerospace Germany GmbH Rodgau
thyssenkrupp Aufzüge GmbH Stuttgart
thyssenkrupp Aufzugswerke GmbH Neuhausen a.d.F.
thyssenkrupp Automotive Systems GmbH Essen
thyssenkrupp Bauservice GmbH Hückelhoven
thyssenkrupp Bautechnik GmbH Essen
thyssenkrupp Bilstein GmbH Ennepetal
thyssenkrupp Business Services GmbH Essen
thyssenkrupp DeliCate GmbH Düsseldorf
thyssenkrupp Edelstahl-Service-Center GmbH Willich
thyssenkrupp Electrical Steel GmbH Gelsenkirchen
thyssenkrupp Electrical Steel Verwaltungsgesellschaft mbH Gelsenkirchen
thyssenkrupp Elevator (CENE) GmbH Essen
thyssenkrupp Elevator (CENE) Infrastruktur GmbH Essen
thyssenkrupp Elevator AG Düsseldorf
thyssenkrupp Elevator Innovation GmbH Essen
thyssenkrupp Encasa GmbH Neuss
thyssenkrupp Facilities Services GmbH Düsseldorf
thyssenkrupp Fahrtreppen GmbH Hamburg
thyssenkrupp Federn GmbH Hagen
thyssenkrupp Federn und Stabilisatoren GmbH Hagen
thyssenkrupp Gerlach GmbH Homburg/Saar
thyssenkrupp GfT Gleistechnik GmbH Essen
thyssenkrupp Grundbesitz Verwaltungs GmbH Essen
thyssenkrupp Grundbesitz-Vermietungs GmbH & Co. KG Essen
thyssenkrupp Immobilien Verwaltungs GmbH & Co. KG Krupp Hoesch Stahl Essen
thyssenkrupp Immobilien Verwaltungs GmbH & Co. KG Stahl Essen
thyssenkrupp Immobilienentwicklungs Concordiahütte GmbH Oberhausen
thyssenkrupp Immobilienentwicklungs Krefeld GmbH Oberhausen
thyssenkrupp Industrial Services Holding GmbH Düsseldorf
thyssenkrupp Industrial Solutions AG Hamburg
thyssenkrupp Information Services GmbH Düsseldorf
thyssenkrupp IT Services GmbH Essen
thyssenkrupp Management Consulting GmbH Düsseldorf
thyssenkrupp Mannex GmbH Essen
thyssenkrupp Marine Systems GmbH Kiel
thyssenkrupp Materials International GmbH Essen
thyssenkrupp Metallurgical Products GmbH Essen
thyssenkrupp MetalServ GmbH Essen
thyssenkrupp Plastics GmbH Essen
thyssenkrupp Presta Chemnitz GmbH Chemnitz
thyssenkrupp Presta Esslingen GmbH Esslingen
thyssenkrupp Presta Ilsenburg GmbH Ilsenburg
thyssenkrupp Presta Mülheim GmbH Mülheim
thyssenkrupp Presta Schönebeck GmbH Schönebeck
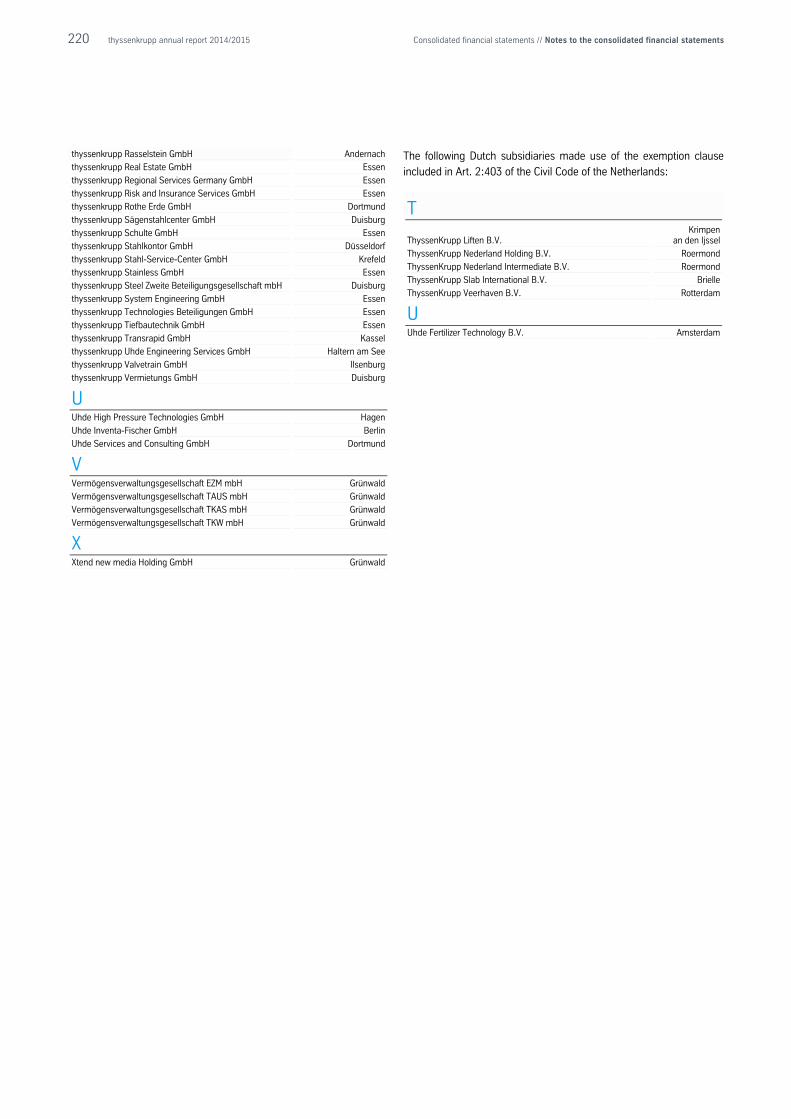
220 thyssenkrupp annual report 2014/2015 Consolidated financial statements // Notes to the consolidated financial statements
thyssenkrupp Rasselstein GmbH Andernach
thyssenkrupp Real Estate GmbH Essen
thyssenkrupp Regional Services Germany GmbH Essen
thyssenkrupp Risk and Insurance Services GmbH Essen
thyssenkrupp Rothe Erde GmbH Dortmund
thyssenkrupp Sägenstahlcenter GmbH Duisburg
thyssenkrupp Schulte GmbH Essen
thyssenkrupp Stahlkontor GmbH Düsseldorf
thyssenkrupp Stahl-Service-Center GmbH Krefeld
thyssenkrupp Stainless GmbH Essen
thyssenkrupp Steel Zweite Beteiligungsgesellschaft mbH Duisburg
thyssenkrupp System Engineering GmbH Essen
thyssenkrupp Technologies Beteiligungen GmbH Essen
thyssenkrupp Tiefbautechnik GmbH Essen
thyssenkrupp Transrapid GmbH Kassel
thyssenkrupp Uhde Engineering Services GmbH Haltern am See
thyssenkrupp Valvetrain GmbH Ilsenburg
thyssenkrupp Vermietungs GmbH Duisburg
U Uhde High Pressure Technologies GmbH Hagen
Uhde Inventa-Fischer GmbH Berlin
Uhde Services and Consulting GmbH Dortmund
V Vermögensverwaltungsgesellschaft EZM mbH Grünwald
Vermögensverwaltungsgesellschaft TAUS mbH Grünwald
Vermögensverwaltungsgesellschaft TKAS mbH Grünwald
Vermögensverwaltungsgesellschaft TKW mbH Grünwald
X Xtend new media Holding GmbH Grünwald
The following Dutch subsidiaries made use of the exemption clause
included in Art. 2:403 of the Civil Code of the Netherlands:
T
ThyssenKrupp Liften B.V. Krimpen
an den Ijssel
ThyssenKrupp Nederland Holding B.V. Roermond
ThyssenKrupp Nederland Intermediate B.V. Roermond
ThyssenKrupp Slab International B.V. Brielle
ThyssenKrupp Veerhaven B.V. Rotterdam
U Uhde Fertilizer Technology B.V. Amsterdam
221 thyssenkrupp annual report 2014/2015 Consolidated financial statements // Notes to the consolidated financial statements
39 List of the Group’s subsidiaries and equity interests A complete listing of the Group’s subsidiaries and equity interests is published in the German Federal
Gazette and is available on the thyssenkrupp website at www.thyssenkrupp.com.
222 thyssenkrupp annual report 2014/2015 Consolidated financial statements // Independent Auditors’ Report
Independent Auditors’ Report
To thyssenkrupp AG, Duisburg and Essen
Report on the Consolidated Financial Statements We have audited the accompanying consolidated financial statements of thyssenkrupp AG, Duisburg and
Essen, and its subsidiaries, which comprise the consolidated statement of financial position, the
consolidated statement of income, the consolidated statement of comprehensive income, the consolidated
statement of changes in equity, the consolidated statement of cash flows, and notes to the consolidated
financial statements for the business year from October 1, 2014 to September 30, 2015.
Board of Managing Directors’ Responsibility for the Consolidated Financial Statements The Board of Managing Directors of thyssenkrupp AG is responsible for the preparation of these
consolidated financial statements. This responsibility includes preparing these consolidated financial
statements in accordance with International Financial Reporting Standards as adopted by the EU, and the
supplementary requirements of German law pursuant to § 315a Abs. 1 HGB (“Handelsgesetzbuch”: German
Commercial Code), to give a true and fair view of the net assets, financial position and results of operations
of the group in accordance with these requirements. The Board of Managing Directors is also responsible for
the internal controls as the Board of Managing Directors determines are necessary to enable the preparation
of consolidated financial statements that are free from material misstatement, whether due to fraud or error.
Auditor’s Responsibility Our responsibility is to express an opinion on these consolidated financial statements based on our audit.
We conducted our audit in accordance with § 317 HGB and German generally accepted standards for the
audit of financial statements promulgated by the Institut der Wirtschaftsprüfer [Institute of Public Auditors in
Germany] (IDW) and additionally observed the International Standards on Auditing (ISA). Accordingly, we are
required to comply with ethical requirements and plan and perform the audit to obtain reasonable assurance
about whether the consolidated financial statements are free from material misstatement.
An audit involves performing audit procedures to obtain audit evidence about the amounts and disclosures
in the consolidated financial statements. The selection of audit procedures depends on the auditor’s
professional judgment. This includes the assessment of the risks of material misstatement of the
consolidated financial statements, whether due to fraud or error. In assessing those risks, the auditor
considers the internal control system relevant to the entity’s preparation of the consolidated financial
statements that give a true and fair view. The aim of this is to plan and perform audit procedures that are
appropriate in the given circumstances, but not for the purpose of expressing an opinion on the
effectiveness of the group’s internal control system. An audit also includes evaluating the appropriateness of
accounting policies used and the reasonableness of accounting estimates made by the Board of Managing
Directors, as well as evaluating the overall presentation of the consolidated financial statements.
We believe that the audit evidence we have obtained is sufficient and appropriate to provide a basis for our
audit opinion.
223 thyssenkrupp annual report 2014/2015 Consolidated financial statements // Independent Auditors’ Report
Audit Opinion According to § 322 Abs. 3 Satz 1 HGB, we state that our audit of the consolidated financial statements has
not led to any reservations.
In our opinion, based on the findings of our audit, the consolidated financial statements comply in all
material respects with IFRSs as adopted by the EU and the additional requirements of German commercial
law pursuant to § 315a Abs. 1 HGB and give a true and fair view of the net assets and financial position of
the Group as at September 30, 2015 as well as the results of operations for the business year then ended,
in accordance with these requirements.
Report on the Group Management Report We have audited the accompanying group management report of thyssenkrupp AG which is combined with
the management report of the company for the business year from October 1, 2014 to September 30,
2015. The Board of Managing Directors of thyssenkrupp AG is responsible for the preparation of the
combined management report in accordance with the requirements of German commercial law applicable
pursuant to § 315a Abs. 1 HGB. We conducted our audit in accordance with § 317 Abs. 2 HGB and German
generally accepted standards for the audit of the combined management report promulgated by the Institut
der Wirtschaftsprüfer (Institute of Public Auditors in Germany) (IDW). Accordingly, we are required to plan
and perform the audit of the combined management report to obtain reasonable assurance about whether
the combined management report is consistent with the consolidated financial statements and the audit
findings, and as a whole provides a suitable view of the Group’s position and suitably presents the
opportunities and risks of future development.
According to § 322 Abs. 3 Satz 1 HGB, we state that our audit of the combined management report has not
led to any reservations.
In our opinion, based on the findings of our audit of the consolidated financial statements and combined
management report, the combined management report is consistent with the consolidated financial
statements, and as a whole provides a suitable view of the Group’s position and suitably presents the
opportunities and risks of future development.
Essen, November 17, 2015
PricewaterhouseCoopers
Aktiengesellschaft
Wirtschaftsprüfungsgesellschaft
Prof. Dr. Norbert Winkeljohann Volker Linke
Wirtschaftsprüfer Wirtschaftsprüfer
224 thyssenkrupp annual report 2014/2015 Responsibility statement
Responsibility statement
To the best of our knowledge, and in accordance with the applicable reporting principles, the consolidated
financial statements give a true and fair view of the assets, liabilities, financial position and profit and loss of
the Group, and the combined management report includes a fair review of the development and
performance of the business and the position of the Group, together with a description of the principal
opportunities and risks associated with the expected development of the Group.
Essen, November 17, 2015
thyssenkrupp AG
The Executive Board
Hiesinger
Burkhard Kaufmann Kerkhoff
225 thyssenkrupp annual report 2014/2015
Additional information
226 Multi-year overview
228 Other directorships held by Executive Board members
229 Other directorships held by Supervisory Board members
231 Glossary
234 Contact and 2016/2017 financial calendar
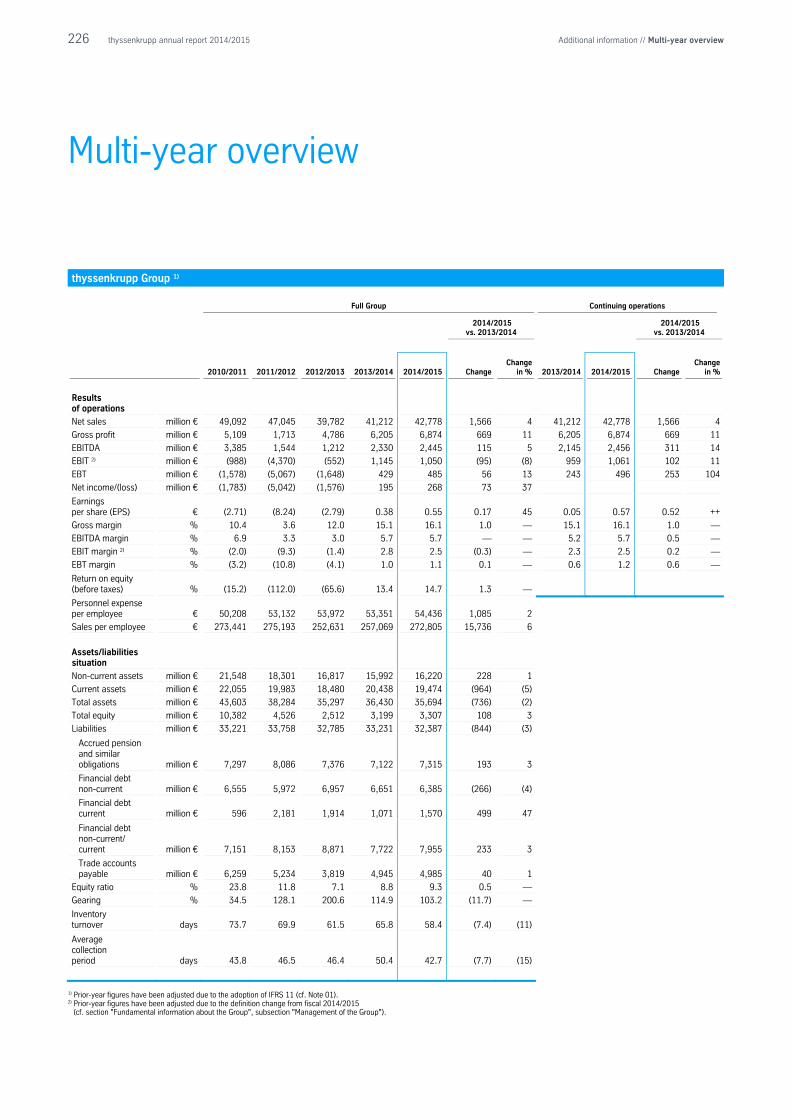
226 thyssenkrupp annual report 2014/2015 Additional information // Multi-year overview
Multi-year overview
thyssenkrupp Group 1)
Full Group Continuing operations
2014/2015
vs. 2013/2014 2014/2015
vs. 2013/2014
2010/2011 2011/2012 2012/2013 2013/2014
2014/2015
Change Change
in % 2013/2014 2014/2015
Change Change
in %
Results of operations
Net sales million € 49,092 47,045 39,782 41,212 42,778 1,566 4 41,212 42,778 1,566 4
Gross profit million € 5,109 1,713 4,786 6,205 6,874 669 11 6,205 6,874 669 11
EBITDA million € 3,385 1,544 1,212 2,330 2,445 115 5 2,145 2,456 311 14
EBIT 2) million € (988) (4,370) (552) 1,145 1,050 (95) (8) 959 1,061 102 11
EBT million € (1,578) (5,067) (1,648) 429 485 56 13 243 496 253 104
Net income/(loss) million € (1,783) (5,042) (1,576) 195 268 73 37
Earnings per share (EPS) € (2.71) (8.24) (2.79) 0.38 0.55 0.17 45 0.05 0.57 0.52 ++
Gross margin % 10.4 3.6 12.0 15.1 16.1 1.0 — 15.1 16.1 1.0 —
EBITDA margin % 6.9 3.3 3.0 5.7 5.7 — — 5.2 5.7 0.5 —
EBIT margin 2) % (2.0) (9.3) (1.4) 2.8 2.5 (0.3) — 2.3 2.5 0.2 —
EBT margin % (3.2) (10.8) (4.1) 1.0 1.1 0.1 — 0.6 1.2 0.6 —
Return on equity (before taxes) % (15.2) (112.0) (65.6) 13.4 14.7 1.3 — Personnel expense per employee € 50,208 53,132 53,972 53,351 54,436 1,085 2 Sales per employee € 273,441 275,193 252,631 257,069 272,805 15,736 6
Assets/liabilities situation Non-current assets million € 21,548 18,301 16,817 15,992 16,220 228 1 Current assets million € 22,055 19,983 18,480 20,438 19,474 (964) (5) Total assets million € 43,603 38,284 35,297 36,430 35,694 (736) (2) Total equity million € 10,382 4,526 2,512 3,199 3,307 108 3 Liabilities million € 33,221 33,758 32,785 33,231 32,387 (844) (3) Accrued pension and similar obligations million € 7,297 8,086 7,376 7,122 7,315 193 3 Financial debt non-current million € 6,555 5,972 6,957 6,651 6,385 (266) (4) Financial debt current million € 596 2,181 1,914 1,071 1,570 499 47 Financial debt non-current/ current million € 7,151 8,153 8,871 7,722 7,955 233 3 Trade accounts payable million € 6,259 5,234 3,819 4,945 4,985 40 1 Equity ratio % 23.8 11.8 7.1 8.8 9.3 0.5 — Gearing % 34.5 128.1 200.6 114.9 103.2 (11.7) — Inventory turnover days 73.7 69.9 61.5 65.8 58.4 (7.4) (11) Average collection period days 43.8 46.5 46.4 50.4 42.7 (7.7) (15)
1) Prior-year figures have been adjusted due to the adoption of IFRS 11 (cf. Note 01). 2) Prior-year figures have been adjusted due to the definition change from fiscal 2014/2015
(cf. section "Fundamental information about the Group", subsection "Management of the Group").
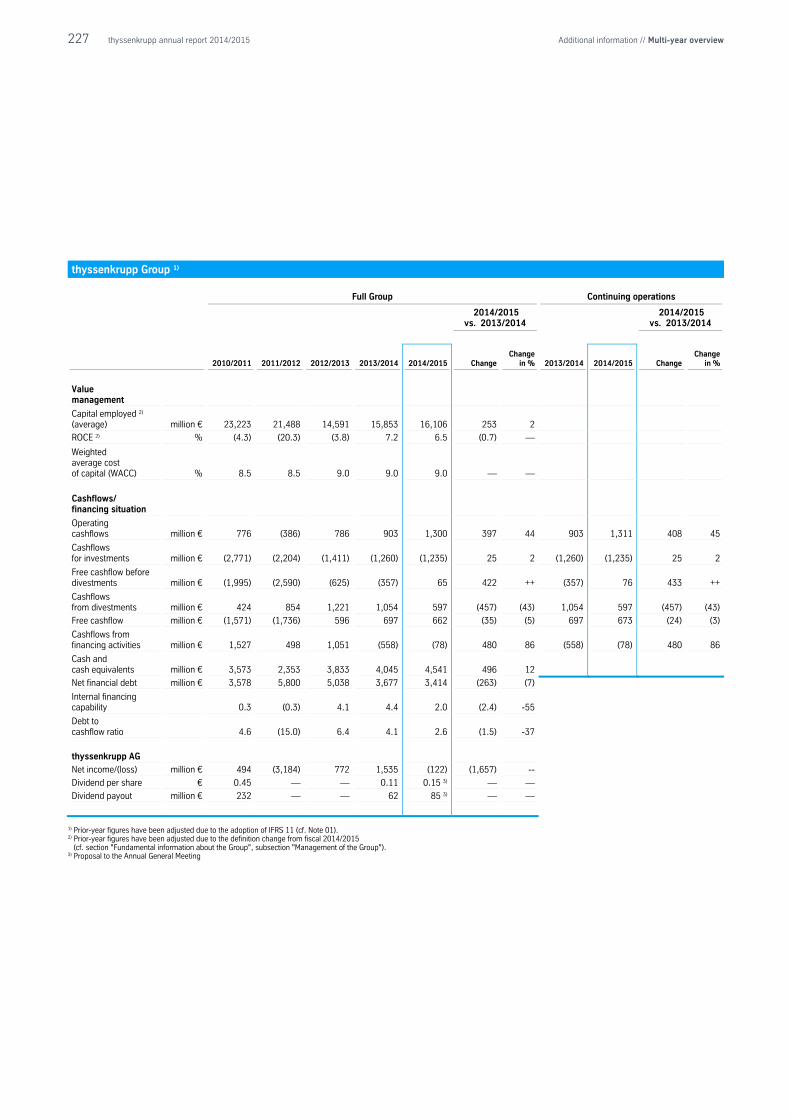
227 thyssenkrupp annual report 2014/2015 Additional information // Multi-year overview
thyssenkrupp Group 1)
Full Group Continuing operations
2014/2015
vs. 2013/2014 2014/2015
vs. 2013/2014
2010/2011 2011/2012 2012/2013 2013/2014
2014/2015
Change Change
in % 2013/2014
2014/2015
Change Change
in %
Value management
Capital employed 2)
(average) million € 23,223 21,488 14,591 15,853 16,106 253 2
ROCE 2) % (4.3) (20.3) (3.8) 7.2 6.5 (0.7) —
Weighted average cost of capital (WACC) % 8.5 8.5 9.0 9.0 9.0 — —
Cashflows/ financing situation
Operating cashflows million € 776 (386) 786 903 1,300 397 44 903 1,311 408 45
Cashflows for investments million € (2,771) (2,204) (1,411) (1,260) (1,235) 25 2 (1,260) (1,235) 25 2
Free cashflow before divestments million € (1,995) (2,590) (625) (357) 65 422 ++ (357) 76 433 ++
Cashflows from divestments million € 424 854 1,221 1,054 597 (457) (43) 1,054 597 (457) (43)
Free cashflow million € (1,571) (1,736) 596 697 662 (35) (5) 697 673 (24) (3)
Cashflows from financing activities million € 1,527 498 1,051 (558) (78) 480 86 (558) (78) 480 86
Cash and cash equivalents million € 3,573 2,353 3,833 4,045 4,541 496 12 Net financial debt million € 3,578 5,800 5,038 3,677 3,414 (263) (7) Internal financing capability 0.3 (0.3) 4.1 4.4 2.0 (2.4) -55 Debt to cashflow ratio 4.6 (15.0) 6.4 4.1 2.6 (1.5) -37
thyssenkrupp AG Net income/(loss) million € 494 (3,184) 772 1,535 (122) (1,657) -- Dividend per share € 0.45 — — 0.11 0.15 3) — — Dividend payout million € 232 — — 62 85 3) — —
1) Prior-year figures have been adjusted due to the adoption of IFRS 11 (cf. Note 01). 2) Prior-year figures have been adjusted due to the definition change from fiscal 2014/2015
(cf. section "Fundamental information about the Group", subsection "Management of the Group"). 3) Proposal to the Annual General Meeting
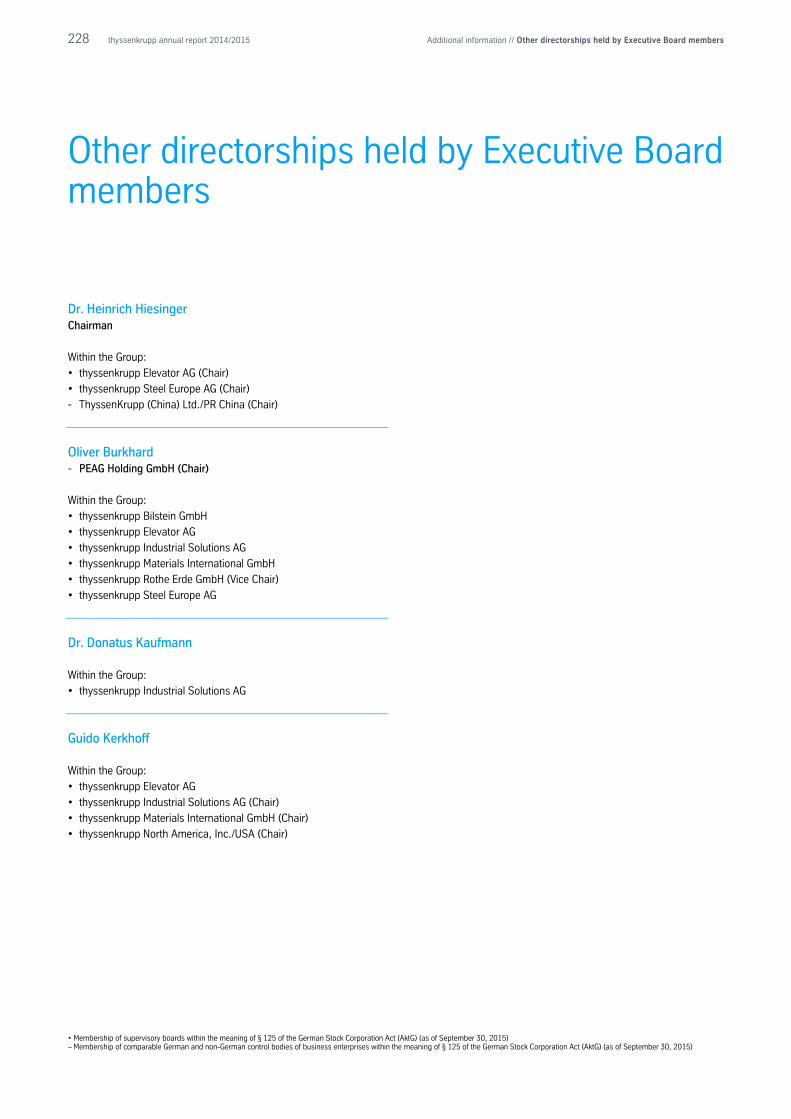
228 thyssenkrupp annual report 2014/2015 Additional information // Other directorships held by Executive Board members
Other directorships held by Executive Board members
Dr. Heinrich Hiesinger Chairman
Within the Group:
• thyssenkrupp Elevator AG (Chair)
• thyssenkrupp Steel Europe AG (Chair)
- ThyssenKrupp (China) Ltd./PR China (Chair)
Oliver Burkhard - PEAG Holding GmbH (Chair)
Within the Group:
• thyssenkrupp Bilstein GmbH
• thyssenkrupp Elevator AG
• thyssenkrupp Industrial Solutions AG
• thyssenkrupp Materials International GmbH
• thyssenkrupp Rothe Erde GmbH (Vice Chair)
• thyssenkrupp Steel Europe AG
Dr. Donatus Kaufmann Within the Group:
• thyssenkrupp Industrial Solutions AG
Guido Kerkhoff Within the Group:
• thyssenkrupp Elevator AG
• thyssenkrupp Industrial Solutions AG (Chair)
• thyssenkrupp Materials International GmbH (Chair)
• thyssenkrupp North America, Inc./USA (Chair)
• Membership of supervisory boards within the meaning of § 125 of the German Stock Corporation Act (AktG) (as of September 30, 2015) – Membership of comparable German and non-German control bodies of business enterprises within the meaning of § 125 of the German Stock Corporation Act (AktG) (as of September 30, 2015)
229 thyssenkrupp annual report 2014/2015 Additional information // Other directorships held by Supervisory Board members
Other directorships held by Supervisory Board members
Prof. Dr. Ulrich Lehner, Düsseldorf Chairman // Member of the Shareholders’ Committee of
Henkel AG & Co. KGaA
• Deutsche Telekom AG (Chair)
• E.ON SE
• Porsche Automobil Holding SE
– Henkel AG & Co. KGaA
(Member of the Shareholders’ Committee)
Dr. Sabine Maaßen, Dinslaken Vice Chairwoman // Legal Counsel, IG Metall
• Daimler AG
Martin Dreher, Heilbronn Retail clerk, Chairman of the Works Council of
thyssenkrupp System Engineering GmbH (Heilbronn) //
Chairman of the Works Council Union
thyssenkrupp Industrial Solutions
Within the Group:
• thyssenkrupp System Engineering GmbH
• thyssenkrupp Industrial Solutions AG
Markus Grolms, Frankfurt/Main IG Metall trade union secretary
Dr. Ingrid Hengster, Frankfurt/Main (since January 30, 2015) // Member of the Executive Board
of KfW Bankengruppe
• DB Mobility Logistics AG
• Deutsche Bahn AG
– European Investment Bank (EIB), Luxembourg
(Expert on the Board of Directors)
Susanne Herberger, Dresden Engineer (FH) – information technology // Vice Chairwoman of the
Group Works Council // Chairwoman of the Works Council Union
thyssenkrupp Elevator Technology
Within the Group:
• thyssenkrupp Elevator AG
Prof. Dr. Hans-Peter Keitel, Essen Vice President of the Federation of German Industries
(Bundesverband der Deutschen Industrie e.V.)
• Airbus Defence and Space GmbH
• National-Bank AG
• RWE AG
• Voith GmbH (Chair)
– Airbus N.V./Netherlands (Board and Nomination Committee)
Ernst-August Kiel, Blumenthal Fitter // Chairman of the Works Council of thyssenkrupp Marine
Systems GmbH (Kiel) // Chairman of the General Works Council of
thyssenkrupp Marine Systems //
Vice Chairman of the Works Council Union
thyssenkrupp Industrial Solutions
Within the Group:
• thyssenkrupp Industrial Solutions AG
Dr. Norbert Kluge, Ratingen Diplom-Sozialwirt // Head of Codetermination Support dept. at the
Hans Böckler Foundation
Dr. Ralf Nentwig, Essen Member of the Executive Committee of the Alfried Krupp von Bohlen
und Halbach Foundation
– Margarethe Krupp-Stiftung für Wohnungsfürsorge
(Vice Chairman of the Supervisory Board)
René Obermann, Bonn Partner at Warburg Pincus LLC
• CompuGroup Medical AG
• E.ON SE
– Spotify Technology S.A./Luxembourg
Prof. Dr. Bernhard Pellens, Bochum Professor of Business Studies and International Accounting, Ruhr
University Bochum
• LVM Pensionsfonds-AG
230 thyssenkrupp annual report 2014/2015 Additional information // Other directorships held by Supervisory Board members
Peter Remmler, Wolfsburg Wholesale and export trader // Chairman of the Works Council of
thyssenkrupp Schulte GmbH (Braunschweig) // Chairman of the
Works Council Union thyssenkrupp Materials Services
Within the Group:
• thyssenkrupp Materials International GmbH
Carola Gräfin v. Schmettow, Düsseldorf Chairwoman of the Management Board of HSBC Trinkaus &
Burkhardt AG
• BVV Versicherungsverein des Bankgewerbes a.G.
– HSBC France S.A. Paris
Wilhelm Segerath, Duisburg Automotive body maker // Chairman of the Group Works Council of
thyssenkrupp AG
– PEAG Holding GmbH (Member of the Advisory Board)
Carsten Spohr, Munich Chairman of the Executive Board of Deutsche Lufthansa AG
• Lufthansa Technik AG (Chair)
– Dr. August Oetker KG (Member of the Advisory Board)
Dr. Lothar Steinebach, Leverkusen Former Member of the Management Board of Henkel AG & Co. KGaA
• ALTANA AG
• Carl Zeiss AG
• Ralf Schmitz GmbH & Co. KGaA
– Air Berlin PLC
(Member of the Board of Directors)
– Diem Client Partner AG/Switzerland
(Member of the Management Board)
Jens Tischendorf, Zurich (since January 30, 2015) // Partner and Director of Cevian
Capital AG
• Bilfinger S.E.
Fritz Weber, Schöndorf Machine setter // Chairman of the General Works Council of
thyssenkrupp Bilstein GmbH // Chairman of the Works Council Union
thyssenkrupp Components Technology
Within the Group:
• thyssenkrupp Bilstein GmbH
Isolde Würz, Mülheim a.d.Ruhr (since February 1, 2015) // Attorney, Head of Governance,
Corporate Function Legal at thyssenkrupp AG
In the course of fiscal year 2014/2015 the following members left the
Supervisory Board: Christian Streiff and Jürgen R. Thumann at the
close of January 30, 2015 and Klaus Preußler at the close of January
31, 2015. Where they held other directorships at the time of departure
these are listed below:
Christian Streiff, Paris (until January 30, 2015) // Vice President of SAFRAN S.A.
– Bridgepoint Ltd./United Kingdom
– Crédit Agricole S.A./France
– SAFRAN S.A./France (Vice-Président)
Jürgen R. Thumann, Düsseldorf (until January 30, 2015) // Chairman of the Advisory Board of
Heitkamp & Thumann Group
– Heitkamp & Thumann Group
(Chairman of the Advisory Board)
Klaus Preußler, Essen (until January 31, 2015) // Industrial clerk, Head of Accounting at
thyssenkrupp Materials International GmbH (Essen)
• Membership of other supervisory boards within the meaning of § 125 of the German Stock Corporation Act (AktG) (as of September 30, 2015) – Membership of comparable German and non-German control bodies of business enterprises within the meaning of § 125 of the German Stock Corporation Act (AktG) (as of September 30, 2015)
231 thyssenkrupp annual report 2014/2015 Additional information // Glossary
Glossary
List of definitions and abbreviations
A ADR American Depositary Receipt AktG Stock Corporation Act Average collection period
Trade accounts receivable divided by sales, multiplied by 360 (the lower the ratio, the faster customers pay)
B Best-in-Class Reloaded Efficiency program at tk Steel Europe. Part of the “impact” initiative.
BIC Brazil, India, China BME Bundesverband Materialwirtschaft, Einkauf und Logistik e. V. (Materials Management, Purchasing and Logistics Association) Business cash flow Free cash flow before divestments, interest and taxes
C Capital employed Interest-bearing invested capital CFRP Carbon fiber reinforced plastics CGU Cash generating unit Cluster management
Joint strategic management of purchasing requirements. Clusters are groups of outsourced products and services that due to their similarity (e.g. comparable technical requirements or same suppliers) can be managed jointly.
Commercial paper program
Program for raising short-term debt capital on the capital market Compliance
General term for measures to comply with laws and company policies
Corporate governance Term for responsible corporate management and control geared to long-term value creation
COSO
Committee of Sponsoring Organizations of the Treadway Commission Cost of capital (WACC)
Minimum return required by capital providers (Weighted Average Cost of Capital)
CUSIP Committee on Uniform Security Identification Procedures
D daproh Corporate data and process harmonization project DJ STOXX
Dow Jones STOXX 600, compiled by index provider Stoxx Ltd. It lists the performance of 600 companies from 18 European countries.
E EBIT Earnings before interest and taxes
EBITDA
Earnings before interest, taxes, depreciation and amortization EBT Earnings before taxes EEG Renewable Energies Act Equity ratio
Ratio of total equity to balance sheet total (the higher the ratio, the lower the indebtedness)
Emerging markets Developing markets in Asia, Latin America and Eastern Europe EMIR audit
European Market Infrastructure Regulation. Adopted in August 2012. Designed to make over-the-counter trading in derivatives more transparent and secure.
232 thyssenkrupp annual report 2014/2015 Additional information // Glossary
F FCF Free cash flow FCF before divestments Free cash flow before divestments = Operating cash flows
less cash flows from investing activities excluding cash inflows from divestments
FCF before M&A Free cash flow before M&A = Operating cash flows less cash flows from investing activities excluding cash inflows or outflows from major M&A transactions
FFO/total debt
Basically, ratio of operating cash flow before changes in net working capital to total debt (the higher the ratio, the better a company’s ability to pay its debts from operating activities). FFO stands for funds from operations.
G Gearing Ratio of financial liabilities to total equity
(the lower the ratio, the higher the share of total equity in capital employed)
H HGB Handelsgesetzbuch (German Commercial Code) HKM Hüttenwerke Krupp Mannesmann
I IAS International Accounting Standards IASB International Accounting Standards Board IFRIC
International Financial Reporting Interpretations Committee or interpretations of the IFRIC
IFRS International Financial Reporting Standards impact
Corporate program to enhance performance and execute the corporate strategy
InCar®plus
InCar®plus is a project that offers automotive manufacturers and suppliers 40 new solutions for the powertrain, chassis & steering and body.
Internal financing strength Ratio of operating cash flows to cash flows from investing activities
Inventory turnover Inventories divided by sales, multiplied by 360 (the lower the ratio, the faster the inventory turnover)
ISIN International Stock Identification Number
L Long-term incentive plan (LTI) Long-term variable compensation for executive board members and other selected executives through stock rights
M MitbestG Codetermination Act
N NAFTA North American Free Trade Agreement Net financial debt
Difference between the cash and cash equivalents shown in the statement of financial position plus current other financial assets available for sale, and non-current and current financial debt; the corresponding assets and liabilities of the disposal groups are also taken into account.
O Operating cash flows Inflow/outflow of cash and cash equivalents outside of investing, divesting or financing activities
OTC Over-the-counter
R Rating Ratings are used to assess the future ability of a company to meet its payment obligations on time and in full. They are based on an analysis of quantitative and qualitative factors.
Redox flow battery
A type of accumulator that stores electrical energy in chemical compounds, with the reaction partners present in dissolved form in a solvent.
ROCE
Return on capital employed
S STI Short-term incentive plan synergize+
Program for the Groupwide management of all purchasing activities. Part of the “impact” initiative.
233 thyssenkrupp annual report 2014/2015 Additional information // Glossary
T thyssenkrupp Value Added (tkVA) Central indicator for value-based management, comparing earnings before interest and taxes with cost of capital
U UmwG Transformation Act
V VorstAG Act on the Appropriateness of Management Remuneration
W WACC Weighted average cost of capital WpHG Securities Trading Act
234 thyssenkrupp annual report 2014/2015 Additional information // Contact and 2016/2017 financial calendar
Contact and 2016/2017 financial calendar
For more information please contact:
Communications Telephone +49 201 844-536043
Fax +49 201 844-536041
E-mail [email protected]
Investor Relations E-mail [email protected]
Institutional investors and analysts Telephone +49 201 844-536464
Fax +49 201 8456-531000
Private investors Telephone +49 201 844-536367
Fax +49 201 8456-531000
Address thyssenkrupp AG
thyssenkrupp Allee 1, 45143 Essen, Germany
Postfach, 45063 Essen, Germany
Telephone +49 201 844-0
Fax +49 201 844-536000
E-mail [email protected]
www.thyssenkrupp.com
2016/2017 financial calendar
January 29, 2016 Annual General Meeting
February 12, 2016 Interim report
1st quarter 2015/2016 (October to December)
Conference call with analysts and investors
May 10, 2016 Interim report
1st half 2015/2016 (October to March)
Conference call with analysts and investors
August 11, 2016 Interim report
9 months 2015/2016 (October to June)
Conference call with analysts and investors
November 24, 2016 Annual report 2015/2016
Annual press conference
Analysts’ and investors’ conference
January 27, 2017 Annual General Meeting
This annual report was published on November 19, 2015.
Forward-looking statements This document contains forward-looking statements that reflect management’s current views with respect to future events. Such statements are subject to risks and uncertainties that are beyond thyssenkrupp’s ability to control or estimate precisely, such as future market and economic conditions, the behavior of other market participants, the ability to successfully integrate acquired businesses and achieve anticipated synergies and the actions of government regulators. If any of these or other risks and uncertainties occur, or if the assumptions underlying any of these statements prove incorrect, then actual results may be materially different from those expressed or implied by such statements. thyssenkrupp does not intend or assume any obligation to update any forward-looking statements to reflect events or circumstances after the date of these materials.
Rounding differences and rates of change Percentages and figures in this report may include rounding differences. The signs used to indicate rates of change are based on economic aspects: Improvements are indicated by a plus (+) sign, deteriorations are shown in brackets ( ). Very high positive and negative rates of change (≥500% or ≤(100)%) are indicated by ++ and −− respectively. Variances for technical reasons Due to statutory disclosure requirements the Company must submit this annual report electronically to the Federal Gazette (Bundesanzeiger). For technical reasons there may be variances in the accounting documents published in the Federal Gazette. German and English versions of the annual report can be downloaded from the internet at www.thyssenkrupp.com. In the event of variances, the German version shall take precedence over the English translation.
TK 8
34 d
1.2
,5.0
1.16
DP

www.thyssenkrupp.com