annual report 2014 - bridgestone.com asia, the economic expansion in china and india continued to...
TRANSCRIPT

Annual Report 2014Financial Review
Contents
1 Management’s Discussion and Analysis
4 Eleven-year Summary
7 Operational Risks
10 Consolidated Balance Sheet
12 Consolidated Statement of Income
13 Consolidated Statement of Comprehensive Income
14 Consolidated Statement of Changes in Equity
15 Consolidated Statement of Cash Flows
16 Notes to Consolidated Financial Statements
43 Independent Auditor’s Report
The Bridgestone Corporation is referred to as the “Company,” and the Company and its subsidiaries are referred to as the “Companies” in this publication.
Forward-Looking StatementsThe descriptions of projections and plans that appear in this annual report are “forward-looking statements.” They involve known and unknown risks and uncertainties in regard to such factors as product liability, currency exchange rates, raw material costs, labor-management relations, and political stability. These and other variables could cause the Bridgestone Group’s actual performance and results to differ from management’s projections and plans.

1Annual Report 2014 Financial Review
Unless otherwise noted, all figures are taken from the consolidated financial statements and notes. The U.S. dollar figures have been translated solely for the convenience of readers outside Japan at ¥120.55 to $1, the prevailing exchange rate on December 31, 2014. Financial disclosures by the Bridgestone Corporation (the “Company”) are in accordance with accounting principles generally accepted in Japan.
Results of Operations Business environmentIn fiscal 2014, the operating environment of the Company and its subsidiaries (the “Companies”) was marked by the rapid depreciation of the yen and falling oil prices in the second half of the fiscal year. In Japan, economic and monetary policies took effect, and the economy continued a gradual recovery. However, following the increase in the consumption tax rate, the recovery in demand was sluggish, and domestic economic conditions remained uncertain. Overseas, despite an uncertain business environment, overall business conditions continued to recover at a slow pace. In the United States, the gradual recovery continued due to an increase in consumer spending, while, despite signs of recovery in Europe, geopolitical risks also had an influence. In Asia, the economic expansion in China and India continued to slow, and in Thailand the economy remained sluggish.
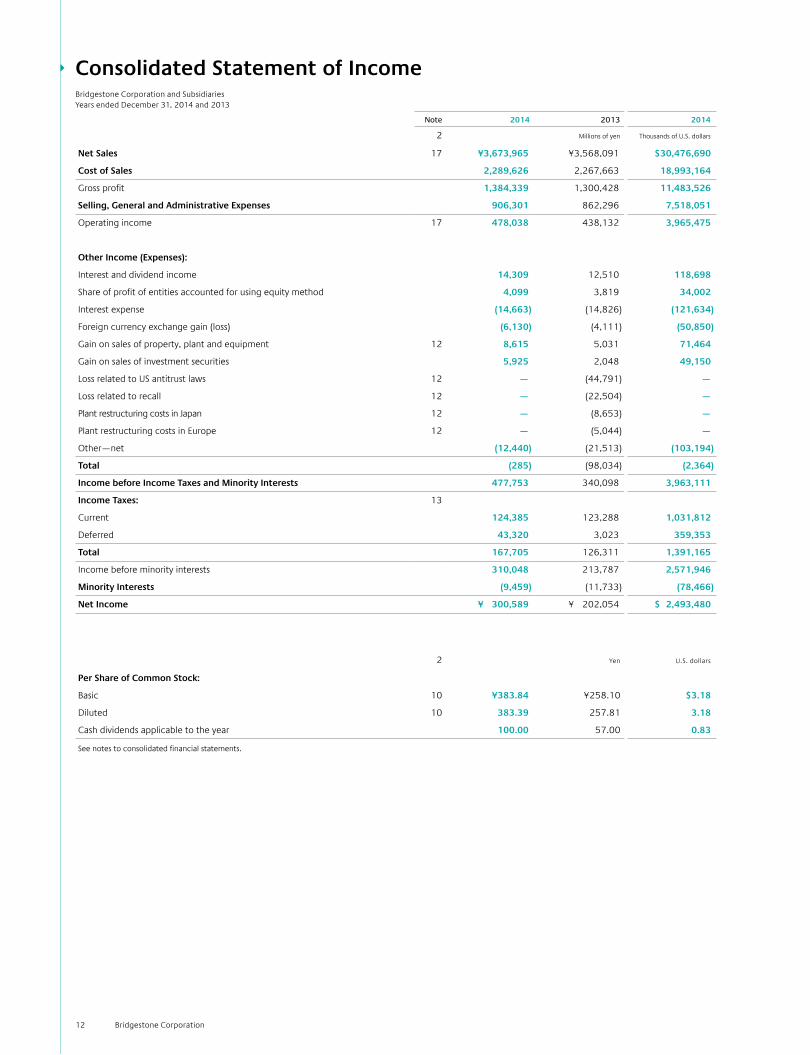
Net salesNet sales rose by 3%, or ¥105.9 billion ($878 million), to ¥3,674.0 billion ($30.5 billion), primarily due to an increase in unit sales of tires and depreciation of the yen. As a result, year-on-year gains in sales were recorded in both the tire segment and the diversified products segment. The average yen/dollar exchange rate in fiscal 2014 was ¥106, compared with ¥98 in the previous year, while the average yen/euro exchange rate in fiscal 2014 was ¥140, compared with ¥130 in the previous year.
Operating incomeDue in large part to the decline in raw materials prices and the depreciation of the yen, operating income rose by 9%, or ¥39.9 billion ($331 million), to ¥478.0 billion ($3,965 million). As a result, the operating income margin increased by 0.7 percentage points, from 12.3% to 13.0%.
Operating Income Margin
2014 2013 2012 2011 2010
% of net sales
13.0 12.3 9.4 6.3 5.8
Management’s Discussion and Analysis
2014
2013
2012
2011
2010
191.3
166.5
286.0
438.1
478.0
Operating Income
¥ billion
2010 2011 2012 2013 2014
¥116/€1
¥88/$1
111
80
103
80
130
98
140
106
80
130
180
Currency Exchange RatesAnnual average rates
Net Sales
¥ billion
Sales of Tires and Diversified ProductsNet of inter-segment transactions
¥ billion
2014
2013
2012
2011
2010
487.6
484.3
485.6
534.43,033.7
2,554.1
2,536.7
2,377.3
585.33,088.6
2014
2013
2012
2011
2010
3,024.4
2,861.6
3,039.7
3,568.1
3,674.0
n n Tires n n Diversified products

2 Bridgestone Corporation
Performance by business segmentThe tire segment includes tires for passenger cars, trucks and buses, construction and mining vehicles, aircraft, and motorcycles, as well as tubes, wheels, related accessories, the retreading business, and automotive maintenance services. Including inter-segment transactions, the tire segment’s sales in fiscal 2014 increased by 2% from the previous year, to ¥3,093.4 billion ($25.7 billion). Operating income also increased, rising by 9%, to ¥435.8 billion ($3,615 million). In the tire segment, the Companies worked to maximize sales momentum by introducing appealing new products globally, enhancing strategic products, and reinforcing fundamental competencies such as specification optimization, and responding promptly to demand fluctuation in each region. In Japan, due to a surge in demand prior to the increase in the consumption tax rate, unit sales of tires for passenger cars and light trucks recorded steady year-on-year gains, and unit sales of tires for trucks and buses registered strong growth. In the Americas, North American unit sales of tires for passenger cars and light trucks recorded steady year-on-year growth, and unit sales of tires for trucks and buses registered strong year-on-year gains. In Europe, unit sales of tires for passenger cars and light trucks decreased year on year, while unit sales of tires for trucks and buses recorded strong growth. In the Asia Pacific region, unit sales of tires for passenger cars and light trucks were unchanged from the previous year, while unit sales of tires for trucks and buses registered steady increases. In China, unit sales of tires for passenger cars and light trucks recorded steady gains year on year, while unit sales of tires for trucks and buses decreased substantially. In the specialty tire business, sales of large and ultra-large off-the-road radial tires for construction and mining vehicles were down year on year due to a delayed recovery in demand stemming from tire inventory adjustments at mines. The diversified products segment includes functional chemical products, a wide range of industrial items, sporting goods, and bicycles. Many of these products are made from rubber or rubber-derived materials. In the diversified products segment, net sales totaled ¥601.9 billion ($4,993 million), an increase of 10% from fiscal 2013. Due to the increasing profit of the domestic business, operating income was ¥42.2 billion ($350 million), an increase of 9% from fiscal 2013.
Composition of Sales by Business SegmentNet of inter-segment transactions
2014 2013
% of net sales
Tires 84.1 85.0
Diversified products 15.9 15.0
100.0 100.0
Performance by marketIn Japan, net sales totaled ¥694.0 billion ($5,757 million), an increase of 3% from fiscal 2013. In the Americas, net sales totaled ¥1,746.3 billion ($14.5 billion), an increase of 7% from fiscal 2013. In Europe, net sales totaled ¥434.1 billion ($3,601 million), an increase of 2% from fiscal 2013. In other regions, net sales totaled ¥799.5 billion ($6,632 million), a decline of 5% from fiscal 2013.
Composition of Sales by MarketNet of inter-segment transactions
2014 2013
% of net sales
Japan 18.9 18.9
The Americas 47.5 45.7
Europe 11.8 11.9
Other 21.8 23.5
100.0 100.0
Other income and expenseThe total of other income and other expenses equaled a loss of ¥285 million ($2 million), compared with the corresponding loss of ¥98.0 billion in the previous year. Net interest-related expenses decreased by ¥1,962 million ($16 million), to ¥354 million ($3 million). In the previous fiscal year, gain on sales of property, plant and equipment was ¥5.0 billion, the loss related to US antitrust laws, etc., was ¥99.7 billion. In fiscal 2014, gain on sales of property, plant and equipment was ¥8.6 billion ($71 million), and gain on sales of investment securities was ¥5.9 billion ($49 million). Income before income taxes and minority interests increased by ¥137.7 billion ($1,142 million), or 40%, to ¥477.8 billion ($3,963 million).
Management’s Discussion and Analysis
3Annual Report 2014 Financial Review
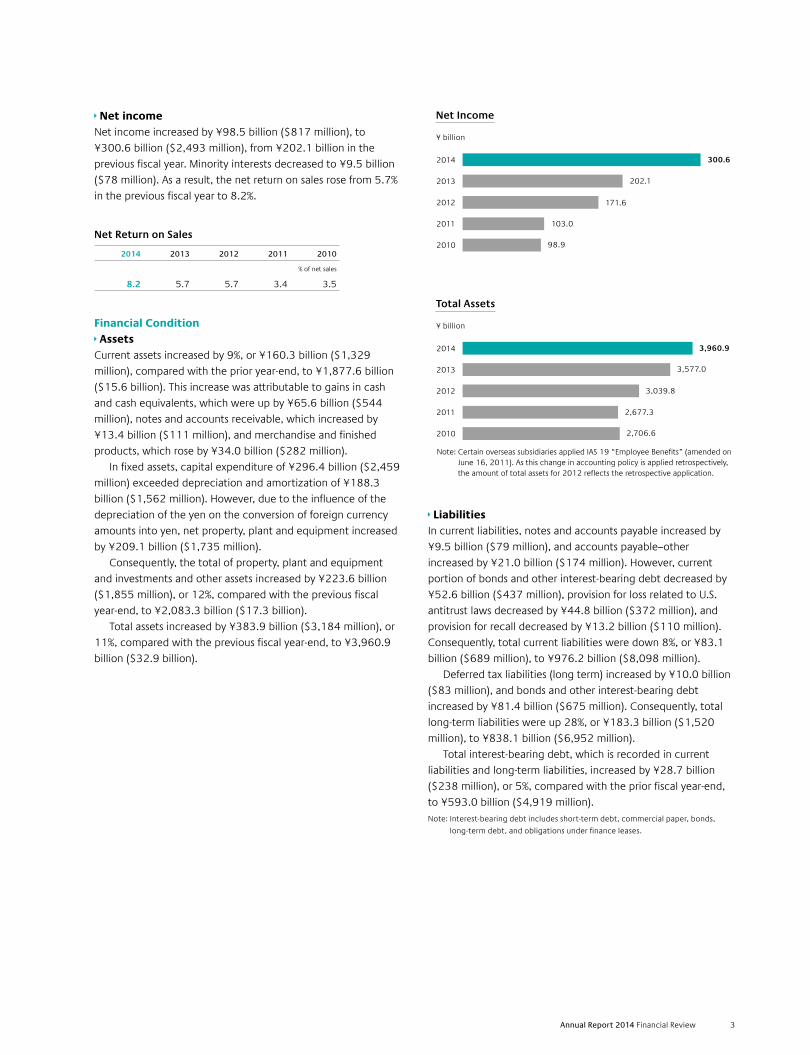
Net incomeNet income increased by ¥98.5 billion ($817 million), to ¥300.6 billion ($2,493 million), from ¥202.1 billion in the previous fiscal year. Minority interests decreased to ¥9.5 billion ($78 million). As a result, the net return on sales rose from 5.7% in the previous fiscal year to 8.2%.
Net Return on Sales
2014 2013 2012 2011 2010
% of net sales
8.2 5.7 5.7 3.4 3.5
Financial Condition AssetsCurrent assets increased by 9%, or ¥160.3 billion ($1,329 million), compared with the prior year-end, to ¥1,877.6 billion ($15.6 billion). This increase was attributable to gains in cash and cash equivalents, which were up by ¥65.6 billion ($544 million), notes and accounts receivable, which increased by ¥13.4 billion ($111 million), and merchandise and finished products, which rose by ¥34.0 billion ($282 million). In fixed assets, capital expenditure of ¥296.4 billion ($2,459 million) exceeded depreciation and amortization of ¥188.3 billion ($1,562 million). However, due to the influence of the depreciation of the yen on the conversion of foreign currency amounts into yen, net property, plant and equipment increased by ¥209.1 billion ($1,735 million). Consequently, the total of property, plant and equipment and investments and other assets increased by ¥223.6 billion ($1,855 million), or 12%, compared with the previous fiscal year-end, to ¥2,083.3 billion ($17.3 billion). Total assets increased by ¥383.9 billion ($3,184 million), or 11%, compared with the previous fiscal year-end, to ¥3,960.9 billion ($32.9 billion).
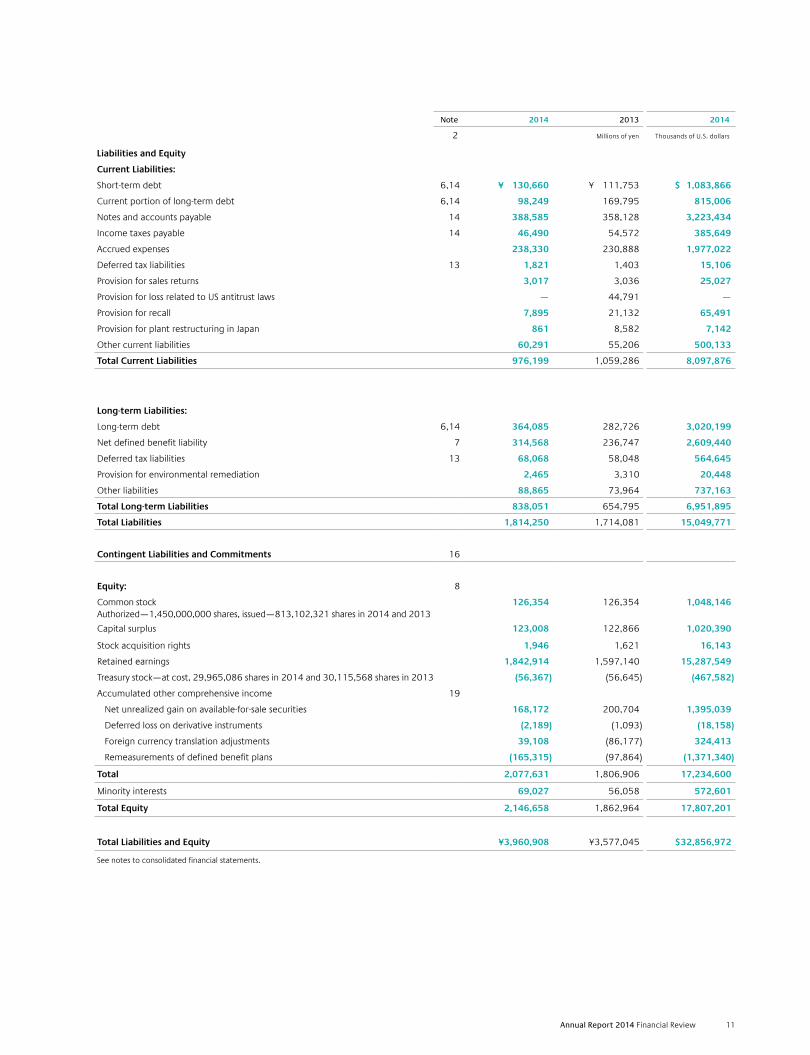
LiabilitiesIn current liabilities, notes and accounts payable increased by ¥9.5 billion ($79 million), and accounts payable–other increased by ¥21.0 billion ($174 million). However, current portion of bonds and other interest-bearing debt decreased by ¥52.6 billion ($437 million), provision for loss related to U.S. antitrust laws decreased by ¥44.8 billion ($372 million), and provision for recall decreased by ¥13.2 billion ($110 million). Consequently, total current liabilities were down 8%, or ¥83.1 billion ($689 million), to ¥976.2 billion ($8,098 million). Deferred tax liabilities (long term) increased by ¥10.0 billion ($83 million), and bonds and other interest-bearing debt increased by ¥81.4 billion ($675 million). Consequently, total long-term liabilities were up 28%, or ¥183.3 billion ($1,520 million), to ¥838.1 billion ($6,952 million). Total interest-bearing debt, which is recorded in current liabilities and long-term liabilities, increased by ¥28.7 billion ($238 million), or 5%, compared with the prior fiscal year-end, to ¥593.0 billion ($4,919 million).Note: Interest-bearing debt includes short-term debt, commercial paper, bonds,
long-term debt, and obligations under finance leases.
2014
2013
2012
2011
2010
103.0
98.9
171.6
202.1
300.6
Net Income
¥ billion
2014
2013
2012
2011
2010
2,677.3
2,706.6
3,039.8
3,577.0
3,960.9
Total Assets
¥ billion
Note: Certain overseas subsidiaries applied IAS 19 “Employee Benefits” (amended on June 16, 2011). As this change in accounting policy is applied retrospectively, the amount of total assets for 2012 reflects the retrospective application.

4 Bridgestone Corporation
EquityTotal equity at December 31, 2014, amounted to ¥2,146.7 billion ($17.8 billion). This was ¥283.7 billion ($2,353 million), or 15%, higher than at the previous fiscal year-end. Cash dividends paid were ¥54.8 billion ($455 million), net unrealized loss on available-for-sale securities decreased by ¥32.5 billion ($270 million), and remeasurements of defined benefit plans declined by ¥67.5 billion ($560 million). However, net income was ¥300.6 billion ($2,493 million), and foreign currency translation adjustments increased by ¥125.3 billion ($1,039 million). The ratio of shareholders’ equity, excluding stock acquisition rights and minority interests, to total assets at the end of December 2014 was 52.4%, an increase of 1.9 percentage points from the previous fiscal year-end. The ratio of total debt to debt and shareholders’ equity was 22.2% at December 31, 2014, compared with a ratio of 23.8% at the previous fiscal year-end. Net return on shareholders’ equity (ROE) was 15.5%, an increase of 2.8 percentage points compared with the previous fiscal year. Net return on total assets (ROA) equaled 8.0%, an increase of 1.9 percentage points compared with the previous fiscal year.
2014 2013 2012 2011 2010 2009 2008 2007 2006 2005 2004
Millions of yen, except per share data and financial ratios Millions of yen, except per share data and financial ratios
Net sales ¥ 3,673,965 ¥ 3,568,091 ¥ 3,039,738 ¥ 3,024,356 ¥ 2,861,615 ¥ 2,597,002 ¥ 3,234,406 ¥ 3,390,219 ¥ 2,991,275 ¥ 2,691,376 ¥ 2,416,685
Overseas sales 2,979,922 2,893,251 2,343,546 2,330,154 2,189,765 1,982,192 2,448,300 2,589,006 2,213,880 1,945,283 1,700,599
Tires (net of inter-segment transactions) 3,088,627 3,033,660 2,554,126 2,536,731 2,377,305 2,151,314 2,622,890 2,750,374 2,393,165 2,152,950 1,927,989
Diversified products (net of inter-segment transactions) 585,338 534,431 485,612 487,625 484,310 445,687 611,516 639,845 598,110 538,426 488,696
Operating income 478,038 438,132 285,995 191,322 166,450 75,712 131,551 249,962 190,876 213,851 197,697
Net income 300,589 202,054 171,606 102,970 98,914 1,044 10,412 131,630 85,121 180,796 114,453
Total equity 2,146,658 1,862,964 1,417,348 1,165,672 1,176,147 1,120,797 1,019,996 1,410,225 1,221,846 1,128,597 934,981
Total assets 3,960,908 3,577,045 3,039,799 2,677,344 2,706,640 2,808,439 2,768,470 3,359,255 3,053,440 2,709,962 2,333,708
Ratio of shareholders’ equity to total assets 52.4 50.5 45.2 42.2 42.2 38.7 35.8 40.8 38.6 41.6 40.1
Per share in Yen:
Net income
Basic 383.84 258.10 219.26 131.56 126.19 1.33 13.33 168.69 109.10 226.92 138.96
Diluted 383.39 257.81 219.10 131.50 126.16 1.33 13.33 168.65 109.07 226.86 138.94
Shareholders’ equity 2,650.47 2,305.64 1,754.30 1,444.53 1,458.01 1,385.43 1,263.30 1,757.23 1,511.43 1,443.43 1,163.82
Cash dividends 100.00 57.00 32.00 22.00 20.00 16.00 24.00 26.00 24.00 24.00 19.00
Capital expenditure 296,396 274,862 245,644 201,390 182,648 178,204 275,301 272,381 261,335 203,670 191,000
Depreciation and amortization 188,333 176,180 155,066 158,044 170,663 180,547 187,420 173,585 145,349 127,609 111,491
Research and development costs 94,147 89,098 82,801 83,982 85,154 85,766 93,252 86,748 86,687 79,415 72,898
*1 Solely for the convenience of readers, the Japanese yen amounts in this annual report are translated into U.S. dollars at the rate of ¥120.55 to $1, the approximate year-end rate.
*2 By adoption of the new accounting standard for presentation of equity, minority interests, stock acquisition rights and deferred gain (loss) on derivative instruments are
included in equity from fiscal 2006.
*3 As described in Note 3. (28) “Application of IAS 19 ‘Employee Benefits’ (amended on June 16, 2011),” certain overseas subsidiaries applied IAS 19 “Employee Benefits”
(amended on June 16, 2011). As this change in accounting policy is applied retrospectively, the amount of total equity and total assets for 2012 reflect the retrospective application.
Eleven-year SummaryBridgestone Corporation and Subsidiaries
Years ended December 31
2014
2013
2012
2011
2010
1,165.7
1,176.1
1,417.3
1,863.0
2,146.7
Total Equity
¥ billion
Note: Certain overseas subsidiaries applied IAS 19 “Employee Benefits” (amended on June 16, 2011). As this change in accounting policy is applied retrospectively, the amount of total equity for 2012 reflects the retrospective application.
2010 2011 2012 2013 2014
42.2 42.245.2
50.552.4
30
40
50
60
Ratio of Shareholders’ Equity to Total Assets
%
Management’s Discussion and Analysis

5Annual Report 2014 Financial Review
2014 2013 2012 2011 2010 2009 2008 2007 2006 2005 2004
Millions of yen, except per share data and financial ratios Millions of yen, except per share data and financial ratios
Net sales ¥ 3,673,965 ¥ 3,568,091 ¥ 3,039,738 ¥ 3,024,356 ¥ 2,861,615 ¥ 2,597,002 ¥ 3,234,406 ¥ 3,390,219 ¥ 2,991,275 ¥ 2,691,376 ¥ 2,416,685
Overseas sales 2,979,922 2,893,251 2,343,546 2,330,154 2,189,765 1,982,192 2,448,300 2,589,006 2,213,880 1,945,283 1,700,599
Tires (net of inter-segment transactions) 3,088,627 3,033,660 2,554,126 2,536,731 2,377,305 2,151,314 2,622,890 2,750,374 2,393,165 2,152,950 1,927,989
Diversified products (net of inter-segment transactions) 585,338 534,431 485,612 487,625 484,310 445,687 611,516 639,845 598,110 538,426 488,696
Operating income 478,038 438,132 285,995 191,322 166,450 75,712 131,551 249,962 190,876 213,851 197,697
Net income 300,589 202,054 171,606 102,970 98,914 1,044 10,412 131,630 85,121 180,796 114,453
Total equity 2,146,658 1,862,964 1,417,348 1,165,672 1,176,147 1,120,797 1,019,996 1,410,225 1,221,846 1,128,597 934,981
Total assets 3,960,908 3,577,045 3,039,799 2,677,344 2,706,640 2,808,439 2,768,470 3,359,255 3,053,440 2,709,962 2,333,708
Ratio of shareholders’ equity to total assets 52.4 50.5 45.2 42.2 42.2 38.7 35.8 40.8 38.6 41.6 40.1
Per share in Yen:
Net income
Basic 383.84 258.10 219.26 131.56 126.19 1.33 13.33 168.69 109.10 226.92 138.96
Diluted 383.39 257.81 219.10 131.50 126.16 1.33 13.33 168.65 109.07 226.86 138.94
Shareholders’ equity 2,650.47 2,305.64 1,754.30 1,444.53 1,458.01 1,385.43 1,263.30 1,757.23 1,511.43 1,443.43 1,163.82
Cash dividends 100.00 57.00 32.00 22.00 20.00 16.00 24.00 26.00 24.00 24.00 19.00
Capital expenditure 296,396 274,862 245,644 201,390 182,648 178,204 275,301 272,381 261,335 203,670 191,000
Depreciation and amortization 188,333 176,180 155,066 158,044 170,663 180,547 187,420 173,585 145,349 127,609 111,491
Research and development costs 94,147 89,098 82,801 83,982 85,154 85,766 93,252 86,748 86,687 79,415 72,898
*1 Solely for the convenience of readers, the Japanese yen amounts in this annual report are translated into U.S. dollars at the rate of ¥120.55 to $1, the approximate year-end rate.
*2 By adoption of the new accounting standard for presentation of equity, minority interests, stock acquisition rights and deferred gain (loss) on derivative instruments are
included in equity from fiscal 2006.
*3 As described in Note 3. (28) “Application of IAS 19 ‘Employee Benefits’ (amended on June 16, 2011),” certain overseas subsidiaries applied IAS 19 “Employee Benefits”
(amended on June 16, 2011). As this change in accounting policy is applied retrospectively, the amount of total equity and total assets for 2012 reflect the retrospective application.
Net Return on Shareholders’ Equity
2014 2013 2012 2011 2010
% of simple average of year-end shareholders’ equity
15.5 12.7 13.7 9.1 8.9
Net Return on Total Assets
2014 2013 2012 2011 2010
% of simple average of year-end total assets
8.0 6.1 6.0 3.8 3.6
Cash flowConsolidated cash and cash equivalents increased by ¥65.6 billion ($544 million) during 2014, to ¥390.2 billion ($3,237 million), compared with an increase of ¥55.2 billion during the prior year. The principal contributors to the decrease in net cash used in operating activities included payment related to US antitrust laws of ¥43.7 billion ($362 million), payment related to recall of ¥11.7 billion ($97 million), income tax paid of ¥128.1 billion ($1,062 million), compared with ¥117.7 billion during the prior year. These contributors offset income taxes and minority interests of ¥477.8 billion ($3,963 million), compared with ¥340.1 billion during the prior year.
2014
2013
2012
2011
2010
152.2
247.7
404.5
471.8
428.6
Cash FlowNet cash provided by operating activities
¥ billion

6 Bridgestone Corporation
Net cash used in investing activities increased by ¥40.5 billion ($336 million), compared with the prior year, to ¥305.7 billion ($2,536 million). Expenditures included payments of ¥288.4 billion ($2,392 million) for purchase of tangible assets, compared with payments of ¥267.0 billion during the prior year. Net cash used in financing activities decreased by ¥115.8 billion ($960 million), compared with the prior year, to ¥67.9 billion ($564 million). The principal contributors to the decrease in net cash used in financing activities included net increase in short-term borrowings of ¥6.9 billion ($57 million), compared with ¥81.1 billion during the prior year, repayments of long-term borrowings of ¥121.7 billion ($1,009 million), compared with ¥67.4 billion during the prior year, payments for redemption of bonds of ¥63.8 billion ($529 million), compared with ¥62.0 billion during the prior year, and payments for cash dividends paid of ¥54.8 billion ($455 million), compared with ¥33.7 billion during the prior year. These contributors offset proceeds from issuance of bonds of ¥70.0 billion ($581 million), compared with ¥50.0 billion in the prior year.
Capital financing and liquidityIn addition to borrowings from financial institutions, the Companies continue to seek to diversify sources of financing through direct financing such as domestic straight bonds, commercial paper, medium-term notes in overseas markets, and securitization of receivables and leases as well as to diversify risks and to minimize interest costs.
DividendComprising interim dividends of ¥40.0 ($0.33) and year-end dividends of ¥60.0 ($0.50) per share, annual dividends for fiscal 2014 totaled ¥100.0 ($0.83) per share.
Projection for Fiscal 2015In 2014, the Companies’ operating environment will continue to require careful attention due to such factors as fluctuations in exchange rates and the prices of raw materials and feedstocks, an ongoing lack of clarity in the global economic situation, and international political conditions that remain unstable. Amid such a challenging business environment, the Companies project the following results through the implementation of Mid-Term Management Plan initiatives. Management forecasts consolidated net sales in fiscal 2015 of ¥3,980.0 billion, an increase of 8% from fiscal 2014. Management expects operating income to increase by 9%, to ¥519.0 billion, with net income rising to ¥319.0 billion. Projected annual dividends in fiscal 2015 are ¥120 per share. These performance forecasts are based on assumed average exchange rates of ¥115 against the dollar and ¥136 against the euro, compared with the full-year average rates recorded in fiscal 2014 of ¥106 and ¥140, respectively.
2014
2013
2012
2011
2010
201.4
182.6
245.6
274.9
296.4
Capital Expenditure
¥ billion
Management’s Discussion and Analysis
7Annual Report 2014 Financial Review
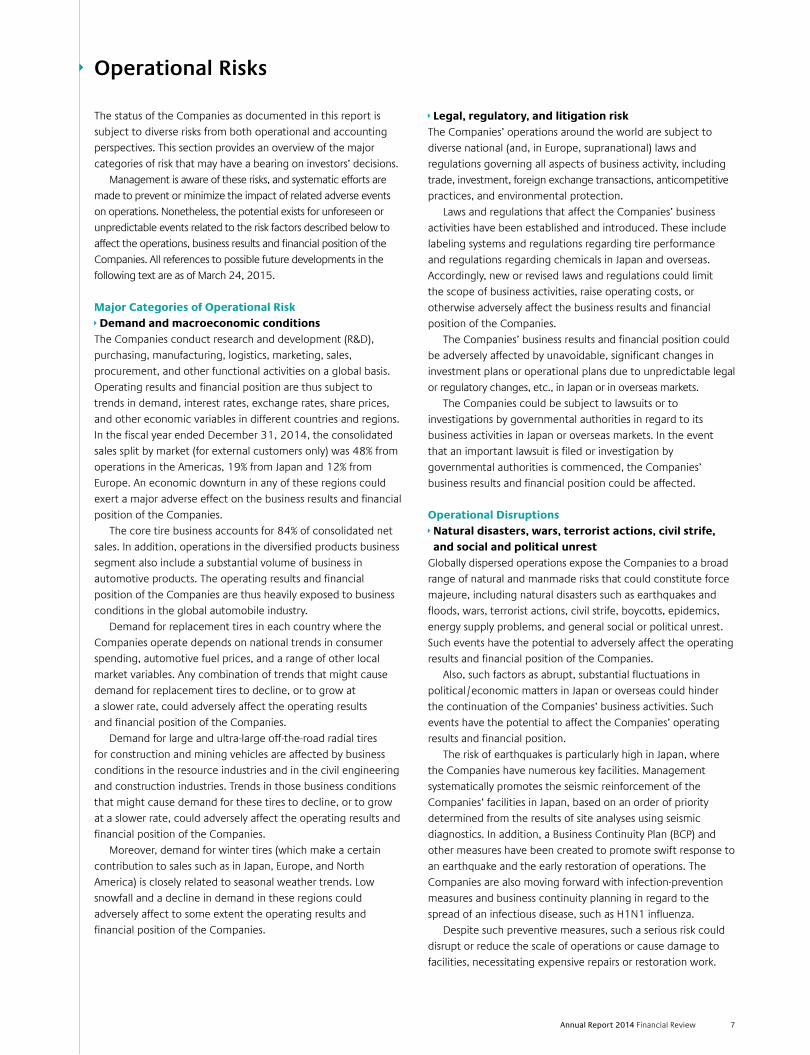
The status of the Companies as documented in this report is subject to diverse risks from both operational and accounting perspectives. This section provides an overview of the major categories of risk that may have a bearing on investors’ decisions. Management is aware of these risks, and systematic efforts are made to prevent or minimize the impact of related adverse events on operations. Nonetheless, the potential exists for unforeseen or unpredictable events related to the risk factors described below to affect the operations, business results and financial position of the Companies. All references to possible future developments in the following text are as of March 24, 2015.
Major Categories of Operational Risk Demand and macroeconomic conditionsThe Companies conduct research and development (R&D), purchasing, manufacturing, logistics, marketing, sales, procurement, and other functional activities on a global basis. Operating results and financial position are thus subject to trends in demand, interest rates, exchange rates, share prices, and other economic variables in different countries and regions. In the fiscal year ended December 31, 2014, the consolidated sales split by market (for external customers only) was 48% from operations in the Americas, 19% from Japan and 12% from Europe. An economic downturn in any of these regions could exert a major adverse effect on the business results and financial position of the Companies. The core tire business accounts for 84% of consolidated net sales. In addition, operations in the diversified products business segment also include a substantial volume of business in automotive products. The operating results and financial position of the Companies are thus heavily exposed to business conditions in the global automobile industry. Demand for replacement tires in each country where the Companies operate depends on national trends in consumer spending, automotive fuel prices, and a range of other local market variables. Any combination of trends that might cause demand for replacement tires to decline, or to grow at a slower rate, could adversely affect the operating results and financial position of the Companies. Demand for large and ultra-large off-the-road radial tires for construction and mining vehicles are affected by business conditions in the resource industries and in the civil engineering and construction industries. Trends in those business conditions that might cause demand for these tires to decline, or to grow at a slower rate, could adversely affect the operating results and financial position of the Companies. Moreover, demand for winter tires (which make a certain contribution to sales such as in Japan, Europe, and North America) is closely related to seasonal weather trends. Low snowfall and a decline in demand in these regions could adversely affect to some extent the operating results and financial position of the Companies.
Legal, regulatory, and litigation riskThe Companies’ operations around the world are subject to diverse national (and, in Europe, supranational) laws and regulations governing all aspects of business activity, including trade, investment, foreign exchange transactions, anticompetitive practices, and environmental protection. Laws and regulations that affect the Companies’ business activities have been established and introduced. These include labeling systems and regulations regarding tire performance and regulations regarding chemicals in Japan and overseas. Accordingly, new or revised laws and regulations could limit the scope of business activities, raise operating costs, or otherwise adversely affect the business results and financial position of the Companies. The Companies’ business results and financial position could be adversely affected by unavoidable, significant changes in investment plans or operational plans due to unpredictable legal or regulatory changes, etc., in Japan or in overseas markets. The Companies could be subject to lawsuits or to investigations by governmental authorities in regard to its business activities in Japan or overseas markets. In the event that an important lawsuit is filed or investigation by governmental authorities is commenced, the Companies’ business results and financial position could be affected.
Operational Disruptions Natural disasters, wars, terrorist actions, civil strife, and social and political unrest
Globally dispersed operations expose the Companies to a broad range of natural and manmade risks that could constitute force majeure, including natural disasters such as earthquakes and floods, wars, terrorist actions, civil strife, boycotts, epidemics, energy supply problems, and general social or political unrest. Such events have the potential to adversely affect the operating results and financial position of the Companies. Also, such factors as abrupt, substantial fluctuations in political/economic matters in Japan or overseas could hinder the continuation of the Companies’ business activities. Such events have the potential to affect the Companies’ operating results and financial position. The risk of earthquakes is particularly high in Japan, where the Companies have numerous key facilities. Management systematically promotes the seismic reinforcement of the Companies’ facilities in Japan, based on an order of priority determined from the results of site analyses using seismic diagnostics. In addition, a Business Continuity Plan (BCP) and other measures have been created to promote swift response to an earthquake and the early restoration of operations. The Companies are also moving forward with infection-prevention measures and business continuity planning in regard to the spread of an infectious disease, such as H1N1 influenza. Despite such preventive measures, such a serious risk could disrupt or reduce the scale of operations or cause damage to facilities, necessitating expensive repairs or restoration work.
Operational Risks

8 Bridgestone Corporation
The costs involved could adversely affect the Companies’ operating results and financial condition. Operational disruptions at those plants where production of certain products or materials is concentrated have the potential to cause greater problems due to the increased possibility of a supply interruption, which could result in claims for compensation based on breach of supply contracts, or in an erosion of customers’ confidence in the Companies as a reliable sources of supply. Any such developments could have a significantly adverse impact on the operating results and financial position of the Companies.
Information Technology (IT) Systems FailuresThe complex operations of the Companies are increasingly dependent on the smooth, round-the-clock functioning of various computing and IT systems. Failure of such technical systems due to external causes, such as natural disasters or computer viruses, or through human error, could cause significant operational disruption, with the potential for major adverse effects on performance. The Companies have instituted comprehensive measures to safeguard IT and computing systems and related data, and to upgrade network security on an ongoing basis in order to prevent systemic failures.
Industrial ActionProlonged strikes or other industrial action could cause operational disruptions and thereby adversely affect the operating results and financial position of the Companies. Management strives to minimize the risk of labor unrest by fostering good labor-management relations throughout global operations.
Corporate and brand imageThe Companies strive to enhance their corporate and brand image consistently through global business activities. Systematic efforts are made to ensure compliance with all applicable laws and regulations and to promote the highest ethical standards. Programs are in place across the Companies to prevent industrial incidents, particularly fires and any accidents that could cause occupational injuries, and to respond immediately to any accidents that occur. Despite such preventive measures, serious ethical lapses or industrial accidents, which are by their nature unpredictable, have the potential to affect the operating results and financial position of the Companies adversely by damaging the image and reputation of the Companies, diminishing the general public’s confidence in the Companies, or leading to a drop in share price.
Currency riskThe global distribution of the Companies’ R&D, manufacturing, logistics, marketing, and sales facilities requires business transactions in numerous currencies. The Companies employ foreign currency forward contracts to hedge short-term exposure to exchange rate fluctuations between the yen and the U.S. dollar, euro, and other leading currencies. However, hedging cannot insulate the Companies’ operations completely from foreign exchange market trends since these operations include extensive import and export activities worldwide. Fluctuations in exchange rates can thus have an adverse effect on the operating results and financial position of the Companies. Exchange rate fluctuations also affect the consolidated performance of the Companies because results are reported in yen. Changes in exchange rates affect the values recorded for sales, expenses, assets, and liabilities in all countries outside Japan when translated into yen. In general terms, yen appreciation against other leading currencies tends to depress the financial results, while yen depreciation tends to have a favorable impact.
CompetitionThe Companies encounter numerous competitors in both the tire and diversified products segments, across the entire product lineup. Competitive price pressures have the potential to adversely affect the operating results and financial position of the Companies. In addition, the Companies face a constant risk of demands for price reductions from large corporate clients. The Companies strive to maintain profitability in the face of downward price pressures by continually seeking to raise productivity, enhance brand image, develop new markets, and launch new products that provide greater value to customers. However, management cannot guarantee that such efforts will always be sufficient to offset the effects of competition. The Companies’ strategy is based on maintaining a highly competitive technological edge. The Companies target the development and introduction of products equipped with new and advanced technologies, and then aim to persuade customers of the value inherent in such technical advances to secure prices sufficient to ensure that profits fully offset the costs of development. Fierce competition in various fields can sometimes prevent the Companies from recovering development costs through pricing, which can also have an adverse effect on operating results and financial position.
Operational Risks

9Annual Report 2014 Financial Review
Product defectsThe Companies invest considerable resources in establishing and maintaining high quality standards for all products manufactured and sold. Management is particularly sensitive to the importance of quality assurance in tires and other products intimately associated with human safety. The Companies have honed their collective quality assurance capabilities by upgrading information systems related to product performance, collecting pertinent market information, and establishing systems to provide early warning of any potential safety issues that may arise before they become problems. Nonetheless, such efforts cannot guarantee a zero level of product defects or eliminate the chance of an extensive product recall, because product defects could occur due to unpredictable factors, and the Companies hold customer safety as their highest priority. Any such defects or recalls could result in customer claims for damages, as well as associated litigation costs, replacement costs, and damage to the Companies’ reputation. Product liability claims, class-action lawsuits, and other litigation pose a particular risk in the United States.
Raw materials procurementDisruption of supplies of raw materials has the potential to affect performance adversely. The Companies use large quantities of natural rubber in tires and other rubber products, most of which are supplied from Southeast Asia. The availability of natural rubber supplies in quantities sufficient for manufacturing purposes is subject to disruption due to natural disasters, wars, terrorist actions, civil strife, and other social or political unrest, in addition to the threat of poor harvests. Supply shortages or capacity constraints are also a potential problem with other basic raw materials. The Companies rely on in-house upstream raw materials operations and on third-party suppliers for important raw materials. Any disruption of activity at those operations or suppliers and any other events that impede the Companies’ plants that use those raw materials could adversely affect the Companies’ operating results and financial condition. Increases in the costs of raw materials due to tight supply, trade for speculative purposes, and other reasons are also potentially detrimental to the operating results and financial position of the Companies. Management cannot guarantee that price rises can always be passed on to customers, or that ongoing efforts to raise productivity will be sufficient to compensate for any sharp increases in raw materials costs.
Pension costsPension-related costs and obligations are reliant on actuarial assumptions concerning a number of variables, including discount rates and the expected rates of investment return on pension assets. There could be a material impact on the operating results and financial position of the Companies if actual results were to differ significantly from initial assumptions, or if deteriorating conditions in financial markets or other factors were to necessitate a change in the underlying assumptions.
Intellectual propertyThe Companies treat intellectual property as an important business resource. Systematic efforts are made to employ intellectual property effectively in improving the competitive position of the Companies, to protect intellectual property rights from infringement, and to avoid infringing the intellectual property rights of other parties. Despite such safeguards, any actual or alleged infringement of third-party intellectual property rights by the Companies could have a negative impact on the use of certain materials or technologies by the Companies, and could potentially also trigger the payment of compensatory damages. Any such outcome could have a negative effect on the operating results and financial position of the Companies. Conversely, if claims by the Companies of intellectual property rights infringement against third parties are not upheld, the Companies could also suffer direct or indirect losses through the diminished differentiation or competitiveness of their products in global markets.
10 Bridgestone Corporation
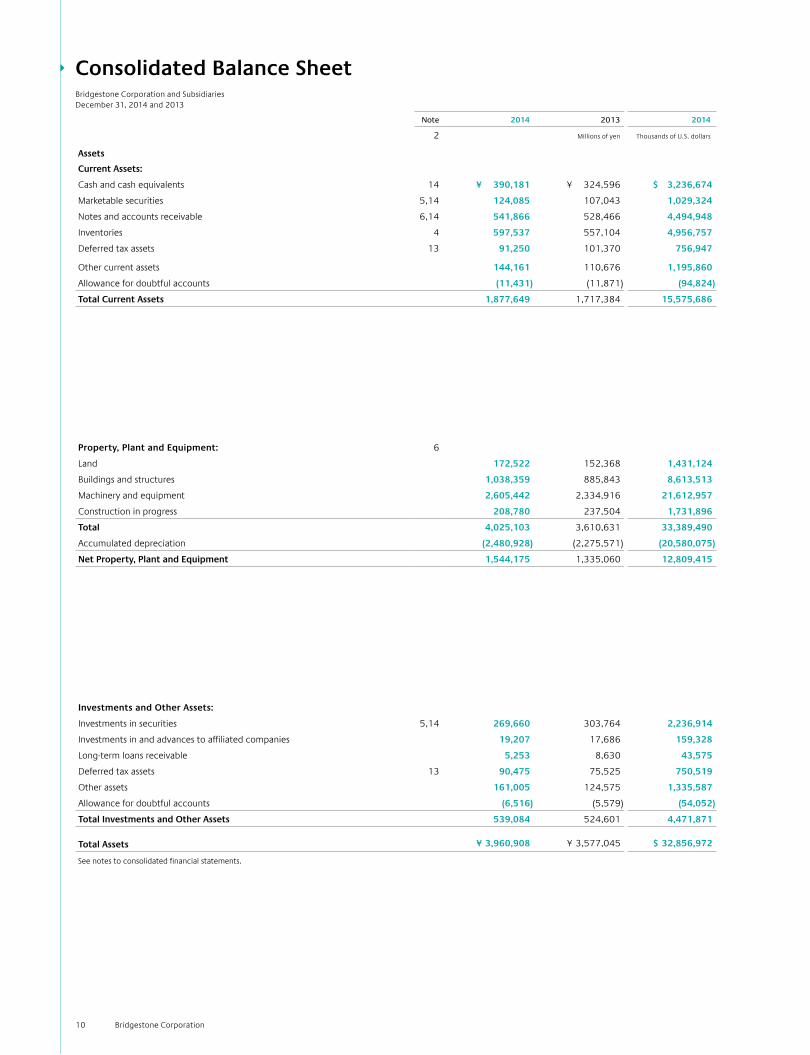
Note 2014 2013 2014
2 Millions of yen Thousands of U.S. dollars
Assets
Current Assets:
Cash and cash equivalents 14 ¥ 390,181 ¥ 324,596 $ 3,236,674
Marketable securities 5,14 124,085 107,043 1,029,324
Notes and accounts receivable 6,14 541,866 528,466 4,494,948
Inventories 4 597,537 557,104 4,956,757
Deferred tax assets 13 91,250 101,370 756,947
Other current assets 144,161 110,676 1,195,860
Allowance for doubtful accounts (11,431) (11,871) (94,824)
Total Current Assets 1,877,649 1,717,384 15,575,686
Property, Plant and Equipment: 6
Land 172,522 152,368 1,431,124
Buildings and structures 1,038,359 885,843 8,613,513
Machinery and equipment 2,605,442 2,334,916 21,612,957
Construction in progress 208,780 237,504 1,731,896
Total 4,025,103 3,610,631 33,389,490
Accumulated depreciation (2,480,928) (2,275,571) (20,580,075)
Net Property, Plant and Equipment 1,544,175 1,335,060 12,809,415
Investments and Other Assets:
Investments in securities 5,14 269,660 303,764 2,236,914
Investments in and advances to affiliated companies 19,207 17,686 159,328
Long-term loans receivable 5,253 8,630 43,575
Deferred tax assets 13 90,475 75,525 750,519
Other assets 161,005 124,575 1,335,587
Allowance for doubtful accounts (6,516) (5,579) (54,052)
Total Investments and Other Assets 539,084 524,601 4,471,871
Total Assets ¥ 3,960,908 ¥ 3,577,045 $ 32,856,972
See notes to consolidated financial statements.
Consolidated Balance SheetBridgestone Corporation and SubsidiariesDecember 31, 2014 and 2013
11Annual Report 2014 Financial Review
Note 2014 2013 2014
2 Millions of yen Thousands of U.S. dollars
Liabilities and Equity
Current Liabilities:
Short-term debt 6,14 ¥ 130,660 ¥ 111,753 $ 1,083,866
Current portion of long-term debt 6,14 98,249 169,795 815,006
Notes and accounts payable 14 388,585 358,128 3,223,434
Income taxes payable 14 46,490 54,572 385,649
Accrued expenses 238,330 230,888 1,977,022
Deferred tax liabilities 13 1,821 1,403 15,106
Provision for sales returns 3,017 3,036 25,027
Provision for loss related to US antitrust laws — 44,791 —
Provision for recall 7,895 21,132 65,491
Provision for plant restructuring in Japan 861 8,582 7,142
Other current liabilities 60,291 55,206 500,133
Total Current Liabilities 976,199 1,059,286 8,097,876
Long-term Liabilities:
Long-term debt 6,14 364,085 282,726 3,020,199
Net defined benefit liability 7 314,568 236,747 2,609,440
Deferred tax liabilities 13 68,068 58,048 564,645
Provision for environmental remediation 2,465 3,310 20,448
Other liabilities 88,865 73,964 737,163
Total Long-term Liabilities 838,051 654,795 6,951,895
Total Liabilities 1,814,250 1,714,081 15,049,771
Contingent Liabilities and Commitments 16
Equity: 8
Common stock Authorized—1,450,000,000 shares, issued—813,102,321 shares in 2014 and 2013
126,354 126,354 1,048,146
Capital surplus 123,008 122,866 1,020,390
Stock acquisition rights 1,946 1,621 16,143
Retained earnings 1,842,914 1,597,140 15,287,549
Treasury stock—at cost, 29,965,086 shares in 2014 and 30,115,568 shares in 2013 (56,367) (56,645) (467,582)
Accumulated other comprehensive income 19
Net unrealized gain on available-for-sale securities 168,172 200,704 1,395,039
Deferred loss on derivative instruments (2,189) (1,093) (18,158)
Foreign currency translation adjustments 39,108 (86,177) 324,413
Remeasurements of defined benefit plans (165,315) (97,864) (1,371,340)
Total 2,077,631 1,806,906 17,234,600
Minority interests 69,027 56,058 572,601
Total Equity 2,146,658 1,862,964 17,807,201
Total Liabilities and Equity ¥3,960,908 ¥3,577,045 $32,856,972
See notes to consolidated financial statements.
12 Bridgestone Corporation
Note 2014 2013 2014
2 Millions of yen Thousands of U.S. dollars
Net Sales 17 ¥3,673,965 ¥3,568,091 $30,476,690
Cost of Sales 2,289,626 2,267,663 18,993,164
Gross profit 1,384,339 1,300,428 11,483,526
Selling, General and Administrative Expenses 906,301 862,296 7,518,051
Operating income 17 478,038 438,132 3,965,475
Other Income (Expenses):
Interest and dividend income 14,309 12,510 118,698
Share of profit of entities accounted for using equity method 4,099 3,819 34,002
Interest expense (14,663) (14,826) (121,634)
Foreign currency exchange gain (loss) (6,130) (4,111) (50,850)
Gain on sales of property, plant and equipment 12 8,615 5,031 71,464
Gain on sales of investment securities 5,925 2,048 49,150
Loss related to US antitrust laws 12 — (44,791) —
Loss related to recall 12 — (22,504) —
Plant restructuring costs in Japan 12 — (8,653) —
Plant restructuring costs in Europe 12 — (5,044) —
Other—net (12,440) (21,513) (103,194)
Total (285) (98,034) (2,364)
Income before Income Taxes and Minority Interests 477,753 340,098 3,963,111
Income Taxes: 13
Current 124,385 123,288 1,031,812
Deferred 43,320 3,023 359,353
Total 167,705 126,311 1,391,165
Income before minority interests 310,048 213,787 2,571,946
Minority Interests (9,459) (11,733) (78,466)
Net Income ¥ 300,589 ¥ 202,054 $ 2,493,480
2 Yen U.S. dollars
Per Share of Common Stock:
Basic 10 ¥383.84 ¥258.10 $3.18
Diluted 10 383.39 257.81 3.18
Cash dividends applicable to the year 100.00 57.00 0.83
See notes to consolidated financial statements.
CONSOLIDATED STATEMENT OF INCOMEBridgestone Corporation and SubsidiariesYears ended December 31, 2012 and 2011
Consolidated Statement of IncomeBridgestone Corporation and SubsidiariesYears ended December 31, 2014 and 2013

13Annual Report 2014 Financial Review
Note 2014 2013 2014
2 Millions of yen Thousands of U.S. dollars
Income before minority interests ¥310,048 ¥213,787 $2,571,946
Other comprehensive income 19
Net unrealized gain (loss) on available-for-sale securities (32,537) 67,259 (269,905)
Deferred gain (loss) on derivative instruments (598) (392) (4,961)
Foreign currency translation adjustments 131,197 163,444 1,088,320
Remeasurements of defined benefit plans (64,354) 35,864 (533,837)
Share of other comprehensive income in affiliates (59) 327 (489)
Total Other Comprehensive Income 33,649 266,502 279,128
Comprehensive income 19 ¥343,697 ¥480,289 $2,851,074
Comprehensive income attribute to:
Shareholders of Bridgestone Corporation ¥327,592 ¥465,087 $2,717,478
Minority interests 16,105 15,202 133,596
See notes to consolidated financial statements.
Consolidated Statement of Comprehensive IncomeBridgestone Corporation and SubsidiariesYears ended December 31, 2014 and 2013

14 Bridgestone Corporation
Accumulated other comprehensive income
Note
Out-standing number
of shares of
common stock
Common stock
Capital surplus
Stock acquisi -
tion rights
Retained earnings
Treasury stock
Net unreal-ized
gain (loss) on available-
for-sale securities
Deferred gain (loss) on
derivative instruments
Foreign currency
translation adjustments
Remeasure-ments of defined
benefit plans TotalMinority interests Total equity
2 Thousands Millions of yen
Balance at January 1, 2013 782,662 ¥126,354 ¥122,630 ¥1,099 ¥1,428,747 ¥(57,247) ¥133,440 ¥ (948) ¥(246,190) ¥(133,764) ¥1,374,121 ¥43,227 ¥1,417,348
Net income for the year 202,054 202,054 202,054
Cash dividends (33,661) (33,661) (33,661)
Purchase of treasury stock (4) (15) (15) (15)
Disposal of treasury stock 329 236 617 853 853
Net change in the year 522 67,264 (145) 160,013 35,900 263,554 12,831 276,385
Balance at December 31, 2013 782,987 ¥126,354 ¥122,866 ¥1,621 ¥1,597,140 ¥(56,645) ¥200,704 ¥(1,093) ¥ (86,177) ¥ (97,864) ¥1,806,906 ¥56,058 ¥1,862,964
Net income for the year 300,589 300,589 300,589
Cash dividends (54,815) (54,815) (54,815)
Purchase of treasury stock (3) (12) (12) (12)
Disposal of treasury stock 153 142 290 432 432
Net change in the year 325 (32,532) (1,096) 125,285 (67,451) 24,531 12,969 37,500
Balance at December 31, 2014 783,137 ¥126,354 ¥123,008 ¥1,946 ¥1,842,914 ¥(56,367) ¥168,172 ¥(2,189) ¥ 39,108 ¥(165,315) ¥2,077,631 ¥69,027 ¥2,146,658
Accumulated other comprehensive income
Note Common
stockCapital surplus
Stock acquisi-
tion rights
Retained earnings
Treasury stock
Net unreal-ized
gain (loss) on available-
for-sale securities
Deferred gain (loss) on
derivative instruments
Foreign currency
translation adjustments
Remeasure-ments of defined
benefit plans TotalMinority interests Total equity
2 Thousands of U.S. dollars
Balance at December 31, 2013 $1,048,146 $1,019,212 $13,447 $13,248,776 $(469,888) $1,664,902 $ (9,067) $ (714,865) $ (811,813) $14,988,850 $465,019 $15,453,869
Net income for the year 2,493,480 2,493,480 2,493,480
Cash dividends (454,707) (454,707) (454,707)
Purchase of treasury stock (100) (100) (100)
Disposal of treasury stock 1,178 2,406 3,584 3,584
Net change in the year 2,696 (269,863) (9,091) 1,039,278 (559,527) 203,493 107,582 311,075
Balance at December 31, 2014 $1,048,146 $1,020,390 $16,143 $15,287,549 $(467,582) $1,395,039 $(18,158) $ 324,413 $(1,371,340) $17,234,600 $572,601 $17,807,201
See notes to consolidated financial statements.
Consolidated Statement of Changes in EquityBridgestone Corporation and SubsidiariesYears ended December 31, 2014 and 2013

15Annual Report 2014 Financial Review
Note 2014 2013 2014
2 Millions of yen Thousands of U.S. dollars
Cash Flows from Operating Activities:
Income before income taxes and minority interests ¥ 477,753 ¥ 340,098 $ 3,963,111Adjustments to reconcile income before income taxes and minority interests to net cash provided by operating activities: Depreciation and amortization
188,333 176,180 1,562,281Amortization of goodwill 1,246 980 10,336
Increase (decrease) in net defined benefit liability (26,290) (12,446) (218,084)
Interest and dividend income (14,309) (12,510) (118,698)
Interest expense 14,663 14,826 121,634
Foreign currency exchange loss (gain) 7,516 (2,245) 62,348
Share of profit of entities accounted for using equity method (1,490) (2,065) (12,360)
Gain on sales of property, plant and equipment (8,615) (5,031) (71,464)
Gain on sales of investments in securities (5,925) (2,048) (49,150)
Loss related to US antitrust laws — 44,791 —
Loss related to recall — 22,504 —
Plant restructuring costs in Japan — 8,653 —
Plant restructuring costs in Europe — 5,044 —
Changes in assets and liabilities:
Decrease (increase) in notes and accounts receivable (4,264) (48,420) (35,371)
Decrease (increase) in inventories 2,292 43,916 19,013
Increase (decrease) in notes and accounts payable 7,735 14,050 64,164
Other (18,473) 5,508 (153,239)
Subtotal 620,172 591,785 5,144,521
Interest and dividends received 14,323 12,479 118,814
Interest paid (14,791) (14,826) (122,696)
Payment related to US antitrust laws (43,652) — (362,107)
Payment related to recall (11,668) — (96,790)
Payment related to plant restructuring in Japan (7,700) — (63,874)
Income taxes paid (128,062) (117,667) (1,062,314)
Net Cash Provided by Operating Activities 428,622 471,771 3,555,554
Cash Flows from Investing Activities:
Payments for purchase of property, plant and equipment (288,382) (267,033) (2,392,219)
Proceeds from sales of property, plant and equipment 10,910 10,087 90,502
Payments for purchase of intangible assets (2,587) (7,534) (21,460)
Proceeds from sales of investments in securities 6,926 3,660 57,453
Proceeds from collection of long-term loans receivable 3,645 1,247 30,236
Other (36,208) (5,657) (300,356)
Net Cash Used in Investing Activities (305,696) (265,230) (2,535,844)
Cash Flows from Financing Activities:
Net increase (decrease) in short-term debt 6,894 (81,077) 57,188
Proceeds from long-term debt 169,367 12,833 1,404,952
Repayments of long-term debt (185,478) (79,420) (1,538,598)
Repayments of obligations under finance leases (1,153) (906) (9,564)
Cash dividends paid (54,798) (33,655) (454,567)
Cash dividends paid to minority (4,121) (4,269) (34,185)
Other 1,354 2,771 11,232
Net Cash Used in Financing Activities (67,935) (183,723) (563,542)
Effect of Exchange Rate Changes on Cash and Cash Equivalents 10,594 32,362 87,880
Net Increase (Decrease) in Cash and Cash Equivalents 65,585 55,180 544,048
Cash and Cash Equivalents at Beginning of Year 324,596 269,416 2,692,626
Cash and Cash Equivalents at End of Year ¥ 390,181 ¥ 324,596 $ 3,236,674
See notes to consolidated financial statements.
Consolidated Statement of Cash FlowsBridgestone Corporation and SubsidiariesYears ended December 31, 2014 and 2013

16 Bridgestone Corporation
Note 1Nature of operations Bridgestone Corporation and its subsidiaries (hereinafter referred to collectively as the “Companies”) engage in developing, manufacturing and marketing tires and diversified products. The Companies market their products worldwide and operate manufacturing plants in every principal market. Development activities take place primarily in Japan, the United States of America (the “U.S.”) and Europe. Tire
operations include retread business, automotive maintenance and repairs, retail business and raw material supplies, as well as tire development, manufacturing and marketing. Diversified products include industrial products, chemical products, automotive components, construction materials, electronic equipment, bicycles and sporting goods.
Note 2 Basis of presentation of consolidated financial statementsThe accompanying consolidated financial statements have been prepared in accordance with the provisions set forth in the Japanese Financial Instruments and Exchange Act and its related accounting regulations, and in accordance with accounting principles generally accepted in Japan (“Japanese GAAP”), which are different in certain respects as to the application and disclosure requirements of International Financial Reporting Standards and the accounting principles generally accepted in the U.S. (“U.S. GAAP”).
The consolidated financial statements are stated in Japanese yen, the currency of the country in which Bridgestone Corporation (the “Company”) is incorporated and operates. The translations of Japanese yen amounts into U.S. dollar amounts are included solely for the convenience of readers outside Japan and have been made at the rate of ¥120.55 to $1, the approximate rate of exchange at December 31, 2014. Such translations should not be construed as representations that the Japanese yen amounts could be converted into U.S. dollars at that or any other rate.
Note 3Summary of significant accounting policies(1) ConsolidationThe consolidated financial statements include the accounts of the Company and all of its subsidiaries in which the Company has effective control. All significant intercompany balances and transactions have been eliminated in consolidation. All material unrealized profits included in assets resulting from transactions within the Companies are also eliminated. Investments in affiliated companies, primarily those owned 20% to 50%, are accounted for under the equity method with appropriate adjustments for intercompany profits and dividends. Share of profit of entities accounted for using equity method is included in other income (expenses) in the consolidated statements of income. The number of consolidated subsidiaries and affiliated companies for 2014 and 2013 is summarized below:
2014 2013
Consolidated subsidiaries 310 311
Affiliated companies 143 146
(2) Unification of accounting policies applied to foreign subsidiaries for the consolidated financial statements
In May 2006, the Accounting Standards Board of Japan (the “ASBJ”) issued ASBJ Practical Issues Task Force (PITF) No. 18, “Practical Solution on Unification of Accounting Policies Applied to Foreign Subsidiaries for the Consolidated Financial
Statements.” PITF No. 18 prescribes that the accounting policies and procedures applied to a parent company and its subsidiaries for similar transactions and events under similar circumstances should in principle be unified for the preparation of the consolidated financial state ments. However, financial statements prepared by foreign subsidiaries in accordance with either International Financial Reporting Standards or U.S. GAAP tentatively may be used for the consoli dation process, except for the following items that should be adjusted in the consolidation process so that net income is accounted for in accordance with Japanese GAAP unless they are not material: (i) amortization of goodwill; (ii) scheduled amortization of actuarial gain or loss of pensions that has been directly recorded in the equity; (iii) expensing capitalized development costs of R&D; (iv) cancellation of the fair value model of accounting for property, plant and equipment and investment properties and incorporation of the cost model of accounting; and (v) exclusion of minority interests from net income, if contained in net income.
(3) Unification of accounting policies applied to foreign affiliated companies for the equity method
In March 2008, the ASBJ issued ASBJ Statement No. 16, “Accounting Standard for Equity Method of Accounting for Investments.” The new standard requires adjustments to be made to conform the affiliate’s accounting policies for similar
Notes to Consolidated Financial StatementsBridgestone Corporation and Subsidiaries
17Annual Report 2014 Financial Review
transactions and events under similar circumstances to those of the parent company when the affiliate’s financial statements are used in applying the equity method unless it is impracticable to determine such adjustments. In addition, financial statements prepared by foreign affiliated companies in accordance with either International Financial Reporting Standards or U.S. GAAP tentatively may be used in applying the equity method if the following items are adjusted so that net income is accounted for in accordance with Japanese GAAP unless they are not material: (i) amortization of goodwill; (ii) scheduled amortization of actuarial gain or loss of pensions that has been directly recorded in the equity; (iii) expensing capitalized development costs of R&D; (iv) cancellation of the fair value model of accounting for property, plant and equipment and investment properties and incorporation of the cost model of accounting; and (v) exclusion of minority interests from net income, if contained in net income.
(4) Cash equivalentsCash equivalents are short-term investments that are readily convertible into cash and that are exposed to insignificant risk of changes in value. Cash equivalents include highly liquid investments with original maturities of three months or less.
(5) Allowance for doubtful accountsAllowance for doubtful accounts is established in amounts considered to be appropriate based on the Companies’ past credit loss experience and an evaluation of potential losses in the receivables outstanding.
(6) InventoriesInventories are substantially stated at the lower of cost, determined by the average method or net selling value. Meanwhile, inventories held by subsidiaries in the U.S. are substantially stated at the lower of cost, which is determined principally by the last-in, first-out method, or market.
(7) Marketable and investment securitiesMarketable and investment securities are classified and accounted for, depending on management’s intent, as follows:(i) trading securities, which are held for the purpose of earning capital gains in the near term, are reported at fair value, and the related unrealized gain and loss are included in earnings; (ii) held-to-maturity debt securities, which are expected to be held to maturity with a positive intent and ability to hold to maturity, are reported at amortized cost; and (iii) available-for-sale securities, which are not classified as either of the aforementioned securities, are reported at fair value, with unrealized gain and loss, net of applicable taxes, reported in a separate component of equity. Nonmarketable available-for-sale securities are stated at cost determined by the moving-average method. For other than temporary declines in fair value, investments in securities are reduced to net realizable value by a charge to income. The Companies do not hold securities for trading purposes.
(8) Property, plant and equipmentProperty, plant and equipment are stated at cost. Depreciation of property, plant and equipment of the Company and its domestic subsidiaries is computed substantially by the declining-balance method based on the estimated useful lives of the assets, while the straight-line method is applied to property, plant and equipment of the Company’s overseas subsidiaries. Maintenance, repair and minor renewals are charged to income as incurred.
(9) Impairment of assetsAssets are reviewed for impairment whenever events or changes in circumstance indicate the carrying amount of an asset or asset group may not be recoverable. An impairment loss is recognized if the carrying amount of an asset or asset group exceeds the sum of the undiscounted future cash flows expected to result from the continued use and eventual disposition of the asset or asset group. The impairment loss would be measured as the amount by which the carrying amount of an asset or asset group exceeds its recoverable amount, which is the higher of the discounted cash flows from the continued use and eventual disposition of the asset or asset group, or the net selling price at disposition.
(10) GoodwillGoodwill recorded by subsidiaries, and the excess of cost of the Company’s investments in subsidiaries and affiliated companies over its equity at the respective dates of acquisition, are mainly being amortized on a straight-line basis over a reasonable economical life of up to twenty years.
(11) Provision for sales returnsProvision for sales returns is estimated and recorded principally to provide for future losses on the return of snow tires.
(12) Provision for recallIn order to reserve for outlays related to check and replacement of object tires, an estimated amount of future obligations is recorded.
(13) Provision for plant restructuring in JapanIn order to reserve for plant restructuring costs in Japan, an estimated amount of future obligations is recorded.
(14) Provision for product warrantiesThe provision for product warranties, included in other liabilities, is estimated and recorded at the time of sale to provide for future potential costs, such as costs related to after-sales services, in amounts considered to be appropriate based on the Companies’ past experience.
(15) Provision for environmental remediationIn order to reserve for outlays for legally required removal and disposal of polychlorinated biphenyl (“PCB”) and other, the estimated amount of future obligations is recorded.
18 Bridgestone Corporation
(16) Retirement and pension plansThe Company and its domestic subsidiaries have contributory funded defined benefit pension plans and unfunded retirement benefit plans for employees of their employees’ benefits. Certain of the Company’s overseas subsidiaries have funded defined benefit pension plans and defined contribution pension plans. Effective April 1, 2000, the Company adopted an accounting standard for retirement benefits and accounted for the liability for retirement benefits based on the projected benefit obligations and plan assets at the balance sheet date. The projected benefit obligations are attributed to periods on a straight-line basis. For the Company and its domestic subsidiaries, actuarial gains and losses are amortized on a straight-line basis over 10 years and past service costs are amortized on a straight-line basis over 10 years within the average remaining service period. For certain overseas subsidiaries, actuarial gains and losses are amortized on a straight-line basis over 8 to 12 years in case actuarial gains and losses exceed 10% of the larger of retirement benefit obligations or pension plan assets and past service costs are amortized on a straight-line basis over 3 to 12 years within the average remaining service period. In addition, at certain consolidated subsidiaries in the Americas, an estimated total amount of expenses for post-retirement benefits in addition to pensions is allotted based on the number of years of service provided by the employees. In May 2012, the ASBJ issued ASBJ Statement No. 26, “Accounting Standard for Retirement Benefits” and ASBJ Guidance No. 25, “Guidance on Accounting Standard for Retirement Benefits,” which replaced the accounting standard for retirement benefits that had been issued by the Business Accounting Council in 1998 with an effective date of April 1, 2000, and the other related practical guidance, and were followed by partial amendments from time to time through 2009.(i) Under the revised accounting standard, actuarial gains and losses and past service costs that are yet to be recognized in profit or loss are recognized within equity (accumulated other comprehensive income), after adjusting for tax effects, and any resulting deficit or surplus is recognized as a liability (net defined benefit liability) or asset (net defined benefit asset).(ii) The revised accounting standard does not change how to recognize actuarial gains and losses and past service costs in profit or loss. Those amounts are recognized in profit or loss over a certain period no longer than the expected average remaining service period of the employees. However, actuarial gains and losses and past service costs that arose in the current period and have not yet been recognized in profit or loss are included in other comprehensive income and actuarial gains and losses and past service costs that were recognized in other comprehensive income in prior periods and then recognized in profit or loss in the current period shall be treated as reclassification adjustments. (iii) The revised accounting standard also made certain amendments relating to the method of attributing expected
benefit to periods and relating to the discount rate and expected future salary increases. This accounting standard and the guidance for (i) and (ii) above are effective for the end of annual periods beginning on or after April 1, 2013, and for (iii) above are effective for the beginning of annual periods beginning on or after April 1, 2014, or for the beginning of annual periods beginning on or after April 1, 2015, subject to certain disclosure in December 2015, both with earlier application being permitted from the beginning of annual periods beginning on or after April 1, 2013. However, no retrospective application of this accounting standard to consolidated financial statements in prior periods is required. The Company applied the revised accounting standard and guidance for retirement benefits for (i) and (ii) above, effective December 31, 2014. As a result, net defined benefit liability of ¥314,568 million ($2,609,440 thousand) and net defined benefit asset which was included in “Other assets” within the investments and other assets of ¥14,032 million ($116,400 thousand) were recorded as of December 31, 2014, and accumulated other comprehensive income for the year ended December 31, 2014, decreased by ¥2,796 million ($23,194 thousand). Prior to January 1, 2014, “Accrued pension and liability for retirement benefits” and “Postretirement liability adjustments for foreign consolidated companies” were disclosed in the consolidated financial statements. Since the end of fiscal year beginning on January 1, 2014, these presentations were changed to “Net defined benefit liability” and “Remeasurements of defined benefit plans,” respectively.
(17) Asset retirement obligationsIn March 2008, the ASBJ issued ASBJ Statement No. 18, “Accounting Standard for Asset Retirement Obligations” and ASBJ Guidance No. 21, “Guidance on Accounting Standard for Asset Retirement Obligations.” Under this accounting standard, an asset retirement obligation is defined as a legal obligation imposed either by law or contract that results from the acquisition, construction, development and the normal operation of a tangible fixed asset and is associated with the retirement of such tangible fixed asset. The asset retirement obligation is recognized as the sum of the discounted cash flows required for the future asset retirement and is recorded in the period in which the obligation is incurred if a reasonable estimate can be made. If a reasonable estimate of the asset retirement obligation cannot be made in the period the asset retirement obligation is incurred, the liability should be recognized when a reasonable estimate of the asset retirement obligation can be made. Upon initial recognition of a liability for an asset retirement obligation, an asset retirement cost is capitalized by increasing the carrying amount of the related fixed asset by the amount of the liability. The asset retirement cost is subsequently allocated to expense through depreciation over the remaining useful life of the asset. Over time, the liability is accreted to its present value each period. Any subsequent
Notes to Consolidated Financial Statements

19Annual Report 2014 Financial Review
revisions to the timing or the amount of the original estimate of undiscounted cash flows are reflected as an adjustment to the carrying amount of the liability and the capitalized amount of the related asset retirement cost.
(18) LeasesFinance leases are capitalized, and the present value of the related payments is recorded as a liability. Amortization of capitalized leased assets is computed substantially by the declining-balance method based on the term of the lease.
(19) Income taxesThe provision for income taxes is computed based on income before income taxes included in the consolidated statement of income. The asset and liability approach is used to recognize deferred tax assets and liabilities for the expected future tax consequences of temporary differences between the carrying amounts and the tax bases of assets and liabilities. Deferred income taxes are measured by applying currently enacted income tax rates to the temporary differences. A valuation allowance is provided for any portion of the deferred tax assets where it is considered more likely than not that they will not be realized.
(20) Foreign currency transactionsShort-term and long-term monetary receivables and payables denominated in foreign currencies are translated into Japanese yen at the exchange rate at the balance sheet date. The foreign currency exchange gain or loss from translation is recognized in the consolidated statement of income.
(21) Foreign currency financial statementsThe balance sheet accounts of the Company’s overseas subsidiaries are translated into Japanese yen at the current exchange rate at the balance sheet date except for equity, which is translated at the historical rate. Differences arising from such translation are shown as foreign currency translation adjustments under accumulated other comprehensive income in a separate component of equity. Revenue and expense accounts of the Company’s overseas subsidiaries are translated into Japanese yen at the average annual exchange rate.
(22) Derivatives and hedging activitiesThe Companies use derivative financial instruments to manage their exposures to fluctuations in foreign currency exchange rates, interest rates and commodity prices. Foreign currency forward contracts, currency swap contracts and currency option contracts are utilized by the Companies to reduce foreign currency exchange risks. Interest rate swaps are utilized by the Companies to reduce interest rate risks. Also, commodity swap contracts are utilized by the Companies to reduce commodity price risks. The Companies do not enter into derivatives for trading or speculative purposes. Derivative financial instruments are classified and accounted for as follows: (i) all derivatives are recognized as
either assets or liabilities and measured at fair value, and gain or loss on derivative transactions are recognized in the consolidated statement of income; and (ii) for derivatives used for hedging purposes, if such derivatives qualify for hedge accounting because of high correlation and effectiveness between the hedging instruments and the hedged items, gain or loss on derivatives is deferred until maturity of the hedged transactions. Foreign currency forward contracts which are designated as hedging exposure to variable cash flows of forecasted transactions are measured at fair value, and the unrealized gain or loss is deferred until the underlying transactions are completed. Other foreign currency forward contracts, currency swap contracts and currency option contracts employed to hedge foreign currency exchange exposures to changes in fair value and in cash flow are also measured at fair value but the unrealized gain or loss is recognized in income. Short-term and long-term debt denominated in foreign currencies for which foreign currency forward contracts and currency swap contracts are used to hedge the foreign currency fluctuations are translated at the contracted rate if the foreign currency forward contracts and currency swap contracts qualify for hedge accounting. Interest rate swaps which qualify for hedge accounting and meet specific matching criteria are not remeasured at market value, but the differential paid or received under the swap agreements is recognized and included in interest expenses. The gain or loss on commodity swap contracts used to hedge fluctuations of commodity prices is recognized currently in income.
(23) Per share of common stockBasic net income per share is computed by dividing net income available to common shareholders by the weighted-average number of common stock outstanding for the period, retroactively adjusted for stock splits. Diluted net income per share reflects the potential dilution that could occur if securities were exercised or converted into common stock. Diluted net income per share of common stock assumes full conversion of the outstanding convertible notes and bonds at the beginning of the year (or at the time of issuance) with an applicable adjustment for related interest expense, net of tax, and full exercise of outstanding warrants and stock options. Cash dividends per share presented in the consolidated statements of income are dividends applicable to the respective fiscal years, including dividends to be paid after the end of the year.
(24) ReclassificationIn preparing the consolidated financial statements, certain reclassifications and rearrangements have been made to the consolidated financial statements issued domestically in order to present them in a form which is more familiar to readers outside Japan. In addition, certain reclassifications have been
20 Bridgestone Corporation
made in the 2013 consolidated financial statements to conform to the classifications used in 2014.
(25) Changes in presentationConsolidated statement of incomePrior to January 1, 2014, “Impairment loss,” “Loss on disposals of property, plant and equipment” and “Dismantlement expenses” were disclosed separately in the consolidated statement of income. Since during this fiscal year ended December 31, 2014 the materiality of these amounts decreased, such amounts were included in “Other—net” within the consolidated statement of income. The amounts of “Impairment loss,” “Loss on disposals of property, plant and equipment” and “Dismantlement expenses” included in “Other—net” for the year ended December 31, 2013 were ¥11,300 million, ¥4,063 million and ¥3,370 million, respectively.Consolidated statement of cash flowsPrior to January 1, 2014, “Amortization of goodwill” was included in “Other” within the cash flows from operating activities section of the consolidated statement of cash flows. Since during this fiscal year ended December 31, 2014, the materiality of the amount increased, such amount was disclosed separately in the cash flows from operating activities section of the consolidated statement of cash flows for the year ended December 31, 2014. The amount included in “Other” for the year ended December 31, 2013 was ¥980 million. Prior to January 1, 2014, “Increase (decrease) in allowance for doubtful accounts,” “Impairment loss,” “Loss on disposals of property, plant and equipment” and “Dismantlement expenses” were disclosed separately in the cash flows from operating activities section of the consolidated statement of cash flows. Since during this fiscal year ended December 31, 2014, the materiality of these amounts decreased, such amounts were included in “Other” within the cash flows from operating activities section of the consolidated statement of cash flows. The amounts of “Increase (decrease) in allowance for doubtful accounts,” “Impairment loss,” “Loss on disposals of property, plant and equipment” and “Dismantlement expenses” included in “Other” for the year ended December 31, 2013 were ¥2,557 million, ¥11,300 million, ¥4,063 million and ¥3,370 million, respectively. Prior to January 1, 2014, “Payments of loans receivable” was disclosed separately in the cash flows from investing activities section of the consolidated statement of cash flows. Since during this fiscal year ended December 31, 2014 the materiality of the amount decreased, such amount was included in “Other” within the cash flows from investing activities section of the consolidated statement of cash flows. The amount included in “Other” for the year ended December 31, 2013 was ¥3,067 million. Prior to January 1, 2014, “Repayments of obligations under finance leases” was included in “Other” within the cash flows from financing activities section of the consolidated statement
of cash flows. Since during this fiscal year ended December 31, 2014 the materiality of the amount increased, such amount was disclosed separately in the cash flows from financing activities section of the consolidated statement of cash flows for the year ended December 31, 2014. The amount included in “Other” for the year ended December 31, 2013 was ¥906 million. Prior to January 1, 2014, “Proceeds from minority interests for additional shares” was disclosed separately in the cash flows from financing activities section of the consolidated statement of cash flows. Since during this fiscal year ended December 31, 2014 the materiality of the amount decreased, such amount was included in “Other” within the cash flows from financing activities section of the consolidated statement of cash flows. The amount included in “Other” for the year ended December 31, 2013 was ¥1,933 million.
(26) Accounting changes and error correctionsIn December 2009, the ASBJ issued ASBJ Statement No. 24, “Accounting Standard for Accounting Changes and Error Corrections” and ASBJ Guidance No. 24, “Guidance on Accounting Standard for Accounting Changes and Error Corrections.” Accounting treatments under this standard and guidance are as follows:(i) Changes in accounting policiesWhen a new accounting policy is applied following revision of an accounting standard, the new policy is applied retrospectively unless the revised accounting standard includes specific transitional provisions, in which case the entity shall comply with the specific transitional provisions.(ii) Changes in presentationWhen the presentation of financial statements is changed, prior period financial statements are reclassified in accordance with the new presentation. (iii) Changes in accounting estimatesA change in an accounting estimate is accounted for in the period of the change if the change affects that period only, and is accounted for prospectively if the change affects both the period of the change and future periods.(iv) Corrections of prior period errorsWhen an error in prior period financial statements is discovered, those statements are restated.
(27) New accounting pronouncementsAccounting standard for retirement benefitsOn May 17, 2012, the ASBJ issued ASBJ Statement No. 26, “Accounting Standard for Retirement Benefits” and ASBJ Guidance No. 25, “Guidance on Accounting Standard for Retirement Benefits,” which replaced the Accounting Standard for Retirement Benefits that had been issued by the Business Accounting Council in 1998 with an effective date of April 1, 2000 and the other related practical guidance, and were followed by partial amendments from time to time through 2009.
Notes to Consolidated Financial Statements
21Annual Report 2014 Financial Review
Major changes are as follows:(i) Treatment in the balance sheetUnder the current requirements, actuarial gains and losses and past service costs that are yet to be recognized in profit or loss are not recognized in the balance sheet, and the difference between retirement benefit obligations and plan assets (hereinafter, “deficit or surplus”), adjusted by such unrecognized amounts, is recognized as a liability or asset. Under the revised accounting standard, actuarial gains and losses and past service costs that are yet to be recognized in profit or loss shall be recognized within equity (accumulated other comprehensive income), after adjusting for tax effects, and any resulting deficit or surplus shall be recognized as a liability (liability for retirement benefits) or asset (asset for retirement benefits).(ii) Treatment in the statement of income and the statement
of comprehensive incomeThe revised accounting standard does not change how to recognize actuarial gains and losses and past service costs in profit or loss. Those amounts would be recognized in profit or loss over a certain period no longer than the expected average remaining service period of the employees. However, actuarial gains and losses and past service costs that arose in the current period and have not yet been recognized in profit or loss shall be included in other comprehensive income and actuarial gains and losses and past service costs that were recognized in other comprehensive income in prior periods and then recognized in profit or loss in the current period shall be treated as reclassification adjustments.(iii) Amendments relating to the method of attributing
expected benefit to periods and relating to the discount rate and expected future salary increases
The revised accounting standard also made certain amendments relating to the method of attributing expected benefit to periods and relating to the discount rate and expected future salary increases. This accounting standard and the guidance for (i) and (ii) above are effective for the end of annual periods beginning on or after April 1, 2013, and for (iii) above are effective for the beginning of annual periods beginning on or after April 1, 2014, or for the beginning of annual periods beginning on or after April 1, 2015, subject to certain disclosure in December 2015, both with earlier application being permitted from the beginning of annual periods beginning on or after April 1, 2013. However, no retrospective application of this accounting standard to consolidated financial statements in prior periods is required. The Company applied the revised accounting standard for (i) and (ii) above effective January 1, 2014, and expects to apply (iii) above from January 1, 2015, and is in the process of measuring the effects of applying the revised accounting standard for (iii) in future applicable periods.
Accounting standards for business combinations and consolidated financial statementsOn September 13, 2013, the ASBJ issued revised ASBJ Statement No. 21, “Accounting Standard for Business Combinations,” revised ASBJ Guidance No. 10, “Guidance on Accounting Standards for Business Combinations and Business Divestitures,” and revised ASBJ Statement No. 22, “Accounting Standard for Consolidated Financial Statements.”
Major accounting changes are as follows:(i) Transactions with noncontrolling interestA parent’s ownership interest in a subsidiary might change if the parent purchases or sells ownership interests in its subsidiary. The carrying amount of minority interest is adjusted to reflect the change in the parent’s ownership interest in its subsidiary while the parent retains its controlling interest in its subsidiary. Under the current accounting standard, any difference between the fair value of the consideration received or paid and the amount by which the minority interest is adjusted is accounted for as an adjustment of goodwill or as profit or loss in the consolidated statement of income. Under the revised accounting standard, such difference shall be accounted for as capital surplus as long as the parent retains control over its subsidiary.(ii) Presentation of the consolidated balance sheetIn the consolidated balance sheet, “minority interest” under the current accounting standard will be changed to “noncontrolling interest” under the revised accounting standard.(iii) Presentation of the consolidated statement of incomeIn the consolidated statement of income, “income before minority interests” under the current accounting standard will be changed to ”net income” under the revised accounting standard, and “net income” under the current accounting standard will be changed to “net income attributable to owners of the parent” under the revised accounting standard. (iv) Provisional accounting treatments for a business combinationIf the initial accounting for a business combination is incomplete by the end of the reporting period in which the business combination occurs, an acquirer shall report in its financial statements provisional amounts for the items for which the accounting is incomplete. Under the current accounting standard guidance, the impact of adjustments to provisional amounts recorded in a business combination on profit or loss is recognized as profit or loss in the year in which the measurement is completed. Under the revised accounting standard guidance, during the measurement period, which shall not exceed one year from the acquisition, the acquirer shall retrospectively adjust the provisional amounts recognized at the acquisition date to reflect new information obtained about facts and circumstances that existed as of the acquisition date and that would have affected the measurement of the amounts recognized as of that date. Such adjustments shall be recognized as if the accounting for the business combination had been completed at the acquisition date.

22 Bridgestone Corporation
(v) Acquisition-related costsAcquisition-related costs are costs, such as advisory fees or professional fees, which an acquirer incurs to effect a business combination. Under the current accounting standard, the acquirer accounts for acquisition-related costs by including them in the acquisition costs of the investment. Under the revised accounting standard, acquisition-related costs shall be accounted for as expenses in the periods in which the costs are incurred. The above accounting standards and guidance for “transactions with noncontrolling interest,” “acquisition-related costs” and “presentation changes in the consolidated financial statements” are effective for the beginning of annual periods beginning on or after April 1, 2015. Earlier application is permitted from the beginning of annual periods beginning on or after April 1, 2014, except for the presentation changes in the consolidated financial statements. In case of earlier application, all accounting standards and guidance above, except for the presentation changes, should be applied simultaneously. Either retrospective or prospective application of the revised accounting standards and guidance for “transactions with noncontrolling interest” and “acquisition-related costs” is permitted. In retrospective application of the revised standards and guidance for “transactions with noncontrolling interest” and “acquisition-related costs,” accumulated effects of retrospective adjustments for all “transactions with noncontrolling interest” and “acquisition-related costs” which occurred in the past shall be reflected as adjustments to the beginning balance of capital surplus and retained earnings for the year of the first-time application. In prospective application, the new standards and guidance for “transactions with noncontrolling interest” and “acquisition-related costs” shall be applied prospectively from
the beginning of the year of the first-time application. The changes in presentation shall be applied to all periods presented in financial statements containing the first-time application of the revised standards and guidance. The revised standards and guidance for “provisional accounting treatments for a business combination” are effective for a business combination which will occur on or after the beginning of annual periods beginning on or after April 1, 2015. Earlier application is permitted for a business combination which will occur on or after the beginning of annual periods beginning on or after April 1, 2014. The Company expects to apply the revised accounting standards and guidance from the beginning of the annual period beginning on January 1, 2016, and is in the process of measuring the effects of applying the revised accounting standards and guidance in future applicable periods.
Accounting standard for revenue from contracts with customersOn May 28, 2014, the Financial Accounting Standards Board (the “FASB”) issued an accounting standards update that clarifies the principles for recognizing revenue and provides a comprehensive model for revenue recognition. The comprehensive model centers on the principal that an entity recognizes revenue to depict the transfer of promised goods or services to customers in an amount that reflects the consideration to which the entity expects to be entitled in the exchange for those goods or services. Certain overseas subsidiaries which apply U.S. GAAP expect to apply this accounting standard from January 1, 2019 and are in the process of measuring the effects of applying this accounting standard in future applicable periods.
Note 4InventoriesInventories at December 31, 2014 and 2013 consists of the following:
2014 2013 2014
Millions of yen Thousands of U.S. dollars
Finished products ¥388,394 ¥354,370 $3,221,850
Work in process 38,309 37,354 317,785
Raw materials and supplies 170,834 165,380 1,417,122
Total ¥597,537 ¥557,104 $4,956,757
Notes to Consolidated Financial Statements

23Annual Report 2014 Financial Review
The information of available-for-sale securities which were sold during the year ended December 31, 2014 is as follows:
Proceeds Realized gains Realized losses Proceeds Realized gains Realized losses
2014
Millions of yen Thousands of U.S. dollars
Securities Classified as: Available-for-sale:
Equity securities ¥6,914 ¥5,925 ¥— $57,354 $49,150 $—
Proceeds from sales of available-for-sale securities for the years ended December 31, 2014 and 2013 are ¥6,914 million ($57,354 thousand) and ¥3,368 million, respectively. Gross realized gains on these sales, for the years ended December
31, 2014 and 2013, computed on the moving average cost basis, are ¥5,925 million ($49,150 thousand) and ¥1,978 million, respectively.
Available-for-sale securities whose fair values are not readily determinable at December 31, 2014 and 2013 are mainly as follows:
2014 2013 2014
Carrying amount Millions of yen Thousands of U.S. dollars
Available-for-sale: Equity securities
¥1,888
¥1,812
$15,662
Note 5Marketable and investment securitiesInformation regarding each category of available-for-sale securities at December 31, 2014 and 2013 are as follows:
Cost Unrealized
gainsUnrealized
losses Fair value Cost Unrealized
gains Unrealized
losses Fair value
2014 2013
Millions of yen
Securities Classified as: Available-for-sale:
Equity securities ¥37,980 ¥229,799 ¥ (7) ¥267,772 ¥38,755 ¥260,175 ¥ (1) ¥298,929
Debt securities 11,200 — (4,856) 6,344 12,791 22 (335) 12,478
Thousands of U.S. dollars
Securities Classified as: Available-for-sale:
Equity securities $315,056 $1,906,255 $ (58) $2,221,253
Debt securities 92,908 — (40,283) 52,625
In addition to the above, the Companies have available-for-sale securities classified as marketable securities under U.S. GAAP of ¥117,741 million ($976,698 thousand) and ¥97,588 million, respectively, for the years ended December 31, 2014 and 2013.

24 Bridgestone Corporation
Notes and accounts receivable and property, plant and equipment were pledged as collateral for certain bank loans. The aggregate carrying amount of the assets pledged as collateral for short-term bank loans of ¥1,377 million ($11,423 thousand) and long-term bank loans of ¥6,341 million ($52,601 thousand) at December 31, 2014 is ¥8,148 million ($67,590 thousand). General agreements with respective banks provide, as is customary in Japan, that additional collateral must be provided under certain circumstances if requested by such banks and that certain banks have the right to offset cash deposited with them against any long-term or short-term debt or obligation that becomes due and, in case of default and certain other specified events, against all other debt payable to the banks. The Company has never been requested to provide any additional collateral. Effective January 2015, Bridgestone Americas, Inc. (“BSAM”) and its major subsidiaries in the U.S. entered into
separate thirteenth amended and restated revolving credit agreements with a syndicate of banks providing an aggregate borrowing commitment of $1,100 million. The revolving credit agreements consist of two tranches, each of which has an aggregate borrowing commitment of $550 million, and which expire in January 2016 and January 2017, respectively. These agreements contain certain customary affirmative and negative covenants, the most restrictive of which includes (i) the maintenance by BSAM and its major subsidiaries of their consoli-dated tangible net worth and (ii) restrictions on entering into additional debt arrangements and the sale of assets. The above agreements replaced the separate twelfth amended and restated revolving credit agreements, whose expiration dates are January 2015 and January 2016. As of December 31, 2014, BSAM’s outstanding balance under the twelfth amended and restated revolving credit agreement was $247 million.
Annual maturities of long-term debt at December 31, 2014 are as follows:
Year ending December 31, Millions of yen Thousands of U.S. dollars
2015 ¥ 98,249 $815,006
2016 100,589 834,417
2017 115,262 956,134
2018 55,317 458,872
2019 91,524 759,220
2020 and thereafter 1,393 11,556
Total ¥462,334 $3,835,205
Note 6Short-term and long-term debtShort-term debt at December 31, 2014 and 2013 consists of the following:
2014 2013 2014
Millions of yen Thousands of U.S. dollars
Short-term bank loans, weighted average interest rate of 2.6% at December 31, 2014 and 3.6% at December 31, 2013 ¥130,660 ¥111,753 $1,083,866
Total ¥130,660 ¥111,753 $1,083,866
Long-term debt at December 31, 2014 and 2013 consists of the following:
2014 2013 2014
Millions of yen Thousands of U.S. dollars
Borrowings from banks, insurance companies and others, weighted average interest rate of 2.5% at December 31, 2014 and 2.3% at December 31, 2013 denominated mainly in Japanese yen, U.S. dollars and Euros:
Secured ¥ 6,341 ¥ 6,080 $ 52,601
Unsecured 322,426 320,212 2,674,625
0.8% yen unsecured straight bonds, due 2014 — 60,000 —
0.2% yen unsecured straight bonds, due 2016 30,000 30,000 248,859
0.3% yen unsecured straight bonds, due 2018 20,000 20,000 165,9060.2% yen unsecured straight bonds, due 2019 70,000 — 580,6720.8% euro unsecured medium term notes, due 2014 — 3,794 —Obligations under finance leases 13,567 12,435 112,542
Total 462,334 452,521 3,835,205
Less current portion (98,249) (169,795) (815,006)
Long-term Debt, Less Current Portion ¥ 364,085 ¥ 282,726 $3,020,199
Notes to Consolidated Financial Statements
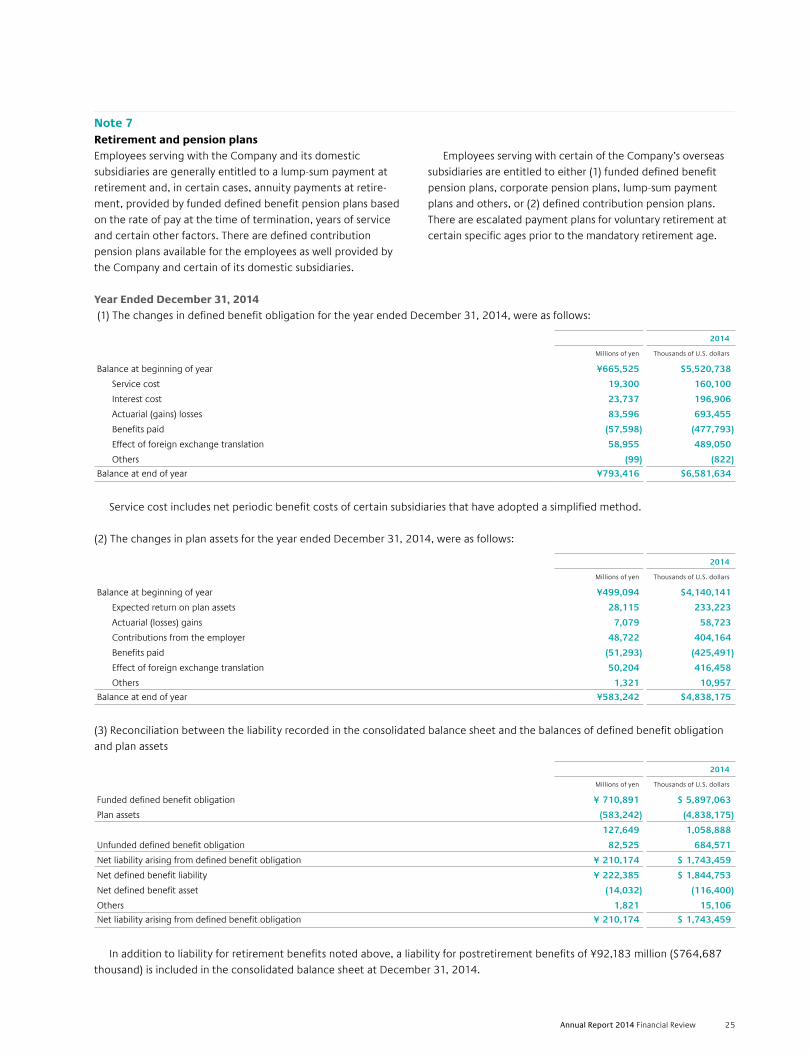
25Annual Report 2014 Financial Review
Note 7Retirement and pension plansEmployees serving with the Company and its domestic subsidiaries are generally entitled to a lump-sum payment at retirement and, in certain cases, annuity payments at retire-ment, provided by funded defined benefit pension plans based on the rate of pay at the time of termination, years of service and certain other factors. There are defined contribution pension plans available for the employees as well provided by the Company and certain of its domestic subsidiaries.
Employees serving with certain of the Company’s overseas subsidiaries are entitled to either (1) funded defined benefit pension plans, corporate pension plans, lump-sum payment plans and others, or (2) defined contribution pension plans. There are escalated payment plans for voluntary retirement at certain specific ages prior to the mandatory retirement age.
Year Ended December 31, 2014 (1) The changes in defined benefit obligation for the year ended December 31, 2014, were as follows:
2014
Millions of yen Thousands of U.S. dollars
Balance at beginning of year ¥665,525 $5,520,738
Service cost 19,300 160,100
Interest cost 23,737 196,906
Actuarial (gains) losses 83,596 693,455
Benefits paid (57,598) (477,793)
Effect of foreign exchange translation 58,955 489,050
Others (99) (822)
Balance at end of year ¥793,416 $6,581,634
Service cost includes net periodic benefit costs of certain subsidiaries that have adopted a simplified method.
(2) The changes in plan assets for the year ended December 31, 2014, were as follows:
2014
Millions of yen Thousands of U.S. dollars
Balance at beginning of year ¥499,094 $4,140,141
Expected return on plan assets 28,115 233,223
Actuarial (losses) gains 7,079 58,723
Contributions from the employer 48,722 404,164
Benefits paid (51,293) (425,491)
Effect of foreign exchange translation 50,204 416,458
Others 1,321 10,957
Balance at end of year ¥583,242 $4,838,175
(3) Reconciliation between the liability recorded in the consolidated balance sheet and the balances of defined benefit obligation and plan assets
2014
Millions of yen Thousands of U.S. dollars
Funded defined benefit obligation ¥ 710,891 $ 5,897,063
Plan assets (583,242) (4,838,175)
127,649 1,058,888
Unfunded defined benefit obligation 82,525 684,571
Net liability arising from defined benefit obligation ¥ 210,174 $ 1,743,459
Net defined benefit liability ¥ 222,385 $ 1,844,753
Net defined benefit asset (14,032) (116,400)
Others 1,821 15,106
Net liability arising from defined benefit obligation ¥ 210,174 $ 1,743,459
In addition to liability for retirement benefits noted above, a liability for postretirement benefits of ¥92,183 million ($764,687 thousand) is included in the consolidated balance sheet at December 31, 2014.
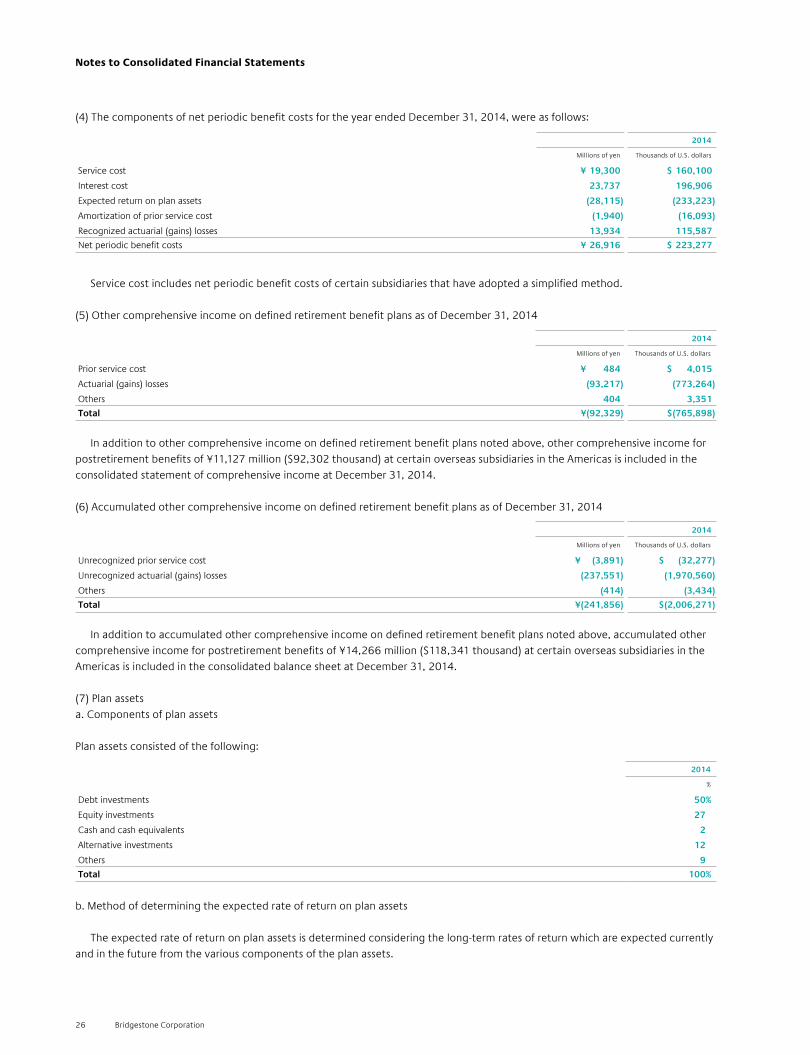
26 Bridgestone Corporation
(4) The components of net periodic benefit costs for the year ended December 31, 2014, were as follows:
2014
Millions of yen Thousands of U.S. dollars
Service cost ¥ 19,300 $ 160,100
Interest cost 23,737 196,906
Expected return on plan assets (28,115) (233,223)
Amortization of prior service cost (1,940) (16,093)
Recognized actuarial (gains) losses 13,934 115,587
Net periodic benefit costs ¥ 26,916 $ 223,277
Service cost includes net periodic benefit costs of certain subsidiaries that have adopted a simplified method.
(5) Other comprehensive income on defined retirement benefit plans as of December 31, 2014
2014
Millions of yen Thousands of U.S. dollars
Prior service cost ¥ 484 $ 4,015
Actuarial (gains) losses (93,217) (773,264)
Others 404 3,351
Total ¥(92,329) $(765,898)
In addition to other comprehensive income on defined retirement benefit plans noted above, other comprehensive income for postretirement benefits of ¥11,127 million ($92,302 thousand) at certain overseas subsidiaries in the Americas is included in the consolidated statement of comprehensive income at December 31, 2014.
(6) Accumulated other comprehensive income on defined retirement benefit plans as of December 31, 2014
2014
Millions of yen Thousands of U.S. dollars
Unrecognized prior service cost ¥ (3,891) $ (32,277)
Unrecognized actuarial (gains) losses (237,551) (1,970,560)
Others (414) (3,434)
Total ¥(241,856) $(2,006,271)
In addition to accumulated other comprehensive income on defined retirement benefit plans noted above, accumulated other comprehensive income for postretirement benefits of ¥14,266 million ($118,341 thousand) at certain overseas subsidiaries in the Americas is included in the consolidated balance sheet at December 31, 2014.
(7) Plan assetsa. Components of plan assets
Plan assets consisted of the following:
2014
%
Debt investments 50%
Equity investments 27
Cash and cash equivalents 2
Alternative investments 12
Others 9
Total 100%
b. Method of determining the expected rate of return on plan assets
The expected rate of return on plan assets is determined considering the long-term rates of return which are expected currently and in the future from the various components of the plan assets.
Notes to Consolidated Financial Statements

27Annual Report 2014 Financial Review
(8) Assumptions used for the year ended December 31, 2014, were set forth as follows:
The Company and domestic subsidiaries
Overseassubsidiaries
2014
Discount rate 1.1% to 1.7% 3.3% to 4.0%
Expected long-term rate of return on plan assets 2.5% 1.0% to 7.3%
(9) Defined contribution pension plans
For the year ended December 31, 2014, the Company and certain of its domestic and overseas subsidiaries paid costs for defined contribution pension plans of ¥7,573 million ($62,820 thousand).
Certain subsidiaries adopt a simplified method for calculating their retirement benefit obligation. Of the net defined benefit liability noted above, a liability for postretirement benefits of ¥72,096 million ($684,088 thousand) is included in the consolidated balance sheet at December 31, 2013.
(2) The components of net periodic benefit costs for the year ended December 31, 2013, are as follows:
2013
Millions of yen
Service cost ¥ 19,912
Interest cost 22,073
Expected return on plan assets (25,568)
Recognized actuarial loss 17,138
Amortization of prior service cost (1,633)
Net periodic benefit costs ¥ 31,922
Net periodic benefit costs noted above do not include payment costs for defined contribution pension plans provided by the Company and certain of its domestic and overseas subsidiaries of ¥7,203 million ($68,346 thousand) for the year ended December 31, 2013.
(3) Assumptions used for the year ended December 31, 2013, are set forth as follows:
The Company and domestic subsidiaries
Overseas subsidiaries
2013
Discount rate 1.6% to 1.9% 3.8% to 5.0%
Expected rate of return on plan assets 2.5% 5.5 to 9.0%
Amortization period of prior service cost 10 years 3 to 12 years
Recognition period of actuarial gain/loss 10 years 8 to 12 years
Year Ended December 31, 2013(1) The liability for retirement benefits at December 31, 2013, consisted of the following:
2013
Millions of yen
Projected benefit obligation ¥ 665,525
Fair value of plan assets (499,094)
Unrecognized prior service cost 1,879
Unrecognized actuarial gain (loss) (15,832)
Prepaid benefit cost 13,877
Others (1,704)
Net liability ¥ 164,651

28 Bridgestone Corporation
Note 8EquitySignificant provisions in the Companies Act of Japan (the “Act”) that affect financial and accounting matters are summarized below:(i) Dividends:The Act allows Japanese companies to pay dividends at any time during the fiscal year in addition to the year-end dividend upon resolution at the shareholders’ meeting. For Japanese companies that meet certain criteria including having a Board of Directors, having independent auditors, having an Audit & Supervisory Board, and the term of service of the directors is prescribed as one year rather than two years of normal term by its articles of incorporation, the Board of Directors may declare dividends (except for dividends in kind) if the company has prescribed so in its articles of incorporation. The Act permits Japanese companies to distribute dividends in kind (non-cash assets) to shareholders subject to certain limitations and additional requirements. Semiannual interim dividends may also be paid once a year upon resolution by the Board of Directors if the articles of incorporation of the company so stipulate. The Act continues to provide certain limitations on the amounts available for dividends or the purchase of treasury stock. The limitation is defined as the amount available for distribution to the shareholders, but the amount of equity after dividends must be maintained at no less than ¥3 million. (ii) Increases/Decreases and Transfer of Common Stock,
Reserve and Surplus:The Act requires that an amount equal to 10% of dividends must be appropriated as a legal reserve (of retained earnings) or as additional paid-in capital (of capital surplus) depending on the equity account charged upon the payment of such dividends until the aggregate amount of legal reserve and additional paid-in capital equals 25% of the common stock. Under the Act, the total amount of additional paid-in capital and legal reserve may be reversed without limitation. The Act also provides that common stock, legal reserve, additional paid-in capital, other capital surplus and retained earnings can be transferred among the accounts under certain conditions upon resolution of the shareholders.
(iii) Treasury Stock and Treasury Stock Acquisition Rights:The Act also provides for Japanese companies to repurchase/dispose of treasury stock by resolution of the Board of Directors. The amount of treasury stock purchased cannot exceed the amount available for distribution to the shareholders which is determined by a specific formula. Under the Act, stock acquisition rights are presented as a separate component of equity. The Act also provides that companies can purchase both treasury stock acquisition rights and treasury stock. Such treasury stock acquisition rights are presented as a separate component of equity or deducted directly from stock acquisition rights.
Notes to Consolidated Financial Statements
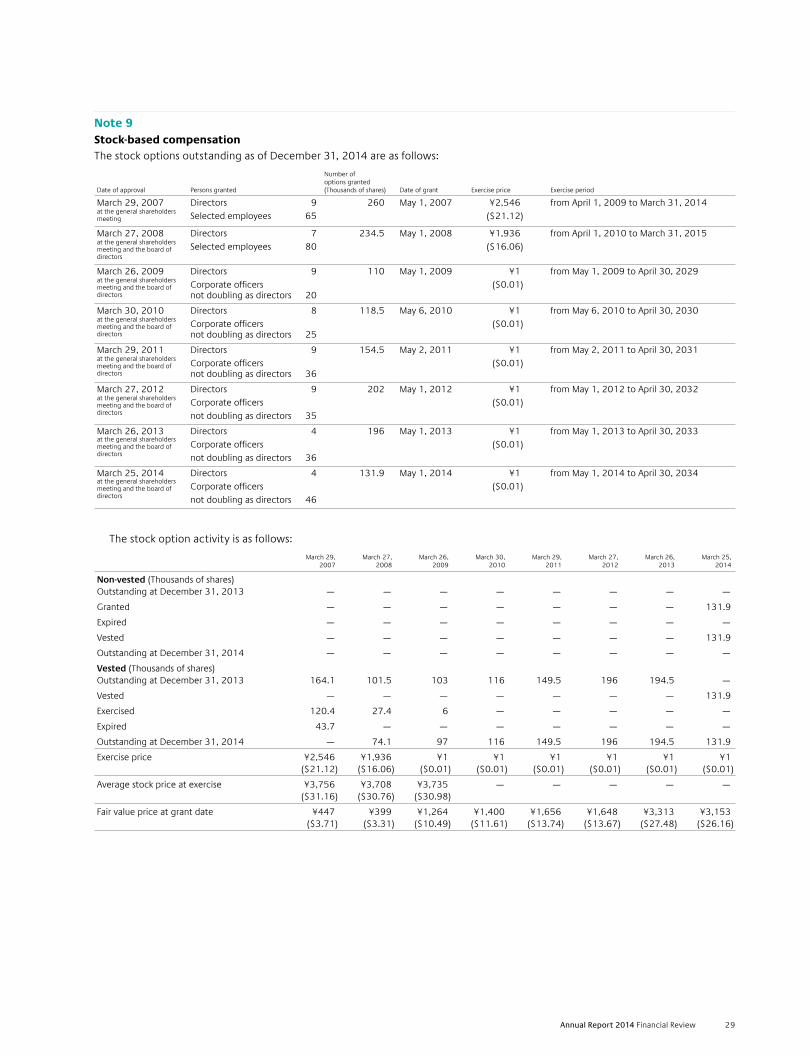
29Annual Report 2014 Financial Review
Note 9Stock-based compensationThe stock options outstanding as of December 31, 2014 are as follows:
Date of approval Persons granted
Number of options granted (Thousands of shares) Date of grant Exercise price Exercise period
March 29, 2007at the general shareholders meeting
Directors 9 Selected employees 65
260 May 1, 2007 ¥2,546 ($21.12)
from April 1, 2009 to March 31, 2014
March 27, 2008at the general shareholders meeting and the board of directors
Directors 7 Selected employees 80
234.5 May 1, 2008 ¥1,936 ($16.06)
from April 1, 2010 to March 31, 2015
March 26, 2009at the general shareholders meeting and the board of directors
Directors 9 Corporate officers not doubling as directors 20
110 May 1, 2009 ¥1 ($0.01)
from May 1, 2009 to April 30, 2029
March 30, 2010at the general shareholders meeting and the board of directors
Directors 8 Corporate officers not doubling as directors 25
118.5 May 6, 2010 ¥1 ($0.01)
from May 6, 2010 to April 30, 2030
March 29, 2011at the general shareholders meeting and the board of directors
Directors 9 Corporate officers not doubling as directors 36
154.5 May 2, 2011 ¥1 ($0.01)
from May 2, 2011 to April 30, 2031
March 27, 2012at the general shareholders meeting and the board of directors
Directors 9 Corporate officers not doubling as directors 35
202 May 1, 2012 ¥1 ($0.01)
from May 1, 2012 to April 30, 2032
March 26, 2013at the general shareholders meeting and the board of directors
Directors 4 Corporate officers not doubling as directors 36
196 May 1, 2013 ¥1 ($0.01)
from May 1, 2013 to April 30, 2033
March 25, 2014at the general shareholders meeting and the board of directors
Directors 4 Corporate officers not doubling as directors 46
131.9 May 1, 2014 ¥1 ($0.01)
from May 1, 2014 to April 30, 2034
The stock option activity is as follows:
March 29, 2007
March 27, 2008
March 26, 2009
March 30, 2010
March 29, 2011
March 27, 2012
March 26, 2013
March 25, 2014
Non-vested (Thousands of shares) Outstanding at December 31, 2013 — — — — — — — —
Granted — — — — — — — 131.9
Expired — — — — — — — —
Vested — — — — — — — 131.9
Outstanding at December 31, 2014 — — — — — — — —
Vested (Thousands of shares) Outstanding at December 31, 2013 164.1 101.5 103 116 149.5 196 194.5 —
Vested — — — — — — — 131.9
Exercised 120.4 27.4 6 — — — — —
Expired 43.7 — — — — — — —
Outstanding at December 31, 2014 — 74.1 97 116 149.5 196 194.5 131.9
Exercise price ¥2,546($21.12)
¥1,936($16.06)
¥1($0.01)
¥1($0.01)
¥1($0.01)
¥1($0.01)
¥1($0.01)
¥1($0.01)
Average stock price at exercise ¥3,756($31.16)
¥3,708($30.76)
¥3,735($30.98)
— — — — —
Fair value price at grant date ¥447($3.71)
¥399($3.31)
¥1,264($10.49)
¥1,400($11.61)
¥1,656($13.74)
¥1,648($13.67)
¥3,313($27.48)
¥3,153($26.16)

30 Bridgestone Corporation
The fair value price is estimated using the Black-Scholes Option Pricing Model with the following assumptions:
March 25, 2014
Volatility of stock price 33.126%
Estimated remaining outstanding period 10 years
Estimated dividend per share ¥57 ($0.47)
Risk-free interest rate 0.613%
Note 10Net income per shareReconciliation of the differences between basic and diluted net income per share (“EPS”) for the years ended December 31, 2014 and 2013 is as follows:
Net income Weighted-average shares EPS
For the year ended December 31, 2014
Millions of yen Thousands of shares Yen U.S. dollars
Basic EPSNet income available to common shareholders ¥300,589 783,112 ¥383.84 $3.18
Effect of dilutive securitiesStock options 927
Diluted EPSNet income for computation ¥300,589 784,039 ¥383.39 $3.18
Net income Weighted-average shares EPS
For the year ended December 31, 2013
Millions of yen Thousands of shares Yen
Basic EPSNet income available to common shareholders ¥202,054 782,860 ¥258.10
Effect of dilutive securitiesStock options 879
Diluted EPSNet income for computation ¥202,054 783,739 ¥257.81
Note 11Research and development costsResearch and development costs are charged to income as incurred. Research and development costs are ¥94,147 million ($780,979 thousand) and ¥89,098 million for the years ended December 31, 2014 and 2013, respectively.
Note 12Other income (expenses)Gain on sales of property, plant and equipmentGain on sales of property, plant and equipment for the years ended December 31, 2014 and 2013 mainly consists of gain on sales of land.
Loss related to US antitrust lawsDuring the year ended December 31, 2013, the Company has recorded the related loss as a result of entering into the plea agreement with the U.S. Department of Justice on February 14, 2014 regarding sales of certain automobile parts.
Loss related to recallDuring the year ended December 31, 2013, due to the Company implementing a recall for certain medium-size and large-size truck and bus tires manufactured by the Tochigi Plant and by BRIDGESTONE (SHENYANG) TIRE CO., LTD., a consolidated subsidiary, the expenses related to the check, replacement, etc., of the recalled tires were recorded.
Plant restructuring costs in JapanDuring the year ended December 31, 2013, the Company has recorded the related expenses based on the resolution related to the closure of the Kuroiso Plant as a part of production realignment in Japan.
Notes to Consolidated Financial Statements

31Annual Report 2014 Financial Review
The tax effects of significant temporary differences and tax loss carryforwards which resulted in deferred tax assets and liabilities at December 31, 2014 and 2013 are as follows:
2014 2013 2014
Millions of yen Thousands of U.S. dollars
Deferred Tax Assets:
Net defined benefit liability ¥ 104,045 ¥ 74,610 $ 863,086
Accrued expenses 37,833 32,994 313,837
Unrealized intercompany profits 31,374 31,513 260,257
Net operating loss carryforwards for tax purposes 56,512 56,820 468,785
Other 69,260 84,992 574,533
Less valuation allowance (36,606) (37,034) (303,658)
Total 262,418 243,895 2,176,840
Deferred Tax Liabilities:
Reserve for deferred gain related fixed assets for tax purposes (13,857) (13,390) (114,948)
Unrealized gain on available-for-sale securities (62,185) (62,638) (515,844)
Depreciation (32,043) (13,061) (265,807)
Other (42,497) (37,362) (352,526)
Total (150,582) (126,451) (1,249,125)
Net deferred tax assets ¥ 111,836 ¥ 117,444 $ 927,715
A reconciliation between the normal effective statutory tax rate and the actual effective tax rate reflected in the consolidated statement of income is as follows:
2014
%
Normal effective statutory tax rate 37.9%
Expenses not deductible for income tax purposes and income not taxable—net (3.6)
Lower income tax rates applicable to income in certain consolidated subsidiaries (2.8)
Tax credit for research and development costs of domestic companies (1.3)
Change in valuation allowance for deferred tax assets 1.3
Other—net 3.6
Actual Effective Tax Rate 35.1%
For the year ended December 31, 2013, a reconciliation is not disclosed, since the difference is less than 5% of the normal effective statutory tax rate.
New tax reform laws enacted in 2014 in Japan changed the normal effective statutory tax rate for the fiscal year beginning on or after April 1, 2014, from approximately 37.9% to 35.5%. The effect of this change was to decrease deferred tax assets and deferred gain (loss) on derivative instruments in the consolidated balance sheet as of December 31, 2014, by ¥2,579 million ($21,394 thousand) and ¥33 million ($274 thousand), respectively, and to increase income taxes—deferred in the consolidated statement of income for the year then ended by ¥2,546 million ($21,120 thousand).
Note 13Income taxesThe Company and its domestic subsidiaries are subject to Japanese national and local income taxes which, in the aggregate, resulted in a normal effective statutory tax rate of approximately 37.9% for each of the years ended December 31, 2014 and 2013.
Plant restructuring costs in EuropeDuring the year ended December 31, 2013, BRIDGESTONE EUROPE NV/SA (“BSEU”), a subsidiary of the Company and Regional Head Office in Europe, has recorded related expenses based on the agreement of a conversion plan with the government, unions and other parties, in order to increase the competi tiveness of the Bari Plant which is fully owned by
BRIDGESTONE ITALIA S.P.A., a subsidiary of BSEU in Italy. BSEU had determined to close the Bari Plant on March 4, 2013; however, the plan indicates the possibility of maintaining industrial activities under conditions to achieve the targeted levels of productivity and cost through the implementation of the commitments.

32 Bridgestone Corporation
Notes to Consolidated Financial Statements
Note 14Financial instruments1. Qualitative information on financial instruments(1) Policies for using financial instrumentsThe Companies raise the necessary funds mainly by bank borrowings or issuance of bonds based on funding requirements of their business activities. The Companies invest temporary cash surpluses only in highly secure financial instruments. The Companies follow the policy of using derivative financial instruments not for speculative purposes, but for managing financial risks as described later.(2) Details of financial instruments used and the
exposures to riskReceivables, such as notes and accounts receivable, are exposed to customer credit risk. Receivables in foreign currencies are exposed to foreign currency exchange fluctuation risk. Marketable securities consist primarily of the reservation of receivables liquidation that are exposed to customer credit risk or certificates of deposit regarded as marketable securities in accordance with U.S. GAAP. Investments in securities consist primarily of equity securities of business partners and are exposed to market price fluctuation risk. Payment terms of payables, such as notes and accounts payable are approximately less than one year. Payables in foreign currencies are exposed to foreign currency exchange fluctuation risk. Borrowings, bonds and obligations under finance leases are mainly for the purpose of obtaining working capital and preparing for capital expenditures. Some of the borrowings and bonds with floating interest rates are exposed to interest rate fluctuation risk. Derivative transactions consist of the use of foreign currency forward contracts and currency option contracts for the purpose of hedging foreign currency exchange fluctuation risk on receivables, payables and forecasted transactions in foreign currencies; currency swap contracts for the purpose of hedging foreign currency exchange fluctuation risk and interest rate fluctuation risk on loans, borrowings and bonds in foreign currencies; interest rate swap contracts for the purpose of hedging interest rate fluctuation risk on borrowings; and commodity swap contracts for the purpose of hedging commodity price fluctuation risk. Hedging instruments and hedged items, hedge policy, assessment method for hedge effectiveness and others related to hedge accounting are described at Note 3. (22) “Derivatives and hedging activities” and Note 15 “Derivatives.”(3) Risk management of financial instrumentsa. Management of credit risk The Companies regularly monitor the financial position of
significant customers and manage the due dates and the receivables balance of each customer to minimize the risk of default resulting from deterioration of customers’ financial position.
The Companies enter into derivative transactions only with highly rated financial institutions in order to minimize counterparty risk.
The maximum credit risk on December 31, 2014 is represented by the book value of the financial instruments exposed to credit risk on the consolidated balance sheet.
b. Management of market risk The Company and certain of its subsidiaries principally use
foreign currency forward contracts to hedge foreign currency exchange fluctuation risk identified by currency and on a monthly basis for receivables and payables in foreign currencies. Also, when receivables and payables in foreign currencies are expected from a forecasted transaction, foreign currency forward contracts and currency option contracts may be used. In addition, currency swap contracts are used to hedge foreign currency exchange fluctuation risk and interest rate fluctuation risk on loans, borrowings and bonds in foreign currencies; interest rate swap contracts are used to hedge interest rate fluctuation risk on borrowings; and commodity swap contracts are used to hedge commodity price fluctuation risk.
With respect to marketable and investment securities, the Company regularly monitors fair market values and financial positions of the issuers, with whom it has business relations, and appropriately reviews the status of these securities considering the relationships with the issuers.
Derivative transactions are carried out under internal regulations by the responsible divisions, and details of transactions are reported to the responsible corporate officers.
c. Management of liquidity risk in financing activities The Companies practice money management effectively by
recognizing the fund position beforehand based on cash flow projection. The Companies also strive to diversify sources of financing in order to reduce liquidity risk.
(4) Supplementary explanation on fair value of financial instruments
Fair values of financial instruments include market prices and values calculated reasonably when there is no market price. As variable factors are incorporated in calculating the relevant fair values, such values may change depending on the different assumptions. The contract amounts described in Note 15 “Derivatives” do not indicate the amounts of market risk related to derivative transactions.

33Annual Report 2014 Financial Review
2. Fair values of financial instrumentsCarrying amount, fair value and unrealized gain (loss) of the financial instruments as of December 31, 2014 and 2013 are as follows: Financial instruments whose fair values are not readily determinable are excluded from the following table.
Carrying amount
Fair value
Unrealized gain (loss)
Carrying amount
Fair value
Unrealized gain (loss)
2014
Millions of yen Thousands of U.S. dollars
(1) Cash and cash equivalents ¥ 390,181 ¥ 390,181 ¥ — $ 3,236,674 $ 3,236,674 $ —
(2) Notes and accounts receivable 541,866 4,494,948
Allowance for doubtful accounts*1 11,431 94,824
530,435 530,435 — 4,400,124 4,400,124 —
(3) Marketable and investment securities 391,857 391,857 — 3,250,577 3,250,577 —
Total ¥1,312,473 ¥1,312,473 ¥ — $10,887,375 $10,887,375 $ —
(1) Short-term debt ¥ 130,660 ¥ 130,660 ¥ — $1,083,866 $1,083,866 $ —
(2) Current portion of long-term debt 98,249 98,249 — 815,006 815,006 —
(3) Notes and accounts payable 388,585 388,585 — 3,223,434 3,223,434 —
(4) Income taxes payable 46,490 46,490 — 385,649 385,649 —
(5) Long-term debt 364,085 368,057 (3,972) 3,020,199 3,053,148 (32,949)
Total ¥1,028,069 ¥1,032,041 ¥(3,972) $ 8,528,154 $ 8,561,103 $(32,949)
Derivative transactions*2 ¥ (11,392) ¥ (11,392) ¥ — $ (94,500) $ (94,500) $ —
Carrying amount
Fair value
Unrealized gain (loss)
2013
Millions of yen
(1) Cash and cash equivalents ¥ 324,596 ¥ 324,596 ¥ —
(2) Notes and accounts receivable 528,466
Allowance for doubtful accounts*1 11,871
516,595 516,595 —
(3) Marketable and investment securities 408,995 408,995 —
Total ¥1,250,186 ¥1,250,186 ¥ —
(1) Short-term debt ¥ 111,753 ¥ 111,753 ¥ —
(2) Current portion of long-term debt 169,795 170,101 (306)
(3) Notes and accounts payable 358,128 358,128 —
(4) Income taxes payable 54,572 54,572 —
(5) Long-term debt 282,726 289,285 (6,559)
Total ¥ 976,974 ¥ 983,839 ¥(6,865)
Derivative transactions*2 ¥ (8,602) ¥ (8,602) ¥ —
*1 This comprises the allowance for doubtful accounts with respect to notes and accounts receivable, short-term loan receivable and others.
*2 Receivables and payables arising from derivative transactions are presented net. If the net amount is a liability, it is written in parentheses ( ).

34 Bridgestone Corporation
Notes to Consolidated Financial Statements
Note 15DerivativesThe Companies enter into foreign currency forward contracts, currency swap contracts and currency option contracts to hedge foreign currency exchange risk associated with certain assets and liabilities denominated in foreign currencies. The Companies enter into interest rate swap contracts to manage their interest rate exposures on certain liabilities. In addition, the Companies enter into commodity swap contracts to hedge the risk of fluctuation of commodity prices for raw materials. All derivative transactions are entered into to hedge foreign currency, interest and commodity price exposures that arise in the course of the Companies’ business. Accordingly, the market risk in these derivatives is basically offset by opposite
movements in the value of hedged assets or liabilities. Because the counterparties to these derivatives are limited to major international financial institutions, the Companies do not anticipate any losses arising from credit risk. Derivative transactions entered into by the Companies have been made in accordance with internal policies which regulate the authorization and credit limit amounts. The contract or notional amounts of derivatives which are shown in the following table do not represent the amounts exchanged by the parties and do not measure the Companies’ exposure to credit or market risk.
Notes
1. Calculation method of fair values of financial instruments, investments in securities,
and derivative transactions are as follows:
Assets
(1) Cash and cash equivalents, and (2) Notes and accounts receivable
The fair values approximate book values because of their short-term maturities.
(3) Marketable and investment securities
The fair values of the reservation of receivables liquidation are based on values
calculated reasonably, the fair values of equity securities are based on the market
prices at the securities exchanges, and the fair values of bonds are based on the
market prices at the securities exchanges or on the prices disclosed by financial
institutions. Information on available-for-sale securities is described in Note 5
“Marketable and investment securities.”
Liabilities
(1) Short-term debt, (2) Current portion of long-term debt, and (4) Income taxes payable
The fair values of bonds with market prices are based on the market prices. The fair
values of others approximate book values because of their short-term maturities.
(3) Notes and accounts payable
The fair values approximate book values because of their short-term maturities.
(5) Long-term debt
The fair values of bonds with market prices are based on the market prices.
The fair values of bonds without market prices and long-term bank borrowings are
determined by discounting the aggregated values of the principal and interest
using an assumed interest rate as if identical debt was newly issued.
Derivative transactions
Information of derivative transactions is described in Note 15 “Derivatives.”
2. Financial instruments whose fair values are extremely difficult to calculate
Carrying amount
2014 2013 2014
Millions of yen Thousands of U.S. dollars
Available-for-sale securities
Unlisted equity securities ¥1,888 ¥1,812 $15,662
It is extremely difficult to calculate their fair values because there are no market prices.
Therefore, these items are not included in “(3) Marketable and investment securities.”
3. Redemption schedule of monetary assets and investments in securities with contractual maturities
Due 2015 Due 2016 to 2019 Due 2020 to 2024 Due 2025 and
thereafter
2014
Millions of yen
Cash and cash equivalents ¥390,181 ¥ — ¥— ¥—Notes and accounts receivable 541,866 — — —Marketable and investment securities
Available-for-sale securities with contractual maturitiesPublic bonds 1,795 3,833 6 —Corporate bonds 2 — — —Other 25,155 — — —
Thousands of U.S. dollars
Cash and cash equivalents $3,236,674 $ — $ — $—Notes and accounts receivable 4,494,948 — — —Marketable and investment securities
Available-for-sale securities with contractual maturitiesPublic bonds 14,890 31,796 50 —Corporate bonds 17 — — —Other 208,669 — — —
4. Please see Note 6 “Short-term and long-term debt” for annual maturities of long-term debt.

35Annual Report 2014 Financial Review
The outstanding balance of derivative contracts which do not qualify for hedge accounting at December 31, 2014 and 2013 are as follows:
Contract amount Fair value Unrealized gain (loss)
2014
Millions of yen
Foreign Currency Forward Contracts: Sell: U.S. dollar ¥61,130 ¥(3,331) ¥(3,331)
Euro 23,387 (505) (505)
Russian ruble 21,188 4,765 4,765
Australian dollar 12,680 85 85
Other 32,386 (366) (366)
Buy:U.S. dollar 24,605 346 346
Japanese yen 22,860 (2,731) (2,731)
Thai baht 6,889 8 8
Poland zloty 3,406 (15) (15)
Other 2,544 (20) (20)
Currency Swap Contracts: U.S. dollar receipt, Japanese yen payment ¥43,306 ¥(4,818) ¥(4,818)
South African rand receipt, U.S. dollar payment 36,165 — —
Euro receipt, Japanese yen payment 11,190 (20) (20)
Poland zloty receipt, Japanese yen payment 10,582 (2,155) (2,155)
Euro receipt, U.S. dollar payment 10,155 542 542
Thai baht receipt, Japanese yen payment 9,742 (1,426) (1,426)
Indian rupee receipt, U.S. dollar payment 8,443 1,283 1,283
Other 7,295 (1,412) (1,412)
Contract amount Fair value Unrealized gain (loss)
2013
Millions of yen
Foreign Currency Forward Contracts: Sell: U.S. dollar ¥50,853 ¥(2,564) ¥(2,564)
Euro 22,766 (1,573) (1,573)
Russian ruble 13,331 (1,177) (1,177)
Australian dollar 15,600 2 2
Other 22,885 (417) (417)
Buy:U.S. dollar 12,707 7 7
Japanese yen 2,143 (89) (89)
Thai baht 81 (1) (1)
Poland zloty 6,967 (13) (13)
Danish Krone 1,361 — —
Other 2,280 (3) (3)
Currency Swap Contracts: U.S. dollar receipt, Japanese yen payment ¥12,965 ¥(1,133) ¥(1,133)
South African rand receipt, U.S. dollar payment 39,352 1,485 1,485
Euro receipt, Japanese yen payment 1,044 (25) (25)
Poland zloty receipt, Japanese yen payment 12,747 (2,355) (2,355)
Euro receipt, U.S. dollar payment 14,604 (548) (548)
Indian rupee receipt, U.S. dollar payment 7,996 1,406 1,406
Other 7,595 (279) (279)

36 Bridgestone Corporation
Notes to Consolidated Financial Statements
Contract amount Fair value Unrealized gain (loss)
2014
Thousands of U.S. dollars
Foreign Currency Forward Contracts: Sell: U.S. dollar $507,092 $(27,632) $(27,632)
Euro 194,002 (4,189) (4,189)
Russian ruble 175,761 39,527 39,527
Australian dollar 105,185 705 705
Other 268,652 (3,036) (3,036)
Buy:U.S. dollar
204,106 2,870 2,870
Japanese yen 189,631 (22,655) (22,655)
Thai baht 57,146 66 66
Poland zloty 28,254 (124) (124)
Other 21,103 (166) (166)
Currency Swap Contracts: U.S. dollar receipt, Japanese yen payment $359,237 $(39,967) $(39,967)
South African rand receipt, U.S. dollar payment 300,000 0 0
Euro receipt, Japanese yen payment 92,825 (166) (166)
Poland zloty receipt, Japanese yen payment 87,781 (17,876) (17,876)
Euro receipt, U.S. dollar payment 84,239 4,496 4,496
Thai baht receipt, Japanese yen payment 80,813 (11,829) (11,829)
Indian rupee receipt, U.S. dollar payment 70,037 10,643 10,643
Other 60,514 (11,713) (11,713)

37Annual Report 2014 Financial Review
The outstanding balance of derivative contracts which qualify for hedge accounting at December 31, 2014 and 2013 are as follows:
Primary hedged item Contract amount Fair value
2014
Millions of yen
Foreign Currency Forward Contracts:
Sell:
U.S. dollar
Accountsreceivable
¥21,226 ¥(1,350)
Euro 8,229 (299)
Australian dollar 6,339 28
Other 52 (25)
Buy:
U.S. dollar Accountspayable
762 24
Other 11 1
Primary hedged item Contract amount Fair value
2013
Millions of yen
Foreign Currency Forward Contracts:
Sell:
U.S. dollar
Accountsreceivable
¥22,501 ¥(858)
Euro 7,565 (477)
Australian dollar 5,029 (8)
Other 60 3
Buy:
U.S. dollar Accountspayable
324 9
Other 40 3
Primary hedged item Contract amount Fair value
2014
Thousands of U.S. dollars
Foreign Currency Forward Contracts:
Sell:
U.S. dollar
Accountsreceivable
$176,076 $(11,199)
Euro 68,262 (2,480)
Australian dollar 52,584 232
Other 431 (207)
Buy:
U.S. dollar Accountspayable
6,321 199
Other 91 8
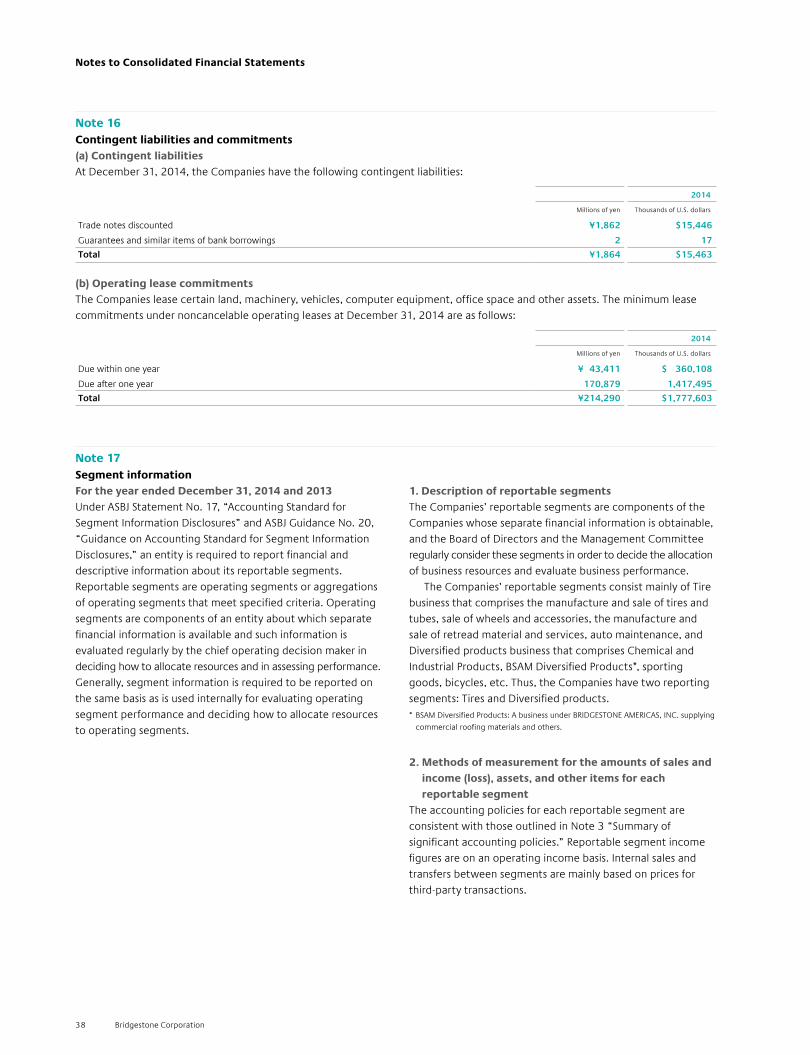
38 Bridgestone Corporation
Notes to Consolidated Financial Statements
Note 17Segment informationFor the year ended December 31, 2014 and 2013Under ASBJ Statement No. 17, “Accounting Standard for Segment Information Disclosures” and ASBJ Guidance No. 20, “Guidance on Accounting Standard for Segment Information Disclosures,” an entity is required to report financial and descriptive information about its reportable segments. Reportable segments are operating segments or aggregations of operating segments that meet specified criteria. Operating segments are components of an entity about which separate financial information is available and such information is evaluated regularly by the chief operating decision maker in deciding how to allocate resources and in assessing performance. Generally, segment information is required to be reported on the same basis as is used internally for evaluating operating segment performance and deciding how to allocate resources to operating segments.
1. Description of reportable segmentsThe Companies’ reportable segments are components of the Companies whose separate financial information is obtainable, and the Board of Directors and the Management Committee regularly consider these segments in order to decide the allocation of business resources and evaluate business performance. The Companies’ reportable segments consist mainly of Tire business that comprises the manufacture and sale of tires and tubes, sale of wheels and accessories, the manufacture and sale of retread material and services, auto maintenance, and Diversified products business that comprises Chemical and Industrial Products, BSAM Diversified Products*, sporting goods, bicycles, etc. Thus, the Companies have two reporting segments: Tires and Diversified products.* BSAM Diversified Products: A business under BRIDGESTONE AMERICAS, INC. supplying
commercial roofing materials and others.
2. Methods of measurement for the amounts of sales and income (loss), assets, and other items for each reportable segment
The accounting policies for each reportable segment are consistent with those outlined in Note 3 “Summary of significant accounting policies.” Reportable segment income figures are on an operating income basis. Internal sales and transfers between segments are mainly based on prices for third-party transactions.
Note 16Contingent liabilities and commitments(a) Contingent liabilitiesAt December 31, 2014, the Companies have the following contingent liabilities:
2014
Millions of yen Thousands of U.S. dollars
Trade notes discounted ¥1,862 $15,446
Guarantees and similar items of bank borrowings 2 17
Total ¥1,864 $15,463
(b) Operating lease commitmentsThe Companies lease certain land, machinery, vehicles, computer equipment, office space and other assets. The minimum lease commitments under noncancelable operating leases at December 31, 2014 are as follows:
2014
Millions of yen Thousands of U.S. dollars
Due within one year ¥ 43,411 $ 360,108
Due after one year 170,879 1,417,495
Total ¥214,290 $1,777,603

39Annual Report 2014 Financial Review
3. Information about sales and income (loss), assets and other items by reportable segment
Tires Diversified products Total Reconciliations* Consolidated
Year ended December 31, 2014
Millions of yen
Net Sales:
External customers ¥3,088,627 ¥585,338 ¥3,673,965 ¥ — ¥3,673,965Inter-segment 4,749 16,528 21,277 (21,277) —Total 3,093,376 601,866 3,695,242 (21,277) 3,673,965Segment income
(Operating income) ¥ 435,837 ¥ 42,187 ¥ 478,024 ¥ 14 ¥ 478,038Segment assets ¥3,517,404 ¥445,601 ¥3,963,005 ¥ (2,097) ¥3,960,908Other
Depreciation and amortization ¥ 170,872 ¥ 17,461 ¥ 188,333 ¥ — ¥ 188,333Amortization of goodwill 649 597 1,246 — 1,246Investment for equity-method affiliates 18,599 199 18,798 (2) 18,796Increase in property, plant and equipment and intangible assets 268,376 44,725 313,101 — 313,101
Tires Diversified products Total Reconciliations* Consolidated
Year ended December 31, 2014
Thousands of U.S. dollars
Net Sales:
External customers $25,621,128 $4,855,562 $30,476,690 $ — $30,476,690Inter-segment 39,395 137,105 176,500 (176,500) —Total 25,660,523 4,992,667 30,653,190 (176,500) 30,476,690Segment income
(Operating income) $ 3,615,405 $ 349,954 $ 3,965,359 $ 116 $ 3,965,475Segment assets $29,177,967 $3,696,400 $32,874,367 $ (17,395) $32,856,972Other
Depreciation and amortization $ 1,417,437 $ 144,844 $ 1,562,281 $ — $ 1,562,281Amortization of goodwill 5,384 4,952 10,336 — 10,336Investment for equity-method affiliates 154,284 1,651 155,935 (17) 155,918Increase in property, plant and equipment and intangible assets 2,226,263 371,008 2,597,271 — 2,597,271
* The reconciliations are as follows:
1 Reconciliations of segment income refer to elimination of inter-segment transactions.
2 Reconciliations of segment assets refer to elimination of inter-segment receivables and payables.
Tires Diversified products Total Reconciliations* Consolidated
Year ended December 31, 2013
Millions of yen
Net Sales:
External customers ¥3,033,660 ¥534,431 ¥3,568,091 ¥ — ¥3,568,091
Inter-segment 3,243 11,787 15,030 (15,030) —
Total 3,036,903 546,218 3,583,121 (15,030) 3,568,091
Segment income
(Operating income) ¥ 399,497 ¥ 38,560 ¥ 438,057 ¥ 75 ¥ 438,132
Segment assets ¥3,175,923 ¥402,226 ¥3,578,149 ¥ (1,104) ¥3,577,045
Other
Depreciation and amortization ¥ 158,723 ¥ 17,457 ¥ 176,180 ¥ — ¥ 176,180
Amortization of goodwill 923 57 980 — 980
Investment for equity-method affiliates 16,978 217 17,195 (4) 17,191
Increase in property, plant and equipment and intangible assets 255,908 19,067 274,975 — 274,975

40 Bridgestone Corporation
Notes to Consolidated Financial Statements
4. Related information1. Information about products and servicesInformation has been omitted, as the classification is the same as that for reportable segments.
2. Information about geographical areas(1) Sales
Japan The Americas United States* Europe Other Total
Year ended December 31, 2014
Millions of yen
¥694,043 ¥1,746,345 ¥1,370,865 ¥434,126 ¥799,451 ¥3,673,965
Thousands of U.S. dollars
$5,757,304 $14,486,479 $11,371,754 $3,601,211 $6,631,696 $30,476,690
Japan The Americas United States* Europe Other Total
Year ended December 31, 2013
Millions of yen
¥674,840 ¥1,628,609 ¥1,206,619 ¥425,005 ¥839,637 ¥3,568,091
Note: Sales are classified by country or region based on location of customers.
* The figure for the United States is included in that of the Americas.
(2) Property, plant and equipment
Japan The Americas United States*1 Europe Other China*2 Total
Year ended December 31, 2014
Millions of yen
¥350,512 ¥587,389 ¥449,749 ¥161,641 ¥444,633 ¥171,801 ¥1,544,175
Thousands of U.S. dollars
$2,907,607 $4,872,576 $3,730,809 $1,340,863 $3,688,369 $1,425,143 $12,809,415
Japan The Americas United States*1 Europe Other China*2 Total
Year ended December 31, 2013
Millions of yen
¥358,325 ¥459,510 ¥339,970 ¥158,932 ¥358,293 ¥140,256 ¥1,335,060
*1 The figure for the United States is included in that of the Americas.
*2 The figure for China is included in that of Other.
3. Information about major customersThe Companies are not required to disclose information on external customers since there are no sales to a single external customer amounting to 10% or more of the Companies’ net sales.
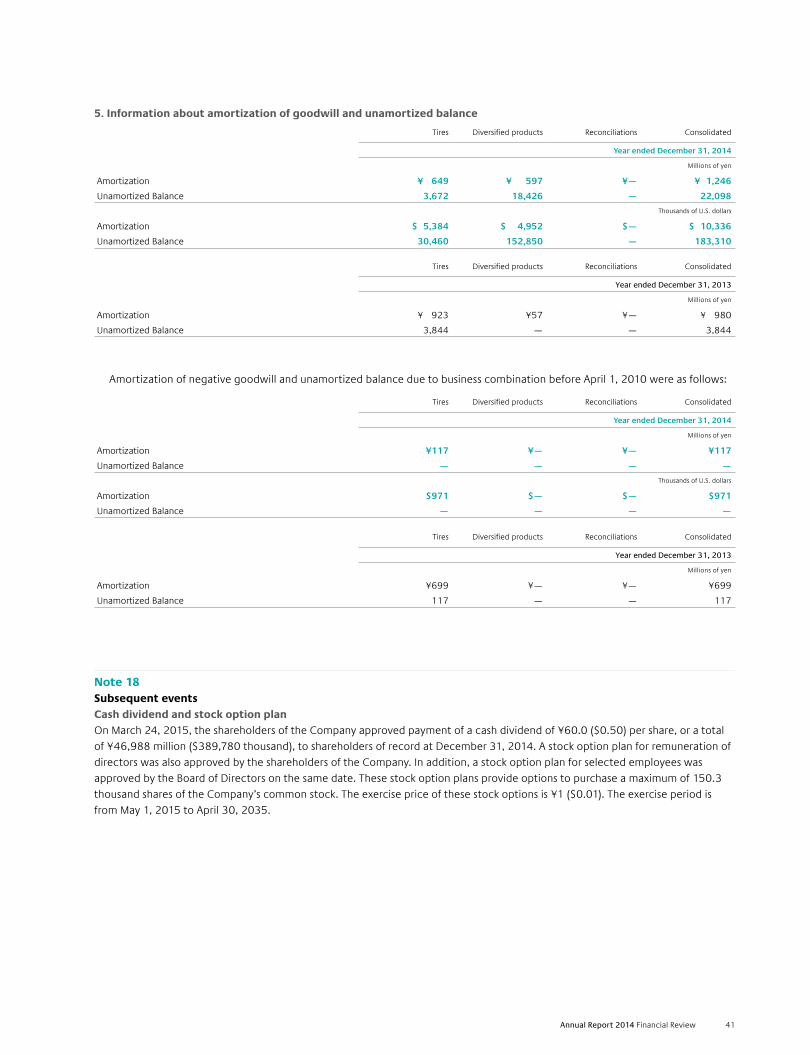
41Annual Report 2014 Financial Review
Note 18Subsequent eventsCash dividend and stock option planOn March 24, 2015, the shareholders of the Company approved payment of a cash dividend of ¥60.0 ($0.50) per share, or a total of ¥46,988 million ($389,780 thousand), to shareholders of record at December 31, 2014. A stock option plan for remuneration of directors was also approved by the shareholders of the Company. In addition, a stock option plan for selected employees was approved by the Board of Directors on the same date. These stock option plans provide options to purchase a maximum of 150.3 thousand shares of the Company’s common stock. The exercise price of these stock options is ¥1 ($0.01). The exercise period is from May 1, 2015 to April 30, 2035.
5. Information about amortization of goodwill and unamortized balance
Tires Diversified products Reconciliations Consolidated
Year ended December 31, 2014
Millions of yen
Amortization ¥ 649 ¥ 597 ¥— ¥ 1,246
Unamortized Balance 3,672 18,426 — 22,098
Thousands of U.S. dollars
Amortization $ 5,384 $ 4,952 $— $ 10,336
Unamortized Balance 30,460 152,850 — 183,310
Tires Diversified products Reconciliations Consolidated
Year ended December 31, 2013
Millions of yen
Amortization ¥ 923 ¥57 ¥— ¥ 980
Unamortized Balance 3,844 — — 3,844
Amortization of negative goodwill and unamortized balance due to business combination before April 1, 2010 were as follows:
Tires Diversified products Reconciliations Consolidated
Year ended December 31, 2014
Millions of yen
Amortization ¥117 ¥— ¥— ¥117
Unamortized Balance — — — —
Thousands of U.S. dollars
Amortization $971 $— $— $971
Unamortized Balance — — — —
Tires Diversified products Reconciliations Consolidated
Year ended December 31, 2013
Millions of yen
Amortization ¥699 ¥— ¥— ¥699
Unamortized Balance 117 — — 117

42 Bridgestone Corporation
Note 19Comprehensive incomeThe components of other comprehensive income for the years ended December 31, 2014 and 2013 were as follows:
2014 2013 2014
Millions of yen Thousands of U.S. dollars
Net Unrealized Gain (Loss) on Available-for-sale Securities:
Gains (losses) arising during the year ¥(27,069) ¥ 93,918 $(224,546)
Reclassification adjustment to profit or loss (5,921) (1,954) (49,116)
Amount before income tax effect (32,990) 91,964 (273,662)
Income tax effect 453 (24,705) 3,757
Total ¥(32,537) ¥ 67,259 $(269,905)
Deferred Gain (Loss) on Derivative Instruments:
Gains (losses) arising during the year ¥ 3,723 ¥ 6,873 $ 30,884
Reclassification adjustment to profit or loss (4,191) (7,132) (34,766)
Reclassification adjustment to acquisition cost of assets (636) (410) (5,276)
Amount before income tax effect (1,104) (669) (9,158)
Income tax effect 506 277 4,197
Total ¥ (598) ¥ (392) $ (4,961)
Foreign Currency Translation Adjustments:
Adjustments arising during the year ¥131,149 ¥163,226 $1,087,922
Reclassification adjustment to profit or loss 48 218 398
Total ¥131,197 ¥163,444 $1,088,320
Remeasurements of Defined Benefit Plans:
Gains (losses) arising during the year ¥(115,221) ¥ 43,461 $ (955,794)
Reclassification adjustment to profit or loss 11,764 17,305 97,586
Amount before income tax effect (103,457) 60,766 (858,208)
Income tax effect 39,103 (24,902) 324,371
Total ¥ (64,354) ¥ 35,864 $ (533,837)
Share of Other Comprehensive Income in Affiliates:
Gains (losses) arising during the year ¥ (196) ¥ (4) $ (1,626)
Reclassification adjustment to profit or loss 137 331 1,137
Total ¥ (59) ¥ 327 $ (489)
Total Other Comprehensive Income ¥33,649 ¥266,502 $279,128
Notes to Consolidated Financial Statements

43Annual Report 2014 Financial Review

Bridgestone Corporation
1-1, Kyobashi 3-chome, Chuo-ku, Tokyo 104-8340, Japan
www.bridgestone.co.jp
May 2015