annual report 2015 - nsl ltd 2015 change (%) for the year (s$’000) ... • malayan banking berhad...
TRANSCRIPT

NSL LTD Annual Report 2015

02Corporate Profile
08Board of Directors
03Group Financial Highlights
09Corporate Research & Development Advisory Panel
045-year Financial Summary
18Corporate Information
06Letter to Shareholders
14Corporate Social Responsibility
16Corporate Directory
10Key Management
11Review of Operations
19Financial Review
Contents

At NSL, we adopt a holistic and proactive strategy, which enables us to be ready to embrace arising
opportunities as well as navigate through emerging challenges. Our actions are aligned for the future.

NSL LTD2
Corporate Profile
NSL and its group of companies is a leading industrial group in Asia Pacific. The Group has businesses in Precast & Prefabricated Bathroom Unit (PBU), Dry Mix, Environmental Services and an investment in Engineering. The Precast & PBU division is a market leader in manufacturing precast concrete components and Prefabricated Bathroom Unit in the region. The Dry Mix division is one of the largest and most reputable regional producers of dry mix plaster and mortar. Environmental Services division, a key player in integrated environmental services in Singapore, has
9Countries
Operations and joint ventures in
businesses in integrated waste management and re-refining of used lubricant. NSL’s investment in Engineering specialises in bulk cargo and container lifting devices. NSL Group is widely recognised as an extensive user of technology to provide innovative solutions to industries. It partners eminent local industry and tertiary institutions to develop best practices and leading technologies in its fields. The Group has operations and joint ventures in nine countries. The Company has been listed on the Singapore Exchange since 1964.
Underpinning our strategy is our commitment to hold firm to our core values.

ANNUAL REPORT 2015 3
Group Financial Highlights
2014* 2015 Change (%)
FOR THE YEAR (S$’000)
Turnover from continuing operations 425,950 446,452 5
Profit before taxation from continuing operations 15,499 30,898 99
Profit attributable to shareholders
- from continuing operations 9,678 26,715 176
- from discontinued operations 15,248 40,040 163
Total group profit attributable to shareholders 24,926 66,755 168
AT YEAR-END (S$’000)
Shareholders’ funds 526,650 560,437 6
Total assets 733,304 727,021 (1)
PER SHARE
Basic earnings per share (cents) 6.7 17.9 168
Dividends (exempt - one tier, cents per share)
- Final 5 5 -
- Special – 3 n/m
OTHERS
No. of employees 3,344 3,078 (8)
* Certain comparative figures have been reclassified to be in line with current financial year presentation.

NSL LTD4
5-Year Financial Summary
FINANCIAL PROFILE (S$’000) 2011* 2012* 2013* 2014* 2015
Turnover 312,050 345,443 421,920 425,950 446,452 Profit before share of results of associated companies and joint venture 22,972 18,980 14,163 15,261 29,175 Share of results of associated companies and joint venture, net of tax (1,860) (10) (53) 238 1,723 Profit before tax 21,112 18,970 14,110 15,499 30,898 Taxation (2,645) (2,182) (5,348) (3,230) (3,185)Profit after tax 18,467 16,788 8,762 12,269 27,713 EBITDA 34,858 33,489 29,639 30,194 43,328 Profit attributable to shareholders- from continuing operations 16,013 16,914 9,220 9,678 26,715 - from discontinued operations 84,256 29,855 139,414 15,248 40,040 Total group profit attributable to shareholders 100,269 46,769 148,634 24,926 66,755 Dividends (exempt-one tier)- Final 37,356 37,356 37,356 18,678 18,678 - Special - - 149,423 - 11,207 Share capital 193,839 193,839 193,839 193,839 193,839 Reserves 382,433 381,567 495,871 332,811 366,598 Dividend cover 2.7x 1.3x 0.8x 1.3x 2.2x
FINANCIAL POSITION (S$’000)
WHAT WE OWNED
Property, plant and equipment 161,131 167,908 163,500 138,943 136,751Associated companies & joint venture 229,416 231,978 5,795 6,107 52,692Investment properties 3,460 3,288 8,420 8,648 8,376Long term receivables, prepayments & investments 17,032 12,711 11,491 10,309 10,280Intangible assets 9,573 9,419 9,672 9,439 9,306Deferred tax assets 1,175 1,408 1,515 3,347 5,290Current assets 312,197 326,083 695,455 556,511 504,326
733,984 752,795 895,848 733,304 727,021WHAT WE OWED AND EQUITYShareholders’ funds 576,272 575,406 689,710 526,650 560,437Non-controlling interests 14,439 13,630 12,932 13,817 11,007Long term liabilities 41,966 41,227 23,571 18,936 17,394Current liabilities 101,307 122,532 169,635 173,901 138,183
733,984 752,795 895,848 733,304 727,021CASH & DEBT POSITION (S$’000)Group borrowings 22,254 25,243 42,735 31,423 28,249Group net cash (cash less borrowings) 114,480 110,717 416,666 257,006 306,199
PER SHARE DATABasic earnings per share (cents) 26.8 12.5 39.8 6.7 17.9Net tangible assets per share (S$) 1.52 1.52 1.82 1.38 1.48
DIVIDENDSDividends (exempt - one tier, cents per share)
- Final 10 10 10 5 5- Special - - 40 - 3
* Certain comparative figures have been reclassified to be in line with current financial year presentation.

ANNUAL REPORT 2015 5
Group Turnover
Basic Earnings Per Share
Group Profit Before Tax
Shareholders’ Funds & Total Assets
(S$million)
(cents)
(S$million)
(S$million)
Shareholders’ Funds
Total Assets
2011
2011
2011
2011
2012
2012
2012
2012
2013
2013
2013
2013
2014
2014
2014*
2014
2015
2015
2015
2015
* Comparative figure has been re-presented to be in line with current financial year presentation.
312
26.8
21
576
734
19
575
753
14
690
15
527
31
560
727733
896
345
12.5
422
39.8
426
6.7
446
17.9
Letter to Shareholders
Dear Shareholders
In 2015, the world economy encountered strong headwinds from the weakening Chinese economy and plummeting oil and commodity prices. The emerging and regional economies were adversely affected by these negative developments. Growth in Europe and Japan also remained tepid prompting Central banks to cut interest rates to negative to provide further stimulant. The US economy was the only bright spark in the developed world that continued to expand moderately. Singapore, a bellwether of the world economy also slowed down, growing at 2% last year.
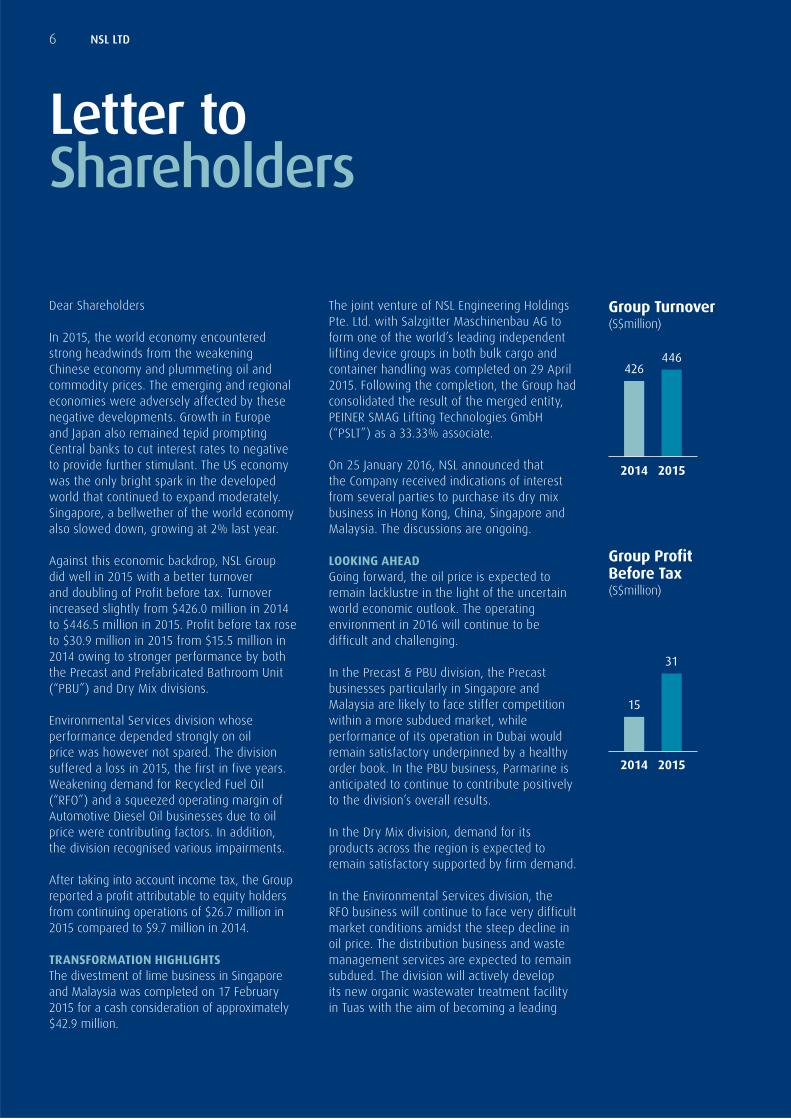
Against this economic backdrop, NSL Group did well in 2015 with a better turnover and doubling of Profit before tax. Turnover increased slightly from $426.0 million in 2014 to $446.5 million in 2015. Profit before tax rose to $30.9 million in 2015 from $15.5 million in 2014 owing to stronger performance by both the Precast and Prefabricated Bathroom Unit (“PBU”) and Dry Mix divisions.
Environmental Services division whose performance depended strongly on oil price was however not spared. The division suffered a loss in 2015, the first in five years. Weakening demand for Recycled Fuel Oil (“RFO”) and a squeezed operating margin of Automotive Diesel Oil businesses due to oil price were contributing factors. In addition, the division recognised various impairments.
After taking into account income tax, the Group reported a profit attributable to equity holders from continuing operations of $26.7 million in 2015 compared to $9.7 million in 2014.
TRANSFORMATION HIGHLIGHTSThe divestment of lime business in Singapore and Malaysia was completed on 17 February 2015 for a cash consideration of approximately $42.9 million.
The joint venture of NSL Engineering Holdings Pte. Ltd. with Salzgitter Maschinenbau AG to form one of the world’s leading independent lifting device groups in both bulk cargo and container handling was completed on 29 April 2015. Following the completion, the Group had consolidated the result of the merged entity, PEINER SMAG Lifting Technologies GmbH (“PSLT”) as a 33.33% associate.
On 25 January 2016, NSL announced that the Company received indications of interest from several parties to purchase its dry mix business in Hong Kong, China, Singapore and Malaysia. The discussions are ongoing.
LOOKING AHEADGoing forward, the oil price is expected to remain lacklustre in the light of the uncertain world economic outlook. The operating environment in 2016 will continue to be difficult and challenging.
In the Precast & PBU division, the Precast businesses particularly in Singapore and Malaysia are likely to face stiffer competition within a more subdued market, while performance of its operation in Dubai would remain satisfactory underpinned by a healthy order book. In the PBU business, Parmarine is anticipated to continue to contribute positively to the division’s overall results.
In the Dry Mix division, demand for its products across the region is expected to remain satisfactory supported by firm demand.
In the Environmental Services division, the RFO business will continue to face very difficult market conditions amidst the steep decline in oil price. The distribution business and waste management services are expected to remain subdued. The division will actively develop its new organic wastewater treatment facility in Tuas with the aim of becoming a leading
Group Turnover(S$million)
Group Profit Before Tax(S$million)
2014
2014
2015
2015
446
31
426
15
NSL LTD6

waste management service provider in Singapore.
Whilst the order book for PSLT remains satisfactory at the moment, the management will monitor market changes closely.
DIVIDENDSubject to the approval of shareholders at the annual general meeting of the Company to be held on 29 April 2016, the Board is recommending a dividend of $0.05 per share for the financial year ended 31 December 2015 to be paid on or about 27 May 2016 or such other date to be determined by the Directors.
Together with the special interim dividend of $0.03 per share that was paid on 26 May 2015, the total dividend for this financial year amounts to $0.08 per share.
IN APPRECIATIONFinally, I would like to thank all of you - our shareholders, management, business partners, customers and employees - for your support and contributions given to the Group during the past year.
We look forward to your continued support in the years ahead.
PROF CHAM TAO SOONChairman9 March 2016
ANNUAL REPORT 2015 7
Against this economic backdrop, NSL Group did well in 2015 with a better turnover and doubling of Profit before tax.” – PROF CHAM TAO SOON
“

NSL LTD8
Board of Directors
ChairmanPROF CHAM TAO SOONChairman• Fundedbyme Asia Pacific Pte Ltd• Soup Restaurant Group Ltd
Special Advisor• SIM Governing Council
DirectorsBAN SONG LONGDirector• Excel Partners Pte Ltd• 98 Holdings Pte Ltd
DAVID FU KUO CHENDirector• Hotel Properties Ltd• 98 Holdings Pte Ltd
JOHN KOH TIONG LUDirector• Mapletree Industrial Trust Management Ltd• Singapore Arts School Ltd• KrisEnergy Ltd
DR TAN TAT WAIDirector• Malayan Banking Berhad• Shangri-La Hotels (Malaysia) Berhad• Southern Steel Berhad*
Executive DirectorOO SOON HEEDirector• Bangkok Cogeneration Company Limited• ComfortDelGro Corporation Limited• Eastern Pretech Pte Ltd• NatSteel Holdings Pte Ltd• SIA Engineering Company Limited• York Transport Equipment (Asia) Pte Ltd
Driving the momentum of our progress is our team of visionary and experienced leaders.
* Dr Tan is a Non-Independent, Non-Executive Director with effect from 1 January 2016.

ANNUAL REPORT 2015 9
Corporate Research & Development Advisory Panel
ChairmanPROF CHAM TAO SOON
MembersDAVID FU KUO CHEN
LAM SIEW WAHDeputy CEO (Industry Development)• Building and Construction Authority
Adjunct Associate Professor• Nanyang Technological University
School of Civil and Environmental Engineering
LIM SWEE CHEANGVice-Dean• National University of Singapore
School of Continuing and Lifelong Learning
Director• EZ-Link Pte Ltd
PROF NG WUN JERNExecutive Director• Nanyang Technological University
Nanyang Environment and Water Research Institute
Professor• Nanyang Technological University
School of Civil and Environmental Engineering
OO SOON HEE
DR ROBERT TIONG
Deputy Director• Nanyang Techonological University
Centre of Infrastructure Systems
Associate Professor• Nanyang Technological University
School of Civil & Environmental Engineering
Ang Kong Hua and Dr Josephine Kwa retired from the Corporate Research & Development Advisory Panel in May and June 2015 respectively.

NSL LTD10
Key Management
MR OO SOON HEE was appointed Executive Director of NSL Ltd on 1 February 2011. He is responsible for the overall management of the NSL Group. Mr Oo had previously spent over 25 years at NSL Ltd in various positions, including Chief Operating Officer, President of NatSteel Group as well as a Director of the Company. Mr Oo holds a Bachelor of Science (Honours) in Applied Chemistry and a Diploma in Business Administration from the University of Singapore.
MR CHIA TONG HEE is presently Senior Vice-President (Finance and Corporate Services) of NSL Ltd. He is responsible for the Finance & Accounting, Treasury, Taxation and Corporate Communications functions of the Group. Prior to joining NSL Ltd in 2005, Mr Chia was an auditor with Pricewaterhouse and subsequently was the financial controller of Wearnes International (1994) Ltd. Mr Chia holds a Bachelor of Accountancy from the National University of Singapore and is a member of the Institute of Singapore Chartered Accountants.
DR LOW CHIN NAM joined NSL Ltd as Chief Strategy and Operations in 2011 and was promoted to Chief Operating Officer on 1 January 2015. He is responsible for the Group’s strategic business development and oversees Group operations. Dr Low started his career in the elite Administrative Service of the Singapore Government before leaving for the commercial sector. He was previously the Chief Operating Officer of M1 Ltd, subsequently, Director of Business Operations of Smartone Telecom Ltd, Hong Kong, and Managing Director of Digiland Pty Ltd., Australia. He holds a Bachelor of Science (Honours) in Electronics Engineering from King’s College, University of London, a Master of Science in Management Science from Imperial College, University of London as well as a Ph.D in Econometrics from Monash University in Australia.

ANNUAL REPORT 2015 11
Review of OperationsPRECAST & PBU
PERFORMANCEPrecast & Prefabricated Bathroom Unit (PBU) division‘s turnover improved 11% to $244.1 million in 2015. This was largely due to higher revenue reported by the precast operation in Singapore.
The division turned profitable last year, reversing a loss before tax of $8.0 million in 2014 to a Profit before tax of $15.0 million in 2015. The improvement was driven by higher demand for precast components in major projects in Singapore and Dubai that were successfully implemented. Malaysia precast operation was however affected by weak market conditions.
DEVELOPMENT HIGHLIGHTSDuring the year, the Singapore operation successfully contributed to the completion of a tight schedule major clean room project with its productivity-enhancing engineering design and new labour-saving casting methodology. The project which entailed careful planning and coordination among various production centres in Singapore and Malaysia was completed within six months with precast concrete volume equivalent to building 2,000 dwelling units of public housing.
Known for delivering innovative precast solutions to its customer, its operation in Dubai successfully
executed a key contract to supply three-dimensional breakwater units that require special mould fabrication and production to withstand the seafront conditions for the iconic Burj Al Arab Hotel.
In 4Q2015, Eastern Pretech Pte Ltd (“EP”) was awarded Singapore Green Label certifications by Singapore Environment Council for its key products such as hollow-core slab, reinforced concrete products and pre-stressed planks. These awards recognise EP’s efforts in using a byproduct of the steelmaking process to replace cement during its production and thereby reducing its carbon footprint. They reaffirm EP’s commitment in caring for the environment and support for the Building and Construction Authority’s sustainability construction movement.
To further strengthen EP’s technological capabilities and enhance its productivity and customer service, the division leveraged on 3D software technology, Building Information Modeling.
GOING FORWARDThe Precast businesses, particularly in Singapore and Malaysia, are expected to face increased competition within a more subdued market while performance of Dubai Precast is expected to remain satisfactory underpinned by a healthy order book.
In the PBU business, Parmarine is expected to continue to contribute positively to the division’s overall results. The Singapore PBU operation will leverage on its European experience to actively market its product which is promoted for construction productivity.
The division will continue to work on improving its productivity and offer appropriate off-site solutions that enhance construction markets.
Turnover & Profit Before Tax(S$million)
2014 2015Precast & PBU Division
219.5 244.1
(8.0)15.0
Turnover
Profit Before Tax
A significant project in
Singapore using Precast
concrete components
NSL LTD12
Review of OperationsDRY MIX
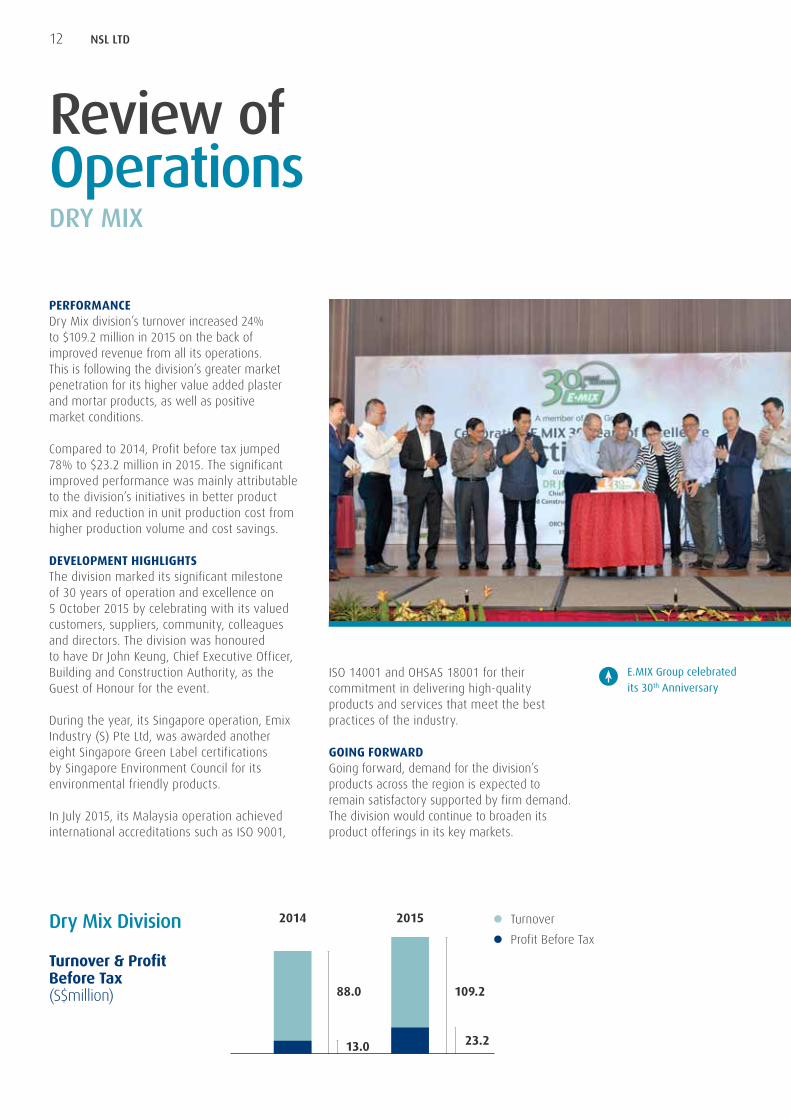
PERFORMANCEDry Mix division’s turnover increased 24% to $109.2 million in 2015 on the back of improved revenue from all its operations. This is following the division’s greater market penetration for its higher value added plaster and mortar products, as well as positive market conditions.
Compared to 2014, Profit before tax jumped 78% to $23.2 million in 2015. The significant improved performance was mainly attributable to the division’s initiatives in better product mix and reduction in unit production cost from higher production volume and cost savings.
DEVELOPMENT HIGHLIGHTSThe division marked its significant milestone of 30 years of operation and excellence on 5 October 2015 by celebrating with its valued customers, suppliers, community, colleagues and directors. The division was honoured to have Dr John Keung, Chief Executive Officer, Building and Construction Authority, as the Guest of Honour for the event.
During the year, its Singapore operation, Emix Industry (S) Pte Ltd, was awarded another eight Singapore Green Label certifications by Singapore Environment Council for its environmental friendly products.
In July 2015, its Malaysia operation achieved international accreditations such as ISO 9001,
ISO 14001 and OHSAS 18001 for their commitment in delivering high-quality products and services that meet the best practices of the industry.
GOING FORWARDGoing forward, demand for the division’s products across the region is expected to remain satisfactory supported by firm demand. The division would continue to broaden its product offerings in its key markets.
E.MIX Group celebrated
its 30th Anniversary
Turnover & Profit Before Tax(S$million)
2014 2015Dry Mix Division
88.0 109.2
13.0 23.2
Turnover
Profit Before Tax

ANNUAL REPORT 2015 13
Review of OperationsENVIRONMENTAL SERVICES
PERFORMANCE OVERVIEWTurnover of Environmental Services division declined 24% to $68.3 million in 2015 mainly due to a significant drop in average selling prices and sales volume for Recycled Fuel Oil (“RFO”). The decline in revenue was also attributed to lower sales of Automotive Diesel Oil (“ADO”) owing to lower average selling prices, despite reporting healthy year-on-year volume growth.
The division recorded a loss of $5.8 million in 2015. The significant decline in operating performance was a result of lower sales of RFO given the prolonged decline in oil price. Further, the division also recognised various impairments totalling $6.2 million. Both the ADO and waste management services continued to be major profit contributors to the division.
DEVELOPMENT HIGHLIGHTSDuring the year, the division expanded its waste management services to include treatment of hydrocarbon contaminated soil and inorganic wastewater. Its technical capabilities were strengthened with the upgrading of the laboratory to a more advanced analysis so that treatment methods for various waste streams could be determined more quickly for better efficiency and customer service.
To strengthen its market position, the division broadened its customer base for Liquid Gold and other automotive specialties through making inroads to new markets such as Myanmar and Timor Leste.
The division further enhanced its competitiveness in the slop market by commissioning new tanks to enable operational flexibility in the management of storage and recovery of RFO.
Turnover & Profit Before Tax(S$million)
2014 2015EnvironmentalServices Division
90.1 68.3
8.8(5.8)
Turnover
Profit Before Tax
The division strengthened its technological
capabilities with an advanced laboratory analysis
system for improved efficiency and customer service
Committed to conserving the environment, the division created a newly formulated range of Cheston products that are environmentally-friendly and biodegradable, meeting the standards of Maritime and Port Authority of Singapore and International Maritime Organization. GOING FORWARDIn the Environmental Services division, the RFO business will continue to face very difficult market conditions amidst the steep decline in oil price. The distribution business and waste management services are expected to remain subdued.
The division will actively develop its new organic wastewater treatment facility in Tuas with the aim of becoming a leading waste management service provider in Singapore. In addition, it will broaden its business service to better position the division to meet the future industrial needs of Singapore.

NSL LTD14
Corporate Social Responsibility
SUPPORTING THE COMMUNITY, THE LOCAL ARTS AND CULTURAL SCENEIn October 2015, NSL’s subsidiary Emix Industry (S) Pte Ltd celebrated its 30th Anniversary with great fanfare, but also with a thought for the less fortunate. A cheque of $30,000 donation was presented to the Community Chest during the dinner celebration to help three beneficiaries; Rainbow Centre – Yishun Park School, Singapore Association of the Visually Handicapped and REACH Family Service Centre.
Apart from the annual donations from Company and employees to Melrose Home, NSL’s Sports and Recreation Committee (“NSL SRC”) organised a memorable day out with the children, bringing them to a farm visit in May.
During the year, NSL OilChem Waste Management (“NOC”) continued its efforts to reach out to the future generations by hosting a visit from Hua Yi Secondary School and giving a career talk to Yang Zheng Primary School. The aim of the outreach was to inspire and prepare them for their future.
Raffles Marina’s annual Western Circuit Sailing Regatta event raised $8,404 in a charity auction to Sailability Singapore. The race, which is held annually, put the skills of the disabled sailors to test in a competitive environment.
NSL is a long standing sponsor of Singapore Symphony Orchestra. The Group has been instrumental in helping the Orchestra to engage with their members, reaching out to community-at-large bringing music to the masses for more than 30 years. NSL was awarded Friend of the Arts in 2015, by Patron of the Arts awards.
CARING FOR THE ENVIRONMENTNSL is a strong advocate for environmental sustainability. Recycling for sustainability is an important aspect of NSL businesses. NSL Chemicals recycles the byproduct from steelmaking into roadstone aggregates which is a more durable substitute for natural aggregates used in road pavement. NOC also recycles waste oil from its waste management services. It recovers the heat generated from its industrial waste incineration plant by conversion into steam and electricity for its internal consumption.
During the year, NOC launched new products with environmental protection in mind. The newly formulated Cheston range of products consists of cement removers, lime cleaners, descalers, mould release agents and degreasers that are non-toxic, low odour and biodegradable, which satisfies
A cheque of $30,000
donation was presented
to the Community Chest
At the heart of NSL’s business is its commitment to Corporate Social Responsibility. While achieving its business goals are important, its actions must also have a positive impact on the community, environment and all stakeholders.

ANNUAL REPORT 2015 15
Emix Industry achieved Singapore Green Label certifications by
Singapore Environment Council for their products, endorsing NSL’s
drive for more environmentally-friendly construction practices
Participants of the badminton tournament at NSL Games
NOC’s eco-friendly Cheston range of products
the standards of Maritime and Port Authority of Singapore and International Maritime Organization.
A part of NSL’s ongoing efforts to care for the environment is to educate and engage the young in building a sustainable future. NSL partnered Clementi Primary School and Yang Zheng Primary School in the Corporate and School Partnership (“CASP”) programme which was conducted by the National Environment Agency to brainstorm and support innovative ways to conserve the environment.
During the year, both Emix Industry (S) Pte Ltd and Eastern Pretech Singapore achieved Singapore Green Label certifications by Singapore Environment Council for their products, an endorsement of NSL’s drive for more environmentally-friendly construction practices. Emix Group’s commitment to the environment was further recognised when
prime time news on Channel NewsAsia and Channel 8 featured their Singapore Green Label products in their news coverage.
INVESTING IN PEOPLENSL recognises that its employees are the greatest asset who drives its competitive advantage. A vital part of the Group’s performance is its employee engagement initiatives which is led by the NSL SRC. An important activity organised by NSL SRC was the year-long tournament, the NSL Games 2014/2015, which consists of 10 different sports and games to promote inter-company bonding and engagement.
In a bid to encourage staff to lead healthier lifestyles, NSL partnered with Health Promotion Board (“HPB”) for their ‘Go Healthy, My Life, My Choice’ campaign. HPB hosted a roadshow at NSL to promote its ‘iQuit 28 Days’ and ‘Million Kg Challenge’ campaigns. During these campaigns, packed fruits were distributed to staff to remind and encourage them to eat healthily with at least two servings of fruit daily.
Over a hundred NSL Group employees and family members went on a weekend trip to Kukup, Malaysia. The idyllic yet interesting setting allowed participants to enhance their friendship and camaraderie. During the year, NSL SRC also organised workshops ranging from mooncake and soap making to vocal lessons for staff enrichment.
Safety is paramount to NSL’s business. NSL is committed to organising regular safety trainings and seminars to upgrade workers’ safety skills and promote safety awareness for all its operations. NSL also started regular safety tests for its operating staff to reinforce safety practices at the factory.

NSL LTD16
Corporate Directory
Precast & PBUEASTERN PRETECH PTE LTD
15 Sungei Kadut Street 2Singapore 729234Tel : (65) 6368 1366Fax : (65) 6368 2256www.easternpretech.com
EASTERN PRETECH (MALAYSIA) SDN BHD
28 Jalan 7/108CTaman Sungai Besi57100 Kuala Lumpur, MalaysiaTel : (60-3) 7980 2728Fax : (60-3) 7980 5662 www.epmsb.com.my
PARMARINE LTD
Murrontie 8PO BOX 95FIN - 30101 Forssa, FinlandTel : (358) 377 77400Fax : (358) 341 27395www.parmarine.fi
DUBAI PRECAST L.L.C.
Post Box 61055Jebel AliIndustrial Area No. 3Dubai, UAETel : (971) 4 8802671Fax : (971) 4 8802159www.dubaiprecast.ae
Dry MixEMIX INDUSTRY (S) PTE LTD
15 Sungei Kadut Street 2Singapore 729234Tel : (65) 6368 1366Fax : (65) 6365 5988www.emixgroup.com
EASTERN GOTECH (GUANGZHOU) LTD
Room 1810DongBao BuildingNo. 767 Dongfengdong RoadGuangzhou, ChinaTel : (020) 3821 0811Fax : (020) 3821 0873
EMIX INDUSTRY (GUANGZHOU) LTD
No. 10, Jing San Road, Eastern Industrial Park, Zengjiang Jie, Zengcheng,Guangzhou, ChinaTel : 020-2623 8238Fax : 020-2623 1168www.emixgroup.com
EMIX INDUSTRY (HK) LIMITED
Emix (HK) LimitedEmix (China) LimitedRoom 804-5, 8/F, AXA Centre151 Gloucester RoadWanchai, Hong KongTel : (852) 2866 9199Fax : (852) 2865 0321www.emixgroup.com
EMIX INDUSTRY (M) SDN BHD
22-1, Jalan 7/108CTaman Sungai Besi57100 Kuala Lumpur, MalaysiaTel : (60-3) 7988 0238Fax : (60-3) 7988 0239www.emixgroup.com
Environmental ServicesNSL OILCHEM WASTE MANAGEMENT PTE LTD
NSL OILCHEM GREEN ENERGY PTE LTD
23 Tanjong Kling RoadSingapore 628049Tel : (65) 6513 3999Fax : (65) 6513 3998www.nsloilchem.com.sg
NSL OILCHEM LOGISTICS PTE LTD
23 Tanjong Kling RoadSingapore 628049Tel : (65) 6863 5270 / 6863 5272Fax : (65) 6861 1928
NSL OILCHEM TRADING PTE LTD
23 Tanjong Kling RoadSingapore 628049Tel : (65) 6861 3311 / 6513 3995Fax : (65) 6513 3993 / 6861 7033
EngineeringPEINER SMAG LIFTING TECHNOLOGIES GMBH
Windmühlenbergstraße 20-2238259 SalzgitterTel : (49) 5341 302 0Fax : (49) 5341 302 424www.peiner-smag.com

ANNUAL REPORT 2015 17
OthersEASTECH STEEL MILL SERVICES (M) SDN BHD
Lot 38046, Mukim Sg. Raia,Batu 5, Jalan Gopeng,31300 Kg. Kepayang,Perak Darul Ridzuan, MalaysiaTel : (60-5) 3189 333 / 3189 339Fax : (60-5) 3188 332
NSL CHEMICALS LTD
26 Tanjong Kling RoadSingapore 628051Tel : (65) 6513 6900Fax : (65) 6268 7592www.nslchemicals.com.sg
NSL PROPERTIES PTE LTD
NSL RESORTS INTERNATIONAL PTE LTD
RAFFLES MARINA HOLDINGS LTD
TIMARU PTE LTD
77 Robinson Road#27-00 Robinson 77Singapore 068896Tel : (65) 6536 1000Fax : (65) 6536 1008
PT EASTECH INDONESIA
Kd. Kedep RT. 02/RW. 17Ds. Tlajung Udik, Kecamatan Gunung Putri,Kabupaten Dati IIBogor 16962, IndonesiaTel : (62-21) 867 3482 / 867 3483Fax : (62-21) 867 3480
RAFFLES MARINA LTD
10 Tuas West DriveSingapore 638404Tel : (65) 6861 8000Fax : (65) 6861 1020www.rafflesmarina.com.sg
RST TEKNOLOGI SDN BHD
2723, Lorong Perusahaan 12Prai Industrial Estate13600, Pulau Pinang MalaysiaTel : (60-4) 380 5080Fax : (60-4) 380 5082

NSL LTD18
Corporate Information
Financial CalendarANNOUNCEMENT OF QUARTERLY RESULTS 2015
• 1st Quarter – 7 May 2015• 2nd Quarter – 14 August 2015• 3rd Quarter – 12 November 2015
FINANCIAL YEAR-END
• 31 December 2015
ANNOUNCEMENT OF UNAUDITED RESULTS 2015
• 25 February 2016
2016 ANNUAL GENERAL MEETING
• 29 April 2016
Underpinning our unwavering commitment to perform are our stakeholders and the community.
Corporate DataREGISTERED OFFICE
77 Robinson Road, #27-00 Robinson 77Singapore 068896Tel: 6536 1000 | Fax: 6536 1008www.nsl.com.sg
COMPANY SECRETARY
Lim Su-Ling
SHARE REGISTRAR
M & C Services Private Limited112 Robinson Road, #05-01Singapore 068902Tel: 6227 6660 | Fax: 6225 1452
AUDITORS
PricewaterhouseCoopers LLP8 Cross Street, #17-00 PWC BuildingSingapore 048424Certified Public AccountantsAudit Partner: Lam Hock Choon(Appointed in year 2012)
BANKS
DBS Bank LtdMalayan Banking BerhadOversea-Chinese Banking Corporation LimitedStandard Chartered BankUnited Overseas Bank Limited

19ANNUAL REPORT 2015
Financial Review
20Directors’ Statement
23Statement of Corporate Governance
32Independent Auditor’s Report
33Consolidated Income Statement
36Consolidated Statement of Changes in Equity
114Notice of Annual General Meeting
37Consolidated Statement of Cash Flows
34Consolidated Statement of Comprehensive Income
39Notes to the Financial Statements
Proxy Form
35Balance Sheets
112Analysis of Shareholdings

NSL LTD20
The Directors present their statement to the members together with the audited financial statements of the Group for the financial year ended 31 December 2015 and the balance sheet of the Company as at 31 December 2015.
In the opinion of the directors,
(a) the balance sheet of the Company and the consolidated financial statements of the Group as set out on pages 33 to 111 are drawn up so as to give a true and fair view of the financial position of the Company and of the Group as at 31 December 2015 and the financial performance, changes in equity and cash flows of the Group for the financial year covered by the consolidated financial statements; and
(b) at the date of this statement, there are reasonable grounds to believe that the Company will be able to pay its debts as and when they fall due.
DIRECTORS
The Directors of the Company in office at the date of this statement are:
Prof CHAM Tao SoonBAN Song LongJohn KOH Tiong LuDavid FU Kuo ChenDr TAN Tat WaiOO Soon Hee
ARRANGEMENTS TO ENABLE DIRECTORS TO ACQUIRE SHARES AND DEBENTURES
Neither at the end of nor at any time during the financial year was the Company a party to any arrangement whose object was to enable the Directors of the Company to acquire benefits by means of the acquisition of shares in, or debentures of, the Company or any other body corporate.
DIRECTORS’ INTERESTS IN SHARES AND DEBENTURES
According to the Register of Directors’ Shareholdings kept by the Company for the purpose of Section 164 of the Companies Act, none of the Directors of the Company at the beginning and at the end of the financial year and as at 21 January 2016 had any interest in the shares and debentures of the Company and its related corporations except, as follows:
Interest held in the name of Director Deemed interest of Director
Name of directors and
corporations in which
interest held
At
21.01.2016
At
31.12.2015
At
01.01.2015
At
21.01.2016
At
31.12.2015
At
01.01.2015
NSL Ltd.
Ordinary shares
Prof Cham Tao Soon * – – – 10,000 10,000 10,000
Related Corporation
Raffles Marina Holdings Ltd
Class B Ordinary Shares
Oo Soon Hee 6,000 6,000 6,000 – – –
* Prof Cham Tao Soon is deemed to have an interest in the NSL Ltd. shares held by his spouse.
Directors’ StatementFor the financial year ended 31 December 2015

21ANNUAL REPORT 2015
Directors’ StatementFor the financial year ended 31 December 2015
MATERIAL CONTRACTS
Except as disclosed in the Statement of Corporate Governance and the financial statements, no material contract (including
loans) of the Company or its subsidiaries involving the interests of the chief executive officer or any director or controlling
shareholders subsisted at the end of the financial year or has been entered into since the end of the financial year or has been
entered into since the end of the previous financial year.
SHARE OPTIONS
The Company has a share option scheme, known as NSL Share Option Plan (the “Plan”), which was approved by the shareholders
at an Extraordinary General Meeting on 25 April 2012.
The Plan is administered by the Remuneration Committee whose members are:
Prof CHAM Tao Soon (Chairman)
Dr TAN Tat Wai
John KOH Tiong Lu
David FU Kuo Chen
The aggregate number of new shares which may be issued pursuant to options granted under the Plan on any date shall not
exceed 10% of the total number of issued shares (excluding treasury shares) on the day preceding that date.
Under the Plan, options to subscribe for the ordinary shares of the Company are to be granted to (i) Group Employees who hold
such rank as may be designated by the Remuneration Committee from time to time; (ii) Non-Executive Directors who, in the
opinion of the Remuneration Committee, have contributed or will contribute to the success of the Group; and (iii) Associated
Company Employees who hold such rank as may be designated by the Remuneration Committee from time to time and who,
in the opinion of the Remuneration Committee, have contributed or will contribute to the success of the Group. Controlling
shareholders of the Company or an associate of such controlling shareholder(s) are not eligible to participate in the Plan.
The exercise price for each share in respect of which an option is exercisable shall be determined by the Remuneration
Committee at its absolute discretion, and fixed by the Remuneration Committee at a price equal to the average of the last dealt
prices of the Company’s ordinary share, as determined by reference to the daily official list or any other publication published
by SGX-ST, for the three (3) consecutive trading days immediately preceding the grant date of that option. No option is to be
granted at a discount to the prevailing market price of the shares.
No option has been granted since the commencement of the Plan.
AUDIT COMMITTEE
The Board of Directors has reviewed and is satisfied with the adequacy of internal controls which comes under the supervision
of the Audit Committee. The details and function of the Audit Committee are set out in the Statement of Corporate Governance.

NSL LTD22
INDEPENDENT AUDITOR
The independent auditor, PricewaterhouseCoopers LLP has expressed its willingness to accept re-appointment.
On behalf of the Directors
Prof CHAM Tao Soon OO Soon Hee
Director Director
Singapore
9 March 2016
Directors’ StatementFor the financial year ended 31 December 2015

23ANNUAL REPORT 2015
The Board recognises that it is the focal point of corporate governance of NSL Ltd. and its group of companies and believes that
good corporate governance will, in the long term enhance return on capital through increased accountability.
The Group had in 1998 adopted an internal Corporate Governance Guide which has been updated from time to time to reflect,
as far as practicable, the changes to the Code of Corporate Governance issued by the Monetary Authority of Singapore (“2012
Code”), the listing manual of the Singapore Exchange Securities Trading Limited (“SGX-ST”) and the Singapore Companies Act.
NSL Ltd’s Corporate Governance Guide (2012) contains, inter alia, matters relating to code of conduct for employees, whistle
blower provisions, terms of reference for Executive Committee, Audit Committee, Nominating Committee and Remuneration
Committee and reporting procedures for interested person transactions, disclosure of directors’ interest and dealings in the
Company’s securities.
The following describes the Company’s corporate governance practices with specific reference to the 2012 Code.
Board of Directors
(Principles 1 to 6)
The Board charts the strategic course for NSL Ltd. and its group of companies in its Precast & Prefabricated Bathroom Unit
(“PBU”), Dry Mix and Environmental Services businesses.
The Board comprises the following members as at the date of this statement:
Prof CHAM Tao Soon Non-Executive Chairman, Independent
OO Soon Hee Executive
BAN Song Long Non-Executive
John KOH Tiong Lu Non-Executive, Independent
David FU Kuo Chen Non-Executive
Dr TAN Tat Wai Non-Executive, Independent
The Board, half of which comprise independent non-executive directors, is able to exercise its powers objectively and
independently from Management. All non-executive directors, except for Mr Ban Song Long and Mr David Fu Kuo Chen,
who are also directors of 98 Holdings Pte Ltd, the intermediate holding company of the Group, are independent i.e. they have
no relationship with the Company, its related companies, its substantial shareholders, or their officers that could interfere,
or be reasonably perceived to interfere, with the exercise of the director’s independent business judgement with a view to
the best interests of the Group, and they are able to exercise objective judgement on corporate affairs independently from
management and its substantial shareholders.
All directors are required to disclose any relationship or appointment which would impair their independence to the Board.
Based on an internal evaluation conducted by the Nominating Committee, the Board views all the non-executive directors of
the Company, except for Mr Ban Song Long and Mr David Fu Kuo Chen, as independent in character, judgement and that there
are no relationships which are likely to affect or could appear to affect the director’s judgement.
The Board meets regularly to oversee the business affairs of the Group, approves financial objectives, annual budgets,
investment and divestment proposals, business strategies and monitors standards of performance of the Group. Board
members are provided with adequate and timely information prior to board meetings and on an ongoing basis; and have
separate and independent access to the Company’s senior management.
Statement of Corporate GovernanceFor the financial year ended 31 December 2015

NSL LTD24
All directors have separate and independent access to the advice and services of the Company Secretary. The Company
Secretary attends all meetings of the Board and ensures that Board procedures are followed and that applicable rules and
regulations are complied with. The Company Secretary also attends all meetings of the Executive Committee, Nominating
Committee and Remuneration Committee. Under the direction of the Chairman, the Company Secretary ensures information
flow within the Board and its committees and between senior management and non-executive directors, as well as facilitating
orientation and assisting with professional development as and when required. Under the Constitution of the Company, the
decision to appoint or remove the Company Secretary can only be taken by the Board as a whole.
The Board has adopted an orientation programme for new directors.
The Board objectively takes decisions in the interests of the Group. The Board has delegated specific responsibilities to four
Committees, namely the Audit, Executive, Nominating and Remuneration Committees. Information on each of the four
Committees is set out below. The Board accepts that while these Committees have the authority to examine particular issues
and will report back to the Board with their decisions and/or recommendations, the ultimate responsibility on all matters
lies with the Board. Matters requiring the Board’s decision and endorsement are defined in the NSL Ltd’s Group Corporate
Authorisation.
Key information on the directors is set out on page 31.
The Constitution of the Company allows directors to participate in a Board meeting by telephone conference or video-
conference whereby all persons participating in the meeting are able to communicate as a group, without requiring the
directors’ physical presence at the meeting. The number of Board and Board Committee meetings held in the current financial
year and the attendance of directors during these meetings is as follows:
Directors’ Attendance At Board, General And Board Committee Meetings
1 January 2015 to 31 December 2015
BOARD AUDIT NOMINATING REMUNERATIONEXECUTIVE
COMMITTEE GENERAL MEETING
CORPORATE
RESEARCH
No. of
MeetingsAttendance
No. of
MeetingsAttendance
No. of
MeetingsAttendance
No. of
MeetingsAttendance
No. of
Meetings Attendance
No. of
Meetings Attendance
No. of
MeetingsAttendance
Prof Cham
Tao Soon4 4 4 4 2 2 4 4 n/a n/a 2 2 3 3
Oo Soon
Hee 4 4 n/a n/a n/a n/a n/a n/a 9 8 2 2 3 3
Ban Song
Long4 3 4 3 n/a n/a n/a n/a 9 9 2 2 n/a n/a
John Koh
Tiong Lu4 4 4 4 2 2 4 4 n/a n/a 2 2 n/a n/a
David Fu
Kuo Chen4 4 n/a n/a 2 2 4 4 9 9 2 2 3 3
Dr Tan Tat
Wai4 4 4 4 2 2 4 4 n/a n/a 2 2 n/a n/a
Audit Committee
(Principle 12)
The Audit Committee comprises the following members, the majority of whom, including the Chairman, are independent
directors. The members of the Audit Committee at the date of this statement are:
John KOH Tiong Lu (Chairman), Independent Director
Prof CHAM Tao Soon, Independent Director
Dr TAN Tat Wai, Independent Director
BAN Song Long, Non-Executive Director
Statement of Corporate GovernanceFor the financial year ended 31 December 2015

25ANNUAL REPORT 2015
The members of the Audit Committee, collectively, have expertise or experience in financial management and are qualified to
discharge the Audit Committee’s responsibilities. None of the members nor the Chairman of the Audit Committee are former
partners or directors of the Group’s auditing firm.
The Audit Committee performs duties as specified in the Companies Act, Cap 50 and the 2012 Code. Its duties include
overseeing the quality and integrity of the accounting, auditing, internal controls and financial practices of the Group, and its
exposure to risks. It also keeps under review the effectiveness of the Company’s systems of accounting and internal controls
for which the Directors are responsible. The Committee is empowered to investigate any matter relating to its functions that
are brought to its attention and in this regard will have full access to records, resources and personnel to enable it to discharge
its functions properly.
In October 2008, the Audit Committee Guidance Committee issued the Guidebook for Audit Committees in Singapore. The
Guidebook was distributed to all members of the Audit Committee. Where appropriate, the Audit Committee will adopt
relevant best practices set out in the Guidebook; which will be used as references to assist the Audit Committee in performing
its functions.
The Audit Committee has full access and co-operation of Management, including internal auditors and has full discretion to
invite any director or executive officer to attend its meetings. The internal and external auditors have unrestricted access to the
Audit Committee.
The Audit Committee held four meetings for the financial year ended 31 December 2015.
In carrying out its duties, the Audit Committee:
(a) Reviewed the effectiveness of the Group’s internal audit function and the scope and results of the external audits;
(b) Met with the auditors to discuss the results of their audits, significant financial reporting issues and judgements, to
enquire if there are material weaknesses and control deficiencies over the Group’s financial reporting process and the
corresponding effects of the financial statements. As a good practice, the Committee also met the auditors separately
in the absence of Management;
(c) Reviewed at least annually the adequacy of the Group’s risk management and internal control systems, including
financial, operational, compliance and information technology controls;
(d) Reviewed the quarterly and annual financial statements, SGXNET announcements and all related disclosures before
submission to the Board for approval;
(e) Reviewed, on an annual basis, non-audit services rendered to the Group by the external auditors to ascertain that the
nature and extent of such services will not prejudice the independence and objectivity of the external auditors; and
(f) Being satisfied with the independence and objectivity of the external auditors, recommended to the Board of Directors
the re-appointment of PricewaterhouseCoopers LLP as auditors of the Company at the forthcoming annual general
meeting. The Committee also reviewed and approved the remuneration and terms of engagement of the external
auditors.
The Group has complied with Rules 712, 715 and 716 of the Listing Manual of the SGX-ST in relation to its auditors.
The Audit Committee and Board of Directors confirmed that they are satisfied that the appointment of different auditors for
its subsidiaries would not compromise the standard and effectiveness of the audit of the Company. Accordingly, the Company
has complied with Rule 1207 (6) (c) of the Listing Manual of the SGX-ST.
The Audit Committee undertakes to investigate complaints of suspected fraud, unlawful business practices and unsafe working
conditions in an objective manner and the Company has put in place a whistle-blower policy and procedures which provide
employees with direct access to the Audit Committee Chairman.
Statement of Corporate GovernanceFor the financial year ended 31 December 2015
NSL LTD26
Whistle-blowing posters, outlining confidential channels for whistle-blowing directly to the Audit Committee Chairman
(cellphone, e-mail and P.O. Box) have been prominently displayed in high traffic areas, in all offices and plants of the Group
world-wide. The Company has made available (vide its website as well as the websites of each of its main business units) to
its vendors, suppliers and customers the same confidential channels for whistle-blowing directly to the Audit Committee
Chairman. In addition, the poster has been translated into 12 languages and disseminated as a pamphlet to most non-English
speaking employees of the Group.
Executive Committee
The Executive Committee (“EC”) comprises the following members:
BAN Song Long (Chairman), Non-Executive Director
David FU Kuo Chen, Non-Executive Director
OO Soon Hee, Executive Director
Under its terms of reference, the EC is authorised to approve and execute such transactions as are authorised and delegated by
the Board as set out in NSL Ltd’s Group Corporate Authorisation.
Nominating Committee
(Principles 2, 4 & 5)
The Nominating Committee (“NC”) comprises the following members:
Prof CHAM Tao Soon (Chairman), Independent Director
Dr TAN Tat Wai, Independent Director
John KOH Tiong Lu, Independent Director
David FU Kuo Chen, Non-Executive Director
Under its terms of reference, the principal duties of the NC are:
• To make recommendations to the Board on all Board appointments and re-nominations.
• To propose objective performance criteria to evaluate the Board’s performance.
• To assess and determine annually the independence of the directors.
The Company has in place a process for assessing the effectiveness of the Board as a whole.
The Nominating Committee is also responsible for determining annually, the independence of directors.
In conducting its assessment on the independence of non-shareholder related non-executive directors, the Nominating
Committee was guided by the 2012 Code and a set of specific criteria. The Nominating Committee noted that only one
guideline out of eight in Principle 2 dealt with the tenure of directorship. The Committee was of the view that an individual’s
independence cannot be arbitrarily determined merely on the basis of a set period of time. On the contrary, these directors
continued to provide stability to the Board and the Company had benefited greatly from the presence of individuals who were
specialists in their own field and they had, over time, not only gained valuable insight into the Group, its business, markets and
industry but have brought their breadth and depth of business experience to the Company.
The Nominating Committee considered specifically whether their length of service had compromised their independence and
having regard to all the other relevant circumstances, concluded that these non-executive directors i.e. Prof Cham Tao Soon,
Mr John Koh Tiong Lu and Dr Tan Tat Wai remained independent from Management and provided a strong independent
element on the Board, being free from any business or other relationship which could materially interfere with the exercise of
their judgement.
Statement of Corporate GovernanceFor the financial year ended 31 December 2015

27ANNUAL REPORT 2015
The Nominating Committee noted the 2012 Code requirement for the Board of Directors to decide on the issue of multiple
board representations of directors and was of the view that the onus was placed on individual directors to ensure he could
discharge all his duties and responsibilities as a director. Therefore, the Nominating Committee did not recommend the setting
of the maximum number of listed company board representations which a director may hold and would leave this issue to be
determined by individual directors. The Nominating Committee is satisfied that sufficient time and attention was given by the
directors to the affairs of the Group, taking into consideration the director’s number of listed company board representations
and other principal commitments.
The Board, through the Nominating Committee, reviews the size and composition of the Board and is of the opinion that, given
the scope and nature of the Group’s operations, the size of the Board is appropriate in facilitating effective decision-making.
Remuneration Committee
(Principles 7 to 9)
The Remuneration Committee (“RC”) comprises the following members:
Prof CHAM Tao Soon (Chairman), Independent Director
Dr TAN Tat Wai, Independent Director
John KOH Tiong Lu, Independent Director
David FU Kuo Chen, Non-Executive Director
Under its terms of reference, the principal duties of the RC include:
• To recommend executive and non-executive directors’ remuneration to the Board in accordance with the approved
remuneration policies and processes of the Company.
• To review and approve Chief Executive Officer and senior management’s remuneration.
• To review all benefits and long-term incentive schemes (including share option schemes) and compensation packages
for the Board and senior management.
In reviewing and determining the remuneration packages of the executive director and senior executives, the RC shall consider,
amongst other things, their responsibilities, skills, expertise and contribution to the Group’s performance and if the remuneration
packages are competitive and sufficient to ensure that the Group is able to attract and retain the best available executive talent.
Statement of Corporate GovernanceFor the financial year ended 31 December 2015

NSL LTD28
Remuneration and Benefits of Directors and Key Executives
The level and mix of each of the Directors’ remuneration, and that of each of the top 5 key executives (who are not directors)
are set out below:
(a) Directors
Name of Director
Base / Fixed
Salary(1)
Variable or
Performance-
related Income
/ Bonuses(1)
Directors’
Fees
Benefits-
in-kind
Share
Options
Granted(2)
Total
Compensation
$’000 $’000 $’000 $’000 $’000 $’000
Executive Director
OO Soon Hee 768 567 54 129 – 1,518
Non-executive Directors
Prof CHAM Tao Soon – – 152 – – 152
BAN Song Long – – 102 – – 102
David FU Kuo Chen – – 96 – – 96
John KOH Tiong Lu – – 120 – – 120
Dr TAN Tat Wai – – 90 – – 90
(1) The salary and performance bonus amounts shown are inclusive of allowances, leave pay and CPF.
(2) No options were granted during the financial year.
(b) Key Executives
The table below shows the level and mix of gross remuneration received by the top 5 executives (excluding Executive
Director) of the Group in bands of S$250,000:
Remuneration Band &
Name of Key Executive
Base / Fixed
Salary(1)
Variable or
Performance-
related Income /
Bonuses(1)
Benefits-in-
kind
Share
Options
Granted(2)
Total
Compensation
% % % % %
S$750,000 to S$999,999
Andy IP Kam Wa 71 29 – – 100
S$250,000 to S$499,999
LOKE Chee Choong 58 42 – – 100
Dr LOW Chin Nam 70 29 1 – 100
Matti MIKKOLA 56 13 31 – 100
TAN Meow Cheng 80 18 2 – 100
(1) The salary and performance bonus amounts shown are inclusive of allowances, leave pay and CPF.
(2) No options were granted during the financial year.
The annual aggregate remuneration paid to the top five key executives (excluding Executive Director) for FY2015 was
S$2,622,000.
Statement of Corporate GovernanceFor the financial year ended 31 December 2015

29ANNUAL REPORT 2015
There is no employee whose remuneration exceeds S$50,000 during the financial year who is an immediate family member of
a director or the CEO of NSL Ltd.
Corporate Research and Development Advisory Panel
The Corporate Research and Development Advisory Panel (“CRD”) as at the date of this statement comprises the following
members:
Prof CHAM Tao Soon (Chairman)
OO Soon Hee
David FU Kuo Chen
Prof NG Wun Jern
LAM Siew Wah
LIM Swee Cheang
Dr TIONG Lee Kong, Robert (appointed on 8 June 2015)
The CRD serves as a forum for open discussion between the academic circle, government bodies and the Group. Members
comprise senior management, scientists and academicians from Universities and Government bodies. Committee usually
meets 2 to 3 times a year.
Risk Management and Internal Controls
(Principle 11)
The Board of Directors, with the assistance of the Audit Committee, ensures that the Management maintains adequate risk
management and internal control systems to safeguard shareholders’ investment and the Group’s assets.
Management regularly reviews the Group’s business and operational activities to identify areas of significant risks as well as
implement appropriate measures to control and mitigate these risks. These measures provide reasonable, but not absolute,
assurance against material misstatements or loss, as well as ensure the safeguarding of assets, maintenance of proper accounting
records and reliable financial information, and compliance with applicable law and regulations.
The nature and management of financial risks are discussed in Note 36 to the Financial Statements.
Review and tests of internal control procedures are carried out by the Company’s internal auditors based on approved internal
audit plan. Significant internal control weaknesses noted by the internal auditors (if any) together with their recommendations,
are included in their reports which are submitted to the Audit Committee.
The Board has obtained assurance from Mr Oo Soon Hee, Executive Director and Mr Chia Tong Hee, Senior Vice-President,
Finance and Corporate Services, that:
(a) the financial records of the Group have been properly maintained and the financial statements give a true and fair view
of the operations and finances of the Group; and
(b) the Group’s risk management and internal control systems, including financial, operational, compliance and information
technology controls were adequate as at 31 December 2015.
Based on the internal controls established and maintained by the Group, work performed by the internal and external auditors,
and reviews performed by Management, various Board Committees and the Board, the Audit Committee and the Board are of
the opinion that the Group’s risk management and internal control systems, including financial, operational, compliance and
information technology controls were adequate as at 31 December 2015.
Statement of Corporate GovernanceFor the financial year ended 31 December 2015

NSL LTD30
Internal Audit Function (Principle 13)
The Company has an in-house internal audit department with a round-the-year internal audit program for the Group. The role of the internal auditors is to assist the Audit Committee to ensure that the Group maintains a sound system of internal controls and may undertake investigations as directed by the Audit Committee.
Internal Audit prepares an annual audit plan. The Audit Committee reviews and approves the annual internal audit plan, which complements that of the external auditors, so as to review the adequacy and effectiveness of the system of internal controls of the Group. The external auditors will highlight any material internal control weaknesses which have come to their attention in the course of their statutory audit. All audit findings and recommendations raised by the internal and external auditors are reported to the Audit Committee. Internal Audit follows up on all recommendations by internal and external auditors to ensure management has implemented these in a timely and appropriate manner and reports the results to the Audit Committee every quarter.
Staffed by suitably qualified executives, Internal Audit has unrestricted direct access to the Audit Committee. The Head of Internal Audit’s primary line of reporting is to the Chairman of the Audit Committee.
Communication with Shareholders(Principles 10, 14, 15 & 16)
The Company makes all necessary disclosures to the public via SGXNET. When material information is disseminated to the SGX-ST, such information is simultaneously posted on the Company’s website at www.nsl.com.sg.
The Board, endeavours, by the release of quarterly and full year results, to provide shareholders with a balanced and understandable assessment of the Group’s performance and prospects.
Shareholders of the Company receive the notice of the Annual General Meeting. The notice is also advertised in the newspapers. At annual general meetings, shareholders are given the opportunity to seek clarification from directors and management on the financial affairs of the Company. External auditors will be present to assist the directors in addressing relevant queries by shareholders.
The Company’s Constitution allows a member to appoint not more than 2 proxies to attend and vote instead of the member.
On 3 January 2016, the Companies Act, Chapter 50 of Singapore (the “Companies Act”) was amended to, inter alia, introduce
a multiple proxies regime to enfranchise indirect investors and CPF investors and allow certain members who are “relevant
intermediaries” such as banks, capital markets services licence holders which provide custodial services for securities and the
CPF Board to appoint more than two proxies to attend, speak and vote at general meetings.
The Company is also proposing to adopt a new constitution which includes new provisions which cater to such multiple
proxies regime at the forthcoming Annual General Meeting. Please refer to the Letter to Shareholders accompanying the 2015
Annual Report for more details.
The Company had put all resolutions to vote by poll at shareholders meetings since December 2002 and announced detailed results showing the number of votes cast for and against each resolution and the respective percentages since 2012.
Securities Transactions
The Company has issued a policy on dealings in the securities of the Company to its Directors, employees and directors of its subsidiaries, setting out the implications of insider trading and guidance on such dealings. Accordingly, the Company has complied with Rule 1207 (19) of the Listing Manual of the SGX-ST.
Interested Person Transactions
Pursuant to Rule 907 of the Listing Manual of the SGX-ST, no interested person transaction was entered into during the financial year.
Statement of Corporate GovernanceFor the financial year ended 31 December 2015

31ANNUAL REPORT 2015
Particulars of Directors as at 9 March 2016
NAME OF
DIRECTOR
ACADEMIC & PROFESSIONAL
QUALIFICATIONS
BOARD COMMITTEE
AS CHAIRMAN OR
MEMBER
DIRECTORSHIP
DATE FIRST
APPOINTED
DATE LAST RE-
ELECTED
BOARD
APPOINTMENT
WHETHER
EXECUTIVE OR
NON-EXECUTIVE
DUE FOR RE-
ELECTION AT AGM
ON 29 APRIL 2016
Prof Cham Tao
Soon
• Bachelor of Engineering degree
from Malaya University
• Bachelor of Science degree from
University of London
• Doctorate of Philosophy degree
from University of Cambridge
• Fellow of the Institution of
Engineers, Singapore
• Fellow of the Institution of
Mechanical Engineers, UK
Chairman:
Nominating Committee
Remuneration
Committee
Corporate Research and
Development Advisory
Panel
Member:
Audit Committee
26 May 1988
28 April 2015
Non-Executive /
Independent
Re-appointment
Oo Soon Hee • Bachelor of Science (Hons) from
University of Singapore
• Diploma in Business
Administration from University of
Singapore
Member:
Executive Committee
Corporate Research and
Development Advisory
Panel
1 February 2011
28 April 2015
Executive
(Responsible
for the overall
Management of
the NSL Group)
Re-appointment
Ban Song Long • Associate of the Institute of
Bankers, London
Chairman:
Executive Committee
Member:
Audit Committee
25 January 2003
28 April 2015
Non-Executive Re-appointment
John Koh Tiong
Lu
• LLM degree from Harvard Law
School
• BA and MA degree (Economics
and Law) from Trinity College,
University of Cambridge
Chairman:
Audit Committee
Member:
Nominating Committee
Remuneration
Committee
30 January 2003
28 April 2015
Non-Executive /
Independent
N/A
David Fu Kuo
Chen
• Bachelor of Science degree in
Engineering from University of
Southern California
Member:
Nominating Committee
Remuneration
Committee
Executive Committee
Corporate Research and
Development Advisory
Panel
25 January 2003
24 April 2013
Non-Executive Retirement by Rotation
(Article 86)
Dr Tan Tat Wai • Bachelor of Science degrees
in Electrical Engineering and
Economics from Massachusetts
Institute of Technology
• Master’s degrees in Economics
from the University of Wisconsin
(Madison) and Harvard University
• Doctor of Philosophy degree in
Economics from University of
Harvard
Member:
Audit Committee
Nominating Committee
Remuneration
Committee
15 February 1993
16 April 2014
Non-Executive /
Independent
N/A
Statement of Corporate GovernanceFor the financial year ended 31 December 2015

NSL LTD32
REPORT ON THE FINANCIAL STATEMENTS
We have audited the accompanying financial statements of NSL Ltd. (the “Company”) and its subsidiaries (the “Group”) set out
on pages 33 to 111, which comprise the consolidated balance sheet of the Group and the balance sheet of the Company as at
31 December 2015, and the consolidated income statement, statement of comprehensive income, statement of changes in
equity and statement of cash flows of the Group for the financial year then ended, and a summary of significant accounting
policies and other explanatory information.
Management’s Responsibility for the Financial Statements
Management is responsible for the preparation of financial statements that give a true and fair view in accordance with the
provisions of the Singapore Companies Act (the “Act”) and Singapore Financial Reporting Standards, and for devising and
maintaining a system of internal accounting controls sufficient to provide a reasonable assurance that assets are safeguarded
against loss from unauthorised use or disposition; and transactions are properly authorised and that they are recorded as
necessary to permit the preparation of true and fair financial statements and to maintain accountability of assets.
Auditor’s Responsibility
Our responsibility is to express an opinion on these financial statements based on our audit. We conducted our audit in
accordance with Singapore Standards on Auditing. Those standards require that we comply with ethical requirements and
plan and perform the audit to obtain reasonable assurance about whether the financial statements are free from material
misstatement.
An audit involves performing procedures to obtain audit evidence about the amounts and disclosures in the financial statements.
The procedures selected depend on the auditor’s judgement, including the assessment of the risks of material misstatement of
the financial statements, whether due to fraud or error. In making those risk assessments, the auditor considers internal control
relevant to the entity’s preparation of financial statements that give a true and fair view in order to design audit procedures
that are appropriate in the circumstances, but not for the purpose of expressing an opinion on the effectiveness of the entity’s
internal control. An audit also includes evaluating the appropriateness of accounting policies used and the reasonableness
of accounting estimates made by the management, as well as evaluating the overall presentation of the financial statements.
We believe that the audit evidence we have obtained is sufficient and appropriate to provide a basis for our audit opinion.
Opinion
In our opinion, the consolidated financial statements of the Group and the balance sheet of the Company are properly drawn
up in accordance with the provisions of the Act and Singapore Financial Reporting Standards so as to give a true and fair view
of the financial position of the Group and of the Company as at 31 December 2015, and of the financial performance, changes
in equity and cash flows of the Group for the financial year ended on that date.
REPORT ON OTHER LEGAL AND REGULATORY REQUIREMENTS
In our opinion, the accounting and other records required by the Act to be kept by the Company and by those subsidiary
corporations incorporated in Singapore, of which we are the auditors, have been properly kept in accordance with the
provisions of the Act.
PricewaterhouseCoopers LLP
Public Accountants and Chartered Accountants
Singapore, 9 March 2016
Independent Auditor’s ReportTo the members of NSL LTD.

33ANNUAL REPORT 2015
The Group
Note
2015
S$’000
2014
S$’000
(restated)
Continuing operations
Sales 4 446,452 425,950
Cost of sales (352,211) (359,514)
Gross profit 94,241 66,436
Other income 5 6,102 6,181
Other gains and losses 6 (6,166) 2,581
Distribution costs (19,004) (18,463)
Administrative expenses (44,507) (39,783)
Finance costs 7 (1,491) (1,691)
Share of results of associated companies, net of tax 22 1,723 238
Profit before income tax 8 30,898 15,499
Income tax expense 10 (3,185) (3,230)
Profit from continuing operations 27,713 12,269
Discontinued operations
Profit from discontinued operations 11 40,012 15,509
Total profit for the financial year 67,725 27,778
Profit attributable to equity holders of the Company:
- from continuing operations 26,715 9,678
- from discontinued operations 40,040 15,248
66,755 24,926
Profit / (loss) attributable to non-controlling interest:
- from continuing operations 998 2,591
- from discontinued operations (28) 261
970 2,852
Basic and fully diluted earnings per share (cents)
- from continuing operations 13 7.15 2.59
- from discontinued operations 13 10.72 4.08
The accompanying notes form an integral part of the financial statements.
Consolidated Income StatementFor the financial year ended 31 December 2015

NSL LTD34
The Group
Note
2015
S$’000
2014
S$’000
Total profit for the financial year 67,725 27,778
Other comprehensive income:
Items that may be reclassified subsequently to profit or loss:
Exchange differences on translating foreign operations
- Losses arising during the year (5,342) (868)
Available-for-sale financial assets
- Gains / (losses) arising during the year 10 532 (331)
- Reclassification 10 (96) (251)
Share of other comprehensive income of associated companies 22 353 (33)
Income tax relating to components of other comprehensive income 10 14 37
Other comprehensive losses for the year, net of tax (4,539) (1,446)
Total comprehensive income for the year, net of tax 63,186 26,332
Total comprehensive income attributable to:
Equity holders of the Company 62,600 23,719
Non-controlling interests 586 2,613
63,186 26,332
The accompanying notes form an integral part of the financial statements.
Consolidated Statement of Comprehensive IncomeFor the financial year ended 31 December 2015

35ANNUAL REPORT 2015
The Group The Company
2015 2014 2015 2014
Note S$’000 S$’000 S$’000 S$’000
SHARE CAPITAL 14 193,839 193,839 193,839 193,839
RESERVES 15 366,598 332,811 267,715 225,785
SHAREHOLDERS’ EQUITY 560,437 526,650 461,554 419,624
NON-CONTROLLING INTERESTS 21 11,007 13,817 – –
TOTAL EQUITY 571,444 540,467 461,554 419,624
CURRENT ASSETS
Inventories 16 48,138 59,121 – –
Receivables and prepayments 17 116,387 132,665 36,846 35,268
Tax recoverable 1,124 1,127 – –
Cash and cash equivalents 18 334,448 288,429 227,033 190,626
500,097 481,342 263,879 225,894
Assets of disposal group classified as held-for-
sale 11 4,229 75,169 – –
504,326 556,511 263,879 225,894
NON-CURRENT ASSETS
Property, plant and equipment 19 136,751 138,943 144 256
Investment properties 20 8,376 8,648 – –
Investments in subsidiaries 21 – – 85,232 85,232
Investments in associated companies 22 52,692 6,107 – –
Long term receivables and prepayments 23 822 1,328 121,354 118,652
Available-for-sale financial assets 24 9,318 8,882 8,836 8,317
Intangible assets 25 9,306 9,439 – –
Deferred tax assets 30 5,290 3,347 – –
Other non-current assets 140 99 – –
222,695 176,793 215,566 212,457
TOTAL ASSETS 727,021 733,304 479,445 438,351
CURRENT LIABILITIES
Borrowings 26 (18,407) (19,695) – –
Trade and other payables 27 (116,058) (129,862) (17,803) (18,657)
Current income tax liabilities (2,429) (3,157) (88) (33)
Deferred income 31 (282) (337) – –
(137,176) (153,051) (17,891) (18,690)
Liabilities directly associated with disposal group
classified as held-for-sale 11 (1,007) (20,850) – –
(138,183) (173,901) (17,891) (18,690)
NON-CURRENT LIABILITIES
Provision for retirement benefits 29 (2,519) (1,994) – –
Deferred tax liabilities 30 (3,864) (3,840) – (37)
Borrowings 26 (9,842) (11,728) – –
Deferred income 31 (1,169) (1,374) – –
(17,394) (18,936) – (37)
TOTAL LIABILITIES (155,577) (192,837) (17,891) (18,727)
NET ASSETS 571,444 540,467 461,554 419,624
The accompanying notes form an integral part of the financial statements.
Balance SheetsAs at 31 December 2015

NSL LTD36
Attributable to Equity Holders of the Company
Note
Share
Capital
Revenue
Reserve
Foreign
Currency
Translation
Reserve
Revaluation
Reserve
Fair Value
Reserve
General
Reserve Total
Non-
controlling
Interests
Total
Equity
S$’000 S$’000 S$’000 S$’000 S$’000 S$’000 S$’000 S$’000 S$’000
THE GROUP
Balance at 1 January 2015 193,839 341,486 (11,853) 220 2,479 479 526,650 13,817 540,467
Profit for the year – 66,755 – – – – 66,755 970 67,725
Other comprehensive (losses) /
income for the year – – (4,605) – 450 – (4,155) (384) (4,539)
Total comprehensive
income / (losses)
for the year – 66,755 (4,605) – 450 – 62,600 586 63,186
Dividends paid 12 – (29,885) – – – – (29,885) – (29,885)
Dividends paid to non-
controlling interests of
subsidiaries – – – – – – – (741) (741)
Total transactions with
owners, recognised
directly in equity – (29,885) – – – – (29,885) (741) (30,626)
Disposal of subsidiaries – 179 1,292 (220) – (179) 1,072 (2,655) (1,583)
Balance as at
31 December 2015 193,839 378,535 (15,166) – 2,929 300 560,437 11,007 571,444
Balance at 1 January 2014 193,839 501,658 (11,191) 1,946 3,024 434 689,710 12,932 702,642
Profit for the year – 24,926 – – – – 24,926 2,852 27,778
Other comprehensive losses
for the year – – (662) – (545) – (1,207) (239) (1,446)
Total comprehensive
income / (losses)
for the year – 24,926 (662) – (545) – 23,719 2,613 26,332
Transfer of reserves – 1,681 – (1,726) – 45 – – –
Dividends paid 12 – (186,779) – – – – (186,779) – (186,779)
Dividends paid to non-
controlling interests of
subsidiaries – – – – – – – (1,728) (1,728)
Total transactions with
owners, recognised
directly in equity – (186,779) – – – – (186,779) (1,728) (188,507)
Balance as at
31 December 2014 193,839 341,486 (11,853) 220 2,479 479 526,650 13,817 540,467
.
Consolidated Statement of Changes in EquityFor the financial year ended 31 December 2015
The accompanying notes form an integral part of the financial statements

37ANNUAL REPORT 2015
The Group
Note
2015
S$’000
2014
S$’000
(restated)
Cash Flows from Operating Activities
Profit from continuing operations 27,713 12,269
Profit from discontinued operations 40,012 15,509
Profit for the financial year 67,725 27,778
Adjustments for:
Taxation 3,312 3,825
Amortisation of intangible assets 246 423
Amortisation of deferred income (354) (255)
Depreciation of property, plant and equipment and investment properties 15,518 19,029
Property, plant and equipment written off 38 221
Interest expense 1,526 1,877
Interest income (3,525) (2,597)
Dividend income from available–for–sale financial assets (758) (1,895)
Allowance for impairment of loans to associated companies – 20
Allowance / (write–back of allowance) for impairment of property, plant and
equipment 5,664 (2,276)
Allowance for impairment of intangible assets 170 –
Write–back of allowance for impairment of investments in associated companies – (106)
Allowance / (write–back of allowance) for impairment of an investment property 100 (400)
Gain on disposal of property, plant and equipment (net) (18) (169)
Insurance compensation – (311)
Net gain on disposal of available–for–sale financial assets – (354)
Provision for retirement benefits (net) 557 398
Share of results of associated companies, net of tax 22 (1,723) (238)
Professional fees related to divestments of subsidiaries – 1,022
Gain on disposal of subsidiaries 11 (41,145) (9,957)
Exchange differences and other adjustments 4 342
Operating cash flows before working capital changes 47,337 36,377
Changes in working capital, net of effects from disposal of subsidiaries:
Inventories 9,562 13,351
Receivables and prepayments 15,759 (5,976)
Deferred income 107 39
Trade and other payables (14,130) 9,403
Cash generated from operations 58,635 53,194
Income tax paid (6,421) (6,073)
Retirement benefits paid (124) (165)
Net cash generated from operating activities 52,090 46,956
Consolidated Statement of Cash FlowsFor the financial year ended 31 December 2015
The accompanying notes form an integral part of the financial statements.

NSL LTD38
The Group
Note
2015
S$’000
2014
S$’000
(restated)
Cash Flows from Investing Activities
Proceeds from disposal of property, plant and equipment 226 543
Proceeds from disposal of available-for-sale financial assets and other assets – 354
Net cash inflow from disposal of subsidiaries 18a 34,668 10,170
Professional fees related to divestment of subsidiaries – (1,022)
Purchases of property, plant and equipment (21,786) (18,172)
Purchases of intangible assets (144) (671)
Interest received 3,062 1,863
Dividends received from associated companies 1,629 –
Dividends received from available-for-sale financial assets 758 1,895
Net cash generated / (used in) from investing activities 18,413 (5,040)
Cash Flows from Financing Activities
Proceeds from borrowings 26,979 28,104
Repayment of borrowings (26,878) (37,380)
Hire purchase and finance lease liabilities (223) (1,754)
Interest paid (1,735) (1,797)
Bank deposits pledged (371) (548)
Dividends paid to shareholders 12 (29,885) (186,779)
Dividends paid to non-controlling interests (741) (1,729)
Net cash used in financing activities (32,854) (201,883)
Net increase / (decrease) in cash and cash equivalents 37,649 (159,967)
Cash and cash equivalents at beginning of the financial year 295,038 455,666
Effects of exchange rate changes on cash and cash equivalents (1,416) (661)
Cash and cash equivalents at end of the financial year 18 331,271 295,038
Consolidated Statement of Cash FlowsFor the financial year ended 31 December 2015
The accompanying notes form an integral part of the financial statements.
39ANNUAL REPORT 2015
Notes to the Financial StatementsFor the financial year ended 31 December 2015
These notes form an integral part of and should be read in conjunction with the accompanying financial statements.
1. GENERAL INFORMATION
NSL Ltd. (the “Company”) is incorporated and domiciled in Singapore and is listed on the Singapore Exchange Securities
Trading Limited. The Company’s registered office is at 77 Robinson Road, #27-00 Robinson 77, Singapore 068896.
The principal activities of the Company are provision of management services and investment holding. The principal
activities of its subsidiaries are mainly manufacturing and sale of building materials, refractory materials, road stones and
provision of environmental services and sale of related products (Note 41).
As set out in Note 11, the engineering business segment which contains solely the spreader businesses as well as
chemical business segment, substantially made up of lime business, have been disposed during the year and the
limestone business has been presented separately on the balance sheet as disposal group held for sale in compliance
with FRS 105 Non-current Assets Held for Sale and Discontinued Operations. The corresponding operating results of the
spreader, lime and limestone businesses were presented separately on the income statement as part of “discontinued
operations” (Note 11).
2. SIGNIFICANT ACCOUNTING POLICIES
A. Basis of preparation
These financial statements have been prepared in accordance with Singapore Financial Reporting Standards (“FRS”)
under the historical cost convention, except as disclosed in the accounting policies below.
The preparation of financial statements in conformity with FRS requires management to exercise its judgement in the
process of applying the Group’s accounting policies. It also requires the use of certain critical accounting estimates
and assumptions. The areas involving a higher degree of judgement or complexity, or areas where assumptions and
estimates are significant to the financial statements are disclosed in Note 3.
These financial statements are expressed in thousands of Singapore Dollars.
B. Interpretations and amendments to published standards effective in 2015
On 1 January 2015, the Group adopted the new or amended FRS and Interpretations of FRS (“INT FRS”) that are mandatory
for application for the financial year. Changes to the Group’s accounting policies have been made as required, in
accordance with the transitional provisions in the respective FRS and INT FRS.
The adoption of these new or amended FRS and INT FRS did not result in substantial changes to the accounting policies
of the Group and the Company and had no material effect on the amounts reported for the current or prior financial
years except for the following:
FRS 108 Operating segments
The Group has adopted the above amendment to FRS 108 on 1 January 2015. The amendment is applicable for annual
periods beginning on or after 1 July 2014. It sets out the required disclosures on the judgements made by management
in aggregating operating segments. This includes description of the segments which have been aggregated and the
economic indicators which have been assessed in determining that the aggregated segments share similar economic
characteristics. The standard is further amended to require a reconciliation of segment assets to entity’s assets when
segment assets are reported.
The Group has included the additional required disclosures in Note 34 of the financial statements.

NSL LTD40
Notes to the Financial StatementsFor the financial year ended 31 December 2015
2. SIGNIFICANT ACCOUNTING POLICIES (CONTINUED)
C. Revenue recognition
Sales comprise the fair value of the consideration received or receivable for the sale of goods, rendering of services and
rental income in the ordinary course of the Group’s activities. Sales are presented, net of value-added tax, rebates and
discounts, and after eliminating sales within the Group.
The Group assesses its role as an agent or principal for each transaction and in an agency arrangement the amounts
collected on behalf of the principal are excluded from revenue. The Group recognises revenue when the amount of
revenue and related cost can be reliably measured, it is probable that the collectability of the related receivable is
reasonably assured when the specific criteria for each of the Group’s activities are met as follows:
(1) Sale of goods
Revenue from the sale of goods is recognised when the Group has delivered the goods to the location specified
by its customers, and the customers have accepted the products in accordance with the sales contract.
(2) Services rendered
Revenue from rendering of services is recognised when the services are rendered.
This includes entrance fees and membership transfer fees of membership clubs which are recognised in profit or
loss on a straight-line basis over the term of membership. Unamortised entrance fees and membership transfer
fees are recognised as deferred income in the balance sheet.
(3) Rental income
Rental income from operating lease (net of any incentives given to the lessee) is recognised on a straight-line
basis over the lease term.
(4) Dividend income
Dividend income is recognised when the right to receive payment is established.
(5) Interest income
Interest income is recognised using the effective interest method.
D. Cost of sales
Cost of sales comprises cost of purchased and manufactured goods sold, other relevant costs attributable to goods sold
and costs of rendering services.
E. Exceptional items
Exceptional items are items of income and expense which are of such nature, size or incidence that their disclosure is
relevant to explain the performance of the Group.
41ANNUAL REPORT 2015
Notes to the Financial StatementsFor the financial year ended 31 December 2015
2. SIGNIFICANT ACCOUNTING POLICIES (CONTINUED)
F. Group accounting
(1) Subsidiaries
(i) Consolidation
Subsidiaries are all entities (including structured entities) over which the Group has control. The Group
controls an entity when the Group is exposed to, or has rights to, variable returns from its involvement
with the entity and has the ability to affect those returns through its power over the entity. Subsidiaries
are fully consolidated from the date on which control is transferred to the Group. They are deconsolidated
from the date on that control ceases.
In preparing the consolidated financial statements, transactions, balances and unrealised gains on
transactions between group entities are eliminated. Unrealised losses are also eliminated but are
considered an impairment indicator of the asset transferred. Accounting policies of subsidiaries have
been changed where necessary to ensure consistency with the policies adopted by the Group.
Non-controlling interests comprise the portion of a subsidiary’s net results of operations and its net
assets, which is attributable to the interests that are not owned directly or indirectly by the equity holders
of the Company. They are shown separately in the consolidated statement of comprehensive income,
statement of changes in equity, and balance sheet. Total comprehensive income is attributed to the
non-controlling interests based on their respective interests in a subsidiary, even if this results in the non-
controlling interests having a deficit balance.
(ii) Acquisitions
The acquisition method of accounting is used to account for business combinations entered into by the
Group.
The consideration transferred for the acquisition of a subsidiary or business comprises the fair value of
assets transferred, the liabilities incurred and the equity interests issued by the Group. The consideration
transferred also includes any contingent consideration arrangement and any pre-existing equity interest
in the subsidiary measured at their fair values at the acquisition date.
Acquisition-related costs are expensed as incurred.
Identifiable assets acquired and liabilities and contingent liabilities assumed in a business combination
are, with limited exceptions, measured initially at their fair values at the acquisition date.
On an acquisition-by-acquistion basis, the Group recognises any non-controlling interest in the acquiree
at the date of acquisition either at fair value or at the non-controlling interest’s proportionate share of the
acquiree’s identifiable net assets.
The excess of (a) the consideration transferred, the amount of any non-controlling interest in the acquiree
and the acquisition-date fair value of any previous equity interest in the acquiree over (b) fair value of
the identifiable net assets acquired is recorded as goodwill. Please refer to Note 2H for the subsequent
accounting policy on goodwill.

NSL LTD42
Notes to the Financial StatementsFor the financial year ended 31 December 2015
2. SIGNIFICANT ACCOUNTING POLICIES (CONTINUED)
F. Group accounting (continued)
(1) Subsidiaries (continued)
(iii) Disposals
When a change in the Group’s ownership interest in a subsidiary results in a loss of control over the
subsidiary, the assets and liabilities of the subsidiary including any goodwill are derecognised. Amounts
previously recognised in other comprehensive income in respect of that entity are also reclassified to
profit or loss or transferred directly to revenue reserve if required by a specific Standard.
Any retained equity interest in the entity is remeasured at fair value. The difference between the carrying
amount of the retained interest at the date when control is lost and its fair value is recognised in profit
or loss.
Please refer to Note 2K for the accounting policy on investments in subsidiaries in the separate financial statements of
the Company.
(2) Transactions with non-controlling interests
Changes in the Group’s ownership interest in a subsidiary that do not result in a loss of control over the subsidiary
are accounted for as transactions with equity owners of the Company. Any difference between the carrying
amounts of the non-controlling interests and the fair value of the consideration paid or received is recognised
within equity attributable to the equity holders of the Company.
(3) Associated companies
Associated companies are entities over which the Group has significant influence, but not control, generally
accompanied by a shareholding giving rise to voting rights of 20% and above but not exceeding 50%.
Investments in associated companies are accounted for in the consolidated financial statements using the equity
method of accounting less impairment losses, if any.
(i) Acquisitions
Investments in associated companies are initially recognised at cost. The cost of an acquisition is measured
at the fair value of the assets given, equity instruments issued or liabilities incurred or assumed at the
date of exchange, plus cost directly attributable to the acquisition. Goodwill on associated companies
represents excess of the cost of acquisition of the associated company over the Group’s share of the fair
value of the identifiable net assets of the associated company and is included in the carrying amount of
the investments.

43ANNUAL REPORT 2015
Notes to the Financial StatementsFor the financial year ended 31 December 2015
2. SIGNIFICANT ACCOUNTING POLICIES (CONTINUED)
F. Group accounting (continued)
(3) Associated companies (continued)
(ii) Equity method of accounting
In applying the equity method of accounting, the Group’s share of its associated companies’ post-
acquisition profits or losses is recognised in profit or loss and its share of post-acquisition other
comprehensive income is recognised in other comprehensive income. These post-acquisition
movements and distributions received from the associated companies are adjusted against the carrying
amount of the investments. When the Group’s share of losses in an associated company equals to or
exceeds its interest in the associated company, the Group does not recognise further losses, unless it has
legal or constructive obligations to make, or has made, payments on behalf of the associated company. If
the associated company subsequently reports profits, the Group resumes recognising its share of those
profits only after its share of the profits equals the share of losses not recognised.
Unrealised gains on transactions between the Group and its associated companies are eliminated to the
extent of the Group’s interest in the associated companies. Unrealised losses are also eliminated unless
the transaction provides evidence of an impairment of the asset transferred. The accounting policies of
associated companies or joint ventures are changed where necessary to ensure consistency with the
accounting policies adopted by the Group.
(iii) Disposals
Investments in associated companies are derecognised when the Group loses significant influence. If
the retained equity interest in the former associated company is a financial asset, the retained equity
interest is re-measured at fair value. The difference between the carrying amount of the retained interest
at the date when significant influence is lost, and its fair value and any proceeds on partial disposal, is
recognised in profit or loss.
Refer to Note 2K for the accounting policy on investments in associated companies in the separate financial statements
of the Company.
G. Property, plant and equipment
(1) Measurement
Property, plant and equipment are initially recognised at cost, and subsequently carried at cost less accumulated
depreciation and impairment losses (Note 2L).
The cost of an item of property, plant and equipment initially recognised includes its purchase price and any
cost that is directly attributable to bringing the asset to the location and condition necessary for it to be capable
of operating in the manner intended by the management. Cost also includes borrowing costs that are directly
attributable to the acquisition, construction or production of a qualifying asset (refer to Note 2I on borrowing
costs).

NSL LTD44
Notes to the Financial StatementsFor the financial year ended 31 December 2015
2. SIGNIFICANT ACCOUNTING POLICIES (CONTINUED)
G. Property, plant and equipment (continued)
(2) Depreciation
Freehold land and capital work-in-progress (“WIP”) are not depreciated. Depreciation of other property, plant
and equipment is calculated using the straight-line method to allocate their depreciable amounts over their
estimated useful lives as follows:
Leasehold land - over the remaining lease period up to 84 years
Buildings - 10 to 60 years
Leasehold improvements - 4 years
Plant and machinery - 3 to 15 years
Vessel - 18 years
Other assets - 3 to 20 years
Other assets comprise furniture and fittings, office appliances and equipment, tooling equipment and motor
vehicles.
The residual values, estimated useful lives and depreciation method of property, plant and equipment are
reviewed, and adjusted as appropriate, at each balance sheet date. The effects of any revision of the residual
values are recognised in profit or loss when the changes arise.
(3) Subsequent expenditure
Subsequent expenditure relating to property, plant and equipment that has already been recognised is added
to the carrying amount of the asset only when it is probable that future economic benefits associated with the
item will flow to the Group and the cost can be reliably measured. All other repair and maintenance expense is
recognised as an expense in profit or loss when incurred.
(4) Disposal
On disposal of an item of property, plant and equipment, the difference between the net disposal proceeds
and its carrying amount is recognised in profit or loss within “other gains and losses”. Any amount in revaluation
reserve relating to that asset is transferred to revenue reserve directly.
H. Intangible assets
(1) Goodwill on acquisitions
Goodwill on acquisitions of subsidiaries on or after 1 January 2010 represents the excess of (i) the sum of the
consideration transferred, the amount of any non-controlling interest in the acquiree and the acquisition-date
fair value of any previous equity interest in the acquiree over (ii) the fair value of the identifiable net assets
acquired.
Goodwill on acquisitions of subsidiaries and businesses prior to 1 January 2010 and on acquisition of associated
companies represents the excess of the cost of the acquisition over the fair value of the Group’s share of the
identifiable net assets acquired.
Goodwill on subsidiaries is recognised separately as intangible assets and carried at cost less accumulated
impairment losses (Note 2L). Goodwill on associated companies is included in the carrying amount of the
investments.
45ANNUAL REPORT 2015
Notes to the Financial StatementsFor the financial year ended 31 December 2015
2. SIGNIFICANT ACCOUNTING POLICIES (CONTINUED)
H. Intangible assets (continued)
(1) Goodwill on acquisitions (continued)
Gains and losses on the disposal of subsidiaries and associated companies include the carrying amount of
goodwill relating to the entity sold, except for goodwill arising from acquisitions prior to 1 January 2001. Such
goodwill was adjusted against revenue reserve in the year of acquisition and was not recognised in profit or loss
on disposal.
(2) Acquired intangible assets
Acquired intangible assets consist of rights to business names, trademarks, tradenames, technology and licences
are recognised at cost less accumulated amortisation and accumulated impairment losses (Note 2L). These costs
are amortised to profit or loss using the straight-line method over their expected useful lives ranging from 3 to 5
years, which is the shorter of their estimated useful lives and period of contractual rights. Costs associated with
maintaining the acquired intangible assets are expensed off when incurred.
The amortisation period and amortisation method of intangible assets (other than goodwill) are reviewed at
least at each balance sheet date. The effects of any revision are recognised in profit or loss when the changes
arise.
I. Borrowing costs
Borrowing costs are recognised in profit or loss using the effective interest method except for those costs that are directly
attributable to the acquisition, construction and production of a qualifying asset which are capitalised into the cost of
the qualifying asset. This includes those costs on borrowings acquired specifically for the acquisition, construction and
production of a qualifying asset as well as those in relation to general borrowings used for the purpose of obtaining the
qualifying assets.
J. Investment properties
Investment properties of the Group, principally comprising office buildings that are held for long term rental yields and/
or capital appreciation and are not occupied by the Group.
Investment properties are initially recognised at cost and subsequently carried at cost less accumulated depreciation
and accumulated impairment losses (Note 2L). Depreciation of investment properties is calculated using a straight-line
method to allocate the depreciable amounts over the estimated useful lives ranging from 10 to 20 years. The residual
values, useful lives and depreciation method of investment properties are reviewed, and adjusted as appropriate, at
each balance sheet date. The effects of any revision are included in profit or loss when the changes arise.
On disposal of an investment property, the difference between the disposal proceeds and the carrying amount is
recognised in profit or loss.
K. Investments in subsidiaries and associated companies
Investments in subsidiaries and associated companies are carried at cost less accumulated impairment losses (Note 2L)
in the Company’s balance sheet.
On disposal of such investments, the difference between disposal proceeds and the carrying amount of the investment
are recognised in profit or loss.

NSL LTD46
Notes to the Financial StatementsFor the financial year ended 31 December 2015
2. SIGNIFICANT ACCOUNTING POLICIES (CONTINUED)
L. Impairment of non-financial assets
(1) Goodwill
Goodwill recognised separately as an intangible asset is tested for impairment annually and whenever there is
indication that the goodwill may be impaired. For the purpose of impairment testing of goodwill, goodwill is
allocated to each of the Group’s cash-generating-unit (“CGU”) expected to benefit from synergies arising from
the business combination.
An impairment loss is recognised when the carrying amount of a CGU, including the goodwill, exceeds the
recoverable amount of the CGU. The recoverable amount of the CGU is the higher of the CGU’s fair value less
cost to sell and value-in-use.
The total impairment loss of a CGU is allocated first to reduce the carrying amount of goodwill allocated to the
CGU and then to the other assets of the CGU pro-rata on the basis of the carrying amount of each asset in the
CGU.
An impairment loss on goodwill is recognised as an expense and is not reversed in a subsequent period.
(2) Other intangible assets
Property, plant and equipment
Investment properties
Investments in subsidiaries and associated companies
Other intangible assets, property, plant and equipment, investment properties, investments in subsidiaries and
associated companies are tested for impairment whenever there is any objective evidence or indication that
these assets may be impaired.
For the purpose of impairment testing, the recoverable amount (i.e. the higher of the fair value less cost to sell
and the value-in-use) is determined on an individual asset basis unless the asset does not generate cash inflows
that are largely independent of those from other assets. If this is the case, the recoverable amount is determined
for the CGU to which the asset belongs. If the recoverable amount of the asset (or CGU) is estimated to be
less than its carrying amount, the carrying amount of the asset (or CGU) is reduced to its recoverable amount.
The difference between the carrying amount and recoverable amount is recognised as an impairment loss in
profit or loss, unless the asset is carried at revalued amount, in which case, such impairment loss is treated as a
revaluation decrease.
An impairment loss for an asset (other than goodwill) is reversed only if, there has been a change in the estimates
used to determine the asset’s recoverable amount since the last impairment loss was recognised. The carrying
amount of this asset (other than goodwill) is increased to its revised recoverable amount, provided that this
amount does not exceed the carrying amount that would have been determined (net of any accumulated
amortisation or depreciation) had no impairment loss been recognised for the asset in prior years. A reversal
of impairment loss for an asset (other than goodwill) is recognised in profit or loss, unless the asset is carried at
revalued amount, in which case, such reversal is treated as a revaluation increase. However, to the extent that
an impairment loss on the same revalued asset was previously recognised in profit or loss, a reversal of that
impairment is also recognised in profit or loss.
47ANNUAL REPORT 2015
Notes to the Financial StatementsFor the financial year ended 31 December 2015
2. SIGNIFICANT ACCOUNTING POLICIES (CONTINUED)
M. Financial assets
(1) Classification
The Group classified its financial assets in the following categories: financial assets at fair value through profit
or loss, loans and receivables and available-for-sale financial assets. The classification depends on the nature of
the assets and the purpose for which the assets were acquired. Management determines the classification of its
financial assets at initial recognition and re-evaluates this designation at every balance sheet date.
(i) Financial assets at fair value through profit or loss
This category has two sub-categories: financial assets held for trading and those designated at fair
value through profit or loss at inception. A financial asset is classified as held for trading if it is acquired
principally for the purpose of selling in the short term. Financial assets designated as at fair value through
profit or loss at inception are those that are managed and their performance are evaluated on a fair value
basis, in accordance with a documented Group investment strategy. Derivatives are also categorised as
held for trading unless they are designated as hedges. Assets in this category are presented as current
assets if they are either held for trading or are expected to be realised within 12 months after the balance
sheet date.
(ii) Loans and receivables
Loans and receivables are non-derivative financial assets with fixed or determinable payments that
are not quoted in an active market. These are presented as current assets, except for those expected
to be realised later than 12 months after the balance sheet date which are presented as non-current
assets. Loans and receivables are presented as cash and bank balances, trade receivables and long term
receivables except for non-current interest free receivables from subsidiaries and associated companies
on the balance sheet which have been accounted for in accordance with Note 2K.
(iii) Available-for-sale financial assets
Available-for-sale financial assets are non-derivatives that are either designated in this category or not
classified in any of the other categories. They are presented as non-current assets unless the investment
matures or management intends to dispose of the assets within 12 months after the balance sheet date.
(2) Recognition and derecognition
Regular way purchases and sales of financial assets are recognised on trade date – the date on which the Group
commits to purchase or sell the asset. Financial assets are derecognised when the rights to receive cash flows
from the financial assets have expired or have been transferred and the Group has transferred substantially all
risks and rewards of ownership.
On disposal of a financial asset, the difference between the carrying amount and the sale proceeds is recognised
in profit or loss. Any amount previously recognised in other comprehensive income relating to that asset is
reclassified to profit or loss.
(3) Initial measurement
Financial assets are initially recognised at fair value plus transaction costs except for financial assets at fair value
through profit or loss, which are recognised at fair value. Transaction costs for financial assets at fair value through
profit or loss are recognised immediately as expense.

NSL LTD48
Notes to the Financial StatementsFor the financial year ended 31 December 2015
2. SIGNIFICANT ACCOUNTING POLICIES (CONTINUED)
M. Financial assets (continued)
(4) Subsequent measurement
Available-for-sale financial assets and financial assets at fair value through profit or loss are subsequently carried at
fair value. Loans and receivables are subsequently carried at amortised cost using the effective interest method.
Changes in the fair values of the financial assets at fair value through profit or loss including the effects of
currency translation, interest and dividends, are recognised in profit or loss when changes arise.
Interest and dividend income on available-for-sale financial assets are recognised separately in other income.
Changes in the fair value of available-for-sale equity securities (i.e. non-monetary items) are recognised in other
comprehensive income and accumulated in the fair value reserve, together with related currency translation
differences.
(5) Impairment
The Group assesses at each balance sheet date whether there is objective evidence that a financial asset or a
group of financial assets is impaired and recognises an allowance for impairment when such evidence exists.
(i) Loans and receivables
Significant financial difficulties of the debtor, probability that the debtor will enter bankruptcy and default
or significant delay in payments are objective evidence that these financial assets are impaired.
The carrying amount of these assets is reduced through the use of an impairment allowance account
which is calculated as the difference between the carrying amount and the present value of estimated
future cash flows, discounted at the original effective interest rate. When the asset becomes uncollectible,
it is written off against the allowance account. Subsequent recoveries of amounts previously written off
are recognised against the same line in profit or loss.
The impairment allowance is reduced through profit or loss in a subsequent period when the amount of
impairment loss decreases and the related decrease can be objectively measured. The carrying amount
of the assets previously impaired is increased to the extent that the new carrying amount does not
exceed the amortised cost had no impairment been recognised in prior periods.
(ii) Available-for-sale financial assets
In addition to the objective evidence of impairment described in Note 2M(5)(i), a significant or prolonged
decline in the fair value of an equity security below its cost is considered as an indicator that the available-
for-sale financial asset is impaired.
If any evidence of impairment exists, the cumulative loss that was previously recognised in other
comprehensive income is reclassified to profit or loss. The cumulative loss is measured as the difference
between the acquisition cost (net of any principal repayments and amortisation) and the current fair
value, less any impairment loss previously recognised in profit or loss. The impairment losses recognised
in profit or loss on equity instruments are not reversed through profit or loss.

49ANNUAL REPORT 2015
Notes to the Financial StatementsFor the financial year ended 31 December 2015
2. SIGNIFICANT ACCOUNTING POLICIES (CONTINUED)
M. Financial assets (continued)
(6) Offsetting financial instruments
Financial assets and liabilities are offset and the net amount reported in the balance sheet when there is a legally
enforceable right to offset and there is an intention to settle on a net basis or realise the asset and settle the
liability simultaneously.
N. Borrowings
Borrowings are initially recognised at fair value, net of transaction costs and subsequently carried at amortised cost. Any
difference between the proceeds (net of transaction costs) and the redemption value is recognised in profit or loss over
the period of the borrowings using the effective interest method.
Borrowings are presented as current liabilities unless the Group has an unconditional right to defer settlement for at
least 12 months after the balance sheet date, in which case they are presented as non-current liabilities.
O. Trade and other payables
Trade and other payables represent liabilities for goods and services provided to the Group prior to the end of financial
year which are unpaid. They are classified as current liabilities if payment is due within one year or less (or in the normal
operating cycle of the business if longer). Otherwise, they are presented as non-current liabilities.
Trade and other payables are initially recognised at fair value, and subsequently carried at amortised cost, using the
effective interest method.
P. Derivative financial instruments
Forward foreign exchange contracts are classified as derivative financial instruments in the financial statement.
Derivative financial instruments are initially recognised at their fair values on the date the contracts are entered into and
subsequently carried at their fair values. The Group does not adopt hedge accounting. Accordingly, changes in fair
value of derivative financial instruments are recognised immediately in profit or loss.
Q. Fair value estimation of financial assets and liabilities
The fair values of financial instruments traded in active markets (such as exchange-traded and over-the-counter
securities and derivatives) are based on quoted market prices at the balance sheet date. The quoted market prices used
for financial assets are the current bid prices; the appropriate quoted market prices for financial liabilities are the current
asking prices.
The fair values of financial instruments that are not traded in an active market are determined by using valuation
techniques. The Group uses a variety of methods, and makes assumptions based on current market conditions that
are existing at each balance sheet date. These include the use of recent arm’s length transactions, reference to other
instruments that are substantially the same and discounted cash flow analysis. The Group also estimates the fair
values of the financial assets by reference to the net assets of these equity securities, adjusting where applicable using
appropriate measures to fair value the underlying assets and liabilities. In determining these fair values, management
evaluates, among other factors, the reliability and appropriateness of the use of the underlying net asset information
provided, taking into consideration factors such as industry and sector outlook, other market comparables and other
prevailing market factors and conditions.
The fair values of forward foreign exchange contracts are determined using actively quoted forward exchange rates at
the balance sheet date.

NSL LTD50
Notes to the Financial StatementsFor the financial year ended 31 December 2015
2. SIGNIFICANT ACCOUNTING POLICIES (CONTINUED)
Q. Fair value estimation of financial assets and liabilities (continued)
The fair value of non-current financial liabilities carried at amortised cost are estimated by discounting the future
contractual cash flows at the current market interest rates that are available to the Group for similar financial liabilities.
The fair value of current financial assets and liabilities carried at amortised cost approximate their carrying amounts.
R. Inventories
Inventories are carried at the lower of cost and net realisable value. Cost is determined on a weighted average basis.
The cost of finished goods and work-in-progress comprises raw materials, direct labour, other direct costs and related
production overheads (based on normal operating capacity) but excludes borrowing costs. Net realisable value is the
estimated selling price in the ordinary course of business, less the estimated costs of completion and selling expenses.
S. Leases
(1) When the Group is the lessee:
The Group leases certain property, plant and equipment from non-related parties.
Lessee - Finance leases
Leases where the Group assumes substantially all the risks and rewards incidental to ownership of the leased
assets are classified as finance leases.
The leased assets and the corresponding leased liabilities (net of finance charges) under finance lease are
recognised on the balance sheet as property, plant and equipment and borrowings respectively at the inception
of the leases based on the lower of the fair values of the leased assets and the present values of the minimum
lease payments.
Each lease payment is apportioned between the finance expense and the reduction of the outstanding lease
liability. The finance charge is recognised in profit or loss on a basis that reflects a constant periodic rate of
interest on the finance lease liability.
The property, plant and equipment acquired under finance leases are depreciated over the shorter of the useful
life of the asset or the lease term.
Lessee - Operating leases
Leases of property, plant and equipment where substantially all risks and rewards incidental to ownership are
retained by the lessor are classified as operating leases. Payments made under operating leases (net of any
incentives received from the lessor) are recognised in profit or loss on a straight-line basis over the period of the
lease.
When an operating lease is terminated before the lease period has expired, any payment required to be made
to the lessor by way of penalty is recognised as an expense in profit or loss in the period in which termination
takes place.
Contingent rents are recognised as an expense in profit or loss when incurred.

51ANNUAL REPORT 2015
Notes to the Financial StatementsFor the financial year ended 31 December 2015
2. SIGNIFICANT ACCOUNTING POLICIES (CONTINUED)
S. Leases (continued) (2) When the Group is the lessor:
The Group leases certain property, plant and equipment and investment properties to non-related parties.
Lessor - Operating leases
Leases of assets where the Group retains substantially all risks and rewards incidental to ownership are classified as operating leases. The property, plant and equipment and investment properties are depreciated over the useful lives of the assets as set out in Notes 2G and 2J. Rental income from operating leases (net of any incentives given to lessees) is recognised in profit or loss on a straight-line basis over the lease term.
Initial direct costs incurred by the Group in negotiating and arranging operating lease are added to the carrying amount of the leased asset and recognised as an expense in profit or loss over the lease term on the same basis as the lease income.
Contingent rents are recognised as income in profit or loss when earned.
T. Income taxes
Current income tax for current and prior periods is recognised at the amount expected to be paid to or recovered from the tax authorities, using the tax rates and tax laws that have been enacted or substantively enacted by the balance sheet date.
Deferred income tax is recognised for all temporary differences arising between the tax bases of assets and liabilities and their carrying amounts in the financial statements except when the deferred income tax arises from initial recognition of goodwill or an asset or liability in a transaction that is not a business combination and affects neither accounting nor taxable profit or loss at the time of the transaction.
A deferred income tax liability is recognised on temporary differences arising on investments in subsidiaries and associated companies, except where the Group is able to control the timing of the reversal of the temporary difference and it is probable that the temporary difference will not reverse in the foreseeable future.
A deferred income tax assets is recognised to the extent that it is probable that future taxable profit will be available against which the deductible temporary differences and tax losses can be utilised.
Deferred income tax is measured:
(i) at the tax rates that are expected to apply when the related deferred income tax asset is realised or the deferred income tax liability is settled, based on tax rates and tax laws that have been enacted or substantively enacted by the balance sheet date; and
(ii) based on the tax consequence that will follow from the manner in which the Group expects, at the balance sheet date, to recover or settle the carrying amounts of its assets and liabilities.
Current and deferred income taxes are recognised as income or expenses in profit or loss, except to the extent that the tax arises from a business combination or a transaction which is recognised directly in equity. Deferred tax on temporary differences arising from the revaluation gains and losses on land and buildings, fair value gains and losses on available-for-sale financial assets are charged or credited directly to equity in the same period the temporary differences arise. Deferred tax arising from a business combination is adjusted against goodwill on acquisition.
The Group accounts for investment tax credits (for example, productivity and innovative credit) similar to accounting for other tax credits where deferred tax asset is recognised for unused tax credits to the extent that it is probable that
future taxable profit will be available against which the unused tax credit can be utilised.

NSL LTD52
Notes to the Financial StatementsFor the financial year ended 31 December 2015
2. SIGNIFICANT ACCOUNTING POLICIES (CONTINUED)
U. Provisions for other liabilities and charges
Provisions for warranty and legal claims are recognised when the Group has a present legal or constructive obligation
as a result of past events, it is more likely than not that an outflow of resources will be required to settle the obligation
and the amount has been reliably estimated. Provisions are not recognised for future operating losses.
The Group recognises the estimated liability to repair or replace products still under warranty at the balance sheet date.
This provision is calculated based on historical experience of the levels of repairs and replacements.
Provisions are measured at the present value of the expenditure expected to be required to settle the obligation using a
pre-tax discount rate that reflects the current market assessment of the time value of money and the risks specific to the
obligation. The increase in the provision due to the passage of time is recognised in profit or loss as finance expense.
Changes in the estimated timing or amount of the expenditure or discount rate are recognised in the profit or loss when
the changes arise.
V. Employee compensation
(1) Pension benefits
The Group operates both defined benefit and defined contribution post-employment benefit plans.
Defined contribution plans are post-employment benefit plans under which the Group pays fixed contributions
into separate entities such as the Central Provident Fund on a mandatory, contractual or voluntary basis. The
Group has no further payment obligations once the contributions have been paid. The Group’s contributions are
recognised as employee compensation expense when they are due.
Defined benefit plans are post-employment benefit pension plans other than defined contribution plans.
Defined benefit plans typically define the amount of benefit that an employee will receive on or after retirement,
usually dependent on one or more factors such as age, years of service and compensation.
Certain subsidiaries of the Group operate separate defined retirement benefit schemes for certain employees.
Such benefits are unfunded.
Retirement benefits are assessed annually using the projected unit credit method; the cost of providing
retirement benefits is charged to profit or loss so as to spread the regular cost over the service lives of employees.
The liability recognised in the balance sheet in respect of a defined benefit pension plan is measured as the
present value of the estimated future cash outflows discounted using market yields of high quality corporate
bonds that are denominated in the currency in which the benefits will be paid, and have tenures approximating
to that of the related post-employment benefit obligations.
Actuarial gains and losses arising from experience adjustments and changes in actuarial assumptions are charged
or credited to equity in other comprehensive income in the period when they arise.
Past service costs are recognised immediately in profit or loss.
(2) Employee leave entitlement
Employee entitlements to annual leave are recognised when they accrue to employees. A provision is made for
the estimated liability for annual leave as a result of services rendered by employees up to the balance sheet
date.

53ANNUAL REPORT 2015
Notes to the Financial StatementsFor the financial year ended 31 December 2015
2. SIGNIFICANT ACCOUNTING POLICIES (CONTINUED)
W. Currency translation
(1) Functional and presentation currency
Items included in the financial statements of each entity in the Group are measured using the currency of the
primary economic environment in which the entity operates (“functional currency”). The financial statements
are presented in Singapore Dollars, which is the functional currency of the Company.
(2) Transaction and balances
Transactions in a currency other than the functional currency (“foreign currency”) are translated into the
functional currency using the exchange rates at the dates of transaction. Currency exchange differences
resulting from the settlement of such transactions and from the translation of monetary assets and liabilities
denominated in foreign currencies at the closing rates at the balance sheet date are recognised in profit or
loss. However, in the consolidated financial statements, currency translation differences arising from borrowings
in foreign currencies and other currency instruments designated and qualifying as net investments in foreign
operations are recognised in other comprehensive income and accumulated in the currency translation reserve.
When a foreign operation is disposed of or any loan forming part of the net investment of the foreign operation
is repaid, a proportionate share of the accumulated currency translation differences is reclassified to profit or loss,
as part of the gain or loss on disposal.
Non-monetary items measured at fair values in foreign currencies are translated using the exchange rates at the
dates when the fair values are determined.
(3) Translation of Group entities’ financial statements
The results and financial position of all the Group entities (none of which has the currency of a hyperinflationary
economy) that have a functional currency different from the presentation currency are translated into the
presentation currency as follows:
(i) assets and liabilities are translated at the closing exchange rate at the reporting date;
(ii) income and expenses are translated at average exchange rates (unless this average is not a reasonable
approximation of the cumulative effect of the rates prevailing on the transaction dates, in which case
income and expenses are translated using the exchange rates at the dates of the transactions); and
(iii) all resulting currency translation differences are recognised in other comprehensive income and
accumulated in the currency translation reserve. These currency translation differences are reclassified to
profit or loss on disposal or partial disposal of the entity giving rise to such reserve.
Goodwill and fair value adjustments arising on the acquisition of foreign operations on or after 1 January 2005
are treated as assets and liabilities of the foreign operations and translated at the closing rates at the reporting
date. For acquisitions prior to 1 January 2005, the goodwill and fair value adjustments are translated at the
exchange rates at the dates of acquisition.
X. Segment reporting
Operating segments are reported in a manner consistent with the internal reporting provided to the executive
committee whose members are responsible for allocating resources and assessing performance of the operating
segments.

NSL LTD54
Notes to the Financial StatementsFor the financial year ended 31 December 2015
2. SIGNIFICANT ACCOUNTING POLICIES (CONTINUED)
Y. Cash and cash equivalents
For the purpose of presentation in the consolidated statement of cash flows, cash and cash equivalents include cash
on hand, deposits with financial institutions which are subject to an insignificant risk of change in value, and bank
overdrafts. Bank overdrafts are presented as current borrowings on the balance sheet. For cash subjected to restriction,
assessment is made on the economic substance of the restriction and whether they meet the definition of cash and
cash equivalents.
Z. Share capital
Ordinary shares are classified as equity. Incremental costs directly attributable to the issuance of new ordinary shares
are deducted against the share capital account.
AA. Dividends
Dividends to the Company’s shareholders are recognised when the dividends are approved for payment.
AB. Government grants
Grants from the government are recognised as a receivable at their fair values when there is reasonable assurance that
the grant will be received and the Group will comply with all the attached conditions.
Government grants receivables are recognised as income over the periods necessary to match them with the related
costs which they are intended to compensate, on a systematic basis. Government grants relating to income are
deducted in reporting the related expense. Government grants related to assets are presented by deducting the grant
in arriving at the carrying value of the asset.
AC. Disposal groups held-for-sale and discontinued operations
Disposal groups are classified as held-for-sale and carried at the lower of carrying amount and fair value less costs to
sell if their carrying amount is recovered principally through a sale transaction rather than through continuing use.
The assets are not depreciated or amortised while they are classified as held-for-sale. Any impairment loss on initial
classification and subsequent measurement is recognised as an expense. Any subsequent increase in fair value less
costs to sell (not exceeding the accumulated impairment loss that has been previously recognised) is recognised in
profit or loss.
A discontinued operation is a component of the Group that either has been disposed of, or that is classified as held-for-
sale and:
(a) represents a separate major line of business or geographical area of operations;
(b) is part of a single co-ordinated plan to dispose of a separate major line of business or geographical area of
operations; or
(c) is a subsidiary acquired exclusively with a view to resale.

55ANNUAL REPORT 2015
Notes to the Financial StatementsFor the financial year ended 31 December 2015
3. CRITICAL ACCOUNTING ESTIMATES, ASSUMPTIONS AND JUDGEMENTS
Estimates, assumptions and judgements are continually evaluated and are based on historical experience and other
factors, including expectations of future events that are believed to be reasonable under the circumstances.
A. Critical accounting estimates and assumptions
(1) Impairment of goodwill
Goodwill is tested for impairment annually in accordance with the accounting policy stated in Note 2L. The
recoverable amounts of cash-generating-units (“CGUs”) have been determined based on value-in-use
calculations. These calculations require the use of estimates.
As at 31 December 2015, the Group recorded goodwill arising on consolidation of S$8,678,000 (2014: S$8,678,000)
(Note 25a). The key estimates, used in the assessment of the carrying value of goodwill in the Precast & PBU
segment, relate to the budgeted average sales growth rate used to extrapolate cash flows of the CGUs beyond
the 5-year budget period. If management’s estimated growth rate of a CGU in Precast & PBU segment were
to decrease by 9%, the recoverable amount of the goodwill will equal to its carrying value, assuming the other
variables remain unchanged.
(2) Impairment of property, plant and equipment
Property, plant and equipment are reviewed for impairment whenever there is indication that the assets are
impaired. If any such indication exists, the recoverable amount (i.e. higher of the fair value less cost to sell and
value-in-use) of the asset is estimated to determine the impairment loss. These calculations require the use
of estimates. During the current financial year, property, plant and equipment of a CGU in the Precast & PBU
segment were reviewed for impairment assessment based on value-in-use calculations. The calculations use
cash flow projections based on financial budgets approved by management covering a 5-year period, annual
sales growth rates ranging from 1% to 20% (2014: 4% to 25%) and discount rate of 12% (2014: 12%). Key estimates
related to average sales growth rate were used to extrapolate cash flows of the CGU beyond the 5-year budget
period. As a result, there was no allowance for impairment recognised (2014: S$104,000). If management’s
estimated average growth rate of the CGU beyond five years were to decrease by 5%, the carrying value of
property, plant and equipment would have decreased by approximately S$719,000, assuming that the other
variables remain unchanged.
Certain idle plant and equipment of a CGU in the Environmental Services segment were reviewed for impairment
based on value-in-use calculations. The calculations used cash flow projections based on financial budgets
approved by management covering a 5-year period. Operation is expected to re-commence in Year 3 with 10%
and 14% sales growth in Year 4 and Year 5, respectively. Discount rate of 12% was used. The calculations show a
net cash outflow. As a result, an impairment loss of S$2,134,000 was recognised (Note 19d).

NSL LTD56
Notes to the Financial StatementsFor the financial year ended 31 December 2015
3. CRITICAL ACCOUNTING ESTIMATES, ASSUMPTIONS AND JUDGEMENTS (CONTINUED)
A. Critical accounting estimates and assumptions (continued)
(3) Fair value of unquoted available-for-sale financial assets
The available-for-sale financial assets of the Group and the Company comprise equity securities and other
investments that are not traded in an active market. As at 31 December 2015, fair value of available-for-sale
financial assets of the Group and the Company that are not traded in an active market amounted to S$9,268,000
(2014: S$8,814,000) and S$8,786,000 (2014: S$8,249,000) respectively (Note 24). The Group’s share of the fair value
of available-for-sale financial assets of its associated companies is included in the carrying value of the associated
companies (Note 22). The fair value of the unquoted available-for-sale financial assets that are not traded in an
active market is determined by using valuation techniques in accordance with Note 2Q. The Group and the
Company estimate the fair values of these financial assets by reference to the net assets of these unquoted
equity securities, adjusting where applicable using appropriate measures to fair value the underlying assets
and liabilities. In determining these fair values, management evaluates, among other factors, the reliability
and appropriateness of the use of the underlying net asset information provided, taking into consideration
factors such as industry and sector outlook, other market comparables and other prevailing market factors and
conditions.
If the net assets of available-for-sale financial assets were to decrease by 10%, the carrying value of available-
for-sale financial assets of the Group and the Company would have decreased by approximately S$932,000 and
S$884,000 respectively, assuming that the other variables remain unchanged.
B. Critical judgements
(1) Impairment of loans and receivables
Management reviews its loans and receivables for objective evidence of impairment at least quarterly in
accordance with the accounting policy stated in Note 2M. Significant financial difficulties of the debtor, the
probability that the debtor will enter bankruptcy, and default or significant delay in payments are considered
objective evidence that a receivable is impaired. In determining this, management makes judgement as to
whether there is observable data indicating that there have been significant changes in the payment ability of
the debtor, or whether there have been significant changes with adverse effect in the technological, market,
economic or legal environment in which the debtor operates in.
Where there is objective evidence of impairment, management makes judgements as to whether an impairment
loss should be recorded in profit or loss. In determining this, management used estimates based on historical
loss experience for asset with similar risk characteristics. The methodology and assumptions used for estimating
both the amount and timing of future cash flows are reviewed regularly to reduce any differences between
the estimated loss and actual loss experience. As at 31 December 2015, the Group recorded allowance for
impairment of receivables amounting to S$17,855,000 (2014: S$13,124,000), and the net allowance for impairment
of receivables for the financial year ended 31 December 2015 is S$5,702,000 (2014: S$4,178,000). Further analysis
of the Group’s credit risk profile is set out in Note 36b.

57ANNUAL REPORT 2015
Notes to the Financial StatementsFor the financial year ended 31 December 2015
4. SALES
The Group
2015
S$’000
2014
S$’000
Sale of goods 414,990 397,342
Services rendered 26,593 23,785
Rental income 4,869 4,823
446,452 425,950
5. OTHER INCOME
The following has been included in arriving at other income:
The Group
2015
S$’000
2014
S$’000
(restated)
Interest income
- Fixed deposits 3,415 2,479
- Others 106 35
3,521 2,514
Dividend income from available-for-sale financial assets 758 1,895
Sale of scrap 611 455
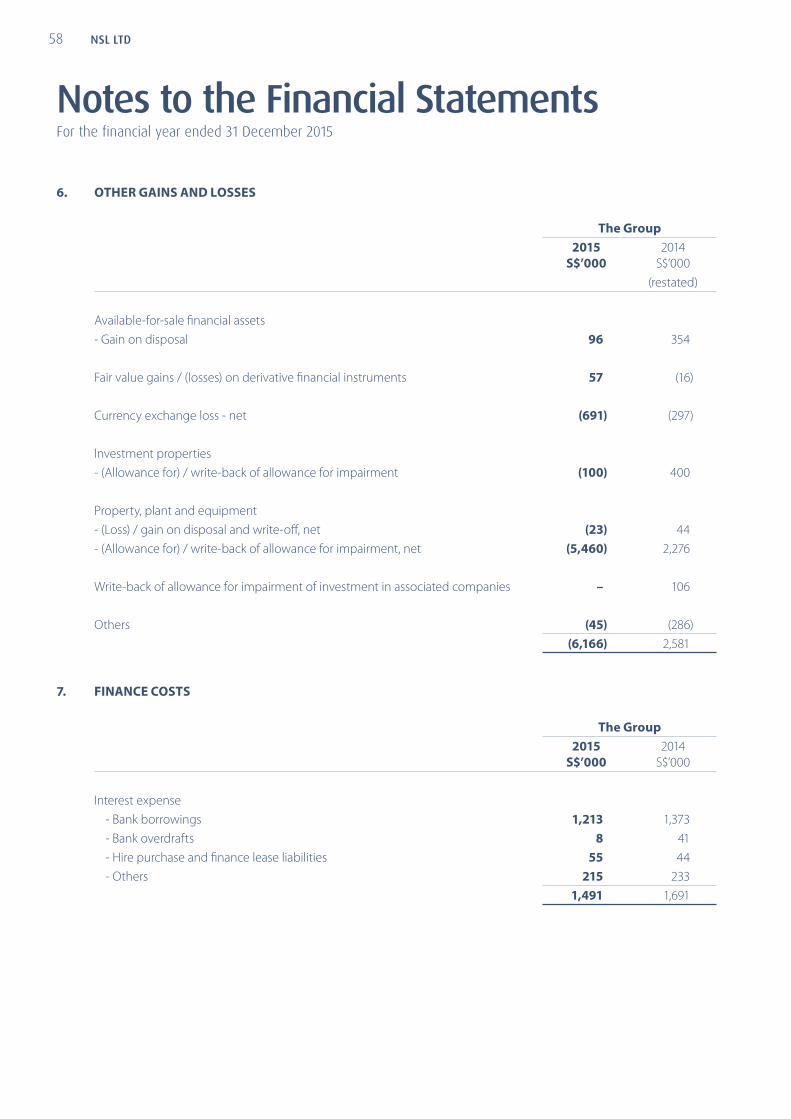
NSL LTD58
Notes to the Financial StatementsFor the financial year ended 31 December 2015
6. OTHER GAINS AND LOSSES
The Group
2015
S$’000
2014
S$’000
(restated)
Available-for-sale financial assets
- Gain on disposal 96 354
Fair value gains / (losses) on derivative financial instruments 57 (16)
Currency exchange loss - net (691) (297)
Investment properties
- (Allowance for) / write-back of allowance for impairment (100) 400
Property, plant and equipment
- (Loss) / gain on disposal and write-off, net (23) 44
- (Allowance for) / write-back of allowance for impairment, net (5,460) 2,276
Write-back of allowance for impairment of investment in associated companies – 106
Others (45) (286)
(6,166) 2,581
7. FINANCE COSTS
The Group
2015
S$’000
2014
S$’000
Interest expense
- Bank borrowings 1,213 1,373
- Bank overdrafts 8 41
- Hire purchase and finance lease liabilities 55 44
- Others 215 233
1,491 1,691

59ANNUAL REPORT 2015
Notes to the Financial StatementsFor the financial year ended 31 December 2015
8. PROFIT BEFORE INCOME TAX
The following have been included in arriving at profit before income tax:
The Group
Note
2015
S$’000
2014
S$’000
(Charged) / credited:
Amortisation of intangible assets 25b (190) (185)
Depreciation of property, plant and equipment 19 (14,451) (15,415)
Depreciation of investment properties 20 (172) (172)
Employee compensation 9 (95,574) (89,437)
Cost of inventories as expense (included in ‘Cost of sales’) (204,301) (211,071)
Sub-contractor charges (24,965) (24,640)
Remuneration paid / payable to auditors of the Company(1)
- for auditing the financial statements
- for other services
(555)
(162)
(629)
(571)
Remuneration paid / payable to other auditors
- for auditing the financial statements(2)
- for other services
(247)
(3)
(236)
(50)
Rental expense - operating leases (12,424) (13,162)
Transportation expense (23,025) (19,005)
Allowance for impairment of trade receivables and bad debts
written off, net (5,854) (3,914)
Allowance for stocks obsolescence (470) (104)
Write-down of inventories to net realisable value, net (518) (2,425)
Amortisation of deferred income 31 354 255
(1) PricewaterhouseCoopers LLP, Singapore
(2) Comprises S$109,000 (2014: S$122,000) paid or payable to the network of member firms of PricewaterhouseCoopers International Limited
outside Singapore and S$138,000 (2014: S$114,000) paid or payable to other firms of auditors in respect of the audit of subsidiaries.
9. EMPLOYEE COMPENSATION
The Group
2015
S$’000
2014
S$’000
Wages and salaries 83,402 77,611
Employer’s contribution to defined contribution plans,
including Central Provident Fund 7,764 7,750
Retirement benefits (Note 29) 517 398
Other staff benefits 3,891 3,678
95,574 89,437
Key management’s remuneration is disclosed in Note 33b.

NSL LTD60
Notes to the Financial StatementsFor the financial year ended 31 December 2015
10. INCOME TAX EXPENSE
The Group
2015
S$’000
2014
S$’000
Tax expense attributable to profit is made up of:
Profit for the financial year:
From continuing operations
Current income tax
- Singapore 2,685 3,007
- Foreign 2,764 2,690
5,449 5,697
Deferred income tax (Note 30) (2,158) (2,707)
3,291 2,990
From discontinued operations
Current income tax
- Singapore 5 297
- Foreign 100 516
105 813
Deferred income tax 22 (99)
127 714
Total current taxation 3,418 3,704
(Over) / under provision in prior financial years:
From continuing operations
Current income tax (107) 92
Deferred income tax (Note 30) 1 148
(106) 240
From discontinued operations
Current income tax – (152)
Deferred income tax (Note 30) – 33
– (119)
Total (over) / under provision in prior years (106) 121
Total tax expense 3,312 3,825
Tax expense is attributable to:
- Continuing operations 3,185 3,230
- Discontinued operations (Note 11) 127 595
3,312 3,825

61ANNUAL REPORT 2015
Notes to the Financial StatementsFor the financial year ended 31 December 2015
10. INCOME TAX EXPENSE (CONTINUED)
The deferred tax credit relating to each component of other comprehensive income is as follows:
The Group
<----------------- 2015 ----------------> <----------------- 2014 ----------------->
Before Tax Tax credit After Tax Before Tax Tax credit After Tax
S$’000 S$’000 S$’000 S$’000 S$’000 S$’000
Fair value gain / (loss) of available-for-
sale financial assets 532 14 546 (331) 37 (294)
Disposals (96) - (96) (251) - (251)
Other comprehensive income / (loss) 436 14 450 (582) 37 (545)
The tax expense on the Group’s profit before tax differs from the amount that would arise using the Singapore corporate
income tax rate as explained below:
The Group
2015
S$’000
2014
S$’000
(restated)
Profit before tax from
- continuing operations 30,898 15,499
- discontinued operations (Note 11) 40,139 16,104
71,037 31,603
Share of profit of associated companies, net of tax
from continuing operations(1) (1,723) (238)
Profit before tax and share of profit of associated companies 69,314 31,365
Tax calculated at a tax rate of 17% (2014: 17%) 11,783 5,332
Income not subject to tax (7,812) (2,717)
Expenses not deductible for tax purposes 800 1,562
Utilisation of previously unrecognised tax assets (1,334) (1,834)
Tax benefit from current year’s tax losses not recognised 698 1,669
Tax provision on unremitted income 278 173
Effects of different tax rates in other countries (526) 410
Tax incentives and rebates (617) (903)
(Over) / under provision of income tax (106) 121
Others 148 12
Tax charge 3,312 3,825
(1) Share of results of associated companies is net of tax expense of S$897,000 (2014: S$103,000).

NSL LTD62
Notes to the Financial StatementsFor the financial year ended 31 December 2015
11. DISCONTINUED OPERATIONS AND DISPOSAL GROUP CLASSIFIED AS HELD-FOR-SALE
Group
2015 2014
S$’000 S$’000
(restated)
Sales 10,684 71,492
Net expenses (11,486) (65,345)
(Loss) / profit before tax from discontinued operations (802) 6,147
Income tax expense (Note 10) (176) (595)
(Loss) / profit after tax from discontinued operations (978) 5,552
Exceptional items:
- Gain on disposal of subsidiaries 41,145 9,957
Profit after tax from discontinued operations 40,167 15,509
Pre-tax loss recognised on the re-measurement of disposal group
to fair value less cost to sell (204) –
Income tax expense (Note 10) 49 –
After tax loss recognised on the re-measurement of disposal group
to fair value less cost to sell (155) –
Profit for the year from discontinued operations* 40,012 15,509
*Breakdown of profit from discontinued operations
Group
2015 2014
S$’000 S$’000
Discontinued Operations (restated)
Engineering operations (1,066) 4,283
Lime and limestones operations (67) 1,269
Exceptional gain on disposal
- Lime business 27,250 –
- NSL Chemicals (Thailand) Pte Ltd (“NSCT”) – 9,957
- Engineering business 13,895 –
41,145 9,957
40,012 15,509
11a On 5 December 2014, the Company and its direct wholly-owned subsidiary, NSL Engineering Holdings Pte. Ltd. (“NSEH”)
entered into agreement with Salzgitter Maschinenbau AG (“SMAG”) in relation to the merger of NSL Engineering Pte Ltd
(“NSE”)‘s RAM container spreader business with SMAG’s grab business as the world’s leading independent lifting device
group in both bulk cargo and container handling. Under the agreement, NSEH will inject NSE into SMAG’s wholly-
owned subsidiary, PEINER SMAG Lifting Technologies GmbH (“PSLT”) in exchange for 33.33% equity stake in PSLT, the
new holding company of NSE Group, with SMAG holding the remaining 66.67% equity stake (“The Merger”).
The NSE Group was a separate major line of business and was responsible for trading and management of spreader business.
In accordance with FRS 105, Non-current Assets Held for Sale and Discontinued Operations, the NSE Group was disclosed as
a discontinued operation and the carrying value of assets and liabilities of the NSE Group were classified as held for sale from
4Q-2014 and measured at the lower of carrying amount and fair value less costs to sell prior to their disposal.

63ANNUAL REPORT 2015
Notes to the Financial StatementsFor the financial year ended 31 December 2015
11. DISCONTINUED OPERATIONS AND DISPOSAL GROUP CLASSIFIED AS HELD-FOR-SALE (CONTINUED)
Following the completion of the Merger on 29 April 2015, the 33.33% non-controlling equity stake in PSLT has been
accounted for as an investment in associated company as the Group has significant influence over PSLT and the share
of financial results of PSLT has been accounted for based on the equity method under FRS 28 Investments in Associates and Joint Ventures.
11bi The divestment of lime business in Singapore and Malaysia was completed on 17 February 2015 for a cash consideration
of approximately S$42.9 million. The gain on divestment of lime business in Singapore and Malaysia recognised during
the financial year was approximately S$26.8 million, subject to finalisation of the completion account’s adjustments.
Pursuant to the completion of divestment of lime business, the Group’s wholly-owned subsidiary, NSL Chemicals Ltd
(“NSC”), granted a call option to the acquirer of the lime business, Lhoist Singapore Pte Ltd (“Lhoist”) or its subsidiary
(“Lhoist Acquirer”), to acquire NSC’s limestone business in Malaysia for an agreed consideration of S$4 million. The call
option was exercisable by Lhoist Acquirer at any time before 30 June 2015 (“Call Option”). The Call Option has since
expired without Lhoist Acquirer exercising its rights under the option.
Following the lapse of the Call Option, management continued to explore alternatives to realise the Group’s carrying
value in the limestone business via a disposal. Accordingly, the carrying value of the assets and liabilities of the limestone
business were classified as held for sale as at 31 December 2015.
Such lime and limestone business was a major line of business in Chemicals segment and was responsible with trading
and management of lime and limestone business. In accordance with FRS 105, Non-current Assets Held for Sale and Discontinued Operations, the lime and limestone business in Chemicals segment was disclosed as a discontinued
operation.
11bii During 3Q-2015, the Group disposed of its wholly-owned dormant subsidiary in the People’s Republic of China (“PRC”),
Chizhou NSL Minerals Co. Ltd (“CNM”), to a third party for net proceeds of approximately S$0.7 million. The gain on
divestment recognised during the financial year was about S$0.4 million. CNM holds quarry assets in the PRC.
11c In 2013, the Group, through its wholly-owned subsidiary, NSL Chemicals Ltd (“NSC”), signed a share purchase agreement
(the “Agreement”) to dispose of the entire issued and paid-up share capital of NSL Chemicals (Thailand) Pte Ltd (“NSCT”),
which holds a 22.83% shareholding in Bangkok Synthetics Co., Ltd (“BST”) to SCG Chemicals Co., Ltd, (“SCG Chemicals”)
for an initial cash consideration of S$311.2 million and Contingent Consideration (as defined below).
In accordance with the Agreement, SCG Chemicals is obliged to pay NSC the insurance compensation (net of tax)
received by BST and its subsidiaries during the period between 1 October 2013 and 31 December 2017 (“Insurance
Claim Proceeds”), pursuant to insurance claims made in relation to the fire incident on 5 May 2012. SCG Chemicals shall
pay NSC an amount equivalent to NSCT’s previous proportionate share of BST (“Contingent Consideration”). Contingent
Consideration totaling S$17.4 million was received and recognised in financial year ended 31 December 2013 upon
completion of the disposal. During the first quarter of 2014, NSC recognised an additional Contingent Consideration of
approximately S$10.0 million (net of tax), based on the Group’s share of insurance compensation (net of tax) received by
BST and its subsidiaries (Note 18a). The amount constituted the final settlement of the Contingent Consideration under
the Agreement.
Gains related to the disposal of NSCT was presented separately on the income statement as part of “discontinued
operations”.

NSL LTD64
Notes to the Financial StatementsFor the financial year ended 31 December 2015
11. DISCONTINUED OPERATIONS AND DISPOSAL GROUP CLASSIFIED AS HELD-FOR-SALE (CONTINUED)
11d The details of assets and liabilities of the disposal group classified as held for sale for the Group are as follows:
Group
2015 2014
Note S$’000 S$’000
Assets
Inventories 9 20,368
Cash and bank balances 18 97 10,424
Receivables and prepayments 97 16,963
Property, plant and equipment 4,026 26,401
Intangible assets – 423
Deferred tax assets – 571
Associated company – 1
Other non-current assets – 18
4,229 75,169
Liabilities
Short term borrowings – 1,887
Trade and other payables 517 14,775
Provision for other liabilities and charges – 2,454
Other current liabilities – 30
Long term borrowings – 309
Deferred tax liabilities 490 1,395
1,007 20,850
11e The impact of the discontinued operations on the cash flows of the Group is as follows:
Group
2015 2014
S$’000 S$’000
Operating cash inflows 962 10,953
Investing cash inflows 32,201 7,180
Financing cash inflows / (outflows) 3,036 (640)
Total cash inflows 36,199 17,493
11f Cumulative (expense) / income recognised in other comprehensive income relating to disposal group classified as held-
for-sale are as follows:
Group
2015 2014
S$’000 S$’000
Currency translation differences (70) 264
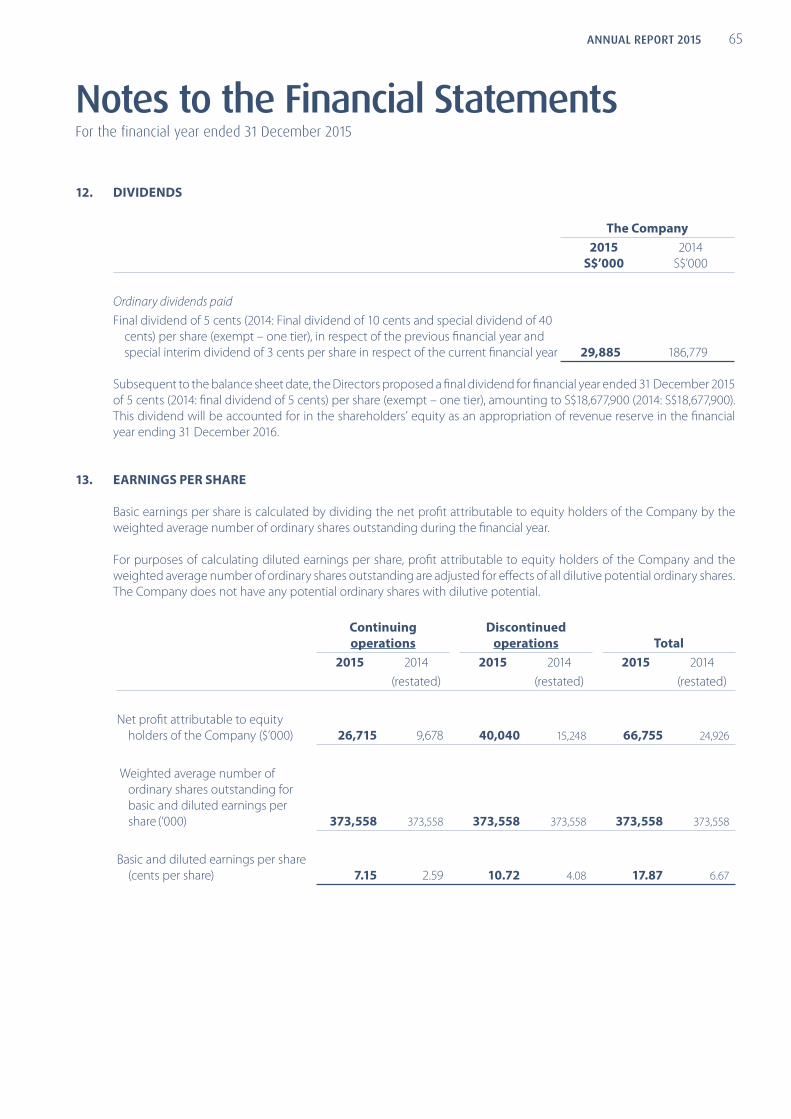
65ANNUAL REPORT 2015
Notes to the Financial StatementsFor the financial year ended 31 December 2015
12. DIVIDENDS
The Company
2015
S$’000
2014
S$’000
Ordinary dividends paid
Final dividend of 5 cents (2014: Final dividend of 10 cents and special dividend of 40
cents) per share (exempt – one tier), in respect of the previous financial year and
special interim dividend of 3 cents per share in respect of the current financial year 29,885 186,779
Subsequent to the balance sheet date, the Directors proposed a final dividend for financial year ended 31 December 2015
of 5 cents (2014: final dividend of 5 cents) per share (exempt – one tier), amounting to S$18,677,900 (2014: S$18,677,900).
This dividend will be accounted for in the shareholders’ equity as an appropriation of revenue reserve in the financial
year ending 31 December 2016.
13. EARNINGS PER SHARE
Basic earnings per share is calculated by dividing the net profit attributable to equity holders of the Company by the
weighted average number of ordinary shares outstanding during the financial year.
For purposes of calculating diluted earnings per share, profit attributable to equity holders of the Company and the
weighted average number of ordinary shares outstanding are adjusted for effects of all dilutive potential ordinary shares.
The Company does not have any potential ordinary shares with dilutive potential.
Continuing
operations
Discontinued
operations Total
2015 2014 2015 2014 2015 2014
(restated) (restated) (restated)
Net profit attributable to equity
holders of the Company ($’000) 26,715 9,678 40,040 15,248 66,755 24,926
Weighted average number of
ordinary shares outstanding for
basic and diluted earnings per
share (‘000) 373,558 373,558 373,558 373,558 373,558 373,558
Basic and diluted earnings per share
(cents per share) 7.15 2.59 10.72 4.08 17.87 6.67

NSL LTD66
Notes to the Financial StatementsFor the financial year ended 31 December 2015
14. SHARE CAPITAL
Issued ordinary shares
The Company No of shares Amount
‘000 S$’000
2015 and 2014
Balance at 1 January and 31 December 373,558 193,839
All issued ordinary shares are fully paid. There is no par value for these ordinary shares.
The Company’s immediate and ultimate holding corporations are 98 Holdings Pte. Ltd. and Excel Partners Pte. Ltd.
respectively, both incorporated in Singapore.
15. RESERVES
15a Composition
The Group The Company
2015
S$’000
2014
S$’000
2015
S$’000
2014
S$’000
Revenue reserve 378,535 341,486 265,107 223,696
Foreign currency translation reserve (15,166) (11,853) – –
Revaluation reserve – 220 – –
Fair value reserve 2,929 2,479 2,608 2,089
General reserve 300 479 – –
366,598 332,811 267,715 225,785
Revenue reserve of the Group is distributable except for share of accumulated losses of associated companies amounting
to S$5,128,000 (2014: S$7,514,000).
General reserve is relating to funds appropriated from the net profits to statutory reserves of a certain subsidiary
established in the United Arab Emirates. 10% of the annual net profits of the subsidiary are allocated to the statutory
reserves until the reserves reach 50% of the paid up capital of the subsidiary. In accordance with the Commercial
Companies Law in United Arab Emirates, no transfer has been made to statutory reserve during the current financial
year, since previously incurred losses have not been fully recovered.
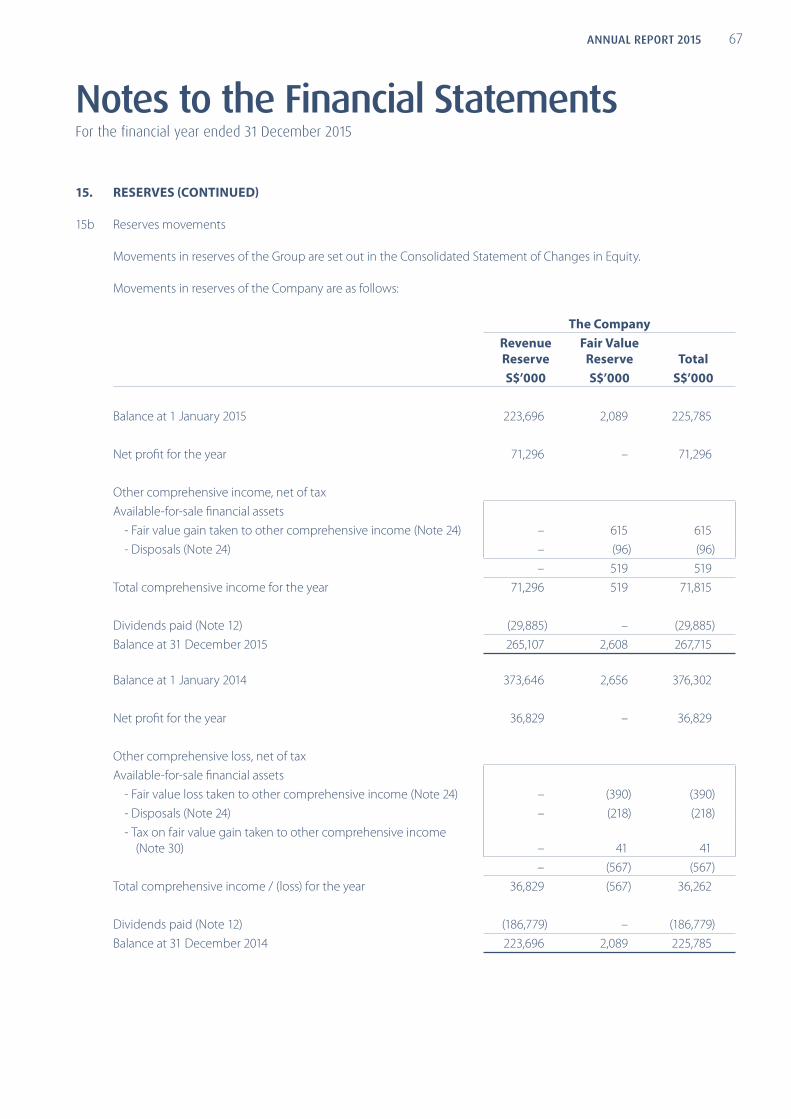
67ANNUAL REPORT 2015
Notes to the Financial StatementsFor the financial year ended 31 December 2015
15. RESERVES (CONTINUED)
15b Reserves movements
Movements in reserves of the Group are set out in the Consolidated Statement of Changes in Equity.
Movements in reserves of the Company are as follows:
The Company
Revenue
Reserve
Fair Value
Reserve Total
S$’000 S$’000 S$’000
Balance at 1 January 2015 223,696 2,089 225,785
Net profit for the year 71,296 – 71,296
Other comprehensive income, net of tax
Available-for-sale financial assets
- Fair value gain taken to other comprehensive income (Note 24) – 615 615
- Disposals (Note 24) – (96) (96)
– 519 519
Total comprehensive income for the year 71,296 519 71,815
Dividends paid (Note 12) (29,885) – (29,885)
Balance at 31 December 2015 265,107 2,608 267,715
Balance at 1 January 2014 373,646 2,656 376,302
Net profit for the year 36,829 – 36,829
Other comprehensive loss, net of tax
Available-for-sale financial assets
- Fair value loss taken to other comprehensive income (Note 24) – (390) (390)
- Disposals (Note 24) – (218) (218)
- Tax on fair value gain taken to other comprehensive income
(Note 30) – 41 41
– (567) (567)
Total comprehensive income / (loss) for the year 36,829 (567) 36,262
Dividends paid (Note 12) (186,779) – (186,779)
Balance at 31 December 2014 223,696 2,089 225,785

NSL LTD68
Notes to the Financial StatementsFor the financial year ended 31 December 2015
16. INVENTORIES
The Group
2015
S$’000
2014
S$’000
At lower of cost and net realisable value
Raw materials 19,888 18,839
Finished goods 23,760 36,025
General stores and consumables 4,435 4,168
Work-in-progress 55 89
48,138 59,121
As at 31 December 2015, inventories of S$2,875,000 (2014: S$22,869,000) were written down to net realisable value.
The Group has recognised a reversal of write-down of inventories of S$64,000 (2014: S$190,000), as the inventories
were sold above the carrying values during the financial year. The reversal has been included in “cost of sales” in the
consolidated income statement.
17. RECEIVABLES AND PREPAYMENTS
The Group The Company
2015
S$’000
2014
S$’000
2015
S$’000
2014
S$’000
Trade receivables
- Associated companies 944 719 – –
- Non-related parties 111,790 119,375 – –
112,734 120,094 – –
Less: Allowance for impairment of trade receivables (17,855) (11,981) – –
Trade receivables – net 94,879 108,113 – –
Non-trade amounts owing by subsidiaries(a) – – 35,223 34,186
Non-trade amounts owing by associated company(b) – 1 – –
Prepayments 12,360 7,247 145 133
Deposits 2,308 2,166 11 11
Interest receivables 1,362 935 1,362 935
Recoverable expenditure 491 512 1 1
Sundry receivables(c) 4,930 13,691 104 2
Derivative financial instruments(d) 57 – – –
116,387 132,665 36,846 35,268
17a Amounts owing by subsidiaries are unsecured, repayable on demand and are interest-free, except that amount of
S$4,446,000 (2014: S$4,446,000) bears interest at 2.7% (2014: 2.7%) per annum.
17b Non-trade amounts owing by associated company are unsecured, repayable on demand and are interest-free.

69ANNUAL REPORT 2015
Notes to the Financial StatementsFor the financial year ended 31 December 2015
17. RECEIVABLES AND PREPAYMENTS (CONTINUED)
17c Sundry receivables are unsecured, interest free and are expected to be repaid within the next 12 months after the
balance sheet date.
17d Derivative financial instruments
The Group
2015 2014
Contract
notional Fair value
Contract
notional Fair value
amount Asset Liability Amount Asset Liability
S$’000 S$’000 S$’000 S$’000 S$’000 S$’000
Forward foreign exchange contracts
- current 1,451 57 - 11,112 29 (272)
The derivative financial instruments in 2014 were related to disposal group and had been reclassified to disposal group.
18. CASH AND CASH EQUIVALENTS
The Group The Company
2015
S$’000
2014
S$’000
2015
S$’000
2014
S$’000
Fixed deposits 230,419 197,912 202,146 181,762
Cash at bank and on hand 104,029 90,517 24,887 8,864
334,448 288,429 227,033 190,626
For the purpose of the consolidated statement of cash flows, cash and cash equivalents comprise the following:
The Group The Company
2015
S$’000
2014
S$’000
2015
S$’000
2014
S$’000
Cash and cash equivalents 334,448 288,429 227,033 190,626
Cash and cash equivalents of disposal group classified as
held for sale (Note 11) 97 10,424 – –
Less: bank deposits pledged (3,274) (2,903) – –
Less: bank overdrafts (Note 26) – (912) – –
Cash and cash equivalents per statement of cash flows 331,271 295,038 227,033 190,626
Bank deposits are pledged to banks for banking facilities granted to subsidiaries (Note 26).
18a Disposal of subsidiaries
During the financial year 2015, the Group completed:
(i) the disposal of its lime business in Singapore and Malaysia for a cash consideration of approximately S$42.9
million;
(ii) the Merger where NSEH injected NSE into SMAG’s wholly-owned subsidiary PSLT in exchange for 33.33% equity
stake in PSLT, the new holding company of NSE Group, with SMAG holding the remaining 66.67% equity stake;
and
(iii) the disposal of CNM to a third party for net proceeds of approximately S$0.7 million.

NSL LTD70
Notes to the Financial StatementsFor the financial year ended 31 December 2015
18. CASH AND CASH EQUIVALENTS (CONTINUED)
18a Disposal of subsidiaries (continued)
Whereas, on 3 December 2013, the Group through its wholly-owned subsidiary NSC, completed the disposal of the
entire issued and paid-up share capital of NSCT, which holds a 22.83% shareholding in BST to SCG Chemicals Co., Ltd
for a total cash consideration of S$338.5 million, of which S$328.5 million was received in 2013 and the remaining S$10.0
million was received in 2014.
Please refer to Note 11 for further details. The effects of the disposal of subsidiaries on the cash flows of the Group were:
The Group
2015
S$’000
2014
S$’000
Carrying amounts of assets and liabilities disposed of
Cash and cash equivalents 8,237 –
Trade and other receivables 16,199 –
Other current asset 22,265 –
Property, plant and equipment 23,188 –
Other non-current assets 770 –
Total assets 70,659 –
Trade and other payables (21,255) –
Deferred income tax liabilities (794) –
Other non-current liabilities (7) –
Total liabilities (22,056) –
Net assets derecognised 48,603 –
Less: Non-controlling interests (2,655) –
Net assets disposed of 45,948 –
The aggregate cash inflows arising from the disposal of subsidiaries were:
The Group
2015
S$’000
2014
S$’000
Net assets disposed of 45,948 –
- Reclassification of currency translation reserve 1,292 –
- Reclassification of revaluation reserve (220) –
47,020 –
Gain on disposal (Note 11) 41,145 9,957*
Total sale consideration, net of transaction costs 88,165 9,957
Less: Investment in associated companies (45,338) –
Less: Cash and cash equivalents in subsidiaries disposed of (8,237) –
(Less) / add: sale consideration (receivable) / received, net (107) 213
Add: Professional fees payable, net 185 –
Net cash inflow on disposal of subsidiaries 34,668 10,170
* This relates to Additional Contingent Consideration received in 2014 based on the Group’s share of insurance compensation (net of tax)
received by BST and its subsidiaries. The amount constituted the final settlement of the Contingent Consideration under the Agreement, as
disclosed in Note 11c.

71ANNUAL REPORT 2015
Notes to the Financial StatementsFor the financial year ended 31 December 2015
19. PROPERTY, PLANT AND EQUIPMENT
Freehold
Land
S$’000
Leasehold
Land
S$’000
Buildings
S$’000
Leasehold
Improvements
S$’000
Plant &
Machinery
S$’000
Vessel
S$’000
Other
Assets*
S$’000
Capital
WIP
S$’000
Total
S$’000
The Group – 2015
Cost
At 1 January 2015 7,179 14,438 170,693 786 146,844 – 40,728 3,896 384,564
Currency realignment (913) (211) (2,494) 51 (4,450) – (165) (130) (8,312)
Additions – 2 2,284 17 8,455 7,500 4,605 (793) 22,070
Disposals and write off – – (114) – (245) – (1,889) – (2,248)
Reclassifications – – 580 – 99 – 149 (828) –
At 31 December 2015 6,266 14,229 170,949 854 150,703 7,500 43,428 2,145 396,074
Representing:
Cost 6,266 14,229 170,949 854 150,703 7,500 43,428 2,145 396,074
Accumulated Depreciation and Impairment Losses
At 1 January 2015 – 2,298 109,953 782 102,081 – 30,507 – 245,621
Currency realignment 4 (1,527) 51 (2,621) – (114) – (4,207)
Charge for the year
– Continuing operations – 264 4,682 6 6,127 144 3,228 – 14,451
Disposals and write off – – – – (170) – (1,832) – (2,002)
Impairment loss – – 1,436 – 3,757 – 267 – 5,460
At 31 December 2015 – 2,566 114,544 839 109,174 144 32,056 – 259,323
Net Book Value
At 31 December 2015 6,266 11,663 56,405 15 41,529 7,356 11,372 2,145 136,751
* Other assets comprise furniture & fittings, office appliances & equipment, tooling equipment and motor vehicles.

NSL LTD72
Notes to the Financial StatementsFor the financial year ended 31 December 2015
19. PROPERTY, PLANT AND EQUIPMENT (CONTINUED)
Freehold
Land
S$’000
Leasehold
Land
S$’000
Buildings
S$’000
Leasehold
Improvements
S$’000
Plant &
Machinery
S$’000
Other
Assets*
S$’000
Capital
WIP
S$’000
Total
S$’000
The Group – 2014
Cost
At 1 January 2014 7,759 21,992 200,631 754 177,880 41,740 3,572 454,328
Currency realignment (145) 26 (99) 32 (1,427) 370 (22) (1,265)
Additions – 170 372 – 10,193 4,425 4,242 19,402
Disposals and write off – (1,295) (16,502) – (3,038) (1,753) (141) (22,729)
Reclassified to disposal group
(Note 11) (435) (7,758) (14,028) – (38,433) (4,368) (150) (65,172)
Reclassifications – 1,303 319 – 1,669 314 (3,605) –
At 31 December 2014 7,179 14,438 170,693 786 146,844 40,728 3,896 384,564
Representing:
Cost 7,179 14,438 170,693 786 146,844 40,728 3,896 384,564
Accumulated Depreciation and Impairment Losses
At 1 January 2014 – 9,334 124,697 747 124,745 31,305 – 290,828
Currency realignment – 6 (326) 32 (961) 367 – (882)
Charge for the year
– Continuing operations – 161 5,245 3 7,144 2,862 – 15,415
– Discontinued operations – 122 550 – 2,289 480 – 3,441
Disposals and write off – (1,284) (16,464) – (2,886) (1,500) – (22,134)
(Write-back of impairment loss)/
Impairment loss – (2,472) – – 196 – – (2,276)
Reclassified to disposal group (Note 11) – (3,569) (3,749) – (28,551) (2,902) – (38,771)
Reclassifications – – – – 105 (105) – –
At 31 December 2014 – 2,298 109,953 782 102,081 30,507 – 245,621
Net Book Value
At 31 December 2014 7,179 12,140 60,740 4 44,763 10,221 3,896 138,943
* Other assets comprise furniture & fittings, office appliances & equipment, tooling equipment and motor vehicles.

73ANNUAL REPORT 2015
Notes to the Financial StatementsFor the financial year ended 31 December 2015
19. PROPERTY, PLANT AND EQUIPMENT (CONTINUED)
Other
Assets*
S$’000
Total
S$’000
The Company – 2015
Cost
At 1 January 2015 1,511 1,511
Additions 58 58
Disposals and write off (8) (8)
At 31 December 2015 1,561 1,561
Accumulated Depreciation
At 1 January 2015 1,255 1,255
Charge for the year 169 169
Disposals and write off (7) (7)
At 31 December 2015 1,417 1,417
Net Book Value
At 31 December 2015 144 144
The Company – 2014
Cost
At 1 January 2014 1,457 1,457
Additions 135 135
Disposals and write off (81) (81)
At 31 December 2014 1,511 1,511
Accumulated Depreciation
At 1 January 2014 1,188 1,188
Charge for the year 148 148
Disposals and write off (81) (81)
At 31 December 2014 1,255 1,255
Net Book Value
At 31 December 2014 256 256
* Other assets comprise furniture & fittings, office appliances & equipment and motor vehicles.

NSL LTD74
Notes to the Financial StatementsFor the financial year ended 31 December 2015
19. PROPERTY, PLANT AND EQUIPMENT (CONTINUED)
19a Included within additions in the consolidated financial statements are plant and equipment and other assets under hire
purchase and finance leases amounting to S$1,001,000 (2014: S$2,204,000).
The carrying amounts of property, plant and equipment held under hire purchase and finance lease are as follows:
2015
S$’000
2014
S$’000
The Group
Plant and machinery – 4,645
Other assets 4,074 498
4,074 5,143
19b The Group’s major properties comprise freehold land in Malaysia and the following leasehold land and buildings:
(i) Factory and office buildings in Jurong, Singapore;
(ii) Land and building in Jurong, Singapore, leased for the operation of a resort-style marina;
(iii) Land and buildings in People’s Republic of China, Hong Kong and Malaysia; and
(iv) Factory and office buildings in United Arab Emirates
19c Included in the Group’s property, plant and equipment are property, plant and equipment of subsidiaries of net book
value of S$20,716,000 (2014: S$32,511,000) charged by way of debentures to banks for overdraft and banking facilities
granted (Note 26).
19d The Group’s net impairment loss of S$5,460,000 (2014: net write-back of S$2,276,000) comprises:
(i) an impairment loss of S$2,134,000 (2014: S$104,000) is recognised for certain plant and equipment, based on
value-in-use calculations;
(ii) an impairment loss of S$3,337,000 (2014: S$92,000) is recognised for certain idle plant and machinery, based on
their recoverable amounts derived from fair value less cost of disposal; and
(iii) a write-back of allowance for impairment loss of S$11,000 for Chemicals division in Singapore. In 2014, a write-
back of allowance for impairment loss of S$2,472,000 was recognised for its leasehold land in Singapore based
on its fair value, as determined by an independent professional valuer using discounted cash flow approach over
a 10-year period, discounted to arrive at the present value.
19e In 2014, a leasehold building with net carrying value of S$25,000, was returned to the authority upon the expiry of
lease terms. The corresponding revaluation reserve of S$1,726,000 was released to revenue reserve upon the return of
leasehold land and building.

75ANNUAL REPORT 2015
Notes to the Financial StatementsFor the financial year ended 31 December 2015
20. INVESTMENT PROPERTIES
The Group
Note
2015
S$’000
2014
S$’000
Cost
At 1 January and 31 December 11,214 11,214
Accumulated depreciation and impairment losses
At 1 January 2,566 2,794
Depreciation charge for the year 8 172 172
Impairment charge for the year 6 100 –
Write-back of allowance for impairment loss 6 – (400)
At 31 December 2,838 2,566
Net book value at 31 December 8,376 8,648
Fair value at 31 December 10,213 10,425
Investment properties of the Group comprise mainly:
Description Location Existing Use Tenure
Office building 118 Joo Chiat Road Singapore 427407 Office Freehold
Valuation techniques and processes
The Group engages an external, independent and qualified valuer (the “valuer”) to determine the fair value of the
property on an annual basis based on the property’s highest and best use.
The fair value of the Group’s investment properties, classified as Level 3 fair value, has been generally derived using the
direct sale comparison approach. In arriving at its fair value, the valuer considered selling price per square foot of shops
and offices in the vicinity. Adjustments have been made to reflect the differences in size, location, condition, tenure,
prevailing market conditions and other relevant factors affecting its fair value. The Group has recognised impairment
loss on the investment properties amounting to S$100,000 during the financial year.
Investment properties are leased to non-related parties under operating leases (Note 35c).

NSL LTD76
Notes to the Financial StatementsFor the financial year ended 31 December 2015
20. INVESTMENT PROPERTIES (CONTINUED)
Valuation techniques and processes (continued)
The following amounts are recognised in the consolidated income statement:
The Group
2015
S$’000
2014
S$’000
Rental income 374 372
Direct operating expenses arising from investment properties that generated rental
income 281 325
Other direct operating expenses arising from investment properties that did not
generate rental income 12 12
21. INVESTMENTS IN SUBSIDIARIES
The Company
2015
S$’000
2014
S$’000
Equity investments at cost
Balance at 1 January 93,232 90,901
Additions – 50,000
Disposals – (47,669)
93,232 93,232
Less: allowance for impairment (8,000) (8,000)
Balance at 31 December 85,232 85,232
In 2014, the Company transferred all its equity stakeholding in NSL Engineering Pte Ltd to a newly incorporated wholly-
owned subsidiary, NSL Engineering Holdings Pte Ltd at the consideration of S$50,000,000. This has resulted the write-
back of previously recognised impairment allowance, amounted to S$12,511,000 in the previous financial year.
Details regarding significant subsidiaries are set out in Note 41.
21a Carrying value of non-controlling interests
2015
S$’000
2014
S$’000
Emix (HK) Limited 3,474 2,256
Dubai Precast LLC (6,223) (6,088)
NSL OilChem Waste Management Pte. Ltd. 5,507 6,303
Raffles Marina Ltd 5,653 5,559
Other subsidiaries with immaterial non-controlling interests 2,596 5,787
Total 11,007 13,817

77ANNUAL REPORT 2015
Notes to the Financial StatementsFor the financial year ended 31 December 2015
21. INVESTMENTS IN SUBSIDIARIES (CONTINUED)
21b Summarised financial information on subsidiaries with material non-controlling interests
Set out below are the summarised financial information for each subsidiary that has non-controlling interests that are
material to the Group. These are presented before inter-company eliminations.
There were no transactions with non-controlling interests for the financial year ended 31 December 2015 and 2014.
Summarised balance sheet
Emix (HK)
Limited
S$’000
Dubai
Precast LLC
S$’000
NSL OilChem
Waste
Management
Pte. Ltd.
S$’000
Raffles
Marina Ltd
S$’000
2015
Assets
– Current assets 12,726 29,032 9,644 2,393
– Non-current assets 7,468 9,771 49,226 33,232
20,194 38,803 58,870 35,625
Liabilities
– Current liabilities 2,824 20,784 11,183 2,400
– Non-current liabilities – 54,555 2,879 21,897
2,824 75,339 14,062 24,297
Net assets / (liabilities) 17,370 (36,536) 44,808 11,328
2014
Assets
– Current assets 6,920 24,387 28,994 2,940
– Non-current assets 6,888 9,056 36,208 33,852
13,808 33,443 65,202 36,792
Liabilities
– Current liabilities 2,526 19,245 9,773 3,558
– Non-current liabilities – 50,940 4,140 22,097
2,526 70,185 13,913 25,655
Net assets / (liabilities) 11,282 (36,742) 51,289 11,137

NSL LTD78
Notes to the Financial StatementsFor the financial year ended 31 December 2015
21. INVESTMENTS IN SUBSIDIARIES (CONTINUED)
21b Summarised financial information on subsidiaries with material non-controlling interests (continued)
Summarised statement of comprehensive income
Emix (HK)
Limited
S$’000
Dubai
Precast LLC
S$’000
NSL OilChem
Waste
Management
Pte. Ltd.
S$’000
Raffles
Marina Ltd
S$’000
2015
Revenue 40,723 42,843 31,238 13,888
Profit / (loss) before income tax 7,969 2,727 (7,502) 480
Income tax (expense) / credit (1,319) – 1,027 (292)
Profit / (loss) after tax 6,650 2,727 (6,475) 188
Other comprehensive income / (loss) 860 (2,115) – –
Total comprehensive income / (loss) 7,510 612 (6,475) 188
Total comprehensive income / (loss)
allocated to non-controlling interests 1,502 122 (796) 94
Dividends paid to non-controlling interests (284) – – –
2014
Revenue 32,564 31,993 57,604 15,722
Profit / (loss) before income tax 4,835 (3,674) 10,177 3,235
Income tax (expense) / credit (801) – (1,446) 1,681
Profit / (loss) after tax 4,034 (3,674) 8,731 4,916
Other comprehensive income / (loss) 468 (1,325) – –
Total comprehensive income / (loss) 4,502 (4,999) 8,731 4,916
Total comprehensive income / (loss)
allocated to non-controlling interests 900 (1,000) 1,073 2,453
Dividends paid to non-controlling interests – – (627) –

79ANNUAL REPORT 2015
Notes to the Financial StatementsFor the financial year ended 31 December 2015
21. INVESTMENTS IN SUBSIDIARIES (CONTINUED)
21b Summarised financial information on subsidiaries with material non-controlling interests (continued)
Summarised statement of cash flows
Emix (HK)
Limited
S$’000
Dubai
Precast LLC
S$’000
NSL OilChem
Waste
Management
Pte. Ltd.
S$’000
Raffles
Marina Ltd
S$’000
2015
Cash flows from operating activities
Cash generated from operations 8,360 4,375 5,353 1,420
Income tax paid, net (1,281) – (1,041) –
Interest (paid) / received (23) – – 10
Net cash provided by / (used in)
operating activities 7,056 4,375 4,312 1,430
Net cash generated from / (used in)
investing activities 36 (1,754) (14,889) (957)
Net cash (used in) / provided by
financing activities (1,763) (151) 5,185 (585)
Includes:
- Interest paid – (144) (132) (585)
Net increase / (decrease) in cash and
cash equivalents 5,329 2,470 (5,392) (112)
Cash and cash equivalents at beginning
of year 2,735 466 5,910 1,300
Exchange gain on cash and cash
equivalents 736 160 – –
Cash and cash equivalents at end of
year 8,800 3,096 518 1,188

NSL LTD80
Notes to the Financial StatementsFor the financial year ended 31 December 2015
21. INVESTMENTS IN SUBSIDIARIES (CONTINUED)
21b Summarised financial information on subsidiaries with material non-controlling interests (continued)
Emix (HK)
Limited
S$’000
Dubai
Precast LLC
S$’000
NSL OilChem
Waste
Management
Pte. Ltd.
S$’000
Raffles
Marina Ltd
S$’000
2014
Cash flows from operating activities
Cash generated from / (used in) operations 1,477 (175) 15,742 1,318
Income tax paid, net (387) – (851) –
Interest paid (24) – – –
Net cash provided by / (used in)
operating activities 1,066 (175) 14,891 1,318
Net cash generated from / (used in)
investing activities 2 (170) (12,124) (1,724)
Net cash (used in) / provided by
financing activities (1,144) 661 (7,861) (548)
Includes:
- Interest paid – (120) (49) (548)
Net (decrease) / increase in cash and
cash equivalents (76) 316 (5,094) (954)
Cash and cash equivalents at beginning
of year 3,074 123 11,004 2,254
Exchange gain on cash and cash
equivalents (263) 27 – –
Cash and cash equivalents at end of
year 2,735 466 5,910 1,300

81ANNUAL REPORT 2015
Notes to the Financial StatementsFor the financial year ended 31 December 2015
22. INVESTMENTS IN ASSOCIATED COMPANIES
The Group
2015
S$’000
2014
S$’000
Carrying value of Group’s interest in associated companies 52,692 6,107
22a In 2014, write-back of allowance for impairment S$106,000 relating to investments in associated companies was
recognised, based on the recoverable amounts derived from estimated future cash flows expected from the investments.
22b The Group has S$6,926,000 (2014: S$3,043,000) unrecognised losses of associated companies during the year. The
accumulated losses of associated companies not recognised were S$11,320,000 (2014: S$4,394,000) at the balance sheet
date.
22c The summarised financial information (not adjusted for the proportionate of effective ownership interest held by the
Group) of associated companies as at balance sheet date is as follows:
The Group
2015 2014
S$’000 S$’000
- Assets 299,264 134,927
- Liabilities (218,595) (131,425)
- Revenue 204,329 71,080
- Net loss for the financial year (500) (6,909)
Details regarding significant associated companies are set out in Note 41.
Set out below are the associated companies of the Group as at 31 December 2015, which, in the opinion of the directors,
are material to the Group. The associated companies as listed below have share capital consisting solely of ordinary
shares, which are held directly by the Group; the country of incorporation is also their principal place of business.
Name of entity
Place of
business/
country of
incorporation
% of
ownership
interest
PEINER SMAG Lifting Technologies GmbH Germany 33.33
PEINER SMAG Lifting Technologies GmbH’s principal activities are investment holding and manufacturing, design and
sale of container and bulk handling equipment.
There are no contingent liabilities relating to the Group’s interest in the associated companies.

NSL LTD82
Notes to the Financial StatementsFor the financial year ended 31 December 2015
22. INVESTMENTS IN ASSOCIATED COMPANIES (CONTINUED)
Summarised financial information for associated companies
Set out below are the summarised financial information for PEINER SMAG Lifting Technologies GmbH.
2015 2014
S$’000 S$’000
Revenue 133,850
Profit after tax 6,240 –
Other comprehensive income 2,199 –
Total comprehensive income 8,439 –
Attributable to:
- Non-controlling interests 1,086 –
- Shareholders of associated company 7,353 –
Current assets 121,811 –
Non-current assets 56,969 –
Current liabilities (76,768) –
Non-current liabilities (2,187) –
Net assets 99,825 –
Attributable to:
- Non-controlling interests 9,834 –
- Shareholders of associated company 89,991 –
Share of net assets at acquisition date 29,026 –
Goodwill 16,312 –
Carrying value of interest in associated company at acquisition date 45,338 –
Group’s share of:
Profit after tax 1,805 –
Other comprehensive income 646 –
Total comprehensive income 2,451 –
Dividends received during the year (1,547) –
Carrying value of interest in associated company at end of the year 46,242 –
Add: Carrying value of individually immaterial associated companies, in aggregate 6,450 6,107
Carrying value of Group’s interest in associated companies 52,692 6,107

83ANNUAL REPORT 2015
Notes to the Financial StatementsFor the financial year ended 31 December 2015
22. INVESTMENTS IN ASSOCIATED COMPANIES (CONTINUED)
The following table summarises, in aggregate, the Group’s share of profit and other comprehensive income of the
Group’s individually immaterial associated companies accounted for using the equity method:
2015
S$’000
2014
S$’000
Net (loss) / profit (82) 238
Other comprehensive loss (293) (33)
Total comprehensive (loss) / income (375) 205
The information above reflects the amounts included in the financial statements of the associated companies (and
not the Group’s share of those amounts), where necessary, adjusted to reflect adjustments made by the Group when
applying the equity method of accounting.
23. LONG TERM RECEIVABLES AND PREPAYMENTS
The Group The Company
2015
S$’000
2014
S$’000
2015
S$’000
2014
S$’000
Prepayments 1,026 1,608 – –
Less: Current portion of long term prepayments (693) (649) – –
Non-current portion of long term prepayments 333 959 – –
Amounts owing by subsidiaries - non-trade(a) – – 162,416 159,714
Less: Allowance for impairment of receivables – – (41,062) (41,062)
– – 121,354 118,652
Amounts owing by associated companies - non-trade(a) 489 457 – –
Less: Allowance for impairment of receivables – (88) – –
489 369 – –
822 1,328 121,354 118,652
23a The amounts owing by subsidiaries and associated companies are non-trade, interest free, unsecured and are not
expected to be repaid within the next 12 months after the balance sheet date. Settlement of the amounts owing by
subsidiaries and associated companies are neither planned nor likely to occur in the foreseeable future. As a result, such
loans are in substance part of the Group’s net investments in associated companies and the Company’s net investments
in subsidiaries. The loans are accounted for in accordance with Note 2K.

NSL LTD84
Notes to the Financial StatementsFor the financial year ended 31 December 2015
24. AVAILABLE-FOR-SALE FINANCIAL ASSETS
The Group The Company
2015
S$’000
2014
S$’000
2015
S$’000
2014
S$’000
Non-current
Balance at 1 January 8,882 9,465 8,317 8,925
Fair value gains / (losses) recognised in other
comprehensive income 532 (332) 615 (390)
Disposals (96) (251) (96) (218)
Balance at 31 December 9,318 8,882 8,836 8,317
Total losses reclassified from fair value reserve to profit
or loss for available-for-sale financial assets held at the
end of financial year 96 251 96 218
Available-for-sale financial assets are analysed as follows:
The Group The Company
2015
S$’000
2014
S$’000
2015
S$’000
2014
S$’000
Listed securities
- Equity securities - Singapore 50 68 50 68
Unlisted securities
- Equity securities 9,089 8,643 8,786 8,249
- Other investments 179 171 – –
9,318 8,882 8,836 8,317
25. INTANGIBLE ASSETS
The Group
2015
S$’000
2014
S$’000
Goodwill arising on consolidation(a) 8,678 8,678
Acquired intangible assets(b) 628 761
9,306 9,439

85ANNUAL REPORT 2015
Notes to the Financial StatementsFor the financial year ended 31 December 2015
25. INTANGIBLE ASSETS (CONTINUED)
25a Goodwill arising on consolidation
The Group
2015
S$’000
2014
S$’000
Cost and Net Book Value
Balance at 1 January 8,678 8,865
Currency realignment – (5)
Reclassified to disposal group (Note 11) – (182)
Balance at 31 December 8,678 8,678
Impairment tests for goodwill
Goodwill is allocated to the Group’s cash-generating-units (“CGUs”) identified according to countries of operation and
business segments.
A segment-level summary of the goodwill allocation is as follows:
Group
2015 2014
Singapore Others Total Singapore Others Total
S$’000 S$’000 S$’000 S$’000 S$’000 S$’000
Precast & PBU – 8,024 8,024 – 8,024 8,024
Environmental Services 654 – 654 654 – 654
654 8,024 8,678 654 8,024 8,678
The recoverable amount of a CGU is determined based on value-in-use calculations. Cash flow projections used in the
value-in-use calculations were based on financial budgets approved by management covering a five-year period. Cash
flows beyond five-year period are extrapolated using the estimated growth rates stated below. The growth rate did not
exceed the long term average growth rate for the business in which the CGU operates.
Key assumptions used for value-in-use calculations are as follows:
2015 2014
Growth rate (1) Discount rate (2) Growth rate (1) Discount rate (2)
Precast & PBU 0% 12% 0% 12%
Environmental Services 3% 12% 3% 12%
(1) Weighted average growth rate used to extrapolate cash flows beyond the budget period.(2) Pre-tax discount rate applied to cash flow projections.
These assumptions have been used for the analysis of each CGU within the business segment. The weighted average
growth rates used are consistent with the industry forecast. The discount rates used are pre-tax and reflected specific
risks relating to the relevant segments.

NSL LTD86
Notes to the Financial StatementsFor the financial year ended 31 December 2015
25. INTANGIBLE ASSETS (CONTINUED)
25b Acquired intangible assets
The Group
2015
S$’000
2014
S$’000
Cost
Balance at 1 January 3,528 7,690
Additions 90 671
Write off – (44)
Currency realignment (97) (280)
Reclassified to disposal group – (4,509)
Balance at 31 December 3,521 3,528
Accumulated amortisation
Balance at 1 January 2,767 6,883
Amortisation charge for the year:
- Continuing operations (Note 8) 190 185
- Discontinued operations – 238
Write off – (44)
Currency realignment (64) (227)
Reclassified to disposal group – (4,268)
Balance at 31 December 2,893 2,767
Net Book Value at 31 December 628 761
Amortisation expense is included in the consolidated income statement as cost of sales.
26. BORROWINGS
26a Short term borrowings
The Group
2015
S$’000
2014
S$’000
Bank overdrafts – secured (Note 18) – 912
Short term bank loans
- Secured 2,000 3,024
2,000 3,936
Current portion of long term bank loans (Note 26(b))
- Unsecured 466 738
- Secured 10,529 6,111
10,995 6,849
Hire purchase and finance lease payables – secured (Note 32) 1,199 1,155
Bills payable – secured 4,213 7,755
18,407 19,695

87ANNUAL REPORT 2015
Notes to the Financial StatementsFor the financial year ended 31 December 2015
26. BORROWINGS (CONTINUED)
26b Long term borrowings
The Group
2015
S$’000
2014
S$’000
Bank loans
- Secured 19,394 16,595
- Unsecured 466 738
19,860 17,333
Less: Amounts due within 12 months (Note 26(a)) (10,995) (6,849)
Amounts due after 12 months 8,865 10,484
Hire purchase and finance lease payables – secured (Note 32) 977 1,244
9,842 11,728
The interest rates per annum of the long term bank loans during the financial year are as follows:
The Group
2015 2014
Loans denominated in:
- Malaysian Ringgit 4.4% to 6.8% 4.4% to 6.8%
- Hong Kong Dollars 2.3% to 6.3% 2.6% to 6.3%
- United Arab Emirates Dirhams 6.3% 7%
The banking facilities are secured against fixed and floating charge over bank deposits and property, plant and
equipment of certain subsidiaries (Notes 18 and 19) of the Group.
Included in bank borrowings are balances amounting to S$4,631,000 of a subsidiary of the Group to be repaid every
quarterly with a principal amount of S$244,000 until August 2020. The subsidiary’s loan agreement (classified as non-
current during the year) is subjected to covenant clauses, whereby the subsidiary is required to meet certain key financial
ratios. The subsidiary did not fulfil the cashflow/debt service ratio as required in the contract.
Due to this breach of the covenant clause, the bank is contractually entitled to request for immediate repayment of the
outstanding loan amount. The outstanding balance is presented as a current portion of long term bank loans as at 31
December 2015.
Subsequent to the financial year on 3 March 2016, the subsidiary has obtained the waiver from the bank to defer
assessment of the compliance of the financial covenant to financial year ending 2016.

NSL LTD88
Notes to the Financial StatementsFor the financial year ended 31 December 2015
27. TRADE AND OTHER PAYABLES
The Group The Company
2015
S$’000
2014
S$’000
2015
S$’000
2014
S$’000
Trade payables – non-related parties 46,666 45,487 – –
Other payables and accruals
- Accrued operating expenses, including staff
compensation 24,137 23,934 2,636 2,592
- Project related accruals 19,183 27,578 – –
- Accrued liability for capital expenditure 331 607 – –
- Advances received from customers 20,357 25,963 – –
- Sundry payables(a) 5,384 6,293 2,730 2,471
Amounts owing to subsidiaries
- Non-trade(a) – – 12,437 13,594
116,058 129,862 17,803 18,657
27a The non-trade amounts owing to subsidiaries and sundry payables are unsecured, interest free and repayable on
demand.
28. PROVISION FOR OTHER LIABILITIES AND CHARGES
The provision for other liabilities and charges were provision made for warranties for certain products. The Group
gave two to five years warranties on certain products and undertakes to repair or replaced items that fail to perform
satisfactorily. A provision was recognised at the balance sheet date for expected warranty claims based on past
experience of the level of repairs and returns. The movement of the provision is as follows:
The Group
2015
S$’000
2014
S$’000
Balance at 1 January – 2,349
Provision made – 351
Provision utilised – (243)
Currency realignment – (3)
Reclassified to disposal group (Note 11) – (2,454)
Balance at 31 December – –

89ANNUAL REPORT 2015
Notes to the Financial StatementsFor the financial year ended 31 December 2015
29. PROVISION FOR RETIREMENT BENEFITS
The amounts recognised in the balance sheets are as follows:
The Group
2015
S$’000
2014
S$’000
Present value of unfunded obligations 2,519 1,994
Certain subsidiaries of the Group operate separate unfunded defined retirement benefit schemes for certain employees.
Benefits are payable based on the last drawn salaries of the respective employees and the number of years of service
with the subsidiaries of the Group. Provision is made using the projected unit credit method described in Note 2V.
Movement in the liability recognised in the balance sheets:
The Group
2015
S$’000
2014
S$’000
Non-current
Balance at 1 January 1,994 1,691
Net expense (Note 9) 517 398
Benefits paid (84) (165)
Currency realignment 92 70
Balance at 31 December 2,519 1,994
The principal actuarial assumptions used were as follows:
The Group
2015
%
2014
%
Discount rate 5 5
Salary increment rate 5 5

NSL LTD90
Notes to the Financial StatementsFor the financial year ended 31 December 2015
30. DEFERRED TAXATION
Deferred income tax assets and liabilities are offset when there is a legally enforceable right to set off current income tax
assets against current income tax liabilities and when the deferred income taxes relate to the same fiscal authority. The
following amounts, determined after appropriate offsetting, are shown in the balance sheets as follows:
The Group The Company
2015
S$’000
2014
S$’000
2015
S$’000
2014
S$’000
Deferred tax assets
To be recovered within one year (205) (404) – –
To be recovered after one year (5,085) (2,943) – –
(5,290) (3,347) – –
Deferred tax liabilities
To be settled within one year 1,215 570 – –
To be settled after one year 2,649 3,270 – 37
3,864 3,840 – 37
The movement in deferred taxes is as follows:
The Group The Company
2015
S$’000
2014
S$’000
2015
S$’000
2014
S$’000
Balance at 1 January 493 4,005 37 99
Credited to:
- Profit or loss (Note 10) (2,157) (2,625) (37) (21)
- Other comprehensive income (14) (37) – (41)
Currency realignment 252 (26) – –
Reclassified to disposal group – (824) – –
Balance at 31 December (1,426) 493 – 37
Deferred income tax assets are recognised for tax losses carried forward and unutilised capital allowances to the extent
that realisation of the related tax benefits through future taxable profits is probable. At 31 December 2015, the Group
has unutilised tax losses and capital allowances of S$12,691,000 (2014: S$17,485,000) and S$4,021,000 (2014: S$4,986,000)
respectively for which deferred tax benefits have not been recognised in the financial statements. These are available
for set-off against future taxable profits subject to meeting certain statutory requirements in their respective countries
of incorporation by those companies with unrecognised tax losses and capital allowances. These unutilised tax losses
and capital allowances do not have expiry dates, except for unutilised tax losses of S$2,514,000 (2014: S$1,976,000) that
will expire in five years for offsetting against future taxable profits.
Deferred income tax liabilities of S$33,000 (2014: S$75,000) have not been recognised for the withholding and other
taxes that will be payable on the earnings of overseas subsidiaries when remitted to the holding company. These
unremitted earnings are permanently reinvested and amounting to S$329,000 (2014: S$1,527,000) at the balance sheet
date.

91ANNUAL REPORT 2015
Notes to the Financial StatementsFor the financial year ended 31 December 2015
30. DEFERRED TAXATION (CONTINUED)
30a Movement in the Group’s deferred tax assets and liabilities (prior to legally enforceable offsetting of balances within
same tax authority) are as follows:
The Group – Deferred Tax Liabilities
Accelerated tax
depreciation Fair value gains
Unremitted
income Total
2015 2014 2015 2014 2015 2014 2015 2014
S$’000 S$’000 S$’000 S$’000 S$’000 S$’000 S$’000 S$’000
Balance at 1 January 3,389 4,988 112 637 1,119 1,070 4,620 6,695
(Credited) / charged to:
- Profit or loss (928) (422) (36) (17) 117 86 (847) (353)
- Other comprehensive
income – – (14) – – (37) (14) (37)
Currency realignment 49 8 – (10) (3) – 46 (2)
Reclassified to disposal group – (1,185) – (498) – – – (1,683)
Balance at 31 December 2,510 3,389 62 112 1,233 1,119 3,805 4,620
The Group – Deferred Tax Assets
Provisions
Unutilised tax
losses / capital
allowances Deferred income Total
2015 2014 2015 2014 2015 2014 2015 2014
S$’000 S$’000 S$’000 S$’000 S$’000 S$’000 S$’000 S$’000
Balance at 1 January (1,828) (2,029) (2,011) (333) (288) (328) (4,127) (2,690)
Charged / (credited) to:
- Profit or loss 313 (702) (1,677) (1,610) 54 40 (1,310) (2,272)
Currency realignment 164 44 42 (68) – – 206 (24)
Reclassified to disposal group – 859 – – – – – 859
Balance at 31 December (1,351) (1,828) (3,646) (2,011) (234) (288) (5,231) (4,127)
30b Movement in the Company’s deferred tax liabilities are as follows:
The Company – Deferred Tax Liabilities
Unremitted income Total
2015 2014 2015 2014
S$’000 S$’000 S$’000 S$’000
Balance at 1 January 37 99 37 99
Credited to:
- Profit or loss (37) (21) (37) (21)
- Other comprehensive income – (41) – (41)
Balance at 31 December – 37 – 37

NSL LTD92
Notes to the Financial StatementsFor the financial year ended 31 December 2015
31. DEFERRED INCOME
Deferred income relates mainly to unearned entrance fees received in respect of club memberships sold. The deferred
income is amortised over the remaining membership period.
The Group
2015
S$’000
2014
S$’000
Balance at 1 January 1,711 1,932
Additions 107 39
Reclassified to disposal group (Note 11) – (5)
Amortisation charge
- Continuing operations (Note 8) (354) (255)
Currency realignment (13) –
Balance at 31 December 1,451 1,711
Current portion 282 337
Non-current portion 1,169 1,374
1,451 1,711
32. HIRE PURCHASE AND FINANCE LEASE LIABILITIES
Hire purchase and finance lease liabilities are analysed as follows:
The Group
2015
S$’000
2014
S$’000
Minimum hire purchase and finance lease liabilities due:
- Within 1 year 1,246 1,200
- Within 2 to 5 years 1,015 1,292
2,261 2,492
Less: Future finance charges (85) (93)
Present value of hire purchase and finance lease liabilities 2,176 2,399
Present value of hire purchase and finance lease liabilities due:
- Within 1 year 1,199 1,155
- Within 2 to 5 years 977 1,244
2,176 2,399
32a The lease agreements do not have renewal clauses but provide the Group with options to purchase the leased
assets at nominal values at the end of the lease term. The weighted average effective interest rate of the hire
purchase and finance lease payables is 2.6% (2014: 2.6%) per annum.
32b Property, plant and equipment acquired under hire purchase and finance leases liabilities are disclosed in Note
19a.
32c The carrying amounts of non-current hire purchase and finance lease liabilities approximate their fair values.

93ANNUAL REPORT 2015
Notes to the Financial StatementsFor the financial year ended 31 December 2015
33. RELATED PARTY TRANSACTIONS
In addition to the related party information disclosed elsewhere in the financial statements, the Group and the Company
have the following significant transactions with related parties on terms agreed between the parties:
33a Sales and purchases of goods and services
The Group
2015
S$’000
2014
S$’000
Sales to associated companies 2,254 1,186
Purchases of goods from associated companies 54 –
33b Key management’s remuneration
The Group
2015
S$’000
2014
S$’000
Salary and other employee benefits 7,963 7,099
Employer’s contribution to defined contribution plans, including Central Provident Fund 319 221
Retirement benefits 99 103
8,381 7,423
Included in the above are Directors’ fees and Directors’ remuneration of S$614,000 (2014: S$510,000) and S$1,464,000
(2014: S$1,397,000) respectively payable / paid to the Directors of the Company.
The details of Directors’ remuneration are disclosed in the Statement of Corporate Governance.
34. FINANCIAL INFORMATION BY SEGMENTS
Operating segments
Operating segments of the Group are determined based on the Group’s internal reporting structure. Segment
information is presented on the same basis as the internal management reports used by the senior management of the
Group in making strategic decisions.
In determining the operating segments, the Group has considered primarily the types of products and services offered,
and the industry Group companies are operating in and their contribution to the Group.
The Group operates mainly in the manufacturing and sale of building materials, including Precast & Prefabricated
Bathroom Unit (“PBU”) and Dry Mix products, as well as the provision of environmental services and sale of related
products. Accordingly, these activities are grouped into separate operating segments within the three main divisions
of Precast & PBU, Dry Mix and Environmental Services.
Operating segment classified as “Others” relates to the Group’s remaining assets, comprising mainly of investment in
an associated company which specialises in bulk cargo and container lifting devices, operation of a marina club, and
operations in the manufacturing and sale of refractory materials and road stone products.

NSL LTD94
Notes to the Financial StatementsFor the financial year ended 31 December 2015
34. FINANCIAL INFORMATION BY SEGMENTS
Operating segments (continued)
Inter-segment transactions are determined on an arm’s length basis. The performance of the segments is measured in
a manner consistent with that in the consolidated income statement.
The information for the reportable segments for the year ended 31 December 2015 is as follows:
Dry Mix
Precast &
PBU
Environmental
Services Others
Total for
Continuing
Operations
Discontinued
Operations
S$’000 S$’000 S$’000 S$’000 S$’000 S$’000
Revenue
External sales 109,171 244,103 68,266 24,912 446,452 10,684
Inter-segment sales 150 2,774 1,380 1,930 6,234 558
Total revenue 109,321 246,877 69,646 26,842 452,686 11,242
Elimination (150) (2,774) (1,380) (1,930) (6,234) (558)
109,171 244,103 68,266 24,912 446,452 10,684
Profit before Taxation and
Exceptional Items 23,163 14,932 (5,799) (1,398) 30,898 (1,006)
Exceptional items – – – – – 41,145
Profit before taxation 23,163 14,932 (5,799) (1,398) 30,898 40,139
Interest income 117 265 119 3,020 3,521 4
Interest expense (218) (1,085) (230) 42 (1,491) (35)
Depreciation (2,331) (6,328) (4,133) (1,831) (14,623) (895)
Amortisation – (190) – 354 164 (56)
(Impairment) / reversal of
impairment of property,
plant and equipment – (3,336) (2,135) 11 (5,460) (204)
Share of results of
associated companies,
net of tax
- PSLT – – – 1,805 1,805 –
- Others (136) – – 54 (82) –
Total Assets 84,123 221,475 64,931 352,263 722,792 4,229
Total Liabilities 22,563 103,282 16,482 12,243 154,570 1,007
Investment in associated
companies 645 1 – 52,046 52,692 –
Additions to:
- Property, plant and
equipment 840 3,128 16,855 1,247 22,070 2,413
- Intangible assets – 90 – – 90 54

95ANNUAL REPORT 2015
Notes to the Financial StatementsFor the financial year ended 31 December 2015
34. FINANCIAL INFORMATION BY SEGMENTS (CONTINUED)
Operating segments (continued)
The information for the reportable segments for the year ended 31 December 2014 is as follows:
Dry Mix
Precast &
PBU
Environmental
Services Others
Total for
Continuing
Operations
Discontinued
Operations
S$’000 S$’000 S$’000 S$’000 S$’000 S$’000
Revenue
External sales 87,972 219,462 90,083 28,433 425,950 71,492
Inter-segment sales 1 2,042 1,480 1,457 4,980 378
Total revenue 87,973 221,504 91,563 29,890 430,930 71,870
Elimination (1) (2,042) (1,480) (1,457) (4,980) (378)
87,972 219,462 90,083 28,433 425,950 71,492
Profit before Taxation and
Exceptional Items 13,013 (7,953) 8,788 1,651 15,499 6,147
Exceptional items – – – – – 9,957
Profit before taxation 13,013 (7,953) 8,788 1,651 15,499 16,104
Interest income 27 176 51 2,260 2,514 83
Interest expense (175) (1,475) (39) (2) (1,691) (186)
Depreciation (2,199) (8,496) (3,178) (1,715) (15,588) (3,441)
Amortisation – (185) – 255 70 (238)
(Impairment) / reversal of
impairment of property,
plant and equipment – (196) – 2,472 2,276 –
Share of results of
associated companies,
net of tax (1) (3) – 242 238 –
Total Assets 64,498 227,529 70,505 295,603 658,135 75,169
Total Liabilities 20,175 122,107 16,135 13,570 171,987 20,850
Investment in associated
companies – 1 – 6,106 6,107 1
Additions to:
- Property, plant and
equipment 4,239 4,073 6,320 2,010 16,642 2,760
- Intangible assets – 399 – – 399 272

NSL LTD96
Notes to the Financial StatementsFor the financial year ended 31 December 2015
34. FINANCIAL INFORMATION BY SEGMENTS (CONTINUED)
Geographical information
The Group’s business segments operate mainly in the following geographical areas:
(i) Singapore – the Company is headquartered and has operations in Singapore. The operations in this area are
principally the manufacturing and sale of building materials, refractory materials and road stones, the provision
of environmental services and sale of related products, and investment holding;
(ii) Malaysia – the operations in Malaysia are principally the manufacturing and sale of building materials and
refractory materials;
(iii) China and Hong Kong – the operations in China and Hong Kong include the manufacturing and sale of building
materials;
(iv) Germany – PEINER SMAG Lifting Technologies GmbH’s principal activities are investment holding and
manufacturing, design and sale of container and bulk handling equipment.
(v) Other countries – the operations in other countries such as Finland, United Arab Emirates and Indonesia include
the manufacturing and sale of building materials and refractory materials.
The Group
External sales for
continuing operations(1)
Non–current assets for
continuing operations(2)
2015
S$’000
2014
S$’000
2015
S$’000
2014
S$’000
Singapore 224,072 188,918 84,833 75,177
Malaysia 64,629 97,708 32,677 45,023
China (including Hong Kong) 45,347 31,735 18,227 18,172
Germany(3) – – 46,242 –
Others 112,404 107,589 25,286 24,864
446,452 425,950 207,265 163,236
(1) External sales by geographical segment are determined based on locations of the respective customers.
(2) Non-current assets by geographical segment are based on locations of the respective assets. Non-current assets include property,
plant and equipment, investment properties, associated companies, intangible assets and other non-current assets.
(3) This relates to our 33.33% interest in associated company PSLT which is incorporated in Germany.

97ANNUAL REPORT 2015
Notes to the Financial StatementsFor the financial year ended 31 December 2015
35. COMMITMENTS
35a Capital commitments
Capital commitments contracted for at the balance sheet date but not recognised in the financial statements, excluding
those relating to investments in associated companies (Note 22) are as follows:
The Group
2015
S$’000
2014
S$’000
Commitments for capital expenditure not provided for in
the financial statements in respect of contracts placed for
property, plant and equipment 853 1,297
Commitments in respect of equity participation in an
associated company 7,424 6,662
8,277 7,959
35b Operating lease commitments - where the Group or Company is a lessee
The Group and Company lease various parcels of land, office space, office equipment and motor vehicles under non-
cancellable operating lease agreements. The leases have varying terms, escalation clauses and renewal rights.
The future aggregate minimum lease payments under non-cancellable operating leases contracted for at the reporting
date but not recognised as liabilities, are as follows:
The Group The Company
2015
S$’000
2014
S$’000
2015
S$’000
2014
S$’000
Payable:
Within 1 year 7,814 7,610 621 784
Within 2 to 5 years 12,838 14,945 22 620
After 5 years 13,753 12,206 – –
34,405 34,761 643 1,404
35c Operating lease commitments - where the Group is a lessor
The Group leases out certain property, plant and equipment and investment properties to non-related parties under
non-cancellable operating leases. The future minimum lease receivables under non-cancellable operating leases
contracted for at the reporting date but not recognised as receivables, are as follows:
The Group
2015
S$’000
2014
S$’000
Receivable:
Within 1 year 1,011 506
Within 2 to 5 years 408 300
1,419 806

NSL LTD98
Notes to the Financial StatementsFor the financial year ended 31 December 2015
36. FINANCIAL RISK MANAGEMENT
The Group’s activities expose it to a variety of financial risks: market risk (including currency risk, price risk and interest
rate risk), credit risk and liquidity risk. The Group’s overall risk management programme focuses on the unpredictability of
financial markets and seeks to minimise potential adverse effects on the Group’s financial performance. The Group uses
derivative financial instruments such as foreign exchange contracts to hedge certain risk exposures.
Financial risk management is carried out and monitored by a central treasury department in accordance with established
policies and guidelines, set by the Board of Directors.
36a Market risk
(i) Currency risk
The Group operates in various countries, which include Singapore, Malaysia, People’s Republic of China (including
Hong Kong), Indonesia, Thailand, United Arab Emirates, Germany and Finland. Certain entities in the Group
regularly transact in currencies other than their respective functional currencies (“foreign currencies”) such as
United States Dollar (“USD”), Malaysian Ringgit (“MYR”) and Euro (“EUR”).
Currency risk arises when transactions are denominated in foreign currencies. The Group manages its currency
risk through natural hedge and foreign exchange forward contracts. It is the Group’s policy not to enter into
forward contracts until a firm commitment is in place.
In addition, the Group is exposed to currency translation risk on the net assets in foreign operations including
foreign currency loans to associated companies which are part of the net investments in foreign operations and
deferred in equity until disposal of the foreign operations. Where appropriate, this exposure is managed through
borrowings denominated in the relevant foreign currencies.
The Group’s currency exposure (net of currency forwards) is as follows:
SGD USD RMB MYR EUR THB AED Others Total
S$’000 S$’000 S$’000 S$’000 S$’000 S$’000 S$’000 S$’000 S$’000
The Group
At 31 December 2015
Cash and bank balances 300,770 1,654 3,127 11,025 4,173 – 3,098 10,698 334,545
Receivables 49,788 416 722 18,524 11,884 – 18,243 4,482 104,059
Available-for-sale financial assets 354 178 – – – 8,786 – – 9,318
Short term borrowings (7,830) – (509) (5,895) – – (661) (3,512) (18,407)
Trade and other payables (29,961) (3,093) (1,963) (22,252) (18,476) (15,891) (4,577) (96,213)
Long term borrowings (977) – – (8,450) – – (415) – (9,842)
Net financial assets / (liabilities) 312,144 (845) 1,377 (7,048) (2,419) 8,786 4,374 7,091 323,460
Less: net financial (assets) /
liabilities denominated in the
respective entities’ functional
currencies (310,603) (44) (83) 6,434 2,636 – (4,374) (4,551)
Add: currency forwards – 818 – 633 – – – –
Currency exposure 1,541 (71) 1,294 19 217 8,786 – 2,540
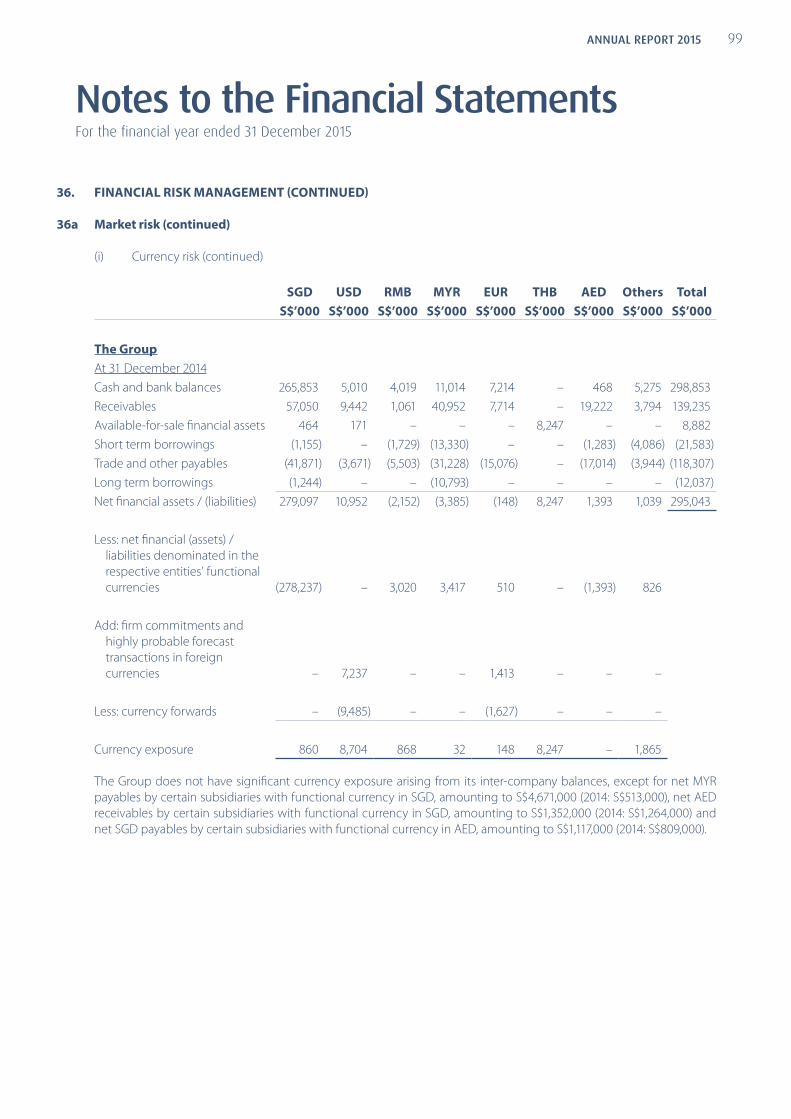
99ANNUAL REPORT 2015
Notes to the Financial StatementsFor the financial year ended 31 December 2015
36. FINANCIAL RISK MANAGEMENT (CONTINUED)
36a Market risk (continued)
(i) Currency risk (continued)
SGD USD RMB MYR EUR THB AED Others Total
S$’000 S$’000 S$’000 S$’000 S$’000 S$’000 S$’000 S$’000 S$’000
The Group
At 31 December 2014
Cash and bank balances 265,853 5,010 4,019 11,014 7,214 – 468 5,275 298,853
Receivables 57,050 9,442 1,061 40,952 7,714 – 19,222 3,794 139,235
Available-for-sale financial assets 464 171 – – – 8,247 – – 8,882
Short term borrowings (1,155) – (1,729) (13,330) – – (1,283) (4,086) (21,583)
Trade and other payables (41,871) (3,671) (5,503) (31,228) (15,076) – (17,014) (3,944) (118,307)
Long term borrowings (1,244) – – (10,793) – – – – (12,037)
Net financial assets / (liabilities) 279,097 10,952 (2,152) (3,385) (148) 8,247 1,393 1,039 295,043
Less: net financial (assets) /
liabilities denominated in the
respective entities’ functional
currencies (278,237) – 3,020 3,417 510 – (1,393) 826
Add: firm commitments and
highly probable forecast
transactions in foreign
currencies – 7,237 – – 1,413 – – –
Less: currency forwards – (9,485) – – (1,627) – – –
Currency exposure 860 8,704 868 32 148 8,247 – 1,865
The Group does not have significant currency exposure arising from its inter-company balances, except for net MYR
payables by certain subsidiaries with functional currency in SGD, amounting to S$4,671,000 (2014: S$513,000), net AED
receivables by certain subsidiaries with functional currency in SGD, amounting to S$1,352,000 (2014: S$1,264,000) and
net SGD payables by certain subsidiaries with functional currency in AED, amounting to S$1,117,000 (2014: S$809,000).

NSL LTD100
Notes to the Financial StatementsFor the financial year ended 31 December 2015
36. FINANCIAL RISK MANAGEMENT (CONTINUED)
36a Market risk (continued)
(i) Currency risk (continued)
SGD USD RMB EUR THB Total
S$’000 S$’000 S$’000 S$’000 S$’000 S$’000
The Company
At 31 December 2015
Cash and bank balances 226,871 155 – 7 – 227,033
Receivables 36,701 – – – – 36,701
Available-for-sale financial assets 50 – – – 8,786 8,836
Trade and other payables (17,554) (247) (2) – – (17,803)
Net financial assets / (liabilities) 246,068 (92) (2) 7 8,786 254,767
Less: net financial assets denominated in
the Company’s functional currency (246,068) – – – –
Currency exposure – (92) (2) 7 8,786
The Company
At 31 December 2014
Cash and bank balances 190,527 91 – 8 – 190,626
Receivables 35,135 – – – – 35,135
Available-for-sale financial assets 69 1 – – 8,247 8,317
Trade and other payables (18,423) (232) (2) – – (18,657)
Net financial assets / (liabilities) 207,308 (140) (2) 8 8,247 215,421
Less: net financial assets denominated in
the Company’s functional currency (207,308) – – – –
Currency exposure – (140) (2) 8 8,247
The Group and Company have no other significant currency exposure, except to USD and THB. Currency
exposure to THB mainly arose from its available-for-sale financial assets in the form of equity investments.

101ANNUAL REPORT 2015
Notes to the Financial StatementsFor the financial year ended 31 December 2015
36. FINANCIAL RISK MANAGEMENT (CONTINUED)
36a Market risk (continued)
(i) Currency risk (continued)
If the USD and THB change against the SGD by 5% and 3% (2014: 5% and 3%) respectively with all other variables
including tax rate being held constant, the effects arising from the net financial asset / liability position will be as
follows:
2015 2014
Increase / (decrease)
Profit after
tax
Other
comprehensive
income Profit after tax
Other comprehensive
income
S$’000 S$’000 S$’000 S$’000
The Group
USD against SGD
- strengthened 55 7 339 7
- weakened (55) (7) (339) (7)
THB against SGD
- strengthened – 264 – 247
- weakened – (264) – (247)
The Company
USD against SGD
- strengthened (4) – 6 –
- weakened 4 – (6) –
THB against SGD
- strengthened – 264 – 247
- weakened – (264) – (247)
(ii) Price risk
The Group and the Company are exposed to equity securities price risk arising from the investments held by the
Group and the Company which are classified on the consolidated balance sheet as available-for-sale financial
assets (Note 24).
If equity prices of available-for-sale financial assets held by the Company and subsidiaries of the Group increase
/ decrease by 5% (2014: 5%) with all other variables including tax rate being held constant, other comprehensive
income of the Group and the Company will be higher or lower by S$462,000 (2014: S$439,000) and S$442,000
(2014: S$416,000) respectively.

NSL LTD102
Notes to the Financial StatementsFor the financial year ended 31 December 2015
36. FINANCIAL RISK MANAGEMENT (CONTINUED)
36a Market risk (continued)
(iii) Cash Flow and Fair Value Interest Rate Risk
Cash flow interest rate risk is the risk that the future cash flows of a financial instrument will fluctuate because of
changes in market interest rates. Fair value interest rate risk is the risk that the fair value of a financial instrument
will fluctuate due to changes in market interest rates.
The Group’s exposure to changes in interest rates relates mainly to debt obligations with financial institutions
and cash and bank balances. Bank loans are contracted on both fixed and variable terms with the objectives of
minimising interest burden whilst maintaining an acceptable debt maturity profile. As the Group does not have
significant fixed-interest borrowings, it does not have significant exposure to fair value interest rate risk.
The Group’s borrowings and cash and bank balances at variable rates (i.e. cash flow interest rate risk) on which
effective hedges have not been entered into, are denominated mainly in SGD. If the SGD interest rate increases /
decreases by 0.5% (2014: 0.5%) with all other variables being held constant, the net profit after tax will be higher
/ lower by S$934,000 (2014: S$1,020,000).
36b Credit risk
Credit risk refers to the risk that a counterpart will default on its contractual obligations resulting in financial loss to the
Group. The Group has policies in place to ensure that sales of products and services are made to customers with an
appropriate credit history. The Group has no significant concentration of credit risk.
The maximum exposure to credit risk for each class of financial assets is the carrying amount of the class of financial
assets presented on the balance sheet, except for banker guarantees of S$848,000 (2014: S$1,018,000) and letters of
credit of S$1,934,000 (2014: S$3,287,000) obtained for certain trade receivables of the Group.
The Group’s major classes of financial assets are cash and bank balances, trade receivables and long term receivables.
The Company’s major classes of financial assets are cash and bank balances and receivables from subsidiaries.
The credit risk of trade receivables and long term receivables (excluding loans which are in substance part of the Group’s
net investments in associated companies) by type of customers is as follows:
The Group
2015 2014
S$’000 S$’000
Associated companies 943 719
Non-related parties:
Government-link companies and Statutory Boards 208 157
Multinational companies 19,121 14,690
Other companies 73,345 103,836
Sole proprietors and individuals 1,262 1,384
94,879 120,786

103ANNUAL REPORT 2015
Notes to the Financial StatementsFor the financial year ended 31 December 2015
36. FINANCIAL RISK MANAGEMENT (CONTINUED)
36b Credit risk (continued)
(i) Financial assets that are neither past due nor impaired
Bank deposits that are neither past due nor impaired are mainly deposits with reputable banks with high credit
ratings.
Trade receivables and long term loan receivables that are neither past due nor impaired are substantially
companies with a good collection track record with the Group.
(ii) Financial assets that are past due and / or impaired
The age analysis of financial assets that are past due but not impaired relating to trade receivables is as follows:
The Group
2015 2014
S$’000 S$’000
Past due up to 3 months 21,883 18,290
Past due 3 to 6 months 5,484 3,200
Past due over 6 months 4,284 10,350
31,651 31,840
The carrying amount of trade receivables and long term loan receivables (excluding loans which are in substance part
of the Group’s net investments in associated companies and subsidiaries) individually determined to be impaired and
the movement in the related allowance for impairment are as follows:
The Group
2015 2014
S$’000 S$’000
Gross amount 19,577 14,736
Less: allowance for impairment (17,855) (13,124)
1,722 1,612
Allowance for impairment
Balance at 1 January 13,124 9,805
Allowance made 6,189 4,865
Allowance written back (487) (687)
Amount written off against allowance (54) (1,130)
Disposal of subsidiaries (1,105) –
Currency translation differences 188 271
Balance at 31 December 17,855 13,124
Allowance for impairment of S$487,000 (2014: S$687,000) was written back during the financial year based on amount
recoverable.
The impaired receivables arise mainly from debtors with significant financial difficulties, default or delay in payments.

NSL LTD104
Notes to the Financial StatementsFor the financial year ended 31 December 2015
36. FINANCIAL RISK MANAGEMENT (CONTINUED)
36c Liquidity risk
In managing liquidity risk, the Group’s policy is to maintain sufficient cash resources and ensure the availability of
funding through adequate amounts of committed credit facilities.
The table below analyses the maturity profile of the Group’s and Company’s non-derivative financial liabilities based
on contractual undiscounted cash flows from the remaining period from the balance sheet date to the contractual
maturity date.
Less than 1
year(i)
Between 1
to 2 years
Between 2
to 5 years Over 5 years
S$’000 S$’000 S$’000 S$’000
The Group
At 31 December 2015
Trade and other payables 101,692 – – –
Short term borrowings 19,520 – – –
Long term borrowings – 2,757 4,555 4,325
At 31 December 2014
Trade and other payables 118,038 – – –
Short term borrowings 22,427 – – –
Long term borrowings – 3,628 4,695 6,104
The Company
At 31 December 2015
Trade and other payables 17,803 – – –
At 31 December 2014
Trade and other payables 18,657 – – –
(i) Included in the table are term loans which contain repayment on demand clauses, exercisable at the banks’ sole
discretion. The analysis above shows the cash outflows based on the earliest period in which the Group and the
Company can be required to pay, i.e. as if the lenders were to invoke their unconditional right to call the loans at
the balance sheet date.
(ii) The table on the following page shows the analysis of maturity profile of the Group’s derivative financial
instruments for which contractual maturities are essential for an understanding of the timing of the cash flows.
The maturity profile is based on contractual undiscounted cash flows from the remaining period from the
balance sheet date to the contractual maturity date.

105ANNUAL REPORT 2015
Notes to the Financial StatementsFor the financial year ended 31 December 2015
36. FINANCIAL RISK MANAGEMENT (CONTINUED)
36c Liquidity risk (continued)
Less than
1 year
S$’000
The Group
At 31 December 2015
Gross-settled currency forwards
- Receipts (1,508)
- Payments 1,451
At 31 December 2014
Gross-settled currency forwards
- Receipts (10,869)
- Payments 11,112
36d Capital risk
The Group’s objectives when managing capital are to ensure the Group’s ability to continue as a going concern and to
maintain an efficient capital structure so as to enhance shareholders value. In order to maintain or achieve a prudent
and efficient capital structure, the Group may adjust the amount of dividend payment, issue new shares, obtain new
borrowings or sell assets to reduce borrowings.
The total capital of the Group and the Company as at balance sheet dates is represented by the respective “Total equity”
as presented on the balance sheets. The Group and the Company monitor capital based on gross debt (Notes 26 and
27) and net cash position which is defined as cash (Note 18) less gross debt.
As part of the monitoring process of the Group’s borrowings, management performs specific review of the need of
individual entities within the Group to obtain external financing, taking into consideration the operating cashflows and
gearing ratio of each entity as well as the prevailing market interest rates.
The Group and the Company are in compliance with all externally imposed capital requirements for the financial years
ended 31 December 2014 and 2015, except that one of the subsidiaries has not complied with the externally imposed
capital requirements for financial year ended 31 December 2015 (Note 26b).
36e Fair value measurements
The table below presents assets and liabilities measured at fair value and classified by level of the following fair value
measurement hierarchy:
(i) quoted price in active markets for identical assets or liabilities (Level 1);
(ii) inputs other than quoted prices included within Level 1 that are observable for the asset or liability, either directly
(i.e. as prices) or indirectly (i.e. derived from prices) (Level 2); and
(iii) inputs for the asset or liability that are not based on observable market data (unobservable inputs) (Level 3).
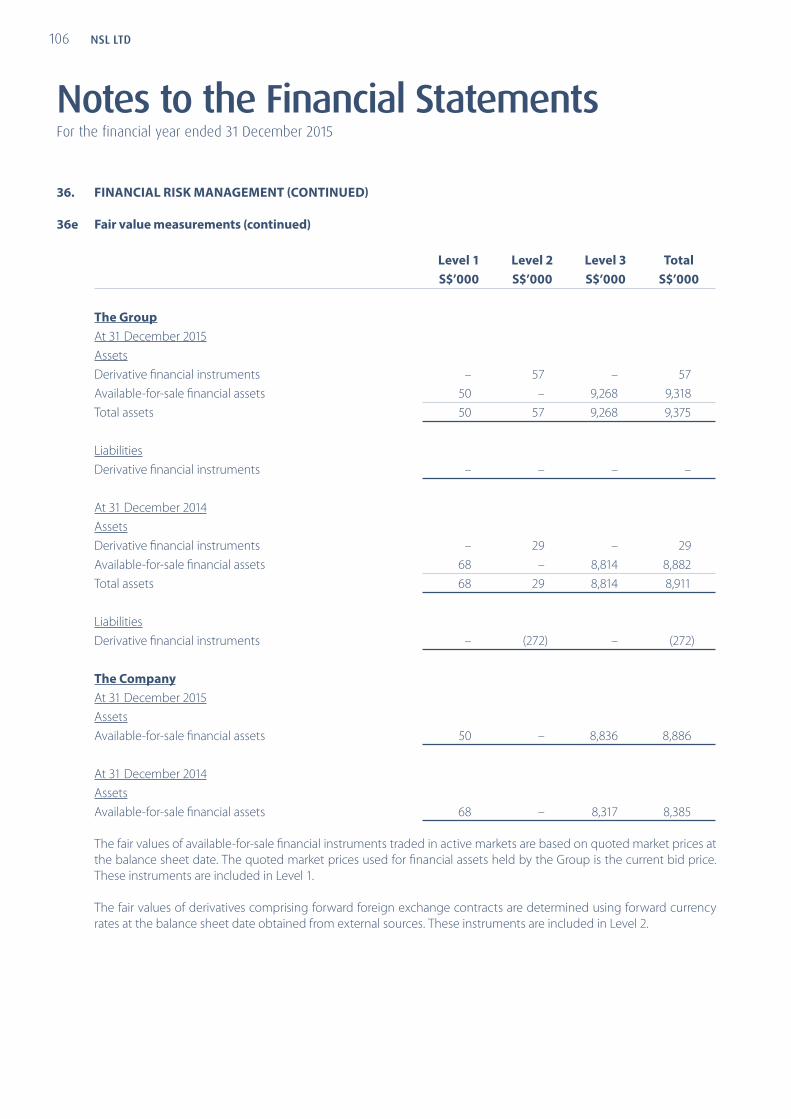
NSL LTD106
Notes to the Financial StatementsFor the financial year ended 31 December 2015
36. FINANCIAL RISK MANAGEMENT (CONTINUED)
36e Fair value measurements (continued)
Level 1 Level 2 Level 3 Total
S$’000 S$’000 S$’000 S$’000
The Group
At 31 December 2015
Assets
Derivative financial instruments – 57 – 57
Available-for-sale financial assets 50 – 9,268 9,318
Total assets 50 57 9,268 9,375
Liabilities
Derivative financial instruments – – – –
At 31 December 2014
Assets
Derivative financial instruments – 29 – 29
Available-for-sale financial assets 68 – 8,814 8,882
Total assets 68 29 8,814 8,911
Liabilities
Derivative financial instruments – (272) – (272)
The Company
At 31 December 2015
Assets
Available-for-sale financial assets 50 – 8,836 8,886
At 31 December 2014
Assets
Available-for-sale financial assets 68 – 8,317 8,385
The fair values of available-for-sale financial instruments traded in active markets are based on quoted market prices at
the balance sheet date. The quoted market prices used for financial assets held by the Group is the current bid price.
These instruments are included in Level 1.
The fair values of derivatives comprising forward foreign exchange contracts are determined using forward currency
rates at the balance sheet date obtained from external sources. These instruments are included in Level 2.
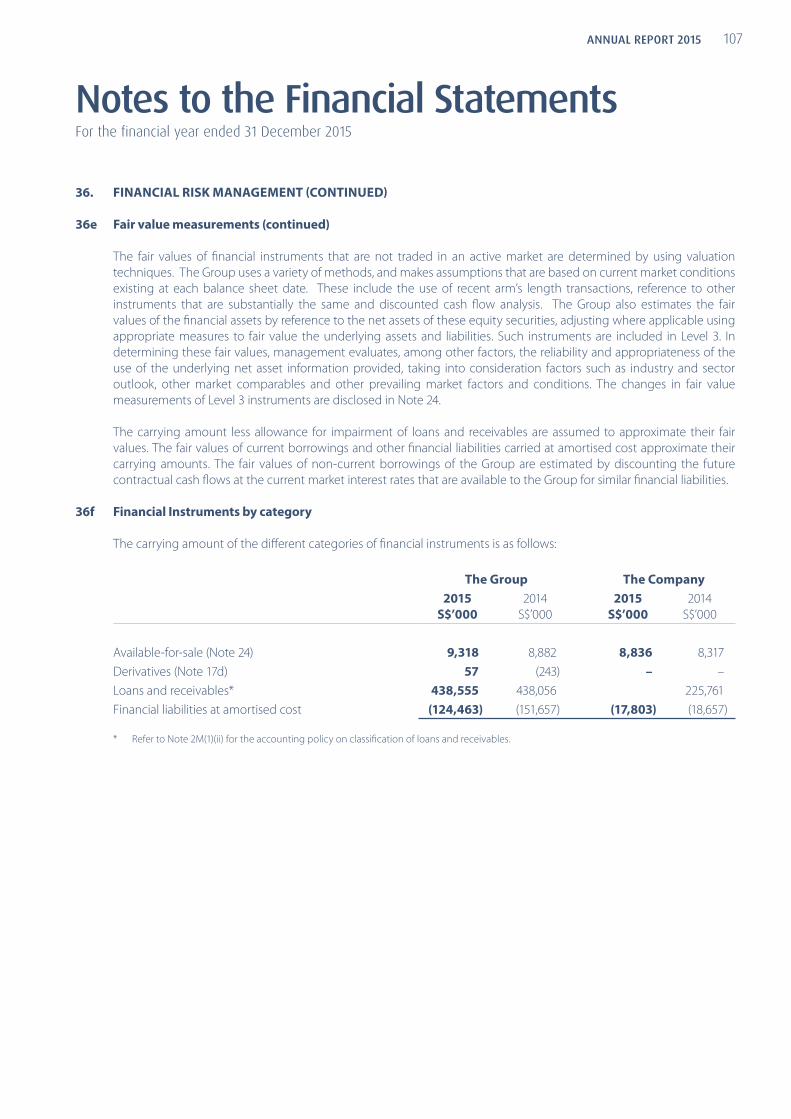
107ANNUAL REPORT 2015
Notes to the Financial StatementsFor the financial year ended 31 December 2015
36. FINANCIAL RISK MANAGEMENT (CONTINUED)
36e Fair value measurements (continued)
The fair values of financial instruments that are not traded in an active market are determined by using valuation
techniques. The Group uses a variety of methods, and makes assumptions that are based on current market conditions
existing at each balance sheet date. These include the use of recent arm’s length transactions, reference to other
instruments that are substantially the same and discounted cash flow analysis. The Group also estimates the fair
values of the financial assets by reference to the net assets of these equity securities, adjusting where applicable using
appropriate measures to fair value the underlying assets and liabilities. Such instruments are included in Level 3. In
determining these fair values, management evaluates, among other factors, the reliability and appropriateness of the
use of the underlying net asset information provided, taking into consideration factors such as industry and sector
outlook, other market comparables and other prevailing market factors and conditions. The changes in fair value
measurements of Level 3 instruments are disclosed in Note 24.
The carrying amount less allowance for impairment of loans and receivables are assumed to approximate their fair
values. The fair values of current borrowings and other financial liabilities carried at amortised cost approximate their
carrying amounts. The fair values of non-current borrowings of the Group are estimated by discounting the future
contractual cash flows at the current market interest rates that are available to the Group for similar financial liabilities.
36f Financial Instruments by category
The carrying amount of the different categories of financial instruments is as follows:
The Group The Company
2015
S$’000
2014
S$’000
2015
S$’000
2014
S$’000
Available-for-sale (Note 24) 9,318 8,882 8,836 8,317
Derivatives (Note 17d) 57 (243) – –
Loans and receivables* 438,555 438,056 225,761
Financial liabilities at amortised cost (124,463) (151,657) (17,803) (18,657)
* Refer to Note 2M(1)(ii) for the accounting policy on classification of loans and receivables.

NSL LTD108
Notes to the Financial StatementsFor the financial year ended 31 December 2015
37. RESTATEMENT OF COMPARATIVE FINANCIAL INFORMATION
The Group’s exceptional items have been reclassified to other income, administrative expenses, other expenses
and other gains and losses. There is no impact to the Group’s total profit for the prior financial year. The table below
summarised the adjustment made to comparative financial information.
Previously
reported Reclassification Restated
Group S$’000 S$’000 S$’000
2014
Statement of comprehensive income
Continuing operations
Other income 6,102 79 6,181
Administrative expenses (39,763) (20) (39,783)
Other expenses (787) 787 –
Other gains and losses – 2,581 2,581
Exceptional items 2,405 (2,405) –
Discontinued operations
Profit from discontinued operations 16,531 (1,022) 15,509
38. EVENTS OCCURRING AFTER BALANCE SHEET DATE
As announced on 25 January 2016, the Company has received indications of interest from several parties to purchase
its Dry Mix business in Hong Kong, China, Singapore and Malaysia. Discussion is ongoing and there is no assurance that
definitive agreements will be signed. The Company will make the relevant disclosures at the appropriate time when
there are further developments.
39. NEW ACCOUNTING STANDARDS AND FRS INTERPRETATIONS
Below are the mandatory standards, amendments and interpretations to existing standards that have been published,
and are relevant for the Group’s accounting periods beginning on or after 1 January 2016 and which the Group has not
early adopted:
• FRS 110 Consolidated financial statements and FRS 28 Investments in associates and joint ventures (effective for
annual periods beginning on or after 1 January 2016).
These amendments address an inconsistency between FRS 110 and FRS 28 in the sale or contribution of assets
between an investor and its associate or joint venture. A full gain or loss is recognised when a transaction
involves a business. A partial gain or loss is recognised when a transaction involves assets that do not constitute
a business, even if those assets are in a subsidiary.
• FRS 1 Presentation of financial statements (effective for annual periods beginning on or after 1 January 2016).
This amendment clarifies guidance in FRS 1 on materiality and aggregation, the presentation of subtotals, the
structure of financial statements and the disclosure of accounting policies.
The adoptions of the above revised FRS amendment are not expected to have any significant impact on the financial
statements of the Group.

109ANNUAL REPORT 2015
Notes to the Financial StatementsFor the financial year ended 31 December 2015
40. AUTHORISATION OF FINANCIAL STATEMENTS
These financial statements were authorised for issue in accordance with a resolution of the Board of Directors of NSL
Ltd. on 9 March 2016.
41. SIGNIFICANT COMPANIES IN THE GROUP
The principal activities of the significant companies in the Group, their countries of incorporation and places of business,
and the extent of NSL Ltd’s equity interest in significant subsidiaries and associated companies are as follows:
Name of company Principal activities
Country of
incorporation
and place of
business
Proportion
of ordinary
shares directly
held
by parent
Proportion
of ordinary
shares held by
the Group
Proportion
of ordinary
shares held
by non–
controlling
interests
2015
%
2014
%
2015
%
2014
%
2015
%
2014
%
Eastern Industries
Private Limited (1)
Investment holding Singapore 100.0 100.0 100.0 100.0 – –
NSL Chemicals Ltd. (1) Investment holding,
manufacturing and
sale of lime products,
refractory materials and
road stones
Singapore 100.0 100.0 100.0 100.0 – –
NSL Engineering Pte
Ltd (1)
Investment holding,
manufacturing, design
and sale of container and
bulk handling equipment
Singapore – – – 100.0 – –
NSL Properties Pte.
Ltd. (1)
Investment holding Singapore 100.0 100.0 100.0 100.0 – –
NSL Resorts
International Pte. Ltd. (1)
Investment holding Singapore 100.0 100.0 100.0 100.0 – –
Eastern Pretech Pte
Ltd (1)
Manufacturing and sale
of building materials
Singapore – – 100.0 100.0 – –
Eastern Pretech
(Malaysia) Sdn Bhd (2)
Manufacturing and sale
of building materials
Malaysia – – 100.0 100.0 – –
Emix Industry (S) Pte.
Ltd. (1)
Trading of plastering
materials
Singapore – – 100.0 100.0 – –
Emix Industry (M) Sdn
Bhd (2)
Manufacturing and sale
of plastering materials
and the provision of
plastering services
Malaysia – – 100.0 100.0 – –
Emix Industry (HK)
Limited (3)
Manufacturing and sale
of plastering materials
Hong Kong – – 80.0 80.0 20.0 20.0
Note: Refer to Page 111 for legends.

NSL LTD110
Notes to the Financial StatementsFor the financial year ended 31 December 2015
41. SIGNIFICANT COMPANIES IN THE GROUP (CONTINUED)
Name of company Principal activities
Country of
incorporation
and place of
business
Proportion
of ordinary
shares directly
held
by parent
Proportion
of ordinary
shares held by
the Group
Proportion
of ordinary
shares held
by non–
controlling
interests
2015
%
2014
%
2015
%
2014
%
2015
%
2014
%
Emix Industry
(Guangzhou) Ltd (3)
Manufacturing and sale
of plastering materials
People’s
Republic of
China
– – 80.0 80.0 20.0 20.0
Dubai Precast
L.L.C. (3),(4)
Manufacturing and sale
of building materials
United Arab
Emirates
– – 45.0 45.0 55.0 55.0
Parmarine Ltd (2) Manufacturing and sale
of building materials
Finland – – 100.0 100.0 – –
NSL Chemicals (M)
Sdn Bhd (2)
Manufacturing and sale
of lime products
Malaysia – – – 80.0 – 20.0
Eastech Steel Mill
Services (M) Sdn Bhd (2)
Manufacturing and sale
of refractory products
Malaysia – – 100.0 100.0 – –
NSL OilChem Waste
Management
Pte Ltd (1)
Treatment and recovery
of waste oil and oily slop
and trading in diesel oil
Singapore – – 87.7 87.7 12.3 12.3
NSL OilChem Logistics
Pte. Ltd. (1)
Trading in oil products
and disposal of oil and
chemical wastes
Singapore – – 87.7 87.7 12.3 12.3
NSL OilChem Trading
Pte. Ltd. (1)
Trading in oil products
and disposal of oil and
chemical wastes
Singapore – – 87.7 87.7 12.3 12.3
NSL Engineering (UK)
Limited (2)
Sale of container and
bulk handling equipment
United Kingdom – – – 100.0 – –
ChangShu RAM
Engineering Co., Ltd (2)
Manufacturing of
container and bulk
handling equipment
People’s
Republic of
China
– – – 100.0 – –
NSL Engineering
Holdings Pte. Ltd. (1)
Investment holding Singapore 100.0 100.0 100.0 100.0 – –
Raffles Marina
Holdings Ltd. (1)
Investment holding Singapore – – 50.1 50.1 49.9 49.9
Raffles Marina Ltd (1) Owning and managing
Raffles Marina Club
Singapore – – 50.1 50.1 49.9 49.9
Note: Refer to Page 111 for legends.

111ANNUAL REPORT 2015
Notes to the Financial StatementsFor the financial year ended 31 December 2015
41. SIGNIFICANT COMPANIES IN THE GROUP (CONTINUED)
Significant Associated Company
Held by a Subsidiary Principal activities
Country of
incorporation
and place of
business Equity holding
Unquoted
2015
%
2014
%
PEINER SMAG Lifting Technologies
GmbH (“PSLT”) (2)
Investment holding,
manufacturing, design and sale
of container and bulk handling
equipment
Germany 33.3 –
Southern Rubber Works Sdn. Bhd. (5) Manufacturing and sale of
industrial gloves and retailer of
shoes
Malaysia 28.6 28.6
Planergo (Pte) Limited (6) Hotel investment Singapore/
Vietnam
25.0 25.0
Legends
(1) Audited by PricewaterhouseCoopers LLP, Singapore
(2) Audited by the network of member firms of PricewaterhouseCoopers International Limited outside Singapore
(3) Audited by Ernst & Young
(4) The percentage of shareholding held by the Group in Dubai Precast L.L.C. (“DP”) is 45%. However, the Group has
assessed DP to be a subsidiary as a result of the Group’s entitlement of 80% share of dividends declared by or
profits of DP post acquisition in 2011 and the ability to appoint a majority of the directors of DP.
(5) Audited by S.THILLAIMUTHU & CO.
(6) Audited by Foo Koo Tan Grant Thornton LLP
Independent Auditor’s Report – Page 32.

NSL LTD112
ISSUED AND FULLY PAID CAPITAL : S$193,838,796.00
CLASS OF SHARES : ORDINARY SHARES
VOTING RIGHTS : ONE VOTE PER SHARE
ORDINARY SHARES HELD AS TREASURY SHARES : NIL
SHAREHOLDINGS BY SIZE
SIZE OF SHAREHOLDINGS
NO. OF
SHAREHOLDERS
% OF
SHAREHOLDERS
NO. OF
SHARES
% OF ISSUED SHARE
CAPITAL
1 to 99 108 1.86 2,213 0.00
100 to 1,000 952 16.39 824,244 0.22
1,001 to 10,000 3,675 63.26 17,059,948 4.57
10,001 to 1,000,000 1,067 18.37 42,546,418 11.39
1,000,001 AND ABOVE 7 0.12 313,125,414 83.82
TOTAL 5,809 100 373,558,237 100
SHAREHOLDERS BY RESIDENCE
COUNTRIES
NO. OF
SHAREHOLDERS
% OF
SHAREHOLDERS
NO. OF
SHARES
% OF ISSUED SHARE
CAPITAL
SINGAPORE 5,475 94.25 370,349,663 99.14
MALAYSIA 263 4.53 1,815,490 0.49
OTHERS 71 1.22 1,393,084 0.37
TOTAL 5,809 100 373,558,237 100
TOP 20 SHAREHOLDERS
NO. NAME OF SHAREHOLDERS
NO. OF
SHARES
% OF ISSUED SHARE
CAPITAL
1 98 HOLDINGS PTE LTD 303,484,453 81.24
2 DBS NOMINEES PTE LTD 2,485,139 0.67
3 CITIBANK NOMINEES SINGAPORE PTE LTD 1,899,100 0.51
4 UNITED OVERSEAS BANK NOMINEES PTE LTD 1,870,722 0.50
5 OCBC NOMINEES SINGAPORE PTE LTD 1,301,000 0.35
6 JUNO INDRIADI MUALIM 1,060,000 0.28
7 GOH BENG HWA @ GHO BIN HOA 1,025,000 0.27
8 ONG SWEE HEOH 903,750 0.24
9 G PANNIR SELVAM 800,000 0.21
10 SUM AH LAM 500,000 0.13
11 LOY HWEE CHOW 455,000 0.12
12 PHILLIP SECURITIES PTE LTD 449,250 0.12
13 LO KAI LEONG @ LOH KAI LEONG 440,000 0.12
14 TAY HWA LANG 430,000 0.12
15 AU SOO LUAN 428,500 0.11
16 ESTATE OF TAN I TONG, DECEASED 399,624 0.11
17 KOW THONG JEN @ KOW CHONG JIN 372,000 0.10
18 UOB KAY HIAN PTE LTD 368,774 0.10
19 EWA BAH @ NG CHAI BOO 364,000 0.10
20 CHONG SIONG LIM STEPHEN 360,000 0.10
TOTAL 319,396,312 85.50
Analysis of ShareholdingsAs at 10 March 2016
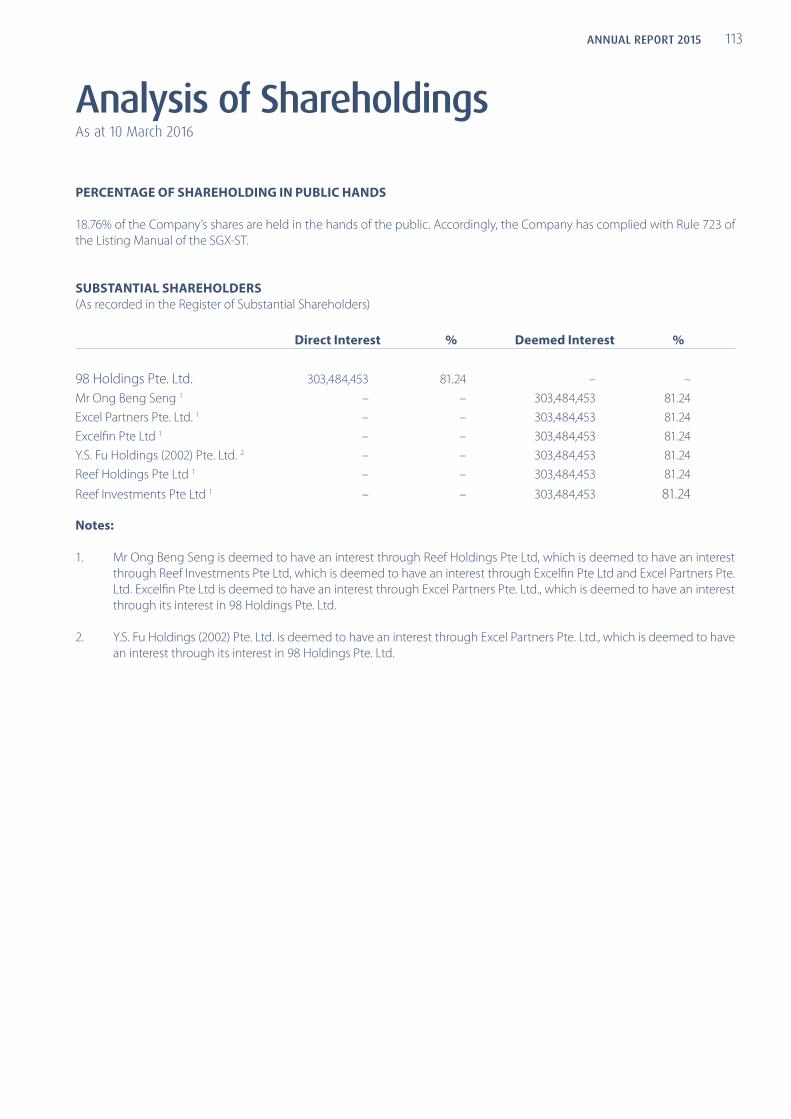
113ANNUAL REPORT 2015
PERCENTAGE OF SHAREHOLDING IN PUBLIC HANDS
18.76% of the Company’s shares are held in the hands of the public. Accordingly, the Company has complied with Rule 723 of
the Listing Manual of the SGX-ST.
SUBSTANTIAL SHAREHOLDERS
(As recorded in the Register of Substantial Shareholders)
Direct Interest % Deemed Interest %
98 Holdings Pte. Ltd. 303,484,453 81.24 – –
Mr Ong Beng Seng 1 – – 303,484,453 81.24
Excel Partners Pte. Ltd. 1 – – 303,484,453 81.24
Excelfin Pte Ltd 1 – – 303,484,453 81.24
Y.S. Fu Holdings (2002) Pte. Ltd. 2 – – 303,484,453 81.24
Reef Holdings Pte Ltd 1 – – 303,484,453 81.24
Reef Investments Pte Ltd 1 – – 303,484,453 81.24
Notes:
1. Mr Ong Beng Seng is deemed to have an interest through Reef Holdings Pte Ltd, which is deemed to have an interest
through Reef Investments Pte Ltd, which is deemed to have an interest through Excelfin Pte Ltd and Excel Partners Pte.
Ltd. Excelfin Pte Ltd is deemed to have an interest through Excel Partners Pte. Ltd., which is deemed to have an interest
through its interest in 98 Holdings Pte. Ltd.
2. Y.S. Fu Holdings (2002) Pte. Ltd. is deemed to have an interest through Excel Partners Pte. Ltd., which is deemed to have
an interest through its interest in 98 Holdings Pte. Ltd.
Analysis of ShareholdingsAs at 10 March 2016

NSL LTD114
Notice of Annual General Meeting
NOTICE IS HEREBY GIVEN that the 56th Annual General Meeting of NSL LTD. (the “Company”) will be held at Bridge Rooms 1, 2
and 3, Raffles Marina, 10 Tuas West Drive, Singapore 638404 on 29 April 2016 at 2.00 p.m. for the following purposes:
ORDINARY BUSINESS
1 To receive and adopt the Directors’ Statement and the Audited Financial Statements for the financial year ended 31
December 2015 together with the Independent Auditor’s Report thereon. (Resolution 1)
2 To re-elect Mr David Fu Kuo Chen, a Director retiring pursuant to Article 86 of the Company’s Constitution and, being
eligible, offers himself for re-election. (Resolution 2)
Mr David Fu Kuo Chen, will, upon re-election as a Director of the Company, remain as a member of the Remuneration Committee
and the Nominating Committee.
3 To re-appoint Prof Cham Tao Soon who is retiring under the resolution passed at the Annual General Meeting of the
Company held on 28 April 2015 pursuant to Section 153(6) of the Companies Act, Chapter 50 of Singapore (which was then
in force) as a Director of the Company, to hold office from the date of this Annual General Meeting. (Resolution 3)
Prof Cham Tao Soon, will, upon re-appointment as a Director of the Company, remain as the Chairman of the Board of Directors,
Chairman of the Remuneration Committee, Chairman of the Nominating Committee and a member of the Audit Committee
and will be considered independent for the purposes of Rule 704(8) of the Listing Manual of the Singapore Exchange Securities
Trading Limited.
4 To re-appoint Mr Ban Song Long who is retiring under the resolution passed at the Annual General Meeting of the
Company held on 28 April 2015 pursuant to Section 153(6) of the Companies Act, Chapter 50 of Singapore (which was
then in force) as a Director of the Company, to hold office from the date of this Annual General Meeting. (Resolution 4)
Mr Ban Song Long, will, upon re-appointment as a Director of the Company, remain as a member of the Audit Committee and
will be considered non-independent for the purposes of Rule 704(8) of the Listing Manual of the Singapore Exchange Securities
Trading Limited.
5 To re-appoint Mr Oo Soon Hee who is retiring under the resolution passed at the Annual General Meeting of the Company
held on 28 April 2015 pursuant to Section 153(6) of the Companies Act, Chapter 50 of Singapore (which was then in force)
as a Director of the Company, to hold office from the date of this Annual General Meeting. (Resolution 5)
6 To approve the payment of Directors’ fees of S$614,000.00 for the financial year ended 31 December 2015. (2014:
S$510,000.00) (Resolution 6)
7 To declare a final dividend of S$0.05 per ordinary share (exempt one-tier) for the financial year ended 31 December 2015.
(2014: final dividend of S$0.05 per ordinary share (exempt one-tier)) (Resolution 7)
8 To re-appoint Messrs PricewaterhouseCoopers LLP as the Company’s Independent Auditor and to authorise the
Directors to fix their remuneration. (Resolution 8)
SPECIAL BUSINESS
To consider and, if thought fit, to pass the following resolutions, of which Resolutions 9, 10 and 11 will be proposed as Ordinary
Resolutions and Resolution 12 will be proposed as a Special Resolution, with or without any modifications:

115ANNUAL REPORT 2015
ORDINARY RESOLUTIONS
9 That pursuant to Section 161 of the Companies Act, Chapter 50 of Singapore, and the listing rules of the Singapore
Exchange Securities Trading Limited (“SGX-ST”), authority be and is hereby given to the Directors of the Company to:
(a) (i) issue shares of the Company (“shares”) whether by way of rights, bonus or otherwise; and/or
(ii) make or grant offers, agreements or options (collectively, “Instruments”) that might or would require
shares to be issued, including but not limited to the creation and issue of (as well as adjustments to)
warrants, debentures or other instruments convertible into shares,
at any time and upon such terms and conditions and for such purposes and to such persons as the Directors
may in their absolute discretion deem fit; and
(b) (notwithstanding the authority conferred by this Resolution may have ceased to be in force) issue shares in
pursuance of any Instrument made or granted by the Directors while this Resolution was in force,
provided that:
(1) the aggregate number of shares to be issued pursuant to this Resolution (including shares to be issued in
pursuance of Instruments made or granted pursuant to this Resolution) does not exceed 50% of the total
number of issued shares (excluding treasury shares) of the Company (as calculated in accordance with sub-
paragraph (2) below), of which the aggregate number of shares to be issued other than on a pro rata basis
to shareholders of the Company (including shares to be issued in pursuance of Instruments made or granted
pursuant to this Resolution) does not exceed 20% of the total number of issued shares (excluding treasury shares)
of the Company (as calculated in accordance with sub-paragraph (2) below);
(2) (subject to such manner of calculation as may be prescribed by the SGX-ST) for the purpose of determining
the aggregate number of shares that may be issued under sub-paragraph (1) above, the total number of shares
(excluding treasury shares) shall be based on the total number of issued shares (excluding treasury shares) of the
Company at the time this Resolution is passed, after adjusting for:
(a) new shares arising from the conversion or exercise of any convertible securities or share options or vesting
of share awards which are outstanding at the time this Resolution is passed; and
(b) any subsequent bonus issue, consolidation or subdivision of shares;
(3) in exercising the authority conferred by this Resolution, the Company shall comply with the provisions of the
Listing Manual of the SGX-ST for the time being in force (unless such compliance has been waived by the SGX-
ST) and the Constitution for the time being of the Company; and
(4) (unless revoked or varied by the Company in General Meeting) the authority conferred by this Resolution shall
continue in force until the conclusion of the next Annual General Meeting of the Company or the date by which
the next Annual General Meeting of the Company is required by law to be held, whichever is the earlier.
(Resolution 9)
10 That:
(a) for the purposes of Sections 76C and 76E of the Companies Act, Chapter 50 of Singapore (the “Companies
Act”), the exercise by the Directors of the Company of all the powers of the Company to purchase or otherwise
acquire ordinary shares of the Company (“Shares”) not exceeding in aggregate the Maximum Limit (as hereafter
defined), at such price or prices as may be determined by the Directors from time to time up to the Maximum
Price (as hereafter defined), whether by way of:
Notice of Annual General Meeting

NSL LTD116
(i) market purchase(s) on the Singapore Exchange Securities Trading Limited (“SGX-ST”) and/or any other
stock exchange on which the Shares may for the time being be listed and quoted (“Other Exchange”);
and/or
(ii) off-market purchase(s) (if effected otherwise than on the SGX-ST or, as the case may be, Other Exchange)
in accordance with any equal access scheme(s) as may be determined or formulated by the Directors as
they consider fit, which scheme(s) shall satisfy all the conditions prescribed by the Companies Act,
and otherwise in accordance with all other laws and regulations and rules of the SGX-ST or, as the case may be,
Other Exchange as may for the time being be applicable, be and is hereby authorised and approved generally
and unconditionally (the “Share Purchase Mandate”);
(b) unless varied or revoked by the Company in General Meeting, the authority conferred on the Directors of the
Company pursuant to the Share Purchase Mandate may be exercised by the Directors at any time and from
time to time during the period commencing from the date of the passing of this Resolution and expiring on the
earliest of:
(i) the date on which the next Annual General Meeting of the Company is held;
(ii) the date by which the next Annual General Meeting of the Company is required by law to be held; and
(iii) the date on which purchases and acquisitions of Shares pursuant to the Share Purchase Mandate are
carried out to the full extent mandated;
(c) in this Resolution:
“Maximum Limit” means that number of Shares representing 10% of the issued Shares (excluding any Shares
held as treasury shares) as at the date of the passing of this Resolution provided however that notwithstanding
the Share Purchase Mandate may enable purchases or acquisitions of up to 10% of the issued Shares (excluding
any Shares held as treasury shares) to be carried out as aforesaid, the Company shall ensure, pursuant to Rule 723
of the Listing Manual of the SGX-ST, that there will be a public float of not less than 10% in the issued Shares at
all times; and
“Maximum Price” in relation to a Share to be purchased, means the purchase price (excluding brokerage, stamp
duties, applicable goods and services tax and other related expenses) not exceeding:
(i) in the case of a market purchase of a Share, 105% of the Average Closing Price; and
(ii) in the case of an off-market purchase of a Share, 120% of the Average Closing Price,
where:
“Average Closing Price” is the average of the closing market prices of a Share over the last five (5) market
days on which the Shares were transacted on the SGX-ST or, as the case may be, Other Exchange, immediately
preceding the date of the market purchase or, as the case may be, the date of the making of the offer pursuant
to an off-market purchase, as deemed to be adjusted for any corporate action that occurs after the relevant five
(5) market day period;
“date of the making of the offer” means the date on which the Company makes an offer for the purchase or
acquisition of Shares from shareholders, stating the purchase price (which shall not be more than the Maximum
Price calculated on the foregoing basis) for each Share and the relevant terms of the equal access scheme for
effecting the Off-Market Purchase; and
“market day” means a day on which the SGX-ST is open for trading in securities; and
Notice of Annual General Meeting

117ANNUAL REPORT 2015
(d) the Directors of the Company and/or any of them be and are hereby authorised to complete and do all such acts
and things (including executing such documents as may be required) as they and/or he may consider expedient
or necessary to give effect to the transactions contemplated and/or authorised by this Resolution.
(Resolution 10)
11 That pursuant to Section 161 of the Companies Act, Chapter 50 of Singapore, the Directors of the Company be and are
hereby authorised to grant options in accordance with the provisions of the NSL Share Option Plan (the “Plan”) and to
allot and issue from time to time such number of ordinary shares of the Company as may be required to be allotted and
issued pursuant to the exercise of options under the Plan, provided that the aggregate number of new ordinary shares
to be issued pursuant to the Plan shall not exceed 10% of the total number of issued ordinary shares (excluding treasury
shares) of the Company from time to time.
(Resolution 11)
SPECIAL RESOLUTION
12 That the regulations contained in the new Constitution submitted to this Meeting and, for the purpose of identification,
subscribed to by the Chairman thereof, be approved and adopted as the new Constitution of the Company in
substitution for, and to the exclusion of, the existing Constitution.
(Resolution 12)
BY ORDER OF THE BOARD
Lim Su-Ling (Ms)
Company Secretary
Singapore
7 April 2016
Notice of Annual General Meeting

NSL LTD118
Explanatory Notes
(i) In relation to items 2 3, 4 and 5 above, for further information on Mr David Fu Kuo Chen, Prof Cham Tao Soon, Mr Ban
Song Long and Mr Oo Soon Hee, please refer to pages 8 and 31 of the Annual Report 2015. Ordinary Resolutions 3, 4
and 5 proposed in items 3, 4 and 5 above respectively are to re-appoint Directors who are above 70 years old and who
are retiring under the respective resolutions passed at the Annual General Meeting held on 28 April 2015 as pursuant
to Section 153(6) of the Companies Act, Chapter 50 of Singapore (the “Companies Act”) which was then in force, such
resolutions could only permit the re-appointment of the Directors to hold office until this Annual General Meeting. If
passed, Ordinary Resolutions 3, 4 and 5 will approve and authorise the continuation of the Directors in office from the
date of this Annual General Meeting onwards without limitation in tenure, save for prevailing applicable laws, listing
rules and/or regulations, including the Company’s Constitution.
(ii) Ordinary Resolution 9 proposed in item 9 above, if passed, will empower the Directors to issue shares and to make
or grant instruments (such as warrants or debentures) convertible into shares and issue shares in pursuance of such
instruments, up to the limits specified therein, until the date of the next Annual General Meeting. For the purpose of
determining the aggregate number of shares that may be issued, the total number of issued shares (excluding treasury
shares) will be calculated based on the total number of issued shares (excluding treasury shares) of the Company at
the time that this Resolution is passed, after adjusting for new shares arising from the conversion or exercise of any
convertible securities or share options or vesting of share awards which are outstanding at the time that this Resolution
is passed, and any subsequent bonus issue, consolidation or subdivision of shares.
(iii) Ordinary Resolution 10 proposed in item 10 above, if passed, will empower the Directors to exercise the power of
the Company to purchase or acquire its issued ordinary shares, until the date of the next Annual General Meeting.
The Company intends to use internal sources of funds, external borrowings, or a combination of internal resources
and external borrowings, to finance purchases or acquisitions of its shares. The amount of financing required for the
Company to purchase or acquire its shares, and the impact on the Company’s financial position, cannot be ascertained
as at the date of this Notice as these will depend on, inter alia, whether the shares are purchased or acquired out of
capital and/or profits of the Company, the aggregate number of shares purchased or acquired, and the consideration
paid at the relevant time. Purely for illustrative purposes only, the financial effects of an assumed purchase or acquisition
by the Company of 29,884,658 shares on 10 March 2016 representing 8% of the issued shares (excluding treasury shares)
as at that date, at a purchase price equivalent to the Maximum Price per share, in the case of a market purchase and
an off-market purchase respectively, based on the audited financial statements of the Group and the Company for the
financial year ended 31 December 2015 and certain assumptions, are set out in Paragraph 2.7 of the Company’s letter to
shareholders dated 7 April 2016 (the “Letter”).
Please refer to the Letter for further details.
(iv) Ordinary Resolution 11 proposed in item 11 above, if passed, will empower the Directors to grant options under the Plan,
and to allot and issue shares pursuant to the exercise of such options provided that the aggregate number of shares to
be issued pursuant to the Plan shall not exceed 10% of the total number of issued Shares (excluding treasury shares) of
the Company from time to time.
(v) Special Resolution 12 proposed in item 12 above is to adopt a new Constitution following the wide-ranging changes
to the Companies Act, introduced pursuant to the Companies (Amendment) Act 2014 (the “Amendment Act”). The
new Constitution will consist of the memorandum and articles of association of the Company which were in force
immediately before 3 January 2016, and incorporate amendments to, inter alia, take into account the changes to the
Companies Act introduced pursuant to the Amendment Act.
Please refer to the Letter for further details.
Notice of Annual General Meeting

119ANNUAL REPORT 2015
Notes:
1. (a) A member of the Company who is not a relevant intermediary is entitled to appoint not more than two proxies
to attend, speak and vote at the meeting. Where such member’s form of proxy appoints more than one proxy,
the proportion of the shareholding concerned to be represented by each proxy shall be specified in the form of
proxy.
(b) A member of the Company who is a relevant intermediary is entitled to appoint more than two proxies to
attend, speak and vote at the meeting, but each proxy must be appointed to exercise the rights attached to a
different share or shares held by such member. Where such member’s form of proxy appoints more than two
proxies, the number and class of shares in relation to which each proxy has been appointed shall be specified in
the form of proxy.
“Relevant intermediary” has the meaning ascribed to it in Section 181 of the Companies Act.
2. A member of the Company which is a corporation is entitled to appoint its authorised representative or proxy to vote
on its behalf.
3. A proxy need not be a member of the Company.
4. The instrument appointing a proxy or proxies must be deposited at the registered office of the Company at 77 Robinson
Road #27-00, Robinson 77, Singapore 068896, not less than 48 hours before the time set for holding the Annual General
Meeting.
Personal Data Privacy:
By submitting an instrument appointing a proxy(ies) and/or representative(s) to attend, speak and vote at the Annual General
Meeting and/or any adjournment thereof, a member of the Company (i) consents to the collection, use and disclosure of the
member’s personal data by the Company (or its agents or service providers) for the purpose of the processing, administration
and analysis by the Company (or its agents or service providers) of proxies and representatives appointed for the Annual General
Meeting (including any adjournment thereof) and the preparation and compilation of the attendance lists, minutes and other
documents relating to the Annual General Meeting (including any adjournment thereof), and in order for the Company (or
its agents or service providers) to comply with any applicable laws, listing rules, take-over rules, regulations and/or guidelines
(collectively, the “Purposes”), (ii) warrants that where the member discloses the personal data of the member’s proxy(ies) and/
or representative(s) to the Company (or its agents or service providers), the member has obtained the prior consent of such
proxy(ies) and/or representative(s) for the collection, use and disclosure by the Company (or its agents or service providers) of
the personal data of such proxy(ies) and/or representative(s) for the Purposes, and (iii) agrees that the member will indemnify
the Company in respect of any penalties, liabilities, claims, demands, losses and damages as a result of the member’s breach
of warranty.
Notice of Annual General Meeting

NSL LTD120
This page has been intentionally left blank.
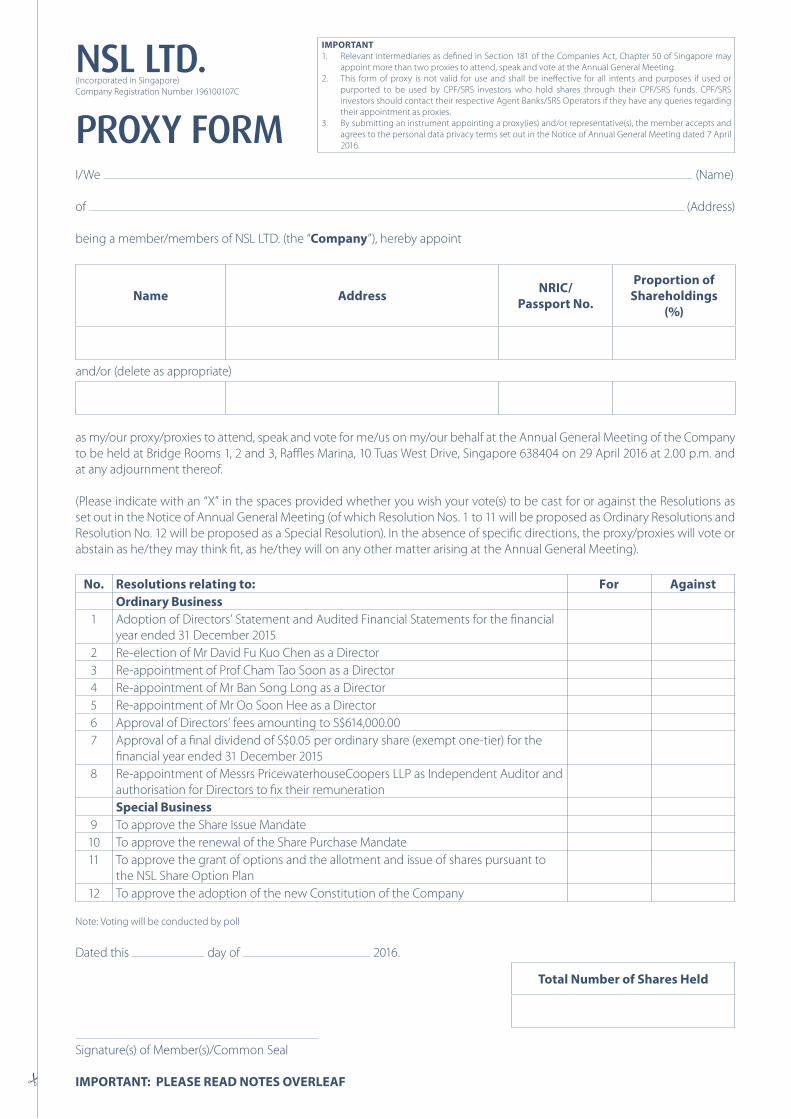
NSL LTD. (Incorporated in Singapore)
Company Registration Number 196100107C
PROXY FORM
IMPORTANT
1. Relevant intermediaries as defined in Section 181 of the Companies Act, Chapter 50 of Singapore may
appoint more than two proxies to attend, speak and vote at the Annual General Meeting.
2. This form of proxy is not valid for use and shall be ineffective for all intents and purposes if used or
purported to be used by CPF/SRS investors who hold shares through their CPF/SRS funds. CPF/SRS
investors should contact their respective Agent Banks/SRS Operators if they have any queries regarding
their appointment as proxies.
3. By submitting an instrument appointing a proxy(ies) and/or representative(s), the member accepts and
agrees to the personal data privacy terms set out in the Notice of Annual General Meeting dated 7 April
2016.
I/We (Name)
of (Address)
being a member/members of NSL LTD. (the “Company”), hereby appoint
Name AddressNRIC/
Passport No.
Proportion of
Shareholdings
(%)
and/or (delete as appropriate)
as my/our proxy/proxies to attend, speak and vote for me/us on my/our behalf at the Annual General Meeting of the Company
to be held at Bridge Rooms 1, 2 and 3, Raffles Marina, 10 Tuas West Drive, Singapore 638404 on 29 April 2016 at 2.00 p.m. and
at any adjournment thereof.
(Please indicate with an “X” in the spaces provided whether you wish your vote(s) to be cast for or against the Resolutions as
set out in the Notice of Annual General Meeting (of which Resolution Nos. 1 to 11 will be proposed as Ordinary Resolutions and
Resolution No. 12 will be proposed as a Special Resolution). In the absence of specific directions, the proxy/proxies will vote or
abstain as he/they may think fit, as he/they will on any other matter arising at the Annual General Meeting).
No. Resolutions relating to: For Against
Ordinary Business
1 Adoption of Directors’ Statement and Audited Financial Statements for the financial
year ended 31 December 2015
2 Re-election of Mr David Fu Kuo Chen as a Director
3 Re-appointment of Prof Cham Tao Soon as a Director
4 Re-appointment of Mr Ban Song Long as a Director
5 Re-appointment of Mr Oo Soon Hee as a Director
6 Approval of Directors’ fees amounting to S$614,000.00
7 Approval of a final dividend of S$0.05 per ordinary share (exempt one-tier) for the
financial year ended 31 December 2015
8 Re-appointment of Messrs PricewaterhouseCoopers LLP as Independent Auditor and
authorisation for Directors to fix their remuneration
Special Business
9 To approve the Share Issue Mandate
10 To approve the renewal of the Share Purchase Mandate
11 To approve the grant of options and the allotment and issue of shares pursuant to
the NSL Share Option Plan
12 To approve the adoption of the new Constitution of the Company
Note: Voting will be conducted by poll
Dated this day of 2016.
Total Number of Shares Held
Signature(s) of Member(s)/Common Seal
IMPORTANT: PLEASE READ NOTES OVERLEAF

Notes:
1. Please insert the total number of shares held by you. If you have shares entered against your name in the Depository
Register (maintained by The Central Depository (Pte) Limited), you should insert that number. If you have shares
registered in your name in the Register of Members of the Company (maintained by or on behalf of the Company), you
should insert that number. If you have shares entered against your name in the Depository Register and registered in
your name in the Register of Members, you should insert the aggregate number. If no number is inserted, this form of
proxy will be deemed to relate to all the shares held by you.
2. (a) A member of the Company who is not a relevant intermediary is entitled to appoint not more than two proxies
to attend, speak and vote at the Meeting. Where such member’s form of proxy appoints more than one proxy,
the proportion of the shareholding concerned to be represented by each proxy shall be specified in the form of
proxy.
(b) A member of the Company who is a relevant intermediary is entitled to appoint more than two proxies to
attend, speak and vote at the Meeting, but each proxy must be appointed to exercise the rights attached to a
different share or shares held by such member. Where such member’s form of proxy appoints more than two
proxies, the number and class of shares in relation to which each proxy has been appointed shall be specified in
the form of proxy.
“Relevant intermediary” has the meaning ascribed to it in Section 181 of the Companies Act, Chapter 50 of Singapore.
3. A proxy need not be a member of the Company.
4. Completion and return of this instrument appointing a proxy or proxies shall not preclude a member from attending
and voting at the Meeting. Any appointment of a proxy or proxies shall be deemed to be revoked if a member attends
the Meeting in person, and in such event, the Company reserves the right to refuse to admit any person or persons
appointed under the instrument of proxy, to the Meeting.
5. The instrument appointing a proxy or proxies must be deposited at the Company’s registered office at 77 Robinson
Road #27-00, Robinson 77, Singapore 068896 not less than 48 hours before the time set for holding the Meeting.
6. The instrument appointing a proxy or proxies must be under the hand of the appointor or of his attorney duly authorised
in writing. Where the instrument appointing a proxy or proxies is executed by a corporation, it must be executed either
under its seal or under the hand of a director or an officer or attorney duly authorised.
7. A corporation which is a member may authorise by resolution of its directors or other governing body such person as
it thinks fit to act as its representative at the Meeting, in accordance with Section 179 of the Companies Act, Chapter 50
of Singapore.
8. The Company shall be entitled to reject an instrument of proxy which is incomplete, improperly completed, illegible or
where the true intentions of the appointor are not ascertainable from the instructions of the appointor specified on the
instrument of proxy (including any related attachment). In addition, in the case of a member whose shares are entered
in the Depository Register, the Company may reject an instrument of proxy if the member, being the appointor, is not
shown to have shares entered against his name in the Depository Register as at 72 hours before the time appointed for
holding the Meeting, as certified by The Central Depository (Pte) Limited to the Company.

This annual report is printed on environmentally-friendly paper.

NSL Ltd77 Robinson Road#27-00 Robinson 77Singapore 068896T: 65361000 | F: 65361008
Co.Reg.No: 196100107C
www.nsl.com.sg