annual report 2015 - boersengefluester.de · revenue 128.3 128.2 0% ebit (earnings before interests...
TRANSCRIPT

Annual Report 2015

Financials (in EUR million) 2015 2014 Change %
Rocket Internet Group (according to IFRS)
Revenue 128.3 128.2 0%
EBIT (Earnings before interests and taxes) −226.1 421.8 −154%
Cash and cash equivalents 1,758.9 2,053.4 −14%
Loss / profit for the period −197.8 428.8 −146%
Earnings per share (in EUR) −1.24 3.24 −138%
Rocket Internet SE (according to German GAAP)
Revenue 34.2 28.8 19%
EBIT (Earnings before interests and taxes) 63.8 −10.7 −696%
Cash on hand and bank balances 1,720.0 1,997.7 −14%
Net loss for the year −73.4 −45.9 60%
Net loss for the year before extraordinary expenses 1) −70.6 −11.3 525%
Revenue (in EUR million) 2015 2014 Change %
Selected Portfolio Companies
Food & Groceries 534.4 164.3 225%
HelloFresh 305.0 69.6 338%
Delivery Hero 197.9 88.0 125%
foodpanda 31.5 6.7 373%
Fashion
Global Fashion Group 930.1 627.4 48%
General Merchandise 2) 3) 450.0 262.5 71%
Lazada 2) 3) 248.0 139.1 78%
Jumia 134.6 61.8 118%
Linio 67.4 61.6 10%
Home & Living 452.9 343.4 32%
Westwing 219.2 183.3 20%
Home24 233.7 160.1 46%
1) Net loss for the year plus extraordinary expenses of EUR 2.9 million and extraordinary expenses of EUR 34.6 million respectively.2) Figures shown were converted to EUR using average exchange rates.3) Growth rate shown is calculated using constant exchange rates.
Further Information on the Report
Further Information on the Internet
Key Figures

02 Letter to our Shareholders
07 About Rocket Internet
41 Our Companies
93 Consolidated Financial Statements
215 Combined Management Report
Content
Table of Content

LETTER TO OUR SHAREHOLDERS ABOUT ROCKET INTERNETANNUAL REPORT 20152
Oliver Samwer, Chief Executive Officer
>36,000 employees in network of
companies
2015 was our first full year as a listed company. It was a year in which we took great strides in strengthening our presence in key online sectors such as Food & Groceries as well as building out our ownership in certain companies. Furthermore, we continued to focus on building out our operating and investing platform. Rocket Internet’s network of companies was able to rely on our ever more sophisticated technologies and systems, our funding support and strategic impetus and last but not least on our dedicated Rocket Internet employees and their functional expertise. We have built a company of extraordinary reach and scope and a highly differentiated business model. A company that shapes its industry sector.
In the past year, we focused on five industry sectors that make up a significant portion of con-sumer online and mobile spending - Food & Groceries, Fashion, General Merchandise, Home & Living and Travel and invested further in our Regional Internet Groups and New Businesses & Investments. Rocket Internet’s network of companies operates a variety of business models in over 110 countries on six continents. Together, these companies counted more than 36,000 em-ployees at the end of 2015.
Dear Shareholders and Friends of Rocket Internet,

COMBINED MANAGEMENT REPORTCONSOLIDATED FINANCIAL STATEMENTS 3OUR COMPANIES
Of the five industry sectors we are focusing on, Food & Groceries played a key role in 2015. I believe it offers the next big opportunity in Internet and mobile commerce as the sector is beginning to transition from offline to online and customer centric models are gaining traction all around the globe. It is an incredibly large and fast-growing online market, with an overall global sales volume of about EUR 5.8 trillion per year.
In line with our conviction of the opportunities ahead in Food & Groceries, we invested in Hello Fresh and Delivery Hero, market leaders in their respective regions and sub-sectors. We increased our stake in HelloFresh, a global leader in the personalized fresh food at home market, to 56.4% from 43.3% at the end of 2014, and acquired a 37.3% stake in Delivery Hero over the course of 2015. Our stake in foodpanda amounted to 49.1% at the end of 2015. These invest-ments allow us to participate in the growth ahead in this promising sector.
Beyond Food & Groceries, we continued to strengthen our position in the fast growing online Fashion market by creating the Global Fashion Group, a leading online fashion group in emerging markets, through a role up of the regional entities Lamoda (Russia and CIS), Dafiti (Latin Ameri-ca), Namshi (Middle East), Zalora/The Iconic (Asia Pacific/Australia) and Jabong (India).
The investments undertaken in 2015 not only protected and expanded Rocket Internet’s position in key sectors, but also provided the companies with growth capital, allowing them to further expand their operations and advance towards profitable and long-term market leadership – our ultimate goal.
We are very excited about the innovation in the online and mobile sector and continue to pursue new business models. In 2015 we founded and scaled ten new companies ranging from food de-livery companies such as foodora to CarSpring, a peer-to-peer marketplace for used cars.
Our aim is to make our companies highly profitable market leaders in the long-term. To achieve this, a company’s growth is more important than its profitability in the early years. Depending on the model and market, we expect a company to break-even in six to nine years. In order to continuously support the growth of our existing network of companies and to continue to pursue new online models, financial flexibility at Rocket Internet is a key prerequisite. Our stock price did not perform as we would have wished in 2015 and showed significant vola-tility. In particular, the recent uncertainties in the markets about the developments in China and emerging markets as well as in the broader Internet sector seem to have contributed to the re-cent development.
In 2015 we focused on enhancing our financial flexibility, whilst having made significant invest-ments in our companies such as Delivery Hero. We ended the year 2015 with a very strong finan-cial position of EUR 1.8 billion gross cash. Rocket Internet accessed the capital markets through a follow-on offering in February 2015 with gross proceeds of EUR 588.5 million and the issuance of a convertible bond with gross proceeds of EUR 550.0 million in July. We are very well capi-talized to launch, scale and invest in companies, supporting them in their goal to reach market leadership.
These achievements have been made possible by a great Rocket Internet team and co-founders. All of us are going the extra mile, not once in a while, but always, everywhere and in every way.
56.4% ownership in HelloFresh
EUR 1.8 billion cash position

LETTER TO OUR SHAREHOLDERS ABOUT ROCKET INTERNETANNUAL REPORT 20154
Outlook 2016
We are entrepreneurs. Our global and well diversified network of companies is a strong base for creating long-term sustainable value for our investors.
2016 will be a year of continued growth and profitability improvement across our network of companies. Our objective for 2016 is to continue making great investments and launching new companies, to strengthen our market share and position in the countries we are present and to generate returns for our shareholders. We will work on further reducing the complexity across our network of companies and on enhancing transparency.
2016 will be another exciting year for Rocket Internet – great opportunities lay ahead. With our ever growing expertise, our sophisticated technology and our state of the art platform, we will continue to define entrepreneurship in the Internet sector in our markets.
Berlin, April 2016
Oliver Samwer Chief Executive Officer Rocket Internet SE
COMBINED MANAGEMENT REPORTCONSOLIDATED FINANCIAL STATEMENTSOUR COMPANIES 5
Peter Kimpel, Chief Financial Officer
Alexander Kudlich, Group Managing Director
Oliver Samwer, Chief Executive Officer


7
1
08 Our Business Model and Strategy
12 What Sets Rocket Internet Apart?
14 Our Operational Platform
18 HelloFresh – Building the Leading Global Online Consumer Food Brand
20 Our Infrastructure
22 Our Technology
26 Our Network
28 Our Global Footprint
30 Employees
32 Rocket Internet Stock Information
35 Report of the Supervisory Board
Content
About Rocket Internet

ABOUT ROCKET INTERNET8 LETTER TO OUR SHAREHOLDERSANNUAL REPORT 2015
Our Business Model and Strategy
One of Rocket Internet's major
focus industries is Food & Groceries
Our Business Model and StrategyRocket Internet builds and invests in Internet compa-nies that take proven online business models to new, fast-growing markets. Our companies are often “first movers” in their markets that quickly capture size-able market share, the foundation for strong and last-ing profitability. We further honed and deepened this approach in 2015, identifying opportunities in new regions and markets, and consistently expanding the Rocket Internet network of companies.

COMBINED MANAGEMENT REPORTCONSOLIDATED FINANCIAL STATEMENTSOUR COMPANIES 9
Rocket Internet has developed a platform, which is able to support our network of companies. Our operational excellence and our access to international expertise and funding enable us to identify, build and scale proven online and mobile business models anywhere in the world. In 2015, we strengthened our approach and made it even more efficient. We have become experts in entering markets that are more difficult to develop than markets in the industrialized world due to a lack of certain basic infrastructure.
Rocket Internet focuses on five industry sectors of online and mobile retail and services that make up a significant share of consumer spending: Food & Groceries, Fashion, General Merchandise, Home & Living, and Travel. Our network of companies operates a variety of business models in over 110 countries on six continents with more than 36,000 employees at the end of 2015.
Our strategy is influenced by five major trends that drive growth in our key markets:
– Internet penetration in emerging markets is low but grow-ing quickly, which means demand for online and mobile services that meet basic needs is growing strongly.
– The smartphone revolution is giving ever more people In-ternet access, a big opportunity for online retailers to ex-ploit new demand in all corners of the world.
– The population in many of our markets is younger than that in the US, which increases the scope for online busi-ness models.
– The middle class in many emerging market economies is expected to grow strongly, which we expect to raise dis-cretionary consumer spending significantly.
– Bricks-and-mortar retailing in many of our target markets is underdeveloped, which will allow online retailers to cap-ture more consumers as they leapfrog to Internet shopping.
By monitoring these developments and keeping a close eye on consumer habits in individual markets, Rocket Internet was able to grow its network of companies even further in 2015.
We seek to disrupt traditional offline industries
with new, innovative online
business models

ABOUT ROCKET INTERNET10 LETTER TO OUR SHAREHOLDERSANNUAL REPORT 2015
Our Business Model and Strategy
01
Pursuing a Strategy of Long-term Market Leadership and Mid-term Profitability
Our aim is to achieve long-term leadership in the markets and sectors we enter. To gain a strong market position, we are willing to invest in the early stages of this effort leading to start-up losses. Long-term value creation is therefore our key focus when starting new businesses. To support this goal, we continue to invest in our product portfolio, technolo-gy, customer experience, infrastructure and logistics capabili-ties. Targeting profitability in the mid-term, our focus for these companies shifts over time to creating an equilibrium between growth and market share on the one hand and unit economics and profitability on the other. It is our objective that these companies reach break-even within six to nine years after launch.
Building Market Leaders through Organic Growth and Selective Investments
Our operational platform and our expanding network of com-panies put Rocket Internet in a position to capitalize on the growth of Internet commerce in Europe and elsewhere. T ech-nological innovation and rapidly changing consumer habits offer online retailers and service-providers significant opportu-nities as Internet-based business models scale quickly. Rocket Internet invests in selected business models and sectors with the aim of owning significant stakes in companies that will become leading players in their markets.
One of Rocket Internet’s major focus areas currently is Food & Groceries, a fast-growing market with a global sales volume of about EUR 5.8 trillion. Rocket Internet views the sector as the next frontier of eCommerce. In order to expand our global position in this segment, in 2015, we increased our stake in HelloFresh, the internationally active player in the fresh food at home market, to 56.4% from 37.1% at the time of the Rocket Internet IPO. HelloFresh has operations in Germany, Austria, the Netherlands, Belgium, the United Kingdom, Australia and the United States. Rocket Internet also invested over EUR 800 million in the food takeaway company Delivery Hero, resulting in an ownership of 37.3%. Moreover, we invested in foodpan-da and increased our stake to 49.1%. Taking a larger stake in these companies gives us a competitive edge in this attractive sector, while providing the companies with capital to expand their operations and pave the way to become market leaders. Moreover, we further strengthened our market position in the Fashion sector by investing EUR 49.4 million in Global Fashion Group (Lamoda, Dafiti, Namshi, Zalora, Jabong), an online fashion group, operating in several emerging markets.
We aim to maximize our share of the
consumer's online and mobile retail and
services wallet

COMBINED MANAGEMENT REPORTCONSOLIDATED FINANCIAL STATEMENTSOUR COMPANIES 11
A Strong Financial Position Enables Us to Support our Companies’ Operational Strategies
We provide companies launched on the Rocket Internet plat-form with the financial means to start up and develop their op-erations. Since we are the initiator of such a company we own a significant majority and hence we benefit from the so-called “founder economics”. Company growth is typically funded through a mix of own and third party capital, underscoring the attractiveness of and value creation in our network of compa-nies. When we see an investment opportunity in a promising business model, we invest with conviction and provide signif-icant amounts of capital. Since capital is a key component in building market leaders, we undertook several measures to raise additional capital in 2015. In February, Rocket Internet sold 12,010,224 new shares, securing EUR 588.5 million in additional funding. In July 2015, we issued a convertible bond, with aggregate principal of EUR 550.0 million.
Retaining and Expanding Ownership in the Network of Companies through Disciplined Capital
Allocation
Rocket Internet’s network comprises companies at different stages of development. When they are launched, we typical-ly own directly or indirectly an 80% to 90% stake, with the remainder set aside for management equity participation. In subsequent financing rounds, we invest and attract external equity financing, which is provided by our local strategic part-ners as well as strategic and financial investors. As we firmly believe in the business models we launch, we seek to retain a larger share of the absolute value creation and therefore intend to maintain relatively high ownership stakes and control in many of our companies. We continue to participate in financing rounds for our companies and also selectively purchase addi-tional stakes through secondary transactions.

ABOUT ROCKET INTERNET12 LETTER TO OUR SHAREHOLDERSANNUAL REPORT 2015
What Sets Rocket Internet Apart?
proprietary technology and standardized launch process enable us to build a new company within 100 days and to quickly in-ternationalize the model. Our companies benefit from network effects, as technological advancements are shared amongst all companies on a certain platform. Each company benefits from the vast Rocket Internet network of functional and regional ex-perts, strategic partnerships, in-house knowledge sharing and sophisticated benchmarking. We seek to capitalize on opportu-nities and try to minimize the risks of Internet entrepreneurship at every stage of development.
Rocket Internet is a global network of companies. It operates over 100 consumer brands in over
110 countries with more than 36,000 employees. Can you explain Rocket Internet to an outsider?
Rocket Internet is a globally operating platform with a highly differentiated approach. Our investments are based on the same strategic premise: We identify successful Internet busi-ness models and bring them to fast growing and underdevel-oped markets. As “first mover”, our aim is to quickly secure a market-leading position and create the foundation for long-term profitability. We do this by building companies in-house and by investing in young companies which we then scale and expand to new markets. Rocket Internet combines strategic, operational and investment excellence to create long-term value.
Rocket Internet is known as a “company-builder”. What differentiates your business model?
Rocket Internet has industrialized the process of company building with its platform approach, based on which compa-nies can be built and scaled expediently and efficiently. We found companies based on business models, which we have observed as being successful in other markets. A new com-pany is built on our technology platform and leverages our pre-existing functional and regional expertise. Having access to the know-how and the ability to scale a business quickly provides the company with a key competitive advantage versus start-ups, which are developed independently. Our
Alexander Kudlich, Group Managing Director
What Sets Rocket Internet Apart?

COMBINED MANAGEMENT REPORTCONSOLIDATED FINANCIAL STATEMENTSOUR COMPANIES 13
03
So Rocket Internet is all about minimizing the risks of Internet entrepreneurship?
Yes, that’s a good way of describing the combined effects of our strategy and business model. We significantly enhance the probability of a start-up company succeeding, because we eliminate four key risks:
1. We only build or invest into Internet-based business models, which have shown to be successful in other markets. That allows us to avoid the customer adoption risk, i.e. the risk that there is no or limited demand for a new product or service.
2. We carefully select and coach the founding teams of each new venture to make sure they have the right skills for the task in hand.
3. We reduce funding risk - our network of companies can tap Rocket Internet’s funding network at every step of the way from seed- to growth-stage and on into profitability.
4. The Rocket Internet platform enables us to leverage our expertise and create significant synergies across our network of companies.
Emerging market economies are currently facing slowing growth. Is this a challenge for
Rocket Internet?
The digitalization “megatrend” is much stronger than any cyclical economic fluctuation. Our companies in emerging markets continue to perform well and experience high growth rates. Emerging-market countries have a high birth rate and the middle class is growing strongly. This means more and more people have disposable income to spend online. In emerging markets countries, the availability of affordable smartphones has provided people with mobile Internet access, paving the way for them to experience eCommerce and global retail brands for the first time in their lives. We call this the “smart-phone revolution”. We’re seeing these users leapfrog physical retail altogether. In addition, we are well diversified across regions, business models and investment stages. Therefore, we can offset weaker with strong performances elsewhere.
On a more personal note, some people at Rocket Internet think you have the most exciting job, overseeing all the newly founded companies?
It is true. Among other things, I run the “birth station” at Rocket Internet, meaning I get to work with our recently launched companies, ensuring the right team is in place, the operational set-up is appropriate for the model and the right strategic decisions are taken (e.g. launch countries, strategic partnerships etc.). While these companies are at their most fragile, we keep them at our headquarter, giving them access to our company infrastructure and daily assistance. This is where you get to see the Rocket Internet platform at work.
Rocket Internet has industrialized the
process of company building with its
platform approach
Our Operational Platform
ABOUT ROCKET INTERNET14 LETTER TO OUR SHAREHOLDERSANNUAL REPORT 2015
Our Operational Platform
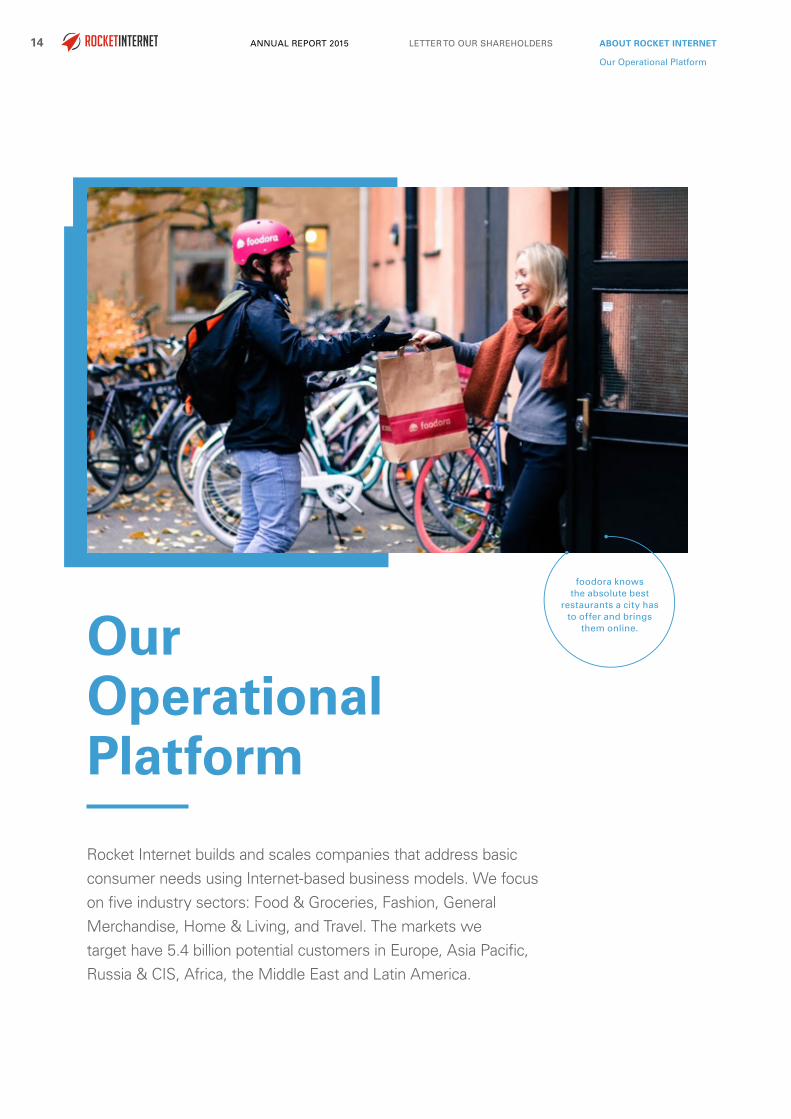
Rocket Internet builds and scales companies that address basic consumer needs using Internet-based business models. We focus on five industry sectors: Food & Groceries, Fashion, General Merchandise, Home & Living, and Travel. The markets we target have 5.4 billion potential customers in Europe, Asia Pacific, Russia & CIS, Africa, the Middle East and Latin America.
foodora knows the absolute best
restaurants a city has to offer and brings
them online.

COMBINED MANAGEMENT REPORTCONSOLIDATED FINANCIAL STATEMENTSOUR COMPANIES 15
Our companies aim to maximize their share of a consumer’s online and, in particular, mobile retail and services wallet. We seek to disrupt traditional offline industries with new, innova-tive, online business models. When building a company, we follow a highly standardized process that takes advantage of network effects and synergies across our platform and net-work of companies. This process is based on best practices we developed when building and launching our current net-work, and commonalities we identified across their more than 30 business models. This standardization takes into account processes best performed locally and those best performed centrally. Local teams focus on on-the-ground implementation, while certain basic functions of a company’s set-up are taken care of centrally, such as the IT infrastructure, marketing sup-port, and strategic development guidance. We tailor this strate-gic, operational and funding support to the development stage and specific needs of each company. At the core of the Rocket Internet platform is an environment of knowledge and support backed by the expertise of our people and technology.
foodora, CarSpring and Movinga are just three of the many companies that have flourished with our support.
foodora is an on-demand food delivery service, available in more than ten countries. It connects customers directly with high-quality restaurants, delivering food via its proprietary logistics operations. The business has grown exponentially and is characterized by high repeat order rates and strong customer loyalty. Rocket Internet’s team of functional experts supported foodora’s rollout at every step of the way, including recruiting, operations, marketing, product and technology. Our expert teams for technology and product worked closely with the foodora team to build a world-class mobile-first platform, including iOS, Android and responsive web applications.
foodora’s iOS app was featured by Apple as “Best of 2015” in Germany and today more than 40% of foodora’s orders are placed through a mobile device. foodora’s rapid growth re-quired the company to hire a large team in a very short period of time. This was only possible through the strong backing of the Rocket Internet recruiting department and its well- es-tablished hiring ecosystem. Initially, Rocket Internet provided foodora with some of its best talent on a temporary basis, until permanent staff was hired. This integrated team took on a high degree of responsibility, enabling fast and efficient growth into more than ten countries. Through knowledge sharing and oper-ational support, Rocket Internet helped foodora to build up its own human resources department, which laid the foundation for its continued growth in the future.
CarSpring is a peer-to-peer marketplace that brings potential used car buyers together with sellers. By checking and eval-uating every car, the company brings transparency and trust to the online sales process. Buyers can finance their purchase directly through CarSpring’s financing service. This scalable business model allows for attractive unit economics and sig-nificant international growth. Rocket Internet’s product experts designed a state-of-the-art user experience, and our engineer-ing team translated this design into a fast and responsive web application. In addition, the product team continued to support CarSpring after its launch, including design and implementa-tion of new features that were developed using early customer feedback. This further optimized the website’s user experience and conversion rate. At the same time, the online marketing team helped to optimize the website for high search engine rankings and created optimized landing pages that form the basis for targeted online marketing campaigns. The marketing team also set up a scaling and bidding strategy, specially de-signed for CarSpring’s Facebook and Google advertisement buying. The CarSpring marketing team is still working closely with the Rocket Internet marketing experts on advertising campaigns in the fields of online and offline marketing.
CarSpring brings transparency and trust to
the online sales process of used
cars

Our Operational Platform
ABOUT ROCKET INTERNET16 LETTER TO OUR SHAREHOLDERSANNUAL REPORT 2015
Movinga is an online moving company that aims to become one of Europe’s most trusted brands in moving. The company leverages a network of logistics partners and gives people who are relocating a quick online quote, based on a few questions they answer on the website. This eliminates the need for an in-home assessment prior to moving day. The vertically-integrat-ed, asset-light and highly scalable platform helps Movinga and its network of moving companies optimize their capacity and routes and generates incremental demand. We provided Movinga focused support in marketing and operations. Lever-aging Rocket Internet best practices, our marketing experts helped Movinga to optimize performance advertising on Face-book and Google, significantly cutting the cost of attracting customers to the website and raising conversion rates at the same time. Furthermore, our team implemented one of Rocket Internet's proprietary automation solutions as the new founda-tion for highly structured and easily scalable paid search adver-tising across all countries. Rocket Internet's operations experts helped Movinga to optimize and streamline the customer care process, significantly reducing the number of customer con-tacts per transaction.
Within each market, we seek to scale and grow our companies to market-leading positions. Our growth culture abides by the key principle of “measuring and optimizing”. We identify lead-ers and best practices by using very granular data and bench-marking our companies in areas like customer acquisition and customer relationship management. We foster internal friendly competition by sharing performance data amongst our com-
panies and continuously conduct market leadership reviews, so that all companies across our network can benefit from the insights we gain. We have a well-defined and rigorous process for shutting down companies that have not met ex-pectations. We believe our platform allows us to consistently scale our companies more quickly than our peers. Our highly standardized business development process, coupled with deep functional expertise, will continue to foster learning curve advantages and synergies across our network.
Book Easy.Move Easy.
No Surprises.

COMBINED MANAGEMENT REPORTCONSOLIDATED FINANCIAL STATEMENTSOUR COMPANIES 17
Our Business Model
We act as founders of our companies, securing the benefits that come with entrepreneurship. We retain major stakes in our businesses and continuously back high performers. To min-imize our risk of losses, we do not hesitate to shut down com-panies, sell non-core businesses and leave markets that do not meet expectations. Based on our platform approach, we seek to create sustainable value for our shareholders. Our recipe:
– We take proven models into new markets to fulfill basic online and mobile consumer needs globally, with a focus on Europe, Asia Pacific, Russia & CIS, Africa, Middle East, Latin America.
– We aim to limit the business concept risk by taking proven “basic consumer needs-based business concepts” to un-derpenetrated markets.
– Our companies target a significant share of the consumer wallet.
– We have accumulated significant operational expertise with our operating platform, consisting of our infrastruc-ture, processes, network and technology.
– Our persistent focus on acting early and quickly bringing new companies into a market often enables us to position our companies as first movers in their markets and benefit from leadership positions, economies of scale and higher margins.
– A strong set of regional strategic and commercial partners provides us with local expertise, access to distribution channels and capital.
– We have a large network that allows our companies to benefit from synergies through being part of the Rocket Internet ecosystem.
– Our platform gives investors access to founder econom-ics, i.e., our initial stake in a new company is high, while financial investment is low.
– We provide investors with transparency, offering quar- terly reporting on the basis of IFRS for companies in our focus sectors, as well as quarterly disclosure of Rocket Internet’s stake in its network of companies.
Overall, we believe our business model offers high capital ef-ficiency and scalability. Once we identify a worthwhile oppor-tunity, we disrupt markets with dedication and speed. Rocket Internet’s highly standardized processes enable our companies
to scale operations in a short period of time, maximizing the opportunity for us and our shareholders. Our value creation strategy focuses on to sustainable market leadership for our companies in the long-run, while making them profitable in the mid-term.
Example: HelloFresh
HelloFresh, the online provider of personalized fresh food at home, is one of the companies that quickly established a lead-ing position in the online grocery market. The company deliv-ers fresh, pre-portioned ingredients each week so consumers can prepare healthy and delicious home-cooked meals using the company’s recipes.
HelloFresh is still investing in building out its leading position in this highly attractive segment. In 2015, it has focused on becoming a nationwide player in the US, setting up logistics centers in three states and increasing general brand awareness (for further information about HelloFresh see the following page).
HelloFresh quickly established a leading position in the online
grocery market.

Our Operational Platform
ABOUT ROCKET INTERNET18 LETTER TO OUR SHAREHOLDERSANNUAL REPORT 2015 ABOUT ROCKET INTERNET18 LETTER TO OUR SHAREHOLDERSANNUAL REPORT 2015
HelloFresh – Building the Leading Global Online Consumer Food Brand
2012
2.3
2013
14.2
2014
69.6
2015
305.0
HelloFresh's Hyper Growth Continues with Full-force
Net Revenues (EURm)
CAGR 409%
Active in 7 countries across 3 continents
17.0 m meals served in Q4 2015
615k active subscribers as of end of Q4 2015
At the end of the year, mobile sessions already amounted to more than 47% of sessions overall
+7,500 recipes in our database with extensive customer ratings and reviews
HelloFresh’s Proposition to its Subscribers
HelloFresh – Building the Leading Global Online Consumer Food Brand
NO PLANNING
NO SHOPPING
NO WASTE
FRESH AND HEALTHY MEALS
1. Box delivered weekly to the door
2. Perfectly por-tioned ingredients for 3-5 meals per week
3. Personalized fresh food, locally sourced
4. Easily managed via subscription platform

COMBINED MANAGEMENT REPORTCONSOLIDATED FINANCIAL STATEMENTSOUR COMPANIES 19COMBINED MANAGEMENT REPORTCONSOLIDATED FINANCIAL STATEMENTSOUR COMPANIES 19
Richmond, CA
Grand Prairie, TX
Linden, NJ
Strategic Partnership with Jamie Oliver
In January 2016, HelloFresh launched an exclusive partnership with one of the greatest celebrity chefs of all time, Jamie Oliver. Through the partnership, HelloFresh and Jamie Oliver aim to promote their shared mission of empowering people to make better food choices and cook using fresh ingredients, no matter what their lifestyle.
HelloFresh customers in the UK, USA, Netherlands, Germany, Belgium and Austria can now look forward to being able to choose a Jamie Oliver recipe for their box.
7-fold capacity increase
Significant Capacity Expansion Laying the Foundations for Sustained Future Growth
With the number of HelloFresh customers continuing to grow at unprecedented levels, 2015 has seen HelloFresh make a number of investments into new fulfillment centers across its markets to meet the higher capacity demands.
In the United States, HelloFresh transitioned its West Coast fulfillment center in Q3 and signed leases on centers in Texas and New Jersey, which will become operational in H1 2016. The new facilities will allow for an approximately 7-fold capac-ity increase, and will employ higher levels of automation and state-of-the art equipment.
In Germany, a lease was signed on a new, larger facility, which will become fully operational by Q2 2016.
Delicious home cooked meals
every week

ABOUT ROCKET INTERNET20 LETTER TO OUR SHAREHOLDERSANNUAL REPORT 2015
Our Infrastructure
Our infrastructure enables us to achieve economies of scale and scope and to realize synergies that improve the perfor-mance of our companies. Across our network of companies, we have more than 36,000 people active across six conti-nents, providing us with strong competitive advantages. Since our companies and people are present on the ground in our target markets, we benefit from lower marginal costs for build-ing additional companies as a result of the local learning curve and positive network effects. Our local professionals enable us to scale our companies more quickly and to identify opportu-nities faster than our competitors. In the process of doing so, we have accumulated significant expertise regarding Internet business models, local operations and logistics, particularly in the fields of marketing, warehousing, content production, sales, last mile delivery, payment and customer care. Thanks to our size and geographical footprint, we are able to have on-site teams from the start of our operations, providing us with a better understanding of the opportunities and challenges in our local markets. In addition, partnerships with leading regional and global companies give us a competitive edge by leveraging their existing infrastructure, relationships and skills. We have established a local ecosystem that can be utilized by all of our companies (e.g. shared last mile delivery capabilities).
Our infrastructure is built upon four components that enable us to create best-in-class online companies and simultaneously expand them to a number of countries and regions:
– Our Functional Expertise
– Our Regional Expertise
– Our Strategic Partners
– Our Entrepreneurs
Our Functional Expertise
Our team of functional experts supports our companies along their full lifecycle in key areas such as systems engineering, product design, online marketing and customer relationship management as well as mobile applications to name just a few. Companies recently incepted draw heavily upon the func-tional expertise of the Rocket Internet platform. This enables our companies to develop a presence in a shorter period of time and with best in class functional know-how. Companies then build out their respective internal teams and internalize these functions to be able to operate independently of Rock-et Internet in their day-to-day operations. Companies often continue to turn to Rocket Internet for support on special projects, hence getting access to best in class expertise while at the same time managing capacity needs more efficiently by outsourcing certain tasks rather than building up a larger permanent workforce. In addition, our functional experts are monitoring key performance indicators and are fostering best practice management and knowledge sharing across our net-work of companies.
Our Infrastructure

COMBINED MANAGEMENT REPORTCONSOLIDATED FINANCIAL STATEMENTSOUR COMPANIES 21
Rocket InternetFunctional Experts Company Lifecycle
Engineering
Product
Marketing
Business Intelligence
CRM
Payment
Security
Operations
Finance & Legal
Define Processes
Implement Systems
TrainCompanies
Optimize &Benchmark
Moderate KnowledgeCommunity
Our Regional Expertise
Rocket Internet's network of companies is active in more than 110 countries worldwide. In order to foster synergies and back our companies, our regional experts coordinate our activities across our target regions (Europe, Asia Pacific, Russia & CIS, Africa, Middle East and Latin America) and support the compa-nies through the local ecosystem. These regional experts cen-tralize knowledge across local markets and business models, facilitate regional strategic and commercial partnerships and support local recruiting and sourcing to accelerate the regional rollout of our businesses.
Our Strategic Partnerships
In addition, we have established relationships with strategic partners, including telecommunications and Internet provid-ers (e.g. United Internet, Philippine Long Distance Telephone Company, MTN, Ooredoo and Millicom), industry partners (e.g. Axa, Tesco, Tengelmann and Kering) and financial inves-tors (e.g. Kinnevik, Access Industries and Holtzbrinck). These partners provide our network of companies with extensive financial, operational and strategic support. For example, our partnerships with telecommunications providers position us to benefit from their mobile subscriber base, billing relationships, their physical distribution network, text message marketing competence, local customer relationship infrastructure and pre-installation of our mobile applications on handsets.
Rocket Internet has also entered into framework agreements with leading global technology companies such as Criteo, Google, Facebook, Rackspace, Responsys and Salesforce to complement our technology platform and provide our network of companies with competitively priced, state-of-the-art tech-nology, online advertising and other services on the basis of framework agreements.
Our Entrepreneurs
Each company is run by an independent leadership team, which we refer to as entrepreneurs, co-founders or managing directors. They are recruited locally as well as globally and typically have entrepreneurial general management profiles with outstanding analytical skills from dynamic backgrounds, such as management consulting, investment banking, leading Internet and technology companies and media and consumer goods companies and have graduated from leading business schools.

ABOUT ROCKET INTERNET22 LETTER TO OUR SHAREHOLDERSANNUAL REPORT 2015
Our Technology
Layer 1:
SkyRocket Core
Layer 2:
Rocket Cloud Services
Layer 3:
Development of Customized Technology Our Companies
– More than 170 developers, product managers and UX designers
– Web, Android and iOS
Examples:
– Direct merchant integration (SellerCenter)
– Marketing automation (RAS)
– Product recommendations (Datajet)
– Launching in less than 100 days
– Independent of business model and sector
Our Framework for Proprietary Technology
Layer 1: SkyRocket
At the heart of our technology platform is SkyRocket, our pro-prietary mobile-first application framework that enables us to launch companies in less than 100 days, independent of the business model. It enables us to expediently assemble and maintain a robust and scalable operational infrastructure based on compatible plug-and-play modules.
SkyRocket provides a blueprint for all key technology compo-nents of a fast-growing online company, covering all steps in the customer journey, from acquisition, to conversion, to re-tention, across the full device universe. It enables us to quickly launch new companies and to provide them from day one with a scalable technology platform that can handle high transaction volume as companies grow. Its standardization provides for cost savings and efficient sharing of technological improve-ments across business models and companies. Having such a common platform across companies also allows us to crowd-source innovative ideas from our network of companies, inte-grate them into the common platform and hence make them available to other companies using the same technology.
Rocket Internet is a technology company at heart. The pro-prietary Rocket Internet technology platform provides our network of companies with state-of-the-art plug-and-play solutions for almost any Internet business model. Our modular infrastructure is built to scale with the needs of our business-es. It can easily be adapted to the specific requirements of individual companies and complex markets. While stand-alone start-ups have to develop their technology from scratch, Rocket Internet provides its network of companies with a pow-erful and field-tested framework, giving them an edge over the competition. Access to the proprietary Rocket Internet technol-ogy platform enables our entrepreneurs to focus on the core business matters of their companies and to scale their oper-ations without technological limitations. Rocket Internet pro-vides an innovative, secure and stable technology framework along the full lifecycle of an online company. This framework consists of three complementary layers:
– SkyRocket: Core application framework we use to build companies in less than 100 days
– Rocket Cloud Services: Industry-specific solutions we pro-vide to our companies
– Custom technology development for our companies: Fully customized technology we build for our companies
Our Technology

COMBINED MANAGEMENT REPORTCONSOLIDATED FINANCIAL STATEMENTSOUR COMPANIES 23
We build companies with a mobile first strategy. In particular in emerging markets, given the lack of fixed line telecoms infrastructure, far more people access the Internet via smart-phones than via computers, but also in Western Europe is the share of mobile traffic ever increasing. On Lazada, our General Merchandize marketplace in South-East Asia, the value of orders placed on mobile devices is exceeding 60% of orders. Our Middle Eastern Fashion company Namshi derived more than 80% of its traffic in 2015 from mobile devices. SkyRocket has been created with this trend towards mobile-first in mind, allowing for the fast and scalable launch of native mobile apps and responsive websites.
Layer 2: Rocket Cloud Services
We have developed a set of proprietary cloud services that are tightly integrated with SkyRocket and enable our companies to solve complex challenges related to their individual business models. We develop and provide these solutions centrally to our companies, such that they can focus on their business in a way that synergies between companies facing similar chal-lenges are maximized. Examples of these services include:
SellerCenter is a cloud service that provides a direct merchant integration platform tailored to the requirements of our mar-ketplace companies, allowing third party vendors to list and manage their product offering on the platform. SellerCenter includes systems to manage products, orders and logistics, business intelligence tools, mobile apps and APIs to seam-lessly integrate with the internal systems of partner vendors. 16 Rocket Internet companies across 47 countries are currently using SellerCenter. The monitoring and reporting tool enables us to monitor front-end and back-end operations of connect-ed companies in real time and report and address emerging problems instantly. Currently, SellerCenter supports more than three million active sellers, more than 31 million active product listings and had processed more than 40 million orders as at December 2015.
Our Rocket Advertising Service (RAS) provides marketing automation services for customer acquisition and retention. For example, it collects user location, device, or even weather information to build consumer profiles in real time. These pro-files help us adjust marketing measures and attract new cus-tomers to our companies’ websites and apps. An automated campaign builder helps Rocket Internet’s companies advertise their brands, product categories and specific inventory based on real time product availability, and self-learning capabilities systematically manage and optimize campaigns in real time.
DataJet empowers our companies to fully control and lever-age their user data, collecting vast amounts of real-time data and using this data to optimize the user experience in native mobile or web applications, resulting in better search results, dynamic merchandising and tailored product recommenda-tions. Thereby, Datajet enables our companies to identify con-sumer interests and create deeper customer relationships.
Layer 3: Custom Development
Leveraging the toolbox provided by SkyRocket and Rocket Cloud Services, our in-house product development team with more than 170 engineers and product managers builds custom technology for each of our companies. Full vertical integration and standardized development processes enable us to launch companies quickly. In addition, our internal development team enables us to support our companies along their full life cycle with custom technology solutions.
Our team of technology engineers excels in their respective focus areas but is also keen on learning about the latest trends and work performed in adjacent areas. To foster knowledge sharing across all levels, every year our senior technology staff host the Rocket Internet Tech Summit in Berlin. Here, they discuss the latest trends in Internet technology and how Rocket Internet can harness them. In 2015, over 30 speakers, including senior technology professionals from leading com-panies such as Amazon and Google presented their leadership approaches, discussed the latest technology trends and also spoke about how to maintain world-class systems.
Christian Hardenberg, Chief Technology Officer: “Rocket Internet is a family of companies - our Tech Summit is similar to a family reunion. We invite the tech leadership of all our companies to Berlin once a year to foster relationships and to discuss common challenges. We always identify the one company that is best at a certain topic and let them
present and teach others. Beyond that, we invite external speakers - it is
just a great way to exchange knowledge.”

Our Technology
ABOUT ROCKET INTERNET24 LETTER TO OUR SHAREHOLDERSANNUAL REPORT 2015
Rocket Technology
Platform
Standardized APIs
Storage
Multivariate Testing
Frontend APIs for native
mobile and web
Recommen-dations API
Deep cloud integrations
Sorting & Ranking API
Search API
Payment service provider
integrations
Real-time Tracking API
ERP integrations
SkyRocket (core application frame-work allowing Rocket to build companies in less than 100 days)
DataJet.io (real-time big data
cloud services)
RedshiftiOS
Collaborative filtering
Android
Product correlations
Responsive Web
Dynamic Merchandising
AWS
Azure
Horizontal (number of countries)
Vertical (traffic
volume)
Paypal
AdyenBrainTree
SAP
FinancialForce
PostgreSQL
Customer Management API
Inventory Management API
Transaction Management API
Scalability
Rocket Internet Technology Platform
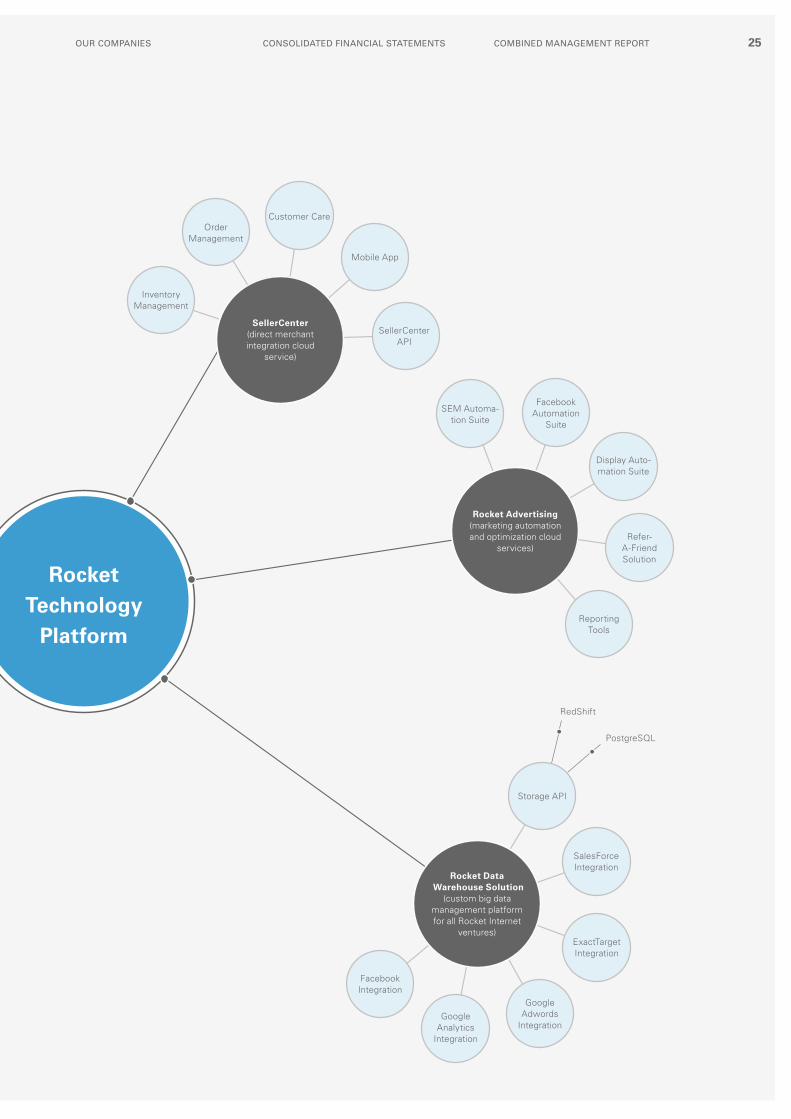
COMBINED MANAGEMENT REPORTCONSOLIDATED FINANCIAL STATEMENTSOUR COMPANIES 25
Rocket Technology
Platform
SellerCenter API
Refer- A-Friend Solution
SalesForce Integration
Mobile App
Display Auto-mation Suite
Storage API
Customer Care
Facebook Automation
Suite
Google Adwords
Integration
Order Management
SEM Automa-tion Suite
Google Analytics
Integration
Facebook Integration
Inventory Management
Reporting Tools
ExactTarget Integration
SellerCenter (direct merchant integration cloud
service)
Rocket Advertising (marketing automation and optimization cloud
services)
Rocket Data Warehouse Solution
(custom big data management platform for all Rocket Internet
ventures)
RedShift
PostgreSQL

ABOUT ROCKET INTERNET26 LETTER TO OUR SHAREHOLDERSANNUAL REPORT 2015
Our Network
Our large and geographically diverse network of companies encompasses our businesses across more than 110 countries on six continents.
The size of our network of companies and their different stages of development provide our companies with substantial opportunity to benefit from synergies and network effects. In particular, we have a strong culture of knowledge transfer that takes place on a regional, functional and business concept level. In our network, knowledge is being shared centrally and locally in a systematic way on a daily, weekly and monthly basis. We also pride ourselves on our speed of execution, our openness to change and our entrepreneurial approach – quali-ties, which we believe are extremely important to our business model and our ability to quickly identify and implement new business concepts as well as to enter new markets and also to attract highly talented employees. Our principal goal is to increase shareholder value by identify-ing, growing and investing in proven Internet models.
In 2015, we significantly expanded our network of companies with the investment in Delivery Hero, acquiring a 37.3% stake. In addition, we launched a number of new businesses and selectively increased our stake in our focus sector companies and achieved major positions at HelloFresh and foodpanda. A number of our businesses also attracted significant funds from existing and new investors, including HelloFresh, foodpanda and Global Fashion Group.
We launched a number of new businesses, selectively increased our stakes in our focus sector companies and achieved majority positions at HelloFresh and foodpanda and acquired a 37.3% stake in at Delivery Hero, creating a global champion in Food & Groceries.
Our Network

COMBINED MANAGEMENT REPORTCONSOLIDATED FINANCIAL STATEMENTSOUR COMPANIES 27
мода с доставкой
Food & Groceries
Fashion
General Merchandise
Home & Living
Travel
Regional Internet Groups
New Businesses & Investments

ABOUT ROCKET INTERNET28 LETTER TO OUR SHAREHOLDERSANNUAL REPORT 2015
Our Global Footprint
Sao Paulo
Our Global Footprint
7,100 AMERICAS
HEADCOUNT
Rocket Internet and its network of com panies are active in more than 110 countries around the globe with more than 36,000 people on the ground. You find our companies and local offices in many of the world’s emerging capitals and cities.

COMBINED MANAGEMENT REPORTCONSOLIDATED FINANCIAL STATEMENTSOUR COMPANIES 29
Dubai
BerlinLondon
Paris
New Delhi
Lagos
Singapore
6,200 EUROPE
HEADCOUNT
4,300RUSSIA & CIS
HEADCOUNT
5,700 AFRICA & MIDDLE EAST
HEADCOUNT13,800
ASIA-PACIFIC
HEADCOUNT

ABOUT ROCKET INTERNET30 LETTER TO OUR SHAREHOLDERSANNUAL REPORT 2015
Employees
13.8
7.1
6.2
5.7
4.34.2
4.3
5.3
7.8
9.3
Headcount Increase by Region January to December 2015numbers in thousand
Asia-Pacific
Americas
Europe
Africa & Middle East
Dec 31, 2015 Jan 1, 2015
Rocket Internet is an inspiring work environment. Employees are key to building leading online companies around the globe and driving the growth of our business. Working at Rocket Internet means being part of a dynamic team, where each of our employees takes ownership to move the company f orward. Rocket Internet attracts talent from around the globe and is continuously looking for the best people. Not only for Rocket Internet, but also for our network of companies - big or small - talent is a crucial success factor.
Attracting the Best Talent Globally
Talent acquisition remains a core priority. Across our network of companies, Rocket Internet’s employee count increased from 30,000 in 2014 to over 36,000 at the end of 2015, driven inter alia by the growth of our businesses in the Asia Pacific, European and Africa & Middle East regions. Rocket Internet’s central Talent Acquisition team employs cutting edge recruit-ment processes and technologies, resulting in more than 100 applications per day. Our functional recruitment specialists manage strong global talent pools for all core positions re-quired by online companies, giving our companies access to high caliber talent. Moreover, our companies leverage the strong Rocket Internet brand throughout the entire recruitment process, thereby attracting better talent than lesser known young companies.
Retaining Talent
As important as hiring great talent is the retention of talent. Our talent retention strategy is based on three pillars. Firstly Rocket Internet offers interesting and challenging work as-signments in a highly dynamic work environment and provides ample growth opportunities for employees either at Rocket Internet or within our network of companies. A second major element of the human resource strategy is targeted develop-ment programs, such as the Rocket University, a program in which employees train one another, as well as general inhouse trainings on core skills (e.g. leadership and time-management). Lastly, we offer competitive compensation, which, depending on the position, might include a combination of base salary, bonus and / or equity options.
Driving Diversity and Equal Opportunity
The number of Rocket Internet employees working at our headquarter, located in Berlin, was 425 employees, as of December 2015. A significant portion (68%) of our personnel provides functional expertise (e.g. product design, online marketing and IT) to our network of companies, while 32% perform corporate functions (e.g. finance, legal and HR).
Employees
Russia & CIS

COMBINED MANAGEMENT REPORTCONSOLIDATED FINANCIAL STATEMENTSOUR COMPANIES 31
WE TAKE OWNERSHIP
We are operators, who build companies from end-to-end and take responsibility proactively
WE THINK TO SCALE
Innovating in a single country is one thing, but delivering the same service on a global scale
is quite another
WE ACT FAST
We go from zero to launch in 100 days - and that requires a specific fearlessness and strong focus
WE EXCHANGE GLOBALLY
Our entire success is built on sharing know-how within our network, across industries and geographic
borders
WE AIM TO WIN
When we build a new company, we are prepared to go the extra mile. We put in everything to ensure
sustainable impact
55%10%
15%
7%
7%4% 2%
Developing Future Entrepreneurs
As a part of our growth strategy we continuously search for the best, highly qualified talent. We offer our employees opportunities to develop in a fast growing, diverse and chal-lenging environment. Moreover, we promote the rise of future entrepreneurs and online leaders by offering trainee programs for more than 20 people in positions such as Global Venture Development, who form a pool for future Founder candidates, and Growth Managers, who are trained to become future Chief Marketing Officers (CMOs). For experienced professionals, Rocket Internet creates tremendous opportunities to take on responsibility and shape industry leading companies.
As Rocket Internet operates in many different regions around the globe, it is essential for us to employ people from different cultural backgrounds, with various abilities, talent and local expertise. We sincerely value the diversity of our company and are convinced that such a diverse environment is beneficial for the development of our people as well as for the success of Rocket Internet and its network of companies. The employees at our headquarter come from 70 different countries, only 55% of our employees are from Germany; hence, the main lan-guage spoken at Rocket Internet is English. We provide equal opportunities to all of our employees. As of December 2015, more than one third of our employees were female; when excluding our personnel in the IT department, 48% of Rocket Internet personnel were women. The high degree of diversity and gender equality makes Rocket Internet a very dynamic and diverse workplace.
Rocket Internet HQ
68%
66%
32%
34%
Functional Experts
Men
Corporate Functions
Women
Nationalities
Gender Diversity
Germany
Africa
Central Europe
Southern Europe
Western Europe
America
Asia Pacific

ABOUT ROCKET INTERNET32 LETTER TO OUR SHAREHOLDERSANNUAL REPORT 2015
Rocket Internet Stock Information
www.rocket-internet.com/investors
Rocket Internet Stock Information
The year 2015 was the first full calendar year for Rocket Internet as a public company and charac-terized by a volatile share price development. Since the initial public offering on October 2, 2014 at EUR 42.50 in the Entry Standard of the Frankfurt Stock Exchange under the ticker symbol RKET, the share has in 2015 seen a closing high of EUR 57.08 on February 10, 2015 and a closing low of EUR 21.29 on September 24, 2016.
In February 2015, Rocket Internet successfully raised EUR 588.5 million by placing 12,010,224 new shares that were issued to institutional investors at a price of EUR 49.00 per share, increas-ing the number of shares outstanding to 165,140,790.
On July 14, 2015, Rocket Internet announced the placement of convertible bonds with an aggre-gate principal amount of EUR 550.0 million maturing July 22, 2022. The bonds carry a coupon of 3.00% per annum, payable semi-annually and the initial conversion price amounts to EUR 47.5355.
Rocket Internet announced on February 2, 2016 that it will use up to EUR 150.0 million to pursue a buyback of the convertible bonds until the end of 2016, thereby reducing interest expenses as well as potential dilution. Repurchased bonds will either be held or cancelled by Rocket Internet.
Share Informationas of March 31, 2016
Issuer Rocket Internet SE
TYPE OF SHARESORDINARY BEARER SHARES WITH NO PAR
VALUE (STÜCKAKTIEN)
STOCK EXCHANGE FRANKFURT STOCK EXCHANGE
MARKET SEGMENTNON-REGULATED MARKET
(ENTRY STANDARD)
TOTAL NUMBER OF SHARES OUTSTANDING 165,140,790
ISSUED SHARE CAPITAL EUR 165,140,790
ISIN DE000A12UKK6
WKN A12UKK
TICKER SYMBOL RKET
COMMON CODE 111314110
THOMSON REUTERS RKET.DE
BLOOMBERG RKET:GR

COMBINED MANAGEMENT REPORTCONSOLIDATED FINANCIAL STATEMENTSOUR COMPANIES 33
38.1
13.28.36.8
6.16.0
21.5
(1) The shareholding percentage shown for Global Founders includes shares that are held by affiliates of Global Founders GmbH.(2) This shareholding percentage was also given in Kinnevik's year-end release 2015, published on February 11, 2016.(3) This shareholding percentage was also given in United Internet's annual report 2015, published on March 11, 2016.(4) This shareholding percentage was also given in PLDT's US - SEC form 20-F filing, published on March 18, 2016.
Rocket Internet Stock Information
Rocket Internet’s Last Known Shareholder Structurein percent
Shareholder Structure
The shareholding percentages shown below are generally based on the shareholdings as last notified to Rocket Internet by its shareholders pursuant to Section 20 German Stock Corporation Act (Aktiengesetz) or the shareholdings as of the time of the IPO in October 2014. The share-holdings have, however, been adjusted for the dilution of and any allocations to shareholders in connection with the share capital increase in February 2015. Please note that these shareholding percentages could have changed within the respective thresholds of Section 20 German Stock Corporation Act (25%/50%) without triggering an obligation of the shareholders to notify Rocket Internet.
Development of the Rocket Internet Stock and Important Stock Market Indices
Dec. 31, 15 Dec. 31, 14 Change
Rocket Internet share (EUR) 28.24 51.39 - 45.0%
DAX 10,743.01 9,805.55 9.6%
MDAX 20,774.62 16,934.85 22.7%
TECDAX 1,830.74 1,371.36 33.5%
Dow Jones 17,425.03 17,823.07 - 2.2%
S&P 500 2,043.94 2,058.90 - 0.7%
MSCI Emerging Markets Index 794.14 956.31 - 17.0%
Global Founders 1)
Kinnevik 2)
Free float
Access Industries
PLDT 4)
Baillie Gifford
United Internet 3)

ABOUT ROCKET INTERNET34 LETTER TO OUR SHAREHOLDERSANNUAL REPORT 2015
Rocket Internet Stock Information Report of the Supervisory Board
DecMar Jun SepJan
160
140
120
100
80
60
40
20
Relative Share Price PerformanceJan 1 to Dec 31, 2015, indexed
S & P 500 Dow Jones Industrial MSCI Emerging Markets
Rocket Internet DAX TECDAX MDAX
40
60
80
100
120
140
The performance of global stocks throughout the year 2015 was shaped by a volatile and uncer-tain market, caused by the unpredictability of future quantitative easing measures by the United States Federal reserve and the European Central Bank as well as geopolitical stress in Europe and the Middle East. In the first months of the year, German stocks continued a bullish path, reaching all-time highs. However, driven by falling oil prices and the fear of higher interest rates in the US as well as a drop in the Shanghai Composite in August, global indices declined in the second half of 2015. While in the first months after the IPO, the Rocket Internet share outperformed global indices, in 2015, it suffered from prevailing market conditions, declining by 45% to EUR 28.24 per share at the end of 2015, compared to EUR 51.39 per share as of December 31, 2014.
Annual General Meeting 2014
On June 23, 2015 Rocket Internet SE held its first Annual General Meeting in Berlin. A total of 92.19% of the capital stock was present. All proposed resolutions were approved with a majority of at least 89.39%.
Financial Calendar
May 31, 2016 Q1 2016 Results for Selected Portfolio Companies
June 9, 2016 Annual General Meeting of Rocket Internet SE
September 22, 2016 H1 2016 Results for Rocket Internet SE and Selected Portfolio Companies

COMBINED MANAGEMENT REPORTCONSOLIDATED FINANCIAL STATEMENTSOUR COMPANIES 35
Professor Dr Marcus Englert, Chairman of the Supervisory Board
Report of the Supervisory Board of Rocket Internet SE for the Financial Year 2015
Dear Shareholders,
The Supervisory Board of Rocket Internet is looking back on its second year of work. Key challenges of the year 2015 for Rocket Internet were significant macroeconomic changes, in particular the economic slowdown in emerging markets and the weakening of emerging market currencies. Furthermore, Rocket Internet pursued key projects such as the formation of Rocket Internet’s online food delivery group, including the integration of Delivery Hero into this group, as well as the formation and integration of the Global Fashion Group. The Supervisory Board advised and supervised the Management Board with respect to these key projects and further material management matters. It was deeply involved in all matters of fundamental importance for Rocket Internet and was thereby able to convince itself of the lawfulness and appropriateness of all actions of the Management Board.
1. Summary
The financial year 2015 brought changes in the composition of the Supervisory Board. At the Annual General Meeting 2015, five of the nine members of the Supervisory Board were elected with two members being confirmed in office and three new members being appointed.
The Supervisory Board continued to be involved in a number of approvals of a variety of mea-sures at the level of Rocket Internet as well as transactions directly relating to Rocket Internet’s network of companies: In March, Rocket Internet’s legal form was converted from AG to SE. In February, Rocket Internet issued new shares by way of an accelerated bookbuild offering which raised gross proceeds of EUR 588.5 million. In July, Rocket Internet issued convertible bonds in the amount of EUR 550.0 million. These bonds are listed on the Open Market (Freiverkehr/Entry Standard) of the Frankfurt Stock Exchange. In addition, the Supervisory Board, after careful review and discussion, approved several transactions regarding Rocket Internet’s network of companies. With respect to transactions not requiring the Supervisory Board’s prior approval, the Management Board kept the Supervisory Board apprised and involved. Apart from the ongoing transactional advice the Supervisory Board offered to the Management Board, the Supervisory Board put a focus on the development of the strategic orientation of Rocket Internet.
In 2015, a total of four Supervisory Board meetings were held: On April 21, 2015, June 23, 2015, September 15, 2015 and December 3, 2015. All members participated in all of those meetings. The Chairman of the Supervisory Board stayed in close contact with the CEO also outside of meetings. In addition, over 40 resolutions were passed outside of meetings in written form or by way of telephone conferences.

ABOUT ROCKET INTERNET36 LETTER TO OUR SHAREHOLDERSANNUAL REPORT 2015
Report of the Supervisory Board
The Management Board of Rocket Internet regularly and timely provided the Supervisory Board with comprehensive information on Rocket Internet policies, fundamental questions of manage-ment and planning, the financial development, compliance, the status of the transition of financial accounting from German GAAP principles to international IFRS standards and any events of significance for Rocket Internet. Relevant deviations from the business plan were comprehen-sively discussed. Members of the Management Board made themselves available at any time for questions and discussions during and also outside of the Supervisory Board’s meetings. The Supervisory Board reviewed whether the financial reporting of Rocket Internet conformed to applicable requirements.
2. Members of the Supervisory Board
The Supervisory Board of Rocket Internet consists of nine members. Until the Annual General Meeting 2015 on June 23, 2015, these were the members which had been elected by the Extraordinary General Meeting of August 22, 2014: Lorenzo Grabau, Erik Mitteregger, Napoleon L. Nazareno, Daniel Shinar, Ralph Dommermuth, Professor Dr Marcus Englert, Dr Erhard Schipporeit, Philip Yea and Professor Dr h.c. Roland Berger. Effective from the end of the Annual General Meeting 2015 after the resignation from office of Mr Dommermuth, the ending of the term of office of Mr Yea and Dr Schipporeit and the (re)election of Professor Dr Englert, Professor Dr h.c. Berger, Professor Dr Joachim Schindler, Dr Martin Enderle and Norbert Lang, the Super-visory Board consists of Professor Dr Englert, Professor Dr h.c. Berger, Dr Enderle, Mr Grabau, Mr Lang, Mr Mitteregger, Mr Nazareno, Professor Dr Schindler and Mr Shinar. The Supervisory Board thanks Mr Yea, Dr Schipporeit and Mr Dommermuth for their support in the past financial year.
Effective from December 16, 2015, Mr Grabau resigned from his position as the Chairman of the Supervisory Board and Professor Dr Englert from his position as deputy chairman. The members of the Supervisory Board thereupon elected Professor Dr Englert as Chairman and Mr Lang as deputy chairman of the Supervisory Board.
The members of the Supervisory Board possess the necessary knowledge, abilities and experience to duly perform their duties. The professional capacity of individual members is complementary so that the Supervisory Board as a whole is in a position to comprehensively perform its duties. It is therefore secured that the Supervisory Board duly performs its control and advisory function in accordance with the law, the Articles of Association and the Rules of Procedure.
3. Focal Points of the Work of the Supervisory Board
The Supervisory Board, after the Annual General Meeting 2015, re-established its previous committees in its constituent meeting (for the composition and tasks of each of the committees, see 4 below). It furthermore formed and appointed an Accelerated Bookbuild Offering (ABO) Committee to accompany the increase of Rocket Internet’s capital by partially utilizing authorized capital granted in the Annual General Meeting 2014. The Supervisory Board also established a Financing Committee which intensely advised the Management Board in the issuance of the convertible bonds. In addition to the SE conversion, the Supervisory Board – primarily through its Audit Committee – closely supervised the transition from German GAAP accounting methods to IFRS accounting. Finally, the Supervisory Board was closely involved in the discussions con-cerning the last portfolio value - valuation methodology applied by Rocket Internet.
After due deliberations with the Management Board, the Supervisory Board approved the business plan and the investment budget of Rocket Internet.
The Audit Committee also dealt with the improvement of the risk and compliance management system of Rocket Internet.

COMBINED MANAGEMENT REPORTCONSOLIDATED FINANCIAL STATEMENTSOUR COMPANIES 37
Furthermore, the Supervisory Board dealt with the appropriateness of the remuneration of the members of the Management Board. In this context, the Supervisory Board engaged an indepen-dent, external advisor to render an opinion on the appropriateness of the remuneration. According to the expert, the remuneration, including all its components, is appropriate and customary in Rocket Internet’s market. The Supervisory Board shares this opinion.
In addition, the Supervisory Board approved multiple financing rounds in companies in the net-work of companies as well as acquisitions of companies. It closely monitored and approved the establishment of Rocket Internet’s global online takeaway food business by acquiring and in creasing its stake in Delivery Hero and building up its stake in foodpanda. After detailed dis-cussion and review, the Supervisory Board furthermore approved, inter alia, multiple financing rounds in Westwing, Global Fashion Group, Home24 and the acquisition of shares in HelloFresh.
4. The Work in the Committees of the Supervisory Board
For the purpose of an efficient distribution and performance of tasks, the Supervisory Board in its constituent meeting after the Annual General Meeting 2015 resolved to re-establish the Audit, the Remuneration, the Nomination, the Executive and the Investment Committee. The commit-tees, namely the Audit and the Investment Committee, supported the Supervisory Board effi-ciently in its work and reported to it on the work of said committees.
Audit CommitteeThe members of the Audit Committee are Professor Dr Schindler, successor of Dr Schipporeit as from June 23, 2015, and Chairman of the Committee as from December 16, 2015 as well as in-dependent member with special knowledge of accounting and auditing (Sec. 100 para. 5 German Stock Corporation Act), Mr Mitteregger (Chairman until December 16, 2015), and Mr Nazareno.
The preparation of discussions and resolutions of the Supervisory Board to review and approve the annual and semi-annual consolidated financial statements and the proposal on the appropria-tion of the distributable profit are among the duties of the Audit Committee. In addition, the Audit Committee is responsible for the monitoring of the independence of the Auditor. It makes a pro-posal to the Supervisory Board for the selection of the auditor as well as for the focus points of the audit. The Committee deals with other periodic financial reporting, with general questions of accounting, including the application of new accounting standards and with the internal risk man-agement system, the internal control system, the internal audit system and all compliance issues.
The Audit Committee met four times in the past financial year with all members present in order to, inter alia, discuss the consolidated financial statements and group consolidated financial state-ments for the financial year 2014 and to make recommendations for their approval and for the instructions to the auditor for the financial year 2015 by the Supervisory Board. In addition, the Committee continued to deal with the transition process of the accounting methods of Rocket Internet from German GAAP to IFRS, the internal risk management system and the compliance management system of Rocket Internet. Members of the management of Rocket Internet and representatives of the auditor were available for the Audit Committee members and participated in its meetings when necessary to discuss particular agenda items.
Remuneration CommitteeProfessor Dr Englert (Chairman), Mr Grabau, Mr Shinar, Mr Nazareno and Mr Lang, successor of Mr Dommermuth as from June 23, 2015, are the members of the Remuneration Committee.
The tasks of the Remuneration Committee are above all the remuneration system, including the variable components for the Management Board and certain leading executives, and its imple-mentation in the relevant service agreements. In addition, the Remuneration Committee prepares the regular review of the remuneration system for the Management Board by the full Supervisory Board.

ABOUT ROCKET INTERNET38 LETTER TO OUR SHAREHOLDERSANNUAL REPORT 2015
Report of the Supervisory Board
Nomination CommitteeThe Nomination Committee consists of Chairman Professor Dr Englert, Mr Grabau, Mr Shinar, Mr Nazareno and Mr Lang, successor of Mr Dommermuth as from June 23, 2015. The Nomina-tion Committee proposes to the Supervisory Board suitable candidates for its proposal to the General Meeting for the election of members of the Supervisory Board.
Executive CommitteeThe Chairman of the Executive Committee is Mr Grabau. Its other members are Professor Dr Englert, Mr Shinar, Mr Nazareno and Mr Lang, successor of Mr Dommermuth as from June 23, 2015. The Executive Committee prepares the meetings of the Supervisory Board and deals with ongoing matters between the meetings of the Supervisory Board. It makes proposals to the Supervisory Board for the appointment and removal of Management Board members, deals with employment and pension agreements and is also responsible for the preparation of decisions in the area of corporate governance.
Investment CommitteeThe Investment Committee consists of Professor Dr Englert as Chairman and Mr Grabau, Mr Shinar, Mr Nazareno and Mr Lang, successor of Mr Dommermuth as from June 23, 2015.
The Investment Committee discusses with the Management Board the annual investment plan and investment focus points of Rocket Internet, reviews the ongoing investment projects, deals with the acquisition of equity and debt capital and with strategic and financial participations. The Investment Committee is furthermore exclusively responsible for the approval of medium sized investments. In this capacity, it approved three business transactions: The increase of Rocket Internet’s shareholding in Travelbird, the final terms of the sale of Zencap and a further investment in Africa Internet Holding GmbH.
Accelerated Bookbuild Offering CommitteeThe ABO Committee consists of Mr Grabau, Professor Dr Englert, and Mr Mitteregger, Mr Grabau being the Chairman. The Supervisory Board conferred to the ABO Committee the author-ity to approve Management Board resolutions on the capital increase, to change the Articles of Association of Rocket Internet in connection with the capital increase and the authority to decide on all expedient measures necessary in connection with the capital increase.
The ABO Committee held two meetings via telephone conference and approved the launch of the capital increase measures as well as the final share price for the new shares and the adaption of the Articles of Association of Rocket Internet.
Financing CommitteeThe Financing Committee acts on behalf of the Supervisory Board in the process of issuing Rocket Internet’s convertible bond. Chairman of the Committee is Mr Grabau. Its other members are Professor Dr Englert and Mr Shinar.
The Financing Committee held one meeting via telephone conference and passed its resolution by telephone. The Committee dealt with significant details of the issuing process, discussed it with the advising banks and external lawyers and reviewed their opinions. It granted the neces-sary approval to the Management Board to the placement of the convertible bonds under ex-clusion of the shareholders’ subscription rights and to the commencement and execution of the book-building procedure.
5. Corporate Governance
In the course of the financial year 2015, the Supervisory Board furthermore continued to follow standards of good corporate governance. According to Sec. 4 para. 2 of the Rules of Procedure of the Supervisory Board, each member of the Supervisory Board is obliged to disclose conflicts of interests to the Supervisory Board. In the financial year 2015, no member of the Supervisory Board has disclosed any conflict of interests.

COMBINED MANAGEMENT REPORTCONSOLIDATED FINANCIAL STATEMENTSOUR COMPANIES 39
6. Annual Financial Statements and Consolidated Financial Statements 2015
Ernst & Young GmbH, Wirtschaftsprüfungsgesellschaft, Berlin, was appointed by the Annual General Meeting 2015 as auditor for the annual financial statements and the consolidated financial statements for the financial year 2015.
Ernst & Young GmbH Wirtschaftsprüfungsgesellschaft audited the accounting system, the annual financial statements of Rocket Internet SE prepared in accordance with German GAAP (HGB), the consolidated financial statements prepared in accordance with IFRS and the combined management report for Rocket Internet and the group for the financial year 2015. The auditor issued unqualified opinions on the annual financial statements, on the consolidated financial statements and on the combined management report for Rocket Internet and the group in the meaning of Sec. 322 para. 2 sentence 1 No. 1 German Commercial Code (HGB).
The annual financial statements, the consolidated financial statements and the combined manage-ment report for Rocket Internet and the group for the financial year 2015 were closely reviewed and discussed in the meeting on April 12, 2016 with the CFO and representatives of the auditor.
The audit report of the auditor was comprehensively dealt with at the accounts meeting of the Supervisory Board in the presence of representatives of the auditor on the same day; all members of the Supervisory Board received the audit reports prior to the meeting. The Chairman of the Audit Committee, Professor Dr Schindler, reported on the preceding meeting of the Audit Committee. Representatives of the auditor reported on the main results of the audit and elaborated in detail on the extent and the focus of the audit.
The Supervisory Board approved the results of the audit. According to the final results of the review by the Audit Committee and the Supervisory Board’s own review, no objections were raised. The Supervisory Board approved the annual financial statements and the consolidated annual financial statements of Rocket Internet for the financial year 2015 in accordance with the recommendation of the Audit Committee. The annual financial statements of Rocket Internet for the financial year 2015 are therefore adopted.
7. Additional Information on the Focus of the Supervisory Board’s Activities in 2016
In the financial year 2016 up to the date of this report, the Supervisory Board dealt in particular with the following measures: In January, after due and careful consideration and having dealt with the matter in previous meetings, the Supervisory Board approved Rocket Internet's involvement and investment in the Rocket Internet Capital Partners fund. In the same month, the Supervisory Board also approved the divestiture of Pizzabo and La Nevera Roja, two online food delivery platforms. In February, it approved the buy-back of some of the convertible bonds up to an amount of EUR 150.0 million until the end of 2016.
The Supervisory Board thanks the members of the Management Board and the employees of Rocket Internet and all group companies for their successful work in the financial year 2015.
Berlin, April 2016
For the Supervisory Board
Professor Dr Marcus Englert Chairman of the Supervisory Board


41
2
42 Introduction
44 Food & Groceries
52 Fashion
66 General Merchandise
74 Home & Living
80 Travel
83 Regional Internet Groups
88 New Businesses & Investments
Content
Our Companies

ABOUT ROCKET INTERNET42 LETTER TO OUR SHAREHOLDERSANNUAL REPORT 2015
Our Companies – Introduction
At Rocket Internet, we focus our company building efforts on five industry sectors Food & Groceries, Fashion, General Merchandise, Home & Living and Travel and geographically on Europe, South-East Asia, Africa, Middle East and Latin America. Founding, investing in and increasing stakes in companies in these sectors allows Rocket Internet to capture exposure to online consumer spend.
Food & Groceries
Food & Groceries account for a significant part of consumer spending. We view this sector as particularly attractive, given the high frequency and repurchase characteristics. We have focused on the two most attractive models in the Food & Groceries sector where we seek to build and maintain market leading positions. HelloFresh has been able to establish an international position in the personalized fresh food at home market. In 2015, HelloFresh entered into a strategic partner-ship with one of the preeminent chefs Jamie Oliver.
The second model, in which we have invested significantly in 2015, is marketplaces for online food takeaway. Rocket Inter-net owns 37.3% in Delivery Hero - one of the world’s largest food networks – with a presence in more than 33 markets, focusing mainly on Continental Europe, Turkey and the Middle East. In addition, we increased our ownership in foodpanda, a market leader in online food takeaway in emerging markets. foodpanda operates in 26 countries in Eastern Europe, the Middle East, South-East Asia and Africa.
Fashion
In 2015, the roll up of our five emerging market online Fashion companies Lamoda, Dafiti, Namshi, Zalora and Jabong into Global Fashion Group was completed. These online fashion retailers offer a wide variety of internationally renowned brands as well as private labels in product categories covering men’s, women’s and children’s clothing, shoes, accessories as well as a certain selection of home decor and beauty items. Overall, the group targets a population across four continents in 27 markets.
General Merchandise
The General Merchandise sector comprises companies of-fering a broad assortment of consumer products (including consumer electronics, fashion, home & living, sporting goods, media as well as health & beauty products). Our General Merchandise businesses have shifted to be predominantly marketplace models, allowing merchants to list and transact their product via the platform. Our General Merchandise com-panies are Lazada in the Asia-Pacific region, Jumia in Africa and Linio in Latin America.
Home & Living
Our two companies that operate in the Home & Living sector are Home24 and Westwing. Home24 is a leading online shop for home & living products in Europe, operating in seven Euro-pean countries and in Brazil, Russia and Kazakhstan. Westwing is a leading international home & living eCommerce company that offers a frequently changing, curated selection of home & living products to its customers in eleven European countries and Brazil.
Travel
Our company in the Travel sector is Traveloka, a company that offers a flight search engine and hotel booking service in South-East Asia.
Rocket Internet has built a large and geographically diverse network of companies, active in more than 110 countries across six continents.
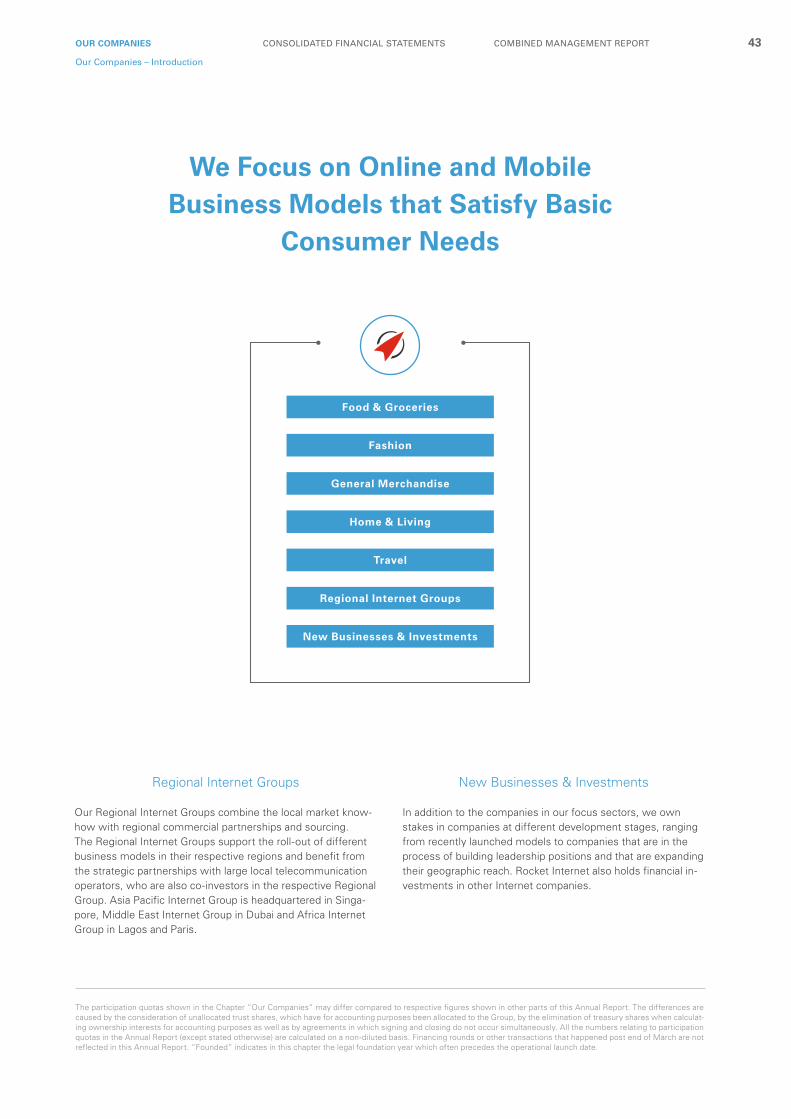
COMBINED MANAGEMENT REPORTCONSOLIDATED FINANCIAL STATEMENTS 43OUR COMPANIES
Our Companies – Introduction
Regional Internet Groups
Our Regional Internet Groups combine the local market know-how with regional commercial partnerships and sourcing. The Regional Internet Groups support the roll-out of different business models in their respective regions and benefit from the strategic partnerships with large local telecommunication operators, who are also co-investors in the respective Regional Group. Asia Pacific Internet Group is headquartered in Singa-pore, Middle East Internet Group in Dubai and Africa Internet Group in Lagos and Paris.
New Businesses & Investments
In addition to the companies in our focus sectors, we own stakes in companies at different development stages, ranging from recently launched models to companies that are in the process of building leadership positions and that are expanding their geographic reach. Rocket Internet also holds financial in-vestments in other Internet companies.
We Focus on Online and Mobile Business Models that Satisfy Basic
Consumer Needs
Food & Groceries
Fashion
General Merchandise
Home & Living
Travel
Regional Internet Groups
New Businesses & Investments
The participation quotas shown in the Chapter “Our Companies” may differ compared to respective figures shown in other parts of this Annual Report. The differences are caused by the consideration of unallocated trust shares, which have for accounting purposes been allocated to the Group, by the elimination of treasury shares when calculat-ing ownership interests for accounting purposes as well as by agreements in which signing and closing do not occur simultaneously. All the numbers relating to participation quotas in the Annual Report (except stated otherwise) are calculated on a non-diluted basis. Financing rounds or other transactions that happened post end of March are not reflected in this Annual Report. “Founded” indicates in this chapter the legal foundation year which often precedes the operational launch date.

ABOUT ROCKET INTERNET44 LETTER TO OUR SHAREHOLDERSANNUAL REPORT 2015
Food & Groceries

COMBINED MANAGEMENT REPORTCONSOLIDATED FINANCIAL STATEMENTSOUR COMPANIES 45
Food & Groceries
Our companies in the Food & Groceries sector include HelloFresh, a leader in the personalized fresh food at home market as well as Delivery Hero and foodpanda, our two online market - place companies that offer food takeaway in complementary geographies. In 2015, our companies in the Food & Groceries sector had EUR 534.4 million in revenues, an increase of 225% over 2014.
EUR 534.4 million
2015 Revenues

ABOUT ROCKET INTERNET46 LETTER TO OUR SHAREHOLDERSANNUAL REPORT 2015
HelloFresh launched its operations in the first quarter of 2012. The company delivers fresh, pre-portioned ingredients that enable its subscribers to prepare healthy and delicious home-cooked meals each week
using the company’s recipes. HelloFresh currently operates in the United States, the United Kingdom, Germany, the Nether-lands, Belgium, Australia and Austria. HelloFresh is a leading global online provider of personalized fresh food at home, hav-ing delivered more than seven million meals in January 2016 and having grown its revenue in the financial year 2015 to EUR 305.0 million.
Every week, HelloFresh’s local nutritionists create diverse and healthy menus, tailored to match each market’s seasonality and the customers’ preferences. The high quality ingredients are selectively purchased from local suppliers and finest pur veyors. All ingredients are pre-portioned to match the corresponding recipes, avoiding waste and making cooking as convenient as possible. HelloFresh operates a flexible sub-scription model that allows customers to pause and cancel orders according to their needs. The meals are delivered using insulated packaging, allowing for a very high level of freshness. HelloFresh operates a just-in-time business model with close to zero inventory and very low fulfillment costs per order. The company’s business is technology driven, utilizing the weekly subscriber data. HelloFresh’s technology platform supports all departments within the group with a purpose-built suite of software tools across recipe creation, procurement, pro-duction, delivery and marketing. In January 2016, HelloFresh launched its strategic partnership with Jamie Oliver, further endorsing HelloFresh as a leading international brand.
SectorFresh Food
at Home
Rocket Internet StakeDecember 2015 56.4%
Subscription CommerceBusiness Model
2011Founded
Europe, North America, Asia-PacificRegions
1,177Dec 2015, Headcount

COMBINED MANAGEMENT REPORTCONSOLIDATED FINANCIAL STATEMENTSOUR COMPANIES 47
Food & Groceries
The following table provides an overview of HelloFresh’s con-solidated key financials, which have been derived from HelloFresh’s accounting or controlling records and have been prepared on the basis of IFRS and HelloFresh’s key perfor-mance indicators, which are based on management reports.
HelloFresh’s net revenue increased by 338.0% from EUR 69.6 million in 2014 to EUR 305.0 million in 2015 driven by the con-tinued strong increase (255.8%) of active subscribers.
HelloFresh’s adjusted EBITDA margin decreased from -17.6% in 2014 to -28.3% in 2015 due to further logistics and market-ing investments.
Net working capital changed from EUR -7.2 million as of De-cember 31, 2014 to EUR -28.4 million as of December 31, 2015 in line with its subscription based model.
HelloFresh’s cash and cash equivalents increased from EUR 19.8 million as of December 31, 2014 to EUR 109.2 million as of December 31, 2015 as a result of funding rounds during 2015.
Key Financials (in EUR million) FY 2015 FY 2014
Net revenue 305.0 69.6
% growth 338.0% 391.8%
Adjusted EBITDA 1) (86.2) (12.2)
% margin (28.3%) (17.6%)
Capex 2) 5.6 0.7
% of net revenue 1.8% 1.0%
Key Performance Indicators (in million) FY 2015 FY 2014
Number of servings delivered 4) 49.5 12.3
% growth 302.4% 412.5%
Active subscribers 5)
(in thousand) 614.5 172.7
% growth 255.8% 444.8%
Balance Sheet (in EUR million) Dec 31, 15 Dec 31, 14
Net working capital 3) (28.4) (7.2)
Cash position 109.2 19.8
(1) Adjusted EBITDA is calculated as (i) EBIT (FY 2014: loss of EUR 15.8m; FY 2015: loss of EUR 115.5m) plus (ii) depreciation of property, plant and equipment and amortization of intangible assets (FY 2014: EUR 0.2m; FY 2015: EUR 0.6m). Adjusted EBITDA excludes share based compensation expenses and non-recurring items that amounted to EUR 3.3m in FY 2014 and EUR 28.6m in FY 2015.
(2) Capital expenditure is calculated as (i) purchase of property, plant and equipment (FY 2014: EUR 0.7m; FY 2015: EUR 5.6m) plus (ii) acquisition of intangible assets excluding goodwill (FY 2014: None; FY 2015: EUR 0.1m).
(3) Net working capital is calculated as (i) inventories (December 31, 2014: EUR 1.4m; December 31, 2015: EUR 5.6m) plus (ii) trade receivables (December 31, 2014: EUR 2.7m; December 31, 2015: EUR 11.5m) minus (iii) trade pay-ables (December 31, 2014: EUR 11.2m; December 31, 2015: EUR 45.5m).
(4) Number of all servings/meals sold and shipped to customers in period.(5) Number of people subscribed to services and having ordered at least once
during the last three months of the period presented.
Key Figures
HelloFresh delivers in-
gredients for healthy home
cooked meals in 7 countries
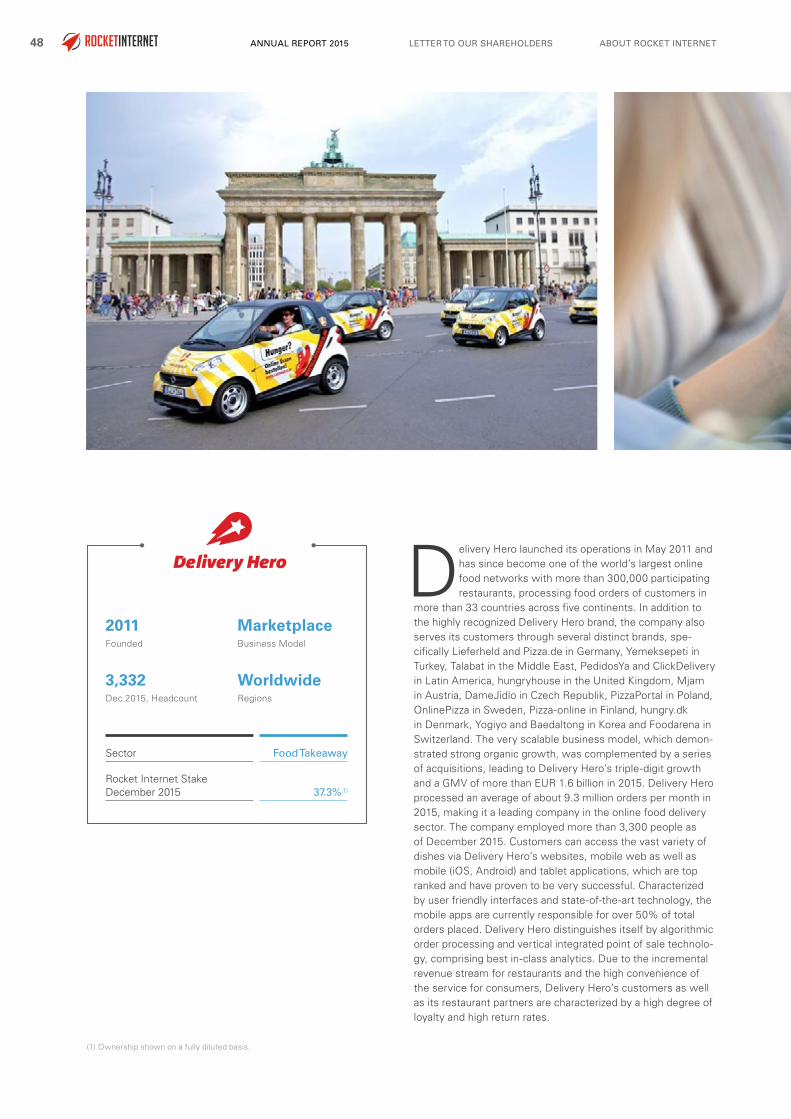
ABOUT ROCKET INTERNET48 LETTER TO OUR SHAREHOLDERSANNUAL REPORT 2015
Delivery Hero launched its operations in May 2011 and has since become one of the world’s largest online food networks with more than 300,000 participating restaurants, processing food orders of customers in
more than 33 countries across five continents. In addition to the highly recognized Delivery Hero brand, the company also serves its customers through several distinct brands, spe-cifically Lieferheld and Pizza.de in Germany, Yemeksepeti in Turkey, Talabat in the Middle East, PedidosYa and ClickDelivery in Latin America, hungryhouse in the United Kingdom, Mjam in Austria, DameJidlo in Czech Republik, PizzaPortal in Poland, OnlinePizza in Sweden, Pizza-online in Finland, hungry.dk in Denmark, Yogiyo and Baedaltong in Korea and Foodarena in Switzerland. The very scalable business model, which demon-strated strong organic growth, was complemented by a series of acquisitions, leading to Delivery Hero’s triple-digit growth and a GMV of more than EUR 1.6 billion in 2015. Delivery Hero processed an average of about 9.3 million orders per month in 2015, making it a leading company in the online food delivery sector. The company employed more than 3,300 people as of December 2015. Customers can access the vast variety of dishes via Delivery Hero’s websites, mobile web as well as mobile (iOS, Android) and tablet applications, which are top ranked and have proven to be very successful. Characterized by user friendly interfaces and state-of-the-art technology, the mobile apps are currently responsible for over 50% of total orders placed. Delivery Hero distinguishes itself by algorithmic order processing and vertical integrated point of sale technolo-gy, comprising best in-class analytics. Due to the incremental revenue stream for restaurants and the high convenience of the service for consumers, Delivery Hero’s customers as well as its restaurant partners are characterized by a high degree of loyalty and high return rates.
Sector Food Takeaway
Rocket Internet StakeDecember 2015 37.3% ¹)
Marketplace Business Model
2011Founded
WorldwideRegions
3,332Dec 2015, Headcount
(1) Ownership shown on a fully diluted basis.

COMBINED MANAGEMENT REPORTCONSOLIDATED FINANCIAL STATEMENTSOUR COMPANIES 49
Food & Groceries
Delivery Hero operates one of the world's largest online food networks
Throughout 2015, Delivery Hero made several acquisitions, including the acquisition of Damejidlo and Jidloted in the Czech Republic as well as in Slovakia, Yemeksepeti in Turkey, eFood in Greece and Talabat in the Middle East. Moreover, it acquired foodora, a high quality food delivery service active in ten coun-tries, which was subsequently merged with its own high quali-ty delivery branch Urban Taste.
The following table provides an overview of Delivery Hero’s key performance indicators which have been taken from man-agement reports.
Delivery Hero’s GMV increased by 148.4% from EUR 656.7 million as of December 31, 2014 to EUR 1,631.3 million as of December 31, 2015.
Delivery Hero’s number of orders increased by 182.6% from 39.5 million in 2014 to 111.6 million in 2015, leading to a re-spective increase of net revenue by 124.8%.
Net revenue changed from EUR 88.0 million as of December 31, 2014 to EUR 197.9 million as of December 31, 2015, on account of the increased scale of operations and number of orders.
Key Performance Indicators (in million) FY 2015 FY 2014
GMV (in EUR million) 1,631.3 656.7
% growth 148.4% 115.9%
Total orders 111.6 39.5
% growth 182.6% 139.8%
Net revenue (in EUR million) 197.9 88.0
% growth 124.8% 111.2%
Key Figures

ABOUT ROCKET INTERNET50 LETTER TO OUR SHAREHOLDERSANNUAL REPORT 2015
foodpanda operates a leading emerging markets online marketplace for food delivery and takeaway in more than 500 cities across 26 countries in Europe, the Middle East, Russia, CIS, India, Asia-Pacific and Latin America. Based
on its very scalable business model and the untapped market potential, foodpanda has grown substancially since its launch in 2012, both organically and through investments in comple-mentary businesses. The company had 3,392 employees as of December 2015. foodpanda’s customers can order food from over 35,000 partner restaurants around the globe via their mobile, tablet or desktop devices. Its mobile apps have prov-en particularly very successful, have been downloaded over 15.5 million times and accounted for 53% of foodpanda’s 22.6 million total orders in 2015. The automated state-of-the-art order transmission technology, enabled foodpanda to increase the automation rate to over 80% in 2015, ensuring efficient order processing. Both, the consumers who order and the restaurants that offer meals are loyal repeat customers, since restaurants benefit from incremental revenue generation, while consumers benefit from the convenience, customer service and mobile focus. foodpanda’s active user base was 4.9 million for the full year of 2015. foodpanda partners with several lead-ing messaging apps around the world, such as WeChat, Viber and Talk in order to address users with targeted messages and push downloads of the foodpanda app.
In November 2015, foodpanda launched a separate product for corporate clients, offering a more convenient order manage-ment for both the companies and their employees. In 2015, foodpanda complemented its strong organic growth with sev-eral acquisitions. The noteworthy transactions are the acqui-sition of Just Eat in India, FoodbyPhone in Thailand, Koziness and MaiDan in Hong Kong, EatOye in Pakistan, the Foodrunner network with branches in Singapore, Malaysia and the Philip-pines, Hungerstation in Saudi Arabia and Otlob in Egypt.
Sector Food Takeaway
Rocket Internet StakeDecember 2015 49.1%
MarketplaceBusiness Model
2013Founded (current legal entity)
Emerging MarketsRegions
3,392Dec 2015, Headcount

COMBINED MANAGEMENT REPORTCONSOLIDATED FINANCIAL STATEMENTSOUR COMPANIES 51
Food & Groceries
The following table provides an overview of foodpanda’s consolidated key financials, which are derived from foodpan-da’s accounting or controlling records and have been prepared on the basis of IFRS and foodpanda’s key performance indi-cators, which are based on management reports.
In 2015, foodpanda continued its strong growth, both organ-ically and through acquisitions. Gross merchandise volume increased by 128.3% from EUR 116.7 million in 2014 to EUR 266.4 million in 2015. Organic growth was realized by adding new vendors, expansion to new countries and cities, acquisi-tion of new customers and improved customer loyalty.
The number of orders increased by 158.6% from 8.7 million in 2014 to 22.6 million in 2015, driven mostly by the strong in-crease in the active user base. Revenue increased by 373.0% from EUR 6.7 million in 2014 to EUR 31.5 million as of Decem-ber 2015.
Adjusted EBITDA is negative as the business is in a high growth phase, investing heavily in marketing and its infrastructure.
foodpanda closed the year with a cash position of EUR 97.9 million, following several successful funding rounds in 2015 as it continues to benefit from strong investor interest in its business model.
(1) Adjusted EBITDA is calculated as (i) operating profit or loss (FY 2014: loss of EUR 39.6m; FY 2015: loss of EUR 117.5m) plus (ii) depreciation of prop-erty, plant and equipment (FY 2014: EUR 0.2m; FY 2015: EUR 0.6m) plus (iii) amortization of intangible assets (FY 2014: EUR 1.4m; FY 2015: EUR 8.4m). Adjusted EBITDA excludes share based compensation expenses that amounted to EUR 4.5m in FY 2014 and EUR 5.9m in FY 2015.
(2) Capital expenditure is calculated as (i) purchase of property, plant and equipment (FY 2014: EUR 0.4m; FY 2015: EUR 2.7m) plus (ii) acquisition of intangible assets including acquisition of subsidiaries and businesses, net of cash acquired, NCI and Investment in associate & other financial assets (FY 2014: EUR 44.4m; FY 2015: EUR 50.7m).
(3) Net working capital is calculated as (i) inventories (December 31, 2014: EUR 0.2m; December 31, 2015: EUR 0.5m) plus (ii) trade and other receivables (December 31, 2014: EUR 5.3m; December 31, 2015: EUR 10.1m) minus (iii) trade and other payables (December 31, 2014: EUR 11.3m; December 31, 2015: EUR 19.9m).
(4) The total value of “total orders” sold in period, converted to EUR using period specific exchange rates, including commission, delivery and service fees, and taxes.
(5) Total number of orders booked and delivered.(6) Pro forma for acquisitions.
Key Figures
Key Performance Indicators (in million) FY 2015 FY 2014
GMV4) (in EUR million) 266.4 6) 116.7 6)
% growth 128.3% N/M
Total orders5) 22.6 6) 8.7 6)
% growth 158.6% N/M
Key Financials (in EUR million) FY 2015 FY 2014
Net revenue 31.5 6.7
% growth 373.0% 838.9%
Gross profit 30.0 6.5
% margin 95.2% 97.4%
Adjusted EBITDA 1) (102.6) (33.6)
% margin N/M N/M
Capex 2) 53.5 44.9
% of net revenue N/M N/M
Balance Sheet (in EUR million) Dec 31, 15 Dec 31, 14
Net working capital 3) (9.4) (5.9)
Cash position 97.9 44.5
Key Figures
More than 50% of foodpanda's total orders are placed through a mobile
device

ABOUT ROCKET INTERNET52 LETTER TO OUR SHAREHOLDERSANNUAL REPORT 2015
Fashion

COMBINED MANAGEMENT REPORTCONSOLIDATED FINANCIAL STATEMENTSOUR COMPANIES 53
Fashion
In 2015, we completed the roll up of Global Fashion Group, which consists of five emerging market fashion eCommerce companies: Lamoda, Dafiti, Namshi, Zalora and Jabong. These online fashion retailers offer a variety of men’s, women’s and children’s clothing, shoes and accessories, as well as a certain selection of home decor and beauty items. In 2015, Global Fashion Group had EUR 930.1 million in revenues, an increase of 48% over 2014.
EUR 930.1 million
2015 Revenues

ABOUT ROCKET INTERNET54 LETTER TO OUR SHAREHOLDERSANNUAL REPORT 2015
Global Fashion Group (GFG) is a leading online fashion destination focused on emerging markets. In 2015, the group's roll up was completed, uniting six emerg-ing market fashion eCommerce companies Lamoda
(Russia/CIS), Dafiti (Brazil/LatAm), Namshi (Middle East), Zalora (South-East Asia), The Iconic (Australia) and Jabong (India). GFG operates across four continents and 27 countries, employing over 10,000 people. With a focus on emerging mar-kets, GFG targets a EUR 368 billion fashion market and over 2.5 billion people, who rapidly continue to move and purchase online. GFG provides a best in-class shopping experience to its more than 15 million total customers, by offering a wide assortment of more than 3,000 leading international and local fashion brands as well as private labels. By working closely with local logistics providers as well as, in some cases, the establishment of own distribution networks, the companies are able to offer cost effective delivery services, including in some countries same day delivery options and free shipping across all regions. The group’s companies distinguish them-selves through a high degree of customer service, excellent technology and highly engaging mobile applications. The group facilitates global best practice sharing across functions, cre-ating economies of scale in sourcing international brands and marketing with global media channels, strengthening the joint private label efforts, enhancing the company's ability to attract and retain top talent and accelerating the development of tech-nology platforms.
Sector Fashion
Rocket Internet StakeDecember 2015 22.5% ¹) 2)
Emerging MarketsRegions
10,548 Dec 2015, Headcount
(1) Anticipates completion of last roll up step in creation of the Global Fashion Group.
(2) Overall Rocket Internet’s ownership is 24.8% if including the stake held through Latin America Internet Group.
eCommerce Business Model
2014Founded
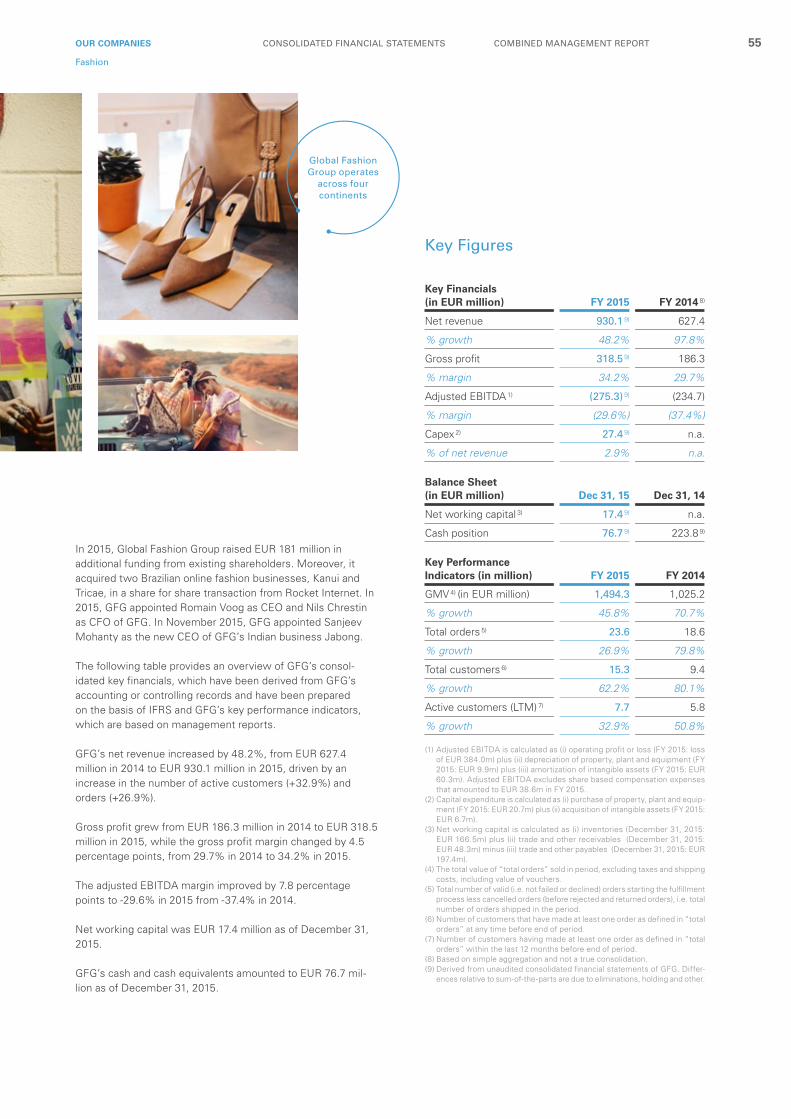
COMBINED MANAGEMENT REPORTCONSOLIDATED FINANCIAL STATEMENTSOUR COMPANIES 55
Fashion
Global Fashion Group operates
across four continents
In 2015, Global Fashion Group raised EUR 181 million in additional funding from existing shareholders. Moreover, it acquired two Brazilian online fashion businesses, Kanui and Tricae, in a share for share transaction from Rocket Internet. In 2015, GFG appointed Romain Voog as CEO and Nils Chrestin as CFO of GFG. In November 2015, GFG appointed Sanjeev Mohanty as the new CEO of GFG’s Indian business Jabong.
The following table provides an overview of GFG’s consol-idated key financials, which have been derived from GFG’s accounting or controlling records and have been prepared on the basis of IFRS and GFG’s key performance indicators, which are based on management reports.
GFG’s net revenue increased by 48.2%, from EUR 627.4 million in 2014 to EUR 930.1 million in 2015, driven by an increase in the number of active customers (+32.9%) and orders (+26.9%).
Gross profit grew from EUR 186.3 million in 2014 to EUR 318.5 million in 2015, while the gross profit margin changed by 4.5 percentage points, from 29.7% in 2014 to 34.2% in 2015.
The adjusted EBITDA margin improved by 7.8 percentage points to -29.6% in 2015 from -37.4% in 2014.
Net working capital was EUR 17.4 million as of December 31, 2015.
GFG’s cash and cash equivalents amounted to EUR 76.7 mil-lion as of December 31, 2015.
Key Performance Indicators (in million) FY 2015 FY 2014
GMV 4) (in EUR million) 1,494.3 1,025.2
% growth 45.8% 70.7%
Total orders 5) 23.6 18.6
% growth 26.9% 79.8%
Total customers 6) 15.3 9.4
% growth 62.2% 80.1%
Active customers (LTM) 7) 7.7 5.8
% growth 32.9% 50.8%
(1) Adjusted EBITDA is calculated as (i) operating profit or loss (FY 2015: loss of EUR 384.0m) plus (ii) depreciation of property, plant and equipment (FY 2015: EUR 9.9m) plus (iii) amortization of intangible assets (FY 2015: EUR 60.3m). Adjusted EBITDA excludes share based compensation expenses that amounted to EUR 38.6m in FY 2015.
(2) Capital expenditure is calculated as (i) purchase of property, plant and equip-ment (FY 2015: EUR 20.7m) plus (ii) acquisition of intangible assets (FY 2015: EUR 6.7m).
(3) Net working capital is calculated as (i) inventories (December 31, 2015: EUR 166.5m) plus (ii) trade and other receivables (December 31, 2015: EUR 48.3m) minus (iii) trade and other payables (December 31, 2015: EUR 197.4m).
(4) The total value of “total orders” sold in period, excluding taxes and shipping costs, including value of vouchers.
(5) Total number of valid (i.e. not failed or declined) orders starting the fulfillment process less cancelled orders (before rejected and returned orders), i.e. total number of orders shipped in the period.
(6) Number of customers that have made at least one order as defined in “total orders” at any time before end of period.
(7) Number of customers having made at least one order as defined in “total orders” within the last 12 months before end of period.
(8) Based on simple aggregation and not a true consolidation.(9) Derived from unaudited consolidated financial statements of GFG. Differ-
ences relative to sum-of-the-parts are due to eliminations, holding and other.
Key Financials (in EUR million) FY 2015 FY 2014 8)
Net revenue 930.1 9) 627.4
% growth 48.2% 97.8%
Gross profit 318.5 9) 186.3
% margin 34.2% 29.7%
Adjusted EBITDA 1) (275.3) 9) (234.7)
% margin (29.6%) (37.4%)
Capex 2) 27.4 9) n.a.
% of net revenue 2.9% n.a.
Balance Sheet (in EUR million) Dec 31, 15 Dec 31, 14
Net working capital 3) 17.4 9) n.a.
Cash position 76.7 9) 223.8 9)
Key Figures

ABOUT ROCKET INTERNET56 LETTER TO OUR SHAREHOLDERSANNUAL REPORT 2015
Lamoda has become one of the leading and most rec-ognized online retailers for fashion in the CIS. Since its launch in Russia in 2011, the company has expanded into Kazakhstan in 2012, where it soon became the
market leader, as well as into Ukraine the following year. Lamoda commenced its Belarus operations in 2014. In 2015, the company recorded net revenue of RUB 15,946.7 million, an increase of 67.9% over the previous year and as of December 2015 Lamoda employed more than 4,000 people. The com-pany offers a growing range of men’s, women’s and children’s clothing, shoes and accessories, sourced from well-known designers as well as promising young brands and has also set-up its own complementary, fast growing private labels. Through its website and its mobile applications, which regu-larly rank high in app-stores, customers can access more than 100,000 products from over 1,000 regional and international brands. In 2015, over 30% of net revenue was generated through the mobile website and applications.
Since its launch, Lamoda has shown high customer growth rates as well as increasing repurchase rates. In 2015 Lamoda invested in its fulfillment center in order to accommodate the steady increase in orders. By establishing its own distribution and delivery capabilities, which process more than 70% of the shipments, Lamoda successfully overcame the logistics challenge in Russia, offering a high quality service, including try-on services as well as next day delivery options in more than 130 cities.
Sector Fashion
eCommerceBusiness Model
2010Founded
CISRegions
4,011Dec 2015, Headcount

COMBINED MANAGEMENT REPORTCONSOLIDATED FINANCIAL STATEMENTSOUR COMPANIES 57
Fashion
In 2015, the company was able to maintain strong growth and improve its margins despite the challenging macroeconomic development in Russia and CIS. Lamoda added numerous new brands throughout 2015 including Michael Kors, Benetton, Blukids, Replay, GAP, Antony Morato, Kurt Geiger, Aeronautica Militare and further increased focus on the private label brand Lost Ink. In November 2015, Lamoda received the National In-ternet Award in the categories “Internet shops” and “Site with the best marketing potential”. Lamoda recently introduced a marketplace model, offering local retailers the possibility to sell their products online via the Lamoda website, thereby expand-ing its product range and enhancing the potential for market share gains and further growth.
The following table provides an overview of Lamoda’s consol-idated key financials, which have been derived from Lamoda’s accounting or controlling records and have been prepared on the basis of IFRS and Lamoda’s key performance indicators, which are based on management reports.
Lamoda’s net revenue increased by 67.9%, from RUB 9,496.2 million in 2014 to RUB 15,946.7 million in 2015, driven by an increase in total customers (57.2%) and total orders (41.6%).
The gross profit margin changed slightly, from 40.8% in 2014 to 40.7% in 2015.
The adjusted EBITDA margin improved by 5.5 percentage points to -17.2% in 2015 from -22.7 in 2014, due to the active management of costs in logistic and inventory.
Net working capital changed from RUB -483.9 million as of December 31, 2014 to RUB +659.5 million as of December 31, 2015.
Lamoda's mobile
applications rank high in app-stores
Key Financials (in RUB million) FY 2015 FY 2014
Net revenue 15,946.7 9,496.2
% growth 67.9% 84.4%
Gross profit 6,486.3 3,879.1
% margin 40.7% 40.8%
Adjusted EBITDA 1) (2,737.4) (2,158.1)
% margin (17.2%) (22.7%)
Key Performance Indicators (in million) FY 2015 FY 2014
GMV 3) (in RUB million) 43,909.3 23,527.2
% growth 86.6% 99.8%
Total orders 4) 5.5 3.9
% growth 41.6% 70.3%
Total customers 5) 4.2 2.7
% growth 57.2% 88.2%
Active customers (LTM) 6) 2.2 1,7
% growth 33.8% 52.1%
Balance Sheet (in RUB million) Dec 31, 15 Dec 31, 14
Net working capital 2) 659.5 (483.9)
(1) Adjusted EBITDA is calculated as (i) operating profit or loss (FY 2014: loss of RUB 2,382.9m; FY 2015: loss of RUB 3,065.3m) plus (ii) depreciation of property, plant and equipment (FY 2014: RUB 134.8m; FY 2015: RUB 232.2m) plus (iii) amortization of intangible assets (FY 2014: RUB 32.0m; FY 2015: RUB 67.6m). Adjusted EBITDA excludes share based compensation expenses that amounted to RUB 58.1m in FY 2014 and RUB 28.1m in FY 2015.
(2) Net working capital is calculated as (i) inventories (December 31, 2014: RUB 1,841.5m; December 31, 2015: RUB 2,912.1m) plus (ii) trade and other receivables (December 31, 2014: RUB 111.8m; December 31, 2015: RUB 189.2m) minus (iii) trade and other payables (December 31, 2014: RUB 2,437.2m; December 31, 2015: RUB 2,441.9m).
(3) The total value of “total orders” sold in period, excluding taxes and shipping costs.
(4) Total number of valid (i.e. not failed or declined) orders starting the fulfillment process less cancelled orders (before rejected and returned orders), i.e. total number of orders shipped in the period.
(5) Number of customers that have made at least one order as defined in “total orders” at any time before end of period.
(6) Number of customers having made at least one order as defined in “total orders” within the last 12 months before end of period.
Key Figures

ABOUT ROCKET INTERNET58 LETTER TO OUR SHAREHOLDERSANNUAL REPORT 2015
Dafiti launched its business in 2011 and has developed into one of the best known online fashion retailers in Latin America. It operates in four Latin American countries, Brazil, Argentina, Chile and Colombia and
employed more than 3,400 people as of December 2015. Dafiti’s net revenue has grown to more than BRL 856.4 million in the year 2015. Dafiti offers an increasing variety of men’s, women’s and children’s clothing, shoes and accessories, as well as home decor products sourced from a large portfolio of third-party vendors. Its products range from popular high-street brands and designer labels to exclusive private label brands launched by Dafiti, which have established themselves as top-sellers in key categories. Offering more than 180,000 products from over 2,700 different international brands in Brazil alone, the company has one of the largest online portfolios of products in the region. Dafiti’s share of mobile sales is increas-ing constantly; its customers are able to browse and shop via both desktop and mobile websites as well as through Dafiti’s proprietary universal iOS and Android applications, which have been downloaded more than six million times. Dafiti contin-ues to invest in its logistics infrastructure with own storage facilities, distribution and delivery capabilities and its customer care service. In order to offer an even greater portfolio to its customers, Dafiti started the establishment of a marketplace model for fashion and lifestyle products in 2015. This is expect-ed to promote further growth.
Sector Fashion
Latin AmericaRegions
3,404Dec 2015, Headcount
2010Founded
eCommerceBusiness Model

COMBINED MANAGEMENT REPORTCONSOLIDATED FINANCIAL STATEMENTSOUR COMPANIES 59
Fashion
In order to foster future growth and strengthen its positioning in the sports and kids market, in 2015, Dafiti acquired two online eCommerce platforms Kanui and Tricae, focusing on men's and children's fashion respectively. Also, Dafiti started new customer service operations and opened a second ser-vice center in Brazil.
The following table provides an overview of Dafiti’s consol-idated key financials, which have been derived from Dafiti’s accounting or controlling records and have been prepared on the basis of IFRS and Dafiti’s key performance indicators, which are based on management reports.
In 2015, Dafiti continued its growth trajectory, net revenue increased by 44.6%, from BRL 592.2 million in 2014 to BRL 856.4 million, driven by a 37.2% increase in the number of customers and an increase in the average order size.
The gross profit margin changed by one percentage point to 38.6% in 2015 from 37.6% in 2014.
The adjusted EBITDA margin improved from -35.2% in 2014 to -27.1% in 2015.
Net working capital changed from BRL -34.8 million as of December 31, 2014 to BRL -24.7 million as of December 31, 2015.
Key Financials (in BRL million) FY 2015 FY 2014
Net revenue 856.4 592.2
% growth 44.6% 41.2%
Gross profit 331.0 222.4
% margin 38.6% 37.6%
Adjusted EBITDA 1) (231.7) (208.2)
% margin (27.1%) (35.2%)
Key Performance Indicators (in million) FY 2015 FY 2014
GMV 3) (in BRL million) 867.7 625.9
% growth 38.6% 37.1%
Total orders 4) 5.4 4.4
% growth 21.0% 34.3%
Total customers 5) 5.1 3.7
% growth 37.2% 57.4%
Active customers (LTM) 6) 2.4 2.1
% growth 14.6% 28.9%
Balance Sheet (in BRL million) Dec 31, 15 Dec 31, 14
Net working capital 2) (24.7) (34.8)
(1) Adjusted EBITDA is calculated as (i) operating profit or loss (FY 2014: loss of BRL 223.5m; FY 2015: loss of BRL 274.5m) plus (ii) depreciation of property, plant and equipment (FY 2014: BRL 4.6m; FY 2015: BRL 6.0m) plus (iii) amortization of intangible assets (FY 2014: BRL 2.6m; FY 2015: BRL 7.6m). Adjusted EBITDA excludes share based compensation expenses that amounted to BRL 8.0m in FY 2014 and BRL 29.2m in FY 2015.
(2) Net working capital is calculated as (i) inventories (December 31, 2014: BRL 129.7m; December 31, 2015: BRL 133.8m) plus (ii) trade and other receiv-ables (December 31, 2014: BRL 48.0m; December 31, 2015: BRL 37.6m) minus (iii) trade and other payables (December 31, 2014: BRL 212.5m; De-cember 31, 2015: BRL 196.2m).
(3) The total value of “total orders” sold in period, excluding taxes and shipping costs, including value of vouchers.
(4) Total number of valid (i.e. not failed or declined) orders starting the fulfillment process less cancelled orders (before rejected and returned orders), i.e. total number of orders shipped in the period.
(5) Number of customers that have made at least one order as defined in “total orders” at any time before end of period.
(6) Number of customers having made at least one order as defined in “total orders” within the last 12 months before end of period.
Key Figures
Dafiti's private labels have established
themselves as top-sellers

ABOUT ROCKET INTERNET60 LETTER TO OUR SHAREHOLDERSANNUAL REPORT 2015
Namshi is a leading online fashion retailer in the Mid-dle East, offering an assortment of clothing, shoes and accessories for men, women and children, both from local and international designers as well as
from its own private labels. Namshi has successfully built an online fashion eCommerce presence in seven countries (Bah-rain, Kuwait, Lebanon, Oman, Qatar, Saudi Arabia and United Arab Emirates), capitalizing on the continuous shift to online purchases in the Middle Eastern region. Namshi’s portfolio of more than 30,000 products from over 500 international brands can be accessed through its website, mobile sites as well as its top rated mobile applications. Mobile sales contributed to 81% of Namshi’s total revenue of AED 439.0 million in 2015. Namshi has grown to 315 employees as of December 2015 and, by the end of the year, Namshi served more than 280,000 active customers.
In 2015, Namshi improved its assortment with local and international brands such as Mango, Topshop and Topman. Throughout 2015, the company continued its strong top line growth and invested in logistics infrastructure as well as new warehouses to provide a platform for future growth. This logistics strategy enables Namshi to offer same-day delivery options and to control the customer experience end-to-end in the United Arab Emirates.
The following table provides an overview of Namshi’s consol-idated key financials, which have been derived from Namshi’s accounting or controlling records and have been prepared on the basis of IFRS and Namshi’s key performance indicators, which are based on management reports.
eCommerce Business Model
2012Founded
Middle EastRegions
315Dec 2015, Headcount
Sector Fashion

COMBINED MANAGEMENT REPORTCONSOLIDATED FINANCIAL STATEMENTSOUR COMPANIES 61
Fashion
Namshi’s net revenue increased further by 161.8%, from AED 167.7 million in 2014 to AED 439.0 million in 2015, due to the strong increase in customers as well as the increase in GMV of 160.8%.
Gross profit margin at Namshi was 54.1% in 2015, almost the same as in 2014.
Due to improved gross margins and an increase in order size the adjusted EBITDA margin improved by 9.8 percentage points, from -12.1% in 2014 to -2.3% in 2015, nearing the break-even point.
Net working capital increased in-line with Namshi’s increase of operations from AED 9.3 million as of December 31, 2014 to AED 38.2 million as of December 31, 2015.
Namshi capitalizes on
the continuous shift to online
purchases in the Middle East
As a result of the formation of GFG, the capital and shareholder structure of the group and its underlying businesses has been aligned. This change has also required a change in accounting treatment of shareholder loans at Namshi. Starting from Q1 2015 the FX impact is no longer to be accounted for within EBITDA, but in equity (same policy applied for all GFG group companies). Prior periods have been adjusted on a pro-forma basis to allow like for like comparison over the disclosed periods.
(1) Adjusted EBITDA is calculated as (i) EBIT (FY 2014: loss of AED 24.6m; FY 2015: loss of AED 11.8m) plus (ii) depreciation of property, plant and equipment (FY 2014: AED 1.3m; FY 2015: AED 2.7m) plus (iii) amortization of intangible assets (FY 2014: AED 0.2m; FY 2015: AED 0.2m). Adjusted EBITDA excludes share based compensation expenses that amounted to AED 2.8m in FY 2014 and AED (1.2)m in FY 2015.
(2) Net working capital is calculated as (i) inventories (December 31, 2014: AED 23.8m; December 31, 2015: AED 61.5m) plus (ii) trade and other receivables including related parties (December 31, 2014: AED 15.7m; December 31, 2015: AED 30.2m) minus (iii) trade and other payables including related parties (December 31, 2014: AED 30.1m; December 31, 2015: AED 53.5m).
(3) The total value of “total orders” sold in period, excluding taxes and shipping costs, including value of vouchers.
(4) Total number of valid (i.e. not failed or declined) orders starting the fulfillment process less cancelled orders (before rejected and returned orders), i.e. total number of orders shipped in the period.
(5) Number of customers that have made at least one order as defined in “total orders” at any time before end of period.
(6) Number of customers having made at least one order as defined in “total orders” within the last 12 months before end of period.
Key Financials (in AED million) FY 2015 FY 2014
Net revenue 439.0 167.7
% growth 161.8% 215.2%
Gross profit 237.3 91.0
% margin 54.1% 54.3%
Adjusted EBITDA 1) (10.2) (20.3)
% margin (2.3%) (12.1%)
Key Performance Indicators (in million) FY 2015 FY 2014
GMV 3) (in AED million) 522.6 200.4
% growth 160.8% 218.8%
Total orders 4) 1.2 0.5
% growth 152.3% 206.6%
Total customers 5) 0.8 0.3
% growth 147.2% 195.5%
Active customers (LTM) 6) 0.3 0.2
% growth 20.3% 207.8%
Balance Sheet (in AED million) Dec 31, 15 Dec 31, 14
Net working capital 2) 38.2 9.3
Key Figures

ABOUT ROCKET INTERNET62 LETTER TO OUR SHAREHOLDERSANNUAL REPORT 2015
ZALORA Group is a leading online fashion retailer in the Asia-Pacific region. It offers clothing, shoes, accesso-ries and beauty products in nine countries in South-East Asia and Greater China (Indonesia, Malaysia, the
Philippines, Singapore, Taiwan, Thailand, Vietnam, Brunei and Hong Kong) under the ZALORA brand and in Australia and New Zealand under the brand The Iconic. Since its launch in March 2012, net revenue of ZALORA has grown to EUR 208.0 million in financial year 2015 and the company employed 2,154 people at the end of 2015. By offering an attractive mix of compelling high-street brands and its own eponymous private label, ZALORA has been able to continuously grow its loyal customer base, characterized by high repurchase rates. The Group’s mobile apps, which have been downloaded over five million times, were redesigned in 2015, offering an improved user experience; 68% of the users now access the company’s online stores through a mobile device. ZALORA successfully promotes general brand awareness and customer loyalty through its fashion blog and Facebook presence with currently 6.4 million followers. The company has an attractive value proposition among online fashion retailers as it offers more than 20,000 products from over 500 brands in each market. ZALORA is increasingly filling the gap of missing offline supply for affordable high street fashion that exists in many South-East Asian markets. ZALORA operates a local distribution network with its own last-mile delivery fleet, enabling it to offer cost-effective next day deliveries in most capital cities and an average delivery time in the very widespread territory of South-East Asia of only 2.4 days.
Sector Fashion
2011Founded
Asia PacificRegions
2,154Dec 2015, Headcount
eCommerceBusiness Model

COMBINED MANAGEMENT REPORTCONSOLIDATED FINANCIAL STATEMENTSOUR COMPANIES 63
Fashion
Zalora's mobile applications have been downloaded over five million
times
ZALORA continued to invest in its infrastructure including warehousing, customer experience, call center, payments and last mile delivery throughout 2015. In addition, the company further improved its assortment by adding key international brands such as Topman and Topshop. ZALORA’s private label is one of the best selling brands, even though it is only avail-able through ZALORA's own website. Throughout the year, ZALORA also focused on its marketplace model, facilitating merchants to sell directly over the Zalora platform.
The following table provides an overview of ZALORA’s consol-idated key financials, which have been derived from ZALORA’s accounting or controlling records and have been prepared on the basis of IFRS and ZALORA’s key performance indicators, which are based on management reports.
In 2015, ZALORA reported an increase of 77.5% in net revenue, from EUR 117.2 million in 2014 to EUR 208.0 million in 2015, driven by a 91.5% growth in the number of total customers and a strong increase in the number of transactions to 6.7 million.
The gross profit margin changed from 34.2% in 2014 to 35.0% in 2015.
Adjusted EBITDA margin improved by 13.7 percentage points from -58.6% in 2014 to -44.9% in 2015.
Adjusted EBITDA amounted to EUR -93.5 million in 2015.
(1) Adjusted EBITDA is calculated as (i) operating profit or loss (FY 2014: loss of EUR 81.3m; FY 2015: loss of EUR 104.2m) plus (ii) depreciation of prop-erty, plant and equipment (FY 2014: EUR 0.7m; FY 2015: EUR 1.4m) plus (iii) amortization of intangible assets (FY 2014: EUR 0.4m; FY 2015: EUR 0.4m). Adjusted EBITDA excludes share based compensation expenses that amounted to EUR 11.5m in FY 2014 and EUR 8.9m in FY 2015.
(2) Net working capital is calculated as (i) inventories (December 31, 2014: EUR 28.1m; December 31, 2015: EUR 33.1m) plus (ii) trade and other receivables (December 31, 2014: EUR 5.1m; December 31, 2015: EUR 10.1m) plus (iii) prepaid expenses (December 31, 2014: EUR 4.7m; December 31, 2015: EUR 4.8m) minus (iv) trade and other payables (December 31, 2014: EUR 29.5m; December 31, 2015: EUR 45.1m).
(3) The total value of “total transactions” sold in period, excluding taxes and shipping costs, including value of vouchers and coupons.
(4) Total number of valid (i.e. not failed or declined) orders starting the fulfill-ment process less cancelled orders (before rejected and returned orders), i.e. total number of orders shipped in the period (eCommerce excluding marketplace).
(5) Total number of valid (i.e. not failed or declined) orders starting the fulfillment process less cancelled orders (before rejected and returned orders), i.e. total number of orders shipped in the period (eCommerce and marketplace).
(6) Number of customers that have made at least one transaction as defined in “total transactions” at any time before end of period.
(7) Number of customers having made at least one order as defined in “total orders” within the last 12 months before end of period.
Key Financials (in EUR million) FY 2015 FY 2014
Net revenue 208.0 117.2
% growth 77.5% 70.2%
Gross profit 72.8 40.0
% margin 35.0% 34.2%
Adjusted EBITDA 1) (93.5) (68.7)
% margin (44.9%) (58.6%)
Key Performance Indicators (in million) FY 2015 FY 2014
GMV 3) (in EUR million) 274.3 151.6
% growth 81.0% 80.3%
Total orders 4) 6.1 3.8
% growth 58.5% 89.5%
Total transactions 5) 6.7 3.9
% growth 70.6% 91.4%
Total customers 6) 5.2 2.7
% growth 91.5% 102.2%
Active customers (LTM) 7) 2.7 1.8
% growth 55.4% 72.9%
Key Figures
Balance Sheet (in EUR million) Dec 31, 15 Dec 31, 14
Net working capital 2) 2.9 8.4

ABOUT ROCKET INTERNET64 LETTER TO OUR SHAREHOLDERSANNUAL REPORT 2015
Since its launch in 2011, Jabong has become a leader in online fashion and a well recognized online fashion brand in India. It offers a wide range of products such as men’s, women’s and children’s clothing, shoes,
beauty products and accessories. The company offers more than 400,000 products from more than 2,000 brands including well-known international brands and its own private labels. Jabong’s net revenue in calendar year 2015 amounted to INR 8,691.4 million. Jabong offers users access via their desktop and mobile devices as well as Jabong’s mobile applications. In 2015, more than half of the company’s net revenue was generated through the mobile website and mobile applications. The brand succeeded in building a loyal customer base, with the majority of orders being placed by returning customers and 3.7 million followers on Facebook. Jabong continues to bring fashion trends to India’s urban population living in metro, tier one, tier two and even tier three cities, in which offline stores are difficult to develop.
Throughout 2015, Jabong continued the development of its marketplace platform, enabling merchants to offer their prod-ucts directly on the Jabong platform and thereby more brands and choice to the consumer. Moreover, Jabong provides a very customer friendly delivery experience to Jabong’s customers as it introduced a real time order tracking feature and also offers “next door” delivery, giving customers the possibility to pick up their packages at nearby business partners such as petrol stations or coffee shops. In December 2015, Sanjeev Mohanty, who had previously been the Managing Director of Benetton India, was appointed as the new CEO & Managing Director of Jabong.
Sector Fashion
2010Founded
IndiaRegions
660Dec 2015, Headcount
eCommerceBusiness Model

COMBINED MANAGEMENT REPORTCONSOLIDATED FINANCIAL STATEMENTSOUR COMPANIES 65
Fashion
The majority of Jabong's orders
are placed by loyal, returning
customers
The following table provides an overview of Jabong’s consol-idated key financials, which have been derived from Jabong’s accounting or controlling records and have been prepared on the basis of IFRS and Jabong’s key performance indicators, which are based on management reports.
Greater focus on its marketplace platform as well as an in-crease in product assortment led to an increase of Jabong’s net revenue from INR 8,114.1 million in 2014, to INR 8,691.4 million in 2015.
Adjusted EBITDA margin improved by 6.9 percentage points from -56.0% in 2014 to -49.1% in 2015, while adjusted EBITDA changed to negative INR 4,263.6 million due to con-tinued strong investments in infrastructure.
Net working capital of Jabong increased from INR 814.3 million as of December 31, 2014, to INR 1,310.8 million as of December 31, 2015.
(1) Adjusted EBITDA is calculated as (i) operating profit or loss (FY 2014: loss of INR 4,727.1m; FY 2015: loss of INR 4,491.3m) plus (ii) depreciation of property, plant and equipment and amortization of intangible assets (FY 2014: INR 148.4m; FY 2015: INR 216.4m). Adjusted EBITDA excludes share based compensation expenses that amounted to INR 38.6m in FY 2014 and INR 11.4m in FY 2015.
(2) Net working capital is calculated as (i) inventories (December 31, 2014: INR 2,362.2m; December 31, 2015: INR 2,867.9m) plus (ii) trade and other receivables (December 31, 2014: INR 999.8m; December 31, 2015: INR 1,021.8m) plus (iii) prepayments and other assets (December 31, 2014: INR 229.4m; December 31, 2015: INR 236.0m) minus (iv) trade and other payables (December 31, 2014: INR 2,777.1m; December 31, 2015: INR 2,814.9m).
(3) The total value of “total transactions” sold in period, excluding taxes and shipping costs, including value of paid vouchers and coupons.
(4) Total number of valid (i.e. not failed or declined) orders starting the fulfillment process less cancelled orders (before rejected and returned orders), i.e. total number of orders shipped in the period.
(5) Total number of valid (i.e. not failed or declined) orders starting the fulfillment process less cancelled orders (before rejected and returned orders), i.e. total number of orders shipped in the period (eCommerce and marketplace).
Key Figures
Key Performance Indicators (in million) FY 2015 FY 2014
GMV 3) (in INR million) 15,029.0 13,206.4
% growth 13.8% 158.3%
Total orders 4) 5.4 5.9
% growth (8.7%) 131.7%
Total transactions 5) 8.8 8.7
% growth 0.6% 158.7%
Key Financials (in INR million) FY 2015 FY 2014
Net revenue 8,691.4 8,114.1
% growth 7.1% 135.7%
Gross profit (467.4) (1,595.8)
% margin (5.4%) (19.7%)
Adjusted EBITDA 1) (4,263.6) (4,540.1)
% margin (49.1%) (56.0%)
Balance Sheet (in INR million) FY 2015 FY 2014
Net working capital 2) 1,310.8 814.3

ABOUT ROCKET INTERNET66 LETTER TO OUR SHAREHOLDERSANNUAL REPORT 2015
General Merchandise

COMBINED MANAGEMENT REPORTCONSOLIDATED FINANCIAL STATEMENTSOUR COMPANIES 67
General Merchandise
Our companies in the General Merchandise sector are Lazada, the market leader in the Asia-Pacific region, Jumia, the market leader in Africa and Linio, the market leader in certain Latin American countries. The companies offer a broad assortment of consumer products such as consumer electronics, fashion, home & living, sporting goods, media as well as health & beauty products. Our companies offer their products both through traditional online retail as well as increasingly via their marketplace models. In 2015, our General Merchandise companies had EUR 450.0 million in revenues, an increase of 71% over 2014.
EUR 450.0 million
2015 Revenues

ABOUT ROCKET INTERNET68 LETTER TO OUR SHAREHOLDERSANNUAL REPORT 2015
Lazada Group launched its business in the first quarter of 2012 and has become one of the leading online shopping and selling destination in South-East Asia, with a presence in Indonesia, Malaysia, the Philippines,
Singapore, Thailand and Vietnam. Lazada features an extensive product offering in categories ranging from consumer elec-tronics and health & beauty products to household goods and fashion. It sells its products and provides third-party brands and merchants a marketplace solution with simple and direct access to approximately 550 million consumers in six countries through one retail channel. Within the last four years, Lazada has successfully grown its business to more than USD 1.0 bil-lion of GMV in 2015.
Lazada’s marketplace model has been the key driver of growth, leading to a strong increase in active sellers and active SKUs. Lazada’s development is also built upon its effortless shopping experience supported by extensive customer care, fast and reli-able delivery, friendly return policy and secure payment options enabled by helloPay, Lazada Group’s payment platform, which includes cash-on-delivery, cash payment over the counter, bank transfers and credit cards. Another driver of Lazada’s growth is its popular mobile platform, especially the best-in-class mobile applications which have won several awards in South-East Asia. By the end of December 2015, Lazada’s mobile sales rep-resented more than 60% of total GMV and its apps had been downloaded almost 30 million times.
Throughout 2015, Lazada has significantly expanded its logis-tics capabilities to accommodate its rapid growth and to ad-dress logistics challenges in the region. These efforts ensure a better experience to shoppers as well as logistics services to sellers. Lazada’s fulfillment network included ten fulfillment centers across South-East Asia, and the company’s last mile unit, Lazada Express, reached more than 65% of its customers,
2011Founded
South-East AsiaRegions
5,692Dec 2015, Headcount
SectorGeneral
Merchandise
Rocket Internet StakeDecember 2015 22.8%
MarketplaceBusiness Model

COMBINED MANAGEMENT REPORTCONSOLIDATED FINANCIAL STATEMENTSOUR COMPANIES 69
General Merchandise
Lazada provides an effortless
shopping experience
covering over 250 cities and districts with 84 last mile distri-bution hubs, six sortation centers and a fleet of over 2,000 vehicles by the end of 2015.
The following table provides an overview of Lazada’s consol-idated key financials, which have been derived from Lazada’s accounting or controlling records and have been prepared on the basis of IFRS and Lazada's key performance indicators, which are based on management reports.
Throughout 2015, Lazada continued to record strong growth of its gross merchandise volume, which amounted to USD 1,024.7 million in 2015, an increase of 167.0% over USD 383.8 million in 2014.
Net revenue increased by 78.2% over the year, due to an in-crease in both customers and orders, resulting in net revenue of USD 275.0 million in 2015, compared to USD 154.3 million in 2014.
Also, gross profit margin increased by 9.9 percentage points, from 14.5% in 2014 to 24.4% in 2015.
Adjusted EBITDA margin reached negative 107.8% of net reve-nue due to the ongoing shift of Lazada’s business towards the marketplace model.
Lazada Group’s cash and cash equivalents at the end of 2015 were USD 75.4 million.
(1) Adjusted EBITDA is calculated as (i) operating profit or loss (FY 2014: loss of USD 150.7m; FY 2015: loss of USD 328.8m) plus (ii) depreciation of property, plant and equipment (FY 2014: USD 1.4m; FY 2015: USD 5.1m) plus (iii) amortization of intangible assets (FY 2014: USD 0.5m; FY 2015: USD 1.2m). Adjusted EBITDA excludes share based compensation expenses that amounted to USD 6.3m in FY 2014 and USD 26.1m in FY 2015.
(2) The total value of “total transactions” sold in period, including taxes and shipping costs. Total transactions are defined as the total number of valid (i.e. not failed or declined) orders starting the fulfillment process less can-celled orders (before rejected and returned orders), i.e. total number of orders shipped in the period (eCommerce and marketplace).
Key Financials (in USD million) FY 2015 FY 2014
Net revenue 275.0 154.3
% growth 78.2% 104.2%
Gross profit 67.0 22.4
% margin 24.4% 14.5%
Adjusted EBITDA 1) (296.5) (142.5)
% margin (107.8%) (92.4%)
Balance Sheet (in USD million) Dec 31, 15 Dec 31, 14
Cash position 75.4 198.0
Key Figures
Key Performance Indicators (in million) FY 2015 FY 2014
GMV 2) (in USD million) 1,024.7 383.8
% growth 167.0% 304.8%

ABOUT ROCKET INTERNET70 LETTER TO OUR SHAREHOLDERSANNUAL REPORT 2015
Jumia is the largest eCommerce platform in Africa, con-necting local and international brands and services with consumers. The company operates in twelve African countries including Algeria, Cameroon, Egypt, Ghana,
Ivory Coast, Kenya, Morocco, Nigeria, Senegal, South Africa, Tanzania and Uganda. It has expanded its merchant base with-in the last year, offering an assortment of more than 83,000 SKU’s from more than 10,000 local and international brands. Its primary focus lies on fashion and electronics, which are offered through two operating models, the business-to-con-sumer eCommerce platform and the online marketplace, en-abling third party merchants and brands to offer their products to the Jumia customer base. In 2015, the company continued to focus on the development of its marketplace platform and associated services such as logistics. Jumia’s products can be shopped through its desktop and mobile websites as well as its mobile applications. The company has continued its strong growth on mobile presence with increasing numbers of users of mobile applications, resulting in a significantly higher share of mobile orders of 45%. In 2015, Jumia significantly grew its business by more than 200% to a GMV of EUR 288.7 million. Jumia’s Black Friday sale in November 2015, the key commer-cial event of the year, reached a GMV of EUR 20 million, which was 25 times the volume of a normal day and nine times the volume of the 2014 Black Friday sale. The company employed 3,486 people by the end of 2015. To further strengthen its market positioning and maintain its high quality delivery experience, Jumia continued to invest in the logistic platform throughout 2015. By operating its own delivery fleets, warehouses and call centers as well as working closely with selected partners, Jumia is able to efficiently han-dle the operational challenges in the region. The established payment on delivery method enables Jumia to successfully respond to a market where a large portion of the population
eCommerce / Marketplace Business Model
Sector
General Merchandise and Fashion
Rocket Internet StakeDecember 2015March 2016
26.9% 1)
33.5% 2)
2012Founded
AfricaRegions
3,486Dec 2015, Headcount
Jumia capitalizes on
increasing traffic from mobile
devices
(1) Reflects 8.1% of Jumia stake held indirectly through Jumia's holding com-pany and 18.8% stake held through Africa Internet Group.
(2) Reflects 16.7% of Jumia stake held indirectly through Jumia's holding company and 16.8% stake held through Africa Internet Group.

COMBINED MANAGEMENT REPORTCONSOLIDATED FINANCIAL STATEMENTSOUR COMPANIES 71
General Merchandise
does not have a bank account. In collaboration with major local telecommunications partners MTN and Millicom, Jumia con-tinues to focus on driving its future growth by increasing traffic from its mobile users through promotions, joint marketing campaigns, mobile apps, business data sharing, cross-selling as well as the joint construction and use of certain infrastruc-ture. Jumia is continuously focusing on the advancement of its marketplace model and enhancing the product offering in order to acquire more customers.
The following table provides an overview of Jumia’s consol-idated key financials, which have been derived from Jumia’s accounting or controlling records and have been prepared on the basis of IFRS and Jumia’s key performance indicators, which are based on management reports.
Jumia’ gross merchandise volume increased by 205.6% from EUR 94.5 million in 2014 to EUR 288.7 million in 2015 driven mainly by an increase in transactions.
Net revenue in 2015 increased by 117.8% from EUR 61.8 million in 2014 to EUR 134.6 million in 2015, as a result of the expansion of its attractive marketplace model.
The gross profit margin amounted to 11.1% in 2015, a decrease of 6.5 percentage points compared to 17.6% in 2014.
Adjusted EBITDA for Jumia decreased from negative EUR 47.9 million in 2014 to negative EUR 111.3 million in 2015.
Jumia’s net working capital was EUR -24.2 million as of De-cember 31, 2015 and its cash position amounted to EUR 9.5 million as of December 31, 2015.
(1) Adjusted EBITDA is calculated as (i) operating profit or loss (FY 2014: loss of EUR 56.4m; FY 2015: loss of EUR 120.7m) plus (ii) depreciation of prop-erty, plant and equipment and amortization of intangible assets (FY 2014: EUR 0.7m; FY 2015: EUR 1.8m). Adjusted EBITDA excludes share based compensation expenses that amounted to EUR 7.7m in FY 2014 and EUR 7.6m in FY 2015.
(2) Capital expenditure is calculated as (i) purchase of property, plant and equipment (FY 2014: EUR 3.9m; FY 2015: EUR 3.8m) plus (ii) acquisition of intangible assets (FY 2014: None; FY 2015: EUR 0.02m).
(3) Net working capital is calculated as (i) inventories (December 31, 2014: EUR 8.5m; December 31, 2015: EUR 8.6m) plus (ii) trade and other receivables (December 31, 2014: EUR 7.7m; December 31, 2015: EUR 6.2m) plus (iii) prepaid expenses (December 31, 2014: EUR 3.1m; December 31, 2015: EUR 1.7m) minus (iv) trade and other payables (December 31, 2014: EUR 25.7m; December 31, 2015: EUR 40.7m).
(4) The total value of “total transactions” sold in period, including taxes, includ-ing shipping costs.
(5) Total number of valid (i.e. not failed or declined) orders starting the fulfill-ment process less cancelled orders (before rejected and returned orders), i.e. total number of orders shipped in the period (eCommerce excluding marketplace).
(6) Total number of valid (i.e. not failed or declined) orders starting the fulfillment process less cancelled orders (before rejected and returned orders), i.e. total number of orders shipped in the period (eCommerce and marketplace).
(7) Number of customers that have made at least one transaction as defined in “total transactions” at any time before end of period.
(8) Number of customers having made at least one transaction as defined in “total transactions” within the last 12 months before end of period.
Key Financials (in EUR million) FY 2015 FY 2014
Net revenue 134.6 61.8
% growth 117.8% 113.2%
Gross profit 14.9 10.9
% margin 11.1% 17.6%
Adjusted EBITDA 1) (111.3) (47.9)
% margin (82.7%) (77.6%)
Capex 2) 3.8 3.9
% of net revenue 2.8% 6.4%
Key Performance Indicators (in million) FY 2015 FY 2014
GMV 4) (in EUR million) 288.7 94.5
% growth 205.6% 172.0%
Total orders 5) 1.6 0.9
% growth 81.9% 94.0%
Total transactions 6) 3.2 1.2
% growth 169.0% 159.0%
Total customers 7) 1.6 0.6
% growth 179.9% 156.7%
Active customers (LTM) 8) 1.2 0.5
% growth 173.0% 132.3%
Balance Sheet (in EUR million) Dec 31, 15 Dec 31, 14
Net working capital 3) (24.2) (6.4)
Cash position 9.5 21.2
Key Figures

ABOUT ROCKET INTERNET72 LETTER TO OUR SHAREHOLDERSANNUAL REPORT 2015
Linio launched its operations in May 2012 and has since become one of the most visited multi-category eCommerce portals for Spanish speaking countries in Latin America, specifically Argentina, Chile, Colombia,
Ecuador, Mexico, Panama, Peru and Venezuela. The company focuses on offering a large product assortment across 60 subcategories, including electronics, home & living, fashion, sports, kids, health & beauty and media, featuring over four million SKUs. Linio offers a wide range of payment methods such as cash on delivery and runs its own delivery service, enabling the company to offer fast delivery options. In 2015, Linio generated GMV of EUR 183.8 million. Linio operates three business lines: First, its marketplace platform, secondly its original business-to-consumer model and thirdly its eCom-merce logistic solutions for merchants. The marketplace plat-form, through which merchants sell original products to Linio’s customers, has been a key driver of recent growth. At the end of December 2015, close to 75% of all transactions were generated through the marketplace platform and the number of marketplace merchants increased to more than 20,000 by the end of 2015. Linio’s wide assortment of products can be accessed through its website as well as mobile sites and its user friendly mobile applications. Mobile devices now account for approximately 35% of total sales. By partnering with major logistic carriers and using dedicated last-mile delivery fleets in selected locations, Linio is able to deliver to areas, which have previously not been served by the market. This is one of the factors leading to Linio’s growth and its highly engaged customer base, evidenced by more than 3.7 million newsletter subscribers and its 3.6 million followers on Facebook. In 2015, Linio reached the one million active customers mark, following customer experience improvement.
2011Founded
Latin AmericaRegions
2,396 Dec 2015, Headcount
SectorGeneral
Merchandise
Rocket Internet StakeDecember 2015March 2016
33.2%21.9%
MarketplaceBusiness Model
Linio's state-of-the-art
website features over four million
SKUs

COMBINED MANAGEMENT REPORTCONSOLIDATED FINANCIAL STATEMENTSOUR COMPANIES 73
General Merchandise
The following table provides an overview of Linio’s consol-idated key financials, which have been derived from Linio’s accounting or controlling records and have been prepared on the basis of IFRS and Linio’s key performance indicators, which are based on management reports.
In 2015, gross merchandise volume of Linio continued to grow by 44.2% from EUR 127.4 million in 2014 to EUR 183.8 million in 2015, fostered by its international assortment, higher traffic and mobile penetration.
Linio’s net revenue increased from EUR 61.6 million in 2014 to EUR 67.4 million in 2015.
The gross profit margin increased by 18 percentage points, from 7.1% in 2014 to 25.1% in 2015, due to increasing moneti-zation of marketplace services and pricing rigor.
Adjusted EBITDA margin decreased slightly from -89.1% in 2014 to -94.9% in 2015. Adjusted EBITDA margin based on GMV improved from -43.1% in 2014 to -34.8% in 2015.
During the financial year 2015, Linio undertook investments to increase the share of marketplace transactions. By the end of financial year 2015, Linio had cash and cash equivalents of EUR 29.3 million.
(1) Adjusted EBITDA is calculated as (i) operating profit or loss (FY 2014: loss of EUR 58.3m; FY 2015: loss of EUR 67.5m) plus (ii) depreciation of property, plant and equipment (FY 2014: EUR 0.6m; FY 2015: EUR 1.0m) plus (iii) amortization of intangible assets (FY 2014: EUR 0.1m; FY 2015: EUR 0.2m). Adjusted EBITDA excludes share based compensation expenses and that amounted to EUR 2.6m in FY 2014 and EUR 2.3m in FY 2015.
(2) Capital expenditure is calculated as (i) purchase of property, plant and equipment (FY 2014: EUR 2.0m; FY 2015: EUR 1.2m) plus (ii) acquisition of intangible assets (FY 2014: EUR 0.3m; FY 2015: EUR 1.3m).
(3) Net working capital is calculated as (i) inventories (December 31, 2014: EUR 8.9m; December 31, 2015: EUR 2.5m) plus (ii) trade and other receivables (December 31, 2014: EUR 3.9m; December 31, 2015: EUR 4.1m) minus (iii) trade and other payables (December 31, 2014: EUR 29.5m; December 31, 2015: EUR 17.4m).
(4) The total value of “total transactions” sold in period, including taxes, includ-ing shipping costs.
(5) Total number of valid (i.e. not failed or declined) orders starting the fulfill-ment process less cancelled orders (before rejected and returned orders), i.e. total number of orders shipped in the period (eCommerce excluding marketplace). Number of total orders decreasing due to introduction of marketplace model.
(6) Total number of valid (i.e. not failed or declined) orders starting the fulfillment process less cancelled orders (before rejected and returned orders), i.e. total number of orders shipped in the period (eCommerce and marketplace).
(7) Number of customers that have made at least one transaction as defined in “total transactions” at any time before end of period.
(8) Number of customers having made at least one transaction as defined in “total transactions” within the last 12 months before end of period.
Key Financials (in EUR million) FY 2015 FY 2014
Net revenue 67.4 61.6
% growth 9.6% 28.5%
Gross profit 16.9 4.4
% margin 25.1% 7.1%
Adjusted EBITDA 1) (64.0) (54.9)
% margin (94.9%) (89.1%)
Capex 2) 2.5 2.2
% of net revenue 3.7% 3.6%
Key Performance Indicators (in million) FY 2015 FY 2014
GMV 4) (in EUR million) 183.8 127.4
% growth 44.2% 107.2%
Total orders 5) 0.6 1.0
% growth (36.7%) 77.7%
Total transactions 6) 2.2 1.5
% growth 48.9% 164.9%
Total customers 7) 1.8 1.0
% growth 76.0% 193.8%
Active customers (LTM) 8) 1.0 0.8
% growth 35.1% 144.1%
Balance Sheet (in EUR million) Dec 31, 15 Dec 31, 14
Net working capital 3) (10.8) (16.6)
Cash position 29.3 57.1
Key Figures

ABOUT ROCKET INTERNET74 LETTER TO OUR SHAREHOLDERSANNUAL REPORT 2015
Home & Living
COMBINED MANAGEMENT REPORTCONSOLIDATED FINANCIAL STATEMENTSOUR COMPANIES 75
Home & Living
Our companies in the Home & Living sector are Westwing, a leading international home & living eCommerce company that offers a frequently changing, curated selection of home & living products to its customers in eleven European countries as well as Brazil, Russia and Kazakhstan and Home24, a leading online shop for home & living products in Europe. In 2015, our companies in the Home & Living sector had EUR 452.9 mil-lion in revenues, an increase of 32% over 2014.
EUR 452.9 million
2015 Revenues

ABOUT ROCKET INTERNET76 LETTER TO OUR SHAREHOLDERSANNUAL REPORT 2015
Westwing is a leading international home & living eCommerce company that offers a frequently changing, curated selection of home & living products to its customers in eleven European
countries as well as Brazil, Russia and Kazakhstan. The com-pany inspires its mostly female customer base with the latest hand-picked selection of decoration products and textiles for home & living as well as furniture, partnering with more than 5,000 different suppliers and offering products of its own pri-vate labels. Westwing distinguishes itself as the destination for curated, inspirational and, at the same time, affordable home & living products. For the financial year 2015, Westwing reported net revenue of EUR 219.2 million and had more than 1,600 employees as of December 2015. Westwing’s custom-ers are highly loyal as demonstrated by the average monthly engagement of over 20 minutes per monthly active customer. The company provides a consistent quality of service and thus achieves high customer satisfaction, which is supported by a strong local presence in its international markets and a multi-national logistics infrastructure. Westwing’s mobile applica-tions add to the outstanding customer experience. With over 2.8 million downloads of its mobile applications, Westwing continues to focus on generating sales from mobile devices, which were the source of over 40% of total revenue in 2015.
In 2015, Westwing started its permanent assortment shop WestwingNow in Germany, a website that provides a fixed assortment with a wide selection of products and fast delivery options as well as the possibility to shop the look of pre- designed rooms, completing the company’s overall Home & Living offering. Westwing underwent several technological improvements and was able to improve processes and effi-ciency. Moreover, it introduced new iOS apps to provide an even better user experience to its mobile customers.
Sector Home & Living
Rocket Internet StakeDecember 2015 31.8%
eCommerceBusiness Model
2011Founded
Europe, CIS, Latin AmericaRegions
1,605Dec 2015, Headcount

COMBINED MANAGEMENT REPORTCONSOLIDATED FINANCIAL STATEMENTSOUR COMPANIES 77
Home & Living
Westwing partners with
more than 5,000 different
suppliers
The following table provides an overview of Westwing’s consolidated key financials, which have been derived from Westwing’s accounting or controlling records and have been prepared on the basis of IFRS and Westwing’s key perfor-mance indicators, which are based on management reports.
Westwing’s net revenue increased by 19.6% from EUR 183.3 million in 2014 to EUR 219.2 million in 2015, despite the neg-ative impact on Westwings business of the adverse foreign exchange movement in Brazil. On a constant currency basis, net revenue grew by 25.7%.
The gross profit margin changed from 43.3% in 2014 to 42.2% in 2015.
Westwing’s adjusted EBITDA changed from EUR -46.9 million in 2014 to EUR -49.9 million in 2015 due to investments into global teams, technology and the impact of customer acquisi-tion initiatives. The adjusted EBITDA margin improved by 2.8 percentage points from -25.6% in 2014 to -22.8% in 2015.
Westwing’s net working capital amounted to EUR -21.8 million at the end of 2015. Its cash and cash equivalents amounted to EUR 18.7 million at the end of 2015.
(1) Adjusted EBITDA is calculated as (i) operating profit or loss (FY 2014: loss of EUR 63.4m; FY 2015: loss of EUR 57.3m) plus (ii) depreciation of prop-erty, plant and equipment and amortization of intangible assets (FY 2014: EUR 2.7m; FY 2015: EUR 2.7m). Adjusted EBITDA excludes share based compensation expenses that amounted to EUR 13.8m in FY 2014 and EUR 4.6m in FY 2015.
(2) Capital expenditure is calculated as (i) purchase of property, plant and equipment (FY 2014: EUR 2.9m; FY 2015: EUR 4.4m) plus (ii) acquisition of intangible assets (FY 2014: EUR 1.8m; FY 2015: EUR 2.0m).
(3) Net working capital is calculated as (i) inventories including prepayments (December 31, 2014: EUR 12.6m; December 31, 2015: EUR 14.5m) plus (ii) trade and other receivables (December 31, 2014: EUR 9.9m; December 31, 2015: EUR 5.8m) minus (iii) trade payables and accruals (December 31, 2014: EUR 30.7m; December 31, 2015: EUR 33.0m) minus (iv) advance payments received (December 31, 2014: EUR 10.1m; December 31, 2015: EUR 9.1m).
(4) The total value of “total orders” sold in period, excluding taxes, shipping costs and vouchers.
(5) Total number of valid (i.e. not failed or declined) orders starting the fulfillment process less cancelled orders (before rejected and returned orders), i.e. total number of valid orders placed in the period.
(6) Number of customers that have made at least one order as defined in “total orders” at any time before end of period.
(7) Number of customers having made at least one order as defined in “total orders” within the last 12 months before end of period.
Key Figures
Key Performance Indicators (in million) FY 2015 FY 2014
GMV 4) (in EUR million) 233.9 193.8
% growth 20.7% 63.9%
Total orders 5) 2.5 2.2
% growth 18.2% 85.2%
Total customers 6) 1.7 1.2
% growth 49.1% 98.5%
Active customers (LTM) 7) 0.9 0.8
% growth 17.5% 76.2%
Key Financials (in EUR million) FY 2015 FY 2014
Net revenue 219.2 183.3
% growth 19.6% 66.1%
Gross profit 92.6 79.3
% margin 42.2% 43.3%
Adjusted EBITDA 1) (49.9) (46.9)
% margin (22.8%) (25.6%)
Capex 2) 6.4 4.7
% of net revenue 2.9% 2.6%
Balance Sheet (in EUR million) Dec 31, 15 Dec 31, 14
Net working capita 3) (21.8) (18.3)
Cash position 18.7 20.7
Key Figures

ABOUT ROCKET INTERNET78 LETTER TO OUR SHAREHOLDERSANNUAL REPORT 2015
Home24 is a leading online shop for home & living products in Europe. The company operates in seven core markets in Europe: Germany, Austria, Switzer-land, Belgium, France, Italy and the Netherlands.
Additionally, Home24 is also operating in Brazil under the mo-bly brand. Since its launch in 2009 (from 2012 onwards under the brand name Home24), the company has been offering a broad range of approximately 180,000 furniture products from over 800 manufacturers ranging from upholstery to lamps and home accessories as well as garden furniture. In 2015, Home24 was able to grow revenue to EUR 233.7 million and employed 1,383 people as of December 2015. The Home24 assortment consists of a variety of brands, including Home24’s own private labels. In addition to the wide assortment, the company sets itself apart through a high degree of product availability as well as through its customer service and fulfill-ment process. Home24 delivers all of its products – regardless of weight and dimensions – for free and directly into the cus-tomer’s room of choice. By combining different logistical ful-fillment channels, Home24 seeks to reduce inventory risk and working capital requirements while, at the same time, offering very attractive delivery times. The company’s updated tablet applications, which have been featured in Apples “Apps of the year” selection, provide its customers with a best-in-class shopping experience, resulting in a higher basket value per customer and an increase in the engagement rate.
In order to increase its inventory capacity and further reduce delivery times, Home24 took a major step in 2015 by opening a new warehouse with over 60,000m2 in Northern Germa ny. Moreover, the company launched nine new private label brands throughout the year, covering sofas, sideboards, mat-tresses, beds, wardrobes, lamps and tables. Levers for future growth will be the further development of its private labels as well as synergies emerging from the recent acquisition of
Sector Home & Living
Rocket Internet StakeDecember 2015March 2016
45.5%44.6%
eCommerceBusiness Model
2009Founded
Europe, Latin AmericaRegions
1,383Dec 2015, Headcount

COMBINED MANAGEMENT REPORTCONSOLIDATED FINANCIAL STATEMENTSOUR COMPANIES 79
Home & Living
Home24's private labels
have established themselves as
top-sellers
Fashion For Home – an international furniture company for premium designer furniture. This acquisition further advances Home24’s positioning as one of the leading European online home & living retailers.
The following table provides an overview of Home24’s consol-idated key financials, which have been derived from Home24’s accounting or controlling records and have been prepared on the basis of IFRS and Home24’s key performance indicators, which are based on management reports.
Home24’s net revenue grew by 45.9% from EUR 160.1 million in 2014 to EUR 233.7 million in 2015, despite the negative im-pact of the Latin American business due to weak retail climate and foreign exchange devaluation.
The gross profit margin increased slightly from 36.8% in 2014 to 38.3% in 2015 driven mostly by more attractive end-con-sumer pricing and the enhancement of its own private label brands.
Home24’s adjusted EBITDA margin decreased from -30.8% in 2014 to -32.2% in 2015, due to ongoing investments into future growth. Adjusted EBITDA changed from EUR -49.4 mil-lion in 2014 to EUR -75.3 million in 2015.
Home24’s net working capital changed from EUR -13.1 million as of December 31, 2014 to EUR -2.8 million as of December 31, 2015 generating more cash with additional revenue.
(1) Adjusted EBITDA is calculated as (i) operating profit or loss (FY 2014: loss of EUR 59.7m; FY 2015: loss of EUR 81.7m) plus (ii) depreciation of prop-erty, plant and equipment (FY 2014: EUR 0.6m; FY 2015: EUR 1.1m) plus (iii) amortization of intangible assets (FY 2014: EUR 5.0m; FY 2015: EUR 3.4m). Adjusted EBITDA excludes share based compensation expenses that amounted to EUR 4.8m in FY 2014, EUR 1.8m in FY 2015.
(2) Capital expenditure is calculated as (i) purchase of property, plant and equipment (FY 2014: EUR 2.9m; FY 2015: EUR 7.1m) plus (ii) acquisition of intangible assets (FY 2014: EUR 2.9m; FY 2015: EUR 9.5m). Figures exclude Fashion For Home (acquired in Q4 2015).
(3) Net working capital is calculated as (i) inventories (December 31, 2014: EUR 25.1m; December 31, 2015: EUR 28.3m) plus (ii) trade and other receivables (December 31, 2014: EUR 7.2m; December 31, 2015: EUR 15.5m) minus (iii) trade and other payables (December 31, 2014: EUR 45.5m; December 31, 2015: EUR 46.6m).
(4) The total value of “total orders” sold in period, excluding taxes and shipping costs.
(5) Total number of valid (i.e. not failed or declined) orders starting the fulfillment process less cancelled orders (before rejected and returned orders), i.e. total number of orders shipped in the period.
(6) Number of customers that have made at least one order as defined in “total orders” at any time before end of period.
(7) Number of customers having made at least one order as defined in “total orders” within the last 12 months before end of period.
Key Figures
Key Performance Indicators (in million) FY 2015 FY 2014
GMV 4) (in EUR million) 244.1 189.2
% growth 29.0% 93.4%
Total orders 5) 1.2 1.0
% growth 20.4% 79.6%
Total customers 6) 2.4 1.4
% growth 69.7% 100.5%
Active customers (LTM) 7) 1.0 0.8
% growth 27.7% 75.7%
Key Financials (in EUR million) FY 2015 FY 2014
Net revenue 233.7 160.1
% growth 45.9% 72.5%
Gross profit 89.5 58.9
% margin 38.3% 36.8%
Adjusted EBITDA 1) (75.3) (49.4)
% margin (32.2%) (30.8%)
Capex 2) 16.6 5.8
% of net revenue 7.1% 3.6%
Balance Sheet (in EUR million) Dec 31, 15 Dec 31, 14
Net working capital 3) (2.8) (13.1)
Cash position 45.9 29.7
Key Figures

ABOUT ROCKET INTERNET80 LETTER TO OUR SHAREHOLDERSANNUAL REPORT 2015
Travel

COMBINED MANAGEMENT REPORTCONSOLIDATED FINANCIAL STATEMENTSOUR COMPANIES 81
Travel
Our company Traveloka is active in the Travel sector, offering bookings for flights, hotels and complete journeys. Traveloka operates a market leading flight search engine and hotel booking platform with focus on travel in South-East Asia.

ABOUT ROCKET INTERNET82 LETTER TO OUR SHAREHOLDERSANNUAL REPORT 2015
Traveloka is a fast growing online booking service for flights and hotels in Indonesia, Malaysia, Singapore, Thailand and Vietnam. Since its launch in 2012, the company continued to experience significant growth
by offering a differentiated and localized experience for cus-tomers to book domestic and international flights and hotels. Users can book via the online website as well as through the iOS application and Android application, which was featured as a “Best App of 2015” in the Google Play Store with more than one million downloads. Traveloka offers a wide variety of payment channels to cater to the needs of local customers including ATM, convenience stores, online transfer and credit cards. Traveloka employed 456 people as of December 31, 2015. The growing customer base and the increasing number of routes, currently more than 18,000 different routes across Asia-Pacific, are expected to further strengthen Traveloka’s market position in Indonesia and grow its market share in the other regions. Throughout 2015, Traveloka strengthened partnerships with international airlines as well as with leading regional carriers.
By investing in its accommodation business, Traveloka seeks to further promote future growth. It is building strong direct relationships with thousands of budget and independent hotels in the region. Additionally, it has already established partner-ships with strong international hotel chains such as Ibis, Best Western, Marriott and Hilton. In 2015, Traveloka was awarded the Indonesian “Top Brand Award 2015” in the categories Online Hotel Reservation and Online Travel Agency.
Sector Online Travel
Rocket Internet Stake December 2015 35.7%
Marketplace Business Model
2012Foundation Date
Asia-PacificRegions
456 Dec 2015, Headcount
Traveloka's mobile
application was featured as a "Best App of
2015"

COMBINED MANAGEMENT REPORTCONSOLIDATED FINANCIAL STATEMENTSOUR COMPANIES 83
Travel
Regional Internet Groups

ABOUT ROCKET INTERNET84 LETTER TO OUR SHAREHOLDERSANNUAL REPORT 2015
As part of our global strategy, we have created Regional Internet Groups in Africa, Middle East and Asia Pacific in order to bundle local market expertise, facilitate regional commercial partnerships, enhance the local presence and sourcing, enable local recruiting as well as to support the rollout of businesses in the respective regions. Strategic and investment partnerships, in particular with mobile telecommunication providers, accelerate the regional rollout of our companies. Our partners such as MTN, Ooredoo and Millicom are co-investors in our Regional Internet Groups and provide them with significant strategic support and opportunities to realize synergies.

COMBINED MANAGEMENT REPORTCONSOLIDATED FINANCIAL STATEMENTSOUR COMPANIES 85
Regional Internet Groups
A frica Internet Group (AIG) operates ten business models in Africa, including the marketplace plat-forms Jumia (shopping mall) Kaymu Africa (shop-ping community), AIG Express (logistics platform),
Jovago Africa (hotel booking platform), Hellofood Africa (food ordering platform) and Easy Taxi Africa (taxi hailing platform) as well as the classifieds companies Lamudi Africa (real estate classifieds), Carmudi Africa (vehicle classifieds) and since beginning of 2015, Vendito Africa (general classifieds) and Everjobs (job classifieds). The Group is dedicated to providing easy-to-use services across the African continent, enabling businesses and consumers to connect and transact. The c om-pany was formed in 2012 and is currently active in 23 African countries.
AIG is actively partnering with telecommunications companies MTN and Tigo (Millicom) on sales and marketing activities, both being shareholders in the company.
In 2015 AIG launched two new companies, Vendito Africa, a general classifieds platform that is already available in six countries throughout Africa, and Everjobs Africa, a job classi-fieds platform which expanded into six African countries. Jumia reported significant growth throughout the year with an increase of 282% in GMV. Jovago is now cooperating with more than 16,000 hotels in Africa, Easy Taxi facilitates the life of more than 10,000 taxi drivers and Kaymu was able to strengthen its market position now partnering with more than 140,000 sellers.
Regional Internet GroupBusiness Model
2012Founded
AfricaRegions
5,423Dec 2015, Headcount
Partners
AXA, Millicom, MTN, Orange,
Goldman Sachs
Rocket Internet StakeDecember 2015March 2016
33.3% 27.1% 1)
AIG launches and supports leading online companies in
Africa
(1) Includes Rocket Internet participation in Rocket Internet Capital Partners fund

ABOUT ROCKET INTERNET86 LETTER TO OUR SHAREHOLDERSANNUAL REPORT 2015
estate classifieds), Carmudi (online car classifieds), Helpling (marketplace for cleaning services), Vaniday (beauty booking platform) and Kaymu (online consumer-to-consumer market-place). MEIG operates across six countries: Bahrain, Jordan, Kuwait, Saudi Arabia, the United Arab Emirates (UAE) and Qatar. As of December 2015, the Group employed 342 people.
Founded in 2015, Wadi is one of the fastest growing eCom-merce platforms in the Middle East, offering 150,000 products from over 2,000 brands and covering products ranging from consumer electronics, fashion and cosmetics, to kitchen appli-ances and more. In February 2016, Wadi raised USD 67 million from a round led by the Al Tayyar Travel Group.
Easy Taxi, one of the world’s leading mobile Taxi booking ser-vices, has established partnerships with thousands of active drivers across five countries in the Middle East, specifically Bahrain, Jordan, Kuwait, Qatar and Saudi Arabia. Lamudi Middle East operates in Saudi Arabia and Jordan, two of the region’s largest markets. To date, they have listed 19,000 properties and are partnering with more than 350 real estate agents, who are using its services. Carmudi was launched in 2014 and operates in the Middle Eastern countries Qatar, Saudi Arabia and the UAE, which are markets with exceptional-ly high levels of car ownership. Carmudi Middle East has listed over 20,000 vehicles across the region, and has partnered with 500 car dealerships. Helpling Middle East is an online platform for household-related services and is active in the UAE. It al-lows users to book trusted and reliable cleaners in a fast and convenient way at attractive prices.
The group is co-owned by our strategic partner MTN (Dubai) Limited, which is an affiliate of MTN Group Limited. Through the cooperation with MTN, MEIG has access to a significant subscriber base and to additional marketing, distribution and payment channels.
In 2013, Rocket Internet created the Middle East Internet Group (MEIG), which bundles our activities across seven business models in six countries in the Middle East. MEIG supports some of the leading Internet companies in the
region, including Wadi (general merchandise marketplace), Easy Taxi (mobile taxi hailing platform), Lamudi (online real
Regional Internet GroupBusiness Model
2013Founded
Middle EastRegions
342Dec 2015, Headcount
Partners MTN
Rocket Internet StakeDecember 2015 50.0%
MEIG - Running Change in the Middle East

COMBINED MANAGEMENT REPORTCONSOLIDATED FINANCIAL STATEMENTSOUR COMPANIES 87
Regional Internet Groups
A sia Pacific Internet Group (APACIG) is active across 15 countries in the Asia Pacific region, including Australia. APACIG focuses on online businesses in the areas of eCommerce, marketplaces, classifieds
and travel and also offers several other services. Currently, the Asia Pacific Internet Group operates 16 business models, including Daraz (consumer goods retailer), Kaymu (online con-sumer-to-consumer marketplace), Jovago (online hotel booking platform), Lamudi (global online real estate classifieds), Car-mudi (global online car classifieds), Everjobs (job classifieds), Easy Taxi (mobile taxi hailing platform), ClickBus (bus booking platform), Helpling (cleaning service platform), Vaniday (online destination for beauty and wellness services), Zenrooms (on-line budget hotel network), Lyke (mobile app for personalized fashion), Easy Taxi (a global mobile taxi hailing platform), Click-Bus (bus booking platform), ads.com.mm (classifieds website) and Next commerce (price comparison engine).
Especially Daraz, one of the largest online shopping malls in Asia, was able to scale its business significantly throughout the year and raised funds in a financing round driven by the external investment of CDC.
In addition, the businesses that were rolled out in 2015, includ-ing Vaniday, Zenrooms and Lyke, were already able to show significant growth.
Since April 2014, the Group has been a joint venture between Rocket Internet and its telecommunications partner Ooredoo Group. The strategic cooperation with Ooredoo, which is active in multiple Asian countries, enables APACIG’s compa-nies faster and easier local scaling by providing them access to a large consumer base of 60 million telecom subscribers. APACIG also holds two-thirds of the shares in Philippines Inter-net Group; the remaining shares are held by its partner PLDT.
Regional Internet GroupBusiness Model
2013Founded
Asia-PacificRegions
2,525Dec 2015, Headcount
Partners Ooredoo
Rocket Internet StakeDecember 2015 50.0%
APACIG is active across 15 countries in the Asia Pacific
region

ABOUT ROCKET INTERNET88 LETTER TO OUR SHAREHOLDERSANNUAL REPORT 2015
New Businesses & Investments

COMBINED MANAGEMENT REPORTCONSOLIDATED FINANCIAL STATEMENTSOUR COMPANIES 89
New Businesses & Investments
In addition to the companies in our focus sectors, we own stakes in companies at various maturity stages, ranging from recently launched models to companies that have already taken steps to build leadership positions and expand geographically. Helpling, Spotcap and Caterwings are three examples of companies grouped under New Businesses & Investments. The companies vary in terms of business model, size and development stage.

ABOUT ROCKET INTERNET90 LETTER TO OUR SHAREHOLDERSANNUAL REPORT 2015
Helpling operates a leading global online marketplace for professional cleaning services outside the US, addressing private households as well as small- and medium-sized companies. The business was
launched in Berlin in the first quarter of 2014 and quickly expanded to many cities in Germany as well as to other Euro-pean countries. Customers can book the cleaning service through Helpling’s website and mobile application in more than 200 cities worldwide. Currently, the service is focused on home cleaning; however, Helpling plans to expand its offering in the future, offering additional household services such as home repair, lockout services, removal services and animal care. One of Helpling’s key commitments is to provide a safe and trustworthy experience for its customers. Therefore, Help-ling conducts a background check on every service provider and encourages its customers to rate the individual service provider.
In 2015, Helpling conducted successful marketing campaigns through several online and offline channels and was able to double the number of unique visitors. Furthermore, in July 2015, Helpling acquired UK’s leading on-demand home cleaning platform Hassle.com, strengthening its competitive positioning in the UK.
MarketplaceBusiness Model
2014Founded
WorldwideRegions
263Dec 2015, Headcount
Sector Cleaning Services
Helpling provides a safe and trustworthy
experience

COMBINED MANAGEMENT REPORTCONSOLIDATED FINANCIAL STATEMENTSOUR COMPANIES 91
New Businesses & Investments
Financial TechnologyBusiness Model
2014Founded
Spain, the Netherlands, AustraliaRegions
63Dec 2015, Headcount
Sector Online Lending
Launched in the second half of 2014, Spotcap is an online lending platform that provides small and medium sized enterprises with short-term credit facilities. Spotcap targets businesses, who are currently not being served
by traditional financial institutions. Companies can apply for a loan through a straight forward online application process, allowing them to receive funding within a short timeframe. The service is currently available in Spain, the Netherlands and Australia; however, Spotcap aims to expand into new markets in Europe, Asia Pacific and Latin America. Due to its recent growth, the company was selected to join the Deutsche Börse Venture Network in August 2015.
Quick and easy
credit decisions

ABOUT ROCKET INTERNET92 LETTER TO OUR SHAREHOLDERSANNUAL REPORT 2015
Caterwings is a leading business to business market-place for catering services that launched in the third quarter of 2015. It offers companies a convenient way to order food for small events or business meet-
ings through Caterwings’ user friendly, well designed website. By offering customers access to several caterers via one market place, the company seeks to bring online the fragment-ed, in transparent catering industry, which is still operating predominantly offline today. Caterwings has already entered into partnerships with more than 80 caterers and currently offers its services in London and Berlin; it plans to expand to other European cities.
MarketplaceBusiness Model
2015Founded
Germany, United KingdomRegions
19Dec 2015, Headcount
Sector Catering
Caterwings seeks to disrupt the fragmented,
intransparent catering industry

3
Contents
94 Consolidated Statement of Comprehensive Income
96 Consolidated Balance Sheet
98 Consolidated Statement of Changes in Equity
100 Consolidated Statement of Cash Flow
102 Notes to the Consolidated Financial Statements
Consolidated Financial Statements
93

Consolidated Statement of Comprehensive Income
In EUR thousand NoteJan 1– Dec 31,
2015Jan 1– Dec 31,
2014
Revenue 6, 11 128,332 128,182
Changes in work in progress 0 194
Internally produced and capitalized assets 12 5,719 2,878
Other operating income 13 4,994 4,200
Result from deconsolidation of subsidiaries 14 167,025 452,601
Gain from distribution of non-cash assets to owners 15 0 60,594
Purchased merchandise and purchased services 16 −64,116 −69,788
Employee benefits expenses 17 −171,656 −141,870
Other operating expenses 18 −82,470 −87,669
Share of profit / loss of associates and joint ventures 19 −188,629 75,109
EBITDA −200,801 424,432
Depreciation and amortization 20 −7,271 −2,653
Impairment of non-current assets 25 −18,050 0
EBIT −226,122 421,778
Financial result 29,717 12,031
Finance costs 21 −65,357 −16,497
Finance income 21 95,074 28,528
Loss / profit before tax −196,406 433,809
Income taxes 22 −1,395 −5,003
Loss / profit for the period −197,801 428,806
Profit / loss attributable to non-controlling interests −4,658 34,215
Loss / profit attributable to equity holders of the parent −202,459 463,022
Earnings per share (in EUR) 23 −1.24 3.24
for the Period January 1 to December 31, 2015
Income Statement
94 ABOUT ROCKET INTERNETLETTER TO OUR SHAREHOLDERSANNUAL REPORT 2015

In EUR thousand NoteJan 1– Dec 31,
2015Jan 1– Dec 31,
2014
Loss / profit for the period −197,801 428,806
Exchange differences on translation of foreign operations −1,144 −455
Net gain on available-for-sale (AFS) financial assets 135,327 0
Deferred taxes on net gain on available-for-sale (AFS) financial assets −209 0
Share of the changes in the net assets of associates / joint ventures that are recognized in OCI of the associates / joint ventures −98,988 80,238
Deferred taxes on share of the changes in the net assets of associates / joint ventures that are recognized in OCI of the associates / joint ventures 1,443 −1,220
Other changes in OCI 0 −321
Net other comprehensive income to be reclassified to profit or loss in subsequent periods 36,431 78,241
Other comprehensive income for the period, net of tax 36,431 78,241
Total comprehensive loss / income for the period, net of tax −161,370 507,048
Total comprehensive loss / income attributable to:
Equity holders of the parent −165,731 541,510
Non-controlling interests 4,361 −34,462
Statement of Comprehensive Income
95COMBINED MANAGEMENT REPORTCONSOLIDATED FINANCIAL STATEMENTSOUR COMPANIES
Consolidated Statement of Comprehensive Income

Consolidated Balance Sheetas of December 31, 2015
Assets
In EUR thousand Note Dec 31, 2015 Dec 31, 2014
Non-current assets
Property, plant and equipment 24 2,826 3,131
Intangible assets 25 129,127 9,024
Investments in associates and joint ventures 10 1,696,421 1,450,762
Non-current financial assets 26, 41 1,333,184 338,530
Other non-current non-financial assets 30 523 4,158
Income tax assets 22 167 112
Deferred tax assets 22 0 48
3,162,248 1,805,765
Current assets
Inventories 27 743 11,238
Trade receivables 28, 40, 41 10,085 20,748
Other current financial assets 29, 41 41,260 15,095
Other current non-financial assets 30 5,246 7,975
Income tax asset 22 482 991
Cash and cash equivalents 31, 40, 41 1,758,889 2,053,448
1,816,705 2,109,496
Assets classified as held for sale 32 17,090 3,879
Total assets 4,996,044 3,919,140
96 ABOUT ROCKET INTERNETLETTER TO OUR SHAREHOLDERSANNUAL REPORT 2015

Equity and Liabilities
In EUR thousand Note Dec 31, 2015 Dec 31, 2014
Equity
Subscribed capital 33 165,141 153,131
Capital reserves 33 3,105,477 2,482,643
Retained earnings 33, 34 883,912 1,014,782
Other components of equity 33 123,844 87,116
Equity attributable to equity holders of the parent 4,278,373 3,737,672
Non-controlling interests 33 73,735 34,184
Total equity 4,352,108 3,771,857
Non-current liabilities
Non-current financial liabilities 35, 40, 41 526,898 5,315
Other non-current non-financial liabilities 38 398 498
Income tax liabilities 22 0 45
Deferred tax liabilities 22 8,169 3,600
535,465 9,457
Current liabilities
Trade payables 36, 40, 41 11,398 43,703
Other current financial liabilities 37, 40, 41 11,754 10,061
Other current non-financial liabilities 38 77,258 71,874
Income tax liabilities 22 512 12,188
100,922 137,827
Liabilities directly associated with assets classified as held for sale 32 7,549 0
Total liabilities 643,936 147,284
Total equity and liabilities 4,996,044 3,919,140
97COMBINED MANAGEMENT REPORTCONSOLIDATED FINANCIAL STATEMENTSOUR COMPANIES
Consolidated Balance Sheet

Consolidated Statement of Changes in Equityfor the Period January 1 to December 31, 2015
In EUR thousand Note
Equity attributable to equity holders of the parentNon-controlling
interests Total equity
Subscribedcapital
Capitalreserves
Treasuryshares
Retainedearnings
Other components of
equity Total
Jan 1, 2014 110 490,707 −43 604,174 8,628 1,103,576 12,750 1,116,325
Profit for the period 463,022 463,022 −34,215 428,806
Other comprehensive income for the period, net of tax 33 78,489 78,489 −247 78,241
Total comprehensive income for the period, net of tax 463,022 78,489 541,510 −34,462 507,048
Proceeds from the issuance of shares to the equity holders of the parent (cash contribution) 33,075 2,037,328 2,070,402 2,070,402
Transaction costs net of tax −28,902 −28,902 −28,902
Issuance of shares to the equity holders of the parent (non-cash contribution) 1 395,511 395,511 395,511
Increase of subscribed capital from own resources 119,946 −119,946 0 0
Proceeds from non-controlling interests 65,901 65,901 35,670 101,571
Transfer and redemption of treasury shares 43 −43 0 0
Non-cash dividends to equity holders of the parent (advance dividends in kind) −153,234 −153,234 −153,234
Dividends paid to equity holders of the parent (advance cash dividends) −286,766 −286,766 −286,766
Changes in scope of consolidation and other changes in non-controlling interests −87,473 80,245 −7,228 20,139 12,911
Withdrawals from capital reserves −270,483 270,483 0 0
Purchase of non-controlling interest without change in control −242 −242 17 −225
Equity-settled share-based payments (IFRS 2) 33, 39 37,179 37,179 70 37,249
Other changes −35 0 −35 −35
153,021 1,991,936 43 410,608 78,489 2,634,097 21,435 2,655,531
Dec 31, 2014 153,131 2,482,643 0 1,014,782 87,116 3,737,672 34,184 3,771,857
Loss for the period −202,459 −202,459 4,658 −197,801
Other comprehensive income for the period, net of tax 33 36,728 36,728 −297 36,431
Total comprehensive loss for the period, net of tax −202,459 36,728 −165,731 4,361 −161,370
Proceeds from the issuance of shares to the equity holders of the parent (cash contribution) 12,010 576,491 588,501 588,501
Issuance of convertible bond 33, 35 37,659 37,659 37,659
Transaction costs net of tax −3,881 −3,881 −3,881
Proceeds from non-controlling interests 35,395 35,395 22,635 58,030
Dividends paid to non-controlling interests −8,033 −8,033
Changes in scope of consolidation and other changes in non-controlling interests −22,830 25,304 2,474 22,490 24,964
Purchase of non-controlling interest without change in control −9,080 −9,080 −481 −9,560
Equity-settled share-based payments (IFRS 2) 33, 39 55,318 55,318 −1,422 53,895
Other changes 46 46 46
12,010 622,833 0 −130,870 36,728 540,701 39,550 580,251
Dec 31, 2015 165,141 3,105,477 0 883,912 123,844 4,278,373 73,735 4,352,108
98 ABOUT ROCKET INTERNETLETTER TO OUR SHAREHOLDERSANNUAL REPORT 2015

In EUR thousand Note
Equity attributable to equity holders of the parentNon-controlling
interests Total equity
Subscribedcapital
Capitalreserves
Treasuryshares
Retainedearnings
Other components of
equity Total
Jan 1, 2014 110 490,707 −43 604,174 8,628 1,103,576 12,750 1,116,325
Profit for the period 463,022 463,022 −34,215 428,806
Other comprehensive income for the period, net of tax 33 78,489 78,489 −247 78,241
Total comprehensive income for the period, net of tax 463,022 78,489 541,510 −34,462 507,048
Proceeds from the issuance of shares to the equity holders of the parent (cash contribution) 33,075 2,037,328 2,070,402 2,070,402
Transaction costs net of tax −28,902 −28,902 −28,902
Issuance of shares to the equity holders of the parent (non-cash contribution) 1 395,511 395,511 395,511
Increase of subscribed capital from own resources 119,946 −119,946 0 0
Proceeds from non-controlling interests 65,901 65,901 35,670 101,571
Transfer and redemption of treasury shares 43 −43 0 0
Non-cash dividends to equity holders of the parent (advance dividends in kind) −153,234 −153,234 −153,234
Dividends paid to equity holders of the parent (advance cash dividends) −286,766 −286,766 −286,766
Changes in scope of consolidation and other changes in non-controlling interests −87,473 80,245 −7,228 20,139 12,911
Withdrawals from capital reserves −270,483 270,483 0 0
Purchase of non-controlling interest without change in control −242 −242 17 −225
Equity-settled share-based payments (IFRS 2) 33, 39 37,179 37,179 70 37,249
Other changes −35 0 −35 −35
153,021 1,991,936 43 410,608 78,489 2,634,097 21,435 2,655,531
Dec 31, 2014 153,131 2,482,643 0 1,014,782 87,116 3,737,672 34,184 3,771,857
Loss for the period −202,459 −202,459 4,658 −197,801
Other comprehensive income for the period, net of tax 33 36,728 36,728 −297 36,431
Total comprehensive loss for the period, net of tax −202,459 36,728 −165,731 4,361 −161,370
Proceeds from the issuance of shares to the equity holders of the parent (cash contribution) 12,010 576,491 588,501 588,501
Issuance of convertible bond 33, 35 37,659 37,659 37,659
Transaction costs net of tax −3,881 −3,881 −3,881
Proceeds from non-controlling interests 35,395 35,395 22,635 58,030
Dividends paid to non-controlling interests −8,033 −8,033
Changes in scope of consolidation and other changes in non-controlling interests −22,830 25,304 2,474 22,490 24,964
Purchase of non-controlling interest without change in control −9,080 −9,080 −481 −9,560
Equity-settled share-based payments (IFRS 2) 33, 39 55,318 55,318 −1,422 53,895
Other changes 46 46 46
12,010 622,833 0 −130,870 36,728 540,701 39,550 580,251
Dec 31, 2015 165,141 3,105,477 0 883,912 123,844 4,278,373 73,735 4,352,108
99COMBINED MANAGEMENT REPORTCONSOLIDATED FINANCIAL STATEMENTSOUR COMPANIES
Consolidated Statement of Changes in Equity
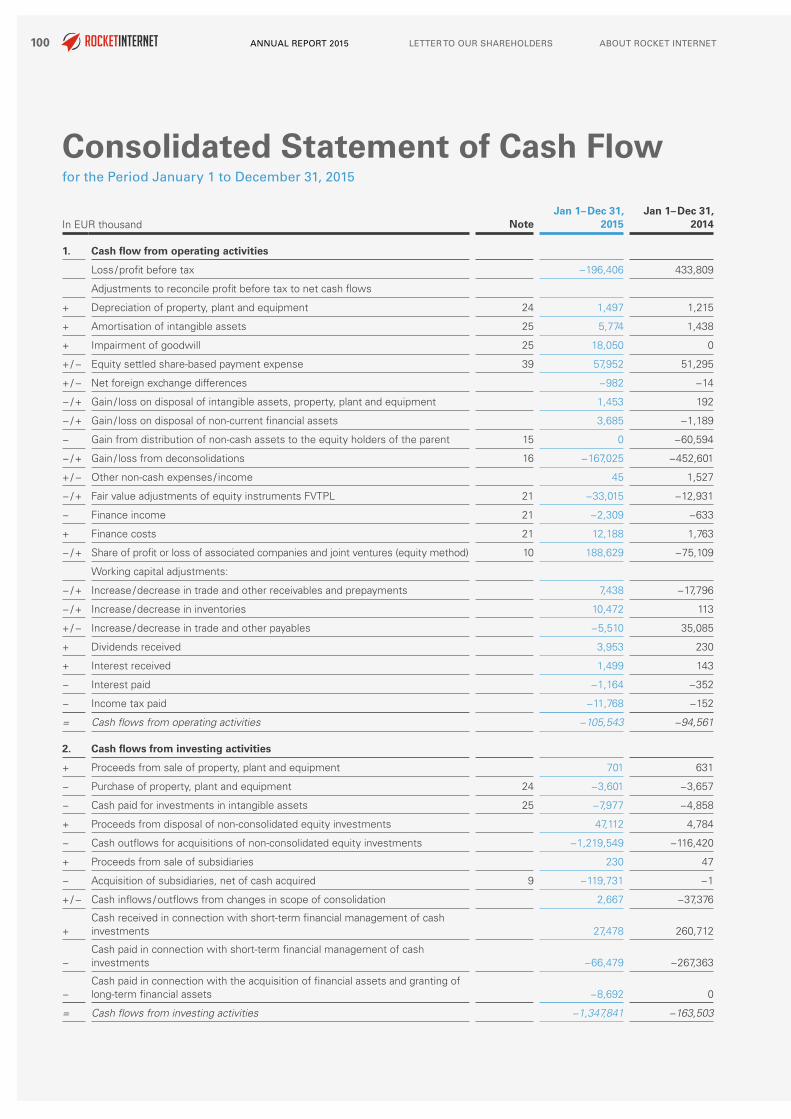
Consolidated Statement of Cash Flow
In EUR thousand NoteJan 1– Dec 31,
2015Jan 1– Dec 31,
2014
1. Cash flow from operating activities
Loss / profit before tax −196,406 433,809
Adjustments to reconcile profit before tax to net cash flows
+ Depreciation of property, plant and equipment 24 1,497 1,215
+ Amortisation of intangible assets 25 5,774 1,438
+ Impairment of goodwill 25 18,050 0
+ / − Equity settled share-based payment expense 39 57,952 51,295
+ / − Net foreign exchange differences −982 −14
− / + Gain / loss on disposal of intangible assets, property, plant and equipment 1,453 192
− / + Gain / loss on disposal of non-current financial assets 3,685 −1,189
− Gain from distribution of non-cash assets to the equity holders of the parent 15 0 −60,594
− / + Gain / loss from deconsolidations 16 −167,025 −452,601
+ / − Other non-cash expenses / income 45 1,527
− / + Fair value adjustments of equity instruments FVTPL 21 −33,015 −12,931
− Finance income 21 −2,309 −633
+ Finance costs 21 12,188 1,763
− / + Share of profit or loss of associated companies and joint ventures (equity method) 10 188,629 −75,109
Working capital adjustments:
− / + Increase / decrease in trade and other receivables and prepayments 7,438 −17,796
− / + Increase / decrease in inventories 10,472 113
+ / − Increase / decrease in trade and other payables −5,510 35,085
+ Dividends received 3,953 230
+ Interest received 1,499 143
− Interest paid −1,164 −352
− Income tax paid −11,768 −152
= Cash flows from operating activities −105,543 −94,561
2. Cash flows from investing activities
+ Proceeds from sale of property, plant and equipment 701 631
− Purchase of property, plant and equipment 24 −3,601 −3,657
− Cash paid for investments in intangible assets 25 −7,977 −4,858
+ Proceeds from disposal of non-consolidated equity investments 47,112 4,784
− Cash outflows for acquisitions of non-consolidated equity investments −1,219,549 −116,420
+ Proceeds from sale of subsidiaries 230 47
− Acquisition of subsidiaries, net of cash acquired 9 −119,731 −1
+ / − Cash inflows / outflows from changes in scope of consolidation 2,667 −37,376
+Cash received in connection with short-term financial management of cash investments 27,478 260,712
−Cash paid in connection with short-term financial management of cash investments −66,479 −267,363
−Cash paid in connection with the acquisition of financial assets and granting of long-term financial assets −8,692 0
= Cash flows from investing activities −1,347,841 −163,503
for the Period January 1 to December 31, 2015
100 ABOUT ROCKET INTERNETLETTER TO OUR SHAREHOLDERSANNUAL REPORT 2015

In EUR thousand NoteJan 1– Dec 31,
2015Jan 1– Dec 31,
2014
3. Cash flows from financing activities
+ Proceeds from issuance of shares to the equity holders of the parent 33 588,501 2,070,402
+ Proceeds from issuance of convertible bonds 35 550,000 0
+ Proceeds from non-controlling interests 58,030 101,571
+ Proceeds from redeemable preference shares 1,000 4,980
− Purchase of non-controlling interest without change in control −9,560 −225
− Transaction costs on issue of shares −14,943 −25,081
+ Proceeds from borrowings 4,546 284
− Repayment of borrowings −4,333 −835
− Dividends paid to equity holders of the parent (advance dividends) 34 0 −286,766
− Dividends paid to non-controlling interests 34 −8,033 0
= Cash flows from financing activities 1,165,208 1,864,330
4. Cash and cash equivalents at the end of the period
Net change in cash and cash equivalents (subtotal of 1 to 3) −288,176 1,606,267
Net foreign exchange difference 3,327 −36
Cash and cash equivalents at the beginning of the period 2,053,448 447,218
Cash and cash equivalents at the end of the period 31 1,768,599 2,053,448
101COMBINED MANAGEMENT REPORTCONSOLIDATED FINANCIAL STATEMENTSOUR COMPANIES
Consolidated Statement of Cash Flow

Notes to the Consolidated Financial Statements1. Corporate and Group Information
General Information Rocket Internet SE (until March 18, 2015 Rocket Internet AG), hereinafter also referred to as “Rocket Internet“, the “Company“ or “parent Company“, is registered in the commercial register Charlottenburg of the district court in Berlin (Registration No.: HRB 165662). Rocket Internet SE registered office is at Johannisstraße 20, 10117 Berlin, Germany. Rocket Internet SE is the parent company of directly and indirectly held subsidiaries and holds directly or indirectly interest in joint ventures and associates, hereinafter together also referred to as the “Rocket Internet Group“ or the “Group“.
The general meeting of Rocket Internet AG as of September 30, 2014 passed the resolution to convert the legal form of Rocket Internet AG to a European stock corporation (Societas Europaea, SE) named “Rocket Internet SE”. With the registration in the commercial register Charlottenburg of the district court of Berlin, the change of the legal form to Rocket Internet SE became effective on March 18, 2015.
Since October 2, 2014 the shares of the Rocket Internet SE, are included in the non-regulated Entry Standard of the Frankfurt Stock Exchange. The admission to the non-regulated Entry Standard does not represent a stock listing pursuant to Sec. 3 (2) AktG.
Subsidiaries, associated companies and joint ventures herein are summarized as “network companies”.
Business ActivitiesRocket Internet SE is one of the leading Internet platforms outside the United States and China. Rocket Internet was founded in 2007 and has since established numerous companies with activities in more than 110 countries on six continents. Rocket Internet identifies proven Internet and mobile business models and builds these either independently in own subsidiaries or invests in already existing companies (the so-called “GFC Investments”). Rocket targets mainly new, underserved or untapped markets, in which new companies will be scaled to market leadership positions. It relies on already proven models with a lower customer acceptance risk. The Group aims to make its network companies, depending on the type of business model, profitable within six to nine years after project launch.
A standardized approach for the formation of companies enables Rocket Internet to bring a company to the market in just a few months after the project was started. The goal is that companies achieve operational independence under the leadership of the parent company.
Rocket Internet has a flexible and scalable technology platform, which enables realizing several new projects per year in its five target regions
– Europe (excluding Russia and CIS), – Africa and Middle-East, – Asia-Pacific (excluding China), – Russia and CIS (Commonwealth of Independent States) and – Latin America.
102 ABOUT ROCKET INTERNETLETTER TO OUR SHAREHOLDERSANNUAL REPORT 2015

Five Industry SectorsRocket Internet is focused on proven Internet-based business models that satisfy basic consumer needs across the following five industry sectors1):
– Food & Groceries (individualized fresh food at home, online food delivery and takeaway), – Fashion (emerging markets online fashion), – General Merchandise (emerging markets online retail as well as marketplaces for online
merchandise), – Home & Living (international Home & Living eCommerce) and – Travel (online and mobile travel bookings, package holidays with transfer).
Regional Internet Groups Rocket Internet has created Regional Internet Groups in order to combine the knowledge of local markets with the business model expertise, to foster regional commercial, strategic and investment partnerships especially with mobile operators. Our regional Internet Groups include Asia Pacific Internet Group, Middle East Internet Group and Africa Internet Group.
New Businesses & InvestmentsIn addition to the companies in the five industry sectors, Rocket Internet owns stakes in companies at varying maturity stages, ranging from recently launched models to companies that are in the process of establishing leadership positions or expanding their geographic reach.
ServicesFurthermore, Rocket Internet Group performs a range of IT, marketing and other services, in particular commercial and technical consulting services for its subsidiaries and non-consolidated equity investments. Rocket Internet is usually intensely involved in the strategic leadership and tactical implementation of the business plans of network companies, in particular in the early years.
Rocket Internet has created the Rocket Internet platform to systematize the process of identifying, building and scaling Internet companies around the world. The goal is to identify commonalities within different business models and leverage these via a platform approach to optimize the building and scaling process.
1) Sectors do not represent reportable segments, which are shown in Note 6.
103COMBINED MANAGEMENT REPORTCONSOLIDATED FINANCIAL STATEMENTSROCKET INTERNET COMPANIES
Notes to the Consolidated Financial Statements

Consumer Brands of the Company NetworkThe following graph shows a selection of the most important consumer brands used by network companies. See Note 6 for further information on the segments.
мода с доставкой
Food & Groceries
Fashion
General Merchandise
Home & Living
Travel
Regional Internet Groups
New Businesses & Investments
Consumer Brands
104 ABOUT ROCKET INTERNETLETTER TO OUR SHAREHOLDERSANNUAL REPORT 2015

Information about the consolidated Group Rocket Internet has a large number of network companies in countries that are particularly relevant for online and mobile business.
While Rocket Internet as well as some service center subsidiaries focus on providing services along the different functional areas of an Internet business, the operational business is carried out exclusively by Rocket Internet’s subsidiaries, associated companies and joint ventures under the umbrella of specifically created consumer brands.
In its role as group holding, Rocket Internet fulfils central functions including operational investment management, accounting, group financial reporting, press and investor relations, risk management and internal audit as well as human resources.
Rocket Internet typically owns directly or indirectly 80% to 90% of its companies2) at the time of launch, with the remainder set aside for management equity participations. In subsequent financing rounds, the companies attract the equity financing necessary to expand their business from Rocket Internet and other external investors. The external equity financing is provided by strategic partners and other strategic and financial investors, including existing Rocket Internet shareholders. These investments are either made directly into the company or indirectly into an intermediate holding company or a Regional Internet Group (Africa Internet Holding GmbH, Asia Internet Holding S.à r.l. or Middle East Internet Holding S.à r.l.). In practice, this has meant that the direct and indirect stakes of Rocket Internet in a company have decreased over time to less than 50%. Furthermore, for several companies in which Rocket Internet holds a participation of more than 50%, shareholder agreements exist that lead to ongoing restrictions of Rocket Internet’s control over those network companies. As of December 31, 2015 Rocket Internet does not consolidate most of its significant network companies but accounts for them using the equity method. The most important associated companies and joint ventures in the Rocket Internet Group as of December 31, 2015 are:
Associated company / joint venture Consumer brands
Global Fashion Group S.A.Dafiti, Lamoda, Zalora & The Iconic, Namshi, Jabong and since September 2015 Kanui and Tricae
Lazada Group S.A. Lazada, helloPay
New TIN Linio II GmbH Linio
Home24 AG Home24, Mobly
Westwing Group GmbH Westwing
HelloFresh AG HelloFresh
Emerging Markets Online Food Delivery Holding S.à r.l.
foodpanda, hellofood, Delivery Club
Africa Internet Holding GmbHCarmudi, EasyTaxi, Everjobs, Hellofood, Jovago, Jumia, Kaymu, Lamudi, Vendito, Zando
Asia Internet Holding S.à r.lDaraz, Lamudi, Carmudi, Easy Taxi, Kaymu, Helpling, Jovago, Shopwings
Middle East Internet Holding S.à r.l. Carmudi, Lamudi, Easy Taxi, Helpling, Wadi
2) All participation quotas for the network companies shown in the financial statements are based on the Group’s ownership calculated pursuant to the respective accounting rules (e.g. reflecting the transaction closing dates, dates of change in con-trol, considering trust shares allocated to the Group etc.) and may therefore differ from the respective information published on the Company’s website which is based on the signing dates.
105COMBINED MANAGEMENT REPORTCONSOLIDATED FINANCIAL STATEMENTSROCKET INTERNET COMPANIES
Notes to the Consolidated Financial Statements

As of December 31, 2015, the consolidated group comprised 181 (previous year 138) fully consolidated companies in addition to Rocket Internet SE.
As a result of Rocket Internet being an operational Internet platform, the consolidated group is subject to changes in each reporting period. During the reporting period, the consolidated group has developed as follows:
See Note 8 for information on the Group’s principal subsidiaries and Note 9 for business combinations and acquisitions of subsidiaries. During the financial year 2015, Rocket Internet performed two significant business combinations.
First-time consolidation relates to formerly dormant subsidiaries that were founded in previous periods and which started operations during the reporting period.
Spin-offs occur when the Group receives an equity stake in a newly spun off subsidiary as a result of the division of an existing company (combined with creation of a new entity).
Transition of subsidiaries to an associated company or joint venture occurs when a subsidiary issues shares to third parties and following this, Rocket Internet’s interest is diluted, such that the Group no longer controls the subsidiary/group of subsidiaries.
Disposals relate to regular sales of interest in a consolidated subsidiary that give rise to the loss of control of a subsidiary.
GermanyOther
countries Total
As of Jan 1, 2014 100 59 159
Acquisitions 9 1 10
Foundings 9 58 67
First-time consolidation 25 39 64
Transition to associated company/ joint venture –64 –76 –140
thereof subsidiaries of associated companies/joint ventures transitioned (–62) (–68) (–130)
Disposals –9 –7 –16
Mergers/accretions/other –5 0 –5
As of Dec 31, 2014 65 74 139
Acquisitions 2 2 4
Foundings 4 53 57
Spin-offs 3 0 3
First-time consolidation 14 42 56
Transition to associated company/joint venture –4 –2 –6
thereof subsidiaries of associated companies/joint ventures transitioned (–3) (–1) (–4)
Disposals –16 –21 –37
Deconsolidation of inactive subsidiaries and liquidations –5 –29 –34
As of Dec 31, 2015 63 119 182
106 ABOUT ROCKET INTERNETLETTER TO OUR SHAREHOLDERSANNUAL REPORT 2015

As of December 31, 2015 the Rocket Internet Group included 51 associated companies and joint ventures (previous year 53) which were accounted for using the at-equity method of accounting or accounted for at fair value through profit or loss (FVTPL). The portfolio of associated compa-nies and joint ventures has developed as follows:
See Note 10, 41 and 46 for information on the Group’s investments in associates and joint ventures.
As a consequence of Rocket Internet’s business model there are significant changes year over year in the scope of consolidated subsidiaries, associates and joint ventures. These changes limit to a certain extent the inter-period-comparability of the consolidated financial statements.
GermanyOther
countries Total
As of Jan 1, 2014 26 2 28
Transition of formerly consolidated entities 2 8 10
Foundings 5 4 9
Acquisitions 9 6 15
Disposals and other changes –5 –4 –9
As of Dec 31, 2014 37 16 53
Transition of formerly consolidated entities 1 1 2
Transition of former other investments 0 1 1
Transition to other investments –3 0 –3
Acquisitions 1 3 4
Disposals and other changes –7 1 –6
As of Dec 31, 2015 29 22 51
thereof at equity 23 12 35
thereof at FVTPL 6 10 16
107COMBINED MANAGEMENT REPORTCONSOLIDATED FINANCIAL STATEMENTSROCKET INTERNET COMPANIES
Notes to the Consolidated Financial Statements

2. Basis of Preparation
Statement of ComplianceThese consolidated financial statements have been prepared in accordance with International Financial Reporting Standards (IFRS) as issued by the International Accounting Standards Board (IASB) and the interpretations of the IFRS Interpretation Committee (IFRS IC) approved by the IASB and in effect and adopted by the European Union (EU) at the reporting date. The requirements of Sec. 315a (1) HGB (“Handelsgesetzbuch”: German Commercial Code) are also taken into account.
The principal accounting policies applied in the preparation of these consolidated financial statements are set out in the Note 3. These policies have been consistently applied to all the periods presented. In the financial year 2015, the Group also adopted the new and amended IFRS and IFRS interpretations which have already been endorsed by the EU and which are effective for financial years beginning on January 1, 2015:
– Annual Improvements to IFRS (Cycle 2011–2013) which affect IFRS 1, IFRS 3, IFRS 13 and IAS 40 and
– IFRIC 21 Levies.
These amendments do not have any significant effect on the Group’s consolidated financial statements.
Standards issued but not yet effective up to the date of issuance of the Group’s financial statements are set out in the Note 5.
General InformationThe consolidated financial statements have been prepared on a historical cost basis, except for investments in available-for-sale financial assets, financial assets and associates under fair value option, contingent consideration and non-cash distribution liability that have been measured at fair value.
The profit and loss statement is prepared using the nature of expense method.
Assets and liabilities are presented using the current and non-current classification.
In the Statement of Cash Flows the operating cash flows are derived using the indirect method, whereas the investing and financing cash flows are determined using the direct method.
The consolidated financial statements provide comparative information in respect of the previous period.
The consolidated statements are presented in Euro (EUR). Unless otherwise indicated, all values are rounded up or down to the nearest thousand in accordance with a commercial rounding approach, which may result in rounding differences and percentage figures presented may not exactly reflect the absolute figures they relate to.
The Company’s financial year is the calendar year.
108 ABOUT ROCKET INTERNETLETTER TO OUR SHAREHOLDERSANNUAL REPORT 2015

3. Summary of Significant Accounting Policies
Basis of ConsolidationThe consolidated financial statements comprise the financial statements of the Company and its subsidiaries as of December 31, 2015. Control is achieved when the Group is exposed, or has rights, to variable returns from its involvement with the respective network company and has the ability to affect those returns through its power over the network company.
Specifically, the Group controls a network company if and only if the Group has:
– Power over the network company (i.e. existing rights that give it the current ability to direct the relevant activities of the network company),
– Exposure, or rights, to variable returns from its involvement with the network company, and – The ability to use its power over the network company to affect its returns.
When the Group has less than the majority of the voting or similar rights of a network company, the Group considers all relevant facts and circumstances in assessing whether it has power over a network company, including:
– The contractual agreements with the other shareholders with voting rights of the network company,
– Rights arising from other contractual agreements, and – The Group's voting rights and potential voting rights.
The Group re-assesses whether or not it controls a network company if facts and circumstances indicate that there are changes to one or more of the three criteria of control. Consolidation of a subsidiary begins when the Group obtains control over the subsidiary and ceases when the Group loses control of the subsidiary. Assets, liabilities, income and expenses of a subsidiary acquired or disposed of during the year are included in the consolidated balance sheet and the statement of comprehensive income from the date the Group gains control until the date the Group ceases to control the subsidiary.
Profit or loss and each component of other comprehensive income (OCI) are attributed to the equity holders of the parent Company and to non-controlling interests, even if this results in the non-controlling interests having a deficit balance. When necessary, adjustments are made to the financial statements of subsidiaries to bring their accounting policies into line with the Group's accounting policies. All intra-group assets and liabilities, equity, income, expenses and cash flows relating to transactions between members of the Group are eliminated fully on consolidation.
A change in the ownership interest of a subsidiary, without a loss of control, is accounted for as an equity transaction.
If the Group loses control over a subsidiary, the following steps apply:
– derecognizes the assets (including goodwill) and liabilities of the subsidiary, – derecognizes the carrying amount of any non-controlling interests, – derecognizes the cumulative translation differences recorded in equity, – recognizes the fair value of the consideration received, – recognizes the fair value of any investment retained, – recognizes any surplus or deficit in profit or loss and – reclassifies the parent's share of components previously recognized in OCI to profit or loss
or retained earnings, as appropriate, as would be required if the Group had directly disposed of the related assets or liabilities.
109COMBINED MANAGEMENT REPORTCONSOLIDATED FINANCIAL STATEMENTSROCKET INTERNET COMPANIES
Notes to the Consolidated Financial Statements

The financial statements of the subsidiaries are prepared for the same reporting period as the parent company.
Business combinationsThe acquisition method of accounting is used to account for the acquisition of subsidiaries. Identifiable assets acquired and liabilities and contingent liabilities assumed in a business combination are measured at their fair value at the acquisition date, irrespective of the extent of any non-controlling interest.
The Group measures non-controlling interest that represents present ownership interest and entitles the holder to a proportionate share of net assets in the event of liquidation on a transaction by transaction basis, either at: (a) fair value, or (b) the non-controlling interest's proportionate share of net assets of the acquiree. Non-controlling interests that are not present ownership interests are measured at fair value.
Goodwill is measured by deducting the net assets of the acquiree from the aggregate of the consideration transferred for the acquiree, the amount of non-controlling interest in the acquiree and fair value of an interest in the acquiree held immediately before the acquisition date. Any negative amount (“negative goodwill, bargain purchase”) is recognized in profit or loss, after management re-assesses whether it identified all the assets acquired and all liabilities and contingent liabilities assumed and reviews appropriateness of their measurement.
The cost of acquisition for the acquiree is measured at the fair value of the consideration transferred, equity instruments issued and liabilities incurred to former owners, including fair value of assets or liabilities from contingent consideration arrangements but excludes acquisition related costs such as advisory, legal, valuation and similar professional services. Transaction costs related to the acquisition and incurred for issuing equity instruments are deducted from equity; transaction costs incurred for issuing debt as part of the business combination are deducted from the carrying amount of the debt and all other transaction costs associated with the acquisition are expensed.
Investment in associates and joint ventures An associate is an entity over which the Group has significant influence. Significant influence is the power to participate in the financial and operating policy decisions of the network company, but is not control or joint control over those policies.
A joint venture is a type of joint arrangement whereby the parties that have joint control of the arrangement have rights to the net assets of the joint venture. Joint control is the contractually agreed sharing of control of an arrangement, which exists only when decisions about the relevant activities require unanimous consent of the parties sharing control. The considerations made in determining joint control are similar to those necessary to determine control over subsidiaries.
The Group’s investments in its associate and joint venture are accounted for
a) using the equity method or b) at fair value through profit or loss (FVTPL).
Investment in associates and joint ventures – Equity methodThe equity method is applied for network companies with operations that are incubated or actively developed by Rocket Internet. The network companies are often former subsidiaries of the Group, where Rocket Internet has the power to participate in the financial and operating policy decisions. In such network companies Rocket Internet is mostly intensely involved in the strategic leadership and implementation of the business plans.
An investment is accounted for using the equity method from the date it becomes an associate or joint venture. Under the equity method, the investment in an associate or joint venture is initially recognized at cost (including transaction costs and the initial fair value of any contingent
110 ABOUT ROCKET INTERNETLETTER TO OUR SHAREHOLDERSANNUAL REPORT 2015
consideration agreement). The concepts underlying the procedures used in accounting for the acquisition of a subsidiary are also adopted for the acquisition of an associate and joint venture (including situations where the equity method is to be applied following a loss of control). Goodwill relating to the associate or joint venture is included in the carrying amount of the investment and is not tested for impairment individually.
In case the Group acquires additional interests in an associate or joint ventures and the equity method is still applied (step acquisitions) the additional interest is initially recognized at cost (including transaction costs and the initial fair value of any contingent consideration agreement). The concepts underlying the procedures used in accounting for the acquisition of a subsidiary are also adopted for the acquisition of the additional interest in the associate and joint venture. The carrying amount of the investment is adjusted to recognize changes in the Group’s share of net assets of the associate or joint venture since the acquisition date.
The statement of comprehensive income reflects the Group’s share of the net income of the associate or joint venture. Any change in OCI of those investees is presented as part of the Group’s OCI. In addition, when there has been a change recognized directly in the equity of the associate or the joint venture, the Group recognizes its share of any changes, when applicable, in the statement of changes in equity. Unrealized gains and losses resulting from transactions between the Group and the associate or joint venture are eliminated to the extent of the interest in the associate.
The proportionate share of expenses resulting from equity-settled share-based payments of associates and joint ventures are offset by the corresponding increase in equity of associates and joint ventures. Therefore the equity-settled share-based payments at the level of associates and joint ventures do not have an impact on both, the subsequent measurement of associates and joint ventures in the Group’s balance sheet as well as on the share of profit/loss of associates and joint ventures recognized in the statement of comprehensive income.
Rocket Internet accounts for a dilution of its investment caused by a share issuance by an equity method investee to a third party as if the Group had sold a proportionate share of its investment (deemed disposal). Besides deemed disposals, the share of profit/loss of associates and joint ventures also include gains or losses from regular disposals of Rocket Internet’s direct or indirect interests in associated companies and joint ventures.
The aggregate of the Group’s share of profit or loss of an associate or joint venture is shown on the statement of profit or loss within operating profit and represents profit or loss after tax and non-controlling interests in the subsidiaries of the associate or joint venture including adjustments made by the Group under the equity method, such as adjustments to the fair value that occurred at the time of acquisition or for adjustments to group-wide accounting policies.
The financial statements of the associate or joint venture are prepared for the same reporting period as the Group. When necessary, adjustments are made to bring the accounting policies in line with those of the Group.
After application of the equity method, the Group determines whether it is necessary to recognize an impairment loss on its investment in its associate or joint venture. At each reporting date, the Group determines whether there is objective evidence that the investment in the associate or joint venture is impaired. If there is such evidence, the Group calculates the amount of impairment as the difference between the recoverable amount of the associate or joint venture and its carrying value, and then recognizes the loss as ‘Share of profit/loss of associates and joint ventures’ in the statement of profit or loss.
Upon loss of significant influence over the associate or joint control over the joint venture, the Group measures and recognizes any retained investment at its fair value. Any difference between the carrying amount of the associate upon loss of significant influence or joint venture upon
111COMBINED MANAGEMENT REPORTCONSOLIDATED FINANCIAL STATEMENTSROCKET INTERNET COMPANIES
Notes to the Consolidated Financial Statements

loss of joint control and the fair value of the retained investment and proceeds from disposal is recognized in profit or loss.
The shareholders’ agreements for associates and joint ventures to which Rocket Internet is a party are important instruments for steering the economic rights among the various investors in these entities and are designed to protect shareholders and to facilitate corporate and transaction issues. In the event of a network company’s IPO the shareholders’ agreements shall, as from the commencement of trading of the network company’s shares on a stock exchange, cease to have effect. The shareholders’ agreements include certain waterfall provisions, which stipulate the order for distributing proceeds from a transfer of shares that result in, or is deemed to be, a change of control or in case of liquidation to the shareholders (“liquidation preferences”). Typically, if triggered, the liquidation preference entitles investors who invested in later financing rounds, which generally means at a higher valuation, to recoup their investment before other shareholders are paid out. Investors who invested in the early stage of a company are usually paid out last. As Rocket Internet is typically among the first investors in a network company, Rocket Internet will generally be able to recoup its investments if the transfer or liquidation proceeds equal or exceed the sum of the investments made by all investors in the company. Any remainder over the sum of the investments of all investors is shared among all shareholders of the company pro rata to their shareholdings or – in the case of a share transfer – to the shares transferred by them. Any amount received by an investor prior to the pro rata allocation is typically deducted from such investor’s stake in the pro rata allocation. When valuing the shares in associates and joint ventures, the Group carefully assesses the accounting implications of the regulations in the shareholders’ agreements. The valuations consider the preferential rights the owned shares have in case of liquidation or sale of the entire network company.
Investment in associates and joint ventures – At fair value through profit or lossThis method is applied for investees where Rocket Internet is acting as an investor within the meaning of IAS 28.18. Please, refer to the accounting policies for financial assets at fair value through profit or loss.
Revenue recognitionThe Group generates revenues primarily from the sale of goods (online and mobile trade / eCommerce), from rendering intermediation services (specialized online and mobile transaction platforms for goods and services / marketplaces) and from rendering other services including consulting services provided for network companies and other customers.
Revenue is recognized to the extent that it is probable that the economic benefits will flow to the Group and the revenue can be reliably measured, regardless of when the payment is being made. Revenue is measured at the fair value of the consideration received or receivable, taking into account contractually defined terms of payment and excluding taxes or duty.
Revenue from the sale of goods is recognized when the significant risks and rewards of ownership of the goods have passed to the buyer, usually upon delivery of the goods.
Revenue from the sale of goods is measured at the fair value of the consideration received or receivable, net of returns and allowances, trade discounts and volume rebates.
In case the customer has the right to return goods, revenues are only recognized before the return period expires, if reliable estimates about the expected returns can be derived from past experience taking into consideration the type of customer, the type of transaction and the specifics of each arrangement. The expected return of goods are presented on a gross basis in the profit and loss statement. Rocket Internet reduces revenue by the full amount of sales that it estimates will be returned. The reduction of goods that is expensed in full upon shipping is then corrected by the estimated amount of returns. Rocket Internet also shows the gross figure for the return of goods in the balance sheet. The right to recover the possession of goods from expected sales returns is recognized under other non-financial assets. The amount of the assets corresponds to the cost
112 ABOUT ROCKET INTERNETLETTER TO OUR SHAREHOLDERSANNUAL REPORT 2015

of the goods delivered for which a return is expected, taking into account the costs incurred for processing the returns and the losses resulting from disposing of these goods. Trade receivables that have not yet been paid and that have underlying transactions that are not expected to be closed due to the goods being returned are derecognized. For customer receivables already paid and for which returns are expected in the future, Rocket Internet recognizes a refund obligation vis-à-vis the customer within other current financial liabilities.
The Group evaluates whether it is appropriate to record the gross amount of product sales and related costs. When the Group is primarily obligated in a transaction, is subject to inventory risk, has latitude in establishing prices and selecting suppliers, or has several but not all of these indicators, revenue is recorded at the gross sales price. The Group records the net amounts as commissions earned if the Group is not primarily obligated and does not have latitude in establishing prices. Such amounts earned are determined using a fixed percentage, a fixed-payment schedule, or a combination of the two.
Revenue from commissions is earned and recognized at the point of order fulfilment to the customers. This is the point at which an intermediation service is successfully processed and the Group has no remaining transactional obligations.
Revenue from consulting services is recognized by reference to the stage of completion. Stage of completion is measured by reference to labor hours incurred until the reporting date as a percentage of the total estimated labor hours for each contract. When the contract outcome cannot be measured reliably, revenue is recognized only to the extent that the expenses incurred are eligible to be recovered.
Transactions are settled by prepayments, credit card, invoicing, PayPal and further country specific payment methods.
Dividends and Interest IncomeDividends are recognized when the Group’s right to receive the payment is established, which is generally when shareholders approve the dividend.
For all financial instruments measured at amortized cost interest income is recorded using the effective interest rate (EIR). EIR is the rate that exactly discounts the estimated future cash payments or receipts over the expected life of the financial instrument or a shorter period, where appropriate, to the net carrying amount of the financial asset or liability. Interest income is included in finance income in the statement of profit or loss.
Sales tax (VAT and similar taxes)Expenses and assets are recognized net of the amount of sales tax, except:
– When the sales tax incurred on a purchase of assets or services is not recoverable from the taxation authority, in which case, the sales tax is recognized as part of the cost of acquisition of the asset or as part of the expense item, as applicable, or
– When receivables and payables are stated with the amount of sales tax included.
The net amount of sales tax recoverable from, or payable to, the taxation authority is included as part of receivables or payables in the balance sheet.
Foreign currency transactions and translationThe financial statements of each of the Group entities are prepared using the currency of the primary economic environment in which the entity operates (‘the functional currency’). The Group financial statements are presented in Euro (EUR), which is also the parent company’s functional currency.
113COMBINED MANAGEMENT REPORTCONSOLIDATED FINANCIAL STATEMENTSROCKET INTERNET COMPANIES
Notes to the Consolidated Financial Statements

Foreign currency transactions are translated into the functional currency using the exchange rate prevailing at the date of the respective transaction. Foreign exchange gains and losses resulting from the settlement of such transactions and from the translation at year-end exchange rates of monetary assets and liabilities denominated in foreign currencies are recognized in the income statement. Foreign exchange gains and losses that relate to borrowings and cash and short-term deposits are presented in the income statement within finance costs, net. All other foreign exchange gains and losses are presented in the income statement within other operating income or expenses.
The balance sheets and results of all the Group entities that have a functional currency different from the presentation currency are translated into the presentation currency as follows:
a) assets and liabilities for each balance sheet presented are translated at the closing rate at the date of that balance sheet;
b) income and expenses for each income statement are translated at average exchange rates (unless this average is not a reasonable approximation of the cumulative effect of the rates prevailing on the transaction dates, in which case income and expenses are translated at the rate on the dates of the transactions); and
c) all resulting exchange differences are recognized in other comprehensive income.
Equity-settled share-based payments The Group operates a number of equity-settled share-based compensation arrangements, under which the Company and its subsidiaries receive services from eligible and selected directors or employees and others providing similar services as consideration for the following equity instruments:
– share options in the Company, – ordinary shares in subsidiaries (“share awards”) or – share options in subsidiaries.
The total amount to be expensed for services received is determined by reference to the grant date fair value of the share-based payment award made. For share awards, the Group analyses whether the price paid by a participant, if any, is in line with the estimated market price of the underlying shares at the grant date. If a positive difference exists between (i) the estimated market value of the shares and (ii) the purchase price; this results in a fair value to be reported and recognized as a share-based payment expense. For share options granted, the grant date fair value is determined using the Black Scholes option valuation formula.
The fair value determined at the grant date is expensed on a straight-line basis over the respec-tive vesting period, based on the Group’s estimate of the number of shares that will eventually vest, with a corresponding credit to equity.
The total expense is recognized over the vesting period, which is the period over which all of the specified vesting conditions are to be satisfied. The vesting period usually starts with the grant date of the award.
However, the recognition of expense may start at an earlier service commencement date when awards need to be formally approved after the employee has started providing services.
The Group recognizes compensation expense from the beginning of the service period, even when the grant date is subsequent to the service commencement date. During the period between service commencement date and grant date, the share-based payment expense recognized is based on the estimated grant date fair value of the award. Once the grant date has been established, the estimated fair value is revised so that the expense is recognized prospectively based on the actual grant date fair value of the equity instruments granted.
114 ABOUT ROCKET INTERNETLETTER TO OUR SHAREHOLDERSANNUAL REPORT 2015

For awards with graded-vesting features, each instalment of the award is treated as a separate grant. This means that each instalment is separately recorded as an expense over the related vesting period. Some instalments vest only upon the occurrence of a specified exit event (e.g. IPO) of the subsidiary or upon the employee still being employed with or providing services to a group entity 12 months after such an event. These instalments are expensed over the expected time to such a vesting event. Therefore, share-based payment expenses would be reversed if no such event occurs by the time the awards elapse. Non-market performance and service conditions are included in the assumptions about the number of options and shares that are expected to vest.
No expense is recognized for awards that do not ultimately vest, except for equity-settled transactions for which vesting is conditional upon a market or non-vesting condition. These are treated as vested irrespective of whether or not the market or non-vesting condition is satisfied, provided that all other performance or service conditions are satisfied.
At the end of each reporting period, the Group revises its estimates of the number of options and shares that are expected to vest based on the non-market vesting conditions. It recognizes the impact of the revision to original estimates, if any, in the income statement, with a corresponding adjustment to equity.
When the terms of equity-settled awards are modified, as a minimum, the expenses recognized are measured at the grant date fair value, to the extent the non-market vesting conditions attached to the awards are met. An additional expense is recognized for any modification that increases the total fair value of the share-based payment transaction, or is otherwise beneficial to the employee as measured at the date of modification.
The expenses related to equity-settled share-based compensation arrangements are recognized as employee benefit expenses.
Application of the equity method of accounting – Equity-settled share-based payments at the level of associates/joint venturesThe expenses resulting from equity-settled share-based payments of associates and joint ventures are offset by the corresponding increase in equity of associates and joint ventures. As a result the total equity of the respective network company remains unchanged.
As there is no change in the Group’s share in the equity of the equity method investee, the proportionate share of expenses resulting from the equity-settled share-based payments at the level of associates and joint ventures do not have an impact on either, the subsequent measurement of associates and joint ventures in the Group’s balance sheet or on the share of profit/loss of associates and joint ventures recognized in the Group’s statement of comprehensive income. As presently there is no clear guidance from the IASB on this topic, the accounting policy applied currently by Rocket Internet may be subject to change in the future.
Share-Based Compensation – Cash settledThe Group recognizes a liability for the services received from its employees in cash-settled share-based payment transactions. The Group re-measures the fair value of the liability at each reporting date and at the date of settlement, with any changes in fair value recognized in profit or loss for the period as employee benefit expenses. The liability is recognized over the vesting period (if applicable).
Property, plant and equipment Property, plant and equipment are stated at cost less accumulated depreciation and accumulated impairment losses, where required.
Costs of minor repairs and maintenance are expensed when incurred.
115COMBINED MANAGEMENT REPORTCONSOLIDATED FINANCIAL STATEMENTSROCKET INTERNET COMPANIES
Notes to the Consolidated Financial Statements

Gains and losses on disposals are determined by comparing proceeds with the carrying amount and are recognized in profit or loss for the year within other operating income or expenses.
Depreciation of property, plant and equipment is calculated using the straight-line method to allocate their cost to their residual values over their estimated useful lives between 1 to 15 years. Leasehold improvements are depreciated over their estimated useful lives or the shorter lease term.
The residual value of an asset is the estimated amount that the Company would currently obtain from disposal of the asset less the estimated costs of disposal, if the asset were already of the age and in the condition expected at the end of its useful life. The assets’ residual values and useful lives are reviewed, and adjusted if appropriate, at the end of each reporting period.
Operating leasesWhere the Company is a lessee in a lease which does not transfer substantially all the risks and rewards incidental to ownership from the lessor to the Company, the total lease payments are charged to profit or loss for the year on a straight-line basis over the lease term. The lease term is the non-cancellable period for which the Company has contracted to lease the asset together with any further terms for which the lessee has the option to continue to lease the asset, with or without further payment, when at the inception of the lease it is reasonably certain that the lessee will exercise the option.
GoodwillGoodwill is initially measured at acquisition cost. Goodwill is allocated to the cash-generating units, or groups of cash-generating units, that are expected to benefit from the synergies of the business combination. Such units or groups of units represent the lowest level at which the Company monitors goodwill and are not larger than an operating segment.
After initial recognition, goodwill is measured at cost less accumulated impairment losses. The Company tests goodwill for impairment at least annually and whenever there are indications that goodwill may be impaired. The carrying value of goodwill is compared to the recoverable amount, which is the higher of the value in use and the fair value less costs to sell. Any impairment is recognized immediately as an expense and is not subsequently reversed.
Gains or losses on the disposal of an operation within a cash generating unit to which goodwill has been allocated, include the carrying amount of goodwill associated with the disposed operation.
Other intangible assetsThe Group‘s intangible assets have definite useful lives and primarily include trademarks, customer bases, acquired computer software and other licenses, and internally developed software.
Acquired computer software and other licenses are capitalized on the basis of the costs incurred to acquire and bring them to use.
Costs associated with maintaining computer software programs are recognized as an expense as incurred.
Costs that are directly attributable to the design, development and testing of identifiable and unique software products controlled by the Company are recognized as internally developed software when the following criteria are met:
– it is technically feasible to complete the software product so that it will be available for use; – management intends to complete the software product and use or sell it; – there is an ability to use or sell the software product; – it can be demonstrated how the software product will generate probable future economic
benefits;
116 ABOUT ROCKET INTERNETLETTER TO OUR SHAREHOLDERSANNUAL REPORT 2015

– there are adequate technical, financial and other resources to complete the development and
– the expenditure attributable to the software product during its development can be reliably measured.
Directly attributable costs that are capitalized as part of the software product mainly include the software development employee cost. Other development expenditures that do not meet these criteria are recognized as an expense as incurred. Development costs previously recognized as an expense are not recognized as an asset in subsequent periods. Development costs which do not meet the criteria mentioned above are immediately expensed. Development costs that have been expensed cannot be capitalized as intangible assets in subsequent periods.
Intangible assets are amortized using the straight-line method over their useful lives:
Impairment of property, plant and equipment and intangible assetsWhenever events or changes in market or business conditions indicate a risk of impairment of property, plant and equipment or intangible assets or a cash generating unit (“CGU”), if applicable, management estimates the recoverable amount, which is determined as the higher of an asset or CGU’s fair value less costs to sell and its value in use. A CGU is defined as the lowest level of identifiable cash inflows. The carrying amount is reduced to the recoverable amount and the impairment loss is recognized in profit or loss for the year.
InventoriesInventories are valued at the lower of cost and net realizable value. Cost of inventory is determined based on the weighted average cost. The cost of inventory includes the costs of purchase or production and costs incurred to bring the inventories to their present location and condition such as shipping and handling.
Write-down expenses due to obsolete and slow moving inventory are deducted from the carrying amount of the inventories.
Cash and cash equivalentsCash and cash equivalents include cash at hand, deposits held on demand with banks, and other short-term highly liquid investments with original maturities of three months or less, for which the risk of changes in value is considered to be insignificant.
Financial instruments A financial instrument is any contract that gives rise to a financial asset of one entity and a financial liability or equity instrument of another entity.
Useful lives in years
Trademarks 11–15 years
Customer base 9–13 years
Internally developed software 3–5 years
Acquired other intangible assets 1–15 years
117COMBINED MANAGEMENT REPORTCONSOLIDATED FINANCIAL STATEMENTSROCKET INTERNET COMPANIES
Notes to the Consolidated Financial Statements

Financial assets
Initial recognition and measurement of financial assets A financial asset is recognized when the Group becomes a party to the contractual provisions of the instrument. The Group initially recognizes loans and receivables on the date on which they originated. Purchases or sales of financial assets that require delivery of assets within a time frame established by regulation or convention in the marketplace (regular way trades) are recognized on the trade date, i.e. the date that the Group commits to purchase or sell the asset.
Financial assets held by the Group are classified, at initial recognition, as financial assets at fair value through profit or loss, loans and receivables, and available-for-sale financial assets. Transaction costs are recognized as well, except in the case of financial assets at fair value through profit or loss. The Group did not make use of the held-to-maturity category, during the years ended December 31, 2015 and 2014.
Subsequent measurement of financial assetsThe subsequent measurement of financial assets depends on its category:
– Financial assets at fair value through profit or loss – Loans and receivables – Available-for-sale financial assets (AFS financial assets)
Financial assets at fair value through profit or lossThe fair value through profit or loss category comprises the following subcategories: financial assets that are initially designated into this category (”Fair value option”), contingent consideration of an acquirer in a business combination, and held-for-trading financial assets.
Rocket’s financial assets in this category include equity investments where Rocket is acting as an investor within the meaning of IAS 28.18 and elects to measure these investments at fair value through profit or loss or which Rocket designates as financial assets at fair value through profit or loss because the investments are managed and measured on the basis of fair values in accordance with risk management and investment strategies. In addition, Rocket designated employee loans into this category, for which settlement amounts could be partly influenced in some circumstances by the performance of shares in certain associated companies and thus include embedded derivatives. Financial assets at fair value through profit or loss are recognized in the balance sheet at fair value with net changes in fair value presented as finance costs (negative net changes in fair value) or finance income (positive net changes in fair value) in the statement of profit or loss.
The group does not have any held-for-trading financial assets.
See Note 41 for information on the Group’s equity investments at fair value through profit or loss.
Loans and receivablesLoans and receivables are non-derivative financial assets with fixed or determinable payments that are not quoted in an active market. After initial recognition, such financial assets are measured at amortized cost using the effective interest rate (EIR) method, less impairment. Amortized cost is calculated by taking into account any discount or premium on acquisition and fees or costs that are an integral part of the EIR. The EIR amortization is included in finance income in the statement of profit or loss. Trade receivables are initially recognized at fair value which primarily represents the original invoice amount. The losses arising from impairment are recognized in the statement of profit or loss in finance costs for loans and in other operating expenses for receivables.
Loans and receivables are included in current assets, except for those having maturities greater than 12 months after the end of the reporting period. These are classified as non-current assets.
118 ABOUT ROCKET INTERNETLETTER TO OUR SHAREHOLDERSANNUAL REPORT 2015

The Group’s loans and receivables comprise loans, trade receivables and other financial assets.
When there is objective evidence that the Group may not be able to collect the trade receivables, the loss is recognized in other operating expenses and reflected in the allowances for doubtful accounts. Balances are written off when recoverability is assessed as being remote.
AFS financial assetsAFS financial assets of the Group comprise equity investments that are not designated at fair value through profit or loss.
After initial recognition, AFS financial assets are measured at fair value with unrealized gains or losses recognized in OCI until the investment is derecognized or impaired, at which time the cumulative gain or loss is recognized in finance income/costs.
Impairment of financial assetsThe Group assesses, at each reporting date, whether there is objective evidence that a financial asset or a group of financial assets is impaired. An impairment exists if one or more events that has occurred since the initial recognition of the asset (an incurred ‘loss event’), has an impact on the estimated future cash flows of the financial asset or the group of financial assets that can be reliably estimated. Evidence of impairment may include indications that the debtors or a group of debtors is experiencing significant financial difficulty, default or delinquency in interest or principal payments, the probability that they will enter bankruptcy or other financial reorganization and observable data indicating that there is a measurable decrease in the estimated future cash flows, such as changes in arrears or economic conditions that correlate with defaults.
If, in a subsequent year, the amount of the estimated impairment loss of financial assets recognized at amortized costs increases or decreases because of an event occurring after the impairment was recognized, the previously recognized impairment loss is increased or reduced by adjusting the allowance account. If a write-off is later recovered due to an event after the impairment was recognized, the recovery is credited in the statement of profit or loss.
In the case of equity investments classified as AFS, objective evidence of impairment would include a significant or prolonged decline in the fair value of the investment below its cost. ‘Significant’ is evaluated against the original cost of the investment and ‘prolonged’ against the period in which the fair value has been below its original cost. When there is evidence of impairment, the cumulative loss – measured as the difference between the acquisition cost and the current fair value, less any impairment loss on that investment previously recognized in the statement of profit or loss – is removed from OCI and recognized in the statement of profit or loss. Impairment losses on equity investments are not reversed through profit or loss; increases in their fair value after impairment are recognized in OCI.
Derecognition of financial assetsThe Group derecognizes a financial asset when the contractual rights to the cash flows from the asset expire, or it transfers the rights to receive the contractual cash flows in a transaction in which substantially all of the risks and rewards of ownership of the financial asset are transferred.
Financial liabilities
Initial recognition and measurement of financial liabilitiesFinancial liabilities are recognized when the Group becomes a party to the contractual provisions of the instrument and classified, at initial recognition, as financial liabilities at fair value through profit or loss or other financial liabilities.
All financial liabilities are recognized initially at fair value and, in the case of other financial liabilities, net of directly attributable transaction costs.
119COMBINED MANAGEMENT REPORTCONSOLIDATED FINANCIAL STATEMENTSROCKET INTERNET COMPANIES
Notes to the Consolidated Financial Statements

The Group’s financial liabilities include convertible bonds, trade and other payables, loans and borrowings including bank overdrafts, refund liabilities from sales with a right of return, contingent consideration of an acquirer in a business combination, and liabilities from mandatorily redeemable preference shares issued by a consolidated subsidiary.
Subsequent measurement of financial liabilitiesThe measurement of financial liabilities depends on their classification, as described below:
Financial liabilities at fair value through profit or lossFinancial liabilities at fair value through profit or loss include financial liabilities held for trading, contingent considerations of an acquirer in a business combination, and financial liabilities designated upon initial recognition as at fair value through profit or loss.
Financial liabilities at fair value through profit or loss of the Group contain only contingent considerations in a business combination.
The Group’s policy does not permit any trading with financial instruments. Equally, no financial derivatives are utilized.
Financial liabilities designated upon initial recognition at fair value through profit or loss are designated at the initial date of recognition, and only if the criteria in IAS 39 are satisfied. The Group has not designated any financial liability as at fair value through profit or loss.
Other financial liabilitiesThis is the category of financial liabilities most relevant to the Group. It includes convertible bonds, trade and other payables, loans and borrowings including bank overdrafts, refund liabilities from sales with a right of return, and liabilities from mandatorily redeemable preference shares issued by a consolidated subsidiary.
After initial recognition, other financial liabilities are measured at amortized cost using the EIR method. Gains and losses are recognized in profit or loss when the liabilities are derecognized as well as the result of the revision of estimated cash flows and through the EIR amortization process.
Trade payables are obligations to pay for goods or services that have been acquired in the ordinary course of business from suppliers.
Loans and borrowings are classified as current liabilities if payment is due within one year or less. If not, they are presented as non-current liabilities.
Other financial liabilities also contain liabilities from mandatorily redeemable preference shares issued by one of the consolidated subsidiaries to a third party investor (minority shareholder). The mandatorily redeemable preference shares take the legal form of equity but are liabilities pursuant to IAS 32.18(a) requirements.
Convertible bondsConvertible bonds issued by the Group are separated into liability and equity components based on the terms of the contract. On issuance of the convertible bonds, the fair value of the liability component is determined using a market rate for an equivalent non-convertible instrument. This amount is classified as a financial liability measured at amortized cost (net of the relevant portion of the transaction costs) until it is expired on conversion or redemption. The remainder of the proceeds is allocated to the conversion option that is recognized and included in equity. The relevant portion of the transaction costs are deducted from equity, net of associated income tax. The carrying amount of the conversion option recognized in equity is not remeasured in subsequent years.
120 ABOUT ROCKET INTERNETLETTER TO OUR SHAREHOLDERSANNUAL REPORT 2015

Transaction costs are apportioned between the liability and equity components of the convertible preference shares based on the allocation of proceeds to the liability and equity components when the instruments are initially recognized.
Derecognition of financial liabilitiesThe Group derecognizes a financial liability when its contractual obligations are discharged, cancelled or expired.
Share capitalOrdinary shares are classified as equity. Incremental costs directly attributable to the issue of new equity instruments are shown, net of taxes, in equity as a deduction from the proceeds.
Any excess of the fair value of consideration received over the par value of shares issued is recorded as share premium in the capital reserves.
Dividends Cash or non-cash distributions to equity holders of the parent are recorded as a liability and deducted from equity in the period in which they are declared and approved by the shareholders and the distribution is no longer at the discretion of the Company.
Non-cash distributions are measured at the fair value of the assets to be distributed with fair value remeasurement recognized directly in equity. Upon distribution of non-cash assets, any difference between the carrying amount of the liability and the carrying amount of the assets distributed is recognized in the statement of profit or loss.
Provisions Provisions are non-financial liabilities of uncertain timing or amount. They are accrued when the Company has a present legal or constructive obligation as a result of past events, it is probable that an outflow of resources embodying economic benefits will be required to settle the obligation, and a reliable estimate of the amount of the obligation can be made. The amount recognized as a provision is the best estimate of the consideration required to settle the present obligation at the reporting date, taking into account the risks and uncertainties surrounding the obligation.
Income taxesIncome taxes have been provided for in the financial statements in accordance with legislation enacted or substantively enacted by the end of the reporting period. The income tax charge or credit comprises current tax and deferred tax and is recognized in profit or loss for the year, except if it is recognized in other comprehensive income or directly in equity because it relates to transactions that are also recognized, in the same or a different period, in other comprehensive income or directly in equity.
Current tax is the amount expected to be paid to, or recovered from, the taxation authorities in respect of taxable profits or losses for the current and prior periods. Taxable profits or losses are based on estimates if financial statements are authorized prior to filing relevant tax returns. Taxes other than on income are recorded within operating expenses.
Deferred income tax is recognized on temporary differences arising between the tax bases of assets and liabilities and their carrying amounts in the financial statements. However, in accordance with the initial recognition exemption, deferred taxes are not recorded for temporary differences on initial recognition of an asset or a liability in a transaction other than a business combination if the transaction, when initially recorded, affected neither book nor taxable profit.
Deferred tax balances are measured at tax rates enacted or substantively enacted at the end of the reporting period, which are expected to apply to the period when the temporary differences will reverse or the tax loss carry forwards will be utilized.
121COMBINED MANAGEMENT REPORTCONSOLIDATED FINANCIAL STATEMENTSROCKET INTERNET COMPANIES
Notes to the Consolidated Financial Statements

Deferred tax assets for deductible temporary differences and tax loss carry forwards are recorded only to the extent that it is probable that future taxable profit will be available against which the deductions can be utilized.
The Company controls the reversal of temporary differences relating to taxes chargeable on dividends from subsidiaries or on gains upon their disposal (“outside basis differences”). Deferred tax liabilities are not recognized on such temporary differences except to the extent that management expects the temporary differences to reverse in the foreseeable future.
Earnings per shareThe Company presents basic and diluted earnings (loss) per share (EPS) data for its ordinary shares. Basic EPS is calculated by dividing the profit or loss attributable to ordinary shareholders of the Company by the weighted average number of ordinary shares outstanding during the period. Diluted EPS is determined by adjusting the profit or loss attributable to ordinary shareholders and the weighted average number of ordinary shares outstanding to reflect the effects of all potential dilutive ordinary shares, which comprise convertible and redeemable preference shares and share options granted to employees. For more information see Note 23.
Segment reportingIn accordance with IFRS 8 – Operating Segments, segment reporting is constructed on the basis of internal management data used for performance analysis of businesses and for the allocation of resources. An operating segment is a distinct component of the group which is engaged in the supply of distinct products and services and which is exposed to risks and returns different from the risks and the returns of other operating segments. See Note 6 for further information.
4. Critical Accounting Judgments, Estimates and Assumptions in Applying Accounting Policies
The preparation of the Group’s consolidated financial statements requires management to make judgements, estimates and assumptions that affect the reported amounts of revenues, expenses, assets and liabilities, and the accompanying disclosures as well as the disclosure of contingent liabilities. Uncertainty about these assumptions and estimates could result in outcomes that require a material adjustment to the carrying amount of assets or liabilities affected in future periods.
Estimates and judgements are continually evaluated and are based on management’s experience and other factors, including expectations of future events that are believed to be reasonable under the circumstances. The Group based its assumptions and estimates on parameters available when the consolidated financial statements were prepared. Existing circumstances and assumptions about future developments, however, may change due to market fluctuations or circumstances arising that are beyond the control of the Group. Such changes are reflected in the assumptions when they occur.
Management also makes certain judgements, apart from those involving estimations, in the process of applying the accounting policies.
Judgements that have the most significant effect on the amounts recognized in the financial statements and estimates that can cause a significant adjustment to the carrying amount of assets and liabilities within the next financial year have been discussed below and are also described in the individual notes of the related financial statement line items.
122 ABOUT ROCKET INTERNETLETTER TO OUR SHAREHOLDERSANNUAL REPORT 2015

Significant Accounting Judgement
Classification of shares in Delivery Hero Holding GmbH as AFS financial assets During the 1st half of 2015, the Group successively purchased 157,679 shares in Delivery Hero Holding GmbH (DHH) which represented approximately 44% (prior to dilutive effects of convertible instruments issued by DHH) of the total outstanding share capital of DHH as of June 30, 2015. Due to the capital increases performed by DHH after June 30, 2015 Rocket Internet’s share decreased to 40% as of December 31, 2015 (prior to dilutive effects of convertible instruments issued by DHH). Under the terms of the DHH Shareholders’ Agreement, the Group’s voting rights are limited to 30%.
The Group did not obtain representation on the DHH’s supervisory board (as specified in the DHH’s articles of incorporation) which precludes Rocket Internet from participating in the policy- making processes of DHH and from obtaining timely, adequate financial information required to apply the equity method of accounting.
In light of the lack of significant influence during the financial year 2015, the Group classified its equity investment in DHH as available-for-sale financial assets. This category includes investments intended to be held for the long-term. As of December 31, 2015 the carrying amount of the shares in DHH amounted to EUR 978,944 thousand. During the financial year 2015, the Group recognized an unrealized gain for its DHH investment in OCI. For more information reference is made to Note 41.
Shareholders’ agreements – Assessment of control, joint control or significant influence over network companies The shareholders’ agreements to which Rocket Internet is a party are important instruments for steering the corporate governance of network companies. The shareholders’ agreements typically specify that a number of important decisions need to be resolved by the shareholders. These important decisions are referred to as reserved matters. The shareholders’ agreements often require a qualified majority of investors and, in certain cases, an unanimous vote of the investors for decisions regarding reserved matters. Sometimes the decision on reserved matters is conferred on an advisory board. This means that the Company typically cannot make or block decisions on reserved matters alone, but needs the support of one or more other investors. The reserved matters include fundamental decisions about the relevant entities, its operative and strategic plans and important transactions that exceed certain thresholds.
Based on the regulations in the shareholders’ agreements the Company assesses whether
– it controls a network company particularly when it is exposed, or has rights, to variable returns from its involvement with the network company and has the ability to affect those returns through its power over the network company,
– it is a party of an arrangement in which two or more parties have joint control or – it has the power to participate in the financial and operating policy decisions of the network
company but is not in control or joint control of those policies (significant influence).
Whether or not the Group controls a network company depends on an evaluation of a number of factors, including, among others, representation on its board of directors, voting rights and other rights of other investors, including their participation in significant decisions made in the ordinary course of business (e.g. approval of the annual operating budget), as well as the Group’s ownership level of the outstanding voting rights of the subsidiary. We refer to Note 8.
123COMBINED MANAGEMENT REPORTCONSOLIDATED FINANCIAL STATEMENTSROCKET INTERNET COMPANIES
Notes to the Consolidated Financial Statements
Deemed disposals of subsidiaries – Fair value measurement of interest retained A deemed disposal occurs where the proportionate interest of a parent company in a subsidiary is reduced other than by an actual disposal, for example, by the issuance of shares to a third party investor by the subsidiary. When the Group no longer has control, the remaining interest is measured at fair value as at the date the control was lost. When establishing the fair value, the group takes into account all the facts and circumstances surrounding the transactions such as timing, transaction size, transaction frequency, and motivations of the investors. The Group considers whether such a transaction has been made at arm’s length. For new share issues, the Group also considers whether, in the event of liquidation or sale, the newly issued shares have preferences to the investee’s assets over earlier issued shares. We refer to Note 14.
Designation of equity instruments as financial assets at fair value through profit and lossThe Group has designated certain associated companies and other equity investments that are not incubated or actively developed by Rocket Internet as financial assets at fair value through profit or loss. Rocket Internet is acting as an investor within the meaning of IAS 28.18 and the Group is not intensely involved in the strategic leadership and tactical implementation of the business plans of such companies. Furthermore, Rocket Internet usually does not perform significant commercial and technical consulting services for these companies. In particular, this category includes the portfolio of investments in several internet companies acquired in August 2014 by a way of an exchange of shares held by United Internet and Global Founders GmbH in the Global Founders Capital Fund for shares in Rocket Internet (the so-called “GFC Investments”). In 2015 further GFC investments were made, such as Craftsvilla, Movinga, Naturebox, Dealerdirect. Other equity investments with ownership percentages below 20% are also included in this category. Moreover, the Group designated the remaining stake in Zalando SE as financial assets at fair value through profit and loss. In a series of transactions, Rocket Internet spun off nearly its entire stake in Zalando SE in 2013. Rocket Internet measures these shares on the basis of fair values. See Note 41 for information on the Group’s equity investments measured at fair value through profit and loss.
Share-based compensation The Group has analyzed all the terms and conditions of its share-based payment awards to determine the appropriate classification of the awards recognized under IFRS 2, Share-based Payment. Some of the awards in consolidated subsidiaries include put rights of employees and others providing similar services that may only be exercised at a specified date more than 10 years from the reporting date, at a price less than the market value of the interests held by employees. Other terms and conditions of these awards allow a subsidiary to settle the awards in equity or to avoid any cash payment. Based on this analysis, the Group assessed it has two settlement scenarios. One scenario would be considered cash-settled in its entirety, whereas the other scenario would be considered equity-settled in its entirety. Given the exit strategies of the Group that would allow settlement in equity, the Group concluded that it has no present obligation to settle in cash and therefore recognized those share-based payment awards as equity-settled plans. This management judgment is re-assessed at each reporting date. For more information see Note 39.
Critical Accounting Estimates and Assumptions
Measuring the fair value of financial assetsWhen the fair values of financial assets recognized in the balance sheet (especially of not listed equity instruments) cannot be measured based on quoted prices in active markets, their fair value is measured using valuation techniques including the discounted cash flow (DCF) model. The inputs to these models are taken from observable markets as far as possible, but where this is not feasible; a degree of judgement is required in establishing fair values. Judgements include considerations of the input used. Changes in assumptions about these factors could affect the reported fair value of financial instruments. See Note 41 for further disclosures.
124 ABOUT ROCKET INTERNETLETTER TO OUR SHAREHOLDERSANNUAL REPORT 2015

Deferred income taxes We consider many factors when assessing the likelihood of future realization of our deferred tax assets, including our recent earnings experience by jurisdiction, expectations of future taxable income, and the carry forward periods available to us for tax reporting purposes, as well as other relevant factors. Due to inherent complexities arising from the nature of our businesses, future changes in income tax laws or variances between our actual and anticipated operating results, we assess the likelihood of future realization of our deferred tax assets based on our judgments and estimates. Therefore, actual income taxes could materially vary from these judgments and estimates. For further information we refer to Note 22.
Share-based compensation – Equity-settled transactions at parent company levelThe Group measures the costs of granting share options of the company to employees by using their fair value at the moment they were granted. Estimating fair value for share-based payment transactions requires determination of the most appropriate valuation model (Black-Scholes-option pricing model), which is dependent on the terms and conditions of the grant. This estimate also requires determination of the most appropriate inputs to the valuation model including especially the expected volatility calculated using data of peer groups and furthermore the anticipated option term, dividend yield and risk-free interest rate. The assumptions and models used for estimating fair value are disclosed in Note 39.
Share-based compensation – Equity-settled transactions at subsidiary levelThe Group measures the cost of equity-settled transactions with employees by reference to the fair value of the equity instruments at the date at which they are granted. This grant date fair value remains unchanged throughout the life of the award. As the consolidated subsidiaries of the Group are unlisted, estimating fair value for share-based payment transactions (ordinary shares and options) requires the use of the most appropriate valuation model, which is dependent on the terms and conditions of the grant.
In determining the fair values of a consolidated subsidiary’s ordinary shares, as of each award grant date, three generally accepted approaches were considered: income approach, market approach and cost approach.
We have employed the “prior sale of company stock” method, a form of the market approach, to estimate the aggregate enterprise value at the level of some intermediate holding subsidiaries of the Company. The prior sale of company stock method considers any prior arm’s length sales of the group subsidiary’s equity securities. Considerations factored into the analysis include: the type and amount of equity sold, the estimated volatility, the estimated time to liquidity, the relationship of the parties involved, the risk-free rate, the timing compared to the ordinary shares valuation date, and the financial condition and structure of the company at the time of the sale. As such, we have benchmarked the value per share to the external transactions of subsidiary shares and external financing rounds. Throughout 2014 and 2015, the respective subsidiaries held a number of financing rounds which resulted in the issuance of new shares. The new shares were transacted with numerous existing and new investors, and therefore we consider the pricing a strong indication of fair value.
We have applied the income approach to estimate the enterprise value of subsidiaries of an inter-mediate holding subsidiary. The income approach is a technique by which fair value is estimated based on cash flows expected to be generated in the future. The principle behind this approach is that the value of the subsidiary is equal to its earnings potential. The future cash flows are discounted using a weighted average cost of capital that takes into consideration the stage of development of the business and the industry and geographies in which it operate. The total sum of all equity values based on discounted cash flows of the operating companies were reconciled to the total equity value of the Holding Company on the basis of financing rounds (i.e. “prior sale of company stock” method).
125COMBINED MANAGEMENT REPORTCONSOLIDATED FINANCIAL STATEMENTSROCKET INTERNET COMPANIES
Notes to the Consolidated Financial Statements

Given that there are multiple classes of equity at the subsidiary level, we employed the hybrid method in order to measure these different categories. The Hybrid method is a hybrid between the probability-weighted expected return method (“PWERM”) and the Option Pricing Method (“OPM”), which estimates the probability weighted value across certain exit scenarios, but uses the OPM to estimate the remaining unknown potential exit scenarios.
A discount for lack of marketability (“DLOM”) was applied, corresponding to the time to exit under the various scenarios, to reflect the increased risk arising from the inability to readily sell the shares. When applying the DLOM, the Finnerty option pricing model was used. Under this method, the cost of the put option, which can hedge the price change before the privately held shares can be sold, was considered as the basis to determine the DLOM.
In addition, we are required to estimate share-based compensation expense net of estimated forfeitures. In determining the estimated forfeiture rates for share-based awards, we periodically conduct an assessment of the actual number of equity awards that have been forfeited to date as well as those expected to be forfeited in the future. We consider many factors when estimating expected forfeitures, including the type of award, the employee class and historical experience. If our actual forfeiture rate is materially different from our estimate, the share-based compensation expense could be significantly different from what we have recorded in the current period.
The assumptions and models used for estimating fair value for share-based payment transactions are disclosed in Note 39.
5. New Accounting Pronouncements
New standards and amendments to existing standards issued but not yet effective up to the date of authorization for issue of the Group’s financial statements which are relevant for the Group are listed below. The Group intends to adopt those standards when they become effective within the EU.
IFRS 9 Financial Instruments: Classification and Measurement (issued on July 24, 2014). IFRS 9 will replace IAS 39 “Financial Instruments: Classification and Measurement”. IFRS 9 provides new guidance on the classification and measurement of financial assets and liabilities, introduces a new impairment model for financial assets as well as new rules on hedge account-ing. It also carries forward the guidance on recognition and derecognition of financial instruments from IAS 39. The impact of the standard is currently being analyzed. The Company intends to implement IFRS 9 starting January 1, 2018.
Amendments to IFRS 11: Accounting for Acquisitions of Interests in Joint Operations (issued on May 6, 2014). The amendments add new guidance on the accounting for the acquisition of an interest in a joint operation that constitutes a business. The amendments are effective for annual reporting periods beginning on or after January 1, 2016.
IFRS 14 Regulatory Deferral Accounts (issued on January 30, 2014). This standard permits an entity which is a first-time adopter of International Financial Reporting Standards to continue to account, with some limited changes, for 'regulatory deferral account balances' in accordance with its previous GAAP, both on initial adoption of IFRS and in subse-quent financial statements and is therefore not relevant for Rocket Internet.
126 ABOUT ROCKET INTERNETLETTER TO OUR SHAREHOLDERSANNUAL REPORT 2015

IFRS 15 Revenues from Contracts with Customers (issued on May 28, 2014) including amendments to IFRS 15 (issued on September 11, 2015). IFRS 15 establishes a comprehensive model for determining whether, how much and when reve-nue is recognized. It supersedes current revenue recognition guidance including IAS 18 Revenue, IAS 11 Construction Contracts and related interpretations. The Group has started to analyze the impacts of this new standard. The Company plans to apply this standard in periods starting January 1, 2018, insofar an endorsement from the EU will have been passed in time.
IFRS 16 Leases (published on January 13, 2016). In this accounting standard the lease accounting is being revised. This standard obliges lessees to disclose essentially all leases in the balance sheet. No difference is made in future between an asset which is leased and one which is acquired on credit terms. The new regulation will lead to an increase in property, plant and equipment in the consolidated balance sheet (for right of use), and at the same time an increase in financial liabilities (due to the payment obligation). As a result, every leasing or rental arrangement is disclosed in the balance sheet. In the income statement, this leads to increased depreciation and interest expense. However, EBITDA will not improve proportionately to the increase in financial liabilities. As a consequence, the ratio of net financial liabilities to adjusted EBITDA (relative indebtedness) will deteriorate although there has been no economic change. Leasing or rental arrangements with terms up to twelve months and low-value contracts are exempted from the recognition obligation. In the field of operating leases, Rocket Internet is predominantly a lessee at present. The effects of IFRS 16 on the consolidated financial statements of Rocket Internet are therefore likely to be mainly in the amount of operating lease obligations and the resulting depreciation and interest effects (see Note 43). IFRS 16 is effective for annual reporting periods beginning on or after January 1, 2019.
Amendments to IAS 1: Disclosure Initiative (issued on December 18, 2014). These narrow-focus amendments clarify IAS 1 requirements relating to materiality, order of the notes, subtotals, accounting policies and disaggregation. The amendments are effective for annual reporting periods beginning on or after January 1, 2016.
Amendments to IFRS 10 and IAS 28: Sale or Contribution of Assets between an Investor and its Associate or Joint Venture (issued on September 11, 2014).These narrow-scope amendments address an inconsistency between the requirements in IFRS 10 and those in IAS 28 (2011), in dealing with the sale or contribution of assets between an investor and its associate or joint venture. In December 2015, the IASB decided to postpone the effective date of these amendments indefinitely. As a consequence EU postponed its endorsement.
Amendments to IAS 16 and IAS 38: Clarification of Acceptable Methods of Depreciation and Amortization (issued on May 12, 2014).These limited-scope amendments clarify the use of a revenue-based depreciation or amortization method. The amendments are effective for annual reporting periods beginning on or after January 1, 2016.
Amendments to IAS 27: Equity Method in Separate Financial Statements (issued on August 12, 2014). These narrow-scope amendments restore the option to use the equity method of accounting in separate financial statements. The amendments are effective for annual reporting periods beginning on or after January 1, 2016.
127COMBINED MANAGEMENT REPORTCONSOLIDATED FINANCIAL STATEMENTSROCKET INTERNET COMPANIES
Notes to the Consolidated Financial Statements

Annual Improvements to IFRSs (2012–2014 Cycle) (issued on September 25, 2014)The IASB published amendments to IFRS 5, IFRS 7, IAS 19 and IAS 34 in the context of its annual improvements process. The amendments are effective for annual reporting periods beginning on or after January 1, 2016.
Annual Improvements to IFRSs (2010–2012 Cycle) (issued on December 12, 2013).In the context of its annual improvements process, the IASB published amendments to IFRS 2, IFRS 3, IFRS 8, IFRS 13, IAS 7, IAS 16/IAS 38 and IAS 24. The amendments are effective for annual reporting periods beginning on or after February 1, 2015.
Amendments to IAS 19: Defined Benefit Plans: Employee Contributions (issued on November, 21 2013). Rocket Internet has currently no defined benefit plans. The adjustment therefore is not relevant for Rocket Internet.
Unless otherwise described above, the new standards and interpretations issued by the IASB and to be adopted for the first time in the future are not expected to significantly affect the Group’s financial statements.
6. Segment Information
Operating segments are components that engage in business activities that may earn revenues or incur expenses, whose operating results are regularly reviewed by the chief operating decision maker (CODM), and for which discrete financial information is available. The CODM is the person or group of persons who allocates resources and assesses the performance of the segments. The function of the CODM is performed by the Board of Management of Rocket Internet SE.
An operating segment is represented by each network company. In case such network company represents an intermediate holding company for a single or multiple internet business models, each internet business model represents an operating segment.
The amounts provided to the CODM are primarily measured in a manner consistent with that of the financial statements. The CODM assesses the performance of the operating segments based on a number of financial metrics including revenue, EBITDA, and cash and cash equivalents. One-off effects from legal and capital reorganization at the level of intermediate holding companies are not reflected on the operating network company level and therefore not included in the segment information provided below.
Sales between segments are carried out at arm’s length.
The following five aggregated reportable segments3) could be identified: Home & Living, Fashion, General Merchandise, Food 1 and Food 2. The aggregated reportable segments reflect the most mature business activities of Rocket. Other network companies do not meet the thresholds for reportable segments. Other investments where Rocket cannot exercise significant influence neither qualify as reportable nor as operating segments.
Fashion comprises the business activities of the Global Fashion Group, which operates retail and wholesale fashion businesses and offers, among other products, clothing, shoes and accessories.
3) Effective from the segment presentation as of December 31, 2015 the reference to eCommerce or Marketplace has been omitted from the description of the five reportable segments. This is due to the fact that eCommerce business models increasingly engage in marketplace business models and vice versa. The reportable segments of the comparative segment information is accordingly adjusted.
128 ABOUT ROCKET INTERNETLETTER TO OUR SHAREHOLDERSANNUAL REPORT 2015
Compared to the previous year consolidated financial statements the reportable segments Fashion 1 (comprising Dafiti (Latin America), Lamoda (Russia/CIS), Namshi (Middle East) and Zalora (Asia Pacific) and Fashion 2 (comprising Jabong (India)) are combined to a single Fashion segment as a result of the establishment of the Global Fashion Group as a discrete operating segment in December 2014. The new segment structure is retrospectively applied to the comparative period.4)
Global Fashion revenue for the comparative information as presented in Note 10 reflects all five fashion ventures only between the establishment of Global Fashion Group in December 2014 and period end. Furthermore, 2014 EBITDA as presented in Note 10 of Global Fashion, is affected by gains from the disposition of its investments as the result of the establishment of the Global Fashion Group. Hence, Global Fashion financial information (see Note 10) is not comparable to the Fashion segment information that includes all five fashion ventures for a 12 months period.
Home & Living includes the business of Home24, a leading online retailer for home and living products operating in Europe and Latin America, and Westwing, an online retailer offering a frequently changing, curated selection of home design products in Europe, CIS and Latin America.
The segment General Merchandise includes Linio, Jumia and Lazada. Linio is a multi-category portal with its own delivery services in Latin America, offering a large product assortment including electronics, home & living, fashion, sports, kids’ merchandise, health & beauty and media. Jumia is an online shopping portal in Africa. The focus of the company lies on fashion and electronics, which are offered through two operating models, the business-to-consumer eCommerce and the online marketplace that provides a sales platform for retailers. Lazada operates an online shopping and selling destination for assorted merchandise in Southeast Asia.
Food 1 includes HelloFresh. HelloFresh operates a subscription-based business model and delivers healthy recipes with the necessary pre-portioned ingredients to customers in Europe, North America and Asia-Pacific.
The segment Food 2 includes the business of foodpanda, which operates the leading emerging economies online marketplace for food delivery and takeaway. Rocket Internet’s available-for-sale investment in DHH is not considered as an operating segment due to Rocket Internet’s restric-tion to exercise significant influence, i.e. to affect the resource allocation, as well as due to its inability to obtain adequate financial information (see also Significant Accounting Judgements in Note 4). Accordingly, for segment presentation purposes DHH is neither part of Food 1 nor Food 2.
The segment Other includes the business activities of Rocket Internet SE (headquarters), the joint ventures Asia Internet Holding and Middle East Internet Holding, as well as advanced businesses such as Lendico, Paymill, Helpling, Traveloka, Travelbird, Wimdu, CupoNation, Zanui, Kanui and Tricae, which are not separately reportable. Rocket Internet SE renders a range of IT, marketing and other services, in particular commercial and technical consulting services to its network companies and holds cash and cash equivalents for new investments and funding purposes. In 2015, Rocket Internet SE generated service revenue from not consolidated companies of EUR 27,870 thousand (previous period EUR 22,968 thousand) which is included in the revenue of the segment “Other”. Cash and cash equivalents held by Rocket Internet SE as of December 31, 2015 amount to EUR 1,720,010 thousand (previous period EUR 1,997,682 thousand).
Despite not having control of some of its network companies throughout 2015 and 2014, the chief operating decision maker of the group reviewed the operating results of the respective operating segments on a 100% basis (i.e. 100% of the revenues, expenses and segment results and cash and cash equivalents) to make decisions about resource allocation and to assess performance. Accordingly, in order to arrive at total consolidated revenues and expenses for
4) The Fashion segment for 2014 represents aggregated revenue and EBITDA of Dafiti, Jabong, Lamoda, Namshi and Zalora.
129COMBINED MANAGEMENT REPORTCONSOLIDATED FINANCIAL STATEMENTSROCKET INTERNET COMPANIES
Notes to the Consolidated Financial Statements

2015 and 2014, the “reconciliation” column reflects, besides consolidation adjustments, for inter-segment business relations, adjustments between aggregated segment revenue and expenses and consolidated revenue and expenses.
Segment information for the reportable segments for the year ended December 31, 2015 is set out below (In EUR thousand):
Segment information for the reportable segments for the year ended December 31, 2014 is set out below (In EUR thousand):
Revenues for each region for which the revenues are material are reported separately as follows:
Revenues are attributed to countries on the basis of the customer’s location.
Home & Living Fashion
GerneralMerchandise Food 1 Food 2 Other
Recon-cillation5) Total
2015
Revenue 452,844 930,082 449,936 304,952 31,544 200,969 –2,241,995 128,332
EBITDA –131,693 –318,613 –475,916 –109,506 –108,663 –229,456 1,173,046 –200,801
Cash and cash equivalents6) 64,609 75,181 110,951 109,235 97,906 1,901,486 –600,479 1,758,889
5) The reconciliation column includes the elimination of EUR 2,272,242 thousand revenues and adjustments of EBITDA of EUR 1,304,484 thousand from non-consolidated network companies. Moreover, the effects from consolidation are included in the reconciliation column.
6) Except for cash and cash equivalents included in the assets held for sale amounting to EUR 9,710 thousand in Rocket Internet Group as well as to EUR 1,466 thousand in the Fashion segment.
Home & Living Fashion
GerneralMerchandise Food 1 Food 2 Other7)
Recon-cillation8) Total
2014
Revenue 343,457 627,502 243,095 69,624 6,669 130,002 –1,292,166 128,182
EBITDA –114,900 –250,342 –227,798 –15,148 –38,500 –89,442 1,160,562 424,432
Cash and cash equivalents 50,435 153,436 242,380 19,760 44,543 2,114,599 –571,705 2,053,448
7) The „Other“ segment is retrospectively adjusted for network entities that were either sold, ceased operations or that became reportable during 2015.8) The reconciliation column includes the elimination of EUR 1,332,322 thousand revenues and adjustments of EBITDA of EUR 713,168 thousand from non-consolidated
network companies. Moreover, the effects from consolidation are included in the reconciliation column.
In EUR thousand
Revenue by region 2015 2014
Germany 32,913 23,431
Brazil 67,408 63,635
Africa 55 23,279
Other 27,956 17,837
Total 128,332 128,182
130 ABOUT ROCKET INTERNETLETTER TO OUR SHAREHOLDERSANNUAL REPORT 2015

Non-current assets for each region for which it is material are reported separately as follows:
The non-current assets reported in the table above only contain intangible assets and property, plant and equipment pursuant to IFRS 8.33(b).
The Rocket Internet Group has a diversified customer base.
7. Capital Management
The Company regards its total equity as capital. The primary objective of the Company’s capital management is to support its operations, to cover the cash burn and to maximize shareholders’ value while minimizing financial risk. Historically, the Company has financed its operations primarily through the issuance of equity instruments to third parties and in 2015, for the first time through the issuance of convertible bonds. To assist management in undertaking strategic activities, capital increases and servicing stock option plans, the shareholders of the Company have autho-rized the future issuance of ordinary shares in specific circumstances with the permission of the Supervisory Board. The Company has declared and paid dividends on its ordinary shares in the financial year 2014. However, the Company did not pay dividends in the financial year 2015 and does not expect to pay dividends in the foreseeable future.
The capital resources for the Group are also derived from cash payments from non-controlling interests, from operating activities and sales of equity investments.
Except for the decision to not declare dividends in the foreseeable future, no changes were made in the objective, policies or processes for managing capital during the years 2015 and 2014.
In EUR thousand
Non-current assets by region 2015 2014
Germany 12,122 8,088
Spain 79,577 0
Italy 38,915 0
Other 1,359 4,067
Total 131,953 12,155
131COMBINED MANAGEMENT REPORTCONSOLIDATED FINANCIAL STATEMENTSROCKET INTERNET COMPANIES
Notes to the Consolidated Financial Statements

8. Principal Subsidiaries
As a result of Rocket Internet being an operational Internet platform, the basis of consolidation is subject to changes in each financial period. Usually, Rocket Internet has control and applies full consolidation when an enterprise is founded. In subsequent financing rounds, the enterprises attract the equity necessary to further extend operations from Rocket Internet as well as from other external investors. This means that Rocket Internet’s direct and indirect share in the entities decreases over time in line with their size and maturity. Please, refer to Note 1 for further details on corporate structure, consumer brands, Group operations and to Note 6 regarding segment information.
Details of the Group’s material subsidiaries at the end of the reporting period are as follows:
The proportions of voting rights in the subsidiaries are the same as the ownership interests presented in the table above. Ownership percentages are calculated on the group parent level, considering all non-controlling interests in the lower levels of the multilevel group hierarchy. In the table above, “n/a” indicates that the respective company was not a subsidiary as of the respective balance sheet date.
The total non-controlling interests as of December 31, 2015 amount to EUR 73,735 thousand (previous year EUR 34,184 thousand).
Name of subsidiary
Place of business andincorporation
Nature of Business
Owner-ship
31/12/15
Owner-ship
31/12/14
Bonnyprints GmbH1) Berlin eCommerce 77.1% 77.1%
Bus Servicos de Agendamento Ltda. São Paulo marketplace 100% 71.8%
Convenience Food Group S.à r.l. Luxemburg interim holding 62.6% 100%
Global Founders Capital GmbH & Co. Beteiligungs KG Nr. 1 Berlin interim holding 100% 100%
Global Founders Capital S.à r.l. Luxemburg interim holding 100% n/a
Global Fin Tech Holding S.à r.l. Luxemburg other services 100% 100%
Global Online Takeaway Group S.A. Luxemburg interim holding 100% n/a
Grupo Yamm Comida a Domicilio S.L. Madrid marketplace 100% n/a
International Rocket GmbH & Co. KG Berlin other services 100% 100%
Kanui Comercio Varejista Ltda.2) São Paulo eCommerce n/a 49.8%
MKC Brillant Services GmbH Berlin other services 65.0% 65.0%
Spotcap Global S.à r.l. Luxemburg interim holding 58.3% 58.3%
Tricae Comercio Varejista Ltda.2) São Paulo eCommerce n/a 48.6%
Webs S.r.l. Bologna marketplace 100% n/a
1) Subsidiary deconsolidated in January 2016.2) Subsidiary of MKC Brillant Services GmbH, deconsolidated in September 2015.
132 ABOUT ROCKET INTERNETLETTER TO OUR SHAREHOLDERSANNUAL REPORT 2015
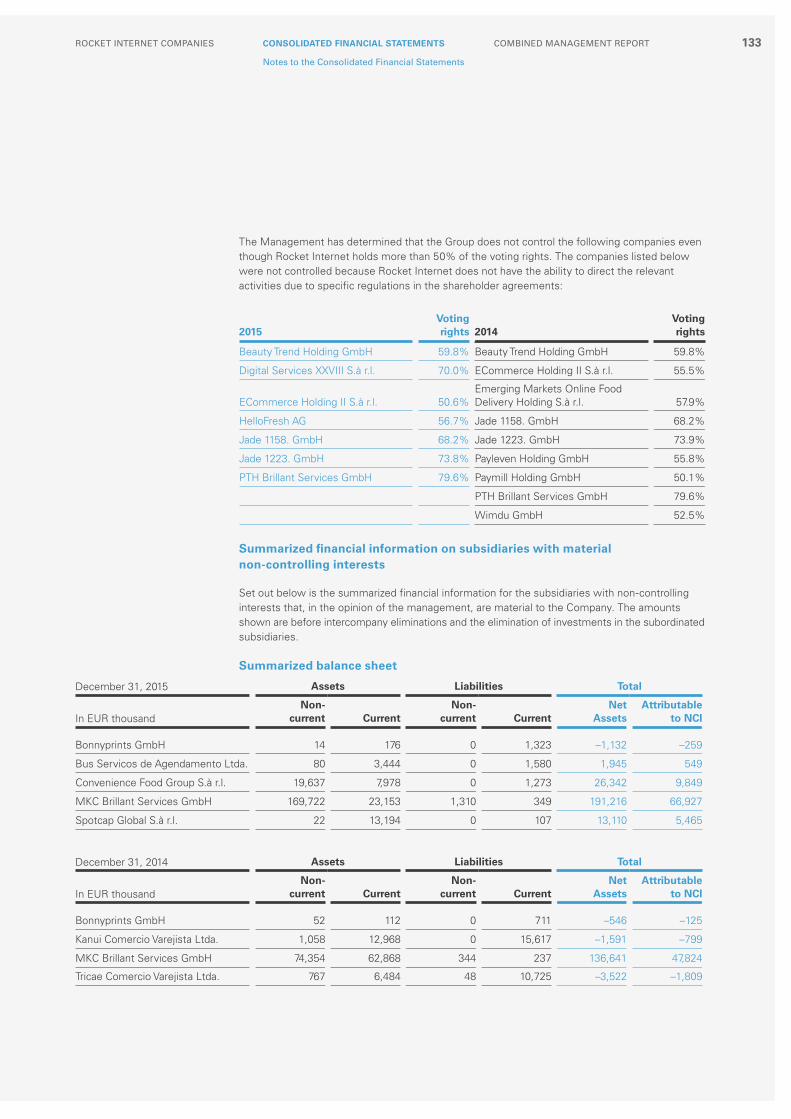
The Management has determined that the Group does not control the following companies even though Rocket Internet holds more than 50% of the voting rights. The companies listed below were not controlled because Rocket Internet does not have the ability to direct the relevant activities due to specific regulations in the shareholder agreements:
Summarized financial information on subsidiaries with material non-controlling interests
Set out below is the summarized financial information for the subsidiaries with non-controlling interests that, in the opinion of the management, are material to the Company. The amounts shown are before intercompany eliminations and the elimination of investments in the subordinated subsidiaries.
Summarized balance sheet
2015Voting rights 2014
Voting rights
Beauty Trend Holding GmbH 59.8% Beauty Trend Holding GmbH 59.8%
Digital Services XXVIII S.à r.l. 70.0% ECommerce Holding II S.à r.l. 55.5%
ECommerce Holding II S.à r.l. 50.6%Emerging Markets Online Food Delivery Holding S.à r.l. 57.9%
HelloFresh AG 56.7% Jade 1158. GmbH 68.2%
Jade 1158. GmbH 68.2% Jade 1223. GmbH 73.9%
Jade 1223. GmbH 73.8% Payleven Holding GmbH 55.8%
PTH Brillant Services GmbH 79.6% Paymill Holding GmbH 50.1%
PTH Brillant Services GmbH 79.6%
Wimdu GmbH 52.5%
December 31, 2015 Assets Liabilities Total
In EUR thousandNon-
current CurrentNon-
current CurrentNet
AssetsAttributable
to NCI
Bonnyprints GmbH 14 176 0 1,323 –1,132 –259
Bus Servicos de Agendamento Ltda. 80 3,444 0 1,580 1,945 549
Convenience Food Group S.à r.l. 19,637 7,978 0 1,273 26,342 9,849
MKC Brillant Services GmbH 169,722 23,153 1,310 349 191,216 66,927
Spotcap Global S.à r.l. 22 13,194 0 107 13,110 5,465
December 31, 2014 Assets Liabilities Total
In EUR thousandNon-
current CurrentNon-
current CurrentNet
AssetsAttributable
to NCI
Bonnyprints GmbH 52 112 0 711 –546 –125
Kanui Comercio Varejista Ltda. 1,058 12,968 0 15,617 –1,591 –799
MKC Brillant Services GmbH 74,354 62,868 344 237 136,641 47,824
Tricae Comercio Varejista Ltda. 767 6,484 48 10,725 –3,522 –1,809
133COMBINED MANAGEMENT REPORTCONSOLIDATED FINANCIAL STATEMENTSROCKET INTERNET COMPANIES
Notes to the Consolidated Financial Statements

Summarized income statement
There were no dividends paid to non-controlling interests during the periods presented.
2015
In EUR thousand RevenueProfit (Loss)
Other comprehensive
income
Total comprehensive
incomeAttributable
to NCI
Bonnyprints GmbH 5,346 –592 0 –592 –136
Bus Servicos de Agendamento Ltda. 3,431 –4,703 –181 –4,884 –1,378
Convenience Food Group S.à r.l. 125 57 0 57 21
Kanui Comercio Varejista Ltda.1) 31,557 –2,776 –515 –3,291 0
MKC Brillant Services GmbH 61 130,931 2,216 133,147 46,602
New TIN Linio I GmbH2) 0 –25,468 0 –25,468 –12,327
Tricae Comercio Varejista Ltda.1) 29,946 –4,540 –307 –4,848 0
Spotcap Global S.à r.l. 82 –594 0 –594 –248
1) until deconsolidation on September 26, 2015.2) fully consolidated from March 31, 2015 until December 14, 2015.
2014
In EUR thousand RevenueProfit (Loss)
Other comprehensive
income
Total comprehensive
incomeAttributable
to NCI
Africa eCommerce Holding GmbH1) 20,520 –26,094 –321 –26,415 16,883
Bonnyprints GmbH 5,819 –546 0 –546 125
Kanui Comercio Varejista Ltda. 34,970 –3,532 –137 –3,669 1,617
MKC Brillant Services GmbH 207 35,204 –444 34,759 –12,166
Tricae Comercio Varejista Ltda. 22,808 –7,860 –74 –7,934 3,970
1) until deconsolidation on July 16, 2014, financial data of the Jumia Group.
134 ABOUT ROCKET INTERNETLETTER TO OUR SHAREHOLDERSANNUAL REPORT 2015

Summarized cash flows
Summarized effect of loss of control of subsidiaries through sale during the periodThe Group lost control of certain subsidiaris through sale in 2015.
In September 2015, the consolidated subsidiary MKC Brillant Services GmbH contributed its shares in the outdoor and sport shop Kanui (Jade 1159. GmbH and their subsidiaries VRB GmbH & Co. B-195 KG and Kanui Comercio Varejista Ltda.), as well as in the online shop for children’s products Tricae (Jade 1218. GmbH and their subsidiaries VRB GmbH & Co. B-196 KG and Tricae Comercio Varejista Ltda.), both located in Brazil, in exchange for shares in the associate Global Fashion Group S.A.
In October 2015, the consolidated subsidiary Global Fin Tech Holding S.à r.l. contributed its 71.4% share in Zencap Global S.à r.l. (Zencap) to Funding Circle Holding Limited, London, (Funding Circle), in exchange for shares in this entity. The shares in Funding Circle are accounted for as other investment measured at fair value. Zencap operates a crowd lending platform focusing on small and middle-sized enterprises.
In January 2015, Rocket Internet´s consolidated subsidiary MKC Brillant Services GmbH contrib-uted its 97% stake in LIH Subholding Nr. 3 UG (haftungsbeschränkt) & Co. KG to Carmudi Global S.à r.l. in exchange for shares in this entity. The LIH Subholding Nr. 3 UG (haftungsbeschränkt) & Co. KG (including its two subsidiaries) comprises the Mexican car classifieds services operating under the consumer brand Carmudi. The shares in Carmudi Global S.à r.l. are classified as Available-for-sale (AFS) equity investments.
2015
In EUR thousandNet cash from
operating activitiesNet cash from
investing activitiesNet cash from
financing activities
Bonnyprints GmbH –62 –1 68
Bus Servicos de Agendamento Ltda. –4,161 –2 7,305
Convenience Food Group S.à r.l. 923 –16,428 15,704
Kanui Comercio Varejista Ltda.1) 754 –772 0
MKC Brillant Services GmbH –276 –4,952 –8,033
New TIN Linio I GmbH2) –28 –15,974 4,070
Tricae Comercio Varejista Ltda.1) –6 –85 100
Spotcap Global S.à r.l. 121 –7,115 9
1) until deconsolidation on September 26, 2015.2) fully consolidated from March 31, 2015 until December 14, 2015.
2014
In EUR thousandNet cash from
operating activitiesNet cash from
investing activitiesNet cash from
financing activities
Africa eCommerce Holding1) –19,460 –996 16,368
Bonnyprints GmbH –232 –22 94
Kanui Comercio Varejista Ltda. –5,672 –547 6,180
MKC Brillant Services GmbH –481 –40,476 50,046
Tricae Comercio Varejista Ltda. –5,868 –467 5,951
1) until deconsolidation on July 16, 2014, financial data of the Jumia Group.
135COMBINED MANAGEMENT REPORTCONSOLIDATED FINANCIAL STATEMENTSROCKET INTERNET COMPANIES
Notes to the Consolidated Financial Statements

In January 2015, Rocket Internet´s consolidated subsidiary MKC Brillant Services GmbH contributed its 97% stake in LIH Subholding Nr. 4 UG (haftungsbeschränkt) & Co. KG to Lamudi Global S.à r.l. in exchange for shares in this entity. The LIH Subholding Nr. 4 UG (haftungsbeschränkt) & Co. KG (including its four subsidiaries) comprises the real estate classified services operating in Mexico, Colombia and Peru under the consumer brand Lamudi. The shares in Lamudi Global S.à r.l. are classified as Available-for-sale (AFS) equity investments.
The Company lost control of the following subsidiaries through sale in 2014.
On April 4, 2014, Rocket Internet’s fully consolidated subsidiary Asia Internet Holding S.à r.l. (as seller) and the associated company Car Classifieds Asia S.à r.l. (as buyer) signed an agreement regarding the sale of the 100% participation in Carmudi GmbH, Berlin, (former Brillant 1253. GmbH).
On August 12, 2014, Rocket Internet SE (as seller) and Bigfoot GmbH (as buyer) agreed on the sale of 100% of the shares in Digital Services Holding X S.à r.l.
According to the agreement dated November 17, 2014, MKC Brillant Services GmbH contributed its shares in LIH Subholding Nr. 5 UG (haftungsbeschränkt) & Co. KG to the associated company Emerging Markets Online Food Delivery Holding S.à r.l. in exchange for shares in this entity. The LIH Subholding Nr. 5 UG (haftungsbeschränkt) & Co. KG (including its 13 subsidiaries) comprised the Latin American delivery services operating under the consumer brands foodpanda and hello-food. The acquisition costs of the shares in Emerging Markets Online Food Delivery Holding S.à r.l., that were received by the seller in return, were measured at fair value of the businesses contributed.
In the years 2015 and 2014 the Group deconsolidated some dormant, non-significant subsidiaries as well as some liquidated subsidiaries. The amount of the results from the deconsolidation of such entities is explained in Note 14. These deconsolidations as well as further minor divestments had no material effect on the financial statements.
The amount of consideration received:
Jan 1—Dec 31, 2015
Jan 1–Dec 31,
2014
In EUR thousand Kanui Tricae Zencap Other Total Total
Cash received 0 0 0 230 230 47
Non-cash consideration 63,388 44,497 24,428 16,309 148,622 18,248
Consideration received 63,388 44,497 24,428 16,539 148,852 18,295
136 ABOUT ROCKET INTERNETLETTER TO OUR SHAREHOLDERSANNUAL REPORT 2015

Analysis of assets and liabilities from subsidiaries over which control was lost through sale during the financial period:
Result from the sale of subsidiaries (including dormant, non-significant and liquidated subsidiaries):
Jan 1—Dec 31, 2015
Jan 1–Dec 31,
2014
In EUR thousand Kanui Tricae Zencap Other Total Total
Current assets 7,950 5,383 3,520 4,980 21,833 8,002
Cash and cash equivalents 133 125 2,381 2,348 4,988 4,310
Trade receivables 1,225 685 121 190 2,221 1,020
Inventories 6,366 4,359 0 511 11,236 454
Other 225 214 1,018 1,932 3,388 2,218
Non-current assets 1,201 793 1,141 1,762 4,897 2,096
Intangible assets 289 31 578 1,334 2,232 542
Property, plant and equipment 811 527 79 209 1,626 335
Other 101 235 483 218 1,038 1,220
Current liabilities 12,962 12,629 2,553 9,742 37,886 25,719
Non-current liabilities 0 56 840 2 898 0
Net assets disposed –3,811 –6,510 1,268 –3,002 –12,054 –15,621
Jan 1—Dec 31, 2015
Jan 1–Dec 31,
2014
In EUR thousand Kanui Tricae Zencap Other Total Total
Consideration received 63,388 44,497 24,428 16,539 148,852 18,295
Net assets disposed of 3,811 6,510 –1,268 3,002 12,054 15,621
Non-controlling interests –3,111 757 –27 –4,050 –6,431 –21,818
Reclassification of the parent's share of components previously recognized in OCI to profit or loss 909 1,649 0 49 2,607 0
Currency translation effects 649 595 0 –209 1,036 0
Other effects –173 –227 –138 113 –425 0
Result from deconsolidation 65,473 53,780 22,995 15,443 157,692 12,098
137COMBINED MANAGEMENT REPORTCONSOLIDATED FINANCIAL STATEMENTSROCKET INTERNET COMPANIES
Notes to the Consolidated Financial Statements

Deconsolidation of subsidiaries due to deemed disposals during the periodThe following former subsidiaries issued shares to third parties, which reduced Rocket Internet’s ownership interest in the subsidiaries so that the Group no longer has a controlling financial interest in these subsidiaries.
The gains and losses on deemed disposals, regular disposals and liquidation of subsidiaries resulting in a loss of control and accordingly a deconsolidation of subsidiaries are reported as a separate line item in the income statement. The portion of the gains due to measuring any investment retained in the former subsidiaries at its fair value at the date when control is lost is disclosed in the Note 14.
2015
Name of the former subsidiaryMonth of
deconsolidation Transition to
Digital Services XXVIII S.à r.l. (Nestpick) October 2015 Associate
New TIN Linio II GmbH (Linio Holding) December 2015 Associate
2014
Name of the former subsidiaryMonth of
deconsolidation Transition to
Africa Internet Holding GmbH July 2014 Joint venture
Asia Internet Holding S.à r.l. August 2014 Joint venture
Azmalo S.à r.l. March 2014Associate of Asia
Internet Holding S.à r.l.
Emerging Markets Taxi Holding S.à r.l. August 2014 Associate
Car Classifieds Asia S.à r.l. January 2014Associate of Asia
Internet Holding S.à r.l.
Classifieds Asia S.à r.l. January 2014Associate of Asia
Internet Holding S.à r.l.
ECommerce Holding II S.à r.l. (Lendico) March 2014 Associate
Helpling Group Holding S.à r.l. October 2014 Associate
Middle East Internet Holding S.à r.l. Mai 2014 Joint venture
Pricepanda Group GmbH January 2014Associate of Asia
Internet Holding S.à r.l.
138 ABOUT ROCKET INTERNETLETTER TO OUR SHAREHOLDERSANNUAL REPORT 2015

Effects of changes in ownership without loss of controlThe following tables show the effects on the equity attributable to owners of the parent from changes in Group ownership interest in the material subsidiaries that did not result in a loss of control:
In January 2015, the Company purchased non-controlling interests in Jade 1317. GmbH for an amount of EUR 9,560 thousand, therefore reversing the corresponding previous allocation of profits to non-controlling interests of EUR 481 thousand and allocating EUR –9,080 thousand to other revenue reserves.
In January 2014, the Company purchased non-controlling interests in Bonnyprints GmbH for an amount of EUR 225 thousand, therefore reversing the corresponding previous allocation of losses to non-controlling interests of EUR 17 thousand and allocating EUR –242 thousand to other revenue reserves.
Furthermore, the investment rounds at all subsidiaries (including the abovementioned subsidiaries) as a result of which the Company’s ownership has decreased resulted in the following movements in equity:
In EUR thousand
Impact on equity attributable to owners of the parent company
in 2015
Convenience Food Group S.à r.l.1) 14,870
Digital Services Holding XXII S.à r.l. (Zipjet) 3,980
Vaniday Global S.à r.l. 3,739
Digital Services Holding XLIII S.à r.l. (Carspring)2) 3,496
Bus Servicos de Agendamento Ltda. 94
Bonnyprints GmbH no change
MKC Brillant Services GmbH no change
Spotcap Global S.à r.l. no change
1) including subsidiaries of Convenience Food Group S.à r.l.2) including subsidiaries of Digital Services Holding XLIII S.à r.l.
In EUR thousand
Impact on equity attributable to owners of the parent company
in 2014
MKC Brillant Services GmbH 24,718
Kanui Comercio Varejista Ltda. 1,921
Tricae Comercio Varejista Ltda. 1,805
attributable to
In EUR thousandshareholders of the parent
non-controlling interests Total
2015 35,395 22,635 58,030
2014 65,901 35,670 101,571
139COMBINED MANAGEMENT REPORTCONSOLIDATED FINANCIAL STATEMENTSROCKET INTERNET COMPANIES
Notes to the Consolidated Financial Statements

9. Business Combinations and Similar Transactions
Business combinations during the financial years 2014 and 2015During the financial year 2014 there were no major transactions or other events that meet the definition of a business combination.
During 2015, Rocket Internet performed a series of strategic transactions to further strengthen its market position in the global online takeaway market. Under the umbrella of the wholly owned subsidiary Global Online Takeaway Group S.A., Rocket Internet combined all its investments in the area including foodpanda, Delivery Hero, Talabat (immediately contributed to Delivery Hero), La Nevera Roja and Pizzabo.it.
Acquisition of Webs S.r.l. (Pizzabo.it)On January 30, 2015, the Group acquired 100% of the voting shares of Webs S.r.l. (Pizzabo.it) for a cash consideration of EUR 51,272 thousand. Pizzabo.it is an unlisted company based in Bologna and a developer and operator of an online delivery platform for takeaway pizzas and other food. The Group acquired Pizzabo.it as a part of the creation of the Global Online Takeaway Group.
The fair values of the identifiable assets and liabilities of Pizzabo.it as of the date of acquisition were:
The fair value of the trade receivables amounts to EUR 139 thousand. The gross amount of trade receivables is EUR 140 thousand. However, none of the trade receivables have been impaired and it is expected that the full contractual amounts can be collected.
In EUR thousand Fair value recognized on acquisition
Assets 8,843
Property, plant and equipment 80
Intangible assets 8,213
Other non-current assets 35
Cash and cash equivalents 361
Trade receivables 139
Other current assets 15
Liabilities 2,818
Provisions 15
Deferred tax liabilities 2,579
Income tax liabilities 44
Trade payables 26
Other financial liabilities 68
Other non-financial liabilities 86
Total identifiable net assets at fair value 6,025
Goodwill arising on acquisition 45,247
Purchase consideration transferred 51,272
140 ABOUT ROCKET INTERNETLETTER TO OUR SHAREHOLDERSANNUAL REPORT 2015

If the acquisition of Pizzabo.it had completed on January 1, 2015, they would have contributed revenues of EUR 1,163 thousand and EBITDA of EUR –2,598 thousand. Since January 30, 2015 Pizzabo.it contributed revenues of EUR 1,056 thousand and EBITDA of EUR –2,659 thousand.
The deferred tax liability comprises the tax effect of the amortization of intangible assets (trade mark, customer relationships and technology) recognized on acquisition.
The goodwill of EUR 45,247 thousand arose because the cost of the combination included a control premium. In addition, the consideration paid comprises the value of expected synergies arising from the acquisition, revenue growth, future market development and the assembled workforce of Pizzabo.it which could not be separately recognized. None of the goodwill recognized is expected to be deductible for income tax purposes.
Consideration includes all payments made to shareholders or on behalf of them that were relevant to gaining control of the company and were not related to acquisition costs.
Contingent cash consideration (earn out payment)
As part of the accounting for the acquisition of Pizzabo.it, a contingent cash consideration liability with an estimated fair value of EUR 7,272 thousand was recognized at the acquisition date. The determination of the fair value is based on discounted cash flows. The key assumptions take into consideration the probability of meeting performance targets and a discount rate. Future develop-ments may require further revisions to the estimate. The maximum consideration to be paid is EUR 15,000 thousand, the minimum consideration amounts to EUR 8,250 thousand. The contingent consideration is classified as financial liability at fair value through profit or loss. Under the contingent consideration agreement, the Group is required to pay the sellers on the first and second anniversary after the closing date an amount equal to 10% of the market valuation of Pizzabo.it, as calculated applying the formula (combination of revenue multiple and EBITDA multiple) specified in the sale and purchase agreement.
Acquisition-related costs amounting to EUR 137 thousand have been excluded from the consideration transferred and have been recognized as an expense in profit or loss in January 2015 within the ‘other operating expenses’ line item.
Acquisition of Grupo Yamm Comida a Domicilio S.L. (La Nevera Roja)On January 26, 2015, the Group acquired 100% of the voting shares of Grupo Yamm Comida a Domicilio S.L. (La Nevera Roja). La Nevera Roja is an unlisted company based in Madrid and a developer of an online delivery platform for takeaway food as well as a delivery service provider to restaurants that do not own their own delivery service. The Group acquired La Nevera Roja for a cash consideration of EUR 80,440 thousand as part of its strategy to establish the Global Online Takeaway Group.
In EUR thousand Purchase consideration
Cash payments on acquisition 44,000
Contingent cash consideration liability (earn out payment) 7,272
Total consideration 51,272
141COMBINED MANAGEMENT REPORTCONSOLIDATED FINANCIAL STATEMENTSROCKET INTERNET COMPANIES
Notes to the Consolidated Financial Statements

The fair values of the identifiable assets and liabilities of La Nevera Roja as at the date of acquisition were:
The gross amount of trade receivables is equally EUR 68 thousand. None of the trade receivables have been impaired and it is expected that the full contractual amounts can be collected.
If the acquisition of La Nevera Roja had completed on January 1, 2015, they would have contributed revenues of EUR 4,962 thousand and EBITDA of EUR –11,860 thousand. Since January 26, 2015 La Nevera Roja contributed revenues of EUR 4,650 thousand and EBITDA of EUR –10,393 thousand. The deferred tax liability comprises the tax effect of the amortization of intangible assets (trade mark, customer relationships and technology) recognized on acquisition.
The goodwill of EUR 70,087 thousand arose because the cost of the combination included a control premium. In addition, the consideration paid comprises the value of expected synergies arising from the acquisition, revenue growth, future market development and the assembled workforce of La Nevera Roja, which is not separately recognized. None of the goodwill recognized is expected to be deductible for income tax purposes.
In EUR thousand Fair value recognized on acquisition
Assets 21,322
Property, plant and equipment 80
Intangible assets 13,663
Other non-current assets 236
Cash and cash equivalents 5,546
Trade receivables 68
Other current assets 1,729
Liabilities 10,969
Loans/other financial liabilities 5,451
Trade payables 3,551
Deferred tax liability 1,090
Other non-financial liabilities 877
Total identifiable net assets at fair value 10,353
Goodwill arising on acquisition 70,087
Purchase consideration transferred 80,440
In EUR thousand Purchase consideration
Cash payments on acquisition 80,440
Total consideration 80,440
142 ABOUT ROCKET INTERNETLETTER TO OUR SHAREHOLDERSANNUAL REPORT 2015

Acquisition-related costs amounting to EUR 181 thousand have been excluded from the consideration transferred and have been recognized as an expense in profit or loss in January 2015 within the ‘other operating expenses’ line item.
Other business combinationsFurthermore, during 2015 the Group acquired for a total cash consideration, net of cash acquired, amounting to EUR 1,198 thousand the following business:
The above mentioned business combinations are individually and collectively immaterial.
Acquisition and disposal of shares in Talabat General Trading & Contracting Company W.L.L. (Talabat)
Following a purchase agreement signed on February 11, 2015, Rocket Internet Group acquired 100% of the shares in Talabat as of March 11, 2015. Talabat is one of the leaders in the online food takeaway market in the Middle East, headquartered in Kuwait. The purchase price was USD 170 million. Talabat operates in Kuwait, Saudi Arabia, United Arab Emirates (UAE), Bahrain, Oman and Qatar with particularly strong market positions in Kuwait, UAE and Saudi Arabia.
On March 9, 2015, Rocket Internet Group signed a share contribution agreement to increase its stake in Delivery Hero Holding GmbH, through the contribution of its newly acquired Talabat shares. On April 30, 2015 (entry in trade register), Delivery Hero Holding GmbH increased its share capital correspondingly. The closing of the transaction occurred on May 15, 2015.
The acquisition of Talabat shares and their direct contribution into the Delivery Hero Holding GmbH are assessed as a single transaction. Therefore Talabat’s operations did not contribute to the Group’s revenues and net loss. The investment in Delivery Hero Holding GmbH increased by the fair value of the shares in Talabat contributed in exchange of Delivery Hero shares.
Trade name of the business Operations
SomuchmoreBerlin based beauty and wellness platform offering a subscription for yoga, meditation, pilates, dance, fitness and diet courses.
ShopkinKin Shopping GmbH, Berlin, develops and offers an online application for shopping.
Volo
Volo allows customers to order food online from restaurants that do not deliver it themselves. Volo was purchased by Rocket Internet in March 2015 and subsequently transferred in April 2015 to foodpanda.
Food Messenger
Malaga (Spain) based on-demand food delivery service. Food Messenger provides delivery logistics to restaurants that generally do not deliver.
143COMBINED MANAGEMENT REPORTCONSOLIDATED FINANCIAL STATEMENTSROCKET INTERNET COMPANIES
Notes to the Consolidated Financial Statements
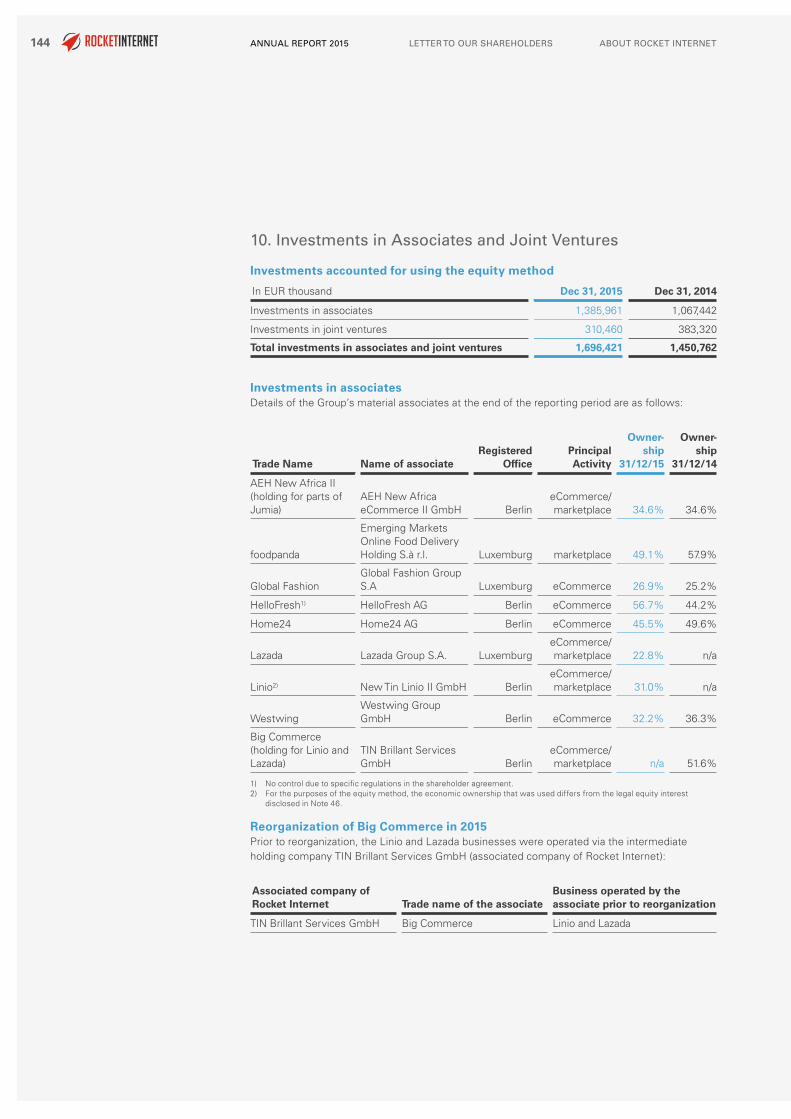
10. Investments in Associates and Joint Ventures
Investments accounted for using the equity method
Investments in associates Details of the Group’s material associates at the end of the reporting period are as follows:
Reorganization of Big Commerce in 2015 Prior to reorganization, the Linio and Lazada businesses were operated via the intermediate holding company TIN Brillant Services GmbH (associated company of Rocket Internet):
In EUR thousand Dec 31, 2015 Dec 31, 2014
Investments in associates 1,385,961 1,067,442
Investments in joint ventures 310,460 383,320
Total investments in associates and joint ventures 1,696,421 1,450,762
Trade Name Name of associateRegistered
OfficePrincipal Activity
Owner-ship
31/12/15
Owner-ship
31/12/14
AEH New Africa II (holding for parts of Jumia)
AEH New Africa eCommerce II GmbH Berlin
eCommerce/ marketplace 34.6% 34.6%
foodpanda
Emerging Markets Online Food Delivery Holding S.à r.l. Luxemburg marketplace 49.1% 57.9%
Global FashionGlobal Fashion Group S.A Luxemburg eCommerce 26.9% 25.2%
HelloFresh1) HelloFresh AG Berlin eCommerce 56.7% 44.2%
Home24 Home24 AG Berlin eCommerce 45.5% 49.6%
Lazada Lazada Group S.A. LuxemburgeCommerce/ marketplace 22.8% n/a
Linio2) New Tin Linio II GmbH BerlineCommerce/ marketplace 31.0% n/a
WestwingWestwing Group GmbH Berlin eCommerce 32.2% 36.3%
Big Commerce (holding for Linio and Lazada)
TIN Brillant Services GmbH Berlin
eCommerce/ marketplace n/a 51.6%
1) No control due to specific regulations in the shareholder agreement.2) For the purposes of the equity method, the economic ownership that was used differs from the legal equity interest
disclosed in Note 46.
Associated company of Rocket Internet Trade name of the associate
Business operated by the associate prior to reorganization
TIN Brillant Services GmbH Big Commerce Linio and Lazada
144 ABOUT ROCKET INTERNETLETTER TO OUR SHAREHOLDERSANNUAL REPORT 2015

During the financial year 2015, Rocket Internet together with co-investors dissolved Big Commerce and established the following holding entities, in which the two businesses are now operated separately:
In the course of the reorganization, New TIN Linio II was split off from Big Commerce in the first quarter of 2015. Big Commerce recognized the split off as a distribution in kind through profit or loss (one-time effect) in accordance with IFRIC 17. As a result of the split off, fair value changes amounting to EUR 29,452 thousand which have previously been recognized in OCI have been recycled through profit or loss.
In the second quarter of 2015, Big Commerce was contributed into the new holding company Lazada Group S.A. In the context of this contribution, no one-time effects were recognized in profit or loss.
Reorganization in conjunction with the establishment of Global Fashion Group in 2014
Prior to reorganization, the following five fashion eCommerce businesses operated via three intermediate holding companies (associated companies of Rocket Internet):
In December 2014, Rocket Internet together with co-investors established the Global Fashion Group S.A. (trade name: “Global Fashion Group”), in which Rocket Internet’s five fashion eCommerce businesses were combined. All direct shareholders in the five existing eCommerce companies
– Dafiti Latam GmbH & Co. Beteiligungs KG (“Dafiti”), – Lamoda GmbH (“Lamoda”), – Zalora Group GmbH (“Zalora”), – Middle East eCommerce Holding GmbH (“Namshi”) and – Jabong GmbH (“Jabong”),
as well as the shareholders of Bigfoot GmbH, BGN Brillant Services GmbH and TIN Brillant Services GmbH mutually agreed to contribute their shares in the aforementioned entities into the Global Fashion Group.
The insertion of Global Fashion Group as parent of Bigfoot I does not result in a business combination and has no impact on the consolidated statement of comprehensive income of Rocket Internet.
Trade name of the business New holding entity after reorganization
Lazada Lazada Group S.A.
Linio New TIN Linio II GmbH
Associated company of Rocket Internet Trade name of the associate
Business operated by the associate prior to reorganization
Bigfoot GmbH Bigfoot I
Dafiti, Jabong and Lamoda business as well as share of Namshi business
BGN Brillant Services GmbH Bigfoot IIZalora business (including ‘The Iconic’ brand)
TIN Brillant Services GmbH Big Commerce Share of Namshi business
145COMBINED MANAGEMENT REPORTCONSOLIDATED FINANCIAL STATEMENTSROCKET INTERNET COMPANIES
Notes to the Consolidated Financial Statements

In addition to the formation of the Global Fashion Group, certain non-global fashion e-commerce businesses were transferred to the newly established holding entities:
After the reorganization, Global Fashion Group operates amongst others the brands Dafiti (Latin America), Jabong (India), Lamoda (Russia), Namshi (Middle East) and Zalora & The Iconic (South East Asia and Australia).
Summarized financial informationSummarized financial information in respect of the Group’s material associates is set out below. The summarized financial information below represents amounts shown in the associate’s financial statements and adjusted by the Group for equity accounting purposes. All of the material associated companies prepare consolidated financial information in accordance with IFRS. Summarized financial information is presented for both, the Groups direct investments in associates being operating network companies (e.g. Home24, HelloFresh, Westwing, foodpanda) as well as for associates being intermediate holding companies (e.g. AEH New Africa II, Bigfoot I, Bigfoot II, Big Commerce, Global Fashion). During the financial years 2014 and 2015, the intermediate holding companies did not fully consolidate all of their operating network companies for the whole period. Furthermore, the effects of legal reorganizations on the intermediate holding company level reflected in their statutory financial statements do not allow a direct reconciliation between segment information as presented in Note 6 and the summarized financial information provided below.
Summarized balance sheets (in thousands):
Trade name of the non-global fashion business Former holding entity
New holding entity after reorganization
FabFurnish Bigfoot I FabFurnish GmbH
Zanui.com Bigfoot II New BGN Other Assets II GmbH
Share of Jumia business Big CommerceAEH New Africa eCommerce II GmbH
December 31, 2015
CompanyCurrency
AEH New Africa II
EURfoodpanda
EUR
Global Fashion
EURHelloFresh
EUR
Current assets 104 117,346 372,777 137,494
Non-current assets 81,670 98,254 1,989,591 108,782
Current liabilities 43 29,182 257,715 60,809
Non-current liabilities 0 10,164 160,202 34,480
Net assets 81,731 176,254 1,944,451 150,987
December 31, 2015 (continued)
CompanyCurrency
Home24EUR
Lazada EUR
LinioEUR
WestwingEUR
Current assets 100,403 123,945 41,138 41,142
Non-current assets 105,592 367,520 134,555 43,679
Current liabilities 73,460 107,184 25,332 52,997
Non-current liabilities 15,875 79,688 36,106 15,270
Net assets 116,660 304,593 114,255 16,554
146 ABOUT ROCKET INTERNETLETTER TO OUR SHAREHOLDERSANNUAL REPORT 2015

Summarized income statements (in thousands):
December 31, 2014
CompanyCurrency
AEH New Africa II
EURBig Commerce
EURfoodpanda
EURGlobal Fashion
EUR
Current assets 109 35,152 51,955 463,596
Non-current assets 102,455 525,362 74,894 1,856,006
Current liabilities 41 25,993 13,799 211,933
Non-current liabilities 0 0 10,193 155,181
Net assets 102,523 534,520 102,856 1,952,487
December 31, 2014 (continued)
CompanyCurrency
HelloFreshEUR
Home24 EUR
WestwingEUR
Current assets 27,283 66,709 44,891
Non-current assets 36,565 49,682 27,299
Current liabilities 13,152 71,109 51,909
Non-current liabilities 7,499 10,547 18,151
Net assets 43,197 34,735 2,131
December 31, 2015
CompanyCurrency
AEH New Africa II
EURfoodpanda
EUR
Global Fashion
EURHelloFresh
EUR
Revenue 0 31,544 930,082 304,952
Profit or loss –20,753 –118,216 –379,746 –121,454
Other comprehensive income 0 –4,373 –26,815 –221
Total comprehensive income –20,753 –122,589 –406,561 –121,675
Dividends received from the associate during the year 0 0 0 0
147COMBINED MANAGEMENT REPORTCONSOLIDATED FINANCIAL STATEMENTSROCKET INTERNET COMPANIES
Notes to the Consolidated Financial Statements

Reconciliation of the above summarized financial information to the carrying amount of the interest in associates recognized in the consolidated financial statements is set out below. Other adjustments reflect non-controlling interests of the associates (in thousands).
December 31, 2015 (continued)
CompanyCurrency
Home24EUR
Lazada EUR
LinioEUR
WestwingEUR
Revenue 233,650 247,845 67,122 219,194
Profit or loss –93,866 –315,674 –69,425 –68,065
Other comprehensive income 691 3,193 178 3,167
Total comprehensive income –93,176 –312,482 –69,247 –64,898
Dividends received from the associate during the year 0 98,0371) 0 0
1) The amount of EUR 98,037 thousand is due to the distribution in kind of Linio in the course of the reorganization of Big Commerce.
December 31, 2014
CompanyCurrency
AEH New Africa II
EURBig Commerce
EURfoodpanda
EUR
Global Fashion1)
EUR
Revenue 0 195 6,669 212,422
Profit or loss –1,934 25,558 –39,737 185,693
Other comprehensive income 0 0 –7,828 –13,533
Total comprehensive income –1,934 25,558 –47,565 172,160
Dividends received from the associate during the year 0 19,2832) 0 10,1483)
1) Financial information taken from the Global Fashion Group consolidated financial statements deviates from segment presentation (Note 6).
2) The amount of EUR 19,283 thousand results from the non-cash distribution of the Namshi business in the course of the reorganization in conjunction with the establishment of Global Fashion Group.
3) The amount of EUR 10,148 thousand results from non-cash distributions of three non-global fashion e-commerce businesses in the course of the reorganization in conjunction with the establishment of Global Fashion Group.
December 31, 2014 (continued)
CompanyCurrency
HelloFreshEUR
Home24 EUR
WestwingEUR
Revenue 69,624 160,126 183,332
Profit or loss –15,244 –62,374 –72,603
Other comprehensive income –684 358 6,412
Total comprehensive income –15,927 –62,017 –66,191
148 ABOUT ROCKET INTERNETLETTER TO OUR SHAREHOLDERSANNUAL REPORT 2015

December 31, 2015
CompanyCurrency
AEH New Africa II
EURfoodpanda
EUR
Global Fashion
EURHelloFresh
EUR
Net assets of the associate 81,731 176,254 1,944,451 150,987
Proportion of the Group’s ownership interest in the associate 34.6% 49.1% 26.9% 56.7%
Goodwill 0 16,555 42,903 111,498
Other adjustments 0 5,398 –19,066 242
Carrying amount of the Group’s interest in the associate 28,260 108,421 547,048 197,287
December 31, 2015 (continued)
CompanyCurrency
Home24EUR
Lazada EUR
LinioEUR
WestwingEUR
Net assets of the associate 116,660 304,593 114,255 16,554
Proportion of the Group’s ownership interest in the associate 45.5% 22.8% 31.0% 32.2%
Goodwill 15,151 121,302 61,403 5,337
Other adjustments 4,069 606 –1,684 10,680
Carrying amount of the Group’s interest in the associate 72,324 191,360 95,117 21,348
December 31, 2014
CompanyCurrency
AEH New Africa II
EURBig Commerce
EURfoodpanda
EUR
Global Fashion
EUR
Net assets of the associate 102,523 534,520 102,856 1,952,487
Proportion of the Group’s ownership interest in the associate 34.6% 51.6% 57.9% 25.2%
Goodwill 0 0 16,447 23,685
Other adjustments 0 0 2,335 –22,893
Carrying amount of the Group’s interest in the associate 35,448 275,800 78,346 492,723
149COMBINED MANAGEMENT REPORTCONSOLIDATED FINANCIAL STATEMENTSROCKET INTERNET COMPANIES
Notes to the Consolidated Financial Statements
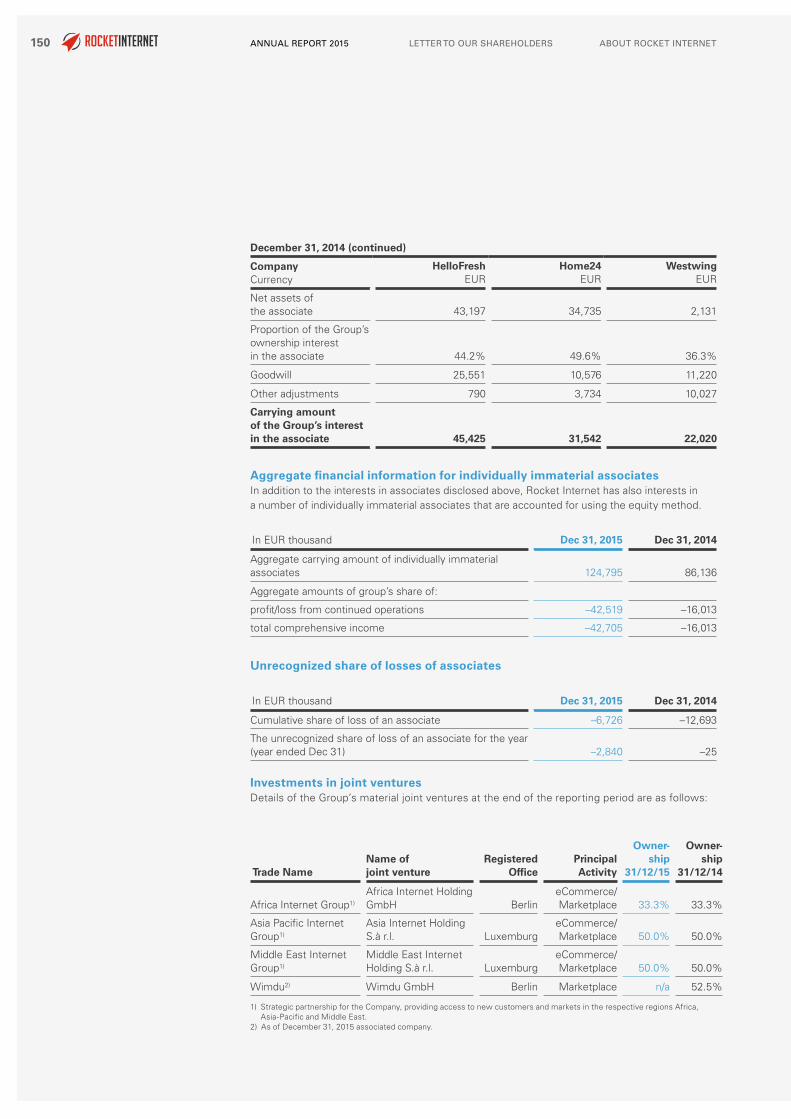
Aggregate financial information for individually immaterial associatesIn addition to the interests in associates disclosed above, Rocket Internet has also interests in a number of individually immaterial associates that are accounted for using the equity method.
Unrecognized share of losses of associates
Investments in joint venturesDetails of the Group’s material joint ventures at the end of the reporting period are as follows:
December 31, 2014 (continued)
CompanyCurrency
HelloFreshEUR
Home24 EUR
WestwingEUR
Net assets of the associate 43,197 34,735 2,131
Proportion of the Group’s ownership interest in the associate 44.2% 49.6% 36.3%
Goodwill 25,551 10,576 11,220
Other adjustments 790 3,734 10,027
Carrying amount of the Group’s interest in the associate 45,425 31,542 22,020
In EUR thousand Dec 31, 2015 Dec 31, 2014
Aggregate carrying amount of individually immaterial associates 124,795 86,136
Aggregate amounts of group’s share of:
profit/loss from continued operations –42,519 –16,013
total comprehensive income –42,705 –16,013
In EUR thousand Dec 31, 2015 Dec 31, 2014
Cumulative share of loss of an associate –6,726 –12,693
The unrecognized share of loss of an associate for the year (year ended Dec 31) –2,840 –25
Trade NameName of joint venture
Registered Office
Principal Activity
Owner-ship
31/12/15
Owner-ship
31/12/14
Africa Internet Group1)
Africa Internet Holding GmbH Berlin
eCommerce/ Marketplace 33.3% 33.3%
Asia Pacific Internet Group1)
Asia Internet Holding S.à r.l. Luxemburg
eCommerce/ Marketplace 50.0% 50.0%
Middle East Internet Group1)
Middle East Internet Holding S.à r.l. Luxemburg
eCommerce/ Marketplace 50.0% 50.0%
Wimdu2) Wimdu GmbH Berlin Marketplace n/a 52.5%
1) Strategic partnership for the Company, providing access to new customers and markets in the respective regions Africa, Asia-Pacific and Middle East.
2) As of December 31, 2015 associated company.
150 ABOUT ROCKET INTERNETLETTER TO OUR SHAREHOLDERSANNUAL REPORT 2015

Summarized financial information in respect of the Group’s material joint ventures is set out below and represents amounts shown in the joint venture’s consolidated financial statements prepared in accordance with IFRSs and adjusted by the Group for equity accounting purposes.
Summarized balance sheets (in thousands):
The above amounts of assets and liabilities include the following:
CompanyReporting date Currency
Africa Internet Group
31/12/15 EUR
Asia Pacific Internet Group
31/12/15 EUR
Middle East Internet Group
31/12/15 EUR
Current assets 127,646 146,312 24,308
Non-current assets 12,442 124,500 20,394
Current liabilities 47,134 15,193 6,298
Non-current liabilities 10,769 8,366 57
Net assets 82,185 247,253 38,346
CompanyReporting date Currency
Africa Internet Group
31/12/14 EUR
Asia Pacific Internet Group
31/12/14 EUR
Middle East Internet Group
31/12/14 EUR
Wimdu
31/12/14 EUR
Current assets 153,605 89,429 37,294 24,621
Non-current assets 123,968 187,488 20,131 256
Current liabilities 31,237 4,825 1,548 14,705
Non-current liabilities 116 1,919 0 0
Net assets 246,220 270,173 55,878 10,172
CompanyReporting date Currency
Africa Internet Group
31/12/15 EUR
Asia Pacific Internet Group
31/12/15 EUR
Middle East Internet Group
31/12/15 EUR
Cash and cash equivalents 28,102 100,839 19,777
Current financial liabilities (excluding trade and other payables and provisions) 15 4,027 2,045
Non-current financial liabilities (excluding trade and other payables and provisions) 857 8,366 57
151COMBINED MANAGEMENT REPORTCONSOLIDATED FINANCIAL STATEMENTSROCKET INTERNET COMPANIES
Notes to the Consolidated Financial Statements

Summarized income statements (in thousands):
CompanyReporting date Currency
Africa Internet Group
31/12/14 EUR
Asia Pacific Internet Group
31/12/14 EUR
Middle East Internet Group
31/12/14 EUR
Wimdu
31/12/14 EUR
Cash and cash equivalents 33,440 44,065 36,155 19,903
Current financial liabilities (excluding trade and other payables and provisions) 610 1,985 171 9,785
Non-current financial liabilities (excluding trade and other payables and provisions) 0 1,918 0 0
CompanyReporting date Currency
Africa Internet Group
31/12/15 EUR
Asia Pacific Internet Group
31/12/15 EUR
Middle East Internet Group
31/12/15 EUR
Revenue 144,626 13,666 11,967
Profit or loss from continuing operations –178,483 –50,544 –22,035
Post-tax profit or loss from discontinued operations 0 0 0
Other comprehensive income –407 –121 32
Total comprehensive income –178,890 –50,665 –22,002
Dividends received from the joint venture during the year 0 0 0
CompanyReporting date Currency
Africa Internet Group
31/12/14 EUR
Asia Pacific Internet Group
31/12/14 EUR
Middle East Internet Group
31/12/14 EUR
Wimdu
31/12/14 EUR
Revenue 63,694 1,743 110 13,528
Profit or loss from continuing operations –80,762 1,249 –6,163 –11,190
Post-tax profit or loss from discontinued operations 0 –1,262 0 0
Other comprehensive income –1,088 –291 0 0
Total comprehensive income –81,850 –304 –6,163 –11,190
Dividends received from the joint venture during the year 0 0 0 0
152 ABOUT ROCKET INTERNETLETTER TO OUR SHAREHOLDERSANNUAL REPORT 2015

The above profit or loss for the year includes the following (in thousands):
Reconciliation of the above summarized financial information to the carrying amount of the interest in the joint venture recognized in the consolidated financial statements (in thousands):
CompanyReporting date Currency
Africa Internet Group
31/12/15 EUR
Asia Pacific Internet Group
31/12/15 EUR
Middle East Internet Group
31/12/15 EUR
Depreciation and amortization –4,598 –5,175 –212
Interest income 207 157 0
Interest expense –808 –185 0
Income tax expense (income) –142 918 –371
CompanyReporting date Currency
Africa Internet Group
31/12/14 EUR
Asia Pacific Internet Group
31/12/14 EUR
Middle East Internet Group
31/12/14 EUR
Wimdu
31/12/14 EUR
Depreciation and amortization –1,727 –366 –21 –137
Interest income 263 70 0 146
Interest expense –352 –52 –1 –6
Income tax expense (income) –293 61 –26 0
CompanyReporting date Currency
Africa Internet Group
31/12/15 EUR
Asia Pacific Internet Group
31/12/15 EUR
Middle East Internet Group
31/12/15 EUR
Net assets of the joint venture 82,185 247,253 38,346
Proportion of the Group’s ownership interest in the joint venture 33.3% 50.0% 50.0%
Goodwill 82,677 18,402 29,443
Other adjustments 20,487 –11,981 1,238
Carrying amount of the Group’s interest in the joint venture 130,560 130,047 49,854
153COMBINED MANAGEMENT REPORTCONSOLIDATED FINANCIAL STATEMENTSROCKET INTERNET COMPANIES
Notes to the Consolidated Financial Statements

Other adjustments reflect non-controlling interests of the joint ventures.
As of December 31, 2015 and 2014, the Group did not have any immaterial joint ventures.
Notes to the Income Statement
11. Revenue
Revenue for the year comprises the following:
Revenue generated from the rendering of services primarily result from consulting services provided to associates and joint ventures. Furthermore, revenues from rendering of intermediation services (marketplaces) are also included therein.
12. Internally Produced and Capitalized Assets
In the reporting period the internally produced and capitalized assets amount to EUR 5,719 thousand (previous year EUR 2,878 thousand) and result from capitalized intangible assets (mainly soft-ware platforms).
CompanyReporting date Currency
Africa Internet Group
31/12/14 EUR
Asia Pacific Internet Group
31/12/14 EUR
Middle East Internet Group
31/12/14 EUR
Wimdu
31/12/14 EUR
Net assets of the joint venture 246,220 270,173 55,878 10,172
Proportion of the Group’s ownership interest in the joint venture 33.3% 50.0% 50.0% 52.5%
Goodwill 84,048 18,402 29,443 0
Other adjustments 1,125 3 –140 0
Carrying amount of the Group’s interest in the joint venture 167,246 153,491 57,242 5,342
In EUR thousand 2015 % 2014 %
Sale of goods 70,733 55 87,435 68
Rendering of services 56,762 44 40,747 32
Interest 837 1 0 0
Total 128,332 100 128,182 100
154 ABOUT ROCKET INTERNETLETTER TO OUR SHAREHOLDERSANNUAL REPORT 2015
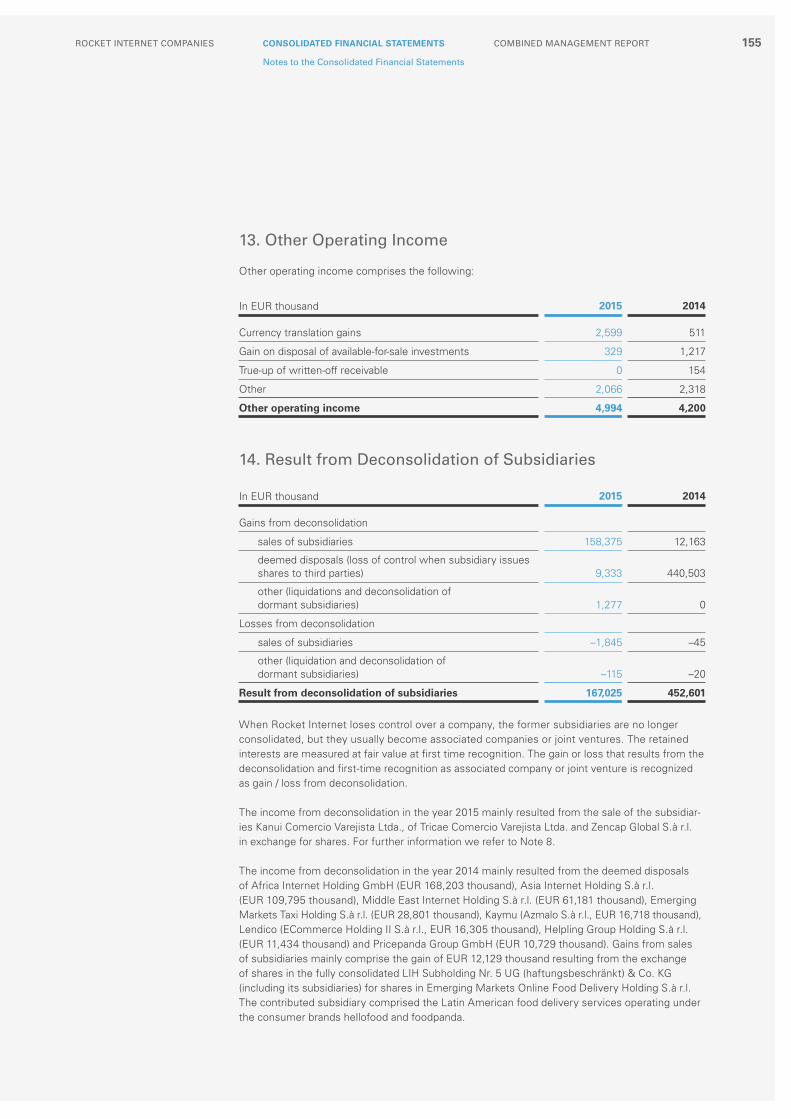
13. Other Operating Income
Other operating income comprises the following:
14. Result from Deconsolidation of Subsidiaries
When Rocket Internet loses control over a company, the former subsidiaries are no longer consolidated, but they usually become associated companies or joint ventures. The retained interests are measured at fair value at first time recognition. The gain or loss that results from the deconsolidation and first-time recognition as associated company or joint venture is recognized as gain / loss from deconsolidation.
The income from deconsolidation in the year 2015 mainly resulted from the sale of the subsidiar-ies Kanui Comercio Varejista Ltda., of Tricae Comercio Varejista Ltda. and Zencap Global S.à r.l. in exchange for shares. For further information we refer to Note 8.
The income from deconsolidation in the year 2014 mainly resulted from the deemed disposals of Africa Internet Holding GmbH (EUR 168,203 thousand), Asia Internet Holding S.à r.l. (EUR 109,795 thousand), Middle East Internet Holding S.à r.l. (EUR 61,181 thousand), Emerging Markets Taxi Holding S.à r.l. (EUR 28,801 thousand), Kaymu (Azmalo S.à r.l., EUR 16,718 thousand), Lendico (ECommerce Holding II S.à r.l., EUR 16,305 thousand), Helpling Group Holding S.à r.l. (EUR 11,434 thousand) and Pricepanda Group GmbH (EUR 10,729 thousand). Gains from sales of subsidiaries mainly comprise the gain of EUR 12,129 thousand resulting from the exchange of shares in the fully consolidated LIH Subholding Nr. 5 UG (haftungsbeschränkt) & Co. KG (including its subsidiaries) for shares in Emerging Markets Online Food Delivery Holding S.à r.l. The contributed subsidiary comprised the Latin American food delivery services operating under the consumer brands hellofood and foodpanda.
In EUR thousand 2015 2014
Currency translation gains 2,599 511
Gain on disposal of available-for-sale investments 329 1,217
True-up of written-off receivable 0 154
Other 2,066 2,318
Other operating income 4,994 4,200
In EUR thousand 2015 2014
Gains from deconsolidation
sales of subsidiaries 158,375 12,163
deemed disposals (loss of control when subsidiary issues shares to third parties) 9,333 440,503
other (liquidations and deconsolidation of dormant subsidiaries) 1,277 0
Losses from deconsolidation
sales of subsidiaries –1,845 –45
other (liquidation and deconsolidation of dormant subsidiaries) –115 –20
Result from deconsolidation of subsidiaries 167,025 452,601
155COMBINED MANAGEMENT REPORTCONSOLIDATED FINANCIAL STATEMENTSROCKET INTERNET COMPANIES
Notes to the Consolidated Financial Statements

15. Gain from Distribution of Non-Cash Assets to Owners
On May 30, 2014, the then existing shareholders of the Company approved a dividend in kind to certain shareholders. Consequently, the Company transferred by way of a separate share transfer agreement 4,145 and 1,892 shares in its associates Bigfoot I to Emesco and AI European Holdings S.à r.l., respectively, as well as 4,559 and 2,082 shares in its associate Bigfoot II to Emesco and AI European Holdings S.à r.l., respectively. The respective gain from distribution of non-cash assets to owners amounts to EUR 60,594 thousand.
No dividends in kind were distributed in 2015.
16. Purchased Merchandise and Purchased Services
Purchased merchandise and purchased services comprise the following:
17. Employee Benefit Expenses
Employee benefit expenses comprise the following:
Social security costs include contributions to the statutory pension insurance of EUR 6,535 thousand (previous year EUR 4,860 thousand).
Regarding the Equity- and Cash-settled share-based payments, please refer to Note 39.
In EUR thousand 2015 2014
Purchased goods / merchandise 44,710 57,364
Purchased services 19,401 12,424
Other 5 0
Purchased merchandise and services 64,116 69,788
In EUR thousand 2015 2014
Salaries, bonuses and other short-term employee benefits 74,383 57,784
Social security 11,460 8,881
Equity-settled share-based payments 57,952 51,295
Cash-settled share-based payments 14,739 16,690
Other 13,123 7,220
Employee benefit expenses 171,656 141,870
156 ABOUT ROCKET INTERNETLETTER TO OUR SHAREHOLDERSANNUAL REPORT 2015
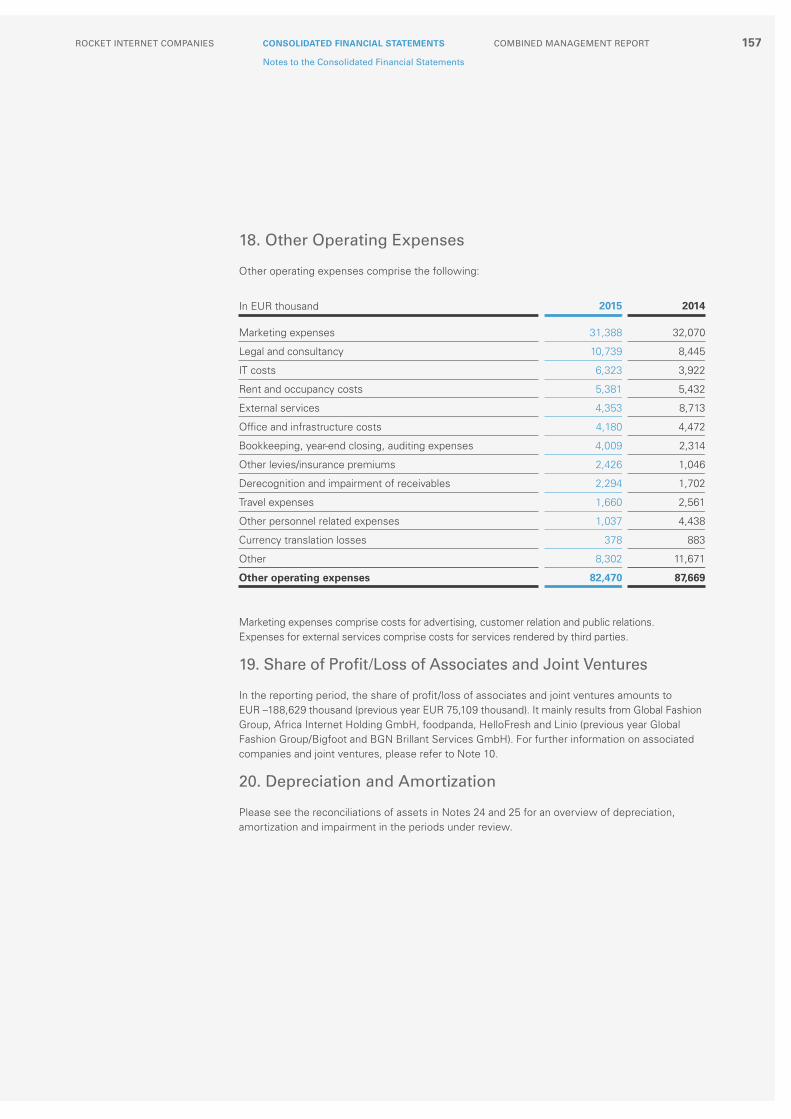
18. Other Operating Expenses
Other operating expenses comprise the following:
Marketing expenses comprise costs for advertising, customer relation and public relations. Expenses for external services comprise costs for services rendered by third parties.
19. Share of Profit/Loss of Associates and Joint Ventures
In the reporting period, the share of profit/loss of associates and joint ventures amounts to EUR –188,629 thousand (previous year EUR 75,109 thousand). It mainly results from Global Fashion Group, Africa Internet Holding GmbH, foodpanda, HelloFresh and Linio (previous year Global Fashion Group/Bigfoot and BGN Brillant Services GmbH). For further information on associated companies and joint ventures, please refer to Note 10.
20. Depreciation and Amortization
Please see the reconciliations of assets in Notes 24 and 25 for an overview of depreciation, amortization and impairment in the periods under review.
In EUR thousand 2015 2014
Marketing expenses 31,388 32,070
Legal and consultancy 10,739 8,445
IT costs 6,323 3,922
Rent and occupancy costs 5,381 5,432
External services 4,353 8,713
Office and infrastructure costs 4,180 4,472
Bookkeeping, year-end closing, auditing expenses 4,009 2,314
Other levies/insurance premiums 2,426 1,046
Derecognition and impairment of receivables 2,294 1,702
Travel expenses 1,660 2,561
Other personnel related expenses 1,037 4,438
Currency translation losses 378 883
Other 8,302 11,671
Other operating expenses 82,470 87,669
157COMBINED MANAGEMENT REPORTCONSOLIDATED FINANCIAL STATEMENTSROCKET INTERNET COMPANIES
Notes to the Consolidated Financial Statements

21. Financial Result
Financial result for the period comprises the following:
For further information regarding the profit / loss from changes in fair value of financial instruments at FVTPL refer to Note 41.
22. Income Tax
Income tax expense recorded in profit or loss comprises the following:
In EUR thousand 2015 2014
Interest and similar income 975 568
Gain on financial instruments at FVTPL 86,172 27,665
Dividends received from associates at FVTPL 4,153 295
Other dividends 372 0
Gain from the derecognition of AFS financial assets FVTOCI 1,329 0
Gain from the revaluation of financial liabilities 5 0
Currency translation gains 2,068 0
Total finance income 95,074 28,528
Interest and similar expenses –11,829 –1,763
Loss on financial instruments at FVTPL –53,157 –14,734
Loss from the revaluation of financial liabilities at FVTPL –355 0
Currency translation losses –17 0
Total finance expense –65,357 –16,497
Net financial result 29,717 12,031
In EUR thousand 2015 2014
Current tax expense/income 958 507
thereof current period 1,116 468
thereof previous years –158 39
Deferred tax expense/income 438 4,496
thereof current period 535 4,495
thereof previous years –97 0
Income tax expense for the year 1,395 5,003
158 ABOUT ROCKET INTERNETLETTER TO OUR SHAREHOLDERSANNUAL REPORT 2015

Reconciliation between the tax expense and profit or loss multiplied by applicable tax rate
The difference between the actual income taxes and the expected income taxes that would arise using the weighted average tax rate to profit or loss before tax relates to the following reconciling items:
The weighted average applicable tax rate was 29.42% (previous year 30.32%), which was derived from the tax rate in each tax jurisdiction weighted by the relevant pre-tax profit or loss.
Deferred TaxesDifferences between IFRS and statutory taxation regulations give rise to temporary differences between the carrying amount of assets and liabilities in the consolidated financial statements and their tax bases. The tax effect of these temporary differences and unused tax loss carry forwards is disclosed below:
Deferred income tax assets are recognized for tax loss carry forwards and deductible temporary differences to the extent that the realization of the related tax benefit through future taxable profits is probable or deferred tax liabilities are recognized. Deferred tax asset for tax loss carryforwards of EUR 8,398 thousand has therefore been recognized as of December 31, 2015 (previous year EUR 5,771 thousand) and due to deductible temporary differences deferred tax asset of EUR 10,692 thousand has therefore been recognized as of December 31, 2015 (previous year EUR 11,025 thousand). Deferred tax assets from deductible temporary differences amounting to EUR 106 thousand were not recognized.
In EUR thousand 2015 2014
Profit before tax –196,406 433,809
Tax calculated at domestic tax rates applicable to profits in the respective countries 57,782 –131,551
Income not subject to tax 25,400 26,043
Expenses not deductible for tax purposes –18,408 –5,624
Tax losses for which no deferred income tax assets was recognized –39,485 –17,470
Utilization of tax losses from previous years 555 0
Share-based payments not deductible for tax purposes –16,195 –14,965
Results of associates/joint ventures and deconsolidation –6,702 140,396
Permanent differences (especially from the impairment of goodwill) –5,585 0
Other tax effects 1,243 –1,832
Income tax expense for the year –1,395 –5,003
In EUR thousand Dec 31, 2015 Dec 31, 2014
Intangible assets –5,480 –2,105
Financial assets –3,812 –650
Cash and cash equivalents in foreign currency –1,659 0
Accruals 10,692 11,025
Shares in associated companies and joint ventures –16,330 –17,773
Deferred tax on tax loss carry forwards 8,398 5,771
Other 22 180
Net deferred tax assets (+) / liabilities (–) –8,169 –3,552
Deferred tax assets and liabilities reported in balance sheet –8,169 –3,552
159COMBINED MANAGEMENT REPORTCONSOLIDATED FINANCIAL STATEMENTSROCKET INTERNET COMPANIES
Notes to the Consolidated Financial Statements

Tax loss carry-forwards in GermanyIn years of tax profits any tax loss carry-forward can be fully used up to an amount of EUR 1 million. Any excess tax profit will be reduced with remaining tax loss carry-forwards by 60%. Thus, 40% of all tax profits exceeding EUR 1 million will be subject to taxation.
As of December 31, 2015 and 2014, the parent company has corporate income tax loss carry forwards originated and generally usable in Germany in the amount of approximately EUR 86,157 thousand and EUR 40,148 thousand respectively, as well as current accumulated trade tax losses amounting to approximately EUR 88,825 thousand and EUR 41,180 thousand, respectively. As of December 31, 2015 and 2014, the parent company has unrecognized unused corporate income tax loss carry forwards originated and generally usable in Germany amounting to approximately EUR 69,936 thousand and EUR 22,855 thousand respectively, as well as current accumulated trade tax losses amounting to approximately EUR 72,603 thousand and EUR 22,886 thousand, respectively.
With regard to Germany, as of December 31, 2015 and 2014, the consolidated subsidiaries have current accumulated corporate income tax loss carry forwards originated and generally usable in Germany in the amount of approximately EUR 23,664 thousand (previous year EUR 34,546 thousand), as well as current accumulated trade tax losses amounting to approximately EUR 24,876 thousand (previous year EUR 36,352 thousand). The decrease of the tax loss carry forwards is mainly due to the deconsolidation of subsidiaries.
Tax loss carry-forwards in other countriesAs of December 31, 2015 and 2014, the consolidated foreign subsidiaries have unrecognized unused accumulated corporate income tax loss carry forwards originated and generally usable in the respective jurisdictions in the amount of approximately EUR 91,507 thousand and EUR 88,421 thousand, respectively.
To a great extent the tax losses result from Luxemburgian subsidiaries amounting to EUR 25,762 thousand (previous year EUR 5,162 thousand), from Spanish subsidiaries amounting to EUR 21,706 thousand (previous year EUR 392 thousand), from British subsidiaries amounting to EUR 16,563 thousand (previous year EUR 2,106 thousand) and from Brazilian subsidiaries amounting to EUR 14,342 thousand (previous year EUR 64,583 thousand). The decrease in income tax loss carry forwards in comparison to the previous year primarily results from deconsolidation of subsidiaries. In the four mentioned countries, tax losses may be carried forward without any time limitation. Furthermore as of December 31, 2015 and 2014, the consolidated Mexican subsidiaries have unrecognized unused tax loss carry forwards of EUR 2,513 thousand and EUR 8,024 thousand, respectively. Losses incurred may be carried forward over a subsequent ten-year period.
The remaining tax losses of EUR 13,133 thousand as of December 31, 2015 include tax losses from various countries. Tax losses of EUR 4,085 thousand thereof expire within an eight-year period, EUR 1,335 thousand expire within nine years, EUR 2,686 thousand expire within 10 years and EUR 1,130 thousand expire within 20 years. The remaining EUR 3,897 thousand may be carried forward without any time limitation.
Tax loss carry forwards are subject to review and possible adjustment by the tax authorities. Furthermore, under current German tax laws, certain substantial changes in the entity ownership and business may further limit the amount of net operating loss carryforwards, which could be utilized annually to offset future taxable income. Given the number of significant mergers, exits, spin-offs and other reorganizational measures, particularly at the level of the Group, there can be no assurance that current tax losses and tax loss carry-forwards originated and generally usable in Germany or in other countries may have been partially or completely lost. As the majority of the consolidated operating subsidiaries has a loss history and continues to incur substantial tax losses, a full valuation allowance has been provided for the deferred tax assets to the extent it exceeds any tax liabilities.
160 ABOUT ROCKET INTERNETLETTER TO OUR SHAREHOLDERSANNUAL REPORT 2015

Outside basis differencesDeferred tax liabilities on temporary differences related to measurement of shares in associated companies and joint ventures of EUR 14,961 thousand (previous year EUR 17,773 thousand) were offset against deferred tax assets arising from unused tax loss carry forwards of EUR 4,680 thousand (previous year EUR 5,521 thousand), and deferred tax assets from deductible temporary differences of EUR 7,161 thousand (previous year EUR 8,270 thousand).
The Group controls the reversal of temporary differences related to taxes chargeable on dividends from subsidiaries or on gains upon their disposal (“outside basis differences”). For temporary differences of EUR 32,901 thousand (previous year EUR 10,882 thousand) deferred tax liabilities are not recognized except to the extent that Management expects the temporary differences to reverse in the foreseeable future.
23. Earnings per Share
Basic earnings per share (EPS) Basic earnings per share are calculated by dividing profit for the period attributable to equity holders of the parent by the weighted average number of ordinary shares in issue during the year.
The weighted average number of ordinary shares outstanding during the period is the number of ordinary shares outstanding at the beginning of the period, adjusted by the number of ordinary shares bought back or issued during the period multiplied by a time-weighting factor. The time-weighting factor is the number of days that the shares are outstanding as a proportion of the total number of days in the period.
As of January 1, 2015, subscribed capital amounted to EUR 153,131 thousand and was fully paid-in. The registered share capital was divided into 153,130,566 no-par value bearer shares.
On February 13, 2015, the subscribed capital of Rocket Internet SE was increased from EUR 153,130,566 to EUR 165,140,790, in partial utilization of the authorized capital and in exclusion of the subscription rights of shareholders. The 12,010,224 new ordinary bearer shares with no-par value have been sold to institutional investors in a private placement transaction.
Diluted earnings per share (EPS) Diluted earnings per share are calculated by dividing profit or loss attributable to ordinary share-holders and weighted-average number of ordinary shares outstanding after adjustment for the effects of all dilutive potential ordinary shares. The calculation of diluted earnings per share excludes potential ordinary shares that would have an antidilutive effect on earnings per share.
The following instruments were not taken into account when calculating diluted earnings per share as their effect would have been antidilutive. The stock options granted to the board members and certain employees in 2014 were not taken into account when calculating diluted earnings per share in 2014, since the performance targets necessary to exercise the options were not achieved at the end of the 2014 reporting period.
Jan 1–Dec 31, 2015 Jan 1–Dec 31, 2014
Share options from SOP I/II (in thousands) 7,150 7,180
Potential ordinary shares from assumed conversion of convertible debt (in thousands)1) 11,570 0
1) On July 22, 2015, Rocket Internet SE issued 5,500 convertible bonds with a principal amount of EUR 100,000 each. The convertible bond has a term of seven years and an interest rate of 3% per year payable semi-annually.
161COMBINED MANAGEMENT REPORTCONSOLIDATED FINANCIAL STATEMENTSROCKET INTERNET COMPANIES
Notes to the Consolidated Financial Statements

Earnings per share are calculated as follows:
Basic earnings per share are identical to diluted earnings per share.
Transactions involving ordinary shares between the reporting date and the date of the authorization of these financial statementsAfter the reporting period end (December 31, 2015) there were no transactions involving ordinary shares of the Company.
Jan 1–Dec 31, 2015 Jan 1–Dec 31, 2014
Profit attributable to equity holders of the parent (In EUR thousand) –202,459 463,022
Weighted average number of ordinary shares in issue (in thousands) 163,722 143,022
Earnings per share (basic and diluted) in EUR –1.24 3.24
162 ABOUT ROCKET INTERNETLETTER TO OUR SHAREHOLDERSANNUAL REPORT 2015

Notes to the Balance Sheet
24. Property, Plant and Equipment
Movements in the carrying amount of property, plant and equipment were as follows:
On December 31, 2015 and 2014, no property and equipment was pledged to third parties as collateral.
In EUR thousandLeasehold
improvements
Other property, plant and equipmen Total
Cost
As of Jan 1, 2014 433 2,638 3,070
Additions 136 3,521 3,657
Disposals –31 –1,010 –1,041
Changes in the basis of consolidation 2 –1,252 –1,250
Reclassified to assets held for sale 0 –211 –211
Currency translation difference 1 7 8
As of Dec 31, 2014 541 3,693 4,234
Additions 439 3,161 3,601
Disposals –138 –666 –804
Changes in the basis of consolidation –39 –1,911 –1,949
Reclassified to assets held for sale 0 –380 –380
Currency translation difference –3 –215 –219
As of Dec 31, 2015 800 3,683 4,483
Depreciation and impairment
As of Jan 1, 2014 –5 –664 –669
Depreciation charge for the year –168 –1,047 –1,215
Disposals 1 359 359
Changes in the basis of consolidation 6 263 269
Reclassified to assets held for sale 0 149 149
Currency translation difference 0 3 3
As of Dec 31, 2014 –166 –938 –1,104
Depreciation charge for the year –359 –1,138 –1,497
Disposals 10 117 127
Changes in the basis of consolidation 79 523 602
Reclassified to assets held for sale 0 166 166
Currency translation difference 2 46 48
As of Dec 31, 2015 –434 –1,223 –1,657
Net book value
As of Jan 1, 2014 428 1,974 2,401
As of Dec 31, 2014 375 2,755 3,131
As of Dec 31, 2015 366 2,460 2,826
163COMBINED MANAGEMENT REPORTCONSOLIDATED FINANCIAL STATEMENTSROCKET INTERNET COMPANIES
Notes to the Consolidated Financial Statements

25. Intangible Assets
Intangible assets developed as follows during the financial years 2014 and 2015:
As of December 31, 2015 and 2014, no intangible assets have been pledged to third parties as collateral.
In EUR thousand Goodwill
Internally generated intangible
assets
Purchased industrial
and similar rights Total
Cost
As of Jan 1, 2014 0 5,985 1,440 7,425
Additions 0 2,569 2,295 4,864
Disposals 0 0 –36 –36
Changes in the basis of consolidation 0 0 –1,069 –1,069
Reclassified to assets held for sale 0 0 –6 –6
Currency translation difference 0 1 2 3
As of Dec 31, 2014 0 8,555 2,625 11,181
Additions 0 5,719 2,258 7,977
Disposals 0 –392 –1,813 –2,205
Changes in the basis of consolidation 117,411 –1,100 22,198 138,510
Reclassified to assets held for sale 0 –1,128 –41 –1,169
Currency translation difference 0 0 –80 –80
As of Dec 31, 2015 117,411 11,656 25,147 154,214
Amortization and impairment
As of Jan 1, 2014 0 –703 –152 –855
Amortization charge for the year 0 –1,151 –287 –1,438
Disposals 0 0 –3 –3
Changes in the basis of consolidation 0 0 140 140
Reclassified to assets held for sale 0 0 0 0
Currency translation difference 0 0 0 0
As of Dec 31, 2014 0 –1,854 –302 –2,156
Amortization charge for the year 0 –3,387 –2,387 –5,774
Impairment –18,050 0 0 –18,050
Disposals 0 117 82 199
Changes in the basis of consolidation 0 0 226 226
Reclassified to assets held for sale 0 458 4 462
Currency translation difference 0 0 6 6
As of Dec 31, 2015 –18,050 –4,666 –2,371 –25,087
Net book value
As of Jan 1, 2014 0 5,282 1,288 6,570
As of Dec 31, 2014 0 6,701 2,323 9,024
As of Dec 31, 2015 99,361 6,990 22,776 129,127
164 ABOUT ROCKET INTERNETLETTER TO OUR SHAREHOLDERSANNUAL REPORT 2015

Goodwill impairment testing For the purposes of impairment testing, goodwill is allocated to the Group’s cash-generating units (CGUs) (network companies) as follows (2014: there was no goodwill recognized in the Group).
The following impairment loss was recognized in relation to the goodwill:
The Management Board estimated the recoverable amount of these CGUs as part of the mandatory impairment testing following the acquisition of these CGUs during the current annual period.
The recoverable amounts of Pizzabo.it and La Nevera Roja were based on the fair value less costs of disposal estimated using the sales prices agreed on in the disposal transactions of these entities in February 2016. It was assumed that the transaction prices agreed on in the sale transactions were a reasonable approximation of the fair value of the respective CGUs at the impairment testing date, December 31, 2015. The fair value measurement was categorized as a Level 3 fair value (see Note 41).
The carrying amounts of Pizzabo.it and La Nevera Roja were determined to be higher than their recoverable amounts of EUR 36,375 thousand and EUR 75,625 thousand and an impairment loss was recognized.
The impairment loss was fully allocated to goodwill and included in the reportable segment “Other”.
26. Non-Current Financial Assets
Non-current financial assets comprise the following:
In EUR thousand Dec 31, 2015
Pizzabo.it 30,847
La Nevera Roja 66,737
97,584
Other units without significant goodwill 1,777
Total 99,361
In EUR thousand 2015
Pizzabo.it 14,400
La Nevera Roja 3,650
Total impairment loss recognized 18,050
In EUR thousand Dec 31, 2015 Dec 31, 2014
Equity instruments at FVTPL 322,349 336,547
AFS Equity investments 999,116 0
Loan receivables 8,692 39
Other 3,027 1,944
Total non-current financial assets 1,333,184 338,530
165COMBINED MANAGEMENT REPORTCONSOLIDATED FINANCIAL STATEMENTSROCKET INTERNET COMPANIES
Notes to the Consolidated Financial Statements

For additional information regarding Equity instruments accounted for at fair value through profit or loss and AFS Equity investments see Note 41.
27. Inventories
Inventories are mainly comprised of merchandise.
Except for customary retention of proprietary rights, all inventories are free from rights of third parties.
28. Trade Receivables
Trade receivables comprise the following:
The aging analysis of trade receivables is as follows:
In EUR thousand Dec 31, 2015 Dec 31, 2014
Gross inventories 743 11,532
Write-down 0 –294
Total inventories 743 11,238
In EUR thousand Dec 31, 2015 Dec 31, 2014
Trade receivables from third parties 3,170 7,981
Trade receivables from subsidiaries (outside consolidation) 941 671
Trade receivables from associated companies and joint ventures 5,974 12,096
Trade receivables 10,085 20,748
Gross trade receivables 10,810 21,460
Valuation allowance –725 –712
Trade receivables 10,085 20,748
In EUR thousand
Book value
Not past due and
not im paired
Past due, but not impaired Impaired receiv-
ables (gross)
Impair-ment
amount1–30 days
31–90 days
91–180 days
> 180days
Dec 31, 2015 10,085 7,126 1,140 1,045 427 347 725 –725
Dec 31, 2014 20,748 20,433 144 36 48 87 712 –712
166 ABOUT ROCKET INTERNETLETTER TO OUR SHAREHOLDERSANNUAL REPORT 2015

Valuation allowances on trade receivables developed as follows:
29. Other Current Financial Assets
Other current financial assets comprise the following:
The aging analysis of other current financial receivables is as follows:
In EUR thousand Valuation allowance
As of Jan 1, 2014 –716
Additions –44
Reversal 34
Change in scope of consolidation 14
As of Dec 31, 2014 –712
Additions –205
Usage 186
Reversal 6
As of Dec 31, 2015 –725
In EUR thousand Dec 31, 2015 Dec 31, 2014
Loan receivables from associated companies and joint ventures 33,307 7,857
Loan receivables from subsidiaries (outside consolidation) 1,328 1,991
Receivables from the sale of investments 2,543 1,930
Loan receivables from third parties 545 0
Security deposits 625 1,872
Other financial assets (current) 2,913 1,445
Total other current financial assets 41,260 15,095
In EUR thousand
Book value
Not past due and
not impaired
Past due, but not impaired Impaired receiv-
ables (gross)
Impair-ment
amount1–30 days
31–90 days
91–180 days
> 180days
Dec 31, 2015 41,260 34,169 88 45 1,052 5,906 19 –19
Dec 31, 2014 15,095 14,554 188 58 38 257 19 –19
167COMBINED MANAGEMENT REPORTCONSOLIDATED FINANCIAL STATEMENTSROCKET INTERNET COMPANIES
Notes to the Consolidated Financial Statements

30. Non-Financial Assets
Non-financial assets comprise the following:
31. Cash and Cash Equivalents / Consolidated Statement of Cash Flows
Cash and cash equivalents comprise the following:
Additional information to the consolidated statement of cash flows
Non-consolidated equity investments Non-consolidated equity investments specified in the consolidated statement of cash flows relate to investments in associates and joint ventures, prepayments on shares in associates and other investments in which Rocket Internet directly or indirectly holds less than 20% of the outstanding voting rights or in which the Group has no significant influence as well as non-material subsidiaries.
Non-cash investing and financing activities and transactionsIn the financial year 2015, non-cash investing and financing activities and transactions of EUR 217,852 thousand were performed. This relates primarily to the acquisition of new shares in Global Fashion Group in exchange for shares in Kanui (Jade 1159. GmbH and its subsidiaries VRB GmbH & Co. KG B-195 and Kanui Comercio Varejista Ltda.) and in Tricae (Jade 1218. GmbH and its subsidiaries VRB GmbH & Co. B-196 KG and Trica Comercio Varejista Ltda.), as well as the exchange of shares in Yemek Sepeti for shares in Delivery Hero. Furthermore, the Group contributed shares in LIH Subholding Nr. 3 UG (haftungsbeschränkt) & Co. KG in exchange for
In EUR thousand Dec 31, 2015 Dec 31, 2014
Prepayments on shares in associated companies 0 3,764
Other prepayments 33 20
Tax receivables 89 0
Other non-financial assets (non-current) 400 374
Other non-current non-financial assets 523 4,158
Receivables from sales tax / VAT 2,623 3,942
Prepaid expenses 1,793 3,338
Prepayments 172 385
Other non-financial assets (current) 657 310
Other current non-financial assets 5,246 7,975
Total Non-financial assets 5,768 12,133
In EUR thousand Dec 31, 2015 Dec 31, 2014
Bank balances 1,758,870 2,053,206
Checks 1 230
Petty cash 18 12
Cash and cash equivalents 1,758,889 2,053,448
168 ABOUT ROCKET INTERNETLETTER TO OUR SHAREHOLDERSANNUAL REPORT 2015
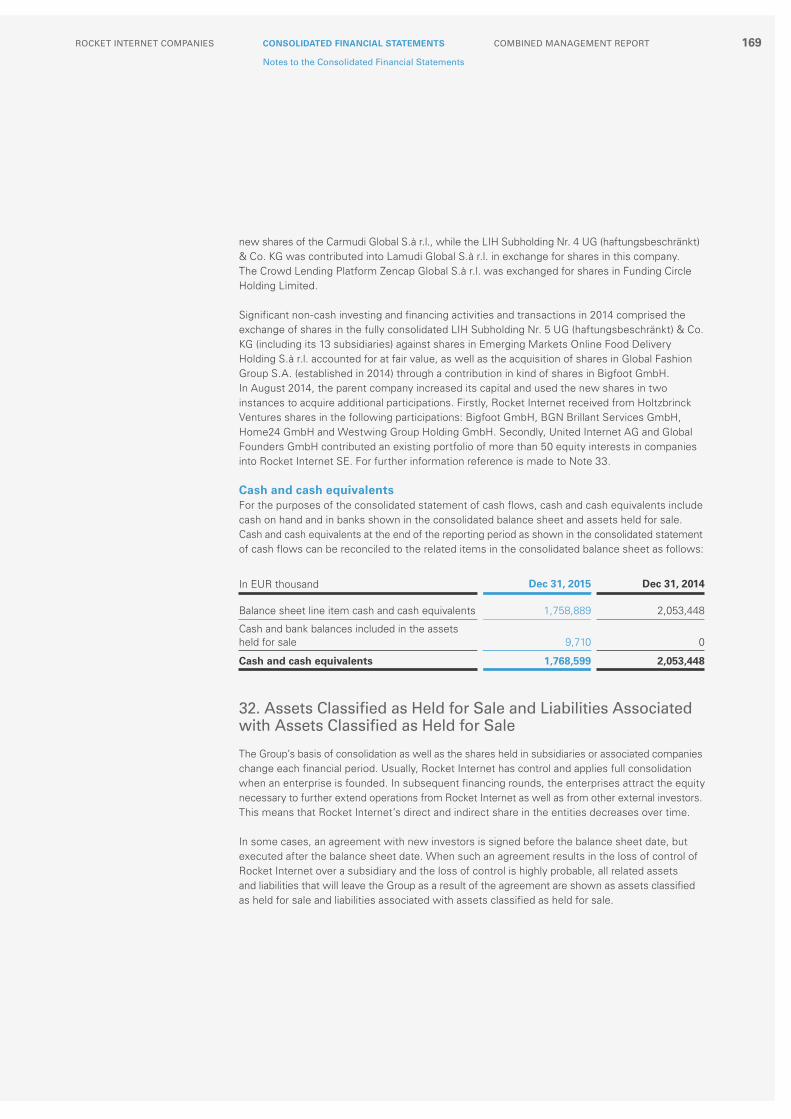
new shares of the Carmudi Global S.à r.l., while the LIH Subholding Nr. 4 UG (haftungsbeschränkt) & Co. KG was contributed into Lamudi Global S.à r.l. in exchange for shares in this company. The Crowd Lending Platform Zencap Global S.à r.l. was exchanged for shares in Funding Circle Holding Limited.
Significant non-cash investing and financing activities and transactions in 2014 comprised the exchange of shares in the fully consolidated LIH Subholding Nr. 5 UG (haftungsbeschränkt) & Co. KG (including its 13 subsidiaries) against shares in Emerging Markets Online Food Delivery Holding S.à r.l. accounted for at fair value, as well as the acquisition of shares in Global Fashion Group S.A. (established in 2014) through a contribution in kind of shares in Bigfoot GmbH. In August 2014, the parent company increased its capital and used the new shares in two instances to acquire additional participations. Firstly, Rocket Internet received from Holtzbrinck Ventures shares in the following participations: Bigfoot GmbH, BGN Brillant Services GmbH, Home24 GmbH and Westwing Group Holding GmbH. Secondly, United Internet AG and Global Founders GmbH contributed an existing portfolio of more than 50 equity interests in companies into Rocket Internet SE. For further information reference is made to Note 33.
Cash and cash equivalentsFor the purposes of the consolidated statement of cash flows, cash and cash equivalents include cash on hand and in banks shown in the consolidated balance sheet and assets held for sale. Cash and cash equivalents at the end of the reporting period as shown in the consolidated statement of cash flows can be reconciled to the related items in the consolidated balance sheet as follows:
32. Assets Classified as Held for Sale and Liabilities Associated with Assets Classified as Held for Sale
The Group’s basis of consolidation as well as the shares held in subsidiaries or associated companies change each financial period. Usually, Rocket Internet has control and applies full consolidation when an enterprise is founded. In subsequent financing rounds, the enterprises attract the equity necessary to further extend operations from Rocket Internet as well as from other external investors. This means that Rocket Internet’s direct and indirect share in the entities decreases over time.
In some cases, an agreement with new investors is signed before the balance sheet date, but executed after the balance sheet date. When such an agreement results in the loss of control of Rocket Internet over a subsidiary and the loss of control is highly probable, all related assets and liabilities that will leave the Group as a result of the agreement are shown as assets classified as held for sale and liabilities associated with assets classified as held for sale.
In EUR thousand Dec 31, 2015 Dec 31, 2014
Balance sheet line item cash and cash equivalents 1,758,889 2,053,448
Cash and bank balances included in the assets held for sale 9,710 0
Cash and cash equivalents 1,768,599 2,053,448
169COMBINED MANAGEMENT REPORTCONSOLIDATED FINANCIAL STATEMENTSROCKET INTERNET COMPANIES
Notes to the Consolidated Financial Statements

Assets classified as held for sale and liabilities associated with assets classified as held for sale comprise the following:
An increase of capital of the online loan platform Spotcap Global S.à r.l. was conducted by external investors in December 2015, which resulted in a dilution of Rocket Internet’s interest to less than 50%. Current loan liabilities from Spotcap are secured by bank accounts in the amount of EUR 1,552 thousand.
A capital increase of Bus Serviços de Agendamento Ltda. was decided upon in October 2015, as a result of which the Group will hold a share of 50%. The relevant articles of association were signed in November 2015. The transaction is expected to be concluded (closing) in the second quarter of 2016.
In EUR thousandDec 31, 2015 Spotcap Other Total
Intangible assets 395 9 404
Property, plant and equipment 54 86 140
Financial assets 13 13 26
Other non-current assets 130 0 130
Non-current assets 593 107 700
Inventories 0 23 23
Trade receivables 1 853 854
Other current financial assets 4,619 1,076 5,695
Other current non-financial assets 68 40 108
Cash and cash equivalents 5,898 3,812 9,710
Current assets 10,586 5,804 16,390
Assets classified as held for sale 11,179 5,911 17,090
Other non-current financial liabilities 50 0 50
Other non-current non-financial liabilities 53 0 53
Non-current liabilities 103 0 103
Current loans 3,989 0 3,989
Current bank liabilities 0 144 144
Trade payables 390 1,930 2,320
Other current financial liabilities 25 0 25
Other current non-financial liabilities 90 879 970
Current liabilities 4,493 2,953 7,446
Liabilities directly associated with assets classified as held for sale 4,596 2,953 7,549
170 ABOUT ROCKET INTERNETLETTER TO OUR SHAREHOLDERSANNUAL REPORT 2015

In accordance with the contract dated December 16, 2015, the sale of Bonnyprints GmbH to Planet Cards SAS was agreed. The transaction was completed on January 19, 2016 (closing).
In August 2014, as a part of the portfolio contribution of the Global Founders Capital funds, the Group acquired shares in Playa Games GmbH. The shares were sold in July 2014 (signing). The closing of the transaction was concluded in May 2015. In December 2014, Philippine Long Distance Telephone Company (PLDT) and Rocket Internet entered into an agreement to establish a Joint Venture for payment services with a focus on emerging markets, with each partner holding a 50% stake. The closing of the transaction was in February 2016.
Cumulative income or expense recognized in other comprehensive income relating to assets and liabilities classified as held for sale amounted to EUR 0 thousand (previous year: EUR 0 thousand).
Disposal groups that meet the criteria of IFRS 5 to be classified as held for sale after the reporting date, but before the date of authorization of the financial statements for issueRocket Internet SE announced the divestiture of two non-core takeaway food operations to JustEat plc on February 5, 2016. Rocket Internet sold La Nevera Roja in Spain and Pizzabo.it in Italy. The transaction in Italy was completed on the day of announcement (closing). It is anticipated that the transaction in Spain will be completed in the second or in the third quarter of 2016 (closing), as it is subject to regulatory approval from the Spanish competition authority, the Comisión Nacional de los Mercados y la Competencia. Had the criteria in paragraphs 7 and 8 of IFRS 5 been already met before reporting period end on December 31, 2015, the following assets and liabilities would have been classified as held for sale:
In EUR thousand Dec 31, 2014 Total
Shares in associates 212
Non-current assets 212
Other current financial assets 3,667
Current assets 3,667
Assets classified as held for sale 3,879
In EUR thousandDec 31, 2015
Webs S.r.l. (Pizzabo.it)
Grupo Yamm Comida a
Domicilio S.L. Total
Goodwill 30,847 66,737 97,584
Other intangible assets 7,625 12,668 20,293
Other non-current assets 374 476 850
Non-current assets 38,845 79,881 118,727
Other current assets 635 984 1,619
Cash and cash equivalents 449 1,460 1,909
Current assets 1,084 2,444 3,528
Assets classified as held for sale 39,930 82,326 122,255
Non-current liabilities 1,547 3,607 5,154
Current liabilities 1,177 3,122 4,299
Liabilities directly associated with assets classified as held for sale 2,724 6,729 9,453
171COMBINED MANAGEMENT REPORTCONSOLIDATED FINANCIAL STATEMENTSROCKET INTERNET COMPANIES
Notes to the Consolidated Financial Statements

33. Share Capital and Reserves
As of January 1, 2014, the share capital amounted to EUR 110 thousand and treasury shares amounted to EUR 43,050 in the Consolidated Financial Statements. The capital reserve amounted to EUR 490,707 thousand and included effects from payments by non-controlling interests of a total of EUR 13,312 thousand.
Based on a resolution passed at the shareholders’ meeting on February 4, 2014, the Company’s nominal capital was increased in exchange for non-cash contribution by EUR 546 to EUR 110,346. In conjunction with this capital increase, the shareholders agreed to convert a liability to a shareholder in equity resulting in an increase of the capital reserve by EUR 14,477 thousand.
In May 2014, the shareholders agreed on a combined distribution of cash and distribution in kind (distribution in advance). Consequently, Rocket Internet SE transferred by way of a separate share transfer agreement shares in two associates to Emesco AB and AI European Holdings S.à r.l. The carrying amount of the transferred shares amounted to EUR 92,640 thousand. The fair value of the distributed shares amounted to EUR 153,234 thousand. Global Founders GmbH received a cash dividend of EUR 286,766 thousand. The distributions were made by withdrawing EUR 270,483 thousand from the capital reserves.
In August 2014, 38,579 treasury shares were redeemed in a simplified redemption process pursuant to Sec. 237 (3) No. 3 AktG (without capital decrease).
In the course of the capital increase resolution dated August 22, 2014, (I) capital reserves amounting to EUR 33 thousand were converted into share capital.
By the capital increase resolution dated August 22, 2014, (II) the share capital was increased by EUR 16 thousand by issuance of new no-par value registered shares to PLDT Online Investments PTE.LTD. (PLDT) in exchange for a cash contribution. In the course of the capital increase resolution dated August 22, 2014 (II) allocations to the capital reserve in the amount of EUR 333,326 thousand were made by PLDT as a consequence of additional paid-in capital for the acquisition of new shares.
By the capital increase resolution dated August 22, 2014, (III) the share capital was increased by EUR 26 thousand by issuance of new no-par value registered shares to United Internet and Global Founders in exchange for cash contributions. In the course of the capital increase resolution dated August 22, 2014 (III) allocations to the capital reserve in the amount of EUR 333,326 thousand were made as a contribution in cash by United Internet and EUR 255,000 thousand as a contribution in kind by United Internet and Global Founders. In total EUR 588,326 thousand were made as a consequence of additional paid-in capital for the acquisition of new shares.
By the capital increase resolution dated August 22, 2014, (IV) the share capital was increased by EUR 5 thousand by issuance of new no-par value registered shares to Holtzbrinck in exchange for cash contributions. In the course of the capital increase resolution dated August 22, 2014, (IV) allocations to the capital reserve in the amount of EUR 126,033 thousand were made by Holtzbrinck as a consequence of additional paid-in capital for the acquisition of new shares.
By the capital increase resolution dated August 22, 2014, (V) the share capital of the Company was increased by EUR 119,913 thousand via the capital increase by conversion of a capital reserve.
In the course of the initial public offering on October 2, 2014, the Group issued 33,028,311 new shares with a notional value of EUR 1 per share.
172 ABOUT ROCKET INTERNETLETTER TO OUR SHAREHOLDERSANNUAL REPORT 2015

In the course of the initial public offering (IPO) on October 2, 2014, a share premium in the amount of EUR 1,370,675 thousand was realized and allocated to the capital reserve. In connection with the IPO, Rocket Internet SE incurred transaction costs directly attributable to the raising of capital amounting to EUR 34,423 thousand, net of the income tax benefit associated with this in the amount of EUR 5,521 thousand. This was recognized as a deduction from the capital reserve. As of December 31, 2014, EUR 25,081 thousand of the total amount of the transaction costs had been paid.
As of December 31, 2014, subscribed capital amounted to EUR 153,131 thousand and was fully paid-in. The registered share capital was divided into 153,130,566 no-par value bearer shares. As of December 31, 2014, no treasury shares were held.
On February 13, 2015, the subscribed capital of Rocket Internet SE was increased from EUR 153,130,566 to EUR 165,140,790 in partial utilization of the authorized capital and in exclusion of the subscription rights of shareholders. The 12,010,224 new ordinary bearer shares with no-par value have been sold to institutional investors in a private placement transaction. The shares have been issued at a price of EUR 49.00 per share. Rocket Internet received proceeds from this issue of shares in the amount of EUR 588,501 thousand (before transaction costs). In connection with the capital increase, Rocket Internet incurred transaction costs directly attributable to the raising of capital, amounting to EUR 2,852 thousand, before income tax benefit associated with this in the amount of EUR 846 thousand. This was recognized as a deduction from the capital reserve.
On July 22, 2015, Rocket Internet SE issued a convertible bond which increased the capital reserves by EUR 37,659 thousand. In connection with the issue, Rocket Internet SE incurred directly attributable transactions costs of EUR 188 thousand, before the income tax benefit associated with these costs in the amount of EUR 56 thousand. For more information, please, refer to Note 35.
As of December 31, 2015, the subscribed capital amounted to EUR 165,141 thousand and was fully paid-in. The registered share capital is divided into 165,140,790 no-par value bearer shares. As of December 31, 2015, no treasury shares were held.
In addition, there has been an adjustment of deferred taxes from previous years, impacting the capital reserve with EUR –1,744 thousand.
During the financial year 2015, the capital reserves increased by EUR 622,833 thousand from EUR 2,482,643 thousand to EUR 3,105,477 thousand.
The changes in the equity-settled share-based payments (IFRS 2) are explained in the table below and are driven by increases in the reserve through the income statement, the deconsolidation of entities and allocation to non-controlling interests.
Equity-settled share-based payments recognized as increase/decrease in equity comprise the following:
In EUR thousand 2015 2014
Equity-settled share-based payments recognized as employee benefit expenses of the period 57,952 51,295
Changes due to deconsolidation and allocation to non-controlling interests –4,057 –14,046
Equity-settled share-based payments (IFRS 2) as presented in consolidated statement of changes in equity 53,895 37,249
173COMBINED MANAGEMENT REPORTCONSOLIDATED FINANCIAL STATEMENTSROCKET INTERNET COMPANIES
Notes to the Consolidated Financial Statements

Changes in Other components of equity, which are attributable to both, the equity holders of the parent company and to the non-controlling interest, comprise the following:
Authorization of the Management Board to issue new shares (authorized capital)By resolution of the General Meeting dated August 22, 2014, the Management Board is authorized to increase the registered capital of the Company until August 21, 2019, with the consent of the Supervisory Board once or repeatedly by up to a total of EUR 60,051,127 by the issuance of up to 60,051,127 new no-par value bearer shares with the value of EUR 1 against contributions in cash or in kind (Genehmigtes Kapital 2014). As of December 31, 2015 the remaining authorized capital totals EUR 15,012,592.
By resolution of the General Meeting dated June 23, 2015, the Management Board is authorized to increase the registered capital of the Company until June 22, 2020, with the consent of the Supervisory Board once or repeatedly by up to a total of EUR 67,557,803 by the issuance of up to 67,557,803 new no-par value bearer shares with the value of EUR 1 against contributions in cash or in kind (Genehmigtes Kapital 2015).
34. Distributions Made and Proposed
During the financial year 2015, no dividends were declared or paid to the shareholders of the parent Company, however a fully consolidated subsidiary paid a cash dividend of EUR 8,033 thousand to a non-controlling shareholder.
Dividends declared and paid to the shareholders of the parent during the financial year 2014 were as follows:
Other components of equity
In EUR thousand
Foreign currency
diffe- rences
Associates and JointVentures
Available-for-SaleAssets Other Total
Dec 31, 2013 568 8,240 0 321 9,129
Net other comprehensive income in 2014 –455 79,017 0 –321 78,241
Dec 31, 2014 113 87,258 0 0 87,371
Net other comprehensive income in 2015 –1,144 –97,544 135,119 0 36,431
Other changes in 2015 0 630 0 0 630
Dec 31, 2015 –1,031 –9,657 135,119 0 124,431
In EUR thousand (except per share data) 2014
Dividends payable as of Jan 1 0
Dividends declared during the year 440,000
Dividends paid during the year –440,000
Dividends payable as of Dec 31 0
Dividends per share declared during the year (in EUR per share)1) 2.87
1) Calculated based on 153,130,566 ordinary shares outstanding and issued as of December 31, 2014.
174 ABOUT ROCKET INTERNETLETTER TO OUR SHAREHOLDERSANNUAL REPORT 2015

In the second quarter of 2014, the shareholders resolved a EUR 440,000 thousand advance combined dividend in kind and in cash. Following the resolution, Rocket Internet transferred 4,145 and 1,892 shares in Bigfoot GmbH to Emesco AB and AI European Holdings S.à r.l., respectively, as well as 4,559 and 2,082 shares in BGN Brillant Services GmbH to Emesco AB and AI European Holdings S.à r.l., respectively. The fair value of the distributed shares amounted to EUR 153,234 thousand. In addition, a cash dividend of EUR 286,766 thousand was paid in accordance with the proportional participation of shareholders to Global Founders GmbH.
Non-cash distribution of the shares in the associated companies was measured at fair value and gave rise to the following gain:
35. Non-Current Financial Liabilities
Non-current financial liabilities comprise the following:
Convertible bonds On July 22, 2015, Rocket Internet SE issued 5,500 convertible bonds with a principal amount of EUR 100,000 each. The convertible bond has a term of seven years and an interest rate of 3% per year payable semi-annually on January, 22 and July, 22.
The contractual cash flows from the convertible bonds are affected by the option of the bondholders of exchanging convertible bonds in the nominal amount of EUR 100,000 for 2,103.6909 shares in Rocket Internet SE. The conversion price is EUR 47.5355.
As of the issue date, the convertible bonds had an aggregate fair value of EUR 550,000 thousand. The fair value of the aggregate convertible bond portfolio is determined based on the market prices quoted on the Frankfurt Stock Exchange for the convertible bonds. The market price was 92% as of December 31, 2015.
The convertible bonds were divided into an equity component and a debt component on the issue date. The fair value of the debt component was determined by discounting the future payment flows while taking into account a market interest rate of 3.51% for a comparable debt instrument.
In EUR thousand 2014
Fair value of the distributed shares 153,234
Less carrying amount prior to distributions (at equity method) 92,640
Gain from distribution of non-cash assets to owners 60,594
In EUR thousand Dec 31, 2015 Dec 31, 2014
Liabilities from convertible bonds 511,968 0
Mandatorily redeemable preference shares issued by consolidated subsidiaries 5,950 4,950
Contingent consideration 7,622 0
Other financial liabilities 1,358 365
Total non-current financial liabilities 526,898 5,315
175COMBINED MANAGEMENT REPORTCONSOLIDATED FINANCIAL STATEMENTSROCKET INTERNET COMPANIES
Notes to the Consolidated Financial Statements

The bond conversion option was recognized in equity at a residual value of EUR 37,659 thousand upon issue of the bond. This was offset by transaction costs of EUR 188 thousand allocable to the equity instrument, which were charged to reserves. Furthermore, deferred tax assets of EUR 56 thousand were recognized in equity. The proportion of the equity component does not change over the term to maturity.
The debt component is reported at amortized cost using the effective interest method. As of December 31, 2015, the long-term portion of the debt component was EUR 511,968 thousand.
In the period under review, interest in the amount of EUR 9,431 thousand accrued on the convertible bonds.
Interest payable on the convertible bonds reported as other current liabilities came to EUR 7,242 thousand as of the reporting date.
36. Trade Payables
As of December 31, 2015, trade payables amount to EUR 11,398 thousand (previous year EUR 43,703 thousand).
37. Other Current Financial Liabilities
Other current financial liabilities comprise the following:
38. Non-Financial Liabilities
Other current non-financial liabilities comprise the following:
In EUR thousand Dec 31, 2015 Dec 31, 2014
Loan liabilities 3,523 7,290
Convertible bond (current) 7,242 0
Bank liabilities 12 164
Refund liability for sales with a right of return 0 1,153
Other financial liabilities 978 1,454
Total other current financial liabilities 11,754 10,061
In EUR thousand Dec 31, 2015 Dec 31, 2014
Personnel liabilities 2,600 2,930
Liabilities from cash-settled share-based payments and similar liabilities 67,597 60,530
Tax liabilities 3,656 4,176
Advance payments received 518 1,358
Deferred income 11 919
Other non-financial liabilities 2,876 1,961
Other current non-financial liabilities 77,258 71,874
Other non-current non-financial liabilities 398 498
Total non-financial liabilities 77,656 72,372
176 ABOUT ROCKET INTERNETLETTER TO OUR SHAREHOLDERSANNUAL REPORT 2015

Liabilities from cash-settled share-based payments relate to employees as well as to others providing similar services (as defined in IFRS 2 and IAS 19).
39. Share-Based Compensation
The Group operates share-based compensation arrangements for eligible and selected directors, employees or others providing similar services to the Group (“a participant” or “participants”). These arrangements consist of four different types of awards:
– I. Share options in the Company, – II. Ordinary shares in subsidiaries, – III. Share options in subsidiaries or – IV. Cash settled awards.
I. Share options in the Company (Stock Option Programs 2014)Under the Stock Option Programs 2014 (“SOP I” and “SOP II”), one share option grants the holder the right to subscribe for one share of the Company.
All share options under the SOP I were granted to the Company’s CEO after the listing of the Company’s shares on the Open Market of the Frankfurt Stock Exchange (Frankfurter Wertpapier-börse or the ‘Open Market’) on October 2, 2014. These share options have an exercise price of EUR 42.63 per share option and will vest in monthly installments over a five-year vesting period and can be, subject to certain conditions, exercised after a waiting period of four years commencing on the date the share options were granted.
The options granted under the SOP I can only be exercised if:
(i) the Company successfully launches an average of at least four companies per year during the four-year waiting period; and
(ii) the stock price reflects, on at least one single trading day within the waiting period, a Company valuation of EUR 6.45 billion.
Under the SOP II, the Supervisory Board is authorized to grant up to 1,201,022 share options to each of the other two members of the Managing Board (i.e. the CFO and the General Managing Director), up to 1,201,023 share options to certain employees of the Company, up to 3,002,557 share options to members of the management of affiliated companies, and up to 600,511 share options to certain employees of affiliated companies. In 2015, a total of 80,000 options were granted under SOP II.
The SOP II provides for an overall ten-year vesting period with a certain number of share options vesting after an initial four-year vesting term and the remaining share options vesting in yearly installments thereafter. The share options can be, subject to their vesting and certain other conditions, exercised after a four-year waiting period commencing on the date the respective share options are granted.
The exercise price of the share options granted prior to listing of the Company’s shares in the Open Market amounts to EUR 26.14 per share option. For share options granted subsequent to the listing of the Company’s shares in the Open Market the exercise price per share option corresponds to the volume-weighted average closing price of the shares twenty consecutive trading days prior to the relevant grant date.
The exercise of share options under the SOP II requires that:
(i) the shares of the Company are included in the Open Market until October 31, 2014; and(ii) the Company successfully launches an average of at least four companies per year during
the four-year waiting period.
177COMBINED MANAGEMENT REPORTCONSOLIDATED FINANCIAL STATEMENTSROCKET INTERNET COMPANIES
Notes to the Consolidated Financial Statements

If the performance targets are not achieved by the end of the waiting period, the share options granted under the Stock Option Programs 2014 will forfeit completely without any further consideration. In addition, the share options are only exercisable within three weeks after publication of financial interim reports or financial statements, which follow the end of the waiting period.
The table below provides an overview of the movements in the share option awards, which entitle the employee to purchase shares in Rocket Internet SE if the vesting conditions are met, and their respective weighted average exercise prices:
The weighted average remaining contractual life for the share options outstanding as of December 31, 2015, is 5.7 years (December 31, 2014: 6.7 years).
The parameters applied in the Black Scholes option valuation formula and the related estimated fair values per share option are as follows as measured on the grant dates in 2015 and 2014:
The average of the vesting period and the contractual expiration date is considered the expected life for all options granted in 2015.
II. Ordinary shares in subsidiariesThe respective share-based payment arrangements provide for equity participation via a trust relationship. The trustee entity holds a certain amount of shares in accordance with the terms and conditions of a trust agreement for the benefit of the trustor, who can be the participant or an investment entity controlled by such a participant. A separate agreement, between the trustor and the relevant company receiving services, governs certain obligations regarding, inter alia, vesting-rights and non-compete obligations that relate to the indirect shareholding of the relevant participant in the relevant company.
Share options 2015 2014
Weighted average exercise
priceNumber
of options
Weighted average exercise
priceNumber
of options
Options outstanding at January 1 EUR 36.57 7,180,488 – –
Granted during the period EUR 26.31 80,000 EUR 36.57 7,180,488
Forfeited during the period EUR 26.14 110,834 – 0
Exercised during the period – – – 0
Options outstanding at December 31 EUR 36.62 7,149,654 EUR 36.57 7,180,488
Exercisable at the end December 31 – – – –
2015SOP II
2014SOP II
Fair value (EUR per Option) 18.22 27.81
Share price (EUR per Share) 31.14 42.50
Exercise price (EUR per Share) 26.31 26.14
Expected volatility (%) 46.09 45.00
Dividend yield (%) 0.00 0.00
Risk-free interest rate (%) 0.50 0.90
Expected life of share options (years) 10.00 10.00
178 ABOUT ROCKET INTERNETLETTER TO OUR SHAREHOLDERSANNUAL REPORT 2015

The vesting scheme, which is dependent on time and subject to continued services, provides for quarterly vesting over a period of typically four years (6.25% per quarter) and typically a 6-month or 12-month cliff. If a leaver event occurs prior to the expiration of the cliff period, typically all shares can be clawed back. Thereafter, in the case of a bad leaver event, the Company can usually claw back all vested and unvested shares, while in case of a good leaver event, the Company may only claw back the unvested shares. A bad leaver event is typically triggered, if, for example, the respective service agreement between a participant and subsidiary is terminated by such company for cause, the participant demonstrably committed a criminal offence against the company, or such member breached its non-compete obligation. A good leaver event is typically triggered, if, for example, the service agreement is terminated by either party without cause.
Shares in subsidiaries of the Group have been issued to participants at the nominal value of the shares of EUR 1. If the applicable vesting conditions are not met (typically if a participant’s employment is terminated), Rocket Internet SE or a subsidiary has a right to reacquire these shares at the nominal value or – if lower – at market value.
Movements in the number of shares are as follows:
The share prices for subsidiaries were estimated using the shares prices paid by investors in past financing rounds. Given that a subsidiary has multiple classes of equity, we employed the hybrid method in order to allocate equity to the various equity classes. The Finnerty Option Pricing Model was used to calculate a liquidity discount for the shares. Based on the estimated fair market value of the relevant shares, the total price paid by the participants for the shares (EUR 1 per share) included a purchase discount. The fair value of the share awards reported as a share-based payment expense is calculated as the difference between the estimated fair value and the price paid for the shares.
The weighted average grant date fair value of the shares awarded during 2015 amounts to EUR 0 (previous year EUR 1,977).
III. Share options in subsidiariesCall option arrangements entitle participants to acquire a pre-defined number of shares in the relevant subsidiary. The call options usually vest subject to continued services at quarterly intervals during a 3-year period (8.33% per quarter) or a 4-year period (6.25% per quarter); typically following a 12-month cliff vesting. In certain cases a 6-month cliff vesting applies and in a few cases there is no cliff vesting.
Under certain call option agreements (and if certain conditions are met), approximately one third of all call options vest upon the later of (i) the occurrence of a change of control event or (ii) 4 years after the first call options were granted. In the case of a change of control event in relation to the subsidiary, the relevant subsidiary is entitled to request that relevant participants exercise all call options outstanding at such point in time. Upon the occurrence of a bad leaver event, all call options that have not been exercised lapse. In the case of a good leaver event, all call options lapse for which the exercise period has not yet commenced.
2015 2014
Number of unvested shares at January 1 3,727 7,055
Deconsolidation of subsidiaries –2,804 –3,927
Granted during the period 5,555 5,772
Vested during the period –1,397 –4,577
Forfeited during the period –623 –596
Number of unvested shares at December 31 4,458 3,727
Number of vested shares at December 31 13,959 12,562
179COMBINED MANAGEMENT REPORTCONSOLIDATED FINANCIAL STATEMENTSROCKET INTERNET COMPANIES
Notes to the Consolidated Financial Statements

Movements in the number of shares options and their related weighted average exercise prices are as follows:
The contractual lives for the options are not specified in the option agreements. As a result, the weighted average remaining contractual life for the options outstanding at the reporting date is dependent on future exit events. In accordance with individual agreements, the outstanding options have an exercise price of EUR 1 per share.
As the options granted have an exercise price of EUR 1 per share, the fair values of the options are equal to their intrinsic values. Accordingly, the main parameters applied are as follows:
The weighted average grant date fair value of the options granted during 2015 amounts to EUR 1,890 (i.e. within the range of EUR 0 and EUR 28,759) per share. In some cases, the grant date fair values have been estimated because the option agreements have not yet been finalized.
The consolidated subsidiaries’ share prices were estimated using the share price paid by investors in past financing rounds. Given that a subsidiary has multiple classes of equity, we employed the hybrid method in order to allocate equity to the various equity classes. The Finnerty Option Pricing Model was used to calculate a liquidity discount for the shares.
IV. Cash settled awardsThis type of share-based payment award granted by certain group companies allows the participants to participate in exit related cash payments via call option arrangements. The notional value and the actual distribution of the relevant call options to the participants are determined by the relevant company’s management and are subject to certain shareholders’ approvals. The participants are entitled to a cash payment amounting to the difference between the exercise price of the call options and the exit proceeds allocated to each share underlying the call options in case of a change of control or listing of the subsidiary on a stock exchange.
The carrying amount and the total intrinsic value of the liability from cash-settled awards as of December 31, 2015 was EUR 64,141 thousand (December 31, 2014: EUR 48,144 thousand). All cash settled awards had vested as of December 31, 2015 and 2014, respectively.
2015 2014
Weighted average exercise
priceNumber
of options
Weighted average exercise
priceNumber
of options
Options outstanding at January 1 EUR 1.00 6,601 EUR 1.00 8,798
Deconsolidation of subsidiaries EUR 1.00 –6,306 EUR 1.00 –8,284
Granted during the year EUR 1.00 3,341 EUR 1.00 6,087
Exercised during the year EUR 1.00 –18 EUR 1.00 0
Forfeited during the year EUR 1.00 –162 EUR 1.00 0
Options outstanding at December 31 EUR 1.00 3,457 EUR 1.00 6,601
Exercisable at the end December 31 EUR 1.00 3,036 EUR 1.00 2,432
2015 2014
Range of share prices (EUR per share) 0–28,759 56–26,203
Exercise price (EUR per share) 1 1
180 ABOUT ROCKET INTERNETLETTER TO OUR SHAREHOLDERSANNUAL REPORT 2015

Total expense arising from share-based payment transactionsThe expense recognized for employee services received during the year is shown in the following table:
40. Financial Risk Management
The risk management function within the Company is carried out in respect of financial risks, operational risks and legal risks. The Group’s main risks arising from existing financial instruments relate to credit risk, liquidity risk, currency risk and share price risk.
The major financial instruments of Rocket Internet Group are cash (35% of total assets; previous year 52%), available-for-sale financial assets (20% of total assets; previous year 0%), equity instruments at fair value through profit and loss (FVTPL) (6% of total assets; previous year 9%) other non-current financial assets (<1% of total assets; previous year <1%), as well as liabilities from convertible bonds (10% of total assets; previous year 0%). The Group also records trade receivables and liabilities as well as loan receivables and liabilities mainly from associated companies and joint ventures, which arise in the ordinary course of business.
The Group places available funds in current accounts seeking to ensure both liquidity and security of principal. The Group’s policy does not permit any trading with financial instruments. No financial derivatives are utilized.
The risk associated with financial assets is controlled through a sophisticated system of operational monitoring. This applies, in particular, to the equity holdings of Rocket Internet Group, which are accounted for either as available-for-sale financial assets (AFS) or at fair value through profit or loss (FVTPL).
Financial risk comprises market risk (including currency risk, interest rate risk and other price risk), credit risk, liquidity risk and share price risk. The primary objectives of the financial risk management function are to establish risk limits, and ensure that exposure to risks stays within these limits. The operational and legal risk management functions are intended to ensure proper functioning of internal policies and procedures, in order to minimize operational and legal risks.
Risk management is carried out by a central treasury department under control of managing directors. The Management Board establishes the principles for overall risk management, as well as policies covering specific areas, such as foreign exchange risk, interest rate risk and investment of excess liquidity.
Credit Risk Credit risk is defined as the risk that our business partners do not meet their contractual payment obligations and this leads to a loss for Rocket Internet Group. The credit risk comprises the direct risk of a default and the decrease in the credit worthiness as well as the concentration of credit risks.
The credit risk exists for all financial assets in particular for deposits, receivables from associates and trade receivables. The Group’s receivables are unsecured. The maximum credit risk corresponds to the book value of the financial assets that are subject to this risk.
In EUR thousand 2015 2014
Equity-settled share-based payments 57,952 51,295
Cash-settled share-based payments 14,739 16,690
Total share-based payment expense 72,691 67,985
181COMBINED MANAGEMENT REPORTCONSOLIDATED FINANCIAL STATEMENTSROCKET INTERNET COMPANIES
Notes to the Consolidated Financial Statements
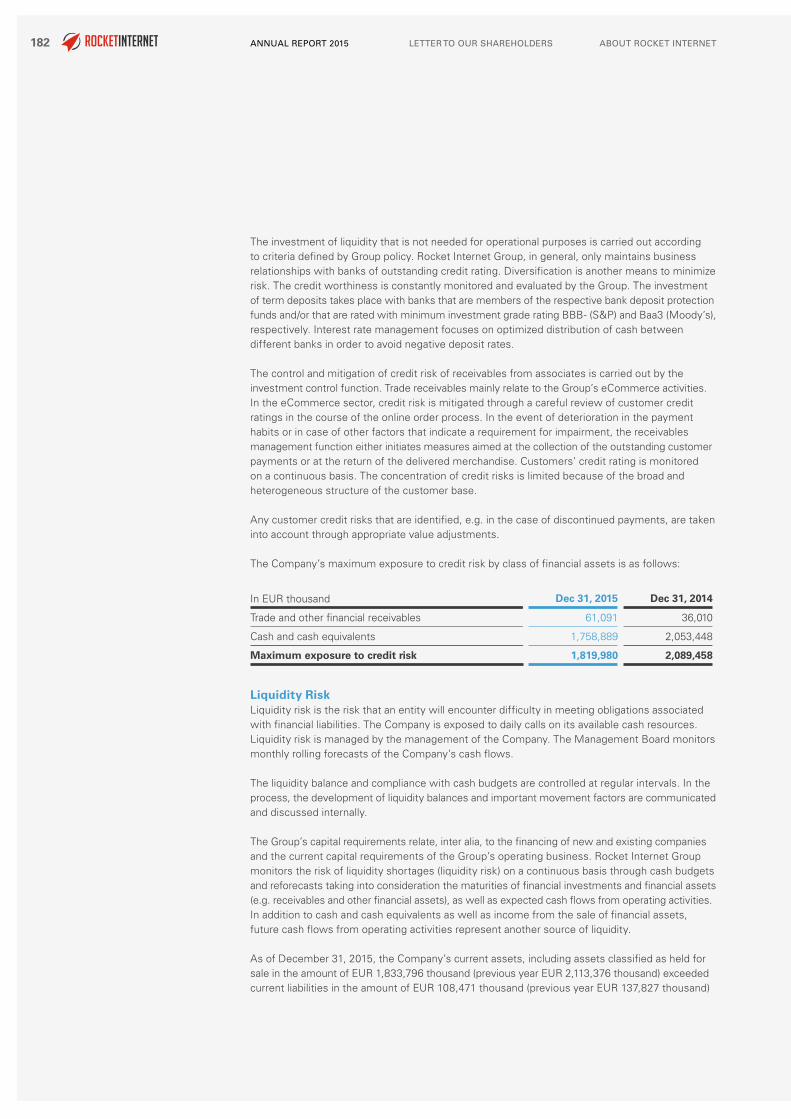
The investment of liquidity that is not needed for operational purposes is carried out according to criteria defined by Group policy. Rocket Internet Group, in general, only maintains business relationships with banks of outstanding credit rating. Diversification is another means to minimize risk. The credit worthiness is constantly monitored and evaluated by the Group. The investment of term deposits takes place with banks that are members of the respective bank deposit protection funds and/or that are rated with minimum investment grade rating BBB- (S&P) and Baa3 (Moody’s), respectively. Interest rate management focuses on optimized distribution of cash between different banks in order to avoid negative deposit rates.
The control and mitigation of credit risk of receivables from associates is carried out by the investment control function. Trade receivables mainly relate to the Group’s eCommerce activities. In the eCommerce sector, credit risk is mitigated through a careful review of customer credit ratings in the course of the online order process. In the event of deterioration in the payment habits or in case of other factors that indicate a requirement for impairment, the receivables management function either initiates measures aimed at the collection of the outstanding customer payments or at the return of the delivered merchandise. Customers’ credit rating is monitored on a continuous basis. The concentration of credit risks is limited because of the broad and heterogeneous structure of the customer base.
Any customer credit risks that are identified, e.g. in the case of discontinued payments, are taken into account through appropriate value adjustments.
The Company’s maximum exposure to credit risk by class of financial assets is as follows:
Liquidity Risk Liquidity risk is the risk that an entity will encounter difficulty in meeting obligations associated with financial liabilities. The Company is exposed to daily calls on its available cash resources. Liquidity risk is managed by the management of the Company. The Management Board monitors monthly rolling forecasts of the Company’s cash flows.
The liquidity balance and compliance with cash budgets are controlled at regular intervals. In the process, the development of liquidity balances and important movement factors are communicated and discussed internally.
The Group’s capital requirements relate, inter alia, to the financing of new and existing companies and the current capital requirements of the Group’s operating business. Rocket Internet Group monitors the risk of liquidity shortages (liquidity risk) on a continuous basis through cash budgets and reforecasts taking into consideration the maturities of financial investments and financial assets (e.g. receivables and other financial assets), as well as expected cash flows from operating activities. In addition to cash and cash equivalents as well as income from the sale of financial assets, future cash flows from operating activities represent another source of liquidity.
As of December 31, 2015, the Company’s current assets, including assets classified as held for sale in the amount of EUR 1,833,796 thousand (previous year EUR 2,113,376 thousand) exceeded current liabilities in the amount of EUR 108,471 thousand (previous year EUR 137,827 thousand)
In EUR thousand Dec 31, 2015 Dec 31, 2014
Trade and other financial receivables 61,091 36,010
Cash and cash equivalents 1,758,889 2,053,448
Maximum exposure to credit risk 1,819,980 2,089,458
182 ABOUT ROCKET INTERNETLETTER TO OUR SHAREHOLDERSANNUAL REPORT 2015

by an amount of EUR 1,725,325 thousand (previous year EUR 1,975,549 thousand). The Company invests the funds almost entirely in demand deposits, in order to be able to respond quickly and smoothly to unforeseen liquidity requirements. The Company’s liquidity portfolio comprises cash and cash equivalents.
The maturity analysis of financial liabilities is as follows:
The amounts disclosed in the tables are the contractual undiscounted cash flows.
Market risks
Currency riskThe Group is exposed to currency risks due to its international business activities outside of the Eurozone. Changes in exchange rates can therefore have an impact on the consolidated financial statements. The individual foreign currency transactions are not hedged since they are generally of a short-term nature. To the extent possible and feasible, hedging is not performed by way of financial engineering measures, but rather through the structuring of existing economic conditions (“natural hedging”). Effects of exchange rate fluctuations resulting from the translation of the financial statements of subsidiaries having a different functional currency into the reporting currency are recognized in equity in the consolidated financial statements. Foreign exchange differences that result from exchange rate changes when translating monetary balance sheet items in foreign currency are recognized in the income statement under other operating expenses or income.
The individual Group companies mainly operate in their functional currency. Therefore, there are no material foreign currency risks for the companies themselves.
Dec 31, 2015Carrying amount Cash flows < 1 year Cash flows 1–5 years Cash flows > 5 years
In EUR thousand Principal Interest Principal Interest Principal Interest
Convertible bond 519,210 0 –16,500 0 –66,000 –550,000 –33,000
Interest-bearing loans and borrowings 4,746 –3,585 -10 –1,161 –8 –7 0
Other non-current financial liabilities 13,719 0 0 –13,719 0 0 0
Other current financial liabilities 978 –978 0 0 0 0 0
Trade payables 11,398 –11,369 0 -29 0 0 0
Dec 31, 2014Carrying amount Cash flows < 1 year Cash flows 1–5 years Cash flows > 5 years
In EUR thousand Principal Interest Principal Interest Principal Interest
Interest-bearing loans and borrowings 7,453 –7,453 –5 0 0 0 0
Other non-current financial liabilities 5,315 0 –5 –5,315 0 0 0
Other current financial liabilities 2,608 –2,608 0 0 0 0 0
Trade payables 43,703 –43,696 0 –7 0 0 0
183COMBINED MANAGEMENT REPORTCONSOLIDATED FINANCIAL STATEMENTSROCKET INTERNET COMPANIES
Notes to the Consolidated Financial Statements

In accordance with IFRS 7, currency risks are depicted using sensitivity analyses. These analysis portray the impact of upward/downward revaluations of the euro in relation to all foreign currencies on earnings before income taxes and, if applicable, on equity. These analyses are based on financial instruments that are denominated in a currency different from the local functional currency and are of a monetary nature. In accordance with the requirements of IFRS 7, exchange rate-related differences from the translation of financial statements into the Group currency euro are not stated. There was no separate impact on equity.
Rocket Internet SE and European Founders Fund GmbH & Co. Beteiligungs KG No. 3 have bank accounts in US Dollar (USD) with a credit of USD 137,708 thousand and other financial assets in the amount of USD 2,280 thousand.
The following table demonstrates the sensitivity to a reasonably possible change in US Dollar (USD) exchange rates, with all other variables remaining unchanged. The Group’s exposure to foreign currency changes for all other currencies is not material.
In financial year 2015, a net foreign exchange gain of EUR 4,272 thousand (previous year net loss of EUR 372 thousand) was recognized.
Interest Rate RiskInterest rate risk is the risk that the fair value or future cash flow of a financial instrument will fluctuate due to changes in market interest rates.
The Group enters in principal only into fixed-rate instruments. The Group does not account for fixed-rate financial instruments at fair value through profit or loss except for employee loans that are designated at fair value through profit or loss. A reasonably possible change in the interest rates does not have a material effect on profit or loss from fair value changes of these instruments.
Share price riskThe Group is exposed to share price risks which are described in Note 41.
In EUR thousand Dec 31, 2015 Dec 31, 2014
Effect on the balance sheet and profit before tax
Change in USD rate + 10% 12,858 0
Change in USD rate - 10% -12,858 0
In EUR thousand Dec 31, 2015 Dec 31, 2014
Net Foreign Exchange Gain - Operational 2,599 511
Net Foreign Exchange Gain - Financial 2,068 0
Net Foreign Exchange Losses - Operational –378 –883
Net Foreign Exchange Losses - Financial –17 0
Net Foreign Exchange Gain/Losses 4,272 –372
184 ABOUT ROCKET INTERNETLETTER TO OUR SHAREHOLDERSANNUAL REPORT 2015
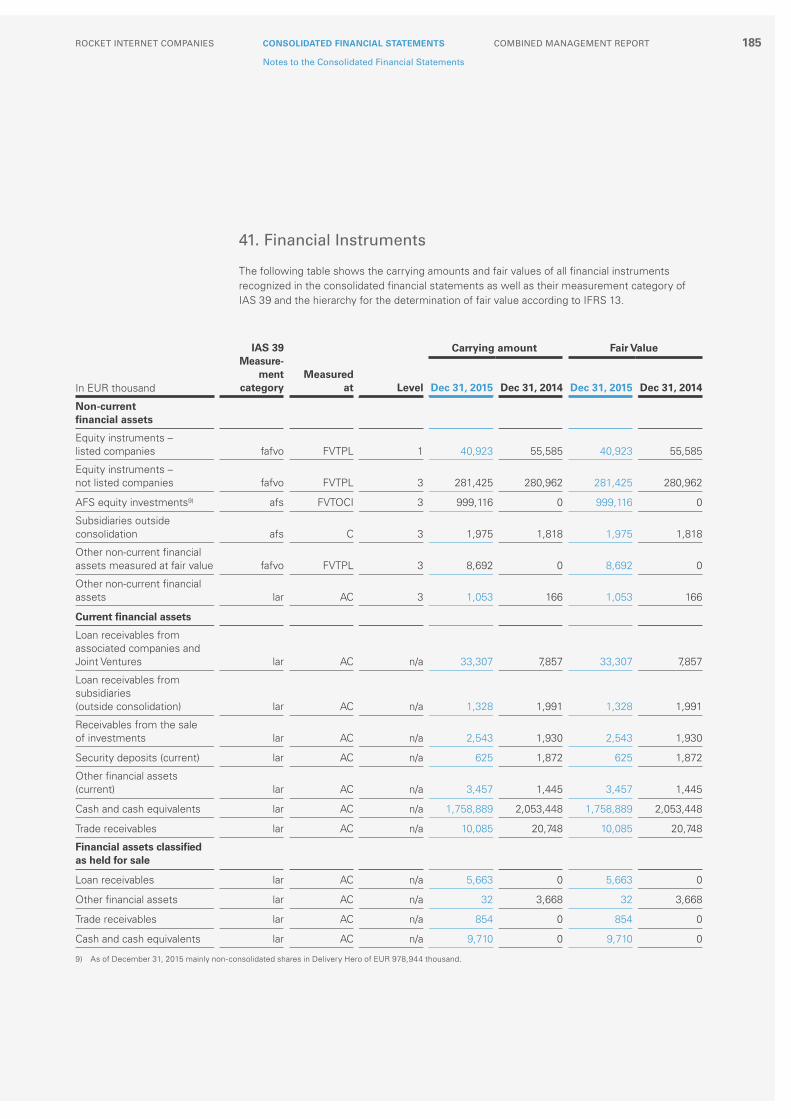
41. Financial Instruments
The following table shows the carrying amounts and fair values of all financial instruments recognized in the consolidated financial statements as well as their measurement category of IAS 39 and the hierarchy for the determination of fair value according to IFRS 13.
IAS 39 Mea sure-
ment cate gory
Measured at Level
Carrying amount Fair Value
In EUR thousand Dec 31, 2015 Dec 31, 2014 Dec 31, 2015 Dec 31, 2014
Non-current financial assets
Equity instruments – listed companies fafvo FVTPL 1 40,923 55,585 40,923 55,585
Equity instruments – not listed companies fafvo FVTPL 3 281,425 280,962 281,425 280,962
AFS equity investments9) afs FVTOCI 3 999,116 0 999,116 0
Subsidiaries outside consolidation afs C 3 1,975 1,818 1,975 1,818
Other non-current financial assets measured at fair value fafvo FVTPL 3 8,692 0 8,692 0
Other non-current financial assets lar AC 3 1,053 166 1,053 166
Current financial assets
Loan receivables from associated companies and Joint Ventures lar AC n/a 33,307 7,857 33,307 7,857
Loan receivables from subsidiaries (outside consolidation) lar AC n/a 1,328 1,991 1,328 1,991
Receivables from the sale of investments lar AC n/a 2,543 1,930 2,543 1,930
Security deposits (current) lar AC n/a 625 1,872 625 1,872
Other financial assets (current) lar AC n/a 3,457 1,445 3,457 1,445
Cash and cash equivalents lar AC n/a 1,758,889 2,053,448 1,758,889 2,053,448
Trade receivables lar AC n/a 10,085 20,748 10,085 20,748
Financial assets classified as held for sale
Loan receivables lar AC n/a 5,663 0 5,663 0
Other financial assets lar AC n/a 32 3,668 32 3,668
Trade receivables lar AC n/a 854 0 854 0
Cash and cash equivalents lar AC n/a 9,710 0 9,710 0
9) As of December 31, 2015 mainly non-consolidated shares in Delivery Hero of EUR 978,944 thousand.
185COMBINED MANAGEMENT REPORTCONSOLIDATED FINANCIAL STATEMENTSROCKET INTERNET COMPANIES
Notes to the Consolidated Financial Statements

IAS 39 Measurement
categoryMeasured
at Level
Carrying amount Fair Value
In EUR thousand Dec 31, 2015 Dec 31, 2014 Dec 31, 2015 Dec 31, 2014
Other non-current financial liabilities
Convertible bond liabilities10) ofl AC 3 511,968 0 505,725 0
Contingent consideration (non-current) flfv FVTPL 3 7,622 0 7,622 0
Mandatorily redeemable preference shares and other derivatives (warrant) issued by a consolidated subsidiary ofl AC 3 5,950 4,950 5,950 4,950
Loan liabilities ofl AC 3 1,211 0 1,211 0
Other non-current financial liabilities ofl AC 3 147 364 147 364
Interest-bearing loans and borrowings (current)
Liabilities from convertible bonds ofl AC n/a 7,242 0 7,242 0
Loan liabilities ofl AC n/a 3,523 7,290 3,523 7,290
Bank liabilities ofl AC n/a 12 164 12 164
Other current financial liabilities
Refund liabilities for sales with a right of return ofl AC n/a 0 1,153 0 1,153
Other current financial liabilities ofl AC n/a 978 1,455 978 1,455
Trade payables ofl AC n/a 11,398 43,703 11,398 43,703
Financial liabilities directly associated with assets classified as held for sale
Loan liabilities ofl AC n/a 3,989 0 3,989 0
Bank liabilities ofl AC n/a 144 0 144 0
Other current financial liabilities ofl AC n/a 75 0 75 0
Trade payables ofl AC n/a 2,320 0 2,320 0
Thereof aggregated according to the measure-ment categories of IAS 39
Available-for-sale (afs) 1,001,091 1,818 1,001,091 1,818
Financial assets under fair value option (fafvo) 331,041 336,547 331,041 336,547
Loans and receivables (lar) 1,827,546 2,093,126 1,827,546 2,093,126
Financial liabilities at fair value (flfv) 7,622 0 7,622 0
Other financial liabilities (ofl) 548,955 59,079 542,712 59,079
10) Fair value measurement based on the price of the convertible bond as of December 31, 2015 of 91.95% (Level 3).
186 ABOUT ROCKET INTERNETLETTER TO OUR SHAREHOLDERSANNUAL REPORT 2015

The following measurement methods were used:
AC – Amortized cost, C – CostFVTOCI – Fair value through other comprehensive income, FVTPL –Fair value through profit or loss
In accordance with IFRS 13, the following hierarchy is used to determine and disclose the fair val-ue of financial instruments:
Level 1: Fair values based on quoted prices in active markets.
Level 2: Fair values that are determined on the basis of valuation techniques which use inputs that are observable market data.
Level 3: Fair values that are determined on the basis of valuation techniques which use inputs that are not based on observable market data.
Except for the shares in Zalando SE and in Care.com Inc., which became publicly listed compa-nies during the calendar year 2014, there were no other reclassifications between fair value mea-surement at Level 1, Level 2 and Level 3 in 2015 and 2014.
Change in financial assets accounted to fair value through profit and loss
2015 2014
In EUR thousand all Level 3 only all Level 3 only
Opening balance as of Jan 1 336,547 280,962 66,078 66,078
Additions (including contributions in kind) 83,199 83,199 266,945 266,804
Reclassifications1) –15,557 –15,557 –7,339 –62,552
Changes in fair value recognized in profit or loss 33,015 19,944 12,931 10,632
Disposals –106,163 –78,431 –2,068 0
Closing balance as of Dec 31 331,041 290,117 336,547 280,962
1) Reclassifications of EUR 15,557 thousand during 2015 mainly relate to TravelBird which is as of December 31, 2015 accounted for as an associated company measured at equity. Reclassifications during 2014 of EUR 55,213 thousand relate to the initial public offerings in care.com and Zalando, which as a result have been reclassified from Level 3 to Level 1.
187COMBINED MANAGEMENT REPORTCONSOLIDATED FINANCIAL STATEMENTSROCKET INTERNET COMPANIES
Notes to the Consolidated Financial Statements

Change in AFS financial assets
The changes in fair value recognized in other comprehensive income (OCI) mainly relate to gain from valuation of shares in Delivery Hero.
Change in financial liabilities accounted at fair value through profit and loss (see note 9)
The profit and loss from changes in fair value is shown in the financial result.
Fair value measurementFair value is the price that would be received to sell an asset or paid to transfer a liability in an orderly transaction between market participants at the measurement date.
The majority of trade receivables, other financial assets, cash and cash equivalents, trade payables and other financial liabilities have short maturities. Thus, the carrying amounts of these instruments approximated their fair values as of the balance sheet date.
The book values of other financial assets and liabilities measured at amortized cost approximate their fair values, as there were no significant changes in the applicable valuation parameters since these instruments were recognized initially.
The fair value of equity instruments traded on an active market is based on the market prices listed on the closing date. The listed market price used for the Group’s financial assets is the current bid price.
When determining the fair value of other financial instruments, the method which allows the best estimation of fair value is selected for each individual case. For assets and liabilities maturing within one year, a nominal value adjusted for interest payments and premiums is assumed to provide a good approximation to fair value.
2015 2014
In EUR thousand all Level 3 only all Level 3 only
Opening balance as of Jan 1 0 0 0 0
Additions 863,804 863,804 0 0
Changes in fair value recognized in OCI 136,657 136,657 0 0
Reclassification to profit or loss –1,329 –1,329 0 0
Disposals –15 –15 0 0
Closing balance as of Dec 31 999,116 999,116 0 0
2015 2014
In EUR thousand all Level 3 only all Level 3 only
Opening balance as of Jan 1 0 0 0 0
Addition 7,272 7,272 0 0
Changes in fair value 350 350 0 0
Closing balance as of Dec 31 7,622 7,622 0 0
188 ABOUT ROCKET INTERNETLETTER TO OUR SHAREHOLDERSANNUAL REPORT 2015

Fair value measurement of not listed equity instruments Rocket Internet’s unlisted equity instruments are valued in accordance with IFRS 13 by using the valuation method that is deemed to be most suitable for each individual company.
Firstly, it is considered whether any significant, recent transactions were made at arm’s length in the companies (e.g. transaction where shares were issued to a new investor). For new share issues, it is taken into account whether the newly issued shares have better preference to the company’s assets than earlier issued shares in the event of sale or liquidation of the company. If preferential rights have a significant impact on the assessment of the respective equity classes, the fair value is determined by using an option pricing model based on the last financing rounds and under consideration of liquidation preferences attached to the respective equity classes as stipulated in the entities’ shareholder agreements. The value of such liquidation preferences is dependent on the probability of future exit scenarios. Given that there are multiple classes of equity at the network company level, we employ the hybrid method in order to allocate values to the various equity classes. The hybrid method is a hybrid between the probability-weighted expected return method and the option pricing method, which estimates the probability-weighted value across future exit scenarios, but uses the option-pricing-model to estimate the remaining unknown potential exit scenarios. Relevant valuation inputs include assumptions on the allocation of exit proceeds to share classes in future exit scenarios (liquidation preferences), but also consist of peer group assumptions (stock price volatility), dividend yield (estimated at zero) and the risk free interest rate at the end of the reporting period. Furthermore, exit scenarios in which liquidation preferences were considered relevant to the fair value were estimated with probability percentages that lie between 0 and 50%.
For companies where no or few recent arm’s length transactions have been carried out, a valuation is conducted based on future cash flows which are discounted to receive their present value. Inputs used for discounted cash flow (DCF) valuations are business plans, cost of capital plus a risk premium and assumptions used to determine a sales proceed at the end of the detailed planning phase. Costs of capital are derived based on the capital asset pricing model, where capital market data for peer groups and risk free rates are used. In addition, a risk premium is added to the cost of capital. The risk premium reflects the uncertainty that results from the fact that the companies are still in the start up or early development phase. The risk free rate is calculated using the Svensson’s method and amounts to 1.5%. Country risk premiums between 0 and 14.9% and a small cap premium of 3.8% are also applied. Long term inflation rates between 0 and 20.3% (with the exception of Venezuela at 155%) are also used in the calculation, as forecasted by the International Monetary Fund. For additional risk premiums, surcharges of between 10 and 33.5% are applied, depending on the age and planning risk of each company. To determine the sales proceeds at the end of the detailed planning phase, sales multiples in the range of 1.4x to 13.3x and/or EBITDA multiples in the range of 10.7x to 24.8x are applied. The multiples are derived from comparable transactions or comparable listed companies in the capital market. Other parameters include an estimate of working capital assumptions, tax rates and assumptions for investment activity and depreciation.
Share price riskThe Group is exposed to financial risks in respect of share prices, meaning the risk of changes in the value of the shareholdings. Rocket Internet’s operations include management of shareholdings (equity instruments) measured at fair value comprising considerable investments in a small number of unlisted companies. Accordingly, Rocket Internet’s financial position and results are dependent on how well these companies develop. The concentration of the shareholdings leads to a risk that it is more difficult for Rocket Internet to make major changes in the composition of the shareholdings in a limited time. Rocket Internet’s strategy is also to be a long-term shareholder. Therefore, there is no strategy for managing short-term fluctuations in share prices.
189COMBINED MANAGEMENT REPORTCONSOLIDATED FINANCIAL STATEMENTSROCKET INTERNET COMPANIES
Notes to the Consolidated Financial Statements

Equity instruments measured at fair value through profit or loss – impact of valuation parameters
On December 31, 2015, 1% (previous year 1%) of Rocket Internet’s total assets were listed equity instruments and 6% (previous year 7%) were unlisted equity instruments measured at fair value. The fair value was determined based on market prices or the discounted cash flow method.
On December 31, 2015, 3% (previous year 7%) of the total assets were not listed equity instruments based on transaction prices, as well as 3% (previous year 0%) of the total assets were not listed equity instruments measured using the DCF method.
The effect of changing critical input factors of the valuation technique on the fair value of Goodgame Studios, Rocket’s most significant non-listed investment measured at fair value through profit or loss in 2015, is shown below.
Simulation of the fair value as of 31 December, 2015, in EUR thousands:
Equity instruments measured at fair value through other comprehensive income (OCI) – impact of valuation parameters
As of December 31, 2015, 20% (previous year: 0%) of the total assets of Rocket Internet’s balance sheet comprise unlisted equity instrume nts that are measured at fair value through OCI.
As of December 31, 2015, 20% (previous year: 0%) of the total assets were not listed equity instruments measured using the DCF method, as well as 0% (previous year: 0%) of the total assets were not listed equity instruments based on transaction prices.
The effect of changing critical input factors in the valuation technique on the fair value of the in 2015 acquired Delivery Hero, which was the most significant not listed investment that was measured at fair value through OCI, is shown below.
Simulation of the fair value as of 31 December, 2015, in EUR thousands:
Fair value measurement of subsidiaries outside consolidationThe unquoted dormant subsidiaries outside consolidation are classified into the available-for-sale category. As for those there are no recent transactions with other investors and their fair value cannot be reliably measured, the Group measures them at cost. In the case of permanent impair-ment, a write-down to the present value of future cash flows is performed.
Exit multiple
Goodgame Studios –20% 0% +20%
Cost of Capital
–20% 78,040 93,942 109,845
0% 70,977 85,276 99,574
+20% 64,913 77,839 90,764
Exit multiple
Delivery Hero –20% 0% +20%
Cost of Capital
–20% 1,223,403 1,433,429 1,643,454
0% 843,079 978,938 1,114,798
+20% 595,678 685,032 774,387
190 ABOUT ROCKET INTERNETLETTER TO OUR SHAREHOLDERSANNUAL REPORT 2015

Book value of financial assets accounted at fair value through profit or loss
Trade name Company nameType of holding
Registered office
Capital/ votes
Dec 31, 2015
Capital/ votes
Dec 31, 2014
Fair ValueDec 31,
2015
Fair ValueDec 31,
2014
Non-current securities at FVTPL – listed
Zalando Zalando SE Other investment Germany 0.5% 0.8% 40,478 50,884
Other companies n/a n/a 445 4,700
Associated companies at FVTPL – not listed
MarleySpoon MarleySpoon GmbH Associated company Germany 28.6% 40.7% 15,012 6,268
Trusted Shops Trusted Shops GmbH Associated company Germany 25.0% 25.0% 10,203 10,000
Jimdo Jimdo GmbH Associated company Germany n/a 25.9% n/a 20,903
Other companies n/a n/a 19,934 25,184
Other investments at FVTPL – not listed
Goodgame Studios Altigi GmbH Other investment Germany 15.0% 15.0% 85,276 101,739
Funding Circle Funding Circle Holdings Ltd. Other investment
Great Britain 1.7% n/a 24,428 n/a
Jimdo Jimdo GmbH Other investment Germany 18.9% n/a 17,464 n/a
CraftsvillaSupera Investment
Pte. Ltd. Other investment Singapore 7.0% n/a 10,848 n/a
Media Math Media Math LLC Other investment USA 1.9% 1.9% 9,830 7,713
Borro Limited Borro Limited Other investmentGreat
Britain 11.0% 5.5% 9,602 7,000
Naturebox Naturebox Inc Other investment USA 10.1% n/a 9,152 n/a
KreditechKreditech Holding
SSL GmbH Other investment Germany 3.2% 6.9% 6,069 5,415
DaWanda DaWanda GmbH Other investment Germany 8.4% 8.4% 6,062 3,800
Movinga Movinga GmbH Other investment Germany 9.4% n/a 5,574 n/a
Iwoca Iwoca Limited Other investmentGreat
Britain 7.2% 9.1% 5,351 1,156
SocietyOneSocietyOne Holdings
Pty Ltd. Other investment Australia 10.7% 10.7% 5,214 6,048
DealerdirectDealerdirect
Global BV Other investment Netherlands 12.5% n/a 5,000 n/a
Yemek Sepeti Yemek Sepeti A.S. Other investment Turkey n/a 11.4% n/a 40,259
TravelBird1)
Travelbird Nederland B.V. Other investment Netherlands n/a 16.4% n/a 15,555
Other companies n/a n/a 36,407 29,923
Other financial assets at FVTPL
Other non-current financial assets n/a n/a 8,692 0
Total 331,041 336,547
1) as of December 31, 2015, an associated company accounted for using the equity method.
191COMBINED MANAGEMENT REPORTCONSOLIDATED FINANCIAL STATEMENTSROCKET INTERNET COMPANIES
Notes to the Consolidated Financial Statements

Details of material associated companies measured at fair valueThe following material investments in associated companies are measured at fair value. There are no significant restrictions on the ability of the associated companies to transfer funds to Rocket Internet in the form of cash dividends or to repay loans or advances made by Rocket Internet. For information on dividends from associated companies, refer to Note 19. The following table summarizes the financial information of material associated companies as included in the companies’ own financial statements. All of the material associated companies prepare financial information in accordance with local GAAP:
Summarized balance sheets (in thousands) for financial year 2015:
Summarized income statements (in thousands) for financial year 2014:
CompanyReporting date Currency
Trusted Shops 31/12/15
EUR
Marley Spoon 31/12/15
EUR
Current assets 13,305 11,343
Non-current assets 728 3,353
Current liabilities 6,070 705
Non-current liabilities 808 0
Net assets 7,155 13,991
CompanyReporting date Currency
Trusted Shops 31/12/15
EUR
Marley Spoon 31/12/15
EUR
Revenue 19,789 611
Profit or loss 1,303 –3,887
Total comprehensive income 1,303 –3,887
CompanyReporting date Currency
Jimdo 31/12/14
EUR
Trusted Shops 31/12/14
EUR
Marley Spoon 31/12/14
EUR
Current assets 4,188 12,776 4,141
Non-current assets 4,234 989 114
Current liabilities 7,306 7,513 154
Non-current liabilities 233 0 0
Net assets 883 6,252 4,101
CompanyReporting date Currency
Jimdo 31/12/14
EUR
Trusted Shops 31/12/14
EUR
Marley Spoon 31/12/14
EUR
Revenue 17,629 16,952 18
Profit or loss 694 648 –1,424
Total comprehensive income 694 648 –1,424
192 ABOUT ROCKET INTERNETLETTER TO OUR SHAREHOLDERSANNUAL REPORT 2015

42. Balances and Transactions with Related Parties
Related parties are shareholders with significant influence on the Rocket Internet Group, joint ventures, associated companies, non-consolidated subsidiaries and individuals that exercise significant influence on the Group’s financial and business policy. Persons who exercise significant influence on the Group’s financial and business policy comprise all individuals in key positions and their close family members. Within Rocket Internet Group, this relates to the parent company’s members of the Management Board and the Supervisory Board as well as the managing directors prior to the change in legal form into an AG.
Shareholders with significant influence
Transactions with shareholders with significant influence
Dividend payment in 2014On May 30, 2014, the shareholders approved an advance dividend in kind to certain shareholders. Consequently, Rocket Internet transferred by way of a separate share transfer agreement 4,145 and 1,892 shares in Bigfoot GmbH to Emesco AB (subsidiary of Investment AB Kinnevik) and AI European Holdings S.à r.l. (shareholder with no significant influence over Rocket Internet SE), respectively, as well as 4,559 and 2,082 shares in BGN Brillant Services GmbH to Emesco AB and AI European Holdings S.à r.l., respectively, as a dividend in kind. The fair value of the distributed shares amounted to EUR 153,234 thousand. In addition, a cash dividend of EUR 286,766 thou-sand was paid to Global Founders GmbH.
No dividends were paid to the shareholders of the parent in 2015.
Portfolio contribution of the Global Founders Capital fundsIn August 2014, United Internet Ventures AG, Montabaur, (United Internet) agreed to invest a total of EUR 435 million for a 10.7% stake in Rocket Internet. United Internet’s EUR 435 million investment consists of EUR 333 million in cash and a contribution in kind valued at EUR 102 million, which comprised United Internet’s equity participation in the Global Founders Capital Fund portfolio (GFC portfolio). As part of this transaction, the equity participation of Global Founders GmbH in the GFC portfolio, valued at EUR 153 million, was also contributed into Rocket Internet in exchange for new shares. In this context the extraordinary shareholders’ meeting of Rocket Internet held on August 22, 2014 resolved to increase Rocket Internet’s share capital by EUR 25,527, from EUR 159,442 to EUR 184,969, while admitting (i) United Internet to subscribe for 16,193 newly issued shares, (ii) Global Founders GmbH and Global Founders Capital Fund to subscribe for an aggregate of 8,132 newly issued shares, (iii) European Founders Fund GmbH & Co. Beteiligungs KG Nr. 2 and European Founders Fund GmbH & Co. Beteiligungs KG Nr. 3, both located in Munich, Germany, to subscribe for 637 and 365 newly issued shares, respectively, and (iv) MOAS GmbH & Co. KG, MOAS Nr. 2 GmbH & Co. KG and MOAS Nr. 3 GmbH & Co. KG, all located in Munich, Germany, to subscribe for an aggregate of 200 newly issued shares. The GFC portfolio consisted of 53 investments in Internet companies held jointly by United Internet and of Global Founders GmbH. The portfolio includes minority stakes in companies such as games maker Goodgame Studios; online travel sites such as Traveloka and Travelbird; online marketplaces Yemek Sepeti and DaWanda; and financial technology companies Kreditech, Borro and SocietyOne.
Trade Names Company Names Significant influence period
Global FoundersGlobal Founders GmbH, Munich1) Jan 1, 2014–Dec 31, 2015
KinnevikInvestment AB Kinnevik, Stockholm Jan 1, 2014–Sep 1, 2014
1) 33.3% of the shares in Global Founders GmbH are indirectly held by the CEO of the Rocket Internet SE.
193COMBINED MANAGEMENT REPORTCONSOLIDATED FINANCIAL STATEMENTSROCKET INTERNET COMPANIES
Notes to the Consolidated Financial Statements
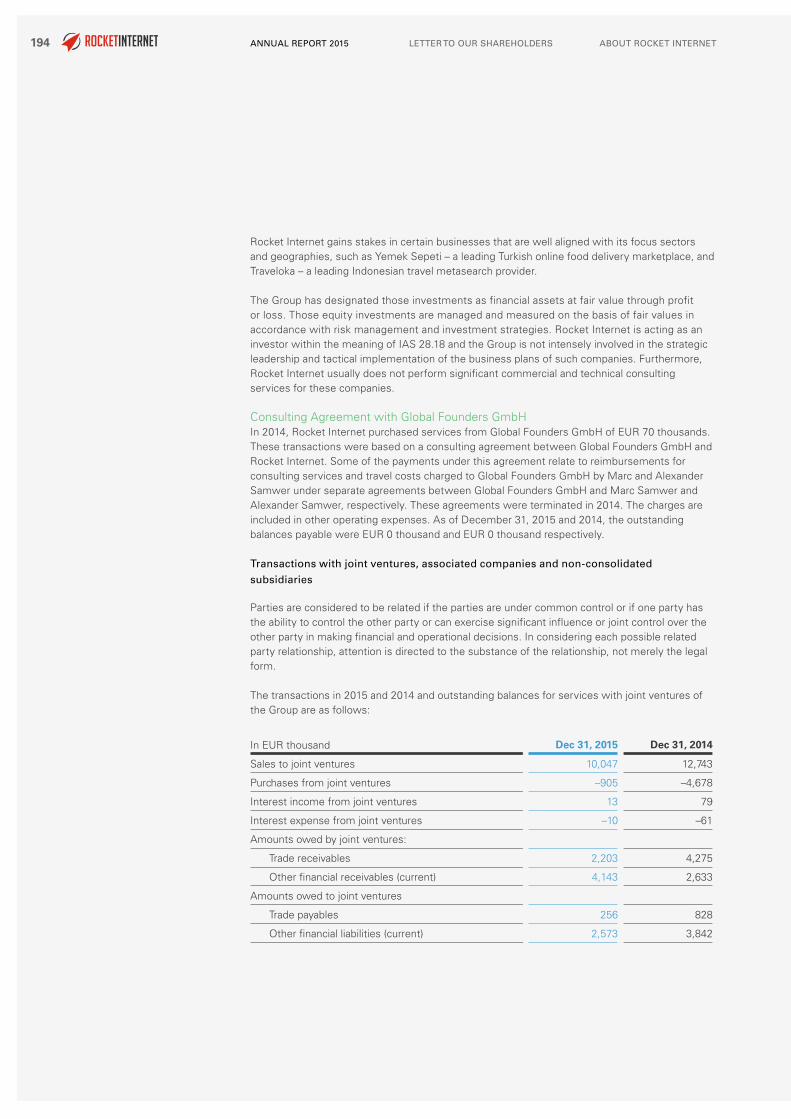
Rocket Internet gains stakes in certain businesses that are well aligned with its focus sectors and geographies, such as Yemek Sepeti – a leading Turkish online food delivery marketplace, and Traveloka – a leading Indonesian travel metasearch provider.
The Group has designated those investments as financial assets at fair value through profit or loss. Those equity investments are managed and measured on the basis of fair values in accordance with risk management and investment strategies. Rocket Internet is acting as an investor within the meaning of IAS 28.18 and the Group is not intensely involved in the strategic leadership and tactical implementation of the business plans of such companies. Furthermore, Rocket Internet usually does not perform significant commercial and technical consulting services for these companies.
Consulting Agreement with Global Founders GmbHIn 2014, Rocket Internet purchased services from Global Founders GmbH of EUR 70 thousands. These transactions were based on a consulting agreement between Global Founders GmbH and Rocket Internet. Some of the payments under this agreement relate to reimbursements for consulting services and travel costs charged to Global Founders GmbH by Marc and Alexander Samwer under separate agreements between Global Founders GmbH and Marc Samwer and Alexander Samwer, respectively. These agreements were terminated in 2014. The charges are included in other operating expenses. As of December 31, 2015 and 2014, the outstanding balances payable were EUR 0 thousand and EUR 0 thousand respectively.
Transactions with joint ventures, associated companies and non-consolidated
subsidiaries
Parties are considered to be related if the parties are under common control or if one party has the ability to control the other party or can exercise significant influence or joint control over the other party in making financial and operational decisions. In considering each possible related party relationship, attention is directed to the substance of the relationship, not merely the legal form.
The transactions in 2015 and 2014 and outstanding balances for services with joint ventures of the Group are as follows:
In EUR thousand Dec 31, 2015 Dec 31, 2014
Sales to joint ventures 10,047 12,743
Purchases from joint ventures –905 –4,678
Interest income from joint ventures 13 79
Interest expense from joint ventures –10 –61
Amounts owed by joint ventures:
Trade receivables 2,203 4,275
Other financial receivables (current) 4,143 2,633
Amounts owed to joint ventures
Trade payables 256 828
Other financial liabilities (current) 2,573 3,842
194 ABOUT ROCKET INTERNETLETTER TO OUR SHAREHOLDERSANNUAL REPORT 2015

The transactions in 2015 and 2014 and outstanding balances for services with associates under significant influence of the Group are as follows:
The transactions in 2015 and 2014 and outstanding balances for services with non-consolidated subsidiaries controlled by Rocket Internet are as follows:
Receivables and payables are unsecured and payable in cash. Other financial receivables and lia-bilities relate to short-term loans.
In EUR thousand Dec 31, 2015 Dec 31, 2014
Sales to associates 20,529 19,124
Contribution of subsidiaries to associates 107.890 18,248
Purchases from associates –751 –3,682
Interest income from associates 335 96
Interest expense from associates –12 –164
Amounts owed by associates:
Trade receivables 3,771 7,821
Other financial receivables (current) 29,164 5,224
Amounts owed to associates
Trade payables 958 822
Other financial liabilities (current) 328 2,467
In EUR thousand Dec 31, 2015 Dec 31, 2014
Sales to non-consolidated subsidiaries 503 486
Purchases from non-consolidated subsidiaries –872 –747
Amounts owed by non-consolidated subsidiaries:
Trade receivables 941 671
Other financial receivables (current) 1,328 1,991
Amounts owed to non-consolidated subsidiaries:
Trade payables 208 142
Other financial liabilities (current) 144 517
195COMBINED MANAGEMENT REPORTCONSOLIDATED FINANCIAL STATEMENTSROCKET INTERNET COMPANIES
Notes to the Consolidated Financial Statements

Key management compensation
Remuneration of the Management BoardAfter the conversion into a stock corporation in July 2014, the following members were elected into the Management Board:
Until the conversion into a stock corporation in July 2014, the Company´s management comprised of the following members:
As part of their remuneration, managing directors were granted options of Rocket Internet SE and shares in subsidiaries at the nominal amount of EUR 1 under equity-settled share-based payment plans described in more detail in Note 39. The compensation paid or payable to key management for employee services is shown below:
Additional disclosures on total remuneration pursuant to Sec. 314 (1) No 6 HGBIn 2015, 614 shares in subsidiaries with a grant date fair value of EUR 2,202 thousand and 332 options in subsidiaries with a grant date fair value of EUR 324 thousand have been issued to members of the Management Board. The total remuneration granted to the members of the Management Board in return for the fulfilment of their duties in the parent company and its subsidiaries was EUR 7,699 thousand.
The members of the Management Board have not been granted any advances or loans. At the balance sheet date, there are no contingencies in favor of members of the Management Board.
Name Position held
Oliver Samwer Chief Executive Officer (CEO)
Peter Kimpel Chief Financial Officer (CFO)
Alexander Kudlich Group Managing Director
Name Position held
Arnt Jeschke Managing Director Finance
Alexander Kudlich Managing Director Business Development
Dr. Johannes Bruder Managing Director Marketing and Products
In EUR thousand 2015 2014
Short-term benefits (cash and non-cash compensation) 5,173 1,134
Share-based payments (expense the reporting period) 37,155 16,370
Total share-based payment expense 42,328 17,504
196 ABOUT ROCKET INTERNETLETTER TO OUR SHAREHOLDERSANNUAL REPORT 2015

Supervisory Board, Remuneration of the Supervisory BoardAs of December 31, 2015, the Supervisory Board of Rocket Internet SE is composed of the following members:
The former members of the Supervisory Board during the financial years 2015 and 2014:
Remuneration (short-term benefits only) of the Supervisory Board of the parent company for performing its functions at the parent company and the subsidiaries amounted to EUR 305 thousand (previous year EUR 95 thousand). No loans or advances were granted to the members of the Supervisory Board.
Name Function Position Member since
Prof. Dr. Marcus Englert Chairman
Management Consultant and Associate Partner of Solon Management Consulting GmbH & Co. KG August 22, 2014
Norbert Lang Vice-chairman Management Consultant June 23, 2015
Prof. Dr. Roland Berger
Founder and former CEO of Roland Berger Strategy Consultants August 22, 2014
Dr. Martin Enderle Management Consultant June 23, 2015
Lorenzo Grabau CEO of Investment AB Kinnevik June 23, 2014
Erik MittereggerNon-executive Member of the Board of Investment AB Kinnevik June 23, 2014
Napoleon L. Nazareno
CEO of Philippine Long Distance Telephone Company August 22, 2014
Prof. Dr. Joachim Schindler Chartered Accountant, Tax Adviser June 23, 2015
Daniel Shinar CEO of ClalTech August 22, 2014
Name Function Position Member since
Ralph Dommermuth CEO of United Internet AGAugust 22, 2014 / June 23, 2015
Dr. Erhard Schipporeit
Management Consultant, former CFO of E.ON AG
August 22, 2014 / June 23, 2015
Philip Yea
Supervisory Board member of bwin.party digital entertainment plc, former CEO of 3i Group plc
August 22, 2014 / June 23, 2015
Jörg Mohaupt Vice-chairman
Director Technology, Media and Telecommunication (TMT) at Access Industries
June 23, 2014 / August 22, 2014
Uwe GleitzSenior Vice President Investments at Rocket Internet SE
June 23, 2014 / August 22, 2014
Christian von Hardenberg
Technical Director at Rocket Internet SE
June 23, 2014 / August 22, 2014
Dr. Franziska Leonhardt
Director Legal Affairs at Rocket Internet SE
June 23, 2014 / August 22, 2014
197COMBINED MANAGEMENT REPORTCONSOLIDATED FINANCIAL STATEMENTSROCKET INTERNET COMPANIES
Notes to the Consolidated Financial Statements

43. Contingent Liabilities and other Contractual Obligations
As of the reporting date, as in the previous year, there are no contingent liabilities.
The Company reports other contractual obligations for the following items:
Capital contribution and investment obligations result from participation agreements concluded prior to the balance sheet date. As of December 31, 2015, they mainly result from capital increases of Africa Internet Holding GmbH and CupoNation Group GmbH (previous year Lazada Group GmbH, Home24 GmbH, Helpling Group Holding S.à r.l., Jade 1317. GmbH).
The future minimum lease payments under non-cancellable operating lease agreements are as follows:
The leasing arrangements include warehouse and office rent as well as rental of IT equipment.
The increase in contractual obligations from rental and lease agreements results from the rental agreement for the new headquarters in Berlin.
As of December 31, 2015, total future sublease payments receivable under the Company’s operating subleases amount to EUR 3,808 thousand (previous year EUR 896 thousand).
Order commitments (except for leasing) were all payable within one year.
In EUR thousand Dec 31, 2015 Dec 31, 2014
Capital contribution and investment obligations 61,000 41,140
Rental and lease agreements 89,457 3,070
Loans granted to associated companies 4,000 0
Purchase commitments and other 0 19
Total contractual obligations 154,457 44,229
In EUR thousand Dec 31, 2015 Dec 31, 2014
Not later than 1 year 3,112 2,018
Later than 1 year and not later than 5 years 27,408 1,052
Later than 5 years 58,937 0
Total operating lease commitments 89,457 3,070
Lease payments during the period 5,381 5,432
198 ABOUT ROCKET INTERNETLETTER TO OUR SHAREHOLDERSANNUAL REPORT 2015

44. Auditor’s Fees
Total fees charged for the financial year by the Group’s auditor (Ernst & Young GmbH Wirtschaftsprüfungsgesellschaft) amount to EUR 1.6 million (previous year EUR 2.7 million) and comprise EUR 1.2 million (previous year EUR 0.7 million) for audit services, EUR 0.4 million (previous year EUR 1.9 million) for other audit-related services and EUR 0.0 million (previous year EUR 0.1 million) for other services.
45. Events after the Reporting Period
On January 19, 2016, Rocket Internet announced the first closing of Rocket Internet Capital Partners Fund, with total commitments of USD 420 million of which Rocket Internet contributed USD 50 million. The Fund will invest alongside Rocket Internet unless investments are deemed strategic for Rocket Internet.
Rocket Internet announced the divestiture of two takeaway food operations in cash on February 5, 2016. The transaction is in line with Rocket Internet's strategy to divest non-core operations that are not market-leading. The companies sold were La Nevera Roja in Spain and Pizzabo.it in Italy. The transaction in Italy was completed on the date of announcement (closing). It is anticipated that the transaction in Spain will be completed in the second or third quarter of 2016 (closing), as it is subject to regulatory approval from the Spanish competition authority, the Comisión Nacional de los Mercados y la Competencia.
Rocket Internet decided a partial buyback of convertible bonds on February 15, 2016. The Management Board of Rocket Internet SE decided to spend up to EUR 150 million on a program to repurchase senior unsecured convertible bonds due 2022 issued by the Company during 2016. Repurchases of Bonds under the program may commence immediately.
The online lending platform Spotcap Global S.à r.l. raised EUR 31.5 million in new funding on February 2, 2016, led by international private equity firm, Finstar Financial Group, with participation from previous investor Holtzbrinck Ventures.
No other events of special significance occurred after the end of the financial year.
199COMBINED MANAGEMENT REPORTCONSOLIDATED FINANCIAL STATEMENTSROCKET INTERNET COMPANIES
Notes to the Consolidated Financial Statements

No. CompanyRegistered Head office
Equity inte rest in % Via no.
1 Rocket Internet SE Berlin
Fully consolidated subsidiaries
Germany
2 Bambino 106. V V UG (haftungsbeschränkt) Berlin 100% 1
3 Bambino 53. V V UG (haftungsbeschränkt) Berlin 100% 1
4 Blanko 7. GmbH & Co. KG Berlin 98.5% 22, 3
5 Bonativo GmbH Berlin 100% 101
6 Bonnyprints GmbH Berlin 77.1% 1
7 Brillant 1390. GmbH & Co. Verwaltungs KG Berlin 89.5% 32, 3, 251
8 CarSpring Services GmbH Berlin 100% 88
9 Caterwings Services GmbH Berlin 100% 90
10 EatFirst Germany GmbH Berlin 100% 113
11European Founders Fund GmbH & Co. Beteiligungs KG Nr. 2 Berlin 100% 1
12European Founders Fund GmbH & Co. Beteiligungs KG Nr. 3 Berlin 100% 1
13 European Founders Fund Investment GmbH Berlin 100% 1
14European Founders Fund Nr. 3 Beteiligungs GmbH Berlin 100% 12
15 Express Quality Food Global Services GmbH Berlin 100% 115
16Global Founders Capital GmbH & Co. Beteiligungs KG Nr. 1 Berlin 100% 1
17 Global Founders Capital Management GmbH Berlin 100% 1
18 GSS Global Shopping Services GmbH Berlin 100% 96
19 International Rocket GmbH & Co. KG Berlin 100% 1
20 Jade 1085. GmbH Berlin 100% 1
21 Jade 1217. GmbH Berlin 89.0% 1, 3
22 Jade 1221. GmbH Berlin 71.1% 44, 3, 1
23 Jade 1234. GmbH Berlin 100% 1
24 Jade 1235. GmbH Berlin 100% 23
25 Jade 1265. GmbH Berlin 91.3% 1, 3
26 Jade 1317. GmbH Berlin 100% 1
27 Jade 1318. GmbH Berlin 63.0% 1, 3
28 Jade 1344. GmbH & Co. Verwaltungs KG Berlin 89.1% 31, 3, 254
29 Jade 1347. GmbH Berlin 100% 122
30 Jade 1348. GmbH & Co. Verwaltungs KG Berlin 100% 33, 3
31 Jade 1353. GmbH Berlin 86.4% 44, 3
32 Jade 1366. GmbH Berlin 86.7% 44, 3, 1
33 Jade 1371. GmbH Berlin 100% 1
34 Jade 1372. GmbH Berlin 100% 1
46. List of Group shareholdings pursuant to Sec. 313 (2) HGB
200 ABOUT ROCKET INTERNETLETTER TO OUR SHAREHOLDERSANNUAL REPORT 2015

No. CompanyRegistered Head office
Equity inte rest in % Via no.
35 Jade 1375. GmbH Berlin 100% 108
36Juwel 131. UG (haftungsbeschränkt) & Co. Erste Verwaltungs KG Berlin 100% 2, 3
37Juwel 190. V V UG (haftungsbeschränkt) & Co. 15. Verwaltungs KG Berlin 100% 43, 3
38Juwel 190. V V UG (haftungsbeschränkt) & Co. 32. Verwaltungs KG Berlin 100% 43, 3
39Juwel 190. V V UG (haftungsbeschränkt) & Co. 41. Verwaltungs KG Berlin 100% 43, 3
40Juwel 190. V V UG (haftungsbeschränkt) & Co. Verwaltungs KG Berlin 100% 44
41Juwel 200. V V UG (haftungsbeschränkt) & Co. Vierte Verwaltungs KG Berlin 100% 25
42 Kin Shopping GmbH Berlin 82.0% 1
43LIH Subholding Nr. 2 UG (haftungsbeschränkt) & Co. KG Berlin 100% 44, 3
44 MKC Brillant Services GmbH Berlin 65.0% 1
45OCM Online Car Marketplace Global Services GmbH Berlin 100% 82
46 Online Marketplace Global Services GmbH Berlin 100% 103
47 R2 International Internet GmbH Berlin 59.2% 1
48RCKT Rocket Communications GmbH & Co. KG Berlin 100% 1
49 Rocket Asia GmbH & Co. KG Berlin 100% 19
50 Rocket Internet Munich GmbH Munich 100% 1
51 Rocket Labs GmbH & Co. KG Berlin 100% 1
52 SOG Shopping Operations Germany GmbH Berlin 100% 95
53 Somuchmore GmbH Berlin 100% 124
54Somuchmore Marketplace UG (haftungsbeschränkt) Berlin 100% 154
55 SpaceWays Global Services GmbH Berlin 100% 94
56 sparks42 GmbH Berlin 79.0% 1
57 Spotcap Global Services GmbH Berlin 100% 164
58Tripda Brazil Holding UG (haftungsbeschränkt) & Co. Verwaltungs KG Berlin 100% 166, 3
59 Vaniday Global Services GmbH Berlin 100% 112
60 Vendomo Deutschland GmbH Berlin 100% 117
61 Vendomo Global Services GmbH Berlin 100% 119
62 ZipJet Global Services GmbH Berlin 100% 98
63 ZipJet GmbH Berlin 100% 97
Other countries
64 Airu Produtos Criativos Ltda. São Paulo 100% 4, 3
65 Argentum Spain S.L.U. Madrid 100% 163
66Beauty Brasil Agendamento de Serviços de Beleza Ltda. São Paulo 100% 107, 112
201COMBINED MANAGEMENT REPORTCONSOLIDATED FINANCIAL STATEMENTSROCKET INTERNET COMPANIES
Notes to the Consolidated Financial Statements
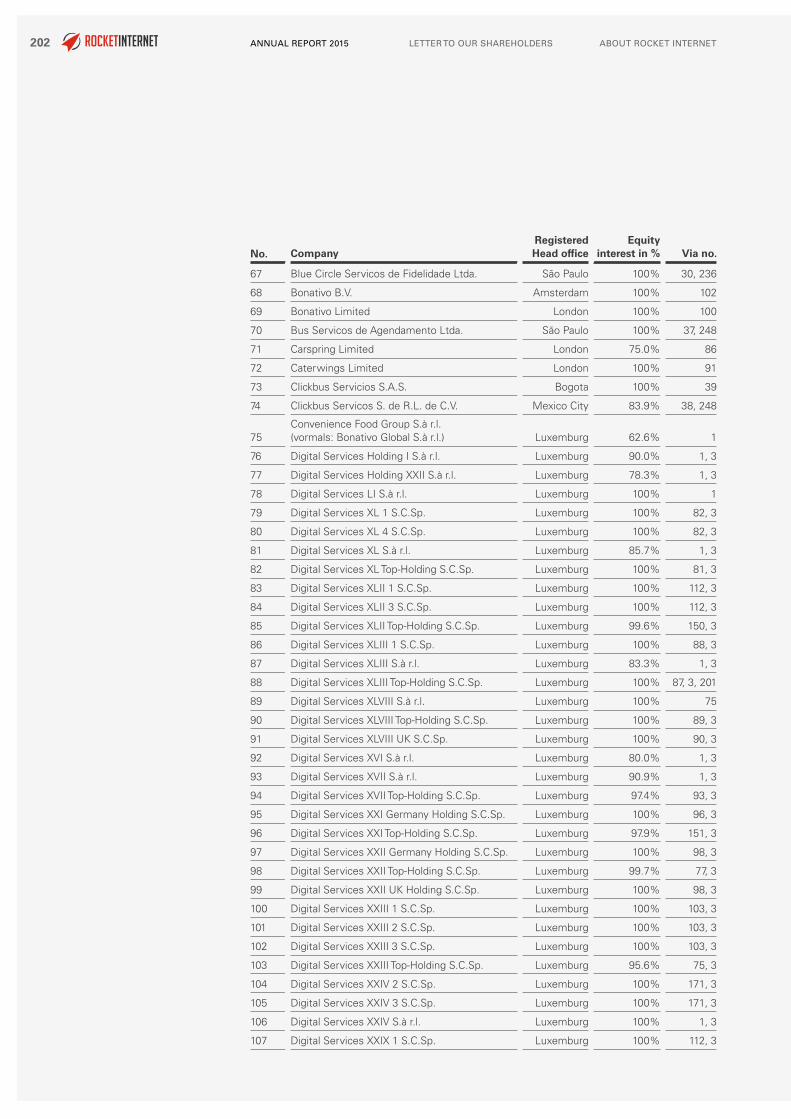
No. CompanyRegistered Head office
Equity inte rest in % Via no.
67 Blue Circle Servicos de Fidelidade Ltda. São Paulo 100% 30, 236
68 Bonativo B.V. Amsterdam 100% 102
69 Bonativo Limited London 100% 100
70 Bus Servicos de Agendamento Ltda. São Paulo 100% 37, 248
71 Carspring Limited London 75.0% 86
72 Caterwings Limited London 100% 91
73 Clickbus Servicios S.A.S. Bogota 100% 39
74 Clickbus Servicos S. de R.L. de C.V. Mexico City 83.9% 38, 248
75Convenience Food Group S.à r.l. (vormals: Bonativo Global S.à r.l.) Luxemburg 62.6% 1
76 Digital Services Holding I S.à r.l. Luxemburg 90.0% 1, 3
77 Digital Services Holding XXII S.à r.l. Luxemburg 78.3% 1, 3
78 Digital Services LI S.à r.l. Luxemburg 100% 1
79 Digital Services XL 1 S.C.Sp. Luxemburg 100% 82, 3
80 Digital Services XL 4 S.C.Sp. Luxemburg 100% 82, 3
81 Digital Services XL S.à r.l. Luxemburg 85.7% 1, 3
82 Digital Services XL Top-Holding S.C.Sp. Luxemburg 100% 81, 3
83 Digital Services XLII 1 S.C.Sp. Luxemburg 100% 112, 3
84 Digital Services XLII 3 S.C.Sp. Luxemburg 100% 112, 3
85 Digital Services XLII Top-Holding S.C.Sp. Luxemburg 99.6% 150, 3
86 Digital Services XLIII 1 S.C.Sp. Luxemburg 100% 88, 3
87 Digital Services XLIII S.à r.l. Luxemburg 83.3% 1, 3
88 Digital Services XLIII Top-Holding S.C.Sp. Luxemburg 100% 87, 3, 201
89 Digital Services XLVIII S.à r.l. Luxemburg 100% 75
90 Digital Services XLVIII Top-Holding S.C.Sp. Luxemburg 100% 89, 3
91 Digital Services XLVIII UK S.C.Sp. Luxemburg 100% 90, 3
92 Digital Services XVI S.à r.l. Luxemburg 80.0% 1, 3
93 Digital Services XVII S.à r.l. Luxemburg 90.9% 1, 3
94 Digital Services XVII Top-Holding S.C.Sp. Luxemburg 97.4% 93, 3
95 Digital Services XXI Germany Holding S.C.Sp. Luxemburg 100% 96, 3
96 Digital Services XXI Top-Holding S.C.Sp. Luxemburg 97.9% 151, 3
97 Digital Services XXII Germany Holding S.C.Sp. Luxemburg 100% 98, 3
98 Digital Services XXII Top-Holding S.C.Sp. Luxemburg 99.7% 77, 3
99 Digital Services XXII UK Holding S.C.Sp. Luxemburg 100% 98, 3
100 Digital Services XXIII 1 S.C.Sp. Luxemburg 100% 103, 3
101 Digital Services XXIII 2 S.C.Sp. Luxemburg 100% 103, 3
102 Digital Services XXIII 3 S.C.Sp. Luxemburg 100% 103, 3
103 Digital Services XXIII Top-Holding S.C.Sp. Luxemburg 95.6% 75, 3
104 Digital Services XXIV 2 S.C.Sp. Luxemburg 100% 171, 3
105 Digital Services XXIV 3 S.C.Sp. Luxemburg 100% 171, 3
106 Digital Services XXIV S.à r.l. Luxemburg 100% 1, 3
107 Digital Services XXIX 1 S.C.Sp. Luxemburg 100% 112, 3
202 ABOUT ROCKET INTERNETLETTER TO OUR SHAREHOLDERSANNUAL REPORT 2015

No. CompanyRegistered Head office
Equity inte rest in % Via no.
108 Digital Services XXIX 2 S.C.Sp. Luxemburg 100% 112, 3
109 Digital Services XXIX 3 S.C.Sp. Luxemburg 100% 112, 3
110 Digital Services XXIX 4 S.C.Sp. Luxemburg 100% 112, 3
111 Digital Services XXIX S.à r.l. Luxemburg 100% 178
112 Digital Services XXIX Top-Holding S.C.Sp. Luxemburg 100% 111, 3
113 Digital Services XXX Germany Holding S.C.Sp. Luxemburg 100% 115, 3
114 Digital Services XXX S.à r.l. Luxemburg 100% 75
115 Digital Services XXX Top-Holding S.C.Sp. Luxemburg 99.3% 114, 3
116 Digital Services XXX UK Holding S.C.Sp. Luxemburg 100% 115, 3
117 Digital Services XXXIII 2 S.C.Sp. Luxemburg 100% 119, 3
118 Digital Services XXXIII S.à r.l. Luxemburg 100% 1
119 Digital Services XXXIII Top-Holding S.C.Sp. Luxemburg 100% 118, 3
120 Digital Services XXXVII 1 S.C.Sp. Luxemburg 100% 122, 3
121 Digital Services XXXVII S.à r.l. Luxemburg 100% 75
122 Digital Services XXXVII Top-Holding S.C.Sp. Luxemburg 100% 121, 3
123 Digital Services XXXVIII 1 S.C.Sp. Luxemburg 100% 154, 3
124 Digital Services XXXVIII 2 S.C.Sp. Luxemburg 100% 154, 3
125 Digital Services XXXVIII 3 S.C.Sp. Luxemburg 100% 154, 3
126 DS XL UK Limited London 100% 79
127 DS XXIX France SAS Paris 100% 110
128 DS XXXVIII UK Limited London 100% 123
129 EatFirst UK Ltd. London 75.0% 116
130 ECommerce Business 11 S.à r.l. Luxemburg 100% 137, 3
131 ECommerce Pay Emerging Markets S.à r.l. Luxemburg 90.9% 132, 3
132 ECommerce Pay Holding S.à r.l. Luxemburg 50.0% 2
133 Emerging Markets Internet Fund SCS Luxemburg 66.7% 1
134 Food Delivery Holding 13 S.à r.l. Luxemburg 100% 137, 3
135 GFC Global Founders Capital S.à r.l. Luxemburg 100% 1
136 Global Fin Tech Holding S.à r.l. Luxemburg 100% 1
137 Global Online Takeaway Group S.A. Luxemburg 100% 1
138 Goldstar eServices Private Limited Gurgaon (IN) 100% 173
139 Grupo Yamm Comida a Domicilio S.L. Madrid 100% 134
140 Internet Services Polen Sp.o.o. Warsaw 100% 19
141 MKC Brazil Servicos de Adminstracao Ltda. São Paulo 100% 40
142 Moonshine eServices Private Limited Gurgaon (IN) 100% 36, 243
143Rocket Brasil Novos Negocios e Participacoes Ltda. São Paulo 100% 19
144 Rocket eServices Ltd. London 100% 19
145 Rocket eServices Private Limited Delhi 100% 19
146 Rocket Internet Capital Partners Lux S.à r.l. Luxemburg 100% 1
147 Rocket Internet Capital Partners SCS Luxemburg 100% 146
148 R-SC Internet Services Egypt LLC Cairo 100% 19, 20
203COMBINED MANAGEMENT REPORTCONSOLIDATED FINANCIAL STATEMENTSROCKET INTERNET COMPANIES
Notes to the Consolidated Financial Statements

No. CompanyRegistered Head office
Equity inte rest in % Via no.
149 R-SC Internet Services Luxembourg S.à r.l. Luxemburg 100% 19
150R-SC Liquidation Services Luxembourg S.à r.l. (vormals: Digital Services XLII S.à.r.l.) Luxemburg 100% 178
151 ShopWings Global S.à r.l. Luxemburg 100% 75
152 Somuchmore France SAS Paris 100% 125
153 Somuchmore Global S.à r.l. Luxemburg 73.3% 1
154 Somuchmore Holding S.à r.l. Luxemburg 90.5% 153, 3
155 SpaceWays Germany Holding S.C.Sp. Luxemburg 100% 94, 3
156 SpaceWays Storage Services UK Ltd. London 75.0% 157
157 SpaceWays UK Holding S.C.Sp. Luxemburg 100% 94, 3
158 Spotcap Australia PTY Ltd. Sydney 100% 159
159 Spotcap Australia S.C.Sp. Luxemburg 100% 164, 3
160 Spotcap Global S.à r.l. Luxemburg 58.3% 136, 3
161 Spotcap Netherlands B.V. Amsterdam 100% 162
162 Spotcap Netherlands S.C.Sp. Luxemburg 100% 164, 3
163 Spotcap Spain S.C.Sp. Luxemburg 100% 164, 3
164 Spotcap Top Holding S.C.Sp. Luxemburg 100% 160, 3
165 TAC Special Opportunities I LLCWilmington
(US) 97.5% 16
166 Tripda Brazil Holding S.C.Sp. Luxemburg 100% 171, 3
167 Tripda Chile Holding S.C.Sp. Luxemburg 100% 171, 3
168 Tripda Chile SAS Santiago 100% 167
169 Tripda Colombia Holding S.C.Sp. Luxemburg 99.8% 171, 3
170 Tripda Colombia SAS Bogota 100% 169
171 Tripda Group Holding S.C.Sp. Luxemburg 100% 106, 3
172 Tripda Inc. Albany (US) 100% 177
173 Tripda India Holding S.C.Sp. Luxemburg 100% 171, 3
174 Tripda Mexico Holding S.C.Sp. Luxemburg 100% 171, 3
175 Tripda Mexico S. de R.L. de C.V. Mexico City 100% 174
176 Tripda Transportes Colaborativos Ltda. São Paulo 100% 166
177 Tripda USA Holding S.C.Sp. Luxemburg 100% 171, 3
178 Vaniday Global S.à r.l. Luxemburg 78.4% 1
179 Vaniday Italy Srl Milan 100% 83
180 Vaniday Russia OOO Moscow 100% 84
181 Webs S.r.l. Bologna 100% 130
182 ZipJet Ltd. London 75.0% 99
Other subsidiaries ¹)
Germany
183 Bambino 107. V V UG (haftungsbeschränkt) Berlin 100% 1
184 Bambino 110. V V UG (haftungsbeschränkt) Berlin 100% 1
185 Bambino 52. V V UG (haftungsbeschränkt) Berlin 100% 1
186 Bambino 54. V V UG (haftungsbeschränkt) Berlin 100% 1
204 ABOUT ROCKET INTERNETLETTER TO OUR SHAREHOLDERSANNUAL REPORT 2015

No. CompanyRegistered Head office
Equity inte rest in % Via no.
187 Bambino 55. V V UG (haftungsbeschränkt) Berlin 100% 1
188 Bambino 61. V V UG (haftungsbeschränkt) Berlin 100% 19
189 Bambino 79. V V UG (haftungsbeschränkt) Berlin 100% 19
190 Bambino 80. V V UG (haftungsbeschränkt) Berlin 100% 19
191 Bambino 81. V V UG (haftungsbeschränkt) Berlin 100% 19
192 Bambino 82. V V UG (haftungsbeschränkt) Berlin 100% 19
193 Bambino 84. V V UG (haftungsbeschränkt) Berlin 100% 19
194 Bambino 91. V V UG (haftungsbeschränkt) Berlin 100% 19
195 Blanko 12. UG (haftungsbeschränkt) & Co. KG Berlin 100% 247, 3
196 Brillant 1259. GmbH Berlin 100% 1
197 Brillant 1390. GmbH Berlin 100% 32
198 Brillant 1418. GmbH Berlin 100% 237
199 Brillant 1423. GmbH Berlin 100% 1
200 Brillant 2055. GmbH Berlin 100% 301
201Carspring Beteiligungs UG (haftungsbeschränkt) Berlin 100% 87
202 CD-Rocket Holding UG (haftungsbeschränkt) Berlin 100% 1
203CityDeal Management II UG (haftungsbeschränkt) Berlin 100% 1
204CityDeal Management UG (haftungsbeschränkt) Berlin 100% 1
205CityDeal Management UG (haftungsbeschränkt) & Co. Beteiligungs KG Berlin 100% 203
206EFF Nr. 2 Portfolio Management UG (haftungs-beschränkt) Berlin 100% 1
207 EFF Nr. 2 Portfolio Verwaltungs GmbH Munich 100% 1
208EFF Nr. 3 Portfolio Management UG (haftungs-beschränkt) Berlin 100% 1
209 EFF Nr. 3 Portfolio Verwaltungs GmbH Munich 100% 1
210European Founders Fund Nr. 2 Geschäftsführungs GmbH Berlin 100% 1
211European Founders Fund Nr. 2 Verwaltungs GmbH Berlin 100% 1
212European Founders Fund Nr. 3 Management GmbH Berlin 100% 1
213European Founders Fund Nr. 3 Verwaltungs GmbH Berlin 100% 1
214GFC Nr. 1 Portfolio Management UG (haftungs-beschränkt) Berlin 100% 1
215 GFC Nr. 1 Portfolio Verwaltungs GmbH Munich 100% 1
216 Global Founders Capital Verwaltungs GmbH Berlin 100% 1
217Jade 1085. GmbH & Co. Achtzehnte Verwaltungs KG Berlin 100% 19, 3
218Jade 1085. GmbH & Co. Dreiundzwanzigste Verwaltungs KG Berlin 100% 19, 3
205COMBINED MANAGEMENT REPORTCONSOLIDATED FINANCIAL STATEMENTSROCKET INTERNET COMPANIES
Notes to the Consolidated Financial Statements

No. CompanyRegistered Head office
Equity inte rest in % Via no.
219Jade 1085. GmbH & Co. Vierundzwanzigste Verwaltungs KG Berlin 100% 19, 3
220Jade 1085. GmbH & Co. Zweiundvierzigste Verwaltungs KG Berlin 100% 19, 3
221 Jade 1154. GmbH Berlin 100% 229
222 Jade 1207. GmbH Berlin 100% 224
223 Jade 1207. GmbH & Co. Verwaltungs KG Berlin 100% 224, 3
224 Jade 1231. GmbH Berlin 100% 1
225 Jade 1232. GmbH Berlin 100% 1
226 Jade 1233. GmbH Berlin 100% 225
227 Jade 1236. GmbH Berlin 100% 1
228 Jade 1238. GmbH Berlin 73.8% 1, 3
229 Jade 1240. GmbH Berlin 100% 1
230 Jade 1241. GmbH Berlin 100% 1
231 Jade 1246. GmbH Berlin 100% 1, 3
232 Jade 1247. GmbH Berlin 100% 1
233 Jade 1279. GmbH Berlin 100% 1
234 Jade 1319. GmbH Berlin 100% 1, 3
235 Jade 1344. GmbH Berlin 100% 31
236 Jade 1348. GmbH Berlin 100% 33
237 Jade 1356. GmbH Berlin 100% 1
238 Jade 1361. GmbH Berlin 100% 237
239 Jade 1368. GmbH Berlin 100% 1, 3
240 Jade 1370. GmbH Berlin 100% 34
241 Jade 1413. GmbH Berlin 100% 22
242 Jade 940. GmbH Berlin 100% 1
243 Juwel 131. V V UG (haftungsbeschränkt) Berlin 100% 2
244 Juwel 133. V V UG (haftungsbeschränkt) Berlin 100% 183
245 Juwel 154. V V UG (haftungsbeschränkt) Berlin 100% 247
246 Juwel 155. V V UG (haftungsbeschränkt) Berlin 100% 1
247 Juwel 156. V V UG (haftungsbeschränkt) Berlin 100% 1
248 Juwel 190. V V UG (haftungsbeschränkt) Berlin 100% 44
249Juwel 190. V V UG (haftungsbeschränkt) & Co. 23. Verwaltungs KG Berlin 100% 43, 3
250Juwel 190. V V UG (haftungsbeschränkt) & Co. 42. Verwaltungs KG Berlin 100% 43, 3
251 Juwel 197. V V UG (haftungsbeschränkt) Berlin 100% 32
252 Juwel 200. V V UG (haftungsbeschränkt) Berlin 100% 25
253Juwel 200. V V UG (haftungsbeschränkt) & Co. Dritte Verwaltungs KG Berlin 100% 25, 3
254 Juwel 202. V V UG (haftungsbeschränkt) Berlin 100% 31
255 Juwel 219. V V UG (haftungsbeschränkt) Berlin 100% 44
256 Kristall 146. GmbH Berlin 100% 228
206 ABOUT ROCKET INTERNETLETTER TO OUR SHAREHOLDERSANNUAL REPORT 2015

No. CompanyRegistered Head office
Equity inte rest in % Via no.
257Motors Myanmar UG (haftungsbeschränkt) & Co. KG Berlin 100% 19
258 Rocket Communications GmbH Berlin 100% 1
259 Rocket Internet Marketplace Solutions GmbH Berlin 100% 1
260 Rocket Middle East GmbH Berlin 100% 1
261 Tekcor 2. V V UG (haftungsbeschränkt) Berlin 100% 19
262 Tripda (GP) GmbH Berlin 100% 34
263 Tripda Beteiligungs UG (haftungsbeschränkt) Berlin 100% 106
264 Tripda Global (GP) UG (haftungsbeschränkt) Berlin 100% 106
265 VRB GmbH & Co. B-101 (Einhunderteins) KG Berlin 100% 1
266 VRB GmbH & Co. B-118 (Einhundertachtzehn) KG Berlin 100% 19, 3
267VRB GmbH & Co. B-122 (Einhundertzweiundzwanzig) KG Berlin 100% 225, 3
268VRB GmbH & Co. B-125 (Einhundertfünfundzwanzig) KG Berlin 100% 228, 3
269 VRB GmbH & Co. B-133 KG Berlin 100% 231, 3
270 VRB GmbH & Co. B-147 KG Berlin 100% 19
271 VRB GmbH & Co. B-153 KG Berlin 100% 19
272 VRB GmbH & Co. B-154 KG Berlin 100% 19
273 VRB GmbH & Co. B-155 KG Berlin 100% 19
Other countries
274 9387102 Canada Limited Toronto 100% 303
275 Argentum Poland S.C.Sp. Luxemburg 100% 164
276 Argentum Poland sp. z.o.o. Warsaw 100% 275
277Beijing Ying Nai Le Qi Information Consultancy Co. Ltd. Beijing 100% 19
278 Classifieds Albania S.C.Sp. Luxemburg 100% 328, 3
279 Classifieds Armenia S.C.Sp. Luxemburg 100% 328, 3
280 Classifieds Azerbaijan S.C.Sp. Luxemburg 100% 328, 3
281 Classifieds Georgia S.C.Sp. Luxemburg 100% 328, 3
282 Classifieds Kyrgyzstan S.C.Sp. Luxemburg 100% 328, 3
283 Classifieds Tajikistan S.C.Sp. Luxemburg 100% 328, 3
284 Classifieds Turkmenistan S.C.Sp. Luxemburg 100% 328, 3
285 Classifieds Uzbekistan S.C.Sp. Luxemburg 100% 328, 3
286 Clickbus Peru S.A.C. Lima 100% 250, 248
287 Digital Services Australia S.C.Sp. Luxemburg 100% 76, 3
288 Digital Services Holding III S.à r.l. Luxemburg 100% 136
289 Digital Services Holding IV S.à r.l. Luxemburg 100% 1
290 Digital Services Holding XXI (GP) S.à r.l. Luxemburg 100% 151
291 Digital Services Holding XXII (GP) S.à r.l. Luxemburg 100% 77
292 Digital Services Holding XXIII (GP) S.à r.l. Luxemburg 100% 75
293 Digital Services I (GP) S.à r.l. Luxemburg 100% 76
294 Digital Services L S.à r.l. Luxemburg 100% 1
207COMBINED MANAGEMENT REPORTCONSOLIDATED FINANCIAL STATEMENTSROCKET INTERNET COMPANIES
Notes to the Consolidated Financial Statements

No. CompanyRegistered Head office
Equity inte rest in % Via no.
295 Digital Services LI (GP) S.à r.l. Luxemburg 100% 78
296 Digital Services LI Pakistan S.C.Sp. Luxemburg 100% 297, 3
297 Digital Services LI Top-Holding S.C.Sp. Luxemburg 100% 78, 3
298 Digital Services LII (GP) S.à r.l. Luxemburg 100% 134
299 Digital Services LII S.à r.l. Luxemburg 100% 1
300 Digital Services XL (GP) S.à r.l. Luxemburg 100% 81
301 Digital Services XL 2 S.C.Sp. Luxemburg 100% 82, 3
302 Digital Services XL 3 S.C.Sp. Luxemburg 100% 82, 3
303 Digital Services XL 5 S.C.Sp. Luxemburg 100% 82, 3
304 Digital Services XL 6 S.C.Sp. Luxemburg 100% 82, 3
305 Digital Services XLII 2 S.C.Sp. Luxemburg 100% 85, 3
306 Digital Services XLIII (GP) S.à r.l. Luxemburg 100% 87
307 Digital Services XLIX (GP) S.à r.l. Luxemburg 100% 308
308 Digital Services XLIX S.à r.l. Luxemburg 100% 1
309 Digital Services XLV S.à r.l. Luxemburg 100% 1
310 Digital Services XLVII (GP) S.à r.l. Luxemburg 100% 311
311 Digital Services XLVII S.à r.l. Luxemburg 100% 1
312 Digital Services XLVIII (GP) S.à r.l. Luxemburg 100% 89
313 Digital Services XVI (GP) S.à r.l. Luxemburg 100% 92
314 Digital Services XVII (GP) S.à r.l. Luxemburg 100% 93
315 Digital Services XVIII (GP) S.à r.l. Luxemburg 100% 316
316 Digital Services XVIII S.à r.l. Luxemburg 100% 1
317 Digital Services XXI France Holding S.C.Sp. Luxemburg 100% 96, 3
318 Digital Services XXI UK Holding S.C.Sp. Luxemburg 100% 96, 3
319 Digital Services XXII France Holding S.C.Sp. Luxemburg 100% 98, 3
320 Digital Services XXIII 4 S.C.Sp. Luxemburg 100% 103, 3
321 Digital Services XXIV (GP) S.à r.l. Luxemburg 100% 106
322 Digital Services XXIV 1 S.C.Sp. Luxemburg 100% 106, 3
323 Digital Services XXIV 4 S.C.Sp. Luxemburg 100% 106, 3
324 Digital Services XXIV 5 S.C.Sp. Luxemburg 100% 106, 3
325 Digital Services XXIX (GP) S.à r.l. Luxemburg 100% 111
326 Digital Services XXVII (GP) S.à r.l. Luxemburg 100% 327
327 Digital Services XXVII S.à r.l. Luxemburg 100% 1
328 Digital Services XXVII Top S.C.Sp. Luxemburg 100% 327, 3
329 Digital Services XXX (GP) S.à r.l. Luxemburg 100% 114
330 Digital Services XXX France S.C.Sp. Luxemburg 100% 115, 3
331 Digital Services XXXIII (GP) S.à r.l. Luxemburg 100% 118
332 Digital Services XXXIII 1 S.C.Sp. Luxemburg 100% 119, 3
333 Digital Services XXXVII (GP) S.à r.l. Luxemburg 100% 121
334 Digital Services XXXVIII 4 S.C.Sp. Luxemburg 100% 154, 3
335 Digital Services XXXVIII Top-Holding S.C.Sp. Luxemburg 100% 153, 3
208 ABOUT ROCKET INTERNETLETTER TO OUR SHAREHOLDERSANNUAL REPORT 2015

No. CompanyRegistered Head office
Equity inte rest in % Via no.
336 DS XL Italy S.r.l. Bolzano (IT) 100% 302
337 DS XL Netherlands B.V. Amsterdam 100% 304
338 DS XXXIII UK Limited London 100% 332
339 DS XXXVII UK Ltd. London 100% 120
340 ECommerce Pay Middle East S.à r.l. Luxemburg 100% 132, 3
341Emeraldone Internet Services Portugal, Unipessoal Lda. Lissabon 100% 194
342 Emerging Markets Capital S.à r.l. Luxemburg 100% 1
343Fastcash Servicos de Administracao e Correspondente Bancario Ltda. São Paulo 100% 384, 383
344 Food Delivery Holding 31 S.à r.l. Luxemburg 100% 130
345 Furniture E-Services Holding USA Inc.Wilmington
(US) 100% 25
346 Furniture E-Services Taiwan Co., Ltd. Taipei 100% 253
347 GG Fun LimitedBirkirkara
(MT) 100% 348, 1
348 GP Management LimitedBirkirkara
(MT) 99.9% 1
349 International Rocket Company LimitedRoad Town
(VG) 100% 19
350 International Rocket Corporate LimitedRoad Town
(VG) 100% 19
351 International Rocket Group LimitedRoad Town
(VG) 100% 19
352 International Rocket Hellas EPE Athens 100% 19, 20
353 International Rocket Holding LimitedRoad Town
(VG) 100% 19
354 International Rocket Ventures LimitedRoad Town
(VG) 100% 19
355 Internet Alti Hizmet Teknolojileri Limited Sirketi Istanbul 100% 267, 226
356 Internet Bes Hizmet Teknolojileri Limited Sirketi Istanbul 100% 223, 222
357 Internet Services Netherlands B.V. Amsterdam 100% 19
358 Inversiones Bazaya C.A. Caracas 100% 19
359 Jade E-Services Azerbaijan LLC Baku 100% 195
360 Kaymu Albania S.C.Sp. Luxemburg 100% 380, 3
361 Kaymu Albania Sh.p.k. Tirana 100% 360
362 Kaymu Armenia S.C.Sp. Luxemburg 100% 380, 3
363 Kaymu Azerbaijan LLC Baku 100% 364
364 Kaymu Azerbaijan S.C.Sp. Luxemburg 100% 380, 3
365 Kaymu Belarus S.C.Sp. Luxemburg 100% 380, 3
366 Kaymu BH d.o.o. Sarajevo 100% 367
367 Kaymu Bosnia S.C.Sp. Luxemburg 100% 380, 3
368 Kaymu Bulgaria EOOD Sofia 100% 369
369 Kaymu Bulgaria S.C.Sp. Luxemburg 100% 380, 3
209COMBINED MANAGEMENT REPORTCONSOLIDATED FINANCIAL STATEMENTSROCKET INTERNET COMPANIES
Notes to the Consolidated Financial Statements

No. CompanyRegistered Head office
Equity inte rest in % Via no.
370 Kaymu Croatia d.o.o. Zagreb 100% 371
371 Kaymu Croatia S.C.Sp. Luxemburg 100% 380, 3
372 Kaymu Georgia LLC Tbilisi 100% 373
373 Kaymu Georgia S.C.Sp. Luxemburg 100% 380, 3
374 Kaymu Macedonia S.C.Sp. Luxemburg 100% 380, 3
375 Kaymu Montenegro S.C.Sp. Luxemburg 100% 380, 3
376 Kaymu Slovakia S.C.Sp. Luxemburg 100% 380, 3
377 Kaymu Slovenia d.o.o. Ljubljana 100% 378
378 Kaymu Slovenia S.C.Sp. Luxemburg 100% 380, 3
379 Kaymu Slovensko s.r.o. Bratislava 100% 376
380 Kaymu Top-Holding S.C.Sp. Luxemburg 100% 92, 3
381 Kaymu Uzbekistan S.C.Sp. Luxemburg 100% 380, 3
382 KaymuBy (Unitary Enterprise) Minsk 100% 365
383 Moneda (GP) S.à r.l. Luxemburg 100% 388
384 Moneda Brazil S.C.Sp. Luxemburg 100% 386, 3
385 Moneda Colombia S.C.Sp. Luxemburg 100% 386, 3
386 Moneda Holding S.C.Sp. Luxemburg 100% 388
387 Moneda Mexico S.C.Sp. Luxemburg 100% 386, 3
388 Moneda Top-Holding S.à r.l. Luxemburg 100% 1
389 Online Car Marketplace España SL Madrid 100% 80
390 Online Platform LLC Tashkent 100% 381
391 Place Mniej Sp. z o.o. Warsaw 87.5% 47
392 R1 E-Services Hungary Kft. Budapest 100% 19
393 RI Capital Advisors Limited London 100% 1
394 Rocket Bulgaria EOOD Sofia 100% 19
395 Rocket Denmark ApS. Copenhagen 100% 19
396 Rocket Internet Chile Limitada Santiago 100% 19, 20
397 Rocket Internet Italy S.r.l. Milan 100% 19
398 Rocket Internet Japan K.K. Tokyo 100% 19
399 Rocket Internet S.R.L. Bucharest 100% 19, 20
400 Rocket Internet Scandinavia AB Stockholm 100% 19
401 Rocket Internet South Africa (Proprietary) Gauteng 100% 19
402 Rocket Korea Ltd. Seoul 100% 19
403 Rocket Serbia d.o.o. Belgrade 100% 19
404 Rocket Slovakia s.r.o. Bratislava 100% 19
405 Rocket US Inc.Wilmington
(US) 100% 19
406 R-SC Egypt for Import and Export Cairo 100% 148
407 R-SC Internet Services Chile Limitada Santiago 100% 19, 20
408 R-SC Internet Services Colombia SAS Bogotá 100% 19
409 RSC Internet Services Finland 2 Oy Helsinki 100% 191
410 R-SC Internet Services France SAS Paris 100% 19
210 ABOUT ROCKET INTERNETLETTER TO OUR SHAREHOLDERSANNUAL REPORT 2015

No. CompanyRegistered Head office
Equity inte rest in % Via no.
411 R-SC Internet Services II Norway AS Oslo 100% 192
412 R-SC Internet Services Japan K.K. Tokyo 100% 217
413 R-SC Internet Services Malaysia Sdn. Bhd Kuala Lumpur 100% 104
414 R-SC Internet Services Nigeria Limited Lagos 100% 19, 20
415 R-SC Internet Services Slovakia s.r.o. Bratislava 100% 188, 3
416 R-SC Internet Services South Africa (PTY) Ltd. Cape Town 100% 19
417 R-SC Internet Services Spain S.L. Madrid 100% 19
418 RSC Internet Services Switzerland GmbH Zürich 100% 19
419 RSC Internet Services Switzerland II GmbH Zürich 100% 189
420R-SC Liquidation Services Luxembourg (GP) S.à r.l. (vormals: Digital Services XLII (GP) S.à r.l.) Luxemburg 100% 150
421 RSC Rocket Internet Services Ltd. Tel Aviv 100% 19
422 R-SC Vietnam Company LimitedHo Chi Minh
City 100% 19
423 RTE Finland Oy Helsinki 100% 19
424 RTE Internet Ireland Ltd. Dublin 100% 19
425 RTE Internet Services Switzerland GmbH Zürich 100% 19
426 RTE Italy S.r.l. London 100% 19
427 RTE Netherlands B.V. Amsterdam 100% 19
428 Shopwings UK Limited London 100% 318
429 Solar eServices Private Limited Gurgaon 100% 219, 20
430 Somuchmore Spain, S.L. Alella (ES) 100% 334
431 SpaceWays Canada Holding S.C.Sp. Luxemburg 100% 94, 3
432 SpaceWays France Holding S.C.Sp. Luxemburg 100% 94, 3
433 SpaceWays France SAS Paris 100% 432
434 SpaceWays USA Holding S.C.Sp. Luxemburg 100% 94, 3
435 Spotcap (GP) S.à r.l. Luxemburg 100% 160
436 Spotcap Canada S.C.Sp. Luxemburg 100% 164, 3
437 Spotcap Loans Ltd. Vancouver 100% 436
438 Spotcap UK Ltd. London 100% 439
439 Spotcap UK S.C.Sp. Luxemburg 100% 164, 3
440Trimly Brasil Agendamento de Servicos de Beleza Ltda. São Paulo 100% 305, 85
441 Tripda Argentina Holding S.C.Sp. Luxemburg 100% 171, 3
442 Tripda South Korea Holding S.C.Sp. Luxemburg 100% 171, 3
443 Tripda Taiwan Holding S.C.Sp. Luxemburg 100% 171, 3
444 Tripda Taiwan Ltd. Taipei 100% 443
445 Tripda Uruguay Holding S.C.Sp. Luxemburg 99.7% 171, 3
446 VRB B-154 Group LimitedRoad Town
(VG) 100% 272
447 VRB B-155 Corporate LimitedRoad Town
(VG) 100% 273
448 Wimdu Australia PTY Limited Sydney 100% 19
211COMBINED MANAGEMENT REPORTCONSOLIDATED FINANCIAL STATEMENTSROCKET INTERNET COMPANIES
Notes to the Consolidated Financial Statements

No. CompanyRegistered Head office
Equity inte rest in % Via no.
449 Wimdu Israel Ltd. Tel Aviv 100% 19
Associated companies and joint ventures
Germany
450 AEH New Africa eCommerce II GmbH Berlin 34.6% 1, 3
451 Affinitas GmbH Berlin 21.9% 1
452 Affinitas Phantom Share GmbH Berlin 34.4% 1
453 Africa Internet Holding GmbH Berlin 33.3% 1
454 Anschlusstor Vermarktungs GmbH Munich 49.0% 16
455 Beauty Trend Holding GmbH2) Berlin 59.8% 1
456 CupoNation Group GmbH4) Munich 40.8% 1, 3
457 FabFurnish GmbH Berlin 29.2% 1
458 HelloFresh AG2) Berlin 56.7% 1, 3
459 Home24 AG Berlin 45.5% 1, 3
460 Jade 1158. GmbH2) Berlin 68.2% 1
461 Jade 1223. GmbH2) Berlin 73.8% 1, 3
462 MarleySpoon GmbH Berlin 28.6% 16
463 Netzoptiker GmbH3) Limburg a.d.L. 42.8% 1
464 New BGN Other Assets II GmbH Berlin 34.6% 1
465 New Bigfoot Other Assets GmbH Berlin 29.2% 1
466 New Middle East Other Assets GmbH Berlin 32.7% 1, 260
467 New TIN Linio II GmbH Berlin 46.0% 1
468 Payleven Holding GmbH Berlin 38.6% 132, 3
469 Paymill Holding GmbH Berlin 48.6% 132, 3
470 Plinga GmbH Berlin 39.3% 1
471 PTH Brillant Services GmbH2) Berlin 79.6% 1, 3
472 Rumble Media GmbH Karlsruhe 38.3% 16
473 TravelTrex GmbH Cologne 25.0% 11
474 Trusted Shops GmbH Cologne 25.0% 16
475 Veliberg GmbH Cologne 22.0% 1
476 Webpotentials GmbH3) Berlin 45.2% 1
477 Westwing Group GmbH Berlin 32.2% 1, 26, 3
478 Wimdu GmbH Berlin 49.4% 1
Other countries
479 Asia Internet Holding S.à r.l. Luxemburg 50.0% 1
480 Clariness AG Stans (CH) 25.0% 16
481 Digital Services XXVIII S.à r.l.2) Luxemburg 70.0% 1
482 ECommerce Holding II S.à r.l.2) Luxemburg 50.6% 136, 184
483Emerging Markets Online Food Delivery Holding S.à r.l. Luxemburg 49.1% 137, 3
484 Emerging Markets Taxi Holding S.à r.l. Luxemburg 38.6% 44
485Enuygun Com Internet Bilgi Hizmetleri Teknoloji ve Ticaret AS Istanbul 48.8% 47
212 ABOUT ROCKET INTERNETLETTER TO OUR SHAREHOLDERSANNUAL REPORT 2015

No. CompanyRegistered Head office
Equity inte rest in % Via no.
486 getAbstract AG Lucerne 22.0% 11
487 Girl Meets Dress Ltd.St. Albans
(UK) 23.7% 16
488 Global Fashion Group S.A. Luxemburg 26.9% 1, 44, 3
489 Helpling Group Holding S.à r.l. Luxemburg 25.9% 1
490 InstaRem PTE LimitedNewtown
(SG) 25.0% 135
491 Lazada Group S.A. Luxemburg 22.8% 1
492 LeadX Holdings LimitedAltrinchnam
(UK) 30.0% 16
493 Middle East Internet Holding S.à r.l. Luxemburg 50.0% 1
494 PT Traveloka Indonesia5) Jakarta 52.7% 2
495 RTV Holding Inc.Road Town
(VG) 20.0% 133
496 TravelBird Nederland B.V. Amsterdam 25.2% 16
497 Ulmon GmbH Vienna 22.8% 16, 135
498 Voopter Internet do Brasil SA6)
Rio de Janeiro 55.2% 16
499 XS Software AD Sofia 40.0% 16
500 Yamsafer Inc.Wilmington
(US) 25.2% 135
1) Not consolidated due to immateriality.2) No control due to contractual arrangements or legal circumstances. 3) In liquidation or in bankruptcy.4) CupoNation Group GmbH: voting rights of 42.0% differ from equity interest.5) PT Traveloka Indonesia: voting rights of 35.7% differ from equity interest.6) Voopter Internet do Brasil SA: voting rights of 48.0% differ from equity interest.
No. Company, registered office
Equity inte rest
in %Votes
in % Via no.
Net result
in EUR thousand
Equity in EUR
thousand
Other investments
Germany
501Delivery Hero Holding GmbH, Berlin 7),8) 40.0% 30.0% 137, 165 –88,906 268,843
7) Values according to the last available consolidated financial statements (IFRS) as of December 31, 2014.8) No significant influence due to legal circumstances.
213COMBINED MANAGEMENT REPORTCONSOLIDATED FINANCIAL STATEMENTSROCKET INTERNET COMPANIES
Notes to the Consolidated Financial Statements

47. Number of Employees pursuant to Sec. 314 No. 4 HGB
The average number of staff employed was as follows:
As of December 31, 2015, the group employed a total of 1,496 employees (previous year 1,586), thereof 639 abroad (previous year 1,078).
48. Authorization of the Financial Statements for Issue
The Management Board authorized the issue of the consolidated financial statements on March 31, 2016.
Berlin, March 31, 2016
The Management Board
Oliver Samwer Peter Kimpel Alexander Kudlich
2015
Germany 872
Other countries 630
Total 1,502
214 ABOUT ROCKET INTERNETLETTER TO OUR SHAREHOLDERSANNUAL REPORT 2015

215
4
216 Fundamentals of the Company and the Group
216 Business Model 221 Research & Development
222 Economic Report 222 General Economic Conditions 223 Industry-Specific Conditions 226 Course of Business 228 Rocket Internet Share and
Capital Structure 229 Position of the Group 236 Position of the Company 238 Financial and Non-Financial
Performance Indicators
239 Events after the Reporting Date
240 Forecast Report, Report of Opportunities and Risks
240 Forecast Report 241 Risk Report 243 Opportunities Report
244 Risk Report Concerning the Use of Financial Instruments
245 Risk of Default (Credit Risk) 245 Liquidity Risk 246 Currency Risk
247 Audit Opinion
Combined Management Report
Contents

1. Fundamentals of the Company and the Group1.1 Business Model
1.1.1 General InformationRocket Internet SE (until March 18, 2015 Rocket Internet AG), hereinafter also referred to as “Rocket Internet“, the “Company“ or “parent Company“, is registered in the commercial register Charlottenburg of the district court in Berlin (Registration No.: HRB 165662). The registered office of Rocket Internet SE is at Johannisstrasse 20, 10117 Berlin, Germany.
Rocket Internet SE is the parent company of directly and indirectly held subsidiaries and holds directly or indirectly interest in joint ventures and associates (hereinafter together also referred to as the “Rocket Internet Group“ or the “Group“).
Since October 2, 2014 the shares of Rocket Internet SE, are included in the non-regulated Entry Standard of the Frankfurt Stock Exchange. The admission to the non-regulated Entry Standard does not represent a stock listing pursuant to Sec. 3 (2) AktG (German Stock Corporation Act).
Subsidiaries, associated companies and joint ventures herein are summarized as “network companies”.
This report combines the Group Management Report of the Rocket Internet Group and the Management Report of Rocket Internet SE. It should be read in conjunction with the Consolidated Financial Statements and Annual Financial Statements, including the notes to the Financial Statements. The Consolidated Financial Statements and the Annual Financial Statements have been prepared on the basis of a number of assumptions and accounting policies explained in greater detail in the respective notes. The Combined Management Report contains forward-look-ing statements about the business, financial condition and earnings performance. These state-ments are based on assumptions and projections based on currently available information and present estimates. They are subject to a multitude of uncertainties and risks. Actual business development may therefore differ materially from what has been expected. Beyond disclosure requirements stipulated by law, Rocket Internet SE does not undertake any obligation to update forward-looking statements.
The Combined Management Report for the financial year 2015 is presented in million euros ex-cept where otherwise indicated. Unless otherwise indicated, all values are rounded up or down in accordance with a commercial rounding approach, which may result in rounding differences and percentage figures presented may not exactly reflect the absolute figures they relate to. The reporting period is January 1 to December 31, 2015. If not otherwise stated comparative figures for the balance sheet are as of December 31, 2014 and comparative figures for statement of comprehensive income and cash flow statement are for the period January 1 to December 31, 2014.
1.1.2 Business ActivitiesRocket Internet SE is one of the leading Internet platforms outside the United States and China.
Rocket Internet was founded in 2007 and has since established numerous companies with activities in more than 110 countries on six continents. Rocket Internet identifies proven Inter-net and mobile business models and builds these either independently in own subsidiaries or invests in already existing companies (the so-called “GFC Investments”, see also Section 1.1.3). Rocket targets mainly new, underserved or untapped fast-growing markets with limited competition, in which new companies will be scaled to market leadership positions. It relies on already proven models with a lower customer acceptance risk. The Group aims to make its network companies, depending on the type of business model, profitable within six to nine years after project launch.
216 ABOUT ROCKET INTERNETLETTER TO OUR SHAREHOLDERSANNUAL REPORT 2015

A standardized approach for the formation of companies enables Rocket Internet to bring a company to market in just a few months after it is decided to implement an identified business model in a country or region (project). The goal is that companies achieve operational indepen-dence under the leadership of the parent company.
Rocket Internet has a flexible and scalable technology platform, which enables starting several new projects per year in its five target regions
– Europe (excluding Russia and CIS), – Africa and Middle-East, – Asia and Pacific (excluding China), – Russia and CIS (Commonwealth of Independent States), and – Latin America.
Five Industry SectorsRocket Internet is focused on proven Internet-based business models that satisfy basic consumer needs across the following five industry sectors1):
– Food & Groceries (individualized fresh food at home and online food delivery and takeaway), – Fashion (emerging markets online fashion), – General Merchandise (emerging markets online retail as well as marketplaces for online
merchandise), – Home & Living (international home & living eCommerce) and – Travel (online and mobile travel bookings, package holidays with transfer).
Regional Internet GroupsRocket Internet has created Regional Internet Groups in order to combine the knowledge of local markets with the business model expertise, to foster regional commercial, strategic and investment partnerships especially with mobile operators. Our Regional Internet Groups include Asia Pacific Internet Group, Middle East Internet Group and Africa Internet Group.
New Businesses & InvestmentsIn addition to the companies in the five industry sectors, Rocket Internet owns stakes in com-panies at varying maturity stages, ranging from recently launched models to companies that are in the process of establishing leadership positions or still expanding their geographic reach.
ServicesFurthermore, Rocket Internet Group performs a range of IT, marketing and other services, par-ticularly commercial and technical consulting services for its subsidiaries and non-consolidated equity investments. Rocket Internet is usually intensely involved in the strategic leadership and tactical implementation of the business plans of its subsidiaries, associates and joint ventures, in particular in the early years.
Rocket Internet has created the Rocket Internet platform to systematize the process of identi-fying, building and scaling Internet companies around the world. The goal is to identify com-monalities within different business models and leverage these via a platform approach to opti-mize the building and scaling process.
1.1.3. Legal Structure of the Group / LocationsRocket Internet has a large number of network companies in countries that are particularly rele-vant for online and mobile business.
While Rocket Internet as well as some of its subsidiaries focus on providing services along the different functional areas of an Internet business, the operational business is carried out
1) Sectors do not represent reportable segments.
217COMBINED MANAGEMENT REPORTCONSOLIDATED FINANCIAL STATEMENTSOUR COMPANIES
Fundamentals of the Company and the Group

exclusively by Rocket Internet’s subsidiaries, associates and joint ventures under the umbrella of specifically created consumer brands.
In its role as group holding, Rocket Internet fulfils central functions including operational invest-ment management, accounting, group financial reporting, press and investor relations, risk man-agement and internal audit as well as human resources.
Rocket Internet typically owns directly or indirectly 80% to 90% of its companies 2) at the time of launch, with the remainder set aside for management equity participations. In subsequent financing rounds, the companies attract the equity financing necessary to expand their business from Rocket Internet and other external investors. The external equity financing is provided by strategic partners and other strategic and financial investors, including existing Rocket Internet shareholders. These investments are either made directly into the company or indirectly into an intermediate holding company or a Regional Internet Group (Africa Internet Holding GmbH, Asia Internet Holding S.à r.l. or Middle East Internet Holding S.à r.l.). In practice, this has meant that the direct and indirect stakes of Rocket Internet in a company have decreased over time to less than 50%. Furthermore, for several companies in which Rocket Internet holds a participation of more than 50%, shareholder agreements exist that lead to ongoing restrictions of Rocket Internet’s control over those network companies. Therefore as of December 31, 2015 Rocket Internet does not consolidate most of its significant network companies, but accounts for them as associated companies and joint ventures. The most important associated companies and joint ventures in the Rocket Internet Group as of December 31, 2015 are:
As of December 31, 2015 Rocket Internet Group included 182 (previous year 139) fully consoli-dated companies (including intermediary holdings), of which 119 (previous year 74) companies were located outside of Germany. In addition, Rocket Internet Group held investments in 51 (previous year 53) associated companies and joint ventures. The list of group shareholdings is presented in the notes to the consolidated financial statements.
Group's investments in other companiesDuring the 1st half of 2015 the Group successively purchased approximately 44% of the total outstanding share capital of Delivery Hero Holding GmbH (DHH). Due to subsequent capital
Associated company / joint venture Consumer brands
Global Fashion Group S.A.Dafiti, Lamoda, Zalora & The Iconic, Namshi, Jabong and since September 2015 Kanui and Tricae
Lazada Group S.A. Lazada, helloPay
New TIN Linio II GmbH Linio
Home24 AG Home24, Mobly
Westwing Group GmbH Westwing
HelloFresh AG HelloFresh
Emerging Markets Online Food Delivery Holding S.à r.l. foodpanda, hellofood, Delivery Club
Africa Internet Holding GmbHCarmudi, EasyTaxi, Everjobs, Hellofood, Jovago, Jumia, Kaymu, Lamudi, Vendito, Zando
Asia Internet Holding S.à r.lDaraz, Lamudi, Carmudi, Easy Taxi, Kaymu, Helpling, Jovago, Shopwings
Middle East Internet Holding S.à r.l. Carmudi, Lamudi, Easy Taxi, Helpling, Wadi
2) All participation quotas for the network companies shown in the financial statements are based on the Group’s ownership calculated pursuant to the respective accounting rules (e.g. reflecting the transaction closing dates, dates of change in control, considering trust shares allocated to the Group etc.) and may therefore differ from the respective information pub-lished on the Company’s website which is based on the signing dates.
218 ABOUT ROCKET INTERNETLETTER TO OUR SHAREHOLDERSANNUAL REPORT 2015

increases performed by DHH Rocket’s share decreased until December 31, 2015 to approximately 40% (prior to dilutive effects of convertible instruments issued by DHH). Under the terms of the DHH Shareholders’ Agreement, the Group’s voting rights are limited to 30%. The Group did not obtain representation on the DHH’s advisory board (as specified in the DHH’s articles of incorporation), which precludes Rocket from the participation in policy-making processes of DHH and from obtaining timely adequate financial information required to apply the equity method of accounting. In light of the lack of significant influence, the Group classified its equity investment in DHH as available-for-sale financial assets.
The Group has designated certain associated companies and other equity investments with ownership percentages below 20% that are not closely related to Rocket’s operations as financial assets at fair value through profit or loss. Those equity investments are managed and measured on the basis of fair values in accordance with the risk management and investment strategies. Rocket is acting as an investor within the meaning of IAS 28.18 and the Group is not intensely involved in the strategic leadership and tactical implementation of the business plans of such companies. Furthermore, Rocket usually does not perform significant commercial and technical consulting services for these companies. Particularly this category includes the portfolio of in-vestments into several internet companies (e.g. YemekSepeti, Goodgame Studios, Jimdo, Trust-ed Shops, Motortalk, Kreditech) acquired in August 2014 by a way of an exchange of shares held by United Internet and Global Founders GmbH in the Global Founders Capital Funds for shares in Rocket Internet. In financial year 2015, additional GFC investments were made in companies such as Craftsvilla, Movinga, Naturebox and Dealerdirect.
1.1.4 Consumer Brands of the Company NetworkThe following illustration shows a selection of the most important consumer brands used by net-work companies:
мода с доставкой
Food & Groceries
Fashion
General Merchandise
Home & Living
Travel
Regional Internet Groups
New Businesses & Investments
Consumer Brands
219COMBINED MANAGEMENT REPORTCONSOLIDATED FINANCIAL STATEMENTSOUR COMPANIES
Fundamentals of the Company and the Group

1.1.5 StrategyRocket Internet builds and invests in Internet companies that take proven online and mobile business models to new, fast-growing markets. Our companies are “first movers” that quickly capture sizeable market share, the foundation for strong and lasting profitability. We further honed and deepened our approach and made it more efficient in 2015, identifying opportunities in new regions and markets, and consistently expanding the Rocket Internet network of companies.
Rocket Internet has developed a platform which is able to provide its network of companies with a competitive advantage. Our operational excellence and access to international expertise and funding enable us to identify, build and scale proven online and mobile business models any-where in the world. We have become experts in entering markets that are more difficult to devel-op due to the lack of basic infrastructure than markets in the industrialized world.
Rocket Internet focuses on five industry sectors of online retail and services that make up a significant share of consumer spending: Food & Groceries, Fashion, General Merchandise, Home & Living and Travel.
Our strategy is influenced by five key trends that drive growth in our key markets:
– Internet penetration in emerging markets is low but growing quickly, which means demand for online services that meet basic needs is surging exponentially.
– The smartphone revolution is giving ever more people Internet access, a big opportunity for online retailers to exploit new demand in all corners of the world.
– The population in many of our markets is younger and thus potentially more tech-savvy than that in the US, which increases the scope for online business models.
– The middle class in many emerging market economies is expected to grow strongly, which we expect to raise discretionary consumer spending significantly.
– Bricks-and-mortar retailing in many target markets is underdeveloped, which will allow online retailers to capture more consumers as they leapfrog to Internet shopping.
By monitoring these developments and keeping a close eye on consumer habits in individual markets, Rocket Internet was able to grow its network of companies still further in 2015.
Our operational platform and our expanding network of companies have put Rocket Internet in a unique position to capitalize on the growth of Internet commerce in and outside Europe. Techno-logical innovation and rapidly changing consumer habits offer online retailers and service provid-ers significant opportunities as Internet-based business models scale quickly. Rocket Internet in-vests in select business models and sectors, with the aim of owning significant stakes in companies that have the potential to become leading players in their markets.
One of Rocket Internet’s major focus areas currently is Food & Groceries, a fast-growing market. Rocket Internet views the sector as the next frontier of eCommerce. In order to expand our global position in this sector, we increased our stake in HelloFresh AG in 2015, a globally active player in the fresh food at home market, to presently 56.7% from 37.5% at the time of the Rocket Internet IPO. HelloFresh AG has operations in Germany, Austria, the Netherlands, Belgium, the United Kingdom, Australia and the United States. Rocket Internet also invested in the food takeaway company Delivery Hero, resulting in an ownership of 40.0% (prior to dilutive effects of convertible instruments issued by DHH) in this highly promising business model. Furthermore, we invested in foodpanda and increased the stake to 49%. Taking a larger stake in these companies gives us a competitive edge in this attractive sector, while providing the companies with capital to expand their operations and pave the way to become market leaders. Moreover, we further strengthened our market position in the Fashion sector by investing in Global Fashion Group S.A. (La Moda, Dafiti, Namshi, Zalora, Jabong), an online fashion group operating in several emerging markets.
220 ABOUT ROCKET INTERNETLETTER TO OUR SHAREHOLDERSANNUAL REPORT 2015

Our aim is to achieve long-term leadership in the markets and sectors we enter. To gain a strong market position, we are willing to invest in the early development stages, leading to start up losses. Long-term value creation is therefore our key focus when starting new businesses. To support this goal, we continue to invest in our product portfolio technology, the customer experi-ence, infrastructure and logistics capabilities. Targeting profitability in the mid-term, our focus for these companies shifts over time to creating equilibrium between growth and market share on the one hand and unit economics and profitability on the other. It’s our objective that these com-panies reach break-even within six to nine years after launch.
We provide companies launched on the Rocket Internet platform with the financial means to start up and develop their operations. Since we are the initiator of the respective company we own a significant majority and hence we benefit from the so-called “founder economics”. Com-pany growth is typically funded through a mix of own and third party capital, underscoring the attractiveness of and value creation in our network of companies. When we see an investment opportunity in a promising business model, we invest with conviction and provide significant amounts of capital. Since capital is a key component in building market leaders, we undertook several measures to raise additional capital in 2015.
Rocket Internet’s network comprises are at different stages of development. At the time of launch, we typically own directly or indirectly an 80% to 90% stake, with the remainder set aside for management equity participation. In subsequent financing rounds, we invest and attract exter-nal equity financing, which is provided by our local strategic partners as well as other strategic and financial investors. As we firmly believe in the business models we launch, we seek to retain a large share of the absolute value creation and therefore intend to maintain relatively high owner-ship stakes and control in many of our companies. We continue to participate in financing rounds for our companies and also selectively purchase additional stakes through secondary transactions.
In January 2016, the Rocket Internet Capital Partners Fund was launched, providing an additional source of funding for the network of companies.
Detailed, up to date information on the strategy and the major network companies of Rocket can be found on the website of the parent company – www.rocket-internet.com.
1.2 Research & Development
Rocket Internet has developed proprietary technologies that are able to provide a competitive advantage for Rocket Internet companies. The internally developed technology platforms are flexible and scalable as they provide network companies with advantages in cost and speed, especially during the start up and market introduction phase. Rocket Internet has created core technology platforms for the network companies, which allow a “plug and play” setup, and which are used as the starting point in the process of establishing a new company. The technology platform is scalable, which enables the processing of high traffic volumes and the integration of a large number of different countries and languages. The companies adapt those platforms to their individual requirements, while their improvements often benefit the whole network.
All units of the company, supported by a central strategic product development function, optimize the existing offerings and establish innovative products in the market. Most importantly, this means that the offering spectrum is expanded continuously through innovations.
Development expenses are capitalized as internally-generated intangible assets, whereas research expenses are recognized in the income statement.
In its core business, the Group constantly develops new products for the needs of its customers. New developments are subject to user tests on a timely basis. Their experience flows, in turn, into the product optimization.
221COMBINED MANAGEMENT REPORTCONSOLIDATED FINANCIAL STATEMENTSOUR COMPANIES
Fundamentals of the Company and the Group

The entire industry is transitioning from classic desktop-internet companies to mobile-first and even mobile-only, which requires the development of new products. Mobile people increasingly do their research and make choices on their way from one place to another. Smartphones and tablets are more and more replacing the home desktop PC. Further, new device classes are being added, such as internet-capable TV sets and smart watches. The Group is committed to support its network companies in delivering products and rendering services to all relevant digital devices.
The major software developments of the financial year 2015 are:
Furthermore, Rocket Internet has developed instruments to analyze essential key performance indicators that allow us to compare the performance of our companies, identify best practices, and share this knowledge within our network of companies.
2. Economic Report2.1 General Economic Conditions
According to the International Monetary Fund’s (IMF) “World Economic Outlook” published in January 2016, global economic activity remained subdued in 2015. Global growth is currently estimated at 3.1% in 2015. Growth in emerging markets and developing economies, which still accounts for over 70% of global growth, declined for the fifth consecutive year, while a modest recovery continued in advanced economies.
The global outlook continues to be influenced by the gradual slowdown and rebalancing of economic activity in China away from investment and manufacturing toward consumption and services, lower prices for energy and other commodities, and a gradual tightening in monetary policy in the United States. Oil prices have declined significantly since September 2015. Lower oil prices strain the fiscal positions of fuel exporters and weigh on their growth prospects, while supporting household demand and lowering business energy costs for importers, especially in advanced economies. In the Euro area, stronger private consumption supported by lower oil prices and favorable financing conditions is outweighing a weakening in net exports. Growth in emerging market and developing economies is projected to increase from 4 % in 2015 – the lowest since the 2008-09 financial crisis, – to 4.3 % and 4.7% in 2016 and 2017 respectively. Higher growth is projected for the Middle East, but lower oil prices, and in some cases geopoliti-cal tensions and domestic strife, continue to weigh on the outlook. Emerging Europe is projected to continue growing at a broadly steady pace, albeit with some slowing in 2016. Russia, which continues to adjust to low oil prices and Western sanctions, is expected to remain in recession in 2016. Most countries in sub-Saharan Africa will see a gradual pickup in growth, but with lower
Software Name Function / Purpose
SkyRocket
Next generation company-building framework that minimizes the company setup costs and reduces the time to launch new companies
RAP: Rocket Advertising Platform
Highly automated online advertising management application with self-learning algorithms that enables efficient growth of customer base at scale
DataJet.ioData driven merchandizing. Real-time stream processing en-gine for search, recommendations and product feeds
SellerCenterGlobal vendor integration. Vendor integration with web & mo-bile apps and public APIs (application program interface)
222 ABOUT ROCKET INTERNETLETTER TO OUR SHAREHOLDERSANNUAL REPORT 2015

commodity prices, at rates that are lower than those seen over the past decade. In Europe, where the tide of refugees is challenging the absorptive capacity of European Union labor markets and testing political systems, policy actions to support the integration of migrants into the labor force are critical to alleviate concerns about social exclusion and long-term fiscal costs, and unlock the potential long-term economic benefits of the refugee inflow.
The development of Gross Domestic Product (GDP) and exchange rates in selected countries is as follows:
2.2 Industry-Specific Conditions
Venture Capital Market in GermanyAn active market for venture capital plays a vital role in the financing of start ups and innovations. In light of this, politicians are asked to improve the venture capital environment in Germany with well targeted measures. In September 2015, the Federal Government adopted a key issues paper on the promotion of venture capital in Germany, which includes several measures to strengthen the venture capital scene in Germany and to improve the financing situation. In the broader perspective, the Federal Government wants to develop Germany into a competitive location for venture capital funds.
In Germany, there is a lack of exit opportunities for venture capitalists, which is partly due to the generally poorly developed capital market. The sale of shares of young companies, that still do not generate profits, on secondary markets or the stock exchange often proves to be difficult. This problem could be addressed through the creation of a pan-European stock market segment for growth-oriented companies. This is a core component of the European Capital Markets Union (CMU). European CMU is intended as a long-term project, whose cornerstones are to be placed by the year of 2019. The European Commission assumes that the underdeveloped market condi-tions are the result of structural problems in the European financial system. The propositions of the European Commission involve not only an expanding financial integration, but also promoting capital market-based corporate financing and specific market segments. The Action Plan of the European Commission includes some of the following measures: improving access to public capital markets, promotion of venture capital and private equity financing, the promotion of inno-vative forms of financing and strengthening pan-European approaches to SME financing.
Country / Currency
Change of GDP in %Exchange rates
(1 EUR = local currency)
2015 2014 Dec 31, 2015 Dec 31, 2014 Change
Russia RUB −3.8% 0.6% 80.674 72.337 +11.5%
Brazil BRL −3.0% 0.1% 4.312 3.221 +33.9%
India INR 7.3% 7.3% 72.022 76.719 −6.1%
Indonesia IDR 4.7% 5.0% 15,039.990 15,076.100 −0.2%
Australia AUD 2.4% 2.7% 1.490 1.483 +0.5%
Singapore SGD 2.2% 2.9% 1.542 1.606 −4.0%
Nigeria NGN 4.0% 6.3% 215.545 219.980 −2.0%
United Arab Emirates AED 3.0% 4.6% 4.012 4.464 −10.1%
Saudi Arabia SAR 3.4% 3.5% 4.097 4.560 −10.2%
223COMBINED MANAGEMENT REPORTCONSOLIDATED FINANCIAL STATEMENTSOUR COMPANIES
Fundamentals of the Company and the Group Economic Report

Despite this difficult framework, Germany was a dynamic IPO location in 2015. Fifteen compa-nies made an IPO in the Prime Standard in 2015 (previous year: 11) and thereby attracted EUR 7.1 billion, – more than twice as much as in the previous year (EUR 3.4 billion). In 2015, 24 companies were newly listed on the Frankfurt Stock Exchange, the highest number since 2007 (19 in 2014). Overall, the newcomers had a market capitalization of EUR 38.5 billion at initial listing (EUR 21.4 billion in 2014). For the coming year 2016, up to 15 German IPOs are expected, provided that market conditions remain supportive.
General Industry Trends 3Following A.T. Kearny’s “The 2015 Global Retail E-Commerce IndexTM”, the eCommerce industry still shows strong growth. This steady growth is supported by the increasing internationalization in the industry as well as a continuously increasing Internet penetration, especially in emerging markets. Another strong sign for the positive development is the rise of IPOs in the eCommerce industry.
One trend is the increasing Big Data business, as more and more companies want to digitize their processes. This includes the management and storage of data, advanced cloud computing solutions, personalized data analyzing tools and data security.
Internet of Things (IoT), network connectivity of every physical objects (such as cars and houses), could revolutionize the targeted marketing of products and services by moving away from the traditional approach of using newspapers or television and instead reach targeted consumers at optimal times in optimal locations.
The mobile telephone is now also a wallet. With the development of smartphones, the mobile Internet and Near Field Communication (NFC) technology, numerous functions and applications can now be integrated, such as vouchers, tickets, loyalty points and payment services. People are now experiencing a new form of convenience with their mobile phones, such as travelling on public transport using mobile tickets rather than coins or physical tickets, using their smart-phones to pay contactlessly while at the same time redeeming coupons and collecting loyalty points or making secure bank payments.
A current trend is the creation and development of “Service” start ups, for example, companies whose purpose is to simplify ordering lunch, help finding cleaners or booking beauty treatments. Examples of Rocket Internet network companies Eatfirst, Helpling and Vaniday.
Another area of expansion in the Internet industry has been “mobile and urban on-demand-services”. Companies in this area want to make life in cities easier. Business models in this area have only recently become possible with the wide-spread market penetration of GPS smartphones and push messages. These business models work best in densely populated areas, as the services are often time and location-specific. They exhibit elements of vertical integration of logistics and at times an aggregation of the supply side. Because consumers can now make secure pur-chases using their smartphones, mobile devices are becoming the most used platform for seeking information on goods and services resulting in the rise of retail spending.
Private transport, which in recent decades has shaped the lives of people and the infrastructure of the cities, requires change in order to reduce emissions and relieve urban congestion. The entire technology industry has recognized the mobility sector as a lucrative market. In metropolitan areas, the private car is no longer the sole means of transport and will be displaced increasingly in the future. Short distance trips are going to be dominated by public transport, car sharing and taxi-type services. It will be more convenient to order a car via mobile app than to even look for a parking space. The car of the future will be like an Internet browser the main interface for the digital life. With the launch of DriveJoy Rocket Internet has entered this market.
3) Sources: internal industry analysis by Rocket Internet SE.
224 ABOUT ROCKET INTERNETLETTER TO OUR SHAREHOLDERSANNUAL REPORT 2015

According to the “(N)ONLINER Atlas” by the “Initiative D21”, a total of almost 78% (previous year 77%) of all Germans (about 54 million people above 14 years old) used the Internet in 2015. The share of smartphone owners increased from 53% in 2014 to 60% in 2015. The ownership of tablets increased to 35% (previous year 28%) which corresponds to a growth rate of 25%. While nearly every user searches the Internet for content and information via search engines (94%), more specific applications are far less frequently used, i.e. by only about two thirds of online users. The information search, especially for consulting purposes, on forums, blogs and other websites takes second place with 68%, while online shopping and social networks (64%) are the third most used applications.
According to the “Measuring the Information Society Report 2015” by the International Telecom-munication Union (ITU), the global internet user rate was 43% in 2015. The rate in developed countries amounted to 82.2%, while emerging markets (which are especially important for Rock-et Internet Group) had a rate of 35.3%. The 2015 growth rate of the global internet user rate was nearly 7%. The number of internet users in the particularly important for Rocket emerging mar-kets has more than doubled in the last five years. The ITU estimates that the Internet user rate will increase to 45% in emerging markets by 2020, providing significant opportunities for Rocket Internet’s network of companies.
Situation in the Specific RegionsFor the consolidated subsidiaries of Rocket Internet Group as well as several important associated companies, the regions Latin America and Europe (excluding Russia) are of particular impor-tance. In the other regions, Rocket Internet Group is mainly represented by its associated compa-nies. The situation differs by region:
Europe (excluding Russia and CIS) with approximately 607 million inhabitants at the end of 2015 and an expected population growth of 1.1% in the period between 2015 and 2020 (source: IMF, WEO database October 2015), has around 455 million Internet users (source: IDC database December 2015, Internet Live Stats July 2014) and an Internet user rate of 74.9%. There are 434 million smartphone users living in Europe (source: WCIS database November 2015), which corresponds to a smartphone user rate of 71.5%. Europe’s B2C eCommerce market volume is estimated at 351 billion USD (source: eMarketer December 2015).
At the end of 2015, approximately 603 million people lived in Latin America (source: IMF, WEO database October 2015). For the period from 2015 to 2020, population growth of 5.7% is expected (source: IMF, WEO database October 2015). With 313 million Internet users (source: IDC data-base December 2015, Internet Live Stats July 2014), this region has an Internet user rate of 52%. There are 288 million smartphone users living in Latin America (source: WCIS database Novem-ber 2015), which corresponds to a smartphone user rate of 47.8%. Latin America’s Business- to-Consumer (B2C) eCommerce is estimated to have a volume of 41 billion USD (source: eMarketer December 2015).
At the end of 2015, approximately 287 million inhabitants lived in Russia and CIS (source: IMF, WEO database October 2015). The population growth expectation for the period 2015 to 2020 for this region lies at 1.7% (source: IMF, WEA database October 2015). With 163 million Internet users (source: IDC database December 2015, Internet Live Stats July 2014), this region has an Internet user rate of 56.7%, and 199 million smartphone users (source: WCIS database Novem-ber 2015), which corresponds to a smartphone user rate of 69.3%. The B2C eCommerce market volume is estimated at 19 billion USD (source: eMarketer December 2015).
At the end of 2015, 2,534 million inhabitants lived in the Asia-Pacific (excluding China) area (source: IMF, WEO database October 2015). For the period 2015 to 2020, a population growth of 6.2% is expected (source: IMF, WEO database October 2015). With 670 million Internet users (source: IDC database December 2015, Internet Live Stats July 2014), the region has an Internet user rate of 26.4%. Furthermore, there are 702 million smartphone users in the Asia-Pacific region (source: WCIS database March 2015), which amounts to a smartphone user rate of 27.7%.
225COMBINED MANAGEMENT REPORTCONSOLIDATED FINANCIAL STATEMENTSOUR COMPANIES
Economic Report

Asia-Pacific’s B2C eCommerce market volume is estimated at 206 billion USD (source: Marketer November 2015).
Africa and the Middle East with approximately 1,367 million inhabitants at the end of 2015 and an expected population growth in the period 2015 to 2020 of 11.8% (source: IMF, WEO database October 2015), are home to about 361 million Internet users (source: IDC database December 2015, Internet Live Stats July 2014), which corresponds to an Internet user rate of 26.4%. The region hosts 286 million smartphone users (source: WCIS database November 2015), which correspond to a smartphone user rate of 20.9%. The B2C eCommerce market volume in Africa and the Middle-East is estimated at USD 15 billion (source: eMarketer December 2015).
2.3 Course of Business
The 2015 financial year was characterized by the acquisition of stakes in various companies as well as by the continued, primarily international expansion of existing companies and the development of various new business models, such as Bonativo, CarSpring, Caterwings, Drive-joy, Nestpick, Sparklist, Somuchmore and Vaniday. This development is reflected in both the increased number of network companies as well as in the extended consolidation scope.
During the 1st half of 2015, the Group performed a series of transactions to strengthen its market position in the global online takeaway market. Under the umbrella of the wholly owned subsidiary Global Online Takeaway Group S.A. Rocket Internet combined all its investments in the online takeaway services (including foodpanda, Delivery Hero, Talabat, La Nevera Roja and Pizzabo.it.). Rocket Internet made several cash investments in the amount of EUR 767.9 million in Delivery Hero and contributed its stake in Yemek Sepeti in exchange for Delivery Hero shares. In addition, Rocket Internet participated in financing rounds of foodpanda in the amount of EUR 68.8 million and acquired foodpanda shares from co-investors for a total price of EUR 6.4 million. It purchased 100% of the shares in La Nevera Roja for EUR 80.4 million and Pizzabo.it for EUR 51.3 million.
Rocket Internet participated in a financing round of HelloFresh and additionally acquired shares from one co-investor. As a result of these transactions (having a total volume of EUR 178.2 million) Rocket obtained, in combination with the previous acquisition of shares from a co-investor in December 2014, a majority share in HelloFresh that does not provide control over HelloFresh AG.
Rocket Internet also participated in financing rounds of Global Fashion Group in the amount of EUR 49.4 million, of Home24 in the amount of EUR 34.0 million, of TravelBird in the amount of EUR 16.5 million, of Lazada in the amount of EUR 15.3 million, of Linio in the amount of EUR 10.0 million and of Helpling in the amount of EUR 5.0 million.
Consolidated revenues remain stable with EUR 128.3 million compared to EUR 128.2 million in the previous year period. The number of fully consolidated companies rose from 139 as of December 31, 2014 up to 182 as of December 31, 2015.
In February 2015, the subscribed capital of Rocket Internet was increased from EUR 153,130,566 to EUR 165,140,790. The 12,010,224 new shares have been placed with institutional investors in a private placement transaction. The shares have been issued at a price of EUR 49.00 per share. Rocket Internet received proceeds from this issue of shares in the amount of EUR 588.5 million (before transactions cost).
In March 2015, Rocket Internet signed a long-term lease agreement for a new headquarters loca-tion in Berlin. The office space will be partially used by Rocket Internet itself and also sub-leased to network companies and other parties.
On March 18, 2015 the conversion of Rocket Internet AG into a European Company (SE) was completed.
226 ABOUT ROCKET INTERNETLETTER TO OUR SHAREHOLDERSANNUAL REPORT 2015

In July 2015, Rocket Internet issued a convertible bond with a maturity of seven years with a total nominal value of EUR 550 million.
In September 2015, shares of fully-consolidated subsidiaries Kanui and Tricae were exchanged against shares of Global Fashion Group.
In October 2015, the Group exchanged the fully-consolidated subsidiary Zencap Global S.à r.l. against shares of Funding Circle Holdings Ltd.
At the end of 2015 an impairment loss in relation to goodwill at La Nevera Roja and Pizzabo.it totaling EUR 18.1 million were recognized. In February 2016, these two henceforth non-core companies were sold to JustEat plc.
In total, Rocket Internet Group generated in the financial year 2015 a loss for the period of EUR −197.8 million (previous year period profit for the period of EUR 428.8 million). The Group’s total comprehensive income for the period, net of tax amounted to EUR -161.4 million (previous year period EUR 507.1 million). In 2015, other comprehensive income for the period net of tax mainly includes unrealized valuation gains for Delivery Hero.
The previous year’s report forecast of a significant increase in consolidated revenue from online and mobile trading (eCommerce) and from rendering online and mobile services (marketplaces) for those companies that were fully consolidated as of December 31, 2014 has been realized. The consolidated revenues (New Businesses & Investments) increased from EUR 71.2 million in financial year 2014 by 19% to EUR 84.6 million in 2015. As forecast in the previous year, the consolidated subsidiaries (New Businesses & Investments), operating in the areas of eCommerce and marketplaces, have generated negative operating results in 2015 due to their expansion.
In the 2014 Combined Management Report the increase of revenues from rendering services was forecast in the low to mid double-digit percentage range for the parent company. Due to the expansion of the service spectrum along with the enlargement of the workforce, the forecast increase has been achieved and revenues from services increased by 19% in 2015. As reflected in the parent company’s annual 2015 financial statements, revenues for services rendered by Rocket Internet increased from EUR 28.8 million to EUR 34.2 million.
In the annual financial statements of the parent company in 2015, a net loss of EUR 73.5 million (previous year period loss of EUR 45.9 million) was recognized, which resulted primarily from the first-time accounting for share-based payment plans as well as for compensation of obligations through profit or loss.
227COMBINED MANAGEMENT REPORTCONSOLIDATED FINANCIAL STATEMENTSOUR COMPANIES
Economic Report

2.4 Rocket Internet Share and Capital Structure
Since its IPO on October 2, 2014 the Rocket Internet share price decreased from EUR 42.50 by EUR 14.21 to EUR 28.29 as of December 31, 2015 (EUR 51.39 as of December 31, 2014). The market capitalization changed from EUR 6.5 billion on October 2, 2014 to EUR 4.7 billion on December 31, 2015 (EUR 7.9 billion on December 31, 2014). In the financial year 2015, average daily trading via the electronic computer trading system XETRA recognized on average 213,000 shares (previous year period 456,000 shares) with an average value of EUR 6.99 million (previous year period EUR 18.57 million) traded daily. The ISIN code for the shares is DE000A12UKK6.
The subscribed capital of Rocket Internet SE amounted to EUR 165,140,790 on December 31, 2015 (previous year period EUR 153,130,566), and was split into 165,140,790 (previous year period 153,130,566) ordinary bearer shares with no-par value (Stückaktien ohne Nennbetrag). Every share grants one vote, other share classes do not exist.
38.1
13.2
Global Founders
Kinnevik
Shareholder structureIn percent
8.3
6.1
6.0
6.8
21.5 Free float
Bailie Gifford & Co
Access Industries
Philippine Long Distance Telephone Company
United Internet
Shareholding percentages are generally based on the shareholdings as last notified to Rocket Internet by its shareholders pursuant to Section 20 AktG (German Stock Corporation Act) or the share-holdings as of the time of the IPO in October 2014. The shareholdings have, however, been adjusted for dilution and consider any allocations to shareholders in connection with the share capital increase in February 2015. Please note that these shareholding percentages could have changed within the respective thresholds of Section 20 AktG (German Stock Corporation Act) (25% / 50%) without triggering an obligation of the shareholders to notify Rocket Internet. The shareholding of Global Founders also includes shares that are held by affiliates of Global Founders GmbH. The percentages for Kinnevik, United Internet and Philippine Long Distance Telephone Company were taken from their respective published consolidated financial statements.
Rocket Internet convertible bondIn July 2015, Rocket Internet issued convertible bond amounting to EUR 550 million, maturing in seven years with a nominal interest rate of 3.0%. The bond has been listed on the Open Market on the Frankfurt Stock Exchange and is also traded on German stock markets. The ISIN code for the bond is DE000A161KH4.
228 ABOUT ROCKET INTERNETLETTER TO OUR SHAREHOLDERSANNUAL REPORT 2015

2.5 Position of the Group
The consolidated financial statements of Rocket Internet were prepared in accordance with IFRS as adopted by the European Union.
2.5.1 Earnings Position of the Group
Revenue was structured as follows:
As in the previous year period, the revenues of the New Businesses & Investments were generated mainly in Brazil by the subsidiaries Kanui and Tricae as well as by the German entity Bonnyprints GmbH. Until their deconsolidation (inclusion into the Global Fashion Group at the end of Septem-ber 2015), Kanui’s (EUR 31.6 million) and Tricae’s (EUR 29.9 million) revenues were included in the company revenues.
Furthermore, the main revenue contributors were Clickbus Brazil, La Nevera Roja and Printvenue India.
The previous year period includes General Merchandise sales in Africa in the amount of EUR 19.8 million generated by Jumia. The Jumia subgroup was deconsolidated following a financing round of Jumia in July 2014.
In EUR millionJan 1–Dec 31,
2015Jan 1–Dec 31,
2014
Revenue 128.3 128.2
Changes in work in progress / internally produced and capitalized assets 5.7 3.1
Other operating income 5.0 4.2
Result from deconsolidation of subsidiaries 167.0 452.6
Gain from distribution of non-cash assets to owners 0.0 60.6
Purchased merchandise and purchased services −64.1 −69.8
Employee benefits expenses −171.7 −141.9
Other operating expenses −82.5 −87.7
Share of profit / loss of associates and joint ventures −188.6 75.1
Impairment of non-current assets, depreciation and amortization −25.3 −2.7
EBIT −226.1 421.8
Financial result 29.7 12.0
Income taxes −1.4 −5.0
Loss / profit for the period −197.8 428.8
Other comprehensive income for the period, net of tax 36.4 78.2
Total comprehensive income for the period, net of tax −161.4 507.1
In EUR million Jan 1–Dec 31, 2015 Jan 1–Dec 31, 2014
New Businesses & Investments 84.6 66% 71.2 56%
General Merchandise 0.0 0% 19.8 15%
Other Services 43.7 34% 37.2 29%
Total 128.3 100% 128.2 100%
229COMBINED MANAGEMENT REPORTCONSOLIDATED FINANCIAL STATEMENTSOUR COMPANIES
Economic Report

The revenues from other services comprise mainly income from consulting services performed for associated companies and joint ventures. The increase of revenues from other services is driven by the expansion of the service spectrum.
Of the total consolidated revenues, 53% were generated in Latin America (previous year period 50%), 26% in Germany (previous year period 18%) and 21% in the rest of the world (previous year period 32%). The change in the regional split is mainly due to the deconsolidation of the Africa eCommerce Holding GmbH (Jumia) in July 2014.
Other operating income in the amount of EUR 5.0 million (previous year period EUR 4.2 million) originated mainly from currency translation gains amounting to EUR 2.6 million (previous year period EUR 0.5 million) and gains on disposal of available-for-sale investments amounting to EUR 0.3 million (previous year period EUR 1.2 million).
The result from deconsolidation of subsidiaries in the amount of EUR 167.0 million (previous year period EUR 452.6 million) mainly originated with EUR 65.5 million from the exchange of shares in Kanui Comercio Varejista Ltda. for shares in Global Fashion Group, with EUR 53.8 million from the exchange of shares in Tricae Comercio Varejista Ltda. for shares in Global Fashion Group, with EUR 23.0 million from the exchange of shares in Zencap Global S.à r.l. for shares in Funding Circle Holdings Ltd., with EUR 9.7 million from the loss of control (deemed disposal) of Digital Services XXVIII S.à r.l. (Nestpick), with EUR 5.5 million from the contribution of 97% of the shares in LIH Subholding Nr. 3 UG (haftungsbeschränkt) & Co. KG to Carmudi Global S.à r.l., with EUR 8.8 million from the contribution of 97% of shares in LIH Subholding Nr. 4 UG (haftungs-beschränkt) & Co. KG to Lamudi Global S.à r.l. (Lamudi) in exchange for shares in these two companies.
In May 2014, the shareholders of the Company agreed on a dividend in kind. In this respect, the Company transferred 4,145 and 1,892 shares from its associates Bigfoot I to Emesco and AI European Holdings S.à r.l., as well as 4,559 and 2,082 shares from Bigfoot II to Emesco and AI European Holdings S.à r.l. by use of a separate business share transfer contract. The resulting gain from distribution of non-cash assets to owners amounted to EUR 60.6 million. No such dis-tributions were made in 2015.
The cost of purchased merchandise and purchased services decreased by 8%. This is caused mainly by the decreased cost of purchased merchandise (EUR 44.7 million; previous year period EUR 57.4 million) partially offset by the increased cost for shipping, payment services, freight / lo-gistics and other purchased services (EUR 19.4 million; previous year period EUR 12.4 million). The decrease is mainly due to the deconsolidation of Africa eCommerce Holding GmbH in July 2014 (purchased merchandise and purchased services EUR 0.0 million; previous year period EUR 19.5 million) as well as an increase in those costs in Tricae (EUR 23.5 million; previous year period EUR 15.3 million) and the decrease in Kanui (EUR 22.2 million; previous year period EUR 24.1 million).
Employee benefits expenses, which amounted to EUR 171.7 million (previous year period EUR 141.9 million), represented a major expense item and included the current remuneration as well as expenses arising from equity-settled and cash-settled share-based payments.
Other operating expenses included mainly advertising and marketing costs (EUR 31.4 million; previous year period EUR 32.1 million), legal and consultancy fees (EUR 10.7 million; previous year period EUR 8.4 million), rental, office and IT costs (EUR 15.9 million; previous year period EUR 13.8 million) and external services (EUR 4.4 million; previous year period EUR 8.7 million). Expenditure was undertaken, in particular, in the area of marketing and related to the acquisition of new market shares and efforts to increase brand awareness. The online marketing activities were aimed, in particular, at the generation of traffic and included traditional search engine mar-keting (SEM), search engine optimization (SEO) as well as affiliate and display marketing.
230 ABOUT ROCKET INTERNETLETTER TO OUR SHAREHOLDERSANNUAL REPORT 2015
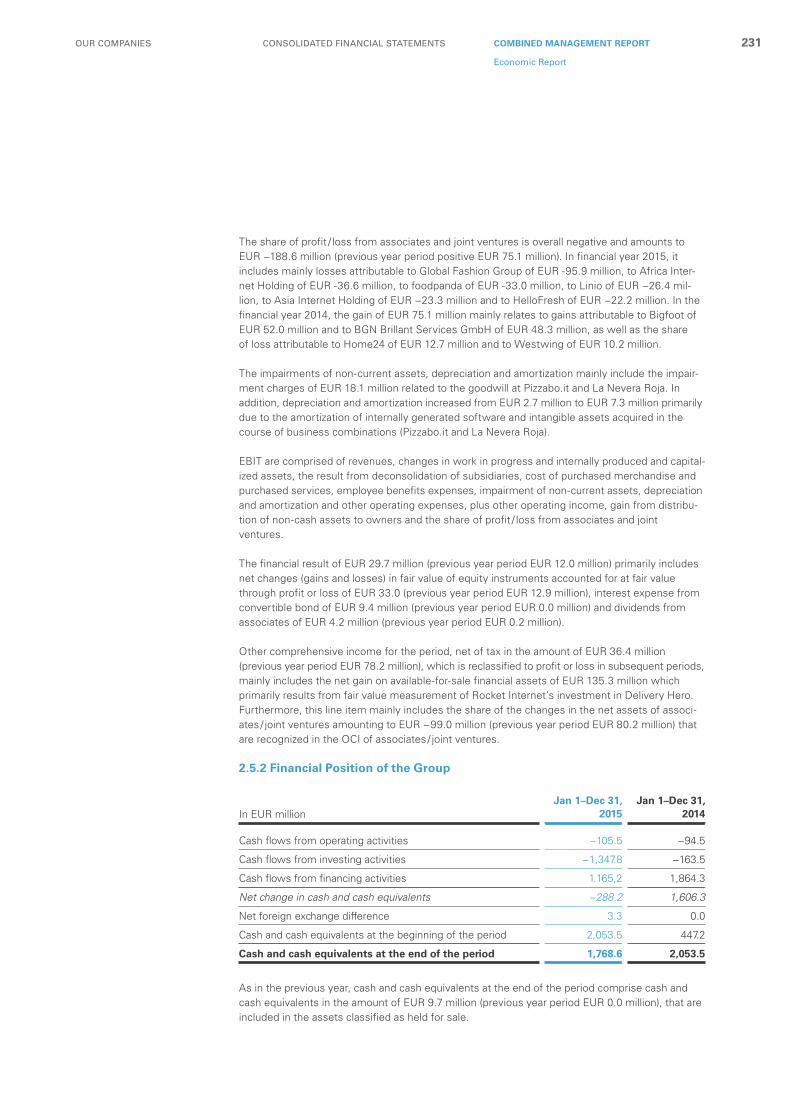
The share of profit / loss from associates and joint ventures is overall negative and amounts to EUR −188.6 million (previous year period positive EUR 75.1 million). In financial year 2015, it includes mainly losses attributable to Global Fashion Group of EUR -95.9 million, to Africa Inter-net Holding of EUR -36.6 million, to foodpanda of EUR -33.0 million, to Linio of EUR −26.4 mil-lion, to Asia Internet Holding of EUR −23.3 million and to HelloFresh of EUR −22.2 million. In the financial year 2014, the gain of EUR 75.1 million mainly relates to gains attributable to Bigfoot of EUR 52.0 million and to BGN Brillant Services GmbH of EUR 48.3 million, as well as the share of loss attributable to Home24 of EUR 12.7 million and to Westwing of EUR 10.2 million.
The impairments of non-current assets, depreciation and amortization mainly include the impair-ment charges of EUR 18.1 million related to the goodwill at Pizzabo.it and La Nevera Roja. In addition, depreciation and amortization increased from EUR 2.7 million to EUR 7.3 million primarily due to the amortization of internally generated software and intangible assets acquired in the course of business combinations (Pizzabo.it and La Nevera Roja).
EBIT are comprised of revenues, changes in work in progress and internally produced and capital-ized assets, the result from deconsolidation of subsidiaries, cost of purchased merchandise and purchased services, employee benefits expenses, impairment of non-current assets, depreciation and amortization and other operating expenses, plus other operating income, gain from distribu-tion of non-cash assets to owners and the share of profit / loss from associates and joint ventures.
The financial result of EUR 29.7 million (previous year period EUR 12.0 million) primarily includes net changes (gains and losses) in fair value of equity instruments accounted for at fair value through profit or loss of EUR 33.0 (previous year period EUR 12.9 million), interest expense from convertible bond of EUR 9.4 million (previous year period EUR 0.0 million) and dividends from associates of EUR 4.2 million (previous year period EUR 0.2 million).
Other comprehensive income for the period, net of tax in the amount of EUR 36.4 million (previous year period EUR 78.2 million), which is reclassified to profit or loss in subsequent periods, mainly includes the net gain on available-for-sale financial assets of EUR 135.3 million which primarily results from fair value measurement of Rocket Internet’s investment in Delivery Hero. Furthermore, this line item mainly includes the share of the changes in the net assets of associ-ates / joint ventures amounting to EUR −99.0 million (previous year period EUR 80.2 million) that are recognized in the OCI of associates / joint ventures.
2.5.2 Financial Position of the Group
As in the previous year, cash and cash equivalents at the end of the period comprise cash and cash equivalents in the amount of EUR 9.7 million (previous year period EUR 0.0 million), that are included in the assets classified as held for sale.
In EUR millionJan 1–Dec 31,
2015Jan 1–Dec 31,
2014
Cash flows from operating activities −105.5 −94.5
Cash flows from investing activities −1,347.8 −163.5
Cash flows from financing activities 1.165,2 1,864.3
Net change in cash and cash equivalents −288.2 1,606.3
Net foreign exchange difference 3.3 0.0
Cash and cash equivalents at the beginning of the period 2,053.5 447.2
Cash and cash equivalents at the end of the period 1,768.6 2,053.5
231COMBINED MANAGEMENT REPORTCONSOLIDATED FINANCIAL STATEMENTSOUR COMPANIES
Economic Report

The negative cash flows from operating activities are typical for the industry and are mainly at-tributable to the start up losses incurred by consolidated subsidiaries.
The cash flows from investing activities consist mainly of the cash-outflows for the Group’s acquisitions of non-consolidated equity investments such as the acquisition of shares in Delivery Hero, GFC Investments as well as the participation in financing rounds of associated companies. Another effect is the cash-outflows from the acquisition of La Nevera Roja and Pizzabo.it. In total, payments in the amount of EUR 1,219.5 million (previous year period EUR 116.4 million) were made for acquisition of non-consolidated companies and of EUR 119.7 million, net of cash acquired (previous year period EUR 0.0 million), for acquisition of consolidated companies. The cash flows from investing activities also include net payments for cash paid in connection with short-term financial management of cash investments in the amount of EUR −39.0 million (previous year period EUR -6.7 million) that are related to the payments in conjunction with short-term loans to associates and to joint ventures. Furthermore, the amount of EUR 11.6 million (previous year period EUR 8.5 million) was invested in fixed and intangible assets in the reporting period, relating particularly to the expansion of operating and business equipment and to internally generated software. Due to exchange rate changes, the cash and cash equivalents of the Group increased to EUR 3.3 million (previous year period EUR 0.0 million).
Cash flows from financing activities mainly include the cash-inflows from capital increases and the issuance of convertible bonds.
In February 2015 the Group carried out an equity increase at the level of the parent company in the amount of EUR 588.5 million, less transaction costs of EUR 2.8 million (previous year period EUR 0.0 million). In addition, EUR 9.3 million were paid for transaction costs in 2015 in-curred in the financial year 2014 in conjunction with the Group’s IPO. The issued convertible bond in July 2015 resulted in a cash inflow of EUR 550.0 million, less transaction costs totaling EUR 2.8 million.
Moreover, during 2015 the Group received payments from capital increases at the level of consolidated subsidiaries totaling EUR 58.0 million (previous year period EUR 101.6 million) from non-controlling shareholders. During the reporting period a non-controlling shareholder of a consolidated subsidiary received a cash dividend of EUR 8.0 million. No dividends were paid to the shareholders of the parent in the reporting period (previous year period EUR 286.8 million). In 2015, the Group purchased shares from non-controlling shareholders of a Group subsidiary for a cash consideration in the amount of EUR 9.6 million (previous year period EUR 0.2 million).
2.5.2.1 Capital StructureThe capital structure as of the balance sheet date is characterized by a high equity ratio of 87% (previous year period 96%). The Group obtained its financing primarily through equity issuance at the level of the parent company, through attracting investors for subsidiaries (non-controlling interests) and through the issuance of a convertible bond in 2015.
In February 2015, the Group carried out an equity increase at the level of the parent company in the amount of EUR 588.5 million, less transaction costs of EUR 2.8 million. The convertible bond issued in July 2015 resulted in a cash inflow of EUR 550.0 million, less transaction costs totaling EUR 2.8 million, of which an amount of EUR 37.7 million was recorded as an equity component.
232 ABOUT ROCKET INTERNETLETTER TO OUR SHAREHOLDERSANNUAL REPORT 2015
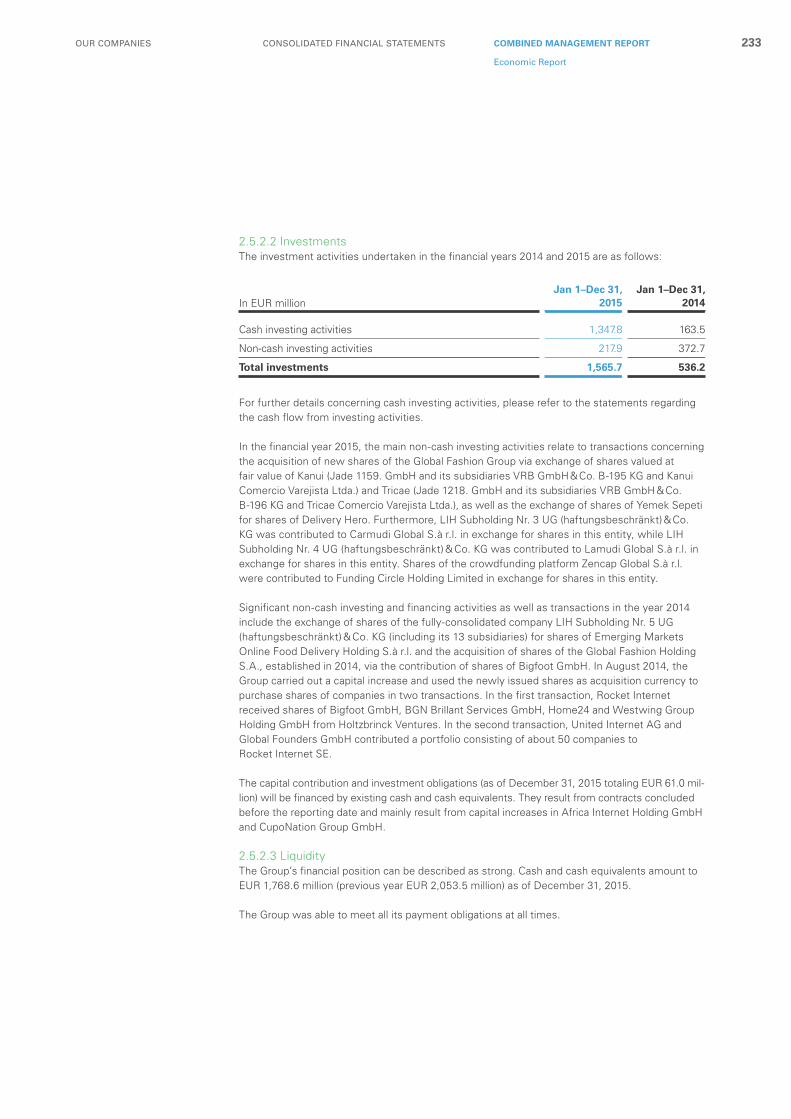
2.5.2.2 InvestmentsThe investment activities undertaken in the financial years 2014 and 2015 are as follows:
For further details concerning cash investing activities, please refer to the statements regarding the cash flow from investing activities.
In the financial year 2015, the main non-cash investing activities relate to transactions concerning the acquisition of new shares of the Global Fashion Group via exchange of shares valued at fair value of Kanui (Jade 1159. GmbH and its subsidiaries VRB GmbH & Co. B-195 KG and Kanui Comercio Varejista Ltda.) and Tricae (Jade 1218. GmbH and its subsidiaries VRB GmbH & Co. B-196 KG and Tricae Comercio Varejista Ltda.), as well as the exchange of shares of Yemek Sepeti for shares of Delivery Hero. Furthermore, LIH Subholding Nr. 3 UG (haftungsbeschränkt) & Co. KG was contributed to Carmudi Global S.à r.l. in exchange for shares in this entity, while LIH Subholding Nr. 4 UG (haftungsbeschränkt) & Co. KG was contributed to Lamudi Global S.à r.l. in exchange for shares in this entity. Shares of the crowdfunding platform Zencap Global S.à r.l. were contributed to Funding Circle Holding Limited in exchange for shares in this entity.
Significant non-cash investing and financing activities as well as transactions in the year 2014 include the exchange of shares of the fully-consolidated company LIH Subholding Nr. 5 UG (haftungsbeschränkt) & Co. KG (including its 13 subsidiaries) for shares of Emerging Markets Online Food Delivery Holding S.à r.l. and the acquisition of shares of the Global Fashion Holding S.A., established in 2014, via the contribution of shares of Bigfoot GmbH. In August 2014, the Group carried out a capital increase and used the newly issued shares as acquisition currency to purchase shares of companies in two transactions. In the first transaction, Rocket Internet received shares of Bigfoot GmbH, BGN Brillant Services GmbH, Home24 and Westwing Group Holding GmbH from Holtzbrinck Ventures. In the second transaction, United Internet AG and Global Founders GmbH contributed a portfolio consisting of about 50 companies to Rocket I nternet SE.
The capital contribution and investment obligations (as of December 31, 2015 totaling EUR 61.0 mil-lion) will be financed by existing cash and cash equivalents. They result from contracts concluded before the reporting date and mainly result from capital increases in Africa Internet Holding GmbH and CupoNation Group GmbH.
2.5.2.3 LiquidityThe Group’s financial position can be described as strong. Cash and cash equivalents amount to EUR 1,768.6 million (previous year EUR 2,053.5 million) as of December 31, 2015.
The Group was able to meet all its payment obligations at all times.
In EUR millionJan 1–Dec 31,
2015Jan 1–Dec 31,
2014
Cash investing activities 1,347.8 163.5
Non-cash investing activities 217.9 372.7
Total investments 1,565.7 536.2
233COMBINED MANAGEMENT REPORTCONSOLIDATED FINANCIAL STATEMENTSOUR COMPANIES
Economic Report

2.5.3 Asset Position of the Group
The Company’s largest asset items are shares in associates and joint ventures, accounted for using the equity method (34% of the balance sheet total; previous year period 37% of the balance sheet total), other non-current financial assets (27% of the balance sheet total; previous year period 9% of the balance sheet total) as well as cash and cash equivalents (35% of the balance sheet total; previous year period 52% of the balance sheet total).
During financial year 2015, Rocket invested a significant amount in Delivery Hero. As of December 31, 2015 the Group owned approximately 40% (prior to dilutive effects of convertible instruments issued by Delivery Hero) of the total outstanding share capital of Delivery Hero. As of December 31, 2015 the carrying amount of the shares in Delivery Hero amounted to EUR 978.9 million (previous year period EUR 0.0 million).
The increase of non-current assets from EUR 1,805.8 million by EUR 1,356.5 million to EUR 3,162.2 million is mainly attributable to the above mentioned acquisition of Delivery Hero shares. Other substantial effects are the purchase of shares in associated companies accounted for using the equity method amounting to EUR 500.1 million, mainly due to Rocket Internet’s participation in financing rounds and purchases of existing shares of HelloFresh, Global Fashion Group, Home24, foodpanda, TravelBird and Lazada. This above mentioned increase of invest-ments in associates was partially reduced by the share of losses of associates and joint ventures. Furthermore, the increase of non-current assets was caused by the increase of intangible assets from EUR 9.0 million by EUR 120.1 million to EUR 129.1 million, mainly due to the acquisition of Pizzabo.it and La Nevera Roja and the resulting increase in goodwill, trademarks and customer base.
Current assets decreased from EUR 2,109.5 million by EUR 292.8 million to EUR 1,816.7 million. The decrease is mainly due to the decrease of cash and cash equivalents in the financial year 2015 (EUR 1,758.9 million; previous year period EUR 2,053.4 million). For details concerning the development of liquidity, refer to the statements under section “2.5.2 Financial Position of the Group”. Other effects are the decrease of inventories from EUR 11.2 million by EUR 10.5 million to EUR 0.7 million, due to the deconsolidation of Kanui and Tricae and the increase of other current financial assets from EUR 15.1 million by EUR 26.2 million to EUR 41.3 million mainly due to the increase of current loan receivables and other financial assets.
Assets
In EUR million Dec 31, 2015 Dec 31, 2014
Non-current assets 3,162.2 63% 1,805.8 46%
Current assets 1,816.7 37% 2,109.5 54%
Assets classified as held for sale 17.1 0% 3.9 0%
Total 4,996.0 100% 3,919.1 100%
Equity & Liabilities
In EUR million Dec 31, 2015 Dec 31, 2014
Equity 4,352.1 87% 3,771.9 96%
Non-current liabilities 535.5 11% 9.4 0%
Current liabilities 100.9 2% 137.8 4%
Liabilities directly associated with assets classified as held for sale 7.6 0% 0 0%
Total 4,996.0 100% 3,919.1 100%
234 ABOUT ROCKET INTERNETLETTER TO OUR SHAREHOLDERSANNUAL REPORT 2015

Assets classified as held for sale mainly consist of the current and non-current assets of Spotcap (EUR 11.2 million) and Clickbus Brazil (EUR 3.5 million).
Total consolidated equity rose from EUR 3,771.9 million by EUR 580.3 million to EUR 4,352.1 million. This development is mainly caused by the increase of the subscribed capital performed in February 2015 with gross proceeds of EUR 588.5 million and due to the recognized income from issuing a convertible bond in the amount of EUR 37.7 million. The increase was also a result of the total comprehensive loss of EUR 161.4 million comprising both, the loss for the period (EUR −197.8 million) and the other comprehensive income after tax (EUR 36.4 million). Other changes in equity result from the increase of the reserves for equity-settled share-based payments, the proceeds from non-controlling interests, dividends paid to non-controlling interests, the purchase of non-controlling interests without change in control and changes in scope of consolidation as well as other changes in non-controlling interests.
Non-current liabilities increased from EUR 9.5 million by EUR 526.0 million to EUR 535.5 million. The increase is mainly due to the convertible bond issued in July 2015 (liabilities as of December 31, 2015 amounted to EUR 512.0 million). Furthermore, the deferred tax liabilities increased from EUR 3.6 million to EUR 8.2 million. Another substantial effect is the increase of non-current financial liabilities, mainly due to the contingent consideration liability incurred in conjunction with the acquisition of Pizzabo.it.
Current liabilities decreased from EUR 137.8 million by EUR 36.9 million to EUR 100.9 million. The decrease is mainly due to the de-recognition of trade payables of Kanui and Tricae which were deconsolidated in September 2015 and the payment of liabilities that existed as of December 31, 2014 from income taxes as well as liabilities from the Company’s IPO. This decrease was partially compensated by the increase in liabilities for cash-settled share-based payments.
Liabilities directly associated with assets classified as held for sale consist mainly of the non-cur-rent and current liabilities of Spotcap (EUR 4.6 million) and of Clickbus Brazil (EUR 1.6 million).
2.5.4 Overall Statement with regard to the Earnings, Financial and Asset Position of the GroupRocket Internet Group addressed its multifaceted challenges during the financial year 2015 most-ly successfully. On the one hand, the reporting period is characterized by strategic acquisitions of shares in various companies and the additional, mostly international expansion of existing busi-nesses as well as by the development of new business models. On the other hand, some of the no longer viable business models were discontinued, sold or limited to operate regionally. Important steps for the corporate reorganization of the network companies (especially Linio and Lazada) were undertaken. Moreover, additional liquidity was improved through the increase in subscribed capital and the issuing of the convertible bond, which was essential for the expansion of network companies as well as for the development or acquisition of new businesses. Despite the high negative result, the overall business development can be considered as satisfactory. Based on our solid balance sheet structure and the existing financing possibilities due to the Rocket Internet Capital Partners Fund established in January 2016, we are well-positioned to achieve future growth both organically and through acquisitions (GFC Investments). We have an unaltered view that our platform strategy leaves us well-positioned to maintain and foster the performance of the Group.
235COMBINED MANAGEMENT REPORTCONSOLIDATED FINANCIAL STATEMENTSOUR COMPANIES
Economic Report
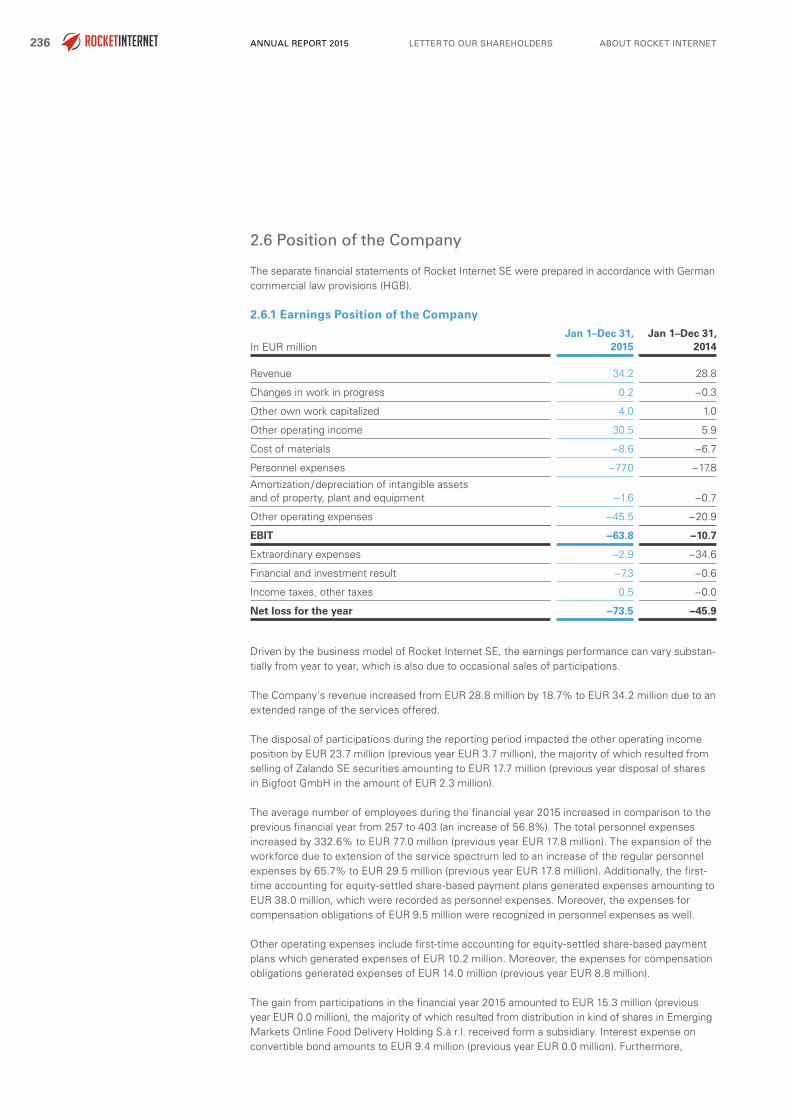
2.6 Position of the Company
The separate financial statements of Rocket Internet SE were prepared in accordance with German commercial law provisions (HGB).
2.6.1 Earnings Position of the Company
Driven by the business model of Rocket Internet SE, the earnings performance can vary substan-tially from year to year, which is also due to occasional sales of participations.
The Company’s revenue increased from EUR 28.8 million by 18.7% to EUR 34.2 million due to an extended range of the services offered.
The disposal of participations during the reporting period impacted the other operating income position by EUR 23.7 million (previous year EUR 3.7 million), the majority of which resulted from selling of Zalando SE securities amounting to EUR 17.7 million (previous year disposal of shares in Bigfoot GmbH in the amount of EUR 2.3 million).
The average number of employees during the financial year 2015 increased in comparison to the previous financial year from 257 to 403 (an increase of 56.8%). The total personnel expenses increased by 332.6% to EUR 77.0 million (previous year EUR 17.8 million). The expansion of the workforce due to extension of the service spectrum led to an increase of the regular personnel expenses by 65.7% to EUR 29.5 million (previous year EUR 17.8 million). Additionally, the first-time accounting for equity-settled share-based payment plans generated expenses amounting to EUR 38.0 million, which were recorded as personnel expenses. Moreover, the expenses for compensation obligations of EUR 9.5 million were recognized in personnel expenses as well.
Other operating expenses include first-time accounting for equity-settled share-based payment plans which generated expenses of EUR 10.2 million. Moreover, the expenses for compensation obligations generated expenses of EUR 14.0 million (previous year EUR 8.8 million).
The gain from participations in the financial year 2015 amounted to EUR 15.3 million (previous year EUR 0.0 million), the majority of which resulted from distribution in kind of shares in Emerging Markets Online Food Delivery Holding S.à r.l. received form a subsidiary. Interest expense on convertible bond amounts to EUR 9.4 million (previous year EUR 0.0 million). Furthermore,
In EUR millionJan 1–Dec 31,
2015Jan 1–Dec 31,
2014
Revenue 34.2 28.8
Changes in work in progress 0.2 −0.3
Other own work capitalized 4.0 1.0
Other operating income 30.5 5.9
Cost of materials −8.6 −6.7
Personnel expenses −77.0 −17.8
Amortization / depreciation of intangible assets and of property, plant and equipment −1.6 −0.7
Other operating expenses −45.5 −20.9
EBIT −63.8 −10.7
Extraordinary expenses −2.9 −34.6
Financial and investment result −7.3 −0.6
Income taxes, other taxes 0.5 −0.0
Net loss for the year −73.5 −45.9
236 ABOUT ROCKET INTERNETLETTER TO OUR SHAREHOLDERSANNUAL REPORT 2015

financial and investment result includes financial asset impairment charges amounting to EUR 14.0 million (previous year EUR 0.9 million).
The extraordinary expenses relate almost exclusively to the cost of raising equity.
The net loss for the financial year amounts to EUR 73.5 million (previous year period net loss for the year of EUR 45.9 million). The Company realized a return on equity of −2.6% (previous year −2.0%). EBIT totaled EUR -63.8 million (previous year EUR −10.7 million) and EBITDA amounted to EUR −62.2 million (previous year EUR −10.0 million).
2.6.2 Financial and Asset Position of the Company
The financial position of the Company can be described as strong. It continues to offer opportunity for investments into new companies and for participations in capital increases in existing ones. Cash and cash equivalents as of December 31, 2015 amounted to EUR 1,720.0 million (previous year EUR 1,997.7 million). Thus, the Company experienced a negative cash flow of EUR 277.7 million (previous year positive cash flow EUR 1,612.2 million). The decrease of cash and cash equivalents is a result of investments in the financial year.
In the reporting period, the Company remains financed mainly through equity with an equity ratio as of December 31, 2015 of 82.7% (previous year 97.5%). No advance dividends were made in 2015 (previous year EUR 291.2 million).
The asset position comprises participations amounting to EUR 1,606.2 million (46.5% of total assets; previous year EUR 256.7 million, 11.1% of total assets), receivables from subsidiaries and companies in which a participation is held in the amount of EUR 81.9 million (2.4% of total assets; previous year EUR 52.3 million, 2.3% of total assets) as well as cash and cash equivalents in the amount of EUR 1,720.0 million (49.8% of total assets; previous year EUR 1,997.7 million, 86.3% of total assets).
The increase in participations by EUR 1,349.5 million is mainly due to the acquisitions of shares in various companies as well as to the further, mostly international expansion of existing busi-nesses. Moreover, the company invested into the development of diverse new business models, such as Global Online Takeaway Group S.A., Global Fashion Group S.A. and GFC Global Founders Capital S.à r.l.. The financial assets were impaired in the amount of EUR 14.0 million, thereby exceeding last year’s figure (previous year EUR 0.9 million), which resulted primarily from impair-ments of Wimdu GmbH and Digital Services XXIV S.à r.l. (Project Tripda). On the other hand, the impairment losses were reversed by EUR 0.6 million (previous year EUR 0.5 million).
Assets
In EUR million Dec 31, 2015 Dec 31, 2014
Fixed assets 1,611.8 47% 258.6 11%
Current assets 1,805.0 52% 2,052.5 89%
Other assets 39.3 1% 2.6 0%
Total 3,456.1 100% 2,313.7 100%
Equity & Liabilities
In EUR million Dec 31, 2015 Dec 31, 2014
Equity 2,857.1 83% 2,256.1 97%
Provisions 36.9 1% 39.1 2%
Liabilities 562.1 16% 18.5 1%
Total 3,456.1 100% 2,313.7 100%
237COMBINED MANAGEMENT REPORTCONSOLIDATED FINANCIAL STATEMENTSOUR COMPANIES
Economic Report

In 2015, loan receivables were impaired by EUR 5.9 million (previous year EUR 0.2 million). The majority thereof relate to PTH Brillant Services GmbH (Office Project) and the Digital Services XXXIII S.à r.l., (Real Estate Project), whose operations were ceased, thereby making their loan receivables irrecoverable.
2.6.3 Overall Statement with regard to the Earnings, Financial and Asset Position of the CompanyRocket Internet SE has successfully addressed its multifaceted challenges during the financial year 2015. Rocket Internet SE’s economic position is characterized by investment activities and expansion of its network of companies. The expenses exceeded the total earnings in the financial year. This is especially due to a first-time recognition of share-based payment expenses and the increased expenses for compensation obligations (EUR 71.6 million) as well as to impair-ments of investments and of granted loans. Despite the high negative result, the overall business development can be considered as satisfactory. The development of investment activities and expansion of the network companies continued even after the reporting date. Based on the company’s noticeably solid balance sheet structure, Rocket Internet SE is in a good position to achieve future growth both organically and through future investments. We have an unaltered view that our platform strategy leaves us well-positioned to maintain and to expand and strengthen our company network in the future.
2.7 Financial and Non-Financial Performance Indicators
Rocket has defined a series of financial performance indicators aimed at the control of the con-solidated group companies and the non-consolidated companies. These are, or can be, so-called non-GAAP financial measures. Other companies, which use financial measures with a similar designation, may define them differently.
Profitable growth of gross and net revenues is an important factor for the long-term increase in corporate value. Rocket Internet measures the profitability of its businesses primarily on the basis of EBITDA and EBIT.
In addition to the above-stated financial performance indicators, the Group uses various other key figures in order to measure the economic success of business activities. For an assessment of the revenue potential of the companies, performance indicators such as the number of orders, number of transactions, number of customers or the number of homepage visitors are used. In the area of eCommerce for instance, Rocket Internet analyzes the turnover ratios of the operative net current assets, return rates in eCommerce and the quality of operative procedures in order to ensure the timely and correct shipping and invoicing of the ordered merchandise as part of the monitoring of operations.
238 ABOUT ROCKET INTERNETLETTER TO OUR SHAREHOLDERSANNUAL REPORT 2015

For example, the performance indicators for the Group’s top two revenue generating subsidiaries are as follows:
The quality of products and solutions is a critical success factor. In this context, the reliability, user friendliness and availability of the products offered online play an important role. Availability and interruption-free operation of the service systems as well as the resistance against targeted attacks, from hackers or through manipulation for example, are essential for providing customers with the promised services.
Rocket Internet’s business approach and business policy is oriented towards sustainability. This approach is demonstrated particularly in high investments in customer relations, new fields of business and, accordingly, in future growth. With regard to customer loyalty and satisfaction as well as service quality, aspects relevant to security (e.g. security of cashless payments, data maintenance of bank accounts and other customer data) are considered highly important.
3. Events after the Reporting Date
On January 19, 2016 Rocket Internet announced the first closing of Rocket Internet Capital Part-ners Fund, with total commitments of USD 420 million of which Rocket Internet contributed USD 50 million. The Fund will invest alongside Rocket Internet, with the exception of investments that are deemed strategic for Rocket Internet.
Rocket Internet announced the divestiture of two takeaway food operations on February 5, 2016. The transaction is in line with Rocket Internet's strategy to divest non-core operations that are not market-leading. The companies sold were La Nevera Roja in Spain and Pizzabo.it in Italy. The transaction in Italy was completed on the date of announcement (closing). It is anticipated that the transaction in Spain will be completed in the second or third quarter of 2016 (closing), as it is still subject to regulatory approval from the Spanish competition authority, the Comisión Nacional de los Mercados y la Competencia.
Rocket Internet decided on a partial buyback of convertible bonds on February 15, 2016. During the year 2016, the Management Board of Rocket Internet SE decided to spend up to EUR 150.0 million on a program to repurchase Company's senior unsecured convertible bonds due in 2022. Repurchases of bonds under the program may commence immediately.
Kanui (in thousands)Jan 1–Dec 31,
2015 *)Jan 1–Dec 31,
2014
Number of orders (sent) 1,007 903
Number of customers 1,243 863
Tricae (in thousands)Jan 1–Dec 31,
2015 *)Jan 1–Dec 31,
2014
Number of orders (sent) 721 586
Number of customers 781 520*) until deconsolidation on September 26, 2015
239COMBINED MANAGEMENT REPORTCONSOLIDATED FINANCIAL STATEMENTSOUR COMPANIES
Economic ReportEvents after the Reporting Date

The online lending platform Spotcap Global S.à r.l raised EUR 31.5 million in new funding on February 2, 2016 led by international private equity firm, Finstar Financial Group, with participation from the previous investor Holtzbrinck Ventures.
No other events of special significance occurred after the end of the financial year.
4. Forecast Report, Report of Opportunities and Risks4.1 Forecast Report
The International Monetary Fund (IMF) published its “World Economic Outlook” (update January 2016), in which it expressed its concerns and downgraded the global growth projection for 2016 and 2017 by 0.2 percentage points to 3.4% and 3.6% respectively. This shift reflects a less opti-mistic outlook for emerging economies.
With regard to the worldwide Internet sector, market parties expect a continuation of the shift from traditional sales channels to online and mobile business and an acceleration of the growth in mobile Internet usage. Accordingly, the entire industry goes through a transition from classic desktop-Internet companies to mobile-first and even mobile-only. The emergence of new com-petitor companies in the incubation business as well as the operative online business and the development of new online business models are very likely.
We expect the further, mostly international expansion of our companies to continue accompanied by the development and acquisition of various new business models. On the one hand, this development will be reflected in an extended consolidation scope and additions to financial assets. On the other hand, the number of fully consolidated companies will decrease in 2016, if the underlying business models are considered unsustainable.
Regarding New Businesses & Investments, Rocket Internet Group expects a considerable increase in consolidated revenue for the financial year 2016 for those companies that continue to be fully consolidated after December 31, 2015. Overall, due to deconsolidation of Kanui and Tricae (in September 2015), the sale of Bonnyprints (in January 2016), La Nevera Roja and Pizzabo.it (in February 2016) and some other former subsidiaries (Zencap, Nestpick, Spotcap, Clickbus Brazil, Zocprint), shutdowns (Airu, Tripda, Kaymu, Vendomo, Spaceways, Shopkin, EatFirst Germany), and a possible selling of further subsidiaries, a sharp decrease in consolidated revenue is forecast for the financial year 2016. Due to the expansion strategy of current and new subsidiaries, nega-tive operating results (EBIT) are expected in the area New Businesses & Investments for 2016.
Rocket Internet does not plan dilutive capital increases in the next three years at the Group level. Moreover, no significant M&A transactions are planned for 2016.
Rocket Internet SE expects revenues to remain stable or to slightly decrease due to the increased individual independence of the network companies. Through the provision of essential adminis-trative company functions and the recognition of expenses from share-based payment plans in the income statement we expect a negative result (EBIT) in the annual financial statements of Rocket Internet SE for the reporting year 2016 provided there are no material divestments of participations.
The earnings position of the Company and the Group can vary substantially from year to year, due to dilution or in some cases as a result of sale of participations.
240 ABOUT ROCKET INTERNETLETTER TO OUR SHAREHOLDERSANNUAL REPORT 2015
The earnings position of the Group can also be subject to high volatility due to the results from deconsolidation (change in status of previously consolidated entities to associated companies). As a result of the strategy change after the IPO, whereby Rocket Internet SE aims to keep a larger share of the economic ownership in most of the new companies, a reduction of income from deconsolidation is forecast.
Results from associated companies and joint ventures are determined by their operations and the consequent results from operational activity on the one hand, and by the conditions agreed with new investors in future financing rounds on the other. For most associated companies and joint ventures, we expect negative proportionate contributions from their operational results, which should be compensated partly by the effects from financing rounds. Overall, we expect a substantial negative result from associated companies and joint ventures but estimate the degree of predictability to be low given the market movements in our business environment.
From the current perspective, the above forecasts were confirmed for the months following the 2015 financial year. Sales figures in the first months of 2016 of the entities consolidated as of December 31, 2015 are above those of the comparative period of 2015.
4.2 Risk Report
4.2.1 Risk Management SystemThe Internet sector is still one of the fastest growing sectors of the economy. This offers generally good opportunities for companies which can establish themselves at an early stage and with promising business models in new geographic locations. At the same time, the rapid pace of de-velopments in the Internet sector entails risks.
4.2.2 RisksCompanies with business models that include founding, financing and investing in young companies in the Internet sector take deliberate entrepreneurial risks.
Rocket Internet Group is primarily exposed to operational, investment and valuation risks. These risks are related to the success potential of the businesses models of the network of companies as well as to the intense competition in the area of online business by other incubators and founders. With regard to the fast-paced nature of the Internet, the future value of investments can also change as a result of external factors such as the introduction of innovative competitor products and services, changes in user behavior (market trends) or the general regulatory conditions.
Moreover, the worldwide expansion particularly into a large number of emerging markets increases the exposure to political, economic, legal as well as other risks and uncertainties. In this context, there is also the risk of target markets and their development deviating from pre-entry expectations.
Historical operational data is available only to a limited extent for many of our network companies. Furthermore, the network companies generate losses and negative cash flows from operating activities. It cannot be ruled out that those network companies will not be able to generate profits or positive cash flows from operating activities in the future. This could have a negative impact on our business development and on Rocket Internet’s earnings, asset and financial position.
Rocket Internet Group attempts to minimize such risks through close management and monitoring of the company network. The opportunities and risks of a new company incubation are evaluated carefully prior to each financing or investment decision. After a company is founded, the business development of each company is monitored on a regular basis in short intervals by means of key performance indicators (KPIs) and financial data. If a business shows an unfavorable develop-ment indicating that the long term viability of such model is in danger, Rocket Internet – when it
241COMBINED MANAGEMENT REPORTCONSOLIDATED FINANCIAL STATEMENTSOUR COMPANIES
Events after the Reporting Date Forecast Report, Report of Opportunities and Risks

comes to associated companies and joint ventures in coordination with co-investors – adjusts the strategic orientation and the operational implementation. In the worst case, discontinuation decisions can be taken in order to prevent further losses. Required value adjustments are recorded at an early stage to maintain a conservative business view of the asset position at all times.
The financing of new companies by several co-investors permits the distribution of risks across several parties.
Moreover, the Company also systematically ensures risk diversification by starting and financing businesses in different operative business fields and geographic areas.
Due to the predominant equity financing via public markets, the Group is directly affected by developments and risks relevant to capital markets. Founding, investing and financing of a company depend on its own financing capability to a particularly high extent, which increases capital procurement risks. The Group has to rely on the financing capability of its existing and future shareholders and their willingness to invest in the event of a further expansion of the network of companies.
The great number of contractual relationships and agreements concluded by the Group on a regular basis give rise to legal risks. This refers especially to legal risks in corporate law, intellectual property law as well as competition and antitrust law in connection with corporate reorganizations. These risks are minimized through mandating renowned corporate and tax law firms. A system of contract templates is in place for standard agreements. In addition, specialized law firms are also increasingly engaged at the level of the company network often located outside Europe, with a view to minimizing the risks resulting from legal uncertainty and capital recoverability. However, because of outsourcing, dependencies on the corporate and tax law firms can occur, which can be reduced by the assignment of engagements to multiple professional firms.
Risks exist for Rocket Internet Group regarding the availability of the utilized IT systems as well as the confidentiality and integrity of data. The outage of IT systems can lead to disturbances of business operations, but it can also have a reputational impact. The confidentiality and security of customer-related data and transactions are considered especially important. The main causes, complexity of systems as well as external attacks, are mitigated by constant monitoring of all systems as well as the improvement of processes and security measures by a special IT Security team.
With respect to recruitment, Rocket Internet Group is active in a highly specialized market. In this context, Berlin is increasingly becoming an established location for Internet and venture capital companies, which leads to increased competition for specialized management staff and functional experts. This personnel-related risk is addressed through personnel retention measures and recruiting measures.
In the area of eCommerce, a disadvantageous private consumption environment could lead to risks from loss of revenue and the associated risk of increased merchandise inventories. Risks from the operative business in the area of eCommerce relate mainly to the purchasing and logistics functions.
Reliable and fast delivery of fault-free merchandise is a crucial competitive factor. Delivery delays and quality defects would have a direct adverse impact on customer trust and would lead to image damage. Like all eCommerce companies, Rocket Internet Group is also strongly dependent on the functionality and stability of its various websites. Disturbances, downtime or unauthorized access and attacks would immediately lead to revenue losses. Another risk for the Group relates to customer payment patterns and receivables default risk.
Companies operating online and mobile marketplaces could become the subject of allegations and legal proceedings, with respect to the content of their webpages or accusations that their webpages were pirated, counterfeited or illegal.
242 ABOUT ROCKET INTERNETLETTER TO OUR SHAREHOLDERSANNUAL REPORT 2015

For companies offering payment solutions as well as the intermediation of loans, the main risks are the currently existing and continuously increasing strict legal and regulatory frameworks and regulation by national and supranational institutions. Risks are inherent particularly in the application and interpretation of these regulations with respect to our specific peer-to-peer business models and potentially resulting claims for damages or penalty payments.
Furthermore, Rocket Internet Group as a whole could become subject to legal proceedings that could disturb or damage business operations.
Please also refer to the statements in section “2.7 Financial and Non-Financial Performance Indicators“ and section “5 Risk Report Concerning the Use of Financial Instruments“.
In summary, it should be noted that the Group performs systematic and regular analyses of the business risks on the basis of qualified early risk detection systems and minimizes the risks through deliberate measures such as risk prevention, limitation of risks, risk diversification and risk insurance. As a result, the continued existence of the Company as a going concern is not jeopardized even in the event of simultaneous occurrence of several risk events.
4.3 Opportunities Report
The Group is very well established in the industry. As a result, it has ample opportunities to make use of innovations and trends in the Internet market within a short time frame through the cre-ation of new businesses. Rocket Internet’s core competencies include, in particular, the pursuit of new digital business models and trends and the early identification of new markets. The imple-mentation of new business models is carried out using the unique platform approach which Rocket Internet developed.
To this end, the Group can rely on a highly qualified workforce. The members of the experienced and dedicated management team have a trained eye for assessing ideas and opportunities in the market with regard to their feasibility and profitability.
As soon as a viable idea is identified, Rocket Internet has the necessary infrastructure and staff to enable a quick implementation of the idea. This includes very efficient group-wide competence centers such as the marketing unit with its CRM (Customer Relationship Management), SEO (Search Engine Optimization) and SEA (Search Engine Advertising) teams. These competence centers support new as well as already existing network companies.
Strong and internationally leading technology partners such as Google, Facebook, Responsys, Sociomantic and Criteo enable Rocket Internet Group to utilize external technologies benefitting from superior terms relative to competitors, which are achieved through bundling service agree-ments across the Group.
Another success factor is the Group’s own core technology developed for different business models like eCommerce, Marketplaces and Financial Technology, which enables Rocket Internet Group to reliably set up several companies in parallel and within a very short time frame. These software solutions can be adapted flexibly to the requirements of the respective company and are very scalable.
Furthermore, Rocket Internet has standardized the process of building companies. The goal is to generate the first sales within 100 days from the decision of establishing the business model.
The parallel development of various business models also enables synergies through the exchange of information, knowledge and best-in-class solutions. The internationality of the Group and the staff structure offer the opportunity to access and understand the most diverse international markets quickly. As a consequence, Rocket Internet Group can promote one of its key strategies:
243COMBINED MANAGEMENT REPORTCONSOLIDATED FINANCIAL STATEMENTSOUR COMPANIES
Forecast Report, Report of Opportunities and Risks
the initial tapping of new and undersupplied markets and markets that have not yet been explored by competitors, in particular in Africa, Asia, Middle East and Latin America, but also in Europe.
The existing capitalization and access to investors as well as the existing strategic partnerships enable Rocket Internet Group to establish and finance new companies internationally and over longer periods. Moreover, the Group can generate economies of scope and scale as a result of its parallel international rollouts and its presence on six continents including many complex emerging markets.
5. Risk Report Concerning the Use of Financial InstrumentsThe major financial instruments of Rocket Internet Group are cash (35% of total assets; previous year 52%), equity investments in available for sale financial assets (20% of total assets; previous year 0%), equity instruments at fair value through profit or loss (FVTPL) (6% of total assets; previous year 9%) and other non-current financial assets (<1% of total assets; previous year <1%), as well as liabilities from convertible bonds (10% of total assets; previous year 0%). The Group also records trade receivables and liabilities as well as loan receivables and liabilities mainly from associated companies and joint ventures, which arise in the ordinary course of business.
The major financial instruments in the annual financial statements prepared in accordance with German GAAP (HGB) of Rocket Internet SE are cash (50% of the total assets, previous year 86%), investments in subsidiaries (34% of total assets, previous year 3%), participations (12% of total assets, previous year 8%), as well as the liabilities from convertible bonds (16% of total assets, previous year 0%). The following statements disclosed for the consolidated financial statement apply for the annual financial statements of the parent company.
The Group’s risks arising from existing financial instruments relate to the financial risks which comprise market risk (including currency risk, interest rate risk and other price risk), risk of default (credit risk), liquidity risk and share price risk. The primary objective of the financial risk manage-ment is to establish risk limits, and ensure that exposure to risks stays within these limits. The operational and legal risk management functions are intended to ensure proper functioning of internal policies and procedures, in order to minimize operational and legal risks.
The Group places available funds in current accounts seeking to ensure both liquidity and security of principal. The Group’s policy does not permit any trading with financial instruments. According-ly, no financial derivatives are utilized. Interest rate risk is the risk that the fair value or future cash flow of a financial instrument will fluctuate due to changes in market interest rates. The Group enters in principal only into fixed-rate instruments. The Group does not account for fixed-rate financial instruments at fair value through profit or loss except for employee loans that are desig-nated at fair value through profit or loss. A reasonably possible change in the interest rates does not have a material effect on profit or loss from fair value changes of these instruments.
The risk associated with financial assets is controlled through a sophisticated system of operational monitoring. This applies, in particular, to the equity holdings of Rocket Internet Group, which are accounted for either as available for sale financial assets or at fair value through profit or loss. The Group is exposed to financial risks in respect of share prices, meaning the risk of changes in the value of the shareholdings. Rocket Internet’s operations include management of sharehold-ings measured at fair value comprising considerable investments in a small number of unlisted companies. Accordingly, Rocket Internet’s financial position and results are dependent on how well these companies develop. The concentration of the shareholdings leads to a risk that it is
244 ABOUT ROCKET INTERNETLETTER TO OUR SHAREHOLDERSANNUAL REPORT 2015

more difficult for Rocket Internet to make major changes in the composition of the shareholdings in a limited time. Rocket Internet’s strategy is also to be a long-term shareholder. Therefore, there is no strategy for managing short-term fluctuations in share prices. For details concerning share price risk please refer to Note 41 in the Notes to the Consolidated Financial Statements.
Risk management is carried out by a central treasury department under control of the Management Board. The Management Board provides principles for overall risk management, as well as policies covering specific areas, such as currency risk and interest rate risk and investment of excess liquidity. Detailed information concerning risk of default, liquidity risk and currency risk is given in the following paragraphs.
5.1 Risk of Default (Credit Risk)
The risk of default is defined as the risk that our business partners do not meet their contractual payment obligations and this leads to a loss for Rocket Internet Group. The risk of default com-prises the direct risk of a default and the decrease in the credit worthiness as well as the concen-tration of default risks.
The risk of default exists for all financial assets in particular for deposits, receivables from associ-ates and trade receivables. The Group’s receivables are unsecured. Therefore, the maximum risk of default corresponds to the book value of the financial assets that are subject to this risk.
The investment of liquidity that is not needed for operational purposes is carried out according to criteria defined as per Group policy. Rocket Internet Group, in general, only maintains business relationships with banks of outstanding credit rating. Diversification is another means to minimize risk. The credit worthiness is constantly monitored by the Group. The investment of term deposits takes place with banks that are members of the respective bank deposit protection funds and that are rated with minimum investment grade rating BBB- (S&P) and Baa3 (Moody’s), respectively. Interest rate management focuses on optimized distribution of cash between different banks in order to avoid negative deposit rates.
The control and mitigation of default risk of receivables from associates is carried out by the investment control function. Trade receivables mainly relate to the Group’s eCommerce activities. In this area, default risk is mitigated through a careful review of customer credit ratings in the course of the online order process. In the event of deterioration in the payment habits or in case of other factors that indicate a requirement for impairment, the receivables management function either initiates measures aimed at the collection of the outstanding customer payments or at the return of the delivered merchandise. Customers’ credit rating is monitored on a continu-ous basis. The concentration of default risks is limited because of the broad and heterogeneous structure of the customer base.
Any customer default risks that are identified, e.g. in the case of discontinued payments, are taken into account through appropriate value adjustments.
5.2 Liquidity Risk
Liquidity risk is the risk that an entity will encounter difficulty in meeting obligations associated with financial liabilities. The Company is exposed to daily calls on its available cash resources. Liquidity risk is managed by the management of the Company. The Management Board monitors monthly rolling forecasts of the Company’s cash flows.
The Group’s capital requirements relate, inter alia, to the financing of new and existing companies and the current capital requirements of the Group’s operative business. Rocket Internet Group monitors the risk of liquidity shortages (liquidity risk) on a continuous basis through cash budgets
245COMBINED MANAGEMENT REPORTCONSOLIDATED FINANCIAL STATEMENTSOUR COMPANIES
Forecast Report, Report of Opportunities and Risks Risk Report Concerning the Use of Financial Instruments
and reforecasts taking into consideration the maturities of financial investments and financial assets (e.g. receivables and other financial assets) as well as expected cash flows from operating activities. In addition to cash and cash equivalents and income from the sale of financial assets, future cash flows from operating activities represent another source of liquidity.
The liquidity balance and compliance with cash budgets are controlled at regular intervals. In the process, the development of liquidity balances and important movement factors are commu-nicated and discussed internally.
5.3 Currency Risk
The Group is exposed to currency risks due to its international business activities outside of the Eurozone. Changes in exchange rates can therefore have an adverse impact on the consolidated financial statements. The individual foreign currency transactions are not hedged since they are generally of a short-term nature. To the extent possible and feasible, hedging is not performed by way of financial engineering measures but rather through the structuring of existing economic conditions (“natural hedging”). Effects of exchange rate fluctuations resulting from the translation of net asset positions into the reporting currency are recognized in equity in the consolidated financial statements. Foreign exchange differences that result from exchange rate changes when translating balance sheet items in foreign currency are recognized in the income statement under other operating expenses or income.
Berlin, March 31, 2016
Oliver Samwer Peter Kimpel Alexander Kudlich
246 ABOUT ROCKET INTERNETLETTER TO OUR SHAREHOLDERSANNUAL REPORT 2015

Audit OpinionWe have audited the consolidated financial statements prepared by Rocket Internet SE, Berlin, comprising the consolidated statement of comprehensive income, the consolidated balance sheet, the consolidated statement of changes in equity, the consolidated statement of cash flows and the notes to the consolidated financial statements, together with the combined management report for the fiscal year from January 1 to December 31, 2015. The preparation of the consolidated financial statements and the combined management report in accordance with IFRSs as adopted by the EU and the additional requirements of German commercial law pursuant to Sec. 315a (1) HGB [“Handelsgesetzbuch”: German Commercial Code] is the responsibility of the Company’s management. Our responsibility is to express an opinion on the consolidated financial statements and the combined management report based on our audit.
We conducted our audit of the consolidated financial statements in accordance with Sec. 317 HGB and German generally accepted standards for the audit of financial statements promulgated by the Institut der Wirtschaftsprüfer [Institute of Public Auditors in Germany] (IDW). Those standards require that we plan and perform the audit such that misstatements materially affecting the presentation of the net assets, financial position and results of operations in the consolidated financial statements in accordance with the applicable financial reporting framework and in the combined management report are detected with reasonable assurance. Knowledge of the business activities and the economic and legal environment of the Group and expectations as to possible misstatements are taken into account in the determination of audit procedures. The effective-ness of the accounting-related internal control system and the evidence supporting the disclosures in the consolidated financial statements and the combined management report are examined primarily on a test basis within the framework of the audit. The audit includes assessing the annual financial statements of the entities to be included in consolidation, the determination of the entities to be included in consolidation, the accounting and consolidation principles used and significant estimates made by management, as well as evaluating the overall presentation of the consolidated financial statements and the combined management report. We believe that our audit provides a reasonable basis for our opinion.
Our audit has not led to any reservations.
In our opinion, based on the findings of our audit, the consolidated financial statements comply with IFRSs as adopted by the EU as well as the additional requirements of German commercial law pursuant to Sec. 315a (1) HGB and give a true and fair view of the net assets, financial position and results of operations of the group in accordance with these requirements. The combined management report is consistent with the consolidated financial statements and as a whole provides a suitable view of the group’s position and suitably presents the opportunities and risks of future development.
Berlin, 31 March 2016
Ernst & Young GmbH
Wirtschaftsprüfungsgesellschaft
Klug Beckers
Wirtschaftsprüfer Wirtschaftsprüfer[German Public Auditor] [German Public Auditor]
247COMBINED MANAGEMENT REPORTCONSOLIDATED FINANCIAL STATEMENTSOUR COMPANIES
Risk Report Concerning the Use of Financial InstrumentsAudit Opinion

ImprintRocket Internet SE Johannisstraße 20 10117 Berlin Germany
Phone: +49 30 300 13 18-68
[email protected] www.rocket-internet.com
Investor [email protected]
Media [email protected]
Concept, Layout & DesignIR-One AG & Co., Hamburg www.ir-1.com
Picture CreditsRocket Internet, Fotolia
Forward looking statements and other notesThis annual report contains certain forward-looking statements relating to the business, financial performance and results of Rocket Internet SE, its subsidiaries and its participations (collectively, “Rocket”) and / or the industry in which Rocket operates. Forward-looking statements concern future circumstances and results and other statements that are not historical facts, sometimes identified by the words “believes”, “expects”, “predicts”, “intends”, “projects”, “plans”, “esti-mates”, “aims”, “foresees”, “anticipates”, “targets”, and similar expressions. The forward-look-ing statements contained in this annual report, including assumptions, opinions and views of Rocket or cited from third party sources, are solely opinions and forecasts which are uncertain and subject to risks. Actual events may differ significantly from any anticipated development due to a number of factors, including without limitation, changes in general economic conditions, in particular economic conditions in the markets in which Rocket operates, changes affecting inter-est rate levels, changes in competition levels, changes in laws and regulations, environmental damages, the potential impact of legal proceedings and actions and Rocket’s ability to achieve operational synergies from acquisitions. Rocket does not guarantee that the assumptions under-lying the forward looking statements in this annual report are free from errors nor does it accept any responsibility for the future accuracy of the opinions expressed in this annual report or any obligation to update the statements in this annual report to reflect subsequent events. The for-ward-looking statements in this annual report are made only as of the date hereof. Neither the delivery of this annual report nor any further discussions of Rocket with any of the recipients thereof shall, under any circumstances, create any implication that there has been no change in the affairs of Rocket since such date. Consequently, Rocket does not undertake any obligation to review, update or confirm recipients’ expectations or estimates or to release publicly any revi-sions to any forward-looking statements to reflect events that occur or circumstances that arise in relation to the content of the annual report.
All values are rounded in accordance with a commercial rounding approach, which may result in rounding differences. Growth, margin or other ratios are based on the actual numbers, which may also result in differences compared to a corresponding computation using rounded numbers.
It is available for download at https://www.rocket-internet.com / investors
248

