annual report 2015–16mrc-assets.s3.amazonaws.com/assets/file/6266.pdfstephen carpenter joseph...
TRANSCRIPT
1
ANNUAL REPORT 2015–16PART TWO

2
Contents
03 Directors’ Report
05 Auditor’s Independence Declaration
06 Comprehensive Operating Statement
07 Balance Sheet
08 Statement of Changes in Equity
09 Cash Flow Statement
10 Notes to the Financial Statements
31 Directors’ Declaration
32 Independent Auditor’s Report
34 Disclosure Index
3
Directors’ Report
The Directors present this report on Melbourne Recital Centre for the financial year ended 30 June 2016.
DirectorsThe names of each person who has been a Director during the period and to the date of this report are:
Kathryn Fagg, Chair
Julie Kantor (Retired February 2016)
Peter Bartlett
Stephen Carpenter
Joseph Corponi
Margaret Farren-Price
Eda Ritchie AM
Paul Donnelly
Mary Delahunty (Appointed 1 July 2016)
Directors have been in office since 1 July 2015 to the date of this report unless otherwise stated.
All Directors are independent of the management.
Company SecretaryStephen Carpenter held the position of Company Secretary at the end of the financial year.
Membership of Melbourne Recital CentreMelbourne Recital Centre is a company limited by guarantee. The sole member of the Company is the Minister for Creative Industries, Martin Foley MP.
Principal ActivitiesThe principal activity of the Company during the financial year was planning and managing the operations of Melbourne Recital Centre.
Operating ResultsThe net result from transactions was a surplus of $86,887 ($263,636 in 2014—15). Total comprehensive result is $148,046 ($267,654 in 2014—15).
Dividends Paid or RecommendedIn line with the Constitution of the Melbourne Recital Centre no part of the income or property was paid, transferred or distributed, directly or indirectly, by way of dividend, bonus, or other profit distribution, to any of the members or Directors during the financial year.
Review of OperationsThe Company’s focus was consolidating its position and broadening its audience.
Significant Changes in State of AffairsThere was no significant change in state of affairs during the financial year.
Proceedings on Behalf of the CompanyNo person has applied for leave of Court to bring proceedings on behalf of the Company or intervene in any proceedings to which the Company is a party for the purpose of taking responsibility on behalf of the Company for all or any part of those proceedings.
The Company was not a party to any such proceedings during the year.
After Balance Date EventsNo matters or circumstances have arisen since the end of the financial year which significantly affected or may significantly affect the operations of the Company, the results of those operations, or the state of affairs of the Company in future financial years.
Future DevelopmentsThe Company expects to maintain the present status and level of operations for the foreseeable future.
Environmental RegulationsNo significant environmental regulations apply that are likely to have a material effect on the operations or financial results of Melbourne Recital Centre.
OptionsNo options over issued shares or interests in the Company were granted during or since the end of the financial year and there were no options outstanding at the date of this report.
4
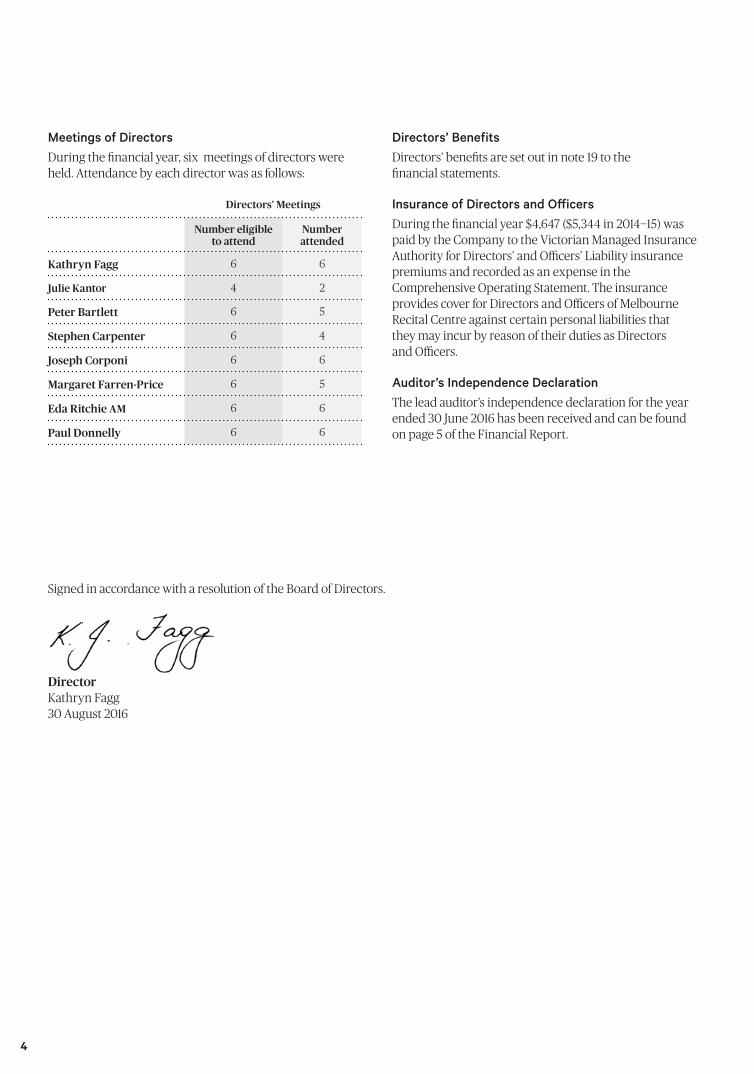
Meetings of DirectorsDuring the financial year, six meetings of directors were held. Attendance by each director was as follows:
Directors’ Meetings
Number eligible to attend
Number attended
Kathryn Fagg 6 6
Julie Kantor 4 2
Peter Bartlett 6 5
Stephen Carpenter 6 4
Joseph Corponi 6 6
Margaret Farren-Price 6 5
Eda Ritchie AM 6 6
Paul Donnelly 6 6
Directors’ BenefitsDirectors’ benefits are set out in note 19 to the financial statements.
Insurance of Directors and OfficersDuring the financial year $4,647 ($5,344 in 2014—15) was paid by the Company to the Victorian Managed Insurance Authority for Directors’ and Officers’ Liability insurance premiums and recorded as an expense in the Comprehensive Operating Statement. The insurance provides cover for Directors and Officers of Melbourne Recital Centre against certain personal liabilities that they may incur by reason of their duties as Directors and Officers.
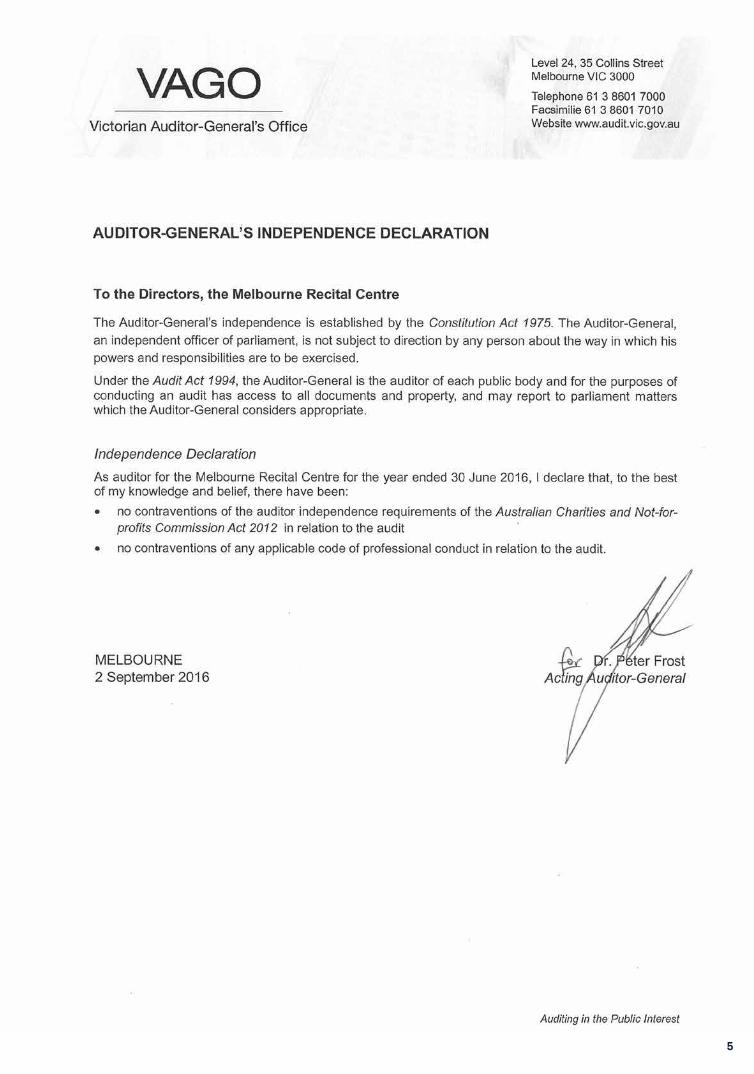
Auditor’s Independence DeclarationThe lead auditor’s independence declaration for the year ended 30 June 2016 has been received and can be found on page 5 of the Financial Report.
Signed in accordance with a resolution of the Board of Directors.
Director Kathryn Fagg 30 August 2016
5
6
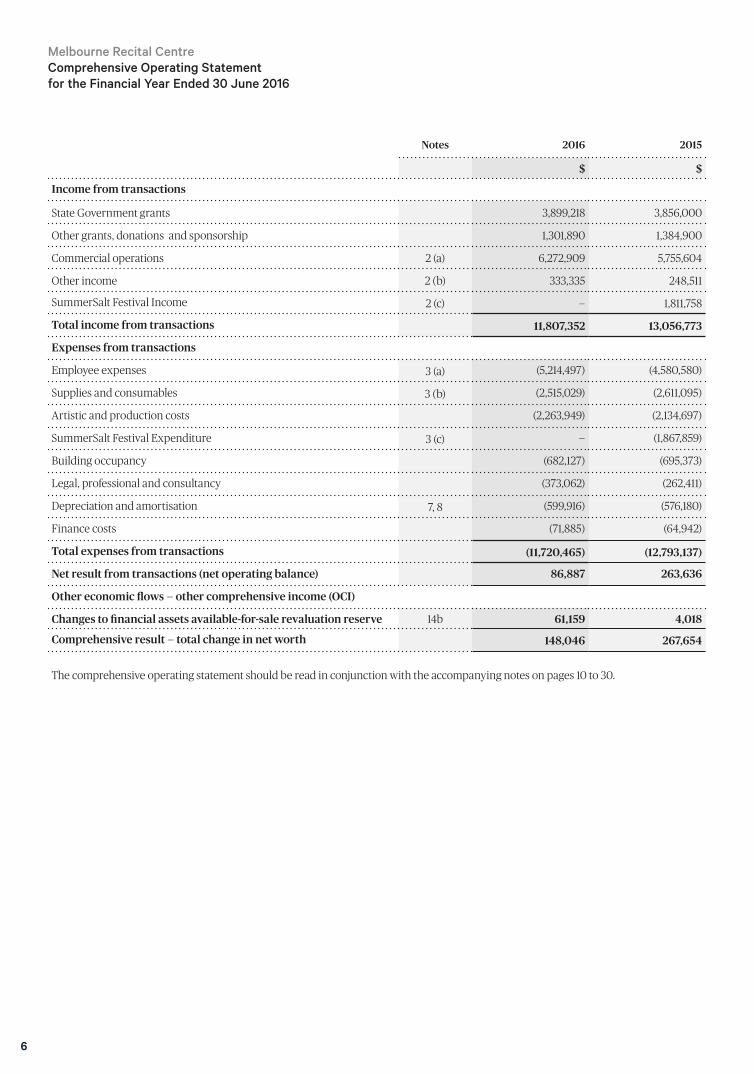
Notes 2016 2015
$ $
Income from transactions
State Government grants 3,899,218 3,856,000
Other grants, donations and sponsorship 1,301,890 1,384,900
Commercial operations 2 (a) 6,272,909 5,755,604
Other income 2 (b) 333,335 248,511
SummerSalt Festival Income 2 (c) — 1,811,758
Total income from transactions 11,807,352 13,056,773
Expenses from transactions
Employee expenses 3 (a) (5,214,497) (4,580,580)
Supplies and consumables 3 (b) (2,515,029) (2,611,095)
Artistic and production costs (2,263,949) (2,134,697)
SummerSalt Festival Expenditure 3 (c) — (1,867,859)
Building occupancy (682,127) (695,373)
Legal, professional and consultancy (373,062) (262,411)
Depreciation and amortisation 7, 8 (599,916) (576,180)
Finance costs (71,885) (64,942)
Total expenses from transactions (11,720,465) (12,793,137)
Net result from transactions (net operating balance) 86,887 263,636
Other economic flows — other comprehensive income (OCI)
Changes to financial assets available-for-sale revaluation reserve 14b 61,159 4,018
Comprehensive result — total change in net worth 148,046 267,654
The comprehensive operating statement should be read in conjunction with the accompanying notes on pages 10 to 30.
Melbourne Recital Centre Comprehensive Operating Statement for the Financial Year Ended 30 June 2016
7
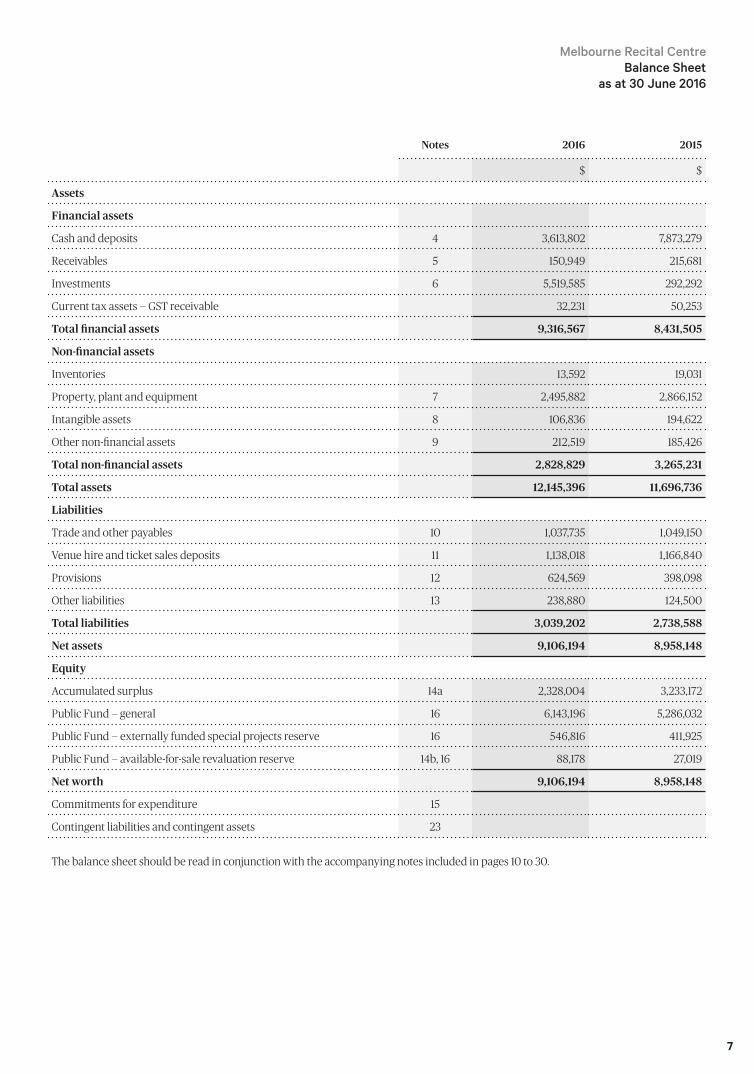
Melbourne Recital Centre Balance Sheet
as at 30 June 2016
Notes 2016 2015
$ $
Assets
Financial assets
Cash and deposits 4 3,613,802 7,873,279
Receivables 5 150,949 215,681
Investments 6 5,519,585 292,292
Current tax assets — GST receivable 32,231 50,253
Total financial assets 9,316,567 8,431,505
Non-financial assets
Inventories 13,592 19,031
Property, plant and equipment 7 2,495,882 2,866,152
Intangible assets 8 106,836 194,622
Other non-financial assets 9 212,519 185,426
Total non-financial assets 2,828,829 3,265,231
Total assets 12,145,396 11,696,736
Liabilities
Trade and other payables 10 1,037,735 1,049,150
Venue hire and ticket sales deposits 11 1,138,018 1,166,840
Provisions 12 624,569 398,098
Other liabilities 13 238,880 124,500
Total liabilities 3,039,202 2,738,588
Net assets 9,106,194 8,958,148
Equity
Accumulated surplus 14a 2,328,004 3,233,172
Public Fund — general 16 6,143,196 5,286,032
Public Fund — externally funded special projects reserve 16 546,816 411,925
Public Fund — available-for-sale revaluation reserve 14b, 16 88,178 27,019
Net worth 9,106,194 8,958,148
Commitments for expenditure 15
Contingent liabilities and contingent assets 23
The balance sheet should be read in conjunction with the accompanying notes included in pages 10 to 30.
8
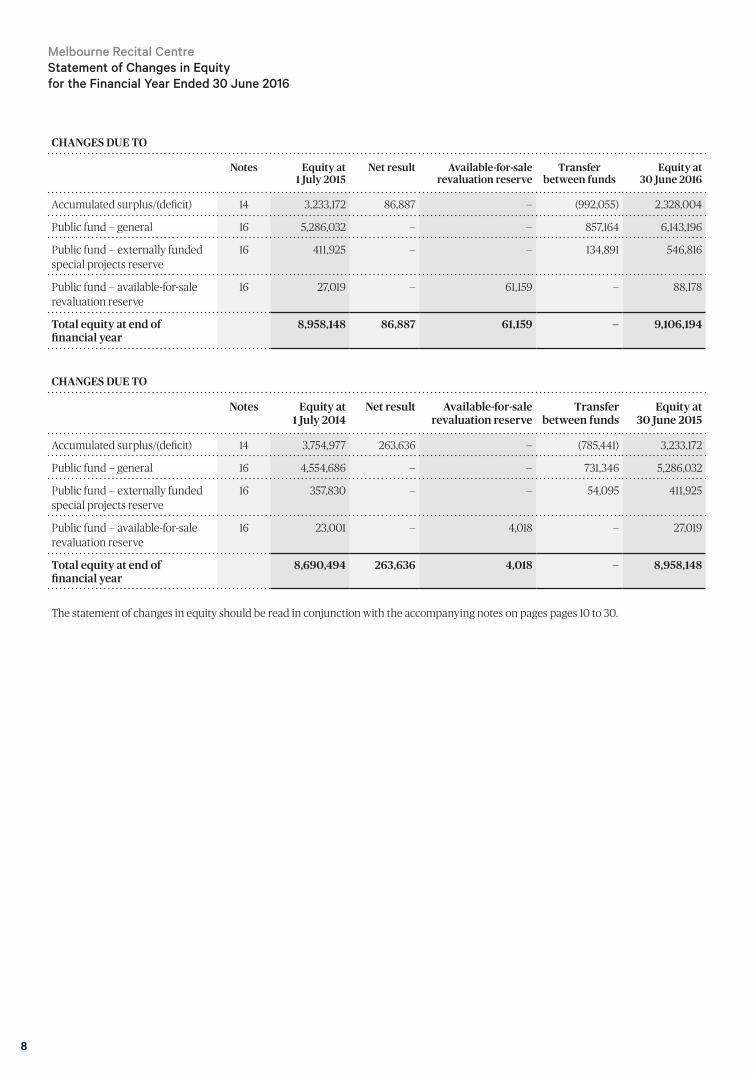
CHANGES DUE TO
Notes Equity at 1 July 2015
Net result Available-for-sale revaluation reserve
Transfer between funds
Equity at 30 June 2016
Accumulated surplus/(deficit) 14 3,233,172 86,887 — (992,055) 2,328,004
Public fund — general 16 5,286,032 — — 857,164 6,143,196
Public fund — externally funded special projects reserve
16 411,925 — — 134,891 546,816
Public fund — available-for-sale revaluation reserve
16 27,019 — 61,159 — 88,178
Total equity at end of financial year
8,958,148 86,887 61,159 — 9,106,194
CHANGES DUE TO
Notes Equity at 1 July 2014
Net result Available-for-sale revaluation reserve
Transfer between funds
Equity at 30 June 2015
Accumulated surplus/(deficit) 14 3,754,977 263,636 — (785,441) 3,233,172
Public fund — general 16 4,554,686 — — 731,346 5,286,032
Public fund — externally funded special projects reserve
16 357,830 — — 54,095 411,925
Public fund — available-for-sale revaluation reserve
16 23,001 — 4,018 — 27,019
Total equity at end of financial year
8,690,494 263,636 4,018 — 8,958,148
The statement of changes in equity should be read in conjunction with the accompanying notes on pages pages 10 to 30.
Melbourne Recital Centre Statement of Changes in Equity for the Financial Year Ended 30 June 2016
9
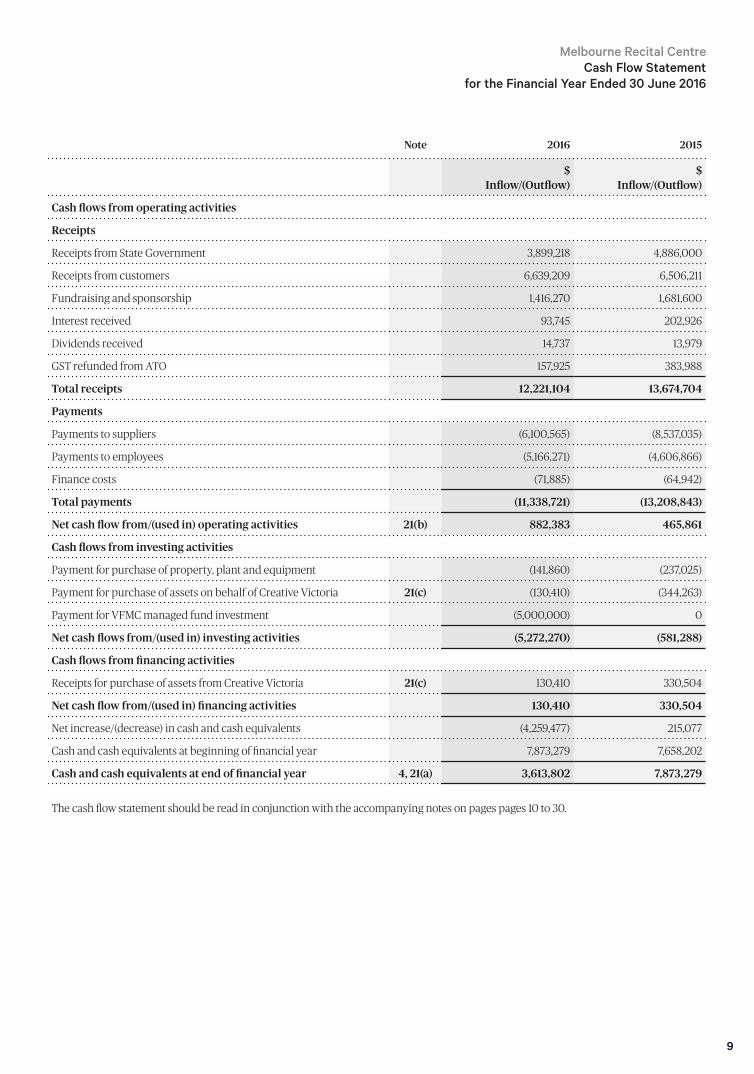
Melbourne Recital Centre Cash Flow Statement
for the Financial Year Ended 30 June 2016
Note 2016 2015
$ Inflow/(Outflow)
$ Inflow/(Outflow)
Cash flows from operating activities
Receipts
Receipts from State Government 3,899,218 4,886,000
Receipts from customers 6,639,209 6,506,211
Fundraising and sponsorship 1,416,270 1,681,600
Interest received 93,745 202,926
Dividends received 14,737 13,979
GST refunded from ATO 157,925 383,988
Total receipts 12,221,104 13,674,704
Payments
Payments to suppliers (6,100,565) (8,537,035)
Payments to employees (5,166,271) (4,606,866)
Finance costs (71,885) (64,942)
Total payments (11,338,721) (13,208,843)
Net cash flow from/(used in) operating activities 21(b) 882,383 465,861
Cash flows from investing activities
Payment for purchase of property, plant and equipment (141,860) (237,025)
Payment for purchase of assets on behalf of Creative Victoria 21(c) (130,410) (344,263)
Payment for VFMC managed fund investment (5,000,000) 0
Net cash flows from/(used in) investing activities (5,272,270) (581,288)
Cash flows from financing activities
Receipts for purchase of assets from Creative Victoria 21(c) 130,410 330,504
Net cash flow from/(used in) financing activities 130,410 330,504
Net increase/(decrease) in cash and cash equivalents (4,259,477) 215,077
Cash and cash equivalents at beginning of financial year 7,873,279 7,658,202
Cash and cash equivalents at end of financial year 4, 21(a) 3,613,802 7,873,279
The cash flow statement should be read in conjunction with the accompanying notes on pages pages 10 to 30.
10
NOTE 1: SUMMARY OF SIGNIFICANT ACCOUNTING POLICIES
(a) Statement of complianceThe general purpose financial statements have been prepared in accordance with the Financial Management Act 1994 (FMA), applicable Australian Accounting Standards and Intrepretations (AASs) and the Australian Charities and Not-for-profits Commission Act 2012. Where applicable, those paragraphs of the AASs applicable to not-for-profit entities have been applied.
The financial statements were authorised for issue by the Board of Directors on the date the declaration was signed.
(b) Basis of accounting preparation and measurementThe accrual basis of accounting has been applied in the preparation of these financial statements whereby assets, liabilities, equity, income and expenses are recognised in the reporting period to which they relate.
The financial statements have been prepared on a historical cost basis, except for non-current physical assets and financial instruments. Non-current physical assets, subsequent to acquisition, are measured at a revalued amount being their fair value at the date of the revaluation less any subsequent accumulated depreciation and subsequent impairment losses. Financial instruments are measured at a revalued amount being their carrying value at the reporting date. Revaluations are made with sufficient regularity to ensure that the carrying amounts do not materially differ from their fair value.
The financial statements are presented in Australian dollars, the functional and presentation currency of Melbourne Recital Centre.
In the application of AASs, management is required to make judgements, estimates and assumptions about carrying values of assets and liabilities that are not apparent from other sources. The estimates and associated assumptions are based on historical experience and various other factors that are believed to be reasonable under the circumstances, the results of which form the basis of making the judgements. Actual results may differ from these estimates.
The financial statements have been prepared on a going-concern basis.
Accounting policies are selected and applied in a manner which ensures that the resulting financial information satisfies the concept of relevance and reliability, thereby ensuring that the substance of the underlying transactions or other events is reported.
In accordance with the requirements of AASB 13 Fair Value Measurement and the relevant Financial Reporting Directions, all assets and liabilities for which fair value is measured or disclosed in the financial statements are categorised within the fair value hierarchy, described as follows, based on the lowest level input that is significant to the fair value measurement as a whole:
• Level 1 — Quoted (unadjusted) market prices in active markets for identical assets or liabilities
• Level 2 — Valuation techniques for which the lowest level input that is significant to the fair value measurement is directly or indirectly observable; and
• Level 3 — Valuation techniques for which the lowest level input that is significant to the fair value measurement is unobservable.
For the purpose of fair value disclosures Melbourne Recital Centre has determined classes of assets and liabilities on the basis of the nature, characteristics and risks of the asset or liability and the level of the fair value hierarchy as explained above.
(c) Reporting entityThe financial statements cover Melbourne Recital Centre (the Company) as an individual reporting entity. Melbourne Recital Centre is an individual company, incorporated and domiciled in Australia.
The Company is a company incorporated under the Corporations Act 2001 and is a company limited by guarantee. If the Company is wound up, the constitution states that each member is required to contribute a maximum of $100 each towards meeting any outstandings and obligations of the Company. At 30 June 2016, the number of members was one, and the sole member of the Company is the Minister of Creative Industries.
The registered office is: Melbourne Recital Centre 31 Sturt Street Southbank 3006
The principal place of business is: Melbourne Recital Centre 31 Sturt Street Southbank 3006
(d) Scope and presentation of financial statementsMelbourne Recital Centre has presented its complete set of financial statements in alignment with the AASB 1049 presentation format used in the Financial Report of the State and the general government sector.
Melbourne Recital Centre Notes to the Financial Statements for the Financial Year Ended 30 June 2016
11
Comprehensive Operating StatementIncome and expenses in the comprehensive operating statement are classified according to whether or not they arise from transactions or other economic flows. This classification is consistent with the whole-of-government reporting format and is allowed under AASB 101 Presentation of Financial Statements.
Transactions are those economic flows that are considered to arise as a result of policy decisions, usually interactions between entities by mutual agreement. Transactions also include flows within an entity such as depreciation, where the owner is simultaneously acting as the owner of the depreciating asset and as the consumer of the service provided by the asset.
Other economic flows included in net result are changes arising from market re-measurements. They include gains and losses from disposals, revaluations and impairments of non-current physical and intangible assets.
Other economic flows — other comprehensive income are gains and losses from revaluation of financial assets to fair value.
The net result is equivalent to profit and loss derived in accordance with AASs.
Balance SheetAssets and liabilities are presented in decreasing order of liquidity with assets aggregated into financial assets and non-financial assets.
Current and non-current assets and liabilities (those expected to be recovered or settled beyond 12 months) are disclosed in the notes, where relevant.
Statement of Changes in EquityThe statement of changes in equity presents reconciliation of each non-owner and owner equity opening balance at the beginning of the reporting period to the closing balance at the end of the reporting period. It also shows separately changes due to amounts recognised in the comprehensive result and amounts recognised in other comprehensive income related to other non-owner changes in equity.
Cash Flow StatementCash flows are classified according to whether or not they arise from operating activities, investing activities, or financing activities. This classification is consistent with requirements under AASB 107 Statement of Cash Flows.
(e) Changes in accounting policiesSubsequent to the 2014—15 reporting period, there have been no new and revised Standards adopted in the current period.
(f) Income from transactionsIncome is recognised to the extent that it is probable that the economic benefits will flow to the Company and the income can be reliably measured.
Grant and sponsorship income is recognised in the operating statement in the reporting period in which the obligations under the grant and sponsorship arrangements are discharged.
Donations in cash and in kind are recognised as revenue when received.
Interest revenue and distribution income from investments are recognised on a proportional basis taking into account the interest rates applicable to the financial assets.
Dividend income is recognised when the right to receive payment is established. Dividends represent the income arising from the Company’s investments in financial assets.
Commercial operationsRevenue from commercial operations is recognised upon the delivery of the service to the customers. Artistic programming income comprises ticket sales from Melbourne Recital Centre Presents events. Income from this area is held as unearned revenue on the balance sheet until the performance has occurred and subsequently recognised as revenue.
Venue hire income comprises rental income for the use of the venue including the recovery of event production costs. Deposits relating to this activity is held as unearned revenue on the balance sheet until the performance has occurred and subsequently recognised as revenue.
Commercial activities comprises ticketing commission, food and beverage income and the recovery of front of house event services. Income from these activities is recognised upon the delivery of goods to customers.
Revenue from the sale of goods is recognised upon the delivery of goods to customers.
(g) Expenses from transactionsExpenses are recognised as they are incurred and reported in the financial year to which they relate.
Employee expensesEmployee expenses include all costs related to employment including wages and salaries, superannuation contributions, fringe benefits tax, leave entitlements, WorkCover premiums, learning and development and training costs.
SuperannuationAll superannuation contributions are to defined contribution plans and expensed when incurred.
Melbourne Recital Centre Notes to the Financial Statements
for the Financial Year Ended 30 June 2016
12
DepreciationThe depreciable amount (fair value less residual value) of all plant, property and equipment is depreciated on a straight line basis over their useful lives to the Company commencing from the time the asset is held ready for use. No depreciation is provided for cultural assets as they do not have a finite useful life.
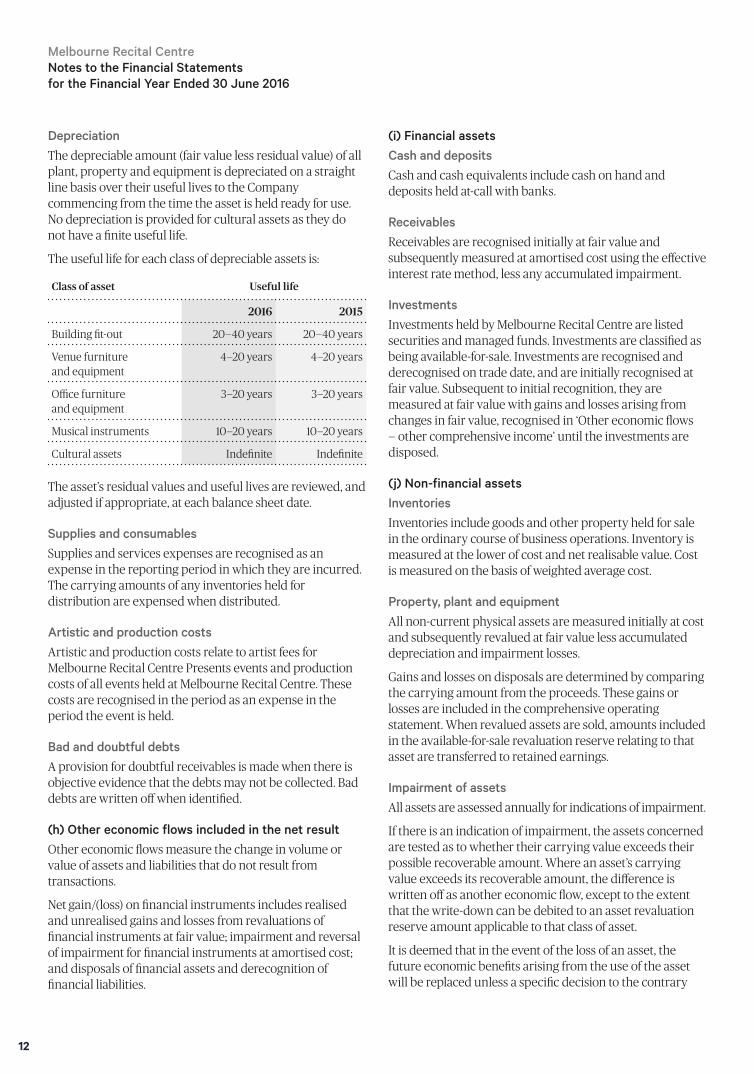
The useful life for each class of depreciable assets is:
Class of asset Useful life
2016 2015
Building fit-out 20—40 years 20—40 years
Venue furniture and equipment
4—20 years 4—20 years
Office furniture and equipment
3—20 years 3—20 years
Musical instruments 10—20 years 10—20 years
Cultural assets Indefinite Indefinite
The asset’s residual values and useful lives are reviewed, and adjusted if appropriate, at each balance sheet date.
Supplies and consumables Supplies and services expenses are recognised as an expense in the reporting period in which they are incurred. The carrying amounts of any inventories held for distribution are expensed when distributed.
Artistic and production costsArtistic and production costs relate to artist fees for Melbourne Recital Centre Presents events and production costs of all events held at Melbourne Recital Centre. These costs are recognised in the period as an expense in the period the event is held.
Bad and doubtful debtsA provision for doubtful receivables is made when there is objective evidence that the debts may not be collected. Bad debts are written off when identified.
(h) Other economic flows included in the net resultOther economic flows measure the change in volume or value of assets and liabilities that do not result from transactions.
Net gain/(loss) on financial instruments includes realised and unrealised gains and losses from revaluations of financial instruments at fair value; impairment and reversal of impairment for financial instruments at amortised cost; and disposals of financial assets and derecognition of financial liabilities.
(i) Financial assetsCash and depositsCash and cash equivalents include cash on hand and deposits held at-call with banks.
ReceivablesReceivables are recognised initially at fair value and subsequently measured at amortised cost using the effective interest rate method, less any accumulated impairment.
InvestmentsInvestments held by Melbourne Recital Centre are listed securities and managed funds. Investments are classified as being available-for-sale. Investments are recognised and derecognised on trade date, and are initially recognised at fair value. Subsequent to initial recognition, they are measured at fair value with gains and losses arising from changes in fair value, recognised in ‘Other economic flows — other comprehensive income’ until the investments are disposed.
(j) Non-financial assetsInventoriesInventories include goods and other property held for sale in the ordinary course of business operations. Inventory is measured at the lower of cost and net realisable value. Cost is measured on the basis of weighted average cost.
Property, plant and equipmentAll non-current physical assets are measured initially at cost and subsequently revalued at fair value less accumulated depreciation and impairment losses.
Gains and losses on disposals are determined by comparing the carrying amount from the proceeds. These gains or losses are included in the comprehensive operating statement. When revalued assets are sold, amounts included in the available-for-sale revaluation reserve relating to that asset are transferred to retained earnings.
Impairment of assetsAll assets are assessed annually for indications of impairment.
If there is an indication of impairment, the assets concerned are tested as to whether their carrying value exceeds their possible recoverable amount. Where an asset’s carrying value exceeds its recoverable amount, the difference is written off as another economic flow, except to the extent that the write-down can be debited to an asset revaluation reserve amount applicable to that class of asset.
It is deemed that in the event of the loss of an asset, the future economic benefits arising from the use of the asset will be replaced unless a specific decision to the contrary
Melbourne Recital Centre Notes to the Financial Statements for the Financial Year Ended 30 June 2016
13
has been made. The recoverable amount for most assets is measured at the higher of depreciated replacement cost and fair value less costs to sell. Recoverable amount for assets held primarily to generate net cash inflows is measured at the higher of the present value of future cash flows expected to be obtained from the asset and fair value less costs to sell.
Intangible assetsIntangible assets comprise software assets and are initially recognised at cost. Software has a finite useful life and therefore these externally purchased assets are subsequently carried at cost less accumulated amortisation and accumulated impairment losses. Costs incurred subsequent to initial acquisition are capitalised when it is expected that additional future economic benefits will flow to the Company.
Amortisation is calculated on a straight line basis over 4 years.
PrepaymentsOther non-financial assets include prepayments, which represent payments in advance of receipt of goods and services or that part of expenditure made in one accounting period covering a term extending beyond that period.
(k) LiabilitiesPayablesPayables consist predominately of accounts payable and other sundry liabilities. Accounts payable represent liabilities for goods and services provided to the Company prior to the end of the financial year that are unpaid, and arise when the Company becomes obliged to make future payments in respect of the purchase of those goods and services.
(l) ProvisionsProvisions are recognised when the Company has a present obligation, the future sacrifice of economic benefits is probable, and the amount of the provision can be measured reliably.
The amount recognised as a provision is the best estimate of the consideration required to settle the present obligation at the end of the reporting period, taking into account the risks and uncertainties surrounding the obligation. Where a provision is measured using the cash flows estimated to settle the present obligation, its carrying amount is the present value of those cash flows.
Employee benefitsProvision is made for benefits accruing to employees in respect of wages, salaries, annual and long service leave for services rendered to the reporting date.
Wages, salaries and annual leaveLiabilities for wages and salaries, including non-monetary benefits and annual leave which are expected to be settled within 12 months of the reporting period, are recognised in the provision for employee benefits. These liabilities are classified as current liabilities and measured at their nominal value.
Those liabilities that are not expected to be settled within 12 months are recognised in the provision for employee benefits as non-current liabilities, measured at present value of the amounts expected to be paid when liabilities are settled using the remuneration rate expected to apply at the time of the settlement.
Long service leaveLiability for long service leave (LSL) is recognised in the provision for employee benefits.
Current liability — unconditional LSL is disclosed in the notes to the financial statements as a current liability even where the Company does not expect to settle the liability within 12 months because it will not have the unconditional right to defer the settlement of the entitlement should an employee take leave within 12 months.
The components of this current LSL liability are measured at:
— Present value — component that the Company does not expect to settle within 12 months; and
— Nominal value — component that the Company expects to settle within 12 months.
Non-current liability — conditional LSL is disclosed as a non-current liability. There is an unconditional right to defer the settlement of the entitlement until the employee has completed the requisite years of service.
This non-current LSL liability is measured at present value. Gain or loss following revaluation of the present value of non-current LSL liability due to changes in bond interest rates is recognised in the operating statement.
Employee benefits on-costsEmployee benefits on-costs (payroll tax, workers compensation, superannuation, annual leave and LSL accrued while on LSL taken in service) are recognised separately from provision for employee benefits.
Melbourne Recital Centre Notes to the Financial Statements
for the Financial Year Ended 30 June 2016
14
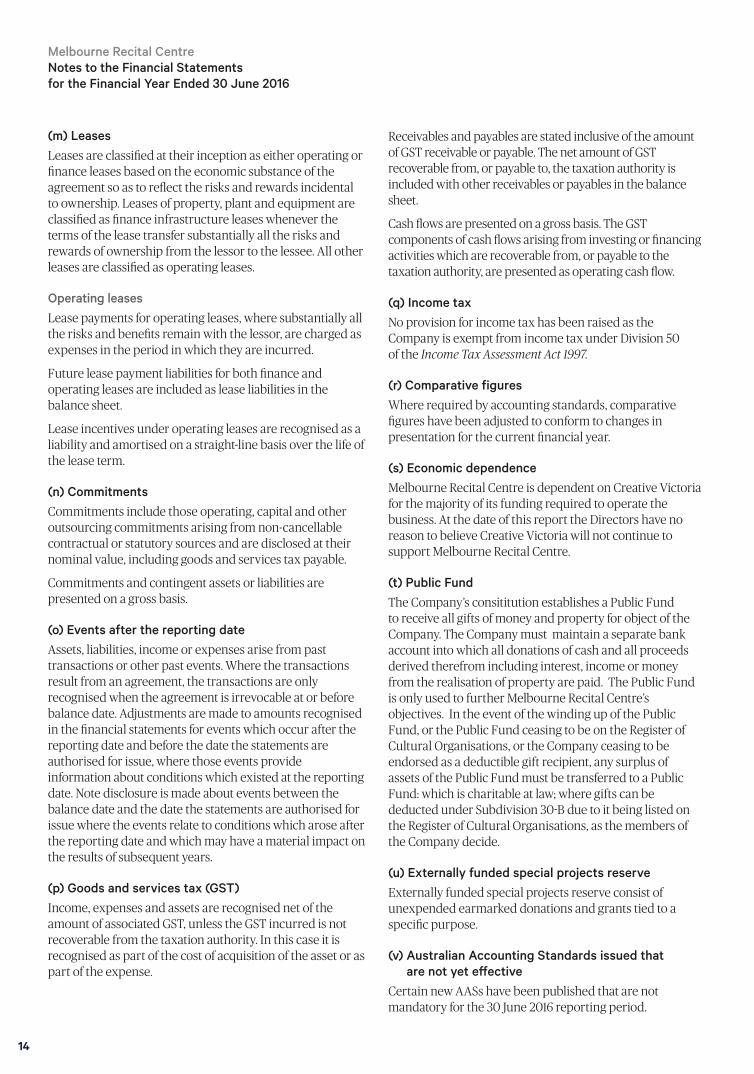
(m) LeasesLeases are classified at their inception as either operating or finance leases based on the economic substance of the agreement so as to reflect the risks and rewards incidental to ownership. Leases of property, plant and equipment are classified as finance infrastructure leases whenever the terms of the lease transfer substantially all the risks and rewards of ownership from the lessor to the lessee. All other leases are classified as operating leases.
Operating leasesLease payments for operating leases, where substantially all the risks and benefits remain with the lessor, are charged as expenses in the period in which they are incurred.
Future lease payment liabilities for both finance and operating leases are included as lease liabilities in the balance sheet.
Lease incentives under operating leases are recognised as a liability and amortised on a straight-line basis over the life of the lease term.
(n) CommitmentsCommitments include those operating, capital and other outsourcing commitments arising from non-cancellable contractual or statutory sources and are disclosed at their nominal value, including goods and services tax payable.
Commitments and contingent assets or liabilities are presented on a gross basis.
(o) Events after the reporting dateAssets, liabilities, income or expenses arise from past transactions or other past events. Where the transactions result from an agreement, the transactions are only recognised when the agreement is irrevocable at or before balance date. Adjustments are made to amounts recognised in the financial statements for events which occur after the reporting date and before the date the statements are authorised for issue, where those events provide information about conditions which existed at the reporting date. Note disclosure is made about events between the balance date and the date the statements are authorised for issue where the events relate to conditions which arose after the reporting date and which may have a material impact on the results of subsequent years.
(p) Goods and services tax (GST)Income, expenses and assets are recognised net of the amount of associated GST, unless the GST incurred is not recoverable from the taxation authority. In this case it is recognised as part of the cost of acquisition of the asset or as part of the expense.
Receivables and payables are stated inclusive of the amount of GST receivable or payable. The net amount of GST recoverable from, or payable to, the taxation authority is included with other receivables or payables in the balance sheet.
Cash flows are presented on a gross basis. The GST components of cash flows arising from investing or financing activities which are recoverable from, or payable to the taxation authority, are presented as operating cash flow.
(q) Income taxNo provision for income tax has been raised as the Company is exempt from income tax under Division 50 of the Income Tax Assessment Act 1997.
(r) Comparative figuresWhere required by accounting standards, comparative figures have been adjusted to conform to changes in presentation for the current financial year.
(s) Economic dependenceMelbourne Recital Centre is dependent on Creative Victoria for the majority of its funding required to operate the business. At the date of this report the Directors have no reason to believe Creative Victoria will not continue to support Melbourne Recital Centre.
(t) Public FundThe Company’s consititution establishes a Public Fund to receive all gifts of money and property for object of the Company. The Company must maintain a separate bank account into which all donations of cash and all proceeds derived therefrom including interest, income or money from the realisation of property are paid. The Public Fund is only used to further Melbourne Recital Centre’s objectives. In the event of the winding up of the Public Fund, or the Public Fund ceasing to be on the Register of Cultural Organisations, or the Company ceasing to be endorsed as a deductible gift recipient, any surplus of assets of the Public Fund must be transferred to a Public Fund: which is charitable at law; where gifts can be deducted under Subdivision 30-B due to it being listed on the Register of Cultural Organisations, as the members of the Company decide.
(u) Externally funded special projects reserveExternally funded special projects reserve consist of unexpended earmarked donations and grants tied to a specific purpose.
(v) Australian Accounting Standards issued that are not yet effective
Certain new AASs have been published that are not mandatory for the 30 June 2016 reporting period.
Melbourne Recital Centre Notes to the Financial Statements for the Financial Year Ended 30 June 2016
15
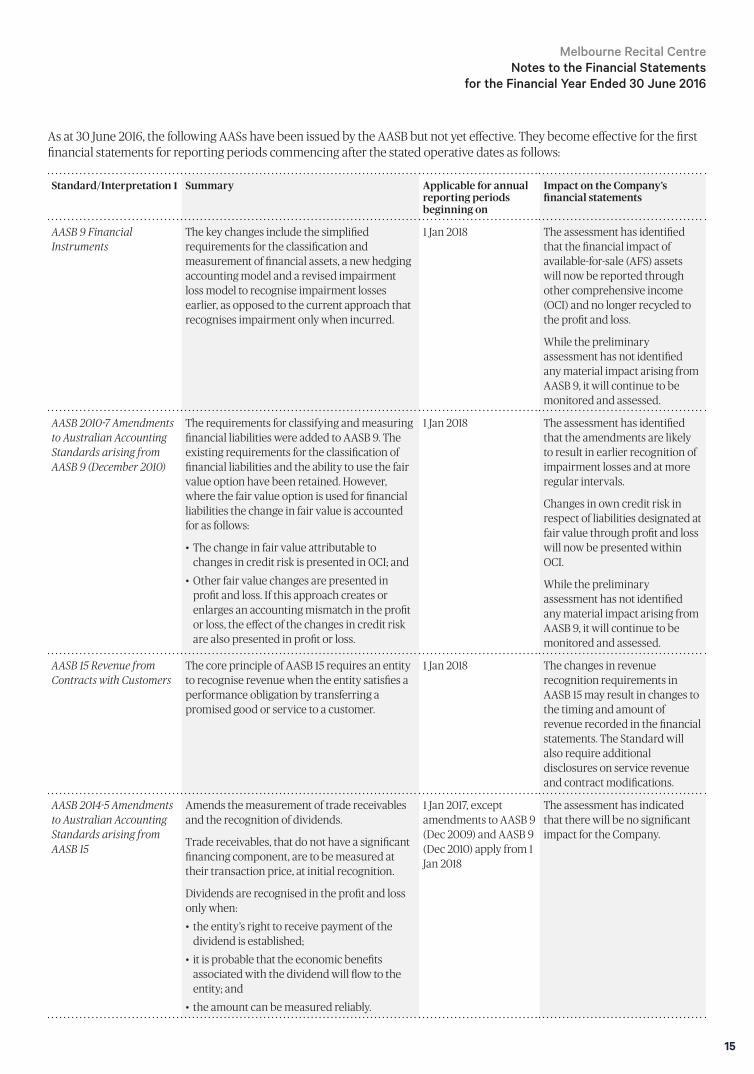
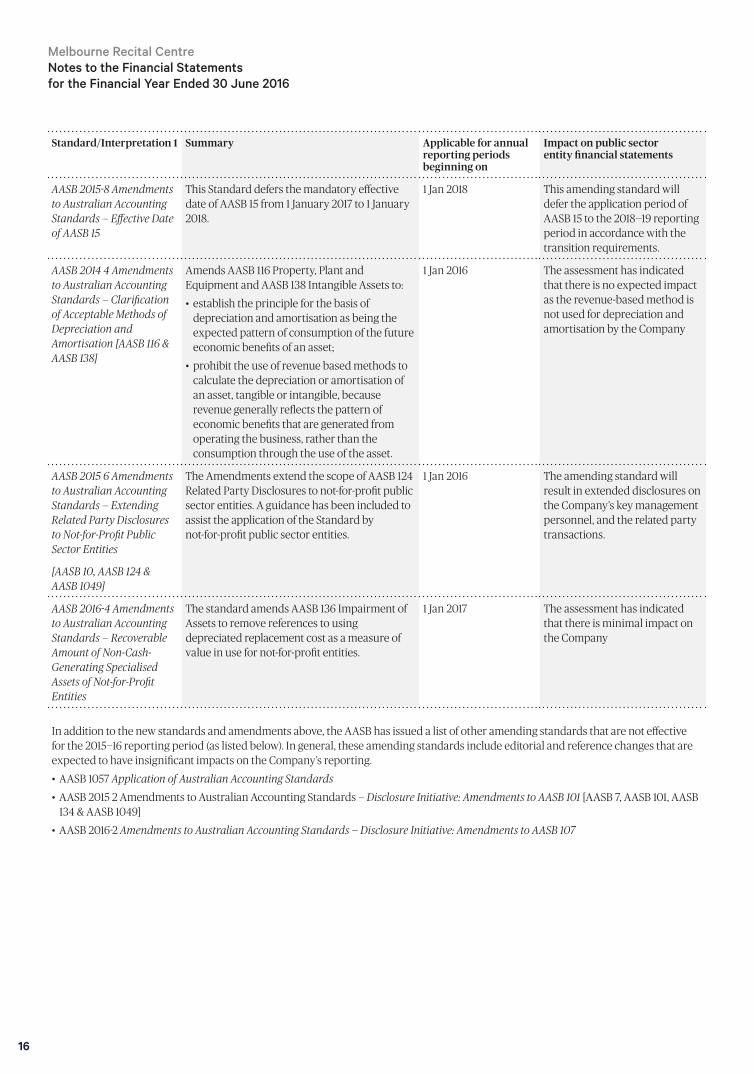
As at 30 June 2016, the following AASs have been issued by the AASB but not yet effective. They become effective for the first financial statements for reporting periods commencing after the stated operative dates as follows:
Standard/Interpretation 1 Summary Applicable for annual reporting periods beginning on
Impact on the Company’s financial statements
AASB 9 Financial Instruments
The key changes include the simplified requirements for the classification and measurement of financial assets, a new hedging accounting model and a revised impairment loss model to recognise impairment losses earlier, as opposed to the current approach that recognises impairment only when incurred.
1 Jan 2018 The assessment has identified that the financial impact of available-for-sale (AFS) assets will now be reported through other comprehensive income (OCI) and no longer recycled to the profit and loss.
While the preliminary assessment has not identified any material impact arising from AASB 9, it will continue to be monitored and assessed.
AASB 2010-7 Amendments to Australian Accounting Standards arising from AASB 9 (December 2010)
The requirements for classifying and measuring financial liabilities were added to AASB 9. The existing requirements for the classification of financial liabilities and the ability to use the fair value option have been retained. However, where the fair value option is used for financial liabilities the change in fair value is accounted for as follows:
• The change in fair value attributable to changes in credit risk is presented in OCI; and
• Other fair value changes are presented in profit and loss. If this approach creates or enlarges an accounting mismatch in the profit or loss, the effect of the changes in credit risk are also presented in profit or loss.
1 Jan 2018 The assessment has identified that the amendments are likely to result in earlier recognition of impairment losses and at more regular intervals.
Changes in own credit risk in respect of liabilities designated at fair value through profit and loss will now be presented within OCI.
While the preliminary assessment has not identified any material impact arising from AASB 9, it will continue to be monitored and assessed.
AASB 15 Revenue from Contracts with Customers
The core principle of AASB 15 requires an entity to recognise revenue when the entity satisfies a performance obligation by transferring a promised good or service to a customer.
1 Jan 2018 The changes in revenue recognition requirements in AASB 15 may result in changes to the timing and amount of revenue recorded in the financial statements. The Standard will also require additional disclosures on service revenue and contract modifications.
AASB 2014-5 Amendments to Australian Accounting Standards arising from AASB 15
Amends the measurement of trade receivables and the recognition of dividends.
Trade receivables, that do not have a significant financing component, are to be measured at their transaction price, at initial recognition.
Dividends are recognised in the profit and loss only when:
• the entity’s right to receive payment of the dividend is established;
• it is probable that the economic benefits associated with the dividend will flow to the entity; and
• the amount can be measured reliably.
1 Jan 2017, except amendments to AASB 9 (Dec 2009) and AASB 9 (Dec 2010) apply from 1 Jan 2018
The assessment has indicated that there will be no significant impact for the Company.
Melbourne Recital Centre Notes to the Financial Statements
for the Financial Year Ended 30 June 2016
16
Standard/Interpretation 1 Summary Applicable for annual reporting periods beginning on
Impact on public sector entity financial statements
AASB 2015-8 Amendments to Australian Accounting Standards — Effective Date of AASB 15
This Standard defers the mandatory effective date of AASB 15 from 1 January 2017 to 1 January 2018.
1 Jan 2018 This amending standard will defer the application period of AASB 15 to the 2018—19 reporting period in accordance with the transition requirements.
AASB 2014 4 Amendments to Australian Accounting Standards — Clarification of Acceptable Methods of Depreciation and Amortisation [AASB 116 & AASB 138]
Amends AASB 116 Property, Plant and Equipment and AASB 138 Intangible Assets to:
• establish the principle for the basis of depreciation and amortisation as being the expected pattern of consumption of the future economic benefits of an asset;
• prohibit the use of revenue based methods to calculate the depreciation or amortisation of an asset, tangible or intangible, because revenue generally reflects the pattern of economic benefits that are generated from operating the business, rather than the consumption through the use of the asset.
1 Jan 2016 The assessment has indicated that there is no expected impact as the revenue-based method is not used for depreciation and amortisation by the Company
AASB 2015 6 Amendments to Australian Accounting Standards — Extending Related Party Disclosures to Not-for-Profit Public Sector Entities
[AASB 10, AASB 124 & AASB 1049]
The Amendments extend the scope of AASB 124 Related Party Disclosures to not-for-profit public sector entities. A guidance has been included to assist the application of the Standard by not-for-profit public sector entities.
1 Jan 2016 The amending standard will result in extended disclosures on the Company’s key management personnel, and the related party transactions.
AASB 2016-4 Amendments to Australian Accounting Standards — Recoverable Amount of Non-Cash-Generating Specialised Assets of Not-for-Profit Entities
The standard amends AASB 136 Impairment of Assets to remove references to using depreciated replacement cost as a measure of value in use for not-for-profit entities.
1 Jan 2017 The assessment has indicated that there is minimal impact on the Company
In addition to the new standards and amendments above, the AASB has issued a list of other amending standards that are not effective for the 2015—16 reporting period (as listed below). In general, these amending standards include editorial and reference changes that are expected to have insignificant impacts on the Company’s reporting.
• AASB 1057 Application of Australian Accounting Standards
• AASB 2015 2 Amendments to Australian Accounting Standards — Disclosure Initiative: Amendments to AASB 101 [AASB 7, AASB 101, AASB 134 & AASB 1049]
• AASB 2016-2 Amendments to Australian Accounting Standards — Disclosure Initiative: Amendments to AASB 107
Melbourne Recital Centre Notes to the Financial Statements for the Financial Year Ended 30 June 2016
17
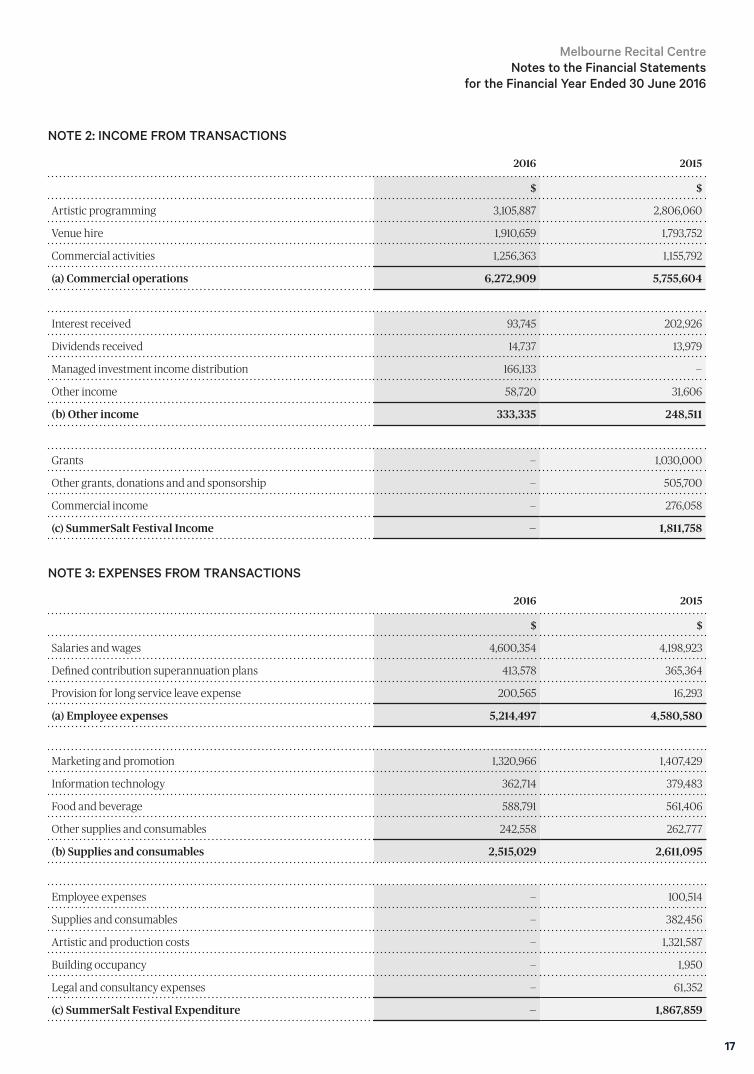
NOTE 2: INCOME FROM TRANSACTIONS
2016 2015
$ $
Artistic programming 3,105,887 2,806,060
Venue hire 1,910,659 1,793,752
Commercial activities 1,256,363 1,155,792
(a) Commercial operations 6,272,909 5,755,604
Interest received 93,745 202,926
Dividends received 14,737 13,979
Managed investment income distribution 166,133 —
Other income 58,720 31,606
(b) Other income 333,335 248,511
Grants — 1,030,000
Other grants, donations and and sponsorship — 505,700
Commercial income — 276,058
(c) SummerSalt Festival Income — 1,811,758
NOTE 3: EXPENSES FROM TRANSACTIONS
2016 2015
$ $
Salaries and wages 4,600,354 4,198,923
Defined contribution superannuation plans 413,578 365,364
Provision for long service leave expense 200,565 16,293
(a) Employee expenses 5,214,497 4,580,580
Marketing and promotion 1,320,966 1,407,429
Information technology 362,714 379,483
Food and beverage 588,791 561,406
Other supplies and consumables 242,558 262,777
(b) Supplies and consumables 2,515,029 2,611,095
Employee expenses — 100,514
Supplies and consumables — 382,456
Artistic and production costs — 1,321,587
Building occupancy — 1,950
Legal and consultancy expenses — 61,352
(c) SummerSalt Festival Expenditure — 1,867,859
Melbourne Recital Centre Notes to the Financial Statements
for the Financial Year Ended 30 June 2016
18
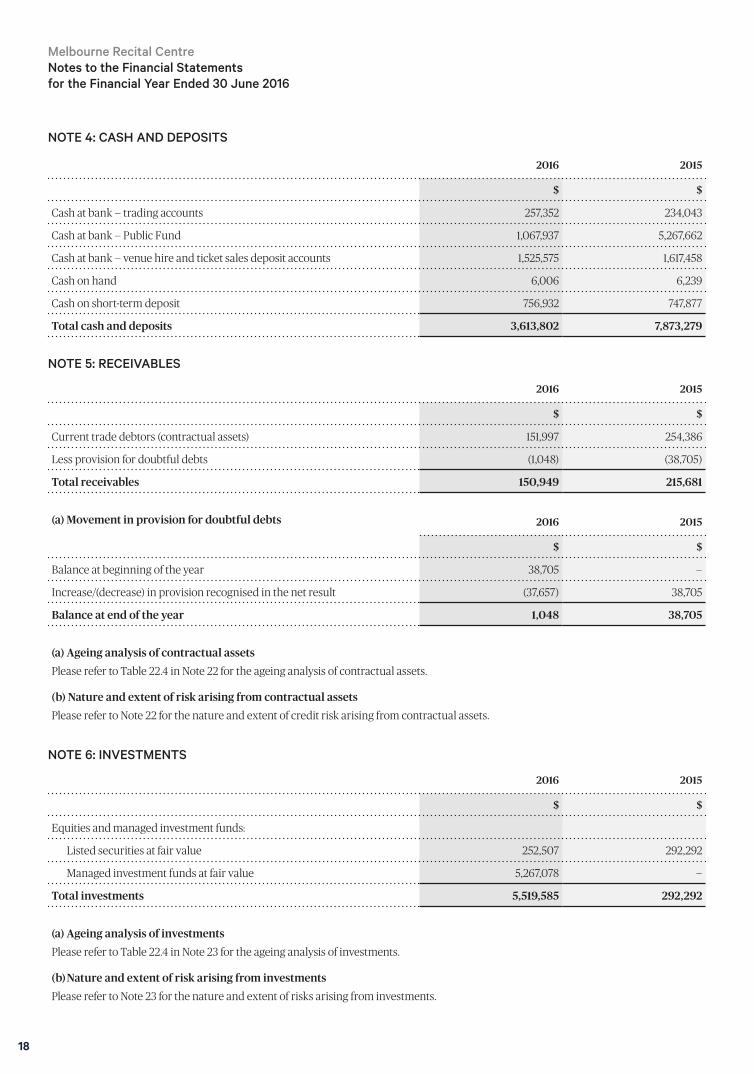
NOTE 4: CASH AND DEPOSITS
2016 2015
$ $
Cash at bank — trading accounts 257,352 234,043
Cash at bank — Public Fund 1,067,937 5,267,662
Cash at bank — venue hire and ticket sales deposit accounts 1,525,575 1,617,458
Cash on hand 6,006 6,239
Cash on short-term deposit 756,932 747,877
Total cash and deposits 3,613,802 7,873,279
NOTE 5: RECEIVABLES
2016 2015
$ $
Current trade debtors (contractual assets) 151,997 254,386
Less provision for doubtful debts (1,048) (38,705)
Total receivables 150,949 215,681
(a) Movement in provision for doubtful debts 2016 2015
$ $
Balance at beginning of the year 38,705 —
Increase/(decrease) in provision recognised in the net result (37,657) 38,705
Balance at end of the year 1,048 38,705
(a) Ageing analysis of contractual assetsPlease refer to Table 22.4 in Note 22 for the ageing analysis of contractual assets.
(b) Nature and extent of risk arising from contractual assetsPlease refer to Note 22 for the nature and extent of credit risk arising from contractual assets.
NOTE 6: INVESTMENTS
2016 2015
$ $
Equities and managed investment funds:
Listed securities at fair value 252,507 292,292
Managed investment funds at fair value 5,267,078 —
Total investments 5,519,585 292,292
(a) Ageing analysis of investmentsPlease refer to Table 22.4 in Note 23 for the ageing analysis of investments.
(b) Nature and extent of risk arising from investmentsPlease refer to Note 23 for the nature and extent of risks arising from investments.
Melbourne Recital Centre Notes to the Financial Statements for the Financial Year Ended 30 June 2016
19
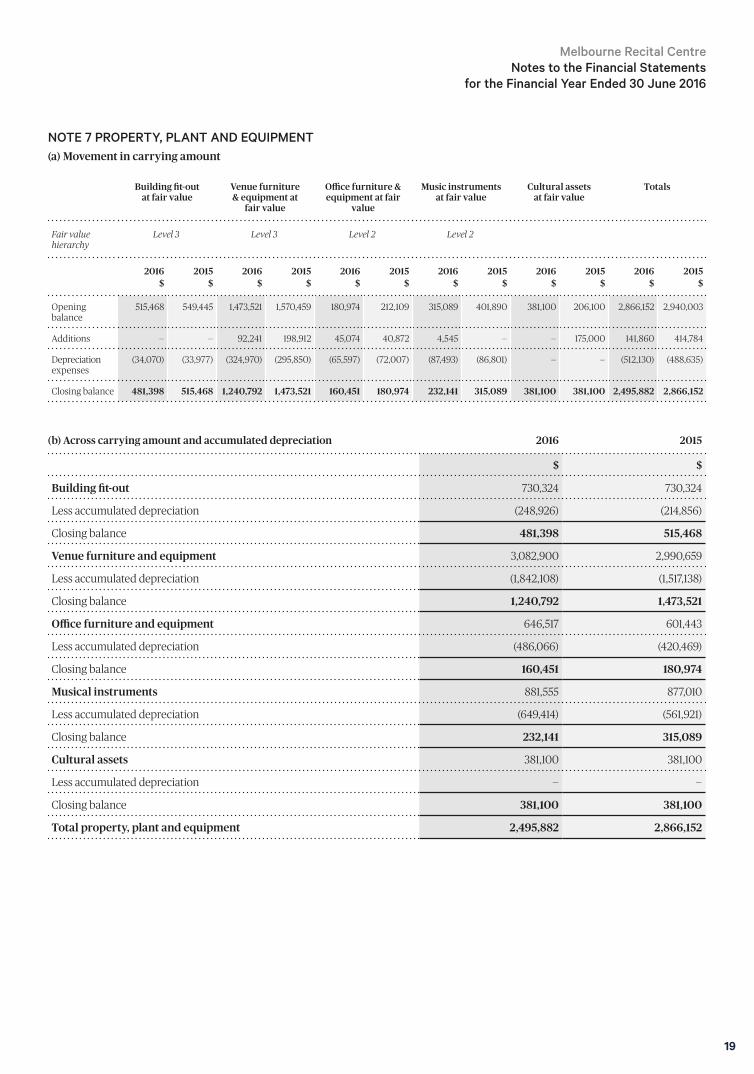
NOTE 7 PROPERTY, PLANT AND EQUIPMENT(a) Movement in carrying amount
Building fit-out at fair value
Venue furniture & equipment at
fair value
Office furniture & equipment at fair
value
Music instruments at fair value
Cultural assets at fair value
Totals
Fair value hierarchy
Level 3 Level 3 Level 2 Level 2
2016 $
2015 $
2016 $
2015 $
2016 $
2015 $
2016 $
2015 $
2016 $
2015 $
2016 $
2015 $
Opening balance
515,468 549,445 1,473,521 1,570,459 180,974 212,109 315,089 401,890 381,100 206,100 2,866,152 2,940,003
Additions — — 92,241 198,912 45,074 40,872 4,545 — — 175,000 141,860 414,784
Depreciation expenses
(34,070) (33,977) (324,970) (295,850) (65,597) (72,007) (87,493) (86,801) — — (512,130) (488,635)
Closing balance 481,398 515,468 1,240,792 1,473,521 160,451 180,974 232,141 315,089 381,100 381,100 2,495,882 2,866,152
(b) Across carrying amount and accumulated depreciation 2016 2015
$ $
Building fit-out 730,324 730,324
Less accumulated depreciation (248,926) (214,856)
Closing balance 481,398 515,468
Venue furniture and equipment 3,082,900 2,990,659
Less accumulated depreciation (1,842,108) (1,517,138)
Closing balance 1,240,792 1,473,521
Office furniture and equipment 646,517 601,443
Less accumulated depreciation (486,066) (420,469)
Closing balance 160,451 180,974
Musical instruments 881,555 877,010
Less accumulated depreciation (649,414) (561,921)
Closing balance 232,141 315,089
Cultural assets 381,100 381,100
Less accumulated depreciation — —
Closing balance 381,100 381,100
Total property, plant and equipment 2,495,882 2,866,152
Melbourne Recital Centre Notes to the Financial Statements
for the Financial Year Ended 30 June 2016
20
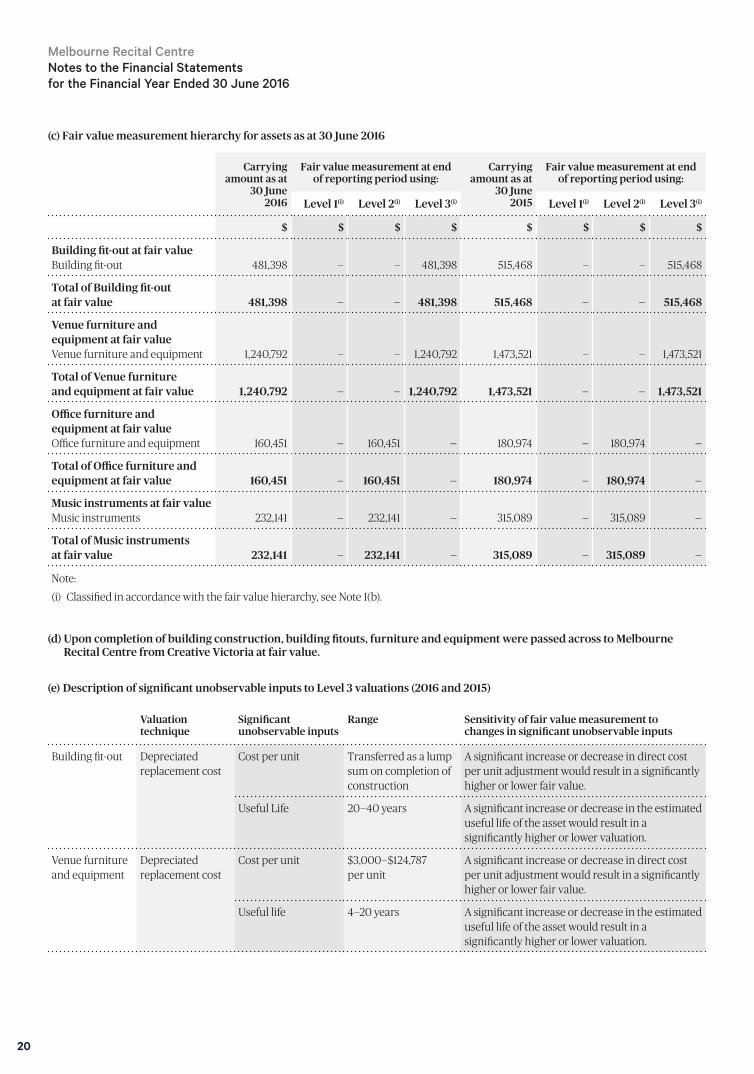
(c) Fair value measurement hierarchy for assets as at 30 June 2016
Carrying amount as at
30 June 2016
Fair value measurement at end of reporting period using:
Carrying amount as at
30 June 2015
Fair value measurement at end of reporting period using:
Level 1(i) Level 2(i) Level 3(i) Level 1(i) Level 2(i) Level 3(i)
$ $ $ $ $ $ $ $
Building fit-out at fair value Building fit-out
481,398
—
—
481,398
515,468
—
—
515,468
Total of Building fit-out at fair value 481,398 — — 481,398 515,468 — — 515,468
Venue furniture and equipment at fair value Venue furniture and equipment
1,240,792
—
—
1,240,792
1,473,521
—
—
1,473,521
Total of Venue furniture and equipment at fair value 1,240,792 — — 1,240,792 1,473,521 — — 1,473,521
Office furniture and equipment at fair value Office furniture and equipment
160,451
—
160,451
—
180,974
—
180,974
—
Total of Office furniture and equipment at fair value 160,451 — 160,451 — 180,974 — 180,974 —
Music instruments at fair value Music instruments
232,141
—
232,141
—
315,089
—
315,089
—
Total of Music instruments at fair value 232,141 — 232,141 — 315,089 — 315,089 —
Note:
(i) Classified in accordance with the fair value hierarchy, see Note 1(b).
(d) Upon completion of building construction, building fitouts, furniture and equipment were passed across to Melbourne Recital Centre from Creative Victoria at fair value.
(e) Description of significant unobservable inputs to Level 3 valuations (2016 and 2015)
Valuation technique
Significant unobservable inputs
Range Sensitivity of fair value measurement to changes in significant unobservable inputs
Building fit-out Depreciated replacement cost
Cost per unit Transferred as a lump sum on completion of construction
A significant increase or decrease in direct cost per unit adjustment would result in a significantly higher or lower fair value.
Useful Life 20 —40 years A significant increase or decrease in the estimated useful life of the asset would result in a significantly higher or lower valuation.
Venue furniture and equipment
Depreciated replacement cost
Cost per unit $3,000—$124,787 per unit
A significant increase or decrease in direct cost per unit adjustment would result in a significantly higher or lower fair value.
Useful life 4—20 years A significant increase or decrease in the estimated useful life of the asset would result in a significantly higher or lower valuation.
Melbourne Recital Centre Notes to the Financial Statements for the Financial Year Ended 30 June 2016
21
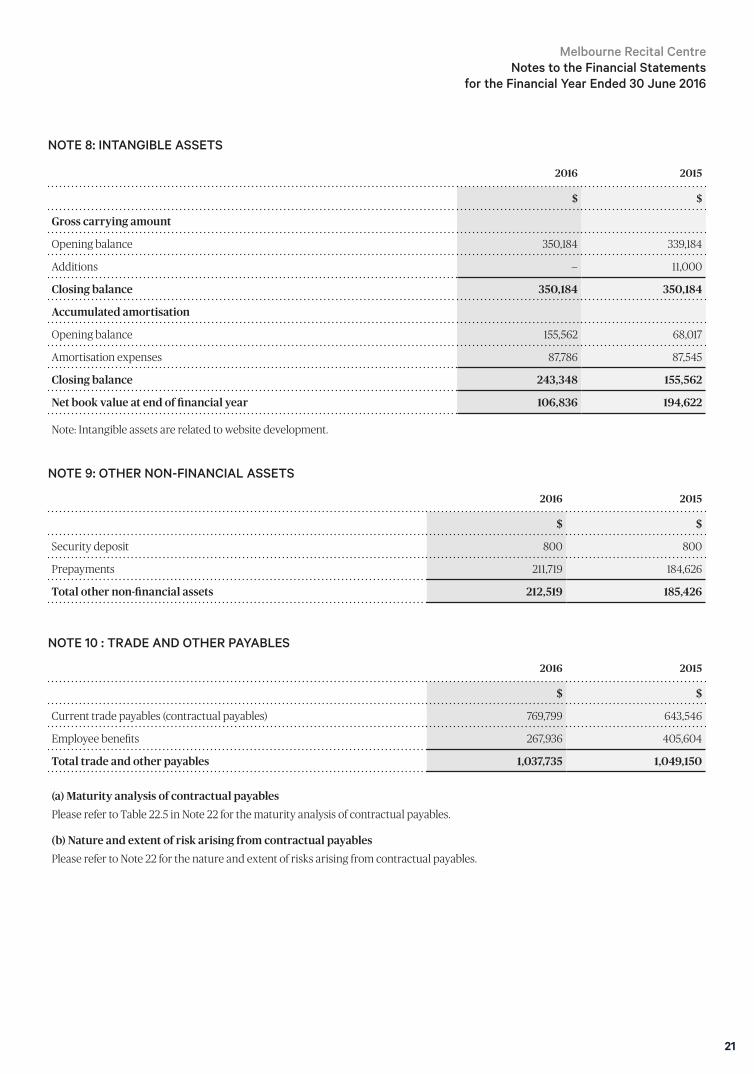
NOTE 8: INTANGIBLE ASSETS
2016 2015
$ $
Gross carrying amount
Opening balance 350,184 339,184
Additions — 11,000
Closing balance 350,184 350,184
Accumulated amortisation
Opening balance 155,562 68,017
Amortisation expenses 87,786 87,545
Closing balance 243,348 155,562
Net book value at end of financial year 106,836 194,622
Note: Intangible assets are related to website development.
NOTE 9: OTHER NON-FINANCIAL ASSETS
2016 2015
$ $
Security deposit 800 800
Prepayments 211,719 184,626
Total other non-financial assets 212,519 185,426
NOTE 10 : TRADE AND OTHER PAYABLES
2016 2015
$ $
Current trade payables (contractual payables) 769,799 643,546
Employee benefits 267,936 405,604
Total trade and other payables 1,037,735 1,049,150
(a) Maturity analysis of contractual payables Please refer to Table 22.5 in Note 22 for the maturity analysis of contractual payables.
(b) Nature and extent of risk arising from contractual payables Please refer to Note 22 for the nature and extent of risks arising from contractual payables.
Melbourne Recital Centre Notes to the Financial Statements
for the Financial Year Ended 30 June 2016
22
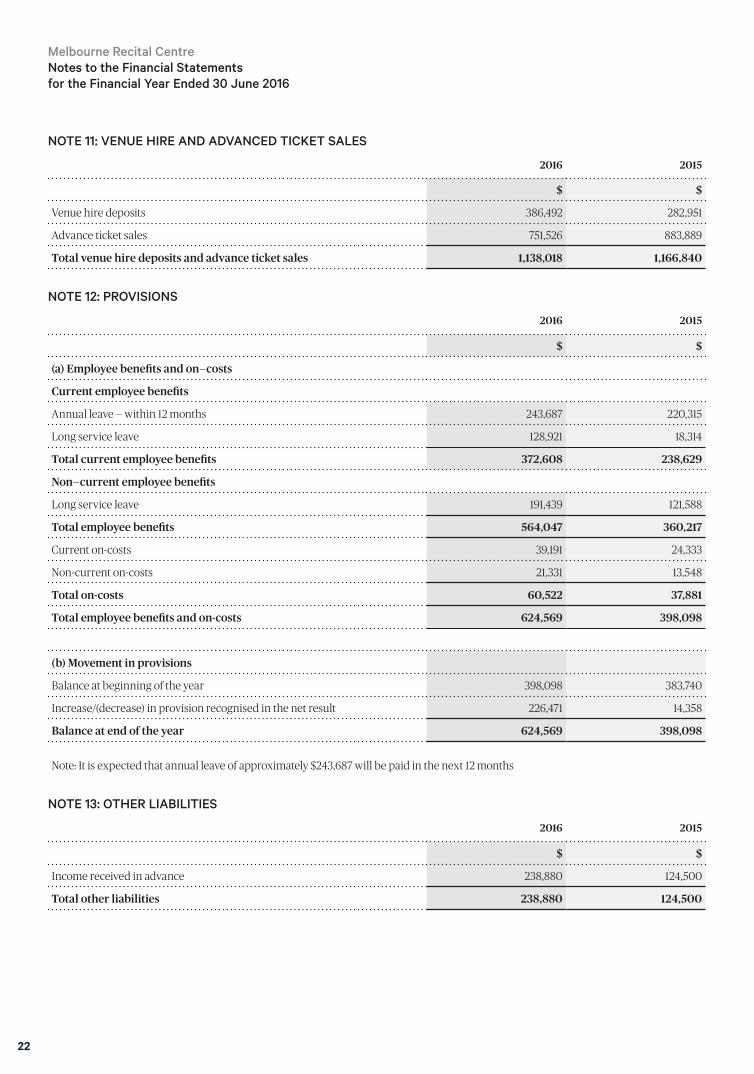
NOTE 12: PROVISIONS
2016 2015
$ $
(a) Employee benefits and on—costs
Current employee benefits
Annual leave — within 12 months 243,687 220,315
Long service leave 128,921 18,314
Total current employee benefits 372,608 238,629
Non—current employee benefits
Long service leave 191,439 121,588
Total employee benefits 564,047 360,217
Current on-costs 39,191 24,333
Non-current on-costs 21,331 13,548
Total on-costs 60,522 37,881
Total employee benefits and on-costs 624,569 398,098
(b) Movement in provisions
Balance at beginning of the year 398,098 383,740
Increase/(decrease) in provision recognised in the net result 226,471 14,358
Balance at end of the year 624,569 398,098
Note: It is expected that annual leave of approximately $243,687 will be paid in the next 12 months
NOTE 13: OTHER LIABILITIES
2016 2015
$ $
Income received in advance 238,880 124,500
Total other liabilities 238,880 124,500
Melbourne Recital Centre Notes to the Financial Statements for the Financial Year Ended 30 June 2016
NOTE 11: VENUE HIRE AND ADVANCED TICKET SALES
2016 2015
$ $
Venue hire deposits 386,492 282,951
Advance ticket sales 751,526 883,889
Total venue hire deposits and advance ticket sales 1,138,018 1,166,840
23
Melbourne Recital Centre Notes to the Financial Statements
for the Financial Year Ended 30 June 2016
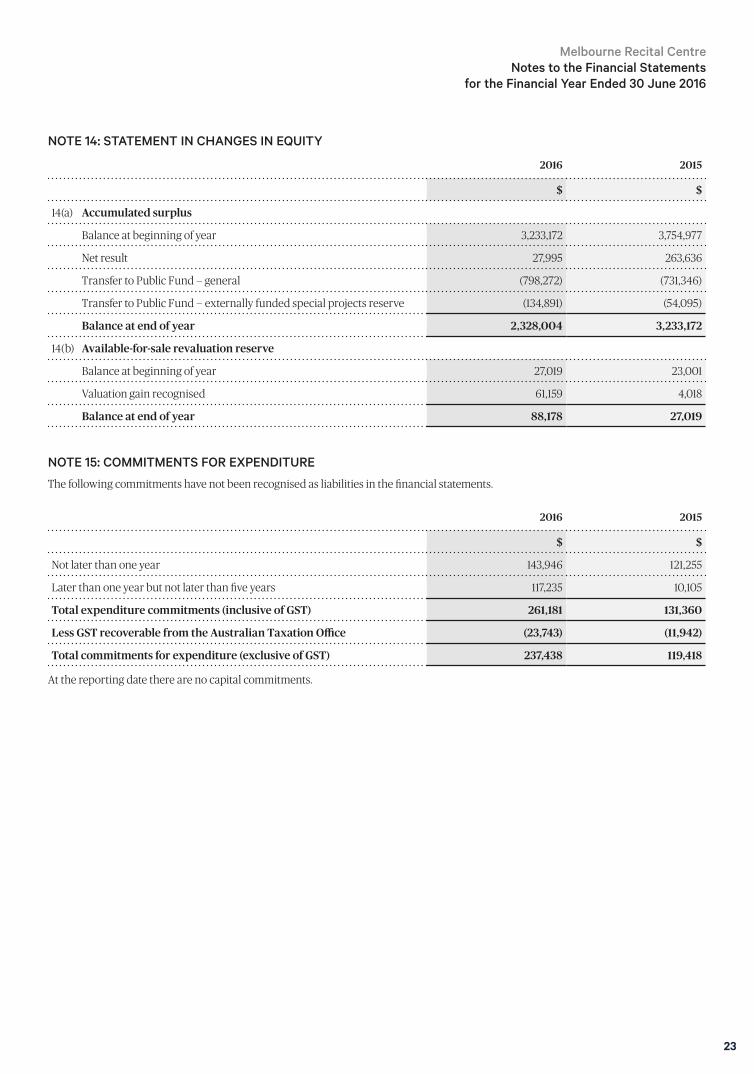
NOTE 14: STATEMENT IN CHANGES IN EQUITY
2016 2015
$ $
14(a) Accumulated surplus
Balance at beginning of year 3,233,172 3,754,977
Net result 27,995 263,636
Transfer to Public Fund — general (798,272) (731,346)
Transfer to Public Fund — externally funded special projects reserve (134,891) (54,095)
Balance at end of year 2,328,004 3,233,172
14(b) Available-for-sale revaluation reserve
Balance at beginning of year 27,019 23,001
Valuation gain recognised 61,159 4,018
Balance at end of year 88,178 27,019
NOTE 15: COMMITMENTS FOR EXPENDITURE
The following commitments have not been recognised as liabilities in the financial statements.
2016 2015
$ $
Not later than one year 143,946 121,255
Later than one year but not later than five years 117,235 10,105
Total expenditure commitments (inclusive of GST) 261,181 131,360
Less GST recoverable from the Australian Taxation Office (23,743) (11,942)
Total commitments for expenditure (exclusive of GST) 237,438 119,418
At the reporting date there are no capital commitments.
24
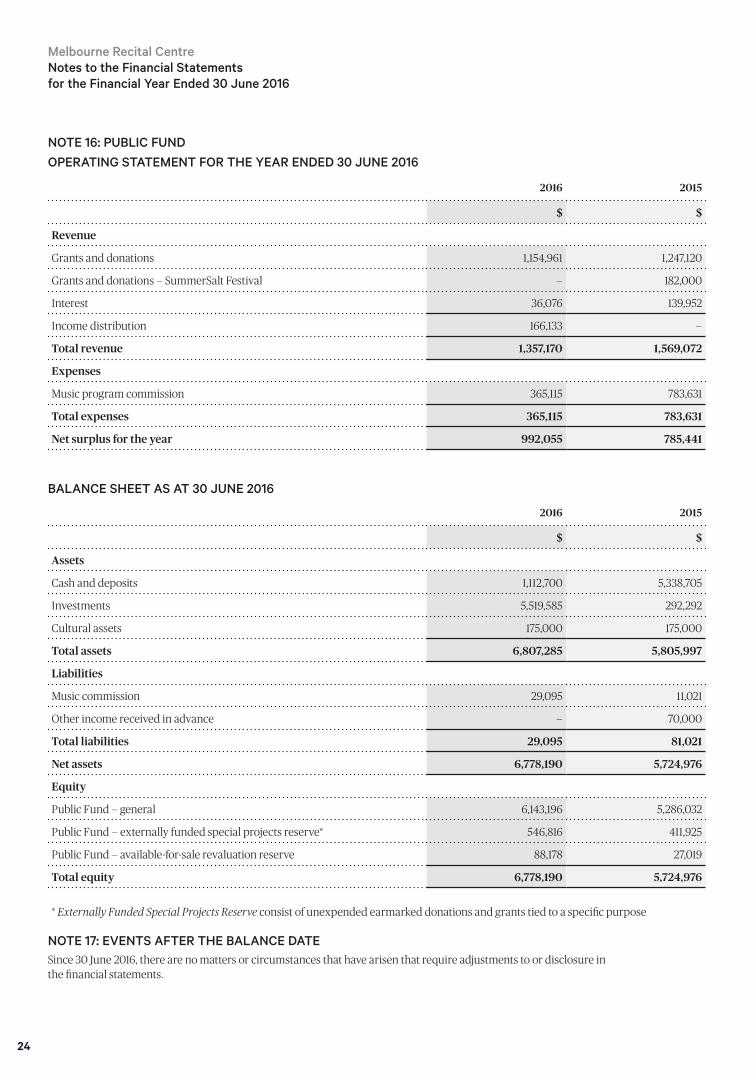
NOTE 16: PUBLIC FUND OPERATING STATEMENT FOR THE YEAR ENDED 30 JUNE 2016
2016 2015
$ $
Revenue
Grants and donations 1,154,961 1,247,120
Grants and donations — SummerSalt Festival — 182,000
Interest 36,076 139,952
Income distribution 166,133 —
Total revenue 1,357,170 1,569,072
Expenses
Music program commission 365,115 783,631
Total expenses 365,115 783,631
Net surplus for the year 992,055 785,441
BALANCE SHEET AS AT 30 JUNE 2016
2016 2015
$ $
Assets
Cash and deposits 1,112,700 5,338,705
Investments 5,519,585 292,292
Cultural assets 175,000 175,000
Total assets 6,807,285 5,805,997
Liabilities
Music commission 29,095 11,021
Other income received in advance — 70,000
Total liabilities 29,095 81,021
Net assets 6,778,190 5,724,976
Equity
Public Fund — general 6,143,196 5,286,032
Public Fund — externally funded special projects reserve* 546,816 411,925
Public Fund — available-for-sale revaluation reserve 88,178 27,019
Total equity 6,778,190 5,724,976
* Externally Funded Special Projects Reserve consist of unexpended earmarked donations and grants tied to a specific purpose
NOTE 17: EVENTS AFTER THE BALANCE DATESince 30 June 2016, there are no matters or circumstances that have arisen that require adjustments to or disclosure in the financial statements.
Melbourne Recital Centre Notes to the Financial Statements for the Financial Year Ended 30 June 2016
25
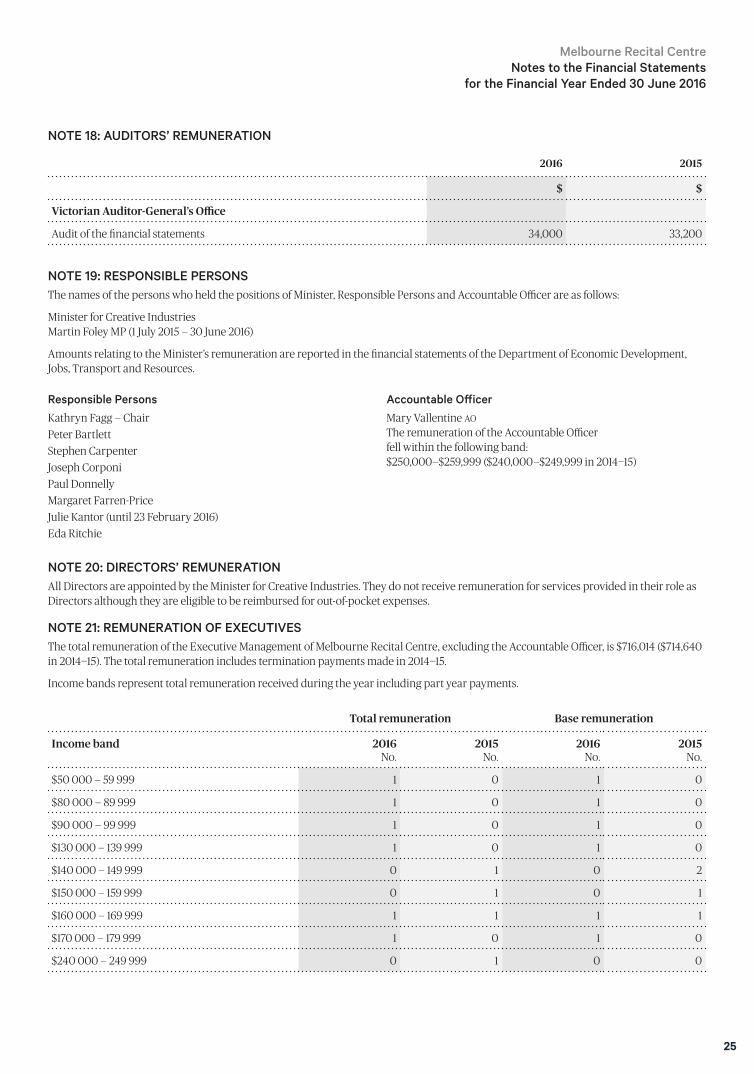
NOTE 18: AUDITORS’ REMUNERATION
2016 2015
$ $
Victorian Auditor-General’s Office
Audit of the financial statements 34,000 33,200
Melbourne Recital Centre Notes to the Financial Statements
for the Financial Year Ended 30 June 2016
NOTE 20: DIRECTORS’ REMUNERATIONAll Directors are appointed by the Minister for Creative Industries. They do not receive remuneration for services provided in their role as Directors although they are eligible to be reimbursed for out-of-pocket expenses.
NOTE 21: REMUNERATION OF EXECUTIVESThe total remuneration of the Executive Management of Melbourne Recital Centre, excluding the Accountable Officer, is $716,014 ($714,640 in 2014—15). The total remuneration includes termination payments made in 2014—15.
Income bands represent total remuneration received during the year including part year payments.
Total remuneration Base remuneration
Income band 2016 No.
2015 No.
2016 No.
2015 No.
$50 000 — 59 999 1 0 1 0
$80 000 — 89 999 1 0 1 0
$90 000 — 99 999 1 0 1 0
$130 000 — 139 999 1 0 1 0
$140 000 — 149 999 0 1 0 2
$150 000 — 159 999 0 1 0 1
$160 000 — 169 999 1 1 1 1
$170 000 — 179 999 1 0 1 0
$240 000 — 249 999 0 1 0 0
NOTE 19: RESPONSIBLE PERSONSThe names of the persons who held the positions of Minister, Responsible Persons and Accountable Officer are as follows:
Minister for Creative Industries Martin Foley MP (1 July 2015 — 30 June 2016)
Amounts relating to the Minister’s remuneration are reported in the financial statements of the Department of Economic Development, Jobs, Transport and Resources.
Responsible PersonsKathryn Fagg — ChairPeter BartlettStephen CarpenterJoseph CorponiPaul DonnellyMargaret Farren-PriceJulie Kantor (until 23 February 2016)Eda Ritchie
Accountable OfficerMary Vallentine AO The remuneration of the Accountable Officer fell within the following band: $250,000—$259,999 ($240,000—$249,999 in 2014—15)
26
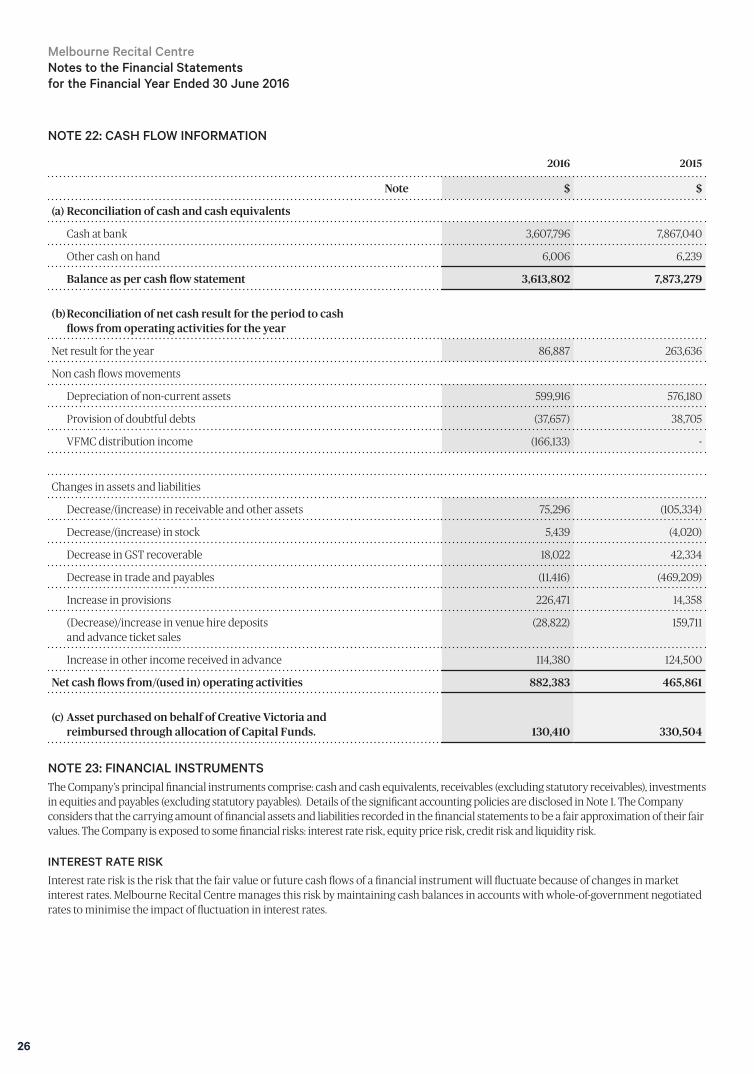
NOTE 22: CASH FLOW INFORMATION
2016 2015
Note $ $
(a) Reconciliation of cash and cash equivalents
Cash at bank 3,607,796 7,867,040
Other cash on hand 6,006 6,239
Balance as per cash flow statement 3,613,802 7,873,279
(b) Reconciliation of net cash result for the period to cash flows from operating activities for the year
Net result for the year 86,887 263,636
Non cash flows movements
Depreciation of non-current assets 599,916 576,180
Provision of doubtful debts (37,657) 38,705
VFMC distribution income (166,133) -
Changes in assets and liabilities
Decrease/(increase) in receivable and other assets 75,296 (105,334)
Decrease/(increase) in stock 5,439 (4,020)
Decrease in GST recoverable 18,022 42,334
Decrease in trade and payables (11,416) (469,209)
Increase in provisions 226,471 14,358
(Decrease)/increase in venue hire deposits and advance ticket sales
(28,822) 159,711
Increase in other income received in advance 114,380 124,500
Net cash flows from/(used in) operating activities 882,383 465,861
(c) Asset purchased on behalf of Creative Victoria and reimbursed through allocation of Capital Funds. 130,410 330,504
NOTE 23: FINANCIAL INSTRUMENTSThe Company’s principal financial instruments comprise: cash and cash equivalents, receivables (excluding statutory receivables), investments in equities and payables (excluding statutory payables). Details of the significant accounting policies are disclosed in Note 1. The Company considers that the carrying amount of financial assets and liabilities recorded in the financial statements to be a fair approximation of their fair values. The Company is exposed to some financial risks: interest rate risk, equity price risk, credit risk and liquidity risk.
INTEREST RATE RISKInterest rate risk is the risk that the fair value or future cash flows of a financial instrument will fluctuate because of changes in market interest rates. Melbourne Recital Centre manages this risk by maintaining cash balances in accounts with whole-of-government negotiated rates to minimise the impact of fluctuation in interest rates.
Melbourne Recital Centre Notes to the Financial Statements for the Financial Year Ended 30 June 2016
27
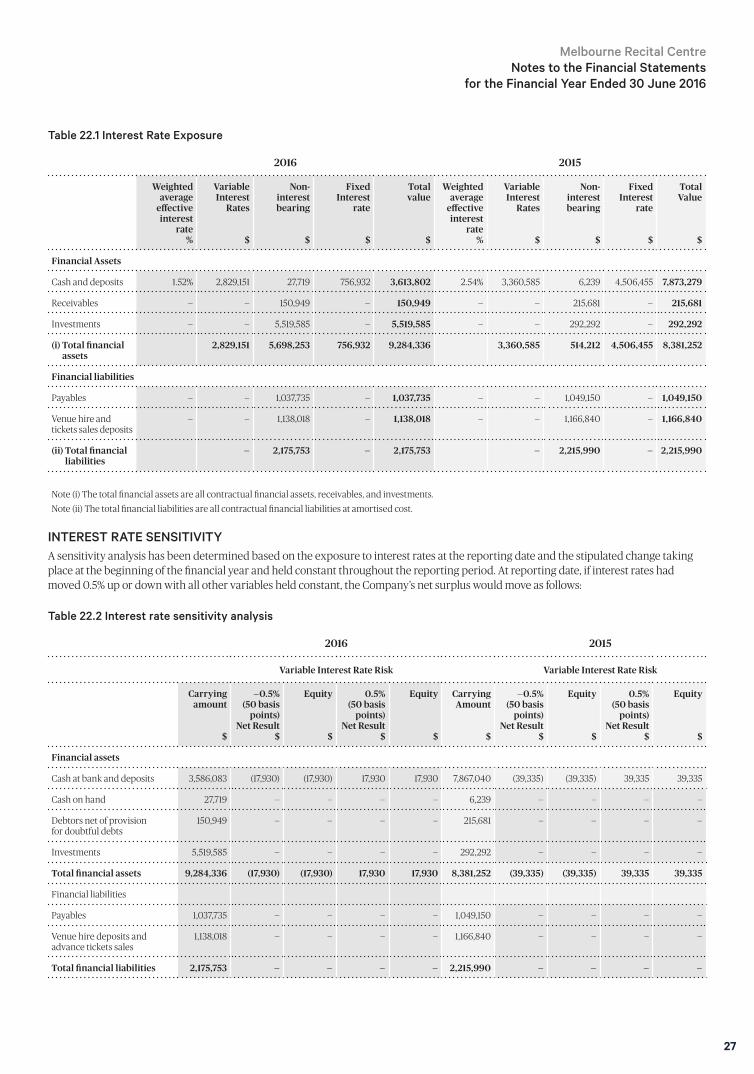
Table 22.1 Interest Rate Exposure
2016 2015
Weighted average
effective interest
rate %
Variable Interest
Rates
$
Non-interest bearing
$
Fixed Interest
rate
$
Total value
$
Weighted average
effective interest
rate %
Variable Interest
Rates
$
Non-interest bearing
$
Fixed Interest
rate
$
Total Value
$
Financial Assets
Cash and deposits 1.52% 2,829,151 27,719 756,932 3,613,802 2.54% 3,360,585 6,239 4,506,455 7,873,279
Receivables — — 150,949 — 150,949 — — 215,681 — 215,681
Investments — — 5,519,585 — 5,519,585 — — 292,292 — 292,292
(i) Total financial assets
2,829,151 5,698,253 756,932 9,284,336 3,360,585 514,212 4,506,455 8,381,252
Financial liabilities
Payables — — 1,037,735 — 1,037,735 — — 1,049,150 — 1,049,150
Venue hire and tickets sales deposits
— — 1,138,018 — 1,138,018 — — 1,166,840 — 1,166,840
(ii) Total financial liabilities
— 2,175,753 — 2,175,753 — 2,215,990 — 2,215,990
Note (i) The total financial assets are all contractual financial assets, receivables, and investments.Note (ii) The total financial liabilities are all contractual financial liabilities at amortised cost.
INTEREST RATE SENSITIVITYA sensitivity analysis has been determined based on the exposure to interest rates at the reporting date and the stipulated change taking place at the beginning of the financial year and held constant throughout the reporting period. At reporting date, if interest rates had moved 0.5% up or down with all other variables held constant, the Company’s net surplus would move as follows:
Table 22.2 Interest rate sensitivity analysis
2016 2015
Variable Interest Rate Risk Variable Interest Rate Risk
Carrying amount
$
—0.5% (50 basis
points) Net Result
$
Equity
$
0.5% (50 basis
points) Net Result
$
Equity
$
Carrying Amount
$
—0.5% (50 basis
points) Net Result
$
Equity
$
0.5% (50 basis
points) Net Result
$
Equity
$
Financial assets
Cash at bank and deposits 3,586,083 (17,930) (17,930) 17,930 17,930 7,867,040 (39,335) (39,335) 39,335 39,335
Cash on hand 27,719 — — — — 6,239 — — — —
Debtors net of provision for doubtful debts
150,949 — — — — 215,681 — — — —
Investments 5,519,585 — — — — 292,292 — — — —
Total financial assets 9,284,336 (17,930) (17,930) 17,930 17,930 8,381,252 (39,335) (39,335) 39,335 39,335
Financial liabilities
Payables 1,037,735 — — — — 1,049,150 — — — —
Venue hire deposits and advance tickets sales
1,138,018 — — — — 1,166,840 — — — —
Total financial liabilities 2,175,753 — — — — 2,215,990 — — — —
Melbourne Recital Centre Notes to the Financial Statements
for the Financial Year Ended 30 June 2016
28
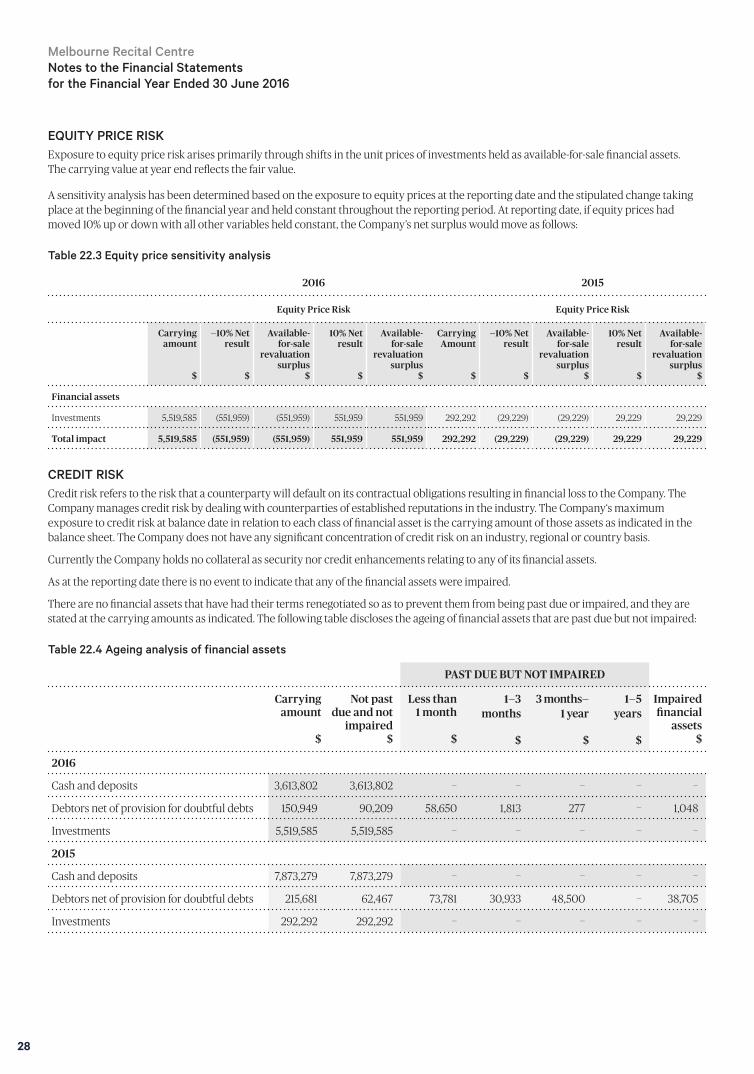
EQUITY PRICE RISKExposure to equity price risk arises primarily through shifts in the unit prices of investments held as available-for-sale financial assets. The carrying value at year end reflects the fair value.
A sensitivity analysis has been determined based on the exposure to equity prices at the reporting date and the stipulated change taking place at the beginning of the financial year and held constant throughout the reporting period. At reporting date, if equity prices had moved 10% up or down with all other variables held constant, the Company’s net surplus would move as follows:
Table 22.3 Equity price sensitivity analysis
2016 2015
Equity Price Risk Equity Price Risk
Carrying amount
$
—10% Net result
$
Available- for-sale
revaluation surplus
$
10% Net result
$
Available- for-sale
revaluation surplus
$
Carrying Amount
$
—10% Net result
$
Available- for-sale
revaluation surplus
$
10% Net result
$
Available- for-sale
revaluation surplus
$
Financial assets
Investments 5,519,585 (551,959) (551,959) 551,959 551,959 292,292 (29,229) (29,229) 29,229 29,229
Total impact 5,519,585 (551,959) (551,959) 551,959 551,959 292,292 (29,229) (29,229) 29,229 29,229
CREDIT RISKCredit risk refers to the risk that a counterparty will default on its contractual obligations resulting in financial loss to the Company. The Company manages credit risk by dealing with counterparties of established reputations in the industry. The Company‘s maximum exposure to credit risk at balance date in relation to each class of financial asset is the carrying amount of those assets as indicated in the balance sheet. The Company does not have any significant concentration of credit risk on an industry, regional or country basis.
Currently the Company holds no collateral as security nor credit enhancements relating to any of its financial assets.
As at the reporting date there is no event to indicate that any of the financial assets were impaired.
There are no financial assets that have had their terms renegotiated so as to prevent them from being past due or impaired, and they are stated at the carrying amounts as indicated. The following table discloses the ageing of financial assets that are past due but not impaired:
Table 22.4 Ageing analysis of financial assets
PAST DUE BUT NOT IMPAIRED
Carrying amount
$
Not past due and not
impaired $
Less than 1 month
$
1—3 months
$
3 months— 1 year
$
1—5 years
$
Impaired financial
assets $
2016
Cash and deposits 3,613,802 3,613,802 — — — — —
Debtors net of provision for doubtful debts 150,949 90,209 58,650 1,813 277 — 1,048
Investments 5,519,585 5,519,585 — — — — —
2015
Cash and deposits 7,873,279 7,873,279 — — — — —
Debtors net of provision for doubtful debts 215,681 62,467 73,781 30,933 48,500 — 38,705
Investments 292,292 292,292 — — — — —
Melbourne Recital Centre Notes to the Financial Statements for the Financial Year Ended 30 June 2016
29
Melbourne Recital Centre Notes to the Financial Statements
for the Financial Year Ended 30 June 2016
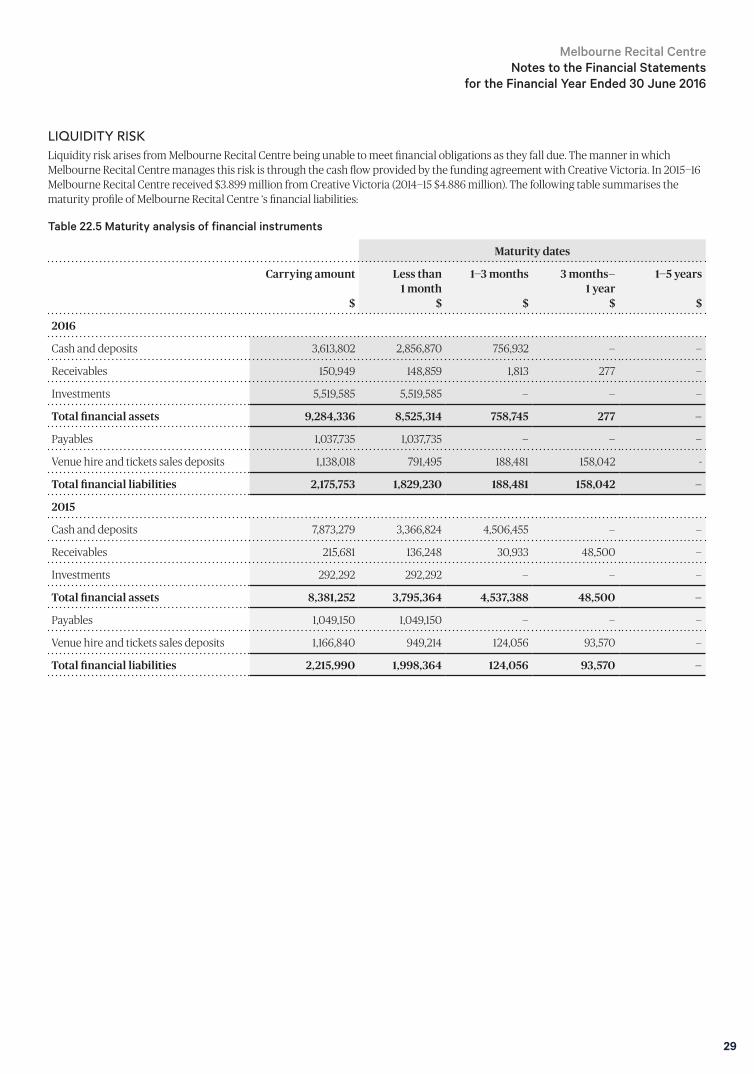
LIQUIDITY RISKLiquidity risk arises from Melbourne Recital Centre being unable to meet financial obligations as they fall due. The manner in which Melbourne Recital Centre manages this risk is through the cash flow provided by the funding agreement with Creative Victoria. In 2015—16 Melbourne Recital Centre received $3.899 million from Creative Victoria (2014—15 $4.886 million). The following table summarises the maturity profile of Melbourne Recital Centre ‘s financial liabilities:
Table 22.5 Maturity analysis of financial instruments
Maturity dates
Carrying amount
$
Less than 1 month
$
1—3 months
$
3 months— 1 year
$
1—5 years
$
2016
Cash and deposits 3,613,802 2,856,870 756,932 — —
Receivables 150,949 148,859 1,813 277 —
Investments 5,519,585 5,519,585 — — —
Total financial assets 9,284,336 8,525,314 758,745 277 —
Payables 1,037,735 1,037,735 — — —
Venue hire and tickets sales deposits 1,138,018 791,495 188,481 158,042 -
Total financial liabilities 2,175,753 1,829,230 188,481 158,042 —
2015
Cash and deposits 7,873,279 3,366,824 4,506,455 — —
Receivables 215,681 136,248 30,933 48,500 —
Investments 292,292 292,292 — — —
Total financial assets 8,381,252 3,795,364 4,537,388 48,500 —
Payables 1,049,150 1,049,150 — — —
Venue hire and tickets sales deposits 1,166,840 949,214 124,056 93,570 —
Total financial liabilities 2,215,990 1,998,364 124,056 93,570 —
30
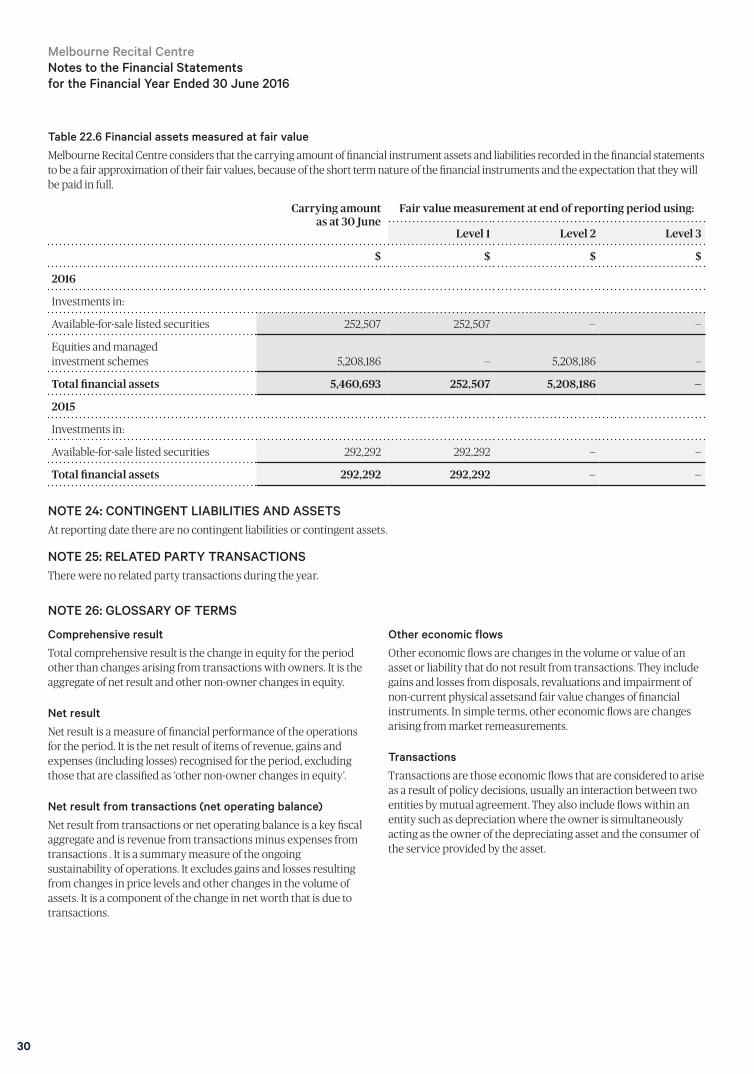
Table 22.6 Financial assets measured at fair valueMelbourne Recital Centre considers that the carrying amount of financial instrument assets and liabilities recorded in the financial statements to be a fair approximation of their fair values, because of the short term nature of the financial instruments and the expectation that they will be paid in full.
Carrying amount as at 30 June
Fair value measurement at end of reporting period using:
Level 1 Level 2 Level 3
$ $ $ $
2016
Investments in:
Available-for-sale listed securities 252,507 252,507 — —
Equities and managed investment schemes 5,208,186 — 5,208,186 —
Total financial assets 5,460,693 252,507 5,208,186 —
2015
Investments in:
Available-for-sale listed securities 292,292 292,292 — —
Total financial assets 292,292 292,292 — —
NOTE 24: CONTINGENT LIABILITIES AND ASSETSAt reporting date there are no contingent liabilities or contingent assets.
NOTE 25: RELATED PARTY TRANSACTIONSThere were no related party transactions during the year.
NOTE 26: GLOSSARY OF TERMS
Comprehensive resultTotal comprehensive result is the change in equity for the period other than changes arising from transactions with owners. It is the aggregate of net result and other non-owner changes in equity.
Net resultNet result is a measure of financial performance of the operations for the period. It is the net result of items of revenue, gains and expenses (including losses) recognised for the period, excluding those that are classified as ‘other non-owner changes in equity’.
Net result from transactions (net operating balance)Net result from transactions or net operating balance is a key fiscal aggregate and is revenue from transactions minus expenses from transactions . It is a summary measure of the ongoing sustainability of operations. It excludes gains and losses resulting from changes in price levels and other changes in the volume of assets. It is a component of the change in net worth that is due to transactions.
Other economic flowsOther economic flows are changes in the volume or value of an asset or liability that do not result from transactions. They include gains and losses from disposals, revaluations and impairment of non-current physical assetsand fair value changes of financial instruments. In simple terms, other economic flows are changes arising from market remeasurements.
TransactionsTransactions are those economic flows that are considered to arise as a result of policy decisions, usually an interaction between two entities by mutual agreement. They also include flows within an entity such as depreciation where the owner is simultaneously acting as the owner of the depreciating asset and the consumer of the service provided by the asset.
Melbourne Recital Centre Notes to the Financial Statements for the Financial Year Ended 30 June 2016
31
Melbourne Recital Centre Notes to the Financial Statements
for the Financial Year Ended 30 June 2016
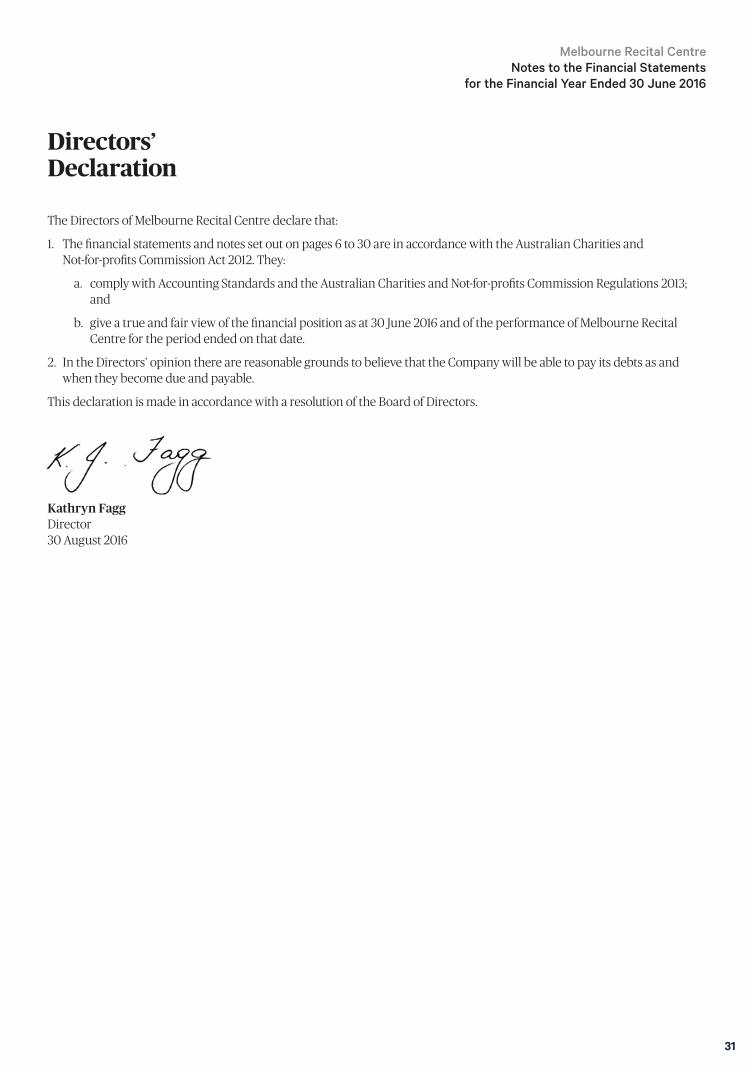
The Directors of Melbourne Recital Centre declare that:
1. The financial statements and notes set out on pages 6 to 30 are in accordance with the Australian Charities and Not-for-profits Commission Act 2012. They:
a. comply with Accounting Standards and the Australian Charities and Not-for-profits Commission Regulations 2013; and
b. give a true and fair view of the financial position as at 30 June 2016 and of the performance of Melbourne Recital Centre for the period ended on that date.
2. In the Directors’ opinion there are reasonable grounds to believe that the Company will be able to pay its debts as and when they become due and payable.
This declaration is made in accordance with a resolution of the Board of Directors.
Kathryn Fagg Director 30 August 2016
Directors’ Declaration
32

33
34
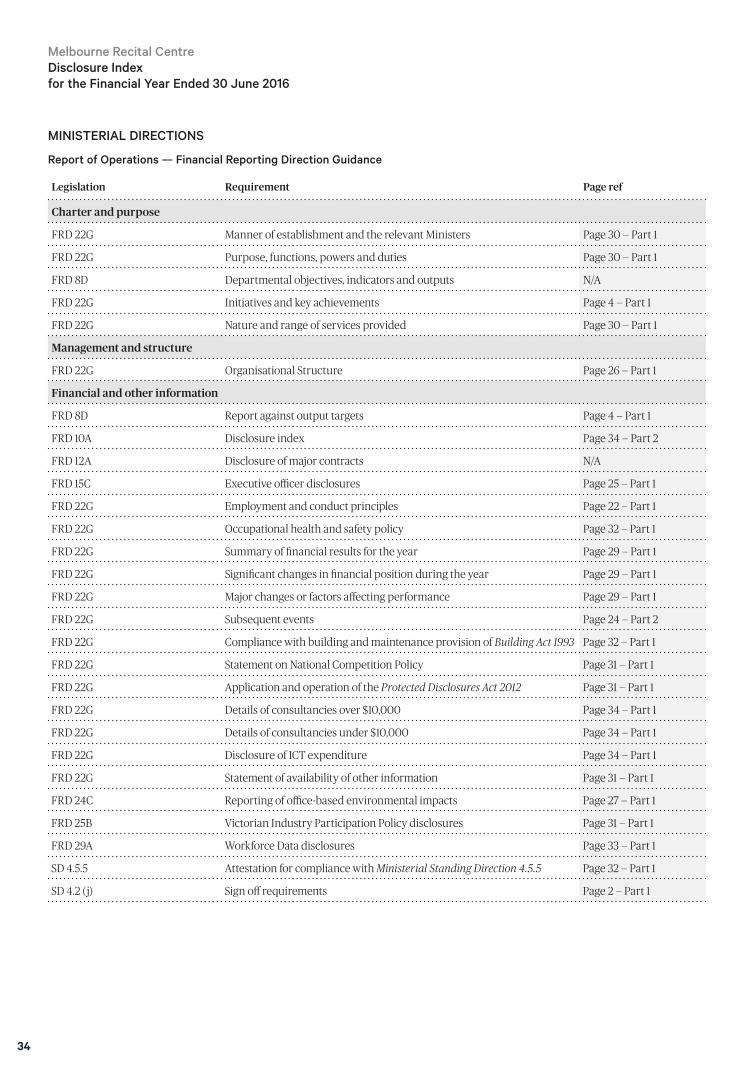
MINISTERIAL DIRECTIONS
Report of Operations — Financial Reporting Direction Guidance
Legislation Requirement Page ref
Charter and purpose
FRD 22G Manner of establishment and the relevant Ministers Page 30 — Part 1
FRD 22G Purpose, functions, powers and duties Page 30 — Part 1
FRD 8D Departmental objectives, indicators and outputs N/A
FRD 22G Initiatives and key achievements Page 4 — Part 1
FRD 22G Nature and range of services provided Page 30 — Part 1
Management and structure
FRD 22G Organisational Structure Page 26 — Part 1
Financial and other information
FRD 8D Report against output targets Page 4 — Part 1
FRD 10A Disclosure index Page 34 — Part 2
FRD 12A Disclosure of major contracts N/A
FRD 15C Executive officer disclosures Page 25 — Part 1
FRD 22G Employment and conduct principles Page 22 — Part 1
FRD 22G Occupational health and safety policy Page 32 — Part 1
FRD 22G Summary of financial results for the year Page 29 — Part 1
FRD 22G Significant changes in financial position during the year Page 29 — Part 1
FRD 22G Major changes or factors affecting performance Page 29 — Part 1
FRD 22G Subsequent events Page 24 — Part 2
FRD 22G Compliance with building and maintenance provision of Building Act 1993 Page 32 — Part 1
FRD 22G Statement on National Competition Policy Page 31 — Part 1
FRD 22G Application and operation of the Protected Disclosures Act 2012 Page 31 — Part 1
FRD 22G Details of consultancies over $10,000 Page 34 — Part 1
FRD 22G Details of consultancies under $10,000 Page 34 — Part 1
FRD 22G Disclosure of ICT expenditure Page 34 — Part 1
FRD 22G Statement of availability of other information Page 31 — Part 1
FRD 24C Reporting of office-based environmental impacts Page 27 — Part 1
FRD 25B Victorian Industry Participation Policy disclosures Page 31 — Part 1
FRD 29A Workforce Data disclosures Page 33 — Part 1
SD 4.5.5 Attestation for compliance with Ministerial Standing Direction 4.5.5 Page 32 — Part 1
SD 4.2 (j) Sign off requirements Page 2 — Part 1
Melbourne Recital Centre Disclosure Index for the Financial Year Ended 30 June 2016
35
Melbourne Recital Centre Disclosure Index
for the Financial Year Ended 30 June 2016
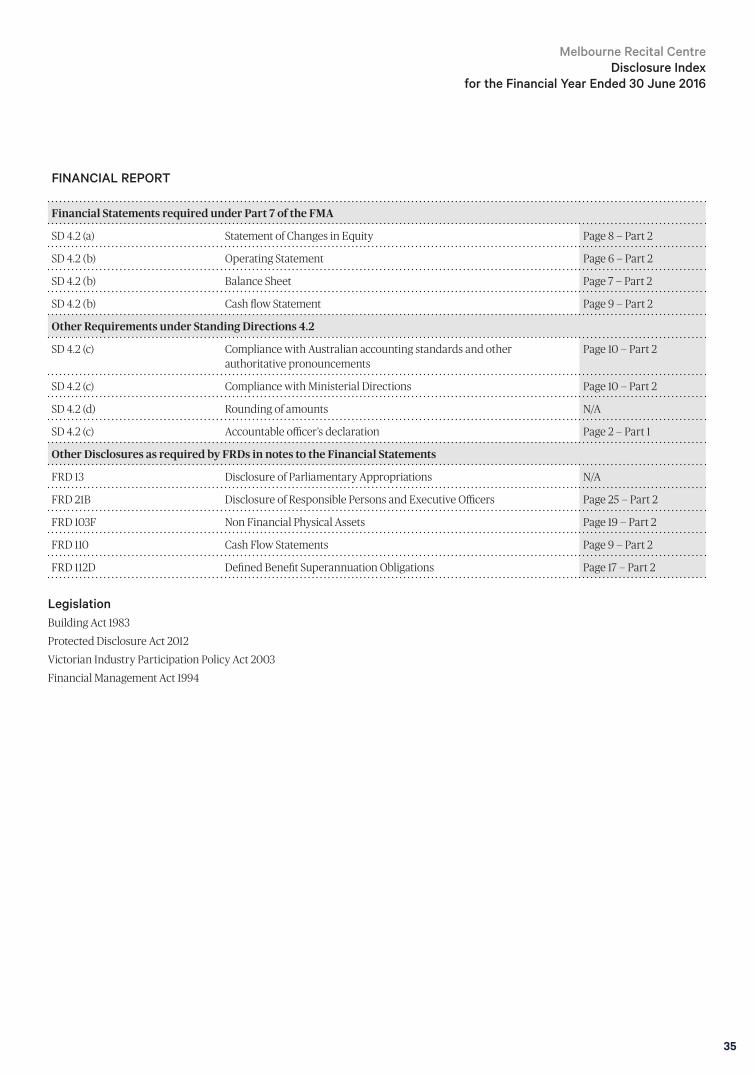
FINANCIAL REPORT
Financial Statements required under Part 7 of the FMA
SD 4.2 (a) Statement of Changes in Equity Page 8 — Part 2
SD 4.2 (b) Operating Statement Page 6 — Part 2
SD 4.2 (b) Balance Sheet Page 7 — Part 2
SD 4.2 (b) Cash flow Statement Page 9 — Part 2
Other Requirements under Standing Directions 4.2
SD 4.2 (c) Compliance with Australian accounting standards and other authoritative pronouncements
Page 10 — Part 2
SD 4.2 (c) Compliance with Ministerial Directions Page 10 — Part 2
SD 4.2 (d) Rounding of amounts N/A
SD 4.2 (c) Accountable officer’s declaration Page 2 — Part 1
Other Disclosures as required by FRDs in notes to the Financial Statements
FRD 13 Disclosure of Parliamentary Appropriations N/A
FRD 21B Disclosure of Responsible Persons and Executive Officers Page 25 — Part 2
FRD 103F Non Financial Physical Assets Page 19 — Part 2
FRD 110 Cash Flow Statements Page 9 — Part 2
FRD 112D Defined Benefit Superannuation Obligations Page 17 — Part 2
LegislationBuilding Act 1983
Protected Disclosure Act 2012
Victorian Industry Participation Policy Act 2003
Financial Management Act 1994

36
31 Sturt Street, Southbank, Victoria 3006 AustraliaT: +613 9699 2228 | [email protected] 46 118 617 619
melbournerecital.com.au