annual report 2016-17 - bombay stock exchange · important web links ... solar project at new...
TRANSCRIPT


Agility and customer centricity – shaping Bosch Limited’s future
Annual Report 2016-17
Innovate
Re-vision
Collaborate

Company Information
Key Managerial PersonnelDr. Steffen BernsManaging Director (upto 31.12.2016)
Soumitra BhattacharyaManaging Director & CFO (w.e.f. 01.01.2017)
Dr. Andreas WolfJoint Managing Director (w.e.f. 01.01.2017)
Jan Oliver RöhrlExecutive Vice-President (Engineering) & Regional President (Diesel Systems) & Alternate Director (w.e.f. 11.02.2017)
S. KarthikJoint CFO (w.e.f. 11.02.2017) & Company Secretary (upto 10.02.2017)
R. VijayCompany Secretary (w.e.f. 11.02.2017)
AuditorsPrice Waterhouse & Co Bangalore LLPFirm Registration Number: 007567S/S-200012
BankersState Bank of IndiaCanara BankCitibank, N.A.Deutsche Bank AG
P. B. No. 3000Hosur RoadAdugodiBengaluru - 560 030
(Where the shares of the Company are listed)BSE LimitedPhiroze Jeejeebhoy TowersDalal StreetMumbai - 400 001
National Stock Exchange of India LimitedExchange Plaza, Bandra-Kurla ComplexBandra (E)Mumbai - 400 051
Registrar & Transfer AgentIntegrated Registry Management Services Private LimitedNo. 30, Ramana Residency4th Cross, Sampige RoadMalleswaramBengaluru - 560 003
Audit CommitteeRenu S. Karnad, ChairpersonV. K. ViswanathanBernhard SteinrueckePrasad ChandranBhaskar Bhat
Bernhard Steinruecke, ChairmanV. K. ViswanathanRenu S. KarnadPrasad ChandranDr. Steffen Berns (upto 31.12.2016)Soumitra Bhattacharya (from 01.01.2017)
Nomination and Remuneration CommitteeBernhard Steinruecke, ChairmanV. K. ViswanathanPrasad ChandranBhaskar Bhat
Prasad Chandran, ChairmanBhaskar BhatSoumitra BhattacharyaDr. Steffen Berns (upto 31.12.2016)Dr. Andreas Wolf (from 01.01.2017)
Bernhard SteinrueckePrasad ChandranBhaskar BhatDr. Steffen Berns (upto 31.12.2016)Soumitra Bhattacharya (from 01.01.2017)

About Bosch Group
About Bosch Limited
Board of Directors
Chairman’s Letter
Agility and customer Centricity – shaping Bosch Limited’s Future
Directors’ Report including Management Discussion and Analysis
Financials at a glance
Annexures to the Report of the Directors
Independent Auditors’ Report - Standalone
Standalone Financial Statements
Independent Auditors’ Report - Consolidated
Consolidated Financial Statements
Report on Corporate Governance
Important Web links
Business Responsibility Report
Sales Offices
4
5
6
7
Foreword 8
10
38
53
56
85
90
145
148
193
204
205
214

About Bosch Group
4 | About Bosch Group | Annual Report 2016-17
The Bosch Group is a leading global supplier of technology and services. It employs roughly 390,000 associates worldwide (as of December 31, 2016). The company generated sales of 73.1 billion euros in 2016. Its operations are divided into four business sectors: Mobility Solutions, Industrial Technology, Consumer Goods, and Energy and Building Technology. As a leading IoT company, Bosch offers innovative solutions for smart homes, smart cities, connected mobility, and connected manufacturing. It uses its expertise in sensor technology, software, and services, as well as its own IoT cloud, to offer its customers connected, cross-domain solutions from a single source. The Bosch Group’s strategic objective is to deliver innovations for a connected life. Bosch improves quality of life worldwide with products and services that are innovative and spark enthusiasm. In short, Bosch creates technology that is “Invented for life.”
The Bosch Group comprises Robert Bosch GmbH and its roughly 440 subsidiaries and regional companies in some 60 countries. Including sales and service
partners, Bosch’s global manufacturing and sales network covers nearly every country in the world. The basis for the company’s future growth is its innovative strength. At 120 locations across the globe, Bosch employs some 59,000 associates in research and development.
The company was set up in Stuttgart in 1886 by Robert Bosch (1861–1942) as “Workshop for Precision Mechanics and Electrical Engineering.” The special ownership structure of Robert Bosch GmbH guarantees the entrepreneurial freedom of the Bosch Group, making it possible for the company to plan over the long term and to undertake significant up-front investments in the safeguarding of its future. Ninety-two percent of the share capital of Robert Bosch GmbH is held by Robert Bosch Stiftung GmbH, a charitable foundation. The majority of voting rights are held by Robert Bosch Industrietreuhand KG, an industrial trust. The entrepreneurial ownership functions are carried out by the trust. The remaining shares are held by the Bosch family and by Robert Bosch GmbH.

About Bosch Limited
Annual Report 2016-17 | About Bosch Limited | 5
Bosch has been present in India for more than 90 years - first through a representative office in Kolkata (then Calcutta) since 1922, and from 1951 through its subsidiary Bosch Limited (then Motor Industries Company Limited).
Robert Bosch GmbH along with its subsidiary holds 70.49 percent stake in Bosch Limited. The Company is headquartered in Bengaluru. Its key manufacturing facilities are located at Bengaluru, Bidadi, Nashik, Jaipur, Gangaikondan, Oragadam near Chennai and Verna, Goa. Bosch Limited has its presence across sectors such as Mobility Solutions, Industrial Technology, Consumer Goods, and Building and Energy technology. It manufactures and trades products as diverse as diesel and gasoline fuel injection systems, automotive aftermarket products, special purpose machines, packaging machines, electric power tools, security systems, and industrial and consumer energy products and solutions. In India, Bosch Limited is the flagship company of the Bosch Group. It earned revenue of over ` 10,500 crores in 2016-17.
The Bosch Group operates in India through twelve companies, viz., Bosch Limited, Bosch Chassis Systems India Private Limited, Bosch Rexroth India Private Limited, Robert Bosch Engineering and Business Solutions Private Limited, Bosch Automotive Electronics India Private Limited, Bosch Electrical Drives India Private Limited, BSH Home Appliances Private Limited, ETAS Automotive India Private Limited, Robert Bosch Automotive Steering India Private Limited, Automotive Services and Solutions Private Limited, Newtech Filters India Private Limited and Mivin Engineering Technologies Private Limited.
Over the years, Bosch in India has grown to include 18 manufacturing facilities and seven development centers. The Group in India employs over 31,000 associates of which close to 18,500 work on areas relating to research and development. In India, Bosch generated consolidated revenue of about ` 18,300 crores in 2016 of which ` 12,950 crores from third party.

Board of Directors
6 | Board of Directors | Annual Report 2016-17
V.K. ViswanathanChairman,Non-ExecutiveNon-Independent Director
Peter TyrollerNon-ExecutiveNon-Independent Director
Bernhard SteinrueckeIndependent Director
Renu S. KarnadIndependent Director
Prasad ChandranIndependent Director
Bhaskar BhatIndependent Director
Soumitra BhattacharyaManaging Director(w.e.f. January 01, 2017)(Joint Managing Director upto December 31, 2016)
Dr. Andreas WolfJoint Managing Director(w.e.f. January 01, 2017)(Alternate Director to Peter Tyroller upto December 31, 2016)
Jan Oliver RöhrlAlternate Director to Peter Tyroller(from February 11, 2017)
Dr. Steffen BernsManaging Director(upto December 31, 2016)

Dear Shareholders,
The financial year 2016-17 has been an eventful one. We have witnessed several developments, both internationally and in our country concerning geo-political, economic and social sectors. The US Presidential elections’ verdict and BREXIT were amongst the two major global developments. Globally, it seemed like a recurring theme to look inwardly and strongly promote national manufacturing and service offerings in order to protect and create jobs locally. This of course, is in strong contrast to the opinions by other international leaders who were stressing importance of global trade and cooperation.
India went through quite a significant transformation with the announcement and implementation of Demonetisation, Re-monetisation, Goods and Service Tax (GST), Insolvency & Bankruptcy Code and Real Estate (Regulation & Development) Act. These reforms will have a long lasting impact on the Indian economy, although the impact might be negative in short run. Against this backdrop India witnessed reasonable GDP growth of 7.1% in 2016-17.
India has also gained some ground with respect to next generation technologies such as Internet of Things (IoT), Artificial Intelligence (AI) and Automation. The adoption and penetration of such technologies will fundamentally alter the way products and services are conceived, designed, manufactured, delivered, consumed and paid for. These advances in technology will undoubtedly throw many challenges whilst creating exciting opportunities. The winner will clearly be the one who is able to anticipate and be ready for such transformational disruption.
Annual Report 2016-17 | Chairman’s Letter | 7
Chairman’s Letter
As for Bosch Limited, the Company was well prepared for a nation-wide transition to Bharat Stage (BS) IV. The Supreme Court judgement directing the switchover of sales to BS IV effective April 01, 2017 has been a definitive milestone causing some logistical difficulties for the industry. Your company was ready and prepared to offer solutions to all its customers that made this transition smooth and effective. As for BS VI, the Government of India has announced the transition directly from Bharat Stage IV to Bharat Stage VI by 2020. This is for the first-time in the country, perhaps even globally, that a country would be leap frogging from BS IV to BS VI skipping the entire stage of BS V. It is collectively agreed that skipping an entire stage has put the Indian automotive ecosystem under tremendous pressure. However, we at Bosch Limited are preparing ourselves to meet this challenge through appropriate investments in technology and capacity building.
Bosch Limited is committed to growing its business beyond mobility portfolio. In order to achieve the Government’s ambitious target of 100 GW of solar power generation in the country by 2022, your Company is committed to play its part. The 4MW ground mounted solar project at New Mangalore Port Trust is amongst the first sea port projects for Bosch in India with more success stories to come. Business units such as, Bosch Energy and Building Solutions (BEBS), Security Technologies and Power Tools, among others have successfully been able to offer products and solutions tailored to cater to requirements of the local market.
The future is full of challenges, yet each challenge offers an opportunity. This has been the driving force behind our fascination for the future and pursuit of innovation to build a better tomorrow. India plays a key role in Bosch’s global success and we are committed to identifying new opportunities, and providing solutions that bring customer delight. Our continued investment in facilities across the country will enhance our market reach and complement India’s growth story. While doing this, we continue to offer our employees an enriching career and forums to enhance their skill sets and capabilities, making them ready for the future. Being responsible fiscally and environmentally is something which shapes our identity and secures our future.
On behalf of Bosch, I take the opportunity to thank all the shareholders for their sustained support. Over last 10 years, your company has been successful in increasing the shareholder wealth by approximately 21% CAGR in addition to two buyback during the years 2008 and 2016. We are committed to enhancing shareholders value and remain humbled by the trust and support extended by you over these years.
Best regards,
VK Viswanathan,Chairman - Board of Directors, Bosch Limited

Foreword
8 | Annual Report 2016-17 | Agility and customer centricity – shaping Bosch Limited’s future
Dear Shareholder,
Embracing change! Simple as it seems, globally many respected organizations have failed to keep pace with the changing boundary conditions of their business. In India, Bosch with it’s over nine decades of existence, has constantly been in a state of evolution. Its composition is akin to an onion bulb. Every layer opens up a new facet about the Group and the environment in which it operates. Our journey has been a great learning curve. From predominantly being considered as an automobile component manufacturer to opening businesses and ensuring growth in other sectors, such as Energy and Security Solutions, to name a few. Currently, we have made headway from being an intelligent organization to a connected set-up. For Bosch India, transitioning to a connected era requires a change in mindset. The decision to become a smart and then eventually a connected company is not an option but an imperative for long-term success. To embrace the opportunities put forth by the future, Bosch Limited needs
to first understand the needs of its existing and potential customer. The thrust on Customer Centricity will necessitate our associates and business partners to adopt more flexible approaches. Current business dynamics will require us to be nimble footed, and hence our focus for the current fiscal and in the years to come is Agility. Cornerstones of Bosch Limited’s success story: Innovate. Re-vision. Collaborate. Agility will require us to put on our creative thinking hats and push the envelope to develop innovative solutions that find resonance with the local mass market. For instance, the Lean Connectivity Unit (LCU) helped us inculcate learnings from our customers and OEMs to build the ideal products for them. This approach of developing a solution based on customer demand promises a bright future for us, and I am excited to see where this takes us.

countries, India has also given guidance with respect to clean air quality. The country intends to go fully electric by 2030.
Bosch Limited, sees significant growth for electric mobility in the coming years. That said, we also firmly opine that the combustion engine can certainly deliver a lot more towards the realization of cleaner mobility. Diesel offers a CO2 advantage of around 15 percent as compared to petrol, and we need to take advantage of this benefit.
Earlier this year, the central government passed the mandate for all vehicles to changeover from BS III emission norms to BS IV emission standards. Bosch Limited was able to offer its customers the required technology by ramping up its production, inclusive of its supplier base. Looking forward, the company is well prepared to offer its large customer base an array of full line solutions, diesel and gasoline included, as the nation transitions from BS IV to BS VI emission norms by 2020. Bosch Limited is prepared and committed to offer its support during this phase of movement.
The Automotive Aftermarket business unit witnessed a muted growth owing to reasons such as, tough liquidity conditions and the roll-out of 're-monetization'.
By taking a consolidated approach to customer service and delivering holistic integrated services, we are certain of continuing on this growth trajectory.
Summing up, I am proud to say that Bosch Limited maintained its steady growth and took progressive steps towards achieving its objectives. We started off the year with an unrelenting vision of excellence, and our results showcase how we have stayed true to this vision. This has been made possible because of the commitment and hard work of our associates which set us up for these results.
Looking forward, you, the shareholder, can anticipate the continuation of our steady performance and be rest assured that Bosch Limited is well geared to meet all regulations and industry changes proactively. The next fiscal year holds many promises, with a progressive government at the center we look forward to more reforms, reduced interest rates and improved liquidity after re-monetization. In the current fiscal and beyond, we will take more definitive steps towards being an ‘Agile’ and ‘Customer Centric’ organization. These measures should help us predict and prepare for the future. We have been, continue to be and will always be ahead of the technology curve. In a future where the world is dynamic and unpredictable, Bosch’s technologies and solutions shall offer the comfort of security, reliability and quality. They are the tenets on which we have built our foundation.
With these thoughts I leave you to read the journey Bosch Limited has made over the past year.
Thank you.
Soumitra BhattacharyaManaging Director, Bosch Limited President, Bosch Group India
Annual Report 2016-17 | Agility and customer centricity – shaping Bosch Limited’s future | 9
Novelty also depends on our ability to further develop on an existing solution/platform to offer enhanced offerings. Take for example, our security solutions team who re-imagined the possibilities of the existing video surveillance systems. The intelligent ‘Bosch Panoramic Camera’ does much more than just track and record movement. It collects data based on pattern analysis and then sends it to operators in real-time for security that is close to unbreakable. It has 360-degree views, no blind spots and operates on central servers for images + intelligence.
What lies ahead of Bosch Limited will require the company to combine its strength to offer solutions as ‘One Bosch.’ As an organization Bosch has moved away from teams working in silos to a matrix structure. Seamless synergy between teams from different domains is what drives us forward and has enabled us to gain expertise over our 90-year old history. Today’s customer is more knowledgeable and demanding than ever before, but in most cases, the solution that they demand is only a fraction of the full-extent of what they actually need. At Bosch, we pride ourselves on anticipating such needs before they arise, and meeting them to deliver cost savings, productivity and satisfaction for our customers.
A prime example of cross-collaboration was highlighted when a leading automotive manufacturer wanted to reduce its CO2 emissions by 10 percent. The result was a 57 percent reduction in energy consumption and 8.44 tonnes of annual CO2 reduction. This success story was a combination of efforts which called for the participation of members from our mobility and energy team. Members from the mobility team offered insights about the customer that were effectively used by the strategy and development team of the energy business. Together, they were able to devise a solution that exceeded the demands of the customer. That’s not it, Bosch Limited is also drawing on the capabilities of its sister company- Robert Bosch Engineering and Business Solutions- to offer enhanced solutions.
Such and more are the stories you will find in the latest edition of Bosch Limited’s Annual Report for financial year 2016-17. Ahead of the curve with technology and solutions from Bosch Limited
The past year’s business environment was rife with global and Indian transitions, such as Trump’s Presidency, ‘Brexit,’ re-monetization and more. As the dust settled on the issue regarding the transition to Bharat Stage VI legislation, we have made key acquisitions which will facilitate our Vision 2020 goal.
The Indian economy experienced a slowdown this financial year, but in the midst of this, Bosch Limited registered a steady growth of 7.6 percent. Even though the transition from BS III to BS IV did have a bearing on the overall market, our growth remained higher than the industry average owing to factors such as future planning and external favorable elements such as healthy monsoon levels in 2016.
Committed to growing the business beyond mobility segment, I am pleased to share that the segment has registered a growth of 16.8 percent. Taking cue from other

Man disrupts, he invents
It is year 2020 and Mahesh has been biding time and waiting for this moment all his life. He has put together his life savings to buy the first vehicle of his new venture. Over the past few years he has been dissuaded from owning a vehicle on grounds of it not being a viable proposition. And yet, here he is, all set to pick up his new three-wheeler. Once inside his new vehicle, Mahesh heaves a sigh of relief. It was exactly how he had envisaged it to be. His brand-new three-wheeler - fuelled up and ready to go! Kick starting life in his new vehicle, Mahesh is eagerly looking forward to the road ahead and supporting him in this journey is Bosch Limited.
Success story - Innovate
10 | Annual Report 2016-17 | Agility and customer centricity – shaping Bosch Limited’s future

Four years ago, in 2016, a team of ten - headed by Markus Schetter, lead researcher in the pre-development section of Diesel Systems, sat at their drawing boards envisioning this exact moment Mahesh is living. India was already the largest manufacturer and market for three-wheelers globally. And it is only projected to grow further. The government however, in a bold move to fight pollution, had announced that India will move up to the toughest emission standards of BS VI from the current BS IV by 2020, skipping an intermediate level. This meant that they had to act fast and act now. Thus was born - the Lean Electronic Fuel Injection System (LEFIS). “My team at the R&D center works by forecasting technology trends and market needs. We foresee the requirements and correspondingly develop innovative solutions. When the government announced the shift from BS IV to BS VI, we knew
that in a cost-sensitive market like India, customers would face the difficulty of being able to afford a fuel injection system that was relevant to European conditions. The challenge on our table was to design a system for India that would not just meet the stringent Particulate Matter (PM) and NOX emissions of BS VI but also be cost-effective and robust to survive the harsh use-case here,” remarked Markus.
“LEFIS is a locally developed product that offers both, superior quality as well as the best value proposition. The LEFIS is a combination of mechanical pump and electronically controlled smart fuel injectors. We developed this solution specifically for the one-cylinder three-wheeler market moving into the BS VI emission standard. But now we see scope of expansion in markets outside the country as well,” added Markus.
Also working on electrification projects, Markus is prepared to respond swiftly to market requirements and to foresee customer needs. Electrification will make its first inroads in the two and three-wheeler segment. Markus and other powertrain development teams across Bosch Limited are engaging with customers to realize the future of electrification in India. “Our teams are in the midst of extensive discussions with customers, it certainly is an exciting phase for India’s mobility roadmap,” mentioned Markus. The project is estimated to go into series testing phase by mid-2019 and enter 2020 fully prepared to meet the BS VI emission regulation. Right on time for Mahesh to walk in and buy his three-wheeler at an affordable price, and that not just meets the stringent emission legislation, but also delivers an impressive fuel economy.
Annual Report 2016-17 | Agility and customer centricity – shaping Bosch Limited’s future | 11

Connecting with your car
It is as straightforward as it seems – your car can now give you real-time information on its whereabouts and even send you alerts when it’s time to give it some proper care. In short, Bosch has just made your car intelligent. Having kicked off in Germany in 2013, Connected Services aims to develop solutions for the mobility of the future.
Launching the project in multiple regions, the India chapter was scheduled to offer solutions for Connected Vehicle and Connected Workshop. Brijesh Suresh, responsible for Connected Services was deputed to understand the market needs and deliver local, customized end-to-end solutions. A study in collaboration with a global research and consulting organization was conducted to understand the market sentiments and identify customer needs. The study indicated that the awareness of telematics and connected solutions was high in the Commercial Vehicle (CV) segment along with passenger vehicle fleets and for warranty insurance companies. However, existing solutions in Germany were not compatible with the Indian market and hence the need for complete localization of the solution.
“We faced many challenges initially – IoT was new to the market, existing global solutions couldn’t be adopted here, and we could not outsource it to external agencies as Bosch has strict quality, safety and security requirements. And so, we decided to pool in existing experts from Bosch to assemble a cross-functional team equipped to deliver. A core team of three was formed, apart from sourcing help from around 30 other members across purchasing, quality, manufacturing, engineering, IT, controlling, after sales service, marketing and sales to provide the Indian solution to the Indian market” says Brijesh.
Connected Vehicles – know your car in real-time
In February 2017, Bosch India launched the Connected Vehicle solution for commercial vehicles and passenger vehicle fleets. The product allows the owner to track, trace, geofence and get custom alerts in case of any deviations. It is connected directly to the vehicle’s battery and does not rely on emission norms and therefore all vehicles under BS II, BS III and BS IV can also reap the benefit of this solution. In addition to the device, Bosch provides external interfaces, such as the
How many more miles can I go before I run out of fuel? Is there traffic ahead? I wonder how I can retrace my way back to that old cake shop we found two days ago? Does my car need servicing? What needs to be fixed? Can I pick up my car now? – Questions like these don’t need to be rhetorical anymore. Bosch’s Connected Services has all the answers you’re looking for.
Success story - Innovate
12 | Annual Report 2016-17 | Agility and customer centricity – shaping Bosch Limited’s future

panic button and fuel sensor to offer an integrated connected solution. You will now have answers to questions regarding your car’s health, safety and comfort of your passengers at the tip of your fingers.
Connected Workshops – for transparent and smart servicing
Knowing when to get your car serviced and what to get fixed, is one step. Connected Workshop solutions from Bosch helps with the entire ecosystem of repair information. The solution provides an integrated IT system allowing vehicle data to be successfully exchanged with the service center. Once in the center, cars are scanned for visual damages and required repairs. Post the scan, vehicle timelines, technician details, bay status and more information is made readily available. That means, you’ll know exactly what stage of service your car is at on a real-time basis.
“Moreover, every time your car needs to be serviced, you can book an appointment through your phone and your service center is notified ensuring they get plenty of time to prepare for the arrival of your car. You can
make online payments and make the entire process transparent and efficient. Connected workshop is intelligent, saves time, effort and reduces errors” added Brijesh.
Brijesh and his team are currently working on new technologies that involve accessing vehicle data directly from various electronic control units (ECU) and providing innovative use cases like driver behavior, accident notification, and emergency calls to name a few. Their operations are run out of Bosch’s Adugodi facility in Bengaluru. In a short span of one year, Brijesh and his team rolled out customized connected services to the Indian market and he has plans for more – “Our focus is to continue to deliver solutions to Bosch customers, which caters to the need of every vehicle on Indian roads. We want to ensure that both the vehicle as well as the environment is safer, more convenient, and more efficient through connectivity”, he concludes.
Annual Report 2016-17 | Agility and customer centricity – shaping Bosch Limited’s future | 13

Connecting you and your loved ones on the go
To ensure a worry-free and well-connected two-wheeler environment for you and your family, Bosch India went beyond office walls to the street, made the customers experience the new solution, collected feedback and developed an award-winning product called the Lean Connectivity Unit (LCU).
Success story - Innovate
14 | Annual Report 2016-17 | Agility and customer centricity – shaping Bosch Limited’s future

A scooter, the gearless companion used by everybody alike in the family, has the talent to transform an everyday errand to a convenient and comfortable mission. However, while you, a sibling or an elder is navigating the city streets post sunset, safety is a concern that refuses to leave your mind. Bosch India has developed a new product, the Lean Connectivity Unit, to help you beat this concern.
Fuelled by the passion to change the way we ride two-wheelers, the Bosch team across entities collaborated, to develop a solution that offers the ease and comfort of connectivity. Dilip Saha, who led the product development explains, “The small team from multiple Bosch entities went beyond the boundaries of their office walls and dug deeper into the two-wheeler
Annual Report 2016-17 | Agility and customer centricity – shaping Bosch Limited’s future | 15

“Connectivity should not be the privilege of the elite. We want the solution to be accessible to the users at the bottom of the pyramid,” says Manohar Halahalli.
16 | Annual Report 2016-17 | Agility and customer centricity – shaping Bosch Limited’s future

Annual Report 2016-17 | Agility and customer centricity – shaping Bosch Limited’s future | 17
Bosch’s Lean Connectivity Unit awarded as a CES 2017 Innovation Awards HONOREE in the Vehicle Intelligence product category at CES (Consumer Electronic Show) 2017 held in USA, Las Vegas.
market to understand the requirements of prospective customers, rather than going by assumptions.” They operated like a start-up. Based on the insights from the user experience study, the Bosch team developed a device for addressing the safety and connectivity concerns of the market. “Based on the continuous learnings from target customers and OEMs, the product Lean Connectivity Unit (LCU) was further refined and improved,” says Rajaram Kharoshe, System Architect.
LCU, an add-on feature for scooters and small motorcycles, establishes a connection between the vehicle and the user’s smartphone, allowing them to make emergency calls with a switch and send coordinates of the vehicle to a pre-set contact in case of an emergency. Additionally, the unit is capable of detecting an accident in case of a collision or a fall and then sending a message to the emergency contact without human interference. This solution was conceptualized and developed within 12 months through multiple short sprints and lean concepts. The team developed the product as per Bosch quality standards and also delivered it in quick turnover time. Fairly simple in design, the Lean Connectivity Unit is easy to fit on the two-wheeler and to navigate during travel. “Connectivity should not be the privilege of
the elite. We want the solution to be accessible to the users at the bottom of the pyramid”, says Manohar Halahalli, who leads marketing and business development for the two-wheeler division. The team aims to sell the product to a larger audience and they will be available over the counter at an affordable price. Thus, be assured that LCU will lend a helping hand to an 18-year old rider and a 50-year old rider, alike. The simple yet life-changing unit – a product conceptualized and developed for the Indian market – has the potential to proliferate in emerging markets such as ASEAN countries, Latin America and the African continent as well. “Anybody can develop a basic connectivity device like the LCU. But our domain experience has helped us understand the customer’s needs better and enhance the product accordingly”, says Manohar. The Bosch India team is on a relentless pursuit to offer a product that caters to the evolving requirements of the scooter market. By continuously validating their ideas and refining the product with additional features, such as a digital signature to unlock the vehicle, hands free telephony and a phone charger. The Bosch team is enabling the two-wheeler market transition to a connected world.

18 | Annual Report 2016-17 | Agility and customer centricity – shaping Bosch Limited’s future
Pumping up collaborations
The world today understands that to achieve success, change is a necessary element. This fact has led to many industries constantly looking for the opportunity to improve. Nowhere is this more evident than in the automotive industry. As emission standards change, finding ways to upgrade systems across all platforms remains the best way to help create a better future. Learning from the past and building on its achievements represents one of these avenues to the future. Bosch exemplifies this idea, with the redesigned plug-in pump (CP4i-ME) for fuel injection that enables the system to meet BS VI norms.
Success story - Re-vision

Annual Report 2016-17 | Agility and customer centricity – shaping Bosch Limited’s future | 19
A project as extensive as planning the future can only be achieved by teams across the world working together. By exchanging information, common goals can be identified and solutions can be found much faster. The development of the plug-in pump saw Halesha Prakash Gowda, senior manager, and his team constantly interacting with their counterparts in Europe while they sought to design pumps that could meet similar requirements in both the regions. Bosch realized that the requirements of India and Europe could be achieved through a singular solution.
Among other tasks, a key challenge both teams sought to address during the development process was the separation of fuel from oil. The plug-in pump, developed by Bosch, avoids such a mix, thereby enabling the use of emission optimized nozzles and
exhaust gas after treatment. Instead of working on their designs separately and duplicating the required effort, the teams combined their efforts to create a single design that could be used across all Bosch locations. This newly designed pump can now deal with more pressure in the engine and deliver increased hydraulic efficiency compared to current plug-in pumps for BS IV. What’s more, the knowledge gained from this project can be applied elsewhere to enhance all automotive systems and benefit the company on a whole.
The plug-in pump forms a part of the efforts underway in India to achieve BS VI compliance. On a global level, the project also stands as a testament to Bosch’s commitment to delivering high quality products at competitive costs.

The impending is in up-skilling
Imagine. Inspire. Innovate. Used often, these stand derivatives to complex processes that hold true to a simple cause. At Bosch Limited, success has been inspired by the ability to innovate for life. This means that it has been and is ahead of its time when it comes to foreseeing what changes in the environment may affect business. A sturdy preparedness to engage with opportunities that are present now, to preparing solutions for problems that may arise in the future, is the company’s stronghold.
Two years ago, the research and development (R&D) team at Bosch Limited’s Diesel Systems realized that there was going to be a shift in emission norms owing to India’s renewed stance towards climate change. Since then, they have been working towards instituting crucial modifications that would prepare them for the switch. The tremble in the industry came in the form of an announcement of introduction of BS VI norms from 2020, skipping BS V completely. The transition from BS IV to BS VI was not just unprecedented, but unexpected by many. The Bosch team however, was in full formation. They not only had the experience of making similar changes in Germany with Euro-VI, but were also primed for the Indian market because of the preparedness and available expertise.
Emission revolution - a course of action
The synergy of competency, collaboration and agility has always proven to be effective at Bosch. A few processes were kickstarted - some working simultaneously, some in calculated progression. Take for instance the need to redesign the plug-in pump for fuel injection that enabled the system to meet BS VI norms. Instead of creating a design from scratch, Bosch used its experience and competence at multiple locations to come out with a single design catering to requirements at both Europe and India. This required an efficient collaboration between teams at India and Germany, unifying the designs using skill sets and resources already available, thus reducing the lead time in product development by avoiding duplication of activities.
Success story - Re-vision
20 | Annual Report 2016-17 | Agility and customer centricity – shaping Bosch Limited’s future

In addition to the fuel injection system, BS VI would also require the exhaust coming out from the engine to be treated after being emitted by the engine. Bosch, in this case, has the advantage of an exclusive and highly competent team to work on exhaust gas treatment (EGT). To drive more changes that BS VI would institute, an army of trained experts would be crucial. Having invested in up-skilling consistently over the years, Bosch looked to reskill its in-house team to suit the transient nature of the time, customers’ needs, and technology trends. While some are being trained at various Bosch locations overseas under the “Train the Trainer” concept, others were trained here at Bosch centers in India.
In line with up-skilling, engineers are regularly deputed to various client locations to cater to the immediacy of
requirements. This is necessary to effectively support the customer base, grasp problems at hand and solve them, apart from conveying the needs of the customer to the core team.
Competency - a driving factor
A solid culture of innovation paired with competency and agility gives way to a responsive evolutionary journey that has been customer-centric and agile, internally. Forecasting future disruptions, preparing to lever these changes with the advantage of being prepared, and carrying out processes with precision - the ability to act swiftly in a short span of time reflects Bosch’s commitment and passion to innovating for the future.
Annual Report 2016-17 | Agility and customer centricity – shaping Bosch Limited’s future | 21

22 | Annual Report 2016-17 | Agility and customer centricity – shaping Bosch Limited’s future
Building the factory of the future
The world is defined by its cycle of industrial revolutions. It began in 1784 when steam engines made distance irrelevant. Electricity arrived around 1900 and changed the role of the operator. Then computers were built in 1969 and simplified complex tasks. Today we are fortunate to be in the midst of the fourth industrial revolution. At the heart of it is IoT and it’s all about digitization, connectivity and smart manufacturing. The internet has already transformed the retail market, banks, even our homes but it first entered the quintessential factory and has since turned it on its head.
Success story - Re-vision

Annual Report 2016-17 | Agility and customer centricity – shaping Bosch Limited’s future | 23
For more than a century, Bosch has excelled at building things. Now in order to ace the digitalized world it needs to connect these things. How? That’s what Pravin Pathak, Project Leader for Industry 4.0, Bosch Limited, and his team are working towards. Fueled by the idea of ‘Lean Manufacturing’ – less of everything – this team is heralding the age of Industry 4.0. It all begins on the factory floor of the 21st century where every tool, machine, material, process, command and person is connected and works together flawlessly.
Pravin firmly believes that Bosch India is uniquely placed to turn the vision of a smart factory into reality because “The power of Industry 4.0 is more obvious than ever.” Whether it’s as simple as marking assets with radio-frequency identification (RFID) tags to reduce inventory by 30 percent or repurposing a complex integrated Transport Management System (iTMS) to manage elements of transportation like network design, monitoring, freight cost clearance, performance and analytics, the team at Bosch Limited is making this transition dynamic and profitable. At the heart of all this is data of two types – “Long-term production planning data and real-time dynamic data.”

24 | Annual Report 2016-17 | Agility and customer centricity – shaping Bosch Limited’s future
DistributedIntelligence
Fast Integration and Flexible
Configuration
Open Standards
Virtual Real-Time Presentation
Digital Life-Cycle Management
11
1
1111
0
00
0
People asKey Players
Secure Value Creation Network
Industry 4.0 - Life-Cycle
Mining and mobilizing this data is critical for Bosch India’s move to smart manufacturing. With more than 50 full-time data scientists hard at work, dozens of projects have been successfully completed across domains to generate millions of dollars in cost savings. For instance, a data mining and parametric modeling initiative that resulted in 50 percent reduction in testing cycle time for a single-cylinder PF51 pump at the Bengaluru plant. The data analytics team also supports global initiatives across plants such as Homburg and China RBCD to save millions of dollars.
Bosch’s vision for 2020 entails that every product is connected via the Internet of Things (IoT). At Bosch India, several legacy assembly lines have been restructured to achieve higher efficiency and increased productivity while having a lower payback time. Through networked manufacturing and instantaneous connectivity, manufacturers can collect, analyze and process data that offers a whole new world of opportunities.

Annual Report 2016-17 | Agility and customer centricity – shaping Bosch Limited’s future | 25

Another key development is the imminent 2019 shift to a state-of-the-art plant in Bidadi. The futuristic center will optimize space by 30 percent and streamline smart manufacturing in terms of production, connectivity and quality. This is a key part of Dr. Andreas Wolf’s, Joint Managing Director, Bosch Limited, plan that was formulated in 2015 to roll out Industry 4.0 across all 18 Bosch manufacturing plants in India. The company is generally aiming for a payback period of less than two years for these projects and is focusing on areas such as digitalization of shopfloor management, usage of machine-to-machine (M2M) connectivity, energy management, and implementation of manufacturing executing systems (MES). This will enable Bosch India to not only improve the
productivity, but also create best practice solutions that can be used across diverse locations. For instance, the MES Pro Master implementation at the Chakan plant (part of Bosch Chassis and Systems India Private Limited, sister company of Bosch Limited), has led to an increase in overall equipment effectiveness (OEE) by a significant percent, thus solidifying its status as a benchmark for OEE productivity among plants with manual lines. The concern about the loss of jobs may not be as widespread as previously thought. The truth is that as smart manufacturing and automation spreads further, new jobs that look nothing like previous ones might be born. This has been the case with every major
Through smart manufacturing, we are trying to realize the ‘lean concept’. Our continous improvement process (CIP) approach enables us to set global benchmarks and profitable targets for every function in the value chain. This helps us achieve and ensure cost competitiveness. Lastly, the numerous time studies we undertake at critical moments of implementation help us to improve our realization of automation.
Supriya C, Assistant Manager
26 | Annual Report 2016-17 | Agility and customer centricity – shaping Bosch Limited’s future

industrial transition and the fourth industrial revolution will be no different. The associates need to be prepared for this change. An intensive training program called the Industry 4.0 Academy has been launched.
Bosch has also implemented an intensive System CIP process for the end-to-end mapping of value streams. Herein, every member in the value chain is given a predetermined set of targets to meet and this contributes to the complete alignment of a process with the best possible outcomes. With this as a blueprint, the restructuring and reduction of supply lines has made value streams even leaner. The manufacturing of A-pumps – a 90-year old legacy
product is one of the best example for this continuous improvement process.
Dr. Andreas Wolf resolutely feels that the Bosch Production system under this roof of I4.0 will definitely lead to disruptive improvements in terms of quality, cost and delivery, in other words higher competitiveness.
Industry 4.0 leads to clearly measurable benefits such as higher efficiency, easier inventory management and significant workload reduction through the intelligent and relevant application of specialized technology and smart automation. By this approach Bosch expects a further boost for growth.
Annual Report 2016-17 | Agility and customer centricity – shaping Bosch Limited’s future | 27

28 | Annual Report 2016-17 | Agility and customer centricity – shaping Bosch Limited’s future
The Bosch security camera that never misses a thing
Imagine a scenario where an unclaimed bag is left unattended in a warehouse. The bag contains a dangerous explosive device and the warehouse is run by one of the e-commerce giants in India. Traditional security cameras will simply record the footage of this bag within the warehouse, and nothing more. But with the help of an intelligent camera, which comes with inbuilt Bosch intelligent video analytics, the warehouse operator can receive a real-time alert about the situation and avoid a potentially dangerous situation.
Success story - Re-vision

Annual Report 2016-17 | Agility and customer centricity – shaping Bosch Limited’s future | 29
Sudhir Tiku, Regional Head, Bosch India Security Systems, understands the importance of security concerns for establishments of all sizes and knows that smart cameras form an integral part of the broader communications and surveillance spectrum. He divides the role of video surveillance systems into three key sections – to proactively combat against fraud and theft, to aid staff in the resolution of situational disputes, and to provide inputs that help understand consumer behavior better.
Securing commercial and retail establishments comes with a unique set of challenges and this is where Bosch India enters the picture with its expertise and effective video surveillance products. Led by Sudhir, the security technology team utilizes state-of-the-art Bosch cameras and creates a value proposition in the Indian market based on quality, solution approach and IP connectivity. The team is also intensifying the vision of making communication products in India and this initiative is witnessing sustainable progress.
Security cameras of the future never blink
Sudhir explains this scenario with an apt example – “A retail store usually requires a high-resolution camera that oversees the cashier. Other cameras spread across the store can also provide a bird’s eye view. However, there are always blind spots which can seriously undermine the reliability of even the most advanced video surveillance solution.”
This has been a traditional drawback with security cameras, and this is exactly the pain point that Sudhir and his team resolved with the range of intelligent ‘Bosch Panoramic Cameras’. These cameras do much more than just track and record movement. They collect data based on pattern analysis and then send it to operators in real-time for security that is close to unbreakable. They have 360-degree views, no blind spots and operate on central servers for images + intelligence.
One of these cameras is as good as four traditional ones, and for operators, this translates to greater ROI, reduced maintenance costs and enhanced security. Sudhir and his team soon realized that even though the price proposition for one of these smart cameras greatly exceeded a traditional security camera, this did not scare away customers. With the right tools, the team was able to communicate that the total cost of ownership of more cameras need not necessarily translate to better security or greater ROI.
Global security expertise with a local twist
Sudhir and his team conducted in-depth analysis and market research to deduce that the Indian consumer wants three things – high-quality, affordable products, and ease of use. Focusing on a localization strategy now drives a substantial part of the communications unit’s revenue and since its inception three years back, this program ensures that products are manufactured and released in an 8 months - 2 years timespan. The end result is that the standardized processes set in place ensure the Bosch quality stamp, deliver affordable localized options, and provide an ease of use that is customized for Indian users and context.
Sudhir is well-versed with the mindset of Indian customers and knows that they “are very demanding as they will ask for multiple demonstrations, conduct a lot of research and also want live on-site installations. We plan to launch 10-12 locally engineered products every year and the commercialization of these products has been a major boost for us. We are also building on the existing Bosch Security Training Academy program that is freely available for anyone to enroll via the Bosch website, and led to the completion of 78 successful programs last year.”
By building local products Bosch India is innovating security technology where it is needed the most and providing customers with efficient and cost-effective solutions for their current and upcoming security concerns.

Harnessing the power of ‘One Bosch’
At Bosch Limited, we hold the unshakeable belief that excellence is only possible by placing the customer at the heart of every developed solution. More often than not, this involves different teams across verticals working in collaboration to deliver an enhanced solution. Seamless synergy between teams from different domains is what drives us forward and has enabled us to gain expertise over our 90-year old history. Today’s customer is more knowledgeable and demanding than ever before, but in most cases, the solution that they demand is only a fraction of the full-extent of what they need. At Bosch, we pride ourselves on anticipating such needs before they arise, and meeting them to deliver cost savings, productivity and satisfaction for our customers. A leading example of this took place when a leading automotive manufacturer wanted to reduce its CO2 emissions by 10 percent. The result was a 57 percent reduction in energy consumption and 8.44 tonnes of annual CO2 reduction.
Success story - Collaborate
30 | Annual Report 2016-17 | Agility and customer centricity – shaping Bosch Limited’s future

Collaborating for success
It was business as usual for Sekhar Dharmavaram Desai, who was the key account holder of a premier automotive manufacturer within Bosch Limited. While attending a customer supplier meet in 2014, the Bosch veteran was alert to pick up on the increasing focus his customer had been giving to projects related to sustainability. Having previously attended several internal drives related to cross-selling, Desai was able to pitch for other businesses of the group in India. “We mapped the offerings that Bosch could offer from its business beyond mobility profile,” said Desai. After several rounds of internal discussion, the team was able to offer the customer a solution from its energy profile. Bringing his years of sales experience to the table, Desai further comments, “It is crucial for us to connect and understand the customer’s interest and his strategy well.” This may seem like plain old sales
rhetoric, but it did achieve the goal, for Desai and his team gained the buy-in and support of the customer’s top management. This set the ball rolling. “In fact, the customer’s team was very transparent and this gave us further insight into the energy conservation plans they had mapped out for the coming years,” said Nilesh Sawant, who led and delivered on this project from Bosch’s Energy Efficiency team. But then what success would that be, if it didn’t involve overcoming a few hiccups? Elaborating further, Desai, stated, “Convincing the customer to implement the heat pump solution was challenging.” After several rounds of technical discussions, the team finally agreed for a pilot project. “All we needed was a toe-hold. We were confident of our offering and the visible benefit it could offer,” said Nilesh. The results post the pilot project were beyond satisfying. The customer was motivated to further their
Annual Report 2016-17 | Agility and customer centricity – shaping Bosch Limited’s future | 31

discussion with Bosch Limited regarding energy savings. This included further deployment of the heat pump solution in areas such as the paint shop and powertrain, among others. “Cross-selling a unique opportunity for Bosch associates” - Ramachandran N
Over the past few years Bosch India’s management team has made concerted efforts to offer its customers full-fledged solutions. This is only possible if business units within the group think about
opportunities beyond their respective silos. “They need to zoom out and look at the macro picture,” says Ramachandran N, the coordinator for Bosch India’s cross-selling activities. As a facilitator, his key objective is to help units understand the goals and objectives of other verticals. Bringing ten legal entities (across India) on a single page to offer solutions as ‘One Bosch’ is no mean task.
Ramachandran opines, “Cross-selling is a unique opportunity for Bosch India’s associates. They have the opportunity to go beyond defined boundaries to learn,
32 | Annual Report 2016-17 | Agility and customer centricity – shaping Bosch Limited’s future

understand and contribute to the development of other businesses.” Take for instance, Desai, who believes that the cross-selling vision and targets gave him an opportunity to think and act differently.
‘One Bosch,’ - same quality across all offerings
Taking precautions against every possible risk, Nilesh and team had simulated data that could be demonstrated to the customer’s management. “We have a competent team onboard that brings
to the table experience and dynamism. Such a combination allows us to offer customers tailor-made solutions.”
“The breadth of our engineering expertise, our deep understanding of this market, coupled with the in-house talent that we nurture and our established processes truly make Bosch unique. All these factors build our value and give us that competitive edge,” remarks Desai.
Annual Report 2016-17 | Agility and customer centricity – shaping Bosch Limited’s future | 33

34 | Annual Report 2016-17 | Agility and customer centricity – shaping Bosch Limited’s future
In pursuit of skilling excellence

Annual Report 2016-17 | Agility and customer centricity – shaping Bosch Limited’s future | 35
Growth and development are knocking on the doors of a digitally enabled India. Every year over 10 million people come of age to work, but rarely do they find a job that excites and challenges them. Managing the aspirations of this young and restless brigade has become the foremost challenge. Building skills is necessary for India to sidestep the risk of stagnation. By ploughing into our homegrown resources, India will be able to create boundless opportunities for its people. With a net enrollment rate of 5.5 million students every year for its vocational courses, India has the arduous task of converting its demographic dividend into an opportunity. Its ability to do this will showcase the country as an exemplar among emerging and developed economies. Over a period of five years, the National Skill Development Center (NSDC) conducted a study which suggests that by 2022 India’s net requirement of manpower would be around 109.73 million. In view of this, the expectations from ‘Skill India’ (central government’s national initiative) has been rising with every passing quarter as the need for qualitative jobs emerges pan-India.
That said, we need to take a step back and put this entire scenario into perspective. While a pertinent issue is the creation of qualitative jobs, that seems like a very first world problem. We need to be realistic to first address issues at hand that are hindering our nation’s growth, such as the creation of an ample pool of skilled workers who can keep pace with the changing demands of the industry. As we take strides towards becoming the fastest growing economy in the world, among developed nations, this progress can only be sustained if we were to offer organizations access to a large pool of skilled workforce.
Skilling to create shared value Concerns related to skilling are deep rooted. Presently, the issue may seem limited to job generation and creation of skilled labor pool, however we must aim to address grass root problems such as
ensuring the availability of trainers. These trainers need to inspire and motivate the youth; they also bear the responsibility of imparting right values and lessons. At first, skilling may seem like a costly proposition that isn’t directly yielding much returns. For organizations operating in a society, such as Bosch which is built on the underpinning of great social equity, we have the moral responsibility of creating shared value. Vocational training can realize the dreams of having an equitable society We need to create value for our economy and that is only possible through mutual growth. For that, the private and the public sector need to join hands to firstly, address key societal issues and lastly, help with the implementation of new development approaches. Jobs associated with vocational training are usually associated with social stigma. The lesser emphasis given to vocational training results in a large number of people being engaged in low paying jobs, combination of factors such as these pose a danger to India’s national GDP. So it is imperative for stakeholders across both the private and public sector to jointly scale up existing skilling programs. National bodies need to ensure standardization of courses to give high practical content rather than outdated curriculum which is common on many occasions. Concerted efforts such as these should help convert our young talent into assets. Furthermore, corporates need to actively participate in industry and government-led skill development programs. Instead of starting from ground zero, we could work towards developing and evolving the existing skilling infrastructure to meet the dynamic demands of a volatility, uncertainty, complexity and ambiguity (VUCA) led world. A case in point is the adoption of the renowned German dual education system, which is widely viewed as the benchmark in vocational training. Bosch India has tailored this training to meet its local requirements.

Facing a severe shortage of well-trained, skilled workers, it is estimated that less than 5.0 percent of India’s workforce has undergone formal skill training. “We had a choice to look at it as a problem or convert it into an opportunity that would prove to be beneficial for the larger good,” says Lakshmanan R, deputy general manager, Bosch Vocational Center. The Center combines scale and quality of skilling efforts with speed and accuracy. This reimagined approach to learning has proven to be highly effective in filling the void as far as skilled or trained professionals is concerned.
Lakshmanan R
36 | Annual Report 2016-17 | Agility and customer centricity – shaping Bosch Limited’s future

Unlocking India’s latent potential through BRIDGE
Over five decades Bosch Limited has gained tremendous expertise in vocational training; after all we are home to India’s premier national skilling institute- Bosch Vocational Center (BVC). For long, the management has had the desire of extending the scope of its training expertise to benefit more people. Acting on this, in 2013, Bosch’s Response to India’s Development and Growth through Employability Enhancement (BRIDGE) was kick started.
BRIDGE focuses on school dropout youths to ensure their job readiness for India’s growing services sector. The program provides on-the-job training and 100 percent placement assistance. So far, over 7,500 youth have been trained and placed across India in more than 125 BRIDGE centers operating in either Government I.T.I.s or Private Higher Secondary Schools / Pre-University Colleges.
The intent of this program is to reshape the lives of this section of society, which is often overlooked,
through education. BRIDGE aims to unlock latent talent to provide India with a pool of high-skilled manpower. Re-visioning India’s resource mapping
Since the initiation of ‘Skill India,’ there has been considerable movement regarding skilling and vocational training. While much of this activity was centered around fund allocation, as industry leaders we possess knowledge across several domains that must be put to use. As the world comes to grip with the ever changing dynamics of power, technological advancement and sustainability challenges, we at Bosch Limited strongly vouch for regional successes to be built on the back of local resources. With a population of over a billion people, India is the only country accounting for such a huge section of youth. We are a nation that is powered by their intellect, enthusiasm and imagination, so the onus of channelizing their energy and making a success out of them is in our hands.
Annual Report 2016-17 | Agility and customer centricity – shaping Bosch Limited’s future | 37

38 | Directors' Report including Managment Discussion and Analysis | Annual Report 2016-17
Directors’ Report including Management Discussion and Analysis
The Directors have pleasure in presenting the SIXTY FIFTH Annual Report together with the Audited Financial Statements for the Financial Year ended March 31, 2017.
1. Financial Results
Attention of the members is drawn to the notification dated February 16, 2015, issued by the Ministry of Corporate Affairs relating to the Companies (Indian Accounting Standards) Rules, 2015. Pursuant to the said notification, the Company has adopted Indian Accounting Standards (Ind AS) with effect from the year under review. Consequently, the financial statements for the previous year (FY 15-16) have been reinstated as per Ind AS to facilitate a like-to-like comparison.
(` Million)
2016-17 2015-16*
Sale of products (including excise duty)
107,500 100,130
Of which Export Sales 8,240 8,712
Profit Before Tax (from Continuing Operations)
20,944 20,824
Provision for tax (6,503) (5,701)
Profit After Tax from Continuing Operations 14,441 15,123
from Discontinued Operations
2,970 191
Total 17,411 15,314
Other comprehensive income - net of tax
1,401 (825)
Total comprehensive income
18,812 14,489
* Re-stated on account of sale of the Starter Motors and Generators business with effect from August 01, 2016 and adoption of Ind AS.
The Company does not propose to transfer any amount to its Reserves for the year under review.
2. Dividend
Pursuant to the requirements of the regulation 43A of SEBI (Listing Obligations and Disclosure Requirements) Regulations, 2015, the Company has adopted a Dividend Distribution Policy. This Policy is uploaded on the website and can be accessed at http://www.boschindia.com/media/in/documents/our_company_1/shareholder_information_1/2017_2/Bosch_Limited_-_Dividend_Distribution_Policy.pdf This policy is enclosed as Annexure 'A' (Page No. 56) to this Report.
The Board of Directors declared a Special Dividend of INR 75 per equity share aggregating to Mio INR 2,755 including Dividend Distribution Tax, on account of consideration received from sale of the Starter Motors and Generators business. The Special Dividend was paid in the month of February 2017.
In line with the Dividend Distribution Policy, the Board has recommended a Final Dividend of INR 90 per share for the Financial Year 2016-17, aggregating to Mio INR 3,306 including Dividend Distribution Tax. The dividend payout ratio (excluding Special Dividend) is approximately 22.9 percent, based on the profits as per Ind AS. The Final Dividend is subject to the approval of the shareholders at the forthcoming Annual General Meeting.
3. Management Discussion and Analysis
In order to avoid duplication between the Directors’ Report and Management Discussion and Analysis, a composite summary of the Company’s performance and various business segments is given below:
3.1 Economic Scenario
3.1.1 Global Economy
The global GDP was in line with expectations at around 3.1 percent. Economic activity in advanced economies and emerging economies is projected to accelerate leading to a global GDP estimate of 3.4 percent in 2017. [Source: IMF]
Among advanced economies, activity rebounded strongly in the USA during the second half of 2016 and witnessed an increase in employment numbers. The economic output remained below potential in a number of other advanced economies including the European Union. In 2016, Japan witnessed a higher than expected growth rate.
Long-term interest rates increased in advanced economies in the second half of 2016 as central banks started focusing on inflation. Crude oil and commodity prices recovered in 2016 after touching a low, on the back of strong infrastructure investment in China and on expectations of fiscal easing in the USA.
3.1.2 Indian Economy
GDP growth is projected to be around 7 percent for 2016-17 as compared to 7.9 percent in 2015-16. It was an eventful year and some of the key events were passage of important legislations including GST, demonetization, ban by Supreme Court on sale of BS III vehicles, etc.
Political stability provided a sound background for the Indian economy and interest rates gradually

Annual Report 2016-17 | Directors' Report including Managment Discussion and Analysis | 39
fell through the year as growth was supported by Government’s capex spending and efficiency improvements. But weakness in the banking sector, signaled by the continuing trend of bad loans affected credit offtake. Uneven distribution of rainfall and a slight deficit could not boost agricultural output as expected.
Foreign investment in India continued to remain buoyant and capital flows ensured that the currency was stable. This was also aided by a moderate growth in exports. The effects of demonetization and the subsequent remonetization are still not clear though the economy seems to have moved beyond this uncertainty. On the monetary policy front though there were signs of growth slowing down, the central bank moved away from an accommodative stance to a neutral stance because of its commitment to an inflation-targeting framework.
The broad indicators for the Indian economy like fiscal deficit, current account deficit and inflation looks to be under control. However, the pickup in growth momentum is yet to be witnessed on ground.
3.2 Industry Structure and Development
Automotive:
In 2016-17, Passenger Vehicle production grew by 11 percent driven by improved market sentiments, favorable fuel prices, easy availability of finance, continued economic revival, increased disposable income and new launches.
Heavy Commercial Vehicles (HCVs) production posted subdued growth of 2 percent impacted by lower fleet expansion, demonetization and emission changeover.
The Light Commercial Vehicles (LCVs) market grew by 6 percent mainly driven by infrastructure and e-Commerce growth along with increased rural demand.
The Tractor market grew by 21 percent favored by a good monsoon and positive farmer sentiments.
Three-wheelers production declined by 16 percent due to muted domestic demand and weakening export demand.
Vehicle Production Growth Rates:
Production +/(-) PY
Segment FY 11-12 FY 12-13 FY 13-14 FY 14-15 FY 15-16 FY 16-17
HCV 12% -26% -20% 26% 23% 2%
LCV 28% 5% -14% -10% 3% 6%
Car +UV 4% 3% -4% 6% 6% 11%
3 Wheeler 10% -4% -1% 14% -2% -16%
Tractor 15% -8% 22% -13% -8% 21%
TOTAL 9% -1% -3% 4% 4% 7%
Non-Automotive:
Considering the new positive thrust to the Indian infrastructure and manufacturing sectors, and a slew of government initiatives like ‘Make in India’ and ‘Skill India’, the power tool market witnessed a considerable growth. However, the do-it-yourself (DIY) segment in power tool is yet to be developed. Unlike the developed nations, the DIY segment is still at a nascent stage in the emerging markets including India.
While pockets of opportunities for growth in security technology industry exist, the space is getting competitive and price sensitive. With the advent of embedded applications in security products, surveillance is now emerging as a tool for gathering business intelligence. The addition of video analytics software to the surveillance solutions is enabling businesses to garner deeper insights into their existing operations.
As value for money continues to characterize the packaging market, packaging solutions have to be innovative and cost efficient. The packaging equipment industry continues to ride on the growth of consumer demand, aided by increasing disposable income with low inflation. Despite a growing market for packaged items, the packaging equipment industry is highly unorganized, comprising several small players, each accounting for a two to five per cent market share. With China and India together projected to account for 21 percent of the global packaging machinery demand by 2020, localization is slated to become a major driver to capture the Indian Packaging market.
The renewable energy sector in India is growing rapidly indicating strong financial prospects. Investments in solar sector are expected to surpass coal by 2019-20, with USD 35 billion committed by global players. At the end of the year under review, India crossed 12.2 GW of cumulative solar installations and still has a way to go to achieve the ambitious target of 100 GW by 2022. Further, India has plans to add 5 GW of rooftop solar and 10 GW from large-scale solar power projects in the current fiscal year. India has a bright opportunity to reshape its energy mix. Social and economic growth are at the top of the Government’s agenda, and new energy sources to serve this demand are increasingly coming from renewable energy.
3.3 Business and segment wise performance
The overall performance of the Company witnessed a growth of 7.6 percent. Mobility business (Automotive) posted a growth of 5.9 percent, while the Business beyond mobility (Non-Automotive)

40 | Directors' Report including Managment Discussion and Analysis | Annual Report 2016-17
grew by 16.8 percent. Domestic mobility business witnessed an increase of 7.4 percent, largely because of rise in sale of diesel and gasoline products, marginally higher than the automotive market growth of 7.0 percent.
The Company predominantly operates in manufacturing and trading of mobility solutions, which constituted 85.5 percent of total sales for the Financial Year 2016-17. The Business beyond mobility, comprising of Industrial Technology, Consumer Goods and Energy and Building Technology, had a share of 14.5 percent. Hence, the operating segment consists of “Mobility Solutions” (Automotive Products) and “Business beyond mobility” (Others).
3.3.1 Operating Segment
Mobility Solutions: -
Diesel Systems
The Diesel Systems division is a systems supplier of key powertrain components. The division offers an extensive range of energy efficient, eco-friendly diesel injection systems for applications ranging from passenger cars and all kinds of commercial vehicles and agricultural equipments to large-scale industrial power-generation units. It focuses primarily on the common-rail system, which comprises of a high-pressure injection pump, the rail and various injectors.
The Diesel Systems business grew by 1.9 percent over the previous year. Higher sales volume of new generation Common Rail Systems (CRS) led to this increase. The Diesel Systems business will continue to ride on new generation CRS in the majority of vehicle segments for future growth. The growth in conventional products such as in-line pumps and conventional injectors may witness some slowdown with nation-wide implementation of BSIV with effect from April 01, 2017, and eventually decline with the country-wide implementation of BSVI.
Automotive Aftermarket
The Automotive Aftermarket division offers a comprehensive range of spare parts for passenger
cars, commercial vehicles and 2 Wheelers for the after sales market and repair solutions including diagnostic and repair-shop solutions. The product portfolio consists of Bosch original-equipment products, as well as products and services developed and manufactured in-house for the spare parts market i.e., Filters and Spark Plugs.
The Company’s Automotive Aftermarket division is the largest Independent Aftermarket (IAM) network in India. It witnessed a muted growth of 0.3 percent due to tough liquidity conditions and the negative, initial impact of "Demonetization".
Automotive Aftermarket completed first ever Go-to-Bosch Service (GO2BS) activity, where many Bosch Diesel Service Customers were contacted in a span of 10 days resulting in an increase in secondary sales. Mega GO2BS was completed in November 2016 in which about 5,000 customers were contacted and approximately 3,782 contacts successfully established.
Gasoline Systems
The Gasoline Systems division develops and manufactures innovative technologies for internal-combustion engines powered by gasoline as well as systems and components for two-wheelers. These include fuel supply systems, fuel injection systems, accelerated pedal modules and sensors. In addition, it also has a substantial portion of revenue from trading in certain kinds of sensors, connectors and electric control units.
During the year under review, Gasoline Systems grew by 21.0 percent over previous year, mainly on account of new launches resulting in increased market share in the passenger car market. New technological acquisitions made during the year will accelerate the division’s growth in the coming years.
The share of domestic sales in the total sales of the mobility solutions increased to 92.7 percent from 91.6 percent in the previous year.
Business beyond Mobility
The Business beyond Mobility grew by 16.8 percent. It was driven predominantly by domestic sales with a
Diesel system - Common Rail System

Annual Report 2016-17 | Directors' Report including Managment Discussion and Analysis | 41
share of 89.5 percent, while exports contributed 10.5 percent.
Industrial Technology - Packaging Technology
The Packaging Technology India is a provider of packaging solutions for the food and confectionery industries. The range includes individual machines, system solutions including secondary packaging and a comprehensive service portfolio.
Packaging Technology division witnessed a growth of 11.3 percent. During the year under review, the Company successfully introduced its first lot of secondary packaging machines. The secondary packaging business has good market potential and its introduction can help in gaining early mover advantage. Good orders were received for Horizontal Form, Fill and Seal (HFFS) packaging machines during the year under review.
Consumer Goods - Power Tools
The Power Tools business comprising of Electric tools, Accessories, measuring instruments and spare parts for Power Tools witnessed a decent growth of 11.6 percent in a challenging economy. The core business of tools achieved growth largely due to
enhanced mass market access supported by channel expansion to Tier 3 and Tier 4 markets. Launch of a new range of more affordable products designed to meet the needs of users in line with the strategy of “ZERO DISTANCE TO USER” also supported the core tool business. E-commerce and the Hardware channels have also emerged as important contributors to the overall business.
Energy and Building Technology (Security Technology, Bosch Energy & Building Solutions and Thermo-technology)
Security Technology
The Security Technology division offers innovative products and solutions in the field of security and communications, principally for commercial applications. The product portfolio encompasses video-surveillance, intrusion-detection, fire-detection, and voice-alarm systems, as well as access-control and building management systems and professional audio and conference systems.
The Security Technology business achieved a growth of 23.0 percent, driven by orders in the Verticals of Transportation, Energy and Commercial Industry. Trend-setting products like the new range of IP
`
GSV 4800 - Baling Machine
Product segment from Bosch Power Tools India
One stop shop for all safety, security and communication systems.

42 | Directors' Report including Managment Discussion and Analysis | Annual Report 2016-17
Cameras, Wired Conference System, Loudspeakers, Video Fire Detection and Microphones introduced during the year were well received.
Bosch Energy & Building Solutions: -
The division’s revenues grew by 92.3 percent over the previous year with a significant growth seen in Solar Photovoltaic (PV) and Energy Efficiency segments. The Solar PV segment saw 100 percent increase in its installed capacity, albeit on a low base.
The energy efficiency business has made its mark in the market with new solutions being developed for energy starved commercial and industrial sectors like healthcare, dairy and textiles while continuing to leverage on the brand capital built in the secondary steel and automotive sectors.
The Solar PV Projects business has continued to leverage on the high market growth rates, acquiring projects in new and diverse customer segments ranging from educational institutions to seaports, including an additional 14MW capacity at the Cochin International Airport. In December 2016, the division commissioned a land mark solar PV project (4 MW) at the New Mangalore Port Trust, reinforcing its commitment of delivering world-class designed and engineered solar PV projects in India. In addition to CAPEX model, the division is also active in OPEX model projects based on customer requirements.
Thermo-technology
The Division’s product portfolio includes heaters, solar thermal systems, heat pumps and industrial boilers.
The year under review was tough for the division on account of intense competition from China.
This resulted in low growth of Solar Water heaters and boilers in India. The Company continues to explore other business opportunities including Air Conditioner business.
3.3.2 Revenue by geographical area
Domestic sales of the Company registered a growth of 8.6 percent. Share of domestic sales in the total sales increased by 1.0 percentage point to 92.3 percent from 91.3 percent in the previous year. The Company’s exports, bulk of which were to Germany, China and Brazil, fell by 5.4 percent. The share of exports in the total sales declined by 1.0 percentage point to 7.7 percent over previous year.
3.4 Financial Performance and Condition
Sale of products
Sale of products grew by 7.4 percent over previous year and stood at Mio INR 107,500. This growth is mainly driven by business beyond mobility which grew by 16.8 percent over previous year.
Sale of services
Sale of services registered a growth of 17.2 percent over previous year, mainly contributed by increase in development receipts on customer projects.
Other operating revenue
Other operating revenue at Mio INR 2,592, increased by 12.8 percent over the previous year, mainly contributed by increased rental income from leasing of office spaces to group entities.
Other income
Other income increased by 2.3 percent over the previous year.
4 MW solar power plant for New Mangalore Port Trust (NMPT)

Annual Report 2016-17 | Directors' Report including Managment Discussion and Analysis | 43
Income from net gain on financial assets measured at Fair Value through Profit and Loss (FVTPL) was at Mio INR 3,172 for the year under review as against Mio INR 2,450 in previous year.
Income from interest on bank and inter-company deposits fell by 20.4 percent due to lower asset base and reduced interest rates.
Cost of materials consumed
The cost of materials consumed as a percentage of sales marginally improved to 48.3 percent as compared to previous year of 48.7 percent, through various cost reductions projects implemented by the Company to offset the price increase.
Personnel cost
Personnel cost as a percentage of sales declined to 12.2 percent compared to 12.8 percent during the previous year. This was possible due to continuous productivity improvement measures to offset inflationary increments.
The Company continues to focus on rationalizing its workforce based on its business needs in a fair manner, while sustaining productivity and competence.
Depreciation and amortization
The depreciation charge for the year under review was Mio INR 4,562 as against Mio INR 3,864 during the previous year ended on March 31, 2016. The addition of fixed asset is mainly on account of expansion of new generation products at our facilities in Bidadi and other locations.
Provision for Tax
Income tax expenses for the year under review is higher by 14.1 percent due to deferred tax credit in the previous year.
Profit After Tax (PAT)
PAT for the Financial Year 2016-17 at Mio INR 14,441, 4.5 percent lower than previous year due to higher tax expenses as above.
Other Comprehensive Income
The investment in equity securities is classified as financial assets through other comprehensive income as per the requirements of Ind AS 109. The changes in fair value of equity securities is recognized under other compressive income. Accordingly, the impact of Mio INR 1,401 during the year under review is mainly contributed by increase in fair value of those investments.
Earnings per Share (EPS)
EPS (basic and diluted) of the Company (including discontinued operations) for Financial Year 2016-17 was INR 560.9 per share.
Share capital
The Company has bought back 878,160 Equity Shares during the year under review. As on March 31, 2017, the Authorised Share Capital comprises of 38,051,460 Equity Shares of INR 10 each. The issued, subscribed and paid-up capital is Mio INR 305.21 divided into 30,520,740 equity shares of INR 10 each.
Reserves & Surplus
Reserves & Surplus as on March 31, 2017 stood at Mio INR 81,729 which includes retained profit for the year under review of Mio INR 11,335 after considering the outflow on account of special dividend of INR 75 per share.
Other Reserve
The increase in Other Reserve from Mio INR 4,452 to Mio INR 5,962 is contributed by change in the fair value of equity instruments valued in line with Ind AS.
Shareholders’ fundThe total shareholder funds decreased to Mio INR 87,996 as on March 31, 2017 from Mio INR 95,349 as on March 31, 2016. Reduction is mainly due to buy-back of shares offset by profit for the year under review.
Fixed assets – capital expenditureThe gross fixed asset value as on March 31, 2017 was Mio INR 13,194 (tangible: Mio INR 13,194 and intangible: Nil) compared to Mio INR 11,487 (tangible: Mio INR 11,487 and intangible: Nil) as on March 31, 2016.
The Company incurred a capital expenditure of Mio INR 6,342 during the year under review in addition to Mio INR 5,982 invested during previous year.
Major investments were made towards development of new products and facilities in Bidadi and Nashik. Net value of assets transferred on carving out of Starter Motors and Generators business is Mio INR 311.
InvestmentsSurplus funds not required for immediate operational needs were invested prudently in tax-effective low-risk instruments. The total investments (excluding investment in property) as on March 31, 2017 was Mio INR 39,090 as against Mio INR 44,319 as on March 31, 2016.
Working capital
InventoriesInventory as on March 31, 2017 decreased by 0.9 percent to Mio INR 11,804 from Mio INR 11,915 as on March 31, 2016 despite increase in sales, reflecting reduction in inventory coverage days.

44 | Directors' Report including Managment Discussion and Analysis | Annual Report 2016-17
Trade receivablesDespite increased turnover, Trade receivables as on March 31, 2017 decreased to Mio INR 11,862 as against Mio INR 13,225 as on March 31, 2016.
Cash and Bank balancesThe total cash and bank balances as on March 31, 2017 was Mio INR 17,176, including cash and cash equivalent of Mio INR 1,312, compared to Mio INR 18,315, including cash and cash equivalent of Mio INR 985 as on March 31, 2016.
Ratio 2016-17 2015-16
Return On Capital Employed (ROCE) (percent)
20.1% 17.9%
Inventory Turnover ratio (in days) 40 45
Trade Receivable Turnover ratio (in days)
43 46
Current Ratio 1.9 2.0
Number of Days in Working Capital (days)
80 82
No. of Employees (average) 9,704 10,067
3.5 Human Resource Development and Industrial Relations
Human Resource Development
During the year under review, Human Resources (HR) continued its transformation initiatives, in a volatile and uncertain business environment, to cater to the organizational requirements.
HR continued its catalyst role and enabled the process of change over to global tools to focus on personnel planning for mid and long term.
The Company continued its efforts to foster and drive younger generation towards future leadership. The Company was again recognized at the National competition for Young Managers 2016 conducted by the All India Management Association with the Company bagging the national level award.
The Company, through its Integrated Talent Management initiatives, continued to enable learning, networking and collaboration by emphasizing on cross entity movement between different Bosch legal entities enabling holistic development and encouraging integration across different entities / locations.
Industrial Relations (Employee Relations)
Industrial Relations in all plants generally remained cordial during the year under review. Transitioning from ‘Industrial Relations’ to ‘Employee Relations’, a more focused approach on increased Employee Engagement and increased collaboration between various plants, corporate departments and amongst all level of employees has been adopted.
During the year under review, a mutually amicable agreement was concluded with ex-temporary workmen at the Bengaluru Plant with support of the Government of Karnataka.
The Company, during the first week of May 2017, successfully concluded the long-term settlement with the Associates of the Jaipur Plant to take effect from June 01, 2017 for a period of 4 years, in an amicable and fair manner, with support of the Government of Rajasthan.
As on the date of this report, talks over the long term settlements are on-going at the manufacturing facilities situated at Bengaluru, Nashik and Naganathapura. The Company continues to deal with the said matters in a fair and firm manner.
During the year under review, several new initiatives such as Introduction of Grievance policy, increase connect with Government and statutory bodies, Engagement calendar, Compliance checklist, self-audits and cross audits, etc. were taken.
3.6 Internal Audit and Internal Financial ControlsThe Company has an Internal Audit function. The Internal Audit Department evaluates the efficacy and adequacy of internal control system, its compliance with operating systems and policies of the Company at all locations of the Company. Based on the report of internal audit function, process owners undertake corrective action in their respective areas and thereby strengthen the controls. Significant audit observations and corrective actions thereon are presented to the Audit Committee.
The Company has an effective and reliable internal financial control system commensurate with the nature of its business, size and complexity of its operations. The internal financial control system provides for well-documented policies and procedures that are aligned with Bosch global standards and processes, adhere to local statutory requirements for orderly and efficient conduct of business, safeguarding of assets, detection and prevention of frauds and errors, adequacy and completeness of accounting records and timely preparation of reliable financial information. This also identifies opportunities for improvement and ensure good practices imbibed in the processes that develop and strengthen the Internal financial control systems and enhance the reliability of company’s financial statements.
The efficacy of the internal checks and control systems is validated by self-audits and verified by internal as well as statutory auditors.
The Audit Committee reviews the internal audit plan, adequacy and effectiveness of the internal control system, significant audit observations and monitors the sustainability of remedial measures. It also reviews functioning of the Whistle Blower mechanism and reviews the action taken on the cases reported.

Annual Report 2016-17 | Directors' Report including Managment Discussion and Analysis | 45
3.7 Opportunities and Threats
The new government policies like smart cities will help the Company to offer solutions like surveillance cameras, power tools for infrastructure activities. Anticipated scrappage policy which is being talked about will give boost for the auto industry when enacted. Landmark GST legislation is expected to have long term positive effect after some initial hiccups.
The direct transition to BS VI from BS IV, skipping BS V is challenging and has associated risks. India will be the first country to skip one level of emission legislation and will move from BS IV to BS VI in three years, a time typically taken for one step.
Due to the strong local development and application team supported by the international development network, the Company is ready to support OEMs for timely introduction of BS VI and is working closely with customers to define the strategy to achieve BS VI norms.
BS VI is also expected to change the market mix of diesel and petrol vehicles.
In general, the demand in the automotive sector may slow down in case of slackness in the implementation of infrastructure projects. Apart from the intensified competition, which puts pressure on selling prices, any runaway increase in input costs may affect the profitability of the Company.
As regards the Business beyond Mobility, the Company’s presence across multiple businesses (industrial technology, consumer goods and energy and building solutions) enables synergies for tapping the existing and prospective customer base with integrated solutions.
3.8 Risks and Concerns
The Company follows a specific, well-defined risk management process that is integrated with operations for identification, categorization and prioritization of operational, financial and strategic business risks. Across the organization, there are teams responsible for the management and mitigation of risks.
The Risk Management Committee headed by Mr. Soumitra Bhattacharya, Managing Director, reviews the effectiveness of the process at regular intervals.
Following are the major risks and mitigation measures:
1. Shift to BS VI: The jump from BS IV to BS VI in a short span of about 3 years, the pace of change and the short time duration for preparedness are challenging. Even though the Company is ready with BS VI compliant technology, it is yet to be proven under Indian conditions (due to constraints such as availability of fuel for testing). Further, there could
be an adverse financial impact due to BS VI products which are largely based on imports and have low replacement requirements in the Aftermarket.
The Company is currently working on project acquisitions and measures are being put in place to minimize the financial impact.
2. Competition: The Company operates in a highly competitive environment and some customers have started adopting de-risking strategies to maintain more than one source for a product. Further, new competitors have entered the market with new or similar products. Spurious parts and cheap imitations continue to put pressure on existing market shares, primarily for Automotive Aftermarket and Power Tools.
Respective business unit teams undertake a comprehensive competitor analysis periodically to evaluate competitors’ strategies vis-a-vis, our own products and services and define our counter strategic and marketing plans.
3. Industrial Relations (IR): IR-related risks continue on account of surplus capacity at our Diesel systems plants and uncertain result of settlement negotiations. They include possible risks arising from stoppage of production and/or leading to unpredictable cost structure and/or possible lay-off.
As part of capability building initiative, the Company has conducted special trainings on Employee Relations and adding value to front line leadership development in the plant.
4. Heavily auto sector dependent: Around 85 percent of the business is dependent on the auto sector. Performance of the Company, therefore, is highly dependent on the sector’s growth.
5. Regulatory Framework: The recent Supreme Court order banning sale and registration of BS-III vehicles with effect from April 01, 2017, impacted the automotive industry. Such uncertain regulatory environment is a challenge to the mid and long term business plans of the industry. The Company, has proactively taken steps to mitigate the risk in a socio-environmentally responsible manner.
6. Economy:Global Geopolitical Scenario: The Company is operating in a global environment and continues to be mildly impacted by geopolitical changes such as Brexit and US elections.
GST: While GST is a welcome change, seamless implementation of GST in the country at least in the beginning could be a risk. It is expected to have a short-term negative impact during the rollout but a long-term positive impact. The Company has set up a strong task force to oversee and ensure a smooth transition to GST implementation.

46 | Directors' Report including Managment Discussion and Analysis | Annual Report 2016-17
3.9 Outlook
The trickle-down effect of the positive sentiment seen in macro-economic indicators and financial markets is yet to be seen prominently in the real economy. With the stable Government in place and reforms like GST being implemented, India could achieve a 7 percent plus GDP growth rate in 2017-18.
The Company expects a moderate growth in the automotive industry in 2017-18, with a continued strong upward trend in passenger cars and muted growth in HCV. This is supported by improved market sentiments, pickup in economic indicators, pent-up demand, new launches and political stability.
The Non-Automotive segment is expected to perform well due to India’s robust economic growth, rising household incomes and increase in consumer spending. The Company plans to expand its market share through revamping its distribution strategy and further developing the retail and e-tail channels in the consumer business.
The Company will continue to invest to meet the demands of the market.
4. Manufacturing Facilities
4.1 Bengaluru (Karnataka)
The Bengaluru plant, with an eminent history of six decades, presently houses the manufacturing of Multi-cylinder pumps & Single-cylinder pumps.
The Plant, following a systematic approach of ‘Continuous Improvement’, is in the process of transforming itself from ‘Fit for Future’ to ‘We Shape the Future’, its new vision statement.
Relocation from Bengaluru to Bidadi, which started in February 2015, has been one of the major strategic actions for the year under review and will continue in the current year. The Plant has adopted a focused and proactive approach to meet the customer demands on account of change in emission norms from BS III to BS IV and thereafter to BS VI. The relocation to the Bidadi facilities is expected to be completed by early 2019.
4.2 Bidadi (Karnataka)
The Bidadi Plant, which manufactures Common Rail Pumps and components, strives to remain lean and agile by improvising on productivity using Industry 4.0 solutions, an enabler of manufacturing excellence.
The Plant undertook various CSR activities like Health camp for women and children, School renovation, RO-drinking water facility in and around its location along with Bidadi Industrial Association which were well appreciated.
During the year under review, the plant successfully installed and commissioned a 3.5 MW solar power plant resulting in carbon dioxide reduction by 10 tons/day.
4.3 Nashik (Maharashtra)
The Nashik Plant, which manufactures diesel injectors and components, achieved a production milestone of 20th million Common Rail Injector in 2016. During the year under review, the Plant successfully ramped up CR 2-20 body production to cater to the export demand of CKD. Further, investments were made for capacity expansion of new generation products and installation of new coating equipment.
As an eco-friendly measure, 10 MW capacity Solar Power Plant has been installed, resulting in carbon dioxide reduction by 32 tons/day.
4.4 Jaipur (Rajasthan)
The Jaipur Plant produces Distributor (VE) Mechanical and Electronic Diesel Control Pumps which are used in Light and Heavy Commercial Vehicles, Sports and Multi-Utility Vehicles (MUV) and tractors. Manufacturing of Conventional Injectors (NHA), which are used in Light and Heavy Commercial Vehicles, Locomotives, Tractors and Gensets, is being relocated from the Nashik Plant to Jaipur.
Growth in the domestic LCV and MUV markets resulted in good turnover despite slight contraction in OE volumes due to demonetization in last quarter of 2016. The BS III to BS IV Emission Norm changeover with effect from April 01, 2017 resulted in higher demands for VE pumps towards the end of the last quarter of the year under review. The Plant successfully met the customer demands and achieved Zero obsolescence of pumps with 100 percent delivery fulfillment.
During the year under review, the plant implemented various cost-reduction measures across the value chain.
4.5 Naganathapura (Karnataka)
The Naganathapura Plant produces Spark Plugs, a product produced by the Bosch group for over a century. The year under review witnessed an increase in the turnover mainly due to higher demand from OE and Independent Aftermarket segments.
Focusing on improving cost competitiveness, productivity improvement projects were implemented along with safety and quality improvement programs.
4.6 Verna (Goa)
During the year under review, Verna plant opened account in secondary packaging product line with the first sale of Baling Machine (GSV 4800). The Plant, with focused approach, continued its efforts to innovate and develop new products. Verna plant also celebrated successful 20 years of Bosch Packaging Technology in India with an ‘in-house show’ which was a well-attended and appreciated event.
4.7 Gangaikondan (Tamil Nadu)
Situated at Tirunelveli, Tamil Nadu with a 6,200 sq. meters of built up area, the state-of-the-art

Annual Report 2016-17 | Directors' Report including Managment Discussion and Analysis | 47
Gangaikondan plant is the only Gasoline Systems plant in India catering to the needs of growing Gasoline automobile market (both four and two wheelers) in India.
The Plant mainly produces Power Train Sensor products, Air Management products, Fuel supply products, Fuel Injection products for Gasoline vehicles. Effective utilization of production lines ensures that the Plant is ready to face higher demands.
The Plant has installed 40KW solar energy panels to harness solar power and reduce dependency on conventional electric supply.
4.8 Chennai (Tamil Nadu)
The Power Tools facility admeasuring approximately 8,500 sq. meters is located at Indospace Industrial Park, Orgadam, Tamil Nadu. At present, the facility caters mainly to the Indian and SAARC markets. It primarily manufactures Small Angle grinders, Large Angle grinders, Marble cutters, Blowers, Drills and two-kg Hammers, along with their motors.
5. Information Technology (IT)
For GST preparedness, IT projects were rolled out for making the Regional SAP system GST compliant. Pre-readiness check and necessary upgrades have been completed in July 2016. Further upgradations are being made to the Regional SAP system to meet the GST go-live date.
6. Change Initiatives
6.1 Continuous Improvement Process (CIP)
Considering the potential for further improvement in CIP practices at the Company to foster a culture of process orientation and problem solving, a project was undertaken for defining CIP road map by end 2018 and for its structured deployment and review by Senior Leadership. This project has supported in considerable improvement in various Key Performance Indicators (KPIs) e.g. Number of Implemented Suggestions per Employee, Savings from CIP Activities, Number of CIP Workshops, No. of VSDIA (Value Stream Design in Indirect Areas) Projects, Key CIP Competencies, Processing Time per Suggestion, etc. with involvement of associates across.
6.2 Bosch Production System (BPS)
To augment the BPS Vision “Competitive Products from Agile and Sustainable Waste-free Supply Chain”, BPS principles have been deployed to interface ‘Source – Make – Deliver’. Using the ‘Pull principle’ improvements have been on “People, Process and Products”. During the year under review, the Company focused on “Lead from the Front” for Plant Managers through mentoring by Bosch BPS Experts. These initiatives led to streamlining of the process in the Value stream and has yielded sustained results like increase in productivity, first pass yield and reduction in throughput time and inventories.
7. Business Excellence
Striving for Excellence is one of the ‘Strategic focal points’ in our mission statement ‘We are Bosch’. The thrust on Business Excellence is predominantly visible in the Diesel Systems business locations in India.
As excellence is a comparative and improvement oriented journey, many initiatives have been taken up to bring in a culture of ‘Outside-in’ with aspects of learning good practices and benchmarking with other organizations in a structured way. Agility as a theme is one of the key focal points for this year at Diesel Systems division in order to transform ourselves towards an ‘Agile Organization’. Agility is being fostered at individual, team and division levels. With visible success in Diesel Systems divisions, Business excellence concepts are now being used across other divisions.
8. Awards and Recognition
During the year under review, the Company won several awards for excellence. Few such awards are:
Award for Business Excellence 2016 – Jaipur Plant
Practices Competition Award – Bengaluru Plant
Excellent Energy Efficient Unit - Nashik Plant
performance” by CSR World Congress
Talent - Bengaluru Plant
Limited Vendor Conference 2016
Mahindra Limited
Greaves
India
SML Isuzu Limited
India
Engines Limited

48 | Directors' Report including Managment Discussion and Analysis | Annual Report 2016-17
9. Directors and Key Managerial Personnel
9.1 Director Retiring by RotationMr. Peter Tyroller retires by rotation at the forthcoming Annual General Meeting, and being eligible, offers himself for re-election at the said Meeting of the Company.
9.2 Changes in the Board and Key Managerial Personnel
9.2.1 Board
Dr. Steffen Berns who was re-appointed as the Managing Director of the Company for a period of 2 years at the 64th Annual General Meeting, resigned as Director and Managing Director with effect from close of business hours on December 31, 2016 upon assuming responsibility as President – Car Multimedia business with Robert Bosch, Germany. The Board places on record its sincere appreciation for contribution made and leadership provided by Dr. Berns during his tenure as the Managing Director of the Company.
Consequent to Dr. Berns returning to Germany, Mr. Soumitra Bhattacharya who was re-appointed as Joint Managing Director for the period January 01, 2017 to June 30, 2020 was re-designated as Managing Director for the said term.
Pursuant to changes at the Senior Management level, Dr. Andreas Wolf was appointed as Joint Managing Director for the period January 01, 2017 to February 28, 2019.
Mr. Jan Oliver Röhrl, who joined the Company as Executive Vice-President (Engineering) & Regional President (Diesel Systems) was appointed as Alternate Director to Mr. Peter Tyroller in place of Dr. Andreas Wolf. Mr. Röhrl, by virtue of being in employment of the Company has been placed in position of a Whole-time Director. The Board of Directors, therefore, approved his appointment as Whole-time Director from February 11, 2017 to December 31, 2020, subject to the approval of Central Government and shareholders.
Approval of the members for the aforementioned re-designation and appointments is being sought at the forthcoming 65th Annual General Meeting. Brief profiles of Mr. Peter Tyroller, Mr. Soumitra Bhattacharya, Dr. Andreas Wolf and Mr. Jan Oliver Röhrl forms a part of the Notice convening the 65th Annual General Meeting.
9.2.2 Key Managerial PersonnelThe Board of Directors, on recommendation of the Nomination and Remuneration Committee, appointed Mr. S Karthik as Joint Chief Financial Officer (Joint CFO) of the Company with effect from February 11, 2017.
Consequent to his appointment as the Joint CFO, Mr. S Karthik relinquished his position as the Company Secretary and Compliance Officer.
Mr. R Vijay was appointed as the Company Secretary of the Company with effect from February 11, 2017
As on the date of this report, the following are the Key Managerial Personnel of the Company:
Mr. Soumitra Bhattacharya (Managing Director & Chief Financial Officer)
Dr. Andreas Wolf (Joint Managing Director)
Mr. Jan Oliver Röhrl [Executive Vice-President (Engineering) & Regional President (Diesel Systems) & Alternate Director]
Mr. S Karthik (Joint Chief Financial Officer)
Mr. R Vijay (Company Secretary)
9.3 Independent Directors
The Independent Directors have given a declaration to the Company that they meet the criteria of independence prescribed under section 149(6) of the Companies Act, 2013 (the Act) and SEBI (Listing Obligations and Disclosure Requirements) Regulations, 2015 (Listing Regulations).
9.3.1. Familiarization Programme for Independent Directors
For details of the familiarization programme for Independent Directors please refer to the Corporate Governance Report.
9.4 Performance Evaluation of Directors
In line with the provisions of the Act and the Listing Regulations, the Board has carried out an annual performance evaluation of its own perfomance, its Committees and individual Directors.
For details of the performance evaluation including evaluation criteria for Independent Directors, please refer the Corporate Governance Report.
10. Board Meetings
During the year under review, six meetings of the Board of Directors were held. The particulars of the meetings and attendance thereat are mentioned in the Corporate Governance Report.
11. Corporate Social Responsibility (CSR) Committee and Initiatives
Consequent to resignation of Dr. Steffen Berns from directorship of the Company, the CSR Committee was reconstituted by inducting Dr. Andreas Wolf as a member in place of Dr. Steffen Berns. As on the date of this report, the CSR Committee comprises of four members. Mr. Prasad Chandran, Independent Director, is the Chairman of the Committee. The other members are Mr. Bhaskar Bhat, Independent Director; Mr. Soumitra Bhattacharya, Managing

Annual Report 2016-17 | Directors' Report including Managment Discussion and Analysis | 49
Director and Dr. Andreas Wolf, Joint Managing Director. The CSR Committee oversees the Company’s CSR initiatives.
The Board of Directors has adopted a CSR policy in line with the provisions of the Companies Act, 2013. The CSR policy, inter-alia, deals with the objectives of the Company’s CSR initiatives, its guiding principles, thrust areas, responsibilities of the CSR Committee, implementation plan and reporting framework.
Some of the key initiatives during the year under review were as under:
(i) Health, Hygiene and Education in Government schools: Medical camps, follow-up and treatment including surgeries for school children, hands on training in science, life skill, computer/English education and Infrastructure development in schools.
(ii) Vocational training focused on employable skills: Short term skill development and training programme for school dropouts; and
(iii) Neighbourhood projects as per the local needs identified by Company’s Plants: Setting up Reverse Osmosis Plant in villages near Jaipur, Check dams near Nashik; Kitchen setup near Jigani, Bengaluru, etc.
Details of the CSR Committee meetings and attendance of the member thereat forms part of the Corporate Governance Report.
Annual Report on Corporate Social Responsibility Activities of the Company is enclosed as Annexure - ‘B’ (Page No. 58) to this report.
12. Audit Committee
The Audit Committee comprises of five members. Mrs. Renu S Karnad, Independent Director, is the Chairperson of the Committee. The other members are Mr. V. K. Viswanathan, Non-Executive & Non-Independent Director, Mr. Bernhard Steinruecke, Mr. Prasad Chandran and Mr. Bhaskar Bhat, Independent Directors.
During the year under review, the Board accepted all the recommendations of the Audit Committee.
Details of the roles & responsibilities, particulars of meeting and attendance thereat are mentioned in the Corporate Governance Report.
13. Subsidiary and Associate Companies
13.1 Subsidiary Company
MICO Trading Private Limited (MTPL)
The Company has only one subsidiary viz., MICO Trading Private Limited. The financial performance of MTPL is as under:-
(Amount in TINR)
Particulars 2016-17 2015-16*
Total Revenue 75.8 86.2
Profit/(Loss) Before Tax 6.8 (19.6)
Profit/(Loss) After Tax 4.7 (19.6)
*Re-stated on account of adoption of Ind AS.
The Directors’ Report along with the Audited Statement of Accounts of MTPL has been uploaded on the website of the Company at www.boschindia.com under the “Shareholder Information” section.
13.2 Associate Company
Newtech Filter India Private Limited (NTFI)
The Company has one Associate Company viz., Newtech Filter India Private Limited. The Company holds 25 percent and Robert Bosch Investment Nederland BV holds 75 percent of the paid-up share capital of NTFI.
NTFI is the manufacturer of automotive filters, selling their products to the Company which further sells the same to end customers. Aftermarket contributed to 73 percent of the product sales while 27 percent were attributed to OEM and OES channels in 2016-17.
The turnover and results of NTFI are as follows:
(Mio INR)
Particulars 2016-17 2015-16 % Growth
Turnover 694 778 11.5
Profit / (Loss) Before Tax
17 14 NA
PBT % on Turnover 2.4 1.8 NA
1. The numbers given above are for April to March period. For 2015-16 numbers are for the 15 month period from January 01.01.15 to 31.03.16
2. Percentage growth in 2016-17 is over 2015-16 on a prorata basis.
A separate statement containing the salient features of the financial statement of the aforementioned Subsidiary and Associate is enclosed as Annexure ‘C’ (Page No. 62) to this Report.
14. Remuneration Policy
The Nomination and Remuneration Policy, inter-alia, provides for criteria and qualifications for appointment of Director, Key Managerial Personnel and Senior Management, Board diversity, remuneration to directors, key managerial personnel, etc. The policy is enclosed as Annexure ‘D’ (Page No. 63) to this Report. The policy can also be accessed at the following link:
http://www.boschindia.com/media/in/documents/our_company_1/shareholder_information_1/2015/Nomination_and_Remuneration_Policy.pdf

50 | Directors' Report including Managment Discussion and Analysis | Annual Report 2016-17
15. Particulars of Employees
Disclosures pertaining to remuneration of employees and other details, as required under Section 197(12) of the Act and rules framed thereunder is enclosed as Annexure ‘E’ (Page No. 66) to this Report.
The information in respect of employees of the Company required pursuant to Rule 5 of Companies (Appointment and Remuneration of Managerial Personnel) Rules, 2014, as amended, will be provided on request. In terms of Section 136 of the Act, the Reports and Accounts are being sent to the Members and others entitled thereto excluding the aforementioned particulars of employees, which is available for inspection by the Members at the Registered Office of the Company during business hours on any working day. Any member desirous of obtaining a copy of the same may write to the Company at [email protected].
16. Corporate Governance
A report on Corporate Governance in terms of the requirements of the Listing Regulations and a certificate from the Practicing Company Secretary, forms part of this Annual Report (Page No. 193).
17. Risk Management
The Company has a well-defined Risk Management policy. The policy has been developed after taking cognizance of the relevant statutory guidelines, Bosch Guidelines on risk management, empirical evidences, stakeholder's feedback, forecast and expert judgment.
The policy, inter-alia, provides for the following:
1. Risk Management framework;
2. In-built pro-active processes within the Risk Management Manual for reporting, evaluating and resolving risks;
3. Identifying and assessing risks associated with various business decisions before they materialize. Take informed decisions at all levels of the organization in line with the Company’s risk appetite;
4. Ensuring protection of shareholders' stake by establishing an integrated Risk Management Framework for identifying, assessing, mitigating, monitoring, evaluating and reporting all risks;
5. Strengthening Risk Management through constant learning and improvement;
6. Adoption and implementation of risk mitigation measures at every level in order to achieve long-term goals effectively and sustainably;
7. Regularly review Risk Tolerance levels of the Company as they may vary with change in the Company’s strategy; and
8. Ensuring sustainable business growth with stability.
In the opinion of the Board, there are no risks that may threaten the existence of the Company.
18. Whistle Blower Policy
The Company has a Whistle Blower Policy which provides a vigil mechanism for dealing with instances of fraud and mismanagement.
Details of the Whistle Blower Policy have been mentioned in the Corporate Governance Report. The Whistle Blower Policy has also been uploaded on the website of the Company and can be accessed at the following link: http://www.boschindia.com/media/in/documents/our_company_1/shareholder_information_1/2014/Whistle_blower_policy.pdf
19. Business Responsibility Report
In terms of the requirements of Regulation 34(2)(f) of the Listing Regulations, a report on Business Responsibility in the format prescribed by Securities and Exchange Board of India forms a part of this Annual Report (Page No. 205).
20. Related Party Transactions
The Audit Committee accords omnibus approval to Related Party Transactions which are foreseen and repetitive in nature. The Audit Committee reviews, on a quarterly basis, the details of the Related Party Transaction entered pursuant to the aforementioned omnibus approval. Additionally, the Company obtains a half yearly certificate from a Chartered Accountant in Practice confirming that the related party transactions during the said period were in ordinary course of business, repetitive in nature and satisfy the Arm’s length principles.
Consequent to the approval of the shareholders for sale of the Starter Motors and Generators business (SG Business) of the Company, the said business was transferred to Robert Bosch Starter Motors Generators India Private Limited with effect from August 01, 2016.
The details of Related Party Transactions under Section 188(1) of the Act required to be disclosed under Form AOC - 2 pursuant to Section 134(3) of the Act is enclosed as Annexure 'F' (Page No. 68).
The Company has framed a policy on determining materiality of Related Party Transaction and dealing with Related Party Transaction. The said policy has been uploaded on the website of the Company and can be accessed at the following link:http://www.boschindia.com/media/in/documents/our_company_1/shareholder_information_1/2014/RPT_Policy.pdf

Annual Report 2016-17 | Directors' Report including Managment Discussion and Analysis | 51
21. Energy Conservation, Technology Absorption, Foreign Exchange Earnings & Outgo
The report in respect of conservation of energy, technology absorption, foreign exchange earnings and outgo as required under Section 134 of the Act read with Rule 8 of Companies (Accounts) Rules, 2014, as amended, is enclosed as Annexure ‘G’ (Page No. 70) to this Report.
22. Auditors
22.1 Statutory Auditor
In terms of the provisions of Section 139 of the Companies Act, 2013, the term of office of Price Waterhouse & Co Bangalore LLP (“PWC”) will end at the conclusion of the forthcoming Annual General Meeting. The Board places on record its appreciation for services rendered by PWC as Statutory Auditors of the Company.
The Board has recommended appointment of M/s. Deloitte Haskins & Sells LLP (Firm Registration No. 117366W/W-100018) (DHS LLP) as Statutory Auditors of the Company. The aforementioned appointment is subject to approval of the shareholders at the forthcoming Annual General Meeting. Accordingly, resolution for appointment of DHS LLP as Statutory Auditors of the Company for a period of 5 consecutive years from the conclusion of the 65th (forthcoming) Annual General Meeting till the conclusion of the 70th Annual General Meeting to audit the Financial Statements of the Company from Financial Year 2017-18 is proposed for approval of the members at the forthcoming AGM.
The Auditors’ Report on the Standalone as well as Consolidated Financial Statements for the Financial Year 2016-17 is unmodified i.e. it does not contain any qualification, reservation or adverse remark.
22.2 Cost Audit & Cost Auditors
The Board of Directors, on recommendation of the Audit Committee, appointed M/s. Rao, Murthy & Associates, Cost Accountants, Bengaluru (Registration No.000065) as Cost Auditors to audit the cost accounts of the Company for the Financial Year 2017-18 in terms of the provisions of Section 148 of the Companies Act, 2013. As per the requirements of the said section, remuneration payable to the Cost Auditors is required to be ratified by the shareholders at the General Meeting. Accordingly, resolution ratifying the remuneration payable to M/s. Rao, Murthy & Associates forms a part of the Notice dated May 25, 2017 convening the 65th Annual General Meeting.
22.3 Secretarial Auditor
The Company appointed Mr. Sachin Bhagwat, Practicing Company Secretary, to conduct Secretarial Audit as per the provisions of the Act for the Financial Year 2016-17. The report of the Secretarial Audit is enclosed as Annexure ‘H’ (Page No. 72) to this report.
There were no qualifications, reservations or adverse remarks in the Report of the Secretarial Auditor.
22.4 Reporting of Fraud
There have been no instances of fraud reported by the aforesaid Auditors under Section 143(12) of the Act and Rules framed thereunder either to the Company or to the Central Government.
23. Directors’ Responsibility Statement
Pursuant to Section 134(5) of the Companies Act, 2013, the Board of Directors report that:
(a) in the preparation of the annual accounts, the applicable accounting standards were followed along with proper explanation relating to material departures;
(b) they have selected and consistently applied accounting policies and have made judgements and estimates that are reasonable and prudent so as to give a true and fair view of the state of affairs of the Company at the end of the financial year and the profit of the Company for that period;
(c) proper and sufficient care has been taken for maintenance of adequate accounting records in accordance with the provisions of the Act for safeguarding the assets of the Company and for preventing and detecting fraud and other irregularities,
(d) the annual accounts have been prepared on a ‘going concern’ basis
(e) proper internal financial controls are in place and that they are adequate and are operating effectively; and
(f) proper systems to ensure compliance with the provisions of all applicable laws were in place and that such systems were adequate and operating effectively.
24. Details of Loans, Guarantee and Investments
Details of loans, guarantee and investments covered under section 186 of the Act, are given in the Notes to the Financial Statements.
25. Deposits
During the year under review, there were no deposits as per the provisions of Companies Act, 2013.
26. Material Changes and Commitments
There were no material changes and commitments between the end of the year under review and the date of this report, which could have an impact on the Company’s operation in the future or its status as a “going concern”.

52 | Directors' Report including Managment Discussion and Analysis | Annual Report 2016-17
27. Significant and Material Orders passed by the Regulators or Courts
Company’s manufacturing facility at Jaipur was closed for a day in the month of October 2016 consequent to notice of closure by Rajasthan State Pollution Control Board (RSPCB). Based on the representation made by the Company, RPSCB revoked their closure order.
Karnataka State Pollution Control Board (KSPCB) had vide Public Notification dated May 05, 2017 directed closure of all industrial units in the catchment area of the Bellandur Lake, Bengaluru. As an abundant caution, operations at the facility of the Company situated at Adugodi, Bengaluru were temporarily halted for a day. Based on the clarification by KSPCB regarding non-applicablity of the said public notice to the Company’s Adugodi facility, operations were resumed with effect from May 08, 2017.
There was no financial impact on account of temporary closure of the facilities situated at Jaipur and Adugodi, Bengaluru pursuant to the above orders.
Further, there were no significant or material orders passed by the Regulators or Courts impacting the going concern status and Company’s operations in future.
28. Buyback
During the year under review, the Company has bought back 878,160 Equity Shares of face value of INR 10 each representing 2.796 percent of the pre-buyback paid up share capital of the Company for an aggregate consideration of Mio INR 20,197 (representing 24.99 percent of the paid up share capital and free reserves). Robert Bosch GmbH, the holding company, also participated in the Buyback.
The Post Issue capital of the Company is Mio INR 305.21 consisting of 30,520,740 Equity Shares of INR 10 each. The present shareholding pattern is as under:
Particulars No. of shares% of the paid-up
share capital
Promoter and Promoter Group
21,512,705 70.49
Others/Public 9,008,035 29.51
29. Extract of Annual Return
In terms of the requirements of Section 134(3)(a) of the Act, an Extract of Annual Return as provided under Section 92(3) of the Act is enclosed as Annexure ‘I’ (Page No. 74) to this Report.
30. Acknowledgements
The Directors express their gratitude to the various Central and State Government Departments for their continued cooperation extended to the Company. The Directors also thank all customers, dealers, suppliers, banks, members and business partners for the excellent support received from them. The Directors would also like to acknowledge the exceptional contribution and commitment of the employees of the Company during the year under review.
31. Cautionary Statement
Statements in the Board’s Report and the Management Discussion & Analysis describing the Company’s objective, expectations or forecasts may be forward looking within the meaning of applicable laws and regulations. Actual results may differ materially from those expressed in the statement.
For and on behalf of the Board of Directors
V. K. Viswanathan DIN: 01782934ChairmanDate: May 25, 2017

Annual Report 2016-17 | FInancials at a glance | 53
Financials at a glance
10 YEARS' PERFORMANCE
(` in Millions)
Particulars 2016-17 2015-16*** 2014-15** 2013 2012 2011 2010 2009 2008 2007
Sales 99,426 92,725 117,414 85,151 84,172 79,295 66,305 47,498 45,416 42,796
Of which Export Sales 8,240 8,712 14,625 10,578 9,402 10,344 8,461 5,855 6,845 6,730
Profit Before Tax 20,944 20,824 19,559 12,566 13,462 15,740 12,028 7,934 8,566 8,560
Less: Provision for tax on Income
6,503 5,701 6,182 3,719 3,879 4,513 3,439 2,028 2,227 2,468
Profit After Tax 14,441 15,123 13,377 8,847 9,583 11,227 8,589 5,906 6,339 6,092
Profit from Discontinued Operations
2,970 191 - - - - - - - -
Items of OCI recognised directly in retained earnings
(109) 39 - - - - - - - -
Profit before appropriation
17,302 15,353 13,377 8,847 9,583 11,227 8,589 5,906 6,339 6,092
Paid-up Capital 305 314 314 314 314 314 314 314 320 321
Reserves 81,729 90,583 73,156 62,629 55,419 46,970 40,666 33,538 30,634 25,313
Net Worth 82,034 90,897 73,470 62,943 55,733 47,284 40,980 33,852 30,955 25,634
Net block of Fixed Assets
13,194 11,487 9,800 9,381 8,633 5,917 4,360 5,133 6,086 4,871
Additions to Gross Block 6,485 5,732 5,757 4,581 6,375 4,423 1,776 2,121 4,248 2,943
Earning per Share 465 482 426 282 305 358 274 187* 198* 190
* Based on weighted average no. of shares.
** 2014-15 represents fifteen months period starting from January 01, 2014 to March 31, 2015.
*** 2015-16 figures are restated for Ind AS and discontinued operation relating to Starter Motors and Generators business .
Previous years' figures have been recast/regrouped wherever necessary.

54 | FInancials at a glance | Annual Report 2016-17
FINANCIAL GRAPHSR
upee
s / M
illio
n
Net Sales
2012 2013 2014-15* 2015-16** 2016-17
0
20,000
40,000
60,000
80,000
100,000
120,000
Return on Capital Employed (ROCE)Return on Net Worth (RONW)
2012 2013 2014-15 2015-16** 2016-170
10
20
30
40
50
(Annualised)
Per
cent
age
ROCE RONW
0
3,000
6,000
9,000
12,000
15,000
2012 2013 2014-15* 2015-16** 2016-17
Rup
ees
/ Mill
ion
Export Earning Per Share (EPS)Dividend Per Share (DPS)
0
40
80
120
0
100
200
300
400
500
2012 2013 2014-15* 2015-16** 2016-17
DP
S (R
upee
s)
EP
S (R
upee
s)
EPS DPS***
2012 2013 2014-15* 2015-16** 2016-17
Profit after Tax (PAT) as % of Sales
Per
cent
age
0
4
8
12
16
20
2012 2013 2014-15** 2015-16** 2016-17
Book Value per share
Rup
ees/
Mill
ion
0
100
200
300
400
500
* 2014-15 represents fifteen months period starting from January 01, 2014 to March 31, 2015.** Re-stated on account of sale of the Starter Motors and Generators business with effect from August 01, 2016 and adoption of Ind AS.*** Excludes Special Dividend.

Annual Report 2016-17 | FInancials at a glance | 55
SALES PERFORMANCE
Primary Segment
0%
20%
40%
60%
80%
100%
2012 2013 2015* 2015-16** 2016-17
% o
f sal
es
Automotive Others
89% 87% 88% 86% 85%
11% 13% 12% 14% 15%
Secondary Segment
0%
20%
40%
60%
80%
100%
2012 2013 2015* 2015-16** 2016-17
% o
f Sal
es
Domestic Export
89% 88% 88% 91% 92%
11% 12% 12% 9% 8%
Mobility Solutions
0%
20%
40%
60%
80%
100%
2012 2013 2015* 2015-16** 2016-17
% o
f Aut
omot
ive
Sal
es
Domestic Export
88% 87% 87% 91% 92%
12% 13% 13% 9% 8%
Business Beyond Mobility
2012 2013 2015* 2015-16** 2016-170%
20%
40%
60%
80%
100%
% o
f Non
- A
utom
otiv
e S
ales
Domestic Export
94% 94% 93% 89% 89%
6% 6% 7% 11% 11%
0.00%
2.00%
4.00%
6.00%
8.00%
10.00%
0
2000
4000
6000
8000
2012 2013 2015* 2015-16** 2016-17
Investment %
to Sales
Inve
stm
ent A
mou
nt (M
io IN
R)
Capex (In Mio INR) Capex/Sales(%)
Capital expenditure percentage to sales
Bangalore Nashik BidadiChennai Gangaikondan Others
28.4%
22.3%
5.4%0.3%
0.6%
43.1%
Location-wise capital expenditure
SEGMENT - WISE SALES
CAPITAL EXPENDITURE
* 2015 represents fifteen months period starting from January 01, 2014 to March 31, 2015.** Re-stated on account of sale of the Starter Motors and Generators business with effect from August 01, 2016 and adoption of Ind AS.

56 | Annexures to the Report of the Directors | Annual Report 2016-17
I. Background
SEBI vide Notification No. SEBI/LAD-NRO/GN/2016-17/008 dated July 08, 2016 amended the SEBI (Listing Obligations and Disclosure Requirements) Regulations, 2015 by inserting Regulation 43A, requiring the top 500 listed entities based on the market capitalization (calculated as on March 31 of every financial year) to formulate a Dividend Distribution Policy. The Company, being one of the top 500 listed companies, has formulated this Dividend Distribution Policy.
II. Definition
Unless the context otherwise requires:
(a) ‘Act’ means the Companies Act, 2013 and includes the rules framed thereunder;
(b) ‘Board’ means the Board of Directors of the Company and includes any Committee thereof constituted or to be constituted.
(c) ‘Company’ means Bosch Limited.
(d) ‘Dividend’ shall have the meaning ascribed to it under the Act and includes an Interim Dividend but excludes Special Dividend.
(e) ‘Listing Regulations’ or ‘SEBI LODR’ means Securities and Exchange Board of India (Listing Obligations and Disclosure Requirements) Regulations, 2015, including any statutory modifications or re-enactments thereto.
(f) ‘Free Reserves’ shall have the meaning ascribed to it under the Act.
(g) ‘Policy’ means Bosch Limited - Dividend Distribution Policy.
The words or expressions used but not defined herein, but defined under Companies Act, 2013 or the Listing Regulations shall have the same meaning assigned therein.
Words in singular number include the plural and vice-versa.
III. Effective Date:
The policy shall come into force from the date of approval of the Board of Directors i.e. February 10, 2017.
IV. Parameters
Dividend payout is contingent upon various factors and their combination thereof, which are enumerated below and the Board of Directors shall before deciding the dividend consider these factors in the best interest of the Company and its shareholders.
1. Circumstances under which the shareholder may not expect dividend
The shareholder may not expect dividend, inter-alia, in the following circumstances, subject to discretion of the Board:
Annexure ‘A’ to the Report of the Board of DirectorsBOSCH LIMITED - DIVIDEND DISTRIBUTION POLICY
a. In event of loss or inadequacy of profit or cashflow.
b. Higher capital investments on account of expansion of business, etc. by the Company.
c. Decision to undertake any acquisition, amalgamation, merger, takeover, etc. requiring significant capital outflow.
d. Other business condition(s) in the opinion of the Board it would be prudent to plough back the profits of the Company.
e. De-growth in the overall business.
f. The Company has been prohibited to declare dividends by any regulatory authority.
g. Any other extra-ordinary circumstances.
2. Financial Parameters
While determining the quantum of dividend the Board of Directors shall, inter-alia, consider the following financial parameters:-
(i) Profit After Tax after considering write-off of accumulated losses, exceptional and extraordinary items, if any
(ii) Accumulated reserves
(iii) Cash flow and treasury position keeping in view the total debt to equity ratio
(iv) Earnings Per Share
(v) Dividend Payout during the previous years
(vi) Capital Expenditure
(vii) Contingent Liabilities
3. Factors to be considered while declaring dividend
The quantum of dividend is an outcome of due deliberation by the Board considering various Internal and External factors including, but not limited to:-
(i) Internal Factors
(a) Business Forecast (near to medium term)
(b) Earning stability
(c) Availability of liquidity
(d) Accumulated Reserves
(e) Working capital requirements of the Company
(f) Capital Expenditure requirements of the Company
(g) Investments in new line(s) of business

Annual Report 2016-17 | Annexures to the Report of the Directors | 57
(h) Expenditure on Research & Development of new products
(i) Investment in technology
(j) Acquisition of brands/businesses
(k) Replacement cost of end-of-lifecycle products
(ii) External Factors
(a) Statutory provisions, legal requirements, regulatory conditions or restrictions laid down under applicable laws
(b) Prevailing macro-economic environment
(c) Re-investment opportunities
(d) Investor Expectations
(e) Prevailing taxation structure including any amendments expected thereof.
Dividend will generally be recommended once a year by the Board, after the approval of the Audited Financial Statement and shall be subject to approval/confirmation of shareholders at the Annual General Meeting (AGM). In certain years and to commemorate special occasions, the Board may consider declaring special dividend for its shareholders.
Considering the above factors, the Company would endeavor to declare a dividend (excluding any special dividend or a payout in the form of a one-time/special dividend) resulting in a pay-out ratio upto 30% of the annual standalone Profits after Tax (PAT) of the Company.
V. Utilization of Retained Earnings
Subject to the applicable regulations, retained earnings may be applied for:
(i) Funding the organic and inorganic growth of the Company
(ii) Diversification of business
(iii) Capacity Expansion
(iv) Replacement of Capital Assets
(v) Declaration of Dividend in future years
(vi) Issue of Bonus Shares
(vii) Buy-back of Shares/Capital Reduction
(viii) Other permissible purposes
VI. Parameters that shall be adopted with regard to various classes of shares
The Company has only one class of shares viz., Equity Shares of Face Value of INR 10 each.
Since the Company has issued only one class of equity shares with equal voting rights, all the members of the Company are entitled to receive the same amount of Dividend per share.
VII. Disclosure
In terms of the requirements of the Listing Regulations, this policy has been uploaded on the website of the Company viz., www.boschindia.com and will also form a part of the Annual Report of the Company.
In case the Company declares dividend on the basis of parameter in addition to the parameters stated in this Policy, such parameters will be disclosed on the website as well as in the Annual Report of the Company.
VIII. General
This Policy is subject to revisions/amendments in accordance with the guidelines as may be issued by the Ministry of Corporate Affairs, SEBI or other regulatory authority, from time to time, on the subject matter. Accordingly, the Company reserves the right to alter, modify, add, delete or amend any of the provisions of this Policy.
Notwithstanding anything contained herein but subject to the applicable laws, the Board may, at their discretion revise, amend or modify the Policy, which they in their absolute discretion may deem fit.
In case of any amendment(s), clarification(s), circular(s), etc. issued by the relevant authorities, not being consistent with the provisions laid down under this Policy, then such amendment(s), clarification(s), circular(s), etc. shall prevail upon the provisions of this Policy and this Policy shall stand amended accordingly from the effective date as laid down under such amendment(s), clarification(s), circular(s), etc.
IX. Cautionary Statement
The Policy reflects the intent of the Company to reward its shareholders by sharing a portion of its profits after retaining sufficient funds for growth of the Company. The Company shall pursue this Policy to pay, subject to the circumstances and factors enlisted herein above, which shall be consistent with the performance of the Company over the years.
This document does not solicit investment in the Company’s shares nor is it an assurance of guaranteed returns (in any form), for investments in the Company’s shares.
The Policy is not an alternative to the decision of the Board for recommending dividend, which is made generally every year after taking into consideration all the relevant circumstances contained in this Policy as may be decided by the Board.

58 | Annexures to the Report of the Directors | Annual Report 2016-17
1. A brief outline of the Company’s CSR Policy, including overview of projects or programs proposed to be undertaken and a reference to the web-link to the CSR policy and projects or programs.
Brief outline of the CSR Policy and overview of projects and programs undertaken are given in the Directors Report.
The CSR Policy can be accessed at:
http://www.boschindia.com/media/in/documents/our_company_1/shareholder_information_1/2017_2/CSRPolicy_Final.pdf
2. Composition of the CSR Committee:
(i) Mr. Prasad Chandran, Chairman (Independent Director)
(ii) Mr. Bhaskar Bhat (Independent Director)
(iii) Mr. Soumitra Bhattacharya (Managing Director)
(iv) Dr. Andreas Wolf (Joint Managing Director) – with effect from January 01, 2017
(v) Dr. Steffen Berns* – upto December 31, 2016 * Managing Director upto December 31, 2016
3. Average Net Profit of the Company for the last three financial years:
Average Net Profit: Mio INR 16,599
4. Prescribed CSR Expenditure (Two percent of the amount as in item 3 above):
Mio INR 332
5. Details of CSR spent for the Financial Year:
a. Total amount spent for the financial year: Mio INR 332.10
b. Amount unspent, if any: Nil
c. Manner in which amount spent in the financial year is detailed below:
[Mio INR]
Sr. No
CSR Projects/Activities
Sector in which the Project is covered
Locations - District (State)
Amount Outlay (Budget) Project or Program wise 2016 - 2017
Amount spent on the Project or Program wise 2016 - 2017
(a)Direct expenditure
(b)Overheads
Cumulative Expenditure up to the reporting period
Amount spent Direct or through implementing agency
1. Child Health Development Programme (CHDP)for Government school children and Cleft Surgery
Hea
lth,
Hyg
iene
& E
duc
atio
n
Bengaluru (Karnataka) Jaipur (Rajasthan) Nashik (Maharashtra)
20.50 20.30 38.68 Implementing Agency -Karuna Trust, Ahila Bharatha Mahila Seva Samaja and Guruji Rugnalaya
2. Primary Health Centre upgradation
Bengaluru (Karnataka)
15.00 15.38 16.09 Implementing Agency -Karuna Trust
Annexure ‘B’ to the Report of the DirectorsANNUAL REPORT ON CORPORATE SOCIAL RESPONSIBILITY (CSR) ACTIVITIES FOR THE FINANCIAL YEAR 2016-17

Annual Report 2016-17 | Annexures to the Report of the Directors | 59
[Mio INR]
Sr. No
CSR Projects/Activities
Sector in which the Project is covered
Locations - District (State)
Amount Outlay (Budget) Project or Program wise 2016 - 2017
Amount spent on the Project or Program wise 2016 - 2017
(a)Direct expenditure
(b)Overheads
Cumulative Expenditure up to the reporting period
Amount spent Direct or through implementing agency
3. Science Education toGovernment school children
Hea
lth,
Hyg
iene
& E
duc
atio
nBengaluru (Karnataka) Jaipur (Rajasthan) Nashik (Maharashtra)
12.00 12.06 21.89 Implementing Agency – Agastya Foundation & Jankalyan Samiti
4. English, Computer and Value Education in Government Schools
Bengaluru (Karnataka)
3.00 2.51 13.15 Direct as well as through Implementing Agency - Children Movement for Civic Awareness
5. Model School Concept for upgrading infrastructure & education quality in Government school
Bengaluru (Karnataka)
10.00 10.17 15.13 Direct
6. Toilet construction in Government schools
Bengaluru (Karnataka) Jaipur (Rajasthan) Nashik (Maharashtra)
17.00 17.37 57.25 Direct
7.BRIDGE Skill development and employability enhancement for underprivileged youth and capacity building and training
Voca
tion
al T
rain
ing
All India 55.00 52.13 93.80 Direct
8. Train the Trainers All India 1.00 0.49 4.18 Direct
9. Infrastructure development for Vocational Training in Govt. ITIs and Lab setup and BRIDGE centers
Bengaluru (Karnataka) Jaipur (Rajasthan) Nashik (Maharashtra)
25.00 24.64 49.56 Direct
10. Model centers in PU colleges
All India 4.00 3.36 3.36 Direct

60 | Annexures to the Report of the Directors | Annual Report 2016-17
[Mio INR]
Sr. No
CSR Projects/Activities
Sector in which the Project is covered
Locations - District (State)
Amount Outlay (Budget) Project or Program wise 2016 - 2017
Amount spent on the Project or Program wise 2016 - 2017
(a)Direct expenditure
(b)Overheads
Cumulative Expenditure up to the reporting period
Amount spent Direct or through implementing agency
11. Support to special children and medical support (Nashik Run)
Nei
ghb
orho
od P
roje
ctNashik (Maharashtra)
1.00 1.00 5.60 Direct
12. Check Dams (Water conservation in drought-prone area)
Nashik (Maharashtra)
16.00 21.08 29.82 Direct
13. Tribal school upgradation, Village development, Clean Air, SHG – MICO Circle maintenance
Nashik (Maharashtra)
1.00 1.69 23.65 Direct
14. RO (Reverse Osmosis) Plants to provide clean drinking water facility to the Villagers
Jaipur (Rajasthan)
12.00 12.76 19.10 Direct
15. Tree plantation Jaipur (Rajasthan)
0.50 0.17 2.58 Direct
16. Development of Rural Knowledge Centre for girls
Jaipur (Rajasthan)
0.50 0.05 3.27 Direct
17. Mid-day meal kitchen setup
Jigani (Karnataka)
51.00 50.68 71.82 Implementing Agency - The Akshaya Patra Foundation
18. Administrative expenses
All India 12.00 9.90 18.80 Direct
19. CSR Awareness and Volunteers Promotional activities
Bengaluru (Karnataka)
3.00 3.86 5.83 Direct
20. Contribution to the corpus of Bosch India Foundation
All India 72.50 72.50 136.50 NA
TOTAL 332.00 332.10 630.06
Details of the implementing agencies:-
Karuna Trust, a registered trust since 1986, is a Non-Government Organisation of repute providing free primary health care for the past 26 years in partnership with various State Governments and Funding Agencies.
Ahila Bharatha Mahila Seva Samaja (ABMSS) is a social organization set up in Bengaluru in 1993 primarily to work towards the betterment of women and children. Since 2013, they added cleft lip and palate treatment as one of their major programmes with the support of Deutsche Cleft Kinderilfe E.V Germany and local donors within the country.
Shri Guruji Rugnalaya, Nashik is amongst well-known hospitals in Nashik. They provide treatment to the children of Government schools in Nashik identified by the Company, at subsidized rates.

Annual Report 2016-17 | Annexures to the Report of the Directors | 61
Agastya International Foundation (“Agastya”), founded in 1999 in Bengaluru is an Indian education trust and non-profit organization whose mission is to spark curiosity, nurture creativity and build confidence among economically disadvantaged children and teachers in India. Agastya runs hands-on science and art education programs in rural and semi-urban regions across 18 states. It is one of the largest science education programs that caters to economically disadvantaged children and teachers in the world.
Jankalyan Samiti is a voluntary Non-Government Organization (NGO) registered trust. Its aim is to promote and conduct activities relating to health care, mass literacy, employment generation training activities, etc. among the poor and the neglected residents in undeveloped colonies and slums in and around Nashik. They support in teaching science in a practical way to the Government school children.
Children Movement for Civic Awareness (CMCA) was founded in the year 2000 as a joint programme between Public Affairs Centre and Swabhimana, two Bengaluru based NGOs. The energy and enthusiasm of the children quickly saw the movement evolve into summer camps and then into ‘Civic Clubs’. The ‘Civic Club’ gained popularity and its impressive growth propelled the two parent organisations to launch CMCA as an autonomous body. CMCA was registered as a Public Charitable Trust on June 15, 2009.
Akshaya Patra Foundation: The Akshaya Patra Foundation is a not-for-profit organisation headquartered at Bengaluru. The Foundation strives to fight issues like hunger and malnutrition in India, by implementing the Mid-Day Meal Scheme in the government schools and government-aided schools.
6. Reasons for not spending the amount specified in Point 5 (b) above:
Not Applicable.
7. A responsibility statement of the CSR Committee that the implementation and monitoring of CSR Policy is in compliance with CSR objective and Policy of the company.
The CSR projects were designed, implemented and periodically reviewed in accordance with the CSR Policy of the Company framed pursuant to the provisions of the Companies Act, 2013 and rules made thereunder.
Soumitra Bhattacharya Andreas Wolf Prasad Chandran
DIN: 02783243 Managing Director
DIN: 07088505 Joint Managing Director
DIN: 00200379 Chairman
Corporate Social Responsibility Committee

62 | Annexures to the Report of the Directors | Annual Report 2016-17
Annexure ‘C’ to the Report of the DirectorsForm AOC-I
STATEMENT CONTAINING SALIENT FEATURES OF THE FINANCIAL STATEMENT OF SUBSIDIARIES/ASSOCIATE COMPANIES/JOINT VENTURES(Pursuant to first proviso to sub-section (3) of section 129 read with rule 5 of Companies (Accounts) Rules, 2014)
Part “A”: SubsidiariesName of the subsidiary: MICO Trading Private Limited
[Amount in TINR]1. Reporting period for the subsidiary concerned, if different from the
holding company’s reporting periodNot Applicable
2. Reporting currency and exchange rate as on the last date of the relevant financial year in the case of foreign subsidiaries
Not Applicable
3. Share Capital 1,0004. Reserves & Surplus 145. Total Assets 1,0836. Total Liabilities 697. Investments Nil8. Turnover* Nil9. Profit/(Loss) before taxation 710. Provision for taxation (2)11. Profit/(Loss) after taxation 512. Proposed Dividend NIL13. % of shareholding 100
*Turnover - Nil. Income from investments - TINR 76.1. Names of subsidiaries which are yet to commence operations: MICO Trading Private Limited2. Names of subsidiaries which have been liquidated or sold during the year: None
Part “B”: Associates and Joint VenturesName of Associate: Newtech Filter India Private Limited
1. Latest audited Balance Sheet Date March 31, 2017 March 31, 2016@
2. Shares of Associate/Joint Ventures by the Company on the year end
Nos. 17,500,000 17,500,000Associates/Joint Venture
(Amount in TINR)175,000 175,000
% 25% 25%3. Description of how there is significant influence Voting Rights Voting Rights4. Reason why the associate/joint venture is not consolidated Consolidated* Consolidated5. Net-worth attributable to Shareholding as per latest audited Bal-
ance Sheet (Amount in TINR)85,250 82,441
6. Profit/(Loss) for the year (attributable to Shareholding) (Amount in TINR)
(8,948) 21,510
i. Considered in consolidation (Amount in TINR) (8,948) 21,510ii. Not Considered in consolidation NIL NIL
* The Financial Statements for the Financial Year ended March 31, 2017 are unaudited and have been considered for the purpose of consolidation pursuant to Section 129 of the Companies Act, 2013
@ Re-stated on account of adoption of Ind AS
1. Names of associates or joint ventures which are yet to commence operations: Nil2. Names of associates or joint ventures which have been liquidated or sold during the year: Nil
For and on behalf of the Board
V.K. Viswanathan (DIN: 01782934) ChairmanBernhard Steinruecke (DIN: 01122939) DirectorRenu S Karnad (DIN: 00008064) DirectorPrasad Chandran (DIN: 00200379) DirectorBhaskar Bhat (DIN: 00148778) DirectorSoumitra Bhattacharya (DIN: 02783243) Managing Director & Chief
Financial OfficerAndreas Wolf (DIN: 07088505) Joint Managing Director
Place: Bengaluru R Vijay Jan Oliver Röhrl (DIN: 07706011) Alternate DirectorDate: May 25, 2017 Company Secretary S Karthik Joint Chief Financial Officer

Annual Report 2016-17 | Annexures to the Report of the Directors | 63
1. Introduction:
In terms of Section 178 of the Companies Act, 2013 and clause 49 of the listing agreement (as amended from time to time), this policy on Nomination and Remuneration of Directors, Key Managerial Personnel (KMP) and Senior Management of Bosch Limited has been formulated by the Nomination and Remuneration Committee and approved by the Board of Directors.
This policy shall act as guidelines on matters relating to the remuneration, appointment, removal and evaluation of performance of the Directors, Key Managerial Personnel and Senior Management.
2. Definitions:
In this policy unless the context otherwise requires:
a) Act means The Companies Act, 2013 and rules made thereunder, as amended from time to time.
b) Company means Bosch Limited.
c) Board means Board of Directors of Bosch Limited.
d) Independent Director means a Director referred to in Section 149(6) of the Companies Act, 2013 read with clause 49 of the listing agreement.
e) Committee means Nomination and Remuneration Committee of the Company as constituted by the Board from time to time.
f) M&SS means Managerial & Superintending Staff of the Company.
g) Key Managerial Personnel or KMP means Managing Director, Joint Managing Director, Whole-time Director, Chief Financial Officer, Company Secretary and such other persons who may be deemed to be KMP under the Companies Act, 2013.
h) Senior Management Personnel means personnel of the Company comprising of all members of management one level below the executive directors including the functional heads. The designation and categories of such Personnel will be determined by the Company based on the functional and reporting structure.
i) ASR means Annual Salary Review.
j) SLx means Salary Level.
The words and expressions used but not defined herein, but defined under the Companies Act, 2013 shall have the meaning assigned therein.
3. Constitution of the Nomination and Remuneration Committee:
The Board has the power to constitute / reconstitute the Committee from time to time in order to make
it consistent with Bosch policies and applicable statutory requirements. At present, the Nomination and Remuneration Committee of the Company comprises of the following members:
a) Mr. Bernhard Steinruecke, Chairman, Independent Director
b) Mr. V.K. Viswanathan, Non-Executive Non-Independent Director
c) Mr. Prasad Chandran, Independent Director
d) Mr. Bhaskar Bhat, Independent Director
Membership of the Committee shall be disclosed in the Annual Report. The terms of the Committee shall be continued unless terminated by the Board of Directors.
4. Key objectives of the Committee:
a) To guide the Board in relation to the appointment and changes in Directors, Key Managerial Personnel and Senior Management including appointment of M&SS in KMP and Senior Management positions;
b) To evaluate the performance of the Members of the Board and provide necessary report to the Board for further evaluation;
c) To recommend to the Board on remuneration payable to the Directors, Key Managerial Personnel and Senior Management;
d) To develop a succession plan for the Board and to regularly review the plan;
e) To determine remuneration based on Company’s financial position, trends and practices on remuneration prevailing in the industry;
f) To retain, motivate and promote talent and to ensure long term sustainability of M&SS talent including KMPs & Senior Management Personnel and create competitive advantage; and
g) Consider any other matter as may be requested by the Board.
5. Meetings:
The meeting of the Committee shall be held at regular intervals as deemed fit and appropriate. The Company Secretary of the Company shall act as the Secretary of the Committee.
The Nomination and Remuneration Committee shall set up a mechanism to carry out its functions, any /all of its powers to any of the Executive / Whole-time Directors and/or Senior M&SS of the Company, as deemed necessary for proper and expeditious execution.
Annexure ‘D’ to the Report of the Board of DirectorsNOMINATION AND REMUNERATION POLICY

64 | Annexures to the Report of the Directors | Annual Report 2016-17
The Chairman of the Committee or in his absence any other member of the Committee authorized by him on his behalf shall attend general meetings of the Company.
6. Committee members interest:
a) A member of the Committee is not entitled to participate in the discussions when his/her own remuneration is discussed at a meeting or when his/her performance is being evaluated.
b) The Committee may invite such executives, as it considers appropriate, to be present at the meetings of the Committee.
7. Effective Date:
This policy is effective 03.12.2014.
8. Appointment of Director, Key Managerial Personnel & Senior Management - Criteria & Qualification:
The appointment of Director, Key Managerial Personnel and Senior Management will be based on the outcome of strategic planning.
The recruitment process for selection to these categories of personnel commences after the approval of manpower requisitions by the appointing authority (depending upon the SLx levels). Relevant approval of concerned is also obtained as part of the process, as deemed fit depending upon the level of hiring.
The Committee shall consider the standards of qualification, expertise and experience of the candidates for appointment as Director, Key Managerial Personnel and Senior Management and accordingly recommend to the Board his/her appointment.
9. Remuneration to Directors, Key Managerial Personnel, Senior Management Personnel and other employees:
a) The Key Managerial Personnel, Senior Management Personnel and other employees shall be paid remuneration as per the Compensation and Benefit policy of the Company as revised through the Annual Salary Review process from time to time.
b) The Human Resource department will inform the Committee, the requisite details on the proposed increments for every ASR cycle / process including payouts for the variable part (Performance Incentive).
c) The compensation structure will also be based on the market salary survey. The survey for total remuneration would be commissioned with external consultants. The basket of companies will be finalized by HR department after considering all the relevant aspects.
d) The composition of remuneration so determined by the Committee shall be reasonable and sufficient to attract, retain and motivate the Key Managerial Personnel and Senior Management of the quality required to meet high standards of performance. The relationship of remuneration to performance shall be clear and meet appropriate performance benchmarks. The Committee may review remuneration of identified senior management personnel from time to time.
e) Remuneration to Non-Executive & Independent Directors:
Sitting Fees
The Non-executive Directors and Independent Directors of the Company are entitled to sitting fees as determined by Board from time to time for attending Board / Committee meetings thereof in accordance with the provisions of Act.
Profit-linked Commission
The profit-linked commission shall be paid within the monetary limit approved by the shareholders of the Company subject to the same not exceeding 1% of the net profits of the Company computed as per the applicable provisions of the Act. Profit linked commission would comprise of a fixed and variable component considering the overall performance of the Company, attendance at the meetings of Board / Committees, Membership / Chairmanship of Committees and responsibilities of Directors.
10. Policy on Board diversity:
The Board of Directors shall comprise of Directors having expertise in different areas / fields like Finance, Sales and Marketing, Banking, Engineering, etc. or as may be considered appropriate. In designing the Board’s composition, Board diversity has been considered from a number of aspects, including but not limited to gender, age, cultural and educational background, ethnicity, professional experience, skills and knowledge. The Board shall have atleast one Board member who has accounting or related financial management expertise and atleast one woman director.
11. Changes amongst Directors, Key Managerial Personnel & Senior Management:
The Committee may recommend to the Board, changes in Board, Key Managerial Personnel or Senior Management Personnel subject to the provisions of the Act and applicable Company’s policies i.e., Rules and Regulations of Service and Conduct for M&SS, Code of Business Conduct and Principles of legal compliance framed and adopted by the Company from time to time.

Annual Report 2016-17 | Annexures to the Report of the Directors | 65
The Key Managerial Personnel and Senior Management Personnel shall superannuate as per the applicable provisions of the regulation and prevailing policy of the Company.
The Board of Directors will have the discretion to retain the Key Managerial Personnel and Senior Management Personnel in the same position / remuneration or revised remuneration after attaining the age of superannuation for organizational development reasons.
12. Amendments to the Nomination and Remuneration Policy:
The Board of Directors on its own and/or as per the recommendations of Nomination and Remuneration Committee can amend this policy, as deemed fit from time to time.
For and on behalf of the Board of Directors
V.K. ViswanathanDIN: 01782934ChairmanDate: May 25, 2017

66 | Annexures to the Report of the Directors | Annual Report 2016-17
Annexure ‘E’ to the Report of the DirectorsDetails pertaining to remuneration as required under section 197(12) read with Rule 5(1) of Companies (Appointment and Remuneration of Managerial Personnel) Rules, 2014
I. The ratio of the remuneration of each Director to the median remuneration of the employees of the Company for the Financial Year:
Sl. No Name of the Director Category
Ratio to median remuneration of
employees*1. Mr. V. K. Viswanathan Chairman,
Non – Executive & Non – Independent Director
1.71
2. Mr. Bernhard Steinruecke Independent Director 1.553. Mrs. Renu S. Karnad Independent Director 1.574. Mr. Prasad Chandran Independent Director 1.675. Mr. Bhaskar Bhat Independent Director 1.456. Mr. Peter Tyroller Non – Executive &
Non – Independent DirectorNA%
7. Mr. Soumitra Bhattacharya Managing Director# & Chief Financial Officer
36.03
8. Dr. Andreas Wolf Joint Managing Director@ 38.999. Mr. Jan Oliver Röhrl Alternate Director 6.62 $
10. Dr. Steffen Berns Managing Director (upto December 31, 2016)
38.32
* Employees for the above purpose and Point No. III below, includes all employees except employees/associates governed under long term wage settlement.
% Mr. Peter Tyroller has waived his remuneration as Director of the Company. # Joint Managing Director upto December 31, 2016. Re-designated as Managing Director with effect from January 01, 2017. @ Alternate Director to Mr. Peter Tyroller upto December 31, 2016. Appointed as Joint Managing Director with effect from
January 01, 2017. $ Appointed as an Alternate Director to Mr. Peter Tyroller with effect from February 11, 2017 and by virtue of being in
employment of the Company appointed as Whole-time Director with effect from said date. Remuneration from the date of appointment as Whole-time Director considered.
II. Percentage increase in remuneration of each Director, Chief Financial Officer, Chief Executive Officer and Company Secretary in the financial year:
Sl. No
Name of the Director/ Key Managerial Personnel Category
% increase in the remuneration during
the financial year
1. Mr. Soumitra Bhattacharya Managing Director & Chief Financial Officer 9.7%
2. Dr. Andreas Wolf Joint Managing Director 27.1%
3. Mr. Jan Oliver Röhrl Alternate Director NA*
4. Mr. S Karthik Joint Chief Financial Officer@ 5.6%
5. Mr. R Vijay Company Secretary NA$
* Appointed as an Alternate Director and consequently as a Whole-time Director with effect from February 11, 2017. Therefore, the increase in remuneration is not comparable.
@ Company Secretary upto February 10, 2017. Appointed as Joint Chief Financial Officer with effect from February 11, 2017. $ Appointed as Company Secretary with effect from February 11, 2017.
The Non-Executive Directors including Independent Directors are remunerated in form of Commission and Sitting Fees. There has been no increase (for the Financial Year 2016-17) in the aggregate commission payable to Non-Executive Directors or the sitting fees per meeting. Therefore, the percentage increase in remuneration payable for the Financial Year 2016-17 has not been provided. However, the actual payout varies depending on attendance at the Board Meetings. For details of remuneration of Non-Executive Directors please refer the Corporate Governance Report.

Annual Report 2016-17 | Annexures to the Report of the Directors | 67
III. The percentage increase in the median remuneration of employees in the Financial Year:
There was an increase of ~8.1% in the median remuneration of employees.
IV. The number of permanent employees on the rolls of Company:
As at March 31, 2017, the Company had 8,488 permanent employees on its rolls.
V. Average percentile increase already made in the salaries of employees other than the managerial personnel in the last Financial Year and its comparison with the percentile increase in the managerial remuneration and justification thereof and point out if there are any exceptional circumstances for increase in the managerial remuneration:
Percentage increase made in the salaries of employees other than the managerial personnel in the last Financial Year i.e. 2016-17 was ~10% whereas the increase in the managerial remuneration in the Financial Year 2016-17 was ~8.7%.
VI. Affirmation that the remuneration is as per the remuneration policy of the company:
It is hereby affirmed that the remuneration paid to the Directors, Key Managerial Personnel and Employees is as per the Nomination and Remuneration Policy of the Company.

68 | Annexures to the Report of the Directors | Annual Report 2016-17
Annexure ‘F’ to the Report of the DirectorsForm No. AOC-2
(Pursuant to clause (h) of sub-section (3) of section 134 of the Act and Rule 8(2) of the Companies (Accounts) Rules, 2014)
Form for disclosure of particulars of contracts/arrangements entered into by the Company with related parties referred to in sub-section (1) of section 188 of the Companies Act, 2013 including certain arm’s length transactions under third proviso thereto.
1. Details of contracts or arrangements or transactions pursuant to section 188(1):
Members would recall that during the Financial Year 2015-16 their approval was sought for sale and transfer of the Starter Motors and Generators business of the Company (SG-IN) to Robert Bosch Starter Motors Generators India Private Limited (RBSG), a related party transaction within the meaning of Section 188 of the Companies Act, 2013 (‘Act’). Details of the said transaction under prescribed Form AOC-2 was enclosed as an Annexure to the Directors’ Report for the Financial Year 2015-16. Pursuant to the approval of the shareholders, SG-IN was transferred to RBSG effective August 01, 2016. Since the transfer of SG-IN concluded during the year under review (w.e.f. 01.08.2016), brief details of the said transaction are furnished below once again.
(a) Name(s) of the related party and nature of relationship
Robert Bosch Starter Motors Generators India Private Limited (RBSG)
Nature of Relationship: Fellow Subsidiary
(b) Nature of contracts / arrangements / transactions
Sale of Starter Motors and Generators business of the Company (SG-IN) as a going concern and on a slump sale basis.
(c) Duration of the contracts / arrangements / transactions / date of transfer
Pursuant to the execution of Business Transfer Agreement, SG-IN has been transferred to RBSG with effect from August 01, 2016 for a net consideration of Mio INR 4,376.
(d) Salient terms of the contracts or arrangements or transactions including the value, if any
(i) All assets, liabilities together with employees to be transferred as a “going concern” on a slump sale basis for a lumpsum consideration of Mio INR 4,862 subject to necessary adjustments in working capital values between November 30, 2015 (valuation date) and the effective date of transfer.
(ii) In the event the global Starter Motors and Generators Business is sold to a third party (either partially or full), on or before 18 (eighteen) months from the date of approval of the Board for sale of SG-IN (i.e. February 05, 2016), resulting in the implicit price for SG-IN being higher than the price at which the Company has sold SG-IN, the Company will then be entitled to an additional consideration equal to the difference between the implicit price agreed with the third party for the SG-IN and the sale consideration.
(iii) The land (admeasuring approximately 11 acres or 45,000 square meters) at Naganathapura, Bengaluru, on which Starter Motors and Generators business has been operating is leased to RBSG at fair rental value and on such other terms and conditions as may be mutually agreed between the Company and RBSG.
(e) Justification for entering into such contracts or arrangements or transactions
Carve-out of SG-IN has been in line with the global realignment of the Starter Motors and Generators division of the Bosch Group (“SG”). This re-alignment of the SG division will improve the division’s growth prospects in a market characterized by tough competition and cost pressure and would also enable the SG business to tap into additional growth opportunities in those regions in which it does not yet have such a broad presence.

Annual Report 2016-17 | Annexures to the Report of the Directors | 69
SG business in India (SG-IN) was established in 1989 and is engaged in the business of manufacturing and selling of Starter Motors and Generators. SG-IN achieved break-even in 2013 and was operating at low margins. SG-IN contributed only 1% to the Earnings Before Interest & Tax of the Company. Key SG-IN products are part of the global platform and SG-IN is highly dependent for product and process competence on Bosch globally. The other dependencies include intellectual properties associated with softwares, licenses, IT infrastructure, proprietary tools and platforms.
For further details and rationale of the said transfer, please refer the corporate presentation at the following link:
http://www.boschindia.com/media/in/documents/our_company_1/shareholder_information_1/2016_1/Corporate_Presentation_2016.pdf
(f) Date(s) of approval by the Board February 05, 2016
(g) Amount paid as advances, if any Nil
(h) Date on which the special resolution was passed in general meeting as required under first proviso to section 188
April 02, 2016 (through Postal Ballot)
Date of declaration of results : April 04, 2016
2. Details of material contracts or arrangement or transactions at arm’s length basis:
Name of related party and relationship: Robert Bosch GmbH, Germany (Holding company) Salient Terms: Ongoing, repetitive and in ordinary course of business Date of approval by the Board, if any:
Approval of the Audit Committee and the shareholders have been obtained pursuant to the requirements of Listing Agreement/SEBI (Listing Obligations and Disclosure Requirements) Regulations, 2015 and the Companies Act, 2013, for an aggregate amount upto Mio INR 50,000 for each financial year.
[Mio INR]
SI. No Nature of Transaction Duration Amount utilised
FY 16-17
1. Purchase of goods (trade goods, components, tools, spares, etc.)
Ongoing 10,874
2. Purchase of assets Ongoing 1,382
3. Sale of goods (products, components, etc.) Ongoing 3,809
4. Sale of services (development income, etc.) Ongoing 903
5. Miscellaneous income Ongoing 82
6. Services received (royalty, development charges, IT charges, etc.)
Ongoing 1,693
Total 18,743
For and on behalf of the Board of Directors
V. K. Viswanathan DIN:01782934
ChairmanDate: May 25, 2017

70 | Annexures to the Report of the Directors | Annual Report 2016-17
A. Conservation of energy
(i) The steps taken or impact on conservation of energy:
optimization.
washing processes.
correction.
conventional lighting.
package unit.
batch loading of heat treatment furnaces.
based drains.
compressors.
dryers.
optimum electrical energy.
Additionally, the Company continues to analyse energy consumption using established tools.
(ii) The steps taken by the Company for utilising alternate sources of energy:
the Company
Manufacturing facilities Cumulative Capacity (per year)
Jaipur 800 MWh
Nashik 14,600 MWh
Gangaikondan 40 kW
Annexure ‘G’ to the Report of the DirectorsCONSERVATION OF ENERGY, TECHNOLOGY ABSORPTION AND FOREIGN EXCHANGE EARNINGS AND OUTGO[Pursuant to Section 134(3)(m) of the Companies Act, 2013 read with Rule 8(3) of Companies (Accounts) Rules, 2014]
of hot water at the Kitchen Block of canteen at Nashik Plant.
and canteen at Naganathapura.
(iii) The capital investment on energy conservation equipment(s):
During the year under review, the Company focused on investments aiming to reduce usage of conventional energy, energy conservation projects and increase the generation of solar energy and or optimization of energy utilisation. Various manufacturing facilities of the Company have initiated installation of Solar Plant Equipment. Location wise details of investment on energy conservation/solar energy equipment(s):
Manufacturing facilities [Mio INR]Bengaluru 7.5Bidadi 240.5Jaipur 48.0Nashik 147.0Naganathapura 5.0Gangaikondan 3.2Chennai 0.7TOTAL 451.9
B. Technology absorption
(i) The efforts made towards technology absorption:
heating.
energy efficiency projects through leveling and auto loading for increasing utilization of machines.
office areas.
CRI 2-20 Injector body manufacturing and setup changes in other process steps.
(ii) The benefits derived like product improvement, cost reduction, product development or import substitution:
The initiatives have resulted in benefits for our customers and the end users as enumerated below:
reduction in CO2.

Annual Report 2016-17 | Annexures to the Report of the Directors | 71
(iii) In case of imported technology (imported during the last three years reckoned from the beginning of the financial year):
Details of technology imported Year of import
Whether the technology
has been fully absorbed
If not fully absorbed, areas where absorption has not taken place, and
the reasons thereof
Flat Plate Collector Basis SKW (platform) 2013 Yes NA
Packaging Machine FLC 3000 (Product Class: 0998); FSM-EM- Component Kit (first generation)
2014 Yes NA
Rail including FDB (Product Class 0449) 2016 Yes NA
327 Solar-Flat Plate Basic/Comfort/IN 2016 Yes NA
Fuel Supply Module without Fuel Level Sender (Product Class 0580)
2016 Yes NA
CP1H Station 338, CP4 Assembly Line (Part), CRI12 Assembly Line, CRI12-16 Station 5 & 6 (Product Class 0846)
2016 Yes NA
PF4 Packaging Machine (HFFS, Product Class 0993)
2016 Yes NA
(iv) The expenditure incurred on Research and Development(R&D):
[Mio INR]
a) Capital 323
b) Revenue 2,638
c) Total 2,961
d) Total R&D expenditure as a percentage of Gross Sales
2.8%
C. Foreign exchange earnings & outgo
[Mio INR]
a) Export activities:
Exports 8,240
b) Total foreign exchange used and earned
Foreign exchange used (in-cluding for capital assets)
32,967
Foreign Exchange Earned 9,306
For and on behalf of the Board of Directors
V. K. Viswanathan DIN: 01782934
ChairmanDate: May 25, 2017

72 | Annexures to the Report of the Directors | Annual Report 2016-17
Annexure ‘H’ to the Report of the DirectorsSECRETARIAL AUDIT REPORT FOR THE FINANCIAL YEAR ENDED 31 MARCH, 2017[Pursuant to section 204(1) of the Companies Act, 2013 and Rule 9 of the Companies (Appointment and Remuneration of Managerial Personnel) Rules, 2014]
To, The Members, Bosch Limited Hosur Road Adugodi Bengaluru - 560 030
I have conducted the Secretarial Audit of the compliance of applicable statutory provisions and the adherence to good corporate practices by Bosch Limited (hereinafter called “the Company”). Secretarial Audit was conducted in a manner that provided me a reasonable basis for evaluating the corporate conduct/statutory compliances and expressing my opinion thereon.
Based on my verification of the Company’s books, papers, minute books, forms and returns filed and other records maintained by the Company and also the information provided by the Company, its officers, agents and authorised representatives during the conduct of Secretarial Audit, I hereby report that in my opinion, the Company has, during the audit period covering the financial year ended on 31 March, 2017, complied with the statutory provisions listed hereunder and also that the Company has proper Board-processes and compliance-mechanism in place to the extent, in the manner and subject to the reporting made hereinafter.
I have examined the books, papers, minute books, forms and returns filed and other records maintained by the Company for the financial year ended on 31 March, 2017 according to the provisions of:
(i) The Companies Act, 2013 (the Act) and the rules made thereunder;
(ii) The Securities Contracts (Regulation) Act, 1956 (‘SCRA’) and the rules made thereunder;
(iii) The Depositories Act, 1996 and the Regulations and Bye-laws framed thereunder;
(iv) Foreign Exchange Management Act, 1999 and the rules and regulations framed thereunder to the extent of foreign direct investment. The provisions of external commercial borrowings and overseas direct investment were not applicable to the Company.
(v) The following Regulations and Guidelines prescribed under the Securities and Exchange Board of India Act, 1992 (‘SEBI Act’):-
(a) The Securities and Exchange Board of India (Substantial Acquisition of Shares and Takeovers) Regulations, 2011;
(b) The Securities and Exchange Board of India (Prohibition of Insider Trading) Regulations, 2015;
(c) The Securities and Exchange Board of India (Issue of Capital and Disclosure Requirements) Regulations, 2009; (Not applicable to the Company during the audit period)
(d) The Securities and Exchange Board of India (Share Based Employee Benefits) Regulations, 2014; (Not applicable to the Company during the audit period)
(e) The Securities and Exchange Board of India (Issue and Listing of Debt Securities) Regulations, 2008; (Not applicable to the Company during the audit period)
(f) The Securities and Exchange Board of India (Registrars to an Issue and Share Transfer Agents) Regulations, 1993 regarding the Companies Act and dealing with client;
(g) The Securities and Exchange Board of India (Delisting of Equity Shares) Regulations, 2009; (Not applicable to the Company during the audit period) and
(h) The Securities and Exchange Board of India (Buyback of Securities) Regulations, 1998
(vi) Other laws as may be applicable to the Company as per the representation made by the Company.

Annual Report 2016-17 | Annexures to the Report of the Directors | 73
I have also examined compliance with the applicable clauses of the following:
(i) Secretarial Standards issued by the Institute of Company Secretaries of India.
(ii) Listing Agreements entered into by the Company with BSE Ltd. and the National Stock Exchange of India Ltd. and The Securities and Exchange Board of India (Listing Obligations and Disclosure Requirements) Regulations, 2015.
During the period under review the Company has complied with the provisions of the Act, Rules, Regulations, Guidelines, Standards, etc. mentioned above.
I further report that
The Board of Directors of the Company is duly constituted with proper balance of Executive Directors, Non-Executive Directors and Independent Directors. The changes in the composition of the Board of Directors that took place during the period under review were carried out in compliance with the provisions of the Act.
Adequate notice is given to all directors to schedule the Board Meetings, agenda and detailed notes on agenda were sent at least seven days in advance, and a system exists for seeking and obtaining further information and clarifications on the agenda items before the meeting and for meaningful participation at the meeting.
As per the minutes of the meetings duly recorded and signed by the Chairman, the decisions of the Board were unanimous and no dissenting views have been recorded.
I further report that there are adequate systems and processes in the Company commensurate with the size and operations of the Company to monitor and ensure compliance with applicable laws, rules, regulations and guidelines.
I further report that during the audit period, no specific events / actions took place having a major bearing on the Company’s affairs in pursuance of the above referred laws, rules, regulations, guidelines, standards, etc. referred to above.
Sachin BhagwatPlace : Pune ACS: 10189Date : 7 May, 2017 CP: 6029

74 | Annexures to the Report of the Directors | Annual Report 2016-17
Annexure ‘I’ to the Report of the DirectorsFORM NO. MGT - 9EXTRACT OF ANNUAL RETURN(As on the Financial Year ended March 31, 2017)[Pursuant to Section 92(3) of the Companies Act, 2013, and rule 12(1) of the Companies (Management and Administration) Rules, 2014, as amended]
I. REGISTRATION AND OTHER DETAILS:
SI. No.
Particulars Details
1 CIN L85110KA1951PLC000761
2 Registration Date 12.11.1951
3 Name of the Company Bosch Limited
4 Category / Sub-Category of the Company
Public Limited Company having Share Capital
5 Address of the Registered office and Contact details
P. B. No. 3000, Hosur Road, Adugodi, Bengalaru - 560 030 Tel : 080 41768626Website : www.boschindia.com E-mail : [email protected]
6 Whether listed company Yes
7 Name, Address and Contact details of Registrar and Transfer Agent (RTA), if any`
Integrated Registry Management Services Private Limited* 30, Ramana Residency, 4th Cross, Malleswaram Bengaluru – 560003.Tel: 080 23460815- 818 E-mail : [email protected]
* Pursuant to the scheme of demerger, the Registry business of Integrated Enterprises (India) Limited was transferred to Integrated Registry Management Services Private Limited with effect from February 17, 2017. There is no change in the operational team or the management of RTA pursuant to the said scheme.
II. PRINCIPAL BUSINESS ACTIVITIES OF THE COMPANY
All the business activities contributing 10% or more of the total turnover of the Company are given below:-
SI. No.
Name and Description of main products / services
NIC Code of the Product / service
% to total turnover of the company
1 Fuel Injection Equipment & Components
34107 70%
III. PARTICULARS OF HOLDING, SUBSIDIARY AND ASSOCIATE COMPANIES -
Sl. No.
Name and Address of the Company CIN/GLN Holding / Subsidiary /
Associate
% of shares held
Applicable Section
1 Robert Bosch GmbH, Postfach 10 60 50 70049 Stuttgart Germany
NA(Body Corporate
incorporated outside India)
Holding 69.0% 2(46) r/w 2(87)
2 Robert Bosch Engineering and Business Solutions Private Limited, 123 Industrial Layout, Hosur Road, Bengaluru - 560 095
U72400KA1997PTC023164 Subsidiary of Holding Company
1.49% 2(46)
3 MICO Trading Private Limited, Hosur Road, Adugodi, Bengaluru - 560 030
U51109KA1992PTC013736 Subsidiary 100% 2(87)
4 Newtech Filter India Private Limited (formerly known as MHB Filter India Private Limited), C/o ESys Information Technologies Private Limited, Shed No 5 Industrial Area, Village : Bairsen (Manjholi) Nalagarh Solan Himachal Pradesh - 174 101
U00291HP2006PTC001074 Associate 25% 2(6)

Annual Report 2016-17 | Annexures to the Report of the Directors | 75
IV. SHARE HOLDING PATTERN (Equity Share Capital Breakup as percentage of Total Equity)
i) Category-wise Share Holding
Category of Shareholders
No. of Shares held at the beginning of the year
No. of Shares held at the end of the year
% change during
the yearDemat Physical Total % of
Total Shares
Demat Physical Total % of Total
Shares
A. Promoters
(1) Indian
(a) Individual/HUF Nil Nil Nil Nil Nil Nil Nil Nil Nil
(b) Central Government Nil Nil Nil Nil Nil Nil Nil Nil Nil
(c) State Government(s) Nil Nil Nil Nil Nil Nil Nil Nil Nil
(d) Bodies Corporate Nil Nil Nil Nil 454,000 Nil 454,000 1.49 1.49
(e) Banks/FI Nil Nil Nil Nil Nil Nil Nil Nil Nil
(f) Any other Nil Nil Nil Nil Nil Nil Nil Nil Nil
Sub Total (A)(1) Nil Nil Nil Nil 454,000 Nil 454,000 1.49 1.49
(2) Foreign
(a) NRI-Individuals Nil Nil Nil Nil Nil Nil Nil Nil Nil
(b) Other-Individuals Nil Nil Nil Nil Nil Nil Nil Nil Nil
(c) Bodies Corporate 22,349,420 Nil 22,349,420 71.18 21,058,705 Nil 21,058,705 69.00 -2.18
(d) Banks/FI Nil Nil Nil Nil Nil Nil Nil Nil Nil
(e) Any other Nil Nil Nil Nil Nil Nil Nil Nil Nil
Sub-Total (A)(2) 22,349,420 Nil 22,349,420 71.18 21,512,705 Nil 21,512,705 70.49 -0.69
Total Shareholding of Promoters (A)=(A)(1)+(A)(2)
22,349,420 22,349,420 71.18 21,512,705 Nil 21,512,705 70.49 -0.69
B. Public Shareholding
(1) Institutions
(a) Mutual Funds/UTI 720,339 150 720,489 2.29 973,802 150 974,042 3.19 0.90
(b) Banks/FI 32,116 5,090 37,206 0.12 26,807 5,090 31,807 0.11 -0.02
(c) Central Government Nil Nil Nil Nil Nil Nil Nil Nil Nil
(d) State Government(s) Nil Nil Nil Nil Nil Nil Nil Nil Nil
(e) Venture Capital Funds Nil Nil Nil Nil Nil Nil Nil Nil Nil
(f) Insurance Companies 2,893,189 250 2,893,439 9.22 2,829,474 250 2,829,724 9.27 0.05
(g) FIIs 2,414,715 50 2,414,765 7.69 2,249,802 50 2,249,852 7.37 -0.32
(h) Foreign Venture Capital Funds
Nil Nil Nil Nil Nil Nil Nil Nil Nil
(i) Others (specify) Nil Nil Nil Nil Nil Nil Nil Nil Nil
Sub-Total (B)(1) 6,060,359 5,540 6,065,899 19.32 6,079,885 5,540 6,085,425 19.94 0.62
(2) Non-Institutions
(a) Bodies Corporate
i. Indian 495,989 19,050 515,039 1.64 465,883 19,050 484,933 1.59 -0.05
ii. Overseas Nil Nil Nil Nil Nil Nil Nil Nil Nil
(b) Individuals
i. Individual Shareholders holding nominal share capital up to INR 1 lakh
1,733,950 194,509 1,928,459 6.14 1,756,048 184,251 1,940,299 6.36 0.22
ii. Individual Shareholders holding nominal share capital in excess of INR 1 lakh
349,814 30,150 379,964 1.22 331,285 30,150 361,435 1.18 -0.03

76 | Annexures to the Report of the Directors | Annual Report 2016-17
Category of Shareholders
No. of Shares held at the beginning of the year
No. of Shares held at the end of the year
% change during
the yearDemat Physical Total % of
Total Shares
Demat Physical Total % of Total
Shares
(c) Others (specify)
i. Shares held by Pakistan citizens vested with the Custodian of enemy property
Nil Nil Nil Nil Nil Nil Nil Nil Nil
ii. Other Foreign Nationals Nil 1,000 1,000 Nil 150 1,000 1,150 Nil 0.00
iii. Foreign Bodies Nil Nil Nil Nil Nil Nil Nil Nil Nil
iv. NRI/OCBs 105,602 1,480 107,082 0.34 85,236 1,480 86,716 0.28 -0.06
v. Clearing Members/Clear-ing House
35,865 Nil 35,865 0.11 30,818 Nil 30,818 0.1 -0.01
vi. Trusts 16,172 Nil 16,172 0.05 17,259 Nil 17,259 0.06 0.01
vii. Limited Liability Partner-ships
Nil Nil Nil Nil Nil Nil Nil Nil 0.00
viii. Foreign Portfolio Inves-tor (Corporate)
Nil Nil Nil Nil Nil Nil Nil Nil 0.00
ix. Qualified Foreign Inves-tor
Nil Nil Nil Nil Nil Nil Nil Nil 0.00
Sub Total (B)(2) 2,737,392 246,189 2,983,581 9.50 2,686,679 235,931 2,922,610 9.58 0.08
Total Public Shareholding (B)=(B)(1)+(B)(2)
8,797,751 251,729 9,049,480 28.82 8,766,564 241,471 9,008,035 29.51 0.69
C. Shares held by Custodian for GDRs & ADRs
GRAND TOTAL(A+B+C) 31,147,171 251,729 31,398,900 100.00 30,279,269 241,471 30,520,740 100.00 0.00
Note: The paid-up share capital of the Company at the beginning of the Financial Year comprised of 31,398,900 Equity Shares of face value of INR 10 each. Consequent to the Buy-back of 878,160 Equity Shares during the year under review, the revised paid-up share capital as on the date of this report comprises of 30,520,740 Equity Shares of face value of INR 10 each as at the end of the year under review.
ii) Shareholding of Promoter/Promoter Group :
Shareholders Name
Shareholding at the beginning of the year Shareholding at the end of the year % change in shareholding
during the year
No. of shares
%of total shares of the
Company
% of Shares Pledged /
encumbered to total shares
No. of shares
%of total shares of the
Company
% of Shares Pledged /
encumbered to total shares
Robert Bosch GmbH
22,349,420 71.18 Nil 21,058,705 69.00 Nil -2.18
Robert Bosch Engineering and Business Solutions Private Limited
Nil Nil Nil 454,000 01.49 Nil 1.49
Total 22,349,420 71.18 Nil 21,512,705 70.49 Nil -0.69

Annual Report 2016-17 | Annexures to the Report of the Directors | 77
iii) Change in Promoter/Promoter Group's Shareholding:
Shareholders Name
Shareholding at the beginning of the year
Cumulative Shareholding during the year
No. of shares
%of total shares of the Company
No. of shares
% of total shares of the
Company
1. Robert Bosch Gmbh
At the beginning of the year 22,349,420 71.18 - -
October 24, 2016 Decrease in shareholding (Buyback of shares)
(836,715) (2.66) 21,512,705 70.49
December 21, 2016 Decrease in Shareholding (Promoter Inter-se transfer)
(454,000) (1.49) 21,058,705 69.00
At the end of the year (1) - - 21,058,705 69.00
2. Robert Bosch Engineering and Busi-ness Solutions Private Limited
At the beginning of the year Nil Nil
December 21, 2016 Increase in shareholding (Promoter Inter-se transfer)
454,000 1.49 454,000 1.49
At the end of the year (2) 454,000 1.49
Total (1)+(2) 21,512,750 70.49
iv) Shareholding Pattern of top ten Shareholders (other than Directors, Promoters and Holders of GDRs and ADRs):
SI No.
For each of the Top 10 Shareholders
Shareholding at the beginning of the year
Cumulative Shareholding during the year *
No. of Shares
% of total Shares of the
Company
No. of Shares
% of total Shares of the
Company 1 General Insurance
Corporation of India 981,142 3.124
Date Sale / Purchase 21.10.16 Sale
Buyback of Shares(16,142) 965,000 3.161
965,000 3.161 2 The New India Assurance
Company Limited 878,926 2.800
Date Sale/ Purchase 20.05.16 Sale (700) 878,22627.05.16 Sale (2,302) 875,92430.06.16 Sale (1,998) 873,92622.07.16 Sale (200) 873,72629.07.16 Sale (800) 872,92605.08.16 Sale (500) 872,42612.08.16 Sale (2,770) 869,65619.08.16 Sale (800) 868,856 02.09.16 Sale (1,565) 867,291 867,291 2.841 3 Life Insurance Corporation
of India 447,238 1.424
Date Sale/ Purchase 12.08.16 Sale (14,005) 433,23319.08.16 Sale (191) 433,04226.08.16 Sale (5,000) 428,04220.09.16 Sale (1,198) 426,844

78 | Annexures to the Report of the Directors | Annual Report 2016-17
SI No.
For each of the Top 10 Shareholders
Shareholding at the beginning of the year
Cumulative Shareholding during the year *
No. of Shares
% of total Shares of the
Company
No. of Shares
% of total Shares of the
Company 09.09.16 Sale (13,303) 413,54111.11.16 Purchase 265 413,80618.11.16 Purchase 612 414,41825.11.16 Purchase 1,101 415,51913.01.17 Sale (75) 415,44427.01.17 Sale (60) 415,384 415,384 415,384 1.360 4 Aberdeen Global Indian
Equity Limited 484,907 1.544
Date Sale/ Purchase 03.06.16 Sale (3,723) 481,18410.06.16 Sale (26,483) 454,70117.06.16 Sale (8,794) 445,90722.07.16 Sale (14,004) 431,90329.07.16 Sale (13,996) 417,90709.09.16 Sale (2,565) 415,34216.09.16 Sale (1,838) 413,50430.09.16 Sale (8,821) 404,68307.10.16 Sale (10,922) 393,76114.10.16 Sale (1,854) 391,90718.11.16 Sale (4,000) 387,90717.03.17 Sale (15,000) 372,90731.03.17 Sale (12,000) 360,907 360,907 1.182 5 United India Insurance
Company Limited 296,539 0.944
Date Sale / Purchase 17.03.17 Sale (4,343) 292,196 24.03.17 Sale (741) 291,455 291,455 0.954 6 Axis Mutual Fund Trustee
Limited 66,872 0.212
Date Sale/ Purchase 15.04.16 Purchase 5,000 71,87213.05.16 Purchase 3,045 74,91727.05.16 Purchase 6,233 81,15003.06.16 Purchase 24 81,17401.07.16 Purchase 10,000 91,17408.07.16 Purchase 12,500 103,67416.09.16 Purchase 5,000 108,67423.09.16 Purchase 7,000 115,67414.10.16 Purchase 2,150 117,82416.12.16 Purchase 7,500 125,32423.12.16 Purchase 17,100 142,42430.12.16 Purchase 12,500 154,92406.01.17 Purchase 7,300 162,22420.01.17 Purchase 8,500 170,72427.01.17 Purchase 6,500 177,22403.02.17 Purchase 23,991 201,21510.02.17 Purchase 9 201,22403.03.17 Purchase 6,000 207,22410.03.17 Purchase 898 208,122

Annual Report 2016-17 | Annexures to the Report of the Directors | 79
SI No.
For each of the Top 10 Shareholders
Shareholding at the beginning of the year
Cumulative Shareholding during the year *
No. of Shares
% of total Shares of the
Company
No. of Shares
% of total Shares of the
Company 17.03.17 Purchase 31,013 239,13524.03.17 Purchase 15,001 254,136 254,136 0.8327 UTI Mutual Fund Various
Schemes256,326 0.816
Date Sale/ Purchase 15.04.16 Sale (8,773) 247,55322.04.16 Sale (25) 247,52829.04.16 Sale (2) 247,52606.05.16 Purchase 73 247,59913.05.16 Purchase 252 247,85120.05.16 Purchase 6 247,85727.05.16 Purchase 993 248,85003.06.16 Sale (1,962) 246,88810.06.16 Sale (498) 246,39017.06.16 Purchase 489 246,87924.06.16 Purchase 4 246,88330.06.16 Purchase 3 246,88601.07.16 Sale (1,519) 245,36708.07.16 Purchase 26 245,39315.07.16 Purchase 89 245,48222.07.16 Sale (207) 245,27529.07.16 Purchase 40 245,31505.08.16 Sale (990) 244,32519.08.16 Purchase 9 244,33426.08.16 Sale (60) 244,27402.09.16 Sale (84) 244,19009.09.16 Sale (100) 244,09016.09.16 Sale (450) 243,64030.09.16 Purchase 4 243,64407.10.16 Sale (900) 242,74414.10.16 Purchase 13 242,75721.10.16 Sale (48,158) 194,59928.10.16 Purchase 41,822 236,42104.11.16 Purchase 28 236,44911.11.16 Purchase 3,664 240,11318.11.16 Sale (5,952) 234,16125.11.16 Purchase 195 234,35602.12.16 Purchase 273 234,62909.12.16 Purchase 191 234,82016.12.16 Purchase 269 235,08923.12.16 Purchase 353 235,44231.12.16 Purchase 449 235,89106.01.17 Purchase 435 236,32613.01.17 Purchase 196 236,52220.01.17 Purchase 41 236,56327.01.17 Purchase 194 236,75703.02.17 Purchase 390 237,14710.02.17 Purchase 251 237,39817.02.17 Sale (10,895) 226,50324.02.17 Purchase 369 226,87203.03.17 Purchase 1,800 228,67210.03.17 Sale (1,189) 227,48317.03.17 Sale (4,300) 223,18324.03.17 Sale (1,463) 221,720

80 | Annexures to the Report of the Directors | Annual Report 2016-17
SI No.
For each of the Top 10 Shareholders
Shareholding at the beginning of the year
Cumulative Shareholding during the year *
No. of Shares
% of total Shares of the
Company
No. of Shares
% of total Shares of the
Company 31.03.17 Purchase 393 222,113 222,113 0.727 8 Birla Sun life Trustee
Company Private Limited 235,727 0.750
Date Sale/ Purchase 15.04.16 Sale (34) 235,69322.04.16 Sale (196) 235,49706.05.16 Sale (52) 235,44513.05.16 Sale (15) 235,43024.06.16 Purchase 362 235,79201.07.16 Sale (25) 235,76708.07.16 Sale (19) 235,74822.07.16 Sale (548) 235,20005.08.16 Purchase 1,243 236,44312.08.16 Sale (1,000) 235,44302.09.16 Sale (1,864) 233,57909.09.16 Sale (8,000) 225,57916.09.16 Sale (1,500) 224,07923.09.16 Sale (4,615) 219,46430.09.16 Sale (5,952) 213,51207.10.16 Sale (2,728) 210,78414.10.16 Purchase 682 211,46628.10.16 Sale (2,500) 208,96611.11.16 Sale (9,250) 199,71618.11.16 Purchase 3 199,71902.12.16 Purchase 10 199,72923.12.16 Sale (2,241) 197,48830.12.16 Sale (1,050) 196,43806.01.17 Sale (207) 196,23113.01.17 Purchase 200 196,43127.01.17 Sale (3,771) 192,66003.02.17 Purchase 3,771 196,43110.02.17 Sale (2,500) 193,93117.02.17 Purchase 1,799 195,73003.03.17 Sale (3,450) 192,28010.03.17 Sale (1,213) 191,06717.03.17 Sale (2,900) 188,16724.03.17 Sale (3,158) 185,00931.03.17 Purchase 643 185,652 185,652 0.608 9 The Oriental Insurance
Company Limited 177,841 0.566 177,841 0.582
10 Vanguard Emerging Markets
Stock Index Fund 118,996 0.378
Increase/Decrease In Share-holding during the year
15.04.16 Purchase 476 119,47222.04.16 Purchase 280 119,75220.05.16 Sale (249) 119,50327.05.16 Sale (661) 118,84203.06.16 Sale (1,351) 117,49110.06.16 Purchase 260 117,75124.06.16 Purchase 1,320 119,071

Annual Report 2016-17 | Annexures to the Report of the Directors | 81
SI No.
For each of the Top 10 Shareholders
Shareholding at the beginning of the year
Cumulative Shareholding during the year *
No. of Shares
% of total Shares of the
Company
No. of Shares
% of total Shares of the
Company 22.07.16 Purchase 270 119,34129.07.16 Purchase 810 120,15105.08.16 Purchase 645 120,79612.08.16 Purchase 675 121,47119.08.16 Purchase 960 122,43109.09.16 Purchase 420 122,85107.10.16 Purchase 448 123,29914.10.16 Purchase 308 123,60721.10.16 Purchase 1,050 124,65728.10.16 Purchase 420 125,07711.11.16 Purchase 910 125,98725.11.16 Purchase 1,106 127,09302.12.16 Purchase 630 127,72306.01.17 Purchase 312 128,03513.01.17 Purchase 663 128,69820.01.17 Purchase 312 129,01003.02.17 Purchase 936 129,94617.02.17 Purchase 260 130,20624.03.17 Purchase 585 130,79131.03.17 Purchase 572 131,363 131,363 0.430 11 Abu Dhabi Investment
Authority 167,367 0.533
Date Sale/ Purchase 15.04.16 Sale (1,594) 165,77329.04.16 Sale (4,482) 161,29106.05.16 Sale (11,219) 150,07220.05.16 Sale (12,689) 137,38327.05.16 Sale (96) 137,28703.06.16 Sale (2,377) 134,91010.06.16 Sale (12,137) 122,77319.08.16 Sale (560) 122,21326.08.16 Sale (1,790) 120,42302.09.16 Sale (1,703) 118,72002.12.16 Sale (2,626) 116,09423.12.16 Sale (11,254) 104,84027.01.16 Sale (1,500) 103,34024.02.17 Sale (544) 102,79603.03.17 Sale (1,292) 101,504 101,504 0.332
Note: The paid-up share capital of the Company at the beginning of the Financial Year comprised of 31,398,900 Equity Shares of face value of INR 10 each. Consequent to the Buy-back of 878,160 Equity Shares during the year under review, the revised paid-up share capital as on the date of this report comprises of 30,520,740 Equity Shares of face value of INR 10 each as at the end of the year under review.

82 | Annexures to the Report of the Directors | Annual Report 2016-17
v) Shareholding of Directors and Key Managerial Personnel:
For each of the Directors and KMP
Shareholding at the beginning of the year
Shareholding at the end of the year
No. of shares
%of total shares of the Company
No. of shares
%of total shares of the Company
At the beginning of the year
None of the Directors or Key Managerial Personnel hold shares in the Company
Date wise increase/decrease in shareholding during the year specifying the reason for increase/decrease (e.g. allotment/ transfer/bonus/sweat equity etc.)
At the end of the year
V. INDEBTEDNESS
Indebtedness of the Company including interest outstanding/accrued but not due for payment
Secured Loans excluding
deposits (INR)
Unsecured Loans (INR)
Deposits (INR)
Total Indebtedness
(INR)
Indebtedness at the beginning of the financial year
i) Principal Amount - 542 - -
ii) Interest due but not paid - - - -
iii) Interest accrued but not due - - - -
Total (i+ii+iii) Nil 542 Nil Nil
Change in Indebtedness during the financial year
- (542) - -
Net Change Nil (542) Nil Nil
Indebtedness at the end of the financial year
i) Principal Amount - Nil - -
ii) Interest due but not paid - - - -
iii) Interest accrued but not due - - - -
Total (i+ii+iii) Nil Nil Nil Nil
VI. REMUNERATION OF DIRECTORS AND KEY MANAGERIAL PERSONNEL
A. Remuneration to Managing Director (MD), Whole-Time Directors (WTD) and/or Manager:
[Mio INR]
SI. no.
Particulars of Remuneration
Dr. Steffen Berns
(Managing Director upto
31.12.16)
Mr. Soumitra Bhattacharya
(Managing Director)#
Dr. Andreas Wolf
(Joint Managing Director)@
Mr. Jan Oliver Röhrl
(Alternate Director)*
Total Amount
1. Gross salary
(a) Salary as per provisions contained in section 17(1) of the Income-tax Act, 1961
20.03 16.16 21.99 04.02 62.20
(b) Value of perquisites u/s 17(2) Income-tax Act, 1961
9.26 6.13 5.62 0.89 21.90
(c) Profits in lieu of salary under section 17(3) Income-tax Act, 1961
- - - - -
2. Stock Option Nil Nil Nil Nil Nil

Annual Report 2016-17 | Annexures to the Report of the Directors | 83
[Mio INR]
SI. no.
Particulars of Remuneration
Dr. Steffen Berns
(Managing Director upto
31.12.16)
Mr. Soumitra Bhattacharya
(Managing Director)#
Dr. Andreas Wolf
(Joint Managing Director)@
Mr. Jan Oliver Röhrl
(Alternate Director)*
Total Amount
3. Sweat Equity Nil Nil Nil Nil Nil
4. Commission 18.73 19.54 20.99 3.38 62.64
- As a % of profit
- Others, specify
5. Others –Contribution to funds 0.90 04.17 01.19 0.16 6.42
TOTAL (A) 48.92 46.00 49.79 8.45 153.16
Ceiling as per the Act 1,734
(being 10% of the net profits of the Company as per Section 198 of the Companies Act,2013)
# Joint Managing Director upto December 31, 2016. Re-designated as Managing Director w.e.f January 01, 2017. @ Alternate Director to Mr. Peter Tyroller upto December 31, 2016. Re-designated as Joint Managing Director w.e.f January 01, 2017.* Mr. Jan Oliver Röhrl was appointed as Alternate Director to Mr. Peter Tyroller with effect from 11.02.17 and by virtue of being in employment
of the Company, appointed as Whole-Time Director from the said date.
B. Remuneration to other directors:
[Mio INR]
SI. no.
Particulars of Remuneration
Mr. Bhaskar Bhat
Mr. Bernhard
Steinruecke
Mrs. Renu S Karnad
Mr. Prasad Chandran
Mr. V K Viswanathan Total
1 Independent directors
Fee for attending board/ committee meetings
0.13 0.15 0.15 0.18 - 0.61
Commission 1.73 1.83 1.85 1.95 - 7.36
Others specify - - - - -
Total (1) 1.86 1.98 2.00 2.13 - 7.97
2 Other Non-Executive Directors
Fee for attending board/ committee meetings
- - - - 0.18 0.18
Commission - - - - 2.00 2.00
Others specify - - - - - -
Total (2) 2.18
Total (B) =(1) + (2) 1.86 1.98 2.00 2.13 2.18 10.15
Total Managerial Remuneration #
163.31
Over all Ceiling as per Act
173.4
(being 1% of the net profit of the Company calculated as per Section 198 of the Companies Act, 2013)
Note: Mr. Peter Tyroller, Non-Executive Director has waived his remuneration as director
# Total remuneration to Managing Director, Whole-time Director and other Directors [being the total of (A) and (B)]

84 | Annexures to the Report of the Directors | Annual Report 2016-17
C. REMUNERATION TO KEY MANAGERIAL PERSONNEL OTHER THAN MD/MANAGER/WTD
[Mio INR]
SI. no. Particulars of Remuneration
R Vijay
(Company Secretary
from 11.02.17)
S Karthik
(Joint CFO from 11.02.17)*
1. Gross salary
(a) Salary as per provisions contained in section 17(1) of the Income-tax Act, 1961
0.72 6.03
(b) Value of perquisites u/s 17(2) Income-tax Act, 1961 0.006 0.47
(c) Profits in lieu of salary under section 17(3) Income-tax Act, 1961
2. Stock Option Nil Nil
3. Sweat Equity Nil Nil
4. Commission
- as % of profit
- others, specify
0.13 2.42
5. Others- Contribution to funds 0.026 0.77
Total (C) 0.882 9.69
* Company Secretary upto February 10, 2017. Appointed as Joint Chief Financial Officer w.e.f February 11, 2017. Includes remuneration drawn as the Company Secretary upto February 10, 2017.
VII. PENALTIES / PUNISHMENT/ COMPOUNDING OF OFFENCES:
Type Section of the Companies Act
Brief Description
Details of Penalty / Punishment/ Compounding fees imposed
Authority [RD / NCLT / COURT]
Appeal made, if any (give Details)
A. Company
Penalty
None Punishment
Compounding
B. Directors
Penalty
None Punishment
Compounding
C. Other Officers in Default
Penalty
None Punishment
Compounding
For and on behalf of the Board of Directors
Place : Bengaluru Date : May 25, 2017
V. K. Viswanathan DIN: 01782934Chairman

Annual Report 2016-17 | Standalone Financial Statements | 85
Report on the Standalone Indian Accounting Standards (Ind AS) Financial Statements1. We have audited the accompanying standalone Ind AS financial statements of Bosch Limited (“the Company”), which
comprise the Balance Sheet as at March 31, 2017, the Statement of Profit and Loss (including Other Comprehensive Income), the Cash Flow Statement and the Statement of Changes in Equity for the year then ended, and a summary of the significant accounting policies and other explanatory information.
Management’s Responsibility for the Standalone Ind AS Financial Statements2. The Company’s Board of Directors is responsible for the matters stated in Section 134(5) of the Companies Act, 2013
(“the Act”) with respect to the preparation of these standalone Ind AS financial statements to give a true and fair view of the financial position, financial performance (including other comprehensive income), cash flows and changes in equity of the Company in accordance with the accounting principles generally accepted in India, including the Indian Accounting Standards specified in the Companies (Indian Accounting Standards) Rules, 2015 (as amended) under Section 133 of the Act. This responsibility also includes maintenance of adequate accounting records in accordance with the provisions of the Act for safeguarding of the assets of the Company and for preventing and detecting frauds and other irregularities; selection and application of appropriate accounting policies; making judgments and estimates that are reasonable and prudent; and design, implementation and maintenance of adequate internal financial controls, that were operating effectively for ensuring the accuracy and completeness of the accounting records, relevant to the preparation and presentation of the standalone Ind AS financial statements that give a true and fair view and are free from material misstatement, whether due to fraud or error.
Auditors’ Responsibility3. Our responsibility is to express an opinion on these standalone Ind AS financial statements based on our audit.
4. We have taken into account the provisions of the Act and the Rules made thereunder including the accounting and auditing standards and matters which are required to be included in the audit report under the provisions of the Act and the Rules made thereunder.
5. We conducted our audit of the standalone Ind AS financial statements in accordance with the Standards on Auditing specified under Section 143(10) of the Act and other applicable authoritative pronouncements issued by the Institute of Chartered Accountants of India. Those Standards and pronouncements require that we comply with ethical requirements and plan and perform the audit to obtain reasonable assurance about whether the standalone Ind AS financial statements are free from material misstatement.
6. An audit involves performing procedures to obtain audit evidence about the amounts and the disclosures in the standalone Ind AS financial statements. The procedures selected depend on the auditors’ judgment, including the assessment of the risks of material misstatement of the standalone Ind AS financial statements, whether due to fraud or error. In making those risk assessments, the auditor considers internal financial control relevant to the Company’s preparation of the standalone Ind AS financial statements that give a true and fair view, in order to design audit procedures that are appropriate in the circumstances. An audit also includes evaluating the appropriateness of the accounting policies used and the reasonableness of the accounting estimates made by the Company’s Board of Directors, as well as evaluating the overall presentation of the standalone Ind AS financial statements.
7. We believe that the audit evidence we have obtained is sufficient and appropriate to provide a basis for our audit opinion on the standalone Ind AS financial statements.
Opinion8. In our opinion and to the best of our information and according to the explanations given to us, the aforesaid
standalone Ind AS financial statements give the information required by the Act in the manner so required and give a true and fair view in conformity with the accounting principles generally accepted in India, of the state of affairs of the Company as at March 31, 2017, and its total comprehensive income (comprising of profit and other comprehensive income), its cash flows and the changes in equity for the year ended on that date.
Other Matter9. The financial information of the Company for the year ended March 31, 2016 and the transition date opening balance
sheet as at April 1, 2015 included in these standalone Ind AS financial statements, are based on the previously issued statutory financial statements for the years ended March 31, 2016 and March 31, 2015 prepared in accordance with the Companies (Accounting Standards) Rules, 2006 (as amended) which were audited by us, on which we expressed an unmodified opinion dated May 25, 2016 and May 29, 2015 respectively. The adjustments to those financial statements for the differences in accounting principles adopted by the Company on transition to the Ind AS have been audited by us.
Our opinion is not qualified in respect of this matter.
Report on Other Legal and Regulatory Requirements10. As required by the Companies (Auditor’s Report) Order, 2016, issued by the Central Government of India in terms of
Section 143 (11) of the Act (“the Order”), and on the basis of such checks of the books and records of the Company as we considered appropriate and according to the information and explanations given to us, we give in the Annexure B a statement on the matters specified in paragraphs 3 and 4 of the Order.
Independent Auditors’ ReportTo The Members of Bosch Limited

86 | Standalone Financial Statements | Annual Report 2016-17
11. As required by Section 143 (3) of the Act, we report that:
(a) We have sought and obtained all the information and explanations which to the best of our knowledge and belief were necessary for the purposes of our audit.
(b) In our opinion, proper books of account as required by law have been kept by the Company so far as it appears from our examination of those books.
(c) The Balance Sheet, the Statement of Profit and Loss (including other comprehensive income), the Cash Flow Statement and the Statement of Changes in Equity dealt with by this Report are in agreement with the books of account.
(d) In our opinion, the aforesaid standalone Ind AS financial statements comply with the Indian Accounting Standards specified under Section 133 of the Act.
(e) On the basis of the written representations received from the directors as on March 31, 2017 and taken on record by the Board of Directors, none of the directors is disqualified as on March 31, 2017 from being appointed as a director in terms of Section 164 (2) of the Act.
(f) With respect to the adequacy of the internal financial controls over financial reporting of the Company and the operating effectiveness of such controls, refer to our separate Report in Annexure A.
(g) With respect to the other matters to be included in the Auditors’ Report in accordance with Rule 11 of the Companies (Audit and Auditors) Rules, 2014, in our opinion and to the best of our knowledge and belief and according to the information and explanations given to us:
i. The Company has disclosed the impact, if any, of pending litigations as at March 31, 2017 on its financial position in its standalone Ind AS financial statements; - Refer Note 16, 17 and 40;
ii. The Company has made provision as at March 31, 2017, as required under the applicable law or accounting standards, for material foreseeable losses, if any, on long-term contracts including derivative contracts – Refer Note 41;
iii. There has been no delay in transferring amounts, required to be transferred, to the Investor Education and Protection Fund by the Company during the year ended March 31, 2017; and
iv. The Company has provided requisite disclosures in the standalone Ind AS financial statements as to holdings as well as dealings in Specified Bank Notes during the period from November 8, 2016 to December 30, 2016. Based on audit procedures and relying on the management representation we report that the disclosures are in accordance with books of account maintained by the Company and as produced to us by the Management – Refer Note 46.
For Price Waterhouse & Co Bangalore LLPFirm Registration Number: 007567S/S-200012Chartered Accountants
Subramanian VivekBengaluru PartnerMay 25, 2017 Membership Number 100332

Annual Report 2016-17 | Standalone Financial Statements | 87
Annexure A to Independent Auditors’ ReportReferred to in paragraph 11(f) of the Independent Auditors’ Report of even date to the members of Bosch Limited on the standalone Indian Accounting Standards (Ind AS) financial statements for the year ended March 31, 2017.
Report on the Internal Financial Controls under Clause (i) of Sub-section 3 of Section 143 of the Act1. We have audited the internal financial controls over financial reporting of Bosch Limited (“the Company”) as of March
31, 2017 in conjunction with our audit of the standalone Indian Accounting Standards (Ind AS) financial statements of the Company for the year ended on that date.
Management’s Responsibility for Internal Financial Controls2. The Company’s management is responsible for establishing and maintaining internal financial controls based on the
internal control over financial reporting criteria established by the Company considering the essential components of internal control stated in the Guidance Note on Audit of Internal Financial Controls over Financial Reporting (the “Guidance Note”) issued by the Institute of Chartered Accountants of India (ICAI). These responsibilities include the design, implementation and maintenance of adequate internal financial controls that were operating effectively for ensuring the orderly and efficient conduct of its business, including adherence to company’s policies, the safeguarding of its assets, the prevention and detection of frauds and errors, the accuracy and completeness of the accounting records, and the timely preparation of reliable financial information, as required under the Act.
Auditors’ Responsibility3. Our responsibility is to express an opinion on the Company’s internal financial controls over financial reporting based
on our audit. We conducted our audit in accordance with the Guidance Note and the Standards on Auditing deemed to be prescribed under section 143(10) of the Act to the extent applicable to an audit of internal financial controls, both applicable to an audit of internal financial controls and both issued by the ICAI. Those Standards and the Guidance Note require that we comply with ethical requirements and plan and perform the audit to obtain reasonable assurance about whether adequate internal financial controls over financial reporting was established and maintained and if such controls operated effectively in all material respects.
4. Our audit involves performing procedures to obtain audit evidence about the adequacy of the internal financial controls system over financial reporting and their operating effectiveness. Our audit of internal financial controls over financial reporting included obtaining an understanding of internal financial controls over financial reporting, assessing the risk that a material weakness exists, and testing and evaluating the design and operating effectiveness of internal control based on the assessed risk. The procedures selected depend on the auditor’s judgement, including the assessment of the risks of material misstatement of the financial statements, whether due to fraud or error.
5. We believe that the audit evidence we have obtained is sufficient and appropriate to provide a basis for our audit opinion on the Company’s internal financial controls system over financial reporting.
Meaning of Internal Financial Controls Over Financial Reporting6. A company’s internal financial control over financial reporting is a process designed to provide reasonable assurance
regarding the reliability of financial reporting and the preparation of financial statements for external purposes in accordance with generally accepted accounting principles. A company’s internal financial control over financial reporting includes those policies and procedures that (1) pertain to the maintenance of records that, in reasonable detail, accurately and fairly reflect the transactions and dispositions of the assets of the company; (2) provide reasonable assurance that transactions are recorded as necessary to permit preparation of financial statements in accordance with generally accepted accounting principles, and that receipts and expenditures of the company are being made only in accordance with authorisations of management and directors of the company; and (3) provide reasonable assurance regarding prevention or timely detection of unauthorised acquisition, use, or disposition of the company’s assets that could have a material effect on the financial statements.
Inherent Limitations of Internal Financial Controls Over Financial Reporting7. Because of the inherent limitations of internal financial controls over financial reporting, including the possibility of
collusion or improper management override of controls, material misstatements due to error or fraud may occur and not be detected. Also, projections of any evaluation of the internal financial controls over financial reporting to future periods are subject to the risk that the internal financial control over financial reporting may become inadequate because of changes in conditions, or that the degree of compliance with the policies or procedures may deteriorate.
Opinion8. In our opinion, the Company has, in all material respects, an adequate internal financial controls system over financial
reporting and such internal financial controls over financial reporting were operating effectively as at March 31, 2017, based on the internal control over financial reporting criteria established by the Company considering the essential components of internal control stated in the Guidance Note issued by the ICAI.
For Price Waterhouse & Co Bangalore LLPFirm Registration Number: 007567S/S-200012Chartered Accountants
Subramanian VivekBengaluru PartnerMay 25, 2017 Membership Number 100332

88 | Standalone Financial Statements | Annual Report 2016-17
Annexure B to Independent Auditors’ ReportReferred to in paragraph 10 of the Independent Auditors’ Report of even date to the members of Bosch Limited on the
standalone Indian Accounting Standards (Ind AS) financial statements as of and for the year ended March 31, 2017.
i. (a) The Company is maintaining proper records showing full particulars, including quantitative details and situation, of fixed assets.
(b) The fixed assets are physically verified by the Management according to a phased programme designed to cover all the items over a period of three years which, in our opinion, is reasonable having regard to the size of the Company and the nature of its assets. Pursuant to the programme, a portion of the fixed assets has been physically verified by the Management during the year and no material discrepancies have been noticed on such verification.
(c) The title deeds of immovable properties, as disclosed in Note 4(a) on Property, Plant and Equipment and Note 5 on Investment properties to the standalone Ind AS financial statements, are held in the name of the Company, except for 1 immovable property amounting to Gross book value of Rs. 2.02 million and Net book value of Rs. 1.64 million whose title deed is not held in the name of the Company.
ii. The physical verification of inventory excluding stocks with third parties have been conducted at reasonable intervals by the Management during the year. In respect of inventory lying with third parties, these have substantially been confirmed by them. The discrepancies noticed on physical verification of inventory as compared to book records were not material and have been appropriately dealt with in the books of accounts.
iii. The Company has not granted any loans, secured or unsecured, to companies, firms, limited liability partnerships or other parties covered in the register maintained under Section 189 of the Act. Therefore, the provisions of Clause (iii)(a), (iii)(b) and (iii)(c) of the Order are not applicable to the Company.
iv. In our opinion, and according to the information and explanations given to us, the Company has complied with the provisions of Section 185 and 186 of the Act in respect of the loans and investments made, and guarantees and security provided by it.
v. The Company has not accepted any deposits from the public within the meaning of Sections 73, 74, 75 and 76 of the Act and the Rules framed there under to the extent notified.
vi. Pursuant to the rules made by the Central Government of India, the Company is required to maintain cost records as specified under Section 148(1) of the Act in respect of its products. We have broadly reviewed the same, and are of the opinion that, prima facie, the prescribed accounts and records have been made and maintained. We have not, however, made a detailed examination of the records with a view to determine whether they are accurate or complete.
vii. (a) According to the information and explanations given to us and the records of the Company examined by us, in our opinion, the Company is generally regular in depositing undisputed statutory dues in respect of tax deducted at source under Income Tax Act, service tax, value added tax and sales tax, though there has been a slight delay in a few cases, and is regular in depositing other undisputed statutory dues, including provident fund, employees’ state insurance, income tax, duty of customs, duty of excise, cess and other material statutory dues, as applicable, with the appropriate authorities.
(b) According to the information and explanations given to us and the records of the Company examined by us, the particulars of dues of income tax, sales tax, service tax, duty of customs, entry tax and excise duty and value added tax as at March 31, 2017 which have not been deposited on account of a dispute, are as follows:
Name of the statute
Nature of dues
Amount(Rs. in
Millions)
Period to which the amount relates
Forum where the dispute is pending
Central Excise Act, 1944
Excise duty, interest and penalty
26.18 1985-88 Supreme Court6.47 2002-04 High Court
40.96 # 1998-99, 1999-01, 2003-13
Customs, Excise and Service Tax Appellate Tribunal
24.37 1992-94, 2002-04, 2007-11 and 2012-13
Upto Commissioner Level
Customs Act, 1962
Customs duty and interest
1.50 2009-10 Customs, Excise and Service Tax Appellate Tribunal
67.35 # 1991-92, 2008-13 Upto Commissioner LevelIncome Tax Act, 1961
Income Tax and Interest
3.37# 2001-03 High Court0.08# 2011-12 Income Tax Appellate Tribunal
560.09# 1979-80, 2010-11, 2012-13
Upto Commissioner level
Entry Tax Acts Entry Tax and Interest
2.48# 1991-92, 1999 -01 Upto Commissioner Level
State and Central Sales Tax Acts
Sales Tax, Interest and Penalty
1.34# 1996-97, 1998-99, 2000-01, 2002-14
Sales Tax Appellate Tribunals of various states
239.08# 1993-94, 1995-2016 Upto Commissioner’s Level
# net of amount paid under protest.

Annual Report 2016-17 | Standalone Financial Statements | 89
viii. According to the records of the Company examined by us and the information and explanation given to us, the Company has not defaulted in repayment of loans or borrowings to any financial institution or bank or Government or dues to debenture holders as at the balance sheet date.
ix. The Company has not raised any moneys by way of initial public offer, further public offer (including debt instruments) and term loans. Accordingly, the provisions of Clause 3(ix) of the Order are not applicable to the Company.
x. During the course of our examination of the books and records of the Company, carried out in accordance with the generally accepted auditing practices in India, and according to the information and explanations given to us, we have neither come across any instance of material fraud by the Company or on the Company by its officers or employees, noticed or reported during the year, nor have we been informed of any such case by the Management.
xi. The Company has paid/ provided for managerial remuneration in accordance with the requisite approvals mandated by the provisions of Section 197 read with Schedule V to the Act.
xii. As the Company is not a Nidhi Company and the Nidhi Rules, 2014 are not applicable to it, the provisions of Clause 3(xii) of the Order are not applicable to the Company.
xiii. The Company has entered into transactions with related parties in compliance with the provisions of Sections 177 and 188 of the Act. The details of such related party transactions have been disclosed in the standalone Ind AS financial statements as required under Ind AS 24, Related Party Disclosures specified under Section 133 of the Act.
xiv. The Company has not made any preferential allotment or private placement of shares or fully or partly convertible debentures during the year. Accordingly, the provisions of Clause 3(xiv) of the Order are not applicable to the Company.
xv. The Company has not entered into any non-cash transactions with its directors or persons connected with him. Accordingly, the provisions of Clause 3(xv) of the Order are not applicable to the Company.
xvi. The Company is not required to be registered under Section 45-IA of the Reserve Bank of India Act, 1934. Accordingly, the provisions of Clause 3(xvi) of the Order are not applicable to the Company.
For Price Waterhouse & Co Bangalore LLPFirm Registration Number: 007567S/S-200012Chartered Accountants
Subramanian VivekBengaluru PartnerMay 25, 2017 Membership Number 100332

90 | Standalone Financial Statements | Annual Report 2016-17
[` in Millions (Mio INR)]Note No.
As at March 31, 2017
As at March 31, 2016
As at April 1, 2015
A Assets
1. Non-current assetsProperty, plant and equipment 4(a) 13,194 11,487 9,800 Capital work-in progress 4(b) 1,289 1,507 2,760 Investment properties 5 1,943 1,786 1,398 Intangible assets 6 - - 1 Investments in subsidiary and associate 7 176 176 176 Financial assets (i) Investments 8(a)(i) 36,409 44,319 31,871 (ii) Loans 8(c) 1,174 1,422 1,670 (iii) Other financial assets 8(f) - 100 - Deferred tax assets 9 4,676 4,958 4,172 Other non-current assets 10 143 191 387 Total non-current assets 59,004 65,946 52,235
2. Current assetsInventories 11 11,804 11,915 12,723 Financial assets (i) Investments 8(a)(ii) 2,681 - 2,866 (ii) Trade receivables 8(b) 11,862 13,225 11,984 (iii) Cash and cash equivalents 8(d) 1,312 985 1,304 (iv) Bank balances other than (iii) above 8(e) 15,864 17,330 17,656 (v) Loans 8(c) 3,205 2,826 2,298 (vi) Other financial assets 8(f) 7,955 7,622 6,742 Other current assets 12 4,311 4,479 3,943 Total current assets 58,994 58,382 59,516 Total assets (1+2) 117,998 124,328 111,751
B Equity and Liabilities
1. Equity Equity share capital 13(a) 305 314 314 Other equity (i) Reserves and surplus 13(b) 81,729 90,583 78,442 (ii) Other reserves 13(c) 5,962 4,452 5,316 Total equity 87,996 95,349 84,072
2. LiabilitiesNon-current liabilitiesFinancial liabilities (i) Borrowings 14(a) - 149 542 (ii) Other financial liabilities 14(b) 60 50 64 Provisions 15 3,642 3,775 4,302 Total non-current liabilities 3,702 3,974 4,908
Current liabilitiesFinancial liabilities (i) Trade payables 14(c) 13,399 13,088 12,036 (ii) Other financial liabilities 14(b) 2,748 3,394 3,483 Provisions 15 7,543 6,176 5,158 Current tax liabilities 16 651 762 630 Other current liabilities 17 1,959 1,585 1,464 Total current liabilities 26,300 25,005 22,771 Total liabilities 30,002 28,979 27,679 Total equity and liabilities (1+2) 117,998 124,328 111,751
Summary of significant accounting policies 2
Balance Sheet
The accompanying notes are an integral part of these financial statements.
As per our report of even date
For Price Waterhouse & Co Bangalore LLP For and on behalf of the Board Firm Registration Number: 007567S/S-200012 V.K. Viswanathan (DIN: 01782934) ChairmanChartered Accountants Soumitra Bhattacharya (DIN: 02783243) Managing Director & Chief
Financial OfficerAndreas Wolf (DIN: 07088505) Joint Managing Director
Subramanian Vivek Bhaskar Bhat (DIN: 00148778) DirectorPartner Prasad Chandran (DIN: 00200379) DirectorMembership Number: 100332 Renu Sud Karnad (DIN: 00008064) Director
Bernhard Steinruecke (DIN: 01122939) DirectorPlace: Bengaluru R Vijay Jan Oliver Röhrl (DIN: 07706011) Alternate DirectorDate: May 25, 2017 Company Secretary S Karthik Joint Chief Financial Officer

Annual Report 2016-17 | Standalone Financial Statements | 91
[` in Millions (Mio INR)]
Note No.
For the year ended
March 31, 2017
For the year ended
March 31, 2016Continuing operationsRevenue from operations : Sale of products (including excise duty) 107,500 100,130 Sale of services 18 2,334 1,991 Other operating revenue 19 2,592 2,298 Other income 20 6,174 6,036 Total income 118,600 110,455 Expenses : Cost of materials consumed 21 30,070 25,529 Purchases of stock-in-trade 22 24,219 23,347 Changes in inventories of finished goods, work-in-progress and stock-in-trade 23 (1,197) 825 Excise duty 8,074 7,405 Employee benefit expense 24 13,428 13,031 Finance costs 25 272 129 Depreciation and amortisation expense 26 4,562 3,864 Other expenses 27 18,228 15,501 Total expenses 97,656 89,631 Profit before tax from continuing operations 20,944 20,824 Income tax expense : Current tax 29 (i) for the year 6,169 6,601 (ii) relating to earlier years (6) (94) Deferred tax charge/ (credit) 340 (806)Profit from continuing operations 14,441 15,123 Discontinued operationProfit before tax from discontinued operation 35 3,711 262 Tax expense of discontinued operation 35 741 71 Profit from discontinued operation 2,970 191 Profit for the year 17,411 15,314 Other comprehensive income (OCI)Items that will not be reclassified to profit or loss Changes in fair value of the equity instruments 13(c) 1,510 (864) Remeasurement of post-employment benefit obligations 13(b) (167) 59 Income tax relating to above 9 58 (20)Other comprehensive income for the year (Net of tax) 1,401 (825)Total comprehensive income for the year 18,812 14,489 Earnings per share - Basic and Diluted of nominal value of Rs.10/-each from continuing operations 39 465 482 Earnings per share - Basic and Diluted of nominal value of Rs.10/-each from discontinued operation 39 96 6 Earnings per share - Basic and Diluted of nominal value of Rs.10/-each from continuing operations and discontinued operation 39 561 488 Summary of significant accounting policies 2Details of R&D expenses/ (income) 28
The accompanying notes are an integral part of these financial statements.
As per our report of even date
For Price Waterhouse & Co Bangalore LLP For and on behalf of the Board Firm Registration Number: 007567S/S-200012 V.K. Viswanathan (DIN: 01782934) ChairmanChartered Accountants Soumitra Bhattacharya (DIN: 02783243) Managing Director & Chief
Financial OfficerAndreas Wolf (DIN: 07088505) Joint Managing Director
Subramanian Vivek Bhaskar Bhat (DIN: 00148778) DirectorPartner Prasad Chandran (DIN: 00200379) DirectorMembership Number: 100332 Renu Sud Karnad (DIN: 00008064) Director
Bernhard Steinruecke (DIN: 01122939) DirectorPlace: Bengaluru R Vijay Jan Oliver Röhrl (DIN: 07706011) Alternate DirectorDate: May 25, 2017 Company Secretary S Karthik Joint Chief Financial Officer

92 | Standalone Financial Statements | Annual Report 2016-17
[` in Millions (Mio INR)]For the year ended
March 31, 2017For the year ended
March 31, 2016A. Cash flow from operating activities
Profit before income tax from continuing operations 20,944 20,824 Profit before income tax from discontinued operation 3,711 262 Adjustments for :
Depreciation and amortisation expense 4,604 4,092 Unrealised exchange loss (net) (26) 32 (Profit)/ Loss on sale of fixed assets 22 (22)Provision for doubtful debts 140 154 Bad debts written off 32 33 Provision/ Liabilities no longer required written back (713) (827)Rental income (875) (493)Gain on sale of business (3,971) (18)Dividend from equity investments designated at FVOCI (81) (57)Interest income (2,762) (3,171)Net gain on financial assets measured at FVTPL (3,172) (2,450)Amortisation of deferred government grant income (160) (80)Amortisation of government grant - (261)Finance cost 272 129
Operating profit before working capital changes 17,965 18,147Changes in working capital:
(Increase)/ decrease in inventories (905) 808 (Increase)/ decrease in trade receivables 201 (1,390)(Increase)/ decrease in other financial assets (254) 82 (Increase)/ decrease in other current assets 158 (567)(Increase)/ decrease in loans 81 (28)(Increase)/ decrease in other non-current assets (24) 16 Increase/ (decrease) in trade payables 1,711 1,084 Increase/ (decrease) in other financial liabilities (301) 113 Increase/ (decrease) in provisions 2,751 1,288 Increase/ (decrease) in other current liabilities 430 70
Net Cash generated from operations 21,813 19,623 Income taxes paid (net of refunds) (7,246) (6,446)Net cash from operating activities 14,567 13,177
B. Cash flow from investing activitiesAdditions to property, plant and equipment (6,367) (4,264)Additions to investment properties (305) (457)Proceeds from sale of property, plant and equipment 51 44 Purchase of investments (28,750) (17,314)Proceeds from sale of investments 38,658 9,320 Inter corporate deposit given (7,550) (6,150)Inter corporate deposit repayment received 6,900 5,250 Loan to fellow subsidiaries given (2,560) (950)Loan to fellow subsidiaries repayment received 2,300 700
Investment in deposit accounts (original maturity of more than 3 months) (15,730) (18,580) Maturity of deposit accounts (original maturity of more than 3 months) 17,200 18,910 Investment in deposit accounts (original maturity of more than 12 months) - (100) Maturity of deposit accounts (original maturity of more than 12 months) 100 -
Purchase consideration received towards sale of business 4,376 22 Dividends received 81 57 Rental income received 875 493 Interest received 3,181 3,070
Net cash from/ (used in) investing activities 12,460 (9,949)C. Cash flow from financing activities
Repayment of borrowings (500) (567)Dividends paid (4,958) (2,669)Dividend distribution tax (1,009) (543)Buy Back of shares (20,198) - Government grant received - 261 Interest paid (32) (42)
Net cash from/ (used in) financing activities (26,697) (3,560)Net cash flows during the year (A+B+C) 330 (332)Unrealised exchange gain/(loss) on cash and cash equivalents (0) 0 Cash and cash equivalents (Opening balance) 959 1,291 Cash and cash equivalents (Closing balance) 1,289 959
As at March 31, 2017 As at March 31, 2016Cash and cash equivalents as per above comprise of the followingCash and cash equivalents [Note 8(d)] 1,312 985Book overdraft [Note 14(b)] (23) (26)Balance as per statement of cash flows 1,289 959
Cash Flow Statement
Notes: (a) Above cash flow statement has been prepared under indirect method in accordance with the Indian Accounting Standard (Ind AS) 7 on "Statement of Cash Flows".(b) Mutual fund dividend reinvested has not been considered above as there was no cash inflow/outflow.
As per our report of even date
For Price Waterhouse & Co Bangalore LLP For and on behalf of the Board Firm Registration Number: 007567S/S-200012 V.K. Viswanathan (DIN: 01782934) ChairmanChartered Accountants Soumitra Bhattacharya (DIN: 02783243) Managing Director & Chief
Financial OfficerAndreas Wolf (DIN: 07088505) Joint Managing Director
Subramanian Vivek Bhaskar Bhat (DIN: 00148778) DirectorPartner Prasad Chandran (DIN: 00200379) DirectorMembership Number: 100332 Renu Sud Karnad (DIN: 00008064) Director
Bernhard Steinruecke (DIN: 01122939) DirectorPlace: Bengaluru R Vijay Jan Oliver Röhrl (DIN: 07706011) Alternate DirectorDate: May 25, 2017 Company Secretary S Karthik Joint Chief Financial Officer

Annual Report 2016-17 | Standalone Financial Statements | 93
Statement of changes in equity
A Equity share capital
[` in Millions (Mio INR)]Note No. Amount
As at April 1, 2015 314Changes in equity share capital 13(a) -As at March 31, 2016 314Changes in equity share capital 13(a) (9)As at March 31, 2017 305
B Other equity
[` in Millions (Mio INR)]
Note No.
Reserves and surplus Other reserves Total
other equityCapital
ReserveShare
Premium
Capital Redemption
Reserve
General Reserve
Retained earnings
FVOCI - equity
instrumentsBalance at April 1, 2015 39 8 67 42,060 36,268 5,316 83,758Profit for the year - - - - 15,314 - 15,314
Other comprehensive income - - - - 39 (864) (825)Total comprehensive income for the year
- - - - 15,353 (864) 14,489
Dividend 13(b)(v) - - - - (2,669) - (2,669)
Dividend distribution taxes 13(b)(v) - - - - (543) - (543)
- - - - (3,212) - (3,212)Balance at March 31, 2016 39 8 67 42,060 48,409 4,452 95,035Balance at April 1, 2016 39 8 67 42,060 48,409 4,452 95,035Profit for the year - - - - 17,411 - 17,411
Other comprehensive income - - - - (109) 1,510 1,401Total comprehensive income for the year
- - - - 17,302 1,510 18,812
Buy back of shares - - 9 (20,198) - - (20,189)Dividend 13(b)(v) - - - - (4,958) - (4,958)
Dividend distribution taxes 13(b)(v) - - - - (1,009) - (1,009)
Balance at March 31, 2017 39 8 76 21,862 59,744 5,962 87,691
The accompanying notes are an integral part of these financial statements.
As per our report of even date
For Price Waterhouse & Co Bangalore LLP For and on behalf of the Board Firm Registration Number: 007567S/S-200012 V.K. Viswanathan (DIN: 01782934) ChairmanChartered Accountants Soumitra Bhattacharya (DIN: 02783243) Managing Director & Chief
Financial OfficerAndreas Wolf (DIN: 07088505) Joint Managing Director
Subramanian Vivek Bhaskar Bhat (DIN: 00148778) DirectorPartner Prasad Chandran (DIN: 00200379) DirectorMembership Number: 100332 Renu Sud Karnad (DIN: 00008064) Director
Bernhard Steinruecke (DIN: 01122939) DirectorPlace: Bengaluru R Vijay Jan Oliver Röhrl (DIN: 07706011) Alternate DirectorDate: May 25, 2017 Company Secretary S Karthik Joint Chief Financial Officer

94 | Standalone Financial Statements | Annual Report 2016-17
Notes to the Financial Statements for the year ended March 31, 2017
Note 1: General Information
Bosch Limited (the "Company") is the flagship company of Robert Bosch Company in India. Headquartered out of Bengaluru, the Company has its key manufacturing facilities in Bengaluru, Nashik, Naganathapura, Jaipur, Goa, Gangaikondan, Chennai and Bidadi. The Company has presence across automotive technology, industrial technology, consumer goods and energy and building technology. It manufactures and trades in products such as diesel and gasoline fuel injection systems, automotive aftermarket products, starters and generators, industrial equipments, packaging machines, electrical power tools, security systems and industrial and consumer energy products and solutions. The Company's shares are listed on Bombay Stock Exchange (BSE) and National Stock Exchange (NSE). During the year, the Company has discontinued the business relating to starters and generators products.
The financial statements are approved for issue by the Company's Board of Directors on May 25, 2017.
Note 2: Summary of Significant Accounting Policies
(a) Basis of preparation:
(i) Compliance with Ind AS
The financial statements comply in all material aspects with Indian Accounting Standards (Ind AS) notified under Section 133 of the Companies Act, 2013 (the Act) [Companies (Indian Accounting Standards) Rules, 2015] and other relevant provisions of the Act.
The financial statements up to year ended March 31, 2016 which were prepared in accordance with the accounting standards notified under Companies (Accounting Standards) Rules, 2006 (as amended) and other relevant provisions of the Act, have now been reinstated as per Ind AS.
These financial statements are the first financial statements of the Company under Ind AS. Reconciliation of the effect of transition on the Company's financial position, financial performance and cash flows from previous GAAP to Ind AS has been summarised in Note 44.
(ii) Historical cost convention
The financial statement has been prepared on a historical cost basis, except for:
- certain financial assets and liabilities (including derivative instruments) that are measured at fair value; and
- defined benefit plans (plan assets measured at fair value)
(iii) The assets and liabilities have been classified as current or non-current as per the Company's normal operating cycle and other criteria set out in the Schedule III to the Companies Act, 2013. Based on the nature of products and the time between the acquisition of assets for processing and their realisation in cash and cash equivalents, the Company has ascertained its operating cycle as 12 months for the purpose of current and non-current classification of assets and liabilities.
(iv) Recent accounting pronouncement
The Ministry of Corporate Affairs (MCA) has notified the Companies (Indian Accounting Standards) (Amendment) Rules, 2017 vide its notification dated March 17, 2017 notifying amendments to Ind AS 7 'Statement of cash flows'. The said notification is applicable to accounting periods commencing on or after the date of notification i.e. April 1, 2017. Impact of amendments with respect to Ind AS 7 is not material to the financial statement.
(b) Revenue recognition:
Revenue is measured at the fair value of the consideration received or receivable. The Company recognises revenue when the amount of revenue can be reliably measured, it is probable that the future economic benefits will flow to the entity and specific criteria have been met for each of the Company's activities as mentioned below:
(i) Sale of products is recognised when the significant risks and rewards of ownership in the goods are transferred to the buyer which is based on the agreed terms. Revenue is based on price agreed with the customers. Amounts disclosed as revenue are inclusive of excise duty and are net of returns, trade discounts, cash discounts, sales incentives, sales tax, etc.
(ii) Sale of services with respect to fixed price contracts is recognised based on agreements/ arrangements with the concerned parties using the proportionate completion method and revenue with respect to time-and-material contracts is recognised as and when the related services are performed.
(iii) Rental income arising from operating lease of investment properties is accounted on accrual basis based on contractual terms with the lessee and is disclosed under other operating revenue in statement of profit and loss.
(c) Investments and other financial assets:
(i) Classification
The Company classifies its financial assets under the following measurement categories:
- those to be measured subsequently at fair value through other comprehensive income (FVOCI) or fair value through profit and loss (FVTPL), and
- those measured at amortised cost.

Annual Report 2016-17 | Standalone Financial Statements | 95
Notes to the Financial Statements for the year ended March 31, 2017
The classification depends on the entity's business model for managing the financial assets and the contractual terms of the cash flows.
For assets measured at fair value, gains and losses will either be recorded in profit or loss or other comprehensive income. For investments in debt instruments, this will depend on the business model in which the investment is held. For investments in equity instruments, this will depend on whether the Company has made an irrevocable election at the time of initial recognition to account for the equity instrument at fair value through other comprehensive income.
The Company reclassifies debt investments when and only when its business model for managing those assets changes.
(ii) Initial recognition and measurement
All financial assets are recognised initially at its fair value plus, in the case of financial assets not recorded at fair value through profit or loss, transaction costs that are attributable to the acquisition of the financial asset. Transaction costs of financial assets carried at fair value through profit or loss are expensed in profit or loss.
(iii) Subsequent measurement
Financial assets that are held for collection of contractual cash flows, where those cash flows represent solely payments of principal and interest, are measured at amortised cost.
Financial assets that are held for collection of contractual cash flows and for selling the financial assets, where the asset's cash flows represent solely payments of principal and interest, are measured at FVOCI. All equity investments are measured at fair value through other comprehensive income, except for investments in subsidiary/ associate which is measured at cost. Changes in the fair value of financial assets are recognised in statement of other comprehensive income. In those cases, there is no subsequent reclassification of fair value gains and losses to statement of profit and loss.
Financial assets that do not meet the criteria for amortised cost or FVOCI are measured at FVTPL. A gain or loss on such financial assets that are subsequently measured at FVTPL and is recognised and presented net in the statement of profit and loss within other income in the period in which it arises.
(iv) Impairment of financial assets
Impairment losses (and reversal of impairment losses) on equity investments measured at FVOCI are not reported separately from other changes in fair value. The Company assesses the expected credit losses associated with its assets carried at amortised cost. The impairment methodology applied depends on whether there has been a significant increase in credit risk. Note 32 details how the company determines whether there has been a significant increase in credit risk. The losses arising from impairment are recognised in the profit or loss.
For trade receivables only, the Company applies the simplified approach permitted by Ind AS 109 Financial Instruments, which requires expected lifetime losses to be recognised from initial recognition of the receivables.
(v) Derecognition of financial assets
The Company derecognises a financial asset when the contractual right to the cash flows from the financial asset expire or it transfers substantially all risk and rewards of ownership of the financial asset. A gain or loss on such financial assets that are subsequently measured at amortised cost is recognised in profit or loss when the asset is derecognised.
(vi) Income recognition
Interest income
Interest income from financial assets measured at amortised cost is recognised using the effective interest rate method and are disclosed in statement of profit and loss.
Dividends
Dividends from equity instruments are recognised as other income in statement of profit and loss only when the right to receive payment is established.
(d) Property, plant and equipment:
Freehold land is carried at historical cost and other items of property, plant and equipment including capital spares are stated at cost of acquisition or construction less accumulated depreciation when, it is probable that future economic benefits associated with the item will flow to the Company and it can be used for more than one year and the cost can be measured reliably.
Subsequent costs are included in the asset's carrying amount or recognised as a separate asset, as appropriate, only when it meets the recognition criteria as mentioned above. The carrying amount of any component accounted for as a separate asset is derecognised when replaced. All other repairs and maintenance are charged to profit or loss during the reporting period in which they are incurred.
Gains and losses on disposal are determined by comparing proceeds with carrying amount. These are included in profit or loss within other income or expense.
Depreciation on property, plant and equipments is provided using the written down value method. As required under Schedule II to the Companies Act 2013, the Company periodically assesses the estimated useful life of its tangible

96 | Standalone Financial Statements | Annual Report 2016-17
assets based on the technical evaluation considering anticipated technological changes and actual usage of the assets. The estimated useful life is either equal to or lower than those prescribed under Part C of Schedule II to the Companies Act, 2013.
The estimated useful life for various property, plant and equipments is given below:
Useful life (in years)
Buildings : Residential : 59 Factory/Office : 29Plant and machinery : General : 6 Data processing equipment : 3Furniture and fixtures : 8Office equipment : 5Vehicles : 5
In respect of specific assets including second hand plant and machinery, capital spares which are estimated to have a lower residual life than envisaged above, depreciation is provided based on the estimated lower residual life, where required.
Low value assets not exceeding INR 15,000/- per unit and all Research and Development assets (except for Buildings) are depreciated at 100% in the quarter of addition.
In respect of additions, depreciation is provided on pro-rata basis from the quarter of addition and in respect of disposals, the same is provided upto the quarter prior to disposal.
Transition to Ind AS
On transition to Ind AS, the Company has elected to continue with the carrying value of all its property, plant and equipment recognised as at April 1, 2015 measured as per the previous GAAP and use that carrying value as the deemed cost of the property, plant and equipment.
(e) Investment properties:
Property that is held for rental income and that is not occupied by the Company, is classified as investment property. Investment properties are measured initially at cost, including related transaction cost. It is carried at cost less accumulated depreciation. Subsequent expenditure is capitalised to the asset's carrying amount only when it is probable that future economic benefits associated with the expenditure will flow to the Company and the cost can be measured reliably. All other repairs and maintenance costs are expensed when incurred.
Land is carried at historical cost, however, buildings are depreciated using the written down value method over their estimated useful lives as mentioned in 2(d) above.
Transition to Ind AS
On transition to Ind AS, the Company has elected to continue with the carrying value of all its investment properties recognised as at April 1, 2015 measured as per the previous GAAP and use that carrying value as deemed cost of investment properties.
(f) Intangible assets
Intangible assets are stated at cost of acquisition less accumulated amortisation. Amortisation on intangible assets is provided using the written down value method based on estimated useful life determined by management.
The estimated useful life for intangible assets is given below:
Useful life (in years)
Know-how, business : 3
Expenditure incurred in research phase is expensed as incurred. Development related expenditure is capitalised as an internally generated intangible asset only if it meets the recognition criteria under Ind AS 38 on Intangible Assets, which inter-alia includes demonstration of technical feasibility, generation of future economic benefits etc. Expenditure that cannot be distinguished between research phase and development phase is expensed as and when incurred.
Transition to Ind AS
On transition to Ind AS, the Company has elected to continue with the carrying value of all its intangible assets recognised as at April 1, 2015 measured as per the previous GAAP and use that carrying value as deemed cost of intangible assets.
Notes to the Financial Statements for the year ended March 31, 2017

Annual Report 2016-17 | Standalone Financial Statements | 97
(g) Trade receivables:
Trade receivables are recognised initially at fair value and subsequently measured at amortised cost less provision for impairment.
(h) Inventories:
Inventories are valued at lower of cost and net realisable value. Cost is generally ascertained on weighted average basis. Cost of raw materials, traded goods and indirect materials include cost of purchase and other costs incurred in bringing the inventories to their present location and condition. The cost of finished goods and work in progress comprises raw materials, direct labour, other direct costs and related production overheads. Net realisable value is the estimated selling price in the ordinary course of business less the estimated costs of completion and the estimated costs necessary to make the sale.
Excise duty on finished goods lying in factories are considered for valuation of inventories, as applicable. Obsolete/ slow moving inventories are adequately provided for.
(i) Employee benefits:
(i) Short term employee benefits:
All employee benefits that are expected to be settled wholly within twelve months after the end of the period in which the employees render the related service are classified as short term employee benefits, which include salaries, wages, short term compensated absences and performance incentives and are measured at the amounts expected to be paid when the liabilities are settled. The liabilities are presented as current employee benefit obligations in the balance sheet. These are recognised as expenses in the period in which the employee renders the related service.
(ii) Post-employment benefits:
Contributions towards Superannuation Fund, Pension Fund and government administered Provident Fund are treated as defined contribution schemes. In respect of contributions made to government administered Provident Fund, the Company has no further obligations beyond its monthly contributions. Such contributions are recognised as expense in the period in which the employee renders related service.
Provident Fund contributions made to Trusts administered by the Company are treated as defined benefit plan. The interest payable to the members of these Trusts shall not be lower than the statutory rate of interest declared by the Central Government under the Employees' Provident Funds and Miscellaneous Provisions Act, 1952 and shortfall, if any, shall be made good by the Company. The Company also provides for post employment defined benefit in the form of Gratuity. The cost of defined benefit is determined using the projected unit credit method, with actuarial valuation being carried out at each balance sheet date. Actuarial gains and losses in respect of the same are charged to the Other Comprehensive Income (OCI).
(iii) Other long term employee benefits:
All employee benefits other than post-employment benefits and termination benefits, which do not fall due wholly within twelve months after the end of the period in which the employees render the related service, including long term compensated absences, service awards, and ex-gratia are determined based on actuarial valuation carried out at each balance sheet date. Estimated liability on account of long term employee benefits is discounted to the present value using the yield on government bonds as the discounting rate for the term of obligations as on the date of the balance sheet. Actuarial gains and losses in respect of the same are charged to the statement of profit and loss.
(iv) Termination benefits:
Termination benefits are payable when employment is terminated by the Company before the normal retirement date, or when an employee accepts voluntary retirement in exchange of these benefits. The Company recognises termination benefits at the earlier of the following dates:
(a) when the Company can no longer withdraw the offer of those benefits; and (b) when the entity recognises costs for a restructuring that is within the scope of Ind AS 37 and involves the payment of termination benefits. The termination benefits are measured based on the number of employees expected to accept the offer in case of voluntary retirement scheme.
(j) Foreign currency transactions:
Items included in the financial statements are measured using the currency of the primary economic environment in which entity operates ('the functional currency'). The financial statements are presented in Indian rupee (INR), which is Company's functional and presentation currency.
Foreign currency transactions are recorded at the rate of exchange prevailing on the date of the transactions. At the year end, all the monetary assets and liabilities denominated in foreign currency are restated at the closing exchange rates. Exchange differences resulting from the settlement of such transactions and from the translation of such monetary assets and liabilities at the year end are recognised in the Statement of Profit and Loss.
(k) Leases:
As a lessee
Notes to the Financial Statements for the year ended March 31, 2017

98 | Standalone Financial Statements | Annual Report 2016-17
Leases in which the Company has substantial portion of the risks and rewards of ownership are classified as finance leases. Assets acquired under finance leases are capitalised at the lower of the fair value of the leased assets at the inception of the lease term and the present value of minimum lease payments. Lease payments are apportioned between the finance charge and the reduction of the outstanding liability. The finance charge is allocated to periods during the lease term at a constant periodic rate of interest on the remaining balance of the liability.
Cost of leasehold land (other than those which will be converted to freehold after a certain period upon satisfying prescribed conditions) is amortised over the lease term.
Leases in which the Company doesn't have substantial portion of the risks and rewards of ownership are classified as operating leases. Payment made under operating leases are charged to statement of profit and loss on a straight line basis.
As a lessor
Leases are classified as finance leases when substantially all of the risks and rewards of ownership transfer from the Company to the lessee. Amounts due from lessees under finance leases are recorded as receivables at the Company's net investment in the leases. Finance lease income is allocated to accounting periods so as to reflect a constant periodic rate of return of the net investment outstanding in respect of the leases.
Lease income from operating leases where the Company is a lessor is recognised as income on a straight line basis. The respective leased assets are disclosed as investment properties.
(l) Income tax :
(i) Current tax:
Current tax is measured at the amount expected to be paid to the tax authorities in accordance with the provisions of Income Tax Act, 1961. Current tax assets and current tax liabilities are offset when there is a legally enforceable right to set off the recognised amounts and there is an intention to settle the asset and the liability on a net basis.
(ii) Deferred tax:
Deferred income tax is provided in full, using the liability method, on temporary differences arising between the tax bases of assets and liabilities and their carrying amounts in the financial statements.
Deferred tax assets are recognised and carried forward only if it is probable that sufficient future taxable income will be available against which such deferred tax assets can be realised. Deferred tax assets and liabilities are measured at the tax rates that have been enacted or substantively enacted as on the balance sheet date. Deferred tax assets and deferred tax liabilities are offset when there is a legally enforceable right to set off assets against liabilities representing current tax.
Current and deferred tax is recognised in profit and loss, except to the extent that it relates to items recognised in other comprehensive income. In this case, the tax is also recognised in other comprehensive income.
(m) Impairment of assets:
At each balance sheet date, the Company assesses whether there is any indication that an asset may be impaired. If any such indication exists, the Company estimates the recoverable amount. If the carrying amount of the asset exceeds its estimated recoverable amount, an impairment loss is recognised in the Statement of Profit and Loss to the extent the carrying amount exceeds recoverable amount. The recoverable amount is the higher of an asset's fair value less costs of disposal and value in use. For the purpose of assessing impairment, assets are grouped at the lowest level of which that are separately identifiable cash inflows which are largely independent of the cash inflows from other assets or group of assets (cash-generating units). Non-financial assets that suffered an impairment are reviewed for possible reversal of the impairment at the end of each reporting period.
(n) Trade and other payables:
These amounts represent liabilities for goods and services provided to the Company prior to the end of financial year which are unpaid. The amounts are unsecured and are usually paid as per payment terms. They are recognised initially at their fair value and subsequently measured at amortised cost.
(o) Borrowings:
Borrowings are initially recognised at fair value, net of transaction costs incurred. Borrowings are subsequently measured at amortised cost using effective interest method.
(p) Provisions and Contingent Liabilities:
Provisions are recognised when the Company has a present legal or constructive obligation as a result of past events, for which it is probable that an outflow of resources embodying economic benefits will be required to settle the obligation and a reliable estimate of the amount can be made.
Provisions are measured at the present value of management's best estimate of the expenditure required to settle the present obligation at the end of the reporting period. The discount rate to determine the present value is a pre-tax rate that reflects current market assessments of the time value of money and the risks specific to the liability. The increase in the provision due to the passage of time is recognised as interest expense.
Notes to the Financial Statements for the year ended March 31, 2017

Annual Report 2016-17 | Standalone Financial Statements | 99
Contingent liabilities are disclosed when there is a possible obligation arising from past events, the existence of which will be confirmed only by the occurrence or non occurrence of one or more uncertain future events not wholly within the control of the company or a present obligation that arises from past events where it is either not probable that an outflow of resources will be required to settle or a reliable estimate of the amount cannot be made.
(q) Government grants:
Grants from the government are recognised at their fair value where there is a reasonable assurance that the grant will be received and the Company will comply with all attached conditions.
Government grants relating to the purchase of property, plant and equipment are included in non-current liabilities as deferred income and are credited to profit or loss on a straight-line basis over the expected lives of the related assets and presented within other income.
(r) Segment Reporting
Segment reporting is based on the management approach with regard to segment identification, under which information regularly provided to the chief operating decision maker (CODM) for decision-making purposes is considered decisive. The executive directors are the chief operating decision maker of the company, who assess the financial position, performance and make strategic decisions.
Revenue and expenses have been identified to segments on the basis of their relationship to the operating activities of the segment. Inter-segment revenue have been accounted for based on the transaction price agreed to between segments which is primarily market based. Revenue and expenses, which relate to the Company as a whole and are not allocable to segments on a reasonable basis, have been included under “Unallocated corporate expenses/ income”.
(s) Cash and cash equivalents:
Cash and cash equivalents includes cash and cheques on hand, current accounts and fixed deposit accounts with banks with original maturities of three months or less that are readily convertible to known amounts of cash and which are subject to an insignificant risk of changes in value.
(t) Derivatives and hedging activities:
The Company uses derivative financial instruments such as forward exchange contracts and currency option contracts to hedge its risks associated with foreign currency fluctuations. Such derivative contracts are not designated as hedges and are accounted for at fair value through profit and loss.
(u) Embedded derivatives:
Derivatives embedded in a host contract that is an asset within the scope of Ind AS 109 are not separated. Financial assets with embedded derivatives are considered in their entirety when determining whether their cash flows are solely payment of principal and interest.
Derivatives embedded in all other host contract are separated only if the economic characteristics and risks of the embedded derivative are not closely related to the economic characteristics and risks of the host and are measured at fair value through profit or loss. Embedded derivatives closely related to host contracts are not separated.
(v) Discontinued operation:
A discontinued operation is a component of the entity that has been disposed and that represents a separate line of business. The results of discontinued operation is presented separately in the statement of profit and loss.
(w) Earning per share (basic and diluted):
Earning per share is calculated by dividing the profit attributable to owners of the company by the weighted average number of equity shares outstanding during the financial year.
Note 3: Critical estimates and judgements
The preparation of financial statements in accordance with Ind AS requires that assumptions and estimates be made for some line items. This note provides the areas that involve a higher degree of judgement or complexity.
(a) Estimation of current tax expense and payable - Note 29
Current tax is measured at the amount expected to be paid to the tax authorities in accordance with the provisions of Income Tax Act, 1961. Deferred income tax is provided in full, using the liability method, on temporary differences arising between the tax bases of assets and liabilities and their carrying amounts in the financial statements. The recognition of deferred tax assets is premised on their future recoverability being probable.
(b) Estimation of defined benefit obligation - Note 30
Employee benefit obligations are measured using actuarial methods. This requires various assumptions, including with respect to salary trends, attrition rate, discounting factor, etc.
(c) Estimation of provision for warranty claims - Note 15
Warranty estimates are established using historical information on the nature, frequency and average cost of warranty claims and also management estimates regarding possible future outflow on servicing the customers for any corrective action in respect of product failure which is generally expected to be settled within a period of 1 to 3 years.
Notes to the Financial Statements for the year ended March 31, 2017

100 | Standalone Financial Statements | Annual Report 2016-17
Note 4 (a) : Property, plant and equipment[` in Millions (Mio INR)]
Gross Block Depreciation Net Block
As
at A
pri
l 1, 2
016
Ad
dit
ions
Ded
ucti
ons/
A
dju
stm
ents
As
at M
arch
31,
201
7
As
at A
pri
l 1, 2
016
For
the
year
Ded
ucti
ons/
A
dju
stm
ents
As
at M
arch
31,
201
7
As
at M
arch
31,
201
7
As
at M
arch
31,
201
6
Land - Freehold 127 0 35 92 - - - - 92 127(127) (-) (-) (127) (-) (-) (-) (-) (127) (127)
- Leasehold 1,653 - - 1,653 10 10 - 20 1,633 1,643(1,477) (176) (-) (1,653) (-) (10) (-) (10) (1,643) (1,477)
Buildings [refer note (a) below]
4,035 597 13 4,619 388 421 3 806 3,813 3,647
(2,324) (1,715) (4) (4,035) (-) (388) (-) (388) (3,647) (2,324)Buildings - R & D* 5 15 - 20 - 1 - 1 19 5
(-) (5) (-) (5) (-) (-) (-) (-) (5) (-)Plant and machinery [refer note (d) below]
9,698 5,407 597 14,508 3,952 3,546 284 7,214 7,294 5,746
(6,227) (3,493) (22) (9,698) (667) (3,293) (8) (3,952) (5,746) (5,560)Plant and machinery - R & D*
133 231 2 362 133 231 2 362 - -
(-) (133) (-) (133) (-) (133) (-) (133) (-) (-)Office equipment 143 29 8 164 67 42 6 103 61 76
(92) (53) (2) (143) (-) (67) (-) (67) (76) (92)Office equipment - R & D* 1 2 0 3 1 2 0 3 - -
(-) (1) (-) (1) (-) (1) (-) (1) (-) (-)Furniture and fixtures 164 56 11 209 49 62 9 102 107 115
(84) (80) (-) (164) (-) (49) (-) (49) (115) (84)Furniture and fixtures - R & D*
- 5 0 5 - 5 - 5 - -
(-) (-) (-) (-) (-) (-) (-) (-) (-) (-)Vehicles 208 142 19 331 80 89 13 156 175 128
(136) (75) (3) (208) (-) (81) (1) (80) (128) (136)Vehicles - R & D* 1 1 - 2 1 1 - 2 - -
(-) (1) (-) (1) (-) (1) (-) (1) (-) (-)Total 16,168 6,485 685 21,968 4,681 4,410 317 8,774 13,194 11,487
(10,467) (5,732) (31) (16,168) (667) (4,023) (9) (4,681) (11,487) (9,800)
Note 4 (b) : Capital work in progress 1,289 1,507 (1,507) (2,760)
* Relating to certain DSIR approved R&D facilities, considered eligible for Income tax benefit.
(a) Buildings include Mio INR 0 (2015-16: Mio INR 0) being the value of shares in co-operative housing societies.
(b) Deductions/ adjustments includes transfer of Mio INR 311 (net block) as part of sale of starter motors and generators business (refer note 35) and transfer of Mio INR 46 (net block) to investment properties (refer note 5).
(c) Depreciation for the year includes depreciation for discontinued operation amounting to Mio INR 42 (2015-16: Mio INR 229).
(d) Plant and machinery includes capital spares and government grant capitalised on transition to Ind AS as at April 1, 2015 and subsequent periods (refer note 44).
(e) Capital work-in-progress mainly comprises plant and machinery and building under construction.
(f) Refer note 42 for disclosure of contractual commitment for the acquisition of property, plant and equipment.
(g) Figures in brackets relate to previous year. Gross carrying amount as at April 1, 2015 represents deemed cost of property, plant and equipment.
Notes to the Financial Statements for the year ended March 31, 2017

Annual Report 2016-17 | Standalone Financial Statements | 101
Note 5 : Investment properties[` in Millions (Mio INR)]
As at March 31, 2017
As at March 31, 2016
Gross carrying amount Opening gross carrying amount/ Deemed cost (April 1, 2015) 1,849 315 Transfer from property, plant and equipments 48 - Additions 182 1,534Closing gross carrying amount 2,079 1,849
Accumulated depreciation Opening accumulated depreciation 69 - Transfer from property, plant and equipments 2 - Depreciation charge 194 69Closing accumulated depreciation 265 69
Opening Capital work-in-progress 6 1,083Closing Capital work-in-progress 129 6
1,943 1,786
(i) Amounts recognised in statement of profit and loss for investment properties
[` in Millions (Mio INR)]
For the year ended March
31, 2017
For the year ended March
31, 2016 Rental income 875 493 Direct operating expenses from property that generated rental income (97) (71) Profit from investment properties before depreciation 778 422 Depreciation charge (194) (69) Profit from investment properties 584 353
(ii) Contractual obligations: Refer note no 42 for disclosure of contractual obligations relating to investment properties.
(iii) Fair value of investment properties:
[` in Millions (Mio INR)]
As at March 31, 2017
As at March 31, 2016
As at April 1, 2015
Land 9,146 7,452 5,070Building 6,380 5,689 2,422
15,526 13,141 7,492
Note 6 : Intangible assets (acquired) :[` in Millions (Mio INR)]
Gross Block Amortisation Net BlockAs at April
1, 2016Additions Deductions/
Adjustments
As at March
31, 2017
As at April
1, 2016
For the year
Deductions/ Adjustments
As at March
31, 2017
As at March
31, 2017
As at March
31, 2016Know-how, business
1 - - 1 1 - - 1 - - (1) (-) (-) (1) (-) (1) (-) (1) (-) (1)
Total 1 - - 1 1 - - 1 - - (1) (-) (-) (1) (-) (1) (-) (1) (-) (1)
(a) Figures in brackets relate to previous year. Gross carrying amount as at April 1, 2015 represents deemed cost of intangible assets.
Notes to the Financial Statements for the year ended March 31, 2017

102 | Standalone Financial Statements | Annual Report 2016-17
Note 7 : Investments in subsidiary and associate :[` in Millions (Mio INR)]
Number AmountAs at March
31, 2017As at March
31, 2016As at April
1, 2015As at March
31, 2017As at March
31, 2016As at April
1, 2015Unquoted equity investments valued at costAssociate (also a fellow subsidiary):Newtech Filter India Private Limited, equity shares of Rs.10/- each fully paid
17,500,000 17,500,000 17,500,000 175 175 175
Subsidiary :MICO Trading Private Limited, equity shares of Rs.10/- each fully paid
100,000 100,000 100,000 1 1 1
176 176 176
Note 8 (a) : Investments(i) Non-current investments [` in Millions (Mio INR)]
Number AmountAs at March
31, 2017As at March
31, 2016As at April
1, 2015As at March
31, 2017As at March
31, 2016As at April
1, 2015Quoted investments
(a) Investment in equity instruments valued at FVOCI:ICICI Bank Limited (Quoted) 2,185,550 2,185,550 2,185,550 606 517 689 Equity shares of Rs.2/- each fully paidHousing Development Finance Corporation Limited (Quoted)
3,404,800 3,404,800 3,404,800 5,115 3,764 4,465
Equity shares of Rs.2/- each fully paid HDFC Bank Limited (Quoted) 188,500 188,500 188,500 272 202 193 Equity shares of Rs.2/- each fully paid
(b) Investment in bonds at amortised cost:India Infrastructure Finance Corporation Limited 8.41% Tax Free secured
bonds of Rs.1,000/- each 100,000 100,000 100,000 100 101 101
8.16% Tax Free secured bonds of Rs.1,000/- each
850,000 850,000 850,000 850 850 850
Indian Railway Finance Corporation Limited 7.55% Tax Free secured
bonds of Rs.100,000/- each 200 200 200 20 19 19
8.00% Tax Free secured bonds of Rs.1,000/- each
54,445 54,445 54,445 54 54 54
8.23% Tax Free secured bonds of Rs.1,000/- each
1,500,000 1,500,000 1,500,000 1,500 1,500 1,500
6.70% Tax Free secured bonds of Rs.100,000/- each
5,000 5,000 5,000 500 497 496
7.07% Tax Free secured bonds of Rs.1,000/- each
90,600 90,600 - 91 91 -
Power Finance Corporation Limited 8.20% Tax Free secured
bonds of Rs.1,000/- each 71,197 71,197 71,197 71 71 71
Notes to the Financial Statements for the year ended March 31, 2017

Annual Report 2016-17 | Standalone Financial Statements | 103
Note 8 (a) : Investments(i) Non-current investments [` in Millions (Mio INR)]
Number AmountAs at March
31, 2017As at March
31, 2016As at April
1, 2015As at March
31, 2017As at March
31, 2016As at April
1, 2015National Highway Authority of India Limited 8.20% Tax Free secured
bonds of Rs.1,000/- each 433,981 433,981 433,981 434 432 432
7.14% Tax Free secured bonds of Rs.1,000/- each
85,709 85,709 - 86 86 -
National Thermal Power Corporation Limited 8.19% Tax Free secured
bonds of Rs.1,000,000/- each 400 400 400 400 400 400
7.11% Tax Free secured bonds of Rs.1,000/- each
37,474 37,474 - 37 37 -
National Housing Bank 8.25% Tax Free secured
bonds of Rs.5,000/- each 63,843 63,843 63,843 319 319 319
Rural Electrification Corporation Limited 8.19% Tax Free secured
bonds of Rs.1,000/- each 750,000 750,000 750,000 750 750 750
(c) Investment in Mutual Funds at FVTPL:ICICI Prudential Mutual FundICICI Prudential FMP Series 75 - 1100 Days Plan N Growth Option of Rs.10/- each
- 25,000,000 25,000,000 - 283 261
ICICI Prudential FMP Series 76 - 1100 Days Plan G Growth Option of Rs.10/- each
- 20,000,000 20,000,000 - 220 203
ICICI Prudential FMP series 76 - 1142 Days Plan M Growth Option of Rs.10/- each
15,000,000 15,000,000 15,000,000 179 164 151
ICICI Prudential FMP Series 76 - 1100 Days Plan T Growth Option of Rs.10/- each
- 30,000,000 30,000,000 - 327 301
ICICI Prudential FMP Series 76 - 1108 Days Plan V Growth Option of Rs.10/- each
5,000,000 5,000,000 5,000,000 59 54 50
ICICI Prudential FMP Series 76 - 1127 Days Plan W Growth Option of Rs.10/- each
25,000,000 25,000,000 - 297 272 -
ICICI Prudential FMP Series 76 - 1135 Days Plan Z Growth Option of Rs.10/- each
25,000,000 25,000,000 - 294 270 -
ICICI Prudential FMP Series 77 - 1132 Days Plan A Growth Option of Rs.10/- each
10,000,000 10,000,000 - 118 108 -
ICICI Prudential FMP Series 77 - 1130 Days Plan D Growth Option of Rs.10/- each
30,000,000 30,000,000 - 353 323 -
ICICI Prudential FMP Series 77 - 1134 Days Plan H Growth Option of Rs.10/- each
10,000,000 10,000,000 - 116 107 -
ICICI Prudential FMP Series 77 - 1151 Days Plan S Growth Option of Rs.10/- each
15,000,000 15,000,000 - 171 157 -
ICICI Prudential FMP Series 78 - 1212 Days Plan A Growth Option of Rs.10/- each
20,000,000 20,000,000 - 224 205 -
Notes to the Financial Statements for the year ended March 31, 2017

104 | Standalone Financial Statements | Annual Report 2016-17
Note 8 (a) : Investments(i) Non-current investments [` in Millions (Mio INR)]
Number AmountAs at March
31, 2017As at March
31, 2016As at April
1, 2015As at March
31, 2017As at March
31, 2016As at April
1, 2015
ICICI Prudential FMP Series 78 -1190 Days Plan E Growth Option of Rs.10/- each
15,000,000 15,000,000 - 167 153 -
ICICI Prudential FMP Series 78 -1185 Days Plan F Growth Option of Rs.10/- each
20,000,000 20,000,000 - 222 204 -
ICICI Prudential FMP Series 78 - 1170 Days Plan I Growth Option of Rs.10/- each
20,000,000 20,000,000 - 223 204 -
ICICI Prudential FMP Series 78 - 1168 Days Plan J Growth Option of Rs.10/- each
15,000,000 15,000,000 - 167 152 -
ICICI Prudential Flexible Income - Regular Plan - Growth Units of Rs.100/- each
- 2,334,094 2,334,094 - 668 614
ICICI Prudential Flexible Income Plan - Direct Plan - Growth Units of Rs.100/- each
- 2,791,471 2,791,471 - 801 736
ICICI Prudential Short Term-Direct Plan - Growth Option Units of Rs.10/- each
17,579,818 30,952,115 30,952,115 616 976 897
HDFC Mutual Fund
HDFC FMP 367 days April 2014 (1) - Series 31 - Regular - Growth Units of Rs.10/- each
- 18,000,000 - - 212 -
HDFC FMP 366 days May 2014 (1) series 31 - Direct - Growth Units of Rs.10/- each
- 20,000,000 - - 234 -
HDFC FMP - 1157 days February 2015 (1) - Growth Option of Rs.10/- each
35,000,000 35,000,000 35,000,000 420 384 354
HDFC FMP 1112 days June 2015 (1) - Direct - Growth Series 33 of Rs.10/- each
20,000,000 20,000,000 - 233 214 -
HDFC FMP 1108 days September 2015 (1) - Direct - Growth Series 34 of Rs.10/- each
10,000,000 10,000,000 - 114 105 -
HDFC FMP 1111 days November 2015 (1) - Direct - Growth - Series 34 of Rs.10/- each
15,000,000 15,000,000 - 168 154 -
HDFC FMP 1105 days December 2015 (1) - Direct - Growth - Series 35 of Rs.10/- each
10,000,000 10,000,000 - 112 102 -
HDFC FMP 1183 days January 2016 (1) - Direct - Growth - Series 35 of Rs.10/- each
10,000,000 10,000,000 - 112 102 -
HDFC FMP 1167 days January 2016 (1) - Direct - Growth - Series 35 of Rs.10/- each
10,000,000 10,000,000 - 112 102 -
HDFC FMP 1155 days February 2016 (1) - Direct - Growth - Series 35 of Rs.10/- each
15,000,000 15,000,000 - 167 152 -
Notes to the Financial Statements for the year ended March 31, 2017

Annual Report 2016-17 | Standalone Financial Statements | 105
Notes to the Financial Statements for the year ended March 31, 2017
Note 8 (a) : Investments(i) Non-current investments [` in Millions (Mio INR)]
Number AmountAs at March
31, 2017As at March
31, 2016As at April
1, 2015As at March
31, 2017As at March
31, 2016As at April
1, 2015
HDFC FMP 1132 days February 2016 (1) - Direct - Growth - Series 35 of Rs.10/- each
10,000,000 10,000,000 - 111 101 -
HDFC Cash Management - Treasury Advantage Plan - Growth Units of Rs.10/- each
- 12,452,990 12,452,990 - 412 380
HDFC Floating Rate Income Fund - Short Term Plan - Growth - Direct Plan Units of Rs.10/- each
16,821,282 16,821,282 16,821,282 477 439 403
HDFC Short Term Plan - Direct Plan - Growth Option units of Rs.10/- each
- 4,433,056 4,433,056 - 133 121
HDFC High Interest Fund - Direct Plan - Short Term Plan - Growth Option units of Rs.10/- each
23,986,704 23,986,704 23,986,704 801 722 669
HDFC Medium Term opportunities Fund - Growth - Regular - Units of Rs10/- each
37,727,708 56,862,363 56,862,363 683 937 864
DHFL Pramerica Mutual Fund
DHFL Pramerica FMP Series 87 - Direct Plan - Growth option Units of Rs. 10/- each
35,000,000 35,000,000 35,000,000 417 382 351
DHFL Pramerica FMP Series 91 - Direct Plan - Growth option Units of Rs. 10/- each
25,000,000 25,000,000 - 293 268 -
DHFL Pramerica Ultra short term Fund - Growth option Units of Rs. 10/- each
- 23,219,095 23,219,095 - 424 390
DHFL Pramerica Short Maturity Fund - Direct Plan - Growth Option Units of Rs.10/- each
32,558,404 32,558,404 32,558,404 1,005 910 835
DHFL Premier Bond Fund - Direct Plan - Growth Option units of Rs.10 each
- 12,493,004 12,493,004 - 310 288
State Bank Mutual Fund
SBI Debt Fund Series - A18 - 366 Days - Direct - Growth Option of Rs.10/- each
- 11,916,548 - - 140 -
SBI Debt Fund Series - A24 - 366 Days -Direct -Growth Option of Rs.10/- each
- 10,000,000 - - 118 -
SBI Debt Fund Series- A28 - 367 Days -Direct -Growth Option of Rs.10/- each
- 10,000,000 - - 117 -
SBI Debt Fund Series B - 8 (1105 Days) Growth Option of Rs.10/- each
25,000,000 25,000,000 25,000,000 297 272 250
SBI Debt Fund Series B - 9 (1105 Days) Growth Option of Rs.10/- each
50,000,000 50,000,000 50,000,000 592 541 500
SBI Debt Fund Series B - 16 (1100 Days) - Direct Plan - Growth of Rs.10/- each
20,000,000 20,000,000 - 235 215 -

106 | Standalone Financial Statements | Annual Report 2016-17
Note 8 (a) : Investments(i) Non-current investments [` in Millions (Mio INR)]
Number AmountAs at March
31, 2017As at March
31, 2016As at April
1, 2015As at March
31, 2017As at March
31, 2016As at April
1, 2015
SBI Debt Fund Series B - 17 (1100 Days) - Direct Plan - Growth of Rs.10/- each
10,000,000 10,000,000 - 117 107 -
SBI Debt Fund Series B - 18 (1100 Days) - Direct Plan - Growth of Rs.10/- each
15,000,000 15,000,000 - 175 161 -
SBI Debt Fund Series B - 19 (1100 Days) - Direct Plan - Growth of Rs.10/- each
10,000,000 10,000,000 - 117 107 -
SBI Debt Fund Series B - 20 (1100 Days) - Direct Plan - Growth of Rs.10/- each
10,000,000 10,000,000 - 117 107 -
SBI Debt Fund Series B - 26 (1100 Days) - Direct Plan - Growth of Rs.10/- each
25,000,000 25,000,000 - 282 258 -
SBI Debt Fund Series B - 28 (1100 Days) - Direct Growth of Rs.10/- each
12,000,000 12,000,000 - 134 123 -
SBI Debt Fund Series B - 31 (1200 Days) - Direct Growth of Rs.10/- each
15,000,000 15,000,000 - 167 152 -
SBI Ultra Short Term Debt Fund - Direct Plan - Growth Units of Rs.1000/- each
- 659,506 659,506 - 1,287 1,186
SBI Short Term Debt Fund - Direct Plan - Growth Units of Rs.10/- each
45,194,070 78,767,786 78,767,786 869 1,381 1,272
UTI Mutual Fund
UTI Fixed Term Income Fund Series XVIII - XII - Direct Growth Plan Option of Rs.10/- each
- 25,000,000 - - 293 -
UTI – Fixed Term Income Fund Series - XVIII - XIII - Direct Growth Plan Option of Rs.10/- each
- 30,000,000 - - 351 -
UTI Fixed Term Income Fund Series XIX - IV - Direct Growth Plan Option of Rs.10/- each
- 15,000,000 - - 175 -
UTI Fixed Term Income Fund Series XXII - III (1099 days) - Direct Growth Plan Option of Rs.10/- each
20,000,000 20,000,000 - 236 215 -
UTI Fixed Term Income Fund Series XXII - IX (1098 days) - Direct Growth Plan Option of Rs.10/- each
65,000,000 65,000,000 - 759 694 -
UTI – Fixed Term Income Fund Series - XXIII - VII (1098 days) - Direct Growth Plan Option of Rs.10/- each
50,000,000 50,000,000 - 564 515 -
UTI Fixed Term Income Fund Series XXIII - XI (1100 days) - Direct Growth Plan Option of Rs.10/- each
13,000,000 13,000,000 - 146 133 -
Notes to the Financial Statements for the year ended March 31, 2017

Annual Report 2016-17 | Standalone Financial Statements | 107
Note 8 (a) : Investments(i) Non-current investments [` in Millions (Mio INR)]
Number AmountAs at March
31, 2017As at March
31, 2016As at April
1, 2015As at March
31, 2017As at March
31, 2016As at April
1, 2015
UTI Fixed Term Income Fund Series XXIV - VI (1181 days) - Direct Growth Plan Option of Rs.10/- each
10,000,000 10,000,000 - 111 101 -
UTI Treasury Advantage Fund - Institutional Plan - Direct Plan - Growth Units of Rs.1,000/- each
56,839 879,403 879,403 128 1,824 1,674
UTI Treasury Advantage Fund- Institutional Plan - Growth - Regular Units of Rs.1,000/- each
181,942 181,942 - 408 376 -
UTI Short Term Income Fund - Growth - Institutional Option - Direct Plan - Growth Units of Rs.10/- each
15,257,113 25,684,642 25,684,642 310 473 436
DSP BlackRock Mutual Fund
DSP BlackRock Money Manager Fund - Growth - Direct Units of Rs.1,000/- each
515,761 515,761 515,761 1,152 1,067 985
IDFC Mutual Fund
IDFC Fixed Term Plan - Series 108 (1144 Days) Units of Rs.10/- each
15,000,000 15,000,000 - 177 162 -
IDFC Ultra Short Term Fund - Growth - Direct units of Rs.10/- each
33,308,277 24,662,395 24,662,395 771 526 483
IDFC Ultra Short Term Fund - Growth - Regular units of Rs.10/- each
7,804,289 7,804,289 7,804,289 180 166 153
IDFC Super Saver Income Fund - Short Term - Direct Plan - Growth units of Rs.10/- each
37,931,493 69,508,942 66,286,524 1,302 2,192 1,924
IDFC Dynamic Bond Fund - Growth- Direct Plan units of Rs.10/- each
- 37,675,248 37,675,248 - 692 652
IDFC Super Saver Income Fund - Medium Term - Direct Plan - Growth units of Rs.10/- each
13,118,625 13,118,625 13,118,625 375 340 314
Tata Mutual Fund
Tata Floater Fund - Direct Plan - Growth Units of Rs.1000/- each
521,988 521,988 287,320 1,295 1,195 605
Tata Short Term Bond Fund - Growth - Direct Units of Rs.10/- each
52,754,903 52,754,903 52,754,903 1,661 1,518 1,395
Birla Mutual Fund
Birla Sun Life Fixed Term Plan - Series MP (1141 Days) - Growth Direct Units of Rs.10/- each
35,000,000 35,000,000 - 410 375 -
Birla Sun Life Fixed Term Plan - Series MR (1153 days) - Growth Direct Units of Rs.10/- each
20,000,000 20,000,000 - 234 214 -
Notes to the Financial Statements for the year ended March 31, 2017

108 | Standalone Financial Statements | Annual Report 2016-17
Note 8 (a) : Investments(i) Non-current investments [` in Millions (Mio INR)]
Number AmountAs at March
31, 2017As at March
31, 2016As at April
1, 2015As at March
31, 2017As at March
31, 2016As at April
1, 2015
Birla Sun Life Fixed Term Plan - Series MX(1128 days) Growth Regular Units of Rs.10/- each
35,000,000 35,000,000 - 399 365 -
Birla Sun Life Fixed Term Plan - Series MY (1107 days) - Growth Direct Units of Rs.10/- each
30,000,000 30,000,000 - 339 310 -
Birla Sun Life Fixed Term Plan - Series NI (1163 days) - Growth Regular Units of Rs.10/- each
25,000,000 25,000,000 - 278 254 -
Birla Sunlife Floating Rate Fund- Long Term Plan -Growth -Direct plan Units of Rs.10/- each
751,475 - - 151 - -
Birla Sun Life Short Term Fund - Growth - Regular Plan Units of Rs.10/- each
12,893,345 25,803,104 22,950,683 803 1,468 1,201
Birla Sun Life Short Term Fund - Direct - Growth - Plan Units of Rs.10/- each
20,700,594 16,354,997 9,142,383 1,295 933 479
Birla Sunlife Treasury Optimizer Plan - Growth - Direct Plan units of Rs.100 each
891,278 891,278 891,278 187 169 155
Total 36,409 44,319 31,871
Aggregate amount of quoted investments
36,409 44,319 31,871
Aggregate amount of market value of quoted investments
36,742 44,645 32,210
Aggregate amount of impairment in the value of investments
- - -
Note 8 (a) : Investments(ii) Current investments [` in Millions (Mio INR)]
Number AmountAs at March
31, 2017As at March
31, 2016As at April
1, 2015As at March
31, 2017As at March
31, 2016As at April
1, 2015
Quoted investments
(a) Investment in bonds at amortised cost:
Indian Railway Finance Corporation Ltd. (Quoted)
- - 200 - - 20
6.05% Tax Free secured bonds of Rs.100,000/- each
(b) Investment in mutual funds at FVTPL:
ICICI Prudential Mutual Fund
ICICI Prudential FMP Series 75 - 1100 Days Plan N Growth Option of Rs.10/- each
25,000,000 - - 310 - -
Notes to the Financial Statements for the year ended March 31, 2017

Annual Report 2016-17 | Standalone Financial Statements | 109
Note 8 (a) : Investments(ii) Current investments [` in Millions (Mio INR)]
Number AmountAs at March
31, 2017As at March
31, 2016As at April
1, 2015As at March
31, 2017As at March
31, 2016As at April
1, 2015
ICICI Prudential FMP Series 76 - 1100 Days Plan G Growth Option of Rs.10/- each
20,000,000 - - 240 - -
ICICI Prudential FMP Series 76 - 1100 Days Plan T Growth Option of Rs.10/- each
30,000,000 - - 358 - -
Birla Sunlife Mutual Fund
Birla Sunlife Fixed Term Plan - Series KZ - Growth Option of Rs.10/- each
- - 20,000,000 - - 218
Birla Sunlife Cash Plus Fund - Growth - Direct Option of Rs.100/- each
- - 446,191 - - 100
DSP BlackRock Mutual Fund
DSP BlackRock Fixed Maturity Plan - Series 154 (12.5Months) - Growth Option of Rs.10/- each
- - 20,000,000 - - 219
HDFC Mutual Fund
HDFC Fixed Maturity Plan - Series 31 (367 Days) - Growth Option of Rs.10/- each
18,000,000 - 18,000,000 229 - 195
HDFC Fixed Maturity Plan - Series 31 (366 Days) May 2014 (1) - Growth Option of Rs.10/- each
20,000,000 - 20,000,000 253 - 216
State Bank of India Mutual Fund
SBI Debt Fund - Series A 14 (380 Days) - Growth Option of Rs.10/- each
- - 15,000,000 - - 164
SBI Debt Fund - Series A 18 (366 Days) - Growth Option of Rs.10/- each
11,916,548 - 20,000,000 151 - 217
SBI Debt Fund - Series A 24 (366 Days) - Growth Option of Rs.10/- each
10,000,000 - 10,000,000 127 - 108
SBI Debt Fund - Series A 28 (367 Days) - Growth Option of Rs.10/- each
10,000,000 - 10,000,000 126 - 107
Tata Mutual Fund
Tata Fixed Maturity Plan - Series 46 Scheme R (379 days maturity) - Growth Option of Rs.10/- each
- - 25,000,000 - - 275
Tata Fixed Maturity Plan - Series 47 Scheme J (368 days maturity) - Growth Option of Rs.10/- each
- - 25,000,000 - - 273
UTI Mutual Fund
UTI Fixed Income Fund - Series XVIII - XII (366 days) - Growth Option of Rs.10/- each
25,000,000 - 25,000,000 318 - 270
Notes to the Financial Statements for the year ended March 31, 2017

110 | Standalone Financial Statements | Annual Report 2016-17
Note 8 (a) : Investments(ii) Current investments [` in Millions (Mio INR)]
Number AmountAs at March
31, 2017As at March
31, 2016As at April
1, 2015As at March
31, 2017As at March
31, 2016As at April
1, 2015
UTI Fixed Income Fund - Series XVIII - XIII (366 days) - Growth Option of Rs.10/- each
30,000,000 - 30,000,000 380 - 323
UTI Fixed Income Fund - Series XIX - IV (366 days) - Growth Option of Rs.10/- each
15,000,000 - 15,000,000 189 - 161
Total 2,681 - 2,866
Aggregate amount of quoted investments
2,681 - 2,866
Aggregate amount of market value of quoted investments
2,681 - 2,866
Aggregate amount of impairment in the value of investments
- - -
Note 8 (b) : Trade receivables[` in Millions (Mio INR)]
As at March 31,
2017
As at March 31,
2016
As at April 1, 2015
Trade receivables - Related parties [refer note (a) below and note 36] 1,528 1,677 2,164 - Others 11,032 12,106 10,224 Less: Allowance for doubtful debts (698) (558) (404)
11,862 13,225 11,984
(a) Includes dues from private companies where directors are interested 429 177 199
Details of secured and unsecured[` in Millions (Mio INR)]
As at March 31,
2017
As at March 31,
2016
As at April 1, 2015
Secured, considered good - - - Unsecured, considered good 11,862 13,225 11,984 Doubtful 698 558 404 Total 12,560 13,783 12,388 Allowance for doubtful debts (698) (558) (404)Total trade receivables 11,862 13,225 11,984
Note 8 (c) : Loans[` in Millions (Mio INR)]
As at March 31, 2017
As at March 31, 2016
As at April 1, 2015
Current Non-Current Current Non-Current Current Non-Current
Unsecured, considered goodLoan to fellow subsidiaries (refer note 36)
3,060 500 2,600 700 2,100 950
Loan to directors (refer note 36) 0 3 0 3 0 4Loan to employees 145 342 226 392 198 412Security deposits - 329 - 327 - 304
3,205 1,174 2,826 1,422 2,298 1,670
Notes to the Financial Statements for the year ended March 31, 2017

Annual Report 2016-17 | Standalone Financial Statements | 111
Note 8 (d) :Cash and cash equivalents[` in Millions (Mio INR)]
As at March 31,
2017
As at March 31,
2016
As at April 1, 2015
Balances with banks
- in current accounts 207 384 345
- deposit accounts with original maturity of less than 3 months 875 288 590
Cash on hand 0 0 0
Cheques on hand 230 313 369
1,312 985 1,304
Note 8 (e) : Other bank balances[` in Millions (Mio INR)]
As at March 31,
2017
As at March 31,
2016
As at April 1, 2015
Deposit accounts (maturity less than 12 months) 15,830 17,300 17,631
Unpaid dividend accounts 34 30 25
15,864 17,330 17,656
Note 8 (f) : Other financial assets[` in Millions (Mio INR)]
As at March 31, 2017
As at March 31, 2016
As at April 1, 2015
Current Non-Current Current Non-Current Current Non-Current
Deposits with maturity of more than 12 months
- - - 100 - -
Inter-corporate deposit 6,800 - 6,150 - 5,250 -
Interest accrued on financial assets at amortised cost
782 - 1,202 - 1,140 -
Others (include non-trade receivables, etc.)
373 - 270 - 352 -
7,955 - 7,622 100 6,742 -
Note 9 : Deferred tax assets[` in Millions (Mio INR)]
As at March 31,
2017
As at March 31,
2016
As at April 1, 2015
Difference between books and Income tax written down value (WDV) of depreciable property, plant and equipment and intangible assets
2,808 2,995 2,832
Expenses allowable for tax purposes when paid and other timing differences 1,868 1,533 1,340
Long term capital losses - 430 -
4,676 4,958 4,172
Notes to the Financial Statements for the year ended March 31, 2017

112 | Standalone Financial Statements | Annual Report 2016-17
Movement in deferred tax assets[` in Millions (Mio INR)]
WDV of depreciable
property, plant and
equipment
Expenses allowable
on payment basis
Tax losses Total
As at April 1, 2015 2,832 1,340 - 4,172
(Charged)/ Credited
- to statement of profit and loss 163 213 430 806
- to other comprehensive income - (20) - (20)
As at March 31, 2016 2,995 1,533 430 4,958
(Charged)/ Credited
- to statement of profit and loss (187) 277 (430) (340)
- to other comprehensive income - 58 - 58
As at March 31, 2017 2,808 1,868 - 4,676
Note 10 : Other non-current assets[` in Millions (Mio INR)]
As at March 31,
2017
As at March 31,
2016
As at April 1, 2015
Capital advances 45 109 297
Security deposits 98 82 90
143 191 387
Note 11 : Inventories(at lower of cost and net realisable value)
[` in Millions (Mio INR)]
As at March 31,
2017
As at March 31,
2016
As at April 1, 2015
Raw materials 2,098 2,688 2,927
Work-in-progress 958 1,321 1,407
Finished goods 3,939 3,307 4,126
Stock-in-trade 4,253 3,989 3,673
Stores and spares 182 208 228
Loose tools 374 402 362
11,804 11,915 12,723
(a) Inventories include the following as goods-in-transit
[` in Millions (Mio INR)]
As at March 31,
2017
As at March 31,
2016
As at April 1, 2015
Raw materials 541 834 670
Stock-in-trade 1,063 1,119 1,074
Loose tools 10 12 36
1,614 1,965 1,780
(b) Amount of inventories recognised as an expense/(income) is Mio INR (238) [2015-16 Mio INR (93)].
(c) Write-down/(reversal of write-down of earlier year) of the inventories to net realisable value amounted to Mio INR 70 [2015-16 Mio INR (30)]. These were recognised as an expense during the year and included in Note 23 in the statement of profit and loss.
Notes to the Financial Statements for the year ended March 31, 2017

Annual Report 2016-17 | Standalone Financial Statements | 113
Note 12 : Other current assets[` in Millions (Mio INR)]
As at March 31,
2017
As at March 31,
2016
As at April 1, 2015
Balance with customs, excise and sales tax authorities, etc. 2,852 2,916 2,397 Deferred expense 91 101 133 Others (include vendor advances, claims receivable, etc.) 1,368 1,462 1,413
4,311 4,479 3,943
Note 13 : Equity share capital and other equity
Note 13(a) : Equity Share capitalAuthorised equity share capital [` in Millions (Mio INR)]
No of shares Amount As at April 1, 2015 38,051,460 381 Increase during the year - - As at March 31, 2016 38,051,460 381 Increase during the year - - As at March 31, 2017 38,051,460 381
(i) Movements in equity share capital (issued, subscribed and fully paid up)
[` in Millions (Mio INR)]
No of shares Amount As at April 1, 2015 31,398,900 314 Increase/ (decrease) during the year - - As at March 31, 2016 31,398,900 314 Increase/ (decrease) during the year (878,160) (9)As at March 31, 2017 30,520,740 305
Rights, preferences and restrictions attached to shares:
The Equity shares of the Company, having face value of Rs. 10/- per share, rank pari passu in all respects including voting rights, entitlement to dividend and share in the proceeds of winding up of the Company in proportion to the number of and amounts paid on the shares held.
(ii) Equity shares held by the holding company and subsidiary of the holding company:
[` in Millions (Mio INR)]
As at March 31, 2017
As at March 31, 2016
As at April 1, 2015
No of shares Amount No of shares Amount No of shares Amount
Robert Bosch GmbH, Federal Republic of Germany, the holding company
21,058,705 211 22,349,420 223 22,349,420 223
Robert Bosch Engineeering and Business Solutions Private Ltd., India, subsidiary of holding company
454,000 5 - - - -
(iii) Details of Equity shares held by shareholders holding more than 5% of the aggregate equity shares in the Company:
As at March 31, 2017
As at March 31, 2016
As at April 1, 2015
No. of shares
Shareholding %
No. of shares
Shareholding %
No. of shares
Shareholding %
Robert Bosch GmbH, Federal Republic of Germany, the holding company
21,058,705 68.99% 22,349,420 71.18% 22,349,420 71.18%
(iv) There are no shares reserved for issue under options and contracts/ commitments. Further, there are no shares that have been allotted during last 5 years pursuant to a contract without payment being received in cash, or by way of bonus shares.
Notes to the Financial Statements for the year ended March 31, 2017

114 | Standalone Financial Statements | Annual Report 2016-17
(v) The Company has bought back 878,160 shares during the year ended March 31, 2017 at buy-back price determined at Rs.23,000/- per share which was approved by the board of directors and shareholders of the Company. Shares bought back during the period of five years immediately preceding the reporting date:
As at March 31,
2017
As at March 31,
2016
As at April 1, 2015
Number of equity shares bought back by the Company 878,160 - -
Note 13(b) : Reserves and surplus[` in Millions (Mio INR)]
As at March 31,
2017
As at March 31,
2016
As at April 1, 2015
Capital reserve [refer note (i)] 39 39 39
Share premium [refer note (ii)] 8 8 8
Capital redemption reserve [refer note (iii)] 76 67 67
General reserve [refer note (iv)] 21,862 42,060 42,060
Retained earnings [refer note (v)] 59,744 48,409 36,268
81,729 90,583 78,442
(i) Capital reserve [` in Millions (Mio INR)]
As at March 31,
2017
As at March 31,
2016
Opening balance 39 39
Additions/(deletions) during the year - -
Closing balance 39 39
(ii) Share premium [` in Millions (Mio INR)]
As at March 31,
2017
As at March 31,
2016Opening balance 8 8 Additions/(deletions) during the year - - Closing balance 8 8
(iii) Capital redemption reserve [` in Millions (Mio INR)]
As at March 31,
2017
As at March 31,
2016Opening balance 67 67 Additions/(deletions) during the year 9 - Closing balance 76 67
(iv) General reserve [` in Millions (Mio INR)]
As at March 31,
2017
As at March 31,
2016Opening balance 42,060 42,060 Less: Utilisation for buy back of shares (20,198) - Closing balance 21,862 42,060
Notes to the Financial Statements for the year ended March 31, 2017

Annual Report 2016-17 | Standalone Financial Statements | 115
(v) Retained earnings [` in Millions (Mio INR)]
As at March 31,
2017
As at March 31,
2016Opening balance 48,409 36,268 Net profit for the year 17,411 15,314 Dividends (refer note no. 33) (4,958) (2,669)Dividend distribution taxes (refer note 33) (1,009) (543)Items of other comprehensive income recognised directly in retained earnings- Remeasurement of post-employment benefit obligations, net of tax (109) 39 Closing balance 59,744 48,409
Note 13(c) : Other reserves [` in Millions (Mio INR)]
FVOCI - Equity
Instruments
Total other reserves
As at April 1, 2015 5,316 5,316 Change in fair value of FVOCI equity instruments (864) (864)As at March 31, 2016 4,452 4,452 Change in fair value of FVOCI equity instruments 1,510 1,510 As at March 31, 2017 5,962 5,962
Note 14(a) : Borrowings[` in Millions (Mio INR)]
As at March 31,
2017
As at March 31,
2016
As at April 1, 2015
Unsecured: Sales tax deferral loan [refer note (a) below] - 149 542
- 149 542
(a) Terms of repayment for unsecured borrowings :
Borrowings Terms of repayment Interest free Sales tax deferral loan - State Government of Maharashtra Repayable in 5 equal annual installments for various schemes
starting January 2009 onwards. - State Government of Rajasthan Repayable in 10 half-yearly equal installments starting
January 2012 onwards.
Note 14(b) : Other financial liabilities[` in Millions (Mio INR)]
As at March 31, 2017
As at March 31, 2016
As at April 1, 2015
Current Non-Current Current Non-Current Current Non-Current
Current maturities of long-term debt [refer note 14 (a)]
- - 351 - 567 -
Unpaid dividend [refer note (a) below]
34 - 30 - 25 -
Book overdraft 23 - 26 - 13 -
Capital creditors 305 - 442 - 361 -
Other payables (includes employee dues, derivative liabilities, etc.)
2,386 60 2,545 50 2,517 64
2,748 60 3,394 50 3,483 64
(a) There are no amounts due for payment to the Investor Education and Protection Fund under Section 125 of the Companies Act, 2013 as at the year end.
Notes to the Financial Statements for the year ended March 31, 2017

116 | Standalone Financial Statements | Annual Report 2016-17
Note 14(c) : Trade payables[` in Millions (Mio INR)]
As at March 31,
2017
As at March 31,
2016
As at April 1, 2015
Trade payables
- Dues of Micro Enterprises and Small Enterprises [refer note (a) below] 212 118 229
- Related parties (refer note 36) 7,666 7,792 7,127
- Others 5,521 5,178 4,680
13,399 13,088 12,036
(a) Disclosure under Micro, Small and Medium Enterprises Development Act, 2006.
[` in Millions (Mio INR)]
As at March 31, 2017 and
for the year ended March 31, 2017
As at March 31, 2016 and
for the year ended March 31, 2016
As at April 1, 2015 and for the fifteen
months period ended March 31,
2015(i) The amount due and remaining unpaid as at the
balance sheet date-Principal 212 118 229 -Interest thereon 3 1 3
(ii) The amount of principal and interest paid beyond due date during the year-Principal 997 961 570 -Interest thereon - - -
(iii) Interest due on principal amounts paid beyond the due date during the year but without interest
12 10 8
(iv) Interest accrued and remaining unpaid as at balance sheet date
56 41 30
(v) Total interest due but not paid for the earlier years 41 30 19
Note 15 : Provisions[` in Millions (Mio INR)]
As at March 31, 2017
As at March 31, 2016
As at April 1, 2015
Current Non-Current Current Non-Current Current Non-Current
Provision for employee benefits 2,933 3,626 2,575 3,773 1,936 4,300
Trade demand and others [refer note (a) below]
3,455 16 2,317 2 1,864 2
Warranty [refer note (a) below] 1,155 - 1,284 - 1,358 -
7,543 3,642 6,176 3,775 5,158 4,302
(a) Disclosure under Indian Accounting Standard (Ind AS) 37 on "Provisions, Contingent Liabilities and Contingent Assets":
[` in Millions (Mio INR)]
Description As at April 1, 2016
Additions during
the year
Utilised/ reversed
during the year
As at March 31, 2017
Trade demand and others [refer note (i) and (ii) below] 2,319 2,380 1,228 3,471 (1,866) (1,532) (1,079) (2,319)
Warranty [refer note (i) and (ii) below] 1,284 332 461 1,155 (1,358) (524) (598) (1,284)
(i) Nature of the provision has not been given on the grounds that it can be expected to prejudice the interests of the Company. Due to the very nature of such provisions, it is not possible to estimate the timing/ uncertainties relating to their outflows.
(ii) Figures in brackets relate to previous year.
Notes to the Financial Statements for the year ended March 31, 2017

Annual Report 2016-17 | Standalone Financial Statements | 117
Note 16 : Current tax liabilities[` in Millions (Mio INR)]
As at March 31,
2017
As at March 31,
2016
As at April 1, 2015
Opening balance 762 630 71 Add: Provision for tax (including earlier years) 7,135 6,578 7,470 Less: Taxes paid (net of refund) (7,246) (6,446) (6,911)Closing Balance 651 762 630
Note 17 : Other current liabilities[` in Millions (Mio INR)]
As at March 31,
2017
As at March 31,
2016
As at April 1, 2015
Statutory dues 1,142 802 701 Deferred income 107 162 112 Indirect taxes 427 425 360 Others (advance from customers,etc.) 283 196 291
1,959 1,585 1,464
Note 18 : Sale of services [` in Millions (Mio INR)]
For the year ended
March 31, 2017
For the year ended
March 31, 2016
Research and development income 1,456 1,332 Others 878 659
2,334 1,991
Note 19 : Other operating revenue [` in Millions (Mio INR)]
For the year ended
March 31, 2017
For the year ended
March 31, 2016
Scrap sales 177 175 Export incentives 361 343 Provision/ liabilities no longer required written back 713 827 Rental income 875 493 Miscellaneous income 466 460
2,592 2,298
Note 20 : Other income [` in Millions (Mio INR)]
For the year ended
March 31, 2017
For the year ended
March 31, 2016
Interest income - Bank and inter corporate deposits 1,664 2,090 - Loans to related parties 352 352 - On financial assets at amortised cost 417 445 - Others 328 281 Government grant (refer note (a) below) - 261 Amortisation of deferred government grant income 160 80 Dividend from equity investments designated at FVOCI 81 57 Net gain on financial assets measured at FVTPL 3,172 2,450 Profit on sale of property, plant and equipment (net) - 20
6,174 6,036
(a) Government grant represents subsidy received/ accrued during the year under the Package Scheme of Incentives, 2001 from the Government of Maharashtra.
Notes to the Financial Statements for the year ended March 31, 2017

118 | Standalone Financial Statements | Annual Report 2016-17
Note 21 : Cost of materials consumed [` in Millions (Mio INR)]
For the year ended
March 31, 2017
For the year ended
March 31, 2016
Raw materials consumed [Refer Note (a) below] 30,103 25,656 Less: Issues capitalised (33) (127)
30,070 25,529
(a) Cost of materials consumed is based on derived values.
Note 22 : Purchases of stock-in-trade [` in Millions (Mio INR)]
For the year ended
March 31, 2017
For the year ended
March 31, 2016
Purchase of goods 24,219 23,347 24,219 23,347
Note 23 : Changes in inventories of finished goods, work-in-progress and stock-in-trade [` in Millions (Mio INR)]
For the year ended
March 31, 2017
For the year ended
March 31, 2016
Opening stock Finished goods 2,736 3,798 Work-in-progress 1,236 1,320 Stock-in-trade 3,981 3,660 Closing stock Finished goods 3,939 2,736 Work-in-progress 958 1,236 Stock-in-trade 4,253 3,981
(1,197) 825
Note 24 : Employee benefit expense [` in Millions (Mio INR)]
For the year ended
March 31, 2017
For the year ended
March 31, 2016
Salaries, wages, bonus etc. 11,754 11,408 Contributions to provident and other funds 783 792 Staff welfare 891 831
13,428 13,031
Note 25 : Finance costs [` in Millions (Mio INR)]
For the year ended
March 31, 2017
For the year ended
March 31, 2016
Interest expense - on financial liability at amortised cost 25 57 - others 246 42 Net interest on defined benefit liability 1 30
272 129
Notes to the Financial Statements for the year ended March 31, 2017

Annual Report 2016-17 | Standalone Financial Statements | 119
Note 26 : Depreciation and amortisation expense [` in Millions (Mio INR)]
For the year ended
March 31, 2017
For the year ended
March 31, 2016
Depreciation of property, plant and equipment [refer note 4(a)] 4,368 3,794
Depreciation on investment properties [refer note 5] 194 69
Amortisation of intangible assets [refer note 6] - 1
4,562 3,864
Note 27 : Other expenses [` in Millions (Mio INR)]
For the year ended
March 31, 2017
For the year ended
March 31, 2016
Consumption of stores and spares 798 648
Consumption of tools 1,808 1,954
Power and fuel 1,080 1,047
Repairs to plant and machinery 1,167 991
Repairs to building 518 374
Royalty and technical service fee 1,519 1,337
Rent 549 541
Rates and taxes 619 244
Insurance 137 125
Expenditure towards Corporate Social Responsibility [refer note (a) below] 332 197
Packing, freight and forwarding 1,685 1,637
Warranty and service expenses 284 253
Travelling and conveyance 996 920
Professional and consultancy charges 1,470 1,289
Advertisement and sales promotion expenses 780 690
Miscellaneous expenses [refer note (b) below] 4,496 3,390
Less: Expenses capitalised (10) (136)
18,228 15,501
(a) Expenditure towards Corporate Social Responsibility :
- Gross amount required to be spent by the Company during the year is Mio INR 332 (2015-16 Mio INR 292).
- Amount spent during the year is Mio INR 332 (2015-16 Mio INR 197).
[` in Millions (Mio INR)]
Sr. No. Particulars In cash Yet to be
paid in cash Total
(i) Construction/acquisition of any asset - - -(-) (-) (-)
(ii) On purposes other than (i) above 309 23 332
(133) (64) (197)
- Total amount paid during the year Mio INR 373 includes Mio INR 64 relating to previous year.
- Figures in brackets relate to previous year
Notes to the Financial Statements for the year ended March 31, 2017

120 | Standalone Financial Statements | Annual Report 2016-17
(b) Miscellaneous expenses include :
[` in Millions (Mio INR)]
For the year ended
March 31, 2017
For the year ended
March 31, 2016
(i) Remuneration to auditors (excluding service tax): Statutory audit fee 11 12 Tax account and audit fees 2 2 Other services 9 12 Reimbursement of expenses 0 0 (ii) Loss on sale of property,plant and equipment (net) 22 - (iii) Provision for doubtful debts 190 152 (iv) Bad debts written off 32 33 (v) Exchange loss [including exchange loss of Mio INR 64 (2015-16: Mio 34 136 INR 5) on account of mark-to-market valuation of outstanding forward and option contracts]
Note 28 : R & D expenses/ (income) *
[` in Millions (Mio INR)]
For the year ended
March 31, 2017
For the year ended
March 31, 2016
R & D Expenses : Cost of materials consumed 124 42 Employee benefit expenses 667 649 Other expenses 833 704
1,624 1,395 R & D Income : Sale of services (1,457) (1,352) Other income 0 0
(1,457) (1,352)
* Relating to certain DSIR approved R & D facilities, considered eligible for Income Tax benefit.
Note 29: Income tax expense
This note provides an analysis of the Company's income tax expense, showing how the tax expense is affected by non-assessable and non-deductible items.
(a) Income tax expense
[` in Millions (Mio INR)]
March 31, 2017
March 31, 2016
Current taxCurrent tax on profits for the year 6,910 6,672 Adjustments for current tax of prior periods (6) (94)Total current tax expenses 6,904 6,578 Deferred taxDecrease/ (Increase) in deferred tax assets 340 (806)(Decrease)/ Increase in deferred tax liabilities - - Total deferred tax expenses/(benefit) 340 (806)Income tax expense 7,244 5,772 Income tax expense attributable to:Profit from continuing operations 6,503 5,701 Profit from discontinued operation 741 71
7,244 5,772
Notes to the Financial Statements for the year ended March 31, 2017

Annual Report 2016-17 | Standalone Financial Statements | 121
(b) Reconciliation of tax expenses and the accounting profit multiplied by tax rate:
[` in Millions (Mio INR)]March 31,
2017March 31,
2016Profit from continuing operations before income tax expense 20,944 20,824 Profit from discontinuing operation before income tax expense 3,711 262
24,655 21,086 Tax at the Indian tax rate of 34.608% (2015-16: 34.608%) 8,533 7,297 Effect of non-deductible expense 379 164 Effect of exempt other income/ weighted deduction (1,338) (1,165)Effect of difference in tax rate for long term capital gain on sale of business (324) - Adjustments for current tax of prior periods (6) (94)Previously unrecognised tax losses used to reduce deferred tax expense (i) - (430)Income tax expense 7,244 5,772
(i) The company has reviewed previously unrecognised capital losses and determined that it is now probable that taxable capital profits will be available against which the capital losses can be utilised. As a consequence, a deferred tax asset of Mio INR 430 was recognised for these losses during the year ended March 31, 2016.
Note 30: Employee Retirement Benefits:Disclosure on Retirement Benefits as required in Indian Accounting Standard (Ind AS) 19 on "Employee Benefits" are given below:
(a) Post Employment Benefit - Defined Contribution Plans
The Company has recognised an amount of Mio INR 287 (2015-16: Mio INR 315) as expense under the defined contribution plans in the Statement of Profit and Loss.
(b) Post Employment Benefit - Defined Benefit Plans
The Company makes annual contributions to the Bosch Employees' Gratuity Fund and makes monthly contributions to Bosch Employees (Bangalore) Provident Fund Trust and Bosch Workmen's (Nashik) Provident Fund Trust, funded defined benefit plans for qualifying employees.
The Gratuity Scheme provides for lumpsum payment to vested employees at retirement/death while in employment or on termination of employment of an amount equivalent to 15 days salary payable for each completed year of service or part thereof in excess of six months. Vesting occurs only upon completion of five years of service, except in case of death or permanent disability.
The Provident Fund Scheme provides for lumpsum payment/transfer to the member employees at retirement/ death while in employment or on termination of employment of an amount equivalent to the credit standing in his account maintained by the Trusts. The present value of the defined benefit obligation and the related current service cost are measured using the projected unit credit method with actuarial valuation being carried out at each balance sheet date.
(c) Total expense recognised in the statement of profit and loss
[` in Millions (Mio INR)]Provident Fund Gratuity
March 31, 2017
March 31, 2016
March 31, 2017
March 31, 2016
Current service cost 347 346 159 158 Net interest costa. Interest expense on defined benefit obligation (DBO) 617 564 276 276 b. Interest (income) on plan assets (617) (564) (275) (246)c. Total net interest cost - - 1 30 Defined benefit cost included in statement of profit and loss 347 346 160 188
(d) Remeasurement effects recognised in other comprehensive income (OCI)
[` in Millions (Mio INR)]Gratuity
March 31, 2017
March 31, 2016
a. Actuarial (gain)/ loss due to demographic assumption changes in DBO 3 - b. Actuarial (gain)/ loss due to financial assumption changes in DBO 96 123 c. Actuarial (gain)/ loss due to experience on DBO 175 (155)d. Return on plan assets (greater)/ less than discount rate (107) (27)Total actuarial (gain)/ loss included in OCI 167 (59)
Notes to the Financial Statements for the year ended March 31, 2017

122 | Standalone Financial Statements | Annual Report 2016-17
[` in Millions (Mio INR)]Provident Fund
March 31, 2017
March 31, 2016
a. Actuarial (gain)/ loss on liability (257) (21)b. Actuarial (gain)/ loss on plan assets 257 21 Total actuarial (gain)/ loss included in OCI - -
(e) Total cost recognised in comprehensive income[` in Millions (Mio INR)]
Provident Fund GratuityMarch 31,
2017March 31,
2016March 31,
2017March 31,
2016Cost recognised in statement of profit and loss 347 346 160 188 Remeasurements effects recognised in OCI - - 167 (59)Total cost recognised in comprehensive Income 347 346 327 129
(f) Change in defined benefit obligation[` in Millions (Mio INR)]
GratuityMarch 31,
2017March 31,
2016Defined benefit obligation as at the beginning of the year 3,772 3,712 Service cost 159 158 Interest cost 276 276 Benefit payments from plan assets (180) (342)Acquisition / divestiture (306) - Actuarial (gain)/ loss - demographic assumptions 3 - Actuarial (gain)/ loss - financial assumptions 96 123 Actuarial (gain)/ Loss - experience 176 (155)Defined benefit obligation as at year end 3,996 3,772
[` in Millions (Mio INR)]Provident Fund
March 31, 2017
March 31, 2016
Defined benefit obligation as at the beginning of the year 7,950 7,061 Current service cost 347 346 Interest cost 617 564 Benefits paid and transfer out (797) (884)Transfer in 41 53 Participant contributions 839 831 Actuarial (gain)/ loss (257) (21)Defined benefit obligation as of current year end 8,740 7,950
(g) Change in fair value of plan assets[` in Millions (Mio INR)]
Provident Fund GratuityMarch 31,
2017March 31,
2016March 31,
2017March 31,
2016Fair value of plan assets at end of prior year 7,950 7,061 3,642 2,947 Expected return on plan assets 617 564 275 246 Employer contributions 347 346 278 763 Participant contributions 839 831 - - Benefit payments from plan assets - - (180) (342)Transfer in/ transfer out 41 53 - - Settlements (797) (884) - - Acquisition/ divestiture - - (248) - Actuarial gain/ (loss) on plan assets (257) (21) 107 28 Fair value of plan assets at end of year 8,740 7,950 3,874 3,642
Notes to the Financial Statements for the year ended March 31, 2017

Annual Report 2016-17 | Standalone Financial Statements | 123
Notes to the Financial Statements for the year ended March 31, 2017
(h) Net defined benefit asset/ (liability)[` in Millions (Mio INR)]
Provident Fund GratuityMarch 31,
2017March 31,
2016March 31,
2017March 31,
2016Defined benefit obligation 8,740 7,950 3,996 3,772 Fair value of plan assets 8,740 7,950 3,874 3,642 (Surplus)/ deficit recognised in balance sheet - - 122 130
(i) Expected company contributions for the next year[` in Millions (Mio INR)]
Provident Fund GratuityMarch 31,
2017March 31,
2016March 31,
2017March 31,
2016
Expected company contributions for the next year 573 579 230 225
(j) Reconciliation of amounts in balance sheet[` in Millions (Mio INR)]
GratuityMarch 31,
2017March 31,
2016Net defined benefit liability (asset) at prior year end 130 764 Defined benefit cost included in statement of profit and loss 160 188 Total remeasurements included in OCI 167 (59)Acquisition/ divestment (57) - Employer contributions (278) (763)Net defined benefit liability (asset) 122 130
(k) Reconciliation of Statement of Other Comprehensive Income[` in Millions (Mio INR)]
Provident Fund GratuityMarch 31,
2017March 31,
2016March 31,
2017March 31,
2016Cumulative OCI - (Income)/Loss, Beginning of Period - - (59) - Total remeasurements included in OCI - - 167 (59)Cumulative OCI - (Income)/Loss - - 108 (59)
(l) Current/ non current liability
[` in Millions (Mio INR)]
Provident Fund Gratuity
March 31, 2017
March 31, 2016
April 1, 2015
March 31, 2017
March 31, 2016
April 1, 2015
Current liability - - - - - -
Non current liability - - - 122 130 765
Total - - - 122 130 765
(m) Assumptions :
Provident Fund GratuityMarch 31,
2017March 31,
2016March 31,
2017March 31,
2016Discount factor [refer note (i) below] 7.30% 7.55% 7.30% 7.55%Weighted average rate of escalation in salary per annum [refer note (ii) below]
NA NA 10.6% 10.7%
Notes:
(i) The discount rate is based on the prevailing market yield on Government Bonds as at the balance sheet date for the estimated term of obligations.
(ii) The estimate of future salary increases considered in actuarial valuation takes into account inflation, seniority, promotion and other relevant factors such as supply and demand in the employment market.

124 | Standalone Financial Statements | Annual Report 2016-17
(n) Risk exposures:
A large portion of assets consists of government and corporate bonds and small portion of assets consists in mutual funds and special deposit account in banks. Through its defined plans, the company is exposed to a number of risks, the most significant of which are detailed below:
Asset Volatility: The plan liabilities are calculated using a discount rate with reference to bond yields, if plan assets underperform this yield, this will create a deficit. Most of the plan asset investments is in fixed income government securities with high grades and public sector corporate bonds. A small portion of the funds are invested in equity securities.
Changes in bond yields: A decrease in bond yields will increase plan liabilities, although this will be partially offset by an increase in the value of the plans' bond holdings.
(o) Sensitivity analysis on defined benefit obligation
[` in Millions (Mio INR)]
Gratuity
March 31, 2017
March 31, 2016
April 1, 2015
Discount rate
a. Discount rate - 50 basis points 4,151 3,974 3,974
b. Discount rate + 50 basis points 3,805 3,587 3,531
Weighted average increase in salary
a. Rate - 50 basis points 3,854 3,694 3,682
b. Rate + 50 basis points 4,095 3,854 3,791
The above sensitivity analysis are based on a change in an assumption while holding all other assumptions constant. In practice, this is unlikely to occur.
This sensitivity analysis shows how the defined benefit obligation would have been affected by changes in the relevant actuarial assumption that were reasonably possible at that date.
(p) Plan assets
Provident Fund Gratuity
March 31, 2017
March 31, 2016
April 1, 2015
March 31, 2017
March 31, 2016
April 1, 2015
% Invested % Invested % Invested % Invested % Invested % Invested
Government Securities (Central and State)
49 52 52 49 53 52
Corporate Bonds (including Public Sector bonds)
39 44 44 33 33 30
Mutual Funds 2 0 - 2 0 -
Cash and bank balances (including Special Deposits Scheme, 1975)
10 4 4 16 14 18
Total 100 100 100 100 100 100
(q) Expected future cashflows
The weighted average duration of the defined benefit obligation is 14.45 years (2015-16 -11.25 years). The expected maturity analysis is as follows:
[` in Millions (Mio INR)]
Provident Fund Gratuity
March 31, 2017
March 31, 2016
April 1, 2015
March 31, 2017
March 31, 2016
April 1, 2015
Within 1 year 338 305 270 231 225 249
Between 1-2 years 401 367 332 235 215 250
Between 2-5 years 1,627 1,522 1,413 699 649 672
From 6 to 10 8,558 8,237 4,080 1,869 1,566 1,432
Total 10,924 10,431 6,095 3,034 2,655 2,603
Notes to the Financial Statements for the year ended March 31, 2017

Annual Report 2016-17 | Standalone Financial Statements | 125
Notes to the Financial Statements for the year ended March 31, 2017
Note 31: Fair value measurements:
(i) Financial instruments by category and hierarchy This section explains the judgements and estimates made in determining the fair values of the financial instruments that are (a) recognised and measured at fair value and (b) measured at amortised cost and for which fair values are disclosed in the financial statements. To provide an indication about the reliability of the inputs used in determining fair value, the Company has classified its financial instruments into the three levels prescribed under the accounting standard. An explanation of each level follows underneath the table.
[` in Millions (Mio INR)]
Level March 31, 2017 March 31, 2016 April 1, 2015
FVPL FVOCI Amortised cost FVPL FVOCI Amortised
cost FVPL FVOCI Amortised cost
Financial assetsInvestments - Equity instruments 1 - 5,993 - - 4,483 - - 5,347 - - Bonds 1 - - 5,212 - - 5,207 - - 5,012 - Mutual funds 1 27,885 - - 34,629 - - 24,378 - -Interest accrued on financial assets at amortised cost
3 - - 782 - - 1,202 - - 1,140
Trade receivables 3 - - 11,862 - - 13,225 - - 11,984
Loans 3 - - 4,379 - - 4,248 - - 3,968
Cash and cash equivalents - - 1,312 - - 985 - - 1,304
Other bank balances - - 15,864 - - 17,330 - - 17,656Inter-corporate deposit 3 - - 6,800 - - 6,150 - - 5,250Deposits with maturity of more than 12 months
3 - - - - - 100 - - -
Others (include non-trade receivables, etc.)
3 - - 373 - - 270 - - 352
Total financial assets 27,885 5,993 46,584 34,629 4,483 48,717 24,378 5,347 46,666Financial liabilitiesBorrowings [refer note (a) below]
3 - - - - - 500 - - 1,109
Trade payables 3 - - 13,399 - - 13,088 - - 12,036
Unpaid dividend 3 - - 34 - - 30 - - 25
Book overdraft - - 23 - - 26 - - 13
Other payables (includes employee dues, etc.)
3 - - 2,367 - - 2,580 - - 2,571
Capital creditors 3 - - 305 - - 442 - - 361
Derivative liabilities 2 79 - - 15 - - 10 - -Total financial liabilities 79 - 16,128 15 - 16,666 10 - 16,115
Note (a) : The amount includes current portion of sales tax deferral.
Level 1: Level 1 hierarchy includes financial instruments measured using quoted prices. This includes listed equity instruments, tax free bonds and mutual funds that have quoted price. The fair value of all equity instruments which are traded in the stock exchanges in valued using the closing price as at the reporting period. The mutual funds are valued using the closing NAV.
Level 2: The fair value of financial instruments that are not traded in an active market (for market, traded bonds, over-the-counter derivatives) is determined using valuation techniques which maximise the use of observable market data and rely as little as possible on entity-specific estimates. If all significant inputs required to fair value an instrument are observable, the instrument is included in level 2.
Level 3: If one or more of the significant inputs is not based on observable market data, the instrument is included in Level 3.
There are no transfers between levels during the year.
(ii) Valuation technique used to determine fair valueSpecific valuation techniques used to value financial instruments include:
- the fair value of forward foreign exchange contracts is determined using forward exchange rates at the balance sheet date
- the fair value of remaining financial instruments is determined using the discounted cash flow analysis

126 | Standalone Financial Statements | Annual Report 2016-17
(iii) Valuation processThe finance and accounts department of the company performs the valuation of financial assets and liabilities required for financial reporting purposes, and report to the Executive Director (ED). Discussions on valuation processes and results are held between the ED and valuation team at least once every three months, in line with the Company's quarterly reporting periods.
The main level 3 inputs are derived and evaluated as follows:
a) Discount rate for sales tax deferral loan are determined using risk free rate.
b) Discount rate for loans to employees are determined using prevailing bank lending rate.
c) The fair values of financial assets and liabilities are determined using the discounted cash flow analysis.
(iv) Fair value of financial assets and liabilities measured at amortised cost[` in Millions (Mio INR)]
March 31, 2017 March 31, 2016 April 1, 2015Carrying amount Fair value Carrying
amount Fair value Carrying amount Fair value
Financial assetsQuoted tax free bonds 5,212 5,546 5,207 5,533 5,012 5,351 Loans 1,174 1,174 1,422 1,422 1,670 1,670 Total financial assets 6,386 6,720 6,629 6,955 6,682 7,021 Financial liabilitiesBorrowings - - 149 149 542 542 Other financial liabilities 60 60 50 50 64 64 Total financial liabilities 60 60 199 199 606 606
With respect to trade receivables, other receivables, inter-corporate deposit, current portion of loans, cash and cash equivalents, other bank balance, trade payables, capital creditors, employee payables and current maturities of long-term debt, the carrying amount is considered to be the same as their fair value due to their short-term nature.
Note 32: Financial risk management
The Company's activities expose it to market risk, liquidity risk and credit risk. In order to minimise any adverse effects on the financial performance of the Company, derivative financial instruments, such as foreign exchange forward contracts and foreign currency option contracts are entered into by the Company to hedge certain foreign currency exposure. Derivatives are used exclusively for hedging and not as trading or speculative instruments.
(A) Credit Risk
Credit risk arises from cash and cash equivalents, instruments carried at amortised cost and deposits with banks, as well as credit exposures to customers including outstanding receivables.
(i) Credit risk management
Credit risk on cash and cash equivalents is limited as the Company generally invests in deposits with banks which have high credit ratings assigned by external agencies. Investments primarily include investment in debt based mutual funds whose portfolios have instruments with high credit rating and government bonds. The board of directors periodically review the investment portfolio of the Company. Credit risk on loans given to fellow subsidiaries is guaranteed by the holding company. Credit risk with respect to trade receivable is managed by the Company through setting up credit limits for customers and also periodically reviewing the credit worthiness of major customers.
Expected credit loss for trade receivables under simplified approach
[` in Millions (Mio INR)]
March 31, 2017 March 31, 2016 April 1, 2015 Less than 6
months More than 6
months Less than 6
months More than 6
months Less than 6
months More than 6
months Gross carrying amount 11,300 1,260 13,095 688 11,767 621 Expected credit losses (Loss allowance provision)
(63) (635) (127) (431) (64) (340)
Carrying amount of trade receivables (net of impairment) 11,237 625 12,968 257 11,703 281
The gross carrying amount of trade receivables is Mio INR 12,560 (March 31, 2016 - Mio INR 13,783, April 1, 2015 - Mio INR 12,388). During the period, the Company made no significant write-offs of trade receivables and it does not expect to receive future cash flows or recoveries from trade receivables previously written off.
Notes to the Financial Statements for the year ended March 31, 2017

Annual Report 2016-17 | Standalone Financial Statements | 127
(ii) Reconciliation of loss allowance provision - Trade Receivables[` in Millions (Mio INR)]
Loss allowance as at April 1, 2015 404 Changes in loss allowance 154 Loss allowance as at March 31, 2016 558 Changes in loss allowance 140 Loss allowance as at March 31, 2017 698
(B) Liquidity risk
Prudent liquidity risk management implies maintaining sufficient cash and marketable securities and the availability of funding through an adequate amount of internal financing by way of daily cash flow projection to meet obligations when due and to close out market positions. Due to the dynamic nature of the underlying businesses, Company treasury maintains flexibility in funding by maintaining availability of funds.
Management monitors daily and monthly rolling forecasts of the Company's liquidity position and cash and cash equivalents on the basis of expected cash flows. This is generally carried in accordance with standard guidelines. The company has liquidity reserves in the form of highly liquid assets like cash and cash equivalents, debt based mutual funds, deposit accounts, etc.
(i) Financing arrangements: The company had access to the following undrawn borrowing facilities at the end of the reporting period
[` in Millions (Mio INR)]
March 31, 2017
March 31, 2016
April 1, 2015
Floating rate - Expiring within one year (bank overdraft and other facilities) 20 20 200 - Expiring beyond one year (bank loans) - - -
20 20 200
(ii) Maturity of Financial liabilities
The table below summarises the company's financial liabilities into relevant maturity groupings based on their contractual maturities for:
a) All non-derivative financial liabilities
b) Net and gross settled derivative financial instruments for which the contractual maturities are essential for an understanding of the timing of the cash flows
The amounts disclosed in the table are the contractual undiscounted cash flows. Balance due within 12 months equal their carrying balances as the impact of discounting is not significant.
[` in Millions (Mio INR)]
March 31, 2017 March 31, 2016 April 1, 2015 Less than More than Less than More than Less than More than
1 year 1 year 1 year 1 year 1 year 1 year Borrowings - - 351 191 567 542 Trade payables 13,399 - 13,088 - 12,036 - Other financial liabilities 2,748 60 3,043 50 2,916 64 Total non-derivative liabilities 16,147 60 16,482 241 15,519 606 Foreign exchange forward contracts
2,763 - 616 - 1,021 -
Options contracts - - 831 - 902 - Total derivative liabilities 2,763 - 1,447 - 1,923 -
(C) Market risk
(i) Foreign currency risk
The company is exposed to foreign exchange risk arising from foreign currency transactions, primarily with respect to USD and EUR. Foreign exchange risk arises from future commercial transactions and recognised assets and liabilities denominated in a currency that is not the Company's functional currency (INR). The risk is measured through a forecast of highly probable foreign currency cash flows. The objective of the hedges is to minimise the volatility of the INR cash flows of highly probable forecast transaction.
The Company imports and exports goods and services which are predominantly denominated in USD and EUR. This exposes the Company to foreign currency risk. To minimise this risk, the Company hedges using forward contracts and foreign currency option contracts on a net exposure basis.
Notes to the Financial Statements for the year ended March 31, 2017

128 | Standalone Financial Statements | Annual Report 2016-17
(a) Foreign currency risk exposure: The Company exposure to foreign currency risk at the end of the reporting period expressed in Mio INR are as follows:
[` in Millions (Mio INR)]
March 31, 2017 March 31, 2016 April 1, 2015
USD EUR USD EUR USD EUR
Financials assets
Trade receivables 1,141 112 1,990 211 2,311 204
Exposure to foreign currency risk - assets 1,141 112 1,990 211 2,311 204
Financial liabilities
Trade payables 4,681 1,489 4,738 2,778 5,410 3,125
Exposure to foreign currency risk - liabilities 4,681 1,489 4,738 2,778 5,410 3,125
Derivative liabilities
Foreign exchange forward contracts
2,763 - 616 - 1,021 -
Foreign currency option contracts - Buy Option Contract
- - 831 - 902 -
Net exposure to foreign currency risk 777 1,377 1,301 2,567 1,176 2,921
(b) Sensitivity: The sensitivity of profit or loss to changes in the exchange rates arises mainly from foreign currency denominated financial instruments:
[` in Millions (Mio INR)]
Impact on profit after tax
March 31, 2017
March 31, 2016
USD Sensitivity
INR/USD - Increase by 1% (March 31, 2016 - 1 %)* (8) (21)
INR/USD - Decrease by 1% (March 31, 2016 - 1%)* 8 21
EUR Sensitivity
INR/EUR - Increase by 1% (March 31, 2016 - 1%)* (14) (26)
INR/EUR - Decrease by 1% (March 31, 2016 - 1%)* 14 26
* Holding all other variable constant
(ii) Cash flow and fair value interest rate risk
(a) Interest rate risk exposure: The company does not have interest bearing borrowings and interest rate risk is towards opportunity cost on investment in tax free bonds. Company analyses it based on the sensitivity analysis and manages it by portfolio diversification.
(b) Sensitivity: Profit or loss is sensitive to changes in interest rate for tax free bonds. A change in the market interest level by 100 basis points would have the following effect on the profit after tax:
[` in Millions (Mio INR)]
Impact on profit after tax
March 31, 2017
March 31, 2016
Interest rates - increase by 100 basis points* 338 337
Interest rates - decrease by 100 basis points* (338) (337)
* Holding all other variables constant
Notes to the Financial Statements for the year ended March 31, 2017

Annual Report 2016-17 | Standalone Financial Statements | 129
(iii) Price risk
(a) Exposure: The Company has invested in equity securities and the exposure is equity securities price risk from investments held by the Company and classified in the balance sheet as fair value through OCI.
(b) Sensitivity: The table below summarises the impact of increase/decrease of the index in the company’s equity and impact on OCI for the period. The analysis is based on the assumption that the equity index had increased/ decreased by 10% with all other variables held constant, and that all the Company's equity instruments moved in line with the index.
[` in Millions (Mio INR)]
Impact on other components of equity
March 31, 2017
March 31, 2016
Price - increase by 10% 599 448
Price - decrease by 10% (599) (448)
Other components of equity would increase/decrease as a result of gains/ (losses) on equity securities classified as fair value through other comprehensive income.
Note 33: Capital management
(a) Risk management
The Company has equity capital and other reserves attributable to the equity shareholders, as the only source of capital and the company does not have any interest bearing borrowings/ debts.
(b) Dividends
[` in Millions (Mio INR)]
March 31, 2017
March 31, 2016
(i) Dividends recognised
Final dividend for the year ended March 31, 2016 of INR 85/- (March 31, 2015 - INR 85/-) per fully paid share
Interim dividend for the year ended March 31, 2017 of INR 75/- (March 31, 2016 - Nil)
2,669
2,289
2,669
-
4,958 2,669
(ii) Dividends not recognised at the end of the reporting period
In addition to the above dividends, since the year ended the directors have recommended the payment of a final dividend of INR 90/- per fully paid equity share (March 31, 2016 - INR 85/-). This proposed dividend is subject to the approval of shareholders in the ensuing annual general meeting
2,747 2,669
2,747 2,669
Note 34: Segment Information
(a) Description of segments and principal activities
The Company's operations predominantly relate to operating segments in the automotive business which consists of diesel systems, gasoline systems and automotive aftermarket products and services and are aggregated into one reportable segment 'Automotive Products' in accordance with the aggregation criteria. Aggregation is done due to the similarities of the products and services provided to the customers, similar production processes and similarities in the regulatory environment. The Company also operates in other businesses consisting of Industrial technology, consumer goods and energy and building technology products and services which are non-automotive and do not meet the threshold criteria for reporting as separate segments. Therefore, the reportable segment consists of "Automotive Products" and "Others".
Revenue by geographical areas is stated on the basis of origin and there are no non-current assets located outside India.
The Accounting principles and policies adopted in the preparation of the financial statements are also consistently applied to record income/ expenditure and assets/ liabilities in individual segments. The inter-segment revenue have been accounted for based on the transaction price agreed to between segments which is primarily market based.
Notes to the Financial Statements for the year ended March 31, 2017

130 | Standalone Financial Statements | Annual Report 2016-17
(b) Details of operating segment[` in Millions (Mio INR)]
Automotive Products Others Eliminations Discontinued
Operation Total
March 31, 2017
March 31, 2016
March 31, 2017
March 31, 2016
March 31, 2017
March 31, 2016
March 31, 2017
March 31, 2016
March 31, 2017
March 31, 2016
Revenue
Gross sale of product 92,060 86,666 15,440 13,464 - - 3,020 9,620 110,520 109,750
Sale of services 2,261 1,916 73 75 - - 1 26 2,335 2,017
Other operating revenue 1,660 1,704 932 594 - - 263 166 2,855 2,464
Inter-segment revenue - - 1,128 594 (1,128) (594) - - - -
Total Revenue 95,981 90,286 17,573 14,727 (1,128) (594) 3,284 9,812 115,710 114,231
Result
Segment result 15,331 15,483 1,401 1,158 - - 3,711 262 20,443 16,903
[` in Millions (Mio INR)]
Revenue from external customers March 31, 2017
March 31, 2016
India 105,532 101,806
Other countries 10,178 12,425
Total 115,710 114,231
(c) Reconciliation of profit
[` in Millions (Mio INR)]
March 31, 2017
March 31, 2016
Segment results 20,443 16,903
Less: Depreciation and amortisation (320) (224)
Less: Non-cash expenses other than depreciation and amortisation (2) (7)
Less: Unallocated corporate expenses (1,368) (1,493)
Add: Other income (refer note 20) 6,174 6,036
Less: Finance costs (refer note 25) (272) (129)
Profit before tax 24,655 21,086
(d) Details of segment assets and liabilities[` in Millions (Mio INR)]
March 31, 2017
March 31, 2016
April 1, 2015
Segment assetsAutomotive Products 36,220 33,965 34,030 Others 6,951 7,366 6,779 Discontinued Operation - 2,904 2,091 Total segment assets 43,171 44,235 42,900
Segment liabilitiesAutomotive Products 24,341 21,322 20,989 Others 3,936 3,277 3,321 Discontinued Operation - 2,329 1,890 Total segment liabilities 28,277 26,928 26,200
Notes to the Financial Statements for the year ended March 31, 2017

Annual Report 2016-17 | Standalone Financial Statements | 131
(e) Reconciliation of assets[` in Millions (Mio INR)]
March 31, 2017
March 31, 2016
April 1, 2015
Segment assets 43,171 44,235 42,900 Property, plant and equipment 1,543 1,012 796 Capital work-in progress 116 88 11 Investments 39,090 44,319 34,737 Investments in subsidiary and associate 176 176 176 Deferred tax assets 4,676 4,958 4,172 Cash and cash equivalents 1,312 985 1,304 Bank balance other than cash and cash equivalents 15,864 17,330 17,656 Loans 3,671 3,402 3,090 Other financial assets 8,112 7,593 6,601 Other current assets 267 230 308 Total assets 117,998 124,328 111,751
(f) Reconciliation of liabilities[` in Millions (Mio INR)]
March 31, 2017
March 31, 2016
April 1, 2015
Segment liabilities 28,277 26,928 26,200 Trade payables 266 192 232 Provisions 620 526 273 Unpaid dividend 34 30 25 Other current liabilities 80 77 55 Other financial liabilities 74 464 264 Current tax liabilities 651 762 630 Total liabilities 30,002 28,979 27,679
Note 35: Discontinued operation : Consequent to the approvals received from the Board of Directors on February 5, 2016 and from the shareholders on April 4, 2016, the Company has executed a Business Transfer Agreement on August 1, 2016 and has sold/ transferred the business of Starter Motors and Generators under the automotive products segment of the Company on a going concern basis by way of Slump sale to Robert Bosch Starter Motors Generators India Private Limited, a fellow subsidiary. Gain on sale of business amounting to Mio INR 3,971 has been recognised during the current year and disclosed under discontinued operation in the statement of profit and loss.
(a) Financial performance and cash flow information:
The financial performance and cash flow information presented are for the period ended August 1, 2016 (March 31, 2017 column) and the year ended March 31, 2016:
[` in Millions (Mio INR)]
March 31, 2017
March 31, 2016
Revenue including other income 3,284 9,817
Expenses (3,544) (9,555)
Profit before income tax (260) 262
Income tax (expense)/ credit 90 (71)
Profit after income tax (170) 191
Gain on sale of division after income tax [refer note (b) below] 3,140 -
Profit from discontinued operation [refer note (i) below] 2,970 191
Other comprehensive income from discontinued operation - -
Net cash flow from operating activities (170) 418
Net cash flow from investing activities (from sale of business) 4,376 -
Net cash flow from financing activities - -
Net cash generated from discontinued operation 4,206 418
Notes to the Financial Statements for the year ended March 31, 2017

132 | Standalone Financial Statements | Annual Report 2016-17
(b) Details of sale of business:
[` in Millions (Mio INR)]
March 31, 2017
March 31, 2016
Consideration received 4,376 -
Carrying amount of net assets sold (405) -
Gain on sale before income tax 3,971 -
Income tax expense on gain (831) -
Gain on sale after income tax 3,140 -
(c) The carrying amount of assets and liabilities as at the date of transfer (August 1, 2016) are as follows:
[` in Millions (Mio INR)]
August 1, 2016
Property, plant and equipment 311
Capital work-in-progress 28
Trade receivable 1,013
Inventories 1,014
Employee loans 47
Other current assets 104
Total Assets 2,517
Trade payables (1,282)
Other financial liablilities (40)
Provision for employee benefits (310)
Trade demand and others (480)
Total Liabilities (2,112)
Net assets 405
(d) There are no assets and liablities of disposal group to be classified as assets held for sale on either of the reporting dates.
Note 36: Related Party Disclosure :
Holding Company : Robert Bosch GmbH, Federal Republic of Germany
Subsidiary Company : MICO Trading Private Limited, India
Associate (also a fellow subsidiary) : Newtech Filter India Private Limited, India
Whole time directors : Dr. Steffen Berns (till December 31, 2016), Mr. Soumitra Bhattacharya, Dr. Andreas Wolf and Mr. Jan Oliver Röhrl (from February 11, 2017)
Non-whole time directors : Mr. V.K. Viswanathan, Mr. Peter Tyroller, Mr. Bernhard Steinruecke, Mr. Prasad Chandran, Ms. Renu S. Karnad and Mr. Bhaskar Bhat
Other related entities: Bosch India Foundation
(a) Key management personnel compensation:
[` in Millions (Mio INR)]
March 31, 2017
March 31, 2016
Short-term employee benefits 157 145
Post-employment benefits 6 6
163 151
Notes to the Financial Statements for the year ended March 31, 2017

Annual Report 2016-17 | Standalone Financial Statements | 133
(b) Related Party transactions/ balances - summary:
[` in Millions (Mio INR)]
Particulars Holding Company
Fellow Subsidiary
Employees' Benefit plans where
there is significant influence
AssociateKey
Management Personnel
Other related entities
Total
Net sale of product 3,809 3,487 3 7,299
(4,856) (3,159) (2) (8,017)
Sale of services 903 656 1 1,560
(648) (651) (0) (1,299)
Rental income 875 875
(493) (493)
Consideration towards sale of business - 4,376 4,376
(22) (-) (22)
Miscellaneous income (including reimbursements received) 82 462 - 544
(84) (512) (22) (618)
Interest earned 352 352
(352) (352)
Purchases of :
Property, plant and equipment 1,382 550 1,932
(455) (242) (697)
Goods 10,874 12,458 550 23,882
(11,293) (10,082) (571) (21,946)
Dividend paid 3,479 34 3,513
(1,900) (-) (1,900)
Amount paid for shares bought back 19,244 19,244
(-) (-)
Services received:
Royalty and technical service fee 0 1,639 1,639
(-) (1,597) (1,597)
Professional, consultancy and other charges 1,693 1,170 2,863
(1,456) (1,099) (2,555)
Liability written back 10 310 320
(-) (-) -
Donation expense 73 73
(64) (64)
Loan given during the year (*) 2,560 2,560
(950) (950)
Loan repaid during the year 2,300 2,300
(700) (700)
Loan to related parties (*) 3,560 3,560
As at March 31, 2016 (3,300) (3,300)
As at April 1, 2015 (3,050) (3,050)
Trade receivables 426 1,102 - 1,528
As at March 31, 2016 (621) (1,054) (2) (1,677)
As at April 1, 2015 (648) (1,516) (-) (2,164)
Other financial assets (non-trade receivables) 51 301 14 366
As at March 31, 2016 (10) (201) (3) (214)
As at April 1, 2015 (62) (198) (2) (262)
(*) Against guarantee given by Robert Bosch GmbH, Federal Republic of Germany, the holding company.
Notes to the Financial Statements for the year ended March 31, 2017

134 | Standalone Financial Statements | Annual Report 2016-17
[` in Millions (Mio INR)]
Particulars Holding Company
Fellow Subsidiary
Employees' Benefit plans where
there is significant influence
AssociateKey
Management Personnel
Other related entities
Total
Trade payables 2,178 5,449 39 7,666
As at March 31, 2016 (2,875) (4,851) (66) (7,792)
As at April 1, 2015 (3,502) (3,590) (35) (7,127)
Other financial liabilities 62 38 7 107
As at March 31, 2016 (71) (45) (64) (180)
As at April 1, 2015 (30) (4) (33) (67)
Contributions made to Employees' Benefit plans 764 764
(1,251) (1,251)
Managerial Remuneration:
Dr. Steffen Berns (upto December 31, 2016) 49 49
(63) (63)
Mr. Soumitra Bhattacharya 46 46
(42) (42)
Dr. Andreas Wolf 50 50
(36) (36)
Mr. Jan Oliver Röhrl (from February 11, 2017) 8 8
(-) (-)
Sitting fees/ commissions to non-executive directors 10 10
(10) (10)
Unpaid Bonus/ Commission as at the year end 10 10
As at March 31, 2016 (45) (45)
As at April 1, 2015 (35) (35)
Loan and Advances transactions :
Loan/Advances given during the year 4 4
(3) (3)
Recovery during the year 4 4
(4) (4)
Amount outstanding at the year end 3 3
As at March 31, 2016 (3) (3)
As at April 1, 2015 (4) (4)
Figures in brackets relate to previous year.
Notes to the Financial Statements for the year ended March 31, 2017

Annual Report 2016-17 | Standalone Financial Statements | 135
(c) Names and details of fellow subsidiaries having transaction value in excess of 10% in line transactions during the year:
[` in Millions (Mio INR)]
Particulars Name of the related party March 31, 2017
March 31, 2016
Sale of services Robert Bosch Automotive Steering LLC, United States
- 151
Bosch Automotive Service Solutions Inc., United States
190 -
Rental income Robert Bosch Engineering and Business Solutions Pvt. Ltd., India
715 402
Bosch Automotive Electronics India Pvt. Ltd., India
135 91
Purchase consideration towards sale of business
Robert Bosch Starter Motors Generators India Pvt. Ltd., India
4,376 -
Miscellaneous income (including reimbursements received)
Bosch Automotive Diesel Systems Co., Ltd., China
- 70
Robert Bosch Engineering and Business Solutions Pvt. Ltd., India
133 101
Bosch Automotive Electronics India Pvt. Ltd., India
63 125
Interest earned Bosch Rexroth (India) Pvt. Ltd., India 278 306 Purchase of goods Bosch Automotive Electronics India Pvt. Ltd.,
India 3,826 3,488
Purchase of property, plant and equipment Moehwald GmbH, Germany 239 - Bosch Sanayi ve Ticaret A.S., Turkey 226 -
Professional, consultancy and other charges received
Robert Bosch Engineering and Business Solutions Pvt. Ltd., India
845 803
Royalty and technical service fee Bosch Technology Licensing Administration GmbH, Germany
1,182 1,081
Robert Bosch Asset Managing C.V., Netherlands
435 502
Loan given BSH Household Appliances Manufacturing Pvt. Ltd., India
100 400
Bosch Rexroth (India) Pvt. Ltd., India 1,100 500 Loan repaid Bosch Rexroth (India) Pvt. Ltd., India 950 700 Contributions made Bosch Employees' Gratuity Fund., India 278 763
Bosch Superannuation Fund Trust., India 137 138 Bosch Employees (Bangalore) Provident Fund Trust., India
270 270
Bosch Workmen's (Nashik) Provident Fund Trust., India
77 76
Note 37: LeasesInformation on leases as per Indian Accounting Standard(Ind AS) 17 on "Leases":
(a) Operating Lease Expense :
The Company has various operating leases for office facilities, warehouses, guest houses and residential premises for employees that are renewable on a periodic basis. Rental expenses for operating leases recognised in the Statement of Profit and Loss for the year is Mio INR 549 (2015-16: Mio INR 541).
Disclosure in respect of Non-cancellable lease is as given below
[` in Millions (Mio INR)]
March 31, 2017
March 31, 2016
April 1, 2015
Future minimum lease payments - Not later than 1 year 144 123 90 - Later than 1 year and not later than 5 years 278 314 136 - Later than 5 years - 61 5
(b) Operating Lease Income :
The Company has leased out certain office spaces that are renewable on a periodic basis. All leases are cancellable with 3 months notice. Rental income received during the year in respect of operating lease is Mio INR 875 (2015-16: Mio INR 493). Details of assets given on operating lease as at year end are as below.
Notes to the Financial Statements for the year ended March 31, 2017

136 | Standalone Financial Statements | Annual Report 2016-17
[` in Millions (Mio INR)]
Gross Block Accumulated Depreciation Written down value Depreciation for the
year
March 31, 2017
March 31, 2016
March 31, 2017
March 31, 2016
March 31, 2017
March 31, 2016
March 31, 2017
March 31, 2016
Land 38 3 - - 38 3 - -
Buildings 2,041 1,846 265 69 1,776 1,777 194 69
Plant and machinery 458 308 197 56 261 252 141 56
Furniture and fixtures - 0 0 0 0 0 1 0
Office equipment 2 1 2 1 - - - 1
Total 2,539 2,158 464 126 2,075 2,032 336 126
Note 38: Research and Development expenses
Total gross Research and Development expenditure recognised in the Statement of Profit and Loss (including amounts shown under Note 4 and Note 28 to the Financial Statements) amounts to Mio INR 2,961 (2015-16: Mio INR 1,741)
Note 39: Earnings Per Share
(a) Basic and diluted earnings per share
[` in Millions (Mio INR)]
For the year ended
March 31, 2017
For the year ended
March 31, 2016
Profit attributable to Equity Shareholders from continuing operations 14,441 15,123
Profit attributable to Equity Shareholders from discontinued operation 2,970 191
Weighted average number of Equity Shares outstanding during the year 31,042,824 31,398,900
Nominal value of Equity Shares (Rs.) 10 10
Basic and Diluted earnings per Share (Rs.) from continuing operations 465 482
Basic and Diluted earnings per Share (Rs.) from discontinued operation 96 6
Basic and Diluted earnings per Share (Rs.) from continuing operations and discontinued operation
561 488
(b) Reconciliation of earnings used in calculating earnings per share
[` in Millions (Mio INR)]
For the year ended
March 31, 2017
For the year ended
March 31, 2016
Profit attributable to the equity holders of the Company used in calculating basic earnings per
share:
From continuing operations 14,441 15,123
From discontinued operation 2,970 191
(c) Weighted average number of shares used as the denominator
For the year ended
March 31, 2017
For the year ended
March 31, 2016
Weighted average number of equity shares used as the denominator in calculating basic and 31,042,824 31,398,900
diluted earnings per share
Notes to the Financial Statements for the year ended March 31, 2017

Annual Report 2016-17 | Standalone Financial Statements | 137
Note 40: Contingent liabilities [` in Millions (Mio INR)]
March 31, 2017
March 31, 2016
April 1, 2015
Claims against the Company not acknowledged as debts:(a) Excise/ Customs Net of tax 0 0 0 Gross 0 0 0 (b) Income Tax [refer note (i) below] 370 85 -
(i) Relates to adjustments made by the Income Tax Department for the financial year 2011-12 and 2012-13 which are disputed by the Company and the matters are lying under appeal with CIT (Appeals).
Note 41: The Company has a process whereby periodically all long term contracts (including derivative contracts) are assessed for material foreseeable losses. At the year end, the Company has reviewed and ensured that adequate provision as required under any law/ accounting standards for material foreseeable losses on such long term contracts (including derivative contracts) has been made in the books of accounts.
Note 42: Estimated amount of contracts remaining to be executed on capital accounts and not provided for (net of advances)
[` in Millions (Mio INR)]
March 31, 2017
March 31, 2016
April 1, 2015
Property, plant and equipment 2,117 2,007 1,760 Investment properties 159 273 764
Note 43: Advances include dues from directors and officers of the Company 4 4 4
Note 44: First-time adoption of Ind AS
The Company has prepared the financial statements in accordance with Ind AS.
The accounting policies set out in Note 2 have been applied in preparing the financial statements for the year ended March 31, 2017, the comparative information presented in these financial statements for the year ended March 31, 2016 and in the preparation of an opening Ind AS balance sheet as at April 1, 2015 (the Company's date of transition). In preparing its opening Ind AS balance sheet, the Company has adjusted the amounts reported previously in financial statements prepared in accordance with the accounting standards notified under Companies (Accounting Standard) Rules, 2006 (as amended) and other relevant provisions of the Act (previous GAAP or Indian GAAP). An explanation of how the transition from previous GAAP to Ind AS has affected the Company's financial position, financial performance and cash flows is set out in the following tables and notes.
A. Exemptions and exceptions availed
Set out below are the applicable Ind AS 101 optional exemptions and mandatory exceptions applied in the transition from previous GAAP to Ind AS
A.1 Ind AS optional exemptions
A.1.1 Deemed cost
Ind AS 101 permits a first-time adopter to elect to continue with the carrying value for all of its property, plant and equipment as recognised in the financial statements as at the date of transition to Ind AS, measured as per the previous GAAP and use that as its deemed cost as at the date of transition after making necessary adjustments for de-commissioning liabilities. This exemption can also be used for intangible assets covered by Ind AS 38 Intangible Assets and investment properties covered by Ind AS 40 Investment Properties. Accordingly, the Company has elected to measure all its property, plant and equipment, intangible assets and investment properties at their previous GAAP carrying value.
A.1.2 Designation of previously recognised financial instruments
Under Ind AS 109, at initial recognition of a financial asset, an entity may make an irrevocable election to present subsequent changes in the fair value of an investment in an equity instrument in other comprehensive income. Ind AS 101 allows an entity to designate investments in equity instruments at FVOCI on the basis of the facts and circumstances at the date of transition to Ind AS. The Company has elected to apply this exemption for its investment in equity investments.
A.1.3 Business combinations
Ind AS 101 provides the option to apply Ind AS 103 prospectively from the transition date or from a specific date prior to the transition date. Accordingly, the Company has elected to apply Ind AS 103 prospectively to business combinations occuring after its transition date.
Notes to the Financial Statements for the year ended March 31, 2017

138 | Standalone Financial Statements | Annual Report 2016-17
A.2 Ind AS mandatory exceptions
A.2.1 Estimates
The Company's estimates in accordance with Ind ASs at the date of transition to Ind AS shall be consistent with estimates made for the same date in accordance with previous GAAP (after adjustments to reflect any difference in accounting policies), unless there is objective evidence that those estimates were in error.
Ind AS estimates as at April 1, 2015 are consistent with the estimates as at the same date made in conformity with previous GAAP. The Company made estimates for following items in accordance with Ind AS at the date of transition as these were not required under previous GAAP:
- Investment in equity instruments carried at FVOCI; - Investment in debt instruments carried at FVPL; and - Impairment of financial assets based on expected credit loss method.
A.2.2 Classification and measurement of financial assets
Ind AS 101 requires an entity to assess classification and measurement of financial assets (investment in debt instruments) on the basis of the facts and circumstances that exist at the date of transition to Ind AS.
A.2.3 Government loan at below market rate of interest - Government grant
Ind AS 101 requires a first-time adopter to apply the requirements of Ind AS 109, Financial instruments and Ind AS 20, Accounting for Government Grants and Disclosure of Government Assistance, prospectively to government loans at below market rate of interest obtained after the date of transition to Ind AS. However, Ind AS 101 allows a first-time adopter to apply the requirements of Ind AS retrospectively to any government loan originated before the date of transition to Ind AS provided that the information needed to do so had been obtained at the time of initially accounting for that loan. Consequently, if the company did not under its previous GAAP recognise and measure the government loan at below market rate of interest on a basis consistent with Ind AS requirements, it shall use its previous GAAP carrying amount of the loan at the date of transition to Ind AS as the carrying amount of the loan in the opening Ind AS balance sheet. Accordingly the company has applied the above requirement prospectively.
B. Reconciliation between previous GAAP and Ind AS
Ind AS 101 requires an entity to reconcile equity, total comprehensive income and cash flows for prior periods. The following tables represent the reconciliation from previous GAAP to Ind AS.
Reconciliation of balance sheet as at date of transition (April 1, 2015)[` in Millions (Mio INR)]
Note No Previous GAAP* Adjustments Ind AS
A Assets1. Non-current assets
Property, plant and equipment 6,7 9,675 125 9,800 Capital work-in progress 2,760 - 2,760 Investment properties 1,398 - 1,398 Intangible assets 1 - 1 Investments in subsidiary and associate 176 - 176 Financial assets (i) Investments 1 24,672 7,199 31,871 (ii) Loans 2 1,802 (132) 1,670 Deferred tax assets 4,172 - 4,172
Other non-current assets 387 - 387
Total non-current assets 45,043 7,192 52,235
2. Current assetsInventories 7 12,761 (38) 12,723 Financial assets (i) Investments 1 2,650 216 2,866 (ii) Trade receivable 11,984 - 11,984 (iii) Cash and cash equivalents 1,304 - 1,304 (iv) Bank balances other than (iii) above 17,656 - 17,656 (v) Loans 2,298 - 2,298 (vi) Other financial assets 6,742 - 6,742 Other current assets 2 3,811 132 3,943 Total current assets 59,206 310 59,516 Total assets 104,249 7,502 111,751
Notes to the Financial Statements for the year ended March 31, 2017

Annual Report 2016-17 | Standalone Financial Statements | 139
[` in Millions (Mio INR)]Note No Previous GAAP* Adjustments Ind AS
B Equity and Liabilities1. Equity
Equity share capital 314 - 314
Other equity (i) Reserves and surplus 12 73,156 5,286 78,442 (ii) Other reserves 1 - 5,316 5,316 Total equity 73,470 10,602 84,072
2. LiabilitiesNon-current liabilitiesFinancial liabilities (i) Borrowings 542 - 542 (ii) Other financial liabilities 64 - 64 Provisions 4,302 - 4,302 Total non-current liabilities 4,908 - 4,908
Current liabilitiesFinancial liabilities (i) Trade payables 12,036 - 12,036 (ii) Other financial liabilities 3,483 - 3,483 Provisions 3 8,370 (3,212) 5,158 Current tax liabilities 630 - 630 Other current liabilities 6 1,352 112 1,464 Total current liabilities 25,871 (3,100) 22,771 Total liabilities 30,779 (3,100) 27,679
Total equity and liabilities 104,249 7,502 111,751 * The previous GAAP figures have been reclassified to conform to Ind AS presentation requirements for the purposes of this note.
Reconciliation of balance sheet as at March 31, 2016
[` in Millions (Mio INR)]
Note No Previous GAAP* Adjustments Ind AS
A Assets
1. Non-current assets
Property, plant and equipment 6,7 11,362 125 11,487
Capital work-in progress 1,507 - 1,507
Investment properties 1,786 - 1,786
Intangible assets - - -
Investments in subsidiary and associate 176 - 176
Financial assets
(i) Investments 1 35,435 8,884 44,319
(ii) Loans 2 1,518 (96) 1,422
(iii) Other financial assets 100 - 100
Deferred tax assets 4 4,528 430 4,958
Other non-current assets 191 - 191
Total non-current assets 56,603 9,343 65,946
Notes to the Financial Statements for the year ended March 31, 2017

140 | Standalone Financial Statements | Annual Report 2016-17
[` in Millions (Mio INR)]
Note No Previous GAAP* Adjustments Ind AS
2. Current assets
Inventories 7 11,991 (76) 11,915
Financial assets
(i) Investments - - -
(ii) Trade receivable 13,225 - 13,225
(iii) Cash and cash equivalents 985 - 985
(iv) Bank balances other than (iii) above 17,330 - 17,330
(v) Loans 2,826 - 2,826
(vi) Other financial assets 7,622 - 7,622
Other current assets 2 4,377 102 4,479
Total current assets 58,356 26 58,382
Total assets 114,959 9,369 124,328
B Equity and Liabilities
1. Equity
Equity share capital 314 - 314
Other equity
(i) Reserves and surplus 12 82,574 8,009 90,583
(ii) Other reserves 1 - 4,452 4,452
Total equity 82,888 12,461 95,349
2. Liabilities
Non-current liabilities
Financial liabilities
(i) Borrowings 5 191 (42) 149
(ii) Other financial liabilities 50 - 50
Provisions 3,775 - 3,775
Total non-current liabilities 4,016 (42) 3,974
Current liabilities
Financial liabilities
(i) Trade payables 13,088 - 13,088
(ii) Other financial liabilities 3,394 - 3,394
Provisions 3 9,388 (3,212) 6,176
Current tax liabilities 762 - 762
Other current liabilities 5,6 1,423 162 1,585
Total current liabilities 28,055 (3,050) 25,005
Total liabilities 32,071 (3,092) 28,979
Total equity and liabilities 114,959 9,369 124,328
* The previous GAAP figures have been reclassified to conform to Ind AS presentation requirements for the purposes of this note.
Notes to the Financial Statements for the year ended March 31, 2017

Annual Report 2016-17 | Standalone Financial Statements | 141
Reconciliation of total comprehensive income for the year ended March 31, 2016
[` in Millions (Mio INR)]
Note No Previous GAAP* Adjustments Ind AS
Continuing operations :
Revenue from operations :
Gross sale of product 8,9 93,185 6,945 100,130
Sale of services 1,991 - 1,991
Other operating revenue 2,298 - 2,298
Other income 1,2,5,6 3,328 2,708 6,036
100,802 9,653 110,455
Expenses :
Cost of materials consumed 25,529 - 25,529
Purchases of stock-in-trade 23,347 - 23,347
Changes in inventories of finished goods, 825 - 825
work-in-progress and stock-in-trade
Excise duty 8 - 7,405 7,405
Employee benefits expense 2,10 12,942 89 13,031
Finance costs 5 72 57 129
Depreciation and amortisation expenses 6,7 3,721 143 3,864
Other expenses 7,9 16,037 (536) 15,501
82,473 7,158 89,631
Profit before tax 18,329 2,495 20,824
Tax expense :
Current tax
(i) for the year/period 6 6,511 90 6,601
(ii) relating to earlier years (94) - (94)
Deferred tax charge/ (credit) 4,10 (356) (450) (806)
Profit from continuing operations 12,268 2,855 15,123
Profit from discontinued operation (net of tax) 191 - 191
Profit for the year 12,459 2,855 15,314
Other Comprehensive Income 1,10,11 - (825) (825)
Total Comprehensive Income 12,459 2,030 14,489
* The previous GAAP figures have been reclassified to conform to Ind AS presentation requirements for the purposes of this note.
Reconciliation of total equity as at March 31, 2016 and April 1, 2015
[` in Millions (Mio INR)]
Note No
As at March 31, 2016
As at April 1, 2015
Total equity (shareholder's funds) as per previous GAAP 82,888 73,470
Adjustments:
Fair valuation gain on Investments (Mutual Funds) 1 4,432 2,099
Net impact of discounting of non-current financial assets and liabilities 2 (30) -
Deferred tax on long term capital loss 4 430 -
Proposed dividend and dividend distribution tax 3 3,212 3,212
Change in fair value of FVOCI equity instruments (OCI) 1 4,452 5,316
Impact of capitalisation of spares as property, plant and equipment 7 (35) (25)
Total adjustments 12,461 10,602
Total equity as per Ind AS 95,349 84,072
Notes to the Financial Statements for the year ended March 31, 2017

142 | Standalone Financial Statements | Annual Report 2016-17
Impact of Ind AS adoption on the statements of cash flows for the year ended March 31, 2016[` in Millions (Mio INR)]
Previous GAAP * Adjustments Ind AS
Net cash flow from operating activities 13,259 (82) 13,177
Net cash flow from investing activities (10,018) 69 (9,949)
Net cash flow from financing activities (3,560) - (3,560)
Net increase/(decrease) in cash and cash equivalents (319) (13) (332)
Cash and cash equivalents as at April 1, 2015 1,304 (13) 1,291
Effects of exchange rate changes on cash and cash equivalents 0 0 0
Cash and cash equivalents as at March 31, 2016 985 (26) 959
* The previous GAAP figures have been reclassified to conform to Ind AS presentation requirements for the purposes of this note.
Analysis of changes in cash and cash equivalents for the purposes of statement of cash flows under Ind AS:
[` in Millions (Mio INR)]
As at March 31, 2016
As at April 1, 2015
Cash and cash equivalents as per previous GAAP 985 1,304
Book overdraft (26) (13)
Cash and cash equivalents for the purpose of statement of cash flows 959 1,291
Notes to Ind AS First Time adoption:
1) Fair Valuation of Investments Under the previous GAAP, investments in equity instruments and mutual funds were classified as long-term investments or current investments based on the intended holding period. Long-term investments were carried at cost less provision for other than temporary decline in the value of such instruments. Current investments were carried at lower of cost and fair value. Under Ind AS, these investments are required to be measured at fair value. The resulting fair value changes of these investments (other than equity instruments designated at FVOCI) have been recognised in retained earnings as at the date of transition and subsequently in the profit or loss for the year ended March 31, 2016. This increased the retained earnings by Mio INR 4,432 as at March 31, 2016 (April 1, 2015 : Mio INR 2,099).
Fair value changes with respect to investments in equity instruments designated at FVOCI have been recognised in FVOCI - Equity investments reserve as at the date of transition and subsequently in the other comprehensive income for the year ended March 31, 2016. This increased other reserves by Mio INR 4,452 as at March 31, 2016 (April 1, 2015 : Mio INR 5,316).
Consequent to the above, the total equity as at March 31, 2016 increased by Mio INR 8,884 ( April 1, 2015 : Mio INR 7,415) and profit for the year increased by Mio INR 2,333 and other comprehensive income for the year ended March 31, 2016 decreased by Mio INR 864.
2) Loans to employees Under the previous GAAP, interest free and concessional loans to employees are recorded at their transaction value. Under Ind AS, all financial assets are required to be recognised at fair value. Accordingly, the company has fair valued the loans to employees under Ind AS. Difference between the fair value and transaction value of the loans to employees has been recognised as deferred expenses. Consequent to this change, the amount of loans to employees decreased by Mio INR 96 as at March 31, 2016 (April 1, 2015 - Mio INR 132). The deferred expense increased by Mio INR 102 (April 1, 2015 - Mio INR 132). The profit for the year and total equity as at March 31, 2016 decreased by Mio INR 30 which is off-set by the notional income of Mio INR 36 recognised on loans to employees.
3) Proposed dividend and dividend distribution tax Under the previous GAAP, dividends proposed by the board of directors after the balance sheet date but before the approval of the financial statements were considered as adjusting events. Accordingly, provision for proposed dividend was recognised as a liability. Under Ind AS, such dividends are recognised when the same is approved by the shareholders in the general meeting. Accordingly, the liability for proposed dividend of Mio INR 3,212 as at March 31, 2016 ( April 1, 2015 - Mio INR 3,212) included under provisions has been reversed with corresponding adjustment to retained earnings. Consequently, the total equity increased by an equivalent amount.
4) Deferred tax Deferred tax have been recognised on account of long term capital loss on transition to Ind AS which increased the deferred tax assets by Mio INR 430 as on March 31, 2016 and deferred tax credit for the year ended March 31, 2016 by Mio INR 430.
5) Borrowings Ind AS 109 requires borrowings to be accounted as financial liabilities at amortised cost. Accordingly, borrowings as at March 31, 2016 have been reduced by Mio INR 42 and deferred income has increased by Mio INR 79 with a corresponding
Notes to the Financial Statements for the year ended March 31, 2017

Annual Report 2016-17 | Standalone Financial Statements | 143
adjustment to retained earnings of Mio INR 37. As a result of the interest expense on reinstatement of borrowing, the profit for the year ended March 31, 2016 has decreased by Mio INR 57 which is off-set by the notional income of Mio INR 18 due to amortisation of deferred income.
6) Government Grant a) The Company had received government grants in earlier years and property, plant and equipments related to
grants were fully depreciated before transition date. Such grants amounting to INR 1,820 Mio INR were disclosed under capital reserve as per requirement of erstwhile Accounting Standard 12 on Government Grants. This amount has been reclassified and disclosed under retained earning in the current year as per requirement of Ind AS 20. During the year ended March 31, 2016 the Company had received grants amounting to Mio INR 261 which has been disclosed as other income and tax expense of Mio INR 90 pertaining to this grant is disclosed under income tax expense.
b) As per Ind AS 20, Government grant related to assets shall be presented in the balance sheet by setting up the grant as deferred income. The grant set up as deferred income is recognised in statement of profit or loss on a systematic basis over the useful life of the asset. Under the previous GAAP, the grant was shown as a deduction from the asset concerned in arriving at its carrying value. Accordingly, the company has recognised the asset related government grant outstanding as on the transition date as deferred income with corresponding adjustment to property, plant and equipment. Consequent to this the deferred income and property, plant and equipment increased by Mio INR 83 as at March 31, 2016 (April 1, 2015: Mio INR 112) and depreciation and other income has increased by Mio INR 60 for the year ended March 31, 2016. There is no impact on the total equity and profit.
7) Capital Spares
As per Ind AS 16, spare parts are to be recognised as Property, Plant and Equipment if they are held for use in production or supply of goods or services and are expected to be used during more than one period. Otherwise such items are to be recognised as Inventory. Under the previous GAAP, only those spares that can be used in connection with Fixed Assets and their use is expected to be irregular are recognised as Property, Plant and Equipment and depreciated over the remaining useful life of the asset. Accordingly, the Company has identified spare parts qualifying for recognition as Property, Plant and Equipment. This change has resulted in increase in the net carrying value of Property Plant and Equipment by Mio INR 42 as at March 31, 2016 (April 1,2015: Mio INR 13) and reduction in value of Inventories by Mio INR 76 as at March 31, 2016 (April 1, 2015 Mio INR 38). Total equity decreased by Mio INR 25 as at April 1,2015. The profit for the year and total equity as at March 31, 2016 decreased by Mio INR 7 due to depreciation charge of Mio INR 83 for the year on the spare parts recognised as Property, Plant and Equipment and reversal of consumption of machinery spares capitalised amounting to Mio INR 76.
8) Excise Duty
Under the previous GAAP, revenue from sale of products was presented exclusive of excise duty. Under Ind AS, revenue from sale of goods is presented inclusive of excise duty. The excise duty is presented on the face of the statement of profit and loss as part of expenses. This change has resulted in an increase in total revenue and total expenses for the year ended March 31, 2016 by Mio INR 7,405. There is no impact on the total equity and profit.
9) Discounts and sales incentives
Under the previous GAAP, certain discounts and sales incentives were disclosed as part of other expenses. Under Ind AS, amounts disclosed as revenue are net of discounts and sales incentives. This change has resulted in an decrease in total revenue and other expenses for the year ended March 31, 2016 by Mio INR 460.
10) Remeasurement of post-employment benefit obligations
Under Ind AS, remeasurements i.e., actuarial gains and loses and the return on plan assets, excluding amounts included in the net interest expense on the net defined benefit liability are recognised in other comprehensive income instead of profit or loss. Under the previous GAAP, these measurements were forming part of the profit or loss for the year. As a result of this change, the profit for the year ended March 31, 2016 decreased by Mio INR 39 (net of tax of Mio INR 20). There is no impact on the total equity as at March 31, 2016.
11) Other Comprehensive income
Under Ind AS, all items of income and expense recognised in a period should be included in profit or loss for the period, unless a standard requires or permits otherwise. Items of income and expense that are not recognised in profit or loss but are shown in the statement of profit and loss as 'other comprehensive income' includes remeasurements of defined benefit plans and fair value gains or (losses) on FVOCI equity instruments. The concept of other comprehensive income did not exist under previous GAAP.
12) Retained Earnings
Retained Earnings has been adjusted consequent to the above Ind AS transition adjustments.
Note 45: Offsetting financial assets and financial liabilities
The Company provides the incentives to selected customers under the terms of the agreements, the amounts payable by the Company are offset against receivables from the customers and only the net amounts are settled. The amounts offset as at March 31, 2017 is Mio INR 960 (March 31, 2016: Mio INR 653; April 1, 2015: Mio INR 716) which is disclosed under note 8(b).
Notes to the Financial Statements for the year ended March 31, 2017

144 | Standalone Financial Statements | Annual Report 2016-17
Note 46: Disclosure on specified bank notes (SBNs)
During the year, the Company has specified bank notes or other denomination notes as defined in the MCA notification G.S.R.308(E) dated March 31, 2017 on the details of Specified Bank Notes (SBN) held and transacted during the period from November 8, 2016 to December 30, 2016, the denomination wise SBNs and other notes as per the notification is given below:
[Amount in INR]
SBNs*Other
denomination notes
Total
Closing cash in hand as on November 8, 2016 22,000 11,446 33,446
(+) Permitted receipts - 146,000 146,000
(-) Permitted payments - (107,864) (107,864)
(-) Amount deposited in banks (22,000) - (22,000)
Closing cash in hand as on December 30, 2016 - 49,582 49,582
* The term 'Specified Bank Notes' shall have the same meaning provided in the notification of the Government of India, in the Ministry of Finance, Department of Economic Affairs number S.O. 3407(E ) dated the 8th November, 2016.
Note 47: Rounding off Amounts mentioned as "0" in the financial statements denote amounts rounded off being less than Rupees one million.
Notes to the financial statements 1 to 47
Notes to the Financial Statements for the year ended March 31, 2017
The accompanying notes are an integral part of these financial statements.
As per our report of even date
For Price Waterhouse & Co Bangalore LLP For and on behalf of the Board Firm Registration Number: 007567S/S-200012 V.K. Viswanathan (DIN: 01782934) ChairmanChartered Accountants Soumitra Bhattacharya (DIN: 02783243) Managing Director & Chief
Financial OfficerAndreas Wolf (DIN: 07088505) Joint Managing Director
Subramanian Vivek Bhaskar Bhat (DIN: 00148778) DirectorPartner Prasad Chandran (DIN: 00200379) DirectorMembership Number: 100332 Renu Sud Karnad (DIN: 00008064) Director
Bernhard Steinruecke (DIN: 01122939) DirectorPlace: Bengaluru R Vijay Jan Oliver Röhrl (DIN: 07706011) Alternate DirectorDate: May 25, 2017 Company Secretary S Karthik Joint Chief Financial Officer

Annual Report 2016-17 | Consolidated Financial Statement | 145
Report on the Consolidated Indian Accounting Standards (Ind AS) Financial Statements1. We have audited the accompanying consolidated Ind AS financial statements of Bosch Limited (“hereinafter referred
to as the Holding Company”) and its subsidiary (the Holding Company and its subsidiary together referred to as “the Group”), and associate company (refer Note 1 to the attached consolidated financial statements), comprising of the consolidated Balance Sheet as at March 31, 2017, the consolidated Statement of Profit and Loss (including Other Comprehensive Income), the consolidated Cash Flow Statement for the year then ended and the Statement of Changes in Equity for the year then ended, and a summary of significant accounting policies and other explanatory information prepared based on the relevant records (hereinafter referred to as “the Consolidated Ind AS Financial Statements”).
Management’s Responsibility for the Consolidated Ind AS Financial Statements 2. The Holding Company’s Board of Directors is responsible for the preparation of these consolidated Ind AS financial
statements in terms of the requirements of the Companies Act, 2013 (hereinafter referred to as “the Act”) that give a true and fair view of the consolidated financial position, consolidated financial performance, consolidated cash flows and changes in equity of the Group including its associate in accordance with accounting principles generally accepted in India including the Indian Accounting Standards specified in the Companies (Indian Accounting Standards) Rules, 2015 (as amended) under Section 133 of the Act. The Holding Company’s Board of Directors is also responsible for ensuring accuracy of records including financial information considered necessary for the preparation of consolidated Ind AS financial statements. The respective Board of Directors of the companies included in the Group and of its associate are responsible for maintenance of adequate accounting records in accordance with the provisions of the Act for safeguarding the assets of the Group and its associate respectively and for preventing and detecting frauds and other irregularities; the selection and application of appropriate accounting policies; making judgements and estimates that are reasonable and prudent; and the design, implementation and maintenance of adequate internal financial controls, that were operating effectively for ensuring the accuracy and completeness of the accounting records, relevant to the preparation and presentation of the financial statements that give a true and fair view and are free from material misstatement, whether due to fraud or error, which has been used for the purpose of preparation of the consolidated Ind AS financial statements by the Board of Directors of the Holding Company, as aforesaid.
Auditors’ Responsibility 3. Our responsibility is to express an opinion on these consolidated Ind AS financial statements based on our audit. While
conducting the audit, we have taken into account the provisions of the Act and the Rules made thereunder including the accounting standards and matters which are required to be included in the audit report.
4. We conducted our audit of the consolidated Ind AS financial statements in accordance with the Standards on Auditing specified under Section 143(10) of the Act and other applicable authoritative pronouncements issued by the Institute of Chartered Accountants of India. Those Standards and pronouncements require that we comply with ethical requirements and plan and perform the audit to obtain reasonable assurance about whether the consolidated Ind AS financial statements are free from material misstatement.
5. An audit involves performing procedures to obtain audit evidence about the amounts and disclosures in the consolidated Ind AS financial statements. The procedures selected depend on the auditors’ judgement, including the assessment of the risks of material misstatement of the consolidated Ind AS financial statements, whether due to fraud or error. In making those risk assessments, the auditor considers internal financial control relevant to the Holding Company’s preparation of the consolidated Ind AS financial statements that give a true and fair view, in order to design audit procedures that are appropriate in the circumstances. An audit also includes evaluating the appropriateness of the accounting policies used and the reasonableness of the accounting estimates made by the Holding Company’s Board of Directors, as well as evaluating the overall presentation of the consolidated Ind AS financial statements.
6. We believe that the audit evidence obtained by us, other than the unaudited financial statements as certified by the management and referred to in sub-paragraph 8 of the Other Matters paragraph below, is sufficient and appropriate to provide a basis for our audit opinion on the consolidated Ind AS financial statements.
Opinion7. In our opinion and to the best of our information and according to the explanations given to us, the aforesaid
consolidated Ind AS financial statements give the information required by the Act in the manner so required and give a true and fair view in conformity with the accounting principles generally accepted in India of the consolidated state of affairs of the Group and its associate as at March 31, 2017, and their consolidated total comprehensive income (comprising of consolidated profit and consolidated other comprehensive income), their consolidated cash flows and consolidated changes in equity for the year ended on that date.
Other Matter8. The consolidated Ind AS financial statements also include the Group’s share of total comprehensive income
(comprising of loss and other comprehensive income) of Rs. 9 million for the year ended March 31, 2017 as considered in the consolidated Ind AS financial statements, in respect of an associate company whose financial statements/financial information have not been audited by us. These financial statements for the year ended March 31, 2017 are unaudited, and our opinion on the consolidated Ind AS financial statements insofar as it relates to the amounts and disclosures included in respect of the associate company and our report in terms of Section 143 (3) of the Act insofar as it relates to the aforesaid associate, is based solely on such unaudited financial statements. In our opinion and according to the information and explanations given to us by the Management, these financial statements are not material to the group.
Independent Auditors’ ReportTo The Members of Bosch Limited

146 | Consolidated Financial Statement | Annual Report 2016-17
9. Our opinion on the consolidated Ind AS financial statements and our report on Other Legal and Regulatory Requirements below, is not modified in respect of the above matter with respect to the financial statements/ financial information certified by the Management.
10. The comparative financial information of the Company for the year ended March 31, 2016 is based on the previously issued statutory financial statements for the year ended March 31, 2016 prepared in accordance with the Companies (Accounting Standards) Rules, 2006 (as amended) which were audited by us, on which we expressed an unmodified opinion dated May 25, 2016. The comparative figures in the consolidated Ind AS financial statements of the Company as at March 31, 2015 and for the year then ended is unaudited.
Our opinion is not qualified in respect of these matters.
Report on Other Legal and Regulatory Requirements11. As required by Section143(3) of the Act, we report, to the extent applicable, that:
(a) We have sought and obtained all the information and explanations which to the best of our knowledge and belief were necessary for the purposes of our audit of the aforesaid consolidated Ind AS financial statements.
(b) In our opinion, proper books of account as required by law maintained by the Holding Company, its subsidiary included in the Group and the associate company incorporated in India including relevant records relating to preparation of the aforesaid consolidated Ind AS financial statements have been kept so far as it appears from our examination of those books and records of the Holding Company.
(c) The Consolidated Balance Sheet, the Consolidated Statement of Profit and Loss (including other comprehensive income), Consolidated Cash Flow Statement and the Consolidated Statement of Changes in Equity dealt with by this Report are in agreement with the relevant books of account maintained by the Holding Company, its subsidiary included in the Group and associate company incorporated in India including relevant records relating to the preparation of the consolidated Ind AS financial statements.
(d) In our opinion, the aforesaid consolidated Ind AS financial statements comply with the Indian Accounting Standards specified under Section 133 of the Act.
(e) On the basis of the written representations received from the directors of the Holding Company as on March 31, 2017 and taken on record by the Board of Directors of the Holding Company and the report of the statutory auditors of its subsidiary company incorporated in India, none of the directors of the Group companies incorporated in India is disqualified as on March 31, 2017 from being appointed as a director in terms of Section 164 (2) of the Act.
(f) With respect to the adequacy of the internal financial controls over financial reporting of the Holding Company and its subsidiary company incorporated in India and the operating effectiveness of such controls, refer to our separate Report in Annexure A.
(g) With respect to the other matters to be included in the Auditors’ Report in accordance with Rule 11 of the Companies (Audit and Auditors) Rules, 2014, in our opinion and to the best of our information and according to the explanations given to us:
i. The consolidated Ind AS financial statements disclose the impact, if any, of pending litigations as at March 31, 2017 on the consolidated financial position of the Group and its associate - Refer Note 16, 17 and 40.
ii. Provision has been made in the consolidated Ind AS financial statements, as required under the applicable law or accounting standards, for material foreseeable losses, if any, on long-term contracts including derivative contracts as at March 31, 2017. Refer (a) Note 41 to the consolidated Ind AS financial statements in respect of such items as it relates to the Group and its associate and (b) the Group’s share of net loss in respect of its associate.
iii. There has been no delay in transferring amounts, required to be transferred, to the Investor Education and Protection Fund by the Holding Company and its subsidiary company and associate company incorporated in India during the year ended March 31, 2017.
iv. The Group has provided requisite disclosures in the financial statements as to holdings as well as dealings in Specified Bank Notes during the period from November 8, 2016 to December 30, 2016. Based on audit procedures and relying on the management representation we report that the disclosures are in accordance with books of account maintained by the Holding Company, and its subsidiary company and associate company incorporated in India and as produced to us by the Management - Refer Note 48.
For Price Waterhouse & Co Bangalore LLPFirm Registration Number: 007567S/S-200012Chartered Accountants
Subramanian VivekBengaluru PartnerMay 25, 2017 Membership Number 100332

Annual Report 2016-17 | Consolidated Financial Statement | 147
Annexure A to Independent Auditors’ ReportReferred to in paragraph 11(f) of the Independent Auditors’ Report of even date to the members of Bosch Limited on the consolidated Indian Accounting Standards (Ind AS) financial statements for the year ended March 31, 2017.
Report on the Internal Financial Controls under Clause (i) of Sub-section 3 of Section 143 of the Act1. In conjunction with our audit of the consolidated Indian Accounting Standards (Ind AS) financial statements of the
Company as of and for the year ended March 31, 2017, we have audited the internal financial controls over financial reporting of Bosch Limited (hereinafter referred to as “the Holding Company”) and its subsidiary company which are companies incorporated in India, as of that date.
Management’s Responsibility for Internal Financial Controls2. The respective Board of Directors of the Holding company and its subsidiary company, which are companies
incorporated in India, are responsible for establishing and maintaining internal financial controls based on internal control over financial reporting criteria established by the Company considering the essential components of internal control stated in the Guidance Note on Audit of Internal Financial Controls Over Financial Reporting (the “Guidance Note”) issued by the Institute of Chartered Accountants of India (ICAI)”. These responsibilities include the design, implementation and maintenance of adequate internal financial controls that were operating effectively for ensuring the orderly and efficient conduct of its business, including adherence to the respective company’s policies, the safeguarding of its assets, the prevention and detection of frauds and errors, the accuracy and completeness of the accounting records, and the timely preparation of reliable financial information, as required under the Act.
Auditor’s Responsibility3. Our responsibility is to express an opinion on the Company’s internal financial controls over financial reporting based
on our audit. We conducted our audit in accordance with the Guidance Note issued by the ICAI and the Standards on Auditing deemed to be prescribed under Section 143(10) of the Companies Act, 2013, to the extent applicable to an audit of internal financial controls, both applicable to an audit of internal financial controls and both issued by the ICAI. Those Standards and the Guidance Note require that we comply with ethical requirements and plan and perform the audit to obtain reasonable assurance about whether adequate internal financial controls over financial reporting was established and maintained and if such controls operated effectively in all material respects.
4. Our audit involves performing procedures to obtain audit evidence about the adequacy of the internal financial controls system over financial reporting and their operating effectiveness. Our audit of internal financial controls over financial reporting included obtaining an understanding of internal financial controls over financial reporting, assessing the risk that a material weakness exists, and testing and evaluating the design and operating effectiveness of internal control based on the assessed risk. The procedures selected depend on the auditor’s judgement, including the assessment of the risks of material misstatement of the financial statements, whether due to fraud or error.
5. We believe that the audit evidence we have obtained and the audit evidence obtained by the other auditors in terms of their reports referred to in the Other Matters paragraph below, is sufficient and appropriate to provide a basis for our audit opinion on the Company’s internal financial controls system over financial reporting.
Meaning of Internal Financial Controls Over Financial Reporting6. A company’s internal financial control over financial reporting is a process designed to provide reasonable assurance
regarding the reliability of financial reporting and the preparation of financial statements for external purposes in accordance with generally accepted accounting principles. A company’s internal financial control over financial reporting includes those policies and procedures that (1) pertain to the maintenance of records that, in reasonable detail, accurately and fairly reflect the transactions and dispositions of the assets of the company; (2) provide reasonable assurance that transactions are recorded as necessary to permit preparation of financial statements in accordance with generally accepted accounting principles, and that receipts and expenditures of the company are being made only in accordance with authorisations of management and directors of the company; and (3) provide reasonable assurance regarding prevention or timely detection of unauthorised acquisition, use, or disposition of the company’s assets that could have a material effect on the financial statements.
Inherent Limitations of Internal Financial Controls Over Financial Reporting7. Because of the inherent limitations of internal financial controls over financial reporting, including the possibility of
collusion or improper management override of controls, material misstatements due to error or fraud may occur and not be detected. Also, projections of any evaluation of the internal financial controls over financial reporting to future periods are subject to the risk that the internal financial control over financial reporting may become inadequate because of changes in conditions, or that the degree of compliance with the policies or procedures may deteriorate.
Opinion8. In our opinion, the Holding Company and its subsidiary company, which are companies incorporated in India, have, in
all material respects, an adequate internal financial controls system over financial reporting and such internal financial controls over financial reporting were operating effectively as at March 31, 2017, based on the internal control over financial reporting criteria established by the Company considering the essential components of internal control stated in the Guidance Note issued by ICAI.
For Price Waterhouse & Co Bangalore LLPFirm Registration Number: 007567S/S-200012Chartered Accountants
Subramanian VivekBengaluru PartnerMay 25, 2017 Membership Number 100332

148 | Consolidated Financial Statement | Annual Report 2016-17
[` in Millions (Mio INR)]Note No.
As at March 31, 2017
As at March 31, 2016
As at April 1, 2015
A Assets
1. Non-current assetsProperty, plant and equipment 4(a) 13,194 11,487 9,800 Capital work-in progress 4(b) 1,289 1,507 2,760 Investment properties 5 1,943 1,786 1,398 Intangible assets 6 - - 1 Investments accounted for using the equity method 7 85 94 72 Financial assets (i) Investments 8(a) 36,409 44,319 31,871 (ii) Loans 8(c) 1,174 1,422 1,670 (iii) Other financial assets 8(f) - 100 - Deferred tax assets 9 4,676 4,958 4,172 Other non-current assets 10 143 191 387 Total non-current assets 58,913 65,864 52,131
2. Current assetsInventories 11 11,804 11,915 12,723 Financial assets (i) Investments 8(a) 2,681 - 2,866 (ii) Trade receivables 8(b) 11,862 13,225 11,984 (iii) Cash and cash equivalents 8(d) 1,312 985 1,304 (iv) Bank balances other than (iii) above 8(e) 15,865 17,331 17,657 (v) Loans 8(c) 3,205 2,826 2,298 (vi) Other financial assets 8(f) 7,955 7,622 6,742 Other current assets 12 4,311 4,479 3,943 Total current assets 58,995 58,383 59,517 Total assets (1+2) 117,908 124,247 111,648
B Equity and Liabilities
1. Equity Equity share capital 13(a) 305 314 314 Other equity (i) Reserves and surplus 13(b) 81,639 90,502 78,339 (ii) Other reserves 13(c) 5,962 4,452 5,316 Total equity 87,906 95,268 83,969
2. LiabilitiesNon-current liabilitiesFinancial liabilities (i) Borrowings 14(a) - 149 542 (ii) Other financial liabilities 14(b) 60 50 64 Provisions 15 3,642 3,775 4,302 Total non-current liabilities 3,702 3,974 4,908
Current liabilitiesFinancial liabilities (i) Trade payables 14(c) 13,399 13,088 12,036 (ii) Other financial liabilities 14(b) 2,748 3,394 3,483 Provisions 15 7,543 6,176 5,158 Current tax liabilities 16 651 762 630 Other current liabilities 17 1,959 1,585 1,464 Total current liabilities 26,300 25,005 22,771 Total liabilities 30,002 28,979 27,679 Total equity and liabilities (1+2) 117,908 124,247 111,648
Summary of significant accounting policies 2
Consolidated Balance Sheet
The accompanying notes are an integral part of these financial statements.
As per our report of even date
For Price Waterhouse & Co Bangalore LLP For and on behalf of the Board Firm Registration Number: 007567S/S-200012 V.K. Viswanathan (DIN: 01782934) ChairmanChartered Accountants Soumitra Bhattacharya (DIN: 02783243) Managing Director & Chief
Financial OfficerAndreas Wolf (DIN: 07088505) Joint Managing Director
Subramanian Vivek Bhaskar Bhat (DIN: 00148778) DirectorPartner Prasad Chandran (DIN: 00200379) DirectorMembership Number: 100332 Renu Sud Karnad (DIN: 00008064) Director
Bernhard Steinruecke (DIN: 01122939) DirectorPlace: Bengaluru R Vijay Jan Oliver Röhrl (DIN: 07706011) Alternate DirectorDate: May 25, 2017 Company Secretary S Karthik Joint Chief Financial Officer

Annual Report 2016-17 | Consolidated Financial Statement | 149
[` in Millions (Mio INR)]
Note No.
For the year ended
March 31, 2017
For the year ended
March 31, 2016 Continuing operations Revenue from operations : Sale of products (including excise duty) 107,500 100,130 Sale of services 18 2,334 1,991 Other operating revenue 19 2,592 2,298 Other income 20 6,174 6,036 Total income 118,600 110,455 Expenses : Cost of materials consumed 21 30,070 25,529 Purchases of stock-in-trade 22 24,219 23,347 Changes in inventories of finished goods, work-in-progress and stock-in-trade 23 (1,197) 825 Excise duty 8,074 7,405 Employee benefit expense 24 13,428 13,031 Finance costs 25 272 129 Depreciation and amortisation expense 26 4,562 3,864 Other expenses 27 18,228 15,501 Total expenses 97,656 89,631 Profit before tax from continuing operations 20,944 20,824 Income tax expense : Current tax 29 (i) for the year 6,169 6,601 (ii) relating to earlier years (6) (94) Deferred tax charge/ (credit) 340 (806) Profit from continuing operations 14,441 15,123 Discontinued operation Profit before tax from discontinued operation 35 3,711 262 Tax expense of discontinued operation 35 741 71 Profit from discontinued operation 2,970 191 Profit for the year before share of net profit/ (loss) of associate 17,411 15,314 Share of net profit/ (loss) of associate accounted for using equity method (9) 22 Profit for the year 17,402 15,336 Other comprehensive income (OCI) Items that will not be reclassified to profit or loss Changes in fair value of the equity instruments 13(c) 1,510 (864) Remeasurement of post-employment benefit obligations 13(b) (167) 59 Income tax relating to above 9 58 (20)Other comprehensive income for the year (Net of tax) 1,401 (825)Total comprehensive income for the year 18,803 14,511 Earnings per share - Basic and Diluted of nominal value of Rs.10/-each from continuing operations 39 465 482 Earnings per share - Basic and Diluted of nominal value of Rs.10/-each from discontinued operation 39 96 6 Earnings per share - Basic and Diluted of nominal value of Rs.10/-each from continuing operations and discontinued operation 39 561 488 Summary of significant accounting policies 2Details of R&D expenses/ (income) 28
The accompanying notes are an integral part of these financial statements.
As per our report of even date
For Price Waterhouse & Co Bangalore LLP For and on behalf of the Board Firm Registration Number: 007567S/S-200012 V.K. Viswanathan (DIN: 01782934) ChairmanChartered Accountants Soumitra Bhattacharya (DIN: 02783243) Managing Director & Chief
Financial OfficerAndreas Wolf (DIN: 07088505) Joint Managing Director
Subramanian Vivek Bhaskar Bhat (DIN: 00148778) DirectorPartner Prasad Chandran (DIN: 00200379) DirectorMembership Number: 100332 Renu Sud Karnad (DIN: 00008064) Director
Bernhard Steinruecke (DIN: 01122939) DirectorPlace: Bengaluru R Vijay Jan Oliver Röhrl (DIN: 07706011) Alternate DirectorDate: May 25, 2017 Company Secretary S Karthik Joint Chief Financial Officer

150 | Consolidated Financial Statement | Annual Report 2016-17
[` in Millions (Mio INR)]For the year ended
March 31, 2017For the year ended
March 31, 2016A. Cash flow from operating activities
Profit before income tax from continuing operations 20,944 20,824 Profit before income tax from discontinued operations 3,711 262 Adjustments for :
Depreciation and amortisation expense 4,604 4,092 Unrealised exchange loss (net) (26) 32 (Profit)/ Loss on sale of fixed assets 22 (22)Provision for doubtful debts 140 154 Bad debts written off 32 33 Provision/ Liabilities no longer required written back (713) (827)Rental income (875) (493)Gain on sale of business (3,971) (18)Dividend from equity investments designated at FVOCI (81) (57)Interest income (2,762) (3,171)Net gain on financial assets measured at FVTPL (3,172) (2,450)Amortisation of deferred government grant income (160) (80)Amortisation government grant - (261)Finance Cost 272 129
Operating profit before working capital changes 17,965 18,147 Changes in working capital:
(Increase)/ decrease in inventories (905) 808 (Increase)/ decrease in trade receivables 201 (1,390)(Increase)/ decrease in other financial assets (254) 82 (Increase)/ decrease in other current assets 158 (567)(Increase)/ decrease in loans 81 (28)(Increase)/ decrease in other non-current assets (24) 16 Increase/ (decrease) in trade payables 1,711 1,084 Increase/ (decrease) in other financial liabilities (301) 113 Increase/ (decrease) in provisions 2,751 1,288 Increase/ (decrease) in other current liabilities 430 70
Net Cash generated from operations 21,813 19,623 Income taxes paid (net of refunds) (7,246) (6,446)Net cash from operating activities 14,567 13,177
B. Cash flow from investing activitiesAdditions to property, plant and equipment (6,367) (4,264)Additions to investment properties (305) (457)Proceeds from sale of property, plant and equipment 51 44 Purchase of investments (28,750) (17,314)Proceeds from sale of investments 38,658 9,320 Inter corporate deposit given (7,550) (6,150)Inter corporate deposit repayment received 6,900 5,250 Loan to fellow subsidiaries given (2,560) (950)Loan to fellow subsidiaries repayment received 2,300 700 Investment in deposit accounts (original maturity of more than 3 months) (15,730) (18,580)Maturity of deposit accounts (original maturity of more than 3 months) 17,200 18,910 Investment in deposit accounts (original maturity of more than 12 months) - (100)Maturity of deposit accounts (original maturity of more than 12 months) 100 - Purchase consideration received towards sale of business 4,376 22 Dividends received 81 57 Rental income received 875 493 Interest received 3,181 3,070
Net cash from/ (used in) investing activities 12,460 (9,949)C. Cash flow from financing activities
Repayment of borrowings (500) (567)Dividends paid (4,958) (2,669)Dividend distribution tax (1,009) (543)Buy Back of shares (20,198) - Government grant received - 261 Interest paid (32) (42)
Net cash from/ (used in) financing activities (26,697) (3,560)Net cash flows during the year (A+B+C) 330 (332)Unrealised exchange gain/(loss) on cash and cash equivalents (0) 0 Cash and cash equivalents (Opening balance) 959 1,291 Cash and cash equivalents (Closing balance) 1,289 959
As at March 31, 2017 As at March 31, 2016Cash and cash equivalents as per above comprise of the followingCash and cash equivalents [Note 8(d)] 1,312 985Book overdraft [Note 14(b)] (23) (26)Balance as per statement of cash flows 1,289 959
Notes: (a) Above cash flow statement has been prepared under indirect method in accordance with the Indian Accounting Standard (Ind AS) 7 on "Statement of Cash Flows". (b) Mutual Fund dividend reinvested has not been considered above as there was no cash inflow/ outflow.
Consolidated Cash Flow Statement
The accompanying notes are an integral part of these financial statements.
As per our report of even date
For Price Waterhouse & Co Bangalore LLP For and on behalf of the Board Firm Registration Number: 007567S/S-200012 V.K. Viswanathan (DIN: 01782934) ChairmanChartered Accountants Soumitra Bhattacharya (DIN: 02783243) Managing Director & Chief
Financial OfficerAndreas Wolf (DIN: 07088505) Joint Managing Director
Subramanian Vivek Bhaskar Bhat (DIN: 00148778) DirectorPartner Prasad Chandran (DIN: 00200379) DirectorMembership Number: 100332 Renu Sud Karnad (DIN: 00008064) Director
Bernhard Steinruecke (DIN: 01122939) DirectorPlace: Bengaluru R Vijay Jan Oliver Röhrl (DIN: 07706011) Alternate DirectorDate: May 25, 2017 Company Secretary S Karthik Joint Chief Financial Officer

Annual Report 2016-17 | Consolidated Financial Statement | 151
Consolidated statement of changes in equity
A Equity share capital
[` in Millions (Mio INR)]Note No. Amount
As at April 1, 2015 314Changes in equity share capital 13(a) - As at March 31, 2016 314Changes in equity share capital 13(a) (9)As at March 31, 2017 305
B Other equity
[` in Millions (Mio INR)]
Note No.
Reserves and surplus Other reserves Total
other equityCapital
ReserveShare
Premium
Capital Redemption
Reserve
General Reserve
Retained earnings
FVOCI - equity
instrumentsBalance at April 1, 2015 39 8 67 41,957 36,268 5,316 83,655 Profit for the year - - - - 15,336 - 15,336 Other comprehensive income - - - - 39 (864) (825)Total comprehensive income for the year
- - - - 15,375 (864) 14,511
Dividend 13(b)(v) - - - - (2,669) - (2,669)Dividend distribution taxes 13(b)(v) - - - - (543) - (543)
- - - - (3,212) - (3,212)Balance at March 31, 2016 39 8 67 41,957 48,431 4,452 94,954 Balance at April 1, 2016 39 8 67 41,957 48,431 4,452 94,954 Profit for the year - - - - 17,402 - 17,402 Other comprehensive income - - - - (109) 1,510 1,401 Total comprehensive income for the year
- - - - 17,293 1,510 18,803
Buy back of shares - - 9 (20,198) - - (20,189)Dividend 13(b)(v) - - - - (4,958) - (4,958)Dividend distribution taxes 13(b)(v) - - - - (1,009) - (1,009)Balance at March 31, 2017 39 8 76 21,759 59,757 5,962 87,601
The accompanying notes are an integral part of these financial statements.
As per our report of even date
For Price Waterhouse & Co Bangalore LLP For and on behalf of the Board Firm Registration Number: 007567S/S-200012 V.K. Viswanathan (DIN: 01782934) ChairmanChartered Accountants Soumitra Bhattacharya (DIN: 02783243) Managing Director & Chief
Financial OfficerAndreas Wolf (DIN: 07088505) Joint Managing Director
Subramanian Vivek Bhaskar Bhat (DIN: 00148778) DirectorPartner Prasad Chandran (DIN: 00200379) DirectorMembership Number: 100332 Renu Sud Karnad (DIN: 00008064) Director
Bernhard Steinruecke (DIN: 01122939) DirectorPlace: Bengaluru R Vijay Jan Oliver Röhrl (DIN: 07706011) Alternate DirectorDate: May 25, 2017 Company Secretary S Karthik Joint Chief Financial Officer

152 | Consolidated Financial Statement | Annual Report 2016-17
Notes to the consolidated Financial Statements for the year ended March 31, 2017
Note 1: General Information
Bosch Limited (the “Company”) is the flagship company of Robert Bosch Group in India. Headquartered out of Bengaluru, the Company has its key manufacturing facilities in Bengaluru, Nashik, Naganathapura, Jaipur, Goa, Gangaikondan, Chennai and Bidadi. The Company has presence across automotive technology, industrial technology, consumer goods and energy and building technology. It manufactures and trades in products such as diesel and gasoline fuel injection systems, automotive aftermarket products, starters and generators, industrial equipments, packaging machines, electrical power tools, security systems and industrial and consumer energy products and solutions. The Company’s shares are listed on Bombay Stock Exchange (BSE) and National Stock Exchange (NSE). During the year, the Company has discontinued the business relating to starters and generators products.
The consolidated financial statements are approved for issue by the Board of Directors on May 25, 2017.
The Company, its subsidiary and its associate (jointly referred to as the “Group” herein under) considered in these consolidated financial statements are mentioned below including the nature of interest:
Relationship Name of the Company Country of Incorporation
% voting power held as at March
31, 2017Subsidiary MICO Trading Private Limited India 100Associate Newtech Filter India Private Limited India 25
Note 2: Summary of Significant Accounting Policies
(a) Basis of preparation:
(i) Compliance with Ind AS
The consolidated financial statements comply in all material aspects with Indian Accounting Standards (Ind AS) notified under Section 133 of the Companies Act, 2013 (the Act) [Companies (Indian Accounting Standards) Rules, 2015] and other relevant provisions of the Act.
The consolidated financial statements up to year ended March 31, 2016 which were prepared in accordance with the accounting standards notified under Companies (Accounting Standards) Rules, 2006 (as amended) and other relevant provisions of the Act, have now been reinstated as per Ind AS.
These consolidated financial statements are the first consolidated financial statements of the Group under Ind AS. Reconciliation of the effect of transition on the Group’s financial position, financial performance and cash flows from previous GAAP to Ind AS has been summarised in Note 45.
(ii) Historical cost convention
The consolidated financial statements has been prepared on a historical cost basis, except for:
- certain financial assets and liabilities (including derivative instruments) that are measured at fair value; and
- defined benefit plans (plan assets measured at fair value)
(iii) The assets and liabilities have been classified as current or non-current as per the Group’s normal operating cycle and other criteria set out in the Schedule III to the Companies Act, 2013. Based on the nature of products and the time between the acquisition of assets for processing and their realisation in cash and cash equivalents, the Group has ascertained its operating cycle as 12 months for the purpose of current and non-current classification of assets and liabilities.
(iv) Recent accounting pronouncement
The Ministry of Corporate Affairs (MCA) has notified the Companies (Indian Accounting Standards) (Amendment) Rules, 2017 vide its notification dated March 17, 2017 notifying amendments to Ind AS 7 ‘Statement of cash flows’. The said notification is applicable to accounting periods commencing on or after the date of notification i.e. April 1, 2017. Impact of amendments with respect to Ind AS 7 is not material to the financial statement.
(b) Basis of consolidation:
In respect of subsidiary company, the financial statements have been consolidated on a line-by-line basis by adding together the book values of like items of assets, liabilities, income and expenses, after fully eliminating intra-group balances and unrealised profits / losses on intra-group transactions as per Indian Accounting Standard - Ind AS 110 “Consolidated Financial Statements”.
Investment in associate company has been accounted under the equity method as per Indian Accounting Standard (Ind AS) 23 “Investments in Associates and Joint Ventures”, whereby the investment is initially recorded at cost, and adjusted thereafter to recognise the Group’s share of the post acquisition profits or losses of the investee in profit and loss, and the Group’s share of other comprehensive income of the investee in other comprehensive income.
The consolidated financial statements have been prepared using uniform accounting policies for like transactions and other events in similar circumstances, except in case of depreciation as mentioned in note 42.

Annual Report 2016-17 | Consolidated Financial Statement | 153
Notes to the consolidated Financial Statements for the year ended March 31, 2017
(c) Revenue recognition:
Revenue is measured at the fair value of the consideration received or receivable. The Group recognises revenue when the amount of revenue can be reliably measured, it is probable that the future economic benefits will flow to the entity and specific criteria have been met for each of the Group’s activities as mentioned below.
(i) Sale of products is recognised when the significant risks and rewards of ownership in the goods are transferred to the buyer which is based on the agreed terms. Revenue is based on price agreed with the customers. Amounts disclosed as revenue are inclusive of excise duty and are net of returns, trade discounts, cash discounts, sales incentives, sales tax, etc.
(ii) Sale of services with respect to fixed price contracts is recognised based on agreements/ arrangements with the concerned parties using the proportionate completion method and revenue with respect to time-and-material contracts is recognised as and when the related services are performed.
(iii) Rental income arising from operating lease of investment properties is accounted on accrual basis based on contractual terms with the lessee and is disclosed under other operating revenue in statement of profit and loss.
(d) Investments and other financial assets:
(i) Classification
The Group classifies its financial assets under the following measurement categories:
- those to be measured subsequently at fair value through other comprehensive income (FVOCI) or fair value through profit and loss (FVTPL), and
- those measured at amortised cost.
The classification depends on the Group’s business model for managing the financial assets and the contractual terms of the cash flows.
For assets measured at fair value, gains and losses will either be recorded in profit or loss or other comprehensive income. For investments in debt instruments, this will depend on the business model in which the investment is held. For investments in equity instruments, this will depend on whether the Group has made an irrevocable election at the time of initial recognition to account for the equity instrument at fair value through other comprehensive income.
The Group reclassifies debt investments when and only when its business model for managing those assets changes.
(ii) Initial recognition and measurement
All financial assets are recognised initially at its fair value plus, in the case of financial assets not recorded at fair value through profit or loss, transaction costs that are attributable to the acquisition of the financial asset. Transaction costs of financial assets carried at fair value through profit or loss are expensed in profit or loss.
(iii) Subsequent measurement
Financial assets that are held for collection of contractual cash flows, where those cash flows represent solely payments of principal and interest, are measured at amortised cost.
Financial assets that are held for collection of contractual cash flows and for selling the financial assets, where the asset’s cash flows represent solely payments of principal and interest, are measured at FVOCI. All equity investments are measured at fair value through other comprehensive income. Changes in the fair value of financial assets are recognised in statement of other comprehensive income. In those cases, there is no subsequent reclassification of fair value gains and losses to statement of profit and loss.
Financial assets that do not meet the criteria for amortised cost or FVOCI are measured at FVTPL. A gain or loss on such financial assets that are subsequently measured at FVTPL and are recognised and presented net in the statement of profit and loss within other income in the period in which it arises.
(iv) Impairment of financial assets
Impairment losses (and reversal of impairment losses) on equity investments measured at FVOCI are not reported separately from other changes in fair value. The Group assesses the expected credit losses associated with its assets carried at amortised cost. The impairment methodology applied depends on whether there has been a significant increase in credit risk. Note 32 details how the Group determines whether there has been a significant increase in credit risk. The losses arising from impairment are recognised in the profit or loss.
For trade receivables only, the Group applies the simplified approach permitted by Ind AS 109 Financial Instruments, which requires expected lifetime losses to be recognised from initial recognition of the receivables.
(v) Derecognition of financial assets
The Group derecognises a financial asset when the contractual right to the cash flows from the financial asset expire or it transfers substantially all risk and rewards of ownership of the financial asset. A gain or loss on such financial assets that are subsequently measured at amortised cost is recognised in profit or loss when the asset is derecognised.
(vi) Income recognition
Interest income
Interest income from financial assets measured at amortised cost is recognised using the effective interest rate method and are disclosed in statement of profit and loss.

154 | Consolidated Financial Statement | Annual Report 2016-17
Dividends
Dividends from equity instruments are recognised as other income in statement of profit and loss only when the right to receive payment is established.
(e) Property, plant and equipment:
Freehold land is carried at historical cost and other items of property, plant and equipment including capital spares are stated at cost of acquisition or construction less accumulated depreciation when, it is probable that future economic benefits associated with the item will flow to the Group and it can be used for more than one year and the cost can be measured reliably.
Subsequent costs are included in the asset’s carrying amount or recognised as a separate asset, as appropriate, only when it meets the recognition criteria as mentioned above. The carrying amount of any component accounted for as a separate asset is derecognised when replaced. All other repairs and maintenance are charged to profit or loss during the reporting period in which they are incurred.
Gains and losses on disposal are determined by comparing proceeds with carrying amount. These are included in profit or loss within other income or expense.
Depreciation on property, plant and equipments is provided using the written down value method. As required under Schedule II to the Companies Act 2013, the Group periodically assesses the estimated useful life of its tangible assets based on the technical evaluation considering anticipated technological changes and actual usage of the assets. The estimated useful life is either equal to or lower than those prescribed under Part C of Schedule II to the Companies Act, 2013.
The estimated useful life for various property, plant and equipments is given below:
Useful life (in years)
Buildings : Residential : 59 Factory/ Office : 29Plant and machinery : General : 6 Data processing equipment : 3Furniture and fixtures : 8Office equipment : 5Vehicles : 5
In respect of specific assets including second hand plant and machinery, capital spares which are estimated to have a lower residual life than envisaged above, depreciation is provided based on the estimated lower residual life, where required.
Low value assets not exceeding Rs.15,000/- per unit and all Research and Development assets (except for Buildings) are depreciated at 100% in the quarter of addition.
In respect of additions, depreciation is provided on pro-rata basis from the quarter of addition and in respect of disposals, the same is provided upto the quarter prior to disposal.
Transition to Ind AS
On transition to Ind AS, the Group has elected to continue with the carrying value of all its property, plant and equipment recognised as at April 1, 2015 measured as per the previous GAAP and use that carrying value as the deemed cost of the property, plant and equipment.
(f) Investment properties:
Property that is held for rental income and that is not occupied by the Group, is classified as investment property. Investment properties are measured initially at cost, including related transaction cost. It is carried at cost less accumulated depreciation. Subsequent expenditure is capitalised to the asset’s carrying amount only when it is probable that future economic benefits associated with the expenditure will flow to the Group and the cost can be measured reliably. All other repairs and maintenance costs are expensed when incurred.
Land is carried at historical cost, however, buildings are depreciated using the written down value method over their estimated useful lives as mentioned in 2(e) above.
Transition to Ind AS
On transition to Ind AS, the Group has elected to continue with the carrying value of all its investment properties recognised as at April 1, 2015 measured as per the previous GAAP and use that carrying value as deemed cost of investment properties.
(g) Intangible assets
Intangible assets are stated at cost of acquisition less accumulated amortisation. Amortisation on intangible assets is provided using the written down value method based on estimated useful life determined by management.
Notes to the consolidated Financial Statements for the year ended March 31, 2017

Annual Report 2016-17 | Consolidated Financial Statement | 155
The estimated useful life for intangible assets is given below:
Useful life (in years)
Know-how, business : 3
Expenditure incurred in research phase is expensed as incurred. Development related expenditure is capitalised as an internally generated intangible asset only if it meets the recognition criteria under Ind AS 38 on Intangible Assets, which inter-alia includes demonstration of technical feasibility, generation of future economic benefits etc. Expenditure that cannot be distinguished between research phase and development phase is expensed as and when incurred.
Transition to Ind AS
On transition to Ind AS, the Group has elected to continue with the carrying value of all its intangible assets recognised as at April 1, 2015 measured as per the previous GAAP and use that carrying value as deemed cost of intangible assets.
(h) Trade receivables:
Trade receivables are recognised initially at fair value and subsequently measured at amortised cost less provision for impairment.
(i) Inventories:
Inventories are valued at lower of cost and net realisable value. Cost is generally ascertained on weighted average basis. Cost of raw materials, traded goods and indirect materials include cost of purchase and other costs incurred in bringing the inventories to their present location and condition. The cost of finished goods and work in progress comprises raw materials, direct labour, other direct costs and related production overheads. Net realisable value is the estimated selling price in the ordinary course of business less the estimated costs of completion and the estimated costs necessary to make the sale.
Excise duty on finished goods lying in factories are considered for valuation of inventories, as applicable. Obsolete/ slow moving inventories are adequately provided for.
(j) Employee benefits:
(i) Short term employee benefits:
All employee benefits that are expected to be settled wholly within twelve months after the end of the period in which the employees render the related service are classified as short term employee benefits, which include salaries, wages, short term compensated absences and performance incentives and are measured at the amounts expected to be paid when the liabilities are settled. The liabilities are presented as current employee benefit obligations in the balance sheet. These are recognised as expenses in the period in which the employee renders the related service.
(ii) Post-employment benefits:
Contributions towards Superannuation Fund, Pension Fund and government administered Provident Fund are treated as defined contribution schemes. In respect of contributions made to government administered Provident Fund, the Group has no further obligations beyond its monthly contributions. Such contributions are recognised as expense in the period in which the employee renders related service.
Provident Fund contributions made to Trusts administered by the Group are treated as defined benefit plan. The interest payable to the members of these Trusts shall not be lower than the statutory rate of interest declared by the Central Government under the Employees’ Provident Funds and Miscellaneous Provisions Act, 1952 and shortfall, if any, shall be made good by the Group. The Group also provides for post employment defined benefit in the form of Gratuity. The cost of defined benefit is determined using the projected unit credit method, with actuarial valuation being carried out at each balance sheet date. Actuarial gains and losses in respect of the same are charged to the Other Comprehensive Income (OCI).
(iii) Other long term employee benefits:
All employee benefits other than post-employment benefits and termination benefits, which do not fall due wholly within twelve months after the end of the period in which the employees render the related service, including long term compensated absences, service awards, and ex-gratia are determined based on actuarial valuation carried out at each balance sheet date. Estimated liability on account of long term employee benefits is discounted to the present value using the yield on government bonds as the discounting rate for the term of obligations as on the date of the balance sheet. Actuarial gains and losses in respect of the same are charged to the statement of profit and loss.
(iv) Termination benefits:
Termination benefits are payable when employment is terminated by the Group before the normal retirement date, or when an employee accepts voluntary retirement in exchange of these benefits. The Group recognises termination benefits at the earlier of the following dates: (a) when the Group can no longer withdraw the offer of those benefits; and (b) when the entity recognises costs for a restructuring that is within the scope of Ind AS 37 and involves the payment of termination benefits. The termination benefits are measured based on the number of employees expected to accept the offer in case of voluntary retirement scheme.
Notes to the consolidated Financial Statements for the year ended March 31, 2017

156 | Consolidated Financial Statement | Annual Report 2016-17
(k) Foreign currency transactions:
Items included in the financial statements are measured using the currency of the primary economic environment in which entity operates (‘the functional currency’). The consolidated financial statements are presented in Indian rupee (INR), which is Group’s functional and presentation currency.
Foreign currency transactions are recorded at the rate of exchange prevailing on the date of the transactions. At the year end, all the monetary assets and liabilities denominated in foreign currency are restated at the closing exchange rates. Exchange differences resulting from the settlement of such transactions and from the translation of such monetary assets and liabilities at the year end are recognised in the Statement of Profit and Loss.
(l) Leases:
As a lessee
Leases in which the Group has substantial portion of the risks and rewards of ownership are classified as finance leases. Assets acquired under finance leases are capitalised at the lower of the fair value of the leased assets at the inception of the lease term and the present value of minimum lease payments. Lease payments are apportioned between the finance charge and the reduction of the outstanding liability. The finance charge is allocated to periods during the lease term at a constant periodic rate of interest on the remaining balance of the liability.
Cost of leasehold land (other than those which will be converted to freehold after a certain period upon satisfying prescribed conditions) is amortised over the lease term.
Leases in which the Group doesn’t have substantial portion of the risks and rewards of ownership are classified as operating leases. Payment made under operating leases are charged to statement of profit and loss on a straight line basis.
As a lessor
Leases are classified as finance leases when substantially all of the risks and rewards of ownership transfer from the Group to the lessee. Amounts due from lessees under finance leases are recorded as receivables at the Group’s net investment in the leases. Finance lease income is allocated to accounting periods so as to reflect a constant periodic rate of return of the net investment outstanding in respect of the leases.
Lease income from operating leases where the Group is a lessor is recognised as income on a straight line basis. The respective leased assets are disclosed as investment properties.
(m) Income tax :
(i) Current tax:
Current tax is measured at the amount expected to be paid to the tax authorities in accordance with the provisions of Income Tax Act, 1961. Current tax assets and current tax liabilities are offset when there is a legally enforceable right to set off the recognised amounts and there is an intention to settle the asset and the liability on a net basis.
(ii) Deferred tax:
Deferred income tax is provided in full, using the liability method, on temporary differences arising between the tax bases of assets and liabilities and their carrying amounts in the financial statements.
Deferred tax assets are recognised and carried forward only if it is probable that sufficient future taxable income will be available against which such deferred tax assets can be realised. Deferred tax assets and liabilities are measured at the tax rates that have been enacted or substantively enacted as on the balance sheet date. Deferred tax assets and deferred tax liabilities are offset when there is a legally enforceable right to set off assets against liabilities representing current tax.
Current and deferred tax is recognised in profit and loss, except to the extent that it relates to items recognised in other comprehensive income. In this case, the tax is also recognised in other comprehensive income.
(n) Impairment of assets:
At each balance sheet date, the Group assesses whether there is any indication that an asset may be impaired. If any such indication exists, the Group estimates the recoverable amount. If the carrying amount of the asset exceeds its estimated recoverable amount, an impairment loss is recognised in the Statement of Profit and Loss to the extent the carrying amount exceeds recoverable amount. The recoverable amount is the higher of asset’s fair value less costs of disposal and value in use. For the purpose of assessing impairment, assets are grouped at the lowest level of which that are separately identifiable cash inflows which are largely independent of the cash inflows from other assets or group of assets (cash-generating units). Non-financial assets that suffered an impairment are reviewed for possible reversal of the impairment at the end of each reporting period.
(o) Trade and other payables:
These amounts represents liabilities for goods and services provided to the Group prior to the end of financial year which are unpaid. The amounts are unsecured and are usually paid as per payment terms. They are recognised initially at their fair value and subsequently measured at amortised cost.
Notes to the consolidated Financial Statements for the year ended March 31, 2017

Annual Report 2016-17 | Consolidated Financial Statement | 157
(p) Borrowings:
Borrowings are initially recognised at fair value, net of transaction costs incurred. Borrowings are subsequently measured at amortised cost using effective interest method.
(q) Provisions and Contingent Liabilities:
Provisions are recognised when the Group has a present legal or constructive obligation as a result of past events, for which it is probable that an outflow of resources embodying economic benefits will be required to settle the obligation and a reliable estimate of the amount can be made.
Provisions are measured at the present value of management’s best estimate of the expenditure required to settle the present obligation at the end of the reporting period. The discount rate to determine the present value is a pre-tax rate that reflects current market assessments of the time value of money and the risks specific to the liability. The increase in the provision due to the passage of time is recognised as interest expense.
Contingent liabilities are disclosed when there is a possible obligation arising from past events, the existence of which will be confirmed only by the occurrence or non occurrence of one or more uncertain future events not wholly within the control of the Group or a present obligation that arises from past events where it is either not probable that an outflow of resources will be required to settle or a reliable estimate of the amount cannot be made.
(r) Government grants:
Grants from the government are recognised at their fair value where there is a reasonable assurance that the grant will be received and the Group will comply with all attached conditions.
Government grants relating to the purchase of property, plant and equipment are included in non-current liabilities as deferred income and are credited to profit or loss on a straight-line basis over the expected lives of the related assets and presented within other income.
(s) Cash and cash equivalents:
Cash and cash equivalents includes cash and cheques on hand, current accounts and fixed deposit accounts with banks with original maturities of three months or less that are readily convertible to known amounts of cash and which are subject to an insignificant risk of changes in value.
(t) Derivatives and hedging activities:
The Group uses derivative financial instruments such as forward exchange contracts and currency option contracts to hedge its risks associated with foreign currency fluctuations. Such derivative contracts are not designated as hedges and are accounted for at fair value through profit and loss.
(u) Embedded derivatives:
Derivatives embedded in a host contract that is an asset within the scope of Ind AS 109 are not separated. Financial assets with embedded derivatives are considered in their entirety when determining whether their cash flows are solely payment of principal and interest.
Derivatives embedded in all other host contract are separated only if the economic characteristics and risks of the embedded derivative are not closely related to the economic characteristics and risks of the host and are measured at fair value through profit or loss. Embedded derivatives closely related to host contracts are not separated.
(v) Discontinued operation:
A discontinued operation is a component of the entity that has been disposed and that represents a separate line of business. The results of discontinued operation is presented separately in the statement of profit and loss.
(w) Earning per share (basic and diluted):
Earning per share is calculated by dividing the profit attributable to owners of the Group by the weighted average number of equity shares outstanding during the financial year.
Note 3: Critical estimates and judgements
The preparation of financial statements in accordance with Ind AS requires that assumptions and estimates be made for some line items. This note provides the areas that involve a higher degree of judgement or complexity.
(a) Estimation of current tax expense and payable - Note 29
Current tax is measured at the amount expected to be paid to the tax authorities in accordance with the provisions of Income Tax Act, 1961. Deferred income tax is provided in full, using the liability method, on temporary differences arising between the tax bases of assets and liabilities and their carrying amounts in the financial statements. The recognition of deferred tax assets is premised on their future recoverability being probable.
(b) Estimation of defined benefit obligation - Note 30
Employee benefit obligations are measured using actuarial methods. This requires various assumptions, including with respect to salary trends, attrition rate, discounting factor, etc.
(c) Estimation of provision for warranty claims - Note 15
Warranty estimates are established using historical information on the nature, frequency and average cost of warranty claims and also management estimates regarding possible future outflow on servicing the customers for any corrective action in respect of product failure which is generally expected to be settled within a period of 1 to 3 years.
Notes to the consolidated Financial Statements for the year ended March 31, 2017

158 | Consolidated Financial Statement | Annual Report 2016-17
Note 4 (a) : Property, plant and equipment[` in Millions (Mio INR)]
Gross Block Depreciation Net Block
As
at A
pri
l 1, 2
016
Ad
dit
ions
Ded
ucti
ons/
A
dju
stm
ents
As
at M
arch
31,
201
7
As
at A
pri
l 1, 2
016
For
the
year
Ded
ucti
ons/
A
dju
stm
ents
As
at M
arch
31,
201
7
As
at M
arch
31,
201
7
As
at M
arch
31,
201
6
Land - Freehold 127 0 35 92 - - - - 92 127 (127) (-) (-) (127) (-) (-) (-) (-) (127) (127)
- Leasehold 1,653 - - 1,653 10 10 - 20 1,633 1,643 (1,477) (176) (-) (1,653) (-) (10) (-) (10) (1,643) (1,477)
Buildings 4,035 597 13 4,619 388 421 3 806 3,813 3,647 [refer note (a) below] (2,324) (1,715) (4) (4,035) (-) (388) (-) (388) (3,647) (2,324)Buildings - R & D* 5 15 - 20 - 1 - 1 19 5
(-) (5) (-) (5) (-) (-) (-) (-) (5) (-) Plant and machinery 9,698 5,407 597 14,508 3,952 3,546 284 7,214 7,294 5,746 [refer note (d) below] (6,227) (3,493) (22) (9,698) (667) (3,293) (8) (3,952) (5,746) (5,560)Plant and machinery 133 231 2 362 133 231 2 362 - - - R & D* (-) (133) (-) (133) (-) (133) (-) (133) (-) (-) Office equipment 143 29 8 164 67 42 6 103 61 76
(92) (53) (2) (143) (-) (67) (-) (67) (76) (92)Office equipment - R & D* 1 2 0 3 1 2 0 3 - -
(-) (1) (-) (1) (-) (1) (-) (1) (-) (-) Furniture and fixtures 164 56 11 209 49 62 9 102 107 115
(84) (80) (-) (164) (-) (49) (-) (49) (115) (84)Furniture and fixtures - 5 0 5 - 5 - 5 - - - R & D* (-) (-) (-) (-) (-) (-) (-) (-) (-) (-) Vehicles 208 142 19 331 80 89 13 156 175 128
(136) (75) (3) (208) (-) (81) (1) (80) (128) (136)Vehicles - R & D* 1 1 - 2 1 1 - 2 - -
(-) (1) (-) (1) (-) (1) (-) (1) (-) (-) Total 16,168 6,485 685 21,968 4,681 4,410 317 8,774 13,194 11,487
(10,467) (5,732) (31) (16,168) (667) (4,023) (9) (4,681) (11,487) (9,800)
Note 4 (b) : Capital work in progress 1,289 1,507 (1,507) (2,760)
* Relating to certain DSIR approved R&D facilities, considered eligible for Income tax benefit.
(a) Buildings include Mio INR 0 (2015-16: Mio INR 0) being the value of shares in co-operative housing societies.
(b) Deductions/ adjustments includes transfer of Mio INR 311 (net block) as part of sale of starter motors and generators business (refer note 34) and transfer of Mio INR 46 (net block) to investment properties (refer note 5).
(c) Depreciation for the year includes depreciation for discontinued operation amounting to Mio INR 42 (2015-16: Mio INR 229).
(d) Plant and machinery includes capital spares and government grant capitalised on transition to Ind AS as at April 1, 2015 and subsequent periods (refer note 46).
(e) Capital work-in-progress mainly comprises plant and machinery and building under construction.
(f) Refer note 44 for disclosure of contractual commitment for the acquisition of property, plant and equipment.
(g) Figures in brackets relate to previous year. Gross carrying amount as at April 1, 2015 represents deemed cost of property, plant and equipment.
Notes to the consolidated Financial Statements for the year ended March 31, 2017

Annual Report 2016-17 | Consolidated Financial Statement | 159
Note 5 : Investment properties[` in Millions (Mio INR)]
As at March 31, 2017
As at March 31, 2016
Gross carrying amount Opening gross carrying amount/ Deemed cost (April 1, 2015) 1,849 315 Transfer from property, plant and equipments 48 - Additions 182 1,534 Closing gross carrying amount 2,079 1,849
Accumulated depreciation Opening accumulated depreciation 69 - Transfer from property, plant and equipments 2 - Depreciation charge 194 69 Closing accumulated depreciation 265 69
Opening Capital work-in-progress 6 1,083 Closing Capital work-in-progress 129 6
1,943 1,786
(i) Amounts recognised in statement of profit and loss for investment properties
[` in Millions (Mio INR)]
For the year ended March
31, 2017
For the year ended March
31, 2016Rental income 875 493 Direct operating expenses from property that generated rental income (97) (71)Profit from investment properties before depreciation 778 422 Depreciation charge (194) (69)Profit from investment properties 584 353
(ii) Contractual obligations: Refer note no 44 for disclosure of contractual obligations relating to investment properties.
(iii) Fair value of investment properties:
[` in Millions (Mio INR)]
As at March 31, 2017
As at March 31, 2016
As at April 1, 2015
Land 9,146 7,452 5,070 Building 6,380 5,689 2,422
15,526 13,141 7,492
Note 6 : Intangible assets (acquired) :[` in Millions (Mio INR)]
Gross Block Amortisation Net BlockAs at
April 1, 2016
Additions Deductions/ Adjustments
As at March
31, 2017
As at April 1, 2016
For the year
Deductions/ Adjustments
As at March
31, 2017
As at March
31, 2017
As at March
31, 2016Know-how, business
1 - - 1 1 - - 1 - - (1) (-) (-) (1) (-) (1) (-) (1) (-) (1)
Total 1 - - 1 1 - - 1 - - (1) (-) (-) (1) (-) (1) (-) (1) (-) (1)
(a) Figures in brackets relate to previous year. Gross carrying amount as at April 1, 2015 represents deemed cost of intangible assets.
Notes to the consolidated Financial Statements for the year ended March 31, 2017

160 | Consolidated Financial Statement | Annual Report 2016-17
Note 7 : Investments accounted for using the equity method[` in Millions (Mio INR)]
Amount
As at March 31, 2017
As at March 31, 2016
As at April 1, 2015
Unquoted equity investments valued at cost
Associate (also a fellow subsidiary):
Newtech Filter India Private Limited, equity shares of Rs.10/- each fully paid 175 175 175
Less: Share of profit/ (loss) for earlier years in Associate (81) (103) (103)
Add: Share of profit/ (loss) for current year in Associate (9) 22 0
85 94 72
Note 8 (a): Investments[` in Millions (Mio INR)]
As at March 31, 2017 As at March 31, 2016 As at April 1, 2015
Non-current Current Non-current Current Non-current Current
Investment in equity instruments 5,993 - 4,483 - 5,346 - Investment in bonds (quoted) 5,213 - 5,207 - 4,992 20 Investment in mutual funds (quoted)
25,203 2,681 34,629 - 21,533 2,846
36,409 2,681 44,319 - 31,871 2,866
Aggregate amount of quoted investments
36,409 2,681 44,319 - 31,871 2,866
Market value of quoted investments
36,743 2,681 44,645 - 32,210 2,866
Aggregate provision for diminution in the value of investments
- - - - - -
Note 8 (b) : Trade receivables[` in Millions (Mio INR)]
As at March 31, 2017
As at March 31, 2016
As at April 1, 2015
Trade receivables
- Related parties [refer note (a) below and note 35] 1,528 1,677 2,164
- Others 11,032 12,106 10,224
Less: Allowance for doubtful debts (698) (558) (404)
11,862 13,225 11,984
(a) Includes dues from private companies where directors are interested 429 177 199
Details of secured and unsecured[` in Millions (Mio INR)]
As at March 31, 2017
As at March 31, 2016
As at April 1, 2015
Secured, considered good - - -
Unsecured, considered good 11,862 13,225 11,984
Doubtful 698 558 404
Total 12,560 13,783 12,388
Allowance for doubtful debts (698) (558) (404)
Total trade receivables 11,862 13,225 11,984
Notes to the consolidated Financial Statements for the year ended March 31, 2017

Annual Report 2016-17 | Consolidated Financial Statement | 161
Note 8 (c) : Loans[` in Millions (Mio INR)]
As at March 31, 2017
As at March 31, 2016
As at April 1, 2015
Current Non-Current Current Non-Current Current Non-Current
Unsecured, considered goodLoan to fellow subsidiaries (refer note 35) 3,060 500 2,600 700 2,100 950Loan to directors (refer note 35) 0 3 0 3 0 4Loan to employees 145 342 226 392 198 412Security deposits - 329 - 327 - 304
3,205 1,174 2,826 1,422 2,298 1,670
Note 8 (d) : Cash and cash equivalents[` in Millions (Mio INR)]
As at March 31, 2017
As at March 31, 2016
As at April 1, 2015
Balances with banks - in current accounts 207 384 345 - deposit accounts with original maturity of less than 3 months 875 288 590 Cash on hand 0 0 0 Cheques on hand 230 313 369
1,312 985 1,304
Note 8 (e) : Other bank balances[` in Millions (Mio INR)]
As at March 31, 2017
As at March 31, 2016
As at April 1, 2015
Deposit accounts (maturity less than 12 months) 15,831 17,301 17,632 Unpaid dividend accounts 34 30 25
15,865 17,331 17,657
Note 8 (f) : Other financial assets[` in Millions (Mio INR)]
As at March 31, 2017
As at March 31, 2016
As at April 1, 2015
Current Non-Current Current Non-Current Current Non-Current
Deposits with maturity of more than 12 months - - - 100 - - Inter-corporate deposit 6,800 - 6,150 - 5,250 - Interest accrued on financial assets at amortised cost 782 - 1,202 - 1,140 - Others (include non-trade receivables, etc.) 373 - 270 - 352 -
7,955 - 7,622 100 6,742 -
Note 9 : Deferred tax assets[` in Millions (Mio INR)]
As at March 31, 2017
As at March 31, 2016
As at April 1, 2015
Difference between books and Income tax written down value (WDV) of depreciable property, plant and equipment and intangible assets
2,808 2,995 2,832
Expenses allowable for tax purposes when paid and other timing differences 1,868 1,533 1,340 Long term capital losses - 430 -
4,676 4,958 4,172
Notes to the consolidated Financial Statements for the year ended March 31, 2017

162 | Consolidated Financial Statement | Annual Report 2016-17
Movement in deferred tax assets[` in Millions (Mio INR)]
WDV of depreciable
property, plant and
equipment
Expenses allowable
on payment basis
Tax losses Total
As at April 1, 2015 2,832 1,340 - 4,172
(Charged)/ Credited
- to statement of profit and loss 163 213 430 806
- to other comprehensive income - (20) - (20)
As at March 31, 2016 2,995 1,533 430 4,958
(Charged)/ Credited
- to statement of profit and loss (187) 277 (430) (340)
- to other comprehensive income - 58 - 58
As at March 31, 2017 2,808 1,868 - 4,676
Note 10 : Other non-current assets[` in Millions (Mio INR)]
As at March 31, 2017
As at March 31, 2016
As at April 1, 2015
Capital advances 45 109 297
Security deposits 98 82 90
143 191 387
Note 11 : Inventories(at lower of cost and net realisable value)
[` in Millions (Mio INR)]
As at March 31, 2017
As at March 31, 2016
As at April 1, 2015
Raw materials 2,098 2,688 2,927
Work-in-progress 958 1,321 1,407
Finished goods 3,939 3,307 4,126
Stock-in-trade 4,253 3,989 3,673
Stores and spares 182 208 228
Loose tools 374 402 362
11,804 11,915 12,723
(a) Inventories include the following as goods-in-transit
[` in Millions (Mio INR)]
As at March 31, 2017
As at March 31, 2016
As at April 1, 2015
Raw materials 541 834 670 Stock-in-trade 1,063 1,119 1,074 Loose tools 10 12 36
1,614 1,965 1,780
(b) Amount of inventories recognised as an expense/(income) is Mio INR (238) [2015-16 Mio INR (93)].
(c) Write-down/(reversal of write-down of earlier year) of the inventories to net realisable value amounted to Mio INR 70 [2015-16 Mio INR (30)]. These were recognised as an expense during the year and included in Note 23 in the statement of profit and loss.
Notes to the consolidated Financial Statements for the year ended March 31, 2017

Annual Report 2016-17 | Consolidated Financial Statement | 163
Note 12 : Other current assets[` in Millions (Mio INR)]
As at March 31, 2017
As at March 31, 2016
As at April 1, 2015
Balance with customs, excise and sales tax authorities, etc. 2,852 2,916 2,397 Deferred expense 91 101 133 Others (include vendor advances, claims receivable, etc.) 1,368 1,462 1,413
4,311 4,479 3,943
Note 13 : Equity share capital and other equity
Note 13(a) : Equity Share capitalAuthorised equity share capital [` in Millions (Mio INR)]
No of shares Amount As at April 1, 2015 38,051,460 381 Increase during the year - - As at March 31, 2016 38,051,460 381 Increase during the year - - As at March 31, 2017 38,051,460 381
(i) Movements in equity share capital (issued, subscribed and fully paid up)
[` in Millions (Mio INR)]
No of shares Amount As at April 1, 2015 31,398,900 314 Increase/ (decrease) during the year - - As at March 31, 2016 31,398,900 314 Increase/ (decrease) during the year (878,160) (9)As at March 31, 2017 30,520,740 305
Rights, preferences and restrictions attached to shares:
The Equity shares of the Company, having face value of Rs. 10/- per share, rank pari passu in all respects including voting rights, entitlement to dividend and share in the proceeds of winding up of the Company in proportion to the number of and amounts paid on the shares held.
(ii) Equity shares held by the holding company and subsidiary of the holding company:
[` in Millions (Mio INR)]
As at March 31, 2017
As at March 31, 2016
As at April 1, 2015
No of shares Amount No of shares Amount No of shares Amount
Robert Bosch GmbH, Federal Republic of Germany, the holding company
21,058,705 211 22,349,420 223 22,349,420 223
Robert Bosch Engineeering and Business Solutions Private Ltd., India, subsidiary of holding company
454,000 5 - - - -
(iii) Details of Equity shares held by shareholders holding more than 5% of the aggregate equity shares in the Company:
As at March 31, 2017
As at March 31, 2016
As at April 1, 2015
No. of shares
Shareholding %
No. of shares
Shareholding %
No. of shares
Shareholding %
Robert Bosch GmbH, Federal Republic of Germany, the holding company
21,058,705 68.99% 22,349,420 71.18% 22,349,420 71.18%
(iv) There are no shares reserved for issue under options and contracts/ commitments. Further, there are no shares that have been allotted during last 5 years pursuant to a contract without payment being received in cash, or by way of bonus shares.
Notes to the consolidated Financial Statements for the year ended March 31, 2017

164 | Consolidated Financial Statement | Annual Report 2016-17
(v) The Company has bought back 878,160 shares during the year ended March 31, 2017 at buy-back price determined at Rs.23,000/- per share which was approved by the board of directors and shareholders of the Company. Shares bought back during the period of five years immediately preceding the reporting date:
As at March 31,
2017
As at March 31,
2016
As at April 1, 2015
Number of equity shares bought back by the Company 878,160 - -
Note 13(b) : Reserves and surplus[` in Millions (Mio INR)]
As at March 31,
2017
As at March 31,
2016
As at April 1, 2015
Capital reserve [refer note (i)] 39 39 39
Share premium [refer note (ii)] 8 8 8
Capital redemption reserve [refer note (iii)] 76 67 67
General reserve [refer note (iv)] 21,759 41,957 41,957
Retained earnings [refer note (v)] 59,757 48,431 36,268
81,639 90,502 78,339
(i) Capital reserve [` in Millions (Mio INR)]
As at March 31,
2017
As at March 31,
2016
Opening balance 39 39
Additions/(deletions) during the year - -
Closing balance 39 39
(ii) Share premium [` in Millions (Mio INR)]
As at March 31,
2017
As at March 31,
2016Opening balance 8 8 Additions/(deletions) during the year - - Closing balance 8 8
(iii) Capital redemption reserve [` in Millions (Mio INR)]
As at March 31,
2017
As at March 31,
2016Opening balance 67 67 Additions/(deletions) during the year 9 - Closing balance 76 67
(iv) General reserve [` in Millions (Mio INR)]
As at March 31,
2017
As at March 31,
2016Opening balance 41,957 41,957 Less: Utilisation for buy back of shares (20,198) - Less: Share of loss of Associate for earlier years - - Closing balance 21,759 41,957
Notes to the consolidated Financial Statements for the year ended March 31, 2017

Annual Report 2016-17 | Consolidated Financial Statement | 165
(v) Retained earnings [` in Millions (Mio INR)]
As at March 31,
2017
As at March 31,
2016Opening balance 48,431 36,268 Net profit for the year 17,402 15,336 Dividends (refer note no. 33) (4,958) (2,669)Dividend distribution taxes (refer note 33) (1,009) (543)Items of other comprehensive income recognised directly in retained earnings- Remeasurement of post-employment benefit obligations, net of tax (109) 39 Closing balance 59,757 48,431
Note 13(c) : Other reserves [` in Millions (Mio INR)]
FVOCI - Equity
Instruments
Total other reserves
As at April 1, 2015 5,316 5,316 Change in fair value of FVOCI equity instruments (864) (864)As at March 31, 2016 4,452 4,452 Change in fair value of FVOCI equity instruments 1,510 1,510 As at March 31, 2017 5,962 5,962
Note 14(a) : Borrowings[` in Millions (Mio INR)]
As at March 31, 2017
As at March 31, 2016
As at April 1, 2015
Unsecured: Sales tax deferral loan [refer note (a) below] - 149 542
- 149 542
(a) Terms of repayment for unsecured borrowings :
Borrowings Terms of repayment Interest free Sales tax deferral loan - State Government of Maharashtra Repayable in 5 equal annual installments for various schemes
starting January 2009 onwards. - State Government of Rajasthan Repayable in 10 half-yearly equal installments starting
January 2012 onwards.
Note 14(b) : Other financial liabilities[` in Millions (Mio INR)]
As at March 31, 2017
As at March 31, 2016
As at April 1, 2015
Current Non-Current Current Non-Current Current Non-Current
Current maturities of long-term debt [refer note 14 (a)] - - 351 - 567 -
Unpaid dividend [refer note (a) below] 34 - 30 - 25 -
Book overdraft 23 - 26 - 13 -
Capital creditors 305 - 442 - 361 -
Other payables (includes employee dues, derivative liabilities, etc.) 2,386 60 2,545 50 2,517 64
2,748 60 3,394 50 3,483 64
(a) There are no amounts due for payment to the Investor Education and Protection Fund under Section 125 of the Companies Act, 2013 as at the year end.
Notes to the consolidated Financial Statements for the year ended March 31, 2017

166 | Consolidated Financial Statement | Annual Report 2016-17
Note 14(c) : Trade payables[` in Millions (Mio INR)]
As at March 31,
2017
As at March 31,
2016
As at April 1, 2015
Trade payables
- Dues of Micro Enterprises and Small Enterprises [refer note (a) below] 212 118 229
- Related parties (refer note 36) 7,666 7,792 7,127
- Others 5,521 5,178 4,680
13,399 13,088 12,036
(a) Disclosure under Micro, Small and Medium Enterprises Development Act, 2006.
[` in Millions (Mio INR)] As at
March 31, 2017 and for the year
ended March 31, 2017
As at March 31, 2016 and
for the year ended
March 31, 2016
As at April 1, 2015 and for the fifteen months
period ended March 31, 2015
(i) The amount due and remaining unpaid as at the balance sheet date-Principal 212 118 229 -Interest thereon 3 1 3
(ii) The amount of principal and interest paid beyond due date during the year-Principal 997 961 570 -Interest thereon - - -
(iii) Interest due on principal amounts paid beyond the due date during the year but without interest
12 10 8
(iv) Interest accrued and remaining unpaid as at balance sheet date
56 41 30
(v) Total interest due but not paid for the earlier years 41 30 19
Note 15 : Provisions[` in Millions (Mio INR)]
As at March 31, 2017 As at March 31, 2016 As at April 1, 2015
Current Non-Current Current Non-Current Current Non-Current
Provision for employee benefits 2,933 3,626 2,575 3,773 1,936 4,300
Trade demand and others [refer note (a) below] 3,455 16 2,317 2 1,864 2
Warranty [refer note (a) below] 1,155 - 1,284 - 1,358 -
7,543 3,642 6,176 3,775 5,158 4,302
(a) Disclosure under Indian Accounting Standard (Ind AS) 37 on "Provisions, Contingent Liabilities and Contingent Assets":
[` in Millions (Mio INR)]
Description As at April 1, 2016
Additions during
the year
Utilised/ reversed
during the year
As at March 31, 2017
Trade demand and others [refer note (i) and (ii) below] 2,319 2,380 1,228 3,471 (1,866) (1,532) (1,079) (2,319)
Warranty [refer note (i) and (ii) below] 1,284 332 461 1,155 (1,358) (524) (598) (1,284)
(i) Nature of the provision has not been given on the grounds that it can be expected to prejudice the interests of the Group. Due to the very nature of such provisions, it is not possible to estimate the timing/ uncertainties relating to their outflows.
(ii) Figures in brackets relate to previous year.
Notes to the consolidated Financial Statements for the year ended March 31, 2017

Annual Report 2016-17 | Consolidated Financial Statement | 167
Note 16 : Current tax liabilities[` in Millions (Mio INR)]
As at March 31,
2017
As at March 31,
2016
As at April 1, 2015
Opening balance 762 630 71 Add: Provision for tax (including earlier years) 7,135 6,578 7,470 Less: Taxes paid (net of refund) (7,246) (6,446) (6,911)
651 762 630
Note 17 : Other current liabilities[` in Millions (Mio INR)]
As at March 31,
2017
As at March 31,
2016
As at April 1, 2015
Statutory dues 1,142 802 701 Deferred income 107 162 112 Indirect taxes 427 425 360 Others (advance from customers,etc.) 283 196 291
1,959 1,585 1,464
Note 18 : Sale of services [` in Millions (Mio INR)]
For the year ended
March 31, 2017
For the year ended
March 31, 2016
Research and development income 1,456 1,332 Others 878 659
2,334 1,991
Note 19 : Other operating revenue [` in Millions (Mio INR)]
For the year ended
March 31, 2017
For the year ended
March 31, 2016
Scrap sales 177 175 Export incentives 361 343 Provision/ liabilities no longer required written back 713 827 Rental income 875 493 Miscellaneous income 466 460
2,592 2,298
Note 20 : Other income [` in Millions (Mio INR)]
For the year ended
March 31, 2017
For the year ended
March 31, 2016
Interest income - Bank and inter corporate deposits 1,664 2,090 - Loans to related parties 352 352 - On financial assets at amortised cost 417 445 - Others 328 281 Government grant (refer note (a) below) - 261 Amortisation of deferred government grant income 160 80 Dividend from equity investments designated at FVOCI 81 57 Net gain on financial assets measured at FVTPL 3,172 2,450 Profit on sale of property, plant and equipment (net) - 20
6,174 6,036
(a) Government grant represents subsidy received/ accrued during the year under the Package Scheme of Incentives, 2001 from the Government of Maharashtra.
Notes to the consolidated Financial Statements for the year ended March 31, 2017

168 | Consolidated Financial Statement | Annual Report 2016-17
Note 21 : Cost of materials consumed [` in Millions (Mio INR)]
For the year ended
March 31, 2017
For the year ended
March 31, 2016
Raw materials consumed [Refer Note (a) below] 30,103 25,656 Less: Issues capitalised (33) (127)
30,070 25,529
(a) Cost of materials consumed is based on derived values.
Note 22 : Purchases of stock-in-trade [` in Millions (Mio INR)]
For the year ended
March 31, 2017
For the year ended
March 31, 2016
Purchase of goods 24,219 23,347 24,219 23,347
Note 23 : Changes in inventories of finished goods, work-in-progress and stock-in-trade [` in Millions (Mio INR)]
For the year ended
March 31, 2017
For the year ended
March 31, 2016
Opening stock Finished goods 2,736 3,798 Work-in-progress 1,236 1,320 Stock-in-trade 3,981 3,660 Closing stock Finished goods 3,939 2,736 Work-in-progress 958 1,236 Stock-in-trade 4,253 3,981
(1,197) 825
Note 24 : Employee benefit expense [` in Millions (Mio INR)]
For the year ended
March 31, 2017
For the year ended
March 31, 2016
Salaries, wages, bonus etc. 11,754 11,408 Contributions to provident and other funds 783 792 Staff welfare 891 831
13,428 13,031
Note 25 : Finance costs [` in Millions (Mio INR)]
For the year ended
March 31, 2017
For the year ended
March 31, 2016
Interest expense - on financial liability at amortised cost 25 57 - others 246 42 Net interest on defined benefit liability 1 30
272 129
Notes to the consolidated Financial Statements for the year ended March 31, 2017

Annual Report 2016-17 | Consolidated Financial Statement | 169
Note 26 : Depreciation and amortisation expense [` in Millions (Mio INR)]
For the year ended
March 31, 2017
For the year ended
March 31, 2016
Depreciation of property, plant and equipment [refer note 4(a)] 4,368 3,794
Depreciation on investment properties [refer note 5] 194 69
Amortisation of intangible assets [refer note 6] - 1
4,562 3,864
Note 27 : Other expenses [` in Millions (Mio INR)]
For the year ended
March 31, 2017
For the year ended
March 31, 2016
Consumption of stores and spares 798 648
Consumption of tools 1,808 1,954
Power and fuel 1,080 1,047
Repairs to plant and machinery 1,167 991
Repairs to building 518 374
Royalty and technical service fee 1,519 1,337
Rent 549 541
Rates and taxes 619 244
Insurance 137 125
Expenditure towards Corporate Social Responsibility [refer note (a) below] 332 197
Packing, freight and forwarding 1,685 1,637
Warranty and service expenses 284 253
Travelling and conveyance 996 920
Professional and consultancy charges 1,470 1,289
Advertisement and sales promotion expenses 780 690
Miscellaneous expenses [refer note (b) below] 4,496 3,390
Less: Expenses capitalised (10) (136)
18,228 15,501
(a) Expenditure towards Corporate Social Responsibility :
- Gross amount required to be spent by the Group during the year is Mio INR 332 (2015-16 Mio INR 292).
- Amount spent during the year is Mio INR 332 (2015-16 Mio INR 197).[` in Millions (Mio INR)]
Sr. No. Particulars In cash Yet to be
paid in cash Total
(i) Construction/acquisition of any asset - - -(-) (-) (-)
(ii) On purposes other than (i) above 309 23 332
(133) (64) (197)
- Total amount paid during the year Mio INR 373 includes Mio INR 64 relating to previous year.
- Figures in brackets relate to previous year
Notes to the consolidated Financial Statements for the year ended March 31, 2017
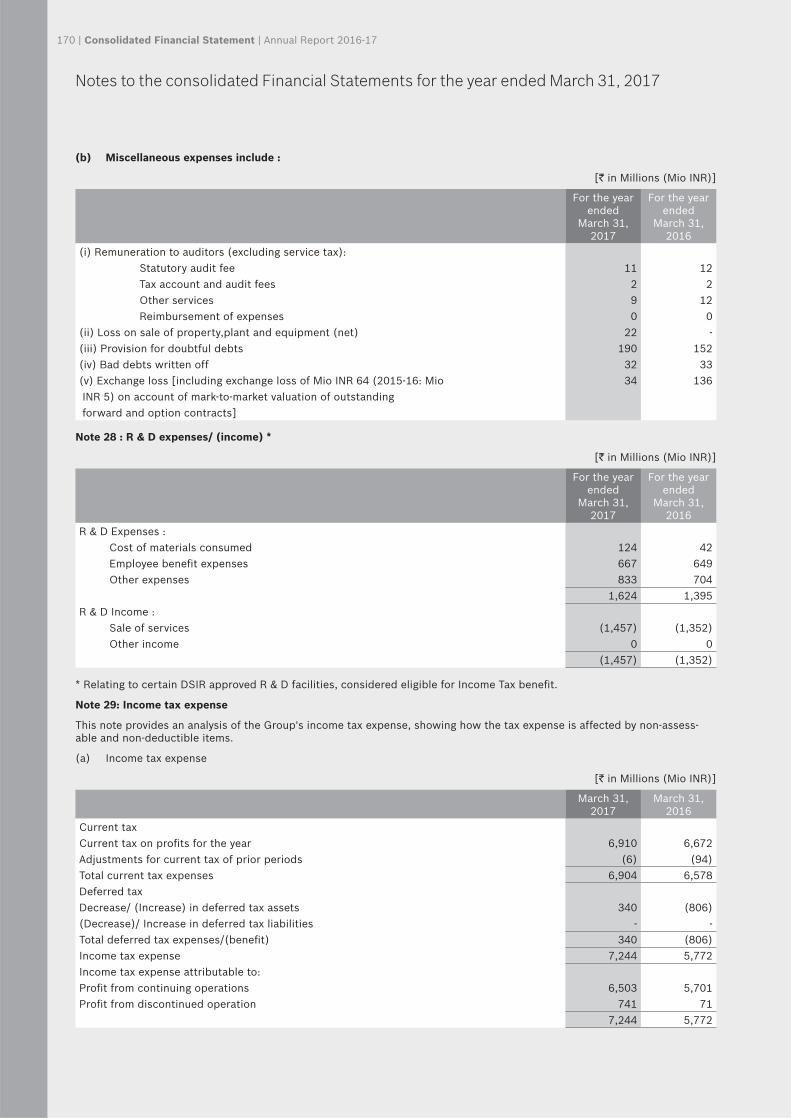
170 | Consolidated Financial Statement | Annual Report 2016-17
(b) Miscellaneous expenses include :
[` in Millions (Mio INR)]
For the year ended
March 31, 2017
For the year ended
March 31, 2016
(i) Remuneration to auditors (excluding service tax): Statutory audit fee 11 12 Tax account and audit fees 2 2 Other services 9 12 Reimbursement of expenses 0 0 (ii) Loss on sale of property,plant and equipment (net) 22 - (iii) Provision for doubtful debts 190 152 (iv) Bad debts written off 32 33 (v) Exchange loss [including exchange loss of Mio INR 64 (2015-16: Mio 34 136 INR 5) on account of mark-to-market valuation of outstanding forward and option contracts]
Note 28 : R & D expenses/ (income) *
[` in Millions (Mio INR)]
For the year ended
March 31, 2017
For the year ended
March 31, 2016
R & D Expenses : Cost of materials consumed 124 42 Employee benefit expenses 667 649 Other expenses 833 704
1,624 1,395 R & D Income : Sale of services (1,457) (1,352) Other income 0 0
(1,457) (1,352)
* Relating to certain DSIR approved R & D facilities, considered eligible for Income Tax benefit.
Note 29: Income tax expense
This note provides an analysis of the Group's income tax expense, showing how the tax expense is affected by non-assess-able and non-deductible items.
(a) Income tax expense
[` in Millions (Mio INR)]
March 31, 2017
March 31, 2016
Current taxCurrent tax on profits for the year 6,910 6,672 Adjustments for current tax of prior periods (6) (94)Total current tax expenses 6,904 6,578 Deferred taxDecrease/ (Increase) in deferred tax assets 340 (806)(Decrease)/ Increase in deferred tax liabilities - - Total deferred tax expenses/(benefit) 340 (806)Income tax expense 7,244 5,772 Income tax expense attributable to:Profit from continuing operations 6,503 5,701 Profit from discontinued operation 741 71
7,244 5,772
Notes to the consolidated Financial Statements for the year ended March 31, 2017

Annual Report 2016-17 | Consolidated Financial Statement | 171
(b) Reconciliation of tax expenses and the accounting profit multiplied by tax rate:
[` in Millions (Mio INR)]March 31,
2017March 31,
2016Profit from continuing operations before income tax expense 20,944 20,824 Profit from discontinuing operation before income tax expense 3,711 262
24,655 21,086 Tax at the Indian tax rate of 34.608% (2015-16: 34.608%) 8,533 7,297 Effect of non-deductible expense 379 164 Effect of exempt other income/ weighted deduction (1,338) (1,165)Effect of difference in tax rate for long term capital gain on sale of business (324) - Adjustments for current tax of prior periods (6) (94)Previously unrecognised tax losses used to reduce deferred tax expense (i) - (430)Income tax expense 7,244 5,772
(i) The Group has reviewed previously unrecognised capital losses and determined that it is now probable that taxable capital profits will be available against which the capital losses can be utilised. As a consequence, a deferred tax asset of Mio INR 430 was recognised for these losses during the year ended March 31, 2016.
Note 30: Employee Retirement Benefits:Disclosure on Retirement Benefits as required in Indian Accounting Standard (Ind AS) 19 on "Employee Benefits" are given below:
(a) Post Employment Benefit - Defined Contribution Plans
The Group has recognised an amount of Mio INR 287 (2015-16: Mio INR 315) as expense under the defined contribution plans in the Statement of Profit and Loss.
(b) Post Employment Benefit - Defined Benefit Plans
The Group makes annual contributions to the Bosch Employees' Gratuity Fund and makes monthly contributions to Bosch Employees (Bangalore) Provident Fund Trust and Bosch Workmen's (Nashik) Provident Fund Trust, funded defined benefit plans for qualifying employees.
The Gratuity Scheme provides for lumpsum payment to vested employees at retirement/death while in employment or on termination of employment of an amount equivalent to 15 days salary payable for each completed year of service or part thereof in excess of six months. Vesting occurs only upon completion of five years of service, except in case of death or permanent disability.
The Provident Fund Scheme provides for lumpsum payment/transfer to the member employees at retirement/ death while in employment or on termination of employment of an amount equivalent to the credit standing in his account maintained by the Trusts. The present value of the defined benefit obligation and the related current service cost are measured using the projected unit credit method with actuarial valuation being carried out at each balance sheet date.
(c) Total expense recognised in the statement of profit and loss
[` in Millions (Mio INR)]Provident Fund Gratuity
March 31, 2017
March 31, 2016
March 31, 2017
March 31, 2016
Current service cost 347 346 159 158 Net interest costa. Interest expense on defined benefit obligation (DBO) 617 564 276 276 b. Interest (income) on plan assets (617) (564) (275) (246)c. Total net interest cost - - 1 30 Defined benefit cost included in statement of profit and loss 347 346 160 188
(d) Remeasurement effects recognised in other comprehensive income (OCI)
[` in Millions (Mio INR)]Gratuity
March 31, 2017
March 31, 2016
a. Actuarial (gain)/ loss due to demographic assumption changes in DBO 3 - b. Actuarial (gain)/ loss due to financial assumption changes in DBO 96 123 c. Actuarial (gain)/ loss due to experience on DBO 175 (155)d. Return on plan assets (greater)/ less than discount rate (107) (27)Total actuarial (gain)/ loss included in OCI 167 (59)
Notes to the consolidated Financial Statements for the year ended March 31, 2017

172 | Consolidated Financial Statement | Annual Report 2016-17
[` in Millions (Mio INR)]Provident Fund
March 31, 2017
March 31, 2016
a. Actuarial (gain)/ loss on liability (257) (21)b. Actuarial (gain)/ loss on plan assets 257 21 Total actuarial (gain)/ loss included in OCI - -
(e) Total cost recognised in comprehensive income[` in Millions (Mio INR)]
Provident Fund GratuityMarch 31,
2017March 31,
2016March 31,
2017March 31,
2016Cost recognised in statement of profit and loss 347 346 160 188 Remeasurements effects recognised in OCI - - 167 (59)Total cost recognised in comprehensive Income 347 346 327 129
(f) Change in defined benefit obligation[` in Millions (Mio INR)]
GratuityMarch 31,
2017March 31,
2016Defined benefit obligation as at the beginning of the year 3,772 3,712 Service cost 159 158 Interest cost 276 276 Benefit payments from plan assets (180) (342)Acquisition / divestiture (306) - Actuarial (gain)/ loss - demographic assumptions 3 - Actuarial (gain)/ loss - financial assumptions 96 123 Actuarial (gain)/ Loss - experience 176 (155)Defined benefit obligation as at year end 3,996 3,772
[` in Millions (Mio INR)]Provident Fund
March 31, 2017
March 31, 2016
Defined benefit obligation as at the beginning of the year 7,950 7,061 Current service cost 347 346 Interest cost 617 564 Benefits paid and transfer out (797) (884)Transfer in 41 53 Participant contributions 839 831 Actuarial (gain)/ loss (257) (21)Defined benefit obligation as of current year end 8,740 7,950
(g) Change in fair value of plan assets[` in Millions (Mio INR)]
Provident Fund GratuityMarch 31,
2017March 31,
2016March 31,
2017March 31,
2016Fair value of plan assets at end of prior year 7,950 7,061 3,642 2,947 Expected return on plan assets 617 564 275 246 Employer contributions 347 346 278 763 Participant contributions 839 831 - - Benefit payments from plan assets - - (180) (342)Transfer in/ transfer out 41 53 - - Settlements (797) (884) - - Acquisition/ divestiture - - (248) - Actuarial gain/ (loss) on plan assets (257) (21) 107 28 Fair value of plan assets at end of year 8,740 7,950 3,874 3,642
Notes to the consolidated Financial Statements for the year ended March 31, 2017

Annual Report 2016-17 | Consolidated Financial Statement | 173
(h) Net defined benefit asset/ (liability)[` in Millions (Mio INR)]
Provident Fund GratuityMarch 31,
2017March 31,
2016March 31,
2017March 31,
2016Defined benefit obligation 8,740 7,950 3,996 3,772 Fair value of plan assets 8,740 7,950 3,874 3,642 (Surplus)/ deficit recognised in balance sheet - - 122 130
(i) Expected Group contributions for the next year[` in Millions (Mio INR)]
Provident Fund GratuityMarch 31,
2017March 31,
2016March 31,
2017March 31,
2016Expected Group contributions for the next year 573 579 230 225
(j) Reconciliation of amounts in balance sheet[` in Millions (Mio INR)]
GratuityMarch 31,
2017March 31,
2016Net defined benefit liability (asset) at prior year end 130 764 Defined benefit cost included in statement of profit and loss 160 188 Total remeasurements included in OCI 167 (59)Acquisition/ divestment (57) - Employer contributions (278) (763)Net defined benefit liability (asset) 122 130
(k) Reconciliation of Statement of Other Comprehensive Income[` in Millions (Mio INR)]
Provident Fund GratuityMarch 31,
2017March 31,
2016March 31,
2017March 31,
2016Cumulative OCI - (Income)/Loss, Beginning of Period - - (59) - Total remeasurements included in OCI - - 167 (59)Cumulative OCI - (Income)/Loss - - 108 (59)
(l) Current/ non current liability
[` in Millions (Mio INR)]
Provident Fund Gratuity
March 31, 2017
March 31, 2016
April 1, 2015
March 31, 2017
March 31, 2016
April 1, 2015
Current liability - - - - - -
Non current liability - - - 122 130 765
Total - - - 122 130 765
(m) Assumptions :
Provident Fund GratuityMarch 31,
2017March 31,
2016March 31,
2017March 31,
2016Discount factor [refer note (i) below] 7.30% 7.55% 7.30% 7.55%Weighted average rate of escalation in salary per annum [refer note (ii) below] NA NA 10.6% 10.7%
Notes:
(i) The discount rate is based on the prevailing market yield on Government Bonds as at the balance sheet date for the estimated term of obligations.
(ii) The estimate of future salary increases considered in actuarial valuation takes into account inflation, seniority, promotion and other relevant factors such as supply and demand in the employment market.
Notes to the consolidated Financial Statements for the year ended March 31, 2017

174 | Consolidated Financial Statement | Annual Report 2016-17
(n) Sensitivity analysis on defined benefit obligation
[` in Millions (Mio INR)]
Gratuity
March 31, 2017
March 31, 2016
April 1, 2015
Discount rate
a. Discount rate - 50 basis points 4,151 3,974 3,974
b. Discount rate + 50 basis points 3,805 3,587 3,531
Weighted average increase in salary
a. Rate - 50 basis points 3,854 3,694 3,682
b. Rate + 50 basis points 4,095 3,854 3,791
The above sensitivity analysis are based on a change in an assumption while holding all other assumptions constant. In practice, this is unlikely to occur.
This sensitivity analysis shows how the defined benefit obligation would have been affected by changes in the relevant actuarial assumption that were reasonably possible at that date.
(o) Plan assets
Provident Fund Gratuity
March 31, 2017
March 31, 2016
April 1, 2015
March 31, 2017
March 31, 2016
April 1, 2015
% Invested % Invested % Invested % Invested % Invested % Invested
Government Securities (Central and State) 49 52 52 49 53 52
Corporate Bonds (including Public Sector bonds) 39 44 44 33 33 30
Mutual Funds 2 0 - 2 0 -
Cash and bank balances (including Special Deposits Scheme, 1975) 10 4 4 16 14 18
Total 100 100 100 100 100 100
(p) Expected future cashflows
The weighted average duration of the defined benefit obligation is 14.45 years (2015-16 -11.25 years). The expected maturity analysis is as follows:
[` in Millions (Mio INR)]
Provident Fund Gratuity
March 31, 2017
March 31, 2016
April 1, 2015
March 31, 2017
March 31, 2016
April 1, 2015
Within 1 year 338 305 270 231 225 249
Between 1-2 years 401 367 332 235 215 250
Between 2-5 years 1,627 1,522 1,413 699 649 672
From 6 to 10 8,558 8,237 4,080 1,869 1,566 1,432
Total 10,924 10,431 6,095 3,034 2,655 2,603
Notes to the consolidated Financial Statements for the year ended March 31, 2017

Annual Report 2016-17 | Consolidated Financial Statement | 175
Note 31: Fair value measurements:
(i) Financial instruments by category and hierarchy This section explains the judgements and estimates made in determining the fair values of the financial instruments that are (a) recognised and measured at fair value and (b) measured at amortised cost and for which fair values are disclosed in the financial statements. To provide an indication about the reliability of the inputs used in determining fair value, the Group has classified its financial instruments into the three levels prescribed under the Accounting Standard. An explanation of each level follows underneath the table.
[` in Millions (Mio INR)]
Level March 31, 2017 March 31, 2016 April 1, 2015
FVPL FVOCI Amortised cost FVPL FVOCI Amortised
cost FVPL FVOCI Amortised cost
Financial assetsInvestments - Equity instruments 1 - 5,993 - - 4,483 - - 5,347 - - Bonds 1 - - 5,212 - - 5,207 - - 5,012 - Mutual funds 1 27,885 - - 34,629 - - 24,378 - - Interest accrued on financial assets at amortised cost 3 - - 782 - - 1,202 - - 1,140 Trade receivables 3 - - 11,862 - - 13,225 - - 11,984 Loans 3 - - 4,379 - - 4,248 - - 3,968 Cash and cash equivalents - - 1,312 - - 985 - - 1,304 Other bank balances - - 15,865 - - 17,331 - - 17,657 Inter-corporate deposit 3 - - 6,800 - - 6,150 - - 5,250 Deposits with maturity of more than 12 months 3 - - - - - 100 - - - Others (include non-trade receivables, etc.) 3 - - 373 - - 270 - - 352 Total financial assets 27,885 5,993 46,585 34,629 4,483 48,718 24,378 5,347 46,667 Financial liabilitiesBorrowings [refer note (a) below] 3 - - - - - 500 - - 1,109Trade payables 3 - - 13,399 - - 13,088 - - 12,036 Unpaid dividend 3 - - 34 - - 30 - - 25 Book overdraft - - 23 - - 26 - - 13 Other payables (includes employee dues, etc.) 3 - - 2,367 - - 2,580 - - 2,571 Capital creditors 3 - - 305 - - 442 - - 361 Derivative liabilities 2 79 - - 15 - - 10 - - Total financial liabilities 79 - 16,128 15 - 16,666 10 - 16,115
Note (a) : The amount includes current portion of sales tax deferral.
Level 1: Level 1 hierarchy includes financial instruments measured using quoted prices. This includes listed equity instruments, tax free bonds and mutual funds that have quoted price. The fair value of all equity instruments which are traded in the stock exchanges in valued using the closing price as at the reporting period. The mutual funds are valued using the closing NAV.
Level 2: The fair value of financial instruments that are not traded in an active market (for market, traded bonds, over-the-counter derivatives) is determined using valuation techniques which maximise the use of observable market data and rely as little as possible on entity-specific estimates. If all significant inputs required to fair value an instrument are observable, the instrument is included in level 2.
Level 3: If one or more of the significant inputs is not based on observable market data, the instrument is included in Level 3.
There are no transfers between levels during the year.
(ii) Valuation technique used to determine fair valueSpecific valuation techniques used to value financial instruments include:
- the fair value of forward foreign exchange contracts is determined using forward exchange rates at the balance sheet date
- the fair value of remaining financial instruments is determined using the discounted cash flow analysis
Notes to the consolidated Financial Statements for the year ended March 31, 2017

176 | Consolidated Financial Statement | Annual Report 2016-17
(iii) Valuation processThe finance and accounts department of the Group performs the valuation of financial assets and liabilities required for financial reporting purposes, and report to the Executive Director (ED). Discussions on valuation processes and results are held between the ED and valuation team at least once every three months, in line with the Group's quarterly reporting periods.
The main level 3 inputs are derived and evaluated as follows:
a) Discount rate for sales tax deferral loan are determined using risk free rate.
b) Discount rate for loans to employees are determined using prevailing bank lending rate.
c) The fair values of financial assets and liabilities are determined using the discounted cash flow analysis.
(iv) Fair value of financial assets and liabilities measured at amortised cost[` in Millions (Mio INR)]
March 31, 2017 March 31, 2016 April 1, 2015Carrying amount Fair value Carrying
amount Fair value Carrying amount Fair value
Financial assetsQuoted tax free bonds 5,212 5,546 5,207 5,533 5,012 5,351 Loans 1,174 1,174 1,422 1,422 1,670 1,670 Total financial assets 6,386 6,720 6,629 6,955 6,682 7,021 Financial liabilitiesBorrowings - - 149 149 542 542 Other financial liabilities 60 60 50 50 64 64 Total financial liabilities 60 60 199 199 606 606
With respect to trade receivables, other receivables, inter-corporate deposit, current portion of loans, cash and cash equivalents, other bank balance, trade payables, capital creditors, employee payables and current maturities of long-term debt, the carrying amount is considered to be the same as their fair value due to their short-term nature.
Note 32: Financial risk management
The Group's activities expose it to market risk, liquidity risk and credit risk. In order to minimise any adverse effects on the financial performance of the Group, derivative financial instruments, such as foreign exchange forward contracts and foreign currency option contracts are entered into by the Group to hedge certain foreign currency exposure. Derivatives are used exclusively for hedging and not as trading or speculative instruments.
(A) Credit Risk
Credit risk arises from cash and cash equivalents, instruments carried at amortised cost and deposits with banks, as well as credit exposures to customers including outstanding receivables.
(i) Credit risk management
Credit risk on cash and cash equivalents is limited as the Group generally invests in deposits with banks which have high credit ratings assigned by external agencies. Investments primarily include investment in debt based mutual funds whose portfolios have instruments with high credit rating and government bonds. The board of directors periodically review the investment portfolio of the Group. Credit risk on loans given to fellow subsidiaries is guaranteed by the holding company. Credit risk with respect to trade receivable is managed by the Group through setting up credit limits for customers and also periodically reviewing the credit worthiness of major customers.
Expected credit loss for trade receivables under simplified approach
[` in Millions (Mio INR)]
March 31, 2017 March 31, 2016 April 1, 2015 Less than 6
months More than 6
months Less than 6
months More than 6
months Less than 6
months More than 6
months Gross carrying amount 11,300 1,260 13,095 688 11,767 621 Expected credit losses (Loss allowance provision) (63) (635) (127) (431) (64) (340)Carrying amount of trade receivables (net of impairment) 11,237 625 12,968 257 11,703 281
The gross carrying amount of trade receivables is Mio INR 12,560 (March 31, 2016 - Mio INR 13,783, April 1, 2015 - Mio INR 12,388). During the period, the Group made no significant write-offs of trade receivables and it does not expect to receive future cash flows or recoveries from trade receivables previously written off.
Notes to the consolidated Financial Statements for the year ended March 31, 2017

Annual Report 2016-17 | Consolidated Financial Statement | 177
(ii) Reconciliation of loss allowance provision - Trade Receivables[` in Millions (Mio INR)]
Loss allowance as at April 1, 2015 404 Changes in loss allowance 154 Loss allowance as at March 31, 2016 558 Changes in loss allowance 140 Loss allowance as at March 31, 2017 698
(B) Liquidity risk
Prudent liquidity risk management implies maintaining sufficient cash and marketable securities and the availability of funding through an adequate amount of internal financing by way of daily cash flow projection to meet obligations when due and to close out market positions. Due to the dynamic nature of the underlying businesses, the Group treasury maintains flexibility in funding by maintaining availability of funds.
Management monitors daily and monthly rolling forecasts of the Group's liquidity position and cash and cash equivalents on the basis of expected cash flows. This is generally carried in accordance with standard guidelines. The Group has liquidity reserves in the form of highly liquid assets like cash and cash equivalents, debt based mutual funds, deposit accounts, etc.
(i) Financing arrangements: The Group had access to the following undrawn borrowing facilities at the end of the reporting period
[` in Millions (Mio INR)]
March 31, 2017
March 31, 2016
April 1, 2015
Floating rate - Expiring within one year (bank overdraft and other facilities) 20 20 200 - Expiring beyond one year (bank loans) - - -
20 20 200
(ii) Maturity of Financial liabilities
The table below summarises the Group's financial liabilities into relevant maturity groupings based on their contractual maturities for:
a) All non-derivative financial liabilities
b) Net and gross settled derivative financial instruments for which the contractual maturities are essential for an understanding of the timing of the cash flows
The amounts disclosed in the table are the contractual undiscounted cash flows. Balance due within 12 months equal their carrying balances as the impact of discounting is not significant.
[` in Millions (Mio INR)]
March 31, 2017 March 31, 2016 April 1, 2015 Less than More than Less than More than Less than More than
1 year 1 year 1 year 1 year 1 year 1 year Borrowings - - 351 191 567 542 Trade payables 13,399 - 13,088 - 12,036 - Other financial liabilities 2,748 60 3,043 50 2,916 64 Total non-derivative liabilities 16,147 60 16,482 241 15,519 606
Foreign exchange forward contracts 2,763 - 616 - 1,021 - Options contracts - - 831 - 902 - Total derivative liabilities 2,763 - 1,447 - 1,923 -
(C) Market risk
(i) Foreign currency risk
The Group is exposed to foreign exchange risk arising from foreign currency transactions, primarily with respect to USD and EUR. Foreign exchange risk arises from future commercial transactions and recognised assets and liabilities denominated in a currency that is not the Group's functional currency (INR). The risk is measured through a forecast of highly probable foreign currency cash flows. The objective of the hedges is to minimise the volatility of the INR cash flows of highly probable forecast transaction.
The Group imports and exports goods and services which are predominantly denominated in USD and EUR. This exposes the Group to foreign currency risk. To minimise this risk, the Group hedges using forward contracts and foreign currency option contracts on a net exposure basis.
Notes to the consolidated Financial Statements for the year ended March 31, 2017

178 | Consolidated Financial Statement | Annual Report 2016-17
(a) Foreign currency risk exposure: The Group exposure to foreign currency risk at the end of the reporting period expressed in Mio INR are as follows:
[` in Millions (Mio INR)]
March 31, 2017 March 31, 2016 April 1, 2015
USD EUR USD EUR USD EUR
Financials assets
Trade receivables 1,141 112 1,990 211 2,311 204
Exposure to foreign currency risk - assets 1,141 112 1,990 211 2,311 204
Financial liabilities
Trade payables 4,681 1,489 4,738 2,778 5,410 3,125
Exposure to foreign currency risk - liabilities 4,681 1,489 4,738 2,778 5,410 3,125
Derivative liabilities
Foreign exchange forward contracts 2,763 - 616 - 1,021 -
Foreign currency option contracts - Buy Option Contract - - 831 - 902 -
Net exposure to foreign currency risk 777 1,377 1,301 2,567 1,176 2,921
(b) Sensitivity: The sensitivity of profit or loss to changes in the exchange rates arises mainly from foreign currency denominated financial instruments:
[` in Millions (Mio INR)]
Impact on profit after tax
March 31, 2017
March 31, 2016
USD Sensitivity
INR/USD - Increase by 1% (March 31, 2016 - 1 %)* (8) (21)
INR/USD - Decrease by 1% (March 31, 2016 - 1%)* 8 21
EUR Sensitivity
INR/EUR - Increase by 1% (March 31, 2016 - 1%)* (14) (26)
INR/EUR - Decrease by 1% (March 31, 2016 - 1%)* 14 26
* Holding all other variable constant
(ii) Cash flow and fair value interest rate risk
(a) Interest rate risk exposure: The Group does not have interest bearing borrowings and interest rate risk is towards opportunity cost on investment in tax free bonds. The Group analyses it based on the sensitivity analysis and manages it by portfolio diversification.
(b) Sensitivity: Profit or loss is sensitive to changes in interest rate for tax free bonds. A change in the market interest level by 100 basis points would have the following effect on the profit after tax:
[` in Millions (Mio INR)]
Impact on profit after tax
March 31, 2017
March 31, 2016
Interest rates - increase by 100 basis points* 338 337
Interest rates - decrease by 100 basis points* (338) (337)
* Holding all other variables constant
(iii) Price risk
(a) Exposure: The Group has invested in equity securities and the exposure is equity securities price risk from investments held by the Group and classified in the balance sheet as fair value through OCI.
Notes to the consolidated Financial Statements for the year ended March 31, 2017

Annual Report 2016-17 | Consolidated Financial Statement | 179
(b) Sensitivity: The table below summarises the impact of increase/decrease of the index in the Group’s equity and impact on OCI for the period. The analysis is based on the assumption that the equity index had increased/ decreased by 10% with all other variables held constant, and that all the Group's equity instruments moved in line with the index.
[` in Millions (Mio INR)]
Impact on other components of equity
March 31, 2017
March 31, 2016
Price - increase by 10% 599 448 Price - decrease by 10% (599) (448)
Other components of equity would increase/decrease as a result of gains/ (losses) on equity securities classified as fair value through other comprehensive income.
Note 33: Capital management
(a) Risk management
The Group has equity capital and other reserves attributable to the equity shareholders, as the only source of capital and the Group does not have any interest bearing borrowings/ debts.
(b) Dividends
[` in Millions (Mio INR)]
March 31, 2017
March 31, 2016
(i) Dividends recognisedFinal dividend for the year ended March 31, 2016 of INR 85/- (March 31, 2015 - INR 85/-) per fully paid share
Interim dividend for the year ended March 31, 2017 of INR 75/- (March 31, 2016 - Nil)
2,669
2,289
2,669
-
4,958 2,669 (ii) Dividends not recognised at the end of the reporting period In addition to the above dividends, since the year ended the directors have recommended the payment of a final dividend of INR 90/- per fully paid equity share (March 31, 2016 - INR 85/-). This proposed dividend is subject to the approval of shareholders in the ensuing annual general meeting 2,747 2,669
2,747 2,669
Note 34: Discontinued operation :Consequent to the approvals received from the Board of Directors on February 5, 2016 and from the shareholders on April 4, 2016, the Group has executed a Business Transfer Agreement on August 1, 2016 and has sold/ transferred the business of Starter Motors and Generators under the automotive products segment of the Group on a going concern basis by way of Slump sale to Robert Bosch Starter Motors Generators India Private Limited, a fellow subsidiary. Gain on sale of business amounting to Mio INR 3,971 has been recognised during the current year and disclosed under discontinued operation in the statement of profit and loss.
(a) Financial performance and cash flow information:
The financial performance and cash flow information presented are for the period ended August 1, 2016 (March 31, 2017 column) and the year ended March 31, 2016:
[` in Millions (Mio INR)]
March 31, 2017
March 31, 2016
Revenue including other income 3,284 9,817 Expenses (3,544) (9,555)Profit before income tax (260) 262 Income tax (expense)/ credit 90 (71)Profit after income tax (170) 191 Gain on sale of division after income tax [refer note (b) below] 3,140 - Profit from discontinued operation [refer note (i) below] 2,970 191 Other comprehensive income from discontinued operation - - Net cash flow from operating activities (170) 418 Net cash flow from investing activities (from sale of business) 4,376 - Net cash flow from financing activities - - Net cash generated from discontinued operation 4,206 418
Notes to the consolidated Financial Statements for the year ended March 31, 2017

180 | Consolidated Financial Statement | Annual Report 2016-17
(b) Details of sale of business:
[` in Millions (Mio INR)]
March 31, 2017
March 31, 2016
Consideration received 4,376 -
Carrying amount of net assets sold (405) -
Gain on sale before income tax 3,971 -
Income tax expense on gain (831) -
Gain on sale after income tax 3,140 -
(c) The carrying amount of assets and liabilities as at the date of transfer (August 1, 2016) are as follows:
[` in Millions (Mio INR)]
August 1, 2016
Property, plant and equipment 311
Capital work-in-progress 28
Trade receivable 1,013
Inventories 1,014
Employee loans 47
Other current assets 104
Total Assets 2,517
Trade payables (1,282)
Other financial liablilities (40)
Provision for employee benefits (310)
Trade demand and others (480)
Total Liabilities (2,112)
Net assets 405
(d) There are no assets and liablities of disposal group to be classified as assets held for sale on either of the reporting dates.
Note 35 : Related Party Disclosure :
Holding Company : Robert Bosch GmbH, Federal Republic of Germany
Whole time directors : Dr. Steffen Berns (till December 31, 2016), Mr. Soumitra Bhattacharya, Dr. Andreas Wolf and Mr. Jan Oliver Röhrl (from February 11, 2017)
Non-whole time directors : Mr. V.K. Viswanathan, Mr. Peter Tyroller, Mr. Bernhard Steinruecke, Mr. Prasad Chandran, Ms. Renu S. Karnad and Mr. Bhaskar Bhat
Other related entities: Bosch India Foundation
(a) Key management personnel compensation:
[` in Millions (Mio INR)]
March 31, 2017
March 31, 2016
Short-term employee benefits 157 145
Post-employment benefits 6 6
163 151
Notes to the consolidated Financial Statements for the year ended March 31, 2017

Annual Report 2016-17 | Consolidated Financial Statement | 181
(b) Related Party transactions/ balances - summary:
[` in Millions (Mio INR)]
Particulars Holding Company
Fellow Subsidiary
Employees' Benefit
plans where there is
significant influence
Key Management
Personnel
Other related entities
Total
Net sale of product 3,809 3,487 7,296
(4,856) (3,159) (8,015)
Sale of services 903 656 1,559
(648) (651) (1,299)
Rental income 875 875
(493) (493)
Consideration towards sale of business - 4,376 4,376
(22) (-) (22)
Miscellaneous income (including reimbursements received) 82 462 544
(84) (512) (596)
Interest earned 352 352
(352) (352)
Purchases of :
Property, plant and equipment 1,382 550 1,932
(455) (242) (697)
Goods 10,874 12,458 23,332
(11,293) (10,082) (21,375)
Dividend paid 3,479 34 3,513
(1,900) (-) (1,900)
Amount paid for shares bought back 19,244 19,244
(-) (-)
Services received:
Royalty and technical service fee 0 1,639 1,639
(-) (1,597) (1,597)
Professional, consultancy and other charges 1,693 1,170 2,863
(1,456) (1,099) (2,555)
Liability written back 10 310 320
(-) (-) -
Donation expense 73 73
(64) (64)
Loan given during the year (*) 2,560 2,560
(950) (950)
Loan repaid during the year 2,300 2,300
(700) (700)
Loan to related parties (*) 3,560 3,560
As at March 31, 2016 (3,300) (3,300)
As at April 1, 2015 (3,050) (3,050)
Trade receivables 426 1,102 1,528
As at March 31, 2016 (621) (1,054) (1,675)
As at April 1, 2015 (648) (1,516) (2,164)
Other financial assets (non-trade receivables) 51 301 352
As at March 31, 2016 (10) (201) (211)
As at April 1, 2015 (62) (198) (260)
(*) Against guarantee given by Robert Bosch GmbH, Federal Republic of Germany, the holding company.
Notes to the consolidated Financial Statements for the year ended March 31, 2017

182 | Consolidated Financial Statement | Annual Report 2016-17
[` in Millions (Mio INR)]
Particulars Holding Company
Fellow Subsidiary
Employees' Benefit
plans where there is
significant influence
Key Management
Personnel
Other related entities
Total
Trade payables 2,178 5,449 7,627
As at March 31, 2016 (2,875) (4,851) (7,726)
As at April 1, 2015 (3,502) (3,590) (7,092)
Other financial liabilities 62 38 7 107
As at March 31, 2016 (71) (45) (64) (180)
As at April 1, 2015 (30) (4) (33) (67)
Contributions made to Employees' Benefit plans 764 764
(1,251) (1,251)
Managerial Remuneration:
Dr. Steffen Berns (upto December 31, 2016) 49 49
(63) (63)
Mr. Soumitra Bhattacharya 46 46
(42) (42)
Dr. Andreas Wolf 50 50
(36) (36)
Mr. Jan Oliver Röhrl (from February 11, 2017) 8 8
(-) (-)
Sitting fees/ commissions to non-executive 10 10
directors (10) (10)
Unpaid Bonus/ Commission as at the year end 10 10
As at March 31, 2016 (45) (45)
As at April 1, 2015 (35) (35)
Loan and Advances transactions :
Loan/Advances given during the year 4 4
(3) (3)
Recovery during the year 4 4
(4) (4)
Amount outstanding at the year end 3 3
As at March 31, 2016 (3) (3)
As at April 1, 2015 (4) (4)
Figures in brackets relate to previous year.
Notes to the consolidated Financial Statements for the year ended March 31, 2017

Annual Report 2016-17 | Consolidated Financial Statement | 183
(c) Names and details of fellow subsidiaries having transaction value in excess of 10% in line transactions during the year:
[` in Millions (Mio INR)]
Particulars Name of the related party March 31, 2017
March 31, 2016
Sale of services Robert Bosch Automotive Steering LLC, United States - 151
Bosch Automotive Service Solutions Inc., United States 190 -
Rental income Robert Bosch Engineering and Business Solutions Pvt. Ltd., India 719 402
Bosch Automotive Electronics India Pvt. Ltd., India 135 91
Purchase consideration towards sale of business
Robert Bosch Starter Motors Generators India Pvt. Ltd., India 4,376 -
Miscellaneous income (including reimbursements received)
Bosch Automotive Diesel Systems Co., Ltd., China - 70
Robert Bosch Engineering and Business Solutions Pvt. Ltd., India 133 101
Bosch Automotive Electronics India Pvt. Ltd., India 63 125
Interest earned Bosch Rexroth (India) Pvt. Ltd., India 278 306
Purchase of goods Bosch Automotive Electronics India Pvt. Ltd., India 3,826 3,488
Purchase of property, plant and equipment Moehwald GmbH, Germany 239 -
Bosch Sanayi ve Ticaret A.S., Turkey 226 -
Professional, consultancy and other charges received
Robert Bosch Engineering and Business Solutions Pvt. Ltd., India 845 803
Royalty and technical service fee Bosch Technology Licensing Administration GmbH, Germany 1,182 1,081
Robert Bosch Asset Managing C.V., Netherlands 435 502
Loan given BSH Household Appliances Manufacturing Pvt. Ltd., India 100 400
Bosch Rexroth (India) Pvt. Ltd., India 1,100 500
Loan repaid Bosch Rexroth (India) Pvt. Ltd., India 950 700
Contributions made Bosch Employees' Gratuity Fund., India 278 763
Bosch Superannuation Fund Trust., India 137 138
Bosch Employees (Bangalore) Provident Fund Trust., India 270 270
Bosch Workmen's (Nashik) Provident Fund Trust., India 77 76
Note 36: LeasesInformation on leases as per Indian Accounting Standard(Ind AS) 17 on "Leases":
(a) Operating Lease Expense :
The Group has various operating leases for office facilities, warehouses, guest houses and residential premises for employees that are renewable on a periodic basis. Rental expenses for operating leases recognised in the Statement of Profit and Loss for the year is Mio INR 549 (2015-16: Mio INR 541).
Disclosure in respect of Non-cancellable lease is as given below
[` in Millions (Mio INR)]
March 31, 2017
March 31, 2016
April 1, 2015
Future minimum lease payments - Not later than 1 year 144 123 90 - Later than 1 year and not later than 5 years 278 314 136 - Later than 5 years - 61 5
Notes to the consolidated Financial Statements for the year ended March 31, 2017

184 | Consolidated Financial Statement | Annual Report 2016-17
(b) Operating Lease Income :
The Group has leased out certain office spaces that are renewable on a periodic basis. All leases are cancellable with 3 months notice. Rental income received during the year in respect of operating lease is Mio INR 875 (2015-16: Mio INR 493). Details of assets given on operating lease as at year end are as below.
[` in Millions (Mio INR)]
Gross Block Accumulated Depreciation Written down value Depreciation for the
year
March 31, 2017
March 31, 2016
March 31, 2017
March 31, 2016
March 31, 2017
March 31, 2016
March 31, 2017
March 31, 2016
Land 38 3 - - 38 3 - -
Buildings 2,041 1,846 265 69 1,776 1,777 194 69
Plant and machinery 458 308 197 56 261 252 141 56
Furniture and fixtures - 0 0 0 0 0 1 0
Office equipment 2 1 2 1 - - - 1
Total 2,539 2,158 464 126 2,075 2,032 336 126
Note 37: Research and Development expenses
Total gross Research and Development expenditure recognised in the Statement of Profit and Loss (including amounts shown under Note 4 and Note 28 to the Financial Statements) amounts to Mio INR 2,961 (2015-16: Mio INR 1,741)
Note 38: Earnings Per Share
(a) Basic and diluted earnings per share
[` in Millions (Mio INR)]
For the year ended
March 31, 2017
For the year ended
March 31, 2016
Profit attributable to Equity Shareholders from continuing operations 14,432 15,145
Profit attributable to Equity Shareholders from discontinued operation 2,970 191
Weighted average number of Equity Shares outstanding during the year 31,042,824 31,398,900
Nominal value of Equity Shares (Rs.) 10 10
Basic and Diluted earnings per Share (Rs.) from continuing operations 465 482
Basic and Diluted earnings per Share (Rs.) from discontinued operation 96 6
Basic and Diluted earnings per Share (Rs.) from continuing operations and discontinued operation 561 488
(b) Reconciliation of earnings used in calculating earnings per share
[` in Millions (Mio INR)]
For the year ended
March 31, 2017
For the year ended
March 31, 2016
Profit attributable to the equity holders of the Group used in calculating basic earnings per share:
From continuing operations 14,432 15,145
From discontinued operation 2,970 191
(c) Weighted average number of shares used as the denominator
For the year ended
March 31, 2017
For the year ended
March 31, 2016
Weighted average number of equity shares used as the denominator in calculating basic and 31,042,824 31,398,900
diluted earnings per share
Notes to the consolidated Financial Statements for the year ended March 31, 2017

Annual Report 2016-17 | Consolidated Financial Statement | 185
Note 39: Contingent liabilities[` in Millions (Mio INR)]
March 31, 2017
March 31, 2016
April 1, 2015
Claims against the Group not acknowledged as debts:(a) Excise/ Customs Net of tax 0 0 0 Gross 0 0 0 (b) Income Tax [refer note (i) below] 370 85 -
(i) Relates to adjustments made by the Income Tax Department for the financial year 2011-12 and 2012-13 which are disputed by the Group and the 'matters are lying under appeal with CIT (Appeals).
Note 40: The Group has a process whereby periodically all long term contracts (including derivative contracts) are assessed for material foreseeable losses. At the year end, the Group has reviewed and ensured that adequate provision as required under any law/ accounting standards for material foreseeable losses on such long term contracts (including derivative contracts) has been made in the books of accounts.
Note 41: Accounting policy of Associate
In case of the Associate company Newtech Filter India Private Limited, it was not practical to use uniform accounting policies for depreciation of assets:
[` in Millions (Mio INR)]
Method of depreciation Written Down Value of Assets of Associate company (Mio INR)
% of total Assets of Associate company with total assets of Group
Straight Line 80 1
The impact of above difference in accounting policies is not considered material.
Note 42: Disclosures mandated by Schedule III to Companies Act, 2013 by way of additional information
[` in Millions (Mio INR)]
Net assets (total assets minus total
liabilities)
Share in profit or (loss)
Share in other comprehensive
income
Share in total comprehensive
income
As a % of consol-
idated net assets
Amount
As a % of consol-
idated net assets
Amount
As a % of consol-
idated net assets
Amount
As a % of consol-
idated net assets
Amount
ParentBosch LimitedMarch 31, 2017 100 87,820 100 17,411 100 1,401 100 18,812 March 31, 2016 100 95,173 100 15,314 100 (825) 100 14,489 SubsidiariesMico Trading Private LimitedMarch 31, 2017 0 1 0 0 0 - 0 - March 31, 2016 0 1 0 0 0 - 0 - Associates[Investment as per the Equity method]Newtech Filter India Private LimitedMarch 31, 2017 0 85 0 (9) 0 - 0 (9)March 31, 2016 0 94 0 22 0 - 0 22
Note 43: Estimated amount of contracts remaining to be executed on capital accounts and not provided for (net of advances)
[` in Millions (Mio INR)]
March 31, 2017
March 31, 2016
April 1, 2015
Property, plant and equipment 2,117 2,007 1,760 Investment properties 159 273 764
Note 44: Advances include dues from directors and officers of the Group 4 4 4
Notes to the consolidated Financial Statements for the year ended March 31, 2017

186 | Consolidated Financial Statement | Annual Report 2016-17
Note 45: First-time adoption of Ind AS
The Group has prepared the financial statements in accordance with Ind AS.
The accounting policies set out in Note 2 have been applied in preparing the financial statements for the year ended March 31, 2017, the comparative information presented in these financial statements for the year ended March 31, 2016 and in the preparation of an opening Ind AS balance sheet as at April 1, 2015 (the Group's date of transition). In preparing its opening Ind AS balance sheet, the Group has adjusted the amounts reported previously in financial statements prepared in accordance with the accounting standards notified under Companies (Accounting Standard) Rules, 2006 (as amended) and other relevant provisions of the Act (previous GAAP or Indian GAAP). An explanation of how the transition from previous GAAP to Ind AS has affected the Group's financial position, financial performance and cash flows is set out in the following tables and notes.
A. Exemptions and exceptions availed
Set out below are the applicable Ind AS 101 optional exemptions and mandatory exceptions applied in the transition from previous GAAP to Ind AS
A.1 Ind AS optional exemptions
A.1.1 Deemed cost
Ind AS 101 permits a first-time adopter to elect to continue with the carrying value for all of its property, plant and equipment as recognised in the financial statements as at the date of transition to Ind AS, measured as per the previous GAAP and use that as its deemed cost as at the date of transition after making necessary adjustments for de-commissioning liabilities. This exemption can also be used for intangible assets covered by Ind AS 38 Intangible Assets and investment properties covered by Ind AS 40 Investment Properties. Accordingly, the Group has elected to measure all its property, plant and equipment, intangible assets and investment properties at their previous GAAP carrying value.
A.1.2 Designation of previously recognised financial instruments
Under Ind AS 109, at initial recognition of a financial asset, an entity may make an irrevocable election to present subsequent changes in the fair value of an investment in an equity instrument in other comprehensive income. Ind AS 101 allows an entity to designate investments in equity instruments at FVOCI on the basis of the facts and circumstances at the date of transition to Ind AS. The Group has elected to apply this exemption for its investment in equity investments.
A.1.3 Business combinations
Ind AS 101 provides the option to apply Ind AS 103 prospectively from the transition date or from a specific date prior to the transition date. Accordingly, the Group has elected to apply Ind AS 103 prospectively to business combinations occuring after its transition date.
A.2 Ind AS mandatory exceptions
A.2.1 Estimates
The Group's estimates in accordance with Ind ASs at the date of transition to Ind AS shall be consistent with estimates made for the same date in accordance with previous GAAP (after adjustments to reflect any difference in accounting policies), unless there is objective evidence that those estimates were in error.
Ind AS estimates as at April 1, 2015 are consistent with the estimates as at the same date made in conformity with previous GAAP. The Group made estimates for following items in accordance with Ind AS at the date of transition as these were not required under previous GAAP:
- Investment in equity instruments carried at FVOCI;
- Investment in debt instruments carried at FVPL; and
- Impairment of financial assets based on expected credit loss method.
A.2.2 Classification and measurement of financial assets
Ind AS 101 requires an entity to assess classification and measurement of financial assets (investment in debt instruments) on the basis of the facts and circumstances that exist at the date of transition to Ind AS.
A.2.3 Government loan at below market rate of interest - Government grant
Ind AS 101 requires a first-time adopter to apply the requirements of Ind AS 109, Financial instruments and Ind AS 20, Accounting for Government Grants and Disclosure of Government Assistance, prospectively to government loans at below market rate of interest obtained after the date of transition to Ind AS. However, Ind AS 101 allows a first time adopter to apply the requirements of Ind AS retrospectively to any government loan originated before the date of transition to Ind AS provided that the information needed to do so had been obtained at the time of initially accounting for that loan. Consequently, if the Group did not under its previous GAAP recognise and measure the government loan at below market rate of interest on a basis consistent with Ind AS requirements, it shall use its previous GAAP carrying amount of the loan at the date of transition to Ind AS as the carrying amount of the loan in the opening Ind AS balance sheet. Accordingly the Group has applied the above requirement prospectively.
B. Reconciliation between previous GAAP and Ind AS
Ind AS 101 requires an entity to reconcile equity, total comprehensive income and cash flows for prior periods. The following tables represent the reconciliation from previous GAAP to Ind AS.
Notes to the consolidated Financial Statements for the year ended March 31, 2017

Annual Report 2016-17 | Consolidated Financial Statement | 187
Reconciliation of balance sheet as at date of transition (April 1, 2015)[` in Millions (Mio INR)]
Note No Previous GAAP* Adjustments Ind AS
A Assets1. Non-current assets
Property, plant and equipment 6,7 9,675 125 9,800 Capital work-in progress 2,760 - 2,760 Investment properties 1,398 - 1,398 Intangible assets 1 - 1 Investments in subsidiary and associate 72 - 72 Financial assets (i) Investments 1 24,672 7,199 31,871 (ii) Loans 2 1,802 (132) 1,670 Deferred tax assets 4,172 - 4,172 Other non-current assets 387 - 387 Total non-current assets 44,939 7,192 52,131
2. Current assetsInventories 7 12,761 (38) 12,723 Financial assets (i) Investments 1 2,650 216 2,866 (ii) Trade receivable 11,984 - 11,984 (iii) Cash and cash equivalents 1,304 - 1,304 (iv) Bank balances other than (iii) above 17,657 - 17,657 (v) Loans 2,298 - 2,298 (vi) Other financial assets 6,742 - 6,742 Other current assets 2 3,811 132 3,943 Total current assets 59,207 310 59,517 Total assets 104,146 7,502 111,648
B Equity and Liabilities1. Equity
Equity share capital 314 - 314 Other equity (i) Reserves and surplus 12 73,053 5,286 78,339 (ii) Other reserves 1 - 5,316 5,316 Total equity 73,367 10,602 83,969
2. LiabilitiesNon-current liabilitiesFinancial liabilities (i) Borrowings 542 - 542 (ii) Other financial liabilities 64 - 64 Provisions 4,302 - 4,302 Total non-current liabilities 4,908 - 4,908 Current liabilitiesFinancial liabilities (i) Trade payables 12,036 - 12,036 (ii) Other financial liabilities 3,483 - 3,483 Provisions 3 8,370 (3,212) 5,158 Current tax liabilities 630 - 630 Other current liabilities 6 1,352 112 1,464 Total current liabilities 25,871 (3,100) 22,771 Total liabilities 30,779 (3,100) 27,679
Total equity and liabilities 104,146 7,502 111,648
* The previous GAAP figures has been reclassified to conform to Ind AS presentation requirements for the purposes of this note.
Notes to the consolidated Financial Statements for the year ended March 31, 2017

188 | Consolidated Financial Statement | Annual Report 2016-17
Reconciliation of balance sheet as at March 31, 2016
[` in Millions (Mio INR)]Note No Previous GAAP* Adjustments Ind AS
A Assets1. Non-current assets
Property, plant and equipment 6,7 11,362 125 11,487 Capital work-in progress 1,507 - 1,507 Investment properties 1,786 - 1,786 Intangible assets - - - Investments in subsidiary and associate 94 - 94 Financial assets (i) Investments 1 35,435 8,884 44,319 (ii) Loans 2 1,518 (96) 1,422 (iii) Other financial assets 100 - 100 Deferred tax assets 4 4,528 430 4,958 Other non-current assets 191 - 191 Total non-current assets 56,521 9,343 65,864
2. Current assetsInventories 7 11,991 (76) 11,915 Financial assets (i) Investments - - - (ii) Trade receivable 13,225 - 13,225 (iii) Cash and cash equivalents 985 - 985 (iv) Bank balances other than (iii) above 17,331 - 17,331 (v) Loans 2,826 - 2,826 (vi) Other financial assets 7,622 - 7,622 Other current assets 2 4,377 102 4,479 Total current assets 58,357 26 58,383 Total assets 114,878 9,369 124,247
B Equity and Liabilities1. Equity
Equity share capital 314 - 314 Other equity (i) Reserves and surplus 12 82,493 8,009 90,502 (ii) Other reserves 1 - 4,452 4,452 Total equity 82,807 12,461 95,268
2. LiabilitiesNon-current liabilitiesFinancial liabilities (i) Borrowings 5 191 (42) 149 (ii) Other financial liabilities 50 - 50 Provisions 3,775 - 3,775 Total non-current liabilities 4,016 (42) 3,974 Current liabilitiesFinancial liabilities (i) Trade payables 13,088 - 13,088 (ii) Other financial liabilities 3,394 - 3,394 Provisions 3 9,388 (3,212) 6,176 Current tax liabilities 762 - 762 Other current liabilities 5,6 1,423 162 1,585 Total current liabilities 28,055 (3,050) 25,005 Total liabilities 32,071 (3,092) 28,979 Total equity and liabilities 114,878 9,369 124,247
* The previous GAAP figures has been reclassified to conform to Ind AS presentation requirements for the purposes of this note.
Notes to the consolidated Financial Statements for the year ended March 31, 2017

Annual Report 2016-17 | Consolidated Financial Statement | 189
Reconciliation of total comprehensive income for the year ended March 31, 2016
[` in Millions (Mio INR)]Note No Previous GAAP* Adjustments Ind AS
Continuing operations :Revenue from operations :
Gross sale of product 8,9 93,185 6,945 100,130 Sale of services 1,991 - 1,991 Other operating revenue 2,298 - 2,298
Other income 1,2,5,6 3,328 2,708 6,036 100,802 9,653 110,455
Expenses :Cost of materials consumed 25,529 - 25,529 Purchases of stock-in-trade 23,347 - 23,347 Changes in inventories of finished goods, 825 825 work-in-progress and stock-in-trade - Excise duty 8 - 7,405 7,405 Employee benefits expense 2,10 12,942 89 13,031 Finance costs 5 72 57 129 Depreciation and amortisation expenses 6,7 3,721 143 3,864 Other expenses 7,9 16,037 (536) 15,501
82,473 7,158 89,631 Profit before tax 18,329 2,495 20,824 Tax expense :Current tax
(i) for the year/period 6 6,511 90 6,601 (ii) relating to earlier years (94) - (94)
Deferred tax charge/ (credit) 4,10 (356) (450) (806)Profit from continuing operations 12,268 2,855 15,123 Profit from discontinued operation (net of tax) 191 - 191 Profit for the year before share of net profit of associate 12,459 2,855 15,314 Share of net profit of associate accounted for using equity method
22 - 22
Profit for the year 12,481 2,855 15,336 Other Comprehensive Income 1,10,11 - (825) (825)Total Comprehensive Income 12,481 2,030 14,511
* The previous GAAP figures has been reclassified to conform to Ind AS presentation requirements for the purposes of this note.
Reconciliation of total equity as at March 31, 2016 and April 1, 2015
[` in Millions (Mio INR)]
Note No
As at March 31, 2016
As at April 1, 2015
Total equity (shareholder's funds) as per previous GAAP 82,807 73,367
Adjustments:
Fair valuation gain on Investments (Mutual Funds) 1 4,432 2,099
Net impact of discounting of non-current financial assets and liabilities 2 (30) -
Deferred tax on long term capital loss 4 430 -
Proposed dividend and dividend distribution tax 3 3,212 3,212
Change in fair value of FVOCI equity instruments (OCI) 1 4,452 5,316
Impact of capitalisation of spares as property, plant and equipment 7 (35) (26)
Total adjustments 12,461 10,601
Total equity as per Ind AS 95,268 83,968
Notes to the consolidated Financial Statements for the year ended March 31, 2017

190 | Consolidated Financial Statement | Annual Report 2016-17
Impact of Ind AS adoption on the statements of cash flows for the year ended March 31, 2016[` in Millions (Mio INR)]
Previous GAAP * Adjustments Ind AS
Net cash flow from operating activities 13,259 (82) 13,177
Net cash flow from investing activities (10,018) 69 (9,949)
Net cash flow from financing activities (3,560) - (3,560)
Net increase/(decrease) in cash and cash equivalents (319) (13) (332)
Cash and cash equivalents as at April 1, 2015 1,304 (13) 1,291
Effects of exchange rate changes on cash and cash equivalents 0 - 0
Cash and cash equivalents as at March 31, 2016 985 (26) 959
* The previous GAAP figures has been reclassified to conform to Ind AS presentation requirements for the purposes of this note.
Analysis of changes in cash and cash equivalents for the purposes of statement of cash flows under Ind AS:
[` in Millions (Mio INR)]
As at March 31, 2016
As at April 1, 2015
Cash and cash equivalents as per previous GAAP 985 1,304
Book overdraft (26) (13)
Cash and cash equivalents for the purpose of statement of cash flows 959 1,291
Notes to Ind AS First Time adoption:
1) Fair Valuation of InvestmentsUnder the previous GAAP, investments in equity instruments and mutual funds were classified as long-term investments or current investments based on the intended holding period. Long-term investments were carried at cost less provision for other than temporary decline in the value of such instruments. Current investments were carried at lower of cost and fair value. Under Ind AS, these investments are required to be measured at fair value. The resulting fair value changes of these investments (other than equity instruments designated at FVOCI) have been recognised in retained earnings as at the date of transition and subsequently in the profit or loss for the year ended March 31, 2016. This increased the retained earnings by Mio INR 4,432 as at March 31, 2016 (April 1, 2015 : Mio INR 2,099).
Fair value changes with respect to investments in equity instruments designated at FVOCI have been recognised in FVOCI - Equity investments reserve as at the date of transition and subsequently in the other comprehensive income for the year ended March 31, 2016. This increased other reserves by Mio INR 4,452 as at March 31, 2016 (April 1, 2015 : Mio INR 5,316).
Consequent to the above, the total equity as at March 31, 2016 increased by Mio INR 8,884 ( April 1, 2015 : Mio INR 7,415) and profit for the year increased by Mio INR 2,333 and other comprehensive income for the year ended March 31, 2016 decreased by Mio INR 864.
2) Loans to employeesUnder the previous GAAP, interest free and concessional loans to employees are recorded at their transaction value. Under Ind AS, all financial assets are required to be recognised at fair value. Accordingly, the Group has fair valued the loans to employees under Ind AS. Difference between the fair value and transaction value of the loans to employees has been recognised as deferred expenses. Consequent to this change, the amount of loans to employees decreased by Mio INR 96 as at March 31, 2016 (April 1, 2015 - Mio INR 132). The deferred expense increased by Mio INR 102 (April 1, 2015 - Mio INR 132). The profit for the year and total equity as at March 31, 2016 decreased by Mio INR 30 which is off-set by the notional income of Mio INR 36 recognised on loans to employees.
3) Proposed dividend and dividend distribution taxUnder the previous GAAP, dividends proposed by the board of directors after the balance sheet date but before the approval of the financial statements were considered as adjusting events. Accordingly, provision for proposed dividend was recognised as a liability. Under Ind AS, such dividends are recognised when the same is approved by the shareholders in the general meeting. Accordingly, the liability for proposed dividend of Mio INR 3,212 as at March 31, 2016 ( April 1, 2015 - Mio INR 3,212) included under provisions has been reversed with corresponding adjustment to retained earnings. Consequently, the total equity increased by an equivalent amount.
4) Deferred taxDeferred tax have been recognised on account of long term capital loss on transition to Ind AS which increased the deferred tax assets by Mio INR 430 as on March 31, 2016 and deferred tax credit for the year ended March 31, 2016 by Mio INR 430.
5) BorrowingsInd AS 109 requires borrowings to be accounted as financial liabilities at amortised cost. Accordingly, borrowings as at
Notes to the consolidated Financial Statements for the year ended March 31, 2017

Annual Report 2016-17 | Consolidated Financial Statement | 191
March 31, 2016 have been reduced by Mio INR 42 and deferred income has increased by Mio INR 79 with a corresponding adjustment to retained earnings of Mio INR 37. As a result of the interest expense on reinstatement of borrowing, the profit for the year ended March 31, 2016 has decreased by Mio INR 57 which is off-set by the notional income of Mio INR 18 due to amortisation of deferred income.
6) Government Grant a) The Group had received government grants in earlier years and property, plant and equipments related to grants
were fully depreciated before transition date. Such grants amounting to INR 1,820 Mio INR were disclosed under capital reserve as per requirement of erstwhile Accounting Standard 12 on Government Grants. This amount has been reclassified and disclosed under retained earning in the current year as per requirement of Ind AS 20. During the year ended March 31, 2016 the Group had received grants amounting to Mio INR 261 which has been disclosed as other income and tax expense of Mio INR 90 pertaining to this grant is disclosed under income tax expense.
b) As per Ind AS 20, Government grant related to assets shall be presented in the balance sheet by setting up the grant as deferred income. The grant set up as deferred income is recognised in statement of profit or loss on a systematic basis over the useful life of the asset. Under the previous GAAP, the grant was shown as a deduction from the asset concerned in arriving at its carrying value. Accordingly, the Group has recognised the asset related government grant outstanding as on the transition date as deferred income with corresponding adjustment to property plant and equipment. Consequent to this the deferred income and property, plant and equipment increased by Mio INR 83 as at March 31, 2016 (April 1, 2015: Mio INR 112) and depreciation and other income has increased by Mio INR 60 for the year ended March 31, 2016. There is no impact on the total equity and profit.
7) Capital Spares
As per Ind AS 16, spare parts are to be recognised as Property, Plant and Equipment if they are held for use in production or supply of goods or services and are expected to be used during more than one period. Otherwise such items are to be recognised as Inventory. Under the previous GAAP, only those spares that can be used in connection with Fixed Assets and their use is expected to be irregular are recognised as Property, Plant and Equipment and depreciated over the remaining useful life of the asset. Accordingly, the company has identified spare parts qualifying for recognition as Property, Plant and Equipment. This change has resulted in increase in the net carrying value of Property Plant and Equipment by Mio INR 42 as at March 31, 2016 (April 1,2015: Mio INR 13) and reduction in value of Inventories by Mio INR 76 as at March 31, 2016 (April 1, 2015 Mio INR 38). Total equity decreased by Mio INR 25 as at April 1,2015. The profit for the year and total equity as at March 31, 2016 decreased by Mio INR 7 due to depreciation charge of Mio INR 83 for the year on the spare parts recognised as Property, Plant and Equipment and reversal of consumption of machinery spares capitalised amounting to Mio INR 76.
8) Excise Duty
Under the previous GAAP, revenue from sale of products was presented exclusive of excise duty. Under Ind AS, revenue from sale of goods is presented inclusive of excise duty. The excise duty is presented on the face of the statement of profit and loss as part of expenses. This change has resulted in an increase in total revenue and total expenses for the year ended March 31, 2016 by Mio INR 7,405. There is no impact on the total equity and profit.
9) Discounts and sales incentives
Under the previous GAAP, certain discounts and sales incentives were disclosed as part of other expenses. Under Ind AS, amounts disclosed as revenue are net of discounts and sales incentives. This change has resulted in an decrease in total revenue and other expenses for the year ended March 31, 2016 by Mio INR 460.
10) Remeasurement of post-employment benefit obligations
Under Ind AS, remeasurements i.e., actuarial gains and loses and the return on plan assets, excluding amounts included in the net interest expense on the net defined benefit liability are recognised in other comprehensive income instead of profit or loss. Under the previous GAAP, these measurements were forming part of the profit or loss for the year. As a result of this change, the profit for the year ended March 31, 2016 decreased by Mio INR 39 (net of tax of Mio INR 20). There is no impact on the total equity as at March 31, 2016.
11) Other Comprehensive income
Under Ind AS, all items of income and expense recognised in a period should be included in profit or loss for the period, unless a standard requires or permits otherwise. Items of income and expense that are not recognised in profit or loss but are shown in the statement of profit and loss as 'other comprehensive income' includes remeasurements of defined benefit plans and fair value gains or (losses) on FVOCI equity instruments. The concept of other comprehensive income did not exist under previous GAAP.
12) Retained Earnings
Retained Earnings has been adjusted consequent to the above Ind AS transition adjustments.
Note 46: Offsetting financial assets and financial liabilities
The Group provides the incentives to selected customers under the terms of the agreements, the amounts payable by the Group are offset against receivables from the customers and only the net amounts are settled. The amounts offset as at March 31, 2017 is Mio INR 960 (March 31, 2016: Mio INR 653; April 1, 2015: Mio INR 716) which is disclosed under note 8(b).
Notes to the consolidated Financial Statements for the year ended March 31, 2017

192 | Consolidated Financial Statement | Annual Report 2016-17
Note 47: Disclosure on specified bank notes (SBNs)
During the year, the Group has specified bank notes or other denomination notes as defined in the MCA notification G.S.R.308(E) dated March 31, 2017 on the details of Specified Bank Notes (SBN) held and transacted during the period from November 8, 2016 to December 30, 2016, the denomination wise SBNs and other notes as per the notification is given below:
[Amount in INR]
SBNs*Other
denomination notes
Total
Closing cash in hand as on November 8, 2016 34,500 21,260 55,760
(+) Permitted receipts - 231,000 231,000
(-) Permitted payments - (167,490) (167,490)
(-) Amount deposited in banks (34,500) - (34,500)
Closing cash in hand as on December 30, 2016 - 84,770 84,770
* The term 'Specified Bank Notes' shall have the same meaning provided in the notification of the Government of India, in the Ministry of Finance, Department of Economic Affairs number S.O. 3407(E ) dated the 8th November, 2016.
Note 48: Rounding off
Amounts mentioned as "0" in the financial statements denote amounts rounded off being less than Rupees one million.
Notes to the financial statements 1 to 48.
Notes to the consolidated Financial Statements for the year ended March 31, 2017
The accompanying notes are an integral part of these financial statements.
As per our report of even date
For Price Waterhouse & Co Bangalore LLP For and on behalf of the Board Firm Registration Number: 007567S/S-200012 V.K. Viswanathan (DIN: 01782934) ChairmanChartered Accountants Soumitra Bhattacharya (DIN: 02783243) Managing Director & Chief
Financial OfficerAndreas Wolf (DIN: 07088505) Joint Managing Director
Subramanian Vivek Bhaskar Bhat (DIN: 00148778) DirectorPartner Prasad Chandran (DIN: 00200379) DirectorMembership Number: 100332 Renu Sud Karnad (DIN: 00008064) Director
Bernhard Steinruecke (DIN: 01122939) DirectorPlace: Bengaluru R Vijay Jan Oliver Röhrl (DIN: 07706011) Alternate DirectorDate: May 25, 2017 Company Secretary S Karthik Joint Chief Financial Officer

Annual Report 2016-17 | Report on Corporate Governance | 193
Report on Corporate Governance
1. Company’s philosophy on Code of Governance
The Company is committed to good Corporate Governance practices aimed at increasing value for all stakeholders. The Company as a constituent of the Bosch Group has always been a value driven company. The Company’s corporate governance philosophy is based on Bosch values focusing on future and result oriented, responsibility and sustainability, initiative and determination, openness and trust, fairness, reliability, credibility, legality and diversity.
Bosch Values and Bosch Code of Business Conduct provides necessary framework for running the business with the highest moral standards and enables the Company to fulfil its legal, financial and ethical objectives. The Company has a well-informed and Independent Board for ensuring the same.
2. Board of Directorsa) Composition of the Board and Category of
Directors:
The composition of the Board of Directors of the Company is governed by the provisions of the Companies Act, 2013 (“the Act”) and the Securities and Exchange Board of India (Listing Obligations and Disclosure Requirements) Regulations, 2015 (the “Listing Regulations”). The Board comprises of an optimum mix of Executive and Non-Executive Directors. The Board has one woman director. Half of the Board comprises of Independent Directors. The Directors of the Company are persons of eminence having vast and varied experience in manufacturing, marketing, banking, finance and business administration.
Dr. Steffen Berns (Managing Director upto December 31, 2016), pursuant to the organisational changes returned to Germany upon assuming responsibility as President – Car Multimedia business with Robert Bosch, Germany. Consequently, Mr. Soumitra Bhattacharya was re-designated as Managing Director with effect from January 01, 2017 and Dr. Andreas Wolf was appointed as Joint Managing Director with effect from January 01, 2017.
The composition of the Board as on March 31, 2017 is as under:-
Sl. No Name of the Director Category
1. Mr. V.K. Viswanathan Chairman, Non-Executive & Non-Independent Director
2. Mr. Peter Tyroller Non-Executive & Non-Independent Director
3. Mr. Bernhard Steinruecke Independent Director
4. Mrs. Renu S. Karnad Independent Director
5. Mr. Prasad Chandran Independent Director
6. Mr. Bhaskar Bhat Independent Director
Sl. No Name of the Director Category
7. Mr. Soumitra Bhattacharya* Managing Director
8. Dr. Andreas Wolf@ Joint Managing Director
9. Mr. Jan Oliver Röhrl Alternate Director to Mr. Peter Tyroller#
* Joint Managing Director upto December 31, 2016. Re-designated as Managing Director with effect from January 01, 2017.
@ Alternate Director to Mr. Peter Tyroller upto December 31, 2016. Appointed as Joint Managing Director from January 01, 2017.
# Effective February 11, 2017.
b) Attendance at Board Meetings and Annual General Meeting:
Six Board Meetings were held during the year under review. Details of attendance of Directors at the Board Meetings are given below:-
Name of Director
Date of the Board Meeting
2016 2017
25th May
1st Jul
12th Aug
1st Sep
9th Nov
10th Feb
Mr. V.K. Viswanathan Y Y Y Y Y Y
Mr. Peter Tyroller Y* Y* Y* Y Y Y
Mr. Bernhard Steinruecke Y @ Y Y Y Y
Mrs. Renu S. Karnad - Y Y Y Y Y
Mr. Prasad Chandran Y Y Y Y Y Y
Mr. Bhaskar Bhat Y Y - Y - Y
Dr. Steffen Berns Y @ Y Y Y NA
Mr. Soumitra Bhattacharya Y Y Y Y Y Y
Dr. Andreas Wolf NA Y
Mr. Jan Oliver Röhrl NA
* Attended by Dr. Andreas Wolf, Alternate Director@ attended through tele-con
All Directors attended the last Annual General Meeting, held on September 01, 2016.
c) Directorships and Committee positions:
The total number of Directorship(s) held by Directors and the positions of Membership/Chairmanship on Committees including Bosch Limited, as on March 31, 2017, are given below:
Name of the Director Directorships held*
Committees@
Membership Chairmanship
Mr. V.K. Viswanathan 9 8 5
Mr. Peter Tyroller 5 Nil Nil
Mr. Bernhard Steinruecke
6 5 1
Mrs. Renu S. Karnad 16 6 1
Mr. Prasad Chandran 3 5 1
Mr. Bhaskar Bhat 13 3 Nil

194 | Report on Corporate Governance | Annual Report 2016-17
Name of the Director Directorships held*
Committees@
Membership Chairmanship
Mr. Soumitra Bhattacharya
7 1 Nil
Dr. Andreas Wolf 5 Nil Nil
Mr. Jan Oliver Röhrl 1 Nil Nil
* includes Directorship in Private Limited companies and foreign companies
@ includes Membership/Chairmanship in Audit & Stakeholders’ Relationship Committees only
d) None of the Directors are inter-se related to each other.
e) None of the Directors hold any shares in the Company.
f) Independent Directors:
In terms of the provisions of the Act, Independent Directors have been appointed for a term of 5 years with effect from April 01, 2014. A letter of appointment encompassing the terms and conditions of appointment, roles, duties and liabilities were issued to the Independent Directors. The main terms of appointment can be accessed at:
http://www.boschindia.com/media/in/documents/our_company_1/shareholder_information_1/2017_2/revisedID_terms_of_reference_2017.pdf
Familiarization programme for Independent Directors generally form a part of the Board process. The Independent Directors are updated on an on-going basis at the Board / Committee meetings, inter-alia, on the following:
- Nature of the industry in which the Company operates;
- Business environment and operational model of various business divisions of the Company including important developments thereon;
- Important changes in regulatory framework having impact on the Company;
- Discussion on the state of economy, preparedness for changes in emission norms, etc.;
- Bosch Group business; and
- The manufacturing facilities of the Company at its various locations.
Details of the Familiarization programme for Independent Directors can be accessed at the following link:
http://www.boschindia.com/media/in/documents/our_company_1/shareholder_information_1/2017_2/Familiarization_Programme_for_Independent_Directors~1.pdf.
3. Audit Committee
a) Terms of reference:
The terms of reference given by the Board of Directors pursuant to Section 177 of the Act and the Listing Regulations are briefly described below:
1. Oversight of the Company’s financial reporting process and the disclosure of its financial information to ensure that the financial statement is correct, sufficient and credible;
2. Recommend appointment, remuneration and terms of appointment of auditors of the Company;
3. Approval of payment to statutory auditors for any other services rendered by the statutory auditors;
4. Reviewing, with the management, the annual financial statements and auditor’s report thereon before submission to the Board for approval, with particular reference to:
a. matters required to be included in the Directors' Responsibility Statement in the Board’s report in terms of clause(c) of sub-section 3 of Section 134 of the Companies Act, 2013;
b. changes, if any, in accounting policies and practices and reasons for the same;
c. major accounting entries involving estimates based on the exercise of judgment by management;
d. significant adjustments made in the financial statements arising out of audit findings;
e. compliance with listing and other legal requirements relating to financial statements;
f. disclosure of any related party transactions;
g. qualifications in the draft audit report;
5. Reviewing with the management:
- the quarterly financial statements before submission to the Board for approval;
- the statement of uses / application of funds raised through an issue (public issue, rights issue, preferential issue, etc.), the statement of funds utilized for purposes other than those stated in the offer document / prospectus / notice and the report submitted by the monitoring agency monitoring the utilisation of proceeds of a public or rights issue, and making appropriate recommendations to the Board to take steps in this matter;
6. Review and monitor the auditor’s independence and performance, and effectiveness of audit process;
7. Approval or any subsequent modification of transactions of the Company with related parties;
8. Scrutiny of inter-corporate loans and investments;
9. Valuation of undertakings or assets of the Company, wherever it is necessary;
10. Evaluation of internal financial controls and risk management systems;
11. Reviewing with the management performance of statutory and internal auditors, adequacy of the internal control systems;

Annual Report 2016-17 | Report on Corporate Governance | 195
12. Reviewing the adequacy of internal audit function, if any, including the structure of the internal audit department, staffing and seniority of the official heading the department, reporting structure coverage and frequency of internal audit;
13. Discussion with internal auditors on any significant findings and follow up there on;
14. Reviewing the findings of any internal investigations by the internal auditors into matters where there is suspected fraud or irregularity or a failure of internal control systems of a material nature and reporting the matter to the Board;
15. Discussion with statutory auditors before the audit commences, about the nature and scope of audit as well as post-audit discussion to ascertain any area of concern;
16. To look into the reasons for substantial defaults in the payment to the depositors, debenture holders, shareholders (in case of non-payment of declared dividends) and creditors;
17. To review the functioning of the Whistle Blower mechanism;
18. Approval of appointment of CFO after assessing the qualifications, experience and background, etc. of the candidate; and
19. Carrying out any other function as mentioned under the Act, the Listing Regulations or decided by the Board from time to time.
b) Composition, names of Members and Chairperson, meetings held during the year and attendance at the meetings:
During the year under review, 6 meetings of the Audit Committee were held on May 24, 2016, July 01, 2016, August 12, 2016, September 01, 2016, November 09, 2016 and February 10, 2017.
The constitution and number of meetings attended by members of the Committee are given below:-
Name of the DirectorNo. of
Meetings Attended
Mrs. Renu S. Karnad, Chairperson(Independent Director)
5
Mr. V.K. Viswanathan(Non-Executive & Non-Independent Director)
6
Mr. Bernhard Steinruecke(Independent Director)
5
Mr. Prasad Chandran(Independent Director)
6
Mr. Bhaskar Bhat(Independent Director)
5
The Company Secretary acts as secretary to the Audit Committee.
All members of the Audit Committee are financially literate and have accounting and related financial management expertise.
4. Nomination and Remuneration Committee (NRC)
a) Terms of reference of NRC, inter-alia, includes the following :
1. Formulation of criteria for determining qualifications, positive attributes and independence of a director and recommend to the Board a policy relating to the remuneration of the directors, key managerial personnel and other employees;
2. Formulation of criteria for evaluation of Independent Directors and the Board including carrying out evaluation of every director’s performance;
3. Devising a policy on Board diversity;
4. Identifying persons who are qualified to become directors and who may be appointed in senior management in accordance with the criteria laid down and recommend to the Board their appointment and removal; and
5. Such other matters as may be prescribed under the Act, Listing Regulations and by the Board of Directors of the Company from time to time.
b) Composition, names of Members and Chairperson, meetings held during the year and attendance at the meetings:
During the year under review, the Committee met 4 times on May 25, 2016, September 01, 2016, November 09, 2016 and February 10, 2017. The constitution and number of meetings attended by members of the Committee are given below:-
Name of the DirectorNo. of
Meetings Attended
Mr. Bernhard Steinruecke, Chairman(Independent Director)
4
Mr. V.K. Viswanathan(Non-Executive & Non-Independent Director)
4
Mr. Prasad Chandran(Independent Director)
4
Mr. Bhaskar Bhat(Independent Director)
3
c) Performance Evaluation of Directors:
In line with the provisions of the Act and Listing Regulations, the Board has carried out the annual performance evaluation of the Board as a whole, its Committees, the Chairman and the Directors.
A structured questionnaire covering various aspects of the Board’s functioning was circulated to the Directors. The criteria for evaluation of Independent Directors included attendance at the meetings, interpersonal skills, independent judgement, knowledge, contribution to strategy, risk management, compliance framework, etc. The feedback and results of the questionnaire are collated and reviewed. Measures for improvements to the Board effectiveness are identified and acted upon.

196 | Report on Corporate Governance | Annual Report 2016-17
5. Remuneration of Directorsa) Directors have no pecuniary relationship with the
Company other than receiving remuneration as Directors.
b) Details of Remuneration: Whole-time Directors/Executive Directors:
The remuneration payable to the Executive Directors are in line with the Act, Listing Regulations and Nomination and Remuneration Policy for remunerating Senior Management / Executives.
Remuneration of Executive Directors consists of a fixed salary and a variable bonus. The variable bonus is based on the economic results and individual performance of the Director. The Board of Directors, on the recommendation of Nomination and Remuneration Committee, determines the variable bonus from year to year. It can amount up to 160% of the base salary. In addition, Executive Directors receive benefits such as Company owned/leased house, services of security and garden maintenance, company car and driver, telephone at home, club membership and reimbursement of expenses incurred at the time of joining and similarly on their return and other benefits extended to the Senior Management, as per the Company’s policy, from time to time.
Details of remuneration paid during the financial year are given below:
Particulars
Dr. Steffen Berns
(Managing Director
upto December 31, 2016)
Mr. Soumitra Bhattacharya
(Managing Director with effect from January 01,
2017)@
Dr. Andreas Wolf (Joint Managing Director
with effect from
January 01, 2017)#
Mr. Jan Oliver Röhrl
(Alternate Director) &
Amount (INR)
Amount (INR)
Amount (INR)
Amount (INR)
Salary 20,034,812 16,158,270 21,987,581 4,026,451
Commission / Bonus
18,729,477 19,542,000 20,990,787 3,376,141
Contribution to Provident Fund & other funds
900,437 4,173,579 1,189,244 156,216
Other perquisites as per Income Tax Rules (incl. book depreciation on assets used by the Directors)
9,258,463 6,127,816 5,624,480 892,915
Stock Options
- - - -
Notice Period
12 months* 12 months* 12 months* 12 months*
Severance Fee
Nil Nil Nil Nil
Total 48,923,189 46,001,665 49,792,092 8,451,723@ includes remuneration drawn as Joint Managing Director upto
December 31, 2016.# includes remuneration drawn as Alternate Director & Whole-time
Director upto December 31, 2016.
& appointed as an Alternate Director to Mr. Peter Tyroller with effect from February 11, 2017 and by virtue of being in employment of the Company, appointed as Whole-time Director effective the aforementioned date.
* unless otherwise decided by the Board.
Non Whole-time Directors:
Remuneration to Non Whole-time Directors is paid by the way of Commission and Sitting Fee for attending the meetings of the Board / Committee thereof in addition to reimbursement of expenses incurred for attending the aforementioned meetings.
The Commission is based on the profits of the Company, for an aggregate amount not exceeding INR 20,000,000 for all Non Whole-time Directors in respect of financial year for a period of five financial years commencing April 01, 2015. Within the overall limit, the Commission for each Director comprises of a fixed component and a variable component. The variable component for each Director is based on the attendance at Board Meetings, responsibilities as the Chairman of the Board, Membership / Chairmanship of various committees.
Details of Commission and Sitting Fees paid to Non Whole-time Directors for the financial year ended March 31, 2017 are given below:
Amount in INR (gross)
Particulars Commission Sitting Fees Total
Mr. V. K. Viswanathan 2,000,000 180,000 2,180,000
Mr. Bernhard Steinruecke 1,825,000 150,000 1,975,000
Mrs. Renu S. Karnad 1,850,000 150,000 2,000,000
Mr. Prasad Chandran 1,950,000 180,000 2,130,000
Mr. Bhaskar Bhat 1,725,000 130,000 1,855,000
Mr. Peter Tyroller has waived his remuneration as a Director.
6. Stakeholders’ Relationship Committee (SRC Committee)
During the year under review, the Stakeholders’ Relationship Committee met 3 times on May 25, 2016, September 01, 2016 and February 10, 2017. The constitution and number of meetings attended by members of the Committee are given below:
Name of the Director No. of Meetings Attended
Mr. Bernhard Steinruecke, Chairman (Independent Director)
3
Mr. V.K. Viswanathan (Non-Executive & Non-Independent Director)
3
Mrs. Renu S. Karnad (Independent Director)
2
Mr. Prasad Chandran (Independent Director)
3
Dr. Steffen Berns* (Managing Director upto December 31, 2016)
2
Mr. Soumitra Bhattacharya$
(Joint Managing Director upto December 31, 2016. Re-designated as Managing Director w.e.f. January 01, 2017)
1
* Member upto December 31, 2016.$ Member with effect from January 01, 2017.

Annual Report 2016-17 | Report on Corporate Governance | 197
Mr. R. Vijay, Company Secretary (with effect from February 11, 2017) is the Compliance Officer.
The Committee reviews grievances received from the shareholders/investors and action taken thereon.
One complaint was received during the month of March 2017. The same was pending as at the end of year under review.
7. Corporate Social Responsibility Committee (CSR Committee)
During the year under review, the CSR Committee met twice on May 25, 2016 and November 08, 2016. The constitution and number of meetings attended by members of the Committee are given below:
Name of the Director No. of Meetings Attended
Mr. Prasad Chandran, Chairman(Independent Director)
2
Mr. Bhaskar Bhat(Independent Director)
1
Dr. Steffen Berns(Managing Director upto December 31, 2016)
2
Mr. Soumitra Bhattacharya(Managing Director with effect from January 01, 2017)
2
Dr. Andreas Wolf(Joint Managing Director with effect from January 01, 2017)
Nil#
# inducted as a member of the CSR Committee with effect from January 01, 2017.
8. Risk Management Committee
Consequent to the resignation of Dr. Steffen Berns, Dr. Andreas Wolf was inducted as a member of the Risk Management Committee effective January 01, 2017.
The Committee comprises of Mr. Soumitra Bhattacharya – Managing Director as the Chairman, Dr. Andreas Wolf – Joint Managing Director and Mr. S. Karthik – Joint Chief Financial Officer, as its Members.
The Committee is responsible for monitoring and reviewing of risk management plan of the Company and all other incidental matters from time to time as required under the Listing Regulations.
9. General Body Meetings:
a) Locations and time of last 3 Annual General Meetings (AGMs) are given below:
2014 10.30 a.m., Thursday, June 05, 2014; ‘Vivanta’ By Taj, Bengaluru
2015 10.30 a.m., Friday, August 28, 2015; ‘Vivanta’ By Taj, Bengaluru
2016 10.30 a.m., Thursday, September 01, 2016; ‘Hotel Shangri-la’, Bengaluru
b) Particulars of Special Resolutions passed in the last three AGMs are given below:
05.06.14: -Nil-
28.08.15: 1) Approval of payment of Commission to Non-Executive Directors/Independent Directors.
2) Approval of Related Party Transactions with Robert Bosch GmbH, Holding Company.*
01.09.16: Approval for alteration of Articles of Association of the Company.
* Robert Bosch GmbH, a related party, abstained from voting.
c) During the year under review, the shareholders accorded their consent to the Special Resolution, approving buyback of upto 878,160 Equity Shares at a price of INR 23,000 per share aggregating to INR 20,197,680,000/- through tender offer method using Stock Exchange Mechanism.
Details of the aforementioned Resolution passed through Postal Ballot is given below:-
Name of the Scrutinizer Mr. Pramod S M of HBP & Co., Practicing Company Secretaries
Mode of voting Postal Ballot & voting by electronic means
Date of Commencement of voting
July 25, 2016 (9 a.m.)
Date of closure of voting
August 23, 2016 (5 p.m.)
Date of Report of Scrutinizer
August 24, 2016
Date of Declaration of Results
August 24, 2016
No. of shareholders casting voting either through
electronic voting or by physical ballot
No. of votes
Buyback of equity shares
Valid Ballots / Votes 1,003 26,564,253
In favour 863 26,544,949
Percentage (%) in favour of the resolution
99.93
Against 140 19,304
Percentage (%) against the resolution
0.07
Invalid Ballots / Votes 10 125
d) As on the date of this report there is no proposal for passing any special resolution by postal ballot.
10. Means of Communication:
The financial results for the quarter / half-year / year would generally be published as under:
Quarter / half-year / year In the month of
quarter ending June 30 August
quarter / half-year ending September 30 November
quarter ending December 31 February
Year ending March 31 May
Quarterly/half-yearly/annual results, notices and information relating to General Meetings, etc. are published in leading newspapers (viz., Business Standard in English – All Editions and Kannada Prabha in Kannada – Bengaluru Edition) and are notified to the Stock Exchanges as required under the Listing Regulations.
The quarterly/half-yearly/annual financial results and other communication to shareholders and Stock Exchanges, inter-alia, presentations to institutional investors & analysts, press releases, etc., are made available in the Company’s website www.boschindia.com under ‘Shareholder Information’ section.

198 | Report on Corporate Governance | Annual Report 2016-17
11. General Shareholder Information:
a) Annual General Meeting – date, time, venue:
65th Annual General Meeting (AGM): 10.30 a.m., September 01, 2017 at ‘Vivanta by Taj’, 41/3, Mahatma Gandhi Road, Bengaluru – 560 001.
b) Financial Year: April 01, 2016 to March 31, 2017
c) Dividend Payment:
The final dividend for the year ended March 31, 2017, if approved at the AGM, will be paid on or after September 05, 2017. Dividend warrants in respect of shares held in electronic/dematerialized form will be posted to the beneficial owners at their address as per the information furnished by NSDL and CDSL as on the record date.
Particulars of dividend declared in the previous years are given below:
Year Dividend per share (INR) Year Dividend per
share (INR)
2005 12.00 2011 (special) 85.00
2006 (interim) 12.00 2011 50.00
2006 (final) 4.00 2012 60.00
2007 25.00 2013 55.00
2008 25.00 2014-15 (15 months)
85.00
2009 30.00 2015-16 85.00
2010 40.00 2016-17 (Special Dividend)
75.00
Payment of Dividend through National Automated Clear-ing House (NACH):
The Company provides the facility for direct credit of the dividend to the Members’ Bank Account. SEBI Regulations also mandate Companies to credit the dividend to the Members electronically. Members are therefore urged to avail of this facility to ensure safe and speedy credit of their dividend into their Bank account through the Banks’ “Automated Clearing House” mode. This ensures direct and immediate credit with no chance of loss of warrant in transit or its fraudulent encashment. However, where it is not possible to use electronic mode of payment, ‘payable-at par’ warrant/s or demand draft/s would be issued. The Company will print the bank account details of the investors on such payment instruments and in cases where the bank details of investors are not available, the address of the investor will be printed on such payment instructions.
Pursuant to the Listing Regulations, the Company is required to maintain Bank details of its Members for the purpose of payment of Dividends, etc. We request the members to opt for electronic mode of payments. Members holding shares in electronic form are requested to approach their Depository Participants(DP) for updating the bank details. Members holding shares in physical form, who wish to avail NACH facility, are requested to give the NACH mandate in the prescribed
form. The form can be obtained from the Company’s website www.boschindia.com under the ‘Shareholder Information’ section.
Particulars of Dividend remaining unclaimed:
In terms of Section 124(5) of the Companies Act, 2013, amounts transferred to the Unpaid Dividend Account of the Company, which remains unpaid or unclaimed for a period of seven years from the date of such transfer, shall be transferred by the Company to the Investor Education and Protection Fund (the Fund) established by the Central Government.
Brief particulars of dividend amount remaining unclaimed are given below:
Year to which the dividend pertains
Declared at the AGM/
(Board Meeting) held on
Date of transfer
to Unpaid Dividend Account
Balance in the Unpaid Dividend
Account as on 31.03.2017 (`)
Due date for transfer to the Fund
2009 03.06.10 08.07.10 1,796,580 07.07.17
2010 01.06.11 06.07.11 2,426,640 05.07.18
2011 (special) (01.06.11) 06.07.11 5,120,570 05.07.18
2011 (final) 04.06.12 10.07.12 3,055,000 09.07.19
2012 (final) 05.06.13 09.07.13 3,861,540 08.07.20
2013 05.06.14 09.07.14 4,210,910 08.07.21
2014-15 28.08.15 01.10.15 6,527,745 30.09.22
2015-16 01.09.16 03.10.16 7,318,245 02.10.23
Details of the unclaimed dividend pertaining to the years 2009 to 2014-15 as on the date of last AGM (September 01, 2016) has been uploaded on Company’s website www.boschindia.com under the ‘Shareholder Information’ section.
Members can claim the unpaid dividend from the Company before it is transferred to the Investor Education and Protection Fund. As per The Investor Education Protection Fund Authority (Accounting, Audit, Transfer and Refund) Rules, 2016 (IEPF), the transferred dividend can be claimed by the concerned member by making an application in IEPF-5 along with necessary documents from IEPF authority.
d) Transfer of underlying shares to Investor Education and Protection Fund (IEPF) in cases where unclaimed dividends have been transferred to IEPF for a consecutive period of seven years):
In terms of Section 124(6) of the Companies Act, 2013 read with The Investor Education & Protection Fund (IEPF) Authority (Accounting, Audit, Transfer and Refund) Rules 2016, as amended, the Company is required to transfer the shares in respect of which dividends have remained unclaimed/unpaid for a period of seven consecutive years to the IEPF Account established by the Central Government. In view of the requirements of the said Rules, a public notice has been published on 04.04.2017 in Business Standard – All Editions and Kannada Prabha – Bengaluru Edition informing the members

Annual Report 2016-17 | Report on Corporate Governance | 199
regarding the provision for transfer of shares to IEPF. Additionally, individual communication to the shareholders whose shares are liable to be transferred to IEPF Account pursuant to the said Rules, requesting them to take immediate action in the matter has been sent.
e) Listing of shares and stock code:
The Company’s equity shares are listed at the following Stock Exchanges and Listing Fees for the year 2017-18 has been paid to the Stock Exchanges.
Name and address of the Stock Exchange Stock Code
BSE LimitedPhiroze Jeejeebhoy Towers,Dalal Street, Fort, Mumbai - 400 001.
500530
National Stock Exchange of India LimitedExchange Plaza, 5th Floor,Bandra-Kurla Complex, Bandra,Mumbai - 400 051.
BOSCHLTD
The International Securities Identification Number (ISIN) for the Company’s Shares is INE 323A01026.
f) Market Price data – high, low during each month in the last financial year (i.e. year under review):
Price and Volume of Shares Traded
Month/ Year
BSE Limited National Stock Exchange of India Limited
High(INR)
Low(INR)
Volume(Nos.)
High(INR)
Low(INR)
Volume(Nos.)
Apr 2016 20,700 18,847 22,626 20,825 18,850 276,030
May 2016 22,544 18,963 39,631 22,541 18,964 451,059
Jun 2016 23,115 20,806 26,987 23,098 20,800 373,400
Jul 2016 25,137 22,100 59,060 25,141 22,125 316,926
Aug 2016 25,650 23,469 42,878 25,671 23,300 373,978
Sep 2016 24,837 22,422 43,165 24,844 22,460 287,013
Oct 2016 23,520 21,811 21,537 23,550 21,800 232,410
Nov 2016 22,368 18,005 33,621 22,378 17,672 361,246
Dec 2016 21,290 19,000 25,023 21,300 18,973 318,282
Jan 2017 22,990 20,069 26,423 23,035 20,020 297,538
Feb 2017 23,640 21,179 28,924 24,000 21,176 342,229
Mar 2017 23,236 21,099 32,366 23,399 21,070 409,680
g) Performance in comparison to broad based indices:
h) Details of securities suspended:
Not applicable.
i) Registrar and Share Transfer Agents (RTA):
Integrated Registry Management Services Private Limited
No.30, Ramana Residency, 4th Cross, Sampige Road, Malleswaram, Bengaluru – 560 003 Tel: (080) 23460815 to 818; Fax: (080) 23460819 E-mail: [email protected]
* Pursuant to the scheme of demerger, the Registry business of Integrated Enterprises (India) Limited was transferred to Integrated Registry Management Services Private Limited with effect from February 17, 2017. There is no change in the operational team or management of the RTA.
j) Share Transfers System
The Company’s shares being in the compulsory demat list, are transferable through the depository system. However, shares held in physical form are processed by its Registrar & Share Transfer Agent in co-ordination with the Company and the share certificates are returned within fifteen days from the date of receipt of the transfer by the Company provided that the transfer documents are complete in all respects.
k) Nomination facility:
Pursuant to the provisions of Section 72 of the Companies Act, 2013, and Rule 19 of the Companies (Share Capital and Debentures) Rules, 2014, members may file Nomination in respect of their shareholdings. Members holding shares in Physical Form willing to avail this facility may submit to the Company the prescribed Form SH-13 and any change or variation in the nomination in prescribed Form SH-14. Form SH-13 and SH-14 can be downloaded from the Company’s website www.boschindia.com under the ‘Shareholder Information' section. Members holding shares in electronic form are requested to give the nomination to their respective Depository Participants directly.

200 | Report on Corporate Governance | Annual Report 2016-17
l) Requirement of PAN:
Members who hold shares in the physical form are advised that in terms of the Listing Regulations, for transfer, transmissions of shares etc., a copy of the PAN card along with other necessary documents shall be submitted to the Company/RTA.
m) Subdivision of shares:
The Company had subdivided the face value of its equity shares from INR 100 to INR 10 in 2004. The old shares having face value of INR 100 are no longer tradable on the stock exchanges. Members holding share certificates of the face value of INR 100 are requested to send the certificates to the Company/RTA for exchange with shares of the face value of INR 10 each.
n) Rights of Members:
The following are some of the important rights of the members:
1. Receive notices of General Meetings, Annual Report, etc.
2. Attend and vote at the General Meetings and appoint proxy in their stead.
3. Request an Extraordinary General Meeting along with other members who collectively hold not less than 1/10th of the total paid up share capital of the Company carrying voting rights.
4. Receive dividends and other corporate benefits like rights, bonus shares, etc. when declared / announced.
5. Transfer the shares.
6. Inspect minutes book of General Meetings.
7. Inspect Register of Members.
8. Nominate a person to whom his/her shares shall vest in the event of death.
9. Seek relief in case of oppression and mismanagement in the manner given under the Companies Act, 2013.
10. Seek relief in case the affairs of the company are managed in a manner prejudicial to the interest of the company or its members by virtue of a Class Action Suit under Section 245.
o) Date of Book Closure:
The Company’s Register of Members and the Share Transfer Books will remain closed from Saturday, June 10, 2017 to Friday, June 16, 2017 (both days inclusive) for the purpose of payment of dividend.
p) Shareholding Pattern (as on March 31, 2017):
Category No. of Members
No. of Shares held
% to the Capital
Promoter & Promoter Group
Robert Bosch GmbH 1 21,058,705 69.00
Robert Bosch Engineering Business Solutions Pvt. Ltd
1 454,000 01.49
Sub-Total 2 21,512,705 70.49
Public & Others
Insurance Companies 12 2,829,724 9.27
Foreign Institutional Investors 357 2,249,852 7.37
Mutual Funds/UTI 118 974,042 3.19
Financial Institutions/ Banks 15 31,807 0.10
Bodies Corporate 1,191 484,933 1.59
Foreign Nationals/NRI/ OCBs 1,540 87,866 0.29
Clearing Member 190 30,818 0.10
Trust 37 17,259 0.06
Individuals 52,646 2,301,734 7.54
Sub-Total 56,106 9,008,035 29.51
Total 56,108 30,520,740 100.00
q) Distribution of shareholding:
Distribution of Shareholding (as on March 31, 2017):
No. of Shares held
Members Shares
No. % No. %
1-500 55,058 98.13 1,324,527 4.34
501-1000 488 0.87 346,417 1.14
1001-2000 270 0.48 381,482 1.25
2001-3000 57 0.10 139,044 0.46
3001-4000 40 0.07 138,498 0.45
4001-5000 25 0.05 113,774 0.37
5001-10000 67 0.12 483,867 1.58
>10000 103 0.18 27,593,131 90.41
Total 56,108 100.00 30,520,740 100.00
r) Dematerialisation of shares and liquidity:
The Promoter and Promoter group, holds 70.49% of the paid-up capital in dematerialised form. Of the remaining 29.51% held by public, shares representing 28.72% of the paid-up capital have been dematerialized.
The Company has entered into an agreement with the following Depositories whereby the equity shares of the Company were admitted as ‘eligible security’ in the depository system:
1. National Securities Depository Limited (NSDL): January 05, 1999.
2. Central Depository Services (India) Limited (CDSL): August 04, 2000.
Members still holding physical share certificates are requested to dematerialize their shares by approaching any of the Depository Participants registered with the Securities and Exchange Board of India (SEBI). From June 26, 2000 the shares of the Company are mandated by SEBI for trading in dematerialized form.

Annual Report 2016-17 | Report on Corporate Governance | 201
s) Outstanding Global Depository Receipts (GDRs) or American Depository Receipts (ADRs) or warrants or any convertible instruments, conversion date and likely impact on equity:
None.
t) Commodity price risk and hedging activities:
The Company has significant usage of commodities like steel, aluminium and copper exposing it to the price risk arsing out of market fluctuations.
For steel, annual negotiations are carried out and contracts are entered ranging from single to multiyear considering the purchase volumes.
In case of copper and aluminum, prices are negotiated quarterly based on LME basis as well as worldwide market competitive offers from India, China and Asian suppliers.
u) Foreign Exchange risk and hedging activities:
The Company is exposed to foreign exchange risk on account of import of various raw materials used in its production and technology products imported and sold, and other export transactions. To reduce this risk the Company constantly evaluates its business plan and opportunities for localization for reducing this risk in the long-term. Hedging is also used as a tool to manage the foreign exchange risk.
v) Plant Locations:
- Bengaluru Post Box No. 3000 Hosur Road, Adugodi
Bengaluru - 560 030
- Bidadi No. 42, II-phase, Sector-2, KIADB Industrial Area,
Shanumangala Bidadi Hobli, Ramanagara District – 562 109
- Nashik Post Box No. 64 75, MIDC Estate Satpur, Trimbak
Road, Nashik - 422 007
- Jaipur SP-663 RIICO Industrial Area Sitapura
Jaipur - 302 022
- Naganathapura Post Box No. 6887 Electronic City P.O.
Bengaluru - 560 100
- Verna N-4A, Phase IV, Verna Industrial Estate Verna,
Salcete, Goa - 403 722
- Gangaikondan P. No. B8, SIPCOT Industrial Centre, Tirunelveli
Taluk, Gangaikondan, Tamil Nadu - 627 352
- Chennai Indospace SKCL, Oragadam Wallajabad Road,
Sriperumbudur Taluk, Kancheepuram - 631 604
w) Investor Service Centre:
Secretarial Department (BCS) Bosch Limited Hosur Road, Adugodi Bengaluru – 560 030 Tel: (080) 2299 2393 (Extn. 2315/2310); Monday to Friday: 9.00 a.m. to 5.00 p.m. (except holidays) Designated e-mail ID for redressal of investor complaints: [email protected]
Compliance Officer Mr. R. Vijay, Company Secretary (from 11.02.17) Mr. S. Karthik (Company Secretary upto 10.02.17)
Shareholders may also contact the Registrar & Share Transfer Agent of the Company.
12. Other Disclosures
a) Related Party Transactions:
During the year under review, there were no materially significant related party transactions that had or may have conflict with the interest of the Company at large. The Company has a policy for Related Party Transactions, which can be accessed at at the following link: http://www.boschindia.com/media/in/documents/our_company_1/shareholder_information_1/2014/RPT_Policy.pdf
b) Penalties & Strictures:
No penalties or strictures have been imposed on the Company by the Stock Exchanges or Securities and Exchange Board of India (SEBI) or any other authority on any matter relating to capital market during the year under review.
c) Vigil Mechanism and Whistle Blower Policy:
The Company has a Whistle Blower Policy which provides a vigil mechanism for dealing with instances of fraud and mismanagement.
The said policy can be accessed at: http://www.boschindia.com/media/in/documents/our_company_1/shareholder_information_1/2014/Whistle_blower_policy.pdf
The Whistle Blower Policy of the Company, inter-alia, provides access to the Chairman of the Audit Committee, protection against victimization, affords protection to the directors, employee and associates of Company in the matter of disclosure of any alleged wrongful conduct concerning the affairs of the Company made in good faith and details the procedure for making such protected disclosure.
During the period under review, no person was denied access to the Audit Committee.
d) Non-mandatory / Discretionary Requirements:
(i) The office of the Chairman and Managing Director is assumed by separate persons.

202 | Report on Corporate Governance | Annual Report 2016-17
(ii) The Auditors have expressed an unmodified opinion on the Financial Statements of the Company for the financial year ended March 31, 2017
(iii) Internal auditors periodically apprise the Audit Committee on findings/observation of Internal Audit and actions taken thereon.
(iv) In addition to the statutory requirements, the Audit Committee have a separate discussion/meeting with the Statutory Auditor and Internal Auditors on matters concerning the Audit without the presence of Executive Management of the Company. Measures for improvements are discussed with the Executive Management.
13. Subsidiary Company
The Company does not have any material non-listed Indian subsidiary.
Pursuant to the Explanation under Regulation 16(1)(c) of the Listing Regulations, the Company has made a policy for determining ‘material’ subsidiary and the same can be accessed at http://www.boschindia.com/media/in/documents/our_company_1/shareholder_information_1/2015/Policy_on_Material_Subsidiary1new.pdf
14. CEO/CFO Certificate
A certificate from the Managing Director and the Joint Chief Financial Officer dated May 25, 2017 on the Financial Statements of the Company for the Financial Year ended March 31, 2017, pursuant to Regulation 17(8) of the Listing Regulations read with Part B of Schedule II thereof, was placed before the Board at its meeting held on May 25, 2017.
15. Code of Conduct
The Code of Conduct for Board Members and Senior Management can be accessed at the following link:
http://www.boschindia.com/media/in/documents/our_company_1/shareholder_information_1/2014/Code_of_Conduct.pdf
The Certificate by the Managing Director of the Company concerning compliance with the Code of Conduct for Directors and Senior Management is given herein:
This is to confirm that:
The Company has obtained from the Directors and Senior Management personnel affirmation that they have complied with the Code of Conduct for Directors and Senior Management for and in respect of the financial year ended March 31, 2017.
Soumitra BhattacharyaManaging Director
Place: BengaluruDate: May 25, 2017
16. Prohibition of Insider Trading and Code of Conduct for Directors, etc.
The Company has adopted a “Code of Conduct to regulate, monitor and report trading by Employees and other Connected Persons” and “Code of Fair Disclosure” pursuant to the Securities and Exchange Board of India (Prohibition of Insider Trading) Regulations, 2015.
The above code prohibits dealing in shares of the Company during the period when trading window is closed. Generally, the trading window is closed seven days prior to the end of every quarter and re-opens forty-eight hours after announcement of the quarterly financial results. The closure of trading window is also intimated to the Stock Exchanges.
17. Reconciliation of Share Capital
During the year under review, an audit was carried out at the end of every quarter by a qualified Practising Company Secretary for reconciling the total admitted capital with National Securities Depository Limited (NSDL) and Central Depository Services (India) Limited (CDSL) and the total issued and listed capital. The audit confirms that the total issued/paid up capital is in agreement with the total number of shares held in physical form and the total number of dematerialized shares held with NSDL and CDSL. The report for every quarter upon reconciliation of capital was submitted to the stock exchanges and was also placed before the Board of Directors at their meetings.
18. Disclosures with respect to Demat Suspense Account/Unclaimed Suspense Account
Not Applicable
19. SEBI Complaints Redress System (SCORES)
SEBI has provided an online platform wherein shareholders can lodge their grievances. This facility is known as SEBI Complaints Redress System (SCORES) which can be access at https://scores.gov.in.
This facility enables the shareholders to raise their grievance online and view its status. Your Company has registered with SEBI SCORES. For further details regarding this facility the shareholders may refer to the above website.
BengaluruMay 25, 2017

Annual Report 2016-17 | Report on Corporate Governance | 203
To,
Members of Bosch Limited
We have examined the compliance of conditions of Corporate Governance by Bosch Limited (“the Com-pany”), for the purpose of certifying of the Corporate Governance under Regulation 17 to 27 of the SEBI (Listing Obligations and Disclosure Requirements) Regulations, 2015 for the period April 01, 2016 to March 31, 2017. We have obtained all the information and explanations which to the best of our knowledge and belief were necessary for the purposes of certification.
The compliance of conditions of Corporate Gov-ernance is the responsibility of the management. Our examination was limited to procedures and implementation thereof, adopted by the Company for ensuring the compliance with the conditions of Corporate Governance. It is neither an audit nor an expression of opinion on the financial statements of the Company.
In our opinion and to the best of our information and according to the explanations given to us, we certify that the Company has complied with the conditions of Corporate Governance as stipulated in Regulations 17 to 27 of the SEBI (Listing Obligations and Disclo-sure Requirements) Regulations, 2015.
We further state that such compliance is neither an assurance as to the future viability of the Company nor of the efficiency or effectiveness with which the management has conducted the affairs of the Com-pany.
For BMP & CoCompany Secretaries
Biswajit GhoshPartner
FCS 8750 / CP No. 8239
Place: BengaluruDate: May 25, 2017

204 | Important Web links | Annual Report 2016-17
Important Web links for shareholders reference:Sl.No. Particulars Web links
1. Composition of various committee of Board
http://www.boschindia.com/en/in/our_company_5/shareholder_information/shareholder_information_5/shareholder_information_2.html
2. Policy on determining Materiality and Archival of disclosures
http://www.boschindia.com/media/in/documents/our_company_1/shareholder_information_1/2015/Policy_on_Materiality_and_Archival.pdf
3. Related Party Transaction Policy http://www.boschindia.com/media/in/documents/our_company_1/shareholder_information_1/2014/RPT_Policy.pdf
4. Whistle Blower Policy http://www.boschindia.com/media/in/documents/our_company_1/shareholder_information_1/2014/Whistle_blower_policy.pdf
5. Corporate Social Responsibility Policy
http://www.boschindia.com/media/in/documents/our_company_1/shareholder_information_1/2017_2/CSRPolicy_Final.pdf
6. Nomination and Remuneration Policy
http://www.boschindia.com/media/in/documents/our_company_1/shareholder_information_1/2015/Nomination_and_Remuneration_Policy.pdf
7. Policy on Material Subsidiary http://www.boschindia.com/media/in/documents/our_company_1/shareholder_information_1/2015/Policy_on_Material_Subsidiary1new.pdf
8. Dividend Distribution Policy http://www.boschindia.com/media/in/documents/our_company_1/shareholder_information_1/2017_2/dividend_distribution_policy_2017.pdf
9. Terms & Conditions of Appointment of Independent Directors
http://www.boschindia.com/media/in/documents/our_company_1/shareholder_information_1/2015/revisedID_terms_of_reference.pdf
10. Details of familiarization programme to independent Directors
http://www.boschindia.com/media/in/documents/our_company_1/shareholder_information_1/2017_2/Familiarization_Programme_for_Independent_Directors~1.pdf
11. Bosch Limited Code of Conduct for Directors and Senior Management
http://www.boschindia.com/media/in/documents/our_company_1/shareholder_information_1/2014/Code_of_Conduct.pdf
12. National Automated Clearing House Mandate
http://www.boschindia.com/media/in/documents/our_company_1/shareholder_information_1/ECSform.pdf
13. Unclaimed / Unpaid dividend details as on 01.09.2016
http://www.boschindia.com/media/in/documents/our_company_1/shareholder_information_1/2016_1/revisedBosch_Form_IEPF-2.pdf
14. Contact details for Investors Grievance Redressal
http://www.boschindia.com/media/in/documents/our_company_1/shareholder_information_1/2017_2/Grievance_Redressel_and_contact_information_details_2017.pdf
15. Annual Report FY 2016-17 http://www.boschindia.com/media/in/documents/our_company_1/shareholder_information_1/2017_2/Annual_Report_2016_17.pdf
16. Subsidiary Accounts FY 2016-17 http://www.boschindia.com/media/in/documents/our_company_1/shareholder_information_1/2017_2/Micotradingannualreport2016_17.pdf
17. 2017 AGM Notice and Proxy Form http://www.boschindia.com/media/in/documents/our_company_1/shareholder_information_1/2017_2/AGM_Notice2016_17.pdf
18. Nomination, cancellation / variation of Nomination Form
http://www.boschindia.com/media/in/documents/our_company_1/shareholder_information_1/Forms.pdf
19. Registrar & Transfer Agent Weblink https://www.integratedindia.in/index.aspx
20. Investor Meet Presentations and Con-call Transcript
http://www.boschindia.com/en/in/our_company_5/shareholder_information/shareholder_information_6/shareholder_information_3.html

Annual Report 2016-17 | Business Responsibility Report | 205
Business Responsibility Report
Section A: General Information about the Company1. Corporate Identity Number (CIN):
L85110KA1951PLC0007612. Name of the Company: Bosch Limited3. Registered office address:
P.B. No. 3000, Hosur Road,Adugodi, Bengaluru - 560 030
4. Website: www.boschindia.com5. E-mail ID: [email protected]. Financial Year reported:
April 01, 2016 to March 31, 20177. Sector(s) that the Company is engaged in
(industrial activity code-wise):Automotive Components and Accessories NIC Code: 29304
8. List three key products/services that the Company manufactures/provides (as in balance sheet)i) Fuel Injection Equipment & Componentsii) Injectors and Nozzlesiii) Power Tools
9. Total number of locations where business activity is undertaken by the Company (as on the date of this report)i) International Location: Nilii) National Locations: 8 Plant and 20 Sales
Offices at different locations across India.10. Markets served by the Company: Local/State/
National/International.
Section B: Financial Details of the Company
[Mio INR]
SI No. Particulars Details
1. Paid up Capital 305.2
2. Total Turnover 107,500
3. Total profit after taxes 14,441
4. Total spending on Corpo-rate Social Responsibility (CSR) as percentage of profit after tax (%)
2.30%
5. List of activities in which expenditure in 4 above has been incurred:-
Please refer Annual Report on CSR Activities
Section C: Other Details
1. Does the Company have any Subsidiary Company/Companies?
Yes, the Company has a subsidiary viz., MICO Trading Private Limited.
2. Does the Subsidiary Company/Companies participate in the BR Initiatives of the Parent Company? If yes, then indicate the number of such subsidiary company(s).
The said subsidiary has not commenced business. Hence, there is no participation by the said subsidiary in business responsibility initiatives.
3. Do any other entity/entities (e.g. suppliers, distributors, etc.) that the Company does business with, participate in the BR initiatives of the Company? If yes, then indicate the percentage of such entity/entities? [Less than 30%, 30-60%, More than 60%]
The Company encourages its suppliers, dealers and other stakeholders to support various initiatives taken by the Company towards its business responsibility.
Section D: BR Information
1. Details of the Director/Directors responsible for implementation of the BR:
Director Identification Number (DIN)
: 02783243
Name : Mr. Soumitra BhattacharyaDesignation : Managing Director & Chief
Financial Officer
Details of the BR head:
SI No. Particulars Details
1. DIN (if applicable)
02783243
2. Name Mr. Soumitra Bhattacharya
3. Designation Managing Director & Chief Financial Officer
4. Telephone number
(080) 2299 2216
5. e-mail id [email protected]

206 | Business Responsibility Report | Annual Report 2016-17
2. Principle-wise (as per NVGs) BR Policy/policies (Reply in Y/N):
The National Voluntary Guidelines on Social, Environmental and Economic Responsibilities of Business (NVGs) released by the Ministry of Corporate Affairs has adopted nine areas of Business Responsibility.
These are briefly as under:
P1 Businesses should conduct and govern themselves with Ethics, Transparency and Accountability.P2 Businesses should provide goods and services that are safe and contribute to sustainability throughout
their life cycle.P3 Businesses should promote the well-being of all employees.P4 Businesses should respect the interests of, and be responsive towards all stakeholders, especially those
who are disadvantaged, vulnerable and marginalized.P5 Businesses should respect and promote human rights.P6 Businesses should respect, protect and make efforts to restore the environment.P7 Businesses, when engaged in influencing public and regulatory policy, should do so in a responsible
manner.P8 Businesses should support inclusive growth and equitable development.
P9 Businesses should engage with and provide value to their customers and consumers in a responsible manner.
SI No. Questions
Bus
ines
s E
thic
s
Pro
duc
t R
esp
onsi
bili
ty
Wel
l-bei
ng o
f E
mp
loye
es
Sta
keho
lder
E
ngag
emen
t
Hum
an R
ight
s
Env
iron
men
t
Pub
lic P
olic
y
CS
R
Cus
tom
er
Rel
atio
ns
P1 P2 P3 P4 P5 P6 P7 P8 P9
1. Do you have a policy/policies for … Y* Y Y Y* Y* Y N Y Y*
2. Has the policy being formulated in consultation with the relevant stakeholders? - - Y - - Y - - -
3. Does the policy conform to any national/ international standards? If yes, specify? - - - - -
Y(ISO14001
and OHSAS18001)
- - -
4. Has the policy been approved by the Board? If yes, has it been signed by MD/owner/CEO/appropriate Board Director?
- - - - - - - Y -
5. Does the company have a specified committee of the Board/Director/Official to oversee the implementation of the policy?
Y - Y - - - - Y -
6. Indicate the link for the policy to be viewed online? - - - - - - - Y** -
7. Has the policy been formally communicated to all relevant internal and external stakeholders?
Y(Internally) - Y
(Internally) - - Y - Y -
8. Does the company have in-house structure to implement the policy/policies? Y Y Y Y Y Y - Y Y
9. Does the Company have a grievance redressal mechanism related to the policy/policies to address stakeholders’ grievances related to the policy/policies?
Y Y Y Y Y Y - Y Y
10. Has the company carried out independent audit/evaluation of the working of this policy by an internal or external agency?
- -Y
(Internal Agency)
- -Y
(Both Internal & External
Agencies)
- - -
* These principles are encompassed in the Company’s code of Business Ethics and Principles of Social Responsibility** The CSR Policy of the Company can be accessed at http://www.boschindia.com/media/in/documents/our_company_1/shareholder_
information_1/2017_2/CSRPolicy_Final.pdf

Annual Report 2016-17 | Business Responsibility Report | 207
2a. If answer to the question at Sr. No 1 against any of the Principle is ‘No’, please explain why: (Tick up to 2 options)
SI No. Questions P1 P2 P3 P4 P5 P6 P7 P8 P9
1. The Company has not understood the Principle
-- -- -- -- -- -- -- -- --
2. The Company is not at a stage where it finds itself in a position to formulate and implement the policies on specified principles
-- -- -- -- -- -- -- -- --
3. The Company does not have financial or manpower resources available for the task
-- -- -- -- -- -- -- -- --
4. It is planned to be done within next 6 months
-- -- -- -- -- -- -- -- --
5. It is planned to be done within the next 1 year
-- -- -- -- -- -- -- -- --
6. Any other reason (please specify) P7
The Company through the various industry forums endeavours to promote growth and technological progress, economic reforms, inclusive development policies and sustainable business principles. Therefore, need for a formal policy has not been felt.
3. Governance related to BR:
BR performance of the Company. Within 3 months, 3-6 months, Annually, More than 1 year.
There is no defined frequency. Assessment is an ongoing exercise and is an inherent part of corporate functions.
How frequently is it published?
No.
Section E: Principle-wise performance
Principle 1: Business should conduct and govern themselves with Ethics, Transparency and Accountability.
1. Does the policy relating to ethics, bribery and corruption cover only the company? Yes/No. Does it extend to the Group/Joint Ventures/Suppliers/Contractors/NGOs/Others?
The Company’s policy relating to ethics, bribery and corruption extends to Group Companies in India, its employees and representatives which include dealers, distributors, agents, sub-contractors and power of attorney holders.
2. How many stakeholder complaints have been received in the past financial year and what percentage was satisfactorily resolved by the management? If so, provide details thereof, in about 50 words or so.
The Company has received 14 stakeholder complaints (other than shareholder complaints) during the Financial Year 2016-17. Out of the complaints received, 11 complaints were satisfactorily resolved and 3 complaints are under review as on the date of this Report.
Principle 2: Businesses should provide goods and services that are safe and contribute to sustainability throughout their life cycle.
1. List up to 3 of your products or services whose design has incorporated social or environmental concerns, risks and/or opportunities.

208 | Business Responsibility Report | Annual Report 2016-17
2. For each such product, provide the following details in respect of resource use (energy, water, raw material etc.) per unit of product (optional):
These products have resulted in reduction in energy consumption by approximately 20%. Additionally, design optimization has resulted in substantial reduction in consumption of raw materials.
3. Does the company have procedures in place for sustainable sourcing (including transportation)? If yes, what percentage of your inputs was sourced sustainably? Also, provide details thereof, in about 50 words or so.
Sourcing of material for the product and Indirect material required for manufacturing has continuously evolved with the concept of using only material which can be recycled. This starts with design and selection of raw material and manufacturing process with suppliers. The manufacturing process is selected and improved year on year to reduce energy and resource consumption.
The Company has implemented Transport Management Center (TMC) enabling consolidation of transportation requirements of various internal business divisions and achieving economies of scale. In TMC, the supplier selection process is streamlined to bring in competent suppliers. By following this process, the Company is not only able to reduce the transportation cost but also carbon footprint paving the way for a greener tomorrow.
4. Has the company taken any steps to procure goods and services from local & small producers, including communities surrounding their place of work? If yes, what steps have been taken to improve their capacity and capability of local and small vendors?
The Company, as a policy, ensures localization and outsourcing in each manufacturing facility is with suppliers who are competitive as well as in close proximity of the facilities.
Localized vendors are preferred, if they meet the quality specifications & EHS requirements.
The Company focuses on increasing the capacity and capability of its suppliers. The Company provides complete hands-on training in classroom and on shop floor to its suppliers on various Bosch systems and quality tools.
5. Does the company have a mechanism to recycle products and waste? If yes, what is the percentage of recycling of products and waste (separately as <5%, 5-10%, >10%). Also, provide details thereof, in about 50 words or so.
Yes, the Company has a mechanism to recycle products and waste. Nearly 95% of product components are recycled post its Life Cycle.
Majority of the products of the Company, which are made up of metals, are recycled on a regular basis. Upto 98% of the solid wastes like paper, plastic, etc. are recycled. Hazardous wastes like used oil, solvents, etc. are sent for recycling.
At all the Company’s locations, wastes are segregated based on their characteristics, collected and stored in an appropriate manner with a separate treatment for organic and inorganic waste. The waste after collection are sent to Central/State Pollution Board approved recyclers for suitable re-use, recycle or disposal.
Principle 3: Businesses should promote the well-being of all Employees
1. Please indicate the total number of employees:
SI No. Category of Employees No. of Employees
1. Associates 6,052
2. Managerial and Superintending Staff (M&SS) 3,589
TOTAL 9,641
2. Please indicate the total number of employees hired on temporary/contractual/casual basis:
1,130

Annual Report 2016-17 | Business Responsibility Report | 209
3. Please indicate the number of permanent women employees.
546
4. Please indicate the number of permanent employees with disabilities:
15
5. Do you have an employee association that is recognized by management?
Yes, there are recognized trade unions affiliated to various central trade union bodies.
6. What percentage of your permanent employees are members of this recognized employee association?
Almost 100% of permanent associates are members of recognized employee associations.
7. Please indicate the number of complaints relating to child labour, forced labour, involuntary labour, sexual harassment in the last financial year and pending, as on the end of the financial year.
SI No. Category No. of complaints filed during
the Financial YearNo. of complaints pending as on end of the Financial Year
1. Child labour/forced labour/involuntary labour
NIL NIL
2. Sexual Harassment* 2 NIL
3. Discriminatory employment NIL NIL* The above may be treated as information pursuant to provisions of Sexual Harassment of Women at Workplace (Prevention, Prohibition and
Redressal) Act, 2013.
8. What percentage of your under mentioned employees were given safety & skill up-gradation training in the last year?
Almost 100% of the employees were given safety training last year. Please refer below the percentage of skill up-gradation training in the last year-
1. Permanent Employees : 72%2. Permanent Women Employees : 32%3. Casual/Temporary/Contractual Employees : 100%4. Employees with Disabilities : 25%
Principle 4: Businesses should respect the interests of, and be responsive towards all Stakeholders, especially those who are disadvantaged, vulnerable and marginalized.
1. Has the company mapped its internal and external stakeholders? Yes/No
Yes.
2. Out of the above, has the company identified the disadvantaged, vulnerable & marginalized stakeholders?
Yes.
3. Are there any special initiatives taken by the Company to engage with the disadvantaged, vulnerable and marginalized stakeholders? If so, provide details thereof, in about 50 words or so.
The Company has always engaged itself in special initiatives with the disadvantaged, vulnerable and marginalized stakeholders. Such disadvantaged, vulnerable and marginalized stakeholders are working in various departments including power tools, packaging and aftermarket spare parts packing.
The Company continues to engage with vulnerable and marginalised stakeholders for their sustainable livelihood. Training and employment is provided to underprivileged school dropouts.
The Company provides medical and educational support to students of Government schools located close to the premises of the Company.

210 | Business Responsibility Report | Annual Report 2016-17
Principle 5: Businesses should respect and promote human rights
1. Does the policy of the company on human rights cover only the company or extend to the Group/Joint Ventures/Suppliers/Contractors/NGOs/Others?
The Company’s Policy on Human Rights covers not only the Company but extends to its Group Companies, Joint Ventures, Suppliers, Contractors, NGOs, etc.
2. How many stakeholder complaints have been received in the past financial year and what percent was satisfactorily resolved by the management?
NIL.
Principle 6: Businesses should respect, promote and make efforts to restore the environment
1. Does the policy related to Principle 6 cover only the company or extend to the Group/Joint Ventures Suppliers/Contractors/NGOs/others.
The Company’s Corporate Environment Policy is known as “Work Safety and Environment Protection Policy”. The policy aims at providing safe work place to employees, protect environment, comply with legal requirements and make products that are safe and eco-friendly. The policy is reviewed for any changes arising due to changes in regulatory requirements, customer requirements or improvements in technology.
All manufacturing locations are certified under the requirements under ISO 14001(Environmental Management System) and OHSAS 18001(Occupational Health and Safety System). The system requirements are broad based by incorporating Bosch internal requirements. Layered audits are carried out to check the level of compliance. Deviation management system ensures that the corrective actions are taken and issues are addressed within a reasonable time frame.
The EHS (Environmental, Health and Safety) performance assessment is carried out annually. The EHS policy also extends to suppliers, contractors, recyclers and to others with whom the activities of the Company and group companies in India are involved.
2. Does the Company have strategies/initiatives to address global environmental issues such as climate change, global warming, etc.? Y/N. If yes, please give hyperlink for webpage, etc.
Yes. Innovative technologies are used to reduce the impact on the environment. In the entire chain of manufacturing, the emphasis is on preserving natural resources.
The Company is committed to actively shape climate protection. It aims to reduce relative CO₂ emissions by 35% by 2020 over 2007 levels, and is thus contributing to systematic CO₂ reduction.
http://www.boschindia.com/content/language1/html/4430.html
3. Does the Company identify and assess potential environmental risks? Y/N
Yes. The locations are certified for requirements under ISO 14001 (Environment Management System) and OHSAS 18001 (Occupational Health and Safety System).
The EHS (Environmental, Health and Safety) performance assessment is carried out annually.
4. Does the company have any project related to Clean Development Mechanism? If so, provide details thereof, in about 50 words or so. Also, if yes, whether any environmental compliance report is filed?
No.
5. Has the company undertaken any other initiatives on – clean technology, energy efficiency, renewable energy, etc., Y/N. If yes, please give hyperlink for web page, etc.
The Company has taken up several initiatives on clean technology, energy efficiency and renewable energy.
Solar power generation, solar hot water generation, steam generation from solar concentrators and turbo ventilators are some of the initiatives taken at our locations for harnessing renewable sources of energy.
Details of these are available at http://www.boschindia.com/content/language1/html/4430.html

Annual Report 2016-17 | Business Responsibility Report | 211
6. Are the Emissions/Waste generated by the company within the permissible limits given by CPCB/SPCB for the Financial Year being reported?
Yes, the emissions/waste generated by the Company are monitored within the permissible limits given by State Pollution Control Board (“SPCB”).
The Company conducts regular audits at the locations where the wastes are disposed to ensure it is treated and disposed in a scientific manner with minimum impact on the environment.
7. Number of show cause/legal notices received from SPCB which are pending (i.e. not resolved to satisfaction) as on end of Financial Year.
NIL
Principle 7: Businesses, when engaged in influencing public and regulatory policy, should do so in a responsible manner
1. Is your company a member of any trade and chamber or association? If Yes, name only those major ones that your business deals with:
The Company is a member of:
i) Confederation of Indian Industry(CII)
ii) Indo-German Chamber of Commerce
iii) Bangalore Chamber of Commerce (BCC)
iv) Automotive Component Manufacturers’ Association of India (ACMA)
v) Bombay Chamber of Commerce and Industry (BCCI)
2. Have you advocated/lobbied through above associations for the advancement or improvement of public good? Yes/No; if yes specify the broad areas (drop box: Governance and Administration, Economic Reforms, Inclusive Development Policies, Energy security, Water, Food Security, Sustainable Business Principles, Others)
Yes, following are the broad areas:
a) Promote growth and technological progress
b) Sustainable business principles
c) Energy Sustainability
d) Water & Food Security
Principle 8: Businesses should support inclusive growth and equitable development
1. Does the company have specified programmes/initiatives/projects in pursuit of the policy related to Principle 8? If yes, details thereof.
In line with the provisions of the Companies Act, 2013 and based on recommendation of the CSR Committee, the Board of Directors have adopted a CSR Policy. The CSR policy, inter-alia, deals with the objectives of the Company’s CSR initiatives, the guiding principles, the thrust areas of CSR, the responsibilities of the CSR Committee, the implementation plan and reporting framework.
The thrust areas of the Company’s CSR activities are:
a) Child health, hygiene and education;
b) Vocational training focused on employable skills; and
c) Neighbourhood projects as per the local needs identified by Company’s Plants
Some of the initiatives taken during the year under review are:
Child Health, Hygiene and Education:
The Health & Hygiene activities included general health camps, malnutrition, dental health camp and a health check-up in the Government schools and also infrastructure support to school children who are studying in Government schools.

212 | Business Responsibility Report | Annual Report 2016-17
Child Health Development Programme (CHDP)
Medical camps covering 55,000 students studying in 350 government schools in and around Bengaluru and Nashik were conducted. From November 2016 onwards, the Bosch CHDP in Bengaluru converged with the Rashtriya Bal Swasthya Karyakram (RBSK) scheme/team, a Government initiative for the school health program.
Child Science Education Programme (CSEP)
In partnership with Agastya International Foundation, 30 LIB (Labs in a Box) have been provided benefitting 4,500 students. In addition, 5 Mobile Science Vans and one Mobile Bike were deployed in Bengaluru, Bidadi, Jaipur and Nashik benefitting more than 20,000 children. 20 Science Fairs have been conducted by the schools themselves.
Child English & Computer Education Programme (CECEP)
The computer labs were set up in 20 Government schools with CPUs, monitors, UPS and other infrastructure, including AMC. Supplementary teachers were also deployed to teach English and Computers.
Vocational training focused on employable skills:
BRIDGE - Bosch’s Response to India’s Development & Growth through Employability Enhancement
Under this unique vocational training programme, select school dropouts are targeted by imparting industry relevant, short term skills development and training programmes with the focus to help the select underprivileged unemployed youth to get suitable employment and bring them back to the main stream.
‘End-to-end solution’ vocational training model includes, training contents development (both soft skills and functional skills), application oriented delivery methodology, continuous evaluation, internship, employment and financial assistance over the course of 2 months.
125 BRIDGE centres have been set up in 16 States in India. More than 7,500 youth have been trained and employed and thousands more will be benefited in years to come.
Neighbourhood Projects:
Bengaluru - Bosch Technical Lab
Technical labs have been set up in 25 Government ITIs under PPP mode in partnership with the Government of Karnataka. 30 Government ITIs in Maharashtra and 33 ITIs in Rajasthan were provided infrastructure facility in classroom. In addition to running BRIDGE course in these ITIs, to make school dropout students employable, the upgradation of technical training infrastructure as per current industry requirements also improve the training quality of existing ITI students.
Nashik - Village development projects
“Jalayukt Shivaar” is the flagship programme for water conservation for the Government of Maharashtra. The Company extended its support to repair old and defunct four check dams through which the issue of water shortage of villages of Trimbakeshwar Tehsil (30 kms from Nashik city) was addressed. This initiative has been appreciated by the state government and has been suggested as a model for best practice.
Total 8 projects have supported more than 500 families and farmers:
- for drinking water - water available for second crop and - increasing overall ground water level.
Jaipur - Reverse Osmosis Plant
7 Reverse Osmosis (RO) plants have been set up in villages near Jaipur in 2016-17 and in total 22 RO plants have been set up till date. Currently, these plants cater to around 3,425 families. During the year under review, construction of wash rooms, putting up smart classrooms, providing green boards for Government schools was another important initiative of the Jaipur Plant.

Annual Report 2016-17 | Business Responsibility Report | 213
Bosch India Foundation (BIF)
The Company, in addition to carrying out CSR activities through various partners & NGOs, also carries out CSR activities through Bosch India Foundation, a trust formed by Bosch group companies in India including Bosch Limited.
The Company contributes approximately 0.5 percent of its Net Profit to the Foundation for carrying out CSR activities.
BIF continued its journey in community and societal development, with a clear focus on sustainability through the following key programs and intervention areas:
a. Holistic integrated village development: The Foundation is working in 150 villages in the states of Karnataka, Tamil Nadu, Rajasthan and Maharashtra around the facilities of the Company covering a total of 24,372 families. The key intervention areas of Economic development - Women empowerment, Agriculture, Livestock, Youth development, Health and Hygiene, Education, Environment and water enabling economic and social empowerment for self-reliant villages.
b. BIF has enabled an artisan training center in Nashik in the field of Electrical apart from the Carpentry Artisan training center in Bengaluru, which was setup in 2015-2016. In 2016, BIF inaugurated a state-of-the-art Artisan training center in relation to electrical trades in Nashik. This center is a collaborative center established at Nasik Engineering Cluster in financial and technical participation of Electrical companies. Presently 19 Trainees are undergoing an intensive training for 6 months in the center.
2. Are the programmes/projects undertaken through in-house team/own foundation/external NGO/ government structures/any other organization?
The Company’s Social Responsibility Projects are implemented through internal team as well as in partnership with Non-Governmental Organizations (NGOs), through Government Institutions and Bosch India Foundation.
3. Have you done any impact assessment of your initiative?
Yes.
4. What is your company’s direct contribution to community development projects and the details of the projects undertaken?
The Company spent an amount of Mio INR 332.10 on community development projects. Details of the projects undertaken are given in Annual Report on CSR Activities enclosed as Annexure ‘B’ (Page No. 58) to the Directors’ Report.
5. Have you taken steps to ensure that this community development initiative is successfully adopted by the community?
The Company ensures that its presence is established right from the commencement of the initiatives. It collaborates with the communities from need identification to project implementation phase. The Company has extensive engagement with various stakeholders. The feedback from the stakeholders is analysed and actions thereon are taken.
Principle 9: Businesses should engage with and provide value to their customers and consumers in a responsible manner
1. What percentage of customer complaints/consumer cases are pending as on the end of financial year.
During the financial year ended March 31, 2017, 5 new cases were filed against the Company. As at the end of the Financial Year, 3 cases were pending for decision.
2. Does the company display product information on the product label, over and above what is mandated as per local laws? Yes/ No/N.A./Remarks (additional information)
Yes, apart from the mandated declarations, additional declarations are furnished on the products/labels relating to the products and their usage.
3. Is there any case filed by any stakeholder against the Company regarding unfair trade practices, irresponsible advertising and/or anti-competitive behaviour during the last five years and pending as on end of Financial Year. If so, provide details thereof, in about 50 words or so.
No.
4. Did your company carry out any consumer survey/consumer satisfaction trends?
No.

214 | Sales Offices | Annual Report 2016-17
Ahmedabad31/32, JMC House, Level 3Opp. to Parimal GardenEllis BridgeAhmedabad - 380 006
Delhi & Gaziabad‘Rishyamook’85-A, Panchkuian RoadNew Delhi - 110 001
Kolkata91-A, Park StreetKolkata - 700 016
Pune3rd FloorGodrej Millennium9 Koregaon ParkPune - 411 001
Bengaluru 21/1, Mission RoadBengaluru - 560 027
ErnakulamMCM Building,IN. SY. No. 145/12A, 32/232N.H. By-Pass RoadPadivattom, ErnakulamCochin - 682 024
Lucknow2nd Floor, Madan Plaza14, Station RoadLucknow - 226 001
Raipur2nd floorPithalia ComplexOpp. Telephone ExchangeNear Fafadih ChowkRaipur - 492 001
BhubaneshwarPlot No. N-6/454IRC VillageJayadev Vihar NayapalliBhubaneshwar - 751 015
Guwahati3rd FloorMayur Garden BuildingOpp. Rajiv BhavanABC, G.S. RoadGuwahati - 781 005
MaduraiGV Towers3/4, Melakkal RoadKochadaiMadurai - 625 010
RanchiBhagirathi ComplexOpp. Adivasi HostelKaram Toli RoadRanchi - 834 001
Chandigarh, Punjab& PanchkulaFF & SF, SCO - 301Sector 9, Panchkula - 134 109Haryana
Indore2nd Floor, MAN House15th PU-3, SchemeNo. 54, AB RoadIndore - 452 008
MumbaiCrystal Building79, Dr. Annie Besant RoadWorliMumbai - 400 018
SecunderabadPlot. 117Srinagar ColonyTrimulgherrySecunderabad - 500 015
ChennaiSabari Sunnyside2nd Floor, Middle Wing#8/17, Shafee Mohamad RoadOff: Greams Road, Thousand Lights, Chennai - 600 006
JaipurT - 304, 305 & 307Sangam TowerChurch RoadOff MI RoadJaipur - 302 001
PatnaPlot No. 21/A-2Patliputra ColonyNear Patliputra GolamberOpp. UNICEF OfficePatna - 800 013
Vijayawada‘RUMR’ PLAZA1st Floor, Opp. Sri ChaitanyaOlympiad SchoolPinanamaneniPolytechnic RoadMogalrajapuramVijayawada - 520 010
*as on May 25, 2017.


Registered Office:
Bosch LimitedP. B. No. 3000, Hosur Road,Adugodi, Bengaluru - 560 030Phone: +91 80 2299 2315, Fax +91 80 2299 2181CIN: L85110KA1951PLC000761E-mail: [email protected]
BoschIndia in