annual report 2016-17 (front cover)...title annual report 2016-17 (front cover) created date...
TRANSCRIPT


GROWINGSUSTAINABLY
ANNUAL REPORT2016-17

Board of Directors (as at March 31, 2017)Mr. R. Seshasayee, Chairman
Mrs. Kanchan Chitale
Mr. Vijay Vaid
Mr. T. Anantha Narayanan
Mr. Ranbir Singh Butola
Mr. Yashodhan Kale
Mr. Shanker Annaswamy
Dr. T. T. Ram Mohan
Mr. Romesh Sobti, Managing Director & CEO
Company SecretaryMr. Haresh K. Gajwani
AuditorsPrice Waterhouse Chartered Accountants LLP252, Veer Savarkar MargShivaji Park, Dadar (West)Mumbai - 400 028
Registrar & Share Transfer AgentLink Intime India Pvt. Ltd.C 101, 247 ParkL.B.S. Marg, Vikhroli (West)Mumbai – 400 083Tel: 022 49186000 Fax: 022 49186060
Contents Page No.
Directors’ Report .......................................................15
Management Discussion & Analysis .........................72
Corporate Governance ...........................................109
Independent Auditors’ Report ................................138
Balance Sheet .........................................................142
.............................................143
Cash Flow Statement ..............................................144
Schedules ...............................................................145
...............................151
Notes on Accounts .................................................159
Disclosures under Basel IIICapital Regulations ..................................................202
Balance Sheet in US Dollars ...................................271
Bank’s Branches .....................................................272
2401, Gen. Thimmayya Road(Cantonment)Pune - 411001
8th Floor, Tower 1, One Indiabulls Centre841, Senapati Bapat MargElphinstone Road (W)Mumbai – 400 013
Secretarial & Investor Services731, Solitaire Corporate Park167, Guru Hargovindji MargAndheri (E), Mumbai 400 093Tel: 022 - 6641 2487/ 2361
1


15
DIRECTORS’ REPORT: 2016-17
The Board of Directors of the Bank have pleasure in presenting the Twenty-third Annual Report covering business and operations of the Bank, together with the Audited Financial Statements for the year ended March 31, 2017.
(` in crores)
Particulars As on March 31, 2017
As on March 31, 2016
Deposits 126,572.22 93,000.35Advances 113,080.51 88,419.34
5,641.71 4,297.942,867.89 2,286.45
During the year under review, despite a persistently challenging operating environment, the Bank improved its business, with Deposits growing by 36.10% and Advances by 27.89% over the previous year.
The Bank continued to focus on increasing earnings from its core banking business, strengthening the fee income streams, and maintaining control on operating costs.
` 5,641.71 crores, as compared to ` 4,297.94 crores in the previous year.
25.43% at ` 2,867.89 crores, as against ` 2,286.45 crores in the previous year.
Appropriations
(` in crores)
5,641.71190.69
2,583.13
2,867.89
5,013.45
Amount available for Appropriation 7,881.34
Transfer to Statutory Reserve 716.97
45.54
(pertaining to shares allotted after March 31, 2016 until Record Date for the 22nd AGM held on July 1, 2016) 0.45
Total Appropriations 762.96Balance carried over to Balance Sheet 7,118.38
DividendThe Earning Per Share (EPS) of the Bank rose to ` 48.06 during the year 2016-17, from ` 39.68 in the previous year.
Directors recommend Dividend of ` 6.00 per Equity Share of ` 10 each for the year ended March 31, 2017. (Dividend for the year 2015-16 was ` 4.50 per Equity Share of ` 10 each).

Annual Report 2016-17
16
`
Financial Performance and State of Affairs of the Bank
` 18,577.16 crores from ` 15,168.69 crores.
` 6,062.60 crores from ` rose to ` 4,171.49 crores from ` 3,296.95 crores, registering growth of 26.53%.
` 3,488.59 crores from ` 2,809.59 crores earned during the previous year.
of the year. Revenue per employee during the year remained steady at ` 40 lakhs.
The quality of the Loan Book remained stable with Net Non-Performing Assets (Net NPAs) standing at 0.39% as at
to 58.58% in the previous year.
• A follow-on issue of Bonds for ` 1,500 crores was made in December 2016.
Bonds for ` 1,000 crores was made in March 2017.
boost Digital and Mobile Banking service was launched during the year. The Bank introduced several new products
Groups. The Bank kept up its focus on deepening as well as strengthening of the fee-based income streams, resulting

17
Performance of Subsidiary and Associate Company
` 217.21 crores, as against Revenue of ` 179.43 crores in the previous ` 0.93 crore in FY 2016-17.
Share Capital` 10 each.
During the year under review, the Bank allotted 31,62,370 Equity Shares of ̀ under its Employee Stock Option Scheme, 2007.
The Bank has not issued any Equity Shares with differential voting rights.
Debentures
nature of Debentures of Face value of ̀ 10,00,000 (Rupees Ten Lakhs each) for cash at par amounting to ̀ 1,500 crores, allotted on December 9, 2016.
` 10,00,000 (Rupees Ten Lakhs each) for cash at par amounting to ` 1,000 crores, alloted on March 22, 2017.

Annual Report 2016-17
18
Trustee I:
www.catalysttrustee.com
Trustee II:
www.beacontrustee.co.in
Trustee III:
www.idbitrustee.com
` 308.90 crores.
Tier II Capital
` 308.90 crores, issued in 2006, were redeemed during the
DepositsThe Bank is a banking company governed by the Banking Regulation Act, 1949 and as such, the provisions in the

19
Capital Adequacy
Particulars March 31, 2017 March 31, 201615.31% 15.50%14.02% 14.92%14.72% 14.92%
0.59% 0.58%
Credit Ratings
Instruments Rating Rating AgencyAA+AA
A1+Senior Bonds program AA+
Research AA
Research Short-Term Debt instruments A1+
Research
Directors
(iii) Mr. T. Anantha Narayanan (iv) Mr. Ranbir Singh Butola (v) Mr. Shanker Annaswamy (vi) Dr. T. T. Ram Mohan.
their Board.

Annual Report 2016-17
20
2007.
Shareholders of the Bank had, in the 21st AGM held on August 17, 2015, approved the re-appointment of
Shareholders of the Bank had, in the 21st AGM of the Bank held on August 17, 2015, approved the re-appointment
31, 2018.
and being eligible, offers himself for re-appointment.
Directors seeking appointment / re-appointment at the ensuing Annual General Meeting, have been furnished in the Notice convening the 23rd AGM.
the 22nd AGM of the Bank held on July 1, 2016, for appointment of Dr. T. T. Ram Mohan in the category
Board and Committee Meetings
by the Board.

21
Performance Evaluation of the Board and its Committees
The Bank has aligned its Board Evaluation Framework in line with the Guidance Note on Board Evaluation issued by
Board of Directors in their meeting held on May 9, 2017.
System for Internal Financial Controls and its Adequacy
etc. The process of recording of transactions in each of the application platforms is subject to various forms of
etc. The Financial Statements are prepared based on computer system outputs. The responsibility of preparation of Financial Statements is entrusted to a dedicated unit which is completely independent of business, risk, audit or
and transfers to Reserves. The Bank has implemented adequate procedures and internal controls which provide
Conservation of energy and technology absorption and foreign exchange earnings and outgo
towards conservation of energy and technology absorption, thus ensuring compliance with the provisions of Section
are furnished in the Management and Discussion Analysis Report, which forms part of the Annual Report. The Bank
outgo are also mentioned in the section on Management and Discussion Analysis.
Risk ManagementThe Bank has an Enterprise-wide Risk Management (ERM) framework in place. The integrated Risk Management
Security Risk across all verticals, independent of business functions.
Risk Management functions in the Bank have been aligned with best industry practices, supported by advanced risk measurement and analytical systems, which enables proactive risk management and monitoring.
The Bank has a comprehensive framework of risk management policies which specify the risk appetite, risk measurement methodologies, and monitoring and control measures for the respective business segments. The policies have been designed keeping risk appetite as the central objective, and business strategies have been aligned to risk policies.
procedures developed by the Bank and monitor adherence to risk parameters and prudential limits set for different portfolios / products / segments.
Discussion and Analysis’.

Annual Report 2016-17
22
Vigil Mechanism / Whistle Blower Policy
The Policy also incorporates suggestions of the Protected Disclosure Scheme for Private Sector and Foreign Banks,
meets at least twice a year.
Statutory Auditors
N500016), who have audited the accounts of the Bank for the year 2016-17, shall retire at the conclusion of the ensuing Annual General Meeting, and are eligible for re-appointment.
Act, 2013.
Independent Auditors’ Report
Secretarial Audit
reservation or adverse remark.

23
Statutory Disclosures
port.
Employee Stock Option Scheme
time to time. The eligibility and number of Options to be granted to an employee is determined on the basis of criteria
Statutory Auditors of the Bank, is being placed before Members in the ensuing AGM.
Directors’ Responsibility Statement
(i) that in the preparation of the Annual Accounts for the year ended March 31, 2017, the applicable Accounting
(ii) that such accounting policies as mentioned in the Notes to the Financial Statements have been selected and applied consistently and that judgements and estimates have been made that are reasonable and prudent so
(vi) that systems to ensure compliance with the provisions of all applicable laws were in place and were adequate and operating effectively.

Annual Report 2016-17
24
Extract of Annual Return
Particulars of EmployeesThe Bank had 25,314 employees on its rolls as on March 31, 2017.
51 employees who had been employed throughout the year were in receipt of remuneration of ` 1.02 crores per annum or more, and 6 employees employed for part of the year were in receipt of remuneration of ` 8.50 lakhs per month or more.
this Annual General Meeting during business hours on working days.
None of the employees hold (by himself or along with his spouse and dependent children) more than two percent of the Equity Shares of the Bank.
Policy on Remuneration to Non-Executive Directors
of private sector Banks, the Board of Directors have, on the basis of the recommendations of Human Resource
held on May 12, 2016, approved the payment of remuneration of ` 25 lakhs per annum w.e.f. April 1, 2016 to
` 10 lakhs per annum for each Director, in such manner as may be decided by the Board of Directors.
Shareholders had, in the 22nd Annual General Meeting of the Bank held on July 1, 2016, accorded their approval for

25
Schedule 18 to the Financial Statements, which forms an integral part of this Annual Report.
integral part of this Report.
Particulars of Loans, Guarantees or Investments outstanding
the ordinary course of business. The particulars of loans made, guarantees given and investments made by the Bank are disclosed in the Financial Statements as per the applicable provisions of Banking Regulation Act, 1949.
Particulars of Contracts or Arrangements with Related Parties
The Policy on Related Party Transactions as approved by the Board of Directors is hosted on the Bank’s website at
Consolidated Financial Statements
prepared and is included in the Annual Report.
Indian Accounting Standards (Ind AS)
statements.
comprising members from cross-functional areas, for the purpose of reviewing and monitoring the progress of

Annual Report 2016-17
26
changes required to be made to its systems and processes.
recognised in equity or other components of equity.
legal form of the arrangement.
attributable fees and costs would be considered to be an adjustment to the effective interest rate.
(e) All Derivatives would be required to be fair-valued and recognised on the Bank’s Balance Sheet.
Options.
methodology for calculating the provision for Standard Assets and Non-Performing Assets (NPAs). The Bank
Corporate Social ResponsibilityThe Bank has voluon sustainability-driven growth.
namely, rural development and inclusiveness, environmental sustainability, preventive healthcare, and other areas of special interest.
Act, 2013.

27
`activities during FY 2016-17, out of which `
manner.
Our social and community outreach programmes are gaining scale and momentum every year and hence the
Business Responsibility Report (BRR)
Board.
Corporate Governance
Regulations, forms an integral part of this Report.
part of this Report.
Management Discussion and Analysis ReportThe Management Discussion and Analysis Report, as prescribed under Regulation 34(2) of the Listing Regulations, forms part of the Annual Report.
status of the Bank and its future operations.
Awards and Accolades
Brief details of various awards are covered in the initial pages of this Annual Report.

Annual Report 2016-17
28
R. Seshasayee
Cautionary Statement
factors that could make a difference include economic conditions in the domestic and overseas markets, changes in Laws / Regulations, and other incidental factors.
Material events that have happened after the Balance Sheet date
Policy on Prevention, Prohibition and Redressal of Sexual Harassment of Women at Workplace
The Policy aims to provide protection to women employees at the workplace and prevent and redress complaints
environment.
and recommend appropriate action.
status of the same is as under.
the year
the year
the year9 9 Nil
Acknowledgements
ethic, and unswerving commitment, which qualities have contributed to the Bank’s continued progress in a challenging environment.
The Board thanks its valued customers for their patronage, and looks forward to the growing of this mutually supportive relationship in future.

29
ANNEXURE I TO THE DIRECTORS’ REPORT
SECRETARIAL AUDIT REPORTFORM NO. MR-3
FOR THE FINANCIAL YEAR ENDED MARCH 31, 2017[Pursuant to Section 204(1) of the Companies Act, 2013 and Rule No. 9 of the Companies (Appointment and
Remuneration of Managerial Personnel) Rules, 2014]
To,The Members,INDUSIND BANK LIMITED CIN: L65191PN1994PLC076333
We have conducted the Secretarial Audit of the compliance of applicable statutory provisions and the adherence to good corporate practices by IndusInd Bank Limited (hereinafter called “the Bank”). Secretarial Audit was conducted in a manner that provided us a reasonable basis for evaluating the corporate conducts / statutory compliances and expressing our opinion thereon.
representatives during the conduct of Secretarial Audit, we hereby report that in our opinion, the Bank has, during
hereunder and also that the Bank has proper Board-processes and compliance mechanism in place to the extent, in the manner and subject to the reporting made hereinafter.
iv. Foreign Exchange Management Act, 1999 and the rules and regulations made thereunder to the extent of Foreign Direct Investment and External Commercial Borrowings. The Bank does not have any Overseas Direct
v. The following Regulations and Guidelines prescribed under the Securities and Exchange Board of India Act,
a. The Securities and Exchange Board of India (Substantial Acquisition of Shares and Takeovers) Regulations,
c. The Securities and Exchange Board of India (Issue of Capital and Disclosure Requirements) Regulations,
f. The Securities and Exchange Board of India (Registrars to an Issue and Share Transfer Agents) Regulations,

Annual Report 2016-17
30
vi. The Banking Regulation Act, 1949.We have also examined compliance with the applicable clauses of the following:i. Secretarial Standards issued by The Institute of Company Secretaries of India. ii. The Securities and Exchange Board of India (Listing Obligations and Disclosure Requirements) Regulations,
During the period under review, the Bank has complied with the provisions of the Act, Rules, Regulations, Guidelines, Standards, etc. mentioned above, to the extent applicable.We further report that -The Board of the Bank is duly constituted with proper balance of Executive Directors, Non-Executive and Independent Directors. The changes in the composition of the Board of Directors that took place during the period under review were carried out in compliance with the provisions of the Act.Adequate notice is given to all directors to schedule the Board Meetings, agenda and detailed notes on agenda were sent at least seven days in advance, and a system exists for seeking and obtaining further information and
During the period under review, decisions were carried through unanimously and no dissenting views were observed, while reviewing the minutes.
operations of the Bank to monitor and ensure compliance with applicable Laws, Rules, Regulations and Guidelines.We further report that during the audit period, the Bank has undertaken following events / actions –
/ Foreign Currency, by way of issue of Securities including but not limited to issue of Bonds / Non-Convertible Debentures (NCDs), i.e., Long-Term Infrastructure Bonds and Subordinated Non-Convertible Debentures /
upto ` 5,000 crores on Private Placement basis.II. During the period under review, the Bank has issued and allotted-
a. 15,000 Senior Unsecured Redeemable Non-Convertible Bonds in the nature of Debentures of Face value of `
b. 10,000 Rated, Listed, Non-Convertible, Perpetual, Sub-ordinated & Unsecured BASEL III-compliant Bonds in the nature of Debentures of Face Value of `Placement basis.
III. During the period under review, the Bank has redeemed 3,054 Upper Tier II Bonds-Series VIII, IX and X aggregating to `
For Bhandari & AssociatesCompany Secretaries
S. N. BhandariPartner
Place : Mumbai
this report.

31
ToThe Members,INDUSIND BANK LIMITED CIN: L65191PN1994PLC076333
letter.
1. Maintenance of Secretarial record is the responsibility of the management of the Bank. Our responsibility is to express an opinion on these secretarial records based on our audit.
provide a reasonable basis for our opinion.
Bank.
4. Wherever required, we have obtained the Management representation about the compliance of Laws, Rules and Regulations and happening of events, etc.
5. The compliance of the provisions of Corporate and other applicable Laws, Rules, Regulations, Standards is the
effectiveness with which the management has conducted the affairs of the Bank.
For Bhandari & AssociatesCompany Secretaries
S. N. BhandariPartner
Place : Mumbai
ANNEXURE A TO THE SECRETARIAL AUDIT REPORT

Annual Report 2016-17
32
ANNEXURE II TO THE DIRECTORS’ REPORT
The details pursuant to Section 197(12) of the Companies Act, 2013 read with Rule 5(1) of the Companies (Appointment and Remuneration of Managerial Personnel) Rules, 2014 (Including Amendment Rules, 2016)
The ratio of the remuneration of each Director to the median remuneration of the employees of the Bank for the
Name RatioRomesh Sobti, Managing Director & CEO
7.14x `25
Details about Remuneration paid to the Managing Director & CEO are given in the Report on Corporate
Annual Report.
Committees of the Board, all Non-Executive Directors (other than the Chairman) received remuneration in the `10 lakhs per annum, in line with RBI Guidelines and on the basis of
Mr. R. Seshasayee, Part-time Non-Executive Chairman received remuneration of `
of the Bank. In view of the guidelines on Compensation to Non-Executive Directors of Private Sector banks contained in RBI
`10 lakhs per annum and the same has been paid with effect from April
The ratio of remuneration to Non-Executive Directors to the median remuneration of the employees of the Bank
Secretary in the Financial Year :
Name PercentageRomesh Sobti, Managing Director & CEO 7%
Haresh Gajwani, Company Secretary 13%
The percentage increase in the median remuneration of employees in the Financial Year:
The number of permanent employees on the rolls of the Bank:
Average percentile increase already made in the salaries of employees other than the managerial personnel
remuneration:
Middle Management and Junior Management. Hence, this section is not applicable to the Bank.
the Remuneration Policy of the Bank. Note: Remuneration of KMPs is as per Form 16 (on an annualised basis), excluding Stock Options exercised, since
Options do not form part of total cost to the Bank.

33
Sl.
No.
Part
icul
ars
ESO
P 20
07
(Upt
o M
arch
31
, 201
7)
Opt
ions
G
rant
ed o
n M
ay 1
2, 2
016
Opt
ions
G
rant
ed
on J
uly
11,
2016
Opt
ions
G
rant
ed
on A
ugus
t 23
, 201
6
Opt
ions
G
rant
ed o
n O
ctob
er
10, 2
016
Opt
ions
G
rant
ed o
n N
ovem
ber
16,
2016
Opt
ions
G
rant
ed
on J
anua
ry
27, 2
017
Opt
ions
G
rant
ed o
n M
arch
24,
20
17
1N
o. o
f opt
ions
gra
nted
13,5
0033
,500
49,0
00
No.
of o
ptio
ns s
urre
nder
ed (c
ance
lled)
4,
000
00
00
00
3Pr
icin
g Fo
rmul
a
4N
o. o
f opt
ions
Ves
ted
00
00
00
0
5N
o. o
f opt
ions
Exe
rcis
ed0
00
00
00
6N
o. o
f sha
res
aris
ing
as a
resu
lt of
exe
rcis
e of
opt
ions
00
00
00
0
7O
ptio
ns L
apse
dN
il-
--
--
--
Varia
tion
in te
rms
of E
SOP
N.A
.-
--
--
0-
9M
oney
real
ised
by
exer
cise
of o
ptio
ns
(` In
Lak
hs)
36,6
06-
--
--
--
10To
tal N
o. o
f Opt
ions
in fo
rce
11,7
36,1
119,
500
33,5
0049
,000
11Em
ploy
ee-w
ise
deta
ils o
f opt
ions
gra
nted
to
:
(a)
Key
Man
ager
ial
Pers
onne
l, i.e
., M
anag
ing
Dire
ctor
& C
EO,
Chi
ef
Secr
etar
y
54,4
3,00
0-
--
--
--
M
r. S.
V. Z
areg
aonk
ar,
--
--
1,50
,000
--
-
(b)
Any
othe
r em
ploy
ee w
ho r
ecei
ves
a gr
ant
in a
ny o
ne y
ear
of o
ptio
ns
amou
ntin
g to
5%
or
mor
e of
the
op
tions
gr
ante
d du
ring
the
year
. (R
efer
Tab
le A
)
44,6
0,00
0-
-14
,50,
000
--
-
gran
ted
optio
n, d
urin
g an
y on
e ye
ar
equa
l to
or
exce
edin
g 1%
of
the
issu
ed ca
pita
l (ex
clud
ing
outs
tand
ing
war
rant
s an
d co
nver
sion
s)
of
the
Bank
at t
he ti
me
of g
rant
.
Nil
--
--
--
-
Sta
tuto
ry D
iscl
osur
es R
egar
ding
ES
OPs
( Fo
rmin
g pa
rt o
f the
Dire
ctor
s’ R
epor
t for
the
year
end
ed M
arch
31,
201
7)
ANNEXURE III TO THE DIRECTORS’ REPORT

Annual Report 2016-17
34
Sl.
No.
Part
icul
ars
ESO
P 20
07
(Upt
o M
arch
31
, 201
7)
Opt
ions
G
rant
ed o
n M
ay 1
2, 2
016
Opt
ions
G
rant
ed
on J
uly
11,
2016
Opt
ions
G
rant
ed
on A
ugus
t 23
, 201
6
Opt
ions
G
rant
ed o
n O
ctob
er
10, 2
016
Opt
ions
G
rant
ed o
n N
ovem
ber
16,
2016
Opt
ions
G
rant
ed
on J
anua
ry
27, 2
017
Opt
ions
G
rant
ed o
n M
arch
24,
20
17
Dilu
ted
Earn
ings
per
sha
re (E
PS) p
ursu
ant
to is
sue
of s
hare
s on
exe
rcis
e of
opt
ion,
ca
lcul
ated
as
per
Acco
untin
g St
anda
rd
The
Dilu
ted
EPS
of th
e Ba
nk c
alcu
late
d af
ter c
onsi
derin
g th
e ef
fect
of p
oten
tial e
quity
sha
res
aris
ing
on a
ccou
nt o
f ex
erci
se o
f Opt
ions
is `
47.5
6.
13W
here
the
com
pany
has
cal
cula
ted
the
empl
oyee
co
mpe
nsat
ion
cost
us
ing
the
intri
nsic
val
ue o
f th
e st
ock
optio
ns,
the
diffe
renc
e be
twee
n th
e em
ploy
ee
com
pens
atio
n co
st s
o co
mpu
ted
and
the
empl
oyee
com
pens
atio
n co
st t
hat
shal
l
fair
valu
e of
opt
ions
, sh
all b
e di
sclo
sed.
and
on E
PS o
f the
com
pany
sha
ll al
so b
e di
sclo
sed
The
Bank
has
cha
rged
`
`70.
05 c
rore
s an
d th
e pr
ofor
ma
`sh
are
wou
ld h
ave
been
``
14W
eigh
ted
aver
age
exer
cise
pric
es a
nd
wei
ghte
d av
erag
e fa
ir va
lues
of
optio
ns
shal
l be
disc
lose
d se
para
tely
for
optio
ns
who
se e
xerc
ise
pric
e ei
ther
equ
als
or
exce
eds
or is
less
tha
n th
e m
arke
t pr
ice
of th
e st
ock
The
wei
ghte
d av
erag
e m
arke
t pric
e of
opt
ions
exe
rcis
ed d
urin
g th
e ye
ar is
`eq
uals
mar
ket p
rice:
The
wei
ghte
d av
erag
e ex
erci
se p
rice
of o
ptio
ns g
rant
ed d
urin
g th
e ye
ar is
`
The
wei
ghte
d av
erag
e fa
ir va
lue
of o
ptio
ns g
rant
ed d
urin
g th
e ye
ar is
`44
1.07
Gra
nts
who
se E
xerc
ise
pric
e is
less
than
mar
ket p
rice:
N.A
.
15A
desc
riptio
n of
th
e m
etho
d an
d
year
to e
stim
ate
the
fair
valu
e of
Opt
ions
, in
clud
ing
the
follo
win
g w
eigh
ted-
aver
age
info
rmat
ion:
The
fair
valu
e ha
s be
en c
alcu
late
d us
ing
the
Blac
k Sc
hole
s O
ptio
n Pr
icin
g m
odel
.
Risk
Fre
e In
tere
st R
ate
6.65
%6.
34%
6.74
%
Expe
cted
Life
4.51
4.51
4.51
4.51
4.51
4.51
4.51
Expe
cted
Vol
atilit
y31
.34%
31.0
5%30
.94%
30.5
3%
Div
iden
d Yi
eld
0.43
%0.
40%
0.37
%0.
41%
0.36
%0.
33%
Pric
e of
the
unde
rlyin
g sh
are
in th
e m
arke
t at
the
time
of o
ptio
n gr
ant.
1,05
3.75
1,09
3.10

35
Sl.
No.
Part
icul
ars
ESO
P 20
07
(Upt
o M
arch
31
, 201
7)
Opt
ions
G
rant
ed o
n M
ay 1
2, 2
016
Opt
ions
G
rant
ed
on J
uly
11,
2016
Opt
ions
G
rant
ed
on A
ugus
t 23
, 201
6
Opt
ions
G
rant
ed o
n O
ctob
er
10, 2
016
Opt
ions
G
rant
ed o
n N
ovem
ber
16,
2016
Opt
ions
G
rant
ed
on J
anua
ry
27, 2
017
Opt
ions
G
rant
ed o
n M
arch
24,
20
17
Tabl
e “A
” An
y ot
her
empl
oyee
w
ho
rece
ives
a
gran
t in
an
y on
e ye
ar
of
Opt
ions
am
ount
ing
to 5
% o
r m
ore
of th
e O
ptio
ns g
rant
ed d
urin
g th
e ye
ar
Nam
eN
umbe
r of O
ptio
ns g
rant
ed:
Sum
ant K
athp
alia
300
,000
Paul
Abr
aham
175
,000
Arun
Khu
rana
150
,000
Sanj
ay M
allik
150
,000
Roop
a Sa
tish
150
,000
Sanj
eev
Anan
d
Zubi
n M
ody
Ram
asw
amy
Mey
yapp
an
Sam
ir D
ewan
S.V.
Par
thas
arat
hy 1
50,0
00
33%
of t
hese
Opt
ions
will
vest
on
33%
of t
hese
Opt
ions
will
vest
on
34%
of t
hese
Opt
ions
will
vest
on

Annual Report 2016-17
36
ANNEXURE IV TO THE DIRECTORS’ REPORT
Form No. MGT-9
EXTRACT OF ANNUAL RETURN
as on the Financial Year ended on March 31, 2017[Pursuant to Section 92(3) of the Companies Act, 2013 and Rule 12(1) of the Companies (Management and Administration) Rules, 2014]
I. Registration and other details:
CIN L65191PN1994PLC076333Registration Date January 31, 1994Name of the Company IndusInd Bank LimitedCategory / Sub-Category of the Company
Company Limited by SharesIndian Non-Government Company
Contact detailsE-mail: [email protected]: www.indusind.com
Whether listed company YesName, Address and Contact details of Registrar and Transfer Agent, if any
LINK INTIME INDIA PRIVATE LIMITED
L.B.S. Marg, Vikhroli (West),
E-mail: [email protected] Website: www.linkintime.co.in
II. Principal business activities of the company All the Business Activities contributing 10% or more of the total turnover of the company are:-
Name and Description of main products / services
NIC Code of the product / service
% to total turnover of the company
Banking Services 64191 100%
III. Particulars of Holding, Subsidiary and Associate Companies
Sl. No.
Name and address of the company CIN / GLN Holding / Subsidiary/ Associate
% of shares
held
Applicable section
1 ALF Insurance Services Private Limited Add: No. 115 & 116 G N Chetty Road, T. Nagar, Chennai – 600 017, Tamil Nadu
Subsidiary (Liquidated vide Order of the Madras High Court dated June
100
IndusInd Marketing and Financial Services Private Limited Add: No.115 & 116 G N Chetty Road, T Nagar, Chennai – 600017, Tamil Nadu
Associate 30
37
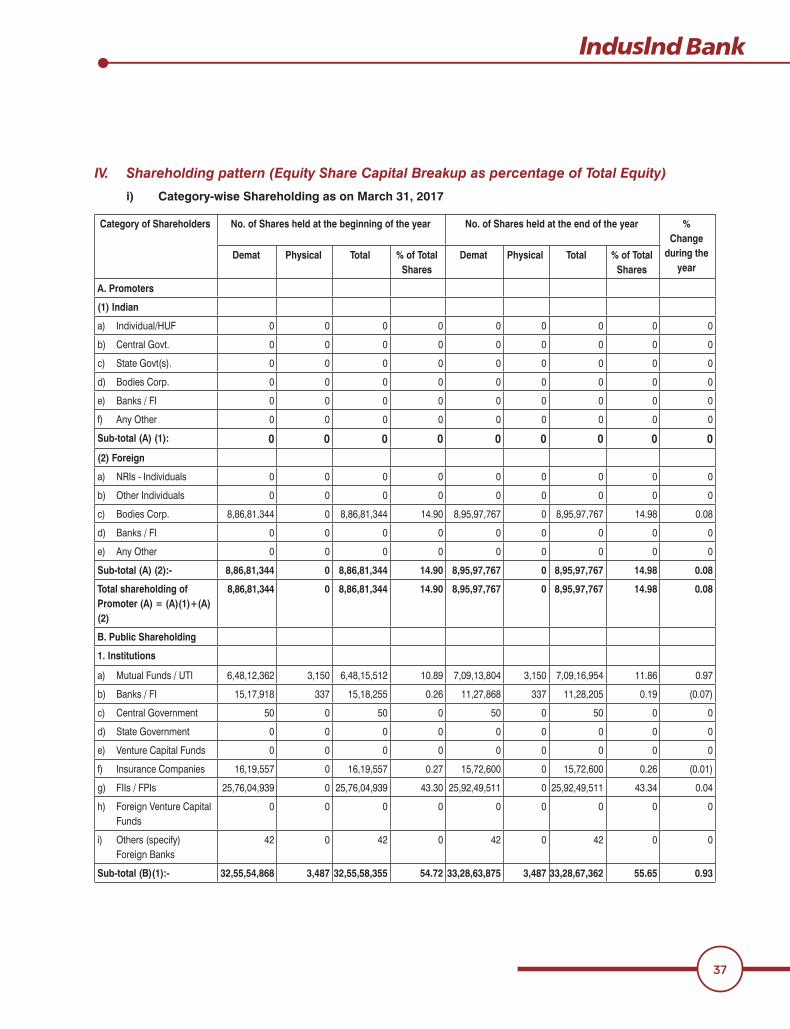
IV. Shareholding pattern (Equity Share Capital Breakup as percentage of Total Equity) i) Category-wise Shareholding as on March 31, 2017
Category of Shareholders No. of Shares held at the beginning of the year No. of Shares held at the end of the year % Change
during the year
Demat Physical Total % of Total Shares
Demat Physical Total % of Total Shares
A. Promoters
(1) Indian
a) Individual/HUF 0 0 0 0 0 0 0 0 0
b) Central Govt. 0 0 0 0 0 0 0 0 0
c) State Govt(s). 0 0 0 0 0 0 0 0 0
d) Bodies Corp. 0 0 0 0 0 0 0 0 0
e) Banks / FI 0 0 0 0 0 0 0 0 0
f) Any Other 0 0 0 0 0 0 0 0 0
Sub-total (A) (1): 0 0 0 0 0 0 0 0 0(2) Foreign
a) NRIs - Individuals 0 0 0 0 0 0 0 0 0
b) Other Individuals 0 0 0 0 0 0 0 0 0
c) Bodies Corp. 0 14.90 0
d) Banks / FI 0 0 0 0 0 0 0 0 0
e) Any Other 0 0 0 0 0 0 0 0 0
Sub-total (A) (2):- 8,86,81,344 0 8,86,81,344 14.90 8,95,97,767 0 8,95,97,767 14.98 0.08
Total shareholding of Promoter (A) = (A)(1)+(A)(2)
8,86,81,344 0 8,86,81,344 14.90 8,95,97,767 0 8,95,97,767 14.98 0.08
B. Public Shareholding
1. Institutions
a) Mutual Funds / UTI 3,150 3,150 7,09,16,954 0.97
b) Banks / FI 337 337 0.19 (0.07)
c) Central Government 50 0 50 0 50 0 50 0 0
d) State Government 0 0 0 0 0 0 0 0 0
e) Venture Capital Funds 0 0 0 0 0 0 0 0 0
f) Insurance Companies 16,19,557 0 16,19,557 0 (0.01)
g) FIIs / FPIs 0 43.30 0 43.34 0.04
h) Foreign Venture Capital Funds
0 0 0 0 0 0 0 0 0
i) Others (specify) Foreign Banks
0 0 0 0 0
Sub-total (B)(1):- 32,55,54,868 3,487 32,55,58,355 54.72 33,28,63,875 3,487 33,28,67,362 55.65 0.93

Annual Report 2016-17
38
Category of Shareholders No. of Shares held at the beginning of the year No. of Shares held at the end of the year % Change
during the year
Demat Physical Total % of Total Shares
Demat Physical Total % of Total Shares
2.Non- Institutions
a) Bodies Corp.
i) Indian 1,99,745 6,59,54,313 11.09
ii) Overseas 6,49,000 14,77,000 3,76,000 5,49,000 0.15 (0.10)
b) Individuals
i) Individual shareholders holding nominal share capital upto ` 1 lakh
63,74,649 4.76 59,35,574 4.69 (0.07)
ii) Individual shareholders holding nominal share capital in excess of `1 lakh
1,09,74,796 1,07,54,194 (0.04)
c) Others (specify)
i) Clearing Member 0 0 0.16
ii) Hindu Undivided Family 0 7,00,040 0 7,00,040 0.13 0.01
iii) Non Resident Indians (REPAT)
0.40 0.40 0
iv) Non Resident Indians (NON REPAT)
0.40 16,49,546 16,71,146
v) Foreign Nationals 0 0 335 0 335 0 0
vi) Foreign Portfolio Investor (Individual)
350 0 350 0 350 0 350 0 0
vii) Directors / Relatives 0 0 0 0.03 0.03
viii) Trusts 0 0.41 0 0.64
SUB TOTAL:(B) (2) 10,77,09,619 83,55,453 11,60,65,072 19.51 10,33,76,496 76,25,516 11,10,02,012 18.56 (0.95)
Total Public Shareholding (B)=(B)(1)+ (B)(2)
43,32,64,487 83,58,940 44,16,23,427 74.23 43,62,40,371 76,29,003 44,38,69,374 74.21 (0.02)
C. Shares held by Custodian for GDRs & ADRs
6,46,81,564 0 6,46,81,564 10.87 6,46,81,564 0 6,46,81,564 10.81 (0.06)#
Grand Total (A+B+C) 58,66,27,395 83,58,940 59,49,86,335 100.00 59,05,19,702 76,29,003 59,81,48,705 100.00
# During the year under review, there is a change in the percentage of the shares held under GDRs, mainly due to issuance and allotment of Equity Shares pursuant to exercise of Stock Options by the employees under ESOP Scheme of the Bank.

39
ii) Shareholding of Promoters as on March 31, 2017:
Sl. No.
Shareholder’s Name
Shareholding at the beginning of the year: (April 1, 2016)
Shareholding at the end of the year: (March 31, 2017)
% change in shareholding
during the year
No. of Shares
% of total Shares of the
company
% of Shares Pledged /
encumbered to total shares
No. of Shares
% of total Shares of the
company
% of Shares Pledged /
encumbered to total shares
1 IndusInd International Holdings Limited
0 6,57,97,767 11.00 0
IndusInd Limited 3.64 0 100
Total 8,86,81,344 14.91 0 8,95,97,767 14.98 100 0.07
# During the year under review, there is a change in shareholding of the Promoters due to inter se transfer of shares between promoter entities and purchase of shares from the secondary market.
iii) Change in Promoters’ Shareholding (please specify, if there is no change)
Sl. No.
Promoters Remarks Date *** Shareholding at the beginning of the year
(April 1, 2016)
Cumulative Shareholding during the year
No. of Shares
% of total Shares of the
company
No. of Shares
% of total Shares of the
company1 INDUSIND
INTERNATIONAL HOLDINGS LIMITED
At the beginning of the Year
(Inter se transfer of shares between Promoter entities)
Decrease (0.36)
Market Purchase Increase 0.05Increase 0.07 10.96Increase 0.03 10.99Increase 0.01 6,57,97,767 11.00
At the end of the year N.A. N.A. 6,57,97,767 11.00INDUSIND LIMITED At the
beginning of the Year
3.64 3.64
(Inter se transfer of shares between Promoter entities)
Increase 0.36
At the end of the year N.A. N.A. 2,38,00,000 3.98

Annual Report 2016-17
40
iv) Shareholding Pattern of Top ten Shareholders (other than Directors, Promoters and Holders of GDRs and ADRs):
Sl. No.
For each of the Top 10 Shareholders
Remarks Date * Shareholding at the beginning of the year
Cumulative Shareholding during the year
No. of shares
% of total shares of the
Company
No. of shares
% of total shares of
the company
1 Bridge India Fund At the beginning of the year
3.53 3.53
At the end of the year N.A. N.A. 2,10,13,458 3.51
UTI - Equity Fund
At the beginning of the year
1.40 1.40
Increase 0.04 1.44
Increase 0.04
Increase 0.06 91,57,045 1.54
Increase 1,71,917 0.03 1.57
Increase 1,41,335 1.59
Increase 0.03
Increase 340 0.00
Decrease (19,693) (0.00) 96,01,146 1.61
Decrease (0.01) 95,60,759 1.61
Decrease (0.00) 95,45,907 1.60
Decrease (0.00) 1.60
Increase 33,905 0.01 1.60
Decrease (3,771) (0.00) 95,57,504 1.60
Decrease (0.00) 1.60
Increase 1,766 0.00 1.60
Increase 0.01 1.61
Increase 0.00 1.61
Increase 0.00 1.61
Decrease (6,666) (0.00) 96,06,776 1.61
Increase 39,000 0.01 96,45,776
Increase 745 0.00
Decrease (17,430) (0.00) 1.61
Decrease (0.01) 1.61
Decrease (0.00) 1.60
Decrease (0.00) 1.60
Decrease (0.01) 1.59

41
Sl. No.
For each of the Top 10 Shareholders
Remarks Date * Shareholding at the beginning of the year
Cumulative Shareholding during the year
No. of shares
% of total shares of the
Company
No. of shares
% of total shares of
the company
Decrease (0.00) 1.59
Increase 0.03 1.61
Decrease (0.00) 1.61
Decrease (0.00) 1.61
Decrease (0.00) 95,95,970 1.61
Decrease (79,905) (0.01) 95,16,065 1.59
Increase 0.00 1.59
Decrease (0.03) 1.57
Decrease (0.01) 1.55
Decrease (93,376) 91,95,149 1.54
Increase 0.00 1.54
Increase 0.00 1.54
Increase 0.00 1.55
Increase 0.01 93,01,940 1.56
Increase 0.00 1.56
Decrease (10,550) (0.00) 93,15,649 1.56
Increase 0.00 1.56
Decrease (0.00) 1.55
Decrease (90,346) 1.54
Decrease (0.00) 1.54
Increase 6,961 0.00 1.54
Increase 0.00 1.54
Increase 0.00 1.54
Decrease (7,979) (0.00) 1.54
Increase 0.00 1.54
Decrease (0.00) 1.54
Decrease (0.00) 1.54
At the end of the year N.A. N.A. 91,92,322 1.54
3 Afrin Dia
At the beginning of the year
1.61 1.61
Decrease (0.07) 91,96,463 1.55
Decrease (1,00,000) 90,96,463 1.53
At the end of the year N.A. N.A. 90,96,463 1.52

Annual Report 2016-17
42
Sl. No.
For each of the Top 10 Shareholders
Remarks Date * Shareholding at the beginning of the year
Cumulative Shareholding during the year
No. of shares
% of total shares of the
Company
No. of shares
% of total shares of
the company
4 Hinduja Ventures Limited
At the beginning of the year
Decrease (1,50,000) (0.03) 1,00,75,196 1.69
Decrease (1,00,000) 99,75,196
Decrease (3,00,000) (0.05) 96,75,196 1.63
Decrease (50,000) (0.01)
Decrease (3,50,000) (0.06) 1.56
Decrease (3,50,000) (0.06) 1.50
Decrease (0.03) 1.46
Decrease (0.01) 1.45
At the end of the year N.A. N.A. 86,68,196 1.45
5 Birla Sun Life Trustee Company Private Limited
At the beginning of the year
Increase 0.00 71,37,955
Decrease (0.00)
Increase
Decrease
Decrease (0.00)
Decrease (39,941) (0.01) 1.19
Increase 0.01 71,60,455
Decrease (0.01)
Decrease (0.00) 71,13,191 1.19
Increase 0.00
Decrease (411) (0.00)
Increase 0.00 71,43,446
Decrease (0.01) 71,00,946 1.19
Increase 30,600 0.01 71,31,546
Decrease (0.00) 1.19
Decrease (1,600) (0.00) 71,01,146 1.19
Increase 15,000 0.00 71,16,146 1.19
Decrease (591) (0.00) 71,15,555 1.19
Increase 0.00 1.19
Increase 0.00 1.19

43
Sl. No.
For each of the Top 10 Shareholders
Remarks Date * Shareholding at the beginning of the year
Cumulative Shareholding during the year
No. of shares
% of total shares of the
Company
No. of shares
% of total shares of
the company
Increase 0.01
Increase 0.03
Decrease (0.01)
Increase 1,100 0.00
Increase 76,407 0.01
Increase 0.00
Increase
Increase 1,54,500 0.03
Increase 0.04
Increase 1,37,000 1.34
Decrease (0.00) 1.34
Increase 0.00 1.34
Increase 0.03
Increase 15,000 0.00
Increase 17,357 0.00
Increase 0.00
Increase 60,000 0.01 1.39
Decrease (0.00) 1.39
Decrease (0.00)
At the end of the year N.A. N.A. 82,74,358 1.38
6 Franklin Templeton Mutual Fund
At the beginning of the year
1.51 1.51
Increase 0.00 1.51
Increase 1,015 0.00 1.51
Decrease (0.00) 1.51
Decrease (0.00) 1.51
Increase 4,05,955 0.07 93,76,459
Increase 305 0.00 93,76,764
Increase 0.00 93,77,017
Increase 0.00 93,77,311
Increase 1,30,163 95,07,474 1.60
Increase 0.00 95,07,734 1.60
Increase 0.00 1.60

Annual Report 2016-17
44
Sl. No.
For each of the Top 10 Shareholders
Remarks Date * Shareholding at the beginning of the year
Cumulative Shareholding during the year
No. of shares
% of total shares of the
Company
No. of shares
% of total shares of
the company
Increase 0.00 1.60
Increase 35 0.00 1.60
Increase 10 0.00 1.60
Increase 109 0.00 1.60
Decrease (0.03) 93,16,916 1.56
Increase 190 0.00 93,17,106 1.56
Decrease (0.01) 1.55
Decrease (1,10,000) 1.53
Decrease (0.04) 1.50
Decrease (0.00) 1.50
Decrease (0.00) 1.49
Decrease (77) (0.00) 1.49
Decrease (93) (0.00) 1.49
Decrease (0.00) 1.49
Increase 0.00 1.49
Increase 49,070 0.01 1.50
Increase 0.05 1.55
Increase 0.00 1.55
Increase 166 0.00 1.55
Decrease (0.05 1.50
Decrease (0.01) 1.49
Decrease (111) (0.00) 1.49
Decrease 1.47
Decrease (1,13,596) 1.45
Decrease (0.05) 1.40
Decrease (0.04) 1.36
Decrease 1.34
Increase 105 0.00 1.34
Decrease (104) (0.00) 1.34
Decrease (3,00,000) (0.05) 77,31,074
Decrease (0.00) 77,30,549
At the end of the year N.A. N.A. 77,30,549 1.29

45
Sl. No.
For each of the Top 10 Shareholders
Remarks Date * Shareholding at the beginning of the year
Cumulative Shareholding during the year
No. of shares
% of total shares of the
Company
No. of shares
% of total shares of
the company
7 ICICI Prudential Life Insurance Company Ltd.
At the beginning of the year
Decrease (0.01) 73,53,610
Decrease (0.04)
Increase 5,371 0.00 71,37,430
Decrease 70,34,905
Increase 0.01 1.19
Increase 0.01 1.19
Increase 40,536 0.01
Increase 0.00
Increase 31,947 0.01 71,74,517
Increase
Decrease (0.00)
Increase 0.00
Decrease (0.03)
Increase 1,90,070 0.03
Decrease (1,33,556)
Increase 0.01
Decrease (1,560) (0.00)
Decrease (0.00)
Increase 0.01
Decrease (0.00)
Decrease 1.19
Increase 73,503 0.01 71,94,443
Increase 1,54,435 0.03
Decrease (1,04,149)
Decrease 1.19
Increase 0.00
Increase
Increase 0.01
Increase 0.03 74,51,906
Increase 110 0.00
Increase 1,07,654 75,59,670

Annual Report 2016-17
46
Sl. No.
For each of the Top 10 Shareholders
Remarks Date * Shareholding at the beginning of the year
Cumulative Shareholding during the year
No. of shares
% of total shares of the
Company
No. of shares
% of total shares of
the company
Decrease (0.03) 73,61,069
Increase 0.01 74,40,597
Decrease (0.00)
Decrease 73,10,739
Increase 146 0.00
Decrease (3,639) (0.00)
Increase 0.01
Increase 0.03 74,93,303
Decrease (0.01) 74,44,155
Decrease (0.00)
Decrease (0.00) 74,19,430
Increase 0.03
Increase 0.00 75,99,761
Increase 0.04 1.31
Increase 0.00 1.31
Decrease (0.01) 1.30
Increase 0.00 77,69,693 1.30
Decrease
Decrease (97,537)
Decrease (37,379) (0.01)
At the end of the year N.A. N.A. 74,85,353 1.25
Tybourne Equity Master Fund
At the beginning of the year
NIL N.A. NIL N.A.
Increase
At the end of the year N.A. N.A. 72,45,546 1.21
9 HDFC Trustee Company Ltd.
At the beginning of the year
Increase 55,07,073 0.93
Increase 0.05 57,95,073 0.97
Increase 0.04 60,04,673 1.01
Increase 51,106 0.01 60,55,779
Decrease (0.01) 1.01
Increase 130 0.00 1.01
Increase 0.00 1.01

47
Sl. No.
For each of the Top 10 Shareholders
Remarks Date * Shareholding at the beginning of the year
Cumulative Shareholding during the year
No. of shares
% of total shares of the
Company
No. of shares
% of total shares of
the company
Increase 1.03
Increase 45,653 0.01 1.04
Increase 1,05,000 1.05
Decrease (0.03)
Increase 163 0.00 60,77,643
Decrease (0.01) 1.01
Decrease (39,600) (0.01) 1.01
Increase 157 0.00 1.01
Decrease (0.01) 1.00
Increase 0.03 61,34,335 1.03
Decrease (49,093) (0.01)
Increase 0.00
Decrease (0.00)
Decrease (0.01) 60,13,763 1.01
Increase 1.03
Decrease (0.03) 1.00
Increase 0.00 59,69,650 1.00
Decrease (0.00) 1.00
Increase 0.00 1.00
Increase 0.00 1.00
Decrease (0.00) 59,73,443 1.00
Increase 0.01 60,39,775 1.01
Increase 61,40,901 1.03
Decrease (0.01)
Increase 1,00,704 1.04
Increase 1,46,143 1.06
Increase 0.05 1.11
Increase 0.00
Increase 10,166 0.00 66,70,791
Increase 1,506 0.00
Increase 194 0.00
Increase 0.01 1.13
Decrease (0.00)

Annual Report 2016-17
48
Sl. No.
For each of the Top 10 Shareholders
Remarks Date * Shareholding at the beginning of the year
Cumulative Shareholding during the year
No. of shares
% of total shares of the
Company
No. of shares
% of total shares of
the company
Decrease (0.01) 66,35,319 1.11
Increase 0.00 66,55,440 1.11
Decrease (9,903) (0.00) 66,45,537 1.11
Decrease (1,07,113) 1.09
Decrease (97) (0.00) 1.09
Increase 66,39,019 1.11
Increase 0.00 66,39,340 1.11
Increase 0.04 69,00,547 1.15
Decrease (14,554) (0.00) 1.15
Increase 0.00 1.15
Increase 0.00 1.15
Increase 0.01 1.16
At the end of the year N.A. N.A. 69,20,602 1.16
10 Franklin Templeton Investment Funds
At the beginning of the year
1.44 1.44
Increase 4,45,679 0.07 1.51
Increase 0.07
Increase 1.60
Increase 3,60,000 0.06 1.66
Increase 5,10,000 0.09 1.75
Decrease (0.05) 1.70
Decrease (0.06) 1.64
Decrease (16,571) (0.00) 1.64
Decrease (0.05) 1.59
Decrease 1.41
Decrease 1.16
Decrease 0.06 1.10
At the end of the year N.A. N.A. 65,82,242 1.10
Note:

49
v) Shareholding of Directors and Key Managerial Personnel:
Sl.
No.
For each of the Directors and KMPs Shareholding at the beginning of the year 01.04.2016
Cumulative Shareholding during the year
No. of Shares % of total Shares of the
company
No. of Shares % of total Shares of the
company1 Mr. T. Anantha Narayanan, Director 0.00 0.00
N.A. N.A. 580 0.00*Dr. T. T. Ram Mohan, Director 0.00 0.00
N.A. N.A. 3,800 0.003 Mr. Vijay Vaid, Director NIL N.A. NIL N.A.
1,500 0.00 1,500 0.00N.A. N.A. 1,500 0.00
4 Mr. Romesh Sobti, Managing Director & CEO
NIL N.A. NIL N.A.
ESOP Allotment 1,00,000 1,00,000Market Sale (39,056) (0.01) 60,944 0.01Market Sale (10,000) (0.00) 50,944 0.01Market Sale (0.00) 30,944 0.01Market Sale (30,944) (0.01) NIL N.A.ESOP Allotment 0.03 0.03Market Sale (77,709) (0.01)Market Sale (30,604) (0.01)Market Sale NIL N.A.ESOP Allotment 0.03 0.03
N.A. N.A. 2,00,000 0.035 Mr. S.V. Zaregaonkar, 0.00 0.00
Market Sale (10,000) (0.00) 15,650 0.00Market Sale (6,000) (0.00) 9,650 0.00Market Sale (4,700) (0.00) 4,950 0.00Market Sale (0.00) 0.00
N.A. N.A. 2,950 0.006 Mr. Haresh K. Gajwani,
Company SecretaryNIL N.A. NIL N.A.
ESOP Allotment 6,600 0.00 6,600 0.00Market Sale (1,000) 0.00 5,600 0.00Market Sale (4,000) 0.00 1,600 0.00Market Sale (1,000) 0.00 600 0.00Market Sale (300) 0.00 300 0.00Market Sale (300) 0.00 NIL N.A.ESOP Allotment 0.00 0.00Market Sale (750) 0.00 0.00Market Sale (350) 0.00 1,540 0.00Market Sale (750) 0.00 790 0.00Market Sale (500) 0.00 0.00Market Sale 0.00 NIL N.A.
N.A. N.A. NIL NIL

Annual Report 2016-17
50
V. Indebtedness Indebtedness of the Company including interest outstanding / accrued but not due for payment ` in croresParticulars Secured Loans
excluding depositsUnsecured
Loans *Deposits Total
IndebtednessIndebtedness at the beginning of
i. Principal Amountii. Interest due but not paidiii. Interest accrued but not due
---
1,17,996-
---
1,17,996-
Total (i+ii+iii) - 1,18,785 - 1,18,785Net Change in Indebtedness during
i. Additionii. Reduction
--
--
--
--
Indebtedness at the end of the
i. Principal Amountii. Interest due but not paidiii. Interest accrued but not due
---
-
---
-
Total (i+ii+iii) - 1,49,974 - 1,49,974
* A Bank is governed by the Banking Regulation Act, 1949 and duly licensed by Reserve Bank of India to operate as a Scheduled Commercial Bank in India, the entire amount of Client Deposits and other Borrowings are shown under “Unsecured Loans”.
VI. Remuneration of directors and Key Managerial PersonnelA. Remuneration to Managing Director, Whole-time Directors and/or Manager:
In ` Sl. No.
Particulars of Remuneration Mr. Romesh Sobti, Managing Director & CEO
1 Gross Salarya. Salary as per provisions contained in Section 17(1) of IT Act, 1961
-Stock Options* -
3 Sweat Equity -4 Commission
- Others
-
5 Others, please specify (PF, Medical)6 Total # 632,06,7047 $ -
*which forms an integral part of the Annual Report.
Total Remuneration details does not include Stock Options.
$

51
B. Remuneration to other Directors: In `
Sr. No.
Particulars of Remuneration Fees for attending Board
/ Committee meetings (in `)
Commission (in `)
Others, (please specify)
Total
(A) Independent Directors:(1) Mrs. Kanchan Chitale 10,00,000 -
Mr. Vijay Vaid 11,40,000 10,00,000 -
(3) Mr. T. Anantha Narayanan 17,00,000 10,00,000 -
(4) Mr. Ranbir S. Butola 13,60,000 10,00,000 -
(5) Mr. Shanker Annaswamy 10,00,000 -
(6) Dr. T. T. Ram Mohan* - 19,07,363
Total (A) 84,20,000 58,87,363 - 1,43,07,363(B) Other Non-Executive Directors:(1) Mr. R. Seshasayee 13,00,000 -
Mr. Y. M. Kale 10,00,000 -
Total (B) 26,80,000 35,00,000 - 61,80,000Total Remuneration (A+B) 1,11,00,000 93,87,363 - 2,04,87,363
Notes:
C. Remuneration to Key Managerial Personnel other than Managing Director / Manager / Whole-time DirectorIn `
Sl. No.
Particulars of Remuneration Key Managerial PersonnelCompany Secretary
Chief Financial Total
1. Gross salarySalary as per provisions contained in section 17(1) of the Income-tax Act, 1961
Act, 1961Stock Options* – – –
3. Sweat Equity – – –4.
Others, specify.– – –
5. Others, please specify 9,03,000Total# 69,28,668 3,40,67,032 4,09,95,700
which forms an integral part of the Annual Report.

Annual Report 2016-17
52
VII. Penalties / Punishment / Compounding of offences
Type Section of the
Companies Act
Brief Description
Details of Penalty / Punishment/ Compounding fees imposed
Authority [RD / NCLT/ COURT]
Appeal made, if any (give
Details)
A. Company
Penalty
None Punishment
Compounding
B. Directors
Penalty
None Punishment
Compounding
Penalty
None Punishment
Compounding

53
ANNEXURE V TO THE DIRECTORS’ REPORT
ANNUAL REPORT ON CORPORATE SOCIAL RESPONSIBILITY (CSR) ACTIVITIES
SI. No.
Particulars
1and a reference to the web-link to the CSR Policy and project or programs.
Remarks
The Bank’s CSR Policy
CSR Mission Statement
while also promoting the well-being of our employees, our natural environment and the community at large.
Guiding Principles
for the way we conduct business. We will pursue a process of continuous improvement of our CSR policy
performance. We will be guided by the principles outlined in the National Voluntary Guidelines on Social, Environmental and Economic Responsibilities of Business (NVGSEE) and the UN Global Compact as listed below:
viii. Communicate our CSR objectives and goals to all internal and external Stakeholders.
viewed at the web link-
http://www.indusind.com/content/csr-home/our-approach/csr-policy.html

Annual Report 2016-17
54
Focus Areas
Rural Development & Inclusiveness• Financial Literacy• Livelihood Development• Education for All (Primary & Secondary)
Environmental Sustainability• Climate Change - GHG mitigation• Renewable Energy & Clean Technology• Biodiversity Protection
Healthcare• Access to cheap & reliable healthcare• Air & Water Quality• Education about health and hygiene• Healthcare research
Areas of Special Interest• Armed Forces• Education• Sports• Heritage, Arts & Culture
The Composition of the CSR Committee.
1. Mrs. Kanchan Chitale (Chairperson)
3. Mr. Romesh Sobti (Managing Director & CEO)
3
`
4 Prescribed CSR Expenditure (Two per cent of the amount as in item 3 above):
`
5
`
b) Amount unspent – `

55
Sl. No.
CSR Project or activities
Sector in which the Project is
covered
Projects or Programs (1)
Local area or other (2) Specify the State and
District where Projects or
Programs were undertaken
Amount Outlay
(Budget) Project or Program-
wise (` in Lakhs) (FY – 2016-
17)
Amount Spent on the Projects or Programs Sub - heads: (1) Direct
Expenditure on Projects or Programs (1)
Overheads (2) (3) (4) (5)
(` in Lakhs)
Cumulative Expenditure
up to the reporting
period (` in Lakhs)
Amount Spent: Direct or through
Implementing Agency
1 3 4 5 6 71. Environmental
SustainabilityEnvironmental Sustainability & Nature Conservation
Pan-India 4,375 (Since FY
Both Direct and through Implementing Partners: Satpuda
Preventive Healthcare & Contributions to various Social Causes
Preventive Healthcare, Imparting of Vocational skills, promoting Culture and Education
Pan-India 347 (Since FY
Both Direct and through Implementing Partners:
3. Rural Development
Rural Development & Inclusiveness
Satara, Maharashtra
Through Implementing Partner:
4. Sports Paralympic Sports, Sports for the Differently Abled
Pan-India (Since FY
Through Implementing Partners:
Samarthanam 5. Education Education Pan-India 116 116
(Since FY Through Implementing Partners: Samhita
6. Awareness & Capacity Building
Awareness & Capacity Building
Pan-India 171 (Since FY
Total 3,381 3,381 5,967

Annual Report 2016-17
56
or any part thereof, the reasons for not spending the amount in its Board report.
`
range within the chosen focus areas. The CSR amount spent on social projects has increased by more than `
supported the Para-Champions representing the country at the Paralympics and adopted the Indian Blind Cricket team who won accolades for the country.
Our social and community outreach programmes are gaining scale and momentum every year and hence the absorption of CSR Spend will be better in the coming years as most of our projects are milestone based and
areas that align with our CSR Mission.
7. A responsibility statement of the CSR Committee that the implementation and monitoring of CSR Policy, is in compliance with CSR Objectives and Policy of the Bank.
This note describes the CSR Policy, focus areas and Projects that the Bank has undertaken during the Financial
Romesh Sobti Kanchan ChitaleManaging Director Chairperson – CSR Committee

57
ANNEXURE VI TO THE DIRECTORS’ REPORT
BUSINESS RESPONSIBILITY REPORT(AS PER SEBI CIRCULAR CIR/CFD/CMD/10/2015 OF NOVEMBER 4, 2015)
SECTION A: GENERAL INFORMATION ABOUT THE COMPANY1. Corporate Identity Number (CIN) of the Company L65191PN1994PLC076333
Name of the Company IndusInd Bank Limited3. Registered Address
Pune – 411 001.4. Website www.indusind.com5. E-mail id [email protected]. Financial Year reported7. Sector(s) that the Company is engaged in (Industrial
activity code-wise)Division 64 – Code 64191 IndusInd Bank Limited is a Company governed by the Banking Regulation Act, 1949.
List three key products/services that the Company manufactures/provides (as in balance sheet)
- Banking and para-Banking services including accepting of deposits such as, Savings Accounts, Current Accounts, Fixed Deposits including banking solutions to large Indian and multinational corporates.
- Granting of Loans to various segments including Industries, Business and Retail Loans.
- Financing of wide range of Vehicles / Equipment to individuals and Priority Sector Lending.
9. Total number of locations where business activity is undertaken by the Company. i. Number of International Locations (Provide
details of major 5) - Dubai- Abu Dhabi - London
ii. Number of National Locations
10. Markets served by the Company – Local / State / National / International
All
SECTION B: FINANCIAL DETAILS OF THE COMPANY1. Paid up Capital (INR) - `
Total Turnover (INR) - ` 3. - ` 4. 4. Total Spending on Corporate Social Responsibility The Bank has spent `
and environmental activities, in the areas of Rural Development and Inclusiveness, Environmental Sustainability, Preventive Healthcare, Education and

Annual Report 2016-17
58
Environmental Sustainability:• The broad areas of focus within Environmental
Sustainability include Biodiversity Conservation, Climate Change and GHG (Greenhouse Gas) Mitigation, Renewable Energy and Clean Technology.
The Bank supported a variety of projects on: Preventive Healthcare:
with SUPPORT, the Bank supported the rehabilitation and skill development of drug-addicted rehabilitated street children in Mumbai making them employable and independent through vocational skill building programmes.
• The Bank also pledged support for the treatment of children affected with Cancer, in partnership with the Bhagwan Mahaveer Cancer Hospital and Research Centre (BMCHRC), Jaipur. The project provides treatment to children aged 14 years and below suffering from curable (90%) Blood Cancers.
Rural Development:
17, the Bank has successfully implemented a Water Conservation Project at Satara, where rejuvenation of a Check Dam at Ghigewadi Village on the river Vasna, tributary of river Krishna, was undertaken. This Project was a part of the larger programme of ‘Jalyukt Shivar
• Through the Inclusive Banking Group, the Bank has reached out to the Base-of-Pyramid
loans that the Bank provides, along with other
and considerably improved their standard of living.
Education• In partnership with the Business Correspondent,
the Bank is currently carrying out a Legal
Bhopal and Sagar districts of Madhya Pradesh.
trained. The Bank is currently in the second year of the Project.

59
• The Bank also supports deserving meritorious students of Ashoka University through the Young India Fellowship Programme, renowned for introducing several young entrepreneurs in the social sector.
• The Bank has also partnered with Nalandaway Foundation, to support Education through Arts
Art experiences offer children opportunities to think and feel as they explore, problem-solving, express and interpret the world around them.
Sports
Go-Sports Foundation, a programme involving
medals for India, at the Paralympics.
• In another unique initiative, the Bank has adopted the Indian Blind Cricket Team, as Principal Sponsors with CABI, Sports Initiative of Samarthanam. The Bank provided them
5. List of activities in which expenditure in 4 above has been incurred:-
a.
b.
c.
Activities include:a. Renewable Energy b. Rural Developmentc. Preventive Healthcare and Social Causesd. Educatione. Sports for the differently-abledf. Environment
SECTION C: OTHER DETAILS1. Does the Company have any Subsidiary Company/
Companies? No
Do the Subsidiary Company/Companies participate in the BR Initiatives of the parent company? If yes, then indicate the number of such subsidiary company(s).
Not applicable.
3. Do any other entity/entities (e.g. suppliers, distributors etc.) that the Company does business with, participate in the BR initiatives of the Company? If yes, then
No

Annual Report 2016-17
60
SECTION D: BR INFORMATION1. Details of Director/Directors responsible for BR
a) Details of the Director/Director responsible for implementation of the BR policy/policies
DIN Number 00031034 Name Mr.Romesh Sobti Designation Managing Director & CEOb) Details of the BR head: DIN Number (if applicable) ---- Name Mr.Adwait Hebbar Designation Head Corporate Services Telephone number e-mail id [email protected]
2. Principle-wise (as per NVGs) BR Policy / Policies (Reply in Y/N)a. Details of Compliance (Reply in Y/N)
Sl. No.
Questions Business Ethics
Product Responsi-
bility
Well-being
of employ-
ees
Stake-holder
engage-ment
Human Rights
Environ-ment
Public Policy
Inclusive Growth
and Equitable Develop-
ment
Customer
Relations
P 1 P2 P 3 P4 P 5 P 6 P 7 P 8 P 91. Do you have a policy / policies
for.... Y Y Y Y Y Y Y Y Y
Has the policy being formulated in consultation with the relevant stakeholders?
Y Y Y Y Y Y Y Y Y
3. Does the policy conform to any national / international standards? If yes, specify? (50 words)
Y Y Y Y Y Y Y Y YThe Policies are in line with Reserve Bank of India, Ministry of Corporate Affairs (MCA) Guidelines and other Regulations / Guidelines, as applicable.
4. Has the policy being approved by the Board?
Is yes, has it been signed by MD/ owner/CEO/appropriate Board Director?
Y Y Y Y Y Y Y Y Y
5. Does the company have a
oversee the implementation of the policy?
Y Y Y Y Y Y Y Y Y
6. Indicate the link for the policy to be viewed online?
http://www.indusind.com/content/csr-home/our-approach/csr-policy.html
http://www.indusind.com/content/home/footer/customer-care/grievance-redressal.html

61
7. Has the policy been formally communicated to all relevant internal and external stakeholders?
Y - Y Y Y Y Y Y Y
Does the company have in-house structure to implement the policy/policies?
Y Y Y Y Y Y Y Y Y
9. Does the Company have a grievance redressal mechanism related to the policy / policies
grievances related to the policy / policies?
Y - Y - Y - - - Y
10. Has the company carried out independent audit/ evaluation of the working of this policy by an internal or external agency?
Y Y Y Y Y - Y - Y
b. If answer to Sr. No. 1 against any principle, is ‘No’, please explain why: (Tick upto 2 options)
Sl. No.
Questions P 1 P 2 P 3 P 4 P 5 P 6 P 7 P 8 P 9
1 The company has not understood the Principles
- - - - - - - - -
The company is not at a
in a position to formulate and implement the
principles
- - - - - - - - -
3 The company does
manpower resources available for the task
- - - - - - - - -
4 It is planned to be done within next 6 months
- - - - - - - - -
5 It is planned to be done within the next 1 year
- - - - - - - - -
6 Any other reason (please specify)
- - - - - - - - -

Annual Report 2016-17
62
3. Governance related to BR
Indicate the frequency with which the Board of Directors, Committee of the Board or CEO to assess the BR performance of the Company. Within 3 months, 3-6 months, Annually, More than 1 year
Annually.
Does the Company publish a BR or a Sustainability Report? What is the hyperlink for viewing this report? How frequently it is published?
The Bank publishes the BR Report annually.
The hyperlinks to view the Report are: http://www.indusind.com/content/csr-home.html
http://www.indusind.com/investor/reports-and-presentation/annual-reports.html
Section E: Principle-wise performance
Principle 11. Does the policy relating to ethics, bribery and corruption cover only the company? Yes/ No. Does it
extend to the Group / Joint Ventures / Suppliers / Contractors / NGOs / Others?
Policy relating to Ethics, Bribery and Corruption cover the Bank and the Suppliers / Contractors / Others, and is
as well as Outsourcing Agreements with the vendors and contractors. The Bank strictly ensures that none of its
requirements are sourced from corporates, generally where highly skilled labour is employed.
was satisfactorily resolved by the management? If so, provide details thereof, in about 50 words or so.
untrue and 3 complaints are currently under investigation.
Principle 21. List up to 3 of your products or services whose design has incorporated social or environmental concerns,
risks and / or opportunities.
Investment in Renewable Energy and Priority Sector Lending
that supports the economic development of the rural sector. As part of the Renewable Energy Global Investors
helped support Micro-Enterprises, such as, saree trading, snack stores, tea stalls and bicycle repair shops.

63
savings habit.
2. For each such product, provide the following details in respect of resource use (energy, water, raw material etc.) per unit of product (optional):
i. Reduction during sourcing / production / distribution achieved since the previous year throughout the value chain?
Not Applicable.
ii. Reduction during usage by consumers (energy, water) has been achieved since the previous year?
Not Applicable
3. Does the company have procedures in place for sustainable sourcing (including transportation)?
presence, raw material sourcing, and have a Supplier Code of Conduct. The Policy endeavours to strengthen
environmental laws.
i. If yes, what percentage of your inputs was sourced sustainably? Also, provide details thereof, in about 50 words or so.
product life cycle. The IT hardware, software and non-IT equipment comprise of large spends for the Bank. The Bank has completed Supplier Sustainability Assessments for these vendors.
4. Has the company taken any steps to procure goods and services from local and small producers, including communities surrounding their place of work?
If yes, what steps have been taken to improve their capacity and capability of local and small vendors?
Not Applicable.
5. Does the company have a mechanism to recycle products and waste? If yes, what is the percentage of recycling of products and waste (separately as <5%, 5-10%, >10%) Also, provide details thereof, in about 50 words or so.
tied up with ITC Ltd. through their Wealth-out-of-Waste (WOW). Waste Paper Collection Arrangement and a few
Principle 31. Please indicate the Total number of employees.
2. Please indicate the Total number of employees hired on temporary/contractual/casual basis.
Total number of employees hired on temporary / contractual / casual basis is 1773.
3. Please indicate the Number of permanent women employees.
4. Please indicate the Number of permanent employees with disabilities.
The Bank had 7 permanent employees with disabilities.

Annual Report 2016-17
64
The Bank evaluates and addresses special infrastructure needs of differently abled employees and facilitates their seamless integration into the system. For the visually impaired employees, the Bank has procured special software which converts text into voice for the employee to understand and respond. Like-wise in the case of hearing- impaired employees, the Bank provides training in “sign-language” to their reporting managers
requirements as well.
5. Do you have an employee association that is recognized by management? The Bank does not have any Association of Employees.
6. What percentage of your permanent employees is members of this recognized employee association? Not Applicable.
7. Please indicate the Number of complaints relating to child labour, forced labour, involuntary labour,
Sl. No.
Category No. of complaints pending as
1 Child labour/forced labour / involuntary labour
Nil Nil
Sexual harassment 9 Nil
3 Discriminatory employment Nil Nil
gender differences, which is then escalated for quick investigation and the case is considered by a Committee of Experts comprising of female social workers and senior female Executives.
8. What percentage of your under mentioned employees were given safety and skill up-gradation training in the last year?
• Permanent Employees • Permanent Women Employees • Casual / Temporary / Contractual Employees • Employees with Disabilities
Skill Upgradation Training
Total Employee Strength
No. of programs
Total no. of participants
Total Man hrs. achieved
Average Man hrs. per participant
Average Man days achieved
1,344 9,60,161 4.75
Employee Training on Fire Safety
to handle emergency situations to ensure a safe work environment. The Bank has an e-learning module on
Fire evacuation drills and training programmes are conducted periodically at various locations of the Bank.
Safety Training.

65
Training on Women’s Safety
on various self-defence techniques like, evasion, avoidance and deterrence, training using common implements
Principle 41. Has the company mapped its internal and external stakeholders? Yes/No Yes, the Bank has mapped the internal and external stakeholders and has clear engagement processes with
them. Description of the processes has been provided in the Sustainability Report.
2. Out of the above, has the company identified the disadvantaged, vulnerable and marginalized stakeholders.
Reserve Bank of India has prescribed guidelines on Financial Inclusion, Priority Sector Lending, lending to
stakeholders.
3. Are there any special initiatives taken by the company to engage with the disadvantaged, vulnerable and marginalized stakeholders. If so, provide details thereof, in about 50 words or so.
The Bank has a dedicated Inclusive Banking Group which adopts a collaborative approach by partnering with suitable intermediaries / institutions for further Financial Inclusion. The target segment are women. The programme is initiated with Micro-credit (less than ` 50,000/-) and will subsequently be expanded to Savings
as a week to a month, which facilitates collections as well as discussions on social issues.
Additionally, the Bank facilitates various corroborative activities like legal literacy, sanitation improvement and several other community development initiatives through these intermediaries and other implementing partners thereby contributing to a rounded engagement at the Base-of-the Pyramid.
Internally, the Bank focuses on providing special infrastructure needs for differently-abled employees and facilitates their seamless integration into the system. The Bank has been conducting Women Safety Awareness Training sessions for its women employees.
Principle 51. Does the policy of the company on human rights cover only the company or extend to the Group / Joint
Ventures / Suppliers / Contractors / NGOs / Others? The Policy of Human Rights covers only the Bank.
satisfactorily resolved by the management?
Principle 61. Does the policy related to Principle 6 cover only the company or extends to the Group / Joint Ventures /
Suppliers / Contractors / NGOs / others.
vendors who follow best environment practices. The Bank is working towards a Sustainable Value Chain and has assessed its major suppliers for their carbon foot-print emissions and has initiated a systematic Supplier Sustainability Assessment for its suppliers.

Annual Report 2016-17
66
2. Does the company have strategies/ initiatives to address global environmental issues such as climate change, global warming, etc? Y/N. If yes, please give hyperlink for webpage etc.
has been measuring its carbon footprint for the past 5 years and disclosing its emissions through the Carbon
environment disclosures are reported in the Sustainability Report.
http://www.indusind.com/content/csr-home/sustainability-report.html
3. Does the company identify and assess potential environmental risks? Y/N
potential environmental and social risks in its investments and also helps encourage its borrowers to be more responsible and sustainable and create an understanding of Environmental and Social Risks in their operations.
4. Does the company have any project related to Clean Development Mechanism? If so, provide details
Not Applicable
energy, etc. Y/N. If yes, please give hyperlink for web page etc.
http://www.indusind.com/content/csr-home/sustainability-report.html
Paper Consumption and Recycling:
In the banking sector, paper is abundantly used in day-to day operations such as printing of account statements, forms, bills and other written communication. Options of e-statement registrations and robust online and mobile banking systems have reduced the downstream paper usage. The Bank uses IT interventions, such as, paperless fax, document imaging and processing, use of Hand-Held Terminals, etc., to reduce its paper consumption.
(WOW) programme in partnership with ITC.
E-waste:
Energy Reduction Initiatives Scale Electricity Saved*
(in MWh)Emissions Reduced
(in MT of CO2)Pan-India 96 79.15
Solar energy generated at Karapakkam facility 49.5 41

67
Carbon Disclosure Project
6. Are the Emissions/Waste generated by the company within the permissible limits given by CPCB/ SPCB
Not Applicable.
7. Number of show cause/ legal notices received from CPCB/SPCB which are pending (i.e. not resolved to satisfaction) as on end of Financial Year
Not Applicable.
Principle 71. Is your company a member of any trade and chamber or association? If Yes, Name only those major ones
that your business deals with:
a. Confederation of Indian Industry (CII) b. Indian Merchants Chambers (IMC) c. Bombay Chamber of Commerce & Industry (BCCI) d. Indian Banks Association (IBA) e. Indian Institute of Banking and Finance (IIBF) f. Banking Codes and Standards Board of India (BCSBI)
2. Have you advocated/lobbied through above associations for the advancement or improvement of public good? Yes/No; if yes specify the broad areas (drop box: Governance and Administration, Economic Reforms, Inclusive Development Policies, Energy security, Water, Food Security, Sustainable Business Principles, Others)
No.
Principle 8
Principle 8? If yes details thereof.
several projects that critically impact communities and the environment around us.
Environmental Sustainability
• Afforestation Projects – The Bank has been supporting Afforestation projects that help in mitigating
the Bank has supported two Afforestation projects with Satpuda Foundation and Centre for Environmental Research and Education. About 30,000 trees were planted in partnership with Satpuda Foundation and close to 5,000 trees were planted in partnership with Centre for Environmental Research and Education. Trees comprising of about 30 species have been planted in the buffer villages of Pench, Navegaon,

Annual Report 2016-17
68
which has decreased energy consumption.
• The Bank has been active in building capacities of its employees through various Green Initiatives with
colleagues but the communities that surround them.
Preventive Healthcare: • In an ongoing project with SUPPORT, the Bank supports the rehabilitation and skill development of drug-
addicted street children in Mumbai, making them employable and independent through Vocational Skill-building Programmes.
cancer, in partnership with the Bhagwan Mahaveer Cancer Hospital and Research Centre (BMCHRC), Jaipur. The project aims to provide treatment to children aged 14 years and below suffering from curable (90%) Blood Cancers.
Rural Development: • The Bank has successfully implemented a Water Conservation Project in Satara, where rejuvenation of
a Check Dam at Ghigewadi village on river Vasna, tributary of river Krishna was undertaken, in one of
Government of Maharashtra. The project has favourably impacted both, the surrounding communities and the environment in terms of access to drinking water for families, recharge of open wells and bore
from the Base-of-the-Pyramid (BoP) segment, both, through Direct and Indirect Channels. The Bank has
which rank low on the CRISIL Financial Inclusion Index. About 44% of these loans were towards Farm (Agri and Agri-Allied) sector, and the balance towards Micro Enterprises (Manufacturing, Trade and Service). Activities covered under Farm (Agri and Agri-Allied) sector include, vegetable cultivation, release of land mortgaged with money lender, bore well digging, pumpset, land development, livestock loans – Buffalo, Cows, Sheep-rearing, Kitchen Poultry units, etc., and activities covered under Micro Enterprises include, saree trading, fruits business, kirana stores, snacks stores, road side dhabas, cycle repair shops, tea
touching virtually every aspect of clients in the BoP segment.
Education and Other Areas: • In an on-going project with its Business Correspondent - Samhita, the Bank is carrying out a Legal
trained to provide para-legal and counselling advice to victims of violence in their neighbourhoods. Legal Counselling Centres managed by these trainers are also being set up.
• In another on-going programme, the Bank supports deserving meritorious students of Ashoka University through the Young India Fellowship Programme, renowned for introducing several young entrepreneurs in the social sector.
children opportunities to think and feel as they explore, problem solving, express and interpret the world

69
around them and this has proven to help children concentrate better in their academic curriculum and subsequently reduce drop-outs.
Sports:
Training, Fitness, Mental conditioning and high performance trainings. At the Paralympics, 3 Athletes from
Bengaluru, winning great accolades for the country. The objective of the Programme is to use cricket as a medium to demonstrate their ability and using sports as a medium of inclusion. Potential players are
economic status.
to NGOs who work for social and environmental causes, leveraging their resources and expertise to bring about positive change. In the past year, employees have raised funds for SUPPORT, Nalandaway Foundation, Samarthanam, Aaranyak, HelpAge India and Prayas and their contributions have made a huge difference in the areas of Education, Children, Empowerment of Women, Differently Abled, Nature Conservation and Elderly Care.
2. Are the programmes/projects undertaken through in-house team/own foundation/external NGO/government structures/any other organization?
The programmes / projects / initiatives are undertaken through in-house team, business correspondents, NGOs, Implementation Agencies, and Environmental Consultants.
3. Have you done any impact assessment of your initiative?
Yes, the Bank continuously monitors and assesses the impact of its initiatives to identify the effectiveness of its interventions.
• The Legal Literacy programme in Madhya Pradesh has created awareness among women on their legal rights and the various provisions to protect them, which has led to increased reporting of cases of violence. Several cases of domestic violence including cases of sexual violence have been reported and ably supported by Samhita.
responsible manner would help improve the quality of lives and help empower women over a period of time.
• The River Rejuvenation Project in Maharashtra impacted, both, the surrounding communities and the environment in terms of access to drinking water for families, recharge of open wells and bore wells,

Annual Report 2016-17
70
4. What is your company’s direct contribution to community development projects- Amount in INR and the details of the projects undertaken.
The Bank has spent `
5. Have you taken steps to ensure that this community development initiative is successfully adopted by the community? Please explain in 50 words, or so.
As highlighted in point 3, the Bank is continuously assessing and monitoring the impact of its initiatives. The Bank targets are the major stakeholders in its community interventions. The Bank ensures that the projects that it undertakes, has complete participation and support from the community, thus ensuring that they are sustainable and generate the necessary impact.
Principle 9
subsequently.
2. Does the company display product information on the product label, over and above what is mandated as per local laws? Yes/No/N.A./Remarks (additional information)
Not Applicable.
No.
4. Did your company carry out any consumer survey/ consumer satisfaction trends?
The Bank regularly carries out surveys to assess satisfaction levels and tracks performance on customer needs and expectations.

71
ANNEXURE VII TO THE DIRECTORS’ REPORT
CERTIFICATE ON COMPLIANCE OF CONDITIONS OF CORPORATE GOVERNANCETo
The Members of IndusInd Bank Limited
We have examined the compliance of conditions of Corporate Governance by INDUSIND BANK LIMITED (“the
The compliance of conditions of Corporate Governance is the responsibility of the Management. Our examination was limited to procedures and implementation thereof, adopted by the Bank for ensuring compliance with the conditions of Corporate Governance. It is neither an audit nor an expression of opinion on the Financial Statements of the Bank.
In our opinion and to the best of our information and according to the explanations given to us, we certify that the Bank
effectiveness with which the Management has conducted the affairs of the Bank.
For Bhandari & AssociatesCompany Secretaries
S. N. BhandariPartner
Place : Mumbai

Financial year 2016-17 was a watershed year for the Indian economy. Major Government Policy reform initiatives were undertaken, which will have a significant and structural impact on the economic and business environment over the next 3-5 years. The most important of these measures was the passage of enabling legislations for the introduction of a nation-wide Goods and Services Tax (GST). The GST will create a common market in the country by reducing barriers to internal trade, making exports more competitive and can potentially raise growth by up to 2%.
The currency swap program (Demonetization) was the other major policy initiative, which is likely to have a long lasting impact on the economy. Demonetization, combined with GST, is expected to induce greater formalization of the economy. It is also likely to lead to a gradual shift in savings towards financial instruments, as against physical assets. The Government and the RBI also undertook complementary steps to reduce the reliance on cash for payments and other transactions, looking to leverage on technology and the unique identification system, Aadhaar. These measures would lead to greater formalization, financialization and digitization over the next 3 years.
Other major reforms announced during the year include the Bankruptcy Code, which once operational, would significantly reduce the time taken for bad debt resolution or liquidation, and will help in dealing with stressed assets in the Banking System. Several steps have also been taken to facilitate foreign investment, improve the ease of doing business and create an ecosystem for start-ups.
On the macro-economic front, developments during the year fostered stability, even though growth slowed down, in part reflecting the impact of demonetization. India remained among the world’s fastest growing large economies, helped by robust domestic consumption. Growth at an estimated 7.1% in FY 2016-17, however, slowed down from 7.9% in FY 2015-16, on weak investment activity and adverse transient impact on demonetization on consumption. The Services and Farm Sector activity supported the overall momentum, with foodgrains output touching a record level on a near-normal monsoon.
Inflation remained well under control with the headline CPI inflation easing to an average of 4.5% in FY 2016-17 from 4.9% in FY 2015-16. The receding of inflation allowed RBI to cut Repo Rate by 50 bps to 6.25%, during the first half of the year.
Management Discussion& AnalysisManagement Discussion& Analysis
The RBI also changed its stance on liquidity in April 2016, with an endeavour to shift from deficit to neutral liquidity conditions, which saw the Central Bank inject liquidity until the demonetization announcement. However, the RBI changed its Policy stance to 'neutral' from ‘accommodative’ in February, noting the upside risks to its inflation target of 4%, including that from a hardening profile of commodity prices, particularly Crude Oil.
The Central Bank also estimated that the adverse impact of demonetization on growth was restricted to about 33 bps and that economic activity would recover following remonetisation, Pay Commission-related increase in Salaries and Allowances, and softer lending rates. Lower Policy Rate and the demonetization- induced jump in Bank Deposits, saw banks reducing borrowing and lending rates during the year. Median 1-year MCLR across banks fell by 85 bps over the year. Yields on Government Bonds also eased, with the 10-year Yield falling by 79 bps during the year.
On the fiscal front, the Central Government continued with the fiscal consolidation process and met its Fiscal Deficit target for the year of 3.5% of GDP. For FY 2017-18, the increase in overall Budget spending has been pegged at 6.6% and the Fiscal Deficit has been projected at 3.2% of GDP. With an increase of 10.7% in the Capital Expenditure over FY 2017-18, focus is on strengthening the productive capacity of the economy. In pursuance of the Government’s on-going push for better Railways and Roads, allocation to the Transport sector has been increased by 20% in FY 2017-18.
The external sector fundamentals of the economy improved, too. The Current Account Deficit (CAD) shrunk to 0.7% of GDP in the first 3 quarters of FY 2017, from 1.4% in the same period of FY 2016. FPIs’ appetite for Indian assets improved in Q4, adding to the steady FDI inflows during the year. FII inflows rose to $12 billion in Q4, reversing sharply from Q3, which saw outflows of $11.3 billion. Helped by a smaller CAD and a pickup in capital inflows, the RBI added to the foreign exchange reserves, which went up by $14.4 billion during the year to $370 billion. Reflecting these improved fundamentals, the INR appreciated by 5.2% against the USD in Q4 and 2.2% over FY 2016-17. Global growth environment turned supportive too, with economic activity across major economies, gaining momentum in Q4.
The year also saw strengthening of challenges to growth. Slow resolution of banks’ NPAs and anaemic private sector investment activity emerged as major challenges on the domestic front. On the global front, heightened global policy uncertainty with trade protectionism and the Fed rate hikes stood out as key risks. Notable global events in that context included the UK deciding to exit from the European Union, and election of President Trump in the US with an inward looking agenda including immigration curbs. The US Federal Reserve hiked rates twice by 25 bps each during FY 2016-17, and signalled that rates would continue to be raised gradually until 2019.
The economic and policy developments over the year however, place India in a relatively strong position to deal with rising global policy uncertainties and tightening of global financial conditions.
2%2%
Nation-wideGST to
enable growthby up to
IndianEconomy
Growth at anestimated
in FY 2016-177.1%7.1%
4.5%4.5%CPI inflation
at in FY 2016-17
from4.9% in
FY 2015-16
Median 1-yearMCLR acrossbanks fell by
in 201685 bps85 bps
For FY 2017-18,the increase inoverall Budget
spendingpegged at
6.6% 6.6% 6.6%
Macroeconomic Scenario & Banking Environment
Annual Report 2016-17
72

Financial year 2016-17 was a watershed year for the Indian economy. Major Government Policy reform initiatives were undertaken, which will have a significant and structural impact on the economic and business environment over the next 3-5 years. The most important of these measures was the passage of enabling legislations for the introduction of a nation-wide Goods and Services Tax (GST). The GST will create a common market in the country by reducing barriers to internal trade, making exports more competitive and can potentially raise growth by up to 2%.
The currency swap program (Demonetization) was the other major policy initiative, which is likely to have a long lasting impact on the economy. Demonetization, combined with GST, is expected to induce greater formalization of the economy. It is also likely to lead to a gradual shift in savings towards financial instruments, as against physical assets. The Government and the RBI also undertook complementary steps to reduce the reliance on cash for payments and other transactions, looking to leverage on technology and the unique identification system, Aadhaar. These measures would lead to greater formalization, financialization and digitization over the next 3 years.
Other major reforms announced during the year include the Bankruptcy Code, which once operational, would significantly reduce the time taken for bad debt resolution or liquidation, and will help in dealing with stressed assets in the Banking System. Several steps have also been taken to facilitate foreign investment, improve the ease of doing business and create an ecosystem for start-ups.
On the macro-economic front, developments during the year fostered stability, even though growth slowed down, in part reflecting the impact of demonetization. India remained among the world’s fastest growing large economies, helped by robust domestic consumption. Growth at an estimated 7.1% in FY 2016-17, however, slowed down from 7.9% in FY 2015-16, on weak investment activity and adverse transient impact on demonetization on consumption. The Services and Farm Sector activity supported the overall momentum, with foodgrains output touching a record level on a near-normal monsoon.
Inflation remained well under control with the headline CPI inflation easing to an average of 4.5% in FY 2016-17 from 4.9% in FY 2015-16. The receding of inflation allowed RBI to cut Repo Rate by 50 bps to 6.25%, during the first half of the year.
The RBI also changed its stance on liquidity in April 2016, with an endeavour to shift from deficit to neutral liquidity conditions, which saw the Central Bank inject liquidity until the demonetization announcement. However, the RBI changed its Policy stance to 'neutral' from ‘accommodative’ in February, noting the upside risks to its inflation target of 4%, including that from a hardening profile of commodity prices, particularly Crude Oil.
The Central Bank also estimated that the adverse impact of demonetization on growth was restricted to about 33 bps and that economic activity would recover following remonetisation, Pay Commission-related increase in Salaries and Allowances, and softer lending rates. Lower Policy Rate and the demonetization- induced jump in Bank Deposits, saw banks reducing borrowing and lending rates during the year. Median 1-year MCLR across banks fell by 85 bps over the year. Yields on Government Bonds also eased, with the 10-year Yield falling by 79 bps during the year.
On the fiscal front, the Central Government continued with the fiscal consolidation process and met its Fiscal Deficit target for the year of 3.5% of GDP. For FY 2017-18, the increase in overall Budget spending has been pegged at 6.6% and the Fiscal Deficit has been projected at 3.2% of GDP. With an increase of 10.7% in the Capital Expenditure over FY 2017-18, focus is on strengthening the productive capacity of the economy. In pursuance of the Government’s on-going push for better Railways and Roads, allocation to the Transport sector has been increased by 20% in FY 2017-18.
The external sector fundamentals of the economy improved, too. The Current Account Deficit (CAD) shrunk to 0.7% of GDP in the first 3 quarters of FY 2017, from 1.4% in the same period of FY 2016. FPIs’ appetite for Indian assets improved in Q4, adding to the steady FDI inflows during the year. FII inflows rose to $12 billion in Q4, reversing sharply from Q3, which saw outflows of $11.3 billion. Helped by a smaller CAD and a pickup in capital inflows, the RBI added to the foreign exchange reserves, which went up by $14.4 billion during the year to $370 billion. Reflecting these improved fundamentals, the INR appreciated by 5.2% against the USD in Q4 and 2.2% over FY 2016-17. Global growth environment turned supportive too, with economic activity across major economies, gaining momentum in Q4.
The year also saw strengthening of challenges to growth. Slow resolution of banks’ NPAs and anaemic private sector investment activity emerged as major challenges on the domestic front. On the global front, heightened global policy uncertainty with trade protectionism and the Fed rate hikes stood out as key risks. Notable global events in that context included the UK deciding to exit from the European Union, and election of President Trump in the US with an inward looking agenda including immigration curbs. The US Federal Reserve hiked rates twice by 25 bps each during FY 2016-17, and signalled that rates would continue to be raised gradually until 2019.
The economic and policy developments over the year however, place India in a relatively strong position to deal with rising global policy uncertainties and tightening of global financial conditions.
CAD shrunk
to 0.7% ofGDP in the
first 3 quartersof FY 2017
0.7%0.7%INR
appreciated
by 5.2%against theUSD in Q4
5.2%5.2%
The US FederalReserve hikedrates twice by
25 bpseach duringFY 2016-17
25 bps25 bps
FII inflowsrose to
in Q4
$12billion
$12billion
73

The salient features of the Bank’s operating performance during the year 2016-17 are summarized in the table below:
Particulars FY 2016-17(Actual)
FY 2015-16(Actual)
Y-o-Y(Growth)
Interest Earned 14,405.67
8,343.07
6,062.60
4,171.49
10,234.09
1,521.02
3,262.06
4,783.08
5,641.71
5,451.01
1,091.33
4,359.68
1,491.79
2,867.89
11,871.74
7,355.17
4,516.57
3,296.95
7,813.52
1,236.09
2,436.01
3,672.10
4,297.94
4,141.42
672.16
3,469.26
1,182.81
2,286.45
21.34%
13.43%
34.23%
26.53%
30.98%
23.05%
33.91%
30.25%
31.27%
31.62%
62.36%
25.67%
26.12%
25.43%
Interest Expended
Net Interest Income
Non-Interest Income
Revenue
Payment to Employees
Other Expenses
Operating Expenses
Operating Profit
Provisions and Contingencies
Profit Before Tax
Provision for taxes
Net Profit
Operating Profit(before Depreciation and Provisions and Contingencies)
(` in crores)
Despite the tough operating environment that prevailed through most part of the financial year, the Bank’s Net Profit, after considering all
expenses and Provisions and Contingencies, rose by 25.43% to `2,867.89 crores as against `2,286.45 crores. The Operating Profit (before
Depreciation and Provisions and Contingencies) rose robustly by 31.27% to `5,641.71 crores, as compared to ̀ 4,297.94 crores in the previous year.
The Net Interest Income of the Bank improved robustly by 34.23% to `6,062.60 crores from `4,516.57 crores. Yield on Advances dropped by 53 bps to 11.71%, while the Cost of Deposits showed a drop of 84 bps at 6.41%. Net Interest Margin for the year improved to 3.99% as compared to 3.81% achieved in the previous year, mainly due to the composition of the Asset Portfolio, benign interest rates movements during the year and judicious mobilization of funding resources through deposits and borrowings, including overseas borrowings and refinance from institutions.
Fee and miscellaneous income at `4,171.49 crores as compared to `3,296.95 crores for the previous year, showed a strong growth of 26.53% y-o-y. Core Fee Income from revenue streams like Commission, Exchange, Fees on distribution of third party products and earnings from foreign exchange business, etc. rose to `3,488.59 crores as against `2,809.59 crores registering a growth of 24.17%.
The Bank expanded its branch network steadily to reach 1,200 branches, as against 1,000 branches at the beginning of the year. Revenue per employee remained steady at `40.43 lakhs.
Though the economy in general and the corporate sector in particular were under severe stress, the asset quality at the Bank remained stable, with Net Non-Performing Assets (Net NPA’s) at 0.39% at March 31, 2017 as against 0.36% a year ago. Provision Coverage Ratio (PCR) was maintained at 58% as compared to 59% in the previous year.
Return on assets (ROA) was placed at 1.86% for the current year as against 1.91% in the previous year.
During the year under review, the Bank allotted 31,62,370 equity shares, pursuant to the exercise of Options under its Employees Stock Option Scheme, 2007. An aggregate of 3,98,39,800 Options, comprising 6.66% of the Bank’s equity capital, have been granted under the Scheme.
Business PerformanceBusiness Performance
Annual Report 2016-17
74

Despite the tough operating environment that prevailed through most part of the financial year, the Bank’s Net Profit, after considering all
expenses and Provisions and Contingencies, rose by 25.43% to `2,867.89 crores as against `2,286.45 crores. The Operating Profit (before
Depreciation and Provisions and Contingencies) rose robustly by 31.27% to `5,641.71 crores, as compared to ̀ 4,297.94 crores in the previous year.
The Net Interest Income of the Bank improved robustly by 34.23% to `6,062.60 crores from `4,516.57 crores. Yield on Advances dropped by 53 bps to 11.71%, while the Cost of Deposits showed a drop of 84 bps at 6.41%. Net Interest Margin for the year improved to 3.99% as compared to 3.81% achieved in the previous year, mainly due to the composition of the Asset Portfolio, benign interest rates movements during the year and judicious mobilization of funding resources through deposits and borrowings, including overseas borrowings and refinance from institutions.
Fee and miscellaneous income at `4,171.49 crores as compared to `3,296.95 crores for the previous year, showed a strong growth of 26.53% y-o-y. Core Fee Income from revenue streams like Commission, Exchange, Fees on distribution of third party products and earnings from foreign exchange business, etc. rose to `3,488.59 crores as against `2,809.59 crores registering a growth of 24.17%.
The Bank expanded its branch network steadily to reach 1,200 branches, as against 1,000 branches at the beginning of the year. Revenue per employee remained steady at `40.43 lakhs.
Though the economy in general and the corporate sector in particular were under severe stress, the asset quality at the Bank remained stable, with Net Non-Performing Assets (Net NPA’s) at 0.39% at March 31, 2017 as against 0.36% a year ago. Provision Coverage Ratio (PCR) was maintained at 58% as compared to 59% in the previous year.
Return on assets (ROA) was placed at 1.86% for the current year as against 1.91% in the previous year.
During the year under review, the Bank allotted 31,62,370 equity shares, pursuant to the exercise of Options under its Employees Stock Option Scheme, 2007. An aggregate of 3,98,39,800 Options, comprising 6.66% of the Bank’s equity capital, have been granted under the Scheme.
25.43% 25.43% Net Profit rose by to ` 2,867.89 crores
31.62%31.62%Operating profit rose by to ` 5,451.01 crores
34.23% 34.23% Net Interest Income rose by to ` 6,062.60 crores
26.53% 26.53% Other Income rose by to ` 4,171.49 crores
BUSINESS PERFORMANCE HIGHLIGHTS
75

Consumer BankingConsumer Banking
Consumer Banking business exhibited healthy growth in revenue during FY 2016-17. All business segments of Consumer Bank continued to outperform, propelled by the objective of delivering best-in-class products and services to Retail clients. The Savings Account Balance Sheet witnessed robust growth of 57%, while funded assets showed 30% y-o-y growth.
The Bank continued with Digitalizing of businesses and ensured maximum usage of its Digital Initiatives by the clients. In line with the Government’s digital push, the Bank laid special emphasis on promoting digital agenda across payments, deposits, lending and sourcing new clients. To give further impetus around the Bank’s focus on ‘Going Digital’ to ‘Fully Digital’, various innovative and convenient approaches were introduced during FY 2016-17. Tablet-based Account Opening process was introduced, wherein an accounts gets opened and fully activated within ‘2 minutes’.
The Bank has launched IndusForex.com, a one-stop portal for all foreign exchange needs of Indian consumers. With the help of this portal, one can buy multi-currency foreign exchange cards
and reload them anytime, anywhere in 8 different currencies. Consumers can also use the portal to send money abroad by Telegraphic Transfer in 16 currencies for all travel-related remittance such as, Education, Immigration, Tour Remittance, Employment, and for Family Maintenance. The Bank became the first to introduce Aadhaar-based e-KYC on Travel Cards at zero margin, thereby boosting customer convenience and enhancing digital experience.
Similarly, the Bank launched an instant and real-time Personal Loan portal branded as ‘Easy Loan’, for catering to existing Account-holders displaying prudent credit behaviour. This contributed 24% to the Personal Loan business for the year.
To make banking easier for its customers, the Bank enabled its best-in-class fingerprint-based Mobile Banking App with new-age digital payment services, viz., UPI and Bharat QR. The Bank also went Live with Aadhaar Pay App for merchants and UPI @ USSD for Retail clients, to tap digital payments at the bottom of the pyramid. The Bank forged multiple relationships across the industry spectrum, including with Payments Banks, Merchant Aggregators, Business Correspondents, Mobile Wallet Providers, and leading financial portals. The purpose and strategy around the partnership is to acquire and diversify Bank’s customer base in a non-linear, B2B2C model.
With the objective of increasing penetration around branch catchments, Consumer Bank has launched first-of-its-kind Transaction Friendly Current Account ‘Indus Freedom’. This is targeted towards 'The Shop Next Door', which are run by individuals or proprietors. Indus Freedom is a step towards digitization wherein, on doing one Mobile
/ Net Banking / ATM transaction a month, the customer gets the ‘No AMB Maintenance’ advantage.
Business Banking Group was one of the major contributors to the topline of Consumer Bank. The strategy of adding new segments that had been implemented during the last financial year led to strong results in year 2016-17, with 37% y-o-y growth in acquisition of new customers. Branch-led assets presently constitute 33% of total Business Banking Assets. New customer sourcing for the year was evenly spread between branch (46%) and non-branch sources (54%), in line with the Assets philosophy of the Bank of leveraging branch distribution. Focus in FY18 would be on further synergising between various asset classes, such as cross-sell on Consumer Finance Division (CFD) assets, with target of 60% branch sourcing for new customer acquisition.
The ‘Loan Against Property’ business had one more year of consistent performance, displaying a healthy growth of 34% in the Loan Book, i.e., `1,803 crores of addition to the Book. In line with the Bank’s focus on internal customers, the contribution from internal channels has now grown to 49% of the total number of loans originated. The Home Loans distribution tie-up with HDFC Limited remains one of the key Asset products distributed through the branch network.
The ‘Loans Against Card Receivables’ (LACR) product was launched in 2014, and in a small span of time has witnessed sharp growth of 119% y-o-y in the Expected Net Receivables and 116% in the number of Live accounts (y-o-y). The portfolio has helped in extending support to the concept of cashless economy. It has helped many Small and Medium Scale Enterprises such as restaurants, garment merchants, petrol pumps, consumer durables, etc., to achieve business growth and to cater to the day-to-day financial demands of business through Card swipes. To further expand the business footprint while strengthening relationships with existing customers, it has penetrated into newer locations and grown the quality portfolio. A healthy Book has been built in LACR, at a yield of more than 17%.
The Personal Loans business continued its measured growth strategy, while contributing a robust yield to the Assets portfolio. The performance of the Book continued to be robust, growing @ 70%, while exhibiting strong portfolio parameters. The product has a live portfolio of 35,000 customers, with 22,000 customers on-boarded in the year 2016-17. Cross-sell synergy with the Consumer Finance Team helped expand the footprint into new geographies.
The Business Loan product was launched in 2013, and completed almost the full cycle with creation of a healthy Asset Book of `678 crores, with 4,400 live clients spread across the Micro, Small and Medium Enterprise segment.
Retail Agriculture
Retail Agri Business witnessed sturdy growth through expansion to key markets. Since its launch, the Bank has built a highly diversified portfolio, ranging from funding of traditional agricultural activities to high-tech farming / Agri-allied activities.
The Bank has emerged as a key player in the States of Punjab, Haryana, Rajasthan, Maharashtra, Gujarat and Madhya Pradesh. The Bank penetrated into new rural / semi-urban locations in the State of Kerala in year 2016-17, and plans to aggressively cover more geographies. Loans have been extended to Weaker Sections, persons with disabilities, and Small and Marginal Farmers, helping the Bank strengthen its commitment to these segments. The Bank’s KCC Book now stands at `700 crores, across about 3,700 farmer accounts across various geographies.
Client Experience
The Bank aims to go beyond client servicing, to provide best-in-class ‘experience’ to its clients.
During the year 2016-17, there has been a renewed thrust on client-centricity, which puts our customers at ‘the very heart of everything we do’.
Transforming ‘Client Experience’ (CEX) has been identified as a key strategic imperative for the next few years. The Bank aspires to differentiate itself through such customer-centric initiatives and garner sustainable competitive advantage in the commoditized banking space. It corroborates the business objectives of retaining strong growth and attaining market leadership.
The Bank has taken steps in this direction, which includes developing better understanding of client needs, matching right capabilities with right clients, enhancing personalization, and revamping key customer journeys. These client-centric initiatives will be an extension to the Bank’s current themes of Responsiveness and Digitization. The Bank has retained the services of Business Consultants of global repute, to ensure rapid building of business vision and creating the right roadmap for transformation.
Innovation
This service solves the key customer issue of having to remember Passwords. With this service, customers can do seamless and secure banking transactions via the Mobile Banking App by just using their fingerprints. A new feature ‘Shake-N-Pay’ has been added, which enables customers to transfer funds to other IndusInd Bank Account-holders by just waving the Mobile handset.
Distribution
The Bank opened 200 new branches as part of the strategy of expanding its banking network to different locations in the country, taking the count to 1,200. The Bank also increased the ATM network to 2,036 by opening 236 new ATMs. The Bank has also partnered with White-Label ATM operators to set up co-branded ATMs.
Annual Report 2016-17
76

Consumer Banking business exhibited healthy growth in revenue during FY 2016-17. All business segments of Consumer Bank continued to outperform, propelled by the objective of delivering best-in-class products and services to Retail clients. The Savings Account Balance Sheet witnessed robust growth of 57%, while funded assets showed 30% y-o-y growth.
The Bank continued with Digitalizing of businesses and ensured maximum usage of its Digital Initiatives by the clients. In line with the Government’s digital push, the Bank laid special emphasis on promoting digital agenda across payments, deposits, lending and sourcing new clients. To give further impetus around the Bank’s focus on ‘Going Digital’ to ‘Fully Digital’, various innovative and convenient approaches were introduced during FY 2016-17. Tablet-based Account Opening process was introduced, wherein an accounts gets opened and fully activated within ‘2 minutes’.
The Bank has launched IndusForex.com, a one-stop portal for all foreign exchange needs of Indian consumers. With the help of this portal, one can buy multi-currency foreign exchange cards
and reload them anytime, anywhere in 8 different currencies. Consumers can also use the portal to send money abroad by Telegraphic Transfer in 16 currencies for all travel-related remittance such as, Education, Immigration, Tour Remittance, Employment, and for Family Maintenance. The Bank became the first to introduce Aadhaar-based e-KYC on Travel Cards at zero margin, thereby boosting customer convenience and enhancing digital experience.
Similarly, the Bank launched an instant and real-time Personal Loan portal branded as ‘Easy Loan’, for catering to existing Account-holders displaying prudent credit behaviour. This contributed 24% to the Personal Loan business for the year.
To make banking easier for its customers, the Bank enabled its best-in-class fingerprint-based Mobile Banking App with new-age digital payment services, viz., UPI and Bharat QR. The Bank also went Live with Aadhaar Pay App for merchants and UPI @ USSD for Retail clients, to tap digital payments at the bottom of the pyramid. The Bank forged multiple relationships across the industry spectrum, including with Payments Banks, Merchant Aggregators, Business Correspondents, Mobile Wallet Providers, and leading financial portals. The purpose and strategy around the partnership is to acquire and diversify Bank’s customer base in a non-linear, B2B2C model.
With the objective of increasing penetration around branch catchments, Consumer Bank has launched first-of-its-kind Transaction Friendly Current Account ‘Indus Freedom’. This is targeted towards 'The Shop Next Door', which are run by individuals or proprietors. Indus Freedom is a step towards digitization wherein, on doing one Mobile
/ Net Banking / ATM transaction a month, the customer gets the ‘No AMB Maintenance’ advantage.
Business Banking Group was one of the major contributors to the topline of Consumer Bank. The strategy of adding new segments that had been implemented during the last financial year led to strong results in year 2016-17, with 37% y-o-y growth in acquisition of new customers. Branch-led assets presently constitute 33% of total Business Banking Assets. New customer sourcing for the year was evenly spread between branch (46%) and non-branch sources (54%), in line with the Assets philosophy of the Bank of leveraging branch distribution. Focus in FY18 would be on further synergising between various asset classes, such as cross-sell on Consumer Finance Division (CFD) assets, with target of 60% branch sourcing for new customer acquisition.
The ‘Loan Against Property’ business had one more year of consistent performance, displaying a healthy growth of 34% in the Loan Book, i.e., `1,803 crores of addition to the Book. In line with the Bank’s focus on internal customers, the contribution from internal channels has now grown to 49% of the total number of loans originated. The Home Loans distribution tie-up with HDFC Limited remains one of the key Asset products distributed through the branch network.
The ‘Loans Against Card Receivables’ (LACR) product was launched in 2014, and in a small span of time has witnessed sharp growth of 119% y-o-y in the Expected Net Receivables and 116% in the number of Live accounts (y-o-y). The portfolio has helped in extending support to the concept of cashless economy. It has helped many Small and Medium Scale Enterprises such as restaurants, garment merchants, petrol pumps, consumer durables, etc., to achieve business growth and to cater to the day-to-day financial demands of business through Card swipes. To further expand the business footprint while strengthening relationships with existing customers, it has penetrated into newer locations and grown the quality portfolio. A healthy Book has been built in LACR, at a yield of more than 17%.
The Personal Loans business continued its measured growth strategy, while contributing a robust yield to the Assets portfolio. The performance of the Book continued to be robust, growing @ 70%, while exhibiting strong portfolio parameters. The product has a live portfolio of 35,000 customers, with 22,000 customers on-boarded in the year 2016-17. Cross-sell synergy with the Consumer Finance Team helped expand the footprint into new geographies.
The Business Loan product was launched in 2013, and completed almost the full cycle with creation of a healthy Asset Book of `678 crores, with 4,400 live clients spread across the Micro, Small and Medium Enterprise segment.
Retail Agriculture
Retail Agri Business witnessed sturdy growth through expansion to key markets. Since its launch, the Bank has built a highly diversified portfolio, ranging from funding of traditional agricultural activities to high-tech farming / Agri-allied activities.
The Bank has emerged as a key player in the States of Punjab, Haryana, Rajasthan, Maharashtra, Gujarat and Madhya Pradesh. The Bank penetrated into new rural / semi-urban locations in the State of Kerala in year 2016-17, and plans to aggressively cover more geographies. Loans have been extended to Weaker Sections, persons with disabilities, and Small and Marginal Farmers, helping the Bank strengthen its commitment to these segments. The Bank’s KCC Book now stands at `700 crores, across about 3,700 farmer accounts across various geographies.
Client Experience
The Bank aims to go beyond client servicing, to provide best-in-class ‘experience’ to its clients.
During the year 2016-17, there has been a renewed thrust on client-centricity, which puts our customers at ‘the very heart of everything we do’.
Transforming ‘Client Experience’ (CEX) has been identified as a key strategic imperative for the next few years. The Bank aspires to differentiate itself through such customer-centric initiatives and garner sustainable competitive advantage in the commoditized banking space. It corroborates the business objectives of retaining strong growth and attaining market leadership.
The Bank has taken steps in this direction, which includes developing better understanding of client needs, matching right capabilities with right clients, enhancing personalization, and revamping key customer journeys. These client-centric initiatives will be an extension to the Bank’s current themes of Responsiveness and Digitization. The Bank has retained the services of Business Consultants of global repute, to ensure rapid building of business vision and creating the right roadmap for transformation.
Innovation
This service solves the key customer issue of having to remember Passwords. With this service, customers can do seamless and secure banking transactions via the Mobile Banking App by just using their fingerprints. A new feature ‘Shake-N-Pay’ has been added, which enables customers to transfer funds to other IndusInd Bank Account-holders by just waving the Mobile handset.
Distribution
The Bank opened 200 new branches as part of the strategy of expanding its banking network to different locations in the country, taking the count to 1,200. The Bank also increased the ATM network to 2,036 by opening 236 new ATMs. The Bank has also partnered with White-Label ATM operators to set up co-branded ATMs.
77

Consumer Banking business exhibited healthy growth in revenue during FY 2016-17. All business segments of Consumer Bank continued to outperform, propelled by the objective of delivering best-in-class products and services to Retail clients. The Savings Account Balance Sheet witnessed robust growth of 57%, while funded assets showed 30% y-o-y growth.
The Bank continued with Digitalizing of businesses and ensured maximum usage of its Digital Initiatives by the clients. In line with the Government’s digital push, the Bank laid special emphasis on promoting digital agenda across payments, deposits, lending and sourcing new clients. To give further impetus around the Bank’s focus on ‘Going Digital’ to ‘Fully Digital’, various innovative and convenient approaches were introduced during FY 2016-17. Tablet-based Account Opening process was introduced, wherein an accounts gets opened and fully activated within ‘2 minutes’.
The Bank has launched IndusForex.com, a one-stop portal for all foreign exchange needs of Indian consumers. With the help of this portal, one can buy multi-currency foreign exchange cards
and reload them anytime, anywhere in 8 different currencies. Consumers can also use the portal to send money abroad by Telegraphic Transfer in 16 currencies for all travel-related remittance such as, Education, Immigration, Tour Remittance, Employment, and for Family Maintenance. The Bank became the first to introduce Aadhaar-based e-KYC on Travel Cards at zero margin, thereby boosting customer convenience and enhancing digital experience.
Similarly, the Bank launched an instant and real-time Personal Loan portal branded as ‘Easy Loan’, for catering to existing Account-holders displaying prudent credit behaviour. This contributed 24% to the Personal Loan business for the year.
To make banking easier for its customers, the Bank enabled its best-in-class fingerprint-based Mobile Banking App with new-age digital payment services, viz., UPI and Bharat QR. The Bank also went Live with Aadhaar Pay App for merchants and UPI @ USSD for Retail clients, to tap digital payments at the bottom of the pyramid. The Bank forged multiple relationships across the industry spectrum, including with Payments Banks, Merchant Aggregators, Business Correspondents, Mobile Wallet Providers, and leading financial portals. The purpose and strategy around the partnership is to acquire and diversify Bank’s customer base in a non-linear, B2B2C model.
With the objective of increasing penetration around branch catchments, Consumer Bank has launched first-of-its-kind Transaction Friendly Current Account ‘Indus Freedom’. This is targeted towards 'The Shop Next Door', which are run by individuals or proprietors. Indus Freedom is a step towards digitization wherein, on doing one Mobile
/ Net Banking / ATM transaction a month, the customer gets the ‘No AMB Maintenance’ advantage.
Business Banking Group was one of the major contributors to the topline of Consumer Bank. The strategy of adding new segments that had been implemented during the last financial year led to strong results in year 2016-17, with 37% y-o-y growth in acquisition of new customers. Branch-led assets presently constitute 33% of total Business Banking Assets. New customer sourcing for the year was evenly spread between branch (46%) and non-branch sources (54%), in line with the Assets philosophy of the Bank of leveraging branch distribution. Focus in FY18 would be on further synergising between various asset classes, such as cross-sell on Consumer Finance Division (CFD) assets, with target of 60% branch sourcing for new customer acquisition.
The ‘Loan Against Property’ business had one more year of consistent performance, displaying a healthy growth of 34% in the Loan Book, i.e., `1,803 crores of addition to the Book. In line with the Bank’s focus on internal customers, the contribution from internal channels has now grown to 49% of the total number of loans originated. The Home Loans distribution tie-up with HDFC Limited remains one of the key Asset products distributed through the branch network.
The ‘Loans Against Card Receivables’ (LACR) product was launched in 2014, and in a small span of time has witnessed sharp growth of 119% y-o-y in the Expected Net Receivables and 116% in the number of Live accounts (y-o-y). The portfolio has helped in extending support to the concept of cashless economy. It has helped many Small and Medium Scale Enterprises such as restaurants, garment merchants, petrol pumps, consumer durables, etc., to achieve business growth and to cater to the day-to-day financial demands of business through Card swipes. To further expand the business footprint while strengthening relationships with existing customers, it has penetrated into newer locations and grown the quality portfolio. A healthy Book has been built in LACR, at a yield of more than 17%.
The Personal Loans business continued its measured growth strategy, while contributing a robust yield to the Assets portfolio. The performance of the Book continued to be robust, growing @ 70%, while exhibiting strong portfolio parameters. The product has a live portfolio of 35,000 customers, with 22,000 customers on-boarded in the year 2016-17. Cross-sell synergy with the Consumer Finance Team helped expand the footprint into new geographies.
The Business Loan product was launched in 2013, and completed almost the full cycle with creation of a healthy Asset Book of `678 crores, with 4,400 live clients spread across the Micro, Small and Medium Enterprise segment.
Retail Agriculture
Retail Agri Business witnessed sturdy growth through expansion to key markets. Since its launch, the Bank has built a highly diversified portfolio, ranging from funding of traditional agricultural activities to high-tech farming / Agri-allied activities.
The Bank has emerged as a key player in the States of Punjab, Haryana, Rajasthan, Maharashtra, Gujarat and Madhya Pradesh. The Bank penetrated into new rural / semi-urban locations in the State of Kerala in year 2016-17, and plans to aggressively cover more geographies. Loans have been extended to Weaker Sections, persons with disabilities, and Small and Marginal Farmers, helping the Bank strengthen its commitment to these segments. The Bank’s KCC Book now stands at `700 crores, across about 3,700 farmer accounts across various geographies.
Client Experience
The Bank aims to go beyond client servicing, to provide best-in-class ‘experience’ to its clients.
During the year 2016-17, there has been a renewed thrust on client-centricity, which puts our customers at ‘the very heart of everything we do’.
Transforming ‘Client Experience’ (CEX) has been identified as a key strategic imperative for the next few years. The Bank aspires to differentiate itself through such customer-centric initiatives and garner sustainable competitive advantage in the commoditized banking space. It corroborates the business objectives of retaining strong growth and attaining market leadership.
The Bank has taken steps in this direction, which includes developing better understanding of client needs, matching right capabilities with right clients, enhancing personalization, and revamping key customer journeys. These client-centric initiatives will be an extension to the Bank’s current themes of Responsiveness and Digitization. The Bank has retained the services of Business Consultants of global repute, to ensure rapid building of business vision and creating the right roadmap for transformation.
Innovation
This service solves the key customer issue of having to remember Passwords. With this service, customers can do seamless and secure banking transactions via the Mobile Banking App by just using their fingerprints. A new feature ‘Shake-N-Pay’ has been added, which enables customers to transfer funds to other IndusInd Bank Account-holders by just waving the Mobile handset.
Distribution
The Bank opened 200 new branches as part of the strategy of expanding its banking network to different locations in the country, taking the count to 1,200. The Bank also increased the ATM network to 2,036 by opening 236 new ATMs. The Bank has also partnered with White-Label ATM operators to set up co-branded ATMs.
In line with the Bank’s theme of ‘responsive innovation’, the all-new version of the Mobile Banking App was launched during the year, with an innovative service ‘Fingerprint Banking’.
FORGET PASSWORDS, FOREVER!
The Bank’s Credit Card business has continued to display strong performance, scaling up and growing distribution and profitability, while remaining focused on the quality of customer receivables. The business has crossed the half-million customers milestone driven by the cross-sell-centric distribution strategy. The business has significantly grown its digital capabilities and has enhanced its distribution infrastructure in branches while leveraging its online and digital presence. The branch infrastructure is being effectively leveraged towards new account bookings and cross-sell initiatives. Customer spends and loyalty have been driven by strong promotional offers, in partnership with leading brands across the country. The creation of strong propositions centred on the Dining and Wellness space has resonated well with customers. Strong
thematic promotions around the Holiday and Festive Seasons have also created customer preference, and have helped drive customer spends.
The Commercial Cards Business has added impetus to the product range in the Bank’s portfolio and has provided Corporate clients with elegant payment solutions for their spending needs, with integrated MIS solutions which have significantly simplified their expense management systems.
The Bank has tie-ups with all three leading network partners, Master Card, Visa and Amex. With the business now past the half-million customers mark, it now has scale in addition to profitability. With strong fundamentals in place, consumer confidence at high levels, and with the societal move towards preference in digital payments over cash, customer spends continue to be robust, driving growth and profitability.
Annual Report 2016-17
78

Consumer Banking business exhibited healthy growth in revenue during FY 2016-17. All business segments of Consumer Bank continued to outperform, propelled by the objective of delivering best-in-class products and services to Retail clients. The Savings Account Balance Sheet witnessed robust growth of 57%, while funded assets showed 30% y-o-y growth.
The Bank continued with Digitalizing of businesses and ensured maximum usage of its Digital Initiatives by the clients. In line with the Government’s digital push, the Bank laid special emphasis on promoting digital agenda across payments, deposits, lending and sourcing new clients. To give further impetus around the Bank’s focus on ‘Going Digital’ to ‘Fully Digital’, various innovative and convenient approaches were introduced during FY 2016-17. Tablet-based Account Opening process was introduced, wherein an accounts gets opened and fully activated within ‘2 minutes’.
The Bank has launched IndusForex.com, a one-stop portal for all foreign exchange needs of Indian consumers. With the help of this portal, one can buy multi-currency foreign exchange cards
and reload them anytime, anywhere in 8 different currencies. Consumers can also use the portal to send money abroad by Telegraphic Transfer in 16 currencies for all travel-related remittance such as, Education, Immigration, Tour Remittance, Employment, and for Family Maintenance. The Bank became the first to introduce Aadhaar-based e-KYC on Travel Cards at zero margin, thereby boosting customer convenience and enhancing digital experience.
Similarly, the Bank launched an instant and real-time Personal Loan portal branded as ‘Easy Loan’, for catering to existing Account-holders displaying prudent credit behaviour. This contributed 24% to the Personal Loan business for the year.
To make banking easier for its customers, the Bank enabled its best-in-class fingerprint-based Mobile Banking App with new-age digital payment services, viz., UPI and Bharat QR. The Bank also went Live with Aadhaar Pay App for merchants and UPI @ USSD for Retail clients, to tap digital payments at the bottom of the pyramid. The Bank forged multiple relationships across the industry spectrum, including with Payments Banks, Merchant Aggregators, Business Correspondents, Mobile Wallet Providers, and leading financial portals. The purpose and strategy around the partnership is to acquire and diversify Bank’s customer base in a non-linear, B2B2C model.
With the objective of increasing penetration around branch catchments, Consumer Bank has launched first-of-its-kind Transaction Friendly Current Account ‘Indus Freedom’. This is targeted towards 'The Shop Next Door', which are run by individuals or proprietors. Indus Freedom is a step towards digitization wherein, on doing one Mobile
/ Net Banking / ATM transaction a month, the customer gets the ‘No AMB Maintenance’ advantage.
Business Banking Group was one of the major contributors to the topline of Consumer Bank. The strategy of adding new segments that had been implemented during the last financial year led to strong results in year 2016-17, with 37% y-o-y growth in acquisition of new customers. Branch-led assets presently constitute 33% of total Business Banking Assets. New customer sourcing for the year was evenly spread between branch (46%) and non-branch sources (54%), in line with the Assets philosophy of the Bank of leveraging branch distribution. Focus in FY18 would be on further synergising between various asset classes, such as cross-sell on Consumer Finance Division (CFD) assets, with target of 60% branch sourcing for new customer acquisition.
The ‘Loan Against Property’ business had one more year of consistent performance, displaying a healthy growth of 34% in the Loan Book, i.e., `1,803 crores of addition to the Book. In line with the Bank’s focus on internal customers, the contribution from internal channels has now grown to 49% of the total number of loans originated. The Home Loans distribution tie-up with HDFC Limited remains one of the key Asset products distributed through the branch network.
The ‘Loans Against Card Receivables’ (LACR) product was launched in 2014, and in a small span of time has witnessed sharp growth of 119% y-o-y in the Expected Net Receivables and 116% in the number of Live accounts (y-o-y). The portfolio has helped in extending support to the concept of cashless economy. It has helped many Small and Medium Scale Enterprises such as restaurants, garment merchants, petrol pumps, consumer durables, etc., to achieve business growth and to cater to the day-to-day financial demands of business through Card swipes. To further expand the business footprint while strengthening relationships with existing customers, it has penetrated into newer locations and grown the quality portfolio. A healthy Book has been built in LACR, at a yield of more than 17%.
The Personal Loans business continued its measured growth strategy, while contributing a robust yield to the Assets portfolio. The performance of the Book continued to be robust, growing @ 70%, while exhibiting strong portfolio parameters. The product has a live portfolio of 35,000 customers, with 22,000 customers on-boarded in the year 2016-17. Cross-sell synergy with the Consumer Finance Team helped expand the footprint into new geographies.
The Business Loan product was launched in 2013, and completed almost the full cycle with creation of a healthy Asset Book of `678 crores, with 4,400 live clients spread across the Micro, Small and Medium Enterprise segment.
Retail Agriculture
Retail Agri Business witnessed sturdy growth through expansion to key markets. Since its launch, the Bank has built a highly diversified portfolio, ranging from funding of traditional agricultural activities to high-tech farming / Agri-allied activities.
The Bank has emerged as a key player in the States of Punjab, Haryana, Rajasthan, Maharashtra, Gujarat and Madhya Pradesh. The Bank penetrated into new rural / semi-urban locations in the State of Kerala in year 2016-17, and plans to aggressively cover more geographies. Loans have been extended to Weaker Sections, persons with disabilities, and Small and Marginal Farmers, helping the Bank strengthen its commitment to these segments. The Bank’s KCC Book now stands at `700 crores, across about 3,700 farmer accounts across various geographies.
Client Experience
The Bank aims to go beyond client servicing, to provide best-in-class ‘experience’ to its clients.
During the year 2016-17, there has been a renewed thrust on client-centricity, which puts our customers at ‘the very heart of everything we do’.
Transforming ‘Client Experience’ (CEX) has been identified as a key strategic imperative for the next few years. The Bank aspires to differentiate itself through such customer-centric initiatives and garner sustainable competitive advantage in the commoditized banking space. It corroborates the business objectives of retaining strong growth and attaining market leadership.
The Bank has taken steps in this direction, which includes developing better understanding of client needs, matching right capabilities with right clients, enhancing personalization, and revamping key customer journeys. These client-centric initiatives will be an extension to the Bank’s current themes of Responsiveness and Digitization. The Bank has retained the services of Business Consultants of global repute, to ensure rapid building of business vision and creating the right roadmap for transformation.
Innovation
This service solves the key customer issue of having to remember Passwords. With this service, customers can do seamless and secure banking transactions via the Mobile Banking App by just using their fingerprints. A new feature ‘Shake-N-Pay’ has been added, which enables customers to transfer funds to other IndusInd Bank Account-holders by just waving the Mobile handset.
Distribution
The Bank opened 200 new branches as part of the strategy of expanding its banking network to different locations in the country, taking the count to 1,200. The Bank also increased the ATM network to 2,036 by opening 236 new ATMs. The Bank has also partnered with White-Label ATM operators to set up co-branded ATMs.
Savings AccountBalance Sheet
grew by
57%
BUSINESSPERFORMANCE
HIGHLIGHTS
Acquisition ofnew customers
grew at
37%
Loan AgainstProperty (LAP)
grew
34%
LACR sawgrowth of
119%in the ENR
Personal LoansBusiness Growth
@ 70%
The Bank’sKCC Bookstands at
`700 cr
FundedAssets grew
30%
The Bank’s Credit Card business has continued to display strong performance, scaling up and growing distribution and profitability, while remaining focused on the quality of customer receivables. The business has crossed the half-million customers milestone driven by the cross-sell-centric distribution strategy. The business has significantly grown its digital capabilities and has enhanced its distribution infrastructure in branches while leveraging its online and digital presence. The branch infrastructure is being effectively leveraged towards new account bookings and cross-sell initiatives. Customer spends and loyalty have been driven by strong promotional offers, in partnership with leading brands across the country. The creation of strong propositions centred on the Dining and Wellness space has resonated well with customers. Strong
thematic promotions around the Holiday and Festive Seasons have also created customer preference, and have helped drive customer spends.
The Commercial Cards Business has added impetus to the product range in the Bank’s portfolio and has provided Corporate clients with elegant payment solutions for their spending needs, with integrated MIS solutions which have significantly simplified their expense management systems.
The Bank has tie-ups with all three leading network partners, Master Card, Visa and Amex. With the business now past the half-million customers mark, it now has scale in addition to profitability. With strong fundamentals in place, consumer confidence at high levels, and with the societal move towards preference in digital payments over cash, customer spends continue to be robust, driving growth and profitability.
Credit CardsCredit Cards
79

The Bank’s Credit Card business has continued to display strong performance, scaling up and growing distribution and profitability, while remaining focused on the quality of customer receivables. The business has crossed the half-million customers milestone driven by the cross-sell-centric distribution strategy. The business has significantly grown its digital capabilities and has enhanced its distribution infrastructure in branches while leveraging its online and digital presence. The branch infrastructure is being effectively leveraged towards new account bookings and cross-sell initiatives. Customer spends and loyalty have been driven by strong promotional offers, in partnership with leading brands across the country. The creation of strong propositions centred on the Dining and Wellness space has resonated well with customers. Strong
thematic promotions around the Holiday and Festive Seasons have also created customer preference, and have helped drive customer spends.
The Commercial Cards Business has added impetus to the product range in the Bank’s portfolio and has provided Corporate clients with elegant payment solutions for their spending needs, with integrated MIS solutions which have significantly simplified their expense management systems.
The Bank has tie-ups with all three leading network partners, Master Card, Visa and Amex. With the business now past the half-million customers mark, it now has scale in addition to profitability. With strong fundamentals in place, consumer confidence at high levels, and with the societal move towards preference in digital payments over cash, customer spends continue to be robust, driving growth and profitability.
Customer Receivables have grown 46%. Analytics and data from the Credit Bureau continues to be key for assessing underwriting risk. The Bank is leveraging the large pool of customer data to drive its cross-sell initiatives. Multiple portfolio actions, including credit line actions, have been undertaken during the year.
Consumer FinanceConsumer Finance
The Consumer Finance Division (CFD) extends funding for a wide range of Vehicles / Equipments, which include Commercial Vehicles, viz., Heavy, Light and Small Vehicles used both for goods and passenger applications, Passenger Cars, Utility Vehicles, Two-Wheelers, and Construction Equipment such as Excavators, Loaders, Tippers, Cranes, etc. Finance is extended for both new and used assets in all the above segments. Tractor funding, a major initiative towards Priority Sector Lending and Financial Inclusion, was launched pan-India.
Aggregate disbursements made during the year rose to `22,605 crores, as against `20,369 crores in FY 2015-16, growing 11% over the previous year. New Loan accounts numbered 10.68 lakhs in 2016-17, as against 10.30 lakh loans boarded in FY 2015-16.
The focus during the year was optimizing the product mix to maximize yields, while
maintaining portfolio quality despite the industry sluggishness.
During the year 2016-17, Used Vehicles disbursement was `3,840 crores, up 10% from `3,499 crore in 2015-16.
This Division also earned Commission Income of `36.60 crores through distribution of various third-party insurance products of Cholamandam MS General Insurance, Bank’s strategic partner for bancassurance is the General Insurance segment.
The operations of this Division are solidly supported by the Document Storage and Retrieval Facility at the Bank’s Karapakkam Unit (near Chennai), which handles processing of Loan Documents and maintenance of records. This Unit handled nearly 2 million Loan bookings and closure transactions and over 35 million customer service / accounting transactions during the year 2016-17.
Annual Report 2016-17
80

The Bank’s Credit Card business has continued to display strong performance, scaling up and growing distribution and profitability, while remaining focused on the quality of customer receivables. The business has crossed the half-million customers milestone driven by the cross-sell-centric distribution strategy. The business has significantly grown its digital capabilities and has enhanced its distribution infrastructure in branches while leveraging its online and digital presence. The branch infrastructure is being effectively leveraged towards new account bookings and cross-sell initiatives. Customer spends and loyalty have been driven by strong promotional offers, in partnership with leading brands across the country. The creation of strong propositions centred on the Dining and Wellness space has resonated well with customers. Strong
thematic promotions around the Holiday and Festive Seasons have also created customer preference, and have helped drive customer spends.
The Commercial Cards Business has added impetus to the product range in the Bank’s portfolio and has provided Corporate clients with elegant payment solutions for their spending needs, with integrated MIS solutions which have significantly simplified their expense management systems.
The Bank has tie-ups with all three leading network partners, Master Card, Visa and Amex. With the business now past the half-million customers mark, it now has scale in addition to profitability. With strong fundamentals in place, consumer confidence at high levels, and with the societal move towards preference in digital payments over cash, customer spends continue to be robust, driving growth and profitability.
The Bank’s Processing and Vaulting facility at Karapakkam has state-of-the-art facilities in terms of data / equipment protection mechanisms and is equipped with access rights with sensors to facilitate monitoring of document movement within the Centre.
The Bank has a Data Centre within the Airtel Data Centre facility with state-of-the-art security systems with a backup at the Bank’s G. N. Chetty
Road premises, as part of Business Continuity Planning.
During the year, Tab-based Application for sourcing of Two-Wheeler loans was launched to improve Turn-Around-Time (TAT) in the Credit Delivery process.
Hand-Held Terminals have been deployed pan-India to handle CFD’s collection activity. These initiatives have substantially enhanced process efficiencies.
Aggregatedisbursements
up at`22,605 cr
New Loanaccounts
increased to10.68 lakh
Used Vehiclesdisbursement
up at`3,840 cr
Corporate and CommercialBanking GroupCorporate and CommercialBanking Group
Corporate Banking
Corporate & Investment Banking provides Universal Banking Solutions to large Indian Groups and Multinational Corporates. The Business Unit has developed deep relationships with several large Indian Business Houses and over the years with continued addition to New-To-Bank clients, the unit has become a banker to almost all the large corporate houses and large market cap companies in India.
WorkingCapital
Finance
Trade andSupply Chain
Finance
Cash andTrade
services
LongTerm
Finance
StructuredFinance and
ProjectFinance
Products o�ered
KarapakkamUnit handled
2 million LoanBookings
Over35 million
customer service/accountingtransactionsin 2016-17
81

Financial Services Group
• Financial Services Group was launched to handle the relationship of Financial Services players in India, i.e., NBFCs, Insurance Companies, Mutual Funds and other Financial Institutions in Public and Private Sector.
• The Group has achieved significant success by winning Escrow / CMS mandates from renowned names in the industry and establishing trade partnerships with NBFCs and FIs.
Capital & Commodities Markets Division
• The Capital and Commodity Markets Division focuses on servicing Capital and Commodity Exchanges and their Members.
• The Bank currently has membership with all large Stock and Commodity Exchanges in the country, and is a Clearing-cum-Settlement Banker to both NSE and BSE in the Capital and Futures Market segments.
International Financial Service Centre Banking Unit (IBU)
The International Financial Service Centre Banking Unit (IBU) has seen significant business in the first year itself, achieving Balance Sheet size of nearly USD 500 mn as on March 31, 2017.
The product offering from IBU includes External Commercial Borrowings (ECBs), Trade Credits, Loans to Overseas Entities, and non-funded products. Having developed the product offerings that cover an area that the Bank was not able to address hitherto, the IBU is slated to be a significant contributor to the Bank’s Balance Sheet as well as profitability.
Environment & Social Management System Policy:
To ensure that the wider impact of our investment activities are positive and lie within a set of international and national standards, a Department-wide Environmental and Social
Management System (ESMS) has been instituted.
This Policy is governed at the macro-level by key stakeholders across the Bank’s Management apparatus, including Board Members, the CEO, and Business Heads. At the micro-level, there is a grass-root implementation mechanism, which is the framework that Relationship Managers and Business Teams employ to perform in-depth evaluation to understand each client’s impact on the key parameters as outlined in the Policy.
ESMS will be administered via an online portal, which in addition to screening proposals, will capture data on the volume of projects financed, that have a positive impact on environmental and social considerations.
Commercial Banking Group
Mid-Corporate Group (MCG)
Set up with a view to target the ‘sweet spot’ of the Indian corporate space, the Mid-Corporates Group focuses on companies in the fast growing Mid-Corporate segment.
Investment Banking (IB)
• Debt Capital Markets (DCM), Advisory (M&A and Private Equity) and Structured & Project Finance are the three main businesses of the Investment Banking Unit. The Unit enables the Bank to partner with growth-oriented corporates throughout their lifecycles.
• During the year, the Bank successfully underwrote and sold down loans to various investors worth more than `5,600 crores, and secured for itself a lead position amongst Private Sector banks in the Loan Underwriting League Tables.
• With strong domain expertise in Wind Energy, Solar Energy, Roads, Ports, Logistics and Power Transmission sectors, the Project Finance team was able to win Project Underwriting and Syndication mandates from several large reputed Indian corporates.
• The Real Estate Group set up last year for
financing construction of Real Estate projects (Residential and Commercial) by developers grew modestly during the year. The Bank adopted a conservative approach in growing this book.
Public Sector Group
• This Group handles relationships with more than 150 Public Sector clients, including Maharatnas and Navratnas.
• It was successful in winning large collection mandates in Tax Free Bond issues of many esteemed Public Sector Units (PSUs). The Group successfully executed several e-Procurement mandates from key PSUs, by providing strong technology-based solutions.
Financial Institutions Group
Financial Institutions Group manages relationships with domestic and international Banks and Financial Institutions. The Group has intensified its geographical coverage and expanded its network of Correspondent Banks across the globe, which helped in scaling up of the Trade and Treasury businesses of the Bank, and ensured seamless execution of cross-border deals.
The Group also successfully raised foreign currency resources from key correspondents which helped support the lending book in Foreign Currency, thus augmenting the Bank’s liquidity and facilitating reduction in costs.
The Group has maintained a strong reputation as a provider of innovative solutions for complex financing requirements. Structured solutions for Trade Finance and Foreign Exchange hedging have been developed to suit unique client needs.
This innovation-based approach has increased penetration in the top corporate groups through a variety of funded and non-funded transactions including Trade products, Foreign Exchange products and Investment Banking offerings.
Over the years, the Group has built a quality portfolio by minimizing exposure to high-risk industries.
The year saw a smart growth in Short-Term Loans for financing Working Capital needs. The Group’s business grew well in terms of both, Assets and Liabilities. It has added over 100 New-To-Bank large corporate clients.
Corporate Banking - At A Glance Corporate Banking - At A Glance
Annual Report 2016-17
82

Financial Services Group
• Financial Services Group was launched to handle the relationship of Financial Services players in India, i.e., NBFCs, Insurance Companies, Mutual Funds and other Financial Institutions in Public and Private Sector.
• The Group has achieved significant success by winning Escrow / CMS mandates from renowned names in the industry and establishing trade partnerships with NBFCs and FIs.
Capital & Commodities Markets Division
• The Capital and Commodity Markets Division focuses on servicing Capital and Commodity Exchanges and their Members.
• The Bank currently has membership with all large Stock and Commodity Exchanges in the country, and is a Clearing-cum-Settlement Banker to both NSE and BSE in the Capital and Futures Market segments.
International Financial Service Centre Banking Unit (IBU)
The International Financial Service Centre Banking Unit (IBU) has seen significant business in the first year itself, achieving Balance Sheet size of nearly USD 500 mn as on March 31, 2017.
The product offering from IBU includes External Commercial Borrowings (ECBs), Trade Credits, Loans to Overseas Entities, and non-funded products. Having developed the product offerings that cover an area that the Bank was not able to address hitherto, the IBU is slated to be a significant contributor to the Bank’s Balance Sheet as well as profitability.
Environment & Social Management System Policy:
To ensure that the wider impact of our investment activities are positive and lie within a set of international and national standards, a Department-wide Environmental and Social
Management System (ESMS) has been instituted.
This Policy is governed at the macro-level by key stakeholders across the Bank’s Management apparatus, including Board Members, the CEO, and Business Heads. At the micro-level, there is a grass-root implementation mechanism, which is the framework that Relationship Managers and Business Teams employ to perform in-depth evaluation to understand each client’s impact on the key parameters as outlined in the Policy.
ESMS will be administered via an online portal, which in addition to screening proposals, will capture data on the volume of projects financed, that have a positive impact on environmental and social considerations.
Commercial Banking Group
Mid-Corporate Group (MCG)
Set up with a view to target the ‘sweet spot’ of the Indian corporate space, the Mid-Corporates Group focuses on companies in the fast growing Mid-Corporate segment.
Investment Banking (IB)
• Debt Capital Markets (DCM), Advisory (M&A and Private Equity) and Structured & Project Finance are the three main businesses of the Investment Banking Unit. The Unit enables the Bank to partner with growth-oriented corporates throughout their lifecycles.
• During the year, the Bank successfully underwrote and sold down loans to various investors worth more than `5,600 crores, and secured for itself a lead position amongst Private Sector banks in the Loan Underwriting League Tables.
• With strong domain expertise in Wind Energy, Solar Energy, Roads, Ports, Logistics and Power Transmission sectors, the Project Finance team was able to win Project Underwriting and Syndication mandates from several large reputed Indian corporates.
• The Real Estate Group set up last year for
financing construction of Real Estate projects (Residential and Commercial) by developers grew modestly during the year. The Bank adopted a conservative approach in growing this book.
Public Sector Group
• This Group handles relationships with more than 150 Public Sector clients, including Maharatnas and Navratnas.
• It was successful in winning large collection mandates in Tax Free Bond issues of many esteemed Public Sector Units (PSUs). The Group successfully executed several e-Procurement mandates from key PSUs, by providing strong technology-based solutions.
Financial Institutions Group
Financial Institutions Group manages relationships with domestic and international Banks and Financial Institutions. The Group has intensified its geographical coverage and expanded its network of Correspondent Banks across the globe, which helped in scaling up of the Trade and Treasury businesses of the Bank, and ensured seamless execution of cross-border deals.
The Group also successfully raised foreign currency resources from key correspondents which helped support the lending book in Foreign Currency, thus augmenting the Bank’s liquidity and facilitating reduction in costs.
The broad business theme of the Group is centered on the following:The broad business theme of the Group is centered on the following:
Offering a full bouquet of customized products to clients, for their Working Capital and other Term / Structured Finance requirements.
Increasing the client-base to create a sustainable earnings stream for the Bank.
Increased cross-sell through alignment of Relationship Managers and the Product Groups, i.e., Transaction Banking, Global Markets and Investment Banking.
Offering structured solutions through Transactional and Investment Banking products to meet clients’ unique and specific needs.
83

Inclusive Banking Group
The Inclusive Banking Group within Commercial Banking is a market leader in providing microloans to the Weaker Sections of society through the ‘Business Correspondent’ model, while also engaging in term lending to Microfinance Institutions (MFI) and Securitisation of such assets.
Loans aggregating `3,309.66 crores were disbursed during the year, a majority of them directly under the Business Correspondent model, actively working with 19,94,915 clients at the base of the pyramid. All borrowers are women, and are provided loans for productive purposes like agriculture / livestock, trading and repair shops, cottage industries, etc. The Business Correspondent portfolio is geographically well-diversified and spread across 110 Districts in 14 States, with a network of 464 MFI branches. The Group proposes to deepen the engagement this year by digitising its service delivery, which would not only enhance partner synergies but also facilitate real-time understanding of customer needs, thereby driving product accessibility at minimal costs.
The range of financial services envisaged is as under:
• Basic Banking Services – Savings and Term Deposits facilitated through a strong Agent Network
• Full range of Credit products to the enterprising clientele – Microcredit, Home Improvement, Two-Wheeler, Micro, Small and
Medium Enterprise, and Agri Business (Dairy, Seed, Equipment, etc.)
Agricultural Business Group (ABG)
The Group offers products such as Pledge Finance and Agricultural Infrastructure Finance. Its presence is spread over 14 States and 59 locations. Engaged in the funding of pledged commodities, the Group has widespread relationships with Collateral Managers to handle commodity-related and associated risks.
ABG also provides specialized services in the Agriculture segment. It has a committed team of specialized Agriculture Finance professionals to cover all segments of the value chain. This Division has scaled up innovative products such as Agri Project Finance, Agri Trade Finance and Agri Infrastructure Finance. In its two years of operations, the vertical has been able to establish itself as a significant player in the Dairy and Agri Infrastructure segments.
Supply Channel Finance (SCF)
The vision of the group is to be the preferred Working Capital Banker to the Dealer and Vendor Community by providing not just Channel Finance and Vendor Finance limits, but also Working Capital Limits. The Group plans to expand briskly through collaborations with existing and new Corporate clients.
In line with the Digitization focus across the organization, the Group will participate on the TREDS platform and will launch the SCF online platform to enable straight-through funding and processing of transactions in the supply chain.
Building a sustainable Working Capital client portfolio.
Widening of client-base for higher growth and greater diversification of risk. 358 new clients were added by MCG during the year.
A large number of structured solutions were successfully originated and concluded.
The highlights of the year are
Annual Report 2016-17
84

The Global Markets Group (GMG) comprises three main functions:
• Asset Liability Management (ALM);
• Trading (Rates, Foreign Exchange and Derivatives); and
• Client Sales, comprising the Client Risk Solutions (CRS) Team, which essentially provides hedging strategies to clients for their exposures across foreign exchange and interest rates, and the Credit Sales Team, which provides clients access to Debt Capital Markets.
The Asset Liability Management Unit manages various regulatory requirements including Cash Reserve Ratio (CRR), Statutory Liquidity Ratio (SLR), Liquidity Coverage Ratio (LCR), Intra-day Liquidity (IDL), High Quality Liquid Assets (HQLA), etc., as prescribed by the Central Bank and other governing bodies. In addition, the Desk manages day-to-day liquidity requirements of the Bank through appropriate funding avenues along with Transfer Pricing, involving both INR and Foreign Currency. The liquidity and resource mobilisation strategy proactively addressed the Structural Liquidity Risk conditions and achieved significant efficiency in the Bank’s sourcing of funds with an
optimal mix of Term Deposits, Market Borrowings and Refinance.
The Trading Desk trades in Rates, Foreign Exchange and Credit. It is instrumental in taking proprietary positions in Government Bonds, Corporate Debt, Interest Rates (INR and Foreign Currency), Interest Rate Futures and Currencies. The Trading desk also trades in Derivatives, and has executed Long-Term Currency and Interest Rate Swaps with established market counterparties.
The Client Risk Solutions (CRS) Team is instrumental in providing hedging solutions to clients across Corporates, Financial Institutions and Retail clients on their foreign exchange, and interest rate exposures. The Bank enters into these transactions based on a strict suitability and credit criteria. Besides the above OTC products, the Bank is also Trading-cum-Clearing Member in NSE, and offers a web-based platform across client segments for hedging of currency exposures by clients.
During the year, the Bank started operations at the IFSC Banking Unit established in GIFT City, Gandhinagar and commenced funding for financing, as well as offering hedging solutions to clients.
Global Markets GroupGlobal Markets Group
The Bank has well laid-out Operational Policy Guidelines, Risk Management Policies, including Client Suitability Policy, and appropriate systems support to monitor transactions and risk on real-time basis. Given the dependency on System and Trading Platforms, the Bank has been conducting Business Continuity Plan drills at regular intervals. The Bank has implemented an Integrated Treasury Application interfaced with the Risk Monitoring System. The Application covers all Client and Trading Products of the Global Markets business and provides seamless straight-through flow of transactions.
85
The Transaction Banking Group (TBG) offers products and services to customers across all Business Units in the areas of Cash Management, Trade Services, Supply Chain Financing, Global Remittances and Digital Banking.
The Bank continued to be one of the leading players in the Rupee Drawing Arrangements, being a preferred Bank for several partners worldwide. More partners were added for real-time cross-border payments using the NPCI-promoted IMPS facility.
IndusInd Bank is among the Top Banks for cross-border flows under IMPS.
The Bank offers customized and differentiated products to its Corporate and Consumer Banking customers for improving their Payables and Receivables Management. Another area of focus has been the proliferation of Escrow Services amongst the Bank’s clients. The Bank’s Cash Management Services have been enhanced by its four Currency Chests.
In line with the Government’s agenda of promoting Digital Payments, the Bank introduced many such products and services. The Bank became one of the first to complete a pilot (with NPCI) for the Bharat Bill Payment System (BBPS), introduced the UPI Payments Platform for its Corporate Customers, and also launched its Corporate Mobile Banking App.
The Bank continued to play a significant role in working with various Government departments across India to provide e-Tendering, e-Procurement and e-Auction services, thereby partnering in the Government’s agenda of increasing Digital Payments and enhancing transparency.
IndusInd Bank received multiple Awards from ‘The Asset’, an independent leading Asian Business Journal, under the following categories:
As a prominent Trade Services Bank, the Bank continues to innovate and has partnered with a RBI-approved TREDS platform, for providing affordable financing to MSME suppliers. In addition to that, the Bank has also raised our focus in providing cost-effective Trade Services and Financing Solutions for clients’ require-ments of Domestic and Global Trade. Fee income in the Trade business grew by 35% during the year.
The Bank’s Supply Chain Finance Solutions continue to support and assist clients in negotiating preferential Trade terms and strengthening relationships with their strategic Supply Chain Partners. Bank’s solutions offer cost-effective financing of Trade receivables across multiple sectors through customized Supplier Financing and Dealer Financing Solutions.
CASHMANAGEMENT SOLUTION
BE
ST
ELECTRONICMANAGEMENT SOLUTION
BE
ST
BE
ST
STRUCTUREDTRADE FINANCE SOLUTION
BE
ST
TREASURYAND WORKING CAPITAL
Transaction Banking GroupTransaction Banking Group
86

Gems and Jewellery Group
The Gems and Jewellery Group caters mostly to Units manufacturing Diamonds in India, involving the livelihood of more than a million artisans, and export of polished diamonds to countries around the globe.
This fits into the Bank’s strategy of contributing to the livelihood of citizens, and catering to our nation’s need of higher exports and Foreign Exchange earnings.
Through expertise in this business, the Bank has been recognized by the Trade Council as a Centre of Excellence, and the same has been
acknowledged through continuous awards and recognitions, the latest being the Gems and Jewellery Export Promotion Council (GJEPC), sponsored by the Commerce Ministry of the Government of India, awarding us the ‘Best Bank’ financing the Industry in the category of ‘Highest Limits Sanctioned’. The sector provides large cross-sell opportunities and contributes to the Bank’s targets in Priority Sector Lending.
The Bank has achieved the RBI-prescribed target for Priority Sector Advances, which aggregated `36,764.32 crores at the end of March 2017, representing 41.29% of the Adjusted Net Bank Credit (ANBC) of the previous year, as against the prescribed target of 40%.
Advances to Agriculture
During the year, the Bank financed over 13,60,353 agriculturists, and Aggregate Agricultural Advances stood at ` 11,712.20 crores, representing 13.15% of ANBC at the end of March 2017. The target set by RBI is 18% of ANBC.
Advances to Other Segments of Priority Sector
The Bank’s finance to ‘Weaker Sections’ increased by ` 527.59 crores and stood at ` 7,736.82 crores, representing 8.69% of ANBC as at the end of March 2017. Effective FY 2016-17, RBI has stipulated furnishing of PSL data on a quarterly average basis for monitoring of compliance with targets. For this purpose, the achievement will be arrived at the end of financial year based on average of Priority Sector target / sub-target achievement as at the end of each quarter and the excess / shortfall in lending being monitored.
Priority Sector LendingPriority Sector Lending
Accordingly, the average of all quarters for FY 2016-17 is represented in the table below:
As of
PSL (40%)
Agriculture
Small & Marginal Farmers
Micro Enterprises
Weaker Section
Target
31,596.12
14,218.26
6,319.22
5,924.27
7,899.03
Achieved
33,166.72
11,156.26
4,263.34
6,440.55
7,428.42
% Achieved
41.99%
14.12%
5.40%
8.15%
9.40%
Excess / (Shortage)
1,570.60
(3,061.99)
(2,055.88)
516.28
(470.61)
(` in crores)
87

Financing farmers / JLGs against hypothecation of agricultural produce.
Financing farmers for transport of their own agriculture produce.
Financing farmers for supply of various Agri and Allied commodities, viz., Sugarcane, Oilseeds, Milk, Rubber, etc.
Financing Agri and Allied Projects, viz., Horticulture, Dairy Farming, Poultry Farming, Bee-keeping, Aquaculture, Floriculture, etc.
Financing Agri Infrastructure, viz., Warehouses, Cold Storages, Godowns, Market Yards, Silos, etc.
Financing farmers / entities engaged in Coffee / Tea / Rubber industry and plantation for Paper Pulp
Financing Dairy segment for expansion and working capital requirements.
Investments in Rated Asset Pools meeting the eligibility criteria for Priority Sector.
Direct Lending through Service Providers under
the Partnership Model for meeting the needs of Agri, Micro, Small and Medium Enterprises and Weaker Sections.
Loans to MFIs for on-lending to farmers for agricultural and allied activities eligible for classification under Priority Sector.
Loans to farmers under the Kisan Credit Card Scheme.
Loans to Service Enterprises – Micro, Small and Medium Enterprises with investment in equipment of > ` 2 crores and < ` 5 crores.
Loans to Manufacturing Enterprises – Micro, Small and Medium Enterprises with investment in Plant and Machinery of > ` 5 crores and < `10 crores.
Weaker Section Advances - Priority Sector Loans to Small / Marginal Farmers, persons from Scheduled Castes and Scheduled Tribes, Loans up to ` 1 lakh to Women Borrowers and Loans to Minority Communities as notified by the Government from time to time.
Approach to Priority Sector Lending
The Bank continues to pursue Priority Sector advances, including those relating to Agriculture / Micro and Small Enterprises / Weaker Sections.
Various Business Units in Corporate, Commercial and Consumer Banking Groups
have built specialized teams to significantly enhance the Bank’s footprint in the PSL segments.
Specific plans and strategies for achieving targets and sub-targets under Priority Sector Lending have been formulated, some of which are indicated below:
Banking business is exposed to a wide spectrum of risks, and it is imperative that the various risks faced by the Bank are effectively measured, monitored and managed.
A robust Enterprise-wide Risk Management (ERM) framework enables effective and proactive management of various risks, while supporting business growth. ERM helps reduce volatility in earnings and enhances Shareholder Value.
The Bank has an integrated Risk Management Department, independent of business functions, covering Credit Risk, Market Risk, Assets-Liabilities Management (ALM) and Operations Risk, including Information Security Risk functions. Risk management practices have been aligned with the best industry practices and are adaptable to a dynamic operating environment and market conditions.
Risk ManagementRisk Management
88

Credit risk policies are aligned with business strategies and the risk appetite in line with RBI guidelines, the economic environment, and the operating outlook;
Gauging Credit Risk at the time of credit assessment by means of risk-rating models designed for different segments of obligors;
Credit Portfolio Management Analysis to monitor Credit Quality, composition of portfolios, concentration risk, yield monitoring and business growth;
Measurement and monitoring of Weighted Average Credit Rating (WACR) of the Credit portfolio;
Prudential internal limits prescribed for assuming exposures on counterparties, industries, sectors, etc.;
Measurement of Credit Quality of Consumer Finance portfolios by means of Behaviour Modelling;
Management of exposures to counterparty banks and countries by setting exposure limits on the basis of their risk profiles;
Stress Testing of Credit Portfolios to measure shock-absorbing capacity under multiple stressed scenarios and assessment of impact of potential credit losses on profitability and capital adequacy.
Credit Risk Management
Credit Risk is managed both at transactions-level as well as at portfolio level.
The key objective of Credit Risk management is to maintain Credit Quality within the defined risk appetite, while achieving appropriate return in relation to risks assumed. Various measures adopted for management of Credit Risk are mentioned hereunder:
Despite the challenging environment, the Bank has been able to maintain the quality of its portfolio. The Bank’s restructured assets are among the lowest in the industry, with both, Corporate as well as the Retail Loan Books having remained resilient.
The Bank has been introducing wider range of Retail products, to have larger share of customers’ wallet and to meet their needs. Such products are governed by structured product programmes specific to the business, which details out the criteria on customer selection and underwriting standards.
Market Risk Management
Market Risk arises from changes in Interest Rates, Exchange Rates, Equity prices and risk-related factors such as market volatilities.
The Bank manages Market Risk in Trading portfolios through a robust framework prescribed in its Market Risk Management Policy.
The Bank has implemented state-of-the-art Market Risk Management System, which enables adoption of Internal Model Approach for computation of Capital Charge towards Market Risk.
The Market Risk System supports VaR, Stress Testing, and Capital Computation Framework, helping manage Market Risk in volatile market conditions. The framework includes monitoring of Value-at-Risk (VaR) limits, PV01 limits for Forex, Investments, Equity and Derivatives portfolios, besides Stop-Loss limits, Exposure limits, Deal-size limits, etc.
89

Asset-Liability Management (ALM)
The Bank’s Asset-Liability Management System supports effective management of Liquidity Risk and Interest Rate Risk, covering all assets and liabilities.
Liquidity Risk is managed through Structural Liquidity Gaps, Liquidity Simulation, Liquidity Coverage Ratio (LCR), Dynamic Liquidity monitoring, Liquidity Ratios analysis, Behavioural analysis of liabilities and assets, and prudential limits for negative gaps in various time buckets.
Interest Rate Sensitivity is monitored through prudential limits for Rate Sensitive Gaps, Earning at Risk, Modified Duration of Equity and other risk parameters.
Interest Rate Risk on Investment portfolios is monitored through, PV01, VaR and Modified Duration on a daily basis. Optimum risk is assumed through duration, to balance between risk containment and profit generation from market movements.
Detailed analysis of liquidity position, interest rate risks, product mix, business growth versus budgets, interest rate outlook, etc., is presented to Asset-Liability Management Committee (ALCO) which meets frequently and reviews business strategies.
ALCO provides directional guidance to Business Units towards effective management of liquidity position, while achieving Business goals. The Bank assesses its structural liquidity position on a daily basis for managing liquidity in a cost-effective manner.
Stress Testing – Liquidity Risk
The Bank carries out stress tests on liquidity position periodically to simulate impact of stressed liquidity scenarios on funding and liquidity position. Stress tests help to be better equipped to meet stressed situations and have contingency funding plans in place.
Contingency Funding Plan
Contingency Funding Plans have been developed to respond swiftly to any anticipated or actual stressed market conditions.
The Bank reviews its Contingency Plans considering the evolving market conditions. Contingency Funding Plan covers available sources of funds to supplement Cash Flow gaps in the event of stressed scenarios, roles and responsibilities of those involved in execution of Contingency Plans and the Contingency Triggers.
Interest Rate Risk on Banking Book (IRRBB)
Interest Rate Risk on Banking Book largely arises on account of: (i) Re-pricing Risk; (ii) Optionality; (iii) Basis Risk; and (iv) Yield Curve Risk.
From an Economic Value perspective, the Bank minimises sensitivity to changes in Interest Rates on Assets and Liabilities. Interest Rate Risk is measured based on the re-pricing behaviour of each items under Asset, Liability and Off-Balance Sheet products.
The Bank’s Assets and Liabilities Management Policy has laid down tolerance limits based on the risk appetite and the impact on NII and Economic Value of Equity (EVE) for a given change in Interest Rate.
The Framework measures and monitors Interest Rate Risk on Banking Book using the Duration Gap Approach, besides the Traditional Gap Approach.
Operational Risk Management
The Risk landscape for banks has been undergoing substantial changes.
Operational Risk is the risk of incurring loss due to failure of systems, technology, processes, employees, projects, disasters, external factors, frauds, etc., including Legal and Regulatory Risks.
Operational Risk arises on account of human error, failed processes, inadequate systems, frauds,
Annual Report 2016-17
90

damage to physical assets, improper behaviour or external events. The Bank aims to ensure that key Operational Risks are managed in a timely and effective manner through a meticulous framework of policies, Standard Operating Processes, and procedures and tools to identify, assess, monitor and control such inherent risks in its businesses.
Banks today face an unprecedented number of new and emerging risks. The Bank’s Risk Management Department keeps a close watch on the operational and external risks and provides direction, and undertakes various initiatives under its Operational Risk Management (ORM) Framework for mitigation of such risks. The ORM Framework encompasses Policy Guidelines, Risk and Control Self-Assessment (RCSA), Loss Data Analysis, Key Risk Indicators (KRIs), implementation of Basel III Norms, RBI Guidelines, etc. The Bank constantly endeavours to enhance its ORM framework to ensure compliance with regulatory norms and generate greater strategic value.
RCSA of all major Operations functions have been carried out and appropriate risk mitigation plans have been designed and implemented. Loss Data Analysis, based on internal as well as external loss data, is carried out periodically to identify trends and reinforce operational controls. An Incident Reporting tool has been designed and implemented for reporting operational risk incidents across the Bank and monitoring actions thereon for mitigation of risks.
New products / processes are rated in a transparent manner so as to enable risk-based decision-making for introduction of the same. All new products / processes are approved by the Operational Risk Management Committee (ORMC), which identifies the risks inherent in the products and prescribes necessary controls to mitigate such risks. Products and processes risks are subjected to review to ensure adequate risk management.
The Bank’s Audit mechanism covers a gamut of activities such as periodical on-site audit, Concurrent Audits and Off-site Surveillance enabled by Bank’s advanced technology-driven processes and the Core Banking System.
The acceleration in unfolding events both domestic and global has further strengthened the Bank’s Business Continuity Framework. The Bank has implemented a comprehensive Bank-wide Business Continuity Plan to ensure functioning of its critical functions during disruption / disaster situations.
Systems Risk
The Bank’s Information Security Policy provides the framework upon which all subsequent security efforts are based, and to guide the development and maintenance of a comprehensive Information Security program. It deals with security of information in various forms like spoken, written, printed and electronic or any other medium and handling of information in terms of creation, viewing, transportation, storage or destruction.
It contains the principles that direct managerial decision-making and facilitates secure business operations. It is designed to enable the Management to ensure the security of information assets and maintain accountability. It also defines the appropriate and authorized behaviour for personnel approved to use the Bank’s information assets. The Banks Data Centre and operations are certified as per 27001:2013 ISMS standards. The Bank has Board-approved Cyber Security Policy in place. The policies and procedures are built around the following principles:
Treat Information Security Risk in line with Business, Regulatory and Legal requirements;
Ensure Availability, Integrity, Confidentiality of Information, establish Accountability and provide Assurance;
Focus on People, Process and Technology for implementation;
Apply least privilege, need to know / use principles;
Promote Information Security Awareness to create Security-aware culture within employees, contractors, third parties and customers;
91

Deal with exceptions and violations appropriately;
Focus on Information Security Governance, Assurance and Evolution to ensure suitability, adequacy and effectiveness;
All activities relating to recovery of non-performing loans and restructuring of stressed assets are handled by the Financial Restructuring and Reconstruction Group (FRRG).
The Bank has actively utilized the Securitization and Reconstruction of Financial Assets and Enforcement of Security Interest Act, 2002 for recovering its dues. During the year, the Insolvency and Bankruptcy Code 2016 has been
notified and it is aimed at making the resolution of non-viable entities possible in a time-bound manner. During the year, the Bank recovered an amount of ` 32.30 crores in written-off accounts. The Net NPAs of the Bank stand at 0.39% of the Total Advances, while the ratio of Gross NPA as percentage of Total Advances amount is 0.93%.
The Bank has strengthened the policy framework on “Know Your Customer” (KYC) norms and “Anti Money Laundering” (AML) measures from time to time, in line with regulations. The Bank has implemented a simplified procedure of “Know Your Customer”, which will benefit Lower Income Group persons to open accounts with minimal documentation.
The Bank had implemented a state-of-the-art Workflow and Imaging System for Account
Opening, booking Term Deposits, processing Trade Finance transactions, sale of Third-Party products and Branch Expenses processing.
The System enables faster turnaround times, and movement of work from branch locations across the country to the Central Operations Unit in real-time mode, thus cutting out the time that physical forms would take to arrive through courier. This has helped in freeing up manpower at the branches to tend to customer service.
Participation of Security Team during the initial stages of Systems acquisition and development;
Structured approach towards Information Security Awareness.
Financial Restructuring andReconstruction GroupFinancial Restructuring andReconstruction Group
General Banking OperationsGeneral Banking Operations
BANK RECOVERED
` 32.30 crIN WRITTEN-OFF ACCOUNTS
The Net NPAs
0.39%of the Bank stand at
Annual Report 2016-17
92

The Bank is a member of the Banking Codes and Standard Board of India (BCSBI), which was set up to ensure that banks in India adhere to a voluntary Code, which sets minimum standards for fair treatment to customers availing of banking services.
The Bank is committed to adhere to all the provisions of the Code prescribed by BCSBI. The Bank has taken steps to implement the provisions of the Code of Commitment to Customers (Individuals). The Code is displayed at all the branches, and is also hosted on the Bank's website in thirteen languages. The Code had been revised in January 2014, and was adopted by the Bank.
The Bank has also adopted the “Code of Commitment to Micro and Small Enterprises” (MSE Code) issued in June 2008 for customers belonging to the Micro and Small Enterprises segment. This Code was revised in 2015 by BCSBI, and was adopted by the Bank. It sets the minimum standards of banking practices.
The Bank has also formulated the Policy on ‘Financing to the Micro, Small and Medium Enterprises’, and the same is hosted on the Bank’s website.
The Bank is participating in Clearing through Cheque Truncation System (CTS). As on March 31, 2017, the Bank had 165 locations covered under the Grid Clearing, through its three CTS Centres at Mumbai, Chennai and Delhi.
The Bank has also started participating in NACH (National Automated Clearing House) transactions both for Debit and Credit (ECS) at Mumbai, and for the Aadhaar-Based Payment System (ABPS) transactions through NPCI.
The Bank has adopted a “Comprehensive Policy”, on settlement of claims in respect of deceased depositors. The Policy covers all types of deposits, and has simplified the procedure for settlement. The forms are also provided on the Bank’s website.
The Bank has put in place a “Deposit Policy” and a “Fair Practice Code”. The former outlines the
guiding principles in respect of various products of the Bank and the terms and conditions governing the operations of the accounts and the rights of depositors. The Fair Practice Code is a voluntary Code, establishing standards to be followed by all our branches in their dealings with the customers.
The Bank has framed the “Citizen’s Charter” to promote fair banking practices and to give information in respect of various activities relating to customer service.
The Bank has put in place “Customer Compensation Policy” as part of the commitment to customers for any direct and actual loss by way of internal loss / payment of charges by customer due to deficiency in service to the extent mentioned in the policy. The Policy is based on principles of transparency and fairness in dealings with customers.
The Bank has framed the “Unclaimed Deposit Policy” based on RBI guidelines with the objective of classification of unclaimed deposits and setting up the Grievance Redressal Mechanism for quick resolution of complaints and record-keeping. Further, in line with RBI directives, balances in unclaimed deposits and other accounts have been transferred to “Deposit Education and Awareness Fund” (DEAF), w.e.f., June 2014. Details relating to accounts unclaimed have been duly uploaded on the Bank’s website.
The Bank has also formulated the ‘Customer Rights Policy’, and the same is hosted on the Bank’s website.
93

Corporate & Global Market Operations (CGMO) manages the operations related to Trade Services, Cross-Border Remittances, Supply Chain Finance, Treasury, Foreign Exchange and Derivatives, Cash Management Services, Payments, Depository and Capital Markets and Bullion Operations. CGMO services clients in both, the Corporate and the Retail segments for these products.
The primary focus of a majority of initiatives during the year was on providing improved Operational Efficiency, improving Client Experience and Proactive Risk Management.
The Bank further centralized processing of activities to build efficiencies of scale. Processing of Cross-Border Remittances (Trade Operations), review of transactional red flags (Depository Operations) and onboarding of clients on systems (Trade Operations and CMS) were centralized during the year.
The Operating Model was further strengthened during the year with enhanced focus on ensuring stability and Business Continuity during any unforeseen challenges. The resilience of the Trade Processing Model (independent hubs in Chennai and Mumbai) was once again put through the severest test during the challenges caused by cyclone Vardah that paralyzed Chennai during December 2016. It was ensured that there was minimal client impact during the BCP situation. Additionally, all critical processes were tested to ensure that they are BCP-ready.
The Bank implemented a state-of-the-art processing system for Trade Operations during the year. The system is expected to significantly improve operational efficiency, and provide clients with a superior experience, including facilitating digitization initiatives. The process for account reconciliation was improved through introduction of a Workflow Management System. As part of improving the operational controls, an
Audit Tracking system (ACE) was implemented to enhance control. Regulatory interface systems (IDPMS & EDPMS) were implemented to support automated reporting of all cross-border remittances, as required by RBI.
These state-of-the-art systems are capable of handling high volumes, will strengthen risk management and will offer clients with world-class products and services.
Client focus is another key focus area, and as one of the initiatives in this area, the Bank added 12 locations for providing customer support locally for CGMO products.
Increased centralized processing and increased footprint to provide client servicing at branches are expected to improve operational efficiency, significantly improved transaction turnaround times and promote world-class client experience.
The Bank continued with the “Voice of Customer” initiative for this year as well. Under this initiative, structured feedback is received from top clients across different client segments. The performance of the Client Servicing Team is measured through the dedicated Service Quality Unit.
Proactive Operational Risk Management has been a major focus area, and is embedded in the organization. The Analytics, Information and Metrics Unit within the CGMO Operational Risk team continues to deliver critical information and metrics that is used to identify potential risk events. A significant achievement was the completion of an end-to-end risk review of the (prevention of) Anti Money Laundering processes (AML) and the Enhanced Due Diligence (EDD) process. These reviews are expected to improve our risk profile in identification and mitigation of Trade-based Money Laundering risks.
Corporate and Global MarketsOperations (CGMO)Corporate and Global MarketsOperations (CGMO)
Annual Report 2016-17
94

During the year, the branch risk review was strengthened and all critical process documents were reviewed and made available on a specialized platform (ARIS). Intraday Liquidity reporting process was improved. Customized training was imparted, and improved controls were put in place to address risks.
People Development was another significant focus area. CGMO continued in its journey towards ‘Continuous Improvement’ with the objective of delivering client satisfaction and year-on-year efficiency benefits. This program focuses on increasing ‘Client Delight, ‘Empowerment’ and ‘Rewards & Recognition’. As part of this initiative, over 825 Process Improvement Initiatives were implemented, resulting in efficiency improvement and risk reduction. An initiative to scientifically
manage the Operations capacity was completed during the year, for significant efficiencies in the next couple of years.
As part of People Development, over 22,000 man-hours of training were delivered during the year, aimed at creating a strong knowledge force within the Unit. Trainings delivered covered product features, risk awareness, regulatory requirements, continuous improvement and soft skills like communication, team effectiveness and leadership skills. Various other people-centric initiatives launched included job up-skilling, cross-functional training, and Family Day at Office. Various CSR events were also conducted during the year, encouraging staff to participate in planned community events.
Operational Controls
The Bank has laid down the Policy Framework related to "Know Your Customer" (KYC) norms, “Anti-Money Laundering Measures” (AML) and Combating of Financing Terrorism (CFT). The policy has been framed on the basis of recommendations of the Financial Action Task Force and the Paper issued on ‘Customer Due Diligence for Banks’ by the Basel Committee on Banking Supervision.
The Bank has sharpened internal controls and compliance through the following:
Separate and independent Compliance function has been set up for Bank-wide compliance;
Separate and independent Vigilance function;
Expenses Management Software has been deployed at all branches for facilitating cost control;
The Process Adherence and Quality function has been operationalised for attaining uniformity in processes followed by branches, to minimise operational risk.
Standard Operating Procedures have been defined for processes at branches to ensure consistency of delivery with the expanding branch network;
Branch Monitoring Unit is entrusted with regular monitoring of branch operations; Voucher verification process has been operationalised for checking all the entries posted by the branches; and
Internal Control Systemsand their AdequacyInternal Control Systemsand their Adequacy
95
Customer Service
In accordance with RBI’s recommendations, a Standing Committee on Customer Service (SCCS) comprising senior Functional Heads of the Bank and a few customers has been established.
The Bank has also constituted a Customer Service Committee of the Board of Directors (CSCB) to review the performance of the SCCS.
The Bank has constituted Branch-level Customer Service Committee (CSC) at all branches, comprising employees and customers. CSC meetings are convened every month to examine complaints / suggestions, cases of delay, difficulties faced / reported by customers / members of the Committee. Feedback and suggestions are submitted to SCCS.
SCCS examines and provides regular feedback to the Customer Service Committee of the Board for necessary policy / procedural actions.
The Bank implemented “Talisma”, a ‘Customer Complaints and Requests Management System’. The key objective of this solution is to have a single system to track requests, complaints and queries at customer level so that the service standards as set out by the Bank are managed and enhanced. The System has been implemented across all branches and the Bank’s Contact Centres in Mumbai and Chennai.
Grievance Redressal Mechanism
The Bank follows the Board-approved “Grievance Redressal Policy”, which lays down a defined escalation process for all customer complaints received at branches and at Corporate Office, within the overall framework of RBI guidelines.
A Quarterly Report related to complaints received and redressed is placed before the Board of Directors. Based on the recurrence of complaints in specific areas, causative factors are identified and remedial measures are initiated.
The Bank maintains a dedicated page for lodging of complaints and the complaint redressal mechanism on its website www.indusind.com contains information on the escalation process.
Details of the Nodal Officer / Regional Managers have been furnished.
These details are also displayed at the Bank’s branches. Details of the Banking Scheme, 2006 are also displayed at Branches and provided on the website.
A link has been created on the Bank’s website for a “Feedback Form”, which gives opportunity to all customers to air their grievances, in a simplified way and get their complaints redressed without delay. Further, customers can contact their respective Branch Manager or call the Bank’s Contact Center on the toll-free number or send an email to the dedicated email IDs to lodge their grievances.
Internal Audit
The Bank’s Internal Audit function is adequately equipped to make an independent and objective evaluation of the adequacy and effectiveness of internal controls on an on-going basis to ensure that units adhere to compliance requirements and internal guidelines.
The Internal Audit function undertakes a comprehensive Risk-based Audit of all operating units. An Audit Plan is drawn up on the basis of risk-profiling of auditee units and audit of operating units is undertaken at a frequency synchronized to the risk profile of each unit in line with the guidelines relating to Risk-Based Internal Audit. The scope of risk-based internal audit, besides examining the adequacy and effectiveness of internal control systems and external compliance, includes evaluation of the risk residing at the auditee units. To complement the Internal Audit Function and have real time supervision and control, critical units of the Bank are covered under Concurrent Audit by reputed Audit Firms.
To ensure its independence, the Head - Internal Audit functionally reports to the Audit Committee of the Board, and for administrative purpose, reports to the Managing Director & CEO of the Bank. The Audit Committee of the Board reviews the performance of Internal Audit Department, the effectiveness of controls laid down by the Bank, and compliance with regulatory guidelines.
Annual Report 2016-17
96

Compliance
The Bank’s approach in compliance is not only to observe what is legally binding but also to embrace broader and high standards of integrity and ethical conduct.
The Bank has an extensive set-up for ensuring enterprise-wide compliance with various legal, regulatory and governance requirements.
The Compliance Function undertakes macro-level compliance activities including review of Compliance Policy and KYC Policy of the Bank, monitoring and testing of compliance related to various activities of the Bank covering branches, Corporate Office functions, and also various Associate concerns.
The Compliance Function is a mandatory stakeholder of the Operations Risk Management Committee (ORMC) and provides signoff for new products / processes routed through this channel.
To further strengthen the Compliance Culture in the Bank, the Compliance Function circulates short notes on significant compliance-related topics, cases based on default events, publishes Monthly Newsletter, etc., and conducts Seminars for frontline staff.
Vigilance Function
The Vigilance Department has been functional in the Bank since October 2008, and its objective is to enhance the level of managerial and operational efficiency & effectiveness. The aim is to prevent, detect and analyse corruption, wrongdoing / misdemeanours on the part of the employees and follow it up by deterrent / preventive action to ensure highest standards of integrity, governance and ethical practices.
Whistle Blower Policy was adopted by the Bank in 2009 as the Bank considers it appropriate to provide a channel to its various stakeholders, namely, the Bank’s employees, customers, suppliers, shareholders, etc., to bring to the notice of the Bank any issue involving compromise / violation of ethical norms, legal or regulatory provisions, etc., without any fear of reprisal, retaliation, discrimination or harassment of any kind.
The Bank’s Vigilance Manual / Whistle Blower Policy and practices are totally in sync with all statutory and regulatory guidelines on Vigil Mechanism to ensure a compliant, fraud-free and ethical work environment.
IndusInd Bank has been awarded the ‘Certificate of Commitment’ by the Central Vigilance Commission.
The Bank’s HR objectives were in synchrony with the Bank’s PC3 business objectives.
HR agenda is to be a strategic business partner by focussing on talent acquisition, talent development, talent management, retention and compliance.
The Bank believes that Human Capital is the key to business growth. The strategic intent of HR is to
hire and retain quality talent, impart requisite knowledge, skills, and attitude, sustain a result-oriented culture, reward and recognize talent, offer meaningful career plans and build employee equity. Falling attrition across all employee levels, negligible attrition at strategic levels, and rising employee productivity indicate positive employee association with the Bank.
Human ResourcesHuman Resources
97

Key Highlights:
Employee headcount of the Bank increased to 25,314 employees in FY17 from 23,060 employees in FY16.The Bank’s hiring was based on the Bank’s Annual Business Plan. The Bank used diversified hiring channels such as Employee Referral Schemes, Job Portals, Consultants, Campus Hiring, Social Media, Hire-Train-Deploy model, etc. for quality hiring. Social Media (LinkedIn, Facebook) was leveraged for niche and leadership hiring. The Bank’s selection process comprised multi-layered interviews, competency assessment tests, background verification, reference checks to recruit the right candidates.
The Bank continues to focus on developing diversified and multi-dimensional skills of its employees.
During FY 17, the Bank conducted 9,60,000
learning man-hours for over 3,40,000 participants through various classroom and e-learning initiatives. Several learning programs in areas of Leadership, Team-Building, Managerial Effectiveness, Internal Responsiveness, Innovation & Creativity, Banking Products, Banking Operational Processes, Credit, Induction and Compliance were conducted during the year. The Bank also conducted Management Trainee programs across Business Units to build entry-level talent with cross-functional skills.
The learning effectiveness was ensured through
learning need assessment, well designed content, delivery by qualified internal & external subject matter experts and a feedback mechanism to improve learning efficacy.
Performance Management Processes namely Goal Setting and Annual Performance Review helped to assign employee performance objectives through “SMARTs”, review individual performance, provide performance counseling and developmental feedback, recognize and reward basis achievement of performance objectives, identify future leaders for driving the Bank’s business growth.
The Annual Performance Appraisal for FY16
was executed meticulously, and individual rewards were linked to performance.
The process of high potential and critical talent Identification progressed across various Business units of the Bank. Talent assessment on desired competencies is being undertaken with a view to create a resource pool with requisite levels of performance and potential. This exercise is helping build a talent pipe-line and potential successors for key supervisory and tactical roles.
The Bank’s Compensation Policy is based on the
philosophy of ‘Pay for Performance’ and Role criticality. The key objectives include linking the Bank’s compensation to business performance and market trends, offer differentiated reward and recognition measures based on performance, build long-term employee ownership and association, and be compliant with the compensation guidelines of RBI.
The Bank continued to focus on Employee Engagement initiatives to connect and bond with the employees. Some of the key initiatives were Quarterly Webcasts by the MD & CEO, Annual Reward and Recognition Programs, Employee-connect by HR and Line Managers, etc. Employee recreation programs such as business off-sites, team get-togethers, sporting competitions, celebration of festivals helped to build a fun-filled work-place.
Technology is being continuously leveraged to improve the HR Operational Processes for superior customer service. Pre-joining and on-boarding processes were shifted to Internet-based system for new joinees. Employee Lifecycle HR processes relating to Attendance, Leave, Payroll, Confirmations, Loans, Mediclaim, Gratuity, Exits, Full and Final Settlement were managed accurately and within the stipulated TATs.
The Bank pursues “Discipline and Compliance” as its core values to create an amiable work environment. Every employee has to adhere to the Bank’s Code of Conduct and follow the Bank’s business processes. Any deviation or breach of the Code of Conduct is handled sternly by the Bank. The Bank also proactively meets the HR-related regulatory and statutory laws.
The Bank strives to attract, develop and retain quality talent and to create a work culture where employees can contribute to the business growth of the Bank.
Annual Report 2016-17
98

Employee Stock Option Scheme
The Bank had instituted an Employee Stock Option Scheme (ESOS- 2007) to enable its employees, including Whole time Directors, to participate in the future growth of the Bank. Under the Scheme, Options can be granted, which upon exercise could give rise to the issuance of a number of shares upto 7% of the Issued Equity Capital of the Bank from time to time. The eligibility and number of Options to be
granted to an employee is determined on the basis of criteria laid down in the Scheme and is approved by the Compensation Committee of the Board of Directors.
An aggregate of 3,98,39,800 Options, comprising 6.66% of the Bank's equity capital, have been granted under the Scheme. Statutory disclosures as required by SEBI (Share Based Employee Benefits) Regulations, 2014 are given at Annexure IV to the Directors’ Report.
Contact details of shareholders such as e-mail IDs, cell phone numbers and telephone numbers are obtained, so as to communicate to them about developments in the Bank. This direct communication is in addition to the regular dissemination of information through usual channels such as the Stock Exchanges, Press, Bank’s website, RTA’s website, etc.
Shareholders of the erstwhile IndusInd Enterprises & Finance Limited (IEFL) who did not respond to earlier communications were contacted individually through Bank’s branches, with requests to exchange Share Certificates of IEFL for Certificates of the Bank.
Shareholders shall continue to receive best-of-class shareholder services and be promptly informed of the developments in the institution.
The Bank has been at the forefront in “Green Initiatives”, and through this process aspires to graduate to paperless compliances.
Shareholders have been requested on several occasions to furnish their e-mail IDs at [email protected] or inform telephonically on 022-66412487 to help accelerate the Bank’s migration to paperless compliances.
With the implementation of the Companies Act, 2013, companies can send Annual Reports and other communications through electronic mode to those shareholders who have registered their
email addresses with the Company or made available by the Depository.
The full text of the Report shall also be made available in an easily navigable format on the website www.indusind.com under the link ‘Investors Reports and Presentation / Annual Reports'.
Shareholders have continually been informed about the easy process for claiming the dividend amounts lying unclaimed with the Bank.
As regards transmission of securities, in case of securities held in physical mode (in single name, without nomination), SEBI have prescribed a threshold limit of ̀ 2,00,000 (Rupees Two lakhs only), i.e., market value of securities per folio, as on date of the application for transmission, for following simplified documentation. SEBI have, however, empowered Issuer Companies to enhance the value of such securities, at their discretion.
Considering the difficulties faced by the legal heirs in obtaining of Succession Certificate / Probate / Letters of Administration, the Board of Directors of the Bank have, for operational convenience, delegated the authority to the Share Transfer Committee for approving the transmission of securities held in physical mode, in case of market value of securities of up to ` 10,00,000 (Rupees Ten lakhs only) subject to simplified documentation procedure prescribed by SEBI.
Shareholders’ SatisfactionShareholders’ Satisfaction
99

Adopting Technology Trends
The Bank strives to generate value by identifying and implementing technological innovations.
The Bank’s Integrated Digital Strategy clearly focusses on how the digital success would be measured. The measurement has to be tangible like reducing TAT for auto loans or increase in number of personal loans by a considerable percentage through digital channels. The strategy has been aligned towards enhancements in customer reach and cost reduction by using myriad new technologies. Some key transformational areas are:
Digital Applications and Portals – Over the last one year, the Bank has launched multiple customer acquisition and transaction fulfilment online applications and portals like FD Online for booking deposits, Forex Online, Tab Banking, pre-approved easy loan and pre-approved Credit Card portal, etc.
ChatBots – The Bank has conducted proof of concepts with Chatbots for use in cases where significant enhancement in customer experience is foreseen. Project is underway to launch conversational Banking app which will be Bank’s new 24x7 Virtual Agents to provide human-like and consistent customer experience to all users at scale. It would be a state-of-the-art cognitive Virtual Assistant which will integrate Speech to Text and Text to Speech functionality to allow for voice input / output in addition to chat.
Artificial Intelligence (AI) and Machine Learning
(ML) – Besides Chatbots, the Bank is also evaluating AI and ML for its applicability in getting insights from the vast data residing in several systems.
Application Program Interface (API) Management – The Bank has set-up Application
Program Interface Management for quickly on-boarding partners and easily integrating with Bank’s system without compromising on security.
Cloud Adoption – The Bank has started aggressively using Cloud Infrastructure. New workloads for better Total Cost of Ownership are being developed as Cloud Native System. Few applications are also being migrated from on-premise to Cloud, after doing cost-benefit analysis and adhering to security controls and measures.
Customer Oriented – New Initiatives
National Payments Corporation of India’s (NPCI’s) Unified Payment Interface (UPI):
NPCI’s UPI is a unique payment solution which empowers a recipient to initiate the Payment Request from a smartphone. Early this year, the Bank had participated in the launch, and went live with the UPI Platform and the Payment Service Provide (PSP) App on December 17, 2016.
The interface is the advanced version IMPS which is a 24X7 Funds Transfer Service. UPI allows a customer to have multiple virtual addresses for multiple accounts in various banks. In order to ensure privacy of customer’s data, there is no account number mapper anywhere other than the customer's own bank. This allows the customer to freely share the financial address with others.
It facilitates ‘Virtual Payment Address’ as a payment identifier for sending and collecting money and works on single click 2-factor authentication. It also provides an option for scheduling ‘push’ and ‘pull’ transactions for various purposes, like sharing bills among peers. One can use the UPI App instead of paying cash on delivery on receipt of product from online shopping websites and can pay for miscellaneous
Information TechnologyInformation Technology
Annual Report 2016-17
100

expenses like paying Utility Bills, Over-The-Counter Payments, Barcode (‘Scan and Pay’) based payments, Donations, School Fees and other such unique tasks.
IMPS system for PPI Company:
Pre-paid instruments (PPI) is one of the fastest growing products in the Indian landscape, with banks and non-banks entering this space in a big way.
The Bank has entered this space with an in-house developed PPI IMPS hub to offer P2A (Person to Account payment). It will help the Bank to partner PPI players and offer banking services through them.
Indus Direct - Corporate Banking App offers the following:
Account Summary and Balances;
Payments – Inter-Bank and Intra-Bank payment initiation (NEFT, RTGS and IMPS);
Payment authorization – Authorized signatories can authorize single or batch payments initiated by the company Executives as per the corporate mandate;
Relationship Manager Connect – Tap to call Relationship Manager / Contact Centre;
Biometric validation enabled for log-in and transactions in iOS and Android biometric- based devices.
Digital Initiatives
FD Opening portal:
The Online FD Opening portal enables Bank’s customers to select and book an FD from the Bank’s website. Existing customers (authenticated through registered mobile number) can open Term deposits through a microsite, by using funds either from IndusInd Bank or from any other bank account.
Forex Online Portal
As part of Digital Banking Initiatives, to scale up defined products, the Bank introduced Forex
Online Portal on November 18, 2016. It is an online portal for selling forex products – Forex Card, Currency and Funds Transfer abroad. It gives customers 24X7 access for these forex products. Customers can book the Rate online by paying part amount, and then the transaction is fulfilled within 24 – 48 hours. Some of the key features are:–
Aadhaar / PAN-based verification
Complete online process with no paper work
Facility of multi payment options, viz., Debit Card, Credit Card, Net Banking
Communication through mails and SMS at every stage
Offers multiple delivery modes - Doorstep, Branch, Courier, etc.
One-Time Password (OTP)-based verification details.
EasyLoan Portal
EasyLoan portal was launched to facilitate real-time, straight through digital fulfilment of pre-approved loans to existing IndusInd customers. The loan amount is credited to the customer’s Savings Account immediately. Buoyed by the success, Pre-approved Credit Card was made available on the common channel to customers without any documentation, with no manual interaction, and Card delivery within two days.
Tab Banking
Rolled out in February 2017, the application offers instant Account Opening. This is an Assisted Model, where a Bank Representative will use the Tablet provided by the Bank to open the account instantly.
The application captures all the fields required for Account Opening and supports biometric scan, Aadhaar-based e-KYC, Profile-based product selection, Choice Account Number selection, and initial Account funding via UPI. It has significantly lowered Turn-Around-Time (TAT) of Account Opening, servicing and channel activation. All accounts are opened by Straight-Through- Processing in Finacle with the data captured on Tab.
101

Application Program Interface (API) Management
API Management is a tool to expose various APIs to partners in a secured and controlled manner. This solution enables our channel partners to connect their applications easily to our services without extensive coding. API management platform has seen about 25-30% growth month on month (number of transactions processed). Earlier, on-boarding any of these partners would take more than a month, which is now reduced to less than a day.
Campaign Management
The Bank launched the Campaign Management System, which allows building and execution of personalized campaigns to be delivered across various channels like E-mail, SMS, Portal, Web, Branches, Phone Banking and ATMs. The solution has Analytics embedded at every stage, which has helped in promoting proactive engagement with customers, increasing customer loyalty and maximizing revenue.
Customer-oriented Enhancements
Mobile Banking enhancements:
IndusMobile has become the preferred channel, and the registration and transaction numbers are steadily increasing, with more than 90+ services available. With the addition of Bharat QR, the Mobile App has become the primary mode of payment without the need for physical Debit Card.
The App is rated 4.3 on Google Playstore, which is best-in-class amongst Indian banks.
The salient features include:
Biometric validation enabled for login and transactions in iOS and Android biometric based devices.
Enhanced Credit Card functionalities, beneficiary addition and few more service requests.
Integration of couponDunia offers, basis location coordinates and customer type.
Government-led Initiatives
Demonetization
On announcement of demonetization of high value notes, the Bank responded quickly by tuning the related IT Systems, to comply with the guidelines issued by RBI / Government of India.
Measures Implemented by the Bank for adherence of guidelines are:
The Bank developed a module for recording the exchange of Specified Bank Notes (SBNs) which was effective from Day One, i.e., November 10, 2016. This module de-duped on the basis of the ID Proof document captured for any subsequent transaction by the same applicant. Details of SBNs were captured in the module.
The Bank also developed a module for computing the permitted weekly withdrawals for SB accounts and Current accounts including ATM withdrawals. The system functionality was built for computing the amount permissible. PAN had been made mandatory for cash deposits above the limit, as directed.
Finacle, the Bank’s Core Banking Solution, was further customized to handle restricted cash withdrawals to APMC and Farmers.
Calibration was carried out for more than 2,000 ATMs for new notes.
Centralized KYC – CKYC
RBI has issued guidelines on operationalization of CKYC for new Individual accounts opened on or after July 15, 2016.
To fulfil the regulatory requirements, the Bank went live with C-KYC.
Security, Risk & Internal E�ciency
Netmonastery Tool has been implemented to monitor security incidents and events to identify and remediate weakness if any.
Annual Report 2016-17
102

Insider Trading Application
This application has been implemented to help the Bank and the staff to comply with the SEBI directives for Insider Trading relating to sale and purchase of its shares. This application provides for placing online requests by the respective staff and subsequent approval by the Compliance Team. Against each approval, the employee can report online the sale of shares. This in turn helps consolidate and report the details to SEBI in a quick, easy and automated manner, thereby improving compliance besides enhancing efficiency.
Board Meet - iPad app
Some of the application features are: Viewing scheduled Meetings, notifications for new meeting / changes, availability of all meeting documents digitally, to join videoconference from the app, text search across meeting data, etc.
Exchange Online – O365 implementation
Project to migrate mailboxes to the Microsoft O365 Cloud Email Service has started successfully. Some of the highlights of Microsoft O365 are higher mailbox capacity, Access – any device, anytime, anywhere, High availability, Better security.
Business Continuity / DR
The Bank has a Business Continuity Plan Document, which includes the backup strategies, archiving and data recovery in case of disasters. All the servers of the Bank are housed in Data Centres in Mumbai and Chennai.
During the year, Bank had rolled out DR automation tool, automating switchover and switchback process.
The tool reviews the secure configuration and hardening of the Servers based on security baselines.
The Rogue App Monitoring Device is a service similar to anti-phishing, to help detect and take down malicious / fraudulent mobile apps in stores that appear like the Bank’s Mobile App.
The SAS - Assets and Liabilities Management (ALM) system went live on December 20, 2016. The frameworks and reports are built to meet the regulatory requirements, including Basel-III Liquidity Standards and the Liquidity Risk and Interest Rate Risk Analysis.
MVS software enables ATMs to recognize customers, and provide them personalized banking services, targeted deals / offers and Service Mesh involving non-banking services.
Internal E�ciency
Business Flow Manager – Intellimatch
To reduce risk and improve process efficiency in reconciliation, the Bank has implemented Business Flow Manager (BFM) module of the Nostro Reconciliation software Intellimatch in the month of April 2016.
Vendor Management System
Bank has implemented Vendor Management System (VMS) having end to end vendor lifecycle management process. Some of the features of VMS are Centralized on-boarding, Online vendor evaluation, Service Level Agreements and Performance monitoring, Centralized contract management, Visibility on financial spends versus service delivery and Blacklisting of the vendor.
103

The important Legislative / Regulatory changes during the year impacting the Banking Industry were:
Introduction of Insolvency and Bankruptcy Code, 2016;
Introduction of the Aadhaar (Targeted Delivery of Financial and Other Subsidies, Benefits and Services) Act, 2016.
Insolvency and Bankruptcy Code, 2016
The Insolvency and Bankruptcy Code has been introduced with the intention to consolidate and amend the laws relating to reorganisation and insolvency resolution of corporate persons, partnership firms and individuals in a time bound manner for maximisation of value of assets of such persons, to promote entrepreneurship, availability
AWARDS
vForum 2016 Award IndusInd Bank received an award in the most Innovative Company category organized by VMWare Software India Private Limited.
IBA Technology Awards 2017 IndusInd Bank won three technology awards. Best Technology Bank - IndusInd Bank was declared winner in the small bank category. IndusInd was adjudged runner up in two categories viz. Best IT Risk and Cyber Security Initiatives and Best Payments Initiatives.
Celent Model Bank Award 2017 IndusInd Bank featured in the 2017 Celent Model Bank Awards. The Bank was the sole winner of Fraud Management and Cybersecurity Celent Model Bank Award for 2017. Celent is a US based research and consulting firm focused on the application of information technology in the global financial services industry. Celent Model Bank is awarded for best practices of technology usage in different areas critical to success in banking.
Best Bank Award IndusInd Bank was bestowed with the ‘Best Bank Award’ for Innovative use of Technology at the 12th IDRBT Banking Technology Excellence Awards. The award was presented at the awards ceremony at IDRBT campus, Hyderabad.
LegalLegal
Annual Report 2016-17
104

of credit and balance the interests of all the stakeholders including alteration in the order of priority of payment of Government dues and to establish an Insolvency and Bankruptcy Board of India, and for matters connected therewith or incidental thereto.
The Insolvency and Bankruptcy Code covers insolvency resolution and liquidation for:
Corporate Persons (Persons giving financial services are excluded from definition of “corporate debtor”);
Partnership Firms.
The said Code has been enacted by the Parliament in the year 2016 and provisions of the said Code shall come into force on such dates as the Central Government may, by notification in the Official Gazette, appoint. Through various notifications issued by the Central Government, many of the provisions of the said Code have become effective.
Impact on Banking Industry:
The Insolvency and Bankruptcy Code, 2016 identifies rights of creditors (including financial creditors) and in case of default on the part of debtor it enables the creditors to make an application in terms of provisions of this Code. The Code ensures time bound resolution or disposal of the applications made under the Code. The Code provides for detailed procedure to be followed in order to ensure that financial interest of all the stakeholders of the debtor is being taken care of.
The Aadhaar (Targeted Delivery of Financial and Other Subsidies, Benefits and Services) Act, 2016
The Aadhaar (Targeted Delivery of Financial and Other Subsidies, Benefits and Services) Act, 2016 aims to provide legal backing to the Aadhaar Unique Identification Number Project and matters connected therewith or incidental thereto.
Important features of the Aadhaar (Targeted Delivery of Financial and Other Subsidies, Benefits and Services) Act, 2016:
The Act provides for the properties / features of Aadhaar number and extent of rights / proofs conferred in respect of an Aadhaar number holder.
The Act provides for establishment of the Unique Identification Authority of India which shall be responsible for the processes of enrolment and authentication and perform such other functions assigned to it under the said Act.
The Act provides for the authentication process by which the Aadhaar number along with demographic information or biometric information of an individual is submitted by the concerned requesting entity to the Central Identities Data Repository for its verification and such Repository verifies the correctness, or the lack thereof, on the basis of information available with it. It enables the Banks to avail these authentication services by paying prescribed fees (with respect to the relevant information submitted by its customers) and in such case Bank shall comply with the applicable provisions of the said Act.
Information on important legal proceedings faced by the Bank:
There are certain legal proceedings in the context of banking business carried on by the Bank which are not unusual for a bank of comparable size. Otherwise the Bank is not involved in any legal proceedings and is not aware of any threatened legal proceedings, which if determined adversely, could result in a material adverse effect on the business.
105

The year 2016-17 has been a memorable year for brand IndusInd Bank. This was the year that the Bank created emotional leadership and forged a connect with consumers that went beyond the transactional nature of the business. It established its leadership as a responsible and socially-conscious organization that put its might behind the ones who deserve our unstinting support.
This was also a year of cementing its responsive innovation brand ethos with the launch of the Fingerprint Banking campaign. Towards this objetive, the Bank carried out engaging initiativesthat led to an increase in the brand’s visibility.
IndusInd Bank was the first Bank in the country to launch the service where customers could do end-to-end banking transactions on its Mobile Banking app ‘IndusMobile’, by using just their fingerprint. The campaign featured Farhan Akhtar, brand endorser for IndusInd Bank, and multi-talented actor Boman Irani. A well-crafted multi media advertising campaign was released,
which included innovative online activations & social media, TV, outdoors - at the airports in metros, leading radio channels and movie multiplexes.
‘Fingerprint Banking’ was launched after studying consumer behavior & insights on remembering complicated & lengthy passwords. It was found that customers tend to forget their passwords and resetting them again was a lot of trouble. With Fingerprint Banking, consumers could afford to forget Passwords forever.
The Bank also launched two new credit cards to further enhance the portfolio mix – Signature Legend Credit Card and Platinum Aura Edge. Both of these chip-based credit cards enable customers
to make transactions with a tap, thus offering an easy and convenient way to make payments. Another significant achievement for the Bank was to enter into an agreement with Infrastructure Leasing and Financial Services Ltd., (IL&FS) the promoter shareholders of IL&FS Securities Services Ltd., (ISSL) to acquire 100% of ISSL. This acqusition has brought in scale to this business and has complemented the Bank’s current product offerings. It also fits nicely into Bank’s strategy of creating differentiated businesses with domain expertise.
The Bank acknowledges the fact that internal stakeholders form the heart of the organization. No communication is complete without their wholehearted participation. To augment internal communication, like in the past, this year too, the Bank arranged quarterly webcasts, organized engaging campaigns/contests and issued regular mailers on various developments to keep them abreast and involved in daily course of activities. Constructive feedback and high quotient of interactivity showcase healthy internal communication.
Understanding the requirement of the millenials that social media is the pulse of new generation banking, during the year 2016-17, your Bank continued being active on social media to listen and to serve its customers better. Along with traditional media, the bank leveraged social media to communicate and reach out to its audience.
The Bank has been very active on Facebook, Twitter and LinkedIn throughout the year with more than 10 lakh followers on Facebook, 34,000 on Twitter and 50,000 on LinkedIn.
The Bank also opened an Instagram page to communicate with young and affluent users. As of March 31, 2017 the Instagram followers’ base has reached 6,000. IndusInd Bank has bagged Gold in Best Social Media Brand Award from Social Samosa in BFSI category for the year 2016-17.
Corporate CommunicationsCorporate Communications
Annual Report 2016-17
106

The Bank also conducted various online marketing campaigns to promote various products and services in the online space to acquire new customers, along with promoting new initiatives.
Taking its sports vertical to the next level, your Bank, in association with GoSports Foundation, supported 18 para-athletes, under its IndusInd Para Champions Programme. Your Bank launched ‘JeetkaHalla’, a high-impact multi-media campaign, to enlist support for the para-athletes. At the heart of the ‘JeetKaHalla’ campaign was a heart-warming and inspiring anthem that showcased the grit and spirit of the para-athletes. The campaign was launched to coincide with the Rio Paralympics 2016. The anthem evoked empathy and cheer for these para-athletes who were never spoken about. The campaign was publicized through an integrated media plan comprising online, social media, radio & cinema and a week of advertising on TV. On radio and TV (music channels), the anthem was played as a part of programming. For internal stakeholders, regular mailers were sent out to keep them abreast with the developments.
Another path breaking campaign which your Bank launched in association with Cricket Association for the Blind in India (CABI) was ‘TheOtherMenInBlue’ for the IndusInd Bank Indian Blind Cricket Team under the World Champions Programme – Cricket for the Blind. Advocating the
cause, IndusInd Bank aimed to garner support for, and generate passion and visibility for the defending champions in the T20 World Cup Cricket for the Blind, which was held from January 29, 2017 to February 12, 2017.
The campaign intended to showcase the fact that cricket, as a religion, needs to be all encompassing. While the nation focusses on and cheers for mainstream cricket, the visually-challenged cricketers also make the country just as proud, both on and off the field. They, too, require support andcheering while they represent their country at the highest level.
While digital marketing gathered momentum, conventional marketing formed the backbone of marketing activity of the Bank. A series of outdoor branding opportunities at strategic and premium locations were launched throughout the year to reinforce the brand messages.
The Bank conducted a series of short bursts of intense marketing activities – all in local flavour to reach out to the rural population. It continued to conduct below-the-line activities at branch levels that not only enhanced the reputation, image and recall value, but also established the Bank as a young, progressive and agile institution.
During the festive season, starting September 2016, your Bank launched an Asset Carnival viz. Loans Festival with attractive offerings on Personal Loans, Loans Against Property, Home Loans, Vehicle Loans and others. This, too, was a multi-media campaign with a robust mix of tactical advertising in outdoor and radio across major cities, and bursts on social media.
107

Several other communication initiatives were also undertaken by the Bank, like sponsorships / donations / events with reputed associations / trusts which garnered higher visibility and reinforced the brand image. Regular client engagement activities, debit and credit card
promotions, regional level promotions, branch promotions were some of the activities which lent further force to branding. Periodic concalls, one-on-one investor meetings, town-halls, roadshows and annual analysts meets have all created a positive impact on the Bank’s image.
The Bank has presence in all 29 States and 5 out of the 7 Union Territories. In addition, the Bank also has Representative Offices in London, Dubai and Abu Dhabi.
During the year 2016-17, apart from expanding its Branch network to reach pan-India network of 1,200 branches, the Bank also refurbished / re-modeled 5 branches and 6 Offices, set up 13 new Administrative Offices and relocated 5 branches towards better business prospects.
A total of 1,097 seats were added across India to
cater to growth in Back-Office / Controlling Office requirements, distinct from branch network capacity additions.
Apart from the Currency Chest set up in Kolkata during the last year, one more Currency Chest shall be ready for operation in Bengaluru during the current fiscal, and 2 more Currency Chests are proposed each in Chandigarh & Ahmedabad in the next fiscal, which are expected to significantly enhance in-house capabilities and provide support for increased business profitability.
THE BANK OPENED
200 NEW BRANCHES 116 OFF-SITE
ATMSduring the year 2016-17
1,162OFF-SITE ATMS
As on March 31, 2017, the Bank had a total network of
1,200BRANCHES
2,036ATMS, inclusive of
Branch Network & InfrastructureBranch Network & Infrastructure
Annual Report 2016-17
108

109
CORPORATE GOVERNANCE(The Report on Corporate Governance forms part of the Directors’ Report for the Financial Year ended March 31, 2017)
Bank’s Philosophy on Corporate Governance
independent Board.
Directors’ Report.
MISSION
VISION
QUALITY POLICY

Annual Report 2016-17
110
The B
website ( ).
Name of Director Nature of Directorship
Special Knowledge / Practical Experience
Occupation
Finance and General
Mrs. Kanchan Chitale
Retired. Former CMD of
Mr. Yashodhan M. Kale Corporate Governance,
Dr. T. T. Ram Mohan

111
March 29, 2017.
Name of the Director Attendance at the Board
Meetings (No. of
Meetings attended #)
Attendanceat the AGM held on July
1, 2016
Number of other Directorships
No. of Committees
of other companies
in which Member $ %
No. of Committees of
other companies in which
Chairperson $ %
Indian Public Limited
Companies
Other Companies /
LLPs1 2
Mrs. Kanchan Chitale 9 11
21 1
Mr. Yashodhan Kale 1 22 2
Dr. T. T. Ram Mohan* 2 2
Notes:
considered.
Committees.
Directors of private sector Banks, the Board of Directors have, on the basis of the recommendations of the
`

Annual Report 2016-17
112
`Directors.
Report.
Particulars Sitting Fees (in `) Remarks(a) Board of Directors 1,00,000
(c) For all other Board Committees 20,000
Name of Director Commission # (in `) Sitting Fee (in `)13,00,000
Mrs. Kanchan Chitale 10,00,000
10,00,000
10,00,000 17,00,000
10,00,000
Mr. Yashodhan Kale 10,00,000
10,00,000
Dr. T. T. Ram Mohan* 10,20,000
Notes:
#

113
approval of the Reserve Bank of India.
` `
` ` 1.72 lakhs, Mediclaim for self and
besides Mr. Yashodhan M. Kale.

Annual Report 2016-17
114
Terms of reference:
(B) Role

115

Annual Report 2016-17
116
Members Number of Meetings attended (includes attendance through videoconference)
Remarks
Mrs. Kanchan Chitale
Mr. Yashodhan Kale
.
Members Number of Meetings attended (includes attendance through videoconference)
Remarks
Mrs. Kanchan ChitaleDr. T. T. Ram Mohan
Members Number of Meetings attended (includes attendance through videoconference)
Remarks
Mrs. Kanchan Chitale

117
Members Number of Meetings attended RemarksDr. T. T. Ram Mohan
Mr. Yashodhan Kale
Ceased to be a member of
Members Number of Meetings attended RemarksMrs. Kanchan Chitale

Annual Report 2016-17
118
Members Number of Meetings attended Remarks

119
Members Number of Meetings attended RemarksMrs. Kanchan Chitale
For ‘Nomination’ matters:
For ‘Remuneration and HR’ matters:

Annual Report 2016-17
120
Members Number of Meetings attended (includes attendance through
videoconference)
Remarks
Mrs. Kanchan Chitale
Members Number of Meetings attended (includes attendance through
videoconference)
Remarks

121
Members Number of Meetings attended (includes attendance through
videoconference)
Remarks
Dr. T. T. Ram Mohan
Mr. Yashodhan Kale Ceased to be a member of the
Members Number of Meetings attended Remarks
Mr. Yashodhan Kale
have been attended to and resolved as on March 31, 2017.

Annual Report 2016-17
122
` 1 crore and above.
Members Number of Meetings attended RemarksMrs. Kanchan ChitaleMr. Yashodhan Kale
and March 29, 2017.
Members Number of Meetings attended Remarks
Mrs. Kanchan Chitale

123
Members Number of Meetings attended (includes attendance through videoconference)
Remarks
Mrs. Kanchan Chitale
Dr. T. T. Ram Mohan
The Terms and Conditions of appointment of Independent Directors have been hosted on the Bank’s website at the
Independent Directors, who had also reviewed the performance of the Board as a whole.

Annual Report 2016-17
124
Board as a whole.
time to time.

125
Details of the three previous Annual General Meetings:
AGM Day and Date Time Venue Whether Special Resolution Passed
22nd 2.00 p.m. Yes
21st 2.00 p.m. Yes
20th 2.00 p.m.
Annual General Meeting Date Resolutions22nd
21st
Independent Director.
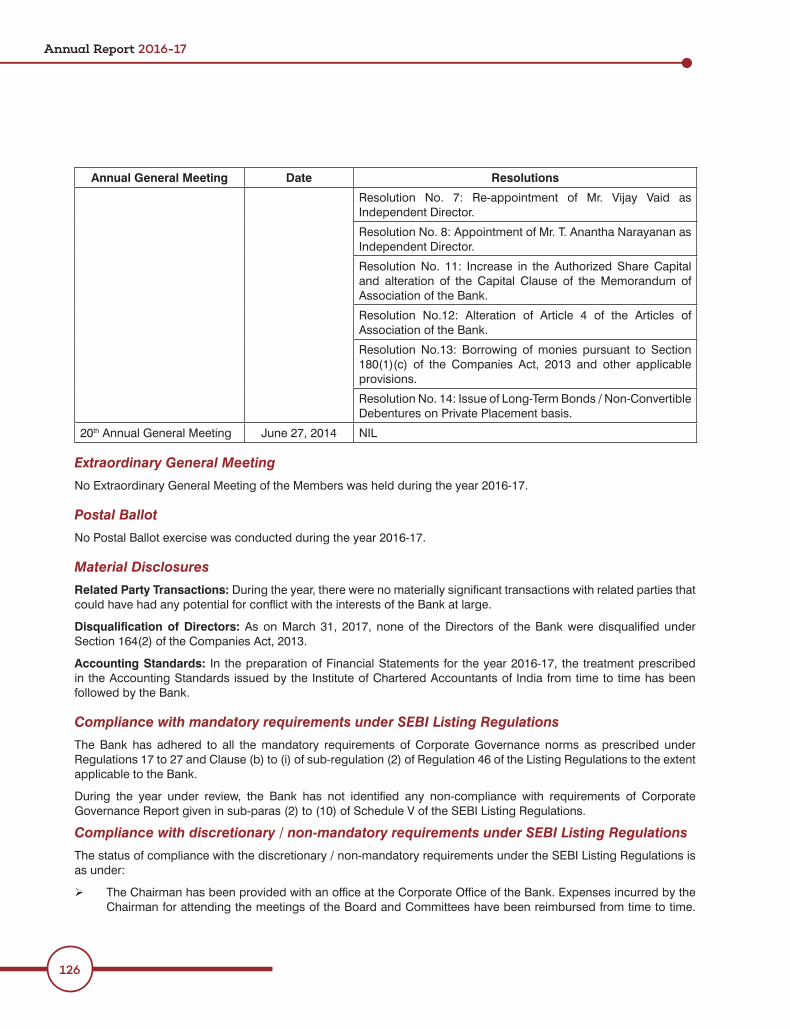
Annual Report 2016-17
126
Annual General Meeting Date Resolutions
Independent Director.
Independent Director.
provisions.
20th
Postal Ballot
Related Party Transactions:
Accounting Standards:
applicable to the Bank.

127
), which is accessible

Annual Report 2016-17
128
Bank’s website (
arts, sports and environmental conservation.

129
responsible manner.
responsible manner.
website
Registration No.CINFinancial YearBoard meeting for adoption of Audited Financial AccountsPosting of Annual Report 2016-17Day, Date and Time of 23rd Annual General MeetingVenue
Meridien)
Financial CalendarBook Closure
Date of Dividend PaymentBank’s Website

Annual Report 2016-17
130
Address for Correspondence
Distribution of Shareholding as on March 31, 2017
Range – Shares No. of Folios Percentage of Folios No. of shares Percentage of Shares
1,33,12,291 2.23
TOTAL 1,17,797 100.00 59,81,48,705 100.00
Outstanding GDRs / ADRs / Warrants or any Convertible Debentures, conversion date and likely impact on Equity
Disclosure of Commodity Price Risk or Foreign Exchange Risk and Hedging activities
Category No. of shares held % of shareholding8,95,97,767 14.98
B.
Sub Total 33,28,67,670 55.656,46,81,564 10.81

131
Category No. of shares held % of shareholding
0.12 Sub Total 11,10,01,704 18.56Grand Total 59,81,48,705 100.00
Sr. No.
Name of Shareholder No. of shares held % of shareholding
1 11.00
2
3
7 1.21
1.10
9
10 1.01
11 1.01
No. of shares held % of shareholding
of which GDRs
Details of complaints received and resolved from April 1, 2016 to March 31, 2017
Complaints Received Attended to Pending29 29 0
0
1 1 0
0
0
1 1 0
Total 157 157 0

Annual Report 2016-17
132
Listing details of the Bank’s Equity Shares / *Bonds / GDRs on Stock Exchanges
Name of the Stock Exchange Address of the Stock Exchange Stock Code No.
111202
are listed.
Date Price of Shares Turnover in ` Lakhs
Nifty Bank Nifty
Open (`) High (`) Low (`) Close (`)
1103.00
1173.00 1173.00
1201.00 1193.90 1232.901197.00 1221.00
0.00
5,000.00
10,000.00
15,000.00
20,000.00
25,000.00
30,000.00
35,000.00
40,000.00
1 Apr 2016 1 May 2016 1 Jun 2016 1 Jul 2016 1 Aug 2016 1 Sep 2016 1 Oct 2016 1 Nov 2016 1 Dec 2016 1 Jan 2017 1 Feb 2017 1 Mar 2017 31 Mar 20171 Apr 2016 1 May 2016 1 Jun 2016 1 Jul 2016 1 Aug 2016 1 Sep 2016 1 Oct 2016 1 Nov 2016 1 Dec 2016 1 Jan 2017 1 Feb 2017 1 Mar 2017 31 Mar 2017
(PLEASE NOTE - ACTUAL VALUES OF INDICES HAVE BEEN RETAINED IN TH E GRAPH. WHEREAS PRICE HAVE BEEN FACTORED FOR THE PURPOSE OF COMPARISON. THE PRICE HAVE BEEN MULTIPLIED BY 25.)
Share Price Comparison with NIFTY and Bank NIFTY
Ni�y Bank Ni�y Price (25X)
0.00
5,000.00
10,000.00
15,000.00
20,000.00
25,000.00
30,000.00
35,000.00
(PLEASE NOTE - ACTUAL VALUES OF INDICES HAVE BEEN RETAINED IN TH E GRAPH. WHEREAS PRICE HAVE BEEN FACTORED FOR THE PURPOSE OF COMPARISON. THE PRICE HAVE BEEN MULTIPLIED BY 5.)
Share Price Comparison with NSE Turnover in Lakhs
Turnover(₹ Lakhs)
Price (5X)

133
Date Price of Shares Turnover in ` Lakhs
SENSEX BANKEXOpen (`) High (`) Low (`) Close (`)
1103.901100.10 1100.10 1123.00
1200.00 1232.20 22397.101219.10
1073.001112.70
22927.39
0.00
5,000.00
10,000.00
15,000.00
20,000.00
25,000.00
30,000.00
35,000.00
40,000.00
(PLEASE NOTE - ACTUAL VALUES OF INDICES HAVE BEEN RETAINED IN TH E GRAPH. WHEREAS PRICE HAVE BEEN FACTORED FOR THE PURPOSE OF COMPARISON. THE PRICE HAVE BEEN MULTIPLIED BY 25.)
Share Price Comparison with SENSEX and BANKEX
SENSEX BANKEX Price (25X)
0.00
500.00
1,000.00
1,500.00
2,000.00
2,500.00
3,000.00
3,500.00
4,000.00
4,500.00
5,000.00
Share Price Comparison with BSE Turnover in Lakhs
Turnover(₹ Lakhs)
Price
1 Apr 2016 1 May 2016 1 Jun 2016 1 Jul 2016 1 Aug 2016 1 Sep 2016 1 Oct 2016 1 Nov 2016 1 Dec 2016 1 Jan 2017 1 Feb 2017 1 Mar 2017 31 Mar 2017
1 Apr 2016 1 May 2016 1 Jun 2016 1 Jul 2016 1 Aug 2016 1 Sep 2016 1 Oct 2016 1 Nov 2016 1 Dec 2016 1 Jan 2017 1 Feb 2017 1 Mar 2017 31 Mar 2017
Particulars No. of Shares Percentage (%)
Total 59,81,48,705 100

Annual Report 2016-17
134
`
Registrar & Share Transfer Agent

135
Mr. Raghunath PoojarySecretarial & Investor Services Cell
Modes of making payment of Dividend through Electronic mode:

Annual Report 2016-17
136
Year Type of dividend Date of declaration of Dividend
Due date for availing unclaimed Dividend
FinalFinalFinalFinalFinalFinalFinal
Transfer of ‘Underlying Shares’ in respect of which dividend has not been claimed for seven consecutive years or more, to the Investor Education and Protection Fund (IEPF)
Details of shares lying in Unclaimed Suspense Account as on March 31, 2017, are as follows:
Particulars Folios Shares
0 0
Closing Balance as on March 31, 2017 801 2,69,976

137
Declaration on compliance with the Code of Ethics and Conduct for Directors and Senior Management
ended March 31, 2017.
For IndusInd Bank Limited
Place: Mumbai Romesh Sobti Date: May 9, 2017 Managing Director & CEO

Annual Report 2016-17
138
To the Members of IndusInd Bank LimitedReport on the Standalone Financial Statements
Management’s Responsibility for the Financial Statements
Auditors’ Responsibility
Opinion
Independent Auditors’ Report

139
Report on Other Legal and Regulatory Requirements
For Price Waterhouse Chartered Accountants LLP
Russell I Parera

Annual Report 2016-17
140
Report on the Internal Financial Controls under Clause (i) of Sub-section 3 of Section 143 of the Act
ended on that date.
Management’s Responsibility for Internal Financial Controls
Auditors’ Responsibility
Meaning of Internal Financial Controls Over Financial Reporting
Annexure A to Independent Auditors’ Report

141
Inherent Limitations of Internal Financial Controls Over Financial Reporting
procedures may deteriorate.
Opinion
For Price Waterhouse Chartered Accountants LLP
Russell I Parera

Annual Report 2016-17
142
Balance Sheet as at March 31, 2017
`
As at 31.03.2017
As at 31.03.2016
CAPITAL AND LIABILITIES
1
TOTAL 178648,41,38 142896,99,28
ASSETS
6
8
11
TOTAL 178648,41,38 142896,99,28
18
For INDUSIND BANK LTD.
For Price Waterhouse Chartered Accountants LLP R. SeshasayeeChairman
T. Anantha NarayananDirectorChartered Accountants
Russell I Parera Romesh SobtiPartner Managing Director
S. V. Zaregaonkar Haresh Gajwani Company Secretary

143
For INDUSIND BANK LTD.
For Price Waterhouse Chartered Accountants LLP R. SeshasayeeChairman
T. Anantha NarayananDirectorChartered Accountants
Russell I Parera Romesh SobtiPartner Managing Director
S. V. Zaregaonkar Haresh Gajwani Company Secretary
Profit and Loss Account for the year ended March 31, 2017
`Year ended Year ended31.03.2017 31.03.2016
I. INCOME
TOTAL 18577,16,25 15168,68,99II. EXPENDITURE
16
TOTAL 15709,26,98 12882,23,98III. PROFIT
TOTAL 7881,34,59 5950,46,66IV. APPROPRIATIONS
TOTAL 7881,34,59 5950,46,66V. EARNINGS PER EQUITY SHARE
``
`
18

Annual Report 2016-17
144
Cash Flow Statement for the year ended March 31, 2017`
Year ended 31.03.2017
Year ended 31.03.2016
A. Cash Flow from Operating Activities4359,68,85 3469,26,11
Adjustments for :
5720,37,15 4329,50,46 Adjustments for :
Cash generated from / (used in) Operations 13454,07,90 (1578,08,46)
Net Cash generated from / (used in) Operating Activities 11569,30,19 (2926,92,56)
B. Cash Flow from Investing Activities
Net Cash used in Investing Activities (273,63,73) (257,51,48)
C. Cash Flow from Financing Activities
Net Cash generated from / (used in) Financing Activities (2768,25,37) 2517,17,00 (11,02,82) -
Net Increase / (Decrease) in Cash and Cash Equivalents 8516,38,27 (667,27,04)
Cash and Cash Equivalents at the beginning of the year 10111,87,15 10779,14,19 Cash and Cash Equivalents at the end of the year 18628,25,42 10111,87,15
Notes:
For INDUSIND BANK LTD.
For Price Waterhouse Chartered Accountants LLP R. SeshasayeeChairman
T. Anantha NarayananDirectorChartered Accountants
Russell I Parera Romesh SobtiPartner Managing Director
S. V. Zaregaonkar Haresh Gajwani Company Secretary

145
Schedules` in ’000s
As at 31.03.2017 As at 31.03.2016SCHEDULE - 1 CAPITAL
Authorised Capital
70,00,00,000 (previous year 70,00,00,000) equity shares of ` 10 each 700,00,00 700,00,00
Issued, Subscribed and Called up Capital
59,81,48,705 (previous year 59,49,86,335) equity shares of ` 10 each 598,14,87 594,98,63
Paid up Capital
59,81,48,705 (previous year 59,49,86,335) equity shares of ` 10 each 598,14,87 594,98,63
[Refer Schedule 18 (Note 1.1)]
TOTAL 598,14,87 594,98,63
SCHEDULE - 2 RESERVES AND SURPLUS
I Statutory Reserve
Opening balance 2205,79,68 1634,18,43
Additions during the year 716,97,32 571,61,25
2922,77,00 2205,79,68
II Share Premium Account
Opening balance 9274,10,55 4211,93,46
Additions during the year 95,31,50 5112,84,48
Less: Share issue expenses - (50,67,39)
9369,42,05 9274,10,55
III General Reserve
Balance as at the end of the year 1,35,57 1,35,57
1,35,57 1,35,57
IV Capital Reserve
Opening balance 170,21,21 157,00,21
Additions during the year 45,53,66 13,21,00
215,74,87 170,21,21
V Investment Allowance Reserve
Balance as at the end of the year 1,00,00 1,00,00
1,00,00 1,00,00
VI Investment Reserve Account
Balance as at the end of the year 40,52,98 40,52,98
40,52,98 40,52,98

Annual Report 2016-17
146
` in ’000sAs at 31.03.2017 As at 31.03.2016
VII Revaluation Reserve Opening balance 380,76,96 391,00,81 Deductions during the year (6,17,53) (10,23,85)
374,59,43 380,76,96VIII Foreign Currency Translation Reserve Opening balance - - Debits during the year (11,02,82) -
(11,02,82) - 7118,38,07 5013,45,32
TOTAL 20032,77,15 17087,22,27
SCHEDULE - 3 DEPOSITSA I Demand Deposits i) From Banks 991,32,40 567,66,73 ii) From Others 18617,48,76 14910,35,03 II Savings Bank Deposits 27037,23,23 17246,24,53 III Term Deposits i) From Banks 7328,65,30 5001,20,36 ii) From Others 72597,52,59 55274,87,96
TOTAL 126572,22,28 93000,34,61B Deposits of Branches I In India 126572,22,28 93000,34,61 II Outside India - -
TOTAL 126572,22,28 93000,34,61
SCHEDULE - 4 BORROWINGSI Borrowings in India i) Reserve Bank of India - 2840,00,00 ii) Other Banks 2367,48,93 4769,68,99 iii) Other Institutions and Agencies 13500,00,00 14622,75,24 iv) Unsecured Non-Convertible Redeemable Non-Cumulative Bonds (Subordinated Upper Tier-2 Bonds)
- 308,90,00
v) Long Term Infrastructure Bonds 2000,00,00 500,00,00 vi) Unsecured Non-Convertible Perpetual Non-Cumulative Bonds (Subordinated Debt qualifying as Additional Tier 1 Capital)
1000,00,00 -
II Borrowings outside India 3586,20,50 1954,52,25TOTAL 22453,69,43 24995,86,48
Secured borrowings included in I & II above - -
Schedules (Contd.)

147
` in ’000sAs at 31.03.2017 As at 31.03.2016
SCHEDULE - 5 OTHER LIABILITIES AND PROVISIONSI 242,39,32 126,86,21
II Bills Payable 600,34,85 520,03,19
III Interest Accrued 947,61,27 789,19,18
IV Proposed Dividend [Refer Schedule 18 (Note 12.4)] - 322,25,01
V Others [Refer Schedule 18 (Note 4.11) for Standard Assets Provisions]
7186,02,14 5446,47,06
TOTAL 8976,37,58 7204,80,65SCHEDULE - 6 CASH AND BALANCES WITH RESERVE BANK OF INDIAI Cash in hand (including foreign currency notes) 1135,52,11 739,52,90
II Balances with Reserve Bank of India
i) In Current Account 6613,22,60 3781,51,15
ii) In Other Accounts - -
TOTAL 7748,74,71 4521,04,05SCHEDULE - 7 BALANCES WITH BANKS AND MONEY AT CALL AND SHORT NOTICEI In India i) Balances with Banks
a) In Current Accounts 323,86,22 454,27,01
b) In Other Deposit Accounts 2333,96,50 3059,52,75
ii) Money at Call and Short Notice - With Other Institutions 6300,00,00 -
TOTAL 8957,82,72 3513,79,76II Outside India
i) In Current Accounts 467,74,28 751,93,34
ii) In Other Deposit Accounts 805,43,70 -
iii) Money at Call and Short Notice 648,50,01 1325,10,00
TOTAL 1921,67,99 2077,03,34GRAND TOTAL 10879,50,71 5590,83,10
SCHEDULE - 8 INVESTMENTSI In India Gross Value 36789,86,48 34110,67,74
Less : Aggregate of provision / depreciation 87,72,66 56,36,27
Net value of Investments in India 36702,13,82 34054,31,47
Schedules (Contd.)

Annual Report 2016-17
148
` in ’000sAs at 31.03.2017 As at 31.03.2016
Comprising :
i) Government securities* 31452,34,18 28108,03,95
ii) Other approved securities - -
iii) Shares 161,24,61 41,32,83
iv) Debentures and bonds 2524,57,26 1812,88,69
v) Subsidiaries and / or Joint Ventures - -
schemes of Mutual Funds, Venture Capital Funds and Others2563,97,77 4092,06,00
II Outside India - -
TOTAL 36702,13,82 34054,31,47
*Includes securities of ` 275.02 crores (previous year ` 403.18 crores) pledged for clearing facility and margin requirements.
SCHEDULE - 9 ADVANCES
A i) Bills Purchased and Discounted 4031,26,82 869,52,78
ii) Cash Credits, Overdrafts and Loans Repayable on Demand 33010,05,62 23144,94,88
iii) Term Loans 76039,18,32 64404,86,53
TOTAL 113080,50,76 88419,34,19
B i) Secured by Tangible Assets (includes advances against book debts)
96573,78,66 76778,24,12
ii) Covered by Bank / Government Guarantees (includes advances against L/Cs issued by Banks)
2215,14,18 1125,55,91
iii) Unsecured 14291,57,92 10515,54,16
TOTAL 113080,50,76 88419,34,19
C I) Advances in India
i) Priority Sector 34821,02,43 28066,51,54
ii) Public Sector 1655,03,58 808,25,51
iii) Banks 48,08 29,69
iv) Others 74886,79,76 59544,27,45
TOTAL 111363,33,85 88419,34,19
II) Advances Outside India 1717,16,91 -
TOTAL 113080,50,76 88419,34,19
Schedules (Contd.)

149
` in ’000sAs at 31.03.2017 As at 31.03.2016
SCHEDULE - 10 FIXED ASSETSI Premises i) At cost, as at the beginning of the year 590,01,82 595,92,11 ii) Additions during the year - -
590,01,82 595,92,11 iii) Less : Deductions during the year 3,43,11 5,90,29 iv) Less : Depreciation to date [Refer Schedule No. 18(9.14)] 74,95,41 66,72,06
TOTAL 511,63,30 523,29,76
i) At cost, as at the beginning of the year 1465,63,13 1232,41,88 ii) Additions during the year 296,22,64 269,56,04
1761,85,77 1501,97,92 iii) Less : Deductions during the year 26,48,75 36,34,79 iv) Less : Depreciation to date [Refer Schedule 18 (Note 9.14)] 940,20,75 771,08,26
TOTAL 795,16,27 694,54,87III Capital Work in Progress 28,43,71 37,47,76
GRAND TOTAL 1335,23,28 1255,32,39SCHEDULE - 11 OTHER ASSETSI Interest Accrued 917,41,89 962,60,98II Tax paid in advance / Tax deducted at source (net of provision) 686,69,35 456,98,06III Stationery and Stamps 1,54,43 40,35IV Non-banking assets acquired in satisfaction of claims 29,68,73 45,52,82V Others [Deferred Tax Assets (Refer Schedule 18 (Note 11.6))] 7266,93,70 7590,61,87
TOTAL 8902,28,10 9056,14,08
SCHEDULE - 12 CONTINGENT LIABILITIESI Claims against the Bank not acknowledged as debts 522,68,84 648,59,09II Liability on account of outstanding Forward Exchange Contracts 215013,20,26 143761,31,22III Liability on account of outstanding Derivative Contracts 138028,58,33 99741,53,69IV Guarantees given on behalf of constituents - In India 38903,46,44 32722,19,60 - Outside India 60,82,61 - V Acceptances, Endorsements and Other Obligations 12739,47,55 6512,09,48
VI Other Items for which the Bank is contingently liable 1118,95,12 1715,59,00
TOTAL 406387,19,15 285101,32,08
Schedules (Contd.)

Annual Report 2016-17
150
` in ’000sYear ended 31.03.2017
Year ended 31.03.2016
SCHEDULE - 13 INTEREST EARNEDI Interest / Discount on Advances / Bills 11479,10,87 9244,55,57II Income on Investments 2466,88,91 2067,02,24III Interest on Balances with RBI and Other Inter-Bank Funds 330,83,18 413,19,79IV Others 128,84,07 146,96,77
TOTAL 14405,67,03 11871,74,37
SCHEDULE - 14 OTHER INCOMEI Commission, Exchange and Brokerage 2895,34,09 2231,47,71
276,91,92 145,25,653,14,57 6,98,95
919,51,71 836,99,93V Income earned by way of dividend from companies in India 30,80 3,39,65VI Miscellaneous Income 76,26,13 72,82,73
TOTAL 4171,49,22 3296,94,62SCHEDULE - 15 INTEREST EXPENDEDI Interest on Deposits 6931,27,54 5708,78,69II Interest on Reserve Bank of India / Inter-Bank Borrowings 341,28,83 563,49,00III Other Interest 1070,50,24 1082,89,44
TOTAL 8343,06,61 7355,17,13SCHEDULE - 16 OPERATING EXPENSESI Payments to and Provisions for Employees 1521,02,16 1236,08,80II Rent, Taxes and Lighting (includes operating lease rentals) 326,56,01 271,32,58III Printing and Stationery 63,06,99 49,45,74IV Advertisement and Publicity 50,33,60 21,01,43V Depreciation on Bank's Property 190,69,88 156,51,93VI Directors' Fees, Allowances and Expenses 2,71,53 1,30,95VII Auditors' Fees and Expenses 2,08,63 1,42,24VIII Law Charges 42,42,54 44,76,42IX Postage, Telegrams, Telephones, etc. 134,78,55 111,00,91X Repairs and Maintenance 255,14,69 201,67,45XI Insurance 137,57,00 103,35,29XII Service Provider Fees 381,26,30 334,39,88XIII Other Expenditure 1675,39,70 1139,76,47
TOTAL 4783,07,58 3672,10,09
Schedules (Contd.)

151
1. General 1.1 IndusInd Bank Limited (“the Bank”) was incorporated in 1994 under the Companies Act, 1956 and is
licensed by the Reserve Bank of India (RBI) to operate as a commercial bank under the Banking Regulation
to corporate and retail clients besides undertaking treasury operations. The Bank operates in India including at the International Financial Service Centres in India, and does not have a branch in any foreign country.
where otherwise stated, and in accordance with statutory requirements prescribed under the Banking Regulation Act, 1949, circulars and guidelines issued by RBI from time to time (RBI guidelines), accounting standards referred to in Section 133 of the Companies Act, 2013 (the Act) and practices prevailing within the banking industry in India.
in India requires management to make estimates and assumptions that affect the reported amounts of
statements. Management believes that the estimates and assumptions used in the preparation of the
prospectively in current and future periods.
2. Transactions involving Foreign Exchange 2.1 Monetary assets and liabilities of domestic and integral foreign operations denominated in foreign currency
Loss account.
2.2 Non-monetary items which are carried in terms of historical cost denominated in a foreign currency are reported using the exchange rate at the date of the transaction; and non-monetary items which are carried at fair value or other similar valuation denominated in a foreign currency are reported using the exchange rates that existed when the values were determined.
2.3 Both monetary and non-monetary assets and liabilities of non-integral foreign operations are translated
Association of India (‘FEDAI’) and the resulting gains or losses are accumulated in the foreign currency translation reserve until disposal of the net investment in the non-integral foreign operation.
2.4 All foreign exchange contracts outstanding at the Balance Sheet date are re-valued on present value basis
2.5 Swap Cost arising on account of foreign currency swap contracts to convert foreign currency funded
head ‘Interest – Others’ over the underlying swap period.
2.6 Income and expenditure of domestic and integral foreign operations denominated in a foreign currency is translated at the rates of exchange prevailing on the date of the transaction. Income and expenditure of non-integral foreign operations is translated at quarterly average closing rates.
2.7 Contingent liabilities at the Balance Sheet date on account of outstanding forward foreign exchange contracts, guarantees, acceptances, endorsements and other obligations denominated in a foreign
Schedule 17 Significant Accounting Policies

Annual Report 2016-17
152
3. Investments
3.1 Categorisation of Investments:
(i) Held to Maturity (HTM) – Securities acquired with the intention to hold till maturity.
(ii) Held for Trading (HFT) – Securities acquired with the intention to trade.
(iii) Available for Sale (AFS) – Securities which do not fall within the above two categories.
Subsequent shifting amongst the categories is done in accordance with RBI guidelines.
(i) Government Securities, (ii) Other Approved Securities, (iii) Shares, (iv) Debentures and Bonds, (v) Investments in Subsidiaries and Joint Ventures, and (vi) Other Investments.
3.3 Acquisition cost:
(i) Broken period interest on debt instruments is treated as a revenue item.
(ii) Brokerage, commission, etc. pertaining to investments, paid at the time of acquisition is charged to
(iii) Cost of investments is computed based on the weighted average cost method.
3.4 Valuation of Investments:
(i) Held to Maturity – Each security in this category is carried at its acquisition cost. Any premium on
Diminution, other than temporary, is determined and provided for each investment individually.
(ii) Held for Trading – Securities are valued scrip-wise and depreciation / appreciation is aggregated
provided for.
(iii) Available for Sale – Securities are valued scrip-wise and depreciation / appreciation is aggregated
provided for.
(iv) Market value of government securities (excluding treasury bills) is determined on the basis of the
Money Market and Derivatives Association (FIMMDA).
(v) Treasury bills are valued at carrying cost, which includes discount amortised over the period to maturity.
(vi) Fair value of other debt securities is determined based on the yield curve and spreads provided by FIMMDA.
(vii) Quoted equity shares are valued at lower of cost and the closing price on a recognised stock exchange. Unquoted equity shares are valued at their break-up value or at ̀ 1/- per company where the latest Balance Sheet is not available.

153
(viii) Units of the schemes of mutual funds are valued at the lower of cost and Net Asset Value (NAV) provided by the respective schemes of mutual funds.
(ix) Investments in equity shares held as long-term investments by erstwhile IndusInd Enterprises & Finance Limited and Ashok Leyland Finance Limited (since merged with the Bank) are valued at
long-term investments is made only if the diminution in value is not temporary in the opinion of management.
(x) Security Receipts (SR) are valued at the lower of redemption value and NAV obtained from the Securitisation Company (SC) / Reconstruction Company (RC).
(xi) Purchase and sale transaction in securities are recorded under Settlement Date method of accounting, except in the case of the equity shares where Trade Date method of accounting is followed.
(xii) Provision for non-performing investments is made in conformity with RBI guidelines.
(xiii) Repurchase (Repo) and Reverse Repurchase (Reverse Repo) transactions (including transactions
and lending respectively. On completion of the second leg of the Repo or Reverse Repo transaction, the difference between the consideration amounts is reckoned as Interest Expenditure or Income, as the case may be. Amounts outstanding in Repo and Reverse Repo account as at the Balance Sheet date is shown as part of Borrowings and Money at Call and at Short Notice respectively, and
account.
(xiv) In respect of the short sale transactions in Central Government dated securities, the short position is covered by outright purchase of an equivalent amount of the same security within a maximum
account.
Investments and an equivalent amount (net of taxes, if any, and net of transfer to Statutory Reserves
Capital Reserve account.
account and an equivalent amount (net of taxes, if any, and net of transfer to Statutory Reserves as applicable to such excess provisions) is appropriated to an Investment Reserve Account (IRA).
when required.
initial period of three years and valued at cost as per RBI guidelines. Units of VCF held under AFS category where current quotations are not available are marked to market based on the Net Asset Value (NAV)
available for a period beyond 18 months, the investments are valued at ` 1/- per VCF.

Annual Report 2016-17
154
4. Derivatives Derivative contracts are designated as hedging or trading and accounted for as follows:
4.1 The hedging contracts comprise of Forward Rate Agreements, Interest Rate Swaps, and Currency Swaps undertaken to hedge interest rate and currency risk on certain assets and liabilities. The net interest
hedge is designated with an asset or liability that is carried at market value or lower of cost and market value, then the hedging instrument is also marked to market with the resulting gain or loss recorded as an
4.2 The trading contracts comprise of trading in Interest Rate Swaps, Interest Rate Futures and Currency
and Loss account. Trading contracts outstanding as at the Balance Sheet date are re-valued at their fair
4.3 Gains or losses on the termination of hedge swaps is deferred and recognised over the shorter of the remaining life of the hedge swap or the remaining life of the underlying asset / liability.
4.5 Fair value of derivative is determined with reference to bid / asks quoted market price or by using valuation models. Where the fair value is calculated using valuation models, the methodology is to calculate the
the present value. The valuation takes into consideration all relevant market factors (e.g. prices, interest rate, currency exchange rates, volatility, liquidity etc.). Most market parameters are either are directly observable or are implied from instrument prices. The model may perform numerical procedures in the pricing such as interpolation when input values do not directly correspond to the most actively traded market trade parameters.
4.6 Provisioning of overdue customer receivable on derivative contracts is made as per RBI guidelines.
5. Advances
considering subsequent recoveries to date.
guidelines. In addition the Bank considers accelerated provisioning based on past experience, evaluation of securities and other related factors.
5.3 A general provision on standard assets is made in accordance with RBI guidelines. Provision made against standard assets is included in ‘Other Liabilities and Provisions’.
5.4 Advances are disclosed in the Balance Sheet, net of provisions and interest suspended for non-performing
bills rediscounted.
5.6 Amounts recovered during the year against bad debts written off in earlier years are recognised in the
5.7 Provision no longer considered necessary in the context of the current status of the borrower as a

155
5.8 For restructured / rescheduled assets, provision is made in accordance with the guidelines issued by RBI, which requires the diminution in the fair value of the assets to be provided at the time of restructuring. The
wherever allowed.
6. Securitisation transactions and direct assignments
6.1 The Bank transfers its loan receivables both through Direct Assignment route as well as transfer to Special Purpose Vehicles (‘SPV’).
receivables are de-recognised as and when these are sold (true sale criteria being fully met) and the consideration has been received by the Bank. Gains / losses are recognised only if the Bank surrenders
issued by the Special Purpose Vehicles (SPV). Any loss arising on account of the sale is recognised in the
accordance with applicable RBI guidelines. Generally, the sale is recognised at the lower of redemption
7. Property, Plant and Equipment
7.1 Fixed assets are stated at cost (except in the case of premises which were re-valued based on values determined by approved valuers) less accumulated depreciation and impairment, if any. Cost includes incidental expenditure incurred on the assets before they are ready for intended use.
7.2 The appreciation on account of revaluation is credited to Revaluation Reserve. Depreciation relating to
7.3 Depreciation is provided over the useful life of the assets, pro rata for the period of use, on a straight-line method. The useful life estimates prescribed in Part C of Schedule II to the Companies Act, 2013 are generally adhered to, except in respect of asset classes where, based on technical evaluation, a different estimate of useful life is considered suitable. Pursuant to this policy, the useful life estimates in respect of the following assets are as follows:
(a) Computers at 3 years.
(b) Application software and perpetual software licences at 5 years.
(c) Printers, Scanners, Routers, Switch at 5 years.
(d) ATMs at 7 years.
(f) Vehicles at 5 years.
(g) Buildings at 60 years.

Annual Report 2016-17
156
The useful life of an asset class is periodically assessed taking into account various criteria such as
with intended user needs, etc. Whenever there is a revision in the estimated useful life of an asset, the unamortised depreciable amount is charged over the revised remaining useful life of the said asset.
indications of impairment based on internal / external factors. In case of impaired assets, the impairment loss i.e. the amount by which the carrying amount of the asset exceeds its recoverable value is charged to
amount.
8. Revenue Recognition 8.1 Interest and discount income on performing assets is recognised on accrual basis. Interest and discount
income on non-performing assets is recognised on realisation.
proportion basis. Income on discounted instruments is recognised over the tenor of the instrument on a constant Yield to Maturity method.
8.3 Dividend income is accounted on accrual basis when the right to receive dividend is established.
8.4 Commission (except for commission on Deferred Payment Guarantees which is recognised over the term on a straight line basis), Exchange and Brokerage are recognised on a transaction date and net of directly attributable expenses.
8.5 Fees are recognised on an accrual basis when binding obligation to recognise the fees has arisen as per agreement, except in cases where the Bank is uncertain of realisation.
8.6 Income from distribution of third party products is recognised on the basis of business booked.
9. Operating Leases
account on a straight-line basis over the lease term.
on the basis of actuarial valuation at the Balance Sheet date. The present value of the obligation under
the Group Gratuity scheme are managed through purchase of appropriate policies from insurers.
10.2 Provident Fund contributions are made under trusts separately established for the purpose and the scheme administered by Regional Provident Fund Commissioner (RPFC), as applicable. The rate at which
The Bank has an obligation to make good the shortfall, if any, between the return from the investments of
as per the guidance note on Valuation of Interest Rate Guarantees on Exempt Provident Funds under AS 15 (Revised) issued by the Institute of Actuaries of India, and such shortfall, if any, is provided for.

157
10.3 Provision for compensated absences is made on the basis of actuarial valuation as at the Balance Sheet
10.4 Intrinsic value method is applied to account for the compensation cost of ESOP granted to the employees of the Bank. Intrinsic value is the amount by which the quoted market price of the underlying shares on the
over the vesting period.
11. Segment Reporting In accordance with the guidelines issued by RBI, the Bank has adopted Segment Reporting as under:
exchange transactions, equities, income from derivatives and money market operations. The expenses of this segment consist of interest expenses on funds borrowed from external sources as well as internal
earnings and expenses of the segment.
expenses of the segment.
(d) Other Banking Operations includes all other operations not covered under Treasury, Corporate / Wholesale Banking and Retail Banking.
Unallocated includes Capital and Reserves, Employee Stock Options (Grants) Outstanding and other unallocable assets, liabilities, income and expenses.
12. Debit and Credit Card reward points liability The liability towards Credit Card reward points is computed based on an actuarial valuation and the liability
towards Debit Card reward points is computed on the basis of management estimates considering past trends.
13. Bullion13.1 The Bank imports bullion including precious metal bars on a consignment basis for selling to its customers.
The imports are on a back-to-back basis and are priced to the customer based on the prevailing price
earned is included in commission income.
13.2 The Bank sells gold coins to its customers. The difference between the sale price to customers and
14. Income-tax
Tax expenses comprise of current and deferred taxes. Current tax is measured at the amount expected to be
current year timing differences between taxable income and accounting income for the year and reversal of timing differences of earlier years. Deferred tax is measured based on the tax rates and the tax laws enacted or substantively enacted at the Balance Sheet date. Deferred tax assets are recognised, in general, only to the

Annual Report 2016-17
158
under tax laws, deferred tax assets are recognised only if there is virtual certainty supported by convincing
assets of earlier years are re-assessed and recognised to the extent that it has become reasonably certain that
15. Earnings per share
by the weighted average number of equity shares outstanding during the period. Diluted earnings per equity share are computed using the weighted average number of equity shares and dilutive potential equity shares outstanding as at end of the year.
16. Provisions, contingent liabilities and contingent assets16.1 A provision is recognised when there is an obligation as a result of past event, and it is probable that an
be made. Provisions are not discounted to their present value and are determined based on best estimate required to settle the obligation at the Balance Sheet date. These are reviewed at each Balance Sheet date
16.2 A disclosure of contingent liability is made when there is:
(a) A possioccurrence or non-occurrence of one or more uncertain future events not within the control of the bank; or
(b) A present obligation arising from a past event which is not recognised as it is not probable that an
the obligation cannot be made.
resources is remote, no provision or disclosure is made.
and related income are recognised in the period in which the change occurs.
17. Cash and Cash equivalents
Money at Call and Short Notice.

159
1. Capital:
1.1 Capital Issue:
During the year ended March 31, 2017, 31,62,370 equity shares aggregating to ` 96.62 crores were allotted on various dates to the employees who exercised their stock options.
equity shares of ` 10/- each were allotted at a price of ` ` ` 10/- each at a
price of ` ` `
who exercised their stock options.
1.2 Capital Adequacy Ratio:
`
No. Particulars March 31, 2017 March 31, 20161.
2. Tier 1 capital ratio
3. Tier 2 capital ratio
96.62
6. 1,000.00 -
- -
1,000.00 -
7. - -
- -
- -
Schedule 18 Notes forming part of the financial statements

Annual Report 2016-17
160
2. Investments:
2.1 Details of Investments:
`
No. Particulars March 31, 2017 March 31, 2016
- -
- -
- -
Movement in provisions held towards depreciation on
31.36
the year- -
2.2 Category wise details of Investments (Net of provision for depreciation):
`
No. Particulars As at March 31, 2017 As at March 31, 2016HTM AFS HFT HTM AFS HFT
- 7,969.71 -
- - - - - -
- -
- - - -
Ventures- - - - - -
investment in units of Mutual
Venture Capital, etc.
- 20.00 -
Total 26,331.38 10,370.76 - 20,163.07 13,891.24 -
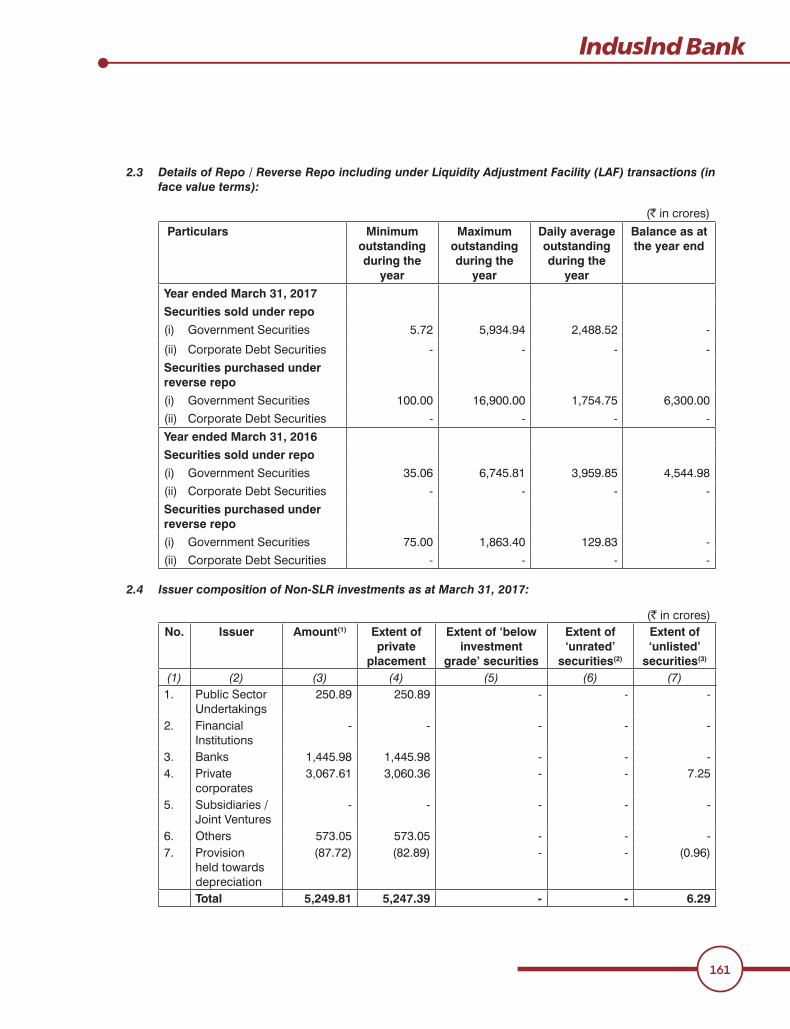
161
2.3 Details of Repo / Reverse Repo including under Liquidity Adjustment Facility (LAF) transactions (in face value terms):
`
Particulars Minimum outstanding during the
year
Maximum outstanding during the
year
Daily average outstanding during the
year
Balance as at the year end
Year ended March 31, 2017 Securities sold under repo
-
- - - -Securities purchased under reverse repo
100.00 16,900.00 6,300.00- - - -
Year ended March 31, 2016Securities sold under repo
- - - -Securities purchased under reverse repo
-- - - -
2.4 Issuer composition of Non-SLR investments as at March 31, 2017:
`No. Issuer Amount(1) Extent of
private placement
Extent of ‘below investment
grade’ securities
Extent of ‘unrated’
securities(2)
Extent of ‘unlisted’
securities(3)
(1) (2) (3) (4) (5) (6) (7)1.
Undertakings- - -
2. Financial - - - - -
3. Banks - - -
corporates3,067.61 3,060.36 - -
- - - - -
6. - - -7.
held towards depreciation
- -
Total 5,249.81 5,247.39 - - 6.29

Annual Report 2016-17
162
Issuer composition of Non-SLR investments as at March 31, 2016:
`No. Issuer Amount(1) Extent of
private placement
Extent of ‘below investment
grade’ securities
Extent of ‘unrated’
securities(2)
Extent of ‘unlisted’
securities(3)
(1) (2) (3) (4) (5) (6) (7)1.
Undertakings- - -
2. Financial - - -
3. Banks 2,600.70 2,600.70 - - -
corporates- - 12.00
- - - - -
6. - - -7.
held towards depreciation
- -
Total 5,946.28 5,938.38 - - 9.75
2.5 Non-performing Non-SLR investments:
`
Particulars Year endedMarch 31, 2017
Year endedMarch 31, 2016
2.26 2.2611.20 -11.20 -
2.26 2.26Total provisions held 2.26 2.26
2.6 Sale / transfer from HTM category: During the year and the previous year, the value of sales and transfer of securities to / from HTM category,

163
3. Derivatives:3.1 Interest Rate Swaps, Forward Rate Agreements and Cross Currency Swaps:
`
No. Particulars As at March 31, 2017
As at March 31, 2016
- -
197.70
`Nature No. Notional
PrincipalBenchmark Terms
Trading 163Trading 131Trading 301TradingTrading 1TradingTrading 112TradingTrading 1
12
`Nature No. Notional
PrincipalBenchmark Terms
Merchant and Cover 1Merchant and Cover 1Merchant and Cover 1 3.06 Merchant and Cover 1 3.06 Trading 97Trading 66TradingTradingTradingTrading 22TradingTrading 9,026.66 Trading 1

Annual Report 2016-17
164
`Nature No. Notional
PrincipalBenchmark Terms
Merchant and Cover 2
Merchant and Cover 2
Merchant and Cover 6
Merchant and Cover 239.06
Trading
Trading
Trading 3
Trading 2
Trading 107
Trading 3
Trading 2,997.09
Trading 2 61.37
Trading 1
Trading
Trading 6 1,099.32
`Nature No. Notional
PrincipalBenchmark Terms
Merchant and Cover
Merchant and Cover
Merchant and Cover 16
Merchant and Cover 2,026.72

165
`Nature No. Notional
PrincipalBenchmark Terms
Merchant and Cover 2
Trading 1
Trading 73
Trading 226
Trading 1
Trading
Trading 109
Trading 3
Trading 2
Trading 3
Trading 9
3.2 Exchange Traded Interest Rate Derivatives:
`
No. Particulars Amount
Marked-to-market value of exchange traded interest rate derivatives

Annual Report 2016-17
166
`
No. Particulars Amount
291.96
Marked-to-market value of exchange traded interest rate derivatives
3.3 Disclosures on Risk Exposure in Derivatives:
in understanding such products and the attendant risks involved.
• Collaterals are generally kept as cash or cash equivalent for securing derivative transactions.
undertakes derivative transactions for hedging customers’ exposure, hedging the Bank’s own exposure,
to hedge their forex and interest rate exposures.

167
`
No. Particulars March 31, 2017 March 31, 2016Currency
derivativesInterest rate derivatives
Currency derivatives
Interest rate derivatives
1.
- - - -
2.
3.
- - - -
20.71
Maximum 73.21
Minimum 2.06 0.09
Derivatives positions net off each other.

Annual Report 2016-17
168
4. Asset Quality:4.1 Non-Performing Assets:
`
No. Particulars March 31, 2017 March 31, 2016
2,206.09
- -
693.66 331.36
220.09
` `during the year ended March 31, 2017.

169
4.2 Provision coverage ratio:
4.3 Details of technical write-offs and recoveries made thereon:
`
Particulars March 31, 2017 March 31, 2016
written-off accounts during the year
`
No. Particulars Amount1.
2. 1,337.03
3.
6.
7.
9.
10.
11. 2,137.32
`
`
` `
March 31, 2017.
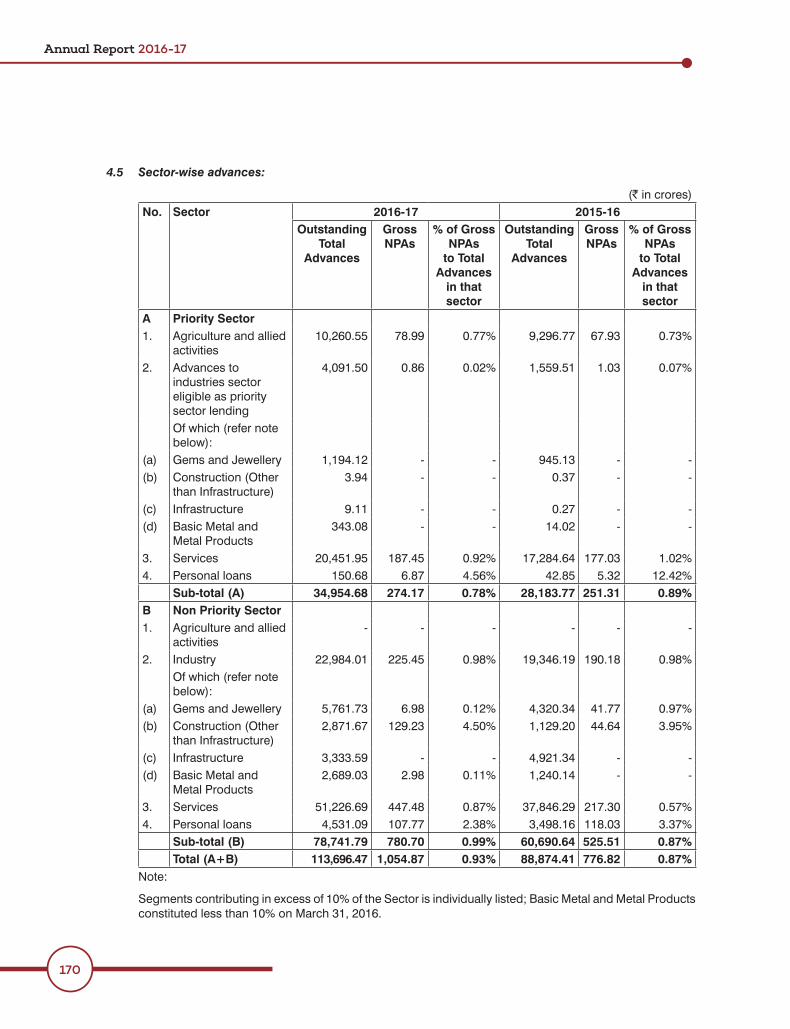
Annual Report 2016-17
170
4.5 Sector-wise advances:
`No. Sector 2016-17 2015-16
Outstanding Total
Advances
Gross NPAs
% of Gross NPAs
to Total Advances
in that sector
Outstanding Total
Advances
Gross NPAs
% of Gross NPAs
to Total Advances
in that sector
A Priority Sector 1.
activities 9,296.77 67.93
2.industries sector
sector lending
1.03
- - - -- - 0.37 - -
9.11 - - 0.27 - -Basic Metal and - - - -
3. 177.03
Sub-total (A) 34,954.68 274.17 0.78% 28,183.77 251.31 0.89%B Non Priority Sector 1.
activities - - - - - -
2.
129.23 1,129.20
- - - -Basic Metal and - -
3. 217.30107.77
Sub-total (B) 78,741.79 780.70 0.99% 60,690.64 525.51 0.87%Total (A+B) 113,696.47 1,054.87 0.93% 88,874.41 776.82 0.87%

171
4.6
Det
ails
of L
oan
Asse
ts s
ubje
cted
to R
estr
uctu
ring
as o
n M
arch
31,
201
7:`
No.
Type
of R
estru
cturin
gUn
der C
DR M
echa
nism
$Un
der S
ME D
ebt R
estru
cturin
g Me
chan
ismOt
hers
Total
Detai
lsSt
an-
dard
Sub-
Stan
-da
rd
Doub
tful
Loss
Total
Stan
-da
rdSu
b-St
an-
dard
Doub
tful
Loss
Total
Stan
-da
rdSu
b-St
an-
dard
Doub
-tfu
lLo
ssTo
talSt
an-
dard
Sub-
Stan
-da
rd
Doub
tful
Loss
Total
1.-
--
82
--
-2
2-
--
212
--
-12
--
-33
4.99
--
-26
.78-
--
173.5
5-
--
535.
32-
--
50.89
--
-4.2
810
.00-
--
10.00
--
-65
.17
2.Fr
esh
restr
uctur
ingdu
ring
the ye
ar
1-
--
12
--
-2
--
--
-3
--
-3
--
-35
.78-
--
0.52
--
-31
.51-
--
67.8
1-
--
3.08
0.19
--
-0.1
9-
--
--
3.27
--
-3.
273.
Upgr
adati
on to
re
struc
tured
stan
dard
ca
tegor
y dur
ing th
e FY
--
--
--
--
--
--
--
--
--
--
--
--
--
--
--
--
--
--
--
--
--
--
--
--
--
--
--
--
--
--
adva
nces
whic
h ce
ase t
o attr
act
highe
r pro
vision
ing
and
/ or a
dditio
nal
risk w
eight
at the
en
d of
the FY
and
show
n as r
estru
cture
d sta
ndar
d ad
vanc
es at
next
FY
--
--
--
--
--
--
--
--
--
--
--
--
Down
grad
ation
s of
restr
uctur
ed ac
coun
ts du
ring
the FY
23
--
-11
--
--
--
--
-63
3-
-30
.63-
-2.46
--
--
--
--
39.10
--2
.46
-23
.69-
--
--
--
--
--
23.6
96.
restr
uctur
ed ac
coun
ts du
ring
the FY
2016
-17
--2
-2-
-4-
-1-
--1
--
--
--
-3-2
--5
-30.63
--1
05.76
--
-12.9
--
--
--11
.11-39
.10-
-118
.66
-2.29
--2
4.43
-0.22
--
--0
.22-
--
--
--2
4.65
7.as
on 31
/03/20
17
-1
-5
3-
--
32
--
-2
9-
1-
10-
-26
2.55
--
-14
.40-
--
205.0
6-
-48
2.01
--
53.23
--
-4.2
510
.00-
--
10.00
--
67.4
8
``
``
$
In c
ase
of N
PAs,
out
stan
ding
repo
rted
is n
et o
f unr
ealis
ed in
tere
st.

Annual Report 2016-17
172
4.6
Det
ails
of L
oan
Asse
ts s
ubje
cted
to R
estr
uctu
ring
as o
n M
arch
31,
201
6:`
No.
Type
of R
estru
cturin
gUn
der C
DR M
echa
nism
$Un
der S
ME D
ebt R
estru
cturin
g Me
chan
ismOt
hers
Total
Detai
lsSt
an-
dard
Sub-
Stan
-da
rd
Doub
tful
Loss
Total
Stan
-da
rdSu
b-St
an-
dard
Doub
tful
Loss
Total
Stan
-da
rdSu
b-St
an-
dard
Doub
tful
Loss
Total
Stan
-da
rdSu
b-St
an-
dard
Doub
tful
Loss
Total
1.13
--
-13
2-
--
2-
-1
-1
-1
-16
--
-40
5.42
32.33
--
-32
.33-
--
0.24
--
437.9
9-
--
68.34
--
-2.4
9-
-0.1
0-
0.10
-0.1
0-
70.93
2.Fr
esh
restr
uctur
ingdu
ring
the ye
ar
--
--
--
--
--
2-
--
22
--
-2
29.03
--
-29
.03-
--
1.51
--
-17
3.55
--
-20
4.09
--
-8.3
01.7
9-
--
1.79
10.00
--
-10
.0020
.09-
--
20.09
3.Up
grad
ation
to
restr
uctur
ed st
anda
rd
categ
ory d
uring
the F
Y
--
--
--
--
--
--
--
--
--
--
--
--
--
--
--
--
--
--
--
--
--
--
--
--
--
--
--
--
--
--
adva
nces
whic
h ce
ase t
o attr
act h
igher
pr
ovisi
oning
and
/ or
addit
ional
risk w
eight
at the
end
of the
FY
show
n as r
estru
cture
d sta
ndar
d ad
vanc
es at
next
FY
-1-
-1-
--
--
-1-
-1-2.
72-
-2.72
--
--
--2.
72-
-2.72
--
--
--
--
Down
grad
ation
s of
restr
uctur
ed ac
coun
ts du
ring
the FY
--
--
--
--
--
--
--
--
--
--
--
--
--
--
--
--
-21.90
-21
.90-
--
--
--
--
--
--21
.90-
21.90
--
6.re
struc
tured
acco
unts
--
--4
--
--
--
--1
--1
--
--5
-7.67
--
-96.7
4-7.
06-
--
-7.06
--
--0
.24-
--1
04.04
--21
.90-
-25.7
5-
--
--
--
-0.10
--0
.10-
-22.00
--2
5.85
7.as
on 31
/03/20
16
--
-8
2-
--
22
--
-2
12-
--
12-
--
334.9
9-
--
26.78
--
-17
3.55
--
-53
5.32
--
-50
.89-
--
4.28
10.00
--
-10
.00-
--
65.17
``
``
$
Excl
udin
g O
ptio
nally
Con
verti
ble
Cum
ulat
ive
Red
eem
able
Pre
fere
nce
Shar
es (O
CC
RPS
) of `
12.
46 c
rore
s.

173
4.7 a) Disclosures on the Scheme for Sustainable Structuring of Stressed Assets (S4A), as on March 31, 2017:
`
No. of accounts where S4A has been applied
Aggregate amount outstanding
Amount outstanding Provision HeldIn Part A In Part B
b) Disclosures on Flexible Structuring of Existing Loans:
`
Period No. of borrowers taken up
structuring
Amount of loans taken up Exposure weighted average duration of loans
structuring
as Standard as NPABefore
applying
structuring
After applying
structuringDuring the year ended March 31, 2016
During the year ended March 31, 2017
c) Disclosures on Strategic Debt Restructuring Scheme (SDR) (accounts which are currently under the stand-still period):
`
No. of accounts where SDR has been invoked
Amount outstanding as on March 31, 2017**
Amount outstanding as on March 31, 2017 with
respect to accounts where conversion of debt to equity is
pending
Amount outstanding as on March 31, 2017 with
respect to accounts where conversion of
debt to equity has taken place**
as Standard as NPA as Standard as NPA as Standard as NPA
` 129.06 crores that is also reported under restructured standard advances

Annual Report 2016-17
174
d) Disclosures on Change in Ownership outside SDR Scheme (accounts which are currently under the stand-still period):
`
No. of accounts where banks have decided to effect change in ownership
Amount outstanding as on
March 31, 2017
Amount outstanding as on
March 31, 2017 with respect to accounts where conversion of debt to equity / invocation of
pledge of equity shares is pending
Amount outstanding as on
March 31, 2017 with respect to accounts where conversion of debt to equity / invocation of
pledge of equity shares has taken
place
Amount outstanding as on
March 31, 2017 with respect to accounts where
change in ownership is envisaged by
issuance of fresh shares or sale of promoters equity
as Standard
as NPA
as Standard
as NPA
as Standard
as NPA
as Standard
as NPA
e) Disclosures on Change in Ownership of Projects Under Implementation (accounts which are currently under the stand-still period):
`No. of project loan accounts where banks have decided to effect change in ownership
Amount outstanding as on March 31, 2017
standard as standard restructured
NPA
(RC) for asset reconstruction:
`No. Particulars 2016-17 2015-161. 1,6332. 330.37
3. 163.13
accounts transferred in earlier years- -
b) Details of book value of investment in security receipts (SRs):
`
Particulars 2016-17 2015-16
- -
Total 353.87 213.51

175
c) Disclosure of Investment in Security Receipts:
`
Particulars As at March 31, 2017 As at March 31, 2016SRs
issuedwithinpast 5 years
SRs issuedmore than 5years
ago butwithin past 8 years
SRs issuedmore than 8years ago
SRsissuedwithinpast 5 years
SRs issuedmore than 5years
ago butwithin past 8 years
SRs issuedmore than 8years ago
as underlying
- - 10.99 -
- - -
underlying
- - - - - -
- - - - - -
Total (i) + (ii) 353.87 - - 202.52 10.99 -
` `
4.9
4.10
4.11 Provision on Standard Assets:
provisions towards restructured standard assets.

Annual Report 2016-17
176
`
Particulars March 31, 2017 March 31, 2016
` `
4.12 Unhedged Foreign Currency Exposure (UFCE) of Clients: Foreign exchange risk is the risk of loss arising out of adverse movements in foreign exchange rates
client to the risk of loss due to volatility in the forex rates. The Bank assesses the risk arising out of such
for standard assets as of March 31, 2017, included an amount of ` `
includes an amount of ` `
4.13 Floating provision:
`
Particulars March 31, 2017 March 31, 2016
Draw-down made during the year
Closing Balance as at end of the year
5. Business ratios:
No. Ratio March 31, 2017 March 31, 2016
` 916.29
` 11.33 9.92
Notes:

177
6. Asset Liability Management:6.1 Maturity Pattern of certain items of Assets and Liabilities as at March 31, 2017:
`Particulars Deposits Loans &
Advances*Investments Borrowings Foreign
currency assets
Foreign currency liabilities
Day 1 -2 to 7 days 792.10
- -- - 290.17
31 days to 2 months 1,912.16 1,927.337,619.62
13,072.92
r to 3 years 2,772.97
- -- - 91.71
Total 1,26,572.22 1,14,180.51 36,702.14 22,453.69 17,620.29 13,465.38
` 1,100.00 crores.
Maturity Pattern of certain items of Assets and Liabilities as at March 31, 2016:
`Particulars Deposits Loans &
Advances*Investments Borrowings Foreign
currency assets
Foreign currency liabilities
Day 1 377.19 - 0.302 to 7 days 31.20
2,669.00 200.10-
31 days to 2 months - --
1,316.6232,790.97
10,323.072,020.33 31.20
-- -- - 63.06
Total 93,000.35 90,119.34 34,054.31 24,995.86 14,761.21 12,615.60
` 1,700.00 crores.

Annual Report 2016-17
178
6.2 Liquidity Coverage Ratio (LCR): Liquidity Coverage Ratio (LCR) aims in ensuring the Bank to maintain an adequate level of unencumbered
severe liquidity stress scenario lasting for 30 days horizon period. LCR measures the Bank’s potential to stand under combined idiosyncratic and market-wide liquidity stress condition, where the Bank experiences accelerated withdrawal of deposits from retail as well wholesale depositors, partial loss of secured funding, increase in collateral requirements and unscheduled draw down of unused credit lines.
Jan 1, 2017 onwards, RBI guidelines mandate computation of LCR on daily average basis, which hitherto were measured on month-ends. The following table presents the minimum LCR to be maintained, in terms of RBI guidelines.
Effective from Jan 1, 2017 Jan 1, 2018 Jan 1, 2019Minimum LCR 80% 90% 100%
The Bank maintains HQLA in terms of Cash, unencumbered excess SLR, proportion of statutory SLR as allowed by RBI, excess statutory cash reserve and high rated corporate bonds issued by entities other
IndusInd Bank has computed LCR on a daily basis from Jan 01, 2017 onwards for domestic and overseas
simple average calculated on daily observations in domestic currency, LCR of the Bank, at consolidated level, for the quarter ended March 31, 2017 worked out to 94.61%.

179
Qua
ntita
tive
disc
losu
re:
Follo
win
g is
the
quan
titat
ive
disc
losu
res
rela
ting
to L
CR
for t
he Y
ear E
ndin
g M
arch
31,
201
7:
`
No.
Part
icul
ars
June
201
6Se
ptem
ber 2
016
Dece
mbe
r 201
6M
arch
201
7
Tota
l Unw
eight
ed
Valu
e (a
vera
ge)
Tota
l Wei
ghte
d Va
lue
(ave
rage
)To
tal U
nweig
hted
Va
lue
(ave
rage
)To
tal W
eigh
ted
Valu
e (a
vera
ge)
Tota
l Unw
eight
ed
Valu
e (a
vera
ge)
Tota
l Wei
ghte
d Va
lue
(ave
rage
)To
tal U
nweig
hted
Va
lue
(ave
rage
)To
tal W
eigh
ted
Valu
e (a
vera
ge)
Hig
h Q
ualit
y Li
quid
Ass
ets
1. 2.
162.
92
3.Un
secu
red
who
lesa
le fu
ndin
g, o
f
--
--
--
--
22,0
63.3
7
--
--
--
--
--
--
expo
sure
s an
d ot
her c
olla
tera
l re
quire
men
ts
--
--
--
--
Cred
it an
d liq
uidi
ty fa
cilit
ies
--
--
--
--
6.3,
026.
333,
026.
33
7.1,
076.
21
36,9
03.9
644
,027
.14
49,9
13.5
558
,699
.98

Annual Report 2016-17
180
`
No.
Part
icul
ars
June
201
6Se
ptem
ber 2
016
Dece
mbe
r 201
6M
arch
201
7
Tota
l Unw
eight
ed
Valu
e (a
vera
ge)
Tota
l Wei
ghte
d Va
lue
(ave
rage
)To
tal U
nweig
hted
Va
lue
(ave
rage
)To
tal W
eigh
ted
Valu
e (a
vera
ge)
Tota
l Unw
eight
ed
Valu
e (a
vera
ge)
Tota
l Wei
ghte
d Va
lue
(ave
rage
)To
tal U
nweig
hted
Va
lue
(ave
rage
)To
tal W
eigh
ted
Valu
e (a
vera
ge)
9.-
--
--
--
-
10.
expo
sure
s
11.
--
--
--
166.
39
12.
19,3
97.1
423
,771
.98
25,6
68.7
128
,876
.79
Tota
l Adj
uste
d Va
lue
Tota
l Adj
uste
d Va
lue
Tota
l Adj
uste
d Va
lue
Tota
l Adj
uste
d Va
lue
13.
Tota
l HQ
LA13
,732
.54
16,4
26.5
422
,131
.53
28,2
14.8
4
17,5
06.8
220
,255
.16
24,2
44.8
429
,823
.19
Liqu
idity
Cov
erag
e Ra
tio (%
)78
.44%
81.1
0%91
.28%
94.6
1%

181
Follo
win
g is
the
quan
titat
ive
disc
losu
res
rela
ting
to L
CR
for t
he Y
ear E
ndin
g M
arch
31,
201
6:
`
No.
Part
icul
ars
June
201
5Se
ptem
ber 2
015
Dece
mbe
r 201
5M
arch
201
6To
tal U
nweig
hted
Va
lue
(ave
rage
)To
tal W
eigh
ted
Valu
e (a
vera
ge)
Tota
l Unw
eight
ed
Valu
e (a
vera
ge)
Tota
l Wei
ghte
d Va
lue
(ave
rage
)To
tal U
nweig
hted
Va
lue
(ave
rage
)To
tal W
eigh
ted
Valu
e (a
vera
ge)
Tota
l Unw
eigh
ted
Valu
e (a
vera
ge)
Tota
l Wei
ghte
d Va
lue
(ave
rage
)H
igh
Qua
lity
Liqu
id A
sset
s1.
11,7
33.6
612
,903
.00
2.
2,76
6.37
2,96
0.13
19,6
97.6
91,
969.
773.
Unse
cure
d w
hole
sale
fund
ing,
of
--
--
--
--
26,3
70.9
9 --
--
--
--
--
--
expo
sure
s an
d ot
her c
olla
tera
l re
quire
men
ts
7,60
9.27
7,60
9.27
--
--
--
--
Cred
it an
d liq
uidi
ty fa
cilit
ies
--
--
--
--
6.2,
306.
972,
306.
977.
9,27
9.39
27,0
77.9
730
,264
.19
30,5
23.0
439
,255
.46
9.-
--
--
--
-10
.ex
posu
res
11.
721.
33-
--
--
-12
.12
,394
.97
14,3
07.5
912
,841
.11
20,9
94.4
1
Tota
l Adj
uste
d Va
lue
Tota
l Adj
uste
d Va
lue
Tota
l Adj
uste
d Va
lue
Tota
l Adj
uste
d Va
lue
13.
Tota
l HQ
LA9,
557.
5211
,841
.21
11,7
33.6
612
,903
.00
14,6
83.0
015
,956
.60
17,6
81.9
318
,261
.05
Liqu
idity
Cov
erag
e Ra
tio (%
)65
.09%
74.2
1%66
.36%
70.6
6%

Annual Report 2016-17
182
7. Exposures:7.1 Exposure to Real Estate Sector:
`No. Particulars March 31, 2017 March 31, 2016(a) Direct exposure
inclusion in priority sector advance `year `
- -- -
(b) Indirect exposure3,167.29
Total Real Estate Exposure 21,911.29 18,556.10
7.2 Exposure to Capital Market:
`No. Particulars March 31, 2017 March 31, 2016
funds the corpus of which is not exclusively invested in
funds
equity oriented mutual funds are taken as primary security
funds, i.e. where the primary security other than shares /
oriented mutual funds does not fully cover the advances
2,010.13
makers
new companies in anticipation of raising resources

183
`No. Particulars March 31, 2017 March 31, 2016
issues
funds
20.00
Total Exposure to Capital Market 6,076.17 4,433.19
` `
7.3 Risk Category-wise exposure to country risk:
`Risk category Exposure (net)
as atMarch 31, 2017
Provision heldas at
March 31, 2017
Exposure (net)as at
March 31, 2016
Provision heldas at
March 31, 2016- -- -
Moderate - -High - -Very High - 69.31 -
37.00 - -- -
Total 5,846.19 - 3,804.55 -
7.4 Single borrower limit and Group Borrower Limit:
of Directors of the Bank as it was within the prudential limit.
7.5 Unsecured advances:
` `collateral or security.

Annual Report 2016-17
184
8. Concentration of Deposits, Advances, Exposures and NPAs:8.1 Concentration of Deposits:
`
Particulars As onMarch 31, 2017
As on March 31, 2016
Total Deposits of twenty largest depositors 31,611.66
Deposits of the Bank
8.2 Concentration of Advances:
`
Particulars As on March 31, 2017
As on March 31, 2016
8.3 Concentration of Exposures:
`
Particulars As on March 31, 2017
As on March 31, 2016
8.4 Concentration of NPAs:
`
Particulars As on March 31, 2017
As on March 31, 2016

185
8.5 Intra-Group Exposure:
`
Particulars As on March 31, 2017
As on March 31, 2016
Total amount of intra-group exposure
Total amount of top-20 intra-group exposure
`
Particulars Year Ending March 31, 2017
PSLC Sold PSLC Purchase
9. Miscellaneous:
9.1 Amount of Provisions for taxation during the year:
`
Particulars 2016-17 2015-16
Deferred tax credit
Total 1,491.79 1,182.81
9.2 Disclosure of penalties imposed by RBI:`
directions / instructions / guidelines, among other things on KYC norms, in exercise of powers vested
9.3 Fixed Assets:
9.3.1 Cost of premises includes ` `
` `
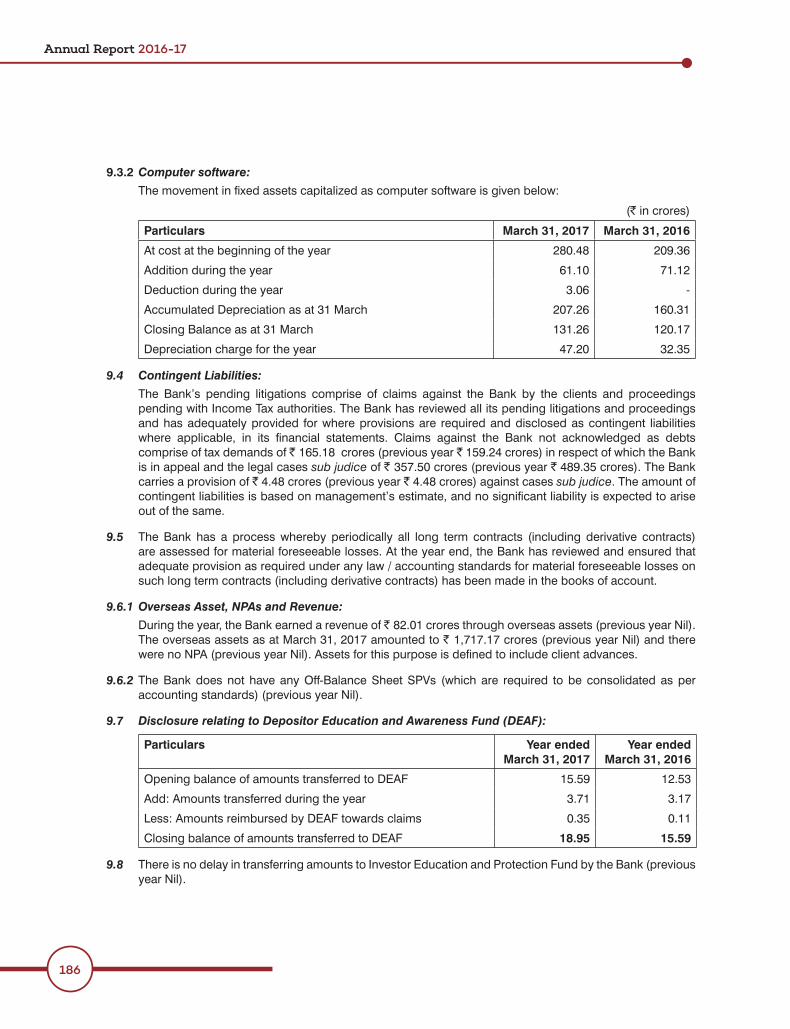
Annual Report 2016-17
186
9.3.2 Computer software:
`
Particulars March 31, 2017 March 31, 2016209.36
61.10 71.12
Deduction during the year 3.06 -
207.26 160.31
Closing Balance as at 31 March 131.26 120.17
Depreciation charge for the year
9.4 Contingent Liabilities:
comprise of tax demands of ` `is in appeal and the legal cases sub judice of ` `carries a provision of ` ` sub judice. The amount of
out of the same.
9.5
9.6.1 Overseas Asset, NPAs and Revenue: During the year, the Bank earned a revenue of `
The overseas assets as at March 31, 2017 amounted to `
9.6.2
9.7 Disclosure relating to Depositor Education and Awareness Fund (DEAF):
Particulars Year ended March 31, 2017
Year ended March 31, 2016
3.71 3.17
0.11
18.95 15.59
9.8

187
9.9 Corporate Social Responsibility (CSR): The Bank has spent an amount of ` `
` 21.16 crores `
9.10 Drawdown from Reserves: The Bank has not undertaken any drawdown from reserves during the year ended March 31, 2017. There
9.11 Credit default swaps:
9.12
of ` amount of `
` `
`
9.13
9.14 Movement in depreciation of Fixed Assets:
`Depreciation 2016-17 2015-16Premises
66.726.20
Charge for the year 2.06 2.07Deduction during the year -Depreciation to date 66.72Other Fixed Assets
771.09Charge for the yearDeduction during the yearDepreciation to date 771.09

Annual Report 2016-17
188
10. Employee Stock Option Scheme (ESOS):10.1
are equity settled where the employees will receive one equity share per stock option.
No. Date of grant No. of options Range of exercise price (`)1.2.3.
6.7. 236.20
9.10.11.12.13. 2,61,000
21-Dec-11 9,20,000
16.17.
2,67,00019.20.21. 30,00022.23.
26. 22,00027.
29.30.

189
No. Date of grant No. of options Range of exercise price (`)31. 33,00032.33.
11,00036.37. 16,30,000
1,93,00039.
12-May-161,126.70
2,76,000
1,093.10
10.2 Recognition of expense:
of fair market price over the exercise price of an option at the grant date, is recognised as a deferred
Bank are listed, prior to the date of the meeting of the Compensation Committee in which stock options
10.3 Stock option activity under the scheme during the year:
Particulars No. of options Weighted average
exercise price (`)
1,216.73
Forfeited / surrendered during the year 2,06,270 707.72
31,62,370
- -
1,17,32,111
The weighted average price of options exercised during the year is ` 1,129.96.

Annual Report 2016-17
190
No. Date of grant Exercise Price Number of shares arising out of options
Weighted average life of options (in years)
1. 17,000
2. 6,00,000
3.
11,70,000
1.36
6.
7. 9,000 2.33
21-Dec-11 2.36
9. 1.97
10.
11. 21,960
12. 2.79
13.
16.
17.
19.
20. 23,330
21. 300.00 7,00,000
22.
23.
26.
27.
29. 11,000
30.
31.
32. 1,77,120
33.
23,600 6.22
10,00,000

191
No. Date of grant Exercise Price Number of shares arising out of options
Weighted average life of options (in years)
36. 12-May-16 6.1337. 1,126.70 6.29
2,76,00039.
1,093.10
7.00
10.4 Fair value methodology:
Particulars 2016-17
standard deviation of the continuously compounded rates of return on the share over a period of time.
to the expected life of the options, till the date of the grant.
March 31, 2017 is ` `
` `` `
Particulars March 31, 2017 March 31, 2016
Basic earnings per share `Diluted earnings per share `
The weighted average fair value of options granted during the year 2016-17 is ` `
11. Disclosures – Accounting Standards:
Gratuity:
valuation.

Annual Report 2016-17
192
`
No. Particulars March 31, 2017 March 31, 2016
Changes in the present value of the obligation
1. 61.67
2.
3. 12.71
7.60
6. 61.67
Reconciliation of opening and closing balance of the fair value of the Plan Assets
1.
2. 0.62
3.
-
17.07
6.
7. 1.22
1. 12.71
2.
3.
0.33 -
6.
Funded status 100 % insurance managed
funds
100 % insurance managed
funds
Actuarial Assumptions
1.
2.
3.
promotion and other relevant factors, such as supply and demand in the employment market.

193
Experience Adjustment:
Particulars March 31, 2017
March 31, 2016
March 31, 2015
March 31, 2014
March 31, 2013
61.67
6.21 3.67 3.20 - 0.69
1.63 1.23
1.22 0.19
date is `
Provident Fund:
`
Assets / Liabilities March 31, 2017 March 31, 20161.20
127.72
Assumptions60 years 60 years
Discount rate
6.36 - 13.23
with interest rate equal to or more
with interest rate equal to or more
with interest rate equal to or more

Annual Report 2016-17
194
11.2 Segment Reporting (AS 17):
Business Segments:
`
Business Segment Treasury Corporate / Wholesale Banking
Retail Banking Other Banking Operation
Total
Particulars 31/03/17 31/03/16 31/03/17 31/03/16 31/03/17 31/03/16 31/03/17 31/03/16 31/03/17 31/03/16
707.61
- -
- -
61,913.39 - -
Note:
surplus, proposed dividend and others.
Geographic Segments:
operations, the Bank is considered to operate only in domestic segment.
11.3 Related party transactions (AS-18):
Key Management Personnel
Associates

195
Subsidiaries
11.4 Operating Leases (AS 19):
`
Particulars March 31, 2017 March 31, 2016
- -
for the year- -
contingent rent. The terms of renewal and escalation clauses are those normally prevalent in similar agreements. There
are no undue restrictions or onerous clauses in the agreements.
11.5 Earnings per share (AS 20):
Particulars Year ended March 31, 2017
Year ended March 31, 2016
`
` 10 10`
` 39.26
11.6 Deferred Tax (AS 22):

Annual Report 2016-17
196
`
Particulars March 31, 2017Deferred Tax
March 31, 2016Deferred Tax
Timing difference on account of Assets Liabilities Assets Liabilities
- -
- 307.32 -
- 177.93 -
- -
Sub-total 563.75 211.28 333.89 170.96Net closing balance carried to the Balance Sheet (included in Schedule 11 – Others)
352.47 162.93
12. Additional Disclosures:
`
Particulars March 31, 2017 March 31, 201631.36
112.60
9.39
Total 2,583.13 1,854.97
12.2 Movement in provisions:
`
Particulars 2016-17 2015-16 16.07
16.30
- -
Closing provision for Reward Points 22.80 16.07

197
`
Particulars 2016-17 2015-16
2.13 1.73
Closing provision 11.52 9.54
12.3 Disclosure relating to Complaints: A. Customer Complaints:
No. Particulars 2016-17 2015-16
2084 455
B. Awards passed by the Banking Ombudsman:
No. Particulars 2016-17 2015-16
the year
(Compiled by management and relied upon by auditors)
12.4 Proposed Dividend:
` 6.00 per equity share amounting to `
`
`
12.5 Letters of Comfort:

Annual Report 2016-17
198
12.6 Disclosure on Remuneration: Nomination and Remuneration Committee:
staff. The Committee is also required to ensure that the cost to income ratio of the Bank supports the
motivate employees.
Compensation Policy:

199
individual increments are linked to their annual performance rating and increment percentages
and retain critical employees.
these segments in its Compensation policy.
malus
any employee of the Bank, irrespective of the reasons for severance.
which are in line with the statutory norms.
compensation is easy to administer and leads to an instant reward to the concerned employees.
compensation of an employee. They are very selectively granted to attract and retain employees.

Annual Report 2016-17
200
Other Disclosures:
Particulars Year ended March 31, 2017 Year ended March 31, 2016
and remuneration paid to its
During the year, one meeting
Committee and two meetings of
Committee were held. The
paid aggregate sitting fees of ` 60,000 for one meeting. The
paid aggregate sitting fees of `
During the year, two meetings of
paid aggregate sitting fee of `
remuneration award. remuneration award.
‘sign on’ awards made during
Details of severance pay in
Total amount of outstanding deferred remuneration split into cash, shares and share linked instruments and other forms
The outstanding deferred remuneration is `
The outstanding deferred remuneration is ` 1.36 crores to
Total amount of deferred remuneration paid out in the
The deferred remuneration paid in FY17 was ` 1.29 crores.
The deferred remuneration paid in FY16 was ` 0.61 crores.
Breakdown of amount of remuneration awards for the
Breakup of remuneration awards
control function staff.
Breakup of remuneration awards
control function staff.` `
` `
`
` 1.36 crores
- ` - `

201
Particulars Year ended March 31, 2017 Year ended March 31, 2016Total amount of outstanding deferred remuneration and retained remuneration exposed to ex-post explicit and implicit
Total amount of reductions during the FY due to ex - post
Total amount of reductions during the FY due to ex - post
Disclosure on remuneration to Non-Executive Directors:
at the rate of ` 1,00,000/- per Board meeting, at the rate of `of the Board, and at the rate of ` amount of `
``
13.
reported cases of delays in payments to micro and small enterprises or interest payments due to delays in such payments.
14.
15.
For INDUSIND BANK LTD.
For Price Waterhouse Chartered Accountants LLP R. Seshasayee T. Anantha NarayananChartered Accountants Chairman Director
Russell I Parera Romesh SobtiPartner Managing Director
S. V. Zaregaonkar Haresh GajwaniDate Company Secretary

Annual Report 2016-17
202
DISCLOSURES UNDER BASEL III CAPITAL REGULATIONS – 31st March 2017DF-1: Scope of Application
Name of the head of the banking group to which the framework applies: INDUSIND BANK LTD.
(i) Qualitative Disclosures:
IndusInd Bank Limited (‘the Bank’) is a commercial bank, incorporated on January 31, 1994. The Bank does not
a) List of group entities considered for consolidation:
the entity/
incorporation
Whether the entity is included under accounting
consolidation (Yes/No)
Explain the
consolidation
Whether the entity is included under regulatory
consolidation (Yes/No)
Explain the
consolidation
Explain the
consolidation
Explain the
consolidated under only
consolidation
None / NA NA NA NA NA NA NA
b) List of group entities not considered for consolidation both under the accounting and regulatory scope of consolidation:
incorporation
Principle activity Total balance sheet equity holding in the
total equity
Regulatory treatment
investments in the capital
the entity
Total balance sheet assets (as stated in the accounting
the legal entity)
None / NA NA NA NA NA NA
(ii) Quantitative Disclosures:
As mentioned above in Para (i) above, the Bank does not have any subsidiary
e) The Bank does not have investment in any insurance entities as on March 31, 2017.
as on March 31, 2017.
DF-2 Capital Adequacy
Applicable Regulations:
Circular – Basel III Capital Regulations

203
Basel III Capital Regulations:
requirements in the trading book, on an ongoing basis and operational risk.
Minimum Capital requirements:
Besides computing CRAR under the Pillar I requirement, the Bank also periodically undertakes stress testing in
and Operational risk and mapping these to the respective business segments.
The Summary of Capital requirements for Credit Risk, Market Risk and Operational Risk as on March 31, 2017 is mentioned below:
Risk Type ` in millionsCapital requirements for Credit Risk 109,832
Securitisation exposures -Capital requirements for Market Risk 6,002Standardised Duration ApproachInterest Rate Risk
Foreign Exchange Risk (including gold) 304Equity Risk

Annual Report 2016-17
204
Risk Type ` in millionsCapital requirements for Operational Risk 13,342Basic Indicator Approach 13,342
Minimum Capital requirements at 9% 129,176Minimum CRAR + CCB at 10.25% 147,117Total Capital Funds 219,674CRAR # 15.31%
Organisation Structure:
Integrated Risk Management: Objectives and Organisation Structure
various segments. The Bank has been progressively adopting the best International practices so as to continually
Organisation Structure:
Credit Risk Management
Market Risk Management
Operational Risk Management
Asset Liability Management
• Risk Management Committee (RMC)
• Credit Risk Management Committee (CRMC)
• Market Risk Management Committee (MRMC)
• Asset Liability Management Committee (ALCO)
• Operational Risk Management Committee (ORMC)

205
implemented.
control environment, risk management processes, risk measurement techniques, capital adequacy and capital planning.
Board.
Credit Risk
• Risks on various counter-parties such as corporates, banks, are monitored through counter-party exposure limits,
risk.
industry cycles.
Market Risk
Mark-to-Market, Sensitivity analysis, Value-at-Risk and monitoring through operational limits such as stop-loss limits,
comprehensive Market Risk Management Policy.
Asset Liability Management (ALM)
and liabilities.
buckets.

Annual Report 2016-17
206
• Interest Rate Sensitivity is monitored on Earning perspective and Economic Value perspective through prudential
Operational Risk
external environment.
surveillance enabled by the Bank’s advanced technology and Core Banking System.
KYC/AML.
operational risks under Basel III norms.
Systems Risk
parties and customers.

207
various social/media in its repository to increase risk management capabilities.
DF-3: Credit Risk: General Disclosures
Credit Risk is made up of two components:
1. Transaction Risk (or Default Risk),
2. Portfolio Risk,
Monitoring concentration risk in particular products, segments, geographies etc thereby avoiding concentration
Tracking Credit quality migration
Adherence to regulatory guidelines

Annual Report 2016-17
208
Personal Loan, etc.
All the related internal and regulatory guidelines such as KYC norms, RBI prudential norms, etc. are adhered to
has changed.
economic or political scenario.
programmes. Further as a mechanism to assess the credit quality, customers are also evaluated through application
Credit Approval Committee
approving system is that no credit proposals are approved or recommended to higher authorities unless all the

209
Corporate & Commercial Banking Segment :
Executive Credit Committee (ECC)
Consumer Banking (CB) Segment :
Joint Sanction on Four Eye Principle
Zonal Credit Committee (ZCC)
Executive Credit Committee
secured by liquid collaterals.
approval.
• Trading entities, Capital Market Broker and Commodity Exchange Broker
quality using a scoring/rating model. The score serves a measure to categorise the customers into various risk classes

Annual Report 2016-17
210
Pricing credit
Capital allocation (under IRB approaches)
Credit Quality Assurance:
Credit Risk Management at Portfolio level:
equity/debt investments, derivative exposures, etc.) are considered. Such monitoring is carried out at monthly intervals. Besides this, respective business units are monitoring the exposure on continuous real-time basis.
risk and control measures is carried out on a monthly basis on various parameters. Further, a comprehensive Stress

211
Impaired credit - Non Performing Assets (NPAs):
term loan,
bank.
Credit Risk Exposures
(a) Total Gross Credit Risk Exposures as on 31st March, 2017
(` in millions)
Fund Based*
Non-Fund Based**
Total Exposures 2,345,519
in banking book.
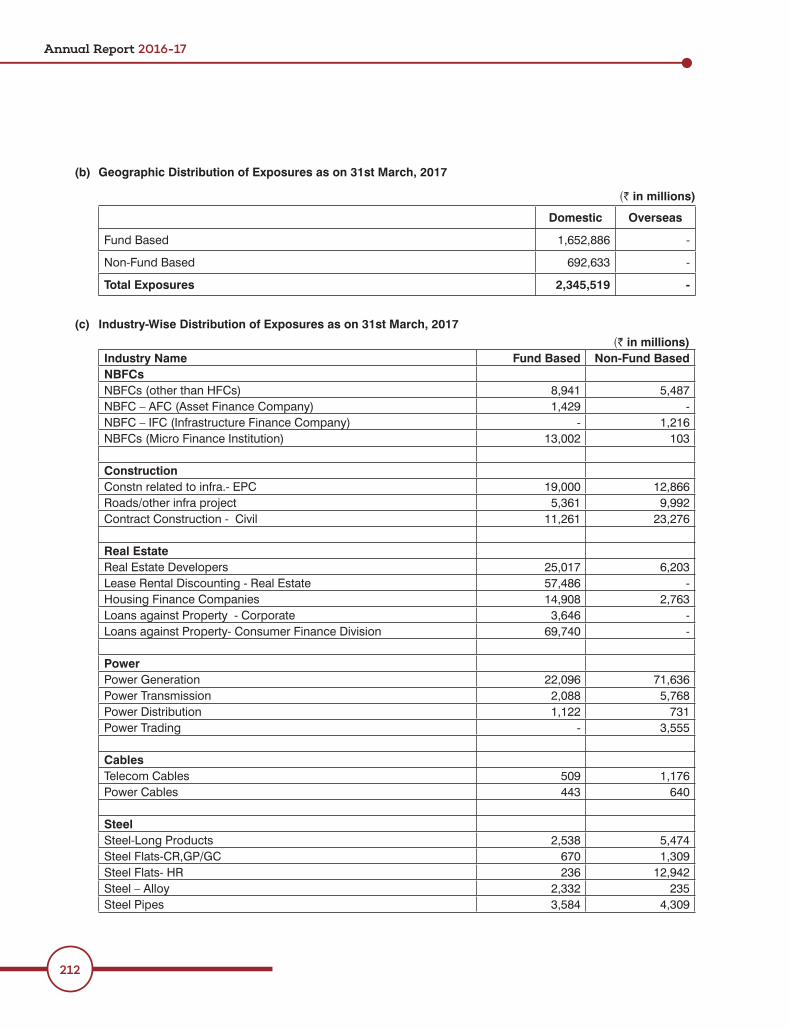
Annual Report 2016-17
212
(b) Geographic Distribution of Exposures as on 31st March, 2017
(` in millions)
Domestic Overseas
Fund Based -
Non-Fund Based -
Total Exposures 2,345,519 -
(c) Industry-Wise Distribution of Exposures as on 31st March, 2017(` in millions)
Industry Name Fund Based Non-Fund BasedNBFCs
NBFC – AFC (Asset Finance Company) 1,429 --
NBFCs (Micro Finance Institution) 13,002 103
Construction19,000
9,992Contract Construction - Civil
Real Estate
-
Loans against Property - Corporate --
Power
1,122 731-
CablesTelecom Cables
443
SteelSteel-Long Products
1,30912,942
Steel – Alloy 2,332Steel Pipes 4,309

213
(` in millions)Industry Name Fund Based Non-Fund BasedSponge Iron - 34
Stainless SteelIron and Steel Rolling Mills 1,990Pig Iron 2,022 297
Textiles
- 2
1,904 972Textiles-Texturising 244 31Textile-Blended YarnTextile – JuteTextiles - Synthetic FabricsTextile – Silk 41Textile – Machinery 1Cotton ginning, Cleaning, Baling -
TelecomTelecom – CellularTelecom Equipments 731
Pharmaceuticals
Pharmaceuticals – Formulations 2,394
ChemicalsChemicals – Organic 1,704Chemicals – Inorganic 1,922 430
FertilisersFertilisers – Phosphatic 1
292 3,117
PaperPaper - Writing and Printing 1,494Paper – Industrial
133
2,120 19,737
Edible OilsAuto Ancillaries

Annual Report 2016-17
214
(` in millions)Industry Name Fund Based Non-Fund Based
291Food CreditAluminium 1,742Capital Market Brokers 1,343
-1,714
Sugar -
Electronic componentsCommodity Market Brokers
- -
ShippingEducational Institutions
CoalIT Enabled Services
473PetrochemicalsBanks 79,393
-
Construction Equipments 232Airlines 1Wood and Wood Product 32
Transport Services - 4313,924
Electric Equipment
Organised Retailing 32Trading – WholesaleTrading – RetailServicesCredit Cards 17,040 -
-Other IndustriesResidual AssetsTotal Exposure 1,652,886 629,635

215
Exposures to industries (other than consumer finance division) in excess of 5% of total exposure
(` in millions)
Industry Fund Based Non-Fund BasedBanks 79,393
(d) Residual Contractual Maturity breakdown of assets
(` in millions)
Assets 1D 2 - 7D 8 - 14D 15 - 30D
31D - 2M
>2M -3M
> 3M -6M
> 6 M - 1 Y
>1Y - 3Y
> 3Y - 5Y
> 5Y - 7Y>
> 7Y - 10Y
> 10Y - 15Y
>15Y Total
Cash - - - - - - - - - - - - -
RBI- - 1,717 4,232 3,142
other Banks- - - 2,130 - - - - -
Investments - - - 49,043
Advances* 43,343
Fixed Assets - - - - - - - - - - - - -
Other Assets 7,923 3,097 2,291 - -
`11,000 mio
(e) Movement of NPAs and Provision for NPAs as on 31st March, 2017(` in millions)
A Amount of NPAs (Gross) 10549Sub-standard 3,931
2,2212,7711,034
LossB Net NPAs 4,389C NPA ratios
0.93%Net NPA to Net advances (%) 0.39%
D Movement of NPAs (Gross)
Additions during the period 14,293Reductions during the periodClosing Balance as on 31.03.17
E Movement of provision for NPAs
Provision made till 31.03.17
1,092-
Closing as on 31.03.17

Annual Report 2016-17
216
Particulars Amount (` in millions)
Recoveries booked directly to income statement 323
(f) Non Performing Investments and Movement of provision for depreciation on Non Performing Investments
(` in millions)
A 23B 23C
313-
Closing Balance as on 31.03.17
(g) Major Industry Break up of NPA and Provision
(` in millions)
Industry Gross NPA131 60
(h) Geography wise Distribution of NPA and Provision
(` in millions)
Overseas - -Total 6,160
DF-4: Credit risk: Disclosures for Portfolios Subject to the Standardised Approach
exposure is subjected to credit risk mitigation.
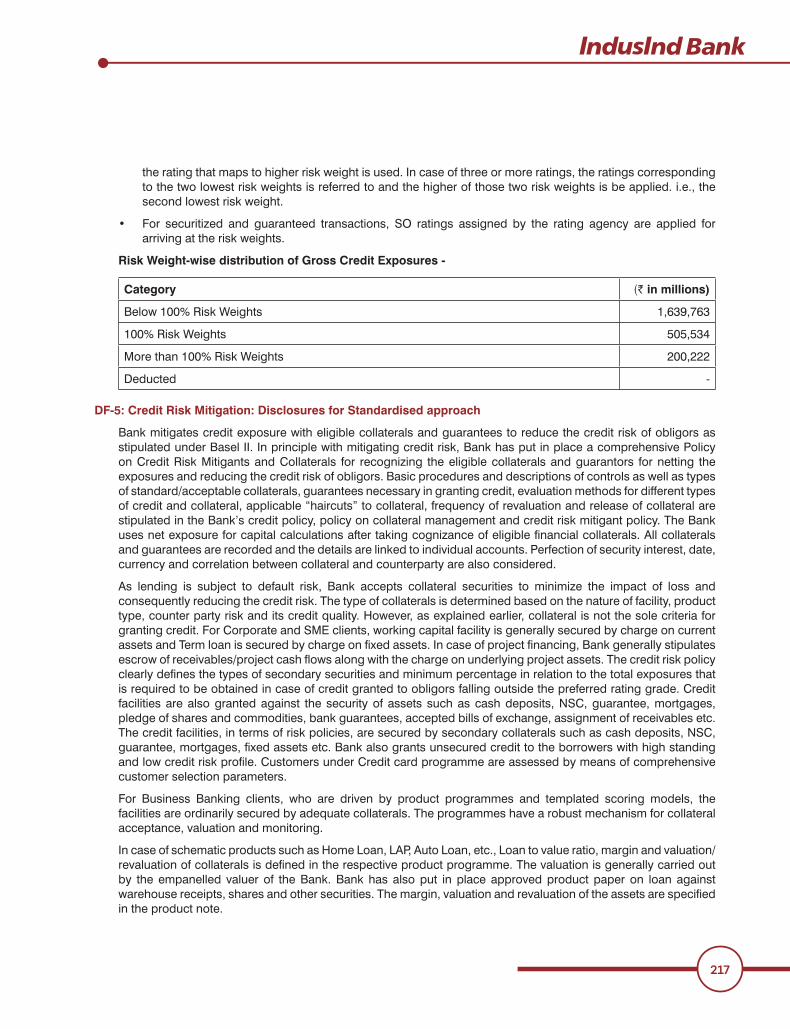
217
Risk Weight-wise distribution of Gross Credit Exposures -
Category (` in millions)
100% Risk Weights
More than 100% Risk Weights 200,222
-
DF-5: Credit Risk Mitigation: Disclosures for Standardised approach
stipulated in the Bank’s credit policy, policy on collateral management and credit risk mitigant policy. The Bank
customer selection parameters.
acceptance, valuation and monitoring.
in the product note.

Annual Report 2016-17
218
(` in millions)
Particulars Eligible Financial Collaterals Supported by guarantee
119,974 473
DF-6: Securitisation Exposures: Disclosure for Standardised approach
exposure on such assets, actual conditional, or contingent, during the period ended March 31, 2017.
cash collaterals to a minimum extent.
Exposure details on account of Securitization transactions
(a) Securitisation exposures in Banking Book

219
(b) Amount of Assets intended to be securitized within a year:
explored.
(c) Securitisation exposures in Trading Book:
Aggregate amount of on-balance sheet securitisation exposures retained or purchased broken down by exposure type
Exposure Type Amount (` in millions)Agriculture LoansSME 243.97
Aggregate amount of securitisation exposures retained or purchased subject to Comprehensive Risk
Exposure Type Amount (` in millions)Agriculture LoansSME 243.97
Aggregate amount of securitisation exposures retained or purchased subject to securitisation framework
Risk Weight band Amount (` in millions)
-Total 1326.11
Aggregate amount of the capital requirements for the securitisation exposures, subject to the securitisation framework broken down into different risk weight bands:
Risk Weight band Capital Charge Amount (` in millions)
- Total 109.01
Securitisation exposures deducted from capital
Exposure Type Exposures deducted entirely from Tier-1 capital
Credit enhancing interest-only strips deducted from total capital
Other exposures deducted from total capital
NA
DF-7: Market risk in Trading book
approved by the Board. These policies serve to outline the Bank’s risk appetite and risk philosophy in respect
requirements, economic environment and revised regulatory guidelines.

Annual Report 2016-17
220
Sources of market risk:
Trading / liquidity risk.
Objectives of Market risk management:
Scope and nature of risk reporting and measurement systems:
Reporting
Measurement
monitored on a daily basis.
Capital requirements for Market risks @ 9%
(` in millions)Market Risk elements Amount of capital requiredInterest Rate RiskForeign Exchange Risk (including gold) 304Equity Risk
DF-8: Operational Risk
assessing, monitoring and controlling / mitigating operational risk exposures, including material operational

221
DF-9: Interest rate risk in the banking book (IRRBB)
Intere
Risk management framework
Monitoring and Control
market outlook, compute liquidity ratios and interest rate risk values based on the earnings and economic value perspective.
Risk measurement and reporting framework:
(RSLs).
Interest rate sensitivity gap Analysis
Earning at Risk Analysis
Stress Testing
Interest rate sensitivity gap: The gap or mismatch risk as at a given date, is measured by calculating gaps
Earning at Risk:
Stress Testing:

Annual Report 2016-17
222
`
Change in interest rates (in bps)
Impact on NII (` in millions)
Currency -100 -50 50 100
INR
Others - - - -
Total (676.88) (338.44) 338.44 676.88
DF-10: General Disclosures for Exposures Related to Counterparty Credit Risk
transactions can be positive or negative to either counterparty. The market value is uncertain and can vary over
Capital is allocated to CCR exposures taking into consideration the regulatory guidelines on Basel – III capital adequacy computation.
• Credit Risk Policy
• Bank Risk Policy
• Country Risk Policy
Exposure on account of Counterparty Credit Risk
(` in millions)
Particulars Amount
-
Netted current credit exposure 93711.30
Collateral held
Net derivative credit exposure

223
DF-11: Composition of Capital
(` Million) At March 31, 2017
Common Equity Tier 1 capital: Instruments and reserves
1related stock surplus (share premium)
2 Retained earnings B=b1-b23 Accumulated other comprehensive income (and other
reserves)
4applicable to non-joint stock companies1)
-
Common share capital issued by subsidiaries and held by -
Common Equity Tier 1 capital before regulatory adjustments
201,253.25
Common Equity Tier 1 capital: regulatory adjustments
7 Prudential valuation adjustments - -
9 -10 -11 - 12 - 13 Securitisation gain on sale - 14
valued liabilities-
-
capital on reported balance sheet)-
17 Reciprocal cross-holdings in common equity -
capital (amount above 10% threshold)
-
19
(amount above 10% threshold)3
-
20 Mortgage servicing rights4 (amount above 10% threshold) - 21 -
22 -

Annual Report 2016-17
224
(` Million) At March 31, 2017
23 -
24 - -
-
unconsolidated insurance subsidiaries-
-
bank9
-
- 27 Regulatory adjustments applied to Common Equity Tier
deductions
-
Total regulatory adjustments to Common Equity Tier 1 - 29 Common Equity Tier 1 Capital (CET1) 201,253.25
Additional Tier 1 Capital: Instruments
30 10,000.00
31 -
32standards (Perpetual debt Instruments)
10,000.00
33 -
34 Additional Tier 1 instruments (and CET1 instruments not -
phase out-
Additional Tier 1 capital before regulatory adjustments 10,000.00 Additional Tier 1 Capital: Regulatory Instruments
37 - Reciprocal cross-holdings in Additional Tier 1 instruments -
39 -

225
(` Million) At March 31, 2017
40 -
41 - 41a
unconsolidated insurance subsidiaries-
41b -
42 Regulatory adjustments applied to Additional Tier 1 due to -
43 Total regulatory adjustments to Additional Tier 1 Capital - 44 Additional Tier 1 Capital (AT1) 10,000.00
Tier 1 Capital (T1 = CET1 + AT1) (29 + 44) 211,253.25
Tier 2 Capital: Instruments and Provisions
stock surplus-
47 -
Tier 2 instruments (and CET1 and AT1 instruments not -
49phase out
-
Provisions12Tier 2 Capital before Regulatory adjustments 8,420.51 Tier 2 capital: Regulatory adjustments
- Reciprocal cross-holdings in Tier 2 instruments -
-
-
-
subsidiaries-
bank
-

Annual Report 2016-17
226
(` Million) At March 31, 2017
Total Regulatory adjustments to Tier 2 Capital - Tier 2 Capital (T2) 8,420.51 Total Capital (TC = T1 + T2) (45 + 58) 219,673.76 Total Risk Weighted Assets (60a + 60b + 60c) 1,435,287.90
Capital Ratios and Buffers
assets)14.02
14.72
requirement plus capital conservation plus countercyclical
- -
7.272
National minima (if different from Basel III)
70minimum)
7.000%
71III minimum)
9.000%
Amounts below the thresholds for deduction (before Risk Weighting)
72entities
-
73entities
-
74 - -
Applicable caps on the inclusion of provisions in Tier 2
exposures subject to standardised approach (prior to -

227
(` Million) At March 31, 2017
77approach
-
exposures subject to internal ratings-based approach (prior -
79ratings-based approach
-
Capital instruments subject to phase-out arrangements (only applicable between March 31, 2017 and March 31, 2022)
Current cap on CET1 instruments subject to phase out arrangements
-
-
Current cap on AT1 instruments subject to phase out arrangements
-
-
Current cap on T2 instruments subject to phase out arrangements
-
redemptions and maturities)-
Notes to the TemplateRow No.
of the template
Particulars (` in million)
10 --
-19 -
----
(i) Increase in Common Equity Tier 1 capital --
Eligible Provisions included in Tier 2 capitalEligible Revaluation Reserves included in Tier 2 capital -

Annual Report 2016-17
228
DF-12: Composition of Capital- Reconciliation Requirements
Step 1(` in million)
Balance Sheet as in Financial
Statements As on March
31, 2017
Balance sheet under Regulatory
scope of consolidation As on March
31, 2017A Capital & Liabilities i Paid-up Capital
200,327.71 Employees’ Stock Option OutstandingMinority Interest - Total Capital 206,461.21
ii 1,265,722.23
- iii
-
10,000.00
iv 89,763.76 Total 1,786,484.14 B Assets i 77,487.47
108,795.07 ii 367,021.38
-
-
iii Loans and advances 1,130,805.08
iv Fixed assets 13,352.33 v Other assets 89,022.81 - vi - vii -
Total Assets 1,786,484.14

229
Step 2
(` in million)Balance Sheet as in Financial
Statements As on March
31, 2017
Balance Sheet under
Regulatory scope of
consolidation As on March
31, 2017
Ref No.
A Capital & Liabilities i Paid-up Capital 5,981.49 a1
Reserves & Surplus 200,479.72
Share Premium a2Balance in P/L a/c. b1
Unallocated Surplus
Adequacy purposes2,742.40 b2
Statutory Reserve 29,227.70 c1 c2
Capital Reserve c3Investment Allowance Reserve 10.00 c4
Investment Reserve Account c7Revaluation Reserve
c9
Minority Interest - -Total Capital 206,461.21
ii Deposits 1,265,722.23
- iii Borrowings 224,536.94
-
outside India
10,000.00 Eligible AT1 Capital 10,000.00 d1
iv Other liabilities & provisions 89,763.76 e1 - - Total 1,786,484.14 B Assets i Cash and balances with Reserve Bank of India 77,487.47
notice
ii Investments: 367,021.38
-

Annual Report 2016-17
230
(` in million)Balance Sheet as in Financial
Statements As on March
31, 2017
Balance Sheet under
Regulatory scope of
consolidation As on March
31, 2017
Ref No.
Associates-
Funds etc.)
iii Loans and advances 1,130,805.08
iv Fixed assets 13,352.33 v Other assets
-
Other Intangibles (excluding MSRs) -
vi - vii - Total Assets 1,786,484.14
Step 3
Common Equity Tier 1 Capital : Instruments and ReservesComponent of
regulator capital reported by bank
Source based on reference
number / letters of the balance
sheet under the regulatory scope of consolidation
from step 21
surplus (share Premium)2 Retained earnings B=b1– b23 Accumulated other comprehensive income (and other
reserves)
4applicable to non-joint stock companies)
-
Common share capital issued by subsidiaries and held by -
Common Equity Tier I Capital before Regulatory adjustments
201,253.25
7 Prudential valuation adjustments --

231
Table DF-13: Main Features of Regulatory Capital Instruments
Sr. No
Particulars Equity Shares Additional Tier 1 Bond
1 Issuer
2
3Regulatory treatment
4 Transitional Basel III rules Common Equity Tier I
Additional Tier 1
Post-transitional Basel III rules Common Equity Tier I
Additional Tier 1
Solo7 Instrument type Common
SharesAmount recognised in regulatory capital (` in ` ` 10,000 Million
9 ` 10 per share ` 1 Million per Bond10 Shareholder's
Equity11 Various* 22.03.201712 Perpetual or dated Perpetual Perpetual13 Original maturity date No Maturity No Maturity14 Issuer call subject to prior supervisory approval No Yes
Optional call date, contingent call dates and redemption amount
NA
NA
Coupons / dividends17 NA Fixed
Coupon rate and any related index NA19 NA Yes20 Fully discretionary, partially discretionary or
mandatory Fully
21 No No22 Noncumulative or cumulative Non-
CumulativeNon-Cumulative
23 Convertible or non-convertible NA Non-convertible24 NA NA

Annual Report 2016-17
232
Sr. No
Particulars Equity Shares Additional Tier 1 Bond
NA NANA NA
27 NA NA
into NA NA
29converts into
NA NA
30 No Yes31 NA
is Common Equity Tier 1 capital
(PONV) Trigger Event. The PONV Trigger Event
as determined by the RBI, and (2) the decision
become non-viable as determined by the relevant authority.
32 NA Fully or Partially33 NA Temporary or Permanent34
mechanism NA
the Bond can be increased in
The Bonds may be subject to more than one reinstatement.
Position in subordination hierarchy in liquidation
instrument)
NA The Bonds are senior / superior
shares and perpetual non-
issued by the Bank.No No
37 NA -
DF-14: Capital Disclosures
this section is

233
DF-16: Equities – Disclosure for Banking Book Positions
DF-17: Summary comparison of accounting assets vs. leverage ratio exposure measure
Leverage Ratio:
credible supplementary measure to the risk based capital requirements
Leverage Ratio = Capital Measure (Tier I Capital)
Exposure Measure
Summary comparison of accounting assets vs. leverage ratio exposure measure Item (` in millions)1
2 -
3
4
-
7 Other adjustments -
Leverage Ratio Exposure 2,282,205

Annual Report 2016-17
234
DF-18: Leverage ratioLeverage ratio
Item Leverage ratio framework(` in Million)
On balance sheet exposure
1 On-balance sheet items (excluding derivatives and SFTs, but including collateral)
2 (Asset amounts deducted in determining Basel III Tier 1 capital)
3 Total on-balance sheet exposures (excluding derivatives and SFTs) (sum 1,782,959
4 eligible cash variation margin) 29,402
-
7 derivatives transactions) -
-
9 -
10 derivatives) -
11 Total derivative exposures (sum of lines 4 to 10) 91,576
12 accounting transactions -
13 assets) -
14 -
Agent transaction exposures -
-Other off-balance sheet exposures
17
19 Off-balance sheet items (sum of lines 17 and 18) 407,670Capital and total exposures
20 Tier 1 capital 211,25321 Total exposures (sum of lines 3, 11, 16 and 19) 2,282,205
Leverage ratio
22 Basel III leverage ratio

235
To the Members of IndusInd Bank LimitedReport on the Consolidated Financial Statements
Management’s Responsibility for the Consolidated Financial Statements
Auditors’ Responsibility
Independent Auditors’ Report

Annual Report 2016-17
236
Opinion
Other Matter`
Report on Other Legal and Regulatory Requirements

237
th th
For Price Waterhouse Chartered Accountants LLP
Russell I Parera

Annual Report 2016-17
238
Report on the Internal Financial Controls under Clause (i) of Sub-section 3 of Section 143 of the Act
that date.
Management’s Responsibility for Internal Financial Controls
Auditors’ Responsibility
Meaning of Internal Financial Controls Over Financial Reporting
Annexure A to Independent Auditors’ ReportReferred to in paragraph 10(g) of the Independent Auditors’ Report of even date to the members of IndusInd Bank Limited on the Consolidated Financial Statements for the year ended March 31, 2017

239
Inherent Limitations of Internal Financial Controls Over Financial Reporting
Opinion
Other Matters
For Price Waterhouse Chartered Accountants LLP
Russell I Parera

Annual Report 2016-17
240
`
As at 31.03.2017
As at 31.03.2016
CAPITAL AND LIABILITIES
1
5
TOTAL 178649,89,70 142898,19,79
ASSETS
6
11
TOTAL 178649,89,70 142898,19,79
Consolidated Balance Sheet as at March 31, 2017
For and on behalf of Board of Directors
For Price Waterhouse Chartered Accountants LLP R. Seshasayee T. Anantha NarayananChartered Accountants Chairman Director
Russell I Parera Romesh SobtiPartner Managing Director
S. V. Zaregaonkar Haresh Gajwani Company Secretary

241
Consolidated Profit and Loss Account for the year ended March 31, 2017
`Year ended Year ended31.03.2017 31.03.2016
I. INCOME
TOTAL 18577,16,25 15168,68,99II. EXPENDITURE
1516
TOTAL 15709,26,98 12882,23,98III. PROFIT
TOTAL 7882,82,56 5951,66,82IV. APPROPRIATIONS
TOTAL 7882,82,56 5951,66,82V. EARNINGS PER EQUITY SHARE
``
`
For and on behalf of Board of Directors
For Price Waterhouse Chartered Accountants LLP R. Seshasayee T. Anantha NarayananChartered Accountants Chairman Director
Russell I Parera Romesh SobtiPartner Managing Director
S. V. Zaregaonkar Haresh Gajwani Company Secretary

Annual Report 2016-17
242
Consolidated Cash Flow Statement for the year ended March 31, 2017
`Year ended 31.03.2017
Year ended 31.03.2016
A. Cash Flow from Operating Activities4359,68,85 3469,26,11
Adjustments for :
5720,64,96 4329,78,14 Adjustments for :
Cash generated from / (used in) Operations 13454,07,90 (1578,08,46)
Net Cash from / (used in) Operating Activities 11569,30,19 (2926,92,56)B. Cash Flow from Investing Activities
Net Cash used in Investing Activities (273,63,73) (257,51,48)C. Cash Flow from Financing Activities
Net Cash generated from / (used in) Financing Activities (2768,25,37) 2517,17,00 (11,02,82) -
Net Increase / (Decrease) in Cash and Cash Equivalents 8516,38,27 (667,27,04)Cash and Cash Equivalents at the beginning of the year 10111,87,15 10779,14,19 Cash and Cash Equivalents at the end of the year 18628,25,42 10111,87,15
Notes:
For and on behalf of Board of Directors
For Price Waterhouse Chartered Accountants LLP R. Seshasayee T. Anantha NarayananChartered Accountants Chairman Director
Russell I Parera Romesh SobtiPartner Managing Director
S. V. Zaregaonkar Haresh Gajwani Company Secretary

243
Schedules to the Consolidated Financial Statements
`
As at 31.03.2017
As at 31.03.2016
SCHEDULE - 1 CAPITAL
Authorised Capital
` 700,00,00 700,00,00
Issued, Subscribed and Called Up Capital
` 598,14,87 594,98,63
Paid up Capital
`
TOTAL 598,14,87 594,98,63
SCHEDULE - 2 RESERVES AND SURPLUS
I Statutory Reserve
2922,77,00 2205,79,68
II Share Premium Account
9369,42,05 9274,10,55
III General Reserve
1,35,57 1,35,57
IV Capital Reserve
215,74,87 170,21,21
V Capital Reserve on Consolidation
35 35

Schedules to the Consolidated Financial Statements (Contd.)
Annual Report 2016-17
244
`
As at 31.03.2017
As at 31.03.2016
VI Investment Allowance Reserve
1,00,00 1,00,00
VII Investment Reserve Account
40,52,98 40,52,98
VIII Revaluation Reserve
374,59,43 380,76,96
IX Foreign Currency Translation Reserve
(11,02,82) -
TOTAL 20034,25,47 17088,42,78
SCHEDULE - 3 DEPOSITS
A I Demand Deposits
II Savings Bank Deposits
III Term Deposits
TOTAL 126572,22,28 93000,34,61
B Deposits of Branches
TOTAL 126572,22,28 93000,34,61

Schedules to the Consolidated Financial Statements (Contd.)
245
`
As at 31.03.2017
As at 31.03.2016
SCHEDULE - 4 BORROWINGSI Borrowings in India
-
II Borrowings outside India TOTAL 22453,69,43 24995,86,48
SCHEDULE - 5 OTHER LIABILITIES AND PROVISIONS
TOTAL 8976,37,58 7204,80,65
SCHEDULE - 6 CASH AND BALANCES WITH RESERVE BANK OF INDIA
TOTAL 7748,74,71 4521,04,05
SCHEDULE 7 BALANCES WITH BANKS AND MONEY AT CALL AND SHORT NOTICEI In India
TOTAL 8957,82,72 3513,79,76

Schedules to the Consolidated Financial Statements (Contd.)
Annual Report 2016-17
246
`
As at 31.03.2017
As at 31.03.2016
II Outside India
TOTAL 1921,67,99 2077,03,34
GRAND TOTAL 10879,50,71 5590,83,10
SCHEDULE - 8 INVESTMENTSI In India
Net value of Investments in India 36703,62,14 34055,51,98
II Outside India TOTAL 36703,62,14 34055,51,98(1) Investment in Associate
Equity Investment in Associate 65 65
TOTAL 1,48,62 1,20,81
` `

Schedules to the Consolidated Financial Statements (Contd.)
247
`
As at 31.03.2017
As at 31.03.2016
SCHEDULE - 9 ADVANCES
A
TOTAL 113080,50,76 88419,34,19
B
TOTAL 113080,50,76 88419,34,19
C
TOTAL 111363,33,85 88419,34,19
TOTAL 113080,50,76 88419,34,19
SCHEDULE - 10 FIXED ASSETS
I Premises
TOTAL 511,63,30 523,29,76

Schedules to the Consolidated Financial Statements (Contd.)
Annual Report 2016-17
248
`
As at 31.03.2017
As at 31.03.2016
TOTAL 795,16,27 694,54,87
III Capital Work in Progress
GRAND TOTAL 1335,23,28 1255,32,39
SCHEDULE - 11 OTHER ASSETS
TOTAL 8902,28,10 9056,14,08
SCHEDULE - 12 CONTINGENT LIABILITIES
TOTAL 406387,19,15 285101,32,08

Schedules to the Consolidated Financial Statements (Contd.)
249
`Year ended31.03.2017
Year ended31.03.2016
SCHEDULE - 13 INTEREST EARNED
TOTAL 14405,67,03 11871,74,37
SCHEDULE - 14 OTHER INCOME
TOTAL 4171,49,22 3296,94,62
SCHEDULE - 15 INTEREST EXPENDED
TOTAL 8343,06,61 7355,17,13
SCHEDULE - 16 OPERATING EXPENSES
TOTAL 4783,07,58 3672,10,09

Annual Report 2016-17
250
Schedule 17 Significant Accounting Policies1. General
Principles of Consolidation
Basis of preparation
Name of the Associate Country of Origin
% Shareholding of Group as at March 31, 2017
% Shareholding of Group as at March 31, 2016
2. Transactions involving Foreign Exchange

251
3. Investments
Held to Maturity (HTM) –
Held for Trading (HFT) –
Available for Sale (AFS) –
Held to Maturity –

Annual Report 2016-17
252
Held for Trading –
Available for Sale –
`
management.
account.
account.
253
`
4. Derivatives
5. Advances

Annual Report 2016-17
254
6. Securitisation transactions and direct assignments
7. Property, Plant and Equipment

255
amount.
8. Revenue Recognition
9. Operating Leases

Annual Report 2016-17
256
11. Segment Reporting
Treasury
Corporate / Wholesale Banking
Retail Banking
Other Banking Operations
Unallocated
12. Debit and Credit Card reward points liability
13. Bullion

257
14. Income-tax
15. Earnings per share
16. Provisions, contingent liabilities and contingent assets
17. Cash and Cash equivalents

Annual Report 2016-17
258
1. Capital:
During the year ended March 31, 2017, 31,62,370 equity shares aggregating to ` 96.62 crores were allotted on various dates to the employees who exercised their stock options.
shares of ` 10 each were allotted at a price of ` ` ` 10 each at a price of `
aggregating to ` `
2. Fixed Assets:
2.1 Cost of premises includes ̀ ` -tion of documents and registration formalities are in progress. Of these properties, the Bank has not obtained full possession of one property having written down value of ` `
2.2 Computer software:
`
Particulars March 31, 2017 March 31, 2016209.36
61.10 71.12
Deduction during the year 3.06 -
207.26 160.31
Closing Balance as at 31 March 131.26 120.17
Depreciation charge for the year
2.3 Movement in depreciation of Fixed Assets:`
Depreciation 2016-17 2015-16Premises
66.72
Transferred from Revaluation Reserve 6.20
Charge for the year 2.06 2.07
Deduction during the year -
Depreciation to date 66.72
Other Fixed Assets771.09
Charge for the year
Deduction during the year
Depreciation to date 771.09
Schedule 18 Notes forming part of the consolidated financial statements

259
3. Contingent Liabilities:
The Bank’s pending litigations comprise of claims against the Bank by the clients and proceedings pending with
statements. Claims against the Bank not acknowledged as debts comprise of tax demands of ` ` sub judice of
` ` ` ` sub judice. The amount of contingent liabilities is based on management’s estimate,
4.
as required under any law / accounting standards for material foreseeable losses on such long term contracts
5.
6. Corporate Social Responsibility (CSR):
The Bank has spent an amount of ` `
an amount of ` `
7.
8.
position of the Bank as at March 31, 2017.
9.1 Employee Stock Option Scheme (“ESOS”):
options of the Bank not exceeding 7% of the aggregate number of issued and paid up equity shares of the
the Compensation Committee, which is normally based on the latest available closing price. Upon vesting,
where the employees will receive one equity share per stock option.
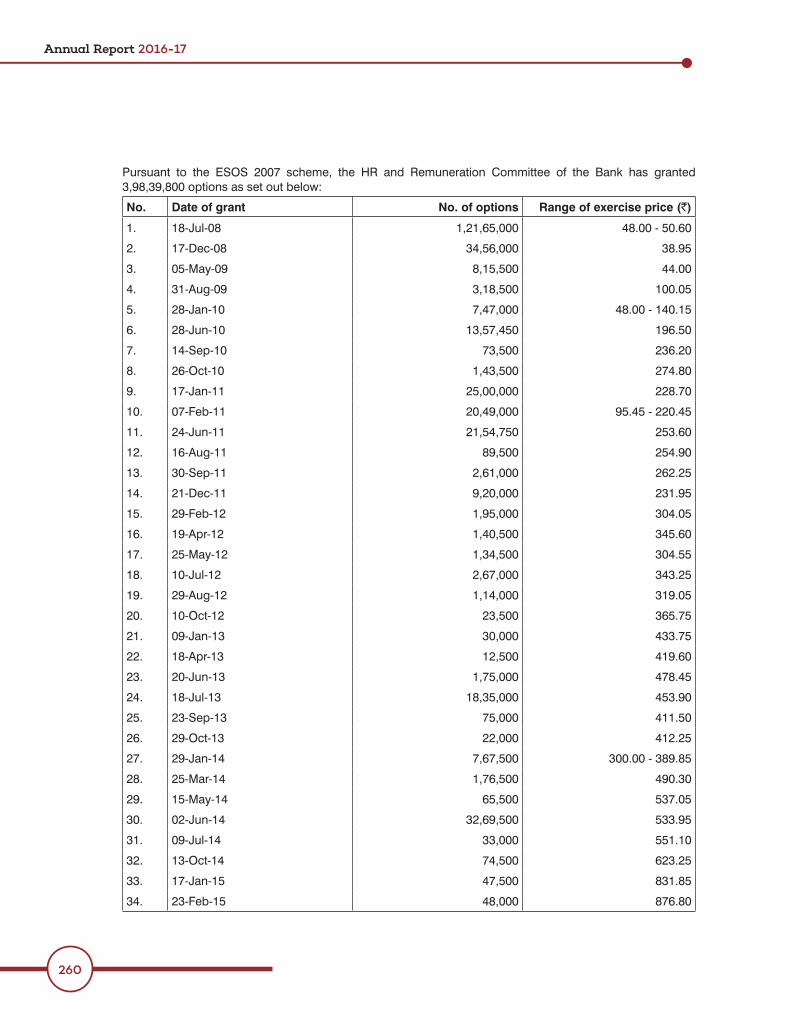
Annual Report 2016-17
260
No. Date of grant No. of options Range of exercise price (`)
1.
2.
3.
6.
7. 236.20
26-Oct-10
9.
10.
11.
12.
13. 2,61,000
21-Dec-11 9,20,000
16.
17.
2,67,000
19.
20. 10-Oct-12
21. 30,000
22.
23.
26. 29-Oct-13 22,000
27.
29.
30.
31. 33,000
32.
33.

261
No. Date of grant No. of options Range of exercise price (`)
11,000
36.
37. 16,30,000
1,93,000
39.
12-May-16
1,126.70
2,76,000
10-Oct-16
16-Nov-16 1,093.10
9.2 Recognition of expense:
fair market price over the exercise price of an option at the grant date, is recognised as a deferred compen-sation cost and amortised on a straight-line basis over the vesting period of such options. The compensation
The fair market price is the latest available closing price on the stock exchange on which the shares of the Bank are listed, prior to the date of the meeting of the Compensation Committee in which stock options are
have been traded highest on the said date is considered for this purpose.
9.3 Stock option activity under the scheme during the year:
Particulars No. of options Weighted average
exercise price (`)
Outstanding at the beginning of the yearGranted during the year 1,216.73
2,06,270 707.7231,62,370
- -Outstanding at the end of the year 1,17,32,111Options exercisable at the end of the year
The weighted average price of options exercised during the year is ` 1,129.96.

Annual Report 2016-17
262
No. Date of grant Exercise Price Number of shares arising out of options
Weighted average life of options (in years)
1. 17,0002. 6,00,000 3.
11,70,0001.36
6.7. 9,000 2.33
21-Dec-11 2.369. 1.9710.11. 21,96012. 2.7913.
10-Oct-12
16.17.
19. 29-Oct-1320. 23,33021. 300.00 7,00,000 22.23.
26.27.
29. 11,00030.31.32. 1,77,12033.
23,600 6.2210,00,000
36. 12-May-16 6.1337. 1,126.70 6.29
2,76,00039. 10-Oct-16
16-Nov-16 1,093.10
7.00

263
9.4 Fair value methodology:
The fair value of options granted during the year has been estimated on the date of grant using the Black-
Particulars 2016-17
Risk free interest rates
-tility has been computed by considering the historical data on daily volatility in the closing equity share price
the options, till the date of the grant.
The stock-based compensation cost calculated as per the intrinsic value method for the year ended March 31, 2017 is ̀ `fair valuation, compensation cost for the year ended March 31, 2017, would have increased by ̀
` ` `
Particulars March 31, 2017 March 31, 2016
Basic earnings per share `
Diluted earnings per share `
The weighted average fair value of options granted during the year 2016-17 is ` `
9.5 Gratuity:
valuation.
`
No. Particulars March 31, 2017 March 31, 2016
Changes in the present value of the obligation
1. 61.67
2.
3. 12.71

Annual Report 2016-17
264
`
No. Particulars March 31, 2017 March 31, 2016
7.60
6. 61.67
Reconciliation of opening and closing balance of the fair value of the Plan Assets
1.
2. 0.62
3.
-
Contributions 17.07
6.
7. 1.22
1. 12.71
2.
3.
0.33 -
6.
Funded status 100% insurance managed
funds
100% insurance managed
funds
Actuarial Assumptions
1. Discount Rate 7.00%
2. 7.60%
3.
30% 30%
promotion and other relevant factors, such as supply and demand in the employment market.

265
Experience Adjustment:
Particulars March 31, 2017 March 31, 201661.67
6.21 3.67
1.22
date is `
9.6 Provident Fund:
employer established provident funds, which require interest shortfalls to be recompensed, are to be consid-
`
Assets / Liabilities March 31, 2017 March 31, 20161.20
127.72
AssumptionsNormal Retirement age 60 years 60 years
Discount rate 7.00%6.36 - 13.23
account balance with interest rate equal to or more
account balance
account balance with interest rate equal to or more
account balance with interest rate equal to or more

Annual Report 2016-17
266
10. Segment Reporting (AS 17):
Business Segments:
`
Business Segment Treasury Corporate / Wholesale Banking
Retail Banking Other Banking Operation
Total
Particulars 31/03/17 31/03/16 31/03/17 31/03/16 31/03/17 31/03/16 31/03/17 31/03/16 31/03/17 31/03/16
Revenue
Revenue
Result 707.61
Unallocated
Contingencies
/ loss
- -
- -
7,261.62
61,913.39 - -
Unallocated
Note:
liabilities include share capital, employee stock option outstanding, reserves and surplus, proposed dividend and others.

267
Geographic Segments:
operations, the Bank is considered to operate only in domestic segment.
11. Related party transactions (AS-18):
Key Management Personnel
Associates
Subsidiaries
there is only one related party in each of the above categories.
12. Operating Leases (AS 19):
`
Particulars March 31, 2017 March 31, 2016
- Not later than one year
for the year
Total of future minimum sub-lease payments expected to be received under non-cancellable sub-lease
- -
- -
The Bank has not sub-leased any of the properties taken on lease. There are no provisions relating to contingent rent.
The terms of renewal and escalation clauses are those normally prevalent in similar agreements. There are no undue restrictions or onerous clauses in the agreements.

Annual Report 2016-17
268
13. Earnings per share (AS 20):
Particulars Year ended March 31, 2017
Year ended March 31, 2016
`
Basic weighted average number of equity shares
Diluted weighted average number of equity shares
` 10 10
`
` 39.26
14. Deferred Tax (AS 22):
`
Particulars March 31, 2017Deferred Tax
March 31, 2016Deferred Tax
Timing difference on account of Assets Liabilities Assets LiabilitiesDifference between book depreciation - -
doubtful debts and advances and - 307.32 -
Difference between book income and - 177.93 -
Others - -
Sub-total 563.75 211.28 333.89 170.96Net closing balance carried to the Balance Sheet (included in
352.47 162.93
15. Additional Disclosures:
A. Proposed Dividend:
` 6.00 per equity share amounting to `
March 31, 2017 and accordingly, the said amount of ̀ -

269
dividend during the year ended March 31, 2017 amounting to `
for declaration of dividend for the year ended March 31, 2016.
B. Additional information for consolidated accounts (Pursuant to Schedule III of Companies Act 2013):
`
Name of the Subsidiary
Net Assets*
2016-17 2015-16 2016-17 2015-16
As a % of Consolidated
Net Assets
Amount As a % of Consolidated
Net Assets
Amount As a % of Consolidated
Amount As a % of Consolidated
Amount
100.00% 100.00% 99.99% 99.99%
Associate
Marketing and - - - - 0.01% 0.01%
Total 100.00% 20,647.60 100.00% 17,697.18 100.00% 2,868.17 100.00% 2,286.73
C. Di
-
16.
cases of delays in payments to micro and small enterprises or interest payments due to delays in such payments.
17.
18.
For and on behalf of Board of Directors
For Price Waterhouse Chartered Accountants LLP R. Seshasayee T. Anantha NarayananChartered Accountants Chairman Director
Russell I Parera Romesh SobtiPartner Managing Director
S. V. Zaregaonkar Haresh GajwaniDate Company Secretary

Annual Report 2016-17
270
Companies (Accounts) Rules, 2014Statement containing salient features of the Financial Statement of Subsidiaries / Associate Companies /
Joint Ventures
Part “A”: Subsidiaries
The Bank did not have any subsidiary, in operation, during the year ended March 31, 2017. Hence, information in this regards is Nil.Notes:
Nil
NilPart “B”: Associates and Joint Ventures
No. Name of Associate Companies / Joint Ventures IndusInd Marketing and Financial Services Private Limited (IMFS)
1. March 31, 20172.
acquired3.
3,000` 30,00030%
Not applicable6. Net worth attributable to the Bank’s shareholding ` 7.
` Nil
Notes:
Nil
Nil
Statement pursuant to Section 129 of the Companies Act, 2013
For and on behalf of Board of DirectorsR. SeshasayeeChairman
T. Anantha NarayananDirector
Romesh SobtiManaging Director
Date S. V. Zaregaonkar Haresh Gajwani
Company Secretary

271
US DOLLAR DENOMINATED
Standalone Balance Sheet as at March 31, 2017
Standalone Profit and Loss Account for the year ended March 31, 2017
(Million of US$)
1 USD = ` 64.85As at
31.03.2017As at
31.03.2016CAPITAL AND LIABILITIESCapital 92.24 91.75Employee Stock Option Outstanding 2.34 2.12Reserves and Surplus 3,089.09 2,634.88Deposits 19,517.69 14,340.84Borrowings 3,462.40 3,854.41Other Liabilities & Provisions 1,384.18 1,111.00 TOTAL 27,547.94 22,035.00ASSETSCash and Balances with Reserve Bank of India 1,194.87 697.15Balances with Banks & Money at Call and Short Notice 1,677.64 862.12Investments 5,659.54 5,251.24Advances 17,437.24 13,634.44Fixed Assets 205.90 193.57Other Assets 1,372.75 1,396.48 TOTAL 27,547.94 22,035.00Contingent Liabilities 62,665.72 43,963.20Bills for Collection 2,930.90 2,121.95
(Million of US$)Year ended Year ended
1 USD = ` 64.85 31.03.2017 31.03.2016I. INCOME
Interest earned 2,221.38 1,830.65Other Income 643.25 508.40 TOTAL 2,864.63 2,339.05
II. EXPENDITUREInterest expended 1,286.52 1,134.18Operating expenses 737.56 566.25Provisions & contingencies 398.32 286.04 TOTAL 2,422.40 1,986.47
III. PROFIT 442.23 352.58773.09 565.00
AMOUNT AVAILABLE FOR APPROPRIATION 1,215.32 917.58
IV. APPROPRIATIONSTransfer to(a) Statutory Reserves 110.56 88.14(b) Capital Reserves 7.02 2.04(c) Investment Reserve Account - -(d) Dividend on equity (includes tax on dividend) 0.07 54.31
117.65 144.49Balance carried over to Balance Sheet 1,097.67 773.09 TOTAL 1,215.32 917.58

Annual Report 2016-17
272
Details of branches are accessible on the Bank’s website at:
https://www.indusind.com/locate-us.html?q1=&q2=branches
Bank’s Branches


Registered Office: 2401 General Thimmayya Road, Cantonment, Pune - 411 001.Tel.: +91 20 3046 1600 - 609
Corporate Office: 8th Floor, Tower 1, One Indiabulls Centre,841, S. B. Marg, Elphinstone Road, Mumbai - 400 013.Tel.: +91 22 2423 1999 / 3049 3999 | Fax: +91 22 2423 1998/ 3049 3998
Visit us at www.indusind.com or email us at [email protected]
CIN: L65191PN1994PLC076333