annual report 2016 2016 - epigenomics...mentation of targeted bisulfite next generation sequencing...
TRANSCRIPT
ANNUAL REPORT 2016
2016DETECTING CANCER IN BLOOD
CONTENTS
Foreword by the Executive Board . . . . . . . . . . . . . . . . . . . . . . . . . . . . . . . . . . . . . . . . . . . . . . . . . . . . . . . . . . . . . . . . . . . . . . . . . . . . . . . . . . . . 1
Report of the Supervisory Board . . . . . . . . . . . . . . . . . . . . . . . . . . . . . . . . . . . . . . . . . . . . . . . . . . . . . . . . . . . . . . . . . . . . . . . . . . . . . . . . . . . . . . 6
Our Share . . . . . . . . . . . . . . . . . . . . . . . . . . . . . . . . . . . . . . . . . . . . . . . . . . . . . . . . . . . . . . . . . . . . . . . . . . . . . . . . . . . . . . . . . . . . . . . . . . . . . . . . . . . . . . . . . . . . . . . . . . . . . . . . . . . . . . . 11
Consolidated Management Report . . . . . . . . . . . . . . . . . . . . . . . . . . . . . . . . . . . . . . . . . . . . . . . . . . . . . . . . . . . . . . . . . . . . . . . . . . . . . 14
Consolidated Financial Statements . . . . . . . . . . . . . . . . . . . . . . . . . . . . . . . . . . . . . . . . . . . . . . . . . . . . . . . . . . . . . . . . . . . . . . . . . . . . . . 51
Notes to the Consolidated Financial Statements . . . . . . . . . . . . . . . . . . . . . . . . . . . . . . . . . . . . . . . . . . . . . . . 57
Auditor’s Report . . . . . . . . . . . . . . . . . . . . . . . . . . . . . . . . . . . . . . . . . . . . . . . . . . . . . . . . . . . . . . . . . . . . . . . . . . . . . . . . . . . . . . . . . . . . . . . . . . . . . . . . . . . . . . . . . . . . . . 111
List of Abbreviations . . . . . . . . . . . . . . . . . . . . . . . . . . . . . . . . . . . . . . . . . . . . . . . . . . . . . . . . . . . . . . . . . . . . . . . . . . . . . . . . . . . . . . . . . . . . . . . . . . . . . . . . . . . 114
Imprint . . . . . . . . . . . . . . . . . . . . . . . . . . . . . . . . . . . . . . . . . . . . . . . . . . . . . . . . . . . . . . . . . . . . . . . . . . . . . . . . . . . . . . . . . . . . . . . . . . . . . . . . . . . . . . . . . . . . . . . . . . . . . . . . . . . . . . . . . . . 116
DEAR SHAREHOLDERS,
Securing US FDA approval of Epi proColon, our groundbreaking blood test for colorectal cancer screening, in April 2016 was a major milestone in our company’s history. This achievement marks a new chapter as we transition into an organization with an increased focus on commercializing our products.
➛ COMMERCIALIZATION OF EPI PROCOLON. We are confident that Epi proColon has great potential to succeed in the world’s biggest market for molecular diagnostics tests. Currently, one in three or almost 23 million Americans do not stay up-to-date with recommended colorectal cancer screenings. As a result, some 50,000 Americans die every year from this largely preventable disease. Colorectal cancer remains the second-leading cause of cancer death in the United States.
Our efforts to market Epi proColon in the U.S.A. got underway just a few weeks after receiving FDA approval. The Laboratory Corporation of America Holdings (LabCorp) is the first leading laboratory network in the U.S.A. to offer the test nationwide. Other laboratory chains such as ARUP and Sonic Laboratories have also added Epi proColon to their product offering.
One important factor which is key to the future revenue potential of Epi proColon is whether it will be covered by public and private health insurers in the U.S.A. We have already achieved important milestones in this regard, including receiving a Tier 1 CPT Code in the CMS 2017 Laboratory Fee schedule of the Centers of Medicare & Medicaid Services (CMS) and a preliminary price determination of USD 83.67 per test. In addition, we have initiated the application acceptance process for a National Coverage Determination (NCD) by CMS, which we expect to receive in the course of fiscal year 2017.
BY THE
EXECUTIVE BOARD
FOREWORD
1FOREWORD BY THE EXECUTIVE BOARD

Our partner in China, BioChain, has developed a broad introductory effort targeted towards full commercialization of the test. BioChain is continuing its efforts to estab-lish Septin9-based tests in routine testing programs and to raise market awareness and acceptance.
In the fall of 2016, we also signed an exclusive distribution agreement with SPD Scientific PTE Ltd. (Singapore) for the territories of Thailand, Vietnam, Malaysia and Singapore in a move to increase our product presence in Southeast Asia.
➛ US LEGISLATIVE INITIATIVE ON COLORECTAL CANCER SCREENING. In September 2016, congressman Donald M. Payne, Jr. (D-NJ), and congressman Charles Dent (R-PA) introduced the ‘’Donald Payne Sr. Colorectal Cancer Detection Act of 2016”. The bill was co-sponsored by congressmen Leonard Lance (R-NJ) and John Delaney (D-MD). The bipartisan initiative aims to provide coverage under the Medicare program for FDA-approved qualifying colorectal cancer (CRC) screening blood-based tests.
We are very excited to join the mission of the bill’s sponsors to fight colorectal cancer in the United States. We believe this new initiative is an opportunity to pro-vide millions of Americans access to colorectal cancer screening and to ultimately save thousands of lives. Under-served and rural populations in particular suffer most from low colorectal cancer screening rates and the higher prevalence of the disease as a result.
A convenient, patient-accepted blood test like Epi proColon has the potential to lower the existing hurdles for participation in cancer screening. The importance of regular screening has again been underscored by the United States Preventive Services Task Force (USPSTF), an independent panel of national experts in preven-tion and evidence-based medicine in the U.S.A. In its most recent recommenda-tion on colorectal screening in June 2016, the panel indicated that there was no generally preferred screening method. More important was participation in some form of screening. Renowned medical associations such as the American Cancer Society as well as a number of organizations and businesses – Epigenomics included – are aiming to increase participation rates in colorectal screening from currently 65% to 80% by 2018.
2 EPIGENOMICS ANNUAL REPORT 2016
➛ INNOVATIVE LUNG CANCER TEST EPI PROLUNG. With Epi proLung, we have developed a new blood-based test that detects the presence of lung cancer in blood plasma. Lung cancer diagnosis remains challenging and there is a high un-met medical need in this field. Radiological evaluations often lead to false positive results. A test to confirm the presence of malignant lung disease would enable earlier detection of the disease, less risk to the patient from invasive diagnostic methods, more successful therapies and lower treatment costs. The development is financed in part by a grant of up to EUR 2.8 million from the European Commission within the framework of the Horizon 2020 research and innovation program awarded in April 2015.
The test is based on a combination of proprietary DNA methylation biomarkers including SHOX2 and PTGER4. In 2016, we were able to achieve significant mile-stones in test development. Our development team has completed the product development phase and successfully conducted preliminary clinical studies. Thus far more than 500 plasma samples have been analyzed using our new test. The results were published in August 2016 in a peer-reviewed medical journal.
We are planning to complete the final clinical validation trials at a number of lung cancer centers in Europe and the U.S.A. in the second half of 2017 with the aim to CE mark this new, blood-based product in accordance with the In-vitro Diagnostic Directive (IVD Directive).
In March 2016, we announced a strategic license agreement with BioChain for the development and marketing of an innovative blood-based lung cancer test for the Chinese market. Under the terms of the agreement, Epigenomics will receive un-disclosed upfront, milestone and minimum annual payments as well as a royalty on future product revenues. In view of the high, rapidly growing prevalence of lung cancer among the Chinese population, the commercialization of a novel, blood-based test represents a major business opportunity for both companies. We are also entitled to commercialize the BioChain product in other markets outside China.
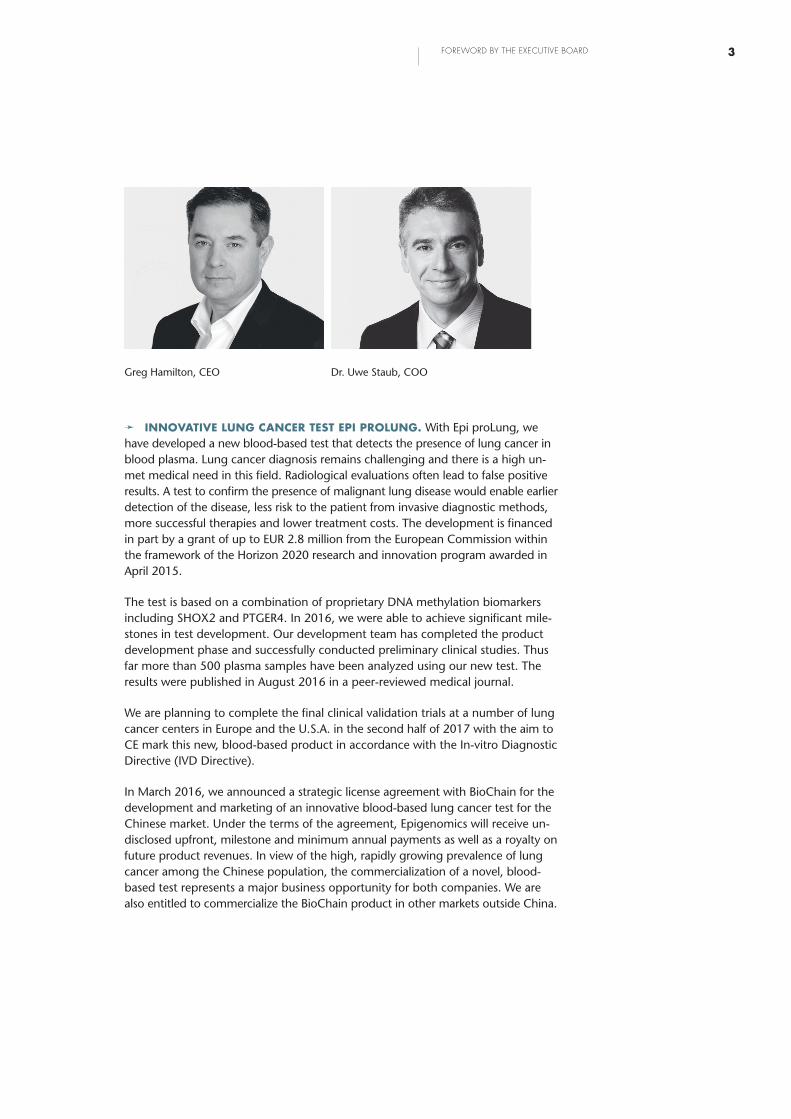
Greg Hamilton, CEO Dr. Uwe Staub, COO
3FOREWORD BY THE EXECUTIVE BOARD
➛ PROMISING NEW RESEARCH. In fiscal year 2016 we began with the imple-mentation of targeted bisulfite Next Generation Sequencing (NGS). NGS is a powerful technology which enables the user to analyze one patient sample with multiple biomarkers at the same time. The technology is established in most molecular diagnostic laboratories where initially tissue samples were used for the analysis. It is now gradually extended into liquid biopsy samples including plasma and urine. We are exploring various liquid biopsy products via NGS based on our own proprietary biomarkers and completed the first proof-of-concept studies. We plan to confirm the initial findings in larger clinical studies in 2017 and will present results later in the year.
➛ SOLID FINANCIAL SITUATION. The Company reports results for the full year 2016 in this annual report, which met out projected financial targets. At EUR 4.2 million, revenue significantly exceeded that of the previous year and was within the detailed forecast we made in November 2016. Adjusted EBITDA was EUR -9.7 mil-lion and thus also within expectations. With cash and cash equivalents of EUR 12.3 million as of December 31, 2016, we have a solid financial buffer to start the new fiscal year. To ensure the continued existence of our business and our ability to leverage the opportunities for innovative cancer tests that arise on the market, we will however still need to rely on debt and equity financing going forward.
➛ LOOKING AHEAD. Important milestones await us in the new fiscal year con-cerning the commercialization of Epi proColon. These include in particular the tar-geted inclusion in the prevention guidelines of various medical associations as well as the expected coverage determination by Medicare and private health insurers. Full Medicare coverage could be achieved through a NCD or legislation. These milestones will propel the commercial growth in the United States, our largest potential market with over 80 million age eligible patients.
44 EPIGENOMICS ANNUAL REPORT 2016

Once the final clinical validation trials and the subsequent CE marking have been completed, we plan to launch our second blood-based cancer test, Epi proLung, in Europe.
In the area of research and development we expect to glean much scientific data from our new biomarker studies for various cancer indications. We are confident that the Next Generation Sequencing (NGS) offers great potential for developing new and even better cancer tests. We intend to exploit this potential to the utmost with the help of our unique expertise in the field of methylation technologies.
We look forward to being able to keep you informed about our progress in devel-oping and marketing innovative diagnostic products. We also wish to take this oppor-tunity to thank our employees for their continued dedication, our customers and partners for their loyalty and you, our shareholders, for your ongoing support and trust.
Yours sincerely,
Greg Hamilton Dr. Uwe Staub (CEO) (COO)
5FOREWORD BY THE EXECUTIVE BOARD
DEAR SHAREHOLDERS,
In fiscal year 2016, Epigenomics entered a new phase in its corporate develop-ment. After receiving FDA approval in the U.S. in April, our focus is now on the promising commercialization of Epi proColon in the world’s biggest market for mo-lecular diagnostic tests.
The appointment of Greg Hamilton as the new CEO of Epigenomics AG is a testa-ment to this. Mr. Hamilton had served with great success in various management positions at molecular diagnostic companies in the U.S. and was responsible for a series of innovative diagnostic products. We are certain that Epigenomics will benefit from Mr. Hamilton’s experience and networks.
We face a number of significant decisions in the coming fiscal year. Some of these concern the Company’s financial security, the implementation of the commercial-ization strategy in the U.S. and the development of the product pipeline. The Su-pervisory Board will work closely with the Executive Board to review and advise on these decisions.
WORK OF THE SUPERVISORY BOARD
Throughout 2016, the Supervisory Board of Epigenomics AG fulfilled all of the duties incumbent upon it in accordance with the law, the Articles of Association and its Rules of Procedure. It advised and monitored the Executive Board in man-aging the Company and kept itself apprised at all times of the Company’s operat-ing performance, the key challenges it faced, and the Executive Board’s assessment as to the overall financial position and risk management of the Company. All cor-porate planning, including financial, capital expenditure and human resources planning, as well as the general business performance was reported on a regular basis by the Executive Board. To the extent that German corporate law or the applicable Rules of Procedure required consent for certain decisions or actions by the Executive Board, such consent was granted by the Supervisory Board after thorough deliberation and careful examination of oral reports and written documentation, which were provided.
OF THE
SUPERVISORY BOARD
REPORT
6 EPIGENOMICS ANNUAL REPORT 2016
The beginning commercialization of Epi proColon in the U.S.A. was one of the most important issues discussed regularly at the Supervisory Board meetings in fiscal year 2016. Further important topics included capital increases which were successfully implemented in May and November 2016, the overall financial situ-ation of the Company, strategic options and human resources issues. Furthermore, where the terms and conditions of potential new cooperation agreements required the consent of the Supervisory Board, these were reviewed and discussed through-out the year in the context of regular assessments.
The Supervisory Board adopted the annual financial statements for fiscal year 2016 and approved the consolidated financial statements. The Supervisory Board always took into account in its work the interests of Epigenomics’ shareholders.
During 2016, six meetings of the Supervisory Board with the Company’s Executive Board took place on February 3/4, March 17, May 24/25, July 25/26, September 19/20 and December 18/19. These meetings were held in Berlin. All members of the Supervisory Board attended all of the meetings.
In addition to the very close dialog between all members of the Supervisory and the Executive Board in joint plenary meetings, detailed written and oral reports of the Executive Board were provided to the Supervisory Board within the framework of supplementary conference calls and individual discussions. Thus, the Supervisory Board was continually kept up to date on the Company’s current business situation and key events throughout the year.
At its meeting on December 18/19, 2016, the Supervisory Board considered in detail the operational budget, financial planning and human resource allocation plan for the fiscal year 2017 and approved the Company’s targets for 2017.
It also approved the Executive Board’s remuneration.
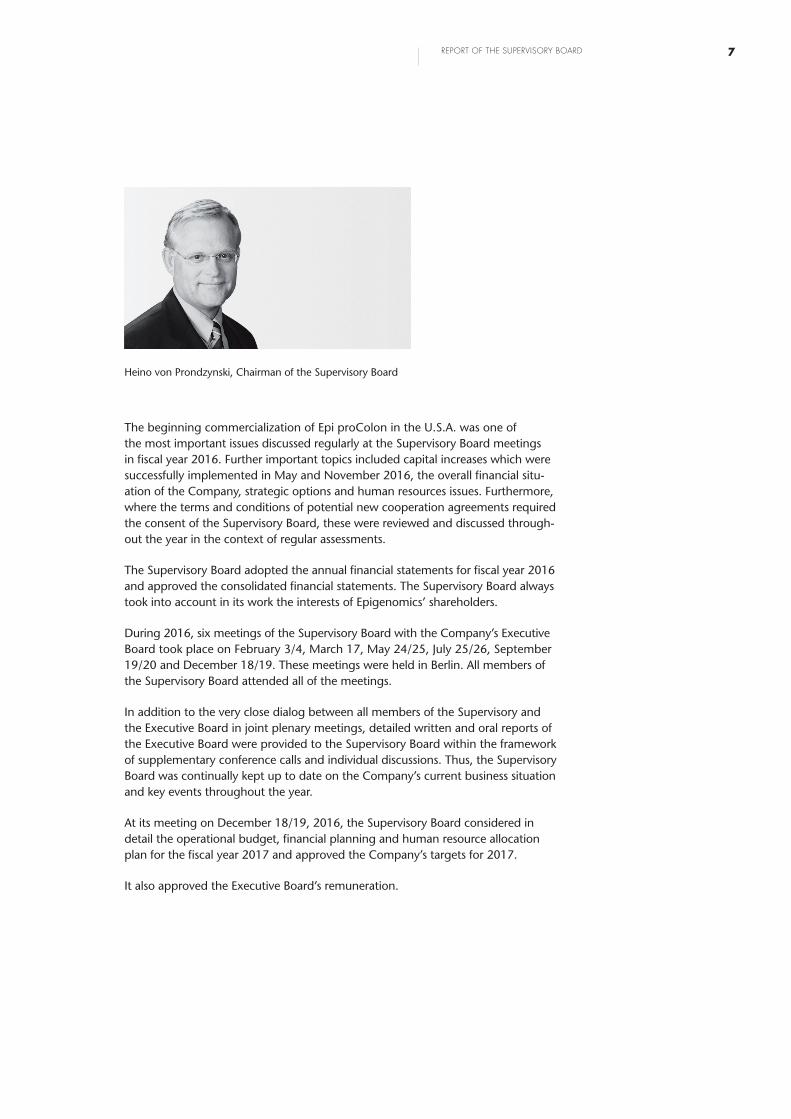
Heino von Prondzynski, Chairman of the Supervisory Board
REPORT OF THE SUPERVISORY BOARD 7
For each formal meeting of the Supervisory Board, in the presence of the Executive Board, all members of the Supervisory Board received comprehensive written reports in advance, prepared by the Executive Board with the input of the respective man-agers of the Company. These detailed documents were suitable for analyzing and discussing all relevant topics of the respective agenda of the Supervisory Board meetings and for adopting all required resolutions. Written minutes of all official meetings and telephone conferences were prepared. Whenever necessary, resolu-tions were also passed by written vote in accordance with the Company’s Articles of Association.
ORGANIZATIONAL CHANGES
At the Annual General Shareholders’ Meeting on May 25, 2016, Dr. Helge Lubenow was elected as a member of the Supervisory Board. Dr. Lubenow had served in vari-ous management positions within the Qiagen Group both in Germany and abroad before founding AGOS Consulting in 2016.
The Supervisory Board unanimously resolved to appoint Mr. Greg Hamilton as CEO of Epigenomics AG with effect from July 1, 2016. The service agreement with Dr. Thomas Taapken was severed as of June 30, 2016.
CONFLICTS OF INTEREST
No conflicts of interest for the members of the Supervisory Board arose during the reporting year.
COMMITTEES
In fiscal year 2016, the Supervisory Board established an Audit Committee chaired by Prof. Günther Reiter. Dr. Helge Lubenow was appointed as a member of the Audit Committee. The Supervisory Board has designated Prof. Dr. Günther Reiter as the main expert for financial reporting and audit matters in accordance with Section 100 of the German Stock Corporation Act (Aktiengesetz – AktG). In this role, he is responsible for communicating regularly with the Executive Board, the Senior Vice President Finance, Accounting and Controlling and with the auditor of the Com-pany, in order to provide advice on the preparation of financial reports, audits and quarterly financial statements. He reports regularly to the full Supervisory Board, highlighting any findings and observations in this area. At the same time, the Super-visory Board designated Ann Clare Kessler, Ph.D., as the main expert on remunera-tion and nomination matters. Heino von Prondzynski was designated the main expert on corporate governance matters.
8 EPIGENOMICS ANNUAL REPORT 2016
CORPORATE GOVERNANCE
The Supervisory Board continuously reviewed all issues of legal and regulatory compliance by the Company. Given the rapidly and constantly changing economic environment and in light of the current financial position of the Company, the Super-visory Board also discussed in detail issues relevant to an effective risk management system. Both the Executive Board and the Supervisory Board regard the commit-ment to sound corporate governance as crucial to reinforcing the Company’s cred-ibility with current and future shareholders, business partners and employees. In October 2016, the Executive Board and the Supervisory Board issued a new Declar-ation of Compliance with the German Corporate Governance Code (the “Code”) pursuant to Section 161 AktG, which is included in this annual report and is also permanently available on Epigenomics’ website (www.epigenomics.com/en/news- investors/investor-relations/corporate-governance.html).
In its declaration, the Company has committed itself to adherence to the Code, and only deviates in explicitly mentioned, Company-specific cases from its recom-mendations.
In accordance with Section 111(5) of the German Stock Corporation Act (Aktien-gesetz – AktG), the Supervisory Board has set a quota for female board members equal to 1/3 of the number of seats on the Supervisory Board. As of the 2016 Annual General Shareholders’ Meeting, the number of female board members was one, which represented 1/3 of the total seats and therefore corresponded to the target level. With Dr. Lubenow’s appointment as the fourth member of the Supervisory Board, women now hold 1/2 of the total seats, thus exceeding the target level.
AUDIT OF THE ANNUAL FINANCIAL STATEMENTS
The audit firm Baker Tilly Roelfs AG Wirtschaftsprüfungsgesellschaft (Baker Tilly), Duesseldorf, has audited the annual financial statements and the corresponding management report of Epigenomics AG for fiscal 2016 in accordance with the principles of the German Commercial Code (HGB), as well as the consolidated financial statements and the Group management report for fiscal year 2016 in accordance with International Financial Reporting Standards (IFRSs), as adopt - ed by the European Union (EU).
Baker Tilly did not raise any objections for either the annual or consolidated finan-cial statements and issued an unqualified audit opinion to each.
REPORT OF THE SUPERVISORY BOARD 9

The consolidated financial statements and the Group management report were prepared in accordance with Section 315a HGB in accordance with International Financial Reporting Standards (IFRSs), as adopted by the EU. Baker Tilly’s audit was conducted in accordance with German generally accepted standards for the audit of financial statements promulgated by the Institute of Public Auditors in Germany (“Institut der Wirtschaftsprüfer in Deutschland e. V.”). The audit reports and the audit opinions were submitted to the Supervisory Board by the Executive Board in a timely manner.
Baker Tilly’s audit reports were presented in a draft version to all members of the Supervisory Board and were discussed in depth at a meeting, in the presence of the auditor, who reported on the main findings of its audit. At this meeting, the Executive Board presented the annual financial statements 2016 and consolidated financial statements 2016, as well as the Company’s risk management system. Baker Tilly also provided a report on the scope, focal points and findings of the audit. As a result of its own observations and examinations, the Supervisory Board raised no objections, accepted and confirmed the findings of the audit. The Super-visory Board, in the presence of the auditor, formally approved the annual financial statements and the consolidated financial statements as of December 31, 2016, without raising any objections or making any amendments on April 7, 2017. By the Supervisory Board’s approval, the 2016 annual financial statements of Epigenomics AG are thus adopted as submitted in accordance with Section 172 AktG.
With respect to the existing internal control and risk management system as well as with the Company’s early warning system, the auditor stated to the Supervisory Board that in its opinion these systems are suitable to meet all legally intended requirements.
The Supervisory Board would like to thank the Executive Board, the senior manage-ment and all employees of Epigenomics for their commitment and dedication throughout fiscal year 2016.
Berlin, April 2017
On behalf of the Supervisory Board
Heino von Prondzynski
10 EPIGENOMICS ANNUAL REPORT 2016
REPORT OF THE SUPERVISORY BOARD
OUR SHARE
SHARE PRICE DEVELOPMENT INFLUENCED BY APPROVAL OF EPI PROCOLON IN THE UNITED STATES
OUR SHARE
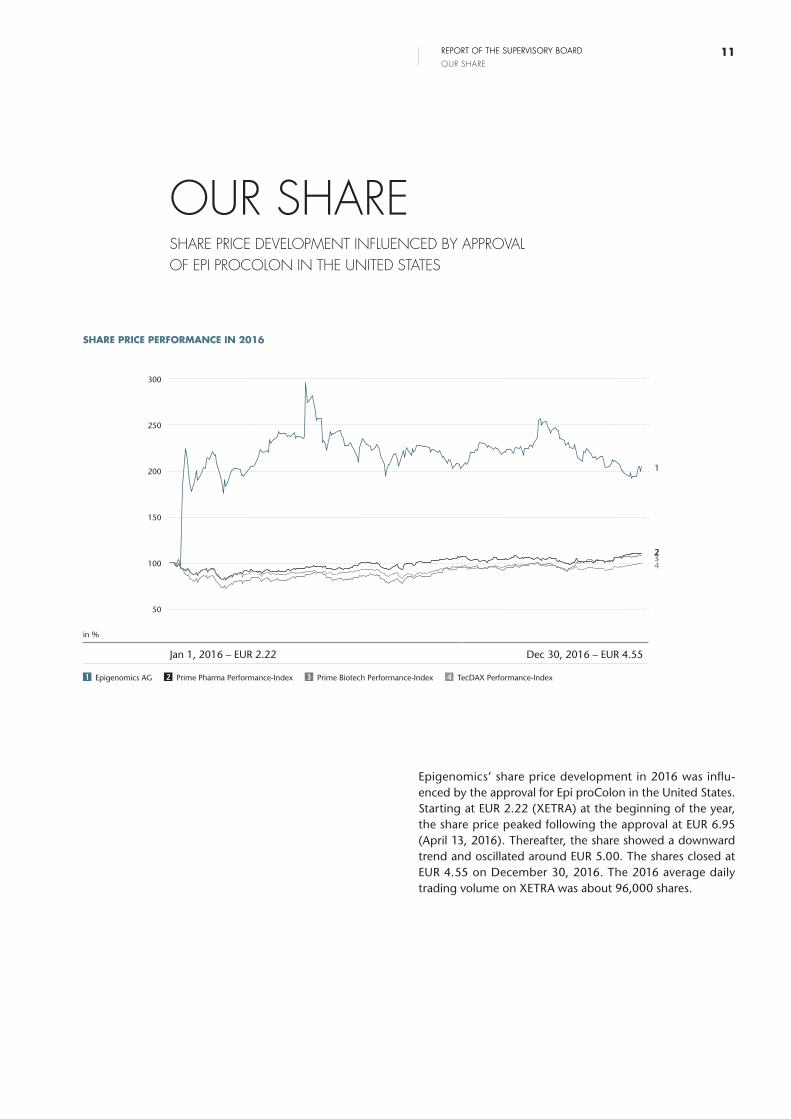
SHARE PRICE PERFORMANCE IN 2016
300
250
200
150
100
502
in %
Jan 1, 2016 – EUR 2.22 Dec 30, 2016 – EUR 4.55
1 Epigenomics AG 2 Prime Pharma Performance-Index 3 Prime Biotech Performance-Index 4 TecDAX Performance-Index
1
234
Epigenomics’ share price development in 2016 was influ-enced by the approval for Epi proColon in the United States. Starting at EUR 2.22 (XETRA) at the beginning of the year, the share price peaked following the approval at EUR 6.95 (April 13, 2016). Thereafter, the share showed a downward trend and oscillated around EUR 5.00. The shares closed at EUR 4.55 on December 30, 2016. The 2016 average daily trading volume on XETRA was about 96,000 shares.
REPORT OF THE SUPERVISORY BOARD 11

CHANGES IN THE SHARE CAPITAL/CAPITAL MEASURES
During the reporting period, the number of outstanding shares increased by 4,646,876 and the total number of shares outstanding was 22,735,260 as of December 31, 2016. The market capitalization of Epigenomics amounted to around EUR 103 million at the end of 2016.
In December 2013, Epigenomics issued 25 convertible notes with a principal amount of EUR 107,000.00 each to investors in Europe and the U.S.A. Ten of these were converted into 1,700,880 new shares throughout 2016, providing the Com-pany with financial means of EUR 4.2 million. The program has been successfully completed at the end of its term by December 31, 2016.
In May 2016, 1,436,000 new shares were issued in the con-text of a capital increase, providing the Company with gross proceeds of EUR 6.8 million.
In November 2016, 1,509,996 new shares were issued in the context of a two capital increases, providing the Company with gross proceeds of EUR 7.1 million.
SHAREHOLDER STRUCTURE
The following shareholders held more than 3% each of Epigenomics AG at the end of the financial year:
Shareholder Voting rights1
BioChain Institute, Inc. 9.3%
UChip Technology Limited 4.0%
As of December 31, 2016, around 87% of the Epigenomics shares were in free float. The largest proportion is held by private investors. Recent voting rights notifications are avail-able on our website under “News & Investors”.
Key data on Epigenomics’ shares
ISIN DE000A11QW50
Security code number A11QW5
Ticker symbol ECX
Stock exchange Frankfurt Stock Exchange Regulated Market (Prime Standard)
Number of shares outstanding (December 31, 2016) 22,735,260
Free float (December 31, 2016) 86.7%
Market capitalization (December 31, 2016) EUR 103.4 million
Year-end closing price EUR 4.55
AS OF DECEMBER 31, 2016
UChip Technology Limited
BioChain Institute, Inc.Free float
¹ according to received voting rights announcements
12 EPIGENOMICS ANNUAL REPORT 2016
TRANSPARENT DIALOG WITH SHAREHOLDERS – CONVERTING INTO REGISTERED SHARES
Epigenomics is committed to maintaining an ongoing and active dialog with the investment community in order to reg-ularly provide timely, accurate and comprehensive informa-tion about the Company and its products.
Throughout 2016, the Company hosted regular conference calls for investors and analysts to discuss the financial results and provide updates on the Company’s developments. Epigenomics’ management also presented at several investor meetings and published updates on clinical data at major scientific conferences in the United States and in Europe. Furthermore, the Company continued to provide opportuni-ties for a close dialog with shareholders and interested inves-tors at road show meetings.
On March 18, 2016, Epigenomics hosted its annual press con-ference and analyst meeting in Frankfurt am Main, Germany. At the Company’s Annual General Shareholders’ Meeting in Berlin on May 25, 2016, all proposals of the Company were agreed by large majorities of the shareholders.
ANALYST COVERAGE AND ADR PROGRAM
In 2016, Epigenomics was covered by the following analysts providing analysis updates and recommendations: goetzpart-ners, Maxim Group LLC, equinet Bank AG, First Berlin Equity Research GmbH, and Edison Investment Research.
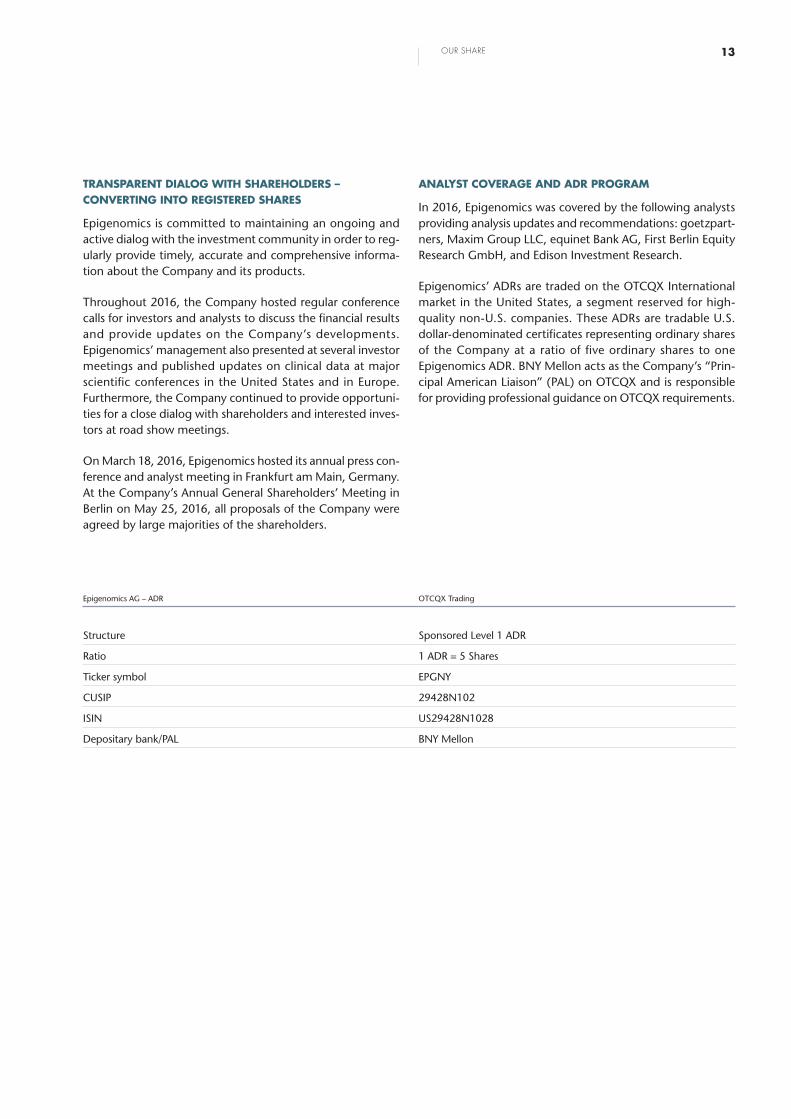
Epigenomics’ ADRs are traded on the OTCQX International market in the United States, a segment reserved for high- quality non-U.S. companies. These ADRs are tradable U.S. dollar-denominated certificates representing ordinary shares of the Company at a ratio of five ordinary shares to one Epigenomics ADR. BNY Mellon acts as the Company’s “Prin-cipal American Liaison” (PAL) on OTCQX and is responsible for providing professional guidance on OTCQX requirements.
Epigenomics AG – ADR OTCQX Trading
Structure Sponsored Level 1 ADR
Ratio 1 ADR = 5 Shares
Ticker symbol EPGNY
CUSIP 29428N102
ISIN US29428N1028
Depositary bank/PAL BNY Mellon
13OUR SHARE

CONTENTS CONSOLIDATED MANAGEMENT REPORT
Organization, Business Activities and Strategy . . . . . . . . . . . . . . . . . . . . . . . . . . . . . . . . . . . . . . . . . . . . . . . . . . . . 15
Economic Environment in 2016 and Outlook for 2017 . . . . . . . . . . . . . . . . . . . . . . . . . . . . . . . . . 18
Overview of our Business in 2016 . . . . . . . . . . . . . . . . . . . . . . . . . . . . . . . . . . . . . . . . . . . . . . . . . . . . . . . . . . . . . . . . . . . . . . . . . . . . . . . . . 22
Commercialization and Business Development . . . . . . . . . . . . . . . . . . . . . . . . . . . . . . . . . . . . . . . . . . . . . . . . . . 26
Research and Development (R&D) . . . . . . . . . . . . . . . . . . . . . . . . . . . . . . . . . . . . . . . . . . . . . . . . . . . . . . . . . . . . . . . . . . . . . . . . . . . . . 26
Quality Management . . . . . . . . . . . . . . . . . . . . . . . . . . . . . . . . . . . . . . . . . . . . . . . . . . . . . . . . . . . . . . . . . . . . . . . . . . . . . . . . . . . . . . . . . . . . . . . . . . . . . . . . . . . . . 27
Financials . . . . . . . . . . . . . . . . . . . . . . . . . . . . . . . . . . . . . . . . . . . . . . . . . . . . . . . . . . . . . . . . . . . . . . . . . . . . . . . . . . . . . . . . . . . . . . . . . . . . . . . . . . . . . . . . . . . . . . . . . . . . . . . . . . . . . . . . . 27
Employees . . . . . . . . . . . . . . . . . . . . . . . . . . . . . . . . . . . . . . . . . . . . . . . . . . . . . . . . . . . . . . . . . . . . . . . . . . . . . . . . . . . . . . . . . . . . . . . . . . . . . . . . . . . . . . . . . . . . . . . . . . . . . . . . . . . . . . 29
Report on Expected Developments and on Opportunities and Risks . . . . . . . . . . . . . . . . . . . . . . . . . . . . . . . . . . . . . . . . . . . . . . . . . . . . . . . . . . . . . . . . . . . . . . . . . . . . . . . . . . . . . . . . . . . . . . . 30
Corporate Governance . . . . . . . . . . . . . . . . . . . . . . . . . . . . . . . . . . . . . . . . . . . . . . . . . . . . . . . . . . . . . . . . . . . . . . . . . . . . . . . . . . . . . . . . . . . . . . . . . . . . . . . . . 37
Additional Mandatory Disclosures for Listed Companies in accordance with Section 315 Paragraph 4 of the German Commercial Code (HGB) . . . . . . . . . . . . . . . . . . . . . . . . . . . . . . . . . . . . . . . . . . . . . . . . . . . . . . . . . . . . . . . . . . . . . . . . . . . . . . . 46
Key Figures . . . . . . . . . . . . . . . . . . . . . . . . . . . . . . . . . . . . . . . . . . . . . . . . . . . . . . . . . . . . . . . . . . . . . . . . . . . . . . . . . . . . . . . . . . . . . . . . . . . . . . . . . . . . . . . . . . . . . . . . . . . . . . . . . . . . 50
14 EPIGENOMICS ANNUAL REPORT 2016

ORGANIZATION, BUSINESS ACTIVITIES AND STRATEGY
GROUP STRUCTURE AND BUSINESS ACTIVITIES
Epigenomics AG is headquartered in Berlin, Germany, and op-e r ates a wholly owned subsidiary in the U.S.A.: Epigenomics, Inc., registered in Seattle, WA, with offices in Germantown, MD. Our business activities consist primarily of targeting the important international markets of North America, Asia and Europe. Epigenomics AG, the parent company, oversees the Group’s central business functions (e.g. accounting, human resources and intellectual property). The Group’s research and development (R&D) activities are also conducted from Berlin. Epigenomics, Inc. is primarily active in developing our business and commercial activities in North America and in international markets outside of Europe.
We are a molecular diagnostics company focusing on devel-oping and commercializing in vitro diagnostic (IVD) tests for the screening, early detection and diagnosis of cancer. Our products are based on a unique and proprietary technology platform, which relies on a fundamental biological phenom-enon called DNA methylation as a source for the discovery of highly innovative disease-specific biomarkers, which are at the core of every diagnostic test we have developed so far.
We develop and commercialize cancer diagnostic tests, mainly in colorectal cancer (CRC) and in lung cancer, both via direct marketing and sales efforts of IVD kits and through licensing partnerships. Following this business model, we serve certain markets directly by offering our own products, while others are or will be served by our commercial partners through the licenses granted to them. All of our cancer mole cular diagnos-tic products address significant unmet medical needs with a view to providing patients and physicians alike with the benefits from more convenient and superior diagnostic tests. In this way, we target substantial markets in the largest eco-nomic regions.
Our lead product Epi proColon is a blood-based test for the early detection of CRC, which relies on our proprietary DNA methylation biomarker Septin9. The test has been CE-marked and has been on the European market in its current version since 2012. In April 2016, the U.S. Food and Drug Adminis-tration (FDA) approved Epi proColon as the first and only blood-based CRC screening test for commercialization on the U.S. market. Obviously the focus of our organization is now set on this huge opportunity. However, there are further pre-requisites apart from the premarket approval (PMA) by the FDA for the commercial success for our test kit on the world’s largest healthcare market. We are now devoting special at-tention to reimbursement, i.e. to convince the payors in the U.S.A. to reimburse the costs of the test to the patients.
Blood-based tests using the Septin9 biomarker are available in different markets worldwide through our partners, includ-ing Abbott Molecular Diagnostics, Inc. (“Abbott”), Quest Diagnos tics, Inc. (“Quest”), and Gamma Dynacare (“Gamma Dyna care”). These product and diagnostic service offerings are performed on the basis of licenses granted to these part-ners by Epigenomics.
Epi proColon is also approved for commercialization in China by the China Food and Drug Administration (CFDA). The test is marketed by our Chinese partner BioChain Institute, Inc. (“BioChain”). BioChain is a leading clinical diagnostics com-pany in cancer and genetic tests in China and the U.S.A. and started offering the test in 2015 in the Chinese market under a license from us. In June 2015, new “Guidelines on Screening, Endoscopic Diagnosis and Treatment of Early Colorectal Can-cer” were published by the Chinese Society of Digestive Endos-copy (CSDE) and by the Society of Oncological Endoscopy of the Chinese Anti-Cancer Association (CACA) citing Septin9-based tests, such as Epi proColon, as one of the methods of choice for early CRC screening. We believe this to be an im-portant step that will help BioChain in their ongoing efforts with the various provincial governments to establish Septin9-based tests in routine healthcare screening programs and increase market adoption while at the same time securing adequate pricing and reimbursement decisions for the com-mercial success of this innovative blood-based test in China.
CONSOLIDATED MANAGEMENT REPORT
15MANAGEMENT REPORT ORGANIZATION, BUSINESS ACTIVITIES AND STRATEGY
CORPORATE STRATEGY
The market opportunity for our first FDA approved product, Epi proColon is significant. The U.S.A. and China specifically represent the largest commercial opportunities for this pro d-uct. Our corporate strategy is to become the global leader in the liquid biopsy market. As the first-ever FDA approved li-quid biopsy product for cancer screening we have established Epigenomics as a pioneer in this fast-growing market. With our strong history and deep IP position in DNA methylation we will continue to expand our liquid biopsy product portfolio while driving commercial adoption of Epi proColon.
To execute this strategy Epigenomics is committed to bringing the appropriate resources necessary for product development and global commercialization. Our commercial strategy will focus on both the United States and China initially. The U.S.A. is a key market as new diagnostic technology is typic ally ad-opted first in the U.S.A. and then across other parts of the globe. China, we believe, will ultimately be an even larger market for the blood-based test than the United States. As such, we have partnered with BioChain for our Epi proColon product and Epi proLung. Long-term success in China neces-sitates international companies to partner with local Chinese companies to ultimately be successful in the market. In Europe and other parts of the world we market our own products in selected markets like Germany, France, and Spain and use a network of distributors and commercialization partners in other major markets. We have entered into commercial part-nerships with some of the most distinguished companies in the clinical diagnostic space through licensing our Septin9 biomarker for CRC and assay technologies to detect Septin9 in blood plasma. We typically participate in the commercial success of our partners through upfront and milestone pay-ments, but most importantly through royalties or profit splits on the sales these partners generate with their diagnostic prod-ucts and services based on our biomarker and technologies.
Beyond our lead product for CRC detection, we are expanding our pipeline of innovative diagnostic tests within the existing indications and for other cancer indications. During 2016, we advanced our liquid biopsy product for lung cancer diagnosis. The diagnosis of lung cancer remains challenging and a high-unmet medical need. Established radiological screening methods suffer from a high false positivity rate and therefore complementary confirmatory diagnostic methods are urgently needed for broad adoption of lung cancer screening. A reflex test that clarifies indeterminate findings will aid in earlier identification of illness, improved outcomes, and lower costs of treatment by reducing unnecessary procedures.
Our new assay is based on a combination of proprietary Epigenomics DNA methylation biomarkers, including the already known SHOX2, as well as the new PTGER4 biomarker. Starting from our existing product Epi proLung which detects the lung cancer biomarker SHOX2 in bronchial fluid, we aim to develop an easy to use blood-based alternative to existing testing methods leveraging our considerable expertise in the emerging field of liquid biopsies and our strong platform in DNA methylation. The product development is partly financed by a grant of up to EUR 2.8 million from the Euro-pean Commission within the framework of the Horizon 2020 program awarded to us in April 2015. We expect to have Epi proLung CE marked by Q3 2017.
MANAGEMENT
Epigenomics is managed by a team comprised of industry experts with long-standing experience in the diagnostics industry, with ample science and management expertise, and with the unequivocal entrepreneurial commitment to build a world-leading cancer molecular diagnostics company.
As a stock corporation under German law, the Company is led by an experienced Executive Board under the oversight of a Supervisory Board elected by our shareholders. Dr. Thomas Taapken served as Chief Executive Officer (CEO) and Chief Finance Officer (CFO) of the Company until June 30, 2016. With effect from July 1, 2016, Greg Hamilton has been appointed as the Company’s new CEO. Greg Hamilton has over 20 years of management experience in molecular diag-nostics, manufacturing and professional service industries. Prior to joining Epigenomics, Mr. Hamilton was Chief Exec-utive Officer & Director of AltheaDx Inc., Chief Operating Officer and Chief Financial Officer of Enigma Diagnostics Inc., Vice President of Operations and Finance at Third Wave Tech-nologies Inc. and Vice President of Operations at Hologic Inc. He has been responsible for multiple FDA-cleared products including a Human Papilloma Virus (HPV) High Risk Screen-ing assay and the first-ever cleared HPV genotyping assay. Mr. Hamilton received his MBA from the University of Chicago and his Bachelor of Science in Finance from Purdue University.
The Executive Board is complemented by Dr. Uwe Staub, who has been the Company’s Chief Operating Officer (COO) since April 2013. Dr. Staub joined Epigenomics in November 2008.
The Supervisory Board of Epigenomics comprises four mem-bers with the required industry experience and expertise. For further details on the current members of the Executive and Supervisory Boards, reference is made to the “Corporate Gover-nance” section of this management report.
16 EPIGENOMICS ANNUAL REPORT 2016
Epigenomics operates under a quality management system certified according to ISO 13485 for the design, development, manufacturing and distribution of IVD products. We have repeatedly demonstrated our ability to operate under the highest regulatory standards, successfully undergoing audits of our ISO-certified quality management system, including an inspection by the FDA. Our quality systems cover all neces-sary requirements for development, manufacturing and com-mercialization of IVD products in regulated market environ-ments around the world.
CORPORATE GOALS
We take a very focused and goal-oriented approach to manag-ing and monitoring operational progress when executing our strategy. The Supervisory Board and the Executive Board of the Company regularly define milestones and deliverables including revenue, operating result and business targets as well as product development, clinical and regulatory mile-stones against which performance of the Company and its employees is regularly monitored.
In order to achieve commercial adoption in the U.S.A., we have focused on three key areas: nationwide availability of the product, inclusion in professional society guidelines and re-imbursement. With the adoption of the product by Labora-tory Corporation of America Holdings (LabCorp) in May 2016, we achieved nationwide availability of the test. Our focus now is to be included in the various professional soci-eties’ 2017 guidelines – for example American Cancer Society CRC Guidelines. Guideline inclusion is important as it impacts reimbursement. Approximately, 50% of our available market in the U.S. is covered by Medicare (patients 65 years of age to 75). There are three key areas of reimbursement, Medicare rate, Medicare coverage and private payor adoption. In Jan-uary 2017, the newly issued CPT Code 81327 for Septin9 was activated at a rate of USD 83.67 per test. We believe that a more appropriate rate is approximately USD 160 per test and we have filed a reconsideration request with CMS. Medicare coverage is achieved either through a National Coverage Determination (NCD) or via legislation (see section 3.1.4). We are currently working on both methods. Private payor adop-tion is impacted both by inclusion in guidelines and Medicare coverage.
Outside of the key U.S. healthcare market, we continued to support our Chinese partner BioChain in its efforts to further push blood based Septin9 testing in the Chinese market. Septin9 is approved by the CFDA for commercialization in China and included in the CSDE and by the Society of Oncological Endoscopy of the CACA respective guidelines. BioChain is now focusing on cost regulation which is deter-mined on a provincial basis.
In summary, we strongly focused our strategy on the key value drivers of the Company throughout the reporting year and will continue to do so in the coming years.
PERFORMANCE INDICATORS
Epigenomics’ goal is to increase shareholder value by system-atically pursuing our mission and strategy. We use financial and non-financial performance indicators to control and monitor the success of our endeavors on an ongoing basis.
The financial indicators used to control our operations include key financial figures which are well established and recog-nized by the international investor community. These includ-ed in the past revenue, gross margin, EBIT, EBITDA, operating result and earnings per share. While our international inves-tors and analysts were used to see EBITDA as a surrogate for cash flow from operating expenses, their view on this indi-cator was distorted in the last years by significant effects from share-based payments. Hence, we introduced EBITDA adjusted share-based payment expenses as a new perfor-mance indicator in the reporting year. In this context, reve-nue and adjusted EBITDA are our key indicators with regard to our financial market reporting.
The aforementioned indicators is monitored closely on a monthly basis and published on a quarterly basis in our man-datory and voluntary financial reports. They are regularly compared against planned and forecasted values as well as against external benchmarks if appropriate. While still being reliant on external funding from investors to support our business operations, our cash consumption is among the im-portant financial indicators and is therefore monitored ex-tremely closely and reported regularly.
Non-financial performance indicators which are important in conducting our business are derived primarily on the basis of our R&D and commercial activities. This set of indicators con-sists of, e.g., sensitivity and specificity numbers for our prod-ucts as obtained from scientific studies and the results of studies published in renowned scientific journals. The prog-ress in market approval processes with governmental agen-cies, the successful passing of audits of our quality system and reaching benchmarks and milestones in our development activities are further important indicators to measure target achievement and to assist us in guiding internal efforts and external communication. Last but not least, we monitor cus-tomer satisfaction using indicators such as delivery and/or turnaround times, number and nature of audit observations and complaint rates.
17MANAGEMENT REPORT ORGANIZATION, BUSINESS ACTIVITIES AND STRATEGY
ECONOMIC ENVIRONMENT IN 2016 AND OUTLOOK FOR 2017
MACROECONOMIC ENVIRONMENT IN 2016
The geopolitical situation in 2016 was again very difficult and offered many new challenges in addition to old, unresolved problems. Two major events of this year in particular signifi-cantly affected the global economy and will continue to do so for years to come.
On the hand, there was the Brexit referendum in June 2016, when the United Kingdom (U.K.) voted in favor of leaving the European Union (EU). This surprised the markets which had relied on the poll forecasts predicting that the U.K. would remain an EU member. Given that the U.K. is one of the five largest European economies and a major trading partner for all other EU countries, as well as being home of the financial center of Europe (London), this decision will have many im-plications for all sides, some of them severe and some of them still not yet foreseeable.
On the other hand, there was the presidential election in the U.S.A. – again with an outcome different from most predic-tions. The world is still debating what can be expected from the Trump administration over the next four years. Even at home, the economy finds as much good as negative aspects in this situation. However, it is certain that President Trump’s focus will be on the domestic industries and markets and that there will be a harsh wind blowing in the faces of their inter-national competitors. At least the capital markets reacted calmly and the widely feared collapse of the prices on the international stock exchanges did not take place.
Both events in combination led a leading German economic research institute to name 2016 “the year when globalization was deselected”.
The global economy expanded at a moderate rate overall. The experts of the International Monetary Fund (IMF) in their “World Economic Outlook” (October 2016) as well as the Organisation for Economic Cooperation and Development (OECD) in their “OECD Economic Outlook, Volume 2016, Issue 2” calculated the real growth of the global gross domestic product (GDP) at around 3%. Despite an ongoing slowdown of its domestic economy in 2016, China remained the main driver for global growth with an estimated 6.7% GDP increase.
Forecasted growth rates for 2016 are rather modest within the EU (1.7%), in Germany (1.9%) in particular, and in the U.S.A. (1.5%). Internal discussions on the continuity of the Eurozone, the Brexit decision, the persistent weakness of the French economy and the resurgent crisis in Italy, the tension between the EU and Russia, and especially the refugee situ-ation and the gathering strength of populist and right-wing parties in numerous countries determined the political land-scape and had a mostly negative impact on European pro-spects.
On the other hand, economic development in the U.S.A. remained even behind already low expectations. Only the U.S. stock exchanges seemed to be uncoupled from the fun-damental development and continued to rally. However, to-wards the end of 2016, the Federal Reserve System (“Fed”) raised the interest rates further, after a first step twelve months earlier.
Within the EU, Germany continued to be an exception with a stable and robust economic situation based on a strong domestic demand, low inflation and further decreasing unem-ployment rates. Especially towards the end of 2016, a strong economic upswing has been recognized (e.g. increasing industry order entries and retail sales). The foreign business of German enterprises gained traction again. At the same time, economic development in other major European coun-tries such as France, Italy and Spain is not getting anywhere. In the U.K., the economic situation was clouded by the Brexit decision which might weaken the business location in the medium and long term. Finally, at the end of 2016 the Euro-pean Central Bank (ECB) still saw no reason to increase the interest rates and will continue to flood the markets with cheap money.
18 EPIGENOMICS ANNUAL REPORT 2016

MACROECONOMIC OUTLOOK FOR 2017
Among the international economic experts there is a general agreement that global GDP growth in 2017 will be slightly higher than in 2016 at around 3.5%. Nevertheless, the OECD explains that “the global economy remains in a low-growth trap, but more active use of fiscal policy will raise growth modestly” (OECD Economic Outlook – “Escaping the Low-Growth Trap?” – presentation by A. Gurria and C.L. Mann in Paris, November 28, 2016). Monetary and fiscal policies will still be used to avoid structural changes and short-term increases in unemployment rates. That leaves only limited opportunities for more dynamic growth in the highly devel-oped countries in the medium to long term. The OECD pro-jection sees the U.S.A. and Canada as the only candidates to increase their 2017 growth rates compared to 2016 – both on a very modest level (U.S.A.: from 1.5% to 2.3% and Canada from 1.2% to 2.1%). Low growth rates for 2017 at the previous year’s level are predicted for the Eurozone, Japan, China, and India, while Brazil improves from negative growth in 2016 to zero growth in 2017. The growth rate in the U.K. will even shrink.
The growth perspectives for the German economy are solid at a very moderate level. The forecasts for the increase rate of the domestic GDP of the leading economic research insti-tutes, the German government and the German Central Bank more or less match the predictions of the OECD, European Commission and IMF and range around 1.4% (+/- 0.4%- points). Major determining factors for economic develop-ment could become the social climate and the expectations in advance of the German parliamentary elections in Septem-ber 2017. Furthermore, it will be interesting to see how the change in power in the U.S.A. and the beginning Brexit ne-gotiations will affect the international trade relations. Being a traditional export nation, Germany’s industry might suffer from protectionist measures of the Trump administration and/or from a continuing weakness of the euro versus the U.S. dollar. In connection with increasing oil prices and po-tentially more difficult conditions in the trade relations with China (due to their announced restrictions with regard to the ongoing massive capital outflow) there are definitely not ma-ny signs of growth in sight. On the domestic front, it must be considered that the height of the refugee crisis seems to have been overcome. However, large numbers of people are still waiting to be recognized as refugees and will then attempt to enter the labor market. A potential increase of the unem-ployment rate, caused by such an event, was predicted by some experts already for 2016, but this prediction likely over-estimated the speed at which the relevant German authorities processed applications.
Any economic outlook is susceptible to major geopolitical developments. Existing and growing tensions between the East (i.e. Russia) and the West, global terror fears and the political instability of the EU remain significant decisive factors with the potential to negate forecasts and estimates in of the event that any of these conflicts were to escalate. In this context, the future development of the U.S. economy under the Trump administration bears risks for the economic growth according to the assessment of the World Bank in its annual outlook “Global Economic Prospects” (January 2017). According to the Bank, investment growth in emerging markets and devel-oping economies will additionally be key to the economic direction of the world as a whole.
Monetary policies in the main economies in 2016 were still characterized by low interest rate levels, even after the Fed raised the interest rates in December 2015 for the first time since the peak of the global financial crisis at the end of 2008 and took a second step at the end of 2016. Up to three more steps in the same direction have been announced for 2017 by the chairwoman of the Fed, Mrs. Yellen, against a backdrop of a slightly increasing inflation rate and a stable employment market. President Mario Draghi of the ECB announced at the end of the reporting year that the bank was extending its quantitative easing program. Nevertheless, its monthly bond purchases would be reduced after Q1 2017 from EUR 80 billion to EUR 60 billion. The bank still sees no reason to change course to meet its inflation target for the Eurozone of 2%. Also no significant changes are expected by analysts in the strategy of the Bank of England for 2017 based on the U.K.’s weak growth perspective. The same applies to the Bank of Japan. However, all forecasts and intentions are derived from scenarios exclud-ing some fundamental changes which may be introduced by the new U.S. administration. Experts agree unanimously that such changes could definitely draw a new picture.
The exchange rate between the euro and the U.S. dollar started at EUR/USD 1.09 into 2016 and floated consistently in a range between 1.08 and 1.15 until early November 2016. After the presidential election in the U.S.A., the rate dropped sharply and reached a 13-year low of EUR/USD 1.04 before Christmas. Most analysts and experts expect the dollar to remain strong and to reach parity with the euro sooner or later in 2017.
19MANAGEMENT REPORT ECONOMIC ENVIRONMENT IN 2016
AND OUTLOOK FOR 2017
CAPITAL MARKET ENVIRONMENT
Global stock markets showed a mixed performance in 2016. Overall, the MSCI World index rose by 5.6% for the year, after a slight decrease in 2015. However, when looking at the single market developments, major differences are recognizable.
The most powerful impact on the global upswing came from the U.S. stock market. After six consecutive years of gains from 2009 to 2014, and a breather in 2015, the Dow Jones index rose again by 13.7% in 2016. Even the presidential election in November was unable to stop this rally, although experts all around the world had expected a negative effect to result from this outcome. Against a backdrop of further low interest rates and only few alternatives, the capital market in the U.S.A. was still seen as one of the safest harbors for international inves-tors, despite the rather modest growth of its local economy.
In China, the stock markets took another direction. The bench-mark Shanghai Composite Index struggled towards the finish line of 2016 with a 12.5% decrease for the year, putting China at the bottom of the 40 largest markets worldwide. The halted growth rates of the Chinese economy over the last two years and a remarkable capital flight out of the world’s second largest economy are among the reasons for this poor develop-ment. Chinese investors are observed to be on shopping tours around the globe and seem to have lost interest in their home market.
In between these two major economies, Japan was not getting anywhere. The Nikkei index closed 2016 more or less un-changed compared to the beginning of the year. The other Asian stock exchanges showed as well a mixed picture in 2016, with some big gainers (e.g. Pakistan and Taiwan) and some low performers (e.g. Singapore and India). Australia’s capital markets benefited once more from the appetite of Chinese investors: the S&P/ASX 200 index rose by 7.5% in the report-ing year, not least thanks to a booming commodity market.
Most stock markets in Europe continued in 2016 the poor development which had started in the final quarter of the previous year. As a consequence, the Stoxx 600 index of Eu-ropean blue chips was down 1.5% this year when the single market indexes in the U.K., France, Spain, Italy, Switzerland, and some other countries lost between 5 and 10%. Among the few European winners in 2016 was the German stock mar-ket, with the DAX 30 index increasing by nearly 7% again, after a 9% gain in 2015. Thus it made a bumpy ride. While the DAX started at around 10,500 points into 2016, it quick-ly plummeted by nearly 15% to 8,700 in February and was still below 10,000 after the first half of the year, before it start-ed a rally towards the end of 2016 with an increase of more than 18% in these six months up to nearly 11,500 points.
Outlooks for the further development over the next twelve months vary. The banks’ financial analysts expect the DAX at year-end 2017 to be between 10,400 and 12,300 with an average expectation of 11,700, i.e. with not much potential left.
The worldwide number of initial public offerings (IPOs) (more than 1,050) decreased significantly by 16% compared to the previous year with a total issue volume of USD 133 billion (down by one third). However, 2016 was still an average year in terms of IPOs. In the U.S.A., the number of such offerings even decreased to 112 (down by 36%) – the lowest number and volume since 2009. In Europe, the total number de-creased as well by 36% to 174, while the number of IPOs in China still remained high (331). Nevertheless, the issue vol-umes shrank on a broad front.
In Germany the IPO activities collapsed from 24 public offer-ings in the previous year to only eight in 2016 (including two private placements). However, at least there was one biotech IPO included (Brain) – the first on the Frankfurt Stock Exchange since 2007.
After a record year in 2014 for healthcare companies with 101 IPOs in the U.S.A. alone, the number of successful initial offer-ings in the world’s leading stock market fell back to 76 in 2015, and eventually to not more than 42 in the reporting year – nevertheless equivalent to 40% of all U.S. IPOs in 2016. The biotech segment showed a rather disappointing perfor-mance: the NASDAQ Biotech Index started at a high level, but after a pessimistic outlook regarding future deal flows at the annual JP Morgan conference in January, the index plunged and could not really recover before year-end. So it finally closed the year with a >20% decrease. Additionally, the industry sen-timent was significantly impacted by the scandals surround-ing the formerly high-flying start-up company, Theranos.
20 EPIGENOMICS ANNUAL REPORT 2016
INDUSTRY SECTOR ENVIRONMENT
According to the annual sector outlook by Deloitte (“2017 Global Life Sciences Outlook – Thriving in Today’s Uncertain Market”), the healthcare sector is undergoing a global trans-formation with regard to business, clinical and operating models. This development is driven not only by aging and growing populations in an environment characterized by in-creasing costs and spending, but also by continuous techno-logical innovation. As in the years before, the highest growth rates for the industry in the future are expected in Asia and the Middle East, while the rates for Europe will be rather modest.
Innovative technologies in life sciences include promising new and improved diagnostic and therapeutic measures with im-proved outcomes for patients and increasing effectiveness for the healthcare systems. Nevertheless, in the prosperous countries worldwide the environment is characterized by health reforms, pressure on costs and prices and by the afore-mentioned rather weak economic situation in general. This leads to what the Deloitte authors call a “mismatch between increasing R&D expenses and the payor and public demand for lower-cost treatments”. Modern technologies are often drivers for rising healthcare costs. Increasing regulatory re-quirements and quality standards have another accelerating effect on the costs of the industry. On the other side, public healthcare budgets are facing increased scrutiny, leading to extensive and in some cases controversial public and political debate. It can be expected that this situation will prevail and even intensify over the coming years. In the U.S.A., such dis-cussions were a major topic in the 2016 presidential election campaign and President Trump has now already begun to im-plement his plans to roll back the Obamacare achievements.
Diagnostics remains an emerging segment of the life sciences industry and is benefiting particularly from innovation and technological progress (e.g. digital health applications). The sub-segment molecular diagnostics and especially in vitro diagnostics (IVD) grew very rapidly over the last years and the Deloitte report predicts, that the global IVD market will reach a value of USD 67 billion by 2020, growing at a rate of more than 5% annually, mainly due to the prevalence of chronic and infectious diseases, ageing population, and increasing usage of point of care testing. Other market researchers (e.g. Visiongain) see growth rates even at over 6%. This market can actually be considered as moderately consolidated with competitors of all sizes in the race, from large European players (e.g. Roche, Philips, BioMerieux) and U.S. groups (e.g. Abbott, Becton Dickinson) to small companies like Epigenomics. A certain level of M&A activities was seen in recent years, whereby some buyers showed a big appetite
(e.g. Thermo Fisher) and do not seem to be finished in their acquisition strategies. The most recent industry trends – li-quid biopsies and next-generation sequencing – will continue to fuel the already strong competition and most likely lead to further exciting M&A transactions in the months to come. While investors from China were increasingly observed in the last two to three years to buy European and U.S. companies across all industries, it is expected that they will sharpen their focus on the life sciences area and diagnostics in particular in the nearer future. Chronic lifestyle and age-related diseases (like cancer) are considered to become a more and more im-portant topic on the agenda of Chinese society as a conse-quence of its fast growing population, increased living stan-dards and adoption of western lifestyles. It also has to be expected that the development in China will increase com-petition and it is only a matter of time until Chinese compa-nies will not only purchase know-how and technology from the western world but will also stir up the global markets with proprietary technologies and own products.
Throughout the healthcare industry, regulation and reim-bursement are vital success factors for companies active in the field of developing and commercializing novel diagnostic tools and methods. It will remain a challenge to adequately address these factors in different markets, given the frag-mented nature of the regulatory and reimbursement land-scapes. While the U.S.A. is still the most attractive single mar-ket from an economic perspective, China is increasingly catching up in terms of public health policy, technology development, maturity of the capital markets and entrepre-neurial spirit among its population. It is becoming the most interesting market to consider in the medium term and it may offer more and greater opportunities for our industry than expected so far.
The specific implications of the global situation on our busi-ness and our Group are discussed in the “Report on oppor-tunities and risks” and the “Report on expected develop-ments” sections of this consolidated management report.
21MANAGEMENT REPORT ECONOMIC ENVIRONMENT IN 2016
AND OUTLOOK FOR 2017

OVERVIEW OF OUR BUSINESS IN 2016
EPI PROCOLON AND COLORECTAL CANCER
PMA approval for Epi proColon in the U.S.A.
On April 12, 2016, the U.S. Food and Drug Administration (FDA) approved the Company’s lead product, Epi proColon, the first and only FDA-approved blood-based CRC screening test.
Epi proColon is now available in the U.S.A. under a joint commer cialization agreement with the Company’s strategic partner Polymedco, a leader in non-invasive CRC screening technology. Epi proColon is indicated for CRC screening in average-risk patients who choose not to undergo CRC screen-ing by guideline-recommended methods such as colonosco-py and stool-based fecal immunochemical tests (FIT). The test received FDA approval based on demonstration of safety and efficacy as established in three major clinical studies. The test also demonstrated its potential to significantly increase participation rates in CRC screening.
As typically required by the FDA for new screening products, the Company is initiating a post-approval study to show the long-term benefit of blood-based CRC screening using Epi proColon.
LabCorp is first U.S. laboratory network to offer Epi proColon test
On May 9, 2016, we announced that Laboratory Corporation of America Holdings (LabCorp) is the first laboratory network in the U.S. to offer Epi proColon. LabCorp, an S&P 500 com-pany, is the world’s leading healthcare diagnostics company, providing comprehensive clinical laboratory services through LabCorp Diagnostics and end-to-end drug development sup-port through Covance Drug Development. LabCorp is a pio-neer in commercializing new diagnostic technologies and is improving people’s health by delivering the combination of world-class diagnostics, drug development services and tech-nology-enabled solutions.
We gained some other major customers in 2016, most not-ably ARUP Laboratories (ARUP), which had already launched a laboratory-developed test for the blood-based detection of CRC based on our Septin9 biomarker and some DNA methyl-ation technologies in 2010.
Epi proColon included in newly issued USPSTF guidelines for colorectal cancer screening
In June 2016, we announced that the United States Preventive Services Task Force (USPSTF) has included Epi proColon in its new recommendation statement for CRC screening, pub-lished in the Journal of the American Medical Association (JAMA). The USPSTF was the first U.S. guideline body to men-tion this novel CRC screening test after its FDA approval.
In its statement, the USPSTF highlighted that there is convin-cing evidence that CRC screening substantially reduces deaths from the disease and that not enough people in the U.S.A. are using screening tests. In the recommendation, the USPSTF names Epi proColon (“SEPT9 DNA test”) as one of several screening tests for the detection of early-stage CRC. The USPSTF also acknowledged that there is no “one size fits all” approach to CRC screening. As a consequence, instead of emphasizing specific screening approaches, the new guide-line rather focuses on the importance of patient participation in CRC screening, without recommending for or against any particular method. However, Epi proColon was not included in the table for “Characteristics for Colorectal Cancer Screen-ing” and a footnote cited limited evidence for the product. This has caused confusion in the market as to whether Epi proColon is truly included in the guidelines. In October 2016, the Journal of American Medicine, the journal that pub-lished the guidelines, published a “letter to the editor” from authors Klaus Mergener, MD, Ph.D., Digestive Health Special-ists, Tacoma, WA, and Nicholas T. Potter, Ph.D., Molecular Pathology Laboratory Network, Inc. documenting the inaccu-rate data listed in the guidelines. We are currently working to provide clarity with regard to the clinical performace data of our test.
Congressman Donald M. Payne, Jr. introduces bipartisan 2016 Colorectal Cancer Detection Act
In September 2016, we announced that U.S. Congressman Donald M. Payne, Jr. (D-NJ), introduced the ‘’Donald Payne Sr. Colorectal Cancer Detection Act of 2016’’ at a panel dis-cussion held in Washington D.C. The bipartisan initiative, led on the Republican side by Congressman Charles Dent (R-PA), aims to provide coverage under the Medicare program for FDA-approved qualifying blood-based CRC screening tests. The panel entitled “Screening the Unscreened: New Ap-proaches to Reaching the Underserved to Prevent Colorectal Cancer” included leading experts within the CRC and gastro-enterology community.
China FDA names Epigenomics’ blood-based Septin9 colorectal cancer test a most innovative medical product for 2015
In May 2016, we announced that the CFDA has named the blood-based Septin9 test an “innovative medical product.” In the recently published “2015 Medical Device Registration
22 EPIGENOMICS ANNUAL REPORT 2016
Annual Report,” only nine out of 7,530 approved medical de-vices were granted this label by the Chinese regulators. The CFDA recognizes the domestic initiative and significant clini-cal value of Septin9 tests. Our strategic development and commercialization partner BioChain Institute Inc. and its affiliate BioChain (Beijing) Science and Technology Corp., have developed the aforementioned product for the China market based on Epigenomics’ technologies. Septin9 was approved by the CFDA for detection of colorectal cancer in 2015.
In 2013, BioChain and Epigenomics entered into a license agreement for the development and commercialization of a Septin9-based colorectal cancer blood-test in China. In 2015, BioChain successfully introduced the test into the Chinese market. Shortly after this, the companies reported that CRC testing, based on Epigenomics’ proprietary Septin9 biomarker, was included in the Chinese Guideline on Screening, Endos-copic Diagnosis and Treatment of Early Colorectal Cancer. Our blood-based Septin9 test Epi proColon is the first CE-marked, FDA and CFDA-approved blood-based CRC detec-tion diagnostic. It is strongly protected by patents in multiple global jurisdictions, including China, where both the marker itself and the detection technology are widely protected by granted and pending patents. Both parties, BioChain and Epigenomics remain highly committed to take all necessary steps to enforce these intellectual property rights that will pro-tect and strengthen BioChain’s market exclusivity in China.
STRATEGIC LICENSE AND DEVELOPMENT AGREEMENT WITH BIOCHAIN ON NOVEL, BLOOD-BASED LUNG CANCER TEST
In March 2016, we announced that we had entered a strategic license agreement with BioChain on the development and commercialization of a novel, blood-based lung cancer test for China.
BioChain will initiate a clinical trial to validate the lung cancer detection test with the goal to obtain market approval by the CFDA. The product development will be based on our novel panel of blood-based DNA methylation biomarkers that has shown promising results in a clinical validation study.
Under the terms of the agreement, Epigenomics receives un-disclosed milestone and minimum annual payments as well as royalties on future revenues. In view of the high, rapidly growing prevalence of lung cancer among the Chinese pop-ulation, the commercialization of a novel, blood-based test represents a major business opportunity for both companies. Epigenomics is entitled to commercialize this product in oth-er markets outside China.
CORPORATE ANNOUNCEMENTS
Supervisory Board of Epigenomics appoints Greg Hamilton as Chief Executive Officer (CEO)
On June 30, we announced that the Supervisory Board appointed Greg Hamilton as Chief Executive Officer with effect from July 1, 2016. Mr. Hamilton, who has held senior management positions in the U.S. molecular diagnostics in-dustry, succeeded Dr. Thomas Taapken, who has served in the dual role of CEO and CFO since 2012, and who left the Company at the end of June 2016.
Greg Hamilton has over 20 years of management experience in molecular diagnostics, manufacturing and professional ser-vice industries. Prior to joining Epigenomics, Mr. Hamilton was Chief Executive Officer & Director of AltheaDx Inc., Chief Operating Officer and Chief Financial Officer of Enigma Diag-nostics Inc., Vice President of Operations and Finance at Third Wave Technologies Inc. and Vice President of Operations at Hologic Inc. He has been responsible for multiple FDA-cleared products including a HPV High Risk Screening assay and the first-ever cleared HPV genotyping assay. Mr. Hamilton re-ceived his MBA from the University of Chicago and his Bach-elor of Science in Finance from Purdue University.
The Supervisory Board expressed its great appreciation for Dr. Taapken’s outstanding contributions to the development of the company. Under his leadership, Epigenomics continued its evolution into a product-oriented molecular diagnostics company with excellent prospects in the field of blood-based cancer detection.
Capital increases by way of private placements
In May 2016, we raised a gross amount of EUR 6.8 million in a private placement under exclusion of the pre-emptive rights of the existing shareholders, by issuing 1,436,000 new regis-tered shares from the Authorized Capital 2015/I against con-tribution in cash. The issue price had been set at EUR 4.76 per share. About 55% of the capital increase was acquired by the Company’s strategic partner BioChain, while the remaining shares issued under the capital increase were acquired by institutional European investors.
In November 2016, we raised a gross amount of EUR 7.1 million in two private placements under exclusion of the pre-emptive rights of the existing shareholders, by issuing 1,509,996 new registered shares from the Authorized Capital 2015/I against contribution in cash. The issue price had been set at EUR 4.83 per share (for 1,035,196 shares) and at EUR 4.52 per share (for 474,800 shares), respectively. The new shares were subscribed by BioChain and two other Chinese investment groups.
23MANAGEMENT REPORT OVERVIEW OF OUR BUSINESS IN 2016
Expiry of the 2013 convertible bonds program
Our 2013 convertible bonds program expired in December 2016. While 15 of 25 bonds had been converted in the pre-vious years, the remaining ten bonds were converted in the reporting year into 1.7 million new shares. We received EUR 4.2 million in conversion payments. Over the three year term of the instrument, we issued nearly 4.4 million new shares and received EUR 14.5 million in cash payments from the bond subscribers.
FINANCIAL RESULTS
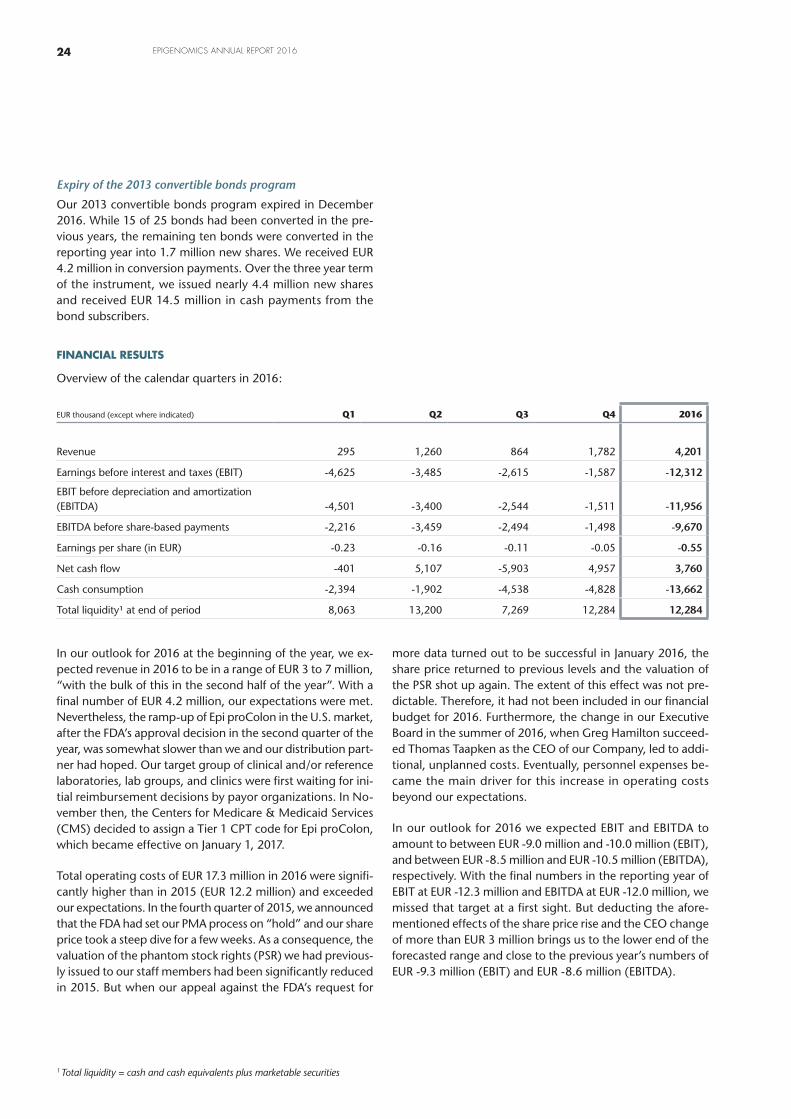
Overview of the calendar quarters in 2016:
EUR thousand (except where indicated) Q1 Q2 Q3 Q4 2016
Revenue 295 1,260 864 1,782 4,201
Earnings before interest and taxes (EBIT) -4,625 -3,485 -2,615 -1,587 -12,312
EBIT before depreciation and amortization (EBITDA) -4,501 -3,400 -2,544 -1,511 -11,956
EBITDA before share-based payments -2,216 -3,459 -2,494 -1,498 -9,670
Earnings per share (in EUR) -0.23 -0.16 -0.11 -0.05 -0.55
Net cash flow -401 5,107 -5,903 4,957 3,760
Cash consumption -2,394 -1,902 -4,538 -4,828 -13,662
Total liquidity¹ at end of period 8,063 13,200 7,269 12,284 12,284
In our outlook for 2016 at the beginning of the year, we ex-pected revenue in 2016 to be in a range of EUR 3 to 7 million, “with the bulk of this in the second half of the year”. With a final number of EUR 4.2 million, our expectations were met. Nevertheless, the ramp-up of Epi proColon in the U.S. market, after the FDA’s approval decision in the second quarter of the year, was somewhat slower than we and our distribution part-ner had hoped. Our target group of clinical and/or reference laboratories, lab groups, and clinics were first waiting for ini-tial reimbursement decisions by payor organizations. In No-vember then, the Centers for Medicare & Medicaid Services (CMS) decided to assign a Tier 1 CPT code for Epi proColon, which became effective on January 1, 2017.
Total operating costs of EUR 17.3 million in 2016 were signifi-cantly higher than in 2015 (EUR 12.2 million) and exceeded our expectations. In the fourth quarter of 2015, we announced that the FDA had set our PMA process on “hold” and our share price took a steep dive for a few weeks. As a consequence, the valuation of the phantom stock rights (PSR) we had previous-ly issued to our staff members had been significantly reduced in 2015. But when our appeal against the FDA’s request for
more data turned out to be successful in January 2016, the share price returned to previous levels and the valuation of the PSR shot up again. The extent of this effect was not pre-dictable. Therefore, it had not been included in our financial budget for 2016. Furthermore, the change in our Executive Board in the summer of 2016, when Greg Hamilton succeed-ed Thomas Taapken as the CEO of our Company, led to addi-tional, unplanned costs. Eventually, personnel expenses be-came the main driver for this increase in operating costs beyond our expectations.
In our outlook for 2016 we expected EBIT and EBITDA to amount to between EUR -9.0 million and -10.0 million (EBIT), and between EUR -8.5 million and EUR -10.5 million (EBITDA), respectively. With the final numbers in the reporting year of EBIT at EUR -12.3 million and EBITDA at EUR -12.0 million, we missed that target at a first sight. But deducting the afore-mentioned effects of the share price rise and the CEO change of more than EUR 3 million brings us to the lower end of the forecasted range and close to the previous year’s numbers of EUR -9.3 million (EBIT) and EUR -8.6 million (EBITDA).
1 Total liquidity = cash and cash equivalents plus marketable securities
24 EPIGENOMICS ANNUAL REPORT 2016
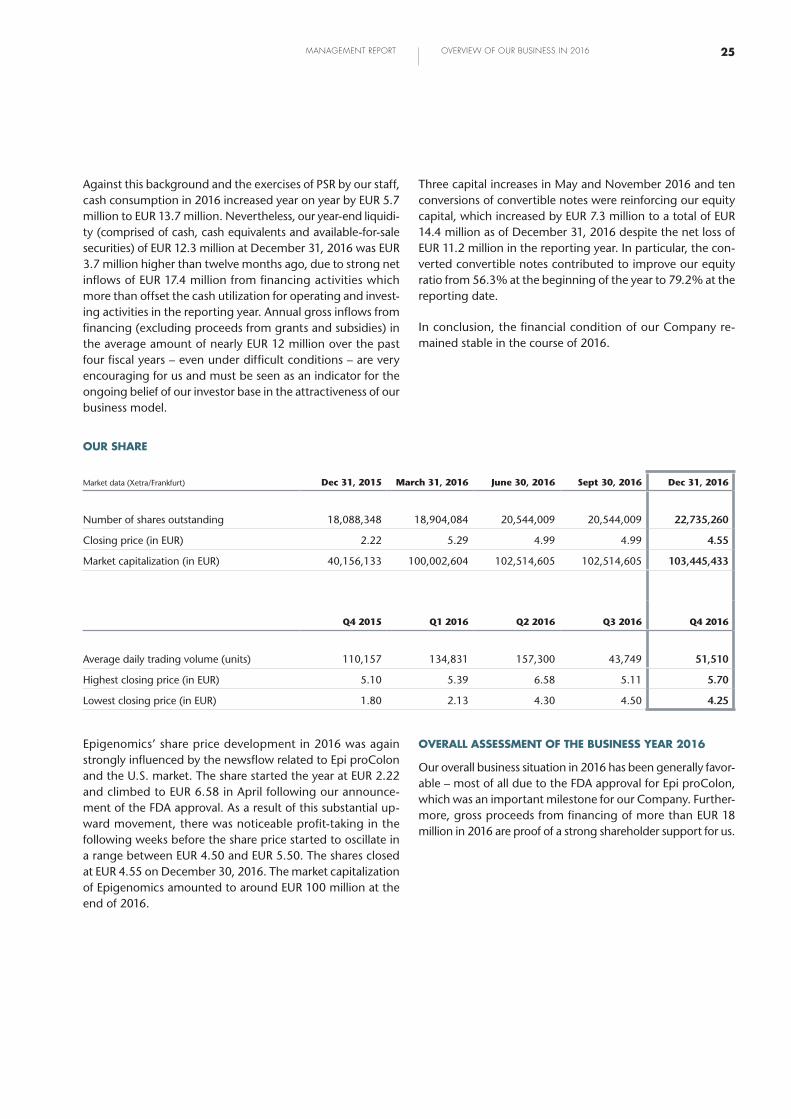
Against this background and the exercises of PSR by our staff, cash consumption in 2016 increased year on year by EUR 5.7 million to EUR 13.7 million. Nevertheless, our year-end liquidi-ty (comprised of cash, cash equivalents and available-for-sale securities) of EUR 12.3 million at December 31, 2016 was EUR 3.7 million higher than twelve months ago, due to strong net inflows of EUR 17.4 million from financing activities which more than offset the cash utilization for operating and invest-ing activities in the reporting year. Annual gross inflows from financing (excluding proceeds from grants and subsidies) in the average amount of nearly EUR 12 million over the past four fiscal years – even under difficult conditions – are very encouraging for us and must be seen as an indicator for the ongoing belief of our investor base in the attractiveness of our business model.
Three capital increases in May and November 2016 and ten conversions of convertible notes were reinforcing our equity capital, which increased by EUR 7.3 million to a total of EUR 14.4 million as of December 31, 2016 despite the net loss of EUR 11.2 million in the reporting year. In particular, the con-verted convertible notes contributed to improve our equity ratio from 56.3% at the beginning of the year to 79.2% at the reporting date.
In conclusion, the financial condition of our Company re-mained stable in the course of 2016.
OUR SHARE
Market data (Xetra/Frankfurt) Dec 31, 2015 March 31, 2016 June 30, 2016 Sept 30, 2016 Dec 31, 2016
Number of shares outstanding 18,088,348 18,904,084 20,544,009 20,544,009 22,735,260
Closing price (in EUR) 2.22 5.29 4.99 4.99 4.55
Market capitalization (in EUR) 40,156,133 100,002,604 102,514,605 102,514,605 103,445,433
Q4 2015 Q1 2016 Q2 2016 Q3 2016 Q4 2016
Average daily trading volume (units) 110,157 134,831 157,300 43,749 51,510
Highest closing price (in EUR) 5.10 5.39 6.58 5.11 5.70
Lowest closing price (in EUR) 1.80 2.13 4.30 4.50 4.25
Epigenomics’ share price development in 2016 was again strongly influenced by the newsflow related to Epi proColon and the U.S. market. The share started the year at EUR 2.22 and climbed to EUR 6.58 in April following our announce-ment of the FDA approval. As a result of this substantial up-ward movement, there was noticeable profit-taking in the following weeks before the share price started to oscillate in a range between EUR 4.50 and EUR 5.50. The shares closed at EUR 4.55 on December 30, 2016. The market capitalization of Epigenomics amounted to around EUR 100 million at the end of 2016.
OVERALL ASSESSMENT OF THE BUSINESS YEAR 2016
Our overall business situation in 2016 has been generally favor-able – most of all due to the FDA approval for Epi proColon, which was an important milestone for our Company. Further-more, gross proceeds from financing of more than EUR 18 million in 2016 are proof of a strong shareholder support for us.
25MANAGEMENT REPORT OVERVIEW OF OUR BUSINESS IN 2016

COMMERCIALIZATION AND BUSINESS DEVELOPMENT
Our primary objective after obtaining FDA approval in 2016 was to achieve nationwide availability of Epi proColon in the U.S.A. With the help of our U.S. commercialization partner Polymedco, we have made significant progress and achieved nationwide availability. In fact, four of the top six laboratories in the U.S. are now offering Septin9 testing. LabCorp was the first national reference lab to offer Epi proColon followed by ARUP and Sonic Healthcare U.S.A. Quest is still utilizing the previous granted license for Septin9 and we are in active dis-cussions to convert them to the FDA-approved Epi proColon. Polymedco and Epigenomics will continue to focus on labo-ratory adoption in 2017. Additionally, we have begun to car-ry out marketing and promotional activities targeting both doctors and patients.
Along with commercialization activities, our team is focused on guideline inclusion by professional societies and reimburse-ment. These two activities are interrelated and will have the greatest impact upon commercial ramp-up of Epi proColon. The timeline for these two items is typically 12 – 24 months post-FDA approval. We believe we are on track to achieve these critical milestones.
The European market for IVD products is highly fragmented and dominated by local effects in each of the countries. Moreover, in many European countries, CRC screening is orga-nized on a governmental level and thus, the barriers to entry into such systems are typically very high. Self-payor segments are small in most markets and need to be addressed individu-ally at the level of physicians and patients. Therefore, for the time being, we only have a very limited focus on European commercialization of Epi proColon. However, we are still see-ing a slow but steady increase in the numbers of tests sold throughout the countries in which we market the product ourselves or through distributors. We would expect increas-ing interest by physicians and patients in the future.
In brief, we are making solid progress on the commercial side. Together with our partners, we share the view that providing Septin9 testing will help physicians to improve patient health outcomes and decrease the rising costs associated with CRC treatment. With this in mind, we continue to build support for Epi proColon in the U.S.A., China and throughout Euro-pean markets.
RESEARCH AND DEVELOPMENT (R&D)
In light of our focused strategy, activities of our R&D organi-zation were geared towards implementing a new detection technology in 2016, and conducting the first proof-of-con-cept studies, as well as driving the development of our new, blood-based Epi proLung product.
The Research team was tasked with the implementation of Next Generation Sequencing (NGS) as a new technology for Epigenomics. The implementation project was planned in the first half of the year, experienced scientists were hired, an Illumina MiSeq system was purchased, and technology and software for evaluation were finally established in the second half of 2016.
Prior to the implementation of NGS, we established Poly-merase Chain Reaction (PCR) assays for more than 80 methyl-ation biomarkers of which many are patented by Epigenomics, and others which originate from recent discovery experiments and are undisclosed, yet. All assays were measured on tissue samples from the 13 most common cancers as well as urine and plasma samples from healthy subjects in order to define which markers are specific to certain cancers. The resulting pattern disclosed that many biomarkers are specific to few cancers and are negative in healthy subjects, which was the prerequisite for further studies with those markers.
Due to the fact that the DNA concentration in urine is about eight to ten-fold higher than in plasma, we established the NGS technology on urine samples. In this first NGS panel, we selected the 13 most promising biomarkers which were posi-tive on bladder cancer, prostate cancer or kidney cancer tissue, but negative in urine of healthy subjects. We were able to demonstrate in a proof-of-concept study, that this panel can be used to measure 13 different biomarkers in one and the same liquid biopsy sample (here: urine). This first result will be confirmed in a larger clinical study early 2017 and results will be presented later in 2017.
DNA extraction and bisulfite conversion was done with our Epi proColon Plasma Quick Kit. This kit can be used to extract DNA from liquid biopsies (shown for plasma, serum and urine). The resulting bisulfite converted DNA can be subject to NGS using different biomarker panels.
During 2017, we will complete NGS panels for lung cancer and colon cancer and clinically validate those panels with plasma samples. Further interesting clinical data is expected on liver cancer, bladder cancer, and prostate cancer.
26 EPIGENOMICS ANNUAL REPORT 2016

The development of our new Epi proLung product achieved significant milestones in 2016. This product development effort is funded by an EU grant (No. 672680). The Epigenomics Deve-lopment team completed product development and success-fully conducted the required design verification studies. During the course of product development to date, more than 500 plasma samples were analyzed with this new device and ob-tained results were published in a peer-reviewed journal in August 2016.
Data presented at different occasions has created a remark-able level of interest among clinicians involved in lung cancer testing. The product, which is intended to be used as a reflex test for patients with findings in a low-dose spiral computed tomography (“LDCT”) screening, is currently clinically vali-dated with suspected lung cancer cases and matched con-trols sourced from the clinical routine in different lung cancer centers in the U.S.A. and Europe. The validation will continue in 2017 when the new, blood-based product will be finally CE-marked according to the IVD Directive.
QUALITY MANAGEMENT
We have a well-established comprehensive quality manage-ment system for the design, development, manufacturing and distribution of IVD products, compliant with the require-ments of 21 CFR 820 and ISO 13485. The 21 Code of Federal Regulations (CFR) 820, Quality System Regulation, covers the current American good manufacturing practice (GMP) re-quirements for medical device manufacturers. ISO 13485 is an internationally recognized quality management standard developed for medical devices and diagnostics by the Inter-national Organization for Standardization (ISO), a worldwide federation of national standards bodies. 21 CFR 820 and ISO 13485 specify requirements for a quality management system, which demonstrates the organization’s ability to pro-vide medical devices and diagnostics that consistently meet customer and applicable regulatory requirements. The imple-mentation of a quality management system compliant to 21 CFR 820 and ISO 13485 demonstrates our ongoing com-mitment to develop safe and effective diagnostic products such as our tests for colorectal and lung cancer.
We are continuously improving our quality management sys-tem to remain a solid foundation for regulatory approval of our products on a global basis.
FINANCIALS
RESULTS OF OPERATIONS
Compared to 2015, our revenue doubled in the reporting year from EUR 2.1 million to EUR 4.2 million. Against a backdrop of decreasing R&D income (EUR 74 thousand compared to EUR 361 thousand in the previous year), product revenue grew from EUR 1.6 million to EUR 2.2 million and licensing revenue from EUR 0.2 million to EUR 0.6 million. In addition, revenue of EUR 1.4 million was recognized from the sale of some patents to a European customer. Thus, Europe could improve its position and became our leading geographical market in 2016 with a revenue share of 45.4% (2015: 44.3%). North America moved to second place with 36.6% (2015: 5.6%), while revenue in the Asian region decreased in 2016 from EUR 1,043 thousand or 50.1% in 2015 to EUR 752 thou-sand or 17.9%, respectively. Revenue in Asia benefited in 2015 from a larger purchase of Epi proColon kits by our Chinese partner BioChain and was driven by their need for a clinical study. After receiving PMA approval from the CFDA in 2015, BioChain started efforts with the various provincial govern-ments to establish Septin9-based tests in routine healthcare screening programs and to increase market adoption while at the same time securing adequate pricing and reimbursement decisions for their version of our blood-based test in China.
Despite the aforementioned doubling of our revenue in the reporting year, the cost of sales increased by only 39% from EUR 1.2 million in 2015 to EUR 1.6 million in 2016. The result-ing gross margin of 61% (2015: 44%) can be explained by the low cost of sales in the aforementioned patent sales (accounting for nearly a third of our total revenue).
Other income in 2016 of EUR 0.7 million decreased by EUR 0.2 million compared to 2015 (EUR 0.9 million) and com-prised mainly third-party research grants (EUR 0.3 million), foreign exchange rate gains (EUR 0.2 million), and the rever-sal of deferred liabilities and provisions (EUR 0.2 million).
Due to the temporary drop of our share price over the turn of the year 2015/2016, the valuation of our outstanding PSR resulted in unplanned share-based payment expenses in the first quarter of 2016 (see “financial results” section for more details). This effect led to a sharp increase in personnel costs in the reporting year from EUR 2.9 million (2015) to EUR 7.3 million, whereby the average headcount of the Group only grew from 38 to 42 employees. The share-based payment effect finally accounted for EUR 2.3 million of the total per-sonnel costs in 2016 while it had relieved these costs in 2015 by approximately EUR 0.7 million, i.e. the net increase in personnel costs amounted to merely EUR 1.4 million and was mainly attributable to the change in our Executive Board and the increase in our headcount.
27MANAGEMENT REPORT COMMERCIALIZATION AND BUSINESS DEVELOPMENT
RESEARCH AND DEVELOPMENT (R&D)
QUALITY MANAGEMENT
FINANCIALS
R&D costs in the amount of EUR 5.1 million in 2016 decreased by EUR 0.7 million compared to 2015 (EUR 5.8 million). While we continued our development activities for a blood-based lung cancer assay from the previous year, we reached the official development phase in the second quarter of the re-porting year, whereby the costs incurred in this context are capitalized since, and are no longer recognized through profit or loss. Furthermore, we did not con duct a clinical study in 2016, compared to the ADMIT trial in 2015. Although our post-approval study for Epi proColon in the U.S.A. was offi-cially started in the fourth quarter of 2016, it has not yet re-sulted in significant costs. These can only be expected once the patient enrollment begins. After our pro ject of launching a blood-based Epi proLung test has advanced officially into the development phase in the second quarter of 2016, R&D costs in the net amount of EUR 27 thousand have been cap-italized (after deduction of received research grants). As the product is still “under construction”, no amortization has been recognized so far. However, R&D costs in 2016 included amortization of other capitalized development costs of EUR 0.2 million (2015: EUR 0.4 million).
Selling, general and administrative (“SG&A”) costs of EUR 10.2 million in the reporting year doubled compared to the previous year (2015: EUR 5.1 million). The increase was main-ly attributable to strongly increased personnel costs (up by EUR 3.3 million) due to the aforementioned effects of PSR valuation increase and the change in the Executive Board. Moreover, costs for external services (including legal advice), consulting and audit (up by EUR 1.3 million) which were to a large extent attributable to the financing transactions pre-pared in 2016 increased.
Other expenses amounted to EUR 0.3 million in 2016 (2015: EUR 0.1 million).
Total operating costs increased to EUR 17.3 million in the re-porting year – up from EUR 12.2 million in 2015. This increase was to a large extent driven by the increase in our share price at the beginning of the year which caused higher costs for PSR (+ EUR 3.0 million). Further reasons for the cost increase were regular staff compensation (+ EUR 1.4 million) and recruiting costs (+ EUR 0.3 million), which both increased due to a higher headcount and the change in the Executive Board, as well as legal, tax and audit costs (+ EUR 0.8 million). The overall in-crease was partly compensated by lower costs for services and consulting (- EUR 0.6 million) and depreciation and amor-tization (- EUR 0.3 million). However, the growth in operating costs was expected and included in our financial guidance for 2016. Though it exceeded our forecast by EUR 1.1 million, it must be considered that the included increase in staff compen-sation due to the share price increase of EUR 3.0 million was unpredictable.
Overall, our EBIT deteriorated in 2016 to EUR -12.3 million (2015: EUR -9.3 million) and EBITDA to EUR -12.0 million (2015: EUR -8.6 million) as a result of the increased operating costs cushioned by the growth in revenue.
With a small financial income in 2016 of EUR 16 thousand – nearly unchanged as compared to 2015 – and deferred tax income in the amount of EUR 1.1 million (2015: EUR 0.3 mil-lion), our net loss ultimately amounted to EUR 11.2 million in 2016 (2015: EUR 9.0 million). Due to an increased average number of issued shares in comparison to 2015, the loss per share in 2016 increased only to EUR 0.55 (2015: EUR 0.52).
FINANCIAL POSITION AND CASH FLOW
Our cash consumption amounted to EUR 13.7 million in 2016, up from EUR 8.0 million in 2015. This significant increase was mainly a result of higher spending for our operating business. As outlined above in our results of operations, the operating costs climbed from EUR 12.2 million in 2015 to EUR 17.3 mil-lion in the reporting year. Furthermore, trade payables de-creased in 2016 (inter alia by payment of a large invoice from 2015) while trade receivables increased significantly towards the end of 2016. We received payment for our 2016 patent sales of EUR 1.4 million not before January 2017.
In 2015, we recorded a net cash inflow from investing activ ities of EUR 0.2 million due to proceeds from an investment grant (EUR 0.4 million) exceeding our payments for the acquisition of fixed assets. In 2016, the proceeds from this investment grant were noticeably higher (EUR 0.9 million) but could not offset our capital expend itures. Payments were mainly made for a release change of our ERP system, for IT equipment and for the development of our lung cancer assay and added up to EUR 1.3 million (2015: EUR 0.2 million).
Cash flow from financing activities of EUR 17.4 million in 2016 (2015: EUR 9.0 million) consisted of the gross proceeds from our share capital increases in May and November 2016 (EUR 14.0 million), EUR 4.2 million in proceeds from the conversion of ten convertible notes throughout the reporting year. Out-flows from financing activities in the amount of EUR 0.7 million were related to the issue of new shares in May and November.
As a consequence of these financing activities, our liquidity at year-end 2016 increased to EUR 12.3 million (comprising of cash and cash equivalents of EUR 11.5 million and available-for-sale securities of EUR 0.8 million) and therefore was EUR 3.7 million higher compared to the EUR 8.6 million at the beginning of the year.
28 EPIGENOMICS ANNUAL REPORT 2016

NET ASSET POSITION
In the final year of our 2013 convertible notes program, all ten notes which were still outstanding at the beginning of 2016 were converted throughout the year. In combination with our capital increases in May and November of the reporting year, this led to a significant increase of our equity ratio, from 56.3% at the end of previous year to 79.2% at December 31, 2016. Total equity increased from EUR 7.1 million to EUR 14.4 million in the course of the reporting year, inter alia because of the issue of more than 4.6 million new shares in return for gross proceeds of EUR 18.2 million. These activities finally overcompensated the consumption of equity by the loss from our operating activities. Accumulated losses (including the net loss of 2016) now amount to EUR 62.9 million.
Total liabilities amounted to EUR 3.8 million at the balance sheet date (December 31, 2015: EUR 5.5 million). The decline of our non-current liabilities from EUR 0.2 million at Decem-ber 31, 2015, to only EUR 0.1 million at the end of the report-ing year was mainly attributable to the vesting of PSR and the reclassification of such rights from non-current to current lia-bilities, while no new PSR were issued in 2016.
The decrease in current liabilities from EUR 5.3 million to EUR 3.7 million was attributable on the one hand to the aforemen-tioned conversion of all outstanding convertible notes with the resulting change of liabilities into equity. On the other hand, trade payables (December 31, 2016: EUR 1.1 million, down from EUR 1.9 million as of December 31, 2015) included at the end of 2015 one large invoice in connection with the preparation of our potential listing at a U.S. stock exchange which was paid in the course of 2016. While deferred income (-EUR 0.3 million) and other liabilities (-EUR 0.3 million) were also reduced over the year, the overall decrease in current liab-ilities was party compensated by a significant increase of cur-rent provisions to EUR 1.9 million (+ EUR 1.0 million) mainly due to a higher valuation of PSR, an increased amount for bonus payments and contract-related provisions.
Total non-current assets increased from EUR 1.8 million at December 31, 2015, to EUR 3.0 million at December 31, 2016, mainly due to significantly higher deferred tax assets (EUR: 1.6 million) based on increased tax loss carryforwards of our U.S. subsidiary. Fixed assets remained nearly unchanged at EUR 1.5 million.
The increase in current assets from EUR 10.8 million at the beginning of 2016 to EUR 15.2 million at the end of the year can be explained mainly by our net cash flow of EUR 3.8 million which led to an increase in cash and cash equivalents. At the same time, trade receivables were up by EUR 2.0 mil-lion in 2016 and included one large invoice of EUR 1.4 million at the year-end 2016. Payment was received shortly after the balance sheet date. Inventories were reduced by EUR 0.8 mil-lion in the course of the year by sales and write-offs (from EUR
1.1 million to EUR 0.3 million) and other current assets by EUR 0.6 million (from EUR 1.0 million to EUR 0.4 million), mainly attributable to a reduction of deferred expenses.
Total assets rose by EUR 5.6 million to EUR 18.2 million as of December 31, 2016.
EMPLOYEES
Epigenomics employed an average of 42 employees through-out 2016 (2015: 38). The number of employees as of Decem-ber 31, 2016, increased to 45 from 39 twelve months ago; 35 employees are based in our Berlin headquarters and ten are based in the U.S.A..
After the market approval decision for Epi proColon in the U.S.A., the headcount of our location in Germantown, MD, on the U.S. East Coast increased according to plan and will gradually be further expanded over the months to come, to support our joint activities with Polymedco regarding the market preparation and market entry for our CRC test in the U.S.A. and to fulfill our commitment to post-approval studies.
The number of 45 employees as of year-end 2016 comprised 23 employees across the areas of research, product develop-ment, IP, regulatory affairs, quality assurance and manufac-turing. Their activities are reported as R&D costs in our finan-cial statements. The remaining 22 employees reported as selling, general and administrative functions are active in the areas of business and commercial development, customer and technical service, accounting, finance, legal, human re-sources, IT, investor relations as well as general management.
Overall personnel costs in 2016 totaled EUR 7.3 million – a 155% increase compared to 2015 (EUR 2.9 million). This in-crease was to a large extent attributable to share-based staff expenses of EUR 2.3 million in 2016, comparing to EUR -0.8 million in the previous year, when a reversal of provisions for issued phantom stock rights as a consequence of the strong share price decrease in November 2015 had been recognized. Further, the 2016 personnel costs were burdened by the change in the Company’s Executive Board in June/July 2016.
In October 2016, we launched a new stock option plan as in-centive scheme especially for our senior management and have issued 314,580 rights from this program. The exercise price of the rights was set at EUR 5.43 per share. These newly issued stock option rights will not be exercisable before October 2020. We consider such long-term stock option programs to be a key instrument to align employees’ and management’s interests with corporate objectives as well as a motivational instrument for our staff. Details of this program and the phan-tom stock programs of previous years can be found in the notes to our consolidated financial statements for 2016.
29MANAGEMENT REPORT FINANCIALS
EMPLOYEES
REPORT ON EXPECTED DEVELOPMENTS AND ON OPPORTUNITIES AND RISKS
REPORT ON EXPECTED DEVELOPMENTS
Planned strategic direction of Epigenomics in the next two years
Over the next two years, we plan to establish our Company as the premier global liquid biopsy company. The key success factors will be the successful U.S. market commercialization of Epi proColon and continued development of new liquid biopsy offerings such as Epi proLung.
Our U.S. commercialization effort will focus on guideline in-clusion, reimbursement, assay automation, and increasing market awareness. As the first-ever FDA-approved liquid bi-opsy test for cancer screening, we believe that the market opportunity is significant. Our peer-reviewed, published data for Epi proColon demonstrate that more than 99% of pa-tients who had been non-compliant with previously available CRC methods were compliant with Epi proColon. These data demonstrate that increasing market awareness is critical as it will drive utilization. In order to efficiently process increasing future volumes, Epigenomics needs to provide automation solutions for the assay. These automation solutions include high throughput and medium throughput options for our laboratory customers.
We will continue to address the European market opportunis-tically. In order to be more successful in this endeavor, we might rely more on partnerships or expanded partnerships in the territory. Alongside these endeavors, we will support BioChain in its commercialization activities in China and its R&D activities towards their development of new tests.
Consequently, following our plans, our R&D activities are con-centrated on the current product pipeline in colorectal and lung cancer diseases to develop successive generations of products with even higher performance, and line extensions to broaden the scope of our proprietary biomarkers to related clinical applications. In this context, we will continue to de-velop our second product, Epi proLung, into a blood-based test, too. We aim to maintain our leadership in DNA methyl-ation technologies and to provide selected partners access to our know-how, expertise and IP in this field via licenses, patent sales, and/or services.
The goal remains to further establish Epigenomics as the li-quid biopsy company with proprietary products in the mar-kets either directly or through commercial partnerships. We believe we have a solid foundation upon which to execute our corporate strategy.
Expected economic conditions in the next two years
We expect overall economic conditions and the capital mar-ket environment in Europe and the U.S.A. to continue to be challenging. Despite the recent worldwide development of the economies, we expect that uncertainty in the capital mar-kets – especially in Europe – could prevail for the near to mid-term future. The geopolitical conditions have become more complicated with the British exit from the EU and the election of a new administration in the United States. The future global economic landscape is to a large extent depen-dent on the political conditions.
Nevertheless, we also assume that despite any possible set-backs, life sciences companies should still be able to raise equity capital based on solid fundamental performance. It also has to be taken into account that the percentage of GDP spending on healthcare will likely grow even in the developed world (especially in the U.S.A.), while certainly it will increase in emerging growth countries like China.
With currency exchange rates remaining volatile between the U.S. dollar and the euro and forecasts over the next twelve months anywhere in the range from EUR/USD 1.00 to EUR/USD 1.18, we have decided in line with previous’ years prac-tice to lock-in our budget rate for 2017 at the effective ex-change rate level at the time of our budget preparation (mid-November 2016), i.e. at EUR/USD 1.10.
Outlook on the earnings situation
Our business projections for 2017 are based mainly on the sales of Epi proColon in the U.S.A.. Nevertheless, since U.S. sales are so interlinked with guideline inclusion and reim-bursement, our outlook on our earnings situation is ham-pered. In our planning, we assumed that achieving greater clarity on reimbursement and further guideline inclusion in the second half of 2017 for Epi proColon will generate increas-ing revenue in the U.S. market throughout 2017, even if initial-ly only on a moderate level. Depending on the sales trajectory going forward, the earnings situation may improve over time.
Based on the aforementioned assumptions and associated uncertainties, we are unable to provide a specific revenue range for 2017 until we achieve greater clarity on guideline inclusion and reimbursement in the United States. In the ab-sence of this clarity we would expect our 2017 revenue to be relatively consistent with our 2016 product and licensing rev-enue. 2016 product revenue was significantly impacted by initial stocking effects post FDA approval. We do not antici-pate such initial effects in 2017 and as such the estimated revenue generated in 2017 is based upon increased test vol-ume.
30 EPIGENOMICS ANNUAL REPORT 2016
Revenue in 2017 will also be partly generated from R&D col-laborations, however, to a very moderate extent.
A further factor for the revenue development will be the progress to be made by our Chinese partner BioChain in the commercialization of their own Septin9-based IVD product for their home market. As they again depend on the devel-opment of the ongoing reimbursement discussions with the Chinese authorities, this is another hardly predictable effect. In 2017, we expect BioChain predominantly to be selling domestically manufactured Septin9 products, thus further shifting our revenue from kit sales to a royalty stream.
At the same time, the moderate revenue development of our Epi proColon IVD kit sales in Europe will remain at compar-able levels to 2016, as long as we do not secure major agree-ments with key accounts or achieve far-reaching reimburse-ment decisions by healthcare insurers. However, we are evaluating entering new partnerships or expanding existing partnerships for parts of the European market. Should we achieve this goal, we are confident that this could have the potential to lift our European sales once we implement such measures.
Our efforts to expand commercial activities in the U.S. market for our lead product will initially burden our operating result. Reflecting these commercialization costs, we expect EBITDA for 2017 to be at a lower level than in 2016. A range from EUR -12.0 to -13.5 million is assumed for 2017 excluding any share-based compensation related expenses. Any delay in the clarity around guideline inclusion and reimbursement may neg-atively impact our revenue estimate on the one hand, which would then be compensated in its impact on the expected loss by lower costs on the other.
Going forward, we will need to sponsor a number of clinical trials in the next two to three years to drive commercial adop-tion by increasing awareness for our products in the medical community and to invest in automation development for higher-throughput CRC testing as well as in R&D activities towards next-generation products. Ultimately, these higher costs in comparison to previous years should be contrasted with growing revenue while generating commercial traction for Epi proColon.
Outlook on the financial situation
Based on our business plans for 2017, we expect a cash con-sumption in line with our EBITDA guidance (excluding stock compensation expenses). The cash expenditures for 2017 are related to our investment in commercialization activities in the U.S.A., clinical studies such as the post approval study and continued development of our pipeline products.
We ended 2016 with EUR 12.3 million in cash and marketable securities. While current financial resources are sufficient at our projected cash consumption to support the Company’s operations beyond 2017, we may raise additional capital in 2017. These additional funds would be utilized to extend operations beyond 2017 and/or increase our investment in certain areas based upon market conditions and opportunities.
Outlook on non-financial performance indicators
As part of our commercialization strategy in the U.S.A., we are focusing on obtaining reimbursement coverage for Epi proColon in 2017. In this context, the inclusion of our product in further professional societies’ guidelines 2017 is an important prerequisite. Moreover, we plan to initiate recruit-ment for the post-approval study with Epi proColon.
In the area of R&D, we plan to complete clinical studies for launching a CE-marked blood-based test for the detection of lung cancer (Epi proLung). We also intend to complete our NGS panels for lung and colon cancer and clinically validate those panels with plasma samples. Further clinical data and respective publications are expected on liver cancer, bladder cancer, and prostate cancer.
Mid-term opportunities
The CRC market opportunity in the U.S.A. and other global markets is significant. With the approval of Epi proColon in 2016 we are now focused on the next stage of the product lifecycle, guideline inclusion and reimbursement in 2017. Successfully completing these key events will position Epigenomics for significant test volume and revenue growth over the next two to five years.
Establishing a leadership position in liquid biopsy allows us to hopefully introduce other disruptive products such as Epi proLung. We expect to CE mark Epi proLung in 2017 and launch it globally thereafter. A non-invasive test such as Epi proLung represents a significant market opportunity.
There are clear opportunities beyond CRC and lung cancer testing with other methylation biomarkers developed by Epigenomics. We are currently identifying new biomarker opportunities for various cancers such as bladder and liver. In addition, we are also investigating these biomarkers on utiliz-ing sequencing platform technologies.
For our shareholders there is the opportunity to see the en-terprise value increase from catalytic events, primarily the continued market commercialization of Epi proColon in the U.S.A. and also additional licensing partnerships or other forms of commercial success.
31MANAGEMENT REPORT REPORT ON EXPECTED DEVELOPMENTS
AND ON OPPORTUNITIES AND RISKS

Overall outlook for the Epigenomics Group
2016 was a transformative year for Epigenomics with the FDA approval of Epi proColon. This approval has launched us into the highly attractive liquid biopsy market. We expect our commercial efforts in guideline inclusion and reimbursement to position the Company for significant growth in the coming years. The CRC opportunity in the U.S.A. alone represents a target market of over 20 million unscreened patients. We are building the foundation upon which we can grow test volume, revenue and introduce additional products to the market thus producing a global leader in molecular diagnostics.
In order to be able to protect the continuity of our business operations, sufficient liquidity has to be maintained or se-cured. We aim to have liquidity to finance at least one year’s operations at all times. Currently, we still rely on the capital markets to raise equity and debt financing from time to time and we expect to have to make use of this alternative again in the near future. In order to not have to rely exclusively on a capital market financing of our business while remaining in control of the situation, we will continue to evaluate other reasonable strategic options for our further development.
REPORT ON OPPORTUNITIES AND RISK
Risk management system
Epigenomics is a globally operating cancer molecular diag-nostics company and as such subject to many industry- and company-specific opportunities and risks. In line with the German “Corporation Sector Supervision and Transparency Act“ (“Gesetz zur Kontrolle und Transparenz im Unterneh-mensbereich” – KonTraG), Epigenomics has an established, comprehensive and effective system to identify early, assess, communicate and manage opportunities and risks across all of its functions and operations. The underlying principles and guidelines have been documented in a Group-wide “Risk Management Policy”. The goal of this policy and all related instruments is to identify risks systematically at the earliest possible stage, estimate their likelihood of occurrence as well as potential qualitative and quantitative impact, and design and implement effective countermeasures. The risk manage-ment system has been regularly discussed and is being devel-oped further at the operational level, senior management level and at the Executive Board and Supervisory Board levels. A core principle is transparency of risks and opportunities across all functions and businesses we are engaged in, inter-active evaluation of these and a culture of seizing opportunities and accepting risks as integral part of doing business in can-cer molecular diagnostics, but doing so responsibly and striv-ing for an optimal balance between opportunities and risks.
Every risk has a clearly identified risk owner whose respon-sibility it is to continuously monitor and control risks as well as manage the implementation of any countermeasures. At quarterly intervals, these risk owners report to the corporate risk manager who in turn communicates the risks to the Ex -ecu tive Board and the latter to the Supervisory Board. In case of any material risk, this risk is immediately brought to the attention of the corporate risk manager and discussed at the appropriate board levels. Important risks and the risk manage-ment system itself have also been discussed in broader man-agement groups as well as between the Company’s auditor and the Supervisory Board throughout the year.
Hence, our management structure, our organizational forums for identifying and assessing opportunities and risks, the monthly internal and the quarterly external reporting as well as our controlling systems all form an integral part of the overall risk management system in a standardized fashion across all functions and locations. All of these tools are regu-larly monitored for effectiveness and optimized as well as reviewed by our auditor and the Supervisory Board.
Aside from the opportunities that our business offers, there are a number of important risks Epigenomics is faced with, which individually or in combination could severely impact our revenue, earnings and financial situation as well as our share price. The main opportunities and risks are described below.
Business-related opportunities and risks
Epigenomics offers two IVD products, the CRC screening test Epi proColon as an FDA approved and CE-marked product and the lung cancer confirmatory test based on bronchial lavage (also CE-marked) in certain markets. However, product revenue so far has been relatively modest. Following our de-cision to focus the organization and its commercial activities to key markets for our lead product Epi proColon, the U.S.A. and China, regulatory approvals and reimbursement deci-sions in these countries are most important for us to be able to generate revenue from product sales in conjunction with our partners and licensing agreements with third parties.
Our ability to grow revenue from our products will depend, among other factors, on the successful marketing and com-mercialization of our tests with key stakeholders in the health-care industry. In 2013 already, we entered into a commercial partnership with Polymedco, a well-established and experi-enced company for the commercialization of diagnostic tests in North America. This agreement gives us access to already existing sales and marketing channels, which we would have to build up on our own without this partnership. Therefore, this collaboration can be seen as a strategy of reducing the risks connected with an independent market development from scratch. Nevertheless, even with such an experienced partner, there are still risks remaining with regard to the com-
32 EPIGENOMICS ANNUAL REPORT 2016
mercialization. In the end, we have to rely on our abilities to create sufficient customer acceptance for our product as soon as possible. At this level, we not only have to address the screening population itself, but as well have to generate sup-port in the medical and laboratory customer communities in parallel. To that effect, we have extended our network in the medical expert community over recent years, in order to gain support for our product with key opinion leaders in the field. However, it must not be taken for granted that all of the in-volved can be convinced of the advantages of a blood-based early detection test.
An important element in being commercially successful is the availability of reimbursement for Epi proColon testing by in-surance carriers including Medicare. Securing Medicare cov-erage at an acceptable reimbursement rate is a risk for the organization, as the Medicare population represents 50% of our available market. The risk of negative reimbursement de-cisions could also have an impact on the decisions of other major payors in the U.S. health system.
Reimbursement risk is also related to inclusion in various pro-fessional society CRC screening guidelines. Payors and health systems use these guidelines as inputs into their payment determinations and thus exclusion or limited inclusion pose a risk to reimbursement and commercial adoption.
Considering the lack of standardized reimbursement rules in Europe, the commercial acceptance of our main product in the different European markets will remain moderate in the foreseeable future. However, any positive reimbursement de-cision in any European country poses a significant opportuni-ty to the commercial success of the product in such market. At this point, though, we have no indication of ongoing re-imbursement negotiations for products like ours in any of the major European countries on a broader scale.
According to our business model, we are partly dependent on large diagnostic companies and reference laboratories to develop, commercialize, sell and distribute our products and licensed products based on our biomarkers and technologies. To ensure that our partners devote their best efforts to com-mercialize these licensed products, we will continue to sup-port them with all the expertise and know-how needed in order to see them succeed in the market. Our dependence on the commercial success of our partners remains a risk fac-tor, especially as strategic decisions of our partners may lead to a change in their focus areas, which can only be mitigated by diversification of our partner base.
In our efforts to be able to sell our products – either directly or through partners – into the laboratory market in the U.S.A. and other countries, we have established relationships with contract manufacturing organizations and vendors of special-ized reagents to secure adequate supply of our product at any time. The ability of our manufacturing partners to provide us with sufficient quantities of product at quality levels mandat-ed by regulatory authorities poses a possible risk to the Com-pany. A failure by any of these partners or product vendors could lead to our inability to supply products to the market and thus negatively impact our ability to generate revenue. In order to mitigate this risk, we work with highly capable companies in this field, with ample experience and track re-cord in providing high-quality products to diagnostic com-panies.
In most markets, the performance of the Epi proColon test is restricted to certain instruments specifically detailed in our regulatory filings. We therefore rely on the availability of these instruments to laboratory customers who would buy the test from our partners or from us directly. Any changes in the offerings of these laboratory instrument manufacturers might limit the ability of our customers to order the test from us. This again would pose a risk of us not being able to generate revenue and thus negatively impact our financial situation. To mitigate this risk, we are constantly observing the space, are in dialog with instrument manufacturers and remain pre-pared to validate our diagnostic products on other instru-mentation platforms in order to be able to react to a chang-ing environment with respect to instruments being sold and established at our customers’ laboratories.
Ahead of applying for PMA approval with the FDA in the U.S.A., we have also entered into licensing agreements with selected reference laboratories in North America, which have introduced their own versions of Septin9-based LDTs (labora-tory-developed tests) in the U.S. market. Since 2011, Quest has offered its LDT (ColoVantage) for aiding the detection of CRC. At the end of 2016, Quest is the only lab still offering an LDT version of Septin9. We are in discussions to convert Quest to the FDA approved version of the test, like ARUP already did. There is a remaining risk that such conversion might not occur, which would limit our ability to fully capture the eco-nomic benefit of our technology given that this LDT license agreement is not as attractive as the ability to directly sell our products to laboratory customers.
33MANAGEMENT REPORT REPORT ON EXPECTED DEVELOPMENTS
AND ON OPPORTUNITIES AND RISKS
The CRC screening field has seen intensive competition over the past years. Some competitors have made progress in devel-oping other non-invasive CRC screening tests, although most of them are offering these as LDT services. It is important that our partners and us defend the established lead in terms of clinical validation with the only FDA-approved CRC blood test.
Epigenomics’ future success partly relies on the experience and the know-how of the management and personnel, which represents a decisive competitive advantage of the Company. Our ability to retain the current level of expertise through key employees in the Company and to be able to recruit such expertise as it might become necessary, remains a critical success factor and might have an effect on the future results of operations and financial condition. The management has implemented a retention plan in the form of share-based pay-ment incentives with the objective of securing long-term commitment of key employees.
In order to achieve successful commercialization of our products and continue development of our next generation products the business must be appropriately capitalized. Without the necessary capital the business could be at risk of not achieving our corporate goals.
IP-related opportunities and risks
Our business relies heavily on commercializing products based on our intellectual property as well as on licenses based on our know-how, licenses to third-party patents and own pat-ent applications. Therefore, any negative impact on the scope, duration, depth and breadth of each single claim granted, on regional coverage, competing IP that we could depend on, difficulties in enforcing the protection, inadver-tently infringing other IP, preventing others from infringing our IP, our inability to in-license key IP etc. would negatively impact our cost base, our ability to compete as well as to commercialize our products and to enter into partnerships, our revenue and ultimately our earnings and overall commer-cial success.
In light of this, we face the possible risk of a challenge of the validity, ownership or enforceability of our patents in court. It may happen that a competitor successfully challenges our patents or that a challenge will result in limiting the coverage of our patents. As a result, we may lose important patent protection relating to our technologies and we could lose our ability to prevent others from utilizing these technologies without compensating us. Litigation itself could result in sub-stantial costs, a delay in commercialization of our products and divert our management’s attention and resources.
Since, over recent years, we have moved our business from only developing new products to also marketing and selling our existing products launched in Europe, patent protection is now even more important to prevent competitors from launching competitive products based on our biomarkers. To that end, we have conducted extensive freedom-to-operate analyses also for our U.S. product, resulting in satisfactory results, at least for the time being. Further freedom-to-oper-ate analyses will be conducted as soon as new products or changes to existing products are planned and such analyses become appropriate. As a precautionary measure, we con-stantly monitor the status of patent applications deemed to be relevant and work closely with our IP lawyers to ensure the best possible protection of our IP rights in light of ongoing developments in this field.
We consider the extensive patent protection on our biomar-kers and underlying technologies to be a competitive advan-tage over many of our competitors. While other companies partly rely their businesses on generic technologies or prod-ucts, we have the distinct advantage of having secured an extensive proprietary intellectual property position, setting us apart from other companies in the field of DNA-based diagnostics. This puts us in the position of being able to com-mercialize our own products while limiting the business risk of competition, even by larger companies in this field.
At the same time, the progress made in managing our IP portfolio and obtaining several key patents for cancer testing (such as our Septin9 and GSTP1 biomarkers) puts Epigenomics in a unique position to provide attractive licensing opportu-nities for the growing number of commercial players active in DNA methylation. This opportunity has been underscored by numerous licensing deals in the past several years.
Opportunities and risks related to the regulatory environment
The regulatory environment in the U.S.A. and the rest of the world is challenging. Specifically, in the U.S.A. the new presi-dential administration has a stated goal of repealing and re-placing the Affordable Care Act. While we believe this process will be beneficial to neutral for our FDA approved product it is still unknown and a risk.
The regulatory environment in cancer molecular diagnostics in the U.S.A. is complex and poses high hurdles for new prod-ucts to enter the market. The U.S. regulatory landscape is affected by numerous entities including the FDA, CMS, USPSTF, and the Congress. New or modified regulations by any of these entities could have a material impact on our business. We utilize both internal and external resources to monitor the activities of these organizations, and to react if necessary in order to lower the corresponding risks.
34 EPIGENOMICS ANNUAL REPORT 2016
Epi proColon has received a PMA, and therefore taken the highest and most difficult approval hurdle. Any change in the regulatory landscape, which would make it easier for compet-itors to develop and commercialize LDTs/homebrew assays, which would be able to compete against companies with PMA approved products, would also pose a risk for our busi-ness.
In parallel, there are increasing trends for tightening regula-tory standards in the Chinese and European markets. As men-tioned for the U.S.A. above, we have always chosen the regu-lated path to commercialization of our products. Given the high regulatory and quality standards under which we oper-ate, going forward, we consider this approach to be a com-petitive advantage over those companies which do not or cannot comply with these requirements.
Financial opportunities and risks
As of December 31, 2016, our available liquidity (cash, cash equivalents and marketable securities) amounted to EUR 12.3 million. Management is aware of the risk of having limited liquid assets to sustain the operations of the business in an appropriate manner. Again in 2016, as in previous years, we repeatedly demonstrated that additional financial resources are accessible to us, even under difficult conditions. With the current funding and based on our business strategy for the months to come, our cash runway is expected to reach into early 2018. Even in case of favorable reimbursement decisions by payors in the U.S.A. for Epi proColon, it cannot be expected that we will generate sufficient income from product sales quickly enough to reach the cash break-even point before the end of that runway. Without any alternative cash inflows from financing activities before that point in time, our continued existence is threatened. In such a scenario, while running out of funds, the Company would have to file for insolvency. In order to mitigate the risks associated with the launch of our product, we will continue to evaluate all strategic options including the option of raising additional capital in the mar-kets at any time throughout 2017.
In case of a successful progress of our market launch of Epi proColon in the U.S.A., we expect to be able to generate increasing income from product sales, which would help in reducing our operating loss over time. By contrast, if the demand for our product after its commercial launch is below expectations and/or reimbursement decisions are delayed or are not be taken in our favor, we would face the risk of further deterioration of our short-term financial position. Under such circumstances, this could result in lower numbers of tests sold and/or in lower than planned prices for the test which could make us miss our revenue, margin and/or earnings targets as a consequence.
To avoid a costly setup of an own production site and the maintenance of such a facility and qualified staff to meet the required GMP standards, we currently do not manufacture the Epi proColon test kits ourselves, but have outsourced these activities to contract-manufacturing providers. Thus, we are facing the risk of dependence from our contract manufac-turers. Ahead of our expected market launch of Epi proColon in the U.S.A., we have addressed this risk by implementing the manufacturing processes at an alternative supplier. This investment and the binding of resources are deemed appro-priate as a risk mitigation strategy.
At the same time, the assembly of our test kits requires spe-cific consumables and materials from audited suppliers of such goods. We cannot easily replace these consumables and materials or their suppliers in the event of delivery or quality problems, since the new vendor would require qualification in accordance with regulatory specifications. In the event of such a problem, any solution would be expensive, require valuable time and could impede our ability to deliver our products to our customers as needed.
As a Germany-based global company which reports in euros and has operations in the U.S.A., we are exposed to foreign exchange rate risks, predominantly stemming from the euro/ U.S. dollar exchange rate. In the future, our partners’ and distributors’ net sales generated in U.S. dollar outside the eu-rozone and our expected royalties and profit shares may also be subject to exchange rate risks. We monitor these risks on a regular basis and evaluate on a case-by-case basis whether hedging transactions are required to reduce our exposure to them. Additionally, it should be mentioned that foreign-cur-rency-related transactions might entail opportunities as well.
We have reduced our portfolio of available-for-sale securities over recent years down to a single remaining item. The histor-ical investment in this remaining item was made under the Company’s investment policy, which was approved by the Supervisory Board. This policy stipulates that investments may only be made in items with an “investment grade” rat-ing. Our securities portfolio is exposed to price risks – in the form of interest rate, issuer and market-related impairment risks – and liquidity risks. Under specific market conditions it could be difficult or impossible to liquidate the securities in the short-term at their fair value – regardless of whether or not the issuer has a good rating. We have not made any invest-ments in securities in recent years, and as part of our risk miti-gation strategy have invested exclusively in money market instruments (i.e. demand deposits, daily and time deposits) on euro or U.S. dollar basis to maximize the availability of liquidity. At the same time, we are accepting the lack of re-turns that could be earned in the money market at the con-tinuously low interest rates. In 2017 and going forward, we will continue to maintain as much of our liquid assets in the form of cash and the most secure cash equivalents possible.
35MANAGEMENT REPORT REPORT ON EXPECTED DEVELOPMENTS
AND ON OPPORTUNITIES AND RISKS
Between 2013 and 2015 we used phantom stock programs as incentive instruments for our Executive Board members and our staff. If our share price develops positively, the exer-cise of rights issued from these programs could impact the Company’s liquidity significantly, as these programs provide for a cash settlement. In an extreme case, the consequence could materialize in 2017 by means of a cash outflow of up to EUR 3.5 million if our share price increases to nearly EUR 10 and all beneficiaries of our program issued between 2013 and 2015 exercise their rights completely. However, we also see an opportunity in these programs as they serve as motiva-tional elements for our Executive Board members and our staff in order to meet our common goals. In 2016, we did not implement another phantom stock program but set up a stock option program for our Executives and our staff mem-bers. There is a disadvantage of much higher costs in the future for the administration of such stock option programs compared to our phantom stock plans. However, executions of stock options later do not lead to cash outflows and will not burden our liquidity.
Other opportunities and risks
We continuously monitor all applicable environmental, health and safety, operational and other applicable statutory and industrial guidelines, and have implemented functions to comply with all of these effectively at each of our business locations. To minimize the potential impact from a variety of tax, corporate, employment, competition, IP and other legal frameworks, we base our decision-making and design of our policies and processes on the advice of internal experts and renowned external advisors in each of these areas. Wherever appropriate and indicated, we set aside provisions to cover any potential liability. There are also risks particularly associ-ated with our share price development. Comparatively low levels of liquidity in the stock, very high volatility based on all of the above-described factors, as well as external influences and negative perceptions by others pose a risk of being wrongly assessed by capital markets participants (particularly analysts and investors). This could lead to unjustified stock sales by shareholders and to a sharp decline in our share price, which could negatively impact our ability to remain viable as a listed company. At the same time, the volatility in our share price represents an opportunity to continuously find new inves-tors for the Company willing to take the risk of an investment even in more challenging times. In order to seize this oppor-tunity, we are actively in dialog with market participants and shareholders of the Company through our investor relations efforts.
There could potentially be other risks as well as significant opportunities beyond the ones described here that we cur-rently either deem of lesser importance or of which we are not aware of at the time of this annual report.
Summary of the opportunity and risk situation of the Epigenomics Group
In previous years, the FDA decision on the approval of our lead product Epi proColon in the U.S.A. had always been considered a significant business opportunity for us as well as our largest risk. Now that the final decision of the agency has been published (and was favorable for us), the opportunity and risk focus has been shifted to the reimbursement subject. We believe that widespread adoption of the test in the U.S.A. hinges on inclusion in relevant screening guidelines and favor-able reimbursement. Even if the first hurdles are taken with the USPSTF inclusion in June 2016 and the CMS decision in November 2016, we will need more decisions for payor orga-nizations. Failure to obtain favorable reimbursement for our product as well as lack of market acceptance and penetration in the U.S.A. based on lack of inclusion in medical guidelines or for any other reason, would have substantial material im-pact on our revenue, earnings, financial position and our abil-ity to raise further capital.
Even if we are successful in the above-described process of achieving guideline inclusion and reimbursement in the U.S.A., we still face a risk that each or all of these steps might take longer than anticipated, thus resulting in a slower than expected commercial adoption. In order to compensate for such potential delay in the U.S. market penetration, we would further accelerate commercial efforts in other countries such as China. Based on the medical need prevailing in most coun-tries of the world we address with our products, there are still major untapped commercial opportunities, which we still have to seize.
Despite of the funds raised in the capital markets over the last years, as a company with significant commercial challenges and opportunities we are still constrained in our financial resources. This limits our ability to cope with potential addi-tional hurdles along the regulatory track or in our commercial efforts. Ultimately, we see our ability to access additional cap-ital to reach our commercial goals as an opportunity to face the threatening illiquidity risk. A failure in raising capital to appropriately fund the business operations can ultimately lead to a total loss of value in our stock.
36 EPIGENOMICS ANNUAL REPORT 2016
CORPORATE GOVERNANCE
For the Executive Board and the Supervisory Board of Epigenomics, corporate governance lies at the heart of re-sponsible and ethical management. The Executive Board and the Supervisory Board maintained a very active exchange throughout 2016 in order to generate long-term value for our shareholders. This represents a key element of sound corpo-rate governance. Moreover, openness and transparency in our corporate communications with shareholders, employees, authorities, the general public and other stakeholder groups represent an overarching principle to our approach towards sound corporate governance.
We welcome the German Corporate Governance Code (the “Code”) and we systematically and regularly monitor com-pliance with the German Corporate Governance principles making amendments wherever possible to ensure fair and re-sponsible corporate management in line with the most recent version of the Code.
In certain aspects, Epigenomics’ corporate governance prin-ciples go above and beyond the legal requirements and the recommendations of the Code. For example, we have estab-lished binding internal guidelines on insider trading and made these part of all employment agreements. Corporate gover-nance compliance matters are overseen by our Manager Legal Affairs, who ensures adherence to the corporate governance principles. The Manager Legal Affairs is in regular dialog with the Executive Board and the Supervisory Board on any com-pliance-related matters.
While, going forward, we are clearly committed to adhering to the Code to the furthest extent possible, there are a few excep-tions based on certain Company-specific factors and peculiar-ities where we chose or had to deviate from the Code.
DECLARATION OF COMPLIANCE 2016 WITH THE GERMAN CORPORATE GOVERNANCE CODE PURSUANT TO SECTION 161 OF THE GERMAN STOCK CORPORATION ACT (AKTG)
Pursuant to Section 161 of the German Stock Corporation Act (Aktiengesetz – AktG), the Executive Board and the Super-visory Board of Epigenomics AG as a listed company have to explain each year, which recommendations of the German Corporate Governance Code were or were not complied with.
The Executive Board and the Supervisory Board of Epigenomics AG hereby declare that, since the last declaration of compliance in October 2015 and the update in July 2016, Epigenomics AG has complied with the recommendations of the German Government Commission on the German Corporate Gover-nance Code (hereinafter also “Code”) in the version of May 5, 2015 (published by the Ministry of Justice in the official part of the Federal Gazette on June 12, 2015), with the exceptions set forth below.
Section 3.8 Paragraph 3
Epigenomics AG has taken out a D&O policy. The policy in-cludes as insured persons also the members of the Super-visory Board. Deviating from Section 3.8 Paragraph 3 the D&O policy does not provide for a deductible for members of the Supervisory Board. We consider such a deductible as inadequate taking into account the nature of the office as member of the Supervisory Board and the function of the Supervisory Board.
Section 5.1.2 Paragraph 1 Sentence 2 and Paragraph 2 Sentence 3 and Section 5.4.1 Paragraph 2 Sentence 1 and Paragraph 3
In the past, when filling the positions in its bodies, the Execu-tive Board and the Supervisory Board considered the compa-ny-specific situation, and also made allowances for potential conflicts of interest as well as the international activities of the Company through an appropriate diversity of their members as well as the appointment of an adequate number of inde-pendent Supervisory Board members. Furthermore, the Super-visory Board determined a maximum term of membership. In deviation from the recommendations in Section 5.1.2 para-graph 2 sentence 3 and in Section 5.4.1 paragraph 2 sentence 1, we however consider the commitment to institute special age limits for members of the Executive Board and the Super-visory Board as an inadequate limitation of the voting rights of our shareholders. In addition, we are convinced that sweep-ing requirements for the composition of the Executive Board as requested in Section 5.1.2 paragraph 1 sentence 2 con-strain the Supervisory Board inadequately in its selection of suitable members of the Executive Board. The same applies accordingly to the specification of sweeping objectives regard-ing the composition of the Supervisory Board, as required in Section 5.4.1 paragraph 2 sentence 1 and assumed in Section 5.4.1 paragraph 3. We strive to achieve an appropriate diver-sity in the Executive Board and the Supervisory Board and to ensure that an adequate number of independent Supervisory Board members is elected. However, it is ultimately in the corporate interest to appoint as members of the Executive Board and the Supervisory Board the most suitable male or female candidates. Furthermore, the Supervisory Board has
37MANAGEMENT REPORT REPORT ON EXPECTED DEVELOPMENTS
AND ON OPPORTUNITIES AND RISKS
CORPORATE GOVERNANCE

defined gender diversity objectives for the proportion of women in both the Executive Board and the Supervisory Board in accordance with Section 111 paragraph 5 of the Stock Corporation Act (Aktiengesetz – AktG). We therefore believe that (additional) sweeping requirements constitute an inad-equate limitation of the individual selection of suitable can-didates for the Executive Board or the Supervisory Board. Furthermore, a target requirement regarding the composi-tion of the Supervisory Board also inadequately impairs our shareholders’ right to elect the Supervisory Board members. Accordingly, we did not and will not comply with these re-commendations of the Code.
Sections 5.3.1 Sentence 1, and 5.3.3
Following the increase of the number of the members of the Supervisory Board to four, as resolved by the Annual General Shareholders’ Meeting on May 25, 2016 which has become effective upon registration with the commercial register, the Supervisory Board has resolved to set up an Audit Committee from among its members. The Annual General Shareholders’ Meeting on May 25, 2016 has further resolved to grant com-pensation to the members of the Supervisory Board for hold-ing a chairman position or being a member of a committee. The deviations from Section 5.3.2 and Section 5.4.6 Para-graph 1 Sentence 2 of the Code therefore no longer apply (cf. update to the Declaration of Compliance in July 2016).
However, due to the size of the Company, the Supervisory Board did not and does not believe that it is necessary to form a Nomination Committee composed exclusively of share-holder representatives which recommends suitable Super-visory Board candidates for the proposals of the Supervisory Board to the general shareholders’ meeting. Rather, this task is being performed by the full Supervisory Board. In addition and again due to the size of the company, the Supervisory Board does not consider it necessary to set up further com-mittees, but believes the formation of the Audit Committee and thus of one committee of the Supervisory Board only to be adequate and appropriate. Hence, the recommendations pursuant to Sections 5.3.1 sentence 1 and 5.3.3 continue not to be complied with.
Berlin, October 2016
On behalf of the Supervisory Board
Heino von Prondzynski (Chairman of the Supervisory Board)
On behalf of the Executive Board
Greg Hamilton Dr. Uwe Staub (CEO) (COO)
This statement has also been made permanently accessible to the general public in German and English on the Company’s website under www.epigenomics.com/en/news-investors/ investors/corporate-governance.
DECLARATION OF GOVERNANCE
In accordance with Section 289a of the German Commercial Code (HGB), the Declaration of Governance has been made permanently accessible to the general public in German and English on Epigenomics AG’s website under www.epigenomics.com/en/news-investors/investors/corporate-governance.html.
KEY FEATURES OF THE INTERNAL CONTROL AND RISK MANAGEMENT SYSTEM RELATED TO THE GROUP ACCOUNTING PROCEDURES OF THE COMPANY
The internal control and risk management system (ICR) of Epigenomics has been set up by the Company’s Executive Board, which also takes responsibility for it. The ICR is not defined as a comprehensive standardized system across the entire enterprise but rather scope of control and intensity are adjusted according to the respective risk. In addition, control options are used at all Company levels and supervision by the management is established. Epigenomics has developed an individual top-down approach for Company-wide controls and supervision including a proof of effectiveness. A flexible setup of the reporting system – supported by established tools and adjusted to the Company’s needs – ensures transpar-ency and targeted supervision by the internal control system. Financial and non-financial indicators are taken into account.
The Supervisory Board and the Executive Board continuously monitor the ICR. Apart from the true and fair view presented by the financial reporting it also ensures the efficiency and cost-effectiveness of the daily business as well as compliance with relevant regulations and internal guidelines. The super-vision of the accounting procedures goes hand in hand with the monitoring of the ICR.
Within the organization of the Company, there are various departments and employees involved in the setup, the coor-d ination and the supervision of control measures. The risk management function and controlling as well as quality de-partments are of major importance here. Due to the limited size of the Group, the Company has not yet established an internal audit function.
38 EPIGENOMICS ANNUAL REPORT 2016
Assessment of the adequacy and the effectiveness of the ICR are continuously ensured by discussions with relevant em-ployees, by benchmarking with other organizations and also by way of a regular dialog with the Company’s auditor and consultations with the Company’s lawyers as required.
The Epigenomics Group has established the principle of sepa-ration of functions as far as reasonable in a commercial orga-nization with a limited number of employees. This principle is supplemented by the principle of dual control. Neither Execu-tive Board members nor any employees are authorized to represent and sign on behalf of the Company on their own.
For routine internal activities, instructions and regulations are provided where possible. Those instructions and regulations can be found within so-called “standard operating proced-ures” (SOPs) as well as in guidelines such as an employee’s manual, detailed job descriptions, a travel policy or an account-ing manual. The guidelines have been made permanently accessible to all concerned employees of the Company via the intranet. All guidelines are checked continuously and amend-ed if necessary. Legal advice from experts is taken as needed to ensure conformity of the internal regulations with the app-licable legal requirements or regulations.
The Company’s controlling system is primarily based on mis-cellaneous planning, monitoring and reporting tools. Qualita-tive information derives from an internally-developed project documentation database, and quantitative information is processed by all Group entities using Microsoft Dynamics Navision™, a widely used enterprise resource planning soft-ware program. Our accounting and controlling departments provide all relevant controlling information to the Executive Board on a monthly basis. The ongoing training of the team members is ensured.
For internal control purposes, we set up an annual budget, usually based on the current long-term strategic business plan of the Company and a corresponding set of goals. The budget is developed bottom-up from all cost centers and R&D projects. All budgets are extensively reviewed internally by the senior management team and the Executive Board, and a final approval of the annual budget by our Supervisory Board is mandatory. The primary focus of our regular internal management reporting lies in comparing actual versus bud-geted values for a comprehensive set of metrics. From these, we compile the external quarterly reports. Quarterly reports are usually accompanied by an internal forecast, which provides us with an updated estimate of expected full-year results and performance vis-à-vis target numbers and public guidance.
Actual versus budget comparisons of financial performance indicators are also drawn on a regular basis within the frame-work of the internal reporting system and are reported monthly to the senior management team of the Company. The focus is on cost and liquidity control. Deviations versus budget or historical values are analyzed on a short-term basis and supplemented by a presentation of alternative options. The reporting is supplemented as needed with additional data requested by the Supervisory Board or the Executive Board as well as the controlling team.
Impairment tests on the Company’s assets are done on a regular basis in accordance with the appropriate accounting standards or, as the case may be, upon reports of a reason-able suspicion of a possible impairment.
REMUNERATION REPORT
Composition and remuneration of the Executive Board
The Executive Board of Epigenomics AG is responsible for in-dependently managing and running operations, developing and implementing corporate strategy and budgetary plan-ning, appointing and guiding senior management and over-seeing general management of the Company. There is a con-tinuous and intensive dialog between the Executive Board and the Supervisory Board and their respective members. In its charter, the Executive Board has been given a clear set of rules and procedures for certain actions and decisions that require Supervisory Board approval.
Dr. Thomas Taapken served as Chief Executive Officer (CEO) and Chief Finance Officer (CFO) of the Company until June 30, 2016. Effective July 1, Greg Hamilton has been appointed as the Company’s new CEO. Mr. Hamilton’s service agree-ment has a term until December 31, 2018. The Executive Board has been complemented by Dr. Uwe Staub, who is the Company’s Chief Operating Officer (COO) since April 2013. Dr. Staub joined Epigenomics in November 2008. The service agreement with Dr. Staub has a term until March 31, 2018.
Total remuneration of the members of the Company’s Execu-tive Board is reviewed by the Supervisory Board annually and is compared against national and international benchmarks. Remuneration takes into account the economic and financial situation of the Company as well as size and complexity of in-ternational operations and responsibilities. The remuneration package comprises both a fixed and a variable component. The variable amount is determined on the basis of a variety of criteria, which are set by the Supervisory Board on a yearly basis, e.g. the achievement of individual performance targets and/or Company performance targets. In addition, Mr. Hamilton is entitled to reimbursement of his travel expenses from his permanent address in San Diego to the Company’s head-quarters in Berlin and the related accommodation there. His
39MANAGEMENT REPORT CORPORATE GOVERNANCE

package of fringe benefits includes an annual car allowance, a 50% matching contribution of the Company in a 401k plan, various insurance policies and, reimbursement for legal and tax advice expenses in the U.S.A. and Germany.
Apart from the fixed and the variable component, a third re-muneration component comprises a long-term performance- based compensation in the form of stock option rights. Such
rights are currently granted under the Company’s new stock option program, which is described in detail in the notes to the consolidated financial statements for the reporting year. From 2013 until 2015, Dr. Staub received the long-term per-formance-based compensation in the form of PSR. The total individual position of the Executive Board members with re-gard to these rights is shown in the following table:
Executive Board member Program
Reporting
year
Rights held
as of Jan 1
Rights
granted
Rights
expired
Rights
exercised
Rights owned
as of Dec 31
thereof
vested
Exercise price
(weighted
avg.) in EUR
Dr. Thomas Taapken (until June 30, 2016)
PSP 03–15 2016 40,000 0 0 0 n/a n/a n/a
2015 40,000 0 0 0 40,000 40,000 6.32
PSP 2013 2016 110,000 0 0 0 n/a n/a n/a
2015 110,000 0 0 0 110,000 66,000 1.62
PSP 2014 2016 73,333 0 0 0 n/a n/a n/a
2015 73,333 0 0 0 73,333 14,666 3.23
PSP 2015 2016 59,000 0 0 0 n/a n/a n/a
2015 0 59,000 0 0 59,000 0 n/a
Total PSRs 2016 282,333 0 0 0 n/a n/a n/a
2015 223,333 59,000 0 0 282,333 120,666 3.37
Executive Board member Program
Reporting
year
Rights held
as of Jan 1
Rights
granted
Rights
expired
Rights
exercised
Rights owned
as of Dec 31
thereof
vested
Exercise price
(weighted
avg.) in EUR
Dr. Uwe Staub PSP 03–15 2016 38,800 0 10,000 0 28,800 28,800 6.96
2015 38,800 0 0 0 38,800 38,800 8.35
PSP 2013 2016 115,000 0 0 95,000 20,000 16,000 6.15
2015 115,000 0 0 0 115,000 65,000 2.18
PSP 2014 2016 60,000 0 0 0 60,000 36,000 3.23
2015 60,000 0 0 0 60,000 12,000 3.23
PSP 2015 2016 24,000 0 0 0 24,000 4,800 5.05
2015 0 24,000 0 0 24,000 0 n/a
Total PSRs 2016 237,800 0 10,000 95,000 132,800 85,600 5.13
2015 213,800 24,000 0 0 237,800 115,800 4.36
40 EPIGENOMICS ANNUAL REPORT 2016
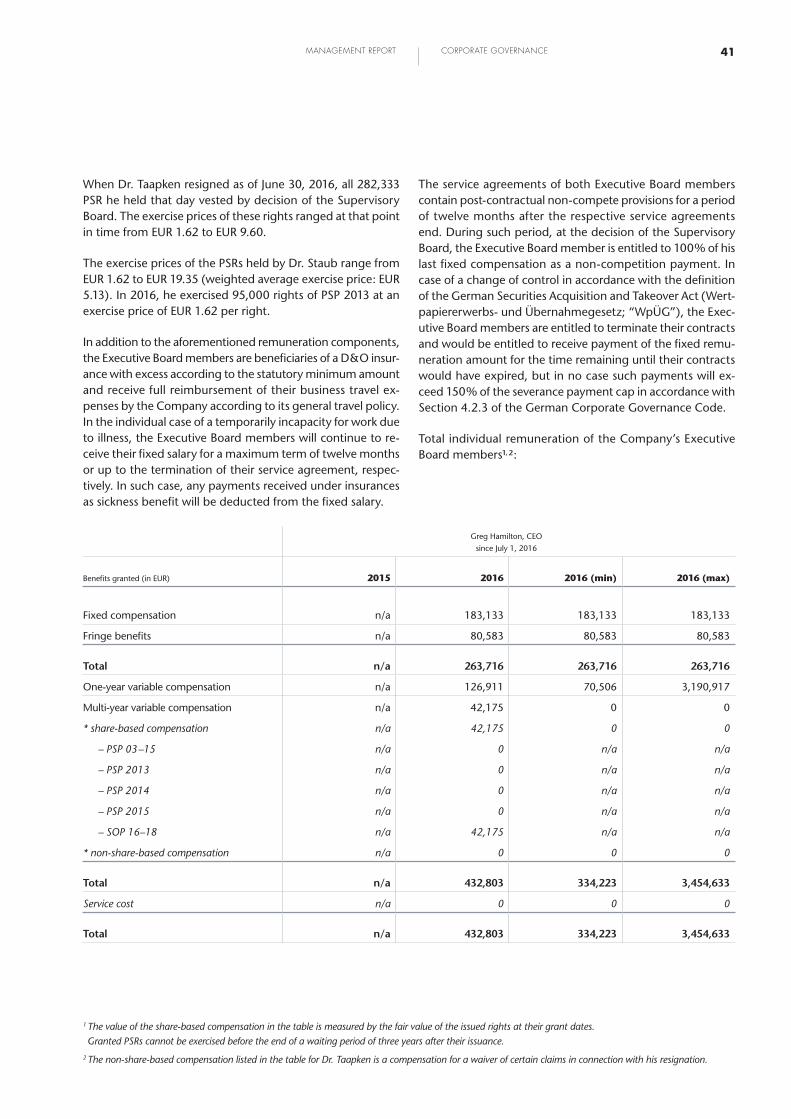
When Dr. Taapken resigned as of June 30, 2016, all 282,333 PSR he held that day vested by decision of the Supervisory Board. The exercise prices of these rights ranged at that point in time from EUR 1.62 to EUR 9.60.
The exercise prices of the PSRs held by Dr. Staub range from EUR 1.62 to EUR 19.35 (weighted average exercise price: EUR 5.13). In 2016, he exercised 95,000 rights of PSP 2013 at an exercise price of EUR 1.62 per right.
In addition to the aforementioned remuneration components, the Executive Board members are beneficiaries of a D&O insur-ance with excess according to the statutory minimum amount and receive full reimbursement of their business travel ex-penses by the Company according to its general travel policy. In the individual case of a temporarily incapacity for work due to illness, the Executive Board members will continue to re-ceive their fixed salary for a maximum term of twelve months or up to the termination of their service agreement, respec-tively. In such case, any payments received under insurances as sickness benefit will be deducted from the fixed salary.
The service agreements of both Executive Board members contain post-contractual non-compete provisions for a period of twelve months after the respective service agreements end. During such period, at the decision of the Supervisory Board, the Executive Board member is entitled to 100% of his last fixed compensation as a non-competition payment. In case of a change of control in accordance with the definition of the German Securities Acquisition and Takeover Act (Wert-papiererwerbs- und Übernahmegesetz; “WpÜG”), the Exec-utive Board members are entitled to terminate their contracts and would be entitled to receive payment of the fixed remu-neration amount for the time remaining until their contracts would have expired, but in no case such payments will ex-ceed 150% of the severance payment cap in accordance with Section 4.2.3 of the German Corporate Governance Code.
Total individual remuneration of the Company’s Executive Board members¹, ²:
Greg Hamilton, CEO
since July 1, 2016
Benefits granted (in EUR) 2015 2016 2016 (min) 2016 (max)
Fixed compensation n/a 183,133 183,133 183,133
Fringe benefits n/a 80,583 80,583 80,583
Total n/a 263,716 263,716 263,716
One-year variable compensation n/a 126,911 70,506 3,190,917
Multi-year variable compensation n/a 42,175 0 0
* share-based compensation n/a 42,175 0 0
– PSP 03 –15 n/a 0 n/a n/a
– PSP 2013 n/a 0 n/a n/a
– PSP 2014 n/a 0 n/a n/a
– PSP 2015 n/a 0 n/a n/a
– SOP 16–18 n/a 42,175 n/a n/a
* non-share-based compensation n/a 0 0 0
Total n/a 432,803 334,223 3,454,633
Service cost n/a 0 0 0
Total n/a 432,803 334,223 3,454,633
1 The value of the share-based compensation in the table is measured by the fair value of the issued rights at their grant dates. Granted PSRs cannot be exercised before the end of a waiting period of three years after their issuance.
2 The non-share-based compensation listed in the table for Dr. Taapken is a compensation for a waiver of certain claims in connection with his resignation.
41MANAGEMENT REPORT CORPORATE GOVERNANCE

Dr. Thomas Taapken, CEO/CFO
April 1, 2011 until June 30, 2016
Benefits granted (in EUR) 2015 2016 2016 (min) 2016 (max)
Fixed compensation 240,000 240,000 120,000 120,000
Fringe benefits 0 0 0 0
Total 240,000 240,000 120,000 120,000
One-year variable compensation 158,951 209,316 0 800,000
Multi-year variable compensation 85,131 405,000 0 0
* share-based compensation 85,131 0 0 0
– PSP 03 –15 0 0 n/a n/a
– PSP 2013 0 0 n/a n/a
– PSP 2014 0 0 n/a n/a
– PSP 2015 85,131 0 n/a n/a
– SOP 16–18 0 0 n/a n/a
* non-share-based compensation 0 405,000 0 0
Total 484,082 854,316 120,000 920,000
Service cost 0 0 0 0
Total 484,082 854,316 120,000 920,000
Dr. Uwe Staub, COO
since April 1, 2013
Benefits granted (in EUR) 2015 2016 2016 (min) 2016 (max)
Fixed compensation 227,500 230,000 230,000 230,000
Fringe benefits 0 0 0 0
Total 227,500 230,000 230,000 230,000
One-year variable compensation 77,500 64,000 0 80,000
Multi-year variable compensation 34,629 34,782 0 0
* share-based compensation 34,629 34,782 0 0
– PSP 03 –15 0 0 n/a n/a
– PSP 2013 0 0 n/a n/a
– PSP 2014 0 0 n/a n/a
– PSP 2015 34,629 0 n/a n/a
– SOP 16–18 0 34,782 n/a n/a
* non-share-based compensation 0 0 0 0
Total 339,629 328,782 230,000 310,000
Service cost 0 0 0 0
Total 339,629 328,782 230,000 310,000
42 EPIGENOMICS ANNUAL REPORT 2016

Greg Hamilton, CEO
since July 1, 2016
Dr. Thomas Taapken, CEO/CFO
April 1, 2011 until June 30, 2016
Dr. Uwe Staub, COO
since April 1, 2013
Allocations (in EUR) 2015 2016 2015 2016 2015 2016
Fixed compensation n/a 183,133 240,000 240,000 227,500 230,000
Fringe benefits n/a 79,052 0 0 0 0
Total n/a 262,185 240,000 240,000 227,500 230,000
One-year variable compensation n/a 0 158,951 209,316 0 70,000
Multi-year variable compensation n/a 0 0 795,100 0 318,250
* share-based compensation n/a 0 0 390,100 0 318,250
– PSP 03 –15 n/a 0 0 39,200 0 0
– PSP 2013 n/a 0 0 350,900 0 318,250
– PSP 2014 n/a 0 0 0 0 0
– PSP 2015 n/a 0 0 0 0 0
– SOP 16/18 n/a 0 0 0 0 0
* non-share-based compensation n/a 0 0 405,000 0 0
Total n/a 262,185 398,951 1,244,416 227,500 618,250
Service cost n/a 0 0 0 0 0
Total n/a 262,185 398,951 1,244,416 227,500 618,250
Shares of the Company held by members of the Executive Board:
Number of shares
Executive Board member
Reporting
year held as of Jan 1 purchased sold held as of Dec 31
Greg Hamilton (since July 1, 2016)
2016 n/a 0 0 0
2015 n/a n/a n/a n/a
Dr. Thomas Taapken (until June 30, 2016)
2016 57,652 0 0 n/a
2015 51,000 6,652 0 57,652
Dr. Uwe Staub 2016 5,000 25,000 0 30,000
2015 5,000 0 0 5,000
Total Executive Board 2016 62,652 25,000 0 30,000
2015 56,000 6,652 0 62,652
43MANAGEMENT REPORT CORPORATE GOVERNANCE

Composition and remuneration of the Supervisory Board
By resolution taken by our Annual General Shareholders’ Meeting (AGM) on May 25, 2016, the number of the Com-pany’s Supervisory Board members has been increased in the reporting year. The Supervisory Board previously consisted of three members. The Act amending the German Stock Corpo-ration Act (Gesetz zur Änderung des Aktiengesetzes) of Decem-ber 22, 2015 repealed the rule previously provided for in Section 95 Sentence 3 of the German Stock Corporation Act (AktG) prescribing that the number of supervisory board members of stock corporations must be generally divisible by three. Henceforth, the number must be divisible by three only if this is necessary to comply with the requirements im-posed by co-determination laws. This, however, does not apply in the case of the Company. Consequently, the number of the Company’s Supervisory Board members is no longer required to be divisible by three. In this light, the Executive Board and the Supervisory Board proposed to the shareholders that the number of Supervisory Board members be increased by one member to a total of four members. This increase allowed the Company to gain additional industry expertise as well as access to further networks of experts. It was further decided to adapt the Articles of Association of the Company to Section 107 Paragraph 1 Sentence 1 AktG, according to which the Supervisory Board shall elect from among its members a chairperson and at least one deputy chairperson. In connection with this increase in the number of Supervis ory Board members, the Board can set up committees again.
The 2016 AGM elected Dr. Helge Lubenow as the new, add-itional member to the Company’s Supervisory Board. Dr. Helge Lubenow is an independent management consultant (AGOS Consulting). She studied Biology and earned a doctor-al degree at the University of Cologne and the Max-Planck- Institute in the field of genetics. After joining Qiagen in 1997, Dr. Lubenow held various senior management positions in Germany and internationally (Norway, United States, Austra-lia). From 2011 to 2015, Dr. Lubenow headed Qiagen’s Molec-ular Diagnostic Business Area as Senior Vice President, directly managing 600 staff members.
Therefore, Epigenomics’ Supervisory Board now consists of four members with broad experience in the pharmaceutical, diagnostics or financial industries.
■■ Heino von Prondzynski – Einsiedeln (CH) – Chairman (since May 2, 2012) Independent consultant and former member of the group management of F. Hoffmann-La Roche Ltd. (CEO of the Division Roche Diagnostics at F. Hoffmann-La Roche Ltd., Basel, CH)
Supervisory Board member from May 2007 until March 2010 and since May 2012
Heino von Prondzynski is not a member of other manda-tory supervisory boards. He is/was a member of compar-able boards with supervisory function of the following German and foreign undertakings:
– HTL-Strefa S.A., Warsaw (POL)– Koninklijke Philips Electronics N.V.
(Royal Philips Electronics), Eindhoven (NL)– Quotient Ltd., Jersey (UK) – Independent Lead Director
■■ Ann Clare Kessler, Ph.D. – Rancho Santa Fe, CA (U.S.A.) – Vice-Chairwoman (since May 2, 2012) Independent consultant and former Head of Global Project Management at F. Hoffmann-La Roche Ltd. (Basel, CH) and former Head of the Division of Exploratory Research at Hoffmann-La Roche Inc. (U.S.A.)
Supervisory Board member since June 2005
Ann Clare Kessler, Ph.D., is not a member of other manda-tory supervisory boards. She is a member of comparable boards with supervisory function of the following German or foreign undertakings:
– Althea Dx Inc., San Diego, CA (U.S.A.) – MedGenesis Therapeutix, Inc., Victoria, BC (CAN)
■■ Prof. Dr. Günther Reiter – Pfullingen (GER) – Vice-Chairman (since November 5, 2014) Professor at the ESB Business School in Reutlingen (GER)
Supervisory Board member since June 2005; Chairman of the Audit Committee
Prof. Dr. Reiter is not a member of other mandatory su-pervisory boards or comparable boards with supervisory function.
■■ Dr. Helge Lubenow – Langenfeld/Rhineland (GER) Independent Management Consultant and former Head of the Molecular Diagnostic Business Area at Qiagen (GER)
Supervisory Board member since May 2016; Member of the Audit Committee
Dr. Lubenow is not a member of other mandatory super-visory boards or comparable boards with supervisory function.
The remuneration structure for the Supervisory Board is based on an annual cash retainer (“fixed remuneration”) and meeting- related payments (“variable remuneration”). The remuner-ation does not comprise any performance-related elements or long-term incentive components.
44 EPIGENOMICS ANNUAL REPORT 2016

Remuneration of the members of the Supervisory Board:
in EUR
Reporting
year Fixed
Variable
remuneration Total
Heino von Prondzynski 2016 90,000 12,000 102,000
2015 90,000 12,000 102,000
Ann C. Kessler, Ph.D. 2016 40,000 12,000 52,000
2015 40,000 12,000 52,000
Prof. Dr. Günther Reiter 2016 45,000 12,000 57,000
2015 40,000 12,000 52,000
Dr. Helge Lubenow (since May 25, 2016)
2016 17,500 6,000 23,500
2015 n/a n/a n/a
Total Supervisory Board 2016 192,500 42,000 234,500
2015 170,000 36,000 206,000
In addition, the members of the Supervisory Board were re-imbursed for expenses totaling EUR 41 thousand in 2016 (2015: EUR 52 thousand).
Shares of the Company held by members of the Supervisory Board:
Number of shares
Supervisory Board member
Reporting
year held as of Jan 1 purchased sold held as of Dec 31
Heino von Prondzynski 2016 129,000 11,000 0 140,000
2015 100,100 28,900 0 129,000
Ann C. Kessler, Ph.D. 2016 10,650 14,000 0 24,650
2015 10,650 0 0 10,650
Prof. Dr. Günther Reiter 2016 0 0 0 0
2015 0 0 0 0
Dr. Helge Lubenow (since May 25, 2016)
2016 n/a 5,000 0 6,000
2015 n/a n/a n/a n/a
Total Supervisory Board 2016 139,650 30,000 0 170,650
2015 110,750 28,900 0 139,650
FINANCIAL MARKET REPORTING
In line with fair and open disclosure and the requirements of the Prime Standard segment of the Frankfurt Stock Exchange, quarterly interim statements and half-year financial reports are made available within two months after quarter-/half-year-end and annual financial statements within four months after year-end. All information is made available simultane-ously on our website www.epigenomics.com. All material news is announced following the latest guidelines and legal re-quirements on ad hoc notification.
45MANAGEMENT REPORT CORPORATE GOVERNANCE

ADDITIONAL MANDATORY DISCLOSURES FOR LISTED COMPANIES IN ACCORDANCE WITH SECTION 315 PARAGRAPH 4 OF THE GERMAN COMMERCIAL CODE (HGB)
In accordance with Section 315 Paragraph 4 of the German Commercial Code (HGB), the Company is required to report on certain structures governed by the German Stock Cor-poration Act (AktG) and other legal frameworks, in order to provide a better overview of the Company and disclose any impediments to a takeover.
SHAREHOLDERS WITH DIRECT OR INDIRECT SHAREHOLDINGS OF MORE THAN 10% OF THE VOTING RIGHTS
Based on the information available to the Company, no direct or indirect holdings exceeding 10% of the voting rights were held as of the balance sheet date.
COMPOSITION OF SHARE CAPITAL
As of December 31, 2016, the share capital of Epigenomics AG consisted exclusively of registered shares with equal rights at a par value of EUR 1.00 each. The total number of outstand-ing shares as of December 31, 2016, was 22,735,260.
Under certain conditions, shareholders may not be entitled to vote in accordance with Section 136 of the German Stock Corporation Act (AktG). We are not aware of any contractual restrictions related to voting rights or the transfer of shares.
LEGISLATION AND PROVISIONS OF THE ARTICLES OF ASSOCIATION APPLICABLE TO THE APPOINTMENT AND DISMISSAL OF MEMBERS OF THE EXECUTIVE BOARD AND GOVERNING AMENDMENTS TO THE ARTICLES OF ASSOCIATION
The appointment and dismissal of members of the Executive Board is subject to the provisions of Sections 84 and 85 of the German Stock Corporation Act (AktG).
The Supervisory Board shall appoint members of the Execu-tive Board for a maximum period of five years. It is permissible to appoint members to the Executive Board on more than one occasion or to extend their period of office, on each oc-casion for a maximum of five years.
The Executive Board may consist of one or more persons. The number of members of the Executive Board shall be deter-mined by the Supervisory Board in accordance with the statu-tory provisions. The Supervisory Board may appoint a member of the Executive Board as its chairperson (“CEO”) and one or more members of the Executive Board as his/her deputy(ies). Deputy members of the Executive Board may be appointed. The statutory provisions regarding the amendment of the Articles of Association are governed in Sections 179 to 181 of the German Stock Corporation Act (AktG).
Pursuant to Section 14 of the Articles of Association, the Super-visory Board is entitled to adopt amendments and comple-tions to the statutes, which only involve the version thereof.
MATERIAL AGREEMENTS OF THE COMPANY SUBJECT TO THE CONDITION OF A CHANGE OF CONTROL FOLLOWING A TAKEOVER BID
(Such disclosure may be omitted if it could materially adverse-ly affect the Company.)
Subject to the condition of a change of control following a takeover bid except from the service agreements of the Ex-ecutive Board members (see section “Composition and remu-neration of the Executive Board” of this consolidated man-agement report) are also the Company’s phantom stock programs and the related agreements with the beneficiaries of these programs, respectively. In case of a takeover or a mandatory offer for the shares of the Company according to the WpÜG the holders of vested PSR become entitled to ex-ercise these rights completely. This shall also apply if the wait-ing period for these rights has not expired yet. The exercise right for the PSR holder shall only apply if the offered consid-eration exclusively comprises of a cash settlement and if the bidder has gained control over the Company, i.e. has ac-quired at least 30% of the voting rights of the Company (section. 29, para. 2, sentence 30, WpÜG).
46 EPIGENOMICS ANNUAL REPORT 2016

AUTHORIZATION OF THE EXECUTIVE BOARD TO ISSUE SHARES
Authorized Capital 2016/I
The Executive Board is authorized until May 24, 2021, to in-crease, with the consent of the Supervisory Board, the share capital of the Company once or several times by up to EUR 380,412.00 against contribution in cash and/or in kind by issuing new non-par value registered shares (Authorized Cap-ital 2016/I). Subscription rights shall be granted to the share-holders. The new shares can also be subscribed by one or more credit institutions or undertakings acting according to Section 53 Paragraph 1 Sentence 1 or Section 53b Paragraph 1 Sentence 1 or Paragraph 7 of the German Banking Act (KWG) under the obligation to offer the shares to the shareholders for subscription (indirect subscription right). The Executive Board is, however, authorized to exclude, with the consent of the Supervisory Board, the shareholders’ statutory subscrip-tion rights in the following events:
■■ for fractional amounts;
■■ if the new shares are issued according to Section 186 Para-graph 3 Sentence 4 AktG against contribution in cash at an issue price which is not significantly below the stock exchange price of the shares already listed, and the pro rata notional portion of the share capital represented by the new shares does not exceed ten per cent (10%) of the share capital at the time this authorization is registered with the commercial register, or, if lower, at the respective time when the authorization is exercised. Other shares which have been newly issued by the Company by way of a capital increase against contribution in cash during the term of this authorization pursuant or corresponding to Section 186 Paragraph 3 Sentence 4, or which have been sold following a repurchase, in each case under ex-clusion of subscription rights, shall be counted towards the 10% limitation. Furthermore, shares for which there is an option or conversion right or obligation, or a share de livery right in favor of the Company, based on bonds with war-rants or convertible bonds or participation rights that have been issued during the term of this authorization under exclusion subscription rights pursuant to Section 221 Paragraph 4 Sentence 2 in connection with Section 186 Paragraph 3 Sentence 4 AktG by the Company or its sub-sidiaries, shall be counted towards the 10% limitation;
■■ for capital increases against contribution in kind in order to be able to offer the new shares to third parties with regard to mergers or upon the purchase (including an indirect purchase) of enterprises, parts of enterprises, shares in enterprises, or the purchase (including an indi-rect purchase) of other assets (including receivables, also to the extent owed by the Company or subsidiaries);
■■ to the extent necessary to grant subscription rights for new shares to holders or creditors of option rights or cred-itors of convertible bonds or participation rights issued by the Company or its subsidiaries in the amount in which they would be entitled thereto upon the exercise of the option or conversion rights or the exercise of share deliv-ery rights, or performance of conversion or option obli-gations.
The Executive Board is further authorized to determine, with the consent of the Supervisory Board, the dividend rights of the new shares in deviation from Section 60 Paragraph 2 AktG as well as the further details of the implementation of capital increases from the Authorized Capital 2016/I. The Supervisory Board is authorized to amend the wording of the Articles of Association, as appropriate, after implementation of a capital increase from the Authorized Capital 2016/I in accordance with the respective share capital increase or after expiry of the term of the authorization.
Authorized Capital 2016/II
The Executive Board is authorized until May 24, 2021, to in-crease, with the consent of the Supervisory Board, the share capital of the Company once or several times by up to a total of EUR 7,561,634.00 against contribution in cash and/or in kind by issuing new non-par value registered shares (Autho-rized Capital 2016/II). Subscription rights shall be granted to the shareholders. The new shares can also be subscribed by one or more credit institutions or undertakings acting accord-ing to Section 53 Paragraph 1 Sentence 1 or Section 53b Para-graph 1 Sentence 1 or Paragraph 7 of the German Banking Act (“KWG”) under the obligation to offer the shares to the share-holders for subscription (indirect subscription right). The Ex-ecutive Board is, however, authorized to exclude, with the consent of the Supervisory Board, the shareholders’ statutory subscription rights in the following events:
■■ for fractional amounts,
■■ for capital increases against contribution in kind in order to be able to offer the new shares to third parties with regard to mergers or upon the purchase (including an indirect purchase) of enterprises, parts of enterprises, shares in enterprises or the purchase (including an indi-rect purchase) of other assets (including receivables, also to the extent owed by the Company or subsidiaries),
■■ for capital increases in cash, to the extent the capital in-creases are implemented for the purpose of the place-ment of the shares in the context of a listing or the sub-sequent placement on a foreign stock exchange.
47MANAGEMENT REPORT ADDITIONAL MANDATORY DISCLOSURES
The Executive Board is further authorized to determine, with the consent of the Supervisory Board, the dividend rights of the new shares in deviation from Section 60 Paragraph 2 AktG as well as the further details of the implementation of capital increases from Authorized Capital 2016/II. The Super-visory Board is authorized to amend the wording of the Art-icles of Association, as appropriate, after implementation of a share capital increase from Authorized Capital 2016/II in accordance with the respective share capital increase or after expiry of the term of the authorization.
Conditional Capital VII
The share capital is further conditionally increased by up to EUR 21,065.00 by issuance of up to 21,065 new non-par value registered shares (Conditional Capital VII). The conditional capital increase can only be carried out to the extent that option rights were issued on the basis of the stock option program 09–13 of the Company and the holders of these share options exercise their right to subscribe to shares of the Company and the Company does not transfer its own shares in fulfillment of these option rights. The new shares will participate in the profit from the beginning of the finan-cial year in which they are issued. Up to a maximum amount of 21,065 new shares could still be created upon exercise of granted and outstanding options from the underlying pro-gram.
Conditional Capital IX
The share capital is further conditionally increased by up to EUR 521,095.00 by issuance of up to 521,095 new non-par value registered shares (Conditional Capital IX). The condi-tional capital increase is only to be implemented if bonds or participation rights are issued on the basis of the authoriza-tion of the Executive Board by resolution of the Annual Gen-eral Shareholders’ Meeting on May 6, 2013, or on the autho-rization of the Executive Board by resolution of the Annual General Shareholders’ Meeting on May 6, 2013, as amended by resolution of the Annual General Shareholders’ Meeting of June 3, 2014, until May 5, 2018, and to the extent that
■■ the holders or creditors of bonds with warrants or conver-sion rights under bonds or participation rights exercise their option or conversion rights, or
■■ holders or creditors of bonds or participation rights are obliged to exercise an option or to convert and fulfill this obligation or
■■ the Company exercises an election right to grant non-par value shares of the Company instead of paying a cash amount due for payment to the holders or creditors
and to the extent that no cash settlement is granted or trea-sury shares or shares of another listed company are delivered. The issuance of the new shares occurs at the respective op-tion or conversion price, in each case as further to be deter-mined and specified in accordance with the aforementioned authorization resolution of the Annual General Shareholders’ Meeting of May 6, 2013, or in accordance with the authori-zation resolution of the Annual General Shareholders’ Meet-ing on May 6, 2013, as amended by resolution of the Annual General Shareholders’ Meeting of June 3, 2014, or the lower issue price determined in accordance with the authorization resolution of the Annual General Shareholders’ Meeting on May 6, 2013, as amended by resolution of the Annual Gen-eral Shareholders’ Meeting of June 3, 2014. The newly issued shares shall carry dividend rights from the commencement of the fiscal year in which the shares are issued, or, as far as legally permissible, if no resolution on the application of the profit of the fiscal year immediately preceding the year of the issuance has been adopted when the new shares are issued, from the commencement of this fiscal year immediately pre-ceding the year of the issuance. The Executive Board is autho-rized, subject to Supervisory Board approval, to determine the further details concerning the implementation of the conditional capital increase.
Conditional Capital X
The share capital is conditionally increased by up to EUR 7,024,702.00 through issuance of up to 7,024,702 new non-par value registered shares (Conditional Capital X). The con-ditional capital increase serves the purpose of granting shares to the holders or creditors of bonds or participation rights issued by the Company or a subsidiary until May 24, 2021, on the basis of the authorization resolution of the General Share-holders’ Meeting of May 25, 2016, if option or conversion rights are exercised, if option or conversion obligations are performed or if the Company exercises its optional right to deliver shares of the Company instead of payment of the cash amount due (or parts thereof). The new shares are issued at the respective option or conversion price to be determined in accordance with the aforementioned authorization resolu-tion. The conditional capital increase is only to be implement-ed if bonds or participation rights are issued in accordance with the authorization resolution of the General Sharehol-ders’ Meeting of May 25, 2016, and only to the extent that
■■ option or conversion rights are exercised or
■■ holders or creditors of bonds or participation rights who are under an obligation to exercise an option or under a conversion obligation perform their obligation to exercise the option or their conversion obligation or
■■ the Company exercises its optional right to deliver shares of the Company instead of paying the cash amount due (or parts thereof)
48 EPIGENOMICS ANNUAL REPORT 2016
and to the extent that no cash settlement is granted and no shares from an authorized capital, treasury shares or shares of another listed company are delivered. The new shares issued carry dividend rights from the commencement of the fiscal year in which they are issued. The Executive Board is autho-rized, as far as legally permissible and with the consent of the Supervisory Board, to determine that, if no resolution on the application of the profit of the fiscal year immediately preced-ing the year of the issuance of the new shares has been adopt-ed when the new shares are issued, the new shares shall car-ry dividend rights from the commencement of the fiscal year immediately preceding the year of the issuance. The Execu-tive Board is also authorized, with the consent of the Super-visory Board, to determine the further details concerning the implementation of the conditional capital increase.
Conditional Capital XI
The share capital is conditionally increased by up to EUR 1,000,000.00 through issuance of up to 1,000,000 new non-par value registered shares (Conditional Capital XI). The con-tingent capital increase serves the purpose of granting or is-suing shares to members of the Executive Board of the Company, to members of the management of domestic and foreign dependent companies of the Company as defined in Sections 15 and 17 AktG and to employees of the Company and of domestic and foreign dependent companies of the Company as defined in Sections 15 and 17 AktG who exercise the subscription rights they were granted prior to the end of April 30, 2018, pursuant to the authorization resolution of the General Shareholders’ Meeting of May 25, 2016 (Stock Option Program 16–18). The new shares are issued against payment by the beneficiary to the Company of the respective exercise price to be determined in accordance with the aforemen-tioned authorization resolution. The conditional capital in-crease is to be implemented only if subscription rights are issued in accordance with the authorization resolution on the Company’s Stock Option Program 16–18 by the General Shareholders’ Meeting of May 25, 2016 and only to the ex-tent that the holders of these subscription rights exercise them and the Company does not grant any treasury shares or cash compensation to fulfill these subscription rights. The new shares issued carry dividend rights from the commence-ment of the fiscal year in which they are created. The Execu-tive Board may determine, as far as legally permissible and with the consent of the Supervisory Board, that, if no resolu-tion on the application of the profit of the fiscal year imme-diately preceding the year of the issuance of the new shares
has been adopted when the new shares are issued, the new shares shall be entitled to dividends from the commencement of the fiscal year immediately preceding the year of the issu-ance; if the new shares are issued to members of the Execu-tive Board, the Supervisory Board shall be authorized to do so. The Supervisory Board is also authorized to determine the further details concerning the implementation of the condi-tional capital increase where the granting of subscription rights to members of the Executive Board is concerned. In all other cases, the Executive Board is authorized to determine such details.
Berlin, April 3, 2017
The Executive Board
49MANAGEMENT REPORT ADDITIONAL MANDATORY DISCLOSURES
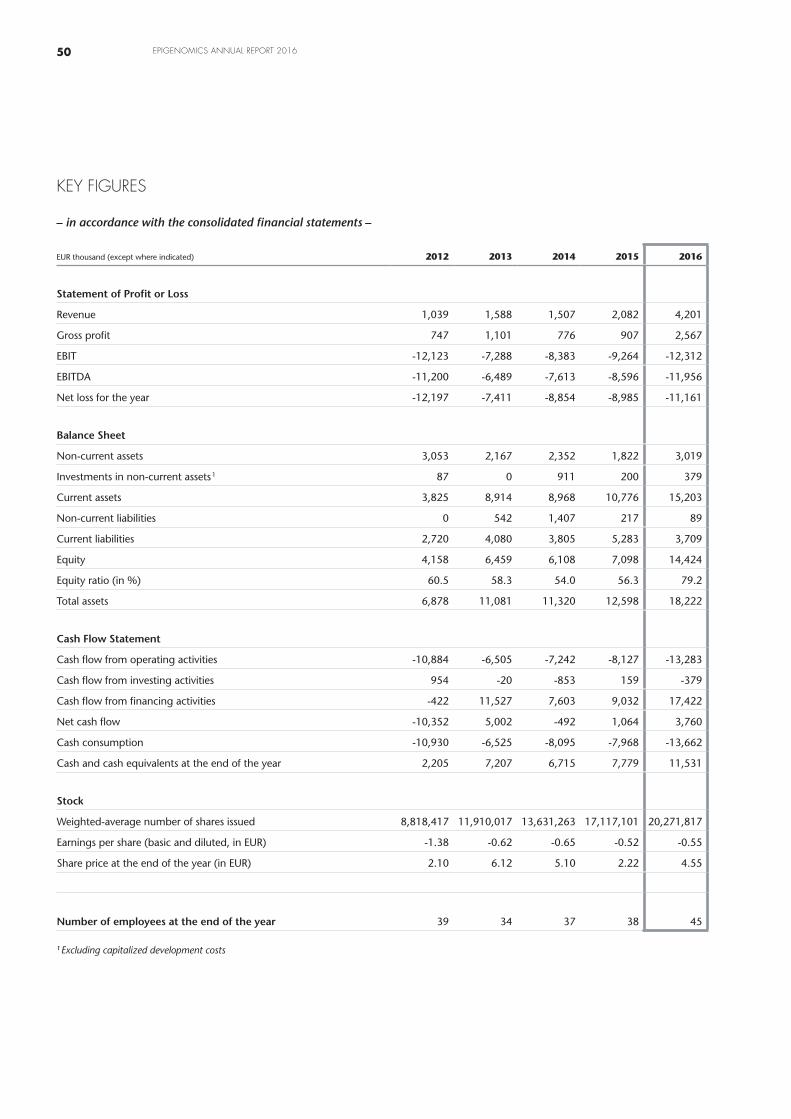
KEY FIGURES
– in accordance with the consolidated financial statements –
EUR thousand (except where indicated) 2012 2013 2014 2015 2016
Statement of Profit or Loss
Revenue 1,039 1,588 1,507 2,082 4,201
Gross profit 747 1,101 776 907 2,567
EBIT -12,123 -7,288 -8,383 -9,264 -12,312
EBITDA -11,200 -6,489 -7,613 -8,596 -11,956
Net loss for the year -12,197 -7,411 -8,854 -8,985 -11,161
Balance Sheet
Non-current assets 3,053 2,167 2,352 1,822 3,019
Investments in non-current assets 1 87 0 911 200 379
Current assets 3,825 8,914 8,968 10,776 15,203
Non-current liabilities 0 542 1,407 217 89
Current liabilities 2,720 4,080 3,805 5,283 3,709
Equity 4,158 6,459 6,108 7,098 14,424
Equity ratio (in %) 60.5 58.3 54.0 56.3 79.2
Total assets 6,878 11,081 11,320 12,598 18,222
Cash Flow Statement
Cash flow from operating activities -10,884 -6,505 -7,242 -8,127 -13,283
Cash flow from investing activities 954 -20 -853 159 -379
Cash flow from financing activities -422 11,527 7,603 9,032 17,422
Net cash flow -10,352 5,002 -492 1,064 3,760
Cash consumption -10,930 -6,525 -8,095 -7,968 -13,662
Cash and cash equivalents at the end of the year 2,205 7,207 6,715 7,779 11,531
Stock
Weighted-average number of shares issued 8,818,417 11,910,017 13,631,263 17,117,101 20,271,817
Earnings per share (basic and diluted, in EUR) -1.38 -0.62 -0.65 -0.52 -0.55
Share price at the end of the year (in EUR) 2.10 6.12 5.10 2.22 4.55
Number of employees at the end of the year 39 34 37 38 45
1 Excluding capitalized development costs
50 EPIGENOMICS ANNUAL REPORT 2016

CONTENTS
Group Statement of Profit or Loss and Other Comprehensive Income . . . . . . . . . . . . . . . . . . . . . . . . . . . . . . . . . . . . . . . . . . . . . . . . . . . . . . . . . . . . . . . . . . . . . . . . . . . . . . . . . . . . . . . . 52
Group Balance Sheet . . . . . . . . . . . . . . . . . . . . . . . . . . . . . . . . . . . . . . . . . . . . . . . . . . . . . . . . . . . . . . . . . . . . . . . . . . . . . . . . . . . . . . . . . . . . . . . . . . . . . . . . . . . . . . 53
Group Statement of Cash Flows . . . . . . . . . . . . . . . . . . . . . . . . . . . . . . . . . . . . . . . . . . . . . . . . . . . . . . . . . . . . . . . . . . . . . . . . . . . . . . . . . . . . . 54
Statement of Changes in Group Equity . . . . . . . . . . . . . . . . . . . . . . . . . . . . . . . . . . . . . . . . . . . . . . . . . . . . . . . . . . . . . . . . . . . . 56
Notes to the Consolidated Financial Statements . . . . . . . . . . . . . . . . . . . . . . . . . . . . . . . . . . . . . . . . . . . . . . . 57
Basic Information, Principles and Methods . . . . . . . . . . . . . . . . . . . . . . . . . . . . . . . . . . . . . . . . . . . . . . . . . 57
Notes to the Group Statement of Profit or Loss and Other Comprehensive Income . . . . . . . . . . . . . . . . . . . . . . . . . . . . . . . . . . . . . . . . . . . . . . . . . . . . . . . . . . . . . . . . . . . . . . . . . . . . 71
Notes to the Group Balance Sheet . . . . . . . . . . . . . . . . . . . . . . . . . . . . . . . . . . . . . . . . . . . . . . . . . . . . . . . . . . . . . . . . . . . 77
Notes to the Group Statement of Cash Flows . . . . . . . . . . . . . . . . . . . . . . . . . . . . . . . . . . . . . . . . . . . . 93
Risks and Risk Management . . . . . . . . . . . . . . . . . . . . . . . . . . . . . . . . . . . . . . . . . . . . . . . . . . . . . . . . . . . . . . . . . . . . . . . . . . . . . . . . 94
Information on Share-based Payment Plans . . . . . . . . . . . . . . . . . . . . . . . . . . . . . . . . . . . . . . . . . . . . . . 97
Other Information . . . . . . . . . . . . . . . . . . . . . . . . . . . . . . . . . . . . . . . . . . . . . . . . . . . . . . . . . . . . . . . . . . . . . . . . . . . . . . . . . . . . . . . . . . . . . . . . . . 107
CONSOLIDATED FINANCIAL STATEMENTS FOR FISCAL 2016 – in accordance with International Financial Reporting Standards (IFRSs) –
51FINANCIAL STATEMENTS
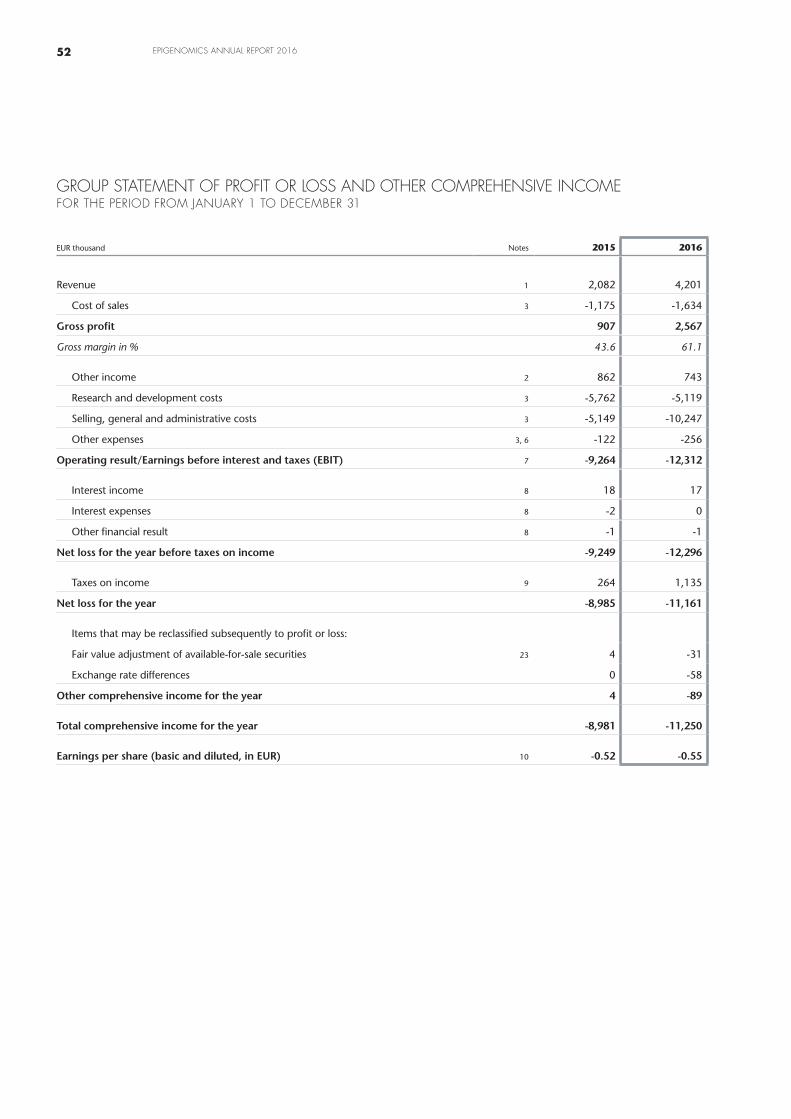
EUR thousand Notes 2015 2016
Revenue 1 2,082 4,201
Cost of sales 3 -1,175 -1,634
Gross profit 907 2,567
Gross margin in % 43.6 61.1
Other income 2 862 743
Research and development costs 3 -5,762 -5,119
Selling, general and administrative costs 3 -5,149 -10,247
Other expenses 3, 6 -122 -256
Operating result/Earnings before interest and taxes (EBIT) 7 -9,264 -12,312
Interest income 8 18 17
Interest expenses 8 -2 0
Other financial result 8 -1 -1
Net loss for the year before taxes on income -9,249 -12,296
Taxes on income 9 264 1,135
Net loss for the year -8,985 -11,161
Items that may be reclassified subsequently to profit or loss:
Fair value adjustment of available-for-sale securities 23 4 -31
Exchange rate differences 0 -58
Other comprehensive income for the year 4 -89
Total comprehensive income for the year -8,981 -11,250
Earnings per share (basic and diluted, in EUR) 10 -0.52 -0.55
GROUP STATEMENT OF PROFIT OR LOSS AND OTHER COMPREHENSIVE INCOME FOR THE PERIOD FROM JANUARY 1 TO DECEMBER 31
52 EPIGENOMICS ANNUAL REPORT 2016
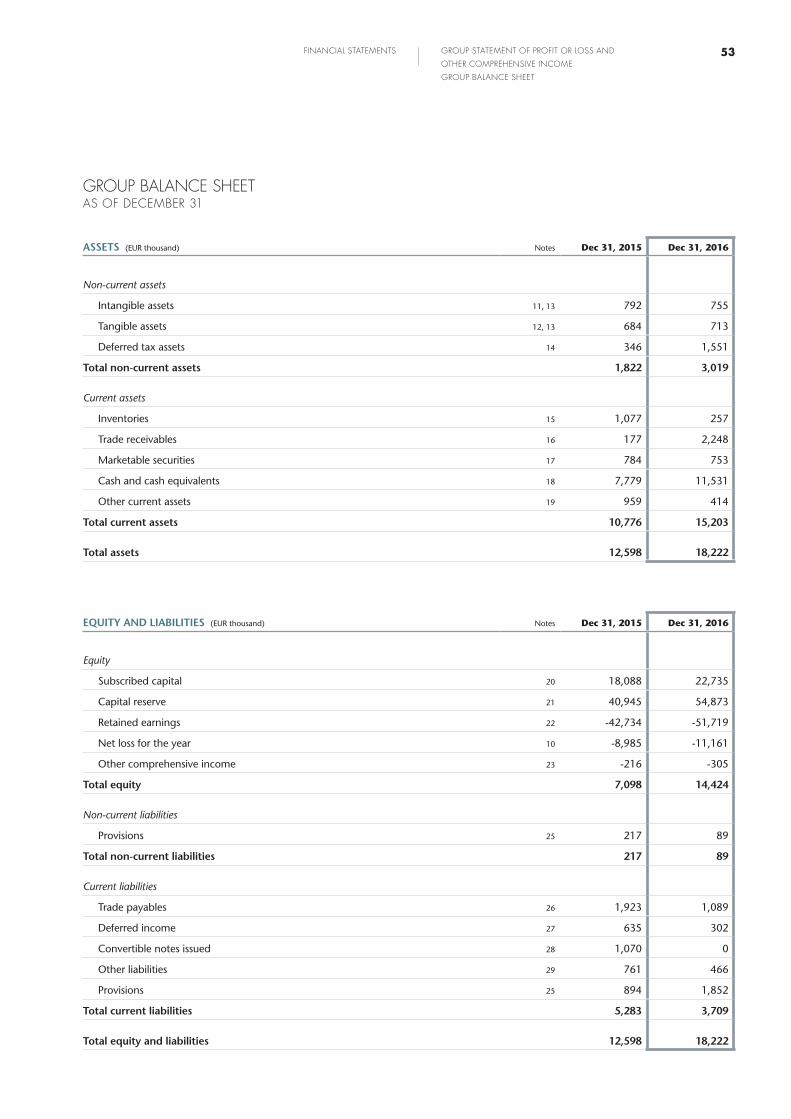
ASSETS (EUR thousand) Notes Dec 31, 2015 Dec 31, 2016
Non-current assets
Intangible assets 11, 13 792 755
Tangible assets 12, 13 684 713
Deferred tax assets 14 346 1,551
Total non-current assets 1,822 3,019
Current assets
Inventories 15 1,077 257
Trade receivables 16 177 2,248
Marketable securities 17 784 753
Cash and cash equivalents 18 7,779 11,531
Other current assets 19 959 414
Total current assets 10,776 15,203
Total assets 12,598 18,222
GROUP BALANCE SHEET AS OF DECEMBER 31
EQUITY AND LIABILITIES (EUR thousand) Notes Dec 31, 2015 Dec 31, 2016
Equity
Subscribed capital 20 18,088 22,735
Capital reserve 21 40,945 54,873
Retained earnings 22 -42,734 -51,719
Net loss for the year 10 -8,985 -11,161
Other comprehensive income 23 -216 -305
Total equity 7,098 14,424
Non-current liabilities
Provisions 25 217 89
Total non-current liabilities 217 89
Current liabilities
Trade payables 26 1,923 1,089
Deferred income 27 635 302
Convertible notes issued 28 1,070 0
Other liabilities 29 761 466
Provisions 25 894 1,852
Total current liabilities 5,283 3,709
Total equity and liabilities 12,598 18,222
53FINANCIAL STATEMENTS GROUP STATEMENT OF PROFIT OR LOSS AND
OTHER COMPREHENSIVE INCOME
GROUP BALANCE SHEET
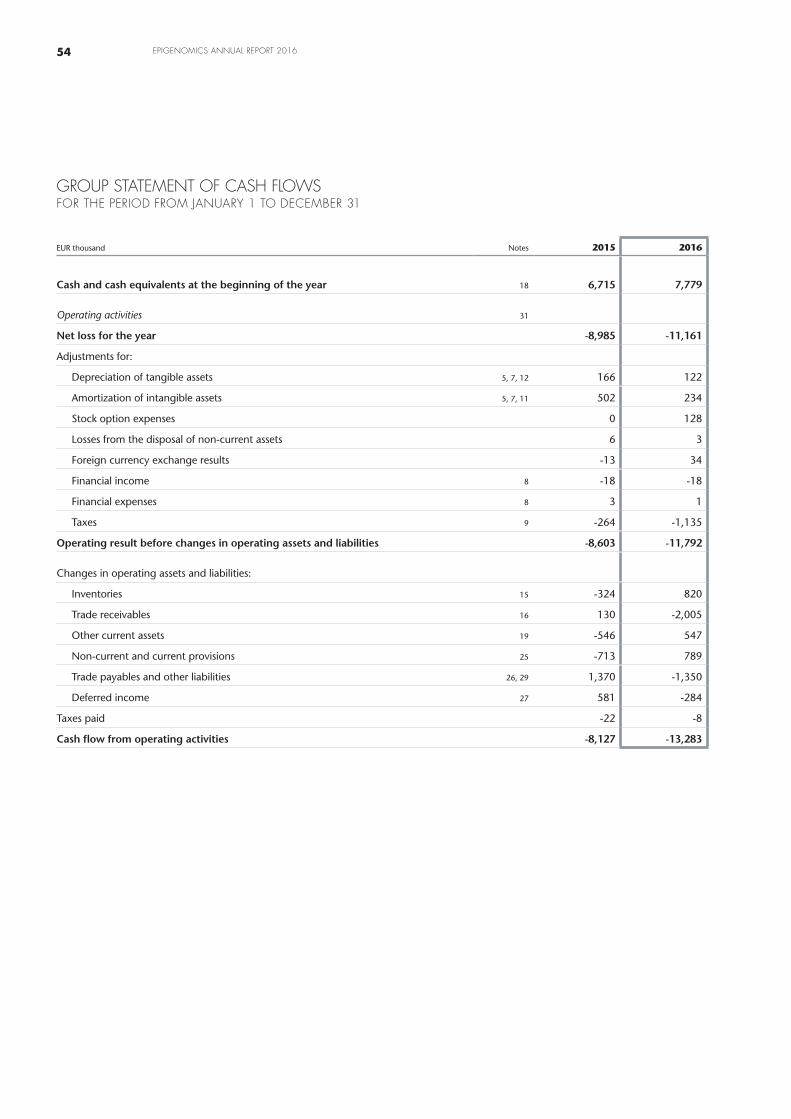
EUR thousand Notes 2015 2016
Cash and cash equivalents at the beginning of the year 18 6,715 7,779
Operating activities 31
Net loss for the year -8,985 -11,161
Adjustments for:
Depreciation of tangible assets 5, 7, 12 166 122
Amortization of intangible assets 5, 7, 11 502 234
Stock option expenses 0 128
Losses from the disposal of non-current assets 6 3
Foreign currency exchange results -13 34
Financial income 8 -18 -18
Financial expenses 8 3 1
Taxes 9 -264 -1,135
Operating result before changes in operating assets and liabilities -8,603 -11,792
Changes in operating assets and liabilities:
Inventories 15 -324 820
Trade receivables 16 130 -2,005
Other current assets 19 -546 547
Non-current and current provisions 25 -713 789
Trade payables and other liabilities 26, 29 1,370 -1,350
Deferred income 27 581 -284
Taxes paid -22 -8
Cash flow from operating activities -8,127 -13,283
GROUP STATEMENT OF CASH FLOWS FOR THE PERIOD FROM JANUARY 1 TO DECEMBER 31
54 EPIGENOMICS ANNUAL REPORT 2016
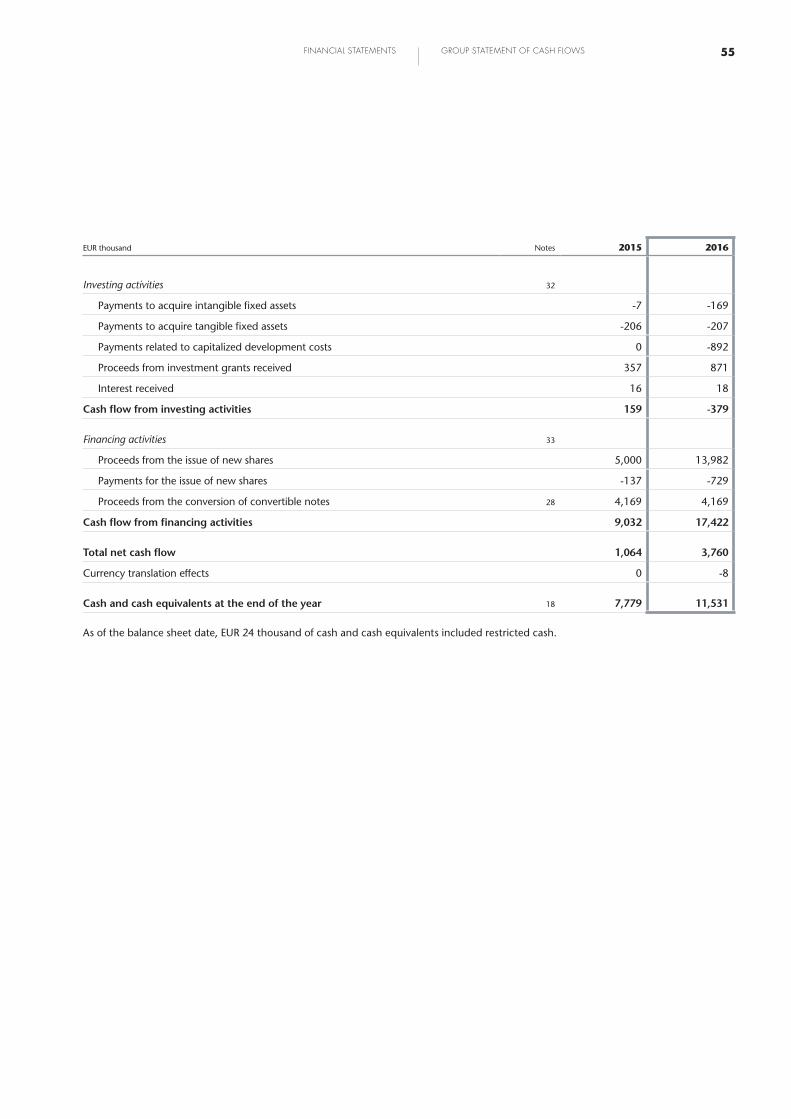
As of the balance sheet date, EUR 24 thousand of cash and cash equivalents included restricted cash.
EUR thousand Notes 2015 2016
Investing activities 32
Payments to acquire intangible fixed assets -7 -169
Payments to acquire tangible fixed assets -206 -207
Payments related to capitalized development costs 0 -892
Proceeds from investment grants received 357 871
Interest received 16 18
Cash flow from investing activities 159 -379
Financing activities 33
Proceeds from the issue of new shares 5,000 13,982
Payments for the issue of new shares -137 -729
Proceeds from the conversion of convertible notes 28 4,169 4,169
Cash flow from financing activities 9,032 17,422
Total net cash flow 1,064 3,760
Currency translation effects 0 -8
Cash and cash equivalents at the end of the year 18 7,779 11,531
55FINANCIAL STATEMENTS GROUP STATEMENT OF CASH FLOWS
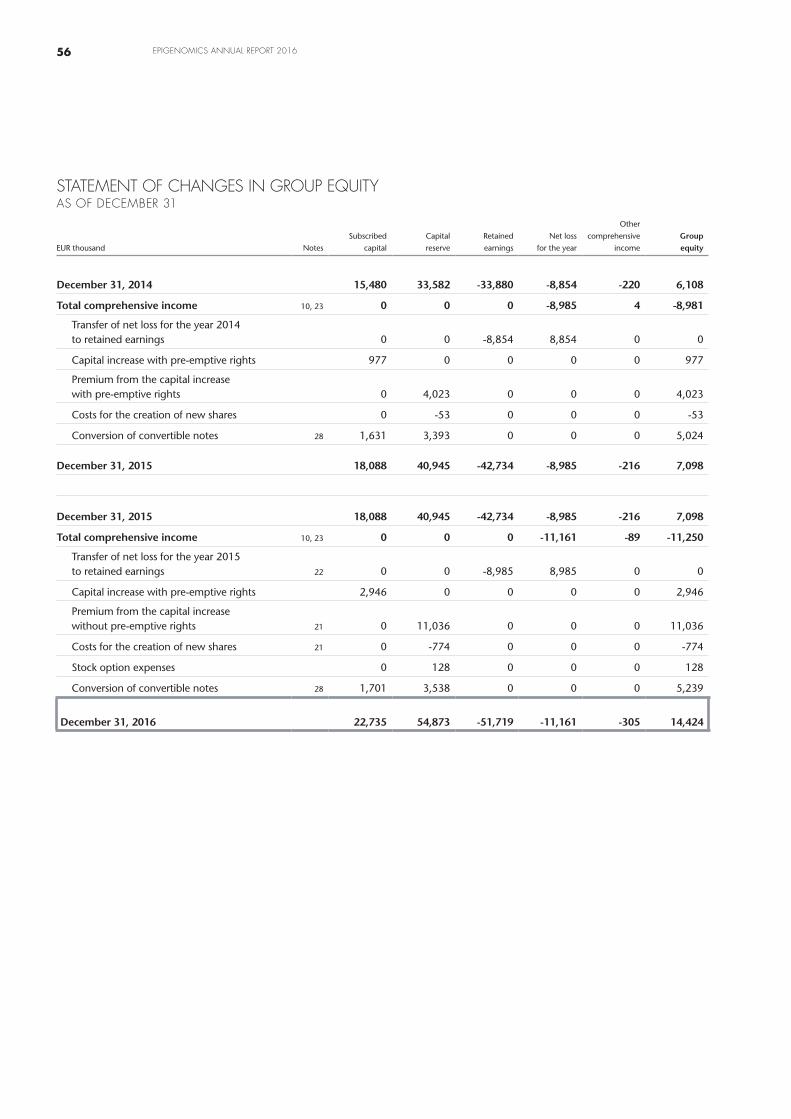
EUR thousand Notes
Subscribed
capital
Capital
reserve
Retained
earnings
Net loss
for the year
Other
comprehensive
income
Group equity
December 31, 2014 15,480 33,582 -33,880 -8,854 -220 6,108
Total comprehensive income 10, 23 0 0 0 -8,985 4 -8,981
Transfer of net loss for the year 2014 to retained earnings 0 0 -8,854 8,854 0 0
Capital increase with pre-emptive rights 977 0 0 0 0 977
Premium from the capital increase with pre-emptive rights 0 4,023 0 0 0 4,023
Costs for the creation of new shares 0 -53 0 0 0 -53
Conversion of convertible notes 28 1,631 3,393 0 0 0 5,024
December 31, 2015 18,088 40,945 -42,734 -8,985 -216 7,098
December 31, 2015 18,088 40,945 -42,734 -8,985 -216 7,098
Total comprehensive income 10, 23 0 0 0 -11,161 -89 -11,250
Transfer of net loss for the year 2015 to retained earnings 22 0 0 -8,985 8,985 0 0
Capital increase with pre-emptive rights 2,946 0 0 0 0 2,946
Premium from the capital increase without pre-emptive rights 21 0 11,036 0 0 0 11,036
Costs for the creation of new shares 21 0 -774 0 0 0 -774
Stock option expenses 0 128 0 0 0 128
Conversion of convertible notes 28 1,701 3,538 0 0 0 5,239
December 31, 2016 22,735 54,873 -51,719 -11,161 -305 14,424
STATEMENT OF CHANGES IN GROUP EQUITY AS OF DECEMBER 31
56 EPIGENOMICS ANNUAL REPORT 2016

NOTES TO THE CONSOLIDATED FINANCIAL STATEMENTS BASIC INFORMATION, PRINCIPLES AND METHODS
DESCRIPTION OF BUSINESS ACTIVITY
Epigenomics (“Epigenomics” or the “Company”) was founded as a limited liability company under
German law (GmbH) in 1998 and has its headquarters in Berlin, Germany. In 2000, the Company was
converted into a stock corporation under German law (AG) and entered into the commercial register
(“Handelsregister”) Charlottenburg under HRB 75861. It has been listed in the Prime Standard segment
of the Frankfurt Stock Exchange (ticker symbol: ECX) since July 19, 2004.
In accordance with its Articles of Association, the object of the Company is the development and mar-
keting of procedures and devices for the production in quantity of particular epigenetic parameters such
as DNA methylation patterns as well as the information technology bases necessary for their procure-
ment and evaluation. Epigenomics AG is a molecular diagnostics company developing and commercial-
izing a pipeline of proprietary products for screening, early detection and diagnosis of cancer. The
Company’s products enable doctors to diagnose cancer earlier and more accurately, leading to improved
outcomes for patients.
GENERAL PRINCIPLES
The consolidated financial statements of Epigenomics AG have been prepared in accordance with Sec-
tion 315a of the German Commercial Code (“HGB”) and in application of the International Financial
Reporting Standards (IFRSs) of the International Accounting Standards Board (IASB), London, in effect
as of the balance sheet date December 31, 2016, as adopted by the European Union (EU).
The Company has incurred balance sheet losses of EUR 51,719 thousand since inception. The Company
incurred losses of EUR 11,161 thousand for 2016 (2015: EUR 8,985 thousand). Accordingly, the “going
concern” principle in accordance with IAS 1.25 Presentation of Financial Statements has been considered.
Starting from EUR 12.3 million in liquid assets (cash, cash equivalents and marketable securities) at year-
end 2016, current financial resources are sufficient at this projected cash consumption to support the
Company’s operations beyond 2017.
The statement of profit or loss has been prepared using the cost of sales method.
REPORTING PERIOD AND REPORTING CURRENCY
The reporting period (comparison period) as defined in these consolidated financial statements is the
period from January 1 to December 31, 2016 (2015). The reporting currency is the euro. Due to round-
ings of many values to the nearest thousand euros there might be rounding differences in the figures
depicted in these notes.
SCOPE OF CONSOLIDATION
The consolidated Group consists of Epigenomics AG as the parent company (registered office: Genest-
strasse 5, 10829 Berlin, Germany) and Epigenomics, Inc. (registered office: Suite 400, 1455 NW Leary
Way, Seattle, WA 98107, U.S.A.), as its sole subsidiary during the reporting period. Epigenomics, Inc.
additionally operates an office in Germantown, MD, U.S.A. Epigenomics AG owned 100% of the share
capital and the voting rights of Epigenomics, Inc. between January 1 and December 31, 2016 and 2015.
For the reporting year and the previous year, the two companies have each submitted separate financial
statements which were either audited or critically reviewed, independent of their consolidation.
57FINANCIAL STATEMENTS
NOTES
STATEMENT OF CHANGES IN GROUP EQUITY
BASIC INFORMATION, PRINCIPLES AND METHODS
PRINCIPLES OF CONSOLIDATION
In acquisition accounting, the carrying amount of the investment is eliminated against the share of equity
of the subsidiary attributable to the parent as at the date of acquisition. Any resulting difference is added
to the assets and liabilities in the amount in which their market value deviates from their carrying amount
at the time of the initial consolidation. Any amount in excess is recognized as goodwill.
All intercompany transaction results, income and expenses, profits and losses, receivables and payables
are eliminated in full on consolidation.
APPLICATION OF NEW AND REVISED IFRSs AND INTERPRETATIONS
In the reporting year, the Group for the first time applied the following amended IFRSs and Interpretations
issued by the IASB and endorsed by the EU that are effective for accounting periods beginning on or
after January 1, 2016. Generally, the amendments mentioned below require prospective application.
Annual Improvements to IFRSs (2010 – 2012 Cycle) (endorsed by the EU as of December 17, 2014)
The Annual Improvements to IFRSs (2010 – 2012 Cycle) include amendments to a number of IFRSs which
are briefly outlined below:
■■ IFRS 2 Share-based Payments: The amendments clarify the definition of vesting condition and
market condition to ensure the consistent classification of conditions attached to a share-based
payment. It also adds definitions for “performance condition” and “service condition” which
were previously included as part of the definition of vesting condition.
■■ IFRS 3 Business Combinations: The amendments clarify that contingent consideration should be
measured at fair value at each reporting date, irrespective of whether or not the contingent con-
sideration falls within the scope of IFRS 9 or IAS 39. Changes in fair value (other than measure-
ment period adjustments as defined in IFRS 3) should be recognized in profit or loss.
■■ IFRS 8 Operating Segments: The amendments clarify on the one hand that an entity has to
disclose the judgments made by management in applying the aggregation criteria to operating
segments, including a brief description of the operating segments aggregated and the economic
indicators assessed in determining whether the operating segments share similar economic char-
acteristics. On the other hand the amendments clarify that a reconciliation of the total of the re-
portable segments’ assets to the entity’s assets should only be provided if information about the
amount of the segment assets are regularly provided to the chief operating decision maker.
■■ IFRS 13 Fair Value Measurement: The amendments clarify that the issuance of IFRS 13 and conse-
quential amendments to IAS 39 and IFRS 9 did not remove the ability to measure short-term re-
ceivables and payables with no stated interest rate at their invoice amounts without discounting,
if the effect of discounting is immaterial.
■■ IAS 16 Property, Plant and Equipment and IAS 38 Intangible Assets: The amendments removed
perceived inconsistencies in the accounting for accumulated depreciation/amortization when an
item of property, plant and equipment or an intangible asset is revalued. The amended standards
clarify that the gross carrying amount is adjusted in a manner consistent with the revaluation of
the carrying amount of the asset and that accumulated depreciation/amortization is the differ-
ence between the gross carrying amount and the carrying amount after taking into account
accumulated impairment losses.
■■ IAS 24 Related Party Disclosures: The amendments clarify that a management entity providing key
management personnel services to the reporting entity or to the parent of the reporting entity is
a related party of the reporting entity. Consequently, the reporting entity should disclose as relat-
ed party transactions the amounts as incurred for the service paid or payable to the management
entity for the provision of key management personnel services.
58 EPIGENOMICS ANNUAL REPORT 2016
Annual Improvements to IFRSs (2012–2014 Cycle) (endorsed by the EU as of December 15, 2015)
The Annual Improvements (2012–2014 Cycle) include amendments to a number of IFRSs which are
briefly outlined below:
■■ IFRS 5 Non-current Assets Held for Sale and Discontinued Operations: The amendments introduce
specific guidance in IFRS 9 for when an entity reclassifies an asset (or disposal group) from held for
sale to held for distribution to owners (or vice versa).
■■ IFRS 7 Financial Instruments – Disclosures: The amendments clarify whether a servicing contract
is considered a continuing involvement in a transferred asset for the purpose of the disclosures
required in relation to transferred assets.
■■ IAS 19 Employee Benefits: The amendments clarify that the rate used to discount post-employment
benefit obligations should be determined by reference to market yields (at the end of the reporting
period) on high quality corporate bonds. The assessment of the depth of a market for high quality
corporate bonds should be at the currency level. For currencies for which there is no deep market
in such high quality corporate bonds, the market yields (at the end of the reporting period) on
government bonds denominated in that currency should be used instead.
Amendments to IFRS 10, IFRS 12 and IAS 28 Investment Entities (endorsed by the EU as of September 22, 2016)
The amendments clarify that the exemption from preparing consolidated financial statements is available
to a parent entity that is a subsidiary of an investment entity, even if the investment entity measures all
its subsidiaries at fair value in accordance with IFRS 10 Consolidated Financial Statements. The amend-
ments also clarify that the requirement for an investment entity to consolidate a subsidiary providing
services related to the former’s investment activities applies only to subsidiaries that are not investment
entities themselves.
Amendments to IFRS 11 Accounting for Acquisitions of Interests in Joint Operations (endorsed by the EU as of November 24, 2015)
The amendments clarify how to account for the acquisition of a joint operation that constitutes a business
as defined in IFRS 3 Business Combinations. The relevant principles on accounting for business combina-
tions in IFRS 3 and other standards should be applied. The same requirements should be applied to the
formation of a joint operation by one of the parties that participate in the joint operation.
Amendments to IAS 1 Disclosure Initiative (endorsed by the EU as of December 18, 2015)
The amendments clarify that an entity need not provide specific disclosures specified in IFRSs if the infor-
mation resulting from any such disclosure is not material, and provide guidance with respect to aggre-
gating and disaggregating information for disclosure purposes. The amendments further clarify that an
entity’s share of the other comprehensive income arising from associates and joint ventures accounted
for using the equity method should be presented separately from those arising from the group, and
should be separated into the share of items that, in accordance with other IFRSs, will not be reclassified
subsequently to profit or loss and that will be reclassified subsequently to profit or loss when specific
conditions are met.
Amendments to IAS 16 and IAS 38 Clarification of Acceptable Methods of Depreciation and Amortization (endorsed by the EU as of December 2, 2015)
The amendments to IAS 16 prohibit entities from using a revenue-based depreciation method for items
of property, plant and equipment. The amendments to IAS 38 introduce a rebuttable presumption that
revenue is not an appropriate basis for amortization of intangible assets.
59NOTES BASIC INFORMATION, PRINCIPLES AND METHODS

Amendments to IAS 16 and IAS 41 Agriculture: Bearer Plants (endorsed by the EU as of November 23, 2015)
The amendments define a bearer plant and require biological assets that meet the definition of a bearer
plant to be accounted for as property, plant and equipment in accordance with IAS 16, instead of IAS 41.
The produce growing on bearer plants continues to be accounted for in accordance with IAS 41.
Amendments to IAS 19 Defined Benefit Plans: Employee Contributions (endorsed by the EU as of December 17, 2014)
The amendments clarify the accounting treatment for contributions from employees or third parties to
a defined benefit plan. In accordance with the amendments, discretionary contributions made by em-
ployees or third parties reduce service costs upon payment of these contributions to the plan. The
amendment requires retrospective application.
Amendments to IAS 27 Equity Method in Separate Financial Statements (endorsed by the EU as of December 18, 2015)
The Amendments to IAS 27 focus on separate financial statements and allow the use of the equity meth-
od in such statements.
The application of the aforementioned amendments has had no impact on the Group’s consolidated
financial statements.
NEW AND REVISED IFRSs AND INTERPRETATIONS THAT DO NOT YET REQUIRE MANDATORY APPLICATION (BUT ALLOW EARLY APPLICATION) FOR THE REPORTING YEAR
Except where indicated, the Group has not applied the following new and revised IFRSs and Interpretations
which have been issued but are not yet effective and have not yet been endorsed by the EU:
Mandatory application for fiscal years beginning on or after January 1, 2017:■■ Amendments to IAS 7 Disclosure Initiative
■■ Amendments to IAS 12 Recognition of Deferred Tax Assets for Unrealized Losses
■■ Annual Improvements to IFRSs (2014–2016 Cycle) – Amendments to IFRS 12
The Amendments to IAS 7 require an entity to provide disclosures that enable users of financial statements
to evaluate changes in liabilities arising from financing activities.
The Amendments to IAS 12 clarify various issues concerning the recognition of deferred tax assets for
unrealized losses with regard to future taxable profits.
The Annual Improvements (2014–2016 Cycle) include amendments to IFRS 12 Disclosure of Interest in
Other Entities which clarify that the requirements specified under this IFRS apply to an entity’s interests
that are classified (or included in a disposal group that is classified) as held for sale or discontinued oper-
ations in accordance with IFRS 5 Non-current Assets Held for Sale and Discontinued Operations.
Mandatory application for fiscal years beginning on or after January 1, 2018:■■ IFRS 9 Financial Instruments (as revised in 2014)
■■ IFRS 15 Revenue from Contracts with Customers
■■ Amendments to IFRS 2 Classification and Measurement of Share-based Payment Transactions
■■ Amendments to IFRS 4 Applying IFRS 9 Financial Instruments with IFRS 4 Insurance Contracts
■■ Amendments to IAS 40 Transfers of Investment Property
■■ Annual Improvements to IFRSs (2014–2016 Cycle) – Amendments to IFRS 1 and IAS 28
■■ IFRIC 22 Foreign Currency Transactions and Advance Consideration
60 EPIGENOMICS ANNUAL REPORT 2016

IFRS 9 (as revised in 2014) will supersede IAS 39 Financial Instruments: Recognition and Measurement in
its entirety upon its effective date. Compared to IFRS 9 (as revised in 2013), the 2014 version includes
limited amendments to the classification and measurement requirements by introducing a “Fair value
through other comprehensive income” measurement category for certain simple debt instruments. It
also adds the impairment requirements relating to the accounting for an entity’s expected credit losses
on its financial assets and commitments to extend credit. IFRS 9 has been endorsed by the EU as of
November 22, 2016.
The new IFRS 15 establishes a single comprehensive model for entities to use in accounting for revenue
arising from contracts with customers. It will supersede the following revenue standards and interpreta-
tions upon its effective date: IAS 18 Revenue, IAS 11 Construction Contracts, IFRIC 13 Customer Loyalty
Programmes, IFRIC 15 Agreements for the Construction of a Real Estate, IFRIC 18 Transfers of Assets from
Customers and SIC 31 Revenue – Barter Transactions Involving Advertising Services. IFRS 15 has been en-
dorsed by the EU as of September 22, 2016.
The Amendments to IFRS 2 clarify issues concerning the treatment and/or distinction between cash-
settled and equity-settled share-based payments.
The Amendments to IFRS 4 clarify the scope of the standard and the applicable conditions for a tem-
porary exemption from IFRS 9 for insurers, as well as for a temporary exemption from specific require-
ments under IAS 28.
The Amendments to IAS 40 clarify that a change in use of investment property occurs when the prop-
erty meets, or ceases to meet, the definition of investment property and there is evidence of the change
in use. In isolation, a change in management’s intentions for the use of a property does not provide
evidence of a change in use.
The Annual Improvements (2014–2016 Cycle) include amendments to IFRS 1 First-time Adoption of
International Financial Reporting Standards, and to IAS 28 Investments in Associates and Joint Ventures. The
amendments to IFRS 1 relate to the deletion of short-term exemptions for first-time adopters. The amend-
ments to IAS 28 clarify the measuring of an associate or a joint venture at fair value.
The new IFRIC 22 addresses the question on how to determine the date of the transaction for the purpose
of determining the exchange rate to use when recognizing revenue in circumstances in which an entity
has received advance consideration in a foreign currency.
Mandatory application for fiscal years beginning on or after January 1, 2019■■ IFRS 16 Leases
The new IFRS 16 provides a comprehensive model for the identification of lease arrangements and their
treatment in the financial statements of both lessees and lessors. Upon its effective date it will supersede
IAS 17 Leases, IFRIC 4 Determining whether an Arrangement contains a Lease, SIC-15 Operating Leases –
Incentives and SIC-27 Evaluating the Substance of Transactions Involving the Legal Form of a Lease. IFRS 16
introduces significant changes to lessee accounting: it removes the distinction between operating and
finance leases under IAS 17 and requires a lessee to recognize a right-of-use asset and a lease liability at
lease commencement for all leases, except for short-term leases and leases of low value assets. A lessee
can apply IFRS 16 either by a full retrospective approach or a modified retrospective approach. If the
latter approach is selected, an entity is not required to restate the comparative information and the
cumulative effect of initially applying IFRS 16 must be presented as an adjustment to opening retained
earnings (or other component of equity as appropriate).
61NOTES BASIC INFORMATION, PRINCIPLES AND METHODS
The Company intends to adopt these new and/or revised standards, amendments and interpretations as
soon as their adoption is mandatory and they are endorsed by the EU. The adoption of the new IFRS 15
is not expected to have any material impact on the Company’s financial statements as from 2018, as its
business model is based on standardized product sales and royalty income which are not significantly
affected by the new regulations. The adoption of IFRS 16 is expected to have a more pronounced impact
on the Company’s financial statements as from 2019. As a result of this new standard on leases, the Com-
pany’s rental agreement for office space at its Berlin headquarters must then be capitalized instead of
being treated as an off-balance sheet liability. Based on the current contractual situation and parameters,
the rental agreement must be capitalized as a non-current asset in a range of approximately EUR 760–860
thousand as of January 1, 2019. This amount is expected to be expensed on a more or less straight-line
basis over the remaining term of the underlying agreement (including optional periods) until April 30, 2026.
Currently, the Company has no other lease agreements in place that would be affected by IFRS 16.
Potential material impact of the adoption of the other amendments, improvements, and new interpreta-
tions on the Company’s financial statements for the fiscal years as from 2018 is not expected (e.g. due to
non-applicability of these standards and interpretations or their mere clarifications regarding presentation).
MANAGEMENT’S JUDGMENT, ASSUMPTIONS AND EXPECTATIONS
The management of the Company has made several judgments in the process of applying the entity’s
accounting policies that have a significant effect on the amounts recognized in the financial statements.
Those judgments concern the capitalization of development costs and the recognition of deferred taxes.
The judgments are described for each relevant position in the enumeration of accounting and valuation
principles.
Management’s expectations on the future are usually based on the current economic outlook according
to the consensus prognoses by leading economic and financial research institutions and independent
analysts. The global economic situation is not expected to improve significantly in 2017, but rather to
rest on shaky ground due to the increasing political challenges around the world.
The plans of the Group’s management do not expect Epigenomics to be highly dependent on the over-
all economic situation in the short term. The Group’s operating activities are furthermore not highly
dependent on the availability of or the price development for commodities or industrial supplies but
rather on the individual situation of the Company and its opportunities to continue its operations by
further financing transactions. Therefore, the Company is still dependent on the condition and the de-
velopment of the capital markets (mainly in the U.S.A. and in Germany), particularly with regard to the
life sciences industry. Additionally, the Company is strongly dependent on guideline inclusion and the
reimbursement decisions by the payors in the healthcare system of the U.S.A. with regard to its lead
product – Epi proColon, and subsequently on the commercial success of this product. The Company’s
strategy going forward assumes further positive reimbursement decisions in 2017 and the years to come.
It is not assumed that there will be any material changes in the legislation of those major countries that
could significantly affect the diagnostics industry. Likewise, we do not anticipate any changes in the tax
laws of Germany and the U.S.A. that would significantly affect our financial situation in the foreseeable
future. In the medium to long term, the reform project for the local healthcare system started by the
Obama administration will influence the activities of all life sciences companies to a greater or lesser
extent. At the present time, however, it is still uncertain when, to what extent and whether this reform
project will be further implemented, now that the administration has changed from Obama to Trump,
and from Democrats to Republicans, respectively. The current development in the FDA’s regulation
62 EPIGENOMICS ANNUAL REPORT 2016

activities towards laboratory-developed tests (LDTs) may have additional impact on certain life sciences
companies and, of course, U.S. diagnostic laboratories, which constitute a large part of our customer
base. However, having successfully obtained market approval for Epi proColon in 2016, the observed
tendency of the FDA’s regulations towards LDTs is likely to be more favorable for our Company than not.
All future scenarios furthermore assume an essentially unchanged access to relevant clinical and biological
samples, corresponding clinical data and sufficient resources for the execution of the Company’s com-
mercial projects.
In the medium term, the euro is expected to remain rather weak vis-à-vis the U.S. dollar. Management
plans are based on an average exchange rate of EUR/USD 1.10 throughout 2017. It also took note of the
predictions of financial experts and banks at the time of the budget preparation, which generally diverge
with regard to this exchange rate.
The preparation of the consolidated financial statements in accordance with IFRSs requires, in the case
of several items, that assumptions or estimates be made that affect the valuation in the Group balance
sheet and/or the Group statement of profit or loss. This also applies to the listing of contingent assets
and liabilities. The actual amounts may vary from these assumptions and estimates.
Determining the useful life of capitalized development costs of the Company’s products requires a long-
term estimation of the market approval timelines for the products, their market acceptance and/or the
speed of their market penetration, regulatory developments in key markets, the timing and the extent
of reimbursement decisions, and competition just to name some of the most important parameters.
Especially for novel products like blood-based cancer tests there are no empirical values and less expe-
rience available which makes any estimations difficult. The Group’s management is closely observing
any development on the key markets and challenging its own projections regularly. Reaching or not
reaching a milestone – like a market approval decision – will therefore lead to reassessments which may
possibly be decisive for a change of the previously assumed useful lives.
In particular, further assumptions and estimates are required for:
■■ determining the useful lives of other tangible and intangible non-current assets,
■■ if the criteria for the capitalization of development costs and the recoverability of internally
generated intangible assets are met,
■■ testing a potential impairment of assets (particularly regarding intangible assets),
■■ determining the terms of in-licensed intellectual property rights,
■■ determining, if deferred taxes are realizable,
■■ determining, if securities classify as “available for sale” or “at fair value through profit or loss”,
■■ determining the fair value of financial instruments,
■■ setting the parameters regarding the valuation of share-based payment instruments, and
■■ accounting for provisions (particularly the determination of the likelihood of occurrence).
63NOTES BASIC INFORMATION, PRINCIPLES AND METHODS
ACCOUNTING AND VALUATION PRINCIPLES
Fair value measurement
These consolidated financial statements have been prepared on the historical cost basis except for certain
financial instruments that are measured at revalued amounts or their fair values at the end of each report-
ing period.
For determining and disclosing the fair value of financial instruments, the Company uses the following
hierarchy in accordance with IFRS 13 Fair Value Measurement:
Level 1: Quoted (unadjusted) prices in active markets for identical assets or liabilities
Level 2: Inputs other than quoted prices included within Level 1 that are observable for assets or
liabilities, either directly (as prices) or indirectly (derived from prices)
Level 3: Inputs for assets or liabilities that are not based on observable market data
(unobservable inputs)
The carrying amounts of financial assets and liabilities such as cash and cash equivalents, marketable
securities, trade receivables, trade payables, convertible notes and other current liabilities approximate
their fair values due to their short-term maturities. The fair value of marketable securities is based on
quoted market prices (level 1). There were no transfers between level 1 and level 2 fair value measure-
ments, and no transfers into or out of level 3 fair value measurements during the reporting period.
Revenue recognition
Revenue from the sale of goods and property rights (e.g. patents), and the rendering of other services is
recognized when:
■■ delivery of the goods or property rights to the buyer has taken place,
■■ transfer of risks and rewards in connection with the goods or property rights has been completed,
■■ the amount of revenue and the costs incurred related to the transaction can be measured
reasonably and
■■ it is probable that the economic benefits associated with the transaction will flow to the entity.
Revenue from research and development collaboration agreements is recorded and recognized when
costs are incurred in connection with the contractual obligations in accordance with the applicable
performance requirements and terms of the respective contracts.
Milestone payments are recorded and recognized when acknowledgement of having achieved applicable
performance requirements is received from the partner.
Non-refundable upfront payments are deferred and recognized on a straight-line basis over the contrac-
tual collaboration term. Optional prolongation terms are considered individually in accordance with the
underlying exercise conditions and anticipated likelihood of their exercise.
Royalty revenue is recognized on an accrual basis in accordance with the substance of the relevant con-
tract. Royalties determined on a time basis are recognized on a straight-line basis over the contracted
period. Royalty arrangements that are based on sales and other measures are recognized by reference
to the underlying contract.
64 EPIGENOMICS ANNUAL REPORT 2016
Cost of sales
Cost of sales include expenses for material used in products sold, changes in inventories, services received
in connection with product sales or other types of revenue, royalties to be paid to third parties and
triggered by product sales or other types of revenue. In addition, cost of sales includes directly allocable
portions of personnel expenses, costs of intellectual property, depreciation and amortization as well as
pro rata overheads.
Other income
Other income includes third-party research grants, currency exchange rate gains, earnings from
the reversal of provisions, income from the sale of assets outside of the Company’s ordinary business
activities, reimbursements from suppliers and insurance companies, and other non-operating earnings.
Government grants
In individual cases, cost contributions from public authorities are granted for research projects. These
grants are partially paid in advance and then reported as deferred income (see below). To some extent,
grants will only be paid after the work has been performed and proven. A current asset is recorded in
such cases.
Subsidies received for product development activities are deducted from capitalized development costs,
and investment grants or subsidies, respectively are offset directly against the acquisition costs of the
subsidized assets, i.e. in both cases the asset value is reduced. The grant is thus liquidated by depreciation
of the reduced investment over the remaining term.
Government grants usually come with certain requirements, which have been met so far by the Com-
pany and are expected to be met going forward. If the requirements were not met anymore in the future,
repayment obligations could arise which have not been recognized yet.
Research and development costs
Research and development costs (R&D costs) include the personnel expenses for the R&D staff, costs
of R&D material, depreciation and amortization, service fees, licensing fees and other direct expenses
in connection with the Company’s research and/or development activities (including clinical studies)
which cannot be classified as revenue-generating activities. In addition, R&D costs include pro rata
overhead costs charged to the R&D departments.
Selling, general and administrative costs
Selling, general and administrative costs (SG&A costs) include:
■■ all direct personnel and material expenses of the corresponding departments,
■■ depreciation and amortization of the corresponding departments,
■■ other direct expenses of the corresponding departments, and
■■ pro rata overheads of the corresponding departments as well as the Company’s statutory costs.
Other expenses
Other expenses consist of all operating expenses which do not classify as cost of sales, R&D costs or
SG&A costs as defined above. This includes in particular but not exclusively
■■ foreign exchange rate losses,
■■ losses from the disposal of assets outside of the ordinary business activities and
■■ expenses due to extraordinary effects or measures like restructuring expenses or write-downs
of non-current assets (e.g. goodwill impairment).
65NOTES BASIC INFORMATION, PRINCIPLES AND METHODS
Share-based payment expenses
The fair value of granted stock options is determined in accordance with IFRS 2 Share-based Payment by
simulation of the future movement in the Company’s share capital on the basis of market parameters
(e.g. volatility and risk free rate) and normal distributed random numbers (“Monte Carlo simulation”).
The fair value of the stock options is expensed over the expected option term of up to four years against
the capital reserve. The valuation date is the grant date.
The fair value of phantom stock rights granted in previous years is calculated using the binomial model
based on the Cox-Ross-Rubinstein model in accordance with IFRS 2 Share-based Payment, and recognized
pro rata temporis as expenses and as a provision due to the obligation of the Company for a cash settle-
ment in the future. If phantom stock rights are held by current employees of the Group, the related
expenses are recorded as personnel costs and included in the payroll provisions. If phantom stock rights
are held by former employees of the Group, the related expenses are recorded as other costs and includ-
ed in other provisions.
Intangible assets
Intangible assets other than goodwill and capitalized development costs are measured at acquisition or
production cost less straight-line amortization. Depending on the investment, the useful life of between
three years (software) and twenty years (patents) will be defined. For patents, the useful life in individual
cases depends on the term of the patent protection. Amortization of intangible assets is allocated in the
statement of profit or loss to the functional area in which they are used. IAS 38 Intangible Assets is applied.
In accordance with this standard, an intangible asset is reported if it is likely that a future economic
benefit is associated with the use of such asset and that its cost can be reliably determined. An impair-
ment test will be carried out annually for assets or groups of assets for which an impairment is assumed.
If the carrying amount of an intangible asset exceeds the recoverable amount of this asset as of the
balance sheet date, this will be taken into account by means of a write-down, the amount of which is
determined by the result of the impairment test. If there is no longer any indication of impairment, the
amount of the impairment is reversed up to the amortized acquisition costs as a maximum.
Capitalized development costs
Expenditure on research activities is recognized as an expense in the period in which it is incurred. An
internally generated intangible asset arising from internal development is recognized if, and only if, all
of the following requirements in accordance with IAS 38.57 Intangible Assets have been fulfilled:
■■ proof of the technical feasibility of completing the intangible asset so that it will be available
for use or sale;
■■ proof of the intention to complete the intangible asset to use or sell it;
■■ proof of the ability to use or sell the intangible asset;
■■ proof of how the intangible asset will generate probable future economic benefits;
■■ proof of the availability of adequate technical, financial and other resources to complete
the development and to use or sell the intangible asset;
■■ demonstration of the ability to measure reliably the expenditure attributable to the intangible
asset during its development.
The amount initially recognized for the capitalization of development costs is the sum of expenditure
incurred from the date when the intangible assets first met the aforementioned recognition criteria.
Where no internally generated intangible asset can be recognized, development expenditure is charged
to profit or loss in the period in which it is incurred. Subsequent to initial recognition, capitalized devel-
opment costs are reported at cost less accumulated amortization and impairment losses, on the same
basis as intangible assets acquired separately. The useful life of such capitalized development costs is
assumed under consideration of the business plan and amounts to up to ten years for the currently
capitalized assets. Depreciation is recorded on a straight-line basis.
66 EPIGENOMICS ANNUAL REPORT 2016
Tangible assets
Tangible assets are measured at acquisition or production cost less depreciation. Apart from directly
attributable costs, pro rata overhead costs and depreciation are also included in the production costs of
internally produced equipment. Public and governmental investment grants lower the acquisition or
production costs. Repair costs are immediately recorded as an expense. Leasehold improvements are
depreciated on a straight-line basis over the remaining term of the underlying leases (including optional
extension periods). Mobile fixed assets are depreciated on a straight-line basis. The useful life is three to
ten years for technical and electronic equipment and five to ten years for operating and office equipment.
In the “Assets schedule”, fully depreciated tangible assets are shown under acquisition/production cost
and accumulated depreciation until the assets in question are decommissioned. In the case of disposal,
assets and related depreciation are eliminated from the accounts. Income or expense resulting from the
disposal of assets (proceeds less residual carrying amount) is shown in the statement of profit or loss
under other income/other expenses.
If the carrying amount of the tangible assets calculated in accordance with the above principles exceeds
the recoverable amount of these assets as of the balance sheet date, it will be taken into account by
means of an impairment. The amount of the impairment is determined by the net sale proceeds or – if
higher – the net present value of future cash flows estimated from the value in use of the asset. An impair-
ment test will be carried out annually for assets or groups of assets for which an impairment is assumed.
If there is no longer any indication of impairment, the amount of the impairment is reversed up to the
amortized acquisition cost as a maximum.
Deferred taxes
Deferred taxes are calculated in accordance with the rules of IAS 12 Income Taxes. They are recognized
on the basis of temporary differences between the carrying amount of assets and liabilities in the financial
statements in accordance with IFRS of the companies involved and in their tax accounts. Furthermore,
deferred tax assets are recognized for unutilized tax loss carryforwards and unutilized tax credits to the
extent that deferred tax liabilities exist, or that taxable income is likely to be available against which to
utilize the benefits of the temporary differences and that these are expected to reverse in the foreseeable
future. At each balance sheet date, it is determined whether or not these requirements are still met. If such
a realization in the foreseeable future is not likely, a valuation allowance is recognized against the tax loss
carryforwards.
Deferred tax assets and tax liabilities from temporary differences associated with investments in subsid-
iaries are not recognized when the timing of the reversal of the temporary difference can be controlled,
and it is probable that the temporary difference will not reverse in the foreseeable future.
Deferred taxes are valued using the tax rates applicable on the balance sheet date or the tax rates which
are expected to be legally applicable at the future point in time when the deferred tax becomes due.
Tax rates are used that have been enacted or substantively enacted by the end of the reporting period.
Deferred tax assets and liabilities are offset against one another only if they are subject to compensation
with regard to the same tax authority and if the Group intends to settle its current tax assets and liabilities
on a net basis.
Inventories
Inventories consist of finished and semi-finished products, raw materials, low-value consumables as well
as other production supplies. They are stated at the lower of acquisition or manufacturing cost and net
realizable value. The manufacturing costs of the finished and semi-finished products include directly
attributable unit costs, depreciation, amortization of capitalized development costs and overheads attrib-
utable to the production process. For finished and semi-finished products the principle of separate
valuation applies.
67NOTES BASIC INFORMATION, PRINCIPLES AND METHODS
Financial instruments
Financial assets and liabilities are initially measured at fair value. Purchases and sales of financial assets
are recognized using trading date accounting.
Primary financial instruments
The reported primary financial instruments include cash and cash equivalents, marketable securities,
trade receivables, trade payables and other liabilities. Those instruments are initially recognized at acqui-
sition cost or at fair value and then at amortized acquisition cost or fair value.
Marketable securities
In accordance with the definitions of IAS 39.9 Financial Instruments: Recognition and Measurement, the
Company’s marketable securities are classified either as “financial assets at fair value through profit or
loss” (FVTPL) or as “available-for-sale financial assets” (AFS). The Group does not hold financial assets
for trading purposes. Irrespective of this classification, financial assets are recognized at fair value. Changes
in fair value are recognized through profit or loss or – if the securities classify for AFS – in other comprehen-
sive income until the securities are disposed of or are determined to be permanently impaired. Impair-
ment losses recognized in profit or loss are subsequently reversed if an increase in the fair value of the
instrument can be objectively determined.
Trade receivables
Trade receivables are recognized at fair value, net of allowances for doubtful accounts.
Derivative financial instruments
Derivative financial instruments are initially recognized at fair value at the date the derivative contracts
are entered into and are subsequently remeasured to their fair values at the end of each reporting period.
The result is recognized as financial result through profit or loss.
As a matter of principle, the fair values of derivative financial instruments correspond to their market
values. For unlisted derivatives the fair values are determined by individual settlement quotes from the
Group’s contractual partner of the underlying agreement.
Impairment of financial assets
At the balance sheet date, a financial asset, other than those measured at fair value, is measured when-
ever there is an indication that the asset might be impaired. A financial asset is impaired when there is
objective evidence that, as a result of one or more events that occurred after the initial recognition of
the financial asset, the estimated future cash flows of the investment have been impacted. Objective
evidence that financial assets are impaired can include the default or the delinquency of a debtor or
economic conditions that correlate with default in payment obligations.
For available-for-sale securities, a significant or prolonged decline in the fair value of the security below
its cost is considered to be objective evidence of impairment or the disappearance of an active market
for this security.
The carrying amount of a financial asset is reduced by the impairment amount directly for all financial
assets with the exception of trade receivables, where the carrying amount is reduced through the use
of an allowance account. When a trade receivable is considered to be no longer collectible, it is written
off against the allowance account. Subsequent recoveries of amounts previously written off are credited
against the allowance account. Changes in the carrying amount of the allowance account are recognized
in profit or loss.
Additionally, global allowances against trade receivables are recognized on a portfolio basis determined
by reference to past default experience.
68 EPIGENOMICS ANNUAL REPORT 2016
Cash equivalents
A cash equivalent is defined as a financial instrument which is readily convertible on a short-term basis
to a known amount of cash and carrying an insignificant risk of changes in value (IAS 7.6 Statement of Cash
Flows). Financial instruments generally qualify as cash equivalents when they are more closely related to
the money markets than to the bond markets and are issued by a debtor rated “investment grade”. All
such cash equivalents must be convertible into primary cash at any time.
Prepaid expenses
Payments before the balance sheet date in respect of expenses for a specific period after that date are
deferred and reported as prepaid expenses in other current assets.
Financial liabilities
On initial recognition, financial liabilities are carried at fair value less transaction costs. The price is deter-
mined on a price-efficient and liquid market. In subsequent periods, the financial liabilities are measured
at amortized cost. Any differences between the amount received and the amount repayable are recognized
through profit or loss over the term of the loan using the effective interest method.
Compound financial instruments constituting a financial liability to the Company and granting an op-
tional conversion right into an equity instrument are recognized separately by an equity and a liability
element in the balance sheet. The liability element is measured at fair value.
Non-current and current liabilities
Liabilities are classified as current when certain criteria in accordance with IAS 1.60 seq. Presentation of
Financial Statements are met. Basically, the Company’s normal operating cycle in accordance with this
definition is 12 months. In the licensing business the operating cycle is even more than 12 months.
Trade payables
Trade payables are initially recognized at the fair value of the received goods and services. After initial
recognition they are measured at amortized cost. Foreign currency liabilities are converted at market
currency exchange rates at the reporting date. Trade payables are derecognized if the obligation on
which this liability is based is fulfilled, cancelled or expired.
Convertible notes issued
Convertible notes are compound financial instruments which must be split in a repayment obligation
(liability element) and a conversion right (equity element). The book value of the equity element to be
recognized in the capital reserves is determined by using the subtraction method (subtraction of the
financial liability from the total value of the compound instrument). The equity element is presented in
equity as “option premium on convertible notes”.
Deferred income
Deferred income is recognized for grants and for research and development payments (“R&D pay-
ments”) received in advance. Grants received in advance for research expenses which were provided by
governmental or comparable supranational, regional or local authorities are recognized through profit
or loss as other income over the subsidized terms of each granted project according to its progress of
fulfillment. Subsidies received in advance for product development activities are deducted from capital-
ized development costs. Payments received in advance from customers for R&D services to be rendered
by the Company in the future or for licenses are deferred and recognized through profit or loss under
the terms and conditions of the contract according to the progress of fulfillment (percentage of com-
pletion method).
69NOTES BASIC INFORMATION, PRINCIPLES AND METHODS
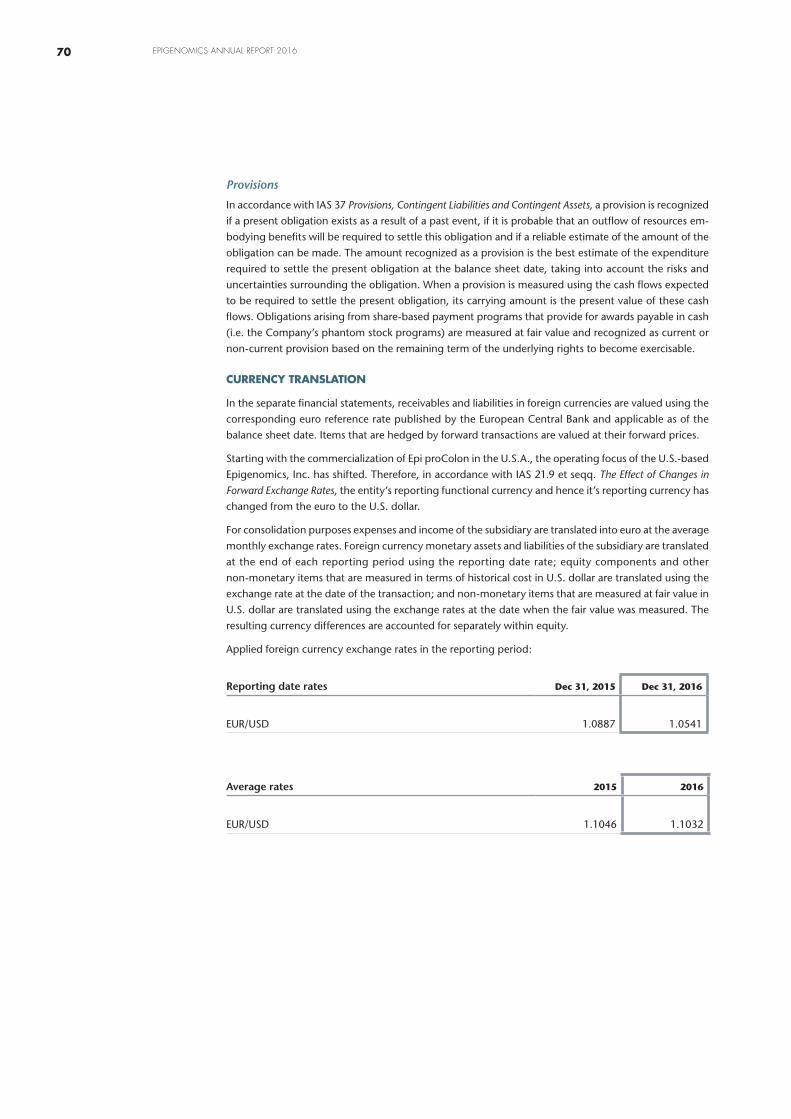
Provisions
In accordance with IAS 37 Provisions, Contingent Liabilities and Contingent Assets, a provision is recognized
if a present obligation exists as a result of a past event, if it is probable that an outflow of resources em-
bodying benefits will be required to settle this obligation and if a reliable estimate of the amount of the
obligation can be made. The amount recognized as a provision is the best estimate of the expenditure
required to settle the present obligation at the balance sheet date, taking into account the risks and
uncertainties surrounding the obligation. When a provision is measured using the cash flows expected
to be required to settle the present obligation, its carrying amount is the present value of these cash
flows. Obligations arising from share-based payment programs that provide for awards payable in cash
(i.e. the Company’s phantom stock programs) are measured at fair value and recognized as current or
non-current provision based on the remaining term of the underlying rights to become exercisable.
CURRENCY TRANSLATION
In the separate financial statements, receivables and liabilities in foreign currencies are valued using the
corresponding euro reference rate published by the European Central Bank and applicable as of the
balance sheet date. Items that are hedged by forward transactions are valued at their forward prices.
Starting with the commercialization of Epi proColon in the U.S.A., the operating focus of the U.S.-based
Epigenomics, Inc. has shifted. Therefore, in accordance with IAS 21.9 et seqq. The Effect of Changes in
Forward Exchange Rates, the entity’s reporting functional currency and hence it’s reporting currency has
changed from the euro to the U.S. dollar.
For consolidation purposes expenses and income of the subsidiary are translated into euro at the average
monthly exchange rates. Foreign currency monetary assets and liabilities of the subsidiary are translated
at the end of each reporting period using the reporting date rate; equity components and other
non-monetary items that are measured in terms of historical cost in U.S. dollar are translated using the
exchange rate at the date of the transaction; and non-monetary items that are measured at fair value in
U.S. dollar are translated using the exchange rates at the date when the fair value was measured. The
resulting currency differences are accounted for separately within equity.
Applied foreign currency exchange rates in the reporting period:
Reporting date rates Dec 31, 2015 Dec 31, 2016
EUR/USD 1.0887 1.0541
Average rates 2015 2016
EUR/USD 1.1046 1.1032
70 EPIGENOMICS ANNUAL REPORT 2016
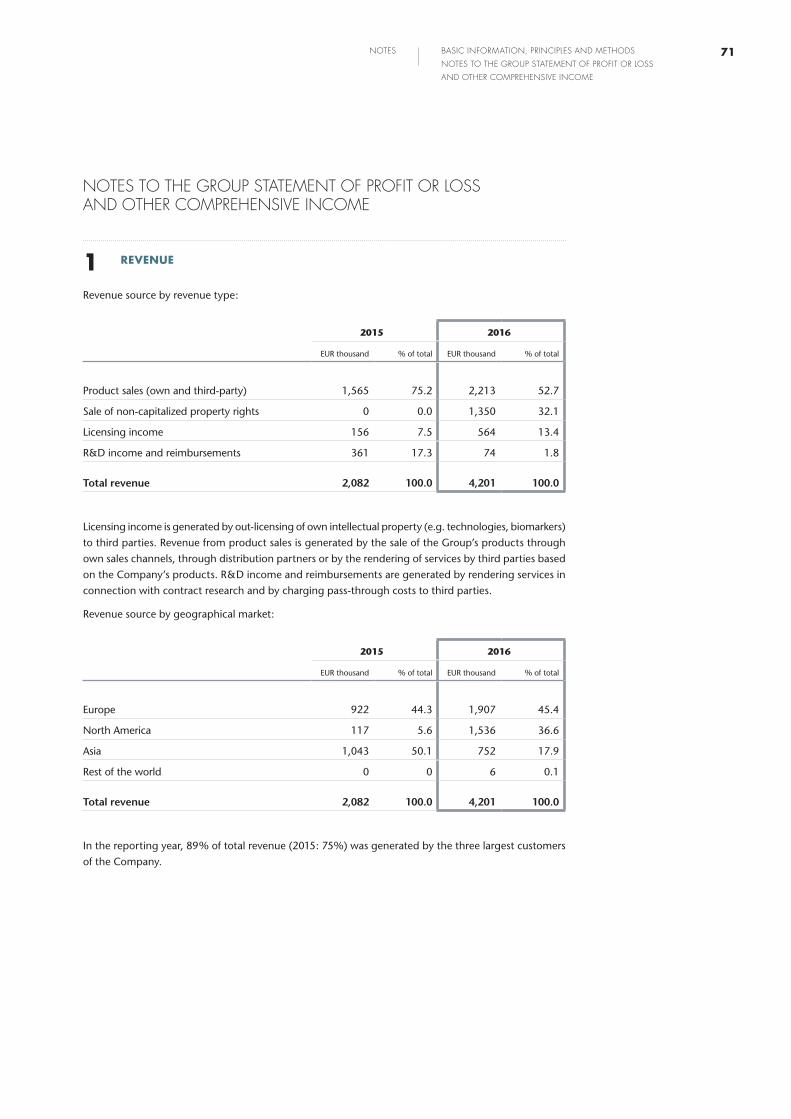
NOTES TO THE GROUP STATEMENT OF PROFIT OR LOSS AND OTHER COMPREHENSIVE INCOME
1 REVENUE
Revenue source by revenue type:
2015 2016
EUR thousand % of total EUR thousand % of total
Product sales (own and third-party) 1,565 75.2 2,213 52.7
Sale of non-capitalized property rights 0 0.0 1,350 32.1
Licensing income 156 7.5 564 13.4
R&D income and reimbursements 361 17.3 74 1.8
Total revenue 2,082 100.0 4,201 100.0
Licensing income is generated by out-licensing of own intellectual property (e.g. technologies, biomarkers)
to third parties. Revenue from product sales is generated by the sale of the Group’s products through
own sales channels, through distribution partners or by the rendering of services by third parties based
on the Company’s products. R&D income and reimbursements are generated by rendering services in
connection with contract research and by charging pass-through costs to third parties.
Revenue source by geographical market:
2015 2016
EUR thousand % of total EUR thousand % of total
Europe 922 44.3 1,907 45.4
North America 117 5.6 1,536 36.6
Asia 1,043 50.1 752 17.9
Rest of the world 0 0 6 0.1
Total revenue 2,082 100.0 4,201 100.0
In the reporting year, 89% of total revenue (2015: 75%) was generated by the three largest customers
of the Company.
71NOTES BASIC INFORMATION, PRINCIPLES AND METHODS
NOTES TO THE GROUP STATEMENT OF PROFIT OR LOSS
AND OTHER COMPREHENSIVE INCOME
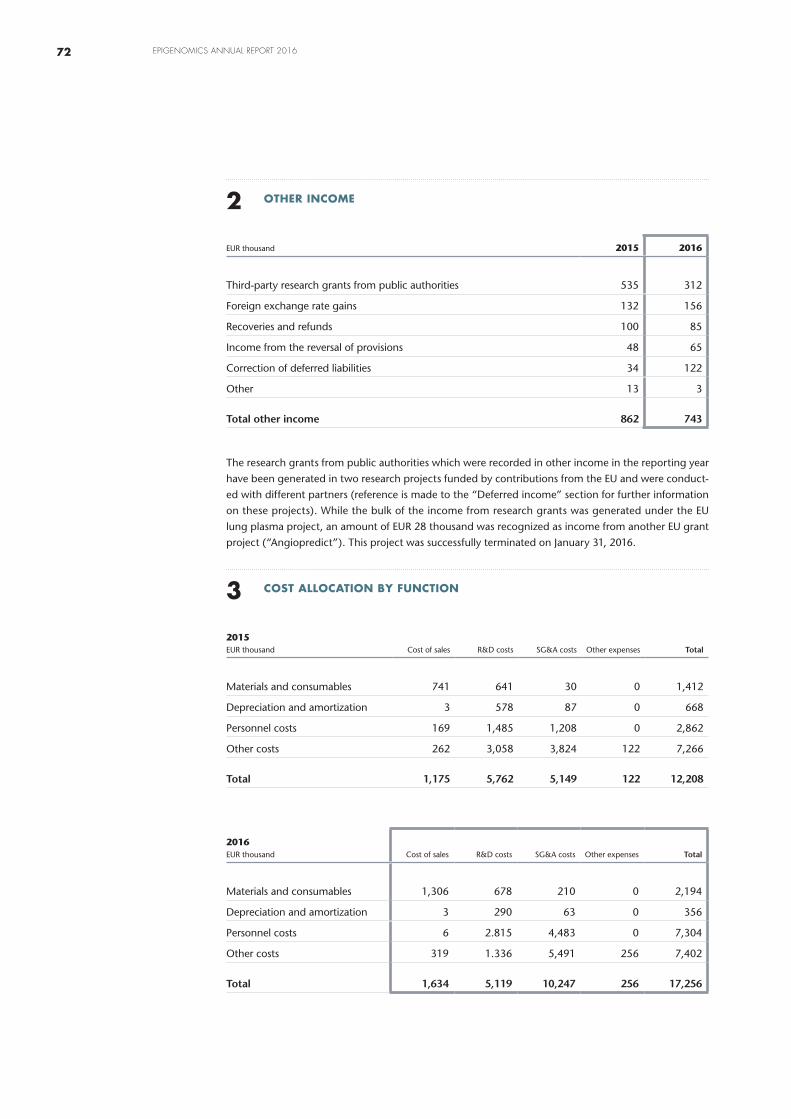
2 OTHER INCOME
EUR thousand 2015 2016
Third-party research grants from public authorities 535 312
Foreign exchange rate gains 132 156
Recoveries and refunds 100 85
Income from the reversal of provisions 48 65
Correction of deferred liabilities 34 122
Other 13 3
Total other income 862 743
The research grants from public authorities which were recorded in other income in the reporting year
have been generated in two research projects funded by contributions from the EU and were conduct-
ed with different partners (reference is made to the “Deferred income” section for further information
on these projects). While the bulk of the income from research grants was generated under the EU
lung plasma project, an amount of EUR 28 thousand was recognized as income from another EU grant
project (“Angiopredict”). This project was successfully terminated on January 31, 2016.
3 COST ALLOCATION BY FUNCTION
2015 EUR thousand Cost of sales R&D costs SG&A costs Other expenses Total
Materials and consumables 741 641 30 0 1,412
Depreciation and amortization 3 578 87 0 668
Personnel costs 169 1,485 1,208 0 2,862
Other costs 262 3,058 3,824 122 7,266
Total 1,175 5,762 5,149 122 12,208
2016 EUR thousand Cost of sales R&D costs SG&A costs Other expenses Total
Materials and consumables 1,306 678 210 0 2,194
Depreciation and amortization 3 290 63 0 356
Personnel costs 6 2.815 4,483 0 7,304
Other costs 319 1.336 5,491 256 7,402
Total 1,634 5,119 10,247 256 17,256
72 EPIGENOMICS ANNUAL REPORT 2016
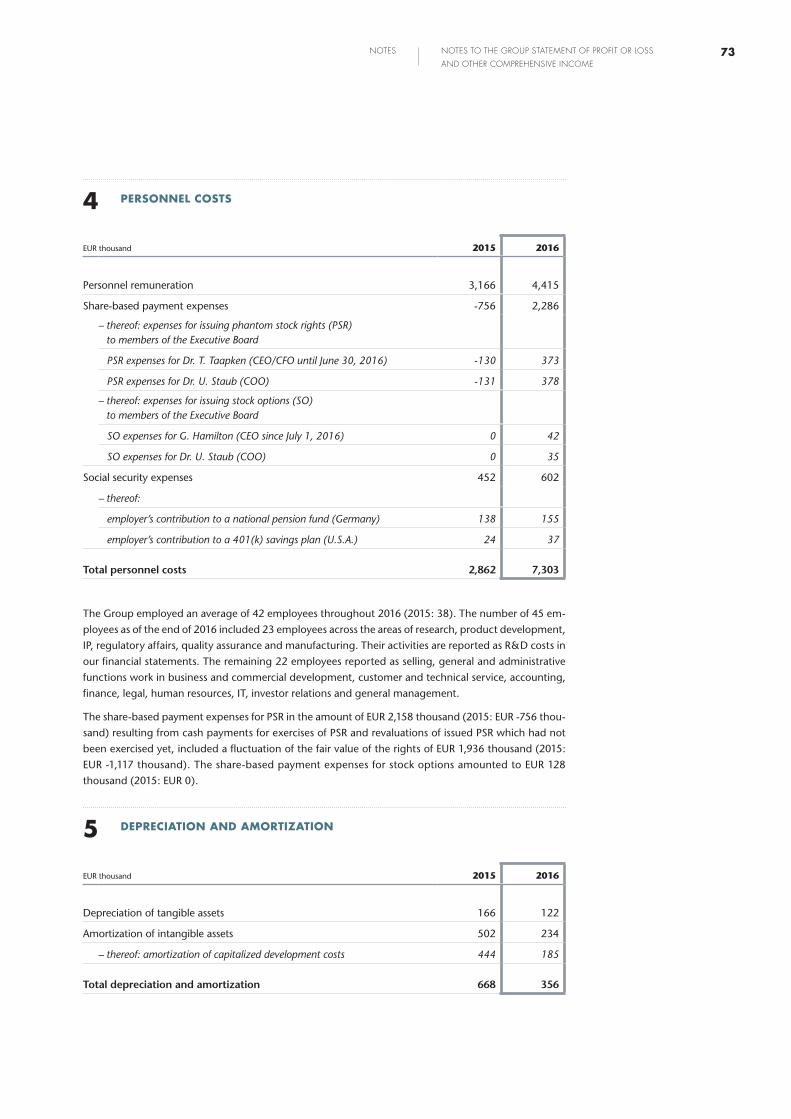
4 PERSONNEL COSTS
EUR thousand 2015 2016
Personnel remuneration 3,166 4,415
Share-based payment expenses -756 2,286
– thereof: expenses for issuing phantom stock rights (PSR) to members of the Executive Board
PSR expenses for Dr. T. Taapken (CEO/CFO until June 30, 2016) -130 373
PSR expenses for Dr. U. Staub (COO) -131 378
– thereof: expenses for issuing stock options (SO) to members of the Executive Board
SO expenses for G. Hamilton (CEO since July 1, 2016) 0 42
SO expenses for Dr. U. Staub (COO) 0 35
Social security expenses 452 602
– thereof:
employer’s contribution to a national pension fund (Germany) 138 155
employer’s contribution to a 401(k) savings plan (U.S.A.) 24 37
Total personnel costs 2,862 7,303
The Group employed an average of 42 employees throughout 2016 (2015: 38). The number of 45 em-
ployees as of the end of 2016 included 23 employees across the areas of research, product development,
IP, regulatory affairs, quality assurance and manufacturing. Their activities are reported as R&D costs in
our financial statements. The remaining 22 employees reported as selling, general and administrative
functions work in business and commercial development, customer and technical service, accounting,
finance, legal, human resources, IT, investor relations and general management.
The share-based payment expenses for PSR in the amount of EUR 2,158 thousand (2015: EUR -756 thou-
sand) resulting from cash payments for exercises of PSR and revaluations of issued PSR which had not
been exercised yet, included a fluctuation of the fair value of the rights of EUR 1,936 thousand (2015:
EUR -1,117 thousand). The share-based payment expenses for stock options amounted to EUR 128
thousand (2015: EUR 0).
5 DEPRECIATION AND AMORTIZATION
EUR thousand 2015 2016
Depreciation of tangible assets 166 122
Amortization of intangible assets 502 234
– thereof: amortization of capitalized development costs 444 185
Total depreciation and amortization 668 356
73NOTES NOTES TO THE GROUP STATEMENT OF PROFIT OR LOSS
AND OTHER COMPREHENSIVE INCOME
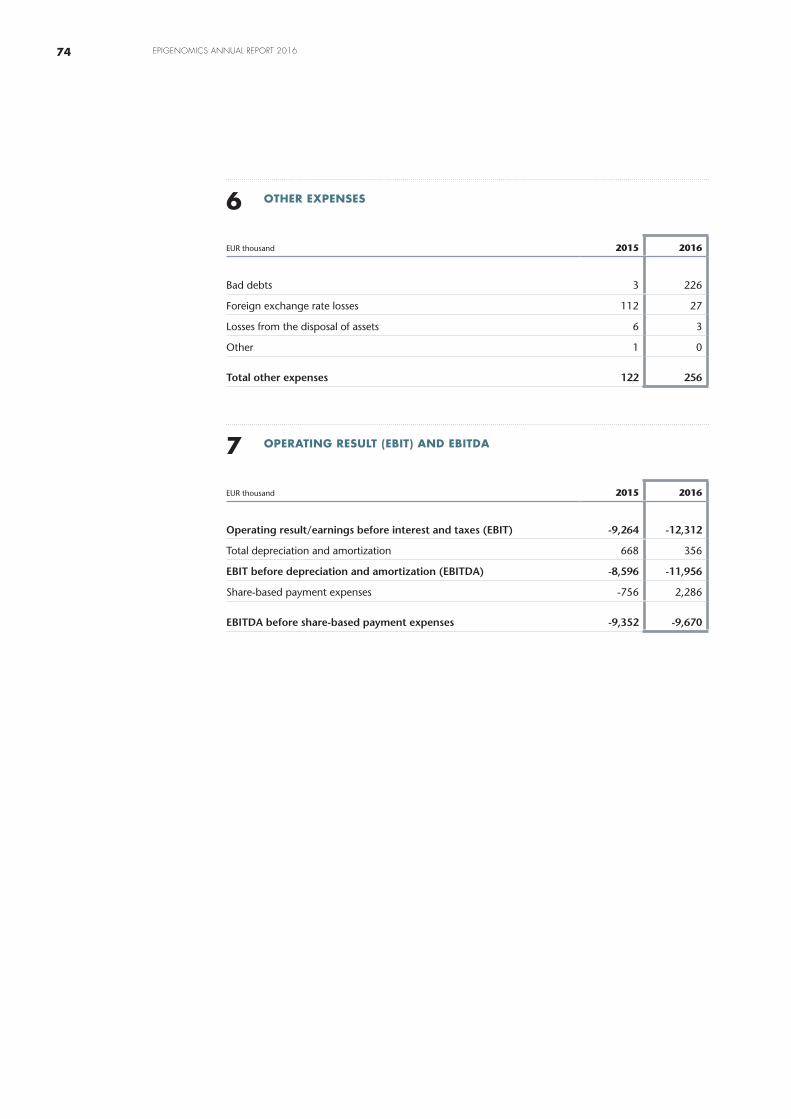
6 OTHER EXPENSES
EUR thousand 2015 2016
Bad debts 3 226
Foreign exchange rate losses 112 27
Losses from the disposal of assets 6 3
Other 1 0
Total other expenses 122 256
7 OPERATING RESULT (EBIT) AND EBITDA
EUR thousand 2015 2016
Operating result/earnings before interest and taxes (EBIT) -9,264 -12,312
Total depreciation and amortization 668 356
EBIT before depreciation and amortization (EBITDA) -8,596 -11,956
Share-based payment expenses -756 2,286
EBITDA before share-based payment expenses -9,352 -9,670
74 EPIGENOMICS ANNUAL REPORT 2016
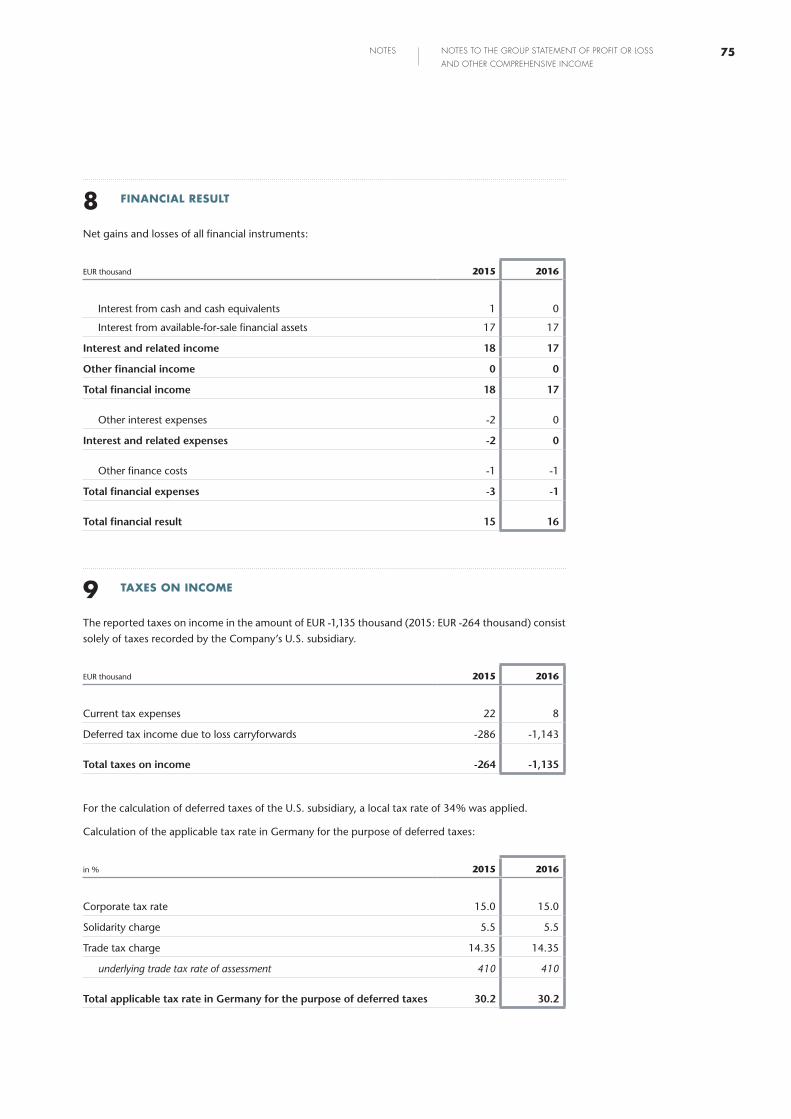
8 FINANCIAL RESULT
Net gains and losses of all financial instruments:
EUR thousand 2015 2016
Interest from cash and cash equivalents 1 0
Interest from available-for-sale financial assets 17 17
Interest and related income 18 17
Other financial income 0 0
Total financial income 18 17
Other interest expenses -2 0
Interest and related expenses -2 0
Other finance costs -1 -1
Total financial expenses -3 -1
Total financial result 15 16
9 TAXES ON INCOME
The reported taxes on income in the amount of EUR -1,135 thousand (2015: EUR -264 thousand) consist
solely of taxes recorded by the Company’s U.S. subsidiary.
EUR thousand 2015 2016
Current tax expenses 22 8
Deferred tax income due to loss carryforwards -286 -1,143
Total taxes on income -264 -1,135
For the calculation of deferred taxes of the U.S. subsidiary, a local tax rate of 34% was applied.
Calculation of the applicable tax rate in Germany for the purpose of deferred taxes:
in % 2015 2016
Corporate tax rate 15.0 15.0
Solidarity charge 5.5 5.5
Trade tax charge 14.35 14.35
underlying trade tax rate of assessment 410 410
Total applicable tax rate in Germany for the purpose of deferred taxes 30.2 30.2
75NOTES NOTES TO THE GROUP STATEMENT OF PROFIT OR LOSS
AND OTHER COMPREHENSIVE INCOME
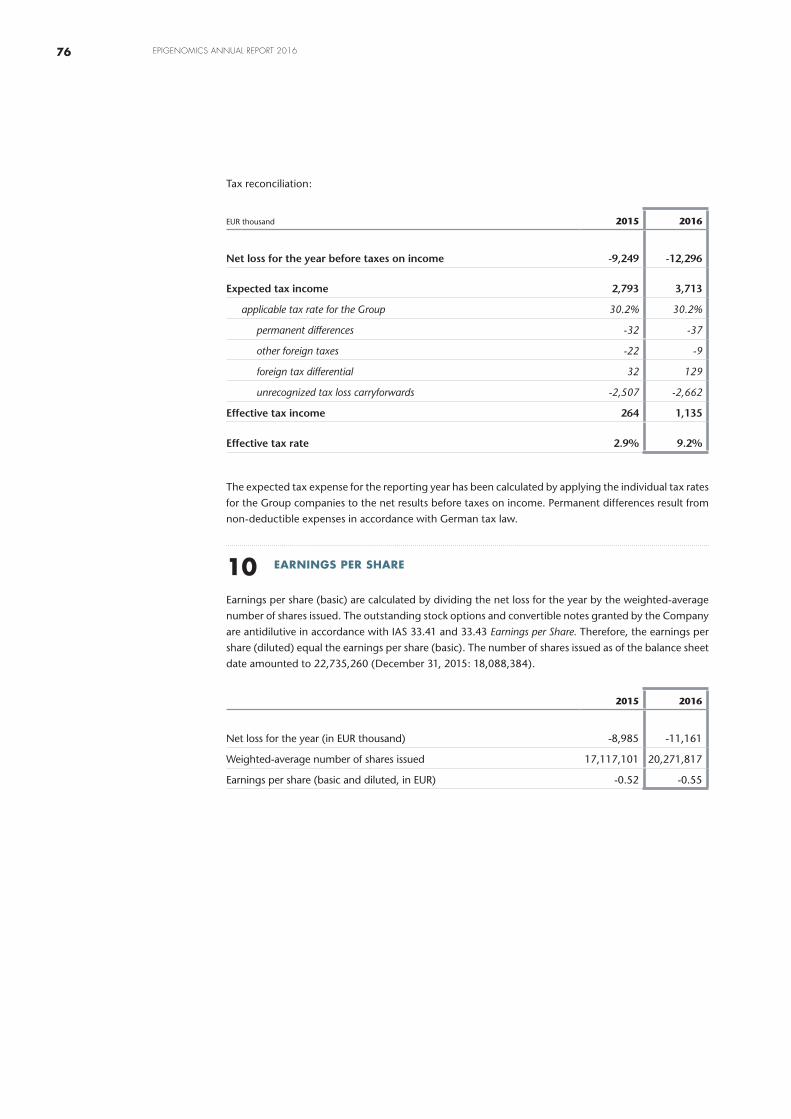
Tax reconciliation:
EUR thousand 2015 2016
Net loss for the year before taxes on income -9,249 -12,296
Expected tax income 2,793 3,713
applicable tax rate for the Group 30.2% 30.2%
permanent differences -32 -37
other foreign taxes -22 -9
foreign tax differential 32 129
unrecognized tax loss carryforwards -2,507 -2,662
Effective tax income 264 1,135
Effective tax rate 2.9% 9.2%
The expected tax expense for the reporting year has been calculated by applying the individual tax rates
for the Group companies to the net results before taxes on income. Permanent differences result from
non-deductible expenses in accordance with German tax law.
10 EARNINGS PER SHARE
Earnings per share (basic) are calculated by dividing the net loss for the year by the weighted-average
number of shares issued. The outstanding stock options and convertible notes granted by the Company
are antidilutive in accordance with IAS 33.41 and 33.43 Earnings per Share. Therefore, the earnings per
share (diluted) equal the earnings per share (basic). The number of shares issued as of the balance sheet
date amounted to 22,735,260 (December 31, 2015: 18,088,384).
2015 2016
Net loss for the year (in EUR thousand) -8,985 -11,161
Weighted-average number of shares issued 17,117,101 20,271,817
Earnings per share (basic and diluted, in EUR) -0.52 -0.55
76 EPIGENOMICS ANNUAL REPORT 2016
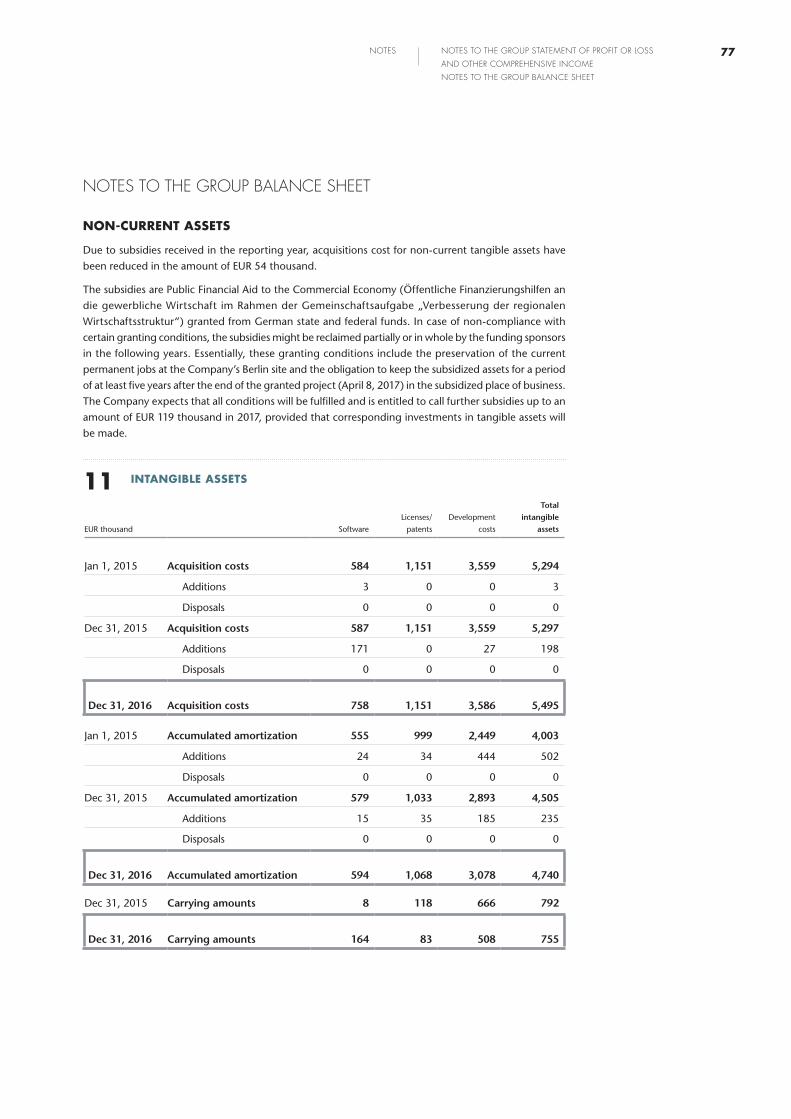
NOTES TO THE GROUP BALANCE SHEET
NON-CURRENT ASSETS
Due to subsidies received in the reporting year, acquisitions cost for non-current tangible assets have
been reduced in the amount of EUR 54 thousand.
The subsidies are Public Financial Aid to the Commercial Economy (Öffentliche Finanzierungshilfen an
die gewerbliche Wirtschaft im Rahmen der Gemeinschaftsaufgabe „Verbesserung der regionalen
Wirtschaftsstruktur“) granted from German state and federal funds. In case of non-compliance with
certain granting conditions, the subsidies might be reclaimed partially or in whole by the funding sponsors
in the following years. Essentially, these granting conditions include the preservation of the current
permanent jobs at the Company’s Berlin site and the obligation to keep the subsidized assets for a period
of at least five years after the end of the granted project (April 8, 2017) in the subsidized place of business.
The Company expects that all conditions will be fulfilled and is entitled to call further subsidies up to an
amount of EUR 119 thousand in 2017, provided that corresponding investments in tangible assets will
be made.
11 INTANGIBLE ASSETS
EUR thousand Software
Licenses/
patents
Development
costs
Total intangible
assets
Jan 1, 2015 Acquisition costs 584 1,151 3,559 5,294
Additions 3 0 0 3
Disposals 0 0 0 0
Dec 31, 2015 Acquisition costs 587 1,151 3,559 5,297
Additions 171 0 27 198
Disposals 0 0 0 0
Dec 31, 2016 Acquisition costs 758 1,151 3,586 5,495
Jan 1, 2015 Accumulated amortization 555 999 2,449 4,003
Additions 24 34 444 502
Disposals 0 0 0 0
Dec 31, 2015 Accumulated amortization 579 1,033 2,893 4,505
Additions 15 35 185 235
Disposals 0 0 0 0
Dec 31, 2016 Accumulated amortization 594 1,068 3,078 4,740
Dec 31, 2015 Carrying amounts 8 118 666 792
Dec 31, 2016 Carrying amounts 164 83 508 755
77NOTES NOTES TO THE GROUP STATEMENT OF PROFIT OR LOSS
AND OTHER COMPREHENSIVE INCOME
NOTES TO THE GROUP BALANCE SHEET
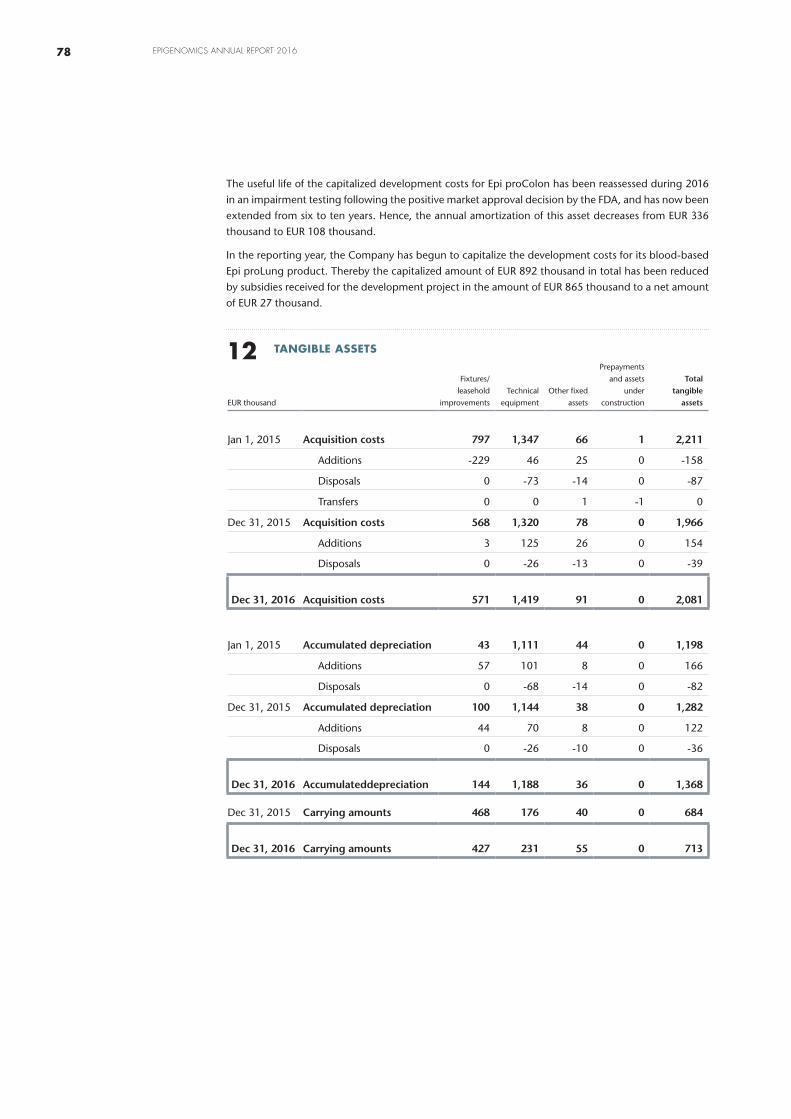
The useful life of the capitalized development costs for Epi proColon has been reassessed during 2016
in an impairment testing following the positive market approval decision by the FDA, and has now been
extended from six to ten years. Hence, the annual amortization of this asset decreases from EUR 336
thousand to EUR 108 thousand.
In the reporting year, the Company has begun to capitalize the development costs for its blood-based
Epi proLung product. Thereby the capitalized amount of EUR 892 thousand in total has been reduced
by subsidies received for the development project in the amount of EUR 865 thousand to a net amount
of EUR 27 thousand.
12 TANGIBLE ASSETS
EUR thousand
Fixtures/
leasehold
improvements
Technical
equipment
Other fixed
assets
Prepayments
and assets
under
construction
Total tangible
assets
Jan 1, 2015 Acquisition costs 797 1,347 66 1 2,211
Additions -229 46 25 0 -158
Disposals 0 -73 -14 0 -87
Transfers 0 0 1 -1 0
Dec 31, 2015 Acquisition costs 568 1,320 78 0 1,966
Additions 3 125 26 0 154
Disposals 0 -26 -13 0 -39
Dec 31, 2016 Acquisition costs 571 1,419 91 0 2,081
Jan 1, 2015 Accumulated depreciation 43 1,111 44 0 1,198
Additions 57 101 8 0 166
Disposals 0 -68 -14 0 -82
Dec 31, 2015 Accumulated depreciation 100 1,144 38 0 1,282
Additions 44 70 8 0 122
Disposals 0 -26 -10 0 -36
Dec 31, 2016 Accumulateddepreciation 144 1,188 36 0 1,368
Dec 31, 2015 Carrying amounts 468 176 40 0 684
Dec 31, 2016 Carrying amounts 427 231 55 0 713
78 EPIGENOMICS ANNUAL REPORT 2016
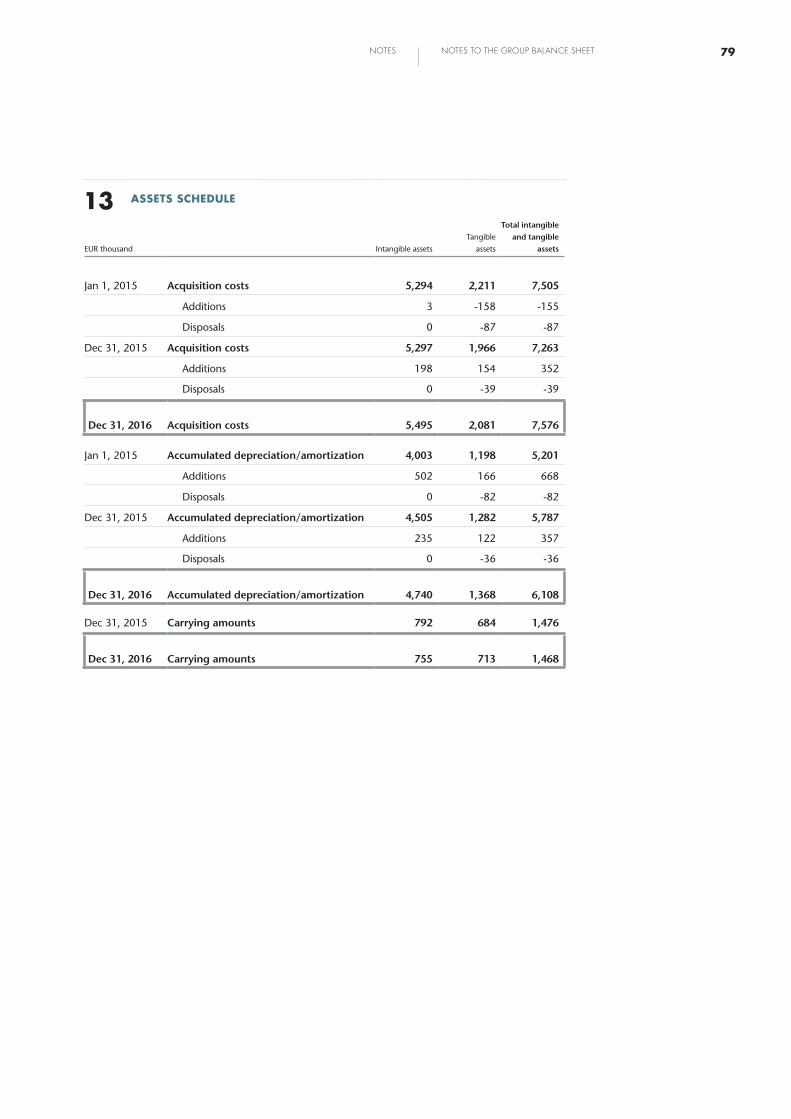
13 ASSETS SCHEDULE
EUR thousand Intangible assets
Tangible
assets
Total intangible and tangible
assets
Jan 1, 2015 Acquisition costs 5,294 2,211 7,505
Additions 3 -158 -155
Disposals 0 -87 -87
Dec 31, 2015 Acquisition costs 5,297 1,966 7,263
Additions 198 154 352
Disposals 0 -39 -39
Dec 31, 2016 Acquisition costs 5,495 2,081 7,576
Jan 1, 2015 Accumulated depreciation/amortization 4,003 1,198 5,201
Additions 502 166 668
Disposals 0 -82 -82
Dec 31, 2015 Accumulated depreciation/amortization 4,505 1,282 5,787
Additions 235 122 357
Disposals 0 -36 -36
Dec 31, 2016 Accumulated depreciation/amortization 4,740 1,368 6,108
Dec 31, 2015 Carrying amounts 792 684 1,476
Dec 31, 2016 Carrying amounts 755 713 1,468
79NOTES NOTES TO THE GROUP BALANCE SHEET

14 DEFERRED TAXES
For the Group, deferred taxes arise furthermore as described in the following table:
Deferred tax assets
from temporary differences
Deferred tax liabilities
from temporary differences
EUR thousand Dec 31, 2015 Dec 31, 2016 Dec 31, 2015 Dec 31, 2016
Intangible and tangible assets 70 58 201 154
Current assets 0 0 100 1
Non-current liabilities 0 0 88 1
Current liabilities 0 0 317 33
Total 70 58 706 189
Total after netting 0 0 636 131
EUR thousand Dec 31, 2015 Dec 31, 2016
Deferred tax assets due to German tax loss carryforwards 53,201 55,270
Deferred tax assets due to U.S. tax credits (R&D) 2,407 2,774
Deferred tax assets due to U.S. tax loss carryforwards 346 1,551
Total deferred tax assets due to tax loss carryforwards 55,954 59,595
Deferred tax position (net) from temporary differences -636 -131
Total deferred tax assets 55,318 59,464
Allowance on deferred tax assets -54,792 -57,913
Recognized deferred tax assets 346 1,551
Overview on tax loss carryforwards (2016 estimated):
EUR thousand 2015 2016
Tax loss carryforwards in Germany (corporation tax) 176,126 183,903
Tax loss carryforwards in Germany (trade tax) 174,577 182,354
Tax loss carryforwards in the U.S.A. (corporation tax) 1,020 4,627
R&D tax credit in the U.S.A. 2,406 2,774
80 EPIGENOMICS ANNUAL REPORT 2016
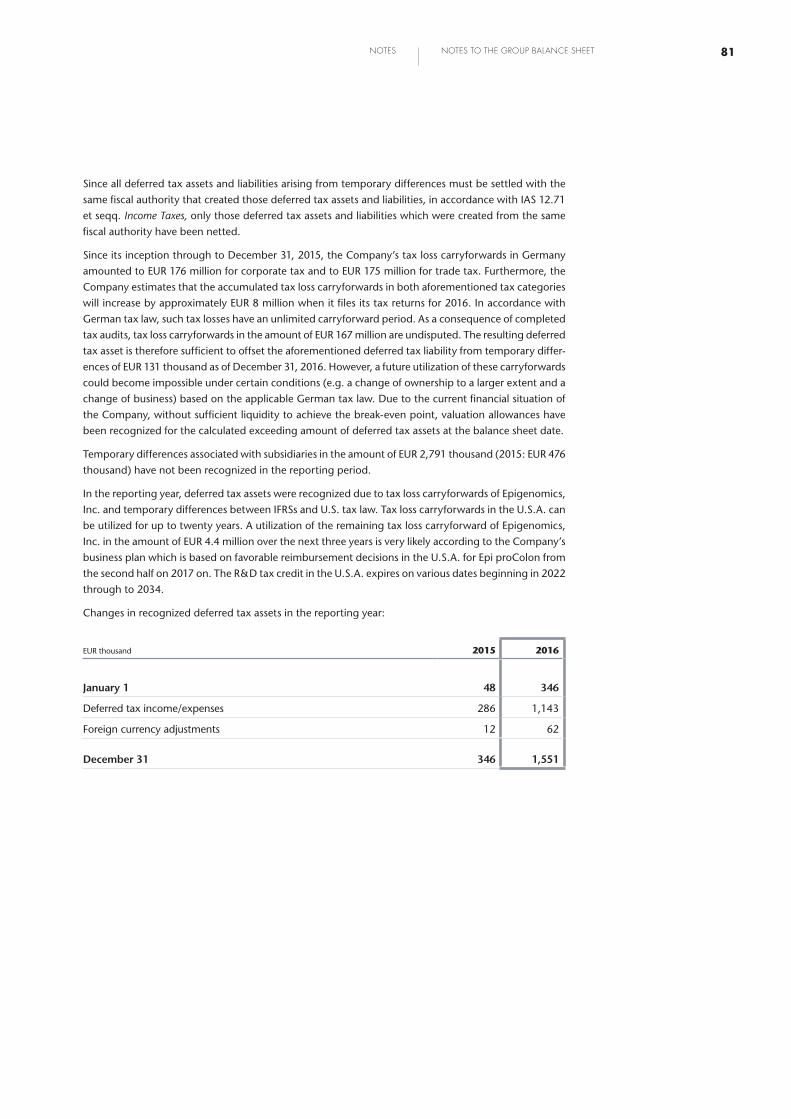
Since all deferred tax assets and liabilities arising from temporary differences must be settled with the
same fiscal authority that created those deferred tax assets and liabilities, in accordance with IAS 12.71
et seqq. Income Taxes, only those deferred tax assets and liabilities which were created from the same
fiscal authority have been netted.
Since its inception through to December 31, 2015, the Company’s tax loss carryforwards in Germany
amounted to EUR 176 million for corporate tax and to EUR 175 million for trade tax. Furthermore, the
Company estimates that the accumulated tax loss carryforwards in both aforementioned tax categories
will increase by approximately EUR 8 million when it files its tax returns for 2016. In accordance with
German tax law, such tax losses have an unlimited carryforward period. As a consequence of completed
tax audits, tax loss carryforwards in the amount of EUR 167 million are undisputed. The resulting deferred
tax asset is therefore sufficient to offset the aforementioned deferred tax liability from temporary differ-
ences of EUR 131 thousand as of December 31, 2016. However, a future utilization of these carryforwards
could become impossible under certain conditions (e.g. a change of ownership to a larger extent and a
change of business) based on the applicable German tax law. Due to the current financial situation of
the Company, without sufficient liquidity to achieve the break-even point, valuation allowances have
been recognized for the calculated exceeding amount of deferred tax assets at the balance sheet date.
Temporary differences associated with subsidiaries in the amount of EUR 2,791 thousand (2015: EUR 476
thousand) have not been recognized in the reporting period.
In the reporting year, deferred tax assets were recognized due to tax loss carryforwards of Epigenomics,
Inc. and temporary differences between IFRSs and U.S. tax law. Tax loss carryforwards in the U.S.A. can
be utilized for up to twenty years. A utilization of the remaining tax loss carryforward of Epigenomics,
Inc. in the amount of EUR 4.4 million over the next three years is very likely according to the Company’s
business plan which is based on favorable reimbursement decisions in the U.S.A. for Epi proColon from
the second half on 2017 on. The R&D tax credit in the U.S.A. expires on various dates beginning in 2022
through to 2034.
Changes in recognized deferred tax assets in the reporting year:
EUR thousand 2015 2016
January 1 48 346
Deferred tax income/expenses 286 1,143
Foreign currency adjustments 12 62
December 31 346 1,551
81NOTES NOTES TO THE GROUP BALANCE SHEET

CURRENT ASSETS
15 INVENTORIES
EUR thousand Dec 31, 2015 Dec 31, 2016
Consumables, raw materials, supplies 192 142
Semi-finished goods 202 0
Finished goods 683 115
Total inventories 1,077 257
The cost of inventories recognized as R&D costs through profit or loss in 2016 amounts to EUR 172
thousand (2015: EUR 465 thousand) and was attributable to write-offs of finished goods due to the
determination of an unlikelihood that these goods could have been sold before the end of their shelf
lives or because their shelf lives had already expired, respectively.
16 TRADE RECEIVABLES
Trade receivables primarily include receivables from development partners, customers and licensees.
These receivables do not bear interest and are therefore not exposed to any interest rate risk. The carrying
amounts of the receivables correspond to their fair values. The maximum default risk corresponded to
the carrying amount as of the balance sheet date.
EUR thousand Dec 31, 2015 Dec 31, 2016
Trade receivables, gross 216 2,474
Allowance for bad debt -39 -226
Trade receivables, net 177 2,248
At the balance sheet date, trade receivables in the amount of EUR 454 thousand were not due (Dec 31,
2015: EUR 49 thousand). There were no trade receivables not yet invoiced at the balance sheet date (Dec
31, 2015: EUR 92 thousand).
Receivables past due at the balance sheet date:
EUR thousand Dec 31, 2015 Dec 31, 2016
Trade receivables past due up to 90 days 29 1,673
Trade receivables past due more than 90 days 46 347
Trade receivables past due 75 2,020
82 EPIGENOMICS ANNUAL REPORT 2016
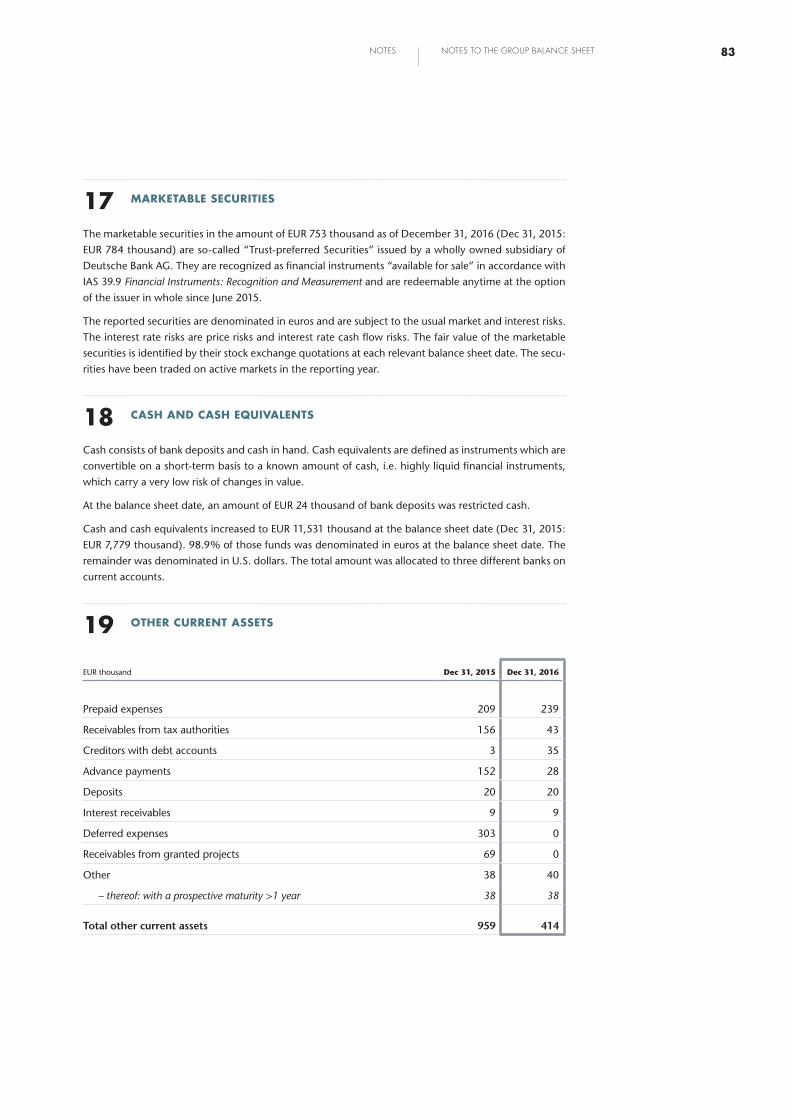
17 MARKETABLE SECURITIES
The marketable securities in the amount of EUR 753 thousand as of December 31, 2016 (Dec 31, 2015:
EUR 784 thousand) are so-called “Trust-preferred Securities” issued by a wholly owned subsidiary of
Deutsche Bank AG. They are recognized as financial instruments “available for sale” in accordance with
IAS 39.9 Financial Instruments: Recognition and Measurement and are redeemable anytime at the option
of the issuer in whole since June 2015.
The reported securities are denominated in euros and are subject to the usual market and interest risks.
The interest rate risks are price risks and interest rate cash flow risks. The fair value of the marketable
securities is identified by their stock exchange quotations at each relevant balance sheet date. The secu-
rities have been traded on active markets in the reporting year.
18 CASH AND CASH EQUIVALENTS
Cash consists of bank deposits and cash in hand. Cash equivalents are defined as instruments which are
convertible on a short-term basis to a known amount of cash, i.e. highly liquid financial instruments,
which carry a very low risk of changes in value.
At the balance sheet date, an amount of EUR 24 thousand of bank deposits was restricted cash.
Cash and cash equivalents increased to EUR 11,531 thousand at the balance sheet date (Dec 31, 2015:
EUR 7,779 thousand). 98.9% of those funds was denominated in euros at the balance sheet date. The
remainder was denominated in U.S. dollars. The total amount was allocated to three different banks on
current accounts.
19 OTHER CURRENT ASSETS
EUR thousand Dec 31, 2015 Dec 31, 2016
Prepaid expenses 209 239
Receivables from tax authorities 156 43
Creditors with debt accounts 3 35
Advance payments 152 28
Deposits 20 20
Interest receivables 9 9
Deferred expenses 303 0
Receivables from granted projects 69 0
Other 38 40
– thereof: with a prospective maturity > 1 year 38 38
Total other current assets 959 414
83NOTES NOTES TO THE GROUP BALANCE SHEET
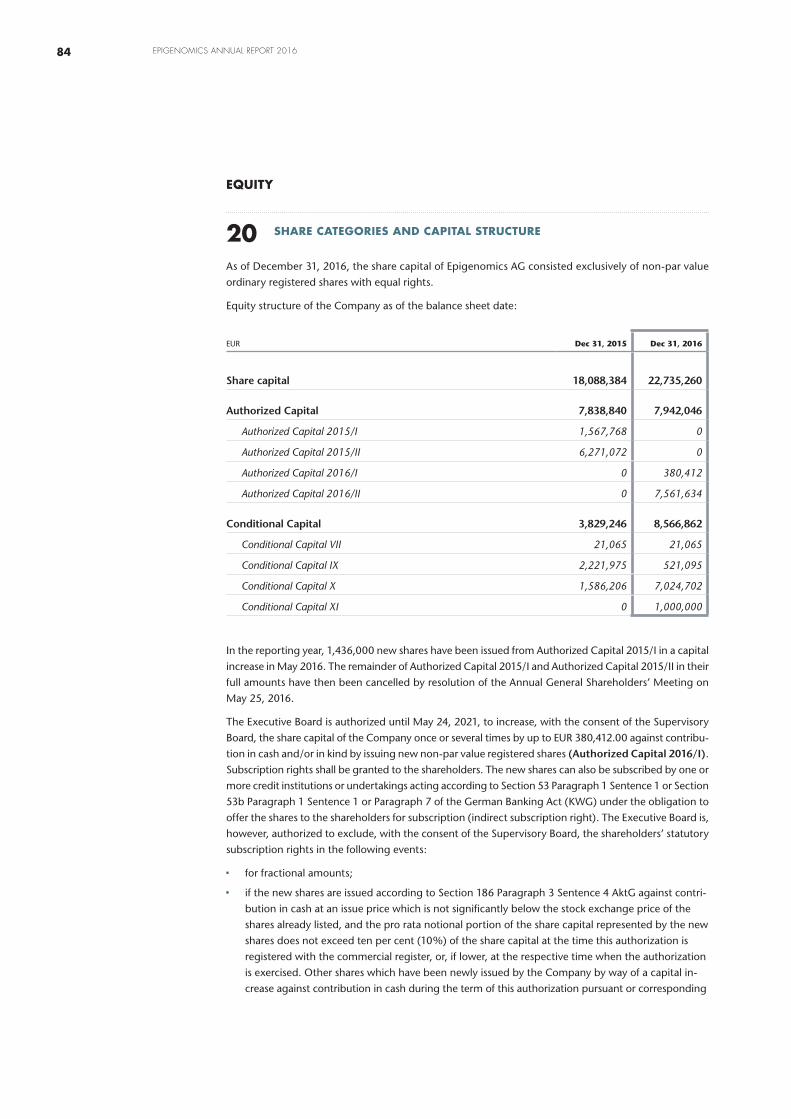
EQUITY
20 SHARE CATEGORIES AND CAPITAL STRUCTURE
As of December 31, 2016, the share capital of Epigenomics AG consisted exclusively of non-par value
ordinary registered shares with equal rights.
Equity structure of the Company as of the balance sheet date:
EUR Dec 31, 2015 Dec 31, 2016
Share capital 18,088,384 22,735,260
Authorized Capital 7,838,840 7,942,046
Authorized Capital 2015/I 1,567,768 0
Authorized Capital 2015/II 6,271,072 0
Authorized Capital 2016/I 0 380,412
Authorized Capital 2016/II 0 7,561,634
Conditional Capital 3,829,246 8,566,862
Conditional Capital VII 21,065 21,065
Conditional Capital IX 2,221,975 521,095
Conditional Capital X 1,586,206 7,024,702
Conditional Capital XI 0 1,000,000
In the reporting year, 1,436,000 new shares have been issued from Authorized Capital 2015/I in a capital
increase in May 2016. The remainder of Authorized Capital 2015/I and Authorized Capital 2015/II in their
full amounts have then been cancelled by resolution of the Annual General Shareholders’ Meeting on
May 25, 2016.
The Executive Board is authorized until May 24, 2021, to increase, with the consent of the Supervisory
Board, the share capital of the Company once or several times by up to EUR 380,412.00 against contribu-
tion in cash and/or in kind by issuing new non-par value registered shares (Authorized Capital 2016/I). Subscription rights shall be granted to the shareholders. The new shares can also be subscribed by one or
more credit institutions or undertakings acting according to Section 53 Paragraph 1 Sentence 1 or Section
53b Paragraph 1 Sentence 1 or Paragraph 7 of the German Banking Act (KWG) under the obligation to
offer the shares to the shareholders for subscription (indirect subscription right). The Executive Board is,
however, authorized to exclude, with the consent of the Supervisory Board, the shareholders’ statutory
subscription rights in the following events:
■■ for fractional amounts;
■■ if the new shares are issued according to Section 186 Paragraph 3 Sentence 4 AktG against contri-
bution in cash at an issue price which is not significantly below the stock exchange price of the
shares already listed, and the pro rata notional portion of the share capital represented by the new
shares does not exceed ten per cent (10%) of the share capital at the time this authorization is
registered with the commercial register, or, if lower, at the respective time when the authorization
is exercised. Other shares which have been newly issued by the Company by way of a capital in-
crease against contribution in cash during the term of this authorization pursuant or corresponding
84 EPIGENOMICS ANNUAL REPORT 2016
to Section 186 Paragraph 3 Sentence 4, or which have been sold following a repurchase, in each
case under exclusion of subscription rights, shall be counted towards the 10% limitation. Further-
more, shares for which there is an option or conversion right or obligation, or a share delivery
right in favor of the Company, based on bonds with warrants or convertible bonds or participation
rights that have been issued during the term of this authorization under exclusion subscription
rights pursuant to Section 221 Paragraph 4 Sentence 2 in connection with Section 186 Paragraph
3 Sentence 4 AktG by the Company or its subsidiaries, shall be counted towards the 10% limitation;
■■ for capital increases against contribution in kind in order to be able to offer the new shares to third
parties with regard to mergers or upon the purchase (including an indirect purchase) of enterprises,
parts of enterprises, shares in enterprises, or the purchase (including an indirect purchase) of other
assets (including receivables, also to the extent owed by the Company or subsidiaries);
■■ to the extent necessary to grant subscription rights for new shares to holders or creditors of option
rights or creditors of convertible bonds or participation rights issued by the Company or its sub-
sidiaries in the amount in which they would be entitled thereto upon the exercise of the option or
conversion rights or the exercise of share delivery rights, or performance of conversion or option
obligations.
The Executive Board is further authorized to determine, with the consent of the Supervisory Board, the
dividend rights of the new shares in deviation from Section 60 Paragraph 2 AktG as well as the further
details of the implementation of capital increases from the Authorized Capital 2016/I. The Supervisory
Board is authorized to amend the wording of the Articles of Association, as appropriate, after implemen-
tation of a capital increase from the Authorized Capital 2016/I in accordance with the respective share
capital increase or after expiry of the term of the authorization.
In the reporting year, 1,509,996 new shares have been created from Authorized Capital 2016/I.
The Executive Board is authorized until May 24, 2021, to increase, with the consent of the Supervisory
Board, the share capital of the Company once or several times by up to a total of EUR 7,561,634.00
against contribution in cash and/or in kind by issuing new non-par value registered shares (Authorized Capital 2016/II). Subscription rights shall be granted to the shareholders. The new shares can also be
subscribed by one or more credit institutions or undertakings acting according to Section 53 Paragraph
1 Sentence 1 or Section 53b Paragraph 1 Sentence 1 or Paragraph 7 of the German Banking Act (“KWG”)
under the obligation to offer the shares to the shareholders for subscription (indirect subscription right).
The Executive Board is, however, authorized to exclude, with the consent of the Supervisory Board, the
shareholders’ statutory subscription rights in the following events:
■■ for fractional amounts,
■■ for capital increases against contribution in kind in order to be able to offer shares to third parties
with regard to mergers or upon the purchase (including an indirect purchase) of enterprises, parts
of enterprises, shares in enterprises or the purchase (including an indirect purchase) of other assets
(including receivables, also to the extent owed by the Company or subsidiaries),
■■ for capital increases in cash, to the extent the capital increases are implemented for the purpose of
the placement of the shares in the context of a listing or the subsequent placement on a foreign
stock exchange.
The Executive Board is further authorized to determine, with the consent of the Supervisory Board, the
dividend rights of the new shares in deviation from Section 60 Paragraph 2 AktG as well as the further
details of the implementation of capital increases from Authorized Capital 2016/II. The Supervisory Board
is authorized to amend the wording of the Articles of Association, as appropriate, after implementation
of a share capital increase from Authorized Capital 2016/II in accordance with the respective share capital
increase or after expiry of the term of the authorization.
In the reporting year, no shares have been issued from Authorized Capital 2016/II.
85NOTES NOTES TO THE GROUP BALANCE SHEET
Conditional Capital VII can no longer be used to grant stock options as the corresponding authorization
for a granting time frame has expired. 21,065 new shares can still be created from Conditional Capital
VII upon exercise of granted options from one of the underlying stock option programs (09–13).
The share capital is further conditionally increased by up to EUR 521,095.00 by issuance of up to 521,095
new non-par value registered shares (Conditional Capital IX). The conditional capital increase is only
to be implemented if bonds or participation rights are issued on the basis of the authorization of the
Executive Board by resolution of the Annual General Shareholders’ Meeting on May 6, 2013, or on the
authorization of the Executive Board by resolution of the Annual General Shareholders’ Meeting on May
6, 2013, as amended by resolution of the Annual General Shareholders’ Meeting of June 3, 2014, until
May 5, 2018, and to the extent that
■■ the holders or creditors of bonds with warrants or conversion rights under bonds or participation
rights exercise their option or conversion rights, or
■■ holders or creditors of bonds or participation rights are obliged to exercise an option or to convert
and fulfill this obligation or
■■ the Company exercises an election right to grant non-par value shares of the Company instead
of paying a cash amount due for payment to the holders or creditors
and to the extent that no cash settlement is granted or treasury shares or shares of another listed com-
pany are delivered. The issuance of the new shares occurs at the respective option or conversion price,
in each case as further to be determined and specified in accordance with the aforementioned authoriza-
tion resolution of the Annual General Shareholders’ Meeting of May 6, 2013, or in accordance with the
authorization resolution of the Annual General Shareholders’ Meeting on May 6, 2013, as amended by
resolution of the Annual General Shareholders’ Meeting of June 3, 2014, or the lower issue price deter-
mined in accordance with the authorization resolution of the Annual General Shareholders’ Meeting on
May 6, 2013, as amended by resolution of the Annual General Shareholders’ Meeting of June 3, 2014.
The newly issued shares shall carry dividend rights from the commencement of the fiscal year in which
the shares are issued, or, as far as legally permissible, if no resolution on the application of the profit of
the fiscal year immediately preceding the year of the issuance has been adopted when the new shares
are issued, from the commencement of this fiscal year immediately preceding the year of the issuance.
The Executive Board is authorized, subject to Supervisory Board approval, to determine the further
details concerning the implementation of the conditional capital increase.
In the reporting year, a total number of 1,700,880 new shares were created from the conversion of
convertible notes previously issued under the aforementioned amended authorization. The convertible
bond program expired at the balance sheet date and no further convertible notes are outstanding.
The share capital is conditionally increased by up to EUR 7,024,702.00 through issuance of up to
7,024,702 new non-par value registered shares (Conditional Capital X). The conditional capital increase
serves the purpose of granting shares to the holders or creditors of bonds or participation rights issued
by the Company or a subsidiary until May 24, 2021 on the basis of the authorization resolution of the
General Shareholders’ Meeting of May 25, 2016 if option or conversion rights are exercised, if option or
conversion obligations are performed or if the Company exercises its optional right to deliver shares of
the Company instead of payment of the cash amount due (or parts thereof). The new shares are issued
at the respective option or conversion price to be determined in accordance with the aforementioned
authorization resolution. The conditional capital increase is only to be implemented if bonds or participa-
tion rights are issued in accordance with the authorization resolution of the General Shareholders’
Meeting of May 25, 2016, and only to the extent that
86 EPIGENOMICS ANNUAL REPORT 2016
■■ option or conversion rights are exercised or
■■ holders or creditors of bonds or participation rights who are under an obligation to exercise an
option or under a conversion obligation perform their obligation to exercise the option or their
conversion obligation or
■■ the Company exercises its optional right to deliver shares of the Company instead of paying the
cash amount due (or parts thereof)
and to the extent that no cash settlement is granted and no shares from an authorized capital, treasury
shares or shares of another listed company are delivered. The new shares issued carry dividend rights
from the commencement of the fiscal year in which they are issued. The Executive Board is authorized,
as far as legally permissible and with the consent of the Supervisory Board, to determine that, if no reso-
lution on the application of the profit of the fiscal year immediately preceding the year of the issuance
of the new shares has been adopted when the new shares are issued, the new shares shall carry dividend
rights from the commencement of the fiscal year immediately preceding the year of the issuance. The
Executive Board is also authorized, with the consent of the Supervisory Board, to determine the further
details concerning the implementation of the conditional capital increase.
In the reporting year, no shares have been issued from Conditional Capital X.
The share capital is conditionally increased by up to EUR 1,000,000.00 through issuance of up to
1,000,000 new non-par value registered shares (Conditional Capital XI). The contingent capital in-
crease serves the purpose of granting or issuing shares to members of the Executive Board of the Com-
pany, to members of the management of domestic and foreign dependent companies of the Company
as defined in Sections 15 and 17 AktG and to employees of the Company and of domestic and foreign
dependent companies of the Company as defined in Sections 15 and 17 AktG who exercise the subscrip-
tion rights they were granted prior to the end of April 30, 2018 pursuant to the authorization resolution
of the General Shareholders’ Meeting of May 25, 2016 (Stock Option Program 16–18). The new shares
are issued against payment by the beneficiary to the Company of the respective exercise price to be
determined in accordance with the aforementioned authorization resolution. The conditional capital
increase is to be implemented only if subscription rights are issued in accordance with the authorization
resolution on the Company’s Stock Option Program 16–18 by the General Shareholders’ Meeting of May
25, 2016 and only to the extent that the holders of these subscription rights exercise them and the
Company does not grant any treasury shares or cash compensation to fulfill these subscription rights.
The new shares issued carry dividend rights from the commencement of the fiscal year in which they
are created. The Executive Board may determine, as far as legally permissible and with the consent of
the Supervisory Board, that, if no resolution on the application of the profit of the fiscal year immedi-
ately preceding the year of the issuance of the new shares has been adopted when the new shares are
issued, the new shares shall be entitled to dividends from the commencement of the fiscal year imme-
diately preceding the year of the issuance; if the new shares are issued to members of the Executive
Board, the Supervisory Board shall be authorized to do so. The Supervisory Board is also authorized to
determine the further details concerning the implementation of the conditional capital increase where
the granting of subscription rights to members of the Executive Board is concerned. In all other cases,
the Executive Board is authorized to determine such details.
In the reporting year, 313,000 stock options were issued based on Conditional Capital XI. However, in
accordance with the terms and conditions of the stock option program, no new shares can be issued
upon exercise of such stock options before October 2020.
87NOTES NOTES TO THE GROUP BALANCE SHEET
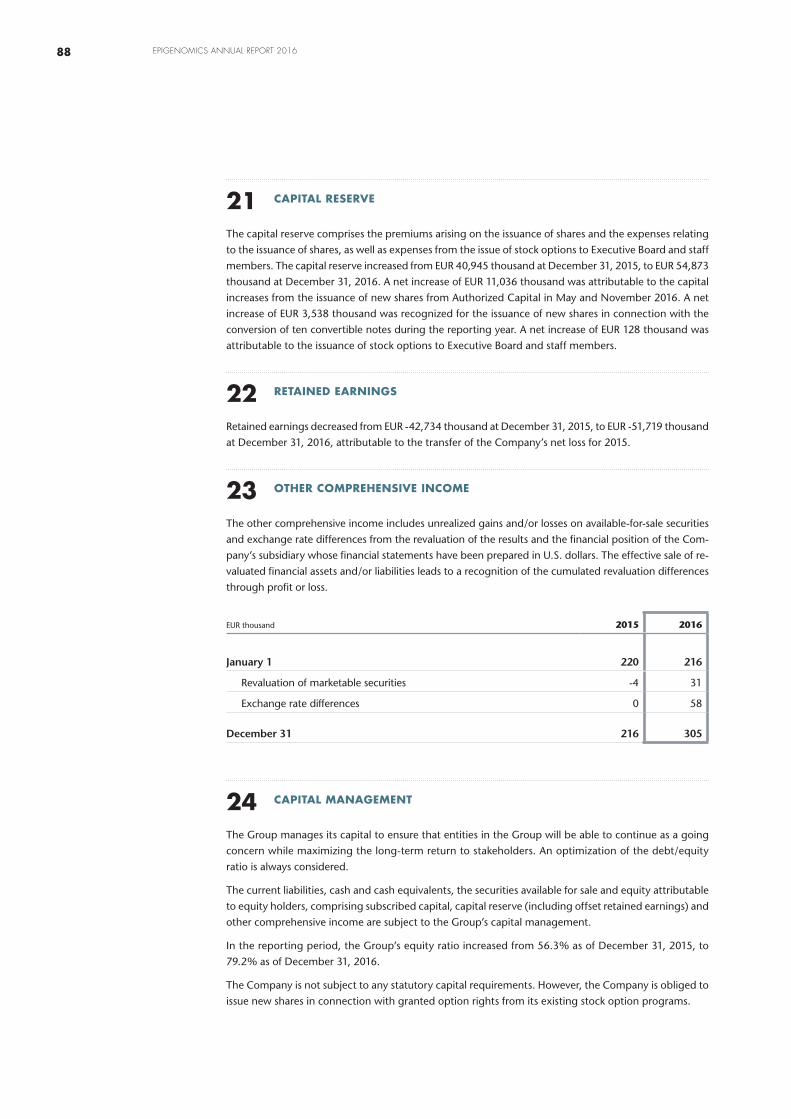
21 CAPITAL RESERVE
The capital reserve comprises the premiums arising on the issuance of shares and the expenses relating
to the issuance of shares, as well as expenses from the issue of stock options to Executive Board and staff
members. The capital reserve increased from EUR 40,945 thousand at December 31, 2015, to EUR 54,873
thousand at December 31, 2016. A net increase of EUR 11,036 thousand was attributable to the capital
increases from the issuance of new shares from Authorized Capital in May and November 2016. A net
increase of EUR 3,538 thousand was recognized for the issuance of new shares in connection with the
conversion of ten convertible notes during the reporting year. A net increase of EUR 128 thousand was
attributable to the issuance of stock options to Executive Board and staff members.
22 RETAINED EARNINGS
Retained earnings decreased from EUR -42,734 thousand at December 31, 2015, to EUR -51,719 thousand
at December 31, 2016, attributable to the transfer of the Company’s net loss for 2015.
23 OTHER COMPREHENSIVE INCOME
The other comprehensive income includes unrealized gains and/or losses on available-for-sale securities
and exchange rate differences from the revaluation of the results and the financial position of the Com-
pany’s subsidiary whose financial statements have been prepared in U.S. dollars. The effective sale of re-
valuated financial assets and/or liabilities leads to a recognition of the cumulated revaluation differences
through profit or loss.
EUR thousand 2015 2016
January 1 220 216
Revaluation of marketable securities -4 31
Exchange rate differences 0 58
December 31 216 305
24 CAPITAL MANAGEMENT
The Group manages its capital to ensure that entities in the Group will be able to continue as a going
concern while maximizing the long-term return to stakeholders. An optimization of the debt/equity
ratio is always considered.
The current liabilities, cash and cash equivalents, the securities available for sale and equity attributable
to equity holders, comprising subscribed capital, capital reserve (including offset retained earnings) and
other comprehensive income are subject to the Group’s capital management.
In the reporting period, the Group’s equity ratio increased from 56.3% as of December 31, 2015, to
79.2% as of December 31, 2016.
The Company is not subject to any statutory capital requirements. However, the Company is obliged to
issue new shares in connection with granted option rights from its existing stock option programs.
88 EPIGENOMICS ANNUAL REPORT 2016
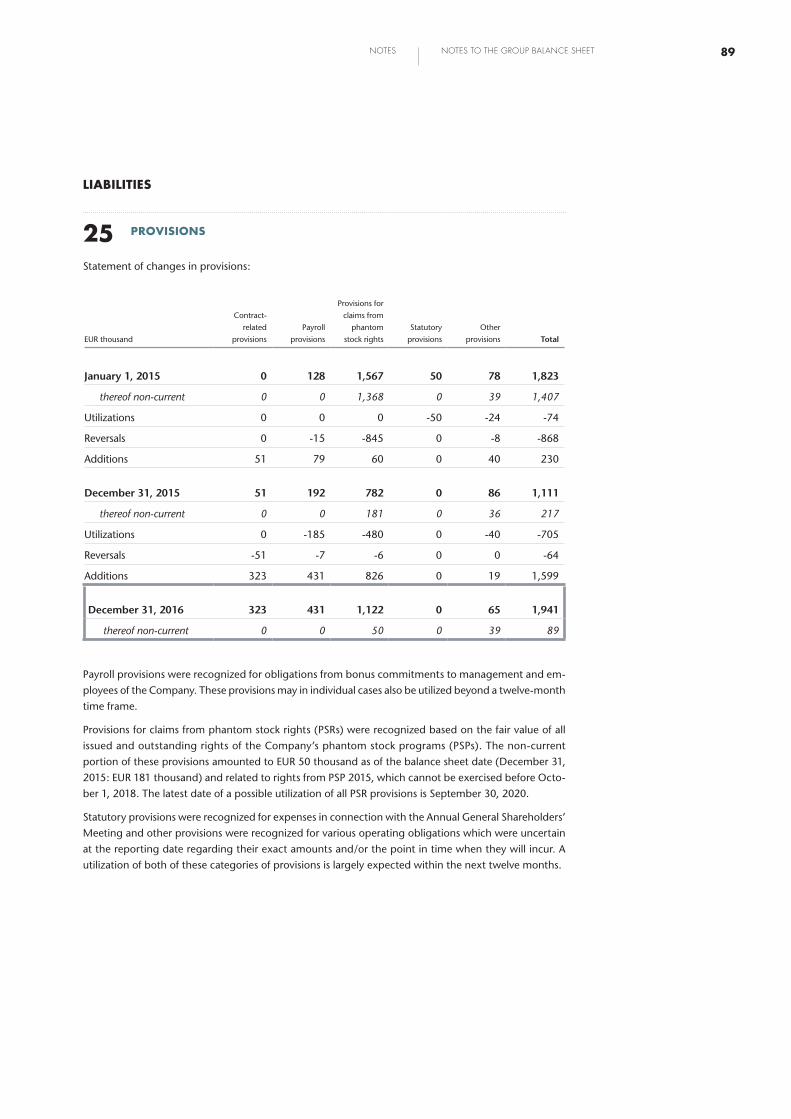
LIABILITIES
25 PROVISIONS
Statement of changes in provisions:
EUR thousand
Contract-
related
provisions
Payroll
provisions
Provisions for
claims from
phantom
stock rights
Statutory
provisions
Other
provisions Total
January 1, 2015 0 128 1,567 50 78 1,823
thereof non-current 0 0 1,368 0 39 1,407
Utilizations 0 0 0 -50 -24 -74
Reversals 0 -15 -845 0 -8 -868
Additions 51 79 60 0 40 230
December 31, 2015 51 192 782 0 86 1,111
thereof non-current 0 0 181 0 36 217
Utilizations 0 -185 -480 0 -40 -705
Reversals -51 -7 -6 0 0 -64
Additions 323 431 826 0 19 1,599
December 31, 2016 323 431 1,122 0 65 1,941
thereof non-current 0 0 50 0 39 89
Payroll provisions were recognized for obligations from bonus commitments to management and em-
ployees of the Company. These provisions may in individual cases also be utilized beyond a twelve-month
time frame.
Provisions for claims from phantom stock rights (PSRs) were recognized based on the fair value of all
issued and outstanding rights of the Company’s phantom stock programs (PSPs). The non-current
portion of these provisions amounted to EUR 50 thousand as of the balance sheet date (December 31,
2015: EUR 181 thousand) and related to rights from PSP 2015, which cannot be exercised before Octo-
ber 1, 2018. The latest date of a possible utilization of all PSR provisions is September 30, 2020.
Statutory provisions were recognized for expenses in connection with the Annual General Shareholders’
Meeting and other provisions were recognized for various operating obligations which were uncertain
at the reporting date regarding their exact amounts and/or the point in time when they will incur. A
utilization of both of these categories of provisions is largely expected within the next twelve months.
89NOTES NOTES TO THE GROUP BALANCE SHEET

26 TRADE PAYABLES
The reported trade payables in the amount of EUR 1,089 thousand as of the balance sheet date (Decem-
ber 31, 2015: EUR 1,923 thousand) are all non-interest-bearing and are generally due within 30 days.
27 DEFERRED INCOME
As of the balance sheet date, there were no repayment obligations for the Company resulting from
deferred income. Deferred income at December 31, 2016, in the amount of EUR 302 thousand (Dec 31,
2015: EUR 635 thousand) consisted solely of payments received from public authorities for an R&D
project. This grant was awarded to the Company under the EU’s Horizon 2020 program. The grant funds
the clinical research to validate our proprietary lung cancer biomarkers with the goal of developing a
CE-marked product for the detection of lung cancer in blood plasma under the new In-vitro Diagnostic
Directive. Completion of the funded project is expected in the second half of 2017. In the reporting year,
the Company received a payment from the EU in the amount of EUR 816 thousand (2015: EUR 970
thousand). Under this project, Epigenomics is entitled to call for further funds of up to EUR 1.0 million.
28 CONVERTIBLE NOTES ISSUED
In December 2013, the Company issued 25 convertible notes, each denominated at EUR 107 thousand
with an issue price of EUR 100 thousand and an aggregate principal amount of EUR 2.675 million. Each
note entitled the holder to convert to 107,000 new ordinary non-par value registered shares at a con-
version price of EUR 5.87 per share. In accordance with the terms and conditions of the convertible notes,
the conversion price for the outstanding notes had to be adjusted in October 2014. Hence, each remaining
note entitled the holder then to convert to 203,925 new ordinary non-par value registered shares at a
conversion price of EUR 3.08 per share.
In a taking of votes amongst the noteholders without a meeting in December 2015, it was agreed to
amend the terms and conditions of the program. The holders voted unanimously in favor of an extension
of the term of the notes from December 31, 2015 until December 31, 2016 and to amend the anti-dilution
protection.
As of January 1, 2016, a remainder of ten notes was still outstanding. In the reporting year, all of these
notes were ultimately converted into a total of 1,700,880 shares. For eight of the ten notes converted in
the reporting year, the Company received a conversion payment from the bondholder in the amount of
EUR 521 thousand each – adding up to a cash inflow of EUR 4.2 million in 2016. As a result of the ten
conversions, Group equity increased by EUR 5,239 thousand, due to an increase in subscribed capital of
EUR 1,701 thousand and an increase in capital reserves of EUR 3,538 thousand.
90 EPIGENOMICS ANNUAL REPORT 2016
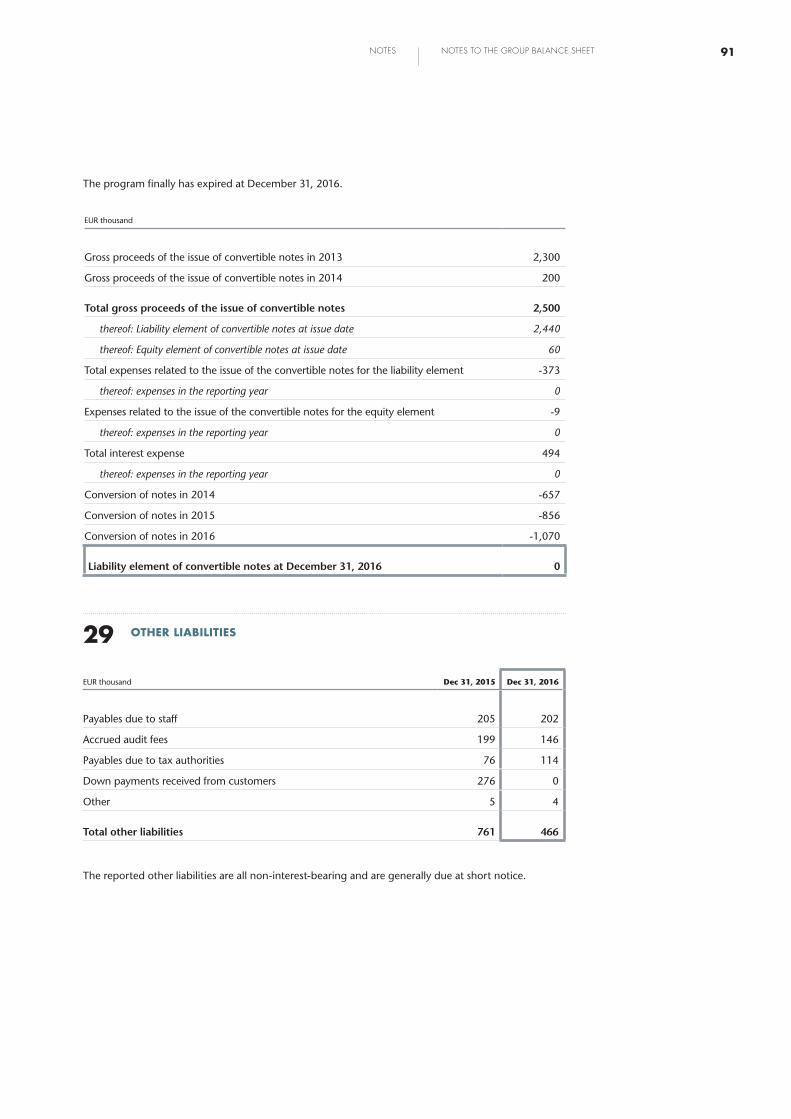
The program finally has expired at December 31, 2016.
EUR thousand
Gross proceeds of the issue of convertible notes in 2013 2,300
Gross proceeds of the issue of convertible notes in 2014 200
Total gross proceeds of the issue of convertible notes 2,500
thereof: Liability element of convertible notes at issue date 2,440
thereof: Equity element of convertible notes at issue date 60
Total expenses related to the issue of the convertible notes for the liability element -373
thereof: expenses in the reporting year 0
Expenses related to the issue of the convertible notes for the equity element -9
thereof: expenses in the reporting year 0
Total interest expense 494
thereof: expenses in the reporting year 0
Conversion of notes in 2014 -657
Conversion of notes in 2015 -856
Conversion of notes in 2016 -1,070
Liability element of convertible notes at December 31, 2016 0
29 OTHER LIABILITIES
EUR thousand Dec 31, 2015 Dec 31, 2016
Payables due to staff 205 202
Accrued audit fees 199 146
Payables due to tax authorities 76 114
Down payments received from customers 276 0
Other 5 4
Total other liabilities 761 466
The reported other liabilities are all non-interest-bearing and are generally due at short notice.
91NOTES NOTES TO THE GROUP BALANCE SHEET
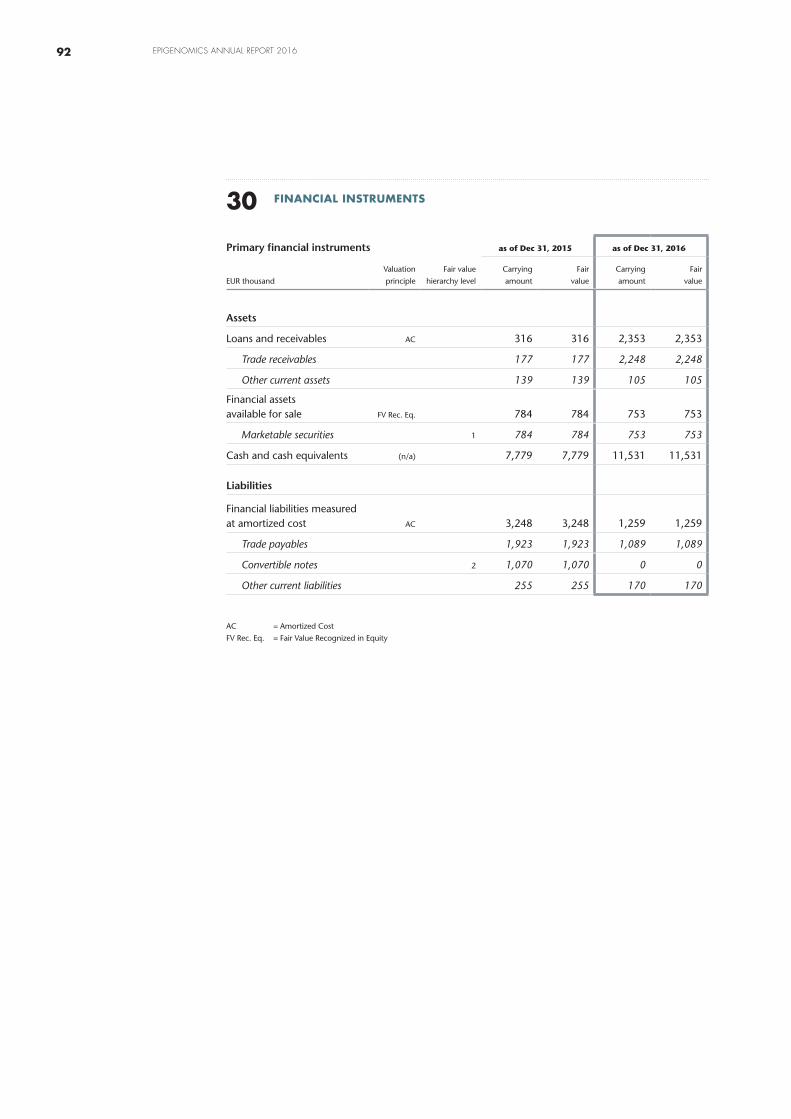
30 FINANCIAL INSTRUMENTS
Primary financial instruments as of Dec 31, 2015 as of Dec 31, 2016
EUR thousand
Valuation
principle
Fair value
hierarchy level
Carrying
amount
Fair
value
Carrying
amount
Fair
value
Assets
Loans and receivables AC 316 316 2,353 2,353
Trade receivables 177 177 2,248 2,248
Other current assets 139 139 105 105
Financial assets available for sale FV Rec. Eq. 784 784 753 753
Marketable securities 1 784 784 753 753
Cash and cash equivalents (n/a) 7,779 7,779 11,531 11,531
Liabilities
Financial liabilities measured at amortized cost AC 3,248 3,248 1,259 1,259
Trade payables 1,923 1,923 1,089 1,089
Convertible notes 2 1,070 1,070 0 0
Other current liabilities 255 255 170 170
AC = Amortized Cost
FV Rec. Eq. = Fair Value Recognized in Equity
92 EPIGENOMICS ANNUAL REPORT 2016
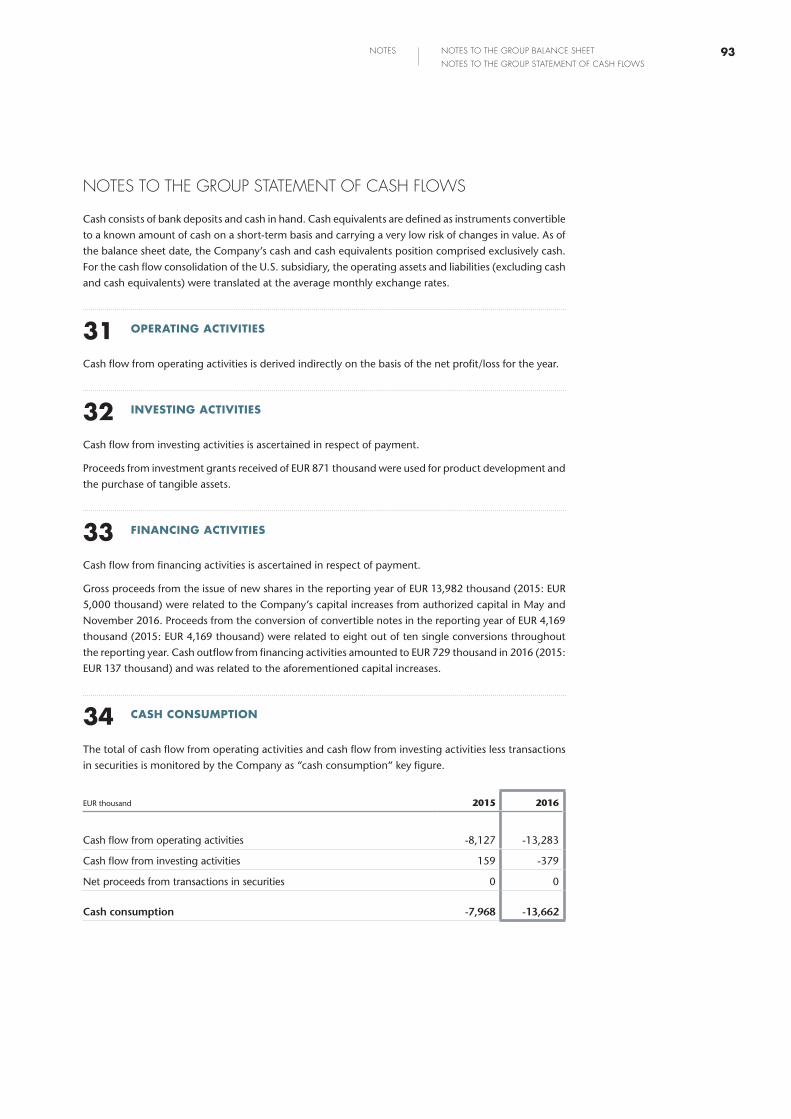
NOTES TO THE GROUP STATEMENT OF CASH FLOWS
Cash consists of bank deposits and cash in hand. Cash equivalents are defined as instruments convertible
to a known amount of cash on a short-term basis and carrying a very low risk of changes in value. As of
the balance sheet date, the Company’s cash and cash equivalents position comprised exclusively cash.
For the cash flow consolidation of the U.S. subsidiary, the operating assets and liabilities (excluding cash
and cash equivalents) were translated at the average monthly exchange rates.
31 OPERATING ACTIVITIES
Cash flow from operating activities is derived indirectly on the basis of the net profit/loss for the year.
32 INVESTING ACTIVITIES
Cash flow from investing activities is ascertained in respect of payment.
Proceeds from investment grants received of EUR 871 thousand were used for product development and
the purchase of tangible assets.
33 FINANCING ACTIVITIES
Cash flow from financing activities is ascertained in respect of payment.
Gross proceeds from the issue of new shares in the reporting year of EUR 13,982 thousand (2015: EUR
5,000 thousand) were related to the Company’s capital increases from authorized capital in May and
November 2016. Proceeds from the conversion of convertible notes in the reporting year of EUR 4,169
thousand (2015: EUR 4,169 thousand) were related to eight out of ten single conversions throughout
the reporting year. Cash outflow from financing activities amounted to EUR 729 thousand in 2016 (2015:
EUR 137 thousand) and was related to the aforementioned capital increases.
34 CASH CONSUMPTION
The total of cash flow from operating activities and cash flow from investing activities less transactions
in securities is monitored by the Company as “cash consumption“ key figure.
EUR thousand 2015 2016
Cash flow from operating activities -8,127 -13,283
Cash flow from investing activities 159 -379
Net proceeds from transactions in securities 0 0
Cash consumption -7,968 -13,662
93NOTES NOTES TO THE GROUP BALANCE SHEET
NOTES TO THE GROUP STATEMENT OF CASH FLOWS

RISKS AND RISK MANAGEMENT
35 GENERAL
For a comprehensive overview of the risks the Company is facing, reference is made to the “Report on
opportunities and risks” section of the consolidated management report 2016.
36 LIQUIDITY RISK
The liquidity risk of Epigenomics results from the Group’s potential inability to meet its financial liabilities,
i.e. not paying its suppliers, creditors or lenders. It is therefore the task of the cash and liquidity man-
agement to assure the individual Group companies’ liquidity at any time. The expected cash inflows and
outflows are constantly monitored to ensure short-term liquidity. These activities are supported by internal
cash forecasts and a corresponding strategy of managing time deposits with the Company’s house banks.
Furthermore, Epigenomics constantly monitors the capital markets and – if required – undertakes all
necessary efforts to raise fresh capital in order to avoid illiquidity.
Epigenomics has a strict cost management in place to avoid unnecessary spending. On the procurement
side, the Company always tries to reduce purchase prices by closing favorable contracts and negotiating
all relevant conditions and takes advantage of granted terms of payment.
37 FOREIGN CURRENCY EXCHANGE RISK
The Group executes transactions denominated in foreign currencies and is therefore exposed to the risk
of exchange rate fluctuations. In past years, the risk mainly stemmed from the need to purchase goods
and services partially in U.S. dollars. In the reporting year, Epigenomics received FDA approval for
Epi proColon in the U.S.A. and started commercialization of the product there. Revenue is now gener-
ated by the Group’s U.S. entity Epigenomics, Inc. in U.S. dollars, while the kits are manufactured and in-
voiced primarily in euros. This leads to an increased foreign currency exchange (FX) risk for the Group.
This risk is reduced by utilizing the proceeds generated in U.S. dollars to finance the operating business
activities of Epigenomics, Inc. (e.g. the purchase of goods and services). With regard to U.S. dollar
amounts in excess of the U.S. entity’s mid- to long-term cash requirements, the Group will constantly
try to mitigate or to eliminate the remaining risk as far as possible, for example through the use of de-
rivative financial instruments (e.g. forward contracts) to minimize this risk. As of the balance sheet date,
there was only a very limited number and volume of positions denominated in foreign currencies other
than the U.S. dollar.
94 EPIGENOMICS ANNUAL REPORT 2016
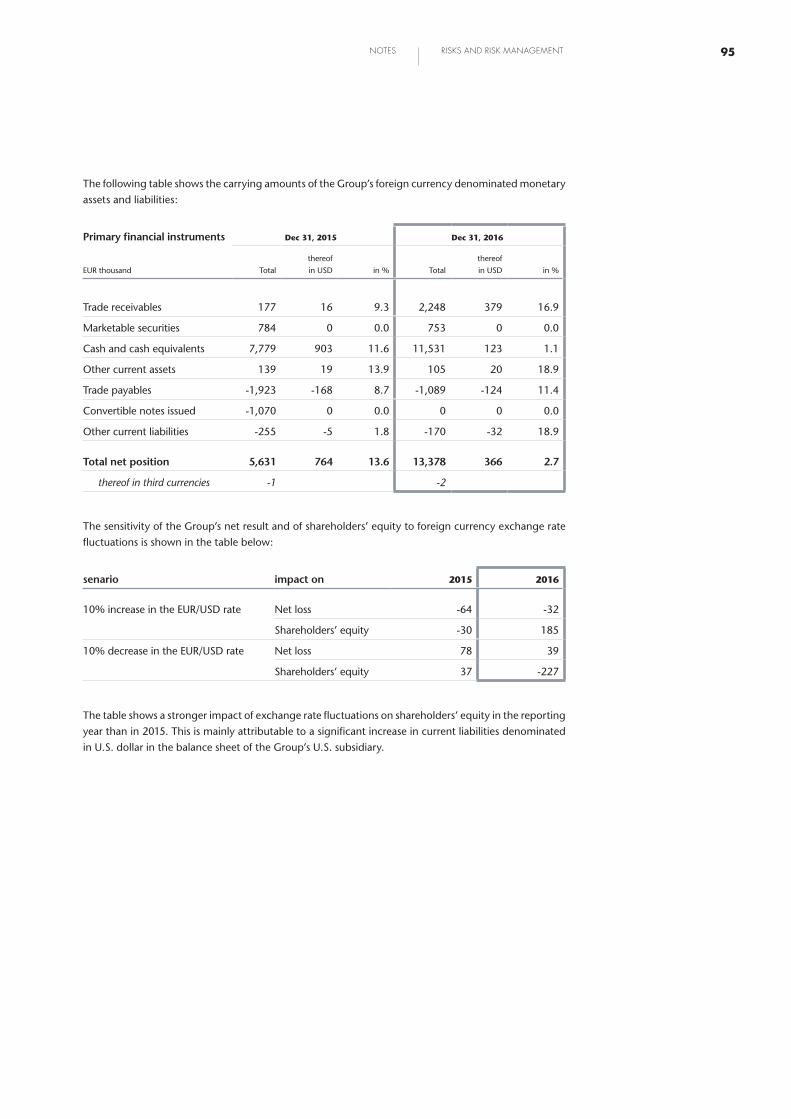
The following table shows the carrying amounts of the Group’s foreign currency denominated monetary
assets and liabilities:
Primary financial instruments Dec 31, 2015 Dec 31, 2016
EUR thousand Total
thereof
in USD in % Total
thereof
in USD in %
Trade receivables 177 16 9.3 2,248 379 16.9
Marketable securities 784 0 0.0 753 0 0.0
Cash and cash equivalents 7,779 903 11.6 11,531 123 1.1
Other current assets 139 19 13.9 105 20 18.9
Trade payables -1,923 -168 8.7 -1,089 -124 11.4
Convertible notes issued -1,070 0 0.0 0 0 0.0
Other current liabilities -255 -5 1.8 -170 -32 18.9
Total net position 5,631 764 13.6 13,378 366 2.7
thereof in third currencies -1 -2
The sensitivity of the Group’s net result and of shareholders’ equity to foreign currency exchange rate
fluctuations is shown in the table below:
senario impact on 2015 2016
10% increase in the EUR/USD rate Net loss -64 -32
Shareholders’ equity -30 185
10% decrease in the EUR/USD rate Net loss 78 39
Shareholders’ equity 37 -227
The table shows a stronger impact of exchange rate fluctuations on shareholders’ equity in the reporting
year than in 2015. This is mainly attributable to a significant increase in current liabilities denominated
in U.S. dollar in the balance sheet of the Group’s U.S. subsidiary.
95NOTES RISKS AND RISK MANAGEMENT

38 CREDIT RISK
Credit risks arise from the Group’s operating and investing business activities. Trade receivables essen-
tially relate on the one hand to renowned commercial partners with acceptable ratings and on the
other to small customers (predominantly laboratories, clinics and researchers) with non-material ordering
volumes. Whenever possible, payments are collected upfront. The Group maintains a long-standing,
good contractual relationship with its major partners (e.g. BioChain and Polymedco). Receivables from
Polymedco are secured up to EUR 500 thousand by an irrevocable standby letter of credit issued by a
leading North American bank.
Securities have only been acquired under careful adherence to the Company’s investment policy, i.e. a
strict selection by the credit ratings of the issuers has been conducted. However, the worldwide financial
market crisis over the last years has shown that even top-rated issuers can suddenly face a threatening
situation or even collapse. Additionally, it has become clear that there is a pending risk of illiquid markets.
Cash and cash equivalents are deposited at three different banks.
In all cases, the maximum amount at risk can be derived from the carrying amounts of the recognized
receivables.
39 INTEREST RATE RISK
The Group holds interest-bearing financial instruments only in the form of marketable securities.
Given the historically low interest rates on the international capital markets, the Group is not exposed
to any interest rate risks from its cash and cash equivalents position.
96 EPIGENOMICS ANNUAL REPORT 2016
INFORMATION ON SHARE-BASED PAYMENT PLANS
40 STOCK OPTION PROGRAMS
As of the balance sheet date, the Company had four stock option programs (SOP) in place:
SOP 06–10: Program is expired. No stock options can be granted from this program anymore and no
new shares can be created anymore upon exercise of granted options from this program.
SOP 09–13: Program is expired. Details of the programs 09–13 can be found in the invitation to the
Company’s 2011 Annual General Shareholders’ Meeting (AGM), respectively. The document is available
on the Company’s website. No stock options can be granted from this program anymore. 21,065 rights
were outstanding at the balance sheet date and at December 31, 2015, with an average exercise price
of EUR 15.65. No rights have been issued, expired, forfeited or exercised during the reporting year. None
of these rights is held by Executive Board members of the Company.
SOP 11–15: Program is expired. No stock options can be granted from this program anymore. No granted
stock options from this program were outstanding at the balance sheet date and at December 31, 2015.
On May 25, 2016, the Company’s AGM resolved to implement a new stock option program (SOP 16–18)
based on the new Conditional Capital XI (see also section 20 “Share categories and capital structure”).
Under this program, the Executive Board and the Supervisory Board of the Company are authorized until
the expiration of April 30, 2018, to issue stock options in accordance with the provisions set forth below
to members of the Executive Board and to employees of the Company as well as to members of the man-
agement and to employees of domestic and foreign dependent companies of the Company provided
that each stock option so issued entitles the beneficiary to subscribe for one non-par value registered share
of the Company. Under this authorization, the Executive Board and the Supervisory Board may issue a
total of up to 1,000,000 stock options which entitle the beneficiaries to subscribe for no more than
1,000,000 non-par value registered shares of the Company. The Supervisory Board of the Company is
exclusively authorized to issue stock options to beneficiaries that are members of the Executive Board of
the Company. In all other respects, the Executive Board is authorized to grant stock options, with the
Executive Board being required to obtain the Supervisory Board’s consent before granting stock options
to holders of a general power of attorney (Prokura) of the Company and to members of the management
of subordinated affiliated companies. The shareholders have no subscription rights.
The beneficiaries are the members of the Executive Board of the Company (group 1), the employees of
the Company (group 2), the members of the management of subordinated affiliated companies (group
3) and the employees of subordinated affiliated companies (group 4).
From the total volume of the Stock Option Program 16–18, the distribution shall be as follows:
■■ Group 1 beneficiaries altogether: a maximum of 25%/250,000 stock options.
■■ Group 2 beneficiaries altogether: a maximum of 35%/350,000 stock options.
■■ Group 3 beneficiaries altogether: a maximum of 7%/70,000 stock options.
■■ Group 4 beneficiaries altogether: a maximum of 33%/330,000 stock options.
Stock options may be issued with effect as of up to four dates, i.e. in each case with effect as of the
beginning of October 1, 2016, April 1, 2017, October 1, 2017 and April 1, 2018 (each an “issue date”).
The subscription rights may only be exercised outside the blackout periods. Blackout periods means the
periods between the end of the fiscal year and the publication of the annual report and the consolidated
financial statements for the respective fiscal year, and between the end of the first, second and third
quarters of a fiscal year and the publication of a quarterly report or a quarterly announcement of the
Company for the respective quarter.
97NOTES RISKS AND RISK MANAGEMENT
INFORMATION ON SHARE-BASED PAYMENT PLANS
One fourth of the subscription rights in every tranche shall vest for the beneficiaries in each case one
year, two years, three years and four years after the issue date of the respective tranche. In deviation
from the above provision, the Supervisory Board may declare full or partial vesting of subscription rights
issued in one tranche in favor of any one or all group 1 beneficiaries, and the Executive Board may with
the consent of the Supervisory Board declare full or partial vesting of subscription rights issued in one
tranche in favor of any one or all group 2 to 4 beneficiaries, at any time after the issue date of the respec-
tive tranche. In this case, the subscription rights shall be deemed vested upon receipt by the respective
beneficiary of the corresponding declaration by the Executive Board or the Supervisory Board.
Subscription rights of each tranche can be exercised for the first time after their vesting and after expi-
ration of the waiting period. The waiting period ends four years after the issue date of the tranche. The
restriction of the exercise of the subscription rights to certain exercise periods and subject to compliance
with all exercise conditions shall remain unaffected by the expiration of the waiting period.
The term of the subscription rights of every tranche starts on the issue date of the subscription rights
and ends seven years after such issue date. Subscription rights that have not been exercised by the end
of their term shall expire without compensation. This shall also apply where the non-exercise of the
subscription rights is attributable to the fact that they could not be exercised, and shall also apply to
vested subscription rights.
The subscription rights can only be exercised against payment of the exercise price to the Company. The
exercise price for a subscription right of the respective tranche equals the non-volume weighted average
stock exchange closing price of the shares of the Company on the ten stock exchange trading days
preceding the issue date of the tranche in the electronic trading system of the Frankfurt Stock Exchange
plus 10%.
After vesting has occurred and after the waiting period has expired, subscription rights may be exercised
only if the closing stock exchange price of the shares of the Company in the electronic trading system
of the Frankfurt Stock Exchange has exceeded the original price by at least 10% on at least one trading
day in the period between the issue date of the tranche and the expiration of the waiting period (per-
formance target). If the performance target has not been reached upon expiration of the waiting period,
the subscription rights shall expire without compensation.
Any subscription rights of a beneficiary that have not yet vested shall expire without compensation upon
termination of the service or employment contract between the beneficiary and the Company (or a
subordinated affiliated company) if the service or employment contract has been terminated by the
beneficiary, or by the Company (or the respective subordinated affiliated company) for cause. This shall
not apply to any termination by group 1 or group 3 beneficiaries on account of a vote of no confidence
by the AGM. Subscription rights of a beneficiary that have vested but have not yet been exercised or
could not yet be exercised by the respective beneficiary shall expire without compensation upon termi-
nation of the service or employment contract between the beneficiary and the Company (or a subordi-
nated affiliated company) if the service or employment contract has been terminated by the Company
(or the respective subordinated affiliated company) for cause. This shall not apply to any termination by
group 1 or group 3 beneficiaries on account of a vote of no confidence by the AGM.
The Executive Board or, in the case of group 1 beneficiaries, the Supervisory Board, may reserve the right
to fulfil subscription rights that have been validly exercised by paying to the beneficiary compensation
in cash instead of delivering any newly issued or previously acquired treasury shares of the Company,
which cash compensation shall equal the difference between the exercise price and the closing price of
the shares of the Company last determined in the electronic trading system of the Frankfurt Stock Ex-
change before the exercise of the subscription right. However, the Company has no obligation to fulfill
subscription rights by cash payments and does currently not intend to fulfill subscription rights by cash
payments.
98 EPIGENOMICS ANNUAL REPORT 2016
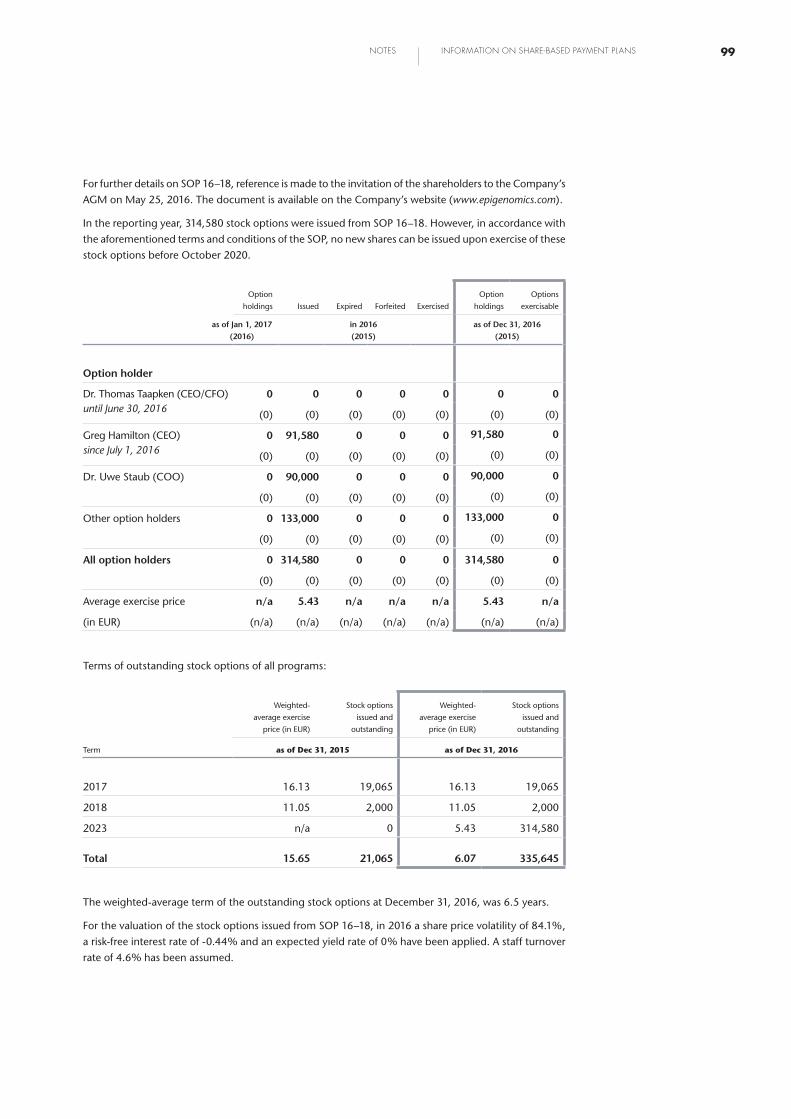
For further details on SOP 16–18, reference is made to the invitation of the shareholders to the Company’s
AGM on May 25, 2016. The document is available on the Company’s website (www.epigenomics.com).
In the reporting year, 314,580 stock options were issued from SOP 16–18. However, in accordance with
the aforementioned terms and conditions of the SOP, no new shares can be issued upon exercise of these
stock options before October 2020.
Option
holdings Issued Expired Forfeited Exercised
Option
holdings
Options
exercisable
as of Jan 1, 2017(2016)
in 2016 (2015)
as of Dec 31, 2016 (2015)
Option holder
Dr. Thomas Taapken (CEO/CFO) until June 30, 2016
0 0 0 0 0 0 0
(0) (0) (0) (0) (0) (0) (0)
Greg Hamilton (CEO) since July 1, 2016
0 91,580 0 0 0 91,580 0
(0) (0) (0) (0) (0) (0) (0)
Dr. Uwe Staub (COO) 0 90,000 0 0 0 90,000 0
(0) (0) (0) (0) (0) (0) (0)
Other option holders 0 133,000 0 0 0 133,000 0
(0) (0) (0) (0) (0) (0) (0)
All option holders 0 314,580 0 0 0 314,580 0
(0) (0) (0) (0) (0) (0) (0)
Average exercise price n/a 5.43 n/a n/a n/a 5.43 n/a
(in EUR) (n/a) (n/a) (n/a) (n/a) (n/a) (n/a) (n/a)
Terms of outstanding stock options of all programs:
Weighted-
average exercise
price (in EUR)
Stock options
issued and
outstanding
Weighted-
average exercise
price (in EUR)
Stock options
issued and
outstanding
Term as of Dec 31, 2015 as of Dec 31, 2016
2017 16.13 19,065 16.13 19,065
2018 11.05 2,000 11.05 2,000
2023 n/a 0 5.43 314,580
Total 15.65 21,065 6.07 335,645
The weighted-average term of the outstanding stock options at December 31, 2016, was 6.5 years.
For the valuation of the stock options issued from SOP 16–18, in 2016 a share price volatility of 84.1%,
a risk-free interest rate of -0.44% and an expected yield rate of 0% have been applied. A staff turnover
rate of 4.6% has been assumed.
99NOTES INFORMATION ON SHARE-BASED PAYMENT PLANS

41 PHANTOM STOCK PROGRAMS – DESCRIPTION
As of the balance sheet date, the Company has four phantom stock programs (PSPs)/virtual share plans
in place as an incentive scheme for management and staff by granting so-called phantom stock rights
(PSR) from such programs to the beneficiaries. The programs define a PSR as a conditional claim of its
holder against the Company for a future payment in cash of a premium to the benefit of the holder. As
PSR will be settled in cash upon their exercise, the Company had to record a provision based on the fair
values of the outstanding rights.
Phantom stock program 03–15 (PSP 03–15)
PSP 03–15 was established in 2013 to serve as a transformation tool for outstanding stock options at that
time. Executive Board and Supervisory Board of the Company therefore had decided to offer PSRs from
the PSP 03–15 to all stock option holders who were employees or members of the Executive Board at
that time and to a dedicated number of former employees of the Company who still held stock options.
For each stock option right that has been returned to the Company in connection with an exchange
offer, one PSR from PSP 03–15 has been granted to its holder. Each PSR from PSP 03–15 became the
legal successor of the returned stock option right then and was on equal terms with its economic value.
Hence, the term of each PSR from PSP 03–15 equals the remaining term of the returned stock option
right. These PSR will expire without compensation at that point in time when the stock option right that
has been returned in exchange would have been expired. After the exchange of previously unvested
stock option rights against PSRs, the vesting rules of the underlying SOPs applied equally with respect
to the vesting of the PSRs. PSRs which have been issued in exchange against vested stock options, have
also vested immediately. Vested PSRs that had been obtained in exchange for stock options from the
SOP 06–10 can be exercised immediately. Vested PSRs that had been obtained in exchange for stock
options from the SOPs 09–13 and 11–15 can only be exercised when the holding or waiting period of
the stock options that were returned in exchange is or would have been expired for its holder.
The exercise price of a PSR from PSP 03–15 equals the exercise price of the stock option right that had
been returned in exchange. The exercise of such a PSR simulates the exercise of the former stock option
right in a so-called “ExerSale” transaction. Unlike the exercise of stock option rights, the holder of a PSR is
not entitled to obtain a share of the Company by the exercise of a PSR. Upon the exercise of a PSR from
PSP 03–15, the holder of the right obtains a claim against the Company on the payment of the PSR
premium. The PSR premium is defined as the absolute difference between the then current market price
of the Epigenomics share and the exercise price of the PSR. The holder of a PSR is entitled to exercise his
right during the exercise period when the strike price at the exercise date is higher than the base value.
The strike price equals the arithmetic average of the Xetra closing rates at the Frankfurt stock exchange
of the five consecutive trading days prior to the exercise date. By exercising the PSR, the holder earns an
entitlement to obtain the “PSR premium” from the Company. The PSR premium equals the absolute
difference between strike price and base value of the right without any limitation. In contrast to the
exercise of stock option rights, the exercise of PSR is not compulsory subject to pre-defined exercise
periods (“trading windows”) and can be done at any time during the year. Nevertheless, the Executive
Board and the Supervisory Board may stipulate compulsory exercise periods for holders of PSRs who are
current employees of the Company. This shall particularly apply for holders of PSRs who may be identi-
fied as “insiders” in accordance with the German Securities Trading Act (“Wertpapierhandelsgesetz”).
It is the sole discretion of the Executive Board of the Company to define and to announce such exercise
periods to the employees of the Company holding PSRs. Such exercise periods as announced by the
Executive Board will then always apply simultaneously to the Executive Board members.
100 EPIGENOMICS ANNUAL REPORT 2016
In case of a takeover or a mandatory offer for the shares of the Company in accordance with the German
Securities Acquisition and Takeover Act (“Wertpapiererwerbs- und Übernahmegesetz” – WpÜG), the
holders of vested PSR become entitled to exercise these rights completely. This also applies if the waiting
period for these rights has not yet expired. The exercise right for the PSR holder shall apply only if the
offered consideration consists solely of a cash settlement and if the bidder has gained control over the
Company. In such a takeover case, the PSR premium equals the difference between the cash amount
which was finally offered to the shareholders as part of a takeover or a mandatory offer and the base
value of the PSR.
Phantom stock program 2013 (PSP 2013), phantom stock program 2014 (PSP 2014), and phantom stock program 2015 (PSP 2015)
PSP 2013 was approved by the Executive Board and the Supervisory Board of the Company in May 2013.
PSP 2014 was approved by the Executive Board and the Supervisory Board of the Company in May 2014.
PSP 2015 was approved by the Executive Board and the Supervisory Board of the Company in September
2015.
No further rights can be issued from the PSP 2013, 2014, and 2015. Eligible beneficiaries of these pro-
grams were the members of the Executive Board and the employees of the Group, with an unterminated
service or employment agreement with a Group company. The Executive Board had the decision-making
power for the issuance of PSR from these programs to employees of the Company and to executives and
employees of the subsidiaries; the Supervisory Board had the decision-making power for the issuance
of such PSR to the members of the Executive Board.
A certain amount of PSR granted to a beneficiary at a certain point in time is defined as a tranche. The PSR
of each tranche which were issued to beneficiaries who are not executives of the Company at the issuance
date, started to vest from the beginning of the first full calendar quarter over the three years following
their issuance in five equal parts, beginning with the first day of the fifth full calendar quarter after the
issuance of the tranche. Thereafter, the further four of the five parts will vest each after the end of the
following four half-years. Thus, the last of the five parts will vest after the last day of the twelfth full
calendar quarter after the issuance of the tranche and therefore at the end of a three-year waiting period.
PSR of each tranche can be initially exercised after their vesting, but not before the end of the waiting
period. The term of the PSR begins with their issuance and ends five years after the beginning of their
vesting period. Rights which were not exercised upon the end of their term will expire without compen-
sation. Basically, PSR can be exercised anytime in the two years between the end of their waiting period
and the end of their term (“exercise period”). Nevertheless, Executive Board and Supervisory Board are
allowed to stipulate adherence to timing restrictions in the exercise periods. This shall apply particular-
ly for holders of rights who are identified by the Executive Board as an “insider” in the meaning of
Section 15b of the German Securities Trading Act (“Wertpapierhandelsgesetz”). The Executive Board of
the Company dutifully reserves the right to establish such timing restrictions in the exercise periods and
to announce such restrictions in the exercise periods to rights holders who are employees of the Compa-
ny at that point in time. Timing restrictions in exercise periods as announced by the Executive Board will
always apply simultaneously to PSR held by the Executive Board members themselves.
101NOTES INFORMATION ON SHARE-BASED PAYMENT PLANS
At the issuance of a PSR tranche, a so-called “base value” of the rights was determined. This base value
equaled the average of the Xetra closing rates of the Epigenomics share at the Frankfurt stock exchange
from the last five trading days before issuance. The holder of a PSR is entitled to exercise his right during
the exercise period when the strike price at the exercise date is higher than the base value. The strike
price equals the arithmetic average of the Xetra closing rates at the Frankfurt stock exchange of the five
consecutive trading days prior to the exercise date. By exercising the PSR, the holder earns an entitlement
to obtain the “PSR premium” from the Company. The PSR premium equals the absolute difference be-
tween the strike price and the base value of the right up to a maximum of EUR 8.00 (PSP 2013), EUR 12.00
(PSP 2014), and EUR 15.00 (PSP 2015), respectively.
Any PSR held by a beneficiary that have not yet vested expire without compensation in any case upon
termination of the service or employment agreement by the beneficiary himself or if the service or
employment agreement has been terminated by the Company for cause. Any PSR of a beneficiary that
have not yet vested shall persist in any case upon termination of the service or employment agreement
by the Company due to business operations. In cases of termination of the service or employment
agreement in mutual consent it is up to the sole discretion of the Executive Board or the Supervisory
Board to decide whether the PSR of the beneficiary that have not vested yet at that point in time shall
persist. If a holder of vested PSR leaves the Company before the expiry date of these rights, he remains
entitled to these vested rights until the expiry date. In such case, the strike price of his rights from PSP
2014 and PSP 2015 will be limited to the arithmetic average of the Xetra closing rates at the Frankfurt
stock exchange of the five consecutive trading days prior to the final termination day of his employment
agreement with the Company.
In case of a takeover or a mandatory offer for the shares of the Company in accordance with the WpÜG,
the holders of vested PSR become entitled to exercise these rights completely. This also applies if the
waiting period for these rights has not expired yet. The exercise right for the PSR holder will only apply
if the offered consideration consists solely of a cash settlement and if the bidder has gained control over
the Company. In such a takeover case, the PSR premium equals the difference between the cash amount
which was finally offered to the shareholders as part of a takeover or a mandatory offer and the base
value of the PSR. However, the limitation of the PSR premium to EUR 8.00 (PSP 2013), EUR 12.00 (PSP
2014), and EUR 15.00 (PSP 2015) will still apply in such case.
102 EPIGENOMICS ANNUAL REPORT 2016
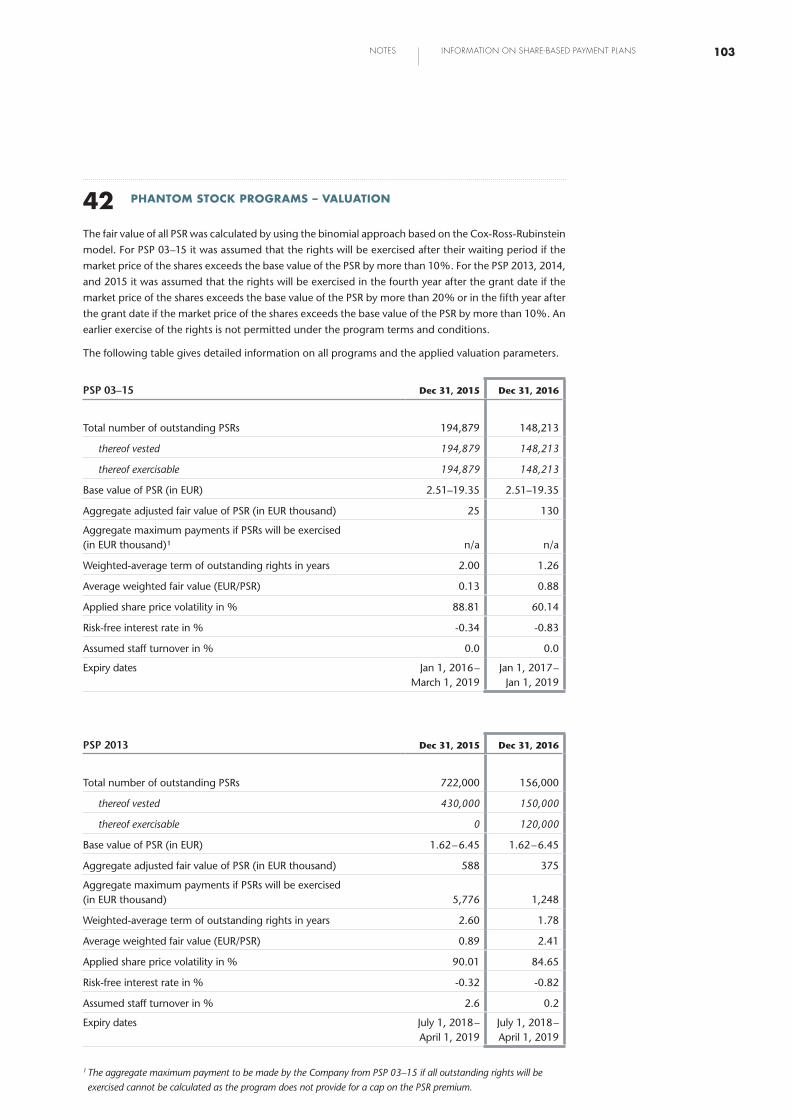
42 PHANTOM STOCK PROGRAMS – VALUATION
The fair value of all PSR was calculated by using the binomial approach based on the Cox-Ross-Rubinstein
model. For PSP 03–15 it was assumed that the rights will be exercised after their waiting period if the
market price of the shares exceeds the base value of the PSR by more than 10%. For the PSP 2013, 2014,
and 2015 it was assumed that the rights will be exercised in the fourth year after the grant date if the
market price of the shares exceeds the base value of the PSR by more than 20% or in the fifth year after
the grant date if the market price of the shares exceeds the base value of the PSR by more than 10%. An
earlier exercise of the rights is not permitted under the program terms and conditions.
The following table gives detailed information on all programs and the applied valuation parameters.
PSP 03–15 Dec 31, 2015 Dec 31, 2016
Total number of outstanding PSRs 194,879 148,213
thereof vested 194,879 148,213
thereof exercisable 194,879 148,213
Base value of PSR (in EUR) 2.51–19.35 2.51–19.35
Aggregate adjusted fair value of PSR (in EUR thousand) 25 130
Aggregate maximum payments if PSRs will be exercised (in EUR thousand)¹ n/a n/a
Weighted-average term of outstanding rights in years 2.00 1.26
Average weighted fair value (EUR/PSR) 0.13 0.88
Applied share price volatility in % 88.81 60.14
Risk-free interest rate in % -0.34 -0.83
Assumed staff turnover in % 0.0 0.0
Expiry dates Jan 1, 2016 – March 1, 2019
Jan 1, 2017 – Jan 1, 2019
PSP 2013 Dec 31, 2015 Dec 31, 2016
Total number of outstanding PSRs 722,000 156,000
thereof vested 430,000 150,000
thereof exercisable 0 120,000
Base value of PSR (in EUR) 1.62 – 6.45 1.62 – 6.45
Aggregate adjusted fair value of PSR (in EUR thousand) 588 375
Aggregate maximum payments if PSRs will be exercised (in EUR thousand) 5,776 1,248
Weighted-average term of outstanding rights in years 2.60 1.78
Average weighted fair value (EUR/PSR) 0.89 2.41
Applied share price volatility in % 90.01 84.65
Risk-free interest rate in % -0.32 -0.82
Assumed staff turnover in % 2.6 0.2
Expiry dates July 1, 2018 – April 1, 2019
July 1, 2018 – April 1, 2019
1 The aggregate maximum payment to be made by the Company from PSP 03–15 if all outstanding rights will be exercised cannot be calculated as the program does not provide for a cap on the PSR premium.
103NOTES INFORMATION ON SHARE-BASED PAYMENT PLANS
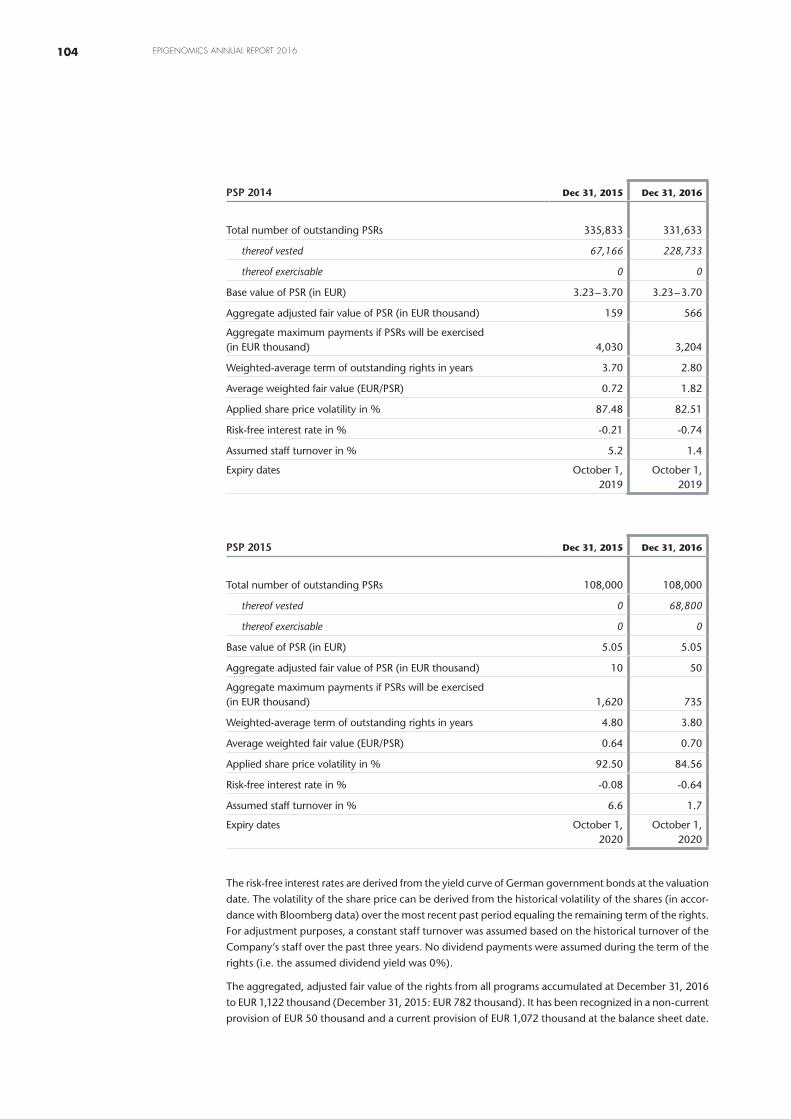
PSP 2014 Dec 31, 2015 Dec 31, 2016
Total number of outstanding PSRs 335,833 331,633
thereof vested 67,166 228,733
thereof exercisable 0 0
Base value of PSR (in EUR) 3.23 – 3.70 3.23 – 3.70
Aggregate adjusted fair value of PSR (in EUR thousand) 159 566
Aggregate maximum payments if PSRs will be exercised (in EUR thousand) 4,030 3,204
Weighted-average term of outstanding rights in years 3.70 2.80
Average weighted fair value (EUR/PSR) 0.72 1.82
Applied share price volatility in % 87.48 82.51
Risk-free interest rate in % -0.21 -0.74
Assumed staff turnover in % 5.2 1.4
Expiry dates October 1, 2019
October 1, 2019
PSP 2015 Dec 31, 2015 Dec 31, 2016
Total number of outstanding PSRs 108,000 108,000
thereof vested 0 68,800
thereof exercisable 0 0
Base value of PSR (in EUR) 5.05 5.05
Aggregate adjusted fair value of PSR (in EUR thousand) 10 50
Aggregate maximum payments if PSRs will be exercised (in EUR thousand) 1,620 735
Weighted-average term of outstanding rights in years 4.80 3.80
Average weighted fair value (EUR/PSR) 0.64 0.70
Applied share price volatility in % 92.50 84.56
Risk-free interest rate in % -0.08 -0.64
Assumed staff turnover in % 6.6 1.7
Expiry dates October 1, 2020
October 1, 2020
The risk-free interest rates are derived from the yield curve of German government bonds at the valuation
date. The volatility of the share price can be derived from the historical volatility of the shares (in accor-
dance with Bloomberg data) over the most recent past period equaling the remaining term of the rights.
For adjustment purposes, a constant staff turnover was assumed based on the historical turnover of the
Company’s staff over the past three years. No dividend payments were assumed during the term of the
rights (i.e. the assumed dividend yield was 0%).
The aggregated, adjusted fair value of the rights from all programs accumulated at December 31, 2016
to EUR 1,122 thousand (December 31, 2015: EUR 782 thousand). It has been recognized in a non-current
provision of EUR 50 thousand and a current provision of EUR 1,072 thousand at the balance sheet date.
104 EPIGENOMICS ANNUAL REPORT 2016
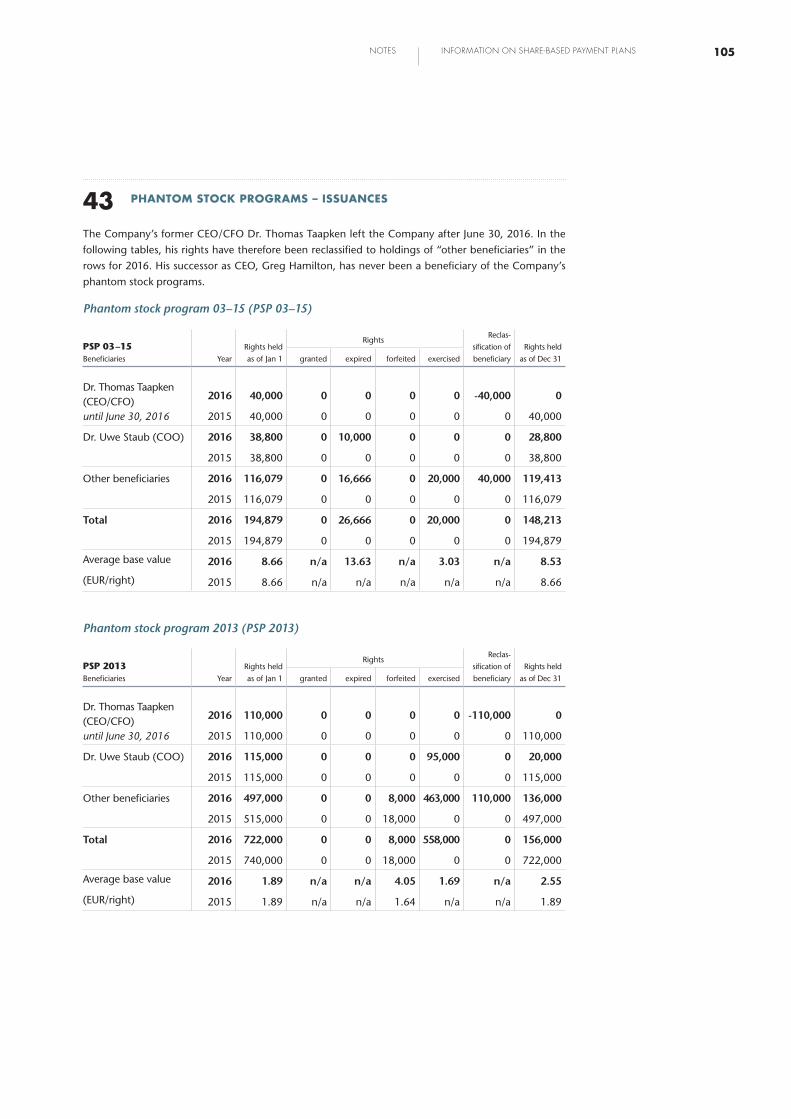
43 PHANTOM STOCK PROGRAMS – ISSUANCES
The Company’s former CEO/CFO Dr. Thomas Taapken left the Company after June 30, 2016. In the
following tables, his rights have therefore been reclassified to holdings of “other beneficiaries” in the
rows for 2016. His successor as CEO, Greg Hamilton, has never been a beneficiary of the Company’s
phantom stock programs.
Phantom stock program 03–15 (PSP 03–15)
PSP 03 –15 Beneficiaries
Year
Rights held
as of Jan 1
RightsReclas-
sification of
beneficiary
Rights held
as of Dec 31granted expired forfeited exercised
Dr. Thomas Taapken (CEO/CFO)until June 30, 2016
2016 40,000 0 0 0 0 -40,000 0
2015 40,000 0 0 0 0 0 40,000
Dr. Uwe Staub (COO) 2016 38,800 0 10,000 0 0 0 28,800
2015 38,800 0 0 0 0 0 38,800
Other beneficiaries 2016 116,079 0 16,666 0 20,000 40,000 119,413
2015 116,079 0 0 0 0 0 116,079
Total 2016 194,879 0 26,666 0 20,000 0 148,213
2015 194,879 0 0 0 0 0 194,879
Average base value 2016 8.66 n/a 13.63 n/a 3.03 n/a 8.53
(EUR/right) 2015 8.66 n/a n/a n/a n/a n/a 8.66
Phantom stock program 2013 (PSP 2013)
PSP 2013 Beneficiaries
Year
Rights held
as of Jan 1
RightsReclas-
sification of
beneficiary
Rights held
as of Dec 31granted expired forfeited exercised
Dr. Thomas Taapken (CEO/CFO)until June 30, 2016
2016 110,000 0 0 0 0 -110,000 0
2015 110,000 0 0 0 0 0 110,000
Dr. Uwe Staub (COO) 2016 115,000 0 0 0 95,000 0 20,000
2015 115,000 0 0 0 0 0 115,000
Other beneficiaries 2016 497,000 0 0 8,000 463,000 110,000 136,000
2015 515,000 0 0 18,000 0 0 497,000
Total 2016 722,000 0 0 8,000 558,000 0 156,000
2015 740,000 0 0 18,000 0 0 722,000
Average base value 2016 1.89 n/a n/a 4.05 1.69 n/a 2.55
(EUR/right) 2015 1.89 n/a n/a 1.64 n/a n/a 1.89
105NOTES INFORMATION ON SHARE-BASED PAYMENT PLANS
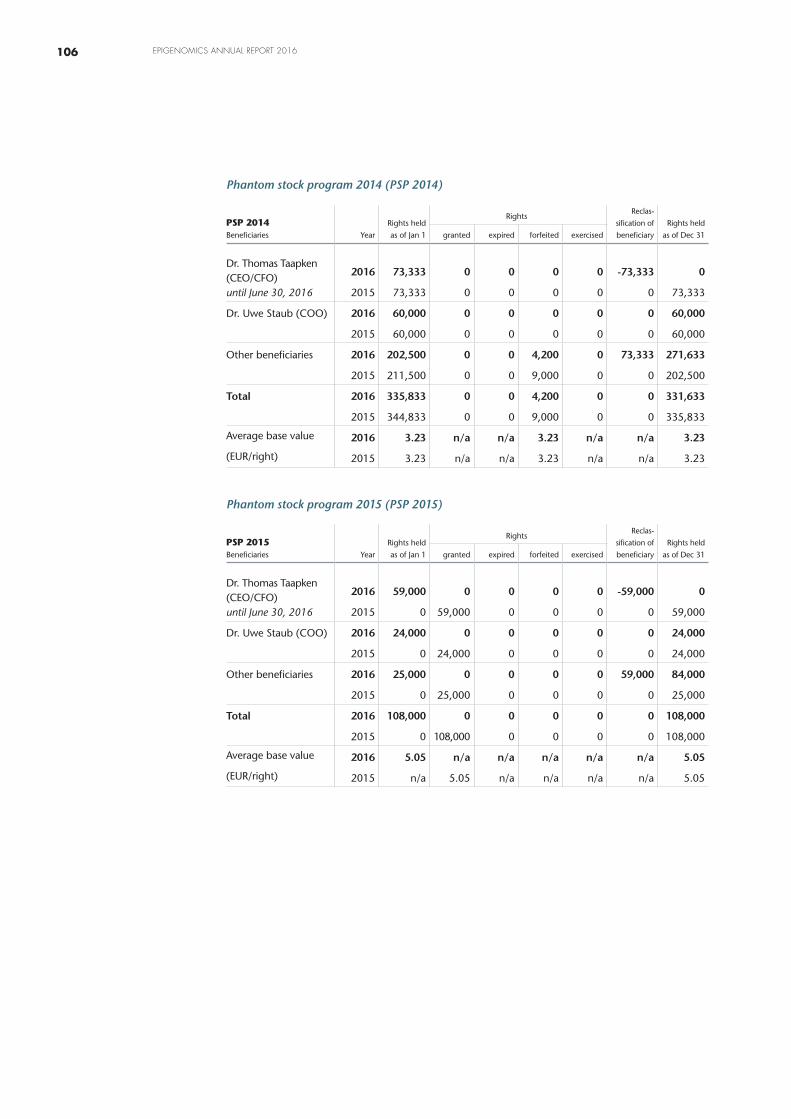
Phantom stock program 2014 (PSP 2014)
PSP 2014 Beneficiaries
Year
Rights held
as of Jan 1
RightsReclas-
sification of
beneficiary
Rights held
as of Dec 31granted expired forfeited exercised
Dr. Thomas Taapken (CEO/CFO)until June 30, 2016
2016 73,333 0 0 0 0 -73,333 0
2015 73,333 0 0 0 0 0 73,333
Dr. Uwe Staub (COO) 2016 60,000 0 0 0 0 0 60,000
2015 60,000 0 0 0 0 0 60,000
Other beneficiaries 2016 202,500 0 0 4,200 0 73,333 271,633
2015 211,500 0 0 9,000 0 0 202,500
Total 2016 335,833 0 0 4,200 0 0 331,633
2015 344,833 0 0 9,000 0 0 335,833
Average base value 2016 3.23 n/a n/a 3.23 n/a n/a 3.23
(EUR/right) 2015 3.23 n/a n/a 3.23 n/a n/a 3.23
Phantom stock program 2015 (PSP 2015)
PSP 2015 Beneficiaries
Year
Rights held
as of Jan 1
RightsReclas-
sification of
beneficiary
Rights held
as of Dec 31granted expired forfeited exercised
Dr. Thomas Taapken (CEO/CFO)until June 30, 2016
2016 59,000 0 0 0 0 -59,000 0
2015 0 59,000 0 0 0 0 59,000
Dr. Uwe Staub (COO) 2016 24,000 0 0 0 0 0 24,000
2015 0 24,000 0 0 0 0 24,000
Other beneficiaries 2016 25,000 0 0 0 0 59,000 84,000
2015 0 25,000 0 0 0 0 25,000
Total 2016 108,000 0 0 0 0 0 108,000
2015 0 108,000 0 0 0 0 108,000
Average base value 2016 5.05 n/a n/a n/a n/a n/a 5.05
(EUR/right) 2015 n/a 5.05 n/a n/a n/a n/a 5.05
106 EPIGENOMICS ANNUAL REPORT 2016
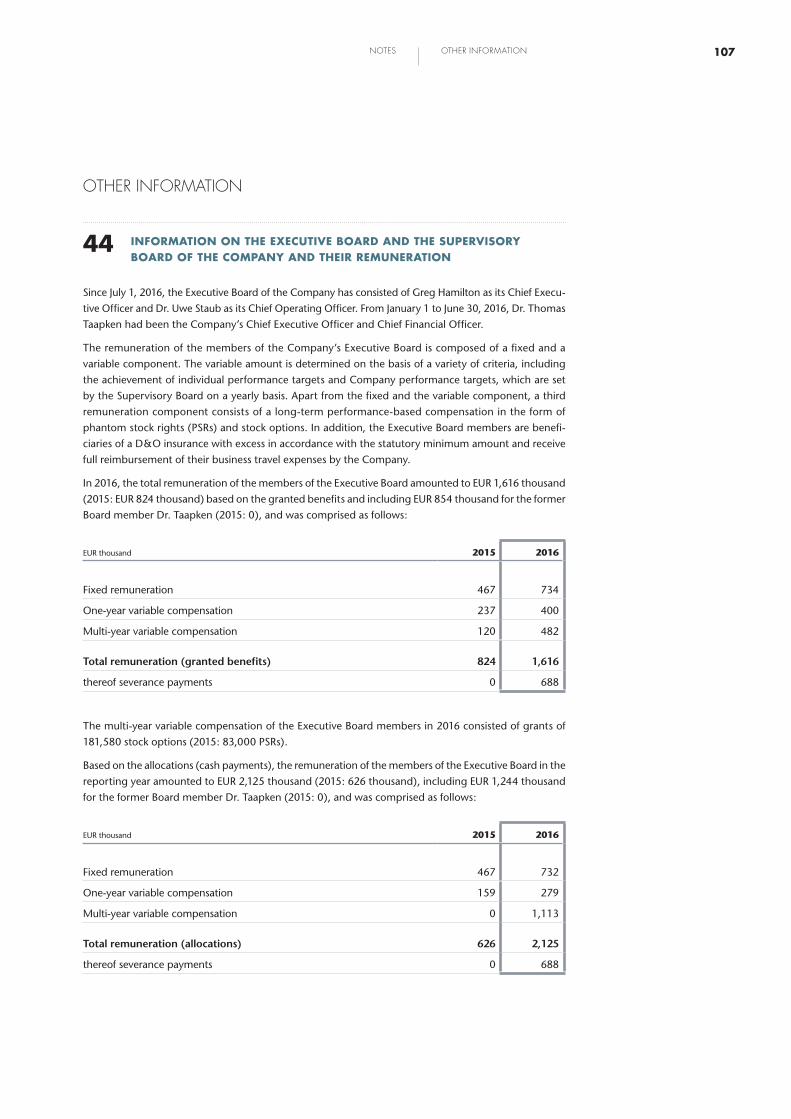
OTHER INFORMATION
44 INFORMATION ON THE EXECUTIVE BOARD AND THE SUPERVISORY BOARD OF THE COMPANY AND THEIR REMUNERATION
Since July 1, 2016, the Executive Board of the Company has consisted of Greg Hamilton as its Chief Execu-
tive Officer and Dr. Uwe Staub as its Chief Operating Officer. From January 1 to June 30, 2016, Dr. Thomas
Taapken had been the Company’s Chief Executive Officer and Chief Financial Officer.
The remuneration of the members of the Company’s Executive Board is composed of a fixed and a
variable component. The variable amount is determined on the basis of a variety of criteria, including
the achievement of individual performance targets and Company performance targets, which are set
by the Supervisory Board on a yearly basis. Apart from the fixed and the variable component, a third
remuneration component consists of a long-term performance-based compensation in the form of
phantom stock rights (PSRs) and stock options. In addition, the Executive Board members are benefi-
ciaries of a D&O insurance with excess in accordance with the statutory minimum amount and receive
full reimbursement of their business travel expenses by the Company.
In 2016, the total remuneration of the members of the Executive Board amounted to EUR 1,616 thousand
(2015: EUR 824 thousand) based on the granted benefits and including EUR 854 thousand for the former
Board member Dr. Taapken (2015: 0), and was comprised as follows:
EUR thousand 2015 2016
Fixed remuneration 467 734
One-year variable compensation 237 400
Multi-year variable compensation 120 482
Total remuneration (granted benefits) 824 1,616
thereof severance payments 0 688
The multi-year variable compensation of the Executive Board members in 2016 consisted of grants of
181,580 stock options (2015: 83,000 PSRs).
Based on the allocations (cash payments), the remuneration of the members of the Executive Board in the
reporting year amounted to EUR 2,125 thousand (2015: 626 thousand), including EUR 1,244 thousand
for the former Board member Dr. Taapken (2015: 0), and was comprised as follows:
EUR thousand 2015 2016
Fixed remuneration 467 732
One-year variable compensation 159 279
Multi-year variable compensation 0 1,113
Total remuneration (allocations) 626 2,125
thereof severance payments 0 688
107NOTES OTHER INFORMATION
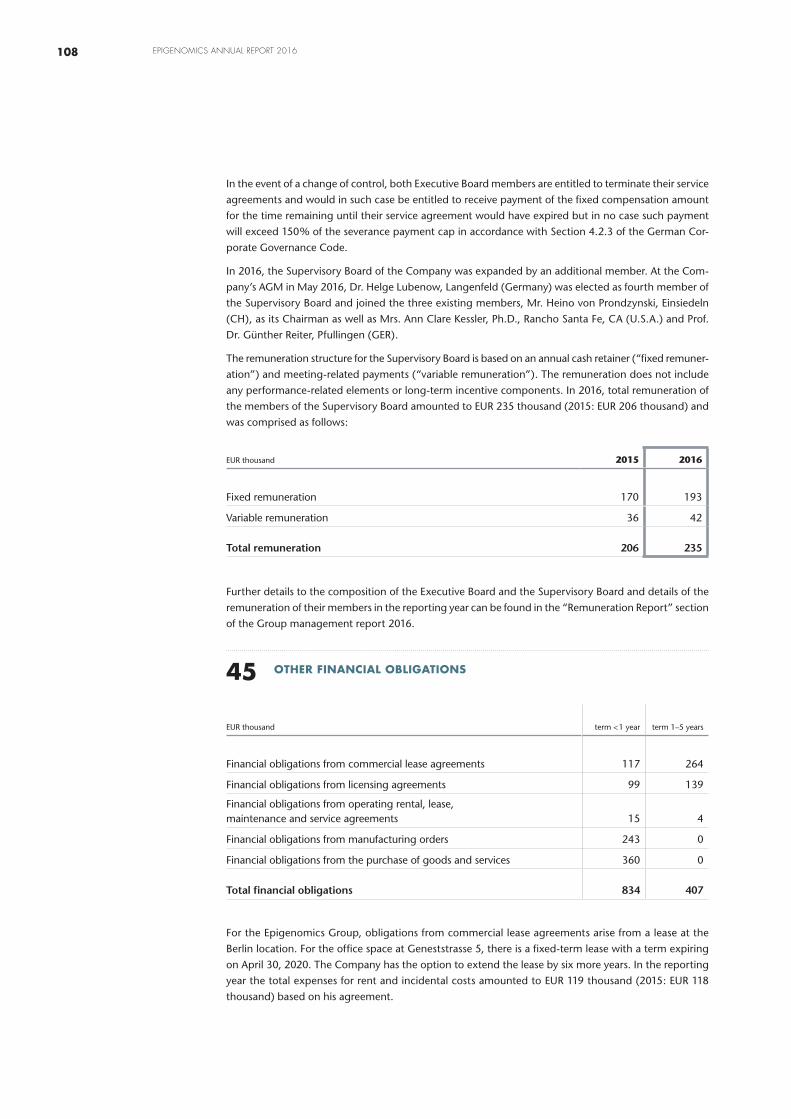
In the event of a change of control, both Executive Board members are entitled to terminate their service
agreements and would in such case be entitled to receive payment of the fixed compensation amount
for the time remaining until their service agreement would have expired but in no case such payment
will exceed 150% of the severance payment cap in accordance with Section 4.2.3 of the German Cor-
porate Governance Code.
In 2016, the Supervisory Board of the Company was expanded by an additional member. At the Com-
pany’s AGM in May 2016, Dr. Helge Lubenow, Langenfeld (Germany) was elected as fourth member of
the Supervisory Board and joined the three existing members, Mr. Heino von Prondzynski, Einsiedeln
(CH), as its Chairman as well as Mrs. Ann Clare Kessler, Ph.D., Rancho Santa Fe, CA (U.S.A.) and Prof.
Dr. Günther Reiter, Pfullingen (GER).
The remuneration structure for the Supervisory Board is based on an annual cash retainer (“fixed remuner-
ation”) and meeting-related payments (“variable remuneration”). The remuneration does not include
any performance-related elements or long-term incentive components. In 2016, total remuneration of
the members of the Supervisory Board amounted to EUR 235 thousand (2015: EUR 206 thousand) and
was comprised as follows:
EUR thousand 2015 2016
Fixed remuneration 170 193
Variable remuneration 36 42
Total remuneration 206 235
Further details to the composition of the Executive Board and the Supervisory Board and details of the
remuneration of their members in the reporting year can be found in the “Remuneration Report” section
of the Group management report 2016.
45 OTHER FINANCIAL OBLIGATIONS
EUR thousand term < 1 year term 1–5 years
Financial obligations from commercial lease agreements 117 264
Financial obligations from licensing agreements 99 139
Financial obligations from operating rental, lease, maintenance and service agreements 15 4
Financial obligations from manufacturing orders 243 0
Financial obligations from the purchase of goods and services 360 0
Total financial obligations 834 407
For the Epigenomics Group, obligations from commercial lease agreements arise from a lease at the
Berlin location. For the office space at Geneststrasse 5, there is a fixed-term lease with a term expiring
on April 30, 2020. The Company has the option to extend the lease by six more years. In the reporting
year the total expenses for rent and incidental costs amounted to EUR 119 thousand (2015: EUR 118
thousand) based on his agreement.
108 EPIGENOMICS ANNUAL REPORT 2016
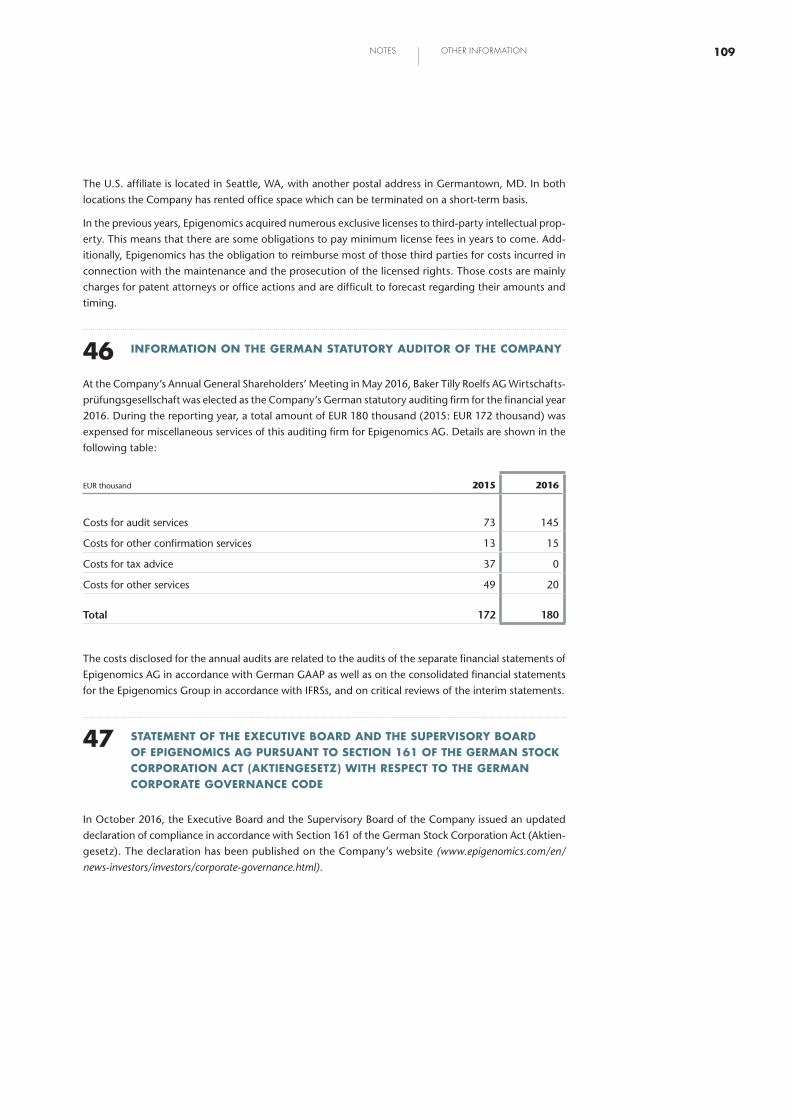
The U.S. affiliate is located in Seattle, WA, with another postal address in Germantown, MD. In both
locations the Company has rented office space which can be terminated on a short-term basis.
In the previous years, Epigenomics acquired numerous exclusive licenses to third-party intellectual prop-
erty. This means that there are some obligations to pay minimum license fees in years to come. Add-
itionally, Epigenomics has the obligation to reimburse most of those third parties for costs incurred in
connection with the maintenance and the prosecution of the licensed rights. Those costs are mainly
charges for patent attorneys or office actions and are difficult to forecast regarding their amounts and
timing.
46 INFORMATION ON THE GERMAN STATUTORY AUDITOR OF THE COMPANY
At the Company’s Annual General Shareholders’ Meeting in May 2016, Baker Tilly Roelfs AG Wirtschafts-
prüfungsgesellschaft was elected as the Company’s German statutory auditing firm for the financial year
2016. During the reporting year, a total amount of EUR 180 thousand (2015: EUR 172 thousand) was
expensed for miscellaneous services of this auditing firm for Epigenomics AG. Details are shown in the
following table:
EUR thousand 2015 2016
Costs for audit services 73 145
Costs for other confirmation services 13 15
Costs for tax advice 37 0
Costs for other services 49 20
Total 172 180
The costs disclosed for the annual audits are related to the audits of the separate financial statements of
Epigenomics AG in accordance with German GAAP as well as on the consolidated financial statements
for the Epigenomics Group in accordance with IFRSs, and on critical reviews of the interim statements.
47 STATEMENT OF THE EXECUTIVE BOARD AND THE SUPERVISORY BOARD OF EPIGENOMICS AG PURSUANT TO SECTION 161 OF THE GERMAN STOCK CORPORATION ACT (AKTIENGESETZ) WITH RESPECT TO THE GERMAN CORPORATE GOVERNANCE CODE
In October 2016, the Executive Board and the Supervisory Board of the Company issued an updated
declaration of compliance in accordance with Section 161 of the German Stock Corporation Act (Aktien-
gesetz). The declaration has been published on the Company’s website (www.epigenomics.com/en/
news-investors/investors/corporate-governance.html).
109NOTES OTHER INFORMATION
48 INFORMATION ON OTHER TRANSACTIONS WITH RELATED PARTIES
At the reporting date, the Company’s payables due to members of its Executive Board amounted to EUR 4
thousand (Dec 31, 2015: EUR 0) and the liabilities due to members of its Supervisory Board amounted
to EUR 144 thousand (Dec 31, 2015: EUR 0). Apart from that, there were no other transactions with
related parties during the reporting year.
49 REPORT ON POST-BALANCE SHEET DATE EVENTS
No events occurred after the balance sheet date which could materially affect the financial, the asset, or
the earnings situation of the Company or its risk assessment.
50 CLEARED FOR PUBLICATION
These consolidated financial statements were approved and cleared for publication by the Executive
Board of the Company on April 3, 2017.
Berlin, April 3, 2017
The Executive Board
110 EPIGENOMICS ANNUAL REPORT 2016

RESPONSIBILITY STATEMENT
To the best of our knowledge, and in accordance with the applicable reporting principles, the consoli-
dated financial statements 2016 give a true and fair view of the assets, liabilities, financial position and
profit or loss of the Group, and the Group management report includes a fair review of the development
and performance of the business and the position of the Group, together with a description of the
principal opportunities and risks associated with the expected development of the Group.
Berlin, April 3, 2017
The Executive Board
AUDITOR’S REPORT
We have audited the group financial statements – comprising the balance sheet, the comprehensive in-
come (statement of profit or loss and other comprehensive income), the statement of changes in equity,
the statement of cash flows and the notes to the financial statements – and the group management
report of the Epigenomics AG, Berlin, for the business year from January 1, 2016 to December 31, 2016.
The preparation of the group financial statements and the group management report in accordance
with IFRS, as adopted by the EU, as well as under German commercial law in accordance with § [Article]
315a (1) HGB [„Handelsgesetzbuch“, “German Commercial Code“] are the responsibility of the com-
pany’s management. Our responsibility is to express an opinion on the group financial statements and
on the group management report based on our audit.
We conducted our audit of the group financial statements in accordance with
§ [Article] 317 HGB and German generally accepted standards for the audit of financial statements
promulgated by the Institut der Wirtschaftsprüfer [Institute of Public Auditors in Germany] (IDW).
Those standards require that we plan and perform the audit such that misstatements materially affecting
the presentation of the net assets, financial position and results of operations in the group financial
statements in accordance with [German] principles of proper accounting and in the group management
report are detected with reasonable assurance. Knowledge of the business activities and the economic
and legal environment of the group and expectations as to possible misstatements are taken into account
in the determination of audit procedures. The effectiveness of the accounting-related internal control
system and the evidence supporting the disclosures in the group financial statements and the group
management report are examined primarily on a test basis within the framework of the audit. The audit
includes assessing the annual financial statements of those entities included in consolidation, the deter-
mination of entities to be included in consolidation, the accounting and consolidation principles used
and significant estimates made by management, as well as evaluating the overall presentation of the
group financial statements and group management report. We believe that our audit provides a reason-
able basis for our opinion.
111NOTES OTHER INFORMATION
RESPONSIBILITY STATEMENT
AUDITOR’S REPORT
Our audit has not led to any reservations.
In our opinion, based on the findings of our audit, the group financial statements comply with the
IFRS, as adopted by the EU, as well as with the additional requirements of German commercial law
pursuant to § [Article] 315a (1) HGB and give a true and fair view of the net assets, financial position
and results of operations of the group in accordance with these requirements. The group management
report is consistent with the group financial statements, complies with legal requirements, as a whole
provides a true view of the group’s position and suitably presents the opportunities and risks of future
development.
Without qualifying our opinion, we refer to the information included in the group management report.
In section 9.2.5 it is stated that the Company’s ability to continue as a going concern is dependent on
future cash inflows outside the operating business.
Munich, March 17, 2017 Baker Tilly Roelfs AG Wirtschaftsprüfungsgesellschaft
(Weissinger) (Muggenthaler)
Wirtschaftsprüfer Wirtschaftsprüferin
[German Public Auditor] [German Public Auditor]
112 EPIGENOMICS ANNUAL REPORT 2016

DISCLAIMER
This publication expressly or implicitly contains certain forward-looking statements concerning
Epi genomics AG and its business. Such statements involve certain known and unknown risks, uncertain-
ties and other factors which could cause the actual results, financial condition, performance or achieve-
ments of Epigenomics AG to be materially different from any future results, performance or achieve-
ments expressed or implied by such forward-looking statements. Epigenomics AG is providing this
statement as of this date and does not undertake to update any forward-looking statements contained
herein as a result of new information, future events or otherwise.
The information contained in this communication does not constitute nor imply an offer to sell or trans-
fer any product, and no product based on this technology is currently available for sale by Epigenomics
in the United States or in Canada. The analytical and clinical performance characteristics of any
Epigenomics product based on this technology which may be sold at some future time in the United
States have not been established.
113NOTES AUDITOR’S REPORT
DISCLAIMER
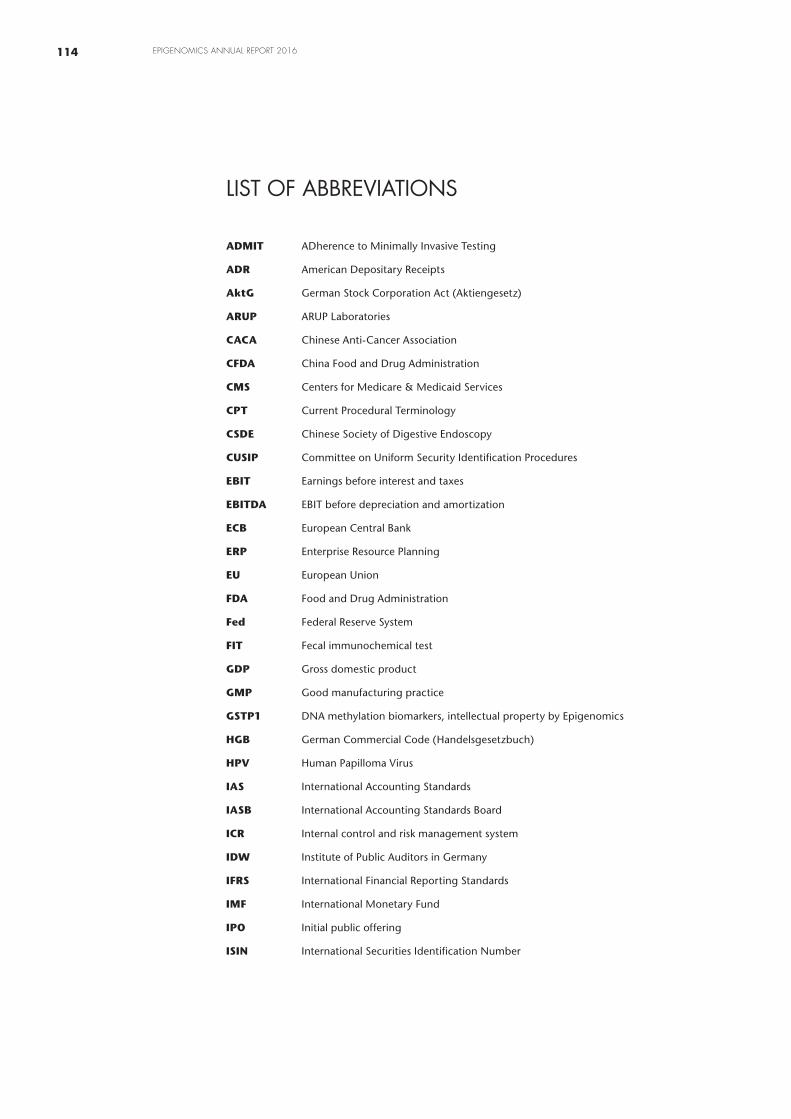
LIST OF ABBREVIATIONS
ADMIT ADherence to Minimally Invasive Testing
ADR American Depositary Receipts
AktG German Stock Corporation Act (Aktiengesetz)
ARUP ARUP Laboratories
CACA Chinese Anti-Cancer Association
CFDA China Food and Drug Administration
CMS Centers for Medicare & Medicaid Services
CPT Current Procedural Terminology
CSDE Chinese Society of Digestive Endoscopy
CUSIP Committee on Uniform Security Identification Procedures
EBIT Earnings before interest and taxes
EBITDA EBIT before depreciation and amortization
ECB European Central Bank
ERP Enterprise Resource Planning
EU European Union
FDA Food and Drug Administration
Fed Federal Reserve System
FIT Fecal immunochemical test
GDP Gross domestic product
GMP Good manufacturing practice
GSTP1 DNA methylation biomarkers, intellectual property by Epigenomics
HGB German Commercial Code (Handelsgesetzbuch)
HPV Human Papilloma Virus
IAS International Accounting Standards
IASB International Accounting Standards Board
ICR Internal control and risk management system
IDW Institute of Public Auditors in Germany
IFRS International Financial Reporting Standards
IMF International Monetary Fund
IPO Initial public offering
ISIN International Securities Identification Number
114 EPIGENOMICS ANNUAL REPORT 2016

ISO International Organization for Standardization
IVD In vitro diagnostic
JAMA Journal of the American Medical Association
KonTraG German Corporation Sector Supervision and Transparency Act
(Gesetz zur Kontrolle und Transparenz im Unternehmensbereich)
LDCT Low-dose spiral computed tomography
LDT Laboratory-developed test
M&A Mergers & Acquisitions
NCD National Coverage Determination
NGS Next Generation Sequencing
OECD Organisation for Economic Cooperation and Development
OTCQX Over-the-counter stock exchange
PAL Principal American Liaison
PCR Polymerase Chain Reaction
PMA Premarket approval
PSP Phantom stock program
PSR Phantom stock rights
PTGER4 DNA methylation biomarkers, intellectual property by Epigenomics
R&D Research and Development
Septin9 DNA methylation biomarkers, intellectual property by Epigenomics
SHOX2 DNA methylation biomarkers, intellectual property by Epigenomics
SO Stock options
SOP Stock option program(s)
SOPs Standard operating procedures
USPSTF United States Preventive Services Task Force
WpÜG German Securities Acquisition and Takeover Act
(Wertpapiererwerbs- und Übernahmegesetz)
115LIST OF ABBREVIATIONS

This annual report is also available in German.
IMPRINTCONCEPT & DESIGN
Impacct Communication GmbH www.impacct.de
EPIGENOMICS AG
Geneststrasse 5 10829 Berlin, Germany
Phone: +49 30 24345-0 Fax: +49 30 24345-555 [email protected]
116 EPIGENOMICS ANNUAL REPORT 2016


CONTACT
Epigenomics AG Geneststrasse 5 10829 Berlin, Germany
Phone: +49 30 24345-0 Fax: +49 30 24345-555 [email protected]
Investor & Public Relations Peter Vogt
Phone: +49 30 24345-386 Fax: +49 30 24345-555 [email protected]
CORPORATE CALENDAR
Interim Statement 2017 – January 1–March 31, 2017 . . . . . . . . . . . . . . . . . . . . . . . . . . . . Wednesday, May 10, 2017
Annual General Shareholders’ Meeting 2017 in Berlin . . . . . . . . . . . . . . . . . . . . . . . . . . . . . . . . . . .Tuesday, May 30, 2017
Half-yearly Report 2017 – January 1–June 30, 2017 . . . . . . . . . . . . . . . . . . . . . . . . . . . . . Wednesday, August 9, 2017
Interim Statement 2017 – January 1–September 30, 2017 . . . . . . . . Wednesday, November 15, 2017