annual report 2016 - assa abloy · pdf fileannual report 2016 the global leader in ......
TRANSCRIPT
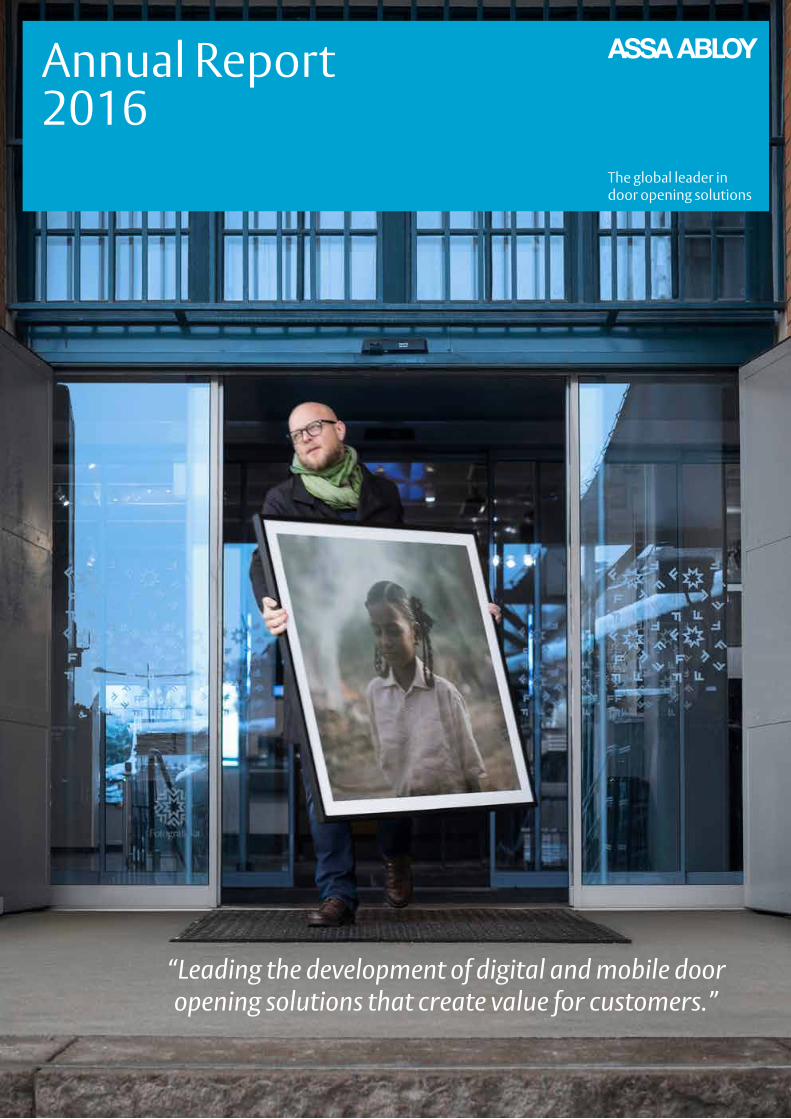
Annual Report 2016
The global leader in door opening solutions
“Leading the development of digital and mobile door opening solutions that create value for customers.”

Report on operationsASSA ABLOY in brief tabStatement by the President and CEO 2Market overview 6Value creation strategy 8Goals and outcomes 9Market presence 10Product leadership 16Cost-efficiency 22Profitable growth 26
DivisionsASSA ABLOY divisions 28EMEA division 29Americas division 30Asia Pacific division 31Global Technologies division 32Entrance Systems division 33
Sustainability reportSustainable development 36
Report of the Board of DirectorsReport of the Board of Directors 39
Significant risks and risk management 41Corporate governance 46Board of Directors 50Executive Team 52Internal control – financial reporting 54Remuneration guidelines for senior management 55
Financial statementsSales and income 56Consolidated income statement and Statement of comprehensive income 57Comments by division 58Results by division 59Financial position 60Consolidated balance sheet 61Cash flow 62Consolidated statement of cash flows 63Changes in consolidated equity 64Parent company financial statements 66Notes 68Comments on five years in summary 94Five years in summary 95Quarterly information 96Definitions of key ratios 97Proposed distribution of earnings 98Auditor’s report 99
Shareholder informationThe ASSA ABLOY share 104Information for shareholders 107
Contents
COVER PHOTO
Leading the development of digital and mobile security solutionsThe sliding doors that ASSA ABLOY delivered to Fotografiska museum in Stockholm help to reduce energy consumption in the building and provide a convenient entrance to museum visitors and employees. The door solu-tion also contributes to a comfortable indoor climate. Photographer Pieter Ten Hoopen is one of the highly esteemed artists whose works have been exhibited at the museum during the year.
ASSA ABLOY in brief
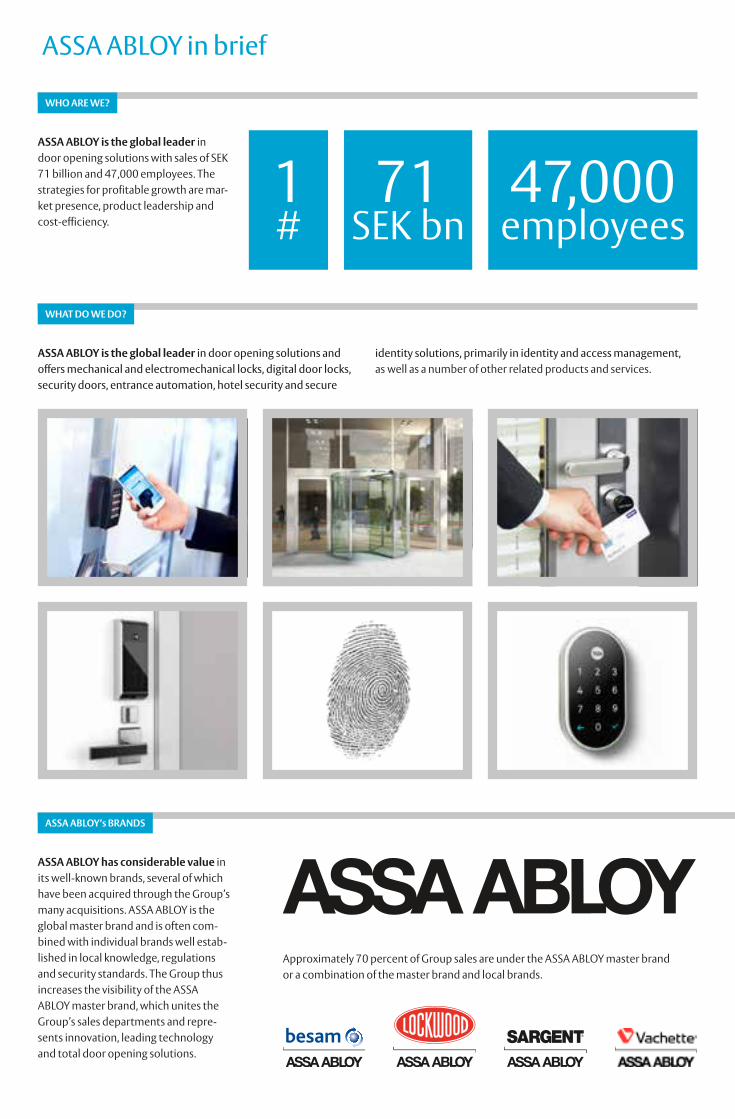
WHO ARE WE?
ASSA ABLOY’s BRANDS
WHAT DO WE DO?
ASSA ABLOY is the global leader in door opening solutions with sales of SEK 71 billion and 47,000 employees. The strategies for profitable growth are mar-ket presence, product leadership and cost-efficiency.
ASSA ABLOY has considerable value in its well-known brands, several of which have been acquired through the Group’s many acquisitions. ASSA ABLOY is the global master brand and is often com-bined with individual brands well estab-lished in local knowledge, regulations and security standards. The Group thus increases the visibility of the ASSA ABLOY master brand, which unites the Group’s sales departments and repre-sents innovation, leading technology and total door opening solutions.
ASSA ABLOY is the global leader in door opening solutions and offers mechanical and electromechanical locks, digital door locks, security doors, entrance automation, hotel security and secure
identity solutions, primarily in identity and access management, as well as a number of other related products and services.
47,000 employees
71 SEK bn
1 #
Approximately 70 percent of Group sales are under the ASSA ABLOY master brand or a combination of the master brand and local brands.
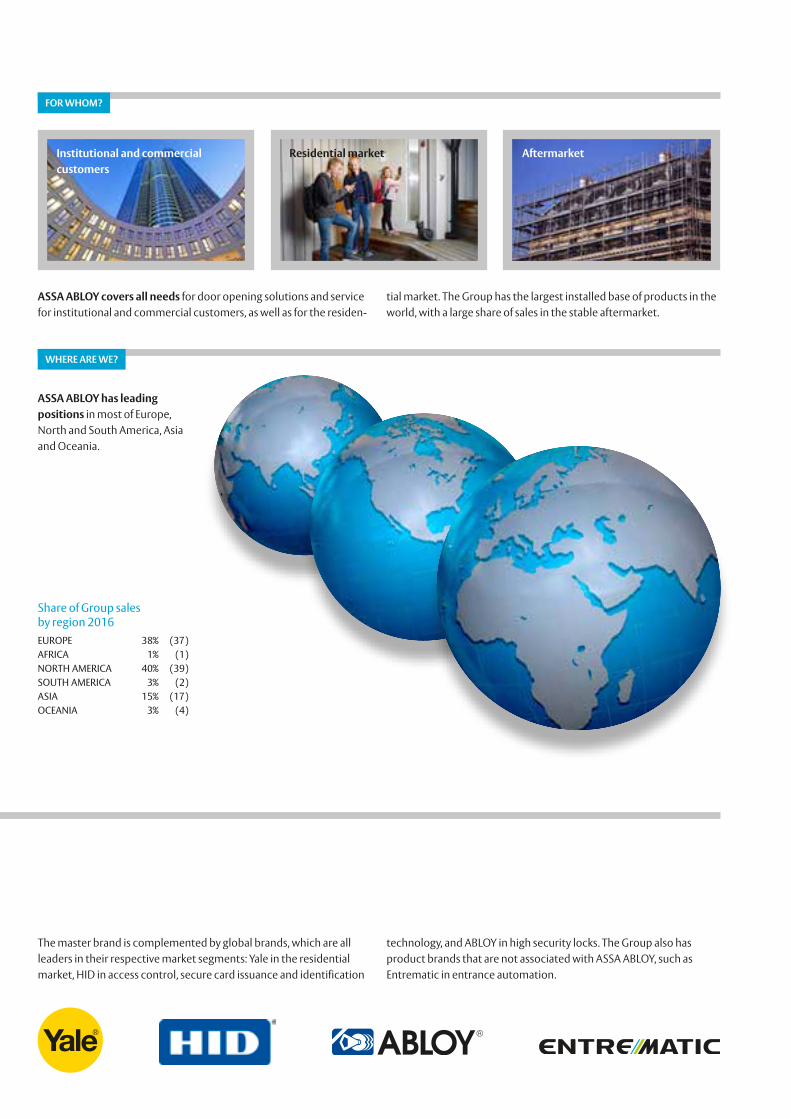
FOR WHOM?
WHERE ARE WE?
ASSA ABLOY has leading positions in most of Europe, North and South America, Asia and Oceania.
ASSA ABLOY covers all needs for door opening solutions and service for institutional and commercial customers, as well as for the residen-
tial market. The Group has the largest installed base of products in the world, with a large share of sales in the stable aftermarket.
Institutional and commercial customers
Residential market
The master brand is complemented by global brands, which are all leaders in their respective market segments: Yale in the residential market, HID in access control, secure card issuance and identification
technology, and ABLOY in high security locks. The Group also has product brands that are not associated with ASSA ABLOY, such as Entrematic in entrance automation.
Share of Group sales by region 2016EUROPE 38% (37)AFRICA 1% (1)NORTH AMERICA 40% (39)SOUTH AMERICA 3% (2)ASIA 15% (17)OCEANIA 3% (4)
Aftermarket
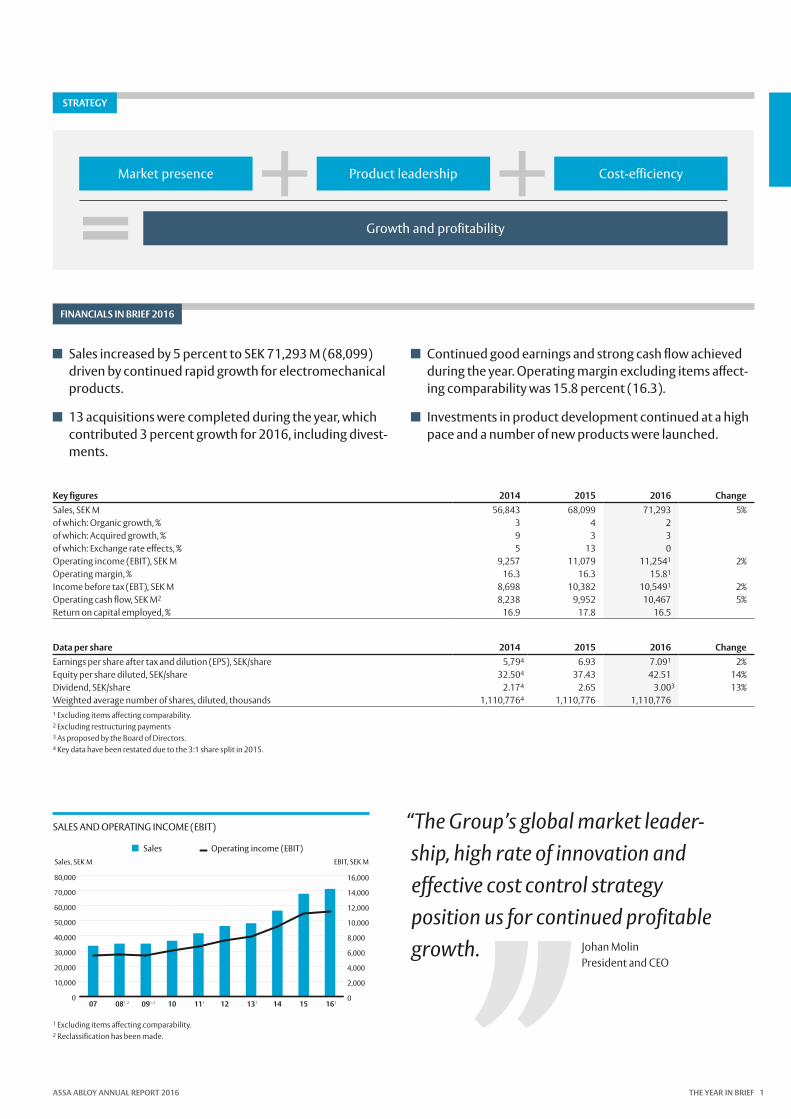
STRATEGY
FINANCIALS IN BRIEF 2016
Cost-efficiencyProduct leadershipMarket presence
Growth and profitability
Sales increased by 5 percent to SEK 71,293 M (68,099) driven by continued rapid growth for electromechanical products.
13 acquisitions were completed during the year, which contributed 3 percent growth for 2016, including divest-ments.
Continued good earnings and strong cash flow achieved during the year. Operating margin excluding items affect-ing comparability was 15.8 percent (16.3).
Investments in product development continued at a high pace and a number of new products were launched.
Key figures 2014 2015 2016 ChangeSales, SEK M 56,843 68,099 71,293 5%of which: Organic growth, % 3 4 2of which: Acquired growth, % 9 3 3of which: Exchange rate effects, % 5 13 0Operating income (EBIT), SEK M 9,257 11,079 11,2541 2%Operating margin, % 16.3 16.3 15.81
Income before tax (EBT), SEK M 8,698 10,382 10,5491 2%Operating cash flow, SEK M2 8,238 9,952 10,467 5%Return on capital employed, % 16.9 17.8 16.5
Data per share 2014 2015 2016 ChangeEarnings per share after tax and dilution (EPS), SEK/share 5,794 6.93 7.091 2%Equity per share diluted, SEK/share 32.504 37.43 42.51 14%Dividend, SEK/share 2.174 2.65 3.003 13%Weighted average number of shares, diluted, thousands 1,110,7764 1,110,776 1,110,7761 Excluding items affecting comparability. 2 Excluding restructuring payments3 As proposed by the Board of Directors. 4 Key data have been restated due to the 3:1 share split in 2015.
“The Group’s global market leader-ship, high rate of innovation and effective cost control strategy position us for continued profitable growth. Johan Molin
President and CEO
0
10,000
20,000
30,000
40,000
50,000
60,000
70,000
80,000
161514131211100908070
2,000
4,000
6,000
8,000
10,000
12,000
14,000
16,000
Sales, SEK M EBIT, SEK M
1 Excluding items affecting comparability.2 Reclassification has been made.
Sales Operating income (EBIT)
1, 2 1, 2 1 1 1
SALES AND OPERATING INCOME (EBIT)
ASSA ABLOY ANNUAL REPORT 2016 THE YEAR IN BRIEF 1
Statement by the President and CEO
Innovation drives our market leadership
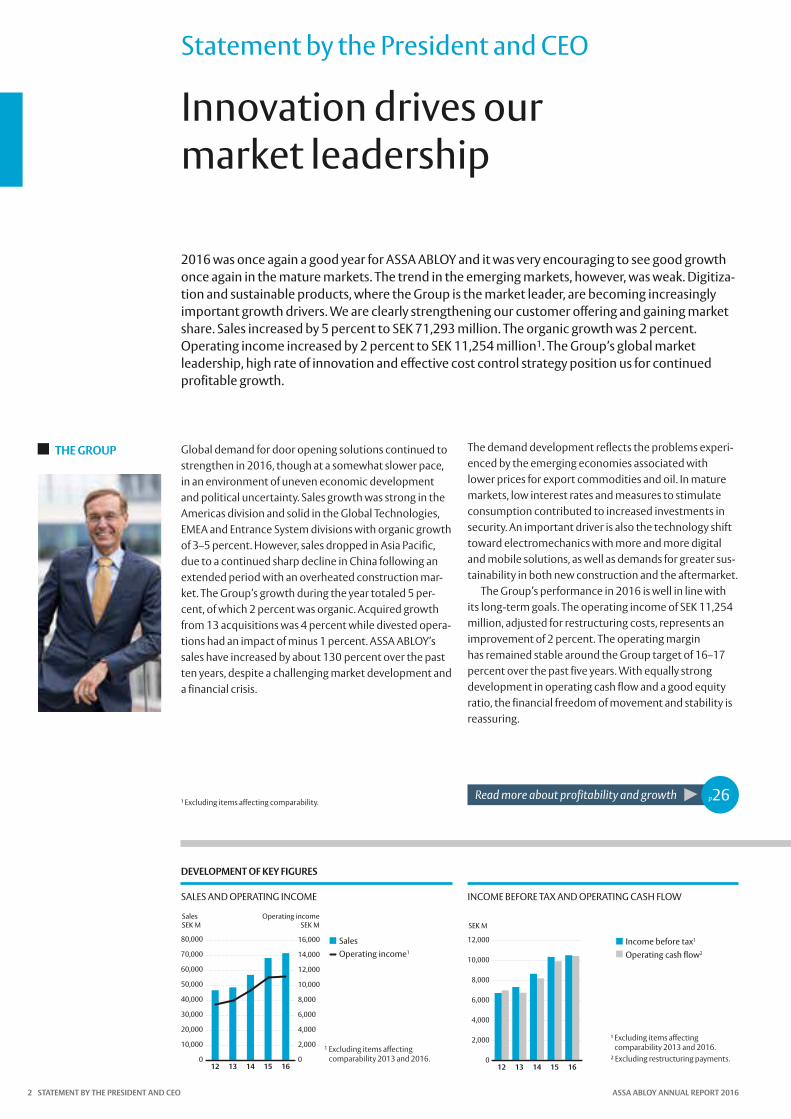
2016 was once again a good year for ASSA ABLOY and it was very encouraging to see good growth once again in the mature markets. The trend in the emerging markets, however, was weak. Digitiza-tion and sustainable products, where the Group is the market leader, are becoming increasingly important growth drivers. We are clearly strengthening our customer offering and gaining market share. Sales increased by 5 percent to SEK 71,293 million. The organic growth was 2 percent. Operating income increased by 2 percent to SEK 11,254 million1. The Group’s global market leadership, high rate of innovation and effective cost control strategy position us for continued profitable growth.
SEK MSales
SEK MOperating income
0
10,000
20,000
30,000
40,000
50,000
60,000
70,000
80,000
1615141312
SalesOperating income1
0
2,000
4,000
6,000
8,000
10,000
12,000
14,000
16,000
SALES AND OPERATING INCOME
1 Excluding items affecting comparability 2013 and 2016.
INCOME BEFORE TAX AND OPERATING CASH FLOW
SEK M
0
2,000
4,000
6,000
8,000
10,000
12,000
1615141312
Income before tax1
Operating cash flow2
¹ Excluding items affecting comparability 2013 and 2016.
² Excluding restructuring payments.
DEVELOPMENT OF KEY FIGURES
THE GROUP Global demand for door opening solutions continued to strengthen in 2016, though at a somewhat slower pace, in an environment of uneven economic development and political uncertainty. Sales growth was strong in the Americas division and solid in the Global Technologies, EMEA and Entrance System divisions with organic growth of 3–5 percent. However, sales dropped in Asia Pacific, due to a continued sharp decline in China following an extended period with an overheated construction mar-ket. The Group’s growth during the year totaled 5 per-cent, of which 2 percent was organic. Acquired growth from 13 acquisitions was 4 percent while divested opera-tions had an impact of minus 1 percent. ASSA ABLOY’s sales have increased by about 130 percent over the past ten years, despite a challenging market development and a financial crisis.
The demand development reflects the problems experi-enced by the emerging economies associated with lower prices for export commodities and oil. In mature markets, low interest rates and measures to stimulate consumption contributed to increased investments in security. An important driver is also the technology shift toward electromechanics with more and more digital and mobile solutions, as well as demands for greater sus-tainability in both new construction and the aftermarket.
The Group’s performance in 2016 is well in line with its long-term goals. The operating income of SEK 11,254 million, adjusted for restructuring costs, represents an improvement of 2 percent. The operating margin has remained stable around the Group target of 16–17 percent over the past five years. With equally strong development in operating cash flow and a good equity ratio, the financial freedom of movement and stability is reassuring.
Read more about profitability and growth p26¹ Excluding items affecting comparability.
STATEMENT BY THE PRESIDENT AND CEO ASSA ABLOY ANNUAL REPORT 20162

DEVELOPMENT OF EARNINGS PER SHARE1,2
Earnings per share has increased by almost 170 percent since 2006.
1 Excluding items affecting comparability.
2 Earnings per share has been restated due to the 3:1 share split in 2015.
SEK
0
1
2
3
4
5
6
7
8
16151413121110090807
THE DIVISIONS
“ASSA ABLOY is a product-driven company where innovation and product development are central to our target of 5 percent organic growth per year.”
The geographically varied demand trend influenced the performance in our divisions.
The EMEA division, with 23 percent of the Group’s total sales, has encountered a varied and subdued demand for several years, especially in southern Europe. Improvement was seen in 2016 with strong growth in Northern Europe and a recovery in Spain and parts of Eastern Europe. The UK and the Benelux countries also initiated a recovery during the year. In Africa, demand was good, while sales fell substantially in the Middle East. Organic growth of 3 percent (4) represents gains in mar-ket share. Five acquisitions contributed 4 percent (4) acquired growth and one divested operation had an effect of –4 percent. Demand for electromechanical solutions with ASSA ABLOY as market leader increased sharply.
The Americas division, with a share of 24 percent of the Group’s total sales, has experienced strong demand in the US for several years. This demand continued in 2016 in both the residential and the commercial mar-kets. Institutional demand also improved following some weak years. The technology shift is accelerating with a sharp increase in sales of digital door opening solutions. Growth was also very good in the door segment. Mexico and several other emerging markets in Central and South America continued to grow at a rapid pace. However, demand weakened in the major Brazilian market as a result of weak growth in the commodities sector and increased political instability. Organic growth in the division was 5 percent (7) and acquired 3 percent (2).
The Asia Pacific division, which accounts for 12 per-cent of the Group’s total sales, had a weak development. The main explanation is the development in China, where the construction market is undergoing a sharp correction after years of overheating. Unfortunately,
we also found accounting irregularities at some of our companies in China and we have made corrections in the accounting. The division is implementing substantial streamlining measures in China to adapt to lower demand. Sales growth continued to be good in most of the other Asian countries, especially in India where the Group is now building up broad market coverage. In Australia and New Zealand sales increased sharply. The division’s organic growth was –9 percent (–3), and –5 percent if adjusted for overstated sales in 2015. The acquired growth was 1 percent (9).
Global Technologies, which accounted for 13 percent of the Group’s total sales, is the Group’s global division for products and solutions in identity and access man-agement. Growth was strong in access control, GovID and Quantum Secure, lower in identification technology, though with improved demand from the institutional segment. The division plays a key role in the technology shift towards digital and mobile technologies, with cut-ting edge expertise and a strong focus on innovation and product development. Hospitality, which gathers together the division’s products and solutions for hotels and cruise ships, continued to show strong growth and profitability, delivering complete digital system solutions to several global hotel chains. Organic growth in the divi-sion was 3 percent (7) and acquired 3 percent (2).
Entrance Systems, which accounted for 28 percent of the Group’s total sales, is the Group’s division for com-plete entrance automation solutions. Entrance Systems continued to see strong sales growth in most segments in the US and in several emerging markets with the exception of China, where the decline continued during
Read more about the divisions p28
ASSA ABLOY ANNUAL REPORT 2016 STATEMENT BY THE PRESIDENT AND CEO 3
STRATEGIES the year. The improved demand in Europe from 2015 continued following several years of subdued growth, though not in the European residential market where the trend was once again negative. Growth was high in entrance automation, industrial and high-performance doors, and good for garage doors and warehouse and logistics solutions. The division’s new service concept has been highly successful. Organic growth in the division was 4 percent (5) and acquired 6 percent (1).
This year’s good growth and profitability show once again that the Group’s strategies work well under a variety of market conditions and that they are well sup-ported in the global development trends that define the future of ASSA ABLOY. These trends point to good pros-pects for continued profitable growth:
Urbanization and demographic changes will continue to provide long-term growth, especially in emerging markets, but most likely with temporary slowdowns. Billions of people will continue to seek prosperity with increased security needs at home and at work in the urban environment.
Digitization is rapidly shifting demand toward more electronic and mobile security solutions. ASSA ABLOY is leading this trend, which is accelerating in both new con-struction and the aftermarket, where the Group’s installed base of locks and doors is the largest in the world.
Sustainable and climate-smart solutions are a signifi-cant global demand trend. Locks, doors and door open-ing solutions play an important role in reducing operat-ing costs and achieving energy and other sustainability targets that apply to a growing number of buildings.
Automation and robotics are increasingly important for quality, security, sustainability and efficiency. ASSA ABLOY is running several Group projects to digitize and automate more and more production and information flows throughout the value chain.
Clearly digitization is an increasingly important force in the transformation of the security industry. Develop-ments in information technology and the networked and connected society are revolutionizing the way we pass through doors, how we identify ourselves to enter build-ings where we live, work and shop, and how we gain access to computers, tools and information in order to live our lives safely and securely. This is ASSA ABLOY’s business and for years we have been the leading force in these developments, thanks to our long-term focus on innovation and product development.
Digitization also permeates everything we do in the Group today, from the strategic decisions to the hands-on and concrete working day at every level of our value chain. From having first focused on cost-efficiency strate-gies, digitization has increasingly become a broader stra-tegic tool to streamline innovation, product develop-ment and production. And now we are in the middle of the next strategic step – strengthening our market pres-ence and customer offering by digitally integrating our relevant information flows and relationships with cus-tomers and other market participants. The result is a sig-nificant shift of resources throughout the Group to mar-keting, sales, service and greater customer benefit.
Market presenceOver the past ten years the strategy for market presence has been dominated by the focus on emerging markets. Its share of the Group’s total sales has increased from 12 percent in 2006 to 24 percent in 2016. We will continue to pursue this initiative, which largely relies on new con-struction and is subject to greater fluctuations in demand, such as the current slowdown in China. How-ever, as we build up this growing base, demand will shift to renovations and upgrades with an increased content of digital solutions, a much more stable business usually accompanied by higher profitability.
An essential aspect of our market success is a clear segmentation of the market in order to increase our cus-tomer focus. We support customers and other market participants with increasingly sophisticated digital tools for drawings and specifications. Demand is growing for sustainable and total door opening solutions, where the Group offers a world-leading product line. The number of specifiers continues to sharply increase, especially in the emerging markets. The number of projects requiring specifications is increasing at a rate of about 10 percent per year. The market is shifting toward more sales directly to end-customers. ASSA ABLOY is focusing on sales excel-lence procedures and its range of services, thereby strengthening its offering to the important aftermarket.
We continue to develop the ASSA ABLOY Group brand for a more cohesive offer, at the expense of the vast flora of local and regional brands. At the same time we are building up the Yale profile as the unifying brand for locks and doors for the private residential market, where inter-est in digital solutions is rapidly growing. The potential is very large, as electronic locks currently account for only a few percent of residential locks.
The digital trend is central to the Group’s efforts to be relevant and convenient for doing business. Our Seam-less Flow group-wide project for automated information flows allows a steadily increasing proportion of the staff to work directly providing customers with consulting, sales and service.
Finally, an essential component of the market pres-ence strategy is acquisitions. Through our global pres-ence and our wide product range we can often offer the best synergies with a proven model for integration. In 2016 we completed 13 acquisitions and acquired growth added SEK 2,592 million to Group sales, or 4 percent, excluding divested operations.
Product leadershipASSA ABLOY is a product-driven company where innova-tion and product development are central to our target of 5 percent organic growth per year. Over the past ten years the Group has greatly increased investments to double the pace of innovation and reduce costs. The goal of having at least 25 percent of total sales from products less than three years old has been exceeded for several years. In 2016 this figure was 30 percent for the Group.
Read more about the strategies p22p16p10
Statement by the President and CEO
STATEMENT BY THE PRESIDENT AND CEO ASSA ABLOY ANNUAL REPORT 20164
OUTLOOK
We engage in dialogue at an early stage with customers and other partners in development and competence centers worldwide to understand the development of needs and requirements. The Group’s common struc-tured process with its modular approach provides good synergies for the innovation initiative.
Digitization and mobility have been strong drivers for many years. Important initiatives include the Group-wide development platforms for products and solutions. One such initiative is Seos, a complete ecosystem for digital keys and smart mobile devices. Another is the wireless Aperio technology for cost-effective connection of several doors in an existing access control system.
The same drivers underlie the Group’s development of standardized and open software combined with physical lock solutions, which provide the functions customers want. Selling digital-based functionality, software, licenses and virtual keys opens up a large aftermarket with shorter life cycles and good profitability potential. As “digital homes” become increasingly common, the Group is working on development under the Yale brand on initiatives together with Google Nest and AT&T.
Sustainability is integrated into our product develop-ment from the concept stage to materials recycling. Customer demand is strong for climate-smart security solutions ranging from intelligent and sustainable doors to large systems solutions for buildings. The Group is developing entire eco-product ranges that focus on energy consumption and provide substantial materials and operational savings.
ASSA ABLOY’s innovation and product development was recognized once again this year by the US business magazine Forbes with a ranking on the list of the 100 most innovative companies.
Cost-efficiencyThe strategy to increase cost-efficiency involves radically reducing break-even costs through increased efficiency in all process and production stages. One ongoing basic activity involves the programs to streamline production at the many companies that the Group acquires each year. The aim is to have assembly plants close to customers in high-cost countries and to relocate component produc-tion to low-cost countries with an increased share of com-ponent sourcing. Since this initiative began in 2006, the Group has closed 76 plants, converted more than 100 plants to assembly and reduced staff by 12,162 people.
In 2016 the sixth such program began with the goal of closing 50 plants and offices over three years. The cost of the restructuring program is SEK 1,597 million with a pay-back period of less than three years. Another important strategy for reducing costs involves increasing sourcing based on long-term agreements and integration with sub-contractors. Professional purchasing teams manage sup-plier relationships in accordance with our code of conduct and environmental certification. With this approach the Group continues to create increasingly efficient and sus-tainable production processes and to free up resources for marketing close to customers.
The cost-efficiency initiative is expanded and deep-ened using lean practices and VA/VE analyses to simplify
material flows and avoid wasting materials. A new initia-tive began in 2016 to streamline logistics and transporta-tion services to customers and from suppliers. Substan-tial savings are possible, in part through the use of digital information technology.
Initiatives such as Seamless Flow, automation and digi-tization of information flows throughout the Group offer great potential. The aim is to reduce costs and resources in indirect support functions, where over 40 percent of employees work, by streamlining systems for product data management, orders and invoicing, purchasing, warehouse-logistics, payroll and e-commerce. The sav-ings will allow us to invest more resources in revenue-generating product development, marketing activities and the initiative to move staff close to the customers.
OutlookMy judgment is that the global economic trend remains weak. While the trend is favorable in North and South America as well as in parts of Europe, it is weak in many markets in Asia and the Middle East.
However, our strategy of expanding our market pres-ence, including in the emerging markets, remains unchanged. We are also continuing our investments in new products, especially in the growth area of electro-mechanics.
Our continued focus on good cost control provides us with good prospects for profitable growth in a challeng-ing global market. In closing I would like to warmly thank all of the employees who strive every day to make ASSA ABLOY the global leader in door opening solutions.
Stockholm February 1, 2017
Johan MolinPresident and CEO
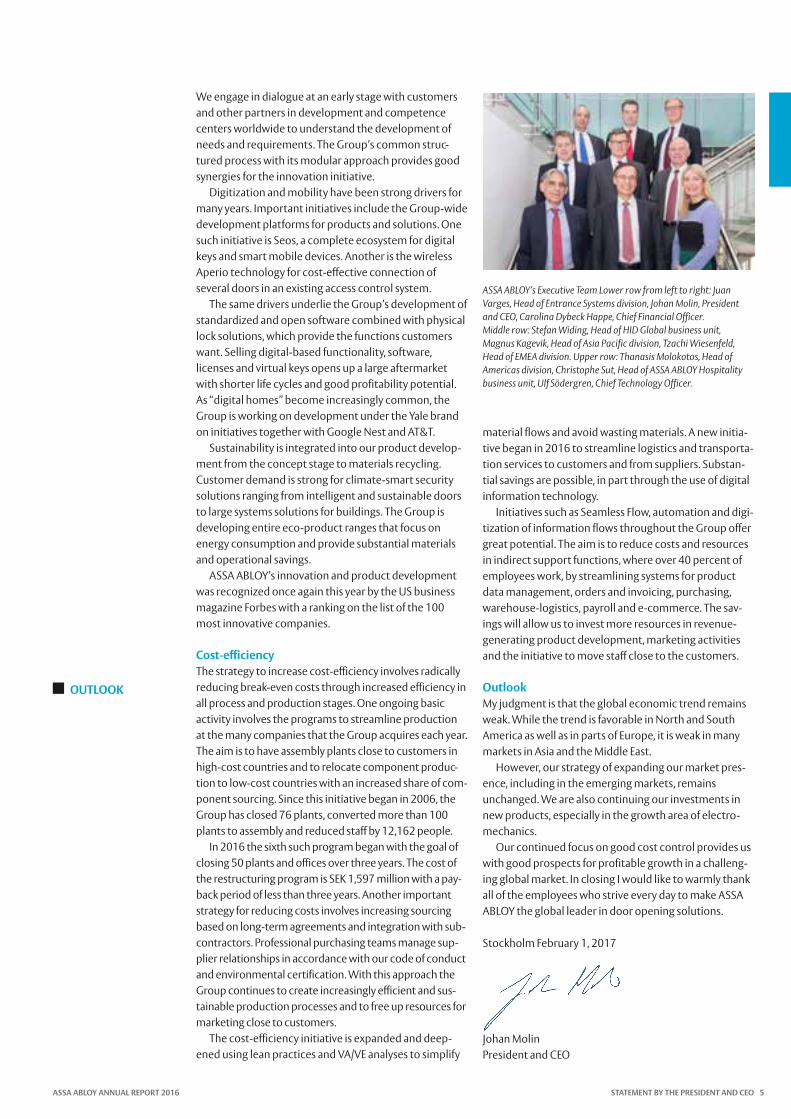
ASSA ABLOY’s Executive Team Lower row from left to right: Juan Varges, Head of Entrance Systems division, Johan Molin, President and CEO, Carolina Dybeck Happe, Chief Financial Officer.Middle row: Stefan Widing, Head of HID Global business unit, Magnus Kagevik, Head of Asia Pacific division, Tzachi Wiesenfeld, Head of EMEA division. Upper row: Thanasis Molokotos, Head of Americas division, Christophe Sut, Head of ASSA ABLOY Hospitality business unit, Ulf Södergren, Chief Technology Officer.
ASSA ABLOY ANNUAL REPORT 2016 STATEMENT BY THE PRESIDENT AND CEO 5

Market overview
Global trends driving demand in the industryDemand for ASSA ABLOY’s products is driven by the increasing need for safety and security as prosperity rises and urbanization continues. In addition, the demand for sustainable door opening solutions is growing, at the same time that technological developments increase the demand for digital and mobile security solutions.
OVERALL TRENDS
HOW THIS AFFECTS ASSA ABLOY
ASSA ABLOY’s RESPONSE
The global economy continues to grow, and the need for safety and security is steadily increasing. Current demand for security reflects the fundamental need for security that has been growing at a faster pace than the global economy for a long time and is predicted to continue to do so.
The prospects for the Group’s long-term growth are good, as global prosperity continues to increase. The market for ASSA ABLOY products is growing with a strong trend in the emerging markets where an increased need for new homes, workplaces and stores is driving demand for secure door opening solutions.
ASSA ABLOY has a well-established strategy for increas-ing its market presence in those countries and seg-ments where demand for safety and security is growing fastest. This strategy goes hand in hand with the Group’s product leadership strategy. ASSA ABLOY has become established as the largest supplier of innova-tive total door opening solutions.
Migration to cities increases the need for housing, offices and other workplaces, as well as commercial space for shopping and institutional facilities for educa-tion and health care. Demand is becoming increasingly advanced and digitized for both individual door locks and large security systems for buildings.
ASSA ABLOY has built up a leading position in the emerging markets for both new construction of hous-ing and for the needs of the institutional and commer-cial markets. With the largest installed base of locks in the world, the increased demand for upgrades, replace-ments and repairs provides conditions for good growth and stability.
Prosperity is largely created in the cities, where the new service jobs are created and where young people migrate for a better future. Estimates suggest that a billion people will become new city dwellers through 2025. At that point, 60 percent of the world’s popula-tion will be living in cities.
SECURITY NEEDS URBANIZATION
MARKET OVERVIEW ASSA ABLOY ANNUAL REPORT 20166
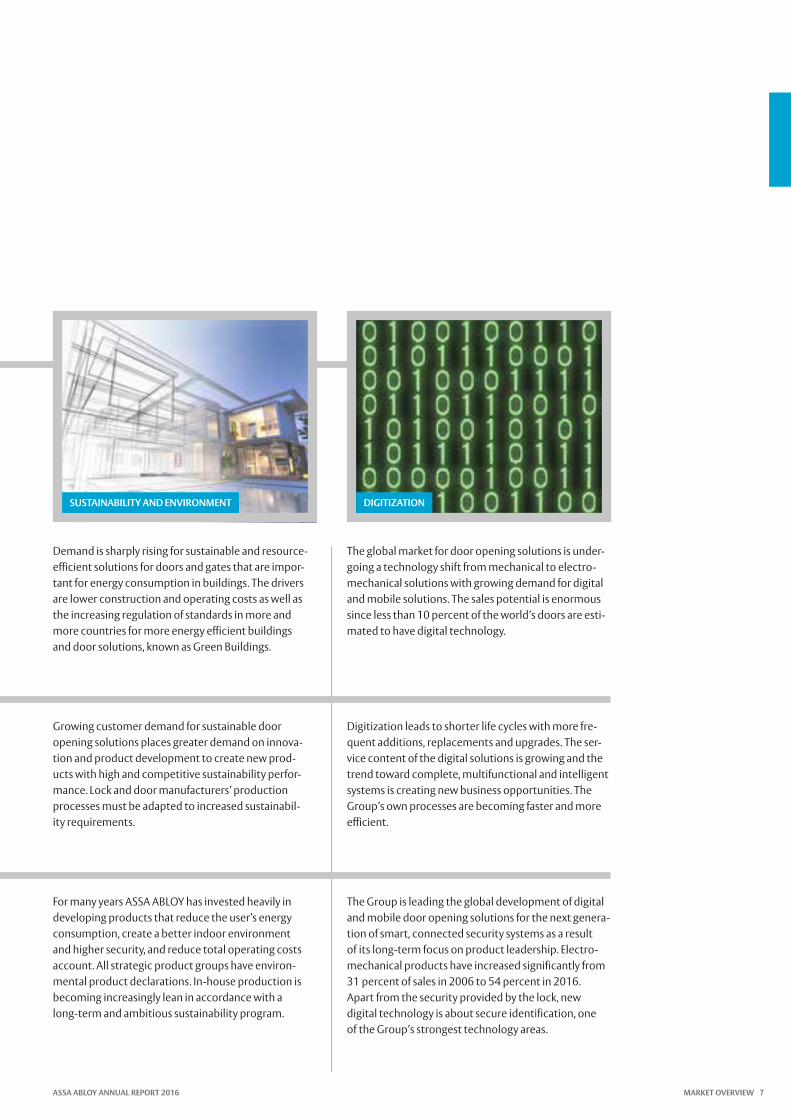
Demand is sharply rising for sustainable and resource-efficient solutions for doors and gates that are impor-tant for energy consumption in buildings. The drivers are lower construction and operating costs as well as the increasing regulation of standards in more and more countries for more energy efficient buildings and door solutions, known as Green Buildings.
Growing customer demand for sustainable door opening solutions places greater demand on innova-tion and product development to create new prod-ucts with high and competitive sustainability perfor-mance. Lock and door manufacturers’ production processes must be adapted to increased sustainabil-ity requirements.
For many years ASSA ABLOY has invested heavily in developing products that reduce the user’s energy consumption, create a better indoor environment and higher security, and reduce total operating costs account. All strategic product groups have environ-mental product declarations. In-house production is becoming increasingly lean in accordance with a long-term and ambitious sustainability program.
Digitization leads to shorter life cycles with more fre-quent additions, replacements and upgrades. The ser-vice content of the digital solutions is growing and the trend toward complete, multifunctional and intelligent systems is creating new business opportunities. The Group’s own processes are becoming faster and more efficient.
The Group is leading the global development of digital and mobile door opening solutions for the next genera-tion of smart, connected security systems as a result of its long-term focus on product leadership. Electro-mechanical products have increased significantly from 31 percent of sales in 2006 to 54 percent in 2016. Apart from the security provided by the lock, new digital technology is about secure identification, one of the Group’s strongest technology areas.
The global market for door opening solutions is under-going a technology shift from mechanical to electro-mechanical solutions with growing demand for digital and mobile solutions. The sales potential is enormous since less than 10 percent of the world’s doors are esti-mated to have digital technology.
SUSTAINABILITY AND ENVIRONMENT DIGITIZATION
ASSA ABLOY ANNUAL REPORT 2016 MARKET OVERVIEW 7

Value creation strategy
VisionTo be the true world leader, most successful and innovative provider of total door opening solutions,
to lead in innovation and provide well- designed, safe, secure and convenient solutions that give true added value to our customers and
to offer an attractive company for our employees.
Strategy for growth and profitabilityThe Group’s overall strategic direction is to spearhead the trend toward increased security with a
product-driven offering centered on the customer. The strategic action plans are focused on three areas: market presence, product leadership and cost-efficiency.
EmployeesContinuing professional devel-opment, capabilities and beliefs are the basis for the Group’s success.
BeliefsBased on accountability, diversity and commitment for a focused, results-driven company with high business ethics.
SustainabilityIs integrated in all Group pro-cesses: innovation, product development, manufacturing, logistics and sales.
Market presence
Increasing growth in the core business and expanding into new markets and segments.
Product leadership
Continuously devel-oping innovative products offering enhanced customer value and lower product costs.
Cost- efficiency
Reducing the cost base through improved processes, flexible final assem-bly close to the customer and pro-duction in low-cost countries.
VALUE CREATION STRATEGY ASSA ABLOY ANNUAL REPORT 20168
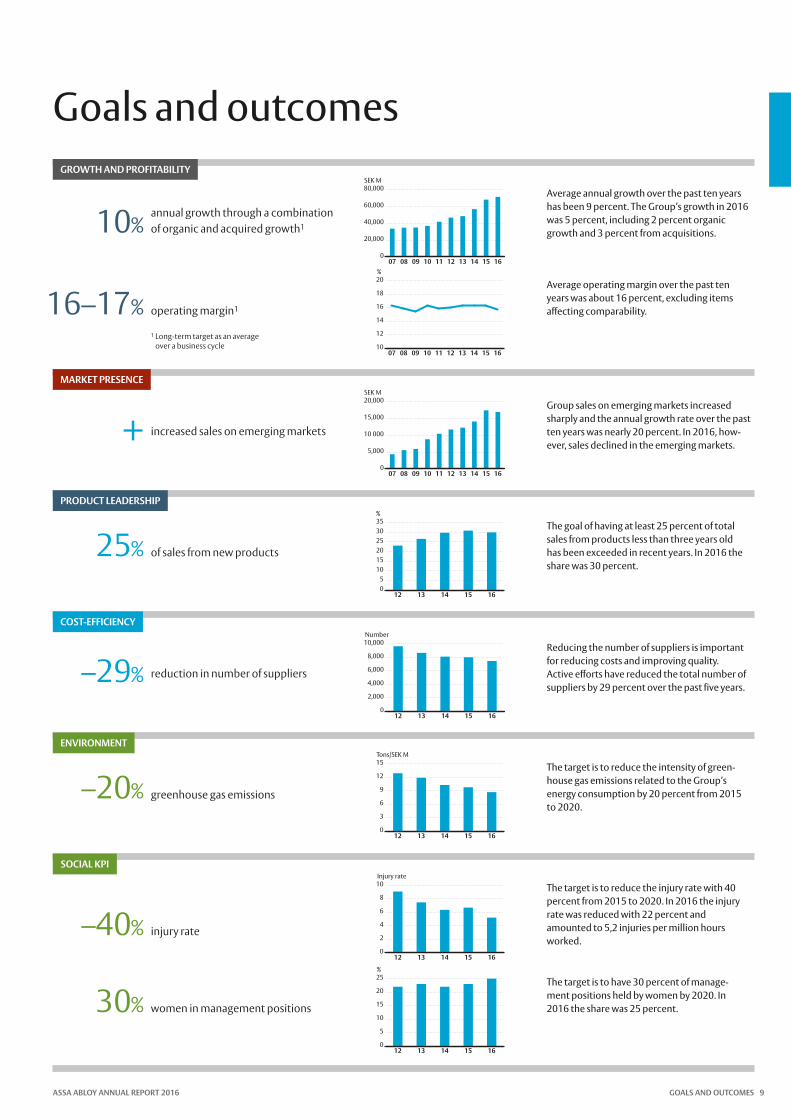
Goals and outcomes
MARKET PRESENCE
+ increased sales on emerging markets
PRODUCT LEADERSHIP
25% of sales from new products
COST-EFFICIENCY
–29% reduction in number of suppliers
ENVIRONMENT
–20% greenhouse gas emissions
SOCIAL KPI
–40%
30%
injury rate
women in management positions
GROWTH AND PROFITABILITY
10%annual growth through a combination of organic and acquired growth1
16–17% operating margin1
1 Long-term target as an average over a business cycle
Average annual growth over the past ten years has been 9 percent. The Group’s growth in 2016 was 5 percent, including 2 percent organic growth and 3 percent from acquisitions.
Average operating margin over the past ten years was about 16 percent, excluding items affecting comparability.
Group sales on emerging markets increased sharply and the annual growth rate over the past ten years was nearly 20 percent. In 2016, how-ever, sales declined in the emerging markets.
The goal of having at least 25 percent of total sales from products less than three years old has been exceeded in recent years. In 2016 the share was 30 percent.
Reducing the number of suppliers is important for reducing costs and improving quality. Active efforts have reduced the total number of suppliers by 29 percent over the past five years.
The target is to reduce the intensity of green-house gas emissions related to the Group’s energy consumption by 20 percent from 2015 to 2020.
The target is to reduce the injury rate with 40 percent from 2015 to 2020. In 2016 the injury rate was reduced with 22 percent and amounted to 5,2 injuries per million hours worked.
The target is to have 30 percent of manage-ment positions held by women by 2020. In 2016 the share was 25 percent.
SEK M
0
5,000
10 000
15,000
20,000
16151413121110090807
SEK M
0
20,000
40,000
60,000
80,000
16151413121110090807%
10
12
14
16
18
20
16151413121110090807
%
05
101520253035
1615141312
Number
0
2,000
4,000
6,000
8,000
10,000
1615141312
Tons/SEK M
0
3
6
9
12
15
1615141312
Injury rate
0
2
4
6
8
10
1615141312
%
0
5
10
15
20
25
1615141312
ASSA ABLOY ANNUAL REPORT 2016 GOALS AND OUTCOMES 9
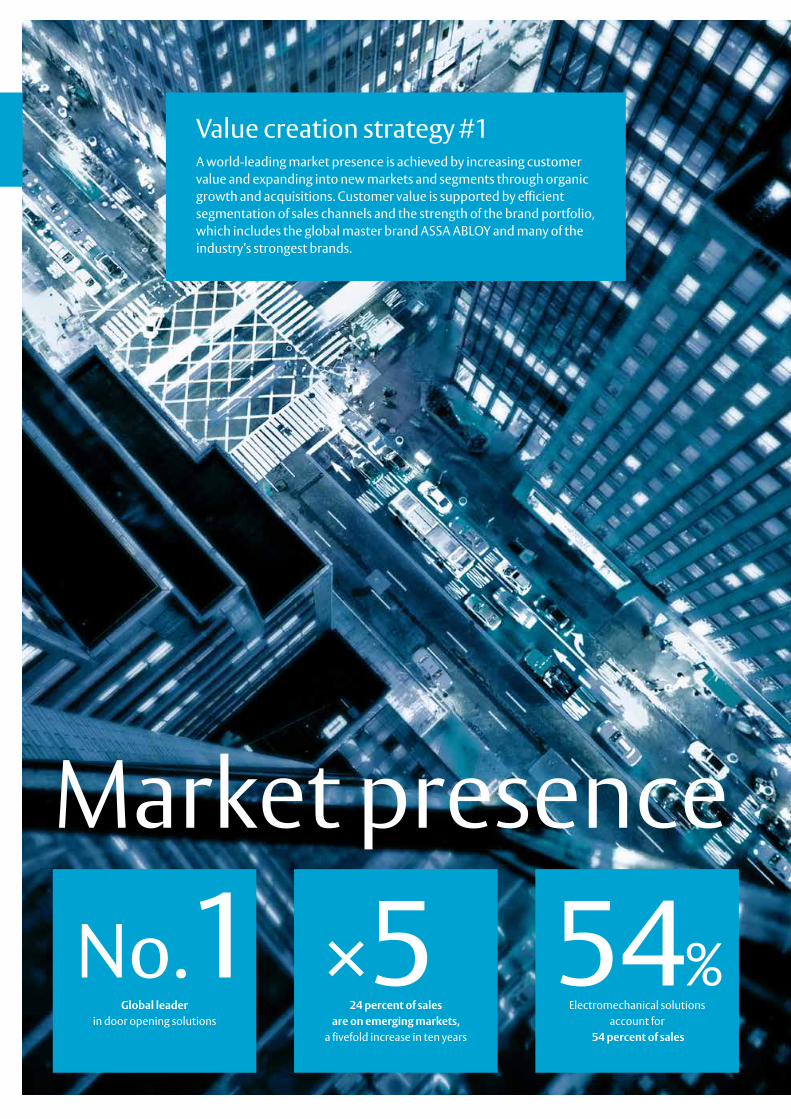
Market presence
Value creation strategy #1A world-leading market presence is achieved by increasing customer value and expanding into new markets and segments through organic growth and acquisitions. Customer value is supported by efficient segmentation of sales channels and the strength of the brand portfolio, which includes the global master brand ASSA ABLOY and many of the industry’s strongest brands.
No.1Global leader
in door opening solutions
×524 percent of sales
are on emerging markets, a fivefold increase in ten years
54%Electromechanical solutions
account for 54 percent of sales
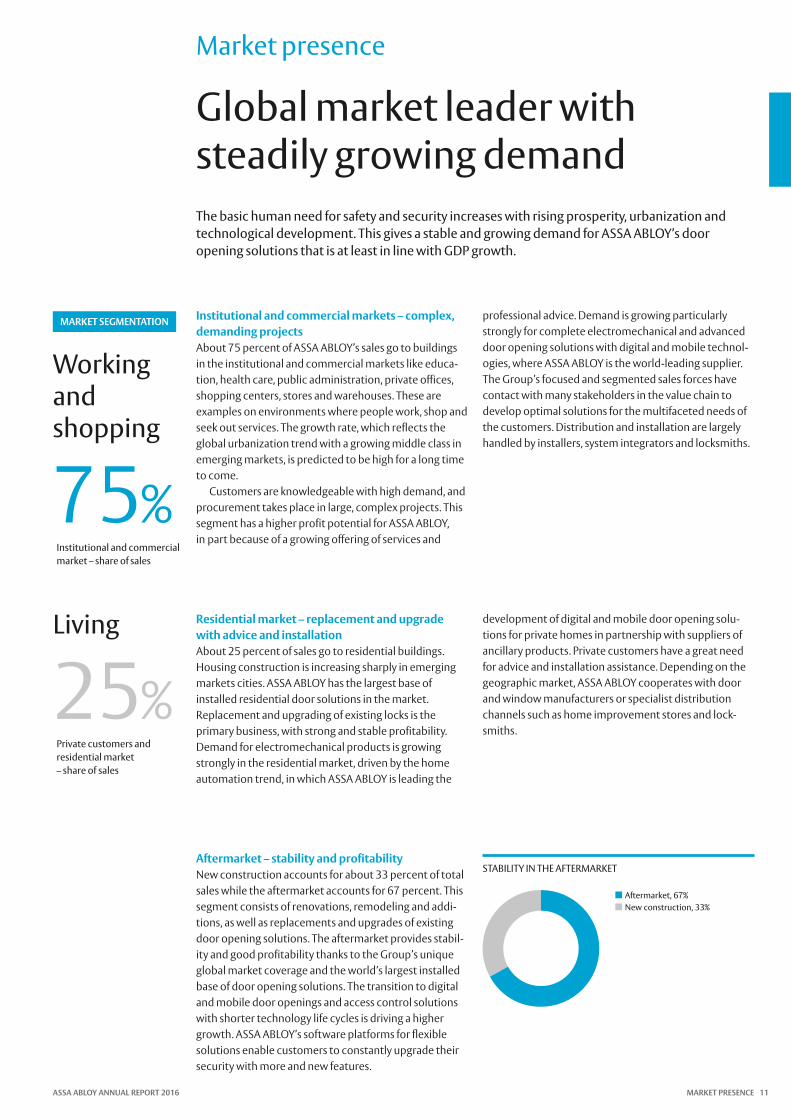
Global market leader with steadily growing demand
Market presence
The basic human need for safety and security increases with rising prosperity, urbanization and technological development. This gives a stable and growing demand for ASSA ABLOY’s door opening solutions that is at least in line with GDP growth.
Working and shopping
75%Institutional and commercial market – share of sales
Living
25%Private customers and residential market – share of sales
STABILITY IN THE AFTERMARKET
Aftermarket, 67% New construction, 33%
Institutional and commercial markets – complex, demanding projectsAbout 75 percent of ASSA ABLOY’s sales go to buildings in the institutional and commercial markets like educa-tion, health care, public administration, private offices, shopping centers, stores and warehouses. These are examples on environments where people work, shop and seek out services. The growth rate, which reflects the global urbanization trend with a growing middle class in emerging markets, is predicted to be high for a long time to come.
Customers are knowledgeable with high demand, and procurement takes place in large, complex projects. This segment has a higher profit potential for ASSA ABLOY, in part because of a growing offering of services and
professional advice. Demand is growing particularly strongly for complete electromechanical and advanced door opening solutions with digital and mobile technol-ogies, where ASSA ABLOY is the world-leading supplier. The Group’s focused and segmented sales forces have contact with many stakeholders in the value chain to develop optimal solutions for the multifaceted needs of the customers. Distribution and installation are largely handled by installers, system integrators and locksmiths.
Aftermarket – stability and profitabilityNew construction accounts for about 33 percent of total sales while the aftermarket accounts for 67 percent. This segment consists of renovations, remodeling and addi-tions, as well as replacements and upgrades of existing door opening solutions. The aftermarket provides stabil-ity and good profitability thanks to the Group’s unique global market coverage and the world’s largest installed base of door opening solutions. The transition to digital and mobile door openings and access control solutions with shorter technology life cycles is driving a higher growth. ASSA ABLOY’s software platforms for flexible solutions enable customers to constantly upgrade their security with more and new features.
Residential market – replacement and upgrade with advice and installation About 25 percent of sales go to residential buildings. Housing construction is increasing sharply in emerging markets cities. ASSA ABLOY has the largest base of installed residential door solutions in the market. Replacement and upgrading of existing locks is the primary business, with strong and stable profitability. Demand for electromechanical products is growing strongly in the residential market, driven by the home automation trend, in which ASSA ABLOY is leading the
development of digital and mobile door opening solu-tions for private homes in partnership with suppliers of ancillary products. Private customers have a great need for advice and installation assistance. Depending on the geographic market, ASSA ABLOY cooperates with door and window manufacturers or specialist distribution channels such as home improvement stores and lock-smiths.
MARKET SEGMENTATION
ASSA ABLOY ANNUAL REPORT 2016 MARKET PRESENCE 11
Market presence
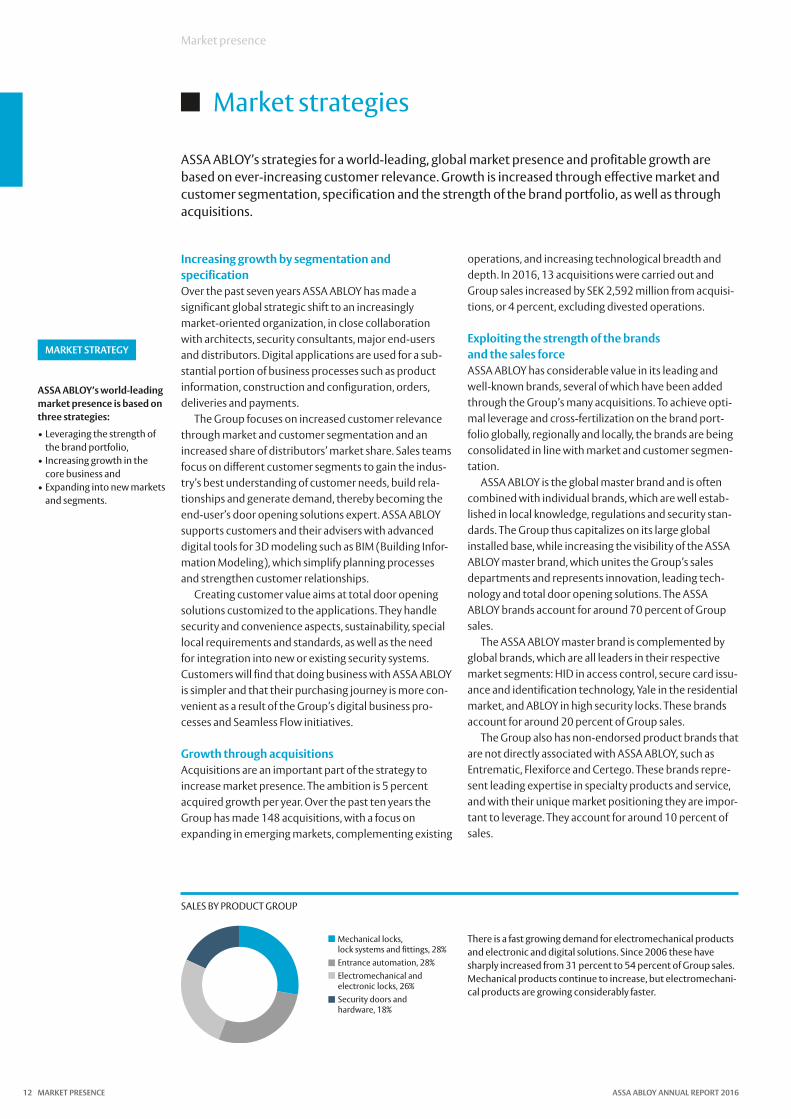
Market strategies
ASSA ABLOY’s strategies for a world-leading, global market presence and profitable growth are based on ever-increasing customer relevance. Growth is increased through effective market and customer segmentation, specification and the strength of the brand portfolio, as well as through acquisitions.
Increasing growth by segmentation and specificationOver the past seven years ASSA ABLOY has made a significant global strategic shift to an increasingly market- oriented organization, in close collaboration with architects, security consultants, major end-users and distributors. Digital applications are used for a sub-stantial portion of business processes such as product information, construction and configuration, orders, deliveries and payments.
The Group focuses on increased customer relevance through market and customer segmentation and an increased share of distributors’ market share. Sales teams focus on different customer segments to gain the indus-try’s best understanding of customer needs, build rela-tionships and generate demand, thereby becoming the end-user’s door opening solutions expert. ASSA ABLOY supports customers and their advisers with advanced digital tools for 3D modeling such as BIM (Building Infor-mation Modeling), which simplify planning processes and strengthen customer relationships.
Creating customer value aims at total door opening solutions customized to the applications. They handle security and convenience aspects, sustainability, special local requirements and standards, as well as the need for integration into new or existing security systems. Customers will find that doing business with ASSA ABLOY is simpler and that their purchasing journey is more con-venient as a result of the Group’s digital business pro-cesses and Seamless Flow initiatives.
Growth through acquisitionsAcquisitions are an important part of the strategy to increase market presence. The ambition is 5 percent acquired growth per year. Over the past ten years the Group has made 148 acquisitions, with a focus on expanding in emerging markets, complementing existing
operations, and increasing technological breadth and depth. In 2016, 13 acquisitions were carried out and Group sales increased by SEK 2,592 million from acquisi-tions, or 4 percent, excluding divested operations.
Exploiting the strength of the brands and the sales force ASSA ABLOY has considerable value in its leading and well-known brands, several of which have been added through the Group’s many acquisitions. To achieve opti-mal leverage and cross-fertilization on the brand port-folio globally, regionally and locally, the brands are being consolidated in line with market and customer segmen-tation.
ASSA ABLOY is the global master brand and is often combined with individual brands, which are well estab-lished in local knowledge, regulations and security stan-dards. The Group thus capitalizes on its large global installed base, while increasing the visibility of the ASSA ABLOY master brand, which unites the Group’s sales departments and represents innovation, leading tech-nology and total door opening solutions. The ASSA ABLOY brands account for around 70 percent of Group sales.
The ASSA ABLOY master brand is complemented by global brands, which are all leaders in their respective market segments: HID in access control, secure card issu-ance and identification technology, Yale in the residential market, and ABLOY in high security locks. These brands account for around 20 percent of Group sales.
The Group also has non-endorsed product brands that are not directly associated with ASSA ABLOY, such as Entrematic, Flexiforce and Certego. These brands repre-sent leading expertise in specialty products and service, and with their unique market positioning they are impor-tant to leverage. They account for around 10 percent of sales.
ASSA ABLOY’s world-leading market presence is based on three strategies:
• Leveraging the strength of the brand portfolio,
• Increasing growth in the core business and
• Expanding into new markets and segments.
SALES BY PRODUCT GROUP
Mechanical locks, lock systems and fittings, 28% Entrance automation, 28%Electromechanical and electronic locks, 26%Security doors and hardware, 18%
MARKET STRATEGY
There is a fast growing demand for electromechanical products and electronic and digital solutions. Since 2006 these have sharply increased from 31 percent to 54 percent of Group sales. Mechanical products continue to increase, but electromechani-cal products are growing considerably faster.
MARKET PRESENCE ASSA ABLOY ANNUAL REPORT 201612
Markets
The global market trend for door opening solutions is growing more rapidly than global GDP. ASSA ABLOY is the world-leading supplier with operations in over 70 countries and sales world-wide. Global expansion takes place through organic growth and acquisitions. For several years the Group has focused on increasing its market presence in emerging markets.
Globalization benefits ASSA ABLOY The difference in demand for door opening solutions between countries is significant due to different cli-mates, development level, regulations and standards. As the most global player with a local presence on all major markets, this gives ASSA ABLOY competitive advantages. The same applies to the globalization trend that promotes group-wide smart and cost-effective-solutions on a large scale at more and more global companies.
The mature markets in North America, Europe and Australia account for three-quarters of ASSA ABLOY’s sales, with demand growth around or just above GDP growth. Demand is now shifting increasingly towards electromechanical technology, with rapid growth in higher value digital and mobile solutions.
Large potential in emerging marketsThe emerging markets offer high growth potential. Since 2006, Group sales to customers in eastern Europe, Africa, Latin America and Asia increased from SEK 3.7 billion to SEK 17 billion, or from 12 percent of total sales to 24 percent. Demand for mechanical locks is higher in the emerging markets than in mature markets, but the growth figures for electromechanical solutions are high due to increased prosperity and the rapid spread of tech-nology. The global shift toward more electromechanical products is mainly in the commercial segment. However, sharply increased demand for digital and mobile security solutions has also been seen in the consumer market over the past two years, in line with increased prosperity and a growing middle class.
Asia is the main growth region, with sales growth of about 800 percent since 2006 to a total of SEK 10.6 billion. The large Chinese market remains an important expansion area for the Group although the demand has
been weak in recent years. As a result of organic growth and more than ten acquisitions since 2006, ASSA ABLOY’s sales in China have increased to SEK 5.3 billion. Today the Group is China’s largest manufacturer and supplier of door opening solutions. The profitable aftermarket for maintenance and upgrades already accounts for around one-third of sales.
Africa and Middle East have great growth potential. The Group is concentrating its market presence to the largest cities in Africa, which account for 90 percent of the continent’s GDP. The growth rate has been about 170 percent since 2006 to SEK 2.4 billion in 2016. In Latin America, sales increased by almost 150 percent since 2006 to SEK 3 billion in 2016.
Fragmented competition – continued consolidation The global door opening solutions market remains frag-mented, with a large number of smaller regional and local businesses, particularly in emerging markets and Europe. Consolidation has been in progress for the past 20 years, with ASSA ABLOY as a driving force. In emerging markets, established lock standards and brands are less common and markets are even more fragmented, such as in Asia where the largest players have a very limited market share.
ASSA ABLOY is the global market leader and consider-ably larger than its closest competitor, Dormakaba (Switzerland), that during 2016 announced its plan to aquire the Mechanical Security businesses from Stanley Black & Decker. Other important competitors with oper-ations in ASSA ABLOY’s segments are: Allegion (USA) and Hörmann (Germany).
SALES BY REGION SALES ON EMERGING MARKETS1
Europe, 38%Africa, 1%North America, 40%South America, 3%Asia, 15%Oceania, 3%
Oceanien
Asien
Sydamerika
Nordamerika
Afrika
Europa
1 Emerging markets are Africa, Asia, the Middle East, South America and eastern Europe.
SEK M
0
5,000
10,000
15,000
20,000
16151413121110090807
Geographical expansion is mainly achieved through acquisitions of leading local companies with well-known brands, in order to build a strong platform on emerging markets in Asia, eastern Europe, the Middle East, Africa and South America. Emerging markets have increased their share of Group sales from 12 percent in 2006 to 24 percent in 2016.
Group sales trend by region 2016 in local currencies
NORTH AMERICA +7%
SOUTH AMERICA +37%
EUROPE +7%
ASIA –6%
OCEANIA 0%
AFRICA +15%
ASSA ABLOY ANNUAL REPORT 2016 MARKET PRESENCE 13
Market presence
Distribution
Distribution is an important part of ASSA ABLOY’s value creation for the customers. The Group reaches its end-customers through a variety of distribution channels at various stages in the supply chain. The number of employees who work with value-creating sales has been substantially grow-ing for many years, thanks to digitization and streamlining provided by the Group’s Seamless Flow processes. One example is the growing number of specifiers tasked with increasing knowledge and demand by offering expertise and digital tools as early as possible in the planning, specification and design of door opening solutions.
Value creation in distribution ASSA ABLOY is increasingly becoming a supplier of inte-grated concepts for total door opening solutions. This takes place in close collaboration with the end custom-ers and their advisers in distribution, creating good cus-tomer relations, market demand and entry barriers for competitors. Distributors also play a key role in providing service and support after installation.
In the commercial segment, distributors in some mar-kets act as advisers and project managers to create good security solutions. They have a good knowledge of cus-tomer needs and ensure that the products comply with local regulations. Electromechanical security products
go from manufacturer to end-user through security installers and specialist distributors. These products are also sold through security systems integrators, who offer a total solution for the installation of perimeter protec-tion, access control, and access to computers and other connected devices.
Specification – advice and digital toolsRapid technological development and the growing num-ber of requirements and standards, especially in the area of sustainability, are constantly increasing complexity for builders and other end-customers. The trend is from component order to prefabricated door openings and
DISTRIBUTION takes place through many different players depending on customer segment and stage in the supply chain:
ASSA ABLOY representative Distributor
ASSA ABLOY DISTRIBUTION / PARTNERS
Building and lock wholesalers, security consultants and locksmiths have a key role in delivering and installing the products specified for various construction projects.
Distribution channels for the security market
ASSA ABLOY creates considerable value for customers in the distribution process. The Group’s advisers, the specifiers, pro-vide specialist advice on security solutions. Architects, building and security consultants can use ASSA ABLOY’s BIM technol-ogy to specify and test solutions in 3D on computer screen for 3D models of buildings and door openings, and order products online.
security systems integrators, locksmiths, security installers, building and lock wholesalers, retailers, home improvement stores, hardware and security stores, OEMs, door and window manufacturers.
MARKET PRESENCE ASSA ABLOY ANNUAL REPORT 201614
advanced total door opening solutions. This is also increasing the competence required by distributors. A central role in marketing is therefore played by ASSA ABLOY’s specifiers, who have increased sharply over the past few years and continue to increase rapidly, especially in emerging markets.
Specification teams work as specialist advisers to cus-tomers, helping them specify products that provide total, well-functioning and economical security solutions. They also collaborate with other key groups early in the order chain, such as building consultants, architects, security consultants and building standards agencies, to “intro-duce” new, innovative security solutions and to create demand with their business-driving competence.
The Group is leading the industry trend for product configurations and 3D modeling using BIM (Building Information Modeling), which facilitates the work of architects and building consultants. BIM technology makes it possible to create digital models of buildings into which ASSA ABLOY products can be applied in 3D. A door design can then be checked and tested on the computer screen, and the solution’s products can be
ordered online. Distributors have constant access to the Group’s advice.
The complex information in BIM creates good opportunities for repeat business, since the customer can quickly see exactly which products are installed in the building, along with their location. This simplifies the upgrade and repair processes.
Building and lock wholesalers, security consultants and locksmiths have a key role in delivering the products specified for different construction projects. Many door and window manufacturers install lockcases and hard-ware in their products before delivery to customers. ASSA ABLOY also shares competence with locksmiths, a key distributor of mechanical and electromechanical security products in many markets. Locksmiths buy direct from ASSA ABLOY or through wholesalers and pro-vide advice, delivery, installation and service. Some lock-smiths have an increased focus on electronics, while IT integrators are increasingly offering physical security solutions.
END CUSTOMERS Large institutional and commercial customers• Healthcare • Education • Retail• Hospitality • Offices • Industry
Small and medium-sized customers• Offices • Stores
Residential market• Apartments • Houses
STAKEHOLDERS Such as architects, security consultants, government agencies responsible for security standards, and other stakeholders.
SPECIFICATION involves configuration, checking and testing proposed security solutions. ASSA ABLOY provides support in the form of specialist advice and smart tools for digital drawings and 3D models.ASSA ABLOY
representativeASSA ABLOY representative
END CUSTOMERSSPECIFICATION
CODES AND SECURITY STANDARDS
ASSA ABLOY has developed close cooperation with customers, architects and security consultants to specify appropriate products and a well-functioning security solution. Many door and window manufacturers install lockcases, hardware and other fittings in their products before delivery to customers.
More advanced electronic and digital security solutions mainly reach the end-user through security installers and specialist distributors. These products and solutions are also sold through systems integrators, who often offer total solutions for the installation of perimeter protection, access control and computer security.
INSTALLERS
InstallerASSA ABLOY representative
Input
STAKEHOLDERS
ASSA ABLOY ANNUAL REPORT 2016 MARKET PRESENCE 15
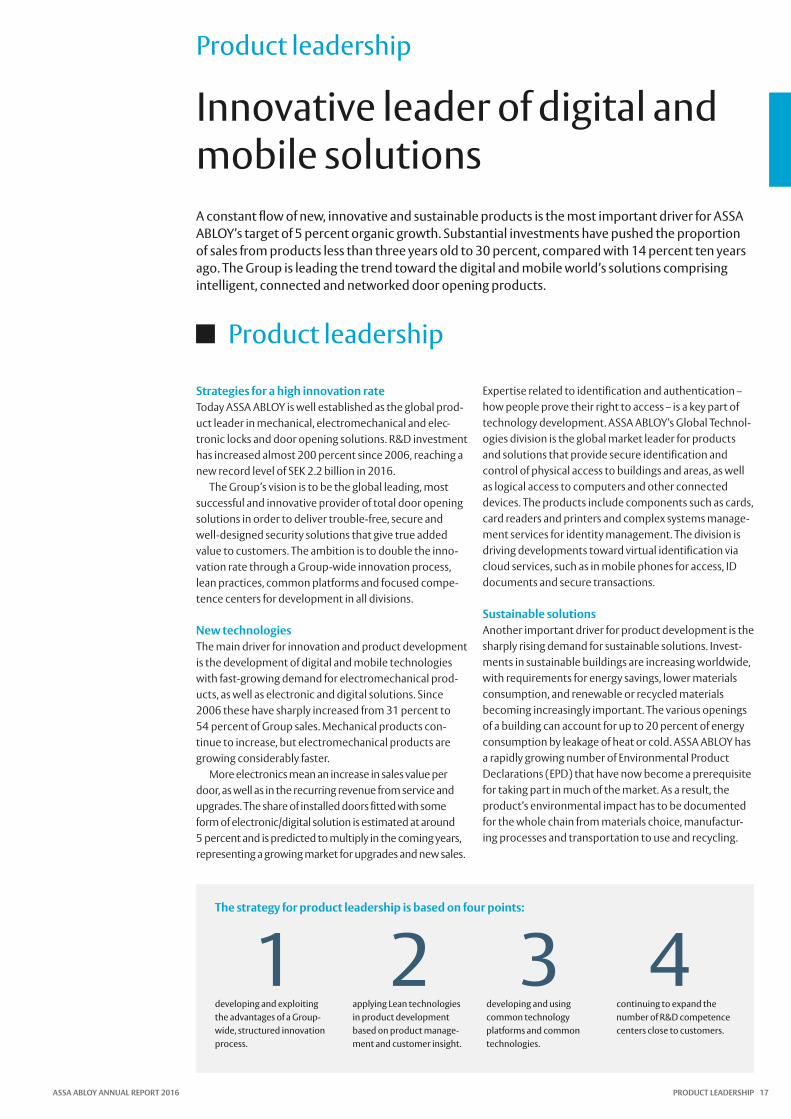
Product leadership
Value creation strategy #2Product leadership is achieved through innovation and continuous product development to enhance customer value, quality, and reduced product costs. Customer benefits are developed in close cooperation with end-users in a constant process of many small steps. The goal is to meet or exceed customer expectations.
No.1The most innovative
supplier of total door opening solutions
54%The share of electromechanical
products and entrance automation has increased from 31 percent to
54 percent of total sales in ten years
30%Products launched in the past three years account
for 30 percent of total sales
Product leadership
Innovative leader of digital and mobile solutions
Product leadership
The strategy for product leadership is based on four points:
1 2 3 4developing and exploiting the advantages of a Group-wide, structured innovation process.
applying Lean technologies in product development based on product manage-ment and customer insight.
developing and using common technology platforms and common technologies.
continuing to expand the number of R&D competence centers close to customers.
A constant flow of new, innovative and sustainable products is the most important driver for ASSA ABLOY’s target of 5 percent organic growth. Substantial investments have pushed the proportion of sales from products less than three years old to 30 percent, compared with 14 percent ten years ago. The Group is leading the trend toward the digital and mobile world’s solutions comprising intelligent, connected and networked door opening products.
Strategies for a high innovation rateToday ASSA ABLOY is well established as the global prod-uct leader in mechanical, electromechanical and elec-tronic locks and door opening solutions. R&D investment has increased almost 200 percent since 2006, reaching a new record level of SEK 2.2 billion in 2016.
The Group’s vision is to be the global leading, most successful and innovative provider of total door opening solutions in order to deliver trouble-free, secure and well-designed security solutions that give true added value to customers. The ambition is to double the inno-vation rate through a Group-wide innovation process, lean practices, common platforms and focused compe-tence centers for development in all divisions.
New technologiesThe main driver for innovation and product development is the development of digital and mobile technologies with fast-growing demand for electromechanical prod-ucts, as well as electronic and digital solutions. Since 2006 these have sharply increased from 31 percent to 54 percent of Group sales. Mechanical products con-tinue to increase, but electromechanical products are growing considerably faster.
More electronics mean an increase in sales value per door, as well as in the recurring revenue from service and upgrades. The share of installed doors fitted with some form of electronic/digital solution is estimated at around 5 percent and is predicted to multiply in the coming years, representing a growing market for upgrades and new sales.
Expertise related to identification and authentication – how people prove their right to access – is a key part of technology development. ASSA ABLOY’s Global Technol-ogies division is the global market leader for products and solutions that provide secure identification and control of physical access to buildings and areas, as well as logical access to computers and other connected devices. The products include components such as cards, card readers and printers and complex systems manage-ment services for identity management. The division is driving developments toward virtual identification via cloud services, such as in mobile phones for access, ID documents and secure transactions.
Sustainable solutionsAnother important driver for product development is the sharply rising demand for sustainable solutions. Invest-ments in sustainable buildings are increasing worldwide, with requirements for energy savings, lower materials consumption, and renewable or recycled materials becoming increasingly important. The various openings of a building can account for up to 20 percent of energy consumption by leakage of heat or cold. ASSA ABLOY has a rapidly growing number of Environmental Product Declarations (EPD) that have now become a prerequisite for taking part in much of the market. As a result, the product’s environmental impact has to be documented for the whole chain from materials choice, manufactur-ing processes and transportation to use and recycling.
ASSA ABLOY ANNUAL REPORT 2016 PRODUCT LEADERSHIP 17
Product leadership
Future security solutions – Convenient, secure, digitalThe global market for door opening solutions is undergoing a technology shift from mechanical to electromechanical and electronic products. With digital and mobile technology, ASSA ABLOY is leading this trend toward third generation door opening solutions. These intelligent connected and networked products and solutions controlled by in-house developed software and cloud-based systems solutions provide further growth opportunities while strengthening competitive-ness. Demand is growing rapidly in all segments in new buildings, as well as in supplementing and upgrading old installations.
The global shift in technology for door opening solutions is accelerating. Sales of mechanical solutions continues to grow, but its percentage of the Group’s total sales is declining. Electromechanical products account for 54 percent of ASSA ABLOY’s sales, compared with 31 per-cent in 2006. This increase is partly an effect of urbaniza-tion in emerging markets, where demand is moving directly to digital and mobile solutions.
Mechanical components will, however, always be needed because they provide the necessary base func-tion in the protection solution: a bolt that locks a door to a wall. However, electronic technology makes it possible to digitally control the bolt, door and the entire entrance environment for more efficient and convenient opera-tion, at a lower operating cost and in large systems with a variety of functions. Opening remotely, controlling product status and controlling openings for enhanced security and energy savings are functions that create new values and satisfied customers.
Global technology leaderMore and more people today are “online and connected” and are looking for total security solutions and conve-nient door environments based on digital and mobile technologies. ASSA ABLOY is the global technology leader, offering a broad diversity ranging from traditional products to hi-tech solutions with which a variety of door environments can be built, constantly developed and customized. This trend is supported by the increased technical standardization that is driving integration of various components in the security solution.
Technology development takes place in stages:• from a good base product,• to a smart product that can be remotely controlled,• to a system of products with several security functions
in one building, • to a complete, intelligent ecosystem, which coordi-
nates multidimensional security solutions for whole complexes of buildings, with user identification and preventive and acute indicators of security risks.
E-commerce, home care, sharing economyDigital technology provides new solutions to old prob-lems and creates new needs that are directly linked to ASSA ABLOY’s expertise and products for convenient and secure access to the home and workplace. Increased e-commerce, more home care and a growing sharing economy are just three examples of such needs.
E-commerce is rapidly expanding worldwide and the physical delivery of goods requires access to the home, along with the ability for trusted suppliers to open doors even when the recipient is not at home. An aging popula-tion means an increased need for home care, where care-givers and home care providers need to be able to visit the home to provide their services. The new sharing economy, in which people share their homes, vacation homes, vehicles and equipment, will also require an “exchange of keys” for easy access to the home, house, garage and other spaces.
This means an increased need for access control sys-tems with the technology to create digital identities, which are represented in mechanical systems by holding a key that fits a lock. This identity can be a code: a digital
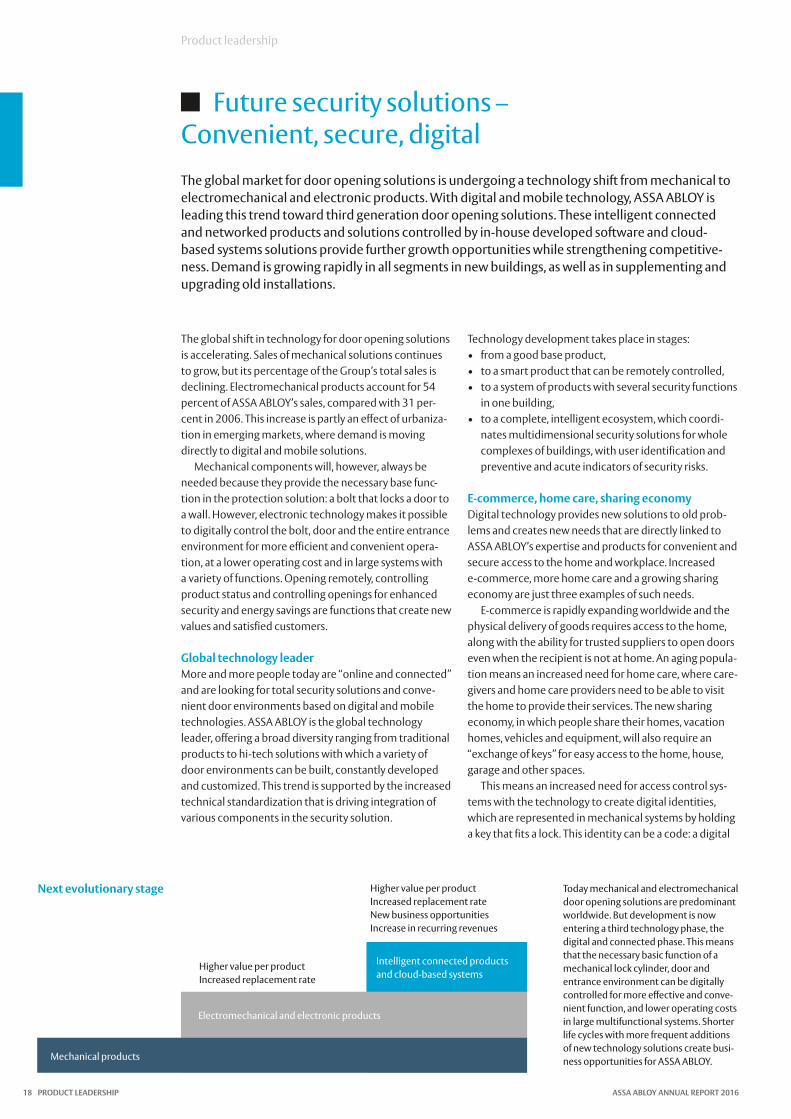
Intelligent connected products and cloud-based systems
Next evolutionary stage
Electromechanical and electronic products
Higher value per product Increased replacement rate
Higher value per product Increased replacement rateNew business opportunitiesIncrease in recurring revenues
Today mechanical and electromechanical door opening solutions are predominant worldwide. But development is now entering a third technology phase, the digital and connected phase. This means that the necessary basic function of a mechanical lock cylinder, door and entrance environment can be digitally controlled for more effective and conve-nient function, and lower operating costs in large multifunctional systems. Shorter life cycles with more frequent additions of new technology solutions create busi-ness opportunities for ASSA ABLOY.Mechanical products
PRODUCT LEADERSHIP ASSA ABLOY ANNUAL REPORT 201618

ASSA ABLOY is leading the development of digital and mobile security solutions. Shared Technologies, the Group’s joint development center, plays a major role in this initiative.
signal that is programmed to apply for a certain person to access a certain door during a certain period. It can be given to a supplier, a care assistant or someone who shares a vacation home. “The key” will be sent to the cell phone, which is rapidly becoming people’s main identity carrier.
Internet of ThingsASSA ABLOY has a broad offering in secure digital and mobile identity and authentication for access manage-ment, with various layers of security and control. ASSA ABLOY’s Seos is a flexible and modular technology plat-form that serves as an eco-system of products and ser-vices. The Seos platform is also a growing integral part of solutions for the future world of the “Internet of Things” and “Digital Homes,” where people have connected devices in the home and at work. Estimates indicate about 25 billion connected devices today, or about 3.5 per person. This figure is projected to double by 2020 to a total of 50 billion connected devices.
This means a strongly growing demand for ASSA ABLOY’s security expertise, products and solutions. The Group has been working for several years in close partnership with a number of suppliers and launched groundbreaking collaborations with AT&T and Google Nest in the area of Home Automation. Several new seg-ment-specific solutions were launched, such as Accentra for apartment buildings and new applications for the CLIQ system.
More servicesAs ASSA ABLOY’s product portfolio contains more electronics and software, the share of service content
is increasing in the Group’s offering, such as upgrades and licenses which results in increased recurring revenue streams based on long-term contracts for supply and service collaborations, cloud services, and subscription agreements.
Improved function and more value from operational cost savings create increased value for the customer and a better price for ASSA ABLOY. Rapid technological devel-opment and stronger demand for convenience lead to shorter life cycles with more frequent additions and replacements. The trend toward complete multifunc-tional and complex systems is creating new business opportunities and ASSA ABLOY strives to achieve open standards to facilitate integration with the customer’s other security and administrative systems. The solutions tie the customer closer and create a stronger recurring revenue stream.
Entrance automation A fast-growing market for the new electronic technolo-gies is entrance automation, in which ASSA ABLOY has gained global market leadership with its Entrance Systems division through acquisitions, innovation and organic growth. Typical areas are warehouses with large gates and entrances in the retail and manufacturing industries. The total market for entrance automation is estimated at EUR 20 billion, with a growth rate above global GDP. The market remains very fragmented. The largest potential is in retail, transportation, logistics and manufacturing in the wake of continued globalization. ASSA ABLOY has a unique offering of total automatic entrance solutions, rapid product development and a comprehensive service concept.
ASSA ABLOY ANNUAL REPORT 2016 PRODUCT LEADERSHIP 19

Continuously efficient innovation process
Product leadership
ASSA ABLOY’s product leadership is based on the Group’s joint innovation process. Guiding prin-ciples are understanding customer needs, a long-term product development plan, active portfolio management, and cost-effectiveness. Shared Technologies, the Group’s joint development center, plays a major role.
Value creation with customer insightEach new product and product solution should create as much customer value as possible through improved function and lower costs. All new projects aim to solve an identified customer need and are based on insight into underlying customer needs and requirements. Broad monitoring and collection of market data and surveys of different customer segments are conducted on an ongoing basis, which also include efforts to understand unspoken customer needs. Cost-savings are achieved through improved designs, new materials and compo-nents, as well as continuous improvement of the devel-opment and production process.
Sustainability ASSA ABLOY’s sustainability program is integrated into the development process from the concept stage to recycling of worn-out products. Specifications for the development of new products and customer solutions may be based on life cycle analyses and a reduction in energy consumption in buildings, as well as concrete sav-ings in materials consumption, packaging and transport solutions. ASSA ABLOY can standardize materials, reduce the number of components, constantly improve quality, and considerably reduce the costs of each new product by developing common technology platforms and modular systems.
Product platforms
CLIQCLIQ is a secure locking system with advanced microelectronics in programmable keys and cylin-ders. The system offers a large number of combinations of mechanical and electronic products, which satisfy various requirements for secure, flexible access control. Most types of locks can be fitted with CLIQ technology, which together with various software programs pro-vides the global market with cus-tomized, flexible access control solutions.
SeosSeos is an identification technol-ogy solution that allows the cus-tomer to use various devices, from smart cards to cell phones, for secure access to applications. Seos’ applications range from building access control, com-puter login and cashless pay-ments to IoT (Internet of Things) applications, time and atten-dance reporting, and secure printing.
AperioAperio is a technology developed as a complement to existing elec-tronic access control systems. It is a convenient solution for end-users to improve the security and control of their premises. Central to Aperio is a wireless communi-cations protocol, which functions at short distances and can con-nect an online access control sys-tem to an Aperio-compatible mechanical lock.
Hi-OHi-O (Highly intelligent Opening) is a concept that simplifies instal-lation, service and maintenance of connected doors thanks to advanced technology and the plug-and-play principle. Hi-O is a standardized technology for con-trol and security of door environ-ments. The technology enables communication between all the components included in a door opening solution.
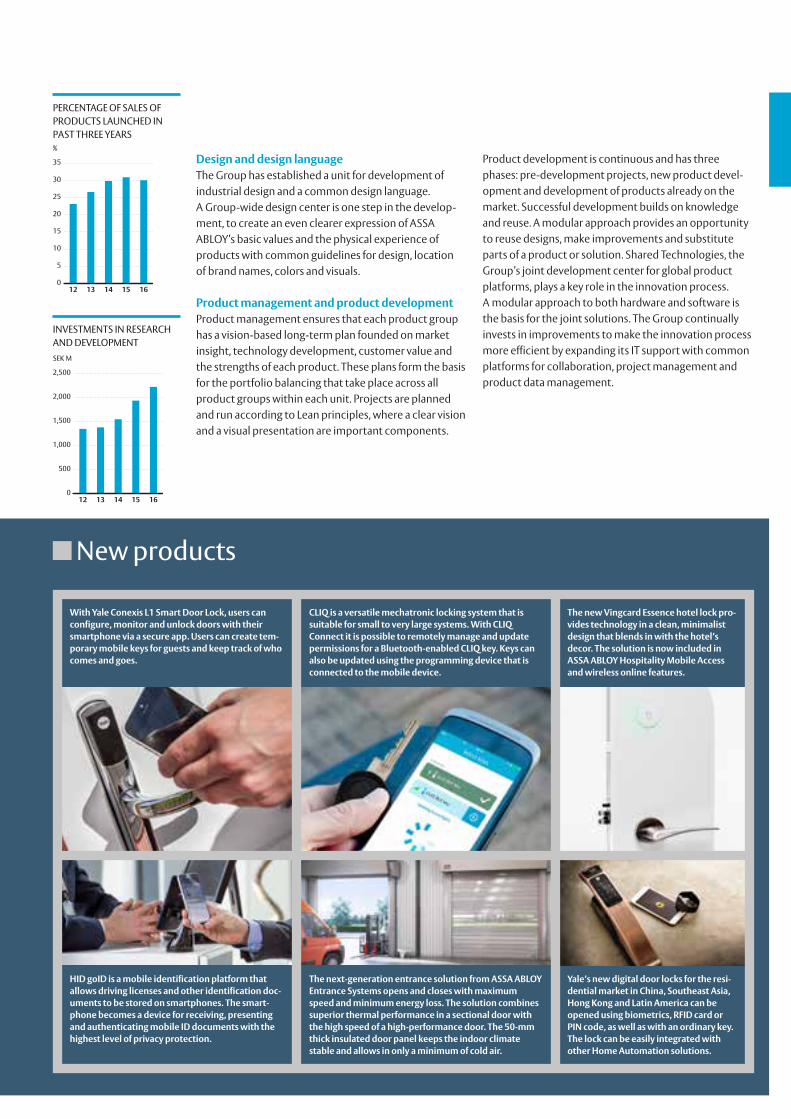
PERCENTAGE OF SALES OF PRODUCTS LAUNCHED IN PAST THREE YEARS%
0
5
10
15
20
25
30
35
1615141312
INVESTMENTS IN RESEARCH AND DEVELOPMENTSEK M
0
500
1,000
1,500
2,000
2,500
1615141312
New products
Design and design languageThe Group has established a unit for development of industrial design and a common design language. A Group-wide design center is one step in the develop-ment, to create an even clearer expression of ASSA ABLOY’s basic values and the physical experience of products with common guidelines for design, location of brand names, colors and visuals.
Product management and product developmentProduct management ensures that each product group has a vision-based long-term plan founded on market insight, technology development, customer value and the strengths of each product. These plans form the basis for the portfolio balancing that take place across all product groups within each unit. Projects are planned and run according to Lean principles, where a clear vision and a visual presentation are important components.
Product development is continuous and has three phases: pre-development projects, new product devel-opment and development of products already on the market. Successful development builds on knowledge and reuse. A modular approach provides an opportunity to reuse designs, make improvements and substitute parts of a product or solution. Shared Technologies, the Group’s joint development center for global product platforms, plays a key role in the innovation process. A modular approach to both hardware and software is the basis for the joint solutions. The Group continually invests in improvements to make the innovation process more efficient by expanding its IT support with common platforms for collaboration, project management and product data management.
With Yale Conexis L1 Smart Door Lock, users can configure, monitor and unlock doors with their smartphone via a secure app. Users can create tem-porary mobile keys for guests and keep track of who comes and goes.
HID goID is a mobile identification platform that allows driving licenses and other identification doc-uments to be stored on smartphones. The smart-phone becomes a device for receiving, presenting and authenticating mobile ID documents with the highest level of privacy protection.
CLIQ is a versatile mechatronic locking system that is suitable for small to very large systems. With CLIQ Connect it is possible to remotely manage and update permissions for a Bluetooth-enabled CLIQ key. Keys can also be updated using the programming device that is connected to the mobile device.
The next-generation entrance solution from ASSA ABLOY Entrance Systems opens and closes with maximum speed and minimum energy loss. The solution combines superior thermal performance in a sectional door with the high speed of a high-performance door. The 50-mm thick insulated door panel keeps the indoor climate stable and allows in only a minimum of cold air.
The new Vingcard Essence hotel lock pro-vides technology in a clean, minimalist design that blends in with the hotel’s decor. The solution is now included in ASSA ABLOY Hospitality Mobile Access and wireless online features.
Yale’s new digital door locks for the resi-dential market in China, Southeast Asia, Hong Kong and Latin America can be opened using biometrics, RFID card or PIN code, as well as with an ordinary key. The lock can be easily integrated with other Home Automation solutions.
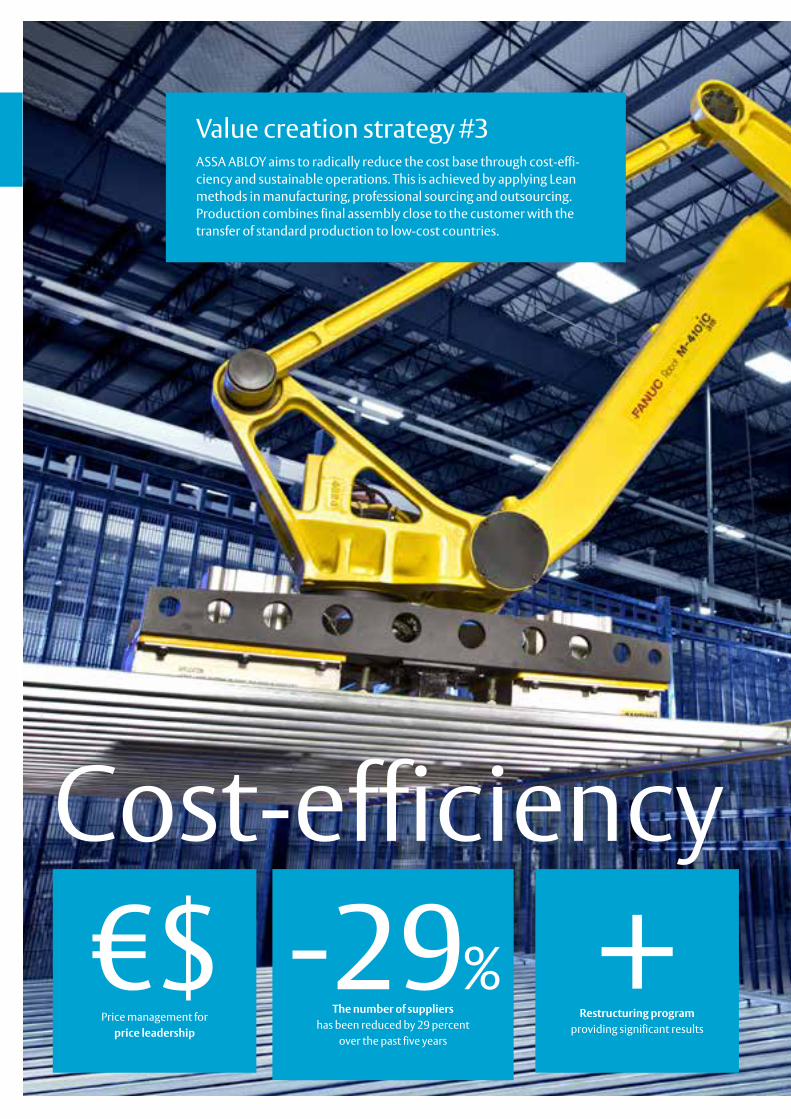
Cost-efficiency
Value creation strategy #3ASSA ABLOY aims to radically reduce the cost base through cost-effi-ciency and sustainable operations. This is achieved by applying Lean methods in manufacturing, professional sourcing and outsourcing. Production combines final assembly close to the customer with the transfer of standard production to low-cost countries.
�$Price management for
price leadership
-29%The number of suppliers
has been reduced by 29 percent over the past five years
+Restructuring program
providing significant results
Production structure
ASSA ABLOY aims to radically reduce the cost base through cost-efficiency in all parts of the value chain. Work continued successfully on professional sourcing, Lean production methods, and Seamless Flow, i.e. streamlining and automating administrative flows. Investments in increased automation of production accelerated during the year. A new Group program was launched in 2016 to continue streamlining the production structure through 2018.
Production structureStreamlining initiatives make significant contributions to achieving the target of an operating margin of 16–17 per-cent and to the Group being a price leader and contribut-ing to sustainable development.
The recurrent multi-year programs to concentrate product assembly to sophisticated plants close to cus-tomers in mature markets comprise a cornerstone of this effort. The more strategic components, such as cylinders, door closers and some electromechanical products, are concentrated to the Group’s own production plants in low-cost countries, while standard components and other products are increasingly sourced from suppliers.
The programs may be seen as ongoing activities, although they are basically structural, as a result of the Group’s acquisition strategy with an average of one acquisition per month. A significant part of the synergy effects on acquisition are the restructuring of manufac-turing and modernization of production, efficiencies in the organization, and global logistics with substantial gains in the work environment and sustainability.
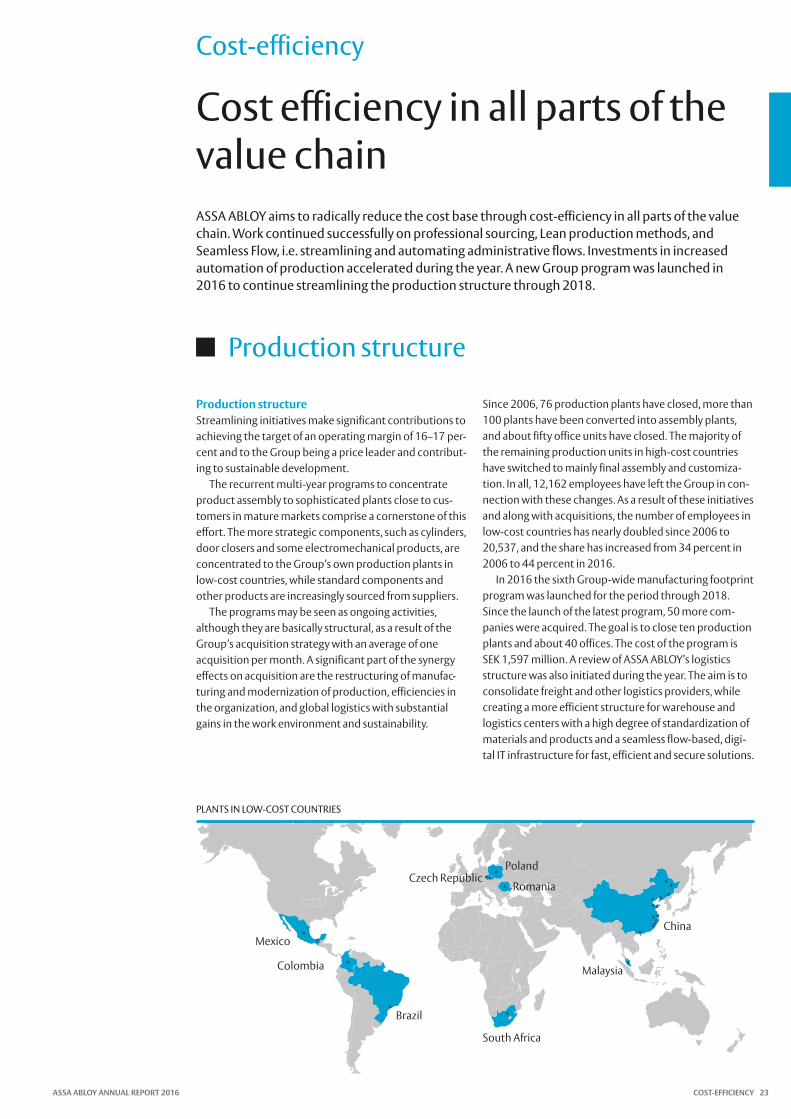
Since 2006, 76 production plants have closed, more than 100 plants have been converted into assembly plants, and about fifty office units have closed. The majority of the remaining production units in high-cost countries have switched to mainly final assembly and customiza-tion. In all, 12,162 employees have left the Group in con-nection with these changes. As a result of these initiatives and along with acquisitions, the number of employees in low-cost countries has nearly doubled since 2006 to 20,537, and the share has increased from 34 percent in 2006 to 44 percent in 2016.
In 2016 the sixth Group-wide manufacturing footprint program was launched for the period through 2018. Since the launch of the latest program, 50 more com-panies were acquired. The goal is to close ten production plants and about 40 offices. The cost of the program is SEK 1,597 million. A review of ASSA ABLOY’s logistics structure was also initiated during the year. The aim is to consolidate freight and other logistics providers, while creating a more efficient structure for warehouse and logistics centers with a high degree of standardization of materials and products and a seamless flow-based, digi-tal IT infrastructure for fast, efficient and secure solutions.
Cost-efficiency
Cost efficiency in all parts of the value chain
PLANTS IN LOW-COST COUNTRIES
Mexico
Brazil
South Africa
China
Poland
RomaniaCzech Republic
Colombia Malaysia
ASSA ABLOY ANNUAL REPORT 2016 COST-EFFICIENCY 23

NUMBER OF SUPPLIERS SHARE OF TOTAL PURCHASES IN LOW-COST COUNTRIES
Number
0
2,000
4,000
6,000
8,000
10,000
1615141312
%
0
10
20
30
40
50
60
1615141312
Reducing the number of suppliers is important for reducing costs and improving quality. Active efforts have reduced the total number of suppliers by 29 percent over the past five years.
Raw materials, components and finished goods from low-cost countries accounted for 53 percent of the Group’s total purchases in 2016.
Cost-efficiency
Professional sourcing
One important long-term change in the Group’s cost structure is the switch from manufacturing standard components in-house to an increased share of sourcing, as well as final assembly and cus-tomization. The Group’s professional sourcing should ensure maximum quality at minimum cost and is a prerequisite for increasingly efficient operations. Sourcing has increased sharply over the past ten years, with a 230 percent increase in the value of sourced materials to SEK 25.6 billion and with a gradual concentration to fewer, more qualified suppliers.
Professional sourcing is growing in importance as ASSA ABLOY switches from its own production toward assembly and customization close to the customer, and becomes a more market-oriented problem solver. The Group’s suppliers are strategic partners who are increas-ingly involved in the development process and in close collaboration grow to be able to deliver not only com-ponents but entire subsystems and entire products. ASSA ABLOY contributes competence transfer and its production and quality expertise.
The ambition is to have an increasingly limited num-ber of large, high-quality suppliers, mainly in low-cost countries, as strategic partners who collaborate in pro-duction and even in product development, based on sup-plier agreements and category and quality management. Over the past five years, the number of suppliers has been reduced by 29 percent to around 7,500 worldwide, with a substantial majority in low-cost countries. The target is to halve this number over the next few years.
The driving force is the Group’s sourcing organization, which has been strongly professionalized over the past
ten years. It categorizes and segments suppliers based on the strategic needs identified by the Group. The divisions have specialized purchasing managers for each compo-nent category. Value analyses and comparative costing, with clear identification of cost distribution, are increas-ingly important methods for managing the actual costs and pricing of the products. The Group has trained over 200 employees in should-cost methods, which provide the knowledge to conduct cost reduction negotiations.
ASSA ABLOY’s Business Partner Code of Conduct is the foundation for collaboration and often results in a long-term improvement in suppliers’ sustainability efforts, with regard to the physical environment, employees’ working environment and conditions, and conduct in other sustainability-related issues. In case of non-compli-ance, collaboration is terminated with the supplier. Monitoring takes place through audit programs, which include over 2,000 suppliers in Latin America, Asia, Africa and eastern Europe.
COST-EFFICIENCY ASSA ABLOY ANNUAL REPORT 201624
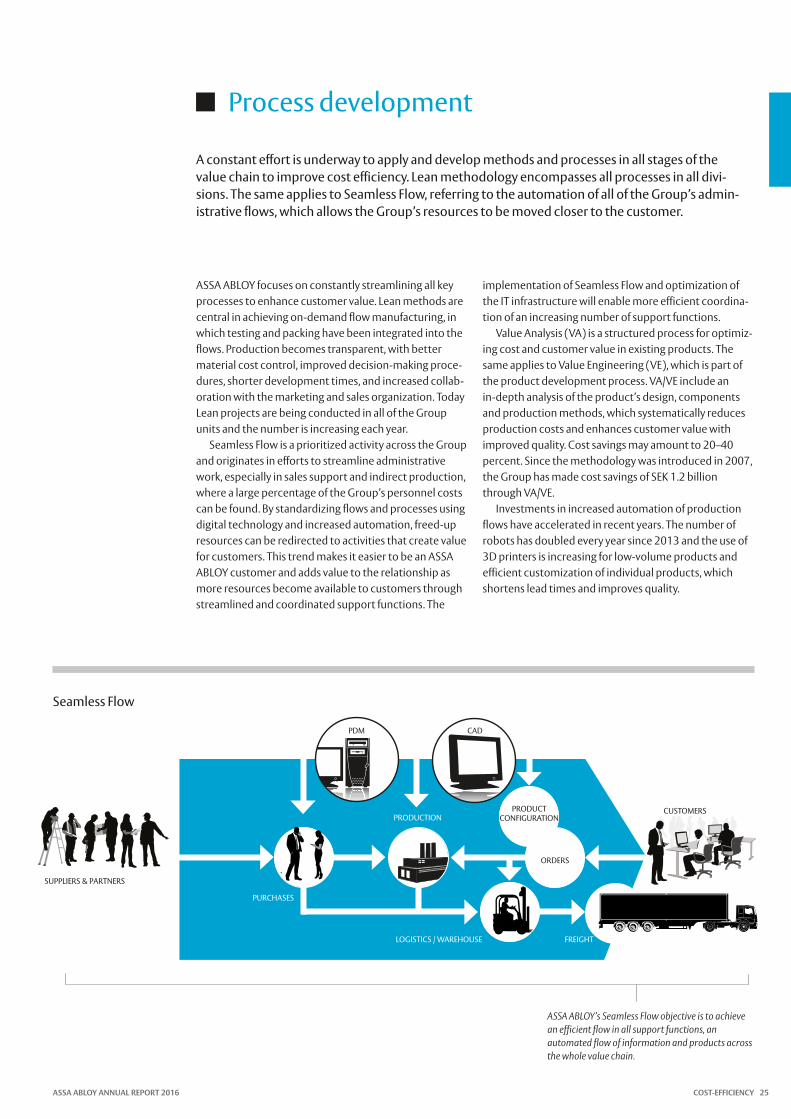
Process development
A constant effort is underway to apply and develop methods and processes in all stages of the value chain to improve cost efficiency. Lean methodology encompasses all processes in all divi-sions. The same applies to Seamless Flow, referring to the automation of all of the Group’s admin-istrative flows, which allows the Group’s resources to be moved closer to the customer.
ASSA ABLOY focuses on constantly streamlining all key processes to enhance customer value. Lean methods are central in achieving on-demand flow manufacturing, in which testing and packing have been integrated into the flows. Production becomes transparent, with better material cost control, improved decision-making proce-dures, shorter development times, and increased collab-oration with the marketing and sales organization. Today Lean projects are being conducted in all of the Group units and the number is increasing each year.
Seamless Flow is a prioritized activity across the Group and originates in efforts to streamline administrative work, especially in sales support and indirect production, where a large percentage of the Group’s personnel costs can be found. By standardizing flows and processes using digital technology and increased automation, freed-up resources can be redirected to activities that create value for customers. This trend makes it easier to be an ASSA ABLOY customer and adds value to the relationship as more resources become available to customers through streamlined and coordinated support functions. The
implementation of Seamless Flow and optimization of the IT infrastructure will enable more efficient coordina-tion of an increasing number of support functions.
Value Analysis (VA) is a structured process for optimiz-ing cost and customer value in existing products. The same applies to Value Engineering (VE), which is part of the product development process. VA/VE include an in-depth analysis of the product’s design, components and production methods, which systematically reduces production costs and enhances customer value with improved quality. Cost savings may amount to 20–40 percent. Since the methodology was introduced in 2007, the Group has made cost savings of SEK 1.2 billion through VA/VE.
Investments in increased automation of production flows have accelerated in recent years. The number of robots has doubled every year since 2013 and the use of 3D printers is increasing for low-volume products and efficient customization of individual products, which shortens lead times and improves quality.
ASSA ABLOY’s Seamless Flow objective is to achieve an efficient flow in all support functions, an automated flow of information and products across the whole value chain.
LOGISTICS / WAREHOUSE FREIGHT
PRODUCTION
PURCHASES
PRODUCT CONFIGURATION
ORDERS
PDM CAD
CUSTOMERS
SUPPLIERS & PARTNERS
Seamless Flow
ASSA ABLOY ANNUAL REPORT 2016 COST-EFFICIENCY 25
The result of ASSA ABLOY’s strategyASSA ABLOY’s strategic focus on market presence, product leadership and cost-efficiency has been very successful. The Group’s growth and earnings trend have created significant value for customers, share-holders and employees.
Profitable growth
ASSA ABLOY grew rapidly during its first decade – mainly through acquisitions – from being a regional lock com-pany in the Nordic countries into the leading global player. With a new management team, in 2006 the Group entered a new phase of growth based on three main strategies for market presence, product leadership and cost-efficiency. With a focus on profitable growth, great value has been created for shareholders and other stake-holders.
Market presence and growthThe fundamental growth driver is strong and long-term: the constantly growing need for security, safety and con-venient solutions for locks and doors. This trend follows the development of prosperity, for which reason
ASSA ABLOY has greatly expanded in emerging markets since 2006. This segment now accounts for 24 percent of total sales, compared with 12 percent in 2006. The Group is now represented in more than 70 countries. In addition to these drivers is the rapid switch in customer demand to electromechanical products and increasingly sustainable and energy-saving products and solutions.
Organic growth is supplemented by an acquisition strategy. An average of over 5 percent of annual growth comes from acquisitions, which strengthen geographical market coverage, expand the product range and add new technologies in expansive areas. Since 2006 ASSA ABLOY has completed 148 acquisitions. In 2016 the Group made 13 acquisitions, which are expected to contribute around SEK 2 billion to annual sales. The Group’s strate-
ASSA ABLOY was founded in 1994 and since then it has grown into the largest global supplier of door opening solutions, with sales of SEK more than 71 billion. Long-term value-creation continues to be the focus of its shareholders, Board of Directors and management. Annual sales growth has averaged 9 percent since 2006. The annual growth rate for operating income has been an average of 9 percent during the same period. Consequently the Group has reached its target an operating margin of 16–17 percent over a business cycle.
Focus on long-term and profitable growth
PROFITABLE GROWTH ASSA ABLOY ANNUAL REPORT 201626

gic decision in 2006 to build a world-leading position in entrance auto-mation was another major growth factor. As a result of several major acquisitions within doors for industries, warehouses, garages, and entrance automation, ASSA ABLOY has created a new division, Entrance Systems. This has grown very rapidly into the Group’s largest division with annual sales of SEK 19.8 billion and a 28 percent share of Group sales. Total growth for the division has been about 600 percent since 2006.
Growth-driving product leadership ASSA ABLOY is the leading innovator and product developer in the tech-nology shift toward increasingly electromechanical, digital and mobile technology. The aim has been to double the pace of innovation. Today 30 percent of the Group’s total sales come from products less than three years old. The growing investment in product development is the main driver for achieving the target of 5 percent annual organic growth. Electro mechanical solutions are rapidly growing and now account for 54 percent of Group sales, compared with 31 percent in 2006.
Cost-efficiency for profitabilityConstant efficiency improvements and cost reductions are the founda-tion of good profitability and sustainable products and businesses. The Group has fundamentally changed the global production structure over the past ten years through five completed multi-year programs – and one that is still ongoing – to concentrate assembly close to major cus-tomer markets and to relocate component production to low-cost countries. By year-end, 76 production plants had been closed, about 100 were converted into assembly plants, and about 50 offices were closed since 2006. The programs reduced the number of employees by 12,162 people. At the same time, sourcing has increased substantially and been
concentrated to fewer, larger and better suppliers. The number of suppliers has been reduced by 29 percent over the past five years.
Additional activities are underway to reduce costs while improving efficiency and customer benefit. All units operate based on Lean pro-cesses with professional teams for smarter production flows. VA/VE methods in product development have reduced material use and con-tribute to improved products that benefit both customers and the environment. Seamless Flow is a top-priority, Group-wide initiative that promotes more efficient digital processes for information flows. It focuses on the administration, which accounts for a large percentage of personnel costs, and moves resources closer to the market and cus-tomer. The Group is making major investments in common IT systems, as well as in the use of automation and robotics in production processes.
Sales growth since 2006
130%
Increase in operating income since 2006
Increase in earnings per share since 2006
140%
170%
0
10,000
20,000
30,000
40,000
50,000
60,000
70,000
80,000
161514131211100908070
2,000
4,000
6,000
8,000
10,000
12,000
14,000
16,000
Sales, SEK M EBIT, SEK M
1 Excluding items affecting comparability.2 Reclassification has been made.
Sales Operating income (EBIT)
1, 2 1, 2 1 1 1
SALES AND OPERATING INCOME (EBIT)
ASSA ABLOY ANNUAL REPORT 2016 PROFITABLE GROWTH 27

Regional divisions
ASSA ABLOY’s divisionsASSA ABLOY is divided into three regional and two global divisions.
The regional divisions manufacture and sell mechanical and electromechanical locks, digital door locks, cylinders and security doors adapted to the local market’s standards and security requirements.
Global Technologies
Share of sales Share of operating income
globalRead more on page 32
Entrance Systems
Share of sales Share of operating income
entreRead more on page 33
Share of sales Share of operating income
AsiaRead more on page 31
Asia Pacific
Share of sales Share of operating income
AmericasRead more on page 30
Americas
24% 31% 12% 7%
13% 15% 28% 24%
Share of sales Share of operating income
emeaRead more on page 29
EMEA
23% 23%
Global divisions The global divisions manufacture and sell electronic access control, identification products and entrance automation on the global market.
ASSA ABLOY’S DIVISIONS ASSA ABLOY ANNUAL REPORT 201628
EMEA
Continued strong growth for electromechanical solutionsDemand continued to increase in 2016 and sales grew organically by 3 percent. Sales of electromechanical locks and solutions increased sharply. Product development continued at a high pace and efficiency and streamlining programs produced good results.
SALES AND OPERATING INCOME
SALES BY PRODUCT GROUP
SEK MSales
SEK MOperating income
12,000
13,000
14,000
15,000
16,000
17,000
1615141312
SalesOperating income1
2,000
2,200
2,400
2,600
2,800
3,000
1 Excluding items affecting comparability 2013 and 2016.
Mekaniska lås, låssystem och tillbehör, 54%Elektromekaniska och elektroniska, 31%Säkerhetsdörrar och beslag, 15%
Säkerhetsdörrar och beslag
Elekromekaniska och elektroniska
Mekaniska lås, låssystem och tillbehör
Mechanical locks, lock systems and fittings, 54%Electromechanical and electronic, 31%Security doors and hardware, 15%
Offering: Mechanical and electromechanical locks, digital door locks, security and fire doors, and fittings.
Markets: EMEA is the leader in its product areas in Europe, the Middle East and Africa. The commercial segment accounts for around 60 percent of sales and the residential segment for 40 percent. EMEA comprises a large number of Group companies with a good knowledge of their local and in many respects diverse markets. Products are sold primar-ily through a number of distribution channels, but also directly to end-users.
Acquisitions 2016: Mauer in Bulgaria, Trojan in the UK and Seawing in Hungary.
Market developmentDemand growth in the division continued to be varied in 2016. Sales increased strongly in Scandinavia, Germany and Spain, were good in the UK, Benelux, Italy, Eastern Europe and Africa, while sales were stable or slightly negative in France and Finland, and strongly negative in the Middle East. The strong demand for electromechanical products seen in recent years accelerated further, with strong interest for digital and mobile solutions in the residential market, especially in northern Europe. Another strong demand trend is sustainable solutions, where EMEA has a market-leading range of products and solutions that meet ever-increasing demands, for example from environmental classification of buildings in the EU.
The division is shifting more and more resources to marketing initiatives. Under the Group’s Seamless Flow project, administrative information flows, processes and opera-tions are being automated, freeing staff to develop direct customer relationships. Nearly 60 percent of the sales staff are now working in direct sales, and the proportion has grown by more than 10 percentage points over the past five years. The division’s e-commerce initiative was further expanded, with about 40 percent of external orders now handled electronically and seamlessly. Digital support is offered to architects and security consultants in the specification process with Openings Studio, a BIM- enabled tool (Building Information Modeling). The division now has over 200 specifiers of its own.
Acquisitions are part of the growth strategy. Acquisitions during the year included Mauer, a leading manufacturer of cylinders and locks in Bulgaria, Trojan Holdings, a leading supplier of fittings for doors and windows in the UK, and Seawing, Hungary’s leading access control company. The Car Lock business, with sales of SEK 550 million, was divested.
Product leadershipThe high pace of product development continued during the year. The share of new products introduced over the past three years was 28 percent of total sales. More than 200 product development projects are expected to result in new products that reach the market over the next few years. The digital products have been highly successful. The CLIQ system, with programmable keys and cylinders, is being expanded to new seg-ments with great success. The same applies for new Bluetooth-based applications and ASSA ABLOY’s Seos mobile keys. “Close Motion,” a new and innovative door closer, was introduced during the year. It has a unique and patented solution for noise-free closing. The division’s High Impact products continued to be successful. They have been devel-oped with the purpose of being sold in large volumes in all markets in the division.
Cost-efficiencyThe division’s restructuring program to reduce the number of plants and to concen-trate on assembly close to customers continued according to plan. As a result, compo-nent production was moved to low-cost countries with consolidation of sub-contrac-tors, leaving fewer and larger partners. The number of direct suppliers decreased by 12 percent during the year. Streamlining of production continued at a high pace with lean projects and increased investment in robots. The Seamless Flow initiative is pro-ducing significant results, and the division is well on the way to consolidating 60 enter-prise resource planning systems into a single application over the next few years. Integration of the Group’s various PDM (Product Data Management) systems is approaching completion. More than 70 percent of users are now on the same platform.
FACTS ON EMEA
Financials in brief 2016 • Sales: SEK 16,837 million (16,524) with 3 percent
organic growth. • Operating income (EBIT): SEK 2,722 million
(2,620).1 • Operating margin: 16.2 percent (15.9).1 1 Excluding items affecting comparability 2016.
See key figures for EMEA p59
ASSA ABLOY ANNUAL REPORT 2016 ASSA ABLOY’S DIVISIONS 29
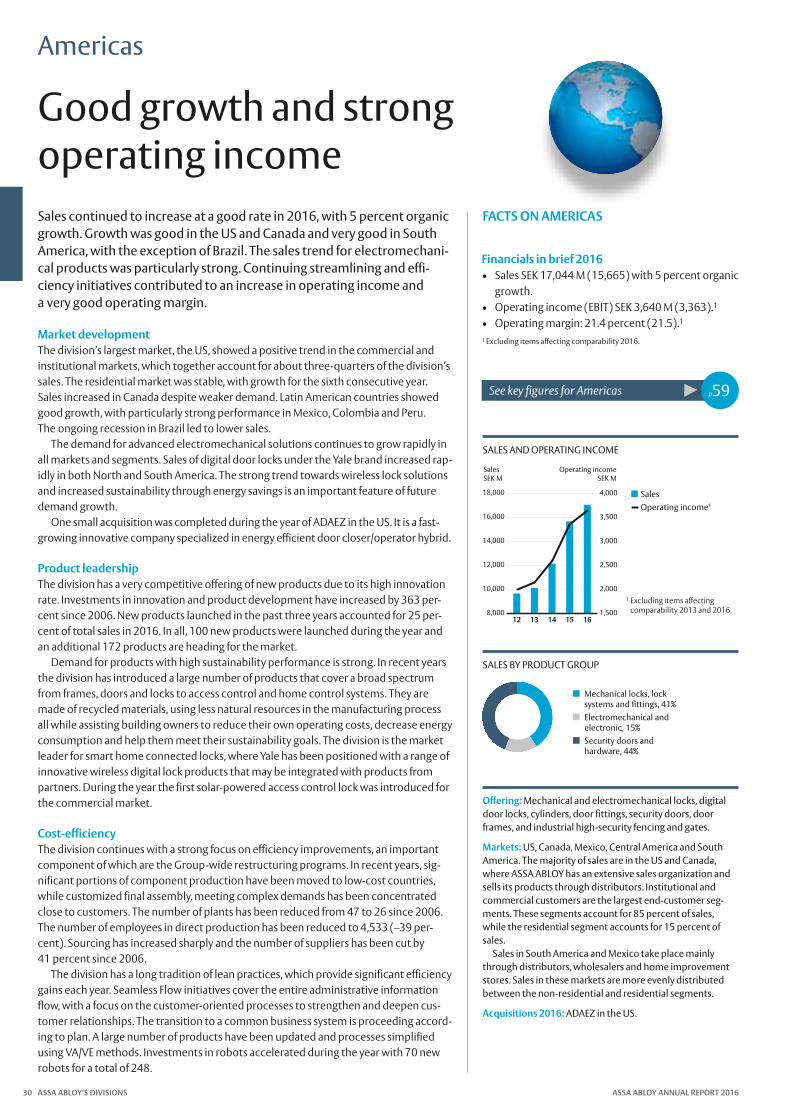
Sales continued to increase at a good rate in 2016, with 5 percent organic growth. Growth was good in the US and Canada and very good in South America, with the exception of Brazil. The sales trend for electromechani-cal products was particularly strong. Continuing streamlining and effi-ciency initiatives contributed to an increase in operating income and a very good operating margin.
SALES AND OPERATING INCOME
SALES BY PRODUCT GROUP
SEK MSales
SEK MOperating income
8,000
10,000
12,000
14,000
16,000
18,000
1615141312
SalesOperating income1
1,500
2,000
2,500
3,000
3,500
4,000
1 Excluding items affecting comparability 2013 and 2016.
Mechanical locks, lock systems and fittings, 41%Electromechanical and electronic, 15%Security doors and hardware, 44%
Offering: Mechanical and electromechanical locks, digital door locks, cylinders, door fittings, security doors, door frames, and industrial high-security fencing and gates.
Markets: US, Canada, Mexico, Central America and South America. The majority of sales are in the US and Canada, where ASSA ABLOY has an extensive sales organization and sells its products through distributors. Institutional and commercial customers are the largest end-customer seg-ments. These segments account for 85 percent of sales, while the residential segment accounts for 15 percent of sales. Sales in South America and Mexico take place mainly through distributors, wholesalers and home improvement stores. Sales in these markets are more evenly distributed between the non-residential and residential segments.
Acquisitions 2016: ADAEZ in the US.
Market developmentThe division’s largest market, the US, showed a positive trend in the commercial and institutional markets, which together account for about three-quarters of the division’s sales. The residential market was stable, with growth for the sixth consecutive year. Sales increased in Canada despite weaker demand. Latin American countries showed good growth, with particularly strong performance in Mexico, Colombia and Peru. The ongoing recession in Brazil led to lower sales.
The demand for advanced electromechanical solutions continues to grow rapidly in all markets and segments. Sales of digital door locks under the Yale brand increased rap-idly in both North and South America. The strong trend towards wireless lock solutions and increased sustainability through energy savings is an important feature of future demand growth.
One small acquisition was completed during the year of ADAEZ in the US. It is a fast- growing innovative company specialized in energy efficient door closer/operator hybrid.
Product leadershipThe division has a very competitive offering of new products due to its high innovation rate. Investments in innovation and product development have increased by 363 per-cent since 2006. New products launched in the past three years accounted for 25 per-cent of total sales in 2016. In all, 100 new products were launched during the year and an additional 172 products are heading for the market.
Demand for products with high sustainability performance is strong. In recent years the division has introduced a large number of products that cover a broad spectrum from frames, doors and locks to access control and home control systems. They are made of recycled materials, using less natural resources in the manufacturing process all while assisting building owners to reduce their own operating costs, decrease energy consumption and help them meet their sustainability goals. The division is the market leader for smart home connected locks, where Yale has been positioned with a range of innovative wireless digital lock products that may be integrated with products from partners. During the year the first solar-powered access control lock was introduced for the commercial market.
Cost-efficiencyThe division continues with a strong focus on efficiency improvements, an important component of which are the Group-wide restructuring programs. In recent years, sig-nificant portions of component production have been moved to low-cost countries, while customized final assembly, meeting complex demands has been concentrated close to customers. The number of plants has been reduced from 47 to 26 since 2006. The number of employees in direct production has been reduced to 4,533 (–39 per-cent). Sourcing has increased sharply and the number of suppliers has been cut by 41 percent since 2006.
The division has a long tradition of lean practices, which provide significant efficiency gains each year. Seamless Flow initiatives cover the entire administrative information flow, with a focus on the customer-oriented processes to strengthen and deepen cus-tomer relationships. The transition to a common business system is proceeding accord-ing to plan. A large number of products have been updated and processes simplified using VA/VE methods. Investments in robots accelerated during the year with 70 new robots for a total of 248.
FACTS ON AMERICAS
Financials in brief 2016 • Sales SEK 17,044 M (15,665) with 5 percent organic
growth. • Operating income (EBIT) SEK 3,640 M (3,363).1 • Operating margin: 21.4 percent (21.5).1 1 Excluding items affecting comparability 2016.
See key figures for Americas p59
Americas
Good growth and strong operating income
Mekaniska lås, låssystem och tillbehör, 41%Elektromekaniska och elektroniska, 15%Säkerhetsdörrar och beslag, 44%
Säkerhetsdörrar och beslag
Elekromekaniska och elektroniska
Mekaniska lås, låssystem och tillbehör
ASSA ABLOY’S DIVISIONS ASSA ABLOY ANNUAL REPORT 201630

The division’s sales declined due to the sharp decline in China, despite a good performance in most other markets in the region. Product develop-ment continued at a record-breaking pace. Major streamlining measures are being implemented in China, which accounts for nearly half of the division’s sales.
SALES AND OPERATING INCOME
SALES BY PRODUCT GROUP
2,000
4,000
6,000
8,000
10,000
12,000
1615141312500
700
900
1,100
1,300
1,500
SEK MSales
SEK MOperating income
SalesOperating income1
1 Excluding items affecting comparability 2013 and 2016.
Mechanical locks, lock systems and fittings, 51%Electromechanical and electronic, 18%Security doors and hardware, 31%
Offering: Mechanical and electromechanical locks, digital door locks, high-security doors, fire doors and hardware.
Markets: The Asian countries are emerging markets without established security standards. New construction accounts for around three-quarters of sales. In China, the same types of lock, handle and hardware are often used in both homes and workplaces. The production units in China also produce for ASSA ABLOY’s other divisions. Australia and New Zealand are mature markets with established lock standards. Reno-vations and upgrades account for the majority of sales.
Market developmentDemand in China continued to weaken, primarily in the residential segment, which accounts for most of the division’s sales in the country. The commercial segment grew, but is still a smaller part of the business. Sales in China decreased sharply and, unfortu-nately, accounting irregularities were also found at some companies. Growth was strong in India, where the division is now building up a leading market position. Demand was good in New Zealand, Thailand, Singapore, the Philippines and Japan. The trend was favorable in South Korea, stable in the rest of Southeast Asia and some-what weaker in Australia.
Strong market trends in the entire region are digital and mobile solutions, where South Korea is leading the way as a global pioneer. Digital door locks are a very popular product that continued to show good growth. Demand for sustainable and climate- smart solutions go hand in hand with the digital trend and increased sharply from a low level, especially in China where the desire to address environmental problems has now become an important driver. Efforts associated with market segmentation and increas-ing resources at the market level are producing good results. ASSA ABLOY is taking over as sole master brand for a growing range of products for the commercial market and Yale is concentrating on the residential market. No acquisitions were completed during the year.
Product leadershipThe division has clear product leadership in its markets, with several years of increased investments in innovation and new products. The number of development engineers continues to increase in the division’s 15 development centers, including in China, where products are also developed for the entire region. The initiative is in response to advanced demand from a large, young and tech-savvy consumer generation. Products introduced over the past three years accounted for 37 percent of total sales, substan-tially higher than the Group target of 25 percent. Interest in sustainable rated products is rapidly growing, especially in China, Australia and New Zealand. The division has the widest range of products with high sustainability performance and a rapidly growing number of environmental product declarations.
Cost-efficiencyThe division is dealing with the sharp slowdown in Chinese demand through measures that include a substantial reduction of staff. The number decreased during the year by about 1,500 to a total of 11,700. As a result the number of employees in the division declined by 21 percent in three years. This reduction is supported in part by the con-tinued streamlining of the division’s plant structure in accordance with the Group’s restructuring program. Other measures include increasing the pace of outsourcing with more purchasing, improving efficiency in production by investing in more robots and expanding the lean program for smarter production flows.
The Seamless Flow initiative also continued successfully during the year and the tran-sition to a common business system continued at a good pace. Streamlining of adminis-trative information flows broadened to include more processes such as product data, order and billing systems, as well as marketing with the expansion of e-commerce. This initiative allowed more resources to be transferred to direct customer relationships.
FACTS ON ASIA PACIFIC
Financials in brief 2016 • Sales SEK 9,189 M (10,171), an organic decline
with 9 percent and with 5 percent adjusted for overstated sales in 2015.
• Operating income (EBIT) SEK 787 M (1,436).1
• Operating margin: 8.6 percent (14.1).11 Excluding items affecting comparability and including SEK 300 M
write-down of working capital 2016.
See key figures for Asia Pacific p59
Asia Pacific
Weak development in China weighed on Asia
Mekaniska lås, låssystem och tillbehör, 51%Elektromekaniska och elektroniska, 18%Säkerhetsdörrar och beslag, 31%
Säkerhetsdörrar och beslag
Elekromekaniska och elektroniska
Mekaniska lås, låssystem och tillbehör
ASSA ABLOY ANNUAL REPORT 2016 ASSA ABLOY’S DIVISIONS 31

Global Technologies, which consists of HID Global and ASSA ABLOY Hospitality, continued to have good sales growth of 3 percent organically. Demand was good in most of HID Global’s product segments in mature markets. ASSA ABLOY Hospitality also continued to grow.
SALES AND OPERATING INCOME
SALES BY PRODUCT GROUP
0
2,000
4,000
6,000
8,000
10,000
1615141312800
1,000
1,200
1,400
1,600
1,800
SEK MSales
SEK MOperating income
SalesOperating income1
1 Excluding items affecting comparability 2013 and 2016.
Access control, 73%Hotel locks, 21%Service, 6%
Offering: HID Global is a global leader in trusted identity solutions, primarily in identity and access management, and in contactless identification technology solutions. Custom-ers comprise companies, healthcare, education, financial, government and state institutions. ASSA ABLOY Hospitality manufactures and sells electronic lock systems, safes, energy management systems and mini-bars for hotels and cruise ships under the VingCard and Elsafe product brands. It is the world’s best-known brands for lock systems and in-room safes, with products installed in over seven million hotel rooms in more than 42,000 hotels worldwide.
Markets: Customers are mainly in the institutional and commercial sectors worldwide.
Acquisitions 2016: Demoteller and Bluvision in the US.
HID GLOBALUnderlying global demand continues to be strong with growing security needs and upgrades to electromechanical technology with digital and mobile solutions. The year showed good sales growth in the mature markets, especially in Europe and North America. Emerging markets showed a mixed picture with very good sales in Africa, good sales in China, while the rest of Asia, South America and the Middle East had a negative development.
The commercial segment is spearheading the rapid development toward digital and mobile solutions with a high growth rate. In the institutional segment demand increased after several years of relatively weak growth. Physical access control and identification technology both reported a year of good growth in most markets, while printer products, with a large proportion of sales in emerging markets, were weaker. The software company Quantum Secure, acquired in 2015, had a strong increase in sales, while authentication solutions remained unchanged. The great success of the division’s mobile access control solutions with a significant increase in the number of customers was particularly gratifying.
HID Global has global product leadership with a continued high pace of product development. New products launched in the past three years account for almost 40 percent of sales, compared with the Group average of approximately 30 percent. One strong driver is the technology shift to digital and mobile solutions with increased soft-ware content that requires regular updates.
The business unit’s access control products, with global leadership, undergo con-stant development with new features and adaptations to different mobile platforms. In the field of printers, new products were launched with better sustainability perfor-mance, lower operating costs and higher resolution. HID Global has seen a rapid increase in the number of new products based on the Seos platform, including readers and cards. One important launch was the first solution for ID cards and driver’s licenses in the mobile phone. The solution has great potential for the future as legislation is adapted to this technology. The US is in the lead here with legislation in the individual states. Similarly, HID Global has developed new authentication techniques that permit logging in to online banking on the mobile phone.
Cost-efficiency improvements continued at a good pace during the year, with posi-tive effects. Within the Group-wide restructuring program, certain operations in access control and ID cards are now being moved from Ireland to Malaysia. The number of development centers has been consolidated. The aim is to create fewer units with larger critical mass for product development, while increasing engineering capacity in emerging markets. The division also continued to consolidate its supplier base, result-ing in lower costs while improving sustainability. Work on the Seamless Flow initiative intensified with major advances, especially in marketing and sales.
ASSA ABLOY HOSPITALITYASSA ABLOY Hospitality continued growth from last year with high operating income and strong margin growth. The main driver is the continued rapid growth of demand for elec-tromechanical door opening solutions using digital and mobile technology. Once again, demand growth is better in mature markets than in emerging markets, where China remains weak with a low growth rate in the new construction market. Several large global hotel chains are now customers for installation of advanced electromechanical systems with both hardware and software. Demand remains high for renovations and upgrades as a result of strongly increased investments in new technological solutions in recent years.
FACTS ON GLOBAL TECHNOLOGIES
Financials in brief 2016 • Sales SEK 9,697 M (9,100) with 3 percent organic
growth.• Operating income (EBIT) SEK 1,752 M (1,647),
a 6 percent increase.1
• Operating margin (EBIT) 18.1 percent (18.1).11 Excluding items affecting comparability 2016.
See key figures for Global Technologies p59
Global Technologies
High rate of development and strong earnings growth
Passerkontroll, 73%Hotellås, 21%Service, 6%
Service
Hotellås
Passerkontroll
ASSA ABLOY’S DIVISIONS ASSA ABLOY ANNUAL REPORT 201632
In 2016 demand developed well with strong sales growth in North America, Pacific and western Europe, while growth in emerging markets was subdued. The pace of product development was high with many new product launches. The division is leading the development toward more sustainable and energy-efficient solutions. The restructuring programs are proceeding according to plan with reduced costs.
SALES AND OPERATING INCOME
SALES BY PRODUCT GROUP
0
4,000
8,000
12,000
16,000
20,000
1615141312500
1,000
1,500
2,000
2,500
3,000
SEK MSales
SEK MOperating income
SalesOperating income1
1 Excluding items affecting comparability 2013 and 2016.
Products, 73%Service, 27%
Offering: Entrance automation products, components and service. The product range includes automatic swing, sliding and revolving doors, industrial doors, garage doors, high-performance doors, docking solutions, hangar doors, gate automation, hardware for overhead sectional doors and sensors.
Markets: Entrance Systems is a global leader with sales worldwide. It has sales companies in 35 countries and dis-tributors in 90 countries. Service operations account for nearly one-third of sales. The products are sold through three channels. In the direct channel, new equipment and comprehensive service are sold direct to end-customers under the ASSA ABLOY brand. The indirect channel mainly targets large and medium-sized distributors under the Entrematic brand. The third channel, Cardo, sells compo-nents and hardware for doors in the industrial and residen-tial segments and sensors for the door and elevator industry.
Acquisitions 2016: Nassau in Denmark, Lighthouse and Greenville in the US and Construction Specialties in Mexico.
Market developmentThe division’s positive organic growth continued during the year with an increase of 4 percent. It was particularly strong in North America in all market segments. In northern and central Europe, demand was good, while it improved from low levels in southern Europe. Growth in emerging markets was slower, in part because of weak growth in China, a market that accounts for a minor portion of the division’s sales. The division continues to invest in emerging markets with the aim of increasing their share of sales from 11 percent to 25 percent.
In the various segments, sales increased strongly for automatic doors, industrial doors and high-performance doors. Growth was good in garage doors and warehouse and logistics solutions, while it was negative in the European residential segment.
The service offering, which accounts for almost one third of the division’s sales con-tinued to perform well. New service concepts based on long-term contracts, preventive maintenance and modernization strengthen customer relationships and provide good opportunities for upselling.
Acquisitions are an important part of the growth. During the year four companies were acquired: Nassau in Denmark, which holds a strong position in Europe in industrial overhead sectional doors, Lighthouse and Greenville in the US, two regional distribu-tors of overhead sectional doors and loading docks, and Construction Specialties, a leader in sales and installation of docking products, overhead sectional doors and high-performance doors in Mexico.
Product leadershipThe launch rate for new products continued at a high pace. New products launched in the past three years accounted for 32 percent of sales, clearly above the Group target of 25 percent. The product development organization is functioning well with new and modular development platforms that reduce complexity and provide significant effi-ciency gains in the use of resources. Product launches included a new range of overhead sectional doors for the North American and European markets, new solutions for load-ing docks, high-performance doors for specific industry applications and sliding doors for emerging markets.
The Group is spearheading developments toward more energy-saving and sustain-able solutions. The division has a large and growing range of energy-efficient solutions, such as products that can be quickly opened and closed, that have good insulation, or with various intelligent sensors and digital technology to control energy consumption.
Cost-efficiencyConsolidation of the production structure proceeded according to plan. During the year, production in Italy was moved to the division’s plants in the Czech Republic. The strategy is to place customized final assembly close to the customer and to move component production to low-cost countries, while concentrating purchases to fewer and larger suppliers. Streamlining is facilitated by investments in robotics, as well as the use of Lean practices and VA/VE for resource efficiency at every level. The Seamless Flow project dur-ing the year included the continued implementation of a common business system for the division. In addition, it covered more and more aspects of the division’s information flows, including increased digitization of marketing and customer relations, as well as implementation of more effective digital solutions in the service organization.
FACTS ON ENTRANCE SYSTEMS
Financials in brief 2016 • Sales SEK 19,789 M (17,957) with 4 percent organic
growth. • Operating income (EBIT) SEK 2,753 M (2,436).1 • Operating margin: 13.9 percent (13.6).11 Excluding items affecting comparability 2016.
See key figures for Entrance Systems p59
Entrance Systems
Increased sales and higher margin
Produkter, 73%Service, 27%
Service
Produkter
ASSA ABLOY ANNUAL REPORT 2016 ASSA ABLOY’S DIVISIONS 33
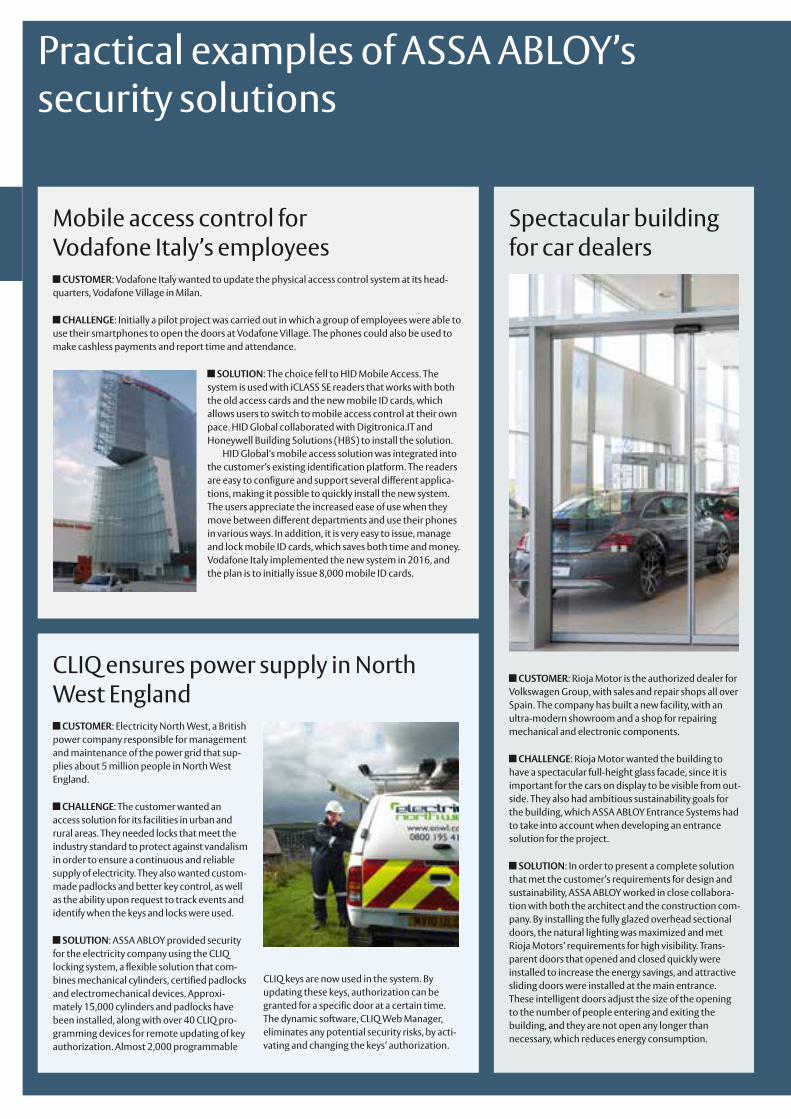
Practical examples of ASSA ABLOY’s security solutions
Spectacular building for car dealers
CUSTOMER: Rioja Motor is the authorized dealer for Volkswagen Group, with sales and repair shops all over Spain. The company has built a new facility, with an ultra-modern showroom and a shop for repairing mechanical and electronic components.
CHALLENGE: Rioja Motor wanted the building to have a spectacular full-height glass facade, since it is important for the cars on display to be visible from out-side. They also had ambitious sustainability goals for the building, which ASSA ABLOY Entrance Systems had to take into account when developing an entrance solution for the project.
SOLUTION: In order to present a complete solution that met the customer’s requirements for design and sustainability, ASSA ABLOY worked in close collabora-tion with both the architect and the construction com-pany. By installing the fully glazed overhead sectional doors, the natural lighting was maximized and met Rioja Motors’ requirements for high visibility. Trans-parent doors that opened and closed quickly were installed to increase the energy savings, and attractive sliding doors were installed at the main entrance. These intelligent doors adjust the size of the opening to the number of people entering and exiting the building, and they are not open any longer than necessary, which reduces energy consumption.
CLIQ ensures power supply in North West England
CUSTOMER: Electricity North West, a British power company responsible for management and maintenance of the power grid that sup-plies about 5 million people in North West England.
CHALLENGE: The customer wanted an access solution for its facilities in urban and rural areas. They needed locks that meet the industry standard to protect against vandalism in order to ensure a continuous and reliable supply of electricity. They also wanted custom- made padlocks and better key control, as well as the ability upon request to track events and identify when the keys and locks were used.
SOLUTION: ASSA ABLOY provided security for the electricity company using the CLIQ locking system, a flexible solution that com-bines mechanical cylinders, certified padlocks and electromechanical devices. Approxi-mately 15,000 cylinders and padlocks have been installed, along with over 40 CLIQ pro-gramming devices for remote updating of key authorization. Almost 2,000 programmable
CLIQ keys are now used in the system. By updating these keys, authorization can be granted for a specific door at a certain time. The dynamic software, CLIQ Web Manager, eliminates any potential security risks, by acti-vating and changing the keys’ authorization.
Mobile access control for Vodafone Italy’s employees
CUSTOMER: Vodafone Italy wanted to update the physical access control system at its head-quarters, Vodafone Village in Milan.
CHALLENGE: Initially a pilot project was carried out in which a group of employees were able to use their smartphones to open the doors at Vodafone Village. The phones could also be used to make cashless payments and report time and attendance.
SOLUTION: The choice fell to HID Mobile Access. The system is used with iCLASS SE readers that works with both the old access cards and the new mobile ID cards, which allows users to switch to mobile access control at their own pace. HID Global collaborated with Digitronica.IT and Honeywell Building Solutions (HBS) to install the solution.
HID Global’s mobile access solution was integrated into the customer’s existing identification platform. The readers are easy to configure and support several different applica-tions, making it possible to quickly install the new system. The users appreciate the increased ease of use when they move between different departments and use their phones in various ways. In addition, it is very easy to issue, manage and lock mobile ID cards, which saves both time and money. Vodafone Italy implemented the new system in 2016, and the plan is to initially issue 8,000 mobile ID cards.
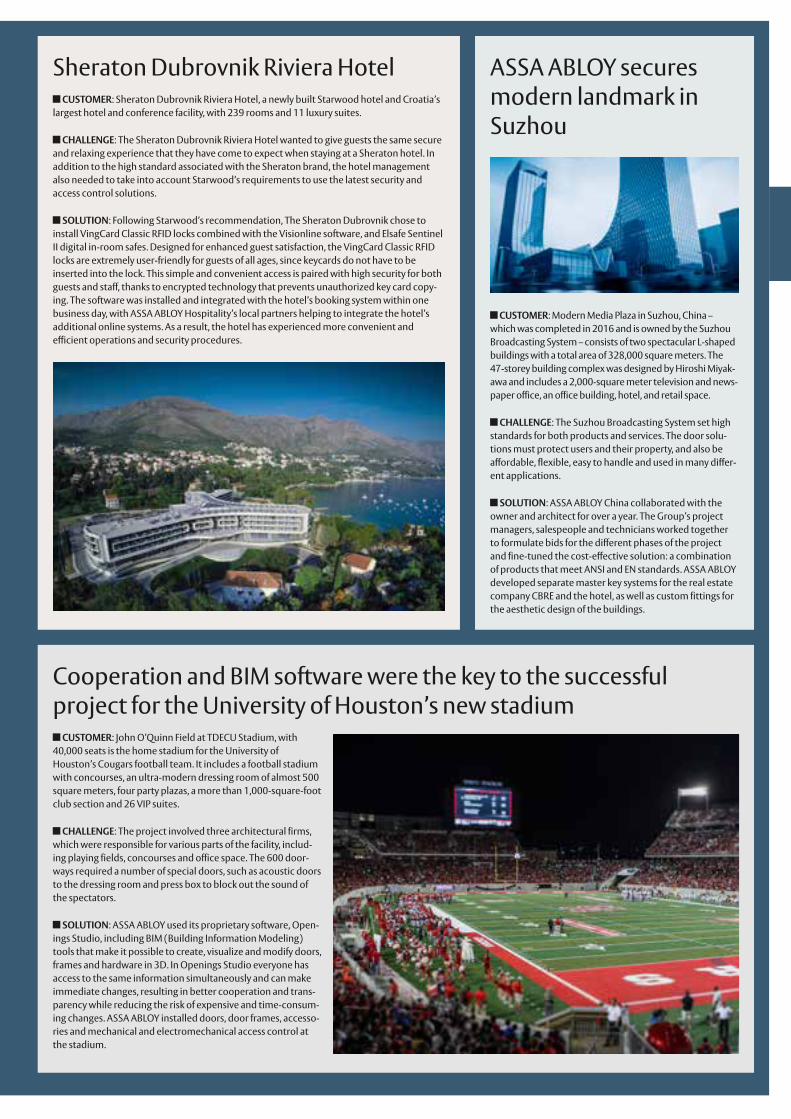
Sheraton Dubrovnik Riviera Hotel CUSTOMER: Sheraton Dubrovnik Riviera Hotel, a newly built Starwood hotel and Croatia’s
largest hotel and conference facility, with 239 rooms and 11 luxury suites.
CHALLENGE: The Sheraton Dubrovnik Riviera Hotel wanted to give guests the same secure and relaxing experience that they have come to expect when staying at a Sheraton hotel. In addition to the high standard associated with the Sheraton brand, the hotel management also needed to take into account Starwood’s requirements to use the latest security and access control solutions.
SOLUTION: Following Starwood’s recommendation, The Sheraton Dubrovnik chose to install VingCard Classic RFID locks combined with the Visionline software, and Elsafe Sentinel II digital in-room safes. Designed for enhanced guest satisfaction, the VingCard Classic RFID locks are extremely user-friendly for guests of all ages, since keycards do not have to be inserted into the lock. This simple and convenient access is paired with high security for both guests and staff, thanks to encrypted technology that prevents unauthorized key card copy-ing. The software was installed and integrated with the hotel’s booking system within one business day, with ASSA ABLOY Hospitality’s local partners helping to integrate the hotel’s additional online systems. As a result, the hotel has experienced more convenient and efficient operations and security procedures.
CUSTOMER: Modern Media Plaza in Suzhou, China – which was completed in 2016 and is owned by the Suzhou Broadcasting System – consists of two spectacular L-shaped buildings with a total area of 328,000 square meters. The 47-storey building complex was designed by Hiroshi Miyak-awa and includes a 2,000-square meter television and news-paper office, an office building, hotel, and retail space.
CHALLENGE: The Suzhou Broadcasting System set high standards for both products and services. The door solu-tions must protect users and their property, and also be affordable, flexible, easy to handle and used in many differ-ent applications.
SOLUTION: ASSA ABLOY China collaborated with the owner and architect for over a year. The Group’s project managers, salespeople and technicians worked together to formulate bids for the different phases of the project and fine-tuned the cost-effective solution: a combination of products that meet ANSI and EN standards. ASSA ABLOY developed separate master key systems for the real estate company CBRE and the hotel, as well as custom fittings for the aesthetic design of the buildings.
ASSA ABLOY secures modern landmark in Suzhou
Cooperation and BIM software were the key to the successful project for the University of Houston’s new stadium
CUSTOMER: John O’Quinn Field at TDECU Stadium, with 40,000 seats is the home stadium for the University of Houston’s Cougars football team. It includes a football stadium with concourses, an ultra-modern dressing room of almost 500 square meters, four party plazas, a more than 1,000-square-foot club section and 26 VIP suites.
CHALLENGE: The project involved three architectural firms, which were responsible for various parts of the facility, includ-ing playing fields, concourses and office space. The 600 door-ways required a number of special doors, such as acoustic doors to the dressing room and press box to block out the sound of the spectators.
SOLUTION: ASSA ABLOY used its proprietary software, Open-ings Studio, including BIM (Building Information Modeling) tools that make it possible to create, visualize and modify doors, frames and hardware in 3D. In Openings Studio everyone has access to the same information simultaneously and can make immediate changes, resulting in better cooperation and trans-parency while reducing the risk of expensive and time-consum-ing changes. ASSA ABLOY installed doors, door frames, accesso-ries and mechanical and electromechanical access control at the stadium.

Sustainable development
Good progress in sustainability
ASSA ABLOY’s sustainability initiatives continued to make good progress in 2016. The new five-year sustainability plan is in line with the objectives. A Group-wide strategy will provide a stronger safety culture throughout the organization. Efforts to reduce energy consumption continue, with an increased focus on transportation and logistics, as well as renewable energy.
Commercial driverCustomers are increasingly asking for sustainable prod-ucts and solutions. Sustainability initiatives are inte-grated into the Group’s strategies for increased market presence, product leadership and cost-efficiency. The divisions have operational responsibility, but governance is based on the Group-wide Code of Conduct that applies to all employees and the Group-wide Business Partner Code of Conduct. ASSA ABLOY reports the results of the sustainability initiatives in greater detail in a separate sustainability report, and applies the sustainability reporting framework, the Global Reporting Initiative (GRI).
Clearer performance monitoringIn 2016 ASSA ABLOY began working based on a new sus-tainability program for the period until 2020. The pro-gram includes several key figures and provides faster and more detailed monitoring. The results from the first year are positive and in line with the plan.
One important area of focus involves reducing energy consumption throughout the operation through more efficient processes and intelligent control systems. ASSA ABLOY is working to increase the proportion of renewable energy with the target of obtaining 20 per-cent of total energy consumption from renewable sources by 2020. A focused approach to energy will enable ASSA ABLOY to reduce the Group’s total carbon emissions.
The Group’s water consumption is largely related to surface treatment processes. Increasing the degree of water purification will make it possible to reuse water multiple times, which reduces consumption.
Good results have been achieved in the effort to reduce the use of chlorinated organic solvents. They are primarily used for painting products and more and more plants are now using alternatives with lower environ-mental impact, such as water-based varnish.
The Group’s units are actively working to reduce waste generation, through measures such as intelligent manu-facturing processes and packaging. The goal is to sepa-rate an increasing proportion of waste to the greatest extent possible for reuse in order to minimize the amount of waste going to the landfill.
The Group’s streamlining program for the production structure combined with other efficiency activities such as Seamless Flow and smarter IT systems provide reduced resource consumption and thereby reduced environ-mental impact.
The Group’s goal is for all units with significant envi-ronmental impact to have an environmental manage-ment system to comply with ISO 14001. As new compa-nies are acquired such systems are gradually introduced, if they are not already in place. A total of 124 units had environmental management systems at the end of the year, which means that the system covers approximately 76 percent of employees in the Group’s factories.
ASSA ABLOY is working systematically with its suppli-ers to improve sustainability performance across the supply chain. Evaluation and improvement of the sup-plier base is a continuous process, with a special focus on audits of suppliers in low-cost countries. To verify the quality of the audits, external auditors have assessed the work processes and confirmed the audit outcomes.
Sustainable productsASSA ABLOY is the global leader in innovation, product development and sales of environmentally certified products, which are products that comply with various standards and certified by a third party. The Group has an increased proportion of products with industry-leading sustainability characteristics, several of which are certi-fied by a third party, such as the “Green Circle.”
In 2016, the Group initiated an internal reporting sys-tem to monitor sales of sustainable and environmentally certified products.
Strong safety cultureAn important initiative involves a safer working environ-ment, an area where the Group aims to reduce the injury rate and improve the safety culture. A Group-wide safety manual has been formulated and is the basis for struc-tured safety initiatives within the Group’s units. Key features include education, risk identification and pro-moting a good safety culture. The Group has introduced an in-depth reporting system for accidents and incidents, as well as key figures for detailed analyzes.
THE GROUP’S REPORTING UNITS
The number of reporting units in the Group amounts to 347 (338).
Number
0
50
100
150
200
250
300
350
1615141312
Read more about ASSA ABLOY’s sustainability initiatives in the 2016 Sustainability Report.
SUSTAINABLE DEVELOPMENT ASSA ABLOY ANNUAL REPORT 201636

Continued focus on development
Employee commitment and expertise are crucial for delivering results based on the strategy’s three components, increased market presence, product leadership and cost-efficiency. ASSA ABLOY’s basic values of transparency, accountability and valuing results and performance along with a clear innovation culture shape the Group’s employer brand. ASSA ABLOY is actively working to offer stimulating work tasks with clarity and development opportunities, where the contributions of every employee are visible.
Internal mobility and development ASSA ABLOY’s recruitment policy gives priority to internal candidates provided they have equal qualifications to external applicants. All job vacancies are advertised on the Group’s global intranet to encourage internal mobility. The Group has a system through which employees are offered opportunities to switch jobs with coworkers, or to work together during periods, which increases productivity and contributes to mobility. Development to meet the require-ments of the future organization, especially the digital conversion, is a priority. During the year a new version of the digital and interactive training program “Entrance to ASSA ABLOY” was initiated.
Diversity and gender equalityThe Code of Conduct states that gender, nationality, social or ethnic origin, age, religion, physical disability, sexual orientation and political opinion must not be the basis for negative discrimination. The Group operates at all levels in order to achieve good diversity, which contributes to more dynamic structures and perspectives. One target is to have 30 percent of management positions held by women by 2020. They held 25 percent of management positions in 2016. Managers are expected to prioritize the underrepre-sented gender in the recruitment process, provided that they have equal qualifications, to ensure compliance with local legislation, and to have at least one person from the underrepresented gender among the final candidates. The Group currently has 28 different nationalities in the senior management structure.
Employee surveyASSA ABLOY conducts an employee survey every two years. Areas covered include how employees view the work situa-tion, ASSA ABLOY as an employer, occupational health and safety, conditions and equal opportunities for professional
development. The results are broken down into over 300 units in the Group and form the basis for concrete action plans. The 2016 survey had a very high response rate of 92 percent. The responses showed improvements on a number of points compared with the 2014 survey, as well as the need for increased efforts. One such area is health and safety, where the Group is now implementing an exten-sive Group-wide program to improve the working environ-ment and strengthen the safety culture.
Development and careerAnnual performance reviews are important tools for moni-toring and planning employees’ professional develop-ment. Another is the internal labor market with rotation across borders and disciplines. This approach spreads knowledge, experience and values in the Group.
Leadership development is aimed at promoting active leadership based on continuous feedback, with the motto “know your people,” where each employee is seen as an individual. The Group has a well-established global develop-ment process for senior managers, the Talent Management Process, which is aimed at ensuring that the Group has the expertise it needs to meet the demands of the future. The foundation consists of two development programs for senior managers: ASSA ABLOY MMT and ASSA ABLOY IMD “Leading the future.” MMT has three modules based on the Group’s three basic strategies: market presence, product leadership and cost-efficiency. About 430 of the Group’s senior managers from 30 countries have participated in the IMD training program, which is conducted in cooperation with the world-famous Swiss management school IMD in Lausanne. The collaborative effort also includes the custom-ized IMD program with about 30 participants per session. Its aim is to support the implementation of the Group’s strategies, with a focus on problem solving and activities based on an analysis of various case studies.
WOMEN AT DIFFERENT LEVELS OF THE ORGANIZATIONShare of women, %
Level 20121 20131 2014 2015 20162 – reports to CEO 18 27 27 27 273 – reports to level 2 16 12 16 17 214 – reports to level 3 18 19 17 16 175 – reports to level 4 23 24 24 25 27Levels 2–5 22 22 22 23 25All employees 35 31 31 31 311 The definition of management positions was revised in 2014. 2012 and 2013 have
been restated for comparability with 2014.
Europe excl. Sweden, 34%Sweden, 21%North America, 19%Asia, 16%Africa och Middle East, 5%South America, 4%Pacific, 1%
Paci�c
South America
Africa ME
Asia
North America
Sweden
Europe
NATIONALITIES – ASSA ABLOY’S MANAGEMENT TEAMS
ASSA ABLOY ANNUAL REPORT 2016 SUSTAINABLE DEVELOPMENT 37
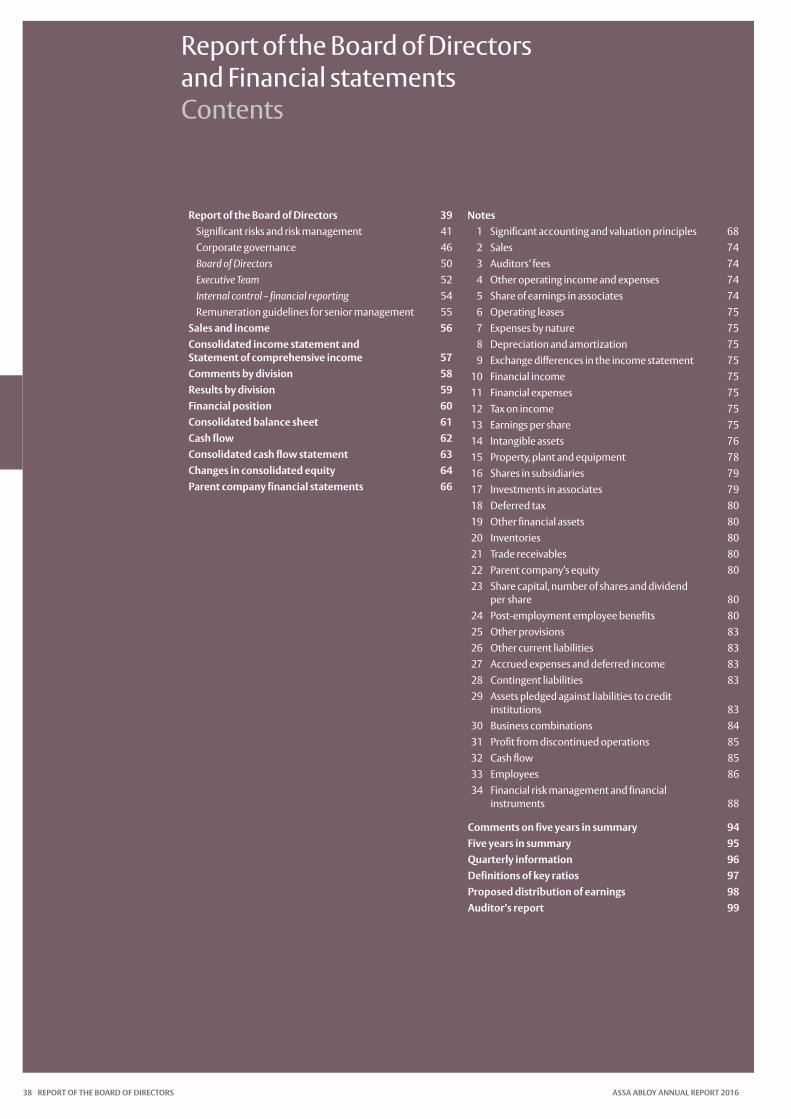
Report of the Board of Directors and Financial statementsContents
Report of the Board of Directors 39Significant risks and risk management 41Corporate governance 46Board of Directors 50Executive Team 52Internal control – financial reporting 54Remuneration guidelines for senior management 55
Sales and income 56Consolidated income statement and Statement of comprehensive income 57Comments by division 58Results by division 59Financial position 60Consolidated balance sheet 61Cash flow 62Consolidated cash flow statement 63Changes in consolidated equity 64Parent company financial statements 66
Notes 1 Significant accounting and valuation principles 68 2 Sales 74 3 Auditors’ fees 74 4 Other operating income and expenses 74 5 Share of earnings in associates 74 6 Operating leases 75 7 Expenses by nature 75 8 Depreciation and amortization 75 9 Exchange differences in the income statement 7510 Financial income 7511 Financial expenses 7512 Tax on income 7513 Earnings per share 7514 Intangible assets 7615 Property, plant and equipment 7816 Shares in subsidiaries 7917 Investments in associates 7918 Deferred tax 8019 Other financial assets 8020 Inventories 8021 Trade receivables 8022 Parent company’s equity 8023 Share capital, number of shares and dividend
per share 8024 Post-employment employee benefits 8025 Other provisions 8326 Other current liabilities 8327 Accrued expenses and deferred income 8328 Contingent liabilities 8329 Assets pledged against liabilities to credit
institutions 8330 Business combinations 8431 Profit from discontinued operations 8532 Cash flow 8533 Employees 8634 Financial risk management and financial
instruments 88
Comments on five years in summary 94Five years in summary 95Quarterly information 96Definitions of key ratios 97Proposed distribution of earnings 98Auditor’s report 99
REPORT OF THE BOARD OF DIRECTORS ASSA ABLOY ANNUAL REPORT 201638
Report of the Board of Directors
The Annual Report of ASSA ABLOY AB (publ.), corporate identity number 556059-3575, contains the consolidated financial statements for the financial year 1 January through 31 December 2016. ASSA ABLOY is the global leader in door opening solutions, dedicated to satisfying end-user needs for security, safety and convenience.
Significant eventsSales and incomeSales for the year totaled SEK 71,293 M (68,099), with organic growth of 2 percent (4) and acquired growth of 3 percent (3). The exchange rate impact on sales was 0 per-cent (13).
Operating income (EBIT) excluding items affecting com-parability increased by 2 percent to SEK 11,254 M (11,079), equivalent to an operating margin of 15.8 percent (16.3). Items affecting comparability consists of costs for the new restructuring program launched during the year.
Impairment of operating assets and correction of past incorrect reporting in China resulted in one-off costs of approximately SEK 700 M. Taking into account the reversal of deferred acquisition payments in China, the total negative impact on operating income for these items is SEK 300 M. Net financial items were SEK –705 M (–697). Income before tax excluding items affecting comparability totaled SEK 10,549 M (10,382).
Operating cash flow increased by 5 percent to SEK 10,467 M (9,952). Earnings per share after full dilution, excluding items affecting comparability, increased 2 percent to SEK 7.09 (6.93).
RestructuringA new restructuring program that covers all divisions was launched in 2016. About fifty closures of plants and offices are planned and some production will be outsourced. The program affects approximately 2,500 people. The total restructuring cost is estimated at SEK 1,597 M before tax and was fully expensed in 2016. The payback period for the pro-gram is expected to be less than three years.
A number of activities were also implemented in 2016 within the framework of previously launched restructuring programs aimed at generating further efficiencies and savings. The most recently launched program from 2013 is still active, but was largely implemented by year-end 2016.
At year-end 2016, 12,162 employees had left the Group, of which 1,412 employees during the year, as a result of the changes in the production structure since the programs began in 2006. A total of 76 plant closures have been imple-mented, including three closures during the year. A large number of plants in high-cost countries have switched from production to final assembly.
The Group’s production is increasingly concentrated in its own plants in China, central and eastern Europe and to exter-nal suppliers in low-cost countries.
Payments for the restructuring programs totaled SEK 442 M (375) for the year. At year-end 2016, the remain-ing provisions for restructuring measures amounted to SEK 1,572 M (551).
Acquisitions and divestmentsIn February 2016, ASSA ABLOY acquired 100 percent of the share capital of the Swiss company CEDES, a leading supplier of sensor technology to the door and elevator industry. The acquisition forms part of the strategy of providing more intelligence in entrance automation to create new innova-tive, integrated customer solutions. CEDES is headquartered in Landquart, Switzerland.
In March 2016 ASSA ABLOY acquired 100 percent of the share capital of Lighthouse, a US distributor of industrial doors and docking systems. The acquisition of Lighthouse represents another important step in the strategy of expand-ing the Group’s market presence in the US in the area of entrance automation. The operation is headquartered in Charlotte, North Carolina, USA.
In October 2016, ASSA ABLOY acquired 100 percent of the share capital of Trojan, a leading British supplier of fit-tings for doors and windows. The acquisition is a good com-plement to ASSA ABLOY’s product offering in the UK. Trojan is headquartered in Walsall, UK.
In November 2016 ASSA ABLOY acquired 100 percent of the share capital in Nassau, a major European supplier of industrial overhead sectional doors. The acquisition pro-vides good coverage and expanded service in the product area for a number of European markets. Nassau is head-quartered in Ringe, Denmark.
In December 2016 ASSA ABLOY acquired 100 percent of the share capital of Bluvision, a leading US supplier of solu-tions in the market for the Internet of Things (IoT). Bluvision is headquartered in Fort Lauderdale, Florida, USA.
Other acquisitions during the year included Construction Specialties (Mexico), which strengthens the leading position in entrance automation, and Mauer (Bulgaria), which strengthens ASSA ABLOY’s presence in the emerging mar-kets.
A total of 13 businesses, including minor acquisitions, were consolidated during the year. The total purchase price of these acquisitions was SEK 3,023 M on a debt-free basis, and acquisition analyses indicate that goodwill and other intangible assets with an indefinite useful life amounted to SEK 2,395 M. No additional acquisitions of non-controlling interests occurred during the year (990).
In September 2016 the Group sold its car locks business to the Japanese company, ALPHA Corporation. The car locks operation, headquartered in Tyniste, Czech Republic, had sales of about SEK 570 M in 2015. The disposal resulted in a small capital gain and will have a positive impact on ASSA ABLOY’s operating margin moving forward, all else being equal.
ASSA ABLOY ANNUAL REPORT 2016 REPORT OF THE BOARD OF DIRECTORS 39
Research and developmentASSA ABLOY’s expenditure on research and development during the year totaled SEK 2,218 M (1,932), equivalent to 3.1 percent (2.8) of sales.
The pace of innovation remained high throughout the year, including in areas such as digital door opening solu-tions, products with increased sustainability and energy- saving products. New products launched in the past three years accounted for 30 percent of sales for the year.
Sustainable developmentASSA ABLOY’s operations in Sweden carry on licensable and notifiable activities under the Swedish Environmental Code in Entrance Systems division in Gothenburg.
Several units outside Sweden carry on licensable activi-ties and hold equivalent licenses under local legislation. ASSA ABLOY’s units worldwide are working systematically and purposefully to reduce their environmental impact.
The 2016 Sustainability Report, reporting on the Group’s prioritized environmental activities and providing other information on sustainable development, is available on the company’s website: www.assaabloy.com.
Internal control and financial reportingDuring the year, weaknesses in internal control and misstate-ments in financial reporting were discovered for parts of the Chinese operation in the Asia Pacific division. Work con-tinued during the year to correct the financial reporting and to strengthen internal control and compliance.
Tax mattersIn 2015 the Administrative Court in Sweden decided not to allow tax deductions for interest expenses relating to one of the Group’s subsidiaries for the years 2008–2012 on the grounds that the deductions were misallocated. The deci-sion was appealed to the Administrative Court of Appeal during the year. The total tax exposure amounts to just over SEK 800 M.
In 2015 the Finnish Tax Administration decided not to allow tax deductions for interest expenses in the Finnish operations for the years 2008–2012. The decision was appealed to a higher court during the year. The total tax exposure amounts to around SEK 750 M.
ASSA ABLOY’s assessment is that the decisions will not have an impact on the Group’s earnings.
Transactions with related partiesNo transactions occurred between ASSA ABLOY and related parties that significantly affected the company’s financial position and performance.
Significant events after the financial year-endNo significant events occurred after the financial year-end and up to the date of adoption of the Annual Report for ASSA ABLOY AB.
OutlookLong-term outlookASSA ABLOY anticipates an increase in demand for security solutions in the long term. A focus on customer value and innovations as well as leverage on the Group’s strong posi-tion will accelerate growth and increase profitability.
Organic sales growth is expected to continue at a good rate. The operating margin (EBIT) and operating cash flow are expected to develop well.
Report of the Board of Directors
REPORT OF THE BOARD OF DIRECTORS ASSA ABLOY ANNUAL REPORT 201640

Report of the Board of Directors
Significant risks and risk management
Risk managementUncertainty about future developments and the course of events is a natural risk for any business. Risk-taking in itself provides opportunities for continued economic growth, but naturally the risks may also have a negative impact on busi-ness operations and company goals. It is therefore essential to have a systematic and efficient risk assessment process and an effective risk management program in general. The purpose of risk management at ASSA ABLOY is not to avoid risks, but to take a controlled approach to identifying, man-aging and minimizing the effects of these risks. This work is based on an assessment of the probability of the risks and their potential impact on the Group.
ASSA ABLOY is an international group with a wide geo-graphical spread, involving exposure to various forms of stra-tegic, operational and financial risks. Strategic risks refer to changes in the business environment with potentially signifi-cant effects on ASSA ABLOY’s operations and business objec-tives. Operational risks comprise risks directly attributable to business operations, entailing a potential impact on the Group’s financial position and performance. Financial risks mainly comprise financing risk, currency risk, interest rate risk, credit risk, and risks associated with the Group’s pension obligations.
OrganizationASSA ABLOY’s Board of Directors has overall responsibility for risk management within the Group and determines the Group’s strategic focus based on recommendations from the Executive Team. In view of the decentralized structure of the Group, and to keep risk analysis and risk management as close as possible to the actual risks, a large proportion of operational risk management takes place at division and business unit levels.
ResponsibilityASSA ABLOY’s Board of Directors has overall responsibility for the Group’s strategic direction in close consultation with the Executive Team. Divisions and business units have overall responsibility for management of operational risks, in accor-dance with the Group’s decentralized approach to organiza-tion, responsibility and authority. In the case of financial risks, allocation of responsibilities and control of the Group’s financing activities are regulated in a financial policy adopted by the Board of Directors. Group Treasury then has the main responsibility for financial risks within the frame-work established in the financial policy, with the exception of credit risks relating to operational business activities, which are managed locally at company level and monitored at division level.
ReviewStrategic risks, such as competitors, brand positioning and so on, are regularly reviewed at ASSA ABLOY AB’s board meetings. The Group’s operational risk management is con-tinuously monitored by the Executive Team through divi-sional reporting and divisional board meetings. For further information on monitoring and management of operational risks, see page 43.
ASSA ABLOY’s Group Treasury monitors the Group’s short and long-term financing, financial cash management, currency risk and other financial risk management. Financial operations are centralized in a Treasury function, which manages most financial transactions as well as financial risks with a Group-wide focus.
ASSA ABLOY ANNUAL REPORT 2016 REPORT OF THE BOARD OF DIRECTORS 41
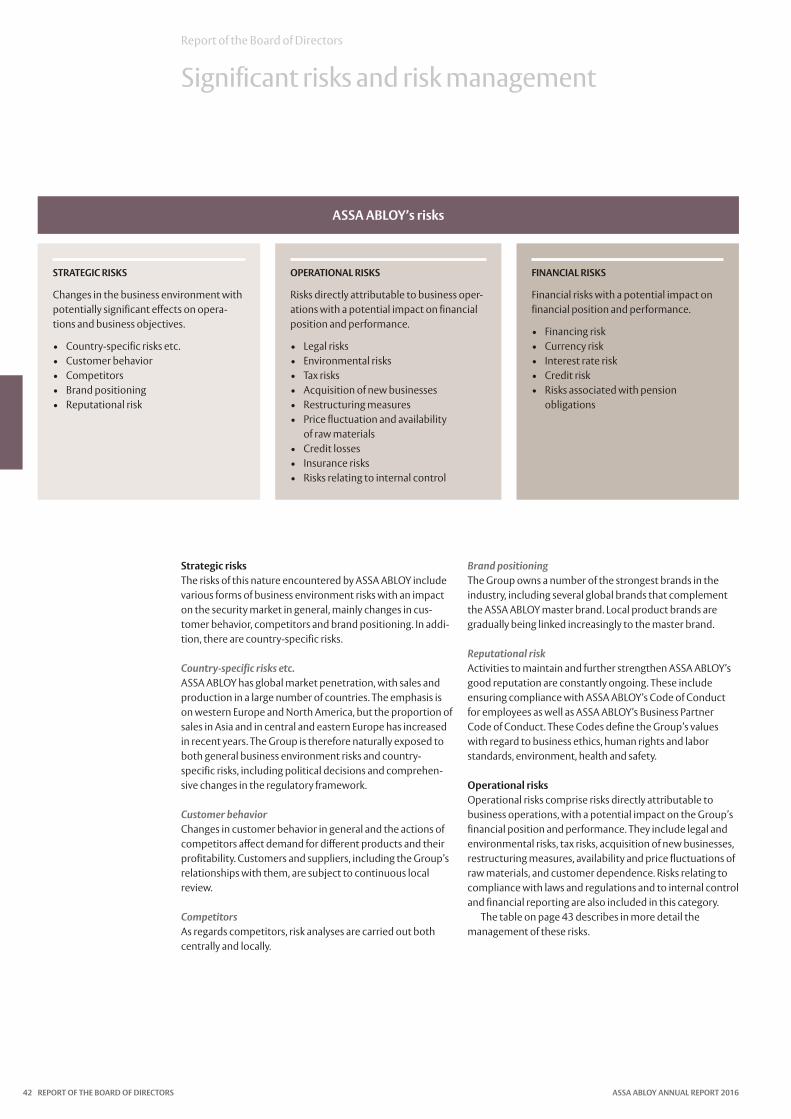
Strategic risksThe risks of this nature encountered by ASSA ABLOY include various forms of business environment risks with an impact on the security market in general, mainly changes in cus-tomer behavior, competitors and brand positioning. In addi-tion, there are country-specific risks.
Country-specific risks etc.ASSA ABLOY has global market penetration, with sales and production in a large number of countries. The emphasis is on western Europe and North America, but the proportion of sales in Asia and in central and eastern Europe has increased in recent years. The Group is therefore naturally exposed to both general business environment risks and country- specific risks, including political decisions and comprehen-sive changes in the regulatory framework.
Customer behaviorChanges in customer behavior in general and the actions of competitors affect demand for different products and their profitability. Customers and suppliers, including the Group’s relationships with them, are subject to continuous local review.
CompetitorsAs regards competitors, risk analyses are carried out both centrally and locally.
Brand positioningThe Group owns a number of the strongest brands in the industry, including several global brands that complement the ASSA ABLOY master brand. Local product brands are gradually being linked increasingly to the master brand.
Reputational riskActivities to maintain and further strengthen ASSA ABLOY’s good reputation are constantly ongoing. These include ensuring compliance with ASSA ABLOY’s Code of Conduct for employees as well as ASSA ABLOY’s Business Partner Code of Conduct. These Codes define the Group’s values with regard to business ethics, human rights and labor standards, environment, health and safety.
Operational risksOperational risks comprise risks directly attributable to business operations, with a potential impact on the Group’s financial position and performance. They include legal and environmental risks, tax risks, acquisition of new businesses, restructuring measures, availability and price fluctuations of raw materials, and customer dependence. Risks relating to compliance with laws and regulations and to internal control and financial reporting are also included in this category.
The table on page 43 describes in more detail the management of these risks.
Report of the Board of Directors
Significant risks and risk management
STRATEGIC RISKS
Changes in the business environment with potentially significant effects on opera-tions and business objectives.
• Country-specific risks etc.• Customer behavior• Competitors• Brand positioning• Reputational risk
OPERATIONAL RISKS
Risks directly attributable to business oper-ations with a potential impact on financial position and performance.
• Legal risks• Environmental risks• Tax risks• Acquisition of new businesses• Restructuring measures• Price fluctuation and availability
of raw materials• Credit losses• Insurance risks• Risks relating to internal control
FINANCIAL RISKS
Financial risks with a potential impact on financial position and performance.
• Financing risk• Currency risk• Interest rate risk• Credit risk• Risks associated with pension
obligations
ASSA ABLOY’s risks
REPORT OF THE BOARD OF DIRECTORS ASSA ABLOY ANNUAL REPORT 201642
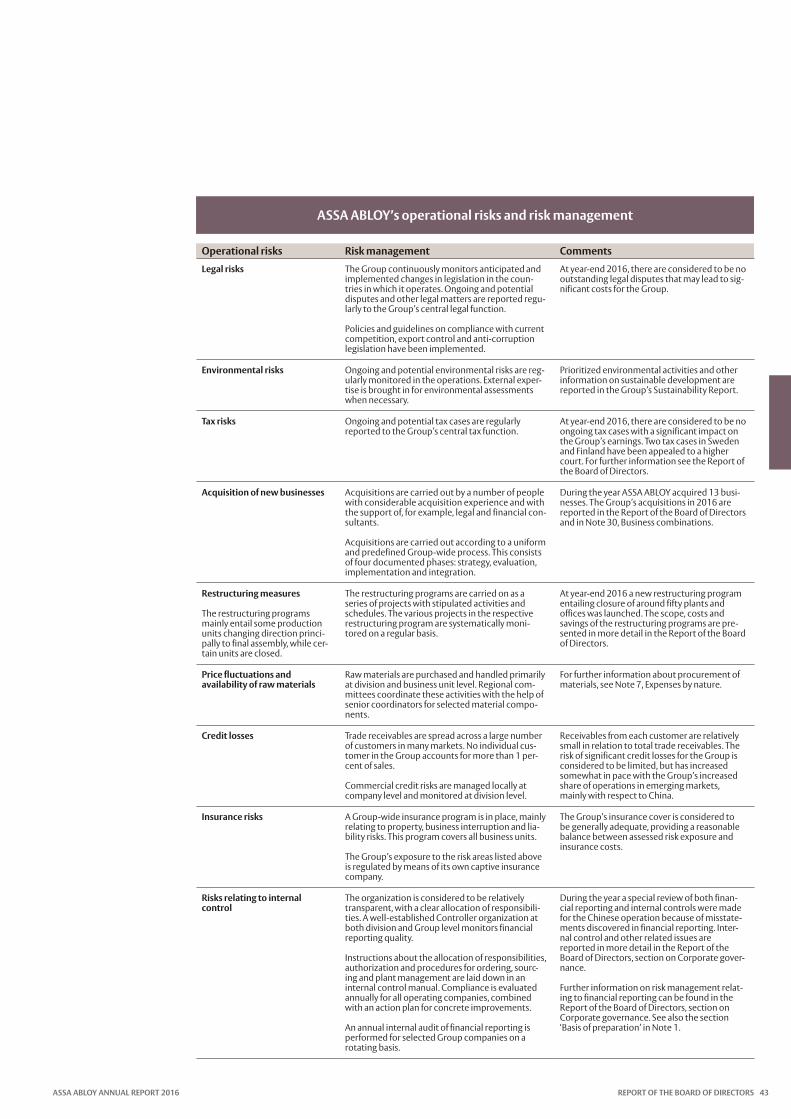
ASSA ABLOY’s operational risks and risk management
Operational risks Risk management Comments
Legal risks The Group continuously monitors anticipated and implemented changes in legislation in the coun-tries in which it operates. Ongoing and potential disputes and other legal matters are reported regu-larly to the Group’s central legal function.
Policies and guidelines on compliance with current competition, export control and anti-corruption legislation have been implemented.
At year-end 2016, there are considered to be no outstanding legal disputes that may lead to sig-nificant costs for the Group.
Environmental risks Ongoing and potential environmental risks are reg-ularly monitored in the operations. External exper-tise is brought in for environmental assessments when necessary.
Prioritized environmental activities and other information on sustainable development are reported in the Group’s Sustainability Report.
Tax risks Ongoing and potential tax cases are regularly reported to the Group’s central tax function.
At year-end 2016, there are considered to be no ongoing tax cases with a significant impact on the Group’s earnings. Two tax cases in Sweden and Finland have been appealed to a higher court. For further information see the Report of the Board of Directors.
Acquisition of new businesses Acquisitions are carried out by a number of people with considerable acquisition experience and with the support of, for example, legal and financial con-sultants.
Acquisitions are carried out according to a uniform and predefined Group-wide process. This consists of four documented phases: strategy, evaluation, implementation and integration.
During the year ASSA ABLOY acquired 13 busi-nesses. The Group’s acquisitions in 2016 are reported in the Report of the Board of Directors and in Note 30, Business combinations.
Restructuring measures
The restructuring programs mainly entail some production units changing direction princi-pally to final assembly, while cer-tain units are closed.
The restructuring programs are carried on as a series of projects with stipulated activities and schedules. The various projects in the respective restructuring program are systematically moni-tored on a regular basis.
At year-end 2016 a new restructuring program entailing closure of around fifty plants and offices was launched. The scope, costs and savings of the restructuring programs are pre-sented in more detail in the Report of the Board of Directors.
Price fluctuations and availability of raw materials
Raw materials are purchased and handled primarily at division and business unit level. Regional com-mittees coordinate these activities with the help of senior coordinators for selected material compo-nents.
For further information about procurement of materials, see Note 7, Expenses by nature.
Credit losses Trade receivables are spread across a large number of customers in many markets. No individual cus-tomer in the Group accounts for more than 1 per-cent of sales.
Commercial credit risks are managed locally at company level and monitored at division level.
Receivables from each customer are relatively small in relation to total trade receivables. The risk of significant credit losses for the Group is considered to be limited, but has increased somewhat in pace with the Group’s increased share of operations in emerging markets, mainly with respect to China.
Insurance risks A Group-wide insurance program is in place, mainly relating to property, business interruption and lia-bility risks. This program covers all business units.
The Group’s exposure to the risk areas listed above is regulated by means of its own captive insurance company.
The Group’s insurance cover is considered to be generally adequate, providing a reasonable balance between assessed risk exposure and insurance costs.
Risks relating to internal control
The organization is considered to be relatively transparent, with a clear allocation of responsibili-ties. A well-established Controller organization at both division and Group level monitors financial reporting quality.
Instructions about the allocation of responsibilities, authorization and procedures for ordering, sourc-ing and plant management are laid down in an internal control manual. Compliance is evaluated annually for all operating companies, combined with an action plan for concrete improvements.
An annual internal audit of financial reporting is performed for selected Group companies on a rotating basis.
During the year a special review of both finan-cial reporting and internal controls were made for the Chinese operation because of misstate-ments discovered in financial reporting. Inter-nal control and other related issues are reported in more detail in the Report of the Board of Directors, section on Corporate gover-nance.
Further information on risk management relat-ing to financial reporting can be found in the Report of the Board of Directors, section on Corporate governance. See also the section ‘Basis of preparation’ in Note 1.
ASSA ABLOY ANNUAL REPORT 2016 REPORT OF THE BOARD OF DIRECTORS 43

Report of the Board of Directors
Significant risks and risk management
Financial risksThe Group’s financial risks mainly comprise financing risk, currency risk, interest rate risk, credit risk, and risks associ-ated with the Group’s pension obligations. A large number of financial instruments are used to manage these risks. Accounting principles, risk management and risk exposure are described in more detail in Notes 1 and 34, as well as Note 24, Post-employment employee benefits.
Financing riskFinancing risk refers to the risk that financing the Group’s capital requirements and refinancing outstanding loans become more difficult or more expensive. It can be reduced by maintaining an even maturity profile for borrowing and a solid credit rating. The risk is further reduced by substantial unutilized confirmed credit facilities.
Currency riskSince ASSA ABLOY sells its products in countries worldwide and has companies in a large number of countries, the Group is exposed to the effects of exchange rate fluctuations. These fluctuations affect Group earnings when the income state-ments of foreign subsidiaries are translated to Swedish kro-nor (translation exposure), and when products are exported and sold in countries outside the country of production (transaction exposure). Translation exposure is primarily related to earnings in USD and EUR. This type of exposure is not hedged. Currency risk in the form of transaction expo-sure, i.e. the relative values of exports and imports of goods, is expected to increase over time due to rationalization of production and sourcing. In accordance with financial policy, the Group only hedged a very limited part of current cur-rency flows in 2016. As a result, exchange rate fluctuations had a direct impact on business operations.
Exchange rate fluctuations also affect the Group’s debt-equity ratio and equity. The difference between the assets and liabilities of foreign subsidiaries in the respective foreign currency is affected by exchange rate fluctuations and causes a translation difference, which affects the Group’s comprehensive income. A general weakening of the Swedish krona leads to an increase in net debt, but at the same time increases the Group’s equity. At year-end, the largest foreign net assets were denominated in USD and EUR.
Interest rate riskWith respect to interest rate risks, interest rate changes have a direct impact on ASSA ABLOY’s net interest expense. The net interest expense is also impacted by the size of the Group’s net debt and its currency composition. Net debt was SEK 23,127 M (22,269) at year-end 2016. Debt was mainly denominated in USD and EUR. Group Treasury analyzes the Group’s interest rate exposure and calculates the impact on income of interest rate changes on a rolling 12-month basis. In addition to raising variable-rate and fixed-rate loans, vari-ous interest rate derivatives are used to adjust interest rate sensitivity.
Credit riskCredit risk arises in ordinary business activities and as a result of financial transactions. Trade receivables are spread across a large number of customers, which reduces credit risk. Credit risks relating to operational business activities are managed locally at company level and monitored at division level.
Financial risk management exposes ASSA ABLOY to cer-tain counterparty risks. Such exposure may arise, for exam-ple, as a result of the placement of surplus cash, borrowings and derivative financial instruments. Counterparty limits are set for each financial counterparty and are continuously monitored.
Pension obligationsAt year-end 2016, ASSA ABLOY had obligations for pensions and other post-employment benefits of SEK 8,184 M (7,421). The Group manages pension assets valued at SEK 5,063 M (4,660). Provisions in the balance sheet for defined benefit and defined contribution plans and post-employment medi-cal benefits totaled SEK 3,121 M (2,761). Changes in the value of assets and liabilities from year to year are due partly to the development of equity and debt capital markets and partly to the actuarial assumptions made. Significant remea-surement of obligations and plan assets is recognized on a current basis in the balance sheet and in other comprehen-sive income. The assumptions made include discount rates and anticipated inflation and salary increases.
REPORT OF THE BOARD OF DIRECTORS ASSA ABLOY ANNUAL REPORT 201644
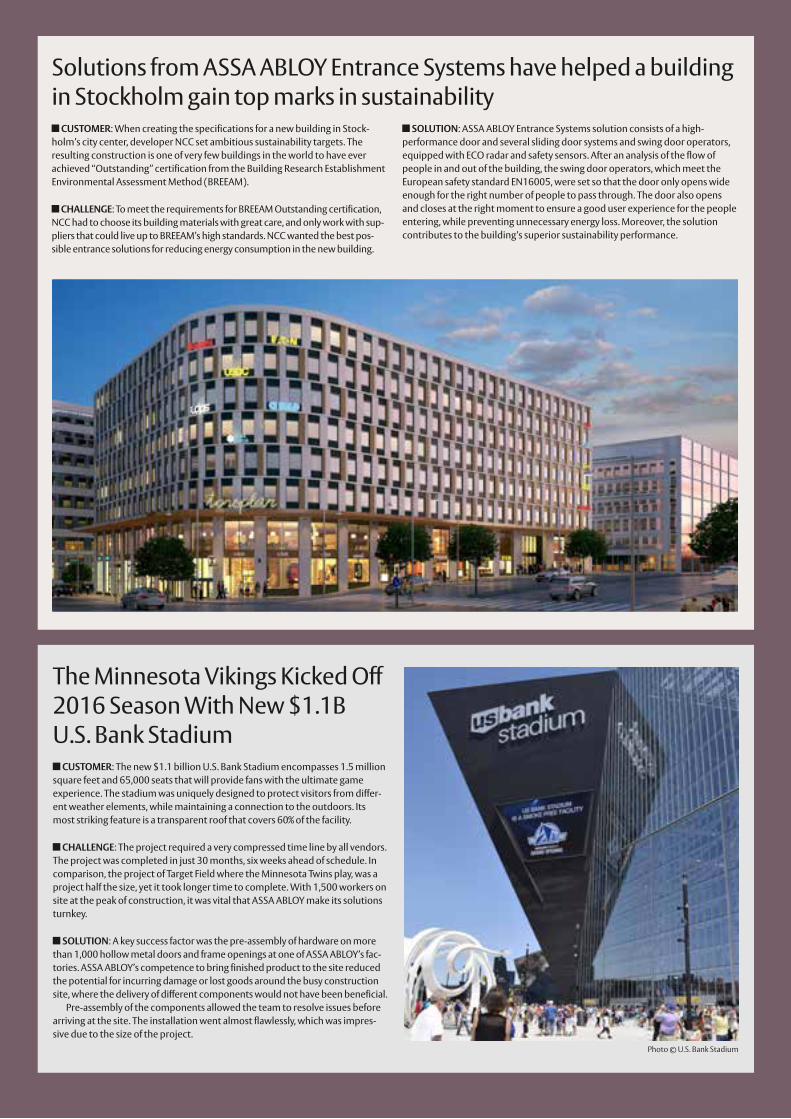
Solutions from ASSA ABLOY Entrance Systems have helped a building in Stockholm gain top marks in sustainability
CUSTOMER: When creating the specifications for a new building in Stock-holm’s city center, developer NCC set ambitious sustainability targets. The resulting construction is one of very few buildings in the world to have ever achieved “Outstanding” certification from the Building Research Establishment Environmental Assessment Method (BREEAM).
CHALLENGE: To meet the requirements for BREEAM Outstanding certification, NCC had to choose its building materials with great care, and only work with sup-pliers that could live up to BREEAM’s high standards. NCC wanted the best pos-sible entrance solutions for reducing energy consumption in the new building.
SOLUTION: ASSA ABLOY Entrance Systems solution consists of a high- performance door and several sliding door systems and swing door operators, equipped with ECO radar and safety sensors. After an analysis of the flow of people in and out of the building, the swing door operators, which meet the European safety standard EN16005, were set so that the door only opens wide enough for the right number of people to pass through. The door also opens and closes at the right moment to ensure a good user experience for the people entering, while preventing unnecessary energy loss. Moreover, the solution contributes to the building’s superior sustainability performance.
The Minnesota Vikings Kicked Off 2016 Season With New $1.1B U.S. Bank Stadium
CUSTOMER: The new $1.1 billion U.S. Bank Stadium encompasses 1.5 million square feet and 65,000 seats that will provide fans with the ultimate game experience. The stadium was uniquely designed to protect visitors from differ-ent weather elements, while maintaining a connection to the outdoors. Its most striking feature is a transparent roof that covers 60% of the facility.
CHALLENGE: The project required a very compressed time line by all vendors. The project was completed in just 30 months, six weeks ahead of schedule. In comparison, the project of Target Field where the Minnesota Twins play, was a project half the size, yet it took longer time to complete. With 1,500 workers on site at the peak of construction, it was vital that ASSA ABLOY make its solutions turnkey.
SOLUTION: A key success factor was the pre-assembly of hardware on more than 1,000 hollow metal doors and frame openings at one of ASSA ABLOY’s fac-tories. ASSA ABLOY’s competence to bring finished product to the site reduced the potential for incurring damage or lost goods around the busy construction site, where the delivery of different components would not have been beneficial.
Pre-assembly of the components allowed the team to resolve issues before arriving at the site. The installation went almost flawlessly, which was impres-sive due to the size of the project.
Photo © U.S. Bank Stadium

Report of the Board of Directors
Corporate governance
ASSA ABLOY is a Swedish public limited liability company with registered office in Stockholm, Sweden, whose Series B share is listed on the Nasdaq Stockholm.
The Group’s corporate governance is based on the Swedish Companies Act, the Annual Accounts Act, the Nasdaq Stockholm Rule Book for Issuers and the Swedish Code of Corporate Governance, as well as other applicable external laws, regulations and recommendations, and inter-nal rules and regulations.
This Corporate Governance Report has been prepared as part of ASSA ABLOY’s application of the Swedish Code of Corporate Governance. The report is audited by ASSA ABLOY’s auditor.
ASSA ABLOY’s objective is that its activities should gener-ate good long-term returns for its shareholders and other stakeholders. An effective scheme of corporate governance for ASSA ABLOY can be summarized in a number of inter-acting components, which are described below.
1ShareholdersAt year-end, ASSA ABLOY had 27,638 shareholders (22,232). The principal shareholders are Invest-
ment AB Latour (9.5 percent of the share capital and 29.5 percent of the votes) and Melker Schörling AB (3.9 percent of the share capital and 11.4 percent of the votes). Foreign shareholders accounted for around 64 percent (64) of the share capital and around 44 percent (44) of the votes. The ten largest shareholders accounted for around 40 percent (38) of the share capital and 59 percent (58) of the votes. For further information on shareholders, see page 105.
A shareholders’ agreement exists between Gustaf Douglas, Melker Schörling and related companies and includes an agreement on right of first refusal if any party disposes of Series A shares. The Board of Directors of ASSA ABLOY is not aware of any other shareholders’ agreements or other agreements between shareholders in ASSA ABLOY.
7 CEO
7 Executive Team
8 Divisions
Important external rules and regulations• Swedish Companies Act• Annual Accounts Act• Nasdaq Stockholm Rule Book for Issuers• Swedish Code of Corporate Governance
(www.bolagsstyrning.se)
Important internal rules and regulations• Articles of Association• Board of Directors’ rules of procedure• Financial Policy• Accounting Manual• Communication Policy• Insider Policy • Internal control procedures• Code of Conduct and Anti-Corruption Policy
Corporate governance structure
1 Shareholders
2 General Meeting
4 Board of Directors
3 Nomination Committee
5 Remuneration Committee
9 Auditor
6 Audit Committee
REPORT OF THE BOARD OF DIRECTORS ASSA ABLOY ANNUAL REPORT 201646

Share capital and voting rightsASSA ABLOY’s share capital amounted at year-end to SEK 370,858,778 distributed among 57,525,969 Series A shares and 1,055,050,365 Series B shares. The total number of votes was 1,630,310,055. Each Series A share carries ten votes and each Series B share one vote. All shares have a par value of around SEK 0.33 and give shareholders equal rights to the company’s assets and earnings.
Repurchase of own sharesSince 2010, the Board of Directors has requested and received a mandate from the Annual General Meeting to repurchase and transfer ASSA ABLOY Series B shares. The aim has been, among other things, to secure the company’s undertakings in connection with its long-term incentive programs (LTI). The 2016 Annual General Meeting authorized the Board of Directors to acquire, during the period until the next Annual General Meeting, a maximum number of Series B shares so that after each repurchase ASSA ABLOY holds a maximum 10 percent of the total number of shares in the company.
ASSA ABLOY holds a total of 1,800,000 (1,800,000) Series B shares after repurchase. These shares account for around 0.2 percent (0.2) of the share capital and each share has a par value of around SEK 0.33. The purchase consideration amounted to SEK 103 M (103). No shares were repurchased in 2016.
Share and dividend policyASSA ABLOY’s Series B share is listed on the Nasdaq Stockholm Large Cap list. At year-end, ASSA ABLOY’s market capitalization amounted to SEK 187,832 M. The Board of Directors’ objective is that, in the long term, the dividend should be equivalent to 33–50 percent of income after standard tax, but always taking into account ASSA ABLOY’s long-term financing requirements.
2General MeetingShareholders’ rights to decide on the affairs of ASSA ABLOY are exercised at the General Meeting. Share-
holders who are registered in the share register on the record date and have duly notified their intent to attend are entitled to take part in the General Meeting, either in person or by proxy. Resolutions at the General Meeting are normally passed by simple majority. For certain matters, however, the Swedish Companies Act prescribes that a proposal should be sup-ported by a higher majority. Individual shareholders who wish to submit a matter for consideration at the General Meeting can send such request to ASSA ABLOY’s Board of Directors at a special address published on the company’s website well before the Meeting.
The Annual General Meeting should be held within six months of the end of the company’s financial year. Matters considered at the Annual General Meeting include: dividend; adoption of the income statement and balance sheet; dis-charge of the Board of Directors and the CEO from liability; election of members of the Board of Directors and Chairman of the Board of Directors; election of the Nomination Committee and auditors; and determination of remuneration guidelines for senior management and fees for the Board of Directors and auditors. An Extraordinary General Meeting may be held if the Board of Directors considers this necessary or if ASSA ABLOY’s auditors or shareholders holding at least 10 percent of the shares so request.
2016 Annual General MeetingThe Annual General Meeting in April 2016 was attended by shareholders representing 55.9 percent of the share capital and 70 percent of the votes.
At the Annual General Meeting, Lars Renström, Carl Douglas, Eva Karlsson, Birgitta Klasén, Eva Lindqvist, Johan Molin, Jan Svensson and Ulrik Svensson were re-elected as members of the Board of Directors. Ulf Ewaldsson was elected a new mem-ber of the Board of Directors. Further, Lars Renström was re-elected as Chairman of the Board of Directors, and Carl Douglas as Vice Chairman. The Annual General Meeting re-elected PricewaterhouseCoopers AB (PwC) as the compa-ny’s auditor up to the end of the 2017 Annual General Meeting.
The Annual General Meeting approved a dividend of SEK 2.65 per share, in accordance with the proposal of the Board of Directors. In addition, the Annual General Meeting passed resolutions on fees payable to the Board of Directors, remu-neration guidelines for senior management, authorization of the Board of Directors regarding repurchase and transfers of own Series B shares, implementation of a long-term incentive program for senior management and other key staff in the Group (LTI 2016), as well as elected members of the Nomina-tion Committee up to and including the 2017 Annual General Meeting.
3Nomination CommitteeUp to and including the 2017 Annual General Meeting, the Nomination Committee comprises
Carl Douglas (Investment AB Latour), Mikael Ekdahl (Melker Schörling AB), Liselott Ledin (Alecta), Marianne Nilsson (Swedbank Robur fonder) and Anders Oscarsson (AMF and AMF fonder).Carl Douglas is Chairman of the Nomination Committee. Carl Douglas is also Vice Chairman of ASSA ABLOY’s Board of Directors. The Nomination Committee thus deviates from the Swedish Code of Corporate Governance in that the Vice Chairman of the Board of Directors is Chairman of the Nomination Committee. The reason for this deviation is that the Nomination Committee considers it important to have the representative from the largest shareholder as Chairman of the Nomination Committee.
If a shareholder represented by one of the members of the Nomination Committee ceases to be among the major share-holders in ASSA ABLOY, the Committee has the right to appoint another representative of one of the major share-holders to replace such a member. The same applies if a mem-ber of the Nomination Committee ceases to be employed by such a shareholder or leaves the Nomination Committee before the 2017 Annual General Meeting.
The Nomination Committee has the task of, on behalf of the shareholders, preparing and submitting proposals for; election of Chairman of the Annual General Meeting, election of Chairman, Vice Chairman and other members of the Board of Directors, election of auditor, determination of fees to the auditor and the Board of Directors (including distribution of fees among the Chairman, Vice Chairman and the other mem-bers of the Board of Directors and remuneration for commit-tee work) as well as election of members of the Nomination Committee and determination of the assignment of the Nomination Committee.
Prior to the 2017 Annual General Meeting, the Nomination Committee makes an assessment of whether the current Board of Directors is appropriately composed and fulfills the demands made on the Board of Directors by the company’s present situation and future direction. The annual evaluation of the Board of Directors and its work is part of the basis for this assessment. The search for suitable board members is carried on throughout the year and proposals for new board members are based in each individual case on a profile of requirements established by the Nomination Committee.
Shareholders wishing to submit proposals to the Nomina-tion Committee can do so by e-mailing: [email protected].
ASSA ABLOY ANNUAL REPORT 2016 REPORT OF THE BOARD OF DIRECTORS 47
The Nomination Committee’s proposals for the 2017 Annual General Meeting are published at the latest in conjunction with the formal notification of the Annual General Meeting, which is expected to be published around 22 March 2017.
4Board of DirectorsIn accordance with the Swedish Companies Act, the Board of Directors is responsible for the organization
and administration of the Group and for ensuring satisfactory control of bookkeeping, asset management and other finan-cial circumstances. The Board of Directors decides on the Group’s overall objectives, strategies, significant policies, acquisitions and divestments as well as investments of major importance. Acquisitions and divestments with a value (on a debt-free basis) exceeding SEK 200 M are decided by the Board of Directors. This amount presumes that the matter relates to acquisitions or divestments in accordance with the strategy agreed by the Board of Directors. The Board of Direc-tors approves the Annual Report and Interim Reports, pro-poses dividend and remuneration guidelines for senior man-agement to the Annual General Meeting, and makes decisions concerning the Group’s financial structure.
The Board of Directors’ other ongoing duties include:• appointing, evaluating and if necessary dismissing the CEO,• approving the CEO’s significant assignments outside the
company,• establishing appropriate guidelines to govern the com-
pany’s conduct in society with the aim of ensuring long-term value-creating capability.
• ensuring that appropriate systems are in place for monitor-ing and control of the company’s operations and the risks for the company associated with its operations,
• ensuring that there is satisfactory control of the company’s compliance with laws and other regulations relevant to the company’s operations, and its compliance with internal guidelines, and
• ensuring that external information provided by the com-pany is transparent, accurate, relevant and reliable.
The Board of Directors’ rules of procedure, including instruc-tions for the CEO and instructions relating to financial report-ing and internal control, are updated and adopted at least once a year.
In addition to organising and leading the work of the Board of Directors, the Chairman’s duties include maintaining con-tact with the CEO to continuously monitor the Group’s opera-tions and development. The Chairman should consult the CEO on strategic issues and represent the company in matters
concerning the ownership structure. The Chairman should also, when necessary, take part in particularly important exter-nal discussions and, in consultation with the CEO, in other matters of particular significance. The Chairman should ensure that the Board receives satisfactory information and docu-mentation to enable it to conduct its work, and ensure that Board decisions are implemented. In addition, the Chairman should ensure that the work of the Board of Directors is evalu-ated annually, and that new members of the Board of Directors receive appropriate training.
The Board of Directors has at least four scheduled meetings and one statutory meeting per year. A scheduled meeting is always held in connection with the company’s publication of its Year-end Report and Interim Reports. At least once a year the Board of Directors visits one of the Group’s businesses, combined with a board meeting. In addition, extraordinary board meetings are held when necessary. All meetings follow an approved agenda. Prior to each meeting, a draft agenda, including documentation, is provided to all members of the Board of Directors.
The Board of Directors has a Remuneration Committee and an Audit Committee. The purpose of these Committees is to deepen and streamline the work of the Board of Directors and to prepare matters in these areas. The members of the Com-mittees are appointed annually by the Board of Directors at the statutory board meeting. Instructions for the Committees are included in the Board of Directors’ rules of procedure.
Board of Directors’ compositionThe Board of Directors is elected annually at the Annual General Meeting for the period until the end of the next Annual General Meeting and shall, according to the Articles of Association, comprise a minimum of six and a maximum of ten members elected by the Meeting. Two of the members are appointed by the employee organizations in accordance with Swedish law. The employee organizations also appoint two deputies. In 2016 the Board of Directors consisted of nine elected members and two employee representatives1. With the exception of the CEO, none of the board members are members of the Executive Team. The CEO has no significant shareholdings or partnerships in companies with significant business relationships with ASSA ABLOY.
Board of Directors’ work in 2016During the year the Board of Directors held nine meetings (seven scheduled meetings, one statutory meeting and one extraordinary meeting). At the scheduled board meetings the CEO reported on the Group’s performance and financial
Report of the Board of Directors
Corporate governance
Extraordinary board meeting Notice Annual General Meeting
Remuneration committee meeting
Audit committee meeting Audit committee meeting
Statutory board meeting Appointment committee membersAdoption Board of Directors’ rules of procedure and significant policies Signatory powers
Scheduled board meetingYear-end resultsProposed distribution of earningsApproval Annual ReportFinal audit reportProposals to Annual General MeetingEvaluation Executive TeamAcquisitions
Scheduled board meeting Interim Report Q1AcquisitionsPresentation Entrance Systems
SUMMARY OF BOARD OF DIRECTORS’ WORK AND COMMITTEE MEETINGS IN 2016
January February March April May June
At the scheduled board meetings the CEO also reported on the Group’s performance and financial position, including the outlook for the coming quarters.
1 Ulrik Svensson left his position as board member of ASSA ABLOY AB at year-end 2016 in connection with his resignation as CEO of Melker Schörling AB.
REPORT OF THE BOARD OF DIRECTORS ASSA ABLOY ANNUAL REPORT 201648
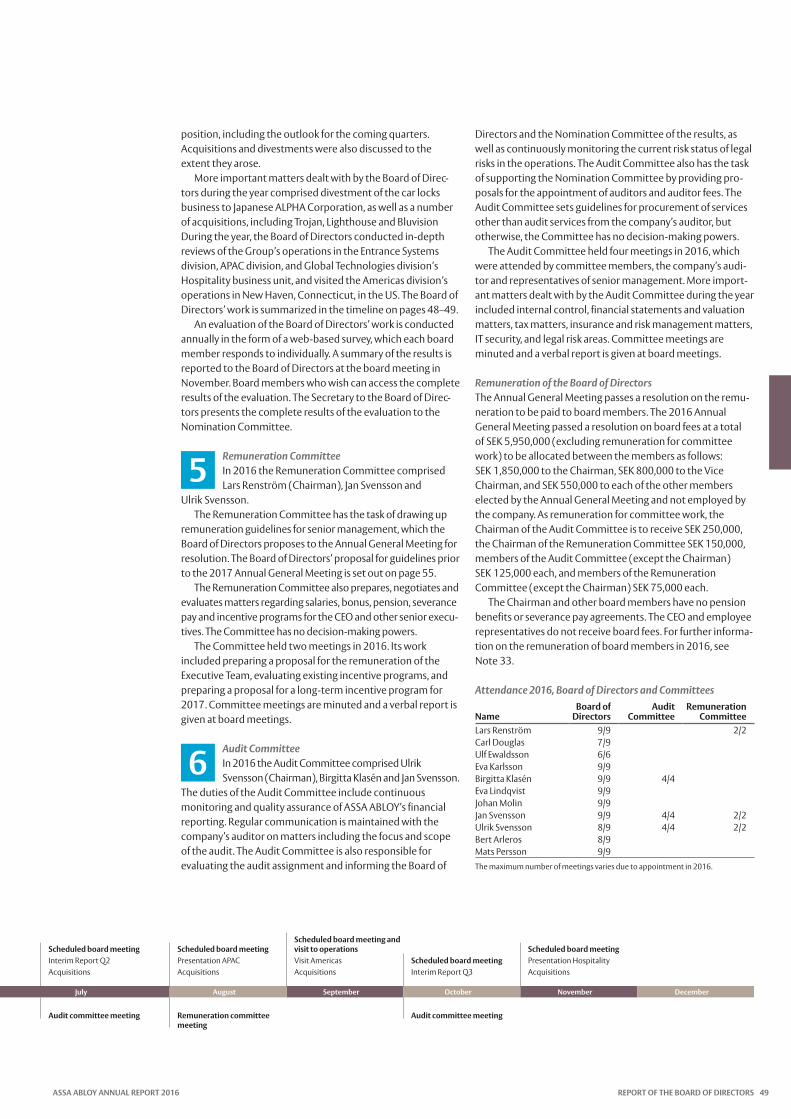
position, including the outlook for the coming quarters. Acquisitions and divestments were also discussed to the extent they arose.
More important matters dealt with by the Board of Direc-tors during the year comprised divestment of the car locks business to Japanese ALPHA Corporation, as well as a number of acquisitions, including Trojan, Lighthouse and Bluvision During the year, the Board of Directors conducted in-depth reviews of the Group’s operations in the Entrance Systems division, APAC division, and Global Technologies division’s Hospitality business unit, and visited the Americas division’s operations in New Haven, Connecticut, in the US. The Board of Directors’ work is summarized in the timeline on pages 48–49.
An evaluation of the Board of Directors’ work is conducted annually in the form of a web-based survey, which each board member responds to individually. A summary of the results is reported to the Board of Directors at the board meeting in November. Board members who wish can access the complete results of the evaluation. The Secretary to the Board of Direc-tors presents the complete results of the evaluation to the Nomination Committee.
5Remuneration CommitteeIn 2016 the Remuneration Committee comprised Lars Renström (Chairman), Jan Svensson and
Ulrik Svensson.The Remuneration Committee has the task of drawing up
remuneration guidelines for senior management, which the Board of Directors proposes to the Annual General Meeting for resolution. The Board of Directors’ proposal for guidelines prior to the 2017 Annual General Meeting is set out on page 55.
The Remuneration Committee also prepares, negotiates and evaluates matters regarding salaries, bonus, pension, severance pay and incentive programs for the CEO and other senior execu-tives. The Committee has no decision-making powers.
The Committee held two meetings in 2016. Its work included preparing a proposal for the remuneration of the Executive Team, evaluating existing incentive programs, and preparing a proposal for a long-term incentive program for 2017. Committee meetings are minuted and a verbal report is given at board meetings.
6Audit CommitteeIn 2016 the Audit Committee comprised Ulrik Svensson (Chairman), Birgitta Klasén and Jan Svensson.
The duties of the Audit Committee include continuous monitoring and quality assurance of ASSA ABLOY’s financial reporting. Regular communication is maintained with the company’s auditor on matters including the focus and scope of the audit. The Audit Committee is also responsible for evaluating the audit assignment and informing the Board of
Directors and the Nomination Committee of the results, as well as continuously monitoring the current risk status of legal risks in the operations. The Audit Committee also has the task of supporting the Nomination Committee by providing pro-posals for the appointment of auditors and auditor fees. The Audit Committee sets guidelines for procurement of services other than audit services from the company’s auditor, but other wise, the Committee has no decision-making powers.
The Audit Committee held four meetings in 2016, which were attended by committee members, the company’s audi-tor and representatives of senior management. More import-ant matters dealt with by the Audit Committee during the year included internal control, financial statements and valuation matters, tax matters, insurance and risk management matters, IT security, and legal risk areas. Committee meetings are minuted and a verbal report is given at board meetings.
Remuneration of the Board of DirectorsThe Annual General Meeting passes a resolution on the remu-neration to be paid to board members. The 2016 Annual General Meeting passed a resolution on board fees at a total of SEK 5,950,000 (excluding remuneration for committee work) to be allocated between the members as follows: SEK 1,850,000 to the Chairman, SEK 800,000 to the Vice Chairman, and SEK 550,000 to each of the other members elected by the Annual General Meeting and not employed by the company. As remuneration for committee work, the Chairman of the Audit Committee is to receive SEK 250,000, the Chairman of the Remuneration Committee SEK 150,000, members of the Audit Committee (except the Chairman) SEK 125,000 each, and members of the Remuneration Committee (except the Chairman) SEK 75,000 each.
The Chairman and other board members have no pension benefits or severance pay agreements. The CEO and employee representatives do not receive board fees. For further informa-tion on the remuneration of board members in 2016, see Note 33.
Attendance 2016, Board of Directors and Committees
Name Board of
DirectorsAudit
CommitteeRemuneration
CommitteeLars Renström 9/9 2/2Carl Douglas 7/9Ulf Ewaldsson 6/6Eva Karlsson 9/9Birgitta Klasén 9/9 4/4Eva Lindqvist 9/9Johan Molin 9/9Jan Svensson 9/9 4/4 2/2Ulrik Svensson 8/9 4/4 2/2Bert Arleros 8/9Mats Persson 9/9The maximum number of meetings varies due to appointment in 2016.
July August September October November December
Audit committee meeting Remuneration committee meeting
Audit committee meeting
Scheduled board meetingInterim Report Q2Acquisitions
Scheduled board meetingPresentation APACAcquisitions
Scheduled board meeting and visit to operationsVisit AmericasAcquisitions
Scheduled board meeting Interim Report Q3
Scheduled board meeting Presentation HospitalityAcquisitions
ASSA ABLOY ANNUAL REPORT 2016 REPORT OF THE BOARD OF DIRECTORS 49

Report of the Board of Directors – Corporate governance
Board of Directors
Elected by the 2016 Annual General Meeting
Lars RenströmChairman.Board member since 2008.Born 1951.Master of Science in Engineering and Master of Science in Business and Economics.President and CEO of Alfa Laval AB 2004–2016. President and CEO of Seco Tools AB 2000–2004. President and Head of Division of Atlas Copco Rock Drilling Tools 1997–2000. Previously a number of senior positions at ABB and Ericsson.Other appointments: Chairman of Tetra Laval Group.Shareholdings (including through companies and related natural parties): 30,000 Series B shares.
Carl DouglasVice Chairman.Board member since 2004.Born 1965.BA (Bachelor of Arts) and D. Litt (h.c.) (Doctor of Letters).Self-employed.Other appointments: Vice Chairman of Securitas AB. Board member of Investment AB Latour.Shareholdings (including through companies and related natural parties): 41,595,729 Series A shares and 63,900,000 Series B shares through Investment AB Latour.
Ulf EwaldssonBoard member since 2016.Born 1965.Master of Science in Engineering and Business Management.Senior Vice President and Chief Technology Officer at Ericsson Group since 2012 as well as of 2016 Head of Strategy. Various managerial positions within the Ericsson Group since 1990, including Head of Product Area Radio. Ulf has worked internationally for over 11 years (China, Japan and Eastern Europe). Other appointments: Board member of KTH Royal Institute of Technology and Telecom Management Forum. Various telecom advisory assignments within EU, member of the Royal Swedish Academy of Engineering Sciences (IVA). Shareholdings (including through companies and related natural parties): –
Eva KarlssonBoard member since 2015.Born 1966.Master of Science in Engineering.President and CEO of Armatec AB since 2014. CEO of SKF Sverige AB and Global Manufacturing Manager 2011–2013, Director of Industrial Marketing & Product Development Industrial Market AB SKF 2005–2010, various positions in the SKF Group mainly in Manufacturing Management.Other appointments: Board member of Bräcke diakoni.Shareholdings (including through companies and related natural parties): –
Birgitta KlasénBoard member since 2008.Born 1949.Master of Science in Engineering.Independent IT consultant (Senior IT Advisor). CIO and Head of Information Management at EADS (European Aeronautics Defence and Space Company) 2004–2005. CIO and Senior Vice President at Pharmacia 1996–2001 and previously CIO at Telia. Various positions at IBM 1976–1994.Other appointments: Board member of Avanza AB.Shareholdings (including through companies and related natural parties): 21,000 Series B shares.
Eva LindqvistBoard member since 2008.Born 1958.Master of Science in Engineering and Master of Science in Business and Economics.Senior Vice President of Mobile Business at TeliaSonera AB 2006–2007. Previously several senior positions at TeliaSonera AB, including President and Head of Business Operation International Carrier, and various positions in the Ericsson Group 1981–1999.Other appointments: Board member of companies including Caverion Oy, Sweco AB and Bodycote plc. Member of the Royal Swedish Academy of Engineering Sciences (IVA).Shareholdings (including through companies and related natural parties): 7,650 Series B shares.
Johan MolinBoard member since 2006.Born 1959.Master of Science in Business and Economics.President and CEO of ASSA ABLOY AB since 2005. CEO of Nilfisk-Advance 2001–2005. Various positions mainly in Finance and Marketing, later divisional head in the Atlas Copco Group 1983–2001.Other appointments: Chairman of Sandvik AB.Shareholdings (including through companies and related natural parties): 1,932,382 Series B shares.
Appointments and shareholdings as at 31 December 2016. This information is updated regularly at www.assaabloy.com.
Lars Renström Carl Douglas Eva KarlssonUlf Ewaldsson Birgitta Klasén Eva Lindqvist Johan Molin
REPORT OF THE BOARD OF DIRECTORS ASSA ABLOY ANNUAL REPORT 201650
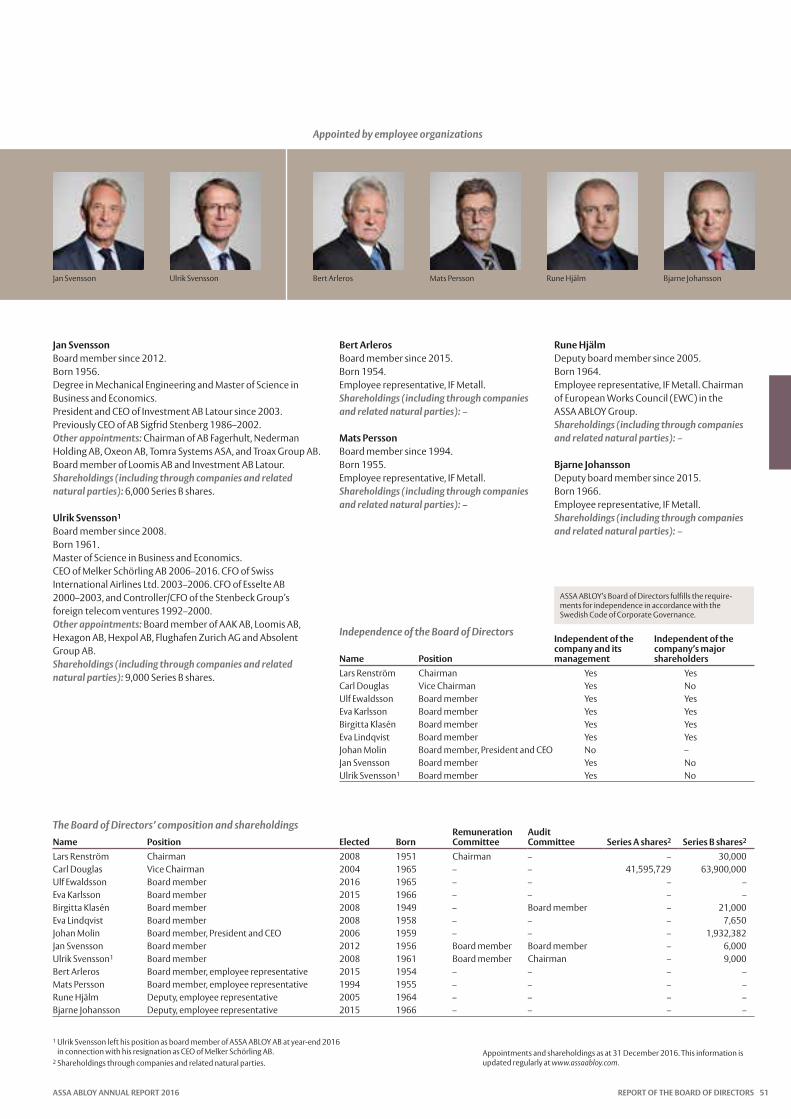
Appointed by employee organizations
Jan SvenssonBoard member since 2012.Born 1956.Degree in Mechanical Engineering and Master of Science in Business and Economics.President and CEO of Investment AB Latour since 2003. Previously CEO of AB Sigfrid Stenberg 1986–2002.Other appointments: Chairman of AB Fagerhult, Nederman Holding AB, Oxeon AB, Tomra Systems ASA, and Troax Group AB. Board member of Loomis AB and Investment AB Latour.Shareholdings (including through companies and related natural parties): 6,000 Series B shares.
Ulrik Svensson1
Board member since 2008.Born 1961.Master of Science in Business and Economics.CEO of Melker Schörling AB 2006–2016. CFO of Swiss International Airlines Ltd. 2003–2006. CFO of Esselte AB 2000–2003, and Controller/CFO of the Stenbeck Group’s foreign telecom ventures 1992–2000.Other appointments: Board member of AAK AB, Loomis AB, Hexagon AB, Hexpol AB, Flughafen Zurich AG and Absolent Group AB. Shareholdings (including through companies and related natural parties): 9,000 Series B shares.
Bert ArlerosBoard member since 2015.Born 1954.Employee representative, IF Metall.Shareholdings (including through companies and related natural parties): –
Mats PerssonBoard member since 1994.Born 1955.Employee representative, IF Metall.Shareholdings (including through companies and related natural parties): –
Rune HjälmDeputy board member since 2005.Born 1964.Employee representative, IF Metall. Chairman of European Works Council (EWC) in the ASSA ABLOY Group.Shareholdings (including through companies and related natural parties): –
Bjarne JohanssonDeputy board member since 2015.Born 1966.Employee representative, IF Metall.Shareholdings (including through companies and related natural parties): –
The Board of Directors’ composition and shareholdingsName Position Elected Born
Remuneration Committee
Audit Committee Series A shares2 Series B shares2
Lars Renström Chairman 2008 1951 Chairman – – 30,000Carl Douglas Vice Chairman 2004 1965 – – 41,595,729 63,900,000Ulf Ewaldsson Board member 2016 1965 – – – –Eva Karlsson Board member 2015 1966 – – – –Birgitta Klasén Board member 2008 1949 – Board member – 21,000Eva Lindqvist Board member 2008 1958 – – – 7,650Johan Molin Board member, President and CEO 2006 1959 – – – 1,932,382Jan Svensson Board member 2012 1956 Board member Board member – 6,000Ulrik Svensson1 Board member 2008 1961 Board member Chairman – 9,000Bert Arleros Board member, employee representative 2015 1954 – – – –Mats Persson Board member, employee representative 1994 1955 – – – –Rune Hjälm Deputy, employee representative 2005 1964 – – – –Bjarne Johansson Deputy, employee representative 2015 1966 – – – –
1 Ulrik Svensson left his position as board member of ASSA ABLOY AB at year-end 2016 in connection with his resignation as CEO of Melker Schörling AB.
2 Shareholdings through companies and related natural parties.
Independence of the Board of Directors
Name Position
Independent of the company and its management
Independent of the company’s major shareholders
Lars Renström Chairman Yes YesCarl Douglas Vice Chairman Yes NoUlf Ewaldsson Board member Yes YesEva Karlsson Board member Yes YesBirgitta Klasén Board member Yes YesEva Lindqvist Board member Yes YesJohan Molin Board member, President and CEO No –Jan Svensson Board member Yes NoUlrik Svensson1 Board member Yes No
Ulrik SvenssonJan Svensson Mats Persson Rune Hjälm Bjarne JohanssonBert Arleros
ASSA ABLOY’s Board of Directors fulfills the require-ments for independence in accordance with the Swedish Code of Corporate Governance.
Appointments and shareholdings as at 31 December 2016. This information is updated regularly at www.assaabloy.com.
ASSA ABLOY ANNUAL REPORT 2016 REPORT OF THE BOARD OF DIRECTORS 51

Report of the Board of Directors – Corporate governance
Executive Team
Johan MolinPresident and CEO since 2005 and Head of Global Technologies division since 2007. Born 1959. Master of Science in Business and Economics. Previous positions: CEO of Nilfisk-Advance 2001–2005. Various positions mainly in Finance and Marketing, later divisional head in the Atlas Copco Group 1983–2001.Other appointments: Chairman of Sandvik AB. Shareholdings (including through companies and related natural parties): 1,932,382 Series B shares.
Carolina Dybeck HappeExecutive Vice President and Chief Financial Officer (CFO) since 2012.Born 1972. Master of Science in Business and Economics.Previous positions: CFO of Trelleborg AB 2011–2012. Previously various positions in the ASSA ABLOY Group, including CFO of ASSA ABLOY EMEA 2007–2011 and ASSA ABLOY Central Europe 2002–2006. Previous to that various positions in finance at EF Education First.Other appointments: Member of the Supervisory Board of E.ON. Shareholdings: 17,550 Series B shares.
Magnus KagevikExecutive Vice President and Head of Asia Pacific division since 2014.Born 1967. Master of Science in Mechanical Engineering.Previous positions: Various positions in the ASSA ABLOY Group, including Head of East Europe EMEA 2011–2014 and Vice President Operations EMEA 2007–2011. Previously various positions in Whirlpool Corporation.Shareholdings: 48,741 Series B shares.
Thanasis MolokotosExecutive Vice President and Head of Americas division since 2004.Born 1958. Master of Science in Engineering.Previous positions: President of ASSA ABLOY Architectural Hardware 2001–2004. Previously various positions and later President of Sargent Manu-facturing 1993–2001. Shareholdings: 143,571 Series B shares.
7OrganizationCEO and Executive TeamThe Executive Team consists of the CEO, the Heads
of the Group’s divisions, the Chief Financial Officer and the Chief Technology Officer. For a presentation of the CEO and the other members of the Executive Team, see pages 52–53.
8Divisions – decentralized organizationASSA ABLOY’s operations are decentralized. Operations are organizationally divided into five
divisions: EMEA, Americas, Asia Pacific, Global Technologies and Entrance Systems. The fundamental principle is that the divisions should be responsible, as far as possible, for busi-ness operations, while various functions at ASSA ABLOY’s headquarters are responsible for coordination, monitoring, policies and guidelines at an overall level. Decentralization is a deliberate strategic choice based on the industry’s local nature and a conviction of the benefits of a divisional control model. The Group’s structure results in a geographical and strategic spread of responsibility ensuring short decision- making paths.
ASSA ABLOY’s operating structure is designed to create maximum transparency, to facilitate financial and opera-tional monitoring, and to promote the flow of information and communication across the Group. The five divisions are divided into around 50 business units. These consist in turn of a large number of sales and production units, depending on the structure of the business unit concerned. Apart from monitoring by unit, monitoring of products and markets is also carried out.
Policies and guidelinesSignificant policies and guidelines in the Group include financial control, communication issues, insider issues, the Group’s brands, environmental issues, business ethics and export control. ASSA ABLOY’s financial policy and account-ing manual provide the framework for financial control and monitoring. The Group’s communication policy aims to ensure that information is provided at the right time and in compliance with applicable rules and regulations. ASSA ABLOY has adopted an insider policy to complement appli-cable insider legislation. This policy applies to individuals in
Executive Team
Johan Molin Carolina Dybeck Happe Magnus Kagevik Thanasis Molokotos
REPORT OF THE BOARD OF DIRECTORS ASSA ABLOY ANNUAL REPORT 201652

Christophe SutExecutive Vice President and Head of Global Technologies business unit ASSA ABLOY Hospitality since 2016.Born 1973. Master of Science in Business and Marketing, Bachelor of Science in Language and Mathematics.Previous positions: Various positions in the ASSA ABLOY Group, 2001–2010 and 2012–2014, including CTO and Vice President Business Development ASSA ABLOY Hospitality and Platform Director for ASSA ABLOY AB. Niscayah Group 2010–2012. SPIT France (ITW group) 1999–2001 and SAM Outillage 1997–1999.Shareholdings: 1,539 Series B shares.
Ulf SödergrenExecutive Vice President and Chief Technology Officer (CTO) since 2006.Born 1953. Master of Science in Engineering and Master of Science in Business and Economics.
Previous positions: Various positions in the ASSA ABLOY Group, including Regional Manager of ASSA ABLOY Scandinavia 2003–2006 and COO and Senior Vice President ASSA ABLOY 2000–2003. Previously various senior positions in Electrolux 1984–2000. Shareholdings: 112,567 Series B shares.
Juan VarguesExecutive Vice President and Head of Entrance Systems division since 2006. Born 1959. Degree in Mechanical Engineering, MBA.Previous positions: Various positions in the Besam Group, including President and CEO of Besam 2004–2005, Execu-tive Vice President and Head of Besam EMEA 1998–2003, and CEO of Besam Ibérica 1992–1997. Previously various positions in the SKF Group 1982–1991.Shareholdings: 232,926 Series B shares.
Stefan WidingExecutive Vice President and Head of Global Technologies business unit HID Global since 2015.Born 1977. Master of Science in Applied Physics and Electrical Engineering and Bachelor of Social Science in Business Administration.Previous positions: Various positions in the ASSA ABLOY Group, including Director of Product Management and General Manager of Shared Tech-nologies Unit 2006–2015. Previously various positions in the Saab Group 2001–2006.Shareholdings: 4,776 Series B shares.
Tzachi WiesenfeldExecutive Vice President and Head of EMEA division since 2006.Born 1958. Bachelor of Science in Industrial Engineering, MBA.Previous positions: Various positions in the ASSA ABLOY Group, including Market Region Manager and Managing Director ASSA ABLOY UK 2004–2006, and President and CEO of Mul-T-Lock Ltd. 2000–2003. Previously various senior positions in Mul-T-Lock 1990–2000.Shareholdings: 20,694 Series B shares.
leading positions at ASSA ABLOY AB (including subsidiaries) as well as certain other categories of employees. Brand guidelines aim to protect and develop the major assets that the Group’s brands represent.
In 2016 ASSA ABLOY’s Code of Conduct for employees was revised and a separate ASSA ABLOY Code of Conduct for business partners was adopted. The Codes, which are based on a set of internationally accepted conventions, define the values and guidelines that should apply both within the Group and for ASSA ABLOY’s business partners with regard to business ethics, human rights and labor standards, envi-ronment, as well as health and safety. ASSA ABLOY has also adopted an anti-corruption policy and an export control policy that apply to the whole Group.
9AuditorAt the 2016 Annual General Meeting, Pricewater-houseCoopers (PwC) was re-elected as the com-
pany’s external auditor up to the end of the 2017 Annual General Meeting. In connection with the 2016 Annual General Meeting, PwC notified that the authorized public
accountant Bo Karlsson would remain the auditor in charge. In addition to ASSA ABLOY, Bo Karlsson, born 1966, is responsible for auditing SKF, Scania and Investment AB Latour.
PwC has been the Group’s auditor since its formation in 1994. PwC submits the audit report for ASSA ABLOY AB, the Group and a large majority of the subsidiaries worldwide. The audit of ASSA ABLOY AB also includes the administration by the Board of Directors and the CEO. The auditor in charge attends all Audit Committee meetings as well as the Febru-ary board meeting, at which he reports his observations and recommendations concerning the Group audit for the year.
The external audit is conducted in accordance with Inter-national Standards in Auditing (ISA), which has been good auditing practice in Sweden since 2011. The audit of the financial statements for legal entities outside Sweden is conducted in accordance with statutory requirements and other applicable rules in each country. For information about the fees paid to auditors and other assignments carried out in the Group in the past three financial years, see Note 3 and the Annual Report for 2015, Note 3.
Ulf Södergren Tzachi WiesenfeldChristophe Sut Juan Vargues Stefan Widing
Appointments and shareholdings as at 31 December 2016. This information is updated regularly at www.assaabloy.com.
ASSA ABLOY ANNUAL REPORT 2016 REPORT OF THE BOARD OF DIRECTORS 53
ASSA ABLOY’s internal control process for financial reporting is designed to provide reasonable assurance of reliable finan-cial reporting, which is in compliance with generally accepted accounting principles, applicable laws and regula-tions, and other requirements for listed companies. The pro-cess is inspired by the internal control framework issued by the Committee of Sponsoring Organizations of the Treadway Commission (COSO).
Control environmentThe Board of Directors is responsible for effective internal control and has therefore established fundamental docu-ments of significance for financial reporting. These docu-ments include the Board of Directors’ rules of procedure and instructions to the CEO, the Code of Conduct, financial policy, and an annual financial evaluation plan. Regular meet-ings are held with the Audit Committee. The Group has an internal audit function whose primary objective is ensuring reliable financial reporting and good internal control.
All units in the Group apply uniform accounting and reporting instructions. Internal control guidelines have been established and are reviewed annually for all operating com-panies. These Group-wide guidelines have a relatively broad scope and concern various processes such as ordering, sourcing, financial statements, plant management, compli-ance with various policies, legal matters, and HR matters.
The Code of Conduct was most recently reviewed and updated in 2016, and compliance is monitored systemati-cally in operations.
Risk assessmentRisk assessment includes identifying and evaluating the risk of material errors in accounting and financial reporting at Group, division and local levels. A number of previously established documents govern the procedures to be used for accounting, finalizing accounts, financial reporting and review. The entire Group uses a financial reporting system with pre-defined report templates.
Control activitiesThe Group’s controller and accounting organization at both central and division levels plays a significant role in ensuring reliable financial information. It is responsible for complete, accurate and timely financial reporting.A global financial internal audit function has been estab-lished and carries out annual financial evaluations in accor-
dance with the plan annually adopted by the Audit Commit-tee. The results of the financial evaluations are submitted to the Audit Committee and the auditors.
In 2016 a special review of financial reporting and internal control was conducted for parts of the Chinese operation in the Asia Pacific division due to deficiencies discovered in compliance and internal controls, as well as errors in financial reporting.
Information and communicationReporting and accounting manuals as well as other financial reporting guidelines are available to all employees con-cerned on the Group’s intranet. A regular review and analysis of financial outcomes is carried out at both business unit and division levels and as part of the Board of Directors’ estab-lished operating structure. The Group also has established procedures for external communication of financial informa-tion, in accordance with the rules and regulations for listed companies.
Review processThe Board of Directors and the Audit Committee evaluate and review the Annual Report and Interim Reports prior to publication. The Audit Committee monitors the financial reporting and other related issues, and regularly discusses these issues with the external auditors. All business units report their financial results monthly in accordance with the Group’s accounting principles. This reporting serves as the basis for quarterly reports and a monthly legal and operating review. Operating reviews conform to a structure in which sales, earnings, cash flow, capital employed and other important key figures and trends for the Group are compiled, and form the basis for analysis and actions by management and controllers at different levels.
Financial reviews take place quarterly at divisional board meetings, monthly in the form of performance reviews and through more informal analysis. Other important Group-wide components of internal control are the annual business planning process and monthly and quarterly forecasts.
The Group-wide internal control guidelines are reviewed during the year in all operating companies through self- assessments and in some cases a second opinion from exter-nal auditors. An action plan was implemented in 2015 to further improve basic processes with an impact on the company’s financial position.
Report of the Board of Directors – Corporate governance
Internal control – financial reporting
REPORT OF THE BOARD OF DIRECTORS ASSA ABLOY ANNUAL REPORT 201654
The Board of Directors’ proposal for remuneration guidelines for senior managementThe Board of Directors of ASSA ABLOY proposes that the Annual General Meeting adopts the following guidelines for the remuneration and other employment conditions of the President and CEO and the other members of the ASSA ABLOY Executive Team. The proposed guidelines below do not involve any material change, compared with the guide-lines adopted by the 2016 Annual General Meeting. The basic principle is that remuneration and other employment conditions should be in line with market conditions and competitive. ASSA ABLOY takes into account both global remuneration practice and practice in the home country of each member of the Executive Team. The total remuneration of the Executive Team should consist of basic salary, variable components in the form of annual and long-term variable remuneration, other benefits and pension.
The total remuneration of the Executive Team, including previous commitments not yet due for payment, is reported in Note 33.
Fixed and variable remunerationThe basic salary should be competitive and reflect responsi-bility and performance. The variable part consists of remu-neration paid partly in cash and partly in the form of shares. The Executive Team should have the opportunity to receive variable cash remuneration, based on the outcome in rela-tion to financial targets and, when applicable, individual tar-gets. This remuneration should be equivalent to a maximum of 75 percent of the basic salary (excluding social security costs).
In addition, the Executive Team should, within the frame-work of the Board of Directors’ proposal for a long-term incentive program, be able to receive variable remuneration in the form of shares, based on the outcome in relation to a range determined by the Board of Directors for the perfor-
mance of the company’s earnings per share in 2017. This remuneration model also includes the right, when purchas-ing shares under certain conditions, to receive free matching shares from the company. This remuneration should, if the share price is unchanged, be equivalent to a maximum of 75 percent of the basic salary (excluding social security costs).
The company’s annual cost of variable remuneration for the Executive Team as above, assuming maximum outcome, totals around SEK 66 M (excluding social security costs and financing cost). This calculation is made on the basis of the current members of the Executive Team.
Other benefits and pensionOther benefits, such as company car, extra health insurance or occupational healthcare, should be payable to the extent this is considered to be in line with market conditions in the market concerned. All members of the Executive Team should be covered by defined contribution pension plans, for which pension premiums are allocated from the execu-tive’s total remuneration and paid by the company during the period of employment.
Notice and severance payIf the CEO is given notice, the company is liable to pay the equivalent of 24 months’ basic salary and other employment benefits. If one of the other members of the Executive Team is given notice, the company is liable to pay a maximum of six months’ basic salary and other employment benefits plus an additional 12 months’ basic salary.
Deviation from guidelinesThe Board of Directors should have the right to deviate from the remuneration guidelines for senior management adopted by the Annual General Meeting, if there are particu-lar reasons for doing so in an individual case.
Report of the Board of Directors
Remuneration guidelines for senior management
ASSA ABLOY ANNUAL REPORT 2016 REPORT OF THE BOARD OF DIRECTORS 55
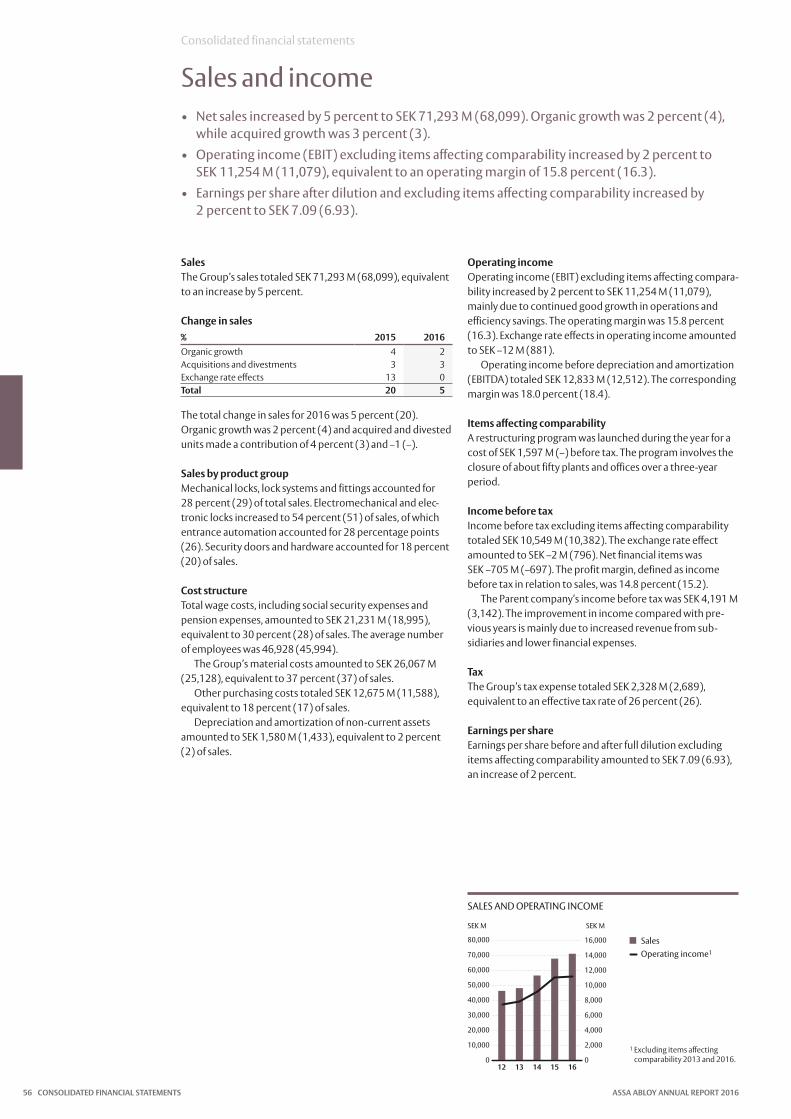
Consolidated financial statements
Sales and income• Net sales increased by 5 percent to SEK 71,293 M (68,099). Organic growth was 2 percent (4),
while acquired growth was 3 percent (3).• Operating income (EBIT) excluding items affecting comparability increased by 2 percent to
SEK 11,254 M (11,079), equivalent to an operating margin of 15.8 percent (16.3).• Earnings per share after dilution and excluding items affecting comparability increased by
2 percent to SEK 7.09 (6.93).
SalesThe Group’s sales totaled SEK 71,293 M (68,099), equivalent to an increase by 5 percent.
Change in sales% 2015 2016Organic growth 4 2Acquisitions and divestments 3 3Exchange rate effects 13 0Total 20 5
The total change in sales for 2016 was 5 percent (20). Organic growth was 2 percent (4) and acquired and divested units made a contribution of 4 percent (3) and –1 (–).
Sales by product groupMechanical locks, lock systems and fittings accounted for 28 percent (29) of total sales. Electromechanical and elec-tronic locks increased to 54 percent (51) of sales, of which entrance automation accounted for 28 percentage points (26). Security doors and hardware accounted for 18 percent (20) of sales.
Cost structureTotal wage costs, including social security expenses and pension expenses, amounted to SEK 21,231 M (18,995), equivalent to 30 percent (28) of sales. The average number of employees was 46,928 (45,994).
The Group’s material costs amounted to SEK 26,067 M (25,128), equivalent to 37 percent (37) of sales.
Other purchasing costs totaled SEK 12,675 M (11,588), equivalent to 18 percent (17) of sales.
Depreciation and amortization of non-current assets amounted to SEK 1,580 M (1,433), equivalent to 2 percent (2) of sales.
Operating incomeOperating income (EBIT) excluding items affecting compara-bility increased by 2 percent to SEK 11,254 M (11,079), mainly due to con tinued good growth in operations and efficiency savings. The operating margin was 15.8 percent (16.3). Exchange rate effects in operating income amounted to SEK –12 M (881).
Operating income before depreciation and amortization (EBITDA) totaled SEK 12,833 M (12,512). The corresponding margin was 18.0 percent (18.4).
Items affecting comparabilityA restructuring program was launched during the year for a cost of SEK 1,597 M (–) before tax. The program involves the closure of about fifty plants and offices over a three-year period.
Income before taxIncome before tax excluding items affecting comparability totaled SEK 10,549 M (10,382). The exchange rate effect amounted to SEK –2 M (796). Net financial items was SEK –705 M (–697). The profit margin, defined as income before tax in relation to sales, was 14.8 percent (15.2).
The Parent company’s income before tax was SEK 4,191 M (3,142). The improvement in income compared with pre-vious years is mainly due to increased revenue from sub-sidiaries and lower financial expenses.
TaxThe Group’s tax expense totaled SEK 2,328 M (2,689), equivalent to an effective tax rate of 26 percent (26).
Earnings per shareEarnings per share before and after full dilution excluding items affecting comparability amounted to SEK 7.09 (6.93), an increase of 2 percent.
SALES AND OPERATING INCOME
SalesOperating income1
1 Excluding items affecting comparability 2013 and 2016.
SEK M SEK M
0
10,000
20,000
30,000
40,000
50,000
60,000
70,000
80,000
1615141312
SalesOperating income1
0
2,000
4,000
6,000
8,000
10,000
12,000
14,000
16,000
CONSOLIDATED FINANCIAL STATEMENTS ASSA ABLOY ANNUAL REPORT 201656

Consolidated financial statements
Consolidated income statement and Statement of comprehensive income
Income statement, SEK M Note 2015 2016Sales 2 68,099 71,293Cost of goods sold –41,704 –44,319Gross income 26,395 26,974
Selling expenses –10,441 –11,543Administrative expenses 3 –3,066 –3,473Research and development costs –1,932 –2,218Other operating income and expenses 4 –10 –210Share of earnings in associates 5 134 127Operating income 6–9, 24, 33 11,079 9,657
Financial income 10 22 9Financial expenses 9, 11, 24 –719 –714Income before tax 10,382 8,952
Tax on income 12 –2,689 –2,328Net income from continuing operations 7,693 6,625
Profit from discontinued operations 31 – 28Net income 7,693 6,653
Net income attributable to: Parent company’s shareholders 7,693 6,651Non-controlling interest 0 1
Earnings per share Before and after dilution, SEK 13 6.93 5.99Before and after dilution and excluding items affecting comparability, SEK 13 6.93 7.09
Statement of comprehensive income, SEK M Note 2015 2016Net income 7,693 6,653
Other comprehensive income:Items that will not be reclassified to profit or lossActuarial gain/loss on post employment benefit obligations 24 150 –138Deferred tax from actuarial gain/loss on post-employment benefit obligations –33 36Total 117 –102
Items that may be reclassified subsequently to profit or lossShare of other comprehensive income of associates –28 126Cashflow hedges 8 7Net investment hedges 89 –31Other hedges – 18Exchange rate differences 75 1,955Total 143 2,077
Total comprehensive income 7,953 8,627
Total comprehensive income attributable to:Parent company’s shareholders 7,953 8,627Non-controlling interest 0 1
SALES BY PRODUCT GROUP, 2016 EARNINGS PER SHARE AFTER TAX AND DILUTION
Mechanical locks, lock systems and fittings, 28% (29)Entrance automation, 28% (26)Electromechanical and electronic locks, 26% (25)Security doors and hardware, 18% (20)
Earnings per share before and after dilution1
1 Excluding items affecting comparability 2013 and 2016.
Mekaniska lås, låssystem och tillbehör, 28% (29) Entréautomatik, 28% (27)Elektromekaniska ochelektroniska lås, 26% (23)Säkerhetsdörrar ochbeslag, 18% (20)
SEK
0
1
2
3
4
5
6
7
8
1615141312
Vinst per aktie efterskatt och utspädning1
ASSA ABLOY ANNUAL REPORT 2016 CONSOLIDATED FINANCIAL STATEMENTS 57

EMEA, 23% (24)Americas, 24% (23)Asia Pacific, 12% (14)Global Technologies, 13% (13)Entrance Systems, 28% (26)
EXTERNAL SALES, 2016
Consolidated financial statements
Comments by divisionASSA ABLOY is organized into five divisions. EMEA (Europe, Middle East and Africa) division, Americas (North and South America) division and Asia Pacific (Asia and Pacific) division manu-facture and sell mechanical and electromechanical locks, security doors and hardware in their respective geographical markets. Global Technologies division operates worldwide in the product areas of access control systems, secure card issuance, identification technology and hotel locks. Entrance Systems division is a global supplier of entrance automation products and service.
EMEASales totaled SEK 16,837 M (16,524), with organic growth of 3 percent (4). Acquired units contributed 0 percent (4) to sales. Operating income excluding items affecting compara-bility amounted to SEK 2,722 M (2,620), with an operating margin (EBIT) of 16.2 percent (15.9). Return on capital employed was 19.9 percent (20.4). Ope r ating cash flow before interest paid was SEK 2,577 M (2,622).
Growth in Europe was good but was unevenly distributed across the different regions. Demand for electro mechanical solutions was very strong during the year with great success for digital products. A continuing focus on innovation and new products, increased marketing campaigns and stream-lining initiatives contributed to EMEA’s good growth and high operating margin.
AmericasSales totaled SEK 17,044 M (15,665), with organic growth of 5 percent (7). Acquired units contributed 3 percent (2) to sales. Operating income excluding items affecting compara-bility amounted to SEK 3,640 M (3,363), with an operating margin (EBIT) of 21.4 percent (21.5). Return on capital employed was 25.0 percent (24.1). Operating cash flow before interest paid was SEK 3,447 M (3,217).
Growth was good in the US and South America, with the exception of Brazil. The trend was positive in the important commercial and institutional customer segments in the US, in part due to the high pace of innovation and new product launches. Stronger demand for digital door opening solu-tions and increased sustainability represent a clear trend. Profitability remained good due to strong growth in key customer segments and continuous rationalizations.
Asia PacificSales totaled SEK 9,189 M (10,171), with organic growth of –9 percent (–3). Acquired units contributed 1 percent (9) to sales. Operating income excluding items affecting compara-bility amounted to SEK 787 M (1,436), with an operating margin (EBIT) of 8.6 percent (14.1). Impairment of operating assets and the reversal of deferred acquisition payments affected operating income by a total of SEK –300 M. Return on capital employed was 6.6 percent (12.6). Ope rating cash flow before interest paid was SEK 1,564 M (1,235).
Demand remained weak in China during the year, espe-cially regarding the residential segment. Growth was seen in the majority of the rest of Asia and was stable in the Pacific. The operating margin decreased during the year because of weak sales and impairment losses, but the effect was offset by continued streamlining initiatives and improved efficiency.
Global TechnologiesSales totaled SEK 9,697 M (9,100), with organic growth of 3 percent (7). Acquired units contributed 3 percent (2) to sales. Operating income excluding items affecting compara-bility amounted to SEK 1,752 M (1,647), with an operating margin (EBIT) of 18.1 percent (18.1). Return on capital employed was 16.6 percent (18.8). Ope rating cash flow before interest paid was SEK 1,724 M (1,557).
Growth was generally good for Europe and the US, but the trend for emerging markets was mixed. Strong growth was seen in Access management and Identification technology for the HID Global business unit. ASSA ABLOY Hospitality showed growth and good profitability, driven by continued increased demand for door opening solutions with digital and mobile technology.
Entrance SystemsSales totaled SEK 19,789 M (17,957), with organic growth of 4 percent (5). Acquired units contributed 6 percent (1) to sales. Operating income excluding items affecting compara-bility amounted to SEK 2,753 M (2,436), with an operating margin (EBIT) of 13.9 percent (13.6). Return on capital employed was 15.7 percent (14.9). Ope rating cash flow before interest paid was SEK 2,713 M (2,637).
All market segments in North America reported strong growth. Growth in North and Central Europe was strong, though generally weaker in the emerging markets. New product launches, a strong service offering and consolida-tion of the production structure were strong contributing factors to the trend of continued strong growth, cash flow and increasing operating margins.
OtherThe costs of Group-wide functions, such as corporate man-agement, accounting and finance, supply management and Group-wide product development, totaled SEK 401 M (422). Elimination of sales between the Group’s segments is included in ‘Other’.
LegendLegendLegendLegendLegend
CONSOLIDATED FINANCIAL STATEMENTS ASSA ABLOY ANNUAL REPORT 201658

Consolidated financial statements
Results by divisionEMEA Americas Asia Pacific
Global Technologies
Entrance Systems Other Total
SEK M 2015 2016 2015 2016 2015 2016 2015 2016 2015 2016 2015 2016 2015 2016Sales, external 16,220 16,535 15,588 16,963 9,401 8,491 9,031 9,619 17,858 19,685 0 0 68,099 71,293Sales, internal 304 302 76 81 770 698 69 78 98 104 –1,3173 –1,2623 – –
Sales 16,524 16,837 15,665 17,044 10,171 9,189 9,100 9,697 17,957 19,789 –1,317 –1,262 68,099 71,293
Organic growth 4% 3% 7% 5% –3% –9% 7% 3% 5% 4% – – 4% 2%Share of earnings in associates – – – – 16 23 – – 118 104 – – 134 127
Operating income (EBIT) excluding items affecting comparability 2,620 2,722 3,363 3,640 1,436 787 1,647 1,752 2,436 2,753 –422 –401 11,079 11,254Operating margin (EBIT) excluding items affecting comparability 15.9% 16.2% 21.5% 21.4% 14.1% 8.6% 18.1% 18.1% 13.6% 13.9% – – 16.3% 15.8%
Items affecting comparability1 – –781 – –34 – –258 – –148 – –207 – –168 – –1,597
Operating income (EBIT) 2,620 1,942 3,363 3,606 1,436 529 1,647 1,603 2,436 2,546 –422 –569 11,079 9,657Operating margin (EBIT) 15.9% 11.5% 21.5% 21.2% 14.1% 5.8% 18.1% 16.5% 13.6% 12.9% – – 16.3% 13.5%Net financial items –697 –705Tax on income –2,689 –2,328Profit from discontinued operations – 28Net income 7,693 6,653
Capital employed 12,916 13,275 13,908 15,749 11,689 11,803 9,815 11,331 16,030 18,291 –509 –98 63,848 70,351– of which goodwill 7,857 8,348 9,903 11,012 7,690 7,920 7,437 8,784 9,891 11,480 – – 42,777 47,544– of which other intangible assets and
property, plant and equipment 3,210 3,296 3,184 3,516 3,908 3,900 2,300 2,499 3,939 4,282 107 125 16,649 17,618– of which investments in associates 8 9 0 – 452 496 – – 1,450 1,605 – – 1,910 2,109Return on capital employed excluding items affecting comparability 20.4% 19.9% 24.1% 25.0% 12.6% 6.6% 18.8% 16.6% 14.9% 15.7% – – 17.8% 16.5%
Operating income (EBIT) 2,620 1,942 3,363 3,606 1,436 529 1,647 1,603 2,436 2,546 –422 –569 11,079 9,657Restructuring costs – 781 – 34 – 258 – 148 – 207 – 168 – 1,597Depreciation and amortization 398 402 300 330 268 283 232 296 231 257 4 11 1,433 1,580Investments in property, plant and equipment and intangible assets –555 –480 –346 –385 –251 –221 –219 –239 –161 –222 –24 –28 –1,555 –1,575Sales of property, plant and equipment and intangible assets 206 8 21 13 13 9 8 1 67 65 – 0 314 97Change in working capital –47 –75 –120 –152 –231 705 –110 –86 63 –141 –57 –188 –502 62Cash flow2 2,622 2,577 3,217 3,447 1,235 1,564 1,557 1,724 2,637 2,713 –499 –607 10,770 11,418
Non-cash items –269 –354 –269 –354Interest paid and received –548 –597 –548 –597Operating cash flow2 9,952 10,467
Average number of employees 10,886 10,835 7,957 8,961 13,651 12,481 3,583 3,907 9,686 10,505 231 240 45,994 46,9281 Items affecting comparability consist of restructuring costs. 2 Excluding restructuring payments.3 Of which eliminations SEK –1,262 M (–1,317).
OPERATING INCOME, 20161, 2 AVERAGE NUMBER OF EMPLOYEES, 2016
EMEA, 23% (23)Americas, 31% (29)Asia Pacific, 7% (13)Global Technologies, 15% (14)Entrance Systems, 24% (21)
1 “Other” is not included in the calcu-lation. See section Comments by division for what is included in “Other”.
2 Excluding items affecting compar-ability.
EMEA, 23% (24)Americas, 19% (17)Asia Pacific, 27% (30)Global Technologies, 8% (8)Entrance Systems, 22% (21)
The segments have been determined on the basis of report-ing to the CEO, who monitors the overall performance and makes decisions on resource allocation.
The different segments generate their revenue from the manufacture and the sale of mechanical, electromechanical and electronic locks, lock systems and fittings, and security doors and hardware.
The breakdown of sales is based on customer sales in the respective country. Sales between segments are carried out at arm’s length.
For further information on sales, see Note 2.
LegendLegendLegendLegendLegend
LegendLegendLegendLegendLegend
ASSA ABLOY ANNUAL REPORT 2016 CONSOLIDATED FINANCIAL STATEMENTS 59
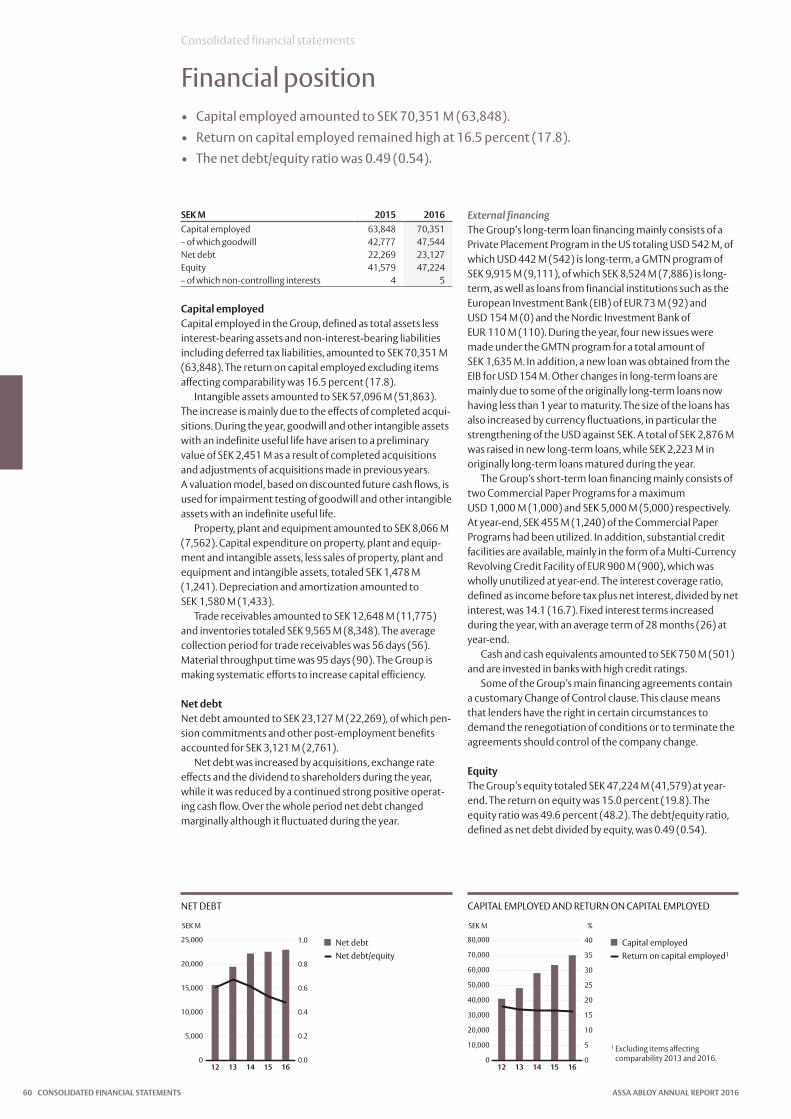
SEK M 2015 2016Capital employed 63,848 70,351– of which goodwill 42,777 47,544Net debt 22,269 23,127Equity 41,579 47,224– of which non-controlling interests 4 5
Capital employedCapital employed in the Group, defined as total assets less interest-bearing assets and non-interest-bearing liabilities including deferred tax liabilities, amounted to SEK 70,351 M (63,848). The return on capital employed excluding items affecting comparability was 16.5 percent (17.8).
Intangible assets amounted to SEK 57,096 M (51,863). The increase is mainly due to the effects of completed acqui-sitions. During the year, goodwill and other intangible assets with an indefinite useful life have arisen to a preliminary value of SEK 2,451 M as a result of completed acquisitions and adjustments of acquisitions made in previous years. A valuation model, based on discounted future cash flows, is used for impairment testing of goodwill and other intangible assets with an indefinite useful life.
Property, plant and equipment amounted to SEK 8,066 M (7,562). Capital expenditure on property, plant and equip-ment and intangible assets, less sales of property, plant and equipment and intangible assets, totaled SEK 1,478 M (1,241). Depreciation and amortization amounted to SEK 1,580 M (1,433).
Trade receivables amounted to SEK 12,648 M (11,775) and inventories totaled SEK 9,565 M (8,348). The average collection period for trade receivables was 56 days (56). Material throughput time was 95 days (90). The Group is making systematic efforts to increase capital efficiency.
Net debtNet debt amounted to SEK 23,127 M (22,269), of which pen-sion commitments and other post-employment benefits accounted for SEK 3,121 M (2,761).
Net debt was increased by acquisitions, exchange rate effects and the dividend to shareholders during the year, while it was reduced by a continued strong positive operat-ing cash flow. Over the whole period net debt changed marginally although it fluctuated during the year.
External financingThe Group’s long-term loan financing mainly consists of a Private Placement Program in the US totaling USD 542 M, of which USD 442 M (542) is long-term, a GMTN program of SEK 9,915 M (9,111), of which SEK 8,524 M (7,886) is long-term, as well as loans from financial institutions such as the European Investment Bank (EIB) of EUR 73 M (92) and USD 154 M (0) and the Nordic Investment Bank of EUR 110 M (110). During the year, four new issues were made under the GMTN program for a total amount of SEK 1,635 M. In addition, a new loan was obtained from the EIB for USD 154 M. Other changes in long-term loans are mainly due to some of the originally long-term loans now having less than 1 year to maturity. The size of the loans has also increased by currency fluctuations, in particular the strengthening of the USD against SEK. A total of SEK 2,876 M was raised in new long-term loans, while SEK 2,223 M in originally long-term loans matured during the year.
The Group’s short-term loan financing mainly consists of two Commercial Paper Programs for a maximum USD 1,000 M (1,000) and SEK 5,000 M (5,000) respectively. At year-end, SEK 455 M (1,240) of the Commercial Paper Programs had been utilized. In addition, substantial credit facilities are available, mainly in the form of a Multi-Currency Revolving Credit Facility of EUR 900 M (900), which was wholly unutilized at year-end. The interest coverage ratio, defined as income before tax plus net interest, divided by net interest, was 14.1 (16.7). Fixed interest terms increased during the year, with an average term of 28 months (26) at year-end.
Cash and cash equivalents amounted to SEK 750 M (501) and are invested in banks with high credit ratings.
Some of the Group’s main financing agreements contain a customary Change of Control clause. This clause means that lenders have the right in certain circumstances to demand the renegotiation of conditions or to terminate the agreements should control of the company change.
EquityThe Group’s equity totaled SEK 47,224 M (41,579) at year-end. The return on equity was 15.0 percent (19.8). The equity ratio was 49.6 percent (48.2). The debt/equity ratio, defined as net debt divided by equity, was 0.49 (0.54).
Consolidated financial statements
Financial position
CAPITAL EMPLOYED AND RETURN ON CAPITAL EMPLOYEDNET DEBT
Net debtNet debt/equity
Capital employedReturn on capital employed1
1 Excluding items affecting comparability 2013 and 2016.
• Capital employed amounted to SEK 70,351 M (63,848).• Return on capital employed remained high at 16.5 percent (17.8).• The net debt/equity ratio was 0.49 (0.54).
SEK M
0
5,000
10,000
15,000
20,000
25,000
1615141312
NettoskuldsättningNettoskuldsättning/Eget kapital
0.0
0.2
0.4
0.6
0.8
1.0
SEK M %
0
10,000
20,000
30,000
40,000
50,000
60,000
70,000
80,000
1615141312
Sysselsatt kapitalAvkastning på sysselsatt kapital1
0
5
10
15
20
25
30
35
40
CONSOLIDATED FINANCIAL STATEMENTS ASSA ABLOY ANNUAL REPORT 201660

SEK M Note 2015 2016ASSETSNon-current assetsIntangible assets 14 51,863 57,096Property, plant and equipment 15 7,562 8,066Investments in associates 17 1,910 2,109Other financial assets 19 77 86Deferred tax assets 18 1,434 1,899Total non-current assets 62,847 69,257
Current assetsInventories 20 8,348 9,565Trade receivables 21 11,775 12,648Current tax receivables 416 497Other current receivables 1,139 1,273Prepaid expenses and accrued income 970 1,123Derivative financial instruments 34 148 167Short-term investments 34 34 2Cash and cash equivalents 34 501 750Total current assets 23,330 26,025TOTAL ASSETS 86,177 95,282
EQUITY AND LIABILITIESEquityParent company's shareholdersShare capital 23 371 371Other contributed capital 9,675 9,675Reserves 2,642 2,540Retained earnings 28,888 34,634Equity attributable to Parent company’s shareholders 41,575 47,220Non-controlling interest 4 5Total equity 41,579 47,224
Non-current liabilitiesLong-term loans 34 15,568 16,901Deferred tax liabilities 18 2,031 2,344Pension provisions 24 2,761 3,121Other non-current provisions 25 1,717 1,945Other non-current liabilities 2,089 1,634Total non-current liabilities 24,166 25,945
Current liabilitiesShort-term loans 34 4,574 3,929Derivative financial instruments 34 80 137Trade payables 6,553 7,443Current tax liabilities 1,145 1,142Current provisions 25 607 797Other current liabilities 26 2,847 3,190Accrued expenses and deferred income 27 4,626 5,474Total current liabilities 20,432 22,112TOTAL EQUITY AND LIABILITIES 86,177 95,282
Consolidated financial statements
Consolidated balance sheet
ASSA ABLOY ANNUAL REPORT 2016 CONSOLIDATED FINANCIAL STATEMENTS 61
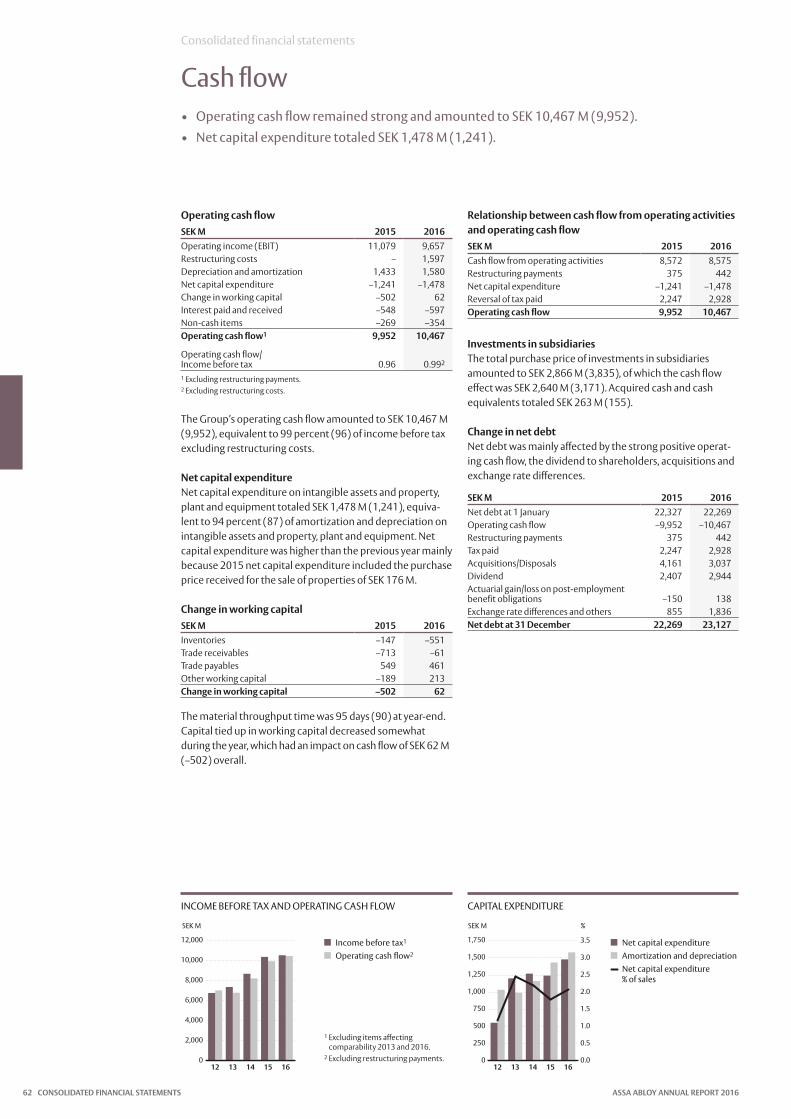
Operating cash flowSEK M 2015 2016Operating income (EBIT) 11,079 9,657Restructuring costs – 1,597Depreciation and amortization 1,433 1,580Net capital expenditure –1,241 –1,478Change in working capital –502 62Interest paid and received –548 –597Non-cash items –269 –354Operating cash flow1 9,952 10,467
Operating cash flow/Income before tax 0.96 0.992
1 Excluding restructuring payments.2 Excluding restructuring costs.
The Group’s operating cash flow amounted to SEK 10,467 M (9,952), equivalent to 99 percent (96) of income before tax excluding restructuring costs.
Net capital expenditureNet capital expenditure on intangible assets and property, plant and equipment totaled SEK 1,478 M (1,241), equiva-lent to 94 percent (87) of amortization and depreciation on intangible assets and property, plant and equipment. Net capital expenditure was higher than the previous year mainly because 2015 net capital expenditure included the purchase price received for the sale of properties of SEK 176 M.
Change in working capitalSEK M 2015 2016Inventories –147 –551Trade receivables –713 –61Trade payables 549 461Other working capital –189 213Change in working capital –502 62
The material throughput time was 95 days (90) at year-end. Capital tied up in working capital decreased somewhat during the year, which had an impact on cash flow of SEK 62 M (–502) overall.
Relationship between cash flow from operating activities and operating cash flowSEK M 2015 2016Cash flow from operating activities 8,572 8,575Restructuring payments 375 442Net capital expenditure –1,241 –1,478Reversal of tax paid 2,247 2,928Operating cash flow 9,952 10,467
Investments in subsidiariesThe total purchase price of investments in subsidiaries amounted to SEK 2,866 M (3,835), of which the cash flow effect was SEK 2,640 M (3,171). Acquired cash and cash equivalents totaled SEK 263 M (155).
Change in net debtNet debt was mainly affected by the strong positive operat-ing cash flow, the dividend to shareholders, acquisitions and exchange rate differences.
SEK M 2015 2016Net debt at 1 January 22,327 22,269Operating cash flow –9,952 –10,467Restructuring payments 375 442Tax paid 2,247 2,928Acquisitions/Disposals 4,161 3,037Dividend 2,407 2,944Actuarial gain/loss on post-employment benefit obligations –150 138Exchange rate differences and others 855 1,836Net debt at 31 December 22,269 23,127
Consolidated financial statements
Cash flow
CAPITAL EXPENDITUREINCOME BEFORE TAX AND OPERATING CASH FLOW
Income before tax1
Operating cash flow2
1 Excluding items affecting comparability 2013 and 2016.
2 Excluding restructuring payments.
Net capital expenditureAmortization and depreciationNet capital expenditure % of sales
• Operating cash flow remained strong and amounted to SEK 10,467 M (9,952).• Net capital expenditure totaled SEK 1,478 M (1,241).
SEK M
0
2,000
4,000
6,000
8,000
10,000
12,000
1615141312
Resultat före skatt1
Operativt kassaflöde2
SEK M %
0
250
500
750
1,000
1,250
1,500
1,750
1615141312
NettoinvesteringarAvskrivningarNettoinvesteringar i % av omsättningen
0.0
0.5
1.0
1.5
2.0
2.5
3.0
3.5
CONSOLIDATED FINANCIAL STATEMENTS ASSA ABLOY ANNUAL REPORT 201662
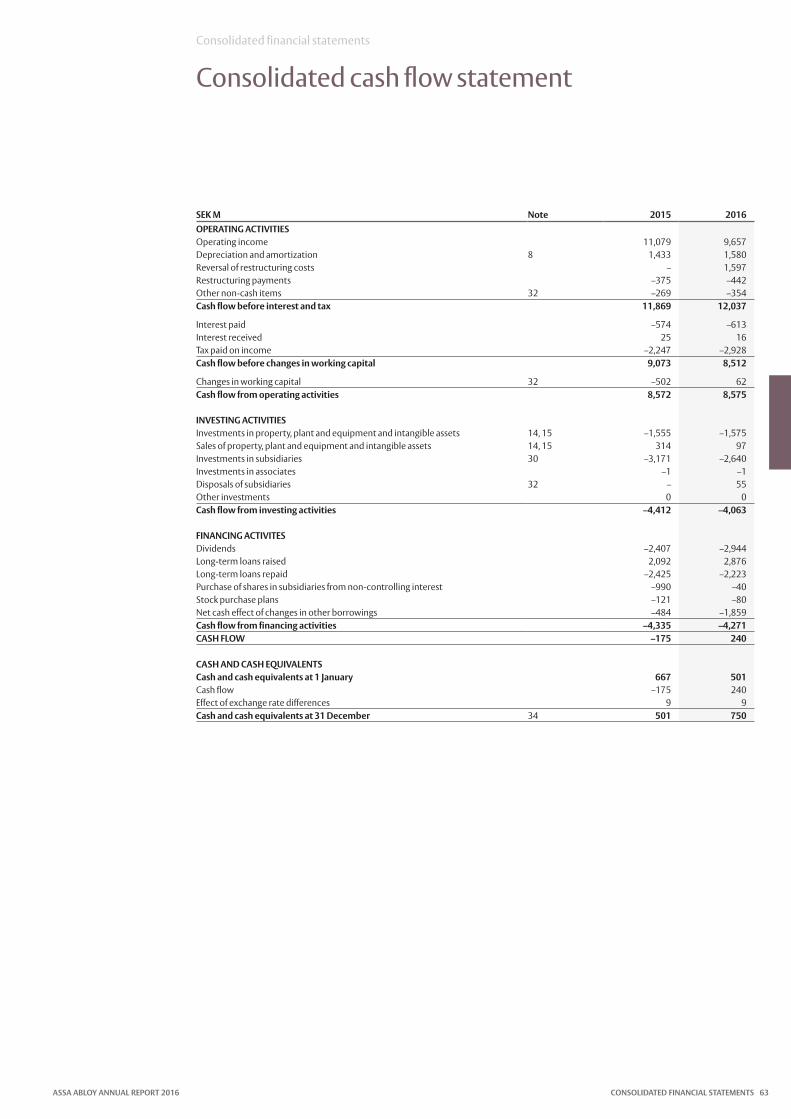
SEK M Note 2015 2016OPERATING ACTIVITIESOperating income 11,079 9,657Depreciation and amortization 8 1,433 1,580Reversal of restructuring costs – 1,597Restructuring payments –375 –442Other non-cash items 32 –269 –354Cash flow before interest and tax 11,869 12,037
Interest paid –574 –613Interest received 25 16Tax paid on income –2,247 –2,928Cash flow before changes in working capital 9,073 8,512
Changes in working capital 32 –502 62Cash flow from operating activities 8,572 8,575
INVESTING ACTIVITIESInvestments in property, plant and equipment and intangible assets 14, 15 –1,555 –1,575Sales of property, plant and equipment and intangible assets 14, 15 314 97Investments in subsidiaries 30 –3,171 –2,640Investments in associates –1 –1Disposals of subsidiaries 32 – 55Other investments 0 0Cash flow from investing activities –4,412 –4,063
FINANCING ACTIVITESDividends –2,407 –2,944Long-term loans raised 2,092 2,876Long-term loans repaid –2,425 –2,223Purchase of shares in subsidiaries from non-controlling interest –990 –40Stock purchase plans –121 –80Net cash effect of changes in other borrowings –484 –1,859Cash flow from financing activities –4,335 –4,271CASH FLOW –175 240
CASH AND CASH EQUIVALENTSCash and cash equivalents at 1 January 667 501Cash flow –175 240Effect of exchange rate differences 9 9Cash and cash equivalents at 31 December 34 501 750
Consolidated financial statements
Consolidated cash flow statement
ASSA ABLOY ANNUAL REPORT 2016 CONSOLIDATED FINANCIAL STATEMENTS 63

Parent company’s shareholders
MSEK NoteShare
capital
Other contributed
capital ReservesRetained earnings
Non- controlling
interest TotalOpening balance 1 January 2015 371 9,675 2,498 23,553 2 36,098Net income 7,693 0 7,693Other comprehensive income 144 117 0 260Total comprehensive income 144 7,810 0 7,953Dividend for 2014 23 –2,407 – –2,407Stock purchase plans –82 – –82Total contributions by and distributions to Parent company’s shareholders –2,489 – –2,489Change in non-controlling interest 15 1 17Total transactions with Parent company’s shareholders –2,474 1 –2,472Closing balance 31 December 2015 23 371 9,675 2,642 28,888 4 41,579
Opening balance 1 January 2016 371 9,675 2,642 28,888 4 41,579Net income 6,651 1 6,653Other comprehensive income –102 2,077 0 1,975Total comprehensive income –102 8,729 1 8,627Dividend for 2015 23 –2,944 – –2,944Stock purchase plans –39 – –39Total contributions by and distributions to Parent company’s shareholders –2,982 – –2,982Change in non-controlling interest – – –Total transactions with Parent company’s shareholders –2,982 – –2,982Closing balance 31 December 2016 23 371 9,675 2,540 34,634 5 47,224
Consolidated financial statements
Changes in consolidated equity
DIVIDENDEQUITY PER SHARE AFTER DILUTION AND RETURN ON EQUITY AFTER TAX
Dividend per shareEarnings per share after tax and dilution1
1 Excluding items affecting com-parability 2013 and 2016.
Equity per share after dilution, SEKReturn on equity after tax, %
SEK %
0
10
20
30
40
50
1615141312
Eget kapital per aktieefter utspädning, SEKAvkastning på eget kapital efter skatt, %
0
5
10
15
20
25
SEK
0
1
2
3
4
5
6
7
8
1615141312
Utdelning per aktieVinst per aktie efter utspädning1
CONSOLIDATED FINANCIAL STATEMENTS ASSA ABLOY ANNUAL REPORT 201664

Saint-Gobain & CertainTeed’s new state-of-the-art headquarters in North America earns LEED 2009 Platinum certification by utilizing sustainable products
CUSTOMER: Saint-Gobain, a French company which prides itself as “the reference in sustainable habitat,” remains eager to partner with other inter-national companies which have also identified sustainability as a priority. This emphasis came into particular focus as Saint-Gobain spent several years planning its new headquarters for North America, a building which would house 800 employees of Saint-Gobain and one of its subsidiaries, CertainTeed.
CHALLENGE: The previous North American head-quarters for Saint-Gobain was a structure suffering from “sick building syndrome” at the same time as the company was selling its customers on leading edge construction materials designed to make their buildings healthier for employees. The new facility was also targeted for a 2015 opening as part of Saint-Gobain’s 350th anniversary – and was intended to reinforce the company commitment to sustainability.
SOLUTION: ASSA ABLOY collaborated with Saint-Gobain to provide six distinct door opening solu-tions, each of which had obtained an Environmental Product Declaration (EPD) for sustainability. Because the ASSA ABLOY Group provides such a wide range of products, it was able to combine them to provide the project with complete and integrated door opening solutions. Using the ASSA ABLOY products, along with 15 other permanent building products from multiple companies, Saint-Gobain was able to meet and even surpass the requirements for LEED 2009 Platinum certification.
Securing top aviation hub in China
CUSTOMER: Zhengzhou Xinzheng International Airport, owned by the Henan Airport Group, will become China’s second-largest integrated trans-port hub and will be serving Zhengzhou the capital of Henan province.
CHALLENGE: The goal was to devise a compre-hensive door-opening solution for a project that includes the construction of two more terminals and two more runways by 2020. The passenger flow is expected to rise to 29 million travelers per year,
0.2 million passenger aircraft and half a million cargo jets will travel to the airport annually.
SOLUTION: ASSA ABLOY China’s complete, optimized, flexible, cost-efficient security solution impressed the customers and the architects (China Northeast Architectural Design and Research Insti-tute – particularly given the current economic situ-ation in China and the durability requirements). We offered a mix of ANSI (US) and EN (European) stan-dard products, The customer was equally satisfied with our team’s responsive communication efforts.
Some 2,000 fire and steel doors and 4,000 sets of hardware secure the terminals, with 49 2.8m-high super-size ASSA ABLOY branded fire doors for the huge entranceways. Products include Yale ANSI standard locksets, door closers and exit devices, and Doormax EN standard floor springs and door accessories. The project will promote the use of our high-end brands for other significant commercial projects.
Photo © Jeffrey Totaro, 2015
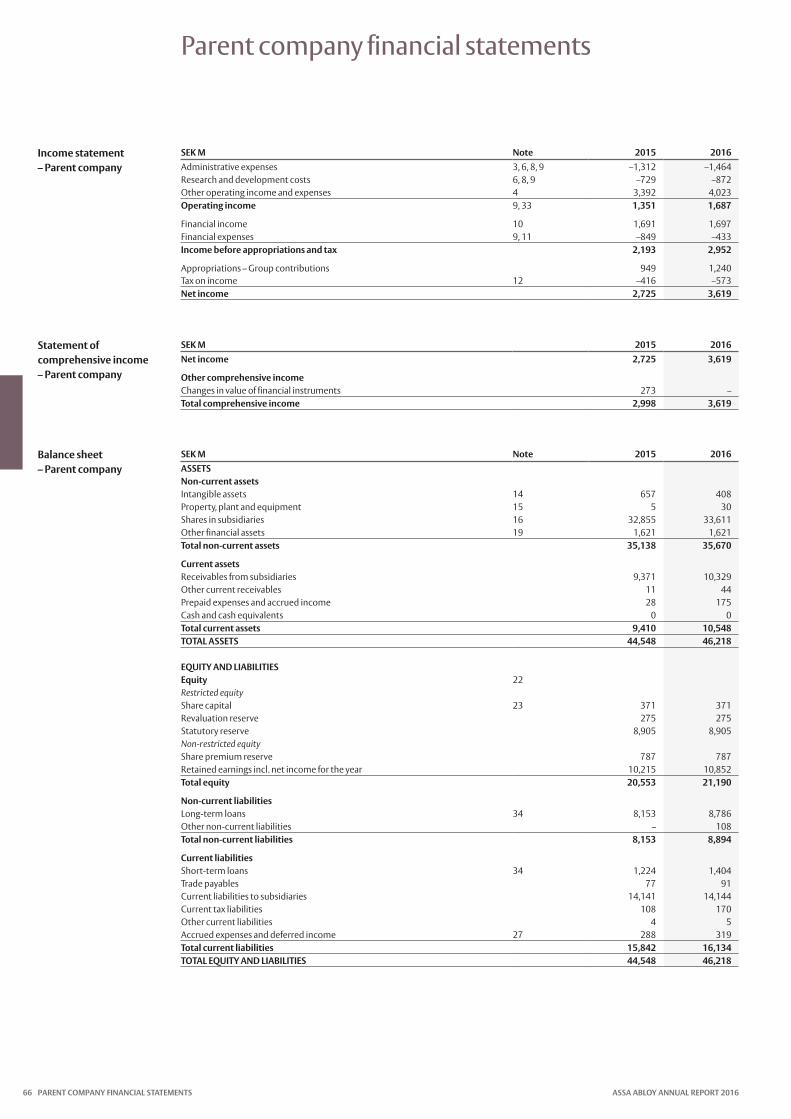
Parent company financial statements
SEK M Note 2015 2016Administrative expenses 3, 6, 8, 9 –1,312 –1,464Research and development costs 6, 8, 9 –729 –872Other operating income and expenses 4 3,392 4,023Operating income 9, 33 1,351 1,687
Financial income 10 1,691 1,697Financial expenses 9, 11 –849 –433Income before appropriations and tax 2,193 2,952
Appropriations – Group contributions 949 1,240Tax on income 12 –416 –573Net income 2,725 3,619
Income statement – Parent company
SEK M 2015 2016Net income 2,725 3,619
Other comprehensive incomeChanges in value of financial instruments 273 –Total comprehensive income 2,998 3,619
Statement of comprehensive income – Parent company
SEK M Note 2015 2016ASSETSNon-current assets Intangible assets 14 657 408Property, plant and equipment 15 5 30Shares in subsidiaries 16 32,855 33,611Other financial assets 19 1,621 1,621Total non-current assets 35,138 35,670
Current assets Receivables from subsidiaries 9,371 10,329Other current receivables 11 44Prepaid expenses and accrued income 28 175Cash and cash equivalents 0 0Total current assets 9,410 10,548TOTAL ASSETS 44,548 46,218
EQUITY AND LIABILITIES Equity 22Restricted equity Share capital 23 371 371Revaluation reserve 275 275Statutory reserve 8,905 8,905Non-restricted equity Share premium reserve 787 787Retained earnings incl. net income for the year 10,215 10,852Total equity 20,553 21,190
Non-current liabilities Long-term loans 34 8,153 8,786Other non-current liabilities – 108Total non-current liabilities 8,153 8,894
Current liabilitiesShort-term loans 34 1,224 1,404Trade payables 77 91Current liabilities to subsidiaries 14,141 14,144Current tax liabilities 108 170Other current liabilities 4 5Accrued expenses and deferred income 27 288 319Total current liabilities 15,842 16,134TOTAL EQUITY AND LIABILITIES 44,548 46,218
Balance sheet – Parent company
PARENT COMPANY FINANCIAL STATEMENTS ASSA ABLOY ANNUAL REPORT 201666
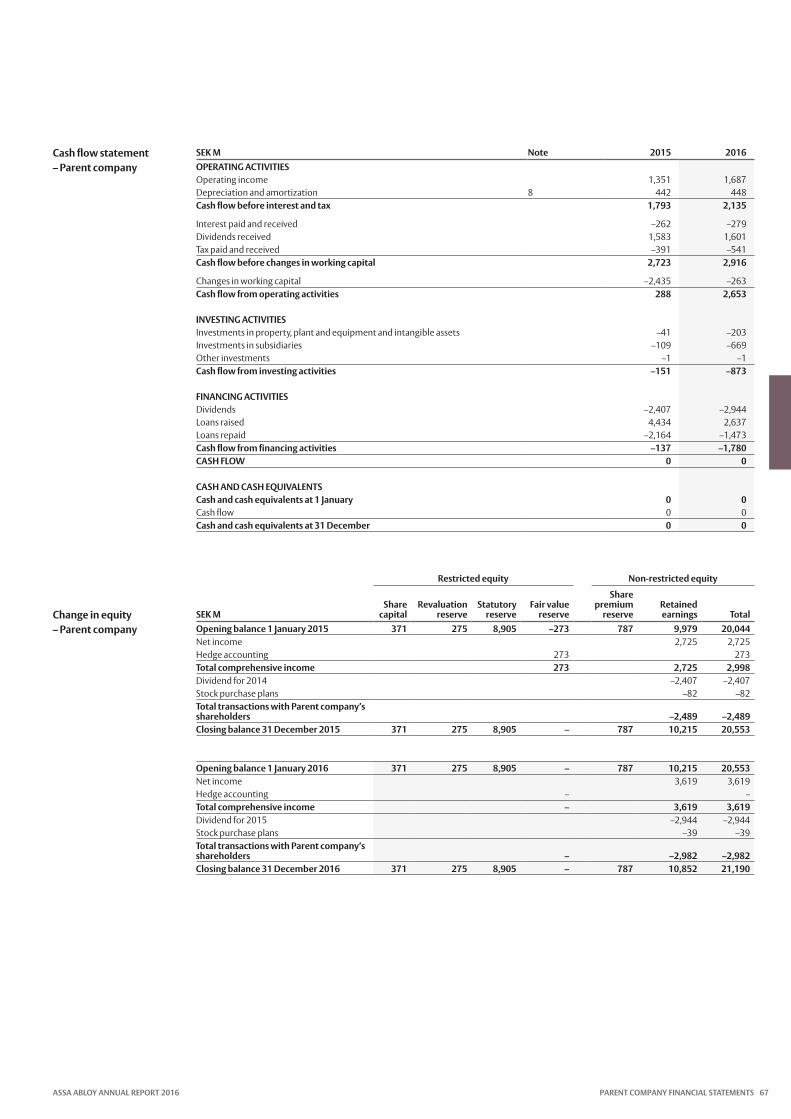
SEK M Note 2015 2016OPERATING ACTIVITIESOperating income 1,351 1,687Depreciation and amortization 8 442 448Cash flow before interest and tax 1,793 2,135
Interest paid and received –262 –279Dividends received 1,583 1,601Tax paid and received –391 –541Cash flow before changes in working capital 2,723 2,916
Changes in working capital –2,435 –263Cash flow from operating activities 288 2,653
INVESTING ACTIVITIESInvestments in property, plant and equipment and intangible assets –41 –203Investments in subsidiaries –109 –669Other investments –1 –1Cash flow from investing activities –151 –873
FINANCING ACTIVITIESDividends –2,407 –2,944Loans raised 4,434 2,637Loans repaid –2,164 –1,473Cash flow from financing activities –137 –1,780CASH FLOW 0 0
CASH AND CASH EQUIVALENTSCash and cash equivalents at 1 January 0 0Cash flow 0 0Cash and cash equivalents at 31 December 0 0
Restricted equity Non-restricted equity
SEK MShare
capitalRevalu ation
reserveStatutory
reserveFair value
reserve
Share premium
reserveRetained earnings Total
Opening balance 1 January 2015 371 275 8,905 –273 787 9,979 20,044Net income 2,725 2,725Hedge accounting 273 273Total comprehensive income 273 2,725 2,998Dividend for 2014 –2,407 –2,407Stock purchase plans –82 –82Total transactions with Parent company’s shareholders –2,489 –2,489Closing balance 31 December 2015 371 275 8,905 – 787 10,215 20,553
Opening balance 1 January 2016 371 275 8,905 – 787 10,215 20,553Net income 3,619 3,619Hedge accounting – –Total comprehensive income – 3,619 3,619Dividend for 2015 –2,944 –2,944Stock purchase plans –39 –39Total transactions with Parent company’s shareholders – –2,982 –2,982Closing balance 31 December 2016 371 275 8,905 – 787 10,852 21,190
Cash flow statement – Parent company
Change in equity – Parent company
ASSA ABLOY ANNUAL REPORT 2016 PARENT COMPANY FINANCIAL STATEMENTS 67
Notes
Note 1 Significant accounting and valuation principles
The Group ASSA ABLOY applies International Financial Reporting Standards (IFRS) as endorsed by the European Union (EU), the Swedish Annual Accounts Act and the Swedish Financial Reporting Board’s RFR 1 Supplementary Accounting Rules for Corporate Groups. The accounting principles are based on IFRS as endorsed by 31 December 2016 and have been applied to all years presented, unless stated otherwise. This Note describes the most significant accounting principles that have been applied in the preparation of the financial statements, which comprise the information provided on pages 39–98.
Basis of preparationASSA ABLOY’s consolidated financial statements have been prepared in accordance with IFRS as endorsed by the EU. The consolidated financial statements have been prepared in accordance with the cost method, except for financial assets and liabilities (including derivatives) measured at fair value through profit or loss and available-for-sale financial assets.
Totals quoted in tables and statements may not always be the exact sum of the indivudual items because of rounding dif-ferences. The aim is that each line item should correspond to its source, and rounding differences may therefore arise.
Key estimates and assessments for accounting purposesThe preparation of financial statements requires estimates and assessments to be made for accounting purposes. The management also makes assessments when applying the Group’s accounting principles. Estimates and assessments may affect the income statement and balance sheet as well as the supplementary information provided in the financial statements. Consequently changes in estimates and assess-ments may lead to changes in the financial statements.
Estimates and assessments play an important part in the measurement of items such as identifiable assets and liabili-ties in acquisitions, in impairment testing of goodwill and other assets, in determining actuarial assumptions for cal-culating employee benefits, as well as in the valutation of deferred taxes. Estimates and assessments are continually evaluated and are based on both historical experience and reasonable expectations about the future.
The Group considers that estimates and assessments relat-ing to impairment testing of goodwill and other intangible assets with indefinite useful life are of material importance to the consolidated financial statements. The Group tests carry-ing amounts for impairment on an annual basis. The recover-able amounts of cash generating units are determined by calculating their values in use. The calculations are based on certain assumptions about the future which, for the Group, are associated with the risk of material adjustments in carrying amounts during the next financial year. Material assumptions and the effects of reasonable changes in them are described in Note 14.
The actuarial assumptions made when calculating post-employment employee benefits also have material importance for the consolidated financial statements. For information on these actuarial assumptions, see Note 24.
New and revised standards applied by the GroupNone of the standards and interpretations to be applied for the first time for the financial year beginning 1 January 2016 had a significant impact on the consolidated financial statements.
New and revised IFRS not yet effectiveThe following IFRS have been published but are not yet effective, and have not been applied in the preparation of the financial statements.• IFRS 9 Financial Instruments• IFRS 15 Revenue from Contract with Customers• IFRS 16 Leases
Of the above new standards, IFRS 9 and IFRS 15 are to be applied from the financial year beginning 1 January 2018, while IFRS 16 takes effect on 1 January 2019. Earlier applica-tion is allowed for all standards.
During the year a major project was initiated relating to the implementation of IFRS 15. Although the impact of the new standard as of the closing date has not yet been fully investi-gated, the Group’s current assessment is that the standard will not have a material impact on the consolidated financial state-ments. IFRS 9 is deemed not to have any significant impact on the consolidated financial statements either, while the Group has not yet evaluated the effects of implementation of IFRS 16.
Consolidated financial statementsThe consolidated financial statements include ASSA ABLOY AB (the Parent company) and all companies over which the Group has control. The Group controls an entity when the Group is exposed to, or has the rights to, variable returns from its involvement with the entity and has the ability to affect those returns through its power over the entity. Companies acquired during the year are included in the consolidated financial statements with effect from the date when a con-trolling interest arose. Companies divested during the year are included in the consolidated financial statements up to the date when a controlling interest ceased.
The consolidated financial statements have been prepared in accordance with the purchase method, which means that the cost of shares in subsidiaries was eliminated against their equity at the acquisition date. In this context, equity in sub-sidiaries is determined on the basis of the fair value of assets, liabilities and contingent liabilities at the acquisition date. Consequently only that part of the equity in subsidiaries that has arisen after the acquisition date is included in consoli-dated equity. The Group determines on an individual basis for each acquisition whether a non- controlling interest in the acquired company shall be recognized at fair value or at the interest’s proportional share of the acquired company’s net assets. Any negative difference, negative goodwill, is recog-nized as revenue immediately after determination.
Deferred considerations are classified as financial liabilities and revalued through profit or loss in operating income. Significant deferred considerations are discounted to present value. Acquisition-related transaction costs are expensed as incurred.
Intra-Group transactions and balance sheet items, and unrealized profits on transactions between Group companies are eliminated in the consolidated financial statements.
Non-controlling interestsNon-controlling interests are based on the subsidiaries’ accounts with application of fair value adjustments resulting from a completed acquisition analysis. Non-controlling inter-ests’ share in subsidiaries’ earnings is recognized in the income statement, in which net income is attributed to the Parent company’s shareholders and to non-controlling interests. Non-controlling interests’ share in subsidiaries’ equity is rec-ognized separately in consolidated equity. Transactions with non-controlling interests are recognized as transactions with the Group’s shareholders in equity.
NOTES ASSA ABLOY ANNUAL REPORT 201668

AssociatesAssociates are defined as companies which are not sub-sidiaries but in which the Group has a significant (but not a controlling) interest. This generally refers to companies in which the Group’s shareholding represents between 20 and 50 percent of the voting rights.
Investments in associates are accounted for in accordance with the equity method. In the consolidated balance sheet, shareholdings in associates are recognized at cost, and the carrying amount is adjusted for the share of associates’ earn-ings after the acquisition date. Dividends from associates are recognized as a reduction in the carrying amount of the hold-ings. The share of associates’ earnings is recognized in the consolidated income statement in operating income as the holdings are related to business operations.
Segment reportingOperating segments are reported in accordance with inter-nal reporting to the chief operating decision maker. Chief operating decision maker is the function that is responsible for allocation of resources and assessing performance of the operating segments. The divisions form the operational structure for internal control and reporting and also consti-tute the Group’s segments for external financial reporting. The Group’s business is divided into five divisions. Three divi-sions are based on products sold in local markets in the respective division: EMEA, Americas and Asia Pacific. Global Technologies and Entrance Systems consist of products sold worldwide.
Foreign currency translationFunctional currency corresponds to local currency in each country where Group companies operate. Transactions in foreign currencies are translated to functional currency by application of the exchange rates prevailing on the transac-tion date. Foreign exchange gains and losses arising from the settlement of such transactions are normally recognized in the income statement, as are those arising from translation of monetary balance sheet items in foreign currencies at the year-end rate. Exceptions are transactions relating to qualify-ing cash flow hedges, which are recognized in other compre-hensive income. Receivables and liabilities are measured at the year-end rate.
In translating the accounts of foreign subsidiaries pre-pared in functional currencies other than the Group’s presentation currency, all balance sheet items except net income are translated at the year-end rate and net income is translated at the average rate. The income statement is translated at the average rate for the period. Exchange differ-ences arising from the translation of foreign subsidiaries are recognized as translation differences in other comprehen-sive income.
The table below shows the weighted average rate and the closing rate for important currencies used in the Group, relative to the Group’s presentation currency (SEK).
Average rate Closing rate
Country Currency 2015 2016 2015 2016Argentina ARS 0.91 0.58 0.65 0.57Australia AUD 6.31 6.36 6.09 6.58Brazil BRL 2.57 2.47 2.16 2.80Canada CAD 6.58 6.46 6.04 6.75Switzerland CHF 8.70 8.67 8.43 8.91Chile CLP 0.013 0.013 0.012 0.014China CNY 1.34 1.29 1.29 1.31Colombia COP 0.0031 0.0028 0.0026 0.0030Czech Republic CZK 0.34 0.35 0.34 0.35Denmark DKK 1.25 1.27 1.23 1.29Euro zone EUR 9.35 9.44 9.14 9.58
Average rate Closing rate
Country Currency 2015 2016 2015 2016United Kingdom GBP 12.84 11.60 12.39 11.19Hong Kong HKD 1.08 1.11 1.08 1.17Hungary HUF 0.030 0.030 0.029 0.031Israel ILS 2.16 2.24 2.15 2.37India INR 0.131 0.127 0.126 0.134Kenya KES 0.086 0.084 0.082 0.089South Korea KRW 0.0074 0.0074 0.0071 0.0076Mexico MXN 0.53 0.46 0.48 0.44Malaysia MYR 2.17 2.06 1.95 2.03Norway NOK 1.04 1.02 0.96 1.05New Zealand NZD 5.89 5.97 5.72 6.33Poland PLN 2.23 2.16 2.16 2.17Romania RON 2.10 2.10 2.02 2.11Russia RUB 0.14 0.13 0.11 0.15Singapore SGD 6.12 6.19 5.91 6.30Thailand THB 0.25 0.24 0.23 0.25Turkey TRY 3.11 2.84 2.87 2.58USA USD 8.41 8.58 8.36 9.11South Africa ZAR 0.66 0.59 0.54 0.67
RevenueRevenue comprises the fair value of goods sold, excluding VAT and discounts, and after eliminating intra-Group sales. The Group’s sales revenue mainly consists of product sales. Service related to products sold represents a limited share of revenue. Revenue from sales of the Group’s products is rec-ognized when all significant risks and benefits associated with ownership have been transferred to the purchaser in accordance with applicable terms of sale, which is normally upon delivery. If the product requires installation at the cus-tomer’s premises, revenue is recognized when installation has been completed. Revenue from service contracts is recognized on a continuous basis over the contract period. In the case of installations over a longer period of time, the percentage of completion method is used.
Intra-Group salesTransactions between Group companies are carried out at arm’s length and thus at market prices. Intra-Group sales are eliminated from the consolidated income statement, and profits on such transactions have been eliminated in their entirety.
Government grantsGrants and support from governments, public authorities and the like are recognized when there is reasonable assur-ance that the company will comply with the conditions attaching to the grant and that the grant will be received. Grants relating to assets are recognized after reducing the carrying amount of the asset by the amount of the grant.
Research and developmentResearch expenditure is expensed as incurred. Development expenditure is recognized in the balance sheet to the extent that it is expected to generate future economic benefits for the Group and provided such benefits can be reliably measured.
Capitalized development expenditure is amortized over the expected useful life. Such intangible assets, which are not yet in use, are tested annually for impairment. Expenditure on the further development of existing products is expensed as incurred.
Note 1 cont.
ASSA ABLOY ANNUAL REPORT 2016 NOTES 69
Borrowing costsBorrowing costs are interest expenses and other expenses directly related to borrowing. Borrowing costs directly attributable to the acquisition, construction or production of a qualifying asset (an asset that necessarily takes a sub-stantial period of time to get ready for its intended use or sale) are included in the cost of the asset. Other borrowing costs are recognized as an expense in the period in which they are incurred.
Tax on incomeThe income statement includes all tax that is to be paid or received for the current year, adjustments relating to tax due for previous years, and changes in deferred tax. These taxes have been calculated at nominal amounts, in accordance with the tax regulations in each country, and in accordance with tax rates that have either been decided or have been notified and can confidently be expected to be confirmed. For items recognized in the income statement, associated tax effects are also recognized in the income statement. The tax effects of items recognized directly against equity or in other comprehensive income are themselves recognized against equity or in other comprehensive income. The liabil-ity method is used in accounting for deferred tax. This means that deferred tax is recognized on all temporary differences between the carrying amounts of assets and liabilities and their respective tax bases. Deferred tax assets relating to tax losses carried forward or other future tax allowances are rec-ognized to the extent that it is probable that the allowance can be offset against taxable income in future taxation. Deferred tax liabilities for temporary differences relating to investments in subsidiaries are not recognized in the con-solidated financial statements, since the Parent company can control the time at which the temporary differences are reversed, and it is not considered likely that such reversal will occur in the foreseeable future. Deferred tax assets and deferred tax liabilities are offset when there is a legal right to do so and when deferred taxes relate to the same tax authority.
Cash flow statement The cash flow statement has been prepared according to the indirect method. The recognized cash flow includes only transactions involving cash payments.
Cash and cash equivalentsCash and cash equivalents include cash and bank balances, and short-term financial investments that mature within three months of the acquisition date.
Goodwill and acquisition-related intangible assetsGoodwill represents the positive difference between the acquisition cost and the fair value of the Group’s share of the acquired company’s identifiable net assets at the acquisition date, and is recognized at cost less accumulated impairment losses. Goodwill is allocated to cash generating units (CGU) and is tested annually to identify any impairment loss. Cash generating units are subject to systematic annual impair-ment testing using a valuation model based on discounted future cash flows. Deferred tax assets based on local tax rates are recognized in terms of tax-deductible goodwill (with corresponding reduction of the goodwill value). Such deferred tax assets are expensed as the tax deduction is utilized. Other acquisition-related intangible assets consist chiefly of various types of intellectual property rights, such as brands, technology and customer relationships. Identifiable
acquisition-related intellectual property rights are initially recognized at fair value at the acquisition date and sub-sequently at cost less accumulated amortization and impair-ment losses. Amortization is on a straight-line basis over the estimated useful life. Acquisition-related intangible assets with an indefinite useful life are tested for impairment annually in the same way as goodwill.
Other intangible assetsAn intangible asset that is not acquisition-related is recog-nized only if it is likely that the future economic benefits associated with the asset will flow to the Group, and if the cost of the asset can be reliably measured. Such an asset is initially recognized at cost and is amortized over its esti-mated useful life, usually between three and five years. The carrying amount is the cost less accumulated amortization and impairment losses.
Property, plant and equipmentProperty, plant and equipment are recognized at cost less accumulated depreciation and impairment losses. Cost in- cludes expenditure directly attributable to acquisition of the asset. Sub sequent expenditure is capitalized if it is probable that economic benefits associated with the asset will flow to the Group, and if the cost can be reliably measured. Expendi-ture on repairs and maintenance is expensed as incurred. Depreciable amount is the cost of an asset less its estimated residual value. Land is not depreciated. For other assets, cost is depreciated over the estimated useful life, which for the Group results in the following average depreciation periods: • Buildings 25–50 years.• Land improvements 10–25 years.• Machinery 7–10 years.• Equipment 3–6 years.
The residual value and useful life of assets are reviewed at each reporting date and adjusted when necessary. Gain or loss on the disposal of property, plant and equipment is rec-ognized in the income statement as ‘Other operating income’ or ‘Other operating expenses’, and consists of the difference between the selling price and the carrying amount.
LeasingThe Group’s leasing is chiefly operating leasing. The lease payments are expensed on a straight-line basis over the term of the lease and are recognized as operating expenses.
ImpairmentAssets with an indefinite useful life are not amortized but are tested for impairment on an annual basis. For impairment testing purposes, assets are grouped at the lowest organiza-tional level where there are separate identifiable cash flows, so-called cash generating units (CGU).
For assets that are depreciated/amortized, impairment testing is carried out when events or circumstances indicate that the carrying amount many not be recoverable.
Impairment losses are recognized in the amount by which the carrying amount of the asset exceeds the recoverable amount, which is the higher of the asset’s fair value, less selling expenses, and value in use.
InventoriesInventories are valued in accordance with the ‘first in, first out’ principle at the lower of cost and net realizable value at the reporting date. Deductions are made for internal profits arising from deliveries between Group companies. Work in
Notes
Note 1 cont.
NOTES ASSA ABLOY ANNUAL REPORT 201670
progress and finished goods include both direct costs incurred and a fair allocation of indirect production costs.
Trade receivablesTrade receivables are recognized initially at fair value and subsequently measured at amortized cost using the effective interest method. A provision is recognized when there is objective evidence that the Group will not be able to collect recorded amounts. The year’s change in such a provision is recognized in the income statement as selling expenses.
Financial assetsFinancial assets include cash and cash equivalents, trade receivables, short-term investments and derivatives, and are classified in the following categories: financial assets at fair value through profit and loss, available-for-sale financial assets, and loans and receivables. Management determines the classification of financial assets at initial recognition.
Financial assets at fair value through the income statementThis category is divided into two sub-categories: financial assets held for trading, and those classified on acquisition as financial assets at fair value through profit and loss. A finan-cial asset is classified in this category if acquired principally for the purpose of selling in the short term or if classified as such by management. Derivatives are also classified as held for trading provided they are not defined as hedges. Assets in this category are classified as current assets.
Available-for-sale financial assetsAvailable-for-sale financial assets are non-derivative assets that have been identified as available for sale or assets that have not been classified in any other category. They are included in non-current assets, unless management intends to sell the asset within 12 months of the end of the reporting period. Changes in fair value are recognized in Other comprehensive income.
Loans and receivablesLoans and receivables are non-derivative financial assets with fixed or determinable payment streams, which are not quoted in an active market. They are recognized in current assets, except for receivables maturing more than 12 months after the reporting date, which are classified as non-current assets.
Loans and receivables are initially recognized at fair value and subsequently carried at amortized cost using the effective interest method.
Financial liabilitiesFinancial liabilities include deferred considerations, loan liabilities, trade payables and derivative instruments. Recognition depends on how the liability is classified.
Financial liabilities at fair value through the income statement This category includes derivatives with negative fair value that are not used for hedging, deferred considerations, and financial liabilities held for trading. Liabilities are measured at fair value on a continuous basis and changes in value are recognized in the income statement as a financial item.
Loan liabilitiesLoan liabilities are initially valued at fair value, net of transac-tion costs, and subsequently at amortized cost. Amortized cost is determined based on the effective interest rate
calculated when the loan was raised. Accordingly, surplus val-ues and negative surplus values as well as direct issue expenses are allocated over the term of the loan. Non-current loan liabilities have an anticipated term of more than one year, while current loan liabilities have a term of less than one year.
Trade payablesTrade payables are initially valued at fair value, and sub-sequently at amortized cost using the effective interest method.
Recognition and measurement of financial assets and liabilitiesAcquisitions and sales of financial assets are recognized on the trade date, the date on which the Group commits to pur-chase or sell the asset. Transaction costs are initially included in fair value for all financial instruments, except for those rec-ognized at fair value through profit and loss where the trans-action cost is recognized through profit and loss. The fair value of quoted investments is based on current bid prices. In the absence of an active market for an investment, the Group applies various measurement techniques to deter-mine fair value. These include use of available information on current arm’s length transactions, comparison with equiva-lent assets and analysis of discounted cash flows. The Group assesses at each reporting date whether there is any objec-tive evidence that a financial asset or a group of financial assets is impaired. A financial asset is derecognized from the balance sheet when the right to receive cash flows from the asset expires or is transferred to another party through the transfer of all the risks and benefits associated with the asset to the other party. A financial liability is derecognized from the balance sheet when the obligation is fulfilled, cancelled or expires, see above.
Derivative instruments and hedgingDerivative instruments are recognized in the balance sheet at the transaction date and are measured at fair value, both initially and in subsequent revaluations. The method for rec-ognizing profit or loss depends on whether the derivative instrument is designated as a hedging instrument, and if so, the nature of the hedged item. For derivatives not desig-nated as hedging instruments, changes in value are recog-nized on a continuous basis through profit or loss under financial items, either as income or expense.
The Group designates derivatives as follows:i) Fair value hedge: a hedge of the fair value of an identified liability;ii) Cash flow hedge: a hedge of a certain risk associated with a forecast cash flow for a certain transaction; or iii) Net investment hedge: a hedge of a net investment in a foreign subsidiary.
When entering into the hedge transaction, the Group docu-ments the relationship between the hedging instrument and hedged items, as well as its risk management strategy for the hedge. The Group also documents its assessment, both on inception and on a regular basis, of whether the derivative instruments used in hedge transactions are effective in offset-ting changes in fair value attributable to the hedged items.
The fair value of forward exchange contracts is calculated at net present value based on prevailing forward rates on the reporting date, while interest rate swaps are measured by estimating future discounted cash flows.
For information on the fair value of derivative instruments, see Note 34, ‘Financial risk management and
Note 1 cont.
ASSA ABLOY ANNUAL REPORT 2016 NOTES 71
financial instruments’. Derivatives at fair value, with a matu-rity of more than 12 months, are classified as non-current interest-bearing liabilities or receivables. Other derivatives are classified as current interest-bearing liabilities and investments respectively.
Fair value hedgesFor derivatives that are designated and qualify as fair value hedges, changes in value of both the hedged item and the hedging instrument are recognized on a continuous basis in the income statement (under financial items). Fair value hedges are used to hedge interest rate risk in borrowing linked to fixed interest terms. If the hedge would no longer qualify for hedge accounting, the fair value adjustment of the carrying amount is dissolved through profit or loss over the remaining term using the effective interest method.
Cash flow hedgesFor derivatives that are designated and qualify as cash flow hedges, changes in value of the hedging instrument are rec-ognized on a continuous basis in other comprehensive income for the part relating to the effective portion of the hedges. Gain or loss arising from ineffective portions of derivatives is recognized directly in the income statement under financial items. When a hedging instrument expires, is sold or no longer qualifies for hedge accounting, and accu-mulated gains or losses relating to the hedge are recognized in equity, these gains/losses remain in equity and are taken to income, while the forecast transaction is finally recog-nized in the income statement. When a forecast transaction is no longer expected to occur, the accumulated gain or loss recognized in equity is immediately transferred to Other comprehensive income in the income statement. When a forecast transaction is no longer expected to occur, the gain or loss recognized in Other comprehensive income is recognized directly under financial items.
Net investment hedgesFor derivatives that are designated and qualify as net invest-ment hedges, the portion of value changes in fair value designated as effective is recognized in other comprehen-sive income. The ineffective portion of the gain or loss is rec-ognized directly in profit or loss for the period under finan-cial items. Accumulated gain or loss in other comprehensive income is recognized in the income statement when the foreign operation, or part thereof, is sold.
ProvisionsA provision is recognized when the Group has a legal or con-structive obligation resulting from a past event and it is prob-able that an outflow of resources will be required to settle the obligation, and that a reliable estimate of the amount can be made. Provisions are recognized at a value equivalent to the outflow of resources that will probably be required to settle the obligation. The amount of a provision is dis-counted to present value where the effect of time value is considered material.
Assets and liabilities of a disposal group classified as held for saleAssets and liabilities are classified as held for sale when their carrying amounts will principally be recovered through a sale and when such a sale is considered highly probable. They are recognized at the lower of carrying amount and fair value less selling expenses.
Employee benefitsThe Group operates both defined contribution and defined benefit pension plans. Comprehensive defined benefit plans are found chiefly in the US, the UK and Germany. Post- employment medical benefits are also provided, mainly in the US, and are reported in the same way as defined benefit pension plans. Calculations relating to the Group’s defined benefit plans are performed by independent actuaries and are based on a number of actuarial assumptions such as dis-count rate, future inflation and salary increases. Obligations are valued on the reporting date at their discounted value. For funded plans, obligations are reduced by the fair value of the plan assets. Actuarial gains and losses resulting from experience-based adjustments and changes in actuarial assumptions are recognized in other comprehensive income during the period they arise. The pension expense for defined benefit plans is spread over the employee’s service period. The Group’s payments relating to defined contribution pen-sion plans are recognized as an expense in the period to which they relate, based on the services performed by the employee. Swedish Group companies calculate tax on pen-sion costs on the difference between pension expense determined in accordance with IAS 19 and pension expense determined in accordance with the regulations applicable in the legal entity.
Equity-based incentive programsThe Group has equity-based remuneration plans in the form of ASSA ABLOY’s long-term incentive program presented for the first time at the 2010 Annual General Meeting. For the long-term incentive program, personnel costs during the vesting period are recognized based on the shares’ fair value on the allotment date, that is, when the company and the employees entered into an agreement on the terms and con-ditions for the program. The long-term incentive program comprises two parts: a matching part where the employee receives one share for every share the latter invests during the term of the program, and a performance-based part where the outcome is based on the company’s financial results (EPS target) during the period. The program requires that the employee continues to invest in the long-term incentive program and that the latter remains employed in the ASSA ABLOY Group.
Fair value is based on the share price on the allotment date; a reduction in fair value relating to the anticipated divi-dend has not been made as the participants are compen-sated for this. The employees pay a price equivalent to the share price on the investment date. The vesting terms are not stock market based and affect the number of shares that ASSA ABLOY will give to the employee when matching. If an employee stops investing in the program, all remaining per-sonnel costs are immediately recognized in the income statement. Personnel costs for shares relating to the perfor-mance-based program are calculated on each accounting date based on an assessment of the probability of the perfor-mance targets being achieved. The costs are calculated based on the number of shares that ASSA ABLOY expects to need to settle at the end of the vesting period. When match-ing shares, social security contributions must be paid in some countries to the value of the employee’s benefit. This value is based on fair value on each accounting date and recognized as a provision for social security contributions.
The long-term incentive programs are essentially equity settled and an amount equivalent to the personnel cost is recognized against retained earnings in equity. In the income statement, the personnel cost is allocated to the respective function.
Notes
Note 1 cont.
NOTES ASSA ABLOY ANNUAL REPORT 201672
Earnings per shareEarnings per share before dilution is calculated by dividing the net income attributable to the Parent company’s share-holders by the weighted average number of outstanding shares (less treasury shares). Earnings per share after dilution is calculated by dividing the net income attributable to the Parent company’s shareholders by the sum of the weighted average number of ordinary shares and potential ordinary shares that may give rise to a dilutive effect. The dilutive effect of potential ordinary shares is only recognized if their conversion to ordinary shares would lead to a reduction in earnings per share after dilution.
DividendDividend is recognized as a liability after the Annual General Meeting has approved the dividend.
The Parent companyThe Group’s Parent company, ASSA ABLOY AB, is responsible for Group management and provides Group-wide functions. The Parent company’s revenue consists of intra-Group franchise and royalty revenues. The significant balance sheet items consist of shares in subsidiaries, intra-Group recei-vables and liabilities, and external borrowing. The Parent company has prepared its annual accounts in accor-dance with the Swedish Annual Accounts Act (1995:1554) and the Swedish Financial Reporting Board’s RFR 2 Account-ing for Legal Entities. RFR 2 requires the Parent company, in its annual accounts, to apply all the International Financial Reporting Standards (IFRS) endorsed by the EU in so far as this is possible within the framework of the Annual Accounts Act and with regard to the relationship between accounting and taxation. The recommendation states which exceptions from and additions to IFRS should be made.
RevenueThe Parent company’s revenue consists of intra-Group franchise and royalty revenues. These are recognized in the income statement as ‘Other operating income’ to make clear that the Parent company has no product sales like other Group companies with external operations.
Pension obligationsThe Parent company’s pension obligations are accounted for in accordance with FAR RedR 4 and are covered by taking out insurance with an insurance company.
DividendDividend revenue is recognized when the right to receive payment is considered certain.
Research and development costsResearch and development costs are expensed as incurred.
Intangible assetsIntangible assets comprise patented technology and other intangible assets. They are amortized over 4–5 years.
Tangible assetsTangible assets owned by the Parent company are recog-nized at cost less accumulated depreciation and any impair-ment losses in the same way as for the Group. They are depreciated over their estimated useful life, which is 5–10 years for equipment and 4 years for IT equipment.
LeasingIn the Parent company all lease agreements are classified as rental agreements (operating leases) irrespective of whether they are financial or operating leases.
Shares in subsidiariesShares in subsidiaries are recognized at cost less impairment losses. When there is an indication that the value of shares and interests in subsidiaries or associates has fallen, the recoverable amount is calculated. If this is lower than the carrying amount, an impairment loss is recognized. Impair-ment losses are recognized in Financial expenses in the income statement.
Financial instrumentsDerivative instruments are recognized at fair value. Changes in the value of derivatives are recognized in profit or loss.
Group contributionsThe Parent company recognizes Group contributions in accordance with RFR 2. Group contributions received and paid are recognized under appropriations in the income statement. The tax effect of Group contributions is recog-nized in accordance with IAS 12 in the income statement.
Contingent liabilitiesThe Parent company has guarantees on behalf of its sub sidiaries. Such an obligation is classified as a financial guarantee in accordance with IFRS. For these guarantees, the Parent company applies the alternative rule in RFR 2, reporting these guarantees as a contingent liability.
Note 1 cont.
ASSA ABLOY ANNUAL REPORT 2016 NOTES 73
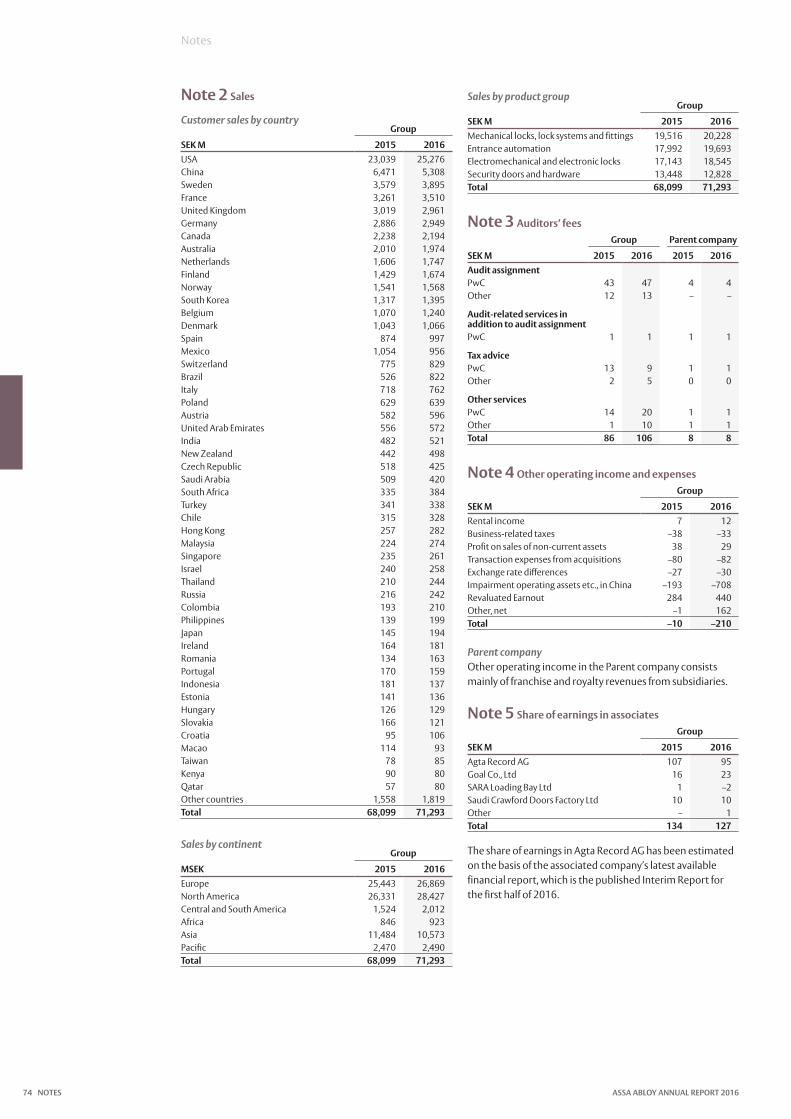
Note 2 Sales
Customer sales by countryGroup
SEK M 2015 2016USA 23,039 25,276China 6,471 5,308Sweden 3,579 3,895France 3,261 3,510United Kingdom 3,019 2,961Germany 2,886 2,949Canada 2,238 2,194Australia 2,010 1,974Netherlands 1,606 1,747Finland 1,429 1,674Norway 1,541 1,568South Korea 1,317 1,395Belgium 1,070 1,240Denmark 1,043 1,066Spain 874 997Mexico 1,054 956Switzerland 775 829Brazil 526 822Italy 718 762Poland 629 639Austria 582 596United Arab Emirates 556 572India 482 521New Zealand 442 498Czech Republic 518 425Saudi Arabia 509 420South Africa 335 384Turkey 341 338Chile 315 328Hong Kong 257 282Malaysia 224 274Singapore 235 261Israel 240 258Thailand 210 244Russia 216 242Colombia 193 210Philippines 139 199Japan 145 194Ireland 164 181Romania 134 163Portugal 170 159Indonesia 181 137Estonia 141 136Hungary 126 129Slovakia 166 121Croatia 95 106Macao 114 93Taiwan 78 85Kenya 90 80Qatar 57 80Other countries 1,558 1,819Total 68,099 71,293
Sales by continentGroup
MSEK 2015 2016Europe 25,443 26,869North America 26,331 28,427Central and South America 1,524 2,012Africa 846 923Asia 11,484 10,573Pacific 2,470 2,490Total 68,099 71,293
Sales by product groupGroup
SEK M 2015 2016Mechanical locks, lock systems and fittings 19,516 20,228Entrance automation 17,992 19,693Electromechanical and electronic locks 17,143 18,545Security doors and hardware 13,448 12,828Total 68,099 71,293
Note 3 Auditors’ feesGroup Parent company
SEK M 2015 2016 2015 2016Audit assignmentPwC 43 47 4 4Other 12 13 – –
Audit-related services in addition to audit assignmentPwC 1 1 1 1
Tax advicePwC 13 9 1 1Other 2 5 0 0
Other servicesPwC 14 20 1 1Other 1 10 1 1Total 86 106 8 8
Note 4 Other operating income and expensesGroup
SEK M 2015 2016Rental income 7 12Business-related taxes –38 –33Profit on sales of non-current assets 38 29Transaction expenses from acquisitions –80 –82Exchange rate differences –27 –30Impairment operating assets etc., in China –193 –708Revaluated Earnout 284 440Other, net –1 162Total –10 –210
Parent companyOther operating income in the Parent company consists mainly of franchise and royalty revenues from subsidiaries.
Note 5 Share of earnings in associatesGroup
SEK M 2015 2016Agta Record AG 107 95Goal Co., Ltd 16 23SARA Loading Bay Ltd 1 –2Saudi Crawford Doors Factory Ltd 10 10Other – 1Total 134 127
The share of earnings in Agta Record AG has been estimated on the basis of the associated company’s latest available financial report, which is the published Interim Report for the first half of 2016.
Notes
NOTES ASSA ABLOY ANNUAL REPORT 201674

Note 6 Operating leasesGroup Parent company
SEK M 2015 2016 2015 2016Lease payments during the year 891 895 12 14Total 891 895 12 14
Nominal value of agreed future lease payments:Due for payment in: (2016) 2017 714 822 16 17(2017) 2018 621 646 16 17(2018) 2019 446 481 17 18(2019) 2020 321 334 17 18(2020) 2021 218 236 18 19(2021) 2022 or later 245 316 18 19Total 2,565 2,835 103 107
Lease payments during the year consist of fees for assets that are held as operating leases such as rented premises, machinery, and computer equipment. The Group has no single substantial operating leases since the lease agree-ments are spread over a large number of subsidiaries.
Note 7 Expenses by natureIn the income statement costs are broken down by function. Below, these same costs are broken down by nature:
Group
SEK M 2015 2016Remuneration of employees (Note 33) 18,995 21,231Direct material costs 25,128 26,067Depreciation and amortization (Note 8, 14, 15) 1,433 1,580Other purchase expenses 11,588 12,675Total 57,144 61,553
Note 8 Depreciation and amortizationGroup Parent company
SEK M 2015 2016 2015 2016Intangible assets 404 483 441 445Machinery 529 534 – –Equipment 274 322 1 3Buildings 219 235 – –Land improvements 6 7 – –Total 1,433 1,580 442 448
Note 9 Exchange differences in the income statementGroup Parent company
SEK M 2015 2016 2015 2016Exchange differences recognized in operating income –27 –29 –6 –22Exchange differences recognized in financial expenses (Note 11) 5 26 –245 –33Total –22 –4 –251 –55
Note 10 Financial incomeGroup Parent company
SEK M 2015 2016 2015 2016Earnings from investments in subsidiaries – – 1,538 1,556Earnings from investments in associates – – 45 45Intra-Group interest income – – 109 96Other financial income 5 1 – –External interest income and similar items 17 8 0 –Total 22 9 1,691 1,697
Note 11 Financial expensesGroup Parent company
SEK M 2015 2016 2015 2016Intra-Group interest expenses – – –233 –251Interest expenses, other liabilities1 –590 –598 –134 –120Interest expenses, interest rate swaps 40 25 – –Interest expenses, foreign exchange forwards –127 –120 – –Exchange rate differences on financial instruments 5 26 –245 –33Fair value adjustments on shares and interests – – –207 1Other financial expenses –47 –47 –29 –30Total –719 –714 –849 –4331 Of which –14 (164) is fair value adjustments on derivatives, non-hedge account-
ing, for the Group.
Note 12 Tax on incomeGroup Parent company
SEK M 2015 2016 2015 2016Current tax –2,489 –2,570 –463 –573Tax attributable to prior years 114 119 37 0Foreign Coupon Tax –4 –28 9 –Deferred tax –309 152 – –Total –2,689 –2,328 –416 –573
Explanation for the difference between nominal Swedish tax rate and effective tax rate based on income before tax:
Group Parent company
Percent 2015 2016 2015 2016Swedish rate of tax on income 22 22 22 22Effect of foreign tax rates 8 8 – –Non-taxable income/non- deductible expenses, net –1 –1 –9 –8Utilized loss carry-forward not recognized in prior period –1 –1 – –Other –2 –2 – –Effective tax rate in income statement 26 26 13 14
Note 13 Earnings per share
Earnings per share before and after dilutionGroup
SEK M 2015 2016Earnings attributable to the Parent company's shareholders 7,693 6,651Net profit 7,693 6,651Weighted average number of shares issued (thousands) 1,110,776 1,110,776Earnings per share (SEK per share) 6.93 5.99of which from continuing operations 6.93 5.96of which from discontinued operations – 0.03
None of the Group’s outstanding long-term incentive programs are expected to result in significant dilution in the future.
Earnings per share before and after dilution excluding items affecting comparability
Group
SEK M 2015 2016Earnings attributable to the Parent company's shareholders 7,693 6,651Items affecting comparability, after tax1 – 1,221Net profit 7,693 7,872Weighted average number of shares issued (thousands) 1,110,776 1,110,776Earnings per share excluding items affecting comparability (SEK per share) 6.93 7.09of which from continuing operations 6.93 7.06of which from discontinued operations – 0.031 Items affecting comparability consist of restructuring costs.
ASSA ABLOY ANNUAL REPORT 2016 NOTES 75
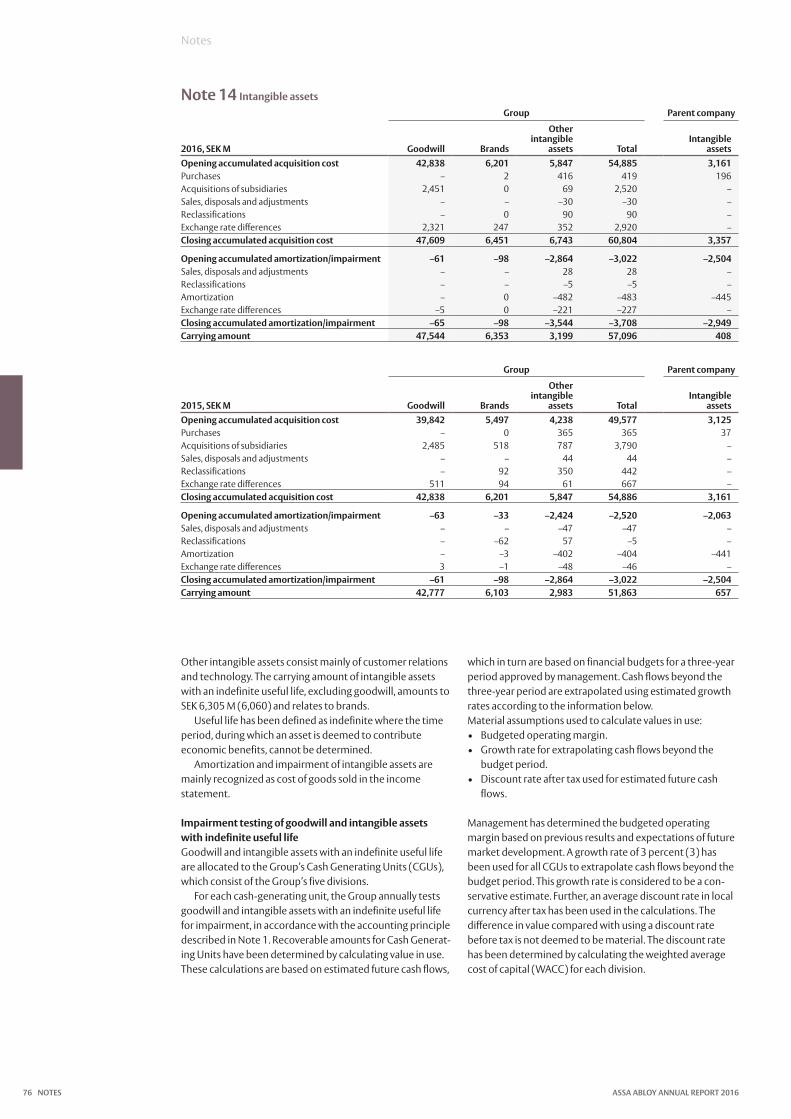
Note 14 Intangible assetsGroup Parent company
2016, SEK M Goodwill Brands
Other intangible
assets Total Intangible
assetsOpening accumulated acquisition cost 42,838 6,201 5,847 54,885 3,161Purchases – 2 416 419 196Acquisitions of subsidiaries 2,451 0 69 2,520 –Sales, disposals and adjustments – – –30 –30 –Reclassifications – 0 90 90 –Exchange rate differences 2,321 247 352 2,920 –Closing accumulated acquisition cost 47,609 6,451 6,743 60,804 3,357
Opening accumulated amortization/impairment –61 –98 –2,864 –3,022 –2,504Sales, disposals and adjustments – – 28 28 –Reclassifications – – –5 –5 –Amortization – 0 –482 –483 –445Exchange rate differences –5 0 –221 –227 –Closing accumulated amortization/impairment –65 –98 –3,544 –3,708 –2,949Carrying amount 47,544 6,353 3,199 57,096 408
Group Parent company
2015, SEK M Goodwill Brands
Other intangible
assets Total Intangible
assetsOpening accumulated acquisition cost 39,842 5,497 4,238 49,577 3,125Purchases – 0 365 365 37Acquisitions of subsidiaries 2,485 518 787 3,790 –Sales, disposals and adjustments – – 44 44 –Reclassifications – 92 350 442 –Exchange rate differences 511 94 61 667 –Closing accumulated acquisition cost 42,838 6,201 5,847 54,886 3,161
Opening accumulated amortization/impairment –63 –33 –2,424 –2,520 –2,063Sales, disposals and adjustments – – –47 –47 –Reclassifications – –62 57 –5 –Amortization – –3 –402 –404 –441Exchange rate differences 3 –1 –48 –46 –Closing accumulated amortization/impairment –61 –98 –2,864 –3,022 –2,504Carrying amount 42,777 6,103 2,983 51,863 657
Other intangible assets consist mainly of customer relations and technology. The carrying amount of intangible assets with an indefinite useful life, excluding goodwill, amounts to SEK 6,305 M (6,060) and relates to brands.
Useful life has been defined as indefinite where the time period, during which an asset is deemed to contribute economic benefits, cannot be determined.
Amortization and impairment of intangible assets are mainly recognized as cost of goods sold in the income statement.
Impairment testing of goodwill and intangible assets with indefinite useful lifeGoodwill and intangible assets with an indefinite useful life are allocated to the Group’s Cash Generating Units (CGUs), which consist of the Group’s five divisions.
For each cash-generating unit, the Group annually tests goodwill and intangible assets with an indefinite useful life for impairment, in accordance with the accounting principle described in Note 1. Recoverable amounts for Cash Generat-ing Units have been determined by calculating value in use. These calculations are based on estimated future cash flows,
which in turn are based on financial budgets for a three-year period approved by management. Cash flows beyond the three-year period are extrapolated using estimated growth rates according to the information below.Material assumptions used to calculate values in use:• Budgeted operating margin. • Growth rate for extrapolating cash flows beyond the
budget period.• Discount rate after tax used for estimated future cash
flows.
Management has determined the budgeted operating margin based on previous results and expectations of future market development. A growth rate of 3 percent (3) has been used for all CGUs to extrapolate cash flows beyond the budget period. This growth rate is considered to be a con-servative estimate. Further, an average discount rate in local currency after tax has been used in the calculations. The difference in value compared with using a discount rate before tax is not deemed to be material. The discount rate has been determined by calculating the weighted average cost of capital (WACC) for each division.
Notes
NOTES ASSA ABLOY ANNUAL REPORT 201676

2016Overall, the discount rate after tax used varied between 8.0 and 9.0 percent (EMEA 8.0 percent, Americas 8.0 percent, Asia Pacific 9.0 percent, Global Technologies 8.0 percent and Entrance Systems 8.0 percent).
Goodwill and intangible assets with an indefinite useful life were allocated to the Cash Generating Units as summarized in the following table:
2016, SEK M EMEA Americas Asia PacificGlobal
TechnologiesEntrance Systems Total
Goodwill 8,348 11,012 7,920 8,784 11,480 47,544Intangible assets with indefinite useful life 218 809 1,862 623 2,793 6,305Total 8,566 11,821 9,782 9,407 14,273 53,849
2015Overall, the discount rate after tax used varied between 9.0 and 10.0 percent (EMEA 9.0 percent, Americas 9.0 percent, Asia Pacific 10.0 percent, Global Technologies 10.0 percent and Entrance Systems 9.0 percent).
Goodwill and intangible assets with an indefinite useful life were allocated to the Cash Generating Units as summarized in the following table:
2015, SEK M EMEA Americas Asia PacificGlobal
TechnologiesEntrance Systems Total
Goodwill 7,857 9,903 7,690 7,437 9,891 42,777Intangible assets with indefinite useful life 213 741 1,825 572 2,708 6,060Total 8,070 10,644 9,515 8,009 12,599 48,837
Sensitivity analysisA sensitivity analysis has been carried out for each cash- generating unit. The results of this analysis are summarized below.
2016If the estimated operating margin after the end of the budg et period had been one percentage point lower than the management’s estimate, the total recoverable amount would be 6 percent lower (EMEA 6 percent, Americas 4 per-cent, Asia Pacific 7 percent, Global Technologies 5 percent, and Entrance Systems 7 percent).
If the estimated growth rate used to extrapolate cash flows beyond the budget period had been one percentage point lower than the basic assumption of 3 percent, the total recov-erable amount would be 15 percent lower (EMEA 15 percent, Americas 15 percent, Asia Pacific 13 percent, Global Technolo-gies 15 percent, and Entrance Systems 15 percent).
If the estimated weighted capital cost used for the Group’s discounted cash flows had been one percentage point higher than the basic assumption of 8.0 to 9.0 percent, the total recoverable amount would be 17 percent lower (EMEA 17 percent, Americas 17 percent, Asia Pacific 15 percent, Global Technologies 17 percent, and Entrance Systems 17 percent).
These calculations are hypothetical and should not be viewed as an indication that these factors are any more or less likely to change. The sensitivity analysis should therefore be interpreted with caution.
None of the hypothetical cases above would lead to an impairment of goodwill in an individual Cash Generating Unit.
2015If the estimated operating margin after the end of the budg et period had been one percentage point lower than the management’s estimate, the total recoverable amount would be 6 percent lower (EMEA 6 percent, Americas 4 per-cent, Asia Pacific 6 percent, Global Technologies 5 percent, and Entrance Systems 7 percent).
If the estimated growth rate used to extrapolate cash flows beyond the budget period had been one percentage point lower than the basic assumption of 3 percent, the total recov-erable amount would be 13 percent lower (EMEA 13 percent, Americas 13 percent, Asia Pacific 11 percent, Global Technolo-gies 11 percent, and Entrance Systems 13 percent).
If the estimated weighted capital cost used for the Group’s discounted cash flows had been one percentage point higher than the basic assumption of 9.0 to 10.0 percent, the total recoverable amount would be 14 percent lower (EMEA 14 percent, Americas 14 percent, Asia Pacific 12 percent, Global Technologies 13 percent, and Entrance Systems 14 percent).
These calculations are hypothetical and should not be viewed as an indication that these factors are any more or less likely to change. The sensitivity analysis should therefore be interpreted with caution.
None of the hypothetical cases above would lead to an impairment of goodwill in an individual Cash Generating Unit.
Note 14 cont.
ASSA ABLOY ANNUAL REPORT 2016 NOTES 77
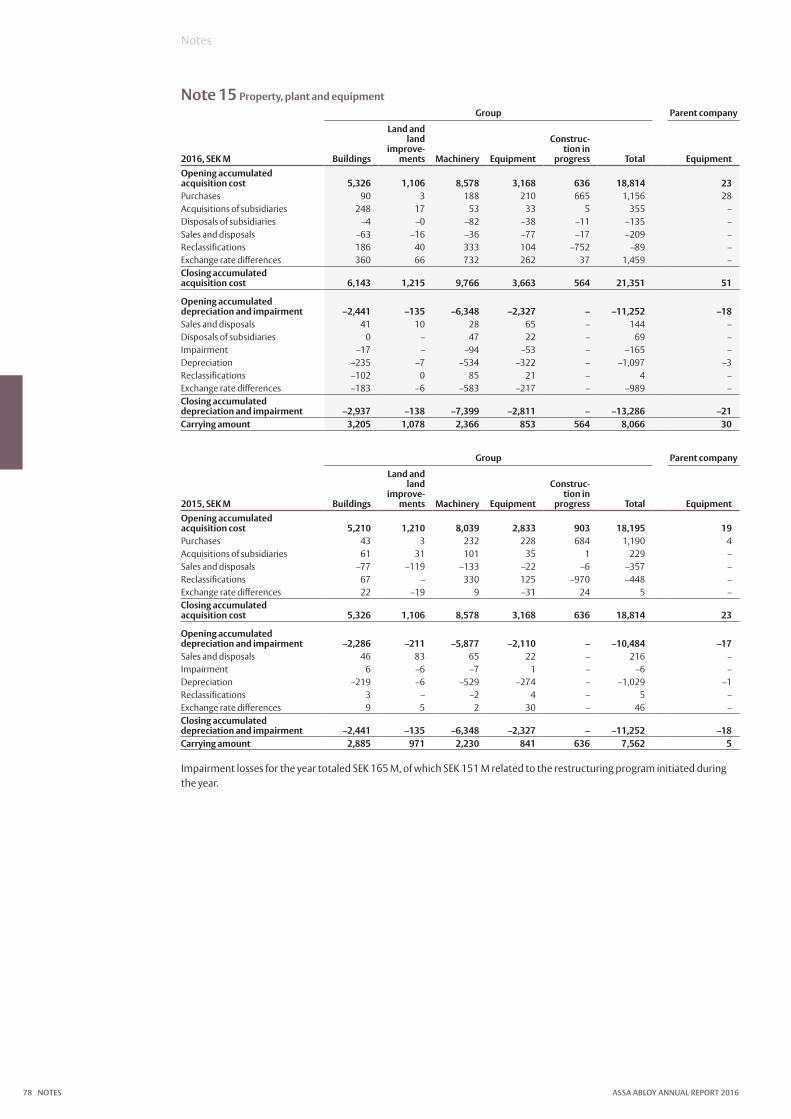
Note 15 Property, plant and equipmentGroup Parent company
2016, SEK M Buildings
Land and land
improve-ments Machinery Equipment
Construc-tion in
progress Total EquipmentOpening accumulated acquisition cost 5,326 1,106 8,578 3,168 636 18,814 23Purchases 90 3 188 210 665 1,156 28Acquisitions of subsidiaries 248 17 53 33 5 355 –Disposals of subsidiaries –4 –0 –82 –38 –11 –135 –Sales and disposals –63 –16 –36 –77 –17 –209 –Reclassifications 186 40 333 104 –752 –89 –Exchange rate differences 360 66 732 262 37 1,459 –Closing accumulated acquisition cost 6,143 1,215 9,766 3,663 564 21,351 51
Opening accumulated depreciation and impairment –2,441 –135 –6,348 –2,327 – –11,252 –18Sales and disposals 41 10 28 65 – 144 –Disposals of subsidiaries 0 – 47 22 – 69 –Impairment –17 – –94 –53 – –165 –Depreciation –235 –7 –534 –322 – –1,097 –3Reclassifications –102 0 85 21 – 4 –Exchange rate differences –183 –6 –583 –217 – –989 –Closing accumulated depreciation and impairment –2,937 –138 –7,399 –2,811 – –13,286 –21Carrying amount 3,205 1,078 2,366 853 564 8,066 30
Group Parent company
2015, SEK M Buildings
Land and land
improve-ments Machinery Equipment
Construc-tion in
progress Total EquipmentOpening accumulated acquisition cost 5,210 1,210 8,039 2,833 903 18,195 19Purchases 43 3 232 228 684 1,190 4Acquisitions of subsidiaries 61 31 101 35 1 229 –Sales and disposals –77 –119 –133 –22 –6 –357 –Reclassifications 67 – 330 125 –970 –448 –Exchange rate differences 22 –19 9 –31 24 5 –Closing accumulated acquisition cost 5,326 1,106 8,578 3,168 636 18,814 23
Opening accumulated depreciation and impairment –2,286 –211 –5,877 –2,110 – –10,484 –17Sales and disposals 46 83 65 22 – 216 –Impairment 6 –6 –7 1 – –6 –Depreciation –219 –6 –529 –274 – –1,029 –1Reclassifications 3 – –2 4 – 5 –Exchange rate differences 9 5 2 30 – 46 –Closing accumulated depreciation and impairment –2,441 –135 –6,348 –2,327 – –11,252 –18Carrying amount 2,885 971 2,230 841 636 7,562 5
Impairment losses for the year totaled SEK 165 M, of which SEK 151 M related to the restructuring program initiated during the year.
Notes
NOTES ASSA ABLOY ANNUAL REPORT 201678

Note 16 Shares in subsidiariesParent company
Company nameCorporate identity number, Registered office
Number of shares
Share of equity, %
Carrying amount,
SEK MASSA Sverige AB 556061-8455, Eskilstuna 70 100 197ASSA ABLOY Entrance Systems AB 556204-8511, Landskrona 1,000 100 192ASSA ABLOY Kredit AB 556047-9148, Stockholm 400 100 6,036ASSA ABLOY Försäkrings AB 516406-0740, Stockholm 60,000 100 145ASSA ABLOY Asia Holding AB 556602-4500, Stockholm 1,000 100 189ASSA ABLOY OY 1094741-7, Joensuu 800,000 100 4,257ASSA ABLOY Norge A/S 979207476, Moss 150,000 100 538ASSA ABLOY Danmark A/S CVR 10050316, Herlev 60,500 100 376ASSA ABLOY Deutschland GmbH HR B 66227, Berlin 1 100 1,086ASSA ABLOY Nederland Holding B.V. 52153924, Raamsdonksveer 180 100 771Pan Pan DOOR Co LTD 210800004058002, Dashiqiao – 661 2,228ASSA ABLOY France SAS 412140907, R.C.S. Versailles 15,184,271 100 1,964Interlock Holding AG CH-020.3.913.588-8, Zürich 211,000 981 0HID Global Switzerland S.A. CH-232-0730018-2, Granges 2,500 100 47ASSA ABLOY Holding GmbH FN 273601f, A-6175, Kematen 1 100 109ASSA ABLOY Ltd 2096505, Willenhall 1,330,000 100 3,077HID Global Ireland Teoranta 364896, Galway 501,000 100 293Mul-T-Lock Ltd 520036583, Yavne 13,787,856 901 901ASSA ABLOY Holdings (SA) Ltd 1948/030356/06, Roodepoort 100,220 100 184ASSA ABLOY Inc 039347-83, Oregon 100 100 2,237Fleming Door Products, Ltd 147126, Ontario 25,846,600 100 0ABLOY Canada Inc. 1148165260, Montreal 1 100 0ASSA ABLOY Door Group ,Inc. 814406948 RC0001, Ontario 1 100 17ASSA ABLOY Australia Pacific Pty Ltd ACN 095354582, Oakleigh, Victoria 48,190,000 100 242Cerramex, S.A de C.V CER8805099Y6, Mexico 4 0 0ASSA ABLOY Mexico, S.A de CV AAM961204CI1, Mexico 50,108,549 100 762Cerraduras y Candados Phillips S.A de C.V CCP910506LK2, Mexico 112 0 0Cerraduras de Colombia S.A. 860009826-8, Bogota 2,201,670 711 142WHAIG Limited EC21330, Bermuda 100,100 100 303ASSA ABLOY Asia Pacific Ltd 53451, Hong Kong 1,000,000 100 72Cardo AB 556026-8517, Malmö 27,000,000 100 5,093ASSA ABLOY Portugal, Unipessoal, Lda (Portugal) PT500243700, Alfragide 1 100 0ASSA ABLOY Mobile Services AB 556909-5929, Stockholm 50,000 100 25ASSA ABLOY Holding Italia S.p.A. IT01254420597, Rome 650,000 100 974HID SA (Argentina) CUIT 30-61783980-2, Buenos Aires 2,400 21 0HID Global SAS FR21341213411, Nanterre 1,000,000 100 82Dynaco US Inc 2979272, Illinois 850 100 309CEDES Holding AG CHE-101.321-677, Landquart 300,000 100 673ASSA ABLOY East Africa Ltd C.20402, Nairobi 13,500 100 90Total 33,6111 The Group’s holdings amount to 100 percent.
Note 17 Investments in associatesGroup
2016 Company name Country of registration
Number of shares
Share of equity, %
Carrying amount,
SEK MAgta Record AG Switzerland 5,166,945 39 1,586Goal Co., Ltd Japan 2,778,790 46 496SARA Loading Bay Ltd United Kingdom 4,990 50 14Talleres Agui S.A. Spain 4,800 40 8Saudi Crawford Doors Ltd Saudi Arabia 800 40 5Other 1Total 2,109
The share of equity in Agta Record AG has been estimated on the basis of the associated company’s latest available financial report, which is the published Interim Report for the first half of 2016. For the period January to June, the company’s revenue totaled SEK 1,542 M (1,391) and income after tax was SEK 78 M (65). The company’s assets totaled SEK 3,127 M (2,736) and total liabilities amounted to SEK 1,148 M (850).
Group
2015 Company name Country of registration
Number of shares
Share of equity, %
Carrying amount,
SEK MAgta Record AG Switzerland 5,166,945 39 1,430Goal Co., Ltd Japan 2,778,790 46 452SARA Loading Bay Ltd United Kingdom 4,990 50 14Talleres Agui S.A. Spain 4,800 40 8Saudi Crawford Doors Ltd Saudi Arabia 800 40 5Other 1Total 1,910
ASSA ABLOY ANNUAL REPORT 2016 NOTES 79
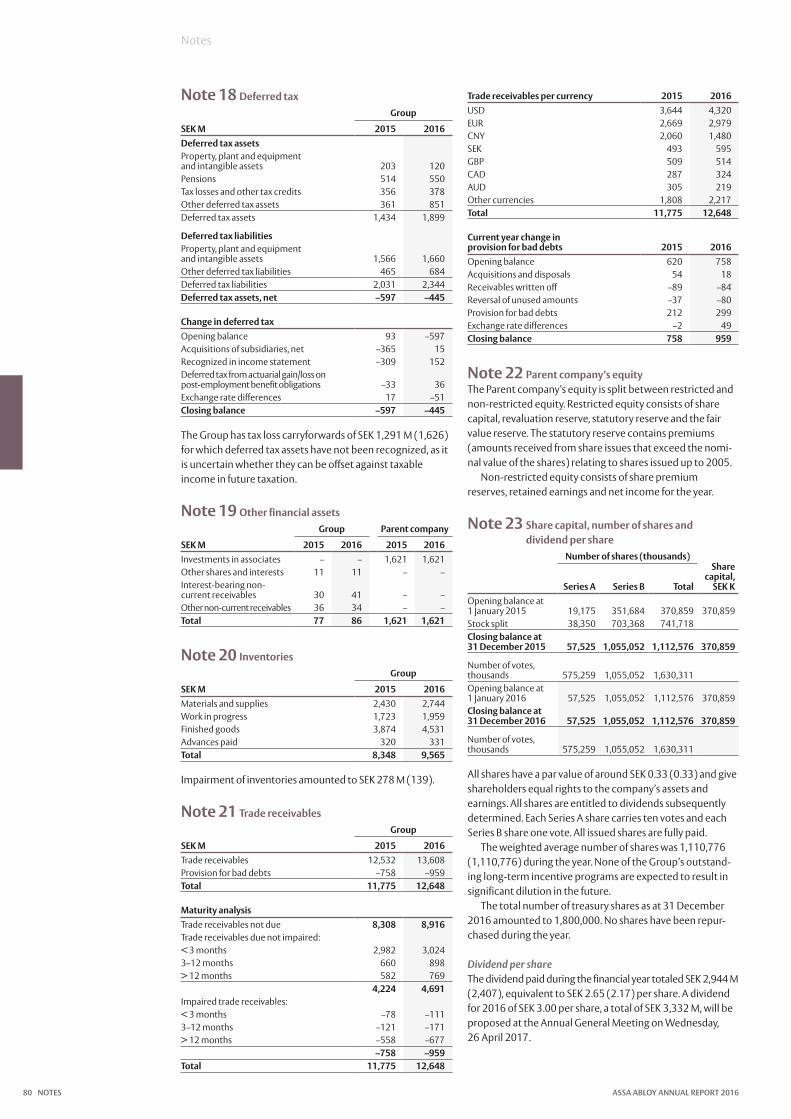
Note 18 Deferred taxGroup
SEK M 2015 2016Deferred tax assetsProperty, plant and equipment and intangible assets 203 120Pensions 514 550Tax losses and other tax credits 356 378Other deferred tax assets 361 851Deferred tax assets 1,434 1,899
Deferred tax liabilitiesProperty, plant and equipmentand intangible assets 1,566 1,660Other deferred tax liabilities 465 684Deferred tax liabilities 2,031 2,344Deferred tax assets, net –597 –445
Change in deferred taxOpening balance 93 –597Acquisitions of subsidiaries, net –365 15Recognized in income statement –309 152Deferred tax from actuarial gain/loss on post-employment benefit obligations –33 36Exchange rate differences 17 –51Closing balance –597 –445
The Group has tax loss carryforwards of SEK 1,291 M (1,626) for which deferred tax assets have not been recognized, as it is uncertain whether they can be offset against taxable income in future taxation.
Note 19 Other financial assetsGroup Parent company
SEK M 2015 2016 2015 2016Investments in associates – – 1,621 1,621Other shares and interests 11 11 – –Interest-bearing non- current receivables 30 41 – –Other non-current receivables 36 34 – –Total 77 86 1,621 1,621
Note 20 InventoriesGroup
SEK M 2015 2016Materials and supplies 2,430 2,744Work in progress 1,723 1,959Finished goods 3,874 4,531Advances paid 320 331Total 8,348 9,565
Impairment of inventories amounted to SEK 278 M (139).
Note 21 Trade receivablesGroup
SEK M 2015 2016Trade receivables 12,532 13,608Provision for bad debts –758 –959Total 11,775 12,648
Maturity analysisTrade receivables not due 8,308 8,916Trade receivables due not impaired:< 3 months 2,982 3,0243–12 months 660 898> 12 months 582 769
4,224 4,691Impaired trade receivables:< 3 months –78 –1113–12 months –121 –171> 12 months –558 –677
–758 –959Total 11,775 12,648
Trade receivables per currency 2015 2016USD 3,644 4,320EUR 2,669 2,979CNY 2,060 1,480SEK 493 595GBP 509 514CAD 287 324AUD 305 219Other currencies 1,808 2,217Total 11,775 12,648
Current year change in provision for bad debts 2015 2016Opening balance 620 758Acquisitions and disposals 54 18Receivables written off –89 –84Reversal of unused amounts –37 –80Provision for bad debts 212 299Exchange rate differences –2 49Closing balance 758 959
Note 22 Parent company’s equityThe Parent company’s equity is split between restricted and non-restricted equity. Restricted equity consists of share capital, revaluation reserve, statutory reserve and the fair value reserve. The statutory reserve contains premiums (amounts received from share issues that exceed the nomi-nal value of the shares) relating to shares issued up to 2005.
Non-restricted equity consists of share premium reserves, retained earnings and net income for the year.
Note 23 Share capital, number of shares and dividend per share
Number of shares (thousands)
Series A Series B Total
Share capital,
SEK KOpening balance at1 January 2015 19,175 351,684 370,859 370,859Stock split 38,350 703,368 741,718Closing balance at31 December 2015 57,525 1,055,052 1,112,576 370,859
Number of votes, thousands 575,259 1,055,052 1,630,311Opening balance at 1 January 2016 57,525 1,055,052 1,112,576 370,859Closing balance at31 December 2016 57,525 1,055,052 1,112,576 370,859
Number of votes, thousands 575,259 1,055,052 1,630,311
All shares have a par value of around SEK 0.33 (0.33) and give shareholders equal rights to the company’s assets and earnings. All shares are entitled to dividends subsequently determined. Each Series A share carries ten votes and each Series B share one vote. All issued shares are fully paid.
The weighted average number of shares was 1,110,776 (1,110,776) during the year. None of the Group’s outstand-ing long-term incentive programs are expected to result in significant dilution in the future.
The total number of treasury shares as at 31 December 2016 amounted to 1,800,000. No shares have been repur-chased during the year.
Dividend per shareThe dividend paid during the financial year totaled SEK 2,944 M (2,407), equivalent to SEK 2.65 (2.17) per share. A dividend for 2016 of SEK 3.00 per share, a total of SEK 3,332 M, will be proposed at the Annual General Meeting on Wednesday, 26 April 2017.
Notes
NOTES ASSA ABLOY ANNUAL REPORT 201680
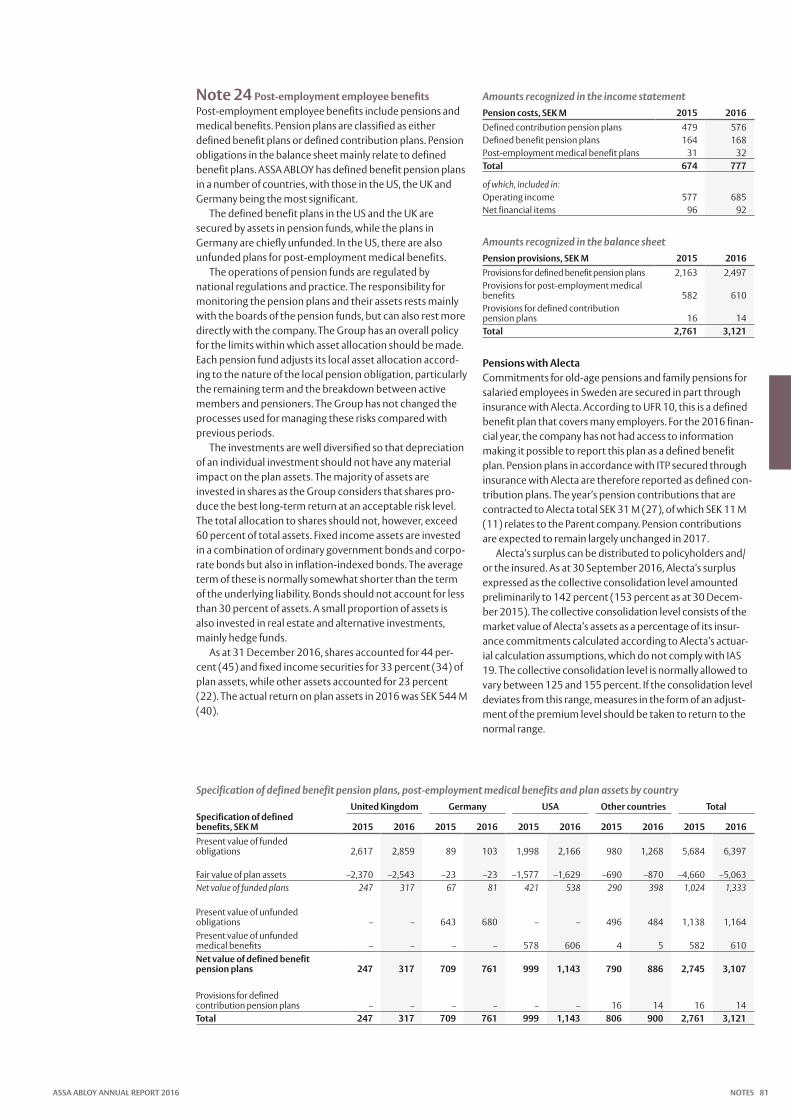
Note 24 Post-employment employee benefitsPost-employment employee benefits include pensions and medical benefits. Pension plans are classified as either defined benefit plans or defined contribution plans. Pension obligations in the balance sheet mainly relate to defined benefit plans. ASSA ABLOY has defined benefit pension plans in a number of countries, with those in the US, the UK and Germany being the most significant.
The defined benefit plans in the US and the UK are secured by assets in pension funds, while the plans in Germany are chiefly unfunded. In the US, there are also unfunded plans for post-employment medical benefits.
The operations of pension funds are regulated by national regulations and practice. The responsibility for monitoring the pension plans and their assets rests mainly with the boards of the pension funds, but can also rest more directly with the company. The Group has an overall policy for the limits within which asset allocation should be made. Each pension fund adjusts its local asset allocation accord-ing to the nature of the local pension obligation, particularly the remaining term and the breakdown between active members and pensioners. The Group has not changed the processes used for managing these risks compared with previous periods.
The investments are well diversified so that depreciation of an individual investment should not have any material impact on the plan assets. The majority of assets are invested in shares as the Group considers that shares pro-duce the best long-term return at an acceptable risk level. The total allocation to shares should not, however, exceed 60 percent of total assets. Fixed income assets are invested in a combination of ordinary government bonds and corpo-rate bonds but also in inflation-indexed bonds. The average term of these is normally somewhat shorter than the term of the underlying liability. Bonds should not account for less than 30 percent of assets. A small proportion of assets is also invested in real estate and alternative investments, mainly hedge funds.
As at 31 December 2016, shares accounted for 44 per-cent (45) and fixed income securities for 33 percent (34) of plan assets, while other assets accounted for 23 percent (22). The actual return on plan assets in 2016 was SEK 544 M (40).
Amounts recognized in the income statement Pension costs, SEK M 2015 2016Defined contribution pension plans 479 576Defined benefit pension plans 164 168Post-employment medical benefit plans 31 32Total 674 777
of which, included in:Operating income 577 685Net financial items 96 92
Amounts recognized in the balance sheetPension provisions, SEK M 2015 2016Provisions for defined benefit pension plans 2,163 2,497Provisions for post-employment medical benefits 582 610Provisions for defined contribution pension plans 16 14Total 2,761 3,121
Pensions with AlectaCommitments for old-age pensions and family pensions for salaried employees in Sweden are secured in part through insurance with Alecta. According to UFR 10, this is a defined benefit plan that covers many employers. For the 2016 finan-cial year, the company has not had access to information making it possible to report this plan as a defined benefit plan. Pension plans in accordance with ITP secured through insurance with Alecta are therefore reported as defined con-tribution plans. The year’s pension contributions that are contracted to Alecta total SEK 31 M (27), of which SEK 11 M (11) relates to the Parent company. Pension contributions are expected to remain largely unchanged in 2017.
Alecta’s surplus can be distributed to policyholders and/or the insured. As at 30 September 2016, Alecta’s surplus expressed as the collective consolidation level amounted preliminarily to 142 percent (153 percent as at 30 Decem-ber 2015). The collective consolidation level consists of the market value of Alecta’s assets as a percentage of its insur-ance commitments calculated according to Alecta’s actuar-ial calculation assumptions, which do not comply with IAS 19. The collective consolidation level is normally allowed to vary between 125 and 155 percent. If the consolidation level deviates from this range, measures in the form of an adjust-ment of the premium level should be taken to return to the normal range.
Specification of defined benefit pension plans, post-employment medical benefits and plan assets by countryUnited Kingdom Germany USA Other countries Total
Specification of defined benefits, SEK M 2015 2016 2015 2016 2015 2016 2015 2016 2015 2016Present value of funded obligations 2,617 2,859 89 103 1,998 2,166 980 1,268 5,684 6,397
Fair value of plan assets –2,370 –2,543 –23 –23 –1,577 –1,629 –690 –870 –4,660 –5,063Net value of funded plans 247 317 67 81 421 538 290 398 1,024 1,333
Present value of unfunded obligations – – 643 680 – – 496 484 1,138 1,164Present value of unfunded medical benefits – – – – 578 606 4 5 582 610Net value of defined benefit pension plans 247 317 709 761 999 1,143 790 886 2,745 3,107
Provisions for defined contribution pension plans – – – – – – 16 14 16 14Total 247 317 709 761 999 1,143 806 900 2,761 3,121
ASSA ABLOY ANNUAL REPORT 2016 NOTES 81
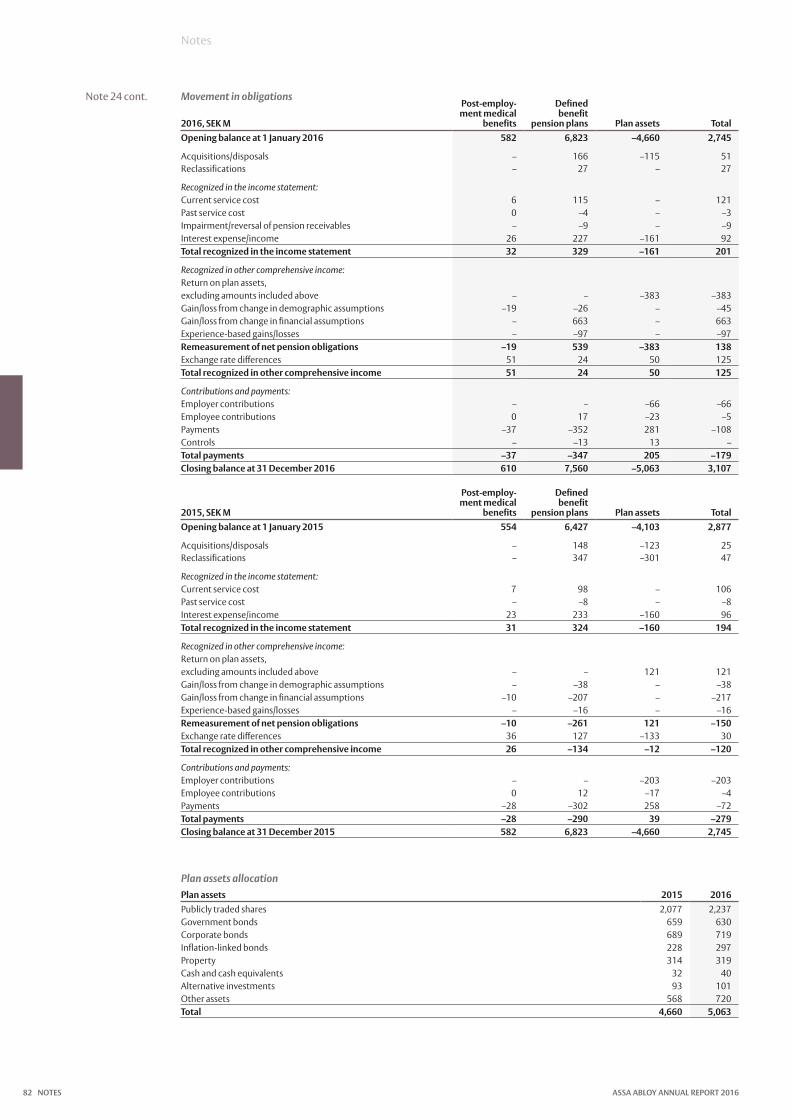
Movement in obligations
2016, SEK M
Post-employ-ment medical
benefits
Defined benefit
pension plans Plan assets TotalOpening balance at 1 January 2016 582 6,823 –4,660 2,745
Acquisitions/disposals – 166 –115 51Reclassifications – 27 – 27
Recognized in the income statement:Current service cost 6 115 – 121Past service cost 0 –4 – –3Impairment/reversal of pension receivables – –9 – –9Interest expense/income 26 227 –161 92Total recognized in the income statement 32 329 –161 201
Recognized in other comprehensive income:Return on plan assets,excluding amounts included above – – –383 –383Gain/loss from change in demographic assumptions –19 –26 – –45Gain/loss from change in financial assumptions – 663 – 663Experience-based gains/losses – –97 – –97Remeasurement of net pension obligations –19 539 –383 138Exchange rate differences 51 24 50 125Total recognized in other comprehensive income 51 24 50 125
Contributions and payments:Employer contributions – – –66 –66Employee contributions 0 17 –23 –5Payments –37 –352 281 –108Controls – –13 13 –Total payments –37 –347 205 –179Closing balance at 31 December 2016 610 7,560 –5,063 3,107
2015, SEK M
Post-employ-ment medical
benefits
Defined benefit
pension plans Plan assets TotalOpening balance at 1 January 2015 554 6,427 –4,103 2,877
Acquisitions/disposals – 148 –123 25Reclassifications – 347 –301 47
Recognized in the income statement:Current service cost 7 98 – 106Past service cost – –8 – –8Interest expense/income 23 233 –160 96Total recognized in the income statement 31 324 –160 194
Recognized in other comprehensive income:Return on plan assets,excluding amounts included above – – 121 121Gain/loss from change in demographic assumptions – –38 – –38Gain/loss from change in financial assumptions –10 –207 – –217Experience-based gains/losses – –16 – –16Remeasurement of net pension obligations –10 –261 121 –150Exchange rate differences 36 127 –133 30Total recognized in other comprehensive income 26 –134 –12 –120
Contributions and payments:Employer contributions – – –203 –203Employee contributions 0 12 –17 –4Payments –28 –302 258 –72Total payments –28 –290 39 –279Closing balance at 31 December 2015 582 6,823 –4,660 2,745
Plan assets allocationPlan assets 2015 2016Publicly traded shares 2,077 2,237Government bonds 659 630Corporate bonds 689 719Inflation-linked bonds 228 297Property 314 319Cash and cash equivalents 32 40Alternative investments 93 101Other assets 568 720Total 4,660 5,063
Notes
Note 24 cont.
NOTES ASSA ABLOY ANNUAL REPORT 201682
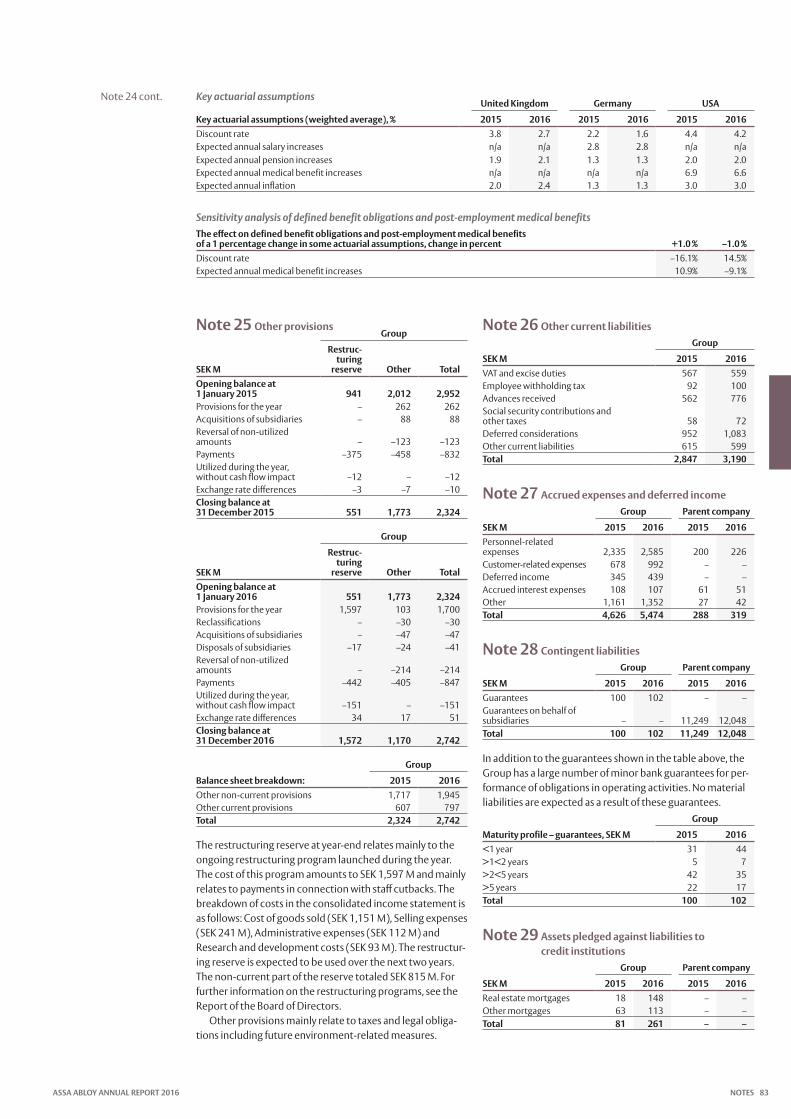
Key actuarial assumptionsUnited Kingdom Germany USA
Key actuarial assumptions (weighted average), % 2015 2016 2015 2016 2015 2016Discount rate 3.8 2.7 2.2 1.6 4.4 4.2Expected annual salary increases n/a n/a 2.8 2.8 n/a n/aExpected annual pension increases 1.9 2.1 1.3 1.3 2.0 2.0Expected annual medical benefit increases n/a n/a n/a n/a 6.9 6.6Expected annual inflation 2.0 2.4 1.3 1.3 3.0 3.0
Sensitivity analysis of defined benefit obligations and post-employment medical benefitsThe effect on defined benefit obligations and post-employment medical benefits of a 1 percentage change in some actuarial assumptions, change in percent +1.0 % –1.0 %Discount rate –16.1% 14.5%Expected annual medical benefit increases 10.9% –9.1%
Note 25 Other provisionsGroup
SEK M
Restruc-turing
reserve Other TotalOpening balance at 1 January 2015 941 2,012 2,952Provisions for the year – 262 262Acquisitions of subsidiaries – 88 88Reversal of non-utilized amounts – –123 –123Payments –375 –458 –832Utilized during the year, without cash flow impact –12 – –12Exchange rate differences –3 –7 –10Closing balance at 31 December 2015 551 1,773 2,324
Group
SEK M
Restruc-turing
reserve Other TotalOpening balance at 1 January 2016 551 1,773 2,324Provisions for the year 1,597 103 1,700Reclassifications – –30 –30Acquisitions of subsidiaries – –47 –47Disposals of subsidiaries –17 –24 –41Reversal of non-utilized amounts – –214 –214Payments –442 –405 –847Utilized during the year, without cash flow impact –151 – –151Exchange rate differences 34 17 51Closing balance at 31 December 2016 1,572 1,170 2,742
Group
Balance sheet breakdown: 2015 2016Other non-current provisions 1,717 1,945Other current provisions 607 797Total 2,324 2,742
The restructuring reserve at year-end relates mainly to the ongoing restructuring program launched during the year. The cost of this program amounts to SEK 1,597 M and mainly relates to payments in connection with staff cutbacks. The breakdown of costs in the consolidated income statement is as follows: Cost of goods sold (SEK 1,151 M), Selling expenses (SEK 241 M), Administrative expenses (SEK 112 M) and Research and development costs (SEK 93 M). The restructur-ing reserve is expected to be used over the next two years. The non-current part of the reserve totaled SEK 815 M. For further information on the restructuring programs, see the Report of the Board of Directors.
Other provisions mainly relate to taxes and legal obliga-tions including future environment-related measures.
Note 26 Other current liabilitiesGroup
SEK M 2015 2016VAT and excise duties 567 559Employee withholding tax 92 100Advances received 562 776Social security contributions and other taxes 58 72Deferred considerations 952 1,083Other current liabilities 615 599Total 2,847 3,190
Note 27 Accrued expenses and deferred incomeGroup Parent company
SEK M 2015 2016 2015 2016Personnel-related expenses 2,335 2,585 200 226Customer-related expenses 678 992 – –Deferred income 345 439 – –Accrued interest expenses 108 107 61 51Other 1,161 1,352 27 42Total 4,626 5,474 288 319
Note 28 Contingent liabilitiesGroup Parent company
SEK M 2015 2016 2015 2016Guarantees 100 102 – –Guarantees on behalf of subsidiaries – – 11,249 12,048Total 100 102 11,249 12,048
In addition to the guarantees shown in the table above, the Group has a large number of minor bank guarantees for per-formance of obligations in operating activities. No material liabilities are expected as a result of these guarantees.
Group
Maturity profile – guarantees, SEK M 2015 2016<1 year 31 44>1<2 years 5 7>2<5 years 42 35>5 years 22 17Total 100 102
Note 29 Assets pledged against liabilities to credit institutions
Group Parent company
SEK M 2015 2016 2015 2016Real estate mortgages 18 148 – –Other mortgages 63 113 – –Total 81 261 – –
Note 24 cont.
ASSA ABLOY ANNUAL REPORT 2016 NOTES 83
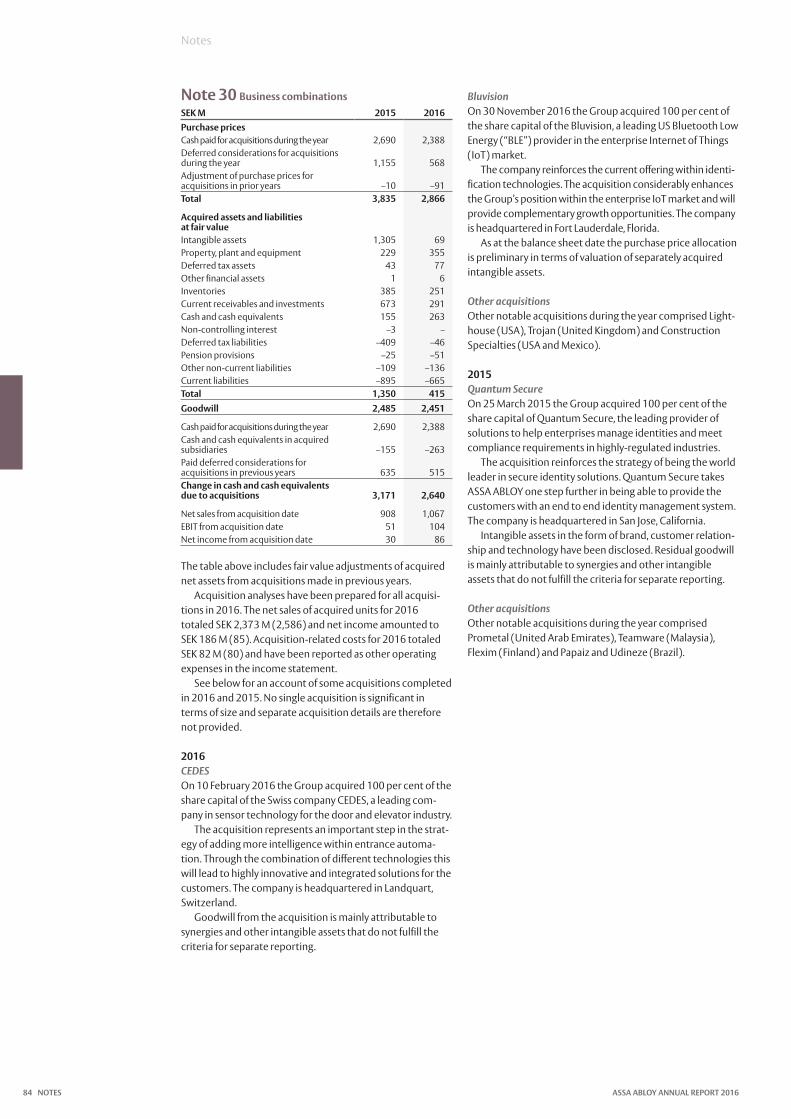
Note 30 Business combinationsSEK M 2015 2016Purchase pricesCash paid for acquisitions during the year 2,690 2,388Deferred considerations for acquisitions during the year 1,155 568Adjustment of purchase prices for acquisitions in prior years –10 –91Total 3,835 2,866
Acquired assets and liabilities at fair valueIntangible assets 1,305 69Property, plant and equipment 229 355Deferred tax assets 43 77Other financial assets 1 6Inventories 385 251Current receivables and investments 673 291Cash and cash equivalents 155 263Non-controlling interest –3 –Deferred tax liabilities –409 –46Pension provisions –25 –51Other non-current liabilities –109 –136Current liabilities –895 –665Total 1,350 415Goodwill 2,485 2,451
Cash paid for acquisitions during the year 2,690 2,388Cash and cash equivalents in acquired subsidiaries –155 –263Paid deferred considerations for acquisitions in previous years 635 515Change in cash and cash equivalents due to acquisitions 3,171 2,640
Net sales from acquisition date 908 1,067EBIT from acquisition date 51 104Net income from acquisition date 30 86
The table above includes fair value adjustments of acquired net assets from acquisitions made in previous years.
Acquisition analyses have been prepared for all acquisi-tions in 2016. The net sales of acquired units for 2016 totaled SEK 2,373 M (2,586) and net income amounted to SEK 186 M (85). Acquisition-related costs for 2016 totaled SEK 82 M (80) and have been reported as other operating expenses in the income statement.
See below for an account of some acquisitions completed in 2016 and 2015. No single acquisition is significant in terms of size and separate acquisition details are therefore not provided.
2016CEDESOn 10 February 2016 the Group acquired 100 per cent of the share capital of the Swiss company CEDES, a leading com-pany in sensor technology for the door and elevator industry.
The acquisition represents an important step in the strat-egy of adding more intelligence within entrance automa-tion. Through the combination of different technologies this will lead to highly innovative and integrated solutions for the customers. The company is headquartered in Landquart, Switzerland.
Goodwill from the acquisition is mainly attributable to synergies and other intangible assets that do not fulfill the criteria for separate reporting.
BluvisionOn 30 November 2016 the Group acquired 100 per cent of the share capital of the Bluvision, a leading US Bluetooth Low Energy (“BLE”) provider in the enterprise Internet of Things (IoT) market.
The company reinforces the current offering within identi-fication technologies. The acquisition considerably enhances the Group’s position within the enterprise IoT market and will provide complementary growth opportunities. The company is headquartered in Fort Lauderdale, Florida.
As at the balance sheet date the purchase price allocation is preliminary in terms of valuation of separately acquired intangible assets.
Other acquisitionsOther notable acquisitions during the year comprised Light-house (USA), Trojan (United Kingdom) and Construction Specialties (USA and Mexico).
2015Quantum SecureOn 25 March 2015 the Group acquired 100 per cent of the share capital of Quantum Secure, the leading provider of solutions to help enterprises manage identities and meet compliance requirements in highly-regulated industries.
The acquisition reinforces the strategy of being the world leader in secure identity solutions. Quantum Secure takes ASSA ABLOY one step further in being able to provide the customers with an end to end identity management system. The company is headquartered in San Jose, California.
Intangible assets in the form of brand, customer relation-ship and technology have been disclosed. Residual goodwill is mainly attributable to synergies and other intangible assets that do not fulfill the criteria for separate reporting.
Other acquisitionsOther notable acquisitions during the year comprised Prometal (United Arab Emirates), Teamware (Malaysia), Flexim (Finland) and Papaiz and Udineze (Brazil).
Notes
NOTES ASSA ABLOY ANNUAL REPORT 201684
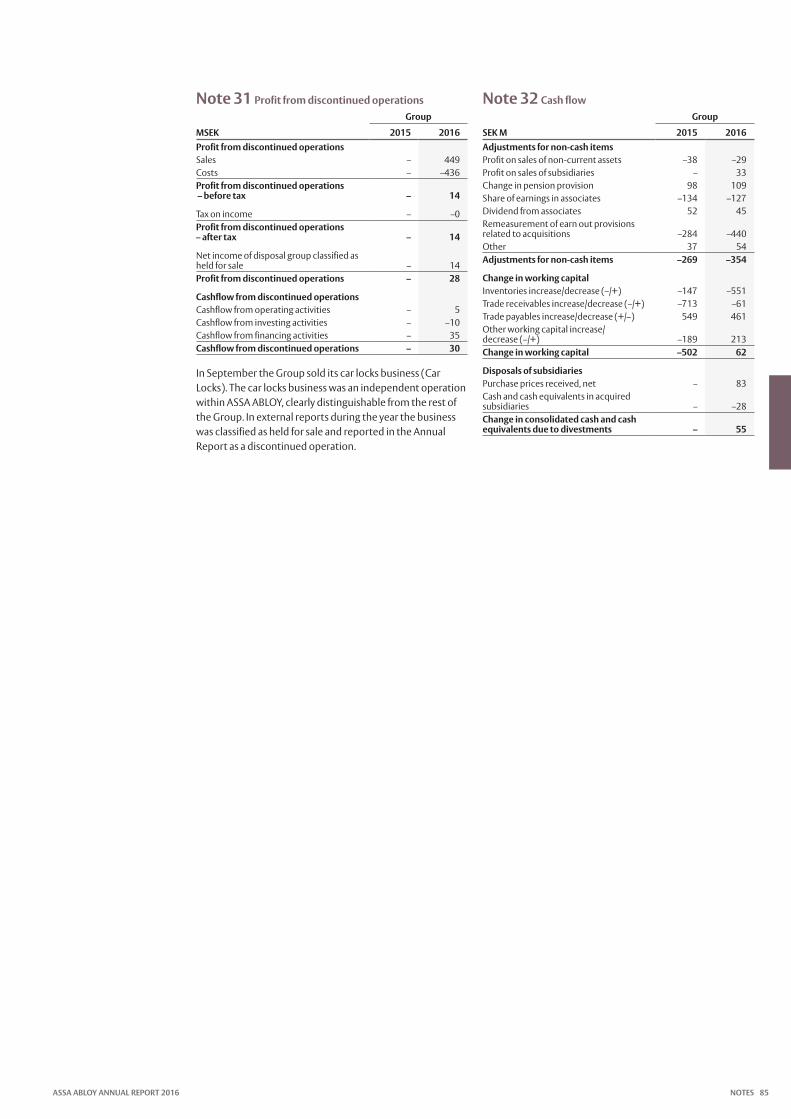
Note 31 Profit from discontinued operationsGroup
MSEK 2015 2016Profit from discontinued operationsSales – 449Costs – –436Profit from discontinued operations – before tax – 14
Tax on income – –0Profit from discontinued operations – after tax – 14
Net income of disposal group classified as held for sale – 14Profit from discontinued operations – 28
Cashflow from discontinued operationsCashflow from operating activities – 5Cashflow from investing activities – –10Cashflow from financing activities – 35Cashflow from discontinued operations – 30
In September the Group sold its car locks business (Car Locks). The car locks business was an independent operation within ASSA ABLOY, clearly distinguishable from the rest of the Group. In external reports during the year the business was classified as held for sale and reported in the Annual Report as a discontinued operation.
Note 32 Cash flowGroup
SEK M 2015 2016Adjustments for non-cash itemsProfit on sales of non-current assets –38 –29Profit on sales of subsidiaries – 33Change in pension provision 98 109Share of earnings in associates –134 –127Dividend from associates 52 45Remeasurement of earn out provisions related to acquisitions –284 –440Other 37 54Adjustments for non-cash items –269 –354
Change in working capitalInventories increase/decrease (–/+) –147 –551Trade receivables increase/decrease (–/+) –713 –61Trade payables increase/decrease (+/–) 549 461Other working capital increase/ decrease (–/+) –189 213Change in working capital –502 62
Disposals of subsidiariesPurchase prices received, net – 83Cash and cash equivalents in acquired subsidiaries – –28Change in consolidated cash and cash equivalents due to divestments – 55
ASSA ABLOY ANNUAL REPORT 2016 NOTES 85

Note 33 Employees
Salaries, wages, other remuneration and social security costsGroup Parent company
SEK M 2015 2016 2015 2016Salaries, wages and other remuneration 14,805 16,536 192 204Social security costs 4,190 4,694 117 115– of which pensions 577 685 29 33Total 18,995 21,231 309 319
Fees to Board members in 2016 (including committee work), SEK thousand
Name and post BoardRemuneration
CommitteeAudit
Committee TotalLars Renström, Chairman 1,850 150 – 2,000Carl Douglas, Vice Chairman 800 – – 800Ulf Ewaldsson, Member 550 – – 550Eva Karlsson, Member 550 – – 550Birgitta Klasén, Member 550 – – 550Eva Lindqvist, Member 550 – 125 675Johan Molin, President and CEO – – – –Ulrik Svensson, Member 550 75 250 875Jan Svensson, Member 550 75 125 750Employee representatives (4) – – – –Total 5,950 300 500 6,750Total fees to Board members amounted to SEK 5.8 M in 2015.
Remuneration and other benefits of the Executive Team in 2016, SEK thousands
Name Fixed salary Variable salaryStock-related
benefits Other benefits Pension costsJohan Molin, President and CEO 16,788 8,784 8,553 129 6,896Other members of the Executive Team (8) 47,196 19,062 14,420 4,349 10,659Total remuneration and benefits 63,984 27,846 22,973 4,478 17,555
Total remuneration and other benefits of the Executive Team amounted to SEK 133 M in 2015.
Salaries and remuneration for the Board of Directors and the Parent company’s Executive TeamSalaries and remuneration for the Board of Directors and the Parent company’s Executive Team totaled SEK 56 M (55), excluding pension costs and social security costs. Pension costs amounted to SEK 10 M (9). Pension obligations for several senior executives are secured through pledged endowment insurances.
Long-term incentive programs1
At the 2010 Annual General Meeting, it was decided to launch a long-term incentive program (LTI 2010) for senior executives and other key staff in the Group. The aim of LTI 2010 is to create the prerequisites for retaining and recruiting competent staff for the Group, providing competi-tive remuneration and uniting the interests of shareholders, senior executives and key staff.
At the 2011 to 2016 Annual General Meetings, it was decided to implement further long-term incentive programs for senior executives and other key staff in the Group. The new long-term incentive programs, named LTI 2011 to LTI 2016 have been drawn up with similar terms to LTI 2010.
For each Series B share acquired by the CEO within the framework of LTI 2014, LTI 2015 and LTI 2016, the company awards one matching stock option and four performance- based stock options. For each Series B share acquired by other members of the Executive Team, the company awards one matching stock option and three performance-based stock options. For other participants, the company awards one matching stock option and one performance-based stock option. In accordance with the terms of the incentive programs, employees have acquired a total of 413,406 shares in ASSA ABLOY AB, of which 127,884 shares were acquired in 2016 within the framework of LTI 2016.
Each matching stock option entitles the holder to receive one free Series B share in the company after three years, provided that the holder, with certain exceptions, is still employed in the Group when the interim report for Q1 2017, 2018 and 2019 for the respective program (LTI 2014–LTI 2016) is published, and has retained the shares acquired within the framework of the long-term incentive programs. Each per form ance-based stock option entitles the holder to receive one free Series B share in the company three years after allotment, provided that the above con-ditions have been fulfilled. In addition, the maximum level in a range determined by the Board of Directors for the perfor-mance of the com pany’s earnings per share must have been fulfilled. The performance-based condition was 100 percent fulfilled for LTI 2014 and LTI 2015 and 67 percent for LTI 2016.
Outstanding matching and performance-based stock options for LTI 2016 total 363,482. The total number of out-standing matching and performance-based stock options for LTI 2014, LTI 2015 and LTI 2016 amounted to 1,072,307 on the reporting date of 31 December 2016.
Fair value is based on the share price on the allotment date. The present value calculation is based on data from an external party. Fair value is adjusted for participants who do not retain their holding of shares for the duration of the program. In the case of performance-based shares, the com-pany assesses the probability of the performance targets being met when calculating the compensation expense.
The fair value of ASSA ABLOY’s Series B share on the allotment date for LTI 2016 of 26 May 2016 was SEK 171.24. The fair value of ASSA ABLOY’s Series B share on the allot-ment date for LTI 2015 of 28 May 2015 was SEK 169.50. The equivalent value on the allotment date for LTI 2014 of 21 May 2014 was SEK 112.86.
The total cost of the Group’s long-term incentive programs (LTI 2013–LTI 2016) excluding social security costs amounted
Notes
1 Number of shares and fair values have been recalculated for all histor-ical periods reflecting the stock split in 2015.
NOTES ASSA ABLOY ANNUAL REPORT 201686
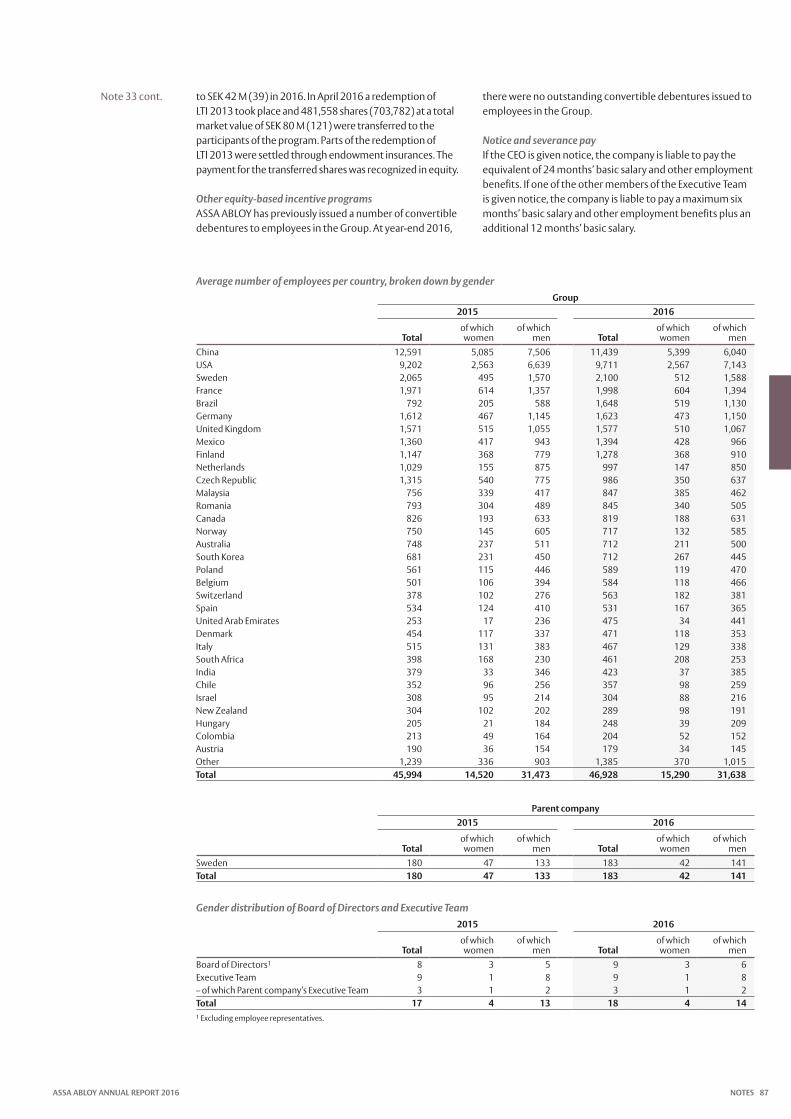
to SEK 42 M (39) in 2016. In April 2016 a redemption of LTI 2013 took place and 481,558 shares (703,782) at a total market value of SEK 80 M (121) were transferred to the participants of the program. Parts of the redemption of LTI 2013 were settled through endowment insurances. The payment for the transferred shares was recognized in equity.
Other equity-based incentive programsASSA ABLOY has previously issued a number of convertible debentures to employees in the Group. At year-end 2016,
there were no outstanding convertible debentures issued to employees in the Group.
Notice and severance payIf the CEO is given notice, the company is liable to pay the equivalent of 24 months’ basic salary and other employment benefits. If one of the other members of the Executive Team is given notice, the company is liable to pay a maximum six months’ basic salary and other employment benefits plus an additional 12 months’ basic salary.
Average number of employees per country, broken down by genderGroup
2015 2016
Totalof which women
of which men Total
of which women
of which men
China 12,591 5,085 7,506 11,439 5,399 6,040USA 9,202 2,563 6,639 9,711 2,567 7,143Sweden 2,065 495 1,570 2,100 512 1,588France 1,971 614 1,357 1,998 604 1,394Brazil 792 205 588 1,648 519 1,130Germany 1,612 467 1,145 1,623 473 1,150United Kingdom 1,571 515 1,055 1,577 510 1,067Mexico 1,360 417 943 1,394 428 966Finland 1,147 368 779 1,278 368 910Netherlands 1,029 155 875 997 147 850Czech Republic 1,315 540 775 986 350 637Malaysia 756 339 417 847 385 462Romania 793 304 489 845 340 505Canada 826 193 633 819 188 631Norway 750 145 605 717 132 585Australia 748 237 511 712 211 500South Korea 681 231 450 712 267 445Poland 561 115 446 589 119 470Belgium 501 106 394 584 118 466Switzerland 378 102 276 563 182 381Spain 534 124 410 531 167 365United Arab Emirates 253 17 236 475 34 441Denmark 454 117 337 471 118 353Italy 515 131 383 467 129 338South Africa 398 168 230 461 208 253India 379 33 346 423 37 385Chile 352 96 256 357 98 259Israel 308 95 214 304 88 216New Zealand 304 102 202 289 98 191Hungary 205 21 184 248 39 209Colombia 213 49 164 204 52 152Austria 190 36 154 179 34 145Other 1,239 336 903 1,385 370 1,015Total 45,994 14,520 31,473 46,928 15,290 31,638
Parent company
2015 2016
Totalof which women
of which men Total
of which women
of which men
Sweden 180 47 133 183 42 141Total 180 47 133 183 42 141
Gender distribution of Board of Directors and Executive Team2015 2016
Totalof which women
of which men Total
of which women
of which men
Board of Directors1 8 3 5 9 3 6Executive Team 9 1 8 9 1 8– of which Parent company’s Executive Team 3 1 2 3 1 2Total 17 4 13 18 4 141 Excluding employee representatives.
Note 33 cont.
ASSA ABLOY ANNUAL REPORT 2016 NOTES 87
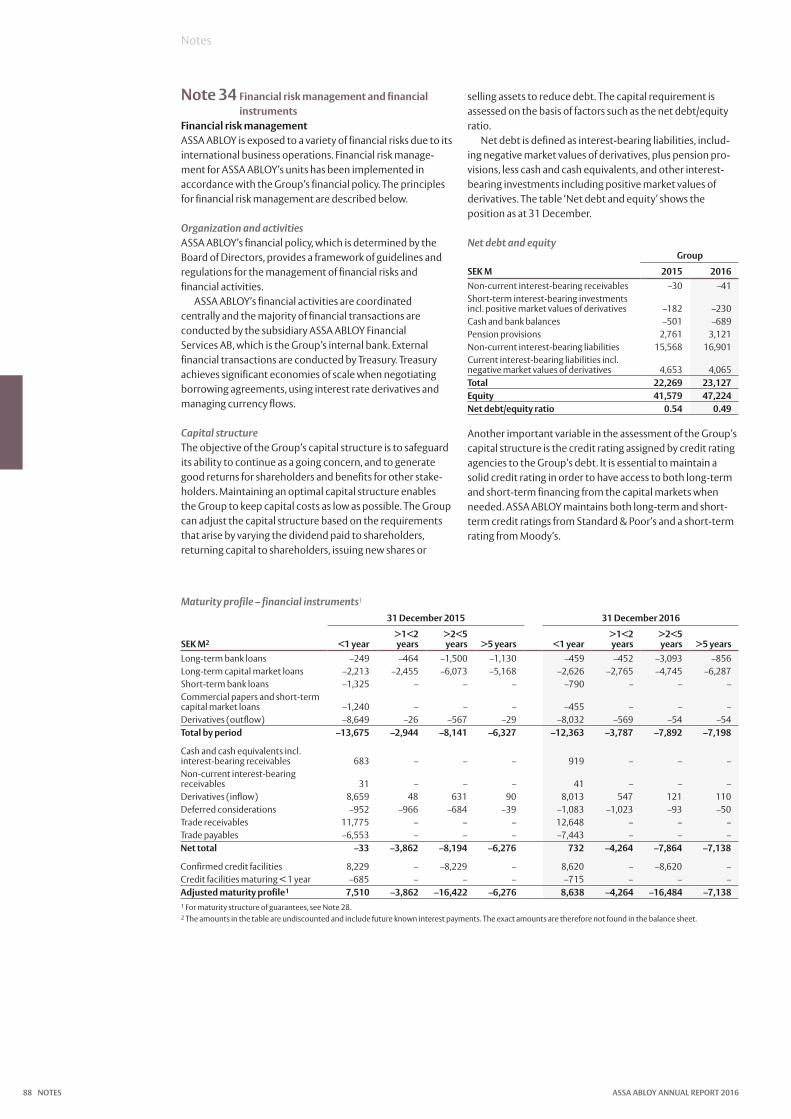
Note 34 Financial risk management and financial instruments
Financial risk managementASSA ABLOY is exposed to a variety of financial risks due to its international business operations. Financial risk manage-ment for ASSA ABLOY’s units has been implemented in accordance with the Group’s financial policy. The principles for financial risk management are described below.
Organization and activitiesASSA ABLOY’s financial policy, which is determined by the Board of Directors, provides a framework of guidelines and regulations for the management of financial risks and financial activities.
ASSA ABLOY’s financial activities are coordinated centrally and the majority of financial transactions are conducted by the subsidiary ASSA ABLOY Financial Services AB, which is the Group’s internal bank. External financial trans actions are conducted by Treasury. Treasury achieves sig nificant economies of scale when negotiating borrowing agreements, using interest rate derivatives and managing currency flows.
Capital structureThe objective of the Group’s capital structure is to safeguard its ability to continue as a going concern, and to generate good returns for shareholders and benefits for other stake-holders. Maintaining an optimal capital structure enables the Group to keep capital costs as low as possible. The Group can adjust the capital structure based on the requirements that arise by varying the dividend paid to shareholders, returning capital to shareholders, issuing new shares or
selling assets to reduce debt. The capital requirement is assessed on the basis of factors such as the net debt/equity ratio.
Net debt is defined as interest-bearing liabilities, includ-ing negative market values of derivatives, plus pension pro-visions, less cash and cash equivalents, and other interest- bearing investments including positive market values of derivatives. The table ‘Net debt and equity’ shows the position as at 31 December.
Net debt and equityGroup
SEK M 2015 2016Non-current interest-bearing receivables –30 –41Short-term interest-bearing investments incl. positive market values of derivatives –182 –230Cash and bank balances –501 –689Pension provisions 2,761 3,121Non-current interest-bearing liabilities 15,568 16,901Current interest-bearing liabilities incl. negative market values of derivatives 4,653 4,065Total 22,269 23,127Equity 41,579 47,224Net debt/equity ratio 0.54 0.49
Another important variable in the assessment of the Group’s capital structure is the credit rating assigned by credit rating agencies to the Group’s debt. It is essential to maintain a solid credit rating in order to have access to both long-term and short-term financing from the capital markets when needed. ASSA ABLOY maintains both long-term and short-term credit ratings from Standard & Poor’s and a short-term rating from Moody’s.
Maturity profile – financial instruments1
31 December 2015 31 December 2016
SEK M2 <1 year>1<2 years
>2<5 years >5 years <1 year
>1<2 years
>2<5 years >5 years
Long-term bank loans –249 –464 –1,500 –1,130 –459 –452 –3,093 –856Long-term capital market loans –2,213 –2,455 –6,073 –5,168 –2,626 –2,765 –4,745 –6,287Short-term bank loans –1,325 – – – –790 – – –Commercial papers and short-term capital market loans –1,240 – – – –455 – – –Derivatives (outflow) –8,649 –26 –567 –29 –8,032 –569 –54 –54Total by period –13,675 –2,944 –8,141 –6,327 –12,363 –3,787 –7,892 –7,198
Cash and cash equivalents incl. interest-bearing receivables 683 – – – 919 – – –Non-current interest-bearing receivables 31 – – – 41 – – –Derivatives (inflow) 8,659 48 631 90 8,013 547 121 110Deferred considerations –952 –966 –684 –39 –1,083 –1,023 –93 –50Trade receivables 11,775 – – – 12,648 – – –Trade payables –6,553 – – – –7,443 – – –Net total –33 –3,862 –8,194 –6,276 732 –4,264 –7,864 –7,138
Confirmed credit facilities 8,229 – –8,229 – 8,620 – –8,620 –Credit facilities maturing < 1 year –685 – – – –715 – – –Adjusted maturity profile1 7,510 –3,862 –16,422 –6,276 8,638 –4,264 –16,484 –7,1381 For maturity structure of guarantees, see Note 28.2 The amounts in the table are undiscounted and include future known interest payments. The exact amounts are therefore not found in the balance sheet.
Notes
NOTES ASSA ABLOY ANNUAL REPORT 201688
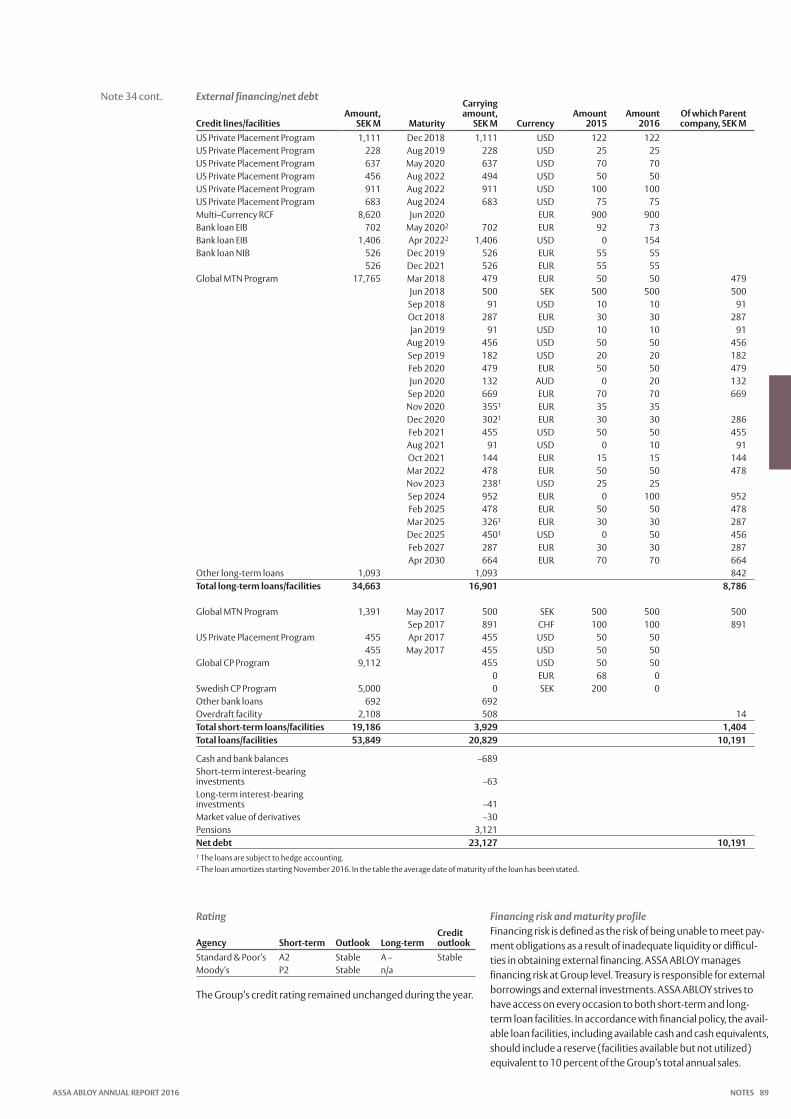
External financing/net debt
Credit lines/facilitiesAmount,
SEK M Maturity
Carrying amount,
SEK M CurrencyAmount
2015Amount
2016Of which Parent company, SEK M
US Private Placement Program 1,111 Dec 2018 1,111 USD 122 122US Private Placement Program 228 Aug 2019 228 USD 25 25US Private Placement Program 637 May 2020 637 USD 70 70US Private Placement Program 456 Aug 2022 494 USD 50 50US Private Placement Program 911 Aug 2022 911 USD 100 100US Private Placement Program 683 Aug 2024 683 USD 75 75Multi–Currency RCF 8,620 Jun 2020 EUR 900 900Bank loan EIB 702 May 20202 702 EUR 92 73Bank loan EIB 1,406 Apr 20222 1,406 USD 0 154Bank loan NIB 526 Dec 2019 526 EUR 55 55
526 Dec 2021 526 EUR 55 55Global MTN Program 17,765 Mar 2018 479 EUR 50 50 479
Jun 2018 500 SEK 500 500 500Sep 2018 91 USD 10 10 91Oct 2018 287 EUR 30 30 287Jan 2019 91 USD 10 10 91
Aug 2019 456 USD 50 50 456Sep 2019 182 USD 20 20 182Feb 2020 479 EUR 50 50 479Jun 2020 132 AUD 0 20 132Sep 2020 669 EUR 70 70 669Nov 2020 3551 EUR 35 35Dec 2020 3021 EUR 30 30 286Feb 2021 455 USD 50 50 455Aug 2021 91 USD 0 10 91Oct 2021 144 EUR 15 15 144Mar 2022 478 EUR 50 50 478Nov 2023 2381 USD 25 25Sep 2024 952 EUR 0 100 952Feb 2025 478 EUR 50 50 478Mar 2025 3261 EUR 30 30 287Dec 2025 4501 USD 0 50 456Feb 2027 287 EUR 30 30 287Apr 2030 664 EUR 70 70 664
Other long-term loans 1,093 1,093 842Total long-term loans/facilities 34,663 16,901 8,786
Global MTN Program 1,391 May 2017 500 SEK 500 500 500Sep 2017 891 CHF 100 100 891
US Private Placement Program 455 Apr 2017 455 USD 50 50455 May 2017 455 USD 50 50
Global CP Program 9,112 455 USD 50 500 EUR 68 0
Swedish CP Program 5,000 0 SEK 200 0Other bank loans 692 692Overdraft facility 2,108 508 14Total short-term loans/facilities 19,186 3,929 1,404Total loans/facilities 53,849 20,829 10,191
Cash and bank balances –689Short-term interest-bearing investments –63Long-term interest-bearing investments –41Market value of derivatives –30Pensions 3,121Net debt 23,127 10,1911 The loans are subject to hedge accounting.2 The loan amortizes starting November 2016. In the table the average date of maturity of the loan has been stated.
Rating
Agency Short-term Outlook Long-termCredit outlook
Standard & Poor’s A2 Stable A – StableMoody’s P2 Stable n/a
The Group’s credit rating remained unchanged during the year.
Financing risk and maturity profileFinancing risk is defined as the risk of being unable to meet pay-ment obligations as a result of inadequate liquidity or difficul-ties in obtaining external financing. ASSA ABLOY manages financing risk at Group level. Treasury is responsible for external borrowings and external investments. ASSA ABLOY strives to have access on every occasion to both short-term and long-term loan facilities. In accordance with financial policy, the avail-able loan facilities, including available cash and cash equivalents, should include a reserve (facilities available but not utilized) equivalent to 10 percent of the Group’s total annual sales.
Note 34 cont.
ASSA ABLOY ANNUAL REPORT 2016 NOTES 89

Maturity profileThe table ‘Maturity profile’ on page 88 shows the maturities for ASSA ABLOY’s financial instruments, including confirmed credit facilities. The maturities are not concentrated to a particular date in the immediate future. An important com-ponent of liquidity planning is the Group’s Multi-Currency Revolving Credit Facility, which matures in June 2020. This credit facility was wholly unutilized at year-end. Moreover, existing financial assets are also taken into account. The table shows undiscounted cash flows relating to the Group’s financial instruments at the reporting date, and these amounts are therefore not found in the balance sheet.
Interest-bearing liabilitiesThe Group’s long-term loan financing mainly consists of a Private Placement Program in the US totaling USD 542 M, of which USD 442 M (542) is long-term, a GMTN program of SEK 9,976 M (9,111), of which SEK 8,585 M (7,886) is long-term, loans from financial institutes as the European Invest-ment Bank (EIB) of EUR 73 M (92) and 154 (0), and a loan from the Nordic Investment Bank of EUR 110 M (110). During the year, four new issues were made under the GMTN program for a total amount of around SEK 1,635 M. In addi-tion, a new loan was obtained from the EIB for USD 154 M. Other changes in long-term loans are mainly due to some of the originally long-term loans now having less than 1 year to maturity. The size of the loans has also been affected by cur-rency fluctuations, in particular the strengthening of the USD against SEK. In total SEK 2,876 M was raised in new long-term loans while SEK 2,223 M of originally long-term loans were repaid during the year.
The Group’s short-term loan financing mainly consists of two Commercial Paper Programs for a maximum USD 1,000 M (1,000) and SEK 5,000 M (5,000) respectively. At year-end, SEK 455 M (1,240) of the Commercial Paper Programs had been utilized. In addition, substantial credit facilities are available, mainly in the form of a Multi-Currency Revolving Credit Facility of EUR 900 M (900). At year-end the average time to maturity for the Group’s interest-bearing liabilities, excluding the pension provision, was 49 months (46).
Some of the Group’s main financing agreements contain a customary Change of Control clause. This clause means that lenders have the right in certain circumstances to demand the renegotiation of conditions or to terminate the agree-ments should control of the company change.
Currency compositionThe currency composition of ASSA ABLOY’s borrowing depends on the currency composition of the Group’s assets and other liabilities. Currency swaps are used to achieve the desired currency composition. See the table ‘Net debt by currency’ below.
Cash and cash equivalents and other interest-bearing receivablesShort-term interest-bearing investments totaled SEK 2 M (34) at year-end. In addition, ASSA ABLOY has non-current interest-bearing receivables of SEK 41 M (30) and financial derivatives with a positive market value of SEK 167 M (148) which, in addition to cash and cash equivalents, are included in the definition of net financial debt. Cash and cash equiva-lents are mainly invested in bank accounts or interest- bearing instruments with high liquidity from issuers with a credit rating of at least A–, according to Standard & Poor’s or similar rating agency. The average term for cash and cash equivalents was 1 day (1) at year-end 2016.
The Parent company’s cash and cash equivalents are held in a sub-account to the Group account.
Group Parent company
SEK M 2015 2016 2015 2016Cash and bank balances 404 689 – –Short-term investments with maturity less than 3 months 97 61 – –Cash and cash equivalents 501 750 – –
Short-term investments with maturity more than 3 months 34 2 – –Long-term interest- bearing receivables 30 41 – –Positive market value of derivatives 148 167 – –Total 713 960 – –
Net debt by currency31 December 2015 31 December 2016
SEK MNet debt excluding
currency swapsNet debt including
currency swapsNet debt excluding
currency swapsNet debt including
currency swapsUSD 8,036 11,620 9,907 12,277EUR 9,993 5,807 9,728 6,616CNY 74 1,975 –199 928AUD 1 557 146 524NOK 407 510 71 640KRW 369 369 369 534PLN 24 329 38 299CZK 21 314 12 340CHF 986 199 1,171 653DKK 31 197 8 456SEK 1,731 147 1,315 –493Other 596 244 562 352Total 22,269 22,269 23,127 23,127
Interest rate risks in interest-bearing assetsTreasury manages interest rate risk in interest-bearing assets. Derivative instruments such as interest rate swaps and FRAs (forward rate agreements) may be used to manage interest rate risk. These investments are mostly short-term. The term for the majority of these investments is three months or less.
The fixed interest term for these short-term investments was 113 days (45) at year-end 2016. A downward change in the yield curve of one percentage point would reduce the Group’s interest income by around SEK 1 M (1) and consoli-dated equity by SEK 1 M (1).
Notes
Note 34 cont.
NOTES ASSA ABLOY ANNUAL REPORT 201690
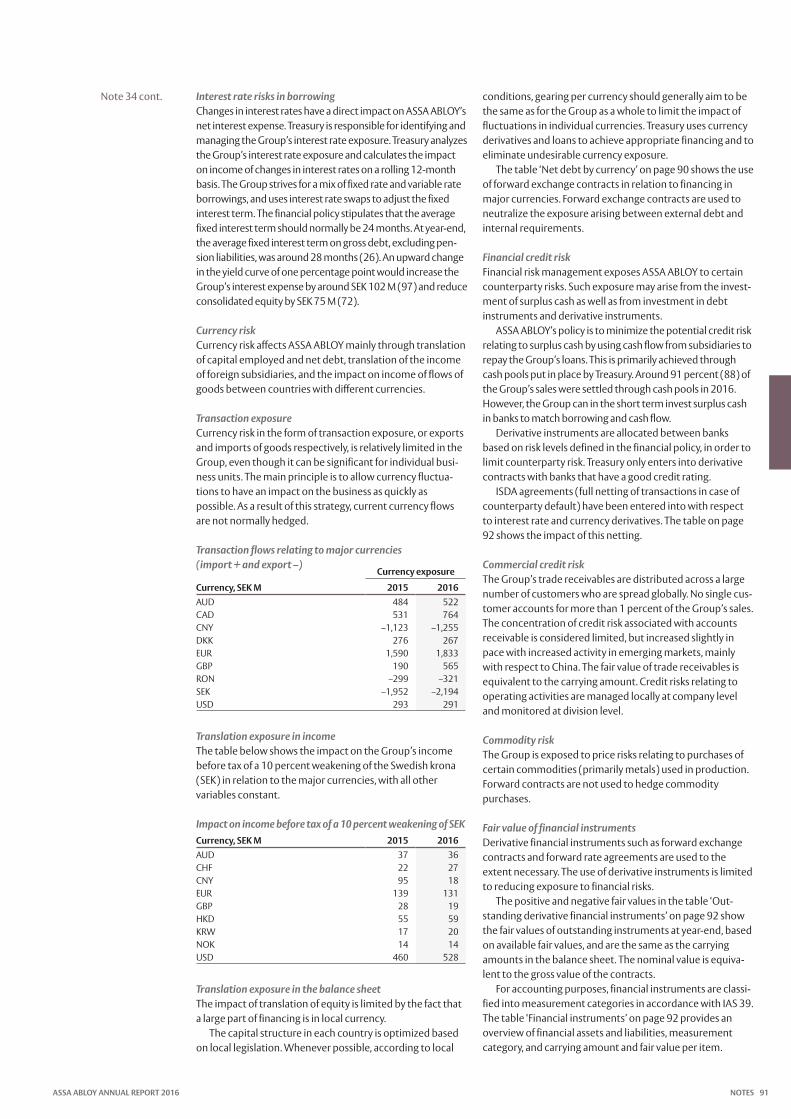
Interest rate risks in borrowingChanges in interest rates have a direct impact on ASSA ABLOY’s net interest expense. Treasury is responsible for identifying and managing the Group’s interest rate exposure. Treasury analyzes the Group’s interest rate exposure and calculates the impact on income of changes in interest rates on a rolling 12-month basis. The Group strives for a mix of fixed rate and variable rate borrowings, and uses interest rate swaps to adjust the fixed interest term. The financial policy stipulates that the average fixed interest term should normally be 24 months. At year-end, the average fixed interest term on gross debt, excluding pen-sion liabilities, was around 28 months (26). An upward change in the yield curve of one percentage point would increase the Group’s interest expense by around SEK 102 M (97) and reduce consolidated equity by SEK 75 M (72).
Currency riskCurrency risk affects ASSA ABLOY mainly through translation of capital employed and net debt, translation of the income of foreign subsidiaries, and the impact on income of flows of goods between countries with different currencies.
Transaction exposureCurrency risk in the form of transaction exposure, or exports and imports of goods respectively, is relatively limited in the Group, even though it can be significant for individual busi-ness units. The main principle is to allow currency fluctua-tions to have an impact on the business as quickly as possible. As a result of this strategy, current currency flows are not normally hedged.
Transaction flows relating to major currencies (import + and export –)
Currency exposure
Currency, SEK M 2015 2016AUD 484 522CAD 531 764CNY –1,123 –1,255DKK 276 267EUR 1,590 1,833GBP 190 565RON –299 –321SEK –1,952 –2,194USD 293 291
Translation exposure in incomeThe table below shows the impact on the Group’s income before tax of a 10 percent weakening of the Swedish krona (SEK) in relation to the major currencies, with all other variables constant.
Impact on income before tax of a 10 percent weakening of SEKCurrency, SEK M 2015 2016AUD 37 36CHF 22 27CNY 95 18EUR 139 131GBP 28 19HKD 55 59KRW 17 20NOK 14 14USD 460 528
Translation exposure in the balance sheetThe impact of translation of equity is limited by the fact that a large part of financing is in local currency.
The capital structure in each country is optimized based on local legislation. Whenever possible, according to local
conditions, gearing per currency should generally aim to be the same as for the Group as a whole to limit the impact of fluctuations in individual currencies. Treasury uses currency derivatives and loans to achieve appropriate financing and to eliminate undesirable currency exposure.
The table ‘Net debt by currency’ on page 90 shows the use of forward exchange contracts in relation to financing in major currencies. Forward exchange contracts are used to neutralize the exposure arising between external debt and internal requirements.
Financial credit riskFinancial risk management exposes ASSA ABLOY to certain counterparty risks. Such exposure may arise from the invest-ment of surplus cash as well as from investment in debt instruments and derivative instruments.
ASSA ABLOY’s policy is to minimize the potential credit risk relating to surplus cash by using cash flow from subsidiaries to repay the Group’s loans. This is primarily achieved through cash pools put in place by Treasury. Around 91 percent (88) of the Group’s sales were settled through cash pools in 2016. However, the Group can in the short term invest surplus cash in banks to match borrowing and cash flow.
Derivative instruments are allocated between banks based on risk levels defined in the financial policy, in order to limit counterparty risk. Treasury only enters into derivative contracts with banks that have a good credit rating.
ISDA agreements (full netting of transactions in case of counterparty default) have been entered into with respect to interest rate and currency derivatives. The table on page 92 shows the impact of this netting.
Commercial credit riskThe Group’s trade receivables are distributed across a large number of customers who are spread globally. No single cus-tomer accounts for more than 1 percent of the Group’s sales. The concentration of credit risk associated with accounts receivable is considered limited, but increased slightly in pace with increased activity in emerging markets, mainly with respect to China. The fair value of trade receivables is equivalent to the carrying amount. Credit risks relating to operating activities are managed locally at company level and monitored at division level.
Commodity riskThe Group is exposed to price risks relating to purchases of certain commodities (primarily metals) used in production. Forward contracts are not used to hedge commodity purchases.
Fair value of financial instrumentsDerivative financial instruments such as forward exchange contracts and forward rate agreements are used to the extent necessary. The use of derivative instruments is limited to reducing exposure to financial risks.
The positive and negative fair values in the table ‘Out-standing derivative financial instruments’ on page 92 show the fair values of outstanding instruments at year-end, based on available fair values, and are the same as the carrying amounts in the balance sheet. The nominal value is equiva-lent to the gross value of the contracts.
For accounting purposes, financial instruments are classi-fied into measurement categories in accordance with IAS 39. The table ‘Financial instruments’ on page 92 provides an overview of financial assets and liabilities, measurement category, and carrying amount and fair value per item.
Note 34 cont.
ASSA ABLOY ANNUAL REPORT 2016 NOTES 91
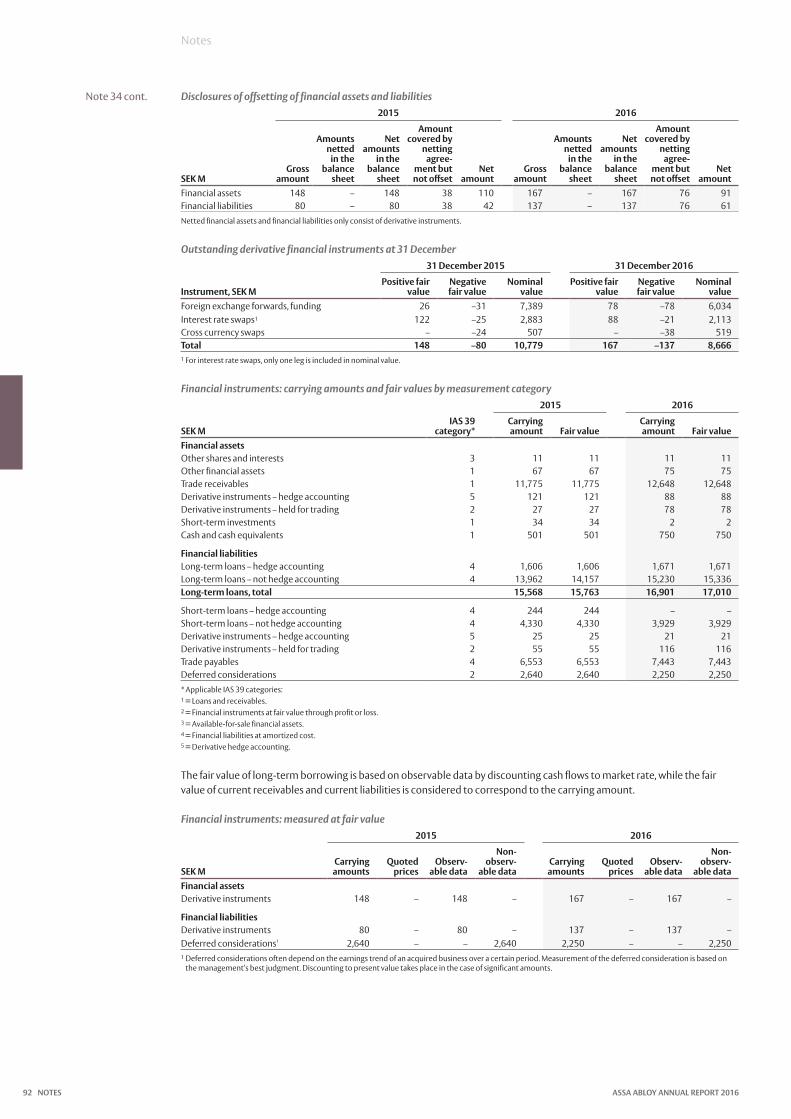
Disclosures of offsetting of financial assets and liabilities 2015 2016
SEK MGross
amount
Amounts netted
in the balance
sheet
Net amounts
in the balance
sheet
Amount covered by
netting agree-
ment but not offset
Net amount
Gross amount
Amounts netted
in the balance
sheet
Net amounts
in the balance
sheet
Amount covered by
netting agree-
ment but not offset
Net amount
Financial assets 148 – 148 38 110 167 – 167 76 91Financial liabilities 80 – 80 38 42 137 – 137 76 61Netted financial assets and financial liabilities only consist of derivative instruments.
Outstanding derivative financial instruments at 31 December31 December 2015 31 December 2016
Instrument, SEK MPositive fair
valueNegative fair value
Nominal value
Positive fair value
Negative fair value
Nominal value
Foreign exchange forwards, funding 26 –31 7,389 78 –78 6,034Interest rate swaps1 122 –25 2,883 88 –21 2,113Cross currency swaps – –24 507 – –38 519Total 148 –80 10,779 167 –137 8,6661 For interest rate swaps, only one leg is included in nominal value.
Financial instruments: carrying amounts and fair values by measurement category2015 2016
SEK MIAS 39
category*Carrying amount Fair value
Carrying amount Fair value
Financial assetsOther shares and interests 3 11 11 11 11Other financial assets 1 67 67 75 75Trade receivables 1 11,775 11,775 12,648 12,648Derivative instruments – hedge accounting 5 121 121 88 88Derivative instruments – held for trading 2 27 27 78 78Short-term investments 1 34 34 2 2Cash and cash equivalents 1 501 501 750 750
Financial liabilities Long-term loans – hedge accounting 4 1,606 1,606 1,671 1,671Long-term loans – not hedge accounting 4 13,962 14,157 15,230 15,336Long-term loans, total 15,568 15,763 16,901 17,010
Short-term loans – hedge accounting 4 244 244 – –Short-term loans – not hedge accounting 4 4,330 4,330 3,929 3,929Derivative instruments – hedge accounting 5 25 25 21 21Derivative instruments – held for trading 2 55 55 116 116Trade payables 4 6,553 6,553 7,443 7,443Deferred considerations 2 2,640 2,640 2,250 2,250* Applicable IAS 39 categories:1 = Loans and receivables.2 = Financial instruments at fair value through profit or loss.3 = Available-for-sale financial assets.4 = Financial liabilities at amortized cost.5 = Derivative hedge accounting.
The fair value of long-term borrowing is based on observable data by discounting cash flows to market rate, while the fair value of current receivables and current liabilities is considered to correspond to the carrying amount.
Financial instruments: measured at fair value2015 2016
SEK MCarrying amounts
Quoted prices
Observ-able data
Non-observ-
able dataCarrying amounts
Quoted prices
Observ-able data
Non-observ-
able dataFinancial assetsDerivative instruments 148 – 148 – 167 – 167 –
Financial liabilitiesDerivative instruments 80 – 80 – 137 – 137 –Deferred considerations¹ 2,640 – – 2,640 2,250 – – 2,2501 Deferred considerations often depend on the earnings trend of an acquired business over a certain period. Measurement of the deferred consideration is based on
the management’s best judgment. Discounting to present value takes place in the case of significant amounts.
Notes
Note 34 cont.
NOTES ASSA ABLOY ANNUAL REPORT 201692

University of East Anglia boosts security with Aperio CUSTOMER: The University of East Anglia (UEA),
one of the UK’s leading public research and teaching establishments.
CHALLENGE: To provide an access control system to secure Crome Court, the on-campus student accommodation completed in 2015. Since the building was designed to create minimal environ-
mental impact, the solution was expected to help fulfill that aim. Divided into flats for eight to 13 people, the building has 231 suite rooms rented out to postgraduates.
SOLUTION: In collaboration with our security partner Gallagher, ASSA ABLOY fulfilled the cus-tomer’s need for a stylish and secure electronic locking system according to the environmentally friendly profile of the housing block. The solution had to be affordable yet reliable, and ASSA ABLOY was required to provide on-site training to assist with lock installation.
UEA used Gallagher’s access control systems for over a decade, UEA adopted their Aperio solution for Crome Court. The system provides an online audit trail and allow real-time monitoring. The battery-powered energy-efficient E100 Online escutcheons are activated only when a user’s credentials are presented to the reader, and UEA staff can control the doors from a web-based inter-face or mobile phone.
Gallagher and Aperio devices may be operated with the same data on the user’s card, which allow easy integration and cost savings. Further doors can be added when needed and the hope is that Aperio will be rolled out across all residential estate at UEA.
A combination of entrance solutions at the biggest fish shop in the Netherlands
CUSTOMER: After nearly a hundred years of being situated in the city center, Schmidt Zeevis decided to move their shop and storage to an industrial zone, where ASSA ABLOY Entrance Systems has installed multiple automatic entrance solutions: automatic pedestrian doors, overhead sectional doors and docking solutions. ASSA ABLOY managed to execute the project versus a tight schedule to move the entire company in one day, and to be operational immediately.
CHALLENGE: The entrance solution needed to provide not only sufficient pas-sage but ability to preserve the cool temperature in the shop where fishes are showcased with ice and need to be kept at the right temperature. The climate of the expedition area was another major challenge and needed to bridge an inside temperature of 2 degrees against a possible occurring outside tempera-ture of above 20 degrees. It also needed to be possible to easily load and unload various types of trucks.
SOLUTION: For their main entrance, Schmidt Zeevis selected a revolving door inclusive automatic sliding doors to provide an entrance with separation between the indoor and outdoor climate, as well as disabled access. The revolv-ing door was included in the six meters façade to create an open and inviting environment. The biggest part of the building consists of storage and process-ing areas, where industrial sectional doors with 70 mm thick insulation panels
and docking systems with telescopic features made it possible to drive in and out easily with both large and heavy truck traffic, and smaller vans. The solution incorporated both mechanical curtain dock shelters with aluminum frames for similar trolleys, as well as inflatable dock shelters with extra sealing for incoming of various types of trucks; hereby the climate control is maintained optimally.
Comments on five years in summary
2012Organic growth was 2 percent, despite the continued weak market conditions globally. The share of sales on emerging markets continued to increase to over 25 percent of total sales. The major investments in product development in recent years have been fruitful. This can be seen from the share of products launched in the past three years, which has increased considerably and currently accounts for around 25 percent of total sales.
Operating income excluding items affecting comparabil-ity increased by 13 percent during the year and operating cash flow remained very strong. Earnings per share after full dilution, excluding items affecting comparability, increased by 13 percent, compared with 2011.
A total of 13 acquisitions were completed during the year, which mainly strengthened the position in entrance automa-tion for high-performance doors and docking systems. These acquisitions increase annual sales by a total of around SEK 4,500 M and provide important products and technology.
Activities in the ongoing restructuring programs remained at a high level during the year. More than 6,700 employees have left the Group, as a result of these activities since the programs began in 2006.
2013Demand remained weak in Europe but leveled off during the year, combined with a continuing recovery in the USA and strong sales growth in emerging markets. Continued sub-stantial investment in innovative new products further con-solidated market leadership, with products launched in the past three years accounting for a record 27 percent of sales.
Operating income, excluding items affecting comparabil-ity, increased by 6 percent compared with 2012, and cash flow showed a positive trend. Earnings per share after full dilution, excluding items affecting comparability, increased 6 percent. A total of 10 acquisitions were consolidated during the year, which mainly strengthened the position in entrance auto-mation for overhead sectional doors and in high- security fencing and gates for the North American market. These acquisitions increase annual sales by a total of around SEK 3,700 M and provide important products and technology.
A new restructuring program was launched during the year for the purpose of continuing to increase the cost- efficiency of all divisions. Some 30 production plants and offices are set to close with an estimated payback period of just over three years. At year-end 2013, more than 8,500 employees had left the Group as a result of restructur-ing activities since the programs began in 2006.
2014ASSA ABLOY continued to grow rapidly during the year, with total sales growth of 17 percent. Demand was strong in the USA, while growth in Europe was more unevenly distributed between the different regions. Emerging markets showed a slowdown, partly due to a credit crunch.
The Group’s continued focus on market presence and innovation during the year took the form of a strengthened sales force and the launch of many new products. Integration of acquisitions made and continued efficiencies contributed to maintaining good earning capacity.
Operating income, excluding items affecting com-parability, increased by 17 percent compared with 2013, and cash flow remained strong. Earnings per share after full dilution, excluding items affecting comparability, increased by 17 percent.
A total of 20 acquisitions were consolidated during the year, which both strengthened the market position in key emerging markets such as China, India and Brazil, and complemented the customer offering in fast-growing new segments such as biometrics.
2015 ASSA ABLOY’s good performance continued during the year despite challenging market conditions and relatively weak underlying growth worldwide. The Group’s growth remained strong during the year, with total sales growth of 7 per cent excluding exchange rate effects. The global mar-ket showed a divided picture with strong demand in the USA and much of Asia, while growth in Europe was more unevenly distributed. Emerging markets showed a slow-down, particularly China.
The focus in recent years on product development, inno-vation and sustainability yielded positive results during the year. ASSA ABLOY has established leadership in the ongoing industry shift from mechanical solutions to electronics, digi-tization and mobile. Growth remained strong for electro-mechanical products and entrance automation, whose share of sales exceeded 50 percent. Integration of acquisitions, efficiencies and rationalizations strengthened the Group’s flexibility and financial strength.
Operating income increased by 20 percent compared with 2014, and cash flow remained very strong. Earnings per share after full dilution increased by 20 percent.
A total of 16 acquisitions were consolidated during the year, which strengthened the market position in important emerging markets such as Brazil, and complemented the customer offering in key areas for the Group such as entrance automation and secure identity solutions.
2016Demand for door opening solutions was relatively good during the year despite the weakened global economy. The Group’s growth remained strong during the year, with total sales growth of 5 percent excluding exchange rate effects. The mature markets, primarily in Europe and the US, showed robust growth, while the trend in the emerging markets in Asia, Africa, the Middle East and parts of South America was more subdued in general, affected by factors such as the low prices for oil and other commodities. For ASSA ABLOY, the weak demand in these markets was most pronounced in China.
A new restructuring program was launched during the year. About fifty production plants and offices are set to close over a three-year period, with an estimated payback period of less than three years.
The focus in recent years on product development, inno-vation and sustainability continued at a high level during 2016. The ongoing technology shift toward an increased share of electromechanics with more digital and mobile solutions is expected to benefit ASSA ABLOY in the long term, and the proportion of sales of electromechanical products exceeded 50 percent.
Operating income for the year, excluding items affecting comparability, increased by 2 percent compared with 2015, and cash flow continued to be very strong. Earnings per share after full dilution, excluding items affecting comparability, increased 2 percent.
A total of 13 acquisitions were consolidated during the year, which strengthened the market position for the Group in key areas such as entrance automation and secure identity solutions. ASSA ABLOY’s car locks operation was sold.
COMMENTS ON FIVE YEARS IN SUMMARY ASSA ABLOY ANNUAL REPORT 201694

RETURN ON CAPITAL EMPLOYED1 OPERATING MARGIN (EBIT)1 AVERAGE NUMBER OF EMPLOYEES
Five years in summary
Amounts in SEK M unless stated otherwise 2012 2013 2014 2015 2016Sales and incomeSales 46,619 48,481 56,843 68,099 71,293Organic growth, % 2 2 3 4 2Acquired growth, % 9 4 9 3 3Operating income before depreciation/amortization (EBITDA)1 8,536 8,917 10,419 12,512 12,833Depreciation and amortization –1,034 –993 –1,163 –1,433 –1,580Operating income (EBIT)1 7,501 7,923 9,257 11,079 11,254Income before tax (EBT)4 6,784 6,381 8,698 10,382 8,952Net income4 5,172 4,775 6,436 7,693 6,653
Cash flowCash flow from operating activities 5,990 6,224 6,679 8,572 8,575Cash flow from investing activities –4,738 –6,030 –3,524 –4,412 –4,063Cash flow from financing activities –1,564 –731 –2,908 –4,335 –4,271Cash flow –312 –537 247 –175 240Operating cash flow3 7,044 6,803 8,238 9,952 10,467
Capital employed and financingCapital employed4 41,422 48,408 58,425 63,848 70,351– of which goodwill 28,932 31,817 39,778 42,777 47,544– of which other intangible assets and property,
plant and equipment 11,093 12,854 14,990 16,649 17,618– of which investments in associates 1,519 1,675 1,861 1,910 2,109Assets and liabilities of disposal group classified as held for sale 385 – – – –Net debt4 15,805 19,595 22,327 22,269 23,127Non-controlling interest 183 0 2 4 5Shareholders' equity, excluding non-controlling interest4 25,819 28,812 36,096 41,575 47,220
Data per share, SEK5
Earnings per share before and after dilution4 4.66 4.30 5.79 6.93 5.99Earnings per share before and after dilution and excluding items affecting comparability1, 4 4.66 4.95 5.79 6.93 7.09Shareholders' equity per share after dilution4 23.29 25.94 32.50 37.43 42.51Dividend per share 1.70 1.90 2.17 2.65 3.002
Price of Series B share at year-end 80.97 113.27 138.27 178.00 169.10
Key ratiosOperating margin (EBITDA), %1 18.3 18.4 18.3 18.4 18.0Operating margin (EBIT), %1 16.1 16.3 16.3 16.3 15.8Profit margin (EBT), %4 14.6 13.2 15.3 15.2 12.6Return on capital employed, %4 18.1 14.9 16.9 17.8 14.1Return on capital employed excluding items affecting comparability, %4 18.1 17.1 16.9 17.8 16.5Return on shareholders' equity, %4 20.9 17.5 19.8 19.8 15.0Equity ratio, %4 43.2 43.8 45.1 48.2 49.6Net debt/equity ratio, times4 0.61 0.68 0.62 0.54 0.49Interest coverage ratio, times4 11.1 13.5 17.4 16.7 14.1Interest on convertible debentures net after tax 3.9 – – – –Total number of shares, thousands5 1,112,576 1,112,576 1,112,576 1,112,576 1,112,576Number of shares outstanding, thousands5 1,108,776 1,110,776 1,110,776 1,110,776 1,110,776Weighted average number of outstanding shares before and after dilution, thousands5 1,108,776 1,110,776 1,110,776 1,110,776 1,110,776Average number of employees 42,762 42,556 44,269 45,994 46,9281 Excluding items affecting comparability in 2013 and 2016.2 Dividend proposed by the Board of Directors.3 Excluding restructuring payments.4 2012 has been adjusted due to a change in accounting principles for defined benefit pension plans.5 Comparatives has been recalculated for all historical periods before 2015 reflecting the stock split (3:1) in 2015.
1 Excluding items affecting comparability 2013 and 2016.
%
0
5
10
15
20
1615141312
Number
0
10,000
20,000
30,000
40,000
50,000
1615141312
%
0
5
10
15
20
1615141312
ASSA ABLOY ANNUAL REPORT 2016 FIVE YEARS IN SUMMARY 95
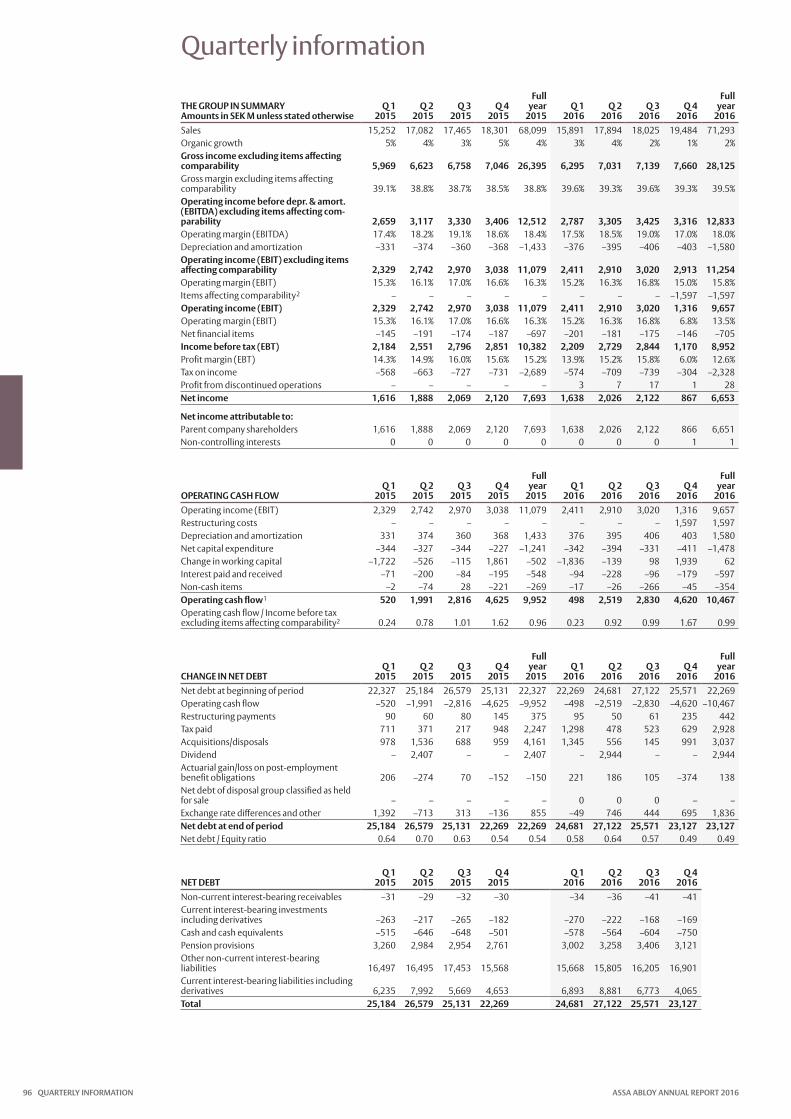
Quarterly information
THE GROUP IN SUMMARY Amounts in SEK M unless stated otherwise
Q 1 2015
Q 2 2015
Q 3 2015
Q 4 2015
Full year
2015Q 1
2016Q 2
2016Q 3
2016Q 4
2016
Full year
2016Sales 15,252 17,082 17,465 18,301 68,099 15,891 17,894 18,025 19,484 71,293Organic growth 5% 4% 3% 5% 4% 3% 4% 2% 1% 2%Gross income excluding items affecting comparability 5,969 6,623 6,758 7,046 26,395 6,295 7,031 7,139 7,660 28,125Gross margin excluding items affecting comparability 39.1% 38.8% 38.7% 38.5% 38.8% 39.6% 39.3% 39.6% 39.3% 39.5%Operating income before depr. & amort. (EBITDA) excluding items affecting com-parability 2,659 3,117 3,330 3,406 12,512 2,787 3,305 3,425 3,316 12,833Operating margin (EBITDA) 17.4% 18.2% 19.1% 18.6% 18.4% 17.5% 18.5% 19.0% 17.0% 18.0%Depreciation and amortization –331 –374 –360 –368 –1,433 –376 –395 –406 –403 –1,580Operating income (EBIT) excluding items affecting comparability 2,329 2,742 2,970 3,038 11,079 2,411 2,910 3,020 2,913 11,254Operating margin (EBIT) 15.3% 16.1% 17.0% 16.6% 16.3% 15.2% 16.3% 16.8% 15.0% 15.8%Items affecting comparability2 – – – – – – – – –1,597 –1,597Operating income (EBIT) 2,329 2,742 2,970 3,038 11,079 2,411 2,910 3,020 1,316 9,657Operating margin (EBIT) 15.3% 16.1% 17.0% 16.6% 16.3% 15.2% 16.3% 16.8% 6.8% 13.5%Net financial items –145 –191 –174 –187 –697 –201 –181 –175 –146 –705Income before tax (EBT) 2,184 2,551 2,796 2,851 10,382 2,209 2,729 2,844 1,170 8,952Profit margin (EBT) 14.3% 14.9% 16.0% 15.6% 15.2% 13.9% 15.2% 15.8% 6.0% 12.6%Tax on income –568 –663 –727 –731 –2,689 –574 –709 –739 –304 –2,328Profit from discontinued operations – – – – – 3 7 17 1 28Net income 1,616 1,888 2,069 2,120 7,693 1,638 2,026 2,122 867 6,653
Net income attributable to:Parent company shareholders 1,616 1,888 2,069 2,120 7,693 1,638 2,026 2,122 866 6,651Non-controlling interests 0 0 0 0 0 0 0 0 1 1
OPERATING CASH FLOWQ 1
2015Q 2
2015Q 3
2015Q 4
2015
Full year
2015Q 1
2016Q 2
2016Q 3
2016Q 4
2016
Full year
2016Operating income (EBIT) 2,329 2,742 2,970 3,038 11,079 2,411 2,910 3,020 1,316 9,657Restructuring costs – – – – – – – – 1,597 1,597Depreciation and amortization 331 374 360 368 1,433 376 395 406 403 1,580Net capital expenditure –344 –327 –344 –227 –1,241 –342 –394 –331 –411 –1,478Change in working capital –1,722 –526 –115 1,861 –502 –1,836 –139 98 1,939 62Interest paid and received –71 –200 –84 –195 –548 –94 –228 –96 –179 –597Non-cash items –2 –74 28 –221 –269 –17 –26 –266 –45 –354Operating cash flow1 520 1,991 2,816 4,625 9,952 498 2,519 2,830 4,620 10,467Operating cash flow / Income before tax excluding items affecting comparability2 0.24 0.78 1.01 1.62 0.96 0.23 0.92 0.99 1.67 0.99
CHANGE IN NET DEBTQ 1
2015Q 2
2015Q 3
2015Q 4
2015
Full year
2015Q 1
2016Q 2
2016Q 3
2016Q 4
2016
Full year
2016Net debt at beginning of period 22,327 25,184 26,579 25,131 22,327 22,269 24,681 27,122 25,571 22,269Operating cash flow –520 –1,991 –2,816 –4,625 –9,952 –498 –2,519 –2,830 –4,620 –10,467Restructuring payments 90 60 80 145 375 95 50 61 235 442Tax paid 711 371 217 948 2,247 1,298 478 523 629 2,928Acquisitions/disposals 978 1,536 688 959 4,161 1,345 556 145 991 3,037Dividend – 2,407 – – 2,407 – 2,944 – – 2,944Actuarial gain/loss on post-employment benefit obligations 206 –274 70 –152 –150 221 186 105 –374 138Net debt of disposal group classified as held for sale – – – – – 0 0 0 – –Exchange rate differences and other 1,392 –713 313 –136 855 –49 746 444 695 1,836Net debt at end of period 25,184 26,579 25,131 22,269 22,269 24,681 27,122 25,571 23,127 23,127Net debt / Equity ratio 0.64 0.70 0.63 0.54 0.54 0.58 0.64 0.57 0.49 0.49
NET DEBTQ 1
2015Q 2
2015Q 3
2015Q 4
2015Q 1
2016Q 2
2016Q 3
2016Q 4
2016Non-current interest-bearing receivables –31 –29 –32 –30 –34 –36 –41 –41Current interest-bearing investments including derivatives –263 –217 –265 –182 –270 –222 –168 –169Cash and cash equivalents –515 –646 –648 –501 –578 –564 –604 –750Pension provisions 3,260 2,984 2,954 2,761 3,002 3,258 3,406 3,121Other non-current interest-bearing liabilities 16,497 16,495 17,453 15,568 15,668 15,805 16,205 16,901Current interest-bearing liabilities including derivatives 6,235 7,992 5,669 4,653 6,893 8,881 6,773 4,065Total 25,184 26,579 25,131 22,269 24,681 27,122 25,571 23,127
QUARTERLY INFORMATION ASSA ABLOY ANNUAL REPORT 201696

CAPITAL EMPLOYED AND FINANCING
Q 1
2015Q 2
2015Q 3
2015Q 4
2015Q 1
2016Q 2
2016Q 3
2016Q 4
2016Capital employed 64,699 64,689 65,070 63,848 67,124 69,449 70,555 70,351– of which goodwill 43,092 41,818 42,404 42,777 43,098 44,387 45,077 47,544– of which other intangible assets and
property, plant and equipment 16,324 16,512 16,693 16,649 16,613 17,036 17,264 17,618– of which investments in associates 1,890 1,901 1,934 1,910 1,970 2,037 2,095 2,109Assets and liabilities of disposal group classified as held for sale – – – – 111 126 – –Net debt 25,184 26,579 25,131 22,269 24,681 27,122 25,571 23,127Non-controlling interests 2 4 4 4 4 3 4 5Equity attributable to Parentcompany’s shareholders 39,513 38,105 39,935 41,575 42,551 42,449 44,981 47,220
DATA PER SHARE, SEKQ 1
2015Q 2
2015Q 3
2015Q 4
2015
Full year
2015Q 1
2016Q 2
2016Q 3
2016Q 4
2016
Full year
2016Earnings per share before and after dilution 1.45 1.70 1.86 1.91 6.93 1.47 1.82 1.91 0.78 5.99Earnings per share before and after dilution and excluding items affecting comparability2 1.45 1.70 1.86 1.91 6.93 1.47 1.82 1.91 1.88 7.09Shareholders' equity per share after dilution 35.57 34.31 35.95 37.43 37.43 38.31 38.22 40.50 42.51 42.51
NUMBER OF SHARESQ 1
2015Q 2
2015Q 3
2015Q 4
2015
Full year
2015Q 1
2016Q 2
2016Q 3
2016Q 4
2016
Full year
2016Total number of shares, millions 1,112.6 1,112.6 1,112.6 1,112.6 1,112.6 1,112.6 1,112.6 1,112.6 1,112.6 1,112.6Weighted average number of out-standing shares before and after dilution, millions 1,110.8 1,110.8 1,110.8 1,110.8 1,110.8 1,110.8 1,110.8 1,110.8 1,110.8 1,110.81 Excluding restructuring payments.2 Items affecting comparability consist of restructuring costs.
Organic growthChange in sales for comparable units after adjustments for acquisitions and exchange rate effects.
Operating margin (EBITDA)Operating income before depreciation and amortization as a percentage of sales.
Operating margin (EBIT)Operating income as a percentage of sales.
Profit margin (EBT)Income before tax as a percentage of sales.
Operating cash flowSee the table on operating cash flow for detailed information.
Net capital expenditureInvestments in tangible and intangible assets less disposals of tangible and intangible assets.
DepreciationDepreciation/amortization of intangible and tangible assets.
Net debtInterest-bearing liabilities less interest-bearing assets.
Capital employedTotal assets less interest-bearing assets and non-interest-bear-ing liabilities including deferred tax liability.
Equity ratioShareholders’ equity as a percentage of total assets.
Interest coverage ratioIncome before tax plus net interest divided by net interest.
Return on shareholders’ equityNet income excluding non-controlling interests as a percentage of average shareholders’ equity (excluding non-controlling interests) after any potential dilution.
Return on capital employedIncome before tax plus net interest as a percentage of average capital employed.
Earnings per share after tax and before dilutionNet income excluding non-controlling interests divided by weighted average number of shares before dilution.
Earnings per share after tax and dilutionNet income excluding non-controlling interests divided by weighted average number of shares after any potential dilution.
Shareholders’ equity per share after dilutionEquity excluding non-controlling interests divided by number of shares after any potential dilution.
Definitions of key ratios
ASSA ABLOY ANNUAL REPORT 2016 QUARTERLY INFORMATION 97
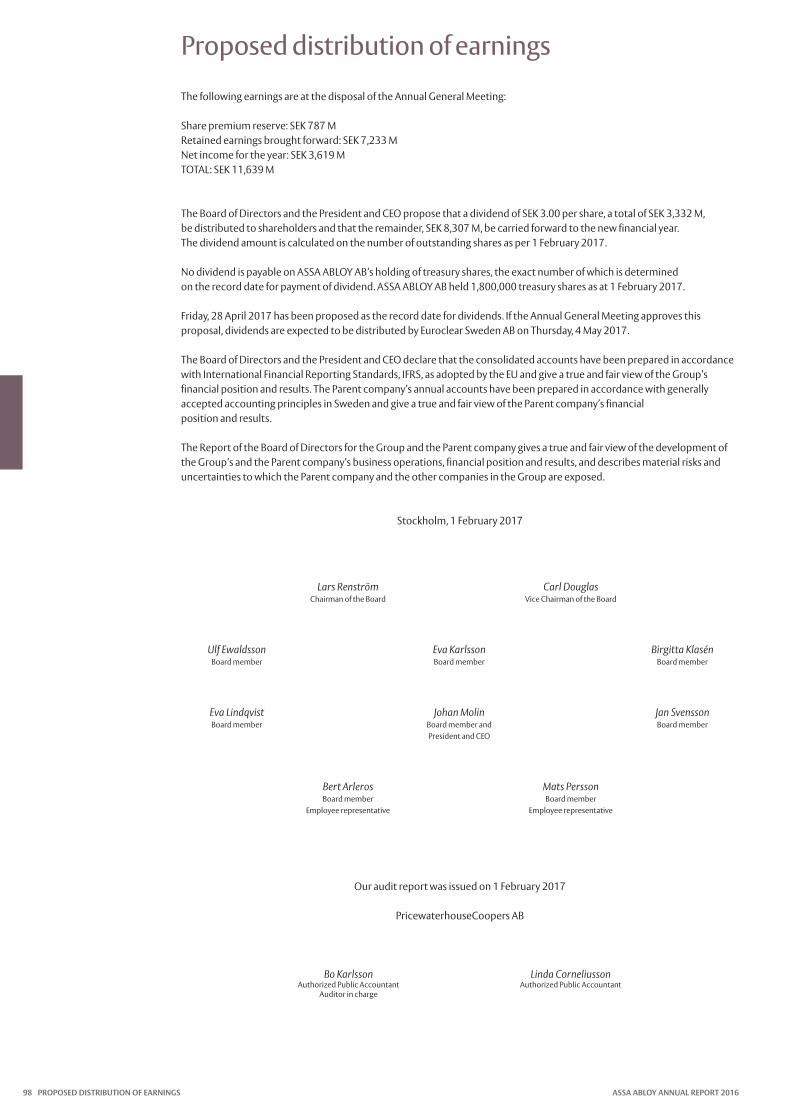
Proposed distribution of earnings
The following earnings are at the disposal of the Annual General Meeting:
Share premium reserve: SEK 787 MRetained earnings brought forward: SEK 7,233 MNet income for the year: SEK 3,619 MTOTAL: SEK 11,639 M
The Board of Directors and the President and CEO propose that a dividend of SEK 3.00 per share, a total of SEK 3,332 M, be distributed to shareholders and that the remainder, SEK 8,307 M, be carried forward to the new financial year.The dividend amount is calculated on the number of outstanding shares as per 1 February 2017.
No dividend is payable on ASSA ABLOY AB’s holding of treasury shares, the exact number of which is determined on the record date for payment of dividend. ASSA ABLOY AB held 1,800,000 treasury shares as at 1 February 2017.
Friday, 28 April 2017 has been proposed as the record date for dividends. If the Annual General Meeting approves this proposal, dividends are expected to be distributed by Euroclear Sweden AB on Thursday, 4 May 2017.
The Board of Directors and the President and CEO declare that the consolidated accounts have been prepared in accordance with International Financial Reporting Standards, IFRS, as adopted by the EU and give a true and fair view of the Group’s financial position and results. The Parent company’s annual accounts have been prepared in accordance with generally accepted accounting principles in Sweden and give a true and fair view of the Parent company’s financial position and results.
The Report of the Board of Directors for the Group and the Parent company gives a true and fair view of the development of the Group’s and the Parent company’s business operations, financial position and results, and describes material risks and uncertainties to which the Parent company and the other companies in the Group are exposed.
Stockholm, 1 February 2017
Lars RenströmChairman of the Board
Carl Douglas Vice Chairman of the Board
Ulf Ewaldsson Board member
Eva Karlsson Board member
Birgitta KlasénBoard member
Eva Lindqvist Board member
Johan Molin Board member andPresident and CEO
Jan Svensson Board member
Bert ArlerosBoard member
Employee representative
Mats Persson Board member
Employee representative
Our audit report was issued on 1 February 2017
PricewaterhouseCoopers AB
Bo Karlsson Linda Corneliusson Authorized Public Accountant Authorized Public Accountant Auditor in charge
PROPOSED DISTRIBUTION OF EARNINGS ASSA ABLOY ANNUAL REPORT 201698

Auditor’s report
To the general meeting of the shareholders of ASSA ABLOY AB (publ), corporate identity number 556059-3575
Report on the annual accounts and consolidated accounts
OpinionsWe have audited the annual accounts and consolidated accounts of ASSA ABLOY AB (publ) for the year 2016, except for the corporate governance statement on pages 46–54. The annual accounts and consolidated accounts of the com-pany are included on pages 39–98 in this document.
In our opinion, the annual accounts have been prepared in accordance with the Annual Accounts Act and present fairly, in all material respects, the financial position of the Parent company as of 31 December 2016 and its financial performance and cash flow for the year then ended in accor-dance with the Annual Accounts Act. The consolidated accounts have been prepared in accordance with the Annual
Accounts Act and present fairly, in all material respects, the financial position of the group as of 31 December 2016 and their financial performance and cash flow for the year then ended in accordance with International Financial Reporting Standards (IFRS), as adopted by the EU, and the Annual Accounts Act. Our opinions do not cover the corporate governance statement on pages 46–54. The statutory administration report is consistent with the other parts of the annual accounts and consolidated accounts.
We therefore recommend that the general meeting of shareholders adopts the income statement and balance sheet for the Parent company and the group.
Basis for OpinionsWe conducted our audit in accordance with International Standards on Auditing (ISA) and generally accepted auditing standards in Sweden. Our responsibilities under those stan-dards are further described in the Auditor’s Responsibilities section. We are independent of the Parent company and the
group in accordance with professional ethics for accoun-tants in Sweden and have otherwise fulfilled our ethical responsibilities in accordance with these requirements.
We believe that the audit evidence we have obtained is sufficient and appropriate to provide a basis for our opinions.
Our audit approachAudit scopeWe designed our audit by determining materiality and assessing the risks of material misstatement in the consoli-dated financial statements. In particular, we considered where management made subjective judgements; for exam-ple, in respect of significant accounting estimates that involved making assumptions and considering future events that are inherently uncertain. As in all of our audits, we also addressed the risk of management override of internal con-trols, including among other matters consideration of whether there was evidence of bias that represented a risk of material misstatement due to fraud.
We tailored the scope of our audit in order to perform sufficient work to enable us to provide an opinion on the consolidated financial statements as a whole, taking into account the structure of the Group, the accounting pro-cesses and controls, and the industry in which the group operates.
The ASSA ABLOY Group is comprised of a large number of companies. None of these companies have, individually, been deemed to be of major significance in the audit of the group. For the group audit, we have selected the Parent company and treasury company and some 70 companies spread across the group’s five divisions, which are audited according to a group-wide audit program. The audit pro-gram includes the assessment of the design and operating effectiveness of selected controls in processes significant to the financial reporting and also includes audit proce-dures in the form of test of details supplemented with ana-lytical procedures applied to the group’s significant income statement and balance sheet items. The majority of the subsidiaries in the group are also the subject of statutory audits according to local requirements.
During 2016, the Auditor-in-Charge and co-signing auditor visited the audit teams in China and the US to participate, on site, in the audit, and to take part in the meetings with repre-sentatives from ASSA ABLOY’s local companies and ASSA ABLOY’s head office. The operations in China and the US have been selected as they are the countries with the largest external sales. In addition, the Chinese operations represent an increased risk exposure in the form of weak compliance with regulatory requirements and deviations from ASSA ABLOY’s internal control framework for financial reporting. As stated in the Report of the Board of Directors, such deviations have resulted in corrections of errors.
MaterialityThe scope of our audit was influenced by our application of materiality. An audit is designed to obtain reasonable assur-ance whether the financial statements are free from material misstatement. Misstatements may arise due to fraud or error. They are considered material if individually or in aggre-gate, they could reasonably be expected to influence the economic decisions of users taken on the basis of the financial statements.
Based on our professional judgement, we determined certain quantitative thresholds for materiality, including the overall materiality for the financial statements as a whole. These, together with qualitative considerations, helped us to determine the scope of our audit and the nature, timing and extent of our audit procedures and to evaluate the effect of misstatements, both individually and in aggregate on the financial statements as a whole.
ASSA ABLOY ANNUAL REPORT 2016 AUDITOR’S REPORT 99

Auditor’s report
Key audit mattersKey audit matters of the audit are those matters that, in our professional judgement, were of most significance in our audit of the annual accounts and consolidated accounts of the current period. These matters were addressed in the context of our audit of, and in forming our opinion thereon, the annual accounts and consolidated accounts as a whole, but we do not provide a separate opinion on these matters.
Key audit matter How our audit addressed the Key audit matter
Goodwill and intangible assets with indefinite useful livesGoodwill and acquisition-related intangible assets are described in the annual report in Note 14 and in the account-ing principles in Note 1.
ASSA ABLOY is an acquisition-intensive company that has an established and structured acquisition process. During the 2016 financial year, a total of 13 acquisitions were consolidated.
ASSA ABLOYs goodwill of SEK 47.5 billion and intangible assets with indefinite useful lives of SEK 6.3 bil-lion, are allocated to the group’s five cash-generating units which are equivalent to the group’s five divisions.
In our audit, we have focused on the valuation of goodwill and intangible assets with indefinite useful lives as these items involve a large degree of judgement on behalf of management in assessing future cash flows.
ASSA ABLOY’s annual test of goodwill and other intangible assets with indefinite useful lives can be traced to observable market data and to the company’s own business plans and fore-casts on future development.
Through test of details we have examined whether ASSA ABLOY’s assessment of whether there is any indication that an asset may be impaired, is based on the company’s financial budgets approved by management. We have also assessed the growth rate that the company has used to forecast cash flows beyond the first three-year period. In conjunction with this, we have compared management’s assumptions regarding the sus-tainable growth rate and the operating margin against actual growth and the actual operating margin during recent years.
Our assessment of the discount rate applied in manage-ment’s calculations reflects the specific risks found in the cash generating units. We have reconciled the data in the calcula-tions and checked it against external sources and have found that the determination of the discount rate is based on estab-lished theory. In this part of the audit, we have utilized PwC’s valuation experts.
We have evaluated the company’s sensitivity analysis of the valuation to changes in significant parameters, which, individu-ally or on a collective basis, could imply the existence of an impairment requirement.
AUDITOR’S REPORT ASSA ABLOY ANNUAL REPORT 2016100

Key audit matter How our audit addressed the Key audit matter
Provisions– restructuring programThe restructuring program is described in the Report of the Board of Directors in the annual report and in Note 25.
A restructuring program was launched during the current financial year and total restructuring costs are expected to amount to SEK 1,597 million.
In our audit, we have focused on the restructuring pro-gram and determined whether the program is qualified to be reported as a provision as the program is based on management’s estimates of future costs.
We have examined the company’s process for identifying projects and the estimated costs of these projects.
Our audit measures include an evaluation of whether the restructuring program complies, in all significant aspects, with the group’s accounting principles for reporting provisions.
Furthermore, we have challenged management’s assump-tions that are the basis for the restructuring provision with the aim of assessing the reasonability of the provision. Based on risk and materiality, we have reconciled the parameters in the cal-culations against supporting documentation. This includes, amongst other things, the examination of minutes, agree-ments, calculations and communication with employees.
Key audit matter How our audit addressed the Key audit matter
Financial reporting – Chinese operationsCorrected errors in China are described in the Report of the Board of Directors.
As seen in the annual report, weaknesses in regulatory compliance and internal control, as well as errors in the financial reporting of parts of the Chinese operations within the Asia Pacific division, have been identified during the year.
With the help of external expertise, ASSA ABLOY has undertaken special investigations in response to the identified errors in the financial reporting. Our audit has had a special focus on these corrected errors. As portions of these errors refer to revenue, we have had a special focus on revenue recognition in China.
In order to ensure the accuracy of the adjusted errors, we have studied the company’s investigation. We have also met with the investigation experts contracted by the company. Further-more, we have performed tests on a selection of revenue items, whereby we have reconciled the revenue against the price agreed in the contract or with the purchase order. Where pos-sible, we have checked the delivery documents signed by third parties. For instances where the third party had not signed the document, we have checked the warehouse delivery note. We have also checked the quantity on the delivery note to the quantity recorded as sales.
In order to examine the correct cut-off of revenue, we have reconciled, for a selection of items, the recorded sales value against goods delivered, invoice date and reporting date. For the period after closing date, we have obtained lists of goods delivery notes and have traced these to the dates on the delivery documents and related invoices.
We have contacted a selection of customers to obtain independent confirmations of the existence of outstanding accounts receivable. For instances where we did not receive an answer, we have performed tests that invoices have been paid after the balance sheet date, or tested the delivery of goods against delivery documents.
ASSA ABLOY ANNUAL REPORT 2016 AUDITOR’S REPORT 101
Auditor’s report
Other Information than the annual accounts and consolidated accountsThis document also contains other information than the annual accounts and consolidated accounts and is found in the sections Report on operations and Divisions. The Board of Directors and the Managing Director are responsible for this other information.
Our opinion on the annual accounts and consolidated accounts does not cover this other information and we do not express any form of assurance conclusion regarding this other information.
In connection with our audit of the annual accounts and consolidated accounts, our responsibility is to read the
information identified above and consider whether the information is materially inconsistent with the annual accounts and consolidated accounts. In this procedure we also take into account our knowledge otherwise obtained in the audit and assess whether the information otherwise appears to be materially misstated.
If we, based on the work performed concerning this information, conclude that there is a material misstate-ment of this other information, we are required to report that fact. We have nothing to report in this regard.
Responsibilities of the Board of Directors and the Managing DirectorThe Board of Directors and the Managing Director are responsible for the preparation of the annual accounts and consolidated accounts and that they give a fair presentation in accordance with the Annual Accounts Act and, concern-ing the consolidated accounts, in accordance with IFRS as adopted by the EU. The Board of Directors and the Managing Director are also responsible for such internal control as they determine is necessary to enable the preparation of annual accounts and consolidated accounts that are free from material misstatement, whether due to fraud or error.
In preparing the annual accounts and consolidated accounts, The Board of Directors and the Managing
Director are responsible for the assessment of the com-pany’s and the group’s ability to continue as a going con-cern. They disclose, as applicable, matters related to going concern and using the going concern basis of accounting. The going concern basis of accounting is however not applied if the Board of Directors and the Managing Director intends to liquidate the company, to cease operations, or has no realistic alternative but to do so.
The Audit Committee shall, without prejudice to the Board of Director’s responsibilities and tasks in general, among other things oversee the company’s financial reporting process.
Auditor’s responsibilityOur objectives are to obtain reasonable assurance about whether the annual accounts and consolidated accounts as a whole are free from material misstatement, whether due to fraud or error, and to issue an auditor’s report that includes our opinions. Reasonable assurance is a high level of assurance, but is not a guarantee that an audit conducted in accordance with ISAs and generally accepted auditing standards in Sweden will always detect a material misstate-ment when it exists. Misstatements can arise from fraud or error and are considered material if, individually or in the
aggregate, they could reasonably be expected to influence the economic decisions of users taken on the basis of these annual accounts and consolidated accounts.
A further description of our responsibility for the audit of the annual accounts and consolidated accounts is avail-able on Revisorsnämnden’s website: www.revisorsinspek-tionen.se/rn/showdocument/documents/rev_dok/ revisors_ansvar.pdf. This description is part of the auditor´s report.
Report on other legal and regulatory requirements
OpinionsIn addition to our audit of the annual accounts and consoli-dated accounts, we have also audited the administration of the Board of Directors and the Managing Director of ASSA ABLOY AB (publ) for the year 2016 and the proposed appropriations of the company’s profit or loss.
We recommend to the general meeting of shareholders that the profit be appropriated in accordance with the proposal in the statutory administration report and that the members of the Board of Directors and the Managing Director be discharged from liability for the financial year.
Basis for OpinionsWe conducted the audit in accordance with generally accepted auditing standards in Sweden. Our responsibilities under those standards are further described in the Auditor’s Responsibilities section. We are independent of the Parent company and the group in accordance with professional ethics for accountants in Sweden and have otherwise ful-filled our ethical responsibilities in accordance with these requirements.
We believe that the audit evidence we have obtained is sufficient and appropriate to provide a basis for our opinions.
AUDITOR’S REPORT ASSA ABLOY ANNUAL REPORT 2016102

Stockholm 1 February 2017
PricewaterhouseCoopers AB
Bo Karlsson Linda Corneliusson Authorised Public Accountant Authorised Public Accountant Auditor in charge
Responsibilities of the Board of Directors and the Managing DirectorThe Board of Directors is responsible for the proposal for appropriations of the company’s profit or loss. At the pro-posal of a dividend, this includes an assessment of whether the dividend is justifiable considering the requirements which the company’s and the group’s type of operations, size and risks place on the size of the Parent company’s and the group’s equity, consolidation requirements, liquidity and position in general.
The Board of Directors is responsible for the company’s organization and the administration of the company’s affairs. This includes among other things continuous assess-
ment of the company’s and the group’s financial situation and ensuring that the company’s organization is designed so that the accounting, management of assets and the company’s financial affairs otherwise are controlled in a reassuring manner. The Managing Director shall manage the ongoing administration according to the Board of Directors’ guidelines and instructions and among other matters take measures that are necessary to fulfil the com-pany’s accounting in accordance with law and handle the management of assets in a reassuring manner.
Auditor’s responsibilityOur objective concerning the audit of the administration, and thereby our opinion about discharge from liability, is to obtain audit evidence to assess with a reasonable degree of assurance whether any member of the Board of Directors or the Managing Director in any material respect:• has undertaken any action or been guilty of any omission
which can give rise to liability to the company, or• in any other way has acted in contravention of the
Companies Act, the Annual Accounts Act or the Articles of Association.
Our objective concerning the audit of the proposed appro-priations of the company’s profit or loss, and thereby our opinion about this, is to assess with reasonable degree of
assurance whether the proposal is in accordance with the Companies Act.
Reasonable assurance is a high level of assurance, but is not a guarantee that an audit conducted in accordance with generally accepted auditing standards in Sweden will always detect actions or omissions that can give rise to lia-bility to the company, or that the proposed appropriations of the company’s profit or loss are not in accordance with the Companies Act.
A further description of our responsibility for the audit of the administration is available on Revisorsnämnden’s website: www.revisorsinspektionen.se/rn/showdocument/documents/rev_dok/revisors_ansvar.pdf. This description is part of the auditor’s report.
The auditor’s examination of the corporate governance statementThe Board of Directors is responsible for that the corporate governance statement on pages 46–54 has been prepared in accordance with the Annual Accounts Act.
Our examination of the corporate governance state-ment is conducted in accordance with FAR’s auditing stan-dard RevU 16 The auditor’s examination of the corporate governance statement. This means that our examination of the corporate governance statement is different and sub-stantially less in scope than an audit conducted in accor-dance with International Standards on Auditing and gener-
ally accepted auditing standards in Sweden. We believe that the examination has provided us with sufficient basis for our opinions.
A corporate governance statement has been prepared. Disclosures in accordance with chapter 6 section 6 the sec-ond paragraph points 2–6 of the Annual Accounts Act and chapter 7 section 31 the second paragraph the same law are consistent with the other parts of the annual accounts and consolidated accounts and are in accordance with the Annual Accounts Act.
ASSA ABLOY ANNUAL REPORT 2016 AUDITOR’S REPORT 103
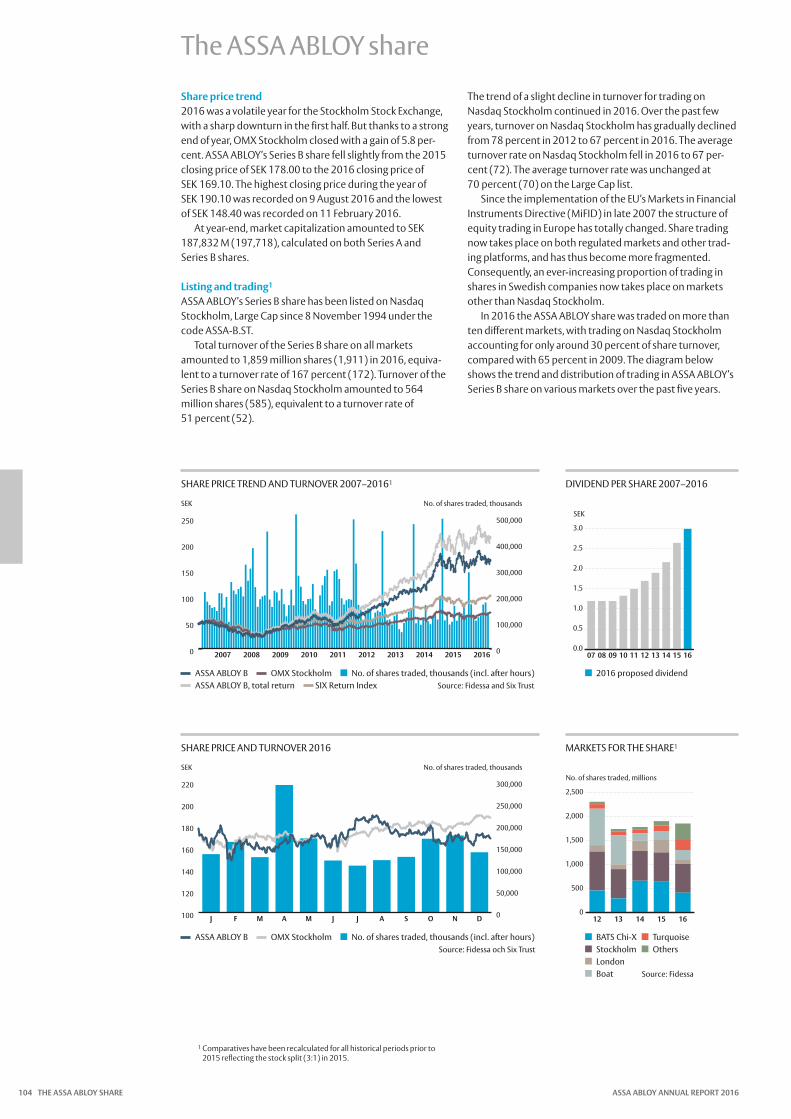
The ASSA ABLOY share
Share price trend2016 was a volatile year for the Stockholm Stock Exchange, with a sharp downturn in the first half. But thanks to a strong end of year, OMX Stockholm closed with a gain of 5.8 per-cent. ASSA ABLOY’s Series B share fell slightly from the 2015 closing price of SEK 178.00 to the 2016 closing price of SEK 169.10. The highest closing price during the year of SEK 190.10 was recorded on 9 August 2016 and the lowest of SEK 148.40 was recorded on 11 February 2016.
At year-end, market capitalization amounted to SEK 187,832 M (197,718), calculated on both Series A and Series B shares.
Listing and trading1
ASSA ABLOY’s Series B share has been listed on Nasdaq Stockholm, Large Cap since 8 November 1994 under the code ASSA-B.ST.
Total turnover of the Series B share on all markets amounted to 1,859 million shares (1,911) in 2016, equiva-lent to a turnover rate of 167 percent (172). Turnover of the Series B share on Nasdaq Stockholm amounted to 564 million shares (585), equivalent to a turnover rate of 51 percent (52).
The trend of a slight decline in turnover for trading on Nasdaq Stockholm continued in 2016. Over the past few years, turnover on Nasdaq Stockholm has gradually declined from 78 percent in 2012 to 67 percent in 2016. The average turnover rate on Nasdaq Stockholm fell in 2016 to 67 per-cent (72). The average turnover rate was unchanged at 70 percent (70) on the Large Cap list.
Since the implementation of the EU’s Markets in Financial Instruments Directive (MiFID) in late 2007 the structure of equity trading in Europe has totally changed. Share trading now takes place on both regulated markets and other trad-ing platforms, and has thus become more fragmented. Consequently, an ever-increasing proportion of trading in shares in Swedish companies now takes place on markets other than Nasdaq Stockholm.
In 2016 the ASSA ABLOY share was traded on more than ten different markets, with trading on Nasdaq Stockholm accounting for only around 30 percent of share turnover, compared with 65 percent in 2009. The diagram below shows the trend and distribution of trading in ASSA ABLOY’s Series B share on various markets over the past five years.
SHARE PRICE AND TURNOVER 2016
SHARE PRICE TREND AND TURNOVER 2007–20161
MARKETS FOR THE SHARE1
DIVIDEND PER SHARE 2007–2016
BATS Chi-X Turquoise Stockholm Others London Boat Source: Fidessa
2016 proposed dividend
ASSA ABLOY B OMX Stockholm No. of shares traded, thousands (incl. after hours)Source: Fidessa och Six Trust
ASSA ABLOY B OMX Stockholm No. of shares traded, thousands (incl. after hours) ASSA ABLOY B, total return SIX Return Index Source: Fidessa and Six Trust
1 Comparatives have been recalculated for all historical periods prior to 2015 reflecting the stock split (3:1) in 2015.
0
50,000
100,000
150,000
200,000
250,000
300,000
DNOSAJJMAMFJ100
120
140
160
180
200
220
SEK No. of shares traded, thousands
0
100,000
200,000
300,000
400,000
500,000
20162015201420132012201120102009200820070
50
100
150
200
250
SEK No. of shares traded, thousandsSEK
0.0
0.5
1.0
1.5
2.0
2.5
3.0
16151413121110090807
No. of shares traded, millions
0
500
1,000
1,500
2,000
2,500
1615141312
THE ASSA ABLOY SHARE ASSA ABLOY ANNUAL REPORT 2016104
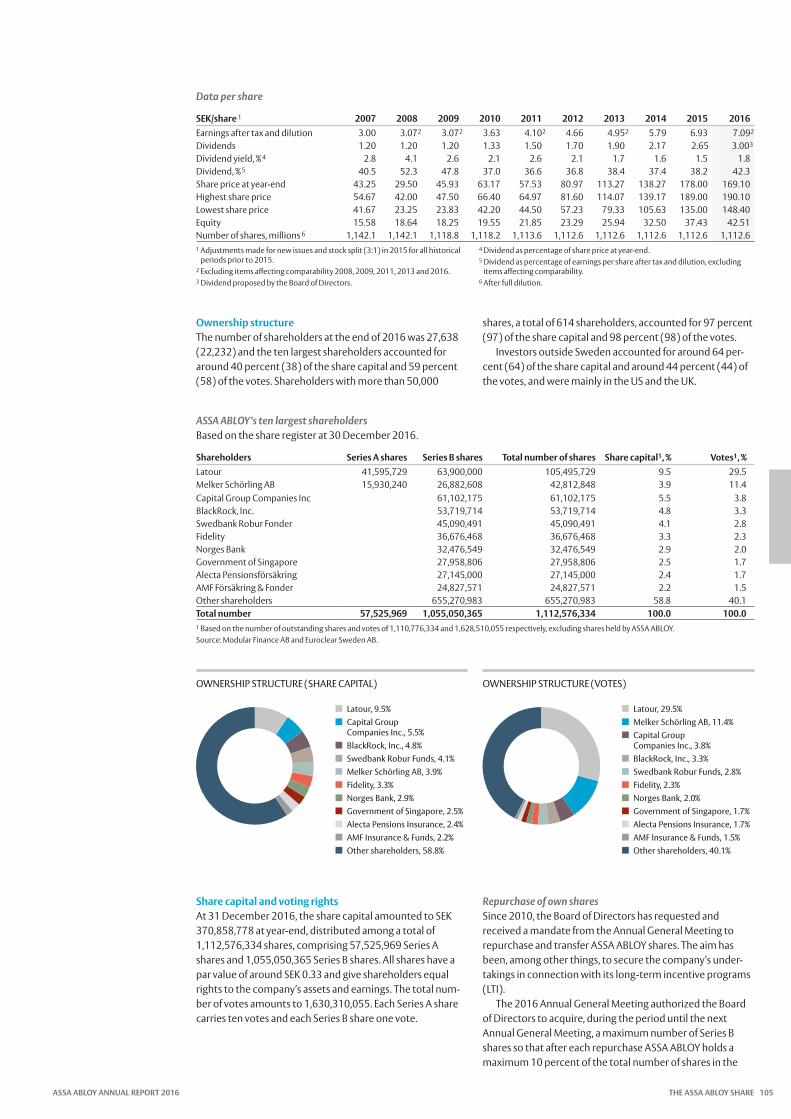
Data per share
SEK/share 1 2007 2008 2009 2010 2011 2012 2013 2014 2015 2016Earnings after tax and dilution 3.00 3.072 3.072 3.63 4.102 4.66 4.952 5.79 6.93 7.092
Dividends 1.20 1.20 1.20 1.33 1.50 1.70 1.90 2.17 2.65 3.003
Dividend yield, % 4 2.8 4.1 2.6 2.1 2.6 2.1 1.7 1.6 1.5 1.8Dividend, % 5 40.5 52.3 47.8 37.0 36.6 36.8 38.4 37.4 38.2 42.3Share price at year-end 43.25 29.50 45.93 63.17 57.53 80.97 113.27 138.27 178.00 169.10Highest share price 54.67 42.00 47.50 66.40 64.97 81.60 114.07 139.17 189.00 190.10Lowest share price 41.67 23.25 23.83 42.20 44.50 57.23 79.33 105.63 135.00 148.40Equity 15.58 18.64 18.25 19.55 21.85 23.29 25.94 32.50 37.43 42.51Number of shares, millions 6 1,142.1 1,142.1 1,118.8 1,118.2 1,113.6 1,112.6 1,112.6 1,112.6 1,112.6 1,112.61 Adjustments made for new issues and stock split (3:1) in 2015 for all historical
periods prior to 2015.2 Excluding items affecting comparability 2008, 2009, 2011, 2013 and 2016.3 Dividend proposed by the Board of Directors.
4 Dividend as percentage of share price at year-end.5 Dividend as percentage of earnings per share after tax and dilution, excluding
items affecting comparability.6 After full dilution.
ASSA ABLOY’s ten largest shareholdersBased on the share register at 30 December 2016.
Shareholders Series A shares Series B shares Total number of shares Share capital1, % Votes1, %Latour 41,595,729 63,900,000 105,495,729 9.5 29.5Melker Schörling AB 15,930,240 26,882,608 42,812,848 3.9 11.4Capital Group Companies Inc 61,102,175 61,102,175 5.5 3.8BlackRock, Inc. 53,719,714 53,719,714 4.8 3.3Swedbank Robur Fonder 45,090,491 45,090,491 4.1 2.8Fidelity 36,676,468 36,676,468 3.3 2.3Norges Bank 32,476,549 32,476,549 2.9 2.0Government of Singapore 27,958,806 27,958,806 2.5 1.7Alecta Pensionsförsäkring 27,145,000 27,145,000 2.4 1.7AMF Försäkring & Fonder 24,827,571 24,827,571 2.2 1.5Other shareholders 655,270,983 655,270,983 58.8 40.1Total number 57,525,969 1,055,050,365 1,112,576,334 100.0 100.01 Based on the number of outstanding shares and votes of 1,110,776,334 and 1,628,510,055 respectively, excluding shares held by ASSA ABLOY.Source: Modular Finance AB and Euroclear Sweden AB.
OWNERSHIP STRUCTURE (SHARE CAPITAL) OWNERSHIP STRUCTURE (VOTES)
Share capital and voting rightsAt 31 December 2016, the share capital amounted to SEK 370,858,778 at year-end, distributed among a total of 1,112,576,334 shares, comprising 57,525,969 Series A shares and 1,055,050,365 Series B shares. All shares have a par value of around SEK 0.33 and give shareholders equal rights to the company’s assets and earnings. The total num-ber of votes amounts to 1,630,310,055. Each Series A share carries ten votes and each Series B share one vote.
Repurchase of own sharesSince 2010, the Board of Directors has requested and received a mandate from the Annual General Meeting to repurchase and transfer ASSA ABLOY shares. The aim has been, among other things, to secure the company’s under-takings in connection with its long-term incentive programs (LTI).
The 2016 Annual General Meeting authorized the Board of Directors to acquire, during the period until the next Annual General Meeting, a maximum number of Series B shares so that after each repurchase ASSA ABLOY holds a maximum 10 percent of the total number of shares in the
Ownership structureThe number of shareholders at the end of 2016 was 27,638 (22,232) and the ten largest shareholders accounted for around 40 percent (38) of the share capital and 59 percent (58) of the votes. Shareholders with more than 50,000
shares, a total of 614 shareholders, accounted for 97 percent (97) of the share capital and 98 percent (98) of the votes.
Investors outside Sweden accounted for around 64 per-cent (64) of the share capital and around 44 percent (44) of the votes, and were mainly in the US and the UK.
Latour, 29.5%Melker Schörling AB, 11.4%Capital Group Companies Inc., 3.8%BlackRock, Inc., 3.3%Swedbank Robur Funds, 2.8%Fidelity, 2.3%Norges Bank, 2.0%Government of Singapore, 1.7%Alecta Pensions Insurance, 1.7%AMF Insurance & Funds, 1.5%Other shareholders, 40.1%
Latour, 9.5%Capital Group Companies Inc., 5.5%BlackRock, Inc., 4.8%Swedbank Robur Funds, 4.1%Melker Schörling AB, 3.9%Fidelity, 3.3%Norges Bank, 2.9%Government of Singapore, 2.5%Alecta Pensions Insurance, 2.4%AMF Insurance & Funds, 2.2%Other shareholders, 58.8%
LegendLegendLegendLegendLegendLegend
LegendLegendLegendLegendLegendLegend
ASSA ABLOY ANNUAL REPORT 2016 THE ASSA ABLOY SHARE 105
Analysts who cover ASSA ABLOY
Company Name Telephone EmailABG Sundal Collier Anders Idborg +46 8 566 296 74 [email protected] of America ML Mark Troman +44 207 996 4194 [email protected] Lars Brorson +44 203 134 1156 [email protected] Rizk Maidi +44 203 207 78 06 [email protected] Johan Wettergren +46 8 588 687 43 [email protected] Suisse Andre Kukhnin +44 207 888 0350 [email protected] Bank Oscar Stjerngren +46 8 568 806 06 [email protected] Bank Andreas Koski +44 207 545 6580 [email protected] Johan Sjöberg +46 8 473 48 31 [email protected] BNP Paribas Sebastian Gruter +44 207 039 9527 [email protected] Sachs Daniela Costa +44 207 774 8354 [email protected] Peder Frölén +46 8 701 12 51 [email protected] Michael Hagmann +44 207 991 2405 [email protected] Capital Jeff Kessler +1 212 351 9701 [email protected] Peter Reilly +44 207 029 8632 [email protected]. Morgan Andreas Willi +44 207 134 4569 [email protected] Markus Almerud +46 8 723 51 63 [email protected] Capital Ryan Gregory +44 203 100 2071 [email protected] Stanley Ben Maslen +44 207 425 3837 [email protected] Felix Wienen +44 207 102 5758 [email protected] Fredrik Agardh +46 8 534 917 20 [email protected] Securities Delphine Brault +33 144 518 325 [email protected] Securities David Jacobsson +46 8 402 52 72 [email protected] Partners James Moore +44 207 000 2135 [email protected] Bank of Canada Matthew Spurr +44 207 029 0787 [email protected] Enskilda Securities Anders Trapp +46 8 522 297 57 [email protected]été Général Alasdair Leslie +44 207 762 4952 [email protected] Anders Roslund +46 8 585 900 93 [email protected] Guillermo Peigneux-Lojo +46 8 453 73 08 [email protected]
Changes in share capital
Year TransactionSeries A
sharesSeries C
sharesSeries B
shares Share capital, SEK*1989 20,000 2,000,0001994 Split 100:1 2,000,000 2,000,0001994 Bonus issue1994 Non-cash issue 1,746,005 1,428,550 50,417,555 53,592,1101996 New share issue 2,095,206 1,714,260 60,501,066 64,310,5321996 Conversion of Series C shares into Series A shares 3,809,466 60,501,066 64,310,5321997 New share issue 4,190,412 66,541,706 70,732,1181998 Converted debentures 4,190,412 66,885,571 71,075,9831999 Converted debentures before split 4,190,412 67,179,562 71,369,9741999 Bonus issue1999 Split 4:1 16,761,648 268,718,248 285,479,8961999 New share issue 18,437,812 295,564,487 314,002,2991999 Converted debentures after split and new share issues 18,437,812 295,970,830 314,408,6422000 Converted debentures 18,437,812 301,598,383 320,036,1952000 New share issue 19,175,323 313,512,880 332,688,2032000 Non-cash issue 19,175,323 333,277,912 352,453,2352001 Converted debentures 19,175,323 334,576,089 353,751,4122002 New share issue 19,175,323 344,576,089 363,751,4122002 Converted debentures 19,175,323 346,742,711 365,918,0342010 Converted debentures 19,175,323 347,001,871 366,177,1942011 Converted debentures 19,175,323 349,075,055 368,250,3782012 Converted debentures 19,175,323 351,683,455 370,858,7782015 Split 3:1 57,525,969 1,055,050,365 370,858,778* SEK 1 per share before split in 2015 – number of shares at the end of the period and around SEK 0.33 per share after split in 2015. Number of shares at the end of the
period 1,112,576,334 (including repurchase of own shares).
The ASSA ABLOY share
company. ASSA ABLOY holds a total of 1,800,000 (1,800,000) Series B shares after repurchase. These shares account for around 0.2 percent (0.2) of the share capital and each share has a par value of around SEK 0.33. The purchase consideration amounted to SEK 103 M.
No shares were repurchased in 2016.
Dividend and dividend policyThe objective of the dividend policy is that, in the long term, the dividend should be equivalent to 33–50 percent of income after standard tax, but always taking into account ASSA ABLOY’s long-term financing requirements.
The Board of Directors and the President and CEO propose that the dividend to shareholders be raised by 13 percent to SEK 3.00 per share (2.65) for the 2016 financial year, equiva-lent to a dividend yield on the Series B share of 1.8 percent (1.5).
In 2016 the total return on the ASSA ABLOY share, defined as market price movement plus reinvested dividends, was –3.5 percent, compared with the reinvested SIX Return Index, which was up 9.6 percent. Over the ten-year period 2007–2016, the total return on ASSA ABLOY’s Series B share was 326 percent, compared with a 107 percent rise in the SIX Return Index and a 43 percent rise in OMX Stockholm.
THE ASSA ABLOY SHARE ASSA ABLOY ANNUAL REPORT 2016106

Information for shareholders
Annual General MeetingThe Annual General Meeting of ASSA ABLOY AB will be held at Moderna Museet (Museum of Modern Art), Skeppsholmen, Stockholm at 15.30 on Wednesday, 26 April 2017. Shareholders wishing to attend the Annual General Meeting should:• Be recorded in the share register kept by Euroclear
Sweden AB by Thursday, 20 April 2017.• Notify ASSA ABLOY AB of their intent to attend no later
than Thursday, 20 April 2017.
Nominee-registered sharesIn addition of giving notice to attend, shareholders whose shares are nominee-registered must be temporarily regis-tered in their own name in the share register (so-called voting right registration) to be able to attend the Annual General Meeting. Such registration must be effected by Thursday, 20 April 2017, and shareholders should contact their bank or nominee well in advance of this date.
Notice of attendance• Website www.assaabloy.com• Telephone +46 (0)8 506 485 14• Address ASSA ABLOY AB, Annual General Meeting
Box 7842, SE-103 98 Stockholm, SwedenThe notice of attendance should state:• Name• Personal or corporate identity number• Address and daytime telephone number• Number of shares• Any assistants attending
If participation is by proxy, the proxy should be submitted in connection with the notice of attendance and the proxy must be presented in original at the latest at the Annual Gen-eral Meeting. Proxy form is available at: www. assaabloy.com.
Nomination CommitteeThe Nomination Committee has the task of, on behalf of the shareholders, preparing and submitting proposals for; elec-tion of Chairman of the Annual General Meeting, election of Chairman, Vice Chairman and other members of the Board of Directors, election of auditor, determination of fees to the auditor and the Board of Directors (including distribution of fees among the Chairman, Vice Chairman and the other members of the Board of Directors and remuneration for committee work) as well as election of members of the Nomination Committee and determination of the assign-ment of the Nomination Committee.
Up to and including the 2017 Annual General Meeting, the Nomination Committee comprises Carl Douglas (Investment AB Latour), Mikael Ekdahl (Melker Schörling AB), Liselott Ledin (Alecta), Marianne Nilsson (Swedbank Robur fonder) and Anders Oscarsson (AMF and AMF fonder). Carl Douglas is Chairman of the Nomination Committee.
DividendsFriday, 28 April 2017 has been proposed as the record date for dividends. If the Annual General Meeting approves the proposal, dividend is expected to be distributed by Euroclear Sweden AB on Thursday, 4 May 2017.
Further informationHedvig WennerholmTelephone +46 (0)8 506 485 [email protected]
Reports can be ordered from ASSA ABLOY AB• Website www.assaabloy.com• Telephone +46 (0)8 506 485 00• Fax +46 (0)8 506 485 85• Mail ASSA ABLOY AB
Box 70340 SE-107 23 Stockholm, Sweden
Financial reportingFirst quarter: 26 April 2017Second quarter: 19 July 2017Third quarter: 20 October 2017Fourth quarter and Year-end report: February 2018Annual Report 2017: March 2018
ASSA ABLOY ANNUAL REPORT 2016 INFORMATION FOR SHAREHOLDERS 107

As the global leader in door opening solutions ASSA ABLOY is using the latest technologies to open doors to events, education, hospitals, homes, hotels, airports and businesses all over the world. Since its formation in 1994, ASSA ABLOY has grown successfully through a combination of organic growth and over 200 acquisitions.
ASSA ABLOY ANNUAL REPORT 2016108

Production: ASSA ABLOY in cooperation with Hallvarsson & Halvarsson.Photo: Peter Hoelstad/Molly & Co, Kristian Älegård, Getty Images and ASSA ABLOY’s image bank etc. Printing: Göteborgstryckeriet in March 2017.
ASSA ABLOY is the global leader in door opening solutions, dedicated to satisfying end-user needs for security, safety and convenience
www.assaabloy.com
ASSA ABLOY ABBox 70340
SE-107 23 StockholmSweden
Visiting address: Klarabergsviadukten 90Tel +46 (0)8 506 485 00 Fax +46 (0)8 506 485 85
Reg. No. 556059-3575
“Future shareholder value is based on organic and acquired growth and a continuing process of rationalization and synergies across the Group.” Johan Molin, President and CEO