annual report 2016 - coop pank · 1 consolidated annual report 2016 business name: public limited...
TRANSCRIPT

Annual Report 2016
1
Consolidated Annual Report 2016 Business name: Public Limited Company (AS) Eesti Krediidipank
Legal address: Narva road 4, 15014 Tallinn, Republic of Estonia
Registry code: 10237832
Telephone: +372 669 0900
Fax: +372 661 6037
E-mail: [email protected]
Website: www.krediidipank.ee
Auditor: AS PricewaterhouseCoopers
Beginning and end of the financial year: 01.01.2016 - 31.12.2016 Attached documents: Independent auditor’s report Proposal for profit allocation

2
Table of contents
Management Board declaration 3
General information 4
Management report 2016 6
AS Eesti Krediidipank Group organizational structure, management arrangement, remuneration and dividend policy 7
Overview of activities, significant events and outlook in the year 2017 12
Key financial indicators, capital adequacy indicators and concentration of exratios of Krediidipank Group
exposures limits of Krediidipank Group 15
Consolidated financial statements of Krediidipank Group 2016 20
Consolidated statement of financial position of AS Eesti Krediidipank 21
Consolidated income statement and statement of comprehensive income of AS Eesti Krediidipank
22
Consolidated statement of changes in shareholders’ equity of AS Eesti Krediidipank 23
Consolidated statement of cash flows of AS Eesti Krediidipank 24
Notes to the financial statements 25
Appended documents: 79
Independent auditor’s report 80
Proposal for profit allocation 83

3
Management Board declaration
All data and supplementary information presented in the 2016 consolidated financial statements of AS Eesti Krediidipank are true and complete; no omissions have been made with regard to data or information that would affect the content or meaning of the information. The consolidated financial statements give a true and fair view of the financial position, performance and cash flows of AS Eesti Krediidipank Group. The consolidated financial statements have been prepared in accordance with International Financial Reporting Standards (IFRS) as adopted by the European Union and referred to in § 17 of the Accounting Act of Estonia. These 2016 consolidated financial statements of AS Eesti Krediidipank are in compliance with the laws of the Republic of Estonia. AS Eesti Krediidipank and the subsidiaries of the bank are going concern. The 2016 consolidated financial statements of AS Eesti Krediidipank will be presented to the general meeting of shareholders for approval in April 2017. The previous 2015 consolidated financial statements were approved by the general meeting of shareholders at 25.04.2016. Margus Rink /signed/ Chairman of the Management Board Janek Uiboupin /signed/ Member of the Management Board Kerli Lõhmus /signed/
Member of the Management Board

4
General information
Business name AS Eesti Krediidipank
Registered 15.03.1992 in Tallinn
Address Narva road 4, Tallinn 15014, Estonia
Commercial register number
10237832 (Commercial Register of the Republic of Estonia)
Date of first entry 19.08.1997
Phone + 372 669 0900
Fax + 372 661 6037
SWIFT/BIC EKRDEE22
Email address [email protected]
Website www.krediidipank.ee
Auditor AS PricewaterhouseCoopers
Commercial register number of the auditor
10142876 (Commercial Register of the Republic of Estonia)
Address of the auditor Pärnu road 15, Tallinn 10141
Balance sheet date of the financial statements
31.12.2016
Reporting period 01.01.2016- 31.12.2016
Reporting currency euro (EUR), in thousands
Shareholders holding in excess of 9% of the shares, as at 20.03.2017 Shareholders holding in excess of 9% of the shares, as at 31.12.2016 Members of the Supervisory board, as at 20.03.2017
Coop Investeeringud OÜ Coop Eesti Keskühistu TÜH liikmesühistud AS INBANK Saratoga Finance SPF S.A. East European Capital Investment Ltd Total percentage of votes represented BM-Bank PJSC Nordea Bank Finland PLC,Clients* Saratoga Finance SPF S.A. East European Capital Investment Ltd Total percentage of votes represented
*nominee account
Jaanus Vihand, Chairman of the Supervisory Board Jaan Marjundi Roman Provotorov Priit Põldoja Marko Kairjak
36.5849% 23.1455%
9.9995% 9.8638% 9.8104%
89.4041%
59.7304% 9.9995% 9.8638% 9.8104% 89.4041%
Members of the supervisory board, as at 31.12.2016
Andrus Kluge, Chairman of the Supervisory Board Timur Dyakov Arthur Klaos Boris Beliaev Ain Soidla
Members of the management board, as at 20.03.2017
Margus Rink, Chairman of the Management Board Janek Uiboupin Kerli Lõhmus

5
Members of the management board, as at 31.12.2016
Valmar Moritz, Chairman of the Management Board Marina Laaneväli, Vice Chairman of the Management Board (since 20.10.2016, previously member of the Management board) Uku Tammaru, Vice Chairman of the Management Board until 13.10.2016 Karin Ossipova, since 14.10.2016 Helo Koskinen, since 14.10.2016 Ieva Rācenāja, until 30.06.2016.
Entities belonging to the Group
AS Eesti Krediidipank, emaettevõte Krediidipanga Liisingu AS AS Martinoza AS Krediidipank Finants
The following definitions are used for the purposes of this report: “Parent company” - AS Eesti Krediidipank, including its Latvian branch, hereinafter also referred to as “Eesti Krediidipank”, “Krediidipank” and “bank”; “AS Eesti Krediidipank group” - parent company AS Eesti Krediidipank and the following companies belonging to the Group: AS Martinoza, Krediidipanga Liisingu AS and AS Krediidipank Finants, hereinafter also referred to as “Krediidipank group”, “group” .

Management report 2016

Eesti Krediidipank annual report 2016
7
AS Eesti Krediidipank group
Legal structure
The following companies were part of AS Eesti Krediidipank group as at 31.12.2016:
Name of the Company
Address Field of activity
Commercial register number Reg. date
Participation
AS Eesti Krediidipank
Narva road 4 Tallinn
banking 10237832 19.08.1997
parent company
Krediidipanga Liisingu AS
Narva road 4 Tallinn
leasing 10079244 27.08.1996
100%
AS Martinoza Narva road 4 Tallinn
real estate management
10078109 28.10.1996
100%
AS Krediidipank Finants
Narva road 4 Tallinn
other credit granting
12546980 03.10.2013
AS Eesti Krediidipank ownership interest of 51%
All companies are registered in the Commercial Register of the Republic of Estonia. The parent company is AS Eesti Krediidipank. AS Eesti Krediidipank has branch in Republic of Latvia: AS Eesti Krediidipank Latvijas filiāle, Cēsu iela 31/3, Rīga, LV-1012, Latvija. Latvian branch’s revenue in 2016 was 485 thousand euros, loss before income tax was 720 thousand euros. There were no income tax or other tax chargeable for profit or loss on 2016. At 31.12.2016, the Latvian branch employed 16 people (in full time equivalent units). Branch has not received any governmental aid. All the above-mentioned subsidiaries are fully consolidated with the line by line method, eliminating all intra-group receivables and liabilities, transactions between group companies, and income and expenses. AS Krediidipank Finants is included in the AS Eesti Krediidipank group and it is considered to be a subsidiary because control over the company exists both on the shareholders level and the level of the supervisory board. The definition of group according to the Regulation (EU) No 575/2013 of the European Parliament and of the Council matches that of IFRS.
Principles of organizational structure
The core activity of AS Eesti Krediidipank group is providing banking services as a credit institution. The activities of subsidiaries are primarily based on providing support services to the bank as a credit institution. The structure of the Group is designed and approved by the management board of the bank in accordance with the provisions of legislation, the articles of association and strategies of the bank and its subsidiaries, as well as by adhering to the instructions provided by the supervisory board and the development priorities of the bank.
Eesti Krediidipank annual report 2016
8
The Group's organizational structure is mainly based on a functional structure. Responsibility for the activities of the bank and its subsidiaries is divided between the members of the bank's management board according to field of activity and function, thereby establishing areas of responsibility. The allocation of areas of responsibility among members of the management board is based on the principle of separation of functions, which ensures the separation of controlling entities from controlled entities. Departments and business lines are formed in order to manage the activities or functions within the area of responsibility of a management board member. The allocation of areas of responsibility among members of the management board is decided by the supervisory board of the bank. The management board of the bank decides the competence, formation and staffing of the departments and business lines and it will also approve the organizational structure.
AS Eesti Krediidipank group management arrangement AS Eesti Krediidipank group acts on the basis of the principle of consolidation, which entails the establishment of collective and coordinated objectives, the sharing of common core values and the formation of competent governing bodies to manage risks across the entire group. The governing body of the Group companies are the management board and the supervisory board of the companies. The strategy, objectives and risk management policy of the Group are approved by the supervisory board of the bank. The management board of the bank and the supervisory boards of the group companies approve a plan of action that is more detailed for the specific company and targeted to the specific company in consideration of the bank's group strategy, objectives and risk appetite approved by the supervisory board of the bank. The core values expressed by the Group strategy are shared by all of the Group companies. The Group manages risks across the entire group. In order to improve the effectiveness of group management, the following committees have been established on the Group level: Audit Committee is comprised of members of the Supervisory Board of the bank (as at 31.12.2016) and it serves as an advisory body in respect of accounting, auditing, risk management, legal compliance, internal control and audit, general supervision and budgeting. Remuneration Committee is comprised of members of the Supervisory Board of the bank (as at 31.12.2016) and its role is to evaluate the implementation of remuneration policy and their adherence to the operational objectives of the bank and to evaluate the effect of decisions related to remuneration to compliance with requirements set forth concerning the Group's risk management, own funds and liquidity. Credit Committee and Credit Commission are competent bodies for making credit decisions and their role is to ensure through their decision-making the adherence to common credit policy across the Group. Price Commission is a competent body for the Group-wide management of real estate risk and realized credit risk of the collaterals. Asset/Liability Management Committee is a competent body on a group-wide basis for the management of liquidity risk, interest rate risk of the bank portfolio and securities portfolio,

Eesti Krediidipank annual report 2016
9
designing of the structure of assets and liabilities, management of profitability and management of capital.
A group-wide internal control system has been implemented by the Group encompassing all operational and management levels for the purposes of ensuring the effectiveness of the Group's operations, reliability of financial reporting, compliance of operations with applicable laws and other legislation, internal regulations approved by governing bodies and the adoption of decisions on the basis of reliable and relevant information. The control is based on a 3-level control system. The first level constitutes internal control that takes place internally within each division. The second level is made up of risk management and compliance function that operate as autonomous and independent control units. The third level comprises the internal audit unit that exercises control over the entire operations of the Group.
AS Eesti Krediidipank governing bodies The governing bodies of AS Eesti Krediidipank are its Supervisory Board and Management Board. The Supervisory Board is appointed by the General Meeting of Shareholders for a five-year term. Shareholders who hold shares at least 1/10 of the share capital are able to nominate candidates for election of members of the Supervisory Board in the form of a draft resolution of the General Meeting of Shareholders. The Management Board is appointed by the Supervisory Board of the bank as a collegial body up to five-year term. When appointing members of the Management Board, the Supervisory Board ensures that the Management Board that is formed would be sufficiently diverse in composition through a profile of knowledge, skills, experience and education in order to make sure that the Management Board has the capability to effectively manage all of the bank's operating segments. The Supervisory Board also aims to take into consideration gender diversity when deciding on the composition of the Management Board. Members of the governing body are appointed based upon requirements applicable to members of governing bodies pursuant to the provisions of the Credit Institutions Act: any appointed individual must have the necessary knowledge, skills, experience, education, professional qualifications and impeccable reputation in business to be able to manage a credit institution. A person whose earlier activities have caused the bankruptcy or compulsory liquidation or revocation of the activity license of a company, or from whom the right to engage in economic activity has been taken away pursuant to law, or whose earlier activities as a manager of a company have shown that he or she is not capable of organizing the management of a company such that the interests of the shareholders, members, creditors and clients of the company are adequately protected, or whose earlier activities have shown that he or she is not suitable to manage a company for other good reasons cannot be elected or appointed manager of a credit institution. In order to ensure compliance with the aforementioned requirements, the bank has adopted an internal policy for the evaluation of the suitability of a member of its governing body: suitability is evaluated before the individual is appointed member of a governing body and, if necessary, during their term of office as members. The bank has established a policy for the regular training for members of the management board in order to ensure sustained competency of its management board members.

Eesti Krediidipank annual report 2016
10
Remuneration policy Krediidipank group applies a single remuneration policy that has been approved by the Supervisory Board of the bank and the effectiveness, adherence to objectives and implementation of the policy is supervised by the Remuneration Committee. In 2016 took place one Remuneration Committee meeting. The remuneration policy applies equally to both employees and members of the management boards of group companies. The compensation structure applicable in Krediidipank group is comprised of three components:
- base salary (fixed and variable pay for successful performance); - performance pay according to the profitability of the Group, which is based on
return on equity; - bonus for outstanding accomplishments.
Performance pay is payable in cash in the period following the reporting period to those employees who have contributed to achieving the results while adhering to the objective and values of the Group and continue to be employed by the Group. The Group does not use any performance pay based on shares or options. Performance pay encourages efficient risk management and does not incentivise excessive risk-taking. Other non-monetary benefits are additional to the salary in the form of flexible work time, various collective events and supplementary paid personal holiday that depends on seniority. The Group's employees work under employment contracts, members of the management on the basis of authorization agreements. The remuneration paid by the Group during the financial year are presented in the table below. in thousands of euros
2016 2015
Wages and salaries and other compensation 3,347 3,352
Performance pay and bonuses 225 255
Redundancy benefits and severance payments 265 81
Fringe benefits 57 72
Social tax, unemployment insurance premiums 1,266 1,218
Total 5,160 4,978
Number of employees at end of reporting period (in full time equivalent units) 163 174
Average number of employees in reporting period (in full time equivalent units) 166 180
Severance payments specified in contracts 247 312
Information regarding management compensation is provided in accounting report note 36. Related parties.
Dividend policy
The current dividend policy was approved by shareholders on the annual general meeting of AS Eesti Krediidipank on 25 April 2016.
The objective of the dividend policy is to define the minimum and maximum level of distributable earnings to shareholders from unrestricted equity. The Bank defines unrestricted equity as the amount of the net assets after deducting the share capital, share premium and reserves.

Eesti Krediidipank annual report 2016
11
According to the dividend policy, the profit allocation decision is adopted on the basis of consolidated group accounts. As dividends, a maximum of 40% of the Group's unrestricted equity, but not more than the profit for the last financial year and not more than the unrestricted equity of the parent company can be distributed.
Dividends are not paid out if the distributable amount is less than EUR 200,000 (two hundred thousand euros).
Herewith, all capital adequacy requirements must be met both on the consolidated and individual level, also after the dividend distribution decision.
Persons that have close links According to the 26 June 2013 Regulation (EU) number 575/2013 of the European Parliament and of the Council, close links is defined as a situation in which two or more natural or legal persons are linked in any of the following ways:
participation in the form of ownership, direct or by way of control, of 20% or more of the voting rights or capital of an undertaking;
control;
a permanent link of both or all of them to the same third person by a control relationship. According to this definition, until 27.01.2017 AS Eesti Krediidipank had significant relationship with BM-Bank PJSC, 8/15 Rozhdestvenka Street, Moscow, that owned 59.7304% of shares of AS Eesti Krediidipank. At the time of management signing the 2016 annual report, AS Eesti Krediidipank had significant relationship with Coop Investeeringud OÜ, which first acquired the 59.7304% shareholding owned by BM-Bank PJSC in AS Eesti Krediidipank and then transferred 23.1455% holding to six members cooperatives of AS Coop Eesti Keskühistu TÜH. At the time of signing the report, Coop Investeeringud OÜ owns 36.5849% of shares of AS Eesti Krediidipank.

Eesti Krediidipank annual report 2016
12
Overview of activities and significant events
2016 was a turning point in the world - the British decided to leave the European Union, and the United States elected a businessman without any previous political experience as president. Both events are estimated to have an impact on the global and EU economies towards the increase in the direction of protectionism. In 2016, the European Central Bank and national central banks continued to revive the economic through bond purchases. Also key interest rates remained low and the fees of the European Central Bank and national central banks in central banks for preserving a liquidity buffer were maintained. Despite the efforts, the average GDP growth in European Union countries in 2016 was very low, as in 2015. The economic environment described above has kept the interest of deposits in Estonia at low levels, with major banks paying no interest at all on certain deposits. Loan interest rates are still at relatively low levels and the continued wage growth has increased the volume of housing loans. At the beginning of 2017, Eesti Pank announced that the loan leasing portfolio of Estonian enterprises and households grew rapidly in 2016, deposits of enterprises and households in bank increased, but the profitability of the banking sector decreased. 2016 was successful for Krediidipank Group. Group’s profit was EUR 1.53 million (2015: EUR 1.78 million). The loan portfolio grew to EUR 153.13 million, the volume of deposits decreased by approximately 5% as compared to the previous year, and totaled EUR 253.81 million at the end of the year. Largely due to a decline in the volume of deposits, the balance volume decreased almost by 5% in 2016 and amounted to EUR 290.17 million at the end of the year. In 2016, housing loan was one of the Bank's focus products. Whereas in 2015, 185 loan contracts were concluded for the amount of EUR 6.84 million, there were 252 loan agreements in the total amount of EUR 11.77 million in 2016. The sales volume of loans secured by real estate decreased slightly in 2016. By the end of the year, the Bank had granted EUR 1.87 million in loans secured by real estate and concluded approximately 100 loan contracts. In the comparison year 2015 98 loan contracts were concluded in the total amount of 2.01 million euros. The leasing and loan portfolio of the bank's subsidiary Krediidipanga Liisingu AS decreased during the year 2016 from 25.22 million euros to 23.83 million euros. During the year, leasing projects amounting to a total of 3.76 million euros were financed. In the year 2015 the total amount of financing was 2.90 million euros. The leasing portfolio was comprised of 62% real estate (2015: 63%), 35% passenger vehicles and vans (2015: 35%), 3% machinery and other equipment (2015: 2%). 2016 turned out as predicted for AS Martinoza the Group’s subsidiary that deals with real estate, which means the sales revenue decreased, being the total of 2.1 million euros (it was 4.7 million euros in the year 2015), vacancies of larger leasable premises of commercial buildings remained very low during the financial year, as in 2015. The balance sheet volume of Martinoza totaled EUR 19.36 million at the end of 2016, in the year 2015 the balance sheet volume was 19.85 million euros. The Bank's subsidiary of Krediidipanga Finants AS, which offers consumer credit Target Loan, operated successfully. During the year, the balance sheet volume increased by EUR 2.10 million, totaling EUR 13.48 million at the end of 2016.

Eesti Krediidipank annual report 2016
13
Events in 2016
Focus products in 2016 The most important products actively offered and developed by Krediidpank were: Settlement package; Target loan; Mortgage loan; Home loan.
1,579 customers have joined the Settlement package during the year, and a total of 5,828 package agreements have been concluded. In the year 2015 the corresponding numbers were 1,753 and 4,576. By the end of 2016, the Target loan loan portfolio of bank’s subsidiary Krediidipank Finants held 7,739 clients and 10,026 valid loan agreements. In the year 2015 the corresponding numbers were 6,283 and 7,584.
New homepage of the Bank and extended usability of the Internet Bank In February, Krediidipank’s new homepage was completed, which can be viewed both from computers and smartphones. In addition, Krediidipank apps for Android and iOS platforms are available for smartphones, making it convenient to use Internet bank.
Three scholarships of EUR 2,000
For the tenth time, Rein Otsason Foundation and Eesti Krediidipank divided the traditional annual scholarships to students specializing in finance and economics from Estonia and foreign countries. In May, on the birth date of Rein Otsason, three scholarships of EUR 2,000 each were granted to Sander Veges (Fudan University School of Economics), Renee Pesor (EBS) and Jelena Komendantova (Tallinn University of Technology).
Sõle branch office shut down.
In accordance with the optimization of branch office network, the Sõle branch in Tallinn was shut down on September 14. Bank's majority shareholder transferred its shares of Krediidpank
In its Quarter III interim report the Russian bank VTB announced that the majority shareholding of BM-Bank JSC in Eesti Krediidipank has been reclassified into asset held for sale. On 27 January 2017 Coop Investeeringud OÜ – a company with owners of Estonian background – obtained the 59.7% shareholding in Eesti Krediidipank, formerly owned by BM-Bank JSC.

Eesti Krediidipank annual report 2016
14
Outlook of Krediidipank group in the year 2017
On its 25th anniversary, Krediidipank is making a big step forward. Coop Eesti, the Bank's new strategic owner, and its 600,000 regular customers are creating an excellent precondition for increasing the Bank's customer base. Employees of Krediidipank have the opportunity to contribute to the development of an Estonian growing bank with innovative strategies. Customers of Krediidipank will retain all current basic services and good depositing opportunities, and, as added value, the network of sales and service networks will increase notably. The Bank will continue operating under its current name of Krediidipank until this autumn, and then will be renamed Coop Pank. During the spring and summer, we will prepare the bank's new product suite and new sales and service channels. Coop Bank will continue operations in the banking market with a distinctive strategy. The cornerstone of our strategy are the bank's existing customers, 600,000 customers of Coop Estonia, and the needs of all our customers. We are creating a bank that:
focuses in particular on providing services to private customers and to small and
medium sized companies connected to private customers;
we see our target market, in addition to current cities, in particular, regions outside
larger cities;
we offer two product packages: daily banking (account, transfers, bank cards, cash and
deposits) and financing (small loan, installment loan, credit card, housing loan);
we serve customers where it's most suitable for the customer: the bank's existing offices,
the sales and service network in Coop stores, Internet/mobile bank, cash transactions in
Coop checkouts;
our customer offering will be based on the synergy between trade and banking as well
as on customer gain.
Our estimated start of operations under Coop Bank is October 2017.

Eesti Krediidipank annual report 2016
15
Key financial indicators and ratios of Krediidipank Group In thousands of euros 2016 2015
As at the end of the reporting period
Balance sheet total 290,170 305,350
Shareholders’ equity 29,577 28,898
Share capital 25,001 25,001
Number of shares of AS Eesti Krediidipank 39,117,600 39,117,600
Loans and advances to customers 153,133 152,652
Deposits 253,812 267,395
For the reporting period
Net profit 1,743 1,772
Total income 14,596 17,076
Net interest income 7,398 5,888
Interest income 9,119 8,307
Interest expense 1,721 2,419
Ratios (annual)
Return on equity (ROE)
Net profit/shareholders´ equity 6.0% 6.3%
Return on assets (ROA)
Net profit/assets 0.6% 0.6%
Equity multiplier (EM)
Total assets/shareholders´ equity 10.2 10.0
Profit margin (PM)
Net profit/total income 11.9% 10.4%
Asset utilization (AU)
Total income/assets 4.9% 6.1%
Earnings per share EPS (euros)
Net profit per common share eligible for dividends 0.04 0.05
Number of account holders* 33,345 43,008
Number of service locations 13 14
Ratios have been calculated based on average balance sheet indicators for the reporting period. *In 2016, the client base was arranged, accounts, which were not used for years and where money was not held, were closed.

Eesti Krediidipank annual report 2016
16
Indicators of capital adequacy of Krediidipank group An overview about formation of regulative equity, capital demands and capital adequacy:
In thousands of euros Capital base 31.12.2016 31.12.2015
Tier 1 capital
Paid-in share capital and share premium 25,175 25,175
Statutory reserve capital 1,970 1,844
Accumulated profit/loss (-) 617 58
Intangible assets (-) -687 -761
Deferred tax asset depending on future taxable profits (-) -1 -1
Adjustment of value arising from requirements of reliable measurement (-) -21 -17
Other deductions from Tier I Capital (-) -1,019 0
Total Tier 1 capital 26,034 26,298
Subordinated debt 3,299 4,000
Tier 2 capital 3,299 4,000
Eligible capital for capital adequacy calculation 29,333 30,298
Risk-weighted assets (RWA)
Central government and central banks using the Standardised Approach 1,452 526
Credit institutions, investment companies and local governments using the Standardised Approach
11,581 13,774
Companies using the Standardised Approach 8,323 4,404
Retail claims using the Standardised Approach 17,371 16,718
Claims secured by mortgage on real estate using the Standardised Approach 55,837 55,353
Claims past due using the Standardised Approach 2,645 2,874
Items subject to particularly high risk using the Standardised Approach 6,845 9,962
Other assets using the Standardised Approach 18,035 18,784
Total credit risk and counterparty credit risk 122,089 122,395
Operational risk using the Basic Indicator Approach 16,132 18,272
Total risk-weighted assets 138,221 140,667
Capital adequacy (%) 21,22% 21,54%
Tier 1 Capital Ratio (%) 18,84% 18,69%
Since 2016, in calculating capital we are taking into account the guidelines provided in the European Commission Regulation No 183/2014, whereby any amounts recorded in the financial year may be included in the calculation of general and specific credit risk adjustments only if the corresponding amounts are deducted from Tier 1 Capital of the credit institution. The Group does not use general credit risk adjustment, but only individual and collective allowances.
Own funds requirements:
Core Tier 1 capital ratio 4.50% Core Tier 1 capital/total risk exposure
Tier 1 capital ratio 6.00% Tier 1 capital/total risk exposure
Total capital ratio 8.00% Total capital/total risk exposure
Systemic risk buffer 1.00% Of total risk exposure
Capital maintenance buffer 2.50% Of total risk exposure
The systemic risk buffer of Krediidipank group as at 31.12.2016 was 1,382 thousand euros compared to 2,813 thousand euros as at 31.12.2015.
Eesti Krediidipank annual report 2016
17
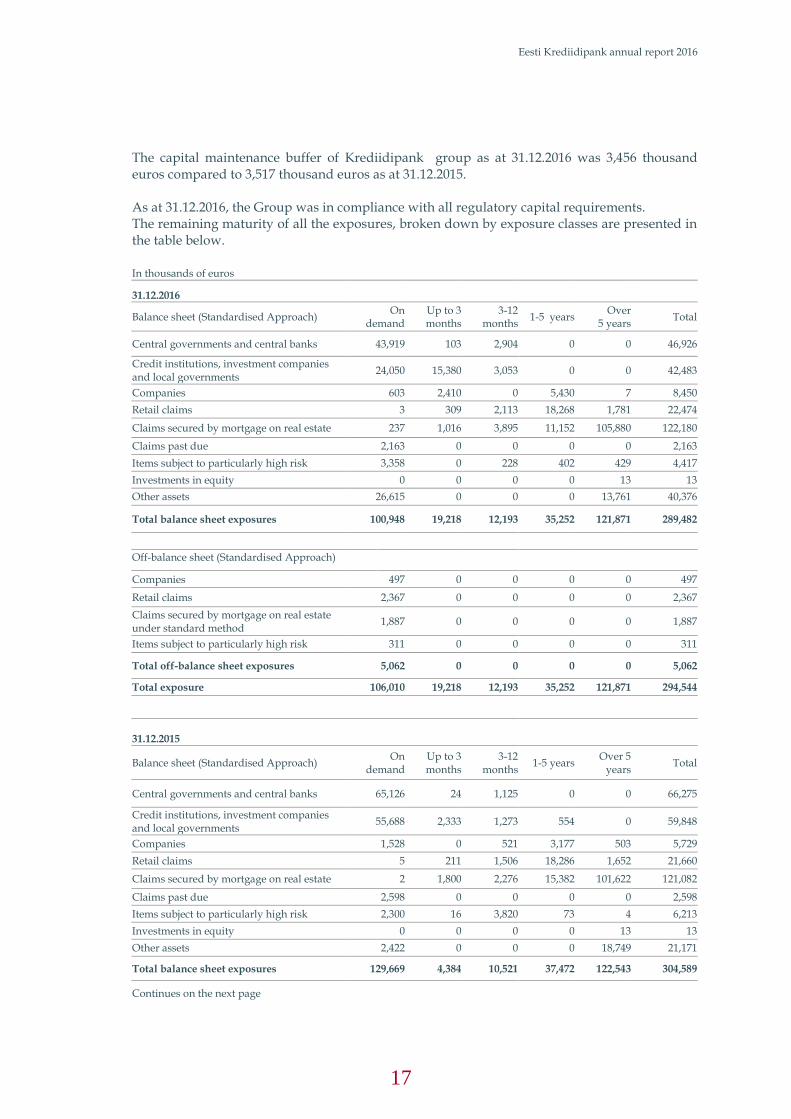
The capital maintenance buffer of Krediidipank group as at 31.12.2016 was 3,456 thousand euros compared to 3,517 thousand euros as at 31.12.2015. As at 31.12.2016, the Group was in compliance with all regulatory capital requirements. The remaining maturity of all the exposures, broken down by exposure classes are presented in the table below. In thousands of euros
31.12.2016
Balance sheet (Standardised Approach) On
demand Up to 3 months
3-12 months
1-5 years Over
5 years Total
Central governments and central banks 43,919 103 2,904 0 0 46,926
Credit institutions, investment companies and local governments
24,050 15,380 3,053 0 0 42,483
Companies 603 2,410 0 5,430 7 8,450
Retail claims 3 309 2,113 18,268 1,781 22,474
Claims secured by mortgage on real estate 237 1,016 3,895 11,152 105,880 122,180
Claims past due 2,163 0 0 0 0 2,163
Items subject to particularly high risk 3,358 0 228 402 429 4,417
Investments in equity 0 0 0 0 13 13
Other assets 26,615 0 0 0 13,761 40,376
Total balance sheet exposures 100,948 19,218 12,193 35,252 121,871 289,482
Off-balance sheet (Standardised Approach)
Companies 497 0 0 0 0 497
Retail claims 2,367 0 0 0 0 2,367
Claims secured by mortgage on real estate under standard method
1,887 0 0 0 0 1,887
Items subject to particularly high risk 311 0 0 0 0 311
Total off-balance sheet exposures 5,062 0 0 0 0 5,062
Total exposure 106,010 19,218 12,193 35,252 121,871 294,544
Tuhandetes eurodes
31.12.2015
Balance sheet (Standardised Approach) On
demand Up to 3 months
3-12 months
1-5 years Over 5
years Total
Central governments and central banks 65,126 24 1,125 0 0 66,275
Credit institutions, investment companies and local governments
55,688 2,333 1,273 554 0 59,848
Companies 1,528 0 521 3,177 503 5,729
Retail claims 5 211 1,506 18,286 1,652 21,660
Claims secured by mortgage on real estate 2 1,800 2,276 15,382 101,622 121,082
Claims past due 2,598 0 0 0 0 2,598
Items subject to particularly high risk 2,300 16 3,820 73 4 6,213
Investments in equity 0 0 0 0 13 13
Other assets 2,422 0 0 0 18,749 21,171
Total balance sheet exposures 129,669 4,384 10,521 37,472 122,543 304,589
Continues on the next page

Eesti Krediidipank annual report 2016
18
Off-balance sheet (Standardised Approach)
Credit institutions, investment companies and local governments
0 207 0 0 0 207
Companies 299 0 0 0 0 299
Retail claims 2,487 0 0 0 0 2,487
Claims secured by mortgage on real estate under standard method
3,663 0 0 0 0 3,663
Items subject to particularly high risk 1,422 0 0 0 0 1,422
Total off-balance sheet exposures 7,871 207 0 0 0 8,078
Total exposure 137,540 4,591 10,521 37,472 122,543 312,667
In addition to the capital adequacy indicator, according to the Capital Requirements Regulation (CRR) and Capital Requirements Directive (CRD IV), an important indicator for banks is the financial leverage ratio in order to limit excessive indebtedness of banks. In order to calculate the financial leverage ratio, the capital indicator (Tier 1 capital, see the table on page 16) is divided by the total exposure indicator (see the table on page 17) and it is expressed as a percentage. The financial leverage ratio of Krediidipank group was at 31.12.2016 8.84%, compared to 8.48% as at 31.12.2015.
Krediidipank group plans its strategy by taking into account the need to maintain its financial leverage ratio on a sustainable level. The bank's management board and the operational body that it has formed, the Asset/Liability Management Committee, monitor the risk levels arising from excessive financial leverage and the compliance of the ratio with regulations, analysing changes in the balance sheet structure and when necessary adopting an action plan for controlling financial leverage. Group’s liquidity position is strong. At 31.12.2016 the Liquidity Coverage Ratio (LCR) was 1,164.0% and at 31.12.2015 354.7%.
Eesti Krediidipank annual report 2016
19
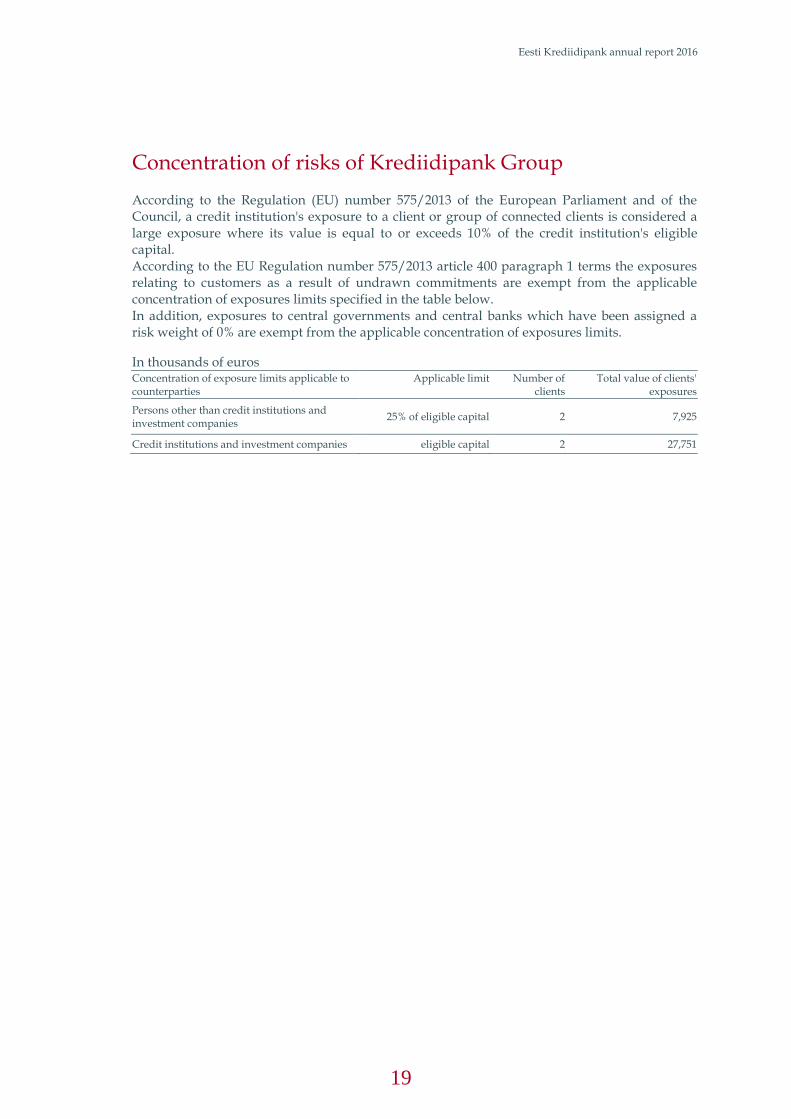
Concentration of risks of Krediidipank Group
According to the Regulation (EU) number 575/2013 of the European Parliament and of the Council, a credit institution's exposure to a client or group of connected clients is considered a large exposure where its value is equal to or exceeds 10% of the credit institution's eligible capital. According to the EU Regulation number 575/2013 article 400 paragraph 1 terms the exposures relating to customers as a result of undrawn commitments are exempt from the applicable concentration of exposures limits specified in the table below. In addition, exposures to central governments and central banks which have been assigned a risk weight of 0% are exempt from the applicable concentration of exposures limits.
In thousands of euros Concentration of exposure limits applicable to counterparties
Applicable limit Number of clients
Total value of clients' exposures
Persons other than credit institutions and investment companies
25% of eligible capital 2 7,925
Credit institutions and investment companies eligible capital 2 27,751

Consolidated financial statements of Krediidipank Group 2016

21
AS Eesti Krediidipank consolidated statement of financial position
In thousands of euros Assets Note 31.12.2016 31.12.2015
Cash on hand 22,337 2,342
Balances with central banks 3 43,919 65,126
Loans and advances to credit institutions 4 39,293 57,716
Financial assets held for trading 10 0 28
Financial assets designated at fair value through profit or loss
10 11,421 6,078
Loans and advances to customers 5-9 153,133 152,652
Held-to-maturity financial assets 10 503 503
Available-for-sale financial assets 10 13 13
Other financial assets 11 714 1,161
Assets held for sale 12 4,279 2,422
Investment property 13 9,105 11,220
Property, plant and equipment 14 4,512 5,088
Intangible assets 15 687 761
Other assets 16 254 240
Total assets 290,170 305,350
Liabilities
Financial liabilities designated at fair value through profit or loss
0 276
Due to credit institutions 18 185 115
Due to customers 19 253,812 267,395
Other financial liabilities 20 1,433 3,576
Other liabilities 21 1,124 1,051
Subordinated debt 22 4,039 4,039
Total liabilities 260,593 276,452
Shareholders’ equity 23
Share capital 25,001 25,001
Share premium 174 174
Reserves 1,970 1,844
Retained earnings (accumulated loss) 2,146 1,838
Shareholders’ equity attributable to owners of the parent company
29,291 28,857
Non-controlling interest 286 41
Total shareholders’ equity 29,577 28,898
Total liabilities and shareholders’ equity 290,170 305,350
Notes to the financial statements on pages 25 to 78 are an integral part of the consolidated financial statements.
22
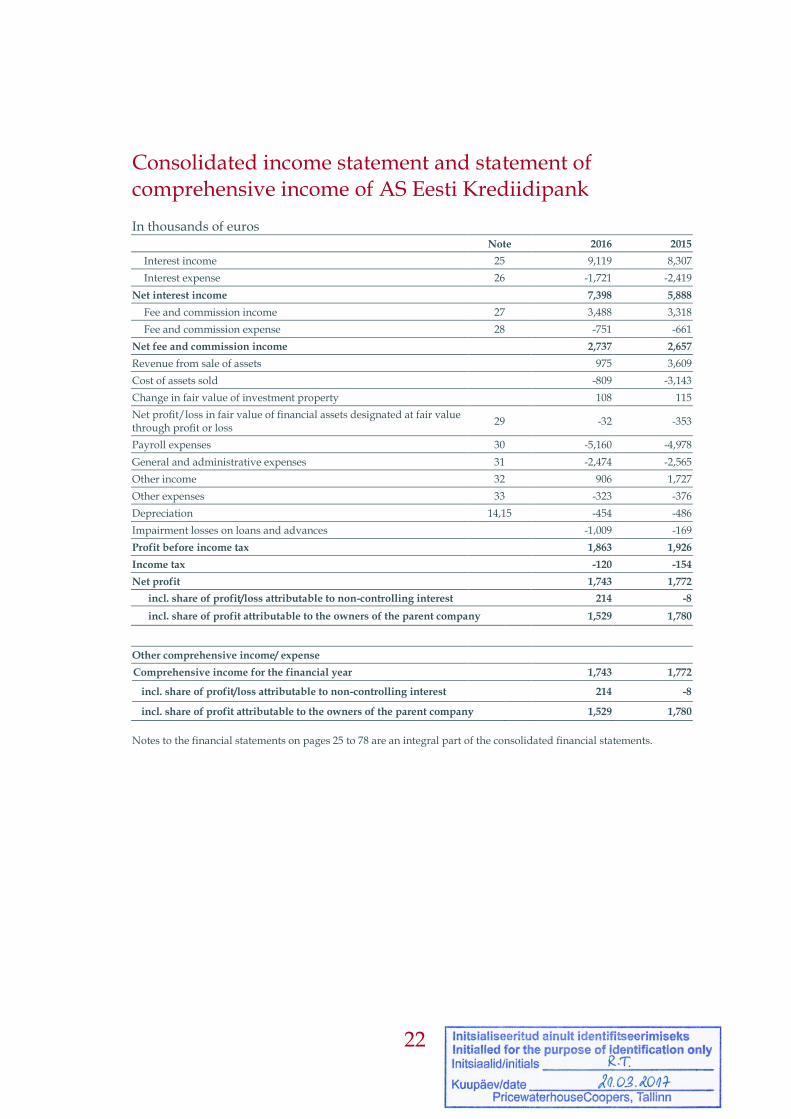
Consolidated income statement and statement of comprehensive income of AS Eesti Krediidipank
In thousands of euros
Note 2016 2015
Interest income 25 9,119 8,307
Interest expense 26 -1,721 -2,419
Net interest income 7,398 5,888
Fee and commission income 27 3,488 3,318
Fee and commission expense 28 -751 -661
Net fee and commission income 2,737 2,657
Revenue from sale of assets 975 3,609
Cost of assets sold -809 -3,143
Change in fair value of investment property 108 115
Net profit/loss in fair value of financial assets designated at fair value through profit or loss
29 -32 -353
Payroll expenses 30 -5,160 -4,978
General and administrative expenses 31 -2,474 -2,565
Other income 32 906 1,727
Other expenses 33 -323 -376
Depreciation 14,15 -454 -486
Impairment losses on loans and advances -1,009 -169
Profit before income tax 1,863 1,926
Income tax -120 -154
Net profit 1,743 1,772
incl. share of profit/loss attributable to non-controlling interest 214 -8
incl. share of profit attributable to the owners of the parent company 1,529 1,780
Other comprehensive income/ expense
Comprehensive income for the financial year 1,743 1,772
incl. share of profit/loss attributable to non-controlling interest 214 -8
incl. share of profit attributable to the owners of the parent company 1,529 1,780
Notes to the financial statements on pages 25 to 78 are an integral part of the consolidated financial statements.

23
Consolidated statement of changes in shareholders’ equity of AS Eesti Krediidipank
In thousands of euros
Share capital
Share premium
Statutory reserve capital
Retained earnings
Total equity attributable
to the shareholders of the parent
company
Non- control-
ling interest
Total share-holders’equity
Balance as of 31.12.2014 25,001 174 1,813 89 27,077 49 27,126
Net profit for the financial year 0 0 0 1,780 1,780 -8 1,772
Total comprehensive income for the period
0 0 0 1,780 1,780 -8 1,772
Changes in reserves 0 0 31 -31 0 0 0
Balance as of 31.12.2015 25,001 174 1,844 1,838 28,857 41 28,898
Dividends paid in 2015 0 0 0 -1,095 -1,095 0 -1,095
Contribution of a non-controlling stake in the share capital of the subsidiary
0 0 0 0 0 31 31
Net profit for the financial year 0 0 0 1,529 1,529 214 1,743
Total comprehensive income for the period
0 0 0 1,529 1,529 214 1,743
Changes in reserves 0 0 126 -126 0 0 0
Balance as of 31.12.2016 25,001 174 1,970 2,146 29,291 286 29,577
Additional information presented in Note 23. Notes to the financial statements on pages 25 to 78 are an integral part of the consolidated financial statements.

24
AS Eesti Krediidipank consolidated statement of cash flows
In thousands of euros Cash flows from operating activities (indirect method) Note 2016 2015
Net profit 1,529 1,780
Adjustments
Change in provisions for loans and advances 1,009 169
Depreciation and impairment of non-current assets 14,15 456 499
Impairment of available-for-sale financial assets 12 82 171
Change in fair value of financial assets designated at fair value through profit or loss
186 372
Revaluation of investment property 13 -108 -115
Net profit/loss on sale of non-current assets (-/+) 12 -2
Effect of changes in currency exchange rates 5 -1
Net interest income 25,26 -7,398 -5,887
Interest received 8,571 6,873
Interest paid -2,293 -2,666
Change in loans and advances related to customers of credit institution and leasing companies
-66 -1,320
Change in fair value of financial assets designated at fair value through profit or loss
-6,040 7,307
Change in long - term receivables from credit institutions 0 -80
Change in loans and advances to credit institutions 70 -241
Change in deposits -13,010 59,439
Change in assets held for sale -1,857 2,116
Change in other assets and liabilities related to operating activities 379 1,234
Total cash flows from operating activities -18,473 69,648
Cash flows from investment activities (direct method)
Redemption and sale of held-to-maturity financial assets 0 4,412
Proceeds from sale of non-current assets and investment property 37 2,474
Purchase of non-current assets and investment property -144 -317
Contribution of a non-controlling stake in the share capital of the subsidiary
31 0
Total cash flows from investing activities -76 6,569
Cash flows from financing activities (direct method)
Dividends paid -1,095 0
Repayments of loans to credit institutions 0 -14,000
Total cash flows from financing activities -1,095 -14,000
Total cash flows -19,644 62,217
Change in cash and cash equivalents -19,644 62,217
Cash and cash equivalents at beginning of the period 124,684 62,467
Cash and cash equivalents at end of the period 105,040 124,684
Cash and cash equivalents balance is comprised of: 105,040 124,684
Cash on hand 22,337 2,342
Demand deposits in central banks 43,919 65,126
Demand and short-term deposits in credit institutions 38,784 57,216
Notes to the financial statements on pages 25 to 78 are an integral part of the consolidated financial statements.

25
Notes to Financial Statements
Note 1. Accounting principles
AS Eesti Krediidipank (Reg. No. 10237832) is a credit institution registered in Tallinn (Estonia) Narva road 4. These consolidated financial statements of AS Eesti Krediidipank for the year 2016 have been approved by the management board of AS Eesti Krediidipank and will be presented to the shareholders for approval Functional and presentation currency The functional currency of the AS Eesti Krediidipank Group is euro. 2016 consolidated financial statements have been presented in thousands of euros. 1.1 Basis of preparation These consolidated financial statements of AS Eesti Krediidipank Group are prepared in accordance with International Financial Reporting Standards (IFRS) as adopted by the EU. The principal accounting policies applied in the preparation of these consolidated financial statements are set out below. These policies have been consistently applied to all the years presented, unless otherwise stated. These financial statements have been prepared under the historical cost convention, except as disclosed in some of the accounting policies below (i.e. financial assets at fair value). Financial statements have been prepared according to accrual principle of accounting. The Group classifies its expenses by nature of expense method. When the presentation or classification of items in the consolidated financial statements is amended, comparative information for the previous period are also reclassified, if not referred differently in specific accounting principle. 1.2 Critical accounting estimates and judgements The preparation of the consolidated financial statements in accordance with the International Financial Reporting Standards as adopted by the EU requires the use of certain critical accounting estimates and assumptions that affect the reported amounts of assets and liabilities and disclosure of contingent assets and liabilities at the date of the financial statements and the reported amounts of revenues and expenses for the reporting period. Although these estimates are based on best knowledge and judgement of current events and actions, the actual outcome and the results ultimately may significantly differ from those estimates. More detailed overview of the estimates made is provided under accounting principles or disclosures set out below. Critical estimates and judgements are primarily used in the following areas: * loan allowances, incl. fair value assessment of collateral (Note 9); * estimation of the fair value of investment property (Note 13); * fair value of financial assets and liabilities (Note 2). Estimates and judgments are continually evaluated based on historical experience and other factors, including expectations of future events that are believed to be reasonable under these circumstances. Changes in assumptions may have a significant impact on the financial statements in the period assumptions are changed. Management believes that the underlying assumptions are appropriate and the Group's financial statements therefore present the financial position and results truly and fairly. 1.3 Consolidation
These consolidated financial statements of the AS Eesti Krediidipank Group are comprised of the financial statements of the parent company AS Eesti Krediidipank and its subsidiaries Krediidipanga Liisingu AS, AS Martinoza and AS Krediidipank Finants as of 31 December 2016.

26
The financial information of all companies controlled by AS Eesti Krediidipank has been consolidated. Group entities use uniform accounting policies. The definition of group according to the Regulation (EU) No 575/2013 of the European Parliament and of the Council matches that of IFRS. The statements of financial position and income statements of the bank and its subsidiaries are consolidated on a line-by-line basis, eliminating the intercompany balances, revenues, income-expenses and unrealised gains/losses on transactions between group companies. Subsidiaries Subsidiaries are all economic entities in which the Group has control. An entity is controlled by the Group if the Group receives or has rights to the variable profit arising from ownership interest in an entity and it is able to influence the size of the profit by exercising its influence over the entity. Subsidiaries are consolidated in the financial statements from the time control arises until it ceases. Pursuant to the Accounting Act of the Republic of Estonia, information of the separate financial statements (primary statements) of the consolidating entity (parent company) shall be disclosed in the notes to the consolidated financial statements (see Note 38). In preparing the primary financial statements of the parent company the same accounting policies have been used as in preparing the consolidated financial statements. In the parent company’s separate primary financial statements, disclosed to these consolidated financial statements, the investments into the shares of subsidiaries are accounted for at cost less any impairment recognised. Non-controlling interest Non-controlling interest is the share of the net profit (loss) of a subsidiary in the statement of comprehensive income, which is attributable to interests which are not owned, directly or indirectly, by the Group. Non-controlling interest forms a separate component of the Group’s subsidiaries shareholders outside the Group or the interest of the subsidiary's shareholders' equity. Non-controlling interests in the comprehensive income is included within equity in the consolidated statement of financial position separately from the equity attributable to the shareholders of the parent company and is disclosed below the consolidated statement of comprehensive income. 1.4 Foreign currency transactions and assets and liabilities denominated in a foreign
currency All other currencies except for the functional currency, the euro, constitute foreign currencies. Foreign currency transactions have been translated to functional currencies based on the foreign currency exchange rates of the European Central Bank prevailing on the transaction date. Monetary assets and liabilities denominated in a foreign currency have been translated into functional currency based on the foreign currency exchange rates of the European Central Bank prevailing on the balance sheet date. Foreign exchange gains and losses are recognised in the income statement as income or expenses of that period. Non-monetary assets and liabilities denominated in a foreign currency measured at fair value have been translated into functional currency based on the foreign currency exchange rates of the European Central Bank prevailing on the balance sheet date. Non-monetary assets and liabilities that are not measured at fair value (e.g. prepayments, inventories accounted for using the cost method; property, plant and equipment as well as intangible assets) in a foreign currency are not translated at the balance sheet date but they continue to be reported using the official exchange rate of the European Central Bank prevailing at the date of the transaction.

27
1.5 Cash and cash equivalents For the purposes of the cash flow statement, cash and cash equivalents comprise cash on hand, demand deposits due from central banks and other credit institutions, that are available for use without any significant restrictions and which are subject to an insignificant risk of changes in value. The section of cash flows from operating activities of the statement of cash flows is presented using the indirect method, the cash flows from investment activities and cash flows from financing activities are presented using the direct method. 1.6 Financial assets
AS Eesti Krediidipank Group classifies the financial instruments into classes that reflect the nature of information and take into account the characteristics of those financial instruments. The classification made can be seen in the table below:
Category (as defined by IAS 39) Class (as determined by the Group)
Financial assets
Loans and receivables
Loans and advances to credit institutions
Loans and advances to customers
Private individuals
Legal entities
Other financial assets
Financial assets at fair value through profit or loss
Held for trading interest rate swaps - derivatives
Debt securities designated at fair value through profit or loss
Held-to-maturity financial assets Debt securities held-to-maturity
Available-for-sale financial assets Investment securities – equity securities
Contingent receivables Contractual amounts of currency – related to derivatives
Financial assets are any assets that are cash, a contractual right to receive cash or another financial asset from another party, a contractual right to exchange financial instruments with another party under conditions that are potentially favorable or an equity instrument of another party. Management determines the classification of its investments at initial recognition. 1.6.1. Loans and receivables
Loans and receivables are non-derivative financial assets with fixed or determinable payments that are not quoted in an active market. They arise when the Group provides money, goods or services directly to a debtor with no intention of trading the resulting receivable. Loans and advances are initially recognised in the consolidated statement of financial position at fair value including any transaction costs, when the cash is paid to the borrower or right to demand payment has arisen and are derecognised only when they are repaid or written-off, regardless of the fact that part of them may be recognised as costs through providing allowances for loans. The loan allowances are presented on the respective line of statement of financial position at negative value. Loans have been recognised in the statement of financial position at amortised cost, using effective interest rate method. Accrued interest on the loans is recorded in the respective line of statement of financial position. For overdrafts and credit cards, the actual use of the limit by the borrower is stated in the statement of financial position. The unused credit limit is recognised as contingent liability. Loan restructuring constitutes a change in the terms of the loan (maturity, payment schedule, interest rate) resulting from a change in the risk level of the borrower. The policies for the accounting and presentation of restructured loans do not differ from other loans. Lease receivables Finance lease transactions are lease transactions under which all significant risks and rights from using the assets are immediately transferred from the Group to the lessee. Legal

28
ownership of assets is transferred to the customer at the end of the lease term. The receivables from the financial lease agreements are recognised at net present value of the minimum lease payments, from which the payments of principal received have been deducted, plus unguaranteed residual value at the end of contract. Lease payments collected are allocated between repayment of principal and finance income. Finance income is recognised over the rental period based on the pattern reflecting a constant periodic rate of return on the lessor's net investment in the financial lease. The lessor's direct expenses related to the contract are part of effective interest rate and are booked as decrease of income from lease over the period of lease contract. Allowances for lease receivables are presented on the respective line of the statement of financial position at negative value. A lease receivable from a client is recognised in the statement of financial position as of the moment of delivering the assets being the subject of the agreement to the client. In case of transactions, in which the assets being the object of the agreement having a long delivery term have not yet been delivered to the client, the payments received from the lessees under these agreements are recognised in the statement of financial position as prepayments of buyers in on line "Other financial liabilities". The amounts paid by the leasing firm for the assets under lease agreements not yet delivered are recognise in the statement of financial position as prepayments to suppliers on line "Other financial assets". Factoring and warehouse receipt financing receivables Factoring transactions are considered to be financing transactions where the leasing firm provides the financial resources to its selling partners through transfer of the rights to the receivables from these sales transactions. The leasing firm acquires the right for the receivables payable by the buyer subject to the sales contract. Factoring is the transfer of receivables. Depending on the terms of the factoring contract the buyer either accepts the transfer of substantially all the risks and rewards of the ownership of the receivable (non-recourse factoring) or retains the right to transfer the risks and rewards back to the seller during a pre-specified term (recourse factoring). Transaction is booked as financing in case the leasing company does not own all the rights related to the receivable. The receivable is included in statement of financial position until payment is received or recourse is expired. If a contract does not include the seller's guarantee and the leasing company acquires control of all rights at the moment of selling the receivable, the transaction is accounted for as an acquisition of a receivable at fair value. Subsequently receivables are measured at acquisition cost. The receivable from the client is recognised as of the moment of factoring the purchase-sale agreement, i.e. as of acquisition of the receivable. Derecognition of factoring assets and liabilities follows the regulation in IAS 39 and the assessment is made based on each specific agreement type and status. Warehouse receipt financing transactions are financing transactions, where the lease firm finances its partners, by granting them a loan against pledged stock reserves. Valuation of loans and receivables The Group assesses consistently whether there is objective evidence that a financial asset or group of financial assets is impaired. A financial asset is impaired and impairment losses are incurred only if there is objective evidence of impairment as a result of one or more events that occurred after the initial recognition of the asset (a "loss event") and that loss event (or events) has an impact on the estimated future cash flows of the financial asset or group of financial assets that can be reliably estimated. For valuation of loans and receivables several risks are prudently considered. The Group uses a customer rating system for evaluating corporate loans, in accordance of which the valuation of the customer receivables is based on the legal entities financial position, trustworthiness of the borrower, timely fulfilment of contractual obligations and other factors, all of which together help to assess the value of the receivable and the amount of incurred loss in the portfolio of loans.

29
Valuation of loans to private individuals is based on timely fulfilment of contractual obligations, solvency and collateral and other factors, affecting the credit risk. The Group first assesses whether objective evidence of impairment exists individually for financial assets that are individually significant, and individually or collectively for financial assets that are not individually significant. If the Group determines that no objective evidence of impairment exists for an individually assessed financial asset, it includes the asset in a group of financial assets with similar credit risk characteristics and collectively assesses them for impairment. Assets that are individually assessed for impairment and for which an impairment loss is or continues to be recognised are not included in a collective assessment of impairment. For the purposes of a collective evaluation of impairment, financial assets are grouped on the basis of similar credit risk characteristics (i.e. on the basis of the Group's grading process that considers asset type, industry, collateral type, past-due status and other relevant factors). Those characteristics are relevant to the estimation of future cash flows for groups of such assets. Future cash flows in a group of financial assets that are collectively evaluated for impairment are estimated on the basis of the historical probabilities of default and historical rates of losses experienced on the assets with credit risk characteristics similar to those in the Group. Historical loss experience is adjusted on the basis of current observable data to reflect the effects of current conditions that did not affect the period on which the historical loss experience is based and to remove the effects of conditions in the historical period that do not currently exist. The methodology and assumptions used for estimating future receivables are reviewed regularly by the Group to reduce any differences between loss estimates and actual loss experience. For assessment of loan losses, the expected collections from the loan and interest payments over the coming periods are considered, as well as expected collections and anticipated proceeds from the realisation of collateral, discounted at the financial asset's original effective interest rate, which together form a recoverable amount of the loan and help to assess the amount of loss incurred of the loan. The amount of the loss is measured as the difference between the asset's carrying amount and the present value of estimated future cash flows. For these assessed incurred loan losses, the relevant allowance has been established. The carrying amount of the asset is reduced through the use of an allowance account and the amount of the loss is recognised in the income statement. Individual allowances are provided for individually assessed loans, and group based allowances for homogenous loan groups. In a subsequent period, if the amount of the impairment loss decreases and the decrease can be related objectively to an event occurring after the impairment was recognised (such as an improvement in the debtor's credit rating), the previously recognised impairment loss is reversed by adjusting the allowance account. The amount of the reversal is recognised in the income statement in "'Impairment losses on loans and advances". When a loan is uncollectible, it is written off against the related allowance for loan impairment. Such loans are written off after all the necessary procedures have been completed and the amount of the loss has been determined. Loans that are either subject to collective impairment assessment or individually significant and whose terms have been renegotiated are no longer considered to be past due and are treated as normal loans. More detailed overview of the credit risk management principles is given in Note 2 "Risk management". Interest income on loans is presented on the income statement on line "Interest income".

30
1.6.2. Financial assets at fair value through profit or loss Financial assets at fair value through profit or loss include financial assets designated at fair value through profit or loss and securities held for trading (incl. derivatives). Securities at fair value through profit or loss are designated irrevocably, at initial recognition, into this category. In the current reporting period this class of securities is included the portfolio of liquid bonds. The intention of the investment is to keep local liquidity reserves in liquid securities, which can be pledged to the central bank or sold in order to raise liquidity whenever necessary. Securities carried at fair value through profit of loss are measured at fair value, which is based on the bid price of the security. If the listing of a security does not indicate a price or quotations are not sufficiently regular, the financial instruments are revalued to fair value by using as a basis all of the available information concerning the issuer in order to determine the fair value of the financial instrument by using the prices of similar quoted securities that are available on the market. Interest income on these instruments is recognised in income statement under "Interest income". The realised and unrealised gains or losses from the revaluation of these securities are presented in the income statement under "Net profit/loss change in fair value of financial assets designated at fair value through profit or loss”. Securities held for trading are securities that have been acquired mainly for the purposes of resale or redemption in the near term or if such securities form a part of an independent portfolio of financial securities that are collectively managed and where proof of recently realised short-term gain exists, and derivative securities. The Group does not own any securities acquired for the purposes of resale or redemption. Derivative financial instruments (swap transactions) are initially recognised in the balance sheet at the fair value net of transaction costs at the trade date and are subsequently valued at fair value through profit or loss. If derivatives are quoted on an active market, market value is used as the fair value. Otherwise, the valuation techniques are used to find the fair value. Profits and losses from derivatives are recognised as income or expense of the period in the statement of comprehensive income under “Net gains/losses from financial assets measured at fair value”. Derivatives are carried in the statement of financial position as assets, if their market value is positive and as liabilities, if the market value is negative. The fair values of derivative assets and liabilities recorded in the balance sheet are not netted. The Group does not use hedge accounting to account for its derivative financial instruments. IFRS 13 determines a hierarchy for fair value measurements, which is based on whether inputs are observable or unobservable. Observable inputs reflect market information obtained from independent sources; unobservable inputs reflect assumptions that are available for a market. The following hierarchy for fair value measurement has been established on the basis of these two categories of inputs: Level 1 – (unadjusted) quoted prices in active markets for identical assets or liabilities that the entity can access at the measurement date. This level includes publicly quoted equity-related securities and debt instruments listed on exchanges, as well as instruments quoted by market participants. Level 2 – inputs other than quoted market prices included within Level 1 that are observable for the asset or liability, either directly (in the form of prices) or indirectly (are derived from prices).

31
Sources for input parameters (for example euro bond yield curve or counterparty credit risk) are Bloomberg and Reuters. Level 3 – inputs for the asset or liability that are not based on observable market information (unobservable inputs). Investment property is classified as Level 3 in the fair value hierarchy.
1.6.3. Available-for-sale financial assets
Securities are classified as available-for-sale financial assets, if they do not belong to one of the aforementioned categories: financial assets held for trading or other financial assets designated at fair value through profit or loss. Available-for-sale investments are intended to be:
held for an indefinite period of time, which may be sold in response to needs for liquidity
changes in interest rates, exchange rates or equity prices
or investments with strategic purpose for long-term holding. Available-for-sale financial assets are recorded at fair value plus transaction costs on their settlement date. Subsequently they are carried at fair value. If the assessment of fair value is not reliable, the securities will be presented at cost. The gains and losses arising from changes in the fair value of available for sale financial assets are recognised in the consolidated statement of comprehensive income on line "revaluation of available-for-sale financial assets". The Group assesses consistently whether there is objective evidence that a financial asset available-for-sale is impaired. In the case of equity investments classified as available-for- sale, a significant or prolonged decline in the fair value of the security below its cost is considered in determining whether the assets are impaired. A debt instrument is considered to be impaired when there is a change in expected cash flows to be collected from the instrument. If any such evidence exists for available-for-sale financial assets, the cumulative loss - measured as the difference between the acquisition cost and the current fair value, less any impairment loss on that financial asset previously recognised in profit or loss - is removed from statement of comprehensive income and recognised in the income statement. Impairment losses recognised in the income statement on equity instruments are not reversed through the income statement. In a subsequent period, if the fair value of a debt instrument classified as available-for-sale increases and the increase can be objectively related to an event occurring after the impairment loss was recognised in profit or loss, the impairment loss is reversed through the income statement. When a financial asset is sold, the cumulative gain previously recognised in statement of comprehensive income on that specific instrument is to the extent reversed from the statement of comprehensive income and the remaining portion is recognised in income statement. Interest calculated using the effective interest method and foreign currency gains and losses on monetary assets classified as available for sale are recognised in the income statement. Dividends on available-for-sale equity instruments are recognised in the income statement when the entity's right to receive payment is established. 1.6.4. Held-to-maturity financial assets
Held-to-maturity financial assets are financial instruments quoted in an active market with a fixed due date and which the Management Board of the bank has an intention and opportunity to hold until their maturity. They do not include: * investments designated as fair value through profit or loss upon their initial recognition; * investments classified as available-for-sale assets; and * investments which meet the criteria of loans and receivables. These investments are initially recognised at fair value, plus all directly attributable transaction costs incremental to such acquisitions and they are subsequently measured at amortised cost

32
using the effective interest rate method. Interest income on held-to-maturity investments is included within interest income in the statement of comprehensive income. Impairment losses are deducted from the carrying amount of the investments and the impairment charge is recorded in the line “Other expenses” in the statement of comprehensive income. 1.7 Property, plant and equipment and intangible assets other than goodwill Land, buildings, IT equipment, office equipment and other assets of long-term use are recognised in the statement of financial position as property, plant and equipment. Intangible assets are identifiable, non-monetary assets without physical substance and as of balance sheet date comprise of acquired software. Property, plant and equipment and intangible assets are initially recognised at acquisition cost, consisting of the purchase price, non-refundable taxes and other direct costs related to taking the asset into use. Subsequent expenditures related to an item of property, plant and equipment are recognised as an asset if these are in accordance with definition of property, plant and equipment and meet the criteria for recognition in the statement of financial position (including if it is probable that future economic benefits associated with the item will flow to the entity). Ongoing repairs and maintenance expenditures are expensed during the reporting period in which they are incurred. Property, plant and equipment and intangible assets with finite useful lives are subsequently stated at historical cost less depreciation / amortisation and any impairment losses. Depreciation / amortisation is calculated starting from the month of acquisition until the asset is fully depreciated. Assets are depreciated / amortised on a straight-line basis. Depreciation / amortisation calculation is based on the useful life of the asset, which serves as basis for forming the depreciation / amortisation rates. Depreciation of property, plant and equipment is charged in accordance with the estimated useful life of the asset from the month following the month it is taken into use: buildings 2% per annum, vehicles 15% per annum, fixtures 12.5% per annum, office equipment 25% per annum, computer hardware and software 10-25% per annum. Non-current assets with an unlimited useful life (land) are not depreciated. Depreciation of non-current assets is presented in the income statement line item "Depreciation". Depreciation of an asset is ceased when the asset is fully depreciated, when the asset is reclassified as non-current assets held for sale or when the asset is retired from use. The appropriateness of the assets´ residual values, depreciation methods used and useful lives are reviewed, and adjusted if that has become appropriate, at each balance sheet date. The gain or loss on sale of non-current assets is determined by way of comparison with the carrying amount. Gain or loss on sale is presented in the income statement in the line items "Other income" and "Other expenses", respectively. Capitalisation of expenses Reconstruction expenses related to the leased space used by the Group are capitalised as property, plant and equipment and expensed on a straight-line basis in accordance with the duration of the lease agreement. Development costs If software development expenses result in additional functionality and if they meet the definition of intangible assets and criteria for inclusion in the statement of financial position

33
(incl. expected participation in the generation of future economic benefits), such expenses are recognised as intangible assets. Expenses related to the use of software are expensed as incurred. Expenditures incurred on advertising and the launch of new products, services and processes are expensed as incurred. Expenditures associated with internally developed trademarks and other such items are expensed as incurred. 1.8 Investment property
Investment property is a real estate property which is primarily held for the purpose of earning rental income or for capital appreciation or for both purposes but not for the use in the ordinary course of business. An investment property is initially recognised in the balance sheet at cost, including the purchase price and any expenditure directly attributable to the acquisition. After initial recognition, investment property is measured at fair value at each balance sheet date. Independent expert valuation is used for determining the fair value of investment property, which is based on either the income approach (the value is determined by calculating the present value of future cash flows generated by the asset) or market approach (comparable market transactions involving similar properties are analysed) or a combination of the two aforementioned approaches is used. Gains and losses arising from a change in the fair value of investment property are recognised in the line item "Change in fair value of investment property" in the income statement of the reporting period in which they are incurred. When the purpose of use of an investment property changes, the asset is reclassified in the balance sheet. From the date when this change occurred, accounting policies of this asset group into which the item has been reclassified shall be applied to the property. If the purpose of use of an investment property changes to property, plant and equipment, the investment property is reclassified as property, plant and equipment and the cost is the fair value of the property at the reclassification date. If the purpose of use of an item of property, plant and equipment changes to investment property, the difference between the carrying amount of the property, plant and equipment and the fair value of the asset at the reclassification date is recognised in the income statement. If a change occurs in the use of an investment property, as evidenced by starting development for the purposes of preparation of the property for sale, the property is reclassified as inventory and the cost of the item of inventory is the fair value at the reclassification date. 1.9 Assets held for sale
Assets held for sale are assets that are held for sale in the course of ordinary business and are recognised at cost. Cost is either cash or the fair value of non-monetary consideration given to acquire an asset at the time of its acquisition or processing. Assets held for sale are measured at the balance sheet date and are carried in the balance sheet at the lower of cost and net realisable value. The net realisable value is the sales price less estimated costs to sell. 1.10 Impairment of non-financial assets Assets with an indefinite useful life are not subject to amortisation and are tested annually for impairment, comparing the carrying value of the asset to its recoverable value. Assets that are subject to amortisation / depreciation are reviewed for impairment whenever events or changes in circumstances indicate that the carrying amount may not be recoverable. In such circumstances the recoverable value of the asset is assessed and compared to its carrying value. An impairment loss is recognised for the amount by which the asset's carrying amount exceeds its recoverable amount.
34
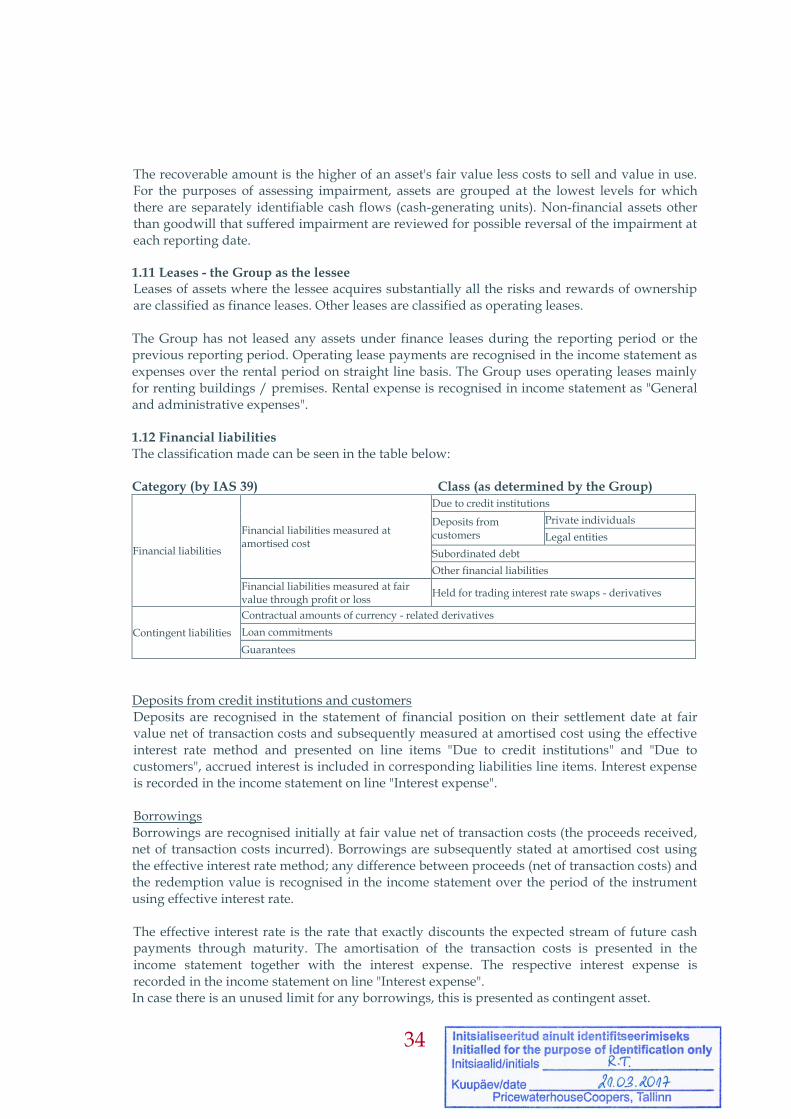
The recoverable amount is the higher of an asset's fair value less costs to sell and value in use. For the purposes of assessing impairment, assets are grouped at the lowest levels for which there are separately identifiable cash flows (cash-generating units). Non-financial assets other than goodwill that suffered impairment are reviewed for possible reversal of the impairment at each reporting date. 1.11 Leases - the Group as the lessee Leases of assets where the lessee acquires substantially all the risks and rewards of ownership are classified as finance leases. Other leases are classified as operating leases. The Group has not leased any assets under finance leases during the reporting period or the previous reporting period. Operating lease payments are recognised in the income statement as expenses over the rental period on straight line basis. The Group uses operating leases mainly for renting buildings / premises. Rental expense is recognised in income statement as "General and administrative expenses". 1.12 Financial liabilities
The classification made can be seen in the table below: Category (by IAS 39) Class (as determined by the Group)
Financial liabilities
Financial liabilities measured at amortised cost
Due to credit institutions
Deposits from customers
Private individuals
Legal entities
Subordinated debt
Other financial liabilities
Financial liabilities measured at fair value through profit or loss
Held for trading interest rate swaps - derivatives
Contingent liabilities
Contractual amounts of currency - related derivatives
Loan commitments
Guarantees
Deposits from credit institutions and customers Deposits are recognised in the statement of financial position on their settlement date at fair value net of transaction costs and subsequently measured at amortised cost using the effective interest rate method and presented on line items "Due to credit institutions" and "Due to customers", accrued interest is included in corresponding liabilities line items. Interest expense is recorded in the income statement on line "Interest expense". Borrowings Borrowings are recognised initially at fair value net of transaction costs (the proceeds received, net of transaction costs incurred). Borrowings are subsequently stated at amortised cost using the effective interest rate method; any difference between proceeds (net of transaction costs) and the redemption value is recognised in the income statement over the period of the instrument using effective interest rate. The effective interest rate is the rate that exactly discounts the expected stream of future cash payments through maturity. The amortisation of the transaction costs is presented in the income statement together with the interest expense. The respective interest expense is recorded in the income statement on line "Interest expense". In case there is an unused limit for any borrowings, this is presented as contingent asset.
35
Payables to employees Payables to employees include unpaid salary accruals and a vacation pay accrual calculated in accordance with employment contracts and the laws of the Republic of Estonia in force as at the balance sheet date. The liability related to the payment of a vacation pay accrual together with social security and unemployment insurance premiums is included within current liabilities in the balance sheet and as wages and salaries expense in the statement of comprehensive income. Social tax includes payments to the state pension fund. The Group has no existing legal or constructive obligations to make pension payments or similar payments supplementary to social tax. 1.13 Financial guarantee contracts Financial guarantee contracts are contracts that require the issuer to make specified payments to reimburse the holder for a loss it incurs because a specified debtor fails to make payments when due, in accordance with the terms of a debt instrument. Such financial guarantees are given to banks, financial institutions, companies and other bodies on behalf of customers to secure loans, other banking facilities and liabilities to other parties. Financial guarantees are initially recognised in the financial statements at fair value (contract value) on the date the guarantee was given. Subsequent to initial recognition, the bank's liabilities under such guarantees are recognised at the outstanding value of guarantee. In the income statement the fee income earned on a guarantee is recognised straight-line basis over the life of the guarantee. In cases where the fees are charged periodically in respect of an outstanding commitment, they are recognised as revenue on a time proportion basis over the respective commitment period. At the end of each reporting period, the commitments are reflected either contract value at the time of reporting or contract value and in addition provision in balance sheet. The amounts disbursed to settle the guarantee obligation are recognised in the statement of financial position on the date it is disbursed. 1.14 Revenue and expense recognition
Interest income and expense is recognised in income statement for all interest-earning financial assets and interest-bearing financial liabilities carried at amortised cost using the effective interest rate method. Interest income also includes similar income on interest bearing financial instruments classified at fair value through profit or loss. The effective interest method is a method of calculating the amortised cost of a financial asset or a financial liability and of allocating the interest income or interest expense over the relevant period. The effective interest rate is the rate that exactly discounts estimated future cash payments or receipts through the expected life of the financial instrument to the net carrying amount of the financial asset or financial liability. When calculating the effective interest rate, the Group estimates cash flows considering all contractual terms of the financial instrument, but does not consider future credit losses. The calculation includes all significant fees paid or received between parties to the contract that are an integral part of the effective interest rate, transaction costs and all other premiums or discounts. Once a financial asset or a group of similar financial assets has been written down as a result of an impairment loss, interest income is recognised using the rate of interest used to discount the future cash flows for the purpose of measuring the impairment loss. Fee and commission income Revenue is recognised in the fair value of the consideration received or receivable for the services provided in the ordinary course of the Group's activities. Fees and commissions are generally recognised on an accrual basis when the service has been provided (e.g. charges
36
related to credit and debit cards). Credit issuance fees for loans / leases are deferred and recognised as an adjustment to the effective interest rate on the credit. Fees from the custodial services of securities are recognised on an accrual basis. Other transaction fee income and other income are recognised on accrual basis at the moment of executing the respective transactions. Dividend income Dividends are recognised in the income statement when the entity's right to receive payment is established. 1.15 Taxation
Corporate income tax According to the effective legislation, the annual profit earned by enterprises is not taxed in Estonia and thus there are no temporary differences between the tax bases and carrying values of assets and liabilities and no deferred tax assets or liabilities arise. Instead of taxing the net profit, the distribution of retained earnings or other payments decreasing the equity are subject to the taxation on the amount paid out as net distribution at the rate set forth in Income Tax Act. The profit of the Latvian branch is taxed in accordance with the legislation of the Republic of Latvia. The corporate income tax arising from the payment of dividends or other payment decreasing the equity is accounted for as an expense in the period when dividends or other payment decreasing the equity are declared, regardless of the actual payment date or the period for which the dividends are paid. 1.16 Statutory reserve capital Statutory reserve capital is formed from annual net profit allocations to comply with the requirements of the Commercial Code. During each financial year, at least one-twentieth of the net profit shall be transferred to the statutory reserve, until reserve reaches one-tenth of share capital. Statutory reserve may be used to cover a loss, or to increase share capital. Payments to shareholders from statutory reserve are not allowed. 1.17 Events after the balance sheet date
Material events that have an effect on the evaluation of assets and liabilities and that became evident between the balance sheet date and the date of preparation of the financial statements by the management board but that are related to transactions in the reporting period or earlier periods, are reported in the financial statements. Events after the balance sheet date that have not been taken into account for evaluating assets and liabilities but have a material impact on the results of the next financial year are disclosed in Note 37 to the financial statements. 1.18 New International Financial Reporting Standards, amendments to published standards and interpretations by the International Financial Reporting Interpretations Committee
The following new or revised standards and interpretations became effective for the Group from 1 January 2016 or later periods:
Amendments to IAS 1 – disclosure initiative – (effective on 1 January 2016) The standard was amended to clarify the concept of materiality and explains that an entity need not provide a specific disclosure required by an IFRS if the information resulting from that disclosure is not material, even if the IFRS contains a list of specific requirements or describes them as minimum requirements. The standard also provides new guidance on subtotals in

37
financial statements, in particular, such subtotals (a) should be comprised of line items made up of amounts recognised and measured in accordance with IFRS; (b) be presented and labelled in a manner that makes the line items that constitute the subtotal clear and understandable; (c) be consistent from period to period; and (d) not be displayed with more prominence than the subtotals and totals required by IFRS standards. The Group has taken the amendment into account. The Group has no significant impact from the other new or amended standards or interpretations that apply from 1.1.2016 or thereafter. New or amended standards, which will be mandatory for the Group from 1.1.2017 or later annual periods:
Amendments to IAS 7 – disclosure initiative - (effective for annual periods beginning on or after 1 January 2017; not yet adopted by the EU) The amended IAS 7 will require disclosure of a reconciliation of movements in liabilities arising from financing activities. The Group is taking the amendment into account in compiling the financial statements.
Amendments to IAS 40 – transfers of investment property - (effective on 1 January 2018) The amendment clarified that to transfer to, or from, investment properties there must be a change in use. This change must be supported by evidence; a change in intention, in isolation, is not enough to support a transfer. The Group is assessing the impact of the amendments on its financial statements and taking the amendment into account in compiling the financial statements.
IFRS 9, Financial Instruments: Classification and Measurement (effective for annual periods beginning from 1 January 2018) Key features of the new standard are:
Financial assets are required to be classified into three measurement categories: those to be measured subsequently at amortised cost, those to be measured subsequently at fair value through other comprehensive income (FVOCI) and those to be measured subsequently at fair value through profit or loss (FVPL).
Classification for debt instruments is driven by the entity's business model for managing the financial assets and whether the contractual cash flows represent solely payments of principal and interest (SPPI). If a debt instrument is held for collection purposes, it may be carried at amortised cost if it also meets the SPPI requirement. Debt instruments that meet the SPPI requirement that are held in a portfolio where an entity both holds to collect assets' cash flows and sells assets may be classified as FVOCI. Financial assets that do not contain cash flows that are SPPI must be measured at FVPL (for example, derivatives). Embedded derivatives are no longer separated from financial assets but will be included in assessing the SPPI condition.
Investments in equity instruments are always measured at fair value. However, management can make an irrevocable election to present changes in fair value in other comprehensive income, provided the instrument is not held for trading. If the equity instrument is held for trading, changes in fair value are presented in profit or loss.
Most of the requirements in IAS 39 for classification and measurement of financial liabilities were carried forward unchanged to IFRS 9. The key change is that an entity will be required to present the effects of changes in own credit risk of financial liabilities designated at fair value through profit or loss in other comprehensive income.
38
IFRS 9 introduces a new model for the recognition of impairment losses - the expected credit losses (ECL) model. There is a 'three stage' approach which is based on the change in credit quality of financial assets since initial recognition. In practice, the new rules mean that entities will have to record an immediate loss equal to the 12-month ECL on initial recognition of financial assets that are not credit impaired (or lifetime ECL for trade receivables). Where there has been a significant increase in credit risk, impairment is measured using lifetime ECL rather than 12-month ECL. The model includes operational simplifications for lease and trade receivables.
Hedge accounting requirements were amended to align accounting more closely with risk management. The standard provides entities with an accounting policy choice between applying the hedge accounting requirements of IFRS 9 and continuing to apply IAS 39 to all hedges because the standard currently does not address accounting for macro hedging. In practice, the new rules mean that the financial assets to be assessed are divided into three stages according to changes in its credit quality. For the first stage of financial assets for which there is no indication to impairment the loss equivalent to 12 months of expected credit losses ("trade receivables" for the entire period of expected credit losses) will have to be recognized since initial recognition. If there has been a significant increase in credit risk the impairment for the financial assets belonging to the second (there has been a significant deterioration in credit quality) and third stage (non-working financial assets) is measured using the entire period of the expected credit losses, rather than the 12-month period the expected credit losses. The Group is currently defining what criteria are used to evaluate the increase of the credit risk of an increase and how much these criteria predictably change the „significant increase“. The probability of default throughout the contract period is being used as a credit quality indicator for the financial assets accounted for in the future. The Group's current collective impairment calculation classifies the deterioration in a loan class as a loss event, but it is not expected that the loss event according to the current model will equal to the movement from the first stage to the second after implementing IFRS 9. The sum of individual impairment for the financial assets with a significant deterioration in credit quality is calculated based on the estimated loss, but after implementing IFRS 9 the expected credit loss will be calculated based on total loss during the contract period, including the fact that the calculation shall be based on the weighted forward-looking information. The Group assesses the likelihood that the new rules will lead to an increase in write-downs and when the standard is first applied, the negative impact on equity. The impact of capital adequacy is not currently possible to estimate, as expected enforces the Basel Committee's new rules for the transition to IFRS 9, but they have not yet been disclosed. The Group does not use hedging, so the amendments in hedge accounting do not have a direct impact on the Group. The Group has set up a working group for carrying out the necessary changes in risk management as well as IT systems. The Group intends to use the exemption in initial implementation of IFRS 9 standard not to restate comparative information for 2017 in financial statements for 2018.
IFRS 15 — Revenue from Contracts with Customers (applies to an annual reporting period beginning on or after 1 January 2018) The core principle of the new standard is that an entity will recognise revenue to depict the transfer of promised goods or services upon delivery of such goods or services to customers at the transaction price. Where distinct goods and services are sold on a bundled basis, they must be recognised separately and an entity will allocate any discounts on the contract price to standalone elements. Variable consideration is only included in the transaction price if, and to

39
the extent that, it is highly probable that its inclusion will not result in a significant revenue reversal in the future when the uncertainty has been subsequently resolved. Costs incurred to fulfil a contract are recognised as an asset and amortised on a systematic basis over the period that income is earned from the contract. The Group is currently assessing the impact of the standard on its financial statements.
IFRS 16 — Leases (is effective for periods beginning on or after 1 January 2019 but has not yet been adopted by the European Union) The new standard specifies the policies to be used to recognise, measure, present and disclose leases. All leases result in the lessee obtaining the right to use an asset at the start of the lease and, if lease payments are made over time, also obtaining financing. Accordingly, IFRS 16 eliminates the classification of leases as either operating leases or finance leases as is required by IAS 17 and, instead, introduces a single lessee accounting model. IFRS 16 substantially carries forward the lessor accounting requirements in IAS 17. Accordingly, a lessor continues to classify its leases as operating leases or finance leases, and to account for those two types of leases differently. The Group is currently assessing the impact of the new standard on its financial statements.

40
Note 2. Risk management
Principles of risk management The Group defines risk as possible negative deviation from the expected result. Risk management is a process aimed at efficiency and profitability of operations that would meet the expectations of shareholders identified in the strategy. As risks are associated with all business activities and on all levels of activity, in addition to the management, risk management involves also all the Group's employees through the internal control system. The tasks of risk management is the identification and measurement of business-related risks, implementation of measures necessary for controlling risks and reporting on risk management performance. Structure and responsibility of risk management The Group's risk management system is centralised on the management level - policies and principles of risk management are established at Group level by the Bank's Supervisory Board or Management Board to ensure implementation of common risk management principles in Eesti Krediidipank and its subsidiaries as well as rapid and effective response to changes in the economic environment or in the Group's business model. Risk management procedures must comply with existing legislative regulations and standards. The Bank's Management Board is responsible for implementation of risk management, control and risk management policies and methods and effectiveness of risk management. In organising risk management, the Management Board may in limited degree delegate risk taking, control and monitoring to collegial decision-making bodies with limited decision-making competence set up by the Management Board. The Bank's Management Board has set up the following committees and commissions with limited decision-making competence: Asset/Liability Management Committee The tasks, composition and activities of the Asset/Liability Management Committee is defined with its rules. The committee's task is to monitor, control, analyze, and evaluate risks, make decisions and implement them in the following areas of responsibility:
assessment and management the Bank's and Group's liquidity risk, short-term and
long-term liquidity position;
monitoring of the maturity structure of the Bank's assets and liabilities;
planning of the balance of interest income and expenses and management of interest
rate risk;
introducing limits on term and volume measures related to counterparties;
bond portfolio management.
Committees/commissions coordinating credit activities: Credit Committee The Credit Committee is the Bank's highest body for making credit decisions, a workgroup responsible for risk management formed in accordance with the Credit Institutions Act and the Bank's statutes for ensuring that the Bank's credit policy is implemented through the adoption of credit decisions and compliance assessment of collateral. Credit Commission Credit Commission performs the functions of the Credit Committee in adopting decisions on lower-risk credit.

41
Price Commission The objective of the Price Commission is the formation of a united and targeted price policy for the real estate portfolio of the Eesti Krediidipank Group as well as the problematic part of the Group's credit portfolio with the view of reaching the best financial result for the Group. For effective implementation of risk management, the Group uses a 3-level control system in accordance with the principles of internal control system approved by the Supervisory Board. Structural units with direct risk control function: First line of defence
The first level constitutes sales and support divisions and subsidiaries. The first line of defence is to ensure that risks related to the activities, products, and processes in its area of responsibility are identified, assessed and that implementation of measures necessary for controlling risks. Second line of defence
The second line of defence performs the risk control function independent from business lines. It constitutes the risk management department and persons/units responsible for sub-risks of the operational risk. Risk Management Department The main functions of the Risk Management Department are:
Group wide view of regular identification, assessment and monitoring of risks;
Stress testing for liquidity, credit and market risks and drawing up relevant risk reports;
The notification of the Management and Supervisory Board of risks;
development of risk management methodology, first line of defence counselling in risk
management;
assessment of credit risk of credit projects and compliance with credit conditions;
organization of planned and special internal checks in the organization.
Compliance function The compliance function is enforcement of various statutory requirements (regulations, guidelines of supervisory authorities, good banking practice, etc.). The independent compliance function acts as an additional first-level control to the existing self-control within the departments in managing compliance risk. Compliance risk means the risk of incurring a loss resulting from failure to comply with or improper performance of statutory requirements. Third line of defence Internal Audit Unit The Internal Audit Unit that is part of the Bank's internal control system monitors the operations of Krediidipank and compliance with regulations, good banking practice and compliance with the requirements and guidelines of the Financial Supervisory Authority. The Internal Audit Unit monitors the implementation of decisions of the competent body by the Bank's structural units, as well as set rules, limits and other internal rules. The activity of the Internal Audit Unit is aimed at protecting the interests of the Bank's shareholders, depositors and other creditors.

42
Capital planning and internal capital adequacy assessment process The Group uses risk-based capital planning which ensures that all risks are adequately covered by own funds at any given time. Capital is defined as the Group's equity which consist of Tier 1 and Tier 2 capital. Overview of regulatory capital is provided in the following table: In thousand euros Capital base 31.12.2016 31.12.2015
Tier I Capital
Paid-in share capital and share premium 25,175 25,175
Statutory reserve capital 1,970 1,844
Accumulated profit/loss (-) 617 58
Intangible assets (-) -687 -761
Deferred tax asset depending on future taxable profits (-) -1 -1
Adjustment of value arising from requirements of reliable measurement (-) -21 -17
Other deductions from Tier I Capital (-) -1,019 0
Total Tier 1 capital 26,034 26,298
Subordinated debt 3,299 4.000
Tier 2 capital 3,299 4.000
Eligible capital for capital adequacy calculation 29,333 30.298
Capital adequacy (%) 21.22% 21.54%
Tier 1 Capital Ratio (%) 18.84% 18.69%
Since 2016, in calculating capital we are taking into account the guidelines provided in the European Commission Regulation No 183/2014, whereby any amounts recorded in the financial year may be included in the calculation of general and specific credit risk adjustments only if the corresponding amounts are deducted from Tier 1 Capital of the credit institution.
Own funds requirements:
Core Tier 1 capital ratio 4.50% Core Tier 1 capital/total risk exposure
Tier 1 capital ratio 6.00% Tier 1 capital/total risk exposure
Total capital ratio 8.00% Total capital/total risk exposure
Systemic risk buffer 1.00% Of total risk exposure
Capital conservation buffer 2.50% Of total risk exposure
The Group's total amount of own funds for calculating capital adequacy has declined during the year 2016 due to the amortization of subordinated debt in the Tier 2 capital (see Note 22) and additionally deducting the allowances from Tier 1 capital in the calculation methodology. As at 31.12.2016, the Group is compliant with all regulatory capital requirements. The Group uses a risk-based capital planning, ensuring that all risks are adequately covered by own funds at any given time. Capital planning is conducted on the basis of balance sheet and profit and loss forecasts that take into account the Group's strategy, future expectations, risk profile and risk appetite. Capital planning is the responsibility of the Bank's Management Board.

43
The internal capital adequacy assessment (ICAAP) is an ongoing process, which aims to assess the Group's risk profile and the corresponding need for capital. ICAAP is the basis for regular capital planning in the Group. The planning and forecasting of capital requirement takes place on the basis of calculating regulatory capital adequacy that takes into account capital requirements arising from ICAAP and supervisory assessment of the Financial Supervisory Authority (SREP) plus capital requirements to cover additional risks that are not taken into account in the context of regulatory capital requirements. The Group's risk profile is assessed in particular by the following risks: credit risk, concentration risk, liquidity risk, market risk, including risk exposure from the portfolio of financial investments, the Bank's portfolio of interest rate risk, operational risk, strategic risk, reputation risk. The recommended minimum capital adequacy level is the minimum required capital adequacy level determined in the SREP assessment plus the need-based reserve required for increasing business volumes, implementing strategy plans and ensuring a stable financial position in accordance with the Group's current operating strategy and balance sheet forecasts. For determining the capital requirement, the balance sheet position is forecast, taking into account changes by items of the risk position and equity. The balance sheet and profit and loss forecasts are reviewed regularly and approved by the Bank's Management Board. It also takes into account the possible impact of strategic and reputation risk to the Group's business success, and determines the necessary equity buffer to ensure that desired internal capital adequacy level if alternative and risk scenarios materialize. Overview of the development of capital adequacy including the capital requirements arising from the SREP assessment are presented to the Bank's Management Board and the Supervisory Board on a quarterly basis.
The Group ensures that all risks are covered by adequate capital at any time. Credit risk management
Credit risk reflects the risk that the counterparty fails to fulfill its obligations to the Group. Credit risk expresses potential loss that could arise from non-compliance with the counterparty obligations in case of credit risk-bearing receivables. Krediidipank follows the standard method of calculating credit risk capital requirements. In calculating capital requirements the Group uses ratings of accepted rating agencies according to the procedure established by the Financial Supervisory Authority. Credit risk management is based on the Group's credit policy. The main objectives of credit policy are to sustainably achieve the rate of return on Group's assets from credit activities required by shareholders, adhering to the prudency and risk diversification principles and taking moderate risks that can be evaluated and managed. The primary assets of the Group that are exposed to credit risk are the following: Loans and advances to central banks and credit institutions (Notes 3-4); Financial investments (Note 10);
Loans and advances to customers (Notes 5-9). The following table provides an overview of the observable positions of the Group that are exposed to credit risk by category.

44
In thousands of euros
31.12.2016 Not past due Past due Past due Total
Impaired Not
impaired Impai-
red Not
impaired Individual
impairment Collective
impairment
Cash on hand 0 22,337 0 0 0 0 22,337
Balances with central banks
0 43,919 0 0 0 0 43,919
Loans and advances to credit institutions
0 39,293 0 0 0 0 39,293
Financial assets held for trading
0 0 0 0 0 0 0
Financial assets designated at fair value through profit or loss
0 11,421 0 0 0 0 11,421
Loans and advances to customers
2,844 136,847 4,618 11,077 -763 -1,490 153,133
Held-to-maturity financial assets
0 503 0 0 0 0 503
Available-for-sale financial assets
0 13 0 0 0 0 13
Other financial assets
0 714 0 0 0 0 714
Total financial assets 2,844 255,047 4,618 11,077 -763 -1,490 271,333
Financial guarantees 0 1,354 0 0 0 0 1,354
Loan commitments 0 539 0 0 0 0 539
Overdraft facilities 0 3,169 0 0 0 0 3,169
Total off-balance sheet exposures
0 5,062 0 0 0 0 5,062
Total exposure to credit risk
2,844 260,109 4,618 11,077 -763 -1,490 276,395
In thousands of euros 31.12.2015 Not past due Past due Past due Total
Impaired Not
impaired Impai-
red Not
impaired Individual
impairment Collective
impairment
Cash on hand 0 2,342 0 0 0 0 2,342
Balances with central banks
0 65,126 0 0 0 0 65,126
Loans and advances to credit institutions
0 57,716 0 0 0 0 57,716
Financial assets held for trading
0 28 0 0 0 0 28
Financial assets designated at fair value through profit or loss
0 6,078 0 0 0 0 6,078
Loans and advances to customers
3,338 137,744 2,599 11,465 -1,447 -1,047 152,652
Held-to-maturity financial assets
0 503 0 0 0 0 503
Available-for-sale 0 13 0 0 0 0 13
Other financial assets
0 1,161 0 0 0 0 1,161
Total financial assets 3,338 270,711 2,599 11,465 -1,447 -1,047 285,619
Continues on the next page

45
Financial guarantees
0 1,253 0 0 0 0 1,253
Loan commitments 0 566 0 0 0 0 566
Overdraft facilities 0 6,052 0 0 0 0 6,052
Total off-balance sheet exposures
0 7,871 0 0 0 0 7,871
Total exposure to credit risk
3,338 278,582 2,599 11,465 -1,447 -1,047 293,490
Past due loans and advances are considered to be loans and receivables where the principal, interest or late payment fee is fully or partially unpaid. Counterparty credit risk management Counterparty credit risk is defined as balances loans and advances to credit institutions. The transaction-related counterparty credit risk exposure, the Assets and Liabilities Committee (ALCO) has imposed limits on transactions with counterparties, encompassing money market transactions and currency transactions. In its evaluation of counterparty creditworthiness and limit of credit, the bank takes into consideration their domicile and makes a judgment regarding the counterparty's financial position, management, legal status and market position. All balances loans and advances to credit institutions are unsecured receivables. As at 31.12.2016 and 31.12.2015, all balances loans and advances to credit institutions were current and not impaired. Credit risk division The Group adheres to the principle of diversification of credit risk according to field of activity, geographical area and product. A summary of the division of exposures by economic sector and geographical areas has been provided in the tables below. Financial assets by economic sector classification In thousands of euros 31.12.2016
E K L S G D I Other Total
Cash on hand 0 22,337 0 0 0 0 0 0 22,337
Balances with central banks 0 43,919 0 0 0 0 0 0 43,919
Loans and advances to credit institutions
0 39,293 0 0 0 0 0 0 39,293
Financial assets designated at fair value through profit or loss
0 3,073 0 1,091 0 2,188 0 5,069 11,421
Loans and advances to customers
117,685 0 11,976 267 7,860 1,880 5,464 8,001 153,133
Held-to-maturity financial assets
0 0 0 0 0 503 0 0 503
Available-for-sale financial assets
0 0 0 0 0 0 0 13 13
Other financial assets 0 621 0 0 0 0 0 93 714
Total 117,685 109,243 11,976 1,358 7,860 4,571 5,464 13,176 271,333
E-private individuals, K - finance and insurance activities, L - activities related to real estate, S- other services G - wholesale and retail, D - power and heat generation, I - hospitality, food service

46
In thousands of euros 31.12.2015
E K L S G D I Other Total
Cash on hand 0 2,342 0 0 0 0 0 0 2,342
Balances with central banks 0 65,126 0 0 0 0 0 0 65,126
Loans and advances to credit institutions
0 57,716 0 0 0 0 0 0 57,716
Financial assets held for trading 0 28 0 0 0 0 0 0 28
Financial assets designated at fair value through profit or loss
0 1,327 0 0 0 2,254 0 2,497 6,078
Loans and advances to customers 114,015 104 13,575 2,052 8,756 927 5,664 7,559 152,652
Held-to-maturity financial assets 0 0 0 0 0 503 0 0 503
Available-for-sale financial assets 0 0 0 0 0 0 0 13 13
Other financial assets 0 1,097 0 0 0 0 0 64 1,161
Total 114,015 127,740 13,575 2,052 8,756 3,684 5,664 10,133 285,619
E- private individuals, K - finance and insurance activities, L - activities related to real estate, S- other services, G - wholesale and retail, D - power and heat generation, I - hospitality, food service Amounts by geographical classification
In thousands of euros 31.12.2016
EE LV IT FI BE DE Other Total
Cash on hand 22,075 262 0 0 0 0 0 22,337
Balances with central banks 43,886 33 0 0 0 0 0 43,919
Loans and advances to credit institutions
20,167 0 0 0 1,252 6,644 11,230 39,293
Financial assets designated at fair value through profit or loss
2,188 0 2,904 1,839 0 0 4,490 11,421
Loans and advances to customers 143,208 8,874 0 654 0 0 397 153,135
Held-to-maturity financial assets 503 0 0 0 0 0 0 503
Available-for-sale financial assets 0 0 0 0 13 0 0 13
Other financial assets 706 8 0 0 0 0 0 714
Total 232,733 9,177 2,904 2,493 1,265 6,644 16,117 271,333
In thousands of euros 31.12.2015
EE LV US GB BE DE Other Total
Cash on hand 2,139 203 0 0 0 0 0 2,342
Balances with central banks 64,968 158 0 0 0 0 0 65,126
Loans and advances to credit institutions
11,941 0 19,316 8,760 8,658 5,486 3,555 57,716
Financial assets held for trading 28 0 0 0 0 0 0 28
Continues on the next page
Financial assets designated at fair value through profit or loss
2,254 0 0 0 0 0 3,824 6,078
Continues on the next page

47
Loans and advances to customers 141,019 10,242 426 48 0 0 917 152,652
Held-to-maturity financial assets 503 0 0 0 0 0 0 503
Available-for-sale financial assets 0 0 0 0 13 0 0 13
Other financial assets 1,058 103 0 0 0 0 0 1,161
Total 223,910 10,706 19,742 8,808 8,658 5,486 8,309 285,619
76.9% of loans and advances to customers are granted to private individuals (31.12.2015: 74.7%). The portfolio of loans granted to corporate entities is diversified between various economic sectors to avoid high levels of concentration. 33.8% (31.12.2015: 35.1%) of loans to companies are granted to companies engaged in the real estate sector and 22.2% (31.12.2015: 22.7%) are attributable to wholesale and retail enterprises. The lending activity of the Group is focused on local financing. The distribution of loans and advances to customers according to main credit product is provided in Note 5. Principles for classification and measurement of receivables
Credit receivables are divided into risk categories in accordance with the borrower’s payment discipline and the financial-economic position: A – no circumstances have arisen that could cause a default on the loan as per the terms of the loan agreement, up to 13 days past due. B – contains potential weaknesses, the mitigation of which may affect the creditworthiness of the borrower in the future, 14-45 days past due. C – contains clearly identifiable deficiencies, giving reason to believe that the repayment of the loan in full is doubtful or the loan has been restructured, 46-59 days past due. D – inadequate creditworthiness of the borrower, giving reason to believe that the repayment of the loan under contract terms is improbable unless the situation materially changes, 60-89 days past due E – the borrower is unable to persistently perform the contract on agreed-upon terms, 90-179 days past due F - the loan is no longer being serviced and there is no prospect of the restoration of solvency and/or the contract has been terminated on an extraordinary basis, 180 days past due and/or the amount of payments collected on the loan during a period of 90 consecutive days is 0. Past due receivables are receivables which scheduled principal or interest part payments are not received by the deadline. In the case of loans granted to private individuals, the basis for impairment of loans is the number of days and classification in the respective risk category. In case of loans granted to legal entities, the basis for impairment of loans is a combination of number of days past due and the internal judgment of the Group with regard to the company's financial position and classification in the respective risk category. Receivables classified in risk categories A to D are classified as performing loans. Across risk categories and product categories homogeneous groups of loans are formed, to which group-based rates of impairment are applied. An individual impairment allowance is recognised on the basis of the probability of cash flows and net realisable value of collateral and the date of expected recovery of collateral. An overview of the Group’s loan portfolio risk categories is provided in the table below with the distribution of private individuals and legal entities.

48
Risk categories of loans and advances to private individuals
In thousands of euros
31.12.2016
Neither past due nor impaired
Past due but not impaired
Individually impaired
Total Collective impairment
Individual impairment
Net
A 106,312 1,679 1,362 109,353 -1,097 -2 108,254
B 31 2,813 7 2,851 -85 0 2,766
C 2,220 1,588 619 4,427 -91 -76 4,260
D 1 448 129 578 -21 -3 554
E 7 508 0 515 -25 0 490
F 123 1,121 293 1,537 -60 -116 1,361
Total 108,694 8,157 2,410 119,261 -1,379 -197 117,685
In thousands of euros
31.12.2015 Neither past due
nor impaired Past due but not
impaired Individually
impaired Total Collective
impairment Individual
impairment Net
A 97,693 1,102 1,507 100,302 -453 -3 99,846
B 4,717 2,072 39 6,828 -44 0 6,784
C 2,065 1,329 172 3,566 -61 -3 3,502
D 581 641 228 1,450 -9 -16 1,425
E 11 549 10 570 -154 -1 415
F 98 954 2,477 3,529 -258 -1,228 2,043
Total 105,165 6,647 4,433 116,245 -979 -1,251 114,015
Risk categories of loans and advances to legal entities
In thousands of euros
31.12.2016 Neither past due
nor impaired Past due but not impaired
Individually impaired
Total Collective impairment
Individual impairment
Net
A 12,099 11 0 12,110 -46 0 12,064
B 12,614 103 810 13,527 -62 -40 13,425
C 3,214 2,569 148 5,931 -3 -13 5,915
D 226 9 250 485 0 -37 448
E 0 39 0 39 0 0 39
F 0 189 3,844 4,033 0 -476 3,557
Total 28,153 2,920 5,052 36,125 -111 -566 35,448
In thousands of euros
31.12.2015 Neither past due
nor impaired Past due but not
impaired Individually
impaired Total Collective
impairment Individual
impairment Net
A 11,743 143 0 11,886 -22 0 11,864
B 10,955 248 116 11,319 -40 -1 11,278
Contiunes on the next page
C 9,537 344 1,145 11,026 -5 -87 10,934
D 308 248 50 606 0 -2 604
E 36 15 193 244 -1 -106 137
F 0 3,820 0 3,820 0 0 3,820
Total 32,579 4,818 1,504 38,901 -68 -196 38,637

49
In 2016 the Group’s the overdue loan portfolio increased at the expense of legal entities, the past due loans of private individuals have decreased by 4.6%. The classification of loans past due by number of days past due and security is provided in Note 6. The value of impaired loans and advances, individual impairments and collective impairments of loans to private individuals and legal entities are provided in the table above and in Note 9. The value of impaired loans and advances was increased in 2016 by a total of 1.53 million euros (2015: decreased EUR 3.4 million), including an increase in the portfolio of loans to legal entities by 3.55 million euros (2015: decreased 4.4 million euros). The value of individually impaired loans and advances to private individuals reduce by 2.02 million euros (2015: increased 1 million euros). The total number of impaired risk exposures was 100 (2015: 140). Individual impairments was accounted for 763 thousand euros total (2015: 1,447 thousand euros) and collective impairments for 1,490 thousand euros total (2015: 958 thousand euros). Interest income on individually impaired loans in 2016 was 96 thousand euros and in 2015 it amounted to 257 thousand euros. The reduction in impaired loans and advances is conditioned by clients’ better paying capacity. As at 31.12.2016, the amount of outstanding impaired loans and advances to private individuals was 2,410 thousand euros, the amount of individually impaired loans was 197 thousand euros and 17.5% of impaired receivables were past due (see the table below). The proportion of individual impairment of impaired receivables in the case of private individuals was 8.2% at 31.12.2016. As at 31.12.2015, the amount of outstanding impaired loans and advances to private individuals was 4,432 thousand euros, the amount of individually impaired loans was 1,251 thousand euros and 48.7% of impaired receivables were past due. The proportion of individual impairment of impaired receivables in the case of private individuals was 28.2% at 31.12.2015.
Structure of impaired loans to private individuals according to past due period In thousands of euros
31.12.2016 Not past
due 1-30 days
31-60 days
61-90 days
91-180 days
More than 180 days
Total Individual impairment
Net
A 1,362 0 0 0 0 0 1,362 -2 1,360
B 7 0 0 0 0 0 7 0 7
C 619 0 0 0 0 0 619 -76 543
D 0 0 0 129 0 0 129 -3 126
F 0 0 0 0 6 287 293 -116 177
Total 1,988 0 0 129 6 287 2,410 -197 2,213
In thousands of euros
31.12.2015 Not past
due 1-30 days
31-60 days
61-90 days
91-180 days
More than 180 days
Total Individual impairment
Net
A 1,506 0 0 0 0 0 1,506 -3 1,503
B 18 21 0 0 0 0 39 0 39
C 38 27 107 0 0 0 172 -3 169
D 31 153 18 26 0 0 228 -16 212
E 0 0 0 0 10 0 10 -1 9
F 680 0 0 0 128 1,669 2,477 -1,228 1,249
Total 2,273 201 125 26 138 1,669 4,432 -1,251 3,181

50
Structure of impaired loans to legal entities according to past due time In thousands of euros
31.12.2016 Not past
due 1-30 days
31-60 days
61-90 days
91-180 days
More than 180 days
Total Individual impairment
Net
A 0 0 0 0 0 0 0 0 0
B 810 0 0 0 0 0 810 -40 770
C 46 101 0 0 0 0 147 -13 134
D 0 0 0 1 0 249 250 -37 213
F 0 0 0 0 0 3,845 3,845 -476 3,369
Total 856 101 0 1 0 4,094 5,052 -566 4,486
In thousands of euros
31.12.2015 Not past
due 1-30 days
31-60 days
61-90 days
91-180 days
More than 180 days
Total Individual impairment
Net
A 0 0 0 0 0 0 0 0 0
B 117 0 0 0 0 0 117 -1 116
C 898 0 247 0 0 0 1,145 -87 1,058
D 50 0 0 0 0 0 50 -2 48
E 0 0 0 0 0 193 193 -106 87
F 0 0 0 0 0 0 0 0 0
Total 1,065 0 247 0 0 193 1,505 -196 1,309
As at 31.12.2016, the amount of outstanding impaired loans and advances to legal entities was 5,052 thousand euros, the amount of individually impaired loans was 566 thousand euros of which 83.0% were past due. As at 31.12.2016 there were 25 loans impaired and past due. As at 31.12.2016 the percentage of individual impairment to total impaired receivables was 11.2% in the case of legal entities. As at 31.12.2015 the amount of outstanding impaired loans and advances to legal entities was 1,505 thousand euros, the amount of individually impairment loans was 196 thousand euros of which 29.2% were past due. As at 31.12.2015 there were 49 loans impaired and past due. As at 31.12.2015 the percentage of individual impairment to total impaired receivables was 13.1% in case of legal entities. Financial effect of loan collateral depends on market value of receivable and collateral for corresponding agreement. Loans and advances by collateralisation type are presented in the table below. Financial effect on change in fair value of loan collateral’s market value appears first of all in case of past due loans and advances, as servicing of those loans is more uncertain and need for realisation of collateral is more probable than in case of not past due loans. Balance sheet value for past due under-collateralised loans as at 31.12.2016 was 464 thousand euros and 791 thousand euros as at 31.12.2015. Balance sheet value of under-collateralised loans and advances is bigger than fair value of collaterals for corresponding receivables and, on the contrary, balance sheet value of over-collateralised loans and advances is smaller than fair value of collaterals for corresponding receivables. Acceptance value of collateral represents the liquidity risk, market risk and legal risk of the collateral and is calculated as a percentage of its market value. Overview of ratios of residual overdue loans and market value of the collateral and the distribution of the credit portfolio by collateral is given in notes 6 and 7. The financial impact of collateral is significant for loans and receivables which are unlikely to be serviced from customer's primary cash flows, as reflected in long payment delays (over 90 days).
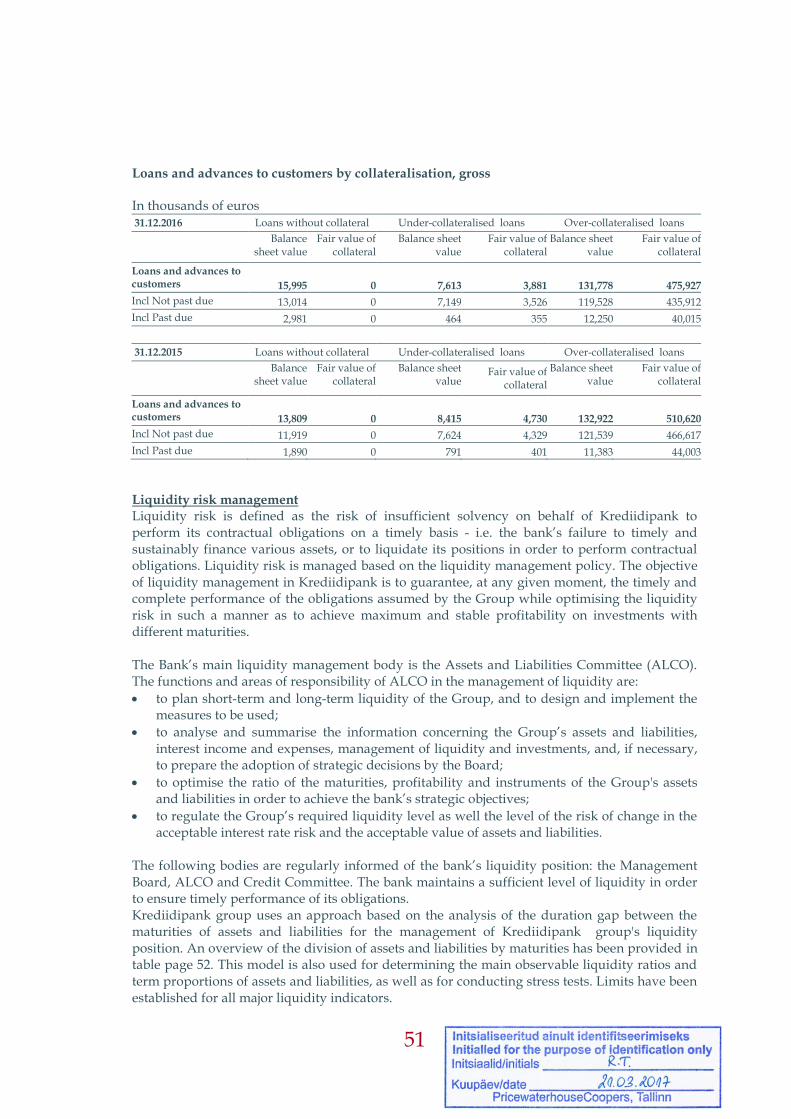
51
Loans and advances to customers by collateralisation, gross In thousands of euros 31.12.2016 Loans without collateral Under-collateralised loans Over-collateralised loans
Balance
sheet value Fair value of
collateral Balance sheet
value Fair value of
collateral Balance sheet
value Fair value of
collateral
Loans and advances to customers 15,995 0 7,613 3,881 131,778 475,927
Incl Not past due 13,014 0 7,149 3,526 119,528 435,912
Incl Past due 2,981 0 464 355 12,250 40,015
31.12.2015 Loans without collateral Under-collateralised loans Over-collateralised loans
Balance
sheet value Fair value of
collateral Balance sheet
value Fair value of
collateral
Balance sheet value
Fair value of collateral
Loans and advances to customers 13,809 0 8,415 4,730 132,922 510,620
Incl Not past due 11,919 0 7,624 4,329 121,539 466,617
Incl Past due 1,890 0 791 401 11,383 44,003
Liquidity risk management Liquidity risk is defined as the risk of insufficient solvency on behalf of Krediidipank to perform its contractual obligations on a timely basis - i.e. the bank’s failure to timely and sustainably finance various assets, or to liquidate its positions in order to perform contractual obligations. Liquidity risk is managed based on the liquidity management policy. The objective of liquidity management in Krediidipank is to guarantee, at any given moment, the timely and complete performance of the obligations assumed by the Group while optimising the liquidity risk in such a manner as to achieve maximum and stable profitability on investments with different maturities. The Bank’s main liquidity management body is the Assets and Liabilities Committee (ALCO). The functions and areas of responsibility of ALCO in the management of liquidity are:
to plan short-term and long-term liquidity of the Group, and to design and implement the measures to be used;
to analyse and summarise the information concerning the Group’s assets and liabilities, interest income and expenses, management of liquidity and investments, and, if necessary, to prepare the adoption of strategic decisions by the Board;
to optimise the ratio of the maturities, profitability and instruments of the Group's assets and liabilities in order to achieve the bank’s strategic objectives;
to regulate the Group’s required liquidity level as well the level of the risk of change in the acceptable interest rate risk and the acceptable value of assets and liabilities.
The following bodies are regularly informed of the bank’s liquidity position: the Management Board, ALCO and Credit Committee. The bank maintains a sufficient level of liquidity in order to ensure timely performance of its obligations. Krediidipank group uses an approach based on the analysis of the duration gap between the maturities of assets and liabilities for the management of Krediidipank group's liquidity position. An overview of the division of assets and liabilities by maturities has been provided in table page 52. This model is also used for determining the main observable liquidity ratios and term proportions of assets and liabilities, as well as for conducting stress tests. Limits have been established for all major liquidity indicators.

52
The following indicators are used for the measurement of liquidity risk:
Liquidity Coverage Ratio (LCR);
Maintenance period in a liquidity crisis situation;
Financing concentration;
Ratio of liquid assets to demand deposits;
Ratio of non-current liabilities to investments requiring stable funding. The Group's total duration gap in the period of up to 12 months is negative. This indicates that the Group has more liabilities with a duration of up to 12 months compared to receivables with the corresponding duration. The management of the duration gap risk is based on estimates concerning forecast cash flows arising from liabilities and the Group ensures an adequate amount of liquidity buffers in order to meet the net outflow of liabilities as they become due. The liquidity policy of the group is built upon the principle of prudence and established liquidity buffers are sufficient to cover even a large-scale outflow of deposits. The Group has established a business continuity and recovery plan for conduct in a liquidity crisis, specifying the actions to be taken for covering a cash flow deficit even in extraordinary circumstances. The overview of the Group's financial assets and financial by residual maturity (including receivables or payables interests in the future) is provided in the table below.
thousands of euros 31.12.2016 Up to 3 months 3-12 months 1-5 years More than 5 years Total
Assets
Cash on hand 22,337 0 0 0 22,337
Balances with central banks 43,919 0 0 0 43,919
Loans and advances to credit institutions 38,793 500 0 0 39,293
Financial assets designated at fair value through profit or loss
1,037 5,457 4,927 0 11,421
Loans and advances to customers 15,220 21,271 73,399 92,503 202,393
Held-to-maturity financial assets 0 0 503 0 503
Available-for-sale financial assets 0 0 0 13 13
Other financial assets 431 0 0 283 714
Total financial assets 121,737 27,228 78,829 92,799 320,593
Liabilities
Due to credit institutions 185 0 0 0 185
Due to customers 170,036 55,902 26,229 2,493 254,660
Other financial liabilities 1,433 0 0 0 1,433
Subordinated debt 76 234 4,969 0 5,279
Total financial liabilities 171,730 56,136 31,198 2,493 261,557
Off-balance sheet liabilities
Undrawn lines of credit and overdraft facilities
3,708 0 0 0 3,708
Financial guarantees 1,355 0 0 0 1,355
Total on-balance-sheet and off-balance-sheet liabilities
176,793 56,136 31,198 2,493 266,620
Duration gap of financial assets and financial liabilities
-55,056 -28,908 47,631 90,306 53,973

53
In thousands of euros 31.12.2015 Up to 3 months 3-12 months 1-5 years More than 5 years Total
Assets
Cash on hand 2,342 0 0 0 2,342
Balances with central banks 65,126 0 0 0 65,126
Loans and advances to credit institutions 57,216 500 0 0 57,716
Financial assets held for trading 28 0 0 0 28
Financial assets designated at fair value through profit or loss
0 2,346 3,732 0 6,078
Loans and advances to customers 13,228 21,605 76,668 88,875 200,376
Held-to-maturity financial assets 0 0 0 503 503
Available-for-sale financial assets 0 0 0 13 13
Other financial assets 913 0 0 248 1,161
Total financial assets 138,853 24,451 80,400 89,639 333,343
Off-balance sheet financial assets
Financial assets held for trading (derivatives)
20,437 0 0 0 20,437
Total on-balance-sheet and off-balance-sheet financial assets
159,290 24,451 80,400 89,639 353,780
Liabilities
Due to credit institutions 115 0 0 0 115
Due to customers 174,918 68,181 23,652 1,538 268,289
Financial liabilities held for trading 276 0 0 0 276
Other financial liabilities 3,576 0 0 0 3,576
Subordinated debt 76 234 5,279 0 5,589
Total financial liabilities 178,961 68,415 28,931 1,538 277,845
Off-balance sheet liabilities
Financial liabilities held for trading (derivatives)
20,685 0 0 0 20,685
Undrawn lines of credit and overdraft facilities
6,618 0 0 0 6,618
Financial guarantees 1,253 0 0 0 1,253
Total on-balance-sheet and off-balance-sheet liabilities
207,517 68,415 28,931 1,538 306,401
Duration gap of financial assets and financial liabilities
-48,227 -43,964 51,469 88,101 47,379
Market risk management Market risk arises from the Group’s trading and investment activities in the interest, currency and equity markets. Among financial products, financial investments and derivative instruments are subject to market risk. Market risk arises from changes in interest rates, currency exchange rates and prices of financial assets. The acceptance of market risk is controlled by using risk limits. Different factors influencing market risks are monitored on a daily basis. The primary market risk bearing assets in the Group are investments in bonds. Investments in bonds are included in the following line items: Financial assets at fair value through profit or loss, Held-to-maturity financial assets and Available-for-sale financial assets. The total size of debt securities portfolio has been increased by a total of 5.34 million euros (87.9%) during the year 2016 (see Note 10). The average maturity of portfolio and summarized market risk has been decreased.

54
The price risk of the debt securities portfolio mainly arises from the potential change in interest rates. The Group uses the VaR (Value at Risk) method to measure the price risk of its portfolio of financial investments. The VaR of the debt securities portfolio given a 100bp increase in interest rates as at 31.12.2016 was 87 thousand euros, the respective indicator as at 31.12.2015 was 257 thousand euros. Currency risk is defined as a risk arising from the differences in the currency structure of the Group's assets and liabilities. Changes in currency exchange rates cause changes in the value of assets and liabilities, as well as the amount of income and expenses measured in the functional currency. The group generally maintains minimum foreign currency positions required for the provision of services to customers. All foreign currency positions are continually monitored and marked to market. The Group covers open foreign currency positions using swap and forward transactions. The total amount of open currency positions as at 31.12.2016 was 57 thousand euros (2015: absolute amount 234 thousand euros), currency risk is low. Data on the structure of assets and liabilities by currency positions and respective net currency positions have been presented in following table:
In thousands of euros 31.12.2016 EUR USD Other Total
Assets
Cash on hand 21,987 282 68 22,337
Balances with central banks 43,919 0 0 43,919
Loans and advances to credit institutions 4,468 28,756 6,069 39,293
Financial assets designated at fair value through profit or loss
5,964 5,457 0 11,421
Loans and advances to customers 152,922 211 0 153,133
Held-to-maturity financial assets 503 0 0 503
Available-for-sale financial assets 13 0 0 13
Other financial assets 376 220 118 714
Total financial assets 230,152 34,926 6,255 271,333
Liabilities
Due to credit institutions 123 62 0 185
Due to customers 213,171 34,423 6,218 253,812
Subordinated debt 4,039 0 0 4,039
Other financial liabilities 1,012 404 17 1,433
Total financial liabilities 218,345 34,889 6,235 259,469
Off-balance sheet liabilities
Undrawn lines of credit and overdraft facilities 3,708 0 0 3,708
Financial guarantees 1,354 0 0 1,354
Total on-balance-sheet and off-balance-sheet liabilities 223,407 34,889 6,235 264,531
Net position 6,745 37 20 6,802

55
In thousands of euros 31.12.2015 EUR USD Other Total
Assets
Cash on hand 1,024 1,218 100 2,342
Balances with central banks 65,126 0 0 65,126
Loans and advances to credit institutions 17,616 28,741 11,359 57,716
Financial assets held for trading 28 0 0 28
Financial assets designated at fair value through profit or loss
5,154 924 0 6,078
Loans and advances to customers 151,908 744 0 152,652
Held-to-maturity financial assets 503 0 0 503
Available-for-sale financial assets 13 0 0 13
Continues on the next page
Other financial assets 910 246 5 1,161
Total financial assets 242,282 31,873 11,464 285,619
Off-balance sheet assets
Financial assets held for trading (derivatives) 0 0 20,437 20,437
Total on-balance-sheet and off-balance-sheet assets 242,282 31,873 31,901 306,056
Liabilities
Due to credit institutions 69 46 0 115
Due to customers 204,846 31,082 31,467 267,395
Financial liabilities held for trading 276 0 0 276
Subordinated debt 4,039 0 0 4,039
Other financial liabilities 2,517 802 257 3,576
Total financial liabilities 211,747 31,930 31,724 275,401
Off-balance-sheet liabilities
Financial liabilities held for trading (derivatives) 20,685 0 0 20,685
Undrawn lines of credit and overdraft facilities 6,618 0 0 6,618
Financial guarantees 1,253 0 0 1,253
Total on-balance-sheet and off-balance-sheet liabilities 240,303 31,930 31,724 303,957
Net position 1,979 -57 177 2,099
Interest rate risk is defined as a risk of unexpected unfavorable changes in interest rates that might affect the revenue generated by the group. The Group is exposed to interest rate risk if the due payment dates of its main assets and liabilities are different, if the structure of assets and liabilities varies in different currencies or if the interest rates of assets and liabilities can be adjusted at different time intervals. The overview of interest-bearing financial assets and financial liabilities by the due date of changing the interest rate is provided in the following table.

56
In thousands of euros
31.12.2016 Up to 3 months
3-12 months
1-5 years
More than 5 years
Total
Interest-earning assets
Balances with central banks 43,919 0 0 0 43,919
Loans and advances to credit institutions 39,284 0 0 0 39,284
Financial assets designated at fair value through profit or loss
1,037 5,457 4,927 0 11,421
Loans and advances to customers, gross 94,176 63,793 23 0 157,992
Held-to-maturity financial assets 0 503 0 0 503
Total interest-earning assets 178,416 69,753 4,950 0 253,119
Interest-bearing liabilities
Due to credit institutions 185 0 0 0 185
Due to customers 244,957 2,737 5,434 17 253,145
Subordinated debt 0 0 4,000 0 4,000
Total interest-bearing liabilities 245,142 2,737 9,434 17 257,330
Exposure to interest rate risk duration gap -66,726 67,016 -4,484 -17 -4,211
In thousands of euros
31.12.2015 Up to 3 months
3-12 months
1-5 years
More than 5 years
Total
Interest-earning assets
Balances with central banks 65,126 0 0 0 65,126
Loans and advances to credit institutions 57,716 0 0 0 57,716
Financial assets designated at fair value through profit or loss
0 2,346 3,732 0 6,078
Loans and advances to customers, gross 89,957 68,189 28 0 158,174
Held-to-maturity financial assets 0 503 0 0 503
Total interest-earning assets 212,799 71,038 3,760 0 287,597
Interest-bearing liabilities
Due to credit institutions 115 0 0 0 115
Due to customers 258,325 3,422 4,391 17 266,155
Subordinated debt 0 0 0 4,000 4,000
Total interest-bearing liabilities 258,440 3,422 4,391 4,017 270,270
Exposure to interest rate risk duration gap -45,641 67,616 -631 -4,017 17,327
Interest rate risk management entails the analysis of the interest rate risk of all of the Group's assets and liabilities and the management of duration. Once a year the assessment of interest risk of the bank portfolio is done. The table below specifies the estimates with regard to the annual impact of a parallel shift in the yield curve on the interest income and interest expense by currency as at 31.12.2016. The shift in the yield curve and the net interest income of the Group is positively correlated, therefore net interest income decreases in the event of a decline in interest rates and net interest income increases in the event of an increase in interest rates. The total impact of an increase in the interest rate of 100 bp on net interest income over one year was 268 thousand euros at the balance sheet date. The interest rate decrease of 100 bp impact was -164 thousand euros. Sensitivity to interest rates is impacted by the transfer of interest rate
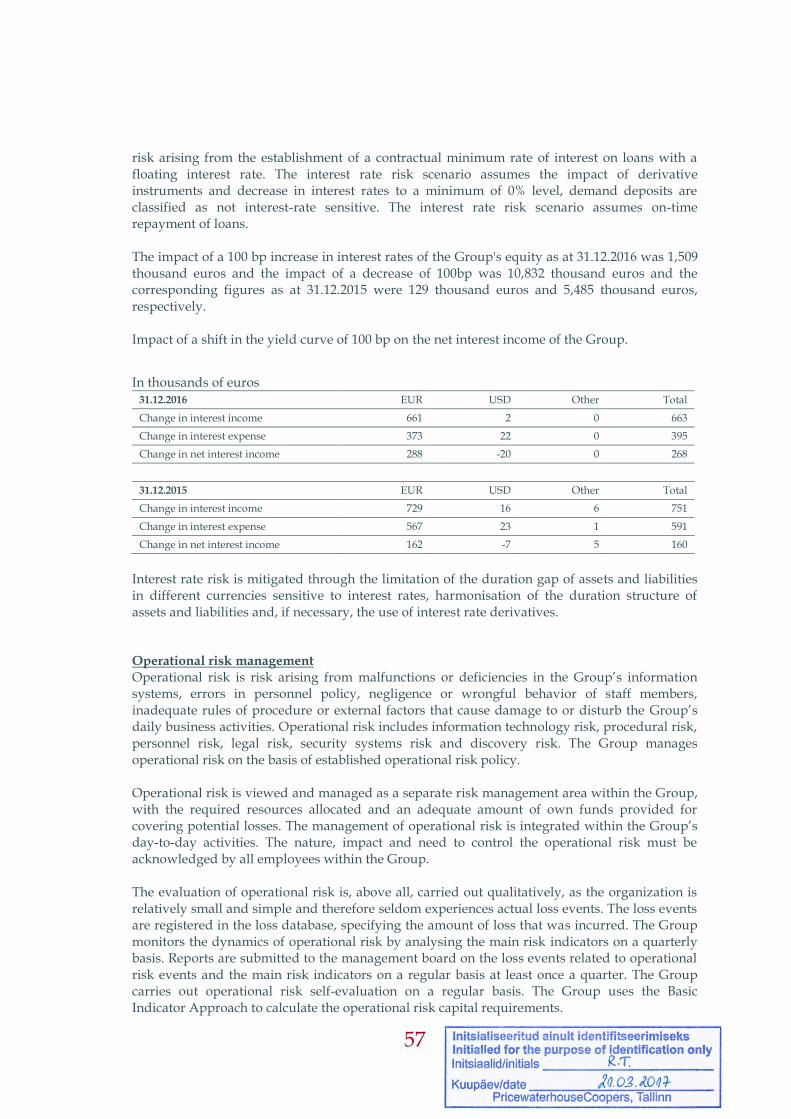
57
risk arising from the establishment of a contractual minimum rate of interest on loans with a floating interest rate. The interest rate risk scenario assumes the impact of derivative instruments and decrease in interest rates to a minimum of 0% level, demand deposits are classified as not interest-rate sensitive. The interest rate risk scenario assumes on-time repayment of loans. The impact of a 100 bp increase in interest rates of the Group's equity as at 31.12.2016 was 1,509 thousand euros and the impact of a decrease of 100bp was 10,832 thousand euros and the corresponding figures as at 31.12.2015 were 129 thousand euros and 5,485 thousand euros, respectively. Impact of a shift in the yield curve of 100 bp on the net interest income of the Group.
In thousands of euros 31.12.2016 EUR USD Other Total
Change in interest income 661 2 0 663
Change in interest expense 373 22 0 395
Change in net interest income 288 -20 0 268
31.12.2015 EUR USD Other Total
Change in interest income 729 16 6 751
Change in interest expense 567 23 1 591
Change in net interest income 162 -7 5 160
Interest rate risk is mitigated through the limitation of the duration gap of assets and liabilities in different currencies sensitive to interest rates, harmonisation of the duration structure of assets and liabilities and, if necessary, the use of interest rate derivatives. Operational risk management
Operational risk is risk arising from malfunctions or deficiencies in the Group’s information systems, errors in personnel policy, negligence or wrongful behavior of staff members, inadequate rules of procedure or external factors that cause damage to or disturb the Group’s daily business activities. Operational risk includes information technology risk, procedural risk, personnel risk, legal risk, security systems risk and discovery risk. The Group manages operational risk on the basis of established operational risk policy. Operational risk is viewed and managed as a separate risk management area within the Group, with the required resources allocated and an adequate amount of own funds provided for covering potential losses. The management of operational risk is integrated within the Group’s day-to-day activities. The nature, impact and need to control the operational risk must be acknowledged by all employees within the Group. The evaluation of operational risk is, above all, carried out qualitatively, as the organization is relatively small and simple and therefore seldom experiences actual loss events. The loss events are registered in the loss database, specifying the amount of loss that was incurred. The Group monitors the dynamics of operational risk by analysing the main risk indicators on a quarterly basis. Reports are submitted to the management board on the loss events related to operational risk events and the main risk indicators on a regular basis at least once a quarter. The Group carries out operational risk self-evaluation on a regular basis. The Group uses the Basic Indicator Approach to calculate the operational risk capital requirements.
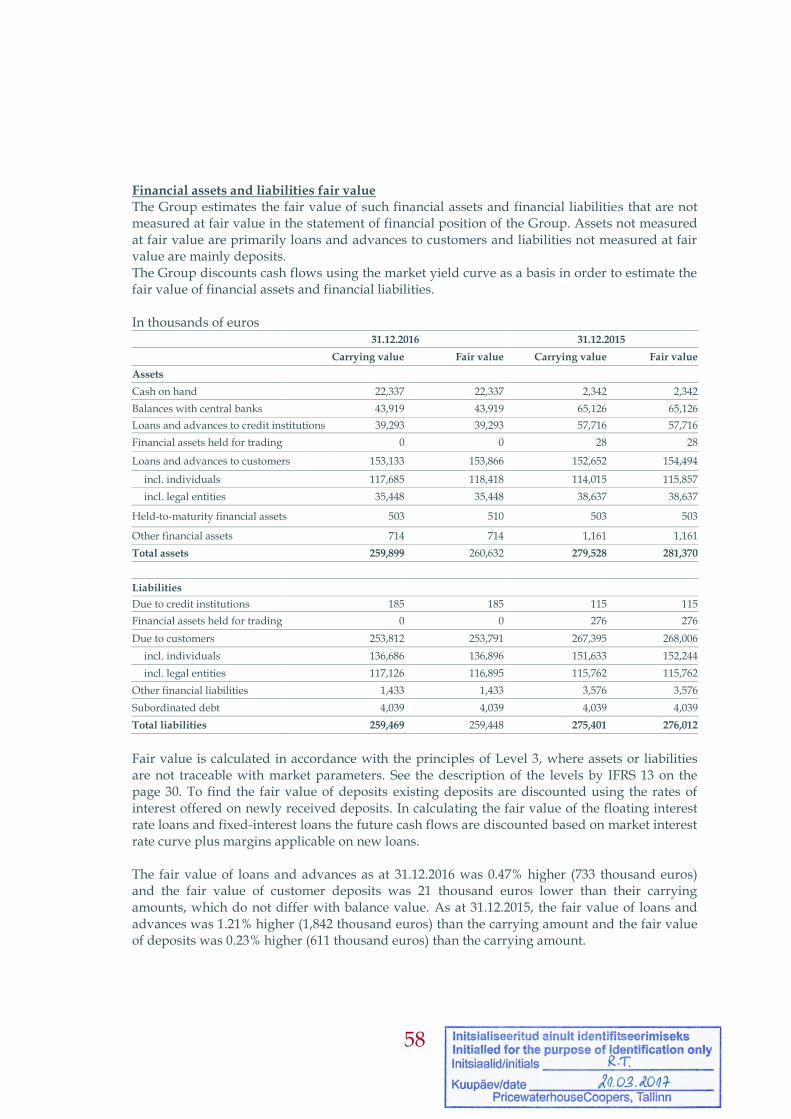
58
Financial assets and liabilities fair value
The Group estimates the fair value of such financial assets and financial liabilities that are not measured at fair value in the statement of financial position of the Group. Assets not measured at fair value are primarily loans and advances to customers and liabilities not measured at fair value are mainly deposits. The Group discounts cash flows using the market yield curve as a basis in order to estimate the fair value of financial assets and financial liabilities. In thousands of euros 31.12.2016 31.12.2015
Carrying value Fair value Carrying value Fair value
Assets
Cash on hand 22,337 22,337 2,342 2,342
Balances with central banks 43,919 43,919 65,126 65,126
Loans and advances to credit institutions 39,293 39,293 57,716 57,716
Financial assets held for trading 0 0 28 28
Loans and advances to customers 153,133 153,866 152,652 154,494
incl. individuals 117,685 118,418 114,015 115,857
incl. legal entities 35,448 35,448 38,637 38,637
Held-to-maturity financial assets 503 510 503 503
Other financial assets 714 714 1,161 1,161
Total assets 259,899 260,632 279,528 281,370
Liabilities
Due to credit institutions 185 185 115 115
Financial assets held for trading 0 0 276 276
Due to customers 253,812 253,791 267,395 268,006
incl. individuals 136,686 136,896 151,633 152,244
incl. legal entities 117,126 116,895 115,762 115,762
Other financial liabilities 1,433 1,433 3,576 3,576
Subordinated debt 4,039 4,039 4,039 4,039
Total liabilities 259,469 259,448 275,401 276,012
Fair value is calculated in accordance with the principles of Level 3, where assets or liabilities are not traceable with market parameters. See the description of the levels by IFRS 13 on the page 30. To find the fair value of deposits existing deposits are discounted using the rates of interest offered on newly received deposits. In calculating the fair value of the floating interest rate loans and fixed-interest loans the future cash flows are discounted based on market interest rate curve plus margins applicable on new loans. The fair value of loans and advances as at 31.12.2016 was 0.47% higher (733 thousand euros) and the fair value of customer deposits was 21 thousand euros lower than their carrying amounts, which do not differ with balance value. As at 31.12.2015, the fair value of loans and advances was 1.21% higher (1,842 thousand euros) than the carrying amount and the fair value of deposits was 0.23% higher (611 thousand euros) than the carrying amount.

59
Note 3. Balances with central banks
In thousands of euros
31.12.2016 31.12.2015
Demand deposits
incl. minimum reserve requirement 1,919 2,221
incl. demand deposits, cash equivalents 42,000 62,905
Total 43,919 65,126
Note 4. Loans and advances to credit institutions
In thousands of euros
31.12.2016 31.12.2015
EU countries, except Estonia 18,344 25,582
Estonia 20,167 11,941
U.S. 0 19,316
All other countries 782 877
Total 39,293 57,716
Classification by credit rating
AA 85 1,952
AA- 20,236 12,014
A+ 184 645
A 2,515 7
A- 7,896 8,658
BBB+ 7,595 24,803
BBB- 130 9,553
BB+ 0 28
BB- 607 0
Not rated 45 56
Total 39,293 57,716
Note 5. Loans and advances to customers
In thousands of euros 31.12.2016 31.12.2015
Total receivables from private individuals 119,261 116,245
Home loan 88,961 82,440
Consumer loan 25,166 27,956
Lease financing 5,134 5,849
Contnues on the next page

60
Total receivables from corporates 36,125 38,901
Investment loan 19,602 22,812
Working capital loan 12,215 12,294
Lease financing 4,308 3,795
Total receivables 155,386 155,146
Allowance for doubtful receivables (Note 9) -2,253 -2,494
Total 153,133 152,652
EU countries, except Estonia 10,097 10,678
Estonia 144,994 143,507
All other countries 295 961
Total receivables 155,386 155,146
Allowance for doubtful receivables (Note 9) -2,253 -2,494
Total 153,133 152,652
Note 6. Past due receivables In thousands of euros, gross
31.12.2016 31.12.2015
Private individuals Loan balance Collateral coverage ratio Loan balance
Collateral coverage ratio
1-30 days 4,718 44.9% 3,814 47.6% 31-60 days 1,370 35.1% 1,391 36.0% 61-90 days 579 37.1% 395 24.2% more than 90 days 1,914 23.8% 3,206 60.3% Total 8,581 8,806
31.12.2016 31.12.2015
Corporates Loan balance Collateral coverage
ratio Loan balance
Collateral coverage ratio
1-30 days 282 32.2% 593 42.7% 31-60 days 43 58.1% 410 79.5% 61-90 days 2,467 49.4% 228 19.3% more than 90 days 4,322 21.1% 4,027 27.7% Total 7,114 5,258
The collateral coverage ratio is calculated contract basis as the receivable from the customer divided by the market value of collateral. Then the results are weighed with contractual net balance in the respective group.

61
Note 7. Collateral structure Loans and advances to credit institutions
In thousands of euros
31.12.2016 31.12.2015
Unsecured 39,293 57,716
Total 39,293 57,716 Structure of collateral of loans
In thousands of euros
Private individuals Corporates
31.12.2016 31.12.2015 31.12.2016 31.12.2015
Mortgage loans 98,480 96,606 30,379 33,811
Leased assets 5,133 5,849 4,308 3,795
Unsecured loans 15,147 13,198 848 611
Personal sureties, guarantees 500 590 424 485
Loans secured by deposits 1 1 3 15
Other 0 1 163 184
Total 119,261 116,245 36,125 38,901
Allowance for doubtful receivables -1,576 -2,230 -677 -264
Total 117,685 114,015 35,448 38,637
Note 8. Finance lease receivables
In thousands of euros 31.12.2016 31.12.2015
Gross investment balance 9,988 10,418
Lease payments receivable, incl.
up to 1 year 4,541 3,717
1-5 years 5,278 6,476
over 5 years 169 225
Future payments 487 602
up to 1 year 220 250
1-5 years 259 338
over 5 years 8 14
Net investment* 9,501 9,816
Lease payments receivable, incl.
up to 1 year 4,321 3,467
1-5 years 5,019 6,137
over 5 years 161 212
Net investment is included in the consolidated statement of financial position in the line item "Loans and advances to customers".

62
Note 9. Impairment of loans and advances
In thousands of euros
31.12.2016 31.12.2015 Balance at the beginning of the reporting period -2,494 -3,019 incl. collective impairments
-1,047 -546 incl. individual impairment -1,447 -2,473 Impairments posted during the reporting period -2,055 -1,600 Adjustment of previous impairments 1,036 1,425 Written-off loan receivables -146 -176 Loans written off during the reporting period 1,406 876 Balance at the end of the reporting period -2,253 -2,494 incl. collective impairments
-1,490 -1,047 incl. individual impairment -763 -1,447
Note 10. Financial investments In thousands of euros 31.12.2016 31.12.2015
Financial assets held for trading 0 28
Concluded with credit institutions, foreign currency related derivative transactions 0 28
incl. level 1 instruments 0 28
Financial assets designated at fair value through profit or loss 11,421 6,078
Debt securities 11,421 6,078
incl. level 1 instruments 11,421 6,078
Held-to-maturity financial assets 503 503
Debt securities 503 503
incl. amortised cost 503 503
Available-for-sale financial assets 13 13
Equity securities 13 13
incl. level 2 instruments 13 13
No reclassifications of financial investments between different levels occurred during the reporting period.
In thousands of euros
31.12.2016 31.12.2015
Financial assets held for trading 0 28
Concluded with credit institutions, foreign currency related derivative transactions 0 28
Financial assets designated at fair value through profit or loss 11,421 6,078
Government debt securities 2,904 1,053
Debt securities of credit institutions and financing institutions 3,073 1,327
Debt securities of other non-financial companies 5,444 3,698
Continues on the next page

63
Held-to-maturity financial assets 503 503
Debt securities of other non-financial companies 503 503
Available-for-sale financial assets 13 13
Shares of other non-financial companies 13 13
Financial assets held for trading 0 28 Derivative contracts with credit institutions registered in EU 0 28
Financial assets designated at fair value through profit or loss 11,421 6,078
Securities of companies registered in the EU 10,362 5,154 Securities registered in other countries 1,059 924
Held-to-maturity financial assets 503 503
Securities of companies registered in the EU 503 503
Available-for-sale financial assets 13 13
Securities of companies registered in the EU 13 13
Financial assets held for trading 0 28
AA- to AA+ credit rating 0 28
Financial assets designated at fair value through profit or loss 11,421 6,078 A- to A+ credit rating 2,188 2,254
BBB- to BBB+ 5,977 1,573
BB- to BB+ 433 555
B- to B+ 1,732 1,696
Not rated* 1,091 0
Held-to-maturity financial assets 503 503
Not rated* 503 503
Available-for-sale financial assets 13 13
Not rated* 13 13
* There are no available credit rating from rating agencies
31.12.2016 31.12.2015
Financial assets held for trading
Opening balance 28 0
During the reporting period:
- currency related derivatives change in fair value -28 28
Closing balance 0 28
Continues on the next page

64
Financial assets designated at fair value through profit or loss Opening balance 6,078 13,184
During the reporting period:
Acquired 9,181 0
Sold 0 0
Redeemed -3,652 -6,734
Change in fair value -186 -372
Closing balance 11,421 6,078
Held-to-maturity financial assets
Continues on the next page
Opening balance 503 3,921
During the reporting period:
Acquired 0 500
Sold 0 0
Redeemed 0 -3,918
Closing balance 503 503
Note 11. Other financial assets In thousands of euros 31.12.2016 31.12.2015 Cash in transit 431 913 Security deposits 190 184 Other receivables 93 64 Total 714 1,161 Other financial assets are all not past due and not impaired.
Note 12. Assets held for sale In thousands of euros
31.12.2016 31.12.2015 Properties under construction 3,563 1,590 Real estate acquired for resale 716 832 Total 4,279 2,422 incl. impairment of inventories during the reporting period 82 171 Note 13. Investment property In thousands of euros
31.12.2016 31.12.2015 Carrying amount at the beginning of the period 11,220 13,515
Sold during the period 0 -2,410 Reclassification from property, plant and equipment 288 0 Reclassification from inventories -2,511 0 Change in fair value 108 115
Continues on the next page

65
Carrying amount at the end of the period 9,105 11,220 incl. investment property earning rental income 9,105 9,127
Rental income 535 533 Expenses incurred on generation of rental income 140 147 Sale of investment property in sale price 0 2,410 Investment property is measured at fair value on the basis of expert appraisal carried out by qualified appraisers, as applicable to level 3 instruments. Independent expert valuation is based on either the income approach, market approach or a combination of the two aforementioned approaches is used. The following attributes are used by expert appraisals for the determination of fair value of investment property:
Rental income: rents under current lease agreements are used;
Vacancy rate: the actual vacancy rate of the investment properties, taking into account the risks associated with the property;
Discount rate: it is calculated using the weighted average cost of capital (WACC) associated with the investment property;
Capitalisation rate: it is based on the estimated level of return at the end of the estimated holding period, taking into consideration the forecast market condition and risks associated with the property. Income approach based on the capability of the asset to generate income in the future. The value is defined as the present value of the expected future income. The income approach is used for the valuation of income-producing real estate (leased asset or can be deemed to be a leased asset). Income-based approaches are the capitalisation of income and discounted cash flow analysis. Market approach is based on analysis to compare the appraised asset to sold assets of similar nature. The comparison determines differences between the appraised asset and sold assets of similar nature and then uses the results to adjust the prices of sold assets and determine the value of the appraised asset. In certain situations it is not possible to only rely on one approach and therefore the methods must be combined. A valuation specialist uses one to three valuation approaches (or combinations thereof) to carry out the appraisal. Typically multiple different results are obtained when several approaches are used, which are then adjusted into the valuation through weighing. No substantive changes have occurred in the approaches used to appraise real estate compared to the financial statements for the year 2015. The mixed method was not used in evaluation in 2016. The following table provides an overview of the valuation methodology used and the classification of investment property. In thousands of euros
31.12.2016
Fair value Rent income per
year
Value or medium
rent price (euros/m2)
Discount rate Capitalisa-tion rate
Possible change in rent price
Impact to value
Investment property which is valued:
Market approach 4,486 159 - - - - -
-other commercial real estate 4,071 153 1.81 – 7.26 - - 5-10% +/- 20%
-residential property 388 6 1.39 – 8.98 - - 0-6% +/- 5%
-land 27 0 0 - - 0-5% +/-25%

66
Income approach -offices
4,619 373 5.70-9.86 9.5-11.0% 7.70-9.0% CPI to 8 % +/- 15%
Investment property total 9,105 532 - - - - -
31.12.2015
Fair value Rent income per
year
Value or medium
rent price (euros/m2)
Discount rate Capitalisa-tion rate
Possible change in rent price
Impact to value
Investment property which is valued:
Market approach 7,020 117 - - - - -
-other commercial real estate 1,956 88 0.22 – 1.41 - - 5-10% +/- 20%
-residential property 665 23 1.39 – 2.64 - - 0-8% +/- 5%
-land 4,399 6 0.01 – 0.24 - - 0-8% +/-25%
Income approach -offices
3,100 254 5.41 EUR 9% 8% CPI to 8 % +/- 15%
Combined method -offices
1,100 88 6.56 EUR 9% 8% CPI to 8 % +/- 10%
Investment property total 11,220 459 - - - - -
Note 14. Property, plant and equipment
In thousands of euros Land and properties Other assets Total
Carrying amount at 01.01.2015 4,299 1,061 5,360
incl. cost 5,446 2,648 8,094
incl. depreciation 1,147 1,587 2,734
Acquisition 0 128 128
Sale at carrying amount 0 62 62
Write-off at carrying amount 0 12 12
Depreciation charged 94 232 326
Carrying amount at 31.12.2015 4,205 883 5,088
incl. cost 5,446 2,400 7,846
incl. depreciation 1,241 1,517 2,758
Acquisition 0
53 53
Sale at carrying amount 0
49 49
Write-off at carrying amount 0 12 12
Reclassification as investment property -288 9 -279
Depreciation charged 93 196 289
Carrying amount at 31.12.2016 3,824 688 4,512
incl. cost 5,092 2,237 7,329
incl. depreciation 1,268 1,549 2,817

67
Note 15. Intangible assets In thousands of euros Carrying amount at 01.01.2015 733
incl. cost 1,834 incl. depreciation 1,101
Acquisition 189 Reclassification as investment property -1 Depreciation charged 160 Carrying amount at 31.12.2015 761
incl. cost 2,014 incl. depreciation 1,253
Acquisition 91 Depreciation charged 165 Carrying amount at 31.12.2016 687
incl. cost 2,104 incl. depreciation 1,417
Note 16. Other assets In thousands of euros
Note 17. Encumbered assets
Assets are deemed encumbered if such assets are used for securing any on-balance sheet or off-balance sheet transaction or improvement of creditworthiness and such assets are pledged and cannot be withdrawn from the pledge without prior approval by the pledgee. Deposited or pledged assets that are not in use and can be readily reclaimed are not deemed to be encumbered assets. The assets of Krediidipank group are predominantly unencumbered with the exception of deposits pledged in the total amount of 0.69 million euros for securing various transactions. The bank has previously pledged notes to the central bank, however, the bank is not subject to any obligations to the central bank with regard to the pledged assets, therefore such assets can be readily reclaimed. The following table gives an overview about encumbered assets.
31.12.2016 31.12.2015 Prepayment for financial supervision 101 97 Settlements with the Tax and Customs Board 3 1 Other prepayments 150 142 Total 254 240

68
In thousands of euros
31.12.2016 Carrying value of encumbered
assets
Fair value of encumbered
assets
Carrying value of unencumbered
assets
Fair value of unencumbered
Total carrying value of assets
Assets 690 690 289,754 302,425 290,170
Due from central banks and credit institutions
690 690 82,522 82,522 83,212
Shares 0 0 13 13 13
Bonds 0 0 11,924 11,931 11,924
incl. government bonds 0 0 2,904 2,904 2,904
incl. bonds of credit/financial institutions 0 0 3,073 3,073 3,073
incl. bonds of non-financial companies 0 0 5,947 5,954 5,947
Loans and advances to customers
0 0 153,133 153,866 153,133
Other assets 0 0 41,888 41,888 41,888
31.12.2015 Carrying value of encumbered
assets
Fair value of encumbered
assets
Carrying value of unencumbered
assets
Fair value of unencumbered
Total carrying value of assets
Assets 1,602 1,602 303,748 350,590 305,350
Due from central banks and credit institutions
1,602 1,602 121,240 121,240 122,842
Shares 0 0 13 13 13
Bonds 0 0 6,581 6,581 6,581
incl. government bonds 0 0 1,053 1,053 1,053
incl. bonds of credit/financial institutions 0 0 1,327 1,327 1,327
incl. bonds of non-financial companies 0 0 4,201 4,201 4,201
Loans and advances to customers 0 0 152,652 154,494 152,652
Other assets 0 0 23,262 23,262 23,262
Note 18. Due to credit institutions In thousands of euros 31.12.2016 31.12.2015 Demand deposits 185 115
incl. EUR 123 69 USD 62 46
Note 19. Due to customers In thousands of euros
31.12.2016 31.12.2015 Private individuals 136,686 151,633 Corporates 117,126 115,762 Total 253,812 267,395
Demand deposits 141,088 105,386 Term deposits 112,724 162,009 Total 253,812 267,395

69
Note 20. Other financial liabilities In thousands of euros
31.12.2016 31.12.2015 Cash in transit 1,061 3,178 Trade payables 100 104 Other financial liabilities 272 294 Total 1,433 3,576
Note 21. Other liabilities In thousands of euros
31.12.2016 31.12.2015 Payables to employees 668 352
Tax liabilities 186 354 Other liabilities 270 345 Total 1,124 1,051
Note 22. Subordinated debt
In thousands of euros
31.12.2016 31.12.2015 Amount Maturity Interest rate Amount Maturity Interest rate
Subordinated loan agreement 4,000 15.02.2021 7.75% 4,000 15.02.2021 7.75%
Accrued interest 39 - 39 - Total 4,039 4,039 Subordinated loan have fixed interest rate.
Note 23. Equity The share capital of the bank amounts to 25,001 thousand euros, which is divided into 39,117,600 shares of no par value. Pursuant to the articles of association, share capital can be increased to 80 million euros without any amendment to the articles of association. As at 31.12.2016 the carrying value of one share is 0.64 euros. According to the requirements of § 336 of the Commercial Code, during each financial year, at least one-twentieth of the net profit shall be transferred to the statutory reserve, until the statutory reserve reaches one-tenth of share capital. Once the statutory reserve capital reaches the amount specified in the articles of association, no more transfers on account of net profit will be made to the statutory reserve capital. On the basis of a decision of the general meeting of shareholders, statutory reserve capital may be used to cover losses, as well as to increase share capital. Distributions to shareholders from the statutory reserve capital are not permitted. Managing the capital according to credibility and regulatory requirements on equity are presented in Note 2 page 42.

70
Note 24. Contingent assets and liabilities In thousands of euros
31.12.2016 Assets Liabilities
Contingent liabilities 0 5,062
incl. financial guarantees 0 1,354
incl. lines of credit and overdraft facilities 0 3,708
31.12.2015
Financial assets held for trading 20,437 20,685
incl. underlying assets of currency related derivatives 20,437 20,685
Contingent liabilities 0 7,871
incl. financial guarantees 0 1,253
incl. lines of credit and overdraft facilities 0 6,618
The tax authorities may at any time inspect the books and records of the company within 5 years subsequent to the reported tax year, and may as a result of their inspection impose additional tax assessments and penalties. The management is not aware of any circumstances which may give rise to a potential material liability in this respect.
Note 25. Interest income
In thousands of euros
2016 2015 From demands to clients 8,331 7,665 On financial assets measured at fair value 511 423 On held-to-maturity financial assets 33 160 On cash and amounts due from banks 244 59 Incl. interest income on liabilities 130 46 Total 9,119 8,307
Interest income on liabilities in the amount of EUR 46 thousand was reflected as the fee and commission income in the 2015 annual report. Interest expense in the amount of 52 thousand was reflected as fee and commission expense in the 2015 annual report. In 2016, EBA published its position on reflecting negative interest rate as interest income and expense in financial accounts. Therefore, the mentioned indicators has been corrected in income statement, cash flow statement and in notes 25-28.

71
Note 26. Interest expense
In thousands of euros
2016 2015 On term deposits 1,244 1,804 On subordinated loans 310 558 On loans 5 4 On demand deposits 0 1 Interest expense on assets 162 52 Total 1,721 2,419
Note 27. Fee and commission income In thousands of euros
2016 2015 Bank transfer fees 1,115 1,139 Gains from foreign exchange transactions 942 808 Charges on card transactions 314 368 Account opening and management fees 438 450 Fees related to securities 26 21 Other fees 653 532 Total 3,488 3,318
Note 28. Fee and commission expense
In thousands of euros
2016 2015 Charges on card transactions 437 435
Bank transfer fees 266 192 Securities transaction and custodial fees 11 10 Other fees 37 24 Total 751 661 Note 29. Net income/expense from financial assets and liabilities at fair value through profit or loss
In thousands of euros 2016 2015 Derivatives 154 19
Currency related derivatives 154 19
Continues on the next page Financial assets at fair value -186 -372 Financial assets at fair value through profit or loss -186 -372 Total -32 -353

72
Note 30. Payroll expenses In thousands of euros
2016 2015 Wages and salaries 3,894 3,760
Social tax, unemployment insurance premiums 1,266 1,218 Total 5,160 4,978
Note 31. General and administrative expenses
In thousands of euros
2016 2015
Services purchased 457 309
Rent of buildings
401 503
Administration and use of information systems 367 336
Advertising expenses 349 285
Office expenses 292 252
Financial supervision fee instalments 86 88
Contributions to Deposit Compensation Fund 85 277
Legal services, state fees 80 97
Training and travel expenses 48 50
Membership fees 30 27
Transport expenses 28 45
Property and casualty insurance 9 11
Other operating expenses 242 285
Total 2,474 2,565
Note 32. Other income
In thousands of euros
2016 2015
Rental income 753 743
Insurance brokerage 29 53
Fines collected 5 33
Redemption of financial assets held-to-maturity 0 834
Other operating income 119 64
Total 906 1,727
Note 33. Other expenses In thousands of euros
2016 2015 Expenses incurred on generation of rental income 304 360 Loss on sale of non-current assets, net 12 0 Foreign exchange loss 5 0 Impairment of other assets 2 16 Total 323 376
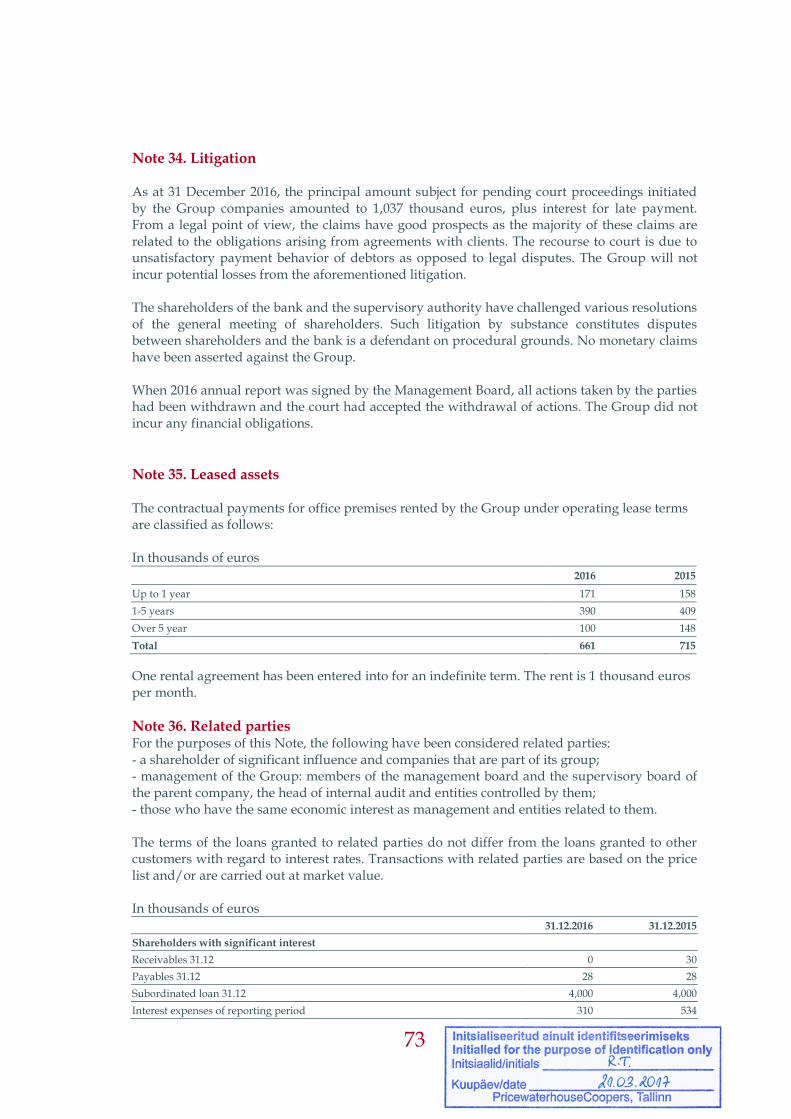
73
Note 34. Litigation
As at 31 December 2016, the principal amount subject for pending court proceedings initiated by the Group companies amounted to 1,037 thousand euros, plus interest for late payment. From a legal point of view, the claims have good prospects as the majority of these claims are related to the obligations arising from agreements with clients. The recourse to court is due to unsatisfactory payment behavior of debtors as opposed to legal disputes. The Group will not incur potential losses from the aforementioned litigation. The shareholders of the bank and the supervisory authority have challenged various resolutions of the general meeting of shareholders. Such litigation by substance constitutes disputes between shareholders and the bank is a defendant on procedural grounds. No monetary claims have been asserted against the Group. When 2016 annual report was signed by the Management Board, all actions taken by the parties had been withdrawn and the court had accepted the withdrawal of actions. The Group did not incur any financial obligations.
Note 35. Leased assets The contractual payments for office premises rented by the Group under operating lease terms are classified as follows: In thousands of euros
2016 2015 Up to 1 year 171 158
1-5 years 390 409 Over 5 year 100 148 Total 661 715
One rental agreement has been entered into for an indefinite term. The rent is 1 thousand euros per month.
Note 36. Related parties
For the purposes of this Note, the following have been considered related parties: - a shareholder of significant influence and companies that are part of its group; - management of the Group: members of the management board and the supervisory board of the parent company, the head of internal audit and entities controlled by them; - those who have the same economic interest as management and entities related to them. The terms of the loans granted to related parties do not differ from the loans granted to other customers with regard to interest rates. Transactions with related parties are based on the price list and/or are carried out at market value. In thousands of euros 31.12.2016 31.12.2015 Shareholders with significant interest Receivables 31.12 0 30 Payables 31.12 28 28 Subordinated loan 31.12 4,000 4,000 Interest expenses of reporting period 310 534
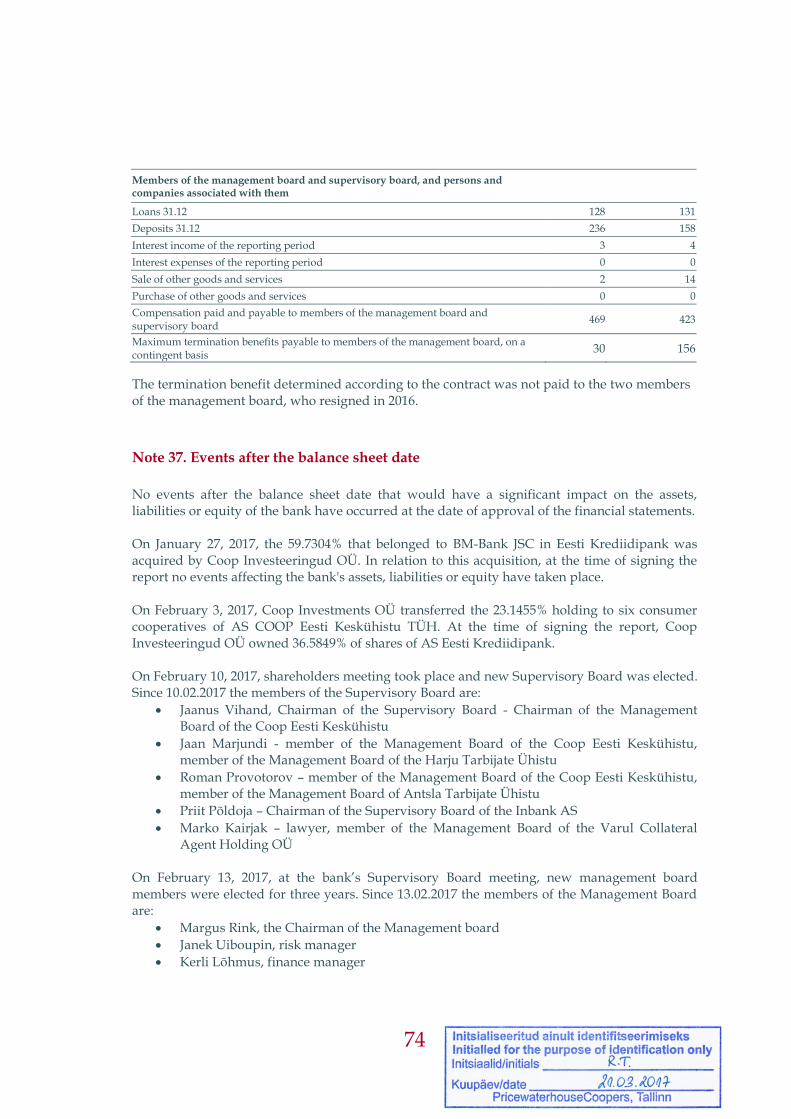
74
Members of the management board and supervisory board, and persons and companies associated with them
Loans 31.12 128 131 Deposits 31.12 236 158 Interest income of the reporting period 3 4 Interest expenses of the reporting period 0 0 Sale of other goods and services 2 14 Purchase of other goods and services 0 0
Compensation paid and payable to members of the management board and supervisory board
469 423
Maximum termination benefits payable to members of the management board, on a contingent basis
30 156
The termination benefit determined according to the contract was not paid to the two members of the management board, who resigned in 2016.
Note 37. Events after the balance sheet date
No events after the balance sheet date that would have a significant impact on the assets, liabilities or equity of the bank have occurred at the date of approval of the financial statements. On January 27, 2017, the 59.7304% that belonged to BM-Bank JSC in Eesti Krediidipank was acquired by Coop Investeeringud OÜ. In relation to this acquisition, at the time of signing the report no events affecting the bank's assets, liabilities or equity have taken place. On February 3, 2017, Coop Investments OÜ transferred the 23.1455% holding to six consumer cooperatives of AS COOP Eesti Keskühistu TÜH. At the time of signing the report, Coop Investeeringud OÜ owned 36.5849% of shares of AS Eesti Krediidipank. On February 10, 2017, shareholders meeting took place and new Supervisory Board was elected. Since 10.02.2017 the members of the Supervisory Board are:
Jaanus Vihand, Chairman of the Supervisory Board - Chairman of the Management Board of the Coop Eesti Keskühistu
Jaan Marjundi - member of the Management Board of the Coop Eesti Keskühistu, member of the Management Board of the Harju Tarbijate Ühistu
Roman Provotorov – member of the Management Board of the Coop Eesti Keskühistu, member of the Management Board of Antsla Tarbijate Ühistu
Priit Põldoja – Chairman of the Supervisory Board of the Inbank AS
Marko Kairjak – lawyer, member of the Management Board of the Varul Collateral Agent Holding OÜ
On February 13, 2017, at the bank’s Supervisory Board meeting, new management board members were elected for three years. Since 13.02.2017 the members of the Management Board are:
Margus Rink, the Chairman of the Management board
Janek Uiboupin, risk manager
Kerli Lõhmus, finance manager

75
Note 38. Primary statements of parent company as a separate entity
Statement of financial position of AS Eesti Krediidipank In thousands of euros Assets 31.12.2016 31.12.2015
Cash on hand 22,337 2,342
Balances with central banks 43,919 65,126
Loans and advances to credit institutions 39,282 57,701
Financial assets held for trading 0 28
Financial assets at fair value through profit or loss 11,421 6,078
Loans and advances to customers 167,255 166,534
Held-to-maturity financial assets 503 503
Available-for-sale financial assets 13 13
Other financial assets 656 1,748
Financial investments in associates and subsidiaries 2,883 2,850
Property, plant and equipment 605 750
Intangible assets 467 512
Investment property 213 213
Other assets 253 237
Total assets 289,807 304,635
Liabilities
Fair value of financial liabilities at fair value through profit or loss 0 276
Due to credit institutions 185 115
Due to customers 254,374 267,936
Other financial liabilities 1,154 3,348
Other liabilities 900 673
Subordinated debt 4,039 4,039
Total liabilities 260,652 276,387
Shareholders’ equity
Share capital 25,001 25,001
Share premium 174 174
Reserves 1,970 1,844
Retained earnings (accumulated loss) 2,010 1,229
Total shareholders’ equity 29,155 28,248
Total liabilities and shareholders’ equity 289,807 304,635

76
Income statement and statement of comprehensive income of AS Eesti Krediidipank In thousands of euros 2016 2015
Interest income 7,659 7,629
Interest expense -1,721 -2,419
Net interest income 5,938 5,210
Fee and commission income 3,104 3,009
Fee and commission expense -737 -654
Net fee and commission income 2,367 2,355
Change in fair value of financial assets designated at fair value through profit or loss -32 -353
Payroll expense -4,577 -4,386
General and administrative expenses -1,933 -2,250
Other income 745 1,756
Other expenses -8 -20
Depreciation -294 -334
Loan losses -196 542
Profit before income tax 2,010 2,520
Income tax -8 0
Net profit 2,002 2,520
Other comprehensive income/loss 0 0
Comprehensive income/loss for the financial year 2,002 2,520

77
Statement of changes in equity of AS Eesti Krediidipank
In thousands of euros
Share capital
Share premium Statutory reserve capital
Retained earnings
Total shareholders’equity
Balance as of 31.12.2014
25,001 174 1,813 -1,260 25,728
Net profit for the financial year 0 0 0 2,520 2,520
Total comprehensive income for the period 0 0 0 2,520 2,520
Changes in reserves 0 0 31 -31 0
Balance as of 31.12.2015
25,001 174 1,844 1,229 28,248
Dividends payout 0 0 0 -1,095 -1,095
Changes in reserves 0 0 126 -126 0
Net profit for the financial year 0 0 0 2,002 2,002
Total comprehensive income for the period 0 0 0 2,002 2,002
Balance as of 31.12.2016 25,001 174 1,970 2,010 29,155
Adjusted unconsolidated equity
Total
Book value of holding under control or significant influence -2,883
Value of holdings under control or significant influence, calculated by equity method
3,019
Adjusted unconsolidated equity as at 31.12.2016 29,291

78
Statement of cash flows of AS Eesti Krediidipank In thousands of euros Cash flows from operating activities (indirect method) 31.12.2016 31.12.2015
Net profit 2,002 2,520
Adjustments
Impairment of loans and advances 196 -542
Depreciation and impairment of non-current assets 294 344
Change in fair value of financial assets designated at fair value through profit or loss
186 372
Net gain on sale of non-current assets and investment property 0 -6
Effect of changes in currency exchange rates 5 -1
Net interest income -5,938 -5,210
Interest received 7,172 6,291
Interest paid -2,293 -2,666
Change in receivables from customers of credit institutions and leasing companies 43 3,300
Change in fair value of financial assets designated at fair value through profit or loss -6,040 7,307
Change in long - term receivables from credit institutions 0 -80
Change in loans and advances to credit institutions 70 -241
Change in deposits -12,990 59,615
Change in other assets and liabilities related to operating activities -1,622 970
Total cash flows from operating activities -18,915 71,973
Cash flows from investment activities (direct method)
Redemption and sale of held-to-maturity financial assets 0 4,412
Proceeds from sale of non-current assets 36 48
Purchase of non-current assets -133 -220
Investments raising in subsidiaries -33 0
Total cash flows from investing activities -130 4,240
Cash flows from financing activities (direct method)
Dividends payout -1,095 0
Loans repaid to credit institutions 0 -14,000
Total cash flows from financing activities -1,095 -14,000
Total cash flows -20,140 62,213
Change in cash and cash equivalents -20,140 62,213
Cash and cash equivalents at beginning of the year 124,669 62,456
Cash and cash equivalents at end of the year 104,529 124,669
The balance of cash and cash equivalents is comprised of: 104,529 124,669
Cash on hand 22,337 2,342
Demand deposits in central bank 43,919 65,126
On demand and short-term deposits in credit institutions 38,273 57,201

79
Appended documents 2016

AS PricewaterhouseCoopers, Pärnu mnt 15, 10141 Tallinn, Estonia; License No. 6; Registry code: 10142876 T: +372 614 1800, F: +372 614 1900, www.pwc.ee
INDEPENDENT AUDITOR’S REPORT
(Translation of the Estonian original) To the Shareholders of AS Eesti Krediidipank
Our opinion
In our opinion, the consolidated financial statements present fairly, in all material respects, the consolidated financial position of AS Eesti Krediidipank and its subsidiaries (together the Group) as at 31 December 2016, and its consolidated financial performance and its consolidated cash flows for the year then ended in accordance with International Financial Reporting Standards as adopted by the European Union. We audited the Group's consolidated financial statements that comprise:
the consolidated statement of financial position as at 31 December 2016;
the consolidated income statement and statement of other comprehensive income for the year then ended;
the consolidated statement of cash flows for the year then ended;
the consolidated statement of changes in equity for the year then ended; and
the notes to the consolidated financial statements, which include a summary of significant accounting policies and other explanatory information.
Basis for opinion We conducted our audit in accordance with International Standards on Auditing (ISAs). Our responsibilities under those standards are further described in the Auditor’s responsibilities for the audit of the consolidated financial statements section of our report. We believe that the audit evidence we have obtained is sufficient and appropriate to provide a basis for our opinion. We are independent of the Group in accordance with the International Ethics Standards Board for Accountants’ Code of Ethics for Professional Accountants (IESBA Code) and the ethical requirements of the Auditors Activities Act of the Republic of Estonia. We have fulfilled our other ethical responsibilities in accordance with the IESBA Code and the ethical requirements of the Auditors Activities Act of the Republic of Estonia.
Other information
The Management Board is responsible for the other information contained in the annual report in addition to the consolidated financial statements and our auditor’s report thereon.

2 (3)
Our opinion on the consolidated financial statements does not cover the other information and we do not express any form of assurance conclusion thereon. In connection with our audit of the consolidated financial statements, our responsibility is to read the other information identified above and, in doing so, consider whether the other information is materially inconsistent with the consolidated financial statements or our knowledge obtained in the audit, or otherwise appears to be materially misstated. If, based on the work we have performed, we conclude that there is a material misstatement of this other information, we are required to report that fact. We have nothing to report in this regard.
Responsibilities of the Management Board and those charged with governance for the
consolidated financial statements The Management Board is responsible for the preparation and fair presentation of the consolidated financial statements in accordance with International Financial Reporting Standards as adopted by the European Union and for such internal control as the Management Board determines is necessary to enable the preparation of consolidated financial statements that are free from material misstatement, whether due to fraud or error. In preparing the consolidated financial statements, the Management Board is responsible for assessing the Group’s ability to continue as a going concern, disclosing, as applicable, matters related to going concern and using the going concern basis of accounting unless the Management Board either intends to liquidate the Group or to cease operations, or has no realistic alternative but to do so. Those charged with governance are responsible for overseeing the Group’s financial reporting process.
Auditor’s responsibilities for the audit of the consolidated financial statements Our objectives are to obtain reasonable assurance about whether the consolidated financial statements as a whole are free from material misstatement, whether due to fraud or error, and to issue an auditor’s report that includes our opinion. Reasonable assurance is a high level of assurance, but is not a guarantee that an audit conducted in accordance with ISAs will always detect a material misstatement when it exists. Misstatements can arise from fraud or error and are considered material if, individually or in the aggregate, they could reasonably be expected to influence the economic decisions of users taken on the basis of these consolidated financial statements. As part of an audit in accordance with ISAs, we exercise professional judgment and maintain professional scepticism throughout the audit. We also:
Identify and assess the risks of material misstatement of the consolidated financial statements, whether due to fraud or error, design and perform audit procedures responsive to those risks, and obtain audit evidence that is sufficient and appropriate to provide a basis for our opinion. The risk of not detecting a material misstatement resulting from fraud is higher than for one resulting from error, as fraud may involve collusion, forgery, intentional omissions, misrepresentations, or the override of internal control.
Obtain an understanding of internal control relevant to the audit in order to design audit procedures that are appropriate in the circumstances, but not for the purpose of expressing an opinion on the effectiveness of the Group’s internal control.
Evaluate the appropriateness of accounting policies used and the reasonableness of accounting estimates and related disclosures made by the Management Board.

3 (3)
Conclude on the appropriateness of the Management Board’s use of the going concern basis of accounting and, based on the audit evidence obtained, whether a material uncertainty exists related to events or conditions that may cast significant doubt on the Group’s ability to continue as a going concern. If we conclude that a material uncertainty exists, we are required to draw attention in our auditor’s report to the related disclosures in the consolidated financial statements or, if such disclosures are inadequate, to modify our opinion. Our conclusions are based on the audit evidence obtained up to the date of our auditor’s report. However, future events or conditions may cause the Group to cease to continue as a going concern.
Evaluate the overall presentation, structure and content of the consolidated financial statements, including the disclosures, and whether the consolidated financial statements represent the underlying transactions and events in a manner that achieves fair presentation.
Obtain sufficient appropriate audit evidence regarding the financial information of the entities or business activities within the Group to express an opinion on the consolidated financial statements. We are responsible for the direction, supervision and performance of the Group audit. We remain solely responsible for our audit opinion.
We communicate with those charged with governance regarding, among other matters, the planned scope and timing of the audit and significant audit findings, including any significant deficiencies in internal control that we identify during our audit. AS PricewaterhouseCoopers /signed/ Tiit Raimla Auditor’s Certificate No.287 21 March 2017
This version of our report is a translation from the original, which was prepared in Estonian. All possible
care has been taken to ensure that the translation is an accurate representation of the original. However, in all matters of interpretation of information, views or opinions, the original language version of our report takes precedence over this translation.
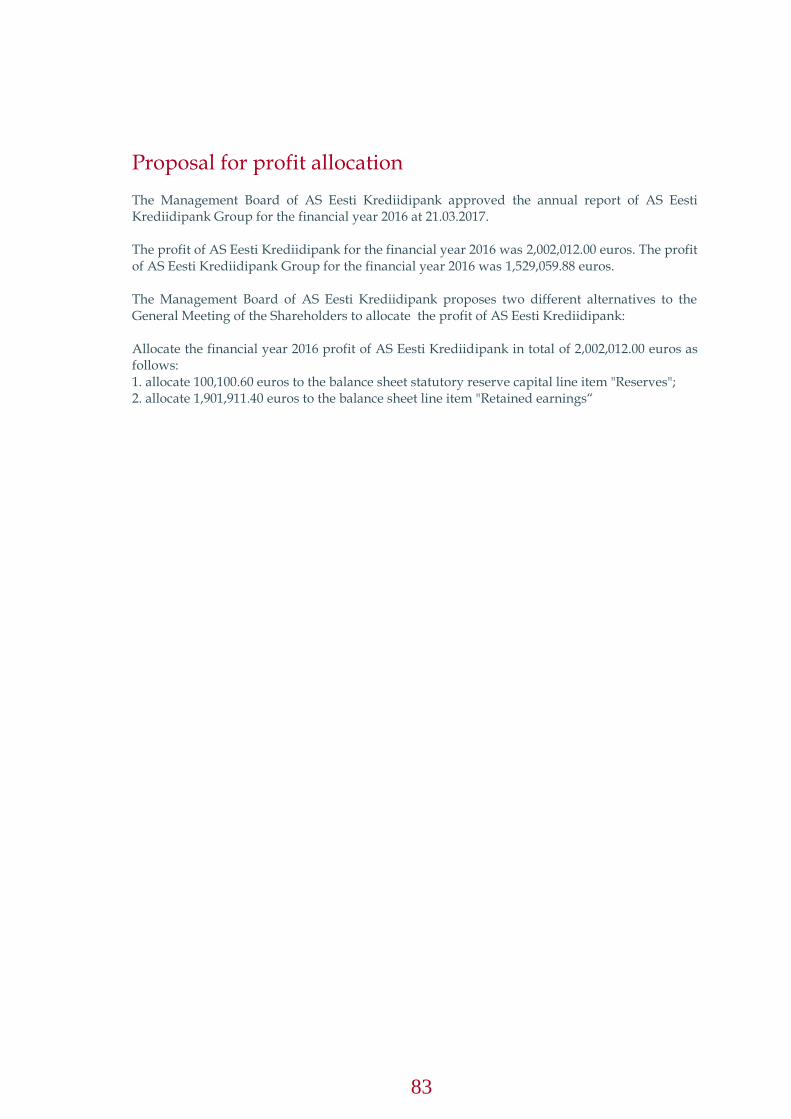
83
Proposal for profit allocation
The Management Board of AS Eesti Krediidipank approved the annual report of AS Eesti Krediidipank Group for the financial year 2016 at 21.03.2017. The profit of AS Eesti Krediidipank for the financial year 2016 was 2,002,012.00 euros. The profit of AS Eesti Krediidipank Group for the financial year 2016 was 1,529,059.88 euros. The Management Board of AS Eesti Krediidipank proposes two different alternatives to the General Meeting of the Shareholders to allocate the profit of AS Eesti Krediidipank: Allocate the financial year 2016 profit of AS Eesti Krediidipank in total of 2,002,012.00 euros as follows: 1. allocate 100,100.60 euros to the balance sheet statutory reserve capital line item "Reserves"; 2. allocate 1,901,911.40 euros to the balance sheet line item "Retained earnings“