annual report 2016 - digital media company in canada
TRANSCRIPT

Determined
Annual Report 2016

2015
2016
2015
2016
2015
2016
2015
2016
Management’s Discussion and Analysis
5
Independent Auditor’s Report
34
Consolidated Statements of Financial Position
35
Table of contents
Consolidated Income Statements
36
Cash Flows from Operating Activities(in millions of Canadian dollars)
$158.1M
Digital Revenues(in millions of Canadian dollars)
$555.8M
Adjusted EBITDA Margin1
28.8%
Free Cash Flow1
(in millions of Canadian dollars)
$94.6M
1 Adjusted EBITDA, Adjusted EBITDA margin, Free Cash Flow and Net Debt are not performance or financial measures defined under IFRS. They do not have a standardized meaning and are therefore not likely to be comparable with similar measures used by other publicly traded companies. We define Adjusted EBITDA as revenues less operating costs, as shown in Yellow Pages Limited’s consolidated income statements. Adjusted EBITDA margin is defined as the percentage of Adjusted EBITDA to revenues. Free cash flow is defined as cash flows from operating activities, as reported in accordance with IFRS, less an adjustment for capital expenditures. We define net debt as current portion of long-term debt plus long-term debt and exchangeable debentures (Total Debt), less cash, as presented in Yellow Pages Limited’s consolidated statements of financial position. Please refer to the “Definitions Relative to Understanding Our Results” section of the Company’s Management’s Discussion and Analysis for the complete definitions of these terms.
(in millions of Canadian dollars)(in millions of Canadian dollars)(in millions of Canadian dollars)
Revenues
$829.8M
Adjusted EBITDA1
$260.7M
Net Debt1
$430.6M
$818.0M $235.2M $384.9M
2016 Financial & Operational Highlights
(1.4%) (9.8%) (10.6%)
(in millions of Canadian dollars)
Total Debt
$497.8M
$402.2M
(19.2%)
2016

2015
2016
Consolidated Statements of Comprehensive (Loss) Income
37
Consolidated Statements of Changes in Equity
38-39
Consolidated Statements of Cash Flows
40
Notes to the Consolidated Financial Statements
41-72
Customer Count
241,500
Customer Acquisition
41,100
Digital-Only Customers
32%
Total Digital Visits2
464.7M
71% Digital Revenues
2 Total digital visits measures the number of visits made across the YP, YP Shopwise, YP Dine, RedFlagDeals, C411, Bookenda and dine.TO online and mobile properties, as well as visits made across the properties of the Company’s application syndication partners.
Digital Revenue(in millions of Canadian dollars)
(as a percentage of total revenues, for the fourth quarter ended December 31, 2016)
$486.3M
$555.8M
YELLOW PAGES LIMITED 2016 ANNUAL REPORT 1

Message to Shareholders
We’re now into the second half of our Return to
Growth plan, a five-year corporate strategy
designed to transform Yellow Pages into the
leading local digital company in Canada and return
the company to revenue growth and profitability.
By the end of 2016, approximately 70% of our
revenue came from digital products and services.
Digital revenues totalled $556M in 2016 and have
steadily grown each year.
We continued to make good progress in 2016
on several other fronts. We beat our customer
acquisition targets, welcoming 41,100 new small
business customers who chose Yellow Pages as
their digital media and marketing solutions provider
of choice. This equals 33% more customers than
we acquired last year. We are on the cusp of
stabilizing our customer base with a net decline of
only 3,500 customers year-over-year, compared
with a net decline of 30,000 customers before we
launched our Return to Growth plan.
Traffic to our media properties remains strong. We
finished 2016 with roughly 465M total digital visits
to our network and experienced a 26% surge in
traffic year-over-year during the fourth quarter of
2016. This stemmed from key traffic partnerships
we hold with Google and Apple, to name a few.
Partnerships like these are powerful endorsements
of the value that our data and content provides to
Canadians in managing their daily needs.
Also a key accomplishment is the significant
deleveraging of our balance sheet. This has allowed
us the financial flexibility to invest in strengthening
our business operations, technologies, and product
offering. Thanks to our strong free cash flow
generation, we’ve successfully repaid $490M on
our Senior Secured Notes since their inception in
2012. In 2016 alone, we repaid over $97M of debt
on the Notes, bringing the outstanding balance to
just under $310M. This is despite having also used
cash on hand to acquire JUICE, enabling us to
expand our footprint in the mobile performance
media ecosystem. Net debt amounted to roughly
$385M at the end of 2016, down from the
approximately $800M at the end of 2012.
Now, after having significantly deleveraged our
balance sheet, successfully built a customer
acquisition engine, and diversified our business to
preserve growth potential, we need to take a closer
look at how we translate these accomplishments
into Adjusted EBITDA stabilization.
While 2016 had its fair share of successes, we
acknowledge that the year did not end as we
would have liked. We’re encountering dynamics
that indicate that a return to growth in profitability
may take longer than previously anticipated.
That being said, the root causes of the
profitability pressures we’re experiencing have
been identified. These are due to unfavourable
changes in our product mix as top line revenues
are shifting to lower margin products. This is
applying pressure to our bottom line, however,
we are working diligently to address and resolve
this dynamic.
Looking forward, we know that our margins will
continue to be under pressure due to the shifting
spends to reseller offerings in our product mix. This
is a structural shift in response to an evolving
landscape and we are currently in the process of
updating and refining our strategy to reflect the
pace of change in the industry and best position
the business to address it.
We need to be looking more closely at how we’ve
structured our sales conversations and approach. We
need to be appropriately counselling our customers
on their purchases. Truly acting more as advisors, and
equipping our customer-facing teams with the right
systems, data and tools, to help them understand
which solutions they truly need and which ones will
YELLOW PAGES LIMITED 2016 ANNUAL REPORT2

company’s future. Their resolve is an advantage and a
strength that is essential in this journey. To the almost
quarter-million Canadian businesses that choose to
do business with Yellow Pages, we also say thank
you. Every day, we will seek to do better for you.
Finally, to our shareholders, while we navigated a
challenging period in the tail-end of 2016, we
continue to believe and have confidence in the
growth potential of this company. When we look at
the accomplishments of the entire year and those
prior, there has been a clear path of progress that
we will continue to build upon.
Know that we tackle the days and years ahead
with a sense of urgency and determination to
create long-term value for each of you.
Julien BillotPresident and
Chief Executive Officer
allow them to grow and nurture their business, as
opposed to just a product/pricing conversation.
We will also continue to seek cost efficiencies with
the goal of optimizing our cost structure.
This is a part of what we’re currently looking at in
our review of our business strategy. Of course, we
have already actioned some key operational areas
in order to help address this issue. We’ve already
started rolling out new tools and training to our
sales teams to have value-based as opposed to
budget-based conversations with customers.
Some of the elements we’re also evaluating are
product offering, pricing and contracting, sales
structure effectiveness, additional upsell channels
and cost structure.
We’ll be sharing the full outcome of our review and
business strategy in May.
In the end, it’s a simple question. We must ask
ourselves where in the Canadian digital advertising
market can we deliver the most value for our
customers, our users, and our shareholders, and
then we must focus our efforts there.
I want to thank all Yellow Pages employees for the
hard work and determination they employ each day
in overcoming current challenges to build this
YELLOW PAGES LIMITED 2016 ANNUAL REPORT 3
J li Bill t

Board of Directors Executive Team
Robert F. MacLellan
Director and Chairman of the Board
Julien Billot
President and Chief Executive Officer
Craig Forman
Director, Corporate Governance and Nominating Committee
Susan KudzmanDirector, Chair of the Human Resources and Compensation Committee
David A. Lazzarato
Director, Chair of the Audit Committee
David G. Leith
Director, Chair of the Corporate Governance and Nominating Committee
Judith A. McHale
Director, Corporate Governance and Nominating Committee
Donald H. Morrison
Director, Human Resources and Compensation Committee
Martin Nisenholtz
Director, Human Resources and Compensation Committee
Kalpana Raina
Director, Audit Committee
Michael G. Sifton
Director, Audit Committee
Julien Billot
President and Chief Executive Officer
Dany Paradis
Senior Vice-President, Operations &
Chief Human Resources Officer
François D. Ramsay
Senior Vice-President, Corporate Affairs
and General Counsel
Pascal Thomas
Senior Vice-President,
Chief Digital Officer
Dominique Vallée
Senior Vice-President, Sales
and Customer Care
Franco Sciannamblo
Vice-President, Corporate Controller
YELLOW PAGES LIMITED 2016 ANNUAL REPORT4

MANAGEMENT’S DISCUSSION AND ANALYSIS
MANAGEMENT’S DISCUSSION AND ANALYSIS February 14, 2017
This management’s discussion and analysis (MD&A) is intended to help the reader understand and assess trends and significant changes in the results of operations and financial condition of Yellow Pages Limited and its subsidiaries for the years ended December 31, 2016 and 2015 and should be read in conjunction with our Audited Consolidated Financial Statements and accompanying notes for the years ended December 31, 2016 and 2015. Quarterly reports, the Annual Report, Supplemental Disclosure and the Annual Information Form (AIF) can be found on SEDAR at www.sedar.com and under the “Investor Relations - Reports & Filings” section of our corporate website: http://corporate.yp.ca.
The financial information presented herein has been prepared on the basis of International Financial Reporting Standards (IFRS) for financial statements and is expressed in Canadian dollars, unless otherwise stated. The audited IFRS-related disclosures and values in this MD&A have been prepared using the standards and interpretations currently issued and effective at the end of our reporting period, December 31, 2016.
Our reporting structure reflects how we manage our business and how we classify our operations for planning and for measuring our performance.
In this MD&A, the words “we”, “us”, “our”, the “Company”, the “Corporation”, “Yellow Pages” and “YP” refer to Yellow Pages Limited and its subsidiaries (including Yellow Pages Digital & Media Solutions Limited, 411 Local Search Corp. (411.ca), Yellow Pages Homes Limited (Yellow Pages NextHome), YPG (USA) Holdings, Inc. and Yellow Pages Digital & Media Solutions LLC (the latter two collectively YP USA), Bookenda Limited (Bookenda), YP Dine Solutions Limited (YP Dine), 9059-2114 Québec Inc. and ByTheOwner Inc. (the latter two collectively ComFree/DuProprio), Juice DMS Advertising Limited and Juice Mobile USA LLC (the latter two collectively JUICE), and 9778748 Canada Inc. (Totem)).
FORWARD-LOOKING INFORMATION This MD&A contains assertions about the objectives, strategies, financial condition, results of operations and businesses of YP. These statements are considered “forward-looking” because they are based on current expectations of our business, on the markets we operate in, and on various estimates and assumptions.
Forward-looking information and statements are based on a number of assumptions which may prove to be incorrect. In making certain forward-looking statements, we have made the following assumptions:
• that general economic conditions in Canada will not materially deteriorate beyond currently anticipated levels;
• that investments in branding will evolve legacy perceptions and boost awareness of our digital media platforms and marketing solutions;
• that we will be able to acquire new customers at the currently anticipated rate and currently anticipated Average Revenue per Customer (ARPC);
• that customer renewal rates, as well as our ability to upsell renewing customers, will not be materially lower than currently anticipated;
• that print decline rates remain stable;
• that we will be able to introduce, sell and provision new products and services that will generate the anticipated return on investment (ROI) for customers;
• that revenues and profitability across its subsidiaries will not be materially lower than anticipated;
• that investments in new content and digital experiences across our owned and operated properties will protect digital audiences;
• that the revenue mix between our digital owned and operated, services and resale solutions will not materially change from currently anticipated levels;
• that exposure to foreign exchange risk arising from foreign currency transactions will remain insignificant;
• that we will be able to realize efficiency gains; and
• that we will be able to attract and retain key personnel in key positions.
Forward-looking information and statements are also based upon the assumption that none of the identified risk factors that could cause actual results to differ materially from the anticipated or expected results described in the forward-looking information and statements will occur.
YELLOW PAGES LIMITED 2016 ANNUAL REPORT 5
MANAGEMENT’S DISCUSSION AND ANALYSIS
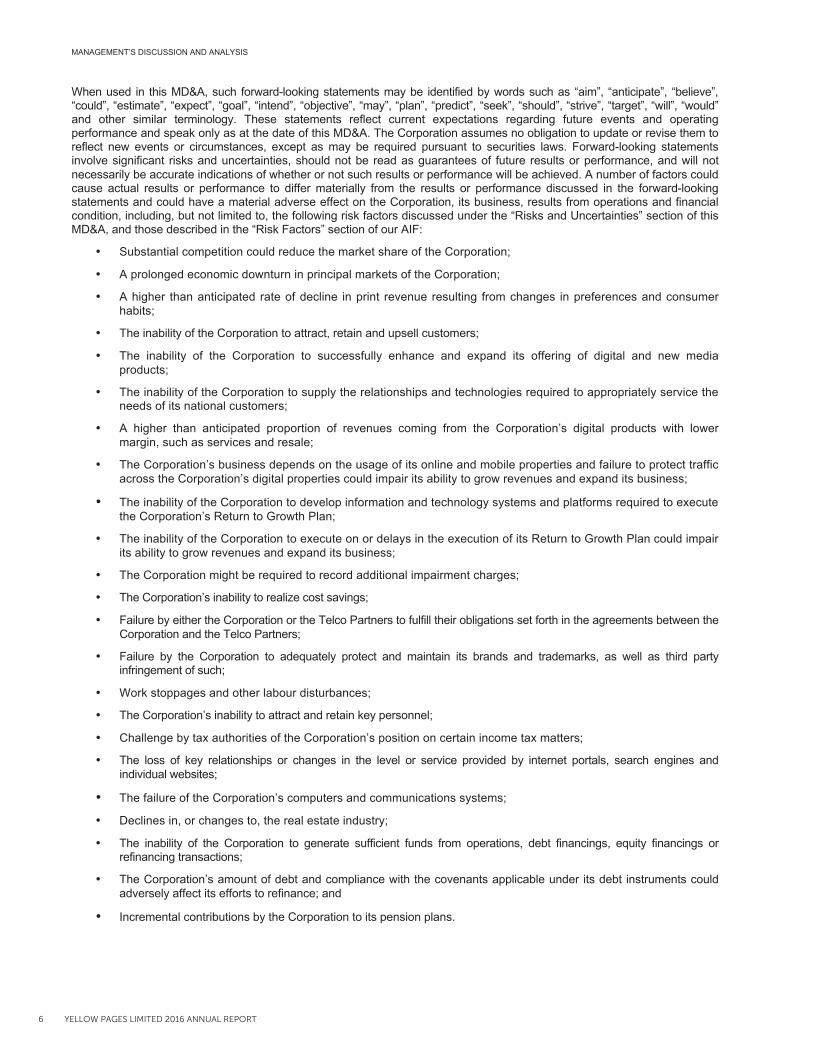
When used in this MD&A, such forward-looking statements may be identified by words such as “aim”, “anticipate”, “believe”, “could”, “estimate”, “expect”, “goal”, “intend”, “objective”, “may”, “plan”, “predict”, “seek”, “should”, “strive”, “target”, “will”, “would” and other similar terminology. These statements reflect current expectations regarding future events and operating performance and speak only as at the date of this MD&A. The Corporation assumes no obligation to update or revise them to reflect new events or circumstances, except as may be required pursuant to securities laws. Forward-looking statements involve significant risks and uncertainties, should not be read as guarantees of future results or performance, and will not necessarily be accurate indications of whether or not such results or performance will be achieved. A number of factors could cause actual results or performance to differ materially from the results or performance discussed in the forward-looking statements and could have a material adverse effect on the Corporation, its business, results from operations and financial condition, including, but not limited to, the following risk factors discussed under the “Risks and Uncertainties” section of this MD&A, and those described in the “Risk Factors” section of our AIF:
• Substantial competition could reduce the market share of the Corporation;
• A prolonged economic downturn in principal markets of the Corporation;
• A higher than anticipated rate of decline in print revenue resulting from changes in preferences and consumer habits;
• The inability of the Corporation to attract, retain and upsell customers;
• The inability of the Corporation to successfully enhance and expand its offering of digital and new media products;
• The inability of the Corporation to supply the relationships and technologies required to appropriately service the needs of its national customers;
• A higher than anticipated proportion of revenues coming from the Corporation’s digital products with lower margin, such as services and resale;
• The Corporation’s business depends on the usage of its online and mobile properties and failure to protect traffic across the Corporation’s digital properties could impair its ability to grow revenues and expand its business;
• The inability of the Corporation to develop information and technology systems and platforms required to execute the Corporation’s Return to Growth Plan;
• The inability of the Corporation to execute on or delays in the execution of its Return to Growth Plan could impair its ability to grow revenues and expand its business;
• The Corporation might be required to record additional impairment charges;
• The Corporation’s inability to realize cost savings;
• Failure by either the Corporation or the Telco Partners to fulfill their obligations set forth in the agreements between the Corporation and the Telco Partners;
• Failure by the Corporation to adequately protect and maintain its brands and trademarks, as well as third party infringement of such;
• Work stoppages and other labour disturbances;
• The Corporation’s inability to attract and retain key personnel;
• Challenge by tax authorities of the Corporation’s position on certain income tax matters;
• The loss of key relationships or changes in the level or service provided by internet portals, search engines and individual websites;
• The failure of the Corporation’s computers and communications systems;
• Declines in, or changes to, the real estate industry;
• The inability of the Corporation to generate sufficient funds from operations, debt financings, equity financings or refinancing transactions;
• The Corporation’s amount of debt and compliance with the covenants applicable under its debt instruments could adversely affect its efforts to refinance; and
• Incremental contributions by the Corporation to its pension plans.
6 YELLOW PAGES LIMITED 2016 ANNUAL REPORT

MANAGEMENT’S DISCUSSION AND ANALYSIS
DEFINITIONS RELATIVE TO UNDERSTANDING OUR RESULTS Income from Operations before Depreciation and Amortization, Impairment of Intangible Assets and Restructuring and Special Charges (Adjusted EBITDA)
We report on our Income from operations before depreciation and amortization, impairment of intangible assets and restructuring and special charges (Adjusted EBITDA). Adjusted EBITDA is not a performance measure defined under IFRS and is not considered an alternative to (loss) income from operations or net (loss) earnings in the context of measuring Yellow Pages’ performance. Adjusted EBITDA does not have a standardized meaning and is therefore not likely to be comparable with similar measures used by other publicly traded companies. Adjusted EBITDA should not be used as an exclusive measure of cash flow since it does not account for the impact of working capital changes, income taxes, interest payments, pension funding, capital expenditures, business acquisitions, debt principal reductions and other sources and uses of cash, which are disclosed on page 23 of this MD&A.
We define Adjusted EBITDA as revenues less operating costs, as shown in Yellow Pages Limited’s consolidated income statements. We use Adjusted EBITDA to evaluate the performance of our business as it reflects its ongoing profitability. We believe that certain investors and analysts use Adjusted EBITDA to measure a company’s ability to service debt and to meet other payment obligations or as a common measurement to value companies in the media and marketing solutions industry as well as to evaluate the performance of a business. Adjusted EBITDA is also one component in the determination of short-term incentive compensation for all management employees.
Free cash flow
Free cash flow is a non-IFRS financial measure generally used as an indicator of financial performance. It should not be seen as a substitute for cash flow from operating activities. Free cash flow is defined as cash flows from operating activities, as reported in accordance with IFRS, less an adjustment for capital expenditures. Free cash flow is not a standardized measure and is not comparable with that of other publicly traded companies. We consider free cash flow to be an important indicator of the performance of our business as it shows how much cash is available to repay debt and to make sound investment decisions. We believe that certain investors and analysts use free cash flow to value a business and its underlying assets as well as to evaluate a company’s performance. The most comparable IFRS financial measure is cash flows from operating activities. Please refer to Section 4 – Free Cash Flow for a reconciliation of cash flows from operating activities to free cash flow.
Net debt
Net debt is a non-IFRS financial measure and does not have any standardized meaning under IFRS. Therefore, it is unlikely to be comparable to similar measures presented by other publicly traded companies. We define net debt as current portion of long-term debt plus long-term debt and exchangeable debentures, less cash, as presented in Yellow Pages Limited’s consolidated statements of financial position. We consider net debt to be an important indicator of our financial leverage as it represents the amount of debt that is not covered by available cash. We believe that certain investors and analysts use net debt to determine a company’s financial leverage. Net debt has no directly comparable IFRS financial measure; it is calculated using certain asset and liability categories from consolidated statements of financial position. Please refer to Section 3 – Liquidity and Capital Resources for a reconciliation of long-term debt, net of cash, to net debt.
This MD&A is divided into the following sections:
1. Our Business and Strategy and Capability to Deliver Results
2. Results
3. Liquidity and Capital Resources
4. Free Cash Flow
5. Critical Assumptions
6. Risks and Uncertainties
7. Controls and Procedures
YELLOW PAGES LIMITED 2016 ANNUAL REPORT 7

MANAGEMENT’S DISCUSSION AND ANALYSIS
1. OUR BUSINESS AND STRATEGY AND CAPABILITY TO DELIVER RESULTS OUR BUSINESS Yellow Pages is one of Canada’s leading digital media and marketing solutions companies, providing local businesses, national brands and consumers with the necessary tools to interact and transact within today’s digital economy.
Customer Offerings
Yellow Pages offers small and medium-sized enterprises (SMEs) across Canada full-serve access to one of the country’s most comprehensive suites of digital and traditional marketing solutions, notably online and mobile priority placement on Yellow Pages’ owned and operated media, content syndication, search engine solutions, website fulfillment, social media campaign management and digital display advertising, as well as video production and print advertising. The Company’s in-house network of close to 1,000 sales professionals are committed to providing effective digital marketing campaigns for local businesses across Canada, while also assisting the Company’s customer base of 241,500 SMEs.
Yellow Pages’ marketing solutions extend beyond SMEs to also focus on the national advertising needs of brands and publishers. The acquisition of JUICE in March 2016, a premium mobile advertising technology company, in conjunction with the Company’s Mediative division, positions the Company as a desktop and mobile national advertising agency. JUICE’s proprietary Programmatic Direct and Real-Time Bidding platforms facilitate the automatic buying and selling of mobile advertising between brands and publishers and by leveraging these proprietary programmatic technologies as well as a database of high-intent consumer data, a publisher network and strong relationships established with a number of large national advertisers, Yellow Pages’ national digital advertising programs allow brands and publishers to maximize revenue and reach across both desktop and mobile platforms.
Yellow Pages continues to actively strengthen its market positioning by introducing digital solutions that address the targeted needs of SMEs and consumers within key verticals.
ComFree/DuProprio (CFDP), acquired in July 2015, has established Yellow Pages as a leader in the Canadian consumer-to-consumer real estate marketplace, by providing homeowners with trusted media as well as expertise to sell their homes in a proven and cost-effective manner. Approximately 20% of all real estate listings and sales in Quebec are represented through CFDP, and various initiatives are currently underway to grow adoption of the platform in Ontario.
Through Bookenda, the Company is enhancing its value proposition to local restaurant owners. Bookenda’s reservation management system offers restaurants a comprehensive solution allowing them to effectively manage reservations and orders, grow market visibility and boost customer loyalty, all at a competitive cost.
Consumer Offerings
Yellow Pages’ owned and operated media, which include desktop, mobile and print properties, continue to serve as effective marketplaces for Canadian local merchants, brands and consumers. Helping Canadians discover their neighbourhoods, the Company’s network of media properties is becoming increasingly specialized across the services, real estate, dining and retail verticals. A description of the Company’s existing digital media properties is found below:
• YP™ – Available both online at YP.ca and as a mobile application, YP allows users to discover and transact within their local neighbourhoods through comprehensive merchant profiles, relevant editorial content, reviews and booking functionalities;
• Canada411 (C411) – One of Canada’s most frequented and trusted online and mobile destinations for personal and local business information;
• RedFlagDeals.com™ – Canada’s leading provider of online and mobile promotions, deals, coupons and shopping forums;
• ComFree/DuProprio – Currently Quebec’s leading real estate digital destination and one of the top five most-visited networks of real estate digital properties in Canada, CFDP offers homeowners a professional and cost-effective service to market and sell their homes;
• YP Dine™ – A digital property allowing users to discover, search for and book local restaurants based on time of day, mood, purpose and expert suggestions, in addition to offering online ordering capabilities;
• Yellow Pages NextHome – Provides Canadians with helpful information in making informed home buying, selling, and/or renting decisions. Digital properties operating under the Yellow Pages NextHome umbrella include YP NextHome Rent and YP NextHome New Construction;
• Bookenda.com – A leading online transaction platform for users and merchants to interact and manage bookings and orders;
8 YELLOW PAGES LIMITED 2016 ANNUAL REPORT

MANAGEMENT’S DISCUSSION AND ANALYSIS
• dine.TO – Provides users in the Greater Toronto Area with an extensive database of online local restaurant listings, reviews, deals, playlists and events;
• YP Shopwise™ – A mobile application offering geo-localized deals and flyers, as well as access to product catalogues from local and national retailers; and
• 411.ca – A digital directory service to help users find and connect with people and local businesses.
STRATEGY AND CAPABILITY TO DELIVER RESULTS The Return to Growth Plan (the Plan), which was introduced in early 2014, sets out three main objectives to promote Yellow Pages’ growth into a leading Canadian digital company: (1) enhance its value proposition to local merchants and national brands as it relates to effective digital marketing, (2) grow consumer awareness and usage of its network of digital media properties, and (3) strengthen the Company’s digital brand perception among Canadians. Since the introduction of the Plan, we have achieved sustained progress, namely, the onset of a certain level of stabilization of the customer base and consolidated revenues, as well as growth in customer acquisition as we transition to a digital-first company. In addition, we have substantially deleveraged our balance sheet.
As we continue to focus on the execution of the Plan, we have initiated a review of our business strategy and management outlook with the purpose of supporting the continued long-term success of our digital-first business. The areas of focus include marketing offers, the customer journey, sales structure, operational platforms and the subsequent effects on long-term revenue, Adjusted EBITDA growth and capital allocation policy. The Company anticipates communicating the outcomes of this exercise and the accompanying strategy in May 2017.
Key highlights on the implementation and execution of Yellow Pages’ Plan for the full year and fourth quarter ended December 31, 2016 include:
• Digital Revenues – Consolidated digital revenues grew 14.3% year-over-year to reach $555.8 million in 2016, representing 67.9% of consolidated revenues. For the fourth quarter ended December 31, 2016, digital revenues grew 10.8% year-over-year to total $143.1 million, representing 70.6% of consolidated revenues;
• Adjusted EBITDA – Adjusted EBITDA totalled $235.2 million, or 28.8% of revenues in 2016, relative to $260.7 million or 31.4% of revenues in 2015. Adjusted EBITDA for the fourth quarter ended December 31, 2016, totalled $57.4 million or 28.3% of revenues, as compared to $64.5 million or 30.9% of revenues for the same period last year;
• Customer Count – The Company’s customer count was 241,500 customers as at December 31, 2016, as compared to 245,000 customers as at December 31, 2015. This represents a net customer count decline of 3,500 year-over-year, a significant improvement when compared to 11,000 net customers lost during the same period last year;
• Digital Visits – Total digital visits (TDV) totalled 464.7 million in 2016, as compared to 464 million in 2015. Total digital visits measures the number of visits made across the YP, YP Shopwise, YP Dine, RedFlagDeals, C411, Bookenda and dine.TO online and mobile properties, as well as visits made across the properties of the Company’s application syndication partners; and
• Debt Repayment – The Company made principal mandatory redemption payments of $97.1 million in 2016 on its 9.25% senior secured notes, bringing the total repayment to $490.3 million since inception of the senior secured notes on December 20, 2012.
Enhancing its Customer Value Proposition
The Company’s customer count totalled 241,500 customers as at December 31, 2016, as compared to 245,000 customers as at December 31, 2015. This represents a net customer count decline of 3,500 year-over-year, a significant improvement from 11,000 net customers lost during the same period last year.
Growth in the customer count remains a critical driver in the Company’s ability to deliver sustainable revenue and Adjusted EBITDA growth. Yellow Pages successfully acquired 41,100 new customers during the year ended December 31, 2016, exceeding the acquisition of 30,800 new customers during the same period last year, representing a 33% increase year-over-year. In 2016, the Company focused on promoting lead generation and optimizing conversion rates within the Company’s sales force to grow customer acquisition and stabilize the customer count. In conjunction, various initiatives and tools were implemented throughout the year, including the introduction of a dialer across Yellow Pages’ call centers to automate the qualification and assignment of incoming customer leads. The dialer, which also acts as a leads management system, enabled the sales force to target leads by segment, launch meaningful campaigns at the optimal times of the year, and ultimately contributed to overall improvements in the conversion rate.
YELLOW PAGES LIMITED 2016 ANNUAL REPORT 9

MANAGEMENT’S DISCUSSION AND ANALYSIS
The customer renewal rate was 82% for the year ended December 31, 2016, as compared to a renewal rate of 85% last year. While this continues to represent strong customer loyalty for the industry, the customer renewal rate remains under pressure due to accelerated levels of customer acquisition as new customer cohorts churn at higher rates than older customer cohorts. In an effort to protect customer renewal rates, Yellow Pages continues to grow specialized onboarding teams and increase retention efforts across sales and customer care channels. Digital-only customers grew to 76,800, or 32% of the customer base as at December 31, 2016, up from 54,500, or 22% of the customer base as at the same period last year. With new platforms and processes being implemented, the Company is actively growing the efficiency and productivity of its customer-facing and digital fulfillment operations.
CUSTOMER ACQUISITION AND RENEWAL1 For the years ended December 31, 2016 2015
Customer count² 241,500 245,000
New customers 41,100 30,800 Customer renewal rate 82% 85%
1 YP only, excludes the contribution of Mediative, JUICE, 411.ca, Yellow Pages NextHome, CFDP and Totem. 2 As at December 31.
Strengthening its Media Assets
Total digital visits (TDV) totalled 464.7 million for the year ended December 31, 2016, as compared to 464 million during the same period last year. TDV performance in 2016 remained stable year-over-year with an increase of 26% in traffic in the fourth quarter of 2016 compared to the same period last year, attributable to the Company’s strong partnership network, syndicating Yellow Pages listings and content.
Extending its Brand Promise
Over the course of 2016, the Company launched a range of multimedia campaigns to enhance the digital brand relevancy and perception of Yellow Pages media and marketing solutions across Canada and raise adoption of the Company’s digital media properties, as well as to boost the level of investment of current and prospective customers in the Company’s marketing solutions.
Yellow Pages launched a campaign comprised of digital mobile and online advertising to promote the Company’s NetSync product, a product allowing merchants to create their online business listing. This campaign successfully generated quality leads for our sales force that ultimately contributed to the customer acquisition target achievement and underscored the need among Canadian small and medium-sized businesses.
On the consumer front, Yellow Pages launched a digital advertising campaign to increase awareness and adoption of the Company’s dining application, YP Dine that can be viewed at the Company’s dedicated YP Dine Facebook page: https://www.facebook.com/ypdine/videos. Also in 2017, Yellow Pages specifically targeted ethnic markets in Toronto and Vancouver. This campaign has yielded positive results, with business owners demonstrating an interest in YP Dine products and services across demographics.
10 YELLOW PAGES LIMITED 2016 ANNUAL REPORT

MANAGEMENT’S DISCUSSION AND ANALYSIS
2. RESULTS This section provides an overview of our financial performance in 2016 compared to 2015 and 2014. We present several metrics to help investors better understand our performance. Some of these metrics are not measures recognized by IFRS. Definitions of these financial metrics are provided on page 7 of this MD&A and are important aspects which should be considered when analyzing our performance.
OVERALL
• Revenues decreased by $11.8 million or 1.4% to $818 million compared to the previous year.
• Digital revenues grew 14.3% year-over-year to reach $555.8 million in 2016. For the year ended December 31, 2016, digital revenues represented 67.9% of consolidated revenues, up from 58.6% for the same period in 2015.
• Income from operations before depreciation and amortization, impairment of intangible assets and restructuring and special charges (Adjusted EBITDA) decreased by $25.5 million or 9.8% to $235.2 million for the year ended December 31, 2016 compared to the same period in 2015.
HIGHLIGHTS (IN THOUSANDS OF CANADIAN DOLLARS– EXCEPT PER SHARE AND PERCENTAGE INFORMATION)
For the years ended December 31, 2016 2015
Revenues $ 817,979 $ 829,771 Income from operations before depreciation and amortization, impairment of intangible assets and
restructuring and special charges (Adjusted EBITDA) $ 235,191 $ 260,687 Adjusted EBITDA margin 28.8% 31.4% Impairment of intangible assets $ 600,000 $ − Net (loss) earnings $ (403,705) $ 61,055 Basic (loss) earnings per share $ (15.23) $ 2.29 Cash flows from operating activities $ 158,113 $ 197,566 Free cash flow $ 94,607 $ 122,145
$829.8
$818.0
2015
2016
REVENUES (IN MILLIONS OF CANADIAN DOLLARS)
(1.4%)
$260.7
$235.2
2015
2016
ADJUSTED EBITDA (IN MILLIONS OF CANADIAN DOLLARS)
(9.8%)
YELLOW PAGES LIMITED 2016 ANNUAL REPORT 11

MANAGEMENT’S DISCUSSION AND ANALYSIS
CONSOLIDATED OPERATING AND FINANCIAL RESULTS (IN THOUSANDS OF CANADIAN DOLLARS – EXCEPT PER SHARE INFORMATION)
For the years ended December 31, 2016 2015 2014
Revenues $ 817,979 $ 829,771 $ 877,528 Operating costs 582,788 569,084 561,552 Income from operations before depreciation and amortization, impairment of
intangible assets and restructuring and special charges 235,191 260,687 315,976 Depreciation and amortization 104,882 80,837 78,076 Impairment of intangible assets 600,000 − − Restructuring and special charges 22,961 30,834 18,359
(Loss) income from operations (492,652) 149,016 219,541 Financial charges, net 56,130 60,922 72,116 (Loss) earnings before income taxes and (loss) earnings from investments in
associates (548,782) 88,094 147,425 (Recovery of) provision for income taxes (145,517) 27,039 (40,937) Loss (earnings) from investments in associates 440 − (178) Net (loss) earnings $ (403,705) $ 61,055 $ 188,540
Basic (loss) earnings per share $ (15.23) $ 2.29 $ 6.95 Diluted (loss) earnings per share $ (15.23) $ 2.05 $ 5.81
As at December 31, 2016 2015 2014
Total assets $ 1,099,937 $ 1,710,627 $ 1,749,560 Long-term debt (including current portion, excluding exchangeable
debentures) $ 310,028 $ 407,353 $ 507,911 Exchangeable debentures $ 92,174 $ 90,478 $ 88,959
ANALYSIS OF CONSOLIDATED OPERATING AND FINANCIAL RESULTS
FISCAL YEAR 2016 VERSUS 2015
Revenues
Revenues for the year ended December 31, 2016 decreased by 1.4% year-over-year and amounted to $818 million in 2016 as compared to $829.8 million for the same period last year. Revenue decline is due to lower print revenues. Included in revenues for the year were revenues generated from our acquired businesses, CFDP and JUICE on July 1, 2015 and March 17, 2016, respectively. On a pro forma basis, which adjusts revenues for the full inclusion of CFDP and JUICE in 2015 as well as for the full inclusion of JUICE during the first quarter of 2016, revenues decreased 6.2% year-over-year.
Digital revenues grew 14.3% year-over-year to reach $555.8 million in 2016, or 67.9% of revenues. This compares to $486.3 million, or 58.6% of revenues, for the same period last year. On a pro forma basis, digital revenues for the year ended December 31, 2016 increased approximately 5% year-over-year. Yellow Pages’ local operations contributed favourably to pro forma digital revenue growth, a result of accelerated customer acquisition and an increase in digital spending among the Company’s renewing customer base. Pro forma digital revenue growth was also favourably impacted by CFDP’s growing network of home sellers and buyers in Quebec and Ontario, as well as by revenue growth in our national advertising operations (JUICE and Mediative), despite a softer than anticipated performance. For the year ended December 31, 2016, 47% of renewing customers experienced a year-over-year increase in annual spending, as compared to 44% of customers over the same period last year.
Print revenues decreased 23.6% year-over-year and amounted to $262.2 million in 2016, adversely impacted by a decline in the number of print customers and the migration of print marketing spending to digital.
12 YELLOW PAGES LIMITED 2016 ANNUAL REPORT

MANAGEMENT’S DISCUSSION AND ANALYSIS
CUSTOMER PENETRATION1 As at December 31, 2016 2015
Print 68% 78% Owned and Operated Digital Media2 70% 66%
Online priority placement 61% 60% Mobile priority placement 26% 27%
Digital Services3 10% 10%
SPENDING DYNAMICS¹ For the years ended December 31, 2016 2015
Amongst Renewing Customers1 Increase in spending4
Customer distribution 47% 44% % of revenues 32% 32%
Stable spending5 Customer distribution 36% 39% % of revenues 27% 27%
Decrease in spending6 Customer distribution 17% 17% % of revenues 41% 41%
Average Revenue per Customer (ARPC) $ 2,689 $ 2,930
OPERATIONAL INDICATORS As at December 31, 2016 2015
Digital-only customers1 76,800 54,500 Digital revenues (in thousands of Canadian dollars)7 $ 555,772 $ 486,346 Digital revenues as a percentage of total revenues7 67.9% 58.6%
1 YP only, excludes the contribution of Mediative, JUICE, 411.ca, Yellow Pages NextHome, CFDP and Totem. 2 Percentage of YP customers purchasing at least one Online Priority Placement, Mobile Priority Placement, NetSync, Content, Video, and/or Legacy product. 3 Percentage of YP customers purchasing at least one PresenceExtended, Website, Search Engine Optimization (SEO), Search Engine Marketing (SEM),
Facebook Solution, and/or Smart Digital Display product. 4 Renewing YP customers experiencing an increase in spending of over 5%, on a year-over-year basis. 5 Renewing YP customers experiencing an increase in spending between 0% and 5%, on a year-over-year basis. 6 Renewing YP customers experiencing a decrease in spending on a year-over-year basis. 7 For the years ended December 31.
Adjusted EBITDA
Adjusted EBITDA decreased by $25.5 million to $235.2 million during 2016, compared with a decline of $55.3 million to $260.7 million during 2015. This represents a year-over-year decline of 9.8% during 2016, as compared to a year-over-year decline of 17.5% the year prior. Our Adjusted EBITDA margin for 2016 was 28.8% compared to 31.4% for 2015. The decrease in Adjusted EBITDA and Adjusted EBITDA margin for the year ended December 31, 2016 was mostly impacted by lower print revenues and a change in product mix, partly offset by cost saving initiatives. The decline in the Adjusted EBITDA margin was also impacted by the acquisitions of CFDP and JUICE, which operate at a lower Adjusted EBITDA margin relative to Yellow Pages prior to the acquisitions.
Cost of sales increased by $14.6 million to $335.2 million in 2016, as compared to $320.6 million for the same period in 2015. The increase for the year is due principally to the acquisitions of CFDP and JUICE on July 1, 2015 and March 17, 2016, respectively, as well as a change in product mix, partly offset by cost saving initiatives.
Gross profit margin decreased to 59% in 2016 compared to 61.4% in 2015. The decrease is primarily due to a change in product mix and the acquisitions of CFDP and JUICE, which operate at a lower gross profit margin relative to Yellow Pages prior to the acquisitions, partly offset by operational efficiencies.
YELLOW PAGES LIMITED 2016 ANNUAL REPORT 13

MANAGEMENT’S DISCUSSION AND ANALYSIS
General and administrative expenses decreased by $0.9 million to $247.6 million during 2016 compared to $248.5 million for the year ended December 31, 2015. The decrease for the year is mainly attributable to cost savings associated with the corporate realignment implemented in the third and fourth quarters of 2015, as well as cost containment initiatives implemented throughout the year, offset by expenses associated with JUICE.
Depreciation and amortization
Depreciation and amortization increased to $104.9 million during 2016 compared to $80.8 million in 2015. The increase is due to higher capital expenditures in connection with the deployment of systems and platforms as the Company implements its digital transformation as well as amortization of the intangible assets related to the acquisition of JUICE.
Impairment of intangible assets
In the context of its annual impairment testing and as a result of a marked acceleration in an unfavourable change in the product mix during the fourth quarter of 2016 in the Yellow Pages CGU, the Company determined that the recoverability of certain of its assets had to be reviewed for impairment purposes. Consequently, we recorded an impairment loss of $600 million during the fourth quarter related to certain of our intangible assets, namely our trademarks and non-competition agreements. The impairment charge is a non-cash item and does not affect the Company’s debt covenants. In this context, the Company anticipates additional pressure on Adjusted EBITDA in 2017. As it works to address the mix issue, the Company expects stabilization in Adjusted EBITDA in the short to mid-term, post-2017. However, not at the levels previously anticipated.
Restructuring and special charges
In 2016, we recorded restructuring and special charges of $23 million associated primarily with internal reorganizations and workforce reductions, as well as transaction costs associated with business acquisitions. In 2015, we recorded restructuring and special charges of $30.8 million associated primarily with workforce reductions related to the corporate realignment, internal reorganizations, transaction costs associated with business acquisitions, and contract termination costs, partially offset by a curtailment gain related to workforce reductions.
Financial charges
Financial charges decreased by $4.8 million to $56.1 million during 2016 compared to $60.9 million for 2015. The decrease is due to a lower level of indebtedness, partially offset by sales taxes resulting from the settlement of a sales tax assessment relating to financing costs and foreign currency losses. As at December 31, 2016, the effective average interest rate on our debt portfolio was 8.9% (2015 – 9%).
(Recovery of) provision for income taxes
The combined statutory provincial and federal tax rates were 26.9% and 26.7% for the years ended December 31, 2016 and 2015, respectively. The Company recorded a recovery of $145.5 million during 2016, comprised of a recovery of income taxes of $161 million associated with an impairment loss of $600 million on certain of its intangible assets recorded during the fourth quarter of 2016. The recovery of income taxes of $161 million is a non-cash item. The Company recorded an expense of $27 million in 2015. The Company recorded a recovery of 26.5% on the loss for the year ended December 31, 2016 compared to an expense of 30.7% on earnings for the year ended December 31, 2015.
The difference between the effective and the statutory rates in 2016 and 2015 is due to the non-deductibility of certain expenses for tax purposes.
Loss from investment in associate
On October 3, 2016, we acquired a 50% ownership in 9778730 Canada Inc., which owns 100% of Coupgon Inc., a digital coupon solutions provider. We recorded a loss from our investment in an associate in the amount of $0.4 million during the year ended December 31, 2016.
Net (loss) earnings
We recorded a net loss of $403.7 million during 2016 compared with net earnings of $61.1 million for 2015. The decrease for the year is principally explained by an impairment of our intangible assets of $600 million as well as lower Adjusted EBITDA and higher depreciation and amortization, mainly resulting from a higher level of capital expenditures in the context of the Company’s digital evolution as well as amortization of intangible assets related to the acquisition of JUICE.
14 YELLOW PAGES LIMITED 2016 ANNUAL REPORT

MANAGEMENT’S DISCUSSION AND ANALYSIS
FISCAL YEAR 2015 VERSUS 2014
Revenues
Revenues decreased by 5.4% year-over-year to reach $829.8 million in 2015. This compares to $877.5 million for the same period in 2014. Revenues remained adversely impacted by a lower customer count within Yellow Pages’ core business, in addition to a decrease in print spending among renewing customers.
Digital revenues are a growing contribution of the Company’s consolidated revenue base. Digital revenues grew by 9.8% year-over-year to reach $486.3 million in 2015, or 58.6% of revenues, as compared to $442.8 million, or 50.5% of revenues, in 2014. Growth in digital revenues was principally driven by accelerated customer acquisition and growth in digital spending among the Company’s renewing customers, as well as the acquisition of CFDP on July 1, 2015. Excluding CFDP, digital revenues for the year ended December 31, 2015 grew by approximately 6% year-over-year.
Print revenues decreased 21% year-over-year to reach $343.4 million in 2015, adversely impacted by a decline in the number of print customers and the migration of print marketing spending to digital.
Adjusted EBITDA
Adjusted EBITDA decreased by $55.3 million to $260.7 million during 2015, compared with a decline of $100.1 million to $316 million for the same period in 2014. This represents a year-over-year decline of 17.5% during 2015, as compared to a year-over-year decline of 24.1% the year prior. Our Adjusted EBITDA margin for 2015 was 31.4% compared to 36% for 2014. The decrease in Adjusted EBITDA and Adjusted EBITDA margin for the year ended December 31, 2015 is due mainly to lower print revenues and a change in product mix, partly offset by cost saving initiatives and lower employee related expenses. The Adjusted EBITDA margin was also adversely impacted by the Company’s Mediative, 411.ca and CFDP operations, which operate at lower Adjusted EBITDA margins relative to Yellow Pages’ core business.
Cost of sales increased by $13.7 million to $320.6 million in 2015, as compared to $306.9 million for the same period in 2014. The increase for the year is due primarily to the acquisitions of 411.ca and CFDP on June 1, 2014 and July 1, 2015, respectively, and a change in product mix, partly offset by cost savings generated from print optimization initiatives.
Gross profit margin decreased to 61.4% in 2015 compared to 65% in 2014. The decrease is primarily due to a change in product mix and the acquisitions of 411.ca and CFDP.
General and administrative expenses decreased by $5.4 million to $249.3 million during 2015 compared with $254.7 million for the year ended December 31, 2014. The decrease is mainly attributable to cost savings associated with the corporate realignment, employee related expenses and amendments to our pension and post-retirement benefit plans, partly offset by expenses associated with 411.ca and CFDP.
Depreciation and amortization
Depreciation and amortization increased to $80.8 million during 2015 compared to $78.1 million in 2014. The increase is due to higher capital expenditures in connection with the deployment of systems and platforms as the Company executes its digital transformation.
Restructuring and special charges
In 2015, we recorded restructuring and special charges of $30.8 million associated primarily with workforce reductions related to a corporate realignment, internal reorganizations, transaction costs associated with business acquisitions, and contract termination costs, partially offset by a curtailment gain related to workforce reductions. In 2014, we recorded restructuring and special charges of $18.4 million associated primarily with internal reorganizations and workforce reductions, partially offset by a net curtailment gain related to workforce reductions.
Financial charges
Financial charges decreased by $11.2 million to $60.9 million during 2015 compared with $72.1 million for 2014. The decrease is mainly attributable to a lower level of indebtedness. As at December 31, 2015 and 2014, the effective average interest rate on our debt portfolio was 9%.
Provision for (recovery of) income taxes
The combined statutory provincial and federal tax rates were 26.70% and 26.56% for the years ended December 31, 2015 and 2014, respectively. The Company recorded an expense of $27 million for the year compared to a recovery of $40.9 million in 2014. The Company recorded an expense of 30.69% on earnings for the year ended December 31, 2015 and a recovery of 27.77% on earnings for the year ended December 31, 2014.
The difference between the effective and the statutory rates in 2015 is due to the non-deductibility of certain expenses for tax purposes. The difference between the effective and the statutory rates in 2014 is primarily due to a recovery of income taxes
YELLOW PAGES LIMITED 2016 ANNUAL REPORT 15

MANAGEMENT’S DISCUSSION AND ANALYSIS
of $84.8 million related to the cancellation of certain income tax liabilities in the fourth quarter of 2014 following the settlement of tax assessments with the Canada Revenue Agency.
Earnings from investments in associates
On June 1, 2014, we acquired the remaining 70% interest in 411.ca, whose results are now consolidated within YP. We recorded earnings of $0.2 million for the period from January 1, 2014 up to the acquisition date.
Net earnings
We recorded net earnings of $61.1 million during 2015 compared with $188.5 million for 2014. The decrease for the year is principally explained by lower Adjusted EBITDA and higher restructuring and special charges, in addition to a recovery of income taxes of $84.8 million during the fourth quarter of 2014 related to the cancellation of certain income tax liabilities following the settlement of tax assessments.
SUMMARY OF CONSOLIDATED QUARTERLY RESULTS
QUARTERLY RESULTS (IN THOUSANDS OF CANADIAN DOLLARS – EXCEPT PER SHARE AND PERCENTAGE INFORMATION)
2016 2015 Q4 Q3 Q2 Q1 Q4 Q3 Q2 Q1
Revenues $ 202,723 $ 201,142 $ 210,487 $ 203,627 $ 208,505 $ 210,593 $ 204,771 $ 205,902 Operating costs 145,305 144,193 151,556 141,734 144,007 146,783 143,178 135,116 Income from operations
before depreciation and amortization, impairment of intangible assets and restructuring and special charges (Adjusted EBITDA) 57,418 56,949 58,931 61,893 64,498 63,810 61,593 70,786
Adjusted EBITDA margin 28.3% 28.3% 28.0% 30.4% 30.9% 30.3% 30.1% 34.4%
Depreciation and amortization 27,745 26,838 25,440 24,859 20,792 21,161 20,212 18,672
Impairment of intangible assets 600,000 − − − − − − −
Restructuring and special charges 7,493 9,691 1,519 4,258 17,168 9,113 2,551 2,002
(Loss) income from operations (577,820) 20,420 31,972 32,776 26,538 33,536 38,830 50,112
Net (loss) earnings (431,583) 3,774 10,953 13,151 5,866 13,155 16,510 25,524 Basic (loss) earnings
per share $ (16.35) $ 0.14 $ 0.41 $ 0.49 $ 0.22 $ 0.49 $ 0.62 $ 0.95 Diluted (loss) earnings
per share $ (16.35) $ 0.14 $ 0.38 $ 0.45 $ 0.21 $ 0.44 $ 0.54 $ 0.81
Revenues decreased throughout the quarters principally impacted by an overall loss of customers, a decline in print spending among renewing customers, partially offset by an increasing number of digital customers. Revenues, starting in the third quarter of 2015, were favourably impacted by the acquisition of CFDP on July 1, 2015. Revenues, starting in the second quarter of 2016, were also favourably impacted by the acquisition of JUICE on March 17, 2016.
The Adjusted EBITDA margin was higher in the first quarter of 2015, given the timing of various investments related to the execution of the Company’s digital evolution as well as a favourable impact related to amendments to our pension and post-retirement benefit plans. Adjusted EBITDA margins remained relatively stable from the second quarter of 2015 to the first quarter of 2016, as print revenue declines, changes in the product mix, investments related to the Plan, and the acquisition of CFDP were offset by cost savings initiatives and lower employee related expenses. The Adjusted EBITDA margin decreased in the second, third, and fourth quarters of 2016 as a result of the acquisition of JUICE.
Depreciation and amortization expense remained relatively stable throughout 2015. Depreciation and amortization expense increased in 2016 in connection with the deployment of platforms and applications related to the Company’s digital evolution. Amortization was further increased in the second, third and fourth quarters of 2016 due to the amortization of intangible assets related to the acquisition of JUICE.
16 YELLOW PAGES LIMITED 2016 ANNUAL REPORT

MANAGEMENT’S DISCUSSION AND ANALYSIS
As the Company advances in the deployment of the Plan and its evolution from a print centric to a digital centric organization, it initiated workforce reductions and cost containment initiatives resulting in restructuring and special charges over the quarters.
Our net loss for the fourth quarter of 2016 was due to an impairment loss of $600 million related to certain of our intangible assets. Our net earnings for the fourth quarter of 2015 and the third quarter of 2016 were negatively impacted by higher restructuring charges resulting from internal reorganizations and workforce reductions.
ANALYSIS OF FOURTH QUARTER 2016 RESULTS
Revenues
Revenues decreased by 2.8% year-over-year to $202.7 million during the fourth quarter of 2016, as compared to $208.5 million for the same period last year. Revenue decline for the quarter is due to lower print revenues. Included in revenues for the quarter were revenues generated from JUICE. On a pro forma basis, which adjusts revenues for the full inclusion of JUICE during the fourth quarter of 2015, revenues decreased 7.1% year-over-year for the three-month period ended December 31, 2016.
Digital revenues grew 10.8% year-over-year to reach $143.1 million during the fourth quarter of 2016, or 70.6% of revenues. This compares to $129.2 million, or 62% of revenues, for the same period last year. On a pro forma basis, digital revenues for the three-month period ended December 31, 2016 increased approximately 3% year-over-year. Pro forma digital revenue growth was favourably impacted by CFDP’s growing network of home sellers and buyers in Quebec and Ontario, as well as by revenue growth in our national advertising operations (JUICE and Mediative), despite a softer than anticipated performance.
Print revenues decreased 24.8% year-over-year and amounted to $59.6 million during the fourth quarter ended December 31, 2016. Print revenue performance was adversely impacted by a decline in the number of print customers and the migration of print marketing spending to digital.
Adjusted EBITDA
Adjusted EBITDA decreased by $7.1 million to $57.4 million during the fourth quarter of 2016, compared to $64.5 million for the same period in 2015. Our Adjusted EBITDA margin for the fourth quarter of 2016 was 28.3% as compared to 30.9% for the same period last year. The decrease in Adjusted EBITDA and Adjusted EBITDA margin for the three-month period ended December 31, 2016 was mostly impacted by lower print revenues and a change in product mix, partly offset by cost saving initiatives. The decline in the Adjusted EBITDA margin was also impacted by the acquisition of JUICE, which operates at a lower Adjusted EBITDA margin relative to Yellow Pages prior to the acquisition.
Cost of sales increased by $4.9 million to $87 million during the fourth quarter of 2016, as compared to $82.1 million during the fourth quarter of 2015. The increase for the fourth quarter of 2016 is mainly due to the acquisition of JUICE on March 17, 2016, partly offset by lower expenses associated with lower revenues.
Gross profit margin decreased to 57.1% for the fourth quarter of 2016 compared to 60.6% for the fourth quarter in 2015. The decrease is primarily due to a change in product mix and the acquisitions of CFDP and JUICE, which operate at a lower gross profit margin relative to Yellow Pages prior to the acquisitions, partly offset by operational efficiencies.
General and administrative expenses decreased by $3.6 million to $58.3 million during the fourth quarter of 2016 compared to $61.9 million for the same period in 2015. The decrease for the quarter is due to cost savings associated with the corporate realignment implemented in the third and fourth quarters of 2015, as well as cost containment initiatives implemented throughout the year, offset by expenses associated with JUICE.
Depreciation and amortization
Depreciation and amortization increased to $27.7 million during the fourth quarter of 2016 compared to $20.8 million during the fourth quarter in 2015. The increase is due to higher capital expenditures in connection with the deployment of systems and platforms as the Company implements its digital evolution as well as amortization of the intangible assets related to the acquisition of JUICE.
Impairment of intangible assets
In the context of its annual impairment testing and as a result of a marked acceleration in an unfavourable change in the product mix during the fourth quarter of 2016 in the Yellow Pages CGU, the Company determined that the recoverability of certain of its assets had to be reviewed for impairment purposes. Consequently, we recorded an impairment loss of $600 million during the fourth quarter related to certain of our intangible assets, namely our trademarks and non-competition agreements. The impairment charge is a non-cash item and does not affect the Company’s debt covenants. In this context, the Company anticipates additional pressure on Adjusted EBITDA in 2017. As it works to address the mix issue, the Company expects stabilization in Adjusted EBITDA in the short to mid-term, post-2017. However, not at the levels previously anticipated.
YELLOW PAGES LIMITED 2016 ANNUAL REPORT 17

MANAGEMENT’S DISCUSSION AND ANALYSIS
Restructuring and special charges
During the fourth quarter of 2016, we recorded restructuring and special charges of $7.5 million associated primarily with internal reorganizations and workforce reductions, as well as transaction costs associated with business acquisitions. During the fourth quarter of 2015, we recorded restructuring and special charges of $17.2 million associated primarily with workforce reductions related to the corporate realignment and contract termination costs, partially offset by a curtailment gain related to the workforce reductions.
Financial charges
Financial charges decreased by $2.6 million to $12.7 million during the fourth quarter of 2016 compared to $15.3 million for the same period in 2015. The decrease is due to a lower level of indebtedness.
(Recovery of) provision for income taxes
The combined statutory provincial and federal tax rates were 26.9% and 26.7% for the three-month periods ended December 31, 2016 and 2015, respectively. During the fourth quarter of 2016, the Company recorded a recovery of $159.3 million, comprised of a recovery of income taxes of $161 million associated with an impairment loss of $600 million on certain of its intangible assets. The recovery of income taxes of $161 million is a non-cash item. The Company recorded an expense of $5.4 million for the three-month period ended December 31, 2015. The Company recorded a recovery of 27% of the loss for the fourth quarter of 2016 compared to 48% of earnings for the fourth quarter of 2015.
The difference between the effective and the statutory rates for the fourth quarter of 2016 is due to the non-deductibility of certain expenses for tax purposes.
The difference between the effective and the statutory rates for the fourth quarter of 2015 is due to the recognition of previously unrecognized tax attributes on assets of our foreign subsidiaries as well as non-taxable and non-deductible items.
Loss from investments in associates
On October 3, 2016, we acquired a 50% ownership in 9778730 Canada Inc., which owns 100% of Coupgon Inc., a digital coupon solutions provider. We recorded a loss from our investment in an associate in the amount of $0.4 million during the fourth quarter of 2016.
Net (loss) earnings
We recorded a net loss of $431.6 million during the fourth quarter of 2016 as compared with net earnings of $5.9 million for the same period last year. The decrease for the quarter is principally explained by an impairment of our intangible assets of $600 million as well as lower Adjusted EBITDA and higher depreciation and amortization, mainly resulting from a higher level of capital expenditures in the context of the Company’s digital evolution as well as amortization of intangible assets related to the acquisition of JUICE, offset by lower restructuring and special charges and financial charges.
18 YELLOW PAGES LIMITED 2016 ANNUAL REPORT

MANAGEMENT’S DISCUSSION AND ANALYSIS
1.7
1.6
Dec. 31, 2015
Dec. 31, 2016
NET DEBT TO LATEST TWELVE- MONTH ADJUSTED EBITDA1 RATIO
3. LIQUIDITY AND CAPITAL RESOURCES This section examines the Company’s capital structure, sources of liquidity and various financial instruments including its debt instruments.
FINANCIAL POSITION
CAPITAL STRUCTURE (IN THOUSANDS OF CANADIAN DOLLARS – EXCEPT PERCENTAGE INFORMATION)
As at December 31, 2016 December 31, 2015
Cash $ 17,260 $ 67,253 Senior secured notes $ 309,669 $ 406,733 Exchangeable debentures 92,174 90,478 Obligations under finance leases 359 620 Net debt $ 384,942 $ 430,578 Equity 368,904 759,524 Total capitalization $ 753,846 $ 1,190,102 Net debt to total capitalization 51.1% 36.2%
As at December 31, 2016, Yellow Pages had $384.9 million of net debt, compared to $430.6 million as at December 31, 2015.
The net debt to Latest Twelve-Month Adjusted EBITDA1 ratio as at December 31, 2016 was 1.6 times compared to 1.7 times as at December 31, 2015. The decrease is due to a lower level of indebtedness, partially offset by lower Adjusted EBITDA and the acquisition of JUICE which resulted in a cash outflow of $35.3 million during the first quarter of 2016.
Asset-Based Loan
In August 2013, the Company, through its subsidiary Yellow Pages Digital & Media Solutions Limited, entered into a five-year $50 million asset-based loan (ABL) expiring in August 2018. The ABL is being used for general corporate purposes. Through the ABL, the Company has access to the funds in the form of prime rate loans, Banker’s acceptance (BA) equivalent loans or letters of credit. The ABL is secured by a first priority lien over the receivables of the Company. Interest is calculated based either on the BA Rate or the Prime Rate plus an applicable margin. The ABL is subject to an availability reserve of $5 million if the Company’s trailing twelve-month fixed charge coverage ratio is below 1.1 times. As at December 31, 2016, the Company had $7.4 million of letters of credit issued and outstanding under the ABL. As such, $42.6 million of the ABL was available as at December 31, 2016.
As at December 31, 2016, the Company was in compliance with all covenants under the loan agreement governing the ABL.
1 Latest twelve-month income from operations before depreciation and amortization, impairment of intangible assets and restructuring and special charges (Latest Twelve-Month Adjusted EBITDA). Latest Twelve-Month Adjusted EBITDA is a non-IFRS measure and may not be comparable with similar measures used by other publicly traded companies. Please refer to page 7 for a definition of Adjusted EBITDA.
$760
$369
$431
$385
Dec. 31, 2015
Dec. 31, 2016
CAPITAL STRUCTURE (IN MILLIONS OF CANADIAN DOLLARS)
Total Equity Net Debt
YELLOW PAGES LIMITED 2016 ANNUAL REPORT 19

MANAGEMENT’S DISCUSSION AND ANALYSIS
Senior Secured Notes
On December 20, 2012, the Company, through its subsidiary Yellow Pages Digital & Media Solutions Limited, issued $800 million of 9.25% senior secured notes (the Senior Secured Notes) maturing November 30, 2018. Interest on the Senior Secured Notes is payable in cash, quarterly in arrears, in equal instalments on the last day of February, May, August and November of each year.
The Company repaid a total of $97.1 million in 2016 and $490.3 million since December 20, 2012 of its Senior Secured Notes, thereby reducing the balance from $800 million to $309.7 million as at December 31, 2016.
As at December 31, 2016, the Company was in compliance with all covenants under the indenture governing the Senior Secured Notes. Mandatory Redemption
Pursuant to the indenture governing the Senior Secured Notes, the Company is required to use an amount equal to 75% of its consolidated Excess Cash Flow for the immediately preceding six-month period ending March 31 or September 30, as applicable, to redeem on a semi-annual basis on the last day of May and November of each year, commencing on May 31, 2013, at a redemption price equal to 100% of the principal amount thereof from holders on a pro rata basis, subject to the Company maintaining a minimum cash balance, including availability on the ABL, of $75 million immediately following the mandatory redemption payment, subject to certain conditions. The $75 million minimum cash balance condition is subject to a reduction in certain cases as provided in the indenture governing the Senior Secured Notes. Excess Cash Flow, as defined in the indenture governing the Senior Secured Notes, means the aggregate cash flow from operating activities adjusted for, among other things, payments relating to interest, taxes, long-term employee compensation plans, certain pension plan contribution payments and the acquisition of property and equipment and intangible assets. For purposes of determining the consolidated Excess Cash Flow, deductions for capital expenditures and information systems/information technology expenses are each subject to an annual deduction limit of $50 million. Under other circumstances, the Company may also have to make additional repayments on the Senior Secured Notes (refer to the indenture governing the Senior Secured Notes).
Optional Redemption
The Company may redeem all or part of the Senior Secured Notes at its option, upon not less than 30 nor more than 60 days prior notice, at a redemption price equal to:
• In the case of a redemption occurring prior to May 31, 2017, 105% of the principal amount thereof, plus accrued and unpaid interest, if any, to the redemption date; or
• In the case of a redemption occurring on or after May 31, 2017, 100% of the principal amount thereof, plus accrued and unpaid interest, if any, to the redemption date.
Exchangeable Debentures On December 20, 2012, the Company, through its subsidiary Yellow Pages Digital & Media Solutions Limited, issued $107.5 million of senior subordinated exchangeable debentures (the Exchangeable Debentures) due November 30, 2022.
Interest on the Exchangeable Debentures accrues at a rate of 8% per annum if, for the applicable interest period, it is paid in cash or 12% per annum, for the applicable interest period, if the Company makes a Payment in Kind election to pay interest in respect of all or any part of the then outstanding Exchangeable Debentures in additional Exchangeable Debentures. Interest on the Exchangeable Debentures is payable semi-annually in arrears in equal instalments on the last day of May and November of each year.
As at December 31, 2016, the Company was in compliance with all covenants under the indenture governing the Exchangeable Debentures.
Exchange Option
The Exchangeable Debentures are exchangeable at the holder’s option into common shares at any time at an exchange price per common share equal to $19.04, subject to adjustment for specified transactions.
Optional Redemption
The Company may, at any time on or after the date on which all of the Senior Secured Notes have been repaid in full, redeem all or part of the Exchangeable Debentures at its option, upon not less than 30 nor more than 60 days’ prior notice, at a redemption price equal to:
• In the case of a redemption occurring prior to May 31, 2021, 110% of the principal amount thereof, plus accrued and unpaid interest, if any, to the redemption date; or
• In the case of a redemption occurring on or after May 31, 2021, 100% of the principal amount thereof, plus accrued and unpaid interest, if any, to the redemption date.
20 YELLOW PAGES LIMITED 2016 ANNUAL REPORT

MANAGEMENT’S DISCUSSION AND ANALYSIS
CREDIT RATINGS
DBRS LIMITED STANDARD AND POOR’S RATING SERVICES
B (high)/Issuer rating – stable outlook B/Corporate credit rating – stable outlook BB (low)/Credit rating for Senior Secured Notes BB-/Credit rating for Senior Secured Notes B (low)/Credit rating for Exchangeable Debentures CCC+/Credit rating for Exchangeable Debentures
Liquidity The Company’s principal source of liquidity is cash generated from operations and cash on hand. The Company expects to generate sufficient liquidity to fund capital expenditures, working capital requirements and current obligations, and service its outstanding debt obligations. As at February 13, 2017, the Company had approximately $15.1 million of cash and $42.8 million available under the ABL.
Options
On December 20, 2012, as part of the implementation of Yellow Pages’ recapitalization transaction, a new stock option plan (the Stock Option Plan) was adopted. The Stock Option Plan is intended to attract and retain the services of selected employees (the Participants) of Yellow Pages who are in a position to make a material contribution to the successful operation of the business, provide meaningful incentive to management to lead Yellow Pages through the transition and transformation of its business and to more closely align the interests of management with those of the shareholders of Yellow Pages Limited. A maximum of 1,290,612 stock options may be granted under the Stock Option Plan.
The stock options expire approximately seven years after the grant date and Participants are required to hold 25% of the common shares received pursuant to the exercise of the stock options until the Participants meet the ownership guidelines which apply to their respective position.
Share data
OUTSTANDING SHARE DATA
As at February 14, 2017 December 31, 2016 December 31, 2015
Common shares outstanding 28,075,306 28,075,304 28,063,919 Exchangeable Debentures outstanding1 5,624,422 5,624,422 5,624,422 Common share purchase warrants outstanding 2,995,486 2,995,488 2,995,498 Stock options outstanding² 630,950 630,950 522,950
1 As at February 14, 2017, Yellow Pages had $107.1 million principal amount of Exchangeable Debentures outstanding, which amount is exchangeable into 5,624,422 common shares of Yellow Pages Limited at an exchange price of $19.04, subject to adjustment for specified transactions pursuant to the indenture governing the Exchangeable Debentures.
2 Included in the stock options outstanding balance of 630,950 as at February 14, 2017 and December 31, 2016 are 366,500 and 186,550 stock options exercisable as at those respective dates. Included in the stock options outstanding balance of 522,950 as at December 31, 2015 are 78,000 stock options exercisable as at that date.
Contractual Obligations and Other Commitments
CONTRACTUAL OBLIGATIONS (IN THOUSANDS OF CANADIAN DOLLARS)
Payments due for the years following December 31, 2016 Total 1 year 2 – 3 years 4 – 5 years After 5 years
Long-term debt1,2 $ 309,669 $ 75,018 $ 234,651 $ − $ − Obligations under finance leases1 359 143 216 − − Exchangeable Debentures1 107,089 − − − 107,089 Operating leases 294,020 21,417 36,720 33,386 202,497 Other 59,677 31,835 21,517 3,806 2,519 Total contractual obligations $ 770,814 $ 128,413 $ 293,104 $ 37,192 $ 312,105
1 Principal amount. 2 The repayment of the Senior Secured Notes may vary subject to the Excess Cash Flow under the indenture governing the Senior Secured Notes as well
as the minimum cash balance requirement post Mandatory Redemptions under the indenture governing the Senior Secured Notes.
YELLOW PAGES LIMITED 2016 ANNUAL REPORT 21

MANAGEMENT’S DISCUSSION AND ANALYSIS
Obligations under finance leases
We enter into finance lease agreements for office equipment and software. As at December 31, 2016, minimum payments under these finance leases up to 2019 totalled $0.4 million.
Operating leases
We rent our premises and office equipment under various operating leases. As at December 31, 2016, minimum payments under these operating leases up to 2034 totalled $294 million.
Purchase obligations
We use the services of outside suppliers to distribute and print our directories and have entered into long-term agreements with a number of these suppliers. These agreements expire between 2017 and 2038. We also have purchase obligations under service contracts for both operating and capital expenditures. As at December 31, 2016, we have an obligation to purchase services for $59.7 million over the next five years and thereafter. Cash from operations will be used to fund these purchase obligations.
Pension Obligations
YP sponsors a pension plan registered with the Canada Revenue Agency and the Financial Services Commission of Ontario with defined benefit (DB) for employees hired prior to January 1, 2006, and defined contribution (DC) components for the non-Québec based employees hired on or after January 1, 2006 (the YP Pension Plan) as well as a DC plan registered with the Régie des Rentes du Québec (the YP Québec Plan), for the Québec based employees hired on or after January 1, 2006. Both plans together cover substantially all employees of the Company.
As at December 31, 2016, the DB component of the YP Pension Plan’s assets totalled $505.2 million and were invested in a diversified portfolio of Canadian fixed income securities and Canadian and international equity securities. Its rate of return on assets was 8.7% for 2016, 0.6% above our benchmark portfolio.
The most recent actuarial valuation of the defined benefit component of the YP Pension Plan for funding purposes was performed as at December 31, 2015. The December 2015 valuation resulted in a solvency deficit of $59 million to be funded over a five-year period. The next actuarial valuation will be as at December 31, 2016.
In 2016, the Company made annual contributions equivalent to the current service cost (the Annual Employer Cost) of $26.8 million, including $13.6 million to fund the deficit. Total cash payments are expected to amount to $26.7 million for 2017, of which $12.8 million will be to fund the deficit.
22 YELLOW PAGES LIMITED 2016 ANNUAL REPORT

MANAGEMENT’S DISCUSSION AND ANALYSIS
SOURCES AND USES OF CASH (IN THOUSANDS OF CANADIAN DOLLARS)
For the years ended December 31, 2016 2015
Cash flows from operating activities Cash flows from operations $ 167,547 $ 208,270 Change in operating assets and liabilities (9,434) (10,704)
$ 158,113 $ 197,566 Cash flows used in investing activities
Additions to intangible assets $ (50,787) $ (69,190) Additions to property and equipment (12,719) (6,231) Business acquisitions (35,271) (51,063) Investment in associate (1,597) − Other (50) − $ (100,424) $ (126,484)
Cash flows used in financing activities Repayment of long-term debt $ (97,325) $ (100,650) Purchase of restricted shares (10,472) (6,838) Issuance of common shares upon exercise of stock options 115 883 $ (107,682) $ (106,605)
Cash flows from operating activities Cash flows from operations
Cash flows from operations decreased by $40.7 million from $208.3 million for the year ended December 31, 2015 to $167.5 million for the same period in 2016. Cash flows from income taxes generated a net outflow of $1.8 million for the year ended December 31, 2016 compared to net income taxes received of $46.7 million during the same period last year as a result of a tax settlement covering prior years. Cash flows from operations in 2016 were also impacted by lower cash Adjusted EBITDA of $16.1 million.
Change in operating assets and liabilities
The change in operating assets and liabilities for the year ended December 31, 2016 generated an outflow of $9.4 million compared to $10.7 million for the same period last year. The outflow for the year ended December 31, 2016 is explained by a higher level of trade receivables associated primarily with longer collection cycles in the national advertising industry, lower deferred revenues mainly due to declining revenues, and a decrease in trade payables, partially offset by the receipt of a settlement of sales tax assessments of $16.6 million. The outflow for the year ended December 31, 2015 is due principally to the increased level of payment of variable compensation, partially offset by lower deferred publication costs resulting from a new print distribution model implemented in 2015.
Cash flows used in investing activities
Cash used in investing activities amounted to $100.4 million for the year ended December 31, 2016 compared with $126.5 million for the same period last year. During the year ended December 31, 2016, we invested in software development and ISIT equipment in the amount of $50.8 million and $12.7 million, respectively, as compared to $69.2 million and $6.2 million, respectively, during the same period last year. Capital expenditures incurred in 2015 and 2016 are related to investments required to maintain the integrity of our infrastructure as well as the development and implementation of new technologies and software aimed at accelerating our evolution into Canada’s leading local digital company. The level of investments is decreasing year-over-year as we are progressing in our evolution. During the first quarter of 2016, we acquired the net assets of JUICE for a purchase price of $35.3 million. During the third quarter of 2015, we acquired all the shares of the CFDP network for a purchase price of $50.2 million.
Cash flows used in financing activities
Cash used in financing activities amounted to $107.7 million during the year ended December 31, 2016 compared to $106.6 million for the same period last year. During the year, we repaid $97.1 million of the Senior Secured Notes compared to $100.3 million during the same period last year. During the year, we purchased common shares of Yellow Pages Limited on the open market to fund the Restricted Share Unit and Performance Share Unit Plan at a cost of $10.5 million compared to $6.8 million during the same period last year.
YELLOW PAGES LIMITED 2016 ANNUAL REPORT 23

MANAGEMENT’S DISCUSSION AND ANALYSIS
FINANCIAL AND OTHER INSTRUMENTS (See Note 22 of the Audited Consolidated Financial Statements of the Company for the years ended December 31, 2016 and 2015).
The Company’s financial instruments primarily consist of cash, trade and other receivables, trade and other payables, long-term debt, Exchangeable Debentures and derivatives designated as cash flow hedges.
There is no carrying value of embedded derivatives as at December 31, 2016. The carrying value is calculated, as is customary in the industry, using discounted cash flows based on quarter-end market rates.
4. FREE CASH FLOW (IN THOUSANDS OF CANADIAN DOLLARS)
For the three-month periods and years ended December 31, 2016 2015 2016 2015
Cash flows from operating activities $ 27,874 $ 42,417 $ 158,113 $ 197,566 Capital expenditures 20,036 17,168 63,506 75,421 Free cash flow $ 7,838 $ 25,249 $ 94,607 $ 122,145
5. CRITICAL ASSUMPTIONS When we prepare our consolidated financial statements in accordance with IFRS, we must make certain estimates and assumptions about our business. These estimates and assumptions in turn affect the reported amounts of assets, liabilities, revenues and expenses and the disclosure of contingent assets and liabilities in the financial statements.
In this section, we provide detailed information on these important estimates and assumptions which are under continuous evaluation by the Company.
Intangible assets, goodwill and property and equipment The values associated with identifiable intangible assets and goodwill involve significant estimates and assumptions, including those with respect to future cash inflows and outflows, discount rates and asset lives. These significant estimates require considerable judgment which could affect Yellow Pages’ future results if the current estimates of future performance and fair values change. These determinations may affect the amount of amortization expense on identifiable intangible assets recognized in future periods and impairment of goodwill, intangible assets and property and equipment.
Yellow Pages assesses impairment by comparing the recoverable amount of an identifiable intangible asset or goodwill with its carrying value. The determination of the recoverable amount involves significant management judgment.
Yellow Pages performed its annual test for impairment of goodwill and indefinite life intangible assets in accordance with the policy described in Note 3.12 of the Audited Consolidated Financial Statements of Yellow Pages Limited for the years ended December 31, 2016 and 2015.
The recoverable amount of the cash generating units (CGUs) was determined based on the value-in-use approach using a discounted cash flow model which relies on significant key assumptions, including after-tax cash flows forecasted over an extended period of time, terminal growth rates and discount rates. We use published statistics or seek advice where possible when determining the assumptions we use. Details of Yellow Pages’ impairment reviews are disclosed in Note 4 of the Audited Consolidated Financial Statements of Yellow Pages Limited for the years ended December 31, 2016 and 2015.
Employee future benefits The present value of the defined benefit obligation is determined by discounting the estimated future cash outflows using interest rates of high-quality corporate bonds that are denominated in the currency in which the benefits will be paid and that have terms to maturity approximating the terms of the related pension liability. Determination of the benefit expense requires assumptions such as the expected return on assets available to fund pension obligations, the discount rate to measure obligations, the projected age of employees upon retirement, the expected rate of future compensation and the expected healthcare cost trend rate. For the purpose of calculating the expected return on plan assets, the assets are valued at fair value. Actual results may differ from results which are estimated based on assumptions.
Income taxes
Estimation of income taxes includes evaluating the recoverability of deferred tax assets based on an assessment of Yellow Pages’ ability to utilize the underlying future tax deductions against future taxable income before they expire. Yellow Pages’ assessment is based upon existing tax laws and estimates of future taxable income. If the assessment of
24 YELLOW PAGES LIMITED 2016 ANNUAL REPORT

MANAGEMENT’S DISCUSSION AND ANALYSIS
Yellow Pages’ ability to utilize the underlying future tax deductions changes, Yellow Pages would be required to recognize more or fewer of the tax deductions as assets, which would decrease or increase the income tax expense in the period in which this is determined.
Yellow Pages is subject to taxation in numerous jurisdictions. Significant judgment is required in determining the consolidated provision for taxation. There are many transactions and calculations for which the ultimate tax determination is uncertain during the ordinary course of business. Yellow Pages maintains provisions for uncertain tax positions that it believes appropriately reflect its risk with respect to tax matters under active discussion, audit, dispute or appeal with tax authorities, or which are otherwise considered to involve uncertainty. These provisions for uncertain tax positions are made using the best estimate of the amount expected to be paid based on a qualitative assessment of all relevant factors. Yellow Pages reviews the adequacy of these provisions at each statement of financial position date. However, it is possible that at some future date an additional liability could result from audits by tax authorities. Where the final tax outcome of these matters is different from the amounts that were initially recorded, such differences will affect the tax provisions in the period in which such determination is made.
ACCOUNTING STANDARDS
The following revised standards are effective for annual periods beginning on January 1, 2016 and their adoption has not had any impact on the amounts in our consolidated financial statements but may affect the accounting for future transactions or arrangements:
Amendments to IAS 16 −− Property, Plant and Equipment, and IAS 38 – Intangible Assets: Clarification of Acceptable Methods of Depreciation and Amortization
In May 2014, the International Accounting Standards Board (IASB) issued Amendments to International Accounting Standard (IAS) 16 – Property, Plant and Equipment and IAS 38 – Intangible Assets: Clarification of Acceptable Methods of Depreciation and Amortization to clarify that the use of revenue-based methods to calculate depreciation is not appropriate as revenue generated by an activity that includes the use of an asset generally reflects factors other than the consumption of the economic benefits embodied in the related asset. The IASB also clarified that revenue is generally presumed to be an inappropriate basis for measuring the consumption of the economic benefits embodied in an intangible asset. This presumption may be rebutted in certain limited circumstances. These amendments must be applied prospectively for annual periods beginning on or after January 1, 2016.
IAS 1 − Presentation of financial statements In December 2014, the IASB issued amendments to IAS 1 – Presentation of financial statements as part of its initiative to improve presentation and disclosure in financial reports. The amendments to IAS 1 clarify the existing presentation and disclosure requirements as they relate to materiality, order of the notes, subtotals, accounting policies and disaggregation. The amendments also provide additional guidance on the application of professional judgment to disclosure requirements when preparing the notes to the financial statements.
Certain new standards, interpretations and amendments to existing standards have been published and are mandatory for Yellow Pages Limited’s accounting periods beginning on or after January 1, 2017. The new standards which are considered to be relevant to Yellow Pages Limited’s operations are as follows:
IFRS 15 − Revenue from Contracts with Customers
In May 2014, the IASB issued IFRS 15 – Revenue from Contracts with Customers. This new standard outlines a single comprehensive model for companies to use when accounting for revenue arising from contracts with customers. It supersedes the IASB’s current revenue recognition standards, including IAS 18 – Revenue and related interpretations. The core principle of IFRS 15 is that revenue is recognized at an amount that reflects the consideration to which the company expects to be entitled in exchange for those goods or services, applying the following five steps:
• Identify the contract with a customer;
• Identify the performance obligations in the contract;
• Determine the transaction price;
• Allocate the transaction price to the performance obligations in the contract; and
• Recognize revenue when (or as) the company satisfies a performance obligation.
This new standard also provides guidance relating to the accounting for contract costs as well as for the measurement and recognition of gains and losses arising from the sale of certain non-financial assets. Additional disclosures will also be required under the new standard, which is effective for annual reporting periods beginning on or after January 1, 2018, with earlier application permitted. For comparative amounts, companies have the option of using either a full retrospective approach or a modified retrospective approach as set out in the new standard.
YELLOW PAGES LIMITED 2016 ANNUAL REPORT 25

MANAGEMENT’S DISCUSSION AND ANALYSIS
On April 12, 2016, the IASB published the final clarifications to IFRS 15. The amendments are effective for annual reporting periods beginning on or after January 1, 2018, with earlier adoption permitted. The amendments do not change the underlying principles of the standard yet clarify how the principles should be applied. Yellow Pages Limited continues to evaluate the impact this standard will have on its consolidated financial statements.
IFRS 9 −− Financial Instruments
In July 2014, the IASB issued the final version of IFRS 9 – Financial Instruments. IFRS 9 replaces the requirements in IAS 39 – Financial Instruments: Recognition and Measurement for classification and measurement of financial assets and liabilities. The new standard introduces a single classification and measurement approach for financial instruments, which is driven by cash flow characteristics and the business model in which an asset is held. This single, principle-based approach replaces existing rule-based requirements and results in a single impairment model being applied to all financial instruments. IFRS 9 also modified the hedge accounting model to incorporate the risk management practices of an entity.
Additional disclosures will also be required under the new standard. The new standard will come into effect for annual periods beginning on or after January 1, 2018 with early adoption permitted. Yellow Pages Limited continues to evaluate the impact this standard will have on its consolidated financial statements.
IFRS 16 − Leases In January 2016, the IASB issued IFRS 16 – Leases. It supersedes the IASB’s current lease standard, IAS 17, which required lessees and lessors to classify their leases as either finance leases or operating leases and to account for those two types of leases differently. It did not require lessees to recognize assets and liabilities arising from operating leases, but it did require lessees to recognize assets and liabilities arising from finance leases.
IFRS 16 sets out the principles for the recognition, measurement, presentation and disclosure of leases. It introduces a single lessee accounting model and requires a lessee to recognize assets and liabilities for all leases with a term of more than twelve months and for which the underlying asset is not of low value. A lessee is required to recognize a right-of-use asset representing its right to use the underlying leased asset and a lease liability representing its obligation to make lease payments.
IFRS 16 contains disclosure requirements for lessees and lessors. This new standard will come into effect for annual periods beginning on or after January 1, 2019. Earlier application is permitted for companies that apply IFRS 15 – Revenue from Contracts with Customers at or before the date of initial application of IFRS 16. Yellow Pages Limited continues to assess the impact this standard will have on its consolidated financial statements.
Amendments to IAS 7 − Statement of Cash Flows In January 2016, the IASB published amendments to IAS 7 – Statement of Cash Flows. The amendments are intended to improve information provided to users of financial statements about an entity’s financing activities, including changes from financing cash flows, changes arising from obtaining or losing control of subsidiaries or other businesses, the effect of changes in foreign exchange rates and changes in fair value. They are effective for annual periods beginning on or after January 1, 2017, applied prospectively, with earlier adoption permitted. The Amendments to IAS 7 are not expected to have a significant impact on the consolidated financial statements of Yellow Pages Limited.
Amendments to IFRS 2 − Share-based Payment In June 2016, the IASB published amendments to IFRS 2 − Share-based Payment. The amendments clarify that the accounting for the effects of vesting and non-conditions on cash-settled share-based payments follow the same approach as for equity-settled share-based payments. The amendments also clarify the classification of share-based payment transactions with net settlement features as well as requiring additional disclosures for these transactions. They are effective for annual periods beginning on or after January 1, 2018, applied prospectively, with earlier adoption permitted. The amendments to IFRS 2 are not expected to have a significant impact on the consolidated financial statements of Yellow Pages Limited.
IFRIC 22 − Foreign Currency Transactions and Advance Consideration
In December 2016, the IASB issued an interpretation paper IFRIC 22 – Foreign Currency Transactions and Advance Consideration. This interpretation paper clarifies that the foreign exchange rate applicable to transactions involving advance consideration paid or received is the rate at the date that the advance consideration is paid or received and a non-monetary asset or liability is recorded, and not the later date at which the related asset or liability is recognized in the financial statements. This interpretation is applicable for annual periods beginning on or after January 1, 2018, and can be applied either prospectively or retrospectively, at the option of the entity. IFRIC 22 is not expected to have a significant impact on the consolidated financial statements of Yellow Pages Limited.
Amendments to IFRS 12 − Disclosure of Interest in Other Entities
In December 2016, the IASB issued amendments to IFRS 12 – Disclosure of Interest in Other Entities as part of its 2014-2016 Annual Improvements Cycle. The amendment clarifies that the requirement to disclose summarised financial
26 YELLOW PAGES LIMITED 2016 ANNUAL REPORT

MANAGEMENT’S DISCUSSION AND ANALYSIS
information does not apply for interests in subsidiaries, associates or joint ventures which are classified, or included in a disposal group that is classified as held for sale in accordance with IFRS 5 – Non-current Assets Held for Sale and Discontinued Operations. This amendment is effective for annual periods beginning on or after January 1, 2017, with retrospective application. The amendments to IFRS 12 are not expected to have a significant impact on the consolidated financial statements of Yellow Pages Limited.
6. RISKS AND UNCERTAINTIES The following section examines the major risks and uncertainties that could materially affect YP’s future business results.
Understanding and managing risks are important parts of YP’s strategic planning process. The Board requires that our senior management identify and properly manage the principal risks related to our business operations. To understand and manage risks at YP, our Board and senior management analyze risks in three major categories:
1. Strategic risks - which are primarily external to the business;
2. Financial risks - generally related to matters addressed in the Financial Risk Management Policy and in the Pension Statement of Investment Policy and Procedures; and
3. Operational risks - related principally to risks across key functional areas of the organization.
YP has put in place certain guidelines in order to seek to manage the risks to which it may be exposed. Please refer to the “Risk Factors” section of our AIF for a complete description of these risk factors. Despite these guidelines, the Company cannot provide assurances that any such efforts will be successful.
Substantial competition could reduce the market share of the Corporation and could have a material adverse effect on the Corporation, its business, results from operations and financial condition
The Corporation competes with other directory, advertising media and classified advertising businesses and across various media and platforms. This includes the internet, newspapers, television, radio, mobile telecommunication devices, magazines, billboards and direct mail advertising. In particular, the directories business faces substantial competition due to increased online penetration, through the use of online search engines and social networking organizations. The Corporation may not be able to compete effectively with these online competitors, some of which may have greater resources. The Corporation’s internet strategy and its directories business may be adversely affected if major search engines build local sales forces or otherwise begin to more effectively reach local businesses for local commercial search services. These competitors may reduce their prices to increase their market share or may be able to offer their services at lower costs than the Corporation can.
The Corporation may be forced to reduce its prices or offer and perform other services in order to remain competitive. The Corporation’s failure to compete effectively with its current or future competitors could have a number of impacts such as a reduction in its advertiser base, lower rates and increased costs. This could have a material adverse effect on the Corporation, its business, results from operations and financial condition.
A prolonged economic downturn in principal markets of the Corporation could have a material adverse effect on the Corporation, its business, results from operations and financial condition
The Corporation derives revenues principally from the sale of advertising in Yellow Pages print and digital directories across Canada. The Corporation’s advertising revenues, as well as those of directories publishers in general, typically do not fluctuate widely with economic cycles. However, a prolonged economic downturn or recession affecting the Corporation’s markets, or any deterioration in general economic conditions, could have a material adverse effect on the Corporation’s business. The adverse effects of an economic downturn or recession on the Corporation could be compounded by the fact that the majority of the Corporation’s customers are SMEs. Such businesses have fewer financial resources and higher rates of failure than larger businesses, and may be more vulnerable to prolonged economic downturns. Therefore, these SMEs may be more likely to reduce or discontinue advertising with the Corporation, which could have a material adverse effect on the Corporation, its business, results from operations and financial condition.
A higher than anticipated rate of decline in print revenue resulting from changes in preferences and consumer habits could have a material adverse effect on the Corporation, its business, results from operations and financial condition
The Corporation could be materially adversely affected if the usage of print telephone directories declines at a rate higher than anticipated. The development of new technologies and the widespread use of internet is causing changes in preferences and consumer habits. The usage of internet-based products providing information, formerly exclusively available in print directories, has increased rapidly. The internet has become increasingly accessible as an advertising medium for businesses of all sizes. Further, the use of the internet, including as a means to transact commerce through mobile devices, has resulted in new technologies and services that compete with traditional advertising mediums. In particular, this has a significant influence on print products, and the decrease in usage gradually leads to lower advertising revenues. References to print business directories may decline faster than expected as users increasingly turn to digital and interactive media delivery devices for local commercial search information.
YELLOW PAGES LIMITED 2016 ANNUAL REPORT 27

MANAGEMENT’S DISCUSSION AND ANALYSIS
The inability of the Corporation to attract, retain and upsell customers could have a material adverse effect on the Corporation, its business, results from operations and financial condition
The Corporation’s revenues remain adversely impacted by a lower customer count. Failure to provide existing customers with marketing solutions that meet their key marketing objectives and generate return on investment may limit the Corporation’s ability to retain existing customers. In addition, the inability of the Corporation’s customer acquisition strategies and channels to find and attract new customers may limit the Corporation’s ability to grow its total customer count. These events could have a material adverse effect on the Corporation, its business, results from operations and financial condition.
The inability of the Corporation to successfully enhance and expand its offering of digital and new media products could have a material adverse effect on the Corporation, its business, results from operations and financial condition
The transition from print to digital causes uncertainties surrounding whether and when new product introductions will compensate for the declining trend in print revenues. If revenue from the Corporation’s digital products does not increase significantly, the Corporation’s cash flow, results of operations and financial condition will be materially adversely affected.
The Corporation expects to derive a greater portion of its total revenue from its digital and other new media products, as directory usage continues to shift from print directories to digital and other new media products. The Corporation’s transformational expansion towards digital and new media products is subject to a variety of challenges and risks, including the following:
• the Corporation may not continue to grow usage on its digital properties at the same rate as other providers or may grow at a slower rate than currently anticipated;
• internet usage as a source of information and a medium for advertising may not continue to grow, or may grow at a slower rate than currently anticipated, as a result of factors that the Corporation cannot predict or control;
• the Corporation may incur substantial additional costs and expenses related to investments in its information technology, modifications to existing products and development of new products and this may reduce profit margins in the future;
• the Corporation may be unable to develop and market new products in a timely and efficient manner, as the Corporation’s markets are characterised by rapidly changing technology, introductions and enhancements to existing products and shifting advertising customer and end-user demands, including technology preferences;
• the Corporation may be unable to improve its information technology systems so as to efficiently manage increased levels of traffic on the Corporation’s digital properties and provide new services and products;
• the Corporation may be unable to keep apprised of changes to search engines’ terms of service or algorithms, which could cause the Corporation’s digital properties, or its advertising customers’ digital properties, to be excluded from or ranked lower in search results or make it more difficult or more expensive for the Corporation to provide search engine marketing and search engine optimisation solutions to its advertising customers;
• the Corporation’s advertising customers may be unwilling to grow their investment in digital advertising; and
• the Corporation may be unable to increase or maintain the prices of its products and services in the future.
If any of the above-mentioned risks were to occur, the Corporation’s digital revenue, as well as its business, results from operations and financial condition could be materially adversely affected.
The inability of the Corporation to supply the relationships and technologies required to appropriately service the needs of its national customers could have a material adverse effect on the Corporation, its business, results from operations and financial condition
The Corporation anticipates that it will continue to depend on various third-party relationships in order to grow its business, such as technology and content providers, real-time advertising exchanges and other strategic partners. The Corporation may not be able to maintain such relationships and these third parties may experience disruptions or performance problems, which could negatively affect the Corporation’s efficiency and reputation.
In addition, the Corporation relies heavily on information technology systems to manage critical functions of its digital and mobile marketing solutions. The future success of the Corporation will depend in part upon its ability to continuously enhance and improve its existing solutions in a timely manner with features and pricing that meet changing advertiser needs. As marketing via new digital advertising channels, such as mobile advertising is emerging, it may evolve in unexpected ways, and the failure of the Corporation to adapt successfully to market evolution could have a material adverse effect on the Corporation, its business, results of operations and financial condition.
28 YELLOW PAGES LIMITED 2016 ANNUAL REPORT

MANAGEMENT’S DISCUSSION AND ANALYSIS
The Corporation’s business depends on the usage of its online and mobile properties and failure to protect traffic across the Corporation’s digital properties could impair its ability to grow revenues and expand its business
The success of numerous of our customers’ marketing campaigns is dependent on how well they can attract valuable audiences. The Corporation will invest in order to protect digital audiences across its network of online and mobile properties by enhancing the quality, completeness and relevance of the content distributed to its properties, and by providing compelling verticalized sites and applications for local discovery. The Corporation may not be able to protect or grow traffic across its digital properties and such investments may not prove to be cost-effective. There can be no assurance that current traffic or potential growth in traffic across the Corporation’s digital properties may maintain or increase advertising customer renewal rates and/or annual spending, or lead to a measurable increase in advertising customers.
A higher than anticipated proportion of revenues coming from the Corporation’s digital products with lower margins, such as services and resale, could have a material adverse effect on the Corporation’s profitability
Digital advertising sold on the Corporation’s owned and operated media currently operate at the highest level of profitability relative to digital service (websites, search engine optimization, content syndication and Facebook) solutions and resale (SEM) solutions. Revenues sourced from digital service and resale solutions that are proportionally materially higher than anticipated may have an adverse impact on the Corporation’s profitability.
The inability of the Corporation to develop information and technology systems and platforms required to execute the Corporation’s Return to Growth Plan could have a material adverse effect on the Corporation, its business, results from operations and financial condition
The achievement of the Corporation’s Return to Growth Plan requires the development of its digital media, mobile and online businesses. The customer preference for digital media, mobile and online products will likely accelerate as younger, more technologically savvy advertisers make up a greater portion of the Corporation’s potential customer base. Moreover, the rapid technological evolution in the advertising industry is driving changes in user behaviour as users seek more control over the way in which they consume content. In order to succeed, the Corporation will need to invest significant resources in order to, among other things:
• accelerate the evolution of its existing products and services;
• develop in a timely manner compelling new digital media, mobile and online products and services that engage users across various platforms;
• attract and retain talent for critical positions;
• continue to transform its organization and operating model to grow its digital media, mobile and online businesses;
• continue to develop and upgrade its technologies and supporting processes to distinguish its products and services offering from those of its competitors; and
• sell advertising in significant markets and be a compelling choice for advertisers on mobile and online.
The Corporation cannot assure that it will be successful in achieving these and other necessary objectives or that the Return to Growth Plan will be successful. Failure to adapt to new technology or delivery methods, or the choice of one technological innovation over another, may have an adverse impact on the Corporation’s ability to compete effectively with its competitors or to achieve its Return to Growth Plan, which could have a material adverse effect on the Corporation, its business, results of operations and financial condition.
The inability of the Corporation to execute on or delays in the execution of its Return to Growth Plan could impair its ability to grow revenues and expand its business
In early 2014, the Corporation introduced the Return to Growth Plan, which was a five year strategic plan to return to growth in customer count, revenues and profitability. The Corporation’s inability to execute on or delays in the execution of the Plan could impair its ability to grow revenue and expand its business, which might have a material adverse effect on the Corporation, its business, results from operations and financial condition.
The Corporation might be required to record additional impairment charges
The Corporation may be subject to impairment losses that would reduce its reported assets and earnings. Economic, legal, regulatory, competitive, contractual and other factors may affect the value of identifiable intangible assets. If any of these factors impair the value of these assets, accounting rules would require the Corporation to reduce their carrying value and recognize an impairment charge, which would reduce the value of the Corporation’s reported assets and earnings of the Corporation in the year the impairment charge is recognized.
YELLOW PAGES LIMITED 2016 ANNUAL REPORT 29

MANAGEMENT’S DISCUSSION AND ANALYSIS
The Corporation’s inability to realize cost savings could have a material adverse effect on the Corporation, its business, results from operations and financial condition
The Return to Growth Plan is designed to improve operational efficiencies and generate cost savings across the organization. The Corporation will continue to realize efficiencies by decommissioning and replacing legacy systems and ISIT datacenters, while optimizing various customer service and digital fulfillment processes. The Corporation may not be able to complete these projects on time, on budget and/or successfully, placing the realization of anticipated cost savings at risk. Delays and/or disruptions in these projects may have an adverse effect on our business, results from operations and financial condition.
Failure by either the Corporation or the Telco Partners to fulfill their obligations set forth in the agreements between the Corporation and the Telco Partners could result in a material adverse effect on the Corporation, its business, results from operations and financial condition
We have a Billing and Collection Services Agreement with Bell Canada (up to 2017), with TELUS (up to 2031), with MTS Inc. (up to 2017) and with Bell Canada Inc. (as successor to Bell Aliant Regional Communications LP) (up to 2037). Through these agreements, our billing is included as a separate line item on the telephone bills of Bell, TELUS, MTS Inc. and Bell Canada Inc. customers who use our services. Bell Canada, TELUS, MTS Inc. and Bell Canada Inc. (the Telco Partners) contract with third parties to conduct monthly billing of customers who use them as their local telephone service providers. In addition, the Telco Partners provide collection services for the Corporation with those customers who are also their customers. Additionally, the Corporation has entered into publishing agreements with each Telco Partner. If the Corporation fails to perform its obligations under these agreements and the agreements are consequently terminated by such Telco Partner, other agreements with such Telco Partners may also be terminated, including the Bell Canada Trademark License Agreement, the TELUS Trademark License Agreement, the MTS Inc. Branding and Trademark Agreement and the Bell Canada Inc. Branding and Trademark Agreement, as well as non-competition covenants we benefit from with such Telco Partners.
We have agreements with outside service suppliers to print and distribute our directories and publications. These agreements are for services that are integral to our business.
The failure of the Telco Partners or any of our other suppliers to fulfill their contractual obligations under these agreements could result in a material adverse effect on our business.
Customers who do not use the Telco Partners as their local telephone provider as well as all new customers are billed directly by the Corporation.
Failure by the Corporation to adequately protect and maintain its brands and trademarks, as well as third party infringement of such, could have a material adverse effect on the Corporation, its business, results from operations and financial condition
The Corporation relies heavily on its existing brands and trademarks for a significant portion of its revenues. Failure to adequately maintain the strength and integrity of these brands and trademarks, or to develop new brands and trademarks, could adversely affect our results from operations and our financial condition.
It is possible that third parties could infringe upon, misappropriate or challenge the validity of the Corporation’s trademarks or our other intellectual property rights. This could have a material adverse effect on our business, our financial condition or our operating results. The actions that the Corporation takes to protect its trademarks and other proprietary rights may not be adequate. Litigation may be necessary to enforce or protect the Corporation's intellectual property rights, its trade secrets or to determine the validity and scope of the proprietary rights of others. We cannot ensure that we will be able to prevent infringement of our intellectual property rights or misappropriation of our proprietary information.
Any such infringement or misappropriation could harm any competitive advantage we currently derive, or may derive, from our proprietary rights. Third parties may assert infringement claims against the Corporation. Any such claims and any resulting litigation could subject the Corporation to significant liability for damages. An adverse judgment arising from any litigation of this type could require the Corporation to design around a third party's patent or to license alternative technology from another party. In addition, litigation may be time-consuming and expensive to defend against and could result in the diversion of the Corporation's time and resources. Any claims from third parties may also result in limitations on the Corporation's ability to use the intellectual property subject to these claims.
Work stoppages and other labour disturbances could have a material adverse effect on the Corporation, its business, results from operations and financial condition
Certain non-management employees of the Corporation are unionized. Current union agreements range between one to five years in duration and are subject to expiration at various dates in the future. Four of these agreements have expired and are being renegotiated. If the Corporation is unable to renew these agreements as they come up for renegotiation from time to time, it could result in work stoppages and other labour disturbances which could have a material adverse effect on our business. Additionally, if a greater percentage of the Corporation’s workforce becomes unionized, this could have a material adverse effect on our business, results from operations and financial condition.
30 YELLOW PAGES LIMITED 2016 ANNUAL REPORT

MANAGEMENT’S DISCUSSION AND ANALYSIS
The Corporation’s inability to attract and retain key personnel could have a material adverse effect on the Corporation, its business, results from operations and financial condition
The success of the Corporation depends on the abilities, experience and personal efforts of senior management of the Corporation, including their ability to retain and attract skilled employees. The Corporation is also dependent on the number and experience of its sales representatives and ISIT employees. The loss of the services of such key personnel could have a material adverse effect on the Corporation, its business, its results from operations and financial condition.
Challenge by tax authorities of the Corporation’s position on certain income tax matters could have a material adverse effect on the Corporation, its business, results from operations and financial condition
In the normal course of the Corporation's activities, the tax authorities are carrying out ongoing reviews. In that respect, the Corporation is of the view that all expenses claimed by the different entities of the group are reasonable and deductible and that the cost amount and capital cost allowance claims of such entities' depreciable properties have been correctly determined. There is no assurance that the tax authorities may not challenge these positions. Such challenge, if successful, may have a material adverse effect on the Corporation, its business, results from operations and financial condition.
The loss of key relationships or changes in the level of service provided by mapping applications and search engines could have a material adverse effect on the Corporation, its business, results from operations and financial condition
The Corporation has entered into agreements with mapping applications and search engines to promote its online directories. These agreements facilitate access to the Corporation’s content and customer advertising, allow the Corporation to generate a higher volume of traffic than it would on its own as well as generate business leads for its advertisers, while retaining the client relationship. Loss of key relationships or changes in the level of service provided by the mapping applications and search engines could impact performance of the Corporation’s internet marketing solutions. In addition, internet marketing services are provided by many other competitors within the markets the Corporation serves and its clients could choose to work with other, sometimes larger providers of these services, or with other search engines directly. The foregoing could have a material adverse effect on the Corporation, its business, results from operations and financial condition.
The failure of the Corporation’s computers and communications systems could have a material adverse effect on the Corporation, its business, results from operations and financial condition
The Corporation’s business activities rely significantly on the efficient and uninterrupted operation of computers and communications systems as well as those of third parties. The Corporation’s media properties, sales and advertising processing, data storage, production, billing, collection and day-to-day operations could be adversely impaired by the failure of such technology, which could in turn have a material adverse effect on the Corporation, its business, results from operations and financial condition.
In addition, the Corporation’s computer and ISIT systems may be vulnerable to damage or interruption from a variety of sources and its disaster recovery systems may be deemed ineffective. Any failure of these systems could impair the Corporation’s business. This could have a material adverse effect on the Corporation, its business, results from operations and financial condition.
Declines in, or changes to, the real estate industry could have a material adverse effect on the Corporation, its business, results from operations and financial condition
On July 1, 2015, Yellow Pages acquired CFDP, growing the Corporation into a leading digital real estate marketplace. As a result of the acquisition, the Corporation has a greater presence in the real estate listing business. The CFDP business and financial performance are affected by the health of, and changes to, the real estate industry. Home-buying patterns are sensitive to economic conditions and tend to decline or grow more slowly during economic downturns. A decrease in real estate activities could lead to reductions in the purchase of package offerings by home sellers. CFDP is subject to rules and regulations in the real estate industry, which may change from time to time in a way that may restrict or complicate CFDP’s ability to deliver its products and harm CFDP’s business and operating results. Declines or disruptions in the real estate market could reduce demand for CFDP’s products and could harm its business and operating results. This could have a material adverse effect on the Corporation, its business, results from operations and financial condition.
The inability of the Corporation to generate sufficient funds from operations, debt financings, equity financings or refinancing transactions could have a material adverse effect on the Corporation, its business, results from operations and financial condition
The ability of the Corporation to make scheduled payments under its indebtedness will depend on, among other things, its future operating performance. There can be no assurance that the Corporation will be able to generate sufficient cash from its operations to pay its debt obligations. The Corporation’s ability to generate sufficient funds from operations, debt financings, equity financings or refinancing transactions is, to a large extent, subject to economic, financial, competitive, operational and other factors, many of which are beyond the Corporation’s control.
YELLOW PAGES LIMITED 2016 ANNUAL REPORT 31

MANAGEMENT’S DISCUSSION AND ANALYSIS
There can be no assurance that the Corporation will continue to be able to obtain on a timely basis sufficient funds on terms acceptable to the Corporation to provide adequate liquidity and to finance the operating and capital expenditures necessary to overcome the challenges associated with the evolution of its business and support its business strategy if cash flows from operations and cash on hand are insufficient.
Failure to generate sufficient funds, whether from operations or debt or equity financings or refinancing transactions, could require the Corporation to delay or abandon some of its anticipated expenditures or to modify its business strategy and could have a material adverse effect on the Corporation, its business, results from operations and financial condition. Furthermore, competitors with greater liquidity or their ability to raise money more easily and on less onerous terms could create a competitive disadvantage for the Corporation.
The Corporation’s amount of debt could adversely affect its efforts to refinance or reduce its indebtedness and could have a material adverse effect on the Corporation, its business, results from operations and financial condition
The Corporation’s amount of debt could have material adverse effects on the Corporation, its business, results from operations and financial condition. For example, it could:
• increase the Corporation’s vulnerability to adverse economic and industry conditions;
• require the Corporation to dedicate a substantial portion of its cash flows from operations to make payments on its debt, thereby reducing funds available for operations, future business opportunities or other purposes;
• limit the Corporation’s flexibility in planning for, or reacting to, changes in its business and its industry;
• place the Corporation at a competitive disadvantage compared to its competitors that have less debt; and
• limit the Corporation’s ability to obtain additional financing, if needed, for working capital, capital expenditures, acquisitions, debt service requirements or other purposes.
In addition, the indenture governing the Senior Secured Notes, the indenture governing the Exchangeable Debentures and the ABL contain a number of financial and other restrictive covenants, including restrictions on the incurrence of additional indebtedness, the payment of dividends and other payment restrictions, the creation of liens, sale and leaseback transactions, mergers, consolidations and sales of assets and certain transactions with affiliates and its business activities. A failure to comply with such obligations could result in a default which, if not cured or waived, could permit acceleration of the relevant indebtedness. If the indebtedness under the indenture governing the Senior Secured Notes, the indenture governing the Exchangeable Debentures or the ABL, as the case may be, were to be accelerated, there can be no assurance that the Corporation would have sufficient liquidity or access to capital to repay in full that indebtedness.
Incremental contributions by the Corporation to its pension plans could have a material adverse effect on the Corporation, its business, results from operations and financial condition
The Corporation is currently and may be required to make incremental contributions to its pension plans in the future depending on various factors including future returns on pension plan assets, long-term interest rates and changes in pension regulations, which may have a materially negative effect on the Corporation’s liquidity and results from operations. The Corporation is currently making incremental contributions to its pension plans to reduce its actuarial solvency deficits.
The funding requirements of the Corporation’s pension plans, resulting from valuations of its pension plan assets and liabilities, depend on a number of factors, including actual returns on pension plan assets, long-term interest rates, plan demographic and pension regulations. Changes in these factors could cause actual future contributions to significantly differ from the Corporation’s current estimates and could require the Corporation to make incremental contributions to its pension plans in the future and, therefore, could have a materially negative effect on the Corporation’s liquidity, business, results from operations and financial condition.
There is no assurance that the Corporation’s pension plans will be able to earn their assumed rate of return. A material portion of the Corporation’s pension plans’ assets is invested in public equity securities. As a result, the ability of the Corporation’s pension plans to earn the rate of return that management has assumed depends significantly on the performance of capital markets. The market conditions also impact the discount rate used to calculate the Corporation’s solvency obligations and thereby could also significantly affect the Corporation’s cash funding requirements.
32 YELLOW PAGES LIMITED 2016 ANNUAL REPORT
MANAGEMENT’S DISCUSSION AND ANALYSIS
7. CONTROLS AND PROCEDURES As a public entity, we must take every step to ensure that material information regarding our reports filed or submitted under securities legislation fairly presents the financial information of YP. Responsibility for this resides with management, including the President and Chief Executive Officer and the Chief Financial Officer. Management is responsible for establishing, maintaining and evaluating disclosure controls and procedures, as well as internal control over financial reporting.
Disclosure Controls and Procedures (DC&P) The evaluation of the design and effectiveness of DC&P (as defined in National Instrument 52-109) was performed under the supervision of the President and Chief Executive Officer and the Chief Financial Officer. They concluded that the Company’s DC&P were effective, as at December 31, 2016.
Internal Control over Financial Reporting (ICFR) The design and effectiveness of ICFR (as defined in National Instruments 52-109) were evaluated under the supervision of the President and Chief Executive Officer and Chief Financial Officer. Based on the evaluations, they concluded that the Company’s ICFR was effective, as at December 31, 2016.
During the quarter beginning on October 1, 2016 and ended on December 31, 2016, no changes were made to the Company’s ICFR that has materially affected, or is reasonably likely to materially affect, the Company’s ICFR.
YELLOW PAGES LIMITED 2016 ANNUAL REPORT 33

INDEPENDENT AUDITOR’S REPORT
To the Shareholders of Yellow Pages Limited
We have audited the accompanying consolidated financial statements of Yellow Pages Limited, which comprise the consolidated statements of financial position as at December 31, 2016 and December 31, 2015, and the consolidated income statements, consolidated statements of comprehensive (loss) income, consolidated statements of changes in equity and consolidated statements of cash flows for the years then ended, and a summary of significant accounting policies and other explanatory information.
Management’s Responsibility for the Consolidated Financial Statements
Management is responsible for the preparation and fair presentation of these consolidated financial statements in accordance with International Financial Reporting Standards, and for such internal control as management determines is necessary to enable the preparation of consolidated financial statements that are free from material misstatement, whether due to fraud or error.
Auditor’s Responsibility
Our responsibility is to express an opinion on these consolidated financial statements based on our audits. We conducted our audits in accordance with Canadian generally accepted auditing standards. Those standards require that we comply with ethical requirements and plan and perform the audit to obtain reasonable assurance about whether the consolidated financial statements are free from material misstatement.
An audit involves performing procedures to obtain audit evidence about the amounts and disclosures in the consolidated financial statements. The procedures selected depend on the auditor’s judgment, including the assessment of the risks of material misstatement of the consolidated financial statements, whether due to fraud or error. In making those risk assessments, the auditor considers internal control relevant to the entity’s preparation and fair presentation of the consolidated financial statements in order to design audit procedures that are appropriate in the circumstances, but not for the purpose of expressing an opinion on the effectiveness of the entity’s internal control. An audit also includes evaluating the appropriateness of accounting policies used and the reasonableness of accounting estimates made by management, as well as evaluating the overall presentation of the consolidated financial statements.
We believe that the audit evidence we have obtained in our audits is sufficient and appropriate to provide a basis for our audit opinion.
Opinion
In our opinion, the consolidated financial statements present fairly, in all material respects, the financial position of Yellow Pages Limited as at December 31, 2016 and December 31, 2015, and its financial performance and its cash flows for the years then ended in accordance with International Financial Reporting Standards.
(signed) Deloitte LLP 1
February 14, 2017
Montréal, Québec
____________________ 1 CPA auditor, CA, public accountancy permit No. A120501
34 YELLOW PAGES LIMITED 2016 ANNUAL REPORT

The accompanying notes are an integral part of these consolidated financial statements.
Approved on behalf of Yellow Pages Limited by
Robert F. MacLellan, Director David A. Lazzarato, Director
CONSOLIDATED STATEMENTS OF FINANCIAL POSITION (IN THOUSANDS OF CANADIAN DOLLARS)
As at December 31, 2016 December 31, 2015
ASSETS CURRENT ASSETS Cash $ 17,260 $ 67,253 Trade and other receivables (Note 22) 114,854 123,826 Prepaid expenses 8,934 8,728 Deferred publication costs 61,144 61,216 Income taxes receivable (Note 14) 3,057 3,192 TOTAL CURRENT ASSETS 205,249 264,215 NON-CURRENT ASSETS
Deferred publication costs 7,936 7,348 Financial and other assets (Note 22) 4,008 4,162 Investment in associate (Note 6) 1,157 − Property and equipment (Note 7) 36,194 30,554 Intangible assets (Note 8) 740,932 1,369,781 Goodwill (Notes 4 and 5) 45,342 26,829 Deferred income taxes (Note 14) 59,119 7,738
TOTAL NON-CURRENT ASSETS 894,688 1,446,412 TOTAL ASSETS $ 1,099,937 $ 1,710,627
LIABILITIES AND EQUITY CURRENT LIABILITIES Trade and other payables (Note 9) $ 79,493 $ 73,627 Provisions (Note 10) 53,010 67,641 Deferred revenues 18,927 23,386 Current portion of long-term debt (Note 12) 75,161 98,530 TOTAL CURRENT LIABILITIES 226,591 263,184 NON-CURRENT LIABILITIES
Provisions (Note 10) 4,327 4,451 Deferred credits (Note 21) 11,821 6,538 Deferred income taxes (Note 14) 7,081 94,970 Post-employment benefits (Note 11) 154,172 182,659 Long-term debt (Note 12) 234,867 308,823 Exchangeable debentures (Note 13) 92,174 90,478
TOTAL NON-CURRENT LIABILITIES 504,442 687,919 TOTAL LIABILITIES 731,033 951,103 CAPITAL AND RESERVES 6,597,891 6,600,966 DEFICIT (6,228,987) (5,841,442) TOTAL EQUITY 368,904 759,524 TOTAL LIABILITIES AND EQUITY $ 1,099,937 $ 1,710,627
YELLOW PAGES LIMITED 2016 ANNUAL REPORT 35

CONSOLIDATED INCOME STATEMENTS (IN THOUSANDS OF CANADIAN DOLLARS, EXCEPT SHARE AND PER SHARE INFORMATION)
For the years ended December 31, 2016 2015
Revenues $ 817,979 $ 829,771 Operating costs (Note 18) 582,788 569,084 Income from operations before depreciation and amortization, impairment of
intangible assets and restructuring and special charges 235,191 260,687 Depreciation and amortization (Notes 7 and 8) 104,882 80,837 Impairment of intangible assets (Note 4) 600,000 − Restructuring and special charges (Note 10) 22,961 30,834 (Loss) income from operations (492,652) 149,016 Financial charges, net (Note 19) 56,130 60,922 (Loss) earnings before income taxes and loss from investment in associate (548,782) 88,094 (Recovery of) provision for income taxes (Note 14) (145,517) 27,039 Loss from investment in associate 440 − Net (loss) earnings $ (403,705) $ 61,055
Basic (loss) earnings per share $ (15.23) $ 2.29
Weighted average shares outstanding – basic (loss) earnings per share (Note 16) 26,500,861 26,688,369 Diluted (loss) earnings per share $ (15.23) $ 2.05
Weighted average shares outstanding – diluted (loss) earnings per share (Note 16) 26,500,861 33,466,228
The accompanying notes are an integral part of these consolidated financial statements.
36 YELLOW PAGES LIMITED 2016 ANNUAL REPORT

CONSOLIDATED STATEMENTS OF COMPREHENSIVE (LOSS) INCOME (IN THOUSANDS OF CANADIAN DOLLARS)
For the years ended December 31, 2016 2015
Net (loss) earnings $ (403,705) $ 61,055 Other comprehensive income: Items that will be reclassified subsequently to net (loss) earnings Net change in fair value of derivatives designated as cash flow hedges (Note 22) 1,125 − Reclassification to (loss) earnings of derivatives designated as cash flow hedges (Note 22) (129) − Income taxes relating to items that will be reclassified subsequently to net (loss) earnings (267) − 729 − Items that will not be reclassified subsequently to net (loss) earnings Actuarial gains (Note 11) 22,101 18,447 Income taxes relating to items that will not be reclassified subsequently to net (loss) earnings (5,941) (4,946) 16,160 13,501 Other comprehensive income 16,889 13,501 Total comprehensive (loss) income $ (386,816) $ 74,556
The accompanying notes are an integral part of these consolidated financial statements.
YELLOW PAGES LIMITED 2016 ANNUAL REPORT 37

CONSOLIDATED STATEMENTS OF CHANGES IN EQUITY (IN THOUSANDS OF CANADIAN DOLLARS)
For the years ended December 31,
Shareholders’ Capital
(Note 15) Restricted
Shares Warrants (Note 15)
Compound Financial
Instruments1 Balance, December 31, 2015 $ 4,031,528 $ (24,965) $ 1,456 $ 3,619
Other comprehensive income − − − −
Net loss − − − −
Total comprehensive income (loss) − − − −
Restricted shares settled − 3,589 − −
Restricted shares (Note 17) − (10,472) − −
Stock options granted (Note 17) − − − −
Exercise of stock options (Note 17) 157 − − −
Balance, December 31, 2016 $ 4,031,685 $ (31,848) $ 1,456 $ 3,619
Shareholders’ Capital
(Note 15) Restricted
Shares Warrants (Note 15)
Compound Financial
Instruments1 Balance, December 31, 2014 $ 4,030,325 $ (18,981) $ 1,456 $ 3,619
Other comprehensive income − − − −
Net earnings − − − −
Total comprehensive income − − − −
Restricted shares settled − 854 − −
Restricted shares (Note 17) − (6,838) − −
Stock options granted (Note 17) − − − −
Exercise of stock options (Note 17) 1,203 − − −
Balance, December 31, 2015 $ 4,031,528 $ (24,965) $ 1,456 $ 3,619
1 The equity component of the exchangeable debentures presented above is net of income taxes of $1.3 million (2015 - $1.3 million).
The accompanying notes are an integral part of these consolidated financial statements.
38 YELLOW PAGES LIMITED 2016 ANNUAL REPORT

2016
Stock-based Compensation
and Other Reserves Reduction of
Capital Reserve Total Capital and
Reserves Deficit Total Equity $ 132,275 $ 2,457,053 $ 6,600,966 $ (5,841,442) $ 759,524
729 − 729 16,160 16,889
− − − (403,705) (403,705)
729 − 729 (387,545) (386,816)
(3,589) − − − −
5,578 − (4,894) − (4,894)
975 − 975 − 975
(42) − 115 − 115
$ 135,926 $ 2,457,053 $ 6,597,891 $ (6,228,987) $ 368,904
2015
Stock-based Compensation
and Other Reserves Reduction of
Capital Reserve Total Capital
and Reserves Deficit Total Equity $ 126,706 $ 2,457,053 $ 6,600,178 $ (5,915,998) $ 684,180
− − − 13,501 13,501
− − − 61,055 61,055
− − − 74,556 74,556
(854) − − − −
5,915 − (923) − (923)
828 − 828 − 828
(320) − 883 − 883
$ 132,275 $ 2,457,053 $ 6,600,966 $ (5,841,442) $ 759,524
YELLOW PAGES LIMITED 2016 ANNUAL REPORT 39

CONSOLIDATED STATEMENTS OF CASH FLOWS (IN THOUSANDS OF CANADIAN DOLLARS)
For the years ended December 31, 2016 2015
OPERATING ACTIVITIES
Net (loss) earnings $ (403,705) $ 61,055 Adjusting items
Depreciation and amortization 104,882 80,837 Impairment of intangible assets 600,000 − Restructuring and special charges (Note 10) 22,961 30,834 Stock-based compensation expense 7,974 6,731 (Recovery of) provision for income taxes recognized in net (loss) earnings (145,517) 27,039 Loss from investment in associate 440 −− Financial charges recognized in net (loss) earnings 56,130 60,922 Past service costs (Note 11) −− (6,618) Other non-cash items 9,967 8,420 Change in operating assets and liabilities (9,434) (10,704)
Funding of post-employment benefit plans in excess of costs (13,165) (26,629) Lease incentives received 8,145 − Restructuring and special charges paid (Note 10) (33,885) (26,464) Income taxes (paid) received, net (1,815) 46,664 Interest paid (44,865) (54,521)
158,113 197,566 INVESTING ACTIVITIES
Additions to intangible assets (50,787) (69,190) Additions to property and equipment (12,719) (6,231) Business acquisitions (Note 5) (35,271) (51,063) Investment in associate (Note 6) (1,597) − Other (50) −
(100,424) (126,484) FINANCING ACTIVITIES
Repayment of long-term debt (97,325) (100,650) Purchase of restricted shares (Note 17) (10,472) (6,838) Issuance of common shares upon exercise of stock options (Note 17) 115 883
(107,682) (106,605) NET DECREASE IN CASH (49,993) (35,523) CASH, BEGINNING OF YEAR 67,253 102,776 CASH, END OF YEAR $ 17,260 $ 67,253 Supplemental disclosure of cash flow information (Note 20)
The accompanying notes are an integral part of these consolidated financial statements.
40 YELLOW PAGES LIMITED 2016 ANNUAL REPORT

NOTES TO THE CONSOLIDATED FINANCIAL STATEMENTS – DECEMBER 31, 2016 (ALL TABULAR AMOUNTS ARE IN THOUSANDS OF CANADIAN DOLLARS, EXCEPT SHARE INFORMATION)
1. DESCRIPTION
Yellow Pages Limited, through its subsidiaries, offers local and national businesses access to digital and print media and marketing solutions to reach consumers in all the provinces and territories of Canada. References herein to Yellow Pages Limited (or the “Company”) represent the financial position, financial performance, cash flows and disclosures of Yellow Pages Limited and its subsidiaries on a consolidated basis.
Yellow Pages Limited’s registered head office is located at 16, Place du Commerce, Montreal, Québec, Canada, H3E 2A5 and the common shares of Yellow Pages Limited are listed on the Toronto Stock Exchange (“TSX”) under the symbol “Y”.
The Board of Directors (the “Board”) approved the consolidated financial statements for the years ended December 31, 2016 and 2015 and authorized their publication on February 14, 2017.
2. REVISED STANDARDS STANDARDS, INTERPRETATIONS AND AMENDMENTS TO PUBLISHED STANDARDS ADOPTED WITH NO EFFECT ON THE CONSOLIDATED FINANCIAL STATEMENTS
The following revised standards are effective for annual periods beginning on January 1, 2016 and their adoption has not had any impact on the amounts reported in these consolidated financial statements but may affect the accounting for future transactions or arrangements:
Amendments to IAS 16 −− Property, Plant and Equipment, and IAS 38 − Intangible Assets: Clarification of Acceptable Methods of Depreciation and Amortization
In May 2014, the International Accounting Standards Board (“IASB”) issued Amendments to IAS 16 − Property, Plant and Equipment and IAS 38 − Intangible Assets: Clarification of Acceptable Methods of Depreciation and Amortization to clarify that the use of revenue-based methods to calculate depreciation is not appropriate as revenue generated by an activity that includes the use of an asset generally reflects factors other than the consumption of the economic benefits embodied in the related asset. The IASB also clarified that revenue is generally presumed to be an inappropriate basis for measuring the consumption of the economic benefits embodied in an intangible asset. This presumption may be rebutted in certain limited circumstances. These amendments must be applied prospectively for annual periods beginning on or after January 1, 2016.
IAS 1 − Presentation of Financial Statements
In December 2014, the IASB issued amendments to IAS 1 − Presentation of Financial Statements as part of its initiative to improve presentation and disclosure in financial reports. The amendments to IAS 1 clarify the existing presentation and disclosure requirements as they relate to materiality, order of the notes, subtotals, accounting policies and disaggregation. The amendments also provide additional guidance on the application of professional judgment to disclosure requirements when preparing the notes to the financial statements.
STANDARDS, INTERPRETATIONS AND AMENDMENTS TO PUBLISHED STANDARDS THAT ARE ISSUED BUT NOT YET EFFECTIVE
Certain new standards, interpretations and amendments to existing standards have been published and are mandatory for Yellow Pages Limited’s accounting periods beginning on or after January 1, 2017. The new standards which are considered to be relevant to Yellow Pages Limited’s operations are as follows:
IFRS 15 − Revenue from Contracts with Customers
In May 2014, the IASB issued IFRS 15 − Revenue from Contracts with Customers. This new standard outlines a single comprehensive model for companies to use when accounting for revenue arising from contracts with customers. It supersedes the IASB’s current revenue recognition standards, including IAS 18 − Revenue and related interpretations. The core principle of IFRS 15 is that revenue is recognized at an amount that reflects the consideration to which the company expects to be entitled in exchange for those goods or services, applying the following five steps:
• Identify the contract with a customer;
• Identify the performance obligations in the contract;
• Determine the transaction price;
• Allocate the transaction price to the performance obligations in the contract; and
• Recognize revenue when (or as) the company satisfies a performance obligation.
YELLOW PAGES LIMITED 2016 ANNUAL REPORT 41
NOTES TO THE CONSOLIDATED FINANCIAL STATEMENTS – DECEMBER 31, 2016 (ALL TABULAR AMOUNTS ARE IN THOUSANDS OF CANADIAN DOLLARS, EXCEPT SHARE INFORMATION)
This new standard also provides guidance relating to the accounting for contract costs as well as for the measurement and recognition of gains and losses arising from the sale of certain non-financial assets. Additional disclosures will also be required under the new standard, which is effective for annual reporting periods beginning on or after January 1, 2018 with earlier adoption permitted. For comparative amounts, companies have the option of using either a full retrospective approach or a modified retrospective approach as set out in the new standard.
On April 12, 2016, the IASB published the final clarifications to IFRS 15. The amendments are effective for annual reporting periods beginning on or after January 1, 2018, with earlier adoption permitted. The amendments do not change the underlying principles of the standard yet clarify how the principles should be applied. Yellow Pages Limited continues to evaluate the impact this standard will have on its consolidated financial statements.
IFRS 9 − Financial Instruments
In July 2014, the IASB issued the final version of IFRS 9 − Financial Instruments. IFRS 9 replaces the requirements in IAS 39 − Financial Instruments: Recognition and Measurement for classification and measurement of financial assets and liabilities. The new standard introduces a single classification and measurement approach for financial instruments, which is driven by cash flow characteristics and the business model in which an asset is held. This single, principle-based approach replaces existing rule-based requirements and results in a single impairment model being applied to all financial instruments. IFRS 9 also modified the hedge accounting model to incorporate the risk management practices of an entity.
Additional disclosures will also be required under the new standard. The new standard will come into effect for annual periods beginning on or after January 1, 2018 with early adoption permitted. Yellow Pages Limited continues to evaluate the impact this standard will have on its consolidated financial statements.
IFRS 16 −− Leases
In January 2016, the IASB issued IFRS 16 − Leases. It supersedes the IASB’s current lease standard, IAS 17, which required lessees and lessors to classify their leases as either finance leases or operating leases and to account for those two types of leases differently. It did not require lessees to recognize assets and liabilities arising from operating leases, but it did require lessees to recognize assets and liabilities arising from finance leases.
IFRS 16 sets out the principles for the recognition, measurement, presentation and disclosure of leases. It introduces a single lessee accounting model and requires a lessee to recognize assets and liabilities for all leases with a term of more than twelve months and for which the underlying asset is not of low value. A lessee is required to recognize a right-of-use asset representing its right to use the underlying leased asset and a lease liability representing its obligation to make lease payments.
IFRS 16 contains disclosure requirements for lessees and lessors. This new standard will come into effect for annual periods beginning on or after January 1, 2019. Earlier application is permitted for companies that apply IFRS 15 − Revenue from Contracts with Customers at or before the date of initial application of IFRS 16. Yellow Pages Limited continues to assess the impact this standard will have on its consolidated financial statements.
Amendments to IAS 7 − Statement of Cash Flows
In January 2016, the IASB published amendments to IAS 7 − Statement of Cash Flows. The amendments are intended to improve information provided to users of financial statements about an entity’s financing activities, including changes from financing cash flows, changes arising from obtaining or losing control of subsidiaries or other businesses, the effect of changes in foreign exchange rates and changes in fair value. They are effective for annual periods beginning on or after January 1, 2017, applied prospectively, with earlier adoption permitted. The Amendments to IAS 7 are not expected to have a significant impact on the consolidated financial statements of Yellow Pages Limited.
Amendments to IFRS 2 − Share-based Payment
In June 2016, the IASB published amendments to IFRS 2 − Share-based Payment. The amendments clarify that the accounting for the effects of vesting and non-conditions on cash-settled share-based payments follow the same approach as for equity-settled share-based payments. The amendments also clarify the classification of share-based payment transactions with net settlement features as well as requiring additional disclosures for these transactions. They are effective for annual periods beginning on or after January 1, 2018, applied prospectively, with earlier adoption permitted. The amendments to IFRS 2 are not expected to have a significant impact on the consolidated financial statements of Yellow Pages Limited.
IFRIC 22 − Foreign Currency Transactions and Advance Consideration
In December 2016, the IASB issued an interpretation paper IFRIC 22 – Foreign Currency Transactions and Advance Consideration. This interpretation paper clarifies that the foreign exchange rate applicable to transactions involving advance consideration paid or received is the rate at the date that the advance consideration is paid or received and a non-monetary asset or liability is recorded, and not the later date at which the related asset or liability is recognized in the financial statements. This interpretation is applicable for annual periods beginning on or after January 1, 2018, and can be
42 YELLOW PAGES LIMITED 2016 ANNUAL REPORT

NOTES TO THE CONSOLIDATED FINANCIAL STATEMENTS – DECEMBER 31, 2016 (ALL TABULAR AMOUNTS ARE IN THOUSANDS OF CANADIAN DOLLARS, EXCEPT SHARE INFORMATION)
applied either prospectively or retrospectively, at the option of the entity. IFRIC 22 is not expected to have a significant impact on the consolidated financial statements of Yellow Pages Limited.
Amendments to IFRS 12 −− Disclosure of Interest in Other Entities
In December 2016, the IASB issued amendments to IFRS 12 – Disclosure of Interest in Other Entities as part of its 2014-2016 Annual Improvements Cycle. The amendment clarifies that the requirement to disclose summarised financial information does not apply for interests in subsidiaries, associates or joint ventures which are classified, or included in a disposal group that is classified as held for sale in accordance with IFRS 5 – Non-current Assets Held for Sale and Discontinued Operations. This amendment is effective for annual periods beginning on or after January 1, 2017, with retrospective application. The amendments to IFRS 12 are not expected to have a significant impact on the consolidated financial statements of Yellow Pages Limited.
3. BASIS OF PRESENTATION AND SIGNIFICANT ACCOUNTING POLICIES 3.1 STATEMENT OF COMPLIANCE
These consolidated financial statements of Yellow Pages Limited and its subsidiaries were prepared by management in accordance with IFRS. These financial statements have been prepared in accordance with the following significant accounting policies which have been applied consistently to all periods presented throughout the consolidated entities.
3.2 BASIS OF MEASUREMENT The consolidated financial statements have been prepared on the historical cost basis except for the revaluation of certain assets and liabilities (including derivative instruments) at fair value as explained in the policies below.
3.3 FUNCTIONAL AND PRESENTATION CURRENCY The consolidated financial statements are presented in Canadian dollars, which is the functional and presentation currency of Yellow Pages Limited.
3.4 BASIS OF CONSOLIDATION 3.4.1 Subsidiaries
Subsidiaries that are directly controlled by Yellow Pages Limited or indirectly controlled through other consolidated subsidiaries are fully consolidated. Subsidiaries are all entities over which Yellow Pages Limited exercises control.
Subsidiaries are fully consolidated from the effective date of acquisition up to the effective date of disposal. Intercompany assets and liabilities and transactions between fully consolidated companies are eliminated. Gains and losses on internal transactions with controlled companies are fully eliminated. Accounting policies and methods are modified where necessary to ensure consistency of accounting treatment at the Yellow Pages Limited level.
3.4.2 Associates Associates are all entities over which Yellow Pages Limited has a significant influence over the entity’s management and operating and financial policy, without exercising control, and generally implies holding 20% to 50% of the voting rights.
Investments in associates are accounted for using the equity method and are initially measured at cost. Subsequently, the share in profits or losses of the associate attributable to equity holders of Yellow Pages Limited is recognized in net earnings. Included in the recognized share of net earnings is the amortization of the amortizable assets based on their fair value at the acquisition date.
3.4.3 Business combinations Acquisitions of subsidiaries and businesses are accounted for using the acquisition method. The cost of the acquisition is measured at the aggregate of the fair values, at the date of exchange, of assets given, liabilities incurred or assumed, and equity instruments issued by Yellow Pages Limited in exchange for control of the acquiree. Transaction costs associated with business acquisitions are recognized in the income statement, as incurred.
Where a business combination is achieved in stages, Yellow Pages Limited’s previously held interests in the acquired entity are re-measured to fair value at the acquisition date (the date Yellow Pages Limited attains control) and the resulting gain or loss, if any, is recognized in the income statement.
3.5 CASH Cash consist of funds on deposit and, from time to time, highly liquid investments with a purchased maturity of three months or less.
YELLOW PAGES LIMITED 2016 ANNUAL REPORT 43

NOTES TO THE CONSOLIDATED FINANCIAL STATEMENTS – DECEMBER 31, 2016 (ALL TABULAR AMOUNTS ARE IN THOUSANDS OF CANADIAN DOLLARS, EXCEPT SHARE INFORMATION)
3.6 FINANCIAL ASSETS Financial assets are classified into the following specified categories: financial assets “at fair value through profit or loss” (“FVTPL”), “held-to-maturity” investments, “available-for-sale” (“AFS”) financial assets and “loans and receivables”. The classification depends on the nature and purpose of the financial assets and is determined at the time of initial recognition.
Financial assets designated as FVTPL are carried at fair value. Changes in fair value are recorded in the income statement. Held-to-maturity investments and loans and receivables are measured at amortized cost using the effective interest method. AFS financial assets are recorded at fair value on the date of acquisition, and are adjusted to fair value at each reporting date. The corresponding unrealized gains and losses are recorded in other comprehensive income (“OCI”) and are reclassified to other income (expense) in the income statements when realized or when an impairment is determined.
A financial asset is de-recognized if the contractual rights to the cash flows from the financial asset expire or the asset is transferred and the transfer qualifies for de-recognition. Cash and trade and other receivables are included in the loans and receivables category.
3.6.1 Effective interest method The effective interest method is a method of calculating the amortized cost of a financial asset (liability) and of allocating interest (income) expense over the relevant period. The effective interest rate is the rate that exactly discounts estimated future cash flows (including all fees that form an integral part of the effective interest rate, transaction costs and other premiums or discounts) through the expected life of the financial asset (liability) or, where appropriate, a shorter period.
3.6.2 Impairment of financial assets Financial assets, other than those at FVTPL, are assessed for indicators of impairment at each statement of financial position date. Financial assets are impaired when there is objective evidence that, as a result of one or more events that occurred after the initial recognition of the financial asset, the estimated future cash flows of the investment have been impacted.
For certain categories of financial assets, such as trade and other receivables, assets that are assessed not to be impaired individually, are subsequently assessed for impairment on a collective basis.
3.7 DEFERRED PUBLICATION COSTS An intangible asset is recognized for direct and incremental publication costs incurred during the sale, manufacturing and distribution of telephone print directories as well as the sale, provisioning and fulfillment of digital products and services. The intangible asset represents costs that will be recovered in future periods, when the related directories revenues are recognized. An intangible asset is capitalized when the following conditions are met:
• Yellow Pages Limited has control over the contract for which the costs were incurred;
• the control results from past events;
• future economic benefits are expected to flow to Yellow Pages Limited; and
• the asset is identifiable, non-monetary and without physical substance.
Deferred publication costs are initially measured at cost and are amortized over the same period in which the related revenues are recognized.
3.8 PROPERTY AND EQUIPMENT Property and equipment are recognized at cost less accumulated depreciation and impairment losses. The various components of property and equipment are depreciated separately based on their estimated useful lives and therefore, their depreciation periods are significantly different. The cost of an asset includes the expenses that are directly attributable to its acquisition. All other borrowing costs are recognized in the income statement in the period in which they are incurred. Yellow Pages Limited has not capitalized any borrowing costs during the periods presented.
Subsequent costs are included in the carrying value of the asset or recognized as a separate component, where necessary, if it is probable that future economic benefits will flow to Yellow Pages Limited and the cost of the asset can be reliably measured. All other repair and maintenance costs are expensed in the year they are incurred.
Depreciation is calculated using the straight-line method, based on the capitalized costs, less any residual value over a period corresponding to the useful life of each asset. Assets held under finance leases are depreciated over their expected useful lives on the same basis as owned assets or, when shorter, the term of the relevant lease.
44 YELLOW PAGES LIMITED 2016 ANNUAL REPORT

NOTES TO THE CONSOLIDATED FINANCIAL STATEMENTS – DECEMBER 31, 2016 (ALL TABULAR AMOUNTS ARE IN THOUSANDS OF CANADIAN DOLLARS, EXCEPT SHARE INFORMATION)
As at December 31, 2016, the expected useful lives are as follows:
Office equipment 10 years Computer equipment 3 years Other equipment 3 – 12 years Leasehold improvements Shorter of term of lease or useful life
The residual value, the depreciation method and the useful life of an asset are reviewed at a minimum, annually.
Property and equipment are tested for impairment when an indication of impairment loss exists. When the asset’s recoverable amount is less than its net carrying value, an impairment loss is recognized. Where an individual asset does not generate independent cash inflows, Yellow Pages Limited determines the recoverable amount of the cash generating units (“CGUs”) or group of CGUs to which the asset belongs.
3.9 LEASING Leases are classified as finance leases whenever the terms of the lease transfer substantially all the risks and rewards of ownership to the lessee. All other leases are classified as operating leases.
Assets held under finance leases are initially recognized as assets at their fair value at the inception of the lease or, if lower, at the present value of the minimum lease payments. The corresponding liability to the lessor is included in the statement of financial position as an obligation under finance lease that is included with long-term debt.
Lease payments are apportioned between finance charges and reduction of the lease obligation so as to achieve a constant rate of interest on the remaining balance of the liability. Finance charges are charged directly to the income statement, unless they are directly attributable to qualifying assets, in which case they are capitalized in accordance with Yellow Pages Limited’s general policy on borrowing costs.
Operating lease payments are recognized as an expense on a straight-line basis over the lease term, except where another systematic basis is more representative of the time pattern in which economic benefits from the leased asset are consumed. Contingent rentals arising under operating leases are recognized as an expense in the period in which they are incurred.
In the event that incentives to enter into operating leases are received, such incentives are recognized as a deferred credit. The aggregate benefit of incentives is recognized as a reduction of rental expense on a straight-line basis.
3.10 INTANGIBLES ASSETS Intangible assets acquired through a business combination are identified and recognized separately from goodwill where they arise from legal or contractual rights or are capable of being separated from the acquiree and sold, transferred, licensed or exchanged. The cost of such intangible assets is deemed to be their fair value at the acquisition date. Intangible assets not acquired through a business combination are reported at cost less accumulated amortization and accumulated impairment losses.
Internally-generated intangible assets, consisting of software used by the Company, are recognized to the extent the criteria in IAS 38 − Intangible Assets are met. Development costs for internally-generated intangible assets are capitalized at cost if, and only if, Yellow Pages Limited can demonstrate:
• the technical feasibility of completing the asset so that it will be available for use or sale;
• the intention to complete the intangible asset and use or sell it;
• the ability to use or sell the intangible asset;
• how the intangible asset will generate probable future economic benefits;
• the availability of adequate technical, financial and other resources to complete the development and to use or sell the intangible asset; and
• the ability to measure reliably the expenditure attributable to the intangible asset during its development.
The amount initially recognized for internally-generated intangible assets is the sum of the expenditures incurred from the date when the intangible asset first meets the recognition criteria listed above. Where no internally-generated intangible asset can be recognized, development expenditures are charged to the income statement in the period in which they are incurred.
Internally-generated intangible assets include the cost of software tools and licenses used in the development of Yellow Pages Limited’s systems, as well as all directly attributable payroll and consulting costs. These items are not amortized until the assets are available for use.
YELLOW PAGES LIMITED 2016 ANNUAL REPORT 45

NOTES TO THE CONSOLIDATED FINANCIAL STATEMENTS – DECEMBER 31, 2016 (ALL TABULAR AMOUNTS ARE IN THOUSANDS OF CANADIAN DOLLARS, EXCEPT SHARE INFORMATION)
Following initial recognition, intangible assets are carried at cost less any accumulated amortization and any accumulated impairment loss. Intangibles assets are amortized, unless their useful lives are indefinite, as follows:
Non-competition agreements Straight-line over life of agreement Customer-related intangible assets Pro rata based on related revenues, not exceeding 36 months Trademarks Indefinite Domain names Indefinite or straight-line over 4 – 12 years Software Straight-line over 3 years
The estimated useful life and amortization method are reviewed at the end of each reporting period or annual reporting period, with the effect of any changes in estimate being accounted for on a prospective basis.
An intangible asset is de-recognized on disposal, or when no future economic benefits are expected from use or disposal. Gains or losses arising from the de-recognition of an intangible asset, measured as the difference between the net disposal proceeds or fair value, as applicable, and the carrying value of the asset, are recognized in the income statement when the asset is de-recognized.
3.11 GOODWILL Goodwill arising on the acquisition of a subsidiary is recognized as an asset at the date that control is acquired (the acquisition date). Goodwill is measured as the excess of the sum of the purchase consideration over the fair value of identifiable net assets acquired.
Goodwill is not amortized. It is reviewed for impairment at least annually or sooner if indicators of impairment exist. Any impairment loss is recognized immediately in the income statement and is not subsequently reversed.
3.12 IMPAIRMENT OF TANGIBLE AND INTANGIBLE ASSETS INCLUDING GOODWILL At each reporting date, Yellow Pages Limited determines whether there are any indications that the carrying values of its tangible and intangible assets are impaired. If any such indication exists, the recoverable amount of the asset is estimated in order to determine the extent of the impairment loss, if any. Where it is not possible to estimate the recoverable amount of an individual asset, Yellow Pages Limited estimates the recoverable amount of the CGU or group of CGUs to which the asset belongs. A CGU is the smallest identifiable group of assets that generate cash flows that are independent of those from other assets.
Intangible assets with indefinite useful lives, intangible assets not yet available for use and goodwill are tested for impairment annually, and whenever there is an indication that the asset may be impaired. A majority of the Company’s intangible assets do not have cash inflows independent of those from other assets and as such, are tested within their respective CGUs.
The recoverable amount is the higher of fair value less costs of disposal and value in use. In assessing value in use, the estimated future cash flows are discounted to their present value using a pre-tax discount rate that reflects current market assessments of the time value of money and the risks specific to the asset (or CGU) for which the estimates of future cash flows have not been adjusted.
If the recoverable amount of an asset (or CGU) is estimated to be less than its carrying value, the carrying value of the asset (or CGU) is reduced to its recoverable amount. An impairment loss is recognized immediately in the income statement.
For the purpose of impairment testing of goodwill, goodwill is tested at the group of CGUs level which represents the lowest level where goodwill is monitored for internal management purposes. Goodwill is tested for impairment annually, or more frequently when there is an indication that the unit may be impaired.
If the recoverable amount of a CGU or group of CGUs is less than the carrying amount, the impairment loss is allocated first to reduce the carrying amount of goodwill and then to the other assets of the unit pro-rata on the basis of the carrying amount of each asset in the unit. The Company does not reduce the carrying value of an asset below the highest of its fair value less costs of disposal and its value in use.
3.13 TRADE AND OTHER PAYABLES Trade and other payables, including accruals, are recorded when Yellow Pages Limited is required to make future payments as a result of purchases of assets or services. Trade and other payables are carried at amortized cost.
3.14 FINANCIAL LIABILITIES The valuation of financial liabilities depends on their classification. Financial liabilities are classified as either financial liabilities “at FVTPL” or “other financial liabilities”.
46 YELLOW PAGES LIMITED 2016 ANNUAL REPORT

NOTES TO THE CONSOLIDATED FINANCIAL STATEMENTS – DECEMBER 31, 2016 (ALL TABULAR AMOUNTS ARE IN THOUSANDS OF CANADIAN DOLLARS, EXCEPT SHARE INFORMATION)
Excluding derivative liabilities and financial liabilities accounted for at FVTPL, Yellow Pages Limited recognizes all financial liabilities, specifically long-term debt, exchangeable debentures, trade and other payables, initially at fair value less transaction costs and subsequently at amortized cost, using the effective interest method.
Financial liabilities designated as FVTPL are carried at fair value. Changes in fair value are recorded in the income statement. Transaction costs incurred in setting up these financial liabilities are recognized immediately as expenses in the income statement.
Yellow Pages Limited de-recognizes financial liabilities when, and only when, Yellow Pages Limited’s obligations are discharged, cancelled or expire.
3.15 PROVISIONS Provisions are recognized when Yellow Pages Limited has a present obligation (legal or constructive) as a result of a past event, it is probable that an outflow of resources will be required to settle the obligation, and a reliable estimate can be made of the amount of the obligation.
The amount recognized as a provision is the best estimate of the consideration required to settle the present obligation at the reporting date, taking into account the risks and uncertainties surrounding the obligation. Provisions are measured at the present value of the expenditures expected to be required to settle the obligation using a pre-tax rate that reflects current market assessments of the time value of money and the risks specific to the obligation. The increase in the provision due to passage of time is recognized as a financial charge.
3.15.1 Onerous contracts Present obligations arising under onerous contracts are recognized and measured as provisions. An onerous contract is considered to exist where Yellow Pages Limited has a contract under which the unavoidable costs of meeting the obligations under the contract exceed the economic benefits expected to be received under it.
3.15.2 Restructuring A restructuring provision is recognized when Yellow Pages Limited has developed a detailed formal plan for the restructuring and has raised a valid expectation in those affected that it will carry out the restructuring by starting to implement the plan or announcing its main features to those affected by it. The measurement of a restructuring provision includes only the direct expenditures arising from the restructuring, which are those amounts that are both necessarily entailed by the restructuring and not associated with the ongoing activities of the entity.
3.16 LONG-TERM DEBT All long-term debt instruments are initially stated at the fair value of the consideration received after deduction of issue costs. Debt instruments are subsequently measured at amortized cost. Issue costs are charged to the income statement together with the coupon, as finance costs, on a constant-yield basis over the term of the debt instrument, or over a shorter period where the lender can require earlier repayment.
3.17 EMPLOYEE BENEFITS 3.17.1 Defined contribution plans
A defined contribution plan is a post-employment benefit plan under which an entity pays fixed contributions into a separate entity and will have no legal or constructive obligation to pay further amounts. Obligations for contributions to defined contribution pension plans are recognized as an employee benefit expense in the income statement when they are due. Prepaid contributions are recognized as an asset to the extent that a cash refund or a reduction in future payments is available.
3.17.2 Defined benefit plans A defined benefit plan is a post-employment benefit plan other than a defined contribution plan. Yellow Pages Limited’s net obligation in respect of defined benefit pension plans is calculated separately for each plan by estimating the amount of future benefits that employees have earned in return for their service in the current and prior periods; that benefit is discounted to determine its present value. The fair value of any plan assets is deducted from the obligation. The discount rate is the yield at the reporting date on high-quality corporate bonds that have terms to maturity approximating to the terms of the related pension liability adjusted for a spread to reflect any additional credit risk and that are denominated in the currency in which the benefits are expected to be paid. The calculation is performed annually by a qualified actuary using the projected benefit method prorated on service.
Yellow Pages Limited recognizes all actuarial gains and losses arising subsequently from defined benefit plans in OCI. Re-measurement, comprising actuarial gains and losses, the effects of changes to the asset ceiling, if applicable, and the return on plan assets, excluding net interest on the defined benefit obligation, is reflected immediately in the statement of financial position with a charge or credit recognized in OCI. Re-measurement recognized in OCI is reflected immediately in retained earnings and will not be classified to the income statement. Past service costs are recognized in the income
YELLOW PAGES LIMITED 2016 ANNUAL REPORT 47
NOTES TO THE CONSOLIDATED FINANCIAL STATEMENTS – DECEMBER 31, 2016 (ALL TABULAR AMOUNTS ARE IN THOUSANDS OF CANADIAN DOLLARS, EXCEPT SHARE INFORMATION)
statement in the period a plan amendment is announced to employees. The net interest amount, which is calculated by applying the discount rate to the net defined liability or asset of defined benefit plans, is included within net financial charges while service costs are recorded in operating expenses.
3.17.3 Other long-term employee benefits Yellow Pages Limited’s net obligation in respect of long-term employee benefits other than pension plans is the amount of future benefit that employees have earned in return for their service in the current and prior periods; that benefit is discounted to determine its present value, and the fair value of any related asset is deducted. The discount rate is the yield at the reporting date on high quality corporate bonds that have terms to maturity approximating the terms of the related obligation. The calculation is performed using the projected unit credit method. Any actuarial gains or losses are recognized in the period in which they arise.
3.17.4 Termination benefits Termination benefits are recognized as an expense when Yellow Pages Limited can no longer withdraw the offer of those benefits, or if earlier, when there is no realistic possibility of withdrawal from a formal detailed plan to either terminate employment before the normal retirement date, or from providing termination benefits as a result of an offer made to encourage voluntary redundancy. Termination benefits for voluntary redundancies are recognized as an expense if Yellow Pages Limited has made an offer of voluntary redundancy, it is probable that the offer will be accepted, and the number of acceptances can be estimated reliably.
3.17.5 Short-term benefits Short-term employee benefit obligations are measured on an undiscounted basis and are expensed as the related service is provided.
A liability is recognized for the amount expected to be paid if Yellow Pages Limited has a present legal or constructive obligation to pay this amount as a result of a past service provided by the employee and the obligation can be estimated reliably.
3.17.6 Share-based payment transactions Yellow Pages Limited’s restricted share units, performance share units, deferred share units and stock options granted to employees and directors are measured at the fair value of the equity instruments at the grant date.
The restricted share units, performance share units and deferred share units granted may be settled in cash or equity at the Company’s option. If the restricted share unit and performance share unit plan is funded, eligible employees will receive, upon vesting of the instruments, common shares. The funded portion of these plans is treated as equity-settled instruments and recorded accordingly in equity. In the event these plans are unfunded, Yellow Pages Limited will pay to the eligible employees and directors, upon vesting of the instruments, an amount in cash. The unfunded portion of these plans is treated as cash-settled instruments and recorded as a liability. At each reporting period, the liability is re-measured at fair value with any changes recorded in operating costs.
The fair value determined at the grant date of the share-based instruments is expensed on a straight-line basis over the vesting period, based on Yellow Pages Limited’s estimate of share-based instruments that will eventually vest. At each reporting period, Yellow Pages Limited revises its estimate of the number of share-based instruments expected to vest. The impact of the revision of the original estimate, if any, is recognized in the income statement, with a corresponding adjustment to the reserve.
3.18 EQUITY INSTRUMENTS ISSUED BY YELLOW PAGES LIMITED An equity instrument is any contract that evidences a residual interest in the assets of an entity after deducting all of its liabilities. Equity instruments issued by Yellow Pages Limited are recorded at the proceeds received, net of direct issue costs.
Transaction costs incurred by Yellow Pages Limited in issuing, acquiring or reselling its own equity instruments are accounted for as a deduction from equity to the extent that they are incremental costs directly attributable to the equity transaction that otherwise would have been avoided.
3.19 OPERATING SEGMENTS Disclosure of segment information is reported in a manner consistent with the internal reports regularly reviewed by Yellow Pages Limited’s Chief Operating Decision Maker in order to assess each segment’s performance and to allocate resources to them. The Chief Operating Decision Maker, who is responsible for allocating resources and assessing performance of the operating segments, has been identified as the President and Chief Executive Officer. The Company currently operates under one segment.
48 YELLOW PAGES LIMITED 2016 ANNUAL REPORT

NOTES TO THE CONSOLIDATED FINANCIAL STATEMENTS – DECEMBER 31, 2016 (ALL TABULAR AMOUNTS ARE IN THOUSANDS OF CANADIAN DOLLARS, EXCEPT SHARE INFORMATION)
3.20 REVENUES Yellow Pages Limited’s revenues are measured at the fair value of the consideration received or receivable after deduction of sales allowances and sales taxes.
Print directory advertising is sold in bundles that can include several related online advertising products. Print products are not sold separately. Revenues from print directory advertising as well as revenues from related online products are recognized in the income statement rateably on a monthly basis from the point at which service is first provided over the life of the contract.
Revenues from private and commercial classified advertisements and display advertisements are recognized at the time the advertisements are published either on a weekly or monthly basis. Revenues related to advertisements appearing on multiple occasions are recognized over the period the advertisements are displayed.
3.21 DERIVATIVE FINANCIAL INSTRUMENTS Yellow Pages Limited enters from time to time into a variety of derivative financial instruments to manage interest rate risk on its long-term debt and to manage the risk of fluctuations in the share price of its common shares affecting its stock-based compensation plans.
Derivatives are initially recognized at fair value at the date a derivative contract is entered into and are subsequently re-measured to their fair value at each statement of financial position date. The resulting gain or loss is recognized in the income statement immediately unless the derivative is designated and effective as a hedging instrument, in which event the timing of the recognition in the income statement depends on the nature of the hedge relationship.
Yellow Pages Limited designates certain derivatives as either hedges of the fair value of recognized assets or liabilities or firm commitments (fair value hedges), hedges of highly probable forecast transactions or hedges of foreign currency risk of firm commitments (cash flow hedges).
3.21.1 Embedded derivatives Derivatives embedded in other financial instruments or other host contracts are treated as separate derivatives when their risks and characteristics are not closely related to those of the host contracts and the host contracts are not measured at fair value with changes in fair value recognized in the income statement.
3.22 BORROWING COSTS Borrowing costs directly attributable to the acquisition or construction of qualifying assets, which are assets that necessarily take a substantial period of time to get ready for their intended use, are added to the cost of those assets, until such time as the assets are substantially ready for their intended use. All other borrowing costs are recognized in profit or loss in the period in which they are incurred. The Company currently has not capitalized any borrowing costs.
3.23 TAXATION Income tax expense represents the sum of the current and deferred tax.
3.23.1 Current income tax Taxable profit differs from profit as reported in the consolidated income statement because it excludes items of income or expense that are taxable or deductible in other years and it further excludes items that are never taxable or deductible. Yellow Pages Limited’s liability for current income tax is calculated using tax rates that have been enacted or substantively enacted by the reporting date.
3.23.2 Deferred tax Deferred tax is recognized on differences between the carrying values of assets and liabilities in the consolidated financial statements and the corresponding tax basis used in the computation of taxable profit, and is accounted for using the liability method. Deferred tax liabilities are generally recognized for all taxable temporary differences, and deferred tax assets are generally recognized for all deductible temporary differences to the extent that it is probable that taxable profits will be available against which those deductible temporary differences can be utilized. Such assets and liabilities are not recognized if the temporary difference arises from goodwill or from the initial recognition (other than in a business combination) of other assets and liabilities in a transaction that affects neither the taxable profit nor the accounting profit.
Deferred tax liabilities are recognized for taxable temporary differences associated with investments in subsidiaries and associates, except where Yellow Pages Limited is able to control the reversal of the temporary difference and it is probable that the temporary difference will not reverse in the foreseeable future. Deferred tax assets arising from deductible temporary differences associated with such investments and interests are only recognized to the extent it is probable that there will be sufficient taxable profits against which to utilize the benefits of the temporary differences and they are expected to reverse in the foreseeable future.
YELLOW PAGES LIMITED 2016 ANNUAL REPORT 49

NOTES TO THE CONSOLIDATED FINANCIAL STATEMENTS – DECEMBER 31, 2016 (ALL TABULAR AMOUNTS ARE IN THOUSANDS OF CANADIAN DOLLARS, EXCEPT SHARE INFORMATION)
The carrying value of deferred tax assets is reviewed at each reporting date and reduced to the extent it is no longer probable that sufficient taxable profits will be available to allow all or part of the asset to be recovered.
Deferred tax assets and liabilities are measured at the tax rates that are expected to apply in the period in which the liability is settled or the asset realized, based on tax rates (and tax laws) that have been enacted or substantively enacted by the reporting date. The measurement of deferred tax liabilities and assets reflects the tax consequences that would follow from the manner in which Yellow Pages Limited expects, at the reporting date, to recover or settle the carrying amount of its assets and liabilities.
Deferred tax assets and liabilities are offset when there is a legally enforceable right to set off tax assets against tax liabilities and when they relate to income taxes levied by the same taxation authority and Yellow Pages Limited intends to settle its tax assets and liabilities on a net basis.
3.23.3 Current and deferred tax for the period Current and deferred taxes are recognized as an expense or income in the income statement, except when they relate to items that are recognized outside net earnings (whether in OCI or directly in equity), in which case the tax is also recognized outside net earnings, or where they arise from the initial accounting for a business combination. In the case of a business combination, the applicable tax effects are taken into account in the accounting for the business combination.
3.24 SIGNIFICANT ESTIMATES AND JUDGMENTS The preparation of consolidated financial statements requires management to make estimates and assumptions that can affect the carrying value of certain assets and liabilities, income and expenses, and the information disclosed in the notes to the consolidated financial statements. Management reviews these estimates and assumptions on a regular basis to ensure their pertinence with respect to past experience and the current economic situation. Items in future financial statements could differ from current estimates as a result of changes in these assumptions. The impact of changes in accounting estimates is recognized during the period in which the change took place and all affected future periods.
The estimates and judgments made by management that are critical to the determination of the carrying value of assets and liabilities are addressed below.
Significant estimates Business acquisitions As a result of the business acquisition in March 2016 of Oriole Media Corp. (doing business as JUICE Mobile), Yellow Pages Limited measured the fair value of JUICE Mobile’s intangible assets, namely its software, using the income approach (refer to Note 5 – Business acquisitions). The measurement at fair value required significant estimation and was based on a discounted cash flow model which maximized the amount of observable market inputs as well as using forecasted cash flows.
As a result of the business acquisition in July 2015 of 9059-2114 Québec Inc., a holding company which owns all of the issued and outstanding shares of ByTheOwner Inc. (collectively “ComFree/DuProprio” (“CFDP”)), Yellow Pages Limited measured the fair value of CFDP’s intangible assets, namely its trademark, using the royalty relief method (refer to Note 5 – Business acquisitions). The measurement at fair value required significant estimation and was based on a discounted cash flow model which maximized the amount of observable market inputs as well as using forecasted cash flows, projected over a five-year period.
Intangible assets and goodwill The valuations associated with measuring the recoverability of identifiable intangible assets and goodwill for impairment analysis purposes involve significant estimates and assumptions, including those with respect to future cash inflows and outflows, discount rates, terminal growth rates and asset lives. These significant estimates could affect Yellow Pages Limited’s future results if the current estimates of future performance and fair values change.
Yellow Pages Limited assesses impairment by comparing the recoverable amount of a CGU or group of CGUs to which an identifiable intangible asset and goodwill belongs, with its carrying value. The determination of the recoverable amount involves significant management estimates.
Yellow Pages Limited performs its annual test for impairment of indefinite life intangible assets and goodwill in the fourth quarter in accordance with the policy described in Note 3.12.
Useful lives of intangible assets and property and equipment Yellow Pages Limited reviews the estimated useful lives of its intangible assets and property and equipment at the end of each reporting period. At the end of the current reporting period, management determined that the useful lives of its intangible assets and property and equipment were adequate.
50 YELLOW PAGES LIMITED 2016 ANNUAL REPORT

NOTES TO THE CONSOLIDATED FINANCIAL STATEMENTS – DECEMBER 31, 2016 (ALL TABULAR AMOUNTS ARE IN THOUSANDS OF CANADIAN DOLLARS, EXCEPT SHARE INFORMATION)
Employee future benefits The present value of the defined benefit obligation is determined by discounting the estimated future cash outflows using interest rates of high-quality corporate bonds that are denominated in the currency in which the benefits will be paid and that have terms to maturity approximating the terms of the related pension liability. Determination of the net benefit costs (recovery) requires assumptions such as the discount rate to measure defined benefit obligations and expected return on plan assets, the projected age of employees upon retirement, the expected rate of future compensation and the expected healthcare cost trend rate. Actual results may differ from results which are estimated based on assumptions.
Income taxes Estimation of income taxes includes evaluating the recoverability of deferred tax assets based on an assessment of Yellow Pages Limited’s ability to utilize the underlying future tax deductions against future taxable income before they expire.
Yellow Pages Limited’s assessment is based upon existing tax laws and estimates of future taxable income. If the assessment of Yellow Pages Limited’s ability to utilize the underlying future tax deductions changes, Yellow Pages Limited would be required to recognize more or fewer of the tax deductions as assets, which would decrease or increase the income tax expense in the period in which this is determined.
Significant judgments Uncertain tax provisions Yellow Pages Limited is subject to taxation in numerous jurisdictions. Significant judgment is required in determining the consolidated provision for taxation. There are many transactions and calculations for which the ultimate tax determination is uncertain during the ordinary course of business. Yellow Pages Limited maintains provisions for uncertain tax positions that it believes appropriately reflect its risk with respect to tax matters under active discussion, audit, dispute or appeal with tax authorities, or which are otherwise considered to involve uncertainty. These provisions for uncertain tax positions are made using the best estimate of the amount expected to be paid based on a qualitative assessment of all relevant factors.
Yellow Pages Limited reviews the adequacy of these provisions at each statement of financial position date. However, it is possible that at some future date an additional liability could result from audits by tax authorities. Where the final tax outcome of these matters is different from the amounts that were initially recorded, such differences will affect the tax provisions in the period in which such determination is made.
4. IMPAIRMENT OF GOODWILL AND INTANGIBLE ASSETS As a majority of the intangible assets do not generate cash inflows that are largely independent of those from other assets or group of assets, the Company performs its impairment analysis of its intangible assets at the CGU level. The CGUs of the Company are as follows: Yellow Pages and Other (includes multiple CGUs for which the carrying value of its intangible assets with indefinite useful lives is not significant in comparison with the Company’s total carrying value of intangible assets with indefinite useful lives).
Goodwill was tested for impairment at the lowest level within the Company at which the goodwill is monitored for internal management purposes: the Other CGUs.
During the fourth quarters of 2015 and 2016, the Company completed its annual impairment analysis and assessed the recoverability of its assets allocated to its CGUs. The Company calculated the recoverable amounts of its CGUs using valuation methods which were consistent with those used in prior periods. The recoverable amounts were determined based on the value in use approach using a discounted cash flow model. The significant key assumptions included in the forecasted cash flows are based on the Company’s business plan taking into consideration growth and product mix trends.
2016
The cash flows are based on the 2017 budget and projected over a five-year period. Applicable terminal growth rates were applied. The forecasted cash flows also incorporated forecasted print revenue declines per annum between 17% and 20% and online revenue growth rates between 7% and 13% for the Yellow Pages and Other CGUs.
As a result of a marked acceleration in an unfavourable change in the product mix in the Yellow Pages CGU, the Company recorded an impairment loss of $600 million as the Company’s carrying value of if its Yellow Pages CGU exceeded its recoverable amount. The impairment loss was applied to certain intangible assets of the Yellow Pages CGU, namely trademarks and non-competition agreements. The recoverable amount of the Yellow Pages CGU post-impairment is $703.9 million, and represents its value in use. The recoverable amount of the Other CGUs exceeded their carrying values, and accordingly, no impairment was recognized.
YELLOW PAGES LIMITED 2016 ANNUAL REPORT 51

NOTES TO THE CONSOLIDATED FINANCIAL STATEMENTS – DECEMBER 31, 2016 (ALL TABULAR AMOUNTS ARE IN THOUSANDS OF CANADIAN DOLLARS, EXCEPT SHARE INFORMATION)
2015
The cash flows were based on the 2016 budget approved by the Board of Directors and projected over a five-year period. Applicable terminal growth rates were applied. The forecasted cash flows also incorporated forecasted print revenue declines per annum between 16% and 22% and online revenue growth rates between 6% and 11% for the Yellow Pages and Other CGUs.
As a result of the impairment analysis, the Company determined that the recoverable amounts of its CGUs exceeded their carrying values and accordingly, no impairment charge was recognized.
Carrying values and other assumptions Cash flows beyond the five-year projections of the plan were extrapolated using the terminal growth rates stated in the table below. The allocation of the carrying value of the intangible assets as at December 31, 2016 and 2015 by CGU or group of CGUs, prior to the impairment charge, and the other key assumptions used for the value in use calculations for the December 31, 2016 and December 31, 2015 impairment analyses are presented below:
1 Prior to the impairment charge of $600 million, as discussed above.
December 31, 2016¹ Yellow Pages Other Total
Carrying value of intangible assets and goodwill by CGU Trademarks and domain names $ 877,862 $ 30,374 $ 908,236 Trademarks and domain names with finite lives 2,094 3,651 5,745 Non-competition agreements 286,866 1,365 288,231 Customer-related intangible assets −− 4,944 4,944 Software 122,843 10,933 133,776 Goodwill −− 45,342 45,342
Total carrying value of intangible assets and goodwill by CGU $ 1,289,665 $ 96,609 $ 1,386,274
December 31, 2015 Yellow Pages Other Total
Carrying value of intangible assets and goodwill by CGU Trademarks and domain names $ 877,862 $ 30,374 $ 908,236 Trademarks and domain names with finite lives 2,356 6,228 8,584 Non-competition agreements 305,124 1,691 306,815 Customer-related intangible assets 2,340 645 2,985 Software 139,468 3,693 143,161 Goodwill −− 26,829 26,829
Total carrying value of intangible assets and goodwill by CGU $ 1,327,150 $ 69,460 $ 1,396,610
Yellow Pages Other Total Key assumptions : Terminal growth rate
December 31, 2016 -15% to 4.5% 1% to 4.5% -15% to 4.5% December 31, 2015 -15% to 4.5% 1.5% to 4.5% -15% to 4.5%
Discount rate – post-tax December 31, 2016 8.4% to 13.6% 12.2% to 15% 8.4% to 15% December 31, 2015 9.9% to 15.3% 12.8% 9.9% to 15.3%
Discount rate – pre-tax December 31, 2016 15.1% to 20.6% 14.8% to 18.6% 14.8% to 20.6% December 31, 2015 16.3% to 23.1% 15.5% to 17.3% 15.5% to 23.1%
52 YELLOW PAGES LIMITED 2016 ANNUAL REPORT

NOTES TO THE CONSOLIDATED FINANCIAL STATEMENTS – DECEMBER 31, 2016 (ALL TABULAR AMOUNTS ARE IN THOUSANDS OF CANADIAN DOLLARS, EXCEPT SHARE INFORMATION)
Sensitivity to changes in assumptions
The table below shows the percentages by which each key assumption must change in isolation in order for the estimated recoverable amount to equal to its carrying value for the Other CGUs:
Yellow Pages Limited has accumulated impairment losses on goodwill, intangible assets and property and equipment in the amounts of $5,847.8 million, $909.6 million and $10.4 million, respectively. There was no impairment loss recorded for the year ended December 31, 2015.
5. BUSINESS ACQUISITIONS 2016 On March 17, 2016, Yellow Pages Limited acquired the net assets of JUICE Mobile, for a purchase price of $35.3 million. The acquisition of JUICE Mobile, a premium advertising technology company whose programmatic platforms facilitate the automatic buying and selling of mobile advertising between brands and publishers, positioned Yellow Pages Limited as a desktop and mobile national advertising agency, expanding the Company’s reach of brands and media publishers. The acquisition was fully funded with cash on hand. Transaction costs of $1.3 million were incurred during the year ended December 31, 2016, and are included in Restructuring and special charges (refer to Note 10 – Provisions).
The following table summarizes the transaction and the purchase price allocation:
March 17, 2016 Fair value of business acquired
Trade and other receivables $ 9,003 Other assets 644 Intangible assets 15,220 Goodwill 18,513 Trade and other payables (7,802) Other liabilities (307)
$ 35,271
JUICE Mobile’s revenues of $31.8 million and net loss of $6.7 million are included in the consolidated income statement from the date of acquisition. Yellow Pages Limited’s consolidated revenues and net loss for the year ended December 31, 2016 would have been $823.7 million and $405.5 million, respectively, had the JUICE Mobile acquisition occurred on January 1, 2016.
The Company acquired in September 2016 the net assets of 9778748 Canada Inc. (“Totem”), a creative agency specializing in customized content creation and delivery for global brands for a purchase price of $1.2 million, payable over 3 years.
December 31, 2016 Other
Key assumptions : Terminal growth rate -1% Discount rate – post-tax 1% Revenue decline per annum -3%
YELLOW PAGES LIMITED 2016 ANNUAL REPORT 53

NOTES TO THE CONSOLIDATED FINANCIAL STATEMENTS – DECEMBER 31, 2016 (ALL TABULAR AMOUNTS ARE IN THOUSANDS OF CANADIAN DOLLARS, EXCEPT SHARE INFORMATION)
2015
In May 2015, Yellow Pages Homes Limited, a wholly-owned subsidiary of the Company, acquired the assets of Western Media Group for a purchase price of $0.9 million. The purchased assets included multi-platform brands in Western Canada, vanmag.com, westernlivingmag.com as well as Western Living Magazine and Vancouver Magazine. These properties generate local lifestyle content specific to the Western Canada region, in the restaurants, real estate and lifestyle categories. The fair value of $0.9 million was mainly comprised of intangible assets.
On July 1, 2015, Yellow Pages Limited acquired all the shares of the CFDP network from Square Victoria Digital Properties Inc. for a purchase price of $50.2 million. The acquisition of CFDP, a leader in connecting home sellers and buyers in Canada, will provide Yellow Pages with an increased presence in the real estate vertical, access to exclusive listings and the platforms required to transact directly with Canadians. The acquisition was fully funded with cash on hand. Transaction costs of $1.3 million were incurred during the year ended December 31, 2015, and were included in Restructuring and special charges (refer to Note 10 – Provisions).
The following table summarizes the transaction and the purchase price allocation:
July 1, 2015
Fair value of business acquired Trade and other receivables $ 1,461 Other assets 851 Property and equipment 1,339 Intangible assets 32,436 Goodwill 26,829 Deferred income tax liabilities, net (6,834) Trade and other payables (2,190) Provisions (2,087) Deferred revenues (1,594)
$ 50,211
CFDP’s revenues of $18.2 million and a net loss of $90 thousand for the year ended December 31, 2015, are included in the consolidated income statement from the date of acquisition. Yellow Pages Limited’s consolidated revenues and net earnings for the year ended December 31, 2015 would have been $853.5 million and $61.7 million, respectively, had the CFDP acquisition occurred on January 1, 2015.
6. INVESTMENT IN ASSOCIATE
On October 3, 2016, Yellow Pages Digital & Media Solutions Limited acquired a 50% ownership in 9778730 Canada Inc., which holds 100% of Coupgon Inc., a digital coupon solutions provider, for cash consideration of $1.2 million. Additional investments during the year ended December 31, 2016 amounted to $0.4 million. The difference between the acquisition price and the fair value of the net assets acquired was insignificant. The investment is being accounted for using the equity method.
54 YELLOW PAGES LIMITED 2016 ANNUAL REPORT

NOTES TO THE CONSOLIDATED FINANCIAL STATEMENTS – DECEMBER 31, 2016 (ALL TABULAR AMOUNTS ARE IN THOUSANDS OF CANADIAN DOLLARS, EXCEPT SHARE INFORMATION)
7. PROPERTY AND EQUIPMENT
2016
Office
equipment1 Computer
equipment Other
equipment Leasehold
improvements Total Cost As at December 31, 2015 $ 32,700 $ 37,425 $ 2,139 $ 33,911 $ 106,175 Business acquisitions 47 159 22 314 542 Additions 4,586 4,180 62 8,961 17,789 Disposals, write-offs and transfers (40) (75) (8) (3) (126) As at December 31, 2016 $ 37,293 $ 41,689 $ 2,215 $ 43,183 $ 124,380 Accumulated depreciation As at December 31, 2015 $ 23,778 $ 25,348 $ 1,384 $ 25,111 $ 75,621 Depreciation expense 1,470 6,499 304 4,411 12,684 Disposals, write-offs and transfers (37) (75) (4) (3) (119) As at December 31, 2016 $ 25,211 $ 31,772 $ 1,684 $ 29,519 $ 88,186 Net book value as at December 31, 2016 $ 12,082 $ 9,917 $ 531 $ 13,664 $ 36,194
2015
Office
equipment1 Computer
equipment Other
equipment Leasehold
improvements Total
Cost As at December 31, 2014 $ 31,666 $ 34,411 $ 1,908 $ 31,940 $ 99,925 Business acquisitions 296 239 196 698 1,429 Additions 772 2,775 72 1,273 4,892 Disposals, write-offs and transfers (34) − (37) − (71) As at December 31, 2015 $ 32,700 $ 37,425 $ 2,139 $ 33,911 $ 106,175 Accumulated depreciation As at December 31, 2014 $ 22,250 $ 19,121 $ 1,138 $ 20,985 $ 63,494 Depreciation expense 1,562 6,227 283 4,126 12,198 Disposals, write-offs and transfers (34) − (37) − (71)
As at December 31, 2015 $ 23,778 $ 25,348 $ 1,384 $ 25,111 $ 75,621 Net book value as at December 31, 2015 $ 8,922 $ 12,077 $ 755 $ 8,800 $ 30,554
1 The net book value of office equipment includes $0.3 million of assets held under finance leases (2015 - $0.6 million).
YELLOW PAGES LIMITED 2016 ANNUAL REPORT 55

NOTES TO THE CONSOLIDATED FINANCIAL STATEMENTS – DECEMBER 31, 2016 (ALL TABULAR AMOUNTS ARE IN THOUSANDS OF CANADIAN DOLLARS, EXCEPT SHARE INFORMATION)
8. INTANGIBLE ASSETS
2016
Trademarks and domain
names1
Non-competition agreements
Customer-related
intangible assets Software2
Total Intangible
assets Cost As at December 31, 2015 $ 936,085 $ 532,773 $ 6,577 $ 327,695 $ 1,803,130 Business acquisitions (Note 5) − 200 6,230 9,720 16,150 Additions − − − 47,457 47,457 Impairment (Note 4) (452,489) (147,511) − − (600,000) Disposals, write-offs and transfers − (3,968) (785) 2 (4,751) As at December 31, 2016 $ 483,596 $ 381,494 $ 12,022 $ 384,874 $ 1,261,986 Accumulated amortization As at December 31, 2015 $ 19,265 $ 225,958 $ 3,592 $ 184,534 $ 433,349 Amortization expense 2,839 18,784 4,009 66,566 92,198 Disposals, write-offs and transfers − (3,968) (523) (2) (4,493) As at December 31, 2016 $ 22,104 $ 240,774 $ 7,078 $ 251,098 $ 521,054 Net book value as at December 31, 2016 $ 461,492 $ 140,720 $ 4,944 $ 133,776 $ 740,932
2015
Trademarks and domain
names1
Non-competition agreements
Customer-related
intangible assets Software2
Total Intangible
assets
Cost As at December 31, 2014 $ 906,694 $ 530,830 $ 5,667 $ 256,486 $ 1,699,677 Business acquisitions (Note 5) 29,391 1,943 910 1,102 33,346 Additions − − − 70,107 70,107 As at December 31, 2015 $ 936,085 $ 532,773 $ 6,577 $ 327,695 $ 1,803,130 Accumulated amortization As at December 31, 2014 $ 16,426 $ 207,273 $ 837 $ 140,174 $ 364,710 Amortization expense 2,839 18,685 2,755 44,360 68,639
As at December 31, 2015 $ 19,265 $ 225,958 $ 3,592 $ 184,534 $ 433,349 Net book value as at December 31, 2015 $ 916,820 $ 306,815 $ 2,985 $ 143,161 $ 1,369,781
1 Trademarks and domain names with indefinite useful lives amounted to $456.8 million (2015 - $908.2 million). 2 Software under development amounted to $10.6 million (2015 - $30 million).
9. TRADE AND OTHER PAYABLES
As at December 31, 2016 December 31, 20151
Trade $ 60,300 $ 53,720
Accrued interest on long-term debt and exchangeable debentures 3,169 3,871
Payroll related 7,075 7,440
Long-term incentive plans 4,667 2,947
Other accrued liabilities 4,282 5,649
$ 79,493 $ 73,627
1 Certain amounts in the prior period were reclassified to conform to this year’s presentation.
56 YELLOW PAGES LIMITED 2016 ANNUAL REPORT

NOTES TO THE CONSOLIDATED FINANCIAL STATEMENTS – DECEMBER 31, 2016 (ALL TABULAR AMOUNTS ARE IN THOUSANDS OF CANADIAN DOLLARS, EXCEPT SHARE INFORMATION)
10. PROVISIONS During the year ended December 31, 2016, Yellow Pages Limited recorded restructuring and special charges of $23 million. The majority of these costs was associated with internal reorganizations and workforce reductions, and transaction costs associated with business acquisitions. During the year ended December 31, 2015, Yellow Pages Limited recorded restructuring and special charges of $30.8 million. The majority of these costs was associated with workforce reductions related to a corporate realignment, internal reorganizations, transaction costs associated with business acquisitions, and contract terminations, partially offset by a curtailment gain of $1.6 million related to workforce reductions (refer to Note 11 – Post-employment benefits).
The provisions for restructuring and special charges represent the present value of the best estimate of the future outflow of economic benefits that will be required to settle the provisions and may vary as a result of new events affecting the severances and charges that will need to be paid.
Other provisions include provisions primarily for vacation and short-term incentive plans.
Provisions for restructuring
Provisions for special charges
Other provisions
Total Provisions
As at December 31, 2015 $ 22,601 $ 17,012 $ 32,479 $ 72,092 Charge1 19,198 3,640 27,831 50,669 Payments (28,843) (5,042) (29,258) (63,143) Surplus provision − − (2,417) (2,417) Reclassifications and other − − 136 136 As at December 31, 2016 $ 12,956 $ 15,610 $ 28,771 $ 57,337 Less current portion 10,403 13,883 28,724 53,010 Non-current portion $ 2,553 $ 1,727 $ 47 $ 4,327 1 Included in the restructuring and special charges of $23 million on the income statement are net charges of $0.1 million not affecting the provision.
11. POST-EMPLOYMENT BENEFITS Yellow Pages Limited maintains pension plans with defined benefit and defined contribution components which cover substantially all of the employees of Yellow Pages Limited. Yellow Pages Limited maintains unfunded supplementary defined benefit pension plans for certain executives and also maintains other retirement and post-employment benefits (“other benefits”) plans which cover substantially all of its employees.
The defined benefit plans typically expose the Company to actuarial risks such as investment, interest rate, longevity and salary risks.
Investment risk The present value of the defined benefit plan obligation is calculated using a discount rate determined by reference to high quality corporate bond yields; if the actual return on plan assets is below the assumed rate, it will create a plan deficit. Currently, the defined benefit plan has a relatively balanced investment in equity securities and debt instruments. Due to the long-term nature of the defined benefit plan obligation, the pension committee considers it appropriate that a reasonable portion of the plan assets should be invested in equity instruments to leverage the return generated by the fund.
Interest risk A decrease in the bond interest rate will increase the defined benefit plan obligation, particularly on a solvency basis. Although this will be partially offset by an increase in the return of the defined benefit plan’s investments, the impact may be material as pension liabilities are sensitive to variations in interest rates.
Longevity risk The present value of the defined benefit plan liability is calculated based on assumptions regarding mortality rates of plan participants both during and after their employment. An increase in the life expectancy of the plan participants will increase the defined benefit obligation.
Salary risk The present value of the defined benefit plan obligation is calculated by reference to the projected salaries of plan participants. As such, a higher salary increase than projected of the plan participants will increase the defined benefit plan’s liability.
The present value of the defined benefit obligation and the related current service cost and past service costs were measured using the projected benefit method prorated on service. This was based on the actuarial valuation of the plan assets and the present value of the defined benefit obligation which was carried out by Morneau Shepell, Fellows of the Canadian Institute of Actuaries and Society of Actuaries, as at December 31, 2015 and extrapolated to December 31, 2016. For funding purposes, an actuarial valuation of the defined benefit component of the Yellow Pages pension plans was also performed as at December 31, 2015.
YELLOW PAGES LIMITED 2016 ANNUAL REPORT 57

NOTES TO THE CONSOLIDATED FINANCIAL STATEMENTS – DECEMBER 31, 2016 (ALL TABULAR AMOUNTS ARE IN THOUSANDS OF CANADIAN DOLLARS, EXCEPT SHARE INFORMATION)
The changes in the defined benefit obligations and in the fair value of assets and the reconciliation of the funded status of the defined benefit plans to the amount recorded on the consolidated statements of financial position as at December 31, 2016 and 2015 were as follows:
As at December 31, 2016 December 31, 2015
Pension Other Pension Other Benefits1 Benefits Benefits1 Benefits Fair value of plan assets, beginning of year $ 487,884 $ – $ 474,854 $ – Employer contributions 17,907 2,002 35,224 2,014 Employee contributions 1,486 – 1,502 – Interest income 19,087 – 18,838 – Return on plan assets excluding interest income (actuarial gains) 20,456 – 3,089 – Benefit payments (38,952) (2,002) (44,725) (2,014) Administration costs (955) – (898) – Fair value of plan assets, end of year $ 506,913 $ – $ 487,884 $ – Accrued benefit obligation, beginning of year $ 632,599 $ 37,944 $ 660,501 $ 41,615 Current service cost 5,526 21 9,737 182 Employee contributions 1,486 – 1,502 – Benefit payments (38,952) (2,002) (44,725) (2,014) Interest cost 24,672 1,479 25,848 1,507 Curtailment gain (28) (15) (1,096) (538) Past service costs – – (2,449) (4,169) Actuarial (gains) losses due to:
Experience adjustments (2,010) – (13,516) 1,033 Changes in demographic assumptions – – – (53) Changes in financial assumptions (843) 1,208 (3,203) 381
Defined benefit obligation, end of year $ 622,450 $ 38,635 $ 632,599 $ 37,944 Net defined benefit obligation $ (115,537) $ (38,635) $ (144,715) $ (37,944) 1 Including unfunded supplementary defined benefit pension plans.
While all the plans are not considered fully funded for financial reporting purposes, registered plans are funded in accordance with the applicable statutory funding rules and regulations governing the particular plans.
The significant assumptions adopted in measuring Yellow Pages Limited’s pension and other benefit obligations as at December 31, 2016 and 2015 were as follows:
As at December 31, 2016 December 31, 2015
Pension Other Pension Other
Benefits Benefits Benefits Benefits
Post-employment benefit obligation Discount rate, end of year 3.75% 3.75% 4.00% 4.00% Rate of compensation increase 2.25% 2.25% 2.95% 2.95% Net benefit plan costs Discount rate (current service cost), end of preceding year 4.25% 4.25% 4.00% 4.00% Discount rate (interest expense), end of preceding year 4.00% 4.00% 4.00% 4.00% Rate of compensation increase 2.95% 2.95% 3.00% 3.00% Weighted average duration (years) 15 13 15 13
For measurement purposes, an 8% annual increase in the per capita cost of covered medical care benefits (the medical care cost trend rate) was assumed in 2016. The rate of increase of the cost of medical care was assumed to decrease to 7.7% in 2017 and gradually decline to 5% by 2026 and to remain at that level thereafter. A 6% annual increase in per capita cost of covered dental care benefits was assumed in 2016. The rate of increase of the cost of covered dental care was assumed to decrease to 5.8% in 2017 and gradually decline to 4% by 2026 and to remain at that level thereafter.
58 YELLOW PAGES LIMITED 2016 ANNUAL REPORT

NOTES TO THE CONSOLIDATED FINANCIAL STATEMENTS – DECEMBER 31, 2016 (ALL TABULAR AMOUNTS ARE IN THOUSANDS OF CANADIAN DOLLARS, EXCEPT SHARE INFORMATION)
The following table shows how the defined benefit obligation as at December 31, 2016 would have been affected by changes that were reasonably possible at that date in each significant actuarial assumption:
Pension Benefits
Other Benefits
Decrease of 0.25% in discount rate, end of year $ 23,808 $ 1,306 Increase of 0.25% in rate of compensation $ 2,696 $ – Increase of 1% in health care cost trend rates $ N/A $ 3,032
The net benefit plan costs included in the income statements are the following components:
For the years ended December 31, 2016 2015
Pension Benefits
Other Benefits
Pension Benefits
Other Benefits
Current service cost $ 5,526 $ 21 $ 9,737 $ 182 Administration costs 955 – 898 – Past service costs – – (2,449) (4,169) Service cost1 $ 6,481 $ 21 $ 8,186 $ (3,987) Curtailment gain (Note 10) $ (28) $ (15) $ (1,096) $ (538)
Interest cost $ 24,672 $ 1,479 $ 25,848 $ 1,507 Interest income (19,087) – (18,838) – Net interest on the net defined benefit obligation (Note 19) $ 5,585 $ 1,479 $ 7,010 $ 1,507 Net benefit costs (recovery) recognized in the income statement $ 12,038 $ 1,485 $ 14,100 $ (3,018) Actuarial (gains) losses recognized in OCI $ (23,309) $ 1,208 $ (19,808) $ 1,361 Total net benefit plan (recovery) costs for the Yellow Pages
(“YP”) defined benefit plans $ (11,271) $ 2,693 $ (5,708) $ (1,657) Net benefit plan costs for the YP defined contribution plans1 7,157 – 7,125 – Total net benefit plan (recovery) costs $ (4,114) $ 2,693 $ 1,417 $ (1,657)
1 Included in operating costs.
As a result of workforce reductions during the years ended December 31, 2016 and 2015, the number of employees covered by the pension plans decreased, and these restructurings gave rise to a curtailment gain as at November 10, 2016, and October 8, 2015, respectively.
During the year ended December 31, 2015, the Company amended the retirement and post-employment benefit plans for certain groups of employees. These amendments were made prospectively and applied only to certain groups of employees and included among other items for the affected employees, the elimination of post-retirement benefits, the elimination of post-retirement indexing for future service, the introduction of employee contributions and the reduction of short-term disability coverage. Certain of these amendments resulted in a recovery of past service costs in the amount of $6.6 million in 2015.
Plan assets include primarily Canadian and foreign equities, government and corporate bonds, debentures and secured mortgages. Plan assets are held in trust and the asset allocation was as follows as at December 31, 2016 and 2015:
(in percentages - %) December 31, 2016 December 31, 2015
Fair value of the plan assets: Canadian bonds and debentures 11.5 27.0 Canadian common stocks 9.5 11.0 Pooled fund units
Canadian pooled equity funds 22.5 17.5 Global pooled equity funds 31.5 31.0 Canadian pooled fixed-income funds 24.5 10.0 Pooled mortgage funds – 2.0
Short-term notes and treasury bills – 0.5 Cash and cash equivalents 0.5 1.0
YELLOW PAGES LIMITED 2016 ANNUAL REPORT 59

NOTES TO THE CONSOLIDATED FINANCIAL STATEMENTS – DECEMBER 31, 2016 (ALL TABULAR AMOUNTS ARE IN THOUSANDS OF CANADIAN DOLLARS, EXCEPT SHARE INFORMATION)
As at December 31, 2016 and 2015, the publicly traded equity securities did not directly include any shares of Yellow Pages Limited.
The total cash payments for pension and other benefit plans made by Yellow Pages Limited amounted to $26.8 million for 2016 (2015 – $44.6 million). Total cash payments for pension and other benefit plans expected in 2017 amount to approximately $26.7 million.
Yellow Pages Limited’s funding policy is to make contributions to its pension plans based on various actuarial cost methods as permitted by pension regulatory bodies. Yellow Pages Limited is responsible to adequately fund the plans. Contributions reflect actuarial assumptions concerning future investment returns, salary projections and future service benefits.
In addition, Yellow Pages Limited recorded an expense for provincial, federal and state pension plans of $9.9 million for the year ended December 31, 2016 (2015 – $9 million).
As at December 31, 2016, Yellow Pages Limited had recognized an accumulated balance of $70.1 million, net of income taxes of $23.4 million, in actuarial losses in OCI.
12. LONG-TERM DEBT The long-term debt is comprised of the following:
As at December 31, 2016 December 31, 2015
Senior secured notes $ 309,669 $ 406,733 Obligations under finance leases 359 620 $ 310,028 $ 407,353 Less current portion1 75,161 98,530 Non-current portion $ 234,867 $ 308,823 1 The current portion of the senior secured notes may vary subject to the Excess Cash Flow clause as well as the minimum cash balance requirement post
Mandatory Redemptions under the indenture governing the senior secured notes.
Asset-Based Loan
In August 2013, the Company, through its subsidiary Yellow Pages Digital & Media Solutions Limited, entered into a five-year $50 million asset-based loan (“ABL”) expiring in August 2018. The ABL is used for general corporate purposes. Through the ABL, the Company has access to the funds in the form of prime rate loans, Banker’s acceptance (“BA”) equivalent loans or letters of credit. The ABL is secured by a first priority lien over the receivables of the Company. The ABL is subject to an availability reserve of $5 million if the Company’s trailing 12-month fixed charge coverage ratio is below 1.1 times. As at December 31, 2016, the Company had $7.4 million of letters of credit issued and outstanding under the ABL. As such, $42.6 million of the ABL was available as at December 31, 2016. Interest is calculated based either on the BA Rate or the Prime Rate plus an applicable margin.
The loan agreement governing the ABL contains restrictive covenants, including restrictions on the incurrence of additional indebtedness, the payment of dividends and other payment restrictions, the creation of liens, sale and leaseback transactions, mergers, consolidations and sales of assets, and certain transactions with affiliates and its business activities.
As at December 31, 2016 and 2015, the Company was in compliance with all covenants under the loan agreement governing the ABL.
Senior Secured Notes
On December 20, 2012, the Company through its subsidiary, Yellow Pages Digital & Media Solutions Limited, issued $800 million of 9.25% senior secured notes (“Senior Secured Notes”) maturing November 30, 2018. Interest on the Senior Secured Notes is payable in cash, quarterly in arrears and in equal instalments at 9.25% per annum on the last day of February, May, August and November of each year.
The Senior Secured Notes are unconditionally guaranteed on a senior secured basis by Yellow Pages Limited and all of its Restricted Subsidiaries (as such term is defined in the indenture governing the Senior Secured Notes).
The Senior Secured Notes and each Senior Secured Note guarantee are secured by a first priority lien, subject to certain permitted liens, in the collateral, which consists of all of the property of Yellow Pages Limited and the Restricted Subsidiaries, whether owned on the Effective Date or thereafter acquired, other than certain excluded property.
The indenture governing the Senior Secured Notes contains restrictive covenants, including restrictions on the incurrence of additional indebtedness, the payment of dividends and other payment restrictions, the creation of liens, sale and leaseback transactions, mergers, consolidations and sales of assets, and certain transactions with affiliates and its
60 YELLOW PAGES LIMITED 2016 ANNUAL REPORT

NOTES TO THE CONSOLIDATED FINANCIAL STATEMENTS – DECEMBER 31, 2016 (ALL TABULAR AMOUNTS ARE IN THOUSANDS OF CANADIAN DOLLARS, EXCEPT SHARE INFORMATION)
business activities. The indenture does not contain the obligation to maintain financial ratios. Financial ratio restrictions only apply upon incurrence of additional indebtedness and other transactions.
As at December 31, 2016 and 2015, the Company was in compliance with all covenants under the indenture governing the Senior Secured Notes.
Mandatory Redemption
Pursuant to the indenture governing the Senior Secured Notes, the Company is required to use an amount equal to 75% of its consolidated Excess Cash Flow for the immediately preceding six-month period ending March 31 or September 30, as applicable, to redeem on a semi-annual basis on the last day of May and November of each year, commencing on May 31, 2013, at a redemption price equal to 100% of the principal amount thereof from holders on a pro rata basis, subject to the Company maintaining a minimum cash balance, including availability on the ABL, of $75 million immediately following the mandatory redemption payment subject to certain conditions. Excess Cash Flow, as defined in the indenture governing the Senior Secured Notes, means the aggregate cash flow from operating activities adjusted for, among other things, payments relating to interest, taxes, long-term employee compensation plans, certain pension plan contribution payments and the acquisitions of property, plant, equipment and intangible assets. For purposes of determining the consolidated Excess Cash Flow, deductions for capital expenditures and information systems/ information technology expenses are each subject to an annual deduction limit of $50 million. Under other circumstances, the Company may also have to make additional repayments on the Senior Secured Notes (refer to the indenture governing the Senior Secured Notes).
Optional Redemption
The Company may redeem all or part of the Senior Secured Notes at its option at any date, upon not less than 30 nor more than 60 days prior notice, at a redemption price equal to:
• In the case of a redemption occurring prior to May 31, 2017, 105% of the principal amount thereof, plus accrued and unpaid interest, if any, to the redemption date; or
• In the case of a redemption occurring on or after May 31, 2017, 100% of the principal amount thereof, plus accrued and unpaid interest, if any, to the redemption date.
Obligations under finance leases
The Company entered into several lease agreements with third parties for office equipment and for software. The obligations under finance leases are secured by a moveable hypothec on the office equipment leased.
The following table provides a reconciliation of our minimum future lease payments to the present value of our finance lease obligations as at December 31, 2016:
Future minimum lease payments Interest
Present value of minimum lease payments
2017 $ 152 $ 9 $ 143 2018 and 2019 221 5 216
$ 373 $ 14 $ 359
13. EXCHANGEABLE DEBENTURES As at December 31, 2016 December 31, 2015
Face value of exchangeable debentures $ 107,089 $ 107,089 Less unaccreted interest 14,915 16,611 $ 92,174 $ 90,478
On December 20, 2012, the Company through its subsidiary Yellow Pages Digital & Media Solutions Limited, issued $107.5 million of senior subordinated exchangeable debentures (“Exchangeable Debentures”) due November 30, 2022. Interest on the Exchangeable Debentures accrues at a rate of 8% per annum if for the applicable interest period, it is paid in cash, or 12% per annum if the Company makes a Payment in Kind (“PIK”) election to pay interest in respect of all or any part of the then outstanding Exchangeable Debentures in additional Exchangeable Debentures. Interest on the Exchangeable Debentures is payable semi-annually in arrears, and in equal instalments on the last day of May and November of each year. The initial fair value on December 20, 2012 of the Exchangeable Debentures was $91.6 million.
The Exchangeable Debentures are senior subordinated and unsecured obligations of Yellow Pages Digital & Media Solutions Limited. The Exchangeable Debentures are unconditionally guaranteed on a subordinated unsecured basis by
YELLOW PAGES LIMITED 2016 ANNUAL REPORT 61

NOTES TO THE CONSOLIDATED FINANCIAL STATEMENTS – DECEMBER 31, 2016 (ALL TABULAR AMOUNTS ARE IN THOUSANDS OF CANADIAN DOLLARS, EXCEPT SHARE INFORMATION)
Yellow Pages Limited and all of its Restricted Subsidiaries (as such term is defined in the indenture governing the Exchangeable Debentures).
The indenture governing the Exchangeable Debentures contains restrictive covenants, including restrictions on the incurrence of additional indebtedness, the payment of dividends and other payment restrictions, the creation of liens, sale and leaseback transactions, mergers, consolidations and sales of assets and certain transactions with affiliates. The indenture does not contain the obligation to maintain financial ratios. Financial ratio restrictions only apply upon incurrence of indebtedness and other transactions.
As at December 31, 2016 and 2015, the Company was in compliance with all covenants under the indenture governing the Exchangeable Debentures.
Exchange Option
The Exchangeable Debentures are exchangeable at the holder’s option into common shares at any time at an exchange price per common share equal to $19.04, subject to adjustment for specified transactions.
The conversion option was valued at $3.6 million, net of income taxes of $1.3 million, at the date of issuance and is included in Equity. The liability portion is being accreted such that the liability at maturity equals the principal amount less exchanges.
Optional Redemption
The Company may, at any time on or after the date on which all of the Senior Secured Notes have been paid in full, redeem all or part of the Exchangeable Debentures at its option at a redemption price equal to:
• in the case of a redemption occurring prior to May 31, 2021, 110% of the principal amount thereof, plus accrued and unpaid interest, if any, to the redemption date; or
• in the case of a redemption occurring on or after May 31, 2021, 100% of the principal amount thereof, plus accrued and unpaid interest, if any, to the redemption date.
The redemption option for cash is an embedded derivative and is recorded at fair value on the consolidated statements of financial position with changes in fair value recognized in financial charges. The fair value was $0.1 million as at December 31, 2016 (2015 – $0.5 million).
14. INCOME TAXES A reconciliation of income taxes at Canadian statutory rates with reported income taxes is as follows:
For the years ended December 31, 2016 2015
(Losses) earnings before income taxes and loss from investment in associate $$ (548,782) $ 88,094 Combined Canadian federal and provincial tax rates1 26.88% 26.70% Income tax (recovery) expense at statutory rates $$ (147,509) $ 23,521 Increase (decrease) resulting from:
Non-deductible expenses for tax purposes 1,354 1,120 Settlement of tax assessments 273 1,045 Other 365 1,353
(Recovery of) provision for income taxes $$ (145,517) $ 27,039 1 The combined applicable statutory tax rate increased by 0.18% resulting mainly from the provincial allocation of revenues earned and the increase in the
Alberta, New Brunswick and Newfoundland statutory tax rates.
(Recovery of) provision for income taxes includes the following amounts:
For the years ended December 31, 2016 2015
Current $$ 89 $ 254 Deferred (145,606) 26,785 $$ (145,517) $ 27,039
62 YELLOW PAGES LIMITED 2016 ANNUAL REPORT

NOTES TO THE CONSOLIDATED FINANCIAL STATEMENTS – DECEMBER 31, 2016 (ALL TABULAR AMOUNTS ARE IN THOUSANDS OF CANADIAN DOLLARS, EXCEPT SHARE INFORMATION)
Deferred income tax (assets) liabilities are attributable to the following items:
Deferred financing
costs
Non-capital losses carry
forward Deferred revenues
Post-employment
benefits Accrued liabilities
Property and equipment and lease incentives
Exchang-eable
Deben-tures
Intangible assets
Deferred income tax
liabilities (assets),
net
December 31, 2015 $ (4,521) $ (15,988) $ (5,610) $ (52,113) $ (10,923) $ 10,919 $ 4,581 $ 160,887 $ 87,232
Business acquisitions – – – – – – – 128 128
Expense (benefit) to income statement 3,947 (10,686) 1,571 171 2,679 6,736 (477) (149,547) (145,606)
Expense to OCI – – – 6,208 – – – – 6,208 December 31,
2016 $ (574) $ (26,674) $ (4,039) $ (45,734) $ (8,244) $ 17,655 $ 4,104 $ 11,468 $ (52,038)
Deferred financing
costs
Non-capital losses carry
forward Deferred revenues
Post-employment
benefits Accrued liabilities
Property and equipment and lease incentives
Exchang-eable
Deben-tures
Intangible assets
Deferred income tax
liabilities (assets),
net
December 31, 2014 $ (34) $ (10,826) $ (7,607) $ (64,226) $ (10,520) $ 1,525 $ 4,987 $ 135,368 $ 48,667
Business acquisitions – (1,383) – – – (156) – 8,373 6,834
(Benefit) expense to income statement (5,052) (3,060) 1,997 7,167 (403) 9,550 (406) 16,992 26,785
Expense to OCI – – – 4,946 – – – – 4,946 Other 565 (719) – – – – – 154 – December 31,
2015 $ (4,521) $ (15,988) $ (5,610) $ (52,113) $ (10,923) $ 10,919 $ 4,581 $ 160,887 $ 87,232
As at December 31, 2016, the Company had not recognized deferred income tax assets with respect to foreign operating losses of $161.4 million which expire from 2028 to 2036, Canadian capital losses of $10.3 million which can be utilized indefinitely, and deductible temporary differences of $153.8 million.
As at December 31, 2016, the Company and its subsidiaries had non-capital losses totalling approximately $96.4 million that may be applied against future taxable income. These non-capital losses expire gradually between 2027 and 2036. The Company recognized a deferred income tax asset on non-capital losses because it is probable that sufficient taxable profit will be available from current operations in the near future.
15. SHAREHOLDERS’ CAPITAL Common shares
For the year ended December 31, 2016 Number of Shares Amount Balance, December 31, 2015 28,063,919 $ 4,031,528 Exercise of stock options (Note 17) 11,375 157 Exchange of common share purchase warrants 10 –
Balance, December 31, 2016 28,075,304 $ 4,031,685
YELLOW PAGES LIMITED 2016 ANNUAL REPORT 63

NOTES TO THE CONSOLIDATED FINANCIAL STATEMENTS – DECEMBER 31, 2016 (ALL TABULAR AMOUNTS ARE IN THOUSANDS OF CANADIAN DOLLARS, EXCEPT SHARE INFORMATION)
For the year ended December 31, 2015 Number of Shares Amount
Balance, December 31, 2014 27,976,661 $ 4,030,325 Exercise of stock options (Note 17) 87,250 1,203 Exchange of common share purchase warrants 8 – Balance, December 31, 2015 28,063,919 $ 4,031,528
Warrants
On December 20, 2012, the Company issued 2,995,506 common share purchase warrants (“Warrants”).
During the years ended December 31, 2016 and 2015, 10 and 8 Warrants, respectively, were exercised in exchange for 10 and 8 common shares of Yellow Pages Limited, respectively. As at December 31, 2016 and 2015, the Company had a total of 2,995,488 and 2,995,498 Warrants outstanding, respectively.
Each Warrant is transferable and entitles the holder to purchase one common share of Yellow Pages Limited at an exercise price of $28.16 per Warrant payable in cash at any time on or prior to December 20, 2022. The fair value of the Warrants on December 20, 2012 was $1.5 million.
The fair value of the Warrants was calculated using a binomial option pricing model with the following assumptions:
Risk free interest rate 2.27% Expected life 10 years Expiry date December 20, 2022 Expected volatility 33.5%
16. EARNINGS PER SHARE The following table reconciles the weighted average number of shares outstanding used in computing basic earnings per share to the weighted average number of shares outstanding used in computing diluted earnings per share as well as net earnings used in the computation of basic earnings per share to net earnings adjusted for any dilutive effect:
For the years ended December 31, 2016 2015 Weighted average number of shares outstanding used in computing basic (loss) earnings per share 26,500,861 26,688,369 Dilutive effect of restricted share units and performance share units – 1,082,187 Dilutive effect of stock options – 71,250 Dilutive effect of Exchangeable Debentures – 5,624,422
Weighted average number of shares outstanding used in computing diluted (loss) earnings per share 26,500,861 33,466,228
For the years ended December 31, 2016 2015 Net (loss) earnings used in the computation of basic (loss) earnings per share $ (403,705) $ 61,055 Impact of assumed conversion of Exchangeable Debentures, net of applicable taxes – 7,393
Net (loss) earnings adjusted for dilutive effect used in the computation of diluted (loss) earnings per share $ (403,705) $ 68,448
17.
Yellow Pages Limited did not calculate the diluted loss per share for the year ended December 31, 2016 as the conversion of the restricted share units, performance share units, stock options and Exchangeable Debentures would not be dilutive to the loss. For the year ended December 31, 2015, the diluted earnings per share calculation did not take into consideration the potential dilutive effect of the Warrants (refer to Note 15 – Shareholders’ capital) as well as certain stock options that are not in the money as they are not dilutive.
64 YELLOW PAGES LIMITED 2016 ANNUAL REPORT

NOTES TO THE CONSOLIDATED FINANCIAL STATEMENTS – DECEMBER 31, 2016 (ALL TABULAR AMOUNTS ARE IN THOUSANDS OF CANADIAN DOLLARS, EXCEPT SHARE INFORMATION)
17. STOCK-BASED COMPENSATION PLANS Yellow Pages Limited’s stock-based compensation plans consist of restricted share units, performance share units, deferred share units and stock options of Yellow Pages Limited.
Restricted Share Unit and Performance Share Unit Plan
On May 6, 2013, Yellow Pages Limited adopted a restricted share unit and performance share unit plan (the “RSU and PSU Plan”) to reward key employees and officers of Yellow Pages Limited (the “Participants”). Following the implementation of the RSU and PSU Plan, Yellow Pages Limited granted to Participants a number of restricted share units (“RSUs”) and/or performance share units (“PSUs”), as applicable, based on the volume weighted average trading price of the common shares for the five days immediately preceding the grant date. The RSUs are time-based awards and will vest upon the continuous employment of the Participants for a period of 36 months starting from the date of the grant or such other period not exceeding 36 months determined by the Board of Directors. The PSUs are performance-based awards and will vest upon confirmation by the Board of Directors of the achievement of specified performance targets and upon the continuous employment of the Participants for a period of 36 months starting from the date of the grant or such other period not exceeding 36 months determined by the Board of Directors. The PSUs for which the performance targets have not been achieved shall automatically be forfeited and cancelled.
Pursuant to the terms of the RSU and PSU Plan, if the RSU and PSU Plan is funded, Participants will receive, upon vesting of the RSUs and PSUs, common shares of the Company acquired on the open market. In the event the RSU and PSU Plan is unfunded, Yellow Pages Limited will pay to the Participant an amount in cash, equivalent to the number of RSUs or PSUs that have vested.
The number of PSUs that vest could potentially reach up to one-and-a-half times the actual number of PSUs awarded if the actual performance reaches the maximum level of performance targets.
During the year ended December 31, 2016, 553,709 common shares of Yellow Pages Limited (2015 – 417,669) were purchased on the open market of the TSX by the trustee appointed under the RSU and PSU Plan at a cost of $10.5 million (2015 – $6.8 million) and are restricted for the purpose of funding of the RSU and PSU Plan. The total number of common shares of Yellow Pages Limited held by the trustee for the purpose of funding the RSU and PSU Plan amounted to 1,686,505 as at December 31, 2016.
The following table summarizes the status of the RSU and PSU grants during the years ended December 31:
2016 2015 Number of RSUs PSUs¹ RSUs PSUs¹
Outstanding, beginning of period 464,924 520,117 399,238 363,290 Granted 199,427 327,137 265,716 360,843 Additional payout related to
achievement of performance targets² – 26,259 – – Settled (159,398) (85,947) (58,517) – Forfeited (60,598) (191,452) (141,513) (204,016) Outstanding, end of period 444,355 596,114 464,924 520,117 Weighted average remaining life 1.1 1.1 1.1 1.4 1 The outstanding number of PSUs represents a payout of 100%. In addition, the potential payout in excess of 100% and limited to a maximum payout of 150%
pursuant to the achievement of certain performance targets, amounted to 297,990 common shares as at December 31, 2016 (2015 – 259,997 common shares).
2 The additional payout is related to the achievement of certain performance targets in excess of 100% and amounted to an additional 44% for the year ended December 31, 2016 (2015 – nil).
During the years ended December 31, 2016, an expense of $5.6 million (2015 – $5.9 million) was recorded in the consolidated income statement in operating costs in relation to the RSU and PSU Plan.
Deferred Share Unit Plan
On June 12, 2013, Yellow Pages Limited adopted a deferred share unit plan (the “DSU Plan”). The DSU Plan was amended in October 2013 to provide for the participation by eligible employees as designated by the Board of Directors. The Company shall settle the vested DSUs in cash or in common shares of Yellow Pages Limited acquired on the open market at the discretion of the Company when a Director leaves the Board of Directors or an eligible employee ceases employment with the Company.
YELLOW PAGES LIMITED 2016 ANNUAL REPORT 65

NOTES TO THE CONSOLIDATED FINANCIAL STATEMENTS – DECEMBER 31, 2016 (ALL TABULAR AMOUNTS ARE IN THOUSANDS OF CANADIAN DOLLARS, EXCEPT SHARE INFORMATION)
The following table summarizes the status of the deferred share unit (“DSU”) grants during the years ended December 31:
2016 2015 Number of DSUs Liability¹ Number of DSUs Liability¹
Outstanding, beginning of period 192,964 $ 2,947 151,141 $ 2,959 Granted 53,928 825 41,823 800
Variation due to change in stock price – 596 – (812) Outstanding and vested, end of period 246,892 $ 4,368 192,964 $ 2,947
1 The liability related to the DSU Plan is recorded in trade and other payables, and the expense related to the units vested and the variation due to changes in stock price is included in operating costs.
Stock options
On December 20, 2012, as part of the implementation of Yellow Pages Limited’s Recapitalization transaction, a new stock option plan (the “Stock Option Plan”) was adopted. The Stock Option Plan is intended to attract and retain the services of selected employees of Yellow Pages Limited who are in a position to make a material contribution to the successful operation of the business, provide meaningful incentive to management to lead Yellow Pages Limited through the transformation of its business and to more closely align the interests of management with those of the shareholders of Yellow Pages Limited. A maximum of 1,290,612 stock options may be granted under the Stock Option Plan.
The following table summarizes the status of the stock option grants under the Stock Option Plan during the years ended December 31:
2016 2015
Number of options
Weighted average exercise price per
option Number of options
Weighted average exercise price per
option
Outstanding, beginning of period 522,950 $ 16.38 480,200 $ 15.10 Granted 251,700 $ 17.83 243,300 $ 16.50
Exercised (11,375) $ 10.12 (87,250) $ 10.12
Forfeited (132,325) $ 17.99 (113,300) $ 16.05
Outstanding, end of period 630,950 $ 16.73 522,950 $ 16.38 Exercisable, end of period 186,550 $ 15.38 78,000 $ 10.12
The following table provides additional information about Yellow Pages Limited’s Stock Option Plan as at December 31:
2016 2015
Exercise price Number of options
outstanding Weighted average
remaining life Number of options
outstanding Weighted average
remaining life
$10.12 167,375 3.3 178,750 4.4 $16.44 166,050 5.2 195,900 6.2 $17.83 163,000 6.2 − − $17.96 4,600 5.4 9,200 6.4 $19.61 7,700 4.5 7,700 5.5 $20.33 4,900 4.4 4,900 5.4 $24.65 117,325 4.2 126,500 5.2
Outstanding, end of period 630,950 4.8 522,950 5.3 Exercisable, end of period 186,550 3.6 78,000 4.4
Stock options were valued using a binomial option pricing model. Expected volatility is based on the historical share price volatility over the average expected life of the options granted. The following table shows the key inputs into the valuation model for the years ended December 31:
2016 2015 Weighted average grant date share price $ 18.28 $ 15.90 Exercise price $ 17.83 $ 16.50
Expected volatility 35% 38%
Option life 7 years 7 years Risk-free interest rate 1.02% 1.44% Weighted average remaining life 6.16 years 6.16 years
66 YELLOW PAGES LIMITED 2016 ANNUAL REPORT

NOTES TO THE CONSOLIDATED FINANCIAL STATEMENTS – DECEMBER 31, 2016 (ALL TABULAR AMOUNTS ARE IN THOUSANDS OF CANADIAN DOLLARS, EXCEPT SHARE INFORMATION)
An expense of $1.0 million was recorded during the year ended December 31, 2016 (2015 – $0.8 million) in relation to the Stock Option Plan.
18. OPERATING COSTS
For the years ended December 31, 2016 2015
Salaries, commissions and benefits $ 300,310 $ 295,628 Supply chain and logistics1,3 143,487 125,995 Other goods and services2,3 80,538 88,600 Information systems 45,624 47,679 Bad debt expense (Note 22) 12,829 11,182 $ 582,788 $ 569,084
1 Supply chain and logistics costs relate to external supplier costs for manufacturing and distribution of our print and online products. 2 Other goods and services include promotion and advertising costs, real estate, office services, consulting services including contractors and professional
fees. Operating leases recognized in operating costs during the year amounted to $22.5 million (2015 - $20.4 million). 3 Certain expenses within other goods and services in the prior period were reclassified to supply chain and logistics to conform to this year’s presentation.
19. FINANCIAL CHARGES, NET The significant components of the financial charges are as follows:
For the years ended December 31, 2016 2015
Interest on long-term debt and Exchangeable Debentures $ 43,776 $ 53,111 Net interest on the defined benefit obligations (Note 11) 7,064 8,517 Sales taxes on tax assessment relating to financing costs 2,372 – Other, net 2,918 (706)
$ 56,130 $ 60,922
20. SUPPLEMENTAL DISCLOSURE OF CASH FLOW INFORMATION The following are non-cash transactions:
For the years ended December 31, 2016 2015
Additions to property and equipment included in trade and other payables $ 5,525 $ 462 Additions to intangible assets included in trade and other payables $ 2,405 $ 5,516 Additions to property and equipment under finance leases $ −− $ 102
21. COMMITMENTS AND CONTINGENCIES a) As at December 31, 2016, Yellow Pages Limited has commitments under various leases for premises, equipment, purchase and service contract obligations for both operating and capital expenditures for each of the next five years and thereafter, and in the aggregate of:
Operating leases Other Total commitments
2017 $ 21,417 $ 31,835 $ 53,252 2018 18,898 16,318 35,216 2019 17,822 5,199 23,021 2020 17,137 2,551 19,688 2021 16,249 1,255 17,504 Thereafter 202,497 2,519 205,016 $ 294,020 $ 59,677 $ 353,697
YELLOW PAGES LIMITED 2016 ANNUAL REPORT 67

NOTES TO THE CONSOLIDATED FINANCIAL STATEMENTS – DECEMBER 31, 2016 (ALL TABULAR AMOUNTS ARE IN THOUSANDS OF CANADIAN DOLLARS, EXCEPT SHARE INFORMATION)
Under certain lease agreements, incentives for leasehold improvements exist. These lease incentives are accounted for in deferred credits and amount to $11.8 million.
b) Yellow Pages Limited has four billing and collection services agreements. The term of the Billing and Collection Services Agreement with Bell Canada (“Bell”) expires on December 31, 2017. The agreement with TELUS Communications Inc. (“TELUS”) expires in 2031. The agreement with MTS Inc. expires on December 31, 2017. The agreement with Bell Canada Inc. (as successor to Bell Aliant Regional Communications LP) expires on April 30, 2017, with two automatic renewal periods for ten years.
Pursuant to publication agreements with each of Bell, TELUS, MTS Inc. and Bell Canada Inc., Yellow Pages Limited produces alphabetical listing telephone directories for each of these companies in order for them to meet their regulatory obligations.
The Company also entered into several other agreements with Bell, TELUS, MTS Inc. and Bell Canada Inc., providing for the use of listing information and trademarks for the publications of directories. If the Company materially fails to perform its obligations under the publication agreements mentioned above and as a result these publication agreements are terminated in accordance with their terms, these other listing information and trademark licenses with Bell, TELUS, MTS Inc. or Bell Canada Inc., as the case may be, may also be terminated. These other agreements with Bell, TELUS, MTS Inc. and Bell Canada Inc. will terminate between 2017 and 2037.
c) Yellow Pages Limited entered into directory printing agreements with its printing suppliers to print, bind and furnish alphabetical, classified and combined directories as well as other publications. It also entered into distribution agreements.
d) Yellow Pages Limited is subject to various claims and proceedings which have been instituted against it during the normal course of business for which certain of the claims are provided for and included in trade and other payables, and provisions based on management’s best estimate of the likelihood of the outcome. Management believes that the disposition of the matters pending or asserted is not expected to have any material adverse effect on the financial position, financial performance or cash flows of Yellow Pages Limited.
22. FINANCIAL RISK MANAGEMENT Credit Risk Credit risk stems primarily from the potential inability of a customer or counterparty to a financial instrument to meet its contractual obligations. Yellow Pages Limited is exposed to credit risk with respect to cash and trade receivables from customers. The carrying value of financial assets represents Yellow Pages Limited’s maximum exposure.
Credit risk associated with cash is minimized substantially by ensuring that these financial assets are placed with creditworthy counterparties. An ongoing review is performed to evaluate changes in the status of counterparties.
Yellow Pages Limited’s extension of credit to customers involves judgment. Yellow Pages Limited has established internal controls designed to mitigate credit risk, including a formal credit policy managed by its credit department. New customers, customers increasing their advertising spend by a certain threshold and customers not respecting payment terms are subject to a specific vetting and approval process.
Yellow Pages Limited considers that it has limited exposure to concentration of credit risk with respect to trade receivables from customers due to its large and diverse customer base operating in numerous industries and its geographic diversity. There are no individual customers that account for 1% or more of revenues and there are no trade receivables from any one individual customer that exceeds 5% of the total balance of trade receivables at any point in time during the year.
Bell, TELUS, MTS Inc. and Bell Canada Inc. provide Yellow Pages Limited with customer collection services with respect to advertisers who are also their customers. As such, they receive money from customers on behalf of Yellow Pages Limited. Yellow Pages Limited retains the ultimate collection risk on these receivables.
Allowance for doubtful accounts and past due receivables are reviewed by management at each statement of financial position date. Yellow Pages Limited updates its estimate of the allowance for doubtful accounts based on the evaluation of the recoverability of trade receivable balances of each customer taking into account historic collection trends of past due accounts and current economic conditions. Trade receivables are written off once determined not to be collectible. Subsequent recoveries of amounts previously written off are credited to the income statement.
68 YELLOW PAGES LIMITED 2016 ANNUAL REPORT

NOTES TO THE CONSOLIDATED FINANCIAL STATEMENTS – DECEMBER 31, 2016 (ALL TABULAR AMOUNTS ARE IN THOUSANDS OF CANADIAN DOLLARS, EXCEPT SHARE INFORMATION)
The components of trade and other receivables are as follows:
As at December 31, 2016 December 31, 2015
Trade receivables Current $ 66,517 $ 65,147 Past due less than 180 days 30,620 26,801 Past due over 180 days 5,243 4,901
Trade receivables $ 102,380 $ 96,849 Other receivables1 $ 12,474 $ 26,977 Trade and other receivables $ 114,854 $ 123,826
1 Other receivables as at December 31, 2015 and 2016 included a loan receivable associated with a forward contract. The balance as at December 31, 2015 also included sales tax receivables of $16.6 million collected in 2016.
Yellow Pages Limited’s trade receivables are stated after deducting an allowance for doubtful accounts. The movements in the allowance for doubtful accounts were as follows:
As at December 31, 2016 December 31, 2015
Balance, beginning of year $ 12,683 $ 19,247 Bad debt expense, net of recovery 12,829 11,182 Written-off (11,631) (17,746) Balance, end of year $ 13,881 $ 12,683
Market Risk
(i) Interest Rate Risk Yellow Pages Limited is exposed to interest rate risks resulting from fluctuations in interest rates on its ABL with rates which are generally based on the Prime rate or Canadian BA rate. Yellow Pages Limited does not use derivative instruments to reduce its exposure to interest rate risk. The Company manages its interest rate risk by maximizing the interest income earned on excess funds while maintaining the necessary liquidity to conduct its day-to-day operations.
Yellow Pages Limited may also be exposed to fluctuations in long-term interest rates relative to the refinancing of its debt obligations upon their maturity. The interest rate on new long-term debt issuances will be based on the prevailing rates at the time of the refinancing, and will also depend on the tenor of the new debt issued. There are no upcoming maturities that will require refinancing. Changes in interest rates will also affect the fair value of future cash flows of Yellow Pages Limited’s fixed rate debt. As interest rates on the Senior Secured Notes and Exchangeable Debentures are fixed, the Company is not exposed to interest rate fluctuation risk.
(ii) Foreign Exchange Risk Yellow Pages Limited is exposed to foreign exchange risk arising from various currency transactions, which are not significant. Foreign exchange transaction risk arises primarily from commercial transactions that are denominated in a currency that is not the functional currency of Yellow Pages Limited’s business unit that is party to the transaction. Yellow Pages Limited is exposed to fluctuations in the U.S. dollar. The effect on net earnings from existing U.S. dollar exposures of a one point increase or decrease in the Canadian/U.S. dollar exchange rate is not significant. The Company’s expenditures, net of revenues, denominated in U.S. dollars were approximately $33 million for the year ended December 31, 2016. In 2016, Yellow Pages Limited entered into foreign currency contracts to hedge this risk.
Liquidity Risk Liquidity risk is the exposure of Yellow Pages Limited to the risk of not being able to meet its financial obligations as they become due.
Yellow Pages Limited manages this risk by maintaining detailed cash forecasts and long-term operating and strategic plans. The management of liquidity requires a constant monitoring of expected cash inflows and outflows which is achieved through a detailed forecast of the Company’s liquidity position to ensure adequate and efficient use of cash resources.
The Company is required to use an amount equal to 75% of its consolidated Excess Cash Flow to redeem on a semi-annual basis the Senior Secured Notes. This requirement is being met through internally-generated cash and cash on hand.
YELLOW PAGES LIMITED 2016 ANNUAL REPORT 69

NOTES TO THE CONSOLIDATED FINANCIAL STATEMENTS – DECEMBER 31, 2016 (ALL TABULAR AMOUNTS ARE IN THOUSANDS OF CANADIAN DOLLARS, EXCEPT SHARE INFORMATION)
The following are the contractual maturities of the financial liabilities and related capital amounts:
Payments due for the years following December 31, 2016 Total 1 year 2 – 3 years 4 – 5 years After 5 years
Non-derivative financial liabilities Long-term debt1,2 $ 309,669 $ 75,018 $ 234,651 $ – $ – Obligations under finance leases1 359 143 216 – – Exchangeable Debentures1 107,089 – – – 107,089 Trade and other payables 79,493 79,493 – – – Provisions 57,337 53,010 4,327 – – Total $ 553,947 $ 207,664 $ 239,194 $ – $ 107,089
1 Principal amount. 2 The repayment of the Senior Secured Notes may vary subject to the Excess Cash Flow clause under the indenture governing the Senior Secured Notes as
well as the minimum cash balance requirement post Mandatory Redemptions under the indenture governing the Senior Secured Notes.
Fair values The fair value is the price that would be received to sell an asset or paid to transfer a liability in an orderly transaction between market participants.
The fair value of cash, trade and other receivables, and trade and other payables is approximately equal to their carrying values due to their short-term maturity. The fair value of the Senior Secured Notes and the Exchangeable Debentures is evaluated based on quoted market prices as at the statement of financial position date.
The following schedule represents the carrying values and the fair values of financial instruments not measured at fair value in the consolidated statement of financial position as at December 31, 2016:
Level Carrying Value Fair Value
Current portion of long-term debt 1 $ 75,161 $ 77,483 Non-current portion of long-term debt 1 $ 234,867 $ 242,129 Exchangeable Debentures 1 $ 92,174 $ 119,672
Fair value hierarchy The three levels of fair value hierarchy are as follows:
• Level 1 – inputs are unadjusted quoted prices of identical instruments in active markets.
• Level 2 – inputs other than quoted prices included in Level 1 that are observable for the asset or liability, either directly or indirectly.
• Level 3 – inputs used in a valuation technique are not based on observable market data in determining fair values of the instruments.
Determination of fair value and the resulting hierarchy requires the use of observable market data whenever available. The classification of a financial instrument in the hierarchy is based upon the lowest level of input that is significant to the measurement of fair value.
The following table summarizes the financial instruments measured at fair value in the consolidated statements of financial position, classified using the fair value hierarchy:
As at Level December 31, 2016 December 31, 2015 Financial asset or liability Investment – available-for-sale 3 $ 3,520 $ 3,520 Foreign currency forward contracts 2 $ 996 $ –
Yellow Pages Limited’s available-for-sale investment is comprised of a privately held equity security and is carried at fair value based on estimates on market rates prevailing at the statement of financial position date. The available-for-sale investment is presented in financial and other assets in the consolidated statements of financial position.
In order to mitigate foreign exchange risk, Yellow Pages Limited entered into foreign currency forward contracts and designated them as cash-flow hedges for accounting purposes. The foreign currency forward contracts are presented in prepaid expenses in the consolidated statement of financial position as at December 31, 2016.
70 YELLOW PAGES LIMITED 2016 ANNUAL REPORT

NOTES TO THE CONSOLIDATED FINANCIAL STATEMENTS – DECEMBER 31, 2016 (ALL TABULAR AMOUNTS ARE IN THOUSANDS OF CANADIAN DOLLARS, EXCEPT SHARE INFORMATION)
23. CAPITAL DISCLOSURES Yellow Pages Limited’s objective in managing capital is to ensure sufficient liquidity to cover financial obligations and investment requirements. Reducing debt and associated interest charges is one of the Company’s primary financial goals which will improve its financial flexibility and support the implementation of its strategic objectives.
Yellow Pages Limited monitors its capital structure and makes adjustments based on the objectives described above in response to changes in economic conditions and the risk characteristics of the underlying assets and the Company’s working capital requirements.
The primary measure used by Yellow Pages Limited to monitor its financial leverage is its ratio of net debt to Latest Twelve Month Adjusted EBITDA1. Yellow Pages Limited also uses other financial metrics to monitor its financial leverage including Fixed Charge Coverage Ratio and net debt to total capitalization.
Yellow Pages Limited’s capital is comprised of net debt, Exchangeable Debentures and equity attributable to shareholders of Yellow Pages Limited as follows:
As at December 31, 2016 December 31, 2015
Cash $ 17,260 $ 67,253 Senior Secured Notes (Note 12) $ 309,669 $ 406,733 Exchangeable Debentures (Note 13) 92,174 90,478 Obligations under finance leases (Note 12) 359 620 Net debt $ 384,942 $ 430,578 Equity attributable to shareholders 368,904 759,524 Total capitalization $ 753,846 $ 1,190,102 Net debt to total capitalization 51.1% 36.2%
For the years ended December 31, 2016 2015
Latest Twelve Month Adjusted EBITDA¹ $ 235,191 $ 260,687 Net debt to Latest Twelve Month Adjusted EBITDA ratio¹ 1.6 1.7
1 Latest twelve month income from operations before depreciation and amortization, impairment of intangible assets and restructuring and special charges (“Latest Twelve Month Adjusted EBITDA”). Latest Twelve Month Adjusted EBITDA is a non-IFRS measure and may not be comparable with similar measures used by other publicly traded companies.
24. GUARANTEES In the normal course of operations, Yellow Pages Limited has entered into agreements which are customary in the industry that provide for indemnifications and guarantees to counterparties in transactions involving business acquisitions, business dispositions and sale of assets. Yellow Pages Limited has entered into agreements which contain indemnification of its directors and officers indemnifying them against expenses (including legal fees), judgments, fines and any amount actually and reasonably incurred by them in connection with any action, suit or proceeding in which the directors and/or officers are sued as a result of their service, if they acted honestly and in good faith with a view to the best interests of Yellow Pages Limited. Yellow Pages Limited benefits from directors’ and officers’ liability insurance which it has purchased. No amount has been accrued in the consolidated statements of financial position as at December 31, 2016 and 2015 with respect to these indemnities.
The nature of these guarantees prevents Yellow Pages Limited from making a reasonable estimate of the maximum potential amount it could be required to pay to counterparties.
25. SEGMENTED INFORMATION The Company operates in a single business segment which is to provide Canadians with digital and print media and marketing solutions.
As at December 31, 2016, Yellow Pages Limited had non-current assets, other than deferred tax assets, held in a foreign country (United States of America) of $1.6 million (2015 - $2.4 million).
YELLOW PAGES LIMITED 2016 ANNUAL REPORT 71

NOTES TO THE CONSOLIDATED FINANCIAL STATEMENTS – DECEMBER 31, 2016 (ALL TABULAR AMOUNTS ARE IN THOUSANDS OF CANADIAN DOLLARS, EXCEPT SHARE INFORMATION)
26. LIST OF SUBSIDIARIES
Principal activity Proportion of ownership
As at December 31, Canada 2016 2015
Yellow Pages Digital & Media Solutions Limited Digital and print media marketing solutions provider 100% 100% Yellow Pages Homes Limited Publisher of locally-targeted real estate listings 100% 100% 411 Local Search Corp. Digital media marketing solutions provider 100% 100% 9059-2114 Quebec Inc. Holding company 100% 100% ByTheOwner Inc. Real estate and related services provider 100% 100% Juice DMS Advertising Limited¹ Digital media marketing solutions provider 100% – YP Dine Solutions Limited Local digital restaurant guides provider 100% 100% Bookenda Limited Booking and reservation management system provider 100% 100% 9778748 Canada Inc.² Publisher 100% –
USA
YPG (USA) Holdings, Inc. Holding company 100% 100% Yellow Pages Digital & Media Solutions, LLC Operational support services provider 100% 100% Juice Mobile USA LLC¹ Digital media marketing solutions provider 100% –
1 On March 17, 2016, Yellow Pages Limited acquired the consolidated net assets of Oriole Media Corp. (doing business as JUICE Mobile). Oriole Media Corp. was subsequently renamed Juice DMS Advertising Limited (refer to Note 5 – Business acquisitions).
2 On September 26, 2016, Yellow Pages Homes Limited acquired the net assets of 9778748 Canada Inc. (doing business as Totem. Refer to Note 5 – Business acquisitions).
27. RELATED PARTY DISCLOSURES Key management personnel compensation
Yellow Pages Limited’s key management personnel have authority and responsibility for planning, directing and controlling the Company’s activities and consist of Yellow Pages Limited’s executive team and the Board of Directors.
Total compensation expense for key management personnel, and the composition thereof, is as follows:
1 During 2016, management reassessed its key management personnel. The prior period has been revised to reflect this change in composition.
For the years ended December 31, 2016 2015
Salary, fees and other short-term employee benefits $ 5,354 $ 5,107 Post-employment benefits 437 364 Stock-based compensation 4,306 3,608 Termination benefits 1,350 –
$ 11,447 $ 9,079
72 YELLOW PAGES LIMITED 2016 ANNUAL REPORT

Head Office
16 Place du Commerce
Verdun, Quebec
H3E 2A5
Investor Relations
Telephone: 1 877 YLO-2003 (1 877 956-2003)
E-mail: [email protected]
Auditor
Deloitte LLP
TSX Symbols
Y Common Shares
YPG.DB Senior Subordinated Unsecured Exchangeable Debentures
Y.WT Warrants
Transfer Agent
CST Trust Company
2001 Boul. Robert-Bourassa, Suite 1600
Montreal, Quebec H3A 2A6
Telephone: 1 800 387-0825
E-Mail Inquiries: [email protected]
For further information on Yellow Pages Limited, visit our corporate website at corporate.yp.ca

C132107
This annual report is printed on Rolland Enviro 100, the environmentally responsible choice,
because it is processed chlorine free, accredited Eco-Logo and 100% post-consumer. In other words,
no new trees have been cut to produce this paper, and all the fibre comes from recycling bins.