annual report 2016 - アズワン株式会社 · 1.6 2.0 2.5 2.9 3.4 4.1 5.0 maximization of...
TRANSCRIPT

ANNUALREPORT 2016
[Our Name]
“AS ONE” is an expression of our business model
of operating as a unified team with many partners.
To succeed in a constantly changing market,
we are working with users, dealers and suppliers
for more progress by creating new forms of value.
Supplying what researchers need
With speed and accuracy
This is the heart of our commitment to
“innovation and creation.”
Financial HighlightsMessage from the PresidentMedium-Term Management Plan (Project-NANA-) E-commerce Overseas operations New productsOverview by SectorCorporate Social ResponsibilityCorporate GovernanceRemarks by Outside DirectorsStock InformationDirectors and AuditorsFinancial AnalysisCompany Information
0305
0911131519212527293141
Contents
AS ONE CORPORATIONANNUAL REPORT 2016
01 AS ONE CORPORATION ANNUAL REPORT 2016 AS ONE CORPORATION ANNUAL REPORT 2016 02
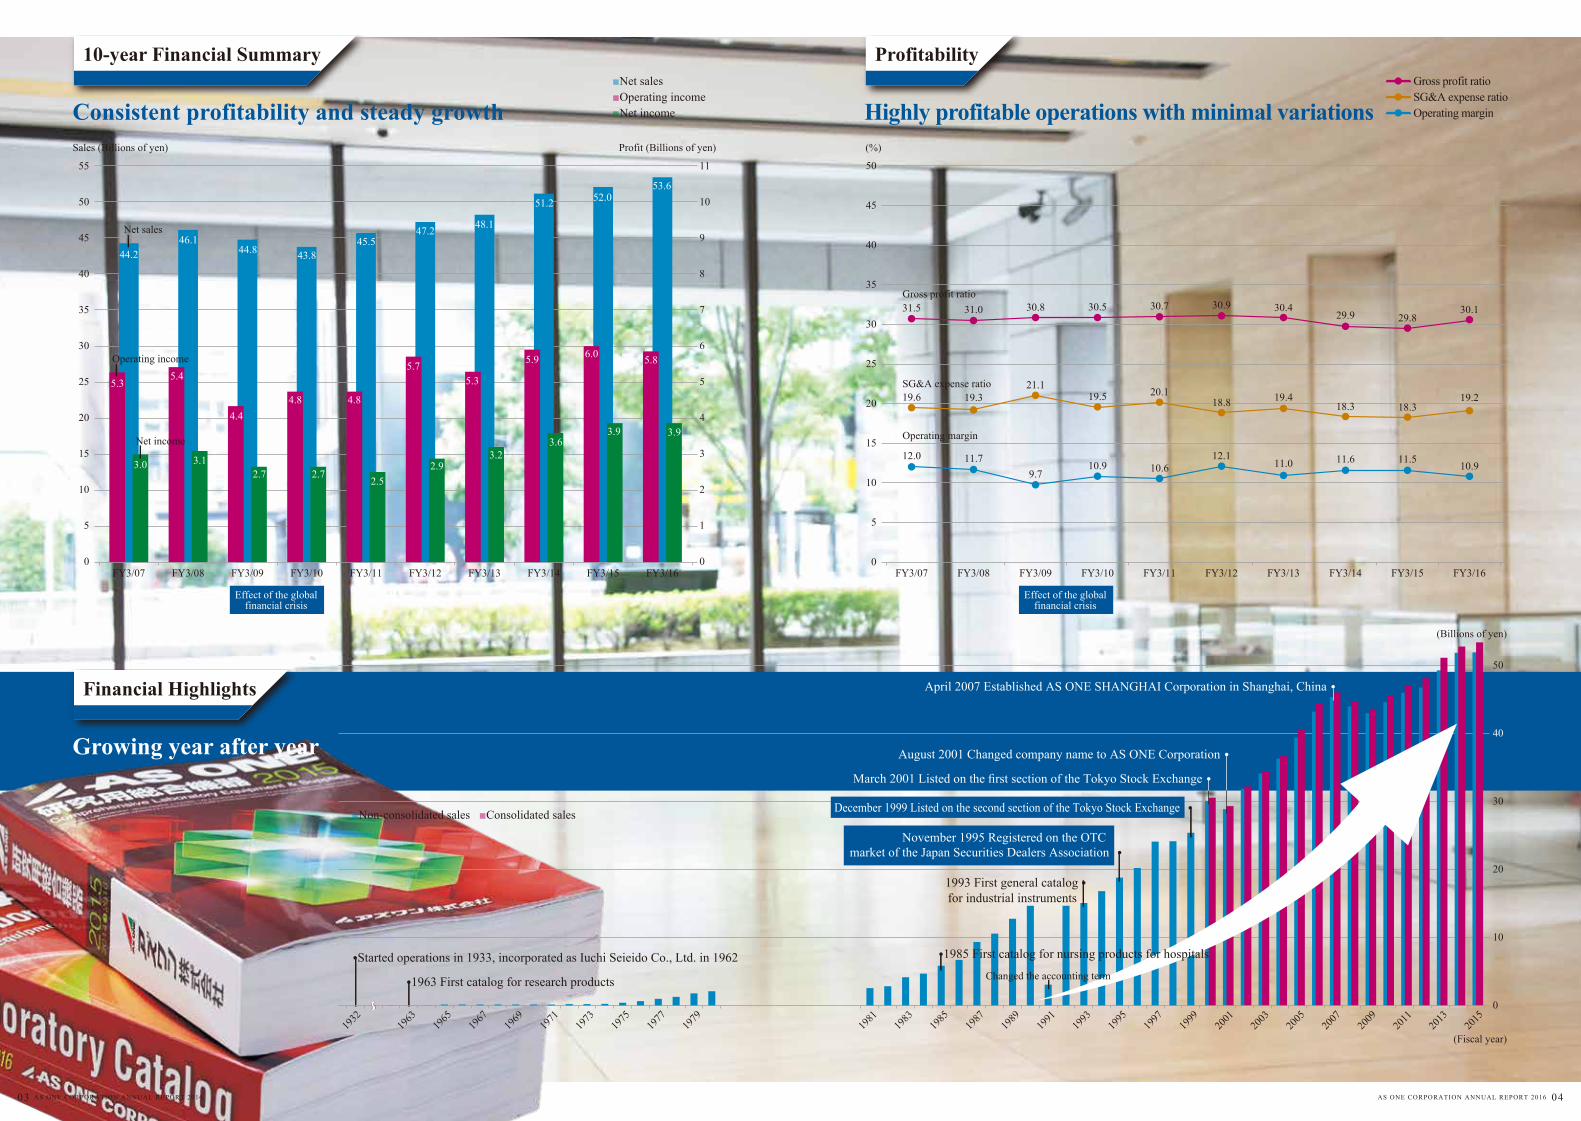
Consistent profitability and steady growth
10-year Financial Summary
Growing year after year
Financial Highlights
Highly profitable operations with minimal variations
Profitability■Net sales■Operating income■Net income
Gross profit ratioSG&A expense ratioOperating margin
5
10
15
20
25
30
35
40
45
50
55
1
2
3
4
5
6
7
8
9
10
11
Sales (Billions of yen) Profit (Billions of yen)
44.2
5.3
3.0
46.1
5.4
3.1
44.8
4.4
2.7
4.8
43.8
2.7
45.5
4.8
2.52.9
47.2
5.7
3.2
48.1
5.3
6.0
3.9
52.0
5.8
3.9
53.6
3.6
51.2
5.9
Effect of the globalfinancial crisis
Effect of the globalfinancial crisis
5
10
15
20
25
30
35
40
45
50
(%)
1932
1963
1965
1967
1969
1971
1973
1975
1977
1979
1981
1983
1985
1987
1989
1991
1993
1995
1997
1999
2001
2003
2005
2007
2009
2011
2013
2015
0
10
20
30
40
50
(Billions of yen)
(Fiscal year)
■Non-consolidated sales ■Consolidated sales
●Started operations in 1933, incorporated as Iuchi Seieido Co., Ltd. in 1962
●1963 First catalog for research products
●1985 First catalog for nursing products for hospitals
1993 First general catalog ●
August 2001 Changed company name to AS ONE Corporation ●
March 2001 Listed on the first section of the Tokyo Stock Exchange ●
November 1995 Registered on the OTC market of the Japan Securities Dealers Association ●
April 2007 Established AS ONE SHANGHAI Corporation in Shanghai, China ●
December 1999 Listed on the second section of the Tokyo Stock Exchange ●
19.6 19.321.1
19.5 20.118.8 19.4
18.3 18.319.2
12.0 11.79.7
10.9 10.612.1
11.0 11.6 11.5 10.9
31.5 31.0 30.8 30.5 30.7 30.9 30.429.9 29.8
30.1
FY3/07 FY3/08 FY3/09 FY3/10 FY3/11 FY3/12 FY3/13 FY3/14 FY3/15 FY3/1600
FY3/07 FY3/08 FY3/09 FY3/10 FY3/11 FY3/12 FY3/13 FY3/14 FY3/15 FY3/160
Net sales
Gross profit ratio
SG&A expense ratio
Operating margin
Operating income
Net income
Changed the accounting term
for industrial instruments
03 AS ONE CORPORATION ANNUAL REPORT 2016 AS ONE CORPORATION ANNUAL REPORT 2016 04
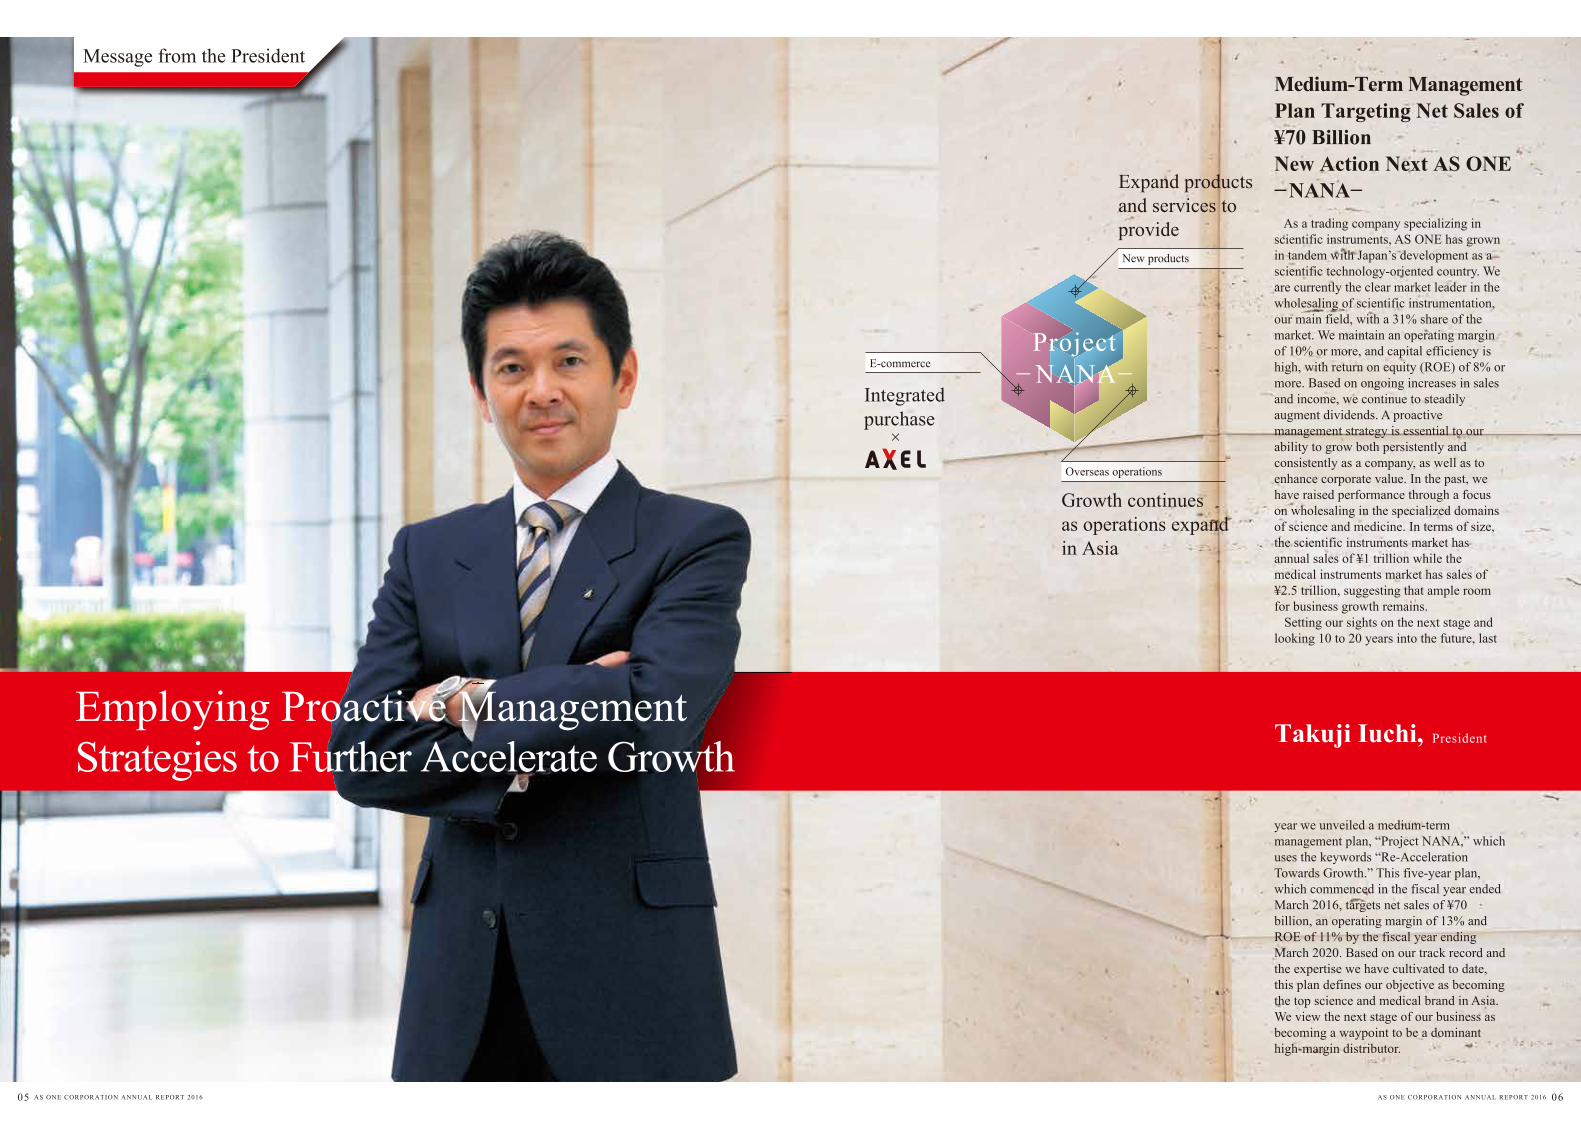
As a trading company specializing in scientific instruments, AS ONE has grown in tandem with Japan’s development as a scientific technology-oriented country. We are currently the clear market leader in the wholesaling of scientific instrumentation, our main field, with a 31% share of the market. We maintain an operating margin of 10% or more, and capital efficiency is high, with return on equity (ROE) of 8% or more. Based on ongoing increases in sales and income, we continue to steadily augment dividends. A proactive management strategy is essential to our ability to grow both persistently and consistently as a company, as well as to enhance corporate value. In the past, we have raised performance through a focus on wholesaling in the specialized domains of science and medicine. In terms of size, the scientific instruments market has annual sales of ¥1 trillion while the medical instruments market has sales of ¥2.5 trillion, suggesting that ample room for business growth remains. Setting our sights on the next stage and looking 10 to 20 years into the future, last
year we unveiled a medium-term management plan, “Project NANA,” which uses the keywords “Re-Acceleration Towards Growth.” This five-year plan, which commenced in the fiscal year ended March 2016, targets net sales of ¥70 billion, an operating margin of 13% and ROE of 11% by the fiscal year ending March 2020. Based on our track record and the expertise we have cultivated to date, this plan defines our objective as becoming the top science and medical brand in Asia. We view the next stage of our business as becoming a waypoint to be a dominant high-margin distributor.
Medium-Term Management Plan Targeting Net Sales of ¥70 BillionNew Action Next AS ONE−NANA−
Employing Proactive Management Strategies to Further Accelerate Growth PresidentTakuji Iuchi,
Growth continues as operations expand in Asia
Overseas operations
Expand products and services to provideNew products
E-commerce
Integrated purchase
Message from the President
Project− NANA−
×
05 AS ONE CORPORATION ANNUAL REPORT 2016 AS ONE CORPORATION ANNUAL REPORT 2016 06
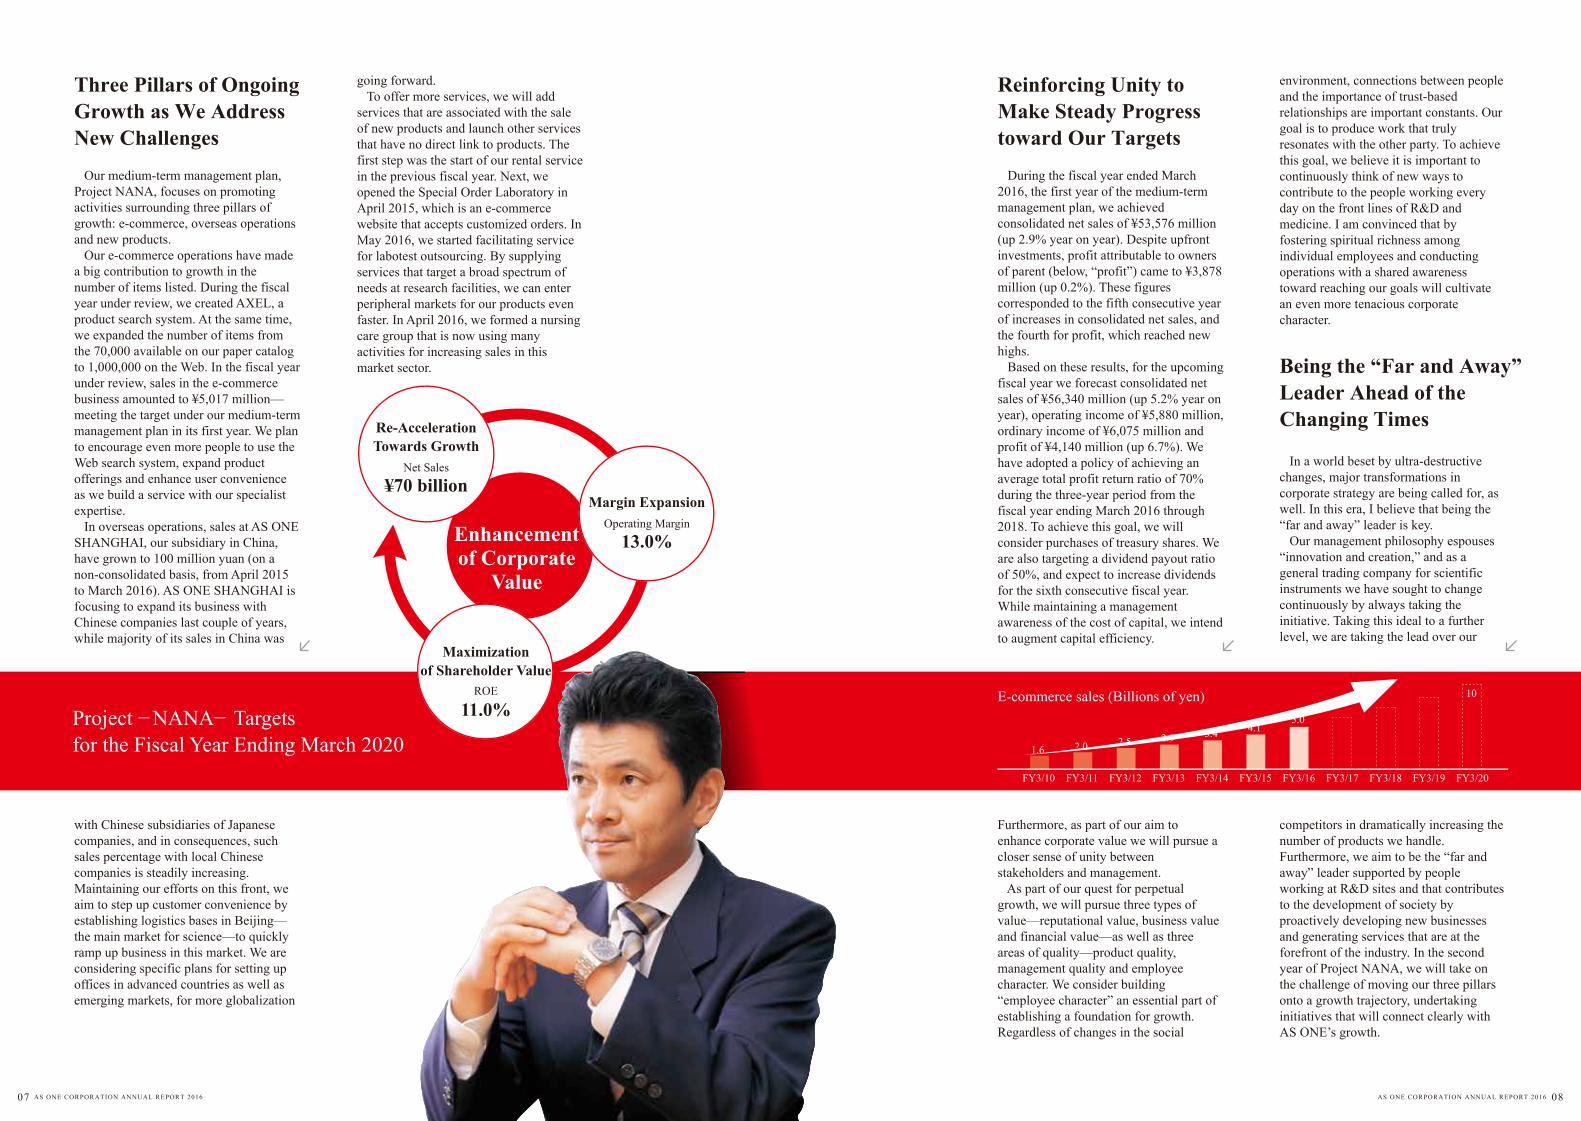
Three Pillars of Ongoing Growth as We Address New Challenges Our medium-term management plan, Project NANA, focuses on promoting activities surrounding three pillars of growth: e-commerce, overseas operations and new products. Our e-commerce operations have made a big contribution to growth in the number of items listed. During the fiscal year under review, we created AXEL, a product search system. At the same time, we expanded the number of items from the 70,000 available on our paper catalog to 1,000,000 on the Web. In the fiscal year under review, sales in the e-commerce business amounted to ¥5,017 million—meeting the target under our medium-term management plan in its first year. We plan to encourage even more people to use the Web search system, expand product offerings and enhance user convenience as we build a service with our specialist expertise. In overseas operations, sales at AS ONE SHANGHAI, our subsidiary in China, have grown to 100 million yuan (on a non-consolidated basis, from April 2015 to March 2016). AS ONE SHANGHAI is focusing to expand its business with Chinese companies last couple of years, while majority of its sales in China was
Reinforcing Unity to Make Steady Progress toward Our Targets During the fiscal year ended March 2016, the first year of the medium-term management plan, we achieved consolidated net sales of ¥53,576 million (up 2.9% year on year). Despite upfront investments, profit attributable to owners of parent (below, “profit”) came to ¥3,878 million (up 0.2%). These figures corresponded to the fifth consecutive year of increases in consolidated net sales, and the fourth for profit, which reached new highs. Based on these results, for the upcoming fiscal year we forecast consolidated net sales of ¥56,340 million (up 5.2% year on year), operating income of ¥5,880 million, ordinary income of ¥6,075 million and profit of ¥4,140 million (up 6.7%). We have adopted a policy of achieving an average total profit return ratio of 70% during the three-year period from the fiscal year ending March 2016 through 2018. To achieve this goal, we will consider purchases of treasury shares. We are also targeting a dividend payout ratio of 50%, and expect to increase dividends for the sixth consecutive fiscal year. While maintaining a management awareness of the cost of capital, we intend to augment capital efficiency.
with Chinese subsidiaries of Japanese companies, and in consequences, such sales percentage with local Chinese companies is steadily increasing. Maintaining our efforts on this front, we aim to step up customer convenience by establishing logistics bases in Beijing—the main market for science—to quickly ramp up business in this market. We are considering specific plans for setting up offices in advanced countries as well as emerging markets, for more globalization
going forward. To offer more services, we will add services that are associated with the sale of new products and launch other services that have no direct link to products. The first step was the start of our rental service in the previous fiscal year. Next, we opened the Special Order Laboratory in April 2015, which is an e-commerce website that accepts customized orders. In May 2016, we started facilitating service for labotest outsourcing. By supplying services that target a broad spectrum of needs at research facilities, we can enter peripheral markets for our products even faster. In April 2016, we formed a nursing care group that is now using many activities for increasing sales in this market sector.
Furthermore, as part of our aim to enhance corporate value we will pursue a closer sense of unity between stakeholders and management. As part of our quest for perpetual growth, we will pursue three types of value—reputational value, business value and financial value—as well as three areas of quality—product quality, management quality and employee character. We consider building “employee character” an essential part of establishing a foundation for growth. Regardless of changes in the social
environment, connections between people and the importance of trust-based relationships are important constants. Our goal is to produce work that truly resonates with the other party. To achieve this goal, we believe it is important to continuously think of new ways to contribute to the people working every day on the front lines of R&D and medicine. I am convinced that by fostering spiritual richness among individual employees and conducting operations with a shared awareness toward reaching our goals will cultivate an even more tenacious corporate character.
Being the “Far and Away” Leader Ahead of the Changing Times
In a world beset by ultra-destructive changes, major transformations in corporate strategy are being called for, as well. In this era, I believe that being the “far and away” leader is key. Our management philosophy espouses “innovation and creation,” and as a general trading company for scientific instruments we have sought to change continuously by always taking the initiative. Taking this ideal to a further level, we are taking the lead over our
competitors in dramatically increasing the number of products we handle. Furthermore, we aim to be the “far and away” leader supported by people working at R&D sites and that contributes to the development of society by proactively developing new businesses and generating services that are at the forefront of the industry. In the second year of Project NANA, we will take on the challenge of moving our three pillars onto a growth trajectory, undertaking initiatives that will connect clearly with AS ONE’s growth.
Project −NANA− Targets for the Fiscal Year Ending March 2020
E-commerce sales (Billions of yen)
FY3/10 FY3/11 FY3/12 FY3/13 FY3/14 FY3/15 FY3/16 FY3/17 FY3/18 FY3/19 FY3/20
10
1.6 2.0 2.5 2.9 3.4 4.15.0
Maximizationof Shareholder Value
ROE
11.0%
Re-AccelerationTowards Growth
Net Sales
¥70 billionMargin Expansion
Operating Margin
13.0%Enhancementof Corporate
Value
07 AS ONE CORPORATION ANNUAL REPORT 2016 AS ONE CORPORATION ANNUAL REPORT 2016 08
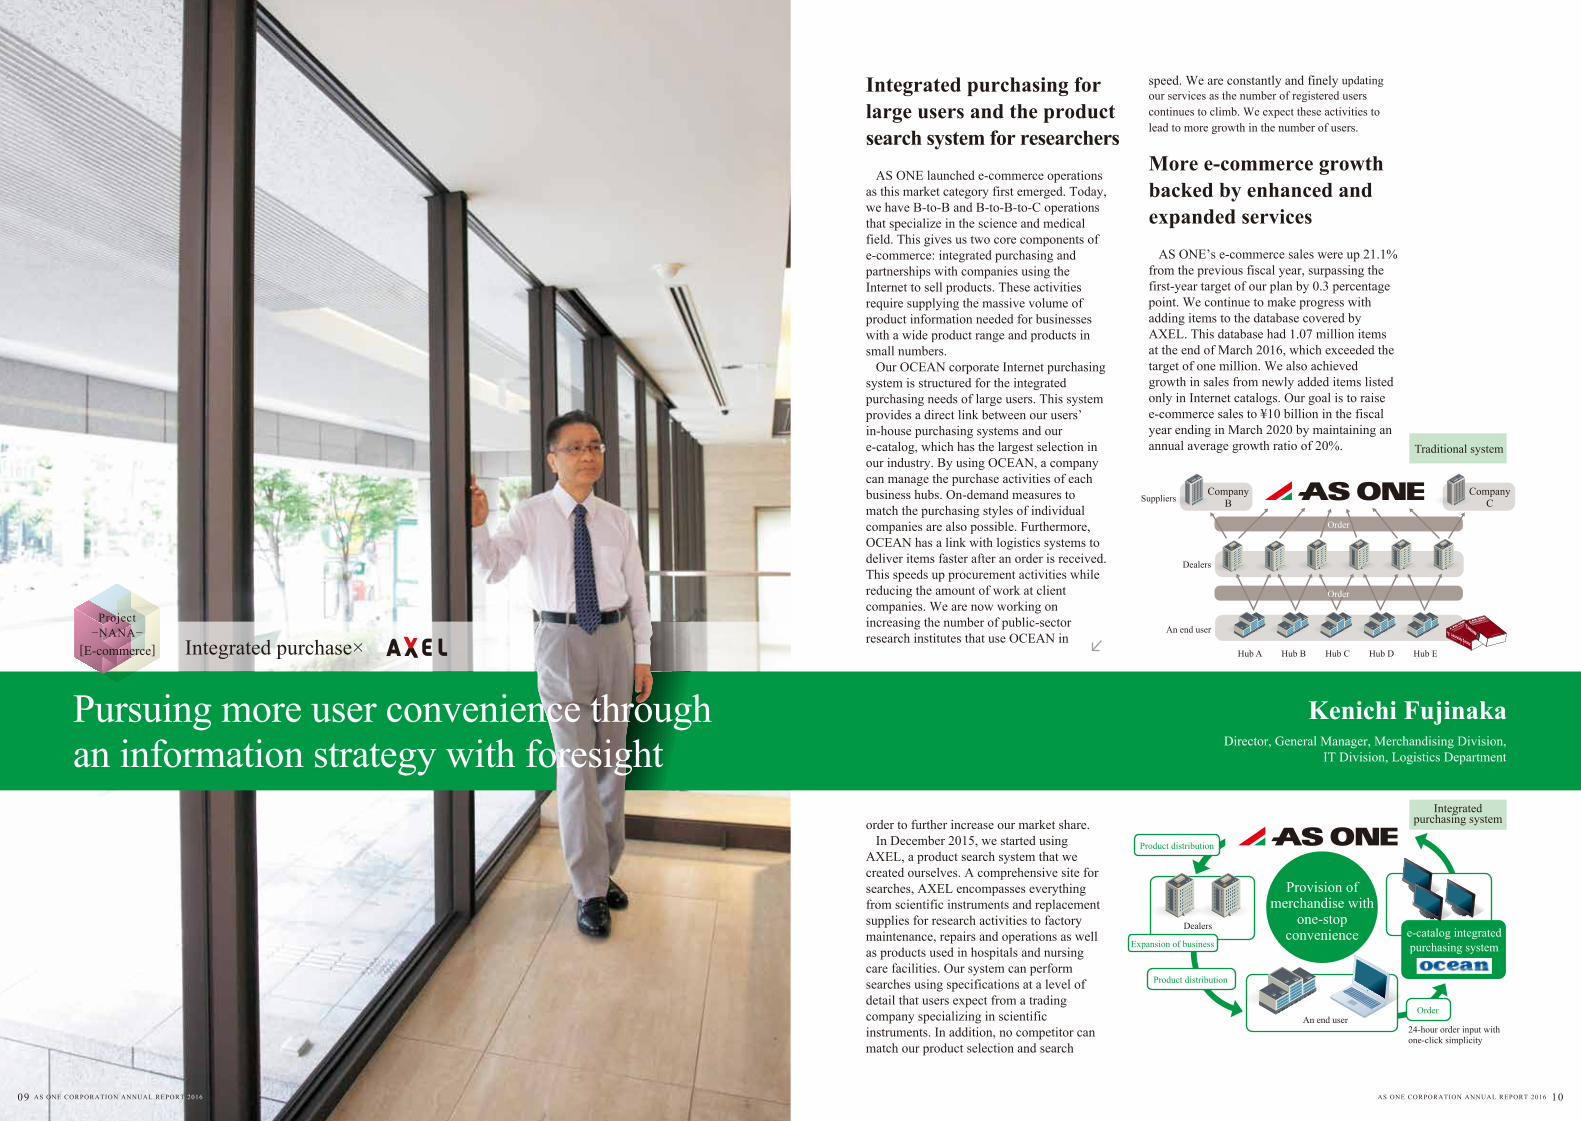
Integrated purchasing for large users and the product search system for researchers AS ONE launched e-commerce operations as this market category first emerged. Today, we have B-to-B and B-to-B-to-C operations that specialize in the science and medical field. This gives us two core components of e-commerce: integrated purchasing and partnerships with companies using the Internet to sell products. These activities require supplying the massive volume of product information needed for businesses with a wide product range and products in small numbers. Our OCEAN corporate Internet purchasing system is structured for the integrated purchasing needs of large users. This system provides a direct link between our users’ in-house purchasing systems and our e-catalog, which has the largest selection in our industry. By using OCEAN, a company can manage the purchase activities of each business hubs. On-demand measures to match the purchasing styles of individual companies are also possible. Furthermore, OCEAN has a link with logistics systems to deliver items faster after an order is received. This speeds up procurement activities while reducing the amount of work at client companies. We are now working on increasing the number of public-sector research institutes that use OCEAN in
More e-commerce growth backed by enhanced and expanded services AS ONE’s e-commerce sales were up 21.1% from the previous fiscal year, surpassing the first-year target of our plan by 0.3 percentage point. We continue to make progress with adding items to the database covered by AXEL. This database had 1.07 million items at the end of March 2016, which exceeded the target of one million. We also achieved growth in sales from newly added items listed only in Internet catalogs. Our goal is to raise e-commerce sales to ¥10 billion in the fiscal year ending in March 2020 by maintaining an annual average growth ratio of 20%.
order to further increase our market share. In December 2015, we started using AXEL, a product search system that we created ourselves. A comprehensive site for searches, AXEL encompasses everything from scientific instruments and replacement supplies for research activities to factory maintenance, repairs and operations as well as products used in hospitals and nursing care facilities. Our system can perform searches using specifications at a level of detail that users expect from a trading company specializing in scientific instruments. In addition, no competitor can match our product selection and search
speed. We are constantly and finely updating our services as the number of registered users continues to climb. We expect these activities to lead to more growth in the number of users.
Kenichi Fujinaka
An end user24-hour order input with one-click simplicity
Dealers e-catalog integratedpurchasing system
Provision ofmerchandise with
one-stopconvenience
Product distribution
Order
Expansion of business
Product distribution
An end user
Hub A Hub B Hub C Hub D Hub E
Dealers
Suppliers
Order
Order
CompanyB
CompanyC
Director, General Manager, Merchandising Division, IT Division, Logistics Department
Integrated purchase×
Pursuing more user convenience through an information strategy with foresight
Integratedpurchasing system
[E-commerce]
Project−NANA−
Traditional system
09 AS ONE CORPORATION ANNUAL REPORT 2016 AS ONE CORPORATION ANNUAL REPORT 2016 10
Full-scale operations in China reach the 100 million yuan milestone
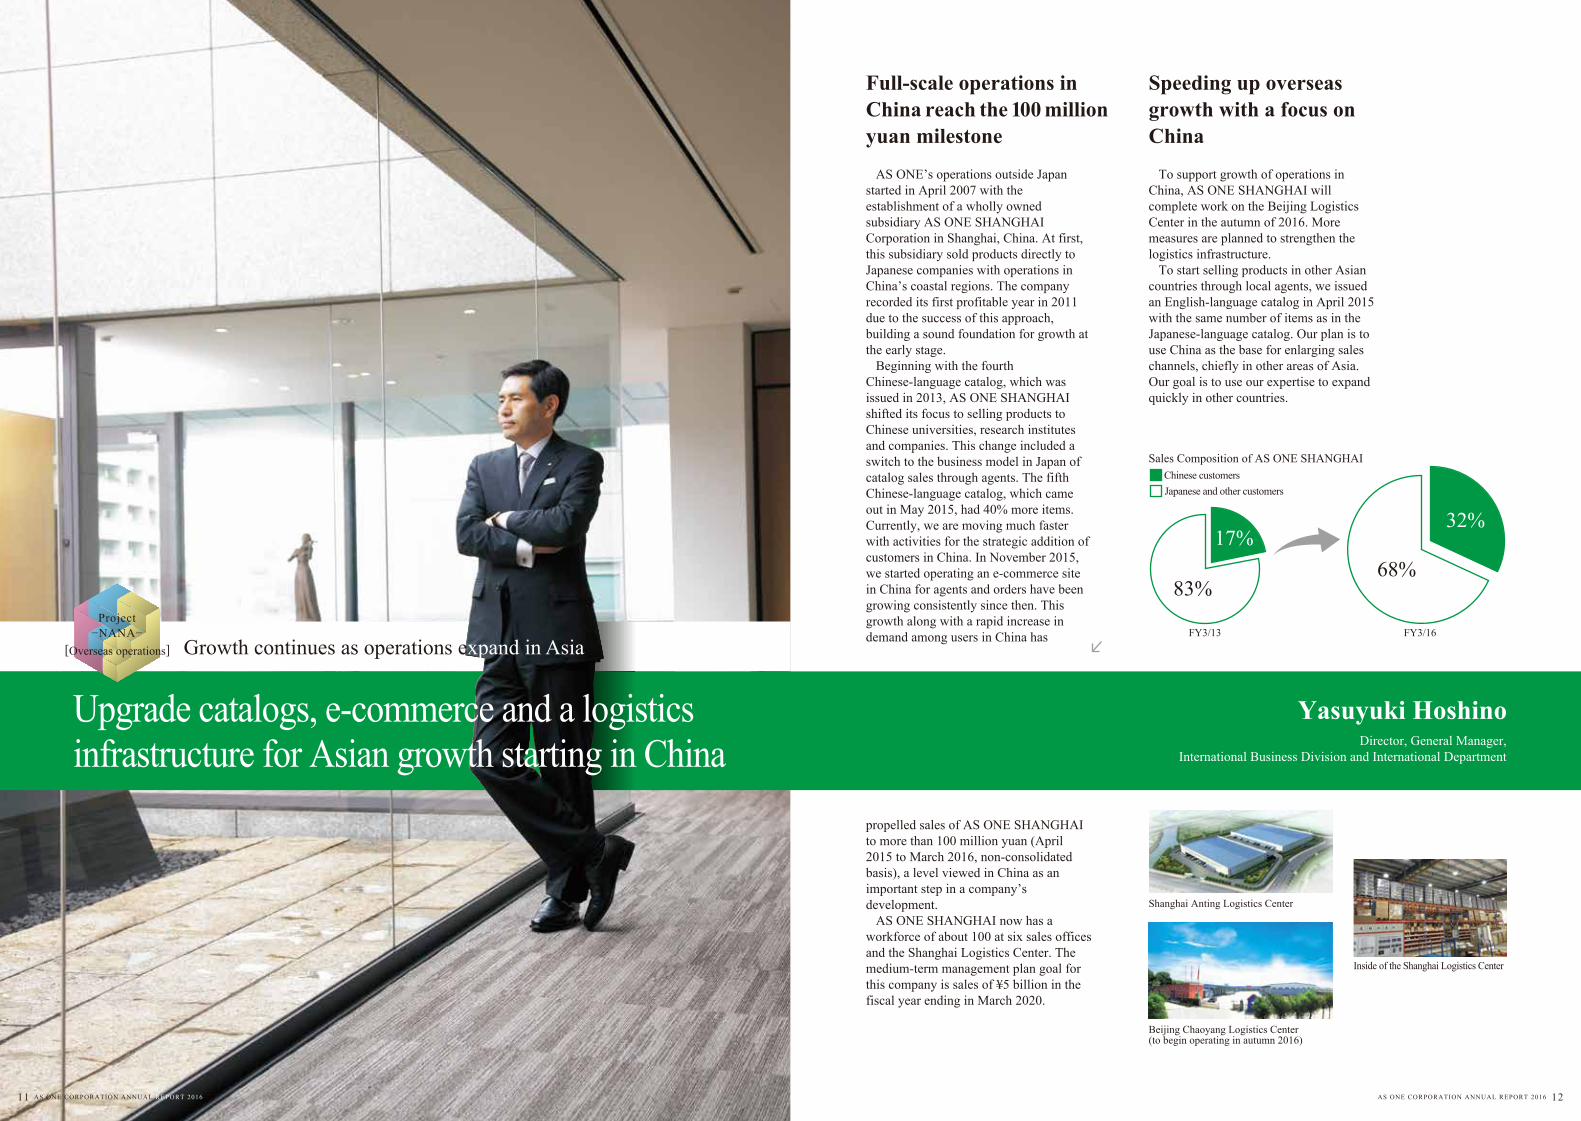
AS ONE’s operations outside Japan started in April 2007 with the establishment of a wholly owned subsidiary AS ONE SHANGHAI Corporation in Shanghai, China. At first, this subsidiary sold products directly to Japanese companies with operations in China’s coastal regions. The company recorded its first profitable year in 2011 due to the success of this approach, building a sound foundation for growth at the early stage. Beginning with the fourth Chinese-language catalog, which was issued in 2013, AS ONE SHANGHAI shifted its focus to selling products to Chinese universities, research institutes and companies. This change included a switch to the business model in Japan of catalog sales through agents. The fifth Chinese-language catalog, which came out in May 2015, had 40% more items. Currently, we are moving much faster with activities for the strategic addition of customers in China. In November 2015, we started operating an e-commerce site in China for agents and orders have been growing consistently since then. This growth along with a rapid increase in demand among users in China has
Speeding up overseas growth with a focus on China
To support growth of operations in China, AS ONE SHANGHAI will complete work on the Beijing Logistics Center in the autumn of 2016. More measures are planned to strengthen the logistics infrastructure. To start selling products in other Asian countries through local agents, we issued an English-language catalog in April 2015 with the same number of items as in the Japanese-language catalog. Our plan is to use China as the base for enlarging sales channels, chiefly in other areas of Asia. Our goal is to use our expertise to expand quickly in other countries.
propelled sales of AS ONE SHANGHAI to more than 100 million yuan (April 2015 to March 2016, non-consolidated basis), a level viewed in China as an important step in a company’s development. AS ONE SHANGHAI now has a workforce of about 100 at six sales offices and the Shanghai Logistics Center. The medium-term management plan goal for this company is sales of ¥5 billion in the fiscal year ending in March 2020.
Yasuyuki HoshinoDirector, General Manager,
International Business Division and International Department
Growth continues as operations expand in Asia
Upgrade catalogs, e-commerce and a logistics infrastructure for Asian growth starting in China
FY3/13 FY3/16
Sales Composition of AS ONE SHANGHAIChinese customersJapanese and other customers
17%
83%
32%
68%
Inside of the Shanghai Logistics Center
Beijing Chaoyang Logistics Center (to begin operating in autumn 2016)
Shanghai Anting Logistics Center
[Overseas operations]
Project−NANA−
11 AS ONE CORPORATION ANNUAL REPORT 2016 AS ONE CORPORATION ANNUAL REPORT 2016 12
Seek new products for re-acceleration towards growth
Creating businesses and adding new products are key strategic goals of the medium-term management plan. The goal is to use these activities to generate new sales of ¥6 billion by the fiscal year ending in March 2020. To reach this goal, we will cover even more specialized market sectors and strengthen our lineup of merchandise and services. To increase the number of specialized markets we serve, we already have teams targeting four specialized business domains: the equipment group (the ASSRE catalog), the SANIFOODS group (the SANIFOODS catalog), the biosciences group (the BioLab catalog) and the ASPURE cleaning items group (the ASPURE catalog). All four groups have launched catalog operations in new business sectors and each group now has annual sales of more than ¥1 billion. Total sales of all four groups exceeded ¥8 billion in the fiscal year ended March 2016. In March 2015, we created a project team to search for new products as part of the current medium-term management plan. The project team has started new expansion in niche specialized markets while performing the required market
Use a broader service lineup to make the AS ONE brand more powerful
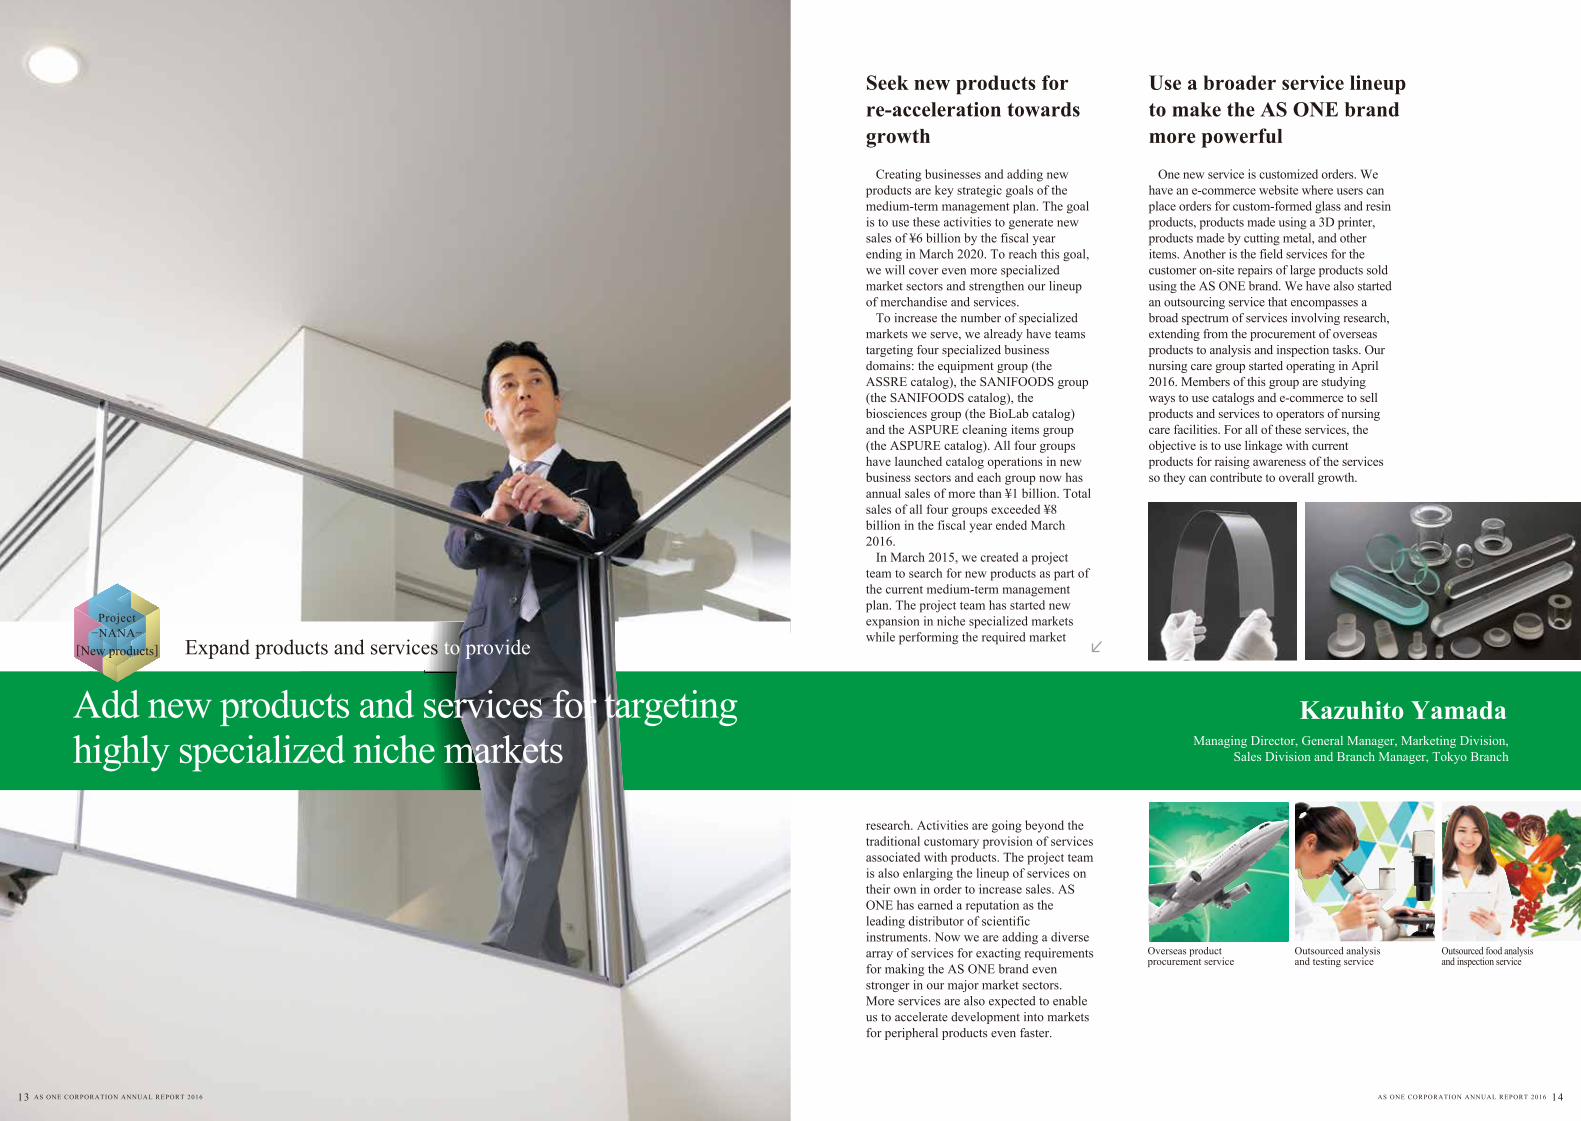
One new service is customized orders. We have an e-commerce website where users can place orders for custom-formed glass and resin products, products made using a 3D printer, products made by cutting metal, and other items. Another is the field services for the customer on-site repairs of large products sold using the AS ONE brand. We have also started an outsourcing service that encompasses a broad spectrum of services involving research, extending from the procurement of overseas products to analysis and inspection tasks. Our nursing care group started operating in April 2016. Members of this group are studying ways to use catalogs and e-commerce to sell products and services to operators of nursing care facilities. For all of these services, the objective is to use linkage with current products for raising awareness of the services so they can contribute to overall growth.
research. Activities are going beyond the traditional customary provision of services associated with products. The project team is also enlarging the lineup of services on their own in order to increase sales. AS ONE has earned a reputation as the leading distributor of scientific instruments. Now we are adding a diverse array of services for exacting requirements for making the AS ONE brand even stronger in our major market sectors. More services are also expected to enable us to accelerate development into markets for peripheral products even faster.
Kazuhito YamadaManaging Director, General Manager, Marketing Division,
Sales Division and Branch Manager, Tokyo Branch
Overseas product procurement service
Outsourced analysis and testing service
Outsourced food analysis and inspection service
Expand products and services to provide
Add new products and services for targeting highly specialized niche markets
[New products]
Project−NANA−
13 AS ONE CORPORATION ANNUAL REPORT 2016 AS ONE CORPORATION ANNUAL REPORT 2016 14
Japan’s foremost total supplier, supporting workplaces
Overview by Sector
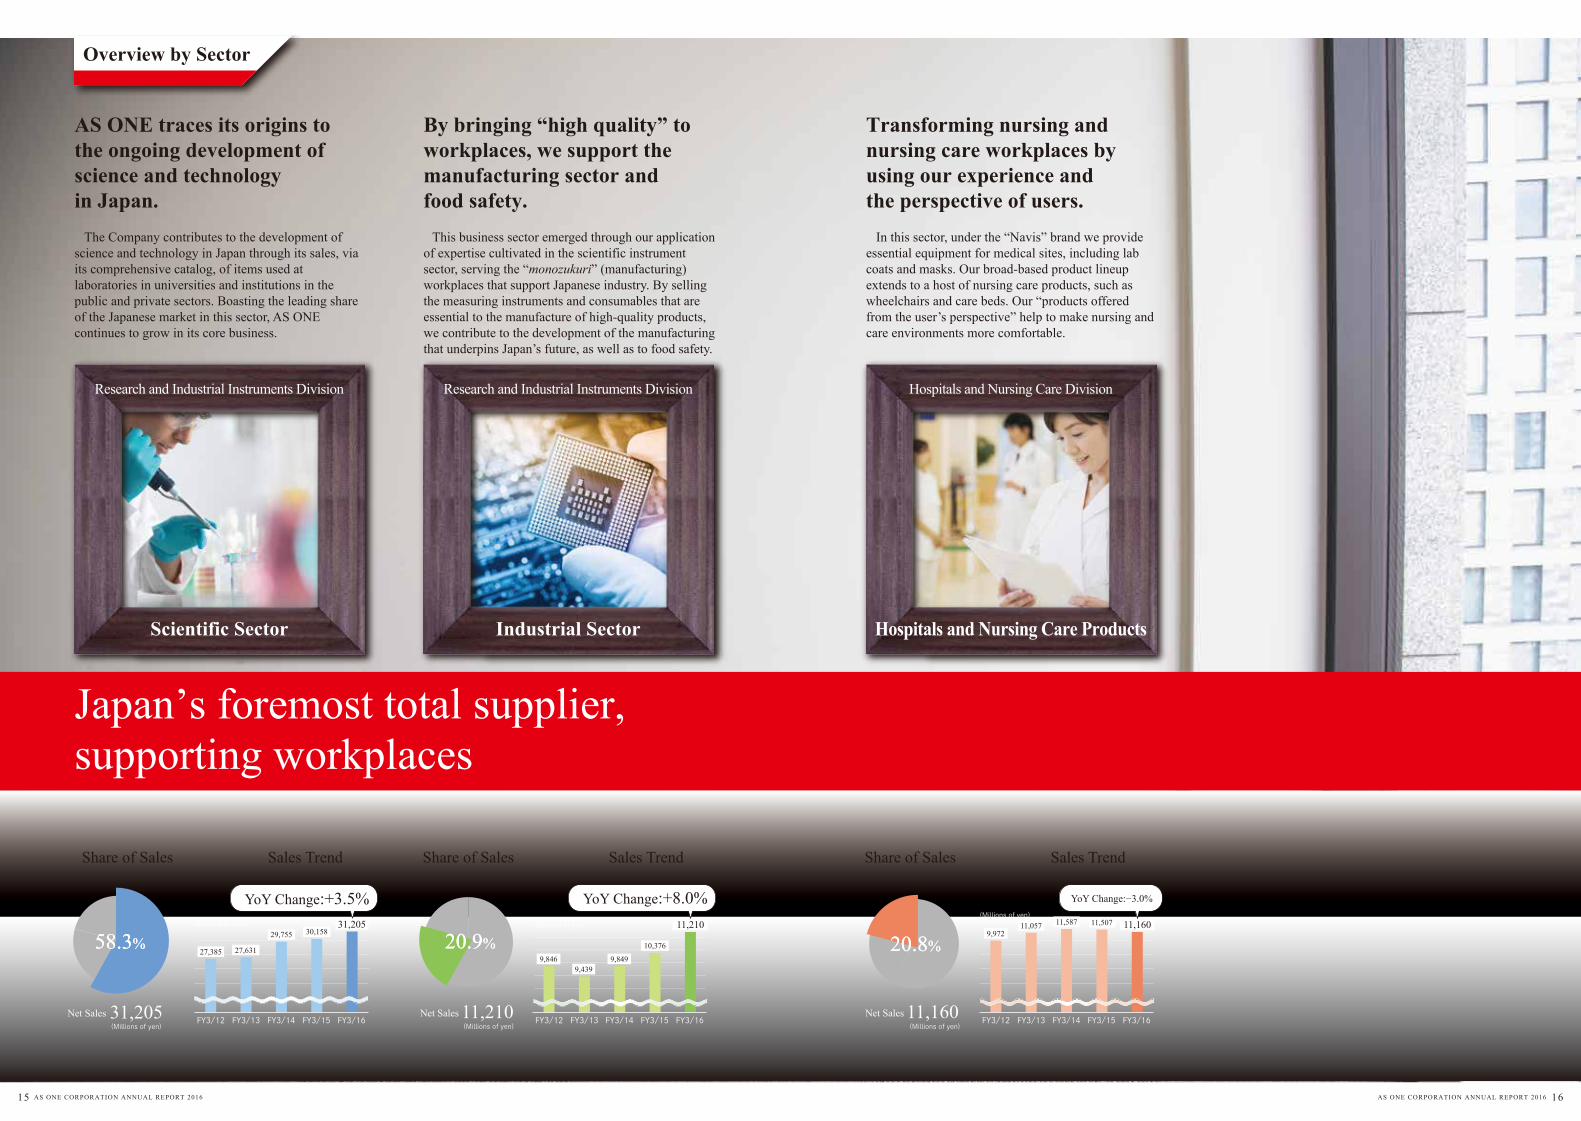
AS ONE traces its origins to the ongoing development of science and technology in Japan. The Company contributes to the development of science and technology in Japan through its sales, via its comprehensive catalog, of items used at laboratories in universities and institutions in the public and private sectors. Boasting the leading share of the Japanese market in this sector, AS ONE continues to grow in its core business.
By bringing “high quality” to workplaces, we support the manufacturing sector and food safety. This business sector emerged through our application of expertise cultivated in the scientific instrument sector, serving the “monozukuri” (manufacturing) workplaces that support Japanese industry. By selling the measuring instruments and consumables that are essential to the manufacture of high-quality products, we contribute to the development of the manufacturing that underpins Japan’s future, as well as to food safety.
Transforming nursing and nursing care workplaces by using our experience and the perspective of users.
Scientific Sector Industrial Sector Hospitals and Nursing Care Products
Research and Industrial Instruments Division Research and Industrial Instruments Division Hospitals and Nursing Care Division
In this sector, under the “Navis” brand we provide essential equipment for medical sites, including lab coats and masks. Our broad-based product lineup extends to a host of nursing care products, such as wheelchairs and care beds. Our “products offered from the user’s perspective” help to make nursing and care environments more comfortable.
Share of Sales Sales Trend
58.3%58.3%
31,205Net Sales(Millions of yen)
FY3/12
(Millions of yen)
27,385 27,631
29,755 30,15831,205
FY3/13 FY3/14 FY3/15 FY3/16
YoY Change:+3.5%
Share of Sales Sales Trend
20.9%20.9%
11,210Net Sales(Millions of yen)
FY3/12
(Millions of yen)
9,8469,439
9,849
10,376
11,210
FY3/13 FY3/14 FY3/15 FY3/16
YoY Change:+8.0%
Share of Sales Sales Trend
20.8%20.8%
11,160Net Sales(Millions of yen)
FY3/12
(Millions of yen)
9,97211,057 11,587 11,507 11,160
FY3/13 FY3/14 FY3/15 FY3/16
YoY Change:−3.0%
15 AS ONE CORPORATION ANNUAL REPORT 2016 AS ONE CORPORATION ANNUAL REPORT 2016 16
Scientific Sector Industrial Sector Hospitals and Nursing Care Products
Research and Industrial Instruments Division Research and Industrial Instruments Division Hospitals and Nursing Care Division
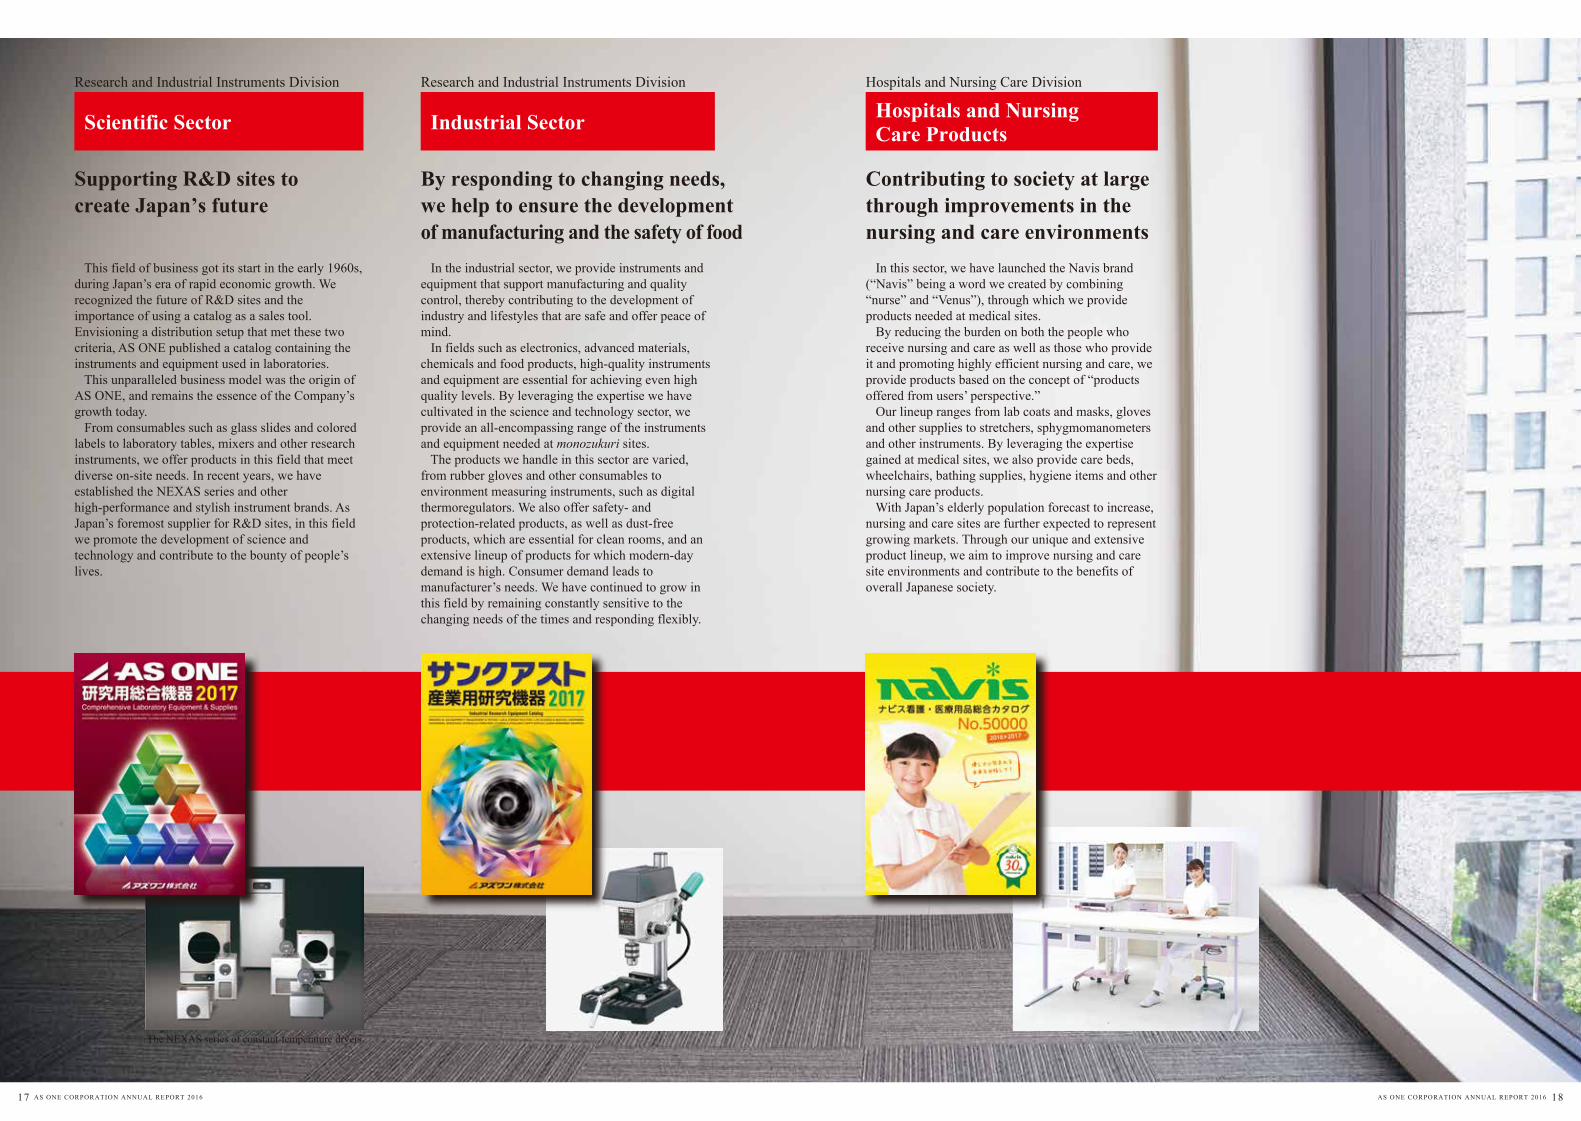
Supporting R&D sites to create Japan’s future
This field of business got its start in the early 1960s, during Japan’s era of rapid economic growth. We recognized the future of R&D sites and the importance of using a catalog as a sales tool. Envisioning a distribution setup that met these two criteria, AS ONE published a catalog containing the instruments and equipment used in laboratories. This unparalleled business model was the origin of AS ONE, and remains the essence of the Company’s growth today. From consumables such as glass slides and colored labels to laboratory tables, mixers and other research instruments, we offer products in this field that meet diverse on-site needs. In recent years, we have established the NEXAS series and other high-performance and stylish instrument brands. As Japan’s foremost supplier for R&D sites, in this field we promote the development of science and technology and contribute to the bounty of people’s lives.
By responding to changing needs, we help to ensure the development of manufacturing and the safety of food In the industrial sector, we provide instruments and equipment that support manufacturing and quality control, thereby contributing to the development of industry and lifestyles that are safe and offer peace of mind. In fields such as electronics, advanced materials, chemicals and food products, high-quality instruments and equipment are essential for achieving even high quality levels. By leveraging the expertise we have cultivated in the science and technology sector, we provide an all-encompassing range of the instruments and equipment needed at monozukuri sites. The products we handle in this sector are varied, from rubber gloves and other consumables to environment measuring instruments, such as digital thermoregulators. We also offer safety- and protection-related products, as well as dust-free products, which are essential for clean rooms, and an extensive lineup of products for which modern-day demand is high. Consumer demand leads to manufacturer’s needs. We have continued to grow in this field by remaining constantly sensitive to the changing needs of the times and responding flexibly.
Contributing to society at large through improvements in the nursing and care environments In this sector, we have launched the Navis brand (“Navis” being a word we created by combining “nurse” and “Venus”), through which we provide products needed at medical sites. By reducing the burden on both the people who receive nursing and care as well as those who provide it and promoting highly efficient nursing and care, we provide products based on the concept of “products offered from users’ perspective.” Our lineup ranges from lab coats and masks, gloves and other supplies to stretchers, sphygmomanometers and other instruments. By leveraging the expertise gained at medical sites, we also provide care beds, wheelchairs, bathing supplies, hygiene items and other nursing care products. With Japan’s elderly population forecast to increase, nursing and care sites are further expected to represent growing markets. Through our unique and extensive product lineup, we aim to improve nursing and care site environments and contribute to the benefits of overall Japanese society.
The NEXAS series of constant-temperature dryers
17 AS ONE CORPORATION ANNUAL REPORT 2016 AS ONE CORPORATION ANNUAL REPORT 2016 18
Aiming to be a Company That Supports Society with a Broad Range of Activities
Corporate Social Responsibility
Science ForestEnvironmental Activities
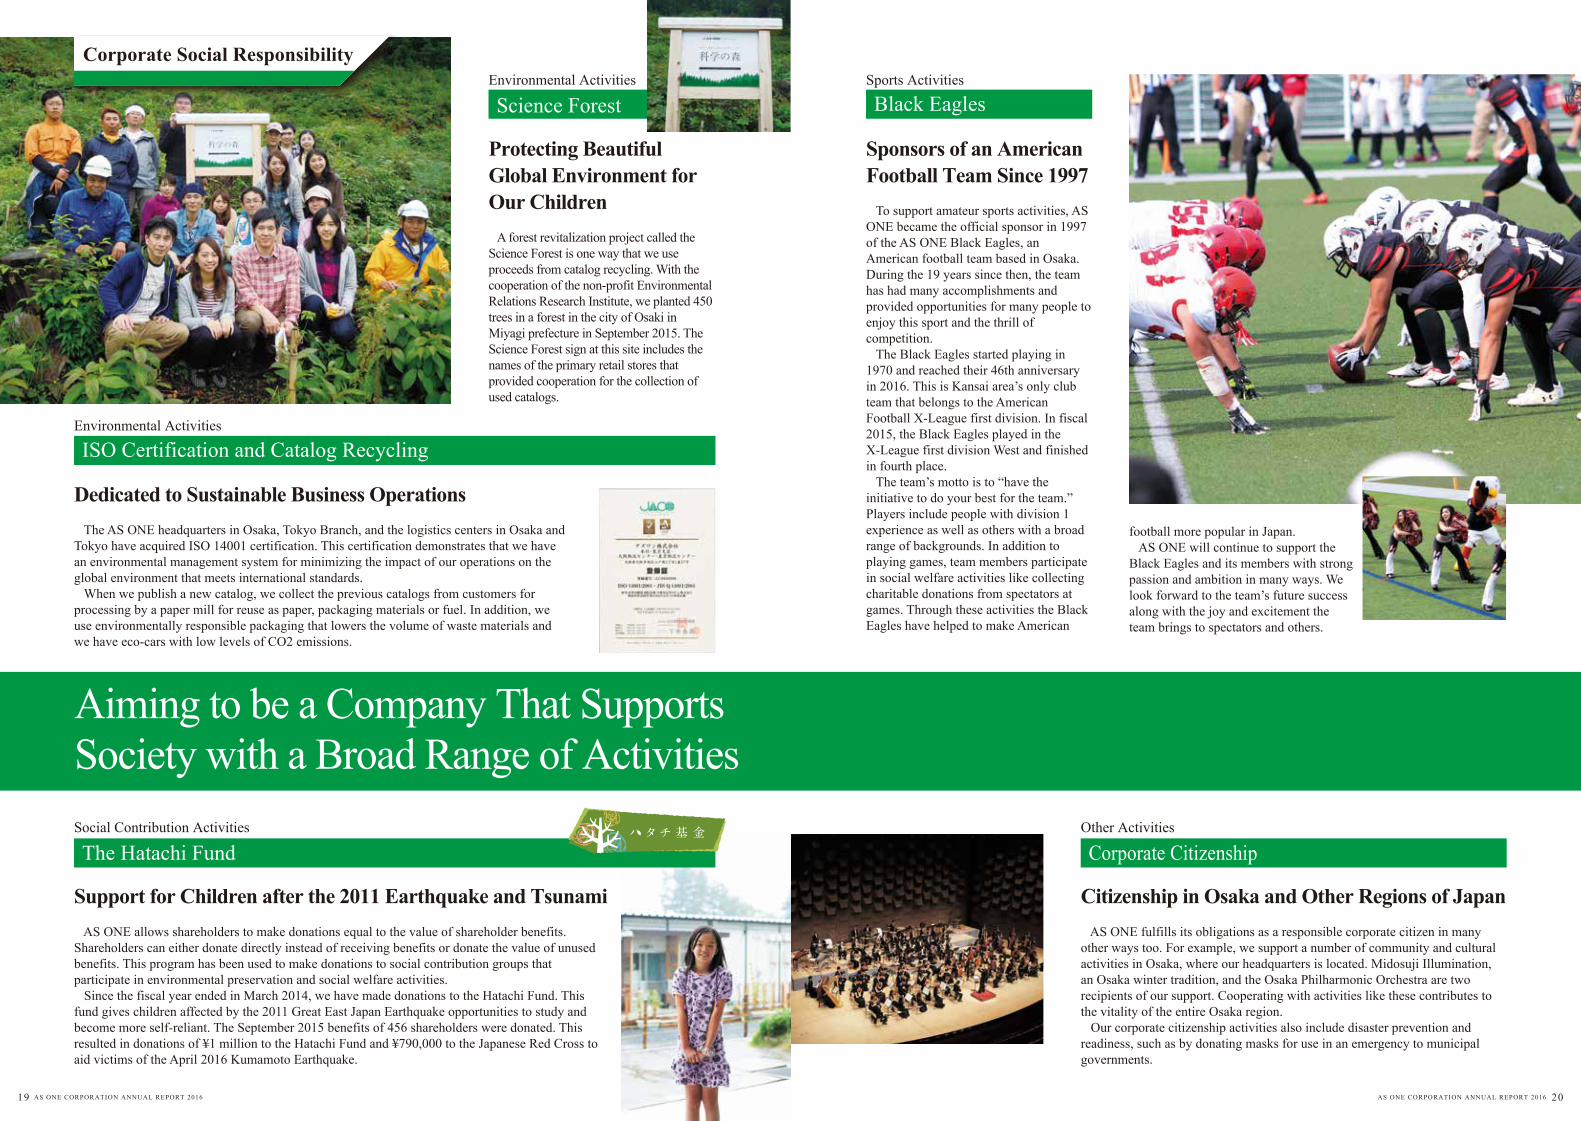
Protecting Beautiful Global Environment for Our Children A forest revitalization project called the Science Forest is one way that we use proceeds from catalog recycling. With the cooperation of the non-profit Environmental Relations Research Institute, we planted 450 trees in a forest in the city of Osaki in Miyagi prefecture in September 2015. The Science Forest sign at this site includes the names of the primary retail stores that provided cooperation for the collection of used catalogs.
ISO Certification and Catalog RecyclingEnvironmental Activities
Dedicated to Sustainable Business Operations The AS ONE headquarters in Osaka, Tokyo Branch, and the logistics centers in Osaka and Tokyo have acquired ISO 14001 certification. This certification demonstrates that we have an environmental management system for minimizing the impact of our operations on the global environment that meets international standards. When we publish a new catalog, we collect the previous catalogs from customers for processing by a paper mill for reuse as paper, packaging materials or fuel. In addition, we use environmentally responsible packaging that lowers the volume of waste materials and we have eco-cars with low levels of CO2 emissions.
Black EaglesSports Activities
Sponsors of an American Football Team Since 1997 To support amateur sports activities, AS ONE became the official sponsor in 1997 of the AS ONE Black Eagles, an American football team based in Osaka. During the 19 years since then, the team has had many accomplishments and provided opportunities for many people to enjoy this sport and the thrill of competition. The Black Eagles started playing in 1970 and reached their 46th anniversary in 2016. This is Kansai area’s only club team that belongs to the American Football X-League first division. In fiscal 2015, the Black Eagles played in the X-League first division West and finished in fourth place. The team’s motto is to “have the initiative to do your best for the team.” Players include people with division 1 experience as well as others with a broad range of backgrounds. In addition to playing games, team members participate in social welfare activities like collecting charitable donations from spectators at games. Through these activities the Black Eagles have helped to make American
football more popular in Japan. AS ONE will continue to support the Black Eagles and its members with strong passion and ambition in many ways. We look forward to the team’s future success along with the joy and excitement the team brings to spectators and others.
The Hatachi FundSocial Contribution Activities
Support for Children after the 2011 Earthquake and Tsunami AS ONE allows shareholders to make donations equal to the value of shareholder benefits. Shareholders can either donate directly instead of receiving benefits or donate the value of unused benefits. This program has been used to make donations to social contribution groups that participate in environmental preservation and social welfare activities. Since the fiscal year ended in March 2014, we have made donations to the Hatachi Fund. This fund gives children affected by the 2011 Great East Japan Earthquake opportunities to study and become more self-reliant. The September 2015 benefits of 456 shareholders were donated. This resulted in donations of ¥1 million to the Hatachi Fund and ¥790,000 to the Japanese Red Cross to aid victims of the April 2016 Kumamoto Earthquake.
Corporate CitizenshipOther Activities
Citizenship in Osaka and Other Regions of Japan AS ONE fulfills its obligations as a responsible corporate citizen in many other ways too. For example, we support a number of community and cultural activities in Osaka, where our headquarters is located. Midosuji Illumination, an Osaka winter tradition, and the Osaka Philharmonic Orchestra are two recipients of our support. Cooperating with activities like these contributes to the vitality of the entire Osaka region. Our corporate citizenship activities also include disaster prevention and readiness, such as by donating masks for use in an emergency to municipal governments.
19 AS ONE CORPORATION ANNUAL REPORT 2016 AS ONE CORPORATION ANNUAL REPORT 2016 20
Corporate Governance
1. Outline of Corporate Governance System
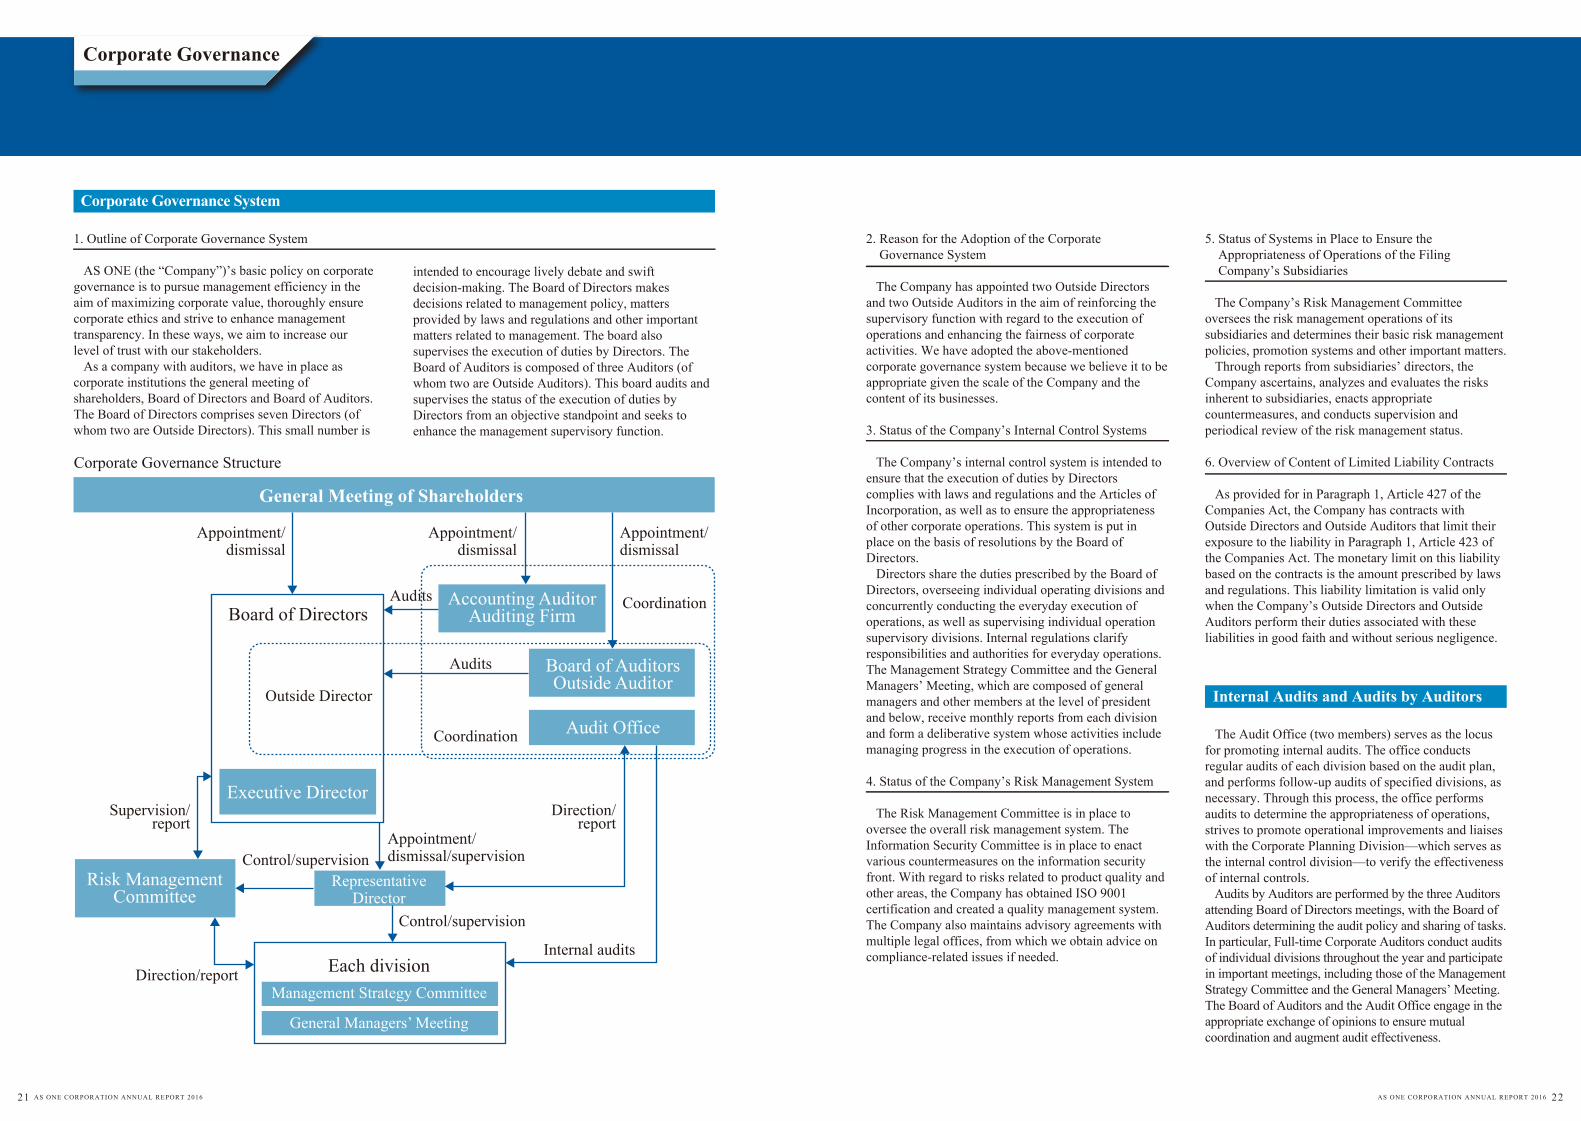
AS ONE (the “Company”)’s basic policy on corporate governance is to pursue management efficiency in the aim of maximizing corporate value, thoroughly ensure corporate ethics and strive to enhance management transparency. In these ways, we aim to increase our level of trust with our stakeholders. As a company with auditors, we have in place as corporate institutions the general meeting of shareholders, Board of Directors and Board of Auditors.The Board of Directors comprises seven Directors (of whom two are Outside Directors). This small number is
intended to encourage lively debate and swift decision-making. The Board of Directors makes decisions related to management policy, matters provided by laws and regulations and other important matters related to management. The board also supervises the execution of duties by Directors. The Board of Auditors is composed of three Auditors (of whom two are Outside Auditors). This board audits and supervises the status of the execution of duties by Directors from an objective standpoint and seeks to enhance the management supervisory function.
2. Reason for the Adoption of the Corporate Governance System
The Company has appointed two Outside Directors and two Outside Auditors in the aim of reinforcing the supervisory function with regard to the execution of operations and enhancing the fairness of corporate activities. We have adopted the above-mentioned corporate governance system because we believe it to be appropriate given the scale of the Company and the content of its businesses.
3. Status of the Company’s Internal Control Systems
The Company’s internal control system is intended to ensure that the execution of duties by Directors complies with laws and regulations and the Articles of Incorporation, as well as to ensure the appropriateness of other corporate operations. This system is put in place on the basis of resolutions by the Board of Directors. Directors share the duties prescribed by the Board of Directors, overseeing individual operating divisions and concurrently conducting the everyday execution of operations, as well as supervising individual operation supervisory divisions. Internal regulations clarify responsibilities and authorities for everyday operations. The Management Strategy Committee and the General Managers’ Meeting, which are composed of general managers and other members at the level of president and below, receive monthly reports from each division and form a deliberative system whose activities include managing progress in the execution of operations.
4. Status of the Company’s Risk Management System
The Risk Management Committee is in place to oversee the overall risk management system. The Information Security Committee is in place to enact various countermeasures on the information security front. With regard to risks related to product quality and other areas, the Company has obtained ISO 9001 certification and created a quality management system. The Company also maintains advisory agreements with multiple legal offices, from which we obtain advice on compliance-related issues if needed.
5. Status of Systems in Place to Ensure the Appropriateness of Operations of the Filing Company’s Subsidiaries
The Company’s Risk Management Committee oversees the risk management operations of its subsidiaries and determines their basic risk management policies, promotion systems and other important matters. Through reports from subsidiaries’ directors, the Company ascertains, analyzes and evaluates the risks inherent to subsidiaries, enacts appropriate countermeasures, and conducts supervision and periodical review of the risk management status.
6. Overview of Content of Limited Liability Contracts
As provided for in Paragraph 1, Article 427 of the Companies Act, the Company has contracts with Outside Directors and Outside Auditors that limit their exposure to the liability in Paragraph 1, Article 423 of the Companies Act. The monetary limit on this liability based on the contracts is the amount prescribed by laws and regulations. This liability limitation is valid only when the Company’s Outside Directors and Outside Auditors perform their duties associated with these liabilities in good faith and without serious negligence.
The Audit Office (two members) serves as the locus for promoting internal audits. The office conducts regular audits of each division based on the audit plan, and performs follow-up audits of specified divisions, as necessary. Through this process, the office performs audits to determine the appropriateness of operations, strives to promote operational improvements and liaises with the Corporate Planning Division—which serves as the internal control division—to verify the effectiveness of internal controls. Audits by Auditors are performed by the three Auditors attending Board of Directors meetings, with the Board of Auditors determining the audit policy and sharing of tasks. In particular, Full-time Corporate Auditors conduct audits of individual divisions throughout the year and participate in important meetings, including those of the Management Strategy Committee and the General Managers’ Meeting. The Board of Auditors and the Audit Office engage in the appropriate exchange of opinions to ensure mutual coordination and augment audit effectiveness.
General Meeting of Shareholders
Accounting AuditorAuditing Firm
RepresentativeDirector
Each division
Board of AuditorsOutside Auditor
Audit Office
Executive Director
Risk ManagementCommittee
Board of Directors
Appointment/dismissal
Corporate Governance Structure
Outside Director
Management Strategy Committee
General Managers’ Meeting
Appointment/dismissal
Appointment/dismissal
Appointment/dismissal/supervision
Control/supervision
Internal audits
Coordination
Coordination
Direction/report
Audits
Audits
Supervision/report
Direction/report
Control/supervision
Corporate Governance System
Internal Audits and Audits by Auditors
21 AS ONE CORPORATION ANNUAL REPORT 2016 AS ONE CORPORATION ANNUAL REPORT 2016 22
Interest-Based Relationships The Company has two Outside Directors and two Outside Auditors. Mr. Joji Suzuki, Outside Director, holds no shares in the Company. Furthermore, there are no business relationship or other special interests between Mr. Suzuki and the Company. Mr. Masashi Mizunaga, Outside Director, holds no shares in the Company. Furthermore, there are no business relationship or other special interests between Mr. Mizunaga and the Company. Mr. Kazutaka Suzuki, Outside Auditor, holds 100 shares of stock in the Company. He is a former employee of Resona Bank, Limited, with which the Company conducts business transactions. The Company’s business relationship with Resona Bank includes the borrowing of funds. Resona Bank holds 926,425 shares in the Company. Mr. Hideaki Mihara, Outside Auditor, holds no shares in the Company. Furthermore, there are no business relationship or other special interests between Mr. Mihara and the Company.
Functions and Roles from the Standpoint of Corporate Governance Mr. Joji Suzuki, Outside Director, has a background in global business management as a corporate executive. He utilizes his extensive experience and broad-ranging insight as a manager to provide effective advice on management. Mr. Masashi Mizunaga, Outside Director, utilizes his extensive experience and broad-ranging insight as a manager, gained through his experience as an entrepreneur and involvement in corporate management, to provide effective advice on management. Mr. Kazutaka Suzuki, Outside Auditor, utilizes his extensive experience and insight in the financial sector to conduct supervision and provide effective advice on management. Mr. Hideaki Mihara, Outside Auditor, utilizes his specialized knowledge and extensive experience as a certified public accountant and tax accountant to conduct supervision and provide effective advice on management.
Independence Criteria To ensure the levels of objectivity and transparency necessary for appropriate governance of the Company, the Company considers it desirable to ensure, to the furthest extent possible, the independence of Outside
Directors and Outside Auditors (hereinafter, collectively referred to as “outside officers”). None of the following apply to the Company’s outside officers who are called upon to be independent.
1. A person who does not meet prescribed laws and regulations
2. A person whose major business partner includes the Group (whose transactions with the Group in the most recent business year amount to 2% or more of the Group’s annual consolidated net sales), or its parent company or important subsidiary or, if the business partner is a company, or an executive director, executive officer, executive employee, manager or other employee of such business partner
3. A major business partner of the Group (excluding 4) (whose transactions with the Group in the most recent business year amount to 2% or more of the Group’s annual consolidated net sales), or its parent company or important subsidiary or, if the business partner is a company, an executive director, executive officer, executive employee, manager or other employee of such business partner
4. A director, auditor, accounting advisor, executive officer, executive employee, manager or other employee of a party indispensable to the Group’s raising of funds, a financial institution on which the Group’s dependence is so high as to preclude alternatives, or other large-scale lender, or of such an entity’s parent company or important subsidiary
5. A consultant, certified public accountant or other accounting professional, attorney or other legal professional, or other specialist who has received money or other such assets averaging ¥10 million or more annually over the past three years other than as officer compensation from the Group
6. A person who receives contributions or subsidies totaling ¥10 million or more annually from the Group
7. A major shareholder (a shareholder directly or indirectly holding 10% or more of total voting rights) of the Company, or if such major shareholder is a company, a director, auditor, accounting advisor, executive officer,
commissioner, executive employee, manager or other employee of such major shareholder or its parent company or important subsidiary
8. An accounting auditor of the Group or an employee, partner or other person belonging to a tax accountant corporation of the Group
9. A director, auditor, accounting advisor, executive officer or executive employee of a company, or its parent company or subsidiary that accept directors (regardless of whether full-time or part-time) from the Group
10. A family member within two degrees of kinship with a director or auditor of the Group
11. A person to whom any of items 1 through 10 have applied in the most recent five years
12. Any other person who could be construed as having an conflict of interests with any of the Company’s general shareholders with regard to matters other than items 2 through 11 above
The Company judges that the four members—Mr. Joji Suzuki, Mr. Masashi Mizunaga, Mr. Kazutaka Suzuki and Mr. Hideaki Mihara—conduct supervision and monitoring objectively and neutrally and have no conflicts of interests with the Company’s general shareholders. Accordingly, the Company has designated the independent executives as provided by the Tokyo Stock Exchange and provided notification to this effect.
Status of Cooperation In addition to gathering necessary information at Board of Directors meetings and asking appropriate questions, the Outside Directors exchange opinions with and maintain relations with Outside Auditors. The Outside Auditors gather information through exchanges of opinion with Audit Office and accounting auditor at the Board of Auditors. In addition, the Outside Auditors frequently exchange opinions with the Corporate Planning Division, centered on Full-time Corporate Auditors, and coordinate closely with them.
Corporate Governance
Outside Directors and Auditors
23 AS ONE CORPORATION ANNUAL REPORT 2016 AS ONE CORPORATION ANNUAL REPORT 2016 24
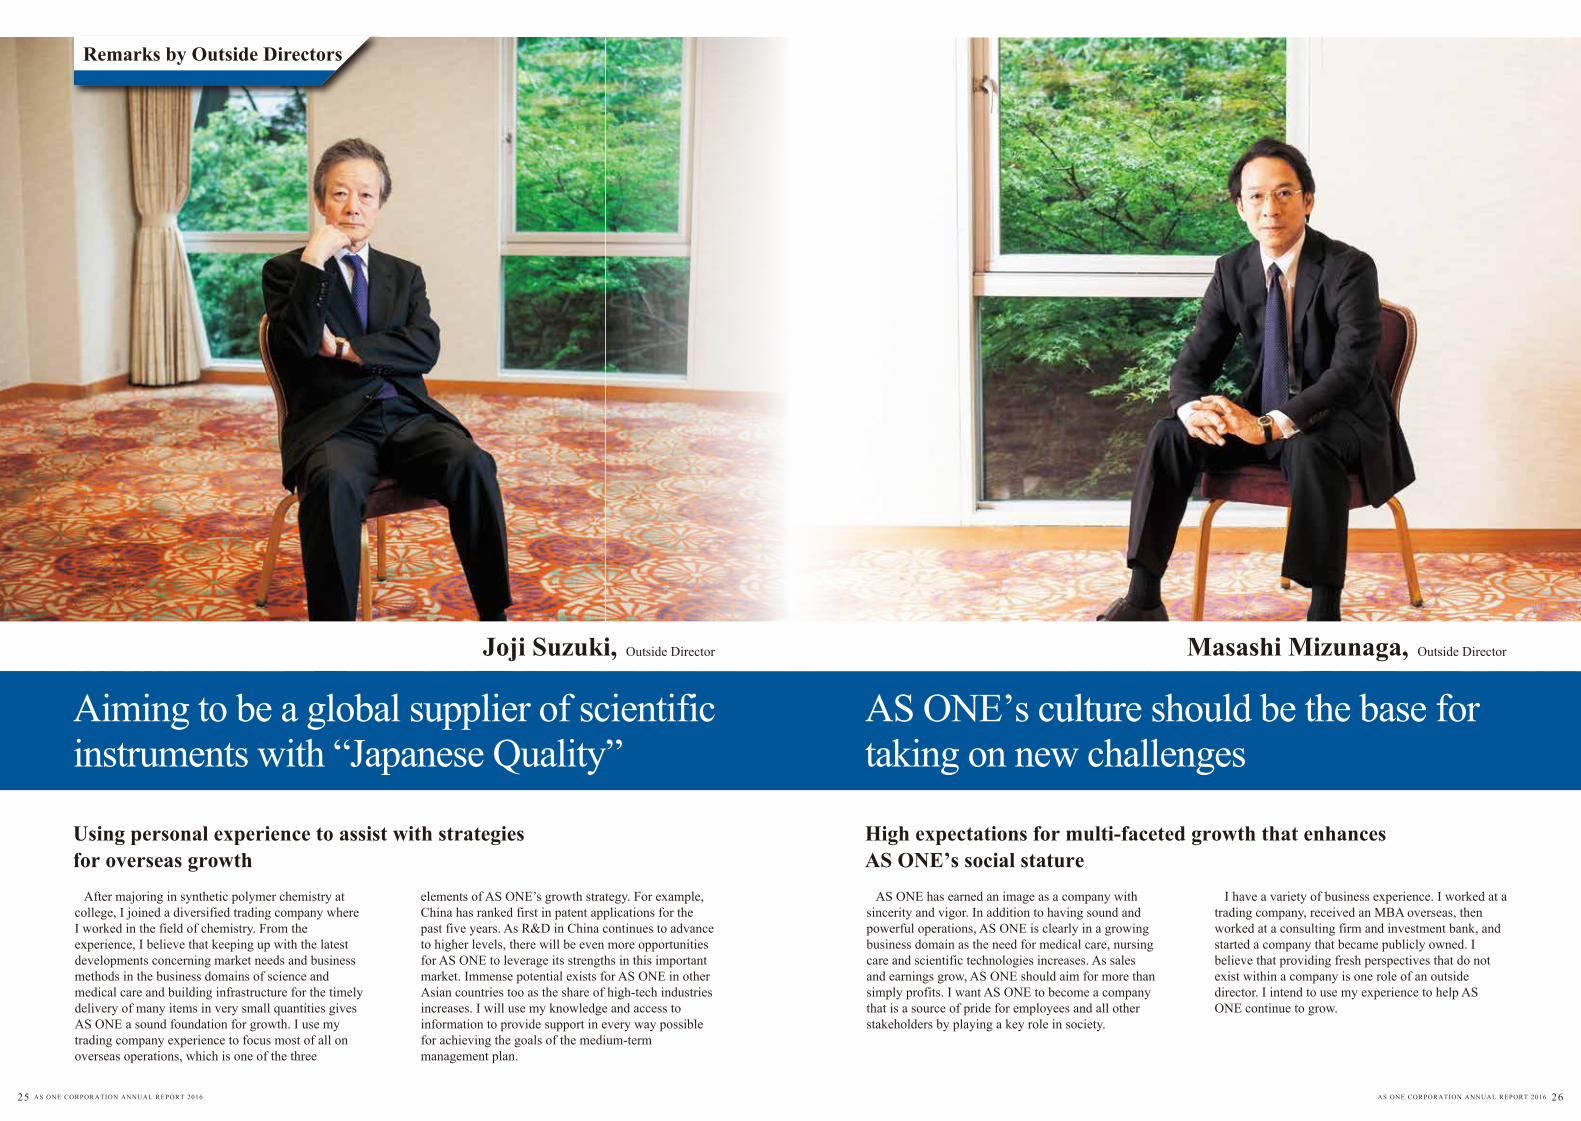
Outside DirectorMasashi Mizunaga,Outside DirectorJoji Suzuki,
Remarks by Outside Directors
Using personal experience to assist with strategies for overseas growth
High expectations for multi-faceted growth that enhances AS ONE’s social stature AS ONE has earned an image as a company with sincerity and vigor. In addition to having sound and powerful operations, AS ONE is clearly in a growing business domain as the need for medical care, nursing care and scientific technologies increases. As sales and earnings grow, AS ONE should aim for more than simply profits. I want AS ONE to become a company that is a source of pride for employees and all other stakeholders by playing a key role in society.
I have a variety of business experience. I worked at a trading company, received an MBA overseas, then worked at a consulting firm and investment bank, and started a company that became publicly owned. I believe that providing fresh perspectives that do not exist within a company is one role of an outside director. I intend to use my experience to help AS ONE continue to grow.
After majoring in synthetic polymer chemistry at college, I joined a diversified trading company where I worked in the field of chemistry. From the experience, I believe that keeping up with the latest developments concerning market needs and business methods in the business domains of science and medical care and building infrastructure for the timely delivery of many items in very small quantities gives AS ONE a sound foundation for growth. I use my trading company experience to focus most of all on overseas operations, which is one of the three
elements of AS ONE’s growth strategy. For example, China has ranked first in patent applications for the past five years. As R&D in China continues to advance to higher levels, there will be even more opportunities for AS ONE to leverage its strengths in this important market. Immense potential exists for AS ONE in other Asian countries too as the share of high-tech industries increases. I will use my knowledge and access to information to provide support in every way possible for achieving the goals of the medium-term management plan.
Aiming to be a global supplier of scientific instruments with “Japanese Quality”
AS ONE’s culture should be the base for taking on new challenges
25 AS ONE CORPORATION ANNUAL REPORT 2016 AS ONE CORPORATION ANNUAL REPORT 2016 26
Fiscal year ended
(Yen)
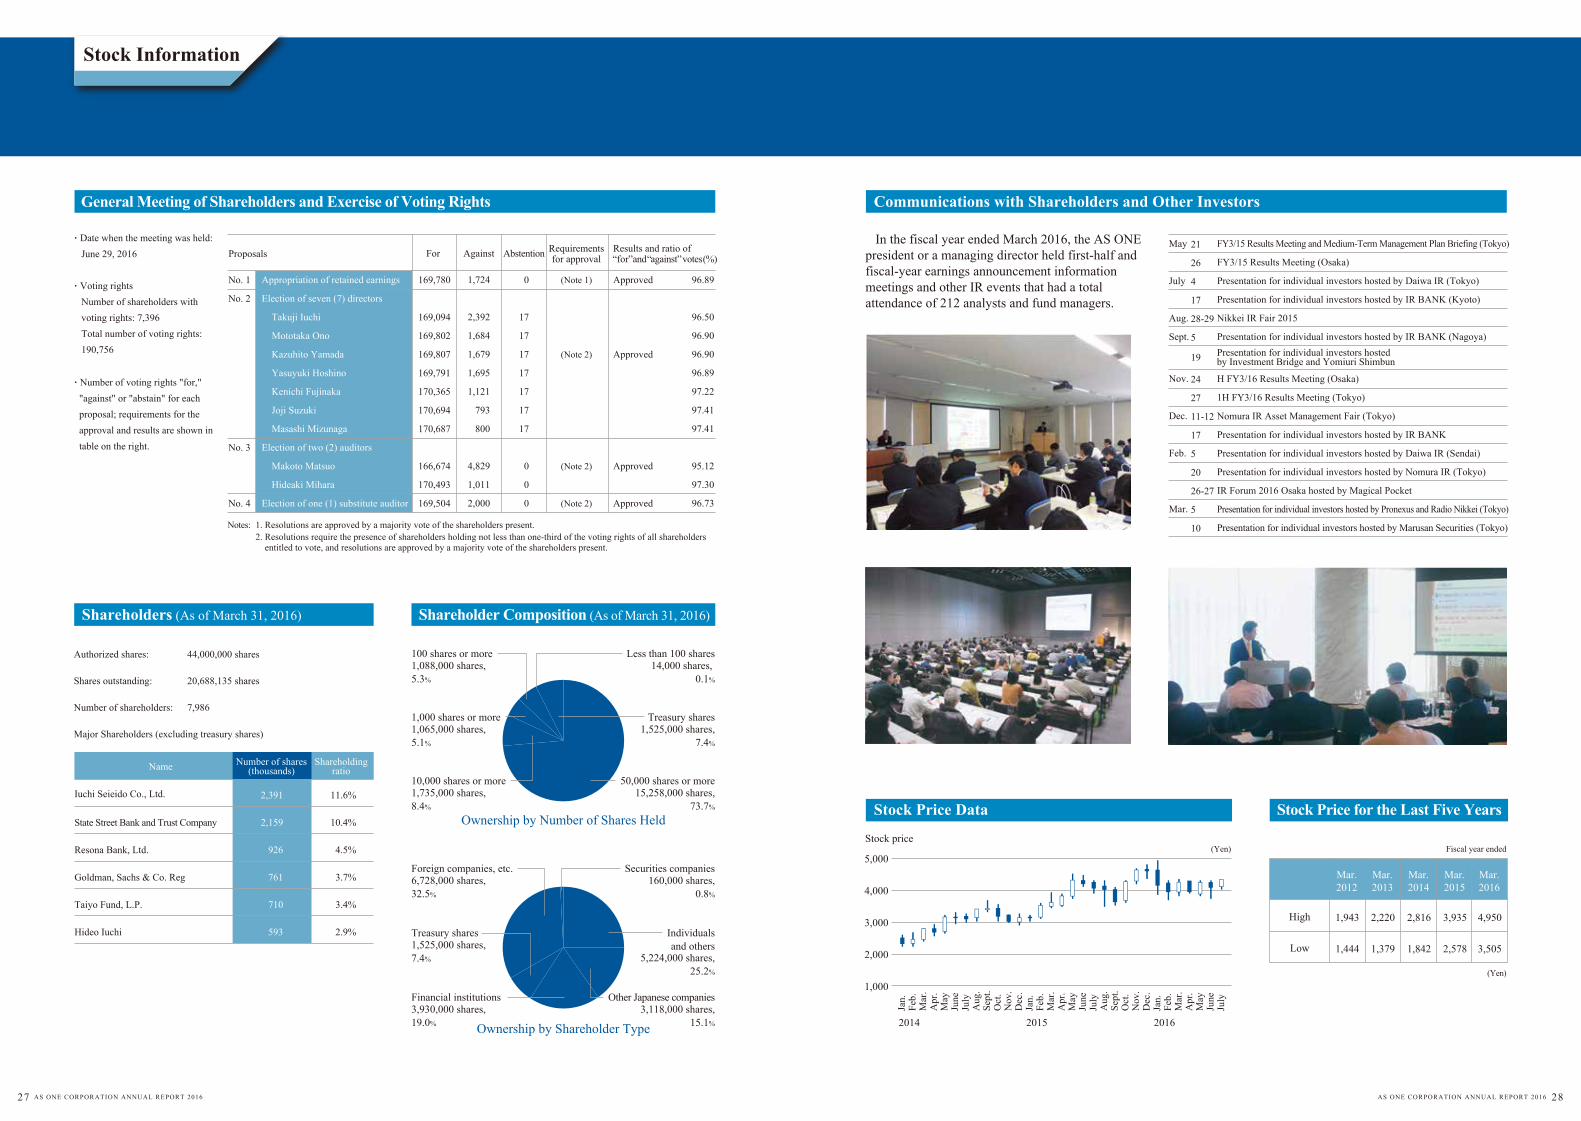
. Number of voting rights "for," "against" or "abstain" for each proposal; requirements for the approval and results are shown in table on the right.
In the fiscal year ended March 2016, the AS ONE president or a managing director held first-half and fiscal-year earnings announcement information meetings and other IR events that had a total attendance of 212 analysts and fund managers.
Individualsand others
5,224,000 shares,25.2%
Securities companies160,000 shares,
0.8%
Foreign companies, etc.6,728,000 shares, 32.5%
Financial institutions3,930,000 shares, 19.0%
Treasury shares1,525,000 shares, 7.4%
Other Japanese companies3,118,000 shares,
15.1%
50,000 shares or more15,258,000 shares,
73.7%
Less than 100 shares14,000 shares,
0.1%
Treasury shares1,525,000 shares,
7.4%
1,000 shares or more1,065,000 shares,5.1%
100 shares or more1,088,000 shares, 5.3%
10,000 shares or more1,735,000 shares, 8.4%
Ownership by Number of Shares Held
Ownership by Shareholder Type
Authorized shares: 44,000,000 shares
Shares outstanding: 20,688,135 shares
Number of shareholders: 7,986
Major Shareholders (excluding treasury shares)
. Date when the meeting was held: June 29, 2016
. Voting rights Number of shareholders with voting rights: 7,396 Total number of voting rights: 190,756
Appropriation of retained earnings
Election of seven (7) directors
Takuji Iuchi
Mototaka Ono
Kazuhito Yamada
Yasuyuki Hoshino
Kenichi Fujinaka
Joji Suzuki
Masashi Mizunaga
Election of two (2) auditors
Makoto Matsuo
Hideaki Mihara
Election of one (1) substitute auditor
No. 1
No. 2
No. 3
No. 4
169,780
169,094
169,802
169,807
169,791
170,365
170,694
170,687
166,674
170,493
169,504
ForMay
July
Aug.
Sept.
21
26
4
17
28-29
5
19
Nov.
Dec.
Feb.
Mar.
24
27
11-12
17
5
20
26-27
5
10
FY3/15 Results Meeting and Medium-Term Management Plan Briefing (Tokyo)
FY3/15 Results Meeting (Osaka)
Presentation for individual investors hosted by Daiwa IR (Tokyo)
Presentation for individual investors hosted by IR BANK (Kyoto)
Nikkei IR Fair 2015
Presentation for individual investors hosted by IR BANK (Nagoya)
H FY3/16 Results Meeting (Osaka)
1H FY3/16 Results Meeting (Tokyo)
Nomura IR Asset Management Fair (Tokyo)
Presentation for individual investors hosted by IR BANK
Presentation for individual investors hosted by Daiwa IR (Sendai)
Presentation for individual investors hosted by Nomura IR (Tokyo)
IR Forum 2016 Osaka hosted by Magical Pocket
Presentation for individual investors hosted by Pronexus and Radio Nikkei (Tokyo)
Presentation for individual investors hosted by Marusan Securities (Tokyo)
Proposals
1,724
2,392
1,684
1,679
1,695
1,121
793
800
4,829
1,011
2,000
Against
0
17
17
17
17
17
17
17
0
0
0
Abstention
(Note 1)
(Note 2)
(Note 2)
(Note 2)
Requirementsfor approval
Approved
Approved
Approved
Approved
Results and ratio of “for” and “against” votes (%)
96.89
96.50
96.90
96.90
96.89
97.22
97.41
97.41
95.12
97.30
96.73
Notes: 1. Resolutions are approved by a majority vote of the shareholders present.2. Resolutions require the presence of shareholders holding not less than one-third of the voting rights of all shareholders entitled to vote, and resolutions are approved by a majority vote of the shareholders present.
Name Shareholdingratio
Number of shares(thousands)
State Street Bank and Trust Company
Resona Bank, Ltd.
Goldman, Sachs & Co. Reg
Taiyo Fund, L.P.
Hideo Iuchi
2,391
2,159
926
761
710
593
11.6%
10.4%
4.5%
3.7%
3.4%
2.9%
Iuchi Seieido Co., Ltd.
Stock Information
(Yen)Stock price
5,000
4,000
3,000
2,000
1,000
2014 20162015
High
Low
Mar.2013
Mar.2012
Mar.2014
Mar.2015
Mar.2016
2,220
1,379
1,943
1,444
2,816
1,842
3,935
2,578
4,950
3,505
General Meeting of Shareholders and Exercise of Voting Rights
Shareholders (As of March 31, 2016) Shareholder Composition (As of March 31, 2016)
Stock Price Data
Communications with Shareholders and Other Investors
Stock Price for the Last Five Years
Jan.
Fe
b.
Mar
. A
pr.
May
June
July
Aug
.Se
pt.
Oct
. N
ov.
Dec
.Ja
n.
Feb.
M
ar.
Apr
. M
ayJu
neJu
lyA
ug.
Sept
.O
ct.
Nov
. D
ec.
Jan.
Fe
b.
Mar
. A
pr.
May
June
July
Presentation for individual investors hosted by Investment Bridge and Yomiuri Shimbun
27 AS ONE CORPORATION ANNUAL REPORT 2016 AS ONE CORPORATION ANNUAL REPORT 2016 28
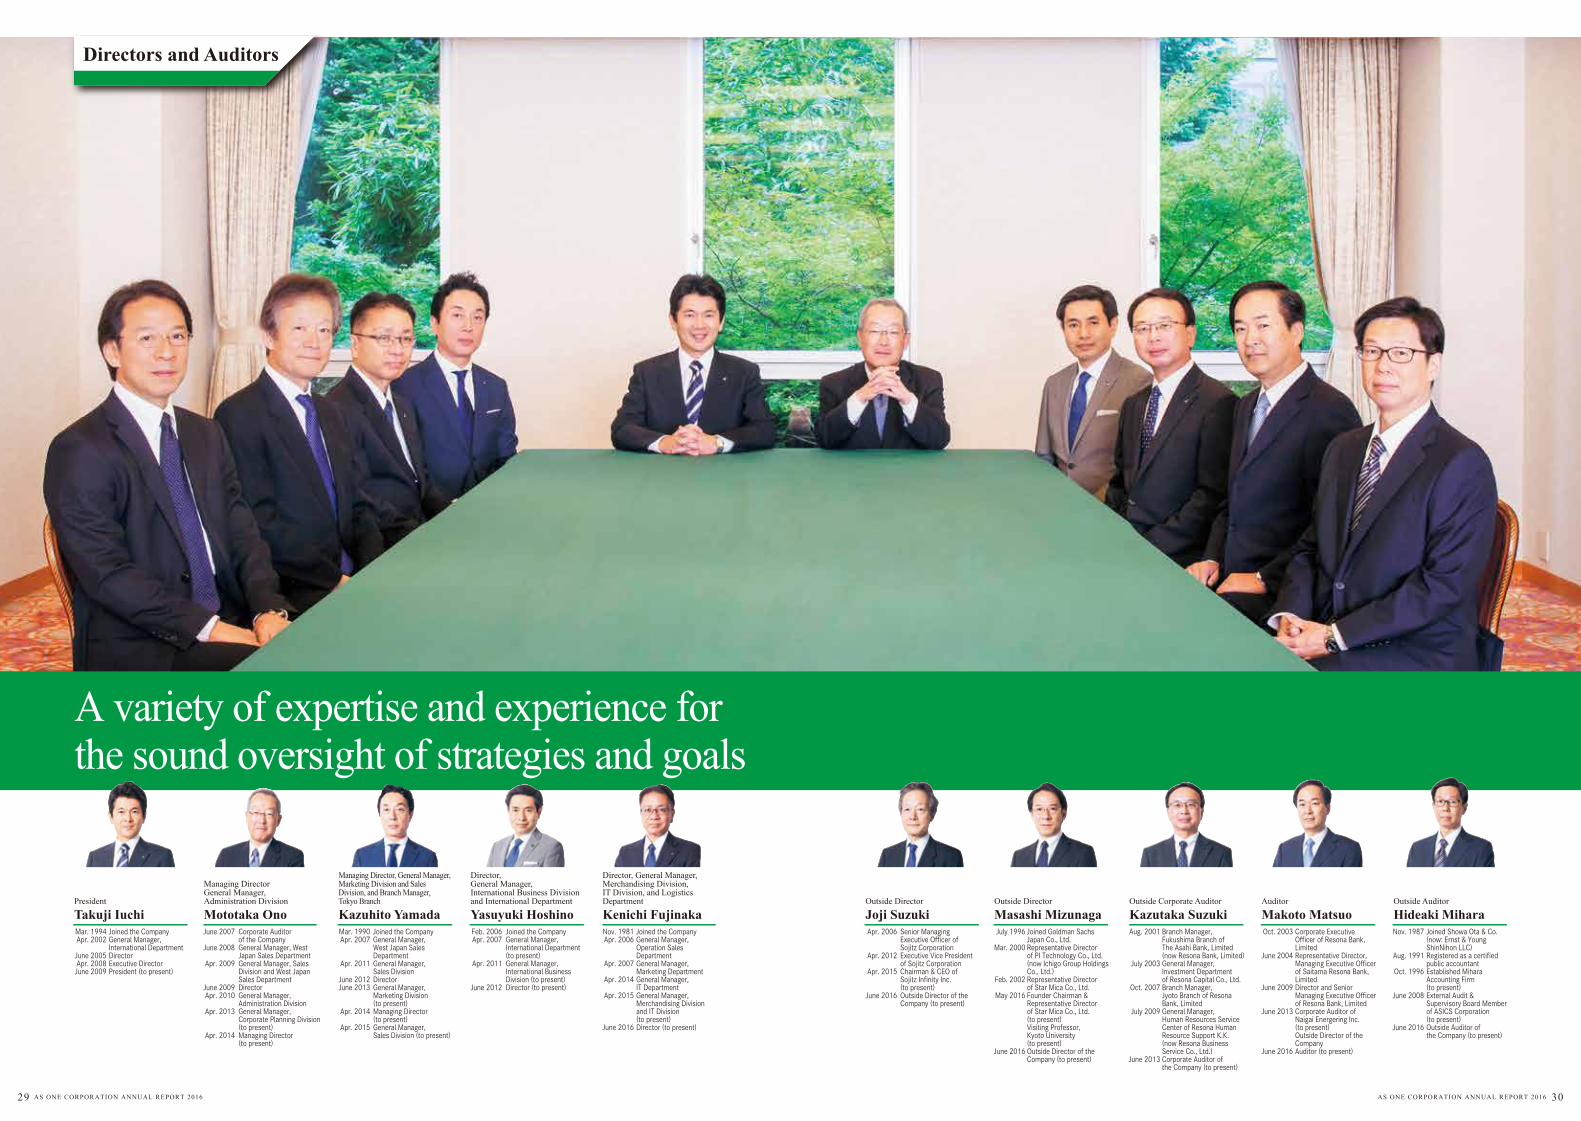
Directors and Auditors
President
Takuji Iuchi Mototaka Ono
Managing DirectorGeneral Manager, Administration Division
A variety of expertise and experience for the sound oversight of strategies and goals
Mar. 1994Apr. 2002
June 2005Apr. 2008June 2009
Joined the CompanyGeneral Manager, International DepartmentDirectorExecutive DirectorPresident (to present)
June 2007
June 2008
Apr. 2009
June 2009Apr. 2010
Apr. 2013
Apr. 2014
Corporate Auditor of the CompanyGeneral Manager, West Japan Sales DepartmentGeneral Manager, Sales Division and West Japan Sales DepartmentDirectorGeneral Manager, Administration DivisionGeneral Manager, Corporate Planning Division (to present)Managing Director (to present)
Kazuhito Yamada
Managing Director, General Manager, Marketing Division and Sales Division, and Branch Manager, Tokyo Branch
Mar. 1990Apr. 2007
Apr. 2011
June 2012June 2013
Apr. 2014
Apr. 2015
Joined the CompanyGeneral Manager, West Japan Sales DepartmentGeneral Manager, Sales DivisionDirectorGeneral Manager, Marketing Division (to present)Managing Director (to present)General Manager, Sales Division (to present)
Yasuyuki Hoshino
Director, General Manager, International Business Division and International Department
Feb. 2006Apr. 2007
Apr. 2011
June 2012
Joined the CompanyGeneral Manager, International Department (to present)General Manager, International Business Division (to present)Director (to present)
Kenichi Fujinaka
Director, General Manager, Merchandising Division, IT Division, and Logistics Department
Nov. 1981Apr. 2006
Apr. 2007
Apr. 2014
Apr. 2015
June 2016
Joined the CompanyGeneral Manager, Operation Sales DepartmentGeneral Manager, Marketing DepartmentGeneral Manager, IT DepartmentGeneral Manager, Merchandising Division and IT Division (to present)Director (to present)
Joji SuzukiOutside Director
Apr. 2006
Apr. 2012
Apr. 2015
June 2016
Masashi MizunagaOutside Director
July 1996
Mar. 2000
Feb. 2002
May 2016
June 2016
Joined Goldman SachsJapan Co., Ltd.Representative Director of PI Technology Co., Ltd.(now Ichigo Group Holdings Co., Ltd.)Representative Directorof Star Mica Co., Ltd.Founder Chairman &Representative Directorof Star Mica Co., Ltd.(to present)Visiting Professor,Kyoto University(to present)Outside Director of the Company (to present)
Kazutaka SuzukiOutside Corporate Auditor
Aug. 2001
July 2003
Oct. 2007
July 2009
June 2013
Branch Manager, Fukushima Branch of The Asahi Bank, Limited (now Resona Bank, Limited)General Manager, Investment Department of Resona Capital Co., Ltd.Branch Manager, Jyoto Branch of Resona Bank, LimitedGeneral Manager, Human Resources Service Center of Resona Human Resource Support K.K. (now Resona Business Service Co., Ltd.)Corporate Auditor of the Company (to present)
Makoto MatsuoAuditor
Oct. 2003
June 2004
June 2009
June 2013
June 2016
Corporate Executive Officer of Resona Bank, LimitedRepresentative Director, Managing Executive Officer of Saitama Resona Bank, LimitedDirector and Senior Managing Executive Officer of Resona Bank, LimitedCorporate Auditor of Naigai Energering Inc. (to present)Outside Director of the CompanyAuditor (to present)
Hideaki MiharaOutside Auditor
Nov. 1987
Aug. 1991
Oct. 1996
June 2008
June 2016
Joined Showa Ota & Co. (now: Ernst & Young ShinNihon LLC)Registered as a certified public accountantEstablished Mihara Accounting Firm (to present)External Audit & Supervisory Board Member of ASICS Corporation (to present)Outside Auditor of the Company (to present)
Senior ManagingExecutive Officer ofSojitz CorporationExecutive Vice Presidentof Sojitz CorporationChairman & CEO ofSojitz Infinity Inc. (to present)Outside Director of theCompany (to present)
29 AS ONE CORPORATION ANNUAL REPORT 2016 AS ONE CORPORATION ANNUAL REPORT 2016 30
Financial results Net sales Scientific Industrial Hospitals/nursing care products Others Gross profit Selling, general and administrative expenses Operating income EBITDA Ordinary income Profit before income taxes Profit attributable to owners of parent Capital expenditure Depreciation
Financial position as of the end of the fiscal year Total assets Net assets Net cash
Cash flows Cash flows from operating activities Cash flows from investing activities Cash flows from financing activities Net increase (decrease) in cash and cash equivalents Cash and cash equivalents at end of period
Per share information Profit Net assets Dividend per share
Financial indicators Operating margin (%) ROA (%) ROE (%) Shareholders’ equity ratio (%) Dividend payout ratio (%)
Other indicators No. of shares outstanding (Thousands) No. of treasury shares at the end of the period (Thousands) Foreign shareholding ratio (%) Number of employees
44,24226,173
9,1378,538
39213,945
8,6555,2905,8045,3105,1763,001
439518
44,85529,72010,729
2,574(8,197)(1,135)(6,758)
4,958
162.091,604.78
48.00
12.0%6.9%
10.4%66.3%29.6%
18,807287
29.9%327
46,08727,284
9,9198,679
20414,270
8,8795,3915,9735,4775,4273,098
618586
45,89731,37312,402
3,943(3,655)(1,897)(1,606)
3,352
167.521,718.67
50.00
11.7%6.8%
10.1%68.4%29.8%
18,807553
28.5%337
44,76225,960
9,1999,602
―
13,7919,4314,3594,9964,4284,7142,6581,626
683
49,00032,02411,377
3,115(3,897)
85629
3,382
134.341,646.10
45.00
9.7%5.6%8.4%
65.4%33.5%
20,6881,233
26.9%351
43,80725,012
8,40410,391
―
13,3208,5584,7615,3654,7394,8012,738
843713
51,44433,83614,074
4,196(3,510)(1,218)(522)
2,859
140.771,739.28
47.00
10.9%5.5%8.3%
65.8%33.4%
20,6881,233
26.2%369
45,53126,192
9,5139,825
―
13,9709,1654,8055,5914,7294,3252,4956,295
926
61,72334,629
7,507
2,2311,5926,885
10,75913,619
128.541,806.97
39.00
10.6%4.4%7.3%
56.1%30.3%
20,6881,523
25.9%388
47,20427,385
9,8469,972
―
14,5818,8795,7016,3915,1025,1172,8551,328
920
60,81936,880
8,632
4,570(9,605)(4,446)(9,941)
3,677
149.001,924.44
45.00
12.1%4.7%8.0%
60.6%30.2%
20,6881,524
25.8%419
48,12827,631
9,43911,057
―
14,6209,3195,3006,1475,2605,2603,209
3541,043
61,77539,68111,414
3,2441,702
(1,695)3,2876,965
167.502,070.65
60.00
11.0%5.2%8.4%
64.2%35.8%
20,6881,524
25.6%421
51,19229,755
9,84911,587
―
15,3019,3825,9196,7615,9285,9113,587
2681,013
64,46042,66014,921
5,2681,141
(3,728)2,7819,746
187.182,226.15
66.00
11.6%5.7%8.7%
66.2%35.3%
20,6881,524
34.1%424
52,04130,15810,37611,507
―
15,4939,5095,9846,8926,1576,1573,869
5631,055
66,66845,85012,092
3,171(5,511)(2,424)(4,737)
5,008
201.912,392.65
71.00
11.5%5.9%8.8%
68.8%35.2%
20,6881,525
34.6%449
53,57631,20511,21011,160
―
16,15110,307
5,8436,6735,9906,0123,878
653958
69,61448,61412,033
5,303(2,181)(2,579)
5305,538
202.412,536.98
101.00
10.9%5.7%8.2%
69.8%49.9%
20,6881,525
32.5%463
474,129 276,157
99,208 98,763
― 142,933
91,219 51,713 59,060 53,013 53,205 34,324
5,787 8,480
616,059 430,220 106,490
46,929 (19,309)(22,831)
4,692 49,015
1.79 22.45
0.89
10.9% 5.7% 8.2%
69.8% 49.9%
20,688 1,525
32.5% 463
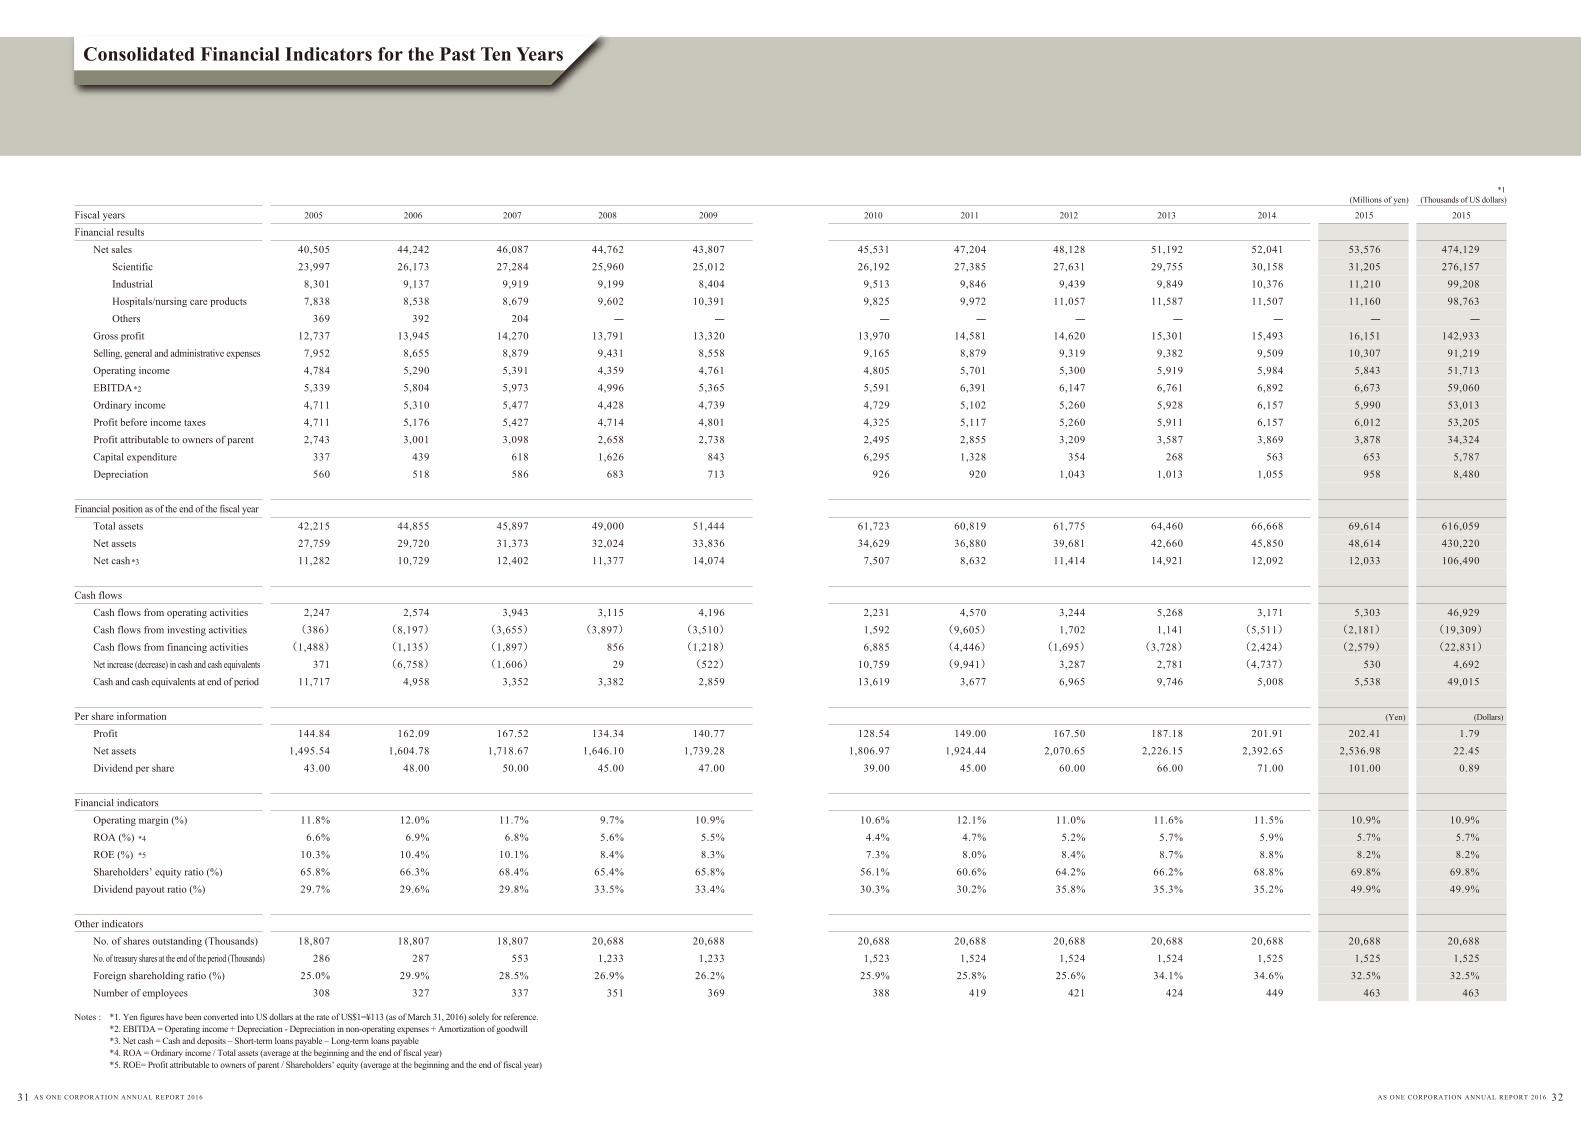
Notes : *1. Yen figures have been converted into US dollars at the rate of US$1=¥113 (as of March 31, 2016) solely for reference.*2. EBITDA = Operating income + Depreciation - Depreciation in non-operating expenses + Amortization of goodwill*3. Net cash = Cash and deposits – Short-term loans payable – Long-term loans payable*4. ROA = Ordinary income / Total assets (average at the beginning and the end of fiscal year)*5. ROE= Profit attributable to owners of parent / Shareholders’ equity (average at the beginning and the end of fiscal year)
*1
*2
*3
*4
*5
(Millions of yen) (Thousands of US dollars)
(Yen) (Dollars)
2006
40,50523,997
8,3017,838
36912,737
7,9524,7845,3394,7114,7112,743
337560
42,21527,75911,282
2,247(386)(1,488)
37111,717
144.841,495.54
43.00
11.8%6.6%
10.3%65.8%29.7%
18,807286
25.0%308
2005Fiscal years 2007 2008 2009 2010 2011 2012 2013 2014 2015 2015
Consolidated Financial Indicators for the Past Ten Years
31 AS ONE CORPORATION ANNUAL REPORT 2016 AS ONE CORPORATION ANNUAL REPORT 2016 32
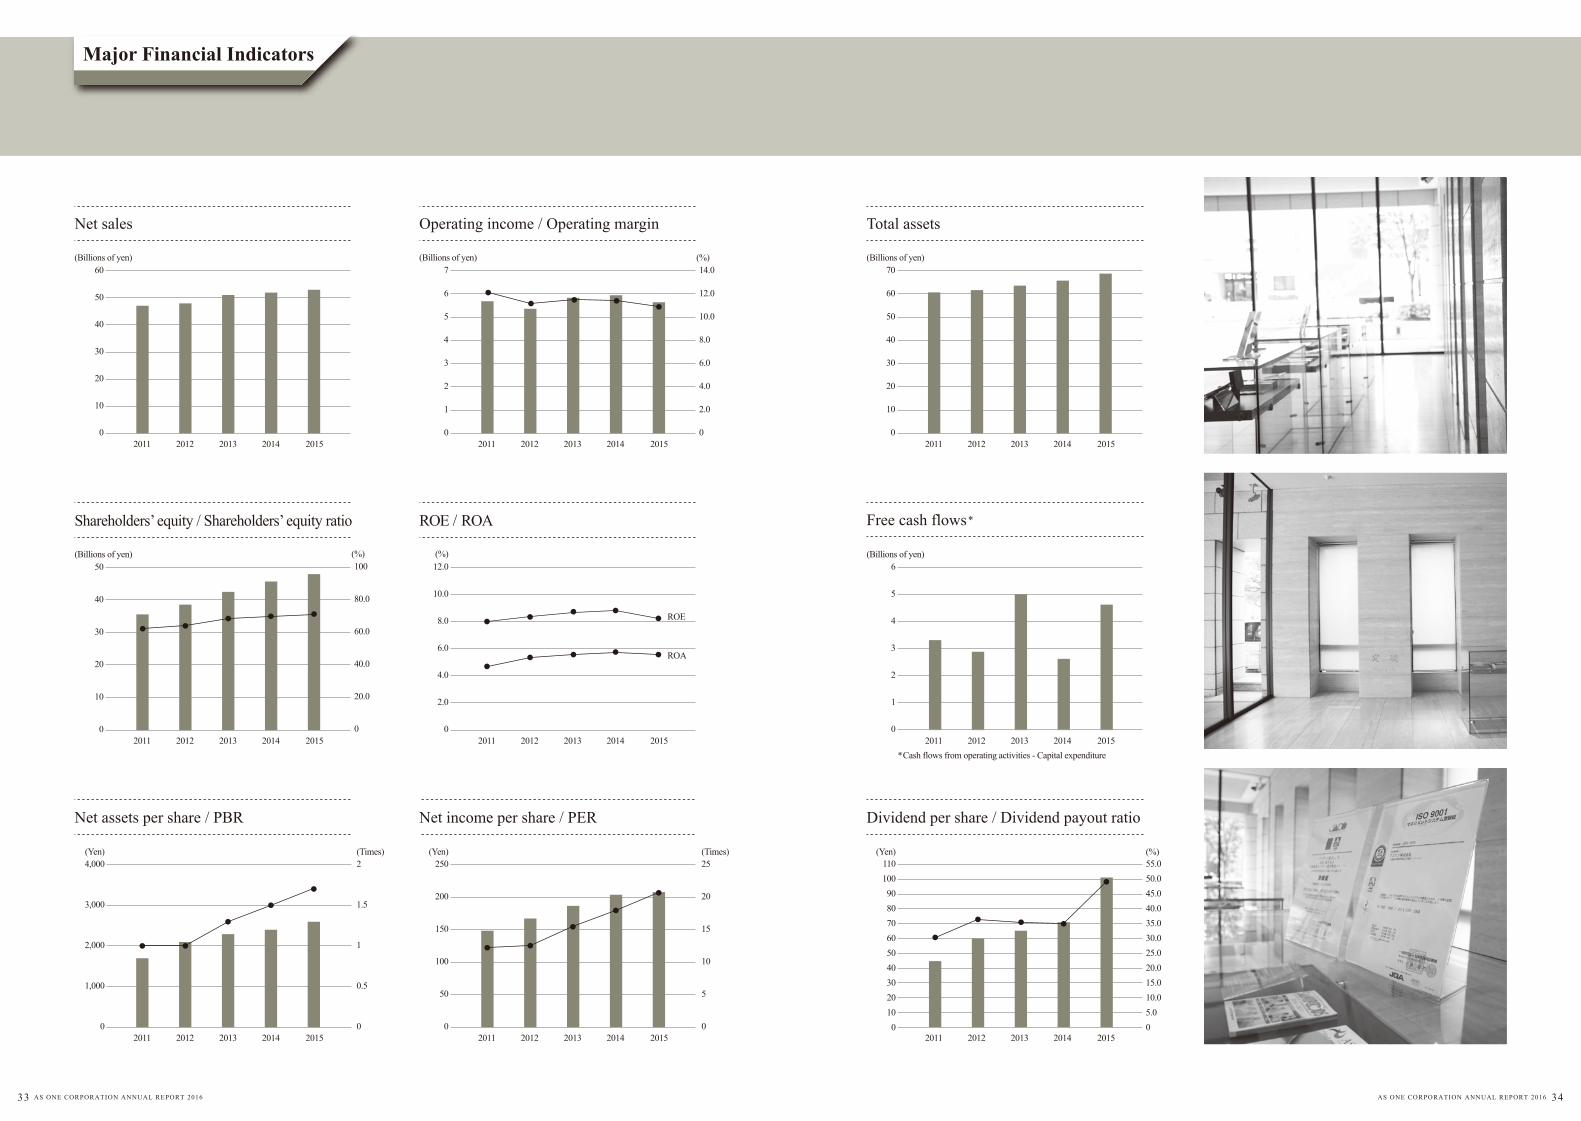
Major Financial Indicators
Net sales
(Billions of yen) (Billions of yen) (%)
Operating income / Operating margin
Free cash flows
Net assets per share / PBR Net income per share / PER Dividend per share / Dividend payout ratio
Total assets
Shareholders’ equity / Shareholders’ equity ratio *
*Cash flows from operating activities - Capital expenditure
20152014201320122011 20152014201320122011 20152014201320122011
20152014201320122011 20152014201320122011 20152014201320122011
20152014201320122011 20152014201320122011 20152014201320122011
60
0
10
20
30
40
50
ROE / ROA
ROA
ROE
(Billions of yen)
(Yen) (Yen) (Yen) (%)
(Billions of yen)
0
10
20
30
40
50 6
0
1
2
3
4
5
7
6
0
1
2
3
4
5
14.0
0
2.0
4.0
6.0
8.0
10.0
12.0
(%) (%)100
0
20.0
40.0
60.0
80.0
(Billions of yen)70
60
0
10
20
30
40
50
250
0
50
100
150
2008090
100110
0
40302010
506070
40.045.050.055.0
0
20.015.010.05.0
25.030.035.0
12.0
8.0
10.0
0
2.0
4.0
6.0
4,000
3,000
0
1,000
2,000
(Times)
1.5
2
0
0.5
1
(Times)
15
20
25
0
5
10
33 AS ONE CORPORATION ANNUAL REPORT 2016 AS ONE CORPORATION ANNUAL REPORT 2016 34
Assets Current assets Cash and deposits Notes and accounts receivable-trade Electronically recorded monetary claims-operating Securities Inventories Deferred tax assets Other Allowance for doubtful accounts Total current assets Non-current assets Property, plant and equipment Buildings and structures Accumulated depreciation Buildings and structures, net Machinery, equipment and vehicles Accumulated depreciation Machinery, equipment and vehicles, net Tools, furniture and fixtures Accumulated depreciation Tools, furniture and fixtures, net Land Leased assets Accumulated depreciation Leased assets, net Construction in progress Total property, plant and equipment Intangible assets Software Software in progress Other Total intangible assets Investments and other assets Investment securities Net defined benefit asset Deferred tax assets Real estate for investment Accumulated depreciation Real estate for investment, net Other Allowance for doubtful accounts Total investments and other assets Total non-current assets Total assets
17,437
17,359
2,652
1,000
5,312
309
353
(24)44,402
5,071
(3,135)1,936
361
(289)71
2,245
(1,917)328
3,397
385
(374)10
8
5,753
1,049
157
41
1,248
10,305
271
4
5,012
(761)4,251
460
(29)15,264
22,266
66,668
16,468
17,001
2,979
5,800
5,864
323
449
(25)48,862
5,075
(3,271)1,803
362
(305)57
2,356
(2,005)351
3,397
479
(387)92
58
5,760
970
58
6
1,035
9,334
25
5
5,014
(862)4,152
474
(35)13,956
20,752
69,614
145,738
150,456
26,371
51,335
51,895
2,864
3,977
(226)432,412
44,913
(28,955)15,957
3,209
(2,703)506
20,853
(17,747)3,106
30,068
4,247
(3,427)819
517
50,975
8,591
514
55
9,160
82,606
223
46
44,378
(7,632)36,745
4,198
(310)123,510
183,646
616,059
Liabilities Current liabilities Notes and accounts payable - trade Short-term loans payable Income taxes payable Provision for bonuses Other Total current liabilities Non-current liabilities Long-term loans payable Deferred tax liabilities Provision for directors' retirement benefits Net defined benefit liability Asset retirement obligations Other Total non-current liabilities Total liabilities
Net assets Shareholders' equity Capital stock Capital surplus Retained earnings Treasury shares Total shareholders' equity Accumulated other comprehensive income Valuation difference on available-for-sale securities Deferred gains or losses on hedges Foreign currency translation adjustment Total accumulated other comprehensive income Subscription rights to shares Total net assetsTotal liabilities and net assets
11,313
1,070
1,017
498
1,245
15,144
4,275
475
107
13
431
370
5,673
20,818
5,075
5,469
36,238
(3,216)43,566
2,035
14
232
2,283
-45,850
66,668
11,896
1,060
1,273
468
1,318
16,015
3,375
605
6
15
439
543
4,983
20,999
5,075
5,469
38,450
(3,217)45,776
2,665
(36)188
2,816
21
48,614
69,614
105,274
9,380
11,266
4,143
11,667
141,732
29,867
5,354
56
133
3,885
4,808
44,105
185,838
44,911
48,402
340,267
(28,475)405,105
23,586
(326)1,666
24,927
187
430,220
616,059
(Millions of yen) (Thousands of US dollars)
FY3/15 FY3/16 FY3/16
(Millions of yen) (Thousands of US dollars)
FY3/15 FY3/16 FY3/16
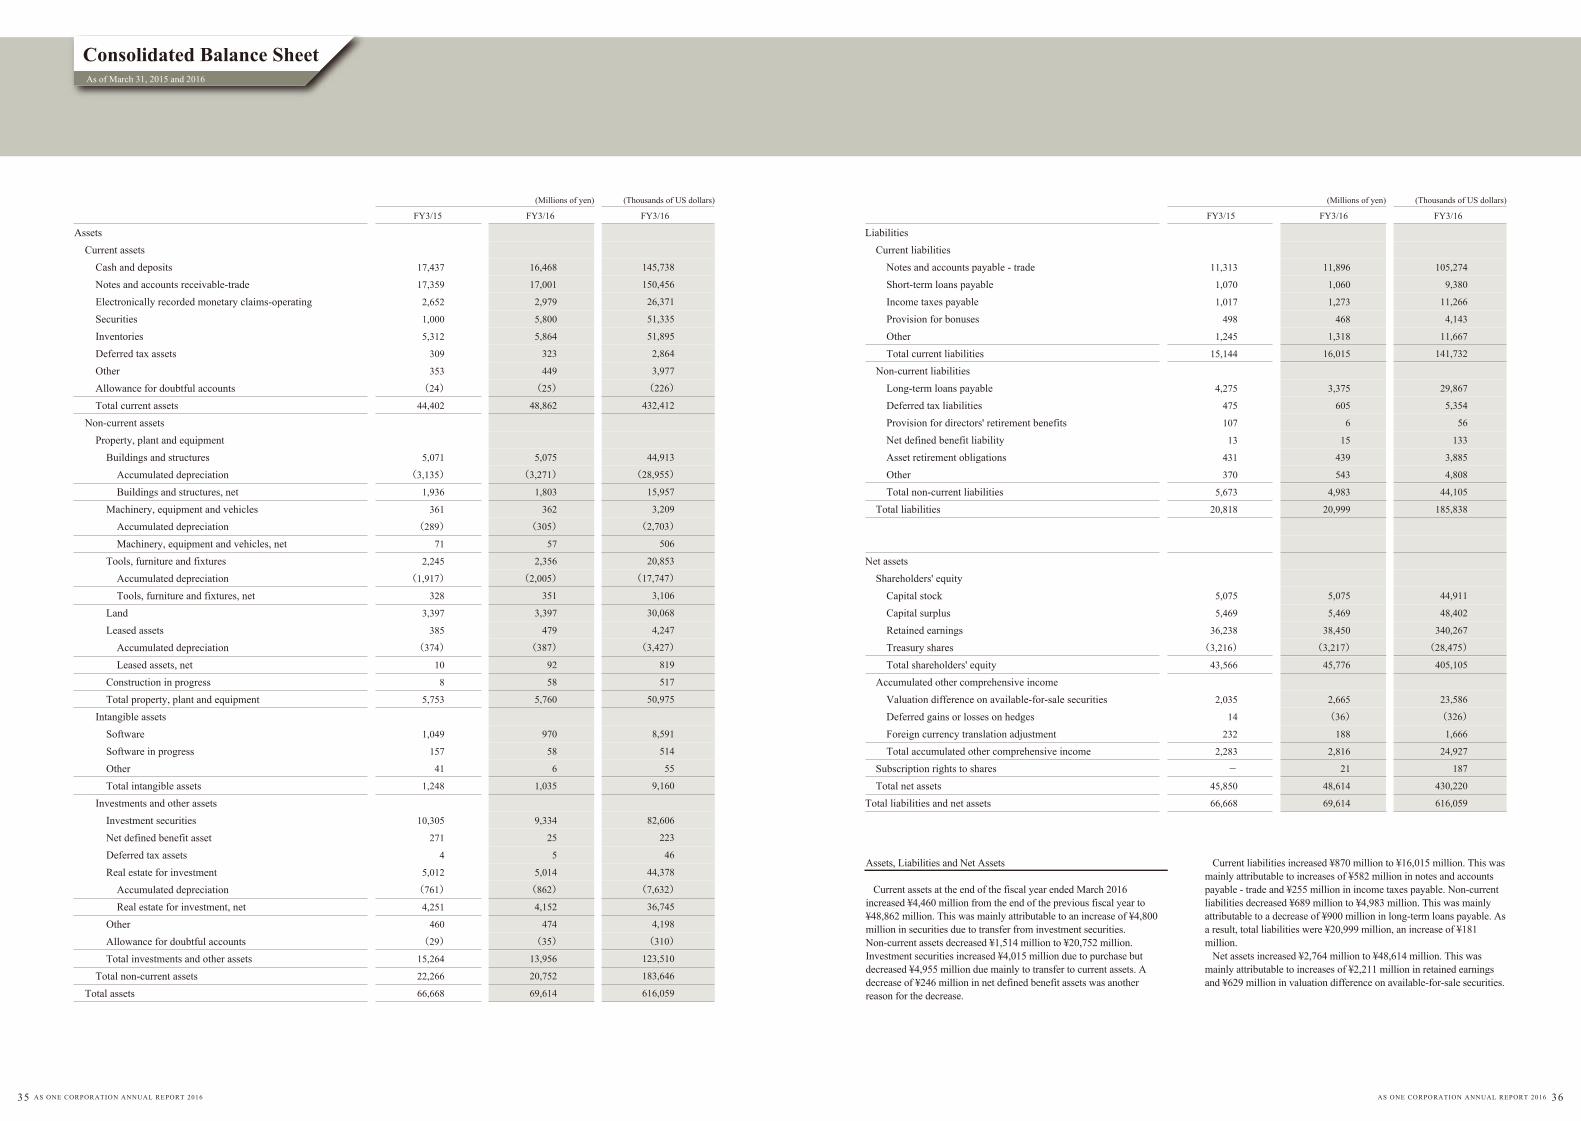
Consolidated Balance SheetAs of March 31, 2015 and 2016
Assets, Liabilities and Net Assets
Current assets at the end of the fiscal year ended March 2016 increased ¥4,460 million from the end of the previous fiscal year to ¥48,862 million. This was mainly attributable to an increase of ¥4,800 million in securities due to transfer from investment securities. Non-current assets decreased ¥1,514 million to ¥20,752 million. Investment securities increased ¥4,015 million due to purchase but decreased ¥4,955 million due mainly to transfer to current assets. A decrease of ¥246 million in net defined benefit assets was another reason for the decrease.
Current liabilities increased ¥870 million to ¥16,015 million. This was mainly attributable to increases of ¥582 million in notes and accounts payable - trade and ¥255 million in income taxes payable. Non-current liabilities decreased ¥689 million to ¥4,983 million. This was mainly attributable to a decrease of ¥900 million in long-term loans payable. As a result, total liabilities were ¥20,999 million, an increase of ¥181 million. Net assets increased ¥2,764 million to ¥48,614 million. This was mainly attributable to increases of ¥2,211 million in retained earnings and ¥629 million in valuation difference on available-for-sale securities.
35 AS ONE CORPORATION ANNUAL REPORT 2016 AS ONE CORPORATION ANNUAL REPORT 2016 36
Cash flows from operating activities Profit before income taxes Foreign exchange losses (gains) Depreciation Increase (decrease) in allowance for doubtful accounts Increase (decrease) in provision for bonuses Increase (decrease) in net defined benefit liability Decrease (increase) in net defined benefit asset Share-based compensation expenses Loss on retirement of non-current assets Other non fundable items Interest and dividend income Interest expenses Decrease (increase) in notes and accounts receivable - trade Decrease (increase) in inventories Increase (decrease) in notes and accounts payable - trade Increase (decrease) in accrued consumption taxes Other, net Subtotal Interest and dividend income received Interest expenses paid Income taxes paid Net cash provided by (used in) operating activities
6,157
(1)1,055
(16)(14)(5)(190)
-7
50
(107)75
(992)(424)
115
185
(174)5,721
118
(75)(2,593)
3,171
6,012
1
958
7
(30)1
246
21
55
(6)(97)
63
14
(561)589
(203)181
7,253
95
(63)(1,982)
5,303
(Millions of yen)(Thousands of
US dollars)
FY3/15 FY3/16 FY3/16
Cash flows from investing activities Payments into time deposits Proceeds from withdrawal of time deposits Purchase of investment securities Proceeds from redemption of investment securities Proceeds from sales of investment securities Purchase of property, plant and equipment Purchase of intangible assets Other, net Net cash provided by (used in) investing activitiesCash flows from financing activities Net increase (decrease) in short-term loans payable Repayments of long-term loans payable Purchase of treasury shares Cash dividends paid Repayments of lease obligationsNet cash provided by (used in) financing activitiesEffect of exchange rate change on cash and cash equivalentsNet increase (decrease) in cash and cash equivalentsCash and cash equivalents at beginning of periodCash and cash equivalents at end of period
(2,445)1,500
(7,012)3,000
-(324)(239)
10
(5,511)
(20)(900)(1)
(1,455)(47)
(2,424)26
(4,737)9,746
5,008
(1,212)2,693
(4,015)1,000
38
(246)(407)(31)
(2,181)
(10)(900)(1)
(1,668)-
(2,579)(10)
530
5,008
5,538
53,205
12
8,480
62
(270)10
2,177
187
494
(57)(866)
561
130
(4,965)5,219
(1,802)1,605
64,188
845
(562)(17,541)
46,929
(10,734)23,837
(35,530)8,849
339
(2,184)(3,603)(283)
(19,309)
(88)(7,964)(13)
(14,764)-
(22,831)(96)4,692
44,322
49,015
(Millions of yen)(Thousands of
US dollars)
FY3/15 FY3/16 FY3/16
Net salesCost of salesGross profitSelling, general and administrative expensesOperating incomeNon-operating income Interest income Dividend income Real estate rent OtherTotal non-operating incomeNon-operating expenses Interest expenses Rent cost of real estate Loss on retirement of non-current assets Other Total non-operating expensesOrdinary income Extraordinary income Gain on sales of investment securities Total extraordinary incomeExtraordinary losses Loss on sales of investment securities Total extraordinary lossesProfit before income taxesIncome taxes - currentIncome taxes - deferredTotal income taxesProfitProfit attributable to owners of parent
52,041
36,548
15,493
9,509
5,984
88
18
372
40
520
75
242
7
22
347
6,157
--
--
6,157
2,103
185
2,288
3,869
3,869
53,576
37,425
16,151
10,307
5,843
73
24
375
34
508
63
221
55
20
361
5,990
22
22
0
0
6,012
2,203
(69)2,133
3,878
3,878
ProfitOther comprehensive income Valuation difference on available-for-sale securities Deferred gains or losses on hedges Foreign currency translation adjustment Total other comprehensive incomeComprehensive incomeComprehensive income attributable to : Owners of parent Non-controlling interests
3,869
775
7
106
889
4,759
4,759
-
3,878
629
(51)(44)
533
4,412
4,412
-
474,129
331,195
142,933
91,219
51,713
653
213
3,326
304
4,497
561
1,962
494
179
3,197
53,013
199
199
6
6
53,205
19,496
(614)18,881
34,324
34,324
34,324
5,570
(453)(394)
4,722
39,046
39,046
-
(Millions of yen) (Thousands of US dollars)
FY3/15 FY3/16 FY3/16
(Millions of yen) (Thousands of US dollars)
FY3/15 FY3/16 FY3/16
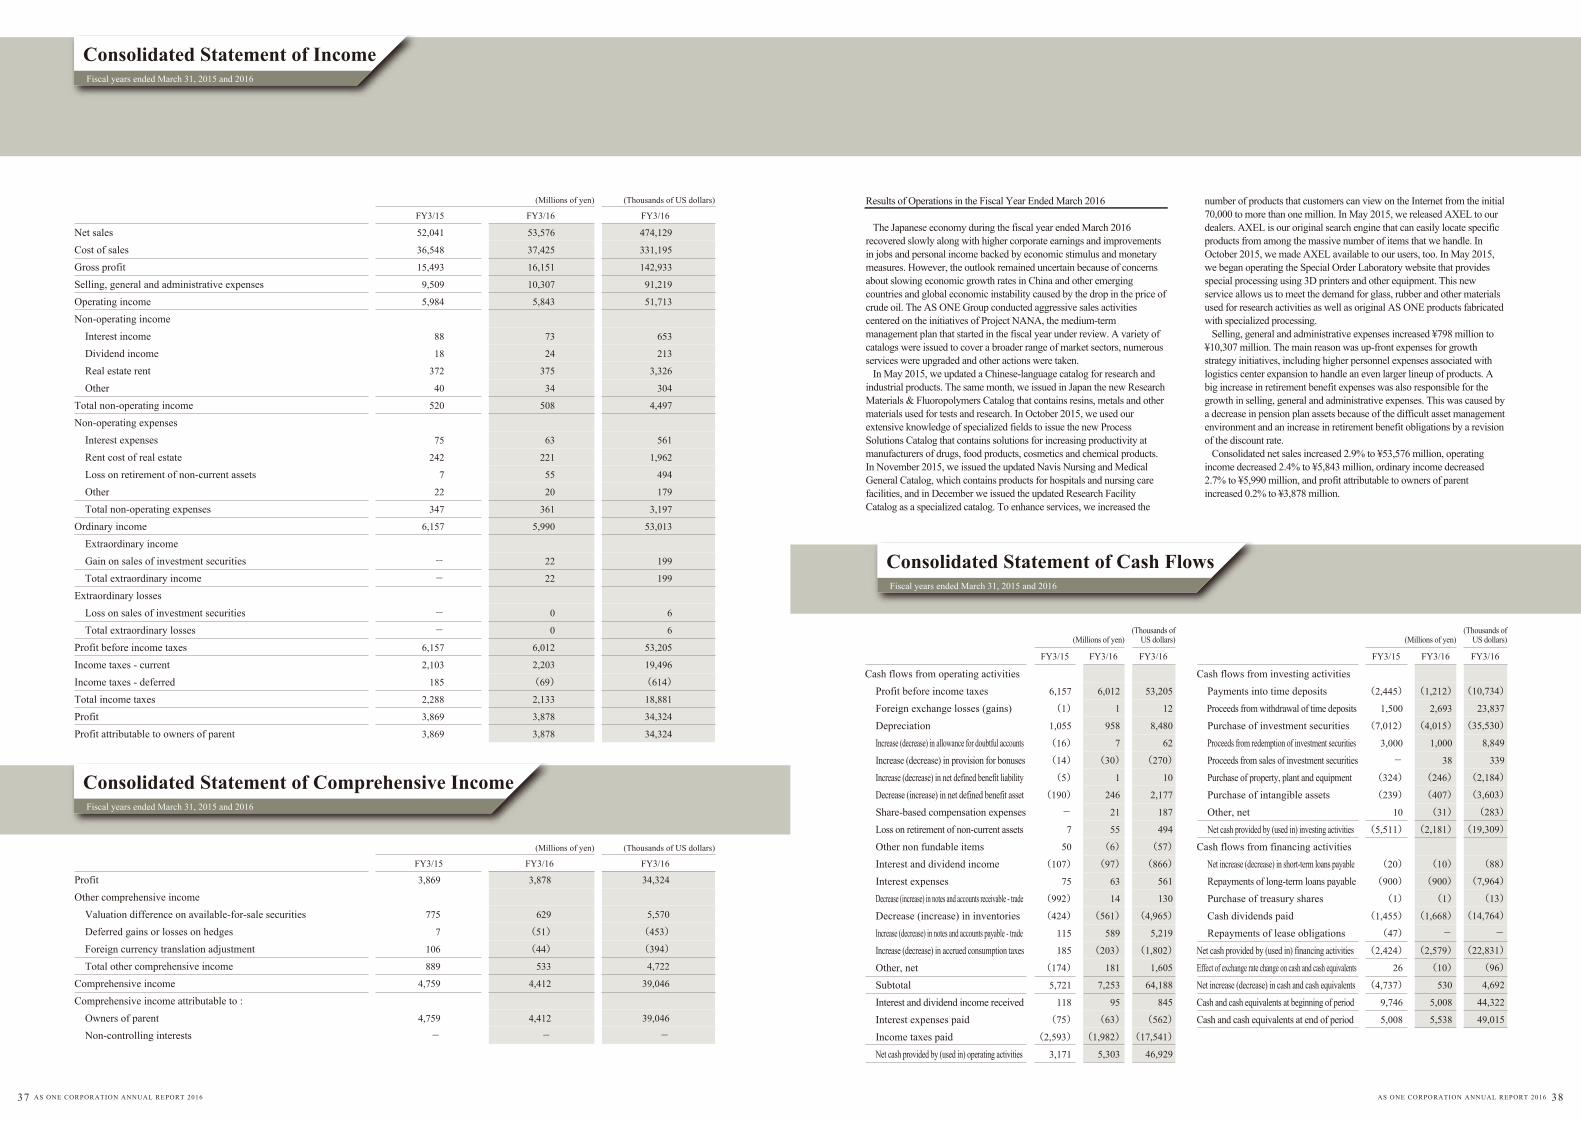
Consolidated Statement of IncomeFiscal years ended March 31, 2015 and 2016
Consolidated Statement of Comprehensive IncomeFiscal years ended March 31, 2015 and 2016
Results of Operations in the Fiscal Year Ended March 2016
The Japanese economy during the fiscal year ended March 2016 recovered slowly along with higher corporate earnings and improvements in jobs and personal income backed by economic stimulus and monetary measures. However, the outlook remained uncertain because of concerns about slowing economic growth rates in China and other emerging countries and global economic instability caused by the drop in the price of crude oil. The AS ONE Group conducted aggressive sales activities centered on the initiatives of Project NANA, the medium-term management plan that started in the fiscal year under review. A variety of catalogs were issued to cover a broader range of market sectors, numerous services were upgraded and other actions were taken. In May 2015, we updated a Chinese-language catalog for research and industrial products. The same month, we issued in Japan the new Research Materials & Fluoropolymers Catalog that contains resins, metals and other materials used for tests and research. In October 2015, we used our extensive knowledge of specialized fields to issue the new Process Solutions Catalog that contains solutions for increasing productivity at manufacturers of drugs, food products, cosmetics and chemical products. In November 2015, we issued the updated Navis Nursing and Medical General Catalog, which contains products for hospitals and nursing care facilities, and in December we issued the updated Research Facility Catalog as a specialized catalog. To enhance services, we increased the
number of products that customers can view on the Internet from the initial 70,000 to more than one million. In May 2015, we released AXEL to our dealers. AXEL is our original search engine that can easily locate specific products from among the massive number of items that we handle. In October 2015, we made AXEL available to our users, too. In May 2015, we began operating the Special Order Laboratory website that provides special processing using 3D printers and other equipment. This new service allows us to meet the demand for glass, rubber and other materials used for research activities as well as original AS ONE products fabricated with specialized processing. Selling, general and administrative expenses increased ¥798 million to ¥10,307 million. The main reason was up-front expenses for growth strategy initiatives, including higher personnel expenses associated with logistics center expansion to handle an even larger lineup of products. A big increase in retirement benefit expenses was also responsible for the growth in selling, general and administrative expenses. This was caused by a decrease in pension plan assets because of the difficult asset management environment and an increase in retirement benefit obligations by a revision of the discount rate. Consolidated net sales increased 2.9% to ¥53,576 million, operating income decreased 2.4% to ¥5,843 million, ordinary income decreased 2.7% to ¥5,990 million, and profit attributable to owners of parent increased 0.2% to ¥3,878 million.
Consolidated Statement of Cash FlowsFiscal years ended March 31, 2015 and 2016
37 AS ONE CORPORATION ANNUAL REPORT 2016 AS ONE CORPORATION ANNUAL REPORT 2016 38
Balance as of March 31, 2014Cumulative effects of changes in accounting policiesRestated balanceChanges of items during periodDividends of surplusProfit attributable to owners of parentPurchase of treasury sharesNet changes of items other than shareholders' equityTotal changes of items during periodBalance as of March 31, 2015Cumulative effects of changes in accounting policiesRestated balanceChanges of items during periodDividends of surplusProfit attributable to owners of parentPurchase of treasury sharesNet changes of items other than shareholders' equityTotal changes of items during periodBalance as of March 31, 2016
5,075
5,075
―
5,075
5,075
―
5,075
5,469
5,469
―
5,469
5,469
―
5,469
33,937
(111)33,825
(1,456)3,869
2,412
36,238
36,238
(1,667)3,878
2,211
38,450
(3,214)
(3,214)
(1)
(1)(3,216)
(3,216)
(1)
(1)(3,217)
41,267
(111)41,155
(1,456)3,869
(1)
2,411
43,566
―
43,566
(1,667)3,878
(1)
2,209
45,776
6
6
7
7
14
14
(51)(51)(36)
1,259
1,259
775
775
2,035
2,035
629
629
2,665
126
126
106
106
232
232
(44)(44)
188
1,393
1,393
889
889
2,283
2,283
533
533
2,816
―
―
―
―
―
―
21
21
21
42,660
(111)42,548
(1,456)3,869
(1)889
3,301
45,850
―
45,850
(1,667)3,878
(1)554
2,764
48,614
44,911
44,911
―
44,911
48,402
48,402
―
48,402
320,696
320,696
(14,753)
34,324
19,570
340,267
(28,462)
(28,462)
(13)
(13)
(28,475)
385,548
―
385,548
(14,753)
34,324
(13)
19,557
405,105
127
127
(453)
(453)
(326)
18,016
18,016
5,570
5,570
23,586
2,061
2,061
(394)
(394)
1,666
20,204
20,204
4,722
4,722
24,927
―
―
187
187
187
405,753
―
405,753
(14,753)
34,324
(13)
4,909
24,466
430,220
Shareholders' equity
Retained earningsCapital surplus Treasury shares Total shareholders' equityCapital stock
(Millions of yen)
Accumulated other comprehensive income
Total accumulated othercomprehensive income
Foreign currencytranslation adjustment
Subscriptionrights to shares Total net assetsDeferred gains or
losses on hedgesValuation difference on
available-for-sale securities
Consolidated Statement of Changes in EquityFiscal years ended March 31, 2015 and 2016
Balance as of March 31, 2015
Cumulative effects of changes in accounting policies
Restated balance
Changes of items during period
Dividends of surplus
Profit attributable to owners of parent
Purchase of treasury shares
Net changes of items other than shareholders' equity
Total changes of items during period
Balance as of March 31, 2016
Shareholders' equity
Retained earningsCapital surplus Treasury shares Total shareholders' equityCapital stock
(Thousands of US dollars)
Accumulated other comprehensive income
Total accumulated othercomprehensive income
Foreign currencytranslation adjustment
Subscriptionrights to shares Total net assetsDeferred gains or
losses on hedgesValuation difference on
available-for-sale securities
39 AS ONE CORPORATION ANNUAL REPORT 2016 AS ONE CORPORATION ANNUAL REPORT 2016 40
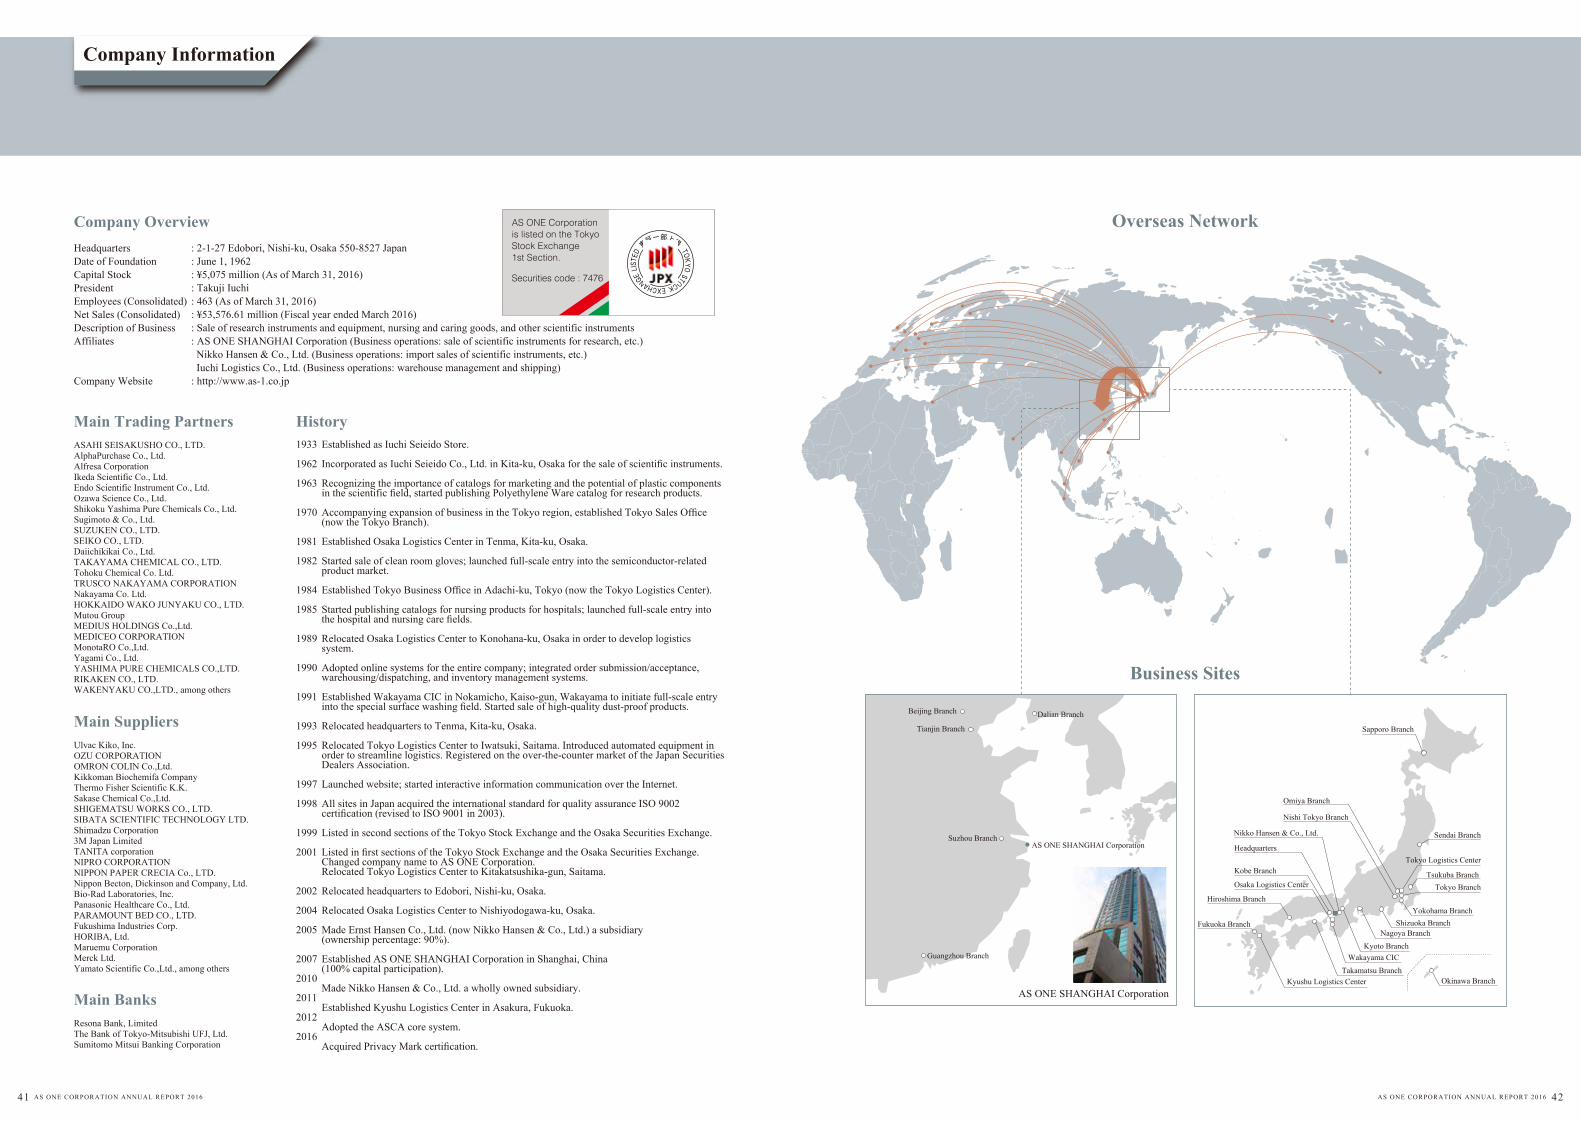
Sapporo Branch
Sendai Branch
Tsukuba Branch
Tokyo Logistics Center
Yokohama Branch
Nagoya BranchShizuoka Branch
Wakayama CIC
Osaka Logistics Center
Kobe Branch
Kyoto Branch
Omiya Branch
Nishi Tokyo Branch
Headquarters
Tokyo Branch
Takamatsu BranchKyushu Logistics Center
Hiroshima Branch
Fukuoka Branch
Nikko Hansen & Co., Ltd.
Company Information
HeadquartersDate of FoundationCapital StockPresidentEmployees (Consolidated)Net Sales (Consolidated)Description of BusinessAffiliates
Company Website
1933
1962
1963
1970
1981
1982
1984
1985
1989
1990
1991
1993
1995
1997
1998
1999
2001
2002
2004
2005
2007
2010
2011
2012
2016
Established as Iuchi Seieido Store.
Incorporated as Iuchi Seieido Co., Ltd. in Kita-ku, Osaka for the sale of scientific instruments.
Recognizing the importance of catalogs for marketing and the potential of plastic components in the scientific field, started publishing Polyethylene Ware catalog for research products.
Accompanying expansion of business in the Tokyo region, established Tokyo Sales Office (now the Tokyo Branch).
Established Osaka Logistics Center in Tenma, Kita-ku, Osaka.
Started sale of clean room gloves; launched full-scale entry into the semiconductor-related product market.
Established Tokyo Business Office in Adachi-ku, Tokyo (now the Tokyo Logistics Center).
Started publishing catalogs for nursing products for hospitals; launched full-scale entry into the hospital and nursing care fields.
Relocated Osaka Logistics Center to Konohana-ku, Osaka in order to develop logistics system.
Adopted online systems for the entire company; integrated order submission/acceptance, warehousing/dispatching, and inventory management systems.
Established Wakayama CIC in Nokamicho, Kaiso-gun, Wakayama to initiate full-scale entry into the special surface washing field. Started sale of high-quality dust-proof products.
Relocated headquarters to Tenma, Kita-ku, Osaka.
Relocated Tokyo Logistics Center to Iwatsuki, Saitama. Introduced automated equipment in order to streamline logistics. Registered on the over-the-counter market of the Japan Securities Dealers Association.
Launched website; started interactive information communication over the Internet.
All sites in Japan acquired the international standard for quality assurance ISO 9002 certification (revised to ISO 9001 in 2003).
Listed in second sections of the Tokyo Stock Exchange and the Osaka Securities Exchange.
Listed in first sections of the Tokyo Stock Exchange and the Osaka Securities Exchange.Changed company name to AS ONE Corporation.Relocated Tokyo Logistics Center to Kitakatsushika-gun, Saitama.
Relocated headquarters to Edobori, Nishi-ku, Osaka.
Relocated Osaka Logistics Center to Nishiyodogawa-ku, Osaka.
Made Ernst Hansen Co., Ltd. (now Nikko Hansen & Co., Ltd.) a subsidiary (ownership percentage: 90%).
Established AS ONE SHANGHAI Corporation in Shanghai, China (100% capital participation).
Made Nikko Hansen & Co., Ltd. a wholly owned subsidiary.
Established Kyushu Logistics Center in Asakura, Fukuoka.
Adopted the ASCA core system.
Acquired Privacy Mark certification.
: 2-1-27 Edobori, Nishi-ku, Osaka 550-8527 Japan: June 1, 1962: ¥5,075 million (As of March 31, 2016): Takuji Iuchi: 463 (As of March 31, 2016): ¥53,576.61 million (Fiscal year ended March 2016): Sale of research instruments and equipment, nursing and caring goods, and other scientific instruments: AS ONE SHANGHAI Corporation (Business operations: sale of scientific instruments for research, etc.) Nikko Hansen & Co., Ltd. (Business operations: import sales of scientific instruments, etc.) Iuchi Logistics Co., Ltd. (Business operations: warehouse management and shipping) : http://www.as-1.co.jp
Company Overview Overseas Network
Business Sites
ASAHI SEISAKUSHO CO., LTD.AlphaPurchase Co., Ltd.Alfresa CorporationIkeda Scientific Co., Ltd.Endo Scientific Instrument Co., Ltd.Ozawa Science Co., Ltd.Shikoku Yashima Pure Chemicals Co., Ltd.Sugimoto & Co., Ltd.SUZUKEN CO., LTD.SEIKO CO., LTD.Daiichikikai Co., Ltd.TAKAYAMA CHEMICAL CO., LTD.Tohoku Chemical Co. Ltd.TRUSCO NAKAYAMA CORPORATIONNakayama Co. Ltd.HOKKAIDO WAKO JUNYAKU CO., LTD.Mutou GroupMEDIUS HOLDINGS Co.,Ltd.MEDICEO CORPORATIONMonotaRO Co.,Ltd.Yagami Co., Ltd.YASHIMA PURE CHEMICALS CO.,LTD.RIKAKEN CO., LTD.WAKENYAKU CO.,LTD., among others
Main Trading Partners
Ulvac Kiko, Inc.OZU CORPORATIONOMRON COLIN Co.,Ltd.Kikkoman Biochemifa CompanyThermo Fisher Scientific K.K.Sakase Chemical Co.,Ltd.SHIGEMATSU WORKS CO., LTD.SIBATA SCIENTIFIC TECHNOLOGY LTD.Shimadzu Corporation3M Japan LimitedTANITA corporationNIPRO CORPORATIONNIPPON PAPER CRECIA Co., LTD.Nippon Becton, Dickinson and Company, Ltd.Bio-Rad Laboratories, Inc.Panasonic Healthcare Co., Ltd.PARAMOUNT BED CO., LTD.Fukushima Industries Corp.HORIBA, Ltd.Maruemu CorporationMerck Ltd.Yamato Scientific Co.,Ltd., among others
Resona Bank, LimitedThe Bank of Tokyo-Mitsubishi UFJ, Ltd.Sumitomo Mitsui Banking Corporation
Main Banks
Main Suppliers
History
Suzhou Branch
Beijing Branch
Guangzhou Branch
Dalian Branch
Tianjin Branch
AS ONE SHANGHAI Corporation
AS ONE SHANGHAI CorporationOkinawa Branch
東証一部上場 TOKYO
STOCK EXCHANG
E LISTED
AS ONE Corporation is listed on the Tokyo Stock Exchange 1st Section.
Securities code : 7476
41 AS ONE CORPORATION ANNUAL REPORT 2016 AS ONE CORPORATION ANNUAL REPORT 2016 42
ANNUALREPORT 2016