annual report 2016 - jnj.brightspotcdn.com · annual report . i’ve worked in the ... $8.6 billion...
TRANSCRIPT

2016
A N N U A L
R E P O R T

I’ve worked in the health care industry for
nearly 30 years. It’s been both an honor and
a privilege to work for Johnson & Johnson,
a company that touches the lives of over
a billion people every day, around the
world. As I look at today’s health care
landscape, it’s incredibly clear that the
pace of change has never been greater,
or frankly, more exciting.
Today’s rapid change brings both
opportunities and risks for any company
in health care, and we are prepared
to address both. There are significant
challenges to overcome, but the tools, the
insights, the technologies, the innovations
– both evolutions and revolutions – all
combine to make today one of the most
promising times for human health and for
Johnson & Johnson.
For over 130 years, our company has been
inventing the future of health care. From
the beginning, we learned that innovation
is seldom the product of a solitary genius.
Rather, true innovations are the result of
collaboration. And that collaboration is
driven by a diversity of ideas, individuals
and disciplines – working together toward
a common goal.
Today, more than ever, the world needs
leaders who are committed to working
together to help bring improved health
and wellness to every person in every
corner of the globe. As the world’s largest
and most broadly based health care
company, we are uniquely positioned to help
transform global health care; to shine a light
on the most important issues we are facing;
to collaborate across boundaries and
borders; to uncover scientific insights and
ideas; and to dedicate resources towards
creating tomorrow’s breakthroughs.
We are united and inspired by Our Credo,
which rings as true today as it did when
it was written more than 70 years ago.
It reminds us that our first responsibility
is to our customers and patients, and it
WE ARE UNITEDAND INSPIREDBY OUR CREDO, WHICH RINGSAS TRUE TODAY AS IT DID WHENIT WAS WRITTENMORE THAN 70YEARS AGO.
MARCH 2017
TO OUR
SHAREHOLDERS
ALEX GORSKY
Chairman and Chief Executive Officer
C H A I R M A N ’ S L E T T E R • I

compels us to deliver on our responsibilities
to our employees, our communities, our
environment, and our shareholders.
With that strong foundation, we will
continue to use our breadth to
comprehensively advance human health;
invest for enduring, long-term impact;
position our businesses to deliver strong,
consistent and sustainable results;
hold ourselves accountable for our
responsibilities; and put people first.
ADVANCING HUMAN HEALTH
We believe having a business that
is broadly based in health care has
been and will continue to be a major
factor in our success. It has allowed us
to deliver strong and consistent growth,
as well as return significant value to
our shareholders, throughout various
economic cycles.
Our company’s structure also allows us
to interconnect our breadth and depth to
drive innovation, and to take advantage of
growth opportunities wherever they may
be across the dynamic health industry. This
is particularly important as the industry
continues to evolve, and as the political
environment poses new challenges and
opportunities. In 2016, this was incredibly
clear in the emerging area of HealthTech.
The potential for the intersection of
technology and health care to completely
change and disrupt the existing health care
ecosystem has never been more imminent.
This new HealthTech space is becoming
integral to everything that we do, and as the
world’s largest and most comprehensive
health care company, no one is better
positioned than Johnson & Johnson to
lead this important work.
In addition to our commitment to advance
health comprehensively, we also employ
disciplined portfolio management to
ensure we are focused on solving the
most important medical and consumer
health needs, investing in promising future
growth areas and that all of our businesses
continue meeting our expectations. During
2016, we completed 14 acquisitions or
significant licensing deals, as well as eight
divestitures, positioning us for continued
profitable growth.
Our acquisition of Abbott Medical Optics,
which closed in early 2017, is an excellent
example of our flexibility to invest in areas
of opportunity across the spectrum of
health care. Our consumer expertise,
particularly in the vision care space,
combined with our medical device
expertise, made this opportunity uniquely
complementary to our portfolio. We
are excited about adding a strong and
differentiated surgical ophthalmic offering
– particularly in cataract surgery – to our
vision care business. That, coupled with
our world-leading ACUVUE® contact lens
business, will help us become a broad-
based leader in vision care. This transaction
is an excellent example of our approach
to acquisitions – it was the right deal,
at the right time and at the right price,
to drive growth and create value for our
shareholders.
WE HAVE TOPUT THE PATIENTIN THE CENTERAND REWARD INNOVATIONS THAT DRIVEBETTEROUTCOMES &LONG-TERMVALUE.
I I • C H A I R M A N ’ S L E T T E R

Our broad base across health care and
strong global footprint also gives us unique
insight and opportunities to work with
governments and health care systems
around the world to influence investments
in health. The volatility that we see in
emerging markets, and the health care cost
challenges that exist in both developed
and emerging markets, clearly demonstrate
the importance of advocating for improved
access to quality health care, as well as
rewards for innovations that drive better
outcomes and long-term value. We will
continue to be a leading voice in these
discussions, advocating for solutions that
are in the best interests of the health and
wellness of patients and consumers.
INVESTING FOR LONG-TERM
GROWTH
In the same way that we are driven to
save and improve lives, we have a very
clear perspective on the imperatives for
our financial performance: our objective
is for Johnson & Johnson to grow sales
organically at a faster rate than the market,
and grow our earnings faster than sales;
an objective we met in 2016.
Additionally, our focus on having a strong
cash flow ensures we are able to make
the appropriate investments in our
business, and then capitalize on the right
opportunities to create greater long-term
value for our shareholders.
C H A I R M A N ’ S L E T T E R • I I I
OUR BROADBASE IN HUMANHEALTH CARE EXTENDS OUR REACH, CAPABILITIES AND STRATEGIC ADVANTAGES FOR PATIENTS,PROVIDERS ANDCONSUMERSAROUND THE WORLD.
We start by funding our internal growth initiatives, including our investments in research and development.
In 2016, our R&D investments totaled $9.1 billion.
$9.1B
$5B
Our first priority is delivering a competitive dividend to our shareholders, which we have increased for 54 consecutive years.
In 2016, we paid $8.6 billion in dividends.
$8.6B
Finally, we consider other prudent ways to return value to shareholders, such as share repurchase programs.
In 2016, we completed two-thirds of our $10 billion share repurchase program.
$10B
After funding our organic growth, we have a strategic capital allocation framework that outlines how we will use our remaining free cash flow.
In 2016, our free cash flow was $15.5 billion*.
$15.5B
After meeting our dividend goals, we target value creating acquisitions.
In 2016, we invested approximately $5 billion in acquisitions and major licensing deals.

Our total shareholder return for 2016
was a strong 15.3%, significantly exceeding
our competitor composite, as well as
exceeding most major indices, including
the S&P 500. This is not only true for 2016,
but I’m proud to say it’s also the case over
the last three, five, ten and twenty year
periods. Historically, approximately 70
percent of our free cash flow deployed
over the last 10 years has been returned
to shareholders in the form of dividends or
share repurchases.
Our strong record of total shareholder
returns is the result of our approach to
managing for the long term, our relentless
drive for innovation, our disciplined portfolio
management and our capital allocation
strategy – all of which are regularly
discussed as part of our ongoing strategic
planning with our Board of Directors.
DRIVING STRONG, CONSISTENT,
SUSTAINABLE RESULTS
As the health care landscape continues to
evolve, all three of our business sectors are
well-positioned to meet the changing needs
of patients and consumers. In terms of our
financial performance, we expect each
business segment to grow and contribute
to our sales and income growth in 2017.
PHARMACEUTICALS
In our Pharmaceuticals business, our
priority is to drive continued growth while
delivering on our near-term pipeline. We
will do this by focusing on our therapeutic
areas of high unmet medical need, our
robust innovation engine and strong
commercial capabilities.
For 2017, we expect our key catalysts for
growth will include:
• Continued strong performance of our
in-line products – increasing penetration
in markets such as anti-coagulants,
psoriasis, and long-acting anti-psychotics
• Capitalizing on the early launch success
from key products such as DARZALEX®,
IMBRUVICA®, and STELARA® for
Crohn’s Disease
• Anticipated regulatory approval for two
new immunology products, guselkumab
and sirukumab, each with greater than
$1 billion in sales potential
Further, we will continue to vigorously
defend our patents on REMICADE®, while
remaining competitive against at-risk
biosimilar entries, given the product’s long
track record of efficacy and safety.
We are confident in our robust
Pharmaceutical pipeline and will continue
working toward our goal of filing 10 new
products by 2019, each with at least $1
billion in potential sales, as well as filing an
additional 40 line extensions by 2019, 10
of which have more than $500 million in
potential sales.
In addition, in January 2017 we announced
a definitive agreement to acquire Actelion
Ltd. for approximately $30 billion. The
transaction is expected to accelerate
our near- and long-term revenue and
earnings growth rates and be immediately
accretive to Johnson & Johnson’s adjusted
earnings per share**. The acquisition would
expand and complement our existing
Janssen portfolio with differentiated in-
ALL THREE OF OUR BUSINESSSECTORS ARE WELL-POSITIONEDTO MEET THE CHANGING NEEDS OF PATIENTS AND CONSUMERS
I V • C H A I R M A N ’ S L E T T E R

opportunities in large, growing markets with
significant unmet needs.
Our goal is to return to above market
growth by the second half of this year, and
we plan to drive that growth through:
• More than doubling the number of new
products in 2016, with at least 12 major
launches planned for 2017
• Accelerating the impact from strategic
acquisitions made in 2016
• Incorporating a suite of holistic, insights-
driven capabilities to help health systems
navigate value-based care through our
CareAdvantage & Orthopaedic Episode-
of-Care partnerships
• Continuing progress on the restructuring
initiative in our hospital medical device
businesses, which is on track to achieve
savings of $800 million to $1 billion, with
the majority expected to be realized by
the end of 2018
OUR RESPONSIBILITY
As the world’s largest and most broadly-
based health care company, we have a
unique perspective on the health and
wellness needs, wants, hopes and fears
of the people whose lives we touch around
the world every day.
We will continue providing leadership on
the health and wellness issues that we
understand better than anyone else. And
we will continue reporting on the social and
environmental performance of our business
through our Citizenship & Sustainability
Report, available at www.jnj.com/caring.
In September 2016, in addition to our
market medicines for pulmonary arterial
hypertension, and reinforces Janssen’s
already robust late-stage pipeline. The
transaction is subject to satisfaction of
closing conditions and is expected to close
by the end of the second quarter of 2017.
CONSUMER
In our Consumer segment, in the near-term,
our priority is to enhance our leadership in
priority categories and continue to improve
profitability to benchmark levels by focusing
on critical geographies and our iconic
mega-brands.
Our plans for Consumer growth in
2017 include:
• Continuing to grow faster than the
market, and gaining market share across
our mega brands
• Bringing innovation to the market, and
launching key, science-based new
products
• Accelerating the growth from recent
acquisitions in our Beauty franchise,
including Vogue International with OGX®
and PROGANIX® hair care brands
• Continuing to utilize supply chain and
operational efficiencies to ensure
operating margins are at benchmark
levels
MEDICAL DEVICES
Our near-term priority in Medical Devices
is to accelerate growth through innovation,
portfolio management and new business
models. We are driving growth in priority
platforms, sustaining leadership in our
core platforms, implementing novel
commercial models and seeking expansion
WE HAVE A UNIQUEPERSPECTIVE ON THE HEALTHAND WELLNESSNEEDS, WANTS,HOPES ANDFEARS OF THE PEOPLE WHOSELIVES WE TOUCHAROUND THE WORLD EVERYDAY.
C H A I R M A N ’ S L E T T E R • V
Citizenship & Sustainability 2020 goals,
we announced a comprehensive UN
Sustainable Development Goals (SDG)
commitment focused on five key areas
where we are uniquely positioned to
create sustainable and scalable impact:
Global Disease Challenges, Essential
Surgery, Women’s & Children’s Health,
Health Workforce, and Environmental
Health. Our SDG vision for 2030 is that
by galvanizing partners, mobilizing
employees and engaging communities,
we will profoundly improve the course of
human health.
We are also an industry leader in keeping
the patient and consumer at the center
of everything we do. In the last few years,
we have taken unprecedented steps
like creating the Johnson & Johnson
Bioethics Committee and the industry’s first
Compassionate Use Advisory Committee;
collaborating to develop massive real world
data sets, such as the Observational Health
Data Sciences and Informatics (OHDSI);
and developing industry-leading clinical trial
data transparency through the Yale Open
Data Access (YODA) Project.
In the first quarter of 2017, we were also
pleased to release the inaugural Janssen
U.S. Transparency Report, in which we
are disclosing more information about
our business practices, including those
related to pricing. This report builds on our
history of responsible pricing practices
and our ongoing efforts to provide more
transparency into how we operate. These
disclosures are just one way we are
continuing to work with others in the
health care system to address the important
issue of U.S. health care costs.
We will continue to defend the interests
of all of the stakeholders defined in Our
Credo: the doctors, nurses and patients; the
mothers and fathers and all others who use
our products; our employees and suppliers;
and the communities in which we live and
work. We will also continue to provide
positive economic impact wherever we do
business, pay our fair share of taxes and
deliver a fair return to our shareholders.
PUTTING PEOPLE FIRST
Whether it is a human-centered insight
that drives the innovation of a breakthrough
product, our advocacy for access to health
care, or our humanitarian work treating
some of the world’s most debilitating
diseases, we are committed to always
putting people first.
This is also true in how we support our
more than 126,000 employees around
the world. All of our compelling strategies
and strong results would not be possible
without our talented, diverse and dedicated
employees. Their commitment and
passion has helped Johnson & Johnson
to be named by top industry and business
publications as being among the most
admired, most respected, most innovative
and best places to work year after year.
For all they do to ensure our success, we
believe employers have an opportunity and
responsibility, as well as an incentive, to
ensure their employees are healthy and
engaged. Our goal for 2020 and beyond is
WE ARECOMMITTED TO ALWAYS PUTTING PEOPLE FIRST.
V I • C H A I R M A N ’ S L E T T E R

* Non-GAAP measure – Free cash flow is defined as operating cash flow less capital spending ($18.7 billion -
$3.2 billion = $15.5 billion)
** Non-GAAP measure; excludes intangible amortization expense and special items
NOTE REGARDING FORWARD-LOOKING STATEMENTS
This letter contains forward-looking statements relating to, among other things, future operating and financial
performance, product development, market position and business strategy. The reader is cautioned not to rely on
these statements, which are based on current expectations of future events. For important information about these
statements, including the risks, uncertainties and other factors that could cause actual results to vary materially from the
assumptions, expectations, and projections expressed in any forward-looking statements, the reader should review the
enclosed Annual Report on Form 10-K for the fiscal year ended January 1, 2017, including in the sections captioned
“Cautionary Note Regarding Forward-Looking Statements” and “Item 1A. Risk Factors”. Johnson & Johnson does not
undertake to update any forward-looking statement as a result of new information or future events or developments.
and resilience; and one way to achieve
this is through the practice of gratitude. I
would like to say how grateful I am to be
the Chairman and Chief Executive Officer
of Johnson & Johnson. I am grateful for
the passion, commitment and unique
contributions of our more than 126,000
employees around the world. I am grateful
to the billions of health care workers,
parents and consumers who place their
trust in our products every day. And finally,
I am grateful to our Board of Directors and
you, our shareholders, for entrusting me
with the great responsibility of leading
this amazing company. Thank you for
your support.
With Our Credo as our inspiration, the
strength of our broad base across human
health care, and our commitment to
delivering strong, consistent, long-term
growth, I am incredibly confident in the
continued success of Johnson & Johnson.
Sincerely,
Alex Gorsky
Chairman and Chief Executive Officer
Johnson & Johnson
to lead by example, cultivating the world’s healthiest workforce.
We have a number of programs in place
to help us achieve that goal across many
facets of our employees’ lives. From
programs that encourage healthy eating,
movement, and resilience; to ensuring the
financial health of our employees through
competitive compensation programs,
Health and Wellness benefits, recognition
programs, long-term incentives, and robust
retirement plans – including a defined
benefit pension plan in the U.S.; as well
as supporting healthy families, through
programs such as our new parental leave
policy, fertility benefits, and global breast
milk shipping benefits.
We not only feel that this is the right thing
to do, but we also believe these programs
help us to achieve our goals of attracting,
developing, and retaining the best talent to
deliver the best outcomes; positioning us to
deliver another 130 years of strong growth
and shareholder returns.
CONFIDENT IN THE FUTURE OF
JOHNSON & JOHNSON
One of the teachings from our wellness
business is the importance of mindfulness
C H A I R M A N ’ S L E T T E R • V I I


UNITED STATESSECURITIES AND EXCHANGE COMMISSION
Washington, D.C. 20549FORM 10-K
ANNUAL REPORT PURSUANT TO SECTION 13 OFTHE SECURITIES EXCHANGE ACT OF 1934
For the fiscal year ended January 1, 2017 Commission file number 1-3215
JOHNSON & JOHNSON(Exact name of registrant as specified in its charter)
New Jersey 22-1024240(State of incorporation) (I.R.S. Employer Identification No.)
One Johnson & Johnson PlazaNew Brunswick, New Jersey 08933
(Address of principal executive offices) (Zip Code)
Registrant’s telephone number, including area code: (732) 524-0400
SECURITIES REGISTERED PURSUANT TO SECTION 12(b) OF THE ACTTitle of each class Name of each exchange on which registered
Common Stock, Par Value $1.004.75% Notes Due November 20190.250% Notes Due January 2022
0.650% Notes Due May 20245.50% Notes Due November 2024
1.150% Notes Due November 20281.650% Notes Due May 2035
New York Stock ExchangeNew York Stock ExchangeNew York Stock ExchangeNew York Stock ExchangeNew York Stock ExchangeNew York Stock ExchangeNew York Stock Exchange
Indicate by check mark if the registrant is a well-known seasoned issuer, as defined in Rule 405 of the SecuritiesAct. Yes Í No ‘
Indicate by check mark if the registrant is not required to file reports pursuant to Section 13 or Section 15(d) of theExchange Act. Yes ‘ No Í
Indicate by check mark whether the registrant (1) has filed all reports required to be filed by Section 13 or 15(d) of theExchange Act during the preceding 12 months (or for such shorter period that the registrant was required to file suchreports), and (2) has been subject to such filing requirements for the past 90 days. Yes Í No ‘
Indicate by check mark whether the registrant has submitted electronically and posted on its corporate website, if any,every Interactive Data File required to be submitted and posted pursuant to Rule 405 of Regulation S-T during thepreceding 12 months (or for such shorter period that the registrant was required to submit and post suchfiles). Yes Í No ‘
Indicate by check mark if disclosure of delinquent filers pursuant to Item 405 of Regulation S-K is not contained herein,and will not be contained, to the best of registrant’s knowledge, in definitive proxy or information statementsincorporated by reference in Part III of this Form 10-K or any amendment to this Form 10-K. ‘
Indicate by check mark whether the registrant is a large accelerated filer, an accelerated filer, a non-accelerated filer, ora smaller reporting company. See the definitions of “large accelerated filer,” “accelerated filer” and “smaller reportingcompany” in Rule 12b-2 of the Exchange Act.
Large accelerated filer Í Accelerated filer ‘ Non-accelerated filer ‘ Smaller reporting company ‘
(Do not check if a smaller reporting company)Indicate by check mark whether the registrant is a shell company (as defined in Rule 12b-2 of the ExchangeAct). Yes ‘ No Í
The aggregate market value of the Common Stock held by non-affiliates computed by reference to the price at whichthe Common Stock was last sold as of the last business day of the registrant’s most recently completed second fiscalquarter was approximately $332 billion.On February 23, 2017, there were 2,713,346,602 shares of Common Stock outstanding.
DOCUMENTS INCORPORATED BY REFERENCEParts I and III: Portions of registrant’s proxy statement for its 2017 annual meeting of shareholders filed
within 120 days after the close of the registrant’s fiscal year (the “Proxy Statement”), areincorporated by reference to this report on Form 10-K (this “Report”).

Item Page
PART I
1 Business 1General 1Segments of Business 1Geographic Areas 2Raw Materials 2Patents 2Trademarks 3Seasonality 3Competition 3Research and Development 4Environment 4Regulation 4Available Information 4
1A. Risk Factors 51B. Unresolved Staff Comments 92 Properties 93 Legal Proceedings 104 Mine Safety Disclosures 10
Executive Officers of the Registrant 11
PART II
5 Market for Registrant’s Common Equity, Related Stockholder Matters and Issuer Purchases ofEquity Securities 13
6 Selected Financial Data 147 Management’s Discussion and Analysis of Results of Operations and Financial Condition 157A. Quantitative and Qualitative Disclosures About Market Risk 358 Financial Statements and Supplementary Data 359 Changes in and Disagreements With Accountants on Accounting and Financial Disclosure 899A. Controls and Procedures 899B. Other Information 89
PART III
10 Directors, Executive Officers and Corporate Governance 9011 Executive Compensation 9012 Security Ownership of Certain Beneficial Owners and Management and Related Stockholder
Matters 9013 Certain Relationships and Related Transactions, and Director Independence 9114 Principal Accountant Fees and Services 91
PART IV
15 Exhibits and Financial Statement Schedules 9216 Form 10-K Summary 92
Signatures 93Exhibit Index 94

CAUTIONARY NOTE REGARDING FORWARD-LOOKING STATEMENTS
This Annual Report on Form 10-K and Johnson & Johnson’s other publicly available documents contain “forward-lookingstatements” within the meaning of the safe harbor provisions of the U.S. Private Securities Litigation Reform Act of 1995.Management and representatives of Johnson & Johnson and its subsidiaries (the “Company”) also may from time to timemake forward-looking statements. Forward-looking statements do not relate strictly to historical or current facts and reflectmanagement’s assumptions, views, plans, objectives and projections about the future. Forward-looking statements may beidentified by the use of words such as “plans,” “expects,” “will,” “anticipates,” “estimates” and other words of similarmeaning in conjunction with, among other things: discussions of future operations; expected operating results andfinancial performance; impact of planned acquisitions and dispositions; the Company’s strategy for growth; productdevelopment; regulatory approvals; market position and expenditures.
Because forward-looking statements are based on current beliefs, expectations and assumptions regarding future events,they are subject to uncertainties, risks and changes that are difficult to predict and many of which are outside of theCompany’s control. Investors should realize that if underlying assumptions prove inaccurate, or known or unknown risks oruncertainties materialize, the Company’s actual results and financial condition could vary materially from expectations andprojections expressed or implied in its forward-looking statements. Investors are therefore cautioned not to rely on theseforward-looking statements. Risks and uncertainties include, but are not limited to:
Risks Related to Product Development, Market Success and Competition
• Challenges and uncertainties inherent in innovation and development of new and improved products and technologieson which the Company’s continued growth and success depend, including uncertainty of clinical outcomes, obtainingregulatory approvals, health plan coverage and customer access, and initial and continued commercial success;
• Challenges to the Company’s ability to obtain and protect adequate patent and other intellectual property rights for newand existing products and technologies in the U.S. and other important markets;
• The impact of patent expirations, typically followed by the introduction of competing biosimilars and generics andresulting revenue and market share losses;
• Increasingly aggressive and frequent challenges to the Company’s patents by competitors and others seeking to launchcompeting generic, biosimilar or other products, potentially resulting in loss of market exclusivity and rapid decline insales for the relevant product;
• Competition in research and development of new and improved products, processes and technologies, which can resultin product and process obsolescence;
• Competition to reach agreement with third parties for collaboration, licensing, development and marketing agreementsfor products and technologies;
• Competition on the basis of cost-effectiveness, product performance, technological advances and patents attained bycompetitors; and
• Allegations that the Company’s products infringe the patents and other intellectual property rights of third parties, whichcould adversely affect the Company’s ability to sell the products in question and require the payment of money damagesand future royalties.
Risks Related to Product Liability, Litigation and Regulatory Activity
• Product efficacy or safety concerns, whether or not based on scientific evidence, potentially resulting in productwithdrawals, recalls, regulatory action on the part of the U.S. Food and Drug Administration (or internationalcounterparts), declining sales and reputational damage;
• Impact of significant litigation or government action adverse to the Company, including product liability claims;• Increased scrutiny of the health care industry by government agencies and state attorneys general resulting in
investigations and prosecutions, which carry the risk of significant civil and criminal penalties, including, but not limitedto, debarment from government business;
• Failure to meet compliance obligations in the McNEIL-PPC, Inc. Consent Decree or the Corporate Integrity Agreementsof the Johnson & Johnson Pharmaceutical Affiliates, or any other compliance agreements with governments orgovernment agencies, which could result in significant sanctions;
• Potential changes to applicable laws and regulations affecting U.S. and international operations, including relating to:approval of new products; licensing and patent rights; sales and promotion of health care products; access to, andreimbursement and pricing for, health care products and services; environmental protection and sourcing of raw materials;
Johnson & Johnson 2016 Annual Report •
• Changes in tax laws and regulations, increasing audit scrutiny by tax authorities around the world and exposures toadditional tax liabilities potentially in excess of reserves; and
• Issuance of new or revised accounting standards by the Financial Accounting Standards Board and the Securities andExchange Commission.
Risks Related to the Company’s Strategic Initiatives and Health Care Market Trends
• Pricing pressures resulting from trends toward health care cost containment, including the continued consolidationamong health care providers, trends toward managed care and the shift toward governments increasingly becoming theprimary payers of health care expenses;
• Restricted spending patterns of individual, institutional and governmental purchasers of health care products andservices due to economic hardship and budgetary constraints;
• Challenges to the Company’s ability to realize its strategy for growth including through externally sourced innovations,such as development collaborations, strategic acquisitions, licensing and marketing agreements, and the potentialheightened costs of any such external arrangements due to competitive pressures;
• The potential that the expected strategic benefits and opportunities from any planned or completed acquisition ordivestiture by the Company, including the planned acquisition of Actelion Ltd., may not be realized or may take longer torealize than expected;
• The potential that the expected benefits and opportunities related to the planned restructuring actions in the MedicalDevice segment may not be realized or may take longer to realize than expected, including due to any requiredconsultation procedures relating to restructuring of workforce; and
• Market conditions and the possibility that the Company’s share repurchase program may be delayed, suspended ordiscontinued.
Risks Related to Economic Conditions, Financial Markets and Operating Internationally
• Impact of inflation and fluctuations in interest rates and currency exchange rates and the potential effect of suchfluctuations on revenues, expenses and resulting margins;
• Potential changes in export/import and trade laws, regulations and policies of the U.S., U.K. and other countries,including any increased trade restrictions and potential drug reimportation legislation;
• The impact on international operations from financial instability in international economies, sovereign risk, possibleimposition of governmental controls and restrictive economic policies, and unstable international governments and legalsystems;
• Changes to global climate, extreme weather and natural disasters that could affect demand for the Company’s productsand services, cause disruptions in manufacturing and distribution networks, alter the availability of goods and serviceswithin the supply chain, and affect the overall design and integrity of the Company’s products and operations; and
• The impact of armed conflicts and terrorist attacks in the U.S. and other parts of the world including social andeconomic disruptions and instability of financial and other markets.
Risks Related to Supply Chain and Operations
• Difficulties and delays in manufacturing, internally or within the supply chain, that may lead to voluntary or involuntarybusiness interruptions or shutdowns, product shortages, withdrawals or suspensions of products from the market, andpotential regulatory action;
• Interruptions and breaches of the Company’s information technology systems, and those of the Company’s vendors,could result in reputational, competitive, operational or other business harm as well as financial costs and regulatoryaction; and
• Reliance on global supply chains and production and distribution processes that are complex and subject to increasingregulatory requirements that may adversely affect supply, sourcing and pricing of materials used in the Company’sproducts.
Investors also should carefully read the Risk Factors described in Item 1A of this Annual Report on Form 10-K for adescription of certain risks that could, among other things, cause the Company’s actual results to differ materially fromthose expressed in its forward-looking statements. Investors should understand that it is not possible to predict or identifyall such factors and should not consider the risks described above and in Item 1A to be a complete statement of allpotential risks and uncertainties. The Company does not undertake to publicly update any forward-looking statement thatmay be made from time to time, whether as a result of new information or future events or developments.
• Johnson & Johnson 2016 Annual Report
PART IItem 1. BUSINESS
GeneralJohnson & Johnson and its subsidiaries (the “Company”) have approximately 126,400 employees worldwide engaged inthe research and development, manufacture and sale of a broad range of products in the health care field. Johnson &Johnson is a holding company, which has more than 230 operating companies conducting business in virtually allcountries of the world. The Company’s primary focus is products related to human health and well-being. Johnson &Johnson was incorporated in the State of New Jersey in 1887.
The Executive Committee of Johnson & Johnson is the principal management group responsible for the strategicoperations and allocation of the resources of the Company. This Committee oversees and coordinates the activities of theCompany’s three business segments: Consumer, Pharmaceutical and Medical Devices. Within the strategic parametersprovided by the Committee, senior management groups at U.S. and international operating companies are eachresponsible for their own strategic plans and the day-to-day operations of those companies. Each subsidiary within thebusiness segments is, with limited exceptions, managed by residents of the country where located.
Segments of BusinessThe Company is organized into three business segments: Consumer, Pharmaceutical and Medical Devices. Additionalinformation required by this item is incorporated herein by reference to the narrative and tabular descriptions of segmentsand operating results under: “Item 7. Management’s Discussion and Analysis of Results of Operations and FinancialCondition” of this Report; and Note 18 “Segments of Business and Geographic Areas” of the Notes to ConsolidatedFinancial Statements included in Item 8 of this Report.
Consumer
The Consumer segment includes a broad range of products used in the baby care, oral care, beauty (previously referred toas skin care), over-the-counter pharmaceutical, women’s health and wound care markets. Baby Care includes theJOHNSON’S® line of products. Oral Care includes the LISTERINE® product line. Major brands in Beauty include theAVEENO®; CLEAN & CLEAR®; DABAO™; JOHNSON’S® Adult; LE PETITE MARSEILLAIS®; NEUTROGENA®; RoC®
and OGX® product lines. Over-the-counter medicines include the broad family of TYLENOL® acetaminophen products;SUDAFED® cold, flu and allergy products; BENADRYL® and ZYRTEC® allergy products; MOTRIN® IB ibuprofenproducts; and the PEPCID® line of acid reflux products. Major brands in Women’s Health outside of North America areSTAYFREE® and CAREFREE® sanitary pads and o.b.® tampon brands. Wound Care brands include the BAND-AID®
Brand Adhesive Bandages and NEOSPORIN® First Aid product lines. These products are marketed to the general publicand sold both to retail outlets and distributors throughout the world.
Pharmaceutical
The Pharmaceutical segment is focused on five therapeutic areas: immunology (e.g., rheumatoid arthritis, inflammatorybowel disease and psoriasis), infectious diseases and vaccines (e.g., HIV, hepatitis, respiratory infections andtuberculosis), neuroscience (e.g., Alzheimer’s disease, mood disorders and schizophrenia), oncology (e.g., prostatecancer, hematologic malignancies and lung cancer), and cardiovascular and metabolic diseases (e.g., thrombosis anddiabetes). Products in this segment are distributed directly to retailers, wholesalers, hospitals and health careprofessionals for prescription use. Key products in the Pharmaceutical segment include: REMICADE® (infliximab), atreatment for a number of immune-mediated inflammatory diseases; SIMPONI® (golimumab), a subcutaneous treatmentfor adults with moderate to severe rheumatoid arthritis, active psoriatic arthritis, active ankylosing spondylitis andmoderately active to severely active ulcerative colitis; SIMPONI ARIA® (golimumab), an intravenous treatment for adultswith moderate to severe rheumatoid arthritis; STELARA® (ustekinumab), a treatment for adults with moderate to severeplaque psoriasis and active psoriatic arthritis, and for adults with moderately to severely active Crohn’s disease;PREZISTA® (darunavir), EDURANT® (rilpivirine), and PREZCOBIX® /REZOLSTA® (darunavir/cobicistat), antiretroviralmedicines for the treatment of human immunodeficiency virus (HIV-1) in combination with other antiretroviral products;
Johnson & Johnson 2016 Annual Report • 1

CONCERTA® (methylphenidate HCl) extended-release tablets CII, a treatment for attention deficit hyperactivity disorder;INVEGA® (paliperidone) extended-release tablets, for the treatment of schizophrenia and schizoaffective disorder;INVEGA SUSTENNA® /XEPLION® (paliperidone palmitate), for the treatment of schizophrenia and schizoaffectivedisorder in adults; INVEGA TRINZA® /TREVICTA® (paliperidone palmitate), for the treatment of schizophrenia in patientsafter they have been adequately treated with INVEGA SUSTENNA® for at least four months; RISPERDAL CONSTA®
(risperidone long-acting injection), for the treatment of schizophrenia and the maintenance treatment of Bipolar 1 Disorderin adults; VELCADE® (bortezomib), a treatment for multiple myeloma and for use in combination with rituximab,cyclophosphamide, doxorubicin and prednisone for the treatment of adult patients with previously untreated mantle celllymphoma; ZYTIGA® (abiraterone acetate), used in combination with prednisone as a treatment for metastatic castration-resistant prostate cancer; IMBRUVICA® (ibrutinib), an oral, once-daily therapy approved for use in treating certain B-cellmalignancies, or blood cancers, and Waldenström’s Macroglobulinemia; DARZALEX® (daratumumab), for the treatment ofrelapsed/refractory multiple myeloma; PROCRIT® (epoetin alfa, sold outside the U.S. as EPREX® ), to stimulate red bloodcell production; XARELTO® (rivaroxaban), an oral anticoagulant for the prevention of deep vein thrombosis (DVT), whichmay lead to pulmonary embolism (PE) in patients undergoing hip or knee replacement surgery, to reduce the risk of strokeand systemic embolism in patients with nonvalvular atrial fibrillation, for the treatment and reduction of risk of recurrence ofDVT and PE; INVOKANA® (canagliflozin), for the treatment of adults with type 2 diabetes; INVOKAMET® /VOKANAMET®
(canagliflozin/metformin HCl), a combination therapy of fixed doses of canagliflozin and metformin hydrochloride for thetreatment of adults with type 2 diabetes; and INVOKAMET® XR (canagliflozin/metformin hydrochloride extended-release),a once-daily, fixed-dose combination therapy of canagliflozin and metformin hydrochloride extended-release, for thetreatment of adults with type 2 diabetes. Many of these medicines were developed in collaboration with strategic partnersor are licensed from other companies and maintain active lifecycle development programs.
Medical Devices
The Medical Devices segment includes a broad range of products used in the orthopaedic, surgery, cardiovascular,diabetes care and vision care fields. These products are distributed to wholesalers, hospitals and retailers, and usedprincipally in the professional fields by physicians, nurses, hospitals, eye care professionals and clinics. They includeorthopaedic products; general surgery, biosurgical, endomechanical and energy products; electrophysiology products totreat cardiovascular disease; sterilization and disinfection products to reduce surgical infection; diabetes care products,such as blood glucose monitoring and insulin delivery products; and disposable contact lenses.
For details regarding acquisitions and divestitures see Note 20 to the Consolidated Financial Statements included inItem 8.
Geographic AreasThe business of Johnson & Johnson is conducted by more than 230 operating companies located in 60 countries,including the U.S., in virtually all countries throughout the world. The products made and sold in the international businessinclude many of those described above under “– Segments of Business – Consumer,” “– Pharmaceutical” and “– MedicalDevices.” However, the principal markets, products and methods of distribution in the international business vary with thecountry and the culture. The products sold in international business include those developed in the U.S. and bysubsidiaries abroad.
Investments and activities in some countries outside the U.S. are subject to higher risks than comparable U.S. activitiesbecause the investment and commercial climate may be influenced by financial instability in international economies,restrictive economic policies and political and legal system uncertainties.
Raw MaterialsRaw materials essential to the Company’s business are generally readily available from multiple sources. Where there areexceptions, the temporary unavailability of those raw materials would not likely have a material adverse effect on thefinancial results of the Company.
PatentsThe Company’s subsidiaries have made a practice of obtaining patent protection on their products and processes wherepossible. They own, or are licensed under, a significant number of patents in the U.S. and other countries relating to theirproducts, product uses, formulations and manufacturing processes, which in the aggregate are believed to be of material
2 • Johnson & Johnson 2016 Annual Report

importance to the Company in the operation of its businesses. The Company’s subsidiaries face patent challenges fromthird parties, including challenges seeking to manufacture and market generic and biosimilar versions of the Company’skey pharmaceutical products prior to expiration of the applicable patents covering those products. Significant legalproceedings and claims involving the Company’s patent and other intellectual property are described in Note 21, “LegalProceedings – Intellectual Property” of the Notes to Consolidated Financial Statements included in Item 8 of this Report.
Sales of the Company’s largest product, REMICADE® (infliximab), accounted for approximately 9.7% of the Company’stotal revenues for fiscal 2016. Accordingly, the patents related to this product are believed to be material to the Company.
There are two sets of patents related specifically to REMICADE® . The first set of patents is co-owned by JanssenBiotech, Inc., a wholly-owned subsidiary of Johnson & Johnson, and NYU Langone Medical Center (NYU). JanssenBiotech, Inc. has an exclusive license to NYU’s interests in the patents. These patents have expired in all countries outsidethe United States. In the United States, the one remaining patent, which expires in September 2018, stands rejectedfollowing reexamination proceedings instituted by a third party in the United States Patent and Trademark Office (USPTO).The patent has also been held invalid by the Federal District Court in the District of Massachusetts. The decisions by theUSPTO and the Federal District Court have been appealed to the U.S. Court of Appeals for the Federal Circuit. Theappeals are pending.
The second set of patents specifically related to REMICADE® was granted to The Kennedy Institute of Rheumatology inEurope, Canada, Australia and the United States. Janssen Biotech, Inc. has licenses (exclusive for human anti-TNFantibodies and semi-exclusive for non-human anti-TNF antibodies) to these patents, which expire in 2017 outside of theUnited States and 2018 in the United States. Certain of these patents have been successfully challenged and invalidated,and others are under review in various patent offices around the world and are also subject to litigation in Canada.
The Company does not expect that any extensions will be available for the above described patents specifically related toREMICADE® . In 2016, a third party received approval from the Food and Drug Administration for sale of its infliximabbiosimilar in the United States and introduced its biosimilar to the U.S. market in late 2016. For a more extensivedescription of legal matters regarding the patents related to REMICADE®, see Note 21 “Legal Proceedings – IntellectualProperty – Pharmaceutical – REMICADE® Related Cases” of the Notes to Consolidated Financial Statements included inItem 8 of this Report.
In addition to competing in the immunology market with REMICADE®, the Company is currently marketing STELARA®
(ustekinumab), SIMPONI® (golimumab) and SIMPONI ARIA® (golimumab), next generation immunology products withremaining patent lives of up to seven years.
TrademarksThe Company’s subsidiaries have made a practice of selling their products under trademarks and of obtaining protectionfor these trademarks by all available means. These trademarks are protected by registration in the U.S. and other countrieswhere such products are marketed. The Company considers these trademarks in the aggregate to be of materialimportance in the operation of its businesses.
SeasonalityWorldwide sales do not reflect any significant degree of seasonality; however, spending has been heavier in the fourthquarter of each year than in other quarters. This reflects increased spending decisions, principally for advertising andresearch and development activity.
CompetitionIn all of their product lines, the Company’s subsidiaries compete with companies both locally and globally. Competitionexists in all product lines without regard to the number and size of the competing companies involved. Competition inresearch, both internally and externally sourced, involving the development and the improvement of new and existingproducts and processes, is particularly significant. The development of new and innovative products, as well as protectingthe underlying intellectual property of the Company’s product portfolio, is important to the Company’s success in all areasof its business. The competitive environment requires substantial investments in continuing research. In addition, thedevelopment and maintenance of customer demand for the Company’s consumer products involve significantexpenditures for advertising and promotion.
Johnson & Johnson 2016 Annual Report • 3

Research and DevelopmentResearch activities represent a significant part of the Company’s businesses. Research and development expendituresrelate to the processes of discovering, testing and developing new products, improving existing products, as well asdemonstrating product efficacy and regulatory compliance prior to launch. The Company remains committed to investingin research and development with the aim of delivering high quality and innovative products. Worldwide costs of researchand development activities amounted to $9.1 billion, $9.0 billion and $8.5 billion for fiscal years 2016, 2015 and 2014,respectively. Research facilities are located in the United States, Belgium, Brazil, Canada, China, France, Germany, India,Israel, Japan, the Netherlands, Singapore, Switzerland and the United Kingdom.
EnvironmentThe Company is subject to a variety of U.S. and international environmental protection measures. The Company believesthat its operations comply in all material respects with applicable environmental laws and regulations. The Company’scompliance with these requirements did not change during the past year, and is not expected to have a material effectupon its capital expenditures, cash flows, earnings or competitive position.
RegulationThe Company’s businesses are subject to varying degrees of governmental regulation in the countries in which operationsare conducted, and the general trend is toward increasingly stringent regulation. In the U.S., the drug, device and cosmeticindustries have long been subject to regulation by various federal and state agencies, primarily as to product safety,efficacy, manufacturing, advertising, labeling and safety reporting. The exercise of broad regulatory powers by the U.S.Food and Drug Administration (the “FDA”) continues to result in increases in the amounts of testing and documentationrequired for FDA approval of new drugs and devices and a corresponding increase in the expense of product introduction.Similar trends are also evident in major markets outside of the U.S.
The costs of human health care have been and continue to be a subject of study, investigation and regulation bygovernmental agencies and legislative bodies around the world. In the U.S., attention has been focused on drug pricesand profits and programs that encourage doctors to write prescriptions for particular drugs, or to recommend, use orpurchase particular medical devices. Payers have become a more potent force in the market place and increased attentionis being paid to drug and medical device pricing, appropriate drug and medical device utilization and the quality and costsof health care generally.
U.S. government agencies continue to implement the extensive requirements of the Patient Protection and Affordable CareAct (the “ACA”). These have both positive and negative impacts on the U.S. healthcare industry with much remaininguncertain as to how various provisions of the ACA, and potential modification or repeal of ACA provisions, will ultimatelyaffect the industry.
The regulatory agencies under whose purview the Company operates have administrative powers that may subject it toactions such as product withdrawals, recalls, seizure of products and other civil and criminal sanctions. In some cases, theCompany’s subsidiaries may deem it advisable to initiate product recalls.
In addition, business practices in the health care industry have come under increased scrutiny, particularly in the UnitedStates, by government agencies and state attorneys general, and resulting investigations and prosecutions carry the risk ofsignificant civil and criminal penalties.
Further, the Company relies on global supply chains, and production and distribution processes, that are complex, aresubject to increasing regulatory requirements that may affect sourcing, supply and pricing of materials used in theCompany’s products. These processes also are subject to lengthy regulatory approvals.
Available InformationThe Company’s main corporate website address is www.jnj.com. Copies of the Company’s Quarterly Reports onForm 10-Q, Annual Report on Form 10-K and Current Reports on Form 8-K filed or furnished to the U.S. Securities andExchange Commission (the “SEC”), and any amendments to the foregoing, will be provided without charge to anyshareholder submitting a written request to the Secretary at the principal executive offices of the Company or by calling1-800-950-5089. All of the Company’s SEC filings are also available on the Company’s website at www.investor.jnj.com/sec.cfm, as soon as reasonably practicable after having been electronically filed or furnished to the SEC. All SEC filings
4 • Johnson & Johnson 2016 Annual Report
are also available at the SEC’s website at www.sec.gov. In addition, the written charters of the Audit Committee, theCompensation & Benefits Committee, the Nominating & Corporate Governance Committee, the Regulatory, Compliance &Government Affairs Committee and the Science, Technology & Sustainability Committee of the Board of Directors and theCompany’s Principles of Corporate Governance, Code of Business Conduct (for employees), Code of BusinessConduct & Ethics for Members of the Board of Directors and Executive Officers, and other corporate governancematerials, are available at www.investor.jnj.com/gov.cfm on the Company’s website and will be provided without charge toany shareholder submitting a written request, as provided above. The information on the Company’s website is not, andwill not be deemed, a part of this Report or incorporated into any other filings the Company makes with the SEC.
Item 1A. Risk FactorsThe Company faces a number of uncertainties and risks that are difficult to predict and many of which are outside of theCompany’s control. In addition to the other information in this report and the Company’s other filings with the SEC,investors should consider carefully the factors set forth below. Investors should be aware that it is not possible to predictor identify all such factors and that the following is not meant to be a complete discussion of all potential risks oruncertainties. If known or unknown risks or uncertainties materialize, the Company’s business, results of operations orfinancial condition could be adversely affected, potentially in a material way.
One of the Company’s key products, REMICADE® (infliximab), is experiencing biosimilar competition, whichwill result in a reduction in U.S. sales of REMICADE®.
The Company has experienced significant challenges to patents covering its largest product, REMICADE® (infliximab)(accounting for approximately 9.7% of the Company’s total revenues for fiscal 2016), and continues to assert certainpatents related to the product. In April 2016, the FDA approved for sale in the United States an infliximab biosimilar to bemarketed by a subsidiary of Pfizer Inc. In October 2016, the notice of launch period under the U.S. Biologics PriceCompetition and Innovation Act (the BPCIA) passed and in November 2016 Pfizer began shipment of an infliximabbiosimilar to wholesalers in the United States. Sales of an infliximab biosimilar in the U.S. market will result in a reduction inU.S. sales of REMICADE®.
Global sales in the Company’s Pharmaceutical and Medical Devices segments may be negatively impactedby healthcare reforms and increasing pricing pressures.
Sales of the Company’s pharmaceutical and medical device products are significantly affected by reimbursements bythird-party payers such as government healthcare programs, private insurance plans and managed care organizations. Aspart of various efforts to contain healthcare costs, these payers are putting downward pressure on prices at whichproducts will be reimbursed. In the United States, increased purchasing power of entities that negotiate on behalf ofMedicare, Medicaid, and private sector beneficiaries, in part due to continued consolidation among health care providers,could result in further pricing pressures. Outside the United States, numerous major markets, including the EU and Japan,have pervasive government involvement in funding healthcare and, in that regard, directly or indirectly impose pricecontrols, limit access to, or reimbursement for, the Company’s products, or reduce the value of its intellectual propertyprotection.
The Company is subject to significant legal proceedings that can result in significant expenses, fines andreputational damage.
In the ordinary course of business, Johnson & Johnson and its subsidiaries are subject to numerous claims and lawsuitsinvolving various issues such as patent disputes, product liability and claims that their product sales, marketing and pricingpractices violate various antitrust, unfair trade practices and/or consumer protection laws. The most significant of theseproceedings are described in Note 21, “Legal Proceedings” under Notes to the Consolidated Financial Statementsincluded in Item 8 of this Report. While the Company believes it has substantial defenses in these matters, it is not feasibleto predict the ultimate outcome of litigation. The Company could in the future be required to pay significant amounts as aresult of settlements or judgments in these matters, potentially in excess of accruals. The resolution of, or increase inaccruals for, one or more of these matters in any reporting period could have a material adverse effect on the Company’sresults of operations and cash flows for that period. Furthermore, as a result of cost and availability factors, effectiveNovember 1, 2005, the Company ceased purchasing third-party product liability insurance.
Product reliability, safety and effectiveness concerns can have significant negative impacts on sales andresults of operations, lead to litigation and cause reputational damage.
Concerns about product safety, whether raised internally or by regulators or consumer advocates, and whether or notbased on scientific evidence, can result in safety alerts, product recalls, governmental investigations, regulatory action on
Johnson & Johnson 2016 Annual Report • 5
the part of the FDA (or its counterpart in other countries), private claims and lawsuits, payment of fines and settlements,declining sales and reputational damage. These circumstances can also result in damage to brand image, brand equityand consumer trust in the Company’s products. Product recalls have in the past, and could in the future, promptgovernment investigations and inspections, the shutdown of manufacturing facilities, continued product shortages andrelated sales declines, significant remediation costs, reputational damage, possible civil penalties and criminal prosecution.
Changes in tax laws or exposures to additional tax liabilities could negatively impact the Company’soperating results.
Changes in tax laws or regulations, including tax reform proposals in the U.S., Belgium and Switzerland, could negativelyimpact the Company’s effective tax rate and results of operations. A change in statutory tax rate may result in therevaluation of the Company’s deferred tax assets and liabilities related to the relevant jurisdiction in the period in which thenew tax law is enacted, potentially resulting in a material expense or benefit recorded to the Company’s ConsolidatedStatement of Earnings for that period. For a discussion of risks of changes in tax rates in other countries, includingBelgium, please see “Management’s Discussion and Analysis of Results of Operations and Financial Condition – OtherInformation – Economic and Market Factors” in Item 7 of this Report.
The Company conducts business and files tax returns in numerous countries and currently has tax audits in progress withmany tax authorities. In connection with the Organization for Economic Cooperation and Development Base Erosion andProfit Shifting (BEPS) project, starting in 2017, companies are required to disclose more information to tax authorities onoperations around the world, which may lead to greater audit scrutiny of profits earned in other countries. The Companyregularly assesses the likely outcomes of its tax audits to determine the appropriateness of its tax reserves. However, anytax authority could take a position on tax treatment that is contrary to the Company’s expectations, which could result in taxliabilities in excess of reserves.
The Company may not be able to successfully secure and defend intellectual property rights essential tothe Company’s businesses.
The Company owns or licenses a significant number of patents and other proprietary rights, determined by patent offices,courts and lawmakers in various countries, relating to its products and manufacturing processes. These rights are essentialto the Company’s businesses and materially important to the Company’s results of operations. Public policy, both withinand outside the U.S., has become increasingly unfavorable toward intellectual property rights. The Company cannot becertain that it will obtain adequate patent protection for new products and technologies in the U.S. and other importantmarkets or that such protections, once granted, will last as long as originally anticipated.
Competitors routinely challenge the validity or extent of the Company’s owned or licensed patents and proprietary rightsthrough litigation, interferences, oppositions and other proceedings. These proceedings absorb resources and can beprotracted as well as unpredictable. In addition, challenges that the Company’s products infringe the patents of thirdparties could result in the need to pay past damages and future royalties and adversely affect the competitive position andsales of the products in question.
The Company has faced increasing patent challenges from third parties seeking to manufacture and market generic andbiosimilar versions of the Company’s key pharmaceutical products prior to expiration of the applicable patents coveringthose products. In the United States, manufacturers of generic versions of innovative human pharmaceutical products maychallenge the validity, or claim non-infringement, of innovator products through the Abbreviated New Drug Application, orANDA, process with the FDA. The BPCIA, enacted in 2010, which created a new regulatory pathway for the approval bythe FDA of biosimilar alternatives to innovator-developed biological products, also created mechanisms for biosimilarapplicants to challenge the patents on the innovator biologics. The inter partes review (IPR) process with the USPTO,created under the 2011 America Invents Act, is also being used by competitors to challenge patents held by theCompany’s subsidiaries. For example, a key patent for ZYTIGA® is currently subject to patent litigation and several IPRproceedings brought by generic companies seeking to invalidate the patent.
In the event the Company is not successful in defending its patents against such challenges, or upon the “at-risk” launch(despite pending patent infringement litigation) by the generic or biosimilar firm of its product, the Company can lose amajor portion of revenues for the referenced product in a very short period of time. Current legal proceedings involving theCompany’s patents and other intellectual property rights are described in Note 21, “Legal Proceedings – IntellectualProperty” of the Notes to the Consolidated Financial Statements included in Item 8 of this Report.
6 • Johnson & Johnson 2016 Annual Report

The Company’s businesses operate in highly competitive product markets and competitive pressures couldadversely affect the Company’s earnings.
The Company faces substantial competition in all three operating segments and in all geographic markets. The Company’sbusinesses compete with companies of all sizes on the basis of cost-effectiveness, technological innovations, intellectualproperty rights, product performance, real or perceived product advantages, pricing and availability and rate ofreimbursement. The Company also competes with other market participants in securing rights to acquisitions,collaborations and licensing agreements with third parties. Competition for rights to product candidates and technologiesmay result in significant investment and acquisition costs and onerous agreement terms for the Company. Competitors’development of more effective or less costly products, and/or their ability to secure patent and other intellectual propertyrights and successfully market products ahead of us, could negatively impact sales of the Company’s existing products aswell as its ability to bring new products to market despite significant prior investment in the related product development.
For the Company’s pharmaceutical businesses, loss of patent exclusivity for a product often is followed by a substantialreduction in sales as competitors gain regulatory approval for generic and other competing products and enter the market.Similar competition can be triggered by the loss of exclusivity for a biological product. For the Company’s medical devicebusinesses, technological innovation, product quality, reputation and customer service are especially important tocompetitiveness. Development by other companies of new or improved products, processes and technologies couldthreaten to make the Company’s products or technologies less desirable, less economical or obsolete. The Company’sconsumer businesses face intense competition from other branded products and retailers’ private-label brands. If theCompany fails to sufficiently differentiate and market its brand name consumer products, this could adversely affectrevenues and profitability of those products.
Significant challenges or delays in the Company’s innovation and development of new products,technologies and indications could have an adverse impact on the Company’s long-term success.
The Company’s continued growth and success depends on its ability to innovate and develop new and differentiatedproducts and services that address the evolving health care needs of patients, providers and consumers. Development ofsuccessful products and technologies is also necessary to offset revenue losses when the Company’s existing productslose market share due to various factors such as competition and loss of patent exclusivity. New products introducedwithin the past five years accounted for approximately 22% of 2016 sales. The Company cannot be certain when orwhether it will be able to develop, license or otherwise acquire companies, products and technologies, whether particularproduct candidates will be granted regulatory approval, and, if approved, whether the products will be commerciallysuccessful.
The Company pursues product development through internal research and development as well as through collaborations,acquisitions, joint ventures and licensing or other arrangements with third parties. In all of these contexts, developing newproducts, particularly pharmaceutical and biotechnology products and medical devices, requires significant investment ofresources over many years. Only a very few biopharmaceutical research and development programs result in commerciallyviable products. The process depends on many factors including the ability to discern patients’ and health care providers’future needs; develop promising new compounds, strategies and technologies; achieve successful clinical trial results;secure effective intellectual property protection; obtain regulatory approvals on a timely basis; and, if and when they reachthe market, successfully differentiate the Company’s products from competing products and approaches to treatment.New products or enhancements to existing products may not be accepted quickly or significantly in the marketplace dueto product and price competition, changes in customer preferences or healthcare purchasing patterns, resistance byhealthcare providers or uncertainty over third-party reimbursement. Even following initial regulatory approval, the successof a product can be adversely impacted by safety and efficacy findings in larger real world patient populations, as well asmarket entry of competitive products.
The Company faces increasing regulatory scrutiny which imposes significant compliance costs and exposesthe Company to government investigations, legal actions and penalties.
Like other companies in the healthcare industry, the Company is subject to extensive regulation, investigations and legalaction, by national, state and local government agencies in the United States and other countries in which they operate.Regulatory issues regarding compliance with Good Manufacturing Practices (cGMP) (and comparable quality regulationsin foreign countries) by manufacturers of drugs, devices and consumer products can lead to fines and penalties, productrecalls, product shortages, interruptions in production, delays in new product approvals and litigation. In addition, themarketing, pricing and sale of the Company’s products are subject to regulation, investigations and legal actions includingunder the Federal Food, Drug, and Cosmetic Act, the Medicaid Rebate Program, federal and state false claims acts, stateunfair trade practices acts and consumer protection laws. Increased scrutiny of health care industry business practices in
Johnson & Johnson 2016 Annual Report • 7

recent years by government agencies and state attorneys general in the U.S., and any resulting investigations andprosecutions, carry risk of significant civil and criminal penalties including, but not limited to, debarment from participationin government healthcare programs. Any such debarment could have a material adverse effect on the Company’s businessand results of operations. The most significant current investigations and litigation brought by government agencies aredescribed in Note 21, “Legal Proceedings – Government Proceedings” under Notes to the Consolidated FinancialStatements included in Item 8 of this Report.
The Company faces a variety of risks associated with conducting business internationally.
The Company’s extensive operations and business activity outside the U.S. are accompanied by certain financial,economic and political risks, including those listed below.
Foreign Currency Exchange: In fiscal 2016, approximately 47% of the Company’s sales occurred outside of the U.S., withapproximately 22% in Europe, 8% in the Western Hemisphere, excluding the U.S., and 17% in the Asia-Pacific and Africaregion. Changes in non-U.S. currencies relative to the U.S. dollar impact the Company’s revenues and expenses. Whilethe Company uses financial instruments to mitigate the impact of fluctuations in currency exchange rates on its cash flows,unhedged exposures continue to be subject to currency fluctuations. In addition, the weakening or strengthening of theU.S. dollar may result in significant favorable or unfavorable translation effects when the operating results of theCompany’s non-U.S. business activity are translated into U.S. dollars.
Inflation and Currency Devaluation Risks: The Company faces challenges in maintaining profitability of operations ineconomies experiencing high inflation rates. The Company has accounted for operations in Venezuela as highlyinflationary, as the prior three-year cumulative inflation rate surpassed 100%. While the Company strives to maintain profitmargins in these areas through cost reduction programs, productivity improvements and periodic price increases, it mightexperience operating losses as a result of continued inflation. In addition, the impact of currency devaluations in countriesexperiencing high inflation rates or significant currency exchange fluctuations could negatively impact the Company’soperating results.
Illegal Importation of Pharmaceutical Products: The illegal importation of pharmaceutical products from countries wheregovernment price controls or other market dynamics result in lower prices may adversely affect the Company’s sales andprofitability in the U.S. and other countries in which the Company operates. With the exception of limited quantities ofprescription drugs for personal use, foreign imports of pharmaceutical products are illegal under current U.S. law.However, the volume of illegal imports continues to rise as the ability of patients and other customers to obtain the lower-priced imports has grown significantly.
Anti-Bribery and Other Regulations: The Company is subject to various federal and foreign laws that govern itsinternational business practices with respect to payments to government officials. Those laws include the U.S. ForeignCorrupt Practices Act (FCPA), which prohibits U.S. publicly traded companies, from promising, offering, or giving anythingof value to foreign officials with the corrupt intent of influencing the foreign official for the purpose of helping the Companyobtain or retain business or gain any improper advantage. The Company’s business is heavily regulated and thereforeinvolves significant interaction with foreign officials. Also, in many countries outside the U.S., the health care providers whoprescribe human pharmaceuticals are employed by the government and the purchasers of human pharmaceuticals aregovernment entities; therefore, the Company’s interactions with these prescribers and purchasers are subject to regulationunder the FCPA. In addition to the U.S. application and enforcement of the FCPA, various jurisdictions in which theCompany operates have laws and regulations, including the U.K Bribery Act 2010, aimed at preventing and penalizingcorrupt and anticompetitive behavior. Enforcement activities under these laws could subject the Company to additionaladministrative and legal proceedings and actions, which could include claims for civil penalties, criminal sanctions, andadministrative remedies, including exclusion from health care programs.
Other Legal, Social and Political Risks. Other risks inherent in conducting business globally include:• protective economic policies taken by governments such as trade protection measures and import/export licensing
requirements;• compliance with local regulations and laws including, in some countries, regulatory requirements restricting the
Company’s ability to manufacture or sell its products in the relevant market;• diminished protection of intellectual property and contractual rights in certain jurisdictions;• potential nationalization or expropriation of the Company’s foreign assets; and• disruptions to markets due to war, armed conflict, terrorism, social upheavals or pandemics.
8 • Johnson & Johnson 2016 Annual Report

Interruptions and delays in manufacturing operations could adversely affect the Company’s business, salesand reputation.
The Company’s manufacture of products requires the timely delivery of sufficient amounts of complex, high-qualitycomponents and materials. These subsidiaries operate 119 manufacturing facilities as well as sourcing from hundreds ofsuppliers around the world. The Company has in the past, and may in the future, face unanticipated interruptions anddelays in manufacturing through its internal or external supply chain. Manufacturing disruptions can occur for many reasonsincluding regulatory action, production quality deviations or safety issues, labor disputes, site-specific incidents (such asfires), natural disasters, raw material shortages, political unrest and terrorist attacks. Such delays and difficulties inmanufacturing can result in product shortages, declines in sales and reputational impact as well as significant remediationand related costs associated with addressing the shortage.
An information security incident, including a cybersecurity breach, could have a negative impact to theCompany’s business or reputation.
To meet business objectives, the Company relies on both internal information technology (IT) systems and networks, andthose of third parties and their vendors, to process and store sensitive data, including confidential research, businessplans, financial information, intellectual property, and personal data. The extensive information security and cybersecuritythreats, which affect companies globally, pose a risk to the security and availability of these IT systems and networks, andthe confidentiality, integrity, and availability of the Company’s sensitive data. The Company continually assesses thesethreats and makes investments to increase internal protection, detection, and response capabilities, as well as ensure theCompany’s third party providers have required capabilities and controls, to address this risk. To date, the Company hasnot experienced any material impact to our business or operations resulting from information or cybersecurity attacks;however, because of the frequently changing attack techniques, along with the increased volume and sophistication of theattacks, there is the potential for the Company to be adversely impacted. This impact could result in reputational,competitive, operational or other business harm as well as financial costs and regulatory action.
Item 1B. UNRESOLVED STAFF COMMENTSNot applicable.
Item 2. PROPERTIESThe Company’s subsidiaries operate 119 manufacturing facilities occupying approximately 21.5 million square feet of floorspace. The manufacturing facilities are used by the industry segments of the Company’s business approximately asfollows:
SegmentSquare Feet
(in thousands)
Consumer 6,928
Pharmaceutical 7,463
Medical Devices 7,087
Worldwide Total 21,478
Within the United States, seven facilities are used by the Consumer segment, seven by the Pharmaceutical segment and21 by the Medical Devices segment. Outside of the United States, 30 facilities are used by the Consumer segment, 17 bythe Pharmaceutical segment and 37 by the Medical Devices segment.
The locations of the manufacturing facilities by major geographic areas of the world are as follows:
Geographic Area Number of FacilitiesSquare Feet
(in thousands)
United States 35 6,015
Europe 37 7,770
Western Hemisphere, excluding U.S. 14 2,862
Africa, Asia and Pacific 33 4,831
Worldwide Total 119 21,478
Johnson & Johnson 2016 Annual Report • 9

In addition to the manufacturing facilities discussed above, the Company maintains numerous office and warehousefacilities throughout the world. Research facilities are also discussed in Item 1 of this Report under “Business – Researchand Development.”
The Company’s subsidiaries generally seek to own their manufacturing facilities, although some, principally in non-U.S.locations, are leased. Office and warehouse facilities are often leased. The Company also engages contractmanufacturers.
The Company is committed to maintaining all of its properties in good operating condition and repair, and the facilities arewell utilized.
McNEIL-PPC, Inc. (now Johnson & Johnson Consumer Inc.) (McNEIL-PPC) continues to operate under a consent decree,signed in 2011 with the FDA, which governs certain McNeil Consumer Healthcare manufacturing operations, and requiresMcNEIL-PPC to remediate the facilities it operates in Lancaster, Pennsylvania, Fort Washington, Pennsylvania, and LasPiedras, Puerto Rico (the “Consent Decree”). The Fort Washington facility was voluntarily shut down in April 2010, andsubsequently many products were transferred to other manufacturing sites and successfully reintroduced to the market.After McNEIL-PPC successfully completed all requirements contained in the Consent Decree Workplans for theLancaster and Las Piedras manufacturing sites and completed the steps required for third-party certification of the FortWashington plant, a third-party cGMP expert submitted written certifications to the FDA for all three manufacturing sites.Following FDA inspections in 2015, McNEIL-PPC received notifications from the FDA that all three manufacturing facilitiesare in conformity with applicable laws and regulations. Commercial production in Fort Washington started as ofSeptember 2015.
Under the Consent Decree, after receiving notice from the FDA of being in compliance with applicable laws andregulations, each of the three facilities is subject to a five-year audit period by a third-party cGMP expert. Thus, a third-party expert will continue to reassess the sites at various times for at least five years. A discussion of legal proceedingsrelated to this matter can be found in Note 21 “Legal Proceedings – Government Proceedings – McNeil ConsumerHealthcare” of the Notes to Consolidated Financial Statements included in Item 8 of this Report.
For information regarding lease obligations, see Note 16 “Rental Expense and Lease Commitments” of the Notes toConsolidated Financial Statements included in Item 8 of this Report. Segment information on additions to property, plantand equipment is contained in Note 18 “Segments of Business and Geographic Areas” of the Notes to ConsolidatedFinancial Statements included in Item 8 of this Report.
Item 3. LEGAL PROCEEDINGSThe information called for by this item is incorporated herein by reference to the information set forth in Note 21 “LegalProceedings” of the Notes to Consolidated Financial Statements included in Item 8 of this Report.
In addition, Johnson & Johnson and its subsidiaries are from time to time party to government investigations, inspections orother proceedings relating to environmental matters, including their compliance with applicable environmental laws.
Item 4. MINE SAFETY DISCLOSURESNot applicable.
10 • Johnson & Johnson 2016 Annual Report
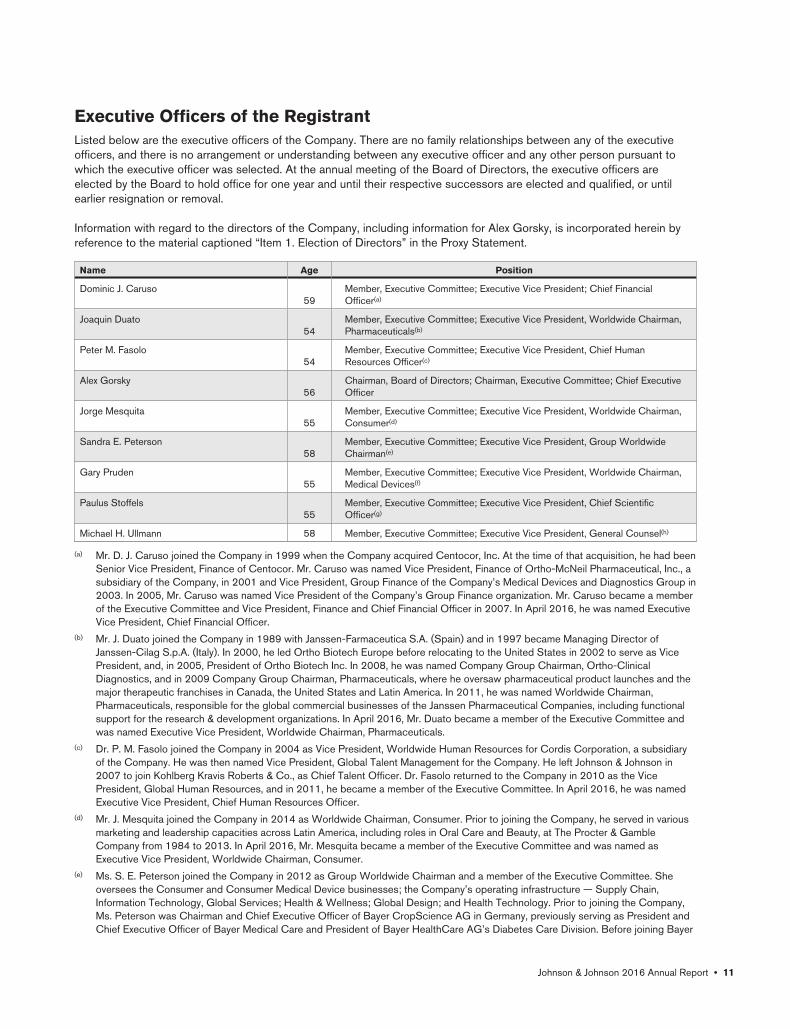
Executive Officers of the RegistrantListed below are the executive officers of the Company. There are no family relationships between any of the executiveofficers, and there is no arrangement or understanding between any executive officer and any other person pursuant towhich the executive officer was selected. At the annual meeting of the Board of Directors, the executive officers areelected by the Board to hold office for one year and until their respective successors are elected and qualified, or untilearlier resignation or removal.
Information with regard to the directors of the Company, including information for Alex Gorsky, is incorporated herein byreference to the material captioned “Item 1. Election of Directors” in the Proxy Statement.
Name Age Position
Dominic J. Caruso59
Member, Executive Committee; Executive Vice President; Chief FinancialOfficer(a)
Joaquin Duato54
Member, Executive Committee; Executive Vice President, Worldwide Chairman,Pharmaceuticals(b)
Peter M. Fasolo54
Member, Executive Committee; Executive Vice President, Chief HumanResources Officer(c)
Alex Gorsky56
Chairman, Board of Directors; Chairman, Executive Committee; Chief ExecutiveOfficer
Jorge Mesquita55
Member, Executive Committee; Executive Vice President, Worldwide Chairman,Consumer(d)
Sandra E. Peterson58
Member, Executive Committee; Executive Vice President, Group WorldwideChairman(e)
Gary Pruden55
Member, Executive Committee; Executive Vice President, Worldwide Chairman,Medical Devices(f)
Paulus Stoffels55
Member, Executive Committee; Executive Vice President, Chief ScientificOfficer(g)
Michael H. Ullmann 58 Member, Executive Committee; Executive Vice President, General Counsel(h)
(a) Mr. D. J. Caruso joined the Company in 1999 when the Company acquired Centocor, Inc. At the time of that acquisition, he had beenSenior Vice President, Finance of Centocor. Mr. Caruso was named Vice President, Finance of Ortho-McNeil Pharmaceutical, Inc., asubsidiary of the Company, in 2001 and Vice President, Group Finance of the Company’s Medical Devices and Diagnostics Group in2003. In 2005, Mr. Caruso was named Vice President of the Company’s Group Finance organization. Mr. Caruso became a memberof the Executive Committee and Vice President, Finance and Chief Financial Officer in 2007. In April 2016, he was named ExecutiveVice President, Chief Financial Officer.
(b) Mr. J. Duato joined the Company in 1989 with Janssen-Farmaceutica S.A. (Spain) and in 1997 became Managing Director ofJanssen-Cilag S.p.A. (Italy). In 2000, he led Ortho Biotech Europe before relocating to the United States in 2002 to serve as VicePresident, and, in 2005, President of Ortho Biotech Inc. In 2008, he was named Company Group Chairman, Ortho-ClinicalDiagnostics, and in 2009 Company Group Chairman, Pharmaceuticals, where he oversaw pharmaceutical product launches and themajor therapeutic franchises in Canada, the United States and Latin America. In 2011, he was named Worldwide Chairman,Pharmaceuticals, responsible for the global commercial businesses of the Janssen Pharmaceutical Companies, including functionalsupport for the research & development organizations. In April 2016, Mr. Duato became a member of the Executive Committee andwas named Executive Vice President, Worldwide Chairman, Pharmaceuticals.
(c) Dr. P. M. Fasolo joined the Company in 2004 as Vice President, Worldwide Human Resources for Cordis Corporation, a subsidiaryof the Company. He was then named Vice President, Global Talent Management for the Company. He left Johnson & Johnson in2007 to join Kohlberg Kravis Roberts & Co., as Chief Talent Officer. Dr. Fasolo returned to the Company in 2010 as the VicePresident, Global Human Resources, and in 2011, he became a member of the Executive Committee. In April 2016, he was namedExecutive Vice President, Chief Human Resources Officer.
(d) Mr. J. Mesquita joined the Company in 2014 as Worldwide Chairman, Consumer. Prior to joining the Company, he served in variousmarketing and leadership capacities across Latin America, including roles in Oral Care and Beauty, at The Procter & GambleCompany from 1984 to 2013. In April 2016, Mr. Mesquita became a member of the Executive Committee and was named asExecutive Vice President, Worldwide Chairman, Consumer.
(e) Ms. S. E. Peterson joined the Company in 2012 as Group Worldwide Chairman and a member of the Executive Committee. Sheoversees the Consumer and Consumer Medical Device businesses; the Company’s operating infrastructure — Supply Chain,Information Technology, Global Services; Health & Wellness; Global Design; and Health Technology. Prior to joining the Company,Ms. Peterson was Chairman and Chief Executive Officer of Bayer CropScience AG in Germany, previously serving as President andChief Executive Officer of Bayer Medical Care and President of Bayer HealthCare AG’s Diabetes Care Division. Before joining Bayer
Johnson & Johnson 2016 Annual Report • 11

in 2005, Ms. Peterson held a number of leadership roles at Medco Health Solutions (previously known as Merck-Medco). In April2016, Ms. Peterson was named Executive Vice President, Group Worldwide Chairman of Johnson & Johnson. Effective June 1,2017, Ms. Peterson will assume leadership of the Hospital Medical Device business, in addition to her current responsibilities.
(f) Mr. G. Pruden joined the Company in 1985 with Janssen Pharmaceutica Inc. and held a number of senior positions in sales,marketing, and strategic account management. In April 2004, he became President of Janssen-Ortho Inc. in Canada. In January2006, Mr. Pruden was appointed Worldwide President, Ethicon Products, and in 2009 became Company Group Chairman, Ethicon.In 2012, he was named Worldwide Chairman, Global Surgery Group, and in 2015, Worldwide Chairman, Medical Devices. In April2016, Mr. Pruden became a member of the Executive Committee and was named Executive Vice President, Worldwide Chairman,Medical Devices. Mr. Pruden has announced his intention to retire from the Company effective June 1, 2017.
(g) Dr. P. Stoffels joined the Company in 2002 with the acquisition of Tibotec Virco NV, where he was Chief Executive Officer of VircoNV and Chairman of Tibotec NV. In 2005, he was appointed Company Group Chairman, Global Virology. In 2006, he assumed therole of Company Group Chairman, Pharmaceuticals, with responsibility for worldwide research and development for the CentralNervous System and Internal Medicine Franchises. Dr. Stoffels was appointed Global Head, Research & Development,Pharmaceuticals in 2009, and in 2011, became Worldwide Chairman, Pharmaceuticals, with responsibility for the Company’stherapeutic pipeline through global research and development and strategic business development. In 2012, Dr. Stoffels was alsoappointed Chief Scientific Officer, with responsibility for enterprise-wide innovation and product safety, and a member of theExecutive Committee. In April 2016, Dr. Stoffels was named Executive Vice President, Chief Scientific Officer.
(h) Mr. M. H. Ullmann joined the Company in 1989 as a corporate attorney in the Law Department. He was appointed CorporateSecretary in 1999 and served in that role until 2006. During that time, he also held various management positions in the LawDepartment. In 2006, he was named General Counsel, Medical Devices and Diagnostics and was appointed Vice President, GeneralCounsel and a member of the Executive Committee in 2012. In April 2016, Mr. Ullmann was named Executive Vice President,General Counsel.
12 • Johnson & Johnson 2016 Annual Report

PART IIItem 5. Market for Registrant’s Common Equity, Related StockholderMatters and Issuer Purchases of Equity SecuritiesAs of February 17, 2017, there were 156,073 record holders of common stock of the Company. Additional informationcalled for by this item is incorporated herein by reference to the following sections of this Report: “Item 7. Management’sDiscussion and Analysis of Results of Operations and Financial Condition – Liquidity and Capital Resources – Dividends”and “– Other Information – Common Stock Market Prices”; Note 17 “Common Stock, Stock Option Plans and StockCompensation Agreements” of the Notes to Consolidated Financial Statements included in Item 8; and Item 12 “SecurityOwnership of Certain Beneficial Owners and Management and Related Stockholder Matters – Equity Compensation PlanInformation”.
Issuer Purchases of Equity SecuritiesOn October 13, 2015, the Company announced that its Board of Directors approved a share repurchase program,authorizing the Company to purchase up to $10.0 billion of the Company’s Common Stock. Share repurchases take placeon the open market from time to time based on market conditions. The repurchase program has no time limit and may bedelayed or suspended for periods or discontinued at any time.
The following table provides information with respect to common stock purchases by the Company during the fiscal fourthquarter of 2016. Common stock purchases on the open market are made as part of a systematic plan to meet the needsof the Company’s compensation programs. The repurchases below also include the stock-for-stock option exercises thatsettled in the fiscal fourth quarter.
Period
Total Numberof Shares
Purchased(1)Avg. Price
Paid Per Share
Total Number ofShares (or Units)
Purchased as Partof Publicly
Announced Plansor Programs(2)
Maximum Number (orApproximate Dollar
Value) of Shares (or Units)that May Yet Be
Purchased Under the Plansor Programs(3)
October 3, 2016 throughOctober 30, 2016 2,485,016 $116.76 – –
October 31, 2016 throughNovember 27, 2016 9,324,574 116.53 8,775,704 –
November 28, 2016 throughJanuary 1, 2017 5,739,190 113.35 3,400,003 –
Total 17,548,780 12,175,707 23,543,007
(1) During the fiscal fourth quarter of 2016, the Company repurchased an aggregate of 17,548,780 shares of Johnson & JohnsonCommon Stock in open-market transactions, of which 12,175,707 shares were purchased pursuant to the repurchase program thatwas publicly announced on October 13, 2015, and of which 5,373,073 shares were purchased in open-market transactions as partof a systematic plan to meet the needs of the Company’s compensation programs.
(2) As of January 1, 2017, an aggregate of 65,362,675 shares were purchased for a total of $7.3 billion since the inception of therepurchase program announced on October 13, 2015.
(3) As of January 1, 2017, the maximum number of shares that may yet be purchased under the plan is 23,543,007 based on the closingprice of Johnson & Johnson Common Stock on the New York Stock Exchange on December 30, 2016 of $115.21 per share.
Johnson & Johnson 2016 Annual Report • 13
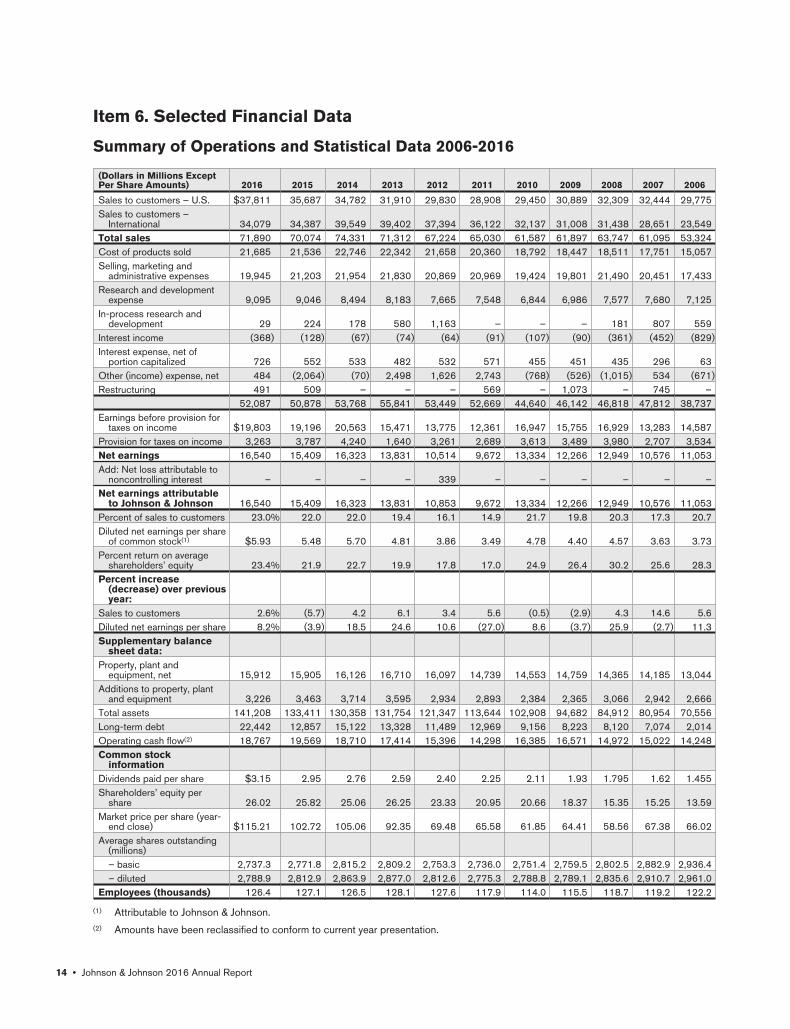
Item 6. Selected Financial Data
Summary of Operations and Statistical Data 2006-2016
(Dollars in Millions ExceptPer Share Amounts) 2016 2015 2014 2013 2012 2011 2010 2009 2008 2007 2006
Sales to customers – U.S. $37,811 35,687 34,782 31,910 29,830 28,908 29,450 30,889 32,309 32,444 29,775Sales to customers –
International 34,079 34,387 39,549 39,402 37,394 36,122 32,137 31,008 31,438 28,651 23,549Total sales 71,890 70,074 74,331 71,312 67,224 65,030 61,587 61,897 63,747 61,095 53,324Cost of products sold 21,685 21,536 22,746 22,342 21,658 20,360 18,792 18,447 18,511 17,751 15,057Selling, marketing and
administrative expenses 19,945 21,203 21,954 21,830 20,869 20,969 19,424 19,801 21,490 20,451 17,433Research and development
expense 9,095 9,046 8,494 8,183 7,665 7,548 6,844 6,986 7,577 7,680 7,125In-process research and
development 29 224 178 580 1,163 – – – 181 807 559Interest income (368) (128) (67) (74) (64) (91) (107) (90) (361) (452) (829)Interest expense, net of
portion capitalized 726 552 533 482 532 571 455 451 435 296 63Other (income) expense, net 484 (2,064) (70) 2,498 1,626 2,743 (768) (526) (1,015) 534 (671)Restructuring 491 509 – – – 569 – 1,073 – 745 –
52,087 50,878 53,768 55,841 53,449 52,669 44,640 46,142 46,818 47,812 38,737Earnings before provision for
taxes on income $19,803 19,196 20,563 15,471 13,775 12,361 16,947 15,755 16,929 13,283 14,587Provision for taxes on income 3,263 3,787 4,240 1,640 3,261 2,689 3,613 3,489 3,980 2,707 3,534Net earnings 16,540 15,409 16,323 13,831 10,514 9,672 13,334 12,266 12,949 10,576 11,053Add: Net loss attributable to
noncontrolling interest – – – – 339 – – – – – –Net earnings attributable
to Johnson & Johnson 16,540 15,409 16,323 13,831 10,853 9,672 13,334 12,266 12,949 10,576 11,053Percent of sales to customers 23.0% 22.0 22.0 19.4 16.1 14.9 21.7 19.8 20.3 17.3 20.7Diluted net earnings per share
of common stock(1) $5.93 5.48 5.70 4.81 3.86 3.49 4.78 4.40 4.57 3.63 3.73Percent return on average
shareholders’ equity 23.4% 21.9 22.7 19.9 17.8 17.0 24.9 26.4 30.2 25.6 28.3Percent increase
(decrease) over previousyear:
Sales to customers 2.6% (5.7) 4.2 6.1 3.4 5.6 (0.5) (2.9) 4.3 14.6 5.6Diluted net earnings per share 8.2% (3.9) 18.5 24.6 10.6 (27.0) 8.6 (3.7) 25.9 (2.7) 11.3Supplementary balance
sheet data:Property, plant and
equipment, net 15,912 15,905 16,126 16,710 16,097 14,739 14,553 14,759 14,365 14,185 13,044Additions to property, plant
and equipment 3,226 3,463 3,714 3,595 2,934 2,893 2,384 2,365 3,066 2,942 2,666Total assets 141,208 133,411 130,358 131,754 121,347 113,644 102,908 94,682 84,912 80,954 70,556Long-term debt 22,442 12,857 15,122 13,328 11,489 12,969 9,156 8,223 8,120 7,074 2,014Operating cash flow(2) 18,767 19,569 18,710 17,414 15,396 14,298 16,385 16,571 14,972 15,022 14,248Common stock
informationDividends paid per share $3.15 2.95 2.76 2.59 2.40 2.25 2.11 1.93 1.795 1.62 1.455Shareholders’ equity per
share 26.02 25.82 25.06 26.25 23.33 20.95 20.66 18.37 15.35 15.25 13.59Market price per share (year-
end close) $115.21 102.72 105.06 92.35 69.48 65.58 61.85 64.41 58.56 67.38 66.02Average shares outstanding
(millions)– basic 2,737.3 2,771.8 2,815.2 2,809.2 2,753.3 2,736.0 2,751.4 2,759.5 2,802.5 2,882.9 2,936.4– diluted 2,788.9 2,812.9 2,863.9 2,877.0 2,812.6 2,775.3 2,788.8 2,789.1 2,835.6 2,910.7 2,961.0
Employees (thousands) 126.4 127.1 126.5 128.1 127.6 117.9 114.0 115.5 118.7 119.2 122.2
(1) Attributable to Johnson & Johnson.(2) Amounts have been reclassified to conform to current year presentation.
14 • Johnson & Johnson 2016 Annual Report

Item 7. Management’s Discussion and Analysis of Results of Operationsand Financial Condition
Organization and Business Segments
Description of the Company and Business Segments
Johnson & Johnson and its subsidiaries (the Company) have approximately 126,400 employees worldwide engaged in theresearch and development, manufacture and sale of a broad range of products in the health care field. The Companyconducts business in virtually all countries of the world with the primary focus on products related to human health andwell-being.
The Company is organized into three business segments: Consumer, Pharmaceutical and Medical Devices. TheConsumer segment includes a broad range of products used in the baby care, oral care, beauty (previously referred to asskin care), over-the-counter pharmaceutical, women’s health and wound care markets. These products are marketed tothe general public and sold both to retail outlets and distributors throughout the world. The Pharmaceutical segment isfocused on five therapeutic areas, including immunology, infectious diseases, neuroscience, oncology, and cardiovascularand metabolic diseases. Products in this segment are distributed directly to retailers, wholesalers, hospitals and healthcare professionals for prescription use. The Medical Devices segment includes a broad range of products used in theorthopaedic, surgery, cardiovascular, diabetes care and vision care fields which are distributed to wholesalers, hospitalsand retailers, and used principally in the professional fields by physicians, nurses, hospitals, eye care professionals andclinics.
The Executive Committee of Johnson & Johnson is the principal management group responsible for the strategicoperations and allocation of the resources of the Company. This Committee oversees and coordinates the activities of theConsumer, Pharmaceutical and Medical Devices business segments.
In all of its product lines, the Company competes with companies both locally and globally, throughout the world.Competition exists in all product lines without regard to the number and size of the competing companies involved.Competition in research, involving the development and the improvement of new and existing products and processes, isparticularly significant. The development of new and innovative products, as well as protecting the underlying intellectualproperty of the Company’s product portfolio, is important to the Company’s success in all areas of its business. Thecompetitive environment requires substantial investments in continuing research. In addition, the development andmaintenance of customer demand for the Company’s consumer products involves significant expenditures for advertisingand promotion.
Management’s Objectives
The Company manages within a strategic framework with Our Credo as the foundation. The Company believes that ourstrategic operating principles: being broadly based in human health care, managing the business for the long term, havinga decentralized management approach, and being committed to our people and values, are crucial to successfully meetingthe demands of the rapidly evolving markets in which we compete. To this end, management is focused on our long-termstrategic growth drivers: creating value through innovation, expanding our global reach with a local focus, excellence inexecution and leading with purpose.
The Company is broadly based in human health care, and is committed to creating value by developing accessible, highquality, innovative products and services. New products introduced within the past five years accounted for approximately22% of 2016 sales. In 2016, $9.1 billion, or 12.7% of sales, was invested in research and development, reflectingmanagement’s commitment to delivering new and differentiated products and services to meet evolving health care needsand sustain the Company’s long-term growth.
Our diverse businesses with more than 230 operating companies located in 60 countries are the key drivers of theCompany’s success. Maintaining the Company’s decentralized management approach, while at the same time leveragingthe extensive resources of the enterprise, positions the Company well to innovate, execute strategic plans and reachmarkets globally, as well as address the needs and challenges of the local markets.
In order to remain a leader in health care, the Company strives to maintain a purpose-driven organization and is committedto developing global business leaders who can achieve these growth objectives. Businesses are managed for the long-term in order to sustain market leadership positions and enable growth, which provides an enduring source of value to ourshareholders.
Johnson & Johnson 2016 Annual Report • 15

Our Credo unifies all Johnson & Johnson employees in achieving these objectives, and provides a common set of valuesthat serve as the foundation of the Company’s responsibilities to patients, consumers and health care professionals,employees, communities and shareholders. The Company believes that these foundational values, its strategic frameworkand long-term growth drivers, along with its overall mission of improving the quality of life for people around the world, willenable Johnson & Johnson to continue to be a leader in the health care industry.
Results of Operations
Analysis of Consolidated Sales
In 2016, worldwide sales increased 2.6% to $71.9 billion, compared to a decrease of 5.7% in 2015 and an increase of4.2% in 2014. These sales changes consisted of the following:
Sales increase/(decrease) due to: 2016 2015 2014
Volume 3.2% 1.2% 6.3
Price 0.7 0.6 (0.2)
Currency (1.3) (7.5) (1.9)
Total 2.6% (5.7)% 4.2
In 2016, acquisitions and divestitures had a negative impact of 1.1% on the worldwide operational sales growth andcompetitive products to the Company’s Hepatitis C products, OLYSIO® /SOVRIAD® (simeprevir) and INCIVO®
(telaprevir), had a negative impact of 0.8% on the worldwide operational sales growth. Operations in Venezuela negativelyimpacted the worldwide operational sales growth 0.3%.
In 2015, the introduction of competitive products to the Company’s Hepatitis C products, OLYSIO® /SOVRIAD®
(simeprevir) and INCIVO® (telaprevir), had a negative impact of 2.7% on the worldwide operational sales growth. In 2015,the impact of acquisitions and divestitures on the worldwide operational sales growth was negative 2.0%.
In 2014, sales of the Company’s Hepatitis C products, OLYSIO® /SOVRIAD® (simeprevir) and INCIVO® (telaprevir), hada positive impact of 2.8%, and the divestiture of the Ortho-Clinical Diagnostics business had a negative impact of 1.4% onthe worldwide operational growth.
Sales by U.S. companies were $37.8 billion in 2016, $35.7 billion in 2015 and $34.8 billion in 2014. This representsincreases of 6.0% in 2016, 2.6% in 2015 and 9.0% in 2014. Sales by international companies were $34.1 billion in 2016,$34.4 billion in 2015 and $39.5 billion in 2014. This represents decreases of 0.9% in 2016, and 13.1% in 2015 and anincrease of 0.4% in 2014.
The five-year compound annual growth rates for worldwide, U.S. and international sales were 2.0%, 5.5% and (1.2)%,respectively. The ten-year compound annual growth rates for worldwide, U.S. and international sales were 3.0%, 2.4% and3.8%, respectively.
Sales by companies in Europe experienced a decline of 1.4% as compared to the prior year, including operational growthof 1.4%, offset by a negative currency impact of 2.8%. Sales by companies in the Western Hemisphere (excluding theU.S.) experienced a decline of 5.1% as compared to the prior year, including operational growth of 4.0% offset by anegative currency impact of 9.1%. Sales by companies in the Asia-Pacific, Africa region achieved growth of 1.8% ascompared to the prior year, including operational growth of 1.4% and a positive currency impact of 0.4%.
The 2016 sales growth percentage as compared to the prior year was negatively impacted by approximately 1.3% fromadditional shipping days in 2015. (See Note 1 to the Consolidated Financial Statements for Annual Closing Date details).While the additional week in 2015 added a few days to sales, it also added a full week’s worth of operating costs;therefore, the net earnings impact was negligible.
In 2016, the Company had two wholesalers distributing products for all three segments that represented approximately13.5% and 10.7% of the total consolidated revenues. In 2015 and 2014, the Company had one wholesaler distributingproducts for all three segments that represented approximately 12.5% and 11.0%, respectively, of the total consolidatedrevenues.
16 • Johnson & Johnson 2016 Annual Report

Analysis of Sales by Business Segments
Consumer Segment
Consumer segment sales in 2016 were $13.3 billion, a decrease of 1.5% from 2015, which included 1.5% operationalgrowth offset by a negative currency impact of 3.0%. U.S. Consumer segment sales were $5.4 billion, an increase of3.8%. International sales were $7.9 billion, a decrease of 4.8%, which included 0.1% operational growth offset by anegative currency impact of 4.9%. In 2016, the impact of acquisitions and divestitures on the Consumer segmentoperational sales growth was negative 0.5%. In 2016, the Consumer segment operational sales growth was negativelyimpacted 1.2% by operations in Venezuela and negatively impacted by 1.1% due to additional shipping days in 2015.
Major Consumer Franchise Sales:*
% Change
(Dollars in Millions) 2016 2015 2014 ’16 vs. ’15 ’15 vs. ’14
OTC $3,977 3,895 4,016 2.1% (3.0)
Beauty** 3,897 3,633 3,873 7.3 (6.2)
Baby Care 2,001 2,157 2,346 (7.2) (8.1)
Oral Care 1,568 1,580 1,647 (0.8) (4.1)
Women’s Health 1,067 1,200 1,302 (11.1) (7.8)
Wound Care/Other 797 1,042 1,312 (23.5) (20.6)
Total Consumer Sales $13,307 13,507 14,496 (1.5)% (6.8)
* Prior year amounts have been reclassified to conform to current year product disclosure.** Formerly Skin Care
The Over-the-Counter (OTC) franchise sales of $4.0 billion increased 2.1% as compared to the prior year, which included4.8% operational growth and a negative currency impact of 2.7%. Operational growth was primarily driven by analgesics,anti-smoking aids and digestive health products.
The Beauty franchise sales of $3.9 billion increased 7.3% as compared to the prior year, which included 9.4% operationalgrowth and a negative currency impact of 2.1%. Operational growth was primarily due to sales from the recentacquisitions of Vogue International LLC, which contributed approximately 4.6%, and NeoStrata Company, Inc., as well assales growth of NEUTROGENA®, AVEENO® adult products and DABAO® products.
The Baby Care franchise sales were $2.0 billion in 2016, a decrease of 7.2% compared to the prior year, primarily due tocompetitive pressure partially offset by sales growth of AVEENO® baby products.
The Oral Care franchise sales were $1.6 billion in 2016, a decrease of 0.8% as compared to the prior year, whichincluded 2.0% operational growth and a negative currency impact of 2.8%. Operational growth was driven by increasedsales of LISTERINE® products, attributable to new product launches and successful marketing campaigns.
The Women’s Health franchise sales were $1.1 billion in 2016, a decrease of 11.1% as compared to the prior year,primarily due to operations in Venezuela and the U.S. divestiture of TUCKS®.
The Wound Care/Other franchise sales were $0.8 billion in 2016, a decrease of 23.5% from 2015, primarily due to theSPLENDA® divestiture.
Consumer segment sales in 2015 were $13.5 billion, a decrease of 6.8% from 2014, which included 2.7% operationalgrowth offset by a negative currency impact of 9.5%. U.S. Consumer segment sales were $5.2 billion, an increase of2.5%. International sales were $8.3 billion, a decrease of 11.9%, which included 2.7% operational growth offset by anegative currency impact of 14.6%. In 2015, divestitures had a negative impact of 1.4% on the worldwide Consumersegment operational growth.
Johnson & Johnson 2016 Annual Report • 17
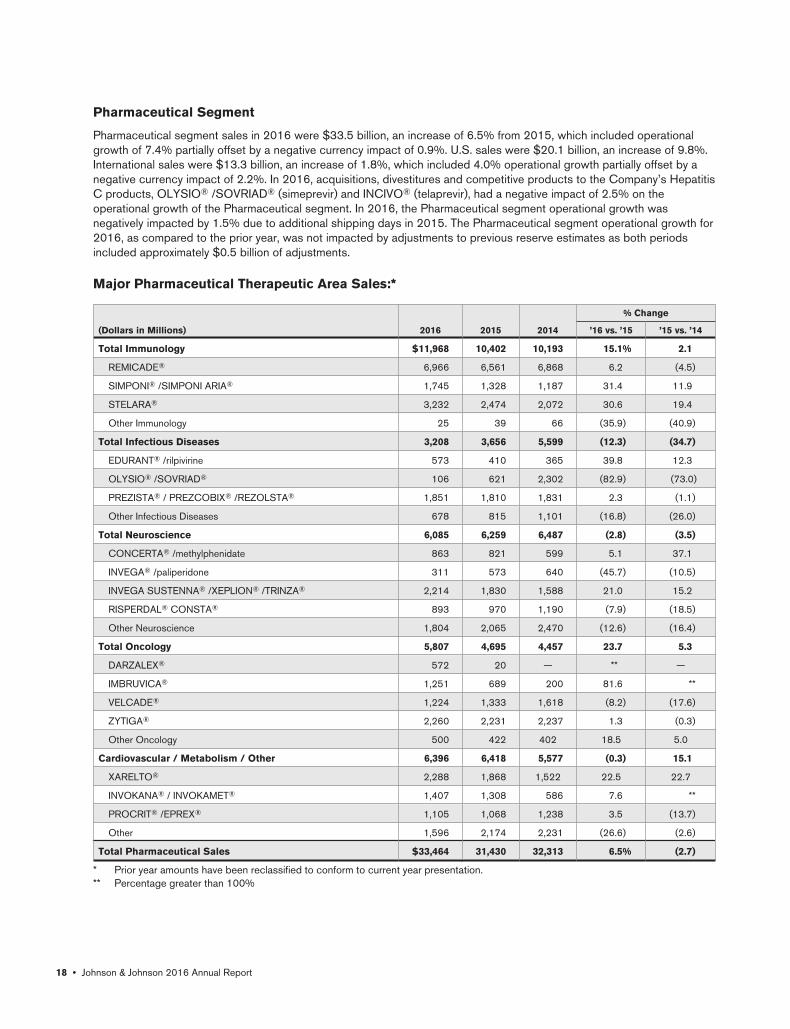
Pharmaceutical Segment
Pharmaceutical segment sales in 2016 were $33.5 billion, an increase of 6.5% from 2015, which included operationalgrowth of 7.4% partially offset by a negative currency impact of 0.9%. U.S. sales were $20.1 billion, an increase of 9.8%.International sales were $13.3 billion, an increase of 1.8%, which included 4.0% operational growth partially offset by anegative currency impact of 2.2%. In 2016, acquisitions, divestitures and competitive products to the Company’s HepatitisC products, OLYSIO® /SOVRIAD® (simeprevir) and INCIVO® (telaprevir), had a negative impact of 2.5% on theoperational growth of the Pharmaceutical segment. In 2016, the Pharmaceutical segment operational growth wasnegatively impacted by 1.5% due to additional shipping days in 2015. The Pharmaceutical segment operational growth for2016, as compared to the prior year, was not impacted by adjustments to previous reserve estimates as both periodsincluded approximately $0.5 billion of adjustments.
Major Pharmaceutical Therapeutic Area Sales:*
% Change
(Dollars in Millions) 2016 2015 2014 ’16 vs. ’15 ’15 vs. ’14
Total Immunology $11,968 10,402 10,193 15.1% 2.1
REMICADE® 6,966 6,561 6,868 6.2 (4.5)
SIMPONI® /SIMPONI ARIA® 1,745 1,328 1,187 31.4 11.9
STELARA® 3,232 2,474 2,072 30.6 19.4
Other Immunology 25 39 66 (35.9) (40.9)
Total Infectious Diseases 3,208 3,656 5,599 (12.3) (34.7)
EDURANT® /rilpivirine 573 410 365 39.8 12.3
OLYSIO® /SOVRIAD® 106 621 2,302 (82.9) (73.0)
PREZISTA® / PREZCOBIX® /REZOLSTA® 1,851 1,810 1,831 2.3 (1.1)
Other Infectious Diseases 678 815 1,101 (16.8) (26.0)
Total Neuroscience 6,085 6,259 6,487 (2.8) (3.5)
CONCERTA® /methylphenidate 863 821 599 5.1 37.1
INVEGA® /paliperidone 311 573 640 (45.7) (10.5)
INVEGA SUSTENNA® /XEPLION® /TRINZA® 2,214 1,830 1,588 21.0 15.2
RISPERDAL® CONSTA® 893 970 1,190 (7.9) (18.5)
Other Neuroscience 1,804 2,065 2,470 (12.6) (16.4)
Total Oncology 5,807 4,695 4,457 23.7 5.3
DARZALEX® 572 20 — ** —
IMBRUVICA® 1,251 689 200 81.6 **
VELCADE® 1,224 1,333 1,618 (8.2) (17.6)
ZYTIGA® 2,260 2,231 2,237 1.3 (0.3)
Other Oncology 500 422 402 18.5 5.0
Cardiovascular / Metabolism / Other 6,396 6,418 5,577 (0.3) 15.1
XARELTO® 2,288 1,868 1,522 22.5 22.7
INVOKANA® / INVOKAMET® 1,407 1,308 586 7.6 **
PROCRIT® /EPREX® 1,105 1,068 1,238 3.5 (13.7)
Other 1,596 2,174 2,231 (26.6) (2.6)
Total Pharmaceutical Sales $33,464 31,430 32,313 6.5% (2.7)
* Prior year amounts have been reclassified to conform to current year presentation.** Percentage greater than 100%
18 • Johnson & Johnson 2016 Annual Report

Immunology products achieved sales of $12.0 billion in 2016, representing an increase of 15.1% as compared to the prioryear. Immunology products growth of 15.1% included operational growth of 15.9% and a negative currency impact of0.8%. The strong growth of REMICADE® (infliximab), STELARA® (ustekinumab) and SIMPONI® /SIMPONI ARIA®
(golimumab) was primarily driven by immunology market growth and increased penetration for both STELARA®
(ustekinumab) and SIMPONI® /SIMPONI ARIA® (golimumab).
The patents for REMICADE® (infliximab) in certain countries in Europe expired in February 2015. Biosimilar versions ofREMICADE® have been introduced in certain markets outside the United States, resulting in a reduction in sales ofREMICADE® in those markets. Additional biosimilar competition will likely result in a further reduction in REMICADE®
sales in markets outside the United States. The introduction of a biosimilar version of REMICADE® in the United States issubject to enforcement of patent rights, approval by the U.S. Food and Drug Administration (FDA) and compliance withthe 180-day notice provisions of the Biologics Price Competition and Innovation Act (the BPCIA). In April 2016, the FDAapproved for sale in the United States an infliximab biosimilar to be marketed by a subsidiary of Pfizer Inc. In October2016, the period for notice of launch under the BPCIA passed and Pfizer Inc., began shipment of an infliximab biosimilar towholesalers in the United States in late November 2016. Sales of an infliximab biosimilar in the U.S. market will result in areduction in U.S. sales of REMICADE® . The Company continues to assert REMICADE® related patent rights. SeeNote 21 to the Consolidated Financial Statements for a description of legal matters regarding the REMICADE® patents.
Infectious disease products sales were $3.2 billion, a decline of 12.3% from 2015, which included an operationaldecrease of 11.2% and a negative currency impact of 1.1%. Competitive products to the Company’s Hepatitis Cproducts, OLYSIO®/SOVRIAD® (simeprevir) and INCIVO® (telaprevir), had a significant negative impact on sales. Thedecline of Hepatitis C sales was partially offset by sales growth of EDURANT® (rilpivirine) and PREZCOBIX® (darunavir/cobicistat).
Neuroscience products sales were $6.1 billion, a decrease of 2.8% from 2015, which included an operational decrease of2.3% and a negative currency impact of 0.5%. Strong sales of INVEGA SUSTENNA®/XEPLION®/TRINZA® (paliperidonepalmitate) were offset by lower sales of INVEGA® (paliperidone) due to generic competition, RISPERDAL CONSTA®
(risperidone) and the impact of divestitures. Sales growth of CONCERTA®/methylphenidate was primarily due to atherapeutic equivalence reclassification of generic competitors.
Oncology products achieved sales of $5.8 billion in 2016, representing an increase of 23.7% as compared to the prioryear. Oncology products growth of 23.7% included operational growth of 25.2% and a negative currency impact of 1.5%.Contributors to the growth of Oncology products were strong sales of IMBRUVICA® (ibrutinib) and DARZALEX®
(daratumumab) due to patient uptake, additional country launches and additional indications for IMBRUVICA®. Genericcompetition negatively impacted the sales growth of VELCADE® (bortezomib). Sales growth of ZYTIGA® (abirateroneacetate) in the Asia Pacific region, primarily due to the launch in China earlier this year, was partially offset by lower salesin Europe due to competition.
Cardiovascular/Metabolism/Other products sales were $6.4 billion, a decline of 0.3% from 2015, which included anoperational increase of 0.8% and a negative currency impact of 1.1%. Contributors to the growth were strong sales ofXARELTO® (rivaroxaban) due to market share growth and INVOKANA®/INVOKAMET® (canagliflozin) due to marketgrowth and continued uptake in the European Union and Canada. Sales of hormonal contraceptives were negativelyimpacted by generic competition and a higher adjustment to previous reserve estimates in 2015 as compared to 2016,which negatively impacted Cardiovascular/Metabolism/Other by approximately 2.3%.
Johnson & Johnson 2016 Annual Report • 19
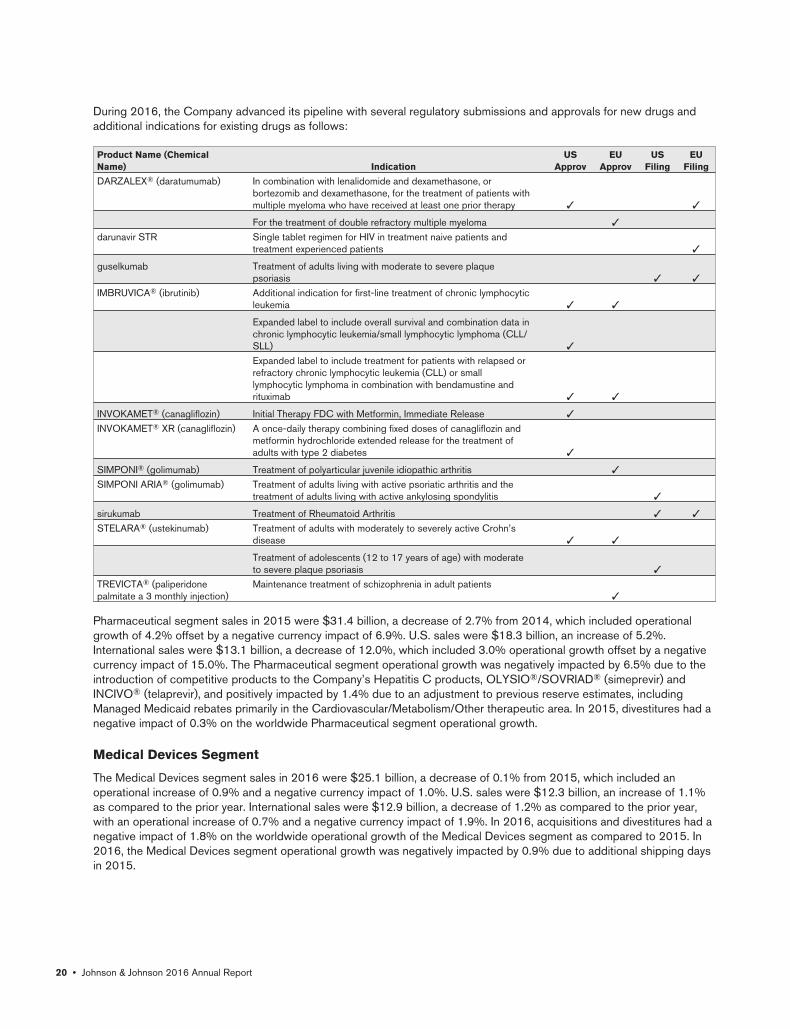
During 2016, the Company advanced its pipeline with several regulatory submissions and approvals for new drugs andadditional indications for existing drugs as follows:
Product Name (ChemicalName) Indication
USApprov
EUApprov
USFiling
EUFiling
DARZALEX® (daratumumab) In combination with lenalidomide and dexamethasone, orbortezomib and dexamethasone, for the treatment of patients withmultiple myeloma who have received at least one prior therapy ✓ ✓
For the treatment of double refractory multiple myeloma ✓
darunavir STR Single tablet regimen for HIV in treatment naive patients andtreatment experienced patients ✓
guselkumab Treatment of adults living with moderate to severe plaquepsoriasis ✓ ✓
IMBRUVICA® (ibrutinib) Additional indication for first-line treatment of chronic lymphocyticleukemia ✓ ✓
Expanded label to include overall survival and combination data inchronic lymphocytic leukemia/small lymphocytic lymphoma (CLL/SLL) ✓
Expanded label to include treatment for patients with relapsed orrefractory chronic lymphocytic leukemia (CLL) or smalllymphocytic lymphoma in combination with bendamustine andrituximab ✓ ✓
INVOKAMET® (canagliflozin) Initial Therapy FDC with Metformin, Immediate Release ✓
INVOKAMET® XR (canagliflozin) A once-daily therapy combining fixed doses of canagliflozin andmetformin hydrochloride extended release for the treatment ofadults with type 2 diabetes ✓
SIMPONI® (golimumab) Treatment of polyarticular juvenile idiopathic arthritis ✓
SIMPONI ARIA® (golimumab) Treatment of adults living with active psoriatic arthritis and thetreatment of adults living with active ankylosing spondylitis ✓
sirukumab Treatment of Rheumatoid Arthritis ✓ ✓
STELARA® (ustekinumab) Treatment of adults with moderately to severely active Crohn’sdisease ✓ ✓
Treatment of adolescents (12 to 17 years of age) with moderateto severe plaque psoriasis ✓
TREVICTA® (paliperidonepalmitate a 3 monthly injection)
Maintenance treatment of schizophrenia in adult patients✓
Pharmaceutical segment sales in 2015 were $31.4 billion, a decrease of 2.7% from 2014, which included operationalgrowth of 4.2% offset by a negative currency impact of 6.9%. U.S. sales were $18.3 billion, an increase of 5.2%.International sales were $13.1 billion, a decrease of 12.0%, which included 3.0% operational growth offset by a negativecurrency impact of 15.0%. The Pharmaceutical segment operational growth was negatively impacted by 6.5% due to theintroduction of competitive products to the Company’s Hepatitis C products, OLYSIO®/SOVRIAD® (simeprevir) andINCIVO® (telaprevir), and positively impacted by 1.4% due to an adjustment to previous reserve estimates, includingManaged Medicaid rebates primarily in the Cardiovascular/Metabolism/Other therapeutic area. In 2015, divestitures had anegative impact of 0.3% on the worldwide Pharmaceutical segment operational growth.
Medical Devices Segment
The Medical Devices segment sales in 2016 were $25.1 billion, a decrease of 0.1% from 2015, which included anoperational increase of 0.9% and a negative currency impact of 1.0%. U.S. sales were $12.3 billion, an increase of 1.1%as compared to the prior year. International sales were $12.9 billion, a decrease of 1.2% as compared to the prior year,with an operational increase of 0.7% and a negative currency impact of 1.9%. In 2016, acquisitions and divestitures had anegative impact of 1.8% on the worldwide operational growth of the Medical Devices segment as compared to 2015. In2016, the Medical Devices segment operational growth was negatively impacted by 0.9% due to additional shipping daysin 2015.
20 • Johnson & Johnson 2016 Annual Report
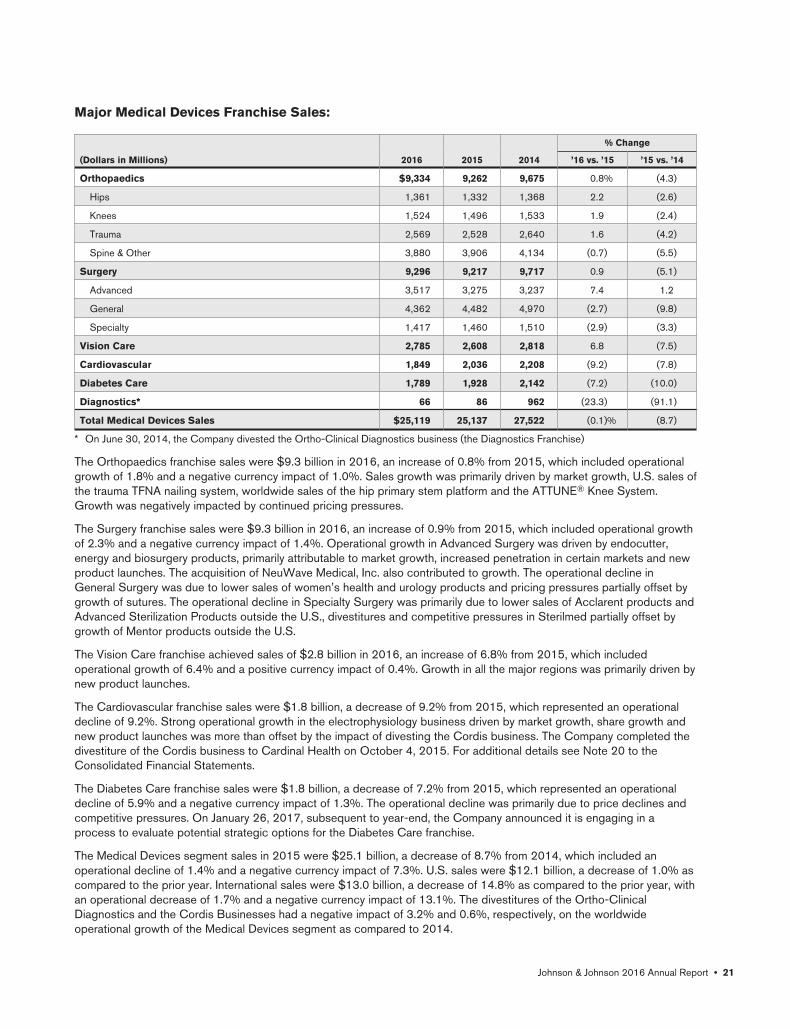
Major Medical Devices Franchise Sales:
% Change
(Dollars in Millions) 2016 2015 2014 ’16 vs. ’15 ’15 vs. ’14
Orthopaedics $9,334 9,262 9,675 0.8% (4.3)
Hips 1,361 1,332 1,368 2.2 (2.6)
Knees 1,524 1,496 1,533 1.9 (2.4)
Trauma 2,569 2,528 2,640 1.6 (4.2)
Spine & Other 3,880 3,906 4,134 (0.7) (5.5)
Surgery 9,296 9,217 9,717 0.9 (5.1)
Advanced 3,517 3,275 3,237 7.4 1.2
General 4,362 4,482 4,970 (2.7) (9.8)
Specialty 1,417 1,460 1,510 (2.9) (3.3)
Vision Care 2,785 2,608 2,818 6.8 (7.5)
Cardiovascular 1,849 2,036 2,208 (9.2) (7.8)
Diabetes Care 1,789 1,928 2,142 (7.2) (10.0)
Diagnostics* 66 86 962 (23.3) (91.1)
Total Medical Devices Sales $25,119 25,137 27,522 (0.1)% (8.7)
* On June 30, 2014, the Company divested the Ortho-Clinical Diagnostics business (the Diagnostics Franchise)
The Orthopaedics franchise sales were $9.3 billion in 2016, an increase of 0.8% from 2015, which included operationalgrowth of 1.8% and a negative currency impact of 1.0%. Sales growth was primarily driven by market growth, U.S. sales ofthe trauma TFNA nailing system, worldwide sales of the hip primary stem platform and the ATTUNE® Knee System.Growth was negatively impacted by continued pricing pressures.
The Surgery franchise sales were $9.3 billion in 2016, an increase of 0.9% from 2015, which included operational growthof 2.3% and a negative currency impact of 1.4%. Operational growth in Advanced Surgery was driven by endocutter,energy and biosurgery products, primarily attributable to market growth, increased penetration in certain markets and newproduct launches. The acquisition of NeuWave Medical, Inc. also contributed to growth. The operational decline inGeneral Surgery was due to lower sales of women’s health and urology products and pricing pressures partially offset bygrowth of sutures. The operational decline in Specialty Surgery was primarily due to lower sales of Acclarent products andAdvanced Sterilization Products outside the U.S., divestitures and competitive pressures in Sterilmed partially offset bygrowth of Mentor products outside the U.S.
The Vision Care franchise achieved sales of $2.8 billion in 2016, an increase of 6.8% from 2015, which includedoperational growth of 6.4% and a positive currency impact of 0.4%. Growth in all the major regions was primarily driven bynew product launches.
The Cardiovascular franchise sales were $1.8 billion, a decrease of 9.2% from 2015, which represented an operationaldecline of 9.2%. Strong operational growth in the electrophysiology business driven by market growth, share growth andnew product launches was more than offset by the impact of divesting the Cordis business. The Company completed thedivestiture of the Cordis business to Cardinal Health on October 4, 2015. For additional details see Note 20 to theConsolidated Financial Statements.
The Diabetes Care franchise sales were $1.8 billion, a decrease of 7.2% from 2015, which represented an operationaldecline of 5.9% and a negative currency impact of 1.3%. The operational decline was primarily due to price declines andcompetitive pressures. On January 26, 2017, subsequent to year-end, the Company announced it is engaging in aprocess to evaluate potential strategic options for the Diabetes Care franchise.
The Medical Devices segment sales in 2015 were $25.1 billion, a decrease of 8.7% from 2014, which included anoperational decline of 1.4% and a negative currency impact of 7.3%. U.S. sales were $12.1 billion, a decrease of 1.0% ascompared to the prior year. International sales were $13.0 billion, a decrease of 14.8% as compared to the prior year, withan operational decrease of 1.7% and a negative currency impact of 13.1%. The divestitures of the Ortho-ClinicalDiagnostics and the Cordis Businesses had a negative impact of 3.2% and 0.6%, respectively, on the worldwideoperational growth of the Medical Devices segment as compared to 2014.
Johnson & Johnson 2016 Annual Report • 21
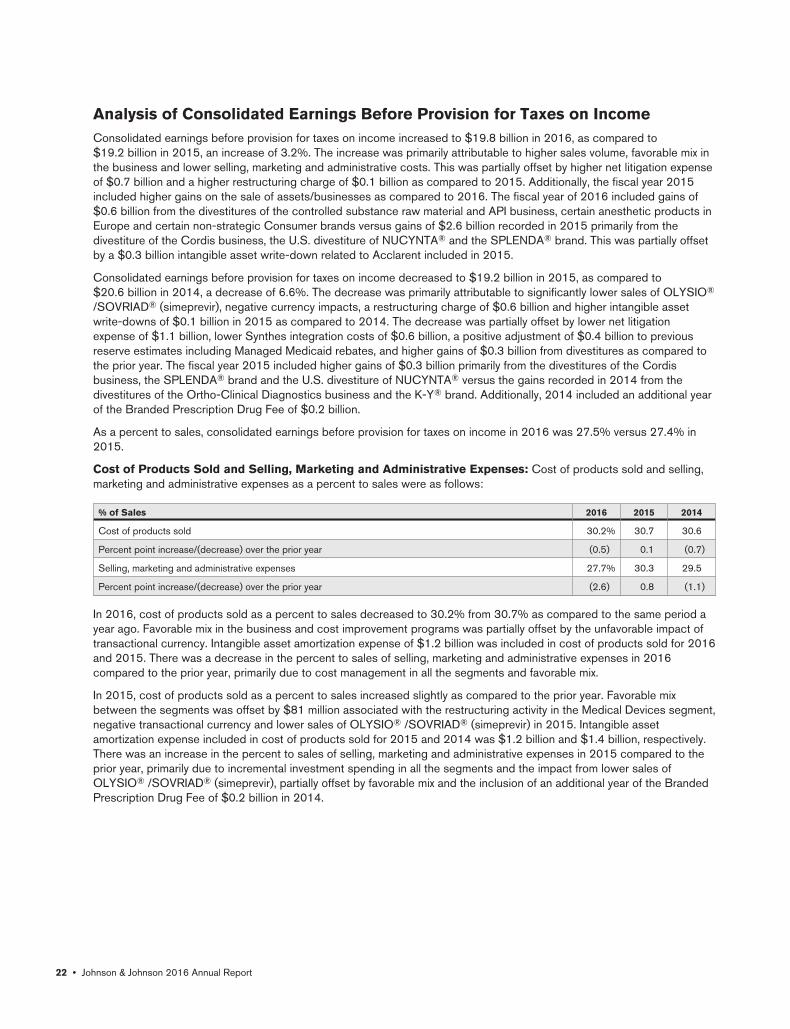
Analysis of Consolidated Earnings Before Provision for Taxes on IncomeConsolidated earnings before provision for taxes on income increased to $19.8 billion in 2016, as compared to$19.2 billion in 2015, an increase of 3.2%. The increase was primarily attributable to higher sales volume, favorable mix inthe business and lower selling, marketing and administrative costs. This was partially offset by higher net litigation expenseof $0.7 billion and a higher restructuring charge of $0.1 billion as compared to 2015. Additionally, the fiscal year 2015included higher gains on the sale of assets/businesses as compared to 2016. The fiscal year of 2016 included gains of$0.6 billion from the divestitures of the controlled substance raw material and API business, certain anesthetic products inEurope and certain non-strategic Consumer brands versus gains of $2.6 billion recorded in 2015 primarily from thedivestiture of the Cordis business, the U.S. divestiture of NUCYNTA® and the SPLENDA® brand. This was partially offsetby a $0.3 billion intangible asset write-down related to Acclarent included in 2015.
Consolidated earnings before provision for taxes on income decreased to $19.2 billion in 2015, as compared to$20.6 billion in 2014, a decrease of 6.6%. The decrease was primarily attributable to significantly lower sales of OLYSIO®
/SOVRIAD® (simeprevir), negative currency impacts, a restructuring charge of $0.6 billion and higher intangible assetwrite-downs of $0.1 billion in 2015 as compared to 2014. The decrease was partially offset by lower net litigationexpense of $1.1 billion, lower Synthes integration costs of $0.6 billion, a positive adjustment of $0.4 billion to previousreserve estimates including Managed Medicaid rebates, and higher gains of $0.3 billion from divestitures as compared tothe prior year. The fiscal year 2015 included higher gains of $0.3 billion primarily from the divestitures of the Cordisbusiness, the SPLENDA® brand and the U.S. divestiture of NUCYNTA® versus the gains recorded in 2014 from thedivestitures of the Ortho-Clinical Diagnostics business and the K-Y® brand. Additionally, 2014 included an additional yearof the Branded Prescription Drug Fee of $0.2 billion.
As a percent to sales, consolidated earnings before provision for taxes on income in 2016 was 27.5% versus 27.4% in2015.
Cost of Products Sold and Selling, Marketing and Administrative Expenses: Cost of products sold and selling,marketing and administrative expenses as a percent to sales were as follows:
% of Sales 2016 2015 2014
Cost of products sold 30.2% 30.7 30.6
Percent point increase/(decrease) over the prior year (0.5) 0.1 (0.7)
Selling, marketing and administrative expenses 27.7% 30.3 29.5
Percent point increase/(decrease) over the prior year (2.6) 0.8 (1.1)
In 2016, cost of products sold as a percent to sales decreased to 30.2% from 30.7% as compared to the same period ayear ago. Favorable mix in the business and cost improvement programs was partially offset by the unfavorable impact oftransactional currency. Intangible asset amortization expense of $1.2 billion was included in cost of products sold for 2016and 2015. There was a decrease in the percent to sales of selling, marketing and administrative expenses in 2016compared to the prior year, primarily due to cost management in all the segments and favorable mix.
In 2015, cost of products sold as a percent to sales increased slightly as compared to the prior year. Favorable mixbetween the segments was offset by $81 million associated with the restructuring activity in the Medical Devices segment,negative transactional currency and lower sales of OLYSIO® /SOVRIAD® (simeprevir) in 2015. Intangible assetamortization expense included in cost of products sold for 2015 and 2014 was $1.2 billion and $1.4 billion, respectively.There was an increase in the percent to sales of selling, marketing and administrative expenses in 2015 compared to theprior year, primarily due to incremental investment spending in all the segments and the impact from lower sales ofOLYSIO® /SOVRIAD® (simeprevir), partially offset by favorable mix and the inclusion of an additional year of the BrandedPrescription Drug Fee of $0.2 billion in 2014.
22 • Johnson & Johnson 2016 Annual Report

Research and Development Expense: Research and development expense by segment of business was as follows:
2016 2015 2014
(Dollars in Millions) Amount % of Sales* Amount % of Sales* Amount % of Sales*
Consumer $580 4.4% 625 4.6 629 4.3
Pharmaceutical 6,967 20.8 6,821 21.7 6,213 19.2
Medical Devices 1,548 6.2 1,600 6.4 1,652 6.0
Total research and development expense $9,095 12.7% 9,046 12.9 8,494 11.4
Percent increase/(decrease) over the prioryear 0.5% 6.5 3.8
* As a percent to segment sales
Research and development activities represent a significant part of the Company’s business. These expenditures relate tothe processes of discovering, testing and developing new products, upfront payments and milestones, improving existingproducts, as well as ensuring product efficacy and regulatory compliance prior to launch. The Company remainscommitted to investing in research and development with the aim of delivering high quality and innovative products. In2016, worldwide costs of research and development activities increased by 0.5% compared to 2015 but decreased as apercent of sales. The decrease as a percent of sales was attributable to higher overall sales in the Pharmaceuticalsegment. The increased dollar spend in the Pharmaceutical segment was for investment spending to advance the pipeline.In 2015, worldwide costs of research and development activities increased by 6.5% compared to 2014. The increase as apercent to sales was attributable to increased investment spending primarily in the Pharmaceutical segment, lower overallsales and business mix.
In-Process Research and Development (IPR&D): In 2016, the Company recorded an IPR&D charge of $29 millionfor the discontinuation of a development program related to Crucell. In 2015, the Company recorded an IPR&D charge of$0.2 billion primarily for the discontinuation of certain development projects related to Covagen. In 2014, the Companyrecorded an IPR&D charge of $0.2 billion for the impairment of various IPR&D projects related to RespiVert, Crucell,Mentor and Synthes for the delay or discontinuation of certain development projects.
Other (Income) Expense, Net: Other (income) expense, net is the account where the Company records gains andlosses related to the sale and write-down of certain investments in equity securities held by Johnson & JohnsonInnovation — JJDC, Inc. (JJDC), gains and losses on divestitures, transactional currency gains and losses, acquisition-related costs, litigation accruals and settlements, as well as royalty income. The change in other (income) expense, net forthe fiscal year 2016 was an unfavorable change of $2.5 billion as compared to the prior year primarily due to higher gainson the sale of assets/businesses in the fiscal year 2015 as compared to 2016. The fiscal year of 2016 included gains of$0.6 billion from the divestitures of the controlled substance raw material and API business, certain anesthetic products inEurope and certain non-strategic Consumer brands versus gains of $2.6 billion recorded in 2015 primarily from thedivestiture of the Cordis business, the U.S. divestiture of NUCYNTA® and the SPLENDA® brand. Additionally, the fiscalyear of 2016 included higher litigation expense of $0.7 billion as compared to 2015. This was partially offset by a$0.3 billion intangible asset write-down related to Acclarent included in the fiscal year 2015.
The change in other (income) expense, net for the fiscal year 2015 was a favorable change of $2.0 billion as compared tothe prior year primarily due to lower litigation expense of $1.1 billion, lower Synthes integration costs of $0.6 billion andhigher JJDC portfolio gains of $0.2 billion as compared to the prior year. Additionally, the fiscal year 2015 included highergains of $0.3 billion primarily from the divestitures of the Cordis business, the SPLENDA® brand and the U.S. divestitureof NUCYNTA® versus the gains recorded in 2014 from the divestitures of the Ortho-Clinical Diagnostics business and theK-Y® brand. This was partially offset by higher intangible asset write-downs of $0.1 billion in 2015.
Interest (Income) Expense: Interest income in 2016 increased by $240 million as compared to 2015 due to a higheraverage balance of cash, cash equivalents and marketable securities and higher interest rates. Cash, cash equivalents andmarketable securities totaled $41.9 billion at the end of 2016, and averaged $40.1 billion as compared to the$35.7 billion average cash balance in 2015.
Interest expense in 2016 was higher as compared to 2015. The average debt balance was $23.5 billion in 2016 versus$19.3 billion in 2015. The total debt balance at the end of 2016 was $27.1 billion as compared to $19.9 billion at the endof 2015. The higher debt balance of approximately $7.2 billion was primarily due to increased borrowings in February andMay of 2016. The Company increased borrowings, capitalizing on favorable terms in the capital markets. The proceeds ofthe borrowings were used for general corporate purposes, primarily the stock repurchase program.
Johnson & Johnson 2016 Annual Report • 23

Interest income in 2015 increased by $61 million as compared to 2014 due to a higher average balance of cash, cashequivalents and marketable securities and higher interest rates. Cash, cash equivalents and marketable securities totaled$38.4 billion at the end of 2015, and averaged $35.7 billion as compared to the $31.1 billion average cash balance in2014. The increase in the year-end cash balance was primarily due to cash generated from operating activities.
Interest expense in 2015 increased slightly as compared to 2014. The average debt balance was $19.3 billion in 2015versus $18.5 billion in 2014. The total debt balance at the end of 2015 was $19.9 billion as compared to $18.8 billion atthe end of 2014. The higher debt balance of approximately $1.1 billion was an increase in commercial paper for generalcorporate purposes, primarily the stock repurchase program.
Income Before Tax by Segment
Income before tax by segment of business were as follows:
Income Before Tax Segment SalesPercent of
Segment Sales
(Dollars in Millions) 2016 2015 2016 2015 2016 2015
Consumer $2,441 1,787 $13,307 13,507 18.3% 13.2
Pharmaceutical 12,827 11,734 33,464 31,430 38.3 37.3
Medical Devices 5,578 6,826 25,119 25,137 22.2 27.2
Total(1) 20,846 20,347 71,890 70,074 29.0 29.0
Less: Expenses not allocated to segments(2) 1,043 1,151
Earnings before provision for taxes on income $19,803 19,196 $71,890 70,074 27.5% 27.4
(1) See Note 18 to the Consolidated Financial Statements for more details.(2) Amounts not allocated to segments include interest (income) expense and general corporate (income) expense.
Consumer Segment: In 2016, the Consumer segment income before tax as a percent to sales was 18.3%, versus13.2% in 2015, primarily driven by favorable selling, marketing and administrative expenses due to cost management andhigher gross profit margins from cost improvement projects and favorable mix. This was partially offset by higher gains in2015 related to divestitures, primarily the divestiture of the SPLENDA® brand. Additionally, operations in Venezuelanegatively impacted the Consumer segment income before tax in 2016 as compared to 2015.
In 2015, the Consumer segment income before tax as a percent to sales was 13.2%, versus 13.4% in 2014, primarily dueto lower divestiture gains in 2015 versus 2014. In 2015, the Consumer segment tax included a gain of $0.3 billion fromdivestitures, primarily the divestiture of the SPLENDA® brand. In 2014, the Consumer segment included a gain $0.5 billionfrom divestitures, primarily the divestiture of the K-Y® brand.
Pharmaceutical Segment: In 2016, the Pharmaceutical segment income before tax as a percent to sales was 38.3%versus 37.3% in 2015. The increase in income before tax was primarily due to strong sales volume growth and favorableselling, marketing and administrative expenses due to cost management. Additionally, the fiscal year 2015, had highergains of $0.7 billion related to divestitures partially offset by a higher IPR&D charge of $0.2 billion as compared to 2016.The fiscal year of 2016 included the gains from the divestitures of the controlled substance raw material and API businessand certain anesthetic products in Europe versus the gains recorded in 2015 from the U.S. divestiture of NUCYNTA® .
In 2015, the Pharmaceutical segment income before tax as a percent to sales was 37.3% versus 36.2% in 2014. Thefavorable income before tax was primarily due to higher gains recognized in 2015 partially offset by a sales decline ofOLYSIO®/SOVRIAD® (simeprevir), increased investment spending and negative currency impacts as compared to 2014.Included in 2015 was a gain of $1.0 billion on the U.S. divestiture of NUCYNTA®, as well as receipt of a contingentpayment and a positive adjustment to previous reserve estimates, including Managed Medicaid rebates. Additionally, thePharmaceutical segment income before tax in 2014 was negatively impacted by $0.2 billion for an additional year of theBranded Prescription Drug Fee and higher intangible asset amortization expense of $0.3 billion primarily related to thewrite-down of INCIVO® (telaprevir).
Medical Devices Segment: In 2016, the Medical Devices segment income before tax as a percent to sales was 22.2%versus 27.2% in 2015. The decrease in the income before tax as a percent to sales was primarily due to lower gains of$1.4 billion related to divestitures, higher litigation expense of $0.8 billion and a higher restructuring charge of $0.1 billionas compared to 2015. This was partially offset by an intangible asset write-down of $0.3 billion related to Acclarent in2015 and favorable selling, marketing and administrative expenses in 2016.
24 • Johnson & Johnson 2016 Annual Report

In 2015, the Medical Devices segment income before tax as a percent to sales was 27.2% versus 28.9% in 2014primarily due to a restructuring charge of $0.6 billion, an intangible asset write-down of $0.3 billion related to Acclarent,and lower gains of $0.5 billion on divestitures as compared to 2014. In 2015, the Medical Devices segment includedgains of $1.4 billion, primarily for the divestiture of the Cordis business versus a gain of $1.9 billion recorded in 2014 forthe divestiture of the Ortho-Clinical Diagnostics business. The 2015 income before tax was favorably impacted by lowernet litigation expense of $0.9 billion, which included a gain from the litigation settlement agreement of $0.6 billion withGuidant, and lower Synthes integration costs of $0.6 billion in 2015 as compared to 2014.
Restructuring: The Company announced restructuring actions in its Medical Devices segment that are expected to resultin annualized pre-tax cost savings of $800 million to $1.0 billion, the majority of which is expected to be realized by theend of 2018. Approximately $250 million in savings were realized in 2016. The savings will provide the Company withadded flexibility and resources to fund investment in new growth opportunities and innovative solutions for customers andpatients. The Company estimates that, in connection with its plans, it will record pre-tax restructuring related charges ofapproximately $2.0 billion to $2.4 billion, most of which are expected to be incurred by the end of 2017. In 2016, theCompany recorded a pre-tax charge of $685 million, of which $45 million is included in cost of products sold and$149 million is included in other (income) expense. In 2015, the Company recorded a pre-tax charge of $590 million, ofwhich $81 million was included in cost of products sold. Restructuring charges of $1.275 billion have been recordedsince the restructuring was announced. See Note 22 to the Consolidated Financial Statements for additional detailsrelated to the restructuring.
Provision for Taxes on Income: The worldwide effective income tax rate was 16.5% in 2016, 19.7% in 2015 and20.6% in 2014 . The 2016 effective tax rate decreased by 3.2% as compared to 2015. As described in Note 1 to theConsolidated Financial Statements, the Company adopted a new accounting standard for the reporting of additional taxbenefits on share-based compensation that vested or were exercised during the fiscal year. The adoption of this newstandard reduced the effective tax rate for the fiscal 2016 by 1.8% versus 2015. The remainder of the change in theeffective tax rate was primarily related to the lower earnings before taxes in the United States and the settlement of severaluncertain tax positions in 2016 versus 2015.
The decrease in the 2015 effective tax rate, as compared to 2014 was primarily attributable to the increases in taxableincome in lower tax jurisdictions relative to higher tax jurisdictions and a tax benefit resulting from a restructuring ofinternational affiliates. Additionally, the 2014 effective tax rate was affected by the items mentioned below.
The increase in the 2014 effective tax rate, as compared to 2013, was attributable to the following: the divestiture of theOrtho-Clinical Diagnostics business at an approximate 44% effective tax rate, litigation accruals at low tax rates, the mix ofearnings into higher tax jurisdictions, primarily the U.S., the accrual of an additional year of the Branded Prescription DrugFee, which is not tax deductible, and additional U.S. tax expense related to a planned increase in dividends from currentyear foreign earnings as compared to the prior year. These increases to the 2014 effective tax rate were partially offset bya tax benefit of $0.4 billion associated with the Conor Medsystems divestiture.
The 2014 effective tax rate was also reduced as the Company adjusted its unrecognized tax benefits as a result of (i) thefederal appeals court’s decision in OMJ Pharmaceuticals, Inc.’s litigation regarding credits under former Section 936 ofthe Internal Revenue Code and (ii) a settlement of substantially all issues related to the Company’s U.S. Internal RevenueService audit of tax years 2006 – 2009.
Liquidity and Capital Resources
Liquidity & Cash Flows
Cash and cash equivalents were $19.0 billion at the end of 2016 as compared to $13.7 billion at the end of 2015. Theprimary sources and uses of cash that contributed to the $5.3 billion increase were approximately $18.8 billion of cashgenerated from operating activities offset by $4.8 billion net cash used by investing activities, and $8.6 billion net cashused by financing activities, and $0.2 billion due to the effect on exchange rate changes on cash and cash equivalents. Inaddition, the Company had $22.9 billion in marketable securities at the end of 2016 and $24.6 billion at the end of 2015.See Note 1 to the Consolidated Financial Statements for additional details on cash, cash equivalents and marketablesecurities.
Cash flow from operations of $18.8 billion was the result of $16.5 billion of net earnings and $4.9 billion of non-cashexpenses and other adjustments for depreciation and amortization, stock-based compensation and assets write-downs,reduced by $0.6 billion from net gains on sale of assets/businesses, $0.3 billion related to deferred taxes and $2.4 billion
Johnson & Johnson 2016 Annual Report • 25

related to accounts receivable, inventories and other current and non-current liabilities. Additional sources of operatingcash flow of $0.7 billion resulted from an increase in accounts payable and accrued liabilities and a decrease in othercurrent and non-current assets.
Investing activities use of $4.8 billion was primarily for acquisitions, net of cash acquired of $4.5 billion and additions toproperty, plant and equipment of $3.2 billion. This was partially offset by proceeds from the net sale of investmentsprimarily marketable securities of $1.8 billion and $1.3 billion of proceeds from the disposal of assets/businesses.
Financing activities use of $8.6 billion was primarily for dividends to shareholders of $8.6 billion and $9.0 billion for therepurchase of common stock. Financing activities also included a source of $7.9 billion from net proceeds of short andlong-term debt and $1.2 billion of proceeds from stock options exercised/employee withholding tax on stock awards, net.
In 2016, the Company announced a definitive agreement to acquire Abbott Medical Optics Inc. for approximately$4.3 billion and on January 26, 2017, subsequent to year end the Company announced a definitive transaction agreementto acquire Actelion Ltd. for approximately $30.0 billion. Abbott Medical Optics closed on February 27, 2017. TheCompany will use cash held by the Company’s foreign subsidiaries to pay for these acquisitions.
On October 13, 2015, the Company announced that its Board of Directors approved a share repurchase program,authorizing the Company to purchase up to $10.0 billion of the Company’s shares of common stock. As of January 1,2017, $7.3 billion has been repurchased under the program. The repurchase program has no time limit and may bedelayed or suspended for periods or discontinued at any time. Any shares acquired will be available for general corporatepurposes. The Company intends to finance the share repurchase program through available cash and access to thecapital markets. The previous share repurchase program approved on July 21, 2014, authorizing the Company to purchaseup to $5.0 billion of the Company’s shares of common stock, was completed on April 28, 2015.
In 2016, the Company continued to have access to liquidity through the commercial paper market. The Company had ashelf registration with the U.S. Securities and Exchange Commission that expired on February 26, 2017. The Companyplans to file a new shelf registration on February 27, 2017 which will enable it to issue debt securities on a timely basis.For additional details on borrowings, see Note 7 to the Consolidated Financial Statements.
The Company anticipates that operating cash flows, existing credit facilities and access to the capital markets will providesufficient resources to fund operating needs in 2017.
Concentration of Credit Risk
Global concentration of credit risk with respect to trade accounts receivables continues to be limited due to the largenumber of customers globally and adherence to internal credit policies and credit limits. Economic challenges in Italy,Spain, Greece and Portugal (the Southern European Region) have impacted certain payment patterns, which havehistorically been longer than those experienced in the U.S. and other international markets. The total net trade accountsreceivable balance in the Southern European Region was approximately $1.1 billion as of January 1, 2017 and $1.3 billionas of January 3, 2016. Approximately $0.7 billion as of January 1, 2017 and approximately $0.8 billion as of January 3,2016 of the Southern European Region net trade accounts receivable balance related to the Company’s Consumer,Vision Care and Diabetes Care businesses as well as certain Pharmaceutical and Medical Devices customers which are inline with historical collection patterns.
The remaining balance of net trade accounts receivable in the Southern European Region has been negatively impactedby the timing of payments from certain government owned or supported health care customers, as well as certaindistributors of the Pharmaceutical and Medical Devices local affiliates. The total net trade accounts receivable balance forthese customers were approximately $0.4 billion at January 1, 2017 and $0.5 billion at January 3, 2016. The Companycontinues to receive payments from these customers and, in some cases, late payments with interest. For customerswhere payment is expected over periods of time longer than one year, revenue and trade receivables have beendiscounted over the estimated period of time for collection. Allowances for doubtful accounts have been increased forthese customers, but have been immaterial to date. The Company will continue to work closely with these customers onpayment plans, monitor the economic situation and take appropriate actions as necessary.
Financing and Market Risk
The Company uses financial instruments to manage the impact of foreign exchange rate changes on cash flows.Accordingly, the Company enters into forward foreign exchange contracts to protect the value of certain foreign currencyassets and liabilities and to hedge future foreign currency transactions primarily related to product costs. Gains or losseson these contracts are offset by the gains or losses on the underlying transactions. A 10% appreciation of the U.S. Dollar
26 • Johnson & Johnson 2016 Annual Report

from the January 1, 2017 market rates would increase the unrealized value of the Company’s forward contracts by$23 million. Conversely, a 10% depreciation of the U.S. Dollar from the January 1, 2017 market rates would decrease theunrealized value of the Company’s forward contracts by $28 million. In either scenario, the gain or loss on the forwardcontract would be offset by the gain or loss on the underlying transaction, and therefore, would have no impact on futureanticipated earnings and cash flows.
The Company hedges the exposure to fluctuations in currency exchange rates, and the effect on certain assets andliabilities in foreign currency, by entering into currency swap contracts. A 1% change in the spread between U.S. andforeign interest rates on the Company’s interest rate sensitive financial instruments would either increase or decrease theunrealized value of the Company’s swap contracts by approximately $82 million. In either scenario, at maturity, the gain orloss on the swap contract would be offset by the gain or loss on the underlying transaction, and therefore, would have noimpact on future anticipated cash flows.
The Company does not enter into financial instruments for trading or speculative purposes. Further, the Company has apolicy of only entering into contracts with parties that have at least an investment grade credit rating. The counter-partiesto these contracts are major financial institutions and there is no significant concentration of exposure with any onecounter-party. Management believes the risk of loss is remote.
The Company invests in both fixed rate and floating rate interest earning securities which carry a degree of interest raterisk. The fair market value of fixed rate securities may be adversely impacted due to a rise in interest rates, while floatingrate securities may produce less income than predicted if interest rates fall. A 1% (100 basis points) change in spread onthe Company’s interest rate sensitive investments would either increase or decrease the unrealized value of cashequivalents and current marketable securities by approximately $336 million.
The Company has access to substantial sources of funds at numerous banks worldwide. In September 2016, theCompany secured a new 364-day Credit Facility. Total credit available to the Company approximates $10 billion, whichexpires on September 14, 2017. Interest charged on borrowings under the credit line agreement is based on either bidsprovided by banks, the prime rate or London Interbank Offered Rates (LIBOR), plus applicable margins. Commitment feesunder the agreement are not material.
Total borrowings at the end of 2016 and 2015 were $27.1 billion and $19.9 billion, respectively. The increase inborrowings between 2016 and 2015 was a result of financing for the Company’s share repurchase program and generalcorporate purposes. In 2016, net cash (cash and current marketable securities, net of debt) was $14.8 billion comparedto net cash of $18.5 billion in 2015. Total debt represented 27.8% of total capital (shareholders’ equity and total debt) in2016 and 21.8% of total capital in 2015. Shareholders’ equity per share at the end of 2016 was $26.02 compared to$25.82 at year-end 2015, an increase of 0.8%.
A summary of borrowings can be found in Note 7 to the Consolidated Financial Statements.
Contractual Obligations and Commitments
The Company’s contractual obligations are primarily for leases, debt and unfunded retirement plans. There are no othersignificant obligations. To satisfy these obligations, the Company will use cash from operations. The following tablesummarizes the Company’s contractual obligations and their aggregate maturities as of January 1, 2017 (see Notes 7, 10and 16 to the Consolidated Financial Statements for further details):
(Dollars in Millions)Debt
Obligations
Interest onDebt
Obligations
UnfundedRetirement
PlansOperating
Leases Total
2017 $1,704 799 83 216 2,802
2018 1,561 735 84 179 2,559
2019 2,538 680 89 134 3,441
2020 629 608 94 105 1,436
2021 1,795 574 100 88 2,557
After 2021 15,919 6,956 610 100 23,585
Total $24,146 10,352 1,060 822 36,380
For tax matters, see Note 8 to the Consolidated Financial Statements. For other retirement plan and post-employmentmedical benefit information, see Note 10 to the Consolidated Financial Statements. The table does not include activityrelated to business combinations.
Johnson & Johnson 2016 Annual Report • 27

Dividends
The Company increased its dividend in 2016 for the 54th consecutive year. Cash dividends paid were $3.15 per share in2016 compared with dividends of $2.95 per share in 2015, and $2.76 per share in 2014 . The dividends were distributedas follows:
2016 2015 2014
First quarter $0.75 0.70 0.66
Second quarter 0.80 0.75 0.70
Third quarter 0.80 0.75 0.70
Fourth quarter 0.80 0.75 0.70
Total $3.15 2.95 2.76
On January 3, 2017, the Board of Directors declared a regular quarterly cash dividend of $0.80 per share, payable onMarch 14, 2017, to shareholders of record as of February 28, 2017. The Company expects to continue the practice ofpaying regular cash dividends.
Other Information
Critical Accounting Policies and Estimates
Management’s discussion and analysis of results of operations and financial condition are based on the Company’sconsolidated financial statements that have been prepared in accordance with accounting principles generally accepted inthe U.S. (GAAP). The preparation of these financial statements requires that management make estimates andassumptions that affect the amounts reported for revenues, expenses, assets, liabilities and other related disclosures.Actual results may or may not differ from these estimates. The Company believes that the understanding of certain keyaccounting policies and estimates are essential in achieving more insight into the Company’s operating results andfinancial condition. These key accounting policies include revenue recognition, income taxes, legal and self-insurancecontingencies, valuation of long-lived assets, assumptions used to determine the amounts recorded for pensions and otheremployee benefit plans and accounting for stock based awards.
Revenue Recognition: The Company recognizes revenue from product sales when goods are shipped or delivered, andtitle and risk of loss pass to the customer. Provisions for certain rebates, sales incentives, trade promotions, coupons,product returns and discounts to customers are accounted for as reductions in sales in the same period the related salesare recorded.
Product discounts granted are based on the terms of arrangements with direct, indirect and other market participants, aswell as market conditions, including prices charged by competitors. Rebates, which include the Medicaid rebate provision,are estimated based on contractual terms, historical experience, patient outcomes, trend analysis and projected marketconditions in the various markets served. The Company evaluates market conditions for products or groups of productsprimarily through the analysis of wholesaler and other third-party sell-through and market research data, as well asinternally generated information.
Sales returns are estimated and recorded based on historical sales and returns information. Products that exhibit unusualsales or return patterns due to dating, competition or other marketing matters are specifically investigated and analyzed aspart of the accounting for sales return accruals.
Sales returns allowances represent a reserve for products that may be returned due to expiration, destruction in the field,or in specific areas, product recall. The returns reserve is based on historical return trends by product and by market as apercent to gross sales. In accordance with the Company’s accounting policies, the Company generally issues credit tocustomers for returned goods. The Company’s sales returns reserves are accounted for in accordance with theU.S. GAAP guidance for revenue recognition when right of return exists. Sales returns reserves are recorded at full salesvalue. Sales returns in the Consumer and Pharmaceutical segments are almost exclusively not resalable. Sales returns forcertain franchises in the Medical Devices segment are typically resalable but are not material. The Company infrequentlyexchanges products from inventory for returned products. The sales returns reserve for the total Company has beenapproximately 1.0% of annual net trade sales during the fiscal reporting years 2016, 2015 and 2014.
28 • Johnson & Johnson 2016 Annual Report

Promotional programs, such as product listing allowances and cooperative advertising arrangements, are recorded in theyear incurred. Continuing promotional programs include coupons and volume-based sales incentive programs. Theredemption cost of consumer coupons is based on historical redemption experience by product and value. Volume-basedincentive programs are based on estimated sales volumes for the incentive period and are recorded as products are sold.The Company also earns service revenue for co-promotion of certain products. For all years presented, service revenueswere 1% or less of the total revenues and are included in sales to customers. These arrangements are evaluated todetermine the appropriate amounts to be deferred or recorded as a reduction of revenue.
In addition, the Company enters into collaboration arrangements that contain multiple revenue generating activities.Amounts due from collaborative partners for these arrangements are recognized as each activity is performed or delivered,based on the relative selling price. Upfront fees received as part of these arrangements are deferred and recognized overthe performance period. See Note 1 to the Consolidated Financial Statements for additional disclosures on collaborations.
Reasonably likely changes to assumptions used to calculate the accruals for rebates, returns and promotions are notanticipated to have a material effect on the financial statements. The Company currently discloses the impact of changesto assumptions in the quarterly or annual filing in which there is a material financial statement impact.
Below are tables that show the progression of accrued rebates, returns, promotions, reserve for doubtful accounts andreserve for cash discounts by segment of business for the fiscal years ended January 1, 2017 and January 3, 2016.
Consumer Segment
(Dollars in Millions)
Balance atBeginningof Period Accruals
Payments/Credits
Balance atEnd ofPeriod
2016
Accrued rebates (1) $139 615 (618) 136
Accrued returns 54 111 (100) 65
Accrued promotions 412 1,908 (1,962) 358
Subtotal $605 2,634 (2,680) 559
Reserve for doubtful accounts 18 12 (6) 24
Reserve for cash discounts 17 209 (201) 25
Total $640 2,855 (2,887) 608
2015
Accrued rebates (1) $122 581 (564) 139
Accrued returns 77 84 (107) 54
Accrued promotions 241 1,846 (1,675) 412
Subtotal $440 2,511 (2,346) 605
Reserve for doubtful accounts 18 5 (5) 18
Reserve for cash discounts 22 206 (211) 17
Total $480 2,722 (2,562) 640
(1) Includes reserve for customer rebates of $37 million at January 1, 2017 and $31 million at January 3, 2016, recorded as a contraasset.
Johnson & Johnson 2016 Annual Report • 29

Pharmaceutical Segment
(Dollars in Millions)
Balance atBeginning of
Period AccrualsPayments/Credits(2)
Balance atEnd ofPeriod
2016
Accrued rebates (1) $3,451 12,306 (12,337) 3,420
Accrued returns 404 140 (210) 334
Accrued promotions 11 10 (21) —
Subtotal $3,866 12,456 (12,568) 3,754
Reserve for doubtful accounts 46 2 (10) 38
Reserve for cash discounts 63 613 (618) 58
Total $3,975 13,071 (13,196) 3,850
2015
Accrued rebates (1) $2,717 10,449 (9,715) 3,451
Accrued returns 422 52 (70) 404
Accrued promotions 34 127 (150) 11
Subtotal $3,173 10,628 (9,935) 3,866
Reserve for doubtful accounts 41 30 (25) 46
Reserve for cash discounts 51 625 (613) 63
Total $3,265 11,283 (10,573) 3,975
(1) Includes reserve for customer rebates of $102 million at January 1, 2017 and $64 million at January 3, 2016, recorded as a contraasset.
(2) Includes adjustments
Medical Devices Segment
(Dollars in Millions)
Balance atBeginning of
Period AccrualsPayments/
Credits
Balance atEnd ofPeriod
2016
Accrued rebates (1) $1,189 5,700 (5,389) 1,500
Accrued returns 239 518 (630) 127
Accrued promotions 47 78 (93) 32
Subtotal $1,475 6,296 (6,112) 1,659
Reserve for doubtful accounts 204 21 (35) 190
Reserve for cash discounts 20 430 (434) 16
Total $1,699 6,747 (6,581) 1,865
2015
Accrued rebates (1) $844 5,216 (4,871) 1,189
Accrued returns 188 556 (505) 239
Accrued promotions 53 95 (101) 47
Subtotal $1,085 5,867 (5,477) 1,475
Reserve for doubtful accounts 216 13 (25) 204
Reserve for cash discounts 16 877 (873) 20
Total $1,317 6,757 (6,375) 1,699
(1) Includes reserve for customer rebates of $430 million at January 1, 2017 and $411 million at January 3, 2016, recorded as a contraasset.
30 • Johnson & Johnson 2016 Annual Report
Income Taxes: Income taxes are recorded based on amounts refundable or payable for the current year and include theresults of any difference between U.S. GAAP accounting and tax reporting, recorded as deferred tax assets or liabilities.The Company estimates deferred tax assets and liabilities based on enacted tax regulations and rates. Future changes intax laws and rates may affect recorded deferred tax assets and liabilities.
The Company has unrecognized tax benefits for uncertain tax positions. The Company follows U.S. GAAP, whichprescribes a recognition threshold and measurement attribute for the financial statement recognition and measurement ofa tax position taken or expected to be taken in a tax return. Management believes that changes in these estimates wouldnot have a material effect on the Company’s results of operations, cash flows or financial position.
At January 1, 2017 and January 3, 2016, the cumulative amounts of undistributed international earnings wereapproximately $66.2 billion and $58.0 billion, respectively. At January 1, 2017 and January 3, 2016, the Company’sforeign subsidiaries held balances of cash, cash equivalents and marketable securities in the amounts of $41.3 billion and$38.2 billion, respectively. The Company has not provided deferred taxes on the undistributed earnings from certaininternational subsidiaries where the earnings are considered to be indefinitely reinvested. The Company intends tocontinue to reinvest these earnings in international operations. If the Company decided at a later date to repatriate theseearnings to the U.S., the Company would be required to provide for the net tax effects on these amounts. The Companydoes not determine the deferred tax liability associated with these undistributed earnings, as such determination is notpractical.
See Note 8 to the Consolidated Financial Statements for further information regarding income taxes.
Legal and Self Insurance Contingencies: The Company records accruals for various contingencies, including legalproceedings and product liability claims as these arise in the normal course of business. The accruals are based onmanagement’s judgment as to the probability of losses and, where applicable, actuarially determined estimates. TheCompany has self insurance through a wholly-owned captive insurance company. In addition to accruals in the selfinsurance program, claims that exceed the insurance coverage are accrued when losses are probable and amounts can bereasonably estimated. Additionally, the Company records insurance receivable amounts from third-party insurers whenrecovery is probable. As appropriate, reserves against these receivables are recorded for estimated amounts that may notbe collected from third-party insurers.
The Company follows the provisions of U.S. GAAP when recording litigation related contingencies. A liability is recordedwhen a loss is probable and can be reasonably estimated. The best estimate of a loss within a range is accrued; however,if no estimate in the range is better than any other, the minimum amount is accrued.
See Notes 1 and 21 to the Consolidated Financial Statements for further information regarding product liability and legalproceedings.
Long-Lived and Intangible Assets: The Company assesses changes in economic conditions and makes assumptionsregarding estimated future cash flows in evaluating the value of the Company’s property, plant and equipment, goodwilland intangible assets. As these assumptions and estimates may change over time, it may or may not be necessary for theCompany to record impairment charges.
Employee Benefit Plans: The Company sponsors various retirement and pension plans, including defined benefit,defined contribution and termination indemnity plans, which cover most employees worldwide. These plans are based onassumptions for the discount rate, expected return on plan assets, mortality rates, expected salary increases, health carecost trend rates and attrition rates. See Note 10 to the Consolidated Financial Statements for further details on these ratesand the effect a rate change to the health care cost trend would have on the Company’s results of operations.
Stock Based Compensation: The Company recognizes compensation expense associated with the issuance of equityinstruments to employees for their services. Based on the type of equity instrument, the fair value is estimated on the dateof grant using either the Black-Scholes option valuation model or a combination of both the Black-Scholes optionvaluation model and Monte Carlo valuation model, and is expensed in the financial statements over the service period. Theinput assumptions used in determining fair value are the expected life, expected volatility, risk-free rate and expecteddividend yield. For performance share units the fair market value is calculated for each of the three component goals at thedate of grant. The fair values for the sales and earnings per share goals of each performance share unit were estimated onthe date of grant using the fair market value of the shares at the time of the award, discounted for dividends, which are notpaid on the performance share units during the vesting period. The fair value for the relative total shareholder return goal ofeach performance share unit was estimated on the date of grant using the Monte Carlo valuation model. See Note 17 tothe Consolidated Financial Statements for additional information.
Johnson & Johnson 2016 Annual Report • 31

New Accounting Pronouncements
Refer to Note 1 to the Consolidated Financial Statements for recently adopted accounting pronouncements and recentlyissued accounting pronouncements not yet adopted as of January 1, 2017.
Economic and Market Factors
The Company is aware that its products are used in an environment where, for more than a decade, policymakers,consumers and businesses have expressed concerns about the rising cost of health care. In response to these concerns,the Company has a long-standing policy of pricing products responsibly. For the period 2006 – 2016, in the UnitedStates, the weighted average compound annual growth rate of the Company’s net price increases for health care products(prescription and over-the-counter drugs, hospital and professional products) was below the U.S. Consumer Price Index(CPI).
The Company operates in certain countries where the economic conditions continue to present significant challenges. TheCompany continues to monitor these situations and take appropriate actions. Inflation rates continue to have an effect onworldwide economies and, consequently, on the way companies operate. The Company has accounted for operations inVenezuela as highly inflationary, as the prior three-year cumulative inflation rate surpassed 100%. In the face of increasingcosts, the Company strives to maintain its profit margins through cost reduction programs, productivity improvements andperiodic price increases.
The Venezuelan government has established alternative systems and offerings of various foreign currency exchanges.Through the fourth quarter of 2015, the number of the Company’s transactions conducted at the official rate declined fromprior quarters. As a result, the Company determined that it was no longer likely that all outstanding net monetary assetswould be settled at the official government rate of 6.3 Bolivares Fuertes to one U.S. Dollar. Therefore in 2015, theCompany recorded a charge of $161 million to revalue its net monetary assets in Venezuela at one of the government’salternative exchange rates (SIMADI) and impair its non-monetary assets. After the revaluation, as of January 3, 2016, theCompany’s Venezuelan subsidiaries represented less than 0.1% of the Company’s consolidated assets and liabilities.
While the Company continues to do business in Greece, the Company closely monitors the economic situation. As ofJanuary 1, 2017, the Company’s Greek subsidiaries represented 0.3% and 0.4% of the Company’s consolidated assetsand revenues, respectively.
On June 23, 2016, the United Kingdom (U.K.) held a referendum in which voters approved an exit from the EuropeanUnion (E.U.), commonly referred to as “Brexit.” Given the lack of comparable precedent, it is unclear what financial, trade,regulatory and legal implications the withdrawal of the U.K. from the E.U. will have. Brexit creates global political andeconomic uncertainty, which may cause, among other consequences, volatility in exchange rates and interest rates,additional cost containment by third-party payors and changes in regulations. However, the Company currently does notbelieve that these and other related effects will have a material impact on the Company’s consolidated financial position oroperating results. As of January 1, 2017, the business of the Company’s U.K. subsidiaries represented less than 3% ofboth the Company’s consolidated assets and fiscal twelve months revenues.
The Company is exposed to fluctuations in currency exchange rates. A 1% change in the value of the U.S. Dollar ascompared to all foreign currencies in which the Company had sales, income or expense in 2016 would have increased ordecreased the translation of foreign sales by approximately $330 million and income by $105 million.
Governments around the world, including in the United States, consider various proposals to make changes to tax laws,which may include increasing or decreasing existing statutory tax rates. A change in statutory tax rate in any country wouldresult in the revaluation of the Company’s deferred tax assets and liabilities related to that particular jurisdiction in theperiod in which the new tax law is enacted. This change would result in an expense or benefit recorded to the Company’sConsolidated Statement of Earnings. The Company closely monitors these proposals as they arise in the countries whereit operates. Changes to the statutory tax rate may occur at any time, and any related expense or benefit recorded may bematerial to the fiscal quarter and year in which the law change is enacted.
The Belgian government is currently considering a proposed change to its corporate tax code, including a proposal tolower its statutory tax rate. If enacted, the proposed change would result in revaluation of the Company’s deferred taxassets, with a corresponding charge to tax expense that may have a material effect on the Company’s results of operationsfor the period. Based on the deferred tax asset balances as of January 1, 2017, the Company estimates for every 1% thatthe statutory tax is lowered there will be additional one-time tax expense of approximately $60-75 million. A significantportion of the deferred tax asset described as “International R&D capitalized for tax” in Note 8 to the ConsolidatedFinancial Statements is related to the Company’s operations in Belgium.
32 • Johnson & Johnson 2016 Annual Report

The U.S. government is currently considering various proposals to changes in its corporate tax code. These proposalsinclude but are not limited to lowering the statutory tax rate and the rules on how international income earned by theCompany is taxed in the U.S. The impact of these proposals may have a material effect on the Company’s results ofoperations for the period and on future periods.
As the Belgian or U.S. governments are still considering these proposals, it is not certain when or if they will be enacted.
The Company faces various worldwide health care changes that may continue to result in pricing pressures that includehealth care cost containment and government legislation relating to sales, promotions and reimbursement of health careproducts.
Changes in the behavior and spending patterns of purchasers of health care products and services, including delayingmedical procedures, rationing prescription medications, reducing the frequency of physician visits and foregoing healthcare insurance coverage, as a result of the current global economic downturn, may continue to impact the Company’sbusinesses.
The Company also operates in an environment increasingly hostile to intellectual property rights. Firms have filedAbbreviated New Drug Applications or Biosimilar Biological Product Applications with the FDA or otherwise challengedthe coverage and/or validity of the Company’s patents, seeking to market generic or biosimilar forms of many of theCompany’s key pharmaceutical products prior to expiration of the applicable patents covering those products. In the eventthe Company is not successful in defending the patent claims challenged in the resulting lawsuits, generic or biosimilarversions of the products at issue will be introduced to the market, resulting in the potential for substantial market share andrevenue losses for those products, and which may result in a non-cash impairment charge in any associated intangibleasset. There is also a risk that one or more competitors could launch a generic or biosimilar version of the product at issuefollowing regulatory approval even though one or more valid patents are in place. For further information, see thediscussion on “REMICADE® Related Cases” and “Litigation Against Filers of Abbreviated New Drug Applications” inNote 21 to the Consolidated Financial Statements.
Legal Proceedings
Johnson & Johnson and certain of its subsidiaries are involved in various lawsuits and claims regarding product liability,intellectual property, commercial and other matters; governmental investigations; and other legal proceedings that arisefrom time to time in the ordinary course of business.
The Company records accruals for loss contingencies associated with these legal matters when it is probable that aliability will be incurred and the amount of the loss can be reasonably estimated. The Company has accrued for certainlitigation matters and continues to monitor each related legal issue and adjust accruals for new information and furtherdevelopments in accordance with Accounting Standards Codification (ASC) 450-20-25. For these and other litigationand regulatory matters currently disclosed for which a loss is probable or reasonably possible, the Company is unable toestimate the possible loss or range of loss beyond the amounts already accrued. Amounts accrued for legal contingenciesoften result from a complex series of judgments about future events and uncertainties that rely heavily on estimates andassumptions. The ability to make such estimates and judgments can be affected by various factors, including whetherdamages sought in the proceedings are unsubstantiated or indeterminate; scientific and legal discovery has notcommenced or is not complete; proceedings are in early stages; matters present legal uncertainties; there are significantfacts in dispute; or there are numerous parties involved.
In the Company’s opinion, based on its examination of these matters, its experience to date and discussions with counsel,the ultimate outcome of legal proceedings, net of liabilities accrued in the Company’s balance sheet, is not expected tohave a material adverse effect on the Company’s financial position. However, the resolution of, or increase in accruals for,one or more of these matters in any reporting period may have a material adverse effect on the Company’s results ofoperations and cash flows for that period.
See Note 21 to the Consolidated Financial Statements for further information regarding legal proceedings.
Johnson & Johnson 2016 Annual Report • 33

Common Stock Market Prices
The Company’s Common Stock is listed on the New York Stock Exchange under the symbol JNJ. As of February 17,2017, there were 156,073 record holders of Common Stock of the Company. The composite market price ranges forJohnson & Johnson Common Stock during 2016 and 2015 were:
2016 2015
High Low High Low
First quarter $109.56 94.28 $106.50 97.15
Second quarter 121.54 107.88 104.48 97.01
Third quarter 126.07 117.04 101.36 81.79
Fourth quarter 122.50 109.32 105.49 89.90
Year-end close $115.21 $102.72
34 • Johnson & Johnson 2016 Annual Report

Item 7A. Quantitative and Qualitative Disclosures about Market RiskThe information called for by this item is incorporated herein by reference to “Item 7. Management’s Discussion andAnalysis of Results of Operations and Financial Condition – Liquidity and Capital Resources – Financing and Market Risk”of this Report; and Note 1 “Summary of Significant Accounting Policies – Financial Instruments” of the Notes toConsolidated Financial Statements included in Item 8 of this Report.
Item 8. Financial Statements and Supplementary DataIndex to Audited Consolidated Financial Statements
36 Consolidated Balance Sheets37 Consolidated Statements of Earnings38 Consolidated Statements of Comprehensive Income39 Consolidated Statements of Equity40 Consolidated Statements of Cash Flows41 Notes to Consolidated Financial Statements86 Report of Independent Registered Public Accounting Firm87 Management’s Report on Internal Control Over Financial Reporting
Johnson & Johnson 2016 Annual Report • 35

Johnson & Johnson and Subsidiaries
Consolidated Balance SheetsAt January 1, 2017 and January 3, 2016(Dollars in Millions Except Share and Per Share Amounts) (Note 1)
2016 2015
Assets
Current assets
Cash and cash equivalents (Notes 1 and 2) $18,972 13,732
Marketable securities (Notes 1 and 2) 22,935 24,644
Accounts receivable trade, less allowances for doubtful accounts $252 (2015, $268) 11,699 10,734
Inventories (Notes 1 and 3) 8,144 8,053
Prepaid expenses and other receivables 3,282 3,047
Total current assets 65,032 60,210
Property, plant and equipment, net (Notes 1 and 4) 15,912 15,905
Intangible assets, net (Notes 1 and 5) 26,876 25,764
Goodwill (Notes 1 and 5) 22,805 21,629
Deferred taxes on income (Note 8) 6,148 5,490
Other assets 4,435 4,413
Total assets $141,208 133,411
Liabilities and Shareholders’ Equity
Current liabilities
Loans and notes payable (Note 7) $4,684 7,004
Accounts payable 6,918 6,668
Accrued liabilities 5,635 5,411
Accrued rebates, returns and promotions 5,403 5,440
Accrued compensation and employee related obligations 2,676 2,474
Accrued taxes on income (Note 8) 971 750
Total current liabilities 26,287 27,747
Long-term debt (Note 7) 22,442 12,857
Deferred taxes on income (Note 8) 2,910 2,562
Employee related obligations (Notes 9 and 10) 9,615 8,854
Other liabilities 9,536 10,241
Total liabilities 70,790 62,261
Shareholders’ equity
Preferred stock – without par value (authorized and unissued 2,000,000 shares) – –
Common stock – par value $1.00 per share (Note 12) (authorized 4,320,000,000 shares; issued3,119,843,000 shares) 3,120 3,120
Accumulated other comprehensive income (Note 13) (14,901) (13,165)
Retained earnings 110,551 103,879
98,770 93,834
Less: common stock held in treasury, at cost (Note 12) (413,332,000 shares and 364,681,000 shares) 28,352 22,684
Total shareholders’ equity 70,418 71,150
Total liabilities and shareholders’ equity $141,208 133,411
See Notes to Consolidated Financial Statements
36 • Johnson & Johnson 2016 Annual Report

Johnson & Johnson and Subsidiaries
Consolidated Statements of Earnings(Dollars and Shares in Millions Except Per Share Amounts) (Note 1)
2016 2015 2014
Sales to customers $71,890 70,074 74,331
Cost of products sold 21,685 21,536 22,746
Gross profit 50,205 48,538 51,585
Selling, marketing and administrative expenses 19,945 21,203 21,954
Research and development expense 9,095 9,046 8,494
In-process research and development 29 224 178
Interest income (368) (128) (67)
Interest expense, net of portion capitalized (Note 4) 726 552 533
Other (income) expense, net 484 (2,064) (70)
Restructuring (Note 22) 491 509 –
Earnings before provision for taxes on income 19,803 19,196 20,563
Provision for taxes on income (Note 8) 3,263 3,787 4,240
Net earnings $16,540 15,409 16,323
Net earnings per share (Notes 1 and 15)
Basic $6.04 5.56 5.80
Diluted $5.93 5.48 5.70
Cash dividends per share $3.15 2.95 2.76
Average shares outstanding (Notes 1 and 15)
Basic 2,737.3 2,771.8 2,815.2
Diluted 2,788.9 2,812.9 2,863.9
See Notes to Consolidated Financial Statements
Johnson & Johnson 2016 Annual Report • 37

Johnson & Johnson and Subsidiaries
Consolidated Statements of Comprehensive Income(Dollars in Millions) (Note 1)
2016 2015 2014
Net earnings $16,540 15,409 16,323
Other comprehensive income (loss), net of tax
Foreign currency translation (612) (3,632) (4,601)
Securities:
Unrealized holding gain (loss) arising during period (52) 471 156
Reclassifications to earnings (141) (124) (5)
Net change (193) 347 151
Employee benefit plans:
Prior service credit (cost), net of amortization 21 (60) 193
Gain (loss), net of amortization (862) 931 (3,698)
Effect of exchange rates 159 148 197
Net change (682) 1,019 (3,308)
Derivatives & hedges:
Unrealized gain (loss) arising during period (359) (115) 92
Reclassifications to earnings 110 (62) (196)
Net change (249) (177) (104)
Other comprehensive income (loss) (1,736) (2,443) (7,862)
Comprehensive income $14,804 12,966 8,461
The tax effects in other comprehensive income for the fiscal years ended 2016, 2015 and 2014 respectively: Securities;$104 million, $187 million and $81 million, Employee Benefit Plans; $346 million, $519 million and $1,556 million,Derivatives & Hedges; $134 million, $95 million and $56 million.
See Notes to Consolidated Financial Statements
38 • Johnson & Johnson 2016 Annual Report

Johnson & Johnson and Subsidiaries
Consolidated Statements of Equity(Dollars in Millions) (Note 1)
TotalRetainedEarnings
AccumulatedOther
ComprehensiveIncome
CommonStockIssued
Amount
TreasuryStock
Amount
Balance, December 29, 2013 $74,053 89,493 (2,860) 3,120 (15,700)
Net earnings 16,323 16,323
Cash dividends paid (7,768) (7,768)
Employee compensation and stock option plans 2,164 (769) 2,933
Repurchase of common stock (7,124) (7,124)
Other (34) (34)
Other comprehensive income (loss), net of tax (7,862) (7,862)
Balance, December 28, 2014 69,752 97,245 (10,722) 3,120 (19,891)
Net earnings 15,409 15,409
Cash dividends paid (8,173) (8,173)
Employee compensation and stock option plans 1,920 (577) 2,497
Repurchase of common stock (5,290) (5,290)
Other (25) (25)
Other comprehensive income (loss), net of tax (2,443) (2,443)
Balance, January 3, 2016 71,150 103,879 (13,165) 3,120 (22,684)
Net earnings 16,540 16,540
Cash dividends paid (8,621) (8,621)
Employee compensation and stock option plans 2,130 (1,181) 3,311
Repurchase of common stock (8,979) (8,979)
Other (66) (66)
Other comprehensive income (loss), net of tax (1,736) (1,736)
Balance, January 1, 2017 $70,418 110,551 (14,901) 3,120 (28,352)
See Notes to Consolidated Financial Statements
Johnson & Johnson 2016 Annual Report • 39

Johnson & Johnson and Subsidiaries
Consolidated Statements of Cash Flows(Dollars in Millions) (Note 1)
2016 2015 2014
Cash flows from operating activitiesNet earnings $16,540 15,409 16,323Adjustments to reconcile net earnings to cash flows from operating activities:
Depreciation and amortization of property and intangibles 3,754 3,746 3,895Stock based compensation 878 874 792Venezuela adjustments – 122 87Asset write-downs 283 624 410Net gain on sale of assets/businesses (563) (2,583) (2,383)Deferred tax provision (341) (270) 441Accounts receivable allowances (11) 18 (28)
Changes in assets and liabilities, net of effects from acquisitions and divestitures:Increase in accounts receivable (1,065) (433) (247)Increase in inventories (249) (449) (1,120)Increase in accounts payable and accrued liabilities 656 287 1,194Decrease in other current and non-current assets 18 65 442(Decrease)/Increase in other current and non-current liabilities (1,133) 2,159 (1,096)
Net cash flows from operating activities 18,767 19,569 18,710Cash flows from investing activitiesAdditions to property, plant and equipment (3,226) (3,463) (3,714)Proceeds from the disposal of assets/businesses, net 1,267 3,464 4,631Acquisitions, net of cash acquired (Note 20) (4,509) (954) (2,129)Purchases of investments (33,950) (40,828) (34,913)Sales of investments 35,780 34,149 24,119Other (primarily intangibles) (123) (103) (299)Net cash used by investing activities (4,761) (7,735) (12,305)Cash flows from financing activitiesDividends to shareholders (8,621) (8,173) (7,768)Repurchase of common stock (8,979) (5,290) (7,124)Proceeds from short-term debt 111 2,416 1,863Retirement of short-term debt (2,017) (1,044) (1,267)Proceeds from long-term debt 12,004 75 2,098Retirement of long-term debt (2,223) (68) (1,844)Proceeds from the exercise of stock options/employee withholding tax on stock awards, net 1,189 1,005 1,543Other (15) (57) –Net cash used by financing activities (8,551) (11,136) (12,499)Effect of exchange rate changes on cash and cash equivalents (215) (1,489) (310)Increase/(Decrease) in cash and cash equivalents 5,240 (791) (6,404)Cash and cash equivalents, beginning of year (Note 1) 13,732 14,523 20,927Cash and cash equivalents, end of year (Note 1) $18,972 13,732 14,523Supplemental cash flow dataCash paid during the year for:
Interest $730 617 603Interest, net of amount capitalized 628 515 488Income taxes 2,843 2,865 3,536
Supplemental schedule of non-cash investing and financing activitiesTreasury stock issued for employee compensation and stock option plans, net of cash proceeds/employee
withholding tax on stock awards 2,043 1,486 1,409Conversion of debt 35 16 17
AcquisitionsFair value of assets acquired $4,586 1,174 2,167Fair value of liabilities assumed and noncontrolling interests (77) (220) (38)Net cash paid for acquisitions $4,509 954 2,129
See Notes to Consolidated Financial Statements
40 • Johnson & Johnson 2016 Annual Report

NOTES TO CONSOLIDATED FINANCIAL STATEMENTS
1. Summary of Significant Accounting Policies
Principles of Consolidation
The consolidated financial statements include the accounts of Johnson & Johnson and its subsidiaries (the Company).Intercompany accounts and transactions are eliminated.
Description of the Company and Business Segments
The Company has approximately 126,400 employees worldwide engaged in the research and development, manufactureand sale of a broad range of products in the health care field. The Company conducts business in virtually all countries ofthe world and its primary focus is on products related to human health and well-being.
The Company is organized into three business segments: Consumer, Pharmaceutical and Medical Devices. TheConsumer segment includes a broad range of products used in the baby care, oral care, beauty (previously referred to asskin care), over-the-counter pharmaceutical, women’s health and wound care markets. These products are marketed tothe general public and sold both to retail outlets and distributors throughout the world. The Pharmaceutical segment isfocused on five therapeutic areas, including immunology, infectious diseases, neuroscience, oncology, and cardiovascularand metabolic diseases. Products in this segment are distributed directly to retailers, wholesalers, hospitals and healthcare professionals for prescription use. The Medical Devices segment includes a broad range of products used in theorthopaedic, surgery, cardiovascular, diabetes care and vision care fields, which are distributed to wholesalers, hospitalsand retailers, and used principally in the professional fields by physicians, nurses, hospitals, eye care professionals andclinics.
New Accounting PronouncementsRecently Adopted Accounting Pronouncements
During the fiscal first quarter of 2016, the Financial Accounting Standards Board (FASB) issued Accounting StandardsUpdate 2016-09 Compensation – Stock Compensation: Improvements to Employee Share Based Payment Accounting.The amendments in the update are effective for annual periods beginning after December 15, 2016 and interim periodswithin those annual periods. Early adoption is permitted for any entity in any interim or annual period. During the fiscalsecond quarter of 2016, the Company elected to early adopt this standard. The update requires the following changes topresentation of the financial statements:
• All excess tax benefits and deficiencies to be recognized as a reduction or an increase to the provision for taxes onincome. Previously, the Company recorded these benefits directly to Retained Earnings. The tax benefit for theCompany was $353 million for the fiscal year 2016. The standard does not permit retroactive presentation of thisbenefit to prior fiscal years on the Consolidated Statement of Earnings.
• The tax benefit or deficiency is required to be classified and presented as a cash flow to/from operating activities. It waspreviously required to be presented as a cash flow to/from financing activities on the Consolidated Statement of CashFlows. As permitted in the standard, the Company has elected to adopt this reclassification on a prospective basis andtherefore prior fiscal years for the Consolidated Statement of Cash Flows have not been recast for this provision.
• Clarifies that all cash payments made to taxing authorities on employees’ share-based compensation should beclassified as a cash outflow from financing activities. This reclassification is required to be recast retrospectively. As aresult, for the fiscal year 2016, $269 million was classified as a cash outflow from financing activities and $290 millionand $239 million, of cash outflow was reclassified from an operating activity to a financing activity (Proceeds from theexercise of stock options/employee withholding tax on stock awards, net) in the fiscal years 2015 and 2014,respectively.
• In the diluted net earnings per share calculation, when applying the treasury stock method for shares that could berepurchased, the assumed proceeds no longer include the amount of excess tax benefit. This did not have a materialimpact on the Company’s diluted net earnings per share calculation.
During the fiscal second quarter of 2015, the FASB issued Accounting Standards Update 2015-03: Simplifying thePresentation of Debt Issuance Costs. This update requires capitalized debt issuance costs to be presented as a reduction
Johnson & Johnson 2016 Annual Report • 41
to the carrying value of debt instead of being classified as a deferred charge. This update is effective for the Company forall annual and interim periods beginning after December 15, 2015 and is required to be applied retroactively for all periodspresented. This update did not have a material impact on the presentation of the Company’s financial position.
During the fiscal third quarter of 2015, the FASB issued Accounting Standards Update 2015-16 Business Combinations:Simplifying the Accounting for Measurement-Period Adjustments. The amendments in this update require that an acquirerrecognize adjustments to provisional amounts that are identified during the measurement period in the reporting period inwhich the adjustment amounts are determined. This update is effective for the Company for all annual and interim periodsbeginning after December 15, 2015. The amendments in this update should be applied prospectively to adjustments toprovisional amounts that occur after the effective date of this update with earlier application permitted for financialstatements that have not been issued. This update did not have a material impact on the Company’s consolidated financialstatements.
During the fiscal third quarter of 2014, the FASB issued Accounting Standards Update No. 2014-15: Disclosure ofUncertainties about an Entity’s Ability to Continue as a Going Concern. This standard requires management to evaluate,for each annual and interim reporting period, whether there are conditions and events, considered in the aggregate, thatraise substantial doubt about an entity’s ability to continue as a going concern within one year after the date the financialstatements are issued or are available to be issued. If substantial doubt is raised, additional disclosures aroundmanagement’s plan to alleviate these doubts are required. This update becomes effective for all annual periods and interimreporting periods ending after December 15, 2016. The adoption of this standard did not have any impact on theCompany’s current disclosures in the financial statements.
Recently Issued Accounting PronouncementsNot Adopted as of January 1, 2017
During the fiscal first quarter of 2017, the FASB issued Accounting Standard Update 2017-01: Clarifying the Definition ofa Business. This update narrows the definition of a business by providing a screen to determine when an integrated set ofassets and activities is not a business. The screen specifies that an integrated set of assets and activities is not a businessif substantially all of the fair value of the gross assets acquired or disposed of is concentrated in a single or a group ofsimilar identifiable assets. This update will be effective for the Company for annual periods beginning after December 15,2017, including interim periods within those annual periods. Early adoption is permitted. This update should be appliedprospectively. The Company is currently assessing the impact of the future adoption of this standard on its financialstatements.
During the fiscal first quarter of 2017, the FASB issued Accounting Standard Update 2017-04: Simplifying the Test forGoodwill Impairment. This update simplifies how an entity is required to test goodwill for impairment. A goodwillimpairment will now be measured by the amount by which a reporting unit’s carrying value exceeds its fair value, not toexceed the carrying amount of goodwill. This update will be effective for the Company for its annual or any interim goodwillimpairment tests in fiscal years beginning after December 15, 2019. Early adoption is permitted. This update should beapplied prospectively. The Company is currently assessing the impact of the future adoption of this standard on itsfinancial statements.
During the fiscal first quarter of 2017, the FASB issued Accounting Standard Update 2017-05: Other Income-Gains andLosses from the Derecognition of Nonfinancial Assets. This update clarifies the scope of asset derecognition guidance,adds guidance for partial sales of nonfinancial assets and clarifies recognizing gains and losses from the transfer ofnonfinancial assets in contracts with noncustomers. This update will be effective for the Company for its annual and interimreporting periods beginning after December 15, 2017, the same time as the amendments in Update 2014-09 Revenuefrom Contracts with Customers. This update allows the Company to choose either a full retrospective method or modifiedretrospective method upon adoption. The Company is currently assessing the impact of the future adoption of thisstandard on its financial statements.
During the fiscal first quarter of 2016, the FASB issued Accounting Standards Update 2016-01 Financial Instruments:Recognition and Measurement of Financial Assets and Financial Liabilities. The amendments in this update supersede theguidance to classify equity securities with readily determinable fair values into different categories (that is, trading oravailable-for-sale) and require equity securities to be measured at fair value with changes in the fair value recognizedthrough net income. The standard amends financial reporting by providing relevant information about an entity’s equityinvestments and reducing the number of items that are recognized in other comprehensive income. This update will beeffective for the Company for annual periods beginning after December 15, 2017, and interim periods within those annualperiods. The Company is unable to estimate the impact of the future adoption of this standard on its financial statementsas it will depend on the equity investments as of the adoption date.
42 • Johnson & Johnson 2016 Annual Report

During the fiscal first quarter of 2016, the FASB issued Accounting Standards Update 2016-02 Leases (Topic 842). Thisupdate requires the recognition of lease assets and lease liabilities on the balance sheet for all lease obligations anddisclosing key information about leasing arrangements. This update requires the recognition of lease assets and leaseliabilities by lessees for those leases classified as operating leases under current generally accepted accounting principles.This update will be effective for the Company for all annual and interim periods beginning after December 15, 2018,including interim periods within those fiscal years. Early application is permitted. The update is required to be adopted usinga modified retrospective approach. The Company anticipates that most of its operating leases will result in the recognition ofadditional assets and the corresponding liabilities on its Consolidated Balance Sheets, however does not expect to have amaterial impact on the financial position. The actual impact will depend on the Company’s lease portfolio at the time ofadoption. The Company continues to assess all implications of the standard and related financial disclosures.
During the fiscal first quarter of 2016, the FASB issued Accounting Standards Update 2016-07 Investments – EquityMethod and Joint Ventures (Topic 323): Simplifying the Transition to the Equity Method of Accounting. The amendmentsin the update eliminate the requirement that when an investment qualifies for the use of the equity method as a result of anincrease in the level of ownership interest or degree of influence, an investor must adjust the investment, results ofoperations, and retained earnings retroactively on a step by step basis as if the equity method had been in effect during allprevious periods that the investment had been held. The amendments in this update are effective for all entities for fiscalyears, and interim periods within those fiscal years, beginning after December 15, 2016. The amendments should beapplied prospectively upon their effective date to increases in the level of ownership interest or degree of influence thatresult in the application of the equity method. Earlier adoption is permitted for any entity in any interim or annual period.The adoption of this standard is not expected to have a material impact on the presentation of the Company’sconsolidated financial statements.
During the fiscal third quarter of 2016, the FASB issued Accounting Standards Update 2016-15 Statement of CashFlows (Topic 230): Classification of Certain Cash Receipts and Cash Payments. This update addresses whether topresent certain specific cash flow items as operating, investing or financing activities. The amendments in this update areeffective for public entities for fiscal years, and interim periods within those fiscal years, beginning after December 15,2017. Early adoption is permitted, including adoption in an interim period. The Company is currently assessing the impactof the future adoption of this standard on its consolidated Statements of Cash Flows.
During the fiscal fourth quarter of 2016, the FASB issued Accounting Standards Update 2016-16 Income Taxes (Topic740): Intra-Entity Transfers of Assets Other Than Inventory. This update removes the current exception in US GAAPprohibiting entities from recognizing current and deferred income tax expenses or benefits related to transfer of assets,other than inventory, within the consolidated entity. The current exception to defer the recognition of any tax impact on thetransfer of inventory within the consolidated entity until it is sold to a third party remains unaffected. The amendments inthis update are effective for public entities for annual reporting periods beginning after December 15, 2017. Early adoptionis permitted and should be in the first interim period if an entity issues interim financial statements. The Company iscurrently assessing the impact of the future adoption of this standard on its consolidated financial statements.
During the fiscal second quarter of 2015, the FASB issued Accounting Standards Update 2015-11: Simplifying theMeasurement of Inventory. This update requires inventory to be measured at the lower of cost or net realizable value. Netrealizable value is the estimated selling prices in the ordinary course of business, less reasonably predictable costs ofcompletion, disposal and transportation. This update will be effective for the Company for all annual and interim periodsbeginning after December 15, 2016. The amendments in this update should be applied prospectively with earlierapplication permitted as of the beginning of an interim or annual reporting period. This update will not have a materialimpact on the presentation of the Company’s financial position.
During the fiscal second quarter of 2014, the FASB issued Accounting Standards Update 2014-09: Revenue fromContracts with Customers, which, along with amendments issued in 2015 and 2016, will replace substantially all currentU.S. GAAP guidance on this topic and eliminate industry-specific guidance. Early adoption of this standard is permittedbut not before the original effective date for all annual periods and interim reporting periods beginning after December 15,2017. The guidance permits two methods of adoption: full retrospective method (retrospective application to each priorreporting period presented) or modified retrospective method (retrospective application with the cumulative effect ofinitially applying the guidance recognized at the date of initial application and providing certain additional disclosures).While the Company continues to evaluate the effect of the standard, preliminarily, it does not anticipate a material impacton its financial statements. To complete the assessment of the impact of the standard to the financial statements, theCompany continues to assess all implications of the standard, method of adoption and related financial disclosures.Additionally, the Company continues to monitor modifications, clarifications and interpretations issued by the FASB thatmay affect current conclusions.
Johnson & Johnson 2016 Annual Report • 43

Cash Equivalents
The Company classifies all highly liquid investments with stated maturities of three months or less from date of purchaseas cash equivalents and all highly liquid investments with stated maturities of greater than three months from the date ofpurchase as current marketable securities. The Company has a policy of making investments only with commercialinstitutions that have at least an investment grade credit rating. The Company invests its cash primarily in governmentsecurities and obligations, corporate debt securities, money market funds and reverse repurchase agreements (RRAs).
RRAs are collateralized by deposits in the form of Government Securities and Obligations for an amount not less than102% of their value. The Company does not record an asset or liability as the Company is not permitted to sell orrepledge the associated collateral. The Company has a policy that the collateral has at least an A (or equivalent) creditrating. The Company utilizes a third party custodian to manage the exchange of funds and ensure that collateral received ismaintained at 102% of the value of the RRAs on a daily basis. RRAs with stated maturities of greater than three monthsfrom the date of purchase are classified as marketable securities.
Investments
Investments classified as held to maturity investments are reported at amortized cost and realized gains or losses arereported in earnings. Investments classified as available-for-sale are carried at estimated fair value with unrealized gainsand losses recorded as a component of accumulated other comprehensive income. Available-for-sale securities availablefor current operations are classified as current assets otherwise, they are classified as long term. Management determinesthe appropriate classification of its investment in debt and equity securities at the time of purchase and re-evaluates suchdetermination at each balance sheet date. The Company periodically reviews its investments in equity securities forimpairment and adjusts these investments to their fair value when a decline in market value is deemed to be other thantemporary. If losses on these securities are considered to be other than temporary, the loss is recognized in earnings.
Property, Plant and Equipment and Depreciation
Property, plant and equipment are stated at cost. The Company utilizes the straight-line method of depreciation over theestimated useful lives of the assets:
Building and building equipment 20 - 30 years
Land and leasehold improvements 10 - 20 years
Machinery and equipment 2 - 13 years
The Company capitalizes certain computer software and development costs, included in machinery and equipment, whenincurred in connection with developing or obtaining computer software for internal use. Capitalized software costs areamortized over the estimated useful lives of the software, which generally range from 3 to 8 years.
The Company reviews long-lived assets to assess recoverability using undiscounted cash flows. When certain events orchanges in operating or economic conditions occur, an impairment assessment may be performed on the recoverability ofthe carrying value of these assets. If the asset is determined to be impaired, the loss is measured based on the differencebetween the asset’s fair value and its carrying value. If quoted market prices are not available, the Company will estimatefair value using a discounted value of estimated future cash flows.
Revenue Recognition
The Company recognizes revenue from product sales when the goods are shipped or delivered and title and risk of losspass to the customer. Provisions for certain rebates, sales incentives, trade promotions, coupons, product returns anddiscounts to customers are accounted for as reductions in sales in the same period the related sales are recorded.
Product discounts granted are based on the terms of arrangements with direct, indirect and other market participants, aswell as market conditions, including prices charged by competitors. Rebates, which include Medicaid, are estimated basedon contractual terms, historical experience, patient outcomes, trend analysis and projected market conditions in the variousmarkets served. The Company evaluates market conditions for products or groups of products primarily through theanalysis of wholesaler and other third-party sell-through and market research data, as well as internally generatedinformation.
Sales returns are generally estimated and recorded based on historical sales and returns information. Products that exhibitunusual sales or return patterns due to dating, competition or other marketing matters are specifically investigated andanalyzed as part of the accounting for sales returns accruals.
44 • Johnson & Johnson 2016 Annual Report
Sales returns allowances represent a reserve for products that may be returned due to expiration, destruction in the field,or in specific areas, product recall. The returns reserve is based on historical return trends by product and by market as apercent to gross sales. In accordance with the Company’s accounting policies, the Company generally issues credit tocustomers for returned goods. The Company’s sales returns reserves are accounted for in accordance with U.S. GAAPguidance for revenue recognition when right of return exists. Sales returns reserves are recorded at full sales value. Salesreturns in the Consumer and Pharmaceutical segments are almost exclusively not resalable. Sales returns for certainfranchises in the Medical Devices segment are typically resalable but are not material. The Company infrequentlyexchanges products from inventory for returned products. The sales returns reserve for the total Company has beenapproximately 1.0% of annual sales to customers during the fiscal reporting years 2016, 2015 and 2014.
Promotional programs, such as product listing allowances and cooperative advertising arrangements, are recorded in theyear incurred. Continuing promotional programs include coupons and volume-based sales incentive programs. Theredemption cost of consumer coupons is based on historical redemption experience by product and value. Volume-basedincentive programs are based on the estimated sales volumes for the incentive period and are recorded as products aresold. The Company also earns service revenue for co-promotion of certain products and includes it in sales to customers.These arrangements are evaluated to determine the appropriate amounts to be deferred or recorded as a reduction ofrevenue.
Shipping and Handling
Shipping and handling costs incurred were $974 million, $996 million and $1,068 million in 2016, 2015 and 2014,respectively, and are included in selling, marketing and administrative expense. The amount of revenue received forshipping and handling is less than 0.5% of sales to customers for all periods presented.
Inventories
Inventories are stated at the lower of cost or market determined by the first-in, first-out method.
Intangible Assets and Goodwill
The authoritative literature on U.S. GAAP requires that goodwill and intangible assets with indefinite lives be assessedannually for impairment. The Company completed the annual impairment test for 2016 in the fiscal fourth quarter. Futureimpairment tests will be performed annually in the fiscal fourth quarter, or sooner if warranted. Purchased in-processresearch and development is accounted for as an indefinite lived intangible asset until the underlying project is completed,at which point the intangible asset will be accounted for as a definite lived intangible asset, or abandoned, at which pointthe intangible asset will be written off or partially impaired.
Intangible assets that have finite useful lives continue to be amortized over their useful lives, and are reviewed forimpairment when warranted by economic conditions. See Note 5 for further details on Intangible Assets and Goodwill.
Financial Instruments
As required by U.S. GAAP, all derivative instruments are recorded on the balance sheet at fair value. Fair value is the exitprice that would be received to sell an asset or paid to transfer a liability. Fair value is a market-based measurementdetermined using assumptions that market participants would use in pricing an asset or liability. The authoritative literatureestablishes a three-level hierarchy to prioritize the inputs used in measuring fair value, with Level 1 having the highestpriority and Level 3 having the lowest. Changes in the fair value of derivatives are recorded each period in current earningsor other comprehensive income, depending on whether the derivative is designated as part of a hedge transaction, and ifso, the type of hedge transaction.
The Company documents all relationships between hedged items and derivatives. The overall risk management strategyincludes reasons for undertaking hedge transactions and entering into derivatives. The objectives of this strategy are:(1) minimize foreign currency exposure’s impact on the Company’s financial performance; (2) protect the Company’s cashflow from adverse movements in foreign exchange rates; (3) ensure the appropriateness of financial instruments; and(4) manage the enterprise risk associated with financial institutions. See Note 6 for additional information on FinancialInstruments.
Johnson & Johnson 2016 Annual Report • 45

Product Liability
Accruals for product liability claims are recorded, on an undiscounted basis, when it is probable that a liability has beenincurred and the amount of the liability can be reasonably estimated based on existing information and actuariallydetermined estimates where applicable. The accruals are adjusted periodically as additional information becomesavailable. The Company accrues an estimate of the legal defense costs needed to defend each matter when those costsare probable and can be reasonably estimated.
As a result of cost and availability factors, effective November 1, 2005, the Company ceased purchasing third-partyproduct liability insurance. The Company has self insurance through a wholly-owned captive insurance company. Inaddition to accruals in the self insurance program, claims that exceed the insurance coverage are accrued when losses areprobable and amounts can be reasonably estimated. Based on the availability of prior coverage, receivables for insurancerecoveries related to product liability claims are recorded on an undiscounted basis, when it is probable that a recovery willbe realized. As appropriate, reserves against these receivables are recorded for estimated amounts that may not becollected from third-party insurers.
Concentration of Credit Risk
Global concentration of credit risk with respect to trade accounts receivables continues to be limited due to the largenumber of customers globally and adherence to internal credit policies and credit limits. Economic challenges in Italy,Spain, Greece and Portugal (the Southern European Region) have impacted certain payment patterns, which havehistorically been longer than those experienced in the U.S. and other international markets. The total net trade accountsreceivable balance in the Southern European Region was approximately $1.1 billion as of January 1, 2017 andapproximately $1.3 billion as of January 3, 2016. Approximately $0.7 billion as of January 1, 2017 and approximately$0.8 billion as of January 3, 2016 of the Southern European Region net trade accounts receivable balance related to theCompany’s Consumer, Vision Care and Diabetes Care businesses as well as certain Pharmaceutical and Medical Devicescustomers which are in line with historical collection patterns.
The remaining balance of net trade accounts receivable in the Southern European Region has been negatively impactedby the timing of payments from certain government owned or supported health care customers, as well as certaindistributors of the Pharmaceutical and Medical Devices local affiliates. The total net trade accounts receivable balance forthese customers were approximately $0.4 billion at January 1, 2017 and $0.5 billion at January 3, 2016. The Companycontinues to receive payments from these customers and, in some cases, late payments with interest. For customerswhere payment is expected over periods of time longer than one year, revenue and trade receivables have beendiscounted over the estimated period of time for collection. Allowances for doubtful accounts have been increased forthese customers, but have been immaterial to date. The Company will continue to work closely with these customers onpayment plans, monitor the economic situation and take appropriate actions as necessary.
Research and Development
Research and development expenses are expensed as incurred. Upfront and milestone payments made to third parties inconnection with research and development collaborations are expensed as incurred up to the point of regulatory approval.Payments made to third parties subsequent to regulatory approval are capitalized and amortized over the remaining usefullife of the related product. Amounts capitalized for such payments are included in other intangibles, net of accumulatedamortization.
The Company enters into collaborative arrangements, typically with other pharmaceutical or biotechnology companies, todevelop and commercialize drug candidates or intellectual property. These arrangements typically involve two (or more)parties who are active participants in the collaboration and are exposed to significant risks and rewards dependent on thecommercial success of the activities. These collaborations usually involve various activities by one or more parties,including research and development, marketing and selling and distribution. Often, these collaborations require upfront,milestone and royalty or profit share payments, contingent upon the occurrence of certain future events linked to thesuccess of the asset in development. Amounts due from collaborative partners related to development activities aregenerally reflected as a reduction of research and development expense because the performance of contract
46 • Johnson & Johnson 2016 Annual Report

development services is not central to the Company’s operations. In general, the income statement presentation for thesecollaborations is as follows:
Nature/Type of Collaboration Statement of Earnings Presentation
Third-party sale of product Sales to customers
Royalties/milestones paid to collaborative partner(post-regulatory approval)*
Cost of products sold
Royalties received from collaborative partner Other income (expense), net
Upfront payments & milestones paid to collaborative partner(pre-regulatory approval)
Research and development expense
Research and development payments to collaborativepartner
Research and development expense
Research and development payments received fromcollaborative partner
Reduction of Research and development expense
* Milestones are capitalized as intangible assets and amortized to cost of goods sold over the useful life.
For all years presented, there was no individual project that represented greater than 5% of the total annual consolidatedresearch and development expense.
The Company has a number of products and compounds developed in collaboration with strategic partners includingXARELTO®, co-developed with Bayer HealthCare AG and IMBRUVICA®, developed in collaboration and co-marketedwith Pharmacyclics LLC, an AbbVie company.
Advertising
Costs associated with advertising are expensed in the year incurred and are included in selling, marketing andadministrative expenses. Advertising expenses worldwide, which comprised television, radio, print media and Internetadvertising, were $2.4 billion, $2.5 billion and $2.6 billion in 2016, 2015 and 2014, respectively.
Income Taxes
Income taxes are recorded based on amounts refundable or payable for the current year and include the results of anydifference between U.S. GAAP accounting and tax reporting, recorded as deferred tax assets or liabilities. The Companyestimates deferred tax assets and liabilities based on enacted tax regulations and rates. Future changes in tax laws andrates may affect recorded deferred tax assets and liabilities in the future.
The Company has unrecognized tax benefits for uncertain tax positions. The Company follows U.S. GAAP whichprescribes a recognition threshold and measurement attribute for the financial statement recognition and measurement ofa tax position taken or expected to be taken in a tax return. Management believes that changes in these estimates wouldnot have a material effect on the Company’s results of operations, cash flows or financial position.
At January 1, 2017 and January 3, 2016, the cumulative amounts of undistributed international earnings wereapproximately $66.2 billion and $58.0 billion, respectively. At January 1, 2017 and January 3, 2016, the Company’sforeign subsidiaries held balances of cash, cash equivalents and marketable securities in the amounts of $41.3 billion and$38.2 billion, respectively. The Company has not provided deferred taxes on the undistributed earnings from certaininternational subsidiaries where the earnings are considered to be indefinitely reinvested. The Company intends tocontinue to reinvest these earnings in international operations. If the Company decided at a later date to repatriate theseearnings to the U.S., the Company would be required to provide for the net tax effects on these amounts. The Companydoes not determine the deferred tax liability associated with these undistributed earnings, as such determination is notpractical.
See Note 8 to the Consolidated Financial Statements for further information regarding income taxes.
Net Earnings Per Share
Basic earnings per share is computed by dividing net earnings available to common shareholders by the weighted averagenumber of common shares outstanding for the period. Diluted earnings per share reflects the potential dilution that couldoccur if securities were exercised or converted into common stock using the treasury stock method.
Johnson & Johnson 2016 Annual Report • 47
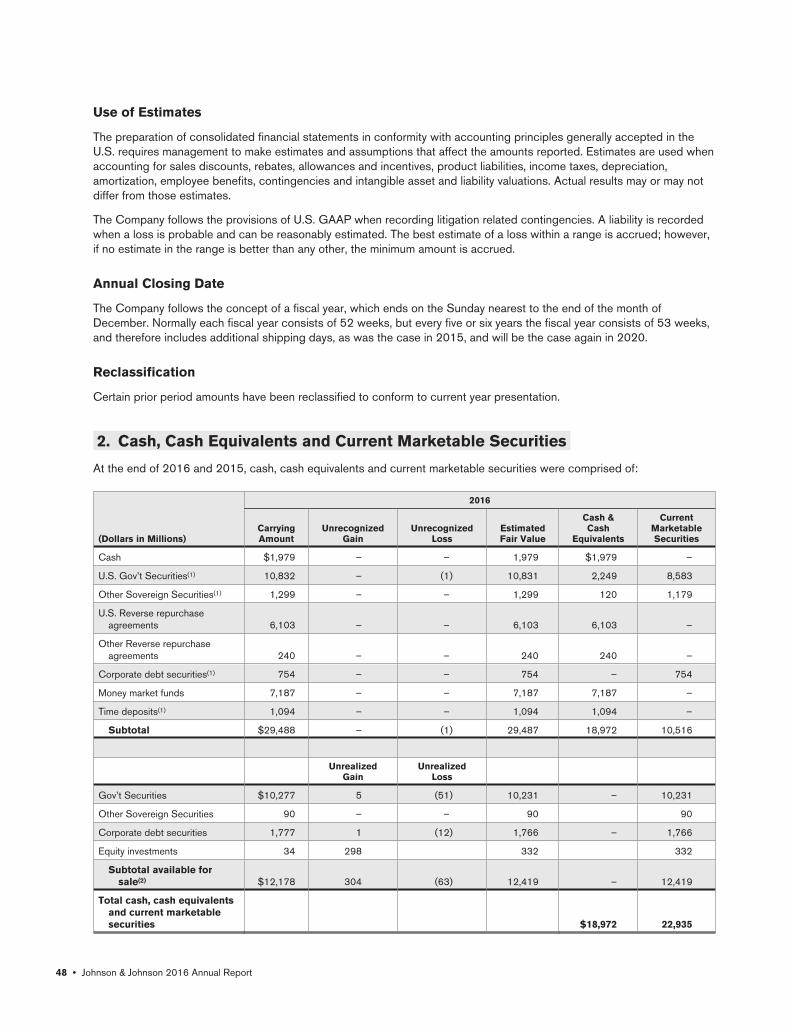
Use of Estimates
The preparation of consolidated financial statements in conformity with accounting principles generally accepted in theU.S. requires management to make estimates and assumptions that affect the amounts reported. Estimates are used whenaccounting for sales discounts, rebates, allowances and incentives, product liabilities, income taxes, depreciation,amortization, employee benefits, contingencies and intangible asset and liability valuations. Actual results may or may notdiffer from those estimates.
The Company follows the provisions of U.S. GAAP when recording litigation related contingencies. A liability is recordedwhen a loss is probable and can be reasonably estimated. The best estimate of a loss within a range is accrued; however,if no estimate in the range is better than any other, the minimum amount is accrued.
Annual Closing Date
The Company follows the concept of a fiscal year, which ends on the Sunday nearest to the end of the month ofDecember. Normally each fiscal year consists of 52 weeks, but every five or six years the fiscal year consists of 53 weeks,and therefore includes additional shipping days, as was the case in 2015, and will be the case again in 2020.
Reclassification
Certain prior period amounts have been reclassified to conform to current year presentation.
2. Cash, Cash Equivalents and Current Marketable Securities
At the end of 2016 and 2015, cash, cash equivalents and current marketable securities were comprised of:
2016
(Dollars in Millions)CarryingAmount
UnrecognizedGain
UnrecognizedLoss
EstimatedFair Value
Cash &Cash
Equivalents
CurrentMarketableSecurities
Cash $1,979 – – 1,979 $1,979 –
U.S. Gov’t Securities(1) 10,832 – (1) 10,831 2,249 8,583
Other Sovereign Securities(1) 1,299 – – 1,299 120 1,179
U.S. Reverse repurchaseagreements 6,103 – – 6,103 6,103 –
Other Reverse repurchaseagreements 240 – – 240 240 –
Corporate debt securities(1) 754 – – 754 – 754
Money market funds 7,187 – – 7,187 7,187 –
Time deposits(1) 1,094 – – 1,094 1,094 –
Subtotal $29,488 – (1) 29,487 18,972 10,516
UnrealizedGain
UnrealizedLoss
Gov’t Securities $10,277 5 (51) 10,231 – 10,231
Other Sovereign Securities 90 – – 90 90
Corporate debt securities 1,777 1 (12) 1,766 – 1,766
Equity investments 34 298 332 332
Subtotal available forsale(2) $12,178 304 (63) 12,419 – 12,419
Total cash, cash equivalentsand current marketablesecurities $18,972 22,935
48 • Johnson & Johnson 2016 Annual Report

2015
(Dollars in Millions)CarryingAmount
UnrecognizedGain
UnrecognizedLoss
EstimatedFair Value
CashEquivalents
CurrentMarketableSecurities
Cash $1,832 — — 1,832 1,832 —
U.S. Gov’t Securities(1) 14,641 1 (2) 14,640 650 13,991
Other Sovereign Securities(1) 2,122 — — 2,122 933 1,189
U.S. Reverse repurchaseagreements 1,579 — — 1,579 1,579 —
Other Reverse repurchaseagreements 2,200 — — 2,200 2,200 —
Corporate debt securities(1) 2,941 — — 2,941 1,793 1,148
Money market funds 3,855 — — 3,855 3,855 —
Time deposits(1) 890 — — 890 890 —
Subtotal $30,060 1 (2) 30,059 13,732 16,328
UnrealizedGain
UnrealizedLoss
Gov’t Securities $7,307 1 (34) 7,274 — 7,274
Other Sovereign Securities — — — — —
Corporate debt securities 1,046 1 (5) 1,042 — 1,042
Subtotal available forsale(2) $8,353 2 (39) 8,316 — 8,316
Total cash, cash equivalentsand current marketablesecurities $13,732 24,644
(1) Held to maturity investments are reported at amortized cost and realized gains or losses are reported in earnings.(2) Available for sale securities are reported at fair value with unrealized gains and losses reported net of taxes in other comprehensive
income.
Fair value of government securities and obligations and corporate debt securities were estimated using quoted brokerprices and significant other observable inputs.
The contractual maturities of the available for sale debt securities at January 1, 2017 are as follows:
(Dollars in Millions)CostBasis
FairValue
Due within one year $474 474
Due after one year through five years 11,430 11,381
Due after five years through ten years 240 232
Total debt securities $12,144 12,087
The Company invests its excess cash in both deposits with major banks throughout the world and other high-qualitymoney market instruments. The Company has a policy of making investments only with commercial institutions that have atleast an investment grade credit rating.
3. InventoriesAt the end of 2016 and 2015, inventories were comprised of:
(Dollars in Millions) 2016 2015
Raw materials and supplies $952 936
Goods in process 2,185 2,241
Finished goods 5,007 4,876
Total inventories $8,144 8,053
Johnson & Johnson 2016 Annual Report • 49
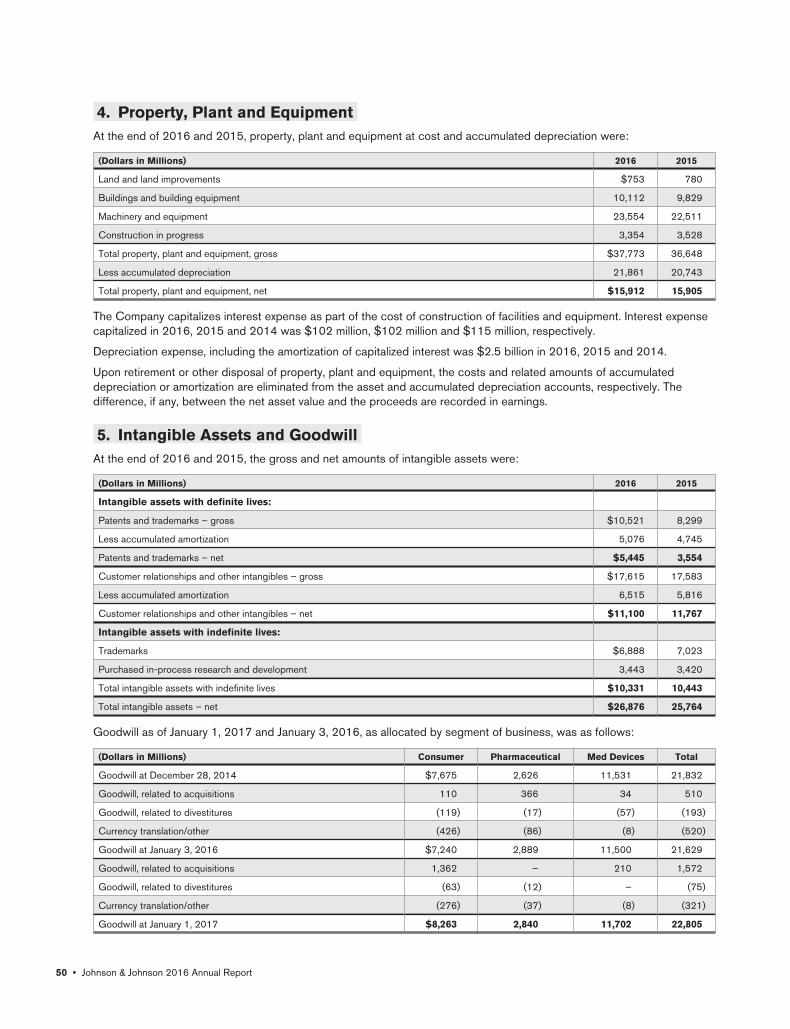
4. Property, Plant and EquipmentAt the end of 2016 and 2015, property, plant and equipment at cost and accumulated depreciation were:
(Dollars in Millions) 2016 2015
Land and land improvements $753 780
Buildings and building equipment 10,112 9,829
Machinery and equipment 23,554 22,511
Construction in progress 3,354 3,528
Total property, plant and equipment, gross $37,773 36,648
Less accumulated depreciation 21,861 20,743
Total property, plant and equipment, net $15,912 15,905
The Company capitalizes interest expense as part of the cost of construction of facilities and equipment. Interest expensecapitalized in 2016, 2015 and 2014 was $102 million, $102 million and $115 million, respectively.
Depreciation expense, including the amortization of capitalized interest was $2.5 billion in 2016, 2015 and 2014.
Upon retirement or other disposal of property, plant and equipment, the costs and related amounts of accumulateddepreciation or amortization are eliminated from the asset and accumulated depreciation accounts, respectively. Thedifference, if any, between the net asset value and the proceeds are recorded in earnings.
5. Intangible Assets and GoodwillAt the end of 2016 and 2015, the gross and net amounts of intangible assets were:
(Dollars in Millions) 2016 2015
Intangible assets with definite lives:
Patents and trademarks – gross $10,521 8,299
Less accumulated amortization 5,076 4,745
Patents and trademarks – net $5,445 3,554
Customer relationships and other intangibles – gross $17,615 17,583
Less accumulated amortization 6,515 5,816
Customer relationships and other intangibles – net $11,100 11,767
Intangible assets with indefinite lives:
Trademarks $6,888 7,023
Purchased in-process research and development 3,443 3,420
Total intangible assets with indefinite lives $10,331 10,443
Total intangible assets – net $26,876 25,764
Goodwill as of January 1, 2017 and January 3, 2016, as allocated by segment of business, was as follows:
(Dollars in Millions) Consumer Pharmaceutical Med Devices Total
Goodwill at December 28, 2014 $7,675 2,626 11,531 21,832
Goodwill, related to acquisitions 110 366 34 510
Goodwill, related to divestitures (119) (17) (57) (193)
Currency translation/other (426) (86) (8) (520)
Goodwill at January 3, 2016 $7,240 2,889 11,500 21,629
Goodwill, related to acquisitions 1,362 – 210 1,572
Goodwill, related to divestitures (63) (12) – (75)
Currency translation/other (276) (37) (8) (321)
Goodwill at January 1, 2017 $8,263 2,840 11,702 22,805
50 • Johnson & Johnson 2016 Annual Report
The weighted average amortization periods for patents and trademarks and customer relationships and other intangibleassets are 19 years and 24 years, respectively. The amortization expense of amortizable assets included in cost ofproducts sold was $1.2 billion, $1.2 billion and $1.4 billion before tax, for the fiscal years ended January 1, 2017,January 3, 2016 and December 28, 2014, respectively. The estimated amortization expense, including Abbott MedicalOptics (AMO), for the five succeeding years approximates $1.5 billion before tax, per year. Intangible asset write-downsare included in Other (income) expense, net.
See Note 20 to the Consolidated Financial Statements for additional details related to acquisitions and divestitures.
6. Fair Value Measurements
The Company uses forward foreign exchange contracts to manage its exposure to the variability of cash flows, primarilyrelated to the foreign exchange rate changes of future intercompany products and third-party purchases of materialsdenominated in a foreign currency. The Company uses cross currency interest rate swaps to manage currency riskprimarily related to borrowings. The Company also uses equity collar contracts to manage exposure to market riskassociated with certain equity investments. All three types of derivatives are designated as cash flow hedges.
Additionally, the Company uses interest rate swaps as an instrument to manage interest rate risk related to fixed rateborrowings. These derivatives are treated as fair value hedges. The Company uses forward foreign exchange contractsdesignated as net investment hedges. Additionally, the Company uses forward foreign exchange contracts to offset itsexposure to certain foreign currency assets and liabilities. These forward foreign exchange contracts are not designated ashedges and therefore, changes in the fair values of these derivatives are recognized in earnings, thereby offsetting thecurrent earnings effect of the related foreign currency assets and liabilities.
The Company does not enter into derivative financial instruments for trading or speculative purposes, or that contain creditrisk related contingent features or requirements to post collateral (excluding equity collar contract) by either the Companyor the counter-party. For equity collar contracts, the Company pledged the underlying hedged marketable equity securitiesto the counter-party as collateral. On an ongoing basis, the Company monitors counterparty credit ratings. The Companyconsiders credit non-performance risk to be low, because the Company primarily enters into agreements with commercialinstitutions that have at least an investment grade credit rating. Refer to the table on significant financial assets andliabilities measured at fair value contained in this footnote for receivables and payables with these commercial institutions.As of January 1, 2017, the Company had notional amounts outstanding for forward foreign exchange contracts, crosscurrency interest rate swaps, interest rate swaps and equity collar contracts of $36.0 billion, $2.3 billion, $1.8 billion and$0.3 billion respectively.
All derivative instruments are recorded on the balance sheet at fair value. Changes in the fair value of derivatives arerecorded each period in current earnings or other comprehensive income, depending on whether the derivative isdesignated as part of a hedge transaction, and if so, the type of hedge transaction.
The designation as a cash flow hedge is made at the entrance date of the derivative contract. At inception, all derivativesare expected to be highly effective. Changes in the fair value of a derivative that is designated as a cash flow hedge and ishighly effective are recorded in accumulated other comprehensive income until the underlying transaction affects earnings,and are then reclassified to earnings in the same account as the hedged transaction. Gains and losses associated withinterest rate swaps and changes in fair value of hedged debt attributable to changes in interest rates are recorded tointerest expense in the period in which they occur. Gains and losses on net investment hedges are accounted for throughthe currency translation account. On an ongoing basis, the Company assesses whether each derivative continues to behighly effective in offsetting changes of hedged items. If and when a derivative is no longer expected to be highly effective,hedge accounting is discontinued. Hedge ineffectiveness, if any, is included in current period earnings in Other (income)expense, net for forward foreign exchange contracts, cross currency interest rate swaps, net investment hedges and equitycollar contracts. For interest rate swaps designated as fair value hedges, hedge ineffectiveness, if any, is included incurrent period earnings within interest expense. For the current reporting period, hedge ineffectiveness associated withinterest rate swaps was not material.
During the fiscal second quarter of 2016, the Company designated its Euro denominated notes issued in May 2016 withdue dates ranging from 2022 to 2035 as a net investment hedge of the Company’s investments in certain of itsinternational subsidiaries that use the Euro as their functional currency in order to reduce the volatility caused by changesin exchange rates. During 2016, the change in the carrying value due to remeasurement of these Euro notes resulted in a$375 million pretax gain reflected in foreign currency translation adjustment, within the Consolidated Statements ofComprehensive Income.
Johnson & Johnson 2016 Annual Report • 51

As of January 1, 2017, the balance of deferred net losses on derivatives included in accumulated other comprehensiveincome was $285 million after-tax. For additional information, see the Consolidated Statements of Comprehensive Incomeand Note 13. The Company expects that substantially all of the amounts related to forward foreign exchange contracts willbe reclassified into earnings over the next 12 months as a result of transactions that are expected to occur over thatperiod. The maximum length of time over which the Company is hedging transaction exposure is 18 months, excludinginterest rate contracts, net investment hedges and equity collar contracts. The amount ultimately realized in earnings maydiffer as foreign exchange rates change. Realized gains and losses are ultimately determined by actual exchange rates atmaturity of the derivative.
The following table is a summary of the activity related to derivatives designated as cash flow hedges for the fiscal yearsended January 1, 2017 and January 3, 2016 :
(Dollars in Millions)
Gain/(Loss)Recognized In
Accumulated OCI(1)
Gain/(Loss)Reclassified FromAccumulated OCI
Into Income(1)
Gain/(Loss)Recognized In
OtherIncome/Expense(2)
Cash Flow Hedges by Income Statement Caption 2016 2015 2016 2015 2016 2015
Sales to customers(3) $(65) (83) (47) (126) (1) (5)
Cost of products sold(3) (212) (22) (3) 122 (15) 14
Research and development expense(3) (76) (3) (90) 6 — 1
Interest (income)/Interest expense, net(4) 66 (40) 37 — — —
Other (income) expense, net(3)(5) (72) 33 (7) 60 2 1
Total $(359) (115) (110) 62 (14) 11
All amounts shown in the table above are net of tax.
(1) Effective portion
(2) Ineffective portion
(3) Forward foreign exchange contracts
(4) Cross currency interest rate swaps
(5) Includes equity collar contracts
For the fiscal years ended January 1, 2017 and January 3, 2016, a loss of $56 million and a loss of $34 million,respectively, was recognized in Other (income) expense, net, relating to forward foreign exchange contracts notdesignated as hedging instruments.
Fair value is the exit price that would be received to sell an asset or paid to transfer a liability. Fair value is a market-basedmeasurement determined using assumptions that market participants would use in pricing an asset or liability. Theauthoritative literature establishes a three-level hierarchy to prioritize the inputs used in measuring fair value. The levelswithin the hierarchy are described below with Level 1 having the highest priority and Level 3 having the lowest.
The fair value of a derivative financial instrument (i.e. forward foreign exchange contracts, interest rate contracts) is theaggregation by currency of all future cash flows discounted to its present value at the prevailing market interest rates andsubsequently converted to the U.S. Dollar at the current spot foreign exchange rate. The Company does not believe thatfair values of these derivative instruments materially differ from the amounts that could be realized upon settlement ormaturity, or that the changes in fair value will have a material effect on the Company’s results of operations, cash flows orfinancial position. The Company also holds equity investments which are classified as Level 1 and debt securities whichare classified as Level 2. The Company did not have any other significant financial assets or liabilities which would requirerevised valuations under this standard that are recognized at fair value.
The following three levels of inputs are used to measure fair value:
Level 1 — Quoted prices in active markets for identical assets and liabilities.
Level 2 — Significant other observable inputs.
Level 3 — Significant unobservable inputs.
52 • Johnson & Johnson 2016 Annual Report

The Company’s significant financial assets and liabilities measured at fair value as of January 1, 2017 and January 3, 2016were as follows:
2016 2015
(Dollars in Millions) Level 1 Level 2 Level 3 Total Total(1)
Derivatives designated as hedging instruments:
Assets:
Forward foreign exchange contracts(7) $ – 747 – 747 452
Interest rate contracts(2)(4)(7) – 31 – 31 28
Total – 778 – 778 480
Liabilities:
Forward foreign exchange contracts(8) – 723 – 723 358
Interest rate contracts(3)(4)(8) – 382 – 382 241
Equity collar contracts(8) – 57 – 57 –
Total – 1,162 – 1,162 599
Derivatives not designated as hedging instruments:
Assets:
Forward foreign exchange contracts(7) – 34 – 34 33
Liabilities:
Forward foreign exchange contracts(8) – 57 – 57 41
Available For Sale Other Investments:
Equity investments(5) 1,209 – – 1,209 1,494
Debt securities(6) $ – 12,087 – 12,087 8,316
(1) 2015 assets and liabilities are all classified as Level 2 with the exception of equity investments of $1,494 million, which are classifiedas Level 1.
(2) Includes $23 million and $20 million of non-current assets for the fiscal years ending January 1, 2017 and January 3, 2016,respectively.
(3) Includes $382 million and $239 million of non-current liabilities for the fiscal years ending January 1, 2017 and January 3, 2016,respectively.
(4) Includes cross currency interest rate swaps and interest rate swaps.(5) Classified as non-current other assets with the exception of $332 million of current assets for January 1, 2017. The carrying amount
of the equity investments were $520 million and $528 million as of January 1, 2017 and January 3, 2016, respectively. The unrealizedgains were $757 million and $979 million as of January 1, 2017 and January 3, 2016, respectively. The unrealized losses were $68million and $13 million as of January 1, 2017 and January 3, 2016, respectively.
(6) Classified as current marketable securities.(7) Classified as other current assets.(8) Classified as accounts payable.
See Notes 2 and 7 for financial assets and liabilities held at carrying amount on the Consolidated Balance Sheet.
Johnson & Johnson 2016 Annual Report • 53

7. Borrowings
The components of long-term debt are as follows:
(Dollars in Millions) 2016EffectiveRate % 2015
EffectiveRate %
2.15% Notes due 2016 $— — 900 2.22
3 month LIBOR+0.07% FRN due 2016 — — 800 0.48
0.70% Notes due 2016 — — 398 0.74
5.55% Debentures due 2017 1,000 5.55 1,000 5.55
1.125% Notes due 2017 699 1.15 700 1.15
5.15% Debentures due 2018 899 5.18 899 5.15
1.65% Notes due 2018 600 1.70 602 1.70
4.75% Notes due 2019 (1B Euro 1.0449)(2)/(1B Euro 1.0882)(3) 1,041(2) 5.83 1,085(3) 5.83
1.875% Notes due 2019 499 1.93 502 1.93
0.89% Notes due 2019 299 1.20 — —
1.125% Notes due 2019 699 1.13 — —
3% Zero Coupon Convertible Subordinated Debentures due 2020 84 3.00 137 3.00
2.95% Debentures due 2020 546 3.15 545 3.15
3.55% Notes due 2021 447 3.67 448 3.67
2.45% Notes due 2021 348 2.48 349 2.48
1.65% Notes due 2021 997 1.65 — —
0.250% Notes due 2022 (1B Euro 1.0449)(2) 1,041(2) 0.26 — —
6.73% Debentures due 2023 249 6.73 250 6.73
3.375% Notes due 2023 807 3.17 811 3.17
2.05% Notes due 2023 497 2.09 — —
0.650% Notes due 2024 (750MM Euro 1.0449)(2) 779(2) 0.68 — —
5.50% Notes due 2024 (500MM GBP 1.2237)(2)/(500MM GBP 1.4818)(3) 605(2) 6.75 737(3) 6.75
2.45% Notes due 2026 1,989 2.47 — —
1.150% Notes due 2028 (750MM Euro 1.0449)(2) 775(2) 1.21 — —
6.95% Notes due 2029 296 7.14 297 7.14
4.95% Debentures due 2033 497 4.95 500 4.95
4.375% Notes due 2033 857 4.24 864 4.24
1.650% Notes due 2035 (1.5B Euro 1.0449)(2) 1,549(2) 1.68 — —
3.55% Notes due 2036 987 3.59 — —
5.95% Notes due 2037 990 5.99 996 5.99
5.85% Debentures due 2038 695 5.85 700 5.86
4.50% Debentures due 2040 537 4.63 540 4.63
4.85% Notes due 2041 296 4.89 298 4.89
4.50% Notes due 2043 495 4.52 499 4.52
3.70% Notes due 2046 1,970 3.74 — —
Other 77 — 104 —
Subtotal 24,146(4) 3.33%(1) 14,961(4) 4.06(1)
Less current portion 1,704 2,104
Total long-term debt $22,442 12,857
(1) Weighted average effective rate.
54 • Johnson & Johnson 2016 Annual Report

(2) Translation rate at January 1, 2017.
(3) Translation rate at January 3, 2016.
(4) The excess of the fair value over the carrying value of debt was $1.6 billion in 2016 and $1.7 billion in 2015.
Fair value of the long-term debt was estimated using market prices, which were corroborated by quoted broker prices andsignificant other observable inputs.
The Company has access to substantial sources of funds at numerous banks worldwide. In September 2016, theCompany secured a new 364-day Credit Facility. Total credit available to the Company approximates $10 billion, whichexpires on September 14, 2017. Interest charged on borrowings under the credit line agreements is based on either bidsprovided by banks, the prime rate or London Interbank Offered Rates (LIBOR), plus applicable margins. Commitment feesunder the agreements are not material.
Throughout 2016, the Company continued to have access to liquidity through the commercial paper market. Short-termborrowings and the current portion of long-term debt amounted to approximately $4.7 billion at the end of 2016, of which$2.7 billion was borrowed under the Commercial Paper Program. The remainder principally represents local borrowing byinternational subsidiaries.
Throughout 2015, the Company continued to have access to liquidity through the commercial paper market. Short-termborrowings and the current portion of long-term debt amounted to approximately $7.0 billion at the end of 2015, of which$4.6 billion was borrowed under the Commercial Paper Program. The remainder principally represents local borrowing byinternational subsidiaries.
Aggregate maturities of long-term obligations commencing in 2017 are:
(Dollars in Millions)
2017 2018 2019 2020 2021After2021
$1,704 1,561 2,538 629 1,795 15,919
8. Income Taxes
The provision for taxes on income consists of:
(Dollars in Millions) 2016 2015 2014
Currently payable:
U.S. taxes $1,896 2,748 2,625
International taxes 1,708 1,309 1,174
Total currently payable 3,604 4,057 3,799
Deferred:
U.S. taxes 294 37 (258)
International taxes (635) (307) 699
Total deferred (341) (270) 441
Provision for taxes on income $3,263 3,787 4,240
Johnson & Johnson 2016 Annual Report • 55

A comparison of income tax expense at the U.S. statutory rate of 35% in 2016, 2015 and 2014, to the Company’seffective tax rate is as follows:
(Dollars in Millions) 2016 2015 2014
U.S. $7,457 8,179 8,001
International 12,346 11,017 12,562
Earnings before taxes on income: $19,803 19,196 20,563
Tax rates:
U.S. statutory rate 35.0% 35.0 35.0
International operations excluding Ireland (9.4) (6.7) (7.0)
Ireland and Puerto Rico operations(1) (7.8) (8.7) (6.9)
Research and orphan drug tax credits (0.4) (0.2) (0.3)
U.S. state and local (0.1) 0.4 1.0
U.S. manufacturing deduction (0.6) (0.6) (0.6)
U.S. tax on international income 1.3 0.2 1.4
Additional tax benefits on share based compensation (1.8) – –
U.S. tax benefit on asset/business disposals – – (1.9)
All other 0.3 0.3 (0.1)
Effective tax rate 16.5% 19.7 20.6
(1) The Company has subsidiaries operating in Puerto Rico under various tax incentives.
The 2016 effective tax rate decreased by 3.2% as compared to 2015. As described in Note 1, the Company adopted anew accounting standard for the reporting of additional tax benefits on share-based compensation that vested or wereexercised during the fiscal year. The adoption of this new standard reduced the effective tax rate of fiscal 2016 by 1.8%versus 2015.
The remainder of the change in the effective tax rate was primarily related to the lower earnings before taxes in the UnitedStates and the settlement of several uncertain tax positions in 2016 versus 2015.
The decrease in the 2015 effective tax rate, as compared to 2014, was primarily attributable to the increases in taxableincome in lower tax jurisdictions relative to higher tax jurisdictions and a tax benefit resulting from a restructuring ofinternational affiliates. Additionally, the 2014 effective tax rate was affected by the items mentioned below.
The increase in the 2014 effective tax rate, as compared to 2013, was attributable to the following: the divestiture of theOrtho-Clinical Diagnostics business at an approximate 44% effective tax rate, litigation accruals at low tax rates, the mix ofearnings into higher tax jurisdictions, primarily the U.S., the accrual of an additional year of the Branded Prescription DrugFee, which is not tax deductible, and additional U.S. tax expense related to a planned increase in dividends from currentyear foreign earnings as compared to the prior year. These increases to the 2014 effective tax rate were partially offset bya tax benefit of $0.4 billion associated with the Conor Medsystems divestiture.
The 2014 effective tax rate was also reduced as the Company adjusted its unrecognized tax benefits as a result of (i) thefederal appeals court’s decision in OMJ Pharmaceuticals, Inc.’s litigation regarding credits under former Section 936 ofthe Internal Revenue Code and (ii) a settlement of substantially all issues related to the Company’s U.S. Internal RevenueService audit of tax years 2006—2009. The impact of the settlement is reflected in the U.S. tax on international incomeand the All other line items within the above reconciliation.
The items noted above reflect the key drivers of the rate reconciliation.
56 • Johnson & Johnson 2016 Annual Report
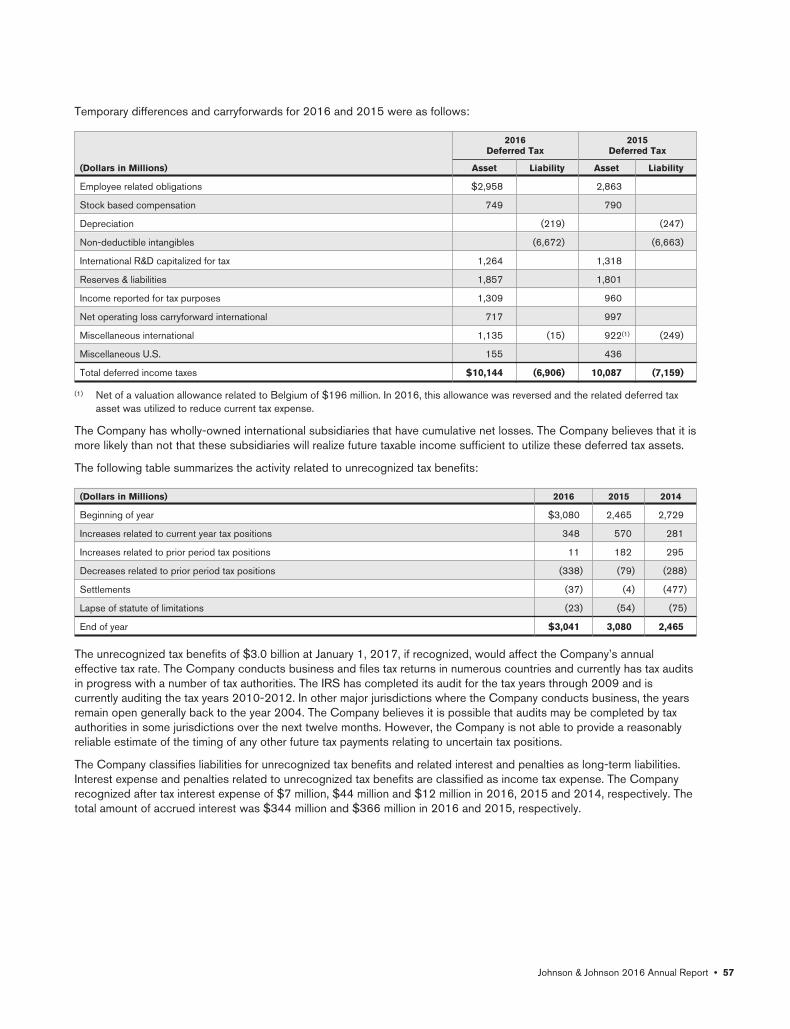
Temporary differences and carryforwards for 2016 and 2015 were as follows:
2016Deferred Tax
2015Deferred Tax
(Dollars in Millions) Asset Liability Asset Liability
Employee related obligations $2,958 2,863
Stock based compensation 749 790
Depreciation (219) (247)
Non-deductible intangibles (6,672) (6,663)
International R&D capitalized for tax 1,264 1,318
Reserves & liabilities 1,857 1,801
Income reported for tax purposes 1,309 960
Net operating loss carryforward international 717 997
Miscellaneous international 1,135 (15) 922(1) (249)
Miscellaneous U.S. 155 436
Total deferred income taxes $10,144 (6,906) 10,087 (7,159)
(1) Net of a valuation allowance related to Belgium of $196 million. In 2016, this allowance was reversed and the related deferred taxasset was utilized to reduce current tax expense.
The Company has wholly-owned international subsidiaries that have cumulative net losses. The Company believes that it ismore likely than not that these subsidiaries will realize future taxable income sufficient to utilize these deferred tax assets.
The following table summarizes the activity related to unrecognized tax benefits:
(Dollars in Millions) 2016 2015 2014
Beginning of year $3,080 2,465 2,729
Increases related to current year tax positions 348 570 281
Increases related to prior period tax positions 11 182 295
Decreases related to prior period tax positions (338) (79) (288)
Settlements (37) (4) (477)
Lapse of statute of limitations (23) (54) (75)
End of year $3,041 3,080 2,465
The unrecognized tax benefits of $3.0 billion at January 1, 2017, if recognized, would affect the Company’s annualeffective tax rate. The Company conducts business and files tax returns in numerous countries and currently has tax auditsin progress with a number of tax authorities. The IRS has completed its audit for the tax years through 2009 and iscurrently auditing the tax years 2010-2012. In other major jurisdictions where the Company conducts business, the yearsremain open generally back to the year 2004. The Company believes it is possible that audits may be completed by taxauthorities in some jurisdictions over the next twelve months. However, the Company is not able to provide a reasonablyreliable estimate of the timing of any other future tax payments relating to uncertain tax positions.
The Company classifies liabilities for unrecognized tax benefits and related interest and penalties as long-term liabilities.Interest expense and penalties related to unrecognized tax benefits are classified as income tax expense. The Companyrecognized after tax interest expense of $7 million, $44 million and $12 million in 2016, 2015 and 2014, respectively. Thetotal amount of accrued interest was $344 million and $366 million in 2016 and 2015, respectively.
Johnson & Johnson 2016 Annual Report • 57
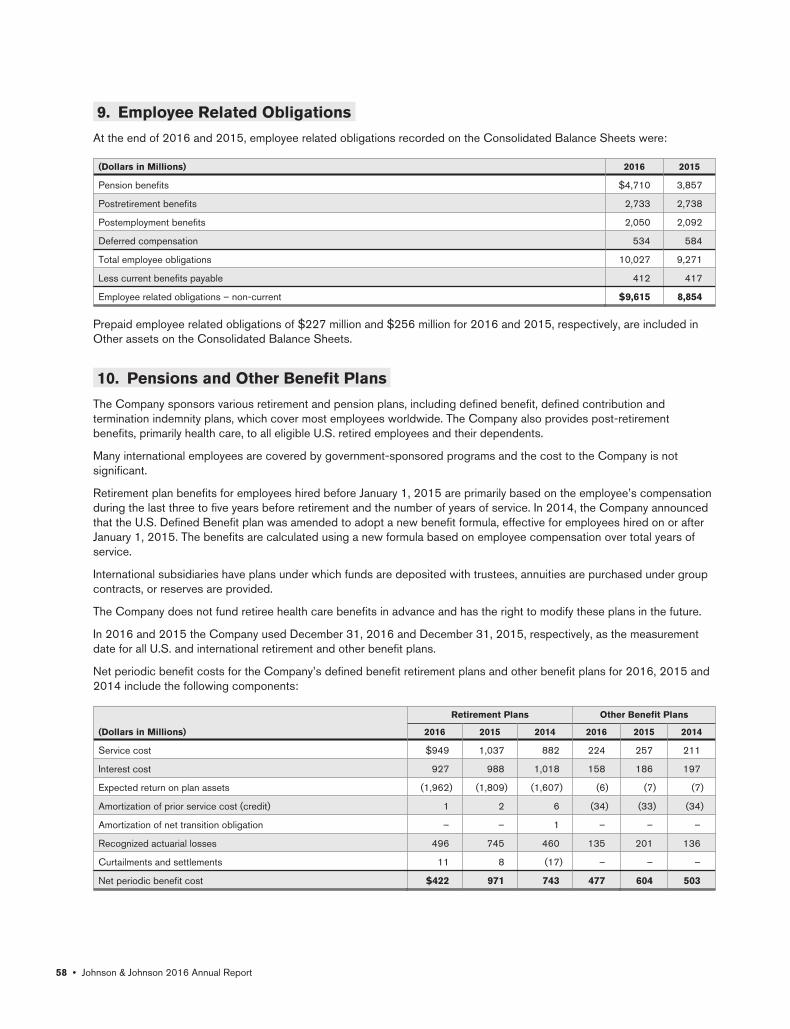
9. Employee Related Obligations
At the end of 2016 and 2015, employee related obligations recorded on the Consolidated Balance Sheets were:
(Dollars in Millions) 2016 2015
Pension benefits $4,710 3,857
Postretirement benefits 2,733 2,738
Postemployment benefits 2,050 2,092
Deferred compensation 534 584
Total employee obligations 10,027 9,271
Less current benefits payable 412 417
Employee related obligations – non-current $9,615 8,854
Prepaid employee related obligations of $227 million and $256 million for 2016 and 2015, respectively, are included inOther assets on the Consolidated Balance Sheets.
10. Pensions and Other Benefit Plans
The Company sponsors various retirement and pension plans, including defined benefit, defined contribution andtermination indemnity plans, which cover most employees worldwide. The Company also provides post-retirementbenefits, primarily health care, to all eligible U.S. retired employees and their dependents.
Many international employees are covered by government-sponsored programs and the cost to the Company is notsignificant.
Retirement plan benefits for employees hired before January 1, 2015 are primarily based on the employee’s compensationduring the last three to five years before retirement and the number of years of service. In 2014, the Company announcedthat the U.S. Defined Benefit plan was amended to adopt a new benefit formula, effective for employees hired on or afterJanuary 1, 2015. The benefits are calculated using a new formula based on employee compensation over total years ofservice.
International subsidiaries have plans under which funds are deposited with trustees, annuities are purchased under groupcontracts, or reserves are provided.
The Company does not fund retiree health care benefits in advance and has the right to modify these plans in the future.
In 2016 and 2015 the Company used December 31, 2016 and December 31, 2015, respectively, as the measurementdate for all U.S. and international retirement and other benefit plans.
Net periodic benefit costs for the Company’s defined benefit retirement plans and other benefit plans for 2016, 2015 and2014 include the following components:
Retirement Plans Other Benefit Plans
(Dollars in Millions) 2016 2015 2014 2016 2015 2014
Service cost $949 1,037 882 224 257 211
Interest cost 927 988 1,018 158 186 197
Expected return on plan assets (1,962) (1,809) (1,607) (6) (7) (7)
Amortization of prior service cost (credit) 1 2 6 (34) (33) (34)
Amortization of net transition obligation – – 1 – – –
Recognized actuarial losses 496 745 460 135 201 136
Curtailments and settlements 11 8 (17) – – –
Net periodic benefit cost $422 971 743 477 604 503
58 • Johnson & Johnson 2016 Annual Report

Amounts expected to be recognized in net periodic benefit cost in the coming year for the Company’s defined benefitretirement plans and other post-retirement plans:
(Dollars in Millions)
Amortization of net transition obligation $ –
Amortization of net actuarial losses 715
Amortization of prior service credit 28
Unrecognized gains and losses for the U.S. pension plans are amortized over the average remaining future service for eachplan. For plans with no active employees, they are amortized over the average life expectancy. The amortization of gainsand losses for the other U.S. benefit plans is determined by using a 10% corridor of the greater of the market value ofassets or the accumulated postretirement benefit obligation. Total unamortized gains and losses in excess of the corridorare amortized over the average remaining future service.
Prior service costs/benefits for the U.S. pension plans are amortized over the average remaining future service of planparticipants at the time of the plan amendment. Prior service cost/benefit for the other U.S. benefit plans is amortized overthe average remaining service to full eligibility age of plan participants at the time of the plan amendment.
The following table represents the weighted-average actuarial assumptions:
Retirement Plans Other Benefit Plans
Worldwide Benefit Plans 2016 2015 2014 2016 2015 2014
Net Periodic Benefit Cost
Service cost discount rate 3.98% 3.78 4.78 4.77 4.31 5.25
Interest cost discount rate 4.24% 3.78 4.78 4.10 4.31 5.25
Rate of increase in compensation levels 4.02% 4.05 4.08 4.32 4.11 4.29
Expected long-term rate of return on plan assets 8.55% 8.53 8.46
Benefit Obligation
Discount rate 3.78% 4.11 3.78 4.42 4.63 4.31
Rate of increase in compensation levels 4.02% 4.01 4.05 4.29 4.28 4.11
The Company’s discount rates are determined by considering current yield curves representing high quality, long-termfixed income instruments. The resulting discount rates are consistent with the duration of plan liabilities. For the fiscal year2016, the Company changed its methodology in determining service and interest cost from the single weighted averagediscount rate approach to duration specific spot rates along that yield curve to the plans’ liability cash flows, whichmanagement has concluded is a more precise estimate. Prior to this change in methodology, the Company measuredservice and interest costs utilizing a single weighted-average discount rate derived from the yield curve used to measurethe plan obligations. The Company has accounted for this change as a change in accounting estimate and, accordingly,has accounted for it on a prospective basis. This change does not impact the benefit obligation and did not have amaterial impact to the 2016 full year results.
The expected rates of return on plan asset assumptions represent the Company’s assessment of long-term returns ondiversified investment portfolios globally. The assessment is determined using projections from external financial sources,long-term historical averages, actual returns by asset class and the various asset class allocations by market.
The following table displays the assumed health care cost trend rates, for all individuals:
Health Care Plans 2016 2015
Health care cost trend rate assumed for next year 6.32% 6.60%
Rate to which the cost trend rate is assumed to decline (ultimate trend) 4.50% 4.50%
Year the rate reaches the ultimate trend rate 2038 2038
Johnson & Johnson 2016 Annual Report • 59

A one-percentage-point change in assumed health care cost trend rates would have the following effect:
(Dollars in Millions)One-Percentage-
Point IncreaseOne-Percentage-Point Decrease
Health Care Plans
Total interest and service cost $30 (23)
Post-retirement benefit obligation $401 (325)
The following table sets forth information related to the benefit obligation and the fair value of plan assets at year-end2016 and 2015 for the Company’s defined benefit retirement plans and other post-retirement plans:
Retirement PlansOther Benefit
Plans
(Dollars in Millions) 2016 2015 2016 2015
Change in Benefit Obligation
Projected benefit obligation – beginning of year $25,855 26,889 4,669 5,081
Service cost 949 1,037 224 257
Interest cost 927 988 158 186
Plan participant contributions 54 48 – –
Amendments (48) 60 – –
Actuarial (gains) losses 2,302 (1,578) (73) (400)
Divestitures & acquisitions (24) (5) – –
Curtailments, settlements & restructuring (25) (20) – (3)
Benefits paid from plan* (1,210) (773) (378) (420)
Effect of exchange rates (664) (791) 5 (32)
Projected benefit obligation – end of year $28,116 25,855 4,605 4,669
Change in Plan Assets
Plan assets at fair value – beginning of year $22,254 22,575 74 79
Actual return on plan assets 2,286 298 7 1
Company contributions 838 752 372 414
Plan participant contributions 54 48 – –
Settlements (25) (20) – –
Divestitures & acquisitions (24) (5) – –
Benefits paid from plan assets* (1,210) (773) (378) (420)
Effect of exchange rates (540) (621) – –
Plan assets at fair value – end of year $23,633 22,254 75 74
Funded status – end of year $(4,483) (3,601) (4,530) (4,595)
Amounts Recognized in the Company’s Balance Sheet consist of the following:
Non-current assets $227 256 – –
Current liabilities (86) (77) (315) (324)
Non-current liabilities (4,624) (3,780) (4,215) (4,271)
Total recognized in the consolidated balance sheet – end of year $(4,483) (3,601) (4,530) (4,595)
Amounts Recognized in Accumulated Other Comprehensive Income consist ofthe following:
Net actuarial loss $7,749 6,501 1,804 2,013
Prior service cost (credit) (12) 34 (150) (185)
Unrecognized net transition obligation – – – –
Total before tax effects $7,737 6,535 1,654 1,828
Accumulated Benefit Obligations – end of year $25,319 23,262
* In 2016, the Company offered a voluntary lump-sum payment option below a pre-determined threshold for certain eligible formeremployees who are vested participants of the U.S. Qualified Defined Benefit Pension Plan. The distribution of the lump-sums was
60 • Johnson & Johnson 2016 Annual Report

substantially completed by the end of fiscal 2016. The amount distributed in 2016 was approximately $420 million. These distributionsfrom the plan did not have a material impact on the Company’s financial position.
Retirement PlansOther Benefit
Plans
(Dollars in Millions) 2016 2015 2016 2015
Amounts Recognized in Net Periodic Benefit Cost and Other ComprehensiveIncome
Net periodic benefit cost $422 971 477 604
Net actuarial (gain) loss 1,965 (75) (72) (389)
Amortization of net actuarial loss (496) (745) (135) (201)
Prior service cost (credit) (48) 60 – –
Amortization of prior service (cost) credit (1) (2) 34 33
Effect of exchange rates (218) (218) (1) (1)
Total recognized in other comprehensive income, before tax $1,202 (980) (174) (558)
Total recognized in net periodic benefit cost and other comprehensive income $1,624 (9) 303 46
The Company plans to continue to fund its U.S. Qualified Plans to comply with the Pension Protection Act of 2006.International Plans are funded in accordance with local regulations. Additional discretionary contributions are made whendeemed appropriate to meet the long-term obligations of the plans. For certain plans, funding is not a common practice, asfunding provides no economic benefit. Consequently, the Company has several pension plans that are not funded.
In 2016, the Company contributed $501 million and $337 million to its U.S. and international pension plans, respectively.
The following table displays the funded status of the Company’s U.S. Qualified & Non-Qualified pension plans andinternational funded and unfunded pension plans at December 31, 2016 and December 31, 2015, respectively:
U.S. Plans International Plans
Qualified Plans Non-Qualified Plans Funded Plans Unfunded Plans
(Dollars in Millions) 2016 2015 2016 2015 2016 2015 2016 2015
Plan Assets $16,057 15,113 – – 7,576 7,141 – –
Projected Benefit Obligation 16,336 15,280 1,905 1,675 9,502 8,542 373 358
Accumulated Benefit Obligation 14,759 13,876 1,568 1,411 8,663 7,661 329 314
Over (Under) Funded Status
Projected Benefit Obligation $(279) (167) (1,905) (1,675) (1,926) (1,401) (373) (358)
Accumulated Benefit Obligation 1,298 1,237 (1,568) (1,411) (1,087) (520) (329) (314)
Plans with accumulated benefit obligations in excess of plan assets have an accumulated benefit obligation, projectedbenefit obligation and plan assets of $8.8 billion, $9.9 billion and $5.6 billion, respectively, at the end of 2016, and$4.5 billion, $5.3 billion and $1.9 billion, respectively, at the end of 2015.
The following table displays the projected future benefit payments from the Company’s retirement and other benefit plans:
(Dollars in Millions) 2017 2018 2019 2020 2021 2022-2026
Projected future benefit payments
Retirement plans $897 908 958 1,010 1,081 6,416
Other benefit plans $325 315 311 307 304 1,465
The following table displays the projected future minimum contributions to the unfunded retirement plans. These amountsdo not include any discretionary contributions that the Company may elect to make in the future.
(Dollars in Millions) 2017 2018 2019 2020 2021 2022-2026
Projected future contributions $83 84 89 94 100 610
Johnson & Johnson 2016 Annual Report • 61

Each pension plan is overseen by a local committee or board that is responsible for the overall administration andinvestment of the pension plans. In determining investment policies, strategies and goals, each committee or boardconsiders factors including, local pension rules and regulations; local tax regulations; availability of investment vehicles(separate accounts, commingled accounts, insurance funds, etc.); funded status of the plans; ratio of actives to retirees;duration of liabilities; and other relevant factors including: diversification, liquidity of local markets and liquidity of basecurrency. A majority of the Company’s pension funds are open to new entrants and are expected to be on-going plans.Permitted investments are primarily liquid and/or listed, with little reliance on illiquid and non-traditional investments suchas hedge funds.
The Company’s retirement plan asset allocation at the end of 2016 and 2015 and target allocations for 2017 are asfollows:
Percent ofPlan Assets
TargetAllocation
2016 2015 2017
Worldwide Retirement Plans
Equity securities 75% 79% 73%
Debt securities 25 21 27
Total plan assets 100% 100% 100%
Determination of Fair Value of Plan Assets
The Plan has an established and well-documented process for determining fair values. Fair value is based upon quotedmarket prices, where available. If listed prices or quotes are not available, fair value is based upon models that primarilyuse, as inputs, market-based or independently sourced market parameters, including yield curves, interest rates, volatilities,equity or debt prices, foreign exchange rates and credit curves.
While the Plan believes its valuation methods are appropriate and consistent with other market participants, the use ofdifferent methodologies or assumptions to determine the fair value of certain financial instruments could result in a differentestimate of fair value at the reporting date.
Valuation Hierarchy
The authoritative literature establishes a three-level hierarchy to prioritize the inputs used in measuring fair value. The levelswithin the hierarchy are described in the table below with Level 1 having the highest priority and Level 3 having the lowest.
A financial instrument’s categorization within the valuation hierarchy is based upon the lowest level of input that issignificant to the fair value measurement.
Following is a description of the valuation methodologies used for the investments measured at fair value.
• Short-term investments – Cash and quoted short-term instruments are valued at the closing price or the amount heldon deposit by the custodian bank. Other investments are through investment vehicles valued using the Net Asset Value(NAV) provided by the administrator of the fund. The NAV is based on the value of the underlying assets owned by thefund, minus its liabilities, and then divided by the number of shares outstanding. The NAV is a quoted price in a marketthat is not active and classified as Level 2.
• Government and agency securities – A limited number of these investments are valued at the closing price reported onthe major market on which the individual securities are traded. Where quoted prices are available in an active market,the investments are classified within Level 1 of the valuation hierarchy. If quoted market prices are not available for thespecific security, then fair values are estimated by using pricing models, quoted prices of securities with similarcharacteristics or discounted cash flows. When quoted market prices for a security are not available in an active market,they are classified as Level 2.
• Debt instruments – A limited number of these investments are valued at the closing price reported on the major marketon which the individual securities are traded. Where quoted prices are available in an active market, the investments areclassified as Level 1. If quoted market prices are not available for the specific security, then fair values are estimated byusing pricing models, quoted prices of securities with similar characteristics or discounted cash flows and are classifiedas Level 2. Level 3 debt instruments are priced based on unobservable inputs.
62 • Johnson & Johnson 2016 Annual Report

• Equity securities – Common stocks are valued at the closing price reported on the major market on which the individualsecurities are traded. Substantially all common stock is classified within Level 1 of the valuation hierarchy.
• Commingled funds – These investment vehicles are valued using the NAV provided by the fund administrator. The NAVis based on the value of the underlying assets owned by the fund, minus its liabilities, and then divided by the number ofshares outstanding. Assets in the Level 2 category have a quoted market price.
• Insurance contracts – The instruments are issued by insurance companies. The fair value is based on negotiated valueand the underlying investments held in separate account portfolios as well as considering the credit worthiness of theissuer. The underlying investments are government, asset-backed and fixed income securities. In general, insurancecontracts are classified as Level 3 as there are no quoted prices nor other observable inputs for pricing.
• Other assets – Other assets are represented primarily by limited partnerships and real estate investments, as well ascommercial loans and commercial mortgages that are not classified as corporate debt. Other assets that are exchangelisted and actively traded are classified as Level 1, while inactively traded assets are classified as Level 2.
The following table sets forth the Retirement Plans’ investments measured at fair value as of December 31, 2016 andDecember 31, 2015:
Quoted Pricesin Active
Markets forIdentical Assets
(Level 1)
SignificantOther
ObservableInputs
(Level 2)
SignificantUnobservable
Inputs(a)
(Level 3)
InvestmentsMeasured at
Net AssetValue(b) Total Assets
(Dollars in Millions) 2016 2015 2016 2015 2016 2015 2016 2015 2016 2015
Short-term investment funds $145 184 652 312 – – – – 797 496
Government and agency securities – – 2,655 1,767 – – – – 2,655 1,767
Debt instruments – – 1,237 1,050 – 1 – – 1,237 1,051
Equity securities 11,433 11,317 12 11 – – – – 11,445 11,328
Commingled funds – – 1,316 1,100 – – 5,767 6,122 7,083 7,222
Insurance contracts – – – – 24 23 – – 24 23
Other assets – – – 107 – – 392 260 392 367
Investments at fair value $11,578 11,501 5,872 4,347 24 24 6,159 6,382 23,633 22,254
(a) The activity for the Level 3 assets is not significant for all years presented.(b) Per adoption of ASU 2015-07, certain investments that are measured at fair value using the net asset value per share (or its
equivalent) practical expedient have not been classified in the fair value hierarchy. As per ASU 2015-7 prior year amounts have beenreclassified to conform to the current year presentation. The fair value amounts presented in this table are intended to permitreconciliation of the fair value hierarchy to the total retirement plan assets.
The Company’s Other Benefit Plans are unfunded except for U.S. commingled funds (Level 2) of $75 million and $74million at December 31, 2016 and December 31, 2015, respectively.
The fair value of Johnson & Johnson Common Stock directly held in plan assets was $847 million (3.6% of total planassets) at December 31, 2016 and $751 million (3.4% of total plan assets) at December 31, 2015.
11. Savings Plan
The Company has voluntary 401(k) savings plans designed to enhance the existing retirement programs covering eligibleemployees. The Company matches a percentage of each employee’s contributions consistent with the provisions of theplan for which he/she is eligible. Total Company matching contributions to the plans were $191 million, $187 million and$172 million in 2016, 2015 and 2014, respectively.
Johnson & Johnson 2016 Annual Report • 63

12. Capital and Treasury Stock
Changes in treasury stock were:
Treasury Stock
(Amounts in Millions Except Treasury Stock Shares in Thousands) Shares Amount
Balance at December 29, 2013 299,215 $15,700
Employee compensation and stock option plans (32,302) (2,933)
Repurchase of common stock 69,707 7,124
Balance at December 28, 2014 336,620 19,891
Employee compensation and stock option plans (24,413) (2,497)
Repurchase of common stock 52,474 5,290
Balance at January 3, 2016 364,681 22,684
Employee compensation and stock option plans (30,839) (3,311)
Repurchase of common stock 79,490 8,979
Balance at January 1, 2017 413,332 $28,352
Aggregate shares of common stock issued were approximately 3,119,843,000 shares at the end of 2016, 2015 and2014.
Cash dividends paid were $3.15 per share in 2016, compared with dividends of $2.95 per share in 2015, and $2.76 pershare in 2014.
On October 13, 2015, the Company announced that its Board of Directors approved a share repurchase program,authorizing the Company to purchase up to $10.0 billion of the Company’s shares of common stock. The repurchaseprogram has no time limit and may be suspended for periods or discontinued at any time. Any shares acquired will beavailable for general corporate purposes. The Company intends to finance the share repurchase program through availablecash and access to the capital markets. As of January 1, 2017, $7.3 billion has been repurchased under the program.
On July 21, 2014, the Company announced that its Board of Directors approved a share repurchase program,authorizing the Company to purchase up to $5.0 billion of the Company’s shares of common stock. This share repurchaseprogram was completed on April 28, 2015.
13. Accumulated Other Comprehensive Income
Components of other comprehensive income (loss) consist of the following:
(Dollars in Millions)
ForeignCurrency
Translation
Gain/(Loss)
OnSecurities
EmployeeBenefitPlans
Gain/(Loss)
OnDerivatives& Hedges
TotalAccumulated
OtherComprehensiveIncome (Loss)
December 29, 2013 $(202) 106 (3,009) 245 (2,860)
Net 2014 changes (4,601) 151 (3,308) (104) (7,862)
December 28, 2014 (4,803) 257 (6,317) 141 (10,722)
Net 2015 changes (3,632) 347 1,019 (177) (2,443)
January 3, 2016 (8,435) 604 (5,298) (36) (13,165)
Net 2016 changes (612) (193) (682) (249) (1,736)
January 1, 2017 $(9,047) 411 (5,980) (285) (14,901)
Amounts in accumulated other comprehensive income are presented net of the related tax impact. Foreign currencytranslation is not adjusted for income taxes where it relates to permanent investments in international subsidiaries. Foradditional details on comprehensive income see the Consolidated Statements of Comprehensive Income.
64 • Johnson & Johnson 2016 Annual Report

Details on reclassifications out of Accumulated Other Comprehensive Income:
Gain/(Loss) On Securities – reclassifications released to Other (income) expense, net.
Employee Benefit Plans – reclassifications are included in net periodic benefit cost. See Note 10 for additionaldetails.
Gain/(Loss) On Derivatives & Hedges – reclassifications to earnings are recorded in the same account as thehedged transaction. See Note 6 for additional details.
14. International Currency Translation
For translation of its subsidiaries operating in non-U.S. Dollar currencies, the Company has determined that the localcurrencies of its international subsidiaries are the functional currencies except those in highly inflationary economies, whichare defined as those which have had compound cumulative rates of inflation of 100% or more during the past three years,or where a substantial portion of its cash flows are not in the local currency.
In consolidating international subsidiaries, balance sheet currency effects are recorded as a component of accumulatedother comprehensive income. This equity account includes the results of translating certain balance sheet assets andliabilities at current exchange rates and some accounts at historical rates, except for those located in highly inflationaryeconomies. The translation of balance sheet accounts for highly inflationary economies are reflected in the operating results.
A rollforward of the changes during 2016, 2015 and 2014 for foreign currency translation adjustments is included inNote 13.
Net currency transaction gains and losses included in Other (income) expense were losses of $289 million, $104 millionand $156 million in 2016, 2015 and 2014, respectively.
15. Earnings Per Share
The following is a reconciliation of basic net earnings per share to diluted net earnings per share for the fiscal years endedJanuary 1, 2017, January 3, 2016 and December 28, 2014:
(In Millions Except Per Share Amounts) 2016 2015 2014
Basic net earnings per share $6.04 5.56 5.80
Average shares outstanding – basic 2,737.3 2,771.8 2,815.2
Potential shares exercisable under stock option plans 142.4 141.5 142.6
Less: shares repurchased under treasury stock method (92.1) (102.6) (96.5)
Convertible debt shares 1.3 2.2 2.6
Adjusted average shares outstanding – diluted 2,788.9 2,812.9 2,863.9
Diluted net earnings per share $5.93 5.48 5.70
The diluted net earnings per share calculation included the dilutive effect of convertible debt that is offset by the relatedreduction in interest expense of $2 million after-tax for year 2016, and $3 million for years 2015 and 2014.
The diluted net earnings per share calculation for 2016, 2015 and 2014 included all shares related to stock options, asthe exercise price of all options was less than the average market value of the Company’s stock.
16. Rental Expense and Lease Commitments
Rentals of space, vehicles, manufacturing equipment and office and data processing equipment under operating leaseswere approximately $330 million, $316 million and $341 million in 2016, 2015 and 2014, respectively.
Johnson & Johnson 2016 Annual Report • 65

The approximate minimum rental payments required under operating leases that have initial or remaining non-cancelablelease terms in excess of one year at January 1, 2017 are:
(Dollars in Millions)
2017 2018 2019 2020 2021After2021 Total
$216 179 134 105 88 100 822
Commitments under capital leases are not significant.
17. Common Stock, Stock Option Plans and Stock Compensation Agreements
At January 1, 2017, the Company had 2 stock-based compensation plans. The shares outstanding are for contracts underthe Company’s 2005 Long-Term Incentive Plan and the 2012 Long-Term Incentive Plan. The 2005 Long-Term IncentivePlan expired April 26, 2012. All options and restricted shares granted subsequent to that date were under the 2012 Long-Term Incentive Plan. Under the 2012 Long-Term Incentive Plan, the Company may issue up to 650 million shares ofcommon stock, plus any shares canceled, expired, forfeited, or not issued from the 2005 Long-Term Incentive Plansubsequent to April 26, 2012. Shares available for future grants under the 2012 Long-Term Incentive Plan were439 million at the end of 2016.
The compensation cost that has been charged against income for these plans was $878 million, $874 million and$792 million for 2016, 2015 and 2014, respectively. The total income tax benefit recognized in the income statement forshare-based compensation costs was $256 million, $253 million and $259 million for 2016, 2015 and 2014,respectively. An additional tax benefit of $353 million was recognized in 2016 due to the adoption of a new accountingstandard for the reporting of additional tax benefits on share-based compensation as described in Note 1. The totalunrecognized compensation cost was $749 million, $744 million and $722 million for 2016, 2015 and 2014, respectively.The weighted average period for this cost to be recognized was 1.09 years, 0.98 years and 1.18 years for 2016, 2015,and 2014, respectively. Share-based compensation costs capitalized as part of inventory were insignificant in all periods.
The Company settles employee benefit equity issuances with treasury shares. Treasury shares are replenished throughoutthe year for the number of shares used to settle employee benefit equity issuances.
Stock Options
Stock options expire 10 years from the date of grant and vest over service periods that range from 6 months to 4 years. Alloptions are granted at the average of the high and low prices of the Company’s Common Stock on the New York StockExchange on the date of grant.
The fair value of each option award was estimated on the date of grant using the Black-Scholes option valuation modelthat uses the assumptions noted in the following table. For 2014 grants, expected volatility represents a blended rate of4-year daily historical average volatility rate, and a 5-week average implied volatility rate based on at-the-money tradedJohnson & Johnson options with a life of 2 years. For 2016 and 2015 grants, expected volatility represents a blended rateof 10-year weekly historical overall volatility rate, and a 5-week average implied volatility rate based on at-the-moneytraded Johnson & Johnson options with a life of 2 years. For all grants, historical data is used to determine the expected lifeof the option. The risk-free rate was based on the U.S. Treasury yield curve in effect at the time of grant.
The average fair value of options granted was $10.01, $10.68 and $8.42, in 2016, 2015 and 2014, respectively. The fairvalue was estimated based on the weighted average assumptions of:
2016 2015 2014
Risk-free rate 1.51% 1.77% 1.87%
Expected volatility 15.76% 15.48% 14.60%
Expected life (in years) 7.0 7.0 6.0
Expected dividend yield 3.10% 2.90% 3.10%
66 • Johnson & Johnson 2016 Annual Report

A summary of option activity under the Plan as of January 1, 2017, January 3, 2016 and December 28, 2014, andchanges during the years ending on those dates is presented below:
(Shares in Thousands)Outstanding
Shares
WeightedAverage
Exercise Price
AggregateIntrinsic
Value(Dollars inMillions)
Shares at December 29, 2013 119,556 $64.70 $3,306
Options granted 24,356 90.44
Options exercised (25,319) 62.31
Options canceled/forfeited (2,881) 75.48
Shares at December 28, 2014 115,712 70.37 4,014
Options granted 20,484 100.06
Options exercised (16,683) 62.53
Options canceled/forfeited (2,996) 82.22
Shares at January 3, 2016 116,517 76.41 3,065
Options granted 22,491 101.87
Options exercised (22,547) 65.66
Options canceled/forfeited (3,006) 92.83
Shares at January 1, 2017 113,455 $83.16 $3,636
The total intrinsic value of options exercised was $980 million, $644 million and $954 million in 2016, 2015 and 2014,respectively.
The following table summarizes stock options outstanding and exercisable at January 1, 2017:
(Shares in Thousands) Outstanding Exercisable
Exercise Price Range OptionsAverage
Life(1)
AverageExercise
Price Options
AverageExercise
Price
$52.13-$58.33 7,361 2.1 $58.32 7,361 $58.32
$58.34-$62.20 11,297 2.4 $61.95 11,297 $61.95
$62.62-$65.62 14,380 3.1 $64.24 14,380 $64.24
$66.07-$72.54 18,127 6.0 $72.52 17,241 $72.52
$90.44-$101.87 62,290 8.1 $97.40 135 $93.73
113,455 6.2 $83.16 50,414 $65.77
(1) Average contractual life remaining in years.
Stock options outstanding at January 3, 2016 and December 28, 2014 were 116,517 and an average life of 5.9 years and115,712 and an average life of 5.7 years, respectively. Stock options exercisable at January 3, 2016 and December 28,2014 were 48,345 at an average price of $62.26 and 57,846 at an average price of $61.94, respectively.
Restricted Share Units and Performance Share Units
The Company grants restricted share units which vest over service periods that range from 6 months to 3 years. TheCompany also grants performance share units, which are paid in shares of Johnson & Johnson Common Stock after theend of a three-year performance period. Whether any performance share units vest, and the amount that does vest, is tiedto the completion of service periods that range from 6 months to 3 years and the achievement, over a three-year period, ofthree equally-weighted goals that directly align with or help drive long-term total shareholder return: operational sales,adjusted operational earnings per share, and relative total shareholder return. The number of shares actually earned at theend of the three-year period will vary, based only on actual performance, from 0% to 200% of the target number ofperformance share units granted.
Johnson & Johnson 2016 Annual Report • 67

A summary of the restricted share units and performance share units activity under the Plans as of January 1, 2017 ispresented below:
(Shares in Thousands)
OutstandingRestricted
Share Units
OutstandingPerformanceShare Units
Shares at December 29, 2013 30,617 1,535
Granted 8,487 1,113
Issued (9,685) (19)
Canceled/forfeited (1,726) (98)
Shares at December 28, 2014 27,693 2,531
Granted 7,637 931
Issued (10,164) (285)
Canceled/forfeited (1,281) (99)
Shares at January 3, 2016 23,885 3,078
Granted 7,173 958
Issued (8,913) (1,437)
Canceled/forfeited (1,084) (184)
Shares at January 1, 2017 21,061 2,415
The average fair value of the restricted share units granted was $92.45, $91.65 and $83.01 in 2016, 2015 and 2014,respectively, using the fair market value at the date of grant. The fair value of restricted share units was discounted fordividends, which are not paid on the restricted share units during the vesting period. The fair value of restricted share unitsissued was $587.7 million, $597.6 million and $541.0 million in 2016, 2015 and 2014, respectively.
The weighted average fair value of the performance share units granted was $105.30, $93.54 and $85.94 in 2016, 2015 and2014, calculated using the weighted average fair market value for each of the three component goals at the date of grant.
The fair values for the sales and earnings per share goals of each performance share unit were estimated on the date ofgrant using the fair market value of the shares at the time of the award discounted for dividends, which are not paid on theperformance share units during the vesting period. The fair value for the relative total shareholder return goal of eachperformance share unit was estimated on the date of grant using the Monte Carlo valuation model. The fair value ofperformance share units issued was $127.7 million, $16.7 million and $1.4 million in 2016, 2015 and 2014, respectively.
18. Segments of Business and Geographic Areas
Sales to Customers
(Dollars in Millions) 2016 2015 2014
Consumer –
United States $5,420 5,222 5,096
International 7,887 8,285 9,400
Total 13,307 13,507 14,496
Pharmaceutical –
United States 20,125 18,333 17,432
International 13,339 13,097 14,881
Total 33,464 31,430 32,313
Medical Devices –
United States 12,266 12,132 12,254
International 12,853 13,005 15,268
Total 25,119 25,137 27,522
Worldwide total $71,890 70,074 74,331
68 • Johnson & Johnson 2016 Annual Report
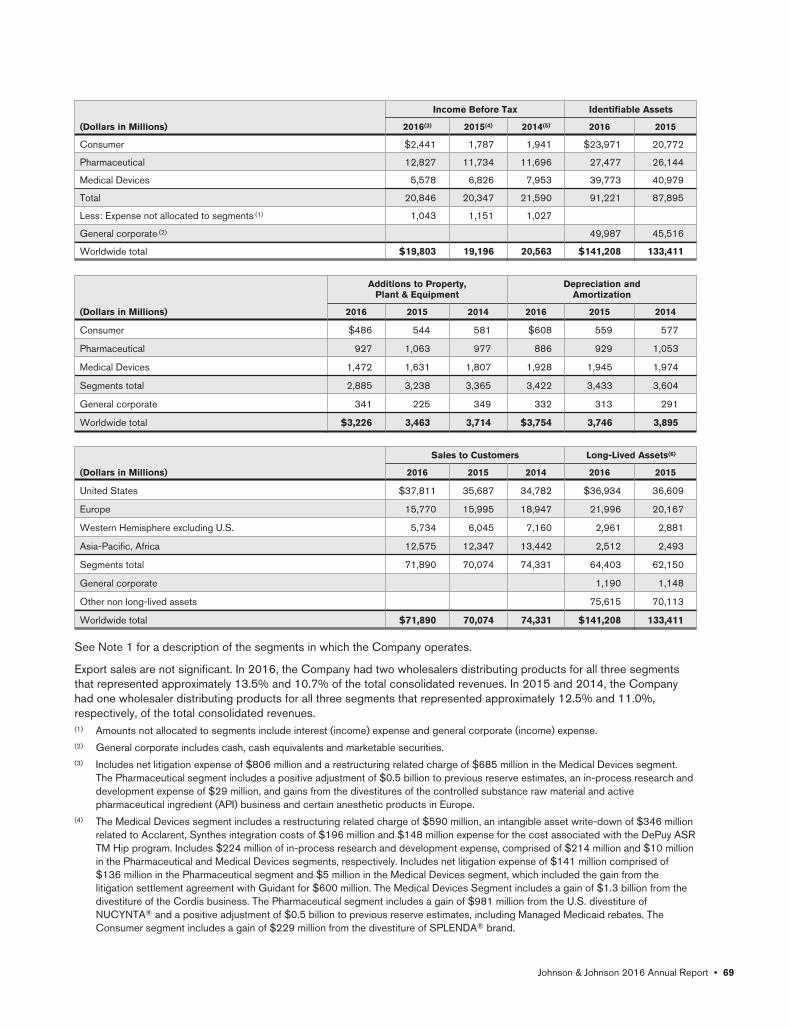
Income Before Tax Identifiable Assets
(Dollars in Millions) 2016(3) 2015(4) 2014(5) 2016 2015
Consumer $2,441 1,787 1,941 $23,971 20,772
Pharmaceutical 12,827 11,734 11,696 27,477 26,144
Medical Devices 5,578 6,826 7,953 39,773 40,979
Total 20,846 20,347 21,590 91,221 87,895
Less: Expense not allocated to segments (1) 1,043 1,151 1,027
General corporate (2) 49,987 45,516
Worldwide total $19,803 19,196 20,563 $141,208 133,411
Additions to Property,Plant & Equipment
Depreciation andAmortization
(Dollars in Millions) 2016 2015 2014 2016 2015 2014
Consumer $486 544 581 $608 559 577
Pharmaceutical 927 1,063 977 886 929 1,053
Medical Devices 1,472 1,631 1,807 1,928 1,945 1,974
Segments total 2,885 3,238 3,365 3,422 3,433 3,604
General corporate 341 225 349 332 313 291
Worldwide total $3,226 3,463 3,714 $3,754 3,746 3,895
Sales to Customers Long-Lived Assets(6)
(Dollars in Millions) 2016 2015 2014 2016 2015
United States $37,811 35,687 34,782 $36,934 36,609
Europe 15,770 15,995 18,947 21,996 20,167
Western Hemisphere excluding U.S. 5,734 6,045 7,160 2,961 2,881
Asia-Pacific, Africa 12,575 12,347 13,442 2,512 2,493
Segments total 71,890 70,074 74,331 64,403 62,150
General corporate 1,190 1,148
Other non long-lived assets 75,615 70,113
Worldwide total $71,890 70,074 74,331 $141,208 133,411
See Note 1 for a description of the segments in which the Company operates.
Export sales are not significant. In 2016, the Company had two wholesalers distributing products for all three segmentsthat represented approximately 13.5% and 10.7% of the total consolidated revenues. In 2015 and 2014, the Companyhad one wholesaler distributing products for all three segments that represented approximately 12.5% and 11.0%,respectively, of the total consolidated revenues.(1) Amounts not allocated to segments include interest (income) expense and general corporate (income) expense.(2) General corporate includes cash, cash equivalents and marketable securities.(3) Includes net litigation expense of $806 million and a restructuring related charge of $685 million in the Medical Devices segment.
The Pharmaceutical segment includes a positive adjustment of $0.5 billion to previous reserve estimates, an in-process research anddevelopment expense of $29 million, and gains from the divestitures of the controlled substance raw material and activepharmaceutical ingredient (API) business and certain anesthetic products in Europe.
(4) The Medical Devices segment includes a restructuring related charge of $590 million, an intangible asset write-down of $346 millionrelated to Acclarent, Synthes integration costs of $196 million and $148 million expense for the cost associated with the DePuy ASRTM Hip program. Includes $224 million of in-process research and development expense, comprised of $214 million and $10 millionin the Pharmaceutical and Medical Devices segments, respectively. Includes net litigation expense of $141 million comprised of$136 million in the Pharmaceutical segment and $5 million in the Medical Devices segment, which included the gain from thelitigation settlement agreement with Guidant for $600 million. The Medical Devices Segment includes a gain of $1.3 billion from thedivestiture of the Cordis business. The Pharmaceutical segment includes a gain of $981 million from the U.S. divestiture ofNUCYNTA® and a positive adjustment of $0.5 billion to previous reserve estimates, including Managed Medicaid rebates. TheConsumer segment includes a gain of $229 million from the divestiture of SPLENDA® brand.
Johnson & Johnson 2016 Annual Report • 69
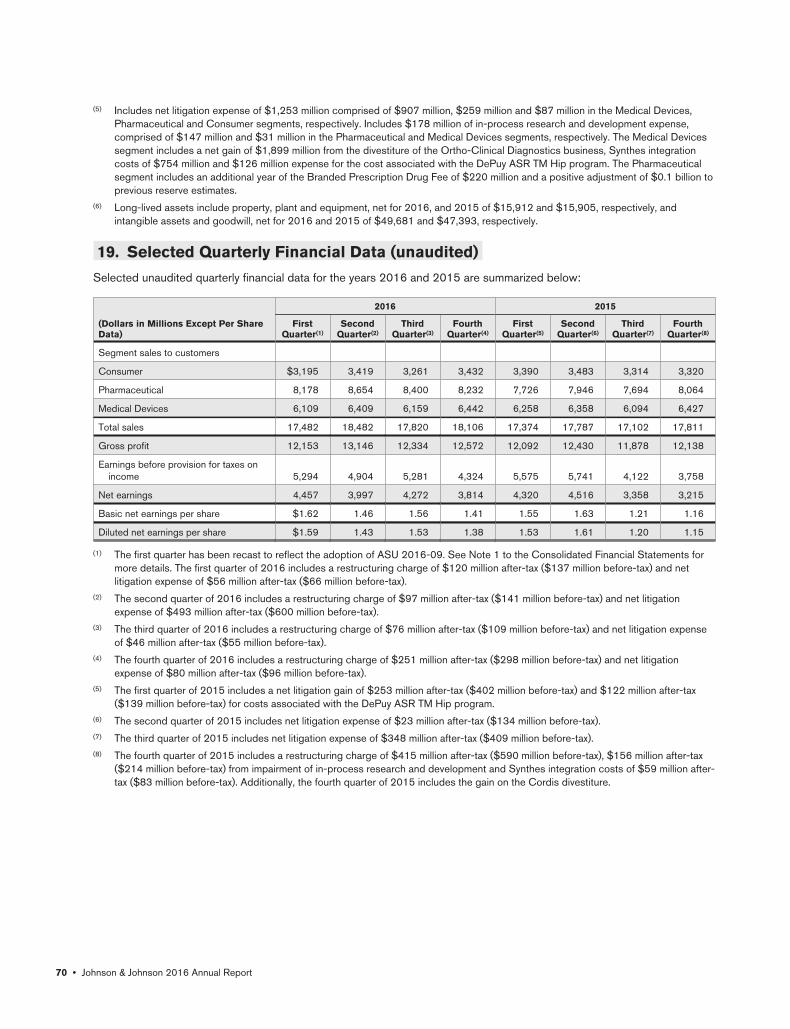
(5) Includes net litigation expense of $1,253 million comprised of $907 million, $259 million and $87 million in the Medical Devices,Pharmaceutical and Consumer segments, respectively. Includes $178 million of in-process research and development expense,comprised of $147 million and $31 million in the Pharmaceutical and Medical Devices segments, respectively. The Medical Devicessegment includes a net gain of $1,899 million from the divestiture of the Ortho-Clinical Diagnostics business, Synthes integrationcosts of $754 million and $126 million expense for the cost associated with the DePuy ASR TM Hip program. The Pharmaceuticalsegment includes an additional year of the Branded Prescription Drug Fee of $220 million and a positive adjustment of $0.1 billion toprevious reserve estimates.
(6) Long-lived assets include property, plant and equipment, net for 2016, and 2015 of $15,912 and $15,905, respectively, andintangible assets and goodwill, net for 2016 and 2015 of $49,681 and $47,393, respectively.
19. Selected Quarterly Financial Data (unaudited)
Selected unaudited quarterly financial data for the years 2016 and 2015 are summarized below:
2016 2015
(Dollars in Millions Except Per ShareData)
FirstQuarter(1)
SecondQuarter(2)
ThirdQuarter(3)
FourthQuarter(4)
FirstQuarter(5)
SecondQuarter(6)
ThirdQuarter(7)
FourthQuarter(8)
Segment sales to customers
Consumer $3,195 3,419 3,261 3,432 3,390 3,483 3,314 3,320
Pharmaceutical 8,178 8,654 8,400 8,232 7,726 7,946 7,694 8,064
Medical Devices 6,109 6,409 6,159 6,442 6,258 6,358 6,094 6,427
Total sales 17,482 18,482 17,820 18,106 17,374 17,787 17,102 17,811
Gross profit 12,153 13,146 12,334 12,572 12,092 12,430 11,878 12,138
Earnings before provision for taxes onincome 5,294 4,904 5,281 4,324 5,575 5,741 4,122 3,758
Net earnings 4,457 3,997 4,272 3,814 4,320 4,516 3,358 3,215
Basic net earnings per share $1.62 1.46 1.56 1.41 1.55 1.63 1.21 1.16
Diluted net earnings per share $1.59 1.43 1.53 1.38 1.53 1.61 1.20 1.15
(1) The first quarter has been recast to reflect the adoption of ASU 2016-09. See Note 1 to the Consolidated Financial Statements formore details. The first quarter of 2016 includes a restructuring charge of $120 million after-tax ($137 million before-tax) and netlitigation expense of $56 million after-tax ($66 million before-tax).
(2) The second quarter of 2016 includes a restructuring charge of $97 million after-tax ($141 million before-tax) and net litigationexpense of $493 million after-tax ($600 million before-tax).
(3) The third quarter of 2016 includes a restructuring charge of $76 million after-tax ($109 million before-tax) and net litigation expenseof $46 million after-tax ($55 million before-tax).
(4) The fourth quarter of 2016 includes a restructuring charge of $251 million after-tax ($298 million before-tax) and net litigationexpense of $80 million after-tax ($96 million before-tax).
(5) The first quarter of 2015 includes a net litigation gain of $253 million after-tax ($402 million before-tax) and $122 million after-tax($139 million before-tax) for costs associated with the DePuy ASR TM Hip program.
(6) The second quarter of 2015 includes net litigation expense of $23 million after-tax ($134 million before-tax).(7) The third quarter of 2015 includes net litigation expense of $348 million after-tax ($409 million before-tax).(8) The fourth quarter of 2015 includes a restructuring charge of $415 million after-tax ($590 million before-tax), $156 million after-tax
($214 million before-tax) from impairment of in-process research and development and Synthes integration costs of $59 million after-tax ($83 million before-tax). Additionally, the fourth quarter of 2015 includes the gain on the Cordis divestiture.
70 • Johnson & Johnson 2016 Annual Report

20. Business Combinations and Divestitures
Certain businesses were acquired for $4,509 million in cash and $77 million of liabilities assumed during 2016. Theseacquisitions were accounted for using the acquisition method and, accordingly, results of operations have been includedin the financial statements from their respective dates of acquisition.
The 2016 acquisitions primarily included: Vogue International LLC, a privately-held company focused on the marketing,development and distribution of salon-influenced and nature inspired hair care and other personal products; NeuWaveMedical, Inc., a privately-held medical device company that manufactures and markets minimally invasive soft tissuemicrowave ablation systems; NeoStrata Company, Inc., a global leader in dermocosmetics, and the global rights for thecommercialization of RHINOCORT® allergy spray outside the United States.
The excess of purchase price over the estimated fair value of tangible assets acquired amounted to $4,077 million and hasbeen assigned to identifiable intangible assets, with any residual recorded to goodwill.
The net purchase price for Vogue International LLC of $3.3 billion was primarily recorded as amortizable intangible assetsfor $2.3 billion and goodwill for $1.1 billion. The weighted average life for the $2.3 billion of total amortizable intangibles isapproximately 22 years. The trademark asset values were determined to have definite lives ranging from 10 to 22 years,with the majority being 22 years. The goodwill is primarily attributable to synergies expected to arise from the businessacquisition and is expected to be deductible for tax purposes. The assets acquired were recorded in the Consumersegment.
During the fiscal third quarter of 2016, the Company announced a definitive agreement to acquire Abbott Medical Optics(AMO), a wholly-owned subsidiary of Abbott Laboratories, for $4.325 billion in cash. The acquisition will includeophthalmic products related to: cataract surgery, laser refractive surgery and consumer eye health. The transaction closedon February 27, 2017. The purchase price allocation is in progress and is expected to result in an allocation of significantvalue to the amortizable intangible assets with any residual recorded as goodwill.
On January 26, 2017, subsequent to year end, the Company announced a definitive transaction agreement under whichthe company will launch an all-cash tender offer in Switzerland to acquire all of the outstanding shares of Actelion Ltd. for$280 per share, payable in U.S. dollars, for approximately $30.0 billion. As part of the transaction, immediately prior to thecompletion of the acquisition, Actelion will spin out its drug discovery operations and early-stage clinical developmentassets into a newly created Swiss biopharmaceutical company (“R&D NewCo”). The shares of R&D NewCo, which will belisted on the SIX Swiss Exchange (SIX), will be distributed to Actelion’s shareholders as a stock dividend upon closing ofthe tender. The Company will initially hold 16% of the shares of R&D NewCo and have rights to an additional 16% of R&DNewCo equity through a convertible note. Actelion has established a leading franchise of differentiated, innovativeproducts for pulmonary arterial hypertension (PAH) that is highly complementary to the existing portfolio of the Company.The addition of Actelion’s specialty in-market medicines and late-stage products is consistent with the Company’s effortsto grow in attractive and complementary therapeutic areas and serve patients with serious illnesses and significant unmetmedical need. The closing is subject to the demerger, antitrust clearance and other customary closing conditions.
On February 15, 2017, subsequent to year end, the Company received a binding offer from Integra LifeSciences HoldingsCorporation to purchase the Codman Neurosurgery business for approximately $1.0 billion.
Subsequent to year end, the Company announced it is engaging in a process to evaluate potential strategic options forthe Johnson & Johnson Diabetes Care Companies, specifically LifeScan, Inc., Animas Corporation, and Calibra Medical,Inc. Strategic options may include the formation of operating partnerships, joint ventures or strategic alliances, a sale ofthe businesses, or other alternatives either separately or together. All options will be evaluated to determine the bestopportunity to drive future growth and maximize shareholder value. There can be no assurance that this process will resultin any transaction or other strategic alternative of any kind therefore, there were no assets held for sale as of January 1,2017 related to the announcement.
Certain businesses were acquired for $954 million in cash and $220 million of liabilities assumed during 2015. Theassumed liabilities primarily represent the fair value of the contingent consideration of $210 million . These acquisitionswere accounted for using the acquisition method and, accordingly, results of operations have been included in thefinancial statements from their respective dates of acquisition.
The 2015 acquisitions primarily included: XO1 Limited, a privately-held biopharmaceutical company developing an anti-thrombin antibody and Novira Therapeutics, Inc., a privately held clinical-stage biopharmaceutical company developinginnovative therapies for curative treatment of chronic hepatitis B virus infection.
Johnson & Johnson 2016 Annual Report • 71
The excess of purchase price over the estimated fair value of tangible assets acquired amounted to $1,173 million and hasbeen assigned to identifiable intangible assets, with any residual recorded to goodwill. Of this amount, approximately $839million has been identified as the value of IPR&D primarily associated with the acquisitions of XO1 Limited and NoviraTherapeutics, Inc. The value of the IPR&D was calculated using cash flow projections discounted for the inherent risk inthe projects.
The IPR&D related to the acquisition of XO1 Limited of $360 million is associated with a recombinant human antibodydeveloped to mimic the activity of a human antibody which appears to produce an anticoagulated state withoutpredisposition to bleeding. A probability of success factor of 36.0% was used to reflect inherent clinical and regulatoryrisk. The discount rate applied was 11.75%.
The IPR&D related to the acquisition of Novira Therapeutics, Inc. of $396 million is associated with its lead candidate NVR3-778 which is an investigational small molecule, direct-acting antiviral, for oral administration in patients with HBV thatinhibits the HBV core or capsid protein. A probability of success factor of 51.0% was used to reflect inherent clinical andregulatory risk. The discount rate applied was 16.0%.
Certain businesses were acquired for $2,129 million in cash and $38 million of liabilities assumed during 2014. Theseacquisitions were accounted for using the acquisition method and, accordingly, results of operations have been includedin the financial statements from their respective dates of acquisition.
The 2014 acquisitions included: Covagen AG, a privately-held, biopharmaceutical company specializing in thedevelopment of multispecific protein therapeutics through the FynomAb® technology platform; Alios BioPharma, Inc., aprivately-held, clinical stage biopharmaceutical company focused on developing therapies for viral diseases; and theORSLTM electrolyte ready-to-drink brand from Jagdale Industries Ltd. The excess of purchase price over the estimated fairvalue of tangible assets acquired amounted to $2,069 million and has been assigned to identifiable intangible assets, withany residual recorded to goodwill. Of this amount, approximately $1,913 million has been identified as the value of IPR&Dassociated with the acquisitions of Covagen AG and Alios BioPharma, Inc. The value of the IPR&D was calculated usingcash flow projections discounted for the inherent risk in the projects.
The IPR&D related to the acquisition of Alios BioPharma, Inc. of $1,688 million is associated with Alios’ lead compoundAL-8176, an orally administered antiviral therapy for treatment of infants with respiratory syncytial virus (RSV). A probabilityof success factor of 60.0% was used to reflect inherent clinical and regulatory risk. The discount rate applied was 11.4%.The IPR&D related to the acquisition of Covagen AG of $225 million is associated with Covagen’s lead compoundCOVA-322, currently in Phase 1b study for psoriasis and holding potential as a treatment for a broad range ofinflammatory diseases including rheumatoid arthritis. A probability of success factor of 26.0% was used to reflect inherentclinical and regulatory risk. The discount rate applied was 12.5%. During 2015, the Company recorded a charge for theimpairment of the IPR&D related to the acquisition of Covagen AG.
In 2012, the Company completed the acquisition of Synthes, Inc. for a purchase price of $20.2 billion in cash and stock.In connection with the acquisition of Synthes, Inc. the Company entered into two accelerated share repurchase (ASR)agreements. In 2013, the Company settled the remaining liabilities under the ASR agreements. While the Companybelieves that the transactions under each ASR agreement and a series of related internal transactions were consummatedin a tax efficient manner in accordance with applicable law, it is possible that the Internal Revenue Service could assertone or more contrary positions to challenge the transactions from a tax perspective. If challenged, an amount up to thetotal purchase price for the Synthes shares could be treated as subject to applicable U.S. tax at approximately thestatutory rate to the Company, plus interest.
Supplemental pro forma information for 2016, 2015 and 2014 in accordance with U.S. GAAP standards related tobusiness combinations, and goodwill and other intangible assets, is not provided, as the impact of the aforementionedacquisitions did not have a material effect on the Company’s results of operations, cash flows or financial position.
During 2016, the Company divestitures included: the controlled substance raw material and active pharmaceuticalingredient (API) business; certain anesthetic products in Europe; and certain non-strategic Consumer brands. In 2016, thepre-tax gains on the divestitures were approximately $0.6 billion.
During 2015, the Company divestitures included: the Cordis business to Cardinal Health; the SPLENDA® brand toHeartland Food Products Group; and the U.S. license rights to NUCYNTA® (tapentadol), NUCYNTA® ER (tapentadolextended-release tablets), and NUCYNTA® (tapentadol) oral solution. In 2015, the pre-tax gains on the divestitures wereapproximately $2.6 billion.
During 2014, the Company divestitures included: the Ortho-Clinical Diagnostics business to The Carlyle Group; the K-Y®
brand to Reckitt Benckiser Group PLC in the U.S. and certain other markets; and the BENECOL® brand to Raisio plc.
72 • Johnson & Johnson 2016 Annual Report

In 2014, the pre-tax gains on the divestitures were approximately $2.4 billion. The Company completed the divestiture ofits Ortho-Clinical Diagnostics business to The Carlyle Group for approximately $4.0 billion and the Company recorded apre-tax gain of approximately $1.9 billion. Ortho-Clinical Diagnostics’ results are included in the Company’s MedicalDevices segment.
21. Legal Proceedings
Johnson & Johnson and certain of its subsidiaries are involved in various lawsuits and claims regarding product liability,intellectual property, commercial and other matters; governmental investigations; and other legal proceedings that arisefrom time to time in the ordinary course of their business.
The Company records accruals for loss contingencies associated with these legal matters when it is probable that aliability will be incurred and the amount of the loss can be reasonably estimated. As of January 1, 2017, the Company hasdetermined that the liabilities associated with certain litigation matters are probable and can be reasonably estimated. TheCompany has accrued for these matters and will continue to monitor each related legal issue and adjust accruals as mightbe warranted based on new information and further developments in accordance with ASC 450-20-25. For these andother litigation and regulatory matters discussed below for which a loss is probable or reasonably possible, the Companyis unable to estimate the possible loss or range of loss beyond the amounts already accrued. Amounts accrued for legalcontingencies often result from a complex series of judgments about future events and uncertainties that rely heavily onestimates and assumptions. The ability to make such estimates and judgments can be affected by various factors,including whether damages sought in the proceedings are unsubstantiated or indeterminate; scientific and legal discoveryhas not commenced or is not complete; proceedings are in early stages; matters present legal uncertainties; there aresignificant facts in dispute; or there are numerous parties involved.
In the Company’s opinion, based on its examination of these matters, its experience to date and discussions with counsel,the ultimate outcome of legal proceedings, net of liabilities accrued in the Company’s balance sheet, is not expected tohave a material adverse effect on the Company’s financial position. However, the resolution of, or increase in accruals for,one or more of these matters in any reporting period may have a material adverse effect on the Company’s results ofoperations and cash flows for that period.
Product Liability
Johnson & Johnson and certain of its subsidiaries are involved in numerous product liability claims and lawsuits involvingmultiple products. Claimants in these cases seek substantial compensatory and, where available, punitive damages. Whilethe Company believes it has substantial defenses, it is not feasible to predict the ultimate outcome of litigation. TheCompany has established accruals for product liability claims and lawsuits in compliance with ASC 450-20 based oncurrently available information, which in some cases may be limited. The Company accrues an estimate of the legaldefense costs needed to defend each matter when those costs are probable and can be reasonably estimated. For certainof these matters, the Company has accrued additional amounts such as estimated costs associated with settlements,damages and other losses. To the extent adverse verdicts have been rendered against the Company, the Company doesnot record an accrual until a loss is determined to be probable and can be reasonably estimated. Product liability accrualscan represent projected product liability for thousands of claims around the world, each in different litigation environmentsand with different fact patterns. Changes to the accruals may be required in the future as additional information becomesavailable.
The most significant of these cases include the DePuy ASR™ XL Acetabular System and DePuy ASR™ Hip ResurfacingSystem, the PINNACLE® Acetabular Cup System, pelvic meshes, RISPERDAL®, XARELTO® and JOHNSON’S® BabyPowder. As of January 1, 2017, in the U.S. there were approximately 2,000 plaintiffs with direct claims in pending lawsuitsregarding injuries allegedly due to the DePuy ASR™ XL Acetabular System and DePuy ASR™ Hip Resurfacing System,9,400 with respect to the PINNACLE® Acetabular Cup System, 54,800 with respect to pelvic meshes, 18,500 withrespect to RISPERDAL®, 16,900 with respect to XARELTO® and 3,100 with respect to JOHNSON’S® Baby Powder.
In August 2010, DePuy Orthopaedics, Inc. (DePuy) announced a worldwide voluntary recall of its ASR™ XL AcetabularSystem and DePuy ASR™ Hip Resurfacing System used in hip replacement surgery. Claims for personal injury have beenmade against DePuy and Johnson & Johnson. The number of pending lawsuits is expected to fluctuate as certain lawsuitsare settled or dismissed and additional lawsuits are filed. Cases filed in federal courts in the United States have beenorganized as a multi-district litigation in the United States District Court for the Northern District of Ohio. Litigation hasalso been filed in countries outside of the United States, primarily in the United Kingdom, Canada, Australia, Ireland,
Johnson & Johnson 2016 Annual Report • 73

Germany and Italy. In November 2013, DePuy reached an agreement with a Court-appointed committee of lawyersrepresenting ASR Hip System plaintiffs to establish a program to settle claims with eligible ASR Hip patients in the UnitedStates who had surgery to replace their ASR Hips, known as revision surgery, as of August 31, 2013. This settlementcovered approximately 8,000 patients. In February 2015, DePuy reached an additional agreement, which effectivelyextends the existing settlement program to ASR Hip patients who had revision surgeries after August 31, 2013 and priorto February 1, 2015. This second agreement is estimated to cover approximately 1,800 additional patients. The estimatedcost of these agreements is covered by existing accruals. This settlement program is expected to bring to a closesignificant ASR Hip litigation activity in the United States. However, many lawsuits in the United States will remain, and thesettlement program does not address litigation outside of the United States. In Australia, a settlement was reached withrepresentatives of a class action lawsuit pending in the Federal Court of New South Wales that resolves the claims of themajority of ASR Hip patients in that country. The Company continues to receive information with respect to potential costsassociated with this recall on a worldwide basis. The Company has established accruals for the costs associated with theDePuy ASR™ Hip program and related product liability litigation. Changes to these accruals may be required in the futureas additional information becomes available.
Claims for personal injury have also been made against DePuy and Johnson & Johnson relating to the PINNACLE®
Acetabular Cup System used in hip replacement surgery. The number of pending product liability lawsuits continues toincrease, and the Company continues to receive information with respect to potential costs and the anticipated number ofcases. Cases filed in federal courts in the United States have been organized as a multi-district litigation in the UnitedStates District Court for the Northern District of Texas. Litigation has also been filed in countries outside of the UnitedStates, primarily in the United Kingdom. The Company has established an accrual for defense costs in connection withproduct liability litigation associated with the PINNACLE® Acetabular Cup System. Changes to this accrual may berequired in the future as additional information becomes available.
Claims for personal injury have been made against Ethicon, Inc. (Ethicon) and Johnson & Johnson arising out of Ethicon’spelvic mesh devices used to treat stress urinary incontinence and pelvic organ prolapse. The number of pending productliability lawsuits continues to increase, and the Company continues to receive information with respect to potential costsand the anticipated number of cases. Cases filed in federal courts in the United States have been organized as a multi-district litigation in the United States District Court for the Southern District of West Virginia. In addition, class actions andindividual personal injury cases or claims have been commenced in various countries outside of the United States,including claims and cases in the United Kingdom, the Netherlands, Belgium, Italy and Venezuela, and class actions inIsrael, Australia and Canada, seeking damages for alleged injury resulting from Ethicon’s pelvic mesh devices. TheCompany has established an accrual with respect to product liability litigation associated with Ethicon’s pelvic meshproducts. Changes to this accrual may be required in the future as additional information becomes available.
Claims for personal injury have been made against Janssen Pharmaceuticals, Inc. and Johnson & Johnson arising out of theuse of RISPERDAL®, indicated for the treatment of schizophrenia, acute manic or mixed episodes associated with bipolar Idisorder and irritability associated with autism, and related compounds. Lawsuits have been primarily filed in state courts inPennsylvania, California, and Missouri. Other actions are pending in various courts in the United States and Canada. Thenumber of pending product liability lawsuits continues to increase, and the Company continues to receive information withrespect to potential costs and the anticipated number of cases. The Company has established an accrual with respect toproduct liability litigation associated with RISPERDAL®. Changes to this accrual may be required in the future asadditional information becomes available.
Claims for personal injury have been made against Janssen Pharmaceuticals, Inc. and Johnson & Johnson arising out of theuse of XARELTO®, an oral anticoagulant. The number of pending product liability lawsuits continues to increase, and theCompany continues to receive information with respect to potential costs and the anticipated number of cases. Casesfiled in federal courts in the United States have been organized as a multi-district litigation in the United States DistrictCourt for the Eastern District of Louisiana. In addition, cases have been filed in state courts across the United States.Many of these cases have been consolidated into a state mass tort litigation in Philadelphia, Pennsylvania; and there arecoordinated proceedings in Delaware, California and Missouri. Class action lawsuits also have been filed in Canada. TheCompany has established an accrual for defense costs in connection with product liability litigation associated withXARELTO®. Changes to this accrual may be required in the future as additional information becomes available.
Claims for personal injury have been made against Johnson & Johnson Consumer Inc. and Johnson & Johnson arising outof the use of JOHNSON’S® Baby Powder. The number of pending product liability lawsuits continues to increase, and theCompany continues to receive information with respect to potential costs and the anticipated number of cases. Lawsuitshave been primarily filed in state courts in Missouri, New Jersey and California. In addition, a federal multi-district litigationproceeding has been created for this litigation in the District Court of New Jersey. The Company has established an
74 • Johnson & Johnson 2016 Annual Report

accrual for defense costs in connection with product liability litigation associated with JOHNSON’S® BabyPowder. Changes to this accrual may be required in the future as additional information becomes available.
Intellectual Property
Certain subsidiaries of Johnson & Johnson are subject, from time to time, to legal proceedings and claims related topatent, trademark and other intellectual property matters arising out of their businesses. Many of these matters involvechallenges to the coverage and/or validity of the patents on various products and allegations that certain of the Company’sproducts infringe the patents of third parties. Although these subsidiaries believe that they have substantial defenses tothese challenges and allegations with respect to all significant patents, there can be no assurance as to the outcome ofthese matters. A loss in any of these cases could adversely affect the ability of these subsidiaries to sell their products,result in loss of sales due to loss of market exclusivity, require the payment of past damages and future royalties, and mayresult in a non-cash impairment charge for any associated intangible asset. The most significant of these matters aredescribed below.
Medical Devices
In June 2009, Rembrandt Vision Technologies, L.P. (Rembrandt) filed a patent infringement lawsuit against Johnson &Johnson Vision Care, Inc. (JJVCI) in the United States District Court for the Eastern District of Texas alleging that JJVCI’smanufacture and sale of its ACUVUE® ADVANCE and ACUVUE OASYS® Hydrogel Contact Lenses infringe their U.S.Patent No. 5,712,327 (the ‘327 patent). Rembrandt is seeking monetary relief. The case was transferred to the UnitedStates District Court for the Middle District of Florida. In May 2012, the jury returned a verdict holding that neither of theaccused lenses infringes the ‘327 patent. Rembrandt appealed, and in August 2013, the United States Court of Appealsfor the Federal Circuit affirmed the District Court’s judgment. Rembrandt asked the District Court to grant it a new trialbased on alleged new evidence, and in July 2014, the District Court denied Rembrandt’s motion. Rembrandt appealedand the Court of Appeals overturned that ruling in April 2016 and remanded the case to the District Court for a new trial.JJVCI’s motion to reconsider and petition for review with the United States Supreme Court were both denied. A new trialis scheduled for August 2017.
In December 2009, the State of Israel filed a lawsuit in the District Court in Tel Aviv Jaffa against OmrixBiopharmaceuticals, Inc. and various affiliates (Omrix). In the lawsuit, the State claimed that an employee of a government-owned hospital was the inventor on several patents related to fibrin glue technology that the employee developed while hewas a government employee. The State claimed that he had no right to transfer any intellectual property to Omrix becauseit belongs to the State. The State sought damages plus royalties on QUIXIL™ and EVICEL® products, or alternatively,transfer of the patents to the State. The case was settled in December 2016.
LifeScan filed a patent infringement lawsuit against UniStrip Technologies, LLC (UniStrip) in the United States DistrictCourt for the District of North Carolina in May 2014, alleging that the making and marketing of UniStrip’s strips for use inLifeScan’s blood glucose monitors infringe U.S. Patent Nos. 6,241,862 (the ‘862 patent) and 7,250,105 (the ‘105patent). In August 2014, the United States Patent and Trademark Office (USPTO) determined that the ‘105 patent isinvalid. In January 2016, the invalidity decision was upheld on appeal. LifeScan filed a motion for rehearing, which wasdenied. In July 2014, UniStrip brought a lawsuit against LifeScan in the United States District Court for the Eastern Districtof Pennsylvania, alleging antitrust violations relating to marketing practices for LifeScan strips.
In March 2013, Medinol Ltd. (Medinol) filed a patent infringement lawsuit against Cordis Corporation (Cordis) andJohnson & Johnson in the United States District Court for the Southern District of New York alleging that all of Cordis’ssales of the CYPHER™ and CYPHER SELECT™ Stents made in the United States since 2005 willfully infringed four ofMedinol’s patents directed to the geometry of articulated stents. Medinol is seeking damages and attorneys’ fees. Aftertrial in January 2014, the District Court dismissed the case, finding Medinol unreasonably delayed bringing its claims, andMedinol did not appeal the decision. In September 2014, the District Court denied a motion by Medinol to vacate thejudgment and grant it a new trial. Medinol’s appeal of this decision has been dismissed. Medinol has filed a petition forreview with the United States Supreme Court. Cordis was divested in 2015 and the Company retained any liability thatmay result from this case.
In November 2016, MedIdea, L.L.C. (MedIdea) filed a patent infringement lawsuit against DePuy Orthopaedics, Inc. in theUnited States District Court for the Northern District of Illinois alleging infringement by the ATTUNE® Knee System of twopatents relating to posterior stabilized knee systems. Specifically, MedIdea alleges that the SOFCAMTM Contact feature ofthe ATTUNE® posterior stabilized knee products infringes the patents-in-suit. MedIdea is seeking monetary damages andinjunctive relief.
Johnson & Johnson 2016 Annual Report • 75

In December 2016, Ethicon Endo-Surgery, Inc. and Ethicon Endo-Surgery, LLC (now known as Ethicon LLC) suedCovidien, Inc. in the U.S. District Court for the District of Massachusetts seeking a declaration that Covidien’s U.S. PatentNos. 6,585,735; 7,118,587; 7,473,253; 8,070,748; and 8,241,284 are either invalid or not infringed by Ethicon’sENSEAL® X1 Large Jaw Tissue Sealer product (ENSEAL X1). The ENSEAL X1 product is scheduled to launch in theUnited States and Europe in the first quarter of 2017.
Pharmaceutical
In April 2016, MorphoSys AG, a German biotech company, filed a patent infringement lawsuit against Janssen Biotech,Inc. (JBI), Genmab U.S. Inc. and Genmab A/S (collectively, Genmab) in the United States District Court for the District ofDelaware, alleging that JBI’s manufacture and sale of DARZALEX® (daratumumab) willfully infringes MorphoSys’ U.S.Patent No. 8,263,746. MorphoSys is seeking money damages. JBI licenses patents and the commercial rights toDARZALEX® from Genmab. In June 2016, JBI filed a motion to dismiss the lawsuit. In November 2016, MorphoSyssought leave to add another patent to the case (U.S. Patent No. 9,200,061), and in February 2017, the Court granted therequest. Trial in the case is currently scheduled to commence in August 2018.
In August 2016, Sandoz Ltd and Hexal AG (collectively, Sandoz) filed a lawsuit in the English High Court against G.D.Searle LLC (a Pfizer company) and Janssen Sciences Ireland UC (JSI) alleging that Searle’s supplementary protectioncertificate SPC/GB07/038 (SPC), which is exclusively licensed to JSI, is invalid and should be revoked. Janssen-CilagLimited sells PREZISTA® (darunavir) in the UK pursuant to this license. In October 2016, Searle and JSI counterclaimedagainst Sandoz for threatened infringement of the SPC based on statements of its plans to launch generic darunavir in theUK. Trial of the case has been scheduled to begin in late April/early May 2017.
REMICADE® Related Cases
U.S. Proceedings
In September 2013, Janssen Biotech, Inc. (JBI) and NYU Langone Medical Center (NYU) received an Office Action fromthe United States Patent and Trademark Office (USPTO) rejecting the claims in U.S. Patent No. 6,284,471 relating toREMICADE® (infliximab) (the ‘471 patent) in a reexamination proceeding instituted by a third party. The ‘471 patent is co-owned by JBI and NYU, and NYU granted JBI an exclusive license to NYU’s rights under the patent. The ‘471 patentexpires in September 2018. Following several office actions by the patent examiner, including two further rejections, andresponses by JBI, the USPTO issued a further action maintaining its rejection of the ‘471 patent. JBI filed a notice ofappeal to the USPTO’s Patent Trial and Appeal Board. In November 2016, the Patent Trial and Appeal Board issued adecision upholding the examiner’s rejection. JBI has filed an appeal to the U.S. Court of Appeals for the Federal Circuit.
In August 2014, Celltrion Healthcare Co. Ltd. and Celltrion Inc. (together, Celltrion) filed an application with the U.S. Foodand Drug Administration (FDA) for approval to make and sell its own infliximab biosimilar. In March 2015, JBI filed a lawsuitin the United States District Court for the District of Massachusetts against Celltrion and Hospira Healthcare Corporation(Hospira), which has exclusive U.S. marketing rights for Celltrion’s infliximab biosimilar, seeking, among other things, adeclaratory judgment that their biosimilar product infringes or potentially infringes several JBI patents, including the‘471 patent and U.S. Patent No. 7,598,083 (the ‘083 patent). In August 2016, the District Court granted both Celltrion’sand Hospira’s motions for summary judgment of invalidity of the ‘471 patent. JBI has appealed those decisions to the U.S.Court of Appeals for the Federal Circuit. This case and the appeal of the reexamination of the ‘471 patent have beendesignated companion cases and will be heard by the same panel of judges in the Federal Circuit.
In June 2016, JBI filed two additional patent infringement lawsuits asserting the ‘083 patent, one against Celltrion in theUnited States District Court for the District of Massachusetts and the other against HyClone Laboratories, Inc., themanufacturer of the cell culture media that Celltrion uses to make its biosimilar product, in the United States District Courtfor the District of Utah. Although the ‘083 patent is already asserted in the existing lawsuit against Celltrion, the additionallawsuit expands the claims to include any use of the cell culture media made in the United States to manufactureCelltrion’s biosimilar. This additional lawsuit against Celltrion has been consolidated with the existing lawsuit discussedabove. Hospira has moved to dismiss all counts of the lawsuit related to the ‘083 patent as to it. Celltrion has moved todismiss all counts of the lawsuit related to the ‘083 patent without prejudice for failure to join all the co-owners of the ‘083patent as plaintiffs. The trial has been postponed pending resolution of these motions.
The FDA approved Celltrion’s infliximab biosimilar for sale in the United States in April 2016, and the 180-day period fornotice of launch of a biosimilar product under the Biologics Price Competition and Innovation Act has passed.
76 • Johnson & Johnson 2016 Annual Report

Hospira’s parent company, Pfizer Inc., began shipment of Celltrion’s infliximab biosimilar to wholesalers in the UnitedStates in late November 2016. Introduction to the U.S. market of the biosimilar will result in a reduction in U.S. sales ofREMICADE®.
Canadian Proceedings
In March 2013, Hospira filed an impeachment proceeding against The Kennedy Institute of Rheumatology (Kennedy)challenging the validity of a Canadian patent related to REMICADE® (a Feldman patent), which is exclusively licensed toJBI. In October 2013, Kennedy, along with JBI, Janssen Inc. (Janssen) and Cilag GmbH International (both affiliates of JBI),filed a counterclaim for infringement against Celltrion and Hospira. The counterclaim alleges that the products described inCelltrion’s and Hospira’s marketing applications to Health Canada for their subsequent entry biologics (SEB) toREMICADE® would infringe the Feldman patents owned by Kennedy. A trial in this patent action concluded in October2016, and closing arguments took place in January 2017. The parties are awaiting a decision.
In January 2014, Health Canada approved Celltrion’s SEB to REMICADE®, allowing Celltrion to market its infliximabbiosimilar in Canada, regardless of the pending patent action. In June 2014, Health Canada approved Hospira’s SEB toREMICADE®. In July 2014, Janssen filed a lawsuit to compel the Canadian Minister of Health to withdraw the Notice ofCompliance for Hospira’s SEB because Hospira did not serve a Notice of Allegation on Janssen to address the patentlisted by Janssen on the Patent Register. In March 2015, the parties entered into a settlement agreement whereby HealthCanada agreed to a Consent Judgment setting aside Hospira’s Notice of Compliance, subject to Health Canada’s appeal,which was filed in June 2015. Nevertheless, Hospira began marketing an infliximab biosimilar as a distributor underCelltrion’s Notice of Compliance. In October 2016, the appeals court reversed the Consent Judgment. Janssen has filedan application for leave to appeal with the Supreme Court of Canada. Hospira continues to market and sell Celltrion’sinfliximab biosimilar in Canada.
In Canada, if the REMICADE® patent discussed above is found to be invalid following all appeals, it could not be reliedupon to prevent the further introduction of infliximab biosimilars prior to the August 1, 2017 expiry date of the patent.
Litigation Against Filers of Abbreviated New Drug Applications (ANDAs)
The following summarizes lawsuits pending against generic companies that have filed Abbreviated New Drug Applications(ANDAs) with the FDA, or undertaken similar regulatory processes outside of the United States, seeking to market genericforms of products sold by various subsidiaries of Johnson & Johnson prior to expiration of the applicable patents coveringthose products. These ANDAs typically include allegations of non-infringement, invalidity and unenforceability of theapplicable patents. In the event the subsidiaries are not successful in these actions, or the statutory 30-month stays of theANDAs expire before the United States District Court rulings are obtained, the third-party companies involved will have theability, upon approval of the FDA, to introduce generic versions of the products at issue to the market, resulting in thepotential for substantial market share and revenue losses for those products, and which may result in a non-cashimpairment charge in any associated intangible asset. In addition, from time to time, subsidiaries may settle these actionsand such settlements can involve the introduction of generic versions of the products at issue to the market prior to theexpiration of the relevant patents. The inter partes review (IPR) process with the United States Patent and TrademarkOffice (USPTO), created under the 2011 America Invents Act, is also being used by generic companies in conjunctionwith these ANDAs and lawsuits to challenge patents held by the Company’s subsidiaries.
CONCERTA®
In December 2014, Janssen Inc. and ALZA Corporation filed a Notice of Application against Actavis Pharma Company(Actavis) in response to Actavis’ Notice of Allegation seeking approval to market a generic version of CONCERTA® beforethe expiration of Canadian Patent No. 2,264,852 (the ‘852 patent). In December 2016, the Canadian Federal Courtallowed the Application and issued an order preventing Actavis from obtaining marketing approval (a Notice ofCompliance) for its generic version of CONCERTA® until the expiration of the ‘852 patent. Actavis did not commence anappeal prior to the deadline for doing so and thus, is prevented from obtaining a Notice of Compliance for a genericversion of CONCERTA® until the expiration of the ‘852 patent.
In October 2016, ALZA Corporation and Janssen Pharmaceuticals, Inc. filed a patent infringement lawsuit in the U.S.District Court for the District of Delaware against Amneal Pharmaceuticals of New York, LLC and Amneal PharmaceuticalsLLC in response to Amneal’s ANDA seeking approval to market a generic version of CONCERTA® before the expiration ofUnited States Patent Nos. 8,163,798 and 9,144,549. In November 2016, Amneal filed a motion for judgment on thepleadings, arguing that certain claims of the patents are invalid and others are not infringed. Janssen has opposed themotion.
Johnson & Johnson 2016 Annual Report • 77

ZYTIGA®
In June and July 2015, Janssen Biotech, Inc. (JBI) received notices of paragraph IV certification from several companiesadvising of their respective ANDAs seeking approval for a generic version of ZYTIGA® before the expiration of one ormore patents relating to ZYTIGA®. In July 2015, JBI, Janssen Oncology, Inc. (Janssen Oncology) and Janssen Research &Development, LLC (collectively, Janssen) and BTG International Ltd. (BTG) filed a patent infringement lawsuit in the UnitedStates District Court for the District of New Jersey against several generic ANDA applicants (and certain of their affiliatesand/or suppliers) in response to their respective ANDAs seeking approval to market a generic version of ZYTIGA® beforethe expiration of United States Patent Nos. 5,604,213 (the ‘213 patent) and/or 8,822,438 (the ‘438 patent). The genericcompanies include Actavis Laboratories, FL, Inc. (Actavis); Amneal Pharmaceuticals, LLC and Amneal Pharmaceuticals ofNew York, LLC (collectively, Amneal); Apotex Inc. and Apotex Corp. (collectively, Apotex); Citron Pharma LLC (Citron);Dr. Reddy’s Laboratories, Ltd. and Dr. Reddy’s Laboratories, Inc. (collectively, Dr. Reddy’s); Mylan Pharmaceuticals Inc.and Mylan Inc. (collectively, Mylan); Par Pharmaceuticals, Inc. and Par Pharmaceutical Companies, Inc. (collectively, Par);Sun Pharmaceutical Industries Ltd. and Sun Pharmaceuticals Industries, Inc. (collectively, Sun); Teva PharmaceuticalsUSA, Inc. (Teva); Wockhardt Bio A.G.; Wockhardt USA LLC and Wockhardt Ltd. (collectively, Wockhardt); West-WardPharmaceutical Corp. (West-Ward); and Hikma Pharmaceuticals, LLC (Hikma). The Court entered a stay of the lawsuitagainst Par and Citron, as each agreed to be bound by the decision against the other defendants in the action. The ‘213patent expired in December 2016 and thus the infringement actions concern only the ‘438 patent. In February 2016, theCourt set a trial date of October 2017.
In August 2015, Janssen and BTG filed an additional jurisdictional protective lawsuit against the Mylan defendants in theUnited States District Court for the Northern District of West Virginia, which has been stayed.
In August 2015, Janssen received a notice of paragraph IV certification from Hetero USA Inc., the U.S. Regulatory Agentfor Hetero Labs Limited Unit-V, a division of Hetero Labs Limited (collectively, Hetero) advising of Hetero’s ANDA seekingapproval for a generic version of ZYTIGA® before expiration of the ‘438 patent. In September 2015, Janssen and BTGfiled an amended complaint in the New Jersey lawsuit to add alleged infringement of the ‘438 patent by Hetero.
In March 2016, Janssen filed a motion in the New Jersey lawsuit to correct inventorship of the ‘438 patent to add aninventor and, if granted, for leave to amend the complaint accordingly. In January 2017, the Court granted Janssen’smotion, and Janssen filed a second amended complaint adding BTG as a co-owner of the ‘438 patent and a co-plaintiffregarding the ‘438 patent infringement claims.
In March 2016, Janssen received a notice from Amerigen Pharmaceuticals Limited (Amerigen) advising of Amerigen’sANDA seeking approval for a generic version of ZYTIGA® before expiration of the ‘438 patent. In response, Janssen andBTG filed a separate patent infringement lawsuit in the United States District Court for the District of New Jersey againstAmerigen in May 2016.
In May 2016, Janssen received a notice of paragraph IV certification from Glenmark Pharmaceuticals Inc., on behalf ofGlenmark Pharmaceuticals SA, a wholly owned subsidiary of Glenmark Pharmaceuticals Ltd. (collectively, Glenmark)advising of Glenmark’s ANDA seeking approval for a generic version of ZYTIGA® before expiration of the ‘438 patent. Inresponse, in June 2016, Janssen and BTG filed a patent infringement lawsuit in the United States District Court for theDistrict of New Jersey against Glenmark. The parties have stipulated to a dismissal of Glenmark Pharmaceuticals Ltd.
The filing of the above-referenced lawsuits triggered a stay until October 2018 during which time the FDA will not grantfinal approval of the generics’ ANDAs unless there is an earlier District Court decision finding the patents-in-suit invalid ornot infringed.
In each of the above lawsuits, Janssen is seeking an order enjoining the defendants from marketing their generic versionsof ZYTIGA® before the expiration of the relevant patents.
In December 2015, Amerigen filed a petition for an inter partes review in the USPTO seeking to invalidate the ‘438 patent.In May 2016, the USPTO granted the inter partes review, and a decision as to the validity of the ‘438 patent is expectedby May 2017. In June 2016, Argentum Pharmaceuticals LLC and Mylan Pharmaceuticals Inc. filed petitions for inter partesreview in the USPTO seeking to invalidate the ‘438 patent and moved to join the inter partes review filed by Amerigen. TheUSPTO instituted Argentum’s petition and granted Argentum’s motion for joinder and, in January 2017, granted Mylan’spetition for inter partes review but denied Mylan’s motion for joinder. In August 2016, Wockhardt Bio AG filed a petitionfor inter partes review in the USPTO seeking to invalidate the ‘438 patent, which the USPTO granted in January 2017. InFebruary 2017, Actavis, Amneal, Dr. Reddy’s, Sun, Teva, West-Ward and Hikma filed a joint petition for inter partes reviewin the USPTO seeking to invalidate the ‘438 patent and moved to join the inter partes review filed by Mylan.
78 • Johnson & Johnson 2016 Annual Report
COMPLERA®
In August and September 2015, Janssen Pharmaceutica NV and Janssen Sciences Ireland UC (collectively, Janssen) andGilead Sciences, Inc. and Gilead Sciences Ireland UC (collectively, Gilead) filed patent infringement lawsuits in the UnitedStates District Courts for the District of Delaware and the District of West Virginia, respectively, against Mylan, Inc. andMylan Pharmaceuticals, Inc. (collectively, Mylan) in response to Mylan’s ANDA seeking approval to market a genericversion of COMPLERA® before the expiration of United States Patent Nos. 8,841,310 (the ‘310 patent), 7,125,879 (the‘879 patent) and 8,101,629 (the ‘629 patent).
In the West Virginia action, in September 2015, Mylan filed an answer and counterclaims asserting invalidity and non-infringement of the ‘310 patent, ‘879 patent, and ‘629 patent, as well as United States Patent No. 8,080,551 (the‘551 patent). In March 2016, the District of West Virginia Court stayed the lawsuit and scheduled a conditional trial date inFebruary 2018, in accordance with the schedule in the first-filed Delaware lawsuit described below.
In the Delaware action, in January and March 2016, Janssen and Gilead amended their complaint to add claims for patentinfringement with respect to the ‘551 patent and United States Patent Nos. 7,399,856 (the ‘856 patent), 7,563,922 (the‘922 patent), 8,101,752 (the ‘752 patent) and 8,618,291 (the ‘291 patent). Mylan filed a motion to dismiss the suit forlack of personal jurisdiction and a motion to dismiss, strike or sever the infringement claims regarding the ‘752 and‘291 patents. In September 2016, the Delaware District Court denied both of Mylan’s motions. A trial in the Delawareaction has been scheduled for February 2018.
In each of these lawsuits, Janssen is seeking an order enjoining the defendants from marketing their generic versions ofCOMPLERA® before the expiration of the relevant patents.
XARELTO®
A number of generic companies have filed ANDAs seeking approval to market generic versions of XARELTO®. In October2015, Janssen Pharmaceuticals, Inc. (JPI) and Bayer Pharma AG and Bayer Intellectual Property GmbH (collectively,Bayer) filed patent infringement lawsuits in the United States District Court for the District of Delaware against AurobindoPharma Limited, Aurobindo Pharma USA, Inc., Breckenridge Pharmaceutical, Inc., Micro Labs USA Inc. and Micro LabsLtd. (collectively, Micro), Mylan Pharmaceuticals Inc., Mylan Inc. (Mylan), Prinston Pharmaceutical, Inc., SigmapharmLaboratories, LLC, Torrent Pharmaceuticals, Limited and Torrent Pharma Inc., in response to those parties’ respectiveANDAs seeking approval to market generic versions of XARELTO® before the expiration of Bayer’s United States PatentNos. 7,157,456 (the ‘456 patent), 7,585,860 (the ‘860 patent) and 7,592,339 (the ‘339 patent) relating to XARELTO®.JPI is the exclusive licensee of the asserted patents.
In November 2015, Mylan moved to dismiss the action. In December 2015, JPI, Bayer, and Mylan stipulated and agreed todismiss the claims against Mylan, and suspend further briefing and argument on Mylan’s motion to dismiss, pendingappeals relating to personal jurisdiction over Mylan Pharmaceuticals Inc. in the District of Delaware. In February 2016, asimilar patent infringement action by JPI and Bayer against Invagen Pharmaceuticals Inc. (Invagen), in response toInvagen’s notice of paragraph IV certification advising of its ANDA seeking FDA approval for a generic XARELTO®
product before expiration of the relevant patents, was consolidated with the original case. The District Court has set a trialdate of March 2018.
In April 2016, JPI and Bayer filed a separate patent infringement action in the District of Delaware against Micro, inresponse to their notice of paragraph IV certification advising of their ANDA seeking FDA approval for a genericXARELTO® product before expiration of the ‘860 and ‘339 patents. In May 2016, this action was consolidated with theoriginal action.
In July 2016, JPI and Bayer filed a separate patent infringement action in the District of Delaware against BreckenridgePharmaceutical, Inc., in response to its notice of paragraph IV certification advising of its ANDA seeking FDA approval fora generic XARELTO® product before expiration of the ‘456 and ‘339 patents. This action has been consolidated with theoriginal action.
In each of these lawsuits, JPI is seeking an order enjoining the defendants from marketing their generic versions ofXARELTO® before the expiration of the relevant patents.
In October 2016, Mylan filed petitions for inter partes review in the USPTO seeking to invalidate the ‘339, ‘456 and ‘860patents.
Johnson & Johnson 2016 Annual Report • 79

Government Proceedings
Like other companies in the pharmaceutical and medical devices industries, Johnson & Johnson and certain of itssubsidiaries are subject to extensive regulation by national, state and local government agencies in the United States andother countries in which they operate. As a result, interaction with government agencies is ongoing. The most significantlitigation brought by, and investigations conducted by, government agencies are listed below. It is possible that criminalcharges and substantial fines and/or civil penalties or damages could result from government investigations or litigation.
Average Wholesale Price (AWP) Litigation
Johnson & Johnson and several of its pharmaceutical subsidiaries (the J&J AWP Defendants), along with numerous otherpharmaceutical companies, are defendants in a series of lawsuits in state and federal courts involving allegations that thepricing and marketing of certain pharmaceutical products amounted to fraudulent and otherwise actionable conductbecause, among other things, the companies allegedly reported an inflated Average Wholesale Price (AWP) for the drugsat issue. Payors alleged that they used those AWPs in calculating provider reimbursement levels. Many of these cases,both federal actions and state actions removed to federal court, were consolidated for pre-trial purposes in a Multi-DistrictLitigation (MDL) in the United States District Court for the District of Massachusetts. The plaintiffs in these cases includedthree classes of private persons or entities that paid for any portion of the purchase of the drugs at issue based on AWP,and state government entities that made Medicaid payments for the drugs at issue based on AWP. In June 2007, after atrial on the merits, the MDL Court dismissed the claims of two of the plaintiff classes against the J&J AWP Defendants. InMarch 2011, the Court dismissed the claims of the third class against the J&J AWP Defendants without prejudice.
AWP cases brought by various Attorneys General have proceeded to trial against other manufacturers. Several statecases against certain Johnson & Johnson subsidiaries have been settled, including the case in Wisconsin, which settled inFebruary 2016. Cases are still pending in Illinois, New Jersey, and Utah. The cases in Illinois and New Jersey have not yetproceeded to trial. In Utah, the claims brought by the Attorney General were dismissed by the Court in 2013, but the Statemay appeal the dismissal after the conclusion of similar pending matters against other defendants. In the AWP caseagainst the J&J AWP Defendants brought by the Commonwealth of Pennsylvania, following a trial in 2010, thePennsylvania Commonwealth Court found in favor of the Commonwealth with regard to certain of its claims under thePennsylvania Unfair Trade Practices and Consumer Protection Law, and in favor of the J&J AWP Defendants on theCommonwealth’s remaining claims. Following an appeal to the Pennsylvania Supreme Court that vacated that judgment,the Commonwealth Court entered a subsequent judgment in favor of the J&J AWP Defendants on all claims. Thatsubsequent judgment has been upheld by the Pennsylvania Supreme Court in a successive appeal.
McNeil Consumer Healthcare
Starting in June 2010, McNeil Consumer Healthcare Division of McNEIL-PPC, Inc. (now Johnson & Johnson ConsumerInc., McNeil Consumer Healthcare Division) (McNeil Consumer Healthcare) and certain affiliates, including Johnson &Johnson (the Companies), received grand jury subpoenas from the United States Attorney’s Office for the Eastern Districtof Pennsylvania requesting documents broadly relating to recalls of various products of McNeil Consumer Healthcare, andthe FDA inspections of the Fort Washington, Pennsylvania and Lancaster, Pennsylvania manufacturing facilities, as well ascertain documents relating to recalls of a small number of products of other subsidiaries. In addition, in February 2011, thegovernment served McNEIL-PPC, Inc. (now Johnson & Johnson Consumer Inc.) (JJCI) with a Civil Investigative Demandseeking records relevant to its investigation to determine if there was a violation of the Federal False Claims Act. In March2015, McNEIL-PPC, Inc. (now JJCI) entered a guilty plea in the United States District Court for the Eastern District ofPennsylvania to a misdemeanor violation of the U.S. Food, Drug and Cosmetic Act. McNEIL-PPC, Inc. (now JJCI) agreedto pay a $20 million fine and a $5 million forfeiture to resolve the matter.
The Companies have also received Civil Investigative Demands from multiple State Attorneys General Offices broadlyrelating to the McNeil recall issues. The Companies continue to cooperate with these inquiries, which are beingcoordinated through a multi-state coalition. If a resolution cannot be reached with this multi-state coalition, it is possiblethat individual State Attorneys General Offices may file civil monetary claims against the Companies.
In January 2011, the Oregon Attorney General filed a civil complaint against Johnson & Johnson, McNEIL-PPC, Inc. (nowJJCI) and McNeil Healthcare LLC in state court alleging civil violations of the Oregon Unlawful Trade Practices Act relatingto an earlier recall of a McNeil OTC product. In November 2012, the state court granted a motion by the Companies todismiss Oregon’s complaint in its entirety, with prejudice. In November 2015, the State Court of Appeals reversed the trialcourt and reinstated Oregon’s consumer protection claims. In February 2016, the Oregon Supreme Court denied theCompanies’ petition for review, and the case was sent back to the trial court.
80 • Johnson & Johnson 2016 Annual Report
Opioids Litigation
As described below, Johnson & Johnson (J&J) and Janssen Pharmaceuticals, Inc. (JPI), along with other pharmaceuticalcompanies, have been named in four lawsuits alleging claims related to marketing of opioids, including DURAGESIC®,NUCYNTA® and NUCYNTA® ER, and have been subpoenaed by two other states for information related to opioidmarketing practices.
In May 2014, Santa Clara and Orange Counties in California filed a complaint in state court in Orange County, Californiaagainst numerous pharmaceutical manufacturers, including J&J and JPI, alleging claims related to opioid marketingpractices, including false advertising, unfair competition, and public nuisance. The counties seek injunctive and monetaryrelief. In February 2015, the defendants filed motions challenging the sufficiency of the complaint. In August 2015, theCourt stayed the case until the FDA concludes its ongoing inquiry into the safety and effectiveness of long-term opioidtreatment. Following a motion by the counties to lift the stay, in October 2016, the Court kept the stay in place in part,requested the parties to confer, and adjourned the matter until a later date.
In June 2014, the City of Chicago filed a complaint in Cook County Circuit Court against the same group ofpharmaceutical manufacturers, including J&J and JPI, alleging a number of claims related to opioid marketing practices,including consumer fraud violations and false claims, and seeking injunctive and monetary relief. The case was laterremoved to the United States District Court for the Northern District of Illinois. In December 2014, J&J and JPI filed amotion to dismiss the City of Chicago’s first amended complaint, which was granted with leave to file an amendedcomplaint. The City filed a second amended complaint, and in November 2015, J&J and JPI filed a motion to dismiss thesecond amended complaint. In September 2016, the Court dismissed eight of the City’s ten causes of action and grantedthe City one final opportunity to replead the dismissed claims. The City filed a third amended complaint in October 2016,and, in December 2016, J&J and JPI filed an answer as to two causes of action and a motion to dismiss the remainingcauses of action.
In September 2014, the Tennessee Attorney General Division of Consumer Affairs issued a Request for Information to JPIand other pharmaceutical companies related to opioids marketing practices.
In August 2015, the New Hampshire Attorney General, Consumer Protection and Antitrust Bureau issued a subpoena toJPI and other pharmaceutical companies related to opioids marketing practices. In October 2015, the State filed a motionin the State of New Hampshire Superior Court to enforce the subpoena. JPI and the other pharmaceutical companiessubsequently filed a joint motion for injunctive relief and a protective order to preclude the State from engaging privatecontingent fee counsel to participate in the State’s investigation or any subsequent enforcement action. In March 2016,the Court granted the protective order on the grounds that the State had not obtained requisite executive and legislativeapprovals to retain private counsel, but rejected the contention that the contingency fee agreement was otherwiseunlawful. All parties have appealed the March 2016 ruling to the New Hampshire Supreme Court. In August 2016, theCourt denied the pharmaceutical companies’ joint motion to enforce the protective order on the ground that the underlyingdeficiency (legislative approval) had been cured. In September 2016, the State stipulated to stay enforcement of anysubpoenas pending the New Hampshire Supreme Court’s consideration of the companies’ appeal of the March 2016ruling.
In December 2015, the State of Mississippi filed a complaint in the Chancery Court of the First Judicial District of HindsCounty against substantially the same group of pharmaceutical manufacturers as in the suits brought by the Californiacounties and City of Chicago, including J&J and JPI, alleging a number of claims related to opioid marketing practices andseeking penalties and injunctive and monetary relief. In March 2016, defendants filed a motion to transfer venue andmotions to dismiss the complaint.
In August 2016, the County of Suffolk in New York filed a complaint against several pharmaceutical manufacturers inNew York Supreme Court, including J&J and JPI, alleging claims related to opioid marketing, including claims based ondeceptive acts and practices, false advertising, fraud and unjust enrichment. The complaint seeks penalties and injunctiveand monetary relief.
In February 2017, the County of Erie and the County of Broome in New York each filed a complaint in New York SupremeCourt against several pharmaceutical manufacturers, including JPI. Both complaints allege claims related to opioidmarketing practices, including statutory claims for deceptive acts and practices, false advertising, and violation ofNew York’s Social Services Law, and common law causes of action for public nuisance, fraud, and unjust enrichment.Each county is seeking compensatory and punitive damages and costs.
Johnson & Johnson 2016 Annual Report • 81

Other
In September 2011, Synthes, Inc. (Synthes) received a Civil Investigative Demand issued pursuant to the False Claims Actfrom the United States Attorney’s Office for the Eastern District of Pennsylvania. The demand sought information regardingallegations that fellowships had been offered to hospitals in exchange for agreements to purchase products. Synthes hasproduced documents and information in response to the demand and is cooperating with the inquiry.
In May 2012, Acclarent, Inc. (Acclarent) received a subpoena from the United States Attorney’s Office for the District ofMassachusetts requesting documents broadly relating to the sales, marketing and alleged off-label promotion by Acclarentof the RELIEVA STRATUS® MicroFlow Spacer product (the RELIEVA STRATUS® Spacer). In March 2016, Acclarentexecuted a civil settlement with the United States Justice Department and other agencies to resolve this investigation.Johnson & Johnson was not a party to this settlement and there was no admission of liability. In a separate matter, in July2016, the former President/CEO and Vice President of Sales of Acclarent (the former Acclarent officers), were convictedof misdemeanor violations in connection with the sale and marketing of the RELIEVA STRATUS® Spacer. There are nocharges against Acclarent, Ethicon, Inc. or Johnson & Johnson in this matter.
In August 2012, DePuy Orthopaedics, Inc., DePuy, Inc. (now DePuy Synthes, Inc.), and Johnson & Johnson Services, Inc.received an informal request from the United States Attorney’s Office for the District of Massachusetts and the CivilDivision of the United States Department of Justice (the United States) for the production of materials relating to theDePuy ASR™ XL Hip device. In July 2014, the United States notified the United States District Court for the District ofMassachusetts that it had declined to intervene in a qui tam case filed pursuant to the False Claims Act against thecompanies. In February 2016, the District Court granted the companies’ motion to dismiss with prejudice, unsealed thequi tam complaint, and denied the qui tam relators’ request for leave to file a further amended complaint. The qui tamrelators appealed the case to the United States Court of Appeals for the First Circuit. The First Circuit’s decision in thecase is pending. Since October 2013, a group of State Attorneys General have issued Civil Investigative Demandsrelating to the development, sales and marketing of several of DePuy Orthopaedics, Inc.’s hip products. The states areseeking monetary and injunctive relief. In July 2014, the Oregon Department of Justice, which was investigating thesematters independently of the other states, announced a settlement of its ASR XL Hip device investigation for a totalpayment of $4 million to the State of Oregon.
In October 2012, Johnson & Johnson was contacted by the California Attorney General’s office regarding a multi-stateAttorney General investigation of the marketing of surgical mesh products for hernia and urogynecological purposes byJohnson & Johnson’s subsidiary, Ethicon, Inc. (Ethicon). Johnson & Johnson and Ethicon have since entered into a seriesof tolling agreements with the 47 states and the District of Columbia participating in the multi-state investigation and haveresponded to Civil Investigative Demands served by certain of the participating states. The states are seeking monetaryand injunctive relief. In May 2016, California and Washington filed civil complaints against Johnson & Johnson and Ethiconalleging violations of their consumer protection statutes. In August 2016, Kentucky filed a similar complaint against thecompanies. Johnson & Johnson and Ethicon have entered into a new tolling agreement with the remaining 44 states andthe District of Columbia.
In December 2012, Therakos, Inc. (Therakos), formerly a subsidiary of Johnson & Johnson and part of the Ortho-ClinicalDiagnostics, Inc. (OCD) franchise, received a letter from the civil division of the United States Attorney’s Office for theEastern District of Pennsylvania informing Therakos that the United States Attorney’s Office was investigating the salesand marketing of Uvadex® (methoxsalen) and the Uvar Xts® System during the period 2000 to the present. The UnitedStates Attorney’s Office requested that OCD and Johnson & Johnson preserve documents that could relate to theinvestigation. Therakos was subsequently acquired by an affiliate of Gores Capital Partners III, L.P. in January 2013, andOCD was divested in June 2014. Following the divestiture of OCD, Johnson & Johnson retains OCD’s portion of anyliability that may result from the investigation for activity that occurred prior to the sale of Therakos. In March 2014 andMarch 2016, the United States Attorney’s Office requested that Johnson & Johnson produce certain documents, andJohnson & Johnson is cooperating with the requests.
In June 2014, the Mississippi Attorney General filed a complaint in Chancery Court of The First Judicial District of HindsCounty, Mississippi against Johnson & Johnson and Johnson & Johnson Consumer Companies, Inc. (now Johnson &Johnson Consumer Inc.) (JJCI). The complaint alleges that defendants failed to disclose alleged health risks associatedwith female consumers’ use of talc contained in JOHNSON’S® Baby Powder and JOHNSON’S® Shower to Shower(a product no longer sold by JJCI) and seeks injunctive and monetary relief. This matter is currently scheduled for trial inSeptember 2017.
In March 2016, Janssen Pharmaceuticals, Inc. (JPI) received a Civil Investigative Demand from the United StatesAttorney’s Office for the Southern District of New York related to JPI’s contractual relationships with pharmacy benefit
82 • Johnson & Johnson 2016 Annual Report
managers over the period from January 1, 2006 to the present with regard to certain of JPI’s pharmaceutical products. Thedemand was issued in connection with an investigation under the False Claims Act.
In January 2017, Janssen Pharmaceuticals, Inc. (JPI) received a Civil Investigative Demand (CID) from the United StatesDepartment of Justice (DOJ) relating to allegations concerning the sales and marketing practices of OLYSIOTM. JPI iscooperating with DOJ in appropriately responding to the CID.
In February 2017, Johnson & Johnson received a subpoena from the United States Attorney’s Office for the District ofMassachusetts seeking the production of records pertaining to payments to any 501(c)(3) charitable organization thatprovides financial assistance to Medicare patients. Multiple pharmaceutical companies have publicly reported receipt ofsimilar subpoenas and ongoing inquiries.
In recent years, Johnson & Johnson has received numerous requests from a variety of United States CongressionalCommittees to produce information relevant to ongoing congressional inquiries. It is the policy of Johnson & Johnson tocooperate with these inquiries by producing the requested information.
General Litigation
In June 2009, following the public announcement that Ortho-Clinical Diagnostics, Inc. (OCD) had received a grand jurysubpoena from the United States Department of Justice, Antitrust Division, in connection with an investigation that hassince been closed, multiple class action complaints were filed against OCD by direct purchasers seeking damages foralleged price fixing. These cases were consolidated for pre-trial purposes in the United States District Court for theEastern District of Pennsylvania as In re Blood Reagent Antitrust Litigation. In August 2012, the District Court granted amotion filed by the plaintiffs for class certification. In April 2015, the United States Court of Appeals for the Third Circuitreversed the class certification ruling and remanded the case to the District Court for further proceedings. In October2015, the District Court again granted the motion by the plaintiffs for class certification. In July 2016, OCD filed a motionfor summary judgment. OCD was divested in 2014 and Johnson & Johnson retained any liability that may result from thesecases.
In September 2011, Johnson & Johnson, Johnson & Johnson Inc. and McNeil Consumer Healthcare Division of Johnson &Johnson Inc. received a Notice of Civil Claim filed by Nick Field in the Supreme Court of British Columbia, Canada (theBC Civil Claim). The BC Civil Claim is a putative class action brought on behalf of persons who reside in British Columbiaand who purchased during the period between September 20, 2001 and in or about December 2010 one or more variousMcNeil infants’ or children’s over-the-counter medicines that were manufactured at the Fort Washington, Pennsylvaniafacility. The BC Civil Claim alleges that the defendants violated the BC Business Practices and Consumer Protection Act,and other Canadian statutes and common laws, by selling medicines that were allegedly not safe and/or effective or didnot comply with Canadian Good Manufacturing Practices. The class certification hearing scheduled for October 2015was adjourned, and there is currently no date set for that hearing.
In May 2014, two purported class actions were filed in federal court, one in the United States District Court for the CentralDistrict of California and one in the United States District Court for the Southern District of Illinois, against Johnson &Johnson (J&J) and Johnson & Johnson Consumer Companies, Inc. (now Johnson & Johnson Consumer Inc.) (JJCI), allegingviolations of state consumer fraud statutes based on nondisclosure of alleged health risks associated with talc containedin JOHNSON’S® Baby Powder and JOHNSON’S® Shower to Shower (a product no longer sold by JJCI). Both casesseek injunctive relief and monetary damages; neither includes a claim for personal injuries. In October 2016, both caseswere transferred to the United States District Court for the District Court of New Jersey as part of a newly created federalmulti-district litigation. In December 2016, J&J and JJCI filed a motion to dismiss one of the cases.
In August 2014, United States Customs and Border Protection (US CBP) issued a Penalty Notice against Janssen OrthoLLC (Janssen Ortho), assessing penalties for the alleged improper classification of darunavir ethanolate (the activepharmaceutical ingredient in PREZISTA®) in connection with its importation into the United States. In October 2014,Janssen Ortho submitted a Petition for Relief in response to the Penalty Notice. In May 2015, US CBP issued anAmended Penalty Notice assessing substantial penalties and Janssen Ortho filed its Petition for Relief in July 2015.
In March and April 2015, over 30 putative class action complaints were filed by contact lens patients in a number of courtsaround the United States against Johnson & Johnson Vision Care, Inc. (JJVCI), other contact lens manufacturers,distributors, and retailers, alleging vertical and horizontal conspiracies to fix the retail prices of contact lenses. Thecomplaints allege that the manufacturers reached agreements with each other and certain distributors and retailersconcerning the prices at which some contact lenses could be sold to consumers. The plaintiffs are seeking damages andinjunctive relief. All of the class action cases were transferred to the United States District Court for the Middle District of
Johnson & Johnson 2016 Annual Report • 83

Florida in June 2015. The plaintiffs filed a Consolidated Class Action complaint in November 2015, and in December2015, JJVCI and other defendants filed motions to dismiss. In June 2016, the Court denied the motions to dismiss.Discovery is ongoing.
In April 2015, Johnson & Johnson Vision Care, Inc. (JJVCI) filed a complaint in the United States District Court for theDistrict of Utah against the State of Utah seeking a declaratory judgment that a law passed by the State to ban unilateralpricing policies solely in the contact lens market violates the Commerce Clause of the United States Constitution. TheCourt denied JJVCI’s motion for a preliminary injunction. JJVCI appealed. Argument on the appeal was held in August2015. In December 2016, the appellate court denied JJVCI’s appeal.
In April 2015, Adimmune Corporation Ltd (Adimmune) commenced an arbitration in the International Court of Arbitration –International Chamber of Commerce against Crucell Switzerland AG (now Janssen Vaccines AG) and Crucell HollandB.V. (now Janssen Vaccines & Prevention B.V.) (collectively, Crucell). Adimmune claims that Crucell breached certainagreements relating to the supply of flu antigen when Crucell ceased purchasing flu antigen from Adimmune. In December2015, Adimmune filed its Statement of Claim seeking monetary damages. The arbitration hearing took place in November2016 and the parties are awaiting a ruling.
In August 2015, two third-party payors filed a purported class action in the United States District Court for the EasternDistrict of Louisiana against Janssen Research & Development, LLC, Janssen Ortho LLC, Janssen Pharmaceuticals, Inc.,Ortho-McNeil-Janssen Pharmaceuticals, Inc. and Johnson & Johnson (as well as certain Bayer entities), alleging that thedefendants improperly marketed and promoted XARELTO® as safer and more effective than less expensive alternativemedications while failing to fully disclose its risks. The complaint seeks damages in an unspecified amount.
Johnson & Johnson or its subsidiaries are also parties to a number of proceedings brought under the ComprehensiveEnvironmental Response, Compensation, and Liability Act, commonly known as Superfund, and comparable state, local orforeign laws in which the primary relief sought is the cost of past and/or future remediation.
22. Restructuring
The Company announced restructuring actions in its Medical Devices segment to better serve the needs of patients andcustomers in today’s evolving healthcare marketplace. The Company is undertaking actions to strengthen its go-to-marketmodel, accelerate the pace of innovation, further prioritize key platforms and geographies, and streamline operations whilemaintaining high quality standards.
The Company estimates that, in connection with its plans, it will record pre-tax restructuring related charges ofapproximately $2.0 billion to $2.4 billion. In 2016, the Company recorded a pre-tax charge of $685 million, of which $45million was included in cost of products sold and $149 million was included in other (income) expense. See table belowfor additional details. Total project costs of $1.275 billion have been recorded since the restructuring has beenannounced.
Additionally, as part of the plan, the Company expects that the restructuring actions will result in position eliminations ofapproximately 4 to 6 percent of the Medical Devices segment’s global workforce over the next two years, subject to anyconsultation procedures in countries, where required. Approximately 1,500 positions have been eliminated since therestructuring was announced.
The Company estimates that approximately one-half of the cumulative pre-tax costs will result in cash outlays, includingapproximately $500 million of employee severance. Approximately one half of the cumulative pre-tax costs are non-cash,relating primarily to facility rationalization, inventory write-offs and intangible asset write-offs.
84 • Johnson & Johnson 2016 Annual Report

The following table summarizes the severance charges and the associated spending under this initiative through the fiscalyear ended 2016:
(Dollars in Millions) Severance Asset Write-offs Other** Total
2015 restructuring charge $484 86 20 590
2015 activity (86) (3) (89)
Reserve balance, January 3, 2016 484 – 17 501
Current year activity:
Charges – 249 436 685
Cash payments (104) – (452) (556)
Settled non cash — (249) – (249)
Reserve balance, January 1, 2017* $380 — 1 381
* Cash outlays for severance are expected to be substantially paid out over the next 18 months in accordance with the Company’s plansand local laws.
** Other includes project expense such as salaries for employees supporting the initiative and consulting expenses.
Johnson & Johnson 2016 Annual Report • 85

Report of Independent Registered PublicAccounting FirmTo the Shareholders and Board of Directors of Johnson & Johnson
In our opinion, the accompanying consolidated balance sheets and the related consolidated statements of earnings, ofcomprehensive income, of equity, and of cash flows present fairly, in all material respects, the financial position ofJohnson & Johnson and its subsidiaries at January 1, 2017 and January 3, 2016, and the results of their operations andtheir cash flows for each of the three years in the period ended January 1, 2017 in conformity with accounting principlesgenerally accepted in the United States of America. Also in our opinion, the Company maintained, in all material respects,effective internal control over financial reporting as of January 1, 2017, based on criteria established in Internal Control –Integrated Framework (2013) issued by the Committee of Sponsoring Organizations of the Treadway Commission(COSO). The Company’s management is responsible for these financial statements, for maintaining effective internalcontrol over financial reporting and for its assessment of the effectiveness of internal control over financial reporting,included in the accompanying Management’s Report on Internal Control over Financial Reporting. Our responsibility is toexpress opinions on these financial statements and on the Company’s internal control over financial reporting based onour integrated audits. We conducted our audits in accordance with the standards of the Public Company AccountingOversight Board (United States). Those standards require that we plan and perform the audits to obtain reasonableassurance about whether the financial statements are free of material misstatement and whether effective internal controlover financial reporting was maintained in all material respects. Our audits of the financial statements included examining,on a test basis, evidence supporting the amounts and disclosures in the financial statements, assessing the accountingprinciples used and significant estimates made by management, and evaluating the overall financial statementpresentation. Our audit of internal control over financial reporting included obtaining an understanding of internal controlover financial reporting, assessing the risk that a material weakness exists, and testing and evaluating the design andoperating effectiveness of internal control based on the assessed risk. Our audits also included performing such otherprocedures as we considered necessary in the circumstances. We believe that our audits provide a reasonable basis forour opinions.
As discussed in Note 1 to the consolidated financial statements, the Company changed the manner in which it accountsfor and presents certain elements of share based payments in 2016.
A company’s internal control over financial reporting is a process designed to provide reasonable assurance regarding thereliability of financial reporting and the preparation of financial statements for external purposes in accordance withgenerally accepted accounting principles. A company’s internal control over financial reporting includes those policies andprocedures that (i) pertain to the maintenance of records that, in reasonable detail, accurately and fairly reflect thetransactions and dispositions of the assets of the company; (ii) provide reasonable assurance that transactions arerecorded as necessary to permit preparation of financial statements in accordance with generally accepted accountingprinciples, and that receipts and expenditures of the company are being made only in accordance with authorizations ofmanagement and directors of the company; and (iii) provide reasonable assurance regarding prevention or timely detectionof unauthorized acquisition, use, or disposition of the company’s assets that could have a material effect on the financialstatements.
Because of its inherent limitations, internal control over financial reporting may not prevent or detect misstatements. Also,projections of any evaluation of effectiveness to future periods are subject to the risk that controls may become inadequatebecause of changes in conditions, or that the degree of compliance with the policies or procedures may deteriorate.
/s/ PricewaterhouseCoopers LLP
Florham Park, New JerseyFebruary 27, 2017
86 • Johnson & Johnson 2016 Annual Report

Management’s Report on Internal ControlOver Financial ReportingUnder Section 404 of the Sarbanes-Oxley Act of 2002, management is required to assess the effectiveness of theCompany’s internal control over financial reporting as of the end of each fiscal year and report, based on that assessment,whether the Company’s internal control over financial reporting is effective.
Management of the Company is responsible for establishing and maintaining adequate internal control over financialreporting. The Company’s internal control over financial reporting is designed to provide reasonable assurance as to thereliability of the Company’s financial reporting and the preparation of external financial statements in accordance withgenerally accepted accounting principles.
Internal controls over financial reporting, no matter how well designed, have inherent limitations. Therefore, internal controlover financial reporting determined to be effective can provide only reasonable assurance with respect to financialstatement preparation and may not prevent or detect all misstatements. Moreover, projections of any evaluation ofeffectiveness to future periods are subject to the risk that controls may become inadequate because of changes inconditions, or that the degree of compliance with the policies or procedures may deteriorate.
The Company’s management has assessed the effectiveness of the Company’s internal control over financial reporting asof January 1, 2017. In making this assessment, the Company used the criteria established by the Committee ofSponsoring Organizations of the Treadway Commission (COSO) in “Internal Control-Integrated Framework (2013).”These criteria are in the areas of control environment, risk assessment, control activities, information and communication,and monitoring. The Company’s assessment included extensive documenting, evaluating and testing the design andoperating effectiveness of its internal controls over financial reporting.
Based on the Company’s processes and assessment, as described above, management has concluded that, as ofJanuary 1, 2017, the Company’s internal control over financial reporting was effective.
The effectiveness of the Company’s internal control over financial reporting as of January 1, 2017 has been audited byPricewaterhouseCoopers LLP, an independent registered public accounting firm, as stated in their report, which appearsherein.
/s/ Alex Gorsky /s/ Dominic J. CarusoAlex Gorsky Dominic J. CarusoChairman, Board of Directors Executive Vice President,Chief Executive Officer Chief Financial Officer
Johnson & Johnson 2016 Annual Report • 87

Shareholder Return Performance GraphsSet forth below are line graphs comparing the cumulative total shareholder return on the Company’s Common Stock forperiods of five years and ten years ending December 31, 2016, against the cumulative total return of the Standard &Poor’s 500 Stock Index, the Standard & Poor’s Pharmaceutical Index and the Standard & Poor’s Health Care EquipmentIndex. The graphs and tables assume that $100 was invested on December 31, 2011 and December 31, 2006 in each ofthe Company’s Common Stock, the Standard & Poor’s 500 Stock Index, the Standard & Poor’s Pharmaceutical Index andthe Standard & Poor’s Health Care Equipment Index and that all dividends were reinvested.
5 Year Shareholder ReturnPerformance J&J vs. Indices
$240
$210
$180
$150
Johnson & Johnson
S&P 500 Index
S&P Pharmaceu�cal Index
$120
S&P Healthcare EquipmentIndex
5-Year CAGR
$902011 2012 2013 201620152014
J&JS&P 500S&P PharmS&P H/C Equip
15.3%14.6%14.5%16.3%
2011 2012 2013 2014 2015 2016
Johnson & Johnson $100.00 $110.83 $149.19 $175.05 $177.08 $204.21
S&P 500 Index $100.00 $115.99 $153.55 $174.55 $176.95 $198.10
S&P Pharmaceutical Index $100.00 $114.43 $154.73 $189.12 $200.06 $196.93
S&P Healthcare Equipment Index $100.00 $117.27 $149.74 $189.09 $200.39 $213.38
10 Year Shareholder ReturnPerformance J&J vs. Indices
$260
$220
$180
$140
Johnson & Johnson
S&P 500 Index
S&P Pharmaceu�cal Index
$100
S&P Healthcare EquipmentIndex
10-Year CAGR
$602006 2007 2008 2009 2010 2011 2012 2013 2014 20162015
J&JS&P 500S&P PharmS&P H/C Equip
9.0%6.9%9.0%7.3%
2006 2007 2008 2009 2010 2011 2012 2013 2014 2015 2016
Johnson & Johnson $100.00 $103.61 $95.56 $106.34 $105.72 $116.17 $128.75 $173.32 $203.36 $205.72 $237.24
S&P 500 Index $100.00 $105.57 $66.51 $84.10 $96.76 $98.80 $114.60 $151.71 $172.46 $174.83 $195.72
S&P Pharmaceutical Index $100.00 $104.66 $85.61 $101.55 $102.34 $120.51 $137.90 $186.48 $227.91 $241.09 $237.32
S&P Healthcare Equipment Index $100.00 $105.13 $76.07 $97.97 $95.32 $94.55 $110.88 $141.58 $178.79 $189.47 $201.76
88 • Johnson & Johnson 2016 Annual Report

Item 9. Changes in and Disagreements with Accountants on Accountingand Financial DisclosureNot applicable.
Item 9A. Controls and ProceduresDisclosure Controls and Procedures. At the end of the period covered by this Report, the Company evaluated theeffectiveness of the design and operation of its disclosure controls and procedures. The Company’s disclosure controlsand procedures are designed to ensure that information required to be disclosed by the Company in the reports that itfiles or submits under the Exchange Act is recorded, processed, summarized and reported within the time periodsspecified in the SEC’s rules and forms. Disclosure controls and procedures include, without limitation, controls andprocedures designed to ensure that information required to be disclosed by the Company in the reports that it files orsubmits under the Exchange Act is accumulated and communicated to the Company’s management, including its principalexecutive and principal financial officers, or persons performing similar functions, as appropriate to allow timely decisionsregarding required disclosure. Alex Gorsky, Chairman and Chief Executive Officer, and Dominic J. Caruso, Executive VicePresident, Chief Financial Officer, reviewed and participated in this evaluation. Based on this evaluation, Messrs. Gorskyand Caruso concluded that, as of the end of the period covered by this Report, the Company’s disclosure controls andprocedures were effective
Reports on Internal Control Over Financial Reporting. The information called for by this item is incorporated herein byreference to “Management’s Report on Internal Control Over Financial Reporting”, and the attestation regarding internalcontrols over financial reporting included in the “Report of Independent Registered Public Accounting Firm” included inItem 8 of this Report.
Changes in Internal Control Over Financial Reporting. During the fiscal quarter ended January 1, 2017, there were nochanges in the Company’s internal control over financial reporting identified in connection with the evaluation requiredunder Rules 13a-15 and 15d-15 under the Exchange Act that have materially affected, or are reasonably likely tomaterially affect, the Company’s internal control over financial reporting.
The Company is implementing a multi-year, enterprise-wide initiative to integrate, simplify and standardize processes andsystems for the human resources, information technology, procurement, supply chain and finance functions. These areenhancements to support the growth of the Company’s financial shared service capabilities and standardize financialsystems. This initiative is not in response to any identified deficiency or weakness in the Company’s internal control overfinancial reporting. In response to this initiative, the Company has and will continue to align and streamline the design andoperation of its financial control environment.
Item 9B. Other InformationNot applicable.
Johnson & Johnson 2016 Annual Report • 89

PART IIIItem 10. Directors, Executive Officers and Corporate Governance
The information called for by this item is incorporated herein by reference to the discussion of the Audit Committee underthe caption “Item 1. Election of Directors – Board Committees”; and the material under the captions “Item 1. Election ofDirectors” and “Stock Ownership and Section 16 Compliance – Section 16(a) Beneficial Ownership ReportingCompliance” in the Proxy Statement; and the material under the caption “Executive Officers of the Registrant” in Part I ofthis Report.
The Company’s Code of Business Conduct, which covers all employees (including the Chief Executive Officer, ChiefFinancial Officer and Controller), meets the requirements of the SEC rules promulgated under Section 406 of theSarbanes-Oxley Act of 2002. The Code of Business Conduct is available on the Company’s website atwww.jnj.com/code-of-business-conduct, and copies are available to shareholders without charge upon written request tothe Secretary at the Company’s principal executive offices. Any substantive amendment to the Code of Business Conductor any waiver of the Code granted to the Chief Executive Officer, the Chief Financial Officer or the Controller will beposted on the Company’s website at www.investor.jnj.com/gov.cfm within five business days (and retained on the websitefor at least one year).
In addition, the Company has adopted a Code of Business Conduct & Ethics for Members of the Board of Directors andExecutive Officers. The Code of Business Conduct & Ethics for Members of the Board of Directors and Executive Officersis available on the Company’s website at www.investor.jnj.com/gov/boardconduct.cfm, and copies are available toshareholders without charge upon written request to the Secretary at the Company’s principal executive offices. Anysubstantive amendment to the Code or any waiver of the Code granted to any member of the Board of Directors or anyexecutive officer will be posted on the Company’s website at www.investor.jnj.com/gov.cfm within five business days (andretained on the website for at least one year).
Item 11. Executive CompensationThe information called for by this item is incorporated herein by reference to the material under the captions “Item 1.Election of Directors – Director Compensation,” “Compensation Committee Report,” “Compensation Discussion andAnalysis” and “Executive Compensation Tables” in the Proxy Statement.
The material incorporated herein by reference to the material under the caption “Compensation Committee Report” in theProxy Statement shall be deemed furnished, and not filed, in this Report and shall not be deemed incorporated byreference into any filing under the Securities Act of 1933, as amended, or the Securities Exchange Act of 1934, asamended, as a result of this furnishing, except to the extent that the Company specifically incorporates it by reference.
Item 12. Security Ownership of Certain Beneficial Owners andManagement and Related Stockholder MattersThe information called for by this item is incorporated herein by reference to the material under the caption “Item 1. StockOwnership and Section 16 Compliance” in the Proxy Statement; and Note 17 “Common Stock, Stock Option Plans andStock Compensation Agreements” of the Notes to Consolidated Financial Statements in Item 8 of this Report.
90 • Johnson & Johnson 2016 Annual Report
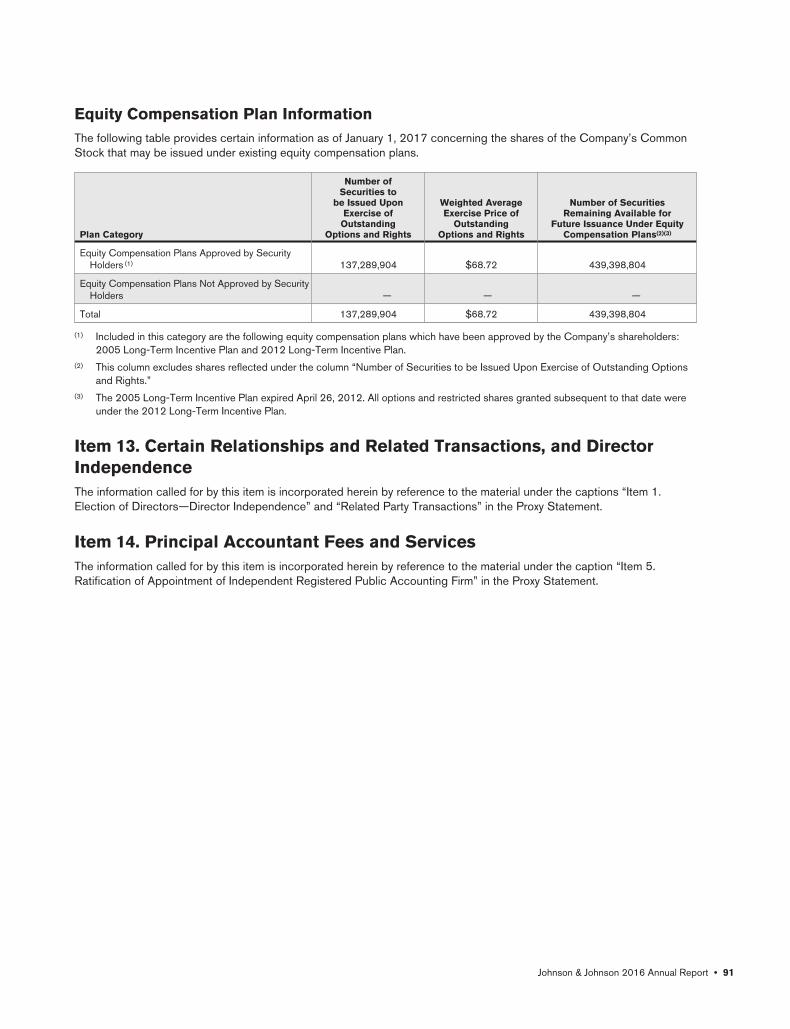
Equity Compensation Plan InformationThe following table provides certain information as of January 1, 2017 concerning the shares of the Company’s CommonStock that may be issued under existing equity compensation plans.
Plan Category
Number ofSecurities to
be Issued UponExercise of
OutstandingOptions and Rights
Weighted AverageExercise Price of
OutstandingOptions and Rights
Number of SecuritiesRemaining Available for
Future Issuance Under EquityCompensation Plans(2)(3)
Equity Compensation Plans Approved by SecurityHolders (1) 137,289,904 $68.72 439,398,804
Equity Compensation Plans Not Approved by SecurityHolders — — —
Total 137,289,904 $68.72 439,398,804
(1) Included in this category are the following equity compensation plans which have been approved by the Company’s shareholders:2005 Long-Term Incentive Plan and 2012 Long-Term Incentive Plan.
(2) This column excludes shares reflected under the column “Number of Securities to be Issued Upon Exercise of Outstanding Optionsand Rights.”
(3) The 2005 Long-Term Incentive Plan expired April 26, 2012. All options and restricted shares granted subsequent to that date wereunder the 2012 Long-Term Incentive Plan.
Item 13. Certain Relationships and Related Transactions, and DirectorIndependenceThe information called for by this item is incorporated herein by reference to the material under the captions “Item 1.Election of Directors—Director Independence” and “Related Party Transactions” in the Proxy Statement.
Item 14. Principal Accountant Fees and ServicesThe information called for by this item is incorporated herein by reference to the material under the caption “Item 5.Ratification of Appointment of Independent Registered Public Accounting Firm” in the Proxy Statement.
Johnson & Johnson 2016 Annual Report • 91

PART IVItem 15. Exhibits and Financial Statement SchedulesThe following documents are filed as part of this report:
1. Financial Statements
Consolidated Balance Sheets at end of Fiscal Years 2016 and 2015
Consolidated Statements of Earnings for Fiscal Years 2016, 2015 and 2014
Consolidated Statements of Comprehensive Income for Fiscal Years 2016, 2015 and 2014
Consolidated Statements of Equity for Fiscal Years 2016, 2015 and 2014
Consolidated Statements of Cash Flows for Fiscal Years 2016, 2015 and 2014
Notes to Consolidated Financial Statements
Report of Independent Registered Public Accounting Firm
All schedules are omitted because they are not applicable or the required information is included in the financialstatements or notes.
2. Exhibits Required to be Filed by Item 60l of Regulation S-K
The information called for by this item is incorporated herein by reference to the Exhibit Index in this Report.
Item 16. Form 10-K SummaryRegistrants may voluntarily include a summary of information required by Form 10-K under this Item 16. The Company haselected not to include such summary information.
92 • Johnson & Johnson 2016 Annual Report

SIGNATURESPursuant to the requirements of Section 13 of the Securities Exchange Act of 1934, the registrant has duly caused thisReport to be signed on its behalf by the undersigned, thereunto duly authorized.
Date: February 27, 2017
JOHNSON & JOHNSON
(Registrant)
By /s/ A. Gorsky
A. Gorsky, Chairman, Board of Directors,and Chief Executive Officer
Pursuant to the requirements of the Securities Exchange Act of 1934, this report has been signed below by the followingpersons on behalf of the registrant and in the capacities and on the dates indicated.
Signature Title Date
/s/ A. Gorsky Chairman, Board of Directors February 27, 2017A. Gorsky Chief Executive Officer
(Principal Executive Officer)
/s/ D. J. Caruso Chief Financial Officer(Principal Financial Officer)
February 27, 2017D. J. Caruso
/s/ R. A. Kapusta Controller and Chief Accounting Officer(Principal Accounting Officer)
February 27, 2017R. A. Kapusta
/s/ M. C. Beckerle Director February 27, 2017M. C. Beckerle
/s/ D. S. Davis Director February 27, 2017D. S. Davis
/s/ I. E. L. Davis Director February 27, 2017I. E. L. Davis
/s/ M. B. McClellan Director February 27, 2017M. B. McClellan
/s/ A. M. Mulcahy Director February 27, 2017A. M. Mulcahy
/s/ W. D. Perez Director February 27, 2017W. D. Perez
/s/ C. Prince Director February 27, 2017C. Prince
/s/ A. E. Washington Director February 27, 2017A. E. Washington
/s/ R. A. Williams Director February 27, 2017R. A. Williams
Johnson & Johnson 2016 Annual Report • 93

EXHIBIT INDEXReg. S-K
Exhibit TableItem No. Description of Exhibit
3(i) Restated Certificate of Incorporation effective February 19, 2016 – Incorporated herein by reference to Exhibit 3(i) of theRegistrant’s Form 10-K Annual Report for the fiscal year ended January 3, 2016.
3(ii) By-Laws of the Company, as amended effective January 26, 2016 – Incorporated herein by reference to Exhibit 3.1 theRegistrant’s Form 8-K Current Report filed January 26, 2016.
4(a) Upon the request of the Securities and Exchange Commission, the Registrant will furnish a copy of all instruments defining therights of holders of long-term debt of the Registrant.
10(a) 2005 Long-Term Incentive Plan – Incorporated herein by reference to Exhibit 4 of the Registrant’s S-8 Registration Statementfiled with the Commission on May 10, 2005 (file no. 333-124785).*
10(b) Form of Stock Option Certificate, Restricted Share Unit Certificate and Performance Share Unit Certificate under the 2005Long-Term Incentive Plan – Incorporated herein by reference to Exhibits 10.1, 10.2 and 10.3 of the Registrant’s Form 8-KCurrent Report filed January 13, 2012.*
10(c) 2012 Long-Term Incentive Plan – Incorporated herein by reference to Appendix A of the Registrant’s Proxy Statement filed withthe Commission on March 14, 2012 .*
10(d) Form of Stock Option Certificate, Restricted Share Unit Certificate and Performance Share Unit Certificate under the 2012Long-Term Incentive Plan – Incorporated herein by reference to Exhibits 10.2, 10.3 and 10.4 of the Registrant’s Form 10-QQuarterly Report filed May 7, 2012.*
10(e) Executive Incentive Plan (as amended) – Incorporated herein by reference to Exhibit 10(f) of the Registrant’s Form 10-K AnnualReport for the fiscal year ended December 31, 2000.*
10(f) Domestic Deferred Compensation (Certificate of Extra Compensation) Plan – Incorporated herein by reference to Exhibit 10(g)of the Registrant’s Form 10-K Annual Report for the year ended December 28, 2003.*
10(g) Amendments to the Certificate of Extra Compensation Plan effective as of January 1, 2009 – Incorporated herein by reference toExhibit 10(j) of the Registrant’s Form 10-K Annual Report for the year ended December 28, 2008.*
10(h) 2009 Certificates of Long-Term Performance Plan – Incorporated herein by reference to Exhibit 10.1 of the Registrant’s Form10-Q Quarterly Report for the quarter ended September 27, 2009.*
10(i) Amended and Restated Deferred Fee Plan for Directors – Incorporated herein by reference to Exhibit 10(k) of the Registrant’sForm 10-K Annual Report for the fiscal year ended January 1, 2012.*
10(j) Executive Income Deferral Plan (Amended and Restated) – Incorporated herein by reference to Exhibit 10.1 of the Registrant’sForm 10-Q Quarterly Report for the quarter ended September 30, 2012.*
10(k) Excess Savings Plan – Incorporated herein by reference to Exhibit 10(j) of the Registrant’s Form 10-K Annual Report for thefiscal year ended December 29, 1996.*
10(l) Amendments to the Johnson & Johnson Excess Savings Plan effective as of January 1, 2009 – Incorporated herein by referenceto Exhibit 10(p) of the Registrant’s Form 10-K Annual Report for the fiscal year ended December 28, 2008.*
10(m) Excess Benefit Plan (Supplemental Retirement Plan) – Incorporated herein by reference to Exhibit 10(h) of the Registrant’s Form10-K Annual Report for the fiscal year ended January 3, 1993.*
10(n) Amendments to the Excess Benefit Plan of Johnson & Johnson and Affiliated Companies effective as of January 1, 2009 –Incorporated herein by reference to Exhibit 10(r) of the Registrant’s Form 10-K Annual Report for the fiscal year endedDecember 28, 2008.*
10(o) Amendment to the Excess Benefit Plan of Johnson & Johnson and Affiliated Companies, effective as of January 1, 2015 –Incorporated herein by reference to Exhibit 10(q) of the Registrant’s Form 10-K Annual Report for the fiscal year endedDecember 28, 2014.*
10(p) Executive Life Plan Agreement – Incorporated herein by reference to Exhibit 10(i) of the Registrant’s Form 10-K Annual Reportfor the fiscal year ended January 3, 1993.*
10(q) Executive Life Plan Agreement Closure Letter – Incorporated herein by reference to Exhibit 10.1 of the Registrant’s Form 10-QQuarterly Report for the quarter ended March 29, 2015.*
10(r) Johnson & Johnson Retirement Savings Plan, Johnson & Johnson Savings Plan for Union Represented Employees, and Johnson &Johnson Savings Plan – Incorporated herein by reference to Exhibits 99.1, 99.2 and 99.3 of the Registrant’s Form S-8 filed withthe Commission on May 6, 2013.*
10(s) Employment Agreement for Dr. Paulus Stoffels–Incorporated herein by reference to Exhibit 10.2 of the Registrant’s Form 10-QQuarterly Report for the quarter ended September 30, 2012.*
10(t) Summary of Employment Arrangements for Sandra E. Peterson – Incorporated herein by reference to Exhibit 10(t) of theRegistrant’s Form 10-K Annual Report for the year ended December 30, 2012.*
94 • Johnson & Johnson 2016 Annual Report
10(u) Severance Pay Plan of Johnson & Johnson and U.S. Affiliated Companies, Amended and Restated as of October 1, 2014 –Incorporated herein by reference to Exhibit 10.1 of the Registrant’s Form 10-Q Quarterly Report for the quarter endedSeptember 28, 2014.*
10(v) First Amendment to the Severance Pay Plan of Johnson & Johnson and U.S. Affiliated Companies (as amended and restatedeffective October 1, 2014) – Incorporated herein by reference to Exhibit 10.1 of the Registrant’s Form 10-Q Quarterly Report forthe quarter ended June 28, 2015.*
10(w) Second Amendment to the Severance Pay Plan of Johnson & Johnson and U.S. Affiliated Companies (as amended and restatedeffective October 1, 2014) – Incorporated herein by reference to Exhibit 10(x) of the Registrant’s Form 10-K Annual Report forthe fiscal year ended January 3, 2016.*
12 Statement of Computation of Ratio of Earnings to Fixed Charges – Filed with this document.
21 Subsidiaries – Filed with this document.
23 Consent of Independent Registered Public Accounting Firm – Filed with this document.
31(a) Certification of Chief Executive Officer Pursuant to Section 302 of the Sarbanes-Oxley Act – Filed with this document.
31(b) Certification of Chief Financial Officer Pursuant to Section 302 of the Sarbanes-Oxley Act – Filed with this document.
32(a) Certification of Chief Executive Officer Pursuant to Section 906 of the Sarbanes-Oxley Act – Furnished with this document.
32(b) Certification of Chief Financial Officer Pursuant to Section 906 of the Sarbanes-Oxley Act – Furnished with this document.
101 XBRL (Extensible Business Reporting Language) The following materials from this Report for the fiscal year ended January 1,2017, formatted in Extensive Business Reporting Language (XBRL): (i) Consolidated Balance Sheets, (ii) ConsolidatedStatements of Earnings, (iii) Consolidated Statements of Comprehensive Income, (iv) Consolidated Statements of Equity, (v)Consolidated Statements of Cash Flows, and (vi) Notes to the Consolidated Financial Statements.
* Management contract or compensatory plan.
A copy of any of the Exhibits listed above will be provided without charge to any shareholder submitting a written requestspecifying the desired exhibit(s) to the Secretary at the principal executive offices of the Company.
The Following Exhibits, indicated as being filed with this document, are omitted from the printed version of this AnnualReport 2016:
Exhibit 12
Exhibit 21
Exhibit 23
Johnson & Johnson 2016 Annual Report • 95

[THIS PAGE INTENTIONALLY LEFT BLANK]

Exhibit 31(a)
CERTIFICATION OF CHIEF EXECUTIVE OFFICER
PURSUANT TO SECTION 302 OF THE SARBANES-OXLEY ACT
I, Alex Gorsky, certify that:
1. I have reviewed this Annual Report on Form 10-K for the fiscal year ended January 1, 2017 (the “report”) ofJohnson & Johnson (the “Company”);
2. Based on my knowledge, this report does not contain any untrue statement of a material fact or omit to state amaterial fact necessary to make the statements made, in light of the circumstances under which such statements weremade, not misleading with respect to the period covered by this report;
3. Based on my knowledge, the financial statements, and other financial information included in this report, fairlypresent in all material respects the financial condition, results of operations and cash flows of the Company as of, andfor, the periods presented in this report;
4. The Company’s other certifying officer(s) and I are responsible for establishing and maintaining disclosure controlsand procedures (as defined in Exchange Act Rules 13a-15(e) and 15d-15(e)) and internal control over financialreporting (as defined in Exchange Act Rules 13a-15(f) and 15d-15(f)) for the Company and have:
(a) Designed such disclosure controls and procedures, or caused such disclosure controls and proceduresto be designed under our supervision, to ensure that material information relating to the Company, including itsconsolidated subsidiaries, is made known to us by others within those entities, particularly during the period inwhich this report is being prepared;
(b) Designed such internal control over financial reporting, or caused such internal control over financialreporting to be designed under our supervision, to provide reasonable assurance regarding the reliability offinancial reporting and the preparation of financial statements for external purposes in accordance with generallyaccepted accounting principles;
(c) Evaluated the effectiveness of the Company’s disclosure controls and procedures and presented in thisreport our conclusions about the effectiveness of the disclosure controls and procedures, as of the end of theperiod covered by this report based on such evaluation; and
(d) Disclosed in this report any change in the Company’s internal control over financial reporting thatoccurred during the Company’s most recent fiscal quarter (the Company’s fourth fiscal quarter in the case of anannual report) that has materially affected, or is reasonably likely to materially affect, the Company’s internal controlover financial reporting; and
5. The Company’s other certifying officer(s) and I have disclosed, based on our most recent evaluation of internalcontrol over financial reporting, to the Company’s auditors and the audit committee of the Company’s board ofdirectors (or persons performing the equivalent functions):
(a) All significant deficiencies and material weaknesses in the design or operation of internal control overfinancial reporting which are reasonably likely to adversely affect the Company’s ability to record, process,summarize and report financial information; and
(b) Any fraud, whether or not material, that involves management or other employees who have a significantrole in the Company’s internal control over financial reporting.
/s/ Alex Gorsky
Alex GorskyChief Executive Officer
Date: February 27, 2017
Johnson & Johnson 2016 Annual Report

Exhibit 31(b)
CERTIFICATION OF CHIEF FINANCIAL OFFICER
PURSUANT TO SECTION 302 OF THE SARBANES-OXLEY ACT
I, Dominic J. Caruso, certify that:
1. I have reviewed this Annual Report on Form 10-K for the fiscal year ended January 1, 2017 (the “report”) ofJohnson & Johnson (the “Company”);
2. Based on my knowledge, this report does not contain any untrue statement of a material fact or omit to state amaterial fact necessary to make the statements made, in light of the circumstances under which such statements weremade, not misleading with respect to the period covered by this report;
3. Based on my knowledge, the financial statements, and other financial information included in this report, fairlypresent in all material respects the financial condition, results of operations and cash flows of the Company as of, andfor, the periods presented in this report;
4. The Company’s other certifying officer(s) and I are responsible for establishing and maintaining disclosure controlsand procedures (as defined in Exchange Act Rules 13a-15(e) and 15d-15(e)) and internal control over financialreporting (as defined in Exchange Act Rules 13a-15(f) and 15d-15(f)) for the Company and have:
(a) Designed such disclosure controls and procedures, or caused such disclosure controls and proceduresto be designed under our supervision, to ensure that material information relating to the Company, including itsconsolidated subsidiaries, is made known to us by others within those entities, particularly during the period inwhich this report is being prepared;
(b) Designed such internal control over financial reporting, or caused such internal control over financialreporting to be designed under our supervision, to provide reasonable assurance regarding the reliability offinancial reporting and the preparation of financial statements for external purposes in accordance with generallyaccepted accounting principles;
(c) Evaluated the effectiveness of the Company’s disclosure controls and procedures and presented in thisreport our conclusions about the effectiveness of the disclosure controls and procedures, as of the end of theperiod covered by this report based on such evaluation; and
(d) Disclosed in this report any change in the Company’s internal control over financial reporting thatoccurred during the Company’s most recent fiscal quarter (the Company’s fourth fiscal quarter in the case of anannual report) that has materially affected, or is reasonably likely to materially affect, the Company’s internal controlover financial reporting; and
5. The Company’s other certifying officer(s) and I have disclosed, based on our most recent evaluation of internalcontrol over financial reporting, to the Company’s auditors and the audit committee of the Company’s board ofdirectors (or persons performing the equivalent functions):
(a) All significant deficiencies and material weaknesses in the design or operation of internal control overfinancial reporting which are reasonably likely to adversely affect the Company’s ability to record, process,summarize and report financial information; and
(b) Any fraud, whether or not material, that involves management or other employees who have a significantrole in the Company’s internal control over financial reporting.
/s/ Dominic J. Caruso
Dominic J. CarusoChief Financial Officer
Date: February 27, 2017
Johnson & Johnson 2016 Annual Report

Exhibit 32(a)
CERTIFICATION OF CHIEF EXECUTIVE OFFICER
PURSUANT TO SECTION 906 OF THE SARBANES-OXLEY ACT
The undersigned, Alex Gorsky, the Chief Executive Officer of Johnson & Johnson, a New Jersey corporation (the“Company”), pursuant to 18 U.S.C. 1350, as adopted pursuant to Section 906 of the Sarbanes-Oxley Act of 2002,hereby certifies that, to the best of my knowledge:
(1) the Company’s Annual Report on Form 10-K for the fiscal year ended January 1, 2017 (the “Report”) fullycomplies with the requirements of Section 13(a) of the Securities Exchange Act of 1934; and
(2) the information contained in the Report fairly presents, in all material respects, the financial condition andresults of operations of the Company.
/s/ Alex Gorsky
Alex GorskyChief Executive Officer
Dated: February 27, 2017
This certification is being furnished to the SEC with this Report on Form 10-K pursuant to Section 906 of theSarbanes-Oxley Act of 2002 and shall not, except to the extent required by such Act, be deemed filed by the Companyfor purposes of Section 18 of the Securities Exchange Act of 1934, as amended, or otherwise subject to the liability ofthat section.
Johnson & Johnson 2016 Annual Report

Exhibit 32(b)
CERTIFICATION OF CHIEF FINANCIAL OFFICER
PURSUANT TO SECTION 906 OF THE SARBANES-OXLEY ACT
The undersigned, Dominic J. Caruso, the Chief Financial Officer of Johnson & Johnson, a New Jersey corporation (the“Company”), pursuant to 18 U.S.C. 1350, as adopted pursuant to Section 906 of the Sarbanes-Oxley Act of 2002,hereby certifies that, to the best of my knowledge:
(1) the Company’s Annual Report on Form 10-K for the fiscal year ended January 1, 2017 (the “Report”) fullycomplies with the requirements of Section 13(a) of the Securities Exchange Act of 1934; and
(2) the information contained in the Report fairly presents, in all material respects, the financial condition andresults of operations of the Company.
/s/ Dominic J. Caruso
Dominic J. CarusoChief Financial Officer
Dated: February 27, 2017
This certification is being furnished to the SEC with this Report on Form 10-K pursuant to Section 906 of theSarbanes-Oxley Act of 2002 and shall not, except to the extent required by such Act, be deemed filed by the Companyfor purposes of Section 18 of the Securities Exchange Act of 1934, as amended, or otherwise subject to the liability ofthat section.
Johnson & Johnson 2016 Annual Report

[THIS PAGE INTENTIONALLY LEFT BLANK]

[THIS PAGE INTENTIONALLY LEFT BLANK]

Reconciliation of Non-GAAP Financial Measures% Incr. /
(Dollars in Millions Except Per Share Data) 2016 2015 (Decr.)
Earnings before provision for taxes on income - as reported $19,803 19,196 3.2%
Intangible asset amortization expense 1,271 1,570
Restructuring/Other (1) 685 590
Litigation expense, net 817 141
DePuy ASRTM Hip program 9 148
In-process research and development 29 224
Other 145 134
Earnings before provision for taxes on income - as adjusted $22,759 22,003 3.4%
Net Earnings - as reported $16,540 15,409 7.3%
Intangible asset amortization expense 931 1,113
Restructuring/Other 544 415
Litigation expense, net 675 118
DePuy ASRTM Hip program 7 130
In-process research and development 23 162
Other 44 98
Net Earnings - as adjusted $18,764 17,445 7.6%
Diluted Net Earnings per share - as reported $5.93 5.48 8.2%
Intangible asset amortization expense 0.33 0.39
Restructuring/Other 0.20 0.15
Litigation expense, net 0.24 0.04
DePuy ASRTM Hip program – 0.05
In-process research and development 0.01 0.06
Other 0.02 0.03
Diluted Net Earnings per share - as adjusted $6.73 6.20 8.5%
Operational Diluted Net Earnings per share - as adjusted at 2014 foreign currency exchangerates 6.76
Impact of currency at 2015 foreign currency exchange rates 0.05 (0.56)
Operational Diluted Net Earnings per share - as adjusted at 2015 foreign currency exchangerates $6.78 6.20 9.4%
(1) Includes $45 million recorded in cost of products sold and $149 million recorded in other (income) expense in 2016, and$81 million recorded in cost of products sold in 2015.
The Company provides earnings before provision for taxes on income, net earnings and net earnings per share (diluted) onan adjusted basis because management believes that these measures provide useful information to investors. Among otherthings, these measures may assist investors in evaluating the Company’s results of operations period over period. Invarious periods, these measures may exclude such items as intangible asset amortization expense, significant costsassociated with acquisitions, restructuring, litigation, and changes in applicable laws and regulations (including significantaccounting or tax matters). These special items may be highly variable, difficult to predict, and of a size that sometimes hassubstantial impact on the Company’s reported results of operations for a period. Management uses these measuresinternally for planning, forecasting and evaluating the performances of the Company’s businesses, including allocatingresources and evaluating results relative to employee performance compensation targets. Unlike earnings before provisionfor taxes on income, net earnings and net earnings per share (diluted) prepared in accordance with GAAP, adjustedearnings before provision for taxes on income, adjusted net earnings and adjusted net earnings per share (diluted) may notbe comparable with the calculation of similar measures for other companies. The limitations of using these non-GAAPfinancial measures as performance measures are that they provide a view of the Company’s results of operations withoutincluding all events during a period, such as intangible asset amortization expense, the effects of an acquisition, the Ortho-Clinical Diagnostics divestiture, restructuring, litigation, and changes in applicable laws and regulations (includingsignificant accounting or tax matters) and do not provide a comparable view of the Company’s performance to othercompanies in the health care industry. Investors should consider non-GAAP financial measures in addition to, and not asreplacements for, or superior to, measures of financial performance prepared in accordance with GAAP.
Johnson & Johnson 2016 Annual Report

Board of Directors
ALEX GORSKYChairman, Board of Directors
MARY C. BECKERLEChief Executive Officer and Director,Huntsman Cancer Institute at the University of Utah;Distinguished Professor of Biology,College of Science, University of Utah
D. SCOTT DAVISFormer Chairman and Chief Executive Officer,United Parcel Service, Inc.
IAN E. L. DAVISChairman, Rolls-Royce Holdings plc;Former Chairman and Worldwide Managing Director,McKinsey & Company
MARK B. McCLELLANDirector, Duke-Robert J. Margolis, MD,Center for Health Policy
ANNE M. MULCAHYFormer Chairman and Chief Executive Officer,Xerox Corporation
WILLIAM D. PEREZRetired President and Chief Executive Officer,Wm. Wrigley Jr. Company
CHARLES PRINCERetired Chairman and Chief Executive Officer,Citigroup Inc.
A. EUGENE WASHINGTONDuke University’s Chancellor for Health Affairs;President and Chief Executive Officer,Duke University Health System
RONALD A. WILLIAMSFormer Chairman and Chief Executive Officer,Aetna Inc.
Senior Management
ALEX GORSKYChief Executive OfficerChairman, Executive Committee
DOMINIC J. CARUSO*Executive Vice President, Chief Financial Officer
JOAQUIN DUATO*Executive Vice President, Worldwide Chairman, Pharmaceuticals
PETER M. FASOLO*Executive Vice President, Chief Human Resources Officer
RONALD A. KAPUSTACorporate ControllerChief Accounting Officer
ASHLEY McEVOYCompany Group Chairman, Consumer Medical Devices
JORGE MESQUITA*Executive Vice President, Worldwide Chairman, Consumer
SANDRA E. PETERSON*Executive Vice President, Group Worldwide Chairman
GARY J. PRUDEN*Executive Vice President, Worldwide Chairman, Medical Devices
MICHELLE R. RYANTreasurer
MICHAEL E. SNEEDWorldwide Vice President, Global Corporate AffairsChief Communications Officer
THOMAS J. SPELLMAN IIICorporate SecretaryAssistant General Counsel
PAULUS STOFFELS*Executive Vice President, Chief Scientific Officer
JENNIFER TAUBERTCompany Group Chairman, Pharmaceuticals, The Americas
MICHAEL H. ULLMANN*Executive Vice President, General Counsel
KATHRYN E. WENGELWorldwide Vice President, Johnson & Johnson Supply Chain
* Member, Executive Committee
Johnson & Johnson 2016 Annual Report
PRINCIPAL OFFICE STOCK LISTING JOHNSON & JOHNSON ONLINE
One Johnson & Johnson PlazaNew Brunswick, New Jersey 08933(732) 524-0400
2017 ANNUAL MEETING OF SHAREHOLDERS
Thursday, April 27, 201710:00 a.m. (Eastern); Doors open at 9:15 a.m.State Theatre15 Livingston AvenueNew Brunswick, New JerseyAll shareholders as of the record date ofFebruary 28, 2017 are invited to attend.A formal Notice of Annual Meeting,Proxy Statement and Proxy have beenmade available to shareholders.
2016 ANNUAL REPORT ON FORM 10-K AND2017 PROXY STATEMENT
Johnson & Johnson’s Annual Report on Form 10-Kfor the fiscal year ended January 1, 2017 isincluded in this Annual Report in its entirety, withthe exception of certain exhibits. The Form 10-K,complete with all of its exhibits, is available on ourwebsite at www.investor.jnj.com/sec.cfm, and theSEC’s website at www.sec.gov.
Shareholders may also obtain copies of theexhibits, our 2016 Annual Report onForm 10-K and our 2017 Proxy Statement,without charge, upon written request to theOffice of the Corporate Secretary at ourprincipal office address, or by calling(800) 950-5089.
ELECTRONIC DELIVERY NOTIFICATION
The 2017 Proxy Statement and our 2016 AnnualReport are available on our websitewww.investor.jnj.com/gov/annualmeetingmaterials.cfm. Shareholders whoreceive paper copies of our Proxy Statement andAnnual Report by mail can elect to receive insteadan e-mail message with a link to those documentson the Internet. Registered shareholders mayenroll in electronic delivery at:www.computershare-na.com/green. Beneficialshareholders (who hold shares of Johnson &Johnson Common Stock through a bank, broker orother holder of record) generally can enroll forelectronic delivery at: enroll.icsdelivery.com/jnj.
Johnson & Johnson Common StockListed on New York Stock ExchangeStock Symbol: JNJ
SHAREHOLDER RELATIONS CONTACT
Thomas J. Spellman IIICorporate Secretary(732) 524-2455
INVESTOR RELATIONS CONTACT
Joseph J. WolkVice President, Investor Relations(800) 950-5089(732) 524-1142Investor Relations website:www.investor.jnj.com
STOCK TRANSFER AGENT AND REGISTRAR
Questions regarding stock holdings,certificate replacement/transfer, dividendsand address changes should be directed toour stock transfer agent and registrar at:Computershare Trust Company, N.A.P.O. Box 30170College Station, TX 77842-3170Overnight mail:Computershare Trust Company, N.A.211 Quality Circle, Suite 210College Station, TX 77845(800) 328-9033 or (781) 575-2718Shareholder website:www.computershare.com/investor
Dividend Reinvestment Plan
The Plan allows for full or partial dividendreinvestment and additional weekly cashinvestments up to $50,000 per year inJohnson & Johnson Common Stock withoutper share or service charges on stockpurchases. If you are interested inparticipating in the Plan and need anenrollment form and/or more information,please call the Plan administrator,Computershare Trust Company, N.A. at(800) 328-9033 or (781) 575-2718(outside the U.S.) or access online atwww.computershare.com/investor.
Hearing Impaired
Shareholders who have inquiries regardingstock-related matters can communicatedirectly with Computershare Trust Company,N.A. via a telecommunications device (TDD).The telephone number for this service is(800) 952-9245 or (781) 575-2692(outside the U.S.).
Our website: www.jnj.com
http://www.jnj.com/media-center
www.facebook.com/jnj
www.twitter.com/JNJCareswww.twitter.com/JNJNews
www.youtube.com/jnj
http://www.linkedin.com/company/johnson-&-johnson
The Johnson & Johnson 2016 Year inReview is available on our website atwww.2016yearinreview.jnj.com.
The information on these websites shouldnot be deemed to be part of this AnnualReport.
C132107
The Johnson & Johnson 2016 Annual Reportcontains many of the valuable trademarksand trade names owned and used by theJohnson & Johnson Family of Companies inthe United States and internationally todistinguish products and services ofoutstanding quality.©Johnson & Johnson 2017

Caring for the world, one person at a time…
inspires and unites the people of